UNITED STATES
SECURITIES AND EXCHANGE COMMISSION
Washington, D.C. 20549
FORM N-CSR
CERTIFIED SHAREHOLDER REPORT OF REGISTERED MANAGEMENT
INVESTMENT COMPANIES
Investment Company
Act file number: 811-06500
Name of Fund: BlackRock MuniYield New York Quality Fund, Inc. (MYN)
Fund Address: 100 Bellevue Parkway, Wilmington, DE 19809
Name and address of agent for service: John M. Perlowski, Chief Executive Officer, BlackRock MuniYield New York Quality Fund, Inc., 50 Hudson Yards, New York,
NY 10001
Registrant’s telephone number, including area code: (800) 882-0052, Option 4
Date of fiscal year end: 07/31/2024
Date of reporting period:
07/31/2024
| Item 1 – |
Reports to Stockholders |
(a) The Reports to Shareholders are attached herewith.
July 31, 2024
BlackRock MuniHoldings New Jersey Quality Fund, Inc. (MUJ) |
BlackRock MuniHoldings New York Quality Fund, Inc. (MHN) |
BlackRock MuniYield Michigan Quality Fund, Inc. (MIY) |
BlackRock MuniYield New York Quality Fund, Inc. (MYN) |
BlackRock MuniYield Pennsylvania Quality Fund (MPA) |
BlackRock New York Municipal Income Trust (BNY) |
BlackRock Virginia Municipal Bond Trust (BHV) |
Not FDIC Insured • May Lose Value • No Bank Guarantee |
Municipal Market Overview For the Reporting Period Ended July 31, 2024
Municipal Market Conditions
Municipals struggled at the start of the period as recent
monetary policy tightening—in which the U.S. Federal Reserve (the “Fed”) raised the Fed Funds rate to 5.25%−5.50%—weighed on the
market. However, after the Fed paused in September, falling inflation and weakening economic growth quickly led to more dovish expectations, causing a strong
interest rate rally into year-end. As a result, municipals posted their strongest performance since the mid-1980s during the fourth quarter of 2023. Since,
economic data has weakened slower than expected and the Fed has remained on hold, prompting mixed performance and increased volatility throughout most of 2024. Lower-rated
credits and the long-end of the yield curve performed best during the period.
Bloomberg Municipal Bond Index(a)
|
Total Returns as of July 31, 2024 |
| |
|
|
| |
|
|
During the 12-months ended July 31, 2024, municipal bond funds experienced net outflows totaling $12 billion (based on data from the Investment Company Institute), as demand shifted from funds to individual bonds and ETFs. At the same time, the market absorbed $434 billion in issuance, a large increase from the $323 billion issued during the prior 12-month period, boosted by increased borrowing needs from issuers on the back of slowing revenue growth, less
fiscal stimulus, and pent-up demand.
AAA Municipal Yield Curves
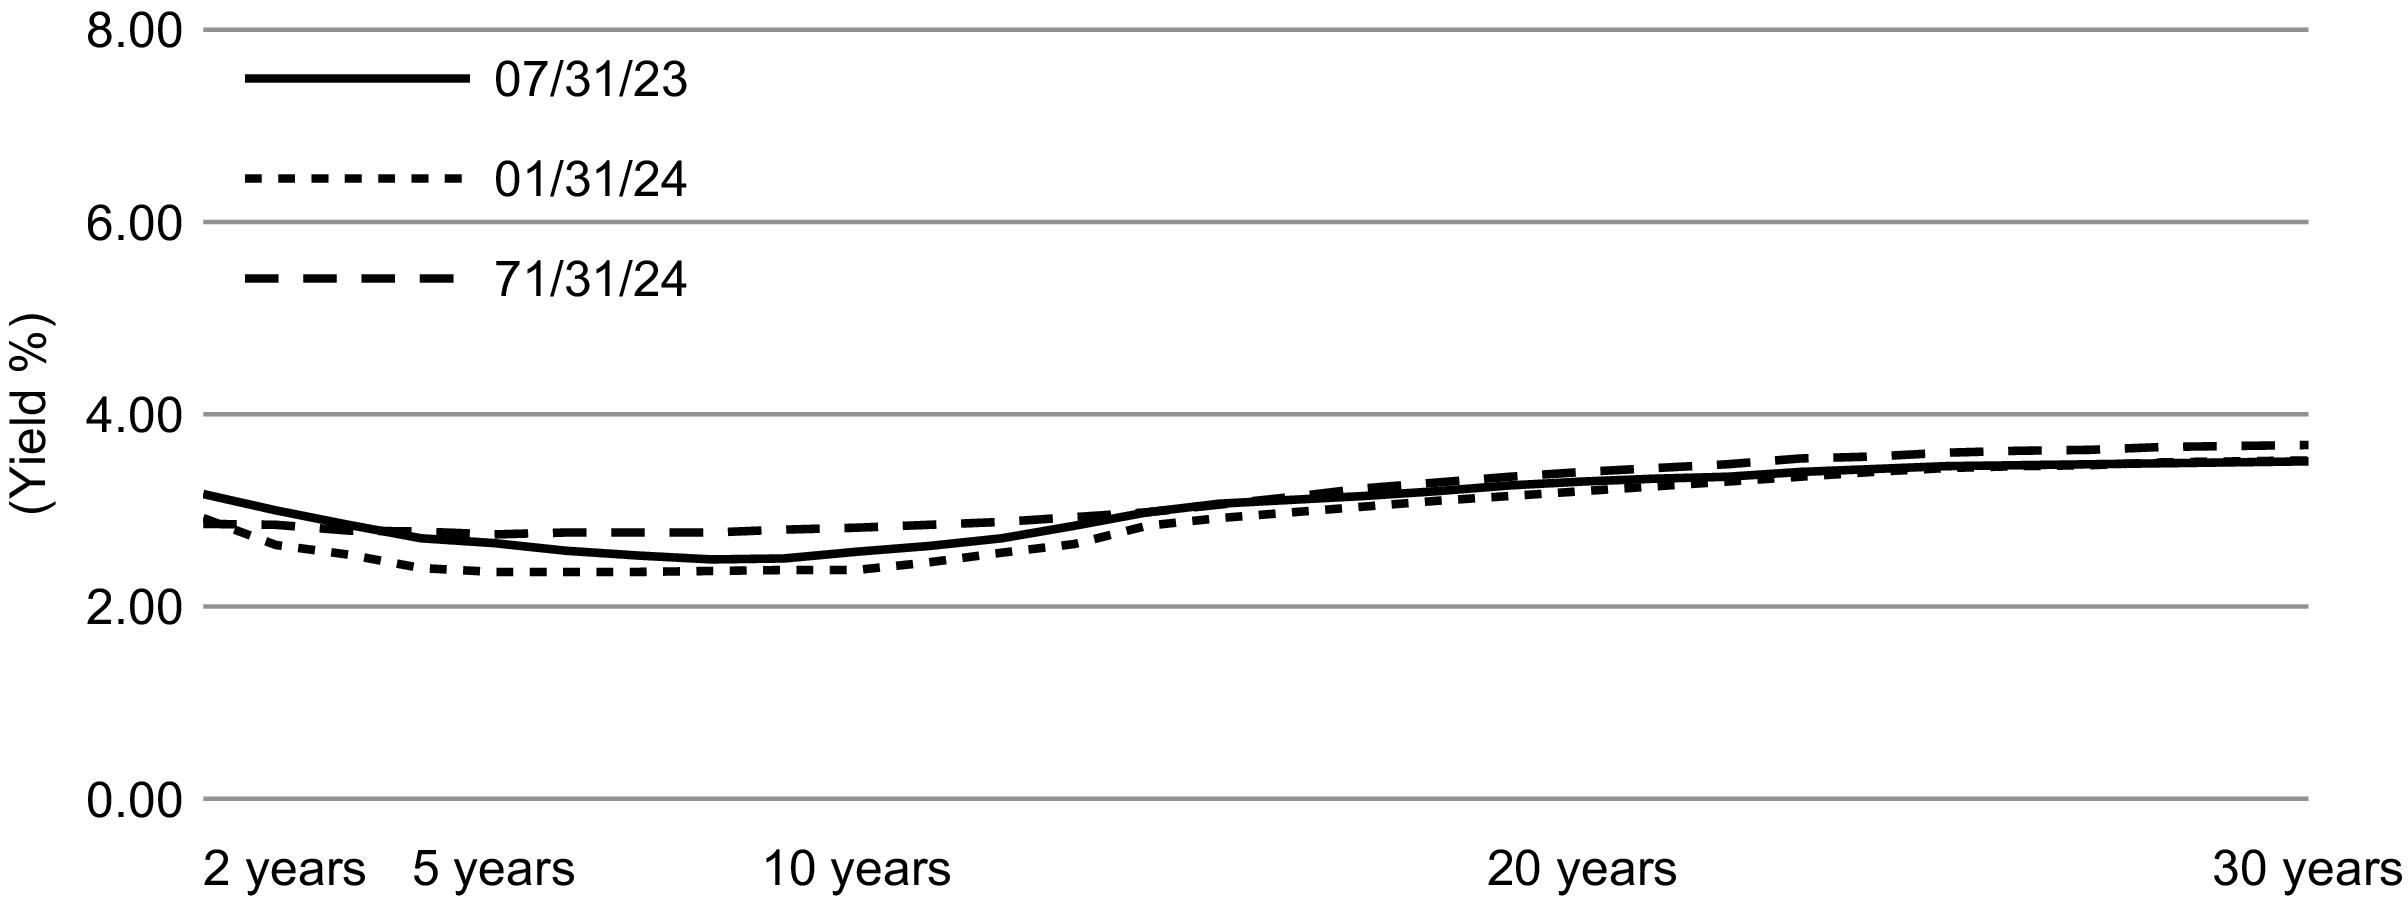
Source: Thomson Municipal Market Data.
From July 31, 2023, to July 31, 2024,
yields on AAA-rated 30-year municipal bonds increased by 17 basis points (bps) from 3.51% to 3.68%, ten-year yields increased by 25 bps from 2.57% to 2.82%, five-year yields increased by 9 bps
from 2.66% to 2.75%, and two-year yields decreased by 15 bps from 3.00% to 2.85% (as measured by Refinitiv Municipal Market Data). As a result, the
municipal yield curve steepened over the 12-month period with the spread between two- and 30-year maturities steepening by 32 bps to a slope of 83 bps, significantly
steeper than the U.S. Treasury curve.
Outperformance throughout the period kept relative valuations at historically rich levels, and municipal-to-Treasury ratios ended well through their five-year averages across
the curve, limiting interest from crossover investors.
Financial Conditions of Municipal Issuers
With reserves at all-time highs, debt service burden near a 50-year low, and a strong equity market fortifying pension plans, states are well-positioned to weather a
potential economic slowdown. Tax receipts have normalized with two consecutive quarters of positive growth; however, expenditures remain elevated due to
inflation. Forty-six states began their new fiscal year in July, with only three states—Massachusetts, Pennsylvania, and South Carolina—starting
without a budget, though none experienced significant disruptions. We believe the fundamental outlook remains stable for states. Local governments and school
districts are particularly well situated since they continue to benefit from the strength in the U.S. residential housing market.
Regarding revenue sectors, no subsector is immune to an economic
contraction; however, most municipal issuers are ultra-defensive since they provide essential services and can raise user fees or taxes to cover operations.
Across all municipal sectors, borrowing has increased dramatically in 2024, primarily as issuers address deferred maintenance. With the uncertainty surrounding
the election, we anticipate the spike in issuance will continue, providing better options in the second half of 2024 to buy solid credits in the primary market or discounted
names in the secondary market.
The opinions
expressed are those of BlackRock as of July 31, 2024 and are subject to change at any time due to changes in market or economic conditions. The comments should not be
construed as a recommendation of any individual holdings or market sectors. Investing involves risk including loss of principal. Bond values fluctuate in price so the value
of your investment can go down depending on market conditions. Fixed income risks include interest-rate and credit risk. Typically, when interest rates rise, there is a
corresponding decline in bond values. Credit risk refers to the possibility that the bond issuer will not be able to make principal and interest payments. There may be
less information on the financial condition of municipal issuers than for public corporations. The market for municipal bonds may be less liquid than for taxable bonds. Some
investors may be subject to Alternative Minimum Tax (“AMT”). Capital gains distributions, if any, are taxable.
(a)
The Bloomberg Municipal Bond Index, a broad, market value-weighted index, seeks to
measure the performance of the U.S. municipal bond market. All bonds in the index are exempt from U.S. federal income taxes or subject to the AMT. Past performance is not an
indication of future results. Index performance is shown for illustrative purposes only. It is not possible to invest directly in an index.
Municipal Market Overview
3
The Benefits and Risks
of Leveraging
The Funds may utilize leverage to seek
to enhance the distribution rate on, and net asset value (“NAV”) of, their common shares (“Common Shares”). However, there is no guarantee that these
objectives can be achieved in all interest rate environments.
In general, the concept of leveraging is based on the premise that the financing cost of leverage, which is based on short-term interest rates, is normally lower than the
income earned by a Fund on its longer-term portfolio investments purchased with the proceeds from leverage. To the extent that the total assets of each Fund
(including the assets obtained from leverage) are invested in higher-yielding portfolio investments, each Fund’s shareholders benefit from the incremental net income. The interest earned on securities purchased with the proceeds from leverage (after paying the leverage costs) is paid to shareholders in the form of dividends, and the value of these portfolio
holdings (less the leverage liability) is reflected in the per share NAV.
To illustrate these concepts, assume a Fund’s Common Shares capitalization is $100 million and it utilizes leverage for an additional $30 million, creating a total value of $130 million available for investment in longer-term income securities. If prevailing short-term interest rates are 3% and longer-term interest rates are 6%, the yield
curve has a strongly positive slope. In this case, a Fund’s financing costs on the $30 million of proceeds obtained from leverage are based on the lower short-term interest rates. At the same time, the securities purchased by a Fund with the proceeds from leverage earn income based on longer-term interest rates. In this case, a Fund’s financing cost of leverage is significantly lower than the income earned on a Fund’s longer-term investments acquired from such leverage proceeds, and therefore the holders of Common Shares
(“Common Shareholders”) are the beneficiaries of the incremental net income.
However, in order to benefit Common Shareholders, the return on assets purchased with leverage proceeds must exceed the ongoing costs associated with the leverage. If
interest and other costs of leverage exceed a Fund’s return on assets purchased with leverage proceeds, income to shareholders is lower than if a Fund had not used leverage. In such circumstance, the investment adviser may nevertheless determine to maintain a
Fund’s leverage if it deems such action to be appropriate. Furthermore, the value of the Funds’ portfolio investments generally varies inversely with the direction of long-term interest rates, although other factors can influence the value of
portfolio investments. In contrast, the amount of each Fund’s obligations under its respective leverage arrangement generally does not fluctuate in relation to interest rates. As a result, changes in interest rates can influence the Funds’ NAVs positively or negatively. Changes in the future direction of interest rates are very difficult to predict accurately, and
there is no assurance that a Fund’s intended leveraging strategy will be successful.
The use of leverage also generally causes greater changes in each Fund’s NAV, market price and dividend rates than comparable portfolios without leverage. In a declining
market, leverage is likely to cause a greater decline in the NAV and market price of a Fund’s Common Shares than if the Fund were not leveraged. In
addition, each Fund may be required to sell portfolio securities at inopportune times or at distressed values in order to comply with regulatory requirements
applicable to the use of leverage or as required by the terms of leverage instruments, which may cause the Fund to incur losses. The use of leverage may limit
a Fund’s ability to invest in certain types of securities or use certain types of hedging strategies. Each Fund incurs expenses in connection with the
use of leverage, all of which are borne by Common Shareholders and may reduce income to the Common Shares. Moreover, to the extent the calculation of each
Fund’s investment advisory fees includes assets purchased with the proceeds of leverage, the
investment advisory fees payable to the Funds’ investment adviser will be higher than if the Funds did not use leverage.
To obtain leverage, each Fund has issued Variable Rate Demand
Preferred Shares (“VRDP Shares” or “Preferred Shares”) and/or leveraged its assets through the use of tender option bond trusts (“TOB
Trusts”) as described in the Notes to Financial Statements.
Under the Investment Company Act of 1940, as amended (the “1940 Act”), each Fund is permitted to borrow money (including through the use of TOB Trusts) or issue
debt securities up to 33 1/3% of its total managed assets or equity securities (e.g., Preferred Shares) up to 50% of its total managed assets. A Fund may
voluntarily elect to limit its leverage to less than the maximum amount permitted under the 1940 Act. In addition, a Fund may also be subject to certain asset
coverage, leverage or portfolio composition requirements imposed by the Preferred Shares’ governing instruments or by agencies rating the Preferred
Shares, which may be more stringent than those imposed by the 1940 Act.
Derivative Financial Instruments
The Funds may invest in various derivative financial instruments.
These instruments are used to obtain exposure to a security, commodity, index, market, and/or other assets without owning or taking physical custody of
securities, commodities and/or other referenced assets or to manage market, equity, credit, interest rate, foreign currency exchange rate, commodity and/or
other risks. Derivative financial instruments may give rise to a form of economic leverage and involve risks, including the imperfect correlation between the
value of a derivative financial instrument and the underlying asset, possible default of the counterparty to the transaction or illiquidity of the instrument.
Pursuant to Rule 18f-4 under the 1940 Act, among other things, the Funds must either use derivative financial instruments with embedded leverage in a limited
manner or comply with an outer limit on fund leverage risk based on value-at-risk. The Funds’ successful use of a derivative financial instrument depends on the investment adviser’s ability to predict pertinent market movements accurately, which cannot be assured. The use of these instruments may result in losses greater than if they had not been used,
may limit the amount of appreciation a Fund can realize on an investment and/or may result in lower distributions paid to shareholders. The Funds’
investments in these instruments, if any, are discussed in detail in the Notes to Financial Statements.
4 2024 BlackRock
Annual Report to Shareholders
Fund
Summary as of July 31, 2024
BlackRock MuniHoldings New Jersey Quality Fund, Inc. (MUJ)
Investment Objective
BlackRock MuniHoldings New Jersey Quality Fund,
Inc.’s (MUJ) (the “Fund”) investment objective is to provide shareholders with current income exempt from U.S. federal
income tax and New Jersey personal income taxes. The Fund seeks to achieve its investment objective by investing primarily in long-term, investment grade
municipal obligations exempt from U.S federal income taxes (except that the interest may be subject to the U.S. federal alternative minimum tax) and New Jersey
personal income taxes. The municipal obligations in which the Fund primarily invests are either rated investment grade quality, or are considered by the
Fund’s investment adviser to be of comparable quality, at the time of investment. Under normal market conditions, the Fund invests at least 80% of its
assets in municipal obligations with remaining maturities of one year or more at the time of investment. The Fund may invest up to 20% of its managed assets in
securities that are rated below investment grade, or are considered by the Fund’s investment adviser to be of comparable quality, at the time of purchase. The Fund may
invest directly in securities or synthetically through the use of derivatives.
No assurance can be given that the Fund’s investment objective will be achieved.
Symbol on New York Stock Exchange |
|
| |
|
Yield on Closing Market Price as of July 31, 2024 ($11.57)(a) |
|
|
|
|
Current Monthly Distribution per Common Share(c) |
|
Current Annualized Distribution per Common
Share(c) |
|
Leverage as of July 31, 2024(d) |
|
| |
Yield on closing market price is calculated by dividing the current annualized distribution per share by the closing market price. Past performance is not an indication
of future results. |
| |
Tax equivalent yield assumes the maximum marginal U.S. federal and state tax rate of 51.55%, which includes the 3.8% Medicare tax. Actual tax rates will vary based on
income, exemptions and deductions. Lower taxes will result in lower tax equivalent
yields. |
| |
The monthly distribution per Common Share, declared on September 12, 2024, was increased to $0.054000 per share. The yield on closing market price, tax equivalent
yield, current monthly distribution per Common Share, and current annualized
distribution per Common Share do not reflect the new distribution rate. The new distribution rate is not constant and is subject to change in the future. A portion of the distribution may be deemed a return of capital or net realized gain. |
| |
Represents VRDP Shares and TOB Trusts as a percentage of total managed assets, which is the total assets of the Fund, including any assets attributable to VRDP Shares
and TOB Trusts, minus the sum of its accrued liabilities. Does not reflect
derivatives or other instruments that may give rise to economic leverage. For a discussion of leveraging techniques utilized by the Fund, please see The Benefits and Risks of Leveraging and Derivative Financial Instruments. |
Market Price and Net Asset Value Per Share Summary
GROWTH OF $10,000 INVESTMENT

(a)
Represents the Fund’s closing market price on the NYSE and reflects the reinvestment of dividends and/or distributions at actual reinvestment prices.
(b)
An unmanaged index that tracks the U.S. long term tax-exempt bond market, including state and local general obligation bonds, revenue bonds, pre-refunded bonds, and insured
bonds.
Fund
Summary as of July 31,
2024(continued)
BlackRock MuniHoldings New Jersey Quality Fund, Inc. (MUJ)
Performance
Returns for the period ended July 31, 2024 were as
follows:
| |
Average Annual Total Returns |
| |
|
|
|
| |
|
|
|
Fund at Market Price(a)(b) |
|
|
|
New Jersey Customized Reference Benchmark(c) |
|
|
|
Bloomberg Municipal Bond Index |
|
|
|
| |
All returns reflect reinvestment of dividends and/or distributions at actual reinvestment prices. Performance results reflect the Fund’s use of leverage, if
any. |
| |
The Fund’s discount to NAV narrowed during the period, which accounts for the difference between performance based on market price and performance based on NAV.
|
| |
The New Jersey Customized Reference Benchmark is comprised of the Bloomberg Municipal Bond: New Jersey Exempt Total Return Index Unhedged (90%) and the New
Jersey Bloomberg Municipal Bond: High Yield (non-Investment Grade) Total Return Index
(10%). The New Jersey Customized Reference Benchmark commenced on September 30,
2016. |
Performance results may include adjustments made for financial reporting purposes in accordance with U.S. generally
accepted accounting principles.
Past performance is not an indication of future results.
The Fund is presenting the performance of one or more indices for
informational purposes only. The Fund is actively managed and does not
seek to track or replicate the performance of any index. The index performance shown is not intended to be indicative of the Fund’s investment
strategies, portfolio components or past or future performance.
More information about the Fund’s historical performance can be found in the “Closed End Funds” section of blackrock.com.
The following discussion relates to the Fund’s absolute
performance based on NAV:
The municipal bond
market gained ground during the reporting period, with income playing the largest role in total returns. Municipal bonds were also well supported by positive economic growth,
strong issuer fundamentals, and favorable supply-and-demand conditions.
Consistent with trends in the broader market, income was the largest contributor to Fund performance. The Fund’s allocation to high yield (below investment-grade)
bonds was a key contributor, as the category outperformed on the strength of its above-average income and tightening yield spreads. Puerto Rico issues were
notable outperformers in high yield. Holdings in the A and BBB categories (the lower end of the investment-grade space), helped performance, as well. At the
sector level, tax-backed and education issues stood out as contributors. Yield curve positioning also helped results. A large percentage of the Fund is held in
longer maturities, which outperformed the front and intermediate parts of the curve.
The Fund continued to use leverage, but the benefit was dampened by increased borrowing costs brought about by the high-rate environment.
The Fund’s cash position was above typical levels at
the close of the period. The state of New Jersey has improved its budget deficits and reduced its debt outstanding, which has led to lower state-specific
supply. With fewer opportunities to source attractive New Jersey tax-exempt bonds, the Fund held a higher cash reserve than it did in the past. However, the cash balance is
earned an attractive yield on a historical basis and was less of a drag on performance than it would have been when interest rates were near zero.
The views expressed reflect the opinions of BlackRock as of the date of this report and are subject to change based on changes in market, economic or other conditions.
These views are not intended to be a forecast of future events and are no guarantee of future results.
6 2024 BlackRock
Annual Report to Shareholders
Fund
Summary as of July 31,
2024(continued)
BlackRock MuniHoldings New Jersey Quality Fund, Inc. (MUJ)
Overview of the Fund’s Total Investments
| |
| |
|
| |
|
| |
|
| |
|
County/City/Special District/School District |
|
| |
|
| |
|
| |
|
| |
|
| |
|
| |
Calendar Year Ended December 31,(c) |
|
| |
|
| |
|
| |
|
| |
|
| |
|
CREDIT QUALITY ALLOCATION |
| |
|
| |
|
| |
|
| |
|
| |
|
| |
|
| |
|
| |
|
| |
For purposes of this report, sector sub-classifications may differ from those utilized for compliance purposes. |
| |
Excludes short-term securities. |
| |
Scheduled maturity dates and/or bonds that are subject to potential calls by issuers over the next five years. |
| |
For purposes of this report, credit quality ratings shown above reflect the highest rating assigned by either S&P Global Ratings or Moody’s Investors Service,
Inc. if ratings differ. These rating agencies are independent, nationally
recognized statistical rating organizations and are widely used. Investment grade ratings are credit ratings of BBB/Baa or higher. Below investment grade ratings are credit ratings of BB/Ba or lower. Investments designated N/R are not rated by either rating agency. Unrated investments do not necessarily indicate low
credit quality. Credit quality ratings are subject to change.
|
| |
The investment adviser evaluates the credit quality of unrated investments based upon certain factors including, but not limited to, credit ratings for similar
investments and financial analysis of sectors and individual investments.
Using this approach, the investment adviser has deemed certain of these unrated securities as investment grade quality. As of July 31, 2024, the market value of unrated securities deemed by the investment adviser to be investment grade represents 1.5% of total investments. |
Fund
Summary as of July 31, 2024
BlackRock MuniHoldings New York Quality Fund, Inc. (MHN)
Investment Objective
BlackRock MuniHoldings New York Quality Fund,
Inc.’s (MHN) (the “Fund”) investment objective is to provide shareholders with current income exempt from U.S. federal
income tax and New York State and New York City personal income taxes. The Fund seeks to achieve its investment objective by investing, under normal market
conditions, at least 80% of its assets in investment grade (as rated or, if unrated, considered to be of comparable quality at the time of investment by the
Fund’s investment adviser) New York municipal obligations exempt from U.S. federal income taxes (except that the interest may be subject to the U.S. federal alternative minimum tax) and New York State
and New York City personal income taxes (“New York Municipal Bonds”), except at times when, in the judgment of its investment adviser, New York
Municipal Bonds of sufficient quality and quantity are unavailable for investment by the Fund. At all times, except during temporary defensive periods, the
Fund invests at least 65% of its assets in New York Municipal Bonds. The Fund invests, under normal market conditions, at least 80% of its assets in municipal
obligations with remaining maturities of one year or more. The Fund may invest up to 20% of its managed assets in securities that are rated below
investment grade, or are considered by BlackRock to be of comparable quality, at the time of purchase. The Fund may invest directly in such securities or synthetically
through the use of derivatives.
No assurance can be given that
the Fund’s investment objective will be achieved.
Symbol on New York Stock Exchange |
|
| |
|
Yield on Closing Market Price as of July 31, 2024 ($10.77)(a) |
|
|
|
|
Current Monthly Distribution per Common Share(c) |
|
Current Annualized Distribution per Common
Share(c) |
|
Leverage as of July 31, 2024(d) |
|
| |
Yield on closing market price is calculated by dividing the current annualized distribution per share by the closing market price. Past performance is not an indication
of future results. |
| |
Tax equivalent yield assumes the maximum marginal U.S. federal and state tax rate of 51.7%, which includes the 3.8% Medicare tax. Actual tax rates will vary based on
income, exemptions and deductions. Lower taxes will result in lower tax equivalent
yields. |
| |
The monthly distribution per Common Share, declared on September 12, 2024, was increased to $0.051500 per share. The yield on closing market price, tax equivalent
yield, current monthly distribution per Common Share, and current annualized
distribution per Common Share do not reflect the new distribution rate. The new distribution rate is not constant and is subject to change in the future. A portion of the distribution may be deemed a return of capital or net realized gain. |
| |
Represents VRDP Shares and TOB Trusts as a percentage of total managed assets, which is the total assets of the Fund, including any assets attributable to VRDP Shares
and TOB Trusts, minus the sum of its accrued liabilities. Does not reflect
derivatives or other instruments that may give rise to economic leverage. For a discussion of leveraging techniques utilized by the Fund, please see The Benefits and Risks of Leveraging and Derivative Financial Instruments. |
Market Price and Net Asset Value Per Share Summary
GROWTH OF $10,000 INVESTMENT

(a)
Represents the Fund’s closing market price on the NYSE and reflects the reinvestment of dividends and/or distributions at actual reinvestment prices.
(b)
An unmanaged index that tracks the U.S. long term tax-exempt bond market, including state and local general obligation bonds, revenue bonds, pre-refunded bonds, and insured
bonds.
8 2024 BlackRock
Annual Report to Shareholders
Fund
Summary as of July 31,
2024(continued)
BlackRock MuniHoldings New York Quality Fund, Inc. (MHN)
Performance
Returns for the period ended July 31, 2024 were as
follows:
| |
Average Annual Total Returns |
| |
|
|
|
| |
|
|
|
Fund at Market Price(a)(b) |
|
|
|
New York Customized Reference Benchmark(c) |
|
|
|
Bloomberg Municipal Bond Index |
|
|
|
| |
All returns reflect reinvestment of dividends and/or distributions at actual reinvestment prices. Performance results reflect the Fund’s use of leverage, if
any. |
| |
The Fund’s discount to NAV narrowed during the period, which accounts for the difference between performance based on market price and performance based on NAV.
|
| |
The New York Customized Reference Benchmark is comprised of the Bloomberg Municipal Bond: New York Exempt Total Return Index Unhedged (90%) and the New York Bloomberg
Municipal Bond: High Yield (non-Investment Grade) Total Return Index (10%). The New
York Customized Reference Benchmark commenced on September 30, 2016. |
Performance results may include adjustments made for financial reporting purposes in accordance with U.S. generally
accepted accounting principles.
Past performance is not an indication of future results.
The Fund is presenting the performance of one or more indices for
informational purposes only. The Fund is actively managed and does not
seek to track or replicate the performance of any index. The index performance shown is not intended to be indicative of the Fund’s investment
strategies, portfolio components or past or future performance.
More information about the Fund’s historical performance can be found in the “Closed End Funds” section of blackrock.com.
The following discussion relates to the Fund’s absolute
performance based on NAV:
The municipal bond
market gained ground during the reporting period, with income playing the largest role in total returns. Municipal bonds were also well supported by positive economic growth,
strong issuer fundamentals, and favorable supply-and-demand conditions.
Consistent with trends in the broader market, income was the largest contributor to Fund performance. In terms of credit tiers, AA rated bonds were the most notable contributors due to their large weighting in the New York municipal market. BBB rated securities, which consisted mainly of holdings in the transportation and higher
education sectors, also performed well. Holdings in the tax-backed sector further contributed, as did positions in Puerto Rico. Yield curve positioning also
helped performance. A large percentage of the Fund is held in longer-maturities, which outperformed the front and intermediate parts of the curve.
The Fund’s use of U.S. Treasury futures to manage interest
rate risk detracted from performance. The Fund continued to use leverage, but the benefit was dampened by increased borrowing costs brought about by the high-rate
environment. A long duration positioning detracted, as well. (Duration is a measure of interest rate sensitivity.)
The views expressed reflect the opinions of BlackRock as of the date of this report and are subject to change based on changes in market, economic or other conditions.
These views are not intended to be a forecast of future events and are no guarantee of future results.
Fund
Summary as of July 31,
2024(continued)
BlackRock MuniHoldings New York Quality Fund, Inc. (MHN)
Overview of the Fund’s Total Investments
| |
| |
|
| |
|
County/City/Special District/School District |
|
| |
|
| |
|
| |
|
| |
|
| |
|
| |
|
| |
|
| |
Calendar Year Ended December 31,(c) |
|
| |
|
| |
|
| |
|
| |
|
| |
|
CREDIT QUALITY ALLOCATION |
| |
|
| |
|
| |
|
| |
|
| |
|
| |
|
| |
|
| |
|
| |
For purposes of this report, sector sub-classifications may differ from those utilized for compliance purposes. |
| |
Excludes short-term securities. |
| |
Scheduled maturity dates and/or bonds that are subject to potential calls by issuers over the next five years. |
| |
For purposes of this report, credit quality ratings shown above reflect the highest rating assigned by either S&P Global Ratings or Moody’s Investors Service,
Inc. if ratings differ. These rating agencies are independent, nationally
recognized statistical rating organizations and are widely used. Investment grade ratings are credit ratings of BBB/Baa or higher. Below investment grade ratings are credit ratings of BB/Ba or lower. Investments designated N/R are not rated by either rating agency. Unrated investments do not necessarily indicate low
credit quality. Credit quality ratings are subject to change.
|
| |
The investment adviser evaluates the credit quality of unrated investments based upon certain factors including, but not limited to, credit ratings for similar
investments and financial analysis of sectors and individual investments.
Using this approach, the investment adviser has deemed certain of these unrated securities as investment grade quality. As of July 31, 2024, the market value of unrated securities deemed by the investment adviser to be investment grade represents 1.2% of total investments. |
10 2024 BlackRock
Annual Report to Shareholders
Fund
Summary as of July 31, 2024
BlackRock MuniYield Michigan Quality Fund, Inc. (MIY)
Investment Objective
BlackRock MuniYield Michigan Quality Fund,
Inc.’s (MIY) (the “Fund”) investment objective is to provide shareholders with as high a level of current income exempt from
U.S. federal and Michigan income taxes as is consistent with its investment policies and prudent investment management. The Fund seeks to achieve its
investment objective by investing at least 80% of its assets in municipal obligations exempt from U.S. federal income taxes (except that the interest may be
subject to the U.S. federal alternative minimum tax) and Michigan income taxes. Under normal market conditions, the Fund invests primarily in long-term
municipal obligations that are investment grade quality, or are considered by the Fund’s investment adviser to be of comparable quality, at the time of
investment. The Fund may invest up to 20% of its managed assets in securities that are rated below investment grade, or are considered by the Fund’s
investment adviser to be of comparable quality, at the time of purchase. The Fund may invest directly in securities or synthetically through the use of
derivatives.
No assurance can be given that the Fund’s
investment objective will be achieved.
On
October 30, 2023, the Board of Directors of the Fund and the Board of Directors of BlackRock MuniYield Quality Fund III (MYI) announced the withdrawal of the merger proposal
that was previously approved by the Boards pursuant to which the Fund would have been merged into MYI, with MYI continuing as the surviving Fund.
Symbol on New York Stock Exchange |
|
| |
|
Yield on Closing Market Price as of July 31, 2024 ($11.61)(a) |
|
|
|
|
Current Monthly Distribution per Common Share(c) |
|
Current Annualized Distribution per Common
Share(c) |
|
Leverage as of July 31, 2024(d) |
|
| |
Yield on closing market price is calculated by dividing the current annualized distribution per share by the closing market price. Past performance is not an indication
of future results. |
| |
Tax equivalent yield assumes the maximum marginal U.S. federal and state tax rate of 45.05%, which includes the 3.8% Medicare tax. Actual tax rates will vary based on
income, exemptions and deductions. Lower taxes will result in lower tax equivalent
yields. |
| |
The monthly distribution per Common Share, declared on September 12, 2024, was increased to $0.054500 per share. The yield on closing market price, tax equivalent
yield, current monthly distribution per Common Share, and current annualized
distribution per Common Share do not reflect the new distribution rate. The new distribution rate is not constant and is subject to change in the future. A portion of the distribution may be deemed a return of capital or net realized gain. |
| |
Represents VRDP Shares and TOB Trusts as a percentage of total managed assets, which is the total assets of the Fund, including any assets attributable to VRDP Shares
and TOB Trusts, minus the sum of its accrued liabilities. Does not reflect
derivatives or other instruments that may give rise to economic leverage. For a discussion of leveraging techniques utilized by the Fund, please see The Benefits and Risks of Leveraging and Derivative Financial Instruments. |
Market Price and Net Asset Value Per Share Summary
GROWTH OF $10,000 INVESTMENT

(a)
Represents the Fund’s closing market price on the NYSE and reflects the reinvestment of dividends and/or distributions at actual reinvestment prices.
(b)
An unmanaged index that tracks the U.S. long term tax-exempt bond market, including state and local general obligation bonds, revenue bonds, pre-refunded bonds, and insured
bonds.
Fund
Summary as of July 31,
2024(continued)
BlackRock MuniYield Michigan Quality Fund, Inc. (MIY)
Performance
Returns for the period ended July 31, 2024 were as
follows:
| |
Average Annual Total Returns |
| |
|
|
|
| |
|
|
|
Fund at Market Price(a)(b) |
|
|
|
Michigan Customized Reference Benchmark(c) |
|
|
|
Bloomberg Municipal Bond Index |
|
|
|
| |
All returns reflect reinvestment of dividends and/or distributions at actual reinvestment prices. Performance results reflect the Fund’s use of leverage, if
any. |
| |
The Fund’s discount to NAV narrowed during the period, which accounts for the difference between performance based on market price and performance based on NAV.
|
| |
The Michigan Customized Reference Benchmark is comprised of the Bloomberg Municipal Bond: Michigan Exempt Total Return Index Unhedged (90%) and the Michigan Bloomberg
Municipal Bond: High Yield (non-Investment Grade) Total Return Index (10%). The
Michigan Customized Reference Benchmark commenced on September 30, 2016. |
Performance results may include adjustments made for financial reporting purposes in accordance with U.S. generally accepted accounting principles.
Past performance is not an indication of future results.
The Fund is presenting the performance of one or more indices for informational purposes only. The Fund is actively managed and does not seek to track or replicate the performance of any index. The index performance shown is not intended to be indicative of the Fund’s investment strategies, portfolio components or past or future
performance.
More information about the Fund’s historical performance can be found in the “Closed End Funds” section of blackrock.com.
The following discussion relates to the Fund’s absolute
performance based on NAV:
The municipal bond
market gained ground during the reporting period, with income playing the largest role in total returns. Municipal bonds were also well supported by positive economic growth,
strong issuer fundamentals, and favorable supply-and-demand trends.
The Fund benefited from the contribution from income at a time of elevated yields, as well as tightening credit spreads. Together, these factors helped offset the adverse
effect of rising U.S. Treasury yields. (Prices and yields move in opposite directions.)
Positions in lower-quality securities and longer-dated bonds
(those with maturities of 20 to 25 years) also contributed positively. In terms of sectors, tax-backed state issues made the largest contributions.
The Fund continued to use leverage, but the benefit was dampened by increased
borrowing costs brought about by the high-rate environment.
The views expressed reflect the
opinions of BlackRock as of the date of this report and are subject to change based on changes in market, economic or other conditions.
These views are not intended to be
a forecast of future events and are no guarantee of future results.
12 2024 BlackRock
Annual Report to Shareholders
Fund
Summary as of July 31,
2024(continued)
BlackRock MuniYield Michigan Quality Fund, Inc. (MIY)
Overview of the Fund’s Total Investments
| |
| |
|
County/City/Special District/School District |
|
| |
|
| |
|
| |
|
| |
|
| |
|
| |
|
| |
|
| |
|
| |
Calendar Year Ended December 31,(c) |
|
| |
|
| |
|
| |
|
| |
|
| |
|
CREDIT QUALITY ALLOCATION |
| |
|
| |
|
| |
|
| |
|
| |
|
| |
|
| |
For purposes of this report, sector sub-classifications may differ from those utilized for compliance purposes. |
| |
Excludes short-term securities. |
| |
Scheduled maturity dates and/or bonds that are subject to potential calls by issuers over the next five years. |
| |
For purposes of this report, credit quality ratings shown above reflect the highest rating assigned by either S&P Global Ratings or Moody’s Investors Service,
Inc. if ratings differ. These rating agencies are independent, nationally
recognized statistical rating organizations and are widely used. Investment grade ratings are credit ratings of BBB/Baa or higher. Below investment grade ratings are credit ratings of BB/Ba or lower. Investments designated N/R are not rated by either rating agency. Unrated investments do not necessarily indicate low
credit quality. Credit quality ratings are subject to change.
|
| |
The investment adviser evaluates the credit quality of unrated investments based upon certain factors including, but not limited to, credit ratings for similar
investments and financial analysis of sectors and individual investments.
Using this approach, the investment adviser has deemed certain of these unrated securities as investment grade quality. As of July 31, 2024, the market value of unrated securities deemed by the investment adviser to be investment grade represents 2.8% of total investments. |
Fund
Summary as of July 31, 2024
BlackRock MuniYield New York Quality Fund, Inc. (MYN)
Investment Objective
BlackRock MuniYield New York Quality Fund,
Inc.’s (MYN) (the “Fund”) investment objective is to provide shareholders with as high a level of current income exempt from
U.S. federal income taxes and New York State and New York City personal income taxes as is consistent with its investment policies and prudent investment
management. The Fund seeks to achieve its investment objective by investing at least 80% of its assets in municipal obligations exempt from U.S. federal income
taxes (except that the interest may be subject to the U.S. federal alternative minimum tax) and New York State and New York City personal income taxes. Under
normal market conditions, the Fund invests primarily in long-term municipal obligations that are investment grade quality, or are considered by the
Fund’s investment adviser to be of comparable quality, at the time of investment. The Fund may invest up to 20% of its managed assets in securities that
are rated below investment grade, or are considered by the Fund’s investment adviser to be of comparable quality, at the time of purchase. The Fund may invest directly
in securities or synthetically through the use of derivatives.
No assurance can be given that the Fund’s investment objective will be achieved.
Symbol on New York Stock Exchange |
|
| |
|
Yield on Closing Market Price as of July 31, 2024 ($10.58)(a) |
|
|
|
|
Current Monthly Distribution per Common Share(c) |
|
Current Annualized Distribution per Common
Share(c) |
|
Leverage as of July 31, 2024(d) |
|
| |
Yield on closing market price is calculated by dividing the current annualized distribution per share by the closing market price. Past performance is not an indication
of future results. |
| |
Tax equivalent yield assumes the maximum marginal U.S. federal and state tax rate of 51.7%, which includes the 3.8% Medicare tax. Actual tax rates will vary based on
income, exemptions and deductions. Lower taxes will result in lower tax equivalent
yields. |
| |
The monthly distribution per Common Share, declared on September 12, 2024, was increased to $0.051200 per share. The yield on closing market price, tax equivalent
yield, current monthly distribution per Common Share, and current annualized
distribution per Common Share do not reflect the new distribution rate. The new distribution rate is not constant and is subject to change in the future. A portion of the distribution may be deemed a return of capital or net realized gain. |
| |
Represents VRDP Shares and TOB Trusts as a percentage of total managed assets, which is the total assets of the Fund, including any assets attributable to VRDP Shares
and TOB Trusts, minus the sum of its accrued liabilities. Does not reflect
derivatives or other instruments that may give rise to economic leverage. For a discussion of leveraging techniques utilized by the Fund, please see The Benefits and Risks of Leveraging and Derivative Financial Instruments. |
Market Price and Net Asset Value Per Share Summary
GROWTH OF $10,000 INVESTMENT

(a)
Represents the Fund’s closing market price on the NYSE and reflects the reinvestment of dividends and/or distributions at actual reinvestment prices.
(b)
An unmanaged index that tracks the U.S. long term tax-exempt bond market, including state and local general obligation bonds, revenue bonds, pre-refunded bonds, and insured
bonds.
14 2024 BlackRock
Annual Report to Shareholders
Fund
Summary as of July 31,
2024(continued)
BlackRock MuniYield New York Quality Fund, Inc. (MYN)
Performance
Returns for the period ended July 31, 2024 were as
follows:
| |
Average Annual Total Returns |
| |
|
|
|
| |
|
|
|
Fund at Market Price(a)(b) |
|
|
|
New York Customized Reference Benchmark(c) |
|
|
|
Bloomberg Municipal Bond Index |
|
|
|
| |
All returns reflect reinvestment of dividends and/or distributions at actual reinvestment prices. Performance results reflect the Fund’s use of leverage, if
any. |
| |
The Fund’s discount to NAV narrowed during the period, which accounts for the difference between performance based on market price and performance based on NAV.
|
| |
The New York Customized Reference Benchmark is comprised of the Bloomberg Municipal Bond: New York Exempt Total Return Index Unhedged (90%) and the New York Bloomberg
Municipal Bond: High Yield (non-Investment Grade) Total Return Index (10%). The New
York Customized Reference Benchmark commenced on September 30, 2016. |
Performance results may include adjustments made for financial reporting purposes in accordance with U.S. generally
accepted accounting principles.
Past performance is not an indication of future results.
The Fund is presenting the performance of one or more indices for
informational purposes only. The Fund is actively managed and does not
seek to track or replicate the performance of any index. The index performance shown is not intended to be indicative of the Fund’s investment
strategies, portfolio components or past or future performance.
More information about the Fund’s historical performance can be found in the “Closed End Funds” section of blackrock.com.
The following discussion relates to the Fund’s absolute
performance based on NAV:
The municipal bond
market gained ground during the reporting period, with income playing the largest role in total returns. Municipal bonds were also well supported by positive economic growth,
strong issuer fundamentals, and favorable supply-and-demand conditions.
Consistent with trends in the broader market, income was the largest contributor to Fund performance. In terms of credit tiers, AA rated bonds were the most notable contributors due to their large weighting in the New York municipal market. BBB rated securities, which consisted mainly of holdings in the transportation and higher
education sectors, also performed well. Holdings in the tax-backed sector further contributed, as did positions in Puerto Rico. Yield curve positioning also
helped performance. A large percentage of the Fund is held in longer-maturities, which outperformed the front and intermediate parts of the curve.
The Fund’s use of U.S. Treasury futures to manage interest
rate risk detracted from performance. The Fund continued to use leverage, but the benefit was dampened by increased borrowing costs brought about by the high-rate
environment. A long duration positioning detracted, as well. (Duration is a measure of interest rate sensitivity.)
The views expressed reflect the opinions of BlackRock as of the date of this report and are subject to change based on changes in market, economic or other conditions.
These views are not intended to be a forecast of future events and are no guarantee of future results.
Fund
Summary as of July 31,
2024(continued)
BlackRock MuniYield New York Quality Fund, Inc. (MYN)
Overview of the Fund’s Total Investments
| |
| |
|
| |
|
County/City/Special District/School District |
|
| |
|
| |
|
| |
|
| |
|
| |
|
| |
|
| |
|
| |
Calendar Year Ended December 31,(c) |
|
| |
|
| |
|
| |
|
| |
|
| |
|
CREDIT QUALITY ALLOCATION |
| |
|
| |
|
| |
|
| |
|
| |
|
| |
|
| |
|
| |
|
| |
For purposes of this report, sector sub-classifications may differ from those utilized for compliance purposes. |
| |
Excludes short-term securities. |
| |
Scheduled maturity dates and/or bonds that are subject to potential calls by issuers over the next five years. |
| |
For purposes of this report, credit quality ratings shown above reflect the highest rating assigned by either S&P Global Ratings or Moody’s Investors Service,
Inc. if ratings differ. These rating agencies are independent, nationally
recognized statistical rating organizations and are widely used. Investment grade ratings are credit ratings of BBB/Baa or higher. Below investment grade ratings are credit ratings of BB/Ba or lower. Investments designated N/R are not rated by either rating agency. Unrated investments do not necessarily indicate low
credit quality. Credit quality ratings are subject to change.
|
| |
The investment adviser evaluates the credit quality of unrated investments based upon certain factors including, but not limited to, credit ratings for similar
investments and financial analysis of sectors and individual investments.
Using this approach, the investment adviser has deemed certain of these unrated securities as investment grade quality. As of July 31, 2024, the market value of unrated securities deemed by the investment adviser to be investment grade represents 1.3% of total investments. |
16 2024 BlackRock
Annual Report to Shareholders
Fund
Summary as of July 31, 2024
BlackRock MuniYield Pennsylvania Quality Fund (MPA)
Investment Objective
BlackRock MuniYield Pennsylvania Quality
Fund’s (MPA) (the “Fund”) investment objective is to provide shareholders with as high a level of current income exempt from
U.S. federal and Pennsylvania income taxes as is consistent with its investment policies and prudent investment management. The Fund seeks to achieve its
investment objective by investing at least 80% of its assets in municipal obligations exempt from U.S. federal income taxes (except that the interest may be
subject to the U.S. federal alternative minimum tax) and Pennsylvania income taxes. Under normal market conditions, the Fund invests primarily in long-term
municipal obligations that are investment grade quality, or are considered by the Fund’s investment adviser to be of comparable quality, at the time of
investment. The Fund may invest up to 20% of its managed assets in securities that are rated below investment grade, or are considered by the Fund’s
investment adviser to be of comparable quality, at the time of purchase. The Fund may invest directly in securities or synthetically through the use of
derivatives.
No assurance can be given that the Fund’s
investment objective will be achieved.
On
October 30, 2023, the Board of Directors of the Fund and the Board of Directors of BlackRock MuniYield Quality Fund III (MYI) announced the withdrawal of the merger proposal
that was previously approved by the Boards pursuant to which the Fund would have been merged into MYI, with MYI continuing as the surviving Fund.
Symbol on New York Stock Exchange |
|
| |
|
Yield on Closing Market Price as of July 31, 2024 ($12.35)(a) |
|
|
|
|
Current Monthly Distribution per Common Share(c) |
|
Current Annualized Distribution per Common
Share(c) |
|
Leverage as of July 31, 2024(d) |
|
| |
Yield on closing market price is calculated by dividing the current annualized distribution per share by the closing market price. Past performance is not an indication
of future results. |
| |
Tax equivalent yield assumes the maximum marginal U.S. federal and state tax rate of 43.87%, which includes the 3.8% Medicare tax. Actual tax rates will vary based on
income, exemptions and deductions. Lower taxes will result in lower tax equivalent
yields. |
| |
The distribution rate is not constant and is subject to change. A portion of the distribution may be deemed a return of capital or net realized gain.
|
| |
Represents VRDP Shares and TOB Trusts as a percentage of total managed assets, which is the total assets of the Fund, including any assets attributable to VRDP Shares
and TOB Trusts, minus the sum of its accrued liabilities. Does not reflect
derivatives or other instruments that may give rise to economic leverage. For a discussion of leveraging techniques utilized by the Fund, please see The Benefits and Risks of Leveraging and Derivative Financial Instruments. |
Market Price and Net Asset Value Per Share Summary
GROWTH OF $10,000 INVESTMENT

(a)
Represents the Fund’s closing market price on the NYSE and reflects the reinvestment of dividends and/or distributions at actual reinvestment prices.
(b)
An unmanaged index that tracks the U.S. long term tax-exempt bond market, including state and local general obligation bonds, revenue bonds, pre-refunded bonds, and insured
bonds.
Fund
Summary as of July 31,
2024(continued)
BlackRock MuniYield Pennsylvania Quality Fund (MPA)
Performance
Returns for the period ended July 31, 2024 were as
follows:
| |
Average Annual Total Returns |
| |
|
|
|
| |
|
|
|
Fund at Market Price(a)(b) |
|
|
|
Pennsylvania Customized Reference Benchmark(c) |
|
|
|
Bloomberg Municipal Bond Index |
|
|
|
| |
All returns reflect reinvestment of dividends and/or distributions at actual reinvestment prices. Performance results reflect the Fund’s use of leverage, if
any. |
| |
The Fund’s discount to NAV narrowed during the period, which accounts for the difference between performance based on market price and performance based on NAV.
|
| |
The Pennsylvania Customized Reference Benchmark is comprised of the Bloomberg Pennsylvania Total Return Index Unhedged (90%) and the Pennsylvania Bloomberg Municipal
Bond: High Yield (non-Investment Grade) Total Return Index (10%). The Pennsylvania
Customized Reference Benchmark commenced on September 30, 2016. |
Performance results may include adjustments made for financial reporting purposes in accordance with U.S. generally
accepted accounting principles.
Past performance is not an indication of future results.
The Fund is presenting the performance of one or more indices for
informational purposes only. The Fund is actively managed and does not
seek to track or replicate the performance of any index. The index performance shown is not intended to be indicative of the Fund’s investment
strategies, portfolio components or past or future performance.
More information about the Fund’s historical performance can be found in the “Closed End Funds” section of blackrock.com.
The following discussion relates to the Fund’s absolute
performance based on NAV:
The municipal bond
market gained ground during the reporting period, with income playing the largest role in total returns. Municipal bonds were also well supported by positive economic growth,
strong issuer fundamentals, and favorable supply-and-demand conditions.
Consistent with trends in the broader market, income was the largest contributor to Fund performance. The Fund’s allocation to high yield (below investment-grade)
bonds was a key contributor, as the category outperformed on the strength of its above-average income and tightening yield spreads. Puerto Rico issues were
notable outperformers in high yield. Holdings in the A and BBB categories (the lower end of the investment-grade space), helped performance, as well. At the
sector level, tax-backed, education, and healthcare issues stood out as contributors. Yield curve positioning also helped results. A large percentage of the Fund is held in longer maturities, which outperformed the
front and intermediate parts of the curve.
The Fund continued to use leverage, but the benefit was dampened by increased borrowing costs brought about by the high-rate environment.
The views expressed reflect the opinions of BlackRock as of the date of this report and are subject to change
based on changes in market, economic or other conditions.
These views are not intended to be a forecast of future events and are no guarantee of future
results.
18 2024 BlackRock
Annual Report to Shareholders
Fund
Summary as of July 31,
2024(continued)
BlackRock MuniYield Pennsylvania Quality Fund (MPA)
Overview of the Fund’s Total Investments
| |
| |
|
| |
|
| |
|
| |
|
County/City/Special District/School District |
|
| |
|
| |
|
| |
|
| |
|
| |
|
| |
Calendar Year Ended December 31,(c) |
|
| |
|
| |
|
| |
|
| |
|
| |
|
CREDIT QUALITY ALLOCATION |
| |
|
| |
|
| |
|
| |
|
| |
|
| |
|
| |
|
| |
|
| |
For purposes of this report, sector sub-classifications may differ from those utilized for compliance purposes. |
| |
Excludes short-term securities. |
| |
Scheduled maturity dates and/or bonds that are subject to potential calls by issuers over the next five years. |
| |
For purposes of this report, credit quality ratings shown above reflect the highest rating assigned by either S&P Global Ratings or Moody’s Investors Service,
Inc. if ratings differ. These rating agencies are independent, nationally
recognized statistical rating organizations and are widely used. Investment grade ratings are credit ratings of BBB/Baa or higher. Below investment grade ratings are credit ratings of BB/Ba or lower. Investments designated N/R are not rated by either rating agency. Unrated investments do not necessarily indicate low
credit quality. Credit quality ratings are subject to change.
|
| |
The investment adviser evaluates the credit quality of unrated investments based upon certain factors including, but not limited to, credit ratings for similar
investments and financial analysis of sectors and individual investments.
Using this approach, the investment adviser has deemed certain of these unrated securities as investment grade quality. As of July 31, 2024, the market value of unrated securities deemed by the investment adviser to be investment grade represents less than 1.0% of total investments. |
Fund
Summary as of July 31, 2024
BlackRock New York Municipal Income Trust (BNY)
Investment Objective
BlackRock New York Municipal Income Trust’s (BNY) (the “Fund”) investment objective is to provide current income exempt from regular U.S. federal income tax and New York State and New York City personal income taxes. The Fund seeks to achieve its investment objective by investing primarily in municipal bonds exempt from U.S. federal
income taxes (except that the interest may be subject to the federal alternative minimum tax) and New York State and New York City personal income taxes. The
Fund invests at least 80% of its assets in municipal bonds that are investment grade quality, or are considered by the Fund’s investment adviser to be of comparable quality, at the time of investment. The Fund may invest directly in securities or synthetically through the use of derivatives.
No assurance can be given that the Fund’s investment objective will be
achieved.
Symbol on New York Stock Exchange |
|
| |
|
Yield on Closing Market Price as of July 31, 2024 ($10.71)(a) |
|
|
|
|
Current Monthly Distribution per Common Share(c) |
|
Current Annualized Distribution per Common
Share(c) |
|
Leverage as of July 31, 2024(d) |
|
| |
Yield on closing market price is calculated by dividing the current annualized distribution per share by the closing market price. Past performance is not an indication
of future results. |
| |
Tax equivalent yield assumes the maximum marginal U.S. federal and state tax rate of 51.7%, which includes the 3.8% Medicare tax. Actual tax rates will vary based on
income, exemptions and deductions. Lower taxes will result in lower tax equivalent
yields. |
| |
The monthly distribution per Common Share, declared on September 12, 2024, was increased to $0.051000 per share. The yield on closing market price, tax equivalent
yield, current monthly distribution per Common Share, and current annualized
distribution per Common Share do not reflect the new distribution rate. The new distribution rate is not constant and is subject to change in the future. A portion of the distribution may be deemed a return of capital or net realized gain. |
| |
Represents VRDP Shares and TOB Trusts as a percentage of total managed assets, which is the total assets of the Fund, including any assets attributable to VRDP Shares
and TOB Trusts, minus the sum of its accrued liabilities. Does not reflect
derivatives or other instruments that may give rise to economic leverage. For a discussion of leveraging techniques utilized by the Fund, please see The Benefits and Risks of Leveraging and Derivative Financial Instruments. |
Market Price and Net Asset Value Per Share Summary
GROWTH OF $10,000 INVESTMENT

(a)
Represents the Fund’s closing market price on the NYSE and reflects the reinvestment of dividends and/or distributions at actual reinvestment prices.
(b)
An unmanaged index that tracks the U.S. long term tax-exempt bond market, including state and local general obligation bonds, revenue bonds, pre-refunded bonds, and insured
bonds.
20 2024 BlackRock
Annual Report to Shareholders
Fund
Summary as of July 31,
2024(continued)
BlackRock New York Municipal Income Trust (BNY)
Performance
Returns for the period ended July 31, 2024 were as
follows:
| |
Average Annual Total Returns |
| |
|
|
|
| |
|
|
|
Fund at Market Price(a)(b) |
|
|
|
New York Customized Reference Benchmark(c) |
|
|
|
Bloomberg Municipal Bond Index |
|
|
|
| |
All returns reflect reinvestment of dividends and/or distributions at actual reinvestment prices. Performance results reflect the Fund’s use of leverage, if
any. |
| |
The Fund’s discount to NAV narrowed during the period, which accounts for the difference between performance based on market price and performance based on NAV.
|
| |
The New York Customized Reference Benchmark is comprised of the Bloomberg Municipal Bond: New York Exempt Total Return Index Unhedged (90%) and the New York Bloomberg
Municipal Bond: High Yield (non-Investment Grade) Total Return Index (10%). The New
York Customized Reference Benchmark commenced on September 30, 2016. |
Performance results may include adjustments made for financial reporting purposes in accordance with U.S. generally
accepted accounting principles.
Past performance is not an indication of future results.
The Fund is presenting the performance of one or more indices for
informational purposes only. The Fund is actively managed and does not
seek to track or replicate the performance of any index. The index performance shown is not intended to be indicative of the Fund’s investment
strategies, portfolio components or past or future performance.
More information about the Fund’s historical performance can be found in the “Closed End Funds” section of blackrock.com.
The following discussion relates to the Fund’s absolute
performance based on NAV:
The municipal bond
market gained ground during the reporting period, with income playing the largest role in total returns. Municipal bonds were also well supported by positive economic growth,
strong issuer fundamentals, and favorable supply-and-demand conditions.
Consistent with trends in the broader market, income was the largest contributor to the Fund’s performance. In terms of credit tiers, AA rated bonds were the most
notable contributors due to their large weighting in the New York municipal market. BBB rated securities, which consisted mainly of holdings in the
transportation and higher education sectors, also performed well. Holdings in the tax-backed sector further contributed, as did positions in Puerto Rico. Yield
curve positioning also helped performance. A large percentage of the Fund is held in longer-maturities, which outperformed the front and intermediate parts of the
curve.
The Fund’s use of U.S. Treasury
futures to manage interest rate risk detracted from performance. The Fund continued to use leverage, but the benefit was dampened by increased borrowing costs brought about
by the high-rate environment. A long duration positioning detracted, as well. (Duration is a measure of interest rate sensitivity.)
The views expressed reflect the opinions of BlackRock as of the date of this report and are subject to change based on changes in market, economic or other conditions.
These views are not intended to be a forecast of future events and are no guarantee of future results.
Fund
Summary as of July 31,
2024(continued)
BlackRock New York Municipal Income Trust (BNY)
Overview of the Fund’s Total Investments
| |
| |
|
| |
|
County/City/Special District/School District |
|
| |
|
| |
|
| |
|
| |
|
| |
|
| |
|
| |
|
| |
Calendar Year Ended December 31,(c) |
|
| |
|
| |
|
| |
|
| |
|
| |
|
CREDIT QUALITY ALLOCATION |
| |
|
| |
|
| |
|
| |
|
| |
|
| |
|
| |
|
| |
|
| |
For purposes of this report, sector sub-classifications may differ from those utilized for compliance purposes. |
| |
Excludes short-term securities. |
| |
Scheduled maturity dates and/or bonds that are subject to potential calls by issuers over the next five years. |
| |
For purposes of this report, credit quality ratings shown above reflect the highest rating assigned by either S&P Global Ratings or Moody’s Investors Service,
Inc. if ratings differ. These rating agencies are independent, nationally
recognized statistical rating organizations and are widely used. Investment grade ratings are credit ratings of BBB/Baa or higher. Below investment grade ratings are credit ratings of BB/Ba or lower. Investments designated N/R are not rated by either rating agency. Unrated investments do not necessarily indicate low
credit quality. Credit quality ratings are subject to change.
|
| |
The investment adviser evaluates the credit quality of unrated investments based upon certain factors including, but not limited to, credit ratings for similar
investments and financial analysis of sectors and individual investments.
Using this approach, the investment adviser has deemed certain of these unrated securities as investment grade quality. As of July 31, 2024, the market value of unrated securities deemed by the investment adviser to be investment grade represents 1.6% of total investments. |
22 2024 BlackRock
Annual Report to Shareholders
Fund
Summary as of July 31, 2024
BlackRock Virginia Municipal Bond Trust (BHV)
Investment Objective
BlackRock Virginia Municipal Bond Trust’s (BHV) (the “Fund”) investment objective is to provide current income exempt from regular U.S. federal income tax and Virginia personal income taxes. The Fund seeks to achieve its investment objective by investing primarily in municipal bonds exempt from U.S. federal income taxes (except that the
interest may be subject to the U.S. federal alternative minimum tax) and Virginia personal income taxes. The Fund invests, under normal market conditions, at
least 80% of its managed assets in municipal bonds that are investment grade quality at the time of investment or, if unrated, determined to be of comparable
quality at the time of investment by the Fund’s investment adviser. The Fund may invest directly in such securities or synthetically through the use of derivatives.
No assurance can be given that the Fund’s investment objective will be
achieved.
On October 30, 2023, the Board of
Directors of the Fund and the Board of Directors of BlackRock MuniYield Quality Fund III (MYI) announced the withdrawal of the merger proposal that was previously approved by
the Boards pursuant to which the Fund would have been merged into MYI, with MYI continuing as the surviving Fund.
Symbol on New York Stock Exchange |
|
| |
|
Yield on Closing Market Price as of July 31, 2024 ($11.11)(a) |
|
|
|
|
Current Monthly Distribution per Common Share(c) |
|
Current Annualized Distribution per Common
Share(c) |
|
Leverage as of July 31, 2024(d) |
|
| |
Yield on closing market price is calculated by dividing the current annualized distribution per share by the closing market price. Past performance is not an indication
of future results. |
| |
Tax equivalent yield assumes the maximum marginal U.S. federal and state tax rate of 46.55%, which includes the 3.8% Medicare tax. Actual tax rates will vary based on
income, exemptions and deductions. Lower taxes will result in lower tax equivalent
yields. |
| |
The monthly distribution per Common Share, declared on September 12, 2024, was increased to $0.051500 per share. The yield on closing market price, tax equivalent
yield, current monthly distribution per Common Share, and current annualized
distribution per Common Share do not reflect the new distribution rate. The new distribution rate is not constant and is subject to change in the future. A portion of the distribution may be deemed a return of capital or net realized gain. |
| |
Represents VRDP Shares and TOB Trusts as a percentage of total managed assets, which is the total assets of the Fund, including any assets attributable to VRDP Shares
and TOB Trusts, minus the sum of its accrued liabilities. Does not reflect
derivatives or other instruments that may give rise to economic leverage. For a discussion of leveraging techniques utilized by the Fund, please see The Benefits and Risks of Leveraging and Derivative Financial Instruments. |
Market Price and Net Asset Value Per Share Summary
GROWTH OF $10,000 INVESTMENT

(a)
Represents the Fund’s closing market price on the NYSE and reflects the reinvestment of dividends and/or distributions at actual reinvestment prices.
(b)
An unmanaged index that tracks the U.S. long term tax-exempt bond market, including state and local general obligation bonds, revenue bonds, pre-refunded bonds, and insured
bonds.
Fund
Summary as of July 31,
2024(continued)
BlackRock Virginia Municipal Bond Trust (BHV)
Performance
Returns for the period ended July 31, 2024 were as
follows:
| |
Average Annual Total Returns |
| |
|
|
|
| |
|
|
|
Fund at Market Price(a)(b) |
|
|
|
Virginia Customized Reference Benchmark(c) |
|
|
|
Bloomberg Municipal Bond Index |
|
|
|
| |
All returns reflect reinvestment of dividends and/or distributions at actual reinvestment prices. Performance results reflect the Fund’s use of leverage, if
any. |
| |
The Fund’s discount to NAV narrowed during the period, which accounts for the difference between performance based on market price and performance based on NAV.
|
| |
The Virginia Customized Reference Benchmark is comprised of the Bloomberg Municipal Bond: Virginia Exempt Total Return Index Unhedged (90%) and the Virginia Bloomberg
Municipal Bond: High Yield (non-Investment Grade) Total Return Index (10%). The
Virginia Customized Reference Benchmark commenced on September 30, 2016. |
Performance results may include adjustments made for financial reporting purposes in accordance with U.S. generally accepted accounting principles.
Past performance is not an indication of future results.
The Fund is presenting the performance of one or more indices for informational purposes only. The Fund is actively managed and does not seek to track or replicate the performance of any index. The index performance shown is not intended to be indicative of the Fund’s investment strategies, portfolio components or past or future
performance.
More information about the Fund’s historical performance can be found in the “Closed End Funds” section of blackrock.com.
The following discussion relates to the Fund’s absolute
performance based on NAV:
The municipal bond
market gained ground during the reporting period, with income playing the largest role in total returns. Municipal bonds were also well supported by positive economic growth,
strong issuer fundamentals, and favorable supply-and-demand conditions.
Positions in long-dated securities—especially in the AA and A ratings categories—made the largest contribution to the Fund’s performance, reflecting both
their positive returns and large weighting in the portfolio. Holdings in high-quality bonds, especially in the tax-backed local, healthcare, and housing
sectors, were notable contributors. Tobacco sector holdings were notable contributors given their longer duration (higher interest rate sensitivity). This
included non-Virginia state securities that the investment adviser believed would accrue higher income to Virginia-based investors after taxes.
The Fund’s use of leverage contributed to returns by
increasing both duration (interest rate sensitivity) and income. While the income benefit of leverage has been reduced by higher short-term borrowing costs,
management has been proactive in tax-loss selling to increase book yields on assets with the goal of maximizing long-term income prospects.
The rally across the fixed-income market compressed municipal
valuations versus U.S. Treasuries. This was particularly true in high-quality states with scarce new issuance, including Virginia. As a result, very few portfolio holdings
produced negative returns during the period.
The Fund used U.S.
Treasury futures in an effort to mitigate interest rate risk, which detracted from performance.
The views expressed reflect the opinions of BlackRock as of the date of this report and are subject to change
based on changes in market, economic or other conditions.
These views are not intended to be a forecast of future events and are no guarantee of future
results.
24
2024 BlackRock Annual Report to Shareholders
Fund
Summary as of July 31,
2024(continued)
BlackRock Virginia Municipal Bond Trust (BHV)
Overview of the Fund’s Total Investments
| |
| |
|
| |
|
| |
|
| |
|
County/City/Special District/School District |
|
| |
|
| |
|
| |
|
| |
|
| |
|
| |
Calendar Year Ended December 31,(c) |
|
| |
|
| |
|
| |
|
| |
|
| |
|
CREDIT QUALITY ALLOCATION |
| |
|
| |
|
| |
|
| |
|
| |
|
| |
|
| |
|
| |
For purposes of this report, sector sub-classifications may differ from those utilized for compliance purposes. |
| |
Excludes short-term securities. |
| |
Scheduled maturity dates and/or bonds that are subject to potential calls by issuers over the next five years. |
| |
For purposes of this report, credit quality ratings shown above reflect the highest rating assigned by either S&P Global Ratings or Moody’s Investors Service,
Inc. if ratings differ. These rating agencies are independent, nationally
recognized statistical rating organizations and are widely used. Investment grade ratings are credit ratings of BBB/Baa or higher. Below investment grade ratings are credit ratings of BB/Ba or lower. Investments designated N/R are not rated by either rating agency. Unrated investments do not necessarily indicate low
credit quality. Credit quality ratings are subject to change.
|
| |
The investment adviser evaluates the credit quality of unrated investments based upon certain factors including, but not limited to, credit ratings for similar
investments and financial analysis of sectors and individual investments.
Using this approach, the investment adviser has deemed certain of these unrated securities as investment grade quality. As of July 31, 2024, the market value of unrated securities deemed by the investment adviser to be investment grade represents 2.0% of total investments. |
Schedule of Investments
July 31, 2024
BlackRock MuniHoldings New Jersey Quality Fund, Inc. (MUJ)
(Percentages shown are based on Net Assets)
| |
|
|
|
| |
| |
|
| |
|
California Infrastructure & Economic Development
Bank, RB, Series A-4, AMT, 01/01/50(a)(b)(c) |
|
|
|
| |
|
| |
|
State of Nevada Department of Business & Industry, RB, Series A4, AMT, 01/01/50(a)(c)
|
|
|
|
| |
|
| |
|
New Jersey Economic Development Authority, ARB |
|
|
|
Series A, AMT, 5.63%, 11/15/30 |
|
|
|
Series B, AMT, 5.63%, 11/15/30 |
|
|
|
New Jersey Economic Development Authority,
RB(d) |
|
|
|
Series A, (NPFGC), 5.25%, 07/01/25 |
|
|
|
Series A, (NPFGC), 5.25%, 07/01/26 |
|
|
|
New Jersey Economic Development Authority,
Refunding RB |
|
|
|
| |
|
|
|
| |
|
|
|
| |
|
|
|
| |
|
|
|
| |
|
|
|
County/City/Special District/School District — 16.1% |
|
City of Bayonne New Jersey, Refunding GO, (BAM SAW), 5.00%, 07/01/26(e)
|
|
|
|
City of Newark New Jersey, GOL, (SAW), 4.50%,
03/15/36 |
|
|
|
Clifton Board of Education, GO |
|
|
|
| |
|
|
|
| |
|
|
|
County of Essex New Jersey, GO, Series B, 3.00%,
09/01/46 |
|
|
|
County of Middlesex New Jersey, Refunding COP, 5.00%, 10/15/31 |
|
|
|
Essex County Improvement Authority, Refunding RB |
|
|
|
(NPFGC GTD), 5.50%, 10/01/27 |
|
|
|
(NPFGC GTD), 5.50%, 10/01/28 |
|
|
|
(NPFGC GTD), 5.50%, 10/01/29 |
|
|
|
Ewing Township Board of Education, GO |
|
|
|
| |
|
|
|
| |
|
|
|
Hudson County Improvement Authority, RB |
|
|
|
| |
|
|
|
Series A-1, (NPFGC GTD), 0.00%,
12/15/32(f) |
|
|
|
Mercer County Improvement Authority, RB, 5.00%,
09/01/40 |
|
|
|
Middlesex County Improvement Authority, RB, Series B, 6.25%, 01/01/37(g)(h)
|
|
|
|
Monroe Township Board of Education/Middlesex
County, Refunding GO, 5.00%, 03/01/25(e) |
|
|
|
New Jersey Economic Development Authority, RB |
|
|
|
| |
|
|
|
Series B, 6.50%, 04/01/31 |
|
|
|
New Jersey Economic Development Authority,
Refunding SAB, 6.50%, 04/01/28 |
|
|
|
| |
|
|
|
County/City/Special District/School District (continued) |
|
Newark Board of Education, Refunding GO,
Sustainability Bonds, (BAM), 3.00%, 07/15/42 |
|
|
|
Union County Improvement Authority, Refunding RB, 5.00%, 03/01/34 |
|
|
|
Union County Utilities Authority, Refunding RB,
Series A, AMT, (GTD), 5.25%, 12/01/31 |
|
|
|
| |
|
|
|
| |
|
Atlantic County Improvement Authority, RB, Series A, (AGM), 4.00%, 07/01/46 |
|
|
|
Camden County Improvement Authority, RB,
Sustainability Bonds, 6.00%, 06/15/52 |
|
|
|
Gloucester County Improvement Authority, RB |
|
|
|
| |
|
|
|
| |
|
|
|
| |
|
|
|
Middlesex County Improvement Authority, RB, 5.00%, 08/15/53 |
|
|
|
New Jersey Economic Development Authority, RB |
|
|
|
| |
|
|
|
Series A, 5.00%, 07/01/27(b) |
|
|
|
Series A, 5.13%, 11/01/29(b)
|
|
|
|
Series A, 5.00%, 01/01/35 |
|
|
|
Series A, 5.25%, 07/01/37(b)
|
|
|
|
Series A, 5.00%, 07/01/38 |
|
|
|
Series A, 6.25%, 11/01/38(b)
|
|
|
|
Series A, 5.38%, 07/01/47(b) |
|
|
|
Series A, 5.00%, 12/01/48 |
|
|
|
Series A, 5.00%, 06/15/49(b) |
|
|
|
Series A, 5.00%, 01/01/50 |
|
|
|
Series A, 5.00%, 07/01/50 |
|
|
|
Series A, 6.50%, 11/01/52(b)
|
|
|
|
Series A, 5.00%, 06/15/54(b) |
|
|
|
Series A, 5.25%, 11/01/54(b)
|
|
|
|
Series WW, 5.00%, 06/15/25(e) |
|
|
|
Series WW, 5.25%, 06/15/25(e)
|
|
|
|
New Jersey Economic Development Authority,
Refunding RB |
|
|
|
| |
|
|
|
| |
|
|
|
Series A, 4.25%, 09/01/27(b)
|
|
|
|
Series A, 5.63%, 08/01/34(b) |
|
|
|
Series A, 5.00%, 09/01/37(b)
|
|
|
|
Series A, 5.88%, 08/01/44(b) |
|
|
|
Series A, 6.00%, 08/01/49(b)
|
|
|
|
Series A, 5.13%, 09/01/52(b) |
|
|
|
New Jersey Educational Facilities Authority, RB |
|
|
|
Series A, 5.25%, 09/01/53 |
|
|
|
Series B, 5.25%, 03/01/54 |
|
|
|
Series C, (AGM), 3.25%, 07/01/49 |
|
|
|
Series C, (AGM), 4.00%, 07/01/50 |
|
|
|
New Jersey Educational Facilities Authority, Refunding
RB |
|
|
|
Series A, 4.00%, 07/01/47 |
|
|
|
Series D, 5.00%, 07/01/38 |
|
|
|
Series D, 5.00%, 07/01/43 |
|
|
|
New Jersey Higher Education Student Assistance
Authority, RB |
|
|
|
Series B, AMT, 4.00%, 12/01/44 |
|
|
|
Series B, AMT, 4.25%, 12/01/45 |
|
|
|
26 2024 BlackRock
Annual Report to Shareholders
Schedule of Investments (continued)
July
31, 2024
BlackRock MuniHoldings New Jersey Quality Fund, Inc. (MUJ)
(Percentages shown are based on Net Assets)
| |
|
|
|
| |
|
New Jersey Higher Education Student Assistance
Authority, RB (continued) |
|
|
|
Series C, AMT, 5.25%, 12/01/54 |
|
|
|
Sub-Series C, AMT, 4.00%, 12/01/48 |
|
|
|
Series C, AMT, Subordinate, 5.00%, 12/01/53 |
|
|
|
New Jersey Higher Education Student Assistance
Authority, Refunding RB |
|
|
|
Series B, AMT, 3.00%, 12/01/32 |
|
|
|
Series B, AMT, 4.00%, 12/01/41 |
|
|
|
Sub-Series C, AMT, 3.63%, 12/01/49 |
|
|
|
Series C, AMT, Subordinate, 5.00%, 12/01/52 |
|
|
|
New Jersey Institute of Technology, RB, Series A, 5.00%, 07/01/40 |
|
|
|
| |
|
|
|
| |
|
Middlesex County Improvement Authority, RB,
(AMBAC), 5.50%, 09/01/30 |
|
|
|
New Jersey Economic Development Authority, Refunding RB |
|
|
|
| |
|
|
|
| |
|
|
|
| |
|
|
|
New Jersey Health Care Facilities Financing Authority, RB |
|
|
|
| |
|
|
|
| |
|
|
|
| |
|
|
|
| |
|
|
|
| |
|
|
|
Series A, 5.50%, 07/01/43 |
|
|
|
Series A, 5.25%, 07/01/54 |
|
|
|
Series B, VRDN, 3.35%,
08/01/24(a)(i) |
|
|
|
New Jersey Health Care Facilities Financing Authority,
Refunding RB |
|
|
|
| |
|
|
|
| |
|
|
|
| |
|
|
|
| |
|
|
|
Series A, 4.00%, 07/01/43 |
|
|
|
Series A, 5.00%, 07/01/43 |
|
|
|
| |
|
|
|
| |
|
New Jersey Housing & Mortgage Finance Agency, RB |
|
|
|
| |
|
|
|
Series A, (AGM), 5.00%, 05/01/27 |
|
|
|
New Jersey Housing & Mortgage Finance Agency, RB,
S/F Housing |
|
|
|
Series H, Sustainability Bonds, 2.15%, 10/01/41 |
|
|
|
Series K, Sustainability Bonds, 4.70%, 10/01/50 |
|
|
|
New Jersey Housing & Mortgage Finance Agency, Refunding RB, M/F Housing |
|
|
|
Series A, 2.45%, 11/01/45 |
|
|
|
Series A, 4.00%, 11/01/48 |
|
|
|
Series A, 2.55%, 11/01/50 |
|
|
|
Series A, 4.10%, 11/01/53 |
|
|
|
Series A, 2.63%, 11/01/56 |
|
|
|
Series D, AMT, 4.25%, 11/01/37 |
|
|
|
Series D, AMT, 4.35%, 11/01/42 |
|
|
|
Series A, Sustainability Bonds, 2.65%, 11/01/46 |
|
|
|
Series A, Sustainability Bonds, 2.70%, 11/01/51 |
|
|
|
| |
|
|
|
| |
|
New Jersey Housing & Mortgage Finance Agency,
Refunding RB, M/F Housing (continued) |
|
|
|
Series A, Sustainability Bonds, 2.75%, 11/01/56 |
|
|
|
New Jersey Housing & Mortgage Finance Agency,
Refunding RB, S/F Housing |
|
|
|
Series A, 3.75%, 10/01/35 |
|
|
|
Series E, 2.40%, 10/01/45 |
|
|
|
Newark Housing Authority, RB, M/F Housing, Series A, 5.00%, 12/01/30 |
|
|
|
| |
|
|
|
| |
|
Casino Reinvestment Development Authority, Inc.,
Refunding RB |
|
|
|
| |
|
|
|
| |
|
|
|
Garden State Preservation Trust, RB(f)
|
|
|
|
Series B, (AGM), 0.00%, 11/01/25 |
|
|
|
Series B, (AGM), 0.00%, 11/01/26 |
|
|
|
Series B, (AGM), 0.00%, 11/01/27 |
|
|
|
Series B, (AGM), 0.00%, 11/01/28 |
|
|
|
New Jersey Economic Development Authority, RB |
|
|
|
| |
|
|
|
| |
|
|
|
Series A, (NPFGC), 5.25%, 07/01/25 |
|
|
|
Series A, (NPFGC), 5.25%, 07/01/26 |
|
|
|
Series A, 5.00%, 06/15/42 |
|
|
|
Series B, 5.00%, 06/15/35 |
|
|
|
Series B, 5.00%, 06/15/43 |
|
|
|
New Jersey Economic Development Authority,
Refunding RB |
|
|
|
| |
|
|
|
Series N-1, (NPFGC), 5.50%, 09/01/27 |
|
|
|
Sub-Series A, 4.00%, 07/01/32 |
|
|
|
Sub-Series A, 5.00%, 07/01/33 |
|
|
|
Sub-Series A, 4.00%, 07/01/34 |
|
|
|
New Jersey Educational Facilities Authority, RB |
|
|
|
Series A, 4.00%, 09/01/28 |
|
|
|
Series A, 5.00%, 09/01/32 |
|
|
|
Series A, 5.00%, 09/01/33 |
|
|
|
State of New Jersey, GO, 5.00%, 06/01/38 |
|
|
|
| |
|
|
|
| |
|
Tobacco Settlement Financing Corp., Refunding RB |
|
|
|
Series A, 5.00%, 06/01/35 |
|
|
|
Series A, 5.00%, 06/01/46 |
|
|
|
Series A, 5.25%, 06/01/46 |
|
|
|
Sub-Series B, 5.00%, 06/01/46 |
|
|
|
| |
|
|
|
| |
|
New Jersey Economic Development Authority, RB |
|
|
|
| |
|
|
|
| |
|
|
|
| |
|
|
|
AMT, (AGM), 5.00%, 01/01/31 |
|
|
|
| |
|
|
|
| |
|
|
|
| |
|
|
|
New Jersey Economic Development Authority,
Refunding ARB |
|
|
|
| |
|
|
|
Schedule of Investments
27
Schedule of Investments (continued)
July
31, 2024
BlackRock MuniHoldings New Jersey Quality Fund, Inc. (MUJ)
(Percentages shown are based on Net Assets)
| |
|
|
|
Transportation (continued) |
|
New Jersey Economic Development Authority,
Refunding ARB (continued) |
|
|
|
| |
|
|
|
New Jersey Transportation Trust Fund Authority, RB |
|
|
|
| |
|
|
|
| |
|
|
|
Series A, 5.00%, 06/15/30 |
|
|
|
Series AA, 5.25%, 06/15/34 |
|
|
|
Series AA, 4.00%, 06/15/36 |
|
|
|
Series AA, 5.00%, 06/15/38 |
|
|
|
Series AA, 5.25%, 06/15/41 |
|
|
|
Series AA, 4.00%, 06/15/45 |
|
|
|
Series AA, 5.00%, 06/15/45 |
|
|
|
Series AA, 4.00%, 06/15/50 |
|
|
|
Series BB, 4.00%, 06/15/44 |
|
|
|
Series BB, 4.00%, 06/15/50 |
|
|
|
Series BB, 5.25%, 06/15/50 |
|
|
|
Series C, (AGM), 0.00%, 12/15/32(f) |
|
|
|
Series C, (AMBAC), 0.00%,
12/15/35(f) |
|
|
|
Series C, (AMBAC), 0.00%, 12/15/36(f) |
|
|
|
Series D, 5.00%, 06/15/32 |
|
|
|
Series S, 5.00%, 06/15/33 |
|
|
|
Series S, 4.50%, 06/15/49 |
|
|
|
Series S, Class BB, 5.00%, 06/15/36 |
|
|
|
Series S, Class BB, 4.00%, 06/15/37 |
|
|
|
Series S, Class BB, 4.00%, 06/15/40 |
|
|
|
Series S, Class BB, 4.00%, 06/15/50 |
|
|
|
New Jersey Transportation Trust Fund Authority, RB,
CAB, Series A, 0.00%, 12/15/35(f) |
|
|
|
New Jersey Transportation Trust Fund Authority, Refunding RB |
|
|
|
| |
|
|
|
Series A, 4.00%, 06/15/35 |
|
|
|
Series A, 5.00%, 12/15/35 |
|
|
|
Series A, 4.00%, 06/15/36 |
|
|
|
Series A, 5.25%, 06/15/41 |
|
|
|
Series AA, 4.25%, 06/15/44 |
|
|
|
New Jersey Turnpike Authority, RB |
|
|
|
Series A, 5.00%, 01/01/34 |
|
|
|
Series A, 4.00%, 01/01/42 |
|
|
|
Series A, 4.00%, 01/01/51 |
|
|
|
Series B, 5.25%, 01/01/49 |
|
|
|
Series E, 5.00%, 01/01/45 |
|
|
|
New Jersey Turnpike Authority, Refunding RB |
|
|
|
Series A, (AGM), 5.25%, 01/01/29 |
|
|
|
Series A, (BHAC-CR AGM), 5.25%, 01/01/29 |
|
|
|
Series A, (AGM), 5.25%, 01/01/30 |
|
|
|
Series A, 4.00%, 01/01/39 |
|
|
|
Series D-2, (AGM), 5.25%, 01/01/26 |
|
|
|
South Jersey Port Corp., ARB |
|
|
|
Series A, 5.00%, 01/01/49 |
|
|
|
Series B, AMT, 5.00%, 01/01/42 |
|
|
|
South Jersey Transportation Authority, RB |
|
|
|
Series A, (AGM-CR), 4.00%, 11/01/50 |
|
|
|
Series A, Subordinate, (BAM), 4.00%, 11/01/50 |
|
|
|
| |
|
|
|
| |
|
New Jersey Economic Development Authority, RB,
AMT, 4.00%, 08/01/59 |
|
|
|
Passaic Valley Sewerage Commission, Refunding RB |
|
|
|
Series J, (AGM), 3.00%, 12/01/40 |
|
|
|
| |
|
|
|
| |
|
Passaic Valley Sewerage Commission, Refunding
RB (continued) |
|
|
|
Series J, (AGM), 3.00%, 12/01/41 |
|
|
|
Series J, (AGM), 3.00%, 12/01/42 |
|
|
|
Series J, (AGM), 3.00%, 12/01/43 |
|
|
|
Series J, (AGM), 3.00%, 12/01/44 |
|
|
|
Series J, (AGM), 3.00%, 12/01/45 |
|
|
|
Rahway Valley Sewerage Authority, RB(f) |
|
|
|
Series A, (NPFGC), 0.00%, 09/01/26 |
|
|
|
Series A, (NPFGC), 0.00%, 09/01/28 |
|
|
|
Series A, (NPFGC), 0.00%, 09/01/29 |
|
|
|
Series A, (NPFGC), 0.00%, 09/01/31 |
|
|
|
Series A, (NPFGC), 0.00%, 09/01/33 |
|
|
|
| |
|
|
|
Total Municipal Bonds in New Jersey |
|
| |
|
| |
|
Port Authority of New York & New Jersey, ARB |
|
|
|
Series 93, 6.13%, 06/01/94 |
|
|
|
| |
|
|
|
| |
|
|
|
| |
|
|
|
| |
|
|
|
Series 218, AMT, 5.00%, 11/01/32 |
|
|
|
Series 218, AMT, 4.00%, 11/01/47 |
|
|
|
Series 221, AMT, 4.00%, 07/15/40 |
|
|
|
Series 221, AMT, 4.00%, 07/15/50 |
|
|
|
Port Authority of New York & New Jersey, Refunding
ARB |
|
|
|
| |
|
|
|
| |
|
|
|
Series 206, AMT, 5.00%, 11/15/42 |
|
|
|
Series 206, AMT, 5.00%, 11/15/47 |
|
|
|
Series 223, AMT, 4.00%, 07/15/41 |
|
|
|
Series 238, AMT, 5.00%, 07/15/39 |
|
|
|
Total Municipal Bonds in New York |
|
| |
|
| |
|
Delaware River Joint Toll Bridge Commission, RB,
5.00%, 07/01/42 |
|
|
|
Delaware River Port Authority, RB |
|
|
|
| |
|
|
|
| |
|
|
|
Total Municipal Bonds in Pennsylvania |
|
| |
|
| |
|
Puerto Rico Sales Tax Financing Corp. Sales Tax Revenue, RB |
|
|
|
Series A-1, Restructured, 4.75%, 07/01/53 |
|
|
|
Series A-1, Restructured, 5.00%, 07/01/58 |
|
|
|
Series A-2, Restructured, 4.78%, 07/01/58 |
|
|
|
Series A-2, Restructured, 4.33%, 07/01/40 |
|
|
|
Series B-1, Restructured, 4.75%, 07/01/53 |
|
|
|
28 2024 BlackRock
Annual Report to Shareholders
Schedule of Investments (continued)
July
31, 2024
BlackRock MuniHoldings New Jersey Quality Fund, Inc. (MUJ)
(Percentages shown are based on Net Assets)
| |
|
|
|
| |
|
Puerto Rico Sales Tax Financing Corp. Sales Tax
Revenue, RB (continued) |
|
|
|
Series B-2, Restructured, 4.78%, 07/01/58 |
|
|
|
Puerto Rico Sales Tax Financing Corp. Sales Tax
Revenue, RB, CAB, Series A-1, Restructured,
0.00%, 07/01/46(f) |
|
|
|
Total Municipal Bonds in Puerto Rico |
|
Total Municipal Bonds — 150.2%
(Cost: $1,043,276,113) |
|
Municipal Bonds Transferred to Tender Option Bond Trusts(j) |
| |
County/City/Special District/School District — 1.7% |
|
Union County Utilities Authority, Refunding RB,
Series A, 5.00%, 06/15/41 |
|
|
|
| |
|
Garden State Preservation Trust, RB, Series A, 5.75%,
11/01/28 |
|
|
|
Total Municipal Bonds in New Jersey |
|
Total Municipal Bonds Transferred to Tender Option Bond
Trusts — 4.4%
(Cost: $29,975,591) |
|
Total Long-Term Investments — 154.6%
(Cost: $1,073,251,704) |
|
| |
|
|
|
| |
Money Market Funds — 7.5% |
|
BlackRock Liquidity Funds, MuniCash, Institutional Shares, 3.47%(k)(l) |
|
|
|
Total Short-Term Securities — 7.5%
(Cost: $52,244,857) |
|
Total Investments — 162.1%
(Cost: $1,125,496,561) |
|
Other Assets Less Liabilities — 0.6% |
|
Liability for TOB Trust Certificates, Including Interest Expense and Fees Payable — (2.8)% |
|
VRDP Shares at Liquidation Value, Net of Deferred Offering Costs —
(59.9)% |
|
Net Assets Applicable to Common Shares — 100.0% |
|
| |
Variable rate security. Interest rate resets periodically. The rate shown is the effective
interest rate as of period end. Security description also includes the reference rate and
spread if published and available. |
| |
Security exempt from registration pursuant to Rule 144A under the Securities Act of 1933,
as amended. These securities may be resold in transactions exempt from registration to
qualified institutional investors. |
| |
|
| |
Security is collateralized by municipal bonds or U.S. Treasury obligations. |
| |
U.S. Government securities held in escrow, are used to pay interest on this security as well as to retire the bond in full at the date indicated, typically at a premium to par. |
| |
|
| |
Issuer filed for bankruptcy and/or is in default. |
| |
Non-income producing security. |
| |
Variable rate security. Rate as of period end and maturity is the date the principal owed can be recovered through demand. |
| |
Represent bonds transferred to a TOB Trust in exchange of cash and residual certificates
received by the Fund. These bonds serve as collateral in a secured borrowing. See Note 4
of the Notes to Financial Statements for details. |
| |
|
| |
Annualized 7-day yield as of period end. |
For purposes of this report, industry and sector sub-classifications may differ from those utilized by the Fund for compliance purposes.
Schedule of Investments
29
Schedule of Investments (continued)
July
31, 2024
BlackRock MuniHoldings New Jersey Quality Fund, Inc. (MUJ)
Affiliates
Investments in issuers considered to be affiliate(s) of the Fund during the year ended July 31, 2024 for purposes of Section 2(a)(3) of
the Investment Company Act of 1940, as amended, were as
follows:
| |
|
|
|
|
Change in
Unrealized
Appreciation
(Depreciation) |
|
|
|
Capital Gain
Distributions
from
Underlying
Funds |
BlackRock Liquidity Funds, MuniCash, Institutional Shares |
|
|
|
|
|
|
|
|
|
| |
Represents net amount purchased (sold). |
Fair Value Hierarchy as of Period End
Various inputs are used in determining the fair value of
financial instruments. For a description of the input levels and information about the Fund’s policy regarding valuation of financial instruments, refer to the Notes to
Financial Statements.
The following table
summarizes the Fund’s financial instruments categorized in the fair value hierarchy. The breakdown of the Fund’s financial instruments into major categories is disclosed in the Schedule of Investments above.
| |
|
|
|
|
| |
|
|
|
|
| |
|
|
|
|
| |
|
|
|
|
| |
|
|
|
|
Municipal Bonds Transferred to Tender Option Bond Trusts |
|
|
|
|
| |
|
|
|
|
| |
|
|
|
|
| |
|
|
|
|
The Fund may hold assets and/or liabilities in which the fair value approximates the carrying amount for financial statement purposes. As of period end, such assets and/or liabilities are categorized within the fair value hierarchy as follows:
| |
|
|
|
|
| |
|
|
|
|
| |
|
|
|
|
VRDP Shares at Liquidation Value |
|
|
|
|
| |
|
|
|
|
See notes to financial
statements.
30
2024 BlackRock Annual Report to Shareholders
Schedule of Investments
July 31, 2024
BlackRock MuniHoldings New York Quality Fund, Inc. (MHN)
(Percentages shown are based on Net Assets)
| |
|
|
|
| |
| |
|
| |
|
Lower Alabama Gas District, RB, Series A, 5.00%,
09/01/46 |
|
|
|
| |
|
| |
|
California Infrastructure & Economic Development Bank, RB, Series A-4, AMT,
01/01/50(a)(b)(c) |
|
|
|
| |
|
| |
|
Guam Power Authority, Refunding RB, Series A, 5.00%,
10/01/41 |
|
|
|
| |
|
| |
|
Kentucky Public Energy Authority, Refunding RB, Series B, 5.00%, 01/01/55(a)
|
|
|
|
| |
|
| |
|
State of Nevada Department of Business & Industry, RB,
Series A4, AMT, 01/01/50(a)(c) |
|
|
|
| |
|
| |
|
New York Liberty Development Corp., RB, 5.50%, 10/01/37 |
|
|
|
New York Liberty Development Corp., Refunding RB,
5.25%, 10/01/35 |
|
|
|
New York State Energy Research & Development Authority, Refunding RB, Series C, 4.00%, 04/01/34 |
|
|
|
New York State Environmental Facilities Corp., RB, AMT,
2.75%, 09/01/50(a) |
|
|
|
New York Transportation Development Corp., ARB, AMT, 5.63%, 04/01/40 |
|
|
|
New York Transportation Development Corp., RB |
|
|
|
| |
|
|
|
| |
|
|
|
New York Transportation Development Corp., Refunding ARB, AMT, 3.00%, 08/01/31 |
|
|
|
| |
|
|
|
County/City/Special District/School District — 30.5% |
|
Battery Park City Authority, RB |
|
|
|
Series A, Sustainability Bonds, 5.00%, 11/01/41 |
|
|
|
Series A, Sustainability Bonds, 5.00%, 11/01/42 |
|
|
|
Series A, Sustainability Bonds, 5.00%, 11/01/43 |
|
|
|
Series A, Sustainability Bonds, 5.00%, 11/01/48 |
|
|
|
Brookhaven Local Development Corp., Refunding RB, 5.00%, 10/01/50 |
|
|
|
| |
|
|
|
Series A, 5.00%, 08/01/51 |
|
|
|
Series A-1, 4.00%, 09/01/46 |
|
|
|
Series A-1, 5.00%, 08/01/47 |
|
|
|
Series B, 5.25%, 10/01/47 |
|
|
|
Series C, 5.25%, 03/01/53 |
|
|
|
Series D, 5.25%, 04/01/54 |
|
|
|
Series F-1, 5.00%, 04/01/45 |
|
|
|
Series F-1, 4.00%, 03/01/47 |
|
|
|
Series I, 5.00%, 03/01/36 |
|
|
|
Sub-Series D-1, 5.50%, 05/01/46 |
|
|
|
| |
|
|
|
County/City/Special District/School District (continued) |
|
City of New York, GO (continued) |
|
|
|
Sub-Series E-1, 4.00%, 04/01/45 |
|
|
|
County of Nassau New York, GOL |
|
|
|
Series A, 4.00%, 04/01/49 |
|
|
|
Series B, (AGM), 5.00%, 07/01/49 |
|
|
|
County of Nassau New York, Refunding GOL, Series B, (AGM), 5.00%, 04/01/40 |
|
|
|
New York City Industrial Development Agency, RB,
(AGC), 0.00%, 03/01/39(d) |
|
|
|
New York City Industrial Development Agency, Refunding RB, (AGM), 4.00%, 03/01/45 |
|
|
|
New York City Transitional Finance Authority Building Aid
Revenue, RB, Series S-1, Subordinate, (SAW),
5.00%, 07/15/43 |
|
|
|
New York City Transitional Finance Authority Future Tax Secured Revenue, RB |
|
|
|
Series A-1, 5.00%, 08/01/38 |
|
|
|
Series B-1, 5.00%, 08/01/45 |
|
|
|
Sub-Series B-1, 5.00%, 11/01/35 |
|
|
|
Sub-Series B-1, 5.00%, 11/01/36 |
|
|
|
Sub-Series E-1, 5.00%, 02/01/43 |
|
|
|
Series C-1, Subordinate, 4.00%, 02/01/39 |
|
|
|
Series F-1, Subordinate, 5.00%, 02/01/44 |
|
|
|
New York City Transitional Finance Authority, RB |
|
|
|
Series F-1, 5.25%, 02/01/53 |
|
|
|
Series B, Subordinate, 5.25%, 05/01/50 |
|
|
|
New York Convention Center Development Corp., RB,
|
|
|
|
Series B, Sub Lien, 0.00%, 11/15/42 |
|
|
|
Series B, Sub Lien, 0.00%, 11/15/47 |
|
|
|
Series B, Sub Lien, 0.00%, 11/15/48 |
|
|
|
Series B, Sub Lien, (AGM-CR), 0.00%, 11/15/55 |
|
|
|
Series B, Sub Lien, (AGM-CR), 0.00%, 11/15/56 |
|
|
|
New York Convention Center Development Corp.,
Refunding RB |
|
|
|
| |
|
|
|
| |
|
|
|
New York Liberty Development Corp., Refunding RB |
|
|
|
Class 1, 5.00%, 11/15/44(b) |
|
|
|
Series 1, 3.00%, 02/15/42 |
|
|
|
Series A, Sustainability Bonds, 3.00%, 11/15/51 |
|
|
|
Triborough Bridge & Tunnel Authority Sales Tax Revenue, RB |
|
|
|
| |
|
|
|
Series A, 5.25%, 05/15/52 |
|
|
|
Series A, 4.13%, 05/15/53 |
|
|
|
Series A-1, 5.25%, 05/15/64 |
|
|
|
Yonkers Industrial Development Agency, Refunding RB,
(SAW), 4.00%, 05/01/41 |
|
|
|
| |
|
|
|
| |
|
Albany Capital Resource Corp., Refunding
RB(e)(f) |
|
|
|
| |
|
|
|
| |
|
|
|
Build NYC Resource Corp., Refunding RB |
|
|
|
| |
|
|
|
Series A, 5.00%, 06/01/43 |
|
|
|
Dobbs Ferry Local Development Corp., RB, 5.00%, 07/01/39 |
|
|
|
Dutchess County Local Development Corp., RB |
|
|
|
| |
|
|
|
Schedule of Investments
31
Schedule of Investments (continued)
July
31, 2024
BlackRock MuniHoldings New York Quality Fund, Inc. (MHN)
(Percentages shown are based on Net Assets)
| |
|
|
|
| |
|
Dutchess County Local Development Corp.,
RB (continued) |
|
|
|
| |
|
|
|
| |
|
|
|
Dutchess County Local Development Corp., Refunding RB |
|
|
|
| |
|
|
|
| |
|
|
|
Madison County Capital Resource Corp., RB |
|
|
|
Series B, 5.00%, 07/01/40 |
|
|
|
Series B, 5.00%, 07/01/43 |
|
|
|
Monroe County Industrial Development Corp., RB, Series A, 5.00%, 07/01/53 |
|
|
|
Monroe County Industrial Development Corp., Refunding
RB |
|
|
|
Series A, 4.00%, 07/01/39 |
|
|
|
Series A, 4.00%, 07/01/50 |
|
|
|
New York State Dormitory Authority, RB |
|
|
|
Series 1, (AMBAC), 5.50%, 07/01/40 |
|
|
|
Series A, 5.00%, 07/01/46 |
|
|
|
Series A, Sustainability Bonds, 5.00%, 07/01/48 |
|
|
|
New York State Dormitory Authority, Refunding RB |
|
|
|
Series A, 5.00%, 07/01/35 |
|
|
|
Series A, 5.00%, 07/01/43 |
|
|
|
Series A, 5.00%, 07/01/48 |
|
|
|
Series A, 5.50%, 07/01/54 |
|
|
|
Onondaga County Trust for Cultural Resources,
Refunding RB |
|
|
|
| |
|
|
|
| |
|
|
|
| |
|
|
|
Schenectady County Capital Resource Corp., Refunding
RB, 5.00%, 01/01/47 |
|
|
|
Troy Capital Resource Corp., Refunding RB, 5.00%, 09/01/39 |
|
|
|
Trust for Cultural Resources of The City of New York,
Refunding RB |
|
|
|
Series A, 5.00%, 07/01/37 |
|
|
|
Series A, 5.00%, 07/01/41 |
|
|
|
| |
|
|
|
| |
|
Build NYC Resource Corp., RB |
|
|
|
| |
|
|
|
| |
|
|
|
Genesee County Funding Corp., Refunding RB,
Series A, 5.25%, 12/01/52 |
|
|
|
Monroe County Industrial Development Corp., RB |
|
|
|
| |
|
|
|
Series A, 5.00%, 12/01/37 |
|
|
|
Monroe County Industrial Development Corp., Refunding
RB |
|
|
|
| |
|
|
|
| |
|
|
|
| |
|
|
|
New York State Dormitory Authority, RB |
|
|
|
Series A, 4.00%, 07/01/50 |
|
|
|
Series C, 4.25%, 05/01/39 |
|
|
|
Series D, 4.25%, 05/01/39 |
|
|
|
New York State Dormitory Authority, Refunding RB |
|
|
|
| |
|
|
|
| |
|
|
|
| |
|
|
|
| |
|
New York State Dormitory Authority, Refunding
RB (continued) |
|
|
|
| |
|
|
|
Series 1, 4.00%, 07/01/47 |
|
|
|
Suffolk County Economic Development Corp., RB, Series C, 5.00%, 07/01/32 |
|
|
|
Westchester County Local Development Corp.,
|
|
|
|
| |
|
|
|
| |
|
|
|
| |
|
|
|
| |
|
New York City Housing Development Corp., RB, M/F Housing |
|
|
|
Sustainability Bonds, 4.80%, 02/01/53 |
|
|
|
Class F-1, Sustainability Bonds, 4.60%, 11/01/42 |
|
|
|
Series A, Sustainability Bonds, 4.75%, 11/01/48 |
|
|
|
Series A, Sustainability Bonds, (FHLMC, FNMA, GNMA), 4.70%, 08/01/54 |
|
|
|
Series A-1, Sustainability Bonds, 4.65%, 11/01/49 |
|
|
|
Series A-1, Sustainability Bonds, 4.75%, 11/01/54 |
|
|
|
Series B-1, Class A, Sustainability Bonds, 4.65%,
11/01/49 |
|
|
|
Series E-1, Sustainability Bonds, (SONYMA), 4.20%, 11/01/42 |
|
|
|
Series E-1, Sustainability Bonds, 4.70%, 11/01/48 |
|
|
|
Series E-1, Sustainability Bonds, 4.85%, 11/01/53 |
|
|
|
Series G, Sustainability Bonds, 4.75%, 11/01/48 |
|
|
|
New York City Housing Development Corp., Refunding RB, Series A, Sustainability Bonds, 4.25%, 11/01/43 |
|
|
|
New York State Housing Finance Agency, RB, M/F
Housing |
|
|
|
Series A, 4.65%, 11/15/38 |
|
|
|
Series B-1, Sustainability Bonds, (SONYMA), 4.85%,
11/01/48 |
|
|
|
Series C-1, Sustainability Bonds, (SONYMA), 4.65%, 11/01/48 |
|
|
|
New York State Housing Finance Agency, Refunding RB,
Series C, (SONYMA), 3.85%, 11/01/39 |
|
|
|
State of New York Mortgage Agency Homeowner Mortgage Revenue, RB, S/F Housing |
|
|
|
Series 250, Sustainability Bonds, (SONYMA), 4.80%,
10/01/48 |
|
|
|
Series 255, Sustainability Bonds, (SONYMA), 4.70%, 10/01/43 |
|
|
|
Series 261, Sustainability Bonds, (SONYMA),
10/01/49(c) |
|
|
|
State of New York Mortgage Agency Homeowner Mortgage Revenue, Refunding RB |
|
|
|
Series 218, AMT, 3.60%, 04/01/33 |
|
|
|
Series 218, AMT, 3.85%, 04/01/38 |
|
|
|
State of New York Mortgage Agency Homeowner
Mortgage Revenue, Refunding RB, S/F Housing,
Series 190, 3.80%, 10/01/40 |
|
|
|
| |
|
|
|
| |
|
New York City Transitional Finance Authority Building Aid Revenue, Refunding RB, Series S-3, Subordinate, (SAW), 4.00%, 07/15/38 |
|
|
|
New York State Dormitory Authority, RB |
|
|
|
Series A, 5.00%, 03/15/38 |
|
|
|
32 2024 BlackRock
Annual Report to Shareholders
Schedule of Investments (continued)
July
31, 2024
BlackRock MuniHoldings New York Quality Fund, Inc. (MHN)
(Percentages shown are based on Net Assets)
| |
|
|
|
| |
|
New York State Dormitory Authority, RB (continued) |
|
|
|
Series A, 5.00%, 03/15/40 |
|
|
|
Series A, 5.00%, 03/15/44 |
|
|
|
Series A, 5.00%, 03/15/45 |
|
|
|
Series A, 5.00%, 03/15/56 |
|
|
|
New York State Dormitory Authority, Refunding RB |
|
|
|
Series A, 5.00%, 03/15/46 |
|
|
|
Series D, 5.00%, 02/15/48 |
|
|
|
New York State Urban Development Corp., RB |
|
|
|
Series A, 4.00%, 03/15/45 |
|
|
|
Series A, 5.00%, 03/15/46 |
|
|
|
New York State Urban Development Corp., Refunding RB, 4.00%, 03/15/46 |
|
|
|
| |
|
|
|
| |
|
Chautauqua Tobacco Asset Securitization Corp.,
Refunding RB |
|
|
|
| |
|
|
|
| |
|
|
|
New York Counties Tobacco Trust VI, Refunding RB |
|
|
|
Series A-2B, 5.00%, 06/01/45 |
|
|
|
Series A-2B, 5.00%, 06/01/51 |
|
|
|
Niagara Tobacco Asset Securitization Corp., Refunding
RB, 5.25%, 05/15/40 |
|
|
|
Westchester Tobacco Asset Securitization Corp., Refunding RB, Sub-Series C, 4.00%, 06/01/42 |
|
|
|
| |
|
|
|
| |
|
Buffalo & Fort Erie Public Bridge Authority, RB, 5.00%,
01/01/47 |
|
|
|
Hudson Yards Infrastructure Corp., Refunding RB |
|
|
|
Series A, 5.00%, 02/15/42 |
|
|
|
Series A, (AGM), 4.00%, 02/15/47 |
|
|
|
Metropolitan Transportation Authority, RB |
|
|
|
Series D-2, Sustainability Bonds, 4.00%, 11/15/48 |
|
|
|
Series D-3, Sustainability Bonds, 4.00%, 11/15/49 |
|
|
|
Metropolitan Transportation Authority, Refunding RB |
|
|
|
Series A, 5.00%, 11/15/48 |
|
|
|
Series A, 5.00%, 11/15/49 |
|
|
|
Series B, 5.25%, 11/15/55 |
|
|
|
Sub-Series C-1, 5.00%, 11/15/34 |
|
|
|
Series A, Sustainability Bonds, 5.25%, 11/15/49 |
|
|
|
Series A-1, Sustainability Bonds, (AGM), 4.00%, 11/15/54 |
|
|
|
Series B-1, Sustainability Bonds, 5.25%, 11/15/57 |
|
|
|
Series C-1, Sustainability Bonds, 4.75%, 11/15/45 |
|
|
|
Sub-Series C-1, Sustainability Bonds, 5.00%,
11/15/34 |
|
|
|
MTA Hudson Rail Yards Trust Obligations, Refunding RB, Series A, 5.00%, 11/15/56 |
|
|
|
New York City Industrial Development Agency, Refunding
RB, Series A, 5.00%, 07/01/28 |
|
|
|
New York State Thruway Authority, RB |
|
|
|
Series N, 4.00%, 01/01/43 |
|
|
|
Series N, 4.00%, 01/01/44 |
|
|
|
Series A, Junior Lien, 5.00%, 01/01/36 |
|
|
|
Series A, Junior Lien, 5.00%, 01/01/41 |
|
|
|
New York State Thruway Authority, Refunding RB |
|
|
|
Series A, 5.00%, 03/15/46 |
|
|
|
Series A, 5.00%, 03/15/48 |
|
|
|
Series O, 4.00%, 01/01/44 |
|
|
|
| |
|
|
|
Transportation (continued) |
|
New York State Thruway Authority, Refunding
RB (continued) |
|
|
|
Series B, Subordinate, 4.00%, 01/01/45 |
|
|
|
Series B, Subordinate, 4.00%, 01/01/50 |
|
|
|
New York Transportation Development Corp., ARB |
|
|
|
| |
|
|
|
| |
|
|
|
| |
|
|
|
| |
|
|
|
Series A, AMT, 5.00%, 07/01/41 |
|
|
|
Series A, AMT, 5.00%, 07/01/46 |
|
|
|
Series A, AMT, 5.25%, 01/01/50 |
|
|
|
New York Transportation Development Corp., RB |
|
|
|
| |
|
|
|
AMT, Sustainability Bonds, (AGM), 5.50%, 06/30/42 |
|
|
|
AMT, Sustainability Bonds, (AGM), 5.50%, 06/30/43 |
|
|
|
AMT, Sustainability Bonds, (AGM), 5.00%, 06/30/49 |
|
|
|
AMT, Sustainability Bonds, 6.00%, 06/30/54 |
|
|
|
AMT, Sustainability Bonds, (AGM), 5.25%, 06/30/60 |
|
|
|
AMT, Sustainability Bonds, 5.50%, 06/30/60 |
|
|
|
New York Transportation Development Corp., Refunding RB |
|
|
|
| |
|
|
|
Series A, AMT, 5.00%, 12/01/25 |
|
|
|
Series A, AMT, 5.00%, 12/01/32 |
|
|
|
Port Authority of New York & New Jersey, ARB |
|
|
|
Series 218, AMT, 5.00%, 11/01/44 |
|
|
|
Series 221, AMT, 4.00%, 07/15/55 |
|
|
|
Port Authority of New York & New Jersey, Refunding
ARB |
|
|
|
Series 198, 5.25%, 11/15/56 |
|
|
|
Series 244, 5.00%, 07/15/54 |
|
|
|
| |
|
|
|
Series 177, AMT, 4.00%, 01/15/43 |
|
|
|
Series 223, AMT, 4.00%, 07/15/39 |
|
|
|
Series 223, AMT, 5.00%, 07/15/56 |
|
|
|
Series 231, AMT, 5.50%, 08/01/47 |
|
|
|
Series 234, AMT, 5.50%, 08/01/52 |
|
|
|
Port Authority of New York & New Jersey, Refunding RB |
|
|
|
Series 226, AMT, 5.00%, 10/15/39 |
|
|
|
Series 242, AMT, 5.00%, 12/01/39 |
|
|
|
Series 242, AMT, 5.00%, 12/01/53 |
|
|
|
Triborough Bridge & Tunnel Authority, RB |
|
|
|
Series A, 5.00%, 11/15/47 |
|
|
|
Series A, 5.50%, 11/15/57 |
|
|
|
Sub-Series B-1, 5.00%, 11/15/48 |
|
|
|
Triborough Bridge & Tunnel Authority, Refunding RB |
|
|
|
Series A, 5.00%, 11/15/46 |
|
|
|
Series A-1, 5.00%, 05/15/51 |
|
|
|
Series B, 5.00%, 11/15/37 |
|
|
|
Series C, 5.00%, 05/15/47 |
|
|
|
Series C, 4.13%, 05/15/52 |
|
|
|
Series C, 5.25%, 05/15/52 |
|
|
|
Series B-1, Sustainability Bonds, 5.25%, 05/15/54 |
|
|
|
Series C, Sustainability Bonds, 5.25%, 11/15/42 |
|
|
|
Triborough Bridge & Tunnel Authority, Refunding RB,
|
|
|
|
Series B, 0.00%, 11/15/28 |
|
|
|
Series B, 0.00%, 11/15/32 |
|
|
|
| |
|
|
|
Schedule of Investments
33
Schedule of Investments (continued)
July
31, 2024
BlackRock MuniHoldings New York Quality Fund, Inc. (MHN)
(Percentages shown are based on Net Assets)
| |
|
|
|
| |
|
Long Island Power Authority, RB |
|
|
|
(BAM-TCRS), 5.00%, 09/01/42 |
|
|
|
| |
|
|
|
Series E, Sustainability Bonds, 5.00%, 09/01/48 |
|
|
|
Series E, Sustainability Bonds, 5.00%, 09/01/53 |
|
|
|
Long Island Power Authority, Refunding RB, Series B, 5.00%, 09/01/41 |
|
|
|
New York City Municipal Water Finance Authority, RB |
|
|
|
Series CC-1, 4.00%, 06/15/52 |
|
|
|
Series DD, 5.00%, 06/15/47 |
|
|
|
Series GG, 5.00%, 06/15/48 |
|
|
|
Sub-Series CC-1, 5.25%, 06/15/54 |
|
|
|
New York City Municipal Water Finance Authority, Refunding RB |
|
|
|
Series AA-3, 5.25%, 06/15/48 |
|
|
|
Series BB-1, 4.00%, 06/15/45 |
|
|
|
Series DD, 4.13%, 06/15/47 |
|
|
|
Series EE, 5.00%, 06/15/45 |
|
|
|
New York Power Authority, RB, Series A, Sustainability
Bonds, (AGM), 5.00%, 11/15/48 |
|
|
|
New York Power Authority, Refunding RB |
|
|
|
Series A, Sustainability Bonds, 4.00%, 11/15/50 |
|
|
|
Series A, Sustainability Bonds, 4.00%, 11/15/55 |
|
|
|
Series A, Sustainability Bonds, 4.00%, 11/15/60 |
|
|
|
New York State Environmental Facilities Corp., RB, Sustainability Bonds, 5.00%, 08/15/41 |
|
|
|
New York State Environmental Facilities Corp.,
Refunding RB |
|
|
|
| |
|
|
|
Series A, 5.25%, 06/15/53 |
|
|
|
Subordinate, 5.00%, 06/15/41 |
|
|
|
Rockland County Solid Waste Management Authority,
RB, Series A, AMT, Sustainability Bonds, 4.00%,
12/15/46 |
|
|
|
Utility Debt Securitization Authority, Refunding RB |
|
|
|
Series 2, Sustainability Bonds, 5.00%, 12/15/50 |
|
|
|
Series 2, Sustainability Bonds, 5.00%, 06/15/53 |
|
|
|
| |
|
|
|
Total Municipal Bonds in New York |
|
| |
|
| |
|
Puerto Rico Sales Tax Financing Corp. Sales Tax
Revenue, RB |
|
|
|
Series A-1, Restructured, 4.75%, 07/01/53 |
|
|
|
Series A-1, Restructured, 5.00%, 07/01/58 |
|
|
|
Series A-2, Restructured, 4.78%, 07/01/58 |
|
|
|
Series A-2, Restructured, 4.33%, 07/01/40 |
|
|
|
Series B-1, Restructured, 4.75%, 07/01/53 |
|
|
|
Series B-2, Restructured, 4.78%, 07/01/58 |
|
|
|
Puerto Rico Sales Tax Financing Corp. Sales Tax Revenue, RB, CAB, Series A-1, Restructured, 0.00%, 07/01/46(d) |
|
|
|
Total Municipal Bonds in Puerto Rico |
|
| |
|
| |
|
Patriots Energy Group Financing Agency, RB, Series A1, 5.25%, 10/01/54(a) |
|
|
|
Total Municipal Bonds — 163.9%
(Cost: $583,612,269) |
|
| |
|
|
|
Municipal Bonds Transferred to Tender Option Bond Trusts(g) |
| |
| |
|
Hudson Yards Infrastructure Corp., Refunding RB,
Series A, 5.00%, 02/15/42 |
|
|
|
Total Municipal Bonds in New York |
|
Total Municipal Bonds Transferred to Tender Option Bond Trusts — 1.3%
(Cost: $4,536,433) |
|
Total Long-Term Investments — 165.2%
(Cost: $588,148,702) |
|
| |
|
|
|
| |
Money Market Funds — 1.8% |
|
BlackRock Liquidity Funds, MuniCash, Institutional Shares, 3.47%(h)(i) |
|
|
|
Total Short-Term Securities — 1.8%
(Cost: $6,514,268) |
|
Total Investments — 167.0%
(Cost: $594,662,970) |
|
Other Assets Less Liabilities — 0.1% |
|
Liability for TOB Trust Certificates, Including Interest Expense and Fees Payable — (0.6)% |
|
VRDP Shares at Liquidation Value, Net of Deferred Offering Costs —
(66.5)% |
|
Net Assets Applicable to Common Shares — 100.0% |
|
| |
Variable rate security. Interest rate resets periodically. The rate shown is the effective
interest rate as of period end. Security description also includes the reference rate and
spread if published and available. |
| |
Security exempt from registration pursuant to Rule 144A under the Securities Act of 1933,
as amended. These securities may be resold in transactions exempt from registration to
qualified institutional investors. |
| |
|
| |
|
| |
Issuer filed for bankruptcy and/or is in default. |
| |
Non-income producing security. |
| |
Represent bonds transferred to a TOB Trust in exchange of cash and residual certificates
received by the Fund. These bonds serve as collateral in a secured borrowing. See Note 4
of the Notes to Financial Statements for details. |
| |
|
| |
Annualized 7-day yield as of period end. |
For purposes of this report, industry and sector sub-classifications may differ from those utilized by the Fund for compliance purposes.
34
2024 BlackRock Annual Report to Shareholders
Schedule of Investments (continued)
July
31, 2024
BlackRock MuniHoldings New York Quality Fund, Inc. (MHN)
Affiliates
Investments in issuers considered to be affiliate(s) of the Fund during the year ended July 31, 2024 for purposes of Section 2(a)(3) of
the Investment Company Act of 1940, as amended, were as
follows:
| |
|
|
|
|
Change in
Unrealized
Appreciation
(Depreciation) |
|
|
|
Capital Gain
Distributions
from
Underlying
Funds |
BlackRock Liquidity Funds New York Money Fund Portfolio(a) |
|
|
|
|
|
|
|
|
|
BlackRock Liquidity Funds, MuniCash, Institutional Shares |
|
|
|
|
|
|
|
|
|
| |
|
|
|
|
|
|
|
|
|
| |
As of period end, the entity is no longer held. |
| |
Represents net amount purchased (sold). |
Derivative Financial Instruments Outstanding as of Period End
| |
|
|
|
Value/
Unrealized
Appreciation
(Depreciation) |
| |
|
|
|
|
10-Year U.S. Treasury Note |
|
|
|
|
| |
|
|
|
|
5-Year U.S. Treasury Note |
|
|
|
|
| |
|
|
|
|
Derivative Financial Instruments
Categorized by Risk Exposure
As of period end, the fair values
of derivative financial instruments located in the Statements of Assets and Liabilities were as follows:
| |
|
|
|
Foreign
Currency
Exchange
Contracts |
|
|
|
Liabilities — Derivative Financial Instruments |
|
|
|
|
|
|
|
Futures contracts
Unrealized depreciation on futures
contracts(a) |
|
|
|
|
|
|
|
| |
Net cumulative unrealized appreciation (depreciation) on futures contracts and centrally cleared swaps, if any, are reported in the Schedule of Investments. In the
Statements of Assets and Liabilities, only current day’s variation
margin is reported in receivables or payables and the net cumulative unrealized appreciation (depreciation) is included in accumulated earnings (loss). |
For the period ended July 31, 2024, the effect of derivative financial instruments in the Statements of Operations was as follows:
| |
|
|
|
Foreign
Currency
Exchange
Contracts |
|
|
|
Net Realized Gain (Loss) from: |
|
|
|
|
|
|
|
| |
|
|
|
|
|
|
|
Net Change in Unrealized Appreciation (Depreciation) on: |
|
|
|
|
|
|
|
| |
|
|
|
|
|
|
|
Average Quarterly Balances of
Outstanding Derivative Financial Instruments
| |
|
Average notional value of contracts — short |
|
Schedule of Investments
35
Schedule of Investments (continued)
July
31, 2024
BlackRock MuniHoldings New York Quality Fund, Inc. (MHN)
For more information
about the Fund’s investment risks regarding derivative financial instruments, refer to the Notes to Financial Statements.
Fair Value Hierarchy as of Period End
Various inputs are used in determining the fair value of financial instruments. For a description of the input levels and information about the Fund’s policy
regarding valuation of financial instruments, refer to the Notes to Financial Statements.
The following table summarizes the Fund’s financial
instruments categorized in the fair value hierarchy. The breakdown of the Fund’s financial
instruments into major categories is disclosed in the Schedule of Investments
above.
| |
|
|
|
|
| |
|
|
|
|
| |
|
|
|
|
| |
|
|
|
|
| |
|
|
|
|
Municipal Bonds Transferred to Tender Option Bond Trusts |
|
|
|
|
| |
|
|
|
|
| |
|
|
|
|
| |
|
|
|
|
Derivative Financial Instruments(a)
|
|
|
|
|
| |
|
|
|
|
| |
|
|
|
|
| |
Derivative financial instruments are futures contracts. Futures contracts are valued at the
unrealized appreciation (depreciation) on the instrument. |
The Fund may hold assets and/or liabilities in which the fair value approximates the carrying amount for financial statement purposes. As of period end, such assets and/or liabilities are categorized within the fair value hierarchy as follows:
| |
|
|
|
|
| |
|
|
|
|
| |
|
|
|
|
VRDP Shares at Liquidation Value |
|
|
|
|
| |
|
|
|
|
See notes to financial
statements.
36
2024 BlackRock Annual Report to Shareholders
Schedule of Investments
July 31, 2024
BlackRock MuniYield Michigan Quality Fund, Inc. (MIY)
(Percentages shown are based on Net Assets)
| |
|
|
|
| |
| |
|
| |
|
California Infrastructure & Economic Development
Bank, RB, Series A-4, AMT, 01/01/50(a)(b)(c) |
|
|
|
| |
|
| |
|
Kentucky Public Energy Authority, Refunding RB, Series B, 5.00%, 01/01/55(a)
|
|
|
|
| |
|
County/City/Special District/School District — 39.3% |
|
Belding Area Schools, GO, (Q-SBLF), 5.25%, 05/01/48 |
|
|
|
Bloomfield Hills School District, GO, 5.00%, 05/01/48 |
|
|
|
Byron Center Public Schools, GO, Series II, (Q-SBLF),
5.25%, 05/01/53 |
|
|
|
Cedar Springs Public School District, GO |
|
|
|
Series II, (Q-SBLF), 5.00%, 05/01/46 |
|
|
|
Series II, (Q-SBLF), 4.50%, 05/01/49 |
|
|
|
Chippewa Valley Schools, GO, (Q-SBLF), 5.00%,
05/01/43 |
|
|
|
City of Lansing Michigan, Refunding GO |
|
|
|
Series B, (AGM), 4.00%, 06/01/43 |
|
|
|
Series B, (AGM), 4.13%, 06/01/48 |
|
|
|
Clarkston Community Schools, GO |
|
|
|
Series I, (Q-SBLF), 5.00%, 05/01/45 |
|
|
|
Series I, (Q-SBLF), 5.00%, 05/01/47 |
|
|
|
Coopersville Area Public Schools, GO |
|
|
|
Series I, (Q-SBLF), 4.00%, 05/01/48 |
|
|
|
Series I, (Q-SBLF), 4.13%, 05/01/52 |
|
|
|
County of Kalamazoo Michigan, GOL, 4.13%, 05/01/47 |
|
|
|
Farmington Public School District, Refunding GO |
|
|
|
| |
|
|
|
| |
|
|
|
| |
|
|
|
Grand Ledge Public Schools, GO, (Q-SBLF), 5.00%, 05/01/44 |
|
|
|
Grand Rapids Public Schools, GO, (AGM), 5.00%,
05/01/49 |
|
|
|
Gull Lake Community School District, GO, Series I, (Q-SBLF), 5.00%, 05/01/48 |
|
|
|
Holly Area School District, GO, Series I, (Q-SBLF),
5.25%, 05/01/48 |
|
|
|
Hudsonville Public Schools, GO, Series I, (Q-SBLF), 4.00%, 05/01/45 |
|
|
|
Hudsonville Public Schools, Refunding GO |
|
|
|
(Q-SBLF), 5.00%, 05/01/46 |
|
|
|
(Q-SBLF), 5.00%, 05/01/49 |
|
|
|
Karegnondi Water Authority, Refunding RB |
|
|
|
| |
|
|
|
| |
|
|
|
Kentwood Public Schools, GO |
|
|
|
| |
|
|
|
Series II, (AGM), 5.00%, 05/01/46 |
|
|
|
Series II, (AGM), 5.00%, 05/01/49 |
|
|
|
Michigan Finance Authority, RB |
|
|
|
| |
|
|
|
Series H-1, 5.00%, 10/01/39(d) |
|
|
|
2nd Lien, (BAM-TCRS), 4.00%, 11/01/50 |
|
|
|
Novi Community School District, GO |
|
|
|
Series I, 5.00%, 05/01/44 |
|
|
|
| |
|
|
|
County/City/Special District/School District (continued) |
|
Novi Community School District, GO (continued) |
|
|
|
Series II, 4.00%, 05/01/43 |
|
|
|
Okemos Public Schools, GO, Series II, (Q-SBLF),
5.00%, 05/01/49 |
|
|
|
Rockford Public Schools, GO, Series II, (Q-SBLF), 5.00%, 05/01/46 |
|
|
|
Southfield Public Schools, GO, (Q-SBLF), 5.00%,
05/01/49 |
|
|
|
Three Rivers Community Schools, GO |
|
|
|
Series II, (Q-SBLF), 4.13%, 05/01/46 |
|
|
|
Series II, (Q-SBLF), 4.25%, 05/01/49 |
|
|
|
Trenton Public Schools School District, GO, (Q-SBLF),
5.00%, 05/01/48 |
|
|
|
| |
|
|
|
(Q-SBLF), 5.00%, 05/01/47 |
|
|
|
(Q-SBLF), 5.00%, 05/01/52 |
|
|
|
Walled Lake Consolidated School District, GO |
|
|
|
(Q-SBLF), 5.00%, 05/01/47 |
|
|
|
(Q-SBLF), 5.00%, 05/01/49 |
|
|
|
Wayne-Westland Community Schools, GO |
|
|
|
(Q-SBLF), 5.00%, 11/01/44 |
|
|
|
(Q-SBLF), 4.50%, 11/01/46 |
|
|
|
West Ottawa Public Schools, GO, (AGM), 4.00%,
11/01/46 |
|
|
|
Zeeland Public Schools, GO, Series A, (AGM), 5.00%, 05/01/33 |
|
|
|
| |
|
|
|
| |
|
Eastern Michigan University, RB, Series A, (AGM),
4.00%, 03/01/44 |
|
|
|
Grand Valley State University, RB, 5.00%, 12/01/43 |
|
|
|
Lake Superior State University, RB, (AGM), 5.00%,
01/15/48 |
|
|
|
Michigan Finance Authority, Refunding RB |
|
|
|
| |
|
|
|
| |
|
|
|
| |
|
|
|
| |
|
|
|
| |
|
|
|
| |
|
|
|
| |
|
|
|
Michigan State University, Refunding RB |
|
|
|
Series B, 4.00%, 02/15/44 |
|
|
|
Series B, 5.00%, 02/15/44 |
|
|
|
Series B, 5.00%, 02/15/48 |
|
|
|
Series C, 4.00%, 02/15/44 |
|
|
|
Michigan Technological University, RB |
|
|
|
Series A, 5.00%, 10/01/45 |
|
|
|
Series A, (AGM), 5.25%, 10/01/52 |
|
|
|
Series C, (AGM), 5.25%, 10/01/48 |
|
|
|
| |
|
|
|
| |
|
|
|
| |
|
|
|
Wayne State University, RB |
|
|
|
Series A, 5.00%, 11/15/43 |
|
|
|
Series A, 4.00%, 11/15/48 |
|
|
|
Western Michigan University, RB |
|
|
|
Series A, (AGM), 5.00%, 11/15/51 |
|
|
|
Schedule of Investments
37
Schedule of Investments (continued)
July
31, 2024
BlackRock MuniYield Michigan Quality Fund, Inc. (MIY)
(Percentages shown are based on Net Assets)
| |
|
|
|
| |
|
Western Michigan University, RB (continued) |
|
|
|
Series A, (AGM), 5.00%, 11/15/53 |
|
|
|
Western Michigan University, Refunding RB, 5.00%,
11/15/49 |
|
|
|
| |
|
|
|
| |
|
Grand Traverse County Hospital Finance Authority, RB |
|
|
|
Series A, 5.00%, 07/01/49 |
|
|
|
Series B, 4.00%, 07/01/49 |
|
|
|
Kalamazoo Economic Development Corp., Refunding
RB, 5.00%, 05/15/42 |
|
|
|
Kentwood Economic Development Corp., Refunding RB, 4.00%, 11/15/43 |
|
|
|
Michigan Finance Authority, RB, 5.00%, 11/01/44 |
|
|
|
Michigan Finance Authority, Refunding RB |
|
|
|
| |
|
|
|
| |
|
|
|
| |
|
|
|
| |
|
|
|
| |
|
|
|
| |
|
|
|
Series 2, 4.00%, 03/01/51 |
|
|
|
Series A, 4.00%, 12/01/40 |
|
|
|
Series A, 5.00%, 12/01/42 |
|
|
|
Series A, 4.00%, 12/01/49 |
|
|
|
Series S, 5.00%, 05/15/34 |
|
|
|
Series S, 5.00%, 05/15/38 |
|
|
|
Michigan State Hospital Finance Authority, Refunding
RB, 5.00%, 11/15/47 |
|
|
|
Michigan Strategic Fund, RB, 5.00%, 11/15/42 |
|
|
|
| |
|
|
|
| |
|
Michigan State Housing Development Authority, RB,
M/F Housing |
|
|
|
| |
|
|
|
Series A, 4.45%, 10/01/34 |
|
|
|
Series A, 4.63%, 10/01/39 |
|
|
|
Series A, 4.30%, 10/01/40 |
|
|
|
Series A, 4.00%, 10/01/43 |
|
|
|
Series A, 4.75%, 10/01/44 |
|
|
|
Series A, 5.00%, 10/01/48 |
|
|
|
Series A, 2.55%, 10/01/51 |
|
|
|
Michigan State Housing Development Authority, RB, S/F Housing |
|
|
|
Series A, Sustainability Bonds, 6.00%, 06/01/54 |
|
|
|
Series D, Sustainability Bonds, 5.50%, 06/01/53 |
|
|
|
| |
|
|
|
| |
|
Michigan Finance Authority, RB |
|
|
|
Series F, 5.00%, 04/01/31 |
|
|
|
Series F, 5.25%, 10/01/41 |
|
|
|
Michigan State Building Authority, Refunding RB |
|
|
|
| |
|
|
|
Series I, 5.00%, 04/15/41 |
|
|
|
Series I, 4.00%, 10/15/46 |
|
|
|
Series I, 5.00%, 10/15/47 |
|
|
|
Michigan Strategic Fund, RB |
|
|
|
AMT, (AGM), 4.25%, 12/31/38 |
|
|
|
| |
|
|
|
State of Michigan Trunk Line Revenue, RB |
|
|
|
| |
|
|
|
| |
|
|
|
| |
|
State of Michigan Trunk Line Revenue, RB (continued) |
|
|
|
| |
|
|
|
| |
|
|
|
Series B, 4.00%, 11/15/45 |
|
|
|
Series B, 5.00%, 11/15/45 |
|
|
|
| |
|
|
|
| |
|
Michigan Finance Authority, Refunding RB |
|
|
|
Series A, Class 1, 4.00%, 06/01/39 |
|
|
|
Series A, Class 1, 4.00%, 06/01/49 |
|
|
|
Michigan Finance Authority, Refunding RB, CAB,
Series B-2, Class 2, 0.00%, 06/01/65(e) |
|
|
|
| |
|
|
|
| |
|
Gerald R Ford International Airport Authority, ARB |
|
|
|
AMT, (GTD), 5.00%, 01/01/51 |
|
|
|
AMT, (GTD), 5.00%, 01/01/54 |
|
|
|
Wayne County Airport Authority, ARB |
|
|
|
Series A, 5.00%, 12/01/42 |
|
|
|
Series A, 5.00%, 12/01/46 |
|
|
|
Series A, (AGM), 5.25%, 12/01/48 |
|
|
|
Series D, 5.00%, 12/01/45 |
|
|
|
| |
|
|
|
Series B, AMT, 5.00%, 12/01/42 |
|
|
|
Wayne County Airport Authority, Refunding RB |
|
|
|
| |
|
|
|
Series F, AMT, 5.00%, 12/01/34 |
|
|
|
| |
|
|
|
| |
|
City of Detroit Michigan Water Supply System Revenue,
RB, Series A, Senior Lien, (NPFGC), 5.00%,
07/01/34 |
|
|
|
Downriver Utility Wastewater Authority, Refunding RB, (AGM), 5.00%, 04/01/43 |
|
|
|
Great Lakes Water Authority Sewage Disposal System
Revenue, RB |
|
|
|
Series A, Senior Lien, 5.25%, 07/01/47 |
|
|
|
Series A, Senior Lien, 5.25%, 07/01/52 |
|
|
|
Great Lakes Water Authority Water Supply System Revenue, RB |
|
|
|
Series B, 2nd Lien, 5.00%, 07/01/46 |
|
|
|
Series B, Senior Lien, 5.25%, 07/01/48 |
|
|
|
Lansing Board of Water & Light, Refunding RB |
|
|
|
Series A, 5.00%, 07/01/44 |
|
|
|
Series A, 5.00%, 07/01/48 |
|
|
|
Series A, 5.25%, 07/01/54 |
|
|
|
Michigan Finance Authority, RB, Sustainability Bonds,
5.50%, 02/28/49 |
|
|
|
Michigan Finance Authority, Refunding RB, Series D-1, 5.00%, 07/01/35 |
|
|
|
| |
|
|
|
Total Municipal Bonds in Michigan |
|
| |
|
| |
|
State of Nevada Department of Business & Industry,
RB, Series A4, AMT, 01/01/50(a)(c) |
|
|
|
38
2024 BlackRock Annual Report to Shareholders
Schedule of Investments (continued)
July
31, 2024
BlackRock MuniYield Michigan Quality Fund, Inc. (MIY)
(Percentages shown are based on Net Assets)
| |
|
|
|
| |
|
| |
|
Commonwealth of Puerto Rico, GO, Series A-1, Restructured, 5.75%, 07/01/31 |
|
|
|
Puerto Rico Sales Tax Financing Corp. Sales Tax
Revenue, RB |
|
|
|
Series A-1, Restructured, 4.75%, 07/01/53 |
|
|
|
Series A-1, Restructured, 5.00%, 07/01/58 |
|
|
|
Series A-2, Restructured, 4.78%, 07/01/58 |
|
|
|
Series A-2, Restructured, 4.33%, 07/01/40 |
|
|
|
Series B-1, Restructured, 4.75%, 07/01/53 |
|
|
|
Series B-1, Restructured, 5.00%, 07/01/58 |
|
|
|
Series B-2, Restructured, 4.33%, 07/01/40 |
|
|
|
Series B-2, Restructured, 4.78%, 07/01/58 |
|
|
|
Puerto Rico Sales Tax Financing Corp. Sales Tax Revenue, RB, CAB, Series A-1, Restructured, 0.00%, 07/01/46(e) |
|
|
|
Total Municipal Bonds in Puerto Rico |
|
Total Long-Term Investments — 155.5%
(Cost: $582,115,963) |
|
| |
|
|
|
| |
Money Market Funds — 4.3% |
|
BlackRock Liquidity Funds, MuniCash, Institutional Shares, 3.47%(f)(g) |
|
|
|
Total Short-Term Securities — 4.3%
(Cost: $16,392,339) |
|
Total Investments — 159.8%
(Cost: $598,508,302) |
|
Other Assets Less Liabilities — 1.3% |
|
VRDP Shares at Liquidation Value, Net of Deferred Offering Costs —
(61.1)% |
|
Net Assets Applicable to Common Shares — 100.0% |
|
| |
Variable rate security. Interest rate resets periodically. The rate shown is the effective
interest rate as of period end. Security description also includes the reference rate and
spread if published and available. |
| |
Security exempt from registration pursuant to Rule 144A under the Securities Act of 1933,
as amended. These securities may be resold in transactions exempt from registration to
qualified institutional investors. |
| |
|
| |
U.S. Government securities held in escrow, are used to pay interest on this security as well as to retire the bond in full at the date indicated, typically at a premium to par. |
| |
|
| |
|
| |
Annualized 7-day yield as of period end. |
For purposes of this report, industry and sector sub-classifications may differ from those utilized by the Fund for compliance purposes.
Investments in issuers considered to be affiliate(s) of the Fund
during the year ended July 31, 2024 for purposes of Section 2(a)(3) of the Investment Company Act of 1940, as amended, were as follows:
| |
|
|
|
|
Change in
Unrealized
Appreciation
(Depreciation) |
|
|
|
Capital Gain
Distributions
from
Underlying
Funds |
BlackRock Liquidity Funds, MuniCash, Institutional Shares |
|
|
|
|
|
|
|
|
|
| |
Represents net amount purchased (sold). |
Schedule of Investments
39
Schedule of Investments (continued)
July
31, 2024
BlackRock MuniYield Michigan Quality Fund, Inc. (MIY)
Fair Value Hierarchy as of Period End
Various inputs are used in determining the fair value of
financial instruments. For a description of the input levels and information about the Fund’s policy regarding valuation of financial instruments, refer to the Notes to
Financial Statements.
The following table
summarizes the Fund’s financial instruments categorized in the fair value hierarchy. The breakdown of the Fund’s financial instruments into major categories is disclosed in the Schedule of Investments above.
The Fund may hold assets and/or liabilities in which the fair value approximates the carrying amount for financial statement purposes. As of period end, such assets and/or liabilities are categorized within the fair value hierarchy as follows:
| |
|
|
|
|
| |
|
|
|
|
VRDP Shares at Liquidation Value |
|
|
|
|
| |
|
|
|
|
See notes to financial
statements.
40
2024 BlackRock Annual Report to Shareholders
Schedule of Investments
July 31, 2024
BlackRock MuniYield New York Quality Fund, Inc. (MYN)
(Percentages shown are based on Net Assets)
| |
|
|
|
| |
| |
|
| |
|
Lower Alabama Gas District, RB, Series A, 5.00%,
09/01/46 |
|
|
|
| |
|
| |
|
California Infrastructure & Economic Development Bank, RB, Series A-4, AMT,
01/01/50(a)(b)(c) |
|
|
|
| |
|
| |
|
Guam Power Authority, Refunding RB, Series A, 5.00%,
10/01/41 |
|
|
|
| |
|
| |
|
Kentucky Public Energy Authority, Refunding RB, Series B, 5.00%, 01/01/55(a)
|
|
|
|
| |
|
| |
|
State of Nevada Department of Business & Industry, RB,
Series A4, AMT, 01/01/50(a)(c) |
|
|
|
| |
|
| |
|
New York Liberty Development Corp., RB, 5.50%, 10/01/37 |
|
|
|
New York Liberty Development Corp., Refunding RB,
5.25%, 10/01/35 |
|
|
|
New York State Energy Research & Development Authority, Refunding RB, Series C, 4.00%, 04/01/34 |
|
|
|
New York State Environmental Facilities Corp., RB, AMT,
2.75%, 09/01/50(a) |
|
|
|
New York Transportation Development Corp., ARB |
|
|
|
| |
|
|
|
| |
|
|
|
New York Transportation Development Corp., RB |
|
|
|
| |
|
|
|
| |
|
|
|
New York Transportation Development Corp., Refunding ARB, AMT, 3.00%, 08/01/31 |
|
|
|
| |
|
|
|
County/City/Special District/School District — 30.8% |
|
Battery Park City Authority, RB |
|
|
|
Series A, Sustainability Bonds, 5.00%, 11/01/41 |
|
|
|
Series A, Sustainability Bonds, 5.00%, 11/01/42 |
|
|
|
Series A, Sustainability Bonds, 5.00%, 11/01/43 |
|
|
|
Series A, Sustainability Bonds, 5.00%, 11/01/48 |
|
|
|
Brookhaven Local Development Corp., Refunding RB, 5.00%, 10/01/50 |
|
|
|
| |
|
|
|
Series A, 5.00%, 08/01/51 |
|
|
|
Series A-1, 4.00%, 09/01/46 |
|
|
|
Series A-1, 5.00%, 08/01/47 |
|
|
|
Series C, 5.25%, 03/01/53 |
|
|
|
Series D, 5.25%, 04/01/54 |
|
|
|
Series E1, 5.25%, 04/01/44 |
|
|
|
Series F-1, 4.00%, 03/01/47 |
|
|
|
Series I, 5.00%, 03/01/36 |
|
|
|
| |
|
|
|
County/City/Special District/School District (continued) |
|
City of New York, GO (continued) |
|
|
|
Sub-Series D-1, 5.50%, 05/01/46 |
|
|
|
Sub-Series E-1, 4.00%, 04/01/45 |
|
|
|
County of Nassau New York, GOL |
|
|
|
Series A, 4.00%, 04/01/49 |
|
|
|
Series A, 4.25%, 04/01/52 |
|
|
|
County of Nassau New York, Refunding GOL |
|
|
|
Series A, (AGM), 4.00%, 04/01/49 |
|
|
|
Series B, (AGM), 5.00%, 04/01/40 |
|
|
|
New York City Industrial Development Agency,
RB(d) |
|
|
|
| |
|
|
|
| |
|
|
|
New York City Industrial Development Agency, Refunding
RB, (AGM), 4.00%, 03/01/45 |
|
|
|
New York City Transitional Finance Authority Building Aid Revenue, RB, Series S-1, Subordinate, (SAW), 5.00%, 07/15/43 |
|
|
|
New York City Transitional Finance Authority Future Tax
Secured Revenue, RB |
|
|
|
Series A-1, 5.00%, 08/01/38 |
|
|
|
Series B-1, 5.00%, 08/01/45 |
|
|
|
Sub-Series B-1, 5.00%, 11/01/35 |
|
|
|
Sub-Series B-1, 5.00%, 11/01/36 |
|
|
|
Sub-Series E-1, 5.00%, 02/01/43 |
|
|
|
Series C-1, Subordinate, 4.00%, 02/01/39 |
|
|
|
Series F-1, Subordinate, 5.00%, 02/01/44 |
|
|
|
New York City Transitional Finance Authority, RB |
|
|
|
Series F-1, 5.25%, 02/01/53 |
|
|
|
Series B, Subordinate, 5.25%, 05/01/50 |
|
|
|
New York Convention Center Development Corp., RB, |
|
|
|
Series B, Sub Lien, 0.00%, 11/15/42 |
|
|
|
Series B, Sub Lien, 0.00%, 11/15/47 |
|
|
|
Series B, Sub Lien, 0.00%, 11/15/48 |
|
|
|
Series B, Sub Lien, (AGM-CR), 0.00%, 11/15/56 |
|
|
|
New York Convention Center Development Corp.,
Refunding RB, 5.00%, 11/15/45 |
|
|
|
New York Liberty Development Corp., Refunding RB |
|
|
|
Class 1, 5.00%, 11/15/44(b) |
|
|
|
Series 1, 3.00%, 02/15/42 |
|
|
|
Series A, Sustainability Bonds, 3.00%, 11/15/51 |
|
|
|
Triborough Bridge & Tunnel Authority Sales Tax Revenue, RB |
|
|
|
| |
|
|
|
Series A, 5.25%, 05/15/52 |
|
|
|
Series A, 4.13%, 05/15/53 |
|
|
|
Series A-1, 5.25%, 05/15/64 |
|
|
|
Yonkers Industrial Development Agency, Refunding RB,
(SAW), 4.00%, 05/01/41 |
|
|
|
| |
|
|
|
| |
|
Albany Capital Resource Corp., Refunding
RB(e)(f) |
|
|
|
| |
|
|
|
| |
|
|
|
Build NYC Resource Corp., RB, Sustainability Bonds,
5.75%, 06/01/52(b) |
|
|
|
Build NYC Resource Corp., Refunding RB |
|
|
|
| |
|
|
|
Series A, 5.00%, 06/01/43 |
|
|
|
Dutchess County Local Development Corp., RB |
|
|
|
| |
|
|
|
Schedule of Investments
41
Schedule of Investments (continued)
July
31, 2024
BlackRock MuniYield New York Quality Fund, Inc. (MYN)
(Percentages shown are based on Net Assets)
| |
|
|
|
| |
|
Dutchess County Local Development Corp.,
RB (continued) |
|
|
|
| |
|
|
|
| |
|
|
|
Dutchess County Local Development Corp., Refunding RB |
|
|
|
| |
|
|
|
| |
|
|
|
Madison County Capital Resource Corp., RB |
|
|
|
Series B, 5.00%, 07/01/40 |
|
|
|
Series B, 5.00%, 07/01/43 |
|
|
|
Monroe County Industrial Development Corp., RB, Series A, 5.00%, 07/01/53 |
|
|
|
Monroe County Industrial Development Corp., Refunding
RB |
|
|
|
Series A, 4.00%, 07/01/39 |
|
|
|
Series A, 4.00%, 07/01/50 |
|
|
|
New York State Dormitory Authority, RB |
|
|
|
Series 1, (AMBAC), 5.50%, 07/01/40 |
|
|
|
Series A, 5.00%, 07/01/46 |
|
|
|
Series A, Sustainability Bonds, 5.00%, 07/01/48 |
|
|
|
New York State Dormitory Authority, Refunding RB |
|
|
|
Series A, 5.00%, 07/01/35 |
|
|
|
Series A, 5.00%, 07/01/43 |
|
|
|
Series A, 5.00%, 07/01/48 |
|
|
|
Series A, 5.50%, 07/01/54 |
|
|
|
Onondaga County Trust for Cultural Resources,
Refunding RB |
|
|
|
| |
|
|
|
| |
|
|
|
| |
|
|
|
Schenectady County Capital Resource Corp., Refunding
RB, 5.00%, 01/01/47 |
|
|
|
Troy Capital Resource Corp., Refunding RB, 5.00%, 09/01/39 |
|
|
|
Trust for Cultural Resources of The City of New York,
Refunding RB |
|
|
|
Series A, 5.00%, 07/01/37 |
|
|
|
Series A, 5.00%, 07/01/41 |
|
|
|
| |
|
|
|
| |
|
Build NYC Resource Corp., RB |
|
|
|
| |
|
|
|
| |
|
|
|
Genesee County Funding Corp., Refunding RB,
Series A, 5.25%, 12/01/52 |
|
|
|
Monroe County Industrial Development Corp., RB |
|
|
|
| |
|
|
|
Series A, 5.00%, 12/01/32 |
|
|
|
Series A, 5.00%, 12/01/37 |
|
|
|
Monroe County Industrial Development Corp., Refunding RB |
|
|
|
| |
|
|
|
| |
|
|
|
| |
|
|
|
New York State Dormitory Authority, RB |
|
|
|
Series A, 4.00%, 07/01/50 |
|
|
|
Series C, 4.25%, 05/01/39 |
|
|
|
Series D, 4.25%, 05/01/39 |
|
|
|
New York State Dormitory Authority, Refunding RB |
|
|
|
| |
|
|
|
| |
|
|
|
| |
|
New York State Dormitory Authority, Refunding
RB (continued) |
|
|
|
| |
|
|
|
| |
|
|
|
Series 1, 4.00%, 07/01/47 |
|
|
|
Suffolk County Economic Development Corp., RB,
Series C, 5.00%, 07/01/32 |
|
|
|
Westchester County Local Development Corp., |
|
|
|
| |
|
|
|
| |
|
|
|
| |
|
|
|
| |
|
New York City Housing Development Corp., RB, M/F
Housing |
|
|
|
Sustainability Bonds, 4.80%, 02/01/53 |
|
|
|
Class F-1, Sustainability Bonds, 4.60%, 11/01/42 |
|
|
|
Series A, Sustainability Bonds, 4.75%, 11/01/48 |
|
|
|
Series A, Sustainability Bonds, (FHLMC, FNMA,
GNMA), 4.70%, 08/01/54 |
|
|
|
Series A-1, Sustainability Bonds, 4.65%, 11/01/49 |
|
|
|
Series A-1, Sustainability Bonds, 4.75%, 11/01/54 |
|
|
|
Series B-1, Class A, Sustainability Bonds, 4.65%, 11/01/49 |
|
|
|
Series E-1, Sustainability Bonds, (SONYMA), 4.20%,
11/01/42 |
|
|
|
Series E-1, Sustainability Bonds, 4.70%, 11/01/48 |
|
|
|
Series E-1, Sustainability Bonds, 4.85%, 11/01/53 |
|
|
|
New York City Housing Development Corp., Refunding RB, Series A, Sustainability Bonds, 4.25%, 11/01/43 |
|
|
|
New York State Housing Finance Agency, RB, M/F
Housing |
|
|
|
Series A, 4.65%, 11/15/38 |
|
|
|
Series B-1, Sustainability Bonds, (SONYMA), 4.85%,
11/01/48 |
|
|
|
Series C-1, Sustainability Bonds, (SONYMA), 4.65%, 11/01/48 |
|
|
|
New York State Housing Finance Agency, Refunding RB,
Series C, (SONYMA), 3.85%, 11/01/39 |
|
|
|
State of New York Mortgage Agency Homeowner Mortgage Revenue, RB, S/F Housing |
|
|
|
Series 250, Sustainability Bonds, (SONYMA), 4.80%,
10/01/48 |
|
|
|
Series 255, Sustainability Bonds, (SONYMA), 4.70%, 10/01/43 |
|
|
|
Series 261, Sustainability Bonds, (SONYMA),
10/01/49(c) |
|
|
|
State of New York Mortgage Agency Homeowner Mortgage Revenue, Refunding RB |
|
|
|
Series 218, AMT, 3.60%, 04/01/33 |
|
|
|
Series 218, AMT, 3.85%, 04/01/38 |
|
|
|
State of New York Mortgage Agency Homeowner
Mortgage Revenue, Refunding RB, S/F Housing,
Series 190, 3.80%, 10/01/40 |
|
|
|
| |
|
|
|
| |
|
New York City Transitional Finance Authority Building Aid Revenue, Refunding RB, Series S-3, Subordinate, (SAW), 4.00%, 07/15/38 |
|
|
|
New York State Dormitory Authority, RB |
|
|
|
Series A, 5.00%, 03/15/38 |
|
|
|
42 2024 BlackRock
Annual Report to Shareholders
Schedule of Investments (continued)
July
31, 2024
BlackRock MuniYield New York Quality Fund, Inc. (MYN)
(Percentages shown are based on Net Assets)
| |
|
|
|
| |
|
New York State Dormitory Authority, RB (continued) |
|
|
|
Series A, 5.00%, 03/15/40 |
|
|
|
Series A, 5.00%, 03/15/44 |
|
|
|
Series A, 5.00%, 03/15/45 |
|
|
|
Series A, 5.00%, 03/15/56 |
|
|
|
Series C, 4.00%, 03/15/45 |
|
|
|
New York State Dormitory Authority, Refunding RB |
|
|
|
Series A, 5.00%, 03/15/46 |
|
|
|
Series D, 5.00%, 02/15/48 |
|
|
|
New York State Urban Development Corp., RB |
|
|
|
Series A, 4.00%, 03/15/45 |
|
|
|
Series A, 5.00%, 03/15/46 |
|
|
|
New York State Urban Development Corp., Refunding
RB, 4.00%, 03/15/46 |
|
|
|
| |
|
|
|
| |
|
Chautauqua Tobacco Asset Securitization Corp., Refunding RB |
|
|
|
| |
|
|
|
| |
|
|
|
New York Counties Tobacco Trust VI, Refunding RB |
|
|
|
Series A-2B, 5.00%, 06/01/45 |
|
|
|
Series A-2B, 5.00%, 06/01/51 |
|
|
|
Niagara Tobacco Asset Securitization Corp., Refunding RB, 5.25%, 05/15/40 |
|
|
|
Westchester Tobacco Asset Securitization Corp.,
Refunding RB, Sub-Series C, 4.00%, 06/01/42 |
|
|
|
| |
|
|
|
| |
|
Buffalo & Fort Erie Public Bridge Authority, RB, 5.00%, 01/01/47 |
|
|
|
Hudson Yards Infrastructure Corp., Refunding RB |
|
|
|
Series A, 5.00%, 02/15/42 |
|
|
|
Series A, (AGM), 4.00%, 02/15/47 |
|
|
|
Metropolitan Transportation Authority, RB |
|
|
|
Series A-1, 4.00%, 11/15/45 |
|
|
|
Series D-2, Sustainability Bonds, 4.00%, 11/15/48 |
|
|
|
Series D-3, Sustainability Bonds, 4.00%, 11/15/49 |
|
|
|
Metropolitan Transportation Authority, Refunding RB |
|
|
|
Series A, 5.00%, 11/15/48 |
|
|
|
Series A, 5.00%, 11/15/49 |
|
|
|
Series B, 5.25%, 11/15/55 |
|
|
|
Series A, Sustainability Bonds, 5.25%, 11/15/49 |
|
|
|
Series A-1, Sustainability Bonds, (AGM), 4.00%,
11/15/54 |
|
|
|
Series B-1, Sustainability Bonds, 5.25%, 11/15/57 |
|
|
|
Series C-1, Sustainability Bonds, 4.75%, 11/15/45 |
|
|
|
MTA Hudson Rail Yards Trust Obligations, Refunding RB, Series A, 5.00%, 11/15/56 |
|
|
|
New York City Industrial Development Agency, Refunding
RB, Series A, 5.00%, 07/01/28 |
|
|
|
New York State Thruway Authority, RB |
|
|
|
Series N, 4.00%, 01/01/43 |
|
|
|
Series N, 4.00%, 01/01/44 |
|
|
|
Series A, Junior Lien, 5.00%, 01/01/36 |
|
|
|
Series A, Junior Lien, 5.00%, 01/01/41 |
|
|
|
New York State Thruway Authority, Refunding RB |
|
|
|
Series A, 5.00%, 03/15/46 |
|
|
|
Series O, 4.00%, 01/01/44 |
|
|
|
Series B, Subordinate, 4.00%, 01/01/45 |
|
|
|
| |
|
|
|
Transportation (continued) |
|
New York State Thruway Authority, Refunding
RB (continued) |
|
|
|
Series B, Subordinate, 4.00%, 01/01/50 |
|
|
|
New York Transportation Development Corp., ARB |
|
|
|
| |
|
|
|
| |
|
|
|
| |
|
|
|
| |
|
|
|
Series A, AMT, 5.00%, 07/01/41 |
|
|
|
Series A, AMT, 5.00%, 07/01/46 |
|
|
|
Series A, AMT, 5.25%, 01/01/50 |
|
|
|
New York Transportation Development Corp., RB |
|
|
|
| |
|
|
|
AMT, Sustainability Bonds, (AGM), 5.50%, 06/30/42 |
|
|
|
AMT, Sustainability Bonds, (AGM), 5.50%, 06/30/43 |
|
|
|
AMT, Sustainability Bonds, (AGM), 5.00%, 06/30/49 |
|
|
|
AMT, Sustainability Bonds, 6.00%, 06/30/54 |
|
|
|
AMT, Sustainability Bonds, (AGM), 5.25%, 06/30/60 |
|
|
|
AMT, Sustainability Bonds, 5.50%, 06/30/60 |
|
|
|
New York Transportation Development Corp., Refunding
RB, Series A, AMT, 5.00%, 12/01/37 |
|
|
|
Port Authority of New York & New Jersey, ARB |
|
|
|
Series 221, AMT, 4.00%, 07/15/39 |
|
|
|
Series 221, AMT, 4.00%, 07/15/55 |
|
|
|
Port Authority of New York & New Jersey, Refunding ARB |
|
|
|
| |
|
|
|
Series 198, 5.25%, 11/15/56 |
|
|
|
Series 205, 5.00%, 11/15/47 |
|
|
|
Series 244, 5.00%, 07/15/54 |
|
|
|
| |
|
|
|
Series 177, AMT, 4.00%, 01/15/43 |
|
|
|
Series 223, AMT, 5.00%, 07/15/56 |
|
|
|
Series 231, AMT, 5.50%, 08/01/47 |
|
|
|
Series 234, AMT, 5.50%, 08/01/52 |
|
|
|
Port Authority of New York & New Jersey, Refunding RB |
|
|
|
Series 242, AMT, 5.00%, 12/01/39 |
|
|
|
Series 242, AMT, 5.00%, 12/01/53 |
|
|
|
Triborough Bridge & Tunnel Authority, RB |
|
|
|
Series A, 5.00%, 11/15/47 |
|
|
|
Series A, 5.50%, 11/15/57 |
|
|
|
Sub-Series B-1, 5.00%, 11/15/48 |
|
|
|
Triborough Bridge & Tunnel Authority, Refunding RB |
|
|
|
Series A-1, 5.00%, 05/15/51 |
|
|
|
Series C, 5.00%, 05/15/47 |
|
|
|
Series C, 4.13%, 05/15/52 |
|
|
|
Series C, 5.25%, 05/15/52 |
|
|
|
Series B-1, Sustainability Bonds, 5.25%, 05/15/54 |
|
|
|
Series C, Sustainability Bonds, 5.25%, 11/15/42 |
|
|
|
Triborough Bridge & Tunnel Authority, Refunding RB,
CAB, Series B, 0.00%, 11/15/32(d) |
|
|
|
| |
|
|
|
| |
|
Long Island Power Authority, RB |
|
|
|
(BAM-TCRS), 5.00%, 09/01/42 |
|
|
|
| |
|
|
|
Series E, Sustainability Bonds, 5.00%, 09/01/48 |
|
|
|
Series E, Sustainability Bonds, 5.00%, 09/01/53 |
|
|
|
Long Island Power Authority, Refunding RB, Series B,
5.00%, 09/01/41 |
|
|
|
New York City Municipal Water Finance Authority, RB |
|
|
|
Series CC-1, 4.00%, 06/15/52 |
|
|
|
Schedule of Investments
43
Schedule of Investments (continued)
July
31, 2024
BlackRock MuniYield New York Quality Fund, Inc. (MYN)
(Percentages shown are based on Net Assets)
| |
|
|
|
| |
|
New York City Municipal Water Finance Authority,
RB (continued) |
|
|
|
Series DD, 5.00%, 06/15/47 |
|
|
|
Series GG, 5.00%, 06/15/48 |
|
|
|
Sub-Series CC-1, 5.25%, 06/15/54 |
|
|
|
New York City Municipal Water Finance Authority,
Refunding RB |
|
|
|
Series AA-3, 5.25%, 06/15/48 |
|
|
|
Series BB-1, 4.00%, 06/15/45 |
|
|
|
Series DD, 4.13%, 06/15/47 |
|
|
|
Series EE, 5.00%, 06/15/45 |
|
|
|
New York Power Authority, RB |
|
|
|
Series A, Sustainability Bonds, (AGM), 5.00%,
11/15/48 |
|
|
|
Series A, Sustainability Bonds, (AGM), 5.13%, 11/15/58 |
|
|
|
New York Power Authority, Refunding RB |
|
|
|
Series A, Sustainability Bonds, 4.00%, 11/15/50 |
|
|
|
Series A, Sustainability Bonds, 4.00%, 11/15/55 |
|
|
|
Series A, Sustainability Bonds, 4.00%, 11/15/60 |
|
|
|
New York State Environmental Facilities Corp., RB,
Sustainability Bonds, 5.00%, 08/15/41 |
|
|
|
New York State Environmental Facilities Corp., Refunding RB |
|
|
|
| |
|
|
|
Series A, 5.25%, 06/15/53 |
|
|
|
Subordinate, 5.00%, 06/15/41 |
|
|
|
Rockland County Solid Waste Management Authority, RB, Series A, AMT, Sustainability Bonds, 4.00%, 12/15/46 |
|
|
|
Utility Debt Securitization Authority, Refunding RB |
|
|
|
Series 2, Sustainability Bonds, 5.00%, 12/15/50 |
|
|
|
Series 2, Sustainability Bonds, 5.00%, 06/15/53 |
|
|
|
| |
|
|
|
Total Municipal Bonds in New York |
|
| |
|
| |
|
Puerto Rico Sales Tax Financing Corp. Sales Tax Revenue, RB |
|
|
|
Series A-1, Restructured, 4.75%, 07/01/53 |
|
|
|
Series A-1, Restructured, 5.00%, 07/01/58 |
|
|
|
Series A-2, Restructured, 4.78%, 07/01/58 |
|
|
|
Series A-2, Restructured, 4.33%, 07/01/40 |
|
|
|
Series B-1, Restructured, 4.75%, 07/01/53 |
|
|
|
Series B-1, Restructured, 5.00%, 07/01/58 |
|
|
|
Series B-2, Restructured, 4.33%, 07/01/40 |
|
|
|
Series B-2, Restructured, 4.78%, 07/01/58 |
|
|
|
Puerto Rico Sales Tax Financing Corp. Sales Tax
Revenue, RB, CAB, Series A-1, Restructured, 0.00%,
07/01/46(d) |
|
|
|
Total Municipal Bonds in Puerto Rico |
|
| |
|
| |
|
Patriots Energy Group Financing Agency, RB, Series A1,
5.25%, 10/01/54(a) |
|
|
|
Total Municipal Bonds — 150.2%
(Cost: $655,764,080) |
|
| |
|
|
|
Municipal Bonds Transferred to Tender Option Bond Trusts(g) |
| |
County/City/Special District/School District — 1.3% |
|
City of New York, GO, Series B, 5.25%, 10/01/47 |
|
|
|
| |
|
New York State Dormitory Authority, RB, Series A,
5.00%, 03/15/44 |
|
|
|
| |
|
Hudson Yards Infrastructure Corp., Refunding RB,
Series A, 5.00%, 02/15/42 |
|
|
|
Triborough Bridge & Tunnel Authority, Refunding RB, Series C, 4.13%, 05/15/52 |
|
|
|
| |
|
|
|
Total Municipal Bonds in New York |
|
Total Municipal Bonds Transferred to Tender Option Bond
Trusts — 6.0%
(Cost: $25,906,799) |
|
Total Long-Term Investments — 156.2%
(Cost: $681,670,879) |
|
| |
|
|
|
| |
Money Market Funds — 1.7% |
|
BlackRock Liquidity Funds, MuniCash, Institutional Shares, 3.47%(h)(i) |
|
|
|
Total Short-Term Securities — 1.7%
(Cost: $7,588,938) |
|
Total Investments — 157.9%
(Cost: $689,259,817) |
|
Other Assets Less Liabilities — 0.1% |
|
Liability for TOB Trust Certificates, Including Interest Expense and Fees Payable — (2.9)% |
|
VRDP Shares at Liquidation Value, Net of Deferred Offering Costs —
(55.1)% |
|
Net Assets Applicable to Common Shares — 100.0% |
|
| |
Variable rate security. Interest rate resets periodically. The rate shown is the effective
interest rate as of period end. Security description also includes the reference rate and
spread if published and available. |
| |
Security exempt from registration pursuant to Rule 144A under the Securities Act of 1933,
as amended. These securities may be resold in transactions exempt from registration to
qualified institutional investors. |
| |
|
| |
|
| |
Issuer filed for bankruptcy and/or is in default. |
| |
Non-income producing security. |
| |
Represent bonds transferred to a TOB Trust in exchange of cash and residual certificates
received by the Fund. These bonds serve as collateral in a secured borrowing. See Note 4
of the Notes to Financial Statements for details. |
| |
|
| |
Annualized 7-day yield as of period end. |
For purposes of this report, industry and sector sub-classifications may differ from those utilized by the Fund for compliance purposes.
44
2024 BlackRock Annual Report to Shareholders
Schedule of Investments (continued)
July
31, 2024
BlackRock MuniYield New York Quality Fund, Inc. (MYN)
Affiliates
Investments in issuers considered to be affiliate(s) of the Fund during the year ended July 31, 2024 for purposes of Section 2(a)(3) of
the Investment Company Act of 1940, as amended, were as
follows:
| |
|
|
|
|
Change in
Unrealized
Appreciation
(Depreciation) |
|
|
|
Capital Gain
Distributions
from
Underlying
Funds |
BlackRock Liquidity Funds New York Money Fund Portfolio(a) |
|
|
|
|
|
|
|
|
|
BlackRock Liquidity Funds, MuniCash, Institutional Shares |
|
|
|
|
|
|
|
|
|
| |
|
|
|
|
|
|
|
|
|
| |
As of period end, the entity is no longer held. |
| |
Represents net amount purchased (sold). |
Derivative Financial Instruments Outstanding as of Period End
| |
|
|
|
Value/
Unrealized
Appreciation
(Depreciation) |
| |
|
|
|
|
10-Year U.S. Treasury Note |
|
|
|
|
| |
|
|
|
|
5-Year U.S. Treasury Note |
|
|
|
|
| |
|
|
|
|
Derivative Financial Instruments
Categorized by Risk Exposure
As of period end, the fair values
of derivative financial instruments located in the Statements of Assets and Liabilities were as follows:
| |
|
|
|
Foreign
Currency
Exchange
Contracts |
|
|
|
Liabilities — Derivative Financial Instruments |
|
|
|
|
|
|
|
Futures contracts
Unrealized depreciation on futures
contracts(a) |
|
|
|
|
|
|
|
| |
Net cumulative unrealized appreciation (depreciation) on futures contracts and centrally cleared swaps, if any, are reported in the Schedule of Investments. In the
Statements of Assets and Liabilities, only current day’s variation
margin is reported in receivables or payables and the net cumulative unrealized appreciation (depreciation) is included in accumulated earnings (loss). |
For the period ended July 31, 2024, the effect of derivative financial instruments in the Statements of Operations was as follows:
| |
|
|
|
Foreign
Currency
Exchange
Contracts |
|
|
|
Net Realized Gain (Loss) from: |
|
|
|
|
|
|
|
| |
|
|
|
|
|
|
|
Net Change in Unrealized Appreciation (Depreciation) on: |
|
|
|
|
|
|
|
| |
|
|
|
|
|
|
|
Average Quarterly Balances of
Outstanding Derivative Financial Instruments
| |
|
Average notional value of contracts — short |
|
Schedule of Investments
45
Schedule of Investments (continued)
July
31, 2024
BlackRock MuniYield New York Quality Fund, Inc. (MYN)
For more information
about the Fund’s investment risks regarding derivative financial instruments, refer to the Notes to Financial Statements.
Fair Value Hierarchy as of Period End
Various inputs are used in determining the fair value of financial instruments. For a description of the input levels and information about the Fund’s policy
regarding valuation of financial instruments, refer to the Notes to Financial Statements.
The following table summarizes the Fund’s financial
instruments categorized in the fair value hierarchy. The breakdown of the Fund’s financial
instruments into major categories is disclosed in the Schedule of Investments
above.
| |
|
|
|
|
| |
|
|
|
|
| |
|
|
|
|
| |
|
|
|
|
| |
|
|
|
|
Municipal Bonds Transferred to Tender Option Bond Trusts |
|
|
|
|
| |
|
|
|
|
| |
|
|
|
|
| |
|
|
|
|
Derivative Financial Instruments(a)
|
|
|
|
|
| |
|
|
|
|
| |
|
|
|
|
| |
Derivative financial instruments are futures contracts. Futures contracts are valued at the
unrealized appreciation (depreciation) on the instrument. |
The Fund may hold assets and/or liabilities in which the fair value approximates the carrying amount for financial statement purposes. As of period end, such assets and/or liabilities are categorized within the fair value hierarchy as follows:
| |
|
|
|
|
| |
|
|
|
|
| |
|
|
|
|
VRDP Shares at Liquidation Value |
|
|
|
|
| |
|
|
|
|
See notes to financial
statements.
46
2024 BlackRock Annual Report to Shareholders
Schedule of Investments
July 31, 2024
BlackRock MuniYield Pennsylvania Quality Fund (MPA)
(Percentages shown are based on Net Assets)
| |
|
|
|
| |
| |
|
| |
|
California Infrastructure & Economic Development Bank,
RB, Series A-4, AMT, 01/01/50(a)(b)(c) |
|
|
|
| |
|
| |
|
Allegheny County Industrial Development Authority, Refunding RB, 4.88%, 11/01/24 |
|
|
|
Lehigh County Industrial Development Authority,
Refunding RB, Series A, 3.00%, 09/01/29 |
|
|
|
Montgomery County Industrial Development Authority, Refunding RB, Series A, 4.10%,
04/01/53(a) |
|
|
|
Pennsylvania Economic Development Financing Authority,
Refunding RB |
|
|
|
Series B, 5.25%, 12/01/38(a)
|
|
|
|
Series C, 5.25%, 12/01/37(a) |
|
|
|
| |
|
|
|
| |
|
|
|
County/City/Special District/School District — 24.1% |
|
Allentown Neighborhood Improvement Zone Development
|
|
|
|
| |
|
|
|
| |
|
|
|
Altoona Area School District, GOL, Series A, (AGM SAW), 5.00%, 12/01/36 |
|
|
|
Bethlehem Area School District, GOL |
|
|
|
Series A, (BAM SAW), 5.00%, 08/01/34 |
|
|
|
Series A, (BAM SAW), 5.00%, 08/01/35 |
|
|
|
Borough of West Chester Pennsylvania, Refunding GO, 3.50%, 11/15/35 |
|
|
|
Bristol Township School District, GOL, (BAM SAW),
5.00%, 06/01/42 |
|
|
|
Chester County Industrial Development Authority, SAB(b) |
|
|
|
| |
|
|
|
| |
|
|
|
City of Lancaster Pennsylvania, GO, (BAM), 4.00%,
11/01/42 |
|
|
|
City of Philadelphia Pennsylvania, Refunding GO, Series A, 5.00%, 08/01/37 |
|
|
|
City of Pittsburgh Pennsylvania, GO, 5.00%, 09/01/43 |
|
|
|
Coatesville School District, GOL,
CAB(d) |
|
|
|
Series A, (BAM SAW), 0.00%, 10/01/34 |
|
|
|
Series A, (BAM SAW), 0.00%, 10/01/35 |
|
|
|
Series A, (BAM SAW), 0.00%, 10/01/37 |
|
|
|
Coatesville School District, Refunding GOL,
CAB(d) |
|
|
|
Series B, (BAM SAW), 0.00%, 10/01/33 |
|
|
|
Series B, (BAM SAW), 0.00%, 10/01/34 |
|
|
|
Series C, (BAM SAW), 0.00%, 10/01/33 |
|
|
|
Northampton County Industrial Development Authority, TA, 7.00%, 07/01/32 |
|
|
|
Pennsylvania Economic Development Financing Authority,
RB |
|
|
|
| |
|
|
|
| |
|
|
|
|
|
|
|
|
| |
|
|
|
School District of Philadelphia, GOL |
|
|
|
Series A, (SAW), 5.00%, 09/01/44 |
|
|
|
Series A, (SAW), 5.50%, 09/01/48 |
|
|
|
Series D, (AGM SAW), 3.00%, 09/01/44 |
|
|
|
| |
|
|
|
County/City/Special District/School District (continued) |
|
Shaler Area School District, GO, (XLCA SAW), 0.00%,
09/01/30(d) |
|
|
|
Springfield School District/Delaware County, GOL, (SAW), 5.00%, 03/01/36 |
|
|
|
State Public School Building Authority, RB(d) |
|
|
|
(AGM SAW), 0.00%, 12/15/24 |
|
|
|
(AGM SAW), 0.00%, 12/15/25 |
|
|
|
| |
|
|
|
| |
|
Berks County Municipal Authority, Refunding RB |
|
|
|
| |
|
|
|
| |
|
|
|
Chester County Industrial Development Authority, RB,
Sustainability Bonds, 4.00%, 12/01/51 |
|
|
|
Delaware County Authority, RB, 5.00%, 08/01/40 |
|
|
|
East Hempfield Township Industrial Development
Authority, RB, 5.00%, 07/01/25(e) |
|
|
|
Latrobe Industrial Development Authority, Refunding RB, 4.00%, 03/01/46 |
|
|
|
Montgomery County Higher Education and Health
Authority, Refunding RB |
|
|
|
| |
|
|
|
Series A, 5.00%, 09/01/37 |
|
|
|
Northampton County General Purpose Authority, Refunding RB, 4.00%, 11/01/38 |
|
|
|
Pennsylvania Higher Education Assistance Agency, RB |
|
|
|
Series 1C, AMT, 5.00%, 06/01/51 |
|
|
|
Series B, AMT, Subordinate, 3.13%, 06/01/48 |
|
|
|
Series B, AMT, Subordinate, 5.00%, 06/01/50 |
|
|
|
Pennsylvania Higher Educational Facilities Authority, RB |
|
|
|
Series AT-1, 4.00%, 06/15/26(e)
|
|
|
|
Series AT-2, 4.00%, 06/15/34 |
|
|
|
Pennsylvania Higher Educational Facilities Authority, Refunding RB |
|
|
|
| |
|
|
|
Series A, 5.00%, 11/01/31 |
|
|
|
Series A, 5.00%, 09/01/45 |
|
|
|
Series A, (AGM), 4.00%, 05/01/50 |
|
|
|
Philadelphia Authority for Industrial Development, RB |
|
|
|
| |
|
|
|
| |
|
|
|
| |
|
|
|
| |
|
|
|
| |
|
|
|
| |
|
|
|
Philadelphia Authority for Industrial Development, Refunding RB |
|
|
|
| |
|
|
|
| |
|
|
|
Series 2015, 5.00%, 04/01/45 |
|
|
|
Series A, 5.25%, 06/15/52 |
|
|
|
Sports & Exhibition Authority of Pittsburgh & Allegheny
County, RB, Series A, VRDN, (AGM), 3.63%,
08/07/24(a)(f) |
|
|
|
Swarthmore Borough Authority, Refunding RB, 5.00%, 09/15/47 |
|
|
|
| |
|
|
|
| |
|
Allegheny County Hospital Development Authority, RB |
|
|
|
Series B, (NPFGC), 6.00%, 07/01/26 |
|
|
|
Series D2, 4.31%, 11/15/47(a) |
|
|
|
Schedule of Investments
47
Schedule of Investments (continued)
July
31, 2024
BlackRock MuniYield Pennsylvania Quality Fund (MPA)
(Percentages shown are based on Net Assets)
| |
|
|
|
| |
|
Allegheny County Hospital Development Authority,
Refunding RB |
|
|
|
Series A, 4.00%, 04/01/37 |
|
|
|
Series A, (AGM-CR), 4.00%, 04/01/44 |
|
|
|
Bucks County Industrial Development Authority, RB, 4.00%, 07/01/46 |
|
|
|
Chester County Health and Education Facilities Authority,
Refunding RB, Series A, 5.00%, 10/01/52 |
|
|
|
Cumberland County Municipal Authority, Refunding RB |
|
|
|
| |
|
|
|
| |
|
|
|
| |
|
|
|
| |
|
|
|
| |
|
|
|
Doylestown Hospital Authority, RB |
|
|
|
| |
|
|
|
| |
|
|
|
DuBois Hospital Authority, Refunding RB, (BAM-TCRS),
4.00%, 07/15/48 |
|
|
|
Geisinger Authority, Refunding RB, Series A-1, 5.00%, 02/15/45 |
|
|
|
Lancaster County Hospital Authority, Refunding RB,
5.00%, 11/01/35 |
|
|
|
Lancaster Industrial Development Authority, RB |
|
|
|
| |
|
|
|
| |
|
|
|
Montgomery County Industrial Development Authority, RB,
Series C, 4.00%, 11/15/43 |
|
|
|
Montgomery County Industrial Development Authority, Refunding RB |
|
|
|
| |
|
|
|
| |
|
|
|
Mount Lebanon Hospital Authority, RB, 4.00%, 07/01/48 |
|
|
|
Northampton County General Purpose Authority, Refunding RB |
|
|
|
| |
|
|
|
Series A1, (AGM), 4.00%, 08/15/43 |
|
|
|
Series A1, 5.25%, 08/15/53 |
|
|
|
Pennsylvania Economic Development Financing Authority, RB |
|
|
|
Series A-2, 4.00%, 05/15/53 |
|
|
|
Series B, 4.00%, 03/15/40 |
|
|
|
Pennsylvania Higher Educational Facilities Authority, RB,
3.00%, 08/15/47 |
|
|
|
Pottsville Hospital Authority, Refunding RB, Series B, 5.00%, 07/01/41 |
|
|
|
St Mary Hospital Authority, Refunding RB |
|
|
|
| |
|
|
|
| |
|
|
|
Wayne County Hospital & Health Facilities Authority, RB, Series A, (GTD), 4.00%, 07/01/46 |
|
|
|
| |
|
|
|
| |
|
Pennsylvania Housing Finance Agency, RB, S/F Housing |
|
|
|
Series 137, Sustainability Bonds, 2.60%, 04/01/46 |
|
|
|
Series 143A, Sustainability Bonds, 5.38%, 10/01/46 |
|
|
|
Series 145A, Sustainability Bonds, 4.60%, 10/01/44 |
|
|
|
Series 145A, Sustainability Bonds, 6.00%, 10/01/54 |
|
|
|
Series 146A, Sustainability Bonds,
10/01/44(c) |
|
|
|
| |
|
|
|
| |
|
Pennsylvania Housing Finance Agency, Refunding RB,
S/F Housing |
|
|
|
Series 142-A, Sustainability Bonds, 5.00%, 10/01/43 |
|
|
|
Series 142-A, Sustainability Bonds, 5.00%, 10/01/50 |
|
|
|
Series 2022, Sustainability Bonds, 4.15%, 10/01/42 |
|
|
|
Philadelphia Authority for Industrial Development, RB, M/F
|
|
|
|
Series A, 3.50%, 12/01/36 |
|
|
|
Series A, 4.00%, 12/01/46 |
|
|
|
Series A, 4.00%, 12/01/51 |
|
|
|
| |
|
|
|
| |
|
Commonwealth of Pennsylvania, GO, Series 1, 4.00%,
03/01/38 |
|
|
|
| |
|
Commonwealth Financing Authority, RB |
|
|
|
| |
|
|
|
| |
|
|
|
| |
|
|
|
| |
|
|
|
| |
|
Allegheny County Airport Authority, ARB, Series A, AMT,
(AGM), 5.50%, 01/01/53 |
|
|
|
City of Philadelphia Pennsylvania Airport Revenue, Refunding ARB |
|
|
|
Series B, AMT, 5.00%, 07/01/35 |
|
|
|
Series B, AMT, 5.00%, 07/01/37 |
|
|
|
Delaware River Joint Toll Bridge Commission, RB, 5.00%,
07/01/42 |
|
|
|
Delaware River Port Authority, RB, 5.00%, 01/01/37 |
|
|
|
Pennsylvania Economic Development Financing Authority,
RB |
|
|
|
| |
|
|
|
| |
|
|
|
Pennsylvania Turnpike Commission Oil Franchise Tax Revenue, Refunding RB, Series A, 4.00%, 12/01/51 |
|
|
|
Pennsylvania Turnpike Commission, RB |
|
|
|
Sub-Series B-1, 5.00%, 06/01/42 |
|
|
|
Sub-Series B-1, 5.25%, 06/01/47 |
|
|
|
Series 1, Subordinate, 5.00%, 12/01/40 |
|
|
|
Series A, Subordinate, 3.00%, 12/01/42 |
|
|
|
Series A, Subordinate, 4.00%, 12/01/46 |
|
|
|
Series A, Subordinate, 4.00%, 12/01/50 |
|
|
|
Series A, Subordinate, (BAM-TCRS), 4.00%, 12/01/50 |
|
|
|
Pennsylvania Turnpike Commission, RB, CAB(d) |
|
|
|
Sub-Series A-3, (AGM), 0.00%, 12/01/40 |
|
|
|
Sub-Series A-3, 0.00%, 12/01/42 |
|
|
|
Pennsylvania Turnpike Commission, Refunding RB |
|
|
|
Series B, 5.25%, 12/01/52 |
|
|
|
Series B-2, (AGM), 5.00%, 06/01/35 |
|
|
|
Series 2017-3, Subordinate, 5.00%, 12/01/40 |
|
|
|
Southeastern Pennsylvania Transportation Authority, RB |
|
|
|
| |
|
|
|
| |
|
|
|
| |
|
|
|
| |
|
Bucks County Water and Sewer Authority, RB |
|
|
|
Series A, (AGM), 5.00%, 12/01/37 |
|
|
|
Series A, (AGM), 5.00%, 12/01/40 |
|
|
|
48 2024 BlackRock
Annual Report to Shareholders
Schedule of Investments (continued)
July
31, 2024
BlackRock MuniYield Pennsylvania Quality Fund (MPA)
(Percentages shown are based on Net Assets)
| |
|
|
|
| |
|
City of Philadelphia Pennsylvania Water & Wastewater
Revenue, RB |
|
|
|
Series A, 5.00%, 10/01/43 |
|
|
|
Series A, 5.25%, 10/01/52 |
|
|
|
Series C, 5.50%, 06/01/52 |
|
|
|
City of Philadelphia Pennsylvania Water & Wastewater
Revenue, Refunding RB |
|
|
|
Series B, (AGM), 4.50%, 09/01/48 |
|
|
|
Series B, (AGM), 5.50%, 09/01/53 |
|
|
|
New Kensington Municipal Sanitary Authority, RB, (AGM), 3.25%, 12/01/47 |
|
|
|
Philadelphia Gas Works Co., Refunding RB |
|
|
|
| |
|
|
|
| |
|
|
|
| |
|
|
|
| |
|
|
|
| |
|
|
|
Williamsport Sanitary Authority, Refunding RB, (BAM),
4.00%, 01/01/40 |
|
|
|
| |
|
|
|
Total Municipal Bonds in Pennsylvania |
|
| |
|
| |
|
Puerto Rico Sales Tax Financing Corp. Sales Tax Revenue, RB |
|
|
|
Series A-1, Restructured, 4.75%, 07/01/53 |
|
|
|
Series A-1, Restructured, 5.00%, 07/01/58 |
|
|
|
Series A-2, Restructured, 4.78%, 07/01/58 |
|
|
|
Series A-2, Restructured, 4.33%, 07/01/40 |
|
|
|
Series B-1, Restructured, 4.75%, 07/01/53 |
|
|
|
Series B-1, Restructured, 5.00%, 07/01/58 |
|
|
|
Series B-2, Restructured, 4.33%, 07/01/40 |
|
|
|
Series B-2, Restructured, 4.78%, 07/01/58 |
|
|
|
Puerto Rico Sales Tax Financing Corp. Sales Tax
Revenue, RB, CAB, Series A-1, Restructured, 0.00%,
07/01/46(d) |
|
|
|
Total Municipal Bonds in Puerto Rico |
|
Total Municipal Bonds — 143.2%
(Cost: $242,600,815) |
|
Municipal Bonds Transferred to Tender Option Bond Trusts(i) |
| |
| |
|
Pennsylvania Higher Educational Facilities Authority, RB,
Series AR, 4.00%, 06/15/38 |
|
|
|
| |
|
|
|
| |
|
Pennsylvania Higher Educational Facilities Authority, RB,
Series AR, 4.00%, 06/15/38 |
|
|
|
Total Municipal Bonds in Pennsylvania |
|
Total Municipal Bonds Transferred to Tender Option Bond
Trusts — 6.7%
(Cost: $11,285,849) |
|
Total Long-Term Investments — 149.9%
(Cost: $253,886,664) |
|
| |
|
|
|
| |
Money Market Funds — 3.3% |
|
BlackRock Liquidity Funds, MuniCash, Institutional Shares, 3.47%(j)(k) |
|
|
|
Total Short-Term Securities — 3.3%
(Cost: $5,575,056) |
|
Total Investments — 153.2%
(Cost: $259,461,720) |
|
Other Assets Less Liabilities — 0.1% |
|
Liability for TOB Trust Certificates, Including Interest Expense and Fees Payable — (4.5)% |
|
VRDP Shares at Liquidation Value, Net of Deferred Offering Costs —
(48.8)% |
|
Net Assets Applicable to Common Shares — 100.0% |
|
| |
Variable rate security. Interest rate resets periodically. The rate shown is the effective
interest rate as of period end. Security description also includes the reference rate and
spread if published and available. |
| |
Security exempt from registration pursuant to Rule 144A under the Securities Act of 1933,
as amended. These securities may be resold in transactions exempt from registration to
qualified institutional investors. |
| |
|
| |
|
| |
U.S. Government securities held in escrow, are used to pay interest on this security as well as to retire the bond in full at the date indicated, typically at a premium to par. |
| |
Variable rate security. Rate as of period end and maturity is the date the principal owed can be recovered through demand. |
| |
Issuer filed for bankruptcy and/or is in default. |
| |
Non-income producing security. |
| |
Represent bonds transferred to a TOB Trust in exchange of cash and residual certificates
received by the Fund. These bonds serve as collateral in a secured borrowing. See Note 4
of the Notes to Financial Statements for details. |
| |
|
| |
Annualized 7-day yield as of period end. |
For purposes of this report, industry and sector sub-classifications may differ from those utilized by the Fund for compliance purposes.
Schedule of Investments
49
Schedule of Investments (continued)
July
31, 2024
BlackRock MuniYield Pennsylvania Quality Fund (MPA)
Affiliates
Investments in issuers considered to be affiliate(s) of the Fund during the year ended July 31, 2024 for purposes of Section 2(a)(3) of
the Investment Company Act of 1940, as amended, were as
follows:
| |
|
|
|
|
Change in
Unrealized
Appreciation
(Depreciation) |
|
|
|
Capital Gain
Distributions
from
Underlying
Funds |
BlackRock Liquidity Funds, MuniCash, Institutional Shares |
|
|
|
|
|
|
|
|
|
| |
Represents net amount purchased (sold). |
Fair Value Hierarchy as of Period End
Various inputs are used in determining the fair value of
financial instruments. For a description of the input levels and information about the Fund’s policy regarding valuation of financial instruments, refer to the Notes to
Financial Statements.
The following table
summarizes the Fund’s financial instruments categorized in the fair value hierarchy. The breakdown of the Fund’s financial instruments into major categories is disclosed in the Schedule of Investments above.
| |
|
|
|
|
| |
|
|
|
|
| |
|
|
|
|
| |
|
|
|
|
| |
|
|
|
|
Municipal Bonds Transferred to Tender Option Bond Trusts |
|
|
|
|
| |
|
|
|
|
| |
|
|
|
|
| |
|
|
|
|
The Fund may hold assets and/or liabilities in which the fair value approximates the carrying amount for financial statement purposes. As of period end, such assets and/or liabilities are categorized within the fair value hierarchy as follows:
| |
|
|
|
|
| |
|
|
|
|
| |
|
|
|
|
VRDP Shares at Liquidation Value |
|
|
|
|
| |
|
|
|
|
See notes to financial
statements.
50
2024 BlackRock Annual Report to Shareholders
Schedule of Investments
July 31, 2024
BlackRock New York Municipal Income Trust (BNY)
(Percentages shown are based on Net Assets)
| |
|
|
|
| |
| |
|
| |
|
Lower Alabama Gas District, RB, Series A, 5.00%,
09/01/46 |
|
|
|
| |
|
| |
|
California Infrastructure & Economic Development Bank, RB, Series A-4, AMT,
01/01/50(a)(b)(c) |
|
|
|
| |
|
| |
|
Guam Power Authority, Refunding RB, Series A, 5.00%,
10/01/41 |
|
|
|
| |
|
| |
|
Kentucky Public Energy Authority, Refunding RB, Series B, 5.00%, 01/01/55(a)
|
|
|
|
| |
|
| |
|
Build NYC Resource Corp., Refunding RB, AMT, 5.00%,
01/01/35(b) |
|
|
|
New York Liberty Development Corp., RB, 5.50%, 10/01/37 |
|
|
|
New York Liberty Development Corp., Refunding RB,
5.25%, 10/01/35 |
|
|
|
New York State Energy Research & Development Authority, Refunding RB, Series C, 4.00%, 04/01/34 |
|
|
|
New York State Environmental Facilities Corp., RB, AMT,
2.75%, 09/01/50(a) |
|
|
|
New York Transportation Development Corp., ARB, AMT, 5.63%, 04/01/40 |
|
|
|
New York Transportation Development Corp., RB |
|
|
|
| |
|
|
|
| |
|
|
|
New York Transportation Development Corp., Refunding ARB, AMT, 3.00%, 08/01/31 |
|
|
|
Niagara Area Development Corp., Refunding RB,
Series A, AMT, 4.75%, 11/01/42(b) |
|
|
|
| |
|
|
|
County/City/Special District/School District — 29.5% |
|
Battery Park City Authority, RB |
|
|
|
Series A, Sustainability Bonds, 5.00%, 11/01/41 |
|
|
|
Series A, Sustainability Bonds, 5.00%, 11/01/42 |
|
|
|
Series A, Sustainability Bonds, 5.00%, 11/01/43 |
|
|
|
Series A, Sustainability Bonds, 5.00%, 11/01/48 |
|
|
|
Brookhaven Local Development Corp., Refunding RB,
5.00%, 10/01/50 |
|
|
|
| |
|
|
|
Series A, 5.00%, 08/01/51 |
|
|
|
Series A-1, 4.00%, 09/01/46 |
|
|
|
Series A-1, 5.00%, 08/01/47 |
|
|
|
Series B, 5.25%, 10/01/39 |
|
|
|
Series B, 5.25%, 10/01/40 |
|
|
|
Series C, 5.25%, 03/01/53 |
|
|
|
Series D, 5.38%, 06/01/32 |
|
|
|
Series D, 5.25%, 04/01/54 |
|
|
|
Series E-1, 5.00%, 03/01/39 |
|
|
|
Series F-1, 5.00%, 03/01/44 |
|
|
|
| |
|
|
|
County/City/Special District/School District (continued) |
|
City of New York, GO (continued) |
|
|
|
Series I, 5.00%, 03/01/36 |
|
|
|
City of New York, Refunding GO, Series B, 4.00%,
08/01/32 |
|
|
|
County of Nassau New York, GOL |
|
|
|
Series A, 4.00%, 04/01/49 |
|
|
|
Series B, (AGM), 5.00%, 07/01/49 |
|
|
|
Hudson Yards Infrastructure Corp., Refunding RB,
Series A, Sustainability Bonds, 4.00%, 02/15/43 |
|
|
|
New York City Industrial Development Agency,
RB(d) |
|
|
|
| |
|
|
|
| |
|
|
|
| |
|
|
|
| |
|
|
|
New York City Transitional Finance Authority Building Aid
Revenue, RB, Series S-1, Subordinate, (SAW),
5.00%, 07/15/43 |
|
|
|
New York City Transitional Finance Authority Future Tax Secured Revenue, RB |
|
|
|
Series E-1, 4.00%, 02/01/49 |
|
|
|
Sub-Series B-1, 5.00%, 11/01/35 |
|
|
|
Sub-Series B-1, 5.00%, 11/01/36 |
|
|
|
Sub-Series E-1, 5.00%, 02/01/43 |
|
|
|
Series A-1, Subordinate, 5.00%, 08/01/41 |
|
|
|
Series A-1, Subordinate, 4.00%, 08/01/48 |
|
|
|
Series F-1, Subordinate, 4.00%, 02/01/51 |
|
|
|
New York City Transitional Finance Authority, RB |
|
|
|
Series F-1, 5.25%, 02/01/53 |
|
|
|
Series B, Subordinate, 5.25%, 05/01/50 |
|
|
|
New York Convention Center Development Corp., RB,
CAB, Series B, Sub Lien, (AGM-CR), 0.00%,
11/15/55(d) |
|
|
|
New York Convention Center Development Corp., Refunding RB |
|
|
|
| |
|
|
|
| |
|
|
|
New York Liberty Development Corp., Refunding RB |
|
|
|
Class 1, 5.00%, 11/15/44(b)
|
|
|
|
Class 2, 5.38%, 11/15/40(b) |
|
|
|
Series 1, 3.00%, 02/15/42 |
|
|
|
Triborough Bridge & Tunnel Authority Sales Tax
Revenue, RB |
|
|
|
Series A, 4.00%, 05/15/48 |
|
|
|
Series A, 5.25%, 05/15/52 |
|
|
|
Series A, 4.13%, 05/15/53 |
|
|
|
Series A, 4.50%, 05/15/63 |
|
|
|
Series A-1, 5.25%, 05/15/64 |
|
|
|
| |
|
|
|
| |
|
Albany Capital Resource Corp., Refunding RB(e)(f) |
|
|
|
| |
|
|
|
| |
|
|
|
Amherst Development Corp., Refunding RB |
|
|
|
| |
|
|
|
| |
|
|
|
Buffalo & Erie County Industrial Land Development
Corp., Refunding RB, Series A, 5.00%, 06/01/35 |
|
|
|
Build NYC Resource Corp., RB(b)
|
|
|
|
| |
|
|
|
| |
|
|
|
Schedule of Investments
51
Schedule of Investments (continued)
July
31, 2024
BlackRock New York Municipal Income Trust (BNY)
(Percentages shown are based on Net Assets)
| |
|
|
|
| |
|
Build NYC Resource Corp., RB(b) (continued) |
|
|
|
Series A, 5.13%, 05/01/38 |
|
|
|
Series A, 5.50%, 05/01/48 |
|
|
|
Build NYC Resource Corp., Refunding RB |
|
|
|
| |
|
|
|
| |
|
|
|
Series A, 5.00%, 06/01/38 |
|
|
|
County of Cattaraugus New York, RB |
|
|
|
| |
|
|
|
| |
|
|
|
Dobbs Ferry Local Development Corp., RB |
|
|
|
| |
|
|
|
| |
|
|
|
Dutchess County Local Development Corp., RB |
|
|
|
| |
|
|
|
| |
|
|
|
| |
|
|
|
Dutchess County Local Development Corp., Refunding RB |
|
|
|
| |
|
|
|
| |
|
|
|
Hempstead Town Local Development Corp., Refunding
RB, 5.00%, 10/01/35 |
|
|
|
Monroe County Industrial Development Corp., RB, Series A, 5.00%, 07/01/53 |
|
|
|
Monroe County Industrial Development Corp., Refunding
RB, Series A, 4.00%, 07/01/50 |
|
|
|
New York State Dormitory Authority, RB |
|
|
|
Series 1, (AMBAC), 5.50%, 07/01/40 |
|
|
|
Series A, Sustainability Bonds, 5.00%, 07/01/48 |
|
|
|
New York State Dormitory Authority, Refunding RB |
|
|
|
Series A, 5.00%, 07/01/35 |
|
|
|
Series A, 5.00%, 07/01/43 |
|
|
|
Series A, 4.00%, 07/01/47 |
|
|
|
Series A, 5.50%, 07/01/54 |
|
|
|
Onondaga County Trust for Cultural Resources, Refunding RB |
|
|
|
| |
|
|
|
| |
|
|
|
Schenectady County Capital Resource Corp., Refunding
RB |
|
|
|
| |
|
|
|
| |
|
|
|
Trust for Cultural Resources of The City of New York, Refunding RB |
|
|
|
Series A, 5.00%, 07/01/37 |
|
|
|
Series A, 5.00%, 07/01/41 |
|
|
|
| |
|
|
|
| |
|
Buffalo & Erie County Industrial Land Development
Corp., RB, 5.25%, 07/01/35 |
|
|
|
Build NYC Resource Corp., RB |
|
|
|
| |
|
|
|
| |
|
|
|
Genesee County Funding Corp., Refunding RB,
Series A, 5.25%, 12/01/52 |
|
|
|
Monroe County Industrial Development Corp., RB |
|
|
|
| |
|
|
|
Series A, 5.00%, 12/01/32 |
|
|
|
| |
|
|
|
| |
|
Monroe County Industrial Development Corp., Refunding
RB |
|
|
|
| |
|
|
|
| |
|
|
|
New York State Dormitory Authority, RB |
|
|
|
Series A, 4.00%, 07/01/50 |
|
|
|
Series D, 4.25%, 05/01/39 |
|
|
|
New York State Dormitory Authority, Refunding RB |
|
|
|
| |
|
|
|
| |
|
|
|
| |
|
|
|
| |
|
|
|
Series 1, 4.00%, 07/01/47 |
|
|
|
Series A, 5.00%, 05/01/43 |
|
|
|
Oneida County Local Development Corp., RB, Class A, (AGM), 4.00%, 12/01/46 |
|
|
|
Suffolk County Economic Development Corp., RB,
Series C, 5.00%, 07/01/32 |
|
|
|
Tompkins County Development Corp., Refunding RB, 5.00%, 07/01/44 |
|
|
|
Westchester County Local Development Corp.,
|
|
|
|
| |
|
|
|
| |
|
|
|
| |
|
|
|
| |
|
New York City Housing Development Corp., RB, M/F Housing |
|
|
|
Series C-1A, 4.20%, 11/01/44 |
|
|
|
Sustainability Bonds, 4.80%, 02/01/53 |
|
|
|
Class F-1, Sustainability Bonds, 4.30%, 11/01/37 |
|
|
|
Series A, Sustainability Bonds, 4.75%, 11/01/48 |
|
|
|
Series A, Sustainability Bonds, (FHLMC, FNMA,
GNMA), 4.70%, 08/01/54 |
|
|
|
Series A-1, Sustainability Bonds, 4.65%, 11/01/49 |
|
|
|
Series A-1, Sustainability Bonds, 4.75%, 11/01/54 |
|
|
|
Series B-1, Class A, Sustainability Bonds, 4.65%, 11/01/49 |
|
|
|
Series E-1, Sustainability Bonds, 4.70%, 11/01/48 |
|
|
|
Series E-1, Sustainability Bonds, 4.85%, 11/01/53 |
|
|
|
New York City Housing Development Corp., Refunding
RB, Series A, Sustainability Bonds, 4.25%, 11/01/43 |
|
|
|
New York State Housing Finance Agency, RB, M/F Housing |
|
|
|
Series E, (SONYMA), 4.15%, 11/01/47 |
|
|
|
Series B-1, Sustainability Bonds, (SONYMA), 4.85%, 11/01/48 |
|
|
|
Series C-1, Sustainability Bonds, (SONYMA), 4.65%,
11/01/48 |
|
|
|
State of New York Mortgage Agency Homeowner Mortgage Revenue, RB, S/F Housing |
|
|
|
Series 259, AMT, Sustainability Bonds, (SONYMA),
4.45%, 10/01/39 |
|
|
|
Series 250, Sustainability Bonds, (SONYMA), 4.80%, 10/01/48 |
|
|
|
Series 255, Sustainability Bonds, (SONYMA), 4.70%,
10/01/43 |
|
|
|
Series 261, Sustainability Bonds, (SONYMA), 10/01/49(c) |
|
|
|
| |
|
|
|
52 2024 BlackRock
Annual Report to Shareholders
Schedule of Investments (continued)
July
31, 2024
BlackRock New York Municipal Income Trust (BNY)
(Percentages shown are based on Net Assets)
| |
|
|
|
| |
|
New York City Transitional Finance Authority Building Aid
Revenue, RB, Series S-1, Subordinate, (SAW),
4.00%, 07/15/45 |
|
|
|
New York City Transitional Finance Authority Building Aid Revenue, Refunding RB, Series S-3, Subordinate, (SAW), 4.00%, 07/15/38 |
|
|
|
New York State Dormitory Authority, RB, Series A,
5.00%, 03/15/56 |
|
|
|
New York State Dormitory Authority, Refunding RB |
|
|
|
Series A, 5.00%, 03/15/46 |
|
|
|
Series A, 4.00%, 03/15/47 |
|
|
|
New York State Urban Development Corp., RB |
|
|
|
Series A, 5.00%, 03/15/46 |
|
|
|
Series A, 4.00%, 03/15/49 |
|
|
|
New York State Urban Development Corp., Refunding RB |
|
|
|
| |
|
|
|
| |
|
|
|
| |
|
|
|
| |
|
Chautauqua Tobacco Asset Securitization Corp.,
Refunding RB |
|
|
|
| |
|
|
|
| |
|
|
|
New York Counties Tobacco Trust IV, Refunding RB, Series A, 6.25%, 06/01/41(b)
|
|
|
|
New York Counties Tobacco Trust VI, Refunding RB |
|
|
|
Series A-2B, 5.00%, 06/01/51 |
|
|
|
Series C, 4.00%, 06/01/51 |
|
|
|
Niagara Tobacco Asset Securitization Corp., Refunding RB, 5.25%, 05/15/40 |
|
|
|
TSASC, Inc., Refunding RB, Series A, 5.00%, 06/01/41 |
|
|
|
Westchester Tobacco Asset Securitization Corp., Refunding RB |
|
|
|
Sub-Series C, 4.00%, 06/01/42 |
|
|
|
Sub-Series C, 5.13%, 06/01/51 |
|
|
|
| |
|
|
|
| |
|
Hudson Yards Infrastructure Corp., Refunding RB,
Series A, 5.00%, 02/15/39 |
|
|
|
Metropolitan Transportation Authority, RB |
|
|
|
Series A-1, 4.00%, 11/15/46 |
|
|
|
Series D-2, Sustainability Bonds, 4.00%, 11/15/48 |
|
|
|
Series D-3, Sustainability Bonds, 4.00%, 11/15/49 |
|
|
|
Metropolitan Transportation Authority, Refunding RB |
|
|
|
Series A, 5.00%, 11/15/49 |
|
|
|
Series A, 4.00%, 11/15/51 |
|
|
|
Series B, 5.00%, 11/15/37 |
|
|
|
Sub-Series C-1, 5.00%, 11/15/34 |
|
|
|
Series A, Sustainability Bonds, 5.25%, 11/15/49 |
|
|
|
Series A-1, Sustainability Bonds, (AGM), 4.00%, 11/15/54 |
|
|
|
Series A-1, Sustainability Bonds, 5.25%, 11/15/57 |
|
|
|
Series B-1, Sustainability Bonds, 5.25%, 11/15/57 |
|
|
|
Sub-Series B-1, Sustainability Bonds, 5.00%,
11/15/51 |
|
|
|
MTA Hudson Rail Yards Trust Obligations, Refunding RB, Series A, 5.00%, 11/15/56 |
|
|
|
New York City Industrial Development Agency, Refunding
RB, Series A, 5.00%, 07/01/28 |
|
|
|
| |
|
|
|
Transportation (continued) |
|
New York State Thruway Authority, RB |
|
|
|
Series A, Junior Lien, 5.00%, 01/01/41 |
|
|
|
Series A, Junior Lien, 5.00%, 01/01/46 |
|
|
|
New York State Thruway Authority, Refunding RB |
|
|
|
Series A, 4.00%, 03/15/42 |
|
|
|
Series O, 4.00%, 01/01/44 |
|
|
|
Series B, Subordinate, 4.00%, 01/01/45 |
|
|
|
Series B, Subordinate, 4.00%, 01/01/50 |
|
|
|
New York Transportation Development Corp., ARB |
|
|
|
| |
|
|
|
| |
|
|
|
| |
|
|
|
| |
|
|
|
Series A, AMT, (AGM-CR), 4.00%, 07/01/41 |
|
|
|
Series A, AMT, 5.00%, 07/01/41 |
|
|
|
Series A, AMT, 5.00%, 07/01/46 |
|
|
|
Series A, AMT, 5.25%, 01/01/50 |
|
|
|
New York Transportation Development Corp., RB |
|
|
|
| |
|
|
|
AMT, Sustainability Bonds, (AGM), 5.50%, 06/30/42 |
|
|
|
AMT, Sustainability Bonds, (AGM), 5.50%, 06/30/43 |
|
|
|
AMT, Sustainability Bonds, (AGM), 5.00%, 06/30/49 |
|
|
|
AMT, Sustainability Bonds, 6.00%, 06/30/54 |
|
|
|
AMT, Sustainability Bonds, (AGM), 5.25%, 06/30/60 |
|
|
|
AMT, Sustainability Bonds, 5.50%, 06/30/60 |
|
|
|
Port Authority of New York & New Jersey, ARB |
|
|
|
Series 218, AMT, 5.00%, 11/01/44 |
|
|
|
Series 221, AMT, 4.00%, 07/15/45 |
|
|
|
Port Authority of New York & New Jersey, Refunding
ARB |
|
|
|
Series 198, 5.25%, 11/15/56 |
|
|
|
Series 244, 5.00%, 07/15/54 |
|
|
|
| |
|
|
|
| |
|
|
|
| |
|
|
|
Series 177, AMT, 4.00%, 01/15/43 |
|
|
|
Series 223, AMT, 5.00%, 07/15/56 |
|
|
|
Series 231, AMT, 5.50%, 08/01/47 |
|
|
|
Series 234, AMT, 5.50%, 08/01/52 |
|
|
|
Port Authority of New York & New Jersey, Refunding RB |
|
|
|
Series 242, AMT, 5.00%, 12/01/39 |
|
|
|
Series 242, AMT, 5.00%, 12/01/53 |
|
|
|
Triborough Bridge & Tunnel Authority, RB |
|
|
|
Series A, 5.00%, 11/15/49 |
|
|
|
Series A, 4.00%, 11/15/56 |
|
|
|
Series A, 5.50%, 11/15/57 |
|
|
|
Sub-Series B-1, 5.00%, 11/15/48 |
|
|
|
Triborough Bridge & Tunnel Authority, Refunding RB |
|
|
|
Series B, 5.00%, 11/15/37 |
|
|
|
Series C, 5.25%, 05/15/52 |
|
|
|
Series B-1, Sustainability Bonds, 5.25%, 05/15/54 |
|
|
|
Series C, Sustainability Bonds, 5.25%, 11/15/42 |
|
|
|
Triborough Bridge & Tunnel Authority, Refunding RB, CAB, Series B, 0.00%, 11/15/32(d)
|
|
|
|
| |
|
|
|
| |
|
Long Island Power Authority, RB |
|
|
|
(AGM), 0.00%, 06/01/28(d)
|
|
|
|
| |
|
|
|
(BAM-TCRS), 5.00%, 09/01/42 |
|
|
|
| |
|
|
|
Series C, (AGC), 5.25%, 09/01/29 |
|
|
|
Schedule of Investments
53
Schedule of Investments (continued)
July
31, 2024
BlackRock New York Municipal Income Trust (BNY)
(Percentages shown are based on Net Assets)
| |
|
|
|
| |
|
Long Island Power Authority, RB (continued) |
|
|
|
Series E, Sustainability Bonds, 5.00%, 09/01/48 |
|
|
|
Series E, Sustainability Bonds, 5.00%, 09/01/53 |
|
|
|
New York City Municipal Water Finance Authority, RB |
|
|
|
Series CC-1, 4.00%, 06/15/52 |
|
|
|
Sub-Series CC-1, 5.25%, 06/15/54 |
|
|
|
Series FF-1, Subordinate, 4.00%, 06/15/49 |
|
|
|
New York City Municipal Water Finance Authority, Refunding RB |
|
|
|
Series AA-3, 5.25%, 06/15/48 |
|
|
|
Series DD, 4.13%, 06/15/46 |
|
|
|
Series DD, 4.13%, 06/15/47 |
|
|
|
New York Power Authority, RB, Series A, Sustainability Bonds, (AGM), 5.00%, 11/15/48 |
|
|
|
New York Power Authority, Refunding RB |
|
|
|
Series A, Sustainability Bonds, 4.00%, 11/15/55 |
|
|
|
Series A, Sustainability Bonds, 4.00%, 11/15/60 |
|
|
|
New York State Environmental Facilities Corp., Refunding RB |
|
|
|
| |
|
|
|
Series A, 5.25%, 06/15/53 |
|
|
|
Rockland County Solid Waste Management Authority,
RB, Series A, AMT, Sustainability Bonds, 4.00%,
12/15/46 |
|
|
|
Utility Debt Securitization Authority, Refunding RB |
|
|
|
Restructured, Sustainability Bonds, 5.00%, 12/15/44 |
|
|
|
Series 2, Sustainability Bonds, 5.00%, 12/15/50 |
|
|
|
Series 2, Sustainability Bonds, 5.00%, 06/15/53 |
|
|
|
| |
|
|
|
Total Municipal Bonds in New York |
|
| |
|
| |
|
Puerto Rico Sales Tax Financing Corp. Sales Tax Revenue, RB |
|
|
|
Series A-1, Restructured, 4.75%, 07/01/53 |
|
|
|
Series A-1, Restructured, 5.00%, 07/01/58 |
|
|
|
Series A-2, Restructured, 4.78%, 07/01/58 |
|
|
|
Series A-2, Restructured, 4.33%, 07/01/40 |
|
|
|
Series B-1, Restructured, 4.75%, 07/01/53 |
|
|
|
Series B-2, Restructured, 4.78%, 07/01/58 |
|
|
|
Puerto Rico Sales Tax Financing Corp. Sales Tax
Revenue, RB, CAB, Series A-1, Restructured, 0.00%,
07/01/46(d) |
|
|
|
Total Municipal Bonds in Puerto Rico |
|
| |
|
| |
|
Patriots Energy Group Financing Agency, RB, Series A1,
5.25%, 10/01/54(a) |
|
|
|
Total Municipal Bonds — 158.8%
(Cost: $449,271,978) |
|
| |
|
|
|
Municipal Bonds Transferred to Tender Option Bond Trusts(g) |
| |
| |
|
Port Authority of New York & New Jersey, ARB, AMT,
Series 221, 4.00%, 07/15/55 |
|
|
|
Total Municipal Bonds in New York |
|
Total Municipal Bonds Transferred to Tender Option Bond Trusts — 0.9%
(Cost: $2,758,270) |
|
Total Long-Term Investments — 159.7%
(Cost: $452,030,248) |
|
| |
|
|
|
| |
Money Market Funds — 2.4% |
|
BlackRock Liquidity Funds, MuniCash, Institutional Shares, 3.47%(h)(i) |
|
|
|
Total Short-Term Securities — 2.4%
(Cost: $7,022,409) |
|
Total Investments — 162.1%
(Cost: $459,052,657) |
|
Other Assets Less Liabilities — 0.0% |
|
Liability for TOB Trust Certificates, Including Interest Expense and Fees Payable — (0.5)% |
|
VRDP Shares at Liquidation Value, Net of Deferred Offering Costs —
(61.6)% |
|
Net Assets Applicable to Common Shares — 100.0% |
|
| |
Variable rate security. Interest rate resets periodically. The rate shown is the effective
interest rate as of period end. Security description also includes the reference rate and
spread if published and available. |
| |
Security exempt from registration pursuant to Rule 144A under the Securities Act of 1933,
as amended. These securities may be resold in transactions exempt from registration to
qualified institutional investors. |
| |
|
| |
|
| |
Issuer filed for bankruptcy and/or is in default. |
| |
Non-income producing security. |
| |
Represent bonds transferred to a TOB Trust in exchange of cash and residual certificates
received by the Fund. These bonds serve as collateral in a secured borrowing. See Note 4
of the Notes to Financial Statements for details. |
| |
|
| |
Annualized 7-day yield as of period end. |
For purposes of this report, industry and sector sub-classifications may differ from those utilized by the Fund for compliance purposes.
54
2024 BlackRock Annual Report to Shareholders
Schedule of Investments (continued)
July
31, 2024
BlackRock New York Municipal Income Trust (BNY)
Affiliates
Investments in issuers considered to be affiliate(s) of the Fund during the year ended July 31, 2024 for purposes of Section 2(a)(3) of
the Investment Company Act of 1940, as amended, were as
follows:
| |
|
|
|
|
Change in
Unrealized
Appreciation
(Depreciation) |
|
|
|
Capital Gain
Distributions
from
Underlying
Funds |
BlackRock Liquidity Funds New York Money Fund Portfolio(a) |
|
|
|
|
|
|
|
|
|
BlackRock Liquidity Funds, MuniCash, Institutional Shares |
|
|
|
|
|
|
|
|
|
| |
|
|
|
|
|
|
|
|
|
| |
As of period end, the entity is no longer held. |
| |
Represents net amount purchased (sold). |
Derivative Financial Instruments Outstanding as of Period End
| |
|
|
|
Value/
Unrealized
Appreciation
(Depreciation) |
| |
|
|
|
|
10-Year U.S. Treasury Note |
|
|
|
|
| |
|
|
|
|
5-Year U.S. Treasury Note |
|
|
|
|
| |
|
|
|
|
Derivative Financial Instruments
Categorized by Risk Exposure
As of period end, the fair values
of derivative financial instruments located in the Statements of Assets and Liabilities were as follows:
| |
|
|
|
Foreign
Currency
Exchange
Contracts |
|
|
|
Liabilities — Derivative Financial Instruments |
|
|
|
|
|
|
|
Futures contracts
Unrealized depreciation on futures
contracts(a) |
|
|
|
|
|
|
|
| |
Net cumulative unrealized appreciation (depreciation) on futures contracts and centrally cleared swaps, if any, are reported in the Schedule of Investments. In the
Statements of Assets and Liabilities, only current day’s variation
margin is reported in receivables or payables and the net cumulative unrealized appreciation (depreciation) is included in accumulated earnings (loss). |
For the period ended July 31, 2024, the effect of derivative financial instruments in the Statements of Operations was as follows:
| |
|
|
|
Foreign
Currency
Exchange
Contracts |
|
|
|
Net Realized Gain (Loss) from: |
|
|
|
|
|
|
|
| |
|
|
|
|
|
|
|
Net Change in Unrealized Appreciation (Depreciation) on: |
|
|
|
|
|
|
|
| |
|
|
|
|
|
|
|
Average Quarterly Balances of
Outstanding Derivative Financial Instruments
| |
|
Average notional value of contracts — short |
|
Schedule of Investments
55
Schedule of Investments (continued)
July
31, 2024
BlackRock New York Municipal Income Trust (BNY)
For more information
about the Fund’s investment risks regarding derivative financial instruments, refer to the Notes to Financial Statements.
Fair Value Hierarchy as of Period End
Various inputs are used in determining the fair value of financial instruments. For a description of the input levels and information about the Fund’s policy
regarding valuation of financial instruments, refer to the Notes to Financial Statements.
The following table summarizes the Fund’s financial
instruments categorized in the fair value hierarchy. The breakdown of the Fund’s financial
instruments into major categories is disclosed in the Schedule of Investments
above.
| |
|
|
|
|
| |
|
|
|
|
| |
|
|
|
|
| |
|
|
|
|
| |
|
|
|
|
Municipal Bonds Transferred to Tender Option Bond Trusts |
|
|
|
|
| |
|
|
|
|
| |
|
|
|
|
| |
|
|
|
|
Derivative Financial Instruments(a)
|
|
|
|
|
| |
|
|
|
|
| |
|
|
|
|
| |
Derivative financial instruments are futures contracts. Futures contracts are valued at the
unrealized appreciation (depreciation) on the instrument. |
The Fund may hold assets and/or liabilities in which the fair value approximates the carrying amount for financial statement purposes. As of period end, such assets and/or liabilities are categorized within the fair value hierarchy as follows:
| |
|
|
|
|
| |
|
|
|
|
| |
|
|
|
|
VRDP Shares at Liquidation Value |
|
|
|
|
| |
|
|
|
|
See notes to financial
statements.
56
2024 BlackRock Annual Report to Shareholders
Schedule of Investments
July 31, 2024
BlackRock Virginia Municipal Bond Trust (BHV)
(Percentages shown are based on Net Assets)
| |
|
|
|
| |
| |
|
| |
|
Black Belt Energy Gas District, RB, Series A, 5.25%,
01/01/54(a) |
|
|
|
| |
|
| |
|
California County Tobacco Securitization Agency, RB, Series D, 0.00%, 06/01/55(b)
|
|
|
|
District of Columbia — 10.2% |
|
| |
|
District of Columbia Tobacco Settlement Financing Corp.,
RB, Series C, 0.00%, 06/15/55(b) |
|
|
|
| |
|
Washington Metropolitan Area Transit Authority, RB,
Series B, 5.00%, 07/01/37 |
|
|
|
Total Municipal Bonds in District of Columbia |
|
| |
|
| |
|
PEFA, Inc., RB, 5.00%, 09/01/49(a) |
|
|
|
| |
|
| |
|
Puerto Rico Sales Tax Financing Corp. Sales Tax Revenue, RB |
|
|
|
Series A-1, Restructured, 4.75%, 07/01/53 |
|
|
|
Series A-1, Restructured, 5.00%, 07/01/58 |
|
|
|
Series A-2, Restructured, 4.78%, 07/01/58 |
|
|
|
Series A-2, Restructured, 4.33%, 07/01/40 |
|
|
|
Total Municipal Bonds in Puerto Rico |
|
| |
|
County/City/Special District/School District — 19.3% |
|
Albemarle County Economic Development Authority, RB, Series A, 5.00%, 06/01/42 |
|
|
|
Chesterfield County Economic Development Authority, RB,
5.00%, 04/01/48 |
|
|
|
Hampton Roads Transportation Accountability Commission, RB, Series A, 4.00%, 07/01/57 |
|
|
|
Lower Magnolia Green Community Development Authority,
SAB, 5.00%, 03/01/35(c) |
|
|
|
| |
|
|
|
| |
|
Virginia College Building Authority, RB, Series A, 4.00%, 02/01/42 |
|
|
|
Virginia College Building Authority, Refunding RB |
|
|
|
| |
|
|
|
| |
|
|
|
Virginia Small Business Financing Authority, Refunding RB, 4.00%, 10/01/38 |
|
|
|
| |
|
|
|
| |
|
Danville Industrial Development Authority, Refunding RB,
(AMBAC), 5.25%, 10/01/28(d) |
|
|
|
Henrico County Economic Development Authority, RB, Class A, 5.00%, 10/01/52 |
|
|
|
Henrico County Economic Development Authority,
Refunding RB, 4.25%, 06/01/26 |
|
|
|
| |
|
|
|
| |
|
Isle Wight County Industrial Development Authority, RB,
(AGM), 5.25%, 07/01/53 |
|
|
|
Norfolk Redevelopment & Housing Authority, RB, Series B, 4.00%, 01/01/25 |
|
|
|
Virginia Beach Development Authority, Refunding RB,
4.00%, 09/01/48 |
|
|
|
Virginia Commonwealth University Health System Authority, RB, Series A, 5.25%, 07/01/49 |
|
|
|
Winchester Economic Development Authority, Refunding
RB, 5.00%, 01/01/44 |
|
|
|
| |
|
|
|
| |
|
Virginia Housing Development Authority, RB, M/F Housing |
|
|
|
Series A, 4.60%, 09/01/49 |
|
|
|
Series B, 5.00%, 03/01/65 |
|
|
|
Series F, 5.35%, 11/01/58 |
|
|
|
Series G, 5.15%, 11/01/52 |
|
|
|
Virginia Housing Development Authority, RB, S/F Housing,
Series C, 4.88%, 07/01/48 |
|
|
|
| |
|
|
|
| |
|
Ballston Quarter Community Development Authority, TA, Series A-1, 5.50%, 03/01/46 |
|
|
|
Ballston Quarter Community Development Authority, TA,
CAB, Series A-2, 7.13%, 03/01/30(e) |
|
|
|
Cherry Hill Community Development Authority, SAB, 5.40%, 03/01/45(c) |
|
|
|
Dulles Town Center Community Development Authority,
Refunding SAB, 4.25%, 03/01/26 |
|
|
|
Virginia College Building Authority, RB |
|
|
|
| |
|
|
|
| |
|
|
|
Series A, (SAW), 4.00%, 09/01/47 |
|
|
|
Virginia Resources Authority, RB, Class B, 5.25%, 11/01/47 |
|
|
|
| |
|
|
|
| |
|
Tobacco Settlement Financing Corp., Refunding RB |
|
|
|
Series B-1, 5.00%, 06/01/47 |
|
|
|
Series B-2, Convertible, 5.20%, 06/01/46(e) |
|
|
|
| |
|
|
|
| |
|
Chesapeake Bay Bridge & Tunnel District, RB, 5.00%, 07/01/46 |
|
|
|
Virginia Small Business Financing Authority, RB |
|
|
|
| |
|
|
|
| |
|
|
|
| |
|
|
|
| |
|
Alexandria Sanitation Authority, RB, 5.00%, 07/15/49 |
|
|
|
City of Norfolk Virginia Water Revenue, RB, 5.00%,
11/01/45 |
|
|
|
Schedule of Investments
57
Schedule of Investments (continued)
July
31, 2024
BlackRock Virginia Municipal Bond Trust (BHV)
(Percentages shown are based on Net Assets)
| |
|
|
|
| |
|
County of Fairfax Virginia Sewer Revenue, RB, Series A,
5.00%, 07/15/54 |
|
|
|
County of Henrico Virginia Water & Sewer Revenue, RB, 4.00%, 05/01/46 |
|
|
|
| |
|
|
|
Total Municipal Bonds in Virginia |
|
Total Long-Term Investments — 153.2%
(Cost: $29,687,107) |
|
| |
|
|
|
| |
Money Market Funds — 4.0% |
|
BlackRock Liquidity Funds, MuniCash, Institutional Shares, 3.47%(f)(g) |
|
|
|
Total Short-Term Securities — 4.0%
(Cost: $792,564) |
|
Total Investments — 157.2%
(Cost: $30,479,671) |
|
Other Assets Less Liabilities — 1.1% |
|
VRDP Shares at Liquidation Value, Net of Deferred Offering Costs —
(58.3)% |
|
Net Assets Applicable to Common Shares — 100.0% |
|
| |
Variable rate security. Interest rate resets periodically. The rate shown is the effective
interest rate as of period end. Security description also includes the reference rate and
spread if published and available. |
| |
|
| |
Security exempt from registration pursuant to Rule 144A under the Securities Act of 1933,
as amended. These securities may be resold in transactions exempt from registration to
qualified institutional investors. |
| |
Security is collateralized by municipal bonds or U.S. Treasury obligations. |
| |
Step coupon security. Coupon rate will either increase (step-up bond) or decrease (step-
down bond) at regular intervals until maturity. Interest rate shown reflects the rate
currently in effect. |
| |
|
| |
Annualized 7-day yield as of period end. |
For purposes of this report, industry and sector sub-classifications may differ from those utilized by the Fund for compliance purposes.
Investments in issuers considered to be affiliate(s) of the Fund
during the year ended July 31, 2024 for purposes of Section 2(a)(3) of the Investment Company Act of 1940, as amended, were as follows:
| |
|
|
|
|
Change in
Unrealized
Appreciation
(Depreciation) |
|
|
|
Capital Gain
Distributions
from
Underlying
Funds |
BlackRock Liquidity Funds, MuniCash, Institutional Shares |
|
|
|
|
|
|
|
|
|
| |
Represents net amount purchased (sold). |
Derivative Financial Instruments Outstanding as of Period
End
| |
|
|
|
Value/
Unrealized
Appreciation
(Depreciation) |
| |
|
|
|
|
10-Year U.S. Treasury Note |
|
|
|
|
| |
|
|
|
|
5-Year U.S. Treasury Note |
|
|
|
|
| |
|
|
|
|
58
2024 BlackRock Annual Report to Shareholders
Schedule of Investments (continued)
July
31, 2024
BlackRock Virginia Municipal Bond Trust (BHV)
Derivative Financial Instruments Categorized by Risk Exposure
As of period end, the fair values of derivative financial instruments located in
the Statements of Assets and Liabilities were as follows:
| |
|
|
|
Foreign
Currency
Exchange
Contracts |
|
|
|
Liabilities — Derivative Financial Instruments |
|
|
|
|
|
|
|
Futures contracts
Unrealized depreciation on futures
contracts(a) |
|
|
|
|
|
|
|
| |
Net cumulative unrealized appreciation (depreciation) on futures contracts and centrally cleared swaps, if any, are reported in the Schedule of Investments. In the
Statements of Assets and Liabilities, only current day’s variation
margin is reported in receivables or payables and the net cumulative unrealized appreciation (depreciation) is included in accumulated earnings (loss). |
For the period ended July 31, 2024, the effect of derivative financial instruments in the Statements of Operations was as follows:
| |
|
|
|
Foreign
Currency
Exchange
Contracts |
|
|
|
Net Realized Gain (Loss) from: |
|
|
|
|
|
|
|
| |
|
|
|
|
|
|
|
Net Change in Unrealized Appreciation (Depreciation) on: |
|
|
|
|
|
|
|
| |
|
|
|
|
|
|
|
Average Quarterly Balances of
Outstanding Derivative Financial Instruments
| |
|
Average notional value of contracts — short |
|
For more information about the Fund’s
investment risks regarding derivative financial instruments, refer to the Notes to Financial Statements.
Fair Value Hierarchy as of Period End
Various inputs are used in determining the fair value of financial instruments. For a description of the input levels and information about the Fund’s policy
regarding valuation of financial instruments, refer to the Notes to Financial Statements.
The following table summarizes the Fund’s financial
instruments categorized in the fair value hierarchy. The breakdown of the Fund’s financial
instruments into major categories is disclosed in the Schedule of Investments
above.
| |
|
|
|
|
| |
|
|
|
|
| |
|
|
|
|
| |
|
|
|
|
| |
|
|
|
|
| |
|
|
|
|
| |
|
|
|
|
| |
|
|
|
|
Derivative Financial Instruments(a)
|
|
|
|
|
| |
|
|
|
|
| |
|
|
|
|
| |
Derivative financial instruments are futures contracts. Futures contracts are valued at the
unrealized appreciation (depreciation) on the instrument. |
Schedule of Investments
59
Schedule of Investments (continued)
July
31, 2024
BlackRock Virginia Municipal Bond Trust (BHV)
The Fund may hold
assets and/or liabilities in which the fair value approximates the carrying amount for financial statement purposes. As of period end, such assets and/or liabilities are
categorized within the fair value hierarchy as follows:
| |
|
|
|
|
| |
|
|
|
|
VRDP Shares at Liquidation Value |
|
|
|
|
| |
|
|
|
|
See notes to financial
statements.
60
2024 BlackRock Annual Report to Shareholders
Statements of Assets and Liabilities
July 31, 2024
| |
|
|
|
|
| |
|
|
|
|
Investments, at value —
unaffiliated(a) |
|
|
|
|
Investments, at value —
affiliated(b) |
|
|
|
|
Cash pledged for futures contracts |
|
|
|
|
| |
|
|
|
|
| |
|
|
|
|
| |
|
|
|
|
| |
|
|
|
|
| |
|
|
|
|
| |
|
|
|
|
| |
|
|
|
|
| |
|
|
|
|
| |
|
|
|
|
| |
|
|
|
|
| |
|
|
|
|
| |
|
|
|
|
Income dividend distributions — Common Shares |
|
|
|
|
Interest expense and fees |
|
|
|
|
| |
|
|
|
|
Directors’ and Officer’s fees |
|
|
|
|
| |
|
|
|
|
| |
|
|
|
|
| |
|
|
|
|
| |
|
|
|
|
Variation margin on futures contracts |
|
|
|
|
Total accrued liabilities |
|
|
|
|
| |
|
|
|
|
| |
|
|
|
|
VRDP Shares, at liquidation value of $100,000 per share, net of deferred offering costs(c)(d)(e) |
|
|
|
|
| |
|
|
|
|
| |
|
|
|
|
Commitments and contingent liabilities |
|
|
|
|
NET ASSETS APPLICABLE TO COMMON SHAREHOLDERS |
|
|
|
|
NET ASSETS APPLICABLE TO COMMON SHAREHOLDERS CONSIST OF |
|
|
|
|
|
|
|
|
|
|
| |
|
|
|
|
NET ASSETS APPLICABLE TO COMMON SHAREHOLDERS |
|
|
|
|
Net asset value per Common Share |
|
|
|
|
(a) Investments, at cost—unaffiliated |
|
|
|
|
(b) Investments, at cost—affiliated |
|
|
|
|
(c) Preferred Shares outstanding
|
|
|
|
|
(d) Preferred Shares authorized
|
|
|
|
|
(e) Par value per Preferred Share
|
|
|
|
|
(f) Common Shares outstanding
|
|
|
|
|
(g) Common Shares authorized
|
|
|
|
|
(h) Par value per Common Share
|
|
|
|
|
See notes to financial statements.
Statements of Assets and Liabilities (continued)
July 31,
2024
| |
|
|
|
| |
|
|
|
Investments, at value —
unaffiliated(a) |
|
|
|
Investments, at value —
affiliated(b) |
|
|
|
Cash pledged for futures contracts |
|
|
|
| |
|
|
|
| |
|
|
|
| |
|
|
|
| |
|
|
|
| |
|
|
|
| |
|
|
|
| |
|
|
|
| |
|
|
|
| |
|
|
|
| |
|
|
|
| |
|
|
|
| |
|
|
|
Income dividend distributions — Common Shares |
|
|
|
Interest expense and fees |
|
|
|
| |
|
|
|
Directors’ and Officer’s fees |
|
|
|
| |
|
|
|
Printing and postage fees |
|
|
|
| |
|
|
|
| |
|
|
|
| |
|
|
|
Variation margin on futures contracts |
|
|
|
Total accrued liabilities |
|
|
|
| |
|
|
|
| |
|
|
|
VRDP Shares, at liquidation value of $100,000 per share, net of deferred offering costs(c)(d)(e) |
|
|
|
| |
|
|
|
| |
|
|
|
Commitments and contingent liabilities |
|
|
|
NET ASSETS APPLICABLE TO COMMON SHAREHOLDERS |
|
|
|
NET ASSETS APPLICABLE TO COMMON SHAREHOLDERS CONSIST OF |
|
|
|
|
|
|
|
|
| |
|
|
|
NET ASSETS APPLICABLE TO COMMON SHAREHOLDERS |
|
|
|
Net asset value per Common Share |
|
|
|
(a) Investments, at cost—unaffiliated |
|
|
|
(b) Investments, at cost—affiliated |
|
|
|
(c) Preferred Shares outstanding
|
|
|
|
(d) Preferred Shares authorized
|
|
|
|
(e) Par value per Preferred Share
|
|
|
|
(f) Common Shares outstanding
|
|
|
|
(g) Common Shares authorized
|
|
|
|
(h) Par value per Common Share
|
|
|
|
See notes to financial statements.
62
2024 BlackRock Annual Report to Shareholders
Statements of Operations
Year Ended July 31, 2024
| |
|
|
|
|
| |
|
|
|
|
| |
|
|
|
|
| |
|
|
|
|
| |
|
|
|
|
| |
|
|
|
|
| |
|
|
|
|
| |
|
|
|
|
| |
|
|
|
|
| |
|
|
|
|
| |
|
|
|
|
| |
|
|
|
|
Remarketing fees on Preferred Shares |
|
|
|
|
| |
|
|
|
|
| |
|
|
|
|
| |
|
|
|
|
| |
|
|
|
|
| |
|
|
|
|
| |
|
|
|
|
Total expenses excluding interest expense, fees and amortization of offering costs |
|
|
|
|
Interest expense, fees and amortization of offering costs(a) |
|
|
|
|
| |
|
|
|
|
| |
|
|
|
|
Fees waived and/or reimbursed by the Manager |
|
|
|
|
Total expenses after fees waived and/or reimbursed |
|
|
|
|
| |
|
|
|
|
REALIZED AND UNREALIZED GAIN (LOSS) |
|
|
|
|
Net realized gain (loss) from: |
|
|
|
|
Investments — unaffiliated |
|
|
|
|
| |
|
|
|
|
| |
|
|
|
|
| |
|
|
|
|
Net change in unrealized appreciation (depreciation) on: |
|
|
|
|
Investments — unaffiliated |
|
|
|
|
| |
|
|
|
|
| |
|
|
|
|
| |
|
|
|
|
Net realized and unrealized gain |
|
|
|
|
NET INCREASE IN NET ASSETS APPLICABLE TO COMMON SHAREHOLDERS
RESULTING FROM OPERATIONS |
|
|
|
|
(a) All or a portion of is related to TOB Trusts
and/or VRDP Shares. |
See notes to financial
statements.
Statements of Operations (continued)
Year Ended July 31,
2024
| |
|
|
|
| |
|
|
|
| |
|
|
|
| |
|
|
|
| |
|
|
|
| |
|
|
|
| |
|
|
|
| |
|
|
|
| |
|
|
|
| |
|
|
|
| |
|
|
|
| |
|
|
|
| |
|
|
|
| |
|
|
|
| |
|
|
|
| |
|
|
|
| |
|
|
|
| |
|
|
|
Remarketing fees on Preferred Shares |
|
|
|
| |
|
|
|
Total expenses excluding interest expense, fees and amortization of offering costs |
|
|
|
Interest expense, fees and amortization of offering costs(a) |
|
|
|
| |
|
|
|
| |
|
|
|
Fees waived and/or reimbursed by the Manager |
|
|
|
Total expenses after fees waived and/or reimbursed |
|
|
|
| |
|
|
|
REALIZED AND UNREALIZED GAIN (LOSS) |
|
|
|
Net realized gain (loss) from: |
|
|
|
Investments — unaffiliated |
|
|
|
| |
|
|
|
| |
|
|
|
| |
|
|
|
Net change in unrealized appreciation (depreciation) on: |
|
|
|
Investments — unaffiliated |
|
|
|
| |
|
|
|
| |
|
|
|
| |
|
|
|
Net realized and unrealized gain |
|
|
|
NET INCREASE IN NET ASSETS APPLICABLE TO COMMON SHAREHOLDERS
RESULTING FROM OPERATIONS |
|
|
|
(a) All or a portion of is related to TOB Trusts
and/or VRDP Shares. |
See notes to financial
statements.
64
2024 BlackRock Annual Report to Shareholders
Statements of Changes in Net Assets
| |
|
|
| |
|
|
|
|
| |
INCREASE (DECREASE) IN NET ASSETS
APPLICABLE TO COMMON SHAREHOLDERS |
|
|
|
|
| |
|
|
|
|
| |
|
|
|
|
| |
|
|
|
|
Net change in unrealized appreciation (depreciation) |
|
|
|
|
Net increase (decrease) in net assets applicable to Common Shareholders resulting from operations |
|
|
|
|
DISTRIBUTIONS TO COMMON
SHAREHOLDERS(a) |
|
|
|
|
From net investment income |
|
|
|
|
| |
|
|
|
|
Decrease in net assets resulting from distributions to Common Shareholders |
|
|
|
|
CAPITAL SHARE TRANSACTIONS |
|
|
|
|
Reinvestment of common distributions |
|
|
|
|
Redemption of shares resulting from share repurchase program (including transaction costs) |
|
|
|
|
Net decrease in net assets derived from capital share transactions |
|
|
|
|
NET ASSETS APPLICABLE TO COMMON
SHAREHOLDERS |
|
|
|
|
Total decrease in net assets applicable to Common Shareholders |
|
|
|
|
| |
|
|
|
|
| |
|
|
|
|
| |
Distributions for annual periods determined in accordance with U.S. federal income tax
regulations. |
See notes to financial statements.
Statements of Changes in Net Assets (continued)
| |
|
|
| |
|
|
|
|
| |
INCREASE (DECREASE) IN NET ASSETS
APPLICABLE TO COMMON SHAREHOLDERS |
|
|
|
|
| |
|
|
|
|
| |
|
|
|
|
| |
|
|
|
|
Net change in unrealized appreciation (depreciation) |
|
|
|
|
Net increase (decrease) in net assets applicable to Common Shareholders resulting from operations |
|
|
|
|
DISTRIBUTIONS TO COMMON
SHAREHOLDERS(a) |
|
|
|
|
From net investment income |
|
|
|
|
| |
|
|
|
|
Decrease in net assets resulting from distributions to Common Shareholders |
|
|
|
|
CAPITAL SHARE TRANSACTIONS |
|
|
|
|
Reinvestment of common distributions |
|
|
|
|
Redemption of shares resulting from share repurchase program (including transaction costs) |
|
|
|
|
Net decrease in net assets derived from capital share transactions |
|
|
|
|
NET ASSETS APPLICABLE TO COMMON
SHAREHOLDERS |
|
|
|
|
Total increase (decrease) in net assets applicable to Common Shareholders |
|
|
|
|
| |
|
|
|
|
| |
|
|
|
|
| |
Distributions for annual periods determined in accordance with U.S. federal income tax
regulations. |
See notes to financial statements.
66
2024 BlackRock Annual Report to Shareholders
Statements of Changes in Net Assets (continued)
| |
|
|
| |
|
|
|
|
| |
INCREASE (DECREASE) IN NET ASSETS
APPLICABLE TO COMMON SHAREHOLDERS |
|
|
|
|
| |
|
|
|
|
| |
|
|
|
|
| |
|
|
|
|
Net change in unrealized appreciation (depreciation) |
|
|
|
|
Net increase (decrease) in net assets applicable to Common Shareholders resulting from operations |
|
|
|
|
DISTRIBUTIONS TO COMMON
SHAREHOLDERS(a) |
|
|
|
|
From net investment income |
|
|
|
|
| |
|
|
|
|
Decrease in net assets resulting from distributions to Common Shareholders |
|
|
|
|
CAPITAL SHARE TRANSACTIONS |
|
|
|
|
Reinvestment of common distributions |
|
|
|
|
Redemption of shares resulting from share repurchase program (including transaction costs) |
|
|
|
|
Net decrease in net assets derived from capital share transactions |
|
|
|
|
NET ASSETS APPLICABLE TO COMMON
SHAREHOLDERS |
|
|
|
|
Total decrease in net assets applicable to Common Shareholders |
|
|
|
|
| |
|
|
|
|
| |
|
|
|
|
| |
Distributions for annual periods determined in accordance with U.S. federal income tax
regulations. |
See notes to financial statements.
Statements of Changes in Net Assets (continued)
| |
|
| |
|
|
| |
INCREASE (DECREASE) IN NET ASSETS
APPLICABLE TO COMMON SHAREHOLDERS |
|
|
| |
|
|
| |
|
|
| |
|
|
Net change in unrealized appreciation (depreciation) |
|
|
Net increase (decrease) in net assets applicable to Common Shareholders resulting from operations |
|
|
DISTRIBUTIONS TO COMMON
SHAREHOLDERS(a) |
|
|
From net investment income |
|
|
| |
|
|
Decrease in net assets resulting from distributions to Common Shareholders |
|
|
CAPITAL SHARE TRANSACTIONS |
|
|
Reinvestment of common distributions |
|
|
Redemption of shares resulting from share repurchase program (including transaction costs) |
|
|
Net decrease in net assets derived from capital share transactions |
|
|
NET ASSETS APPLICABLE TO COMMON
SHAREHOLDERS |
|
|
Total decrease in net assets applicable to Common Shareholders |
|
|
| |
|
|
| |
|
|
| |
Distributions for annual periods determined in accordance with U.S. federal income tax
regulations. |
See notes to financial statements.
68
2024 BlackRock Annual Report to Shareholders
Statements of Cash Flows
Year Ended July 31, 2024
| |
|
|
|
|
CASH PROVIDED BY (USED FOR) OPERATING ACTIVITIES |
|
|
|
|
Net increase in net assets resulting from operations |
|
|
|
|
Adjustments to reconcile net increase in net assets resulting from operations to net cash provided by operating
activities: |
|
|
|
|
Proceeds from sales of long-term investments and principal paydowns/payups |
|
|
|
|
Purchases of long-term investments |
|
|
|
|
Net proceeds from sales of short-term securities |
|
|
|
|
Amortization of premium and accretion of discount on investments and other fees |
|
|
|
|
Net realized loss on investments |
|
|
|
|
Net unrealized appreciation on investments |
|
|
|
|
(Increase) Decrease in Assets |
|
|
|
|
| |
|
|
|
|
| |
|
|
|
|
| |
|
|
|
|
| |
|
|
|
|
Increase (Decrease) in Liabilities |
|
|
|
|
| |
|
|
|
|
| |
|
|
|
|
| |
|
|
|
|
Interest expense and fees |
|
|
|
|
| |
|
|
|
|
Directors’ and Officer’s fees |
|
|
|
|
| |
|
|
|
|
| |
|
|
|
|
| |
|
|
|
|
| |
|
|
|
|
Variation margin on futures contracts |
|
|
|
|
Net cash provided by operating activities |
|
|
|
|
CASH PROVIDED BY (USED FOR) FINANCING ACTIVITIES |
|
|
|
|
Cash dividends paid to Common Shareholders |
|
|
|
|
Repayments of TOB Trust Certificates |
|
|
|
|
Net payments on Common Shares redeemed |
|
|
|
|
Decrease in bank overdraft |
|
|
|
|
Amortization of deferred offering costs |
|
|
|
|
Net cash used for financing activities |
|
|
|
|
| |
|
|
|
|
Net increase in restricted and unrestricted cash |
|
|
|
|
Restricted and unrestricted cash at beginning of year |
|
|
|
|
Restricted and unrestricted cash at end of year |
|
|
|
|
SUPPLEMENTAL DISCLOSURE OF CASH FLOW INFORMATION |
|
|
|
|
Cash paid during the year for interest expense |
|
|
|
|
RECONCILIATION OF RESTRICTED AND UNRESTRICTED CASH AT THE END OF YEAR TO THE
STATEMENTS OF ASSETS AND LIABILITIES
|
|
|
|
|
| |
|
|
|
|
| |
|
|
|
|
| |
|
|
|
|
See notes to financial statements.
Statements of Cash Flows (continued)
Year Ended July 31,
2024
| |
|
|
|
CASH PROVIDED BY (USED FOR) OPERATING ACTIVITIES |
|
|
|
Net increase in net assets resulting from operations |
|
|
|
Adjustments to reconcile net increase in net assets resulting from operations to net cash provided by operating activities: |
|
|
|
Proceeds from sales of long-term investments |
|
|
|
Purchases of long-term investments |
|
|
|
Net proceeds from sales of short-term securities |
|
|
|
Amortization of premium and accretion of discount on investments and other fees |
|
|
|
Net realized loss on investments |
|
|
|
Net unrealized appreciation on investments |
|
|
|
(Increase) Decrease in Assets |
|
|
|
| |
|
|
|
| |
|
|
|
| |
|
|
|
| |
|
|
|
Increase (Decrease) in Liabilities |
|
|
|
| |
|
|
|
| |
|
|
|
| |
|
|
|
Interest expense and fees |
|
|
|
| |
|
|
|
Directors’ and Officer’s fees |
|
|
|
| |
|
|
|
Printing and postage fees |
|
|
|
| |
|
|
|
| |
|
|
|
| |
|
|
|
Variation margin on futures contracts |
|
|
|
Net cash provided by operating activities |
|
|
|
CASH PROVIDED BY (USED FOR) FINANCING ACTIVITIES |
|
|
|
Cash dividends paid to Common Shareholders |
|
|
|
Repayments of TOB Trust Certificates |
|
|
|
Net payments on Common Shares redeemed |
|
|
|
Decrease in bank overdraft |
|
|
|
Amortization of deferred offering costs |
|
|
|
Net cash used for financing activities |
|
|
|
| |
|
|
|
Net increase in restricted and unrestricted cash |
|
|
|
Restricted and unrestricted cash at beginning of year |
|
|
|
Restricted and unrestricted cash at end of year |
|
|
|
SUPPLEMENTAL DISCLOSURE OF CASH FLOW INFORMATION |
|
|
|
Cash paid during the year for interest expense |
|
|
|
RECONCILIATION OF RESTRICTED AND UNRESTRICTED CASH AT THE END OF YEAR TO THE
STATEMENTS OF ASSETS AND LIABILITIES
|
|
|
|
| |
|
|
|
| |
|
|
|
| |
|
|
|
See notes to financial statements.
70
2024 BlackRock Annual Report to Shareholders
Financial Highlights
(For a share outstanding throughout each period)
| |
|
| |
|
|
|
|
|
| |
Net asset value, beginning of year |
|
|
|
|
|
|
|
|
|
|
|
|
Net realized and unrealized gain (loss) |
|
|
|
|
|
Net increase (decrease) from investment operations |
|
|
|
|
|
Distributions to Common Shareholders(b) |
|
|
|
|
|
From net investment income |
|
|
|
|
|
| |
|
|
|
|
|
Total distributions to Common Shareholders |
|
|
|
|
|
Net asset value, end of year |
|
|
|
|
|
Market price, end of year |
|
|
|
|
|
Total Return Applicable to Common Shareholders(c) |
|
|
|
|
|
| |
|
|
|
|
|
| |
|
|
|
|
|
Ratios to Average Net Assets Applicable to Common Shareholders(d) |
|
|
|
|
|
| |
|
|
|
|
|
Total expenses after fees waived and/or reimbursed |
|
|
|
|
|
Total expenses after fees waived and/or reimbursed and excluding interest expense, fees and amortization of
offering costs(f)(g) |
|
|
|
|
|
Net investment income to Common Shareholders |
|
|
|
|
|
| |
|
|
|
|
|
Net assets applicable to Common Shareholders, end of year (000) |
|
|
|
|
|
VRDP Shares outstanding at $100,000 liquidation value, end of year (000) |
|
|
|
|
|
Asset coverage per VRDP Shares at $100,000 liquidation value, end of year |
|
|
|
|
|
TOB Trust Certificates, end of year (000) |
|
|
|
|
|
Asset coverage per $1,000 of TOB Trust Certificates, end of year(j) |
|
|
|
|
|
| |
|
|
|
|
|
| |
Based on average Common Shares outstanding. |
| |
Distributions for annual periods determined in accordance with U.S. federal income tax regulations. |
| |
Total returns based on market price, which can be significantly greater or less than the net asset value, may result in substantially different returns. Where
applicable, excludes the effects of any sales charges and assumes the reinvestment
of distributions at actual reinvestment prices. |
| |
Excludes fees and expenses incurred indirectly as a result of investments in underlying funds. |
| |
Includes non-recurring expenses of reorganization costs. Without these costs, total expenses, total expenses after fees waived and/or reimbursed and total expenses after
fees waived and/or reimbursed and excluding interest expense, fees, and
amortization of offering costs, would have been 1.71%, 1.70% and 0.92%, respectively. |
| |
Interest expense, fees and amortization of offering costs related to TOB Trusts and/or VRDP Shares. See Note 4 and Note 10 of the Notes to Financial Statements for details.
|
| |
The total expense ratio after fees waived and/or reimbursed and excluding interest expense, fees, amortization of offering costs, liquidity and remarketing fees as
follows: |
| |
Calculated by subtracting the Fund’s total liabilities (not including VRDP Shares and TOBs) from the Fund’s total assets and dividing this by the sum of the amount of TOBs and liquidation value
of the VRDP Shares, and by multiplying the results by
100,000. |
| |
Calculated by subtracting the Fund’s total liabilities (not including VRDP Shares) from the Fund’s total assets and dividing this by the liquidation value of the VRDP Shares, and by multiplying
the results by 100,000. |
| |
Effective July 18, 2022, TOB Trust Certificates are treated as senior securities pursuant to Rule 18f-4 of the 1940 Act. Calculated by subtracting the Fund’s total liabilities (not including
VRDP Shares and TOBs) from the Fund’s total assets and dividing this by the amount of TOBs, and by
multiplying the results by 1,000. |
See notes to financial
statements.
Financial Highlights (continued)
(For a share
outstanding throughout each period)
| |
|
| |
|
|
Period from
09/01/21
to 07/31/22 |
|
|
|
| |
Net asset value, beginning of period |
|
|
|
|
|
|
|
|
|
|
|
|
|
|
Net realized and unrealized gain (loss) |
|
|
|
|
|
|
Net increase (decrease) from investment operations |
|
|
|
|
|
|
Distributions to Common Shareholders(b) |
|
|
|
|
|
|
From net investment income |
|
|
|
|
|
|
| |
|
|
|
|
|
|
Total distributions to Common Shareholders |
|
|
|
|
|
|
Net asset value, end of period |
|
|
|
|
|
|
Market price, end of period |
|
|
|
|
|
|
Total Return Applicable to Common Shareholders(c) |
|
|
|
|
|
|
| |
|
|
|
|
|
|
| |
|
|
|
|
|
|
Ratios to Average Net Assets Applicable to Common Shareholders(e) |
|
|
|
|
|
|
| |
|
|
|
|
|
|
Total expenses after fees waived and/or reimbursed |
|
|
|
|
|
|
Total expenses after fees waived and/or reimbursed and excluding interest expense, fees
and amortization of offering costs(h)(i) |
|
|
|
|
|
|
Net investment income to Common Shareholders |
|
|
|
|
|
|
| |
|
|
|
|
|
|
Net assets applicable to Common Shareholders, end of period (000) |
|
|
|
|
|
|
VRDP Shares outstanding at $100,000 liquidation value, end of period (000) |
|
|
|
|
|
|
Asset coverage per VRDP Shares at $100,000 liquidation value, end of period |
|
|
|
|
|
|
TOB Trust Certificates, end of period (000) |
|
|
|
|
|
|
Asset coverage per $1,000 of TOB Trust Certificates, end of period(l) |
|
|
|
|
|
|
| |
|
|
|
|
|
|
| |
Based on average Common Shares outstanding. |
| |
Distributions for annual periods determined in accordance with U.S. federal income tax regulations. |
| |
Total returns based on market price, which can be significantly greater or less than the net asset value, may result in substantially different returns. Where
applicable, excludes the effects of any sales charges and assumes the reinvestment
of distributions at actual reinvestment prices. |
| |
|
| |
Excludes fees and expenses incurred indirectly as a result of investments in underlying funds. |
| |
Includes non-recurring expenses of proxy costs. Without these costs, total expenses, total expenses after fees waived and/or reimbursed and total expenses after fees
waived and/or reimbursed and excluding interest expense, fees, and amortization of
offering costs would have been 4.05%, 3.94% and 0.93%, respectively. |
| |
|
| |
Interest expense, fees and amortization of offering costs related to TOB Trusts and/or VRDP Shares. See Note 4 and Note 10 of the Notes to Financial Statements for
details. |
| |
The total expense ratio after fees waived and/or reimbursed and excluding interest expense, fees, amortization of offering costs, liquidity and remarketing fees as
follows: |
| |
|
|
Period from
09/01/21
to 07/31/22 |
|
|
|
| |
| |
|
|
|
|
|
|
| |
Calculated by subtracting the Fund’s total liabilities (not including VRDP Shares and TOBs) from the Fund’s total assets and dividing this by the sum of the amount of TOBs and liquidation value
of the VRDP Shares, and by multiplying the results by
100,000. |
| |
Calculated by subtracting the Fund’s total liabilities (not including VRDP Shares) from the Fund’s total assets and dividing this by the liquidation value of the VRDP Shares, and by multiplying the
results by 100,000. |
| |
Effective July 18, 2022, TOB Trust Certificates are treated as senior securities pursuant to Rule 18f-4 of the 1940 Act. Calculated by subtracting the Fund’s total liabilities (not including
VRDP Shares and TOBs) from the Fund’s total assets and dividing this by the amount of TOBs, and by
multiplying the results by 1,000. |
See notes to financial
statements.
72
2024 BlackRock Annual Report to Shareholders
Financial Highlights (continued)
(For a share
outstanding throughout each period)
| |
|
| |
|
|
|
|
|
| |
Net asset value, beginning of year |
|
|
|
|
|
|
|
|
|
|
|
|
Net realized and unrealized gain (loss) |
|
|
|
|
|
Net increase (decrease) from investment operations |
|
|
|
|
|
Distributions to Common Shareholders(b) |
|
|
|
|
|
From net investment income |
|
|
|
|
|
| |
|
|
|
|
|
Total distributions to Common Shareholders |
|
|
|
|
|
Net asset value, end of year |
|
|
|
|
|
Market price, end of year |
|
|
|
|
|
Total Return Applicable to Common Shareholders(c) |
|
|
|
|
|
| |
|
|
|
|
|
| |
|
|
|
|
|
Ratios to Average Net Assets Applicable to Common Shareholders(d) |
|
|
|
|
|
| |
|
|
|
|
|
Total expenses after fees waived and/or reimbursed |
|
|
|
|
|
Total expenses after fees waived and/or reimbursed and excluding interest expense, fees and amortization of
offering costs(f)(g) |
|
|
|
|
|
Net investment income to Common Shareholders |
|
|
|
|
|
| |
|
|
|
|
|
Net assets applicable to Common Shareholders, end of year (000) |
|
|
|
|
|
VRDP Shares outstanding at $100,000 liquidation value, end of year (000) |
|
|
|
|
|
Asset coverage per VRDP Shares at $100,000 liquidation value, end of year |
|
|
|
|
|
TOB Trust Certificates, end of year (000) |
|
|
|
|
|
Asset coverage per $1,000 of TOB Trust Certificates, end of year(j) |
|
|
|
|
|
| |
|
|
|
|
|
| |
Based on average Common Shares outstanding. |
| |
Distributions for annual periods determined in accordance with U.S. federal income tax regulations. |
| |
Total returns based on market price, which can be significantly greater or less than the net asset value, may result in substantially different returns. Where
applicable, excludes the effects of any sales charges and assumes the reinvestment
of distributions at actual reinvestment prices. |
| |
Excludes fees and expenses incurred indirectly as a result of investments in underlying funds. |
| |
Includes non-recurring expenses of reorganization costs. Without these costs, total expenses, total expenses after fees waived and/or reimbursed and total expenses after
fees waived and/or reimbursed and excluding interest expense, fees, and amortization
of offering costs would have been 3.64%, 3.60% and 0.85%, respectively. |
| |
Interest expense, fees and amortization of offering costs related to TOB Trusts and/or VRDP Shares. See Note 4 and Note 10 of the Notes to Financial Statements for
details. |
| |
The total expense ratio after fees waived and/or reimbursed and excluding interest expense, fees, amortization of offering costs, liquidity and remarketing fees as
follows: |
| |
Calculated by subtracting the Fund’s total liabilities (not including VRDP Shares and TOBs) from the Fund’s total assets and dividing this by the sum of the amount of TOBs and liquidation value
of the VRDP Shares, and by multiplying the results by
100,000. |
| |
Calculated by subtracting the Fund’s total liabilities (not including VRDP Shares) from the Fund’s total assets and dividing this by the liquidation value of the VRDP Shares, and by multiplying
the results by 100,000. |
| |
Effective July 18, 2022, TOB Trust Certificates are treated as senior securities pursuant to Rule 18f-4 of the 1940 Act. Calculated by subtracting the Fund’s total liabilities (not including
VRDP Shares and TOBs) from the Fund’s total assets and dividing this by the amount of TOBs, and by
multiplying the results by 1,000. |
See notes to financial
statements.
Financial Highlights (continued)
(For a share
outstanding throughout each period)
| |
|
| |
|
|
|
|
|
| |
Net asset value, beginning of year |
|
|
|
|
|
|
|
|
|
|
|
|
Net realized and unrealized gain (loss) |
|
|
|
|
|
Net increase (decrease) from investment operations |
|
|
|
|
|
Distributions to Common Shareholders(b) |
|
|
|
|
|
From net investment income |
|
|
|
|
|
| |
|
|
|
|
|
Total distributions to Common Shareholders |
|
|
|
|
|
Net asset value, end of year |
|
|
|
|
|
Market price, end of year |
|
|
|
|
|
Total Return Applicable to Common Shareholders(c) |
|
|
|
|
|
| |
|
|
|
|
|
| |
|
|
|
|
|
Ratios to Average Net Assets Applicable to Common Shareholders(d) |
|
|
|
|
|
| |
|
|
|
|
|
Total expenses after fees waived and/or reimbursed |
|
|
|
|
|
Total expenses after fees waived and/or reimbursed and excluding interest expense, fees and amortization of
offering costs(f)(g) |
|
|
|
|
|
Net investment income to Common Shareholders |
|
|
|
|
|
| |
|
|
|
|
|
Net assets applicable to Common Shareholders, end of year (000) |
|
|
|
|
|
VRDP Shares outstanding at $100,000 liquidation value, end of year (000) |
|
|
|
|
|
Asset coverage per VRDP Shares at $100,000 liquidation value, end of year |
|
|
|
|
|
TOB Trust Certificates, end of year (000) |
|
|
|
|
|
Asset coverage per $1,000 of TOB Trust Certificates, end of year(j) |
|
|
|
|
|
| |
|
|
|
|
|
| |
Based on average Common Shares outstanding. |
| |
Distributions for annual periods determined in accordance with U.S. federal income tax regulations. |
| |
Total returns based on market price, which can be significantly greater or less than the net asset value, may result in substantially different returns. Where
applicable, excludes the effects of any sales charges and assumes the reinvestment
of distributions at actual reinvestment prices. |
| |
Excludes fees and expenses incurred indirectly as a result of investments in underlying funds. |
| |
Includes non-recurring expenses of proxy costs. Without these costs, total expenses, total expenses after fees waived and/or reimbursed and total expenses after fees
waived and/or reimbursed and excluding interest expense, fees, and amortization of
offering costs would have been 3.50%, 3.47% and 0.86%, respectively. |
| |
Interest expense, fees and amortization of offering costs related to TOB Trusts and/or VRDP Shares. See Note 4 and Note 10 of the Notes to Financial Statements for details.
|
| |
The total expense ratio after fees waived and/or reimbursed and excluding interest expense, fees, amortization of offering costs, liquidity and remarketing fees as
follows: |
| |
Calculated by subtracting the Fund’s total liabilities (not including VRDP Shares and TOBs) from the Fund’s total assets and dividing this by the sum of the amount of TOBs and liquidation value
of the VRDP Shares, and by multiplying the results by
100,000. |
| |
Calculated by subtracting the Fund’s total liabilities (not including VRDP Shares) from the Fund’s total assets and dividing this by the liquidation value of the VRDP Shares, and by multiplying
the results by 100,000. |
| |
Effective July 18, 2022, TOB Trust Certificates are treated as senior securities pursuant to Rule 18f-4 of the 1940 Act. Calculated by subtracting the Fund’s total liabilities (not including
VRDP Shares and TOBs) from the Fund’s total assets and dividing this by the amount of TOBs, and by
multiplying the results by 1,000. |
See notes to financial
statements.
74
2024 BlackRock Annual Report to Shareholders
Financial Highlights (continued)
(For a share
outstanding throughout each period)
| |
|
| |
|
|
|
|
|
| |
Net asset value, beginning of year |
|
|
|
|
|
|
|
|
|
|
|
|
Net realized and unrealized gain (loss) |
|
|
|
|
|
Net increase (decrease) from investment operations |
|
|
|
|
|
Distributions to Common Shareholders(b) |
|
|
|
|
|
From net investment income |
|
|
|
|
|
| |
|
|
|
|
|
Total distributions to Common Shareholders |
|
|
|
|
|
Net asset value, end of year |
|
|
|
|
|
Market price, end of year |
|
|
|
|
|
Total Return Applicable to Common Shareholders(c) |
|
|
|
|
|
| |
|
|
|
|
|
| |
|
|
|
|
|
Ratios to Average Net Assets Applicable to Common Shareholders(d) |
|
|
|
|
|
| |
|
|
|
|
|
Total expenses after fees waived and/or reimbursed |
|
|
|
|
|
Total expenses after fees waived and/or reimbursed and excluding interest expense, fees and amortization of
offering costs(f)(g) |
|
|
|
|
|
Net investment income to Common Shareholders |
|
|
|
|
|
| |
|
|
|
|
|
Net assets applicable to Common Shareholders, end of year (000) |
|
|
|
|
|
VRDP Shares outstanding at $100,000 liquidation value, end of year (000) |
|
|
|
|
|
Asset coverage per VRDP Shares at $100,000 liquidation value, end of year |
|
|
|
|
|
TOB Trust Certificates, end of year (000) |
|
|
|
|
|
Asset coverage per $1,000 of TOB Trust Certificates, end of year(j) |
|
|
|
|
|
| |
|
|
|
|
|
| |
Based on average Common Shares outstanding. |
| |
Distributions for annual periods determined in accordance with U.S. federal income tax regulations. |
| |
Total returns based on market price, which can be significantly greater or less than the net asset value, may result in substantially different returns. Where
applicable, excludes the effects of any sales charges and assumes the reinvestment
of distributions at actual reinvestment prices. |
| |
Excludes fees and expenses incurred indirectly as a result of investments in underlying funds. |
| |
Includes non-recurring expenses of proxy and reorganization costs. Without these costs, total expenses, total expenses after fees waived and/or reimbursed and total
expenses after fees waived and/or reimbursed and excluding interest expense, fees,
and amortization of offering costs would have been 3.33%, 3.28% and 0.88%, respectively. |
| |
Interest expense, fees and amortization of offering costs related to TOB Trusts and/or VRDP Shares. See Note 4 and Note 10 of the Notes to Financial Statements for details.
|
| |
The total expense ratio after fees waived and/or reimbursed and excluding interest expense, fees, amortization of offering costs, liquidity and remarketing fees as
follows: |
| |
Calculated by subtracting the Fund’s total liabilities (not including VRDP Shares and TOBs) from the Fund’s total assets and dividing this by the sum of the amount of TOBs and liquidation value
of the VRDP Shares, and by multiplying the results by
100,000. |
| |
Calculated by subtracting the Fund’s total liabilities (not including VRDP Shares) from the Fund’s total assets and dividing this by the liquidation value of the VRDP Shares, and by multiplying
the results by 100,000. |
| |
Effective July 18, 2022, TOB Trust Certificates are treated as senior securities pursuant to Rule 18f-4 of the 1940 Act. Calculated by subtracting the Fund’s total liabilities (not including
VRDP Shares and TOBs) from the Fund’s total assets and dividing this by the amount of TOBs, and by
multiplying the results by 1,000. |
See notes to financial
statements.
Financial Highlights (continued)
(For a share
outstanding throughout each period)
| |
|
| |
|
|
|
|
|
| |
Net asset value, beginning of year |
|
|
|
|
|
|
|
|
|
|
|
|
Net realized and unrealized gain (loss) |
|
|
|
|
|
Net increase (decrease) from investment operations |
|
|
|
|
|
Distributions to Common Shareholders(b) |
|
|
|
|
|
From net investment income |
|
|
|
|
|
| |
|
|
|
|
|
Total distributions to Common Shareholders |
|
|
|
|
|
Net asset value, end of year |
|
|
|
|
|
Market price, end of year |
|
|
|
|
|
Total Return Applicable to Common Shareholders(c) |
|
|
|
|
|
| |
|
|
|
|
|
| |
|
|
|
|
|
Ratios to Average Net Assets Applicable to Common Shareholders(d) |
|
|
|
|
|
| |
|
|
|
|
|
Total expenses after fees waived and/or reimbursed |
|
|
|
|
|
Total expenses after fees waived and/or reimbursed and excluding interest expense, fees and amortization
of offering costs(g)(h) |
|
|
|
|
|
Net investment income to Common Shareholders |
|
|
|
|
|
| |
|
|
|
|
|
Net assets applicable to Common Shareholders, end of year (000) |
|
|
|
|
|
VRDP Shares outstanding at $100,000 liquidation value, end of year (000) |
|
|
|
|
|
Asset coverage per VRDP Shares at $100,000 liquidation value, end of year |
|
|
|
|
|
VMTP Shares outstanding at $100,000 liquidation value, end of year (000) |
|
|
|
|
|
Asset coverage per VMTP Shares at $100,000 liquidation value, end of year |
|
|
|
|
|
TOB Trust Certificates, end of year (000) |
|
|
|
|
|
Asset coverage per $1,000 of TOB Trust Certificates, end of year(k) |
|
|
|
|
|
| |
|
|
|
|
|
| |
Based on average Common Shares outstanding. |
| |
Distributions for annual periods determined in accordance with U.S. federal income tax regulations. |
| |
Total returns based on market price, which can be significantly greater or less than the net asset value, may result in substantially different returns. Where
applicable, excludes the effects of any sales charges and assumes the reinvestment
of distributions at actual reinvestment prices. |
| |
Excludes fees and expenses incurred indirectly as a result of investments in underlying funds. |
| |
Includes non-recurring expenses of proxy costs. Without these costs, total expenses, total expenses after fees waived and/or reimbursed and total expenses after
fees waived and/or reimbursed and excluding interest expense, fees, and
amortization of offering costs would have been 3.82%, 3.78% and 0.99%, respectively. |
| |
Includes non-recurring expenses of reorganization costs. Without these costs, total expenses, total expenses after fees waived and/or reimbursed and total expenses after
fees waived and/or reimbursed and excluding interest expense, fees, and amortization
of offering costs would have been 1.69%, 1.69% and 1.11%, respectively. |
| |
Interest expense, fees and amortization of offering costs related to TOB Trusts and/or VRDP/VMTP Shares. See Note 4 and Note 10 of the Notes to Financial Statements for details.
|
| |
The total expense ratio after fees waived and/or reimbursed and excluding interest expense, fees, amortization of offering costs, liquidity and remarketing fees as
follows: |
| |
Calculated by subtracting the Fund’s total liabilities (not including VRDP Shares and TOBs) from the Fund’s total assets and dividing this by the sum of the amount of TOBs and liquidation value
of the VRDP Shares, and by multiplying the results by
100,000. |
| |
Calculated by subtracting the Fund’s total liabilities (not including VRDP/VMTP Shares) from the
Fund’s total assets and dividing this by the liquidation
value of the VRDP/VMTP Shares, and by multiplying the results by
100,000. |
76
2024 BlackRock Annual Report to Shareholders
Financial Highlights (continued)
(For a share
outstanding throughout each period)
| |
Effective July 18, 2022, TOB Trust Certificates are treated as senior securities pursuant to Rule 18f-4 of the 1940 Act. Calculated by subtracting the Fund’s total liabilities (not including
VRDP Shares and TOBs) from the Fund’s total assets and dividing this by the amount of TOBs, and by
multiplying the results by 1,000. |
See notes to financial
statements.
Financial Highlights (continued)
(For a share
outstanding throughout each period)
| |
|
| |
|
|
Period from
09/01/21
to 07/31/22 |
|
|
|
| |
Net asset value, beginning of period |
|
|
|
|
|
|
|
|
|
|
|
|
|
|
Net realized and unrealized gain (loss) |
|
|
|
|
|
|
Net increase (decrease) from investment operations |
|
|
|
|
|
|
Distributions to Common Shareholders(b) |
|
|
|
|
|
|
From net investment income |
|
|
|
|
|
|
| |
|
|
|
|
|
|
Total distributions to Common Shareholders |
|
|
|
|
|
|
Net asset value, end of period |
|
|
|
|
|
|
Market price, end of period |
|
|
|
|
|
|
Total Return Applicable to Common Shareholders(c) |
|
|
|
|
|
|
| |
|
|
|
|
|
|
| |
|
|
|
|
|
|
Ratios to Average Net Assets Applicable to Common Shareholders(e) |
|
|
|
|
|
|
| |
|
|
|
|
|
|
Total expenses after fees waived and/or reimbursed |
|
|
|
|
|
|
Total expenses after fees waived and/or reimbursed and excluding interest expense, fees
and amortization of offering costs(i)(j) |
|
|
|
|
|
|
Net investment income to Common Shareholders |
|
|
|
|
|
|
| |
|
|
|
|
|
|
Net assets applicable to Common Shareholders, end of period (000) |
|
|
|
|
|
|
VRDP Shares outstanding at $100,000 liquidation value, end of period (000) |
|
|
|
|
|
|
Asset coverage per VRDP Shares at $100,000 liquidation value, end of period |
|
|
|
|
|
|
TOB Trust Certificates, end of period (000) |
|
|
|
|
|
|
Asset coverage per $1,000 of TOB Trust Certificates, end of period(m) |
|
|
|
|
|
|
| |
|
|
|
|
|
|
| |
Based on average Common Shares outstanding. |
| |
Distributions for annual periods determined in accordance with U.S. federal income tax regulations. |
| |
Total returns based on market price, which can be significantly greater or less than the net asset value, may result in substantially different returns. Where
applicable, excludes the effects of any sales charges and assumes the reinvestment
of distributions at actual reinvestment prices. |
| |
|
| |
Excludes fees and expenses incurred indirectly as a result of investments in underlying funds. |
| |
Includes non-recurring expenses of reorganization costs. Without these costs, total expenses, total expenses after fees waived and/or reimbursed and total expenses
after feeswaived and/or reimbursed and excluding interest expense, fees, and
amortization of offering costs would have been 4.68%, 4.45% and 1.74%, respectively. |
| |
Audit and printing costs were not annualized in the calculation of the expense ratios. If these expenses were annualized, the total expenses, total expenses after fees
waived and/or reimbursed and total expenses after fees waived and/or
reimbursed and excluding interest expense, fees and amortization of offering costs would have been 2.62%, 2.40% and 1.57%, respectively. |
| |
|
| |
Interest expense, fees and amortization of offering costs related to TOB Trusts and/or VRDP Shares. See Note 4 and Note 10 of the Notes to Financial Statements for details.
|
| |
The total expense ratio after fees waived and/or reimbursed and excluding interest expense, fees, amortization of offering costs, liquidity and remarketing fees as
follows: |
| |
|
|
Period from
09/01/21
to 07/31/22 |
|
|
|
| |
| |
|
|
|
|
|
|
| |
Calculated by subtracting the Fund’s total liabilities (not including VRDP Shares and TOBs) from the Fund’s total assets and dividing this by the sum of the amount of TOBs and liquidation value
of the VRDP Shares, and by multiplying the results by
100,000. |
| |
Calculated by subtracting the Fund’s total liabilities (not including VRDP Shares) from the Fund’s total assets and dividing this by the liquidation value of the VRDP Shares, and by multiplying
the results by 100,000. |
78
2024 BlackRock Annual Report to Shareholders
Financial Highlights (continued)
(For a share
outstanding throughout each period)
| |
Effective July 18, 2022, TOB Trust Certificates are treated as senior securities pursuant to Rule 18f-4 of the 1940 Act. Calculated by subtracting the Fund’s total liabilities (not including
VRDP Shares and TOBs) from the Fund’s total assets and dividing this by the amount of TOBs, and by
multiplying the results by 1,000. |
See notes to financial
statements.
Notes
to Financial Statements
The
following are registered under the Investment Company Act of 1940, as amended (the “1940 Act”), as closed-end management investment companies and are referred to
herein collectively as the “Funds”, or individually as a “Fund”:
| |
|
|
Diversification
Classification |
BlackRock MuniHoldings New Jersey Quality Fund, Inc. |
|
|
|
BlackRock MuniHoldings New York Quality Fund, Inc. |
|
|
|
BlackRock MuniYield Michigan Quality Fund, Inc. |
|
|
|
BlackRock MuniYield New York Quality Fund, Inc. |
|
|
|
BlackRock MuniYield Pennsylvania Quality Fund |
|
|
|
BlackRock New York Municipal Income Trust |
|
|
|
BlackRock Virginia Municipal Bond Trust |
|
|
|
The Boards of Directors and Boards of Trustees of the Funds are
collectively referred to throughout this report as the “Board,” and the directors/trustees thereof are collectively referred to throughout this
report as “Directors”. The Funds determine and make available for publication the net asset values (“NAVs”) of their Common Shares on a daily
basis.
On October 30, 2023, the Board of Directors/Trustees of each of MIY, MPA, BHV and BlackRock Investment Quality Municipal Trust, Inc. (BKN) (collectively, the "Target
Funds") and the Board of Directors of BlackRock MuniYield Quality Fund III, Inc. (MYI) announced the withdrawal of merger proposals that were previously
approved by the Boards pursuant to which each of the Target Funds would have been merged into MYI, with MYI continuing as the surviving Fund. While the Board
of Directors believe that the mergers would have benefited shareholders for the reasons discussed in the proxy statement, it was determined that the proxy
solicitation process and associated costs would be more burdensome and expensive as a result of opposition from an activist shareholder, making the mergers no longer in the
best interests of each Fund’s shareholders.
The Funds, together with certain other registered investment
companies advised by BlackRock Advisors, LLC (the “Manager”) or its affiliates, are included in a complex of funds referred to as the BlackRock Fixed-Income
Complex.
2.
SIGNIFICANT ACCOUNTING POLICIES
The
financial statements are prepared in conformity with accounting principles generally accepted in the United States of America (“U.S. GAAP”), which may require management to make estimates and assumptions that affect the reported amounts of assets and liabilities in the financial statements, disclosure of contingent assets and
liabilities at the date of the financial statements and the reported amounts of increases and decreases in net assets from operations during the reporting
period. Actual results could differ from those estimates. Each Fund is considered an investment company under U.S. GAAP and follows the accounting and
reporting guidance applicable to investment companies. Below is a summary of significant accounting policies:
Investment Transactions and Income Recognition: For financial reporting purposes, investment transactions are recorded on the dates
the transactions are executed.
Realized gains and losses on investment transactions are
determined using the specific identification method. Dividend income and
capital gain distributions, if any, are recorded on the ex-dividend dates. Non-cash dividends, if any, are recorded on the ex-dividend dates at fair
value. Interest income, including amortization and accretion of premiums and discounts on debt securities, is recognized daily on an accrual basis.
Bank Overdraft: The Funds had outstanding cash disbursements exceeding deposited cash amounts at the
custodian during the reporting period. The Funds are obligated to repay the custodian for any overdraft, including any related costs or expenses, where applicable. For financial reporting purposes, overdraft fees, if any, are included in
interest expense in the Statements of Operations.
Collateralization: If required by an exchange
or counterparty agreement, the Funds may be required to deliver/deposit cash and/or securities to/with an exchange, or broker-dealer or custodian as collateral for certain
investments.
Distributions:
Distributions from net investment income are declared and paid monthly.
Distributions of capital gains are recorded on the ex-dividend dates and made at least annually. The portion of distributions, if any, that exceeds a fund’s current and accumulated earnings and profits, as measured on a tax basis, constitute a non-taxable return of capital. The character and timing of distributions are determined in accordance with U.S. federal income tax regulations, which may differ from U.S. GAAP.
Distributions to Preferred Shareholders are accrued and determined as described in
Note 10.
Deferred Compensation Plan: Under the Deferred Compensation Plan (the “Plan”) approved by each
Board, the directors who are not “interested persons” of the Funds, as defined in the 1940 Act (“Independent Directors”), may
defer a portion of their annual complex-wide compensation. Deferred amounts earn an approximate return as though equivalent dollar amounts had been invested in
common shares of certain funds in the BlackRock Fixed-Income Complex selected by the Independent Directors. This has the same economic effect for the
Independent Directors as if the Independent Directors had invested the deferred amounts directly in certain funds in the BlackRock Fixed-Income Complex.
The Plan is not funded and obligations thereunder represent
general unsecured claims against the general assets of each Fund, as
applicable. Deferred compensation liabilities, if any, are included in the
Directors’ and Officer’s fees payable in the Statements of Assets and Liabilities and will remain as a liability of the
Funds until such amounts are distributed in accordance with the Plan. Net appreciation (depreciation) in the value of participants’ deferral accounts is allocated among the participating
funds in the BlackRock Fixed-Income Complex and reflected as Directors and Officer expense on the Statements of Operations. The Directors and Officer expense
may be negative as a result of a decrease in value of the deferred accounts.
80 2024 BlackRock
Annual Report to Shareholders
Notes
to Financial Statements (continued)
Indemnifications: In the normal course of business, a Fund enters into contracts that contain a variety of representations that provide general indemnification. A Fund’s maximum exposure under these
arrangements is unknown because it involves future potential claims against a Fund, which cannot be predicted with any certainty.
Other: Expenses directly related to a Fund are charged to that Fund. Other operating expenses shared by several funds, including other funds managed by the Manager, are prorated among those funds on the basis of relative net assets or other appropriate methods.
The Funds have an arrangement with their custodian whereby credits are earned on uninvested cash balances, which could be used to reduce custody fees and/or overdraft charges.
3.
INVESTMENT VALUATION AND FAIR VALUE MEASUREMENTS
Investment Valuation Policies: Each Fund’
s investments are valued at fair value (also referred to as “market value” within the financial statements) each day that the Fund is open for business and, for financial reporting purposes, as of the report date. U.S. GAAP defines fair value as the price a fund would receive to sell an asset or pay to
transfer a liability in an orderly transaction between market participants at the measurement date. The Board has approved the designation of each Fund’s Manager as the valuation designee for each Fund. Each Fund determines the fair values of its financial instruments using various independent dealers or pricing services under the Manager’s policies. If a security’s market price is not readily available or does not otherwise accurately represent the fair value of the security, the security will be valued in
accordance with the Manager’s policies and procedures as reflecting fair value. The Manager has formed a committee (the “Valuation
Committee”) to develop pricing policies and procedures and to oversee the pricing function for all financial instruments, with assistance from other BlackRock pricing
committees.
Fair Value Inputs and
Methodologies: The following methods and inputs are used to establish the fair value of each
Fund’s assets and liabilities:
•Fixed-income investments for which market quotations are readily available are generally valued using the last available bid price or current market quotations provided
by independent dealers or third-party pricing services. Pricing services generally value fixed-income securities assuming orderly transactions of an institutional round
lot size, but a fund may hold or transact in such securities in smaller, odd lot sizes. Odd lots may trade at lower prices than institutional round lots. The pricing services
may use matrix pricing or valuation models that utilize certain inputs and assumptions to derive values, including transaction data (e.g., recent representative bids and
offers), market data, credit quality information, perceived market movements, news, and other relevant information. Certain fixed-income securities, including
asset-backed and mortgage related securities may be valued based on valuation models that consider the estimated cash flows of each tranche of the entity, establish a benchmark yield and develop an estimated tranche specific spread to the benchmark yield based on the unique attributes of the tranche. The amortized cost method of valuation may be used with respect to debt obligations with sixty days or less remaining to maturity unless the Manager determines such method does not represent fair value.
•Investments in open-end U.S. mutual funds (including money market funds) are valued at
that day’s published NAV.
•Futures contracts are valued based on that day’s last reported settlement or trade price on the exchange where the contract is traded.
If events (e.g., market volatility, company announcement or a
natural disaster) occur that are expected to materially affect the value of such investment, or in the event that application of these methods of valuation
results in a price for an investment that is deemed not to be representative of the market value of such investment, or if a price is not available, the
investment will be valued by the Valuation Committee in accordance with the Manager’s policies and procedures as reflecting fair value (“Fair Valued
Investments”). The fair valuation approaches that may be used by the Valuation Committee include market approach, income approach and cost approach.
Valuation techniques such as discounted cash flow, use of market comparables and matrix pricing are types of valuation approaches and are typically used in
determining fair value. When determining the price for Fair Valued Investments, the Valuation Committee seeks to determine the price that each Fund might
reasonably expect to receive or pay from the current sale or purchase of that asset or liability in an arm’s-length transaction. Fair value
determinations shall be based upon all available factors that the Valuation Committee deems relevant and consistent with the principles of fair value
measurement.
Fair Value
Hierarchy: Various inputs are used in determining the fair value of financial instruments. These inputs to valuation techniques are categorized into a fair value hierarchy consisting of three broad levels for financial reporting purposes as follows:
•Level 1 – Unadjusted price quotations in active markets/exchanges for identical assets or liabilities that each Fund has the ability to access;
•Level 2 – Other observable inputs (including, but not limited to, quoted prices for similar assets or liabilities in markets that are active, quoted prices for
identical or similar assets or liabilities in markets that are not active, inputs other than quoted prices that are observable for the assets or liabilities (such as interest
rates, yield curves, volatilities, prepayment speeds, loss severities, credit risks and default rates) or other market–corroborated inputs); and
•Level 3 – Unobservable inputs based on the best information available in the circumstances, to the extent observable inputs are not available (including the
Valuation
Committee’s
assumptions used in determining the fair value of financial instruments).
The hierarchy gives the highest priority to unadjusted quoted prices in active markets for identical assets or liabilities (Level 1 measurements) and the lowest priority to
unobservable inputs (Level 3 measurements). Accordingly, the degree of judgment exercised in determining fair value is greatest for instruments categorized in
Level 3. The inputs used to measure fair value may fall into different levels of the fair value hierarchy. In such cases, for disclosure purposes, the fair
value hierarchy classification is determined based on the lowest level input that is significant to the fair value measurement in its entirety. Investments classified within Level 3 have significant unobservable inputs used by the Valuation Committee in determining the price for Fair Valued Investments. Level 3 investments include equity or debt issued by privately held companies
or funds that may not have a secondary market and/or may have a limited number of investors. The categorization of a value determined for financial instruments is based on the
pricing transparency of the financial instruments and is not necessarily an indication of the risks associated with investing in those securities.
Notes to Financial Statements
81
Notes
to Financial Statements (continued)
4.
SECURITIES AND OTHER INVESTMENTS
Zero-Coupon Bonds: Zero-coupon bonds are normally issued at a significant discount from face value and do not provide for periodic interest payments. These bonds may experience greater volatility in market value than other debt obligations of similar maturity which provide for regular interest payments.
Forward Commitments, When-Issued and Delayed
Delivery Securities: The Funds may purchase securities on a when-issued basis and may purchase or sell securities on a forward commitment basis. Settlement of such transactions normally occurs within a month or more after the purchase or sale commitment is made. The Funds may purchase securities under such conditions with the intention of actually acquiring them but may enter into a separate agreement to sell the securities before the settlement
date. Since the value of securities purchased may fluctuate prior to settlement, the Funds may be required to pay more at settlement than the security is
worth. In addition, a fund is not entitled to any of the interest earned prior to settlement. When purchasing a security on a delayed delivery basis, the Funds
assume the rights and risks of ownership of the security, including the risk of price and yield fluctuations. In the event of default by the counterparty, the
Funds’ maximum amount of loss is the unrealized appreciation of unsettled when-issued transactions. These types of securities may be considered unfunded and may obligate the Funds to make future cash payments. An unfunded commitment is marked-to-market and any unrealized appreciation (depreciation) is separately presented in the Statements of Assets and Liabilities and Statements of Operations.
Municipal Bonds Transferred to TOB Trusts: The Funds leverage their assets through the use of “TOB Trust” transactions. The funds
transfer municipal bonds into a special purpose trust (a “TOB Trust”). A TOB Trust issues two classes of beneficial interests: short-term floating
rate interests (“TOB Trust Certificates”), which are sold to third-party investors, and residual inverse floating rate interests (“TOB
Residuals”), which are issued to the participating funds that contributed the municipal bonds to the TOB Trust. The TOB Trust Certificates have interest
rates that reset weekly and their holders have the option to tender such certificates to the TOB Trust for redemption at par and any accrued interest at each
reset date. The TOB Residuals held by a fund provide the fund with the right to cause the holders of a proportional share of the TOB Trust Certificates to tender
their certificates to the TOB Trust at par plus accrued interest. The funds may withdraw a corresponding share of the municipal bonds from the TOB Trust. Other
funds managed by the investment adviser may also contribute municipal bonds to a TOB Trust into which a fund has contributed bonds. If multiple
BlackRock-advised funds participate in the same TOB Trust, the economic rights and obligations under the TOB Residuals will be shared among the funds ratably
in proportion to their participation in the TOB Trust.
TOB Trusts are supported by a liquidity facility provided by a third-party bank or other financial institution (the “Liquidity
Provider”) that allows the holders of the TOB Trust Certificates to tender their certificates in exchange for payment of par plus accrued interest on any
business day. The tendered TOB Trust Certificates are remarketed by a Remarketing Agent. In the event of a failed remarketing, the TOB Trust may draw upon a
loan from the Liquidity Provider to purchase the tendered TOB Trust Certificates. Any loans made by the Liquidity Provider will be secured by the purchased TOB
Trust Certificates held by the TOB Trust and will be subject to an increased interest rate based on number of days the loan is outstanding.
The TOB Trust may be collapsed without the consent of a fund,
upon the occurrence of a termination event as defined in the TOB Trust agreement. Upon the occurrence of a termination event, a TOB Trust would be liquidated
with the proceeds applied first to any accrued fees owed to the trustee of the TOB Trust, the Remarketing Agent and the Liquidity Provider. Upon certain
termination events, TOB Trust Certificates holders will be paid before the TOB Residuals holders (i.e., the Funds) whereas in other termination events, TOB Trust Certificates
holders and TOB Residuals holders will be paid pro rata.
While a fund’s investment policies and restrictions expressly permit investments in inverse floating rate securities, such as TOB Residuals, they restrict the ability
of a fund to borrow money for purposes of making investments. MIY’s,
MYN’s and
MPA’s management believes that a fund’s restrictions on borrowings do not apply to the
Funds’ TOB Trust transactions. Each Fund’s transfer of the municipal bonds to a TOB Trust is considered a secured borrowing for financial reporting
purposes. The cash received by the TOB Trust from the sale of the TOB Trust Certificates, less certain transaction expenses, is paid to a Fund. A Fund typically invests the cash received in additional municipal bonds.
Accounting for TOB Trusts: The municipal bonds deposited into a TOB Trust are
presented in a Fund’s Schedule of Investments and the TOB Trust
Certificates are shown in Other Liabilities in the Statements of Assets and Liabilities. Any loans drawn by the TOB Trust pursuant to the liquidity facility to
purchase tendered TOB Trust Certificates are shown as Loan for TOB Trust Certificates. The carrying amount of a Fund’s payable to the holder of the TOB Trust Certificates, as reported in the
Statements of Assets and Liabilities as TOB Trust Certificates, approximates its fair value.
Interest income, including amortization and accretion of premiums and discounts, from the underlying municipal bonds is recorded by
a Fund on an accrual basis. Interest expense incurred on the TOB Trust transaction and other expenses related to remarketing, administration, trustee, liquidity and other services to a TOB Trust are
shown as interest expense, fees and amortization of offering costs in the Statements of Operations. Fees paid upon creation of the TOB Trust are recorded as
debt issuance costs and are amortized to interest expense, fees and amortization of offering costs in the Statements of Operations to the expected maturity of the TOB Trust. In connection with the
restructurings of the TOB Trusts to non-bank sponsored TOB Trusts, a Fund incurred non-recurring, legal and restructuring fees, which are recorded as
interest expense, fees and amortization of offering costs in the Statements of Operations. Amounts recorded within interest expense, fees and amortization of offering costs in
the Statements of Operations are:
82 2024 BlackRock
Annual Report to Shareholders
Notes
to Financial Statements (continued)
For the year ended July 31, 2024, the following table is a summary of each Fund’s TOB
Trusts:
| |
Underlying
Municipal Bonds
Transferred to
TOB Trusts(a)
|
Liability for
TOB Trust
Certificates(b)
|
Range of
Interest Rates
on TOB Trust
Certificates at
Period End |
Average
TOB Trust
Certificates
Outstanding |
Daily Weighted
Average Rate
of Interest and
Other Expenses
on TOB Trusts |
| |
|
|
|
|
|
| |
|
|
|
|
|
| |
|
|
|
|
|
| |
|
|
|
|
|
| |
|
|
|
|
|
| |
|
|
|
|
|
| |
|
|
|
|
|
| |
The municipal bonds transferred to a TOB Trust are generally high grade municipal bonds. In certain cases, when municipal bonds transferred are lower grade municipal
bonds, the TOB Trust transaction may include a credit enhancement feature
that provides for the timely payment of principal and interest on the bonds to the TOB Trust by a credit enhancement provider in the event of default of the municipal bond. The TOB Trust would be responsible for the payment of the credit enhancement fee and the Funds, as TOB Residuals holders,
would be responsible for reimbursement of any payments of principal and
interest made by the credit enhancement provider. The maximum potential amounts owed by the Funds, for such reimbursements, as applicable, are included in the maximum potential amounts disclosed for recourse TOB Trusts in the Schedules of Investments. |
| |
TOB Trusts may be structured on a non-recourse or recourse basis. When a Fund invests in TOB Trusts on a non-recourse basis, the Liquidity Provider may be required to
make a payment under the liquidity facility to allow the TOB Trust to
repurchase TOB Trust Certificates. The Liquidity Provider will be reimbursed from the liquidation of bonds held in the TOB Trust. If a Fund invests in a TOB Trust on a recourse basis,
a Fund enters into a reimbursement
agreement with the Liquidity Provider where a Fund is required to reimburse the Liquidity Provider for any shortfall between the amount paid by the Liquidity Provider and proceeds received from liquidation of municipal bonds held in the TOB Trust (the
“Liquidation Shortfall”). As a result, if a Fund invests in a recourse TOB Trust, a Fund will bear the risk of loss with respect to any
Liquidation Shortfall. If multiple funds participate in any such TOB Trust, these losses will be shared ratably, including the maximum potential amounts owed by a Fund at July 31, 2024, in proportion to their
participation in the TOB Trust. The recourse TOB Trusts are identified in the
Schedules of Investments including the maximum potential amounts owed by a Fund at July 31, 2024. |
5.
DERIVATIVE FINANCIAL INSTRUMENTS
The Funds engage in various portfolio investment strategies using derivative contracts both to increase the returns of the Funds and/or
to manage their exposure to certain risks such as credit risk, equity risk, interest rate risk, foreign currency exchange rate risk, commodity price risk or
other risks (e.g., inflation risk). Derivative financial instruments categorized by risk exposure are included in the Schedules of Investments. These contracts may be
transacted on an exchange or over-the-counter (“OTC”).
Futures Contracts: Futures contracts are purchased or sold to gain exposure to,
or manage exposure to, changes in interest rates (interest rate risk) and changes in the value of equity securities (equity risk) or foreign currencies (foreign currency
exchange rate risk).
Futures contracts are
exchange-traded agreements between the Funds and a counterparty to buy or sell a specific quantity of an underlying instrument at a specified price and on a
specified date. Depending on the terms of a contract, it is settled either through physical delivery of the underlying instrument on the settlement date or by payment of a cash amount on the settlement date. Upon entering into a futures contract, the Funds are required to deposit initial margin with the broker in the form of cash or
securities in an amount that varies depending on a contract’s size and risk profile. The initial margin deposit must then be maintained at an established
level over the life of the contract. Amounts pledged, which are considered restricted, are included in cash pledged for futures contracts in the Statements of Assets and
Liabilities.
Securities deposited as initial
margin are designated in the Schedules of Investments and cash deposited, if any, are shown as cash pledged for futures contracts in the Statements of Assets
and Liabilities. Pursuant to the contract, the Funds agree to receive from or pay to the broker an amount of cash equal to the daily fluctuation in market
value of the contract (“variation margin”). Variation margin is recorded as unrealized appreciation (depreciation) and, if any, shown as
variation margin receivable (or payable) on futures contracts in the Statements of Assets and Liabilities. When the contract is closed, a realized gain or loss
is recorded in the Statements of Operations equal to the difference between the notional amount of the contract at the time it was opened and the notional
amount at the time it was closed. The use of futures contracts involves the risk of an imperfect correlation in the movements in the price of futures contracts and interest
rates, foreign currency exchange rates or underlying assets.
6.
INVESTMENT ADVISORY AGREEMENT AND OTHER TRANSACTIONS WITH AFFILIATES
Investment Advisory: Each Fund entered into an Investment Advisory Agreement with the Manager, the Funds’ investment adviser and an indirect, wholly-owned subsidiary of BlackRock, Inc.
(“BlackRock”), to provide investment advisory and administrative services. The Manager is responsible for the management of each Fund’s portfolio and provides the personnel, facilities, equipment and certain other services necessary to the
operations of each Fund.
For such services, each
Fund, except BNY and BHV, pays the Manager a monthly fee at an annual rate equal to the following percentages of the average daily value of each Fund’s net
assets:
For purposes of calculating these fees, for each Fund except for BNY and BHV, “net assets” mean the total assets of the Fund minus the sum of its accrued
liabilities (which does not include liabilities represented by TOB Trusts and the liquidation preference of any outstanding preferred shares). It is
understood that the liquidation preference of any outstanding preferred stock (other than accumulated dividends) and TOB Trusts is not considered a liability in determining a
Fund’s NAV.
Notes to Financial Statements
83
Notes
to Financial Statements (continued)
For such services, BNY and BHV, pays the Manager a monthly fee at an annual rate equal to the
following percentages of the average weekly value of each Fund’s managed assets:
For purposes of calculating these fees, for BNY and BHV, “managed assets” are determined as total assets of the Fund (including any assets attributable to money borrowed for investment purposes) less the sum of its accrued liabilities (other than money borrowed for investment purposes).
Expense Waivers and Reimbursements: With respect to BHV, the Manager voluntarily agreed to waive a portion of its
investment advisory fees to the annual rate of 0.13% of the Fund’s average weekly managed assets. This voluntary waiver may be reduced or
discontinued at any time. This amount is included in fees waived and/or reimbursed by the Manager in the Statements of Operations. During the year ended July 31, 2024, the
Manager waived $40,640 pursuant to this agreement.
With respect to each Fund, the Manager contractually agreed to waive its investment advisory fees by the amount of investment advisory fees each Fund pays to the Manager
indirectly through its investment in affiliated money market funds (the “affiliated money market fund waiver") through June 30, 2026. The contractual
agreement may be terminated upon 90 days’ notice by a majority of the Independent Directors, or by a vote of a majority of the outstanding voting
securities of a Fund. These amounts are included in fees waived and/or reimbursed by the Manager in the Statements of Operations. For the year ended July 31, 2024, the amounts waived were as follows:
| |
Fees Waived and/or Reimbursed
by the Manager |
| |
|
| |
|
| |
|
| |
|
| |
|
| |
|
| |
|
The Manager contractually agreed to waive its investment advisory
fee with respect to any portion of each Fund’s assets invested in affiliated equity and fixed-income mutual funds and affiliated exchange-traded funds that have a contractual management fee through June 30, 2026. The agreement can be renewed for annual periods thereafter, and
may be terminated on 90 days’ notice, each subject to approval by a majority of the Funds’
Independent Directors. For the year ended July 31, 2024, there were no fees waived by the Manager
pursuant to this arrangement.
The Manager,
for MHN, voluntarily agreed to waive its investment advisory fee on the proceeds of the Preferred Shares and TOB Trusts that exceed 35% of total assets minus
the sum of its accrued liabilities (which does not include liabilities represented by TOB Trusts and the liquidation preference of any outstanding preferred
shares). The voluntary waiver may be reduced or discontinued at any time without notice. This amount is included in fees waived and/or reimbursed by the
Manager in the Statements of Operations. For the year ended July 31, 2024 the waiver was $294,124.
With respect to each Fund, effective May 1, 2024, the Manager
voluntarily agreed to waive a portion of its investment advisory fee attributable to each Fund’s outstanding preferred shares for each month in which the
monthly dividend on the Fund’s preferred shares exceeds the calculated value of the Fund’s gross monthly income attributable to investments from
the proceeds of the preferred shares (determined by multiplying the Fund’s gross monthly income by the ratio of (i) the liquidation preference of any
outstanding preferred shares to (ii) total assets of the Fund minus the sum of its accrued liabilities (which does not include liabilities represented by TOB
Trusts and the liquidation preference of any outstanding preferred shares). This voluntary waiver may be reduced or discontinued at any time without notice. In
addition, each Fund received its pro rata portion of a one-time aggregate $2 million voluntary advisory fee waiver. These amounts are included in fees waived
and/or reimbursed by the Manager in the Statements of Operations. For the year ended July 31, 2024, the amounts waived were as follows:
| |
Fees Waived and/or Reimbursed
by the Manager |
| |
|
| |
|
| |
|
| |
|
| |
|
| |
|
| |
|
Directors and Officers: Certain directors and/or officers of the Funds are directors and/or officers of BlackRock or its affiliates. The Funds
reimburse the Manager for a portion of the compensation paid to the Funds’ Chief Compliance Officer, which is included in Directors and Officer in the Statements of Operations.
For the year ended July 31, 2024, purchases and sales of investments, excluding short-term securities, were as follows:
84 2024 BlackRock
Annual Report to Shareholders
Notes
to Financial Statements (continued)
8.
INCOME TAX INFORMATION
It is
each Fund’s policy to comply with the requirements of the Internal Revenue Code of 1986, as amended, applicable to
regulated investment companies, and to distribute substantially all of its taxable income to its shareholders. Therefore, no U.S. federal income tax provision is
required.
Each Fund files U.S. federal and various state and local tax returns. No income tax
returns are currently under examination. The statute of limitations on
each Fund’ s U.S. federal
tax returns generally remains open for a period of three years after they are filed. The statutes of limitations on each Fund’s state and local tax
returns may remain open for an additional year depending upon the jurisdiction.
Management has analyzed tax laws and regulations and their application to the Funds as of July 31, 2024, inclusive of the open tax return
years, and does not believe that there are any uncertain tax positions that require recognition of a tax liability in the Funds’ financial statements.
U.S. GAAP requires that certain components of net assets be adjusted
to reflect permanent differences between financial and tax reporting. These reclassifications have no effect on net assets or NAVs per share. As of period end, permanent
differences attributable to non-deductible expenses were reclassified to the following accounts:
| |
|
Accumulated
Earnings (Loss) |
| |
|
|
| |
|
|
| |
|
|
| |
|
|
| |
|
|
| |
|
|
| |
|
|
The tax character of distributions paid was as follows:
Notes to Financial Statements
85
Notes
to Financial Statements (continued)
As of July 31, 2024, the tax components of accumulated earnings (loss) were as follows:
| |
Non-Expiring
Capital Loss
|
|
|
| |
|
|
|
| |
|
|
|
| |
|
|
|
| |
|
|
|
| |
|
|
|
| |
|
|
|
| |
|
|
|
| |
Amounts available to offset future realized capital gains. |
| |
The difference between book-basis and tax-basis net unrealized gains (losses) was attributable primarily to the tax deferral of losses on wash sales, amortization
methods for premiums on fixed income securities, the realization for tax
purposes of unrealized gains (losses) on certain futures contracts, the treatment of residual interests in tender option bond trusts, the accrual of income on securities in default and the deferral of compensation to Directors. |
As of July 31, 2024, gross unrealized appreciation and depreciation
based on cost of investments (including short positions and derivatives, if any) for U.S. federal income tax purposes were as follows:
| |
|
Gross Unrealized
Appreciation |
Gross Unrealized
Depreciation |
Net Unrealized
Appreciation
(Depreciation) |
| |
|
|
|
|
| |
|
|
|
|
| |
|
|
|
|
| |
|
|
|
|
| |
|
|
|
|
| |
|
|
|
|
| |
|
|
|
|
In the
normal course of business, the Funds invest in securities or other
instruments and may enter into certain transactions, and such activities subject each Fund to various risks, including among others, fluctuations in the market (market risk) or
failure of an issuer to meet all of its obligations. The value of securities or other instruments may also be affected by various factors, including, without
limitation: (i) the general economy; (ii) the overall market as well as local, regional or global political and/or social instability; (iii) regulation,
taxation or international tax treaties between various countries; or (iv) currency, interest rate and price fluctuations. Local, regional or global events such as war, acts
of terrorism, the spread of infectious illness or other public health issues, recessions, or other events could have a significant impact on the Funds and their investments.
The Funds may hold a significant amount of bonds subject to
calls by the issuers at defined dates and prices. When bonds are called by issuers and the Funds reinvest the proceeds received, such investments may be
in securities with lower yields than the bonds originally held, and correspondingly, could adversely impact the yield and total return performance of a Fund.
A Fund structures and “sponsors” the TOB Trusts in
which it holds TOB Residuals and has certain duties and responsibilities, which may give rise to certain additional risks including, but not limited to, compliance,
securities law and operational risks.
As
short-term interest rates rise, the Funds’ investments in the TOB Trusts may adversely affect
the Funds’ net investment income and dividends to Common Shareholders. Also, fluctuations in the market value of municipal bonds deposited into the TOB Trust may adversely affect the Funds’ NAVs per share.
86 2024 BlackRock
Annual Report to Shareholders
Notes
to Financial Statements (continued)
The U.S. Securities and Exchange Commission (“SEC”) and various federal banking and
housing agencies have adopted credit risk retention rules for securitizations (the “Risk Retention Rules”). The Risk Retention Rules would require
the sponsor of a TOB Trust to retain at least 5% of the credit risk of the underlying assets supporting the TOB Trust’s municipal bonds. The Risk
Retention Rules may adversely affect the Funds’ ability to engage in TOB Trust transactions
or increase the costs of such transactions in certain circumstances.
TOB Trusts constitute an important component of the municipal bond market. Any modifications or changes to rules governing TOB Trusts may
adversely impact the municipal market and the Funds, including through reduced demand for and liquidity of municipal bonds and increased financing costs for
municipal issuers. The ultimate impact of any potential modifications on the TOB Trust market and the overall municipal market is not yet certain.
Illiquidity Risk: Each Fund may invest without limitation in illiquid or less liquid investments or investments in which no secondary market is readily available or which are otherwise illiquid, including private placement securities. A Fund may not be able to readily dispose of such investments at prices that approximate those at which
a Fund could sell such investments if they were more widely traded and, as a result of such illiquidity, a Fund may have to sell other investments or
engage in borrowing transactions if necessary to raise funds to meet its obligations. Limited liquidity can also affect the market price of investments,
thereby adversely affecting a Fund’s NAV and ability to make dividend distributions. Privately issued debt securities are often of below investment
grade quality, frequently are unrated and present many of the same risks as investing in below investment grade public debt securities.
Market Risk: Each Fund may be exposed to prepayment risk, which is the risk that borrowers may exercise their option to prepay principal earlier than scheduled during periods of declining interest rates, which would force each Fund to reinvest in lower yielding securities. Each Fund may also be exposed to reinvestment risk, which is the
risk that income from each Fund’s portfolio will decline if each Fund invests the proceeds from matured, traded or called fixed-income securities at
market interest rates that are below each Fund portfolio’s current earnings rate.
Municipal securities are subject to the risk that litigation,
legislation or other political events, local business or economic conditions, credit rating downgrades, or the bankruptcy of the issuer could have a
significant effect on an issuer’s ability to make payments of principal and/or interest or otherwise affect the value of such securities. Municipal
securities can be significantly affected by political or economic changes, including changes made in the law after issuance of the securities, as well as
uncertainties in the municipal market related to, taxation, legislative changes or the rights of municipal security holders, including in connection with an
issuer insolvency. Municipal securities backed by current or anticipated revenues from a specific project or specific assets can be negatively affected by the
discontinuance of the tax benefits supporting the project or assets or the inability to collect revenues for the project or from the assets. Municipal
securities may be less liquid than taxable bonds, and there may be less publicly available information on the financial condition of municipal security issuers than for
issuers of other securities.
Counterparty Credit
Risk: The Funds may be exposed to counterparty credit risk, or the risk
that an entity may fail to or be unable to perform on its commitments related to unsettled or open transactions, including making timely interest and/or
principal payments or otherwise honoring its obligations. The Funds manage counterparty credit risk by entering into transactions only with counterparties that
the Manager believes have the financial resources to honor their obligations and by monitoring the financial stability of those counterparties. Financial
assets, which potentially expose the Funds to market, issuer and counterparty credit risks, consist principally of financial instruments and receivables due
from counterparties. The extent of the Funds’ exposure to market, issuer and counterparty
credit risks with respect to these financial assets is approximately their value recorded in the Statements of Assets and Liabilities, less any collateral held by the
Funds.
A derivative contract may suffer a
mark-to-market loss if the value of the contract decreases due to an unfavorable change in the market rates or values of the underlying instrument. Losses can also occur if
the counterparty does not perform under the contract.
With exchange-traded futures, there is less counterparty credit risk to the Funds since the exchange or clearinghouse, as counterparty to such instruments, guarantees
against a possible default. The clearinghouse stands between the buyer and the seller of the contract; therefore, credit risk is limited to failure of the
clearinghouse. While offset rights may exist under applicable law, a Fund does not have a contractual right of offset against a clearing broker or
clearinghouse in the event of a default (including the bankruptcy or insolvency). Additionally, credit risk exists in exchange-traded futures with respect to
initial and variation margin that is held in a clearing broker’s customer accounts. While clearing brokers are required to segregate customer margin from
their own assets, in the event that a clearing broker becomes insolvent or goes into bankruptcy and at that time there is a shortfall in the aggregate amount
of margin held by the clearing broker for all its clients, typically the shortfall would be allocated on a pro rata basis across all the clearing broker’s customers,
potentially resulting in losses to the Funds.
Geographic/Asset Class Risk: A diversified portfolio, where this is appropriate and consistent with a fund’s objectives, minimizes the risk that a price change of a particular investment will have a material impact on the NAV of a fund. The investment concentrations within each Fund’s portfolio are disclosed in its Schedule of Investments.
The Funds invest a substantial amount of their assets in issuers located in a single
state or limited number of states. When a fund concentrates its investments in this manner, it assumes the risk that economic, regulatory, political or social
conditions affecting that state or group of states could have a significant impact on the fund and could affect the income from, or the value or liquidity of, the
fund’s portfolio. Investment percentages in specific states or U.S. territories are presented in the Schedules of Investments.
Certain Funds invest a
significant portion of their assets in securities within a single or limited number of market sectors. When a fund concentrates its investments in this
manner, it assumes the risk that economic, regulatory, political and social conditions affecting such sectors may have a significant impact on the Fund and
could affect the income from, or the value or liquidity of, the Fund’s portfolio. Investment percentages in specific sectors are presented in the Schedules of
Investments.
Certain Funds invest a significant portion of their assets in high yield securities. High
yield securities that are rated below investment-grade (commonly referred to as “junk bonds”) or are unrated may be deemed speculative, involve
greater levels of risk than higher-rated securities of similar maturity and are more likely to default. High yield securities may be issued by less
creditworthy issuers, and issuers of high yield securities may be unable to meet their interest or principal payment obligations. High yield securities are
subject to extreme price fluctuations, may be less liquid than higher rated fixed-income securities, even under normal economic conditions, and frequently have redemption
features.
Notes to Financial Statements
87
Notes
to Financial Statements (continued)
The Funds invest a significant portion of their assets in fixed-income securities and/or use
derivatives tied to the fixed-income markets. Changes in market interest rates or economic conditions may affect the value and/or liquidity of such
investments. Interest rate risk is the risk that prices of bonds and other fixed-income securities will decrease as interest rates rise and increase as
interest rates fall. The Funds may be subject to a greater risk of rising interest rates during a period of historically low interest rates. The Federal
Reserve has raised the federal funds rate as part of its efforts to address inflation. Changing interest rates may have unpredictable effects on markets, may result in
heightened market volatility, and could negatively impact the Funds’ performance.
The Funds invest a significant portion of their assets in securities of issuers located in the United States. A decrease in imports or exports, changes in trade regulations, inflation and/or an economic recession in the United States may have a material adverse effect on the U.S. economy and the securities listed on U.S. exchanges. Proposed
and adopted policy and legislative changes in the United States may also have a significant effect on U.S. markets generally, as well as on the value of
certain securities. Governmental agencies project that the United States will continue to maintain elevated public debt levels for the foreseeable future which
may constrain future economic growth. Circumstances could arise that could prevent the timely payment of interest or principal on U.S. government debt, such as
reaching the legislative “debt ceiling.” Such non-payment would result in substantial negative consequences for the U.S. economy and the global
financial system. If U.S. relations with certain countries deteriorate, it could adversely affect issuers that rely on the United States for trade. The United
States has also experienced increased internal unrest and discord. If these trends were to continue, they may have an adverse impact on the U.S. economy and the issuers in
which the Funds invest.
10.
CAPITAL
SHARE TRANSACTIONS
MPA, BNY and BHV are authorized to issue an unlimited number of
shares, all of which were initially classified as Common Shares. MUJ, MHN, MIY and MYN are authorized to issue 200 million shares, all of which were initially
classified as Common Shares. The par value for each Fund’s Common Shares is $0.10, except for BNY and BHV for which it is $0.001. The par value for
MUJ’s, MHN’s, MIY’s and MYN’s Preferred Shares outstanding is $0.10. The par value for MPA’s Preferred Shares outstanding is $0.05. The par value for BNY’s and BHV’s Preferred Shares outstanding is $0.001. The Board is authorized, however, to reclassify any unissued Common Shares to Preferred Shares without the approval of Common Shareholders. MPA is authorized to issue 1 million Preferred Shares.
For the periods shown, shares issued and outstanding increased by the following amounts as a result of dividend reinvestment:
The Funds participate in an open market share repurchase program
(the “Repurchase Program”). From December 1, 2022 through November 30, 2023, each Fund may repurchase up to 5% of its outstanding common shares
under the Repurchase Program, based on common shares outstanding as of the close of business on November 30, 2022, subject to certain conditions. From December
1, 2023 through November 30, 2024, each Fund may repurchase up to 5% of its outstanding common shares under the Repurchase Program, based on common shares
outstanding as of the close of business on November 30, 2023, subject to certain conditions. The Repurchase Program has an accretive effect as shares are purchased at a
discount to the Fund’s NAV. There is no assurance that the Funds will purchase shares in any particular amounts.
The total cost of the shares repurchased is reflected in each Fund’s Statements of Changes in Net Assets. For the periods shown, shares repurchased and
cost, including transaction costs, were as follows:
88 2024 BlackRock
Annual Report to Shareholders
Notes
to Financial Statements (continued)
A Fund’s Preferred Shares rank prior to its Common Shares as to the payment of dividends by the Fund and
distribution of assets upon dissolution or liquidation of the Fund. The 1940 Act prohibits the declaration of any dividend on Common Shares or the repurchase
of Common Shares if the Fund fails to maintain asset coverage of at least 200% of the liquidation preference of the Fund’s outstanding Preferred Shares. In addition, pursuant to the Preferred Shares’ governing instruments, a Fund is restricted from declaring and paying dividends on classes of shares ranking junior to or on parity with its Preferred Shares or repurchasing such shares if the Fund fails to declare and
pay dividends on the Preferred Shares, redeem any Preferred Shares required to be redeemed under the Preferred Shares’ governing instruments or comply
with the basic maintenance amount requirement of the ratings agencies rating the Preferred Shares.
Holders of Preferred Shares have voting rights equal to the
voting rights of holders of Common Shares (one vote per share) and vote together with holders of Common Shares (one vote per share) as a single class on
certain matters. Holders of Preferred Shares, voting as a separate class, are also entitled to (i) elect two members of the Board, (ii) elect the full Board if
dividends on the Preferred Shares are not paid for a period of two years and (iii) a separate class vote to amend the Preferred Share governing documents. In
addition, the 1940 Act requires the approval of the holders of a majority of any outstanding Preferred Shares, voting as a separate class, to (a) adopt any plan
of reorganization that would adversely affect the Preferred Shares, (b) change a
Fund’s sub-classification as a closed-end investment company or change its fundamental
investment restrictions or (c) change its business so as to cease to be an investment company.
Each Fund (for purposes of this section, each a “VRDP
Fund”) have issued Series W-7 VRDP Shares, $100,000 liquidation preference per share, in one or more privately negotiated offerings to qualified
institutional buyers as defined pursuant to Rule 144A under the Securities Act of 1933, as amended (the “Securities Act”). The VRDP Shares include a liquidity
feature and may be subject to a special rate period. As of period end, the VRDP Shares outstanding were as follows:
Redemption Terms: A VRDP Fund is required to redeem its VRDP Shares on the maturity date, unless
earlier redeemed or repurchased. Six months prior to the maturity date, a VRDP Fund is required to begin to segregate liquid assets with the Fund’s custodian to fund the redemption. In addition, a VRDP Fund is required to redeem certain of its outstanding VRDP Shares if it fails to comply with certain asset coverage, basic maintenance amount or leverage requirements.
Subject to certain conditions, the VRDP Shares may also be
redeemed, in whole or in part, at any time at the option of a VRDP Fund. The redemption price per VRDP Share is equal to the liquidation preference per share plus any
outstanding unpaid dividends.
Liquidity Feature: VRDP Shares are subject to
a fee agreement between the VRDP Fund and the liquidity provider that requires a per annum liquidity fee and, in some cases, an upfront or initial commitment
fee, payable to the liquidity provider. These fees, if applicable, are shown as liquidity fees in the Statements of Operations. As of period end, the fee agreement is set to
expire, unless renewed or terminated in advance, as follows:
Notes to Financial Statements
89
Notes
to Financial Statements (continued)
The VRDP Shares are also subject to a purchase agreement in connection with the liquidity
feature. In the event a purchase agreement is not renewed or is terminated in advance, and the VRDP Shares do not become subject to a purchase agreement with
an alternate liquidity provider, the VRDP Shares will be subject to mandatory purchase by the liquidity provider prior to the termination of the purchase
agreement. In the event of such mandatory purchase, a VRDP Fund is required to redeem the VRDP Shares six months after the purchase date. Immediately after
such mandatory purchase, the VRDP Fund is required to begin to segregate liquid assets with its custodian to fund the redemption. There is no assurance that a VRDP Fund will
replace such redeemed VRDP Shares with any other preferred shares or other form of leverage.
Remarketing: A VRDP Fund may incur remarketing fees on the aggregate principal amount of all its VRDP Shares, which, if any, are included in remarketing fees on Preferred Shares in the Statements of Operations. During any special rate period (as described below), a VRDP Fund may incur nominal or no remarketing fees.
Ratings: As of period end, the VRDP Shares were assigned the following ratings:
| |
Moody’s Investors
Service, Inc.
Long-Term
Ratings |
Fitch Ratings, Inc.
Long-Term
Ratings |
| |
|
|
| |
|
|
| |
|
|
| |
|
|
| |
|
|
| |
|
|
| |
|
|
Special Rate Period: A VRDP Fund has commenced a “special rate period” with respect to
its VRDP Shares, during which the VRDP Shares will not be subject to any remarketing and the dividend rate will be based on a predetermined methodology. During
a special rate period, short-term ratings on VRDP Shares are withdrawn. As of period end, the following VRDP Funds have commenced/are set to commence a special rate
period:
| |
|
Expiration Date as
of Period Ended
07/31/24 |
| |
|
|
| |
|
|
| |
|
|
| |
|
|
| |
|
|
| |
|
|
| |
|
|
Prior to the expiration date, the VRDP Fund and the VRDP Shares
holder may mutually agree to extend the special rate period. If a special rate period is not extended, the VRDP Shares will revert to remarketable securities
upon the termination of the special rate period and will be remarketed and available for purchase by qualified institutional investors.
During the special rate period: (i) the liquidity and fee
agreements remain in effect, (ii) VRDP Shares remain subject to mandatory redemption by the VRDP Fund on the maturity date, (iii) VRDP Shares will not be
remarketed or subject to optional or mandatory tender events, (iv) the VRDP Fund is required to comply with the same asset coverage, basic maintenance amount
and leverage requirements for the VRDP Shares as is required when the VRDP Shares are not in a special rate period, (v) the VRDP Fund will pay dividends
monthly based on the sum of an agreed upon reference rate and a percentage per annum based on the long-term ratings assigned to the VRDP Shares and (vi) the VRDP Fund will
pay nominal or no fees to the liquidity provider and remarketing agent.
Dividends: Except during the Special Rate Period as described above, dividends
on the VRDP Shares are payable monthly at a variable rate set weekly by the remarketing agent. Such dividend rates are generally based upon a spread over a
base rate and cannot exceed a maximum rate. A change in the short-term credit rating of the liquidity provider or the VRDP Shares may adversely affect the
dividend rate paid on such shares, although the dividend rate paid on the VRDP Shares is not directly based upon either short-term rating. In the event of a
failed remarketing, the dividend rate of the VRDP Shares will be reset to a maximum rate. The maximum rate is determined based on, among other things, the long-term preferred
share rating assigned to the VRDP Shares and the length of time that the VRDP Shares fail to be remarketed.
For the year ended July 31, 2024, the annualized dividend rate for the VRDP Shares were as follows:
For the year ended July 31, 2024, VRDP Shares issued and outstanding of each VRDP Fund remained constant.
Offering Costs: The Funds incurred costs in connection with the issuance of VRDP Shares, which were recorded as a direct deduction from the carrying value of the related debt liability and will be amortized over the life of the VRDP Shares with the exception of any upfront fees paid by a VRDP Fund to the liquidity provider which, if any,
were amortized over the life of the liquidity agreement.
Amortization of these costs is included in interest expense, fees and amortization of offering costs in the Statements of Operations.
90 2024 BlackRock
Annual Report to Shareholders
Notes
to Financial Statements (continued)
Financial Reporting: The VRDP Shares are considered debt of the issuer; therefore, the liquidation preference, which approximates fair value of the VRDP Shares, is recorded as a liability in the Statements of Assets and Liabilities net of deferred offering costs. Unpaid dividends are included in interest expense and fees payable in
the Statements of Assets and Liabilities, and the dividends accrued and paid on the VRDP Shares are included as a component of interest expense, fees and
amortization of offering costs in the Statements of Operations. The VRDP Shares are treated as equity for tax purposes. Dividends paid to holders of the VRDP
Shares are generally classified as tax-exempt income for tax-reporting purposes. Dividends and amortization of deferred offering costs on VRDP Shares are
included in interest expense, fees and amortization of offering costs in the Statements of Operations:
| |
|
Deferred Offering
Costs Amortization |
| |
|
|
| |
|
|
| |
|
|
| |
|
|
| |
|
|
| |
|
|
| |
|
|
Management’s evaluation of the impact of all subsequent
events on the Funds’ financial statements was completed through the date the financial statements were issued and the following
items were noted:
The Funds declared and paid or will pay
distributions to Common Shareholders as follows:
| |
|
|
|
|
Dividend Per
Common Share |
| |
|
|
|
|
|
| |
|
|
|
|
|
| |
|
|
|
|
|
| |
|
|
|
|
|
| |
|
|
|
|
|
| |
|
|
|
|
|
| |
|
|
|
|
|
| |
|
|
|
|
|
| |
|
|
|
|
|
| |
|
|
|
|
|
| |
|
|
|
|
|
| |
|
|
|
|
|
| |
|
|
|
|
|
| |
|
|
|
|
|
| |
|
|
|
|
|
| |
|
|
|
|
|
| |
|
|
|
|
|
| |
|
|
|
|
|
| |
|
|
|
|
|
| |
|
|
|
|
|
| |
|
|
|
|
|
The Funds declared and paid or will pay distributions to Preferred Shareholders as
follows:
| |
Dividends declared for period August 1, 2024 to August 31, 2024. |
Notes to Financial Statements
91
Report
of Independent Registered Public Accounting Firm
To
the Shareholders and the Board of Trustees/Directors of BlackRock MuniHoldings New Jersey Quality Fund, Inc., BlackRock MuniHoldings New York Quality Fund, Inc.,
BlackRock MuniYield Michigan Quality Fund, Inc., BlackRock MuniYield New York Quality Fund, Inc., BlackRock MuniYield Pennsylvania Quality Fund, BlackRock New
York Municipal Income Trust, and BlackRock Virginia Municipal Bond Trust:
Opinion on the Financial Statements and Financial Highlights
We have audited the accompanying statements of assets and
liabilities of BlackRock MuniHoldings New Jersey Quality Fund, Inc., BlackRock MuniHoldings New York Quality Fund, Inc., BlackRock MuniYield Michigan Quality
Fund, Inc., BlackRock MuniYield New York Quality Fund, Inc., BlackRock MuniYield Pennsylvania Quality Fund, BlackRock New York Municipal Income Trust, and
BlackRock Virginia Municipal Bond Trust (the “Funds”), including the schedules of investments, as of July 31, 2024, the related statements of
operations and cash flows for the year then ended, the statements of changes in net assets for each of the two years in the period then ended, the financial
highlights for the periods indicated in the table below, and the related notes. In our opinion, the financial statements and financial highlights present
fairly, in all material respects, the financial position of the Funds as of July 31, 2024, and the results of their operations and their cash flows for the
year then ended, the changes in their net assets for each of the two years in the period then ended, and the financial highlights for the periods indicated in
the table below, in conformity with accounting principles generally accepted in the United States of America.
| |
|
BlackRock MuniHoldings New Jersey Quality Fund, Inc., BlackRock MuniYield Michigan Quality Fund, Inc., BlackRock MuniYield New York Quality Fund, Inc., BlackRock MuniYield Pennsylvania Quality Fund, and BlackRock New York Municipal Income Trust |
For each of the five years in the period ended July 31, 2024 |
BlackRock MuniHoldings New York Quality Fund, Inc.
and BlackRock Virginia Municipal Bond Trust |
For each of the two years in the period ended July 31, 2024, for the period from September 1, 2021 through July 31, 2022, and for each of the three years in the period ended August 31, 2021 |
These financial statements and financial highlights are the responsibility of the Funds’ management. Our responsibility is to express an opinion on the Funds’
financial statements and financial highlights based on our audits. We are a public accounting firm registered with the Public Company Accounting Oversight
Board (United States) (PCAOB) and are required to be independent with respect to the Funds in accordance with the U.S. federal securities laws and the
applicable rules and regulations of the Securities and Exchange Commission and the PCAOB.
We conducted our audits in accordance with the standards of the
PCAOB. Those standards require that we plan and perform the audit to obtain reasonable assurance about whether the financial statements and financial
highlights are free of material misstatement, whether due to error or fraud. The Funds are not required to have, nor were we engaged to perform, an audit of
their internal control over financial reporting. As part of our audits, we are required to obtain an understanding of internal control over financial reporting but not for
the purpose of expressing an opinion on the effectiveness of the Funds’ internal control over financial reporting. Accordingly, we express no such opinion.
Our audits included performing procedures to assess the risks of
material misstatement of the financial statements and financial highlights, whether due to error or fraud, and performing procedures that respond to those
risks. Such procedures included examining, on a test basis, evidence regarding the amounts and disclosures in the financial statements and financial
highlights. Our audits also included evaluating the accounting principles used and significant estimates made by management, as well as evaluating the overall
presentation of the financial statements and financial highlights. Our procedures included confirmation of securities owned as of July 31, 2024, by correspondence with custodians or counterparties; when replies were not received, we performed other auditing procedures. We believe that our audits provide a reasonable basis for our
opinion.
Deloitte
& Touche LLP
Boston, Massachusetts
September 20, 2024
We have served as the auditor of one or more BlackRock investment companies since
1992.
92
2024 BlackRock Annual Report to Shareholders
Important Tax Information (unaudited)
The following amounts,
or maximum amounts allowable by law, are hereby designated as tax-exempt interest dividends for the fiscal year ended July 31, 2024:
| |
Exempt-Interest
Dividends |
| |
|
| |
|
| |
|
| |
|
| |
|
| |
|
| |
|
The Funds hereby designate the following amounts, or maximum amounts
allowable by law, as interest income eligible to be treated as a Section 163(j) interest dividend for the fiscal year ended July 31, 2024:
The Funds hereby designate the following amounts, or maximum amounts
allowable by law, as interest-related dividends eligible for exemption from U.S. withholding tax for nonresident aliens and foreign corporations for the fiscal year ended
July 31, 2024:
| |
Interest-
Related
Dividends |
| |
|
| |
|
| |
|
| |
|
Important Tax Information
93
Disclosure of Investment Advisory Agreements
The Boards of Directors/Trustees, as applicable (collectively, the “Board,” the
members of which are referred to as “Board Members”) of BlackRock MuniHoldings New Jersey Quality Fund, Inc. (“MUJ”), BlackRock
MuniHoldings New York Quality Fund, Inc. (“MHN”), BlackRock MuniYield Michigan Quality Fund, Inc. (“MIY”), BlackRock MuniYield New York
Quality Fund, Inc. (“MYN”), BlackRock MuniYield Pennsylvania Quality Fund (“MPA”), BlackRock New York Municipal Income Trust (“BNY”) and BlackRock Virginia Municipal Bond Trust (“BHV”) (collectively, the “Funds” and each, a “Fund”) met on May 3, 2024 (the “May Meeting”) and June
6-7, 2024 (the “June Meeting”) to consider the approval to continue the investment advisory agreements (the “Advisory Agreements” or
the “Agreements”) between each Fund and BlackRock Advisors, LLC (the “Manager” or “BlackRock”), each Fund’s investment
advisor.
Consistent with the requirements of the Investment Company Act of 1940 (the “1940 Act”), the Board considers the approval of the continuation of the Agreements
for each Fund on an annual basis. The Board members who are not “interested persons” of each Fund, as defined in the 1940 Act, are considered
independent Board members (the “Independent Board Members”). The Board’s consideration entailed a year-long deliberative process during which
the Board and its committees assessed BlackRock’s various services to each Fund, including through the review of written materials and oral
presentations, and the review of additional information provided in response to requests from the Independent Board Members. The Board had four quarterly
meetings per year, each of which extended over a two-day period, as well as additional ad hoc meetings and executive sessions throughout the year, as needed.
The committees of the Board similarly met throughout the year. The Board also had an additional one-day meeting to consider specific information regarding the
renewal of the Agreements. In considering the renewal of the Agreements, the Board assessed, among other things, the nature, extent and quality of the services
provided to each Fund by BlackRock, BlackRock’s personnel and affiliates, including (as applicable): investment management services; accounting
oversight; administrative and shareholder services; oversight of each Fund’s service providers; risk management and oversight; and legal, regulatory and
compliance services. Throughout the year, including during the contract renewal process, the Independent Board Members were advised by independent legal
counsel, and met with independent legal counsel in various executive sessions outside of the presence of BlackRock’s management.
During the year, the Board, acting directly and through its
committees, considered information that was relevant to its annual consideration of the renewal of the Agreements, including the services and support provided
by BlackRock to each Fund and its shareholders. BlackRock also furnished additional information to the Board in response to specific questions from the Board.
Among the matters the Board considered were: (a) investment performance for one-year, three-year, five-year, and/or since inception periods, as applicable,
against peer funds, relevant benchmarks, and other performance metrics, as applicable, as well as BlackRock senior management’s and portfolio
managers’ investment performance analyses, and the reasons for any outperformance or underperformance relative to its peers, benchmarks, and other
performance metrics, as applicable; (b) leverage management, as applicable; (c) fees, including advisory, administration, if applicable, and other amounts paid
to BlackRock and its affiliates by each Fund for services; (d) Fund operating expenses and how BlackRock allocates expenses to each Fund; (e) the resources
devoted to risk oversight of, and compliance reports relating to, implementation of each Fund’s investment objective, policies and restrictions, and
meeting regulatory requirements; (f) BlackRock’s and each Fund’s adherence to applicable compliance policies and procedures; (g) the nature,
character and scope of non-investment management services provided by BlackRock and its affiliates and the estimated cost of such services, as available; (h)
BlackRock’s and other service providers’ internal controls and risk and compliance oversight mechanisms; (i) BlackRock’s implementation of
the proxy voting policies approved by the Board; (j) execution quality of portfolio transactions; (k) BlackRock’s implementation of each Fund’s valuation and liquidity procedures; (l) an analysis of management fees paid to BlackRock for products with similar investment mandates across the open-end fund, closed-end fund, sub-advised mutual fund, collective investment trust and institutional separate account product channels, as applicable, and the similarities and differences between these
products and the services provided as compared to each Fund; (m) BlackRock’s compensation methodology for its investment professionals and the incentives
and accountability it creates, along with investment professionals’ investments in the fund(s) they manage; (n) periodic updates on BlackRock’s
business; and (o) each Fund’s market discount/premium compared to peer funds.
Prior to and in preparation for the May Meeting, the Board
received and reviewed materials specifically relating to the renewal of the Agreements. The Independent Board Members continuously engaged in a process with
their independent legal counsel and BlackRock to review the nature and scope of the information provided to the Board to better assist its deliberations. The
materials provided in connection with the May Meeting included, among other things: (a) information independently compiled and prepared by Broadridge Financial
Solutions, Inc. (“Broadridge”), based on either a Lipper classification or Morningstar category, regarding each Fund’s fees and expenses as compared with a peer group of funds as determined by Broadridge (“Expense Peers”) and the investment performance of each Fund as compared with a peer group of funds
(“Performance Peers”); (b) information on the composition of the Expense Peers and Performance Peers and a description of Broadridge’s
methodology; (c) information on the estimated profits realized by BlackRock and its affiliates pursuant to the Agreements and a discussion of fall-out benefits
to BlackRock and its affiliates; (d) a general analysis provided by BlackRock concerning investment management fees received in connection with other types of
investment products, such as institutional accounts, sub-advised mutual funds, closed-end funds, and open-end funds, under similar investment mandates, as
applicable; (e) a review of non-management fees; (f) the existence, impact and sharing of potential economies of scale, if any, with each Fund; (g) a summary
of aggregate amounts paid by each Fund to BlackRock; and (h) various additional information requested by the Board as appropriate regarding BlackRock’s and each
Fund’s operations.
At the May Meeting,
the Board reviewed materials relating to its consideration of the Agreements and the Independent Board Members presented BlackRock with questions and requests
for additional information. BlackRock responded to these questions and requests with additional written information in advance of the June Meeting, and such responses were
reviewed by the Board Members.
At the June
Meeting, the Board concluded its assessment of, among other things: (a) the nature, extent and quality of the services provided by BlackRock; (b) the investment
performance of each Fund as compared to its Performance Peers and to other metrics, as applicable; (c) the advisory fee and the estimated cost of the services
and estimated profits realized by BlackRock and its affiliates from their relationship with each Fund; (d) each Fund’s fees and expenses compared to its
Expense Peers; (e) the existence and sharing of potential economies of scale; (f) any fall-out benefits to BlackRock and its affiliates as a result of
BlackRock’s relationship with each Fund; and (g) other factors deemed relevant by the Board Members.
The Board also considered other matters it deemed important to
the approval process, such as other payments made to BlackRock or its affiliates relating to securities lending and cash management, and BlackRock’s
services related to the valuation and pricing of Fund portfolio holdings. The Board noted the willingness of BlackRock’s personnel to engage in open,
candid discussions with the Board. The Board evaluated the information available to it on a fund-by-fund basis. The following paragraphs provide more
94 2024 BlackRock
Annual Report to Shareholders
Disclosure of Investment Advisory Agreements (continued)
information about some of the primary factors that were relevant to the Board’s decision.
The Board Members did not identify any particular information, or any single factor as determinative, and each Board Member may have attributed different weights to the
various items and factors considered.
A. Nature, Extent and Quality of the Services Provided by
BlackRock
The Board, including the
Independent Board Members, reviewed the nature, extent and quality of services provided by BlackRock, including the investment advisory services, and the
resulting performance of each Fund. Throughout the year, the Board compared Fund performance to the performance of a comparable group of closed-end funds,
relevant benchmarks, and performance metrics, as applicable. The Board met with BlackRock’s senior management personnel responsible for investment
activities, including the senior investment officers. The Board also reviewed the materials provided by each Fund’s portfolio management team discussing
each Fund’s performance, investment strategies and outlook.
The Board considered, among other factors, with respect to BlackRock: the experience of each Fund’s portfolio management team;
research capabilities; investments by portfolio managers in the funds they manage; portfolio trading capabilities; use of technology; commitment to compliance;
credit analysis capabilities; risk analysis and oversight capabilities; and the approach to training and retaining portfolio managers and other research,
advisory and management personnel. The Board also considered BlackRock’s overall risk management program, including the continued efforts of BlackRock
and its affiliates to address cybersecurity risks and the role of BlackRock’s Risk & Quantitative Analysis Group. The Board engaged in a review of
BlackRock’s compensation structure with respect to each Fund’s portfolio management team and BlackRock’s ability to attract and retain high-quality talent
and create performance incentives.
In
addition to investment advisory services, the Board considered the nature and quality of the administrative and other non-investment advisory services provided to each Fund. BlackRock and its affiliates provide each Fund with certain administrative, shareholder and other services (in addition to any such services provided to each Fund by
third parties) and officers and other personnel as are necessary for the operations of each Fund. In particular, BlackRock and its affiliates provide each Fund
with administrative services including, among others: (i) responsibility for disclosure documents and periodic shareholder reports; (ii) preparing
communications with analysts to support secondary market trading of each Fund; (iii) oversight of daily accounting and pricing; (iv) responsibility for
periodic filings with regulators and stock exchanges; (v) overseeing and coordinating the activities of third-party service providers including, among others,
each Fund’s custodian, fund accountant, transfer agent, and auditor; (vi) organizing Board meetings and preparing the materials for such Board meetings;
(vii) providing legal and compliance support; (viii) furnishing analytical and other support to assist the Board in its consideration of strategic issues such
as the merger, consolidation or repurposing of certain closed-end funds; and (ix) performing or managing administrative functions necessary for the operation
of each Fund, such as tax reporting, expense management, fulfilling regulatory filing requirements, and shareholder call center and other services. The Board
reviewed the structure and duties of BlackRock’s fund administration, shareholder services, and legal and compliance departments and considered
BlackRock’s policies and procedures for assuring compliance with applicable laws and regulations. The Board considered the operation of BlackRock’s
business continuity plans.
B. The Investment Performance of each Fund
The Board, including the Independent Board
Members, reviewed and considered the performance history of each Fund throughout the year and at the May Meeting. In preparation for the May Meeting, the Board
was provided with reports independently prepared by Broadridge, which included an analysis of each Fund’s performance as of December 31, 2023, as
compared to its Performance Peers. The performance information is based on net asset value (“NAV”), and utilizes Lipper data. Lipper’s methodology calculates a fund’s total return assuming distributions are reinvested on the ex-date at a fund’s ex-date NAV. Broadridge ranks funds in quartiles,
ranging from first to fourth, where first is the most desirable quartile position and fourth is the least desirable. In connection with its review, the Board
received and reviewed information regarding the investment performance of each Fund as compared to its Performance Peers and certain performance metrics
(“Performance Metrics”). The Board and its Performance Oversight Committee regularly review and meet with Fund management to discuss the performance of each Fund
throughout the year.
In evaluating performance, the Board focused particular attention on funds with less favorable performance records. The Board also noted that while it found the data
provided by Broadridge generally useful, it recognized the limitations of such data, including in particular, that notable differences may exist between a fund
and its Performance Peers (for example, the investment objectives and strategies). Further, the Board recognized that the performance data reflects a snapshot
of a period as of a particular date and that selecting a different performance period could produce significantly different results. The Board also
acknowledged that long-term performance could be impacted by even one period of significant outperformance or underperformance, and that a single investment theme could have
the ability to disproportionately affect long-term performance.
The Board reviewed and considered MUJ’s performance relative to MUJ’s Performance Metrics. Based on an overall rating relative to the Performance Metrics, MUJ
generally performed in line with expectations. The Board noted that BlackRock believes that the Performance Metrics are an appropriate performance comparison
for MUJ, and that BlackRock has explained its rationale for this belief to the Board.
The Board reviewed and considered MHN’s performance
relative to MHN’s Performance Metrics. Based on an overall rating relative to the Performance Metrics, MHN generally performed in line with expectations.
The Board noted that BlackRock believes that the Performance Metrics are an appropriate performance comparison for MHN, and that BlackRock has explained its rationale for
this belief to the Board.
The Board reviewed
and considered MIY’s performance relative to MIY’s Performance Metrics. Based on an overall rating relative to the Performance Metrics, MIY generally
performed in line with expectations. The Board noted that BlackRock believes that the Performance Metrics are an appropriate performance comparison for MIY,
and that BlackRock has explained its rationale for this belief to the Board.
The Board reviewed and considered MYN’s performance relative to MYN’s Performance Metrics. Based on an overall rating
relative to the Performance Metrics, MYN generally performed in line with expectations. The Board noted that BlackRock believes that the Performance Metrics
are an appropriate performance comparison for MYN, and that BlackRock has explained its rationale for this belief to the Board.
Disclosure of Investment Advisory Agreements
95
Disclosure of Investment Advisory Agreements (continued)
The
Board reviewed and considered MPA’s performance relative to MPA’s Performance Metrics. Based on an overall rating relative to the Performance Metrics, MPA generally performed below expectations. The Board noted that BlackRock believes that the Performance Metrics are an appropriate performance comparison for MPA, and that BlackRock has explained its rationale for this belief to the Board. The Board and BlackRock reviewed MPA’s underperformance relative to the Performance Metrics.
The Board reviewed and considered BNY’s performance
relative to BNY’s Performance Metrics. Based on an overall rating relative to the Performance Metrics, BNY generally performed in line with expectations.
The Board noted that BlackRock believes that the Performance Metrics are an appropriate performance comparison for BNY, and that BlackRock has explained its rationale for
this belief to the Board.
The Board reviewed
and considered BHV’s performance relative to BHV’s Performance Metrics. Based on an overall rating relative to the Performance Metrics, BHV generally
performed below expectations. The Board noted that BlackRock believes that the Performance Metrics are an appropriate performance comparison for BHV, and that
BlackRock has explained its rationale for this belief to the Board. The Board and BlackRock reviewed BHV’s underperformance relative to the Performance
Metrics.
C. Consideration of the Advisory/Management Fees and the Estimated Cost of the Services and
Estimated Profits Realized by BlackRock and its Affiliates from their Relationship with each Fund
The Board, including the Independent Board Members, reviewed each
Fund’s contractual management fee rate compared with those of its Expense Peers. The contractual management fee rate represents a combination of the
advisory fee and any administrative fees, before taking into account any reimbursements or fee waivers. The Board also compared each Fund’s total expense
ratio, as well as its actual management fee rate as a percentage of managed assets, which is the total assets of each Fund (including any assets attributable
to money borrowed for investment purposes) minus the sum of each Fund’s accrued liabilities (other than money borrowed for investment purposes) to those
of its Expense Peers. The total expense ratio represents a fund’s total net operating expenses, excluding any investment related expenses. The total expense ratio gives effect to any expense reimbursements or fee waivers, and the actual management fee rate gives effect to any management fee reimbursements or waivers. The Board considered that the fee and expense information in the Broadridge report for each Fund reflected information for a specific period and that historical asset levels and
expenses may differ from current levels, particularly in a period of market volatility. The Board considered the services provided and the fees charged by
BlackRock and its affiliates to other types of clients with similar investment mandates, as applicable, including institutional accounts and sub-advised mutual
funds (including mutual funds sponsored by third parties).
The Board received and reviewed statements relating to BlackRock’s financial condition. The Board reviewed BlackRock’s
profitability methodology and was also provided with an estimated profitability analysis that detailed the revenues earned and the expenses incurred by
BlackRock for services provided to each Fund. The Board reviewed BlackRock’s estimated profitability with respect to each Fund and other funds the Board
currently oversees for the year ended December 31, 2023 compared to available aggregate estimated profitability data provided for the prior two years. The
Board reviewed BlackRock’s estimated profitability with respect to certain other U.S. fund complexes managed by the Manager and/or its affiliates. The
Board reviewed BlackRock’s assumptions and methodology of allocating expenses in the estimated profitability analysis, noting the inherent limitations in
allocating costs among various advisory products. The Board recognized that profitability may be affected by numerous factors including, among other things,
fee waivers and expense reimbursements by the Manager, the types of funds managed, precision of expense allocations and business mix. The Board thus recognized that
calculating and comparing profitability at the individual fund level is difficult.
The Board noted that, in general, individual fund or product line profitability of other advisors is not publicly available. The Board reviewed BlackRock’s overall
operating margin, in general, compared to that of certain other publicly traded asset management firms. The Board considered the differences between BlackRock
and these other firms, including the contribution of technology at BlackRock, BlackRock’s expense management, and the relative product mix.
The Board considered whether BlackRock has the financial
resources necessary to attract and retain high quality investment management personnel to perform its obligations under the Agreements and to continue to
provide the high quality of services that is expected by the Board. The Board further considered factors including but not limited to BlackRock’s
commitment of time and resources, assumption of risk, and liability profile in servicing each Fund, including in contrast to what is required of BlackRock with
respect to other products with similar investment mandates across the open-end fund, closed-end fund, sub-advised mutual fund, collective investment trust, and
institutional separate account product channels, as applicable.
The Board noted that MUJ’s contractual management fee rate ranked in the first quartile, and that the actual management fee rate
and total expense ratio each ranked in the first quartile relative to the Expense Peers. After discussion between the Board, including the Independent Board
Members, and BlackRock, the Board and BlackRock agreed to the implementation of a voluntary advisory fee waiver, effective as of May 1, 2024, pursuant to which
BlackRock will waive a portion of its advisory fee attributable to MUJ’s outstanding preferred shares for each month in which the monthly dividend on the
preferred shares exceeds the calculated value of MUJ’s gross monthly income attributable to investments from the proceeds of the preferred shares. In
addition, the Board also noted that BlackRock has agreed to, and MUJ will receive the benefit of its pro rata portion of, a one-time voluntary advisory fee
waiver pursuant to which BlackRock will be waiving an aggregate of $2 million of advisory fees with respect to certain BlackRock-advised municipal closed-end
funds.
The Board noted that MHN’s
contractual management fee rate ranked in the first quartile, and that the actual management fee rate and total expense ratio each ranked in the first quartile
relative to the Expense Peers. After discussion between the Board, including the Independent Board Members, and BlackRock, the Board and BlackRock agreed to
the implementation of a voluntary advisory fee waiver, effective as of May 1, 2024, pursuant to which BlackRock will waive a portion of its advisory fee attributable to MHN’s outstanding preferred shares for each month in which the monthly dividend on the preferred shares exceeds the calculated value of MHN’s gross monthly income
attributable to investments from the proceeds of the preferred shares. In addition, the Board also noted that BlackRock has agreed to, and MHN will receive the
benefit of its pro rata portion of, a one-time voluntary advisory fee waiver pursuant to which BlackRock will be waiving an aggregate of $2 million of advisory
fees with respect to certain BlackRock-advised municipal closed-end funds.
The Board noted that MIY’s contractual management fee rate ranked in the first quartile, and that the actual management fee rate
and total expense ratio each ranked in the first quartile relative to the Expense Peers. After discussion between the Board, including the Independent Board
Members, and BlackRock, the Board and BlackRock agreed to the implementation of a voluntary advisory fee waiver, effective as of May 1, 2024, pursuant to which
BlackRock will waive a portion of its advisory fee attributable to MIY’s
96 2024 BlackRock
Annual Report to Shareholders
Disclosure of Investment Advisory Agreements (continued)
outstanding preferred shares for each month in which the monthly dividend on the preferred
shares exceeds the calculated value of MIY’s gross monthly income attributable to investments from the proceeds of the preferred shares. In addition, the
Board also noted that BlackRock has agreed to, and MIY will receive the benefit of its pro rata portion of, a one-time voluntary advisory fee waiver pursuant
to which BlackRock will be waiving an aggregate of $2 million of advisory fees with respect to certain BlackRock-advised municipal closed-end funds.
The Board noted that MYN’s contractual management fee rate
ranked in the first quartile, and that the actual management fee rate and total expense ratio each ranked in the first quartile relative to the Expense Peers.
After discussion between the Board, including the Independent Board Members, and BlackRock, the Board and BlackRock agreed to the implementation of a voluntary
advisory fee waiver, effective as of May 1, 2024, pursuant to which BlackRock will waive a portion of its advisory fee attributable to MYN’s outstanding
preferred shares for each month in which the monthly dividend on the preferred shares exceeds the calculated value of MYN’s gross monthly income attributable to investments from the proceeds of the preferred shares. In addition, the Board also noted that BlackRock has agreed to, and MYN will receive the benefit of its pro rata
portion of, a one-time voluntary advisory fee waiver pursuant to which BlackRock will be waiving an aggregate of $2 million of advisory fees with respect to
certain BlackRock-advised municipal closed-end funds.
The Board noted that MPA’s contractual management fee rate ranked in the first quartile, and that the actual management fee rate
and total expense ratio each ranked in the first quartile relative to the Expense Peers. After discussion between the Board, including the Independent Board
Members, and BlackRock, the Board and BlackRock agreed to the implementation of a voluntary advisory fee waiver, effective as of May 1, 2024, pursuant to which
BlackRock will waive a portion of its advisory fee attributable to MPA’s outstanding preferred shares for each month in which the monthly dividend on the
preferred shares exceeds the calculated value of MPA’s gross monthly income attributable to investments from the proceeds of the preferred shares. In
addition, the Board also noted that BlackRock has agreed to, and MPA will
receive the benefit of its pro rata portion of, a one-time voluntary advisory fee waiver pursuant to which BlackRock will be waiving an aggregate of $2 million
of advisory fees with respect to certain BlackRock-advised municipal closed-end funds.
The Board noted that BNY’s contractual management fee rate
ranked in the first quartile, and that the actual management fee rate and total expense ratio each ranked in the first quartile relative to the Expense Peers.
After discussion between the Board, including the Independent Board Members, and BlackRock, the Board and BlackRock agreed to the implementation of a voluntary
advisory fee waiver, effective as of May 1, 2024, pursuant to which BlackRock will waive a portion of its advisory fee attributable to BNY’s outstanding
preferred shares for each month in which the monthly dividend on the preferred shares exceeds the calculated value of BNY’s gross monthly income attributable to investments from the proceeds of the preferred shares. In addition, the Board also noted that BlackRock has agreed to, and BNY will receive the benefit of its pro rata
portion of, a one-time voluntary advisory fee waiver pursuant to which BlackRock will be waiving an aggregate of $2 million of advisory fees with respect to
certain BlackRock-advised municipal closed-end funds.
The Board noted that BHV’s contractual management fee rate ranked in the third quartile, and that the actual management fee rate
and total expense ratio ranked in the first and fourth quartiles, respectively, relative to the Expense Peers. The Board also noted that BlackRock had agreed
to voluntarily waive a portion of the advisory fee payable by BHV. After discussions between the Board, including the Independent Board Members, and BlackRock,
the Board and BlackRock agreed to a continuation of the current 13 basis point voluntary advisory fee waiver. After discussion between the Board, including the
Independent Board Members, and BlackRock, the Board and BlackRock agreed to the implementation of a voluntary advisory fee waiver, effective as of May 1, 2024,
pursuant to which BlackRock will waive a portion of its advisory fee attributable to BHV’s outstanding preferred shares for each month in which the
monthly dividend on the preferred shares exceeds the calculated value of BHV’s gross monthly income attributable to investments from the proceeds of the
preferred shares. In addition, the Board also noted that BlackRock has agreed to, and BHV will receive the benefit of its pro rata portion of, a one-time
voluntary advisory fee waiver pursuant to which BlackRock will be waiving an aggregate of $2 million of advisory fees with respect to certain BlackRock-advised municipal
closed-end funds.
The Board, including the
Independent Board Members, considered the extent to which any economies of scale might benefit each Fund in a variety of ways as the assets of each Fund
increase. The Board considered multiple factors, including the advisory fee rate and breakpoints, and fee waivers, as applicable. The Board considered each Fund’s
asset levels and whether the current fee was appropriate.
Based on the Board’s review and consideration of the issue, the Board concluded that most closed-end funds do not have fund level breakpoints because closed-end funds
generally do not experience substantial growth after the initial public offering. Closed-end funds are typically priced at scale at a fund’s
inception.
E. Other Factors Deemed Relevant by the Board Members
The Board, including the Independent Board Members, also took into account other ancillary or “fall-out” benefits that
BlackRock or its affiliates may derive from BlackRock’s respective relationships with each Fund, both tangible and intangible, such as BlackRock’s
ability to leverage its investment professionals who manage other portfolios and its risk management personnel, an increase in BlackRock’s profile in the
investment advisory community, and the engagement of BlackRock’s affiliates as service providers to each Fund, including for administrative, securities
lending and cash management services. With respect to securities lending, during the year the Board also considered information provided by independent
third-party consultants related to the performance of each BlackRock affiliate as securities lending agent. The Board also considered BlackRock’s overall
operations and its efforts to expand the scale of, and improve the quality of, its operations. The Board also noted that, subject to applicable law, BlackRock
may use and benefit from third-party research obtained by soft dollars generated by certain registered fund transactions to assist in managing all or a number
of its other client accounts.
In connection with its consideration of the Agreements, the Board also received information regarding BlackRock’s brokerage and soft dollar practices. The Board
received reports from BlackRock which included information on brokerage commissions and trade execution practices throughout the year.
The Board also considered the various notable initiatives and
projects BlackRock performed in connection with its closed-end fund product line. These initiatives included developing equity shelf programs; efforts to
eliminate product overlap with fund mergers; ongoing services to manage leverage that has become increasingly complex; periodic evaluation of share repurchases
and other support initiatives for certain BlackRock funds; and efforts to reduce fund discounts, including continued communication efforts with
Disclosure of Investment Advisory Agreements
97
Disclosure of Investment Advisory Agreements (continued)
shareholders, fund analysts and financial advisers. With respect to the latter, the Independent
Board Members noted BlackRock’s continued commitment to supporting the secondary market for the common shares of its closed-end funds through a
comprehensive secondary market communication program designed to raise investor and analyst awareness and understanding of closed-end funds. BlackRock’s
support services included, among other things: sponsoring and participating in conferences; communicating with closed-end fund analysts covering the BlackRock
funds throughout the year; providing marketing and product updates for the closed-end funds; and maintaining and enhancing its closed-end fund website.
At the June Meeting, in a continuation of the discussions that
occurred during the May Meeting, and as a culmination of the Board’s year-long deliberative process, the Board, including the Independent Board Members,
unanimously approved the continuation of the Advisory Agreements between the Manager and each Fund for a one-year term ending June 30, 2025. Based upon its
evaluation of all of the aforementioned factors in their totality, as well as other information, the Board, including the Independent Board Members, was
satisfied that the terms of the Agreements were fair and reasonable and in the best interest of each Fund and its shareholders. In arriving at its decision to
approve the Agreements, the Board did not identify any single factor or group of factors as all-important or controlling, but considered all factors together,
and different Board Members may have attributed different weights to the various factors considered. The Independent Board Members were advised by independent
legal counsel throughout the deliberative process.
98 2024 BlackRock
Annual Report to Shareholders
Investment Objectives, Policies and Risks
Recent Changes
The following information is a summary of certain changes since July 31, 2023. This information may not reflect all of the changes that have occurred since
you purchased the relevant Fund.
During each Fund’s most recent fiscal year, there were no material changes in the Fund’s investment objectives or policies that have not been approved by
shareholders or in the principal risk factors associated with investment in the Fund.
Investment Objectives and Policies
BlackRock MuniHoldings New Jersey Quality Fund, Inc.
(MUJ)
The Fund’s investment objective
is to provide shareholders with current income exempt from federal income tax and New Jersey personal income taxes. The investment objective of the Fund is a fundamental
policy that may not be changed without a vote of a majority of the Fund’s outstanding voting securities.
The Fund seeks to achieve its investment objective by investing primarily in a portfolio of municipal obligations, the interest on which, in the opinion of bond counsel to
the issuer, is exempt from federal income tax and New Jersey personal income taxes (“New Jersey Municipal Bonds”). The Fund invests substantially
all (at least 80%) of its assets in New Jersey Municipal Bonds, except at times when BlackRock Advisors, LLC (the “Manager”) considers that New
Jersey Municipal Bonds of sufficient quantity and quality are unavailable at suitable prices. To the extent that the Manager considers that suitable New Jersey
Municipal Bonds are not available for investment, the Fund may purchase municipal obligations exempt from federal income taxes but not New Jersey personal
income taxes (“Municipal Bonds”). The Fund may invest directly in securities or synthetically through the use of derivatives. The Fund will
maintain at least 80% of its assets in New Jersey Municipal Bonds, except during interim periods pending investment of the net proceeds of public offerings of
its securities and during temporary defensive periods. Under normal circumstances, at least 80% of the Fund’s assets will be invested in municipal obligations with
remaining maturities of one year or more. There can be no assurance that the Fund’s investment objective will be realized.
Ordinarily, the Fund does not intend to realize significant investment income subject to federal income tax and New Jersey personal
income taxes. The Fund may invest all or a portion of its assets in certain tax-exempt securities classified as “private activity bonds” (in
general, bonds that benefit non-governmental entities) that may subject certain investors in the Fund to a federal alternative minimum tax.
The Fund may also invest in securities not issued by or on behalf
of a state or territory or by an agency or instrumentality thereof, if the Fund nevertheless believes such securities pay interest or distributions that are
exempt from federal income taxation (“Non-Municipal Tax-Exempt Securities”). Non-Municipal Tax-Exempt Securities may include securities issued by
other investment companies that invest in New Jersey Municipal Bonds and Municipal Bonds, to the extent such investments are permitted by the Investment
Company Act of 1940, as amended (the “1940 Act”). Other Non-Municipal Tax-Exempt Securities could include trust certificates or other instruments evidencing interests in one or more long-term New Jersey Municipal Bonds or Municipal Bonds. Certain Non-Municipal Tax-Exempt Securities may be characterized as derivative instruments. For purposes of the Fund’s investment objective and policies, Non-Municipal Tax-Exempt Securities that pay interest that is exempt from federal income
taxes and New Jersey personal income taxes will be considered “New Jersey Municipal Bonds” and Non-Municipal Tax-Exempt Securities that pay
interest that is exempt from federal income taxes will be considered “Municipal Bonds.”
The Fund invests in investment grade New Jersey Municipal Bonds
and Municipal Bonds that are rated at the date of purchase in the four highest rating categories of Moody’s Investors Service, Inc.
(“Moody’s”) (currently Aaa, Aa, A and Baa), S&P Global Ratings (“S&P”) (currently AAA, AA, A and BBB) or Fitch Ratings, Inc. (“Fitch”) (currently AAA, AA, A and BBB) or, if unrated, are considered to be of comparable quality by the Manager. In the case of long-term debt, the investment grade rating categories are AAA
through BBB for S&P and Fitch and Aaa through Baa for Moody’s. In the case of short-term notes, the investment grade rating categories are SP-1+
through SP-2 for S&P, MIG 1 through MIG 3 for Moody’s and F-1+ through F-3 for Fitch. In the case of tax-exempt commercial paper, the investment
grade rating categories are A-1+ through A-3 for S&P, P-1 through P-3 for Moody’s and F-1+ through F-3 for Fitch. Obligations ranked in the lowest
investment grade rating category (BBB, SP-2 and A-3 for S&P; Baa, MIG 3 and P-3 for Moody’s; and BBB and F-3 for Fitch), while considered
“investment grade,” may have certain speculative characteristics. There may be sub-categories or gradations indicating relative standing within the
rating categories set forth above. In assessing the quality of New Jersey Municipal Bonds and Municipal Bonds with respect to the foregoing requirements, the
Manager takes into account the portfolio insurance as well as the nature of any letters of credit or similar credit enhancement to which particular New Jersey
Municipal Bonds and Municipal Bonds are entitled and the creditworthiness of the insurance company or financial institution that provided such insurance or credit enhancements. Insurance is expected to protect the Fund against losses caused by a bond issuer’s failure to make interest or principal payments. However, insurance
does not protect the Fund or its shareholders against losses caused by declines in a bond’s market value. Also, the Fund cannot be certain that any
insurance company does not make these payments. If a bond’s insurer fails to fulfill its obligations or loses its credit rating, the value of the bond could
drop.
The Fund may invest up to 20% of its
managed assets in securities that are rated below investment grade, which are securities rated Ba or below by Moody’s, BB or below by S&P or Fitch or
are considered by the Manager to be of comparable quality, at the time of purchase, subject to the Fund’s other investment policies. Below investment grade
quality is regarded as predominantly speculative with respect to the issuer’s capacity to pay interest and repay principal. Such securities commonly are
referred to as “high yield” or “junk” bonds.
The Fund may invest in variable rate demand obligations (“VRDOs”) and VRDOs in the form of participation interests
(“Participating VRDOs”) in variable rate tax-exempt obligations held by a financial institution, typically a commercial bank. The VRDOs in which
the Fund may invest are tax-exempt obligations, in the opinion of counsel to the issuer, that contain a floating or variable interest rate adjustment formula
and a right of demand on the part of the holder thereof to receive payment of the unpaid principal balance plus accrued interest on a short notice period not
to exceed seven days. There is, however, the possibility that because of default or insolvency the demand feature of VRDOs may not be honored. The interest
rates are adjustable at intervals (ranging from daily to up to one year) to some prevailing market rate for similar investments, such adjustment formula being
calculated to maintain the market value of the VRDOs, at approximately the par value of the VRDOs on the adjustment date. The adjustments typically are based
upon SIFMA or some other appropriate interest rate adjustment index. VRDOs that contain an unconditional right of demand to receive payment of the unpaid
principal balance plus accrued interest on a notice period exceeding seven days may be deemed to be illiquid securities. Participating VRDOs provide the Fund with a
Investment Objectives, Policies and Risks
99
Investment Objectives, Policies and Risks (continued)
specified undivided interest (up to 100%) in the underlying obligation and the right to demand
payment of the unpaid principal balance plus accrued interest on the Participating VRDOs from the financial institution on a specified number of days’ notice, not to
exceed seven days.
The average maturity of the
Fund’s portfolio securities varies based upon the Manager’s assessment of economic and market conditions. The net asset value of the shares of
common stock of a closed-end investment company such as the Fund, which invests primarily in fixed-income securities, changes as the general levels of interest
rates fluctuate. When interest rates decline, the value of a fixed income portfolio can be expected to rise. Conversely, when interest rates rise, the value of
a fixed income portfolio can be expected to decline. Prices of longer-term securities generally fluctuate more in response to interest rate changes than do
short-term or medium-term securities. These changes in net asset value are likely to be greater in the case of a fund having a leveraged capital structure, such as that used
by the Fund.
The Fund invests primarily in
long-term New Jersey Municipal Bonds and Municipal Bonds with a maturity of more than ten years. However, the Fund may also invest in intermediate-term New
Jersey Municipal Bonds and Municipal Bonds with a maturity of between three years and ten years. The Fund may also invest in short-term tax-exempt securities,
short-term U.S. Government securities, repurchase agreements or cash. Investments in such short-term securities or cash will not exceed 20% of the Fund’s total assets, except during interim periods pending investment of the net proceeds from public offerings of the Fund’s securities or in anticipation of the repurchase or
redemption of the Fund’s securities and temporary periods when, in the opinion of the Manager, prevailing market or economic conditions warrant. The Fund
does not ordinarily intend to realize significant interest income that is subject to federal income tax and New Jersey personal income taxes.
Leverage: The Fund may utilize leverage to seek to enhance the yield and net asset value of its common shares. However, this objective cannot be achieved in all interest rate environments. The Fund currently leverages its assets through the use of variable rate demand preferred shares (“VRDP Shares”) and residual interest municipal
tender option bonds (“TOB Residuals”), which are derivative interests in municipal bonds. The TOB Residuals in which the Fund will invest pay
interest or income that, in the opinion of counsel to the issuer of such TOB Residuals, is exempt from regular U.S. federal income tax.
The Fund may enter into reverse repurchase agreements with respect to its portfolio
investments subject to the Fund’s investment restrictions.
The Fund may enter into derivative securities transactions that have leverage embedded in them.
The Fund is authorized to borrow money in amounts of up to 5% of
the value of its total assets at the time of such borrowings; provided, however, that the Fund is authorized to borrow moneys in amounts of up to 33 1/3% of
the value of its total assets at the time of such borrowings to finance the repurchase of its own common shares pursuant to tender offers or otherwise to redeem or repurchase
preferred shares.
BlackRock MuniHoldings New
York Quality Fund, Inc. (MHN)
The
Fund’s investment objective is to provide shareholders with current income exempt from federal income tax and New York State and New York City personal income taxes. The Fund’s investment objective is a fundamental policy that may not be changed without a vote of a majority of the Fund’s outstanding voting securities. The
Fund seeks to achieve its investment objective by investing at least 80% of its assets in municipal obligations, the interest on which, in the opinion of bond
counsel to the issuer, is exempt from federal income tax and New York State and New York City personal income taxes (“New York Municipal Bonds”),
except at times when BlackRock Advisors, LLC (the “Manager”) considers that New York Municipal Bonds of sufficient quantity and quality are
unavailable at suitable prices. To the extent that the Manager considers that suitable New York Municipal Bonds are not available for investment, the Fund may
purchase municipal obligations exempt from federal income taxes but not New York personal income taxes (“Municipal Bonds”). At all times, at least
65% of the Fund’s total assets will be invested in New York Municipal Bonds and at least 80% of each Fund’s total assets will be invested in New
York Municipal Bonds and Municipal Bonds, except during interim periods pending investment of the net proceeds of public offerings of its securities and during
temporary defensive periods. The Fund may invest directly in securities or synthetically through the use of derivatives. Under normal circumstances, at least 80% of the Fund’s assets will be invested in municipal obligations with remaining maturities of one year or more. There can be no assurance that the Fund’s investment
objective will be realized.
The Fund may invest in certain tax-exempt securities classified as “private activity bonds” (or industrial development bonds, under pre-1986 law)
(“PABs”) (in general, bonds that benefit non-governmental entities) that may subject certain investors in the Fund to an alternative minimum tax.
The percentage of the Fund’s total assets invested in PABs will vary from time to time.
The investment grade Municipal Bonds in which the Fund will
primarily invest are those Municipal Bonds that are rated at the date of purchase in the four highest rating categories of S&P Global Ratings
(“S&P”), Moody’s Investors Service, Inc. (“Moody’s”), or Fitch Ratings, Inc. (“Fitch”) or, if unrated, are considered to be of comparable quality by the Manager. In the case of long-term debt, the investment grade rating categories are AAA through BBB for S&P and Fitch and Aaa through Baa for Moody’s. In
the case of short-term notes, the investment grade rating categories are SP-1 + through SP-2 for S&P, MIG-1 through MIG-3 for Moody’s and F-1 +
through F-3 for Fitch. In the case of tax-exempt commercial paper, the investment grade rating categories are A-1+ through A-3 for S&P, Prime-1 through
Prime-3 for Moody’s and F-1+ through F-3 for Fitch. Obligations ranked in the lowest investment grade rating category (BBB, SP-2 and A-3 for S&P;
Baa, MIG-3 and Prime-3 for Moody’s; and BBB and F-3 for Fitch), while considered “investment grade,” may have certain speculative
characteristics. There may be sub-categories or gradations indicating relative standing within the rating categories set forth above. In assessing the quality
of New York Municipal Bonds and Municipal Bonds with respect to the foregoing requirements, the Manager takes into account the nature of any letters of credit
or similar credit enhancement to which particular New York Municipal Bonds and Municipal Bonds are entitled and the creditworthiness of the financial
institution that provided such credit enhancement. All percentage and ratings limitations on securities in which the Fund may invest apply at the time of
making an investment and shall not be considered violated if an investment rating is subsequently downgraded to a rating that would have precluded the Fund’s initial investment in such security. In the event that the Fund disposes of a portfolio security subsequent to its being downgraded, the Fund may experience a greater risk of loss
than if such security had been sold prior to such downgrade.
The Fund may invest up to 20% of its managed assets in securities that are rated below investment grade, or are considered by the Manager
to be of comparable quality, at the time of purchase, subject to the Fund’s other investment policies. Bonds of below investment grade quality are
regarded as having predominantly speculative characteristics with respect to the issuer’s capacity to pay interest and repay principal. Such securities are sometimes
referred to as “high yield” or “junk” bonds.
100 2024 BlackRock
Annual Report to Shareholders
Investment Objectives, Policies and Risks (continued)
The
Fund intends to invest primarily in long-term Municipal Bonds with maturities of more than ten years. However, the Fund also may invest in intermediate term Municipal Bonds with maturities of between three years and ten years. The Fund also may invest from time to time in short-term Municipal Bonds with maturities of less than three
years. The average maturity of the Fund’s portfolio securities will vary based upon the Manager’s assessment of economic and market conditions.
The Fund may invest in short-term, tax-exempt securities,
short-term U.S. Government securities, repurchase agreements or cash. Such short-term securities or cash will not exceed 20% of its total assets except during
interim periods pending investment of the net proceeds of public offerings of the Fund’s securities or in anticipation of the repurchase or redemption of
the Fund’s securities and temporary periods when, in the opinion of the Manager, prevailing market or financial conditions warrant. The Fund also may
invest in variable rate demand obligations (“VRDOs”) and VRDOs in the form of participation interests (“Participating VRDOs”) in variable rate tax-exempt obligations held by a financial institution. The Fund’s hedging strategies are not fundamental policies and may be modified by the Board of Directors of the Fund without the approval
of the Fund’s stockholders. The Fund is also authorized to invest in indexed and inverse floating rate obligations for hedging purposes and to seek to enhance
return.
The Fund may invest in securities not
issued by or on behalf of a state or territory or by an agency or instrumentality thereof, if the Fund nevertheless believes such securities pay interest that
is excludable from gross income for federal income tax purposes and, if applicable, exempt from New York State and New York City personal income taxes
(“Non-Municipal Tax-Exempt Securities”). Non-Municipal Tax-Exempt Securities could include trust certificates, partnership interests or other
instruments evidencing interest in one or more long-term Municipal Bonds. Non-Municipal Tax-Exempt Securities also may include securities issued by other
investment companies that invest in New York Municipal Bonds and Municipal Bonds, to the extent such investments are permitted by the Fund’s investment
restrictions and applicable law, including the Investment Company Act of 1940, as amended (the “1940 Act”). Non-Municipal TaxExempt
Securities are subject to the same risks associated with an investment in Municipal Bonds as well as many of the risks associated with investments in
derivatives. For purposes of the Fund’s investment objective and policies, Non-Municipal Tax-Exempt Securities that pay interest that is exempt from
federal income taxes and New York personal income taxes will be considered “New York Municipal Bonds” and Non-Municipal Tax-Exempt Securities that pay interest
that is exempt from federal income taxes will be considered “Municipal Bonds.”
The Fund ordinarily does not intend to realize significant investment income not exempt from federal income tax and New York personal income tax. From time to time, the
Fund may realize taxable capital gains.
Federal tax legislation has limited the types and volume of bonds the interest on which qualifies for a federal income tax-exemption. As a result, this legislation and
legislation that may be enacted in the future may affect the availability of Municipal Bonds for investment by the Fund.
Leverage: The Fund may utilize leverage to seek to enhance the yield and net asset value of its common shares. However, this objective cannot be achieved in all interest rate environments. The Fund currently leverages its assets through the use of variable rate demand preferred shares (“VRDP Shares”) and residual interest municipal
tender option bonds (“TOB Residuals”), which are derivative interests in municipal bonds. The TOB Residuals in which the Fund will invest pay
interest or income that, in the opinion of counsel to the issuer of such TOB Residuals, is exempt from regular U.S. federal income tax.
The Fund may enter into reverse repurchase agreements with respect to its portfolio
investments subject to its investment restrictions.
The Fund
may enter into derivative securities transactions that have leverage embedded in them.
The Fund is authorized to borrow money in amounts of up to 5% of the value of its total assets at the time of such borrowings; provided, however, that the Fund is
authorized to borrow moneys in amounts of up to 33 1/3% of the value of its total assets at the time of such borrowings to finance the repurchase of its own
common shares pursuant to tender offers or otherwise to redeem or repurchase preferred shares.
BlackRock MuniYield Michigan Quality Fund (MIY)
The Fund’s investment objective is to provide
shareholders with as high a level of current income exempt from federal and Michigan income taxes as is consistent with its investment policies and prudent
investment management. The Fund seeks to achieve its investment objective by investing at least 80% of an aggregate of the Fund’s net assets (including
proceeds from the issuance of any preferred stock) and the proceeds of any borrowings for investment purposes, in a portfolio of municipal obligations issued
by or on behalf of the State of Michigan, its political subdivisions, agencies and instrumentalities and by other qualifying issuers, each of which pays
interest that, in the opinion of bond counsel to the issuer, is excludable from gross income for federal income tax purposes (except that the interest may be
includable in taxable income for purposes of the federal alternative minimum tax) and exempt from Michigan income taxes (“Michigan Municipal
Bonds”). The Fund also may invest in municipal obligations issued by or on behalf of states, territories and possessions of the United States and their
political subdivisions, agencies or instrumentalities, each of which pays interest that is excludable from gross income for federal income tax purposes, in the
opinion of bond counsel to the issuer, but is not excludable from gross income for Michigan income tax purposes (“Municipal Bonds”). Unless
otherwise noted, the term “Municipal Bonds” also includes Michigan Municipal Bonds. The Fund may invest directly in securities or synthetically
through the use of derivatives. In general, the Fund does not intend for its investments to earn a large amount of interest income that is (i) includable in
gross income for federal income tax purposes or (ii) not exempt from Michigan income taxes. From time to time, the Fund may realize taxable capital gains. The
Fund’s investment objective and its policy of investing at least 80% of an aggregate of the Fund’s net assets (including proceeds from the issuance
of any preferred stock) and the proceeds of any borrowings for investment purposes, in Municipal Bonds are fundamental policies that may not be changed without
the approval of a majority of the outstanding voting securities of the Fund (as defined in the Investment Company Act of 1940, as amended (the “1940 Act”)). There
can be no assurance that the Fund’s investment objective will be realized.
The Fund may invest in certain tax-exempt securities classified as “private activity bonds” (or industrial development bonds, under pre-1986 law)
(“PABs”) (in general, bonds that benefit non-governmental entities) that may subject certain investors in the Fund to an alternative minimum tax.
The percentage of the Fund’s total assets invested in PABs will vary from time to time.
Under normal market conditions, the Fund expects to invest
primarily in a portfolio of long-term Municipal Bonds that are commonly referred to as “investment grade” securities, which are obligations rated
at the time of purchase within the four highest-quality ratings as determined by either Moody’s Investors Service, Inc. (“Moody’s”) (currently Aaa, Aa, A and Baa), S&P Global Ratings (“S&P”) (currently AAA, AA, A and BBB) or Fitch Ratings, Inc. (“Fitch”) (currently AAA, AA, A and BBB) or are
considered by BlackRock Advisors, LLC (the “Manager”) to be of comparable quality. In the case of short-term notes, the investment grade rating
categories are SP-1+ through SP-2 for S&P, MIG
Investment Objectives, Policies and
Risks
101
Investment Objectives, Policies and Risks (continued)
1
through MIG 3 for Moody’s and F1+ through F3 for Fitch. In the case of tax-exempt commercial paper, the investment grade rating categories are A-1+ through A-3 for S&P, Prime-1 through Prime-3 for Moody’s and F1+ through F3 for Fitch. Obligations ranked in the lowest investment grade rating category (BBB, SP-2 and A-3 for S&P;
Baa, MIG 3 and Prime-3 for Moody’s; and BBB and F3 for Fitch), while considered “investment grade,” may have certain speculative
characteristics. There may be sub-categories or gradations indicating relative standing within the rating categories set forth above. In assessing the quality
of Municipal Bonds with respect to the foregoing requirements, the Manager takes into account the nature of any letters of credit or similar credit enhancement
to which particular Municipal Bonds are entitled and the creditworthiness of the financial institution that provided such credit enhancement. Insurance is
expected to protect the Fund against losses caused by a bond issuer’s failure to make interest or principal payments. However, insurance does not protect
the Fund or its shareholders against losses caused by declines in a bond’s market value. If a bond’s insurer fails to fulfill its obligations or
loses its credit rating, the value of the bond could drop. If unrated, such securities will possess creditworthiness comparable, in the opinion of the Manager, to other
obligations in which the Fund may invest.
The Fund
may invest up to 20% of its managed assets in securities that are rated below investment grade, which are securities rated Ba or below by Moody’s, BB or below by S&P or Fitch or are considered by the Manager to be of comparable quality, at the time of purchase, subject to the Fund’s other investment policies. Below
investment grade quality is regarded as predominantly speculative with respect to the issuer’s capacity to pay interest and repay principal. Such
securities commonly are referred to as “high yield” or “junk” bonds.
All percentage and ratings limitations on securities in which the
Fund may invest apply at the time of making an investment and shall not be considered violated as a result of subsequent market movements or if an investment
rating is subsequently downgraded to a rating that would have precluded the Fund’s initial investment in such security. In the event that the Fund
disposes of a portfolio security subsequent to its being downgraded, the Fund may experience a greater risk of loss than if such security had been sold prior to such
downgrade.
The average maturity of the
Fund’s portfolio securities varies from time to time based upon an assessment of economic and market conditions by the Manager. The Fund’s portfolio at any given
time may include both long-term and intermediate-term municipal bonds.
The net asset value of the shares of common stock of a closed-end investment company, such as the Fund, which invests primarily in fixed income securities, changes as the
general levels of interest rates fluctuate. When interest rates decline, the value of a fixed income portfolio can be expected to rise. Conversely, when
interest rates rise, the value of a fixed income portfolio can be expected to decline. Prices of longer term securities generally fluctuate more in response to
interest rate changes than do shorter term securities. These changes in net asset value are likely to be greater in the case of a fund having a leveraged capital structure,
such as the Fund.
For temporary periods or to
provide liquidity, the Fund has the authority to invest as much as 20% of its total assets in tax-exempt and taxable money market obligations with a maturity
of one year or less (such short-term obligations being referred to herein as “Temporary Investments”). In addition, the Fund reserves the right as a defensive measure to invest temporarily a greater portion of its assets in Temporary Investments, when, in the opinion of the Manager, prevailing market or financial conditions
warrant. Taxable money market obligations will yield taxable income. The Fund also may invest in variable rate demand obligations (“VRDOs”) and
VRDOs in the form of participation interests (“Participating VRDOs”) in variable rate tax-exempt obligations held by a financial institution. The
Fund’s hedging strategies are not fundamental policies and may be modified by the Board of Directors of the Fund without the approval of the Fund’s
stockholders. The Fund is also authorized to invest in indexed and inverse floating rate obligations for hedging purposes and to seek to enhance return.
The Fund may invest in securities not issued by or on behalf of a
state or territory or by an agency or instrumentality thereof, if the Fund receives an opinion of counsel to the issuer that such securities pay interest that
is excludable from gross income for federal income tax purposes and, if applicable, exempt from Michigan income taxes (“Non-Municipal Tax-Exempt
Securities”). Non-Municipal Tax-Exempt Securities could include trust certificates, partnership interests or other instruments evidencing interest in one
or more long-term Municipal Bonds. Non-Municipal Tax-Exempt Securities also may include securities issued by other investment companies that invest in
Municipal Bonds, to the extent such investments are permitted by the Fund’s investment restrictions and applicable law. Non-Municipal Tax-Exempt
Securities are subject to the same risks associated with an investment in Municipal Bonds as well as many of the risks associated with investments in
derivatives. If the Internal Revenue Service were to issue any adverse ruling or take an adverse position with respect to the taxation on these types of
securities, there is a risk that the interest paid on such securities would be deemed taxable at the federal level.
The Fund ordinarily does not intend to realize significant investment income not
exempt from federal income tax. From time to time, the Fund may realize taxable capital gains.
Federal tax legislation may limit the types and volume of bonds the interest on which qualifies for a federal income tax-exemption. As a result, current legislation and
legislation that may be enacted in the future may affect the availability of Municipal Bonds for investment by the Fund.
Leverage: The Fund may utilize leverage to seek to enhance the yield and net asset value of its common shares. However, this objective cannot be achieved in all interest rate environments. The Fund currently leverages its assets through the use of variable rate demand preferred shares (“VRDP Shares”) and residual interest municipal
tender option bonds (“TOB Residuals”), which are derivative interests in municipal bonds. The TOB Residuals in which the Fund will invest pay
interest or income that, in the opinion of counsel to the issuer of such TOB Residuals, is exempt from regular U.S. federal income tax.
The Fund may enter into reverse repurchase agreements with respect to its portfolio investments subject to the Fund’s investment restrictions. The Fund may enter into
“dollar roll” transactions.
The Fund may leverage its portfolio by entering into one or more credit facilities.
The Fund may enter into derivative securities transactions that have leverage embedded in them.
The Fund may also borrow money as a temporary measure for
extraordinary or emergency purposes, including the payment of dividends and the settlement of securities transactions which otherwise might require untimely
dispositions of Fund securities. Certain short-term borrowings (such as for cash management purposes) are not subject to the 1940 Act’s limitations on leverage if (i)
repaid within 60 days, and (ii) not in excess of 5% of the Fund’s total assets.
102 2024 BlackRock
Annual Report to Shareholders
Investment Objectives, Policies and Risks (continued)
BlackRock MuniYield New York Quality Fund, Inc. (MYN)
The Fund’s investment objective is to provide stockholders
with as high a level of current income exempt from federal income taxes and New York State and New York City personal income taxes as is consistent with its
investment policies and prudent investment management. The Fund seeks to achieve its investment objective by investing, as a fundamental policy, at least 80%
of an aggregate of the Fund’s net assets (including proceeds from the issuance of any preferred stock) and the proceeds of any borrowings for investment
purposes, in a portfolio of municipal obligations issued by or on behalf of the State of New York, its political subdivisions, agencies and instrumentalities and by other qualifying instrumentalities, each of which pays interest that, in the opinion of bond counsel to the issuer, is excludable from gross income for federal income tax
purposes (except that the interest may be includable in taxable income for purposes of the federal alternative minimum tax) and exempt from New York State and
New York City personal income taxes (“New York Municipal Bonds”). The Fund also may invest in municipal obligations issued by or on behalf of
states, territories and possessions of the United States and their political subdivisions, agencies or instrumentalities, which pay interest that is excludable
from gross income for federal income tax purposes, in the opinion of bond counsel to the issuer, but is not exempt from New York State and New York City
personal income taxes (“Municipal Bonds”). Unless otherwise noted, the term “Municipal Bonds” also includes New York Municipal Bonds.
The Fund may invest directly in securities or synthetically through the use of derivatives. In general, the Fund does not intend for its investments to earn a
large amount of interest income that is (i) includable in gross income for federal income tax purposes or (ii) not exempt from New York State and New York City
personal income taxes. The Fund’s investment objective and its policy of investing at least 80% of an aggregate of the Fund’s net assets (including proceeds from the issuance of any preferred stock) and the proceeds of any borrowings for investment purposes, in New York Municipal Bonds are fundamental policies that may not be
changed without the approval of a majority of the outstanding voting securities of the Fund (as defined in the Investment Company Act of 1940, as amended (the
“1940 Act”)). There can be no assurance that the Fund’s investment objective will be realized.
The Fund may invest in certain tax-exempt securities classified
as “private activity bonds” (or industrial development bonds, under pre-1986 law) (“PABs”) (in general, bonds that benefit
non-governmental entities) that may subject certain investors in the Fund to an alternative minimum tax. The percentage of the Fund’s total assets invested in PABs will
vary from time to time.
Under normal market
conditions, the Fund expects to invest primarily in a portfolio of long-term Municipal Bonds that are commonly referred to as “investment grade” securities, which are obligations rated at the time of purchase within the four highest-quality ratings as determined by either Moody’s Investors Service, Inc.
(“Moody’s”) (currently Aaa, Aa, A and Baa), S&P Global Ratings (“S&P”) (currently AAA, AA, A and BBB) or Fitch Ratings,
Inc. (“Fitch”) (currently AAA, AA, A and BBB) or are considered by BlackRock Advisors, LLC (the “Manager”) to be of comparable quality.
In the case of short-term notes, the investment grade rating categories are SP-1+ through SP-2 for S&P, MIG 1 through MIG 3 for Moody’s and F1+
through F3 for Fitch. In the case of tax-exempt commercial paper, the investment grade rating categories are A-1+ through A-3 for S&P, Prime-1 through
Prime-3 for Moody’s and F1+ through F3 for Fitch. Obligations ranked in the lowest investment grade rating category (BBB, SP-2 and A-3 for S&P; Baa, MIG 3 and Prime-3 for Moody’s; and BBB and F3 for Fitch), while considered “investment grade,” may have certain speculative characteristics. There may be
sub-categories or gradations indicating relative standing within the rating categories set forth above. In assessing the quality of Municipal Bonds with
respect to the foregoing requirements, the Manager takes into account the nature of any letters of credit or similar credit enhancement to which particular
Municipal Bonds are entitled and the creditworthiness of the financial institution that provided such credit enhancement. Insurance is expected to protect the
Fund against losses caused by a bond issuer’s failure to make interest or principal payments. However, insurance does not protect the Fund or its
stockholders against losses caused by declines in a bond’s market value. If a bond’s insurer fails to fulfill its obligations or loses its credit
rating, the value of the bond could drop. If unrated, such securities will possess creditworthiness comparable, in the opinion of the Manager, to other obligations in which
the Fund may invest.
The Fund may invest up
to 20% of its managed assets in securities that are rated below investment grade, which are securities rated at the time of purchase Ba or below by
Moody’s, BB or below by S&P or Fitch, or securities determined by the Manager to be of comparable quality. Below investment grade quality is regarded
as predominantly speculative with respect to the issuer’s capacity to pay interest and repay principal. Such securities commonly are referred to as “high
yield” or “junk” bonds.
All
percentage and ratings limitations on securities in which the Fund may invest apply at the time of making an investment and shall not be considered violated as a result of subsequent market movements or if an investment rating is subsequently downgraded to a rating that would have precluded the Fund’s initial investment in such
security. In the event that the Fund disposes of a portfolio security subsequent to its being downgraded, the Fund may experience a greater risk of loss than
if such security had been sold prior to such downgrade.
The average maturity of the Fund’s portfolio securities varies from time to time based upon an assessment of economic and market
conditions by the Manager. The Fund’s portfolio at any given time may include both long-term and intermediate-term municipal bonds.
The net asset value of the shares of common stock of a closed-end
investment company, such as the Fund, which invests primarily in fixed income securities, changes as the general levels of interest rates fluctuate. When
interest rates decline, the value of a fixed income portfolio can be expected to rise. Conversely, when interest rates rise, the value of a fixed income
portfolio can be expected to decline. Prices of longer term securities generally fluctuate more in response to interest rate changes than do shorter term securities. These
changes in net asset value are likely to be greater in the case of a fund having a leveraged capital structure, such as the Fund.
For temporary periods or to provide liquidity, the Fund has the authority to invest as much as 20% of its total assets in tax-exempt and
taxable money market obligations with a maturity of one year or less (such short-term obligations being referred to herein as “Temporary
Investments”). In addition, the Fund reserves the right as a defensive measure to invest temporarily a greater portion of its assets in Temporary
Investments, when, in the opinion of the Manager, prevailing market or financial conditions warrant. Taxable money market obligations will yield taxable
income. The Fund also may invest in variable rate demand obligations (“VRDOs”) and VRDOs in the form of participation interests
(“Participating VRDOs”) in variable rate tax-exempt obligations held by a financial institution. The Fund’s hedging strategies are not fundamental policies and may be modified by the Board of Directors of the Fund without the approval of the Fund’s stockholders. The Fund is also authorized to invest in indexed and inverse floating
rate obligations for hedging purposes and to seek to enhance return.
The Fund may invest in securities not issued by or on behalf of a state or territory or by an agency or instrumentality thereof, if the
Fund receives an opinion of counsel to the issuer that such securities pay interest that is excludable from gross income for federal income tax purposes and,
if applicable, exempt from New York State and New York City personal income taxes (“Non-Municipal Tax-Exempt Securities”). Non-Municipal Tax-Exempt
Securities could include trust certificates, partnership interests or other
Investment Objectives, Policies and
Risks
103
Investment Objectives, Policies and Risks (continued)
instruments evidencing interest in one or more long-term Municipal Bonds. Non-Municipal
Tax-Exempt Securities also may include securities issued by other investment companies that invest in Municipal Bonds, to the extent such investments are
permitted by the Fund’s investment restrictions and applicable law. Non-Municipal Tax-Exempt Securities are subject to the same risks associated with an
investment in Municipal Bonds as well as many of the risks associated with investments in derivatives. If the Internal Revenue Service were to issue any
adverse ruling or take an adverse position with respect to the taxation on these types of securities, there is a risk that the interest paid on such securities would be
deemed taxable at the federal level.
The Fund ordinarily does not
intend to realize significant investment income not exempt from federal income tax. From time to time, the Fund may realize taxable capital gains.
Federal tax legislation may limit the types and volume of bonds the interest on which qualifies for a federal income tax-exemption. As a
result, current legislation and legislation that may be enacted in the future may affect the availability of Municipal Bonds for investment by the Fund.
Leverage: The Fund may utilize leverage to seek to enhance the yield and net asset value of its common shares. However, this objective cannot be achieved in all interest rate environments. The Fund currently leverages its assets through the use of variable rate demand preferred shares (“VRDP Shares”) and residual interest municipal
tender option bonds (“TOB Residuals”), which are derivative interests in municipal bonds. The TOB Residuals in which the Fund will invest pay
interest or income that, in the opinion of counsel to the issuer of such TOB Residuals, is exempt from regular U.S. federal income tax.
The Fund may enter into reverse repurchase agreements with
respect to its portfolio investments subject to the Fund’s investment restrictions. The Fund may enter into “dollar roll” transactions.
The Fund may enter into derivative securities transactions that have leverage
embedded in them.
The Fund may leverage its portfolio by
entering into one or more credit facilities.
The Fund may also borrow money as a temporary measure for extraordinary or emergency purposes, including the payment of dividends and the
settlement of securities transactions which otherwise might require untimely dispositions of Fund securities. Certain short-term borrowings (such as for cash
management purposes) are not subject to the 1940 Act’s limitations on leverage if (i) repaid within 60 days, and (ii) not in excess of 5% of the Fund’s total
assets.
BlackRock MuniYield Pennsylvania
Quality Fund (MPA)
The Fund’s
investment objective is to provide shareholders with as high a level of current income exempt from U.S. federal and Pennsylvania income taxes as is consistent
with its investment policies and prudent investment management. The Fund seeks to achieve its investment objective by investing, as a fundamental policy, at
least 80% of an aggregate of the Fund’s net assets (including proceeds from the issuance of any preferred shares) and the proceeds of any borrowings for
investment purposes, in a portfolio of municipal obligations issued by or on behalf of the State of Pennsylvania, its political subdivisions, agencies and
instrumentalities and by other qualifying issuers, each of which pays interest that, in the opinion of bond counsel to the issuer, is excludable from gross
income for federal income tax purposes (except that the interest may be includable in taxable income for purposes of the federal alternative minimum tax) and
exempt from Pennsylvania income taxes (“Pennsylvania Municipal Bonds”). The Fund also may invest in municipal obligations issued by or on behalf of
states, territories and possessions of the United States and their political subdivisions, agencies or instrumentalities, each of which pays interest that is
excludable from gross income for federal income tax purposes, in the opinion of bond counsel to the issuer, but is not excludable from gross income for
Pennsylvania income tax purposes (“Municipal Bonds”). Unless otherwise noted, the term “Municipal Bonds” also includes Pennsylvania
Municipal Bonds. The Fund may invest directly in securities or synthetically through the use of derivatives. In general, the Fund does not intend for its
investments to earn a large amount of interest income that is (i) includable in gross income for federal income tax purposes or (ii) not exempt from
Pennsylvania income taxes. From time to time, the Fund may realize taxable capital gains.
The Fund’s investment objective and its policy of investing
at least 80% of an aggregate of the Fund’s net assets (including proceeds from the issuance of any preferred shares) and the proceeds of any borrowings
for investment purposes, in Pennsylvania Municipal Bonds are fundamental policies that may not be changed without the approval of a majority of the outstanding
voting securities of the Fund (as defined in the Investment Company Act of 1940, as amended (the “1940 Act”)). There can be no assurance that the Fund’s
investment objective will be realized.
The
Fund may invest in certain tax-exempt securities classified as “private activity bonds” (or industrial development bonds, under pre-1986 law) (“PABs”) (in general, bonds that benefit non-governmental entities) that may subject certain investors in the Fund to an alternative minimum tax. The percentage of the Fund’s total assets
invested in PABs will vary from time to time.
Under normal market conditions, the Fund expects to invest primarily in a portfolio of long-term Municipal Bonds that are commonly referred to as “investment
grade” securities, which are obligations rated at the time of purchase within the four highest-quality ratings as determined by either Moody’s
Investors Service, Inc. (“Moody’s”) (currently Aaa, Aa, A and Baa), S&P currently AAA, AA, A and BBB) or Fitch Ratings
(“Fitch”) (currently AAA, AA, A and BBB). In the case of short-term notes, the investment grade rating categories are SP-1+ through SP-2 for
S&P, MIG 1 through MIG 3 for Moody’s and F1+ through F3 for Fitch. In the case of tax-exempt commercial paper, the investment grade rating categories
are A-1+ through A-3 for S&P, Prime-1 through Prime-3 for Moody’s and F1+ through F3 for Fitch. Obligations ranked in the lowest investment grade rating category (BBB, SP-2 and A-3 for S&P; Baa, MIG 3 and Prime-3 for Moody’s; and BBB and F3 for Fitch), while considered “investment grade,” may have
certain speculative characteristics. There may be sub-categories or gradations indicating relative standing within the rating categories set forth above. In
assessing the quality of Municipal Bonds with respect to the foregoing requirements, BlackRock Advisors, LLC (the “Manager”) takes into account the
nature of any letters of credit or similar credit enhancement to which particular Municipal Bonds are entitled and the creditworthiness of the financial
institution that provided such credit enhancement. If unrated, such securities will possess creditworthiness comparable, in the opinion of the Manager, to
other obligations in which the Fund may invest. Insurance is expected to protect the Fund against losses caused by a bond issuer’s failure to make
interest or principal payments. However, insurance does not protect the Fund or its shareholders against losses caused by declines in a bond’s market
value. If a bond’s insurer fails to fulfill its obligations or loses its credit rating, the value of the bond could drop. If unrated, such securities will possess
creditworthiness comparable, in the opinion of the Manager, to other obligations in which the Fund may invest.
104 2024 BlackRock
Annual Report to Shareholders
Investment Objectives, Policies and Risks (continued)
The
Fund may invest up to 20% of its managed assets in securities that are rated below investment grade, which are securities rated Ba or below by Moody’s, BB or below by S&P or Fitch or are considered by the Manager to be of comparable quality, at the time of purchase, subject to the Fund’s other investment policies. Below
investment grade quality is regarded as predominantly speculative with respect to the issuer’s capacity to pay interest and repay principal. Such
securities commonly are referred to as “high yield” or “junk” bonds.
All percentage and ratings limitations on securities in which the
Fund may invest apply at the time of making an investment and shall not be considered violated as a result of subsequent market movements or if an investment
rating is subsequently downgraded to a rating that would have precluded the Fund’s initial investment in such security. In the event that the Fund
disposes of a portfolio security subsequent to its being downgraded, the Fund may experience a greater risk of loss than if such security had been sold prior to such
downgrade.
The average maturity of the
Fund’s portfolio securities varies from time to time based upon an assessment of economic and market conditions by the Manager. The Fund’s portfolio at any given
time may include long-term, intermediate-term and short-term Municipal Bonds.
The net asset value of the shares of common stock of a closed-end investment company, such as the Fund, which invests primarily in fixed income securities, changes as the
general levels of interest rates fluctuate. When interest rates decline, the value of a fixed income portfolio can be expected to rise. Conversely, when
interest rates rise, the value of a fixed income portfolio can be expected to decline. Prices of longer term securities generally fluctuate more in. response
to interest rate changes than do shorter term securities. These changes in net asset value are likely to be greater in the case of a fund having a leveraged capital
structure, such as the Fund.
For temporary
periods or to provide liquidity, the Fund has the authority to invest as much as 20% of its total assets in tax-exempt and taxable money market obligations with
a maturity of one year or less (such short-term obligations being referred to herein as “Temporary Investments”). In addition, the Fund reserves
the right as a defensive measure to invest temporarily a greater portion of its assets in Temporary Investments, when, in the opinion of the Manager,
prevailing market or financial conditions warrant. Taxable money market obligations will yield taxable income. The Fund also may invest in variable rate demand
obligations (“VRDOs”) and VRDOs in the form of participation interests (“Participating VRDOs”) in variable rate tax-exempt obligations
held by a financial institution. The Fund’s hedging strategies are not fundamental policies and may be modified by the Board of Trustees of the Fund
without the approval of the Fund’s shareholders. The Fund is also authorized to invest in indexed and inverse floating rate obligations for hedging purposes and to seek
to enhance return.
The Fund may invest in
securities not issued by or on behalf of a state or territory or by an agency or instrumentality thereof, if the Fund receives an opinion of counsel to the
issuer that such securities pay interest that is excludable from gross income for federal income tax purposes and, if applicable, exempt from Pennsylvania
income taxes (“Non-Municipal Tax-Exempt Securities”). Non-Municipal Tax-Exempt Securities could include trust certificates, partnership interests
or other instruments evidencing interest in one or more long-term Municipal Bonds. Non-Municipal Tax-Exempt Securities also may include securities issued by
other investment companies that invest in Municipal Bonds, to the extent such investments are permitted by the Fund’s investment restrictions and
applicable law. Non-Municipal Tax-Exempt Securities are subject to the same risks associated with an investment in Municipal Bonds as well as many of the risks
associated with investments in derivatives. If the Internal Revenue Service were to issue any adverse ruling or take an adverse position with respect to the
taxation on these types of securities, there is a risk that the interest paid on such securities would be deemed taxable at the federal level.
The Fund ordinarily does not intend to realize significant
investment income not exempt from federal and Pennsylvania income taxes. From time to time, the Fund may realize taxable capital gains.
Federal tax legislation may limit the types and volume of bonds
the interest on which qualifies for a federal income tax-exemption. As a result, current legislation and legislation that may be enacted in the future may affect the
availability of Municipal Bonds for investment by the Fund.
Leverage: The Fund may utilize leverage to seek to enhance the yield and net
asset value of its common shares. However, this objective cannot be achieved in all interest rate environments. The Fund currently leverages its assets through
the use of variable rate demand preferred shares (“VRDP Shares”) and residual interest municipal tender option bonds (“TOB Residuals”),
which are derivative interests in municipal bonds. The TOB Residuals in which the Fund will invest pay interest or income that, in the opinion of counsel to the issuer of
such TOB Residuals, is exempt from regular U.S. federal income tax.
The Fund may enter into reverse repurchase agreements with respect to its portfolio investments subject to the Fund’s investment restrictions.
The Fund may enter into derivative securities transactions that have leverage
embedded in them.
The Fund may also borrow
money as a temporary measure for extraordinary or emergency purposes, including the payment of dividends and the settlement of securities transactions which
otherwise might require untimely dispositions of Fund securities. Certain short-term borrowings (such as for cash management purposes) are not subject to the 1940 Act’s
limitations on leverage if (i) repaid within 60 days, and (ii) not in excess of 5% of the Fund’s total assets.
BlackRock New York Municipal Income Trust (BNY)
The Fund’s investment objective is to provide current income exempt from federal income taxes. The Fund’s investment policies provide that, as a matter of
fundamental policy, under normal market conditions, the Fund will invest at least 80% of its managed assets in investments the income from which is exempt from
federal income tax and New York State and New York City personal income taxes (except that interest may be subject to the alternative minimum tax). For the
purposes of the foregoing policy “managed assets” are the Fund’s net assets plus borrowings for investment purposes. The Fund may invest
directly in securities or synthetically through the use of derivatives. The Fund may not change its investment objective or the foregoing fundamental policy
without the approval of the holders of a majority of the Fund’s outstanding common shares and outstanding preferred shares voting together as a single
class, and of the holders of a majority of the outstanding preferred shares voting as a separate class. A majority of the outstanding means (1) 67% or more of
the shares present at a meeting, if the holders of more than 50% of the outstanding shares are present or represented by proxy, or (2) more than 50% of the outstanding
shares, whichever is less.
Investment Objectives, Policies and Risks
105
Investment Objectives, Policies and Risks (continued)
The
Fund’s investment policies provide that, under normal market conditions, the Fund will invest at least 80% of its total assets in investment grade quality municipal bonds. Investment grade quality means that such bonds are rated, at the time of investment, within the four highest rating categories of Moody’s Investors Service, Inc.
(“Moody’s”) (currently Aaa, Aa, A and Baa), S&P Global Ratings (“S&P”) (currently AAA, AA, A and BBB) or Fitch Ratings,
Inc. (“Fitch”) (currently AAA, AA, A and BBB) or are unrated but judged to be of comparable quality by BlackRock Advisors, LLC (the
“Manager”). Municipal bonds rated Baa by Moody’s are investment grade, but Moody’s considers municipal bonds rated Baa to have
speculative characteristics. Changes in economic conditions or other circumstances are more likely to lead to a weakened capacity for issuers of municipal
bonds that are rated BBB or Baa (or that have equivalent ratings) to make principal and interest payments than is the case for issuers of higher grade
municipal bonds. In the case of short term notes, the investment grade rating categories are SP-1+ through SP-2 for S&P, MIG-1 through MIG-3 for
Moody’s and F-1+ through F-3 for Fitch. In the case of tax exempt commercial paper, the investment grade rating categories are A-1+ through A-3 for
S&P, Prime-1 through Prime-3 for Moody’s and F-1+ through F-3 for Fitch. Obligations ranked in the lowest investment grade rating category (BBB, SP-2
and A-3 for S&P; Baa, MIG-3 and Prime-3 for Moody’s and BBB and F-3 for Fitch), while considered “investment grade,” may have certain
speculative characteristics. There may be sub-categories or gradations indicating relative standing within the rating categories set forth above. In assessing
the quality of municipal bonds with respect to the foregoing requirements, the Manager takes into account the nature of any letters of credit or similar credit
enhancement to which particular municipal bonds are entitled and the creditworthiness of the financial institution that provided such credit enhancement.
The Fund may invest up to 20% of its total assets in municipal
bonds that are rated, at the time of investment, Ba/BB or B by Moody’s, S&P or Fitch or that are unrated but judged to be of comparable quality by
the Manager. Such securities, sometimes referred to as “high yield” or “junk” bonds, are predominantly speculative with respect to the
capacity to pay interest and repay principal in accordance with the terms of the security and generally involve a greater volatility of price than securities
in higher rating categories.
The foregoing credit quality policies apply only at the time a security is purchased, and the Fund is not required to dispose of a security if a rating agency downgrades
its assessment of the credit characteristics of a particular issue. In determining whether to retain or sell a security that a rating agency has downgraded,
the Manager may consider such factors as the Manager’s assessment of the credit quality of the issuer of the security, the price at which the security
could be sold and the rating, if any, assigned to the security by other rating agencies. In the event that the Fund disposes of a portfolio security subsequent
to its being downgraded, the Fund may experience a greater risk of loss than if such security had been sold prior to such downgrade.
Subject to the Fund’s policy of investing, under normal
market conditions, at least 80% of its managed assets (as defined for this policy) in investments the income from which is exempt from federal income tax and
New York City and New York State personal income taxes, the Fund may invest in securities that pay interest that is not exempt from New York City and New York
State personal income taxes when, in the judgment of the Manager, the return to the shareholders after payment of applicable New York City and New York State
personal income taxes would be higher than the return available from comparable securities that pay interest that is, or make other distributions that are, exempt from New
York City and New York State personal income taxes.
The Fund may also invest in securities of other open- or closed-end investment companies that invest primarily in municipal bonds of the types in which the Fund may invest
directly and in tax-exempt preferred shares that pay dividends that are exempt from regular federal income tax. In addition, the Fund may purchase municipal
bonds that are additionally secured by insurance, bank credit agreements or escrow accounts. The credit quality of companies which provide these credit
enhancements will affect the value of those securities. Although the insurance feature reduces certain financial risks, the premiums for insurance and the
higher market price paid for insured obligations may reduce the Fund’s income. The insurance feature does not guarantee the market value of the insured obligations or
the net asset value of the common shares.
The
Fund may invest in certain tax exempt securities classified as “private activity bonds” (or industrial development bonds, under pre-1986 law) (in general, bonds that benefit non-governmental entities) that may subject certain investors in the Fund to an alternative minimum tax. The percentage of the Fund’s total assets invested in private
activity bonds will vary from time to time. The Fund has not established any limit on the percentage of its portfolio that may be invested in municipal bonds
subject to the alternative minimum tax provisions of federal tax law, and the Fund expects that a portion of the income it produces will be includable in alternative minimum
taxable income.
The average maturity of the
Fund’s portfolio securities varies from time to time based upon an assessment of economic and market conditions by the Manager. The Fund’s portfolio at any given
time may include both long-term and intermediate-term municipal bonds.
The Fund’s stated expectation is that it will invest in municipal bonds that, in the Manager’s opinion, are underrated or undervalued. Underrated municipal
bonds are those whose ratings do not, in the opinion of the Manager, reflect their true higher creditworthiness. Undervalued municipal bonds are bonds that, in
the opinion of the Manager, are worth more than the value assigned to them in the marketplace. The Manager may at times believe that bonds associated with a
particular municipal market sector (for example, but not limited to electric utilities), or issued by a particular municipal issuer, are undervalued. The
Manager may purchase those bonds for the Fund’s portfolio because they represent a market sector or issuer that the Manager considers undervalued, even
if the value of those particular bonds appears to be consistent with the value of similar bonds. Municipal bonds of particular types (for example, but not
limited to hospital bonds, industrial revenue bonds or bonds issued by a particular municipal issuer) may be undervalued because there is a temporary excess of
supply in that market sector, or because of a general decline in the market price of municipal bonds of the market sector for reasons that do not apply to the
particular municipal bonds that are considered undervalued. The Fund’s investment in underrated or undervalued municipal bonds will be based on the
Manager’s belief that their yield is higher than that available on bonds bearing equivalent levels of interest rate risk, credit risk and other forms of risk, and that their prices will ultimately rise, relative to the market, to reflect their true value. Any capital appreciation realized by the Fund will generally result in capital
gain distributions subject to federal capital gains taxation. The Fund ordinarily does not intend to realize significant investment income not exempt from
federal income tax. From time to time, the Fund may realize taxable capital gains.
Leverage: The Fund may utilize leverage to
seek to enhance the yield and net asset value of its common shares. However, this objective cannot be achieved in all interest rate environments. The Fund
currently leverages its assets through the use of variable rate demand preferred shares (“VRDP Shares”) and residual interest municipal tender option
bonds (“TOB Residuals”), which are derivative interests in municipal bonds. The TOB Residuals in which the Fund will invest pay interest or income
that, in the opinion of counsel to the issuer of such TOB Residuals, is exempt from regular U.S. federal income tax.
The Fund may enter into reverse repurchase agreements with respect to its portfolio
investments subject to the Fund’s investment restrictions.
106 2024 BlackRock
Annual Report to Shareholders
Investment Objectives, Policies and Risks (continued)
The Fund may enter into
derivative securities transactions that have leverage embedded in them.
The Fund reserves the right to borrow funds, subject to the Fund’s investment restrictions. The proceeds of borrowings may be used for any valid purpose including,
without limitation, liquidity, investments and repurchases of shares of the Fund.
BlackRock Virginia Municipal Bond Trust (BHV)
The Fund’s investment objective is to provide current
income exempt from regular federal income taxes and Virginia personal income tax. As a fundamental policy, under normal market conditions, the Fund will invest
at least 80% of its Managed Assets in municipal bonds, the interest of which is exempt from regular federal income tax and Virginia personal income tax. The
Fund may invest directly in securities or synthetically through the use of derivatives. The Fund cannot change its investment objective or the foregoing
fundamental policy without the approval of the holders of a majority of the outstanding common shares and the outstanding preferred shares, including the variable demand rate preferred shares (“VRDP Shares”), voting together as a single class, and of the holders of a majority of the outstanding preferred shares, including
the VRDP Shares, voting as a separate class. A majority of the outstanding means (1) 67% or more of the shares present at a meeting, if the holders of more
than 50% of the outstanding shares are present or represented by proxy, or (2) more than 50% of the outstanding shares, whichever is less.
Under normal market conditions, the Fund invests at least 80% of
its Managed Assets in investment grade quality municipal bonds. Investment grade quality means that such bonds are rated, at the time of investment, within the
four highest quality ratings as determined by either Moody’s Investors Service, Inc. (“Moody’s”) (currently Aaa, Aa, A and Baa),
S&P Global Ratings (“S&P”) (currently AAA, AA, A and BBB) or Fitch Ratings, Inc. (“Fitch”) (currently AAA, AA, A and BBB) or are unrated but judged to be of comparable quality by BlackRock Advisors, LLC (the “Manager”). Municipal bonds rated Baa by Moody’s are investment grade, but Moody’s considers municipal bonds
rated Baa to have speculative characteristics. Changes in economic conditions or other circumstances are more likely to lead to a weakened capacity for issuers
of municipal bonds that are rated BBB or Baa (or that have equivalent ratings) to make principal and interest payments than is the case for issues of higher
grade municipal bonds. In the case of short term notes, the investment grade rating categories are SP-1+ through SP-2 for S&P, MIG 1 through MIG 3 for
Moody’s and F1+ through F3 for Fitch. In the case of tax exempt commercial paper, the investment grade rating categories are A-1+ through A-3 for
S&P, Prime-1 through Prime-3 for Moody’s and F1+ through F3 for Fitch. Obligations ranked in the lowest investment grade rating category (BBB, SP-2
and A-3 for S&P; Baa, MIG 3 and Prime-3 for Moody’s and BBB and F3 for Fitch), while considered “investment grade,” may have certain
speculative characteristics. There may be sub-categories or gradations indicating relative standing within the rating categories set forth above. In assessing
the quality of municipal bonds with respect to the foregoing requirements, the Manager takes into account the nature of any letters of credit or similar credit enhancement to
which particular municipal bonds are entitled and the creditworthiness of the financial institution that provided such credit enhancement.
The Fund may invest up to 20% of its Managed Assets in municipal bonds that are rated, at the time of investment, Ba/BB or B by
Moody’s, S&P or Fitch or that are unrated but judged to be of comparable quality by the Manager. Securities rated Ba/BB or below are commonly
referred to as “high yield” or “junk” bonds and are regarded as predominantly speculative with respect to the issuer’s capacity
to pay interest and repay principal in accordance with the terms of the security and generally involve a greater volatility of price than securities in higher
rating categories. Below investment grade securities and comparable unrated securities involve substantial risk of loss, are considered speculative with
respect to the issuer’s ability to pay interest and any required redemption or principal payments and are susceptible to default or decline in market value due to
adverse economic and business developments.
All percentage and ratings limitations on securities in which the Fund may invest apply at the time of making an investment and shall not
be considered violated if an investment rating is subsequently downgraded to a rating that would have precluded the Fund’s initial investment in such
security. In determining whether to retain or sell a security that a rating agency has downgraded, the Manager may consider such factors as the Manager’s
assessment of the credit quality of the issuer of the security, the price at which the security could be sold and the rating, if any, assigned to the security
by other rating agencies. In the event that the Fund disposes of a portfolio security subsequent to its being downgraded, the Fund may experience a greater risk of loss than
if such security had been sold prior to such downgrade.
Subject to the Fund’s policy, under normal market conditions, of investing at least 80% of its Managed Assets in municipal bonds, the interest from which is exempt
from Virginia personal income tax, the Fund may invest in securities that pay interest that is not exempt from Virginia personal income tax when, in the
judgment of the Manager, the return to the shareholders after payment of applicable Virginia personal income tax would be higher than the return available from
comparable securities that pay interest that is, or make other distributions that are, exempt from Virginia personal income tax.
The Fund may also invest in securities of other open- or
closed-end investment companies that invest primarily in municipal bonds of the types in which the Fund may invest directly and in tax-exempt preferred shares
that pay dividends that are exempt from regular federal income tax. In addition, the Fund may purchase municipal bonds that are additionally secured by
insurance, bank credit agreements or escrow accounts. The credit quality of companies which provide these credit enhancements will affect the value of those
securities. Although the insurance feature reduces certain financial risks, the premiums for insurance and the higher market price paid for insured obligations may reduce the Fund’s income. The insurance feature does not guarantee the market value of the insured obligations or the net asset value of the common shares. The Fund
may purchase insured bonds and may purchase insurance for bonds in its portfolio.
The Fund may invest in certain tax exempt securities classified as “private activity bonds” (or industrial development bonds,
under pre-1986 law) (“PABs”) (in general, bonds that benefit non-governmental entities) that may subject certain investors in the Fund to an
alternative minimum tax. The percentage of the Fund’s total assets invested in PABs will vary from time to time. The Fund has not established any limit
on the percentage of its portfolio that may be invested in municipal bonds subject to the federal alternative minimum tax provisions of federal tax law, and
the Fund expects that a portion of the income it produces will be includable in alternative minimum taxable income. VRDP Shares may not be a suitable
investment for investors who are subject to the federal alternative minimum tax or who would become subject to the federal alternative minimum tax as a result
of purchasing VRDP Shares. The suitability of an investment in VRDP Shares will depend upon a comparison of the after-tax yield likely to be provided from the
Fund with that from comparable tax-exempt investments not subject to the federal alternative minimum tax, and from comparable fully taxable investments, in
light of each such investor’s tax position. Special considerations may apply to corporate investors.
The average maturity of the Fund’s portfolio securities
will vary based upon the Manager’s assessment of economic and market conditions. The Fund’s portfolio at any given time may include both long-term and
intermediate-term municipal bonds.
Investment Objectives, Policies and
Risks
107
Investment Objectives, Policies and Risks (continued)
The
Fund’s stated expectation is that it may invest in municipal bonds that, in the Manager’s opinion, are underrated or undervalued. Underrated municipal bonds are those whose ratings do not, in the opinion of the Manager, reflect their true higher creditworthiness. Undervalued municipal bonds are bonds that, in the opinion of the Manager,
are worth more than the value assigned to them in the marketplace. The Manager may at times believe that bonds associated with a particular municipal market
sector (for example, but not limited to electric utilities), or issued by a particular municipal issuer, are undervalued. The Manager may purchase those bonds
for the Fund’s portfolio because they represent a market sector or issuer that the Manager considers undervalued, even if the value of those particular
bonds appears to be consistent with the value of similar bonds. Municipal bonds of particular types (for example, but not limited to hospital bonds, industrial
revenue bonds or bonds issued by a particular municipal issuer) may be undervalued because there is a temporary excess of supply in that market sector, or
because of a general decline in the market price of municipal bonds of the market sector for reasons that do not apply to the particular municipal bonds that
are considered undervalued. The Fund’s investment in underrated or undervalued municipal bonds will be based on the Manager’s belief that their
yield is higher than that available on bonds bearing equivalent levels of interest rate risk, credit risk and other forms of risk, and that their prices will
ultimately rise, relative to the market, to reflect their true value. Any capital appreciation realized by the Fund will generally result in capital gain distributions
subject to federal capital gains taxation.
The Fund ordinarily does not intend to realize significant investment income not exempt from federal income taxes. From time to time, the Fund may realize taxable capital
gains.
Federal tax legislation may limit the types and volume of bonds the interest on which qualifies for a U.S. federal income tax exemption. As a result, current legislation
and legislation that may be enacted in the future may affect the availability of municipal bonds for investment by the Fund.
Leverage: The Fund may utilize leverage to seek to enhance the yield and net asset value of its common shares. However, this objective cannot be achieved in all interest rate environments. The Fund currently leverages its assets through the use of VRDP Shares and residual interest municipal tender option bonds (“TOB Residuals”),
which are derivative interests in municipal bonds. The TOB Residuals in which the Fund will invest pay interest or income that, in the opinion of counsel to
the issuer of such TOB Residuals, is exempt from regular U.S. federal income tax.
The Fund may enter into reverse repurchase agreements with respect to its portfolio investments subject to the Fund’s investment
restrictions.
The Fund may enter into derivative securities
transactions that have leverage embedded in them.
The Fund reserves the right to borrow funds subject to the Fund’s investment restrictions. The proceeds of borrowings may be used for any valid purpose including,
without limitation, liquidity, investments and repurchases of shares of the Fund.
The Fund may also borrow money as a temporary measure for extraordinary or emergency purposes, including the payment of dividends and the
settlement of securities transactions which otherwise might require untimely dispositions of Fund securities.
This section contains a discussion of the general risks of
investing in each Fund. The net asset value and market price of, and dividends paid on, the common shares will fluctuate with and be affected by, among other
things, the risks more fully described below. As with any fund, there can be no guarantee that the Fund will meet its investment objective or that the
Fund’s performance will be positive for any period of time. Each risk noted below is applicable to each Fund unless the specific Fund or Funds are noted in a
parenthetical. The order of the below risk factors does not indicate the significance of any particular risk factor.
Non-Diversification Risk (MUJ, MHN, MIY, MYN, MPA and BHV): The Fund is a
non-diversified fund. Because the Fund may invest in securities of a smaller number of issuers, it may be more exposed to the risks associated with and developments affecting
an individual issuer than a fund that invests more widely.
Investment and Market Discount Risk: An investment in the Fund’s common
shares is subject to investment risk, including the possible loss of the entire amount that you invest. As with any stock, the price of the Fund’s common
shares will fluctuate with market conditions and other factors. If shares are sold, the price received may be more or less than the original investment. Common
shares are designed for long-term investors and the Fund should not be treated as a trading vehicle. Shares of closed-end management investment companies
frequently trade at a discount from their net asset value. This risk is separate and distinct from the risk that the Fund’s net asset value could
decrease as a result of its investment activities. At any point in time an investment in the Fund’s common shares may be worth less than the original amount invested, even after taking into account distributions paid by the Fund. During periods in which the Fund may use leverage, the Fund’s investment, market discount and certain
other risks will be magnified.
Debt Securities Risk: Debt securities, such as bonds, involve risks, such as
credit risk, interest rate risk, extension risk, and prepayment risk, each of which are described in further detail below:
•Credit Risk — Credit risk refers to the possibility that the issuer of a debt security (i.e., the borrower) will not be able to make payments of interest and principal when due. Changes in an issuer’s credit rating or the market’s perception of an issuer’s creditworthiness may also affect the value of the Fund’s investment in that
issuer. The degree of credit risk depends on both the financial condition of the issuer and the terms of the obligation.
•Interest Rate Risk — The market value of bonds and other fixed-income securities changes in response to interest rate changes and other factors. Interest rate risk is the risk that prices of bonds and other fixed-income securities will increase as interest rates fall and decrease as interest rates rise.
The Fund may be subject to a greater risk
of rising interest rates due to the recent period of historically low interest rates. For example, if interest rates increase by 1%, assuming a current
portfolio duration of ten years, and all other factors being equal, the value of the Fund’s investments would be expected to decrease by 10%.
(Duration is a measure of the price sensitivity of a debt security or portfolio of debt securities to relative changes in interest rates.) The magnitude of
these fluctuations in the market price of bonds and other fixed-income securities is generally greater for those securities with longer maturities.
Fluctuations in the market price of the
108 2024 BlackRock
Annual Report to Shareholders
Investment Objectives, Policies and Risks (continued)
Fund’s investments will not affect interest income derived from instruments already owned by the Fund, but will be reflected in the Fund’s net asset value.
The Fund may lose money if short-term or long-term interest rates rise sharply in a manner not anticipated by Fund management.
To the extent the Fund invests in debt
securities that may be prepaid at the option of the obligor (such as mortgage-backed securities), the sensitivity of such securities to changes in interest
rates may increase (to the detriment of the Fund) when interest rates rise. Moreover, because rates on certain floating rate debt securities typically reset
only periodically, changes in prevailing interest rates (and particularly sudden and significant changes) can be expected to cause some fluctuations in the net asset value of the Fund to the extent that it invests in floating rate debt securities.
These basic principles of bond prices also
apply to U.S. Government securities. A security backed by the “full faith and credit” of the U.S. Government is guaranteed only as to its stated
interest rate and face value at maturity, not its current market price. Just like other fixed-income securities, government-guaranteed securities will
fluctuate in value when interest rates change.
A general rise in interest rates has the
potential to cause investors to move out of fixed-income securities on a large scale, which may increase redemptions from funds that hold large amounts of
fixed-income securities. Heavy redemptions could cause the Fund to sell assets at inopportune times or at a loss or depressed value and could hurt the
Fund’s performance.
•Extension Risk — When interest rates rise, certain obligations will be paid off by the obligor more slowly than anticipated, causing the value of these obligations to fall.
•Prepayment Risk — When interest rates fall, certain obligations will be paid off by the obligor more quickly than originally anticipated, and the Fund may have to invest the proceeds in securities with lower yields.
Municipal Securities Risks: Municipal securities risks include the ability of
the issuer to repay the obligation, the relative lack of information about certain issuers of municipal securities, and the possibility of future legislative
changes which could affect the market for and value of municipal securities. Budgetary constraints of local, state, and federal governments upon which the issuers may be
relying for funding may also impact municipal securities. These risks include:
•General Obligation Bonds Risks — Timely payments depend on the issuer’s credit quality, ability to raise tax revenues
and ability to maintain an adequate tax base.
•Revenue Bonds Risks — These payments depend on the money earned by the particular facility or class of
facilities, or the amount of revenues derived from another source.
•Private Activity Bonds Risks — Municipalities and other public authorities issue private activity bonds to finance development of industrial facilities for use by a private enterprise. The private enterprise pays the principal and interest on the bond, and the issuer does not pledge its full faith, credit and taxing power for repayment. The Fund’s investments may consist of private activity bonds that may subject certain shareholders to an alternative minimum tax.
•Moral Obligation Bonds Risks — Moral obligation bonds are generally issued by special purpose public authorities of a state or municipality. If the issuer is unable to meet its obligations, repayment of these bonds becomes a moral commitment, but not a legal obligation, of the state or municipality.
•Municipal Notes Risks — Municipal notes are shorter term municipal debt obligations. If there is a shortfall in the anticipated proceeds, the notes may not be fully repaid and the Fund may lose money.
•Municipal Lease Obligations Risks — In a municipal lease obligation, the issuer agrees to make payments when due on the lease
obligation. Although the issuer does not pledge its unlimited taxing power for payment of the lease obligation, the lease obligation is secured by the leased
property.
•Tax-Exempt Status Risk — The Fund and its investment manager will rely on the opinion of issuers’ bond counsel
and, in the case of derivative securities, sponsors’ counsel, on the tax-exempt status of interest on municipal bonds and payments under derivative securities. Neither
the Fund nor its investment manager will independently review the bases for those tax opinions, which may ultimately be determined to be incorrect and subject the Fund and
its shareholders to substantial tax liabilities.
State Specific Risk (MUJ, MHN, MIY, MYN, MPA, BNY and BHV): The Fund invests
primarily in municipal bonds issued by or on behalf of its designated state. As a result, the Fund is more exposed to risks affecting issuers of its designated
state’s municipal securities than is a fund that invests more widely. Fund management does not believe that the current economic conditions will adversely affect the
Fund’s ability to invest in high quality state municipal securities in its designated state.
Taxability Risk: The Fund intends to minimize the payment of taxable income to
shareholders by investing in tax-exempt or municipal securities in reliance at the time of purchase on an opinion of bond counsel to the issuer that the
interest paid on those securities will be excludable from gross income for U.S. federal income tax purposes. Such securities, however, may be determined to
pay, or have paid, taxable income subsequent to the Fund’s acquisition of the securities. In that event, the treatment of dividends previously paid or to
be paid by the Fund as “exempt interest dividends” could be adversely affected, subjecting the Fund’s shareholders to increased U.S. federal income tax liabilities. Alternatively, the Fund might enter into an agreement with the IRS to pay an agreed upon amount in lieu of the IRS adjusting individual shareholders’
income tax liabilities. If the Fund agrees to enter into such an agreement, the Fund’s yield could be adversely affected. Further, shareholders at the
time the Fund enters into such an agreement that were not shareholders when the dividends in question were paid would bear some cost for a benefit they did not
receive. Federal tax legislation may limit the types and volume of bonds the interest on which qualifies for a federal income tax-exemption. As a result,
current legislation and legislation that may be enacted in the future may affect the availability of municipal securities for investment by the Fund. In
addition, future laws, regulations, rulings or court decisions may cause interest on municipal securities to be subject, directly or indirectly, to U.S.
federal income taxation or interest on state municipal securities to be subject to state or local income taxation, or the value of state municipal securities
to be subject to state or local intangible personal property tax, or may otherwise prevent the Fund from realizing the full current benefit of the tax-exempt status of such
securities. Any such change could also affect the market price of such securities, and thus the value of an investment in the Fund.
Investment Objectives, Policies and Risks
109
Investment Objectives, Policies and Risks (continued)
Insurance Risk: Insurance guarantees that interest payments on a municipal
security will be made on time and that the principal will be repaid when the security matures. However, insurance does not protect against losses caused by
declines in a municipal security’s value. The Fund cannot be certain that any insurance company will make the payments it guarantees. If a municipal security’s
insurer fails to fulfill its obligations or loses its credit rating, the value of the security could drop.
High Yield Bonds Risk: Although junk bonds generally pay higher rates of
interest than investment grade bonds, junk bonds are high risk investments that are considered speculative and may cause income and principal losses for the
Fund.
Indexed and Inverse
Securities Risk (MIY, MYN and MPA): Indexed and inverse securities provide a potential return based on a particular index of value or interest rates. The Fund’s return on these securities will be subject to risk with respect to the value of the particular index. These securities are subject to leverage risk and
correlation risk. Certain indexed and inverse securities have greater sensitivity to changes in interest rates or index levels than other securities, and the
Fund’s investment in such instruments may decline significantly in value if interest rates or index levels move in a way Fund management does not
anticipate.
U.S. Government
Obligations Risk: Certain securities in which the Fund may invest, including securities issued by certain U.S. Government agencies and U.S. Government sponsored enterprises, are not guaranteed by the U.S. Government or supported by the full faith and credit of the United States. In addition, circumstances could arise that
could prevent the timely payment of interest or principal on U.S. Government obligations, such as reaching the legislative “debt ceiling.” Such
non-payment could result in losses to the Fund and substantial negative consequences for the U.S. economy and the global financial system.
Variable Rate Demand Obligations Risks (MUJ,
MHN, MIY, MYN and MPA): Variable rate demand obligations are floating rate securities that combine an interest in a long term municipal bond with a right to demand payment before maturity from a bank or other financial institution. If the bank or financial institution is unable to pay, the
Fund may lose money.
Repurchase Agreements and Purchase and Sale Contracts Risk (MUJ and MHN): If the
other party to a repurchase agreement or purchase and sale contract defaults on its obligation under the agreement, the Fund may suffer delays and incur costs
or lose money in exercising its rights under the agreement. If the seller fails to repurchase the security in either situation and the market value of the security declines,
the Fund may lose money.
Leverage Risk: The Fund’s use of leverage may increase or decrease from time to time in its discretion and the Fund may, in the future, determine not to use leverage.
The use of leverage creates an opportunity for increased common
share net investment income dividends, but also creates risks for the holders of common shares. The Fund cannot assure you that the use of leverage will result in a higher
yield on the common shares. Any leveraging strategy the Fund employs may not be successful.
Leverage involves risks and special considerations for common shareholders, including:
•the likelihood of greater volatility of net asset value, market price and dividend rate of the common shares than a comparable portfolio without leverage;
•the risk that fluctuations in interest rates or dividend rates on any leverage that the Fund must pay will reduce the return to the common shareholders;
•the effect of leverage in a declining market, which is likely to cause a greater decline in the net asset value of the common shares than if the Fund were not leveraged,
which may result in a greater decline in the market price of the common shares;
•leverage may increase operating costs, which may reduce total return.
Any decline in the net asset value of the Fund’s investments will be borne entirely by the holders of common shares. Therefore, if
the market value of the Fund’s portfolio declines, leverage will result in a greater decrease in net asset value to the holders of common shares than if
the Fund were not leveraged. This greater net asset value decrease will also tend to cause a greater decline in the market price for the common shares.
Tender Option Bonds Risk: The Fund’s participation in tender option bond transactions may reduce the Fund’s returns and/or increase volatility. Investments in tender option bond transactions expose the Fund to counterparty risk and leverage risk. An investment in a tender option bond transaction typically will involve greater risk than an
investment in a municipal fixed rate security, including the risk of loss of principal. Distributions on TOB Residuals will bear an inverse relationship to
short-term municipal security interest rates. Distributions on TOB Residuals paid to the Fund will be reduced or, in the extreme, eliminated as short-term
municipal interest rates rise and will increase when short-term municipal interest rates fall. TOB Residuals generally will underperform the market for fixed
rate municipal securities in a rising interest rate environment. The Fund may invest special purpose trusts formed for the purpose of holding municipal bonds
contributed by one or more funds (“TOB Trusts”) on either a non-recourse or recourse basis. If the Fund invests in a TOB Trust on a recourse basis, it could
suffer losses in excess of the value of its TOB Residuals.
Reverse Repurchase Agreements Risk: Reverse repurchase agreements involve the
sale of securities held by the Fund with an agreement to repurchase the securities at an agreed-upon price, date and interest payment. Reverse repurchase
agreements involve the risk that the other party may fail to return the securities in a timely manner or at all. The Fund could lose money if it is unable to
recover the securities and the value of the collateral held by the Fund, including the value of the investments made with cash collateral, is less than the
value of the securities. These events could also trigger adverse tax consequences for the Fund. In addition, reverse repurchase agreements involve the risk that the interest
income earned in the investment of the proceeds will be less than the interest expense.
Dollar Rolls Risk (MIY and MYN): Dollar rolls involve the risk that the market
value of the securities that the Fund is committed to buy may decline below the price of the securities the Fund has sold. These transactions may involve
leverage.
Illiquid
Investments Risk: The Fund may invest without limitation in illiquid or less liquid investments or investments in which no secondary market is readily available or which
are otherwise illiquid, including private placement securities. The Fund may not be able to readily dispose of such investments at prices that approximate
those at which the Fund could sell such investments if they were more widely traded and, as a result of such illiquidity, the Fund may have to sell other
investments or engage in borrowing transactions if necessary to raise cash to meet its obligations. Limited liquidity can also affect the market price of
investments, thereby adversely affecting the Fund’s net asset
110 2024 BlackRock
Annual Report to Shareholders
Investment Objectives, Policies and Risks (continued)
value
and ability to make dividend distributions. The financial markets in general, and certain segments of the mortgage-related securities markets in particular, have in recent years experienced periods of extreme secondary market supply and demand imbalance, resulting in a loss of liquidity during which market prices were suddenly and substantially below traditional measures of intrinsic value. During such periods, some investments could be sold only at arbitrary prices and with substantial losses.
Periods of such market dislocation may occur again at any time. Privately issued debt securities are often of below investment grade quality, frequently are
unrated and present many of the same risks as investing in below investment grade public debt securities.
Investment Companies and ETFs Risk (MUJ, MHN,
MIY, BNY and BHV): Subject to the limitations set forth in the Investment Company Act of 1940, as amended, and the rules thereunder, the Fund may acquire shares in other investment companies and in exchange-traded funds (“ETFs”), some of which may be affiliated investment
companies. The market value of the shares of other investment companies and ETFs may differ from their net asset value. As an investor in investment companies
and ETFs, the Fund would bear its ratable share of that entity’s expenses, including its investment advisory and administration fees, while continuing to
pay its own advisory and administration fees and other expenses (to the extent not offset by the Manager through waivers). As a result, shareholders will be
absorbing duplicate levels of fees with respect to investments in other investment companies and ETFs (to the extent not offset by the Manager through waivers).
The securities of other investment companies and ETFs in
which the Fund may invest may be leveraged. As a result, the Fund may be indirectly exposed to leverage through an investment in such securities. An investment
in securities of other investment companies and ETFs that use leverage may expose the Fund to higher volatility in the market value of such securities and the possibility
that the Fund’s long-term returns on such securities (and, indirectly, the long-term returns of shares of the Fund) will be diminished.
As with other investments, investments in other investment companies, including ETFs, are subject to market and selection risk. To the
extent the Fund is held by an affiliated fund, the ability of the Fund itself to hold other investment companies may be limited.
Derivatives Risk: The Fund’s use of derivatives may increase its costs, reduce the Fund’s returns and/or increase volatility. Derivatives involve significant risks, including:
•Leverage Risk — The Fund’s use of derivatives can magnify the Fund’s gains and losses. Relatively small market movements may result in large changes in the value of a derivatives position and can result in losses that greatly exceed the amount originally invested.
•Market Risk — Some derivatives are more sensitive to interest rate changes and market price fluctuations than other securities. The Fund could also suffer losses related to its derivatives positions as a result of unanticipated market movements, which losses are potentially unlimited. Finally, the Manager may not be able to predict correctly the direction of securities prices, interest rates and other economic factors, which could cause the Fund’s derivatives positions to lose value.
•Counterparty Risk — Derivatives are also subject to counterparty risk, which is the risk that the other party in the transaction will be unable or unwilling to fulfill its contractual obligation, and the related risks of having concentrated exposure to such a counterparty.
•Illiquidity Risk — The possible lack of a liquid secondary market for derivatives and the resulting inability of the Fund to sell or otherwise close a derivatives position could expose the Fund to losses and could make derivatives more difficult for the Fund to value accurately.
•Operational Risk — The use of derivatives includes the risk of potential operational issues, including documentation issues, settlement issues, systems failures, inadequate controls and human error.
•Legal
Risk — The risk of insufficient documentation, insufficient capacity or authority
of counterparty, or legality or enforceability of a contract.
•Volatility and Correlation Risk — Volatility is defined as the characteristic of a security, an index or a market to
fluctuate significantly in price within a short time period. A risk of the Fund’s use of derivatives is that the fluctuations in their values may not correlate with the
overall securities markets.
•Valuation Risk — Valuation for derivatives may not be readily available in the market. Valuation may be more
difficult in times of market turmoil since many investors and market makers may be reluctant to purchase complex instruments or quote prices for them.
•Hedging Risk — Hedges are sometimes subject to imperfect matching between the derivative and the underlying security, and there can be no assurance that the Fund’s hedging transactions will be effective. The use of hedging may result in certain adverse tax consequences.
•Tax Risk — Certain aspects of the tax treatment of derivative instruments, including swap agreements and commodity-linked derivative instruments, are currently unclear and may be affected by changes in legislation, regulations or other legally binding authority. Such treatment may be less favorable than that given to a direct investment in an underlying asset and may adversely affect the timing, character and amount of income the Fund realizes from its investments.
Risk of Investing in the United States: Certain changes in the U.S. economy, such as when the U.S. economy weakens or when its financial markets decline, may have an adverse effect on the securities to which the Fund has exposure.
Market Risk and Selection Risk: Market risk is the risk that one or more markets
in which the Fund invests will go down in value, including the possibility that the markets will go down sharply and unpredictably. The value of a security or
other asset may decline due to changes in general market conditions, economic trends or events that are not specifically related to the issuer of the security
or other asset, or factors that affect a particular issuer or issuers, exchange, country, group of countries, region, market, industry, group of industries,
sector or asset class. Local, regional or global events such as war, acts of terrorism, the spread of infectious illness or other public health issues like
pandemics or epidemics, recessions, or other events could have a significant impact on the Fund and its investments. Selection risk is the risk that the
securities selected by Fund management will underperform the markets, the relevant indices or the securities selected by other funds with similar investment
objectives and investment strategies. This means you may lose money.
Investment Objectives, Policies and Risks
111
Investment Objectives, Policies and Risks (continued)
An
outbreak of an infectious coronavirus (COVID-19) that was first detected in December 2019 developed into a global pandemic that has resulted in numerous disruptions in the market and has had significant economic impact leaving general concern and uncertainty. Although vaccines have been developed and approved for use by various governments, the duration of the pandemic and its effects cannot be predicted with certainty. The impact of this coronavirus, and other epidemics and pandemics that may
arise in the future, could affect the economies of many nations, individual companies and the market in general ways that cannot necessarily be foreseen at the present
time.
Shareholder Activism: Shareholder activism involving closed-end funds has recently been increasing. Shareholder activism can take many forms, including engaging in public campaigns to demand that the Fund consider significant transactions such as a tender offer, merger or liquidation or to attempt to influence the Fund’s
corporate governance and/or management, commencing proxy contests to attempt to elect the activists’ representatives or others to the Fund’s Board
of Directors/Trustees (the “Board”), or to seek other actions such as a termination of the Fund’s investment advisory contract with its
current investment manager or commencing litigation. If the Fund becomes the subject of shareholder activism, then management and the Board may be required to
divert significant resources and attention to respond to the activist and the Fund may incur substantial costs defending against such activism if management
and the Board determine that the activist’s demands are not in the best interest of the Fund. Further, the Fund’s share price could be subject to significant
fluctuation or otherwise be adversely affected by the events, risks and uncertainties of any shareholder activism.
112 2024 BlackRock
Annual Report to Shareholders
Automatic Dividend Reinvestment Plan
Pursuant to MUJ, MHN, MIY, MYN, MPA, BNY and BHV’s Dividend Reinvestment Plan (the “Reinvestment Plan”), Common Shareholders are automatically
enrolled to have all distributions of dividends and capital gains and other distributions reinvested by Computershare Trust Company, N.A. (the
“Reinvestment Plan Agent”) in the respective Fund’s Common Shares pursuant to the Reinvestment Plan. Shareholders who do not participate in the Reinvestment Plan will receive all distributions in cash paid by check and mailed directly to the shareholders of record (or if the shares are held in street name or other nominee name, then to the nominee) by the Reinvestment Plan Agent,
which serves as agent for the shareholders in administering the Reinvestment Plan.
After MUJ, MHN, MIY, MYN, MPA, BNY and BHV declare a dividend or determine to make a capital gain or other distribution, the Reinvestment
Plan Agent will acquire shares for the participants’ accounts, depending upon the following circumstances, either (i) through receipt of unissued but
authorized shares from the Funds (“newly issued shares”) or (ii) by purchase of outstanding shares on the open market or on the Fund’s primary exchange (“open-market purchases”). If, on the dividend payment date, the net asset
value (“NAV”) per share is equal to or less than the market price per share plus estimated brokerage commissions (such condition often referred to
as a “market premium”), the Reinvestment Plan Agent will invest the dividend amount in newly issued shares acquired on behalf of the participants.
The number of newly issued shares to be credited to each participant’s account will be determined by dividing the dollar amount of the dividend by the
NAV on the date the shares are issued. However, if the NAV is less than 95% of the market price on the dividend payment date, the dollar amount of the dividend
will be divided by 95% of the market price on the dividend payment date. If, on the dividend payment date, the NAV is greater than the market price per share
plus estimated brokerage commissions (such condition often referred to as a “market discount”), the Reinvestment Plan Agent will invest the
dividend amount in shares acquired on behalf of the participants in open-market purchases. If the Reinvestment Plan Agent is unable to invest the full dividend
amount in open-market purchases, or if the market discount shifts to a market premium during the purchase period, the Reinvestment Plan Agent will invest any
un-invested portion in newly issued shares. Investments in newly issued shares made in this manner would be made pursuant to the same process described above and the date of
issue for such newly issued shares will substitute for the dividend payment date.
You may elect not to participate in the Reinvestment Plan and to receive all dividends in cash by contacting the Reinvestment Plan Agent, at the address set forth below.
Participation in the Reinvestment Plan is completely
voluntary and may be terminated or resumed at any time without penalty by notice if received and processed by the Reinvestment Plan Agent prior to the dividend
record date. Additionally, the Reinvestment Plan Agent seeks to process notices received after the record date but prior to the payable date and such notices
often will become effective by the payable date. Where late notices are not processed by the applicable payable date, such termination or resumption will be effective with
respect to any subsequently declared dividend or other distribution.
The Reinvestment Plan Agent’s fees for the handling of the reinvestment of distributions will be paid by each Fund. However, each participant will pay a pro rata
share of brokerage commissions incurred with respect to the Reinvestment Plan Agent’s open-market purchases in connection with the reinvestment of all
distributions. The automatic reinvestment of all distributions will not relieve participants of any U.S. federal, state or local income tax that may be payable on such
dividends or distributions.
Each Fund
reserves the right to amend or terminate the Reinvestment Plan. There is no direct service charge to participants in the Reinvestment Plan; however, each Fund
reserves the right to amend the Reinvestment Plan to include a service charge payable by the participants. Participants in MPA, BNY and BHV that request a sale
of shares are subject to a $2.50 sales fee and a $0.15 per share sold fee. Per share fees include any applicable brokerage commissions the Reinvestment Plan
Agent is required to pay. Participants in MUJ, MHN, MIY and MYN that request a sale of shares are subject to a $0.02 per share sold brokerage commission. All
correspondence concerning the Reinvestment Plan should be directed to Computershare Trust Company, N.A. through the internet at computershare.com/blackrock, or
in writing to Computershare, P.O. Box 43006, Providence, RI 02940-3078, Telephone: (800) 699-1236. Overnight correspondence should be directed to the
Reinvestment Plan Agent at Computershare, 150 Royall Street, Suite 101, Canton, MA 02021.
Automatic Dividend Reinvestment Plan
113
Director and Officer Information
| |
| |
|
Principal Occupation(s) During Past 5 Years |
Number of BlackRock-Advised
Registered Investment Companies
(“RICs”) Consisting of Investment
Portfolios (“Portfolios”) Overseen |
Public Company and Other
Investment Company
Directorships Held During
Past 5 Years |
| |
Chair of the Board (Since
2022)
Director
(Since 2007) |
Dean, Columbia Business School from 2004 to 2019;
Faculty member, Columbia Business School since 1988. |
68 RICs consisting of 103 Portfolios |
ADP (data and information services) from 2004 to 2020; Metropolitan Life Insurance Company (insurance); TotalEnergies SE (multi-energy) |
| |
Vice Chair of the Board
(Since 2022)
Director
(Since 2007) |
Baker Foundation Professor and George Fisher Baker Jr.
Professor of Business Administration, Emeritus, Harvard
Business School since 2022; George Fisher Baker Jr.
Professor of Business Administration, Harvard Business
School from 2008 to 2022; Deputy Dean for Academic
Affairs from 2006 to 2010; Chairman of the Finance Unit,
from 2005 to 2006; Senior Associate Dean and Chairman
of the MBA Program from 1999 to 2005; Member of the
faculty of Harvard Business School since 1981. |
70 RICs consisting of 105 Portfolios |
|
| |
|
Advisor, U.S. Department of the Treasury from 2014 to
2015; President, Retirement Plan Services, for T. Rowe
Price Group, Inc. from 2007 to 2012; executive positions
within Fidelity Investments from 1989 to 2007. |
70 RICs consisting of 105 Portfolios |
Unum (insurance); The Hanover Insurance Group (Board Chair); Huntsman Corporation (Lead Independent Director and non-Executive Vice Chair of the Board) (chemical products) |
| |
|
Chief Financial Officer, Intel Foundry since 2024; Vice
Chairman, Kioxia, Inc. from 2019 to 2024; Chief Financial
Officer, Xilinx, Inc. from 2016 to 2019; Corporate
Controller, Xilinx, Inc. from 2008 to 2016. |
68 RICs consisting of 103 Portfolios |
|
| |
|
Lieutenant General, Inspector General of the United States
Air Force from 2017 to 2019; Lieutenant General, Assistant
Vice Chief of Staff and Director, Air Staff, United States Air
Force from 2016 to 2017; Major General, Commander,
22nd Air Force, AFRC, Dobbins Air Reserve Base, Georgia
from 2014 to 2016; Pilot, United Airlines from 1990 to
2020. |
68 RICs consisting of 103 Portfolios |
KULR Technology Group, Inc. in 2021; The Boeing Company (airplane manufacturer) |
| |
|
President and Chief Operating Officer, Cintas Corporation
from 2008 to 2018. |
68 RICs consisting of 103 Portfolios |
PulteGroup, Inc. (home construction); Rockwell Automation Inc. (industrial automation); Vestis Corporation (uniforms and facilities services) |
114 2024 BlackRock
Annual Report to Shareholders
Director and Officer Information (continued)
Independent Directors(a) (continued) |
| |
Position(s) Held
(Length of Service)(c) |
Principal Occupation(s) During Past 5 Years |
Number of BlackRock-Advised
Registered Investment Companies
(“RICs”) Consisting of Investment
Portfolios (“Portfolios”) Overseen |
Public Company and Other Investment Company
Directorships Held
During Past 5 Years |
| |
|
Chief Executive Officer, Chief Investment Officer and
various other positions, National Railroad Retirement
Investment Trust from 2003 to 2016; Associate Vice
President for Treasury Management, The George
Washington University from 1999 to 2003; Assistant
Treasurer, Episcopal Church of America from 1995 to
1999. |
70 RICs consisting of 105 Portfolios |
PennyMac Mortgage Investment Trust |
| |
|
Consultant, Posit PBC (enterprise data science) since
2020; Director, ScotiaBank (U.S.) from 2020 to 2023;
Chairman, Chief Executive Officer and President of
OppenheimerFunds, Inc. from 2015, 2014 and 2013,
respectively to 2019; Trustee, President and Principal
Executive Officer of 104 OppenheimerFunds funds from
2014 to 2019; Portfolio manager of various
OppenheimerFunds fixed income mutual funds from
1986 to 2014. |
70 RICs consisting of 105 Portfolios |
Trustee of 104 Oppenheimer Funds funds from 2014 to 2019 |
Interested Directors(a)(e) |
| |
|
Principal Occupation(s) During Past 5 Years |
Number of BlackRock-Advised
Registered Investment Companies
(“RICs”) Consisting of Investment
Portfolios (“Portfolios”) Overseen |
Public Company and Other
Investment Company
Directorships Held During
Past 5 Years |
| |
|
Vice Chairman of BlackRock, Inc. since 2019; Member of
BlackRock’s Global Executive and Global Operating
Committees; Co-Chair of BlackRock’s Human Capital
Committee; Senior Managing Director of BlackRock, Inc.
from 2010 to 2019; oversaw BlackRock’s Strategic Partner
Program and Strategic Product Management Group from
2012 to 2019; Member of the Board of Managers of
BlackRock Investments, LLC from 2011 to 2018; Global
Head of BlackRock’s Retail and iShares® businesses from
2012 to 2016. |
96 RICs consisting of 271 Portfolios |
|
| |
Director
(Since 2015)
President and Chief
Executive Officer
(Since 2010) |
Managing Director of BlackRock, Inc. since 2009; Head of
BlackRock Global Accounting and Product Services since
2009; Advisory Director of Family Resource Network
(charitable foundation) since 2009. |
98 RICs consisting of 273 Portfolios |
|
| |
The address of each Director is c/o BlackRock, Inc., 50 Hudson Yards, New York, New York 10001. |
| |
Each Independent Director holds office until his or her successor is duly elected and qualifies or until his or her earlier death, resignation, retirement or removal as
provided by the Fund’s by-laws or charter or statute, or until
December 31 of the year in which he or she turns 75. Directors who are “interested persons,” as defined in the Investment Company Act serve until their successor
is duly elected and qualifies or until their earlier death, resignation, retirement or
removal as provided by the Fund’s by-laws or statute, or until December 31 of the year in which they turn 72. The Board may determine to extend the terms of Independent Directors on a case-by-case basis, as appropriate. |
| |
Following the combination of Merrill Lynch Investment Managers, L.P. (“MLIM”) and BlackRock, Inc. in September 2006, the various legacy MLIM and legacy
BlackRock fund boards were realigned and consolidated into three new fund
boards in 2007. Certain Independent Directors first became members of the boards of other legacy MLIM or legacy BlackRock funds as follows: R. Glenn Hubbard, 2004 and W. Carl Kester, 1995. |
| |
Ms. Egan, Dr. Kester, Ms. Lynch, Mr. Steinmetz and Mr. Perlowski are also trustees of the BlackRock Credit Strategies Fund and BlackRock Private Investments
Fund. |
| |
Mr. Fairbairn and Mr. Perlowski are both “interested persons,” as defined in the 1940 Act, of the Fund based on their positions with BlackRock, Inc. and its
affiliates. Mr. Fairbairn and Mr. Perlowski are also board members of the BlackRock
Multi-Asset Complex. |
Director and Officer Information
115
Director and Officer Information (continued)
Officers Who Are Not Directors(a) |
| |
Position(s) Held
(Length of Service) |
Principal Occupation(s) During Past 5 Years |
| |
Vice President
(Since 2015) |
Member of BlackRock’s Global Operating Committee since 2023; Managing Director of BlackRock, Inc. since 2015. |
| |
Chief Financial Officer
(Since 2021) |
Managing Director of BlackRock, Inc. since September 2019; Executive Vice President of PIMCO from 2016 to 2019. |
| |
|
Managing Director of BlackRock, Inc. since 2007. |
| |
Chief Compliance Officer
(Since 2023) |
Managing Director of BlackRock, Inc. since 2018; Chief Compliance Officer of the BlackRock-advised funds in the
BlackRock Multi-Asset Complex, the BlackRock Fixed-Income Complex and the iShares Complex since
2023; Deputy Chief Compliance Officer for the BlackRock-advised funds in the
BlackRock Multi-Asset Complex, the BlackRock Fixed- Income Complex and the iShares
Complex from 2014 to 2023. |
| |
|
Managing Director of BlackRock, Inc. since 2018. |
| |
The address of each Officer is c/o BlackRock, Inc., 50 Hudson Yards, New York, New York 10001. |
| |
Officers of the Fund serve at the pleasure of the Board. |
Effective December 31, 2023, Frank Fabozzi retired as Director of the Funds. |
Effective January 19, 2024, Arthur Steinmetz became an Independent Director of the Funds. |
116
2024 BlackRock Annual Report to Shareholders
Proxy Results
The Annual Meeting of Shareholders was held on July 26, 2024 for
shareholders of record on May 28, 2024 to elect director nominees for each Fund. There were no broker non-votes with regard to any of the
Funds.
Shareholders elected the Class II Directors as
follows:
| |
Voted
on by holders of Preferred Shares only. |
For the Funds listed above, Directors whose term of office continued after the Annual Meeting of Shareholders because they were not up for election are Cynthia L. Egan,
Robert Fairbairn, Lorenzo A. Flores, Stayce D. Harris, R. Glenn Hubbard, W. Carl Kester and John M. Perlowski.
The Annual Meeting of Shareholders of BNY (the
“Meeting”) was held on June 17, 2024 and adjourned to July 16, 2024 for shareholders of record on April 22, 2024 to consider and vote on the
election of three Class II Directors. The Meeting was initially called for June 17, 2024, but adjourned to July 16, 2024 to seek additional shareholder participation. There
were no broker non-votes.
The vote results in the election of
Class II Directors were as follows:
| |
Voted
on by holders of Preferred Shares only. |
J. Phillip Holloman, Arthur P. Steinmetz and Catherine A. Lynch, incumbent Class II Directors, were re-elected as Class II Directors of BNY. The vote standard to
elect Board members is described in BNY’s most recent proxy statement. The Directors of BNY whose term of office continued after the Meeting because they were not up for election are Cynthia L. Egan, Robert Fairbairn, Lorenzo A. Flores, Stayce D. Harris, R. Glenn Hubbard, W. Carl Kester and John M. Perlowski.
The Annual Meeting of Shareholders of MHN (the
“Meeting”) was held on June 18, 2024 for shareholders of record on April 22, 2024 to consider and vote on the election of three Class II Directors. There were no
broker non-votes.
The vote results in the election of Class II
Directors were as follows:
| |
Voted
on by holders of Preferred Shares only. |
Catherine A. Lynch was re-elected as a Class II Director of MHN and no other nominee received the required number of votes to be re-elected or elected to the Board of
MHN. J. Phillip Holloman and Arthur P. Steinmetz, incumbent Class II Directors, will continue to serve as Class II Directors until their successors
have been duly elected and qualified. The vote standard to elect Board members is described in MHN’s most recent proxy statement. The Directors of MHN whose term of office continued after the Meeting
because they were not up for election are Cynthia L. Egan, Robert Fairbairn, Lorenzo A. Flores, Stayce D. Harris, R. Glenn Hubbard, W. Carl Kester and John M.
Perlowski.
The Annual Meeting of Shareholders
of MPA (the “Meeting”) was held on June 18, 2024 for shareholders of record on April 22, 2024 to consider and vote on the election of ten Directors. There were no
broker non-votes.
Additional Information
117
Additional Information (continued)
The vote results in the
election of Class II Directors were as follows:
| |
Voted
on by holders of Preferred Shares only. |
Cynthia L. Egan, Robert Fairbairn, Lorenzo A. Flores, Stayce D. Harris, J. Phillip Holloman, R. Glenn Hubbard, John M. Perlowski, Arthur P. Steinmetz, W. Carl Kester and
Catherine A. Lynch were re-elected as Directors of MPA. The vote standard to elect Board members is described in MPA’s most recent proxy statement.
The Annual Meeting of Shareholders of MYN (the
“Meeting”) was held on June 17, 2024 for shareholders of record on April 22, 2024 to consider and vote on the election of three Class II Directors.
There were no broker non-votes.
The vote results in the
election of Class II Directors were as follows:
| |
Voted
on by holders of Preferred Shares only. |
Catherine A. Lynch was re-elected as a Class II Director of MYN and no other nominee received the required number of votes to be re-elected or elected to the Board of
MYN. J. Phillip Holloman and Arthur P. Steinmetz, incumbent Class II Directors, will continue to serve as Class II Directors until their successors have
been duly elected and qualified. The vote standard to elect Board members is described in MYN’s most recent proxy statement. The Directors of MYN whose term of office continued after the Meeting
because they were not up for election are Cynthia L. Egan, Robert Fairbairn, Lorenzo A. Flores, Stayce D. Harris, R. Glenn Hubbard, W. Carl Kester and John M.
Perlowski.
The Funds are listed for trading on the NYSE and have filed with the NYSE their annual chief
executive officer certification regarding compliance with the NYSE’s listing standards. The Funds filed with the SEC the certification of its chief executive officer
and chief financial officer required by Section 302 of the Sarbanes-Oxley Act.
118 2024 BlackRock
Annual Report to Shareholders
Additional Information (continued)
Environmental, Social and Governance (“ESG”) Integration
Although the Funds do not seek to implement a specific
sustainability objective, strategy or process unless otherwise disclosed, Fund management will consider ESG factors as part of the investment process for the
Funds. Fund management views ESG integration as the practice of incorporating financially material ESG data or information into investment processes with the
objective of enhancing risk-adjusted returns. These ESG considerations will vary depending on the Funds’ particular investment strategies and may include consideration of third-party research as well
as consideration of proprietary BlackRock research across the ESG risks and opportunities regarding an issuer. The ESG characteristics utilized in the
Funds’ investment process are anticipated to evolve over time and one or more characteristics
may not be relevant with respect to all issuers that are eligible for investment. Certain of these considerations may affect the Funds’ exposure to certain companies or industries. While Fund management views ESG considerations as having the potential to contribute to the Funds’ long-term performance, there is no guarantee that such results will be achieved.
Each Fund’s dividend policy is to make regular monthly cash distributions to holders of its common shares (stated in terms of a fixed cents per common share dividend distribution rate). Each Fund intends to distribute all or a portion of its net investment income to its shareholders on a monthly basis. In addition, in any monthly
period, in order to maintain its declared distribution amount, each Fund may pay out more or less than the entire amount of net investment income earned in any
particular month. In the event a Fund distributes more than its net investment income during any yearly period, such distributions may also come from
sources other than net income, including return of capital. The Funds’ current accumulated but undistributed net investment income, if any, is
disclosed as accumulated earnings (loss) in the Statements of Assets and Liabilities, which comprises part of the financial information included in this report.
The Funds do not make available copies of their Statements of
Additional Information because the Funds’ shares are not continuously offered, which means that the Statement of Additional Information of each Fund has
not been updated after completion of the respective Fund’s offerings and the information contained in each Fund’s Statement of Additional Information may have
become outdated.
The following information is
a summary of certain changes since July 31, 2023. This information may not reflect all of the changes that have occurred since you purchased the relevant Fund.
Except if noted otherwise herein, there were no changes to
the Funds’ charters or by-laws that would delay or prevent a change of control of the Funds that were not approved by the shareholders. Except if noted
otherwise herein, there have been no changes in the persons who are primarily responsible for the day-to-day management of the Funds’ portfolios.
In accordance with Section 23(c) of the Investment Company Act of
1940, each Fund may from time to time purchase shares of its common stock in the open market or in private transactions.
Quarterly performance, semi-annual and annual reports, current
net asset value and other information regarding the Funds may be found on BlackRock’s website, which can be accessed at blackrock.com. Any reference to BlackRock’s website in this report is intended to allow
investors public access to information regarding the Funds and does not, and is not intended to, incorporate BlackRock’s website in this report.
Shareholders can sign up for e-mail notifications of quarterly
statements, annual and semi-annual shareholder reports by enrolling in the electronic delivery program. Electronic copies of shareholder reports are available on
BlackRock’s website.
To enroll in electronic
delivery:
Shareholders Who Hold Accounts with
Investment Advisers, Banks or Brokerages:
Please contact your
financial adviser. Please note that not all investment advisers, banks or brokerages may offer this service.
The Funds will mail only one copy of shareholder documents, annual and semi-annual reports, Rule 30e-3 notices and proxy statements, to shareholders with multiple accounts at the same address. This practice is commonly called “householding” and is intended to reduce expenses and eliminate duplicate mailings of shareholder
documents. Mailings of your shareholder documents may be householded indefinitely unless you instruct us otherwise. If you do not want the mailing of these
documents to be combined with those for other members of your household, please call the Funds at (800) 882-0052.
Availability of Quarterly Schedule of Investments
The Funds file their complete schedules of portfolio
holdings with the SEC for the first and third quarters of each fiscal year as an exhibit to their reports on Form N-PORT. The Funds’ Forms N-PORT are
available on the SEC’s website at sec.gov. Additionally, each Fund makes its
portfolio holdings for the first and third quarters of each fiscal year available at
blackrock.com/fundreports.
Additional Information
119
Additional Information (continued)
Availability of Proxy Voting Policies, Procedures and Voting Records
A description of the policies and procedures that the Funds use
to determine how to vote proxies relating to portfolio securities and information about how the Funds voted proxies relating to securities held in the
Funds’ portfolios during the most recent 12-month period ended June 30 is available without charge, upon request (1) by calling (800) 882-0052; (2) on the BlackRock
website at blackrock.com; and (3) on the SEC’s website at sec.gov.
Availability of Fund Updates
BlackRock will update performance and certain other data for the
Funds on a monthly basis on its website in the “Closed-end Funds” section of blackrock.com as well as certain other material information as necessary from time to time. Investors and
others are advised to check the website for updated performance information and the release of other material information about the Funds. This reference to
BlackRock’s website is intended to allow investors public access to information regarding the Funds and does not, and is not intended to, incorporate BlackRock’s
website in this report.
BlackRock Privacy
Principles
BlackRock is committed to
maintaining the privacy of its current and former fund investors and individual clients (collectively, “Clients”) and to safeguarding their non-public personal information. The following information is provided to help you understand what personal information BlackRock collects, how we protect that information and why in
certain cases we share such information with select parties.
If you are located in a jurisdiction where specific laws, rules or regulations require BlackRock to provide you with additional or
different privacy-related rights beyond what is set forth below, then BlackRock will comply with those specific laws, rules or regulations.
BlackRock obtains or verifies personal non-public information
from and about you from different sources, including the following: (i) information we receive from you or, if applicable, your financial intermediary, on
applications, forms or other documents; (ii) information about your transactions with us, our affiliates, or others; (iii) information we receive from a consumer reporting
agency; and (iv) from visits to our websites.
BlackRock does not sell or disclose to non-affiliated third parties any non-public personal information about its Clients, except as
permitted by law or as is necessary to respond to regulatory requests or to service Client accounts. These non-affiliated third parties are required to protect
the confidentiality and security of this information and to use it only for its intended purpose.
We may share information with our affiliates to service your
account or to provide you with information about other BlackRock products or services that may be of interest to you. In addition, BlackRock restricts access
to non-public personal information about its Clients to those BlackRock employees with a legitimate business need for the information. BlackRock maintains
physical, electronic and procedural safeguards that are designed to protect the non-public personal information of its Clients, including procedures relating to the proper
storage and disposal of such information.
Fund and Service Providers
Investment Adviser
BlackRock Advisors, LLC
Wilmington, DE 19809
Accounting Agent and Custodian
State Street Bank and Trust Company
Boston, MA 02114
Computershare Trust Company, N.A.
Canton, MA 02021
Bank of America, N.A.(a)
New York, NY 10036
The
Toronto-Dominion Bank(b)
New York, NY 10019
(a)
For MUJ, MHN and BNY.
(b) For MIY, MYN, MPA and
BHV.
VRDP Remarketing Agent
BofA Securities, Inc.(a)
New York, NY 10036
TD Securities (USA) LLC(b)
New York, NY 10019
VRDP Tender and Paying Agent
The Bank of New York Mellon
New
York, NY 10286
Independent Registered Public
Accounting Firm
Deloitte & Touche LLP
Boston, MA 02116
Willkie Farr & Gallagher LLP
New York, NY 10019
100 Bellevue Parkway
Wilmington, DE 19809
120 2024 BlackRock
Annual Report to Shareholders
Glossary of Terms Used in this Report
| |
| |
|
| |
Assured Guaranty Municipal Corp.
|
| |
AGM Insured Custodial Receipt
|
| |
|
| |
|
| |
|
| |
Build America Mutual Assurance Co.
|
| |
Build America Mutual Assurance Co. - Transferable
Custodial Receipts |
| |
Berkshire Hathaway Assurance Corp. - Custodian
Receipt |
| |
Capital Appreciation Bonds
|
| |
Certificates of Participation
|
| |
|
| |
Federal Home Loan Mortgage Corp.
|
| |
Federal National Mortgage
Association |
| |
Government National Mortgage
Association |
| |
|
| |
|
| |
|
| |
|
| |
National Public Finance Guarantee
Corp. |
| |
Qualified School Bond Loan Fund
|
| |
|
| |
|
| |
|
| |
|
| |
State of New York Mortgage Agency
|
| |
|
| |
|
| |
Variable Rate Demand Note
|
Glossary of Terms Used in This Report
121
THIS PAGE
INTENTIONALLY LEFT BLANK.
THIS PAGE
INTENTIONALLY LEFT BLANK.
Want to know
more?
blackrock.com |
800-882-0052
This report is intended for current holders. It is not a prospectus. Past performance results shown in this report should not be considered a representation of future performance. The Funds have leveraged their Common Shares, which creates risks for Common Shareholders, including the likelihood of greater volatility of NAV and market price of the Common Shares, and the risk that fluctuations in short-term interest rates may reduce the Common Shares’ yield. Statements and other information herein are as dated and are subject to change.
(b) Not Applicable
| Item 2 – |
Code of Ethics – The registrant (or the “Fund”) has adopted a code of ethics, as of the end of
the period covered by this report, applicable to the registrant’s principal executive officer, principal financial officer, principal accounting officer or controller, or persons performing similar functions. During the period covered by this
report, the code of ethics was amended to update certain information and to make other non-material changes. During the period covered by this report, there have been no waivers granted under the
code of ethics. The registrant undertakes to provide a copy of the code of ethics to any person upon request, without charge, who
calls 1-800-882-0052, option 4. |
| Item 3 – |
Audit Committee Financial Expert – The registrant’s board of directors (the “board of
directors”), has determined that (i) the registrant has the following audit committee financial experts serving on its audit committee and (ii) each audit committee financial expert is independent: |
Lorenzo A. Flores
Catherine
A. Lynch
Arthur P. Steinmetz
Under applicable securities laws, a person determined to be an audit committee financial expert will not be deemed an “expert” for
any purpose, including without limitation for the purposes of Section 11 of the Securities Act of 1933, as a result of being designated or identified as an audit committee financial expert. The designation or identification of a person as an
audit committee financial expert does not impose on such person any duties, obligations, or liabilities greater than the duties, obligations, and liabilities imposed on such person as a member of the audit committee and board of directors in the
absence of such designation or identification. The designation or identification of a person as an audit committee financial expert does not affect the duties, obligations, or liability of any other member of the audit committee or board of
directors.
| Item 4 – |
Principal Accountant Fees and Services |
The following table presents fees billed by Deloitte & Touche LLP (“D&T”) in each of the last two fiscal years for the
services rendered to the Fund:
|
|
|
|
|
|
|
|
|
|
|
|
|
|
|
|
|
| |
|
(a) Audit Fees |
|
(b) Audit-Related Fees1 |
|
(c) Tax Fees2 |
|
(d) All Other Fees |
| Entity Name |
|
Current
Fiscal
Year
End |
|
Previous
Fiscal
Year
End |
|
Current
Fiscal
Year
End |
|
Previous
Fiscal
Year
End |
|
Current
Fiscal
Year
End |
|
Previous
Fiscal
Year
End |
|
Current
Fiscal
Year
End |
|
Previous
Fiscal
Year
End |
BlackRock MuniYield
New York
Quality Fund,
Inc. |
|
$32,538 |
|
$32,538 |
|
$0 |
|
$0 |
|
$21,736 |
|
$21,700 |
|
$0 |
|
$407 |
The following table presents fees billed by D&T that were required to be approved by the
registrant’s audit committee (the “Committee”) for services that relate directly to the operations or financial reporting of the Fund and that are rendered on behalf of BlackRock Advisors, LLC
(the “Investment Adviser” or “BlackRock”) and entities controlling, controlled by, or under common control with BlackRock (not including
any sub-adviser whose role is primarily portfolio management and is subcontracted with or overseen by another investment adviser) that provide ongoing services to the Fund (“Affiliated Service
Providers”):
|
|
|
|
|
| |
|
Current Fiscal Year End |
|
Previous Fiscal Year End |
| (b) Audit-Related Fees1 |
|
$0 |
|
$0 |
| (c) Tax Fees2 |
|
$0 |
|
$0 |
| (d) All Other Fees3 |
|
$2,149,000 |
|
$2,154,000 |
1 The nature of the services includes
assurance and related services reasonably related to the performance of the audit or review of financial statements not included in Audit Fees, including accounting consultations, agreed-upon procedure reports, attestation reports, comfort letters, out-of-pocket expenses and internal control reviews not required by regulators.
2 The nature of the services includes tax compliance and/or tax preparation,
including services relating to the filing or amendment of federal, state or local income tax returns, regulated investment company qualification reviews, taxable income and tax distribution calculations.
3 Non-audit fees of $2,149,000 and
$2,154,000 for the current fiscal year and previous fiscal year, respectively, were paid to the Fund’s principal accountant in their entirety by BlackRock, in connection with services provided to the Affiliated Service Providers of the Fund and
of certain other funds sponsored and advised by BlackRock or its affiliates for a service organization review and an accounting research tool subscription. These amounts represent aggregate fees paid by BlackRock and were not allocated on a per fund
basis.
(e)(1) Audit Committee Pre-Approval Policies and Procedures:
The Committee has adopted policies and procedures with regard to the pre-approval of
services. Audit, audit-related and tax compliance services provided to the registrant on an annual basis require specific pre-approval by the Committee. The Committee also must approve other non-audit services provided to the registrant and those non-audit services provided to the Investment Adviser and Affiliated Service Providers that
relate directly to the operations and the financial reporting of the registrant. Certain of these non-audit services that the Committee believes are (a) consistent with the SEC’s auditor
independence rules and (b) routine and recurring services that will not impair the independence of the independent accountants may be approved by the Committee without consideration on a specific case-by-case basis (“general pre-approval”). The term of any
general pre-approval is 12 months from the date of the pre-approval, unless the Committee provides for a different period. Tax or other non-audit services provided to the registrant which have a direct impact on the operations or financial reporting of the registrant will only be
deemed pre-approved provided that any individual project does not exceed $10,000 attributable to the registrant or $50,000 per project. For this purpose, multiple projects will be aggregated to
determine if they exceed the previously mentioned cost levels.
Any proposed services exceeding
the pre-approved cost levels will require specific pre-approval by the Committee, as will any other services not subject to general pre-approval (e.g., unanticipated but permissible services). The Committee is informed of each service approved subject to general pre-approval at
the next regularly scheduled in-person board meeting. At this meeting, an analysis of such services is presented to the Committee for ratification. The Committee may delegate to the Committee
Chairman the authority to approve the provision of and fees for any specific engagement of permitted non-audit services, including services
exceeding pre-approved cost levels.
(e)(2) None of the services described in each of Items 4(b) through (d) were approved by
the Committee pursuant to the de minimis exception in paragraph (c)(7)(i)(C) of Rule 2-01 of Regulation S-X.
(f) Not Applicable
(g) The aggregate non-audit fees, defined as the sum of the fees shown under “Audit-Related Fees,” “Tax Fees” and “All Other Fees,” paid to the accountant for services rendered by the
accountant to the registrant, the Investment Adviser and the Affiliated Service Providers were:
|
|
|
|
|
| Entity Name |
|
Current Fiscal Year End |
|
Previous Fiscal Year End |
| BlackRock MuniYield New York
Quality Fund,
Inc. |
|
$21,736 |
|
$22,107 |
Additionally, the amounts billed by D&T in connection with services provided to the Affiliated
Service Providers of the Fund and of other funds sponsored or advised by BlackRock or its affiliates during the current and previous fiscal years for a service organization review and an accounting research tool subscription were:
|
|
|
| Current Fiscal Year End |
|
Previous Fiscal Year End |
| $2,149,000 |
|
$2,154,000 |
These amounts represent aggregate fees paid by BlackRock and were not allocated on a per fund basis.
(h) The Committee has considered and determined that the provision of non-audit services
that were rendered to the Investment Adviser and the Affiliated Service Providers that were not pre-approved pursuant to paragraph (c)(7)(ii) of
Rule 2-01 of Regulation S-X is compatible with maintaining the principal accountant’s independence.
(i) Not Applicable
(j) Not
Applicable
| Item 5 – |
Audit Committee of Listed Registrant |
(a) The following individuals are members of the registrant’s separately designated standing audit committee established in accordance
with Section 3(a)(58)(A) of the Securities Exchange Act of 1934 (15 U.S.C. 78c(a)(58)(A)):
Lorenzo A. Flores
J. Phillip Holloman
Catherine
A. Lynch
Arthur P. Steinmetz
(b) Not Applicable
(a) The registrant’s Schedule of Investments is included as part of the Report to Stockholders filed under Item 1(a) of this Form.
(b) Not Applicable due to no such divestments during the semi-annual period covered since the
previous Form N-CSR filing.
| Item 7 – |
Financial Statements and Financial Highlights for Open-End Management
Investment Companies – Not Applicable |
| Item 8 – |
Changes in and Disagreements with Accountants for Open-End Management
Investment Companies – Not Applicable |
| Item 9 – |
Proxy Disclosures for Open-End Management Investment Companies –
Not Applicable |
| Item 10 – |
Remuneration Paid to Directors, Officers, and Others of Open-End
Management Investment Companies – Not Applicable. |
| Item 11 – |
Statement Regarding Basis for Approval of Investment Advisory Contract – The registrant’s statement
regarding the basis for approval of the investment advisory contract is included as part of the Report to Stockholders filed under Item 1(a) of this Form. |
| Item 12 – |
Disclosure of Proxy Voting Policies and Procedures
for Closed-End Management Investment Companies – The board of directors has delegated the voting of proxies for the Fund’s portfolio securities to the Investment Adviser pursuant to the
Investment Adviser’s proxy voting guidelines. Under these guidelines, the Investment Adviser will vote proxies related to Fund securities in the best interests of the Fund and its stockholders. From time to time, a vote may present a conflict
between the interests of the Fund’s stockholders, on the one hand, and those of the Investment Adviser, or any affiliated person of the Fund or the Investment Adviser, on the other. In such event, provided that the Investment Adviser’s
Equity Investment Policy Oversight Committee, or a sub-committee thereof (the “Oversight Committee”) is aware of the real or potential conflict or material
non-routine matter and if the Oversight Committee does not reasonably believe it is able to follow its general voting guidelines (or if the particular proxy matter is not addressed in the guidelines) and vote
impartially, the Oversight Committee may retain an independent fiduciary to advise the Oversight Committee on how to vote or to cast votes on behalf of the Investment Adviser’s clients. If the Investment Adviser determines not to retain an
independent fiduciary, or does not desire to follow the advice of such independent fiduciary, the Oversight Committee shall determine how to vote the proxy after consulting with the Investment Adviser’s Portfolio Management Group and/or the
Investment Adviser’s Legal and Compliance Department and concluding that the vote cast is in its client’s best interest notwithstanding the conflict. A copy of the Fund’s Proxy Voting Policy and Procedures are attached as
Exhibit 99.PROXYPOL, a copy of the Fund’s Global Corporate Governance & Engagement Principles are attached as Exhibit 99.GLOBAL.CORP.GOV and a
copy of the Fund’s Corporate Governance and Proxy Voting Guidelines for U.S. Securities are attached as Exhibit 99.US.CORP.GOV. Information on how the Fund voted proxies relating to portfolio
securities during the most recent 12-month period ended June 30 is available without charge, (i) at www.blackrock.com and (ii) on the SEC’s website at http://www.sec.gov.
|
| Item 13 – |
Portfolio Managers of Closed-End Management Investment
Companies |
(a)(1) As of the date of filing this Report:
The registrant is managed by a team of investment professionals comprised of Walter O’Connor, CFA, Managing Director at BlackRock,
Christian Romaglino, CFA, Director at
BlackRock, CFA, Director at BlackRock, Kevin Maloney, CFA, Director at BlackRock, Phillip Soccio, CFA, Director at BlackRock, Michael Kalinoski, CFA, Director at BlackRock and Kristi Manidis,
Director at BlackRock. Each is a member of BlackRock’s municipal tax-exempt management group. Each is jointly responsible for the
day-to-day management of the registrant’s portfolio, which includes setting the registrant’s overall investment strategy, overseeing the management of the
registrant and/or selection of its investments. Messrs. O’Connor and Romaglino have been members of the registrant’s portfolio management team since 2006 and 2018, respectively. Messrs. Maloney, Soccio and Kalinoski and Ms. Manidis
have been members of the registrant’s portfolio management team since 2023.
|
|
|
| Portfolio Manager |
|
Biography |
| |
|
| Walter O’Connor, CFA |
|
Managing Director of BlackRock since 2006; Managing Director of Merrill Lynch
Investment Managers, L.P. (“MLIM”) from 2003 to
2006; Director of MLIM from 1998 to 2003. |
| |
|
| Christian Romaglino, CFA |
|
Director of BlackRock since 2017; Portfolio Manager for the Municipal Mutual Fund Desk within BlackRock’s Global Fixed Income Group
since 2017; Portfolio Manager of Brown Brothers Harriman from 2007 to 2017. |
| |
|
| Kevin Maloney, CFA |
|
Director of BlackRock since 2021; Vice President of BlackRock from 2018 to 2020; Associate of BlackRock from 2014 to 2017; Analyst of
BlackRock from 2011 to 2013. |
| |
|
| Phillip Soccio, CFA |
|
Director of BlackRock since 2009; Vice President of BlackRock from 2005 to 2008. |
| |
|
| Michael Kalinoski, CFA |
|
Director of BlackRock since 2006; Director of Merrill Lynch Investment Managers, L.P. (“MLIM”) from 1999 to 2006. |
| |
|
| Kristi Manidis |
|
Director of BlackRock, Inc. since 2016; Vice President of BlackRock, Inc. from 2011 to 2015; Associate of BlackRock, Inc. from 2009 to 2011;
Analyst of BlackRock, Inc. from 2006 to 2010. |
(a)(2) As of July 31, 2024:
|
|
|
|
|
|
|
|
|
|
|
|
|
| |
|
(ii) Number of Other Accounts Managed
and Assets by Account Type |
|
(iii) Number of Other Accounts and
Assets for Which Advisory Fee is
Performance-Based |
| (i) Name of Portfolio Manager |
|
Other Registered
Investment
Companies |
|
Other Pooled
Investment
Vehicles |
|
Other Accounts |
|
Other Registered
Investment
Companies |
|
Other Pooled
Investment
Vehicles |
|
Other
Accounts |
| Walter O’Connor, CFA |
|
33
|
|
0 |
|
0 |
|
0 |
|
0 |
|
0 |
| |
|
$31.27 Billion
|
|
$0 |
|
$0 |
|
$0 |
|
$0 |
|
$0 |
| Christian Romaglino, CFA |
|
36
|
|
0 |
|
0 |
|
0 |
|
0 |
|
0 |
| |
|
$16.98 Billion
|
|
$0 |
|
$0 |
|
$0 |
|
$0 |
|
$0 |
| Kevin Maloney, CFA |
|
39
|
|
0 |
|
0 |
|
0 |
|
0 |
|
0 |
| |
|
$40.89 Billion
|
|
$0 |
|
$0 |
|
$0 |
|
$0 |
|
$0 |
| Philip Soccio, CFA |
|
34
|
|
0 |
|
0 |
|
0 |
|
0 |
|
0 |
| |
|
$28.12 Billion
|
|
$0 |
|
$0 |
|
$0 |
|
$0 |
|
$0 |
| Michael Kalinoski, CFA |
|
34
|
|
0 |
|
0 |
|
0 |
|
0 |
|
0 |
| |
|
$34.73 Billion
|
|
$0 |
|
$0 |
|
$0 |
|
$0 |
|
$0 |
| Kristi Manidis |
|
36
|
|
0 |
|
2 |
|
0 |
|
0 |
|
0 |
|
|
|
|
|
|
|
|
|
|
|
|
|
| |
|
(ii) Number of Other Accounts Managed
and Assets by Account Type |
|
(iii) Number of Other Accounts and
Assets for Which Advisory Fee is
Performance-Based |
| (i) Name of Portfolio Manager |
|
Other Registered
Investment
Companies |
|
Other Pooled
Investment
Vehicles |
|
Other Accounts |
|
Other Registered
Investment
Companies |
|
Other Pooled
Investment
Vehicles |
|
Other
Accounts |
| |
|
$25.14 Billion
|
|
$0 |
|
$864.2 Million |
|
$0 |
|
$0 |
|
$0 |
(iv) Portfolio Manager Potential Material Conflicts of Interest
BlackRock has built a professional working environment, firm-wide compliance culture and compliance procedures and systems
designed to protect against potential incentives that may favor one account over another. BlackRock has adopted policies and procedures that address the allocation of investment opportunities, execution of portfolio transactions, personal trading by
employees and other potential conflicts of interest that are designed to ensure that all client accounts are treated equitably over time. Nevertheless, BlackRock furnishes investment management and advisory services to numerous clients in addition
to the Fund, and BlackRock may, consistent with applicable law, make investment recommendations to other clients or accounts (including accounts which are hedge funds or have performance or higher fees paid to BlackRock, or in which portfolio
managers have a personal interest in the receipt of such fees), which may be the same as or different from those made to the Fund. In addition, BlackRock, Inc., its affiliates and significant shareholders and any officer, director, shareholder
or employee may or may not have an interest in the securities whose purchase and sale BlackRock recommends to the Fund. BlackRock, Inc., or any of its affiliates or significant shareholders, or any officer, director, shareholder, employee or
any member of their families may take different actions than those recommended to the Fund by BlackRock with respect to the same securities. Moreover, BlackRock may refrain from rendering any advice or services concerning securities of
companies of which any of BlackRock, Inc.’s (or its affiliates’ or significant shareholders’) officers, directors or employees are directors or officers, or companies as to which BlackRock, Inc. or any of its affiliates or significant
shareholders or the officers, directors and employees of any of them has any substantial economic interest or possesses material non-public information. Certain portfolio managers also may
manage accounts whose investment strategies may at times be opposed to the strategy utilized for a fund. It should also be noted that a portfolio manager may be managing hedge fund and/or long only accounts, or may be part of a team managing
hedge fund and/or long only accounts, subject to incentive fees. Such portfolio managers may therefore be entitled to receive a portion of any incentive fees earned on such accounts.
As a fiduciary, BlackRock owes a duty of loyalty to its clients and must treat each client fairly. When BlackRock
purchases or sells securities for more than one account, the trades must be allocated in a manner consistent with its fiduciary duties. BlackRock attempts to allocate investments in a fair and equitable manner among client accounts, with no
account receiving preferential treatment. To this end, BlackRock, Inc. has adopted policies that are intended to ensure reasonable efficiency in client transactions and provide BlackRock with sufficient flexibility to allocate investments in a
manner that is consistent with the particular investment discipline and client base, as appropriate.
(a)(3) As of July 31, 2024:
Portfolio Manager Compensation Overview
The discussion below describes the portfolio managers’ compensation as of July 31, 2024.
BlackRock’s financial arrangements with its portfolio managers, its competitive compensation and its career path
emphasis at all levels reflect the value senior management places on key resources. Compensation may include a variety of components and may vary from year to year based on a number of factors. The principal components of compensation include a base
salary, a performance-based discretionary bonus, participation in various benefits programs and one or more of the incentive compensation programs established by BlackRock.
Base Compensation. Generally, portfolio managers receive base compensation based on their position with the firm.
Discretionary Incentive Compensation. Discretionary incentive compensation is a function of several
components: the performance of BlackRock, Inc., the performance of the portfolio manager’s group within BlackRock, the investment performance, including risk-adjusted returns, of the firm’s assets under management or supervision by that
portfolio manager relative to predetermined benchmarks, and the individual’s performance and contribution to the overall performance of these portfolios and BlackRock. In most cases, these benchmarks are the same as the benchmark or benchmarks
against which the performance of the Funds or other accounts managed by the portfolio managers are measured. Among other things, BlackRock’s Chief Investment Officers make a subjective determination with respect to each portfolio manager’s
compensation based on the performance of the Funds and other accounts managed by each portfolio manager relative to the various benchmarks. Performance of fixed income funds is measured on a pre-tax and/or after-tax basis over various time periods
including 1-, 3- and 5- year periods, as applicable. With respect to these portfolio managers, such
benchmarks for the Fund and other accounts are: A combination of market-based indices (e.g., Bloomberg Municipal Bond Index), certain customized indices and certain fund industry peer groups.
Distribution of Discretionary Incentive Compensation. Discretionary incentive compensation is distributed to
portfolio managers in a combination of cash, deferred BlackRock, Inc. stock awards, and/or deferred cash awards that notionally track the return of certain BlackRock investment products.
Portfolio managers receive their annual discretionary incentive compensation in the form of cash. Portfolio managers whose
total compensation is above a specified threshold also receive deferred BlackRock, Inc. stock awards annually as part of their discretionary incentive compensation. Paying a portion of discretionary incentive compensation in the form of deferred
BlackRock, Inc. stock puts compensation earned by a portfolio manager for a given year “at risk” based on BlackRock’s ability to sustain and improve its performance over future periods. In some cases, additional deferred BlackRock,
Inc. stock may be granted to certain key employees as part of a long-term incentive award to aid in retention, align interests with long-term shareholders and motivate performance. Deferred BlackRock, Inc. stock awards are generally granted in the
form of BlackRock, Inc. restricted stock units that vest pursuant to the terms of the applicable plan and, once vested, settle in BlackRock, Inc. common stock. The portfolio managers of this Fund have deferred BlackRock, Inc. stock awards.
For certain portfolio managers, a portion of the discretionary incentive
compensation is also distributed in the form of deferred cash awards that notionally track the returns of select BlackRock investment products they manage, which provides direct alignment of portfolio manager discretionary incentive compensation
with investment product results. Deferred cash awards vest ratably over a number of years and, once vested, settle in the form of cash. Only portfolio managers who manage specified products and whose total compensation is above a specified threshold
are eligible to participate in the deferred cash award program.
Other Compensation Benefits. In
addition to base salary and discretionary incentive compensation, portfolio managers may be eligible to receive or participate in one or more of the following:
Incentive Savings Plans — BlackRock, Inc. has created a variety of incentive savings plans in which
BlackRock, Inc. employees are eligible to participate, including a 401(k) plan, the BlackRock Retirement Savings Plan (RSP), and the BlackRock Employee Stock Purchase Plan (ESPP). The employer contribution components of the RSP include a company
match equal to 50% of the first 8% of eligible pay contributed to the plan capped at $5,000 per year, and a company retirement contribution equal to 3-5% of eligible compensation up to the Internal
Revenue Service limit ($330,000 for 2023). The RSP offers a range of investment options, including registered investment companies and collective investment funds managed by the firm. BlackRock, Inc. contributions follow the investment direction set
by participants for their own contributions or, absent participant investment direction, are invested into a target date fund that corresponds to, or is closest to, the year in which the participant attains age 65. The ESPP allows for investment in
BlackRock, Inc. common stock at a 5% discount on the fair market value of the stock on the purchase date. Annual participation in the ESPP is limited to the purchase of 1,000 shares of common stock or a dollar value of $25,000 based on its fair
market value on the purchase date. All of the eligible portfolio managers are eligible to participate in these plans.
(a)(4) Beneficial Ownership of Securities – As of July 31, 2024:
|
|
|
| Portfolio Manager |
|
Dollar Range of Equity Securities
of the Fund Beneficially Owned |
| Walter O’Connor, CFA |
|
None |
| Christian Romaglino, CFA |
|
None |
| Kevin Maloney, CFA |
|
None |
| Phillip Soccio, CFA |
|
None |
| Michael Kalinoski, CFA |
|
None |
| Kristi Manidis |
|
None |
(b) Not Applicable
| Item 14 – |
Purchases of Equity Securities by Closed-End Management
Investment Company and Affiliated Purchasers – Not Applicable due to no such repurchases during the period covered by this report. |
| Item 15 – |
Submission of Matters to a Vote of Security Holders – There have been no material changes to these
procedures. |
| Item 16 – |
Controls and Procedures |
(a) The registrant’s principal executive and principal financial officers, or persons performing similar functions, have concluded that
the registrant’s disclosure controls and procedures (as defined in Rule 30a-3(c) under the Investment Company Act of 1940, as amended (the “1940 Act”)) are effective as of a date
within 90 days of the filing date of this report based on the evaluation of these controls and procedures required by Rule 30a-3(b) under the 1940 Act and Rule
13a-15(b) or 15d-15(b) under the Securities Exchange Act of 1934, as amended.
(b) There were no changes in the registrant’s internal control over financial reporting (as defined in
Rule 30a-3(d) under the 1940 Act) that occurred during the period covered by this report that have materially affected, or are reasonably likely to materially affect, the registrant’s internal
control over financial reporting.
| Item 17 – |
Disclosure of Securities Lending Activities
for Closed-End Management Investment Companies – Not Applicable |
| Item 18 – |
Recovery of Erroneously Awarded Compensation – Not Applicable |
| Item 19 – |
Exhibits attached hereto |
(a)(1) Code of Ethics – See Item 2
(a)(2) Any policy required by the listing standards adopted pursuant to Rule 10D-1 under the Exchange
Act (17 CFR 240.10D-1) by the registered national securities exchange or registered national securities association upon which the registrant’s securities are listed – Not Applicable
(a)(3) Section 302 Certifications are attached
(a)(4) Any written solicitation to purchase securities under Rule 23c-1 – Not
Applicable
(a)(5) Change in Registrant’s independent public accountant – Not Applicable
(b) Section 906 Certifications are attached
Pursuant to the requirements of the Securities Exchange Act of 1934 and the Investment Company Act of 1940, the
registrant has duly caused this report to be signed on its behalf by the undersigned, thereunto duly authorized.
|
|
|
| BlackRock MuniYield New York Quality Fund, Inc. |
|
|
| By: |
|
/s/ John M. Perlowski |
|
|
John M. Perlowski |
|
|
Chief Executive Officer (principal executive officer) of |
|
|
BlackRock MuniYield New York Quality Fund, Inc. |
|
| Date: September 20, 2024 |
Pursuant to the requirements of the Securities Exchange Act of 1934 and the Investment Company Act of 1940, this report has
been signed below by the following persons on behalf of the registrant and in the capacities and on the dates indicated.
|
|
|
| By: |
|
/s/ John M. Perlowski |
|
|
John M. Perlowski |
|
|
Chief Executive Officer (principal executive officer) of |
|
|
BlackRock MuniYield New York Quality Fund, Inc. |
|
| Date: September 20, 2024 |
|
|
| By: |
|
/s/ Trent Walker |
|
|
Trent Walker |
|
|
Chief Financial Officer (principal financial officer) of |
|
|
BlackRock MuniYield New York Quality Fund, Inc. |
|
| Date: September 20, 2024 |