
John Hancock Life Insurance Company of New York Separate Account B
JOHN HANCOCK LIFE INSURANCE COMPANY OF NEW YORK
(“John Hancock NY”)
Flexible Premium Variable Universal Life Insurance Policy
CORPORATE VUL
Prospectus dated April 25, 2022
You may choose to allocate your policy value to one or more of the options that the policies make available for that purpose. These options include our “variable investment accounts,” where the policy value will vary directly with the positive or negative investment experience of underlying investment “portfolios.” To provide you with that investment experience, amounts that you allocate to a variable investment account are held in a corresponding “subaccount” of John Hancock Life Insurance Company of New York Separate Account B (“Separate Account”), and the subaccount invests those amounts exclusively in one of the portfolios.
You may also allocate policy value to a “fixed account” that the policy makes available. This prospectus provides detailed information about all such options to which you can allocate your policy value.
Please note that the Securities and Exchange Commission (“SEC”) has not approved or disapproved these securities or determined if this prospectus is truthful or complete. Any representation to the contrary is a criminal offense.
Additional information about certain investment products, including variable life insurance, has been prepared by the SEC’s staff and is available at Investor.gov.
| MEANING OF CERTAIN WORDS |
||||
| 4 | ||||
| 4 | ||||
| 6 | ||||
| 6 | ||||
| 6 | ||||
| 7 | ||||
| 7 | ||||
| 7 | ||||
| 7 | ||||
| 7 | ||||
| 7 | ||||
| 8 | ||||
| 10 | ||||
| 10 | ||||
| 10 | ||||
| 10 | ||||
| 11 | ||||
| Limitations on transfers to or from a variable investment account |
11 | |||
| 12 | ||||
| 12 | ||||
| 12 | ||||
| Dollar cost averaging and asset allocation balancer programs |
13 | |||
| 13 | ||||
| 13 | ||||
| 13 | ||||
| 13 | ||||
| 14 | ||||
| 14 | ||||
| 15 | ||||
| 15 | ||||
| 15 | ||||
| 15 | ||||
| 15 | ||||
| 16 | ||||
| 16 | ||||
| 17 | ||||
| 17 | ||||
| 17 | ||||
| 17 | ||||
| 18 | ||||
| 18 | ||||
| 18 | ||||
| 18 | ||||
| 18 | ||||
2
| 19 | ||||
| 19 | ||||
| 19 | ||||
| 19 | ||||
| 20 | ||||
| 20 | ||||
| 22 | ||||
| 22 | ||||
| 22 | ||||
| 22 | ||||
| 23 | ||||
| 23 | ||||
| Tax Consequences of Electing Certain Supplementary Benefit Riders |
24 | |||
| 24 | ||||
| 24 | ||||
| 24 | ||||
| 25 | ||||
| 25 | ||||
| Early Surrender or Withdrawal Risk/Not a Short-Term Investment |
25 | |||
| 25 | ||||
| 26 | ||||
| 26 | ||||
| 26 | ||||
| 26 | ||||
| 27 | ||||
| Additional Information About How Certain Policy Charges Work |
27 | |||
| 28 | ||||
| 28 | ||||
| 29 | ||||
| 29 | ||||
| 29 | ||||
| 29 | ||||
| 30 | ||||
| 30 | ||||
| 31 | ||||
| 31 | ||||
| 31 | ||||
| 31 | ||||
| 32 | ||||
| 32 | ||||
| 33 | ||||
| 33 | ||||
| Appendix-1 | ||||
3
Important Information You Should Consider About the Policy
| FEES AND EXPENSES | ||||||||||||||||
| Charges for Early Withdrawals | There is a fee assessed upon a withdrawal. |
| ||||||||||||||
| Transaction Charges | In addition to withdrawal charges (if applicable), you may also be charged for the following transactions:
A premium charge will be deducted upon payment of premium.
A transfer fee may be deducted upon transfers into or out of a variable investment account after you have made more than 12 such transfers in a year. |
| ||||||||||||||
| Ongoing Fees and Expenses (annual charges) | In addition to withdrawal charges and transaction charges, you will also be subject to certain ongoing fees and expenses, including a cost of insurance charge, administrative charge, Base Face Amount charge, asset-based risk charge, policy loan costs, and supplementary benefit rider charges. Some of these fees and expenses are based wholly or in part on the characteristics of the insured persons (e.g., age, sex, and underwriting classification). You should view the “policy specifications” page of your policy for rates applicable to your policy.
You will also bear expenses associated with the portfolios under the policy, as shown in the following table:
|
Charges at the portfolio level
| ||||||||||||||
| Annual Fee | Minimum | Maximum | ||||||||||||||
| Variable investment options (portfolio fees and expenses) |
0.39% | 1.68% | ||||||||||||||
| RISKS | ||||||||
| Risk of Loss |
You can lose money by investing in this policy. | PRINCIPAL RISKS OF INVESTING IN A POLICY” | ||||||
| Not a Short-Term Investment | This policy is not a short-term investment and is not appropriate for an investor who needs ready access to cash. The policy is unsuitable as a short-term savings vehicle because of substantial policy-level charges, including the premium charge and the surrender charge, as well as potential adverse tax consequences from such short-term use. | Early Surrender or Withdrawal Risk/Not a Short-Term Investment | ||||||
| Risks Associated with Investment Options | An investment in this policy is subject to the risk of poor performance and can vary depending on the performance of the account allocation options available under the policy (e.g., portfolios). Each such option (including the fixed account) will have its own unique risks, and you should review these options before making an allocation decision. | Investment Risk/Risk of Loss | ||||||
4
| Insurance Company Risks | Your investment in the policy is subject to risks related to John Hancock NY, including that the obligations (including under the fixed account option), guarantees, or benefits are subject to the claims-paying ability of John Hancock NY. Information about John Hancock NY, including its financial strength ratings, is available upon request from your John Hancock NY representative. Our current financial strength ratings can also be obtained by contacting the Service Office at 1-877-391-3748, option 4. | |||||||
| Policy Lapse | This policy will go into default if at the beginning of any policy month the policy’s net cash surrender value would be zero or below after deducting the monthly deductions then due. The “net cash surrender value” is your policy value, less any policy debt, and less any applicable surrender charges. This can happen as a result of insufficient premium payments, poor performance of the variable or general account options you have chosen, withdrawals, or unpaid loans or loan interest. If a default is not cured within a 61-day grace period, your policy will lapse without value, and no death benefit or other benefits will be payable. You can apply to reinstate a policy that has gone into default, subject to conditions including payment of a specified amount of additional premiums. | Lapse and Reinstatement | ||||||
| RESTRICTIONS | ||||||||
| Investments | There are restrictions that may limit the variable investment account options and general account options (including the fixed account) that you may choose, as well as limitations on the transfer of policy value among those options. These restrictions may include a monthly limit on the number of transfers you may make. We may also impose additional restrictions to discourage market timing and disruptive trading activity.
In particular, your allocation options will be affected if you elect to take a loan or receive benefits under certain supplementary benefit riders.
Among other things, the policy also allows us to eliminate the shares of a portfolio or substitute shares of another new or existing portfolio, subject to applicable legal requirements. |
Limitations on transfers to or from a variable investment account
Limitations on transfers out of the fixed account
Effect of Loans on Cash Value and Death Benefit
| ||||||
| Optional Benefits | There are restrictions and limitations relating to optional benefits, as well as conditions under which an optional benefit may be modified or terminated by us. For example, certain supplementary benefit riders may be subject to underwriting, and your election of an option may result in restrictions upon some of the policy benefits, including availability of investment options. |
| ||||||
5
| TAXES | ||||||||
| Tax Implications | You should consult with a tax professional to determine the tax implications of an investment in and payments received under the policy. There is no additional tax benefit to you if the policy is purchased through a tax-qualified plan or an individual retirement account (IRA). If we pay out any amount of your policy value upon surrender or partial withdrawal, all or part of that distribution would generally be treated as a return of the premiums you’ve paid and not subjected to income tax, with any portion not treated as a return of your premiums includible in your income. Distributions also are subject to tax penalties under some circumstances. |
Tax Consequences of Owning a Policy | ||||||
| CONFLICTS OF INTEREST | ||||||||
| Investment Professional Compensation | Some investment professionals may receive compensation for selling the policy, including by means of commissions and revenue sharing arrangements. These investment professionals may have a financial incentive to offer or recommend this policy over another investment. | Commissions Paid to Dealers | ||||||
| Exchanges | Some investment professionals may have a financial incentive to offer you a new policy in place of the one you already own, and you should only exchange your policy if you determine, after comparing the features, fees, and risks of both policies, that it is preferable for you to purchase the new policy rather than continue to own the existing policy. | Commissions Paid to Dealers | ||||||
The purpose of the policy is to provide lifetime protection against economic loss due to the death of the insured person and to help you accumulate assets through an investment portfolio. Fees, expenses and tax implications can make variable life insurance unsuitable as a short-term savings vehicle.
We call the investments you make in the policy “premiums” or “premium payments.” The Minimum Initial Premium is a dollar amount that is stated in your policy specifications and that must be paid to us in full before your policy will take effect. Premium payments after the initial premium may not be required, but you must pay enough premium to keep the policy in force. That’s why the policy is called a “flexible premium” policy. After the payment of the initial premium, premiums may be paid at any time and in any amount until the insured person’s attained age 100, subject to the need to pay enough premium to keep the policy in force, and to limitations on maximum premium amount.
Federal tax law limits the amount of premium payments you can make relative to the amount of your policy’s insurance coverage. We will not knowingly accept any amount by which a premium payment exceeds this limit. In addition, in order to limit our investment risk exposure under certain market conditions, we may refuse to accept additional premium payments.
From each premium payment you make, we deduct the applicable premium charges identified in the FEE TABLE. We invest the rest (the “net premium”) in the variable investment accounts or any fixed investment option you’ve elected.
6
The policy offers a number of variable investment accounts. You can find some important information about each portfolio in the APPENDIX, but for a full description of each portfolio, including the investment objectives and strategies, policies, restrictions, and risks, you should read the portfolio’s prospectus carefully before investing in the corresponding variable investment account.
You can also allocate policy value to the fixed account (where it is credited with rates of interest that we declare from time to time but will never be less than a minimum rate guaranteed in your policy specifications).
If the net cash surrender value is insufficient to pay the charges when due your policy can terminate (i.e. “lapse”). This can happen because you haven’t paid enough premium or because the investment performance of the variable investment accounts you’ve chosen has been poor.
Death benefit. When the insured person dies, we will pay the “death benefit” minus any outstanding policy debt and unpaid fees and charges. There are two ways of calculating the death benefit. You choose which one you want in the application.
| • | Option 1 - The death benefit will equal the greater of (1) the Total Face Amount, or (2) the minimum death benefit (as described below). The “Total Face Amount” is the amount of life insurance coverage equal to the “Base Face Amount” plus any “Supplemental Face Amount,” as set forth in your policy. |
| • | Option 2 - The death benefit will equal the greater of (1) the Total Face Amount plus the policy value on the date of death, or (2) the minimum death benefit. |
Surrender of the policy. You may surrender the policy in full while the insured person is alive. If you do, we will pay you the policy value less any outstanding policy debt. This is called your “net cash surrender value.”
Withdrawals. After the first policy year, you may make a withdrawal of part of your net cash surrender value. Generally, each withdrawal must be at least $500. We reserve the right to charge a fee of up to the lesser of 2% of the withdrawal amount or $25 for each withdrawal. Your policy value is automatically reduced by the amount of the withdrawal. A withdrawal may also reduce the Total Face Amount.
Policy loans. If your policy is in force and has sufficient policy value, you may borrow from it at any time by completing the appropriate form. Generally, the minimum amount of each loan is $500. The maximum amount you can borrow is determined by a formula as described in your policy. Interest is charged on each loan. If there is an outstanding loan the amount of the loan and accrued interest will be deducted from the death benefit and other policy proceeds.
Supplementary benefits. When you apply for the policy, you can request any of the below-listed supplementary benefit riders that we make available. Availability of riders varies from state to state. Charges for most riders will be deducted monthly from the policy value. Some riders may not be available in combination with other riders or benefits.
| • | Enhanced Cash Value Rider |
| • | Change of Life Insured Rider |
| • | Overloan Protection Rider |
You can find information about the fees we charge for these riders under “Optional Benefit Charges” in the Fee Table below. We also offer, at no charge, a dollar cost averaging (“DCA”) program and an asset allocation balancer program.
7
The following tables describe the fees and expenses that you will pay when buying, owning, and surrendering or making withdrawals from the policy. Please refer to your policy specifications for information about the specific fees you will pay each year based on the options you have elected.
The first table describes the fees and expenses that you will pay at the time that you buy the policy, surrender or make withdrawals from the policy, or transfer policy value between investment options.
| TRANSACTION FEES | ||||
| Charge | When Charge is Deducted | Amount Deducted | ||
|
Maximum premium charge |
Upon payment of premium | 7% of each premium paid (currently, 1.5%) | ||
|
Maximum transfer fee (fn1) |
Upon each transfer into or out of a variable investment account beyond an annual limit of twelve | $25.00 (currently $0) | ||
|
Maximum withdrawal fee (fn1) |
Upon making a withdrawal | The lesser of 2% of the withdrawal amount or $25.00 | ||
| Overloan Protection Rider (fn2) |
At exercise of benefit | |||
| Minimum charge |
0.04% | |||
|
Maximum charge |
8.0% | |||
|
Enhanced Cash Value Rider (fn3) |
Upon payment of premium | 0.5% of premium paid in the first 7 policy years, up to the Limiting Premium (1) for each policy year stated in the Policy Specifications page of the policy. | ||
|
Change of Life Insured Rider |
At exercise of benefit | $250.00 | ||
(fn1) This charge is not currently imposed, but we reserve the right to do so in the policy.
(fn2) The charge for this rider is determined as a percentage of unloaned account value. The rates vary by the attained age of the insured person at the time of exercise. The rates also differ according to the tax qualification test elected at issue. The guaranteed minimum rate for the guideline premium test is .04% (currently .04%) and the guaranteed maximum rate is 2.50% (currently 2.50%). The guaranteed minimum rate for the cash value accumulation test is .054% (currently .054%) and the guaranteed maximum rate is 8.00% (currently 8.00%). The minimum rate shown in the table is for an insured person who has reached attained age 99 and the guideline premium test has been elected. The maximum rate shown is for an insured person who has reached attained age 75 and the cash value accumulation test has been elected.
(fn3) The “Limiting Premium” is an amount determined by multiplying the Base Face Amount at issue by an applicable rate which varies by the sex and issue age of the insured person. The minimum rate is for a 15-year old female and is $17.90 per $1000 of Base Face Amount. The maximum rate is for a 90-year old male and is $216.26 per $1,000 of Base Face Amount. The rate for a representative insured person is for a 45 year old male and is $56.49 per $1000 of Base Face Amount. Thus, for the representative 45 year old male with $100,000 of Base Face Amount, the Limiting Premium for the policy year would be $5,649.00.
8
The next table describes the fees and expenses that you will pay periodically during the time that you own the policy, not including portfolio fees and expenses.
| PERIODIC CHARGES OTHER THAN ANNUAL PORTFOLIO EXPENSES | ||||
| Charge | When Charge is Deducted | Amount Deducted | ||
|
Base Policy Charges: |
||||
| Cost of Insurance (fn1): |
Monthly | |||
| Minimum charge |
$0.07 per $1,000 of NAR | |||
| Maximum charge |
$83.33 per $1,000 of NAR | |||
|
Charge for a representative insured person |
$0.38 per $1,000 of NAR | |||
|
Administrative charge |
Monthly | $12.00 | ||
| Face Amount charge (fn2): |
Monthly | |||
| Minimum charge |
$0.09 per $1,000 of Base Face Amount in policy years 1-10 | |||
| Maximum charge |
$1.08 per $1,000 of Base Face Amount in policy years 1-10 | |||
|
Charge for a representative insured person |
$0.28 per $1,000 of Base Face Amount | |||
|
Asset-based risk charge (fn3) |
Monthly | 0.08% of policy value in policy years 1-10
0.03% of policy value in policy year 11 and thereafter | ||
|
Maximum policy loan interest rate (fn4) |
Accrues daily Payable annually | 3.75% annual rate | ||
(fn1) The cost of insurance charge is determined by multiplying the amount of insurance for which we are at risk (the net amount at risk or “NAR”) by the applicable cost of insurance rate. The rates vary widely depending upon the length of time the policy has been in effect, the insurance risk characteristics of the insured person and (generally) the gender of the insured person. The minimum rate shown in the table is the rate in the first policy year for a policy issued to cover a 15 year old female preferred underwriting risk. The maximum rate shown in the table at both guaranteed and current rates is the rate in the first policy year for a policy issued to cover a 90 year old male substandard smoker underwriting risk. This includes the so-called extra mortality charge. The representative insured person referred to in the table is a 45 year old male standard non-smoker underwriting risk with a policy in the first policy year.
(fn2) This charge is determined by multiplying the Base Face Amount at issue by the applicable rate. The rates vary by the sex and issue age of the insured person and duration (Policy Year). The minimum rate shown in the table is for a 15 year old female. The maximum rate shown in the table is for a 90 year old male. The representative insured person referred to in the table is a 45 year old male.
(fn3) This charge only applies to that portion of policy value held in the investment accounts. The charge determined does not apply to any fixed account.
(fn4) 3.75% is the maximum effective annual interest rate we can charge and applies only during policy years 1-10. The effective annual interest rate is 3.00% thereafter (although we reserve the right to increase the rate after the tenth policy year to as much as 3.25%). The amount of any loan is transferred from the accounts to a special loan account which earns interest at an effective annual rate of 3.00%. Therefore, the cost of a loan is the difference between the loan interest we charge and the interest we credit to the special loan account.
9
The next item shows the minimum and maximum total operating expenses charged by the portfolios that you may pay periodically during the time that you own the policy. A complete list of the portfolios available under the policy, including their annual expenses, may be found at the back of this document.
| Annual Portfolio Expenses | Minimum | Maximum | ||||||
| Range of expenses that are deducted from portfolio assets, including management fees, distribution and/or service (12b-1) fees, and other expenses (fn1) |
0.39 | % | 1.68 | % | ||||
GENERAL DESCRIPTION OF THE POLICY
Owner and beneficiary. The owner of the policy is the person who can exercise most of the rights under the policy, such as the right to choose the accounts in which to invest or the right to surrender the policy. In many cases, the person buying the policy is also the person who will be the owner. However, the application for a policy can name another person or entity (such as a trust) as owner. It is possible to name so-called “joint owners” of the policy. If more than one person owns a policy, all owners must join in most requests to exercise rights under the policy. Whenever we’ve used the term “you” in this prospectus, we’ve assumed that the reader is the person who has whatever right or privilege is being discussed. There may be tax consequences if the owner and the insured person are different, so you should discuss this issue with your tax adviser.
While the insured person is alive, you will have a number of options under the policy. These options include:
| • | Determine when and how much you allocate to the variable investment accounts and any fixed account |
| • | Borrow or withdraw amounts you have in the variable investment account and any fixed account |
| • | Change the beneficiary who will receive the death benefit |
| • | Change the amount of insurance |
| • | Surrender the policy for its net cash surrender value |
| • | Choose the form in which we will pay out the death benefit or other proceeds |
You name your beneficiary when you apply for the policy. The beneficiary is entitled to the proceeds we pay following the insured person’s death. Until the death of the insured person you can change your beneficiary by written request. Such a change requires the consent of any named irrevocable beneficiary. A new beneficiary designation will not affect any payments we make before we receive it. If no beneficiary is living when the insured person dies, we will pay the insurance proceeds to the owner or the owner’s estate.
All premiums received prior to the Issue Date of the policy will be held in the general account and credited with interest from the date of receipt at the rate of return then being earned on amounts allocated to the Money Market variable investment account. After the Issue Date but prior to the Allocation Date, net premiums received are allocated to the Money Market variable investment account. The “Allocation Date” of the policy is the tenth day after the Issue Date. The Issue Date is shown in your policy specifications. On the Allocation Date, the net premiums paid plus return credited, if any, will be allocated among the variable investment accounts or the fixed account in accordance with the policy owner’s instructions. Any net premium received on or after the Allocation Date will be allocated among variable investment accounts or the fixed account as of the business day on or next following the date the premium is received at the Service Office. In your application for a policy, you give us your initial instructions as to how you wish your initial and future premium payments to be allocated among the variable investment and fixed accounts. Your instructions must be in percentages that add up to 100%. By written request and at any time, you may change the variable investment accounts or fixed account in which future premium payments will be invested.
There are restrictions that may limit the variable investment and fixed account options that you may choose, as well as limitations on the transfer of policy value among those options. For example, your investment options
10
will be limited if you exercise benefits under the Overloan Protection Rider. Specifically, all value you have in the variable investment accounts will automatically be transferred to the fixed account, and, so long as you continue to receive any of those benefits, you will not be permitted to allocate any additional amounts to the variable investment account.
You may transfer your policy value from one variable investment account or fixed account to another, subject to the limitations discussed below. To do so, you must tell us how much to transfer, either as a whole number percentage or as a specific dollar amount. A confirmation of each transfer will be sent to you Without our approval, the maximum amount you may transfer to or from any account (fixed or investment) in any policy year is $1,000,000.
We have adopted policies and procedures with respect to frequent transfers of policy value among variable investment accounts.
Limitations on transfers to or from a variable investment account. Our current practice is to restrict transfers into or out of variable investment accounts to two per calendar month (except with respect to those policies described in the following paragraphs). For purposes of this restriction, and in applying the limitation on the number of free transfers, any transfers made during the period from the opening of a business day (usually 9:00 a.m. Eastern time) to the close of that business day (usually 4:00 p.m. Eastern time) are considered one transfer. You may, however, transfer to the Money Market variable investment account even if the two transfers per month limit has been reached, but only if 100% of the account value in all variable investment accounts is transferred to the Money Market variable investment account. If such a transfer to the Money Market variable investment account is made, then for the 30 calendar day period after such transfer no transfers from the Money Market variable investment account to any other variable investment account or any fixed account may be made. If your policy offers a dollar cost averaging or automatic asset allocation rebalancing program, any transfers pursuant to such program are not considered transfers subject to these restrictions on frequent trading.
Policies such as yours may be purchased by a corporation or other entity as a means to informally finance the liabilities created by an employee benefit plan, and to this end the entity may aggregately manage the policies purchased to match its liabilities under the plan. Policies sold under these circumstances are subject to special transfer restrictions. In lieu of the two transfers per month restriction, we will allow the policy owner under these circumstances to rebalance the variable investment accounts in its policies within the following limits: (i) during the 10 calendar day period after any policy values are transferred from one variable investment account into a second variable investment account, the values can only be transferred out of the second variable investment account if they are transferred into the Money Market variable investment account; and (ii) any policy values that would otherwise not be transferable by application of the 10 day limit described above and that are transferred into the Money Market variable investment account may not be transferred out of the Money Market variable investment account into any other variable investment account or any fixed account for 30 calendar days.
Subject to our approval, we may offer policies purchased by a corporation or other entity that has purchased policies to match its liabilities under an employee benefit plan, as described above, the ability to electronically rebalance the variable investment accounts in its policies. Under these circumstances, in lieu of imposing any specific limit upon the number and timing of transfers, we will monitor aggregate trades among the subaccounts for frequency, pattern and size for potentially harmful investment practices. If we detect trading activity that we believe may be harmful to the overall operation of any variable investment account or underlying portfolio, we may impose conditions on policies employing electronic rebalancing to submit trades, including setting limits upon the number and timing of transfers, and revoking privileges to make trades by any means other than written communication submitted via U.S. mail. While we seek to identify and prevent disruptive frequent trading activity, it may not always be possible to do so. Therefore no assurance can be given that the restrictions we
11
impose will be successful in preventing all disruptive frequent trading and avoiding harm to long-term investors. The restrictions described in these paragraphs will be applied uniformly to all policy holders subject to the restrictions.
We will apply these limitations uniformly to each class of policies.
Frequent transfers among variable investment accounts. Variable investment accounts in variable life insurance products can be a prime target for abusive transfer activity because these products value their variable investment accounts on a daily basis and allow transfers among variable investment accounts without immediate tax consequences. As a result, some investors may seek to frequently transfer into and out of variable investment accounts or to make large transfers in reaction to market news or to exploit a perceived pricing inefficiency. Whatever the reason, long-term investors in any variable investment account can be harmed by large or frequent transfer activity. For example, such activity may expose the variable investment account’s portfolio to increased portfolio transaction costs and/or disrupt the portfolio manager’s ability to effectively manage the portfolio’s investments in accordance with the portfolio’s investment objectives and policies. This could include causing the portfolio to maintain higher levels of cash than would otherwise be the case, or liquidating investments prematurely. Accordingly, frequent or large transfers may result in dilution with respect to interests held for long-term investment and adversely affect policy owners, beneficiaries and the portfolios.
To discourage market timing and disruptive trading activity, we impose restrictions on transfers and reserve the right to change, suspend or terminate telephone, facsimile and internet transaction privileges. We also reserve the right to impose a fee of up to $25 for any transfer beyond an annual limit (which would be 12 or more). No transfer fee will be imposed on any transfer from a variable investment account into any fixed account if the transfer occurs during the following periods:
| • | within 18 months after the policy’s Issue Date, or |
| • | within 60 days after the later of the effective date of a material change in the investment objectives of any variable investment account or the date you are notified of the change. |
While we seek to identify and prevent disruptive trading activity, it may not always be possible to do so. Therefore, no assurance can be given that the restrictions we impose will be successful in preventing all disruptive trading and avoiding harm to long-term investors.
Limitations on transfers out of the fixed account. Transfers out of the fixed account option in any one policy year are limited to the greater of (i) the fixed account maximum transfer amount of $2,000, (ii) the fixed account maximum transfer percentage of 25% multiplied by the amount of the fixed account on the immediately preceding policy anniversary, or (iii) the amount transferred out of the fixed account during the previous policy year. Any transfer out of the fixed account may not involve a transfer to the Money Market variable investment account. We reserve the right to impose a minimum amount limit on transfers out of any fixed account. We also reserve the right to impose different restrictions on any additional fixed account that we may offer in the future. We may waive the transfer restrictions on the fixed account.
Potential additional limitations. We reserve the right to take other actions to restrict transfers, including, but not limited to: (i) restricting the number of transfers made during a defined period, (ii) restricting the dollar amount of transfers, (iii) restricting transfers into and out of certain variable investment accounts, (iv) restricting the method used to submit transfers, and (v) deferring a transfer at any time we are unable to purchase or redeem shares of the portfolio. We may also impose additional administrative conditions upon or prohibit a transfer request made by a third party giving instructions on behalf of multiple policies, whether owned by the same owner or different owners. If you engage a third party for asset allocation services, then you may be subject to these transfer restrictions because of the actions of that party in providing those services. We will notify the third party you have engaged if we exercise this right. A portfolio also may require us to impose additional trading restrictions if violations of its policies against frequent or disruptive trading in its shares are discovered.
12
Dollar cost averaging and asset allocation balancer programs. We may offer policy owners a dollar cost averaging (“DCA”) program. Under the DCA program, you will designate an amount that will be transferred monthly from one variable investment account into any other variable investment account or a fixed account. If insufficient funds exist to effect a DCA transfer, the transfer will not be effected and you will be so notified. We do not apply any minimum amount requirements for participation in the DCA program. You can participate in both the dollar cost averaging and asset rebalancing programs at the same time. Under the asset allocation balancer program you will designate an allocation of policy value among variable investment accounts. We will move amounts among the variable investment accounts at specified intervals you select — annually, semi-annually, quarterly or monthly. A change to your premium allocation instructions will automatically result in a change in asset allocation balancer instructions so that the two are identical unless you either instruct us otherwise or have elected the dollar cost averaging program. This asset allocation balancer program only applies to policy value in the variable investment accounts. No fee is charged for these programs. We reserve the right to cease to offer these programs as of 90 days after written notice is sent to you.
The fixed investment option is part of our general account. Our general account consists of all assets owned by us other than those in the Separate Account and any other separate accounts which we have established and may establish. Any interest credited to a policy owner from an investment in a fixed investment option and any guaranteed benefits we may provide under the policy that exceed the value of amounts held in the Separate Account will be paid from the Company’s general account and will be subject to the Company’s financial strength and claims paying ability. Subject to applicable law, John Hancock NY has sole discretion over the investment of the assets of the general account and policy owners do not share in the investment experience of, or have any preferential claim on, those assets. John Hancock NY bears full investment risk for all amounts allocated to the fixed investment option.
Because of exemptive and exclusionary provisions, interests in our fixed investment option have not been and will not be registered under the Securities Act of 1933 and our general account has not been registered as an investment company under the Investment Company Act of 1940 (“1940 Act”). Accordingly, neither the general account nor any interests therein are subject to the provisions of these acts. Disclosures regarding the general account, however, are subject generally to applicable provisions of federal securities laws relating to the accuracy and completeness of statements made in the prospectus.
The fixed investment option. Account value allocated to any fixed investment option will accrue interest daily at an effective annual rate that we determine and that depends on a number of significant considerations in addition to the actual investment experience we expect for the general account. We currently offer only one fixed investment option — the standard fixed investment option. The effective annual rate we declare for the standard fixed investment option will never be less than 3%. We reserve the right to offer one or more additional fixed investment options with characteristics that differ from those of the current fixed investment option, but we are under no obligation to do so. Any interest we credit in excess of the guaranteed interest crediting rate will be based on our sole discretion. Additionally, interest credited on a non-guaranteed basis varies over time is rarely the same year-over-year and there may be extended periods of time during which no interest above the guaranteed minimum is declared.
Generally, the policy is available with a minimum Total Face Amount at issue of $100,000 and a minimum Base Face Amount at issue of $50,000. At the time of issue, the insured person must have an attained age of no more than 90. The insured person must meet certain health and other insurance risk criteria called “underwriting standards.”
13
The Minimum Initial Premium is set forth in your policy specifications. Factors that determine the minimum initial premium amount generally include the insured persons’ age, sex and risk classification including any additional ratings; the Total Face Amount of insurance and election of any Supplemental Face Amount; choice of Death Benefit Option 1 vs. Option 2; and any selected supplementary benefit riders. Premium payments after the initial premium may not be required, but you must pay enough premium to keep the policy in force. That’s why the policy is called a “flexible premium” policy.
If you pay premiums by check or money order, they must be drawn on a U.S. bank in U.S. dollars and made payable to “John Hancock.” We will not accept credit card checks. We will not accept starter or third party checks if they fail to satisfy our administrative requirements. Premiums after the first must be sent to the John Hancock NY Service Office at the appropriate address shown on the back cover of this prospectus. We will also accept premiums by wire or by exchange from another insurance company, or via an electronic funds transfer program (any owner interested in making monthly premium payments must use this method).
In addition to the Minimum Initial Premium, your policy specifications will also show the “Planned Premium” that you chose for the policy. Payment of Planned Premiums is not necessarily required, however. You need only pay enough premium to keep the policy in force.
The amount and frequency of the Planned Premium are determined by you, in consultation with your financial advisor, based upon your financial objectives for the policy. Depending upon the amount and timing of your actual premium payments, investment results, changing objectives and other factors, you may need to change the amount and frequency of your premium payments from the Planned Premium amount in order for the policy to continue to support your financial objectives. You may be required to pay additional premiums beyond the Planned Premium amount in order to keep your policy from lapsing. You should request in-force illustrations periodically in order to help assure that you are keeping on track with your objectives.
Federal tax law limits the amount of premium payments you can make relative to the amount of your policy’s insurance coverage. Also, in order to limit our exposure to unanticipated investment risk, we may refuse to accept additional premium payments. For example, with large premium payments in an environment of decreasing interest rates, we may not be able to acquire investments for our general account that will sufficiently match the liabilities we are incurring under our fixed account guarantees. Excessive allocations may also interfere with the effective management of our variable investment accounts, if we are unable to make an orderly investment of the additional premium into the variable investment accounts. Also, we may refuse to accept or limit an amount of premium if the amount of the premium would increase our insurance risk exposure, and the insured person doesn’t provide us with adequate evidence that he or she continues to meet our requirements for issuing insurance.
We will notify you in writing of our refusal to accept premium and will promptly thereafter take the necessary steps to return the premium to you. Notwithstanding the foregoing limits on the premium that we will accept, we will not refuse to accept any premium necessary to prevent the policy from terminating.
A policy will go into default if at the beginning of any policy month the policy’s net cash surrender value would be zero or below after deducting the monthly deductions then due. Therefore, a policy could lapse eventually if increases in policy value (prior to deduction of policy charges) are not sufficient to cover policy charges. We will notify you of the default and will allow a 61-day grace period in which you may make a premium payment sufficient to bring the policy out of default. The required payment will be equal to the amount necessary to bring the net cash surrender value to zero, if it was less than zero on the date of default, plus an amount equal to three times the monthly deductions due on the date of default, plus any applicable premium charge. If the insured
14
person should die during the grace period, the policy value used in the calculation of the death benefit will be the policy value as of the date of default and the death benefit will be reduced by any outstanding monthly deductions due at the time of death. If the required payment is not received by the end of the grace period, the policy will terminate (i.e., “lapse”) with no value.
Effectiveness and Policy Date. After you apply for a policy, we gather and evaluate all the information we need to decide whether to issue a policy to you and, if so, what the insured person’s risk classification should be. After we approve an application for a policy and assign an appropriate insurance risk classification, we will prepare the policy for delivery. The policy will take effect only if all of the following conditions are satisfied:
| • | The policy is delivered to and received by the applicant. |
| • | The Minimum Initial Premium is received by us. |
| • | The insured person is living and there has been no deterioration in the insurability of the insured person since the date of the application. |
If all of the above conditions are satisfied, the policy will take effect on the date shown in the policy as the “Policy Date.” That is the date on which we begin to take monthly deductions. Policy months, policy years and policy anniversaries are all measured from the Policy Date. Under limited circumstances, we may backdate a policy, upon request, by assigning a Policy Date earlier than the date the application is signed. However, in no event will a policy be backdated earlier than the earliest date allowed by state law, which is generally three months to one year prior to the date of application for the policy. The most common reasons for backdating are to preserve a younger age at issue for the insured person or to retain a common monthly deduction date in certain corporate-owned life insurance cases involving multiple policies issued over time. If used to preserve age, backdating will result in lower insurance charges. However, monthly deductions will begin earlier than would otherwise be the case.
Temporary insurance coverage. If a specified amount of premium is paid with the application for a policy and other conditions are met, we will provide temporary term life insurance coverage on the insured person for a period prior to the time coverage under the policy takes effect. Such temporary term coverage will be subject to the terms and conditions described in the Temporary Life Insurance Agreement and Receipt attached to the application for the policy, including conditions to coverage and limits on amount and duration of coverage.
Option 1 and Option 2. When the insured person dies, we will pay the death benefit minus any outstanding policy debt and unpaid fees and charges. There are two ways of calculating the death benefit. You must choose which one you want in the application. The two death benefit options are described below.
| • | Option 1 - The death benefit will equal the greater of (1) the Total Face Amount, or (2) the minimum death benefit (as described below). |
| • | Option 2 - The death benefit will equal the greater of (1) the Total Face Amount plus the policy value on the date of death, or (2) the minimum death benefit. |
For the same premium payments, the death benefit under Option 2 will tend to be higher than the death benefit under Option 1. On the other hand, the monthly insurance charge will be higher under Option 2 to compensate us for the additional insurance risk. Because of that, the policy value will tend to be higher under Option 1 than under Option 2 for the same premium payments.
Poor investment performance of the portfolios, expenses, and deduction of charges under the policy all will reduce the policy value and net cash surrender value and may also reduce the death benefit. However, favorable
15
investment performance may increase the policy value, net cash surrender value, and death benefit. Therefore, if you experience better investment performance or lower expenses and charges than you assumed, you may be able to reduce your premium payments while maintaining the death benefit and other values under your policy; or if you continue to pay premiums at the same level, the death benefit and other values under your policy may increase. Conversely, if the investment performance falls short of what you assumed, or the expenses or charges are higher, the death benefit and other values under your policy may decrease unless you pay additional premiums.
Base Face Amount and Supplemental Face Amount. Total Face Amount is composed of the Base Face Amount and any Supplemental Face Amount you elect. The Supplemental Face Amount you can have generally cannot exceed 900% of the Base Face Amount at the Issue Date. Thereafter, increases to the Supplemental Face Amount cannot exceed 400% of the Total Face Amount at the Issue Date.
You should consider a number of factors in determining whether to elect coverage in the form of Base Face Amount or in the form of Supplemental Face Amount. For the same amount of premiums paid, the amount of the Face Amount charge deducted from policy value and the amount of compensation paid to the selling insurance agent will generally be less if coverage is included as Supplemental Face Amount, rather than as Base Face Amount. On the other hand, the amount of any Supplemental Face Amount included in the calculation of the death benefit at and after the policy anniversary nearest the insured person’s 100th birthday will be limited to the lesser of the current Supplemental Face Amount or the policy value. If your priority is to reduce your Face Amount charges, you may wish to maximize the proportion of the Supplemental Face Amount. However, if your priority is to maximize the death benefit when the insured person reaches age 100, then you may wish to maximize the proportion of the Base Face Amount.
Minimum death benefit. In order for a policy to qualify as life insurance under Federal tax law, there has to be a minimum amount of insurance in relation to policy value. There are two tests that can be applied under Federal tax law — the “guideline premium test” and the “cash value accumulation test.” You must elect which test you wish to have applied at issue. Once elected, the test cannot be changed without our approval.
Under the guideline premium test, we compute the minimum death benefit each business day by multiplying the policy value (and any benefit under the Enhanced Cash Value Rider) on that date by the death benefit factor applicable on that date. A table showing the factor for each age will appear in the policy, and the following table shows those factors for selected ages:
|
Attained Age |
Applicable Factor | |
| 40 and under |
250% | |
| 45 |
215% | |
| 50 |
185% | |
| 55 |
150% | |
| 60 |
130% | |
| 65 |
120% | |
| 70 |
115% | |
| 75 |
105% | |
| 90 |
105% | |
| 95 and above |
100% |
Under the cash value accumulation test, we compute the minimum death benefit each business day by multiplying the policy value (and any benefit under the Enhanced Cash Value Rider) on that date by the death benefit factor applicable on that date. The factor decreases as attained age increases. A table showing the factor for each age will appear in the policy.
16
These death benefit factors are subject to change based on the issue date of your policy. Please refer to your policy and contact your John Hancock NY representative for the death benefit factors that are specific to your policy.
The cash value accumulation test may be preferable if you want to fund the policy so that the minimum death benefit will increase earlier than would be required under the guideline premium test, or if you want to fund the policy at the “7 pay” limit for the full seven years.
To the extent that the calculation of the minimum death benefit under the selected life insurance qualification test causes the death benefit to exceed our limits, we reserve the right to return premiums or distribute a portion of the policy value so that the resulting amount of insurance is maintained within our limits. Alternatively, if we should decide to accept the additional amount of insurance, we may require additional evidence of insurability.
Calculation and payment of the death benefit. We will ordinarily pay any death benefit within seven days after we receive the last required form or request and any other documentation that may be required. You may choose to receive proceeds from the policy as a single sum. If we do not have information about the desired manner of payment within seven days after the date we receive documentation of the insured person’s death, we will pay the proceeds as a single sum. As permitted by state law and our current administrative procedures, death claim proceeds may be placed into an interest-bearing John Hancock retained asset account in the beneficiary’s name. The interest earned in a John Hancock retained asset account is normally subject to income tax. You should consult with your tax advisor if you have any questions regarding taxation of the interest earned. We will provide the beneficiary with a checkbook, so checks may be written for all or a part of the proceeds. The retained asset account is part of our general account and is subject to the claims of our creditors. It is not a bank account and it is not insured by the FDIC. We may receive a benefit from managing proceeds held in a retained asset account.
Additional Information About Standard Death Benefits
Requesting an increase or decrease in coverage. After the first policy year, you may make a written request for an unscheduled increase in the Supplemental Face Amount. We must receive your written request within two months of your next policy anniversary. Generally, each such increase must be at least $50,000. However, you will have to provide us with evidence that the insured person qualifies for the same risk classification that applied to them at issue. Generally, any increase will be effective on the next policy anniversary following the date we approve the request.
After the first policy year, we may approve a reduction in the Base Face Amount or the Supplemental Face Amount, but only if:
| • | the remaining Total Face Amount will be at least $100,000, |
| • | the remaining Base Face Amount will be at least $50,000, and |
| • | the remaining Total Face Amount will at least equal the minimum required by the tax laws to maintain the policy’s life insurance status. |
An approved decrease will take effect on the monthly deduction date on or next following the date we approve the request. We reserve the right to require that the Supplemental Face Amount be fully depleted before the Base Face Amount can be reduced.
Change of death benefit option. The death benefit option may be changed from Option 2 to Option 1 after the first policy year. We reserve the right to limit a request for a change if the change would cause the policy to fail to qualify as life insurance for tax purposes. We will not allow a change in death benefit option if it would cause the Total Face Amount to decrease below $100,000.
17
A change in the death benefit option from Option 2 to Option 1 will result in a change in the policy’s Total Face Amount, in order to avoid any change in the amount of the death benefit. The new Total Face Amount will be equal to the Total Face Amount prior to the change plus the policy value as of the date of the change. The change will take effect on the monthly deduction date on or next following the date the written request for the change is received at our Service Office.
Tax consequences of coverage changes. If you change the death benefit option, the Federal tax law test (“guideline premium test” or “cash value accumulation test”) that you elected at issue will continue to apply.
A change in the death benefit option or Total Face Amount will often change the policy’s limits under the Federal tax law test that you elected. To avoid having the policy cease to qualify as life insurance for tax purposes, we reserve the right to (i) refuse or limit a change in the death benefit option or Total Face Amount and (ii) change the Guideline Single Premium or Guideline Level Premium, as applicable.
Limitations on payment of death benefit. If the insured person commits suicide within certain time periods (generally within two years from the Issue Date of the policy), the amount payable will be equal to the premiums paid, less the amount of any policy debt on the date of death, and less any withdrawals. Also if an application misstated the age or sex of the insured person, we will adjust, if necessary, the Base Face Amount, any Supplemental Face Amount, and every other benefit to that which would have been purchased at the correct age or sex by the most recent cost of insurance charge.
You may surrender the policy in full at any time, in which case we will pay you the policy’s full surrender value and coverage under the policy and any riders and other benefits under the policy will cease. After the first policy year, you may take a withdrawal of part of your surrender value once in each policy month, except that no withdrawals are permitted after the insured person has reached age 100. The amount of payment you will receive upon a surrender or withdrawal is based on values calculated as of the day we receive your request in good order or, if that is not a business day, on the next day that is. We generally pay that amount to you within seven days thereafter.
Additional Information Regarding Surrender and Withdrawal
The surrender of the policy terminates the life insurance coverage and other policy benefits. If you surrender your policy, we will pay you the policy value less any policy debt and surrender charge that then applies. You must return your policy when you request a surrender.
After the first policy year, you may make a withdrawal of part of your net cash surrender value once in each policy month. Generally, each withdrawal must be at least $500. There is a withdrawal fee for each withdrawal of the lesser of 2% of the withdrawal amount or $25. We will automatically reduce the policy value of your policy by the amount of the withdrawal fee. Unless otherwise specified by you, each account (fixed and investment) will be reduced in the same proportion as the policy value is then allocated among them. We will not permit a withdrawal if it would cause your net cash surrender value to fall below 3 months’ worth of monthly deductions. We also reserve the right to refuse any withdrawal that would cause the policy’s Total Face Amount to fall below $100,000 or the Base Face Amount to fall below $50,000.
Because it reduces the policy value, any withdrawal will reduce your death benefit under either Option 1 or Option 2. Under Option 1, such a withdrawal may also reduce the Total Face Amount. Generally, any such reduction in the Total Face Amount will be implemented by first reducing any Supplemental Face Amount then in effect. We may approve reductions in the Base Face Amount prior to eliminating the Supplemental Face
18
Amount. You should consider a number of factors in determining whether to continue coverage in the form of Base Face Amount or Supplemental Face Amount. If such a reduction in Total Face Amount would cause the policy to fail the Internal Revenue Code’s (“Code”) definition of life insurance, we will not permit the withdrawal.
Availability of Loans, Limitations and Interest
If your policy is in force and has sufficient policy value, you may borrow from it at any time by completing the appropriate form. We process policy loans as of the business day on or next following the day we receive the loan request. You can repay all or part of a loan at any time. Policy loans permanently affect the calculation of your policy value and may also result in adverse tax consequences. The amount of the outstanding loan (which includes accrued and unpaid interest) is subtracted from the amount otherwise payable when the policy proceeds become payable.
Generally, the minimum amount of each loan is $500. The amount available for loan will not be less than 90% of the net cash surrender value. The maximum amount you can borrow is the amount determined as set out below.
| • | We first determine the net cash surrender value of your policy. |
| • | We then subtract an amount equal to 12 times the monthly deductions then being deducted from policy value. |
| • | We then multiply the resulting amount by 0.75% in policy years 1 through 10 and 0% thereafter (although we reserve the right to increase the percentage after the tenth policy year to as much as .25%). |
| • | We then subtract the third item above from the second item above. |
The interest charged on any loan is an effective annual rate of 3.75% in the first 10 policy years and 3.00% thereafter. However, we reserve the right to increase the percentage after the tenth policy year to as much as 3.25%. Accrued interest will be added to the loan daily and will bear interest at the same rate as the original loan amount. Unless otherwise specified by you, the amount of the loan is deducted from the accounts (fixed and investment) in the same proportion as the policy value is then allocated among them. The amount of the loan is then placed in a special loan account. This special loan account will earn interest at an effective annual rate of 3.00%.
Effect of Loans on Cash Value and Death Benefit
Unless otherwise specified by you, the amount of the loan is deducted from the variable investment accounts and any fixed investment option in the same proportion as the account value is then allocated among them. Amounts in the loan account do not participate in the investment experience of the variable investment accounts or the fixed investment option, and therefore loans can affect the account value and death benefit whether or not the loan is repaid. The account value, the surrender value, and any death benefit above the Total Sum Insured are permanently affected by any loan, whether or not it is repaid in whole or in part. This is because the variable investment accounts or any fixed investment option and the special loan account will generally have different rates of investment return.
Taking out a loan on the policy increases the risk that the policy may lapse because of the difference between the interest rate charged on the loan and the interest rate credited to the special loan account. Also, whenever the outstanding loan equals or exceeds your policy value after the insured person reaches age 100, the policy will terminate 31 days after we have mailed notice of termination to you (and to any assignee of record at such
19
assignee’s last known address) specifying the amount that must be paid to avoid termination, unless a repayment of at least the amount specified is made within that period. Policy loans may also result in adverse tax consequences under certain circumstances.
The tax consequences of a loan interest credited differential of 0% are unclear. You should consult a tax adviser before effecting a loan to evaluate possible tax consequences. If we determine that a loan will be treated as a taxable distribution because of the differential between the loan interest rate and the rate being credited on the special loan account, we reserve the right to increase the rate charged on the loan to a rate that would, in our reasonable judgment, result in the transaction being treated as a loan under Federal tax law. The right to increase the rate charged on the loan is restricted in some states. Please see your John Hancock NY representative for details. We process policy loans as of the business day on or next following the day we receive the loan request.
You can repay all or part of a loan at any time. Each repayment will be allocated among the accounts as set out below.
| • | The same proportionate part of the loan as was borrowed from the fixed account will be repaid to that fixed account. |
| • | The remainder of the repayment will be allocated among the accounts in the same way a new premium payment would be allocated (unless otherwise specified by you). |
If you want a payment to be used as a loan repayment, you must include instructions to that effect. Otherwise, all payments will be assumed to be premium payments. We process loan repayments as of the day we receive the repayment. Loan repayments received prior to the close of the New York Stock Exchange (“NYSE”) will be applied on the same day it was received. Loan repayments received after the close of the NYSE will be applied as of the next business day.
OTHER BENEFITS AVAILABLE UNDER THE POLICY
In addition to the standard death benefits associated with your policy, other standard and/or optional benefits may also be available to you. The following tables summarize information about those benefits. Information about the fees associated with each benefit included in the tables may be found in the FEE TABLE.
| STANDARD BENEFITS | ||||
| Name of Benefit | Purpose | Brief Description of Restrictions/Limitations | ||
|
Dollar cost averaging |
Under the dollar cost averaging program, you will designate an amount that will be transferred monthly from one variable investment account into any other variable investment account or a fixed account. | We reserve the right to cease to offer this program after written notice to you. | ||
| Asset allocation balancing | Under the asset allocation balancer program, you will designate a percentage allocation of policy value among variable investment accounts. We will automatically transfer amounts among the variable investment accounts at intervals you select (annually, semi-annually, quarterly, or monthly) to reestablish your chosen allocation. | We reserve the right to cease this program after written notice to you. | ||
20
| OPTIONAL BENEFITS | ||||
| Name of Benefit | Purpose | Brief Description of Restrictions/Limitations | ||
|
Enhanced Cash Value Rider |
To add an amount (calculated pursuant to a formula in the rider) to the proceeds payable to the policy owner if the owner surrenders the policy during the first seven policy years. | This benefit does not apply to a surrender pursuant to non-taxable exchange, and this rider does not increase the amount available for a policy loan. | ||
|
Change of Life Insured Rider |
To give the policy owner the flexibility to change the policy’s insured person from one individual to another. Many aspects of such a change will be similar to the issuance of a new policy, including our right to evaluate, and begin to base our charge rates on, the insurance risk characteristics of the new insured person. Also, any supplementary benefit rider may apply after the change only with our approval. | This benefit is available only to certain owners whose policies are supporting employee benefit plan obligations. | ||
|
Overloan Protection Rider |
Prevents your policy from lapsing on any date if policy debt exceeds the death benefit. | The benefit is subject to a number of eligibility requirements relating to, among other things, the number of years the policy has been in force, the attained age of the insured person, the death benefit option elected and the tax status of the policy.
When the Overloan Protection Benefit in this rider is invoked, all values in the variable investment accounts are transferred to the fixed account and will continue to grow at the current fixed account interest rate. Thereafter, policy changes and transactions are limited as set forth in the rider. Any supplementary benefit rider requiring a monthly deduction will automatically be terminated.
When the Overloan Protection Rider causes the policy to be converted into a fixed policy, there is risk that the Internal Revenue Service could assert that the policy has been effectively terminated and that the outstanding loan balance should be treated as a distribution. | ||
21
More About Certain Optional Benefits
When you apply for a policy, you can request any of the optional supplementary benefit riders that we then make available. Availability of any rider, the benefits it provides and the charges for it may vary by state. Our rules and procedures will govern eligibility for any rider and, in some cases, the configuration of the actual rider benefits. Each rider contains specific details that you should review before you decide to choose the rider. You may request an example illustrating the operation of any of the following optional supplementary benefit riders by contacting the Service Office at 1-877-391-3748, option 4. Charges for most riders will be deducted from the policy value. We may change these charges (or the rates that determine them), but not above any applicable maximum amount stated in your policy specifications. We may add to, delete from or modify the list of optional supplementary benefit riders.”
When the Overloan Protection benefit in this rider is invoked, all values in the investment accounts are immediately transferred to the fixed account and will continue to grow at the current fixed account interest rate. Transfer fees do not apply to these transfers. Thereafter, policy changes and transactions are limited as set forth in the rider; for example, death benefit increases or decreases, additional premium payments, policy loans, withdrawals, surrender and transfers are no longer allowed. Any outstanding policy debt will remain. Interest will continue to be charged at the policy’s specified loan interest rate, and the policy’s loan account will continue to be credited with the policy’s loan interest credited rate. Any supplementary benefit rider requiring a monthly deduction will automatically be terminated.
When the Overloan Protection Rider causes the policy to be converted into a fixed policy, there is risk that the Internal Revenue Service could assert that the policy has been effectively terminated and that the outstanding loan balance should be treated as a distribution. Depending on the circumstances, all or part of such deemed distribution may be taxable as income. You should consult a tax adviser as to the risks associated with the Overloan Protection Rider.
22
Tax Consequences of Owning a Policy
Tax consequences will vary based on your own particular circumstances, and for further information you should consult a qualified tax adviser. This material does not constitute tax or legal advice and neither John Hancock NY nor any of its agents, employees or registered representatives are in the business of offering such advice.
Federal, state and local tax laws, regulations and interpretations can change from time to time. As a result, the tax consequences to you and the beneficiary may be altered, in some cases retroactively. The policy may be used in various arrangements, including non-qualified deferred compensation or salary continuation plans, split dollar insurance plans, executive bonus plans, retiree medical benefit plans and others. The tax consequences of such plans may vary depending on the particular facts and circumstances of each individual arrangement. Therefore, if the value of using the policy in any such arrangement depends in part on the tax consequences, a qualified tax adviser should be consulted for advice.
Generally, death benefits paid under policies such as yours are not subject to income tax unless policy ownership has been transferred in exchange for payment. Earnings on your policy value are ordinarily not subject to income tax as long as we don’t pay them out to you. If we do distribute any amount of your policy value, all or part of that distribution would generally be treated as a return of the premiums you’ve paid and not subjected to income tax. Any portion not treated as a return of your premiums would be includible in your income.
Distributions for tax purposes include amounts received upon surrender or partial withdrawals and may include the charges for certain supplementary benefit riders as described below. You may also be deemed to have received a distribution for tax purposes if you assign all or part of your policy rights or change your policy’s ownership. Amounts you borrow are generally not taxable to you.
Please note that certain distributions associated with a reduction in death benefit or other policy benefits within the first fifteen years after issuance of the policy are ordinarily taxable in whole or in part.
Some of the tax rules change if your policy becomes a “modified endowment contract.” This can happen if you’ve paid premiums in excess of limits prescribed by the tax laws. In that case, additional taxes and penalties may be payable for policy distributions of any kind, including loans.
We expect the policy to receive the same Federal income and estate tax treatment as fixed benefit life insurance policies. Section 7702 of the Code defines a life insurance contract for Federal tax purposes. For a policy to be treated as a life insurance contract, it must satisfy either the cash value accumulation test or the guideline premium test. We will monitor compliance with these standards. If we determine that a policy does not satisfy the definition of life insurance under section 7702, we may take whatever steps are appropriate and reasonable to bring it into compliance with section 7702.
It is possible that, despite our monitoring, a policy might fail to qualify as a life insurance contract under section 7702 of the Code. This could happen, for example, if we inadvertently failed to return to you any premium payments that were in excess of amounts permitted under section 7702, or if any of the funds failed to meet certain investment diversification or other requirements of the Code. If this were to occur, you would be subject to income tax on the income credited to the policy from the date of issue to the date of the disqualification and for subsequent periods.
If the policy complies with section 7702, the death benefit proceeds under the policy ordinarily should be excludible from the beneficiary’s gross income under section 101 of the Code. (As noted above, a transfer of the policy for valuable consideration may limit the exclusion of death benefits from the beneficiary’s income.)
23
Tax consequences of ownership or receipt of policy proceeds under Federal, state and local estate, inheritance, gift and other tax laws will depend on the circumstances of each owner or beneficiary. If the person insured by the policy is also its owner, either directly or indirectly through an entity such as a revocable trust, the death benefit will be includible in his or her estate for purposes of the Federal estate tax. If the owner is not the person insured, the value of the policy will be includible in the owner’s estate upon his or her death. Even if ownership has been transferred, the death proceeds or the policy value may be includible in the former owner’s estate if the transfer occurred less than three years before the former owner’s death or if the former owner retained certain kinds of control over the policy. You should consult your tax adviser regarding these possible tax consequences.
Increases in policy value as a result of interest or investment experience will not be subject to Federal income tax unless and until values are received through actual or deemed distributions. In general, unless the policy is a modified endowment contract, the owner will be taxed only on the amount of distributions that exceed the premiums paid under the policy. An exception to this general rule occurs in the case of a decrease in the policy’s death benefit or any other change that reduces benefits under the policy in the first fifteen years after the policy is issued and that results in a cash distribution to the policy owner. Changes that reduce benefits include partial withdrawals and reductions in face amount that result in a distribution that is required to keep the policy in compliance with section 7702. For purposes of this rule any distribution within the two years immediately before a reduction in benefits will also be treated as if it were a result of the reduction. A cash distribution that reduces policy benefits will be taxed in whole or in part (to the extent of any gain in the policy) under rules prescribed in section 72(e) of the Code. The taxable amount is subject to limits prescribed in section 7702(f)(7). Any taxable distribution will be ordinary income to the owner (rather than capital gain).
Tax Consequences of Electing Certain Supplementary Benefit Riders
Cash value enhancement rider. If you have elected the Enhanced Cash Value Rider, we will not treat the rider charge as a distribution from your life insurance policy for federal income tax purposes, however, such charge will reduce your investment in the policy.
We are taxed as a life insurance company. Under current tax law rules, we include the investment income (exclusive of capital gains) of the Separate Account in our taxable income and take deductions for investment income credited to our policy holder reserves. We are also required to capitalize and amortize certain costs instead of deducting those costs when they are incurred. We do not currently charge the Separate Account for any resulting income tax costs, other than a charge we may impose against the Separate Account to compensate us for the cost of a delay in the deductibility of deferred acquisition costs (the “DAC tax” adjustment) pursuant to section 848 of the Internal Revenue Code. We also claim certain tax credits or deductions relating to foreign taxes paid and dividends received by the series funds. These benefits can be material. We do not pass these benefits through to the Separate Account, principally because: (i) the deductions and credits are allowed to us and not the policy owners under applicable tax law; and (ii) the deductions and credits do not represent investment return on the Separate Account assets that is passed through to policy owners.
The policies permit us to deduct a charge for any taxes we incur that are attributable to the operation or existence of the policies or the Separate Account. Currently, we do not anticipate making any specific charge for such taxes other than any DAC tax charge and premium taxes where applicable. If the level of the current taxes increases, however, or is expected to increase in the future, we reserve the right to make a charge in the future.
PRINCIPAL RISKS OF INVESTING IN THE POLICY
If the net cash surrender value is insufficient to pay the charges when due your policy can terminate (i.e., “lapse”). For example, this can happen because you haven’t paid enough premium, because the performance of
24
the variable investment or general account options you’ve chosen has been poor, or because of a combination of all factors. Since withdrawals and policy charges reduce your policy value, these also increase the risk of lapse. Policy loans also increase the risk of lapse. There is no guarantee that your policy will not lapse even if you pay your planned premium.
The policy offers a number of variable investment accounts, as listed in the APPENDIX. The investment performance of any variable investment account may be good or bad, and you may lose money on amounts you invest in a policy. Your policy value will increase or decrease based on the investment performance of the variable investment accounts you’ve chosen. The variable investment accounts cover a broad spectrum of investment styles and strategies, some variable investment accounts are riskier than others. These risks (and potential rewards) are discussed in detail in the prospectuses of the portfolios. The death benefit may also increase or decrease with investment experience.
An investment in a policy is also subject to risks related to John Hancock NY, including that the obligations (including under the fixed account option), guarantees, or benefits are subject to the claims-paying ability of John Hancock NY. Information about John Hancock NY, including its financial strength ratings, is available upon request from your John Hancock NY representative. Our current financial strength ratings can also be obtained by contacting the Service Office at 1-877-391-3748, option 4.
There is a risk that you will not be able to transfer your policy value from one variable investment account to another because of limitations on the dollar amount or frequency of transfers you can make. The limitations on transfers out of the fixed account are more restrictive than those that apply to transfers out of variable investment accounts. If you purchase certain supplementary benefit riders you will be subject to special transfer restrictions.
To discourage market timing and disruptive trading activity, we impose restrictions on transfers and reserve the right to change, suspend or terminate telephone, facsimile and internet transaction privileges. While we seek to identify and prevent disruptive trading activity, it may not always be possible to do so. Therefore, no assurance can be given that the restrictions we impose will be successful in preventing all disruptive trading and avoiding harm to long term investors.
Early Surrender or Withdrawal Risk/Not a Short-Term Investment
This policy is not a short-term investment and is not appropriate for an investor who needs ready access to cash. Depending on the policy value at the time you are considering surrender, there may be little or no surrender value payable to you.
In order for you to receive the tax benefits extended to life insurance under the Code, your policy must comply with certain requirements of the Code. We will monitor your policy for compliance with these requirements, but a policy might fail to qualify as life insurance in spite of our monitoring, which can have adverse tax consequences. If the policy were determined not to qualify as life insurance under the Code, you would be taxed on any income or gains those assets generate. In other words, you would lose the value of the so-called “tax-deferred inside build-up” that is a major benefit of life insurance.
There is a tax risk associated with policy loans. Although no part of a loan is treated as income to you when the loan is made unless your policy is a “modified endowment contract,” surrender or lapse of the policy with a loan outstanding would result in the loan being treated as a distribution at the time of lapse or surrender. This could
25
result in a considerable tax bill. Under certain circumstances involving large amounts of outstanding loans and an insured person of advanced age, you might find yourself having to choose between high premium requirements to keep your policy from lapsing and a significant tax burden if you allow the lapse to occur.
Tax consequences of ownership or receipt of policy proceeds (including surrender or withdrawal proceeds) under Federal, state and local estate, inheritance, gift and other tax laws can vary greatly depending upon the circumstances of each owner or beneficiary. There can also be unfavorable tax consequences on such things as the change of policy ownership or assignment of ownership interests. For these and all the other reasons mentioned above, we recommend you consult with a qualified tax adviser before buying the policy and before exercising certain rights under the policy.
There are tax risks associated with the election of certain supplementary benefit riders. (See “Tax Consequences of Electing Certain Supplementary Benefit Riders”).
ADDITIONAL INFORMATION REGARDING THE POLICY
Under the policies, we deduct the charges discussed immediately below under “Deductions from premium payments” and “Deductions from policy value.” Although the Fee Table in this prospectus provides disclosure about the maximum rates we are permitted to charge, we currently deduct some of the charges at less than those maximum rates. As a general matter, however, we also are permitted to increase or decrease the rate at which we are deducting any charge, provided that the rate can never exceed the maximum set forth in your policy (including in any applicable supplementary benefit rider) and as disclosed in the Fee Table. By contacting the John Hancock NY Service Office or your John Hancock NY representative at any time, you can obtain information about the then-current rate of any charges that are applicable to your particular circumstances and/or obtain a personalized illustration that will demonstrate the manner in which those specific current charges impact the values under your policy.
Deductions from premium payments.
Premium charge - A charge to help defray our sales costs and related taxes. The current charge is 1.5% of each premium paid, although we reserve the right to increase the percentage to as high as 7%.
Administrative charge - A monthly charge to help cover our administrative costs. This is a flat dollar charge of up to $12.
Face Amount charge - A monthly charge for the first ten policy years to primarily help cover sales costs. To determine the charge we multiply the amount of Base Face Amount at issue by a rate which varies by duration (Policy Year) and by the insured person’s sex and issue age.
Cost of insurance charge - A monthly charge for the cost of insurance. To determine the charge, we multiply the net amount of insurance for which we are then at risk by a cost of insurance rate. The rate is derived from an actuarial table. The table in your policy will show the maximum cost of insurance rates. The cost of insurance rates that we currently apply are generally less than the maximum rates. The current rates will never be more than the maximum rates shown in the policy. The cost of insurance we use will depend on age of the insured person at issue, the insurance risk characteristics and (usually) gender of the insured person, the and the length of time the policy has been in effect. Regardless of the table used, cost of insurance rates generally increase each year that you own your policy, as the insured person’s age increases. (The insured person’s “age” on any date is his or her
26
age on the birthday nearest that date.) For death benefit Option 1, the net amount at risk is equal to the greater of zero, or the result of (a) minus (b) where:
(a) is the death benefit as of the first day of the Policy Month, divided by 1.0024663; and
(b) is the policy value as of the first day of the Policy Month after the deduction of all other monthly deductions.
Since the net amount at risk for death benefit Option 1 is based on a formula that includes as factors the death benefit and the policy value, the net amount at risk is affected by the investment performance of the investment accounts chosen, payment of premiums and charges assessed.
If the minimum death benefit is greater than the Total Face Amount, the cost of insurance charge will reflect the amount of that additional benefit.
For death benefit Option 2, the net amount at risk is equal to the Total Face Amount of insurance divided by 1.0024663.
Asset-based risk charge. A monthly charge to help cover sales, administrative and other costs. The charge is a percentage of that portion of your policy value allocated to investment accounts. This charge does not apply to the current fixed account.
Withdrawal fee. A fee for each withdrawal of policy value to compensate us for the administrative expenses of processing the withdrawal. The fee is the lesser of 2% of the withdrawal amount or $25. This fee is not currently imposed, but we reserve the right to do so.
Supplementary benefit rider charges. A charge for any supplementary insurance benefits added to the policy by means of a rider. Maximum charges for the various riders are shown in the Fee Table above under “Transaction Fees” or “Periodic Charges Other than Annual Portfolio Expenses,” as appropriate. These charges are also specified in the rider’s provisions or the policy specifications. You can obtain information about the specific charges applicable to you from your John Hancock NY representative.
Loan interest charge. We will charge interest on any amount you borrow from your policy. 3.75% is the maximum effective annual interest rate we can charge and applies only during policy years 1-10. The effective annual interest rate is 3.00% thereafter (although we reserve the right to increase the rate after the tenth policy year to as much as 3.25%). The amount of any loan is transferred from the accounts to a special loan account which earns interest at an effective annual rate of 3.00%. Therefore, the cost of a loan is the difference between the loan interest we charge and the interest we credit to the special loan account.
Transfer fee. We currently do not impose a fee upon transfers of policy value among the variable investment accounts, but reserve the right to impose a fee of up to $25 for any transfer beyond an annual limit (which will not be less than 12) to compensate us for the costs of processing these transfers.
Charges at the portfolio level. The portfolios must pay investment management fees and other operating expenses from portfolio assets. These fees and expenses are different for each portfolio and reduce the investment return of each portfolio. Therefore, they also indirectly reduce the return you will earn on any variable investment accounts you select. Expenses of the portfolios are not fixed or specified under the terms of the policy, and those expenses may vary from year to year. See APPENDIX.
Additional Information About How Certain Policy Charges Work
The premium charges help to compensate us for the cost of selling our policies. The amount of the charges in any policy year does not specifically correspond to sales expenses for that year. We expect to recover our total sales expenses over the life of the policies. To the extent that the premium charges do not cover total sales expenses,
27
the sales expenses may be recovered from other sources, including gains from the asset-based risk charge and other gains with respect to the policies, or from our general assets. Similarly, administrative expenses not fully recovered by the administrative charge may also be recovered from such other sources. We also may make a profit from any charge and can use any such profits to defray any of our expenses under the policies or for any other proper corporate purpose.
Unless we agree otherwise or you do not have sufficient funds in any fixed account or variable investment accounts, we deduct the monthly deductions from your policy’s variable investment accounts and any fixed account in proportion to the amount of policy value you have in each of those accounts.
Other Charges We Could Impose in the Future
Except for a portion of the premium charge, we currently make no specific charge for our Federal income taxes. However, if we incur, or expect to incur, income taxes attributable to any subaccount of the Separate Account or this class of policies in future years, we reserve the right to make a charge for such taxes. Any such charge would reduce what you earn on any affected accounts. However, we expect that no such charge will be necessary.
We also reserve the right to increase the premium charge in order to correspond with changes in the state premium tax levels or in the Federal income tax treatment of the deferred acquisition costs for this type of policy.
Under current laws, we may incur state and local taxes (in addition to premium taxes) in several states. At present, these taxes are not significant. If there is a material change in applicable state or local tax laws, we may make charges for such taxes.
Our right to increase any charge up to the maximum rate shown in the policy specifications applies to then outstanding policies, as well as to policies issued after the increase.
We pay compensation to broker-dealers for the promotion and sale of the policies, and for providing ongoing service in relation to policies that have already been purchased. We may also pay a limited number of broker-dealers commissions or overrides to “wholesale” the policies; that is, to provide marketing support and training services to the broker-dealer firms that do the actual selling. The compensation paid is not expected to exceed 35% of target premium, and 6% of premium in excess of target, paid in the first policy year, 6% of target and excess premium paid in years 2-5, and 4.75% of target and excess premium paid in years 6-10. This compensation schedule is exclusive of additional compensation and revenue sharing and inclusive of overrides and expense allowances paid to broker-dealers for sale of the policies (not including riders). Under their own arrangements, broker-dealers determine how much of any amounts received from us is to be paid to their registered representatives.
To the extent permitted by SEC and Financial Industry Regulatory Authority (“FINRA”) rules and other applicable laws and regulations, we may enter into special compensation or reimbursement arrangements (“revenue sharing”), either directly or through JH Distributors, with selected broker-dealers and other financial intermediaries. In consideration of these arrangements, a firm may feature our policy in its sales system, give us preferential access to sales staff, or allow JH Distributors or its affiliates to participate in conferences, seminars or other programs attended by the firm’s sales force. We hope to benefit from these revenue sharing and other arrangements through increased sales of our policies.
Selling broker-dealers and other financial intermediaries may receive, directly or indirectly, additional payments in the form of cash, other compensation or reimbursement. These additional compensation or reimbursement arrangements may include, for example, payments in connection with the firm’s “due diligence” examination of the policies, payments for providing conferences or seminars, sales or training programs for invited registered representatives and other employees, payment for travel expenses, including lodging, incurred by registered representatives and other employees for such seminars or training programs, seminars for the public or client
28
seminars, advertising and sales campaigns regarding the policies, payments to assist a firm in connection with its systems, operations and marketing expenses and/or other events or activities sponsored by the firms. We may contribute to, as well as sponsor, various educational programs, sales promotions, and/or other contests in which participating firms and their sales persons may receive gifts and prizes such as merchandise, cash or other rewards as may be permitted under FINRA rules and other applicable laws and regulations.
You should contact your registered representative for more information on compensation arrangements in connection with your purchase of a policy. We provide additional information on special compensation or reimbursement arrangements involving broker-dealers and other financial intermediaries in the Statement of Additional Information (the “SAI”).
Lapse. A policy will go into default if at the beginning of any policy month the policy’s net cash surrender value would be zero or below after deducting the monthly deductions then due. Therefore, a policy could lapse eventually if increases in policy value (prior to deduction of policy charges) are not sufficient to cover policy charges. See “Premium Due Dates” above. If the insured person should die during the grace period, the policy value used in the calculation of the death benefit will be the policy value as of the date of default and the insurance benefit will be reduced by any outstanding monthly deductions due at the time of death.
Reinstatement. You can reinstate a policy that has gone into default and terminated at any time within 21 days following the date of termination without furnishing evidence of insurability, subject to the following conditions:
(a) The insured person’s risk classification is standard or preferred, and
(b) The insured person’s attained age is less than 46.
By making a written request, you can reinstate a policy that has gone into default and terminated at any time within the three-year period following the date of termination subject to the following conditions:
(a) You must provide to us evidence of the insured person’s insurability that is satisfactory to us; and
(b) You must pay a premium equal to the amount that was required to bring the policy out of default immediately prior to termination, plus the amount needed to keep the policy in force to the next scheduled date for payment of the Planned Premium.
If the reinstatement is approved, the date of reinstatement will be the later of the date we approve your request or the date the required payment is received at our Service Office. The policy value on the date of reinstatement, prior to the crediting of any Net Premium paid in connection with the reinstatement, will be equal to the policy value on the date the policy terminated. Any policy debt not paid upon termination of a policy will be reinstated if the policy is reinstated.
Generally, the suicide exclusion and incontestability provisions will apply from the effective date of reinstatement. A surrendered policy cannot be reinstated.
We may vary the charges and other terms of our policies where special circumstances result in sales or administrative expenses, mortality risks or other risks that are different from those normally associated with the policies, subject to the maximum charges described in this prospectus. For example, with respect to policies issued to a class of associated individuals or to a trustee, employer or similar entity where we anticipate that the sales to the members of the class will result in lower than normal sales or administrative expenses, lower taxes or
29
lower risks to us, we may offer the policies with reduced charges or with additional or enhanced features or benefits. We will make these programs available in accordance with our established administrative procedures in effect at the time of the application for a policy. The factors we consider in determining the eligibility of a particular group for such a program are: (i) the nature of the association and its organizational framework; (ii) the method by which sales will be made to the members of the class; (iii) the facility with which premiums will be collected from the associated individuals and the association’s capabilities with respect to administrative tasks; (iv) the anticipated lapse and surrender rates of the policies; (v) the size of the class of associated individuals and the number of years it has been in existence; (vi) the aggregate amount of premiums paid; and (vii) any other such circumstances which result in a reduction in sales or administrative expenses, lower taxes or lower risks. Any reduction in charges or feature or benefit enhancement will be reasonable and will apply uniformly to all prospective policy investors in the class and will not unfairly discriminate against any owner.
Policy or Separate Account Changes
We reserve the right to make any changes in the policy necessary to ensure the policy is within the definition of life insurance under the Federal tax laws and is in compliance with any changes in Federal or state tax laws.
In our policies, we reserve the right to make certain changes if they would serve the best interests of policy owners or would be appropriate in carrying out the purposes of the policies. These changes include the following:
| • | Changes necessary to comply with or obtain or continue exemptions under the Federal securities laws |
| • | Adding or removing fixed accounts or variable investment accounts |
| • | Combining variable investment accounts |
| • | Closing the variable investment accounts to new allocations or transfers |
| • | Changes in the form of organization of any separate account |
Any such changes will be made only to the extent permitted by applicable laws and only in the manner permitted by such laws. When required by law, we will obtain your approval of the changes and the approval of any appropriate regulatory authority.
We also reserve the right, subject to compliance with applicable law, including approval of owners if so required, (1) to transfer assets determined by John Hancock NY to be associated with the class of policies to which your policy belongs from the Separate Account to another separate account or subaccount, (2) to deregister the Separate Account under the 1940 Act, (3) to substitute for the fund shares held by a subaccount any other investment permitted by law, and (4) to take any action necessary to comply with or obtain any exemptions from the 1940 Act. Any such change will be made only if, in our judgment, the change would best serve the interests of owners of policies in your policy class or would be appropriate in carrying out the purposes of such policies. We would notify owners of any of the foregoing changes and to the extent legally required, obtain approval of affected owners and any regulatory body prior thereto. Such notice and approval, however, may not be legally required in all cases.
We will ordinarily pay any death benefit, withdrawal, surrender value or loan within seven days after we receive the last required form or request (and, with respect to the death benefit, any other documentation that may be required). You may choose to receive proceeds from the policy as a single sum. If we do not have information about the desired manner of payment within seven days after the date we receive documentation of the insured person’s death, we will pay the proceeds as a single sum. As permitted by state law and our current administrative procedures, death claim proceeds may be placed into an interest-bearing John Hancock retained asset account in the beneficiary’s name. The interest earned in a John Hancock retained asset account is normally subject to income tax. You should consult with your tax advisor if you have any questions regarding taxation of
30
the interest earned. We will provide the beneficiary with a checkbook, so checks may be written for all or a part of the proceeds. The retained asset account is part of our general account and is subject to the claims of our creditors. It is not a bank account and it is not insured by the FDIC. We may receive a benefit from managing proceeds held in a retained asset account. Alternatively, you can elect to have proceeds of $1,000 or more applied to any of the other payment options we may offer at the time. You cannot choose an option if the monthly payments under the option would be less than $50. We will issue a supplementary agreement when the proceeds are applied to any alternative payment option. That agreement will spell out terms of the option in full. Please contact our Service Office for more information.
We reserve the right to defer payment of that portion of your policy value that is attributable to a premium payment made by check for a reasonable period of time (not to exceed fifteen days) to allow the check to clear the banking system. We will not delay payment longer than necessary for us to verify a check has cleared the banking system.
We reserve the right to defer payment of any death benefit, loan or other distribution that is derived from a variable investment account if (1) the NYSE is closed (other than customary weekend and holiday closings) or trading on the NYSE is restricted; (2) an emergency exists, as determined by the SEC, as a result of which disposal of securities is not reasonably practicable or it is not reasonably practicable to fairly determine the policy value; or (3) the SEC by order permits the delay for the protection of owners. Transfers and allocations of policy value among the variable investment accounts may also be postponed under these circumstances. If we need to defer calculation of separate account values for any of the foregoing reasons, all delayed transactions will be processed at the next values that we do compute.
State laws allow us to defer payment of any portion of the net cash surrender value derived from the fixed account for up to six months. These laws were enacted many years ago to help insurance companies in the event of a liquidity crisis.
At and after the policy anniversary nearest the insured person’s 100th birthday, the following will occur:
| • | Any Supplemental Face Amount will be limited. |
| • | We will stop deducting any monthly deductions. |
| • | We will stop accepting any premium payments. |
GENERAL DESCRIPTION OF REGISTRANT, DEPOSITOR AND PORTFOLIOS
Your policy is issued by John Hancock Life Insurance Company of New York, 100 Summit Lake Drive, Valhalla, New York 10595.
The “registrant” of the policies with the SEC is the John Hancock Life Insurance Company of New York Separate Account B, a separate account operated by us under New York law (the “Separate Account”). Each subaccount of the Separate Account invests its assets in one of the portfolios shown in the APPENDIX.
The Separate Account’s assets are our property. Each policy provides that amounts we hold in the Separate Account pursuant to the policies cannot be reached by any other persons who may have claims against us and can’t be used to pay any obligations of John Hancock NY other than those arising out of policies that use the Separate Account. Income, gains and losses credited to, or charged against, the Separate Account reflect the Separate Account’s own investment experience and not the investment experience of John Hancock NY’s other
31
assets. All obligations under the policies (including under any fixed account options), guarantees, or benefits are obligations of John Hancock NY and are subject to its claims paying ability.
We normally compute policy values for each business day as of the close of the NYSE on that day (usually 4:00 p.m. Eastern time). In case of emergency or other disruption resulting in the NYSE closing at a time other than the regularly scheduled close, the close of our business day may be the regularly scheduled close of the NYSE or another time permitted by the SEC and applicable regulations. Over time, the amount you’ve invested in any variable investment account will increase or decrease the same as if you had invested the same amount directly in the corresponding portfolio and had reinvested all of that portfolios’ dividends and distributions in additional portfolio shares, except that we will deduct certain additional charges which will reduce your policy value. We describe these charges under “Charges at the portfolio level.” For certain policy years, we also will apply a policy credit to your policy value.
Information regarding each portfolio, including (i) its name; (ii) its investment objective; (iii) its investment adviser and any sub-investment adviser; (iv) current expenses; and (v) performance is available in the APPENDIX to this prospectus. Each portfolio has issued a prospectus that contains more detailed information about the portfolio. You can obtain the prospectus (hard copy or electronic) and additional information about any portfolio, at the addresses or phone number set forth in the first paragraph of the APPENDIX. On each business day, shares of each series are purchased or redeemed by us for each subaccount based on, among other things, the amount of net premiums allocated to the subaccount, distributions reinvested, and transfers to, from and among subaccounts, all to be effected as of that date. Such purchases and redemptions are effected at each series fund’s net asset value per share determined for that same date. A “business day” is any date on which the NYSE is open for trading.
We will purchase and redeem series fund shares for the Separate Account at their net asset value without any sales or redemption charges. Shares of a series fund represent an interest in one of the funds of the series fund which corresponds to a subaccount of the Separate Account. Any dividend or capital gains distributions received by the Separate Account will be reinvested in shares of that same fund at their net asset value as of the dates paid. We normally calculate the unit values for each variable investment account once every business day as of the close of that day, usually 4:00 p.m. Eastern time. Sales and redemptions within any variable investment account will be transacted using the unit value calculated as follows after we receive your request either in writing or other form that we specify: If we receive your request before the close of our business day, we’ll use the unit value calculated as of the end of that business day. If we receive your request at or after the close of our business day, we’ll use the unit value calculated as of the end of the next business day. If a scheduled transaction falls on a day that is not a business day, we’ll process it as of the end of the next business day.
We will vote all portfolio shares that we hold in the Separate Account for policy owners in proportion to instructions timely received by us from policy owners from all our Separate Accounts that are registered with the SEC under the 1940 Act. We will vote all portfolio shares that we otherwise are entitled to vote (including our own shares and other shares for which we receive no instructions) on any matter in proportion to the instructions timely received by us and any affiliated insurance companies with respect to the matter from policy owners in separate accounts of these insurance companies that are registered with the SEC under the 1940 Act. The effect of this proportional voting is that a small number of policy owners can determine the outcome of a vote. The voting privileges described above reflect our understanding of applicable Federal securities law requirements. To the extent that applicable law, regulations or interpretations change to eliminate or restrict the need for such voting privileges, we reserve the right to proceed in accordance with any such revised requirements.
32
We will determine the number of portfolio shares for which voting instructions may be given not more than 90 days prior to the meeting. Proxy material will be distributed to each person having the voting interest under the policy together with appropriate forms for giving voting instructions.
We determine the number of a portfolio’s shares held in a subaccount attributable to each owner by dividing the amount of a policy’s variable investment account value held in the subaccount by the net asset value of one share in the series fund. Fractional votes will be counted. We determine the number of shares as to which the owner may give instructions as of the record date for a series fund’s meeting. Owners of policies may give instructions regarding the election of the Board of Trustees or Board of Directors of a series fund, ratification of the selection of independent auditors, approval of series fund investment advisory agreements and other matters requiring a shareholder vote.
There are no legal proceedings to which the Depositor, the Separate Account or the principal underwriter is a party or to which the assets of the Separate Account are subject that are likely to have a material adverse effect on the Separate Account or the ability of the principal underwriter to perform its contract with the Separate Account or of the Depositor to meet its obligations under the policy.
The financial statements of the Separate Account, as well as the consolidated financial statements of John Hancock NY are in the SAI. The financial statements of John Hancock NY have relevance for the policies only to the extent that they bear upon its ability to meet its obligations under the policies. You may request an SAI by contacting our Service Office at a phone number or address shown on the back cover of this prospectus.
33
APPENDIX: PORTFOLIOS AVAILABLE UNDER THE POLICY
The following is a list of portfolios available under the policies. More information about the portfolios is available in the prospectuses for the portfolios, which may be amended from time to time. You can request this information at no cost by calling 1-877-391-3748, option 4 or by sending an email request to webmail@jhancock.com.
The current expenses and performance information below reflect fees and expenses of the portfolios, but do not reflect the other fees and expenses that your policy may charge. Expenses would be higher and performance would be lower if these other charges were included. Each portfolio’s past performance is not necessarily an indication of future performance.
| INVESTMENT OBJECTIVE |
PORTFOLIO AND ADVISER/SUBADVISER |
CURRENT EXPENSES* |
AVERAGE ANNUAL TOTAL RETURNS (as of 12/31/21) (%) | |||||||
| 1-YEAR | 5-YEAR | 10-YEAR | ||||||||
| To approximate the aggregate total return of a broad-based U.S. domestic equity market index. | 500 Index Trust - Series NAV John Hancock Variable Trust Advisers LLC/Manulife Investment Management (North America) Limited |
0.25% | 28.36 | 18.18 | 16.27 | |||||
| To seek income and capital appreciation. | Active Bond Trust - Series NAV John Hancock Variable Trust Advisers LLC/Manulife Investment Management (US) LLC |
0.66% | -0.42 | 4.30 | 4.27 | |||||
| To seek to provide high total return (including income and capital gains) consistent with preservation of capital over the long term. | American Asset Allocation Capital Research and Management Company (Adviser to the Master Fund, American Fund Insurance Series) |
0.92% | 14.71 | 11.31 | 10.93 | |||||
| To seek to provide long-term growth of capital. | American Global Growth Capital Research and Management Company (Adviser to the Master Fund, American Fund Insurance Series) |
1.05% | 16.00 | 19.23 | 15.23 | |||||
| To seek to provide growth of capital. | American Growth Trust - Series I Capital Research and Management Company (Adviser to the Master Fund, American Fund Insurance Series) |
0.97% | 21.55 | 24.97 | 19.27 | |||||
| To seek to provide long-term growth of capital and income. | American Growth-Income Capital Research and Management Company (Adviser to the Master Fund, American Fund Insurance Series) |
0.91% | 23.61 | 15.97 | 15.01 | |||||
| To seek to provide long-term growth of capital. | American International Capital Research and Management Company (Adviser to the Master Fund, American Fund Insurance Series) |
1.16% | -1.81 | 9.23 | 7.74 | |||||
| Appendix-1 | App tbl #2 |
| INVESTMENT OBJECTIVE |
PORTFOLIO AND ADVISER/SUBADVISER |
CURRENT EXPENSES* |
AVERAGE ANNUAL TOTAL RETURNS (as of 12/31/21) (%) | |||||||
| 1-YEAR | 5-YEAR | 10-YEAR | ||||||||
| To provide long-term growth of capital. Current income is a secondary objective. | Blue Chip Growth John Hancock Variable Trust Advisers LLC/T. Rowe Price Associates, Inc. |
0.76% | 16.92 | 23.20 | 19.24 | |||||
| To seek long-term growth of capital. | Capital Appreciation John Hancock Variable Trust Advisers LLC/Jennison Associates LLC |
0.73% | 15.76 | 26.65 | 20.19 | |||||
| To seek long-term capital appreciation. | Capital Appreciation Value John Hancock Variable Trust Advisers LLC/T. Rowe Price Associates, Inc. |
0.87% | 18.16 | 14.83 | 13.62 | |||||
| To seek total return consisting of income and capital appreciation. | Core Bond Trust - Series NAV John Hancock Variable Trust Advisers LLC/Allspring Global Investments, LLC |
0.61% | -1.99 | 3.52 | 3.09 | |||||
| To seek long-term growth of capital. | Disciplined Value International John Hancock Variable Trust Advisers LLC/Boston Partners Global Investors, Inc. |
0.87% | 13.15 | 5.54 | 5.98 | |||||
| To seek long-term capital appreciation. | Emerging Markets Value John Hancock Variable Trust Advisers LLC/Dimensional Fund Advisors LP |
0.98% | 11.25 | 7.99 | 4.31 | |||||
| To provide substantial dividend income and also long-term growth of capital. | Equity Income Trust - Series NAV John Hancock Variable Trust Advisers LLC/T. Rowe Price Associates, Inc. |
0.71% | 25.49 | 11.02 | 11.92 | |||||
| To seek growth of capital. | Financial Industries John Hancock Variable Trust Advisers LLC/Manulife Investment Management (US) LLC |
0.84% | 29.70 | 11.52 | 12.92 | |||||
| To seek long-term growth of capital. | Fundamental All Cap Core John Hancock Variable Trust Advisers LLC/Manulife Investment Management (US) LLC |
0.70% | 30.68 | 20.25 | 18.00 | |||||
| Appendix-2 | App tbl #2 |
| INVESTMENT OBJECTIVE |
PORTFOLIO AND ADVISER/SUBADVISER |
CURRENT EXPENSES* |
AVERAGE ANNUAL TOTAL RETURNS (as of 12/31/21) (%) | |||||||
| 1-YEAR | 5-YEAR | 10-YEAR | ||||||||
| To seek long-term capital appreciation. | Fundamental Large Cap Value John Hancock Variable Trust Advisers LLC/Manulife Investment Management (US) LLC |
0.71% | 30.00 | 14.06 | 14.41 | |||||
| To seek long-term capital appreciation. | Global Equity Trust - Series NAV John Hancock Variable Trust Advisers LLC/Manulife Investment Management (US) LLC |
0.87% | 21.32 | 8.86 | 9.33 | |||||
| To seek long-term capital appreciation. | Health Sciences Trust - Series NAV John Hancock Variable Trust Advisers LLC/T. Rowe Price Associates, Inc. |
0.95% | 11.23 | 18.55 | 20.05 | |||||
| To realize an above-average total return over a market cycle of three to five years, consistent with reasonable risk. | High Yield Trust - Series NAV John Hancock Variable Trust Advisers LLC/Western Asset Management Company, LLC |
0.77% | 5.78 | 6.22 | 6.45 | |||||
| To seek to track the performance of a broad-based equity index of foreign companies primarily in developed countries and, to a lesser extent, in emerging markets. | International Equity Index John Hancock Variable Trust Advisers LLC/SSGA Funds Management, Inc. |
0.34% | 7.59 | 9.64 | 7.21 | |||||
| To seek long-term capital appreciation. | International Small Company John Hancock Variable Trust Advisers LLC/Dimensional Fund Advisors LP |
0.95% | 13.77 | 9.41 | 9.43 | |||||
| To provide a high level of current income consistent with the maintenance of principal and liquidity. | Investment Quality Bond John Hancock Variable Trust Advisers LLC/Wellington Management Company LLP |
0.68% | -1.21 | 4.22 | 3.56 | |||||
| To seek a balance between a high level of current income and growth of capital, with a greater emphasis on growth of capital. | Lifestyle Balanced John Hancock Variable Trust Advisers LLC/Manulife Investment Management (US) LLC |
0.62% | 9.51 | 9.34 | 8.17 | |||||
| Appendix-3 | App tbl #2 |
| INVESTMENT OBJECTIVE |
PORTFOLIO AND ADVISER/SUBADVISER |
CURRENT EXPENSES* |
AVERAGE ANNUAL TOTAL RETURNS (as of 12/31/21) (%) | |||||||
| 1-YEAR | 5-YEAR | 10-YEAR | ||||||||
| To seek a high level of current income with some consideration given to growth of capital. | Lifestyle Conservative John Hancock Variable Trust Advisers LLC/Manulife Investment Management (US) LLC |
0.64% | 2.94 | 6.14 | 5.23 | |||||
| To seek long-term growth of capital. Current income is also a consideration. | Lifestyle Growth John Hancock Variable Trust Advisers LLC/Manulife Investment Management (US) LLC |
0.60% | 14.13 | 11.46 | 10.11 | |||||
| To seek a balance between a high level of current income and growth of capital, with a greater emphasis on income. | Lifestyle Moderate John Hancock Variable Trust Advisers LLC/Manulife Investment Management (US) LLC |
0.63% | 7.23 | 8.28 | 7.23 | |||||
| To seek growth of capital and current income while seeking to both manage the volatility of return and limit the magnitude of portfolio losses. | Managed Volatility Balanced Portfolio - Series NAV John Hancock Variable Trust Advisers LLC/Manulife Investment Management (US) LLC |
0.73% | 9.88 | 7.47 | 6.84 | |||||
| To seek current income and growth of capital, while seeking to both manage the volatility of return and limit the magnitude of portfolio losses. | Managed Volatility Conservative Portfolio - Series NAV John Hancock Variable Trust Advisers LLC/Manulife Investment Management (US) LLC |
0.72% | 3.52 | 5.11 | 4.76 | |||||
| To seek long term growth of capital while seeking to both manage the volatility of return and limit the magnitude of portfolio losses. | Managed Volatility Growth Portfolio - Series NAV John Hancock Variable Trust Advisers LLC/Manulife Investment Management (US) LLC |
0.76% | 12.85 | 8.12 | 7.33 | |||||
| To seek current income and growth of capital while seeking to both manage the volatility of return and limit the magnitude of portfolio losses. | Managed Volatility Moderate Portfolio - Series NAV John Hancock Variable Trust Advisers LLC/Manulife Investment Management (US) LLC |
0.73% | 8.03 | 7.00 | 6.49 | |||||
| Appendix-4 | App tbl #2 |
| INVESTMENT OBJECTIVE |
PORTFOLIO AND ADVISER/SUBADVISER |
CURRENT EXPENSES* |
AVERAGE ANNUAL TOTAL RETURNS (as of 12/31/21) (%) | |||||||
| 1-YEAR | 5-YEAR | 10-YEAR | ||||||||
| To seek long-term growth of capital. | Mid Cap Growth Trust (formerly Mid Cap Stock Trust) - Series NAV John Hancock Variable Trust Advisers LLC/Wellington Management Company LLP |
0.86% | 3.58 | 23.93 | 18.54 | |||||
| Seeks to approximate the aggregate total return of a mid cap U.S. domestic equity market index. | Mid Cap Index Trust - Series NAV John Hancock Variable Trust Advisers LLC/Manulife Investment Management (North America) Limited |
0.40% | 24.27 | 12.67 | 13.79 | |||||
| To seek long-term capital appreciation. | Mid Value Trust - Series NAV John Hancock Variable Trust Advisers LLC/T. Rowe Price Associates, Inc. |
0.91% | 24.26 | 10.15 | 12.95 | |||||
| To obtain maximum current income consistent with preservation of principal and liquidity. | Money Market Trust - Series NAV John Hancock Variable Trust Advisers LLC/Manulife Investment Management (US) LLC |
0.28% | 0.00 | 0.91 | 0.47 | |||||
| To seek maximum total return, consistent with preservation of capital and prudent investment management. | Opportunistic Fixed Income John Hancock Variable Trust Advisers LLC/Wellington Management Company LLP |
0.81% | -2.06 | 4.86 | 2.72 | |||||
| To seek to achieve a combination of long-term capital appreciation and current income. | Real Estate Securities John Hancock Variable Trust Advisers LLC/Wellington Management Company LLP |
0.74% | 46.80 | 12.99 | 12.08 | |||||
| To seek long-term growth of capital. Current income is incidental to the fund’s objective. | Science & Technology John Hancock Variable Trust Advisers LLC/Allianz Global Investors U.S. LLC and T. Rowe Price Associates, Inc. |
1.05% | 8.58 | 27.10 | 21.28 | |||||
| To seek income and capital appreciation. | Select Bond Trust - Series NAV John Hancock Variable Trust Advisers LLC/Manulife Investment Management (US) LLC |
0.59% | -1.15 | 3.96 | 3.36 | |||||
| Appendix-5 | App tbl #2 |
| INVESTMENT OBJECTIVE |
PORTFOLIO AND ADVISER/SUBADVISER |
CURRENT EXPENSES* |
AVERAGE ANNUAL TOTAL RETURNS (as of 12/31/21) (%) | |||||||
| 1-YEAR | 5-YEAR | 10-YEAR | ||||||||
| To seek a high level of current income consistent with preservation of capital. Maintaining a stable share price is a secondary goal. | Short Term Government Income Trust - Series NAV John Hancock Variable Trust Advisers LLC/Manulife Investment Management (US) LLC |
0.64% | -1.54 | 1.39 | 0.99 | |||||
| Seeks to approximate the aggregate total return of a small cap U.S. domestic equity market index. | Small Cap Index Trust - Series NAV John Hancock Variable Trust Advisers LLC/Manulife Investment Management (North America) Limited |
0.46% | 14.59 | 11.66 | 12.94 | |||||
| To seek long-term capital appreciation. | Small Cap Opportunities John Hancock Variable Trust Advisers LLC/Dimensional Fund Advisors LP and GW&K Investment Management, LLC |
0.83% | 31.16 | 11.66 | 12.70 | |||||
| To seek long-term capital appreciation. | Small Cap Stock Trust - Series NAV John Hancock Variable Trust Advisers LLC/Wellington Management Company LLP |
1.05% | 1.27 | 20.55 | 15.69 | |||||
| To seek long-term capital appreciation. | Small Cap Value Trust - Series NAV John Hancock Variable Trust Advisers LLC/Wellington Management Company LLP |
1.04% | 26.30 | 6.28 | 10.52 | |||||
| To seek long-term growth of capital. | Small Company Value John Hancock Variable Trust Advisers LLC/T. Rowe Price Associates, Inc. |
1.18% | 22.81 | 10.37 | 12.13 | |||||
| To seek a high level of current income. | Strategic Income Opportunities Trust - Series NAV John Hancock Variable Trust Advisers LLC/Manulife Investment Management (US) LLC |
0.70% | 0.95 | 4.08 | 4.84 | |||||
| To seek to track the performance of the Bloomberg U.S. Aggregate Bond Index (the “Bloomberg Index”) (which represents the U.S. investment grade bond market). | Total Bond Market John Hancock Variable Trust Advisers LLC/Manulife Investment Management (US) LLC |
0.26% | -1.86 | 3.31 | 2.68 | |||||
| Appendix-6 | App tbl #2 |
| INVESTMENT OBJECTIVE |
PORTFOLIO AND ADVISER/SUBADVISER |
CURRENT EXPENSES* |
AVERAGE ANNUAL TOTAL RETURNS (as of 12/31/21) (%) | |||||||
| 1-YEAR | 5-YEAR | 10-YEAR | ||||||||
| Seeks to approximate the aggregate total return of a broad U.S. domestic equity market index. | Total Stock Market Index John Hancock Variable Trust Advisers LLC/Manulife Investment Management (North America) Limited |
0.51% | 24.51 | 17.43 | 15.68 | |||||
| The fund seeks a high level of current income consistent with the maintenance of liquidity and the preservation of capital. | Ultra Short Term Bond John Hancock Variable Trust Advisers LLC/Manulife Investment Management (US) LLC |
0.61% | -0.41 | 1.28 | 0.77 | |||||
| INVESTMENT OBJECTIVE |
PORTFOLIO AND ADVISER/SUBADVISER |
CURRENT EXPENSES* |
AVERAGE ANNUAL TOTAL RETURNS (as of 12/31/21) (%) | |||||||
| 1-YEAR | 5-YEAR | 10-YEAR | ||||||||
| The Portfolio seeks maximum real return consistent with preservation of real capital and prudent investment management. | PIMCO VIT All Asset Pacific Investment Management Company LLC/Research Affiliates, LLC |
1.54% | 15.90 | 8.26 | 5.71 | |||||
| To seek to provide capital appreciation. | TOPS ® Aggressive Growth ValMark Advisers, Inc./Milliman Financial Risk Management, LLC |
0.55% | 19.31 | 12.65 | 11.48 | |||||
| To seek to provide income and capital appreciation. | TOPS ® Balanced ETF - Class 2 ValMark Advisers, Inc./Milliman Financial Risk Management, LLC |
0.56% | 9.62 | 7.60 | 6.72 | |||||
| To seek to preserve capital and provide moderate income and moderate capital appreciation. | TOPS ® Conservative ETF - Class 2 ValMark Advisers, Inc./Milliman Financial Risk Management, LLC |
0.58% | 6.45 | 5.76 | 4.90 | |||||
| To seek to provide capital appreciation. | TOPS ® Growth ETF - Class 2 ValMark Advisers, Inc./Milliman Financial Risk Management, LLC |
0.55% | 16.52 | 11.31 | 10.13 | |||||
| To seek to provide capital appreciation. | TOPS ® Moderate Growth ValMark Advisers, Inc./Milliman Financial Risk Management, LLC |
0.55% | 12.82 | 9.53 | 8.50 | |||||
* The portfolios’ annual expenses may reflect temporary fee or expense waivers or reimbursements.
| Appendix-7 | App tbl #2 |
JOHN HANCOCK NY SERVICE OFFICE
| Overnight Express Delivery | Mail Delivery | |
| Life Post Issue John Hancock Insurance Company 30 Dan Road, Suite #55979 Canton, MA 02021 |
Life Post Issue John Hancock Insurance Company PO Box 55979 Boston, MA 02205 | |
| Phone: | Fax: | |
| 1-877-391-3748, option 4 | 1-617-572-1571 | |
In addition to this prospectus, John Hancock NY has filed with the SEC an SAI that contains additional information about John Hancock NY and the Separate Account, including information on our history, services provided to the Separate Account, and the audited financial statements for John Hancock NY and the Separate Account. The SAI is incorporated by reference into this prospectus, and personalized illustrations of death benefits, policy values and surrender values are available, without charge, upon request. You may obtain the personalized illustrations from your John Hancock NY representative. The SAI may be obtained, without charge, by contacting the John Hancock NY Service Office. You should also contact the John Hancock NY Service Office to request any other information about your policy or to make any inquiries about its operation.
Reports and other information about the Separate Account are available on the SEC’s Internet website at http://www.sec.gov. Copies of such information may be obtained, upon payment of a duplicating fee, by submitting an electronic request to the following e-mail address: publicinfo@sec.gov.
1940 Act File No. 811-8329 — 1933 Act File No. 333-131139
EDGAR Contract Identifier No. C000027561
| Name of Policy (and SEC EDGAR Identifier #) | Name of Policy (and SEC EDGAR Identifier #) |
| Accumulation SVUL (C000049289) | Majestic VCOLIX (C000070693) |
| Accumulation Survivorship Variable Universal Life 2020 (C000221085) | Majestic VULX (C000067662) |
| Accumulation Variable Universal Life (C000027562) | Protection SVUL (C000049288) |
| Accumulation Variable Universal Life 08 (C000069367) | Protection Variable Universal Life (C000027560) |
| Accumulation Variable Universal Life 2014 (C000141201) | Protection Variable Universal Life 09 (C000076061) |
| Accumulation Variable Universal Life 2019 (C000217917) | Protection Variable Universal Life 2012 (C000113134) |
| Corporate VUL (C000027561) | Protection Variable Universal Life 2017 (C000198121) |
| Corporate VUL 08 (C000069368) | Simplified Life (C000142068) |
| Majestic Accumulation Variable Universal Life 2019 (C000217918) | SPVL (C000027558) |
| Majestic Performance Variable Universal Life (C000034066) | Survivorship VUL (C000027559) |
| Majestic Survivorship VULX (C000062402) | VUL Accumulator (C000027556) |
| Majestic Survivorship Variable Universal Life 2020 (C000221086) | VUL Protector (C000027557) |
| Page No. | |
|
|
2 |
|
|
2 |
|
|
2 |
|
|
2 |
|
|
2 |
|
|
2 |
|
|
2 |
|
|
3 |
|
|
3 |
|
|
3 |
|
|
3 |
|
FINANCIAL STATEMENTS
|
F-1 |
| • | Fixed dollar payments: The amount of these payments varies widely. JH Distributors may, for example, make one or more payments in connection with a firm’s conferences, seminars or training programs, seminars for the public, advertising and sales campaigns regarding the policies, to assist a firm in connection with its systems, operations and marketing expenses, or for other activities of a selling firm or wholesaler. JH Distributors may make these payments upon the initiation of a relationship with a firm, and at any time thereafter. |
| • | Payments based upon sales: These payments are based upon a percentage of the total amount of money received, or anticipated to be received, for sales through a firm of some or all of the insurance products that we and/or our affiliates offer. JH Distributors makes these payments on a periodic basis. |
| • | Payments based upon “assets under management”: These payments are based upon a percentage of the policy value of some or all of our (and/or our affiliates’) insurance products that were sold through the firm. JH Distributors makes these payments on a periodic basis. |
A U D I T E D S T A T U T O R Y - B A S I S F I N A N C I A L
S T A T E M E N T S
John Hancock Life Insurance Company of New York
For the Years Ended December 31, 2021, 2020 and 2019
With Report of Independent Auditors
AUDITED STATUTORY-BASIS FINANCIAL STATEMENTS
JOHN HANCOCK LIFE INSURANCE COMPANY OF NEW YORK
YEARS ENDED DECEMBER 31, 2021, 2020 and 2019
Contents
| 1 |
||||
| Statutory-Basis Financial Statements: |
||||
| 3 |
||||
| 5 |
||||
| Statements of Changes in Capital and Surplus—Statutory-Basis |
6 |
|||
| 7 |
||||
| 8 |
||||
Report of Independent Auditors
The Board of Directors and Stockholder
John Hancock Life Insurance Company of New York
Opinion
We have audited the statutory-basis financial statements of John Hancock Life Insurance Company of New York (the Company), which comprise the balance sheets as of December 31, 2021 and 2020, and the related statements of operations, changes in capital and surplus and cash flow for each of the three years in the period ended December 31, 2021, and the related notes to the financial statements (collectively referred to as “the financial statements”).
Unmodified Opinion on Statutory Basis of Accounting
In our opinion, the accompanying financial statements present fairly, in all material respects, the financial position of the Company at December 31, 2021 and 2020, and the results of its operations and its cash flows for each of the three years in the period ended December 31, 2021, on the basis of accounting described in Note 2.
Adverse Opinion on U.S. Generally Accepted Accounting Principles
In our opinion, because of the significance of the matter described in the Basis for Adverse Opinion on U.S. Generally Accepted Accounting Principles section of our report, the financial statements do not present fairly, in accordance with accounting principles generally accepted in the United States of America, the financial position of the Company at December 31, 2021 and 2020, or the results of its operations or its cash flows for each of the three years in the period ended December 31, 2021.
Basis for Opinion
We conducted our audits in accordance with auditing standards generally accepted in the United States of America (GAAS). Our responsibilities under those standards are further described in the Auditor’s Responsibilities for the Audit of the Financial Statements section of our report. We are required to be independent of the Company and to meet our other ethical responsibilities in accordance with the relevant ethical requirements relating to our audits. We believe that the audit evidence we have obtained is sufficient and appropriate to provide a basis for our audit opinions.
Basis for Adverse Opinion on U.S. Generally Accepted Accounting Principles
As described in Note 2 to the financial statements, the Company prepared these financial statements using accounting practices prescribed or permitted by the New York State Department of Financial Services, which is a basis of accounting other than accounting principles generally accepted in the United States of America. The effects on the financial statements of the variances between these statutory accounting practices described in Note 2 and accounting principles generally accepted in the United States of America, although not reasonably determinable, are presumed to be material and pervasive.
Responsibilities of Management for the Financial Statements
Management is responsible for the preparation and fair presentation of the financial statements in accordance with the accounting practices prescribed or permitted by the New York State Department of Financial Services. Management also is responsible for the design, implementation, and maintenance of internal control relevant to the preparation and fair presentation of financial statements that are free of material misstatement, whether due to fraud or error.
In preparing the financial statements, management is required to evaluate whether there are conditions or events, considered in the aggregate, that raise substantial doubt about the Company’s ability to continue as a going concern for one year after the date that the financial statements are issued.
1
Auditor’s Responsibilities for the Audit of the Financial Statements
Our objectives are to obtain reasonable assurance about whether the financial statements as a whole are free from material misstatement, whether due to fraud or error, and to issue an auditor’s report that includes our opinion. Reasonable assurance is a high level of assurance but is not absolute assurance and therefore is not a guarantee that an audit conducted in accordance with GAAS will always detect a material misstatement when it exists. The risk of not detecting a material misstatement resulting from fraud is higher than for one resulting from error, as fraud may involve collusion, forgery, intentional omissions, misrepresentations, or the override of internal control. Misstatements are considered material if there is a substantial likelihood that, individually or in the aggregate, they would influence the judgment made by a reasonable user based on the financial statements.
In performing an audit in accordance with GAAS, we:
| • | Exercise professional judgment and maintain professional skepticism throughout the audit. |
| • | Identify and assess the risks of material misstatement of the financial statements, whether due to fraud or error, and design and perform audit procedures responsive to those risks. Such procedures include examining, on a test basis, evidence regarding the amounts and disclosures in the financial statements. |
| • | Obtain an understanding of internal control relevant to the audit in order to design audit procedures that are appropriate in the circumstances, but not for the purpose of expressing an opinion on the effectiveness of the Company’s internal control. Accordingly, no such opinion is expressed. |
| • | Evaluate the appropriateness of accounting policies used and the reasonableness of significant accounting estimates made by management, as well as evaluate the overall presentation of the financial statements. |
| • | Conclude whether, in our judgment, there are conditions or events, considered in the aggregate, that raise substantial doubt about the Company’s ability to continue as a going concern for a reasonable period of time. |
We are required to communicate with those charged with governance regarding, among other matters, the planned scope and timing of the audit, significant audit findings, and certain internal control-related matters that we identified during the audit.
| /s/ Ernst & Young LLP |
| Boston, Massachusetts |
| March 30, 2022 |
2
JOHN HANCOCK LIFE INSURANCE COMPANY OF NEW YORK
BALANCE SHEETS—STATUTORY-BASIS
| December 31, | ||||||||
| 2021 | 2020 | |||||||
| (in millions) | ||||||||
| Admitted assets |
||||||||
| Cash and invested assets: |
||||||||
| Bonds |
$ | 5,828 | $ | 5,451 | ||||
| Stocks: |
||||||||
| Preferred stocks |
13 | 13 | ||||||
| Common stocks |
72 | 104 | ||||||
| Mortgage loans on real estate |
659 | 692 | ||||||
| Real estate: |
||||||||
| Investment properties |
236 | 238 | ||||||
| Cash, cash equivalents and short-term investments |
17 | 7 | ||||||
| Policy loans |
135 | 128 | ||||||
| Derivatives |
1,087 | 1,480 | ||||||
| Receivable for securities |
- | 1 | ||||||
| Other invested assets |
823 | 856 | ||||||
| Total cash and invested assets |
8,870 | 8,970 | ||||||
| Investment income due and accrued |
77 | 81 | ||||||
| Premiums due |
3 | 5 | ||||||
| Amounts recoverable from reinsurers |
77 | 28 | ||||||
| Funds held by or deposited with reinsured companies |
776 | 806 | ||||||
| Net deferred tax asset |
113 | 107 | ||||||
| Other reinsurance receivable |
22 | 37 | ||||||
| Amounts due from affiliates |
307 | 396 | ||||||
| Other assets |
8 | 6 | ||||||
| Assets held in separate accounts |
9,241 | 8,903 | ||||||
| Total admitted assets |
$ | 19,494 | $ | 19,339 | ||||
The accompanying notes are an integral part of the statutory-basis financial statements.
3
JOHN HANCOCK LIFE INSURANCE COMPANY OF NEW YORK
BALANCE SHEETS—STATUTORY-BASIS
| December 31, | ||||||||
| 2021 | 2020 | |||||||
| (in millions) | ||||||||
| Liabilities and capital and surplus |
||||||||
| Liabilities: |
||||||||
| Policy and contract obligations: |
||||||||
| Policy reserves |
$ | 6,596 | $ | 6,376 | ||||
| Policyholders’ and beneficiaries’ funds |
221 | 225 | ||||||
| Dividends payable to policyholders |
5 | 8 | ||||||
| Policy benefits in process of payment |
15 | 12 | ||||||
| Other amount payable on reinsurance |
81 | 71 | ||||||
| Other policy obligations |
1 | 2 | ||||||
| Total policy and contract obligations |
6,919 | 6,694 | ||||||
| Payable to parent and affiliates |
6 | 3 | ||||||
| Transfers to (from) separate account, net |
(17 | ) | (20) | |||||
| Asset valuation reserve |
198 | 234 | ||||||
| Reinsurance in unauthorized companies |
23 | 15 | ||||||
| Funds withheld from unauthorized reinsurers |
372 | 379 | ||||||
| Interest maintenance reserve |
632 | 716 | ||||||
| Current federal income taxes payable |
16 | 122 | ||||||
| Derivatives |
691 | 967 | ||||||
| Payables for collateral on derivatives |
31 | 47 | ||||||
| Other general account obligations |
62 | 66 | ||||||
| Obligations related to separate accounts |
9,241 | 8,903 | ||||||
| Total liabilities |
18,174 | 18,126 | ||||||
| Capital and surplus: |
||||||||
| Common stock (par value $1; 3,000,000 shares authorized; 2,000,003 shares issued and outstanding at December 31, 2021 and 2020) |
2 | 2 | ||||||
| Paid-in surplus |
913 | 913 | ||||||
| Unassigned surplus |
405 | 298 | ||||||
| Total capital and surplus |
1,320 | 1,213 | ||||||
| Total liabilities and capital and surplus |
$ | 19,494 | $ | 19,339 | ||||
The accompanying notes are an integral part of the statutory-basis financial statements.
4
JOHN HANCOCK LIFE INSURANCE COMPANY OF NEW YORK
STATEMENTS OF OPERATIONS—STATUTORY-BASIS
| Years Ended December 31, | ||||||||||||
| 2021 | 2020 | 2019 | ||||||||||
| (in millions) | ||||||||||||
| Premiums and other revenues: |
||||||||||||
| Life and annuity premiums, net |
$ | 1,006 | $ | 962 | $ | 516 | ||||||
| Consideration for supplementary contracts with life contingencies |
9 | 12 | 10 | |||||||||
| Net investment income |
410 | 328 | 319 | |||||||||
| Amortization of interest maintenance reserve |
24 | 21 | 12 | |||||||||
| Commissions and expense allowance on reinsurance ceded |
20 | 22 | 8 | |||||||||
| Reserve adjustment on reinsurance ceded |
- | - | 2 | |||||||||
| Separate account administrative and contract fees |
109 | 99 | 101 | |||||||||
| Other revenue |
32 | 34 | 35 | |||||||||
| Total premiums and other revenues |
1,610 | 1,478 | 1,003 | |||||||||
| Benefits paid or provided: |
||||||||||||
| Death, surrender and other contract benefits, net |
1,690 | 1,372 | 1,399 | |||||||||
| Annuity benefits |
145 | 121 | 141 | |||||||||
| Disability benefits |
1 | 2 | 2 | |||||||||
| Interest and adjustments on policy or deposit-type funds |
7 | 7 | 4 | |||||||||
| Payments on supplementary contracts with life contingencies |
7 | 12 | 11 | |||||||||
| Increase (decrease) in life and annuity reserves |
215 | 530 | (70) | |||||||||
| Total benefits paid or provided |
2,065 | 2,044 | 1,487 | |||||||||
| Insurance expenses and other deductions: |
||||||||||||
| Commissions and expense allowance on reinsurance assumed |
72 | 69 | 84 | |||||||||
| General expenses |
52 | 41 | 49 | |||||||||
| Insurance taxes, licenses and fees |
13 | 9 | 13 | |||||||||
| Net transfers to (from) separate accounts |
(712 | ) | (375 | ) | (389) | |||||||
| Investment income ceded |
19 | 39 | 35 | |||||||||
| Other (income) deductions |
(71 | ) | (66 | ) | (114) | |||||||
| Total insurance expenses and other deductions |
(627 | ) | (283 | ) | (322) | |||||||
| Income (loss) from operations before dividends to policyholders, federal income taxes and net realized capital gains (losses) |
172 | (283 | ) | (162) | ||||||||
| Dividends to policyholders |
9 | 12 | 16 | |||||||||
| Income (loss) from operations before federal income taxes and net realized capital gains (losses) |
163 | (295 | ) | (178) | ||||||||
| Federal income tax expense (benefit) |
7 | (15 | ) | (41) | ||||||||
| Income (loss) from operations before net realized capital gains (losses) |
156 | (280 | ) | (137) | ||||||||
| Net realized capital gains (losses) |
(14 | ) | (7 | ) | (60) | |||||||
| Net income (loss) |
$ | 142 | $ | (287 | ) | $ | (197) | |||||
The accompanying notes are an integral part of the statutory-basis financial statements.
5
JOHN HANCOCK LIFE INSURANCE COMPANY OF NEW YORK
STATEMENTS OF CHANGES IN CAPITAL AND SURPLUS—STATUTORY-BASIS
| Common Stock |
Paid-in Surplus |
Unassigned Surplus (Deficit) |
Total Capital and |
|||||||||||||
| (in millions) | ||||||||||||||||
| Balances at January 1, 2019 |
$ | 2 | $ | 913 | $ | 748 | $ | 1,663 | ||||||||
| Net income (loss) |
(197 | ) | (197) | |||||||||||||
| Change in net unrealized capital gains (losses) |
87 | 87 | ||||||||||||||
| Change in net deferred income tax |
53 | 53 | ||||||||||||||
| Decrease (increase) in non-admitted assets |
(25 | ) | (25) | |||||||||||||
| Decrease (increase) in asset valuation reserves |
(40 | ) | (40) | |||||||||||||
| Dividend paid to Parent |
(100 | ) | (100) | |||||||||||||
| Change in surplus as a result of reinsurance |
(17 | ) | (17) | |||||||||||||
| Balances at December 31, 2019 |
2 | 913 | 509 | 1,424 | ||||||||||||
| Net income (loss) |
(287 | ) | (287) | |||||||||||||
| Change in net unrealized capital gains (losses) |
73 | 73 | ||||||||||||||
| Change in net deferred income tax |
87 | 87 | ||||||||||||||
| Decrease (increase) in non-admitted assets |
(41 | ) | (41) | |||||||||||||
| Change in liability for reinsurance in unauthorized reinsurance |
(6 | ) | (6) | |||||||||||||
| Change in reserve due to change in valuation basis |
(36 | ) | (36) | |||||||||||||
| Decrease (increase) in asset valuation reserves |
5 | 5 | ||||||||||||||
| Change in surplus as a result of reinsurance |
(4 | ) | (4) | |||||||||||||
| Other adjustments, net |
(2 | ) | (2) | |||||||||||||
| Balances at December 31, 2020 |
2 | 913 | 298 | 1,213 | ||||||||||||
| Net income (loss) |
142 | 142 | ||||||||||||||
| Change in net unrealized capital gains (losses) |
(55 | ) | (55) | |||||||||||||
| Change in net deferred income tax |
7 | 7 | ||||||||||||||
| Decrease (increase) in non-admitted assets |
(11 | ) | (11) | |||||||||||||
| Change in liability for reinsurance in unauthorized reinsurance |
(8 | ) | (8) | |||||||||||||
| Decrease (increase) in asset valuation reserves |
36 | 36 | ||||||||||||||
| Change in surplus as a result of reinsurance |
(5 | ) | (5) | |||||||||||||
| Other adjustments, net |
1 | 1 | ||||||||||||||
| Balances at December 31, 2021 |
$ | 2 | $ | 913 | $ | 405 | $ | 1,320 | ||||||||
The accompanying notes are an integral part of the statutory-basis financial statements.
6
JOHN HANCOCK LIFE INSURANCE COMPANY OF NEW YORK
STATEMENTS OF CASH FLOW—STATUTORY-BASIS
| Years Ended December 31, | ||||||||||||
| 2021 | 2020 | 2019 | ||||||||||
| (in millions) | ||||||||||||
| Operations |
||||||||||||
| Premiums and other considerations collected, net of reinsurance |
$ | 1,017 | $ | 975 | $ | 1,059 | ||||||
| Net investment income received |
422 | 329 | 321 | |||||||||
| Separate account fees |
109 | 99 | 101 | |||||||||
| Commissions and expenses allowance on reinsurance ceded |
15 | 18 | (9) | |||||||||
| Miscellaneous income |
61 | 64 | 55 | |||||||||
| Benefits and losses paid |
(1,883) | (1,543) | (1,544) | |||||||||
| Net transfers from (to) separate accounts |
715 | 376 | 389 | |||||||||
| Commissions and expenses (paid) recovered |
(57) | (109) | (105) | |||||||||
| Dividends paid to policyholders |
(12) | (16) | (18) | |||||||||
| Federal and foreign income and capital gain taxes (paid) recovered |
(121) | 15 | (10) | |||||||||
| Net cash provided by operating activities |
266 | 208 | 239 | |||||||||
| Investment activities |
||||||||||||
| Proceeds from sales, maturities, or repayments of investments: |
||||||||||||
| Bonds |
3,475 | 3,176 | 844 | |||||||||
| Stocks |
49 | 38 | 44 | |||||||||
| Mortgage loans on real estate |
117 | 58 | 31 | |||||||||
| Other invested assets |
192 | 165 | 281 | |||||||||
| Total investment proceeds |
3,833 | 3,437 | 1,200 | |||||||||
| Cost of investments acquired: |
||||||||||||
| Bonds |
3,923 | 3,364 | 1,104 | |||||||||
| Stocks |
5 | 4 | 5 | |||||||||
| Mortgage loans on real estate |
94 | 133 | 25 | |||||||||
| Real estate |
4 | 2 | 11 | |||||||||
| Other invested assets |
79 | 55 | 138 | |||||||||
| Derivatives |
29 | 63 | 70 | |||||||||
| Total cost of investments acquired |
4,134 | 3,621 | 1,353 | |||||||||
| Net increase (decrease) in receivable/payable for securities and collateral on derivatives |
(15) | (175) | 201 | |||||||||
| Net (increase) decrease in policy loans |
(7) | (6) | - | |||||||||
| Net cash provided by (used in) investment activities |
(323) | (365) | 48 | |||||||||
| Financing and miscellaneous activities |
||||||||||||
| Net deposits (withdrawals) on deposit-type contracts |
(5) | (7) | (11) | |||||||||
| Dividend paid to parent |
- | - | (100) | |||||||||
| Other cash provided (applied) |
72 | 158 | (198) | |||||||||
| Net cash provided by (used in) financing and miscellaneous activities |
67 | 151 | (309) | |||||||||
| Net increase (decrease) in cash, cash equivalents and short-term investments |
10 | (6) | (22) | |||||||||
| Cash, cash equivalents and short-term investments at beginning of year |
7 | 13 | 35 | |||||||||
| Cash, cash equivalents and short-term investments at end of year |
$ | 17 | $ | 7 | $ | 13 | ||||||
| Non-cash activities during the year: |
||||||||||||
| Bonds transfer of assets |
$ | 10 | $ | - | $ | - | ||||||
| Mortgage loans transfer of assets |
(10) | - | - | |||||||||
| Premium and other operating activity related to reinsurance transactions, net |
- | - | 525 | |||||||||
| Investing activities related to reinsurance transactions, net |
- | - | (525) | |||||||||
The accompanying notes are an integral part of the statutory-basis financial statements.
7
JOHN HANCOCK LIFE INSURANCE COMPANY OF NEW YORK
NOTES TO STATUTORY-BASIS FINANCIAL STATEMENTS
1. Organization and Nature of Operations
John Hancock Life Insurance Company of New York (the “Company”) is a life insurance company organized on February 10, 1992 under the laws of the State of New York. The New York State Department of Financial Services (the “Insurance Department”) granted the Company a license to operate on July 22, 1992. The Company is a wholly-owned subsidiary of John Hancock Life Insurance Company (U.S.A.) (“JHUSA”). JHUSA is a wholly-owned subsidiary of The Manufacturers Investment Corporation (“MIC”). MIC is a wholly-owned subsidiary of John Hancock Financial Corporation (“JHFC”), which is an indirect, wholly-owned subsidiary of The Manufacturers Life Insurance Company (“MLI”). MLI, in turn, is a wholly-owned subsidiary of Manulife Financial Corporation (“MFC”), a Canadian-based, publicly traded financial services holding company.
The Company provides a wide range of financial protection and wealth management products and services to both individual and institutional customers. Through its insurance operations, the Company offers a variety of individual life insurance products that are distributed through multiple distribution channels, including insurance agents, brokers, banks, and financial planners. The Company also offers a variety of retirement products to retirement plans. The Company distributes these products through multiple distribution channels, including insurance agents and affiliated brokers, securities brokerage firms, financial planners, pension plan sponsors, pension plan consultants, and banks.
Pursuant to a distribution agreement with the Company, John Hancock Distributors LLC (“JHD”), a registered broker-dealer and a wholly-owned subsidiary of JHUSA, acts as the principal underwriter of variable life contracts and other products issued by the Company.
The Company’s results and operations have been and may continue to be adversely impacted by COVID-19 and the economic environment. The adverse effects include but are not limited to significant volatility in equity markets, decline in interest rates, increase in credit risk, strain on commodity markets and alternative long duration asset prices, foreign currency exchange rate volatility, increases in insurance claims, persistency and redemptions, and disruption of business operations. The breadth and depth of these events and their duration contribute additional uncertainty around estimates used in determining the carrying value of certain assets and liabilities included in these financial statements.
2. Significant Accounting Policies
Use of Estimates
The preparation of financial statements requires management to make estimates and assumptions that affect amounts reported in the financial statements and accompanying notes. Such estimates and assumptions could change in the future as more information becomes known and may impact the amounts reported and disclosed herein.
Basis of Presentation
These financial statements have been prepared in conformity with accounting practices prescribed or permitted by the Insurance Department. The National Association of Insurance Commissioners’ (“NAIC”) Accounting Practices and Procedures Manual (“NAIC SAP”) has been adopted as a component of practices prescribed or permitted by the State of New York. The New York Superintendent of the Insurance Department (the “Superintendent”) has the authority to prescribe or permit other specific practices that deviate from prescribed practices. NAIC SAP practices differ from accounting principles generally accepted in the United States (“GAAP”) as described below.
Investments: Investments in bonds not backed by other loans are principally stated at amortized cost using the constant yield (interest) method. Bonds can also be stated at the lesser of amortized cost or fair value based on their NAIC designated rating. Non-redeemable preferred stocks, which have characteristics of equity securities, are reported at cost or lower of cost or market value as determined by the Securities Valuation Office of the NAIC (“SVO”) rating, and the related net unrealized capital gains (losses) are reported in unassigned surplus along with any adjustment for federal income taxes. Redeemable preferred stocks, which have characteristics of debt securities and are rated as medium quality or better, are reported at cost or amortized cost. All other redeemable preferred stocks are reported at the lower of cost, amortized cost, or fair value.
For bonds other than loan-backed and structured securities, the Company has a process in place to identify securities that could potentially have an impairment that is other-than-temporary. The Company recognizes other-than-temporary
8
JOHN HANCOCK LIFE INSURANCE COMPANY OF NEW YORK
NOTES TO STATUTORY-BASIS FINANCIAL STATEMENTS
impairment losses on bonds with unrealized losses when the entity does not have the intent and ability to hold the security for a period of time sufficient to allow for any anticipated recovery in value. Declines in value due to credit difficulties are also considered to be other-than-temporarily impaired when the Company does not have the intent and ability to hold the security for a period of time sufficient to allow for any anticipated recovery in value. The entire difference between amortized cost and fair value on such bonds with credit difficulties is recognized as an impairment loss in income.
Loan-backed and structured securities (i.e., collateralized mortgage obligations) are adjusted for the effects of changes in prepayment assumptions on the related accretion of discounts or amortization of premiums of such securities using either the retrospective or prospective methods. The retrospective adjustment method is used to value all such securities, except principal-only and interest-only securities and such securities with NAIC designations of 3-6, which are valued using the prospective method. If it is determined that a decline in fair value is other-than-temporary, the cost basis of the security is written down to the present value of estimated future cash flows using the original effective interest rate inherent in the security.
Common stocks are primarily reported at fair value based on quoted market prices and the related net unrealized capital gains (losses) are reported in unassigned surplus, net of any adjustment for federal income taxes. There are no restrictions on common and preferred stocks.
Non-insurance subsidiaries, which have significant ongoing operations other than for the benefit of the Company and its affiliates, are reported based on the underlying audited GAAP equity. Non-insurance subsidiaries, which have no significant ongoing operations other than for the benefit of the Company and its affiliates, are reported based on the underlying audited GAAP equity, including the admitted portion of goodwill. Dividends from subsidiaries are included in net investment income. The remaining net change in the subsidiaries’ equity is included in the change in net unrealized capital gains (losses).
Realized capital gains (losses) on sales of securities are recognized using the first in, first out (“FIFO”) method. The cost basis of bonds, common and preferred stocks, and other invested assets is adjusted for impairments in value deemed to be other-than-temporary and such adjustments are reported as a component of net realized capital gains (losses).
Mortgage loans on real estate are reported at unpaid principal balances, less an allowance for impairments. Valuation allowances, if necessary, are established for mortgage loans on real estate based on the difference between the net value of the collateral, determined as the fair value of the collateral less estimated costs to obtain and sell, and the recorded investment in the mortgage loan. The initial valuation allowance and subsequent changes in the allowance for mortgage loans are charged or credited directly to unassigned surplus. A mortgage loan is considered to be impaired when, based on current information and events, it is probable that the Company will be unable to collect all principal and interest amounts due according to the contractual terms of the mortgage agreement. When management determines foreclosure is probable and the impairment is other-than-temporary, the mortgage loan is written down and a realized loss is recognized.
Real estate held for the production of income is reported at depreciated cost, net of related obligations. Real estate that the Company has the intent to sell is reported at the lower of depreciated cost or fair value, net of related obligations. Depreciation is calculated on a straight-line basis over the estimated useful lives of the properties.
Cash equivalents are short-term highly liquid investments with original maturities of three months or less and are principally stated at amortized cost. Short-term investments include investments with maturities of one year or less and greater than three months at the date of acquisition and are principally stated at amortized cost.
Policy loans are reported at unpaid principal balances.
Derivative instruments that meet the criteria to qualify for hedge accounting are accounted for in a manner consistent with the item hedged (i.e., amortized cost or fair value with the related net unrealized capital gains (losses) reported in unassigned surplus along with any adjustment for federal income taxes). Derivative instruments that are entered into for other hedging purposes, also known as economic hedges, do not meet the criteria to qualify for hedge accounting. These derivative instruments are accounted for at fair value, and the related changes in fair value are recognized as net unrealized capital gains (losses) reported in unassigned surplus, net of any adjustments for federal income taxes. Embedded derivatives are not accounted for separately from the host contract.
9
JOHN HANCOCK LIFE INSURANCE COMPANY OF NEW YORK
NOTES TO STATUTORY-BASIS FINANCIAL STATEMENTS
Other invested assets consist of ownership interests in partnerships and limited liability companies (“LLCs”) which are carried based on the underlying audited GAAP equity, with the exception of affordable housing tax credit properties, which are carried at amortized cost. The related net unrealized capital gains (losses) are reported in unassigned surplus, net of any adjustments for federal income taxes. The Company records its share of income using the most recent financial information available, which is generally on a three month lag. Depending on the timing of receipt of the audited financial statements of these other invested assets, the investee level financial data may be up to one year in arrears.
Interest Maintenance and Asset Valuation Reserves: Under a formula prescribed by the NAIC, the Company defers the portion of realized capital gains (losses) on sales of fixed income investments, principally bonds and mortgage loans, and interest-related hedging activities that are attributable to changes in the general level of interest rates and amortizes those deferrals over the remaining period to maturity based on groupings of individual securities sold in five-year bands. That net deferral is reported as the interest maintenance reserve (“IMR”) in the accompanying Balance Sheets. Realized capital gains (losses) are reported in income, net of federal income tax and transferred to the IMR. Interest rate swaps and swaptions supporting our Variable Annuities dynamic hedging program are not in an accounting hedge relationship and any realized capital gains (losses) on these sold interest rate swaps and swaptions are not deferred to IMR. The asset valuation reserve (“AVR”) provides a valuation allowance for invested assets. The AVR is determined by an NAIC prescribed formula with changes reflected directly in unassigned surplus.
Subsidiaries: The accounts and operations of the Company’s subsidiaries are not consolidated with the accounts and operations of the Company.
Goodwill: Goodwill is admitted subject to an aggregate limitation of 10% of the capital and surplus in the most recently filed quarterly statement, excluding electronic data processing (“EDP”) equipment, operating system software, net deferred tax assets, and net positive goodwill. Goodwill is amortized over the period the Company benefits economically, not to exceed 10 years. Goodwill is reported in other invested assets in the Balance Sheets.
Separate Accounts: Separate account assets and liabilities reported in the accompanying Balance Sheets represent funds that are separately administered, principally for annuity contracts and variable life insurance policies, and for which the contract holder, rather than the Company, bears the investment risk. Separate account obligations are intended to be satisfied from separate account assets and not from assets of the general account. Separate accounts are generally reported at fair value. The operations of the separate accounts are not included in the Statements of Operations; however, income earned on amounts initially invested by the Company in the formation of new separate accounts is included in other revenue. Fees charged to contract holders, principally mortality, policy administration, and surrender charges are included in separate account administrative and contract fees. The assets in the separate accounts are not pledged to others as collateral or otherwise restricted. For the years ended December 31, 2021, 2020 and 2019, there were no gains (losses) on transfers of assets from the general account to the separate account.
Nonadmitted Assets: Certain assets designated as nonadmitted, principally deferred income taxes, the Company’s investment in John Hancock Variable Trust Advisers LLC (“JHVTA”) (formerly John Hancock Investment Management Services, LLC), an affiliated company, other invested assets, furniture and equipment, prepaid expenses, and other assets not specifically identified as admitted assets within the NAIC SAP are excluded from the accompanying Balance Sheets and are charged directly to unassigned surplus.
Policy Acquisition Costs: The costs of acquiring and renewing business are expensed when incurred.
Policy Reserves: Reserves for life, annuity, and deposit-type contracts are developed by actuarial methods and are determined based on interest rates, mortality tables and valuation methods prescribed by the NAIC that will provide, in the aggregate, reserves that are greater than or equal to the maximum of guaranteed policy cash values or the amounts required by the Superintendent.
| · | The Company waives deduction of deferred fractional premiums on the death of lives insured and annuity contract holders and returns any premium beyond the date of death. Surrender values on policies do not exceed the corresponding benefit reserves. At December 31, 2021 and 2020, the Company held reserves of $423 million and $458 million, respectively, on insurance in-force amounts for which gross premiums were less than net premiums according to the standard of valuation set by the State of New York. |
10
JOHN HANCOCK LIFE INSURANCE COMPANY OF NEW YORK
NOTES TO STATUTORY-BASIS FINANCIAL STATEMENTS
| · | At December 31, 2021 and 2020, the Company held reserves of $800 million and $700 million, respectively, as a result of asset adequacy testing (“AAT”). |
| · | Reserves for individual life insurance policies are maintained using the 1941, 1958, 1980, 2001 and 2017 Commissioner’s Standard Ordinary Mortality Tables and using principally the Commissioner’s Reserve Valuation Method. In 2020, the New York State Department of Financial Services (“NY DFS”) adopted Insurance Regulation 213 (“Reg 213”) amendments, introducing the NY DFS’s version of principle-based reserving (“PBR”) for companies filing in New York. The Company received approval for a 1-year deferral on PBR implementation for Permanent Life policies. At December 31, 2021, PBR has been implemented for Term Life, Permanent Life and Variable Annuity policies. |
| · | Annuity and supplementary contracts with life contingency reserves are based principally on the 1937 Standard Annuity Table, the Group Annuity Mortality Tables for 1951, 1971, 1983 and 1994, the 1971 and 1983 Individual Annuity Mortality Tables, the A-2000 Individual Annuity Mortality Table, and the 2012 Individual Annuity Reserving Mortality Table. |
| · | Liabilities related to policyholder funds left on deposit with the Company are generally equal to fund balances. |
| · | For life insurance, the calendar year exact method is used to calculate the reserve at December 31, 2021 and 2020. Reserves at December 31, 2021 and 2020 are calculated based on the rated age. For certain policies with substandard table ratings, substandard multiple extras are applied via the Lotter method. |
| · | Tabular interest, tabular less actual reserve released, and tabular costs have been determined by formula. Tabular interest on funds not involving life contingencies is calculated as one percent of the product of such valuation rate of interest times the mean of the amount of funds subject to such valuation rate of interest held at the beginning and end of the valuation year. |
| · | From time to time, the Company finds it appropriate to modify certain required policy reserves because of changes in actuarial assumptions. Reserve modifications resulting from such determinations are recorded directly to unassigned surplus. |
| · | Reserves for variable deferred annuity contracts are calculated in accordance with NY DFS Reg 213 §103.6. The reserve is calculated using stochastic scenarios and assumptions set by the Company, subject to two reserve floors, one based on a standardized calculation using prescribed stochastic scenarios and assumptions, the other using a prescribed, standard scenario. |
Reinsurance: Reinsurance ceded contracts do not relieve the Company from its obligations to policyholders. The Company remains liable to its policyholders for the portion reinsured to the extent that any reinsurer does not meet its obligations for reinsurance ceded to it under the reinsurance agreements. Failure of the reinsurers to honor their obligations could result in losses to the Company; consequently, estimates are established for amounts deemed or estimated to be uncollectible. To minimize its exposure to significant losses from reinsurance insolvencies, the Company evaluates the financial condition of its reinsurers and monitors concentration of credit risk arising from similar characteristics of the insurer.
Premiums, commissions, expense reimbursements, benefits, and reserves related to reinsured business are accounted for on bases consistent with those used in accounting for the original policies issued and the terms of the reinsurance contracts. Premiums ceded to other companies have been reported as a reduction of premium income. Amounts applicable to reinsurance ceded for future policy benefits, unearned premium reserves, and claim liabilities have been reported as reductions of these items.
The Company records a liability for unsecured policy reserves ceded to reinsurers not authorized in the State of New York to assume such business. Changes to those amounts are credited or charged directly to unassigned surplus. Policy and contract liabilities ceded to reinsurers have been reported as reductions of the related reserves. Commissions and expense allowances allowed by reinsurers on business ceded are reported as income when received. Investment income ceded includes separate account fee income, net investment income and realized investment and other gains (losses), which was ceded to the affiliated reinsurers. NAIC SAP prescribes that no gain be recognized upon inception of a reinsurance treaty. The initial gain is recorded directly to unassigned surplus and released into income over the life of the treaty.
11
JOHN HANCOCK LIFE INSURANCE COMPANY OF NEW YORK
NOTES TO STATUTORY-BASIS FINANCIAL STATEMENTS
Federal Income Taxes: Total federal income taxes are based upon the Company’s best estimate of its current and deferred tax assets or liabilities. Current tax expense is reported in the Statements of Operations as federal income tax expense if resulting from operations and within net realized capital gains (losses) if resulting from capital transactions. Changes in the balances of deferred taxes, which provide for book versus tax temporary differences, are subject to limitations and are reported within various lines within surplus. The provision for federal and foreign income taxes incurred in the Statements of Operations is different from that which would be obtained by applying the statutory federal income tax rate to income before income tax (including realized capital gains). For additional information, see the Federal Income Taxes Note for reconciliation of effective tax rate.
Participating Insurance and Policyholder Dividends: Participating business which is assumed from JHUSA, represented approximately 14% and 15% of the Company’s aggregate reserve for group fixed annuity and life contracts at December 31, 2021 and 2020, respectively. The amount of policyholders’ dividends to be paid is approved annually by JHUSA’s Board of Directors. Policyholder dividends are recognized when declared rather than over the term of the related policies. The determination of the amount of policyholders’ dividends is complex and varies by policy type. In general, the aggregate amount of policyholders’ dividends is calculated based upon actual interest, mortality, morbidity, persistency, and expense experience for the year, as well as management’s judgment as to the appropriate level of statutory surplus to be retained by the Company.
Statements of Cash Flow: Cash, cash equivalents and short-term investments in the Statements of Cash Flow represent movements of cash and highly liquid debt investments with initial maturities of one year or less.
Premiums and Benefits: Premiums for whole, term, and universal life, annuity policies, and group annuity contracts with any mortality and morbidity risk are recognized as revenue when due. Revenues for universal life and annuity policies with mortality or morbidity risk consist of the entire premium received. Premiums received for variable universal life, as well as annuity policies and group annuity contracts without mortality or morbidity risk are recorded using deposit accounting and are credited directly to an appropriate policy reserve account, without recognizing premium revenue. Benefits incurred represent the total of death benefits paid, annuity benefits paid and the change in policy reserves.
Policy and Contract Claims: Policy and contract claims are determined on an individual-case basis for reported losses. Estimates of incurred but not reported losses are developed on the basis of past experience.
Guaranty Fund Assessments: Guaranty fund assessments are accrued when the Company receives knowledge of an insurance insolvency.
Variances Between NAIC SAP and GAAP: The more significant variances from GAAP are: (a) bonds would generally be reported at fair value; (b) changes in the fair value of derivative financial instruments would generally be reported as revenue unless deemed an effective hedge; (c) embedded derivatives would be bifurcated from the underlying contract or security and accounted for separately at fair value; (d) income recognition on partnerships and LLCs, which are accounted for under the equity method, would not be limited to the amount of cash distribution; (e) majority-owned noninsurance subsidiaries, variable interest entities where the Company is the primary beneficiary, and certain other controlled entities would be consolidated; (f) changes in the balances of deferred income taxes would generally be included in net income; (g) market value adjusted (“MVA”) annuity products would be reported in the general account of the Company; (h) all assets, subject to valuation allowances, would be recognized; (i) reserves would generally be based upon the net level premium method or the estimated gross margin method with estimates of future mortality, morbidity, persistency and interest; (j) reinsurance ceded, unearned ceded premium and unpaid ceded claims would be reported as an asset; (k) AVR and the IMR would not be recorded; (l) changes to the mortgage loan valuation allowance would be reported in income; (m) surplus notes would be reported as liabilities; (n) premiums received in excess of policy charges for universal life and annuity policies would not be recognized as premium revenue and benefits would represent the excess of benefits paid over the policy account value and interest credited to the account values; (o) certain acquisition costs, such as commissions and other variable costs, directly related to acquiring new business are charged to current operations as incurred, would generally be capitalized and amortized based on profit emergence over the expected life of the policies or over the premium payment period; and (p) changes in unrealized capital gains (losses) and foreign currency translations would be presented as other comprehensive income.
The effects of the foregoing variances from GAAP on the accompanying statutory-basis financial statements have not been determined, but are presumed to be material.
12
JOHN HANCOCK LIFE INSURANCE COMPANY OF NEW YORK
NOTES TO STATUTORY-BASIS FINANCIAL STATEMENTS
3. Permitted or Prescribed Statutory Accounting Practices
The financial statements of the Company are presented in conformity with accounting practices prescribed or permitted by the Insurance Department.
For determining the Company’s solvency under the State of New York’s insurance laws and regulations, the Insurance Department recognizes only statutory accounting practices prescribed or permitted by the State of New York for determining and reporting the financial condition and results of operations of the Company. NAIC SAP has been adopted as a component of practices prescribed or permitted by the State of New York. The Superintendent has the authority to prescribe or permit other specific practices that deviate from prescribed practices. As of December 31, 2021 and 2020, the Superintendent had not prescribed or permitted the Company to use any accounting practices that would result in the Company’s income or financial position to deviate from NAIC SAP.
13
JOHN HANCOCK LIFE INSURANCE COMPANY OF NEW YORK
NOTES TO STATUTORY-BASIS FINANCIAL STATEMENTS
4. Accounting Changes
Accounting changes adopted to conform to the provisions of NAIC SAP are reported as changes in accounting principles. The cumulative effect of changes in accounting principles is reported as an adjustment to unassigned surplus in the period of the change in accounting principle. The cumulative effect is the difference between the amount of unassigned surplus at the beginning of the year and the amount of unassigned surplus that would have been reported at that date if the new accounting principle had been applied retrospectively.
During 2021, the NAIC Valuation of Securities Task Force (“VOSTF”) adopted changes to the P&P Manual for real estate leased backed securities, impacting the assets reclassified under the guidelines for ground lease financing transactions. As a result, the Company reclassified $10 million from mortgage loans to bonds. The reclassifications had no material impact on the Company’s financial position, results of operations, financial statement disclosures and Risk-Based Capital.
Adoption of New Accounting Standards
In November 2020, the NAIC adopted the final version of the Group Capital Calculation template (“GCC”) and instructions. The purpose of the calculation is to provide additional analytical information to the lead state supervisor in charge of a group and is effective after December 31, 2021. As a wholly owned subsidiary of MFC subject to the supervision of the group’s activities on a consolidated basis, including capital adequacy, by the Canadian Insurance Regulator, the Office of the Superintendent of Financial Institutions (“OSFI”), it is not expected that these capital requirements will affect the Company.
Effective January 1, 2020, NY DFS adopted Reg 213 §103.6. The requirement is applicable to all variable annuity business in force. The guidance did not have a material impact on the Company’s financial position, results of operations, and financial statement disclosures.
Effective December 31, 2019, the NAIC made non-substantive revisions to Statement of Statutory Accounting Principles (“SSAP”) No. 100R, Fair Value Measurements to adopt with modification the disclosure amendments reflected in Accounting Standards Update (“ASU”) 2018-13 Changes to the Disclosure Requirements for Fair Value Measurement. The revisions included elimination of certain fair value disclosures. The Company adopted the amendment in 2019. The guidance did not have a material impact on the Company’s financial position, results of operations, and financial statement disclosures.
In November 2018, the NAIC adopted SSAP No. 108 – Derivatives Hedging Variable Annuity Guarantees as a substantive guidance which permits and specifies the requirements for applying a special accounting treatment for derivative contracts hedging variable annuity guarantee benefits that are subject to fluctuations as a result of interest rate sensitivity. The provisions of SSAP No. 108 are separate and distinct from the statutory guidance in SSAP No. 86 - Derivatives. Application of the adopted guidance is limited to the derivative transactions specified in SSAP No. 108 and permitted only if all of the requirements for the special accounting treatment are met. The guidance is effective beginning January 1, 2020. The Company has not elected hedge accounting under SSAP 108.
In November 2018, the NAIC made non-substantive revisions to SSAP No. 51R – Life Contracts to adopt ASU 2018-28 Updates to Liquidity Disclosures. The revisions included enhancements to the existing disclosures on annuity actuarial reserves and deposit type liabilities by withdrawal characteristics and added life liquidity disclosures. The Company adopted the amendment in 2019. The guidance did not have a material impact on the Company’s financial position, results of operations, and financial statement disclosures.
In November 2018, the NAIC made non-substantive revisions to SSAP No. 86 - Derivatives to incorporate hedge documentation and assessment efficiencies from ASU 2017-12 Targeted Improvements to Accounting for Hedging Activities as issued by Financial Accounting Standards Board (“FASB”). The revisions will allow companies to perform subsequent assessments of hedge effectiveness qualitatively if certain conditions are met, allow companies more time to perform the initial quantitative hedge effectiveness assessment and clarify that companies may apply the “criterial terms match” method for a group of forecasted transactions if they meet the requirements. The revisions were effective beginning January 1, 2019 and the Company adopted the amendment in 2019. The guidance did not have a material impact on the Company’s financial position, results of operations, and financial statement disclosures.
14
JOHN HANCOCK LIFE INSURANCE COMPANY OF NEW YORK
NOTES TO STATUTORY-BASIS FINANCIAL STATEMENTS
In March 2017, the NAIC made substantive revisions to SSAP No. 69 – Statement of Cash Flow to adopt ASU 2016-15 Statement of Cash Flows: Classification of Certain Cash Receipts and Cash Payments as issued by the FASB, without modifications. The revisions clarified the classification of eight specific cash flow issues with the objective of reducing diversity in practice. The amendment is to be applied retrospectively, effective for fiscal years beginning after December 15, 2018 and interim periods within those years. The Company adopted the amendment in 2019. The guidance did not have a material impact on the Company’s financial position, results of operations, and financial statement disclosures.
In August 2017, the NAIC adopted non-substantive revisions to SSAP No. 69 – Statement of Cash Flow to adopt ASU 2016-18 Statement of Cash Flows: Restricted Cash as issued by the FASB. The revision clarifies that restricted cash and cash equivalents shall not be reported as operating, investing or financing activities, but shall be reported with cash and cash equivalents when reconciling beginning and ending amounts on the cash flow statement. A consequential change was incorporated in SSAP No. 1 – Accounting Policies, Risks & Uncertainties and Other Disclosures to ensure information on restricted cash, cash equivalents and short-term investments is reported in the restricted asset disclosure. The revision was effective December 31, 2019, to be adopted retrospectively to allow for comparative cash flow statements. The Company adopted the amendment in 2019. The guidance did not have a material impact on the Company’s financial position, results of operations, and financial statement disclosures.
On September 22, 2017, The Bilateral Agreement Between the United States of America and the European Union (EU) on Prudential Measures Regarding Insurance and Reinsurance, known as the Covered Agreement, was signed by the United States Department of the Treasury and the US Trade Representative. The Covered Agreement includes provisions that serve to reduce reinsurance collateral requirements for certified reinsurers that are licensed and domiciled in Qualified Jurisdictions. On June 25, 2019, the NAIC Executive Committee adopted revisions to the Credit for Reinsurance Model Law (#785) and Credit for Reinsurance Model Regulation (#786), which implement the reinsurance collateral provisions of the Covered Agreements with the European Union (EU) and the United Kingdom (UK). These revisions create a new type of jurisdiction, which is called a Reciprocal Jurisdiction and eliminate reinsurance collateral requirements and local presence requirements for EU and UK reinsurers that maintain a minimum amount of own-funds equivalent to $250 million and a solvency capital requirement (SCR) of 100% under Solvency II. The revisions also provide Reciprocal Jurisdiction status for accredited U.S. jurisdictions and Qualified Jurisdictions if they meet certain requirements in the credit for reinsurance models. U.S. states must adopt these revisions prior to September 1, 2022 or face potential federal preemption by the Federal Insurance Office. To avoid preemption, the laws must be enacted prior to September 1, 2022, and must adhere exactly to the models as they have been adopted by the NAIC. On December 7, 2019, the Statutory Accounting Principles (E) Working Group adopted revisions to Appendix A-785 to incorporate the updates from the adopted Credit for Reinsurance Model Law (#785) and the Credit for Reinsurance Model Regulation (#786) that include the relevant provisions from the Covered Agreement. The State of New York enacted and adopted #785 and #786 legislation effective September 1, 2021. The guidance did not have a material impact on the Company’s financial position, results of operations, and financial statement disclosures.
In August 2016, the NAIC adopted substantive revisions to SSAP No. 51 – Life Contracts in order to allow PBR for life insurance contracts as specified in the Valuation Manual. Current statutory accounting guidance refers to existing model laws for reserving guidance which are primarily based on formulaic methodology. Also, in June 2016, the NAIC adopted updates to Appendix A-820: Minimum Life and Annuity Reserve Standards as part of the PBR project, which incorporate relevant aspects of the 2009 revisions to the Standard Valuation Law (Model #820) into Appendix A-820. The effective date is January 1, 2017 and companies are allowed to defer adoption for three years until January 1, 2020. NY DFS adopted Reg 213 amendments in 2020. The Company previously received approval from NY DFS to defer this adoption until January 1, 2021 for Permanent Life policies. PBR has now been implemented for Term Life policies (new policies written after adoption), and Variable Annuity policies (all in-force) and Permanent Life policies. Adoption is on a prospective basis, therefore, there was no impact to surplus upon adoption.
15
JOHN HANCOCK LIFE INSURANCE COMPANY OF NEW YORK
NOTES TO STATUTORY-BASIS FINANCIAL STATEMENTS
Future Adoption of New Accounting Standards
In April 2020, the NAIC adopted INT 20-1 Reference Rate Reform as an interpretation of statutory accounting guidance to incorporate the US GAAP guidance from ASU 2020-04, Reference Rate Reform (Topic 848) “Facilitation of the Effects of Reference Rate Reform on Financial Reporting”. The effective date of this guidance begins on March 12, 2020 and sunsets on Dec 31, 2022. The guidance provides limited period elective application of accounting relief (expedients) to address the direct effects from the reference rate reform on affected contracts and hedging relationships. The Company’s exposure to these changes is not significant and has not resulted in significant changes to the Company’s risk management strategies.
Reconciliation Between Audited Financial Statements and NAIC Annual Statements
There were no differences in net income (loss) or capital and surplus between the audited financial statements and the NAIC statements as filed as of and for the years ended December 31, 2021, 2020 and 2019.
5. Investments
Bonds
The carrying value and fair value of the Company’s investments in bonds are summarized as follows:
| Carrying Value |
Gross Unrealized Gains |
Gross Unrealized Losses |
Fair Value | |||||||||||||
| (in millions) | ||||||||||||||||
| December 31, 2021: |
||||||||||||||||
| U.S. government and agencies |
$ | 2,929 | $ | 83 | $ | (17 | ) | $ | 2,995 | |||||||
| States and political subdivisions |
115 | 8 | (1 | ) | 122 | |||||||||||
| Foreign governments |
42 | 7 | - | 49 | ||||||||||||
| Corporate bonds |
2,438 | 239 | (14 | ) | 2,663 | |||||||||||
| Mortgage-backed and asset-backed securities |
304 | 33 | (1 | ) | 336 | |||||||||||
| Total bonds |
$ | 5,828 | $ | 370 | $ | (33 | ) | $ | 6,165 | |||||||
| December 31, 2020: |
||||||||||||||||
| U.S. government and agencies |
$ | 3,073 | $ | 217 | $ | (42) | $ | 3,248 | ||||||||
| States and political subdivisions |
62 | 7 | - | 69 | ||||||||||||
| Foreign governments |
34 | 5 | - | 39 | ||||||||||||
| Corporate bonds |
1,970 | 375 | (1) | 2,344 | ||||||||||||
| Mortgage-backed and asset-backed securities |
312 | 43 | - | 355 | ||||||||||||
| Total bonds |
$ | 5,451 | $ | 647 | $ | (43 | ) | $ | 6,055 | |||||||
16
JOHN HANCOCK LIFE INSURANCE COMPANY OF NEW YORK
NOTES TO STATUTORY-BASIS FINANCIAL STATEMENTS
A summary of the carrying value and fair value of the Company’s investments in bonds at December 31, 2021, by contractual maturity, is as follows:
| Carrying Value |
Fair Value |
|||||||
| (in millions) | ||||||||
| Due in one year or less |
$ | 55 | $ | 55 | ||||
| Due after one year through five years |
616 | 626 | ||||||
| Due after five years through ten years |
543 | 562 | ||||||
| Due after ten years |
4,310 | 4,586 | ||||||
| Mortgage-backed and asset-backed securities |
304 | 336 | ||||||
| Total |
$ | 5,828 | $ | 6,165 | ||||
|
|
|
|||||||
The expected maturities in the foregoing table may differ from the contractual maturities because certain borrowers have the right to call or prepay obligations with or without call or prepayment penalties.
The Company maintains assets which are pledged as collateral in connection with various agreements and transactions. Additionally, the Company holds assets on deposit with government authorities as required by state law. The following table summarizes the carrying value or fair value, as applicable, of the pledged or deposited assets:
| December 31, | ||||||||
| 2021 | 2020 | |||||||
| (in millions) |
||||||||
| At fair value: |
||||||||
| Bonds and cash pledged in support of over-the-counter derivative instruments |
$ | 99 | $ | 143 | ||||
| Bonds and cash pledged in support of exchange-traded futures |
38 | 35 | ||||||
| Bonds and cash pledged in support of cleared interest rate swaps |
35 | 35 | ||||||
| Total fair value |
$ | 172 | $ | 213 | ||||
| At carrying value: |
||||||||
| Bonds on deposit with government authorities |
$ | - | $ | - | ||||
| Mortgage loans pledged in support of real estate |
- | - | ||||||
| Bonds held in trust |
- | - | ||||||
| Pledged collateral under reinsurance agreements |
- | - | ||||||
| Total carrying value |
$ | - | $ | - | ||||
At December 31, 2021 and 2020, the Company held below investment grade corporate bonds of $76 million and $75 million, with an aggregate fair value of $81 million and $81 million, respectively. The Company performs periodic evaluations of the relative credit standing of the issuers of these bonds.
The Company has a process in place to identify securities that could potentially have an impairment that is other-than-temporary. This process involves monitoring market events that could impact issuers’ credit ratings, business climate, management changes, litigation and government actions, and other similar factors. This process also involves monitoring late payments, downgrades by rating agencies, key financial ratios, financial statements, revenue forecasts, and cash flow projections as indicators of credit issues.
At the end of each quarter, the MFC Loan Review Committee reviews all securities where there is evidence of impairment or a significant unrealized loss at the Balance Sheet date. Impairment is considered to have occurred, based on management’s judgment, when it is deemed probable that the Company will not be able to collect all amounts due according to the debt security’s contractual terms. The analysis focuses on each company’s or project’s ability to service its debts in a timely fashion and the length of time the security has been trading below amortized cost. The results of this analysis are reviewed by the Transaction and Portfolio Review Committee at MFC. This committee includes MFC’s Chief Financial Officer, Chief
17
JOHN HANCOCK LIFE INSURANCE COMPANY OF NEW YORK
NOTES TO STATUTORY-BASIS FINANCIAL STATEMENTS
Investment Officer, Chief Risk Officer, Chief Credit Officer, and other senior management. This quarterly process includes a fresh assessment of the credit quality of each investment in the entire fixed maturity security portfolio.
The Company considers relevant facts and circumstances in evaluating whether the impairment of a security is other-than-temporary. Relevant facts and circumstances considered include (1) the length of time the fair value has been below cost; (2) the financial position of the issuer, including the current and future impact of any specific events; and (3) the Company’s ability and intent to hold the security to maturity or until it recovers in value. To the extent the Company determines that a security is deemed to be other-than-temporarily impaired, the difference between book value and fair value would be charged to income. For loan-backed and structured securities in an unrealized loss position, where the Company does not intend to sell or is not likely to be required to sell the security, the Company calculates an other-than-temporary impairment loss by subtracting the net present value of the projected future cash flows of the security from the amortized cost of the security. The net present value is calculated by discounting the Company’s best estimate of projected future cash flows at the effective interest rate implicit in the debt security prior to impairment. The projection of future cash flows is subject to the same analysis the Company applies to its overall impairment evaluation process, as noted above, which incorporates security specific information such as late payments, downgrades by rating agencies, key financial ratios, financial statements, and fundamentals of the industry and geographic area in which the issuer operates, as well as overall macroeconomic conditions. The cash flow estimates, including prepayment assumptions, are based on data from third-party data sources or internal estimates, and are driven by assumptions regarding the underlying collateral, including default rates, recoveries, and changes in value.
There are a number of significant risks and uncertainties inherent in the process of monitoring impairments and determining if impairment is other-than-temporary. These risks and uncertainties include (1) the risk that the Company’s assessment of an issuer’s ability to meet all of its contractual obligations will change based on changes in the credit characteristics of that issuer; (2) the risk that the economic outlook will be worse than expected or have more of an impact on the issuer than anticipated; (3) the risk that fraudulent information could be provided to the Company’s investment professionals who determine the fair value estimates and other-than-temporary impairments; and (4) the risk that new information obtained by the Company or changes in other facts and circumstances lead the Company to change its intent to hold the security to maturity or until it recovers in value. Any of these situations could result in a charge to income in a future period.
At December 31, 2021 and 2020, the Company had no Other-Than-Temporary Impairments (OTTI) for loan-backed and structured securities.
18
JOHN HANCOCK LIFE INSURANCE COMPANY OF NEW YORK
NOTES TO STATUTORY-BASIS FINANCIAL STATEMENTS
The following table shows gross unrealized losses and fair values of bonds, aggregated by investment category and length of time that individual securities have been in a continuous unrealized loss position:
| Less than 12 months | 12 months or more | Total | ||||||||||||||||||||||||||||||
| Fair Value |
Gross Unrealized Losses |
Fair Value |
Gross Unrealized Losses |
Fair Value |
Gross Unrealized Losses |
|||||||||||||||||||||||||||
| (in millions) |
||||||||||||||||||||||||||||||||
| December 31, 2021: |
||||||||||||||||||||||||||||||||
| U.S. government and agencies |
$ | 985 | $ | (13) | $ | 221 | $ | (4) | $ | 1,206 | $ | (17) | ||||||||||||||||||||
| States and political subdivisions |
39 | (1) | 3 | - | 42 | (1) | ||||||||||||||||||||||||||
| Foreign governments |
4 | - | - | - | 4 | - | ||||||||||||||||||||||||||
| Corporate bonds |
571 | (12) | 29 | (2) | 600 | (14) | ||||||||||||||||||||||||||
| Mortgage-backed and asset-backed securities |
27 | (1) | - | - | 27 | (1) | ||||||||||||||||||||||||||
| Total |
$ | 1,626 | $ | (27) | $ | 253 | $ | (6) | $ | 1,879 | $ | (33) | ||||||||||||||||||||
| Less than 12 months | 12 months or more | Total | ||||||||||||||||||||||||||||||
| |
Fair Value |
|
|
Gross Unrealized Losses |
|
|
Fair Value |
|
|
Gross Unrealized Losses |
|
|
Fair Value |
|
|
Gross Unrealized Losses |
| |||||||||||||||
| (in millions) |
||||||||||||||||||||||||||||||||
| December 31, 2020: |
||||||||||||||||||||||||||||||||
| U.S. government and agencies |
$ | 1,356 | $ | (42) | $ | - | $ | - | $ | 1,356 | $ | (42) | ||||||||||||||||||||
| States and political subdivisions |
3 | - | - | - | 3 | - | ||||||||||||||||||||||||||
| Foreign governments |
- | - | - | - | - | - | ||||||||||||||||||||||||||
| Corporate bonds |
67 | (1) | 1 | - | 68 | (1) | ||||||||||||||||||||||||||
| Mortgage-backed and asset-backed securities |
6 | - | - | - | 6 | - | ||||||||||||||||||||||||||
| Total |
$ | 1,432 | $ | (43) | $ | 1 | $ | - | $ | 1,433 | $ | (43) | ||||||||||||||||||||
At December 31, 2021 and 2020, there were 150 and 34 bonds that had a gross unrealized loss of which the single largest unrealized loss was $13 million and $42 million, respectively. The Company anticipates that these bonds will perform in accordance with their contractual terms and the Company currently has the ability and intent to hold these bonds until they recover or mature. Unrealized losses can be created by rising interest rates or by rising credit concerns and therefore widening credit spreads. Credit concerns are apt to play a larger role in the unrealized loss on below investment grade securities. Unrealized losses on investment grade securities principally relate to changes in interest rates or changes in credit spreads since the securities were acquired. Credit rating agencies’ statistics indicate that investment grade securities have been found to be less likely to develop credit concerns.
The sales of investments in bonds, including non-cash sales from reinsurance transactions, resulted in the following:
| Years Ended December 31, | ||||||||||||
| 2021 | 2020 | 2019 | ||||||||||
| (in millions) | ||||||||||||
| Proceeds |
$ | 3,079 | $ | 3,035 | $ | 1,153 | ||||||
| Realized gross gains |
64 | 493 | 41 | |||||||||
| Realized gross losses |
(129 | ) | (5 | ) | (5 | ) | ||||||
19
JOHN HANCOCK LIFE INSURANCE COMPANY OF NEW YORK
NOTES TO STATUTORY-BASIS FINANCIAL STATEMENTS
For the years ended December 31, 2021 and 2020, realized capital losses include $0 million and $3 million related to bonds that had experienced an other-than-temporary decline in value and were comprised of 0 and 5 securities, respectively.
The Company had no nonadmitted accrued investment income from bonds (unaffiliated) at December 31, 2021 and 2020.
Affiliate Transactions
In 2021, the Company sold certain bonds to an affiliate, JHUSA. These bonds had a book value of $209 million and fair value of $214 million. The Company recognized $5 million in pre-tax realized gains before transfer to the IMR.
In 2021, the Company sold certain bonds to an affiliate, John Hancock Reassurance Company Limited (“JHRECO”). These bonds had a book value of $50 million and fair value of $49 million. The Company recognized $1 million in pre-tax realized loss before transfer to the IMR.
In 2021, the Company acquired at fair value, certain bonds from an affiliate, JHUSA, for $72 million.
In 2021, the Company acquired at fair value, certain bonds from an affiliate, JHLH, for $46 million.
In 2020, the Company sold certain bonds to its parent, JHUSA. These bonds had a book value of $59 million and fair value of $65 million. The Company recognized $6 million in pre-tax realized gains before transfer to the IMR.
In 2019, the Company sold certain bonds to its parent, JHUSA. These bonds had a book value of $121 million and fair value of $123 million. The Company recognized $2 million in pre-tax realized gains before transfer to the IMR.
In 2019, the Company acquired, at fair value, certain bonds from its parent, JHUSA, for $130 million.
20
JOHN HANCOCK LIFE INSURANCE COMPANY OF NEW YORK
NOTES TO STATUTORY-BASIS FINANCIAL STATEMENTS
Preferred and Common Stocks
Cost and fair value of the Company’s investments in preferred and common stocks are summarized as follow:
| Cost | Gross Unrealized Gains |
Gross Unrealized Losses |
Fair Value | |||||||||||||
| (in millions) | ||||||||||||||||
| December 31, 2021: |
||||||||||||||||
| Preferred stocks: |
||||||||||||||||
| Nonaffiliated |
$ | 8 | $ | 5 | $ | - | $ | 13 | ||||||||
| Affiliates |
- | - | - | - | ||||||||||||
| Common stocks: |
||||||||||||||||
| Nonaffiliated |
51 | 21 | - | 72 | ||||||||||||
| Affiliates* |
- | - | - | - | ||||||||||||
| Total stocks |
$ | 59 | $ | 26 | $ | - | $ | 85 | ||||||||
| Cost | |
Gross Unrealized Gains |
|
|
Gross Unrealized Losses |
|
Fair Value | |||||||||
| (in millions) |
||||||||||||||||
| December 31, 2020: |
||||||||||||||||
| Preferred stocks: |
||||||||||||||||
| Nonaffiliated |
$ | 9 | $ | 4 | $ | - | $ | 13 | ||||||||
| Affiliates |
- | - | - | - | ||||||||||||
| Common stocks: |
||||||||||||||||
| Nonaffiliated |
75 | 32 | (3 | ) | 104 | |||||||||||
| Affiliates* |
- | - | - | - | ||||||||||||
| Total stocks |
$ | 84 | $ | 36 | $ | (3 | ) | $ | 117 | |||||||
*Affiliates - fair value represents the carrying value
At December 31, 2021 and 2020, there were 2 and 2 nonaffiliated equity securities that had a gross unrealized loss excluding securities that have been written down to zero. The single largest unrealized loss was $0 million and $3 million at December 31, 2021 and 2020, respectively. The Company anticipates that these equity securities will recover in value in the near term.
The Company has a process in place to identify equity securities that could potentially have an impairment that is other-than-temporary. The Company considers relevant facts and circumstances in evaluating whether the impairment of a security is other-than-temporary. Relevant facts and circumstances include (1) the length of time the fair value has been below cost; (2) the financial position of the issuer; and (3) the Company’s ability and intent to hold the security until it recovers. To the extent the Company determines that a security is deemed to be other-than-temporarily impaired, the difference between book value and fair value would be charged to income.
For the years ended December 31, 2021, 2020 and 2019, realized capital losses include $0 million, $3 million, and $0 million related to preferred and common stocks that have experienced an other-than-temporary decline in value and were comprised of 0, 14, and 0 securities, respectively.
21
JOHN HANCOCK LIFE INSURANCE COMPANY OF NEW YORK
NOTES TO STATUTORY-BASIS FINANCIAL STATEMENTS
Mortgage Loans on Real Estate
At December 31, 2021 and 2020, the mortgage loan portfolio was diversified by geographic region and specific collateral property type as displayed below. The Company controls credit risk through credit approvals, limits, and monitoring procedures.
| December 31, 2021: | ||||||||||||
| Property Type | Carrying Value |
Geographic Concentration | Carrying Value |
|||||||||
| (in millions) | (in millions) | |||||||||||
| Apartments |
$ | 273 | East North Central | $ | 49 | |||||||
| Industrial |
75 | East South Central | 5 | |||||||||
| Office buildings |
135 | Middle Atlantic | 152 | |||||||||
| Retail |
124 | Mountain | 40 | |||||||||
| Agricultural |
- | New England | 12 | |||||||||
| Agribusiness |
1 | Pacific | 236 | |||||||||
| Mixed use |
- | South Atlantic | 83 | |||||||||
| Other |
51 | West North Central | 38 | |||||||||
| Allowance |
- | West South Central | 44 | |||||||||
| Canada / Other |
- | |||||||||||
| Allowance |
- | |||||||||||
| Total mortgage loans on real estate |
$ | 659 | Total mortgage loans on real estate | $ | 659 | |||||||
| December 31, 2020: |
||||||||||||
| Property Type |
|
Carrying Value |
|
Geographic Concentration | |
Carrying Value |
| |||||
| (in millions) |
(in millions) | |||||||||||
| Apartments |
$ | 241 | East North Central | $ | 55 | |||||||
| Industrial |
83 | East South Central | 5 | |||||||||
| Office buildings |
169 | Middle Atlantic | 154 | |||||||||
| Retail |
129 | Mountain | 40 | |||||||||
| Agricultural |
- | New England | 14 | |||||||||
| Agribusiness |
1 | Pacific | 249 | |||||||||
| Mixed use |
- | South Atlantic | 91 | |||||||||
| Other |
69 | West North Central | 34 | |||||||||
| Allowance |
- | West South Central | 50 | |||||||||
| Canada / Other | - | |||||||||||
| Allowance | - | |||||||||||
| Total mortgage loans on real estate |
$ | 692 | Total mortgage loans on real estate | $ | 692 | |||||||
At December 31, 2021, the aggregate mortgages outstanding to any one borrower do not exceed $33 million.
During 2021, the respective maximum and minimum lending rates for mortgage loans issued were 3.64% and 2.27% for commercial loans. The Company issued no agricultural loans during 2021 or 2020. The Company issued no purchase money mortgages in 2021 or 2020. At the issuance of a loan, the percentage of any one loan to value of security, exclusive of insured, guaranteed or purchase money mortgages does not exceed 75%. The average recorded investment in impaired loans was $0 million and $0 million at December 31, 2021 and 2020, respectively. The Company recognized $0 million, $0 million, and $0 million of interest income during the period the loans were impaired for the years ended December 31, 2021, 2020 and 2019, respectively.
22
JOHN HANCOCK LIFE INSURANCE COMPANY OF NEW YORK
NOTES TO STATUTORY-BASIS FINANCIAL STATEMENTS
The following table shows the age analysis of mortgage loans aggregated by type:
| Farm | Residential | Commercial | Mezzanine | Total | ||||||||||||||||
| (in millions) | ||||||||||||||||||||
| December 31, 2021: |
||||||||||||||||||||
| Recorded Investment |
||||||||||||||||||||
| Current |
$ | 1 | $ | - | $ | 657 | $ | 1 | $ | 659 | ||||||||||
| 30 - 59 Days Past Due |
- | - | - | - | - | |||||||||||||||
| 60 - 89 Days Past Due |
- | - | - | - | - | |||||||||||||||
| 90 - 179 Days Past Due |
- | - | - | - | - | |||||||||||||||
| 180 + Days Past Due |
- | - | - | - | - | |||||||||||||||
| December 31, 2020: |
||||||||||||||||||||
| Recorded Investment |
||||||||||||||||||||
| Current |
$ | 1 | $ | - | $ | 690 | $ | 1 | $ | 692 | ||||||||||
| 30 - 59 Days Past Due |
- | - | - | - | - | |||||||||||||||
| 60 - 89 Days Past Due |
- | - | - | - | - | |||||||||||||||
| 90 - 179 Days Past Due |
- | - | - | - | - | |||||||||||||||
| 180 + Days Past Due |
- | - | - | - | - | |||||||||||||||
The Company had no recorded investment of mortgage loans 90 to 179 days or 180 days or greater past due still accruing interest or where interest has been reduced in 2021 and 2020. The Company was not a participant or co-lender in a mortgage loan agreement in 2021 and 2020.
Generally, the terms of the restructured mortgage loans call for the Company to receive some form or combination of an equity participation in the underlying collateral, excess cash flows or an effective yield at the maturity of the loans sufficient to meet the original terms of the loans. There are no contractual commitments made to extend credit to debtors owning receivables whose terms have been modified in troubled debt restructurings. The Company accrues interest income on impaired loans to the extent deemed collectible and the loan continues to perform under its original or restructured contractual terms. Interest income on non-performing loans generally is recognized on a cash basis.
For mortgage loans, the Company evaluates credit quality through regular monitoring of credit related exposures, considering both qualitative and quantitative factors in assigning an internal risk rating (“IRR”). These ratings are updated at least annually.
The carrying value of mortgage loans by IRR was as follows:
| December 31, | ||||||||
| 2021 | 2020 | |||||||
| (in millions) | ||||||||
| AAA |
$ | 22 | $ | 41 | ||||
| AA |
244 | 241 | ||||||
| A |
268 | 294 | ||||||
| BBB |
120 | 93 | ||||||
| BB |
5 | 23 | ||||||
| B and lower and unrated |
- | - | ||||||
| Total |
$ | 659 | $ | 692 | ||||
Affiliated Transactions
In 2019, the Company acquired at fair value, certain mortgages from an affiliate, Hancock Mortgage REIT Inc., (“HMREIT”), for $5 million.
23
JOHN HANCOCK LIFE INSURANCE COMPANY OF NEW YORK
NOTES TO STATUTORY-BASIS FINANCIAL STATEMENTS
Real Estate
The composition of the Company’s investment in real estate is summarized as follows:
| December 31, | ||||||||
| 2021 | 2020 | |||||||
| (in millions) | ||||||||
| Properties occupied by the company |
$ | - | $ | - | ||||
| Properties held for the production of income |
281 | 277 | ||||||
| Properties held for sale |
- | - | ||||||
| Less accumulated depreciation |
(45 | ) | (39) | |||||
| Total |
$ | 236 | $ | 238 | ||||
The Company recorded $0 million, $0 million, and $0 million of impairments on real estate investments during the years ended December 31, 2021, 2020 and 2019, respectively.
Other Invested Assets
The Company had no investments in partnerships or LLCs that exceed 10% of its admitted assets at December 31, 2021 and 2020.
Other invested assets primarily consist of investments in partnerships and LLCs. The Company recorded $0 million, $9 million, and $0 million of impairments on partnerships and LLCs in 2021, 2020, and 2019, respectively. Any impairment is based on significant judgement by the Company in determining whether the objective evidence of other-than-temporary impairment exists. The Company considers relevant facts and circumstances in evaluating whether the impairment of another invested asset is other-than-temporary. Relevant facts and circumstances include (1) the length of time the fair value has been below cost; (2) the financial position of the investee; (3) the Company’s ability and intent to hold the other invested asset until it recovers. To the extent the Company determines that an other invested asset is deemed to be other-than-temporarily impaired, the difference between book and fair value would be charged to income.
Affiliate Transactions
In 2019, Manulife Private Capital and Manulife Investment Management Private Markets launched a closed-end pooled fund that offers third-party investors the opportunity to invest alongside JHUSA’s and MLI’s general account and/or their affiliates (collectively the “General Account”) in private equity funds and private equity co-investments in the US and in Canada. The fund was seeded with a pool of private equity fund investments and direct private equity co-investments from the Company. The assets sold by the Company, to seed the fund, had a book value of $173 million and fair value of $180 million which resulted in a gain to operations of $7 million.
Other
The Company had no exposure to the subprime mortgage related risk at December 31, 2021 or 2020.
24
JOHN HANCOCK LIFE INSURANCE COMPANY OF NEW YORK
NOTES TO STATUTORY-BASIS FINANCIAL STATEMENTS
Net Investment Income and Net Realized and Other Gains (Losses)
Major categories of the Company’s net investment income are summarized as follows:
| 2021 | 2020 | 2019 | ||||||||||
| (in millions) | ||||||||||||
| Income: |
||||||||||||
| Bonds |
$ | 166 | $ | 161 | $ | 165 | ||||||
| Preferred stocks |
- | - | - | |||||||||
| Common stocks |
1 | 1 | 2 | |||||||||
| Mortgage loans on real estate |
31 | 29 | 29 | |||||||||
| Real estate |
34 | 46 | 39 | |||||||||
| Policy loans |
6 | 5 | 5 | |||||||||
| Cash, cash equivalents and short-term investments |
- | 2 | 7 | |||||||||
| Other invested assets |
168 | 92 | 92 | |||||||||
| Derivatives |
45 | 36 | 19 | |||||||||
| Other income |
- | - | - | |||||||||
| Total investment income |
451 | 372 | 358 | |||||||||
| Expenses |
||||||||||||
| Investment expenses |
(32 | ) | (35 | ) | (30) | |||||||
| Investment taxes, licenses and fees, excluding federal income taxes |
(4 | ) | (4 | ) | (4) | |||||||
| Investment interest expense |
- | - | - | |||||||||
| Depreciation on real estate and other invested assets |
(5 | ) | (5 | ) | (5) | |||||||
| Total investment expenses |
(41 | ) | (44 | ) | (39) | |||||||
| Net investment income |
$ | 410 | $ | 328 | $ | 319 | ||||||
Other invested assets above represent income earned from the Company’s investment in JHVTA.
Realized capital gains (losses) and amounts transferred to the IMR are as follows:
| Years Ended | ||||||||||||
| 2021 | 2020 | 2019 | ||||||||||
| (in millions) | ||||||||||||
| Realized capital gains (losses) |
$ | (69) | $ | 500 | $ | 7 | ||||||
| Less amount transferred to the IMR (net of related tax benefit (expense) of $16 in 2021, $(102) in 2020, and $(9) in 2019) |
(61) | 384 | 33 | |||||||||
| Realized capital gains (losses) before tax |
(8) | 116 | (26) | |||||||||
| Less federal income taxes on realized capital gains (losses) before effect of transfer to the IMR |
6 | 123 | 34 | |||||||||
| Net realized capital gains (losses) |
$ | (14) | $ | (7 | ) | $ | (60) | |||||
6. Derivatives
Derivatives are financial contracts, the value of which is derived from underlying interest rates, foreign exchange rates, credit, equity price movements, indices or other market risks arising from on-balance sheet financial instruments and selected anticipated transactions. The Company uses derivatives including swaps and futures agreements to manage current and anticipated exposures to changes in interest rates and equity market prices.
25
JOHN HANCOCK LIFE INSURANCE COMPANY OF NEW YORK
NOTES TO STATUTORY-BASIS FINANCIAL STATEMENTS
Over-the-counter (“OTC”) bilateral swaps are contractual agreements between the Company and a counterparty to exchange a series of cash flows based upon rates applied to a notional amount. For interest rate swaps, counterparties generally exchange fixed or floating interest rate payments based on a notional value in a single currency.
Cleared OTC interest rate swaps are contractual agreements between the Company and a counterparty whereby the transaction must be cleared through a central clearing house, and subject to mandatory margin and reporting requirements.
Futures agreements are contractual obligations to buy or sell a financial instrument or foreign currency on a predetermined future date at a specified price. Futures agreements are contracts with standard amounts and settlement dates that are traded on regulated exchanges.
Options are contractual agreements whereby the holder has the right, but not the obligation, to buy (call option) or sell (put option) a security, exchange rate, interest rate, or other financial instrument at a predetermined price/rate within a specified time.
Types of Derivatives and Derivative Strategies
Interest Rate Contracts. The Company uses interest rate futures contracts, OTC interest rate swap agreements and cleared interest rate swap agreements as part of its overall strategies of managing the duration of assets and liabilities or the average life of certain asset portfolios to specified targets. Interest rate swap agreements are contracts with counterparties to exchange interest rate payments of a differing character (i.e., fixed-rate payments exchanged for variable-rate payments) based on an underlying principal balance (notional principal). The net differential to be paid or received on interest rate swap agreements is accrued and recognized as a component of net investment income.
The Company uses interest rate swap agreements in effective cash flow and fair value hedge accounting relationships. These derivatives hedge the variable cash flows associated with certain floating-rate bonds, as well as, future fixed income asset acquisitions, which will support the Company’s life insurance businesses. These derivatives reduce the impact of future interest rate changes on the cost of acquiring adequate assets to support the investment income assumptions used in pricing these products. For its fair value hedging relationships, the Company uses interest rate swap agreements to hedge the risk of changes in fair value of existing fixed rate assets and liabilities arising from changes in benchmark interest rates.
The Company uses exchange-traded interest rate futures primarily to hedge mismatches between the duration of assets in a portfolio and the duration of liabilities supported by those assets, to hedge against changes in value of securities the Company owns or anticipates acquiring, and to hedge against changes in interest rates on anticipated liability issuances by replicating U.S. Treasury or swap curve performance. The Company utilizes exchange-traded interest rate futures in other hedging relationships.
Equity Market Contracts. Equity index futures contracts are contractual obligations to buy or sell a specified amount of an underlying equity index at an agreed contract price on a specified date. Equity index futures are contracts with standard amounts and settlement dates that are traded on regulated exchanges. The Company utilizes equity index futures in other hedging relationships.
Equity index options are contractual agreements whereby the holder has the right, but not the obligation, to buy (call option) or sell (put option) an underlying equity market index on or before a specified future date at a specified price. The Company utilizes equity index options in other hedging relationships.
26
JOHN HANCOCK LIFE INSURANCE COMPANY OF NEW YORK
NOTES TO STATUTORY-BASIS FINANCIAL STATEMENTS
The table below provides a summary of the gross notional amount and fair value of derivatives contracts for all derivatives in effective hedge accounting relationships and other hedging relationships:
| December 31, 2021 | ||||||||||||||||||||||
| (in millions) | Notional Amount |
Carrying Value Assets |
Carrying Value Liabilities |
Fair Value Assets |
Fair Value Liabilities |
|||||||||||||||||
| Effective Hedge Accounting Relationships |
||||||||||||||||||||||
| Fair value hedges |
Interest rate swaps | $ | 146 | $ | 2 | $ | - | $ | 10 | $ | 15 | |||||||||||
| Cash flow hedges |
Interest rate swaps | - | - | - | - | - | ||||||||||||||||
| Total Derivatives in Effective Hedge Accounting Relationships |
$ | 146 | $ | 2 | $ | - | $ | 10 | $ | 15 | ||||||||||||
| Other Hedging Relationships |
||||||||||||||||||||||
| Interest rate swaps | $ | 7,679 | $ | 1,082 | $ | 691 | $ | 1,082 | $ | 691 | ||||||||||||
| Interest rate futures | 126 | - | - | - | - | |||||||||||||||||
| Equity index options | 139 | 3 | - | 3 | - | |||||||||||||||||
| Equity index futures | 181 | - | - | - | - | |||||||||||||||||
| Total Derivatives in Other Hedging Relationships |
$ | 8,125 | $ | 1,085 | $ | 691 | $ | 1,085 | $ | 691 | ||||||||||||
| Total Derivatives |
$ | 8,271 | $ | 1,087 | $ | 691 | $ | 1,095 | $ | 706 | ||||||||||||
| December 31, 2020 | ||||||||||||||||||||||
| (in millions) | Notional Amount |
Carrying Value Assets |
Carrying Value Liabilities |
Fair Value Assets |
Fair Value Liabilities |
|||||||||||||||||
| Effective Hedge Accounting Relationships |
||||||||||||||||||||||
| Fair value hedges |
Interest rate swaps | $ | 172 | $ | 3 | $ | - | $ | 18 | $ | 26 | |||||||||||
| Cash flow hedges |
Interest rate swaps | - | - | - | - | - | ||||||||||||||||
| Total Derivatives in Effective Hedge Accounting Relationships |
$ | 172 | $ | 3 | $ | - | $ | 18 | $ | 26 | ||||||||||||
| Other Hedging Relationships |
||||||||||||||||||||||
| Interest rate swaps | $ | 8,074 | $ | 1,475 | $ | 967 | $ | 1,475 | $ | 967 | ||||||||||||
| Interest rate futures | 126 | - | - | - | - | |||||||||||||||||
| Equity index options | 99 | 2 | - | 2 | - | |||||||||||||||||
| Equity index futures | 186 | - | - | - | - | |||||||||||||||||
| Total Derivatives in Other Hedging Relationships |
$ | 8,485 | $ | 1,477 | $ | 967 | $ | 1,477 | $ | 967 | ||||||||||||
| Total Derivatives |
$ | 8,657 | $ | 1,480 | $ | 967 | $ | 1,495 | $ | 993 | ||||||||||||
Hedging Relationships
The Company generally does not enter into derivative contracts for speculative purposes. In certain circumstances, these hedges also meet the requirements for hedge accounting and are reported in a manner consistent with the hedged asset or liability. For the years ended December 31, 2021, 2020 and 2019, the Company recorded net unrealized gains of ($1) million, $7 million, and $4 million, respectively related to derivatives that no longer qualify for hedge accounting.
Fair Value Hedges. The Company uses interest rate swaps to manage its exposure to changes in fair value of fixed-rate financial instruments caused by changes in interest rates.
27
JOHN HANCOCK LIFE INSURANCE COMPANY OF NEW YORK
NOTES TO STATUTORY-BASIS FINANCIAL STATEMENTS
Cash Flow Hedges. The Company uses interest rate swaps to hedge the variability in cash flows from variable rate financial instruments and forecasted transactions.
For the year ended December 31, 2021, all of the Company’s hedged forecast transactions qualified as cash flow hedges and no cash flow hedges were discontinued because it was probable that the original forecasted transactions would occur by the end of the originally specified time period documented at inception of the hedging relationship.
The maximum time frame for which variable cash flows are hedged is 0 years.
Derivatives Not Designated as Hedging Instruments (Economic Hedges). The Company enters into interest rate swap agreements and interest rate futures contracts to manage exposure to interest rates without designating the derivatives as hedging instruments.
The Company offers certain variable annuity products with a guaranteed minimum withdrawal benefit (“GMWB”) and guaranteed minimum death benefit (“GMDB”). These guarantees are effectively an embedded option on the basket of mutual funds offered to contract holders. The Company manages a hedging program to reduce its exposure to certain contracts with the GMWB and GMDB guarantees. This dynamic hedging program uses interest rate swap agreements, equity index futures (including but not limited to the Dow Jones Industrial, Standard & Poor’s 500 (“S&P”), Russell 2000, and Dow Jones Euro Stoxx 50 indices), currency futures, total return swaps, equity index options, swaptions and U.S. Treasury futures to match the sensitivities of the GMWB and GMDB liabilities to the market risk factors.
The Company deferred net realized gains (losses) of $0 million, $1 million, and $0 million (including $0 million, $1 million, and $0 million of gains (losses) for derivatives in other hedging relationships) related to interest rates for the years ended December 31, 2021, 2020 and 2019, respectively. Deferred net realized gains (losses) are reported in the IMR and amortized over the remaining period to expiration date.
For the years ended December 31, 2021, 2020 and 2019 net gains and losses related to derivatives in other hedging relationships were recognized by the Company, and the components were recorded in net unrealized and net realized gains (losses) as follows:
| Years ended December 31, | ||||||||||||
| 2021 | 2020 | 2019 | ||||||||||
| (in millions) | ||||||||||||
| Other Hedging Relationships |
||||||||||||
| Net unrealized capital gain (loss): |
||||||||||||
| Interest rate swaps |
$ | (118 | ) | $ | 144 | $ | 124 | |||||
| Interest rate futures |
- | (1 | ) | 6 | ||||||||
| Equity index options |
1 | - | 5 | |||||||||
| Equity index futures |
(2 | ) | (2 | ) | (8 | ) | ||||||
| Total net unrealized capital gain (loss) |
$ | (119 | ) | $ | 141 | $ | 127 | |||||
| Net realized capital gain (loss): |
||||||||||||
| Interest rate swaps |
$ | (1 | ) | $ | 1 | $ | - | |||||
| Interest rate futures |
4 | (11 | ) | (13 | ) | |||||||
| Equity index options |
6 | 3 | - | |||||||||
| Equity index futures |
(37 | ) | (54 | ) | (56 | ) | ||||||
| Total net realized capital gain (loss) |
$ | (28 | ) | $ | (61 | ) | $ | (69 | ) | |||
| Total gain (loss) from derivatives in other hedging relationships |
$ | (147 | ) | $ | 80 | $ | 58 | |||||
28
JOHN HANCOCK LIFE INSURANCE COMPANY OF NEW YORK
NOTES TO STATUTORY-BASIS FINANCIAL STATEMENTS
Credit Risk
The Company’s exposure to loss on derivatives is limited to the amount of any net gains that may have accrued with a particular counterparty. Gross derivative counterparty exposure is measured as the total fair value (including accrued interest) of all outstanding contracts in a gain position excluding any offsetting contracts in negative positions and the impact of collateral on hand. The Company may be exposed to credit-related losses in the event of nonperformance by counterparties to the derivative financial instruments. The current credit exposure of the Company’s derivative contracts is limited to the fair value in excess of the collateral held at the reporting date.
The Company manages its credit risk by entering into transactions with creditworthy counterparties, obtaining collateral where appropriate, and entering into master netting agreements that provide for a netting of payments and receipts with a single counterparty. The Company enters into credit support annexes with its OTC derivative dealers in order to manage its credit exposure to those counterparties. As part of the terms and conditions of those agreements, the pledging and accepting of collateral in connection with the Company’s derivative usage is required. As of December 31, 2021 and 2020, the Company had accepted collateral consisting of cash of $31 million and $47 million and various securities with a fair value of $545 million and $642 million, respectively, which are held in separate custodial accounts. In addition, the Company has pledged collateral to support both the OTC derivative instruments, exchange traded futures and cleared interest rate swap transactions. For further details regarding pledged collateral see the Investments Note.
Under U.S. regulations, certain interest rate swap agreements are required to be cleared through central clearing houses. These transactions are contractual agreements that require initial and variation margin collateral postings and are settled on a daily basis through a clearing house. As such, they reduce the credit risk exposure in the event of default by a counterparty.
Financing Premiums
The following table presents the Company’s aggregate, non-discounted total premium cost for derivative contracts with financing premiums and the premium cost due in each of the following years, and thereafter.
| Fiscal Year | Derivative Premium Payments Due |
|||
| (in millions) | ||||
| 2022 |
$ | 6 | ||
| 2023 |
- | |||
| 2024 |
- | |||
| 2025 |
- | |||
| Thereafter |
- | |||
| Total Future Settled Premiums |
$ | 6 | ||
| Undiscounted Future Premium Commitments |
Derivative Fair Value With Premium Commitments |
Derivative Fair Value Excluding Impact of Future Settled Premiums |
||||||||
| (in millions) | ||||||||||
| Prior Year |
$ 5 | $ | 2 | $ | 7 | |||||
| Current Year |
$ 6 | $ | 3 | $ | 9 | |||||
29
JOHN HANCOCK LIFE INSURANCE COMPANY OF NEW YORK
NOTES TO STATUTORY-BASIS FINANCIAL STATEMENTS
7. Fair Value
The following is a description of the valuation techniques used to measure fair value and the general classification of these instruments pursuant to the fair value hierarchy:
| · | Financial Instruments Measured at Fair Value and Reported in the Balance Sheet after Initial Recognition – This category includes assets and liabilities measured at fair value. Financial instruments in this category include common stocks, derivatives, and separate account assets and liabilities. |
| · | Other Financial Instruments Not Reported at Fair Value After Initial Recognition – This category includes assets and liabilities as follows: |
Bonds – For bonds, including corporate debt, U.S. Treasury, commercial and residential mortgage-backed securities, asset-backed securities, collateralized debt obligations, issuances by foreign governments, and obligations of state and political subdivisions, fair values are based on quoted market prices when available. When market prices are not available, fair value is generally estimated using discounted cash flow analyses, incorporating current market inputs for similar financial instruments with comparable terms and credit quality (matrix pricing). The significant inputs into these models include, but are not limited to, yield curves, credit risks and spreads, measures of volatility, and prepayment speeds.
Mortgage Loans on Real Estate –The fair value of unimpaired mortgage loans is estimated using discounted cash flows and takes into account the contractual maturities and discount rates, which were based on current market rates for similar maturity ranges and adjusted for risk due to the property type. The fair value of impaired mortgage loans is based on the net of the collateral less estimated cost to obtain and sell. Fair value of commercial mortgages is derived through an internal valuation methodology using both observable and unobservable inputs. Unobservable inputs include credit assumptions and liquidity spread adjustments. Fair value of fixed-rate residential mortgages is determined using the discounted cash flow method. Inputs used for valuation are primarily comprised of prevailing interest rates and prepayment rates, if applicable. Fair value of variable-rate residential mortgages is assumed to be their carrying value.
Cash, Cash Equivalents and Short-Term Investments – The carrying values for cash, cash equivalents, and short-term investments approximate their fair value due to the short-term maturities of these instruments.
Policy Loans – These loans are carried at unpaid principal balances, which approximate their fair values.
Policy Reserves – Policy reserves consist of guaranteed investment contracts. The fair values associated with these financial instruments are determined by projecting cash flows and discounting the cash flows at current corporate rates, defined as U.S. Treasury rates plus MFC’s corporate spread. The fair value attributable to credit risk represents the present value of the spread.
Policyholders’ and Beneficiaries’ Funds – Includes term certain contracts and supplementary contracts without life contingencies. The fair values associated with the term certain contracts and supplementary contracts without life contingencies are determined by projecting cash flows and discounting the cash flows at current corporate rates, defined as U.S. Treasury rates plus MFC’s corporate spread. The fair value attributable to credit risk represents the present value of the spread. Fair value disclosure is not required for those balances that can be withdrawn by the policyholder at any time without prior notice or penalty. The fair value is the amount estimated to be payable to the policyholder as of the reporting date which is generally the carrying value and provides no additional disclosure value.
Financial Instruments Measured at Fair Value and Reported in the Balance Sheet after Initial Recognition
Valuation Hierarchy
The Company categorizes its fair value measurements according to a three-level hierarchy. The hierarchy prioritizes the inputs used by the Company’s valuation techniques. A level is assigned to each fair value measurement based on the lowest level input significant to the fair value measurement in its entirety. The three levels of the fair value hierarchy are defined as follows:
30
JOHN HANCOCK LIFE INSURANCE COMPANY OF NEW YORK
NOTES TO STATUTORY-BASIS FINANCIAL STATEMENTS
| · | Level 1 – Fair value measurements that reflect unadjusted, quoted prices in active markets for identical assets and liabilities that the Company has the ability to access at the measurement date reflecting market transactions. Level 1 assets primarily include exchange traded equity securities and certain separate account assets. |
| · | Level 2 – Fair value measurements using inputs other than quoted prices included within Level 1 that are observable for the asset or liability, either directly or indirectly. These include quoted prices for similar assets and liabilities in active markets, quoted prices for identical or similar assets and liabilities in inactive markets, inputs that are observable that are not prices (such as interest rates, credit risks, etc.), and inputs that are derived from or corroborated by observable market data. Most bonds are classified within Level 2. Also, included in the Level 2 category are certain separate account assets and liabilities and derivative assets and liabilities. |
| · | Level 3 – Fair value measurements using significant nonmarket observable inputs. These include valuations for assets and liabilities that are derived using data, some or all of which is not market observable data, including assumptions about risk. Level 3 securities include less liquid securities such as securities that have little or no price transparency. |
Determination of Fair Value
Fair value is defined as the price that would be received to sell an asset or paid to transfer a liability in an orderly transaction (not a forced liquidation or distress sale) between market participants at the measurement date, that is, an exit value.
When available, quoted market prices are used to determine fair value. If quoted market prices are not available, fair value is typically based upon alternative valuation techniques such as discounted cash flows, matrix pricing, consensus pricing services and other techniques. Broker quotes are generally used when external public vendor prices are not available.
The Company has a process in place that includes a review of price movements relative to the market, a comparison of prices between vendors, and a comparison to internal matrix pricing which uses predominately external observable data. Judgement is applied in adjusting external observable data for items including liquidity and credit factors.
The following is a description of the valuation techniques used to measure fair value and the general classification of these instruments pursuant to the fair value hierarchy:
Bonds
Refer to the previous page for the determination of fair value of bonds. Generally, impaired bonds with a NAIC designation rating of 6 whose cost is greater than its fair value are reported at fair value and are classified within Level 3.
Preferred Stocks
Preferred stocks with active markets are classified within Level 1, as fair values are based on quoted market prices. Preferred stocks not traded in active markets are classified within Level 3.
Common Stocks
Common stocks with active markets are classified within Level 1, as fair values are based on quoted market prices. Common stocks not traded in active markets are classified within Level 3.
31
JOHN HANCOCK LIFE INSURANCE COMPANY OF NEW YORK
NOTES TO STATUTORY-BASIS FINANCIAL STATEMENTS
Derivatives
The fair value of derivatives is determined through the use of quoted market prices for exchange-traded derivatives or through the use of pricing models for OTC derivatives. The pricing models used are based on market standard valuation methodologies, and the inputs to these models are consistent with what a market participant would use when pricing the instruments. Derivative valuations can be affected by changes in interest rates, currency exchange rates, financial indices, credit spreads, default risk (including the counterparties to the contract), and volatility. The Company’s derivatives are generally classified within Level 2 given the significant inputs to the pricing models for most OTC derivatives are observable or can be corroborated by observable market data. Inputs that are observable generally include interest rates, foreign currency exchange rates, and interest rate curves; however, certain OTC derivatives may rely on inputs that are significant to the fair value, but are unobservable in the market or cannot be derived principally from or corroborated by observable market data and would be classified within Level 3. Inputs that are unobservable generally include broker quotes, volatilities, and inputs that are outside of the observable portion of the interest rate curve or other relevant market measures. These unobservable inputs may involve significant management judgment or estimation.
Even though unobservable, these inputs are based on assumptions deemed appropriate given the circumstances and consistent with what market participants would use when pricing such instruments. The credit risk of both the counterparty and the Company are considered in determining the fair value for all OTC derivatives after taking into account the effects of netting agreements and collateral arrangements.
Separate Account Assets and Liabilities
For separate accounts structured as a unitized fund, the fair value of the separate account assets is based on the fair value of the underlying funds owned by the separate account. Assets owned by the Company’s separate accounts consist of investments in mutual funds with values that are based upon quoted market prices or reported net asset values (“NAV”). Open-ended mutual fund investments that are traded in an active market and have a publicly available price are included in Level 1. Investment performance related to separate account assets is fully offset by corresponding amounts credited to contract holders whose interest in the separate account assets is recorded by the Company as separate account liabilities. Separate account liabilities are set equal to the fair value of separate account assets.
The fair value of fund investments is based upon quoted market prices or reported net asset value (“NAV”). Fund investments that are traded in an active market and have a NAV that the Company can access at the measurement date are classified within Level 1. Level 2 assets consist primarily of bonds which are valued using matrix pricing with independent pricing data.
32
JOHN HANCOCK LIFE INSURANCE COMPANY OF NEW YORK
NOTES TO STATUTORY-BASIS FINANCIAL STATEMENTS
The following table presents the Company’s assets and liabilities that are measured and reported at fair value in the Balance Sheets after initial recognition by fair value hierarchy level:
| December 31, 2021 | ||||||||||||||||||||||||
| Carrying Value |
Total Fair Value |
Level 1 | Level 2 | Level 3 | Net Asset Value (NAV) | |||||||||||||||||||
| (in millions) | ||||||||||||||||||||||||
| Assets: |
||||||||||||||||||||||||
| Bond with NAIC 6 rating: |
||||||||||||||||||||||||
| Industrial and misc |
$ | - | $ | - | $ | - | $ | - | $ | - | $ | - | ||||||||||||
| Loan-backed and structured securities |
- | - | - | - | - | - | ||||||||||||||||||
| Total bonds with NAIC 6 rating |
- | - | - | - | - | - | ||||||||||||||||||
| Preferred stocks: |
||||||||||||||||||||||||
| Industrial and misc |
- | - | - | - | - | - | ||||||||||||||||||
| Total preferred stocks |
- | - | - | - | - | - | ||||||||||||||||||
| Common stocks: |
||||||||||||||||||||||||
| Industrial and misc |
72 | 72 | 59 | - | 13 | - | ||||||||||||||||||
| Total common stocks |
72 | 72 | 59 | - | 13 | - | ||||||||||||||||||
| Derivatives: |
||||||||||||||||||||||||
| Interest rate swaps |
1,082 | 1,082 | - | 1,082 | - | - | ||||||||||||||||||
| Interest rate treasury locks |
- | - | - | - | - | - | ||||||||||||||||||
| Interest rate options |
- | - | - | - | - | - | ||||||||||||||||||
| Interest rate futures |
- | - | - | - | - | - | ||||||||||||||||||
| Foreign currency swaps |
- | - | - | - | - | - | ||||||||||||||||||
| Foreign currency forwards |
- | - | - | - | - | - | ||||||||||||||||||
| Foreign currency futures |
- | - | - | - | - | - | ||||||||||||||||||
| Equity total return swaps |
- | - | - | - | - | - | ||||||||||||||||||
| Equity index options |
3 | 3 | - | 3 | - | - | ||||||||||||||||||
| Equity index futures |
- | - | - | - | - | - | ||||||||||||||||||
| Credit default swaps |
- | - | - | - | - | - | ||||||||||||||||||
| Total derivatives |
1,085 | 1,085 | - | 1,085 | - | - | ||||||||||||||||||
| Assets held in separate accounts |
9,241 | 9,241 | 9,241 | - | - | - | ||||||||||||||||||
| Total assets |
$ | 10,398 | $ | 10,398 | $ | 9,300 | $ | 1,085 | $ | 13 | $ | - | ||||||||||||
| Liabilities: |
||||||||||||||||||||||||
| Derivatives: |
||||||||||||||||||||||||
| Interest rate swaps |
$ | 691 | $ | 691 | $ | - | $ | 691 | $ | - | $ | - | ||||||||||||
| Interest rate treasury locks |
- | - | - | - | - | - | ||||||||||||||||||
| Interest rate options |
- | - | - | - | - | - | ||||||||||||||||||
| Interest rate futures |
- | - | - | - | - | - | ||||||||||||||||||
| Foreign currency swaps |
- | - | - | - | - | - | ||||||||||||||||||
| Foreign currency forwards |
- | - | - | - | - | - | ||||||||||||||||||
| Foreign currency futures |
- | - | - | - | - | - | ||||||||||||||||||
| Equity total return swaps |
- | - | - | - | - | - | ||||||||||||||||||
| Equity index options |
- | - | - | - | - | - | ||||||||||||||||||
| Equity index futures |
- | - | - | - | - | - | ||||||||||||||||||
| Credit default swaps |
- | - | - | - | - | - | ||||||||||||||||||
| Total derivatives |
691 | 691 | - | 691 | - | - | ||||||||||||||||||
| Liabilities held in separate accounts |
9,241 | 9,241 | 9,241 | - | - | - | ||||||||||||||||||
| Total liabilities |
$ | 9,932 | $ | 9,932 | $ | 9,241 | $ | 691 | $ | - | $ | - | ||||||||||||
33
JOHN HANCOCK LIFE INSURANCE COMPANY OF NEW YORK
NOTES TO STATUTORY-BASIS FINANCIAL STATEMENTS
| December 31, 2020 | ||||||||||||||||||||||||
| Carrying Value |
Total Fair Value |
Level 1 | Level 2 | Level 3 | Net Asset Value (NAV) |
|||||||||||||||||||
| (in millions) | ||||||||||||||||||||||||
| Assets: |
||||||||||||||||||||||||
| Bond with NAIC 6 rating: |
||||||||||||||||||||||||
| Industrial and misc |
$ | - | $ | - | $ | - | $ | - | $ | - | $ | - | ||||||||||||
| Loan-backed and structured securities |
- | - | - | - | - | - | ||||||||||||||||||
| Total bonds with NAIC 6 rating |
- | - | - | - | - | - | ||||||||||||||||||
| Preferred stocks: |
||||||||||||||||||||||||
| Industrial and misc |
- | - | - | - | - | - | ||||||||||||||||||
| Total preferred stocks |
- | - | - | - | - | - | ||||||||||||||||||
| Common stocks: |
||||||||||||||||||||||||
| Industrial and misc |
104 | 104 | 95 | - | 9 | - | ||||||||||||||||||
| Total common stocks |
104 | 104 | 95 | - | 9 | - | ||||||||||||||||||
| Derivatives: |
||||||||||||||||||||||||
| Interest rate swaps |
1,475 | 1,475 | - | 1,475 | - | - | ||||||||||||||||||
| Interest rate treasury locks |
- | - | - | - | - | - | ||||||||||||||||||
| Interest rate options |
- | - | - | - | - | - | ||||||||||||||||||
| Interest rate futures |
- | - | - | - | - | - | ||||||||||||||||||
| Foreign currency swaps |
- | - | - | - | - | - | ||||||||||||||||||
| Foreign currency forwards |
- | - | - | - | - | - | ||||||||||||||||||
| Foreign currency futures |
- | - | - | - | - | - | ||||||||||||||||||
| Equity total return swaps |
- | - | - | - | - | - | ||||||||||||||||||
| Equity index options |
2 | 2 | - | 2 | - | - | ||||||||||||||||||
| Equity index futures |
- | - | - | - | - | - | ||||||||||||||||||
| Credit default swaps |
- | - | - | - | - | - | ||||||||||||||||||
| Total derivatives |
1,477 | 1,477 | - | 1,477 | - | - | ||||||||||||||||||
| Assets held in separate accounts |
8,903 | 8,903 | 8,903 | - | - | - | ||||||||||||||||||
| Total assets |
$ | 10,484 | $ | 10,484 | $ | 8,998 | $ | 1,477 | $ | 9 | $ | - | ||||||||||||
| Liabilities: |
||||||||||||||||||||||||
| Derivatives: |
||||||||||||||||||||||||
| Interest rate swaps |
$ | 967 | $ | 967 | $ | - | $ | 967 | $ | - | $ | - | ||||||||||||
| Interest rate treasury locks |
- | - | - | - | - | - | ||||||||||||||||||
| Interest rate options |
- | - | - | - | - | - | ||||||||||||||||||
| Interest rate futures |
- | - | - | - | - | - | ||||||||||||||||||
| Foreign currency swaps |
- | - | - | - | - | - | ||||||||||||||||||
| Foreign currency forwards |
- | - | - | - | - | - | ||||||||||||||||||
| Foreign currency futures |
- | - | - | - | - | - | ||||||||||||||||||
| Equity total return swaps |
- | - | - | - | - | - | ||||||||||||||||||
| Equity index options |
- | - | - | - | - | - | ||||||||||||||||||
| Equity index futures |
- | - | - | - | - | - | ||||||||||||||||||
| Credit default swaps |
- | - | - | - | - | - | ||||||||||||||||||
| Total derivatives |
967 | 967 | - | 967 | - | - | ||||||||||||||||||
| Liabilities held in separate accounts |
8,903 | 8,903 | 8,903 | - | - | - | ||||||||||||||||||
| Total liabilities |
$ | 9,870 | $ | 9,870 | $ | 8,903 | $ | 967 | $ | - | $ | - | ||||||||||||
34
JOHN HANCOCK LIFE INSURANCE COMPANY OF NEW YORK
NOTES TO STATUTORY-BASIS FINANCIAL STATEMENTS
Fair Value of Financial Instruments Not Reported at Fair Value in the Balance Sheet
The table below presents the carrying amounts and fair value by fair value hierarchy level for certain assets and liabilities that are not reported at fair value in the Balance Sheets:
| December 31, 2021 | ||||||||||||||||||||
| Carrying Value |
Total Fair Value |
Level 1 | Level 2 | Level 3 | ||||||||||||||||
| (in millions) | ||||||||||||||||||||
| Assets: |
||||||||||||||||||||
| Bonds (1) |
$ | 5,828 | $ | 6,165 | $ | - | $ | 5,989 | $ | 176 | ||||||||||
| Preferred stocks |
13 | 13 | - | - | 13 | |||||||||||||||
| Mortgage loans on real estate |
659 | 714 | - | - | 714 | |||||||||||||||
| Cash, cash equivalents and short term investments |
17 | 17 | 17 | - | - | |||||||||||||||
| Policy loans |
135 | 135 | - | 135 | - | |||||||||||||||
| Derivatives in effective hedge accounting and RSAT relationships |
2 | 10 | - | 10 | - | |||||||||||||||
| Total assets |
$ | 6,654 | $ | 7,054 | $ | 17 | $ | 6,134 | $ | 903 | ||||||||||
| Liabilities: |
||||||||||||||||||||
| Liabilities: |
||||||||||||||||||||
| Consumer notes |
$ | - | $ | - | $ | - | $ | - | $ | - | ||||||||||
| Borrowed money |
- | - | - | - | - | |||||||||||||||
| Policy reserves |
66 | 64 | - | - | 64 | |||||||||||||||
| Policyholders’ and beneficiaries’ funds |
126 | 131 | - | 131 | - | |||||||||||||||
| Derivatives in effective hedge accounting and RSAT relationships |
- | 15 | - | 15 | - | |||||||||||||||
| Total liabilities |
$ | 192 | $ | 210 | $ | - | $ | 146 | $ | 64 | ||||||||||
| December 31, 2020 | ||||||||||||||||||||
| Carrying Value |
Total Fair Value |
Level 1 | Level 2 | Level 3 | ||||||||||||||||
| (in millions) | ||||||||||||||||||||
| Assets: |
||||||||||||||||||||
| Bonds (1) |
$ | 5,451 | $ | 6,055 | $ | - | $ | 5,834 | $ | 221 | ||||||||||
| Preferred stocks |
13 | 13 | - | - | 13 | |||||||||||||||
| Mortgage loans on real estate |
692 | 790 | - | - | 790 | |||||||||||||||
| Cash, cash equivalents and short term investments |
7 | 7 | 7 | - | - | |||||||||||||||
| Policy loans |
128 | 128 | - | 128 | - | |||||||||||||||
| Derivatives in effective hedge accounting and RSAT relationships |
3 | 18 | - | 18 | - | |||||||||||||||
| Total assets |
$ | 6,294 | $ | 7,011 | $ | 7 | $ | 5,980 | $ | 1,024 | ||||||||||
| Liabilities: |
||||||||||||||||||||
| Consumer notes |
$ | - | $ | - | $ | - | $ | - | $ | - | ||||||||||
| Borrowed money |
- | - | - | - | - | |||||||||||||||
| Policy reserves |
72 | 70 | - | - | 70 | |||||||||||||||
| Policyholders’ and beneficiaries’ funds |
124 | 129 | - | 129 | - | |||||||||||||||
| Derivatives in effective hedge accounting and RSAT relationships |
- | 26 | - | 26 | - | |||||||||||||||
| Total liabilities: |
$ | 196 | $ | 225 | $ | - | $ | 155 | $ | 70 | ||||||||||
| (1) | Bonds are carried at amortized cost unless they have NAIC designation rating of 6. |
35
JOHN HANCOCK LIFE INSURANCE COMPANY OF NEW YORK
NOTES TO STATUTORY-BASIS FINANCIAL STATEMENTS
Level 3 Financial Instruments
The changes in Level 3 financial instruments measured and reported at fair value for the years ended December 31, 2021, 2020 and 2019, are summarized as follows:
| Net realized/unrealized |
Transfers | |||||||||||||||||||||||||||||||||||||||||||
| Balance at |
Net income (1) |
Surplus | Amounts credited to separate account liabilities (2) |
Purchases | Issuances | Sales | Settlements | Into Level 3 (3) |
Out of Level 3 (3) |
Balance at | ||||||||||||||||||||||||||||||||||
| (in millions) | ||||||||||||||||||||||||||||||||||||||||||||
| Bonds with NAIC 6 rating: |
||||||||||||||||||||||||||||||||||||||||||||
| Impaired corporate bonds |
$ | - | $ | - | $ | - | $ | - | $ | - | $ | - | $ | - | $ | - | $ | - | $ | - | $ | - | ||||||||||||||||||||||
| Impaired mortgage- backed and asset-backed securities |
- | - | - | - | - | - | - | - | - | - | - | |||||||||||||||||||||||||||||||||
| Total bonds with NAIC 6 rating |
- | - | - | - | - | - | - | - | - | - | - | |||||||||||||||||||||||||||||||||
| Preferred stocks: |
||||||||||||||||||||||||||||||||||||||||||||
| Industrial and misc |
- | - | - | - | - | - | - | - | - | - | - | |||||||||||||||||||||||||||||||||
| Total preferred stocks |
- | - | - | - | - | - | - | - | - | - | - | |||||||||||||||||||||||||||||||||
| Common stocks: |
||||||||||||||||||||||||||||||||||||||||||||
| Industrial and misc |
9 | - | 4 | - | - | - | - | - | - | - | 13 | |||||||||||||||||||||||||||||||||
| Total common stocks |
9 | - | 4 | - | - | - | - | - | - | - | 13 | |||||||||||||||||||||||||||||||||
| Net derivatives |
- | - | - | - | - | - | - | - | - | - | - | |||||||||||||||||||||||||||||||||
| Separate account assets/liabilities |
- | - | - | - | - | - | - | - | - | - | - | |||||||||||||||||||||||||||||||||
| Total |
$ | 9 | $ | - | $ | 4 | $ | - | $ | - | $ | - | $ | - | $ | - | $ | - | $ | - | $ | 13 | ||||||||||||||||||||||
36
JOHN HANCOCK LIFE INSURANCE COMPANY OF NEW YORK
NOTES TO STATUTORY-BASIS FINANCIAL STATEMENTS
| Net realized/unrealized |
Transfers | |||||||||||||||||||||||||||||||||||||||||||
| Balance at |
Net income (1) |
Surplus | Amounts credited to separate account liabilities (2) |
Purchases | Issuances | Sales | Settlements | Into Level 3 (3) |
Out of Level 3 (3) |
Balance at | ||||||||||||||||||||||||||||||||||
| (in millions) | ||||||||||||||||||||||||||||||||||||||||||||
| Bonds with NAIC 6 rating: |
||||||||||||||||||||||||||||||||||||||||||||
| Impaired corporate bonds |
$ | - | $ | - | $ | - | $ | - | $ | - | $ | - | $ | - | $ | - | $ | - | $ | - | $ | - | ||||||||||||||||||||||
| Impaired mortgage-backed and asset-backed securities |
- | - | - | - | - | - | - | - | - | - | - | |||||||||||||||||||||||||||||||||
| Total bonds with NAIC 6 rating |
- | - | - | - | - | - | - | - | - | - | - | |||||||||||||||||||||||||||||||||
| Preferred stocks: |
||||||||||||||||||||||||||||||||||||||||||||
| Industrial and misc |
- | - | - | - | - | - | - | - | - | - | - | |||||||||||||||||||||||||||||||||
| Total preferred stocks |
- | - | - | - | - | - | - | - | - | - | - | |||||||||||||||||||||||||||||||||
| Common stocks: |
||||||||||||||||||||||||||||||||||||||||||||
| Industrial and misc |
11 | 5 | (1 | ) | - | - | - | (6 | ) | - | - | - | 9 | |||||||||||||||||||||||||||||||
| Total common stocks |
11 | 5 | (1 | ) | - | - | - | (6 | ) | - | - | - | 9 | |||||||||||||||||||||||||||||||
| Net derivatives |
- | - | - | - | - | - | - | - | - | - | - | |||||||||||||||||||||||||||||||||
| Separate account assets/liabilities |
- | - | - | - | - | - | - | - | - | - | - | |||||||||||||||||||||||||||||||||
| Total |
$ | 11 | $ | 5 | $ | (1 | ) | $ | - | $ | - | $ | - | $ | (6) | $ | - | $ | - | $ | - | $ | 9 | |||||||||||||||||||||
37
JOHN HANCOCK LIFE INSURANCE COMPANY OF NEW YORK
NOTES TO STATUTORY-BASIS FINANCIAL STATEMENTS
| Net realized/unrealized |
Transfers | |||||||||||||||||||||||||||||||||||||||||||
| Balance at |
Net income (1) |
Surplus | Amounts credited to separate account liabilities (2) |
Purchases | Issuances | Sales | Settlements | Into Level 3 (3) |
Out of Level 3 (3) |
Balance at | ||||||||||||||||||||||||||||||||||
| (in millions) | ||||||||||||||||||||||||||||||||||||||||||||
| Bonds with NAIC 6 rating: |
||||||||||||||||||||||||||||||||||||||||||||
| Impaired corporate bonds |
$ | - | $ | - | $ | - | $ | - | $ | - | $ | - | $ | - | $ | - | $ | - | $ | - | $ | - | ||||||||||||||||||||||
| Impaired mortgage-backed and asset-backed securities |
- | - | - | - | - | - | - | - | - | - | - | |||||||||||||||||||||||||||||||||
| Total bonds with NAIC 6 rating |
- | - | - | - | - | - | - | - | - | - | - | |||||||||||||||||||||||||||||||||
| Preferred stocks: |
||||||||||||||||||||||||||||||||||||||||||||
| Industrial and misc |
- | - | - | - | - | - | - | - | - | - | - | |||||||||||||||||||||||||||||||||
| Total preferred stocks |
- | - | - | - | - | - | - | - | - | - | - | |||||||||||||||||||||||||||||||||
| Common stocks: |
||||||||||||||||||||||||||||||||||||||||||||
| Industrial and misc |
33 | 4 | (8 | ) | - | - | - | (18 | ) | - | - | - | 11 | |||||||||||||||||||||||||||||||
| Total common stocks |
33 | 4 | (8 | ) | - | - | - | (18 | ) | - | - | - | 11 | |||||||||||||||||||||||||||||||
| Net derivatives |
- | - | - | - | - | - | - | - | - | - | - | |||||||||||||||||||||||||||||||||
| Separate account assets/liabilities |
- | - | - | - | - | - | - | - | - | - | - | |||||||||||||||||||||||||||||||||
| Total |
$ | 33 | $ | 4 | $ | (8 | ) | $ | - | $ | - | $ | - | $ | (18 | ) | $ | - | $ | - | $ | - | $ | 11 | ||||||||||||||||||||
| (1) | This amount is included in net realized capital gains (losses) on the Statements of Operations. |
| (2) | Changes in the fair value of separate account assets are credited directly to separate account liabilities in accordance with NAIC SAP and are not reflected in income. |
| (3) | For financial instruments that are transferred into and/or out of Level 3, the Company uses the fair value of the instruments at the beginning of the period. |
38
JOHN HANCOCK LIFE INSURANCE COMPANY OF NEW YORK
NOTES TO STATUTORY-BASIS FINANCIAL STATEMENTS
The transfers into Level 3 primarily result from securities that were impaired during the year or securities where a lack of observable market data (versus the previous year) resulted in reclassifying instruments into Level 3. The transfers out of Level 3 primarily result from observable market data becoming available for that instrument, thus eliminating the need to extrapolate market data beyond observable points. Additionally, securities carried at fair value at the beginning of the period but carried at amortized cost at the end of the period due to rating change or change in fair value relative to amortized cost, are included in transfers out of Level 3. Conversely, any securities carried at amortized cost at the beginning of the period and carried at fair value at the end of the year due to SVO rating change or change in fair value relative to amortized cost, are included into transfers into Level 3.
8. Reinsurance
Certain premiums and benefits are assumed from or ceded to affiliate and other insurance companies under various reinsurance agreements. The Company entered into these reinsurance agreements to shift underlying risk on certain of its products, and to improve cash flow and statutory capital. The ceded reinsurance agreements provide the Company with increased capacity to write larger risks and maintain its exposure to loss within its capital resources.
Total reinsurance amounts included in the Company’s accompanying statutory-basis financial statements were as follows:
| Years ended December 31, | ||||||||||||
| 2021 | 2020 | 2019 | ||||||||||
| (in millions) |
||||||||||||
| Premiums earned |
||||||||||||
| Direct |
$ | 1,100 | $ | 1,034 | $ | 1,113 | ||||||
| Assumed |
144 | 163 | 186 | |||||||||
| Ceded |
(238 | ) | (235 | ) | (783 | ) | ||||||
| Net |
$ | 1,006 | $ | 962 | $ | 516 | ||||||
| Benefits to policyholders ceded |
$ | (472 | ) | $ | (553 | ) | $ | (443 | ) | |||
Reserve amounts ceded to reinsurers not authorized in the State of New York are mostly covered by funds withheld assets, letters of credit or trust agreements. Amounts payable or recoverable for reinsurance on policy and contract liabilities are not subject to periodic or maximum limits. At December 31, 2021, any material recoveries were collateralized or settled by the assuming company.
Neither the Company nor any of its related parties control, directly or indirectly, any external reinsurers with whom the Company conducts business. No policies issued by the Company have been reinsured with a foreign company, which is controlled, either directly or indirectly, by a party not primarily engaged in the business of insurance. The Company does not have any reinsurance agreements in effect under which the reinsurer may unilaterally cancel the agreement. At December 31, 2021, there were no reinsurance agreements in effect such that the amount of losses paid or accrued through the statement date may result in a payment to the reinsurer of amounts which, in aggregate and allowing for offset of mutual credits from other reinsurance agreements with the same reinsurer, exceed the total direct premium collected under the reinsured policies.
As of December 31, 2021, if all reinsurance agreements were cancelled the estimated aggregate reduction in unassigned surplus is $592 million.
39
JOHN HANCOCK LIFE INSURANCE COMPANY OF NEW YORK
NOTES TO STATUTORY-BASIS FINANCIAL STATEMENTS
The following tables and commentary disclose the reinsurance treaty transactions considered material to the Company.
Non-Affiliated Reinsurance
The table and commentary below consist of the impact of the New York Life (“NYL”) Agreements:
| Years ended December 31, | ||||||||||||
| 2021 | 2020 | 2019 | ||||||||||
| (in millions) | ||||||||||||
| Premiums ceded |
$ | (54 | ) | $ | (62 | ) | $ | (66 | ) | |||
| Premiums assumed |
22 | 25 | 26 | |||||||||
| Benefits ceded |
(145 | ) | (157 | ) | (144 | ) | ||||||
| Benefits assumed |
58 | 63 | 58 | |||||||||
| Other reinsurance receivable (payable) |
9 | - | (4 | ) | ||||||||
| Funds held by or deposited with reinsured companies |
776 | 806 | 837 | |||||||||
Effective July 1, 2015, the Company entered into coinsurance reinsurance agreements with NYL to cede 100% quota share (“QS”) of the Company’s John Hancock Life Insurance (“JHLICO”) Closed Block policies (“NYL 100% Coinsurance”). In addition, NYL agreed to retrocede 40% QS of the same policy risks back to the Company under a coinsurance funds withheld (“FWH”) agreement (“NYL 40% FWH Retrocession”). Collectively, these agreements are known as the NYL Agreements. The NYL 100% Coinsurance keeps the assets supporting the JHLICO Closed Block together in NYL, and the NYL 40% FWH Retrocession adjusts the net reinsurance to NYL to 60% of the JHLICO Closed Block policies at risk.
The table and commentary below consist of the impact of the Reinsurance Group of America (“RGA”) Agreement:
| Year ended December 31, | ||||||||||||
| 2021 | 2020 | 2019 | ||||||||||
| (in millions) | ||||||||||||
| Premiums ceded, net |
$ | - | $ | - | $ | (99 | ) | |||||
| Benefits ceded, net |
(4 | ) | (10 | ) | (11 | ) | ||||||
| Other reinsurance receivable |
1 | 1 | 1 | |||||||||
| Other amounts payable on reinsurance |
- | - | - | |||||||||
Effective January 1, 2019, the Company entered into a coinsurance agreement with RGA to cede 90% quota share (“QS”) of a significant block of individual pay-out annuities. The transaction was structured such that the Company transferred the policy liabilities of $92 million and related invested assets of $98 million. The Company recognized a pre-tax gain of $3 million net of realized capital gains, including a ceding commission received of $1 million, and an increase of $3 million to statutory surplus. Under the terms of the agreement, the Company will maintain responsibility for servicing the policies. The transaction closed on February 7, 2019.
40
JOHN HANCOCK LIFE INSURANCE COMPANY OF NEW YORK
NOTES TO STATUTORY-BASIS FINANCIAL STATEMENTS
The table and commentary below consist of the impact of the Jackson National Life Insurance Company (“Jackson”) Agreement:
| Year ended December 31, | ||||||||||||
| 2021 | 2020 | 2019 | ||||||||||
| (in millions) |
||||||||||||
| Premiums ceded, net |
$ | - | $ | - | $ | (444 | ) | |||||
| Benefits ceded, net |
(33 | ) | (34 | ) | (35 | ) | ||||||
| Funds held by or deposited with reinsured companies |
- | - | - | |||||||||
| Other reinsurance receivable |
4 | 4 | 3 | |||||||||
| Other amounts payable on reinsurance |
- | - | - | |||||||||
Effective January 1, 2019, the Company entered into a coinsurance agreement with Jackson, a wholly-owned subsidiary of Prudential plc, to cede 90% QS of a block of legacy group pay-out annuities. The transaction was structured such that the Company transferred the policy liabilities of $352 million and related invested assets of $437 million. The Company incurred a pre-tax loss of $80 million net of realized capital gains, including a ceding commission paid of $26 million, and a decrease of $60 million to statutory surplus. Under the terms of the agreement, the Company will maintain responsibility for servicing the policies. The transaction closed on March 15, 2019.
The table and commentary below consist of the impact of the Global Atlantic Financial Group (“GAFG”) Agreement:
| Years ended December 31, | ||||||||||||
| 2021 | 2020 | 2019 | ||||||||||
| (in millions) | ||||||||||||
| Premiums ceded, net |
$ | (2 | ) | $ | (2 | ) | $ | (1 | ) | |||
| Benefits ceded, net |
(76 | ) | (79 | ) | (100 | ) | ||||||
| Other reinsurance receivable |
8 | 7 | 16 | |||||||||
| Other amounts payable on reinsurance |
- | - | - | |||||||||
Effective July 1, 2012, the Company entered into a coinsurance agreement with GAFG, formerly named Commonwealth Annuity (“CWA”), to cede its fixed deferred annuities at 90% quota share (“QS”). The transaction was structured such that the Company transferred the actuarial liabilities and related invested assets. Under the terms of the agreement, the Company will maintain responsibility for servicing the policies.
At the beginning of 2020, the Company had a number of reinsurance agreements with Scottish Re (U.S.), Inc. (“SRUS”). On March 6, 2019, SRUS was declared impaired and placed into rehabilitation by the Delaware Chancery Court. The Company reached a settlement agreement with the Receiver of SRUS, which was approved by the Delaware Chancery Court on February 28, 2020. Under the terms of the settlement, the yearly renewable term reinsurance agreements between the Company and SRUS were terminated effective as of January 1, 2020; certain term coinsurance agreements were novated to Hannover Life Reassurance Company of America (“Hannover Life”) effective January 1, 2019; and the arbitration between the Company and SRUS was dismissed with prejudice. During December 2021, the Company collected $1 million from Hannover Life as settlement for the 2020 net claims recoverable balance. As of December 31, 2021, SRUS is still listed as an accredited reinsurer with the State of New York Department of Financial Services. The Company recorded a reserve credit of $7 million and $8 million as of December 31, 2021 and 2020 respectively related to the various agreements with SRUS.
41
JOHN HANCOCK LIFE INSURANCE COMPANY OF NEW YORK
NOTES TO STATUTORY-BASIS FINANCIAL STATEMENTS
Affiliated Reinsurance
The table and commentary below consist of the impact of the reinsurance agreements with its parent, JHUSA:
| Years ended December 31, | |||||||||||||||
| 2021 | 2020 | 2019 | |||||||||||||
| (in millions) | |||||||||||||||
| Premiums assumed, net |
$ | 122 | $ | 138 | $ | 159 | |||||||||
| Benefits assumed, net |
377 | 439 | 396 | ||||||||||||
| Other reinsurance receivable |
8 | 6 | 3 | ||||||||||||
| Other amounts payable on reinsurance |
56 | 59 | 42 | ||||||||||||
| Funds withheld from unauthorized reinsurers |
- | - | - | ||||||||||||
| Treaty settlement received (paid) |
(136 | ) | (171 | ) | (207) | ||||||||||
On January 1, 2010, the assets supporting the policyholders who reside in the state of New York (“NY business”) were transferred from JHUSA to the Company. The transfer included participating traditional life insurance, universal life insurance, fixed deferred and immediate annuities, participating pension contracts where assets were held in separate accounts, and variable annuities. The NY business was transferred using assumption reinsurance, modified coinsurance and coinsurance with cut-through provisions.
The table and commentary below consist of the impact of the reinsurance agreements with an affiliate, JHRECO:
| Years ended December 31, | ||||||||||||
| 2021 | 2020 | 2019 | ||||||||||
| (in millions) |
||||||||||||
| Premiums ceded |
$ | - | $ | - | $ | (7 | ) | |||||
| Benefits ceded |
(9 | ) | (28 | ) | (6 | ) | ||||||
| Other reinsurance receivable (payable) |
3 | 19 | - | |||||||||
| Funds withheld from unauthorized reinsurers |
- | - | 5 | |||||||||
| Treaty Settlement received (paid) |
9 | 23 | 2 | |||||||||
The Company reinsures a portion of the risk related to certain life policies with JHRECO.
The table and commentary below consist of the impact of the reinsurance agreements with an affiliate, Manulife Reinsurance Limited (“MRL”):
| Years ended December 31, | ||||||||||||
| 2021 | 2020 | 2019 | ||||||||||
| (in millions) |
||||||||||||
| Premiums ceded |
$ | 6 | $ | 4 | $ | 2 | ||||||
| Benefits ceded |
(16 | ) | (19 | ) | (17 | ) | ||||||
| Other reinsurance receivable |
- | - | - | |||||||||
| Other amounts payable on reinsurance |
1 | 1 | 1 | |||||||||
| Funds withheld from unauthorized reinsurers |
372 | 379 | 367 | |||||||||
| Treaty Settlement received (paid) |
(3 | ) | (3 | ) | (3 | ) | ||||||
42
JOHN HANCOCK LIFE INSURANCE COMPANY OF NEW YORK
NOTES TO STATUTORY-BASIS FINANCIAL STATEMENTS
Effective July 1, 2005, the Company entered into a reinsurance agreement with MRL to reinsure 90% of all risks not already reinsured to third parties on selected single and joint survivorship guaranteed universal life contracts. The agreement is written on a coinsurance FWH basis.
In 2021 and 2020, the Company did not commute any ceded reinsurance.
43
JOHN HANCOCK LIFE INSURANCE COMPANY OF NEW YORK
NOTES TO STATUTORY-BASIS FINANCIAL STATEMENTS
9. Federal Income Taxes
The components of the net deferred tax asset/(liability) (“DTA”/”DTL”) are as follows:
| December 31, 2021 | ||||||||||||||||
| (1) | (2) | (3) | ||||||||||||||
| (Col 1 + 2) | ||||||||||||||||
| Ordinary | Capital | Total | ||||||||||||||
|
|
|
|
||||||||||||||
| (in millions) |
||||||||||||||||
| (a) Gross deferred tax assets |
$ | 345 | $ | - | $ | 345 | ||||||||||
| (b) Statutory valuation allowance adjustments |
- | - | - | |||||||||||||
|
|
|
|
||||||||||||||
| (c) Adjusted gross deferred tax assets (a - b) |
345 | - | 345 | |||||||||||||
| (d) Deferred tax assets nonadmitted |
75 | - | 75 | |||||||||||||
|
|
|
|
||||||||||||||
| (e) Subtotal net admitted deferred tax asset (c - d) |
270 | - | 270 | |||||||||||||
| (f) Deferred tax liabilities |
138 | 19 | 157 | |||||||||||||
|
|
|
|
||||||||||||||
| (g) Net admitted deferred tax asset / (net deferred tax liability) (e - f) |
$ | 132 | $ | (19 | ) | $ | 113 | |||||||||
|
|
|
|
||||||||||||||
| December 31, 2020 | ||||||||||||||||
| (4) | (5) | (6) | ||||||||||||||
| Ordinary | Capital | (Col 4 + 5) Total |
||||||||||||||
|
|
|
|
||||||||||||||
| (in millions) |
||||||||||||||||
| (a) Gross deferred tax assets |
$ | 325 | $ | 1 | $ 326 | |||||||||||
| (b) Statutory valuation allowance adjustments |
- | - | - | |||||||||||||
|
|
|
|
||||||||||||||
| (c) Adjusted gross deferred tax assets (a - b) |
325 | 1 | 326 | |||||||||||||
| (d) Deferred tax assets nonadmitted |
60 | - | 60 | |||||||||||||
|
|
|
|
||||||||||||||
| (e) Subtotal net admitted deferred tax asset (c - d) |
265 | 1 | 266 | |||||||||||||
| (f) Deferred tax liabilities |
140 | 19 | 159 | |||||||||||||
|
|
|
|
||||||||||||||
| (g) Net admitted deferred tax asset / (net deferred tax liability) (e - f) |
$ | 125 | $ | (18 | ) | $ | 107 | |||||||||
|
|
|
|
||||||||||||||
| Change | ||||||||||||||||
| (7) (Col 1 - 4) |
(8) (Col 2 - 5) |
(9) (Col 7 + 8) |
||||||||||||||
|
|
|
|
||||||||||||||
| (in millions) |
||||||||||||||||
| (a) Gross deferred tax assets |
$ | 20 | $ | (1 | ) | $ | 19 | |||||||||
| (b) Statutory valuation allowance adjustments |
- | - | - | |||||||||||||
|
|
|
|
||||||||||||||
| (c) Adjusted gross deferred tax assets (a - b) |
20 | (1 | ) | 19 | ||||||||||||
| (d) Deferred tax assets nonadmitted |
15 | - | 15 | |||||||||||||
|
|
|
|
||||||||||||||
| (e) Subtotal net admitted deferred tax asset (c - d) |
5 | (1 | ) | 4 | ||||||||||||
| (f) Deferred tax liabilities |
(2 | ) | - | (2 | ) | |||||||||||
|
|
|
|
||||||||||||||
| (g) Net admitted deferred tax asset / (net deferred tax liability) (e - f) |
$ | 7 | $ | (1 | ) | $ | 6 | |||||||||
|
|
|
|
||||||||||||||
44
JOHN HANCOCK LIFE INSURANCE COMPANY OF NEW YORK
NOTES TO STATUTORY—BASIS FINANCIAL STATEMENTS
The Company has not recorded a valuation allowance with respect to the realizability of its deferred tax assets. In assessing the need for a valuation allowance, management considered the future reversal of taxable temporary differences, future taxable income exclusive of reversing temporary differences, taxable income in the carry back period, as well as tax planning strategies. Tax planning strategies were considered to the extent they were both prudent and feasible and if implemented, would result in the realization of deferred tax assets. Based on management’s assessment of all available information, management believes that it is more likely than not the Company will realize the full benefit of its deferred tax assets.
The amount of adjusted gross deferred tax assets admitted under each component and the resulting increase in deferred tax assets by character are as follows:
| December 31, 2021 | ||||||||||||
| (1) | (2) | (3) | ||||||||||
| (Col 1 + 2) | ||||||||||||
| Ordinary | Capital | Total | ||||||||||
|
|
|
| ||||||||||
| (in millions) |
||||||||||||
| 2. Admission calculation components SSAP No. 101 |
||||||||||||
| (a) Federal income taxes paid in prior years recoverable through loss carrybacks. |
$ | - | $ | - | $ | - | ||||||
| (b) Adjusted gross deferred tax assets expected to be realized (excluding the amount of deferred tax assets from 2(a) above) after application of the threshold limitation. (The lesser of 2(b)1 and 2(b)2 below) |
113 | - | 113 | |||||||||
| 1. Adjusted gross deferred tax assets expected to be realized following the Balance Sheet date. |
113 | - | 113 | |||||||||
| 2. Adjusted gross deferred tax assets allowed per limitation threshold. |
181 | - | 181 | |||||||||
| (c) Adjusted gross deferred tax assets (excluding the amount of deferred tax assets from 2(a) and 2(b) above) offset by gross deferred tax liabilities. |
157 | - | 157 | |||||||||
|
|
|
| ||||||||||
| (d) Deferred tax assets admitted as the result of application of SSAP No. 101. Total (2(a) + 2(b) + 2(c)) |
$ | 270 | $ | - | $ | 270 | ||||||
|
|
|
| ||||||||||
45
JOHN HANCOCK LIFE INSURANCE COMPANY OF NEW YORK
NOTES TO STATUTORY-BASIS FINANCIAL STATEMENTS
| December 31, 2020 | ||||||||||||
| (4) | (5) | (6) | ||||||||||
| (Col 4 + 5) | ||||||||||||
| Ordinary | Capital | Total | ||||||||||
|
|
|
| ||||||||||
| (in millions) |
||||||||||||
| 2. Admission calculation components SSAP No. 101 |
||||||||||||
| (a) Federal income taxes paid in prior years recoverable through loss carrybacks. |
$ | - | $ | 1 | $ | 1 | ||||||
| (b) Adjusted gross deferred tax assets expected to be realized (excluding the amount of deferred tax assets from 2(a) above) after application of the threshold limitation. (The lesser of 2(b)1 and 2(b)2 below) |
106 | - | 106 | |||||||||
| 1. Adjusted gross deferred tax assets expected to be realized following the Balance Sheet date. |
106 | - | 106 | |||||||||
| 2. Adjusted gross deferred tax assets allowed per limitation threshold. |
166 | - | 166 | |||||||||
| (c) Adjusted gross deferred tax assets (excluding the amount of deferred tax assets from 2(a) and 2(b) above) offset by gross deferred tax liabilities. |
159 | - | 159 | |||||||||
|
|
|
| ||||||||||
| (d) Deferred tax assets admitted as the result of application of SSAP No. 101. Total (2(a) + 2(b) + 2(c)) |
$ | 265 | $ | 1 | $ | 266 | ||||||
|
|
|
| ||||||||||
| Change | ||||||||||||
| (7) | (8) | (9) | ||||||||||
| (Col 1 - 4) | (Col 2 - 5) | (Col 7 + 8) | ||||||||||
| Ordinary | Capital | Total | ||||||||||
|
|
|
| ||||||||||
| (in millions) |
||||||||||||
| 2. Admission calculation components SSAP No. 101 |
||||||||||||
| (a) Federal income taxes paid in prior years recoverable through loss carrybacks. |
$ | - | $ | (1 | ) | $ | (1 | ) | ||||
| (b) Adjusted gross deferred tax assets expected to be realized (excluding the amount of deferred tax assets from 2(a) above) after application of the threshold limitation. |
||||||||||||
| (The lesser of 2(b)1 and 2(b)2 below) |
7 | - | 7 | |||||||||
| 1. Adjusted gross deferred tax assets expected to be realized following the Balance Sheet date. |
7 | - | 7 | |||||||||
| 2. Adjusted gross deferred tax assets allowed per limitation threshold. |
15 | - | 15 | |||||||||
| (c) Adjusted gross deferred tax assets (excluding the amount of deferred tax assets from 2(a) and 2(b) above) offset by gross deferred tax liabilities. |
(2 | ) | - | (2 | ) | |||||||
|
|
|
| ||||||||||
| (d) Deferred tax assets admitted as the result of application of SSAP No. 101. Total (2(a) + 2(b) + 2(c)) |
$ | 5 | $ | (1 | ) | $ | 4 | |||||
|
|
|
| ||||||||||
46
JOHN HANCOCK LIFE INSURANCE COMPANY OF NEW YORK
NOTES TO STATUTORY-BASIS FINANCIAL STATEMENTS
| 2021 | 2020 | |||||||
|
|
|
|||||||
| (in millions) |
||||||||
| (a) Ratio percentage used to determine recovery period and threshold limitation amount |
1005 | % | 920 | % | ||||
| (b) Amount of adjusted capital and surplus used to determine recovery period and threshold limitation in 2(b)2 above |
$ | 1,207 | $ | 1,106 | ||||
Impact of tax planning strategies is as follows:
| December 31, 2021 | ||||||||
| (1) | (2) | |||||||
| Ordinary | Capital | |||||||
|
|
|
|||||||
| (in millions) | ||||||||
| (a) Determination of Adjusted Gross Deferred Tax Assets and Net Admitted Deferred Tax Assets by tax character as a percentage. |
||||||||
| 1. Adjusted Gross DTAs Amount From Note 9A1(c) |
$ | 345 | $ | - | ||||
| 2. Percentage of Adjusted Gross DTAs By Tax Character Attributable To The Impact of Tax Planning Strategies |
0 | % | 0 | % | ||||
| 3. Net Admitted Adjusted Gross DTAs Amount from Note 9A1(e) |
$ | 270 | $ | - | ||||
| 4. Percentage of Net Admitted Adjusted Gross DTAs by Tax Character Attributable To The Impact of Tax Planning Strategies |
0 | % | 0 | % | ||||
| December 31, 2020 | ||||||||
| (3) | (4) | |||||||
| Ordinary | Capital | |||||||
|
|
|
|||||||
| (in millions) |
||||||||
| (a) Determination of Adjusted Gross Deferred Tax Assets and Net Admitted Deferred Tax Assets by tax character as a percentage. |
||||||||
| 1. Adjusted Gross DTAs Amount From Note 9A1(c) |
$ | 325 | $ | 1 | ||||
| 2. Percentage of Adjusted Gross DTAs By Tax Character Attributable To The Impact of Tax Planning Strategies |
0 | % | 0 | % | ||||
| 3. Net Admitted Adjusted Gross DTAs Amount from Note 9A1(e) |
$ | 265 | $ | 1 | ||||
| 4. Percentage of Net Admitted Adjusted Gross DTAs by Tax Character Attributable To The Impact of Tax Planning Strategies |
0 | % | 0 | % | ||||
47
JOHN HANCOCK LIFE INSURANCE COMPANY OF NEW YORK
NOTES TO STATUTORY-BASIS FINANCIAL STATEMENTS
| Change | ||||||||
| (5) | (6) | |||||||
| (Col 1 - 3) | (Col 2 - 4) | |||||||
| Ordinary | Capital | |||||||
|
|
|
|||||||
| (in millions) | ||||||||
| (a) Determination of Adjusted Gross Deferred Tax Assets and Net Admitted Deferred Tax Assets by tax character as a percentage. |
||||||||
| 1. Adjusted Gross DTAs Amount From Note 9A1(c) |
$ | 20 | $ | (1 | ) | |||
| 2. Percentage of Adjusted Gross DTAs By Tax Character Attributable To The Impact of Tax Planning Strategies |
0 | % | 0 | % | ||||
| 3. Net Admitted Adjusted Gross DTAs Amount from Note 9A1(e) |
$ | 5 | $ | (1 | ) | |||
| 4. Percentage of Net Admitted Adjusted Gross DTAs by Tax Character Attributable To The Impact of Tax Planning Strategies |
0 | % | 0 | % | ||||
The Company’s tax planning strategies do not include the use of reinsurance.
There are no unrecognized deferred tax liabilities for amounts described in ASC 740-10-25-3.
Current income taxes incurred consist of the following major components:
| Years Ended December 31, | ||||||||||||
| (1) | (2) | (3) | ||||||||||
| (Col 1 - 2) | ||||||||||||
| 2021 | 2020 | Change | ||||||||||
|
|
|
|||||||||||
| (in millions) | ||||||||||||
| 1. Current income tax |
||||||||||||
| (a) Federal |
$ | 7 | $ | (15 | ) | $ | 22 | |||||
| (b) Foreign |
- | - | - | |||||||||
|
|
|
|||||||||||
| (c) Subtotal |
7 | (15 | ) | 22 | ||||||||
| (d) Federal income tax expense (benefit) on net capital gains |
6 | 123 | (117) | |||||||||
| (e) Utilization of capital loss carryforwards |
- | - | - | |||||||||
| (f) Other |
- | - | - | |||||||||
|
|
|
|||||||||||
| (g) Federal and foreign income taxes incurred |
$ | 13 | $ | 108 | $ | (95) | ||||||
|
|
|
|||||||||||
48
JOHN HANCOCK LIFE INSURANCE COMPANY OF NEW YORK
NOTES TO STATUTORY-BASIS FINANCIAL STATEMENTS
The tax effects of temporary differences that give rise to significant portions of the deferred tax assets and liabilities are as follows:
| December 31, | ||||||||||||
| (1) | (2) | (3) | ||||||||||
| (Col 1 - 2) | ||||||||||||
| 2021 | 2020 | Change | ||||||||||
| (in millions) |
||||||||||||
| 2. Deferred tax assets: |
||||||||||||
| (a) Ordinary: |
||||||||||||
| (1) Discounting of unpaid losses |
$ | - | $ | - | $ | - | ||||||
| (2) Unearned premium reserve |
- | - | - | |||||||||
| (3) Policyholder reserves |
300 | 285 | 15 | |||||||||
| (4) Investments |
4 | 4 | - | |||||||||
| (5) Deferred acquisition costs |
30 | 27 | 3 | |||||||||
| (6) Policyholder dividends accrual |
1 | 2 | (1 | ) | ||||||||
| (7) Fixed assets |
- | - | - | |||||||||
| (8) Compensation and benefits accrual |
- | - | - | |||||||||
| (9) Pension accrual |
- | - | - | |||||||||
| (10) Receivables - nonadmitted |
- | - | - | |||||||||
| (11) Net operating loss carryforward |
- | - | - | |||||||||
| (12) Tax credit carry-forward |
- | - | - | |||||||||
| (13) Other (including items <5% of total ordinary tax assets) |
10 | 7 | 3 | |||||||||
| (99) Subtotal |
$ | 345 | $ | 325 | $ | 20 | ||||||
| (b) Statutory valuation allowance adjustment |
- | - | - | |||||||||
| (c) Nonadmitted |
75 | 60 | 15 | |||||||||
| (d) Admitted ordinary deferred tax assets (2(a)(99) - 2(b) - 2(c)) |
$ | 270 | $ | 265 | $ | 5 | ||||||
| (e) Capital: |
||||||||||||
| (1) Investments |
$ | - | $ | 1 | $ | (1 | ) | |||||
| (2) Net capital loss carryforward |
- | - | - | |||||||||
| (3) Real estate |
- | - | - | |||||||||
| (4) Other (including items <5% of total capital tax assets) |
- | - | - | |||||||||
| (99) Subtotal |
$ | - | $ | 1 | $ | (1 | ) | |||||
| (f) Statutory valuation allowance adjustment |
- | - | - | |||||||||
| (g) Nonadmitted |
- | - | - | |||||||||
| (h) Admitted capital deferred tax assets (2(e)(99) - 2(f) - 2(g)) |
$ | - | $ | 1 | $ | (1 | ) | |||||
| (i) Admitted deferred tax assets (2(d)+2(h)) |
$ | 270 | $ | 266 | $ | 4 | ||||||
| 3. Deferred tax liabilities: |
||||||||||||
| (a) Ordinary: |
||||||||||||
| (1) Investments |
$ | 129 | $ | 128 | $ | 1 | ||||||
| (2) Fixed assets |
1 | - | 1 | |||||||||
| (3) Deferred and uncollected premium |
1 | 1 | - | |||||||||
| (4) Policyholder reserves |
7 | 10 | (3 | ) | ||||||||
| (5) Other (including items <5% of total ordinary tax liabilities) |
- | 1 | (1 | ) | ||||||||
| (99) Subtotal |
$ | 138 | $ | 140 | $ | (2 | ) | |||||
| (b) Capital: |
||||||||||||
| (1) Investments |
$ | 19 | $ | 19 | $ | - | ||||||
| (2) Real estate |
- | - | - | |||||||||
| (3) Other (including items <5% of total capital tax liabilities) |
- | - | - | |||||||||
| (99) Subtotal |
$ | 19 | $ | 19 | $ | - | ||||||
| (c) Deferred tax liabilities (3(a)(99) + 3(b)(99)) |
$ | 157 | $ | 159 | $ | (2 | ) | |||||
| 4. Net deferred tax assets/liabilities (2(i) - 3(c)) |
$ | 113 | $ | 107 | $ | 6 | ||||||
49
JOHN HANCOCK LIFE INSURANCE COMPANY OF NEW YORK
NOTES TO STATUTORY-BASIS FINANCIAL STATEMENTS
The change in net deferred income taxes is comprised of the following:
| December 31, | ||||||||||||
| 2021 | 2020 | Change | ||||||||||
| (in millions) |
||||||||||||
| Total deferred tax assets |
$ | 345 | $ | 326 | $ | 19 | ||||||
| Total deferred tax liabilities |
157 | 159 | (2 | ) | ||||||||
| Net deferred tax assets (liabilities) |
$ | 188 | $ | 167 | $ | 21 | ||||||
| Tax effect of unrealized gains and losses |
14 | |||||||||||
| Tax effect of unrealized foreign exchange gains (losses) |
- | |||||||||||
| Other |
- | |||||||||||
| Change in net deferred income taxes |
$ | 7 | ||||||||||
The provision for federal and foreign income taxes incurred is different from that which would be obtained by applying the statutory federal income tax rate of 21% to income before income tax (including realized capital gains). The significant items causing this difference are as follows:
| Years Ended December 31, | ||||||||||||
| 2021 | 2020 | 2019 | ||||||||||
| (in millions) |
||||||||||||
| Ordinary provisions computed at statutory rate |
$ | 25 | $ | (75 | ) | $ | (52 | ) | ||||
| Net realized capital gains (losses) before IMR at statutory rate |
(5 | ) | 117 | 16 | ||||||||
| Change in nonadmitted assets |
- | - | - | |||||||||
| Reinsurance |
(3 | ) | (2 | ) | (4 | ) | ||||||
| Valuation allowance |
- | - | - | |||||||||
| Tax-exempt income |
- | - | - | |||||||||
| Nondeductible expenses |
- | - | - | |||||||||
| Foreign tax expense gross up |
- | - | - | |||||||||
| Amortization of IMR |
(5 | ) | (4 | ) | (11 | ) | ||||||
| Tax recorded in surplus |
1 | (8 | ) | (2 | ) | |||||||
| Dividend received deduction |
(3 | ) | (3 | ) | (4 | ) | ||||||
| Investment in subsidiaries |
(1 | ) | (3 | ) | (2 | ) | ||||||
| Prior year adjustment |
(2 | ) | (1 | ) | (2 | ) | ||||||
| Tax credits |
(1 | ) | (1 | ) | (1 | ) | ||||||
| Change in tax reserve |
(1 | ) | - | 1 | ||||||||
| Pension |
- | - | - | |||||||||
| Tax rate change |
- | - | - | |||||||||
| Other |
1 | 1 | 1 | |||||||||
| Total |
$ | 6 | $ | 21 | $ | (60 | ) | |||||
| Federal and foreign income taxes incurred |
$ | 7 | $ | (15 | ) | $ | (41 | ) | ||||
| Capital gains tax |
6 | 123 | 34 | |||||||||
| Change in net deferred income taxes |
(7 | ) | (87 | ) | (53 | ) | ||||||
| Total statutory income tax expense (benefit) |
$ | 6 | $ | 21 | $ | (60 | ) | |||||
At December 31, 2021 the Company did not have any net operating losses, net capital losses, or credit carry forwards.
Federal income taxes incurred on capital gains available for recoupment in the event of future net capital losses were $0 million, $119 million and $0 million for 2021, 2020 and 2019, respectively.
50
JOHN HANCOCK LIFE INSURANCE COMPANY OF NEW YORK
NOTES TO STATUTORY-BASIS FINANCIAL STATEMENTS
The Company has no deposits under Section 6603 of the Internal Revenue Code.
The Company is included in the consolidated federal income tax return of JHFC with the following entities:
| Essex Corporation |
John Hancock Funding Company LLC | |
| Manulife Investment Management Farmland Services Inc (formerly known as (“FKA”) Farmland Management Services, Inc.) |
John Hancock Insurance Agency Inc. | |
| Guide Financial, Inc. |
John Hancock Leasing Corp. | |
| Manulife Investment Management Agriculture Services Inc (FKA Hancock Farmland Services, Inc. ) |
John Hancock Life & Health Insurance Company | |
| Manulife Investment Management Forest Management Inc (FKA Hancock Forest Management Inc.) |
John Hancock Life Insurance Company (USA) | |
| Manulife Investment Management Timberland and Agriculture Inc (FKA Hancock Natural Resource Group Inc.) |
John Hancock Realty Advisors Inc. | |
| JH 575 Rengstorff LLC |
John Hancock Realty Mgt. Inc. | |
| JH Hostetler LLC |
John Hancock Signature Services Inc. | |
| JH Kearny Mesa 5 LLC |
Manulife Investment Management Timberland and Agriculture GP Inc (FKA John Hancock Natural Resource Corp.) | |
| JH Kearny Mesa 7 LLC |
Manulife (Michigan) Reassurance Company | |
| JH Kearny Mesa 9 LLC |
Manulife Reinsurance (Bermuda) Limited | |
| JH Networking Insurance Agency Inc. |
Manulife Reinsurance Limited | |
| JH Ott LLC |
Manulife Service Corporation | |
| JH Tulare 8 LLC |
MCC Asset Management Inc. | |
| John Hancock Assignment Company |
PT Timber Inc. | |
| John Hancock Financial Corporation |
JH Signature Insurance Agency, Inc. | |
| John Hancock Financial Network Inc. |
The Manufacturers Investment Corporation | |
In accordance with the income tax sharing agreements in effect for the applicable tax years, the Company’s income tax expense (benefit) is computed as if the Company filed separate federal income tax returns with tax benefits provided for operating losses and tax credits when utilized by the consolidated group. Intercompany settlements of income taxes are made through an increase or reduction to amounts due to or from affiliates. Such settlements occur on a periodic basis in accordance with the tax sharing agreements.
Taxes receivable from (payable to) JHUSA, are ($19) million and ($125) million at December 31, 2021 and 2020, respectively, and are included in other assets or current federal income taxes payable on the Balance Sheets.
The Company files income tax returns in the U.S. federal jurisdiction and various state and local jurisdictions. The Company is under continuous examination by the Internal Revenue Service (“IRS”). The IRS completed the audit of tax years 2014-2015 with the exception of one issue that is currently in appeals. The audit of tax years 2016-2018 was completed in December 2021 with the issuance of the IRS Revenue Agent Report (“RAR”). The RAR includes two unagreed issues which
the Company will appeal.
51
JOHN HANCOCK LIFE INSURANCE COMPANY OF NEW YORK
NOTES TO STATUTORY-BASIS FINANCIAL STATEMENTS
A reconciliation of the beginning and ending amount of unrecognized tax benefits is as follows:
|
|
|
|||||||
| 2021 | 2020 | |||||||
|
|
|
|||||||
| (in millions) |
||||||||
| Balance at beginning of year |
$ | 3 | $ | 3 | ||||
| Additions based on tax positions related to the current year |
- | - | ||||||
| Payments |
- | - | ||||||
| Additions for tax positions of prior years |
- | - | ||||||
| Reductions for tax positions of prior years |
(1 | ) | - | |||||
|
|
|
|||||||
| Balance at end of year |
$ | 2 | $ | 3 | ||||
|
|
|
|||||||
Included in the balances as of December 31, 2021 and 2020, are $2 million and $3 million, respectively, of unrecognized benefits that, if recognized, would affect the Company’s effective tax rate. Included in the balances as of December 31, 2021 and 2020 are $0 million and $0 million, respectively, of tax positions for which the ultimate deductibility is highly certain but for which there is uncertainty about the timing of such deductibility.
The Company has no unrecognized tax benefits that will significantly increase or decrease in the next twelve months.
The Company recognizes interest accrued related to unrecognized tax benefits and penalties in income tax expense in the Statements of Operations. The Company recognized approximately $0 million, $0 million and $0 million of interest expense / (benefit) in each of the years ended December 31, 2021, 2020, and 2019, respectively. The Company had approximately $0 million and $0 million accrued for interest as of December 31, 2021 and 2020, respectively. The Company did not recognize any material penalties for the years ended December 31, 2021, 2020 and 2019.
The Company filed a refund claim with the IRS for the Alternative Minimum Tax (“AMT”) credit carryforward balance that remained as of December 31, 2017. The Company received a refund of $2 million and has no remaining tax recoverable.
On March 27, 2020, Congress signed into law the Coronavirus Aid, Relief, and Economic Security Act, (“CARES Act”) in response to the economic fallout of the COVID-19 pandemic in the United States. The CARES Act provided a 5-year carryback for net operating losses arising in tax years 2018, 2019 and 2020 to provide relief to businesses. In 2020, the Company filed a claim with the IRS to carry back 2018 net operating losses to recoup taxes paid in 2017, in lieu of carrying forward to 2019. There was no material impact to the Company in 2020.
In 2018, the Company updated policy level tax reserves in accordance with the Tax Cuts and Jobs Act and reflected impacts of $24 million in its temporary differences for Actuarial Liabilities in both deferred tax assets and deferred tax liabilities. The transitional deferred tax asset is being amortized into taxable income over 8 years, in the amount of $3 million per year.
10. Capital and Surplus
There are no restrictions placed on the Company’s unassigned surplus other than restrictions on dividend payments described below.
Under New York State insurance laws (“NYSIL”), no insurer without the prior approval of the Superintendent, may pay any shareholder dividend in the calendar year immediately following a calendar year for which the insurer’s net gain from operations, after tax, not including realized capital gains, was negative. NYSIL also limits the aggregate amount of dividends a life insurer may pay in any calendar year out of positive earned surplus, to the greater of (i) 10% of its statutory policyholders’ surplus as of the immediately preceding calendar year or (ii) the Company’s statutory net gain from operations, after tax, not including realized capital gains and (losses) for the immediately preceding calendar year, not to exceed 30% of its statutory policyholders’ surplus as of the immediately preceding calendar year.
In addition, NYSIL allows for a shareholder dividend even if the company does not have sufficient positive earned surplus, limited to the lesser of (i) 10% of its statutory policyholders’ surplus as of the immediately preceding calendar year or (ii) the Company’s statutory net gain from operations, after tax, not including realized capital gains and (losses) for the immediately
52
JOHN HANCOCK LIFE INSURANCE COMPANY OF NEW YORK
NOTES TO STATUTORY-BASIS FINANCIAL STATEMENTS
preceding calendar year. The Company paid shareholder dividends of $0 million, $0 million, and $100 million to its parent, JHUSA, in 2021, 2020 and 2019, respectively.
Life/health insurance companies are subject to certain Risk-Based Capital (“RBC”) requirements as specified by the NAIC. Under those requirements, the amount of capital and surplus maintained by a life/health insurance company is to be determined based on the various risk factors related to it. As of December 31, 2021 and 2020, based on calculations pursuant to those requirements, the Company’s total adjusted capital exceeds the company action level RBC.
11. Related Party Transactions
Service Agreements
The Company has formal service agreements with JHUSA whereby the Company will pay a fee for services received under the agreements which include legal, personnel, marketing, investment accounting, and certain other administrative services and are billed based on intercompany cost allocations or total average daily net assets. Costs incurred under the agreements were $58 million, $55 million, and $62 million at December 31, 2021, 2020 and 2019, respectively. As of December 31, 2021 and 2020, the Company had amounts payable of $11 million and $11 million, respectively.
The Company has an Administrative Service Agreement with JHVTA and John Hancock Investment Management LLC (“JHIM”) (formerly John Hancock Advisers, LLC) pursuant to which the Company will provide certain administrative and related functional support services as required by JHVTA and JHIM in connection with variable contracts issued by the Company which provide for investment in selected portfolios of JHVTA and JHIM. For such services, JHVTA and JHIM will pay the Company a quarterly fee equal to a percentage of the average daily net assets of the funds attributable to the contracts issued by the Company. The amount earned under the agreement was $16 million, $14 million and $15 million for the years ended December 31, 2021, 2020 and 2019 respectively.
The Company has an Underwriting and Distribution Agreement with JHD pursuant to which JHD is appointed as the principal underwriter and exclusive distributor of the variable life and other products issued by the Company. For the years ended December 31, 2021, 2020 and 2019, the Company was billed by JHD for underwriting commissions of $51 million, $48 million, and $62 million, respectively. The Company had amounts payable for services provided of $3 million and $3 million at December 31, 2021 and 2020, respectively.
Management believes the allocation methods used are reasonable and appropriate in the circumstances; however, the Company’s Balance Sheets and Statements of Operations may not necessarily be indicative of the financial condition that would have existed if the Company operated as an unaffiliated entity.
Other
During 2021, 2020 and 2019, respectively, the Company received dividends of $18 million, $14 million, and $15 million from JHVTA. These dividends are included in the Company’s net investment income.
The Company did not own any shares of the stock of its parent, JHUSA, or its ultimate parent, MFC, at December 31, 2021 and 2020.
The Company is party to the Second Restated and Amended Liquidity Pool and Loan Facility Agreement effective January 1, 2010 with JHUSA. Pursuant to the agreement, participating affiliates are permitted to invest their excess cash in the liquidity pool and earn interest calculated at a rate that is reset daily to the one-month U.S. Dollar London Inter-Bank Bid Rate (“LIBID”), subject to an aggregate limit of $5 billion and an amount not to exceed 10% of the Company’s admitted assets as shown in the last financial statement filed with the Insurance Division. As of December 31, 2021 and 2020, the Company had a receivable from JHUSA in the amount of $309 million and $377 million, respectively, which is included in amounts due from affiliates in the Balance Sheets.
The Company had receivables from JHVTA relating to distributions of $0 million and $0 million, which were included in investment income due and accrued at December 31, 2021 and 2020, respectively.
53
JOHN HANCOCK LIFE INSURANCE COMPANY OF NEW YORK
NOTES TO STATUTORY-BASIS FINANCIAL STATEMENTS
The Company did not recognize any impairment write-down for its investment in subsidiaries, controlled or affiliated companies for the years ended December 31, 2021, 2020 and 2019, respectively.
The Company also enters into reinsurance transactions with its affiliates. Refer to the Reinsurance Note for further details.
12. Commitments, Contingencies and Legal Proceedings
Commitments: The Company has extended commitments to purchase long-term bonds of $4 million, to purchase other invested assets of $99 million, and issue agricultural and commercial mortgages of $2 million at December 31, 2021. Approximately 27% of these commitments expire in 2022.
Contingencies: As of December 31, 2021, the Company does not have any material contingencies.
Legal Proceedings: The Company is regularly involved in litigation, both as a defendant and as a plaintiff. The litigation naming the Company as a defendant ordinarily involves its activities as a provider of insurance protection and wealth management products, and a taxpayer. In addition, the Insurance Department, the New York Attorney General, the Securities and Exchange Commission (“SEC”), the Financial Regulatory Authority, and other government and regulatory bodies regularly make inquiries and, from time to time, require the production of information or conduct examinations concerning the Company’s compliance with, among other things, insurance laws, securities laws, and laws governing the activities of broker-dealers. An estimation of the range of potential outcomes in any given matter is often unavailable until such matters have developed and sufficient information emerges to support an assessment of the range of possible loss, such as quantification of a damage demand from plaintiffs, discovery from other parties and investigation of factual allegations, rulings by the court on motions or appeals, analysis by experts, and the progress of settlement negotiations. On a quarterly and annual basis, the Company reviews relevant information with respect to litigation contingencies and updates its accruals and estimates of reasonably possible losses or ranges of loss based on such reviews.
In June 2018, a class action was initiated against the Company in the U.S. District Court for the Southern District of New York on behalf of owners of Performance Universal Life (“UL”) policies issued between 2003 and 2010 whose policies were subject to a Cost of Insurance (“COI”) increase announced in 2018. The class, as defined, now covers policies subjected to the COI increase. In addition to the class action, there are nine individual lawsuits opposing the Performance UL COI increases that also have been filed. Each of the lawsuits, except two, is brought by plaintiffs owning multiple policies and/or by entities managing them for investment purposes. Three of the non-class lawsuits are pending in New York state court; and six are pending in the U.S. District Court for the Southern District of New York. Discovery has commenced in these cases. No hearings on substantive matters have been scheduled. On January 5, 2022, the Court gave preliminary approval to a proposed settlement of the class litigation. The settlement is being implemented and a Final Fairness Hearing is scheduled for May 17, 2022. In 2021, the Company recorded an accrual for the potential settlement of the class action. The Company intends to continue to vigorously defend these matters.
54
JOHN HANCOCK LIFE INSURANCE COMPANY OF NEW YORK
NOTES TO STATUTORY-BASIS FINANCIAL STATEMENTS
13. Annuity Actuarial Reserves
The Company’s annuity actuarial reserves and deposit fund liabilities and related separate account liabilities that are subject to discretionary withdrawal (with adjustment), subject to discretionary withdrawal (without adjustment), and not subject to discretionary withdrawal provisions are summarized as follows:
| December 31, 2021 | ||||||||||||||||||||
| General Account |
Separate Account with Guarantees |
Separate Account Nonguaranteed |
Total | Percent of Total |
||||||||||||||||
| (in millions) | ||||||||||||||||||||
| Subject to discretionary withdrawal: |
||||||||||||||||||||
| With fair value adjustment |
$ | 37 | $ | - | $ | - | $ | 37 | 0 | % | ||||||||||
| At book value less current surrender charge of 5% or more |
2 | - | - | 2 | 0 | % | ||||||||||||||
| At fair value |
4 | - | 8,813 | 8,817 | 78 | % | ||||||||||||||
| Total with adjustment or at fair value |
43 | - | 8,813 | 8,856 | 78 | % | ||||||||||||||
| At book value without adjustment (minimal or no charge or adjustment) |
1,106 | - | - | 1,106 | 10 | % | ||||||||||||||
| Not subject to discretionary withdrawal |
1,311 | - | 3 | 1,314 | 12 | % | ||||||||||||||
| Total (gross) |
2,460 | - | 8,816 | 11,276 | 100 | % | ||||||||||||||
|
|
|
|||||||||||||||||||
| Reinsurance ceded |
1,219 | - | - | 1,219 | ||||||||||||||||
|
|
|
|||||||||||||||||||
| Total (net) |
$ | 1,241 | $ | - | $ | 8,816 | $ | 10,057 | ||||||||||||
|
|
|
|||||||||||||||||||
| Amount included in book value less current surrender charge above that will move to book value without adjustment in the year after the statement date |
$ | 1 | $ | - | $ | - | $ | 1 | ||||||||||||
| December 31, 2020 | ||||||||||||||||||||
| |
General Account |
|
|
Separate Account with Guarantees |
|
|
Separate Account Nonguaranteed |
|
Total | |
Percent of Total |
| ||||||||
| (in millions) | ||||||||||||||||||||
| Subject to discretionary withdrawal: |
||||||||||||||||||||
| With fair value adjustment |
$ | 38 | $ | - | $ | - | $ | 38 | 0 | % | ||||||||||
| At book value less current surrender charge of 5% or more |
1 | - | - | 1 | 0 | % | ||||||||||||||
| At fair value |
- | - | 8,527 | 8,527 | 77 | % | ||||||||||||||
| Total with adjustment or at fair value |
39 | - | 8,527 | 8,566 | 77 | % | ||||||||||||||
| At book value without adjustment (minimal or no charge or adjustment) |
1,169 | - | - | 1,169 | 11 | % | ||||||||||||||
| Not subject to discretionary withdrawal |
1,339 | - | 3 | 1,342 | 12 | % | ||||||||||||||
| Total (gross) |
2,547 | - | 8,530 | 11,077 | 100 | % | ||||||||||||||
|
|
|
|||||||||||||||||||
| Reinsurance ceded |
1,288 | - | - | 1,288 | ||||||||||||||||
| Total (net) |
$ | 1,259 | $ | - | $ | 8,530 | $ | 9,789 | ||||||||||||
|
|
|
|||||||||||||||||||
| Amount included in book value less current surrender charge above that will move to book value without adjustment in the year after the statement date |
$ | - | $ | - | $ | - | $ | - | ||||||||||||
55
JOHN HANCOCK LIFE INSURANCE COMPANY OF NEW YORK
NOTES TO STATUTORY-BASIS FINANCIAL STATEMENTS
| 14. | Life Actuarial Reserves |
The Company’s life actuarial reserves and related separate account liabilities that are subject to discretionary withdrawal and not subject to discretionary withdrawal provisions are summarized as follows:
| December 31, 2021 | ||||||||||||
| Account Value |
Cash Value | Reserve | ||||||||||
| A. General Account |
||||||||||||
| (1) Subject to discretionary withdrawal, surrender values, or policy loans: |
||||||||||||
| a. Term Policies with Cash Value |
$ | - | $ | - | $ | - | ||||||
| b. Universal Life |
362 | 361 | 347 | |||||||||
| c. Universal Life with Secondary Guarantees |
1,260 | 1,111 | 3,016 | |||||||||
| d. Indexed Universal Life |
2 | 2 | 2 | |||||||||
| e. Indexed Universal Life with Secondary Guarantees |
130 | 114 | 124 | |||||||||
| f. Indexed Life |
- | - | - | |||||||||
| g. Other Permanent Cash Value Life Insurance |
2,605 | 2,605 | 2,582 | |||||||||
| h. Variable Life |
4 | 2 | 4 | |||||||||
| i. Variable Universal Life |
126 | 125 | 140 | |||||||||
| j. Miscellaneous Reserves |
- | - | 1,452 | |||||||||
| (2) Not subject to discretionary withdrawal or no cash values |
||||||||||||
| a. Term Policies without Cash Value |
- | - | 424 | |||||||||
| b. Accidental Death Benefits |
- | - | 2 | |||||||||
| c. Disability - Active Lives |
- | - | 7 | |||||||||
| d. Disability - Disabled Lives |
- | - | 32 | |||||||||
| e. Miscellaneous Reserves |
- | - | 21 | |||||||||
| (3) Total (gross: direct + assumed) |
$ | 4,489 | $ | 4,320 | $ | 8,153 | ||||||
| (4) Reinsurance Ceded |
1,810 | 1,781 | 2,892 | |||||||||
| (5) Total (net) (3) - (4) |
$ | 2,679 | $ | 2,539 | $ | 5,261 | ||||||
| B. Separate Account with Guarantees |
||||||||||||
| (1) Subject to discretionary withdrawal, surrender values, or policy loans: |
||||||||||||
| h. Variable Life |
$ | - | $ | - | $ | - | ||||||
| i. Variable Universal Life |
- | - | - | |||||||||
| (2) Not subject to discretionary withdrawal or no cash values |
||||||||||||
| a. Term Policies without Cash Value |
- | - | - | |||||||||
| b. Accidental Death Benefits |
- | - | - | |||||||||
| c. Disability - Active Lives |
- | - | - | |||||||||
| d. Disability - Disabled Lives |
- | - | - | |||||||||
| e. Miscellaneous Reserves |
- | - | - | |||||||||
| (3) Total (gross: direct + assumed) |
$ | - | $ | - | $ | - | ||||||
| (4) Reinsurance Ceded |
- | - | - | |||||||||
| (5) Total (net) (3) - (4) |
$ | - | $ | - | $ | - | ||||||
| C. Separate Account Nonguaranteed |
||||||||||||
| (1) Subject to discretionary withdrawal, surrender values, or policy loans: |
||||||||||||
| h. Variable Life |
$ | 6 | $ | - | $ | - | ||||||
| i. Variable Universal Life |
439 | 422 | 407 | |||||||||
| (2) Not subject to discretionary withdrawal or no cash values |
||||||||||||
| a. Term Policies without Cash Value |
- | - | - | |||||||||
| b. Accidental Death Benefits |
- | - | - | |||||||||
| c. Disability - Active Lives |
- | - | - | |||||||||
| d. Disability - Disabled Lives |
- | - | - | |||||||||
| e. Miscellaneous Reserves |
- | - | - | |||||||||
| (3) Total (gross: direct + assumed) |
$ | 445 | $ | 422 | $ | 407 | ||||||
| (4) Reinsurance Ceded |
- | - | - | |||||||||
| (5) Total (net) (3) - (4) |
$ | 445 | $ | 422 | $ | 407 | ||||||
56
JOHN HANCOCK LIFE INSURANCE COMPANY OF NEW YORK
NOTES TO STATUTORY-BASIS FINANCIAL STATEMENTS
| December 31, 2020 | ||||||||||||
| Account Value |
Cash Value | Reserve | ||||||||||
| A. General Account |
||||||||||||
| (1) Subject to discretionary withdrawal, surrender values, or policy loans: |
||||||||||||
| a. Term Policies with Cash Value |
$ | - | $ | - | $ | - | ||||||
| b. Universal Life |
111 | 110 | 119 | |||||||||
| c. Universal Life with Secondary Guarantees |
1,487 | 1,317 | 3,095 | |||||||||
| d. Indexed Universal Life |
27 | 22 | 29 | |||||||||
| e. Indexed Universal Life with Secondary Guarantees |
79 | 71 | 68 | |||||||||
| f. Indexed Life |
- | - | - | |||||||||
| g. Other Permanent Cash Value Life Insurance |
2,647 | 2,647 | 2,640 | |||||||||
| h. Variable Life |
5 | 2 | 4 | |||||||||
| i. Variable Universal Life |
121 | 118 | 131 | |||||||||
| j. Miscellaneous Reserves |
- | - | 1,397 | |||||||||
| (2) Not subject to discretionary withdrawal or no cash values |
||||||||||||
| a. Term Policies without Cash Value |
- | - | 422 | |||||||||
| b. Accidental Death Benefits |
- | - | 2 | |||||||||
| c. Disability - Active Lives |
- | - | 8 | |||||||||
| d. Disability - Disabled Lives |
- | - | 33 | |||||||||
| e. Miscellaneous Reserves |
- | - | 26 | |||||||||
| (3) Total (gross: direct + assumed) |
$ | 4,477 | $ | 4,287 | $ | 7,974 | ||||||
| (4) Reinsurance Ceded |
1,876 | 1,837 | 2,966 | |||||||||
| (5) Total (net) (3) - (4) |
$ | 2,601 | $ | 2,450 | $ | 5,008 | ||||||
| B. Separate Account with Guarantees |
||||||||||||
| (1) Subject to discretionary withdrawal, surrender values, or policy loans: |
||||||||||||
| h. Variable Life |
$ | - | $ | - | $ | - | ||||||
| i. Variable Universal Life |
- | - | - | |||||||||
| (2) Not subject to discretionary withdrawal or no cash values |
||||||||||||
| a. Term Policies without Cash Value |
- | - | - | |||||||||
| b. Accidental Death Benefits |
- | - | - | |||||||||
| c. Disability - Active Lives |
- | - | - | |||||||||
| d. Disability - Disabled Lives |
- | - | - | |||||||||
| e. Miscellaneous Reserves |
- | - | - | |||||||||
| (3) Total (gross: direct + assumed) |
$ | - | $ | - | $ | - | ||||||
| (4) Reinsurance Ceded |
- | - | - | |||||||||
| (5) Total (net) (3) - (4) |
$ | - | $ | - | $ | - | ||||||
| C. Separate Account Nonguaranteed |
||||||||||||
| (1) Subject to discretionary withdrawal, surrender values, or policy loans: |
||||||||||||
| h. Variable Life |
$ | 5 | $ | - | $ | - | ||||||
| i. Variable Universal Life |
385 | 366 | 353 | |||||||||
| (2) Not subject to discretionary withdrawal or no cash values |
||||||||||||
| a. Term Policies without Cash Value |
- | - | - | |||||||||
| b. Accidental Death Benefits |
- | - | - | |||||||||
| c. Disability - Active Lives |
- | - | - | |||||||||
| d. Disability - Disabled Lives |
- | - | - | |||||||||
| e. Miscellaneous Reserves |
- | - | - | |||||||||
| (3) Total (gross: direct + assumed) |
$ | 390 | $ | 366 | $ | 353 | ||||||
| (4) Reinsurance Ceded |
- | - | - | |||||||||
| (5) Total (net) (3) - (4) |
$ | 390 | $ | 366 | $ | 353 | ||||||
57
JOHN HANCOCK LIFE INSURANCE COMPANY OF NEW YORK
NOTES TO STATUTORY-BASIS FINANCIAL STATEMENTS
15. Separate Accounts
Separate accounts held by the Company include individual and group variable annuity and variable life products that offer guaranteed and non-guaranteed returns. The net investment experience of the separate account is credited directly to the policyholder and can be positive or negative.
For guarantees of amounts in the event of death, the net amount at risk is defined as the excess of the initial sum insured over the current sum insured for fixed premium variable life insurance contracts, and, for other variable life insurance contracts, is equal to the sum insured when the account value is zero and the policy is still in force.
The deposits related to variable annuities generally provide a GMDB. For annuity products, this can take the form of either (a) return of no less than total deposits made to the contract less any partial withdrawals; (b) total deposits made to the contract less any partial withdrawals plus a minimum return; (c) the highest contract value on a specified anniversary date minus any withdrawals following the contract anniversary; or (d) a combination benefit of (b) and (c) above. The assets and liabilities of these accounts are carried at fair value. The GMDB reserve is held in the Company’s general account policy reserves.
Contracts with guaranteed minimum income benefit (“GMIB”) rider provides a guaranteed lifetime annuity which may be elected by the contract holder after a stipulated waiting period (ten years), and which may be larger than what the contract account balance could purchase at then-current annuity purchase rates.
Multiple variations of an optional GMWB rider have also been offered by the Company. The GMWB rider provides contract holders a guaranteed annual withdrawal amount over a specified time period or in some cases for as long as they live. In general, guaranteed annual withdrawal amounts are based on deposits and may be reduced if withdrawals exceed allowed amounts. Guaranteed amounts may also be increased as a result of “step-up” provisions which increase the benefit base to higher account values at specified intervals. Guaranteed amounts may also be increased if withdrawals are deferred over a specified period. In addition, certain versions of the GMWB rider extend lifetime guarantees to spouses.
Unaffiliated reinsurance has been utilized to mitigate risk related to some of the guarantee benefit riders. Hedging has also been utilized to mitigate risk related to some of the GMWB riders.
For GMDB, the net amount at risk is defined as the current guaranteed minimum death benefit in excess of the current account balance. For GMIB, the net amount at risk is defined as the excess of the current annuitization income base over the current account value. For GMWB, the net amount at risk is defined as the current guaranteed withdrawal amount minus the current account value. For all the guarantees, the net amount at risk is floored at zero at the single contract level.
The deposits related to the variable life insurance contracts are invested in separate accounts and the Company guarantees a specified death benefit if certain specified premiums are paid by the policyholder, regardless of separate account performance.
All of the Company’s separate account assets were legally insulated at December 31, 2021 and 2020. The assets legally insulated from the general account are attributed to the following products/transactions:
| Product/Transaction | ||||||||
| December 31, | ||||||||
| (in millions) |
2021 | 2020 | ||||||
|
|
|
|||||||
| Group Annuity Contracts (401K) |
$ | 6,286 | $ | 6,026 | ||||
| Variable and Fixed Annuities |
2,533 | 2,508 | ||||||
| Life Insurance |
422 | 369 | ||||||
|
|
|
|||||||
| Total |
$ | 9,241 | $ | 8,903 | ||||
|
|
|
|||||||
58
JOHN HANCOCK LIFE INSURANCE COMPANY OF NEW YORK
NOTES TO STATUTORY-BASIS FINANCIAL STATEMENTS
To compensate the general account for the risk taken, the separate account paid risk charges and amounts toward separate account guarantees as follows:
| Risk Charges Paid to General Account |
Amounts toward Separate Account Guarantees | |||||||
|
|
|
| ||||||
| (in millions) |
||||||||
| 2021 |
$ | 12 | $ | 3 | ||||
| 2020 |
$ | 12 | $ | 4 | ||||
| 2019 |
$ | 14 | $ | 5 | ||||
| 2018 |
$ | 15 | $ | 3 | ||||
| 2017 |
$ | 16 | $ | 3 | ||||
The Company had the following variable annuities with guaranteed benefits:
| December 31, | ||||||||
|
|
|
| ||||||
| 2021 | 2020 | |||||||
|
|
|
| ||||||
| (in millions, except for ages) | ||||||||
| Account value | $ | 2,568 | $ | 2,554 | ||||
| Amount of reserve held | 215 | 234 | ||||||
| Net amount at risk - gross | 165 | 192 | ||||||
| Weighted average attained age | 69 | 70 | ||||||
The following assumptions and methodology were used to determine the amounts above at December 31, 2021 and 2020:
| · | Reg 213 is used in both years to determine the aggregate reserve for products falling under the scope. The liability is evaluated using a standard scenario; a stochastic reserve using industry prescribed assumptions (Standard Projection) and a stochastic reserve using Company specific assumptions. The Company holds the highest of the three values. |
| · | The Company used the prescribed Economic Scenario Generator (“ESG”) for Reg 213 in both years, so there are no calibration criteria requirement. |
| · | In 2021 and 2020, annuity mortality is based on the Ruark Variable Annuity Table, which is based on an industry study of variable annuity deaths. The table is further adjusted by factors varied by rider types (living benefit/GMDB only) and qualified and non-qualified business. |
| · | In 2021 and 2020, annuity base lapse rates vary by product, policy year, and rider type, where the lapse rates range from 0.5% to 40% for GMDB, GMIB and GMWB. These rates are dynamically reduced for guarantees that are in-the-money and rates are also dynamically increased for GMWBs that are out-of-the-money. |
| · | For variable annuities, the applicable swap curve at December 31 is used for discounting in both years. |
59
JOHN HANCOCK LIFE INSURANCE COMPANY OF NEW YORK
NOTES TO STATUTORY-BASIS FINANCIAL STATEMENTS
Account balances of variable contracts with guarantees were invested in separate accounts with the following characteristics:
| December 31, | ||||||||
|
|
|
| ||||||
| 2021 | 2020 | |||||||
|
|
|
| ||||||
| (in millions) |
||||||||
| Type of Fund | ||||||||
| Equity | $ | 1,724 | $ | 1,641 | ||||
| Balanced | 775 | 768 | ||||||
| Bonds | 320 | 349 | ||||||
| Money Market | 13 | 13 | ||||||
|
|
|
| ||||||
| Total | $ | 2,832 | $ | 2,771 | ||||
|
|
|
| ||||||
Information regarding the nonguaranteed separate accounts of the Company is as follows:
| December 31, | ||||||||
|
|
|
| ||||||
| 2021 | 2020 | |||||||
|
|
|
| ||||||
| (in millions) |
||||||||
| Premiums, deposits and other considerations |
$ | 806 | $ | 735 | ||||
|
|
|
| ||||||
| Reserves for accounts with assets at: |
||||||||
| Fair value |
9,224 | 8,883 | ||||||
| Amortized cost |
- | - | ||||||
|
|
|
| ||||||
| Total |
$ | 9,224 | $ | 8,883 | ||||
|
|
|
| ||||||
| December 31, | ||||||||
|
|
|
| ||||||
| 2021 | 2020 | |||||||
|
|
|
| ||||||
| (in millions) |
||||||||
| Reserves for separate accounts by withdrawal characteristics: |
||||||||
| Subject to discretionary withdrawal: |
||||||||
| With fair value adjustment |
$ | - | $ | - | ||||
| At book value without fair value adjustments and with current surrender charge of 5% or more |
80 | 90 | ||||||
| At fair value |
9,065 | 8,716 | ||||||
| At book value without fair value adjustments and with current surrender charge of less than 5% |
76 | 74 | ||||||
|
|
|
| ||||||
| Subtotal |
9,221 | 8,880 | ||||||
| Not subject to discretionary withdrawal |
3 | 3 | ||||||
|
|
|
| ||||||
| Total |
$ | 9,224 | $ | 8,883 | ||||
|
|
|
| ||||||
60
JOHN HANCOCK LIFE INSURANCE COMPANY OF NEW YORK
NOTES TO STATUTORY-BASIS FINANCIAL STATEMENTS
Amounts transferred to and from separate accounts are as follows:
| December 31, | ||||||||||||
|
|
|
| ||||||||||
| 2021 | 2020 | 2019 | ||||||||||
|
|
|
| ||||||||||
| (in millions) | ||||||||||||
| Transfers to separate accounts | $ | 876 | $ | 1,021 | $ | 842 | ||||||
| Transfers from separate accounts | 1,588 | 1,396 | 1,231 | |||||||||
|
|
|
| ||||||||||
| Net transfers to (from) separate accounts | $ | (712 | ) | $ | (375 | ) | $ | (389 | ) | |||
|
|
|
| ||||||||||
16. Employee Benefits
Retirement Plans: The Company participates in the John Hancock Pension Plan, a qualified defined benefit plan sponsored by MIC. The Company also participates in the John Hancock Non-Qualified Pension Plan, a non-qualified defined benefit plan for employees whose qualified cash balance benefit is restricted by the Internal Revenue Code. The non-qualified defined benefit plan was frozen except for grandfathered participants as of January 1, 2008, and the benefits accrued under this plan continue to be subject to the plan’s provisions. The expense for these plans was charged to the Company and was not material for the years ended December 31, 2021, 2020 and 2019.
401(k) Plan: The Company participates in The Investment-Incentive Plan for John Hancock Employees, a qualified defined contribution plan for its employees who meet certain eligibility requirements. The plan is sponsored by JHUSA. The expense for the defined contribution plan was charged to the Company and was not material for the years ended December 31, 2021, 2020 and 2019.
Other Postretirement Benefit Plan: The Company participates in the John Hancock Employee Welfare Plan (“the Welfare Plan”), a postretirement and postemployment medical and life insurance benefit plan for its retired employees and their spouses. The Welfare Plan is sponsored by MIC. The expense for other postretirement benefits was charged to the Company and was not material for the years ended December 31, 2021, 2020 and 2019.
17. Subsequent Events
The Company evaluated the recognition and disclosure of subsequent events for its December 31, 2021 financial statements through March 30, 2022, the date the financial statements were issued. The Company did not have any subsequent events requiring disclosure.
61
A u d i t e d F i n a n c i a l S t a t e m e n t s
John Hancock Life Insurance Company of New York Separate Account B
December 31, 2021
1 of 67
John Hancock Life Insurance Company of New York
Separate Account B
Audited Financial Statements
December 31, 2021
Contents
| Report of Independent Registered Public Accounting Firm | 3 | |
| Statements of Assets and Liabilities | 6 | |
| Statements of Operations and Changes in Contract Owners’ Equity | 22 | |
| Notes to Financial Statements | 53 |
2 of 67
Report of Independent Registered Public Accounting Firm
To the Board of Directors of John Hancock Life Insurance Company of New York and Contract Owners of John Hancock Life Insurance Company of New York Separate Account B
Opinion on the Financial Statements
We have audited the accompanying statements of assets and liabilities of each of the subaccounts listed in the Appendix that comprise John Hancock Life Insurance Company of New York Separate Account B (the “Separate Account”) as of December 31, 2021, and the related statements of operations and changes in contract owners’ equity for the two years in the period then ended, and the related notes (collectively referred to as the “financial statements”). In our opinion, the financial statements present fairly, in all material respects, the financial position of each subaccount as of December 31, 2021, and the results of its operations and changes in contract owners’ equity for each of the two years then ended, in conformity with U.S. generally accepted accounting principles.
Basis for Opinion
These financial statements are the responsibility of the Separate Account’s management. Our responsibility is to express an opinion on each of the subaccounts’ financial statements based on our audits. We are a public accounting firm registered with the Public Company Accounting Oversight Board (United States) (“PCAOB”) and are required to be independent with respect to the Separate Account in accordance with the U.S. federal securities laws and the applicable rules and regulations of the Securities and Exchange Commission and the PCAOB.
We conducted our audits in accordance with the standards of the PCAOB. Those standards require that we plan and perform the audits to obtain reasonable assurance about whether the financial statements are free of material misstatement, whether due to error or fraud. Our audits included performing procedures to assess the risks of material misstatement of the financial statements, whether due to error or fraud, and performing procedures that respond to those risks. Such procedures included examining, on a test basis, evidence regarding the amounts and disclosures in the financial statements. Our procedures included confirmation of securities owned as of December 31, 2021, by correspondence with the fund companies or their transfer agents, as applicable. Our audits also included evaluating the accounting principles used and significant estimates made by management, as well as evaluating the overall presentation of the financial statements. We believe that our audits provide a reasonable basis for our opinion.
We have served as the auditor of the Separate Account since 1999.
Boston, Massachusetts
March 30, 2022
3 of 67
Appendix
Subaccounts comprising John Hancock Life
Insurance Company of New York Separate Account B
| 500 Index Fund Series NAV | Lifestyle Growth Portfolio Series NAV |
| Active Bond Trust Series I | Lifestyle Moderate Portfolio Series NAV |
| Active Bond Trust Series NAV | M Capital Appreciation |
| American Asset Allocation Trust Series I | M International Equity |
| American Global Growth Trust Series I | M Large Cap Growth |
| American Growth Trust Series I | M Large Cap Value |
| American Growth-Income Trust Series I | Managed Volatility Balanced Portfolio Series I |
| American International Trust Series I | Managed Volatility Balanced Portfolio Series NAV |
| Blue Chip Growth Trust Series I | Managed Volatility Conservative Portfolio Series I |
| Blue Chip Growth Trust Series NAV | Managed Volatility Conservative Portfolio Series NAV |
| Capital Appreciation Trust Series I | Managed Volatility Growth Portfolio Series I |
| Capital Appreciation Trust Series NAV | Managed Volatility Growth Portfolio Series NAV |
| Capital Appreciation Value Trust Series NAV | Managed Volatility Moderate Portfolio Series I |
| Core Bond Trust Series I | Managed Volatility Moderate Portfolio Series NAV |
| Core Bond Trust Series NAV | Mid Cap Growth Trust Series I |
| Disciplined Value International Trust Series I | Mid Cap Growth Trust Series NAV |
| Disciplined Value International Trust Series NAV | Mid Cap Index Trust Series I |
| Emerging Markets Value Trust Series I | Mid Cap Index Trust Series NAV |
| Emerging Markets Value Trust Series NAV | Mid Value Trust Series I |
| Equity Income Trust Series I | Mid Value Trust Series NAV |
| Equity Income Trust Series NAV | Money Market Trust Series I |
| Financial Industries Trust Series I | Money Market Trust Series NAV |
| Financial Industries Trust Series NAV | Opportunistic Fixed Income Trust Series I |
| Fundamental All Cap Core Trust Series I | Opportunistic Fixed Income Trust Series NAV |
| Fundamental All Cap Core Trust Series NAV | PIMCO All Asset |
| Fundamental Large Cap Value Trust Series I | Real Estate Securities Trust Series I |
| Fundamental Large Cap Value Trust Series NAV | Real Estate Securities Trust Series NAV |
| Global Equity Trust Series I | Science & Technology Trust Series I |
| Global Equity Trust Series NAV | Science & Technology Trust Series NAV |
| Health Sciences Trust Series I | Select Bond Trust Series I |
| Health Sciences Trust Series NAV | Select Bond Trust Series NAV |
| High Yield Trust Series I | Short Term Government Income Trust Series I |
| High Yield Trust Series NAV | Short Term Government Income Trust Series NAV |
| International Equity Index Series I | Small Cap Index Trust Series I |
| International Equity Index Series NAV | Small Cap Index Trust Series NAV |
| International Small Company Trust Series I | Small Cap Opportunities Trust Series I |
| International Small Company Trust Series NAV | Small Cap Opportunities Trust Series NAV |
| Investment Quality Bond Trust Series I | Small Cap Stock Trust Series I |
| Investment Quality Bond Trust Series NAV | Small Cap Stock Trust Series NAV |
| Lifestyle Balanced Portfolio Series NAV | Small Cap Value Trust Series I |
| Lifestyle Conservative Portfolio Series NAV | Small Cap Value Trust Series NAV |
4 of 67
Appendix
Subaccounts comprising John Hancock Life
Insurance Company of New York Separate Account B
| Small Company Value Trust Series I | Total Stock Market Index Trust Series I |
| Small Company Value Trust Series NAV | Total Stock Market Index Trust Series NAV |
| Strategic Income Opportunities Trust Series I | Ultra Short Term Bond Trust Series I |
| Strategic Income Opportunities Trust Series NAV | Ultra Short Term Bond Trust Series NAV |
| Total Bond Market Series Trust NAV |
5 of 67
JOHN HANCOCK LIFE INSURANCE COMPANY OF NEW YORK SEPARATE ACCOUNT B
STATEMENTS OF ASSETS AND LIABILITIES
December 31, 2021
| American Asset | American Global | |||||||||||||||||||||||
| 500 Index Fund | Active Bond Trust | Active Bond Trust | Allocation Trust | Growth Trust Series | American Growth | |||||||||||||||||||
| Series NAV | Series I | Series NAV | Series I | I | Trust Series I | |||||||||||||||||||
| Total Assets | ||||||||||||||||||||||||
| Investments at fair value | $ | 48,471,836 | $ | 494,444 | $ | 2,185,860 | $ | 9,343,848 | $ | 1,463,835 | $ | 8,675,045 | ||||||||||||
| Units outstanding | 443,289 | 17,620 | 23,815 | 326,230 | 38,698 | 108,441 | ||||||||||||||||||
| Unit value | $ | 109.35 | $ | 28.06 | $ | 91.79 | $ | 28.64 | $ | 37.83 | $ | 80.00 | ||||||||||||
| Shares | 924,506 | 50,505 | 223,047 | 712,727 | 67,676 | 327,237 | ||||||||||||||||||
| Cost | $ | 30,502,211 | $ | 493,151 | $ | 2,191,576 | $ | 9,203,061 | $ | 1,214,863 | $ | 6,475,896 | ||||||||||||
See accompanying notes.
6 of 67
JOHN HANCOCK LIFE INSURANCE COMPANY OF NEW YORK SEPARATE ACCOUNT B
STATEMENTS OF ASSETS AND LIABILITIES
December 31, 2021
| American Growth- | American | |||||||||||||||||||||||
| Income Trust Series | International Trust | Blue Chip Growth | Blue Chip Growth | Capital Appreciation | Capital Appreciation | |||||||||||||||||||
| I | Series I | Trust Series I | Trust Series NAV | Trust Series I | Trust Series NAV | |||||||||||||||||||
| Total Assets | ||||||||||||||||||||||||
| Investments at fair value | $ | 5,289,827 | $ | 3,695,815 | $ | 1,601,481 | $ | 22,388,087 | $ | 975,665 | $ | 4,250,463 | ||||||||||||
| Units outstanding | 102,143 | 127,571 | 21,206 | 57,564 | 10,987 | 48,595 | ||||||||||||||||||
| Unit value | $ | 51.79 | $ | 28.97 | $ | 75.52 | $ | 388.93 | $ | 88.80 | $ | 87.47 | ||||||||||||
| Shares | 285,166 | 179,757 | 39,108 | 545,519 | 130,437 | 562,975 | ||||||||||||||||||
| Cost | $ | 4,746,406 | $ | 3,497,824 | $ | 1,337,029 | $ | 19,583,288 | $ | 879,447 | $ | 3,887,837 | ||||||||||||
See accompanying notes.
7 of 67
JOHN HANCOCK LIFE INSURANCE COMPANY OF NEW YORK SEPARATE ACCOUNT B
STATEMENTS OF ASSETS AND LIABILITIES
December 31, 2021
| Capital Appreciation | Disciplined Value | Disciplined Value | ||||||||||||||||||||||
| Value Trust Series | Core Bond Trust | Core Bond Trust | International Trust | International Trust | Emerging Markets | |||||||||||||||||||
| NAV | Series I | Series NAV | Series I | Series NAV | Value Trust Series I | |||||||||||||||||||
| Total Assets | ||||||||||||||||||||||||
| Investments at fair value | $ | 12,948,380 | $ | 535,765 | $ | 5,056,284 | $ | 386,966 | $ | 2,473,896 | $ | 96,277 | ||||||||||||
| Units outstanding | 324,731 | 21,653 | 253,711 | 11,961 | 118,147 | 4,881 | ||||||||||||||||||
| Unit value | $ | 39.87 | $ | 24.74 | $ | 19.93 | $ | 32.35 | $ | 20.94 | $ | 19.72 | ||||||||||||
| Shares | 924,224 | 40,898 | 388,049 | 26,910 | 173,485 | 9,169 | ||||||||||||||||||
| Cost | $ | 11,405,705 | $ | 546,756 | $ | 5,164,520 | $ | 339,257 | $ | 2,197,146 | $ | 88,383 | ||||||||||||
See accompanying notes.
8 of 67
JOHN HANCOCK LIFE INSURANCE COMPANY OF NEW YORK SEPARATE ACCOUNT B
STATEMENTS OF ASSETS AND LIABILITIES
December 31, 2021
| Emerging Markets | Fundamental All | |||||||||||||||||||||||
| Value Trust Series | Equity Income Trust | Equity Income Trust | Financial Industries | Financial Industries | Cap Core Trust | |||||||||||||||||||
| NAV | Series I | Series NAV | Trust Series I | Trust Series NAV | Series I | |||||||||||||||||||
| Total Assets | ||||||||||||||||||||||||
| Investments at fair value | $ | 1,963,160 | $ | 879,480 | $ | 6,781,508 | $ | 189,287 | $ | 1,358,279 | $ | 2,146 | ||||||||||||
| Units outstanding | 123,450 | 16,949 | 78,837 | 4,000 | 23,766 | 21 | ||||||||||||||||||
| Unit value | $ | 15.90 | $ | 51.89 | $ | 86.02 | $ | 47.32 | $ | 57.15 | $ | 102.19 | ||||||||||||
| Shares | 187,146 | 52,885 | 410,503 | 11,556 | 83,228 | 59 | ||||||||||||||||||
| Cost | $ | 1,780,141 | $ | 794,179 | $ | 6,154,664 | $ | 151,671 | $ | 1,082,697 | $ | 2,096 | ||||||||||||
See accompanying notes.
9 of 67
JOHN HANCOCK LIFE INSURANCE COMPANY OF NEW YORK SEPARATE ACCOUNT B
STATEMENTS OF ASSETS AND LIABILITIES
December 31, 2021
| Fundamental All | Fundamental Large | Fundamental Large | ||||||||||||||||||||||
| Cap Core Trust | Cap Value Trust | Cap Value Trust | Global Equity Trust | Global Equity Trust | Health Sciences | |||||||||||||||||||
| Series NAV | Series I | Series NAV | Series I (a) | Series NAV (b) | Trust Series I | |||||||||||||||||||
| Total Assets | ||||||||||||||||||||||||
| Investments at fair value | $ | 1,685,526 | $ | 1,178,403 | $ | 4,267,924 | $ | 107,291 | $ | 1,615,092 | $ | 354,508 | ||||||||||||
| Units outstanding | 27,433 | 19,802 | 101,524 | 3,634 | 59,695 | 2,181 | ||||||||||||||||||
| Unit value | $ | 61.44 | $ | 59.51 | $ | 42.04 | $ | 29.52 | $ | 27.06 | $ | 162.54 | ||||||||||||
| Shares | 45,977 | 40,761 | 147,577 | 4,234 | 63,787 | 11,330 | ||||||||||||||||||
| Cost | $ | 1,133,562 | $ | 817,032 | $ | 2,982,254 | $ | 83,771 | $ | 1,257,254 | $ | 289,038 | ||||||||||||
| (a) | Renamed on April 1, 2021. Previously known as Global Trust Series I. |
| (b) | Renamed on April 1, 2021. Previously known as Global Trust Series NAV. |
See accompanying notes.
10 of 67
JOHN HANCOCK LIFE INSURANCE COMPANY OF NEW YORK SEPARATE ACCOUNT B
STATEMENTS OF ASSETS AND LIABILITIES
December 31, 2021
| International Small | ||||||||||||||||||||||||
| Health Sciences | High Yield Trust | High Yield Trust | International Equity | International Equity | Company Trust | |||||||||||||||||||
| Trust Series NAV | Series I | Series NAV | Index Series I | Index Series NAV | Series I | |||||||||||||||||||
| Total Assets | ||||||||||||||||||||||||
| Investments at fair value | $ | 5,006,434 | $ | 342,511 | $ | 3,015,151 | $ | 251,106 | $ | 7,421,247 | $ | 31,089 | ||||||||||||
| Units outstanding | 39,383 | 10,659 | 98,783 | 13,959 | 104,848 | 1,256 | ||||||||||||||||||
| Unit value | $ | 127.12 | $ | 32.13 | $ | 30.52 | $ | 17.99 | $ | 70.78 | $ | 24.75 | ||||||||||||
| Shares | 156,549 | 64,625 | 579,837 | 12,400 | 366,663 | 1,933 | ||||||||||||||||||
| Cost | $ | 4,335,694 | $ | 337,298 | $ | 3,033,317 | $ | 206,038 | $ | 6,267,135 | $ | 25,612 | ||||||||||||
See accompanying notes.
11 of 67
JOHN HANCOCK LIFE INSURANCE COMPANY OF NEW YORK SEPARATE ACCOUNT B
STATEMENTS OF ASSETS AND LIABILITIES
December 31, 2021
| Lifestyle | ||||||||||||||||||||||||
| International Small | Investment Quality | Lifestyle Balanced | Conservative | Lifestyle Growth | ||||||||||||||||||||
| Company Trust | Investment Quality | Bond Trust Series | Portfolio Series | Portfolio Series | Portfolio Series | |||||||||||||||||||
| Series NAV | Bond Trust Series I | NAV | NAV | NAV | NAV | |||||||||||||||||||
| Total Assets | ||||||||||||||||||||||||
| Investments at fair value | $ | 1,875,081 | $ | 184,355 | $ | 669,948 | $ | 4,574,190 | $ | 226,506 | $ | 30,759,084 | ||||||||||||
| Units outstanding | 75,295 | 6,306 | 32,929 | 256,935 | 15,187 | 1,543,426 | ||||||||||||||||||
| Unit value | $ | 24.90 | $ | 29.23 | $ | 20.35 | $ | 17.80 | $ | 14.91 | $ | 19.93 | ||||||||||||
| Shares | 116,537 | 16,031 | 58,460 | 272,760 | 16,087 | 1,657,278 | ||||||||||||||||||
| Cost | $ | 1,538,493 | $ | 182,225 | $ | 675,422 | $ | 4,140,157 | $ | 217,454 | $ | 27,659,523 | ||||||||||||
See accompanying notes.
12 of 67
JOHN HANCOCK LIFE INSURANCE COMPANY OF NEW YORK SEPARATE ACCOUNT B
STATEMENTS OF ASSETS AND LIABILITIES
December 31, 2021
| Lifestyle Moderate | Managed Volatility | |||||||||||||||||||||||
| Portfolio Series | M Capital | M International | M Large Cap | Balanced Portfolio | ||||||||||||||||||||
| NAV | Appreciation | Equity | Growth | M Large Cap Value | Series I | |||||||||||||||||||
| Total Assets | ||||||||||||||||||||||||
| Investments at fair value | $ | 1,948,127 | $ | 792,160 | $ | 1,105,536 | $ | 1,206,949 | $ | 1,403,227 | $ | 922,904 | ||||||||||||
| Units outstanding | 115,992 | 4,512 | 24,303 | 8,117 | 34,919 | 26,907 | ||||||||||||||||||
| Unit value | $ | 16.80 | $ | 175.57 | $ | 45.49 | $ | 148.69 | $ | 40.19 | $ | 34.30 | ||||||||||||
| Shares | 123,221 | 27,992 | 76,508 | 35,635 | 91,178 | 73,951 | ||||||||||||||||||
| Cost | $ | 1,791,120 | $ | 725,108 | $ | 933,448 | $ | 1,025,160 | $ | 1,145,523 | $ | 892,607 | ||||||||||||
See accompanying notes.
13 of 67
JOHN HANCOCK LIFE INSURANCE COMPANY OF NEW YORK SEPARATE ACCOUNT B
STATEMENTS OF ASSETS AND LIABILITIES
December 31, 2021
| Managed Volatility | ||||||||||||||||||||||||
| Managed Volatility | Managed Volatility | Conservative | Managed Volatility | Managed Volatility | Managed Volatility | |||||||||||||||||||
| Balanced Portfolio | Conservative | Portfolio Series | Growth Portfolio | Growth Portfolio | Moderate Portfolio | |||||||||||||||||||
| Series NAV | Portfolio Series I | NAV | Series I | Series NAV | Series I | |||||||||||||||||||
| Total Assets | ||||||||||||||||||||||||
| Investments at fair value | $ | 49,330,406 | $ | 86,850 | $ | 7,960,395 | $ | 2,671,213 | $ | 64,520,455 | $ | 520,205 | ||||||||||||
| Units outstanding | 1,908,563 | 2,811 | 361,313 | 84,056 | 2,455,465 | 15,300 | ||||||||||||||||||
| Unit value | $ | 25.85 | $ | 30.90 | $ | 22.03 | $ | 31.78 | $ | 26.28 | $ | 34.00 | ||||||||||||
| Shares | 3,940,128 | 7,449 | 680,958 | 201,146 | 4,851,163 | 43,314 | ||||||||||||||||||
| Cost | $ | 49,352,075 | $ | 87,285 | $ | 7,988,443 | $ | 2,600,548 | $ | 63,418,062 | $ | 527,169 | ||||||||||||
See accompanying notes.
14 of 67
JOHN HANCOCK LIFE INSURANCE COMPANY OF NEW YORK SEPARATE ACCOUNT B
STATEMENTS OF ASSETS AND LIABILITIES
December 31, 2021
| Managed Volatility | Mid Cap Growth | |||||||||||||||||||||||
| Moderate Portfolio | Mid Cap Growth | Trust Series NAV | Mid Cap Index | Mid Cap Index | Mid Value Trust | |||||||||||||||||||
| Series NAV | Trust Series I (c) | (d) | Trust Series I | Trust Series NAV | Series I | |||||||||||||||||||
| Total Assets | ||||||||||||||||||||||||
| Investments at fair value | $ | 13,626,368 | $ | 813,070 | $ | 3,950,619 | $ | 668,830 | $ | 5,471,777 | $ | 344,603 | ||||||||||||
| Units outstanding | 538,857 | 7,949 | 17,690 | 7,501 | 93,254 | 6,843 | ||||||||||||||||||
| Unit value | $ | 25.29 | $ | 102.29 | $ | 223.32 | $ | 89.17 | $ | 58.68 | $ | 50.36 | ||||||||||||
| Shares | 1,132,699 | 40,940 | 193,658 | 26,871 | 219,838 | 28,789 | ||||||||||||||||||
| Cost | $ | 13,790,711 | $ | 782,541 | $ | 3,895,561 | $ | 573,566 | $ | 4,603,410 | $ | 305,747 | ||||||||||||
| (c) | Renamed on October 1, 2021. Previously known as Mid Cap Stock Trust Series I. |
| (d) | Renamed on October 1, 2021. Previously known as Mid Cap Stock Trust Series NAV. |
See accompanying notes.
15 of 67
JOHN HANCOCK LIFE INSURANCE COMPANY OF NEW YORK SEPARATE ACCOUNT B
STATEMENTS OF ASSETS AND LIABILITIES
December 31, 2021
| Opportunistic Fixed | Opportunistic Fixed | |||||||||||||||||||||||
| Mid Value Trust | Money Market Trust | Money Market Trust | Income Trust Series | Income Trust Series | ||||||||||||||||||||
| Series NAV | Series I | Series NAV | I | NAV | PIMCO All Asset | |||||||||||||||||||
| Total Assets | ||||||||||||||||||||||||
| Investments at fair value | $ | 1,686,100 | $ | 2,041,117 | $ | 3,583,109 | $ | 170,182 | $ | 1,282,005 | $ | 696,418 | ||||||||||||
| Units outstanding | 21,732 | 145,195 | 341,909 | 6,273 | 32,985 | 28,953 | ||||||||||||||||||
| Unit value | $ | 77.59 | $ | 14.06 | $ | 10.48 | $ | 27.13 | $ | 38.87 | $ | 24.05 | ||||||||||||
| Shares | 142,047 | 2,041,117 | 3,583,109 | 13,825 | 104,653 | 59,219 | ||||||||||||||||||
| Cost | $ | 1,477,939 | $ | 2,041,117 | $ | 3,583,109 | $ | 173,701 | $ | 1,321,123 | $ | 642,126 | ||||||||||||
See accompanying notes.
16 of 67
JOHN HANCOCK LIFE INSURANCE COMPANY OF NEW YORK SEPARATE ACCOUNT B
STATEMENTS OF ASSETS AND LIABILITIES
December 31, 2021
| Real Estate | Real Estate | Science & | Science & | |||||||||||||||||||||
| Securities Trust | Securities Trust | Technology Trust | Technology Trust | Select Bond Trust | Select Bond Trust | |||||||||||||||||||
| Series I | Series NAV | Series I | Series NAV | Series I | Series NAV | |||||||||||||||||||
| Total Assets | ||||||||||||||||||||||||
| Investments at fair value | $ | 232,091 | $ | 2,755,547 | $ | 646,068 | $ | 7,715,935 | $ | 38,945 | $ | 1,419,104 | ||||||||||||
| Units outstanding | 2,293 | 9,797 | 10,486 | 74,797 | 2,788 | 101,108 | ||||||||||||||||||
| Unit value | $ | 101.22 | $ | 281.26 | $ | 61.61 | $ | 103.16 | $ | 13.97 | $ | 14.04 | ||||||||||||
| Shares | 8,449 | 101,047 | 17,657 | 206,585 | 2,794 | 101,874 | ||||||||||||||||||
| Cost | $ | 161,456 | $ | 1,836,953 | $ | 540,288 | $ | 6,798,827 | $ | 38,675 | $ | 1,402,719 | ||||||||||||
See accompanying notes.
17 of 67
JOHN HANCOCK LIFE INSURANCE COMPANY OF NEW YORK SEPARATE ACCOUNT B
STATEMENTS OF ASSETS AND LIABILITIES
December 31, 2021
| Short Term | Short Term | Small Cap | Small Cap | |||||||||||||||||||||
| Government Income | Government Income | Small Cap Index | Small Cap Index | Opportunities Trust | Opportunities Trust | |||||||||||||||||||
| Trust Series I | Trust Series NAV | Trust Series I | Trust Series NAV | Series I | Series NAV | |||||||||||||||||||
| Total Assets | ||||||||||||||||||||||||
| Investments at fair value | $ | 150,021 | $ | 725,334 | $ | 237,271 | $ | 4,333,351 | $ | 171,825 | $ | 2,040,091 | ||||||||||||
| Units outstanding | 13,051 | 62,732 | 3,652 | 83,301 | 2,221 | 53,351 | ||||||||||||||||||
| Unit value | $ | 11.49 | $ | 11.56 | $ | 64.97 | $ | 52.02 | $ | 77.36 | $ | 38.24 | ||||||||||||
| Shares | 12,628 | 61,055 | 13,747 | 250,628 | 5,120 | 61,264 | ||||||||||||||||||
| Cost | $ | 153,450 | $ | 746,072 | $ | 193,971 | $ | 3,649,918 | $ | 146,760 | $ | 1,541,967 | ||||||||||||
See accompanying notes.
18 of 67
JOHN HANCOCK LIFE INSURANCE COMPANY OF NEW YORK SEPARATE ACCOUNT B
STATEMENTS OF ASSETS AND LIABILITIES
December 31, 2021
| Small Company | ||||||||||||||||||||||||
| Small Cap Stock | Small Cap Stock | Small Cap Value | Small Cap Value | Small Company | Value Trust Series | |||||||||||||||||||
| Trust Series I | Trust Series NAV | Trust Series I | Trust Series NAV | Value Trust Series I | NAV | |||||||||||||||||||
| Total Assets | ||||||||||||||||||||||||
| Investments at fair value | $ | 126,910 | $ | 3,083,350 | $ | 30,875 | $ | 2,716,497 | $ | 121,787 | $ | 1,119,505 | ||||||||||||
| Units outstanding | 1,940 | 39,602 | 767 | 23,914 | 1,495 | 23,963 | ||||||||||||||||||
| Unit value | $ | 65.42 | $ | 77.86 | $ | 40.25 | $ | 113.59 | $ | 81.46 | $ | 46.72 | ||||||||||||
| Shares | 12,369 | 293,094 | 1,687 | 149,094 | 9,673 | 89,489 | ||||||||||||||||||
| Cost | $ | 136,086 | $ | 2,919,855 | $ | 29,549 | $ | 2,515,743 | $ | 114,001 | $ | 1,050,211 | ||||||||||||
See accompanying notes.
19 of 67
JOHN HANCOCK LIFE INSURANCE COMPANY OF NEW YORK SEPARATE ACCOUNT B
STATEMENTS OF ASSETS AND LIABILITIES
December 31, 2021
| Strategic Income | Strategic Income | Total Stock Market | ||||||||||||||||||||||
| Opportunities Trust | Opportunities Trust | Total Bond Market | Total Stock Market | Index Trust Series | Ultra Short Term | |||||||||||||||||||
| Series I | Series NAV | Series Trust NAV | Index Trust Series I | NAV | Bond Trust Series I | |||||||||||||||||||
| Total Assets | ||||||||||||||||||||||||
| Investments at fair value | $ | 247,613 | $ | 2,603,048 | $ | 1,879,193 | $ | 299,364 | $ | 11,918,210 | $ | 574,725 | ||||||||||||
| Units outstanding | 7,394 | 104,475 | 65,798 | 5,027 | 59,880 | 53,542 | ||||||||||||||||||
| Unit value | $ | 33.49 | $ | 24.92 | $ | 28.56 | $ | 59.55 | $ | 199.03 | $ | 10.73 | ||||||||||||
| Shares | 17,586 | 185,534 | 179,999 | 9,694 | 386,078 | 51,361 | ||||||||||||||||||
| Cost | $ | 240,805 | $ | 2,519,766 | $ | 1,902,874 | $ | 222,673 | $ | 8,571,537 | $ | 595,706 | ||||||||||||
See accompanying notes.
20 of 67
JOHN HANCOCK LIFE INSURANCE COMPANY OF NEW YORK SEPARATE ACCOUNT B
STATEMENTS OF ASSETS AND LIABILITIES
December 31, 2021
| Ultra Short Term | ||||
| Bond Trust Series | ||||
| NAV | ||||
| Total Assets | ||||
| Investments at fair value | $ | 527,536 | ||
| Units outstanding | 48,829 | |||
| Unit value | $ | 10.80 | ||
| Shares | 47,101 | |||
| Cost | $ | 543,044 | ||
See accompanying notes.
21 of 67
JOHN HANCOCK LIFE INSURANCE COMPANY OF NEW YORK SEPARATE ACCOUNT B
STATEMENTS OF OPERATIONS AND CHANGES IN CONTRACT OWNERS’ EQUITY
For the years ended December 31,
| 500 Index Fund Series NAV | Active Bond Trust Series I | Active Bond Trust Series NAV | ||||||||||||||||||||||
| 2021 | 2020 | 2021 | 2020 | 2021 | 2020 | |||||||||||||||||||
| Income: | ||||||||||||||||||||||||
| Dividend distributions received | $ | 607,125 | $ | 591,613 | $ | 16,019 | $ | 14,228 | $ | 71,891 | $ | 56,050 | ||||||||||||
| Expenses: | ||||||||||||||||||||||||
| Mortality and expense risk and administrative charges | - | - | - | - | - | - | ||||||||||||||||||
| Net investment income (loss) | 607,125 | 591,613 | 16,019 | 14,228 | 71,891 | 56,050 | ||||||||||||||||||
| Realized gains (losses) on investments: | ||||||||||||||||||||||||
| Capital gain distributions received | 1,799,137 | 608,800 | 7,583 | - | 33,516 | - | ||||||||||||||||||
| Net realized gain (loss) | 1,093,448 | 1,070,157 | 414 | 1,519 | 4,957 | 5,417 | ||||||||||||||||||
| Realized gains (losses) | 2,892,585 | 1,678,957 | 7,997 | 1,519 | 38,473 | 5,417 | ||||||||||||||||||
| Unrealized appreciation (depreciation) during the period | 7,061,928 | 3,505,922 | (26,344 | ) | 23,894 | (115,912 | ) | 89,524 | ||||||||||||||||
| Net increase (decrease) in net assets from operations | 10,561,638 | 5,776,492 | (2,328 | ) | 39,641 | (5,548 | ) | 150,991 | ||||||||||||||||
| Changes from principal transactions: | ||||||||||||||||||||||||
| Purchase payments | 1,727,939 | 1,577,177 | 16,699 | 12,360 | 77,932 | 80,509 | ||||||||||||||||||
| Transfers between sub-accounts and the company | 1,677,691 | 2,291,965 | 23,558 | 9,712 | 215,112 | 112,990 | ||||||||||||||||||
| Transfers on general account policy loans | (288,029 | ) | 54,799 | - | (102 | ) | (29,485 | ) | (2,967 | ) | ||||||||||||||
| Withdrawals | (208,277 | ) | (749,465 | ) | (1,588 | ) | (36,225 | ) | (5,132 | ) | 1 | |||||||||||||
| Annual contract fee | (1,398,615 | ) | (1,195,512 | ) | (15,495 | ) | (16,474 | ) | (79,028 | ) | (79,474 | ) | ||||||||||||
| Net increase (decrease) in net assets from principal transactions | 1,510,709 | 1,978,964 | 23,174 | (30,729 | ) | 179,399 | 111,059 | |||||||||||||||||
| Total increase (decrease) in net assets | 12,072,347 | 7,755,456 | 20,846 | 8,912 | 173,851 | 262,050 | ||||||||||||||||||
| Net assets at beginning of period | 36,399,489 | 28,644,033 | 473,598 | 464,686 | 2,012,009 | 1,749,959 | ||||||||||||||||||
| Net assets at end of period | $ | 48,471,836 | $ | 36,399,489 | $ | 494,444 | $ | 473,598 | $ | 2,185,860 | $ | 2,012,009 | ||||||||||||
| 2021 | 2020 | 2021 | 2020 | 2021 | 2020 | |||||||||||||||||||
| Units, beginning of period | 428,542 | 399,694 | 16,783 | 17,915 | 21,828 | 20,643 | ||||||||||||||||||
| Units issued | 42,140 | 73,363 | 1,463 | 1,133 | 3,682 | 3,498 | ||||||||||||||||||
| Units redeemed | (27,393 | ) | (44,515 | ) | (626 | ) | (2,265 | ) | (1,695 | ) | (2,313 | ) | ||||||||||||
| Units, end of period | 443,289 | 428,542 | 17,620 | 16,783 | 23,815 | 21,828 | ||||||||||||||||||
| See accompanying notes. | 22 of 67 |
JOHN HANCOCK LIFE INSURANCE COMPANY OF NEW YORK SEPARATE ACCOUNT B
STATEMENTS OF OPERATIONS AND CHANGES IN CONTRACT OWNERS’ EQUITY
For the years ended December 31,
| American Asset Allocation Trust Series I | American Global Growth Trust Series I | American Growth Trust Series I | ||||||||||||||||||||||
| 2021 | 2020 | 2021 | 2020 | 2021 | 2020 | |||||||||||||||||||
| Income: | ||||||||||||||||||||||||
| Dividend distributions received | $ | 144,590 | $ | 100,891 | $ | - | $ | 554 | $ | 31,793 | $ | 4,535 | ||||||||||||
| Expenses: | ||||||||||||||||||||||||
| Mortality and expense risk and administrative charges | - | - | - | - | - | - | ||||||||||||||||||
| Net investment income (loss) | 144,590 | 100,891 | - | 554 | 31,793 | 4,535 | ||||||||||||||||||
| Realized gains (losses) on investments: | ||||||||||||||||||||||||
| Capital gain distributions received | 488,512 | 872,685 | 80,565 | 68,333 | 523,839 | 724,890 | ||||||||||||||||||
| Net realized gain (loss) | (22,926 | ) | (134,451 | ) | 27,852 | 12,785 | 106,786 | 11,033 | ||||||||||||||||
| Realized gains (losses) | 465,586 | 738,234 | 108,417 | 81,118 | 630,625 | 735,923 | ||||||||||||||||||
| Unrealized appreciation (depreciation) during the period | 579,033 | (6 | ) | 56,275 | 142,287 | 843,335 | 1,586,879 | |||||||||||||||||
| Net increase (decrease) in net assets from operations | 1,189,209 | 839,119 | 164,692 | 223,959 | 1,505,753 | 2,327,337 | ||||||||||||||||||
| Changes from principal transactions: | ||||||||||||||||||||||||
| Purchase payments | 490,828 | 562,585 | 82,195 | 59,931 | 313,788 | 293,365 | ||||||||||||||||||
| Transfers between sub-accounts and the company | 53,653 | (605,197 | ) | 282,344 | 29,788 | 375,592 | (86,767 | ) | ||||||||||||||||
| Transfers on general account policy loans | (2,735 | ) | (26,411 | ) | 342 | - | (35,010 | ) | (23,635 | ) | ||||||||||||||
| Withdrawals | (28,103 | ) | (63,514 | ) | (1,389 | ) | (17,685 | ) | (135,115 | ) | (101,284 | ) | ||||||||||||
| Annual contract fee | (407,787 | ) | (388,792 | ) | (48,251 | ) | (37,179 | ) | (201,961 | ) | (167,565 | ) | ||||||||||||
| Net increase (decrease) in net assets from principal transactions | 105,856 | (521,329 | ) | 315,241 | 34,855 | 317,294 | (85,886 | ) | ||||||||||||||||
| Total increase (decrease) in net assets | 1,295,065 | 317,790 | 479,933 | 258,814 | 1,823,047 | 2,241,451 | ||||||||||||||||||
| Net assets at beginning of period | 8,048,783 | 7,730,993 | 983,902 | 725,088 | 6,851,998 | 4,610,547 | ||||||||||||||||||
| Net assets at end of period | $ | 9,343,848 | $ | 8,048,783 | $ | 1,463,835 | $ | 983,902 | $ | 8,675,045 | $ | 6,851,998 | ||||||||||||
| 2021 | 2020 | 2021 | 2020 | 2021 | 2020 | |||||||||||||||||||
| Units, beginning of period | 322,344 | 346,830 | 30,172 | 28,896 | 103,615 | 105,461 | ||||||||||||||||||
| Units issued | 17,214 | 28,246 | 11,482 | 5,316 | 10,897 | 9,073 | ||||||||||||||||||
| Units redeemed | (13,328 | ) | (52,732 | ) | (2,956 | ) | (4,040 | ) | (6,071 | ) | (10,919 | ) | ||||||||||||
| Units, end of period | 326,230 | 322,344 | 38,698 | 30,172 | 108,441 | 103,615 | ||||||||||||||||||
| See accompanying notes. | 23 of 67 |
JOHN HANCOCK LIFE INSURANCE COMPANY OF NEW YORK SEPARATE ACCOUNT B
STATEMENTS OF OPERATIONS AND CHANGES IN CONTRACT OWNERS’ EQUITY
For the years ended December 31,
| American Growth-Income Trust Series I | American International Trust Series I | Blue Chip Growth Trust Series I | ||||||||||||||||||||||
| 2021 | 2020 | 2021 | 2020 | 2021 | 2020 | |||||||||||||||||||
| Income: | ||||||||||||||||||||||||
| Dividend distributions received | $ | 37,324 | $ | 55,057 | $ | 74,564 | $ | 11,021 | $ | - | $ | - | ||||||||||||
| Expenses: | ||||||||||||||||||||||||
| Mortality and expense risk and administrative charges | - | - | - | - | - | - | ||||||||||||||||||
| Net investment income (loss) | 37,324 | 55,057 | 74,564 | 11,021 | - | - | ||||||||||||||||||
| Realized gains (losses) on investments: | ||||||||||||||||||||||||
| Capital gain distributions received | 247,241 | 534,708 | 6,647 | 135,154 | 208,053 | 181,933 | ||||||||||||||||||
| Net realized gain (loss) | (42,466 | ) | (59,963 | ) | 17,662 | 6,737 | 42,599 | 1,532 | ||||||||||||||||
| Realized gains (losses) | 204,775 | 474,745 | 24,309 | 141,891 | 250,652 | 183,465 | ||||||||||||||||||
| Unrealized appreciation (depreciation) during the period | 786,764 | (14,710 | ) | (170,883 | ) | 280,242 | (9,119 | ) | 194,967 | |||||||||||||||
| Net increase (decrease) in net assets from operations | 1,028,863 | 515,092 | (72,010 | ) | 433,154 | 241,533 | 378,432 | |||||||||||||||||
| Changes from principal transactions: | ||||||||||||||||||||||||
| Purchase payments | 245,218 | 238,281 | 187,023 | 153,273 | 21,925 | 21,887 | ||||||||||||||||||
| Transfers between sub-accounts and the company | (223,865 | ) | 166,141 | 241,375 | 8,554 | (43,800 | ) | (20,565 | ) | |||||||||||||||
| Transfers on general account policy loans | (10,474 | ) | (24,305 | ) | 2,279 | (10,781 | ) | (47,948 | ) | 3,046 | ||||||||||||||
| Withdrawals | (86,051 | ) | (148,726 | ) | (10,395 | ) | (26,584 | ) | (8,239 | ) | (579 | ) | ||||||||||||
| Annual contract fee | (172,413 | ) | (162,991 | ) | (105,756 | ) | (92,402 | ) | (37,146 | ) | (34,306 | ) | ||||||||||||
| Net increase (decrease) in net assets from principal transactions | (247,585 | ) | 68,400 | 314,526 | 32,060 | (115,208 | ) | (30,517 | ) | |||||||||||||||
| Total increase (decrease) in net assets | 781,278 | 583,492 | 242,516 | 465,214 | 126,325 | 347,915 | ||||||||||||||||||
| Net assets at beginning of period | 4,508,549 | 3,925,057 | 3,453,299 | 2,988,085 | 1,475,156 | 1,127,241 | ||||||||||||||||||
| Net assets at end of period | $ | 5,289,827 | $ | 4,508,549 | $ | 3,695,815 | $ | 3,453,299 | $ | 1,601,481 | $ | 1,475,156 | ||||||||||||
| 2021 | 2020 | 2021 | 2020 | 2021 | 2020 | |||||||||||||||||||
| Units, beginning of period | 107,362 | 105,038 | 116,627 | 114,343 | 22,820 | 23,420 | ||||||||||||||||||
| Units issued | 7,156 | 12,452 | 17,292 | 11,993 | 332 | 429 | ||||||||||||||||||
| Units redeemed | (12,375 | ) | (10,128 | ) | (6,348 | ) | (9,709 | ) | (1,946 | ) | (1,029 | ) | ||||||||||||
| Units, end of period | 102,143 | 107,362 | 127,571 | 116,627 | 21,206 | 22,820 | ||||||||||||||||||
| See accompanying notes. | 24 of 67 |
JOHN HANCOCK LIFE INSURANCE COMPANY OF NEW YORK SEPARATE ACCOUNT B
STATEMENTS OF OPERATIONS AND CHANGES IN CONTRACT OWNERS’ EQUITY
For the years ended December 31,
| Blue Chip Growth Trust Series NAV | Capital Appreciation Trust Series I | Capital Appreciation Trust Series NAV | ||||||||||||||||||||||
| 2021 | 2020 | 2021 | 2020 | 2021 | 2020 | |||||||||||||||||||
| Income: | ||||||||||||||||||||||||
| Dividend distributions received | $ | - | $ | - | $ | - | $ | - | $ | - | $ | - | ||||||||||||
| Expenses: | ||||||||||||||||||||||||
| Mortality and expense risk and administrative charges | - | - | - | - | - | - | ||||||||||||||||||
| Net investment income (loss) | - | - | - | - | - | - | ||||||||||||||||||
| Realized gains (losses) on investments: | ||||||||||||||||||||||||
| Capital gain distributions received | 2,897,457 | 2,307,265 | 148,052 | 67,934 | 643,619 | 322,589 | ||||||||||||||||||
| Net realized gain (loss) | 302,709 | 207,630 | (24,555 | ) | (93,375 | ) | (104,375 | ) | (373,628 | ) | ||||||||||||||
| Realized gains (losses) | 3,200,166 | 2,514,895 | 123,497 | (25,441 | ) | 539,244 | (51,039 | ) | ||||||||||||||||
| Unrealized appreciation (depreciation) during the period | 73,172 | 2,336,837 | 8,119 | 314,094 | 66,175 | 1,411,441 | ||||||||||||||||||
| Net increase (decrease) in net assets from operations | 3,273,338 | 4,851,732 | 131,616 | 288,653 | 605,419 | 1,360,402 | ||||||||||||||||||
| Changes from principal transactions: | ||||||||||||||||||||||||
| Purchase payments | 1,228,697 | 1,197,467 | 58,698 | 24,872 | 140,405 | 137,386 | ||||||||||||||||||
| Transfers between sub-accounts and the company | (91,922 | ) | (78,610 | ) | (5,102 | ) | 66,320 | 9,558 | 53,201 | |||||||||||||||
| Transfers on general account policy loans | (32,011 | ) | 18,686 | - | (39 | ) | (19,889 | ) | (2,861 | ) | ||||||||||||||
| Withdrawals | (111,795 | ) | (419,166 | ) | (12 | ) | (36,521 | ) | (244,604 | ) | (70,985 | ) | ||||||||||||
| Annual contract fee | (514,328 | ) | (462,436 | ) | (40,024 | ) | (30,506 | ) | (117,882 | ) | (99,566 | ) | ||||||||||||
| Net increase (decrease) in net assets from principal transactions | 478,641 | 255,941 | 13,560 | 24,126 | (232,412 | ) | 17,175 | |||||||||||||||||
| Total increase (decrease) in net assets | 3,751,979 | 5,107,673 | 145,176 | 312,779 | 373,007 | 1,377,577 | ||||||||||||||||||
| Net assets at beginning of period | 18,636,108 | 13,528,435 | 830,489 | 517,710 | 3,877,456 | 2,499,879 | ||||||||||||||||||
| Net assets at end of period | $ | 22,388,087 | $ | 18,636,108 | $ | 975,665 | $ | 830,489 | $ | 4,250,463 | $ | 3,877,456 | ||||||||||||
| 2021 | 2020 | 2021 | 2020 | 2021 | 2020 | |||||||||||||||||||
| Units, beginning of period | 56,023 | 54,659 | 10,825 | 10,530 | 51,315 | 51,707 | ||||||||||||||||||
| Units issued | 4,487 | 6,344 | 629 | 1,419 | 3,810 | 6,293 | ||||||||||||||||||
| Units redeemed | (2,946 | ) | (4,980 | ) | (467 | ) | (1,124 | ) | (6,530 | ) | (6,685 | ) | ||||||||||||
| Units, end of period | 57,564 | 56,023 | 10,987 | 10,825 | 48,595 | 51,315 | ||||||||||||||||||
| See accompanying notes. | 25 of 67 |
JOHN HANCOCK LIFE INSURANCE COMPANY OF NEW YORK SEPARATE ACCOUNT B
STATEMENTS OF OPERATIONS AND CHANGES IN CONTRACT OWNERS’ EQUITY
For the years ended December 31,
| Capital Appreciation Value Trust Series NAV | Core Bond Trust Series I | Core Bond Trust Series NAV | ||||||||||||||||||||||
| 2021 | 2020 | 2021 | 2020 | 2021 | 2020 | |||||||||||||||||||
| Income: | ||||||||||||||||||||||||
| Dividend distributions received | $ | 97,268 | $ | 105,688 | $ | 9,770 | $ | 12,918 | $ | 95,793 | $ | 112,100 | ||||||||||||
| Expenses: | ||||||||||||||||||||||||
| Mortality and expense risk and administrative charges | - | - | - | - | - | - | ||||||||||||||||||
| Net investment income (loss) | 97,268 | 105,688 | 9,770 | 12,918 | 95,793 | 112,100 | ||||||||||||||||||
| Realized gains (losses) on investments: | ||||||||||||||||||||||||
| Capital gain distributions received | 1,288,285 | 785,368 | 22,658 | 3 | 216,258 | 1 | ||||||||||||||||||
| Net realized gain (loss) | 88,224 | 35,649 | 1,242 | 1,675 | 16,612 | 29,278 | ||||||||||||||||||
| Realized gains (losses) | 1,376,509 | 821,017 | 23,900 | 1,678 | 232,870 | 29,279 | ||||||||||||||||||
| Unrealized appreciation (depreciation) during the period | 461,865 | 612,582 | (44,329 | ) | 30,727 | (422,117 | ) | 240,100 | ||||||||||||||||
| Net increase (decrease) in net assets from operations | 1,935,642 | 1,539,287 | (10,659 | ) | 45,323 | (93,454 | ) | 381,479 | ||||||||||||||||
| Changes from principal transactions: | ||||||||||||||||||||||||
| Purchase payments | 746,740 | 622,503 | 10,833 | 11,055 | 200,302 | 226,986 | ||||||||||||||||||
| Transfers between sub-accounts and the company | 380,813 | (36,204 | ) | 15,666 | 6,191 | 283,851 | 224,117 | |||||||||||||||||
| Transfers on general account policy loans | (25,034 | ) | (647 | ) | (20,202 | ) | (785 | ) | (27,372 | ) | 164,538 | |||||||||||||
| Withdrawals | (51,876 | ) | (48,260 | ) | (2,877 | ) | (21,439 | ) | (51,395 | ) | (191,623 | ) | ||||||||||||
| Annual contract fee | (549,341 | ) | (512,856 | ) | (12,231 | ) | (16,258 | ) | (173,941 | ) | (198,991 | ) | ||||||||||||
| Net increase (decrease) in net assets from principal transactions | 501,302 | 24,536 | (8,811 | ) | (21,236 | ) | 231,445 | 225,027 | ||||||||||||||||
| Total increase (decrease) in net assets | 2,436,944 | 1,563,823 | (19,470 | ) | 24,087 | 137,991 | 606,506 | |||||||||||||||||
| Net assets at beginning of period | 10,511,436 | 8,947,613 | 555,235 | 531,148 | 4,918,293 | 4,311,787 | ||||||||||||||||||
| Net assets at end of period | $ | 12,948,380 | $ | 10,511,436 | $ | 535,765 | $ | 555,235 | $ | 5,056,284 | $ | 4,918,293 | ||||||||||||
| 2021 | 2020 | 2021 | 2020 | 2021 | 2020 | |||||||||||||||||||
| Units, beginning of period | 311,486 | 311,325 | 21,997 | 22,857 | 241,884 | 230,707 | ||||||||||||||||||
| Units issued | 25,900 | 29,487 | 1,180 | 783 | 35,303 | 51,832 | ||||||||||||||||||
| Units redeemed | (12,655 | ) | (29,326 | ) | (1,524 | ) | (1,643 | ) | (23,476 | ) | (40,655 | ) | ||||||||||||
| Units, end of period | 324,731 | 311,486 | 21,653 | 21,997 | 253,711 | 241,884 | ||||||||||||||||||
| See accompanying notes. | 26 of 67 |
JOHN HANCOCK LIFE INSURANCE COMPANY OF NEW YORK SEPARATE ACCOUNT B
STATEMENTS OF OPERATIONS AND CHANGES IN CONTRACT OWNERS’ EQUITY
For the years ended December 31,
| Disciplined Value International Trust Series | ||||||||||||||||||||||||
| Disciplined Value International Trust Series I | NAV | Emerging Markets Value Trust Series I | ||||||||||||||||||||||
| 2021 | 2020 | 2021 | 2020 | 2021 | 2020 | |||||||||||||||||||
| Income: | ||||||||||||||||||||||||
| Dividend distributions received | $ | 9,824 | $ | 6,541 | $ | 64,493 | $ | 41,322 | $ | 2,173 | $ | 1,973 | ||||||||||||
| Expenses: | ||||||||||||||||||||||||
| Mortality and expense risk and administrative charges | - | - | - | - | - | - | ||||||||||||||||||
| Net investment income (loss) | 9,824 | 6,541 | 64,493 | 41,322 | 2,173 | 1,973 | ||||||||||||||||||
| Realized gains (losses) on investments: | ||||||||||||||||||||||||
| Capital gain distributions received | (1 | ) | (2 | ) | - | 3 | - | - | ||||||||||||||||
| Net realized gain (loss) | 546 | (2,291 | ) | 18,270 | (33,249 | ) | 760 | (6,919 | ) | |||||||||||||||
| Realized gains (losses) | 545 | (2,293 | ) | 18,270 | (33,246 | ) | 760 | (6,919 | ) | |||||||||||||||
| Unrealized appreciation (depreciation) during the period | 35,206 | 9,837 | 197,947 | 68,573 | 7,617 | 5,651 | ||||||||||||||||||
| Net increase (decrease) in net assets from operations | 45,575 | 14,085 | 280,710 | 76,649 | 10,550 | 705 | ||||||||||||||||||
| Changes from principal transactions: | ||||||||||||||||||||||||
| Purchase payments | 12,756 | 14,249 | 87,784 | 86,489 | 1,253 | 1,324 | ||||||||||||||||||
| Transfers between sub-accounts and the company | 2,930 | 4,731 | 62,081 | 26,405 | (3,634 | ) | (8,370 | ) | ||||||||||||||||
| Transfers on general account policy loans | (12,422 | ) | 763 | 1,185 | 1,196 | (295 | ) | (296 | ) | |||||||||||||||
| Withdrawals | (966 | ) | 77 | (24,613 | ) | (54,595 | ) | 6 | (353 | ) | ||||||||||||||
| Annual contract fee | (10,671 | ) | (8,994 | ) | (61,593 | ) | (58,726 | ) | (1,058 | ) | (1,074 | ) | ||||||||||||
| Net increase (decrease) in net assets from principal transactions | (8,373 | ) | 10,826 | 64,844 | 769 | (3,728 | ) | (8,769 | ) | |||||||||||||||
| Total increase (decrease) in net assets | 37,202 | 24,911 | 345,554 | 77,418 | 6,822 | (8,064 | ) | |||||||||||||||||
| Net assets at beginning of period | 349,764 | 324,853 | 2,128,342 | 2,050,924 | 89,455 | 97,519 | ||||||||||||||||||
| Net assets at end of period | $ | 386,966 | $ | 349,764 | $ | 2,473,896 | $ | 2,128,342 | $ | 96,277 | $ | 89,455 | ||||||||||||
| 2021 | 2020 | 2021 | 2020 | 2021 | 2020 | |||||||||||||||||||
| Units, beginning of period | 12,224 | 11,726 | 115,007 | 114,451 | 5,042 | 5,692 | ||||||||||||||||||
| Units issued | 500 | 883 | 8,939 | 13,237 | 335 | 781 | ||||||||||||||||||
| Units redeemed | (763 | ) | (385 | ) | (5,799 | ) | (12,681 | ) | (496 | ) | (1,431 | ) | ||||||||||||
| Units, end of period | 11,961 | 12,224 | 118,147 | 115,007 | 4,881 | 5,042 | ||||||||||||||||||
| See accompanying notes. | 27 of 67 |
JOHN HANCOCK LIFE INSURANCE COMPANY OF NEW YORK SEPARATE ACCOUNT B
STATEMENTS OF OPERATIONS AND CHANGES IN CONTRACT OWNERS’ EQUITY
For the years ended December 31,
| Emerging Markets Value Trust Series NAV | Equity Income Trust Series I | Equity Income Trust Series NAV | ||||||||||||||||||||||
| 2021 | 2020 | 2021 | 2020 | 2021 | 2020 | |||||||||||||||||||
| Income: | ||||||||||||||||||||||||
| Dividend distributions received | $ | 47,226 | $ | 33,186 | $ | 16,511 | $ | 19,740 | $ | 131,700 | $ | 148,165 | ||||||||||||
| Expenses: | ||||||||||||||||||||||||
| Mortality and expense risk and administrative charges | - | - | - | - | - | - | ||||||||||||||||||
| Net investment income (loss) | 47,226 | 33,186 | 16,511 | 19,740 | 131,700 | 148,165 | ||||||||||||||||||
| Realized gains (losses) on investments: | ||||||||||||||||||||||||
| Capital gain distributions received | 2 | (2 | ) | 17,177 | 51,051 | 133,883 | 377,052 | |||||||||||||||||
| Net realized gain (loss) | 33,663 | (603 | ) | 2,558 | (14,569 | ) | (24,166 | ) | (120,427 | ) | ||||||||||||||
| Realized gains (losses) | 33,665 | (605 | ) | 19,735 | 36,482 | 109,717 | 256,625 | |||||||||||||||||
| Unrealized appreciation (depreciation) during the period | 100,423 | 56,313 | 151,111 | (48,041 | ) | 1,166,086 | (321,734 | ) | ||||||||||||||||
| Net increase (decrease) in net assets from operations | 181,314 | 88,894 | 187,357 | 8,181 | 1,407,503 | 83,056 | ||||||||||||||||||
| Changes from principal transactions: | ||||||||||||||||||||||||
| Purchase payments | 142,072 | 131,797 | 23,732 | 23,666 | 229,839 | 233,808 | ||||||||||||||||||
| Transfers between sub-accounts and the company | 160,163 | 26,853 | (26,164 | ) | 22,900 | (43,863 | ) | 69,315 | ||||||||||||||||
| Transfers on general account policy loans | (22,802 | ) | (2,177 | ) | (16,579 | ) | (5,199 | ) | (38,674 | ) | (22,674 | ) | ||||||||||||
| Withdrawals | (29,123 | ) | (25,395 | ) | (3,020 | ) | 120 | (103,339 | ) | (46,141 | ) | |||||||||||||
| Annual contract fee | (72,616 | ) | (62,078 | ) | (37,402 | ) | (35,600 | ) | (182,233 | ) | (176,111 | ) | ||||||||||||
| Net increase (decrease) in net assets from principal transactions | 177,694 | 69,000 | (59,433 | ) | 5,887 | (138,270 | ) | 58,197 | ||||||||||||||||
| Total increase (decrease) in net assets | 359,008 | 157,894 | 127,924 | 14,068 | 1,269,233 | 141,253 | ||||||||||||||||||
| Net assets at beginning of period | 1,604,152 | 1,446,257 | 751,556 | 737,488 | 5,512,275 | 5,371,022 | ||||||||||||||||||
| Net assets at end of period | $ | 1,963,160 | $ | 1,604,152 | $ | 879,480 | $ | 751,556 | $ | 6,781,508 | $ | 5,512,275 | ||||||||||||
| 2021 | 2020 | 2021 | 2020 | 2021 | 2020 | |||||||||||||||||||
| Units, beginning of period | 112,220 | 104,941 | 18,163 | 18,005 | 80,418 | 79,149 | ||||||||||||||||||
| Units issued | 23,711 | 23,230 | 486 | 1,211 | 6,280 | 6,351 | ||||||||||||||||||
| Units redeemed | (12,481 | ) | (15,951 | ) | (1,700 | ) | (1,053 | ) | (7,861 | ) | (5,082 | ) | ||||||||||||
| Units, end of period | 123,450 | 112,220 | 16,949 | 18,163 | 78,837 | 80,418 | ||||||||||||||||||
| See accompanying notes. | 28 of 67 |
JOHN HANCOCK LIFE INSURANCE COMPANY OF NEW YORK SEPARATE ACCOUNT B
STATEMENTS OF OPERATIONS AND CHANGES IN CONTRACT OWNERS’ EQUITY
For the years ended December 31,
| Financial Industries Trust Series I | Financial Industries Trust Series NAV | Fundamental All Cap Core Trust Series I | ||||||||||||||||||||||
| 2021 | 2020 | 2021 | 2020 | 2021 | 2020 | |||||||||||||||||||
| Income: | ||||||||||||||||||||||||
| Dividend distributions received | $ | 1,513 | $ | 1,779 | $ | 11,559 | $ | 12,809 | $ | 2 | $ | 10 | ||||||||||||
| Expenses: | ||||||||||||||||||||||||
| Mortality and expense risk and administrative charges | - | - | - | - | - | - | ||||||||||||||||||
| Net investment income (loss) | 1,513 | 1,779 | 11,559 | 12,809 | 2 | 10 | ||||||||||||||||||
| Realized gains (losses) on investments: | ||||||||||||||||||||||||
| Capital gain distributions received | 946 | 12,582 | 6,792 | 87,476 | 163 | 81 | ||||||||||||||||||
| Net realized gain (loss) | 837 | (381 | ) | 13,005 | (15,000 | ) | 1,233 | 206 | ||||||||||||||||
| Realized gains (losses) | 1,783 | 12,201 | 19,797 | 72,476 | 1,396 | 287 | ||||||||||||||||||
| Unrealized appreciation (depreciation) during the period | 40,954 | (11,231 | ) | 276,962 | (50,733 | ) | (577 | ) | 441 | |||||||||||||||
| Net increase (decrease) in net assets from operations | 44,250 | 2,749 | 308,318 | 34,552 | 821 | 738 | ||||||||||||||||||
| Changes from principal transactions: | ||||||||||||||||||||||||
| Purchase payments | 269 | 310 | 69,526 | 70,822 | 2,168 | 2,138 | ||||||||||||||||||
| Transfers between sub-accounts and the company | (1,801 | ) | 1,484 | 16,717 | 22,230 | 3 | (1 | ) | ||||||||||||||||
| Transfers on general account policy loans | - | 3 | 3,797 | (751 | ) | (1,507 | ) | (13 | ) | |||||||||||||||
| Withdrawals | 39 | (446 | ) | (13,995 | ) | (9,475 | ) | 3 | 3 | |||||||||||||||
| Annual contract fee | (3,772 | ) | (2,953 | ) | (52,494 | ) | (48,240 | ) | (2,555 | ) | (2,160 | ) | ||||||||||||
| Net increase (decrease) in net assets from principal transactions | (5,265 | ) | (1,602 | ) | 23,551 | 34,586 | (1,888 | ) | (33 | ) | ||||||||||||||
| Total increase (decrease) in net assets | 38,985 | 1,147 | 331,869 | 69,138 | (1,067 | ) | 705 | |||||||||||||||||
| Net assets at beginning of period | 150,302 | 149,155 | 1,026,410 | 957,272 | 3,213 | 2,508 | ||||||||||||||||||
| Net assets at end of period | $ | 189,287 | $ | 150,302 | $ | 1,358,279 | $ | 1,026,410 | $ | 2,146 | $ | 3,213 | ||||||||||||
| 2021 | 2020 | 2021 | 2020 | 2021 | 2020 | |||||||||||||||||||
| Units, beginning of period | 4,120 | 4,177 | 23,293 | 22,226 | 41 | 40 | ||||||||||||||||||
| Units issued | 5 | 42 | 1,650 | 3,756 | 25 | 35 | ||||||||||||||||||
| Units redeemed | (125 | ) | (99 | ) | (1,177 | ) | (2,689 | ) | (45 | ) | (34 | ) | ||||||||||||
| Units, end of period | 4,000 | 4,120 | 23,766 | 23,293 | 21 | 41 | ||||||||||||||||||
| See accompanying notes. | 29 of 67 |
JOHN HANCOCK LIFE INSURANCE COMPANY OF NEW YORK SEPARATE ACCOUNT B
STATEMENTS OF OPERATIONS AND CHANGES IN CONTRACT OWNERS’ EQUITY
For the years ended December 31,
| Fundamental Large Cap Value Trust Series | ||||||||||||||||||||||||
| Fundamental All Cap Core Trust Series NAV | Fundamental Large Cap Value Trust Series I | NAV | ||||||||||||||||||||||
| 2021 | 2020 | 2021 | 2020 | 2021 | 2020 | |||||||||||||||||||
| Income: | ||||||||||||||||||||||||
| Dividend distributions received | $ | 2,507 | $ | 4,504 | $ | 8,582 | $ | 8,821 | $ | 33,026 | $ | 33,128 | ||||||||||||
| Expenses: | ||||||||||||||||||||||||
| Mortality and expense risk and administrative charges | - | - | - | - | - | - | ||||||||||||||||||
| Net investment income (loss) | 2,507 | 4,504 | 8,582 | 8,821 | 33,026 | 33,128 | ||||||||||||||||||
| Realized gains (losses) on investments: | ||||||||||||||||||||||||
| Capital gain distributions received | 124,496 | 32,274 | 127,925 | 15,972 | 464,844 | 57,473 | ||||||||||||||||||
| Net realized gain (loss) | 54,644 | 31,238 | 21,151 | 4,609 | 127,640 | 32,596 | ||||||||||||||||||
| Realized gains (losses) | 179,140 | 63,512 | 149,076 | 20,581 | 592,484 | 90,069 | ||||||||||||||||||
| Unrealized appreciation (depreciation) during the period | 218,568 | 223,471 | 120,235 | 74,530 | 373,366 | 243,771 | ||||||||||||||||||
| Net increase (decrease) in net assets from operations | 400,215 | 291,487 | 277,893 | 103,932 | 998,876 | 366,968 | ||||||||||||||||||
| Changes from principal transactions: | ||||||||||||||||||||||||
| Purchase payments | 73,658 | 65,203 | 26,504 | 25,788 | 150,214 | 154,161 | ||||||||||||||||||
| Transfers between sub-accounts and the company | 14,723 | 127,248 | (13,914 | ) | 9,738 | (90,570 | ) | 11,037 | ||||||||||||||||
| Transfers on general account policy loans | (4,166 | ) | (3,079 | ) | (10,991 | ) | 291 | 11 | (71 | ) | ||||||||||||||
| Withdrawals | (27,664 | ) | (135,298 | ) | (4,948 | ) | 188 | (56,654 | ) | (28,015 | ) | |||||||||||||
| Annual contract fee | (62,515 | ) | (53,002 | ) | (27,361 | ) | (23,722 | ) | (107,724 | ) | (95,307 | ) | ||||||||||||
| Net increase (decrease) in net assets from principal transactions | (5,964 | ) | 1,072 | (30,710 | ) | 12,283 | (104,723 | ) | 41,805 | |||||||||||||||
| Total increase (decrease) in net assets | 394,251 | 292,559 | 247,183 | 116,215 | 894,153 | 408,773 | ||||||||||||||||||
| Net assets at beginning of period | 1,291,275 | 998,716 | 931,220 | 815,005 | 3,373,771 | 2,964,998 | ||||||||||||||||||
| Net assets at end of period | $ | 1,685,526 | $ | 1,291,275 | $ | 1,178,403 | $ | 931,220 | $ | 4,267,924 | $ | 3,373,771 | ||||||||||||
| 2021 | 2020 | 2021 | 2020 | 2021 | 2020 | |||||||||||||||||||
| Units, beginning of period | 27,464 | 26,971 | 20,338 | 19,929 | 104,329 | 102,700 | ||||||||||||||||||
| Units issued | 2,414 | 5,521 | 379 | 1,013 | 5,379 | 7,563 | ||||||||||||||||||
| Units redeemed | (2,445 | ) | (5,028 | ) | (915 | ) | (604 | ) | (8,184 | ) | (5,934 | ) | ||||||||||||
| Units, end of period | 27,433 | 27,464 | 19,802 | 20,338 | 101,524 | 104,329 | ||||||||||||||||||
| See accompanying notes. | 30 of 67 |
JOHN HANCOCK LIFE INSURANCE COMPANY OF NEW YORK SEPARATE ACCOUNT B
STATEMENTS OF OPERATIONS AND CHANGES IN CONTRACT OWNERS’ EQUITY
For the years ended December 31,
| Global Equity Trust Series I | Global Equity Trust Series NAV | Health Sciences Trust Series I | ||||||||||||||||||||||
| 2021(a) | 2020 | 2021(b) | 2020 | 2021 | 2020 | |||||||||||||||||||
| Income: | ||||||||||||||||||||||||
| Dividend distributions received | $ | - | $ | 1,055 | $ | - | $ | 15,822 | $ | - | $ | - | ||||||||||||
| Expenses: | ||||||||||||||||||||||||
| Mortality and expense risk and administrative charges | - | - | - | - | - | - | ||||||||||||||||||
| Net investment income (loss) | - | 1,055 | - | 15,822 | - | - | ||||||||||||||||||
| Realized gains (losses) on investments: | ||||||||||||||||||||||||
| Capital gain distributions received | - | 739 | (2 | ) | 10,644 | 35,136 | 32,432 | |||||||||||||||||
| Net realized gain (loss) | 692 | (1,300 | ) | 15,653 | (13,891 | ) | 11,666 | 3,819 | ||||||||||||||||
| Realized gains (losses) | 692 | (561 | ) | 15,651 | (3,247 | ) | 46,802 | 36,251 | ||||||||||||||||
| Unrealized appreciation (depreciation) during the period | 18,550 | 4,127 | 267,300 | 61,449 | (8,242 | ) | 39,510 | |||||||||||||||||
| Net increase (decrease) in net assets from operations | 19,242 | 4,621 | 282,951 | 74,024 | 38,560 | 75,761 | ||||||||||||||||||
| Changes from principal transactions: | ||||||||||||||||||||||||
| Purchase payments | 1,949 | 1,885 | 89,942 | 88,139 | 1,954 | 2,118 | ||||||||||||||||||
| Transfers between sub-accounts and the company | 794 | (3,670 | ) | 17,632 | 1,149 | 3,011 | (5,250 | ) | ||||||||||||||||
| Transfers on general account policy loans | - | 4,141 | (5,258 | ) | (3,290 | ) | (21,761 | ) | (1,341 | ) | ||||||||||||||
| Withdrawals | 7 | 40 | (23,841 | ) | (49,950 | ) | (3,156 | ) | (1,309 | ) | ||||||||||||||
| Annual contract fee | (4,119 | ) | (3,832 | ) | (55,729 | ) | (56,095 | ) | (11,634 | ) | (11,443 | ) | ||||||||||||
| Net increase (decrease) in net assets from principal transactions | (1,369 | ) | (1,436 | ) | 22,746 | (20,047 | ) | (31,586 | ) | (17,225 | ) | |||||||||||||
| Total increase (decrease) in net assets | 17,873 | 3,185 | 305,697 | 53,977 | 6,974 | 58,536 | ||||||||||||||||||
| Net assets at beginning of period | 89,418 | 86,233 | 1,309,395 | 1,255,418 | 347,534 | 288,998 | ||||||||||||||||||
| Net assets at end of period | $ | 107,291 | $ | 89,418 | $ | 1,615,092 | $ | 1,309,395 | $ | 354,508 | $ | 347,534 | ||||||||||||
| 2021 | 2020 | 2021 | 2020 | 2021 | 2020 | |||||||||||||||||||
| Units, beginning of period | 3,674 | 3,777 | 58,715 | 60,071 | 2,377 | 2,514 | ||||||||||||||||||
| Units issued | 125 | 285 | 4,830 | 4,834 | 30 | 20 | ||||||||||||||||||
| Units redeemed | (165 | ) | (388 | ) | (3,850 | ) | (6,190 | ) | (226 | ) | (157 | ) | ||||||||||||
| Units, end of period | 3,634 | 3,674 | 59,695 | 58,715 | 2,181 | 2,377 | ||||||||||||||||||
| (a) | Renamed on April 1, 2021. Previously known as Global Trust Series I. |
| (b) | Renamed on April 1, 2021. Previously known as Global Trust Series NAV. |
| See accompanying notes. | 31 of 67 |
JOHN HANCOCK LIFE INSURANCE COMPANY OF NEW YORK SEPARATE ACCOUNT B
STATEMENTS OF OPERATIONS AND CHANGES IN CONTRACT OWNERS’ EQUITY
For the years ended December 31,
| Health Sciences Trust Series NAV | High Yield Trust Series I | High Yield Trust Series NAV | ||||||||||||||||||||||
| 2021 | 2020 | 2021 | 2020 | 2021 | 2020 | |||||||||||||||||||
| Income: | ||||||||||||||||||||||||
| Dividend distributions received | $ | - | $ | - | $ | 17,261 | $ | 19,082 | $ | 182,642 | $ | 218,914 | ||||||||||||
| Expenses: | ||||||||||||||||||||||||
| Mortality and expense risk and administrative charges | - | - | - | - | - | - | ||||||||||||||||||
| Net investment income (loss) | - | - | 17,261 | 19,082 | 182,642 | 218,914 | ||||||||||||||||||
| Realized gains (losses) on investments: | ||||||||||||||||||||||||
| Capital gain distributions received | 468,736 | 412,010 | (2 | ) | - | 5 | (2 | ) | ||||||||||||||||
| Net realized gain (loss) | 80,639 | (2,607 | ) | (3,515 | ) | (4,165 | ) | (25,543 | ) | (33,179 | ) | |||||||||||||
| Realized gains (losses) | 549,375 | 409,403 | (3,517 | ) | (4,165 | ) | (25,538 | ) | (33,181 | ) | ||||||||||||||
| Unrealized appreciation (depreciation) during the period | (31,338 | ) | 566,306 | 5,441 | 2,383 | 46,099 | 7,044 | |||||||||||||||||
| Net increase (decrease) in net assets from operations | 518,037 | 975,709 | 19,185 | 17,300 | 203,203 | 192,777 | ||||||||||||||||||
| Changes from principal transactions: | ||||||||||||||||||||||||
| Purchase payments | 250,089 | 229,453 | 8,968 | 9,159 | 82,262 | 83,721 | ||||||||||||||||||
| Transfers between sub-accounts and the company | (37,683 | ) | 190,687 | 13,727 | 4,124 | 33,363 | (3,945 | ) | ||||||||||||||||
| Transfers on general account policy loans | 11,165 | 14,765 | (14,955 | ) | (1,331 | ) | (850,013 | ) | (7,252 | ) | ||||||||||||||
| Withdrawals | (67,980 | ) | (171,894 | ) | (192 | ) | (5,811 | ) | (29,864 | ) | (63,512 | ) | ||||||||||||
| Annual contract fee | (217,419 | ) | (213,175 | ) | (6,597 | ) | (7,015 | ) | (60,803 | ) | (67,299 | ) | ||||||||||||
| Net increase (decrease) in net assets from principal transactions | (61,828 | ) | 49,836 | 951 | (874 | ) | (825,055 | ) | (58,287 | ) | ||||||||||||||
| Total increase (decrease) in net assets | 456,209 | 1,025,545 | 20,136 | 16,426 | (621,852 | ) | 134,490 | |||||||||||||||||
| Net assets at beginning of period | 4,550,225 | 3,524,680 | 322,375 | 305,949 | 3,637,003 | 3,502,513 | ||||||||||||||||||
| Net assets at end of period | $ | 5,006,434 | $ | 4,550,225 | $ | 342,511 | $ | 322,375 | $ | 3,015,151 | $ | 3,637,003 | ||||||||||||
| 2021 | 2020 | 2021 | 2020 | 2021 | 2020 | |||||||||||||||||||
| Units, beginning of period | 39,814 | 39,249 | 10,610 | 10,655 | 126,048 | 128,389 | ||||||||||||||||||
| Units issued | 3,023 | 4,639 | 663 | 515 | 4,689 | 7,723 | ||||||||||||||||||
| Units redeemed | (3,454 | ) | (4,074 | ) | (614 | ) | (560 | ) | (31,954 | ) | (10,064 | ) | ||||||||||||
| Units, end of period | 39,383 | 39,814 | 10,659 | 10,610 | 98,783 | 126,048 | ||||||||||||||||||
| See accompanying notes. | 32 of 67 |
JOHN HANCOCK LIFE INSURANCE COMPANY OF NEW YORK SEPARATE ACCOUNT B
STATEMENTS OF OPERATIONS AND CHANGES IN CONTRACT OWNERS’ EQUITY
For the years ended December 31,
| International Equity Index Series I | International Equity Index Series NAV | International Small Company Trust Series I | ||||||||||||||||||||||
| 2021 | 2020 | 2021 | 2020 | 2021 | 2020 | |||||||||||||||||||
| Income: | ||||||||||||||||||||||||
| Dividend distributions received | $ | 6,442 | $ | 5,359 | $ | 199,652 | $ | 148,700 | $ | 394 | $ | 544 | ||||||||||||
| Expenses: | ||||||||||||||||||||||||
| Mortality and expense risk and administrative charges | - | - | - | - | - | - | ||||||||||||||||||
| Net investment income (loss) | 6,442 | 5,359 | 199,652 | 148,700 | 394 | 544 | ||||||||||||||||||
| Realized gains (losses) on investments: | ||||||||||||||||||||||||
| Capital gain distributions received | 3,000 | 2,107 | 91,276 | 57,366 | 888 | 898 | ||||||||||||||||||
| Net realized gain (loss) | 2,909 | 2,500 | 127,627 | 25,567 | 570 | 98 | ||||||||||||||||||
| Realized gains (losses) | 5,909 | 4,607 | 218,903 | 82,933 | 1,458 | 996 | ||||||||||||||||||
| Unrealized appreciation (depreciation) during the period | 5,831 | 12,491 | 94,029 | 605,419 | 2,116 | 844 | ||||||||||||||||||
| Net increase (decrease) in net assets from operations | 18,182 | 22,457 | 512,584 | 837,052 | 3,968 | 2,384 | ||||||||||||||||||
| Changes from principal transactions: | ||||||||||||||||||||||||
| Purchase payments | 4,630 | 4,595 | 218,550 | 241,073 | 327 | 1,334 | ||||||||||||||||||
| Transfers between sub-accounts and the company | 3,363 | 4,766 | 296,491 | 1,109,285 | 4 | (1,144 | ) | |||||||||||||||||
| Transfers on general account policy loans | (8,079 | ) | (2,696 | ) | (215,919 | ) | (9,878 | ) | - | 1,022 | ||||||||||||||
| Withdrawals | 70 | (11,312 | ) | (21,473 | ) | (80,114 | ) | 3 | 4 | |||||||||||||||
| Annual contract fee | (5,351 | ) | (5,393 | ) | (183,768 | ) | (157,742 | ) | (2,521 | ) | (1,646 | ) | ||||||||||||
| Net increase (decrease) in net assets from principal transactions | (5,367 | ) | (10,040 | ) | 93,881 | 1,102,624 | (2,187 | ) | (430 | ) | ||||||||||||||
| Total increase (decrease) in net assets | 12,815 | 12,417 | 606,465 | 1,939,676 | 1,781 | 1,954 | ||||||||||||||||||
| Net assets at beginning of period | 238,291 | 225,874 | 6,814,782 | 4,875,106 | 29,308 | 27,354 | ||||||||||||||||||
| Net assets at end of period | $ | 251,106 | $ | 238,291 | $ | 7,421,247 | $ | 6,814,782 | $ | 31,089 | $ | 29,308 | ||||||||||||
| 2021 | 2020 | 2021 | 2020 | 2021 | 2020 | |||||||||||||||||||
| Units, beginning of period | 14,255 | 14,950 | 103,590 | 82,078 | 1,347 | 1,362 | ||||||||||||||||||
| Units issued | 395 | 554 | 9,539 | 30,260 | 13 | 131 | ||||||||||||||||||
| Units redeemed | (691 | ) | (1,249 | ) | (8,281 | ) | (8,748 | ) | (104 | ) | (146 | ) | ||||||||||||
| Units, end of period | 13,959 | 14,255 | 104,848 | 103,590 | 1,256 | 1,347 | ||||||||||||||||||
| See accompanying notes. | 33 of 67 |
JOHN HANCOCK LIFE INSURANCE COMPANY OF NEW YORK SEPARATE ACCOUNT B
STATEMENTS OF OPERATIONS AND CHANGES IN CONTRACT OWNERS’ EQUITY
For the years ended December 31,
| International Small Company Trust Series | ||||||||||||||||||||||||
| NAV | Investment Quality Bond Trust Series I | Investment Quality Bond Trust Series NAV | ||||||||||||||||||||||
| 2021 | 2020 | 2021 | 2020 | 2021 | 2020 | |||||||||||||||||||
| Income: | ||||||||||||||||||||||||
| Dividend distributions received | $ | 24,227 | $ | 31,061 | $ | 3,800 | $ | 4,285 | $ | 14,690 | $ | 13,428 | ||||||||||||
| Expenses: | ||||||||||||||||||||||||
| Mortality and expense risk and administrative charges | - | - | - | - | - | - | ||||||||||||||||||
| Net investment income (loss) | 24,227 | 31,061 | 3,800 | 4,285 | 14,690 | 13,428 | ||||||||||||||||||
| Realized gains (losses) on investments: | ||||||||||||||||||||||||
| Capital gain distributions received | 52,603 | 50,111 | 4,126 | 101 | 15,571 | 312 | ||||||||||||||||||
| Net realized gain (loss) | 39,710 | 5,529 | 269 | 1,181 | 7,653 | 1,394 | ||||||||||||||||||
| Realized gains (losses) | 92,313 | 55,640 | 4,395 | 1,282 | 23,224 | 1,706 | ||||||||||||||||||
| Unrealized appreciation (depreciation) during the period | 116,410 | 61,427 | (10,445 | ) | 10,429 | (45,431 | ) | 34,694 | ||||||||||||||||
| Net increase (decrease) in net assets from operations | 232,950 | 148,128 | (2,250 | ) | 15,996 | (7,517 | ) | 49,828 | ||||||||||||||||
| Changes from principal transactions: | ||||||||||||||||||||||||
| Purchase payments | 62,936 | 65,001 | 9,542 | 8,599 | 43,683 | 36,580 | ||||||||||||||||||
| Transfers between sub-accounts and the company | 2,467 | 13,209 | 2,146 | 9,647 | 123,865 | 23,768 | ||||||||||||||||||
| Transfers on general account policy loans | (51,549 | ) | (3,814 | ) | - | 83 | (39,628 | ) | 157,697 | |||||||||||||||
| Withdrawals | (13,732 | ) | (9,800 | ) | (61 | ) | (12,031 | ) | (54,841 | ) | (154,341 | ) | ||||||||||||
| Annual contract fee | (47,624 | ) | (45,322 | ) | (5,818 | ) | (6,275 | ) | (26,406 | ) | (24,429 | ) | ||||||||||||
| Net increase (decrease) in net assets from principal transactions | (47,502 | ) | 19,274 | 5,809 | 23 | 46,673 | 39,275 | |||||||||||||||||
| Total increase (decrease) in net assets | 185,448 | 167,402 | 3,559 | 16,019 | 39,156 | 89,103 | ||||||||||||||||||
| Net assets at beginning of period | 1,689,633 | 1,522,232 | 180,796 | 164,777 | 630,792 | 541,689 | ||||||||||||||||||
| Net assets at end of period | $ | 1,875,081 | $ | 1,689,633 | $ | 184,355 | $ | 180,796 | $ | 669,948 | $ | 630,792 | ||||||||||||
| 2021 | 2020 | 2021 | 2020 | 2021 | 2020 | |||||||||||||||||||
| Units, beginning of period | 77,190 | 75,393 | 6,104 | 6,085 | 30,629 | 28,789 | ||||||||||||||||||
| Units issued | 4,996 | 9,673 | 375 | 656 | 10,215 | 14,998 | ||||||||||||||||||
| Units redeemed | (6,891 | ) | (7,876 | ) | (173 | ) | (637 | ) | (7,915 | ) | (13,158 | ) | ||||||||||||
| Units, end of period | 75,295 | 77,190 | 6,306 | 6,104 | 32,929 | 30,629 | ||||||||||||||||||
| See accompanying notes. | 34 of 67 |
JOHN HANCOCK LIFE INSURANCE COMPANY OF NEW YORK SEPARATE ACCOUNT B
STATEMENTS OF OPERATIONS AND CHANGES IN CONTRACT OWNERS’ EQUITY
For the years ended December 31,
| Lifestyle Balanced Portfolio Series NAV | Lifestyle Conservative Portfolio Series NAV | Lifestyle Growth Portfolio Series NAV | ||||||||||||||||||||||
| 2021 | 2020 | 2021 | 2020 | 2021 | 2020 | |||||||||||||||||||
| Income: | ||||||||||||||||||||||||
| Dividend distributions received | $ | 118,139 | $ | 95,056 | $ | 6,621 | $ | 5,931 | $ | 713,602 | $ | 568,273 | ||||||||||||
| Expenses: | ||||||||||||||||||||||||
| Mortality and expense risk and administrative charges | - | - | - | - | - | - | ||||||||||||||||||
| Net investment income (loss) | 118,139 | 95,056 | 6,621 | 5,931 | 713,602 | 568,273 | ||||||||||||||||||
| Realized gains (losses) on investments: | ||||||||||||||||||||||||
| Capital gain distributions received | 181,156 | 126,356 | 5,117 | 4,324 | 1,940,081 | 1,208,561 | ||||||||||||||||||
| Net realized gain (loss) | 33,690 | 29,288 | 991 | 2,394 | 317,025 | 77,251 | ||||||||||||||||||
| Realized gains (losses) | 214,846 | 155,644 | 6,108 | 6,718 | 2,257,106 | 1,285,812 | ||||||||||||||||||
| Unrealized appreciation (depreciation) during the period | 57,951 | 196,988 | (6,248 | ) | 9,468 | 725,842 | 1,144,188 | |||||||||||||||||
| Net increase (decrease) in net assets from operations | 390,936 | 447,688 | 6,481 | 22,117 | 3,696,550 | 2,998,273 | ||||||||||||||||||
| Changes from principal transactions: | ||||||||||||||||||||||||
| Purchase payments | 389,589 | 370,102 | 15,737 | 17,857 | 1,478,483 | 1,656,701 | ||||||||||||||||||
| Transfers between sub-accounts and the company | 146,575 | 15,006 | 3,264 | (12,317 | ) | 2,225,998 | 289,489 | |||||||||||||||||
| Transfers on general account policy loans | 1,220 | (19,432 | ) | 2,123 | - | (96,884 | ) | (27,642 | ) | |||||||||||||||
| Withdrawals | (23 | ) | (73,654 | ) | (3 | ) | (4 | ) | (313,651 | ) | (164,586 | ) | ||||||||||||
| Annual contract fee | (330,791 | ) | (310,667 | ) | (15,509 | ) | (16,076 | ) | (1,324,553 | ) | (1,232,239 | ) | ||||||||||||
| Net increase (decrease) in net assets from principal transactions | 206,570 | (18,645 | ) | 5,612 | (10,540 | ) | 1,969,393 | 521,723 | ||||||||||||||||
| Total increase (decrease) in net assets | 597,506 | 429,043 | 12,093 | 11,577 | 5,665,943 | 3,519,996 | ||||||||||||||||||
| Net assets at beginning of period | 3,976,684 | 3,547,641 | 214,413 | 202,836 | 25,093,141 | 21,573,145 | ||||||||||||||||||
| Net assets at end of period | $ | 4,574,190 | $ | 3,976,684 | $ | 226,506 | $ | 214,413 | $ | 30,759,084 | $ | 25,093,141 | ||||||||||||
| 2021 | 2020 | 2021 | 2020 | 2021 | 2020 | |||||||||||||||||||
| Units, beginning of period | 244,607 | 245,885 | 14,799 | 15,512 | 1,437,043 | 1,403,896 | ||||||||||||||||||
| Units issued | 24,349 | 16,495 | 1,149 | 2,803 | 188,618 | 95,195 | ||||||||||||||||||
| Units redeemed | (12,021 | ) | (17,773 | ) | (761 | ) | (3,516 | ) | (82,235 | ) | (62,048 | ) | ||||||||||||
| Units, end of period | 256,935 | 244,607 | 15,187 | 14,799 | 1,543,426 | 1,437,043 | ||||||||||||||||||
| See accompanying notes. | 35 of 67 |
JOHN HANCOCK LIFE INSURANCE COMPANY OF NEW YORK SEPARATE ACCOUNT B
STATEMENTS OF OPERATIONS AND CHANGES IN CONTRACT OWNERS’ EQUITY
For the years ended December 31,
| Lifestyle Moderate Portfolio Series NAV | M Capital Appreciation | M International Equity | ||||||||||||||||||||||
| 2021 | 2020 | 2021 | 2020 | 2021 | 2020 | |||||||||||||||||||
| Income: | ||||||||||||||||||||||||
| Dividend distributions received | $ | 52,850 | $ | 44,869 | $ | - | $ | - | $ | 26,239 | $ | 13,718 | ||||||||||||
| Expenses: | ||||||||||||||||||||||||
| Mortality and expense risk and administrative charges | - | - | - | - | - | - | ||||||||||||||||||
| Net investment income (loss) | 52,850 | 44,869 | - | - | 26,239 | 13,718 | ||||||||||||||||||
| Realized gains (losses) on investments: | ||||||||||||||||||||||||
| Capital gain distributions received | 71,839 | 51,574 | 131,373 | 16,411 | - | - | ||||||||||||||||||
| Net realized gain (loss) | 12,285 | 4,887 | 11,150 | (48,102 | ) | 7,304 | (67 | ) | ||||||||||||||||
| Realized gains (losses) | 84,124 | 56,461 | 142,523 | (31,691 | ) | 7,304 | (67 | ) | ||||||||||||||||
| Unrealized appreciation (depreciation) during the period | (6,385 | ) | 92,134 | (20,972 | ) | 152,245 | 71,159 | 88,901 | ||||||||||||||||
| Net increase (decrease) in net assets from operations | 130,589 | 193,464 | 121,551 | 120,554 | 104,702 | 102,552 | ||||||||||||||||||
| Changes from principal transactions: | ||||||||||||||||||||||||
| Purchase payments | 138,276 | 148,284 | 16,550 | 24,434 | 42,977 | 45,085 | ||||||||||||||||||
| Transfers between sub-accounts and the company | 18,449 | 44,167 | (21,528 | ) | (22,167 | ) | 31,397 | 73,667 | ||||||||||||||||
| Transfers on general account policy loans | 624 | 601 | (828 | ) | (44 | ) | (831 | ) | (44 | ) | ||||||||||||||
| Withdrawals | (27 | ) | (1,915 | ) | (580 | ) | (84,147 | ) | (433 | ) | (165 | ) | ||||||||||||
| Annual contract fee | (133,807 | ) | (126,803 | ) | (23,487 | ) | (24,147 | ) | (25,929 | ) | (22,973 | ) | ||||||||||||
| Net increase (decrease) in net assets from principal transactions | 23,515 | 64,334 | (29,873 | ) | (106,071 | ) | 47,181 | 95,570 | ||||||||||||||||
| Total increase (decrease) in net assets | 154,104 | 257,798 | 91,678 | 14,483 | 151,883 | 198,122 | ||||||||||||||||||
| Net assets at beginning of period | 1,794,023 | 1,536,225 | 700,482 | 685,999 | 953,653 | 755,531 | ||||||||||||||||||
| Net assets at end of period | $ | 1,948,127 | $ | 1,794,023 | $ | 792,160 | $ | 700,482 | $ | 1,105,536 | $ | 953,653 | ||||||||||||
| 2021 | 2020 | 2021 | 2020 | 2021 | 2020 | |||||||||||||||||||
| Units, beginning of period | 114,542 | 110,070 | 4,697 | 5,416 | 23,280 | 20,085 | ||||||||||||||||||
| Units issued | 6,390 | 11,010 | 483 | 972 | 2,261 | 4,495 | ||||||||||||||||||
| Units redeemed | (4,940 | ) | (6,538 | ) | (668 | ) | (1,691 | ) | (1,238 | ) | (1,300 | ) | ||||||||||||
| Units, end of period | 115,992 | 114,542 | 4,512 | 4,697 | 24,303 | 23,280 | ||||||||||||||||||
| See accompanying notes. | 36 of 67 |
JOHN HANCOCK LIFE INSURANCE COMPANY OF NEW YORK SEPARATE ACCOUNT B
STATEMENTS OF OPERATIONS AND CHANGES IN CONTRACT OWNERS’ EQUITY
For the years ended December 31,
| Managed Volatility Aggressive Portfolio | ||||||||||||||||||||||||
| M Large Cap Growth | M Large Cap Value | Series NAV | ||||||||||||||||||||||
| 2021 | 2020 | 2021 | 2020 | 2021 | 2020 | |||||||||||||||||||
| Income: | ||||||||||||||||||||||||
| Dividend distributions received | $ | - | $ | - | $ | 21,300 | $ | 20,610 | $ | 50,911 | $ | 262,631 | ||||||||||||
| Expenses: | ||||||||||||||||||||||||
| Mortality and expense risk and administrative charges | - | - | - | - | - | - | ||||||||||||||||||
| Net investment income (loss) | - | - | 21,300 | 20,610 | 50,911 | 262,631 | ||||||||||||||||||
| Realized gains (losses) on investments: | ||||||||||||||||||||||||
| Capital gain distributions received | 211,218 | 131,316 | - | 11,307 | 3 | 202,687 | ||||||||||||||||||
| Net realized gain (loss) | 87,986 | 102,703 | 8,833 | (5,881 | ) | 1,170,550 | 65,959 | |||||||||||||||||
| Realized gains (losses) | 299,204 | 234,019 | 8,833 | 5,426 | 1,170,553 | 268,646 | ||||||||||||||||||
| Unrealized appreciation (depreciation) during the period | (47,344 | ) | 34,179 | 307,332 | (29,427 | ) | 548,549 | (1,432,787 | ) | |||||||||||||||
| Net increase (decrease) in net assets from operations | 251,860 | 268,198 | 337,465 | (3,391 | ) | 1,770,013 | (901,510 | ) | ||||||||||||||||
| Changes from principal transactions: | ||||||||||||||||||||||||
| Purchase payments | 61,195 | 36,298 | 44,843 | 46,557 | 270,841 | 1,238,556 | ||||||||||||||||||
| Transfers between sub-accounts and the company | (238,048 | ) | (138,354 | ) | (87,866 | ) | 144,211 | (19,776,033 | ) | (430,626 | ) | |||||||||||||
| Transfers on general account policy loans | - | - | (827 | ) | (43 | ) | (3,414 | ) | (17,682 | ) | ||||||||||||||
| Withdrawals | (1,199 | ) | (129 | ) | (304 | ) | (144 | ) | (53,731 | ) | (180,923 | ) | ||||||||||||
| Annual contract fee | (49,332 | ) | (47,362 | ) | (37,563 | ) | (32,100 | ) | (195,551 | ) | (640,486 | ) | ||||||||||||
| Net increase (decrease) in net assets from principal transactions | (227,384 | ) | (149,547 | ) | (81,717 | ) | 158,481 | (19,757,888 | ) | (31,161 | ) | |||||||||||||
| Total increase (decrease) in net assets | 24,476 | 118,651 | 255,748 | 155,090 | (17,987,875 | ) | (932,671 | ) | ||||||||||||||||
| Net assets at beginning of period | 1,182,473 | 1,063,822 | 1,147,479 | 992,389 | 17,987,869 | 18,920,540 | ||||||||||||||||||
| Net assets at end of period | $ | 1,206,949 | $ | 1,182,473 | $ | 1,403,227 | $ | 1,147,479 | $ | (6 | ) | $ | 17,987,869 | |||||||||||
| 2021 | 2020 | 2021 | 2020 | 2021 | 2020 | |||||||||||||||||||
| Units, beginning of period | 9,662 | 11,204 | 37,123 | 31,090 | 774,376 | 775,419 | ||||||||||||||||||
| Units issued | 787 | 2,105 | 2,690 | 7,318 | 9,292 | 56,142 | ||||||||||||||||||
| Units redeemed | (2,332 | ) | (3,647 | ) | (4,894 | ) | (1,285 | ) | (783,668 | ) | (57,185 | ) | ||||||||||||
| Units, end of period | 8,117 | 9,662 | 34,919 | 37,123 | - | 774,376 | ||||||||||||||||||
| See accompanying notes. | 37 of 67 |
JOHN HANCOCK LIFE INSURANCE COMPANY OF NEW YORK SEPARATE ACCOUNT B
STATEMENTS OF OPERATIONS AND CHANGES IN CONTRACT OWNERS’ EQUITY
For the years ended December 31,
| Managed Volatility Balanced Portfolio Series | Managed Volatility Balanced Portfolio Series | Managed Volatility Conservative Portfolio | ||||||||||||||||||||||
| I | NAV | Series I | ||||||||||||||||||||||
| 2021 | 2020 | 2021 | 2020 | 2021 | 2020 | |||||||||||||||||||
| Income: | ||||||||||||||||||||||||
| Dividend distributions received | $ | 23,018 | $ | 24,470 | $ | 1,251,206 | $ | 1,130,111 | $ | 2,636 | $ | 2,412 | ||||||||||||
| Expenses: | ||||||||||||||||||||||||
| Mortality and expense risk and administrative charges | - | - | - | - | - | - | ||||||||||||||||||
| Net investment income (loss) | 23,018 | 24,470 | 1,251,206 | 1,130,111 | 2,636 | 2,412 | ||||||||||||||||||
| Realized gains (losses) on investments: | ||||||||||||||||||||||||
| Capital gain distributions received | - | 64,209 | 1 | 2,306,231 | - | 1,100 | ||||||||||||||||||
| Net realized gain (loss) | (10,279 | ) | (14,322 | ) | (196,537 | ) | (250,109 | ) | (567 | ) | (635 | ) | ||||||||||||
| Realized gains (losses) | (10,279 | ) | 49,887 | (196,536 | ) | 2,056,122 | (567 | ) | 465 | |||||||||||||||
| Unrealized appreciation (depreciation) during the period | 71,297 | (54,504 | ) | 3,412,909 | (2,307,902 | ) | 1,014 | (228 | ) | |||||||||||||||
| Net increase (decrease) in net assets from operations | 84,036 | 19,853 | 4,467,579 | 878,331 | 3,083 | 2,649 | ||||||||||||||||||
| Changes from principal transactions: | ||||||||||||||||||||||||
| Purchase payments | 13,517 | 13,517 | 2,469,050 | 3,186,947 | - | - | ||||||||||||||||||
| Transfers between sub-accounts and the company | 2,542 | 1,282 | (193,703 | ) | (14,598 | ) | 9,633 | 1,177 | ||||||||||||||||
| Transfers on general account policy loans | (11,999 | ) | (26 | ) | (128,418 | ) | 15,317 | - | 3,725 | |||||||||||||||
| Withdrawals | (112,727 | ) | (302,194 | ) | (638,916 | ) | (535,820 | ) | 40 | 35 | ||||||||||||||
| Annual contract fee | (21,910 | ) | (25,723 | ) | (2,423,202 | ) | (2,452,967 | ) | (6,745 | ) | (5,569 | ) | ||||||||||||
| Net increase (decrease) in net assets from principal transactions | (130,577 | ) | (313,144 | ) | (915,189 | ) | 198,879 | 2,928 | (632 | ) | ||||||||||||||
| Total increase (decrease) in net assets | (46,541 | ) | (293,291 | ) | 3,552,390 | 1,077,210 | 6,011 | 2,017 | ||||||||||||||||
| Net assets at beginning of period | 969,445 | 1,262,736 | 45,778,016 | 44,700,806 | 80,839 | 78,822 | ||||||||||||||||||
| Net assets at end of period | $ | 922,904 | $ | 969,445 | $ | 49,330,406 | $ | 45,778,016 | $ | 86,850 | $ | 80,839 | ||||||||||||
| 2021 | 2020 | 2021 | 2020 | 2021 | 2020 | |||||||||||||||||||
| Units, beginning of period | 31,083 | 41,200 | 1,946,054 | 1,933,830 | 2,708 | 2,730 | ||||||||||||||||||
| Units issued | 369 | 405 | 75,649 | 120,061 | 294 | 196 | ||||||||||||||||||
| Units redeemed | (4,545 | ) | (10,522 | ) | (113,140 | ) | (107,837 | ) | (191 | ) | (218 | ) | ||||||||||||
| Units, end of period | 26,907 | 31,083 | 1,908,563 | 1,946,054 | 2,811 | 2,708 | ||||||||||||||||||
| See accompanying notes. | 38 of 67 |
JOHN HANCOCK LIFE INSURANCE COMPANY OF NEW YORK SEPARATE ACCOUNT B
STATEMENTS OF OPERATIONS AND CHANGES IN CONTRACT OWNERS’ EQUITY
For the years ended December 31,
| Managed Volatility Conservative Portfolio | Managed Volatility Growth Portfolio Series | |||||||||||||||||||||||
| Series NAV | Managed Volatility Growth Portfolio Series I | NAV | ||||||||||||||||||||||
| 2021 | 2020 | 2021 | 2020 | 2021 | 2020 | |||||||||||||||||||
| Income: | ||||||||||||||||||||||||
| Dividend distributions received | $ | 244,569 | $ | 245,968 | $ | 57,656 | $ | 31,935 | $ | 1,429,113 | $ | 876,278 | ||||||||||||
| Expenses: | ||||||||||||||||||||||||
| Mortality and expense risk and administrative charges | - | - | - | - | - | - | ||||||||||||||||||
| Net investment income (loss) | 244,569 | 245,968 | 57,656 | 31,935 | 1,429,113 | 876,278 | ||||||||||||||||||
| Realized gains (losses) on investments: | ||||||||||||||||||||||||
| Capital gain distributions received | 2 | 109,523 | - | 87,946 | - | 2,354,618 | ||||||||||||||||||
| Net realized gain (loss) | (29,006 | ) | (35,085 | ) | (3,130 | ) | (27,155 | ) | (3,589 | ) | (139,619 | ) | ||||||||||||
| Realized gains (losses) | (29,004 | ) | 74,438 | (3,130 | ) | 60,791 | (3,589 | ) | 2,214,999 | |||||||||||||||
| Unrealized appreciation (depreciation) during the period | 58,964 | (52,500 | ) | 188,154 | (132,499 | ) | 4,796,838 | (3,580,988 | ) | |||||||||||||||
| Net increase (decrease) in net assets from operations | 274,529 | 267,906 | 242,680 | (39,773 | ) | 6,222,362 | (489,711 | ) | ||||||||||||||||
| Changes from principal transactions: | ||||||||||||||||||||||||
| Purchase payments | 177,105 | 185,106 | 79,032 | 84,858 | 3,397,450 | 3,306,466 | ||||||||||||||||||
| Transfers between sub-accounts and the company | (59,301 | ) | 511,699 | 776,666 | (88,143 | ) | 18,938,413 | (272,248 | ) | |||||||||||||||
| Transfers on general account policy loans | (45,488 | ) | (6,734 | ) | 81,910 | 30,037 | (232,167 | ) | (210,694 | ) | ||||||||||||||
| Withdrawals | (203,318 | ) | (442,924 | ) | 2,294 | (25,490 | ) | (2,612,916 | ) | (733,722 | ) | |||||||||||||
| Annual contract fee | (335,246 | ) | (352,623 | ) | (50,278 | ) | (48,216 | ) | (2,559,894 | ) | (2,170,701 | ) | ||||||||||||
| Net increase (decrease) in net assets from principal transactions | (466,248 | ) | (105,476 | ) | 889,624 | (46,954 | ) | 16,930,886 | (80,899 | ) | ||||||||||||||
| Total increase (decrease) in net assets | (191,719 | ) | 162,430 | 1,132,304 | (86,727 | ) | 23,153,248 | (570,610 | ) | |||||||||||||||
| Net assets at beginning of period | 8,152,114 | 7,989,684 | 1,538,909 | 1,625,636 | 41,367,207 | 41,937,817 | ||||||||||||||||||
| Net assets at end of period | $ | 7,960,395 | $ | 8,152,114 | $ | 2,671,213 | $ | 1,538,909 | $ | 64,520,455 | $ | 41,367,207 | ||||||||||||
| 2021 | 2020 | 2021 | 2020 | 2021 | 2020 | |||||||||||||||||||
| Units, beginning of period | 383,041 | 388,294 | 54,647 | 56,907 | 1,776,643 | 1,776,513 | ||||||||||||||||||
| Units issued | 6,472 | 35,866 | 30,205 | 9,392 | 945,699 | 118,164 | ||||||||||||||||||
| Units redeemed | (28,200 | ) | (41,119 | ) | (796 | ) | (11,652 | ) | (266,877 | ) | (118,034 | ) | ||||||||||||
| Units, end of period | 361,313 | 383,041 | 84,056 | 54,647 | 2,455,465 | 1,776,643 | ||||||||||||||||||
| See accompanying notes. | 39 of 67 |
JOHN HANCOCK LIFE INSURANCE COMPANY OF NEW YORK SEPARATE ACCOUNT B
STATEMENTS OF OPERATIONS AND CHANGES IN CONTRACT OWNERS’ EQUITY
For the years ended December 31,
| Managed Volatility Moderate Portfolio Series | Managed Volatility Moderate Portfolio Series | |||||||||||||||||||||||
| I | NAV | Mid Cap Growth Trust Series I | ||||||||||||||||||||||
| 2021 | 2020 | 2021 | 2020 | 2021(c) | 2020 | |||||||||||||||||||
| Income: | ||||||||||||||||||||||||
| Dividend distributions received | $ | 14,072 | $ | 13,218 | $ | 370,629 | $ | 330,957 | $ | - | $ | - | ||||||||||||
| Expenses: | ||||||||||||||||||||||||
| Mortality and expense risk and administrative charges | - | - | - | - | - | - | ||||||||||||||||||
| Net investment income (loss) | 14,072 | 13,218 | 370,629 | 330,957 | - | - | ||||||||||||||||||
| Realized gains (losses) on investments: | ||||||||||||||||||||||||
| Capital gain distributions received | - | 22,848 | (3 | ) | 553,757 | 232,317 | 88,874 | |||||||||||||||||
| Net realized gain (loss) | (395 | ) | (633 | ) | (71,007 | ) | (80,430 | ) | 18,055 | 2,728 | ||||||||||||||
| Realized gains (losses) | (395 | ) | 22,215 | (71,010 | ) | 473,327 | 250,372 | 91,602 | ||||||||||||||||
| Unrealized appreciation (depreciation) during the period | 25,574 | (18,597 | ) | 722,437 | (405,960 | ) | (221,262 | ) | 232,351 | |||||||||||||||
| Net increase (decrease) in net assets from operations | 39,251 | 16,836 | 1,022,056 | 398,324 | 29,110 | 323,953 | ||||||||||||||||||
| Changes from principal transactions: | ||||||||||||||||||||||||
| Purchase payments | 3,283 | 6,386 | 754,359 | 840,100 | 21,793 | 23,400 | ||||||||||||||||||
| Transfers between sub-accounts and the company | 367 | 10,162 | (41,349 | ) | (110,718 | ) | 17,204 | (13,797 | ) | |||||||||||||||
| Transfers on general account policy loans | - | (19,999 | ) | (19,833 | ) | (4,490 | ) | 203 | (30 | ) | ||||||||||||||
| Withdrawals | (1,067 | ) | 331 | (12,898 | ) | (152,199 | ) | (32,889 | ) | (2,142 | ) | |||||||||||||
| Annual contract fee | (28,232 | ) | (24,410 | ) | (571,633 | ) | (589,989 | ) | (29,220 | ) | (28,060 | ) | ||||||||||||
| Net increase (decrease) in net assets from principal transactions | (25,649 | ) | (27,530 | ) | 108,646 | (17,296 | ) | (22,909 | ) | (20,629 | ) | |||||||||||||
| Total increase (decrease) in net assets | 13,602 | (10,694 | ) | 1,130,702 | 381,028 | 6,201 | 303,324 | |||||||||||||||||
| Net assets at beginning of period | 506,603 | 517,297 | 12,495,666 | 12,114,638 | 806,869 | 503,545 | ||||||||||||||||||
| Net assets at end of period | $ | 520,205 | $ | 506,603 | $ | 13,626,368 | $ | 12,495,666 | $ | 813,070 | $ | 806,869 | ||||||||||||
| 2021 | 2020 | 2021 | 2020 | 2021 | 2020 | |||||||||||||||||||
| Units, beginning of period | 16,080 | 16,964 | 533,812 | 534,457 | 8,168 | 8,431 | ||||||||||||||||||
| Units issued | 86 | 525 | 98,691 | 32,009 | 316 | 268 | ||||||||||||||||||
| Units redeemed | (866 | ) | (1,409 | ) | (93,646 | ) | (32,654 | ) | (535 | ) | (531 | ) | ||||||||||||
| Units, end of period | 15,300 | 16,080 | 538,857 | 533,812 | 7,949 | 8,168 | ||||||||||||||||||
| (c) | Renamed on October 1, 2021. Previously known as Mid Cap Stock Trust Series I. |
| See accompanying notes. | 40 of 67 |
JOHN HANCOCK LIFE INSURANCE COMPANY OF NEW YORK SEPARATE ACCOUNT B
STATEMENTS OF OPERATIONS AND CHANGES IN CONTRACT OWNERS’ EQUITY
For the years ended December 31,
| Mid Cap Growth Trust Series NAV | Mid Cap Index Trust Series I | Mid Cap Index Trust Series NAV | ||||||||||||||||||||||
| 2021(d) | 2020 | 2021 | 2020 | 2021 | 2020 | |||||||||||||||||||
| Income: | ||||||||||||||||||||||||
| Dividend distributions received | $ | - | $ | - | $ | 5,593 | $ | 8,198 | $ | 48,951 | $ | 62,824 | ||||||||||||
| Expenses: | ||||||||||||||||||||||||
| Mortality and expense risk and administrative charges | - | - | - | - | - | - | ||||||||||||||||||
| Net investment income (loss) | - | - | 5,593 | 8,198 | 48,951 | 62,824 | ||||||||||||||||||
| Realized gains (losses) on investments: | ||||||||||||||||||||||||
| Capital gain distributions received | 1,099,619 | 398,351 | 34,480 | 54,460 | 284,502 | 405,353 | ||||||||||||||||||
| Net realized gain (loss) | 134,904 | 82,861 | 5,744 | (4,683 | ) | 76,231 | (15,065 | ) | ||||||||||||||||
| Realized gains (losses) | 1,234,523 | 481,212 | 40,224 | 49,777 | 360,733 | 390,288 | ||||||||||||||||||
| Unrealized appreciation (depreciation) during the period | (1,105,783 | ) | 1,028,039 | 88,715 | 8,618 | 664,219 | 168,580 | |||||||||||||||||
| Net increase (decrease) in net assets from operations | 128,740 | 1,509,251 | 134,532 | 66,593 | 1,073,903 | 621,692 | ||||||||||||||||||
| Changes from principal transactions: | ||||||||||||||||||||||||
| Purchase payments | 193,764 | 180,697 | 3,706 | 3,903 | 280,705 | 277,510 | ||||||||||||||||||
| Transfers between sub-accounts and the company | 170,332 | (187,671 | ) | (13,510 | ) | 6,208 | (118,447 | ) | 41,626 | |||||||||||||||
| Transfers on general account policy loans | (37,176 | ) | (154 | ) | - | 16 | (64,401 | ) | (11,051 | ) | ||||||||||||||
| Withdrawals | (54,923 | ) | (101,064 | ) | (1,787 | ) | (41,198 | ) | (29,240 | ) | (107,920 | ) | ||||||||||||
| Annual contract fee | (155,408 | ) | (134,836 | ) | (20,169 | ) | (17,717 | ) | (208,326 | ) | (189,037 | ) | ||||||||||||
| Net increase (decrease) in net assets from principal transactions | 116,589 | (243,028 | ) | (31,760 | ) | (48,788 | ) | (139,709 | ) | 11,128 | ||||||||||||||
| Total increase (decrease) in net assets | 245,329 | 1,266,223 | 102,772 | 17,805 | 934,194 | 632,820 | ||||||||||||||||||
| Net assets at beginning of period | 3,705,290 | 2,439,067 | 566,058 | 548,253 | 4,537,583 | 3,904,763 | ||||||||||||||||||
| Net assets at end of period | $ | 3,950,619 | $ | 3,705,290 | $ | 668,830 | $ | 566,058 | $ | 5,471,777 | $ | 4,537,583 | ||||||||||||
| 2021 | 2020 | 2021 | 2020 | 2021 | 2020 | |||||||||||||||||||
| Units, beginning of period | 17,184 | 18,718 | 7,886 | 8,647 | 96,105 | 93,675 | ||||||||||||||||||
| Units issued | 1,906 | 1,395 | 72 | 269 | 8,612 | 15,695 | ||||||||||||||||||
| Units redeemed | (1,400 | ) | (2,929 | ) | (457 | ) | (1,030 | ) | (11,463 | ) | (13,265 | ) | ||||||||||||
| Units, end of period | 17,690 | 17,184 | 7,501 | 7,886 | 93,254 | 96,105 | ||||||||||||||||||
| (d) | Renamed on October 1, 2021. Previously known as Mid Cap Stock Trust Series NAV. |
| See accompanying notes. | 41 of 67 |
JOHN HANCOCK LIFE INSURANCE COMPANY OF NEW YORK SEPARATE ACCOUNT B
STATEMENTS OF OPERATIONS AND CHANGES IN CONTRACT OWNERS’ EQUITY
For the years ended December 31,
| Mid Value Trust Series I | Mid Value Trust Series NAV | Money Market Trust Series I | ||||||||||||||||||||||
| 2021 | 2020 | 2021 | 2020 | 2021 | 2020 | |||||||||||||||||||
| Income: | ||||||||||||||||||||||||
| Dividend distributions received | $ | 3,181 | $ | 4,398 | $ | 16,534 | $ | 21,087 | $ | 68 | $ | 6,606 | ||||||||||||
| Expenses: | ||||||||||||||||||||||||
| Mortality and expense risk and administrative charges | - | - | - | - | - | - | ||||||||||||||||||
| Net investment income (loss) | 3,181 | 4,398 | 16,534 | 21,087 | 68 | 6,606 | ||||||||||||||||||
| Realized gains (losses) on investments: | ||||||||||||||||||||||||
| Capital gain distributions received | 15,472 | 6,245 | 76,778 | 29,134 | - | - | ||||||||||||||||||
| Net realized gain (loss) | 3,250 | (2,439 | ) | 2,150 | (82,447 | ) | - | - | ||||||||||||||||
| Realized gains (losses) | 18,722 | 3,806 | 78,928 | (53,313 | ) | - | - | |||||||||||||||||
| Unrealized appreciation (depreciation) during the period | 49,982 | 18,613 | 239,085 | 153,379 | (2 | ) | (1 | ) | ||||||||||||||||
| Net increase (decrease) in net assets from operations | 71,885 | 26,817 | 334,547 | 121,153 | 66 | 6,605 | ||||||||||||||||||
| Changes from principal transactions: | ||||||||||||||||||||||||
| Purchase payments | 3,598 | 5,430 | 78,788 | 84,681 | 20,006 | 11,444 | ||||||||||||||||||
| Transfers between sub-accounts and the company | (9,587 | ) | (1,099 | ) | (29,233 | ) | (16,913 | ) | 2,922 | 3,532 | ||||||||||||||
| Transfers on general account policy loans | (11,086 | ) | 85 | (351 | ) | (75 | ) | 243 | (5,307 | ) | ||||||||||||||
| Withdrawals | (29 | ) | (1,976 | ) | (42,802 | ) | (54,272 | ) | (1,794 | ) | (16,239 | ) | ||||||||||||
| Annual contract fee | (7,100 | ) | (5,917 | ) | (61,404 | ) | (57,402 | ) | (64,534 | ) | (60,980 | ) | ||||||||||||
| Net increase (decrease) in net assets from principal transactions | (24,204 | ) | (3,477 | ) | (55,002 | ) | (43,981 | ) | (43,157 | ) | (67,550 | ) | ||||||||||||
| Total increase (decrease) in net assets | 47,681 | 23,340 | 279,545 | 77,172 | (43,091 | ) | (60,945 | ) | ||||||||||||||||
| Net assets at beginning of period | 296,922 | 273,582 | 1,406,555 | 1,329,385 | 2,084,208 | 2,145,153 | ||||||||||||||||||
| Net assets at end of period | $ | 344,603 | $ | 296,922 | $ | 1,686,100 | $ | 1,406,555 | $ | 2,041,117 | $ | 2,084,208 | ||||||||||||
| 2021 | 2020 | 2021 | 2020 | 2021 | 2020 | |||||||||||||||||||
| Units, beginning of period | 7,330 | 7,402 | 22,527 | 23,361 | 148,137 | 152,943 | ||||||||||||||||||
| Units issued | 185 | 331 | 2,096 | 2,621 | 5,541 | 957 | ||||||||||||||||||
| Units redeemed | (672 | ) | (403 | ) | (2,891 | ) | (3,455 | ) | (8,483 | ) | (5,763 | ) | ||||||||||||
| Units, end of period | 6,843 | 7,330 | 21,732 | 22,527 | 145,195 | 148,137 | ||||||||||||||||||
| See accompanying notes. | 42 of 67 |
JOHN HANCOCK LIFE INSURANCE COMPANY OF NEW YORK SEPARATE ACCOUNT B
STATEMENTS OF OPERATIONS AND CHANGES IN CONTRACT OWNERS’ EQUITY
For the years ended December 31,
| Opportunistic Fixed Income Trust Series | ||||||||||||||||||||||||
| Money Market Trust Series NAV | Opportunistic Fixed Income Trust Series I | NAV | ||||||||||||||||||||||
| 2021 | 2020 | 2021 | 2020 | 2021 | 2020 | |||||||||||||||||||
| Income: | ||||||||||||||||||||||||
| Dividend distributions received | $ | 194 | $ | 33,350 | $ | 4,759 | $ | 6,452 | $ | 38,381 | $ | 47,027 | ||||||||||||
| Expenses: | ||||||||||||||||||||||||
| Mortality and expense risk and administrative charges | - | - | - | - | - | - | ||||||||||||||||||
| Net investment income (loss) | 194 | 33,350 | 4,759 | 6,452 | 38,381 | 47,027 | ||||||||||||||||||
| Realized gains (losses) on investments: | ||||||||||||||||||||||||
| Capital gain distributions received | - | 2 | 6,496 | - | 51,472 | - | ||||||||||||||||||
| Net realized gain (loss) | - | - | 621 | 195 | (1,080 | ) | (2,100 | ) | ||||||||||||||||
| Realized gains (losses) | - | 2 | 7,117 | 195 | 50,392 | (2,100 | ) | |||||||||||||||||
| Unrealized appreciation (depreciation) during the period | 1 | 1 | (15,437 | ) | 14,628 | (115,245 | ) | 107,170 | ||||||||||||||||
| Net increase (decrease) in net assets from operations | 195 | 33,353 | (3,561 | ) | 21,275 | (26,472 | ) | 152,097 | ||||||||||||||||
| Changes from principal transactions: | ||||||||||||||||||||||||
| Purchase payments | 5,425,837 | 3,487,668 | 1,868 | 1,834 | 69,726 | 76,595 | ||||||||||||||||||
| Transfers between sub-accounts and the company | (5,980,596 | ) | (7,372,295 | ) | 7,607 | 74 | 91,522 | (40,408 | ) | |||||||||||||||
| Transfers on general account policy loans | (35,721 | ) | (3,396 | ) | (9,754 | ) | (7 | ) | (66,712 | ) | 539 | |||||||||||||
| Withdrawals | (187,779 | ) | (1,311,091 | ) | (41 | ) | 91 | (24,054 | ) | (12,833 | ) | |||||||||||||
| Annual contract fee | (299,131 | ) | (352,963 | ) | (2,745 | ) | (2,841 | ) | (35,635 | ) | (39,664 | ) | ||||||||||||
| Net increase (decrease) in net assets from principal transactions | (1,077,390 | ) | (5,552,077 | ) | (3,065 | ) | (849 | ) | 34,847 | (15,771 | ) | |||||||||||||
| Total increase (decrease) in net assets | (1,077,195 | ) | (5,518,724 | ) | (6,626 | ) | 20,426 | 8,375 | 136,326 | |||||||||||||||
| Net assets at beginning of period | 4,660,304 | 10,179,028 | 176,808 | 156,382 | 1,273,630 | 1,137,304 | ||||||||||||||||||
| Net assets at end of period | $ | 3,583,109 | $ | 4,660,304 | $ | 170,182 | $ | 176,808 | $ | 1,282,005 | $ | 1,273,630 | ||||||||||||
| 2021 | 2020 | 2021 | 2020 | 2021 | 2020 | |||||||||||||||||||
| Units, beginning of period | 444,888 | 975,555 | 6,384 | 6,425 | 32,095 | 32,644 | ||||||||||||||||||
| Units issued | 598,607 | 663,497 | 327 | 165 | 4,156 | 3,516 | ||||||||||||||||||
| Units redeemed | (701,586 | ) | (1,194,164 | ) | (438 | ) | (206 | ) | (3,266 | ) | (4,065 | ) | ||||||||||||
| Units, end of period | 341,909 | 444,888 | 6,273 | 6,384 | 32,985 | 32,095 | ||||||||||||||||||
| See accompanying notes. | 43 of 67 |
JOHN HANCOCK LIFE INSURANCE COMPANY OF NEW YORK SEPARATE ACCOUNT B
STATEMENTS OF OPERATIONS AND CHANGES IN CONTRACT OWNERS’ EQUITY
For the years ended December 31,
| PIMCO All Asset | Real Estate Securities Trust Series I | Real Estate Securities Trust Series NAV | ||||||||||||||||||||||
| 2021 | 2020 | 2021 | 2020 | 2021 | 2020 | |||||||||||||||||||
| Income: | ||||||||||||||||||||||||
| Dividend distributions received | $ | 69,104 | $ | 23,339 | $ | 2,927 | $ | 3,259 | $ | 35,688 | $ | 37,373 | ||||||||||||
| Expenses: | ||||||||||||||||||||||||
| Mortality and expense risk and administrative charges | - | - | - | - | - | - | ||||||||||||||||||
| Net investment income (loss) | 69,104 | 23,339 | 2,927 | 3,259 | 35,688 | 37,373 | ||||||||||||||||||
| Realized gains (losses) on investments: | ||||||||||||||||||||||||
| Capital gain distributions received | - | (1 | ) | - | 19,397 | 7 | 217,185 | |||||||||||||||||
| Net realized gain (loss) | 780 | (2,053 | ) | 6,233 | 1,052 | 47,541 | 32,650 | |||||||||||||||||
| Realized gains (losses) | 780 | (2,054 | ) | 6,233 | 20,449 | 47,548 | 249,835 | |||||||||||||||||
| Unrealized appreciation (depreciation) during the period | 23,635 | 20,279 | 67,251 | (34,033 | ) | 802,930 | (383,555 | ) | ||||||||||||||||
| Net increase (decrease) in net assets from operations | 93,519 | 41,564 | 76,411 | (10,325 | ) | 886,166 | (96,347 | ) | ||||||||||||||||
| Changes from principal transactions: | ||||||||||||||||||||||||
| Purchase payments | 45,871 | 40,500 | 12,848 | 7,840 | 103,523 | 99,774 | ||||||||||||||||||
| Transfers between sub-accounts and the company | (4,709 | ) | 4,786 | (559 | ) | 1,015 | (23,585 | ) | 67,184 | |||||||||||||||
| Transfers on general account policy loans | (10,769 | ) | (7,771 | ) | (11,503 | ) | (518 | ) | (6,443 | ) | (11,825 | ) | ||||||||||||
| Withdrawals | (4,146 | ) | (5,364 | ) | 2,660 | (508 | ) | (1,624 | ) | (41,092 | ) | |||||||||||||
| Annual contract fee | (12,049 | ) | (11,509 | ) | (13,338 | ) | (10,608 | ) | (68,768 | ) | (67,143 | ) | ||||||||||||
| Net increase (decrease) in net assets from principal transactions | 14,198 | 20,642 | (9,892 | ) | (2,779 | ) | 3,103 | 46,898 | ||||||||||||||||
| Total increase (decrease) in net assets | 107,717 | 62,206 | 66,519 | (13,104 | ) | 889,269 | (49,449 | ) | ||||||||||||||||
| Net assets at beginning of period | 588,701 | 526,495 | 165,572 | 178,676 | 1,866,278 | 1,915,727 | ||||||||||||||||||
| Net assets at end of period | $ | 696,418 | $ | 588,701 | $ | 232,091 | $ | 165,572 | $ | 2,755,547 | $ | 1,866,278 | ||||||||||||
| 2021 | 2020 | 2021 | 2020 | 2021 | 2020 | |||||||||||||||||||
| Units, beginning of period | 28,366 | 27,331 | 2,400 | 2,444 | 9,740 | 9,440 | ||||||||||||||||||
| Units issued | 1,929 | 2,148 | 160 | 115 | 637 | 1,058 | ||||||||||||||||||
| Units redeemed | (1,342 | ) | (1,113 | ) | (267 | ) | (159 | ) | (580 | ) | (758 | ) | ||||||||||||
| Units, end of period | 28,953 | 28,366 | 2,293 | 2,400 | 9,797 | 9,740 | ||||||||||||||||||
| See accompanying notes. | 44 of 67 |
JOHN HANCOCK LIFE INSURANCE COMPANY OF NEW YORK SEPARATE ACCOUNT B
STATEMENTS OF OPERATIONS AND CHANGES IN CONTRACT OWNERS’ EQUITY
For the years ended December 31,
| Science & Technology Trust Series I | Science & Technology Trust Series NAV | Select Bond Trust Series I | ||||||||||||||||||||||
| 2021 | 2020 | 2021 | 2020 | 2021 | 2020 | |||||||||||||||||||
| Income: | ||||||||||||||||||||||||
| Dividend distributions received | $ | - | $ | - | $ | - | $ | - | $ | 1,099 | $ | 1,209 | ||||||||||||
| Expenses: | ||||||||||||||||||||||||
| Mortality and expense risk and administrative charges | - | - | - | - | - | - | ||||||||||||||||||
| Net investment income (loss) | - | - | - | - | 1,099 | 1,209 | ||||||||||||||||||
| Realized gains (losses) on investments: | ||||||||||||||||||||||||
| Capital gain distributions received | 131,064 | 47,162 | 1,530,376 | 599,973 | 185 | - | ||||||||||||||||||
| Net realized gain (loss) | 15,441 | 4,979 | 247,708 | 173,604 | 122 | 52 | ||||||||||||||||||
| Realized gains (losses) | 146,505 | 52,141 | 1,778,084 | 773,577 | 307 | 52 | ||||||||||||||||||
| Unrealized appreciation (depreciation) during the period | (95,529 | ) | 155,014 | (1,154,973 | ) | 1,908,105 | (1,902 | ) | 1,834 | |||||||||||||||
| Net increase (decrease) in net assets from operations | 50,976 | 207,155 | 623,111 | 2,681,682 | (496 | ) | 3,095 | |||||||||||||||||
| Changes from principal transactions: | ||||||||||||||||||||||||
| Purchase payments | 11,616 | 10,154 | 288,942 | 262,705 | 883 | 883 | ||||||||||||||||||
| Transfers between sub-accounts and the company | 65,739 | (1,935 | ) | 55,216 | (60,442 | ) | 11 | 14,226 | ||||||||||||||||
| Transfers on general account policy loans | (2,663 | ) | (261 | ) | (12,110 | ) | 44,282 | - | - | |||||||||||||||
| Withdrawals | (1,955 | ) | (3,763 | ) | (172,277 | ) | (174,531 | ) | (1,457 | ) | - | |||||||||||||
| Annual contract fee | (36,068 | ) | (30,092 | ) | (307,334 | ) | (276,628 | ) | (1,027 | ) | (929 | ) | ||||||||||||
| Net increase (decrease) in net assets from principal transactions | 36,669 | (25,897 | ) | (147,563 | ) | (204,614 | ) | (1,590 | ) | 14,180 | ||||||||||||||
| Total increase (decrease) in net assets | 87,645 | 181,258 | 475,548 | 2,477,068 | (2,086 | ) | 17,275 | |||||||||||||||||
| Net assets at beginning of period | 558,423 | 377,165 | 7,240,387 | 4,763,319 | 41,031 | 23,756 | ||||||||||||||||||
| Net assets at end of period | $ | 646,068 | $ | 558,423 | $ | 7,715,935 | $ | 7,240,387 | $ | 38,945 | $ | 41,031 | ||||||||||||
| 2021 | 2020 | 2021 | 2020 | 2021 | 2020 | |||||||||||||||||||
| Units, beginning of period | 9,833 | 10,458 | 76,211 | 79,005 | 2,902 | 1,833 | ||||||||||||||||||
| Units issued | 1,263 | 247 | 4,892 | 5,877 | 60 | 1,135 | ||||||||||||||||||
| Units redeemed | (610 | ) | (872 | ) | (6,306 | ) | (8,671 | ) | (174 | ) | (66 | ) | ||||||||||||
| Units, end of period | 10,486 | 9,833 | 74,797 | 76,211 | 2,788 | 2,902 | ||||||||||||||||||
| See accompanying notes. | 45 of 67 |
JOHN HANCOCK LIFE INSURANCE COMPANY OF NEW YORK SEPARATE ACCOUNT B
STATEMENTS OF OPERATIONS AND CHANGES IN CONTRACT OWNERS’ EQUITY
For the years ended December 31,
| Short Term Government Income Trust Series | Short Term Government Income Trust Series | |||||||||||||||||||||||
| Select Bond Trust Series NAV | I | NAV | ||||||||||||||||||||||
| 2021 | 2020 | 2021 | 2020 | 2021 | 2020 | |||||||||||||||||||
| Income: | ||||||||||||||||||||||||
| Dividend distributions received | $ | 41,762 | $ | 42,748 | $ | 2,684 | $ | 2,519 | $ | 13,306 | $ | 12,548 | ||||||||||||
| Expenses: | ||||||||||||||||||||||||
| Mortality and expense risk and administrative charges | - | - | - | - | - | - | ||||||||||||||||||
| Net investment income (loss) | 41,762 | 42,748 | 2,684 | 2,519 | 13,306 | 12,548 | ||||||||||||||||||
| Realized gains (losses) on investments: | ||||||||||||||||||||||||
| Capital gain distributions received | 6,920 | 1 | - | (1 | ) | - | 1 | |||||||||||||||||
| Net realized gain (loss) | 4,157 | 5,492 | 6 | 187 | 441 | (207 | ) | |||||||||||||||||
| Realized gains (losses) | 11,077 | 5,493 | 6 | 186 | 441 | (206 | ) | |||||||||||||||||
| Unrealized appreciation (depreciation) during the period | (68,344 | ) | 70,945 | (5,070 | ) | 2,546 | (25,004 | ) | 11,613 | |||||||||||||||
| Net increase (decrease) in net assets from operations | (15,505 | ) | 119,186 | (2,380 | ) | 5,251 | (11,257 | ) | 23,955 | |||||||||||||||
| Changes from principal transactions: | ||||||||||||||||||||||||
| Purchase payments | 61,332 | 63,646 | 7,536 | 3,998 | 28,725 | 31,555 | ||||||||||||||||||
| Transfers between sub-accounts and the company | 86,546 | 36,120 | 9,126 | (22 | ) | 20,157 | 94,277 | |||||||||||||||||
| Transfers on general account policy loans | (44,094 | ) | (367 | ) | - | 125 | 1,744 | (1,941 | ) | |||||||||||||||
| Withdrawals | (38,552 | ) | (60,467 | ) | 25 | 42 | (4,120 | ) | (11,002 | ) | ||||||||||||||
| Annual contract fee | (48,039 | ) | (55,772 | ) | (10,628 | ) | (10,888 | ) | (29,495 | ) | (36,549 | ) | ||||||||||||
| Net increase (decrease) in net assets from principal transactions | 17,193 | (16,840 | ) | 6,059 | (6,745 | ) | 17,011 | 76,340 | ||||||||||||||||
| Total increase (decrease) in net assets | 1,688 | 102,346 | 3,679 | (1,494 | ) | 5,754 | 100,295 | |||||||||||||||||
| Net assets at beginning of period | 1,417,416 | 1,315,070 | 146,342 | 147,836 | 719,580 | 619,285 | ||||||||||||||||||
| Net assets at end of period | $ | 1,419,104 | $ | 1,417,416 | $ | 150,021 | $ | 146,342 | $ | 725,334 | $ | 719,580 | ||||||||||||
| 2021 | 2020 | 2021 | 2020 | 2021 | 2020 | |||||||||||||||||||
| Units, beginning of period | 99,829 | 101,083 | 12,531 | 13,114 | 61,278 | 54,660 | ||||||||||||||||||
| Units issued | 10,263 | 10,127 | 1,309 | 357 | 8,090 | 30,086 | ||||||||||||||||||
| Units redeemed | (8,984 | ) | (11,381 | ) | (789 | ) | (940 | ) | (6,636 | ) | (23,468 | ) | ||||||||||||
| Units, end of period | 101,108 | 99,829 | 13,051 | 12,531 | 62,732 | 61,278 | ||||||||||||||||||
| See accompanying notes. | 46 of 67 |
JOHN HANCOCK LIFE INSURANCE COMPANY OF NEW YORK SEPARATE ACCOUNT B
STATEMENTS OF OPERATIONS AND CHANGES IN CONTRACT OWNERS’ EQUITY
For the years ended December 31,
| Small Cap Index Trust Series I | Small Cap Index Trust Series NAV | Small Cap Opportunities Trust Series I | ||||||||||||||||||||||
| 2021 | 2020 | 2021 | 2020 | 2021 | 2020 | |||||||||||||||||||
| Income: | ||||||||||||||||||||||||
| Dividend distributions received | $ | 1,368 | $ | 2,471 | $ | 27,031 | $ | 42,162 | $ | 787 | $ | 792 | ||||||||||||
| Expenses: | ||||||||||||||||||||||||
| Mortality and expense risk and administrative charges | - | - | - | - | - | - | ||||||||||||||||||
| Net investment income (loss) | 1,368 | 2,471 | 27,031 | 42,162 | 787 | 792 | ||||||||||||||||||
| Realized gains (losses) on investments: | ||||||||||||||||||||||||
| Capital gain distributions received | 16,993 | 12,827 | 310,536 | 211,856 | 3,395 | 6,545 | ||||||||||||||||||
| Net realized gain (loss) | 4,281 | 1,177 | 109,300 | (5,177 | ) | (186 | ) | (5,906 | ) | |||||||||||||||
| Realized gains (losses) | 21,274 | 14,004 | 419,836 | 206,679 | 3,209 | 639 | ||||||||||||||||||
| Unrealized appreciation (depreciation) during the period | 8,480 | 19,456 | 73,007 | 510,229 | 36,886 | 9,592 | ||||||||||||||||||
| Net increase (decrease) in net assets from operations | 31,122 | 35,931 | 519,874 | 759,070 | 40,882 | 11,023 | ||||||||||||||||||
| Changes from principal transactions: | ||||||||||||||||||||||||
| Purchase payments | 3,471 | 3,348 | 164,108 | 153,185 | 5,182 | 5,227 | ||||||||||||||||||
| Transfers between sub-accounts and the company | (5,979 | ) | 45 | 184,091 | 506,568 | 4 | 3 | |||||||||||||||||
| Transfers on general account policy loans | - | 23 | (49,217 | ) | (10,819 | ) | - | 210 | ||||||||||||||||
| Withdrawals | 13 | (5,324 | ) | (1,848 | ) | (46,381 | ) | (39 | ) | (6,956 | ) | |||||||||||||
| Annual contract fee | (6,385 | ) | (5,618 | ) | (154,087 | ) | (127,004 | ) | (6,112 | ) | (4,546 | ) | ||||||||||||
| Net increase (decrease) in net assets from principal transactions | (8,880 | ) | (7,526 | ) | 143,047 | 475,549 | (965 | ) | (6,062 | ) | ||||||||||||||
| Total increase (decrease) in net assets | 22,242 | 28,405 | 662,921 | 1,234,619 | 39,917 | 4,961 | ||||||||||||||||||
| Net assets at beginning of period | 215,029 | 186,624 | 3,670,430 | 2,435,811 | 131,908 | 126,947 | ||||||||||||||||||
| Net assets at end of period | $ | 237,271 | $ | 215,029 | $ | 4,333,351 | $ | 3,670,430 | $ | 171,825 | $ | 131,908 | ||||||||||||
| 2021 | 2020 | 2021 | 2020 | 2021 | 2020 | |||||||||||||||||||
| Units, beginning of period | 3,790 | 3,923 | 80,849 | 64,021 | 2,235 | 2,364 | ||||||||||||||||||
| Units issued | 48 | 134 | 12,869 | 24,688 | 66 | 110 | ||||||||||||||||||
| Units redeemed | (186 | ) | (267 | ) | (10,417 | ) | (7,860 | ) | (80 | ) | (239 | ) | ||||||||||||
| Units, end of period | 3,652 | 3,790 | 83,301 | 80,849 | 2,221 | 2,235 | ||||||||||||||||||
| See accompanying notes. | 47 of 67 |
JOHN HANCOCK LIFE INSURANCE COMPANY OF NEW YORK SEPARATE ACCOUNT B
STATEMENTS OF OPERATIONS AND CHANGES IN CONTRACT OWNERS’ EQUITY
For the years ended December 31,
| Small Cap Opportunities Trust Series NAV | Small Cap Stock Trust Series I | Small Cap Stock Trust Series NAV | ||||||||||||||||||||||
| 2021 | 2020 | 2021 | 2020 | 2021 | 2020 | |||||||||||||||||||
| Income: | ||||||||||||||||||||||||
| Dividend distributions received | $ | 10,338 | $ | 9,240 | $ | - | $ | - | $ | - | $ | - | ||||||||||||
| Expenses: | ||||||||||||||||||||||||
| Mortality and expense risk and administrative charges | - | - | - | - | - | - | ||||||||||||||||||
| Net investment income (loss) | 10,338 | 9,240 | - | - | - | - | ||||||||||||||||||
| Realized gains (losses) on investments: | ||||||||||||||||||||||||
| Capital gain distributions received | 40,786 | 71,591 | 18,812 | 5,439 | 458,062 | 271,724 | ||||||||||||||||||
| Net realized gain (loss) | 16,541 | (57,728 | ) | 164 | 790 | 57,614 | (34,278 | ) | ||||||||||||||||
| Realized gains (losses) | 57,327 | 13,863 | 18,976 | 6,229 | 515,676 | 237,446 | ||||||||||||||||||
| Unrealized appreciation (depreciation) during the period | 400,602 | 201,670 | (22,348 | ) | 13,146 | (487,128 | ) | 756,507 | ||||||||||||||||
| Net increase (decrease) in net assets from operations | 468,267 | 224,773 | (3,372 | ) | 19,375 | 28,548 | 993,953 | |||||||||||||||||
| Changes from principal transactions: | ||||||||||||||||||||||||
| Purchase payments | 52,457 | 51,309 | 3,139 | 659 | 161,431 | 147,076 | ||||||||||||||||||
| Transfers between sub-accounts and the company | 86,973 | 301,396 | 75,576 | (9,347 | ) | 66,602 | 31,241 | |||||||||||||||||
| Transfers on general account policy loans | (165 | ) | (2,720 | ) | 303 | - | (5,266 | ) | (3,379 | ) | ||||||||||||||
| Withdrawals | (19,709 | ) | (34,675 | ) | (1 | ) | (49 | ) | (10,375 | ) | (36,636 | ) | ||||||||||||
| Annual contract fee | (42,813 | ) | (30,694 | ) | (2,504 | ) | (614 | ) | (116,442 | ) | (99,261 | ) | ||||||||||||
| Net increase (decrease) in net assets from principal transactions | 76,743 | 284,616 | 76,513 | (9,351 | ) | 95,950 | 39,041 | |||||||||||||||||
| Total increase (decrease) in net assets | 545,010 | 509,389 | 73,141 | 10,024 | 124,498 | 1,032,994 | ||||||||||||||||||
| Net assets at beginning of period | 1,495,081 | 985,692 | 53,769 | 43,745 | 2,958,852 | 1,925,858 | ||||||||||||||||||
| Net assets at end of period | $ | 2,040,091 | $ | 1,495,081 | $ | 126,910 | $ | 53,769 | $ | 3,083,350 | $ | 2,958,852 | ||||||||||||
| 2021 | 2020 | 2021 | 2020 | 2021 | 2020 | |||||||||||||||||||
| Units, beginning of period | 51,283 | 37,165 | 832 | 1,026 | 38,485 | 37,980 | ||||||||||||||||||
| Units issued | 6,711 | 20,664 | 1,117 | 14 | 4,808 | 3,694 | ||||||||||||||||||
| Units redeemed | (4,643 | ) | (6,546 | ) | (9 | ) | (208 | ) | (3,691 | ) | (3,189 | ) | ||||||||||||
| Units, end of period | 53,351 | 51,283 | 1,940 | 832 | 39,602 | 38,485 | ||||||||||||||||||
| See accompanying notes. | 48 of 67 |
JOHN HANCOCK LIFE INSURANCE COMPANY OF NEW YORK SEPARATE ACCOUNT B
STATEMENTS OF OPERATIONS AND CHANGES IN CONTRACT OWNERS’ EQUITY
For the years ended December 31,
| Small Cap Value Trust Series I | Small Cap Value Trust Series NAV | Small Company Value Trust Series I | ||||||||||||||||||||||
| 2021 | 2020 | 2021 | 2020 | 2021 | 2020 | |||||||||||||||||||
| Income: | ||||||||||||||||||||||||
| Dividend distributions received | $ | 152 | $ | 232 | $ | 14,587 | $ | 21,546 | $ | 365 | $ | 265 | ||||||||||||
| Expenses: | ||||||||||||||||||||||||
| Mortality and expense risk and administrative charges | - | - | - | - | - | - | ||||||||||||||||||
| Net investment income (loss) | 152 | 232 | 14,587 | 21,546 | 365 | 265 | ||||||||||||||||||
| Realized gains (losses) on investments: | ||||||||||||||||||||||||
| Capital gain distributions received | 258 | 2,573 | 22,789 | 228,416 | 3,020 | 6,076 | ||||||||||||||||||
| Net realized gain (loss) | (161 | ) | (389 | ) | (45,980 | ) | (92,690 | ) | (5,757 | ) | (15,008 | ) | ||||||||||||
| Realized gains (losses) | 97 | 2,184 | (23,191 | ) | 135,726 | (2,737 | ) | (8,932 | ) | |||||||||||||||
| Unrealized appreciation (depreciation) during the period | 6,367 | (4,540 | ) | 593,109 | (248,140 | ) | 26,091 | 17,831 | ||||||||||||||||
| Net increase (decrease) in net assets from operations | 6,616 | (2,124 | ) | 584,505 | (90,868 | ) | 23,719 | 9,164 | ||||||||||||||||
| Changes from principal transactions: | ||||||||||||||||||||||||
| Purchase payments | - | - | 108,378 | 113,482 | 4,846 | 4,669 | ||||||||||||||||||
| Transfers between sub-accounts and the company | 9 | - | (145,087 | ) | 137,834 | (2,630 | ) | 643 | ||||||||||||||||
| Transfers on general account policy loans | - | - | (103 | ) | (2,075 | ) | (5,661 | ) | 407 | |||||||||||||||
| Withdrawals | 6 | 7 | (4,398 | ) | (21,027 | ) | 158 | (5,240 | ) | |||||||||||||||
| Annual contract fee | (1,336 | ) | (939 | ) | (79,957 | ) | (68,044 | ) | (4,262 | ) | (4,164 | ) | ||||||||||||
| Net increase (decrease) in net assets from principal transactions | (1,321 | ) | (932 | ) | (121,167 | ) | 160,170 | (7,549 | ) | (3,685 | ) | |||||||||||||
| Total increase (decrease) in net assets | 5,295 | (3,056 | ) | 463,338 | 69,302 | 16,170 | 5,479 | |||||||||||||||||
| Net assets at beginning of period | 25,580 | 28,636 | 2,253,159 | 2,183,857 | 105,617 | 100,138 | ||||||||||||||||||
| Net assets at end of period | $ | 30,875 | $ | 25,580 | $ | 2,716,497 | $ | 2,253,159 | $ | 121,787 | $ | 105,617 | ||||||||||||
| 2021 | 2020 | 2021 | 2020 | 2021 | 2020 | |||||||||||||||||||
| Units, beginning of period | 802 | 838 | 25,052 | 22,659 | 1,592 | 1,649 | ||||||||||||||||||
| Units issued | - | - | 1,940 | 4,598 | 42 | 202 | ||||||||||||||||||
| Units redeemed | (35 | ) | (36 | ) | (3,078 | ) | (2,205 | ) | (139 | ) | (259 | ) | ||||||||||||
| Units, end of period | 767 | 802 | 23,914 | 25,052 | 1,495 | 1,592 | ||||||||||||||||||
| See accompanying notes. | 49 of 67 |
JOHN HANCOCK LIFE INSURANCE COMPANY OF NEW YORK SEPARATE ACCOUNT B
STATEMENTS OF OPERATIONS AND CHANGES IN CONTRACT OWNERS’ EQUITY
For the years ended December 31,
| Strategic Income Opportunities Trust Series | ||||||||||||||||||||||||
| Small Company Value Trust Series NAV | Strategic Income Opportunities Trust Series I | NAV | ||||||||||||||||||||||
| 2021 | 2020 | 2021 | 2020 | 2021 | 2020 | |||||||||||||||||||
| Income: | ||||||||||||||||||||||||
| Dividend distributions received | $ | 3,814 | $ | 2,682 | $ | 8,250 | $ | 3,758 | $ | 88,154 | $ | 40,151 | ||||||||||||
| Expenses: | ||||||||||||||||||||||||
| Mortality and expense risk and administrative charges | - | - | - | - | - | - | ||||||||||||||||||
| Net investment income (loss) | 3,814 | 2,682 | 8,250 | 3,758 | 88,154 | 40,151 | ||||||||||||||||||
| Realized gains (losses) on investments: | ||||||||||||||||||||||||
| Capital gain distributions received | 27,507 | 52,826 | (2 | ) | 1 | (10 | ) | (1 | ) | |||||||||||||||
| Net realized gain (loss) | (97,214 | ) | (72,646 | ) | 652 | 45 | 18,150 | 205 | ||||||||||||||||
| Realized gains (losses) | (69,707 | ) | (19,820 | ) | 650 | 46 | 18,140 | 204 | ||||||||||||||||
| Unrealized appreciation (depreciation) during the period | 280,374 | 111,767 | (6,745 | ) | 14,596 | (83,511 | ) | 149,808 | ||||||||||||||||
| Net increase (decrease) in net assets from operations | 214,481 | 94,629 | 2,155 | 18,400 | 22,783 | 190,163 | ||||||||||||||||||
| Changes from principal transactions: | ||||||||||||||||||||||||
| Purchase payments | 40,262 | 42,574 | 6,568 | 5,955 | 118,806 | 143,781 | ||||||||||||||||||
| Transfers between sub-accounts and the company | (4,162 | ) | 12,313 | 10,378 | 4,163 | 154,654 | 34,054 | |||||||||||||||||
| Transfers on general account policy loans | (15,167 | ) | - | (29 | ) | 3,465 | (33,781 | ) | 25,914 | |||||||||||||||
| Withdrawals | (27,507 | ) | (12,811 | ) | (1,701 | ) | 35 | (18,788 | ) | (87,145 | ) | |||||||||||||
| Annual contract fee | (33,701 | ) | (31,748 | ) | (10,341 | ) | (10,492 | ) | (80,008 | ) | (95,745 | ) | ||||||||||||
| Net increase (decrease) in net assets from principal transactions | (40,275 | ) | 10,328 | 4,875 | 3,126 | 140,883 | 20,859 | |||||||||||||||||
| Total increase (decrease) in net assets | 174,206 | 104,957 | 7,030 | 21,526 | 163,666 | 211,022 | ||||||||||||||||||
| Net assets at beginning of period | 945,299 | 840,342 | 240,583 | 219,057 | 2,439,382 | 2,228,360 | ||||||||||||||||||
| Net assets at end of period | $ | 1,119,505 | $ | 945,299 | $ | 247,613 | $ | 240,583 | $ | 2,603,048 | $ | 2,439,382 | ||||||||||||
| 2021 | 2020 | 2021 | 2020 | 2021 | 2020 | |||||||||||||||||||
| Units, beginning of period | 24,850 | 24,135 | 7,250 | 7,168 | 98,841 | 98,053 | ||||||||||||||||||
| Units issued | 2,582 | 2,758 | 385 | 461 | 15,649 | 11,936 | ||||||||||||||||||
| Units redeemed | (3,469 | ) | (2,043 | ) | (241 | ) | (379 | ) | (10,015 | ) | (11,148 | ) | ||||||||||||
| Units, end of period | 23,963 | 24,850 | 7,394 | 7,250 | 104,475 | 98,841 | ||||||||||||||||||
| See accompanying notes. | 50 of 67 |
JOHN HANCOCK LIFE INSURANCE COMPANY OF NEW YORK SEPARATE ACCOUNT B
STATEMENTS OF OPERATIONS AND CHANGES IN CONTRACT OWNERS’ EQUITY
For the years ended December 31,
| Total Bond Market Series Trust NAV | Total Stock Market Index Trust Series I | Total Stock Market Index Trust Series NAV | ||||||||||||||||||||||
| 2021 | 2020 | 2021 | 2020 | 2021 | 2020 | |||||||||||||||||||
| Income: | ||||||||||||||||||||||||
| Dividend distributions received | $ | 43,574 | $ | 30,386 | $ | 3,088 | $ | 4,462 | $ | 124,480 | $ | 136,618 | ||||||||||||
| Expenses: | ||||||||||||||||||||||||
| Mortality and expense risk and administrative charges | - | - | - | - | - | - | ||||||||||||||||||
| Net investment income (loss) | 43,574 | 30,386 | 3,088 | 4,462 | 124,480 | 136,618 | ||||||||||||||||||
| Realized gains (losses) on investments: | ||||||||||||||||||||||||
| Capital gain distributions received | 4 | (5 | ) | 13,523 | 22,255 | 522,658 | 663,900 | |||||||||||||||||
| Net realized gain (loss) | 2,608 | 4,655 | 9,536 | 9,133 | 114,921 | 140,375 | ||||||||||||||||||
| Realized gains (losses) | 2,612 | 4,650 | 23,059 | 31,388 | 637,579 | 804,275 | ||||||||||||||||||
| Unrealized appreciation (depreciation) during the period | (73,029 | ) | 36,686 | 36,202 | 14,064 | 1,478,294 | 736,994 | |||||||||||||||||
| Net increase (decrease) in net assets from operations | (26,843 | ) | 71,722 | 62,349 | 49,914 | 2,240,353 | 1,677,887 | |||||||||||||||||
| Changes from principal transactions: | ||||||||||||||||||||||||
| Purchase payments | 84,411 | 49,927 | 6,251 | 2,328 | 291,144 | 289,005 | ||||||||||||||||||
| Transfers between sub-accounts and the company | 530,931 | 418,447 | (3,638 | ) | 6,135 | 855,937 | 1,521,129 | |||||||||||||||||
| Transfers on general account policy loans | (1,438 | ) | 3,427 | (13,541 | ) | (783 | ) | (8,832 | ) | (7,769 | ) | |||||||||||||
| Withdrawals | (15,631 | ) | (14,463 | ) | (57 | ) | (43,754 | ) | (48,546 | ) | (202,077 | ) | ||||||||||||
| Annual contract fee | (64,382 | ) | (56,087 | ) | (12,523 | ) | (10,485 | ) | (240,900 | ) | (204,121 | ) | ||||||||||||
| Net increase (decrease) in net assets from principal transactions | 533,891 | 401,251 | (23,508 | ) | (46,559 | ) | 848,803 | 1,396,167 | ||||||||||||||||
| Total increase (decrease) in net assets | 507,048 | 472,973 | 38,841 | 3,355 | 3,089,156 | 3,074,054 | ||||||||||||||||||
| Net assets at beginning of period | 1,372,145 | 899,172 | 260,523 | 257,168 | 8,829,054 | 5,755,000 | ||||||||||||||||||
| Net assets at end of period | $ | 1,879,193 | $ | 1,372,145 | $ | 299,364 | $ | 260,523 | $ | 11,918,210 | $ | 8,829,054 | ||||||||||||
| 2021 | 2020 | 2021 | 2020 | 2021 | 2020 | |||||||||||||||||||
| Units, beginning of period | 47,152 | 33,180 | 5,443 | 6,526 | 55,233 | 43,744 | ||||||||||||||||||
| Units issued | 22,181 | 17,796 | 106 | 252 | 6,252 | 15,058 | ||||||||||||||||||
| Units redeemed | (3,535 | ) | (3,824 | ) | (522 | ) | (1,335 | ) | (1,605 | ) | (3,569 | ) | ||||||||||||
| Units, end of period | 65,798 | 47,152 | 5,027 | 5,443 | 59,880 | 55,233 | ||||||||||||||||||
| See accompanying notes. | 51 of 67 |
JOHN HANCOCK LIFE INSURANCE COMPANY OF NEW YORK SEPARATE ACCOUNT B
STATEMENTS OF OPERATIONS AND CHANGES IN CONTRACT OWNERS’ EQUITY
For the years ended December 31,
| Ultra Short Term Bond Trust Series I | Ultra Short Term Bond Trust Series NAV | |||||||||||||||
| 2021 | 2020 | 2021 | 2020 | |||||||||||||
| Income: | ||||||||||||||||
| Dividend distributions received | $ | 11,048 | $ | 11,539 | $ | 10,548 | $ | 10,253 | ||||||||
| Expenses: | ||||||||||||||||
| Mortality and expense risk and administrative charges | - | - | - | - | ||||||||||||
| Net investment income (loss) | 11,048 | 11,539 | 10,548 | 10,253 | ||||||||||||
| Realized gains (losses) on investments: | ||||||||||||||||
| Capital gain distributions received | - | - | - | - | ||||||||||||
| Net realized gain (loss) | (538 | ) | (142 | ) | (2,716 | ) | (189 | ) | ||||||||
| Realized gains (losses) | (538 | ) | (142 | ) | (2,716 | ) | (189 | ) | ||||||||
| Unrealized appreciation (depreciation) during the period | (13,218 | ) | (2,389 | ) | (10,076 | ) | (2,473 | ) | ||||||||
| Net increase (decrease) in net assets from operations | (2,708 | ) | 9,008 | (2,244 | ) | 7,591 | ||||||||||
| Changes from principal transactions: | ||||||||||||||||
| Purchase payments | - | - | 36,174 | 28,390 | ||||||||||||
| Transfers between sub-accounts and the company | - | - | (44,136 | ) | 61,918 | |||||||||||
| Transfers on general account policy loans | - | - | (51 | ) | (44 | ) | ||||||||||
| Withdrawals | (42 | ) | - | (16,273 | ) | 17 | ||||||||||
| Annual contract fee | (31,372 | ) | (28,674 | ) | (17,405 | ) | (20,036 | ) | ||||||||
| Net increase (decrease) in net assets from principal transactions | (31,414 | ) | (28,674 | ) | (41,691 | ) | 70,245 | |||||||||
| Total increase (decrease) in net assets | (34,122 | ) | (19,666 | ) | (43,935 | ) | 77,836 | |||||||||
| Net assets at beginning of period | 608,847 | 628,513 | 571,471 | 493,635 | ||||||||||||
| Net assets at end of period | $ | 574,725 | $ | 608,847 | $ | 527,536 | $ | 571,471 | ||||||||
| 2021 | 2020 | 2021 | 2020 | |||||||||||||
| Units, beginning of period | 56,453 | 59,132 | 52,676 | 46,238 | ||||||||||||
| Units issued | - | - | 10,082 | 19,190 | ||||||||||||
| Units redeemed | (2,911 | ) | (2,679 | ) | (13,929 | ) | (12,752 | ) | ||||||||
| Units, end of period | 53,542 | 56,453 | 48,829 | 52,676 | ||||||||||||
| See accompanying notes. | 52 of 67 |
JOHN HANCOCK LIFE INSURANCE COMPANY OF NEW YORK SEPARATE ACCOUNT B
December 31, 2021
1. Organization
John Hancock Life Insurance Company of New York Separate Account B (the “Account”) is a separate account established by John Hancock Life Insurance Company of New York (the “Company”). The Account operates as a Unit Investment Trust under the Investment Company Act of 1940, as amended (the “Act”) and is an investment company and accordingly follows the investment company accounting and reporting guidance of the Financial Accounting Standards Board (“FASB”) Accounting Standards Codification (“ASC”) Topic 946 Financial Services – Investment Companies. The Account consists of 86 active sub-accounts which are exclusively invested in a corresponding portfolio of the John Hancock Variable Insurance Trust (the “Trust”), and 5 active sub-accounts that are invested in portfolios of other Non -affiliated Trusts (the “Non-affiliated Trusts”). The Trust and Non-affiliated Trusts are registered under the Act as an open-ended management investment company, commonly known as a mutual fund, which does not transact with the general public. The Account is a funding vehicle for the allocation of net premiums under single premium variable life and variable universal life insurance contracts (the “Contracts”) issued by the Company.
The Company is a wholly owned subsidiary of John Hancock Life Insurance Company (U.S.A.) (“JHUSA”), which in turn is an indirect, wholly owned subsidiary of the Manufacturers Life Insurance Company which is an indirect, wholly owned subsidiary of Manulife Financial Corporation (““MFC””), a Canadian based publicly traded life insurance company. MFC and its subsidiaries are known collectively as Manulife Financial.
The Company is required to maintain assets in the Account with a total fair value of at least equal to the reserves and other liabilities relating to the variable benefits under all Contracts participating in the Account. These assets may not be charged with liabilities which arise from any other business the Company conducts. However, all obligations under the Contracts are general corporate obligations of the Company.
In addition to the Account, certain contract owners may also allocate funds to the fixed account, which is part of the Company’s general account. Because of exemptive and exclusionary provisions, interests in the fixed account have not been registered under the Securities Act of 1933, and the Company’s general account has not been registered as an investment company under the Investment Company Act of 1940. Net interfund transfers include transfers between separate and general accounts.
Each sub-account holds shares of a particular series (“Portfolio”) of a registered investment company. Sub - accounts that invest in Portfolios of the Trust may offer 2 classes of units to fund Contracts issued by the Company. These classes, Series I and Series NAV, represent an interest in the same Trust Portfolio, but in different classes of that Portfolio. Series I and Series NAV shares of the Trust Portfolio differ in the level of 12b -
1 fees and other expenses assessed against the Portfolio’s assets.
As a result of a portfolio change, the following sub -accounts of the Account were renamed as follows:
| Previous Name | New Name | Effective Date |
| Global Trust Series I | Global Equity Trust Series I | 04/01/2021 |
| Global Trust Series NAV | Global Equity Trust Series NAV | 04/01/2021 |
| M id Cap Stock Trust Series I | M id Cap Growth Trust Series I | 10/01/2021 |
| M id Cap Stock Trust Series NAV | M id Cap Growth Trust Series NAV | 10/01/2021 |
Sub-accounts closed in 2021 are as follows:
| S ub-accounts Closed | Effective Date |
| Lifestyle Aggressive Portfolio Series NAV | 04/23/2021 |
| M anaged Volatility Aggressive Portfolio Series I | 04/23/2021 |
| M anaged Volatility Aggressive Portfolio Series NAV | 04/23/2021 |
53 of 67
JOHN HANCOCK LIFE INSURANCE COMPANY OF NEW YORK SEPARATE ACCOUNT B
NOTES TO FINANCIAL STATEMENTS (CONTINUED)
December 31, 2021
2. Significant Accounting Policies
Estimates
The preparation of financial statements in conformity with U.S. generally accepted accounting principles requires management to make estimates and assumptions that affect the amounts reported in the financial statements and accompanying notes. Actual results could differ from reported results using those estimates.
Valuation of Investments
Investments made in the Portfolios of the Trust, and of the Non-affiliated Trusts, are valued at fair value based on the reported net asset values of such Portfolios. Investment transactions are recorded on the trade date. Income from dividends, and gains from realized gain distributions are recorded on the ex-dividend date. Realized gains and losses on the sales of investments are computed on a first-in, first-out basis.
Amounts Receivable/Payable
Receivables/Payables from/to Portfolios/the Company are due to unsettled contract transactions (net of asset-based charges) and/or subsequent/preceding purchases/sales of the respective Portfolios’ shares. The amounts are due from/to either the respective Portfolio and/or the Company for the benefit of contract owners. There are no unsettled policy transactions at December 31, 2021.
54 of 67
JOHN HANCOCK LIFE INSURANCE COMPANY OF NEW YORK SEPARATE ACCOUNT B
NOTES TO FINANCIAL STATEMENTS
December 31, 2021
3. Federal Income Taxes
The Account does not file separate tax returns. The taxable income of the Account is consolidated with that of the Company within the consolidated federal tax return. Any tax contingencies arising from the taxable income generated by the Account is the responsibility of the Company and the Company holds any and all tax contingencies on its financial statements. The Company’s consolidated federal tax return for the years 2014 and 2015 are currently under examination by the Internal Revenue Service. The years from 2015 are also open for examination by the internal revenue service. The Account is not a party to the consolidated tax sharing agreement thus no amount of income taxes or tax contingencies are passed through to the Account. The legal form of the Account is not taxable in any state or foreign jurisdictions.
The income taxes topic of the FASB ASC establishes a minimum threshold for financial statement recognition of the benefit of positions taken, or expected to be taken, in filing tax returns (including whether the Account is taxable in certain jurisdictions). The topic requires the evaluation of tax positions taken or expected to be taken in the course of preparing the Company’s tax returns to determine whether tax positions are “more-likely-than-not” of being sustained by the applicable tax authority. Tax positions deemed to meet the more-likely-than-not threshold would be recorded as tax expense or benefit.
The Account complies with the provisions of FASB ASC Topic 740, Income Taxes. As of December 31, 2021, the Account did not have a liability for any uncertain tax positions. The Account recognizes interest and penalties, if any, related to tax liabilities as income tax expense in the Statements of Operations and Changes in Contract Owners’ Equity.
4. Transactions with Affiliates
The Company has an administrative services agreement with Manulife Financial, whereby Manulife Financial or its designee, with the consent of the Company, performs certain services on behalf of the Company necessary for the operation of the Account. John Hancock Investment Management Services, LLC (“JHIMS”), a Delaware limited liability company controlled by MFC, serves as investment adviser for the Trust.
John Hancock Distributors, LLC, a registered broker-dealer and wholly owned subsidiary of JHUSA, acts as the principle underwriter of the Contracts pursuant to a distribution agreement with the Company . Contracts are sold by registered representatives of either John Hancock Distributors, LLC or other broker-dealers having distribution agreements with John Hancock Distributors , LLC.
Certain officers of the Account are officers and directors of JHUSA or the Trust.
Contract charges, as described in Note 9, are paid to the Company.
55 of 67
JOHN HANCOCK LIFE INSURANCE COMPANY OF NEW YORK SEPARATE ACCOUNT B
NOTES TO FINANCIAL STATEMENTS (CONTINUED)
December 31, 2021
5. Fair Value Measurements
ASC 820 “Fair Value Measurements and Disclosures” provides a single definition of fair value for accounting purposes, establishes a consistent framework for measuring fair value, and expands disclosure requirements about fair value measurements. ASC 820 defines fair value as the value that would be received to sell an asset or paid to transfer a liability in an orderly transaction between market participants at the measurement date; that is, an exit value. An exit value is not a forced liquidation or distressed sale.
Following ASC 820 guidance, the Account has categorized its fair value measurements according to a three -level hierarchy. The hierarchy prioritizes the inputs used by the Account’s valuation techniques. A level is assigned to each fair value measurement based on the lowest level input significant to the fair value measurement in its entirety. The three levels of the fair value hierarchy are defined as follows:
| • | Level 1 – Fair value measurements that reflect unadjusted, quoted prices in active markets for identical assets and liabilities that the Account has the ability to access at the measurement date. |
| • | Level 2 – Fair value measurements using inputs other than quoted prices included within Level 1 that are observable, either directly or indirectly. |
| • | Level 3 – Fair value measurements using significant non market observable inputs. |
All of the Account’s sub-accounts’ investments in a Portfolio of the Trust were valued at the reported net asset value of the Portfolio and categorized as Level 1 as of December 31, 2021. The following table presents the Account’s assets that are measured at fair value on a recurring basis by fair value hierarchy level under ASC 820, as of December 31, 2021:
| Level 1 | Level 2 | Level 3 | Total | |||||||||||||
| Mutual Funds | ||||||||||||||||
| Affiliated | 412,385,611 | - | - | 412,385,611 | ||||||||||||
| NonAffiliated | 5,204,290 | - | - | 5,204,290 | ||||||||||||
| Total | 417,589,901 | - | - | 417,589,901 | ||||||||||||
Assets owned by the Account are primarily open -ended mutual fund investments issued by the Trust. These are classified within Level 1, as fair values of the underlying funds are based upon reported net asset values (“NAV”), which represent the values at which each sub-account can redeem its investments.
Changes in valuation techniques may result in transfer in or out of an assigned level within the disclosure hierarchy. Transfers between investment levels may occur as the availability of a price source or data used in an investment’s valuation changes. Transfers between investment levels are recognized at the beginning of the reporting period. There have been no transfers between any level of fair value measurements during the period ended December 31, 2021.
56 of 67
JOHN HANCOCK LIFE INSURANCE COMPANY OF NEW YORK SEPARATE ACCOUNT B
NOTES TO FINANCIAL STATEMENTS (CONTINUED)
December 31, 2021
6. Purchases and Sales of Investments
The cost of purchases including reinvestment of dividend distributions and proceeds from the sales of investments in the Portfolios of the Trust and Non-affiliated Trusts during 2021 were as follows:
| Sub-Account | Purchases | Sales | ||||||
| 500 Index Fund Series NAV | $ | 6,509,663 | $ | 2,592,692 | ||||
| Active Bond Trust Series I | 64,326 | 17,552 | ||||||
| Active Bond Trust Series NAV | 440,409 | 155,602 | ||||||
| American Asset Allocation Trust Series I | 1,098,498 | 359,541 | ||||||
| American Global Growth Trust Series I | 499,460 | 103,655 | ||||||
| American Growth Trust Series I | 1,309,357 | 436,432 | ||||||
| American Growth-Income Trust Series I | 587,170 | 550,191 | ||||||
| American International Trust Series I | 582,530 | 186,799 | ||||||
| Blue Chip Growth Trust Series I | 231,619 | 138,773 | ||||||
| Blue Chip Growth Trust Series NAV | 4,474,954 | 1,098,857 | ||||||
| Capital Appreciation Trust Series I | 200,922 | 39,309 | ||||||
| Capital Appreciation Trust Series NAV | 947,182 | 535,975 | ||||||
| Capital Appreciation Value Trust Series NAV | 2,357,524 | 470,667 | ||||||
| Core Bond Trust Series I | 61,550 | 37,935 | ||||||
| Core Bond Trust Series NAV | 1,013,359 | 469,859 | ||||||
| Disciplined Value International Trust Series I | 25,911 | 24,463 | ||||||
| Disciplined Value International Trust Series NAV | 247,883 | 118,548 | ||||||
| Emerging Markets Value Trust Series I | 8,596 | 10,151 | ||||||
| Emerging Markets Value Trust Series NAV | 421,148 | 196,226 | ||||||
| Equity Income Trust Series I | 56,717 | 82,463 | ||||||
| Equity Income Trust Series NAV | 765,902 | 638,587 | ||||||
| Financial Industries Trust Series I | 2,700 | 5,505 | ||||||
| Financial Industries Trust Series NAV | 104,525 | 62,623 | ||||||
| Fundamental All Cap Core Trust Series I | 2,451 | 4,173 | ||||||
| Fundamental All Cap Core Trust Series NAV | 258,347 | 137,309 | ||||||
| Fundamental Large Cap Value Trust Series I | 157,227 | 51,429 | ||||||
| Fundamental Large Cap Value Trust Series NAV | 708,821 | 315,674 | ||||||
| Global Equity Trust Series I (a) | 3,179 | 4,549 | ||||||
| Global Equity Trust Series NAV (b) | 118,286 | 95,541 | ||||||
| Health Sciences Trust Series I | 39,678 | 36,127 | ||||||
| Health Sciences Trust Series NAV | 832,901 | 425,993 | ||||||
| High Yield Trust Series I | 37,956 | 19,745 | ||||||
| High Yield Trust Series NAV | 321,764 | 964,172 | ||||||
| International Equity Index Series I | 16,523 | 12,446 | ||||||
| International Equity Index Series NAV | 965,429 | 580,619 | ||||||
| International Small Company Trust Series I | 1,589 | 2,494 | ||||||
| International Small Company Trust Series NAV | 198,482 | 169,149 | ||||||
| Investment Quality Bond Trust Series I | 18,852 | 5,117 | ||||||
| Investment Quality Bond Trust Series NAV | 237,654 | 160,720 | ||||||
| Lifestyle Aggressive Portfolio Series NAV (c) | 395,948 | 2,136,328 | ||||||
| Lifestyle Balanced Portfolio Series NAV | 711,292 | 205,427 | ||||||
| Lifestyle Conservative Portfolio Series NAV | 28,543 | 11,194 | ||||||
| Lifestyle Growth Portfolio Series NAV | 6,190,179 | 1,567,102 | ||||||
| Lifestyle Moderate Portfolio Series NAV | 228,695 | 80,494 | ||||||
| M Capital Appreciation | 213,324 | 111,824 | ||||||
| M International Equity | 128,529 | 55,107 | ||||||
| M Large Cap Growth | 318,315 | 334,481 | ||||||
| M Large Cap Value | 120,651 | 181,069 | ||||||
| Managed Volatility Aggressive Portfolio Series I (c) | 32,197 | 780,547 | ||||||
57 of 67
JOHN HANCOCK LIFE INSURANCE COMPANY OF NEW YORK SEPARATE ACCOUNT B
NOTES TO FINANCIAL STATEMENTS (CONTINUED)
December 31, 2021
6. Purchases and Sales of Investments (continued):
| Sub-Account | Purchases | Sales | ||||||
| Managed Volatility Aggressive Portfolio Series NAV (c) | $ | 279,101 | $ | 19,986,077 | ||||
| Managed Volatility Balanced Portfolio Series I | 36,833 | 144,391 | ||||||
| Managed Volatility Balanced Portfolio Series NAV | 3,147,851 | 2,811,832 | ||||||
| Managed Volatility Conservative Portfolio Series I | 11,395 | 5,830 | ||||||
| Managed Volatility Conservative Portfolio Series NAV | 384,906 | 606,583 | ||||||
| Managed Volatility Growth Portfolio Series I | 971,373 | 24,093 | ||||||
| Managed Volatility Growth Portfolio Series NAV | 25,141,217 | 6,781,212 | ||||||
| Managed Volatility Moderate Portfolio Series I | 17,000 | 28,577 | ||||||
| Managed Volatility Moderate Portfolio Series NAV | 2,810,065 | 2,330,793 | ||||||
| Mid Cap Growth Trust Series I (d) | 265,117 | 55,710 | ||||||
| Mid Cap Growth Trust Series NAV (e) | 1,534,303 | 318,095 | ||||||
| Mid Cap Index Trust Series I | 46,136 | 37,823 | ||||||
| Mid Cap Index Trust Series NAV | 808,633 | 614,890 | ||||||
| Mid Value Trust Series I | 27,566 | 33,117 | ||||||
| Mid Value Trust Series NAV | 247,546 | 209,238 | ||||||
| Money Market Trust Series I | 77,954 | 121,044 | ||||||
| Money Market Trust Series NAV | 6,262,935 | 7,340,130 | ||||||
| Opportunistic Fixed Income Trust Series I | 20,236 | 12,046 | ||||||
| Opportunistic Fixed Income Trust Series NAV | 252,809 | 128,109 | ||||||
| PIMCO All Asset | 113,234 | 29,931 | ||||||
| Real Estate Securities Trust Series I | 16,894 | 23,859 | ||||||
| Real Estate Securities Trust Series NAV | 175,940 | 137,147 | ||||||
| Science & Technology Trust Series I | 205,340 | 37,608 | ||||||
| Science & Technology Trust Series NAV | 2,023,609 | 640,797 | ||||||
| Select Bond Trust Series I | 2,126 | 2,430 | ||||||
| Select Bond Trust Series NAV | 192,049 | 126,173 | ||||||
| Short Term Government Income Trust Series I | 17,905 | 9,161 | ||||||
| Short Term Government Income Trust Series NAV | 108,019 | 77,700 | ||||||
| Small Cap Index Trust Series I | 21,456 | 11,975 | ||||||
| Small Cap Index Trust Series NAV | 999,598 | 518,986 | ||||||
| Small Cap Opportunities Trust Series I | 9,011 | 5,794 | ||||||
| Small Cap Opportunities Trust Series NAV | 291,732 | 163,867 | ||||||
| Small Cap Stock Trust Series I | 95,919 | 593 | ||||||
| Small Cap Stock Trust Series NAV | 847,910 | 293,900 | ||||||
| Small Cap Value Trust Series I | 424 | 1,335 | ||||||
| Small Cap Value Trust Series NAV | 246,699 | 330,488 | ||||||
| Small Company Value Trust Series I | 6,821 | 10,984 | ||||||
| Small Company Value Trust Series NAV | 144,717 | 153,671 | ||||||
| Strategic Income Opportunities Trust Series I | 21,170 | 8,048 | ||||||
| Strategic Income Opportunities Trust Series NAV | 477,970 | 248,943 | ||||||
| Total Bond Market Series Trust NAV | 678,736 | 101,264 | ||||||
| Total Stock Market Index Trust Series I | 22,598 | 29,495 | ||||||
| Total Stock Market Index Trust Series NAV | 1,788,687 | 292,747 | ||||||
| Ultra Short Term Bond Trust Series I | 11,048 | 31,413 | ||||||
| Ultra Short Term Bond Trust Series NAV | 119,832 | 150,974 | ||||||
| (a) | Renamed on April 1, 2021. Previously known as Global Trust Series I. |
| (b) | Renamed on April 1, 2021. Previously known as Global Trust Series NAV. |
| (c) | Terminated as an investment option on April 23, 2021. The information above represents operations and change in owner’s contract holder equities from beginning of the year through termination date. |
| (d) | Renamed on October 1, 2021. Previously known as Mid Cap Stock Trust Series I. |
| (e) | Renamed on October 1, 2021. Previously known as Mid Cap Stock Trust Series NAV. |
58 of 67
JOHN HANCOCK LIFE INSURANCE COMPANY OF NEW YORK SEPARATE ACCOUNT B
NOTES TO FINANCIAL STATEMENTS (CONTINUED)
December 31, 2021
7. Unit Values
A summary of unit values and units outstanding for variable life contracts and the expense and income ratios, excluding expenses of the underlying Portfolios, were as follows:
| At December 31, | For the years and periods ended December 31, | |||||||||||||
| Units | Unit Fair Value | Assets | Expense Ratio | Investment | Total Return | |||||||||
| Sub-account | Year | (000s) | Highest to Lowest (a) | (000s) | Highest to Lowest (b) | Income Ratio (c) | Highest to Lowest (d) | |||||||
| 500 Index Fund Series NAV(*) | 2021 | 443 | $ 111.18 to $ 69.51 | $ 48,472 | 0.00 % to 0.00 % | 1.42 % | 28.36 % to 28.36 % | |||||||
| 2020 | 429 | 86.62 to 54.15 | 36,399 | 0.00 to 0.00 | 1.97 | 18.14 to 18.14 | ||||||||
| 2019 | 400 | 73.32 to 45.84 | 28,644 | 0.00 to 0.00 | 1.81 | 31.16 to 31.16 | ||||||||
| 2018 | 381 | 55.90 to 34.95 | 20,776 | 0.00 to 0.00 | 1.42 | -4.64 to -4.65 | ||||||||
| 2017 | 369 | 58.62 to 36.65 | 21,067 | 0.00 to 0.00 | 1.81 | 21.54 to 21.54 | ||||||||
| Active Bond Trust Series I(*) | 2021 | 18 | 28.06 to 28.06 | 494 | 0.00 to 0.00 | 3.29 | -0.57 to -0.57 | |||||||
| 2020 | 17 | 28.22 to 28.22 | 474 | 0.00 to 0.00 | 2.99 | 8.79 to 8.79 | ||||||||
| 2019 | 18 | 25.94 to 25.94 | 465 | 0.00 to 0.00 | 2.77 | 9.26 to 9.26 | ||||||||
| 2018 | 18 | 23.74 to 23.74 | 434 | 0.00 to 0.00 | 3.20 | -0.60 to -0.60 | ||||||||
| 2017 | 18 | 23.89 to 23.89 | 435 | 0.00 to 0.00 | 4.01 | 4.84 to 4.84 | ||||||||
| Active Bond Trust Series NAV(*) | 2021 | 24 | 91.78 to 91.78 | 2,186 | 0.00 to 0.00 | 3.33 | -0.42 to -0.42 | |||||||
| 2020 | 22 | 92.17 to 92.17 | 2,012 | 0.00 to 0.00 | 3.08 | 8.73 to 8.73 | ||||||||
| 2019 | 21 | 84.77 to 84.77 | 1,750 | 0.00 to 0.00 | 2.91 | 9.29 to 9.29 | ||||||||
| 2018 | 18 | 77.56 to 77.56 | 1,404 | 0.00 to 0.00 | 3.38 | -0.55 to -0.55 | ||||||||
| 2017 | 16 | 77.99 to 77.99 | 1,282 | 0.00 to 0.00 | 3.59 | 4.89 to 4.89 | ||||||||
| American Asset Allocation Trust Series I(*) | 2021 | 326 | 28.64 to 28.64 | 9,344 | 0.00 to 0.00 | 1.64 | 14.71 to 14.71 | |||||||
| 2020 | 322 | 24.97 to 24.97 | 8,049 | 0.00 to 0.00 | 1.40 | 12.02 to 12.02 | ||||||||
| 2019 | 347 | 22.29 to 22.29 | 7,731 | 0.00 to 0.00 | 1.50 | 20.78 to 20.78 | ||||||||
| 2018 | 303 | 18.46 to 18.46 | 5,591 | 0.00 to 0.00 | 1.85 | -4.91 to -4.91 | ||||||||
| 2017 | 259 | 19.41 to 19.41 | 5,030 | 0.00 to 0.00 | 1.33 | 15.79 to 15.79 | ||||||||
| American Global Growth Trust Series I(*) | 2021 | 39 | 37.83 to 37.83 | 1,464 | 0.00 to 0.00 | 0.00 | 16.00 to 16.00 | |||||||
| 2020 | 30 | 32.61 to 32.61 | 984 | 0.00 to 0.00 | 0.07 | 29.96 to 29.96 | ||||||||
| 2019 | 29 | 25.09 to 25.09 | 725 | 0.00 to 0.00 | 0.68 | 34.71 to 34.71 | ||||||||
| 2018 | 24 | 18.63 to 18.63 | 453 | 0.00 to 0.00 | 0.73 | -9.37 to -9.37 | ||||||||
| 2017 | 18 | 20.55 to 20.55 | 374 | 0.00 to 0.00 | 0.27 | 30.92 to 30.92 | ||||||||
| American Growth Trust Series I(*) | 2021 | 108 | 112.82 to 74.94 | 8,675 | 0.00 to 0.00 | 0.41 | 21.55 to 21.55 | |||||||
| 2020 | 104 | 92.82 to 61.65 | 6,852 | 0.00 to 0.00 | 0.09 | 51.52 to 51.52 | ||||||||
| 2019 | 105 | 61.26 to 40.69 | 4,611 | 0.00 to 0.00 | 0.85 | 30.30 to 30.30 | ||||||||
| 2018 | 103 | 47.01 to 31.23 | 3,478 | 0.00 to 0.00 | 0.39 | -0.66 to -0.66 | ||||||||
| 2017 | 101 | 47.32 to 31.43 | 3,441 | 0.00 to 0.00 | 0.37 | 27.87 to 27.86 | ||||||||
| American Growth-Income Trust Series I(*) | 2021 | 102 | 70.25 to 47.07 | 5,290 | 0.00 to 0.00 | 0.76 | 23.61 to 23.61 | |||||||
| 2020 | 107 | 56.83 to 38.08 | 4,509 | 0.00 to 0.00 | 1.43 | 13.11 to 13.11 | ||||||||
| 2019 | 105 | 50.25 to 33.66 | 3,925 | 0.00 to 0.00 | 1.59 | 25.70 to 25.70 | ||||||||
| 2018 | 101 | 39.97 to 26.78 | 3,020 | 0.00 to 0.00 | 1.51 | -2.18 to -2.18 | ||||||||
| 2017 | 95 | 40.87 to 27.38 | 2,932 | 0.00 to 0.00 | 1.10 | 22.03 to 22.03 | ||||||||
| American International Trust Series I(*) | 2021 | 128 | 49.11 to 27.89 | 3,696 | 0.00 to 0.00 | 2.03 | -1.81 to -1.81 | |||||||
| 2020 | 117 | 50.02 to 28.41 | 3,453 | 0.00 to 0.00 | 0.39 | 13.56 to 13.55 | ||||||||
| 2019 | 114 | 44.04 to 25.02 | 2,988 | 0.00 to 0.00 | 1.00 | 22.40 to 22.40 | ||||||||
| 2018 | 115 | 35.98 to 20.44 | 2,457 | 0.00 to 0.00 | 2.91 | -13.46 to -13.46 | ||||||||
| 2017 | 94 | 41.58 to 23.62 | 2,325 | 0.00 to 0.00 | 0.99 | 31.65 to 31.65 | ||||||||
| Blue Chip Growth Trust Series I(*) | 2021 | 21 | 75.52 to 75.52 | 1,601 | 0.00 to 0.00 | 0.00 | 16.87 to 16.87 | |||||||
| 2020 | 23 | 64.62 to 64.62 | 1,475 | 0.00 to 0.00 | 0.00 | 34.30 to 34.30 | ||||||||
| 2019 | 23 | 48.11 to 48.11 | 1,127 | 0.00 to 0.00 | 0.00 | 29.79 to 29.79 | ||||||||
| 2018 | 25 | 37.07 to 37.07 | 930 | 0.00 to 0.00 | 0.02 | 1.97 to 1.97 | ||||||||
| 2017 | 25 | 36.35 to 36.35 | 902 | 0.00 to 0.00 | 0.07 | 36.28 to 36.28 | ||||||||
| Blue Chip Growth Trust Series NAV(*) | 2021 | 58 | 388.92 to 388.92 | 22,388 | 0.00 to 0.00 | 0.00 | 16.92 to 16.92 | |||||||
| 2020 | 56 | 332.65 to 332.65 | 18,636 | 0.00 to 0.00 | 0.00 | 34.40 to 34.40 | ||||||||
| 2019 | 55 | 247.50 to 247.50 | 13,528 | 0.00 to 0.00 | 0.01 | 29.83 to 29.83 | ||||||||
| 2018 | 50 | 190.64 to 190.64 | 9,553 | 0.00 to 0.00 | 0.06 | 2.03 to 2.03 | ||||||||
| 2017 | 44 | 186.84 to 186.84 | 8,271 | 0.00 to 0.00 | 0.11 | 36.34 to 36.34 | ||||||||
| Capital Appreciation Trust Series I(*) | 2021 | 11 | 88.80 to 88.80 | 976 | 0.00 to 0.00 | 0.00 | 15.75 to 15.75 | |||||||
| 2020 | 11 | 76.72 to 76.72 | 830 | 0.00 to 0.00 | 0.00 | 56.04 to 56.04 | ||||||||
| 2019 | 11 | 49.17 to 49.17 | 518 | 0.00 to 0.00 | 0.04 | 32.89 to 32.89 | ||||||||
| 2018 | 11 | 37.00 to 37.00 | 401 | 0.00 to 0.00 | 0.27 | -0.80 to -0.80 | ||||||||
| 2017 | 11 | 37.30 to 37.30 | 417 | 0.00 to 0.00 | 0.06 | 36.53 to 36.53 | ||||||||
| Capital Appreciation Trust Series NAV(*) | 2021 | 49 | 87.45 to 87.45 | 4,250 | 0.00 to 0.00 | 0.00 | 15.76 to 15.76 | |||||||
| 2020 | 51 | 75.55 to 75.55 | 3,877 | 0.00 to 0.00 | 0.00 | 56.29 to 56.29 | ||||||||
| 2019 | 52 | 48.34 to 48.34 | 2,500 | 0.00 to 0.00 | 0.04 | 32.88 to 32.88 | ||||||||
| 2018 | 51 | 36.38 to 36.38 | 1,857 | 0.00 to 0.00 | 0.37 | -0.72 to -0.72 | ||||||||
| 2017 | 34 | 36.64 to 36.64 | 1,239 | 0.00 to 0.00 | 0.11 | 36.51 to 36.51 | ||||||||
| Capital Appreciation Value Trust Series NAV(*) | 2021 | 325 | 39.87 to 39.87 | 12,948 | 0.00 to 0.00 | 0.83 | 18.16 to 18.16 | |||||||
| 2020 | 311 | 33.74 to 33.74 | 10,511 | 0.00 to 0.00 | 1.15 | 17.41 to 17.41 | ||||||||
| 2019 | 311 | 28.74 to 28.74 | 8,948 | 0.00 to 0.00 | 1.54 | 24.44 to 24.44 | ||||||||
| 2018 | 274 | 23.09 to 23.09 | 6,327 | 0.00 to 0.00 | 2.34 | 0.45 to 0.45 | ||||||||
| 2017 | 235 | 22.99 to 22.99 | 5,394 | 0.00 to 0.00 | 1.46 | 15.13 to 15.13 | ||||||||
59 of 67
JOHN HANCOCK LIFE INSURANCE COMPANY OF NEW YORK SEPARATE ACCOUNT B
NOTES TO FINANCIAL STATEMENTS (CONTINUED)
December 31, 2021
7. Unit Values (continued):
| At December 31, | For the years and periods ended December 31, | |||||||||||||
| Units | Unit Fair Value | Assets | Expense Ratio | Investment | Total Return | |||||||||
| Sub-account | Year | (000s) | Highest to Lowest (a) | (000s) | Highest to Lowest (b) | Income Ratio (c) | Highest to Lowest (d) | |||||||
| Core Bond Trust Series I(*) | 2021 | 22 | $ 24.74 to $ 24.74 | $ 536 | 0.00 % to 0.00 % | 1.79 % | -1.96 % to -1.96 % | |||||||
| 2020 | 22 | 25.24 to 25.24 | 555 | 0.00 to 0.00 | 2.34 | 8.62 to 8.62 | ||||||||
| 2019 | 23 | 23.23 to 23.23 | 531 | 0.00 to 0.00 | 2.25 | 8.32 to 8.32 | ||||||||
| 2018 | 28 | 21.45 to 21.45 | 603 | 0.00 to 0.00 | 2.47 | -0.59 to -0.59 | ||||||||
| 2017 | 29 | 21.58 to 21.58 | 619 | 0.00 to 0.00 | 2.02 | 3.40 to 3.40 | ||||||||
| Core Bond Trust Series NAV(*) | 2021 | 254 | 19.93 to 19.93 | 5,056 | 0.00 to 0.00 | 1.92 | -1.98 to -1.98 | |||||||
| 2020 | 242 | 20.33 to 20.33 | 4,918 | 0.00 to 0.00 | 2.43 | 8.79 to 8.79 | ||||||||
| 2019 | 231 | 18.69 to 18.69 | 4,312 | 0.00 to 0.00 | 2.62 | 8.33 to 8.33 | ||||||||
| 2018 | 174 | 17.25 to 17.25 | 3,009 | 0.00 to 0.00 | 2.65 | -0.54 to -0.54 | ||||||||
| 2017 | 161 | 17.35 to 17.35 | 2,790 | 0.00 to 0.00 | 2.26 | 3.47 to 3.47 | ||||||||
| Disciplined Value International Trust Series I(*) | 2021 | 12 | 32.35 to 32.35 | 387 | 0.00 to 0.00 | 2.56 | 13.06 to 13.06 | |||||||
| 2020 | 12 | 28.61 to 28.61 | 350 | 0.00 to 0.00 | 2.23 | 3.28 to 3.28 | ||||||||
| 2019 | 12 | 27.71 to 27.71 | 325 | 0.00 to 0.00 | 2.73 | 12.33 to 12.33 | ||||||||
| 2018 | 13 | 24.66 to 24.66 | 320 | 0.00 to 0.00 | 2.51 | -15.03 to -15.03 | ||||||||
| 2017 | 13 | 29.03 to 29.03 | 371 | 0.00 to 0.00 | 1.87 | 17.14 to 17.14 | ||||||||
| Disciplined Value International Trust Series NAV(*) | 2021 | 118 | 20.94 to 20.94 | 2,474 | 0.00 to 0.00 | 2.72 | 13.15 to 13.15 | |||||||
| 2020 | 115 | 18.50 to 18.50 | 2,128 | 0.00 to 0.00 | 2.29 | 3.27 to 3.27 | ||||||||
| 2019 | 114 | 17.92 to 17.92 | 2,051 | 0.00 to 0.00 | 2.99 | 12.40 to 12.40 | ||||||||
| 2018 | 107 | 15.94 to 15.94 | 1,713 | 0.00 to 0.00 | 2.61 | -14.96 to -14.96 | ||||||||
| 2017 | 98 | 18.75 to 18.75 | 1,835 | 0.00 to 0.00 | 1.91 | 17.25 to 17.25 | ||||||||
| Emerging Markets Value Trust Series I(*) | 2021 | 5 | 19.73 to 19.73 | 96 | 0.00 to 0.00 | 2.31 | 11.18 to 11.18 | |||||||
| 2020 | 5 | 17.74 to 17.74 | 89 | 0.00 to 0.00 | 2.51 | 3.56 to 3.56 | ||||||||
| 2019 | 6 | 17.13 to 17.13 | 98 | 0.00 to 0.00 | 3.24 | 10.94 to 10.94 | ||||||||
| 2018 | 5 | 15.44 to 15.44 | 83 | 0.00 to 0.00 | 2.58 | -13.59 to -13.59 | ||||||||
| 2017 | 5 | 17.87 to 17.87 | 94 | 0.00 to 0.00 | 2.15 | 32.69 to 32.69 | ||||||||
| Emerging Markets Value Trust Series NAV(*) | 2021 | 123 | 15.90 to 15.90 | 1,963 | 0.00 to 0.00 | 2.62 | 11.25 to 11.25 | |||||||
| 2020 | 112 | 14.29 to 14.29 | 1,604 | 0.00 to 0.00 | 2.62 | 3.72 to 3.72 | ||||||||
| 2019 | 105 | 13.78 to 13.78 | 1,446 | 0.00 to 0.00 | 3.36 | 10.90 to 10.90 | ||||||||
| 2018 | 97 | 12.43 to 12.43 | 1,204 | 0.00 to 0.00 | 2.70 | -13.48 to -13.48 | ||||||||
| 2017 | 94 | 14.36 to 14.36 | 1,348 | 0.00 to 0.00 | 1.53 | 32.67 to 32.67 | ||||||||
| Equity Income Trust Series I(*) | 2021 | 17 | 51.89 to 51.89 | 879 | 0.00 to 0.00 | 1.95 | 25.41 to 25.41 | |||||||
| 2020 | 18 | 41.37 to 41.37 | 752 | 0.00 to 0.00 | 3.08 | 1.02 to 1.02 | ||||||||
| 2019 | 18 | 40.96 to 40.96 | 737 | 0.00 to 0.00 | 2.24 | 26.34 to 26.34 | ||||||||
| 2018 | 15 | 32.42 to 32.42 | 492 | 0.00 to 0.00 | 1.87 | -9.58 to -9.58 | ||||||||
| 2017 | 16 | 35.85 to 35.85 | 568 | 0.00 to 0.00 | 2.26 | 16.28 to 16.28 | ||||||||
| Equity Income Trust Series NAV(*) | 2021 | 79 | 86.02 to 86.02 | 6,782 | 0.00 to 0.00 | 2.06 | 25.49 to 25.49 | |||||||
| 2020 | 80 | 68.54 to 68.54 | 5,512 | 0.00 to 0.00 | 3.16 | 1.01 to 1.01 | ||||||||
| 2019 | 79 | 67.86 to 67.86 | 5,371 | 0.00 to 0.00 | 2.38 | 26.47 to 26.47 | ||||||||
| 2018 | 67 | 53.66 to 53.66 | 3,581 | 0.00 to 0.00 | 1.93 | -9.52 to -9.52 | ||||||||
| 2017 | 70 | 59.30 to 59.30 | 4,144 | 0.00 to 0.00 | 1.83 | 16.28 to 16.28 | ||||||||
| Financial Industries Trust Series I(*) | 2021 | 4 | 47.32 to 47.32 | 189 | 0.00 to 0.00 | 0.85 | 29.70 to 29.70 | |||||||
| 2020 | 4 | 36.49 to 36.49 | 150 | 0.00 to 0.00 | 1.39 | 2.17 to 2.17 | ||||||||
| 2019 | 4 | 35.71 to 35.71 | 149 | 0.00 to 0.00 | 4.47 | 31.79 to 31.79 | ||||||||
| 2018 | 4 | 27.10 to 27.10 | 96 | 0.00 to 0.00 | 1.16 | -14.49 to -14.49 | ||||||||
| 2017 | 4 | 31.69 to 31.69 | 116 | 0.00 to 0.00 | 1.10 | 15.29 to 15.29 | ||||||||
| Financial Industries Trust Series NAV(*) | 2021 | 24 | 57.15 to 57.15 | 1,358 | 0.00 to 0.00 | 0.93 | 29.70 to 29.70 | |||||||
| 2020 | 23 | 44.06 to 44.06 | 1,026 | 0.00 to 0.00 | 1.49 | 2.31 to 2.31 | ||||||||
| 2019 | 22 | 43.07 to 43.07 | 957 | 0.00 to 0.00 | 4.46 | 31.71 to 31.71 | ||||||||
| 2018 | 22 | 32.70 to 32.70 | 721 | 0.00 to 0.00 | 1.19 | -14.38 to -14.38 | ||||||||
| 2017 | 22 | 38.19 to 38.19 | 842 | 0.00 to 0.00 | 0.82 | 15.29 to 15.29 | ||||||||
| Fundamental All Cap Core Trust Series I(*) | 2021 | 0 | 103.06 to 103.06 | 2 | 0.00 to 0.00 | 0.08 | 30.63 to 30.63 | |||||||
| 2020 | 0 | 78.90 to 78.90 | 3 | 0.00 to 0.00 | 0.38 | 26.88 to 26.88 | ||||||||
| 2019 | 0 | 62.18 to 62.18 | 3 | 0.00 to 0.00 | 0.46 | 36.45 to 36.45 | ||||||||
| 2018 | 0 | 45.57 to 45.57 | 2 | 0.00 to 0.00 | 0.44 | -13.16 to -13.16 | ||||||||
| 2017 | 0 | 52.48 to 52.48 | 1 | 0.00 to 0.00 | 0.82 | 27.70 to 27.70 | ||||||||
| Fundamental All Cap Core Trust Series NAV(*) | 2021 | 27 | 61.44 to 61.44 | 1,686 | 0.00 to 0.00 | 0.16 | 30.68 to 30.68 | |||||||
| 2020 | 27 | 47.02 to 47.02 | 1,291 | 0.00 to 0.00 | 0.43 | 26.97 to 26.97 | ||||||||
| 2019 | 27 | 37.03 to 37.03 | 999 | 0.00 to 0.00 | 0.51 | 36.58 to 36.58 | ||||||||
| 2018 | 26 | 27.11 to 27.11 | 693 | 0.00 to 0.00 | 0.46 | -13.16 to -13.16 | ||||||||
| 2017 | 30 | 31.22 to 31.22 | 924 | 0.00 to 0.00 | 0.84 | 27.77 to 27.77 | ||||||||
| Fundamental Large Cap Value Trust Series I(*) | 2021 | 20 | 59.51 to 59.51 | 1,178 | 0.00 to 0.00 | 0.77 | 29.96 to 29.96 | |||||||
| 2020 | 20 | 45.79 to 45.79 | 931 | 0.00 to 0.00 | 1.13 | 11.96 to 11.96 | ||||||||
| 2019 | 20 | 40.90 to 40.90 | 815 | 0.00 to 0.00 | 1.14 | 35.85 to 35.85 | ||||||||
| 2018 | 22 | 30.10 to 30.10 | 652 | 0.00 to 0.00 | 1.12 | -17.03 to -17.03 | ||||||||
| 2017 | 22 | 36.28 to 36.28 | 806 | 0.00 to 0.00 | 1.57 | 17.43 to 17.43 | ||||||||
60 of 67
JOHN HANCOCK LIFE INSURANCE COMPANY OF NEW YORK SEPARATE ACCOUNT B
NOTES TO FINANCIAL STATEMENTS (CONTINUED)
December 31, 2021
7. Unit Values (continued):
| At December 31, | For the years and periods ended December 31, | |||||||||||||
| Units | Unit Fair Value | Assets | Expense Ratio | Investment | Total Return | |||||||||
| Sub-account | Year | (000s) | Highest to Lowest (a) | (000s) | Highest to Lowest (b) | Income Ratio (c) | Highest to Lowest (d) | |||||||
| Fundamental Large Cap Value Trust Series NAV(*) | 2021 | 102 | $ 42.04 to $ 42.04 | $ 4,268 | 0.00 % to 0.00 % | 0.83 % | 30.00 % to 30.00 % | |||||||
| 2020 | 104 | 32.34 to 32.34 | 3,374 | 0.00 to 0.00 | 1.18 | 12.01 to 12.01 | ||||||||
| 2019 | 103 | 28.87 to 28.87 | 2,965 | 0.00 to 0.00 | 1.24 | 35.97 to 35.97 | ||||||||
| 2018 | 103 | 21.23 to 21.23 | 2,197 | 0.00 to 0.00 | 1.19 | -17.03 to -17.03 | ||||||||
| 2017 | 100 | 25.59 to 25.59 | 2,556 | 0.00 to 0.00 | 1.68 | 17.54 to 17.54 | ||||||||
| Global Equity Trust Series I(*) | 2021 (e) | 4 | 29.52 to 29.52 | 107 | 0.00 to 0.00 | 0.00 | 21.30 to 21.30 | |||||||
| 2020 | 4 | 24.34 to 24.34 | 89 | 0.00 to 0.00 | 1.36 | 6.60 to 6.60 | ||||||||
| 2019 | 4 | 22.83 to 22.83 | 86 | 0.00 to 0.00 | 2.32 | 16.05 to 16.05 | ||||||||
| 2018 | 4 | 19.68 to 19.68 | 69 | 0.00 to 0.00 | 1.68 | -14.49 to -14.49 | ||||||||
| 2017 | 5 | 23.01 to 23.01 | 106 | 0.00 to 0.00 | 1.93 | 18.88 to 18.88 | ||||||||
| Global Equity Trust Series NAV(*) | 2021 (f) | 60 | 27.06 to 27.06 | 1,615 | 0.00 to 0.00 | 0.00 | 21.32 to 21.32 | |||||||
| 2020 | 59 | 22.30 to 22.30 | 1,309 | 0.00 to 0.00 | 1.38 | 6.71 to 6.71 | ||||||||
| 2019 | 60 | 20.90 to 20.90 | 1,255 | 0.00 to 0.00 | 2.21 | 16.06 to 16.06 | ||||||||
| 2018 | 64 | 18.01 to 18.01 | 1,145 | 0.00 to 0.00 | 1.87 | -14.42 to -14.42 | ||||||||
| 2017 | 65 | 21.04 to 21.04 | 1,361 | 0.00 to 0.00 | 1.97 | 18.90 to 18.90 | ||||||||
| Health Sciences Trust Series I(*) | 2021 | 2 | 162.55 to 162.55 | 355 | 0.00 to 0.00 | 0.00 | 11.19 to 11.19 | |||||||
| 2020 | 2 | 146.19 to 146.19 | 348 | 0.00 to 0.00 | 0.00 | 27.17 to 27.17 | ||||||||
| 2019 | 3 | 114.96 to 114.96 | 289 | 0.00 to 0.00 | 0.00 | 28.68 to 28.68 | ||||||||
| 2018 | 4 | 89.34 to 89.34 | 343 | 0.00 to 0.00 | 0.00 | 0.69 to 0.69 | ||||||||
| 2017 | 4 | 88.73 to 88.73 | 356 | 0.00 to 0.00 | 0.00 | 27.51 to 27.51 | ||||||||
| Health Sciences Trust Series NAV(*) | 2021 | 39 | 127.12 to 127.12 | 5,006 | 0.00 to 0.00 | 0.00 | 11.23 to 11.23 | |||||||
| 2020 | 40 | 114.29 to 114.29 | 4,550 | 0.00 to 0.00 | 0.00 | 27.26 to 27.26 | ||||||||
| 2019 | 39 | 89.80 to 89.80 | 3,525 | 0.00 to 0.00 | 0.00 | 28.67 to 28.67 | ||||||||
| 2018 | 38 | 69.79 to 69.79 | 2,632 | 0.00 to 0.00 | 0.00 | 0.76 to 0.76 | ||||||||
| 2017 | 33 | 69.27 to 69.27 | 2,316 | 0.00 to 0.00 | 0.00 | 27.61 to 27.61 | ||||||||
| High Yield Trust Series I(*) | 2021 | 11 | 32.13 to 32.13 | 343 | 0.00 to 0.00 | 5.06 | 5.82 to 5.82 | |||||||
| 2020 | 11 | 30.37 to 30.37 | 322 | 0.00 to 0.00 | 6.45 | 5.81 to 5.81 | ||||||||
| 2019 | 11 | 28.70 to 28.70 | 306 | 0.00 to 0.00 | 5.07 | 15.67 to 15.67 | ||||||||
| 2018 | 13 | 24.81 to 24.81 | 324 | 0.00 to 0.00 | 6.06 | -3.01 to -3.01 | ||||||||
| 2017 | 13 | 25.58 to 25.58 | 338 | 0.00 to 0.00 | 5.53 | 7.50 to 7.50 | ||||||||
| High Yield Trust Series NAV(*) | 2021 | 99 | 30.52 to 30.52 | 3,015 | 0.00 to 0.00 | 5.11 | 5.78 to 5.78 | |||||||
| 2020 | 126 | 28.85 to 28.85 | 3,637 | 0.00 to 0.00 | 6.58 | 5.77 to 5.77 | ||||||||
| 2019 | 128 | 27.28 to 27.28 | 3,503 | 0.00 to 0.00 | 5.69 | 15.99 to 15.99 | ||||||||
| 2018 | 125 | 23.52 to 23.52 | 2,945 | 0.00 to 0.00 | 6.88 | -3.02 to -3.02 | ||||||||
| 2017 | 107 | 24.25 to 24.25 | 2,587 | 0.00 to 0.00 | 5.39 | 7.46 to 7.46 | ||||||||
| International Equity Index Series I(*) | 2021 | 14 | 17.99 to 17.99 | 251 | 0.00 to 0.00 | 2.55 | 7.60 to 7.60 | |||||||
| 2020 | 14 | 16.72 to 16.72 | 238 | 0.00 to 0.00 | 2.57 | 10.64 to 10.64 | ||||||||
| 2019 | 15 | 15.11 to 15.11 | 226 | 0.00 to 0.00 | 2.57 | 21.37 to 21.37 | ||||||||
| 2018 | 13 | 12.45 to 12.45 | 160 | 0.00 to 0.00 | 2.21 | -14.10 to -14.10 | ||||||||
| 2017 | 15 | 14.49 to 14.49 | 223 | 0.00 to 0.00 | 2.06 | 27.30 to 27.30 | ||||||||
| International Equity Index Series NAV(*) | 2021 | 105 | 70.78 to 70.78 | 7,421 | 0.00 to 0.00 | 2.73 | 7.59 to 7.59 | |||||||
| 2020 | 104 | 65.78 to 65.78 | 6,815 | 0.00 to 0.00 | 2.82 | 10.76 to 10.76 | ||||||||
| 2019 | 82 | 59.39 to 59.39 | 4,875 | 0.00 to 0.00 | 2.70 | 21.44 to 21.44 | ||||||||
| 2018 | 67 | 48.91 to 48.91 | 3,254 | 0.00 to 0.00 | 2.45 | -14.10 to -14.10 | ||||||||
| 2017 | 61 | 56.94 to 56.94 | 3,482 | 0.00 to 0.00 | 1.66 | 27.45 to 27.45 | ||||||||
| International Small Company Trust Series I(*) | 2021 | 1 | 24.75 to 24.75 | 31 | 0.00 to 0.00 | 1.25 | 13.72 to 13.72 | |||||||
| 2020 | 1 | 21.76 to 21.76 | 29 | 0.00 to 0.00 | 2.19 | 8.37 to 8.37 | ||||||||
| 2019 | 1 | 20.08 to 20.08 | 27 | 0.00 to 0.00 | 2.12 | 22.60 to 22.60 | ||||||||
| 2018 | 2 | 16.38 to 16.38 | 31 | 0.00 to 0.00 | 1.26 | -20.10 to -20.10 | ||||||||
| 2017 | 2 | 20.50 to 20.50 | 40 | 0.00 to 0.00 | 0.99 | 29.45 to 29.45 | ||||||||
| International Small Company Trust Series NAV(*) | 2021 | 75 | 24.90 to 24.90 | 1,875 | 0.00 to 0.00 | 1.32 | 13.77 to 13.77 | |||||||
| 2020 | 77 | 21.89 to 21.89 | 1,690 | 0.00 to 0.00 | 2.22 | 8.41 to 8.41 | ||||||||
| 2019 | 75 | 20.19 to 20.19 | 1,522 | 0.00 to 0.00 | 2.36 | 22.71 to 22.71 | ||||||||
| 2018 | 72 | 16.45 to 16.45 | 1,182 | 0.00 to 0.00 | 1.26 | -20.07 to -20.07 | ||||||||
| 2017 | 67 | 20.59 to 20.59 | 1,376 | 0.00 to 0.00 | 1.43 | 29.59 to 29.59 | ||||||||
| Investment Quality Bond Trust Series I(*) | 2021 | 6 | 29.23 to 29.23 | 184 | 0.00 to 0.00 | 2.09 | -1.26 to -1.26 | |||||||
| 2020 | 6 | 29.61 to 29.61 | 181 | 0.00 to 0.00 | 2.35 | 9.37 to 9.37 | ||||||||
| 2019 | 6 | 27.07 to 27.07 | 165 | 0.00 to 0.00 | 2.30 | 9.37 to 9.37 | ||||||||
| 2018 | 8 | 24.75 to 24.75 | 192 | 0.00 to 0.00 | 2.73 | -0.81 to -0.81 | ||||||||
| 2017 | 8 | 24.95 to 24.95 | 199 | 0.00 to 0.00 | 2.22 | 4.60 to 4.60 | ||||||||
| Investment Quality Bond Trust Series NAV(*) | 2021 | 33 | 20.34 to 20.34 | 670 | 0.00 to 0.00 | 2.16 | -1.21 to -1.21 | |||||||
| 2020 | 31 | 20.59 to 20.59 | 631 | 0.00 to 0.00 | 2.34 | 9.45 to 9.45 | ||||||||
| 2019 | 29 | 18.81 to 18.81 | 542 | 0.00 to 0.00 | 2.74 | 9.35 to 9.35 | ||||||||
| 2018 | 25 | 17.20 to 17.20 | 435 | 0.00 to 0.00 | 2.89 | -0.67 to -0.67 | ||||||||
| 2017 | 35 | 17.32 to 17.32 | 612 | 0.00 to 0.00 | 2.80 | 4.67 to 4.67 | ||||||||
61 of 67
JOHN HANCOCK LIFE INSURANCE COMPANY OF NEW YORK SEPARATE ACCOUNT B
NOTES TO FINANCIAL STATEMENTS (CONTINUED)
December 31, 2021
7. Unit Values (continued):
| At December 31, | For the years and periods ended December 31, | |||||||||||||
| Units | Unit Fair Value | Assets | Expense Ratio | Investment | Total Return | |||||||||
| Sub-account | Year | (000s) | Highest to Lowest (a) | (000s) | Highest to Lowest (b) | Income Ratio (c) | Highest to Lowest (d) | |||||||
| Lifestyle Balanced Portfolio Series NAV(*) | 2021 | 257 | $ 17.80 to $ 17.80 | $ 4,574 | 0.00 % to 0.00 % | 2.72 % | 9.51 % to 9.51 % | |||||||
| 2020 | 245 | 16.26 to 16.26 | 3,977 | 0.00 to 0.00 | 2.64 | 12.68 to 12.68 | ||||||||
| 2019 | 246 | 14.43 to 14.43 | 3,548 | 0.00 to 0.00 | 2.26 | 17.89 to 17.89 | ||||||||
| 2018 | 199 | 12.24 to 12.24 | 2,432 | 0.00 to 0.00 | 2.64 | -3.29 to -4.39 | ||||||||
| 2017 | 154 | 12.80 to 12.80 | 1,971 | 0.00 to 0.00 | 2.73 | 12.38 to 12.38 | ||||||||
| Lifestyle Conservative Portfolio Series NAV(*) | 2021 | 15 | 14.92 to 14.92 | 227 | 0.00 to 0.00 | 2.98 | 2.94 to 2.94 | |||||||
| 2020 | 15 | 14.49 to 14.49 | 214 | 0.00 to 0.00 | 2.81 | 10.81 to 10.81 | ||||||||
| 2019 | 16 | 13.08 to 13.08 | 203 | 0.00 to 0.00 | 2.31 | 12.52 to 12.52 | ||||||||
| 2018 | 16 | 11.62 to 11.62 | 188 | 0.00 to 0.00 | 3.58 | -1.92 to -1.92 | ||||||||
| 2017 | 9 | 11.85 to 11.85 | 108 | 0.00 to 0.00 | 2.72 | 7.01 to 7.01 | ||||||||
| Lifestyle Growth Portfolio Series NAV(*) | 2021 | 1,543 | 19.93 to 19.93 | 30,759 | 0.00 to 0.00 | 2.48 | 14.13 to 14.13 | |||||||
| 2020 | 1,437 | 17.46 to 17.46 | 25,093 | 0.00 to 0.00 | 2.60 | 13.64 to 13.64 | ||||||||
| 2019 | 1,404 | 15.37 to 15.37 | 21,573 | 0.00 to 0.00 | 2.01 | 21.52 to 21.52 | ||||||||
| 2018 | 1,266 | 12.64 to 12.64 | 16,009 | 0.00 to 0.00 | 2.34 | -6.07 to -6.07 | ||||||||
| 2017 | 1,181 | 13.46 to 13.46 | 15,902 | 0.00 to 0.00 | 4.06 | 16.20 to 16.20 | ||||||||
| Lifestyle Moderate Portfolio Series NAV(*) | 2021 | 116 | 16.79 to 16.79 | 1,948 | 0.00 to 0.00 | 2.81 | 7.23 to 7.23 | |||||||
| 2020 | 115 | 15.66 to 15.66 | 1,794 | 0.00 to 0.00 | 2.76 | 12.22 to 12.22 | ||||||||
| 2019 | 110 | 13.96 to 13.96 | 1,536 | 0.00 to 0.00 | 2.25 | 15.95 to 15.95 | ||||||||
| 2018 | 92 | 12.04 to 12.04 | 1,102 | 0.00 to 0.00 | 2.81 | -2.24 to -3.53 | ||||||||
| 2017 | 75 | 12.48 to 12.48 | 932 | 0.00 to 0.00 | 2.59 | 10.56 to 10.56 | ||||||||
| M Capital Appreciation | 2021 | 5 | 175.57 to 175.57 | 792 | 0.00 to 0.00 | 0.00 | 17.74 to 17.74 | |||||||
| 2020 | 5 | 149.12 to 149.12 | 700 | 0.00 to 0.00 | 0.00 | 17.73 to 17.73 | ||||||||
| 2019 | 5 | 126.67 to 126.67 | 686 | 0.00 to 0.00 | 0.33 | 28.85 to 28.85 | ||||||||
| 2018 | 5 | 98.31 to 98.31 | 519 | 0.00 to 0.00 | 0.32 | -14.15 to -14.15 | ||||||||
| 2017 | 5 | 114.51 to 114.51 | 552 | 0.00 to 0.00 | 0.00 | 19.02 to 19.02 | ||||||||
| M International Equity | 2021 | 24 | 45.49 to 45.49 | 1,106 | 0.00 to 0.00 | 2.52 | 11.05 to 11.05 | |||||||
| 2020 | 23 | 40.96 to 40.96 | 954 | 0.00 to 0.00 | 1.79 | 8.90 to 8.90 | ||||||||
| 2019 | 20 | 37.62 to 37.62 | 756 | 0.00 to 0.00 | 2.96 | 20.32 to 20.32 | ||||||||
| 2018 | 19 | 31.26 to 31.26 | 579 | 0.00 to 0.00 | 1.61 | -20.57 to -20.57 | ||||||||
| 2017 | 15 | 39.36 to 39.36 | 595 | 0.00 to 0.00 | 1.63 | 24.05 to 24.05 | ||||||||
| M Large Cap Growth | 2021 | 8 | 148.69 to 148.69 | 1,207 | 0.00 to 0.00 | 0.00 | 21.50 to 21.50 | |||||||
| 2020 | 10 | 122.39 to 122.39 | 1,182 | 0.00 to 0.00 | 0.00 | 28.89 to 28.89 | ||||||||
| 2019 | 11 | 94.95 to 94.95 | 1,064 | 0.00 to 0.00 | 0.00 | 36.09 to 36.09 | ||||||||
| 2018 | 12 | 69.77 to 69.77 | 810 | 0.00 to 0.00 | 0.00 | -4.95 to -4.95 | ||||||||
| 2017 | 11 | 73.41 to 73.41 | 803 | 0.00 to 0.00 | 0.00 | 38.97 to 38.97 | ||||||||
| M Large Cap Value | 2021 | 35 | 40.18 to 40.18 | 1,403 | 0.00 to 0.00 | 1.61 | 30.01 to 30.01 | |||||||
| 2020 | 37 | 30.91 to 30.91 | 1,147 | 0.00 to 0.00 | 2.14 | -3.16 to -3.16 | ||||||||
| 2019 | 31 | 31.92 to 31.92 | 992 | 0.00 to 0.00 | 1.84 | 21.51 to 21.51 | ||||||||
| 2018 | 29 | 26.27 to 26.27 | 762 | 0.00 to 0.00 | 1.55 | -12.07 to -12.07 | ||||||||
| 2017 | 26 | 29.87 to 29.87 | 771 | 0.00 to 0.00 | 1.60 | 14.99 to 14.99 | ||||||||
| Managed Volatility Balanced Portfolio Series I(*) | 2021 | 27 | 34.30 to 34.30 | 923 | 0.00 to 0.00 | 2.52 | 9.76 to 9.76 | |||||||
| 2020 | 31 | 31.25 to 31.25 | 969 | 0.00 to 0.00 | 2.07 | 1.81 to 1.81 | ||||||||
| 2019 | 41 | 30.69 to 30.69 | 1,263 | 0.00 to 0.00 | 0.80 | 17.92 to 17.92 | ||||||||
| 2018 | 182 | 26.03 to 26.03 | 4,742 | 0.00 to 0.00 | 2.27 | -4.89 to -4.89 | ||||||||
| 2017 | 194 | 27.37 to 27.37 | 5,310 | 0.00 to 0.00 | 2.19 | 14.14 to 14.14 | ||||||||
| Managed Volatility Balanced Portfolio Series NAV(*) | 2021 | 1,909 | 25.85 to 25.85 | 49,330 | 0.00 to 0.00 | 2.61 | 9.88 to 9.88 | |||||||
| 2020 | 1,946 | 23.52 to 23.52 | 45,778 | 0.00 to 0.00 | 2.66 | 1.77 to 1.77 | ||||||||
| 2019 | 1,934 | 23.11 to 23.11 | 44,701 | 0.00 to 0.00 | 2.09 | 18.02 to 18.02 | ||||||||
| 2018 | 1,938 | 19.58 to 19.58 | 37,956 | 0.00 to 0.00 | 2.39 | -4.82 to -4.82 | ||||||||
| 2017 | 1,959 | 20.58 to 20.58 | 40,305 | 0.00 to 0.00 | 2.30 | 14.15 to 14.15 | ||||||||
| Managed Volatility Conservative Portfolio Series I(*) | 2021 | 3 | 30.90 to 30.90 | 87 | 0.00 to 0.00 | 3.04 | 3.48 to 3.48 | |||||||
| 2020 | 3 | 29.86 to 29.86 | 81 | 0.00 to 0.00 | 3.19 | 3.39 to 3.39 | ||||||||
| 2019 | 3 | 28.88 to 28.88 | 79 | 0.00 to 0.00 | 2.46 | 13.37 to 13.37 | ||||||||
| 2018 | 3 | 25.47 to 25.47 | 71 | 0.00 to 0.00 | 2.74 | -2.18 to -2.18 | ||||||||
| 2017 | 3 | 26.04 to 26.04 | 71 | 0.00 to 0.00 | 2.64 | 7.81 to 7.81 | ||||||||
| Managed Volatility Conservative Portfolio Series NAV(*) | 2021 | 361 | 22.03 to 22.03 | 7,960 | 0.00 to 0.00 | 3.07 | 3.52 to 3.52 | |||||||
| 2020 | 383 | 21.28 to 21.28 | 8,152 | 0.00 to 0.00 | 3.03 | 3.43 to 3.43 | ||||||||
| 2019 | 388 | 20.58 to 20.58 | 7,990 | 0.00 to 0.00 | 2.39 | 13.51 to 13.51 | ||||||||
| 2018 | 424 | 18.13 to 18.13 | 7,684 | 0.00 to 0.00 | 2.01 | -2.21 to -2.21 | ||||||||
| 2017 | 1,035 | 18.54 to 18.54 | 19,180 | 0.00 to 0.00 | 8.37 | 7.94 to 7.94 | ||||||||
| Managed Volatility Growth Portfolio Series I(*) | 2021 | 84 | 31.78 to 31.78 | 2,671 | 0.00 to 0.00 | 2.52 | 12.82 to 12.82 | |||||||
| 2020 | 55 | 28.17 to 28.17 | 1,539 | 0.00 to 0.00 | 2.25 | -1.42 to -1.42 | ||||||||
| 2019 | 57 | 28.57 to 28.57 | 1,626 | 0.00 to 0.00 | 1.83 | 19.56 to 19.56 | ||||||||
| 2018 | 60 | 23.90 to 23.90 | 1,430 | 0.00 to 0.00 | 1.91 | -6.54 to -6.54 | ||||||||
| 2017 | 79 | 25.57 to 25.57 | 2,029 | 0.00 to 0.00 | 1.91 | 18.59 to 18.59 | ||||||||
62 of 67
JOHN HANCOCK LIFE INSURANCE COMPANY OF NEW YORK SEPARATE ACCOUNT B
NOTES TO FINANCIAL STATEMENTS (CONTINUED)
December 31, 2021
7. Unit Values (continued):
| At December 31, | For the years and periods ended December 31, | |||||||||||||
| Units | Unit Fair Value | Assets | Expense Ratio | Investment | Total Return | |||||||||
| Sub-account | Year | (000s) | Highest to Lowest (a) | (000s) | Highest to Lowest (b) | Income Ratio (c) | Highest to Lowest (d) | |||||||
| Managed Volatility Growth Portfolio Series NAV(*) | 2021 | 2,455 | $ 26.28 to $ 26.28 | $ 64,520 | 0.00 % to 0.00 % | 2.46 % | 12.86 % to 12.86 % | |||||||
| 2020 | 1,777 | 23.28 to 23.28 | 41,367 | 0.00 to 0.00 | 2.27 | -1.37 to -1.37 | ||||||||
| 2019 | 1,777 | 23.61 to 23.61 | 41,938 | 0.00 to 0.00 | 1.82 | 19.68 to 19.68 | ||||||||
| 2018 | 1,800 | 19.72 to 19.72 | 35,504 | 0.00 to 0.00 | 2.24 | -6.56 to -6.56 | ||||||||
| 2017 | 1,797 | 21.11 to 21.11 | 37,922 | 0.00 to 0.00 | 2.08 | 18.71 to 18.71 | ||||||||
| . | ||||||||||||||
| Managed Volatility Moderate Portfolio Series I(*) | 2021 | 15 | 34.00 to 34.00 | 520 | 0.00 to 0.00 | 2.72 | 7.89 to 7.89 | |||||||
| 2020 | 16 | 31.51 to 31.51 | 507 | 0.00 to 0.00 | 2.75 | 3.31 to 3.31 | ||||||||
| 2019 | 17 | 30.50 to 30.50 | 517 | 0.00 to 0.00 | 2.11 | 16.72 to 16.72 | ||||||||
| 2018 | 19 | 26.13 to 26.13 | 497 | 0.00 to 0.00 | 1.76 | -3.99 to -3.99 | ||||||||
| 2017 | 30 | 27.22 to 27.22 | 828 | 0.00 to 0.00 | 2.30 | 11.88 to 11.88 | ||||||||
| . | ||||||||||||||
| Managed Volatility Moderate Portfolio Series NAV(*) | 2021 | 539 | 25.29 to 25.29 | 13,626 | 0.00 to 0.00 | 2.87 | 8.02 to 8.02 | |||||||
| 2020 | 534 | 23.41 to 23.41 | 12,496 | 0.00 to 0.00 | 2.84 | 3.28 to 3.28 | ||||||||
| 2019 | 534 | 22.67 to 22.67 | 12,115 | 0.00 to 0.00 | 2.21 | 16.85 to 16.85 | ||||||||
| 2018 | 533 | 19.40 to 19.40 | 10,334 | 0.00 to 0.00 | 2.52 | -3.93 to -3.93 | ||||||||
| 2017 | 525 | 20.19 to 20.19 | 10,593 | 0.00 to 0.00 | 2.71 | 12.02 to 12.02 | ||||||||
| . | ||||||||||||||
| Mid Cap Growth Trust Series I(*) | 2021 (g) | 8 | 102.28 to 102.28 | 813 | 0.00 to 0.00 | 0.00 | 3.54 to 3.54 | |||||||
| 2020 | 8 | 98.79 to 98.79 | 807 | 0.00 to 0.00 | 0.00 | 65.39 to 65.39 | ||||||||
| 2019 | 8 | 59.73 to 59.73 | 504 | 0.00 to 0.00 | 0.00 | 34.53 to 34.53 | ||||||||
| 2018 | 8 | 44.40 to 44.40 | 371 | 0.00 to 0.00 | 0.00 | -1.56 to -1.56 | ||||||||
| 2017 | 8 | 45.10 to 45.10 | 364 | 0.00 to 0.00 | 0.00 | 28.54 to 28.54 | ||||||||
| . | ||||||||||||||
| Mid Cap Growth Trust Series NAV(*) | 2021 (h) | 18 | 223.33 to 223.33 | 3,951 | 0.00 to 0.00 | 0.00 | 3.57 to 3.57 | |||||||
| 2020 | 17 | 215.62 to 215.62 | 3,705 | 0.00 to 0.00 | 0.00 | 65.47 to 65.47 | ||||||||
| 2019 | 19 | 130.31 to 130.31 | 2,439 | 0.00 to 0.00 | 0.00 | 34.64 to 34.64 | ||||||||
| 2018 | 19 | 96.79 to 96.79 | 1,814 | 0.00 to 0.00 | 0.00 | -1.54 to -1.54 | ||||||||
| 2017 | 17 | 98.30 to 98.30 | 1,637 | 0.00 to 0.00 | 0.00 | 28.66 to 28.66 | ||||||||
| . | ||||||||||||||
| Mid Cap Index Trust Series I(*) | 2021 | 8 | 89.16 to 89.16 | 669 | 0.00 to 0.00 | 0.88 | 24.21 to 24.21 | |||||||
| 2020 | 8 | 71.78 to 71.78 | 566 | 0.00 to 0.00 | 1.66 | 13.22 to 13.22 | ||||||||
| 2019 | 9 | 63.41 to 63.41 | 548 | 0.00 to 0.00 | 1.13 | 25.59 to 25.59 | ||||||||
| 2018 | 10 | 50.49 to 50.49 | 490 | 0.00 to 0.00 | 1.11 | -11.46 to -11.46 | ||||||||
| 2017 | 10 | 57.02 to 57.02 | 580 | 0.00 to 0.00 | 0.58 | 15.81 to 15.81 | ||||||||
| . | ||||||||||||||
| Mid Cap Index Trust Series NAV(*) | 2021 | 93 | 58.67 to 58.67 | 5,472 | 0.00 to 0.00 | 0.95 | 24.27 to 24.27 | |||||||
| 2020 | 96 | 47.21 to 47.21 | 4,538 | 0.00 to 0.00 | 1.71 | 13.27 to 13.27 | ||||||||
| 2019 | 94 | 41.68 to 41.68 | 3,905 | 0.00 to 0.00 | 1.22 | 25.72 to 25.72 | ||||||||
| 2018 | 93 | 33.16 to 33.16 | 3,071 | 0.00 to 0.00 | 1.18 | -11.45 to -11.45 | ||||||||
| 2017 | 92 | 37.45 to 37.45 | 3,448 | 0.00 to 0.00 | 0.50 | 15.86 to 15.86 | ||||||||
| . | ||||||||||||||
| Mid Value Trust Series I(*) | 2021 | 7 | 50.36 to 50.36 | 345 | 0.00 to 0.00 | 0.95 | 24.34 to 24.34 | |||||||
| 2020 | 7 | 40.50 to 40.50 | 297 | 0.00 to 0.00 | 1.74 | 9.60 to 9.60 | ||||||||
| 2019 | 7 | 36.95 to 36.95 | 274 | 0.00 to 0.00 | 1.14 | 19.54 to 19.54 | ||||||||
| 2018 | 7 | 30.91 to 30.91 | 225 | 0.00 to 0.00 | 0.75 | -10.84 to -10.84 | ||||||||
| 2017 | 8 | 34.67 to 34.67 | 276 | 0.00 to 0.00 | 0.98 | 11.43 to 11.43 | ||||||||
| . | ||||||||||||||
| Mid Value Trust Series NAV(*) | 2021 | 22 | 77.58 to 77.58 | 1,686 | 0.00 to 0.00 | 1.04 | 24.26 to 24.26 | |||||||
| 2020 | 23 | 62.43 to 62.43 | 1,407 | 0.00 to 0.00 | 1.77 | 9.72 to 9.72 | ||||||||
| 2019 | 23 | 56.90 to 56.90 | 1,329 | 0.00 to 0.00 | 1.21 | 19.49 to 19.49 | ||||||||
| 2018 | 23 | 47.62 to 47.62 | 1,101 | 0.00 to 0.00 | 0.84 | -10.68 to -10.68 | ||||||||
| 2017 | 23 | 53.32 to 53.32 | 1,238 | 0.00 to 0.00 | 1.15 | 11.46 to 11.46 | ||||||||
| . | ||||||||||||||
| Money Market Trust Series I(*) | 2021 | 145 | 14.06 to 14.06 | 2,041 | 0.00 to 0.00 | 0.00 | 0.00 to 0.00 | |||||||
| 2020 | 148 | 14.06 to 14.06 | 2,084 | 0.00 to 0.00 | 0.31 | 0.30 to 0.30 | ||||||||
| 2019 | 153 | 14.02 to 14.02 | 2,145 | 0.00 to 0.00 | 1.92 | 1.92 to 1.92 | ||||||||
| 2018 | 157 | 13.75 to 13.75 | 2,164 | 0.00 to 0.00 | 1.53 | 1.53 to 1.53 | ||||||||
| 2017 | 164 | 13.55 to 13.55 | 2,225 | 0.00 to 0.00 | 0.59 | 0.60 to 0.60 | ||||||||
| . | ||||||||||||||
| Money Market Trust Series NAV(*) | 2021 | 342 | 10.46 to 10.46 | 3,583 | 0.00 to 0.00 | 0.00 | 0.00 to 0.00 | |||||||
| 2020 | 445 | 10.46 to 10.46 | 4,660 | 0.00 to 0.00 | 0.49 | 0.33 to 0.33 | ||||||||
| 2019 | 976 | 10.43 to 10.43 | 10,179 | 0.00 to 0.00 | 1.94 | 1.97 to 1.97 | ||||||||
| 2018 | 483 | 10.23 to 10.23 | 4,944 | 0.00 to 0.00 | 1.58 | 1.60 to 1.60 | ||||||||
| 2017 | 542 | 10.07 to 10.07 | 5,459 | 0.00 to 0.00 | 0.65 | 0.61 to 0.61 | ||||||||
| . | ||||||||||||||
| Opportunistic Fixed Income Trust Series I(*) | 2021 | 6 | 27.13 to 27.13 | 170 | 0.00 to 0.00 | 2.69 | -2.02 to -2.02 | |||||||
| 2020 | 6 | 27.69 to 27.69 | 177 | 0.00 to 0.00 | 3.95 | 13.80 to 13.80 | ||||||||
| 2019 | 6 | 24.33 to 24.33 | 156 | 0.00 to 0.00 | 6.69 | 6.38 to 6.38 | ||||||||
| 2018 | 9 | 22.87 to 22.87 | 206 | 0.00 to 0.00 | 2.56 | -1.90 to -1.90 | ||||||||
| 2017 | 11 | 23.32 to 23.32 | 245 | 0.00 to 0.00 | 2.21 | 8.75 to 8.75 | ||||||||
| . | ||||||||||||||
| Opportunistic Fixed Income Trust Series NAV(*) | 2021 | 33 | 38.87 to 38.87 | 1,282 | 0.00 to 0.00 | 2.93 | -2.06 to -2.06 | |||||||
| 2020 | 32 | 39.68 to 39.68 | 1,274 | 0.00 to 0.00 | 4.03 | 13.90 to 13.90 | ||||||||
| 2019 | 33 | 34.84 to 34.84 | 1,137 | 0.00 to 0.00 | 6.36 | 6.37 to 6.37 | ||||||||
| 2018 | 33 | 32.75 to 32.75 | 1,067 | 0.00 to 0.00 | 2.64 | -1.74 to -1.74 | ||||||||
| 2017 | 52 | 33.33 to 33.33 | 1,734 | 0.00 to 0.00 | 2.68 | 8.71 to 8.71 | ||||||||
| . | ||||||||||||||
63 of 67
JOHN HANCOCK LIFE INSURANCE COMPANY OF NEW YORK SEPARATE ACCOUNT B
NOTES TO FINANCIAL STATEMENTS (CONTINUED)
December 31, 2021
7. Unit Values (continued):
| At December 31, | For the years and periods ended December 31, | |||||||||||||
| Units | Unit Fair Value | Assets | Expense Ratio | Investment | Total Return | |||||||||
| Sub-account | Year | (000s) | Highest to Lowest (a) | (000s) | Highest to Lowest (b) | Income Ratio (c) | Highest to Lowest (d) | |||||||
| PIMCO All Asset | 2021 | 29 | $ 33.96 to $ 24.06 | $ 696 | 0.00 % to 0.00 % | 10.62 % | 15.90 % to 15.90 % | |||||||
| 2020 | 28 | 29.30 to 20.76 | 589 | 0.00 to 0.00 | 4.65 | 7.74 to 7.74 | ||||||||
| 2019 | 27 | 27.19 to 19.26 | 526 | 0.00 to 0.00 | 2.65 | 11.44 to 11.44 | ||||||||
| 2018 | 25 | 24.40 to 17.29 | 430 | 0.00 to 0.00 | 2.94 | -5.59 to -5.59 | ||||||||
| 2017 | 24 | 25.85 to 18.31 | 445 | 0.00 to 0.00 | 3.20 | 13.19 to 13.19 | ||||||||
| . | ||||||||||||||
| Real Estate Securities Trust Series I(*) | 2021 | 2 | 101.22 to 101.22 | 232 | 0.00 to 0.00 | 1.46 | 46.78 to 46.78 | |||||||
| 2020 | 2 | 68.95 to 68.95 | 166 | 0.00 to 0.00 | 2.08 | -5.64 to -5.64 | ||||||||
| 2019 | 2 | 73.08 to 73.08 | 179 | 0.00 to 0.00 | 2.18 | 29.40 to 29.40 | ||||||||
| 2018 | 3 | 56.47 to 56.47 | 167 | 0.00 to 0.00 | 1.48 | -3.46 to -3.46 | ||||||||
| 2017 | 4 | 58.50 to 58.50 | 257 | 0.00 to 0.00 | 0.22 | 6.24 to 6.24 | ||||||||
| . | ||||||||||||||
| Real Estate Securities Trust Series NAV(*) | 2021 | 10 | 281.26 to 281.26 | 2,756 | 0.00 to 0.00 | 1.54 | 46.80 to 46.80 | |||||||
| 2020 | 10 | 191.60 to 191.60 | 1,866 | 0.00 to 0.00 | 2.17 | -5.58 to -5.58 | ||||||||
| 2019 | 9 | 202.92 to 202.92 | 1,916 | 0.00 to 0.00 | 2.16 | 29.47 to 29.47 | ||||||||
| 2018 | 10 | 156.74 to 156.74 | 1,505 | 0.00 to 0.00 | 1.71 | -3.43 to -3.43 | ||||||||
| 2017 | 10 | 162.30 to 162.30 | 1,658 | 0.00 to 0.00 | 0.44 | 6.26 to 6.26 | ||||||||
| . | ||||||||||||||
| Science & Technology Trust Series I(*) | 2021 | 10 | 61.61 to 61.61 | 646 | 0.00 to 0.00 | 0.00 | 8.53 to 8.53 | |||||||
| 2020 | 10 | 56.77 to 56.77 | 558 | 0.00 to 0.00 | 0.00 | 57.46 to 57.46 | ||||||||
| 2019 | 10 | 36.05 to 36.05 | 377 | 0.00 to 0.00 | 0.12 | 38.06 to 38.06 | ||||||||
| 2018 | 12 | 26.11 to 26.11 | 321 | 0.00 to 0.00 | 0.00 | -0.61 to -0.61 | ||||||||
| 2017 | 14 | 26.27 to 26.27 | 356 | 0.00 to 0.00 | 0.05 | 41.13 to 41.13 | ||||||||
| . | ||||||||||||||
| Science & Technology Trust Series NAV(*) | 2021 | 75 | 103.16 to 103.16 | 7,716 | 0.00 to 0.00 | 0.00 | 8.58 to 8.58 | |||||||
| 2020 | 76 | 95.00 to 95.00 | 7,240 | 0.00 to 0.00 | 0.00 | 57.58 to 57.58 | ||||||||
| 2019 | 79 | 60.29 to 60.29 | 4,763 | 0.00 to 0.00 | 0.18 | 38.09 to 38.09 | ||||||||
| 2018 | 74 | 43.66 to 43.66 | 3,233 | 0.00 to 0.00 | 0.00 | -0.57 to -0.57 | ||||||||
| 2017 | 49 | 43.91 to 43.91 | 2,141 | 0.00 to 0.00 | 0.09 | 41.21 to 41.21 | ||||||||
| . | ||||||||||||||
| Select Bond Trust Series I(*) | 2021 | 3 | 13.97 to 13.97 | 39 | 0.00 to 0.00 | 2.78 | -1.19 to -1.19 | |||||||
| 2020 | 3 | 14.14 to 14.14 | 41 | 0.00 to 0.00 | 3.39 | 9.08 to 9.08 | ||||||||
| 2019 | 2 | 12.96 to 12.96 | 24 | 0.00 to 0.00 | 2.67 | 8.94 to 8.94 | ||||||||
| 2018 | 2 | 11.90 to 11.90 | 22 | 0.00 to 0.00 | 2.80 | -0.43 to -0.43 | ||||||||
| 2017 | 2 | 11.95 to 11.95 | 22 | 0.00 to 0.00 | 2.48 | 3.67 to 3.67 | ||||||||
| . | ||||||||||||||
| Select Bond Trust Series NAV(*) | 2021 | 101 | 14.04 to 14.04 | 1,419 | 0.00 to 0.00 | 2.90 | -1.15 to -1.15 | |||||||
| 2020 | 100 | 14.20 to 14.20 | 1,417 | 0.00 to 0.00 | 3.12 | 9.13 to 9.13 | ||||||||
| 2019 | 101 | 13.01 to 13.01 | 1,315 | 0.00 to 0.00 | 2.71 | 9.01 to 9.01 | ||||||||
| 2018 | 100 | 11.94 to 11.94 | 1,190 | 0.00 to 0.00 | 2.84 | -0.38 to -0.38 | ||||||||
| 2017 | 100 | 11.98 to 11.98 | 1,198 | 0.00 to 0.00 | 2.85 | 3.65 to 3.65 | ||||||||
| . | ||||||||||||||
| Short Term Government Income Trust Series I(*) | 2021 | 13 | 11.49 to 11.49 | 150 | 0.00 to 0.00 | 1.78 | -1.59 to -1.59 | |||||||
| 2020 | 13 | 11.68 to 11.68 | 146 | 0.00 to 0.00 | 1.70 | 3.60 to 3.60 | ||||||||
| 2019 | 13 | 11.27 to 11.27 | 148 | 0.00 to 0.00 | 1.18 | 3.39 to 3.39 | ||||||||
| 2018 | 29 | 10.90 to 10.90 | 321 | 0.00 to 0.00 | 2.07 | 0.84 to 0.84 | ||||||||
| 2017 | 30 | 10.81 to 10.81 | 328 | 0.00 to 0.00 | 1.35 | 0.57 to 0.57 | ||||||||
| . | ||||||||||||||
| Short Term Government Income Trust Series NAV(*) | 2021 | 63 | 11.56 to 11.56 | 725 | 0.00 to 0.00 | 1.84 | -1.53 to -1.53 | |||||||
| 2020 | 61 | 11.74 to 11.74 | 720 | 0.00 to 0.00 | 1.76 | 3.65 to 3.65 | ||||||||
| 2019 | 55 | 11.33 to 11.33 | 619 | 0.00 to 0.00 | 1.71 | 3.44 to 3.44 | ||||||||
| 2018 | 56 | 10.95 to 10.95 | 611 | 0.00 to 0.00 | 1.91 | 0.89 to 0.89 | ||||||||
| 2017 | 46 | 10.86 to 10.86 | 497 | 0.00 to 0.00 | 1.42 | 0.62 to 0.62 | ||||||||
| . | ||||||||||||||
| Small Cap Index Trust Series I(*) | 2021 | 4 | 64.97 to 64.97 | 237 | 0.00 to 0.00 | 0.57 | 14.49 to 14.49 | |||||||
| 2020 | 4 | 56.74 to 56.74 | 215 | 0.00 to 0.00 | 1.44 | 19.29 to 19.29 | ||||||||
| 2019 | 4 | 47.57 to 47.57 | 187 | 0.00 to 0.00 | 1.00 | 25.05 to 25.05 | ||||||||
| 2018 | 4 | 38.04 to 38.04 | 148 | 0.00 to 0.00 | 0.93 | -11.42 to -11.42 | ||||||||
| 2017 | 4 | 42.95 to 42.95 | 169 | 0.00 to 0.00 | 0.45 | 14.39 to 14.39 | ||||||||
| . | ||||||||||||||
| Small Cap Index Trust Series NAV(*) | 2021 | 83 | 52.02 to 52.02 | 4,333 | 0.00 to 0.00 | 0.66 | 14.59 to 14.59 | |||||||
| 2020 | 81 | 45.40 to 45.40 | 3,670 | 0.00 to 0.00 | 1.61 | 19.32 to 19.32 | ||||||||
| 2019 | 64 | 38.05 to 38.05 | 2,436 | 0.00 to 0.00 | 1.04 | 25.07 to 25.07 | ||||||||
| 2018 | 63 | 30.42 to 30.42 | 1,924 | 0.00 to 0.00 | 1.00 | -11.31 to -11.31 | ||||||||
| 2017 | 63 | 34.30 to 34.30 | 2,174 | 0.00 to 0.00 | 0.50 | 14.43 to 14.43 | ||||||||
| . | ||||||||||||||
| Small Cap Opportunities Trust Series I(*) | 2021 | 2 | 77.37 to 77.37 | 172 | 0.00 to 0.00 | 0.49 | 31.10 to 31.10 | |||||||
| 2020 | 2 | 59.02 to 59.02 | 132 | 0.00 to 0.00 | 0.73 | 9.88 to 9.88 | ||||||||
| 2019 | 2 | 53.71 to 53.71 | 127 | 0.00 to 0.00 | 0.41 | 25.54 to 25.54 | ||||||||
| 2018 | 3 | 42.79 to 42.79 | 118 | 0.00 to 0.00 | 0.42 | -13.84 to -13.84 | ||||||||
| 2017 | 3 | 49.66 to 49.66 | 139 | 0.00 to 0.00 | 0.42 | 11.07 to 11.07 | ||||||||
| . | ||||||||||||||
| Small Cap Opportunities Trust Series NAV(*) | 2021 | 53 | 38.24 to 38.24 | 2,040 | 0.00 to 0.00 | 0.56 | 31.16 to 31.16 | |||||||
| 2020 | 51 | 29.15 to 29.15 | 1,495 | 0.00 to 0.00 | 0.86 | 9.93 to 9.93 | ||||||||
| 2019 | 37 | 26.52 to 26.52 | 986 | 0.00 to 0.00 | 0.46 | 25.60 to 25.60 | ||||||||
| 2018 | 35 | 21.11 to 21.11 | 731 | 0.00 to 0.00 | 0.47 | -13.81 to -13.81 | ||||||||
| 2017 | 35 | 24.50 to 24.50 | 847 | 0.00 to 0.00 | 0.46 | 11.18 to 11.18 | ||||||||
| . | ||||||||||||||
64 of 67
JOHN HANCOCK LIFE INSURANCE COMPANY OF NEW YORK SEPARATE ACCOUNT B
NOTES TO FINANCIAL STATEMENTS (CONTINUED)
December 31, 2021
7. Unit Values (continued):
| At December 31, | For the years and periods ended December 31, | |||||||||||||
| Units | Unit Fair Value | Assets | Expense Ratio | Investment | Total Return | |||||||||
| Sub-account | Year | (000s) | Highest to Lowest (a) | (000s) | Highest to Lowest (b) | Income Ratio (c) | Highest to Lowest (d) | |||||||
| Small Cap Stock Trust Series I(*) | 2021 | 2 | $ 65.40 to $ 65.40 | $ 127 | 0.00 % to 0.00 % | 0.00 | 1.20 % to 1.20 % | |||||||
| 2020 | 1 | 64.63 to 64.63 | 54 | 0.00 to 0.00 | 0.00 | 51.55 to 51.55 | ||||||||
| 2019 | 1 | 42.64 to 42.64 | 44 | 0.00 to 0.00 | 0.00 | 38.02 to 38.02 | ||||||||
| 2018 | 1 | 30.90 to 30.90 | 32 | 0.00 to 0.00 | 0.00 | -5.19 to -5.19 | ||||||||
| 2017 | 1 | 32.59 to 32.59 | 36 | 0.00 to 0.00 | 0.00 | 26.46 to 26.46 | ||||||||
| . | ||||||||||||||
| Small Cap Stock Trust Series NAV(*) | 2021 | 40 | 77.86 to 77.86 | 3,083 | 0.00 to 0.00 | 0.00 | 1.27 to 1.27 | |||||||
| 2020 | 38 | 76.89 to 76.89 | 2,959 | 0.00 to 0.00 | 0.00 | 51.62 to 51.62 | ||||||||
| 2019 | 38 | 50.71 to 50.71 | 1,926 | 0.00 to 0.00 | 0.00 | 38.10 to 38.10 | ||||||||
| 2018 | 33 | 36.72 to 36.72 | 1,221 | 0.00 to 0.00 | 0.00 | -5.22 to -5.22 | ||||||||
| 2017 | 35 | 38.74 to 38.74 | 1,352 | 0.00 to 0.00 | 0.00 | 26.70 to 26.70 | ||||||||
| . | ||||||||||||||
| Small Cap Value Trust Series I(*) | 2021 | 1 | 40.24 to 40.24 | 31 | 0.00 to 0.00 | 0.51 | 26.18 to 26.18 | |||||||
| 2020 | 1 | 31.89 to 31.89 | 26 | 0.00 to 0.00 | 1.07 | -6.70 to -6.70 | ||||||||
| 2019 | 1 | 34.18 to 34.18 | 29 | 0.00 to 0.00 | 0.54 | 26.52 to 26.52 | ||||||||
| 2018 | 2 | 27.01 to 27.01 | 65 | 0.00 to 0.00 | 0.60 | -12.50 to -12.50 | ||||||||
| 2017 | 3 | 30.87 to 30.87 | 98 | 0.00 to 0.00 | 0.96 | 3.73 to 3.73 | ||||||||
| . | ||||||||||||||
| Small Cap Value Trust Series NAV(*) | 2021 | 24 | 113.59 to 113.59 | 2,716 | 0.00 to 0.00 | 0.56 | 26.30 to 26.30 | |||||||
| 2020 | 25 | 89.94 to 89.94 | 2,253 | 0.00 to 0.00 | 1.20 | -6.68 to -6.68 | ||||||||
| 2019 | 23 | 96.38 to 96.38 | 2,184 | 0.00 to 0.00 | 0.64 | 26.62 to 26.62 | ||||||||
| 2018 | 24 | 76.12 to 76.12 | 1,812 | 0.00 to 0.00 | 0.76 | -12.45 to -12.45 | ||||||||
| 2017 | 19 | 86.94 to 86.94 | 1,681 | 0.00 to 0.00 | 0.71 | 3.79 to 3.79 | ||||||||
| . | ||||||||||||||
| Small Company Value Trust Series I(*) | 2021 | 1 | 81.49 to 81.49 | 122 | 0.00 to 0.00 | 0.30 | 22.70 to 22.70 | |||||||
| 2020 | 2 | 66.41 to 66.41 | 106 | 0.00 to 0.00 | 0.30 | 9.25 to 9.25 | ||||||||
| 2019 | 2 | 60.79 to 60.79 | 100 | 0.00 to 0.00 | 0.87 | 25.53 to 25.53 | ||||||||
| 2018 | 2 | 48.43 to 48.43 | 80 | 0.00 to 0.00 | 0.37 | -12.94 to -12.94 | ||||||||
| 2017 | 2 | 55.63 to 55.63 | 111 | 0.00 to 0.00 | 0.24 | 11.49 to 11.49 | ||||||||
| . | ||||||||||||||
| Small Company Value Trust Series NAV(*) | 2021 | 24 | 46.72 to 46.72 | 1,120 | 0.00 to 0.00 | 0.36 | 22.81 to 22.81 | |||||||
| 2020 | 25 | 38.04 to 38.04 | 945 | 0.00 to 0.00 | 0.35 | 9.25 to 9.25 | ||||||||
| 2019 | 24 | 34.82 to 34.82 | 840 | 0.00 to 0.00 | 0.94 | 25.65 to 25.65 | ||||||||
| 2018 | 25 | 27.71 to 27.71 | 682 | 0.00 to 0.00 | 0.34 | -12.93 to -12.93 | ||||||||
| 2017 | 47 | 31.83 to 31.83 | 1,497 | 0.00 to 0.00 | 0.25 | 11.58 to 11.58 | ||||||||
| . | ||||||||||||||
| Strategic Income Opportunities Trust Series I(*) | 2021 | 7 | 33.49 to 33.49 | 248 | 0.00 to 0.00 | 3.37 | 0.90 to 0.90 | |||||||
| 2020 | 7 | 33.19 to 33.19 | 241 | 0.00 to 0.00 | 1.72 | 8.59 to 8.59 | ||||||||
| 2019 | 7 | 30.56 to 30.56 | 219 | 0.00 to 0.00 | 2.99 | 10.91 to 10.91 | ||||||||
| 2018 | 6 | 27.56 to 27.56 | 167 | 0.00 to 0.00 | 3.86 | -5.03 to -5.03 | ||||||||
| 2017 | 6 | 29.02 to 29.02 | 176 | 0.00 to 0.00 | 3.28 | 5.59 to 5.59 | ||||||||
| . | ||||||||||||||
| Strategic Income Opportunities Trust Series NAV(*) | 2021 | 104 | 24.92 to 24.92 | 2,603 | 0.00 to 0.00 | 3.50 | 0.95 to 0.95 | |||||||
| 2020 | 99 | 24.69 to 24.69 | 2,439 | 0.00 to 0.00 | 1.77 | 8.61 to 8.61 | ||||||||
| 2019 | 98 | 22.73 to 22.73 | 2,228 | 0.00 to 0.00 | 2.93 | 11.00 to 11.00 | ||||||||
| 2018 | 90 | 20.48 to 20.48 | 1,844 | 0.00 to 0.00 | 3.89 | -5.00 to -5.00 | ||||||||
| 2017 | 88 | 21.56 to 21.56 | 1,890 | 0.00 to 0.00 | 3.22 | 5.66 to 5.66 | ||||||||
| . | ||||||||||||||
| Total Bond Market Series Trust NAV(*) | 2021 | 66 | 28.56 to 28.56 | 1,879 | 0.00 to 0.00 | 2.71 | -1.86 to -1.86 | |||||||
| 2020 | 47 | 29.10 to 29.10 | 1,372 | 0.00 to 0.00 | 2.62 | 7.38 to 7.38 | ||||||||
| 2019 | 33 | 27.10 to 27.10 | 899 | 0.00 to 0.00 | 2.41 | 8.30 to 8.30 | ||||||||
| 2018 | 29 | 25.02 to 25.02 | 737 | 0.00 to 0.00 | 2.72 | -0.24 to -0.24 | ||||||||
| 2017 | 31 | 25.08 to 25.08 | 776 | 0.00 to 0.00 | 2.96 | 3.34 to 3.34 | ||||||||
| . | ||||||||||||||
| Total Stock Market Index Trust Series I(*) | 2021 | 5 | 59.56 to 59.56 | 299 | 0.00 to 0.00 | 1.07 | 24.45 to 24.45 | |||||||
| 2020 | 5 | 47.86 to 47.86 | 261 | 0.00 to 0.00 | 1.80 | 21.44 to 21.44 | ||||||||
| 2019 | 7 | 39.41 to 39.41 | 257 | 0.00 to 0.00 | 1.53 | 29.63 to 29.63 | ||||||||
| 2018 | 8 | 30.40 to 30.40 | 245 | 0.00 to 0.00 | 1.01 | -5.70 to -5.70 | ||||||||
| 2017 | 13 | 32.24 to 32.24 | 418 | 0.00 to 0.00 | 1.61 | 20.59 to 20.59 | ||||||||
| . | ||||||||||||||
| Total Stock Market Index Trust Series NAV(*) | 2021 | 60 | 199.04 to 199.04 | 11,918 | 0.00 to 0.00 | 1.19 | 24.51 to 24.51 | |||||||
| 2020 | 55 | 159.85 to 159.85 | 8,829 | 0.00 to 0.00 | 2.00 | 21.50 to 21.50 | ||||||||
| 2019 | 44 | 131.56 to 131.56 | 5,755 | 0.00 to 0.00 | 1.66 | 29.70 to 29.70 | ||||||||
| 2018 | 42 | 101.44 to 101.44 | 4,266 | 0.00 to 0.00 | 1.25 | -5.66 to -5.66 | ||||||||
| 2017 | 42 | 107.52 to 107.52 | 4,550 | 0.00 to 0.00 | 1.44 | 20.65 to 20.65 | ||||||||
| . | ||||||||||||||
| Ultra Short Term Bond Trust Series I(*) | 2021 | 54 | 10.73 to 10.73 | 575 | 0.00 to 0.00 | 1.86 | -0.46 to -0.46 | |||||||
| 2020 | 56 | 10.78 to 10.78 | 609 | 0.00 to 0.00 | 1.86 | 1.46 to 1.46 | ||||||||
| 2019 | 59 | 10.63 to 10.63 | 629 | 0.00 to 0.00 | 5.31 | 3.12 to 3.12 | ||||||||
| 2018 | 2 | 10.31 to 10.31 | 22 | 0.00 to 0.00 | 1.67 | 1.40 to 1.40 | ||||||||
| 2017 | 2 | 10.17 to 10.17 | 24 | 0.00 to 0.00 | 1.60 | 0.66 to 0.66 | ||||||||
| . | ||||||||||||||
| Ultra Short Term Bond Trust Series NAV(*) | 2021 | 49 | 10.80 to 10.80 | 528 | 0.00 to 0.00 | 1.95 | -0.41 to -0.41 | |||||||
| 2020 | 53 | 10.85 to 10.85 | 571 | 0.00 to 0.00 | 2.01 | 1.62 to 1.62 | ||||||||
| 2019 | 46 | 10.68 to 10.68 | 494 | 0.00 to 0.00 | 2.07 | 3.08 to 3.08 | ||||||||
| 2018 | 31 | 10.36 to 10.36 | 321 | 0.00 to 0.00 | 1.74 | 1.53 to 1.53 | ||||||||
| 2017 | 33 | 10.20 to 10.20 | 341 | 0.00 to 0.00 | 1.74 | 0.62 to 0.62 | ||||||||
65 of 67
JOHN HANCOCK LIFE INSURANCE COMPANY OF NEW YORK SEPARATE ACCOUNT B
NOTES TO FINANCIAL STATEMENTS (CONTINUED)
December 31, 2021
| 7. | Unit Values (continued): |
(*) Sub-account that invests in affiliated Trust .
(a) As the unit fair value is presented as a range of minimum to maximum values, based on the product grouping representing the minimum and maximum expense ratio amounts, some individual contract unit values are not within the ranges presented.
(b) These ratios represent the annualized contract expenses of the separate account, consisting primarily of the items known as “Revenue from underlying fund (12b-1, ST A, Other)” and “Revenue from Sub-account” (formerly referred to as the administrative maintenance charges and sales and service fees (AMC and SSF)). The ratios include only those expenses that result in a direct reduction to unit value s. Charges made directly to unitholder accounts through the redemption of units and expenses of the underlying fund are excluded.
(c) These ratios represent the distributions from net investment income received by the sub-account from the underlying Portfolio, net of
management fees assessed by the portfolio manager, divided by the average net assets. These ratios exclude those expenses, such as mortality and expense charges, that are assessed against policyholder accounts either through the reductions in the unit values or the redemptions of units. The recognition of investment income by the sub-account is affected by the timing of the declaration of dividends by the underlying Portfolio in which the sub-accounts invest ..
(d) These ratios, represent the total return for the periods indicated, including changes in the value of the underlying Port folio, and expenses assessed through the reduction of unit values. These ratios do not include any expenses assessed through the redemption of units. Investment options indicated in footnote 1 with a date notation, if any, denote the effective date of that investment option in the variable account . The total return is calculated for the period indicated or from the effective date through the end of the reporting period. For closed sub-accounts, the total return is calculated from the beginning of the reporting period to the date the sub-account closed. As the total return is presented as a range of minimum to maximum values, based on the product grouping representing the minimum and maximum expense ratio amounts, some individual contract total returns are not within the ranges presented.
(e) Renamed on April 1, 2021. Previously known as Global Trust Series I.
(f) Renamed on April 1, 2021. Previously known as Global Trust Series NAV.
(g) Renamed on October 1, 2021. Previously known as Mid Cap Stock Trust Series I.
(h) Renamed on October 1, 2021. Previously known as Mid Cap Stock Trust Series NAV.
66 of 67
JOHN HANCOCK LIFE INSURANCE COMPANY OF NEW YORK SEPARATE ACCOUNT B
NOTES TO FINANCIAL STATEMENTS (CONTINUED)
December 31, 2021
8. Diversification Requirements
The Internal Revenue Service has issued regulations under Section 817(h) of the Internal Revenue Code (“the Code”). Under the provisions of Section 817(h) of the Code, a Contract will not be treated as a variable life contract for federal tax purposes for any period for which the investments of the Account on which the contract is based are not adequately diversified. The Code provides that the “adequately diversified” requirement may be met if the underlying investments satisfy either a statutory safe harbor test or diversification requirement set forth in regulations issued by the Secretary of the Treasury. The Company believes that the Account satisfies the current requirements of the regulations, and the Account will continue to meet such requirements.
9. Contract Charges
The Company deducts certain charges from gross premiums before placing the remaining net premiums in the sub-account. In the event of a surrender by the contract holder, surrender charges may be levied by the Company against the contract value at the time of termination to cover sales and administrative expenses associated with underwriting and issuing the Contract. Additionally, each month a deduction consisting of an administrative charge, a charge for cost of insurance, and charges for supplementary benefits is deducted from the contract value. Contract charges are paid through the redemption of sub -accounts and are reflected as terminations.
67 of 67
| Name and Principal Business Address | Position with Depositor | |
|
Marianne Harrison 200 Berkeley Street Boston, MA
02116 |
Chair, President & Chief Executive Officer | |
|
Emanuel Alves 197 Clarendon Street Boston, MA
02116 |
Director, Senior Vice President, General Counsel | |
|
Paul M. Connolly 75 Indian Spring Road Milton, MA
02186 |
Director | |
|
Thomas Edward Hampton 1900 K Street NW Washington, DC
20006 |
Director | |
|
J. Stephanie Nam 1 West 72nd Street, Apt. 35 New York NY
10023 |
Director | |
|
Ken Ross 200 Berkeley St. Boston, MA
02116 |
Director, Vice President | |
|
Rex Schlaybaugh, Jr. 400 Renaissance Center Detroit, MI
48243 |
Director | |
|
Brooks Tingle 200 Berkeley Street Boston, MA
02116 |
Director, Senior Vice President | |
|
Shamus Weiland 200 Bloor Street E. Toronto, ON M4W
1E5 |
Director | |
|
Henry H. Wong 200 Berkeley Street Boston, MA
02116 |
Director, Vice President | |
| Executive
Vice Presidents |
||
|
Andrew G.
Arnott** |
||
|
Christopher Paul
Conkey** |
||
|
James D.
Gallagher** |
||
|
Scott S.
Hartz** |
Chief Investment Officer – U.S. Investments | |
|
Halina K. von dem
Hagen*** |
Treasurer | |
| Senior
Vice Presidents |
||
|
John C.S.
Anderson** |
||
|
Michael
Biagiotti* |
||
|
Kevin J.
Cloherty** |
||
|
Peter
DeFrancesco* |
Head of Digital – Direct to Consumer | |
|
Linda
Levyne* |
||
|
Patrick
McGuinness* |
||
|
Joelle
Metzman** |
||
|
Patrick M.
Murphy* |
||
|
Lee Ann
Murray** |
||
|
Sebastian
Pariath* |
||
|
Gaurav Hans
Saini* |
||
|
Martin
Sheerin* |
Chief Financial Officer | |
|
Anthony
Teta* |
||
|
Leo
Zerilli** |
||
| Vice
Presidents |
||
|
Lynda
Abend* |
||
|
John
Addeo** |
| Name and Principal Business Address | Position with Depositor | |
|
Mark
Akerson* |
||
|
Kevin
Askew** |
||
|
Zahir
Bhanji*** |
CFO- JH Insurance | |
|
Stephen J.
Blewitt** |
||
|
Alan M.
Block** |
||
|
Jon
Bourgault** |
Senior Counsel | |
|
Paul
Boyne** |
||
|
Ian B.
Brodie** |
||
|
Ted
Bruntrager* |
CCO & Chief Risk Officer | |
|
Grant
Buchanan*** |
||
|
Daniel C.
Budde** |
||
|
Robert
Burrow** |
||
|
Jennifer Toone
Campanella** |
||
|
Yan Rong
Cao* |
||
|
Rick A.
Carlson** |
||
|
Patricia Rosch
Carrington** |
||
|
Todd J.
Cassler* |
||
|
Alex
Catterick**** |
||
|
Ken K.
Cha* |
||
|
Diana
Chan*** |
Treasury Operations | |
|
Eileen
Cloherty* |
Chief Accountant | |
|
William E.
Corson** |
||
|
Kenneth
D’Amato* |
||
|
Kenneth
Dai*** |
Treasury | |
|
John J.
Danello** |
||
|
Michelle M.
Dauphinais* |
||
|
Laura
David* |
||
|
Frederick D
Deminico** |
||
|
Jeffrey
Duckworth** |
||
|
Karin Jane
Egan* |
||
|
Jacqueline De Ritis
Field* |
||
|
Marc
Feliciano** |
||
|
Carolyn
Flanagan** |
||
|
Lauren Marx
Fleming** |
||
|
Philip J.
Fontana** |
||
|
Scott
Francolini* |
||
|
Paul
Gallagher** |
||
|
Susan
Ghalili* |
||
|
Jeffrey N.
Given** |
||
|
Thomas C.
Goggins** |
||
|
Howard C.
Greene** |
||
|
Len van
Greuning* |
Chief Information Officer | |
|
Erik
Gustafson** |
||
|
Jeffrey
Hammer*** |
||
|
Anne
Hammer* |
||
|
Richard
Harris*** |
Appointed Actuary | |
|
John
Hatch* |
Chief Operations Officer | |
|
Michael
Hession* |
||
|
Kevin
Hill* |
||
|
James C.
Hoodlet* |
||
|
Sesh
Iyengar** |
||
|
Daniel S. Janis
III** |
||
|
Rishi
Kapur*** |
Treasury | |
|
Recep C.
Kendircioglu** |
||
|
Neal P.
Kerins* |
||
|
Hung
Ko*** |
||
|
Audrea
Laffely* |
||
|
Diane R.
Landers** |
| Name and Principal Business Address | Position with Depositor | |
|
Michael
Landolfi** |
||
|
Julie
Law* |
||
|
Scott
Lively** |
||
|
Jeffrey H.
Long** |
||
|
Jennifer
Lundmark* |
||
|
Edward P.
Macdonald** |
||
|
Patrick
MacDonnell** |
||
|
Nathaniel I.
Margolis** |
||
|
Robert G.
Maulden** |
||
|
John B.
Maynard** |
||
|
Karen
McCafferty** |
||
|
Shawn
McCarthy** |
||
|
Andrew J.
McFetridge** |
||
|
Jonathan
McGee** |
||
|
Kevin
McGuire* |
||
|
Michael
McNamara* |
||
|
Steven E.
Medina** |
||
|
Maureen
Milet** |
CCO – Investments | |
|
Michelle
Morey* |
||
|
Scott
Morin* |
||
|
Catherine
Murphy* |
Deputy Appointed Actuary | |
|
Jeffrey H.
Nataupsky** |
||
|
Scott
Navin** |
||
|
Sinead
O’Connor* |
||
|
Jeffrey
Packard** |
||
|
Gary M.
Pelletier** |
||
|
David
Pemstein** |
||
|
Charlie
Philbrook* |
||
|
Tracey
Polsgrove* |
||
|
Mark
Regan* |
||
|
Todd Renneker**
|
||
|
Sandra
Rezendes* |
||
|
Charles A.
Rizzo** |
||
|
Susan
Roberts* |
||
|
Keri
Rogers** |
||
|
Ian
Roke** |
||
|
Josephine M.
Rollka* |
||
|
Devon
Russell* |
||
|
Colette
Sagar* |
||
|
Thomas
Samoluk** |
||
|
Paul
Sanabria** |
||
|
Emory W.
Sanders* |
||
|
Jeffrey R.
Santerre** |
||
|
Dolores (Dee Dee)
Schreitmueller** |
||
|
Stephen
Schuman* |
||
|
Christopher L.
Sechler** |
||
|
Thomas
Shea** |
||
|
Susan
Simi** |
||
|
Darren
Smith** |
||
|
Jayanthi
Srinivasan*** |
||
|
Wilfred
Talbot* |
||
|
Gary
Tankersley* |
||
|
Michelle
Taylor-Jones* |
||
|
William Henry Thompson
Jr.* |
||
|
Nathan
Thooft** |
||
|
Brian E.
Torrisi** |
||
|
Simonetta
Vendittelli* |
Controller | |
|
Patrick R.
Verderico* |
| Name and Principal Business Address | Position with Depositor | |
|
Adam
Weigold** |
||
|
Jennifer
White* |
||
|
Adam
Wise** |
||
|
R. Blake
Witherington** |
||
|
Thomas
Zakian** |
||
|
Ross
Zilber* |
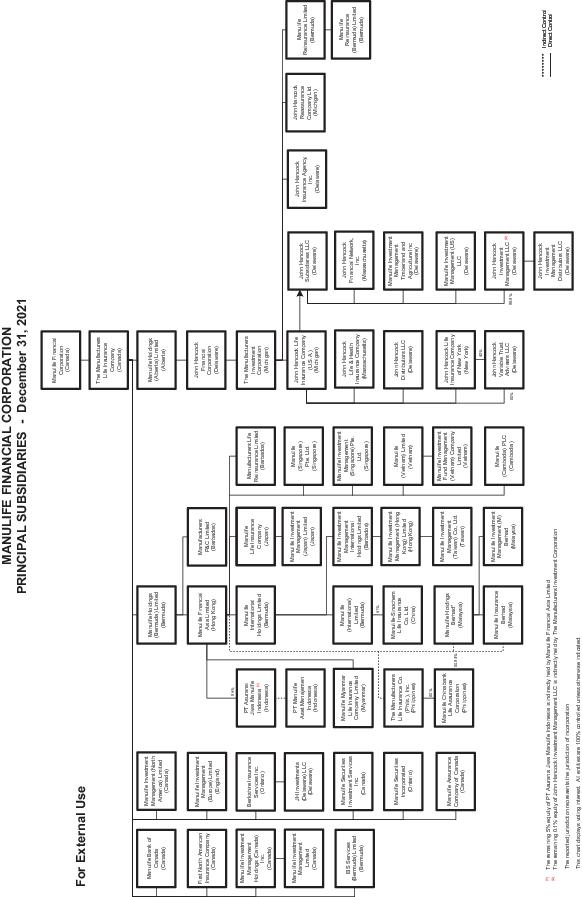
| Name of Investment Company | Capacity in Which Acting | |
|
John Hancock Variable Life Account
S |
Principal Underwriter | |
|
John Hancock Variable Life Account
U |
Principal Underwriter | |
|
John Hancock Variable Life Account
V |
Principal Underwriter | |
|
John Hancock Variable Life Account
UV |
Principal Underwriter | |
|
John Hancock Life Insurance Company (U.S.A.) Separate Account
R |
Principal Underwriter | |
|
John Hancock Life Insurance Company (U.S.A.) Separate Account
T |
Principal Underwriter | |
|
John Hancock Life Insurance Company (U.S.A.) Separate Account
W |
Principal Underwriter | |
|
John Hancock Life Insurance Company (U.S.A.) Separate Account
X |
Principal Underwriter | |
|
John Hancock Life Insurance Company (U.S.A.) Separate Account
Q |
Principal Underwriter | |
|
John Hancock Life Insurance Company (U.S.A.) Separate Account
A |
Principal Underwriter | |
|
John Hancock Life Insurance Company (U.S.A.) Separate Account
N |
Principal Underwriter | |
|
John Hancock Life Insurance Company (U.S.A.) Separate Account
H |
Principal Underwriter | |
|
John Hancock Life Insurance Company (U.S.A.) Separate Account
I |
Principal Underwriter | |
|
John Hancock Life Insurance Company (U.S.A.) Separate Account
J |
Principal Underwriter | |
|
John Hancock Life Insurance Company (U.S.A.) Separate Account
K |
Principal Underwriter | |
|
John Hancock Life Insurance Company (U.S.A.) Separate Account
L |
Principal Underwriter | |
|
John Hancock Life Insurance Company (U.S.A.) Separate Account
M |
Principal Underwriter | |
|
John Hancock Life Insurance Company of New York Separate Account
B |
Principal Underwriter | |
|
John Hancock Life Insurance Company of New York Separate Account
A |
Principal Underwriter |
| Name | Title | |
|
Rick
Carlson** |
Vice President, US Taxation | |
|
James C.
Hoodlet* |
Director | |
|
Jeffrey H.
Long** |
Chief Financial Officer and Financial Operations Principal | |
|
Martin
Sheerin* |
Director | |
|
Gary
Tankersley* |
Director, President and Chief Executive Officer | |
|
Christopher
Walker*** |
Director, Vice President, Investments | |
|
Tracy
Lannigan** |
Corporate Secretary |
| (1) | (2) | (3) | (4) | (5) | ||||
| Name
of Principal Underwriter |
Net
Underwriting Discounts and Commissions |
Compensation
on Events Occasioning the Deduction of a Deferred Sales Load |
Brokerage
Commissions |
Other
Compensation | ||||
| John Hancock Distributors LLC | $0 | $0 | $0 | $0 |
| Signatures | Title |
| /s/
Simonetta Vendittelli Simonetta Vendittelli |
Vice President and Controller |
| /s/
Martin Sheerin Martin Sheerin |
Senior Vice President and Chief Financial Officer |
| /s/
Marianne Harrison Marianne Harrison |
Chair, President and Chief Executive Officer |
| *
Emanuel Alves |
Director |
| *
Paul M. Connolly |
Director |
| *
Thomas Edward Hampton |
Director |
| *
J. Stephanie Nam |
Director |
| *
Ken Ross |
Director |
| *
Rex Schlaybaugh, Jr. |
Director |
| *
Brooks Tingle |
Director |
| *
Shamus Weiland |
Director |
| *
Henry H. Wong |
Director |
| /s/James
C. Hoodlet James C. Hoodlet, as Attorney-In-Fact |
| Investment Objective | Portfolio and Adviser/Subadviser | Current
Expenses* |
Average
Annual Total Returns (as of 12/31/21) | ||
| 1-Year | 5-Year | 10-Year | |||
| Seeks to provide maximum capital appreciation. | M
Capital Appreciation Fund M Financial Investment Advisers, Inc./Frontier Capital Management Company, LLC |
1.04% | 17.74 | 12.78 | 14.26 |
| Seeks to provide long-term capital appreciation. | M
International Equity Fund M Financial Investment Advisers, Inc./Dimensional Fund Advisors LP |
0.69% | 11.05 | 7.47 | 6.03 |
| Seeks to provide long-term capital appreciation. | M
Large Cap Growth Fund M Financial Investment Advisers, Inc./DSM Capital Partners LLC |
0.75% | 21.49 | 23.00 | 18.15 |
| Seeks to provide long-term capital appreciation. | M
Large Cap Value Fund M Financial Investment Advisers, Inc./Brandywine Global Investment Management, LLC |
0.65% | 30.01 | 9.12 | 11.27 |
| JOHN HANCOCK NEW YORK
SELLING AGREEMENT
APPROVALS/APPOINTMENTS |
Life Agent (LA) License Key Line Requirements: For Annuities: Variable For RPS : Life For Insurance -Life and/or Variable |
JHNY APPROVED BROKER-DEALERS AS OF MARCH 25, 2022
| BROKER DEALER |
TAX ID / BROKER DEALER |
APPROVAL DATE |
||||
| A.P. Securities, Inc. |
11-3031179 | 7/27/2001 | ||||
| Advest, Inc. |
06-0950348 | 7/6/2005 | ||||
| Advisory Group Equity Services, Ltd. |
04-2830039 | 5/3/2002 Re-approved 2/19/2021 |
||||
| Aegis Capital Corp. |
11-2671906 | 8/8/2005 | ||||
| Alexander Capital LP |
13-3866977 | 1/26/2016 | ||||
| Allstate Financial Services, LLC |
47-0826838 | 10/19/2001 | ||||
| All-Vest Securities, Inc. |
11-2591111 | 8/14/2001 | ||||
| American Capital Partners, LLC |
01-0564579 | 11/17/2011 | ||||
| American Global Wealth, Inc. |
39-1259164 | 10/9/2020 | ||||
| American Portfolios Financial Services, Inc. |
11-3018002 | 5/5/2002 | ||||
| Ameriprise Financial Services, Inc |
41-0973005 | 7/15/2003 | ||||
| Ameritas Investment Corp. |
47-0663374 | 11/13/2003 | ||||
| APW Capital, Inc. |
22-3580765 | 1/27/2009 | ||||
| Arkadios Capital, LLC |
81-1052458 | 6/5/2020 | ||||
| Art Hauser Insurance Inc. |
31-0800707 | 10/22/2015 | ||||
| Atlantic Financial, LLC |
26-1738719 | 2/23/2011 | ||||
| Ausdal Financial Partners, Inc. |
42-1129623 | 3/12/2021 | ||||
| Avantax Investment Services, Inc. |
75-1869963 | 7/18/2003 | ||||
| Avantax Investment Services, Inc. |
75-1869963 | 3/28/2005 | ||||
| Bay Colony Securities Co. , Inc. |
04-3333156 | 11/20/2009 | ||||
| BB & T Investment Services, Inc. |
56-1815852 | 11/1/2005 | ||||
| BCG Securities, Inc. |
23-1664237 | 10/12/2006 | ||||
| Benchmark Investments, Inc. |
71-0825385 | 8/26/2020 | ||||
| Benjamin F. Edwards & Company, Inc. |
26-3199152 | 10/14/2009 | ||||
| Berthel, Fisher & Company Financial Services, Inc. |
42-1029773 | 4/14/2004 |
| FOR INTERNAL USE ONLY Important Note: JHNY no longer offers Variable and Fixed annuity products effective December 31, 2012. |
March 2022 |
| JOHN HANCOCK NEW YORK
SELLING AGREEMENT
APPROVALS/APPOINTMENTS |
Life Agent (LA) License Key Line Requirements: For Annuities: Variable For RPS : Life For Insurance -Life and/or Variable |
| BROKER DEALER |
TAX ID / BROKER DEALER |
APPROVAL DATE |
||||
| BG Worldwide Securities, Inc. |
30-0039439 | 3/15/2007 | ||||
| Bolton Global Capital |
04-3077774 | 5/4/2001 | ||||
| Brighton Securities Corp. |
16-0961085 | 8/11/1998 | ||||
| Brokerageselect |
06-1549225 | 2/7/2007 | ||||
| Brokers International Financial Services, LLC |
42-1427068 | 6/23/2020 | ||||
| Buckman, Buckman & Reid, Inc. |
22-2926943 | 5/20/2008 | ||||
| Cabot Lodge Securities, LLC |
45-3717999 | 4/11/2013 | ||||
| Cadaret, Grant & Co., Inc. |
22-2361254 | 6/12/1995 | ||||
| Calton & Associates, Inc. |
59-2845944 | 7/30/2005 | ||||
| Cambridge Investment Research, Inc. |
42-1445429 | 12/3/2001 | ||||
| Cantella & Co., Inc. |
04-3211861 | 8/21/1998 | ||||
| CapFinancial Securities LLC |
46-4350797 | 6/6/2014 | ||||
| Capital Brokerage |
91-1143830 | 10/23/2003 | ||||
| Capital Investment Group, Inc. |
56-1394939 | 1/21/2011 | ||||
| Capitol Securities Management, Inc. |
54-1570635 | 3/26/2013 | ||||
| CBIZ Financial Solutions, Inc. |
52-1396995 | 4/13/2005 | ||||
| Centauraus Financial, Inc. |
33-0530236 | 5/4/2001 | ||||
| CES Insurance Agency, Inc./Commonwealth Financial Network |
04-2865307 | 11/2/1992 | ||||
| Cetera Advisor Networks, LLC |
95-3845382 | 11/24/1994 | ||||
| Cetera Advisors LLC |
84-0858799 | 10/26/1992 | ||||
| CFD Investments, Inc. |
35-1692812 | 1/24/2007 | ||||
| Chapin Davis Insurance Inc. |
52-1719456 | 11/4/2014 | ||||
| Chelsea Financial Services |
11-3489062 | 6/16/2009 | ||||
| Citigroup Global Markets, Inc. |
11-2418191 | 11/9/1992 | ||||
| Citizens Securities, Inc. (formerly CCO Investment Services Corp.) |
05-0487400 | 11/28/2005 |
| FOR INTERNAL USE ONLY Important Note: JHNY no longer offers Variable and Fixed annuity products effective December 31, 2012. |
March 2022 |
| JOHN HANCOCK NEW YORK
SELLING AGREEMENT
APPROVALS/APPOINTMENTS |
Life Agent (LA) License Key Line Requirements: For Annuities: Variable For RPS : Life For Insurance -Life and/or Variable |
| BROKER DEALER |
TAX ID / BROKER DEALER |
APPROVAL DATE |
||||
| Client One Securities, LLC |
27-1408998 | 7/1/2020 | ||||
| Client One Securities, LLC |
52-2265514 | 4/2/2002 | ||||
| Coastal Equities, Inc. |
56-2456935 | 8/9/2016 | ||||
| Colliers Securities, LLC |
41-1883794 | 9/5/2014 | ||||
| Compass Securities Ins. |
04-2844064 | 6/6/2001 | ||||
| Concorde Investment Services, LLC |
27-0498480 | 8/29/2011 | ||||
| Concourse Financial Group Securities, Inc. |
63-0879387 | 2/11/1999 | ||||
| Coombe Financial Services, Inc |
14-6025667 | 5/30/2006 | ||||
| Coordinated Capital Securities, Inc |
39-1468428 | 9/23/2011 | ||||
| CoreCap Investments, Inc. |
23-2809463 | 2/24/2017 | ||||
| Crown Capital Securities, L.P. |
33-0837984 | 6/11/2001 | ||||
| CUNA Brokerage Services, Inc. |
39-1205591 | 9/15/1999 | ||||
| Deutsche Bank Securities, Inc. |
13-2730828 | 12/7/1992 | ||||
| Di Giulio Financial Services, Inc. |
16-1573323 | 10/17/2001 | ||||
| Dinosaur Securities, LLC |
13-4123021 | 6/29/2010 | ||||
| DMK Advisor Group, Inc. |
84-1345780 | 8/10/2020 | ||||
| Edward D. Jones, & Co., L.P. |
43-0345811 | 8/17/2000 | ||||
| EF Legacy Securities, LLC |
47-3919321 | 2/18/2022 | ||||
| Equitable Advisors, LLC |
06-1555494 | 11/1/1999 | ||||
| Equity Services Inc. |
03-0221141 | 4/22/1998 | ||||
| Excel Securities & Associates, Inc. |
16-1540153 | 8/18/2004 | ||||
| Fairport Capital, Inc. |
06-1103413 | 7/21/2010 | ||||
| Falcone & Marshall Financial Services, Inc. |
16-1594634 | 3/26/2015 | ||||
| Financial Telesis, Inc. |
68-0279977 | 5/5/2005 | ||||
| First Allied Securities, Inc. |
11-3152836 | 3/15/2004 |
| FOR INTERNAL USE ONLY Important Note: JHNY no longer offers Variable and Fixed annuity products effective December 31, 2012. |
March 2022 |
| JOHN HANCOCK NEW YORK
SELLING AGREEMENT
APPROVALS/APPOINTMENTS |
Life Agent (LA) License Key Line Requirements: For Annuities: Variable For RPS : Life For Insurance -Life and/or Variable |
| BROKER DEALER |
TAX ID / BROKER DEALER |
APPROVAL DATE |
||||
| First Heartland Capital, Inc. |
43-1635588 | 6/11/2002 | ||||
| First Palladium, LLC |
82-2239026 | 8/22/2018 | ||||
| First Republic Securities LLC |
91-2076555 | 5/21/2015 | ||||
| First Williston Corporation |
11-2042681 | 5/28/1997 | ||||
| Fortune Financial Services, Inc. |
25-1799740 | 10/2/2007 | ||||
| Founders Financial Securities, LLC |
20-2052994 | 12/15/2008 | ||||
| FSC Securities Corporation |
58-1288674 | 3/21/1995 | ||||
| Fulcrum Securities, Inc |
20-1098652 | 8/4/2010 | ||||
| G.A. Repple & Company |
59-2599605 | 6/30/2003 | ||||
| Garden State Securities, Inc. |
22-2319866 | 12/19/2001 | ||||
| GDC Securities, LLC |
06-1415515 | 1/29/1996 | ||||
| Geneos Wealth Management, Inc. |
02-0580939 | 6/11/2002 | ||||
| Genworth Financial Securities Corp |
36-3120284 | 3/20/2002 | ||||
| GFA Securities, LLC |
57-1169794 | 5/5/2004 | ||||
| Gradient Securities, LLC |
26-4463739 | 4/25/2013 | ||||
| Great American Investors, Inc. |
48-1099886 | 12/17/2010 | ||||
| Grove Point Financial, LLC (formerly H. Beck, Inc.) |
52-1321340 | 11/2/1992 | ||||
| GWN Securities, Inc. |
65-0939556 | 7/1/2004 | ||||
| Hamilton Cavanaugh Investment Brokers, Inc. |
13-3750891 | 3/2/2009 | ||||
| Hazard & Siegel, Inc. |
16-0954584 | 12/26/2003 | ||||
| Henley & Company, LLC. |
02-0723575 | 3/28/2005 | ||||
| HighTower Securities, LLC |
36-4454225 | 3/18/2009 | ||||
| Hornor, Townsend & Kent |
23-1706189 | 10/21/1995 | ||||
| HRC Investment Services, Inc. |
11-3140280 | 10/27/1999 | ||||
| Hudson Heritage Capital Management, Inc. |
13-3970289 | 1/24/2000 |
| FOR INTERNAL USE ONLY Important Note: JHNY no longer offers Variable and Fixed annuity products effective December 31, 2012. |
March 2022 |
| JOHN HANCOCK NEW YORK
SELLING AGREEMENT
APPROVALS/APPOINTMENTS |
Life Agent (LA) License Key Line Requirements: For Annuities: Variable For RPS : Life For Insurance -Life and/or Variable |
| BROKER DEALER |
TAX ID / BROKER DEALER |
APPROVAL DATE |
||||
| IBN Financial Services, Inc. |
16-1493299 | 6/11/2002 | ||||
| IDB Capital Corp. |
13-4134872 | 1/1/2008 | ||||
| Independent Financial Group, LLC |
71-0927304 | 8/4/2010 (Annuity) 6/4/2021 (USI) |
||||
| Infinex Investments, Inc. |
06-1367288 | 11/27/2012 | ||||
| Innovation Partners, LLC |
30-0451254 | 11/19/2013 | ||||
| International Assets Advisory LLC |
59-3734291 | 12/19/2012 | ||||
| Intervest International Equities Corp. |
98-0096287 | 12/5/2002 (Annuity) 5/12/2021 (Group) |
||||
| J.P. Morgan Securities LLC |
13-4110995 | 7/6/2005 (Reinstated 10/30/13) |
||||
| J.W. Cole Financial, Inc. |
16-1632597 | 6/16/2005 | ||||
| Jacques Financial LLC |
52-2217889 | 12/21/2012 | ||||
| Janney Montgomery Scott, Inc. |
23-0731260 | 10/1/1997 | ||||
| Kern, Suslow Securities, Inc. |
13-3516214 | 3/1/1999 | ||||
| Kestra Investment Services, LLC |
74-2794194 | 6/11/2002 | ||||
| Key Investment Services, LLC |
13-4300906 | 2/2/2006 | ||||
| Key2Life Brokerage Inc. |
26-3013748 | 11/19/2008 | ||||
| Kovack Securities, Inc. |
65-0747270 | 11/24/2003 | ||||
| L. M. Kohn and Company |
31-1311805 | 11/9/2000 | ||||
| Larimer Capital Corporations |
84-1028373 | 5/7/2007 | ||||
| Larson Financial Securities, LLC |
27-1372444 | 9/1/2010 | ||||
| LaSalle St. Securities, LLC |
36-2797246 | 5/14/2001 | ||||
| Lebenthal Financial Services, Inc. |
20-3156765 | 5/19/2008 | ||||
| Leigh D. Baldwin & Co., Inc. |
22-3348632 | 4/21/1995 | ||||
| Lesko Securities Inc. |
16-1152736 | 6/30/2004 | ||||
| Leumi Investment Services, Inc. |
13-4132289 | 3/26/2004 | ||||
| Level Four Financial, LLC |
20-0629176 | 2/1/2007 |
| FOR INTERNAL USE ONLY Important Note: JHNY no longer offers Variable and Fixed annuity products effective December 31, 2012. |
March 2022 |
| JOHN HANCOCK NEW YORK
SELLING AGREEMENT
APPROVALS/APPOINTMENTS |
Life Agent (LA) License Key Line Requirements: For Annuities: Variable For RPS : Life For Insurance -Life and/or Variable |
| BROKER DEALER |
TAX ID / BROKER DEALER |
APPROVAL DATE |
||||
| Liberty Partners Financial Services, LLC |
90-0139675 | 11/26/2012 | ||||
| Lifemark Securities Corp. |
16-1238365 | 3/6/1995 | ||||
| Lincoln Financial Advisors Corporation |
35-1151034 | 7/12/2001 | ||||
| Lincoln Financial Securities Corp. |
02-0275490 | 12/11/1993 | ||||
| Lincoln Investment Planning, Inc. |
23-1702591 | 4/1/2002 | ||||
| Lockton Investment Securities, LLC |
20-3247391 | 12/19/2012 | ||||
| Lombard Securities, Inc. |
52-1695548 | 2/17/2009 | ||||
| LPL Financial Corporation |
95-2834236 | 6/4/1998 | ||||
| M & T Securities, Inc. |
16-1263079 | 5/17/1999 | ||||
| M Holdings Securities, Inc. |
91-1802259 | 5/23/2000 | ||||
| Madison Avenue Securities, Inc. |
71-0987804 | 4/19/2007 | ||||
| Marlin Trading, Inc. |
13-3990383 | 3/14/2001 | ||||
| May Capital Group, LLC |
22-3324819 | 7/6/2006 | ||||
| McDonald Investments Inc. |
34-1391952 | 2/2/2006 | ||||
| Mercer Allied Company, LP |
14-1775694 | 11/30/2007 | ||||
| Merrill Lynch, Pierce, Fenner & Smith (MLPF&S) |
13-2808480 | 10/25/1992 | ||||
| Mesirow Financial, Inc. |
36-3429604 | 3/14/2007 | ||||
| Mid Atlantic Capital Corporation |
25-1409618 | 6/25/2004 | ||||
| Mid-Atlantic Securities, Inc. |
62-1726305 | 10/17/2001 | ||||
| MMA Securities LLC (formerly NIA Securities, LLC) |
22-3570392 | 8/4/2003 | ||||
| MMC Securities, Inc. |
06-1685865 | 6/12/2002 | ||||
| MML Investor Services, Inc. |
04-2746212 | 3/30/1994 | ||||
| Money Concepts Capital Corp. |
59-2268067 | 3/23/2003 | ||||
| Morgan Stanley Smith Barney LLC |
26-4310844 | 7/7/1999 | ||||
| MSEC, LLC |
27-2587292 | 1/3/2020 |
| FOR INTERNAL USE ONLY Important Note: JHNY no longer offers Variable and Fixed annuity products effective December 31, 2012. |
March 2022 |
| JOHN HANCOCK NEW YORK
SELLING AGREEMENT
APPROVALS/APPOINTMENTS |
Life Agent (LA) License Key Line Requirements: For Annuities: Variable For RPS : Life For Insurance -Life and/or Variable |
| BROKER DEALER |
TAX ID / BROKER DEALER |
APPROVAL DATE |
||||
| Mutual Funds Associates |
16-0922871 | 9/1/1994 | ||||
| Mutual Securities Inc. of California |
95-3703162 | 4/18/2012 | ||||
| MWA Financial Services, Inc. |
36-4420471 | 7/29/2003 | ||||
| National Securities Corporation |
91-0519466 | 10/3/2007 | ||||
| Nations Financial Group, Inc. |
39-1909295 | 12/3/2004 | ||||
| Nationwide Planning Associates, Inc. |
22-3196827 | 3/13/2003 | ||||
| Nationwide Securities LLC (aka NSLLC) |
36-2434406 | 1/30/2009 | ||||
| NBC Securities, Inc. |
63-0923499 | 10/5/2017 | ||||
| Nelson Securities, Inc. |
91-1219910 | 6/28/1993 | ||||
| Newbridge Securities Corp |
54-1879031 | 11/15/2006 | ||||
| Newport Group Securities, Inc. |
59-2386168 | 6/14/2012 | ||||
| Next Financial Group, Inc. |
54-1900002 | 2/4/2000 | ||||
| Northern Lights Distributors, LLC |
77-0625792 | 5/29/2007 | ||||
| Northwestern Mutual Investment Services, LLC. |
52-2114207 | 12/11/2008 | ||||
| NYLife Securities Inc. |
27-0145686 | 3/31/2007 | ||||
| Oberlin Financial International, LLC |
82-3775196 | 3/27/2020 | ||||
| Oppenheimer & Co., Inc. |
13-6567518 | 11/18/2003 | ||||
| P & A Financial Securities, Inc. |
16-1533600 | 8/14/2000 | ||||
| Park Avenue Securities, LLC. |
13-4023176 | 9/21/1993 | ||||
| Parkerland Brokerage Services, Inc. |
39-1794957 | 2/23/2017 | ||||
| Parsonex Securities, Inc. |
20-8580639 | 8/10/2009 | ||||
| Paulson Investment Company, Inc. |
93-0789804 | 3/7/2003 | ||||
| Pensionmark Securities, LLC |
81-2334025 | 4/1/2021 | ||||
| People’s Securities, Inc. |
06-1082686 | 9/23/2014 | ||||
| Phoenix Equity Planning Corporation |
23-2795977 | 6/4/2004 |
| FOR INTERNAL USE ONLY Important Note: JHNY no longer offers Variable and Fixed annuity products effective December 31, 2012. |
March 2022 |
| JOHN HANCOCK NEW YORK
SELLING AGREEMENT
APPROVALS/APPOINTMENTS |
Life Agent (LA) License Key Line Requirements: For Annuities: Variable For RPS : Life For Insurance -Life and/or Variable |
| BROKER DEALER |
TAX ID / BROKER DEALER |
APPROVAL DATE |
||||
| PHX Financial, Inc. |
41-2225155 | 5/9/2019 | ||||
| Pinnacle Investments, LLC |
20-5319494 | 7/7/2005 | ||||
| PlanMember Securities Corporation |
95-3706234 | 5/30/2008 | ||||
| Principal Securities Inc. (formerly Princor Financial Securities Corp.) |
42-0941553 | 3/22/1999 | ||||
| Private Client Services, LLC |
61-1383537 | 1/25/2010 | ||||
| Pro Integrity Securities, Inc. |
73-1552325 | 1/9/2002 | ||||
| Prospera Financial Services, Inc. |
75-1832551 | 3/24/1998 | ||||
| Pruco Securities Corp |
22-1211670 | 8/24/2000 | ||||
| Purshe Kaplan Sterling Investments |
13-3749682 | 5/16/2001 | ||||
| Pyramid Funds Corporation |
14-1498866 | 10/3/2012 | ||||
| Quint Capital Corporation |
59-3007259 | 1/11/2021 | ||||
| R & W Brokerage, Inc. |
11-2779581 | 2/22/2008 | ||||
| R. Seelaus & Co., Inc |
22-2501042 | 2/2/2009 | ||||
| Raymond James Financial Services (fka I. M. & R, Inc.) |
59-1237041 | 3/15/2004 | ||||
| RBC Capital Markets Corp |
41-1416330 | 6/29/2004 | ||||
| RBC Capital Markets Corporation |
41-1416330 | 1/1/2002 | ||||
| Regal Securities, Inc. |
36-2916812 | 6/8/2008 | ||||
| Reid & Associates, LLC |
14-1778902 | 9/25/2013 | ||||
| RNR Securities, LLC. |
11-3374561 | 6/11/2002 | ||||
| Robb, P.J. Variable Corp. |
62-1592808 | 10/8/1999 | ||||
| Robert W. Baird |
39-6037917 | Reinstated 7/25/2017 | ||||
| Rockefeller Financial, LLC |
83-2489877 | 2/9/2022 | ||||
| Ross Securities Corporation |
13-4147466 | 2/25/2015 | ||||
| Royal Alliance Associates, Inc. |
93-0987232 | 7/22/2003 | ||||
| S.C. Parker & Co., Inc. |
16-0876114 | 10/25/2005 |
| FOR INTERNAL USE ONLY Important Note: JHNY no longer offers Variable and Fixed annuity products effective December 31, 2012. |
March 2022 |
| JOHN HANCOCK NEW YORK
SELLING AGREEMENT
APPROVALS/APPOINTMENTS |
Life Agent (LA) License Key Line Requirements: For Annuities: Variable For RPS : Life For Insurance -Life and/or Variable |
| BROKER DEALER |
TAX ID / BROKER DEALER |
APPROVAL DATE |
||||
| SA Stone Wealth Management |
75-2975513 | 6/8/2018 | ||||
| Sage, Rutty & Co., Inc. |
16-0620690 | 11/27/1992 | ||||
| SagePoint Financial, Inc (formerly AIG Financial Advisors, Inc.) |
20-1741754 | 11/8/2005 | ||||
| Sanctuary Securities, Inc. |
36-2957364 | 7/15/2019 | ||||
| Saperston Asset Management Inc. |
16-1539208 | 5/10/1998 | ||||
| Saxony Securities, Inc. |
43-1932300 | 1/15/2004 | ||||
| Saybrus Equity Services, LLC |
27-1869321 | 9/23/2010 | ||||
| SCF Securities Inc. |
86-0936511 | -6/19/2014 (Servicing Only Annuity) - 03/2/2017 ( Life) |
||||
| Securian Financial Services, Inc. |
41-1486060 | 8/6/1999 | ||||
| Securities America, Inc. |
11-2551174 | 4/28/1997 | ||||
| SEI Investments Distribution Co. |
23-2177800 | 10/8/2004 | ||||
| Sentinel Securities, Inc. |
04-3527574 | 9/11/2008 | ||||
| SIGMA Financial Corporation |
38-2472555 | 2/29/2000 | ||||
| Signature Securities Group Corporation |
13-4120476 | 9/22/2004 | ||||
| SMH Capital, Inc. |
76-0224835 | 2/15/2007 | ||||
| Sorrento Pacific Financial, LLC |
04-3746212 | 5/30/2001 | ||||
| Sovereign Legacy Securities, Inc. |
11-1738990 | 7/19/2011 | ||||
| Spire Securities, LLC |
20-8920866 | 8/17/2009 | ||||
| Stacey Braun Financial Services, Inc. |
13-4193719 | 7/6/2007 | ||||
| Stanley Laman Group Securities LLC |
33-1027312 | 7/31/2008 | ||||
| Sterling Monroe Securities, LLC |
75-3049285 | 5/31/2007 | ||||
| Stifel, Nicolaus & Company, Inc. |
43-0538770 | 4/27/2007 | ||||
| Syndicated Capital, Inc. |
95-4042447 | 9/25/2000 | ||||
| TD Waterhouse Investor Services, Inc. |
06-0988655 | 10/10/2003 | ||||
| TFS Securities, Inc. |
22-2825878 | 8/28/2007 |
| FOR INTERNAL USE ONLY Important Note: JHNY no longer offers Variable and Fixed annuity products effective December 31, 2012. |
March 2022 |
| JOHN HANCOCK NEW YORK
SELLING AGREEMENT
APPROVALS/APPOINTMENTS |
Life Agent (LA) License Key Line Requirements: For Annuities: Variable For RPS : Life For Insurance -Life and/or Variable |
| BROKER DEALER |
TAX ID / BROKER DEALER |
APPROVAL DATE |
||||
| The Enterprise Securities Company |
38-2932225 | 2/29/2016 | ||||
| The F.I. Group, Inc. |
16-1572019 | 6/17/2006 | ||||
| The Investment Center, Inc. |
22-2699900 | 9/21/1995 | ||||
| The Leaders Group, Inc. |
84-1275292 | 8/30/1999 | ||||
| The New Penfacs, Inc |
41-2238941 | 2/20/2009 | ||||
| The Strategic Financial Alliance, Inc. |
03-0510324 | 10/4/2007 | ||||
| Timecapital Securities Corp. |
11-2339821 | 2/17/1994 | ||||
| Transamerica Financial Advisors, Inc. |
59-2476008 | 11/18/2003 | ||||
| Trevor, Cole, Reid & Monroe, Inc. |
13-3100833 | 3/15/2002 | ||||
| Triad Advisors, Inc. |
65-0173164 | 10/7/2001 | ||||
| Trubee, Collins & Co., Inc. |
16-1406627 | 11/17/2005 | ||||
| Truist Investment Services, Inc. |
58-1648698 | 8/16/2006 | ||||
| Trustmont Financial Group, Inc. |
25-1527294 | 10/12/2005 | ||||
| UBS Financial Services, Inc. |
13-2638166 | 11/11/1992 | ||||
| United Planners Financial Services of America |
86-0588303 | 5/21/2001 | ||||
| Univest Securities Inc. DBA Universal Financial Group |
11-3188003 | 2/25/2002 | ||||
| USA Financial Securities Corp. |
38-3397033 | 7/20/2009 | ||||
| USI Securities, Inc. |
06-1493970 | 1/27/2001 | ||||
| VALIC Financial Advisors, Inc. |
76-0519992 | 4/26/2004 | ||||
| Valmark Securities, Inc. |
34-1724087 | 3/20/2000 | ||||
| Vanderbilt Securities, LLC. |
11-3639254 | 11/17/2003 | ||||
| Vaughan & Company Securities, Inc. |
22-2578806 | 12/22/1997 | ||||
| Vision |
13-4066286 | 5/24/2011 | ||||
| WBB Securities, LLC |
33-0984561 | 7/24/2007 | ||||
| Wedbush Morgan Securities, Inc. |
95-2495390 | 9/13/2007 |
| FOR INTERNAL USE ONLY Important Note: JHNY no longer offers Variable and Fixed annuity products effective December 31, 2012. |
March 2022 |
| JOHN HANCOCK NEW YORK
SELLING AGREEMENT
APPROVALS/APPOINTMENTS |
Life Agent (LA) License Key Line Requirements: For Annuities: Variable For RPS : Life For Insurance -Life and/or Variable |
| BROKER DEALER |
TAX ID / BROKER DEALER |
APPROVAL DATE |
||||
| Wells Fargo Clearing Services, LLC |
48-1305000 | 6/24/2004 | ||||
| Wells Fargo Clearing Services, LLC |
34-1542819 | 1/30/2004 | ||||
| Westco Investment Corp. |
11-2870554 | 6/25/1993 | ||||
| Western International Securities, Inc. |
84-1314321 | 7/15/2008 | ||||
| Westport Resources Investment Services, Inc |
22-2955076 | 1/17/2013 | ||||
| White Mountain Capital, LLC |
13-4077093 | 6/11/2002 | ||||
| Wilmington Capital Securities LLC |
20-1894227 | 1/4/2016 | ||||
| Woodbury Financial Services, Inc. |
41-0944586 | 1/16/2004 | ||||
| World Equity Group, Inc. |
36-3797444 | 10/15/2010 |
| FOR INTERNAL USE ONLY Important Note: JHNY no longer offers Variable and Fixed annuity products effective December 31, 2012. |
March 2022 |
Consent of Independent Registered Public Accounting Firm
We consent to the reference to our firm under the caption “Services” as the independent registered public accounting firm in the Statement of Additional Information, dated April 25, 2022, and included in this Post-Effective Amendment No. 16 to the Registration Statement (Form N-6 No. 333-131139) of John Hancock Life Insurance Company of New York Separate Account B (the “Registration Statement”).
We also consent to the use of our reports (1) dated March 30, 2022, with respect to the statutory-basis financial statements of John Hancock Life Insurance Company of New York and (2) dated March 30, 2022, with respect to the financial statements of each of the subaccounts within John Hancock Life Insurance Company of New York Separate Account B, for the year ended December 31, 2021, included in this Registration Statement, filed with the Securities and Exchange Commission.
/s/ Ernst & Young LLP
Boston, Massachusetts
April 19, 2022

POWER OF ATTORNEY
I, Emanuel Alves, in my capacity as a Director of John Hancock Life Insurance Company (U.S.A.) and John Hancock Life Insurance Company of New York, do hereby constitute and appoint James C. Hoodlet, Tracy Lannigan, and Lisa Shepard or any of them individually, my true and lawful attorneys and agents to execute, in the name of, and on behalf of, the undersigned as a member of said Board of Directors, the Registration Statements listed below filed with the Securities and Exchange Commission (“SEC”) under the Securities Act of 1933 and the Investment Company Act of 1940, and any and all amendments to the Registration Statements listed below filed with the SEC, and the undersigned hereby ratifies and confirms as his or her own act and deed all that each of said attorneys and agents shall do or cause to have done by virtue hereof.
| Variable Life Registration Statements filed for the John Hancock Variable Life Account S: | ||
| John Hancock Variable Life Account S (Medallion Executive Variable Life, Medallion Executive Variable Life II, Medallion Executive Variable Life III) | #333-164150 | |
| John Hancock Variable Life Account S (Majestic VUL, Majestic Variable Universal Life 98) | #333-164151 | |
| John Hancock Variable Life Account S (Variable Master Plan Plus) | #333-164152 | |
| John Hancock Variable Life Account S (Majestic Variable COLI) | #333-164153 | |
| John Hancock Variable Life Account S (Variable Estate Protection, Majestic Variable Estate Protection, Majestic Variable Estate Protection 98, Variable Estate Protection Plus) | #333-164156 | |
| John Hancock Variable Life Account S (Variable Estate Protection Edge, Performance Survivorship Variable Universal Life, Majestic Performance Survivorship Variable Universal Life) | #333-164154 | |
| John Hancock Variable Life Account S (Performance Executive Variable Life) | #333-164155 | |
| Variable Life Registration Statements filed for the John Hancock Variable Life Account UV: | ||
| John Hancock Variable Life Account UV (Annual Premium Variable Life) | #333-164157 | |
| John Hancock Variable Life Account UV (Flex V1) | #333-164158 | |
| John Hancock Variable Life Account UV (Flex V2) | #333-164159 | |
| John Hancock Variable Life Account UV (Medallion Variable Life) | #333-164160 | |
| John Hancock Variable Life Account UV (Variable Estate Protection) | #333-164161 | |
| John Hancock Variable Life Account UV (Variable Estate Protection Plus) | #333-164162 | |
| John Hancock Variable Life Account UV (Variable Estate Protection Edge, Performance Survivorship Variable Universal Life, Majestic Performance Survivorship Variable Universal Life) | #333-164164 | |
| John Hancock Variable Life Account UV (Majestic Variable Universal Life 98) | #333-164163 | |
| John Hancock Variable Life Account UV (Majestic Variable Estate Protection 98) | #333-164165 | |
| John Hancock Variable Life Account UV (Medallion Executive Variable Life III) | #333-164166 | |
| John Hancock Variable Life Account UV (Medallion Variable Universal Life Plus) | #333-164167 | |
| John Hancock Variable Life Account UV (Medallion Variable Universal Life Edge, Medallion Variable Universal Life Edge II) | #333-164168 | |
| John Hancock Variable Life Account UV (Majestic Variable COLI) | #333-164169 | |
| John Hancock Variable Life Account UV (Performance Executive Variable Life) | #333-164170 | |
| Variable Life Registration Statements filed for the John Hancock Variable Life Account U: | ||
| John Hancock Variable Life Account U (Medallion Variable Life, Medallion Variable Universal Life Plus) | #333-164171 | |
| John Hancock Variable Life Account U (Annual Premium Variable Life) | #333-164172 | |
| John Hancock Variable Life Account U (Medallion Variable Universal Life Edge, Medallion Variable Universal Life Edge II) | #333-164173 | |
| John Hancock Variable Life Account U (eVariable Life) | #333-164174 | |
| Variable Life Registration Statements filed for the John Hancock Variable Life Account V: | ||
| John Hancock Variable Life Account V (Flex V1) | # 333-164175 | |
| John Hancock Variable Life Account V (Flex V2) | # 333-164176 | |
| Variable Life Registration Statements filed for the John Hancock Life Insurance Company (U.S.A.) Account A: | ||
| John Hancock Life Insurance Company (U.S.A.) Account A (VUL Accumulator II, EPVUL, Accumulation) | # 333-85284 | |
| John Hancock Life Insurance Company (U.S.A.) Account A (VUL Protector) | # 333-88748 | |
| John Hancock Life Insurance Company (U.S.A.) Account A (SPVL) | # 333-71136 | |
| John Hancock Life Insurance Company (U.S.A.) Account A (Survivorship VUL 2003) | # 333-100597 | |
| John Hancock Life Insurance Company (U.S.A.) Account A (Protection Variable Universal Life) | # 333-124150 | |
| John Hancock Life Insurance Company (U.S.A.) Account A (Majestic Performance VUL) | # 333-131299 | |
| John Hancock Life Insurance Company (U.S.A.) Account A (Survivorship Variable Universal Life) | # 333-141692 | |
| John Hancock Life Insurance Company (U.S.A.) Account A (Majestic Survivorship VULX) | # 333-148991 | |
| John Hancock Life Insurance Company (U.S.A.) Account A (Majestic VULX) | # 333-151630 | |
| John Hancock Life Insurance Company (U.S.A.) Account A (Accumulation Variable Universal Life 08) | # 333-152406 | |
| John Hancock Life Insurance Company (U.S.A.) Account A (Majestic VCOLIX) | # 333-153252 | |
| John Hancock Life Insurance Company (U.S.A.) Account A (Protection Variable Universal Life 09) | # 333-157212 | |
| John Hancock Life Insurance Company (U.S.A.) Account A (Protection Variable Universal Life 2012) | # 333-179570 | |
| John Hancock Life Insurance Company (U.S.A.) Account A (Accumulation VUL 2014) | # 333-193994 | |
| John Hancock Life Insurance Company (U.S.A.) Account A (Simplified Life) | # 333-194818 | |
| John Hancock Life Insurance Company (U.S.A.) Account A (Protection Variable Universal Life 2017) | # 333-217721 | |
| John Hancock Life Insurance Company (U.S.A.) Account A (Accumulation VUL 2019) | #333-233647 | |
| John Hancock Life Insurance Company (U.S.A.) Account A (Majestic Accumulation VUL 2019) | #333-233648 | |
| John Hancock Life Insurance Company (U.S.A.) Account A (Accumulation Survivorship VUL 2020) | #333-236446 | |
| John Hancock Life Insurance Company (U.S.A.) Account A (Majestic Survivorship VUL 2020) | #333-236447 | |
| John Hancock Life Insurance Company (U.S.A.) Account A (Protection Variable Universal Life 2021) | #333-248502 | |
| John Hancock Life Insurance Company (U.S.A.) Account A (Accumulation Variable Universal Life 2021) | #333-254210 | |
| John Hancock Life Insurance Company (U.S.A.) Account A (Majestic Accumulation Variable Universal Life 2021) | #333-254211 | |
| Variable Life Registration Statements filed for the John Hancock Life Insurance Company (U.S.A.) Account N: | ||
| John Hancock Life Insurance Company (U.S.A.) Account N (Corporate VUL 03, Corporate VUL 04) | # 333-100567 | |
| John Hancock Life Insurance Company (U.S.A.) Account N (Corporate VUL 05) | # 333-126668 | |
| John Hancock Life Insurance Company (U.S.A.) Account N (Corporate VUL 08) | # 333-152409 | |
| Variable Life Registration Statements filed for the John Hancock Life Insurance Company of New York Account B: | ||
| John Hancock Life Insurance Company of New York Account B (VUL Accumulator) | # 333-85296 | |
| John Hancock Life Insurance Company of New York Account B (VUL Protector 2002) | # 333-88972 | |
| John Hancock Life Insurance Company of New York Account B (SPVL) | # 333-33504 | |
| John Hancock Life Insurance Company of New York Account B (Survivorship VUL 2003) | # 333-100664 | |
| John Hancock Life Insurance Company of New York Account B (Protection Variable Universal Life) | # 333-127543 | |
| John Hancock Life Insurance Company of New York Account B (Corporate VUL 05) | # 333-131139 | |
| John Hancock Life Insurance Company of New York Account B (Accumulation VUL) | # 333-131134 | |
| John Hancock Life Insurance Company of New York Account B (Majestic Performance VUL) | # 333-132905 | |
| John Hancock Life Insurance Company of New York Account B (Survivorship Variable Universal Life) | # 333-141693 | |
| John Hancock Life Insurance Company of New York Account B (Majestic Survivorship VULX) | # 333-148992 | |
| John Hancock Life Insurance Company of New York Account B (Majestic VULX) | # 333-151631 | |
| John Hancock Life Insurance Company of New York Account B (Accumulation Variable Universal Life 08) | # 333-152407 | |
| John Hancock Life Insurance Company of New York Account B (Corporate VUL 08) | # 333-152408 | |
| John Hancock Life Insurance Company of New York Account B (Majestic VCOLIX) | # 333-153253 | |
| John Hancock Life Insurance Company of New York Account B (Protection Variable Universal Life 09) | # 333-157213 | |
| John Hancock Life Insurance Company of New York Account B (Protection Variable Universal Life 2012) | # 333-179571 | |
| John Hancock Life Insurance Company of New York Account B (Accumulation VUL 2014) | # 333-193995 | |
| John Hancock Life Insurance Company of New York Account B (Simplified Life) | # 333-194819 | |
| John Hancock Life Insurance Company of New York Account B (Protection Variable Universal Life 2017) | # 333-221236 | |
| John Hancock Life Insurance Company of New York Account B (Accumulation VUL 2019) | # 333-235396 | |
| John Hancock Life Insurance Company of New York Account B (Majestic Accumulation VUL 2019) | # 333-235397 | |
| John Hancock Life Insurance Company of New York Account B (Accumulation Survivorship VUL 2020) | # 333-238712 | |
| John Hancock Life Insurance Company of New York Account B (Majestic Accumulation Survivorship VUL 2020) | # 333-238713 | |
Each of said attorneys and agents shall have, and may exercise, all of the powers hereby conferred.
This Power of Attorney is intended to supersede any and all prior Power of Attorneys in connection with the above-mentioned acts and is effective October 6, 2021 and remains in effect until revoked or revised.
| Signature | Title | Date | ||
| /s/Emanuel Alves |
Director | October 6, 2021 | ||
| Emanuel Alves | ||||