UNITED STATES
SECURITIES AND EXCHANGE COMMISSION
Washington, D.C. 20549
FORM N-CSR
CERTIFIED SHAREHOLDER REPORT OF REGISTERED
MANAGEMENT INVESTMENT COMPANIES
Investment Company Act file number: 811-22545
CENTRE FUNDS
(Exact name of registrant as specified in charter)
48 Wall Street, Suite 1100, New York, New York 10005
(Address of principal executive offices) (Zip code)
James A. Abate
48 Wall Street, Suite 1100
New York, New York 10005
(Name and address of agent for service)
Registrant’s telephone number, including area code: (212) 918-4705
Date of fiscal year end: September 30
Date of reporting period: October 1, 2023 – March 31, 2024
Item 1. Reports to Stockholders.
| (a) |
TABLE OF CONTENTS
| PAGE | |
| SHAREHOLDER LETTER | 1 |
| PORTFOLIO UPDATE | 5 |
| Centre American Select Equity Fund | 5 |
| Centre Global Infrastructure Fund | 7 |
| DISCLOSURE OF FUND EXPENSES | 9 |
| SCHEDULES OF INVESTMENTS | 10 |
| Centre American Select Equity Fund | 10 |
| Centre Global Infrastructure Fund | 12 |
| STATEMENTS OF ASSETS AND LIABILITIES | 14 |
| STATEMENTS OF OPERATIONS | 15 |
| STATEMENTS OF CHANGES IN NET ASSETS | 16 |
| Centre American Select Equity Fund | 16 |
| Centre Global Infrastructure Fund | 17 |
| FINANCIAL HIGHLIGHTS | 18 |
| Centre American Select Equity Fund | 18 |
| Centre Global Infrastructure Fund | 20 |
| NOTES TO FINANCIAL STATEMENTS | 22 |
| ADDITIONAL INFORMATION | 30 |
| Centre Funds | Shareholder Letter |
| March 31, 2024 (Unaudited) |
Dear Fellow Shareholders,
It is with pleasure that we publish the Centre Funds’ Semi-Annual Report covering the six-month period ended March 31, 2024. We want to thank our fellow shareholders for their continued support and confidence in the Centre Funds. The Centre Funds offer a select series of fundamentally-driven, actively managed funds to choose from, each available in investor and institutional share classes. We are passionate about active management.
Our aim at Centre Funds is to deliver strong, long-term performance results for investors through an exceptional focus on producing returns and managing risk and downside volatility in select investment strategies. We want investors to associate Centre Funds with high-conviction, differentiated fund strategies that may not be available elsewhere and are tactical, pragmatic, and opportunistic. Each Fund’s investment strategy aims to capitalize on defined market opportunities with consistent methodology and repeatable investment processes to achieve differentiated returns and risk profiles. We remain focused on fundamentally-driven investment approaches within truly active, high conviction, disciplined and research-intensive processes. At Centre Funds, we place service excellence at the core of everything that we do and are committed to providing useful information on the Funds.
Centre American Select Equity Fund (the “Equity Fund”)
The Equity Fund is a U.S. large capitalization valuation sensitive capital appreciation stock fund that seeks long-term growth of capital and is focused on risk adjusted returns through active and pragmatic management. The Equity Fund may complement its equity security holdings with hedges and other capital preservation strategies when deemed appropriate. The Equity Fund is intended to be a risk managed core equity fund.
Centre Global Infrastructure Fund (the “Infrastructure Fund”)
The Infrastructure Fund pursues a bottom-up, active management approach and invests in what we deem the most attractive listed infrastructure-related companies from the United States and developed international economies. Also, the Infrastructure Fund seeks to balance its exposures to where the weights of the Telecommunication, Utilities, Energy, Transportation, and Social Infrastructure industries are broadly represented. The Infrastructure Fund’s objective is to seek long-term growth of capital and current income, and distributes dividend and interest income monthly.
Funds’ Performance
Equity Fund
For the six-month period ended March 31, 2024, the Equity Fund, Investor Share Class, delivered a total return of 16.47% and the Institutional Share Class delivered a total return of 16.70%1. During the same six-month period, the S&P 500 Index, a key barometer of the U.S. stock market, delivered a total return of 23.47%.
The strongest contributors to performance within the Equity Fund over the six-month period ended March 31, 2024, included investments within the Technology sector: Nvidia, Broadcom, and Microsoft; Consumer Discretionary sector: Amazon and Hasbro; and the Communication Services sector: Meta Platforms. Stock investments that contributed negatively to relative the Equity Fund’s performance over the period were in the Consumer Staples sector and included Boston Beer Company and Treehouse Foods; and the Industrials sector: Flowserve and Kirby. Sectoral biases, particularly our underweight posture in Information Technology contributed negatively. The Equity Fund’s performance was also negatively impacted from a relative total return perspective from certain hedges and other investments that Centre Asset Management, LLC, the investment adviser to the Fund (“Centre” or the “Adviser”), viewed as capital protective in nature. These hedges, namely put options on U.S. large capitalization indices such as the S&P 500, accounted for the bulk of negative relative underperformance as the put option positions were affected negatively from the rise in S&P 500 but also from the corresponding sharp fall in implied volatility. Despite the negative impact over the six-month period ended March 31, 2024, the beneficial use of hedges was evident during previous sharp corrective episodes, most notably in January 2022, February/March 2020, and such capital protection measures implemented by Centre, over the longer-term, have insulated the Equity Fund from the same magnitude of maximum drawdown2 experienced by the overall stock market over prior volatile3 episodes, namely in August 2015, January 2016, February 2018, and December 2018. Given the continued presence of certain potentially de-stabilizing factors that the Adviser believes could negatively impact the value of underlying equity securities held in the Fund’s portfolio, the Fund may continue the strategy of tactically and opportunistically purchasing put options on leading benchmark equity indexes as a potential hedge against the systematic or general market risk of its underlying stock holdings.
| 1 | Disclosure: Past performance does not guarantee future results. |
| 2 | Maximum drawdown is the maximum loss from a peak to a trough of a portfolio before a new peak is attained. |
| 3 | Volatility is a measure of systematic risk of a security or a portfolio in comparison to the market as a whole. |
| Semi-Annual Report | March 31, 2024 | 1 |
| Centre Funds | Shareholder Letter |
| March 31, 2024 (Unaudited) |
Infrastructure Fund
For the six-month period ended March 31, 2024, the Infrastructure Fund, Investor Share Class, delivered a total return of 15.11% and the Institutional Share Class delivered a total return of 15.21%4 with the trailing annual dividend distribution yield of 2.46%5. During the same six-month period, as a comparison, the S&P Global Infrastructure Index delivered a total return of 11.96%.
During the period, investments providing the strongest contribution to the Infrastructure Fund’s performance within the Energy sector included: Targa Resources, Oneok, and Williams; and within the Utilities sector: Enel, Tokyo Gas, Iberdrola, Mercury NZ, and Constellation Energy; within the Communications sector: Orange, Telefonica, Deutsche Telekom, and Softbank Group; and within the Social infrastructure industries: HCA HealthCare and Universal Health Services. Stocks that contributed negatively to the Infrastructure Fund’s performance included Kirby, Tokyo Gas, Cheniere Energy, Dominion Energy, NextEra Energy, Eversource Energy, Vodafone, and Verizon. We continue to believe that our combined approach of differentiated stock selection and portfolio construction, whereby the Infrastructure Fund is diversified across regions and developed countries as well as balanced across Telecommunication, Utilities, Energy, Transportation, and Social Infrastructure industries, is the most favorable for investors seeking to feature listed infrastructure investments as part of an overall balanced portfolio seeking capital appreciation and income.
Market Review & Outlook
In analyzing the overall index returns from the U.S. stock market since its late October 2023 lows, one can point broadly to four themes: 1) expectations that short-term interest rates would decline and financial conditions ease; 2) economic activity and, consequently profits, would pivot and emerge from their stagnation and grow as well as broaden out from both units volume growth as well as profit margin expansion; 3) the implementation of more powerful artificial intelligence (AI) systems such as generative AI and large language models would lead to a sharp increase in labor productivity as it helps people streamline their work and do it more quickly, and 4) that a diversified and balanced approach using a mixture of stocks and bonds to an overall portfolio allocation was sub-optimal to an all equity portfolio based upon volatility6 re-assessments.
After surging in the post-Covid period because of supply constraints and record expansionary fiscal and monetary policy, inflation has moved lower but remains persistently above the Federal Reserve’s target rate of two percent. Market expectations of easing by the Federal Reserve have changed significantly over the past several months. Last fall, markets looked for six or seven Fed easing moves beginning at the start of 2024. Today, markets expect at most three easing moves starting in either June or July. We have been reluctant to embrace any easing moves by the Federal Reserve as we see it handcuffed by persistent inflation and have articulated that the Fed would only ease in response to a crisis, namely a significant weakening of economic growth, further stress in the banking sector, or a geopolitical event. A point not fully appreciated by many market participants believing in the whole-hearted positives of Fed easing is that some of the largest drawdown episodes in the stock market, whether in 2001-2 or 2007-2008, occurred while the Fed was drastically cutting interest rates, so be careful what you wish for. One troubling sign consistent with this belief in aggressive cuts by the Fed is that the price of gold has risen significantly to new highs, inferring future negative real yields, usually only seen in response to deep crises, not a gradual reduction of interest rates by the Fed trying to guide a soft landing of the economy.
The economic outlook when viewed through the more traditional metrics highlight the continued absence of recession as the U.S. unemployment rate remains at a very low level even though full-time jobs growth recently fell to a three-year low while being offset by part-time jobs growth soaring; U.S. manufacturing indicators such as the ISM Manufacturing Index7 hovering in slight contraction to neutral territory; global manufacturing purchasing managers’ indexes rebounding but remaining choppy; and the broader based Conference Board Leading Economic Indicators remaining at recessionary levels for over one year but beginning to show signs of pivoting. Other forecasting measures of relevance such as the negatively sloping yield curve indicate imminent recession but are offset by improving financial conditions indexes, as well as tight credit spreads on fixed income indexes, and a strongly positive consensus S&P 500 Index constituent aggregate earnings outlook. More anecdotal, it’s important to consider how much the U.S. economy has been supported by the tremendous fiscal stimulus over the past several years and its sustainability. Spending on highways, roads, semiconductor and renewable energy subsidies, and other fiscal priorities of President Biden continue at elevated levels amplifying the risk from a policy shift to tax and spending cuts, historically favored by Republicans, after the November presidential elections. Aside from fiscal policy risks, shifts on trade policy that reverberate to the economy and inflation are likely to be a focus heading into the November elections as China, which is enduring a downturn in consumer spending and real estate overhang, has resorted to boosting exports to compensate. That may set off a backlash in U.S. and European industries as well as lead to a series of currency devaluations in Japan and elsewhere in the Asia-Pacific region.
Through the EVA8 bottom-up prism through which we look at companies in aggregate, we observe fundamentals mostly moving sideways. Specifically, global market aggregate sales growth has fallen to near zero, profit margins have moved sideways driven by cost-cutting and expense restructuring but remain at elevated levels, and asset efficiency measures have deteriorated somewhat but seem to be bottoming. Unfortunately, aggregate market valuations, in terms of implied growth, discount a very sharp improvement in EVA fundamentals, consistent with the traditional consensus aggregate earnings outlook noted above. Even if consensus revenue growth estimates are reached, we fail to see the two-fold operating leverage implied in consensus earnings growth estimates at a time when profit margins are inflecting lower from extreme historical highs as they are today, particularly with labor cost increases not abating. With this backdrop, we continue to emphasize more idiosyncratic risk-oriented companies that are less influenced by a pervasive market effect and have historically demonstrated defensiveness, as they produce and sell goods that are considered essential, with a particular emphasis in the Consumer Staples and Health Care sectors, as well as identifying companies across other sectors with a “margin of safety,” whose profit margins and/or asset efficiency are depressed relative to history but inflecting higher from company specific actions while valuations remain attractive.
| 4 | Disclosure: Past performance does not guarantee future results. |
| 5 | Source: Bloomberg. There is no assurance that the Fund will always be able to pay a distribution of any particular amount, or that a distribution will consist solely of the Fund's current and accumulated earnings and profits. |
| 6 | Volatility is a measure of systematic risk of a security or a portfolio in comparison to the market as a whole. |
| 7 | The ISM manufacturing index, also known as the purchasing managers' index (PMI), is a monthly indicator of U.S. economic activity based on a survey of purchasing managers at more than 300 manufacturing firms. It is considered to be a key indicator of the state of the U.S. economy. |
| 8 | Economic Value Added (EVA) is an estimate of a company’s economic profit. Economic profit, which refers to the profit earned by a company minus the cost of financing the company’s capital, is an amount that may be considered in the assessment of a company’s overall value. |
| 2 | centrefunds.com |
| Centre Funds | Shareholder Letter |
| March 31, 2024 (Unaudited) |
Artificial intelligence is critical to understand in the context of an outlook on the economy, profits, and the stock market. While much financial press has been written around the importance of the Magnificent Seven9 technology companies in terms of disproportionate market indexes performance, the reality is that the Magnificent Seven have accounted for nearly 90% and over 100% of S&P 500 Index operating earnings per share growth in the fourth quarter of 2023 and first quarter of 2024, respectively. In other words, the stock market’s advance has been extremely narrow for an exceptionally good reason-without the Magnificent Seven companies, full year 2023 operating earnings per share would have been negative. Thus far, the most important catalyst for earnings growth within the Magnificent Seven has been AI, whether it’s the semiconductor chips provided by Nvidia, or massive data requirements hosted by Microsoft, Meta, Alphabet, or Amazon’s AWS division. A key issue for stock selection is understanding the efficacy of the capital investments being made today, which will determine the persistence of the spending by companies on AI as company Chief Financial Officers exert more influence on budgeting and away from a “if you build it, (they) will come” mindset.
From discussions with industry executives and technology implementation consultants, we see the greatest impact coming from image generative AI whereby businesses can create highly targeted suggestions based on customer preferences, purchase history, and browsing patterns. This approach not only improves customer satisfaction but can also significantly boost sales. A notable example is with Chick-fil-A, a popular quick-service restaurant chain with over 2,800 restaurants across the United States, notorious for its long drive-through lines. Utilizing 3D cameras, edge computing, and advanced analytics, an IoT10 system was established to monitor hot food and alert staff when it’s time to discard items.11 In addition, in an effort to reduce wait times at drive throughs, Chick-fil-A is testing vehicle image recognition to match with previous customer orders so that cook and wait times can be shortened. Burger King is similarly testing technology that will be able to identify customers in their loyalty program and show their previous orders and calculate probabilities that the customer will want the same order again. There are many other examples but a key attribute of why we believe this is where AI will make a significant productivity and return on investment difference is that it is generated within proprietary data sources, not oceans of public data online to provide automated insights. This is the most important point in AI now.
AI-powered search relies principally upon public data and text vacuumed up from the internet. The ability to quickly use AI to summarize basic research on a topic of interest to capture relevant stats, themes, and trends is clearly a time saving tool. There are two significant points of concern that we have, one that will most likely be solved through litigation or settlement by working out renumeration for proper use of copyrighted materials to train AI models12. The second point gives us much greater concern. In theory, unlike traditional internet search using Google, Bing, and Yahoo, AI deciphers the underlying intent and context of a query, furnishing more personalized and precise results. Aside from the obvious concerns of accuracy, the problem lies in whether AI enhanced search results in the depression of creative thought and polemic responses resulting in long-term productivity decline as creative thinking skills atrophy. One only needs to observe the entire Hollywood movie producing industry as an example of what happens when there is a broad, collective collapse in creativity and a rise in group-think. What happens when this becomes economy-wide and consequential decisions are made based on AI generated superficial summaries rather than fact-finding research and detailed analysis or even accidental innovations like penicillin or modern smoke detectors? Also, will AI lower employment for white collar workers, like offshoring did for blue collar workers and, thus, negatively contribute to falling living standards and consumer purchasing power?
One of the greatest books written is Nobel Prize winner Bertrand Russel's classic, "History of Western Philosophy". Colleagues and friends of mine who’ve gone through medical episodes requiring them to rest or rehab at home for a period of time invariably get a gift of the book (hardcover of course) delivered from me. The reason why I’ve read, re-read, and find joy in sharing the book with others is that I view it as the ultimate “gateway” history book to stimulate interest in the ideologies of significant philosophers and related historical events throughout the ages. First published in 1945, the book covers twenty-six chapters and traces philosophy within a historical context from the rise of Greek civilization to the emergence of logical analysis in the twentieth century. When I reference it as a “gateway” book, what I mean is that, as a history buff, one chapter of interest, such as the slim ten pages on Christianity During the First Four Centuries, usually results in me reading three or four other comprehensive books on a particular topic. Russell’s writing is witty and well structured, but polemic in that the book reflects Russell's own perspective of the history and various philosophers, which usually does not align with the views of other scholars and philosophers and, is much less in-depth as would be expected from a book that covers such a long time period of history in about 900 pages. Reliance solely upon Russell’s summary and interpretation of the topics and persons covered is analogous to where I believe AI and Machine Learning are leading search engines such as Google’s Generative Experiences and Bing’s Integration of ChatGPT. In other words, rather than traditional search that yields many results enabling a user to drill down and leave it up to them to assess the validity of the data and the source, as well as accuracy, AI driven search yields AN ANSWER, generating a summary in a certain way and without all the extra clicking. Machine driven summarization closes the door unfortunately to creativity, inventiveness, and imagination in education and the workplace. As we discussed in our prior Outlook, there have been many new eras in the past century plus – from railroads, through the development of the automobile, radio, telephone, and national electrification. Are today’s technological advances, AI being the latest hype, contributing to productivity enhancement and an increase in real earnings growth which forms the basis of stock price and valuation multiple expansion? We remain skeptical for now on a broad economy-wide basis but excited on the idiosyncratic level within corporations using their own proprietary data sources.
| 9 | The Magnificent Seven stocks are a group of the most influential companies in the U.S. stock market. The term has been popularized to describe a set of dominant companies, particularly in the tech sector. |
| 10 | The term IoT, or Internet of Things, refers to the collective network of connected devices and the technology that facilitates communication between devices and the cloud, as well as between the devices themselves. |
| 11 | OCTOBER 7, 2023, AI CASE STUDIES, AI Expert Network |
| 12 | The New York Times Company Plaintiff, V. Microsoft Corporation, Open AI, Inc., Et Al., United States District Court Southern District Of New York |
| Semi-Annual Report | March 31, 2024 | 3 |
| Centre Funds | Shareholder Letter |
| March 31, 2024 (Unaudited) |
It's hard to forget the now infamous 1999 book, Dow 36,000: The New Strategy for Profiting From the Coming Rise in the Stock Market13, which argued that stocks were significantly undervalued and concluded that there would be a four-fold market increase of the Dow Jones Industrial Average by 2002 (the book was published right before the dot.com implosion and bear market whereby the DJIA wouldn’t again touch its January 2000 high water mark of 11,750 until 2006). The premise of the book was that stocks were no riskier than bonds and, thus, the equity risk premium should be zero resulting in a swift re-rating of stocks to elevated P/E multiples, all else being equal. Unfortunately, it seems that we alone have a memory of these nonsensical theories as some research papers from some leading academics14 are gaining renewed interest by asset allocation and retirement specialists after a difficult year for bonds in 2022 to make the case for a portfolio of 100% equities, even advocating the use of leverage when people are young, based on the fact that long-term real investment losses of equities are rare. This thinking ignores the psychology of investors’ loss aversion bias resulting in emotional short-term investment decisions.
It’s well understood that as interest rates go up, bond price go down and P/E multiples should go down as well given that a P/E is a function of interest rates, growth, and a premium for risk over holding the risk-free asset, U.S. Treasury Bonds. While over the long-term, stock market returns are most closely correlated with the change in earnings, in the shorter-term including discrete calendar years, it is changes in the P/E multiple that have the most impact on returns15, the negative impact from the rise in interest rates during 2022 being a good example. While most companies and corporate financiers looking at the equity component of project financing will use a stable equity risk premium, usually at least four percent, to reflect the time horizon of the asset, investors must appreciate that the equity risk premium in a market that is revaluated continuously is dynamic and highlights the relative attractiveness of risky assets such as stocks versus the risk-free alternative daily. The numerical figure one derives from an estimate of the forward equity risk premium is not one that typically coincides with actual short-term excess returns. However, its usefulness is looking at the current premium relative to an extended period of history to understand the current stock market’s opportunity or vulnerability to a change in risk appetites by investors. Unfortunately, the current suppressed level of our proprietary forward equity risk premium is lower than that observed in early 2000 or just prior to the stock market crash of 1987. The bottom line is that the margin of safety for equity indexes or systematic risk is at an extreme low level and dependent on interest rates falling dramatically, the growth rate of earnings to surprise positively at a rate that would be consistent with a booming global economy, and a significant de-escalation of potential shocks from geopolitical events that could impact risk. The fact is that we cannot reconcile our research to this current market implied view of an equity risk premium of zero and leave such hypotheses to non-practicing academics.
Centre continues to believe that the market outlook remains challenging as we see limited upside from market participation with the potential of a significant drawdown, as price momentum surrounding AI and a valuation re-rating driven by anticipated cuts in interest rates have been the dominant factors in explaining performance since the October 2023 market lows. Despite these challenges due to heightened risk and uncertainty regarding economic recovery, fiscal and monetary policy, and geopolitical risks, we believe stock picking opportunities exist and, when deemed tactically advantageous, we will continue to complement underlying equity securities with tail hedges and other capital preservation strategies in order to further dampen the negative impact from downside beta. The American Select Equity Fund’s portfolio of companies is designed to be relatively defensive with high barriers to entry and we continue to believe that our bottom-up focus, which allows flexibility to search for the best opportunities within the universe of large-capitalization equity securities, is most consistent with financial theory, empirical evidence, and the current environment. In the Global Infrastructure Fund, diversification across regions and developed countries as well as being balanced across the Telecommunication, Utilities, Energy, Transportation, and Social Infrastructure sectors should aid in returns and risk management. Centre believes its disciplined high-conviction approach to stock selection, with a cognizance of risk management, seems positioned to perform well relative to less risk aware and less historically appreciative strategies.
Sincerely,
James Abate
President, Centre Funds
| 13 | James K. Glassman; Kevin A. Hassett (October 1, 1999). Dow 36,000: The New Strategy for Profiting From the Coming Rise in the Stock Market. Crown Business. pp. 304. ISBN 978-0812931457. |
| 14 | Stocks for the long run? Evidence from a broad sample of developed markets? Aizhan Anarkulovaa, Scott Cederburga, Michael S. O'Doherty. Also see Life-Cycle Investing and Leverage: Buying Stock on Margin Can Reduce Retirement Risk NBER Working Paper No. w14094, Ian Ayres and Barry J. Nalebuff Yale University. |
| 15 | Focus on Value: A Corporate and Investor Guide to Wealth Creation, Book by James A. Abate and James L. Grant, originally published: October 25, 2001. |
| 4 | centrefunds.com |
| Centre American Select Equity Fund | Portfolio Update |
March 31, 2024 (Unaudited)
SECTOR WEIGHTINGS
As a percentage of Net Assets
| Consumer Staples | 29.02% |
| Information Technology | 21.73% |
| Health Care | 13.26% |
| Consumer Discretionary | 11.62% |
| Communication Services | 9.62% |
| Energy | 5.92% |
| Financials | 5.22% |
| Materials | 2.81% |
| Purchased Options | 0.41% |
| Cash and Cash Equivalents | 0.39% |
| Totals | 100.00% |
These allocations are reflective as of 3/31/24 and may not reflect future positions of the portfolio.
GROWTH OF HYPOTHETICAL $10,000 INVESTMENT THROUGH MARCH 31, 2024
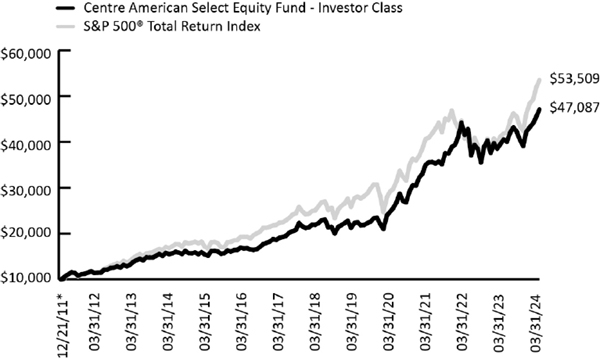
This graph assumes an initial investment of $10,000 at December 21, 2011, the inception date for Investor Class shares, and that any dividends and distributions are reinvested. This graph depicts the performance of the Fund's Investor Class versus the S&P 500® Total Return Index. Taxes on Fund distributions or when shares are redeemed, if any, are not reflected. Unlike the Fund, an index is not available for investment, is unmanaged and does not have expenses that affect the results. The comparison is shown for illustrative purposes only.
The line graph above shows the performance of Investor Class shares only, since the Investor Class has the longest period of annual returns. The performance of the Institutional Class shares will differ from the performance shown because the Institutional Class shares have different expenses than the Investor Class shares.
TOTAL RETURNS – FOR THE PERIOD ENDED MARCH 31, 2024
| 1 Month |
6 Month |
YTD | 1 Year |
3
Year Average Annualized |
5
Year Average Annualized |
10
Year Average Annualized |
Since Inception* Average Annualized | |
| Centre American Select Equity Fund – Investor Class | 3.61% | 16.47% | 9.00% | 19.03% | 12.50% | 16.16% | 12.30% | 13.45% |
| S&P 500® Total Return Index | 3.22% | 23.48% | 10.56% | 29.88% | 11.49% | 15.05% | 12.96% | 14.64% |
| Centre American Select Equity Fund – Institutional Class | 3.69% | 16.70% | 9.06% | 19.52% | 12.97% | 16.70% | 12.66% | 12.51% |
| S&P 500® Total Return Index | 3.22% | 23.48% | 10.56% | 29.88% | 11.49% | 15.05% | 12.96% | 12.92% |
| * | Inception date of December 21, 2011 for Investor Class. Inception date of January 21, 2014 for Institutional Class. |
The performance information quoted above represents past performance, which is not a guarantee of future results, and does not reflect the deduction of taxes that a shareholder would pay on Fund distributions or the redemption of Fund shares. Investment return and principal value of an investment will fluctuate so that an investor’s shares, when redeemed, may be worth more or less than their original cost. Total return includes reinvestment of dividends and capital gains, if any. Current performance may be lower or higher than the performance data quoted. For the most current month-end performance data, please call 855-298-4236.
| Semi-Annual Report | March 31, 2024 | 5 |
| Centre American Select Equity Fund | Portfolio Update |
March 31, 2024 (Unaudited)
The investment adviser to the Fund, Centre Asset Management, LLC (the “Adviser” or “Centre”), has contractually agreed to reduce its advisory fees and/or reimburse other expenses of the Fund for not less than one year and until the next following effective date of the post-effective amendment to the registration statement of Centre Funds relating to the Fund (on or about January 29, 2025) to the extent necessary to limit the total operating expenses of the Fund including (but not limited to) investment advisory fees of the Adviser, but excluding, as applicable, any front-end or contingent deferred sales loads, taxes, leverage interest, distribution/service (Rule 12b-1) fees, shareholder services fees, brokerage commissions, acquired fund fees and expenses, (except that, if an acquired fund is an underlying fund managed by the Adviser and such acquired fund is not subject to an effective expense limitation or fee waiver agreement at any time during the term of this Agreement, then, for that time, the operating expenses of each class of shares of the Fund shall not exclude the amount of advisory fees included in such acquired fund’s fees and expenses to which the Fund would otherwise be subject), expenses incurred in connection with any merger or reorganization, and extraordinary expenses (such as litigation and other expenses not incurred in the ordinary course of the Fund's business) to an annual rate of 1.10% of the average daily net assets of the Investor Class shares and 0.95% of the average daily net assets of the Institutional Class shares (the “Expense Limitation Agreement”). The Expense Limitation Agreement may be terminated at any time, and without payment of any penalty, by the Board of Trustees of the Trust (the “Board”), on behalf of the Fund, upon 60 days' written notice to the Adviser, but may not be terminated by the Adviser without the consent of the Board. No recoupment will be made more than three years after the date that the applicable amount was initially waived or reimbursed by the Adviser, and the recoupment may not cause the Fund to exceed the then-existing expense limitation for that class at the time such waiver or reimbursement was made.
The S&P 500® Total Return Index is a commonly recognized, market-capitalization weighted index of 500 widely held securities, designed to measure broad U.S. equity performance.
You cannot invest directly in an index.
| 6 | centrefunds.com |
| Centre Global Infrastructure Fund | Portfolio Update |
March 31, 2024 (Unaudited)
INDUSTRY WEIGHTINGS
As a percentage of Net Assets
| Oil, Gas & Consumable Fuels | 28.71% |
| Diversified Telecommunication Services | 24.22% |
| Electric Utilities | 18.83% |
| Wireless Telecommunication Services | 11.07% |
| Health Care Providers & Services | 6.30% |
| Multi-Utilities | 6.27% |
| Transportation Infrastructure | 3.59% |
| Diversified Telecommunications | 0.65% |
| Cash and Cash Equivalents | 0.36% |
| Totals | 100.00% |
COUNTRY WEIGHTINGS
As a percentage of Net Assets
| United States | 56.36% |
| Canada | 10.78% |
| Japan | 7.66% |
| Spain | 4.94% |
| Germany | 4.05% |
| New Zealand | 3.55% |
| Italy | 3.05% |
| Australia | 2.39% |
| Great Britain | 2.14% |
| South Korea | 1.74% |
| France | 1.68% |
| Singapore | 0.65% |
| Switzerland | 0.65% |
| Cash and Cash Equivalents | 0.36% |
| Totals | 100.00% |
These allocations are reflective as of 3/31/24 and may not reflect future positions of the portfolio.
GROWTH OF HYPOTHETICAL $10,000 INVESTMENT THROUGH MARCH 31, 2024
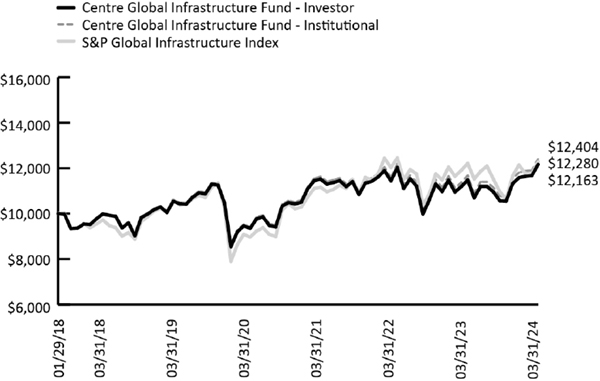
This graph assumes an initial investment of $10,000 at January 29, 2018, the Fund’s inception date, and that any dividends and distributions are reinvested. This graph depicts the performance of the Fund versus the S&P Global Infrastructure Index. Taxes on any Fund distributions or when shares are redeemed, if any, are not reflected. Unlike the Fund, an index is not available for investment, is unmanaged and does not have expenses that affect the results. The comparison is shown for illustrative purposes only.
| Semi-Annual Report | March 31, 2024 | 7 |
| Centre Global Infrastructure Fund | Portfolio Update |
March 31, 2024 (Unaudited)
TOTAL RETURNS – FOR THE PERIOD ENDED MARCH 31, 2024
| 1 Month | 6 Month | YTD | 1 Year | 3
Year Average Annualized |
5
Year Average Annualized |
Since
Inception Average Annualized (January 29, 2018) | |
| Centre Global Infrastructure Fund – Investor | 4.22% | 15.11% | 5.05% | 8.65% | 3.11% | 3.64% | 3.23% |
| Centre Global Infrastructure Fund – Institutional | 4.25% | 15.21% | 5.05% | 9.08% | 3.51% | 3.95% | 3.55% |
| S&P Global Infrastructure Index | 4.55% | 11.96% | 1.13% | 3.13% | 4.59% | 3.97% | 3.39% |
The performance information quoted above represents past performance, which is not a guarantee of future results, and does not reflect the deduction of taxes that a shareholder would pay on Fund distributions or the redemption of Fund shares. Investment return and principal value of an investment will fluctuate so that an investor’s shares, when redeemed, may be worth more or less than their original cost. Total return includes reinvestment of dividends and capital gains, if any. Current performance may be lower or higher than the performance data quoted. For the most current month-end performance data, please call 855-298-4236.
The Adviser has contractually agreed to reduce its advisory fees and/or reimburse other expenses of the Fund for an initial period of not less than one year and until the next following effective date of the post-effective amendment to the registration statement of Centre Funds relating to the Fund (on or about January 29, 2025) incorporating the Fund's financial statements for that fiscal year to the extent necessary to limit the total operating expenses of the Fund, including (but not limited to) investment advisory fees of the Adviser, but excluding, as applicable, any front-end or contingent deferred sales loads taxes, leverage interest, distribution/ service (Rule 12b-1) fees, shareholder services fees, brokerage commissions, acquired fund fees and expenses, (except that, if an acquired fund is an underlying fund managed by the Adviser and such acquired fund is not subject to an effective expense limitation or fee waiver agreement at any time during the term of this Agreement, then, for that time, the operating expenses of each class of shares of the Fund shall not exclude the amount of advisory fees included in such acquired fund’s fees and expenses to which the Fund would otherwise be subject), expenses incurred in connection with any merger or reorganization, and extraordinary expenses (such as litigation and other expenses not incurred in the ordinary course of the Fund's business) to an annual rate of 1.25% of the average daily net assets of the Investor Class shares and 1.10% of the average daily net assets of the Institutional Class shares. The Expense Limitation Agreement may be terminated at any time, and without payment of any penalty, by the Board, on behalf of the Fund, upon 60 days' written notice to the Adviser, but may not be terminated by the Adviser without the consent of the Board. No recoupment will be made more than three years after the date that the applicable amount was initially waived or reimbursed by the Adviser, and the recoupment may not cause the Fund to exceed the then-existing expense limitation for that class at the time such waiver or reimbursement was made.
The S&P Global Infrastructure Net Total Return Index is designed to track performance of the stocks of large infrastructure companies in developed or emerging markets that must be domiciled in developed markets, or whose stocks are listed on developed market exchanges around the world. The index includes companies involved in utilities, energy and transportation infrastructure, such as the management or ownership of oil and gas storage and transportation; airport services; highways and rail tracks; marine ports and services; and electric, gas and water utilities.
You cannot invest directly in an index.
| 8 | centrefunds.com |
| Centre Funds | Disclosure of Fund Expenses |
March 31, 2024 (Unaudited)
The Example. As a shareholder of a series of Centre Funds (each series, a “Fund” and together, the “Funds”), you will incur two types of costs: (1) transaction costs, including any applicable redemption fees; and (2) ongoing costs, including management fees, distribution and/or service (12b-1) fees (if applicable) and other Fund expenses. The following examples are intended to help you understand your ongoing costs (in dollars) of investing in a Fund and to compare these costs with the ongoing costs of investing in other mutual funds. The examples are based on an investment of $1,000 invested on October 1, 2023 and held through March 31, 2024.
Actual Expenses. The first line under each class of the table below provides information about actual account values and actual expenses. You may use the information in this line, together with the amount you invested, to estimate the expenses that you paid over the period. Simply divide your account value by $1,000 (for example, an $8,600 account value divided by $1,000 = 8.6), then multiply the result by the number in the first line under the heading “Expenses Paid During Period 10/1/2023-3/31/2024” to estimate the expenses you paid on your account during this period.
Hypothetical Example for Comparison Purposes. The second line under each class of the table below provides information about hypothetical account values and hypothetical expenses based on each Fund’s actual expense ratio and an assumed rate of return of 5% per year before expenses, which is not the Fund’s actual return. The hypothetical account values and expenses may not be used to estimate the actual ending account balance or expenses you paid for the period. You may use this information to compare the ongoing costs of investing in a Fund and to other funds. To do so, compare this 5% hypothetical example with the 5% hypothetical examples that appear in the shareholder reports of the other funds. Please note that the expenses shown in the table are meant to highlight your ongoing costs only and do not reflect any transactional costs, such as redemption fees, if any. Therefore, the second line under each class of the table below is useful in comparing ongoing costs only, and will not help you determine the relative total costs of owning different funds. In addition, if these transactional costs were included, your costs would have been higher.
| Beginning Account Value 10/01/2023 |
Ending Account Value 03/31/2024 |
Expense Ratio(a) | Expenses
Paid During Period 10/1/2023-3/31/2024 (b) | |
| Centre American Select Equity Fund | ||||
| Investor Class | ||||
| Actual | $ 1,000.00 | $ 1,164.70 | 1.34% | $ 7.25 |
| Hypothetical (5% return before expenses) | $ 1,000.00 | $ 1,018.30 | 1.34% | $ 6.76 |
| Institutional Class | ||||
| Actual | $ 1,000.00 | $ 1,167.00 | 1.04% | $ 5.63 |
| Hypothetical (5% return before expenses) | $ 1,000.00 | $ 1,019.80 | 1.04% | $ 5.25 |
| Centre Global Infrastructure Fund | ||||
| Investor Class | ||||
| Actual | $ 1,000.00 | $ 1,151.10 | 1.57% | $ 8.44 |
| Hypothetical (5% return before expenses) | $ 1,000.00 | $ 1,017.15 | 1.57% | $ 7.92 |
| Institutional Class | ||||
| Actual | $ 1,000.00 | $ 1,152.10 | 1.18% | $ 6.35 |
| Hypothetical (5% return before expenses) | $ 1,000.00 | $ 1,019.10 | 1.18% | $ 5.96 |
| (a) | Annualized, based on the Fund's most recent fiscal half year expenses less any waivers/reimbursements. |
| (b) | Expenses are equal to the Fund's annualized expense ratio, multiplied by the average account value over the period, multiplied by the number of days in the most recent fiscal half year (183), divided by 366. |
| Semi-Annual Report | March 31, 2024 | 9 |
| Centre American Select Equity Fund | Schedule of Investments |
March 31, 2024 (Unaudited)
| Shares | Value | |||||||
| COMMON STOCKS (99.20%) | ||||||||
| Communication Services (9.62%) | ||||||||
| Entertainment (3.18%) | ||||||||
| Walt Disney Co. | 100,860 | $ | 12,341,230 | |||||
| Interactive Media & Services (6.44%) | ||||||||
| Alphabet, Inc., Class A(a) | 54,696 | 8,255,267 | ||||||
| Alphabet, Inc., Class C(a) | 46,414 | 7,066,996 | ||||||
| Meta Platforms, Inc., Class A | 19,905 | 9,665,470 | ||||||
| 24,987,733 | ||||||||
| Total Communication Services | 37,328,963 | |||||||
| Consumer Discretionary (11.62%) | ||||||||
| Automobiles (1.15%) | ||||||||
| Tesla, Inc.(a) | 25,498 | 4,482,293 | ||||||
| Broadline Retail (8.21%) | ||||||||
| Amazon.com, Inc.(a) | 134,779 | 24,311,436 | ||||||
| MercadoLibre, Inc.(a) | 4,983 | 7,534,097 | ||||||
| 31,845,533 | ||||||||
| Leisure Products (2.26%) | ||||||||
| Hasbro, Inc. | 154,954 | 8,758,000 | ||||||
| Total Consumer Discretionary | 45,085,826 | |||||||
| Consumer Staples (29.02%) | ||||||||
| Beverages (7.62%) | ||||||||
| Boston Beer Co., Inc., Class A(a) | 25,199 | 7,671,080 | ||||||
| Molson Coors Beverage Co., Class B | 143,382 | 9,642,439 | ||||||
| PepsiCo, Inc. | 69,918 | 12,236,349 | ||||||
| 29,549,868 | ||||||||
| Food Products (10.36%) | ||||||||
| Conagra Brands, Inc. | 308,062 | 9,130,958 | ||||||
| Ingredion, Inc. | 83,685 | 9,778,592 | ||||||
| Kraft Heinz Co. | 250,643 | 9,248,727 | ||||||
| McCormick & Co., Inc. | 156,989 | 12,058,325 | ||||||
| 40,216,602 | ||||||||
| Household Products (8.24%) | ||||||||
| Clorox Co. | 64,813 | 9,923,518 | ||||||
| Colgate-Palmolive Co. | 110,577 | 9,957,459 | ||||||
| Kimberly-Clark Corp. | 66,150 | 8,556,503 | ||||||
| Procter & Gamble Co. | 21,832 | 3,542,242 | ||||||
| 31,979,722 | ||||||||
| Tobacco (2.80%) | ||||||||
| Altria Group, Inc. | 248,973 | 10,860,202 | ||||||
| Total Consumer Staples | 112,606,394 | |||||||
| Energy (5.92%) | ||||||||
| Oil, Gas & Consumable Fuels (5.92%) | ||||||||
| Exxon Mobil Corp. | 37,354 | 4,342,029 | ||||||
| Kinder Morgan, Inc. | 523,786 | 9,606,235 | ||||||
| The Williams Cos., Inc. | 231,070 | 9,004,798 | ||||||
| 22,953,062 | ||||||||
| Total Energy | 22,953,062 | |||||||
| Shares | Value | |||||||
| Financials (5.22%) | ||||||||
| Banks (1.38%) | ||||||||
| JPMorgan Chase & Co. | 26,750 | $ | 5,358,025 | |||||
| Financial Services (3.84%) | ||||||||
| Berkshire Hathaway, Inc., Class B(a) | 16,803 | 7,065,998 | ||||||
| Mastercard, Inc., Class A | 7,671 | 3,694,123 | ||||||
| Visa, Inc., Class A | 14,782 | 4,125,361 | ||||||
| 14,885,482 | ||||||||
| Total Financials | 20,243,507 | |||||||
| Health Care (13.26%) | ||||||||
| Health Care Equipment & Supplies (5.70%) | ||||||||
| Medtronic PLC | 136,266 | 11,875,582 | ||||||
| Zimmer Biomet Holdings, Inc. | 77,532 | 10,232,673 | ||||||
| 22,108,255 | ||||||||
| Health Care Providers & Services (1.09%) | ||||||||
| UnitedHealth Group, Inc. | 8,561 | 4,235,127 | ||||||
| Pharmaceuticals (6.47%) | ||||||||
| Eli Lilly & Co. | 7,347 | 5,715,672 | ||||||
| Jazz Pharmaceuticals PLC(a) | 68,483 | 8,246,723 | ||||||
| Johnson & Johnson | 70,437 | 11,142,429 | ||||||
| 25,104,824 | ||||||||
| Total Health Care | 51,448,206 | |||||||
| Information Technology (21.73%) | ||||||||
| Communications Equipment (2.41%) | ||||||||
| F5 Networks, Inc.(a) | 49,275 | 9,342,047 | ||||||
| Semiconductors & Semiconductor Equipment (6.48%) | ||||||||
| Broadcom, Inc. | 4,021 | 5,329,474 | ||||||
| NVIDIA Corp. | 21,916 | 19,802,421 | ||||||
| 25,131,895 | ||||||||
| Software (7.12%) | ||||||||
| Microsoft Corp. | 65,694 | 27,638,780 | ||||||
| Technology Hardware, Storage & Peripherals (5.72%) | ||||||||
| Apple, Inc. | 129,528 | 22,211,461 | ||||||
| Total Information Technology | 84,324,183 | |||||||
| Materials (2.81%) | ||||||||
| Chemicals (2.81%) | ||||||||
| International Flavors & Fragrances, Inc. | 126,766 | 10,900,608 | ||||||
| Total Materials | 10,900,608 | |||||||
| TOTAL COMMON STOCKS | ||||||||
| (Cost $274,773,681) | 384,890,749 | |||||||
| Expiration Date | Exercise Price | Contracts | Notional Value | Value | ||||||||||||
| PURCHASED OPTIONS (0.41%) | ||||||||||||||||
| Puts | ||||||||||||||||
See Notes to Financial Statements.
| 10 | centrefunds.com |
| Centre American Select Equity Fund | Schedule of Investments |
March 31, 2024 (Unaudited)
| Expiration Date | Exercise Price | Contracts | Notional Value | Value | ||||||||||||
| S&P 500® Index: 9/20/2024 | $ | 4,175 | 735 | $ | 386,194,725 | $ | 1,594,950 | |||||||||
| Total Puts | 1,594,950 | |||||||||||||||
| TOTAL PURCHASED OPTIONS | ||||||||||||||||
| (Cost $2,017,310) | 1,594,950 | |||||||||||||||
| 7-Day Yield | Shares | Value | ||||||||||
| SHORT TERM INVESTMENTS (0.32%) | ||||||||||||
| Money Market Fund (0.32%) | ||||||||||||
| First American Treasury Obligations | 5.220 | % | 1,244,741 | 1,244,741 | ||||||||
| TOTAL SHORT TERM INVESTMENTS | ||||||||||||
| (Cost $1,244,741) | 1,244,741 | |||||||||||
| TOTAL INVESTMENTS (99.93%) | ||||||||||||
| (Cost $278,035,732) | $ | 387,730,440 | ||||||||||
| Other Assets In Excess Of Liabilities (0.07%) | 259,719 | |||||||||||
| NET ASSETS (100.00%) | $ | 387,990,159 | ||||||||||
| (a) | Non-income producing security. |
See Notes to Financial Statements.
| Semi-Annual Report | March 31, 2024 | 11 |
| Centre Global Infrastructure Fund | Schedule of Investments |
March 31, 2024 (Unaudited)
| Shares | Value | |||||||
| COMMON STOCKS (99.64%) | ||||||||
| ASIA (16.00%) | ||||||||
| Australia (2.39%) | ||||||||
| Transportation Infrastructure (2.39%) | ||||||||
| Transurban Group | 78,344 | $ | 680,022 | |||||
| Total Australia | 680,022 | |||||||
| Japan (7.66%) | ||||||||
| Diversified Telecommunication Services (1.59%) | ||||||||
| Nippon Telegraph & Telephone Corp. | 380,000 | 451,843 | ||||||
| Wireless Telecommunication Services (6.07%) | ||||||||
| KDDI Corp. | 18,300 | 540,127 | ||||||
| SoftBank Corp. | 34,600 | 443,643 | ||||||
| SoftBank Group Corp. | 12,600 | 745,945 | ||||||
| 1,729,715 | ||||||||
| Total Japan | 2,181,558 | |||||||
| New Zealand (3.55%) | ||||||||
| Diversified Telecommunication Services (1.75%) | ||||||||
| Spark New Zealand, Ltd. | 174,741 | 497,461 | ||||||
| Electric Utilities (1.80%) | ||||||||
| Mercury NZ, Ltd. | 123,757 | 512,395 | ||||||
| Total New Zealand | 1,009,856 | |||||||
| Singapore (0.65%) | ||||||||
| Diversified Telecommunications (0.65%) | ||||||||
| Singapore Telecommunications, Ltd. | 99,400 | 186,248 | ||||||
| Total Singapore | 186,248 | |||||||
| South Korea (1.75%) | ||||||||
| Diversified Telecommunication Services (1.75%) | ||||||||
| KT Corp., ADR | 35,426 | 496,673 | ||||||
| Total South Korea | 496,673 | |||||||
| TOTAL ASIA | ||||||||
| (Cost $4,203,738) | 4,554,357 | |||||||
| EUROPE (16.51%) | ||||||||
| France (1.68%) | ||||||||
| Diversified Telecommunication Services (0.93%) | ||||||||
| Orange SA | 22,663 | 266,212 | ||||||
| Multi-Utilities (0.75%) | ||||||||
| Engie SA | 12,711 | 212,693 | ||||||
| Total France | 478,905 | |||||||
| Germany (4.05%) | ||||||||
| Diversified Telecommunication Services (3.29%) | ||||||||
| Deutsche Telekom AG | 38,573 | 936,329 | ||||||
| Shares | Value | |||||||
| Multi-Utilities (0.76%) | ||||||||
| E.ON SE | 15,630 | $ | 217,273 | |||||
| Total Germany | 1,153,602 | |||||||
| Great Britain (2.14%) | ||||||||
| Multi-Utilities (1.13%) | ||||||||
| National Grid PLC | 23,804 | 320,271 | ||||||
| Wireless Telecommunication Services (1.01%) | ||||||||
| Vodafone Group PLC | 323,543 | 287,730 | ||||||
| Total Great Britain | 608,001 | |||||||
| Italy (3.05%) | ||||||||
| Electric Utilities (3.05%) | ||||||||
| Enel SpA | 131,445 | 867,735 | ||||||
| Total Italy | 867,735 | |||||||
| Spain (4.94%) | ||||||||
| Diversified Telecommunication Services (1.75%) | ||||||||
| Cellnex Telecom SA(a)(b) | 6,731 | 237,968 | ||||||
| Telefonica SA | 59,055 | 260,517 | ||||||
| 498,485 | ||||||||
| Electric Utilities (1.99%) | ||||||||
| Iberdrola SA | 45,611 | 565,641 | ||||||
| Transportation Infrastructure (1.20%) | ||||||||
| Aena SME SA(a)(b) | 1,743 | 343,087 | ||||||
| Total Spain | 1,407,213 | |||||||
| Switzerland (0.65%) | ||||||||
| Diversified Telecommunication Services (0.65%) | ||||||||
| Swisscom AG | 302 | 184,646 | ||||||
| Total Switzerland | 184,646 | |||||||
| TOTAL EUROPE | ||||||||
| (Cost $4,024,130) | 4,700,102 | |||||||
| NORTH AMERICA (67.13%) | ||||||||
| Canada (10.78%) | ||||||||
| Oil, Gas & Consumable Fuels (10.78%) | ||||||||
| Enbridge, Inc. | 44,450 | 1,606,310 | ||||||
| Pembina Pipeline Corp. | 14,198 | 501,130 | ||||||
| TC Energy Corp. | 23,885 | 959,950 | ||||||
| 3,067,390 | ||||||||
| Total Canada | 3,067,390 | |||||||
| United States (56.35%) | ||||||||
| Diversified Telecommunication Services (12.51%) | ||||||||
| AT&T, Inc. | 84,241 | 1,482,642 | ||||||
| Verizon Communications, Inc. | 49,522 | 2,077,943 | ||||||
| 3,560,585 | ||||||||
| Electric Utilities (11.99%) | ||||||||
| American Electric Power Co., Inc. | 3,416 | 294,118 | ||||||
See Notes to Financial Statements.
| 12 | centrefunds.com |
| Centre Global Infrastructure Fund | Schedule of Investments |
March 31, 2024 (Unaudited)
| Shares | Value | |||||||
| Constellation Energy Corp. | 2,114 | $ | 390,773 | |||||
| Duke Energy Corp. | 5,264 | 509,081 | ||||||
| Edison International | 2,489 | 176,047 | ||||||
| Exelon Corp. | 6,569 | 246,797 | ||||||
| NextEra Energy, Inc. | 13,602 | 869,304 | ||||||
| PG&E Corp. | 12,998 | 217,846 | ||||||
| The Southern Co. | 7,159 | 513,587 | ||||||
| Xcel Energy, Inc. | 3,661 | 196,779 | ||||||
| 3,414,332 | ||||||||
| Health Care Providers & Services (6.30%) | ||||||||
| HCA Healthcare, Inc. | 4,597 | 1,533,237 | ||||||
| Universal Health Services, Inc., Class B | 1,428 | 260,553 | ||||||
| 1,793,790 | ||||||||
| Multi-Utilities (3.63%) | ||||||||
| Consolidated Edison, Inc. | 2,365 | 214,766 | ||||||
| Dominion Energy, Inc. | 5,564 | 273,693 | ||||||
| Public Service Enterprise Group, Inc. | 3,409 | 227,653 | ||||||
| Sempra Energy | 4,436 | 318,638 | ||||||
| 1,034,750 | ||||||||
| Oil, Gas & Consumable Fuels (17.93%) | ||||||||
| Cheniere Energy, Inc. | 5,412 | 872,847 | ||||||
| Kinder Morgan, Inc. | 64,673 | 1,186,103 | ||||||
| ONEOK, Inc. | 13,105 | 1,050,628 | ||||||
| Targa Resources Corp. | 4,887 | 547,295 | ||||||
| The Williams Cos., Inc. | 37,127 | 1,446,839 | ||||||
| 5,103,712 | ||||||||
| Wireless Telecommunication Services (3.99%) | ||||||||
| T-Mobile US, Inc. | 6,952 | 1,134,705 | ||||||
| Total United States | 16,041,874 | |||||||
| TOTAL NORTH AMERICA | ||||||||
| (Cost $14,900,967) | 19,109,264 | |||||||
| TOTAL COMMON STOCKS | ||||||||
| (Cost $23,128,835) | 28,363,723 | |||||||
| 7-Day Yield | Shares | Value | ||||||||||
| SHORT TERM INVESTMENTS (0.81%) | ||||||||||||
| Money Market Fund (0.81%) | ||||||||||||
| First American Treasury Obligations | 5.220 | % | 230,362 | 230,362 | ||||||||
| TOTAL SHORT TERM INVESTMENTS | ||||||||||||
| (Cost $230,362) | 230,362 | |||||||||||
| Value | ||||
| TOTAL INVESTMENTS (100.45%) | ||||
| (Cost $23,359,197) | $ | 28,594,085 | ||
| Liabilities in Excess of Other Assets (-0.45%) | (127,431 | ) | ||
| NET ASSETS (100.00%) | $ | 28,466,654 | ||
| (a) | Security was purchased pursuant to Rule 144A under the Securities Act of 1933 and may be resold in transactions exempt from registration only to qualified institutional buyers. As of March 31, 2024, these securities had a total aggregate market value of $581,055, representing 2.04% of net assets. |
| (b) | Securities were purchased pursuant to Regulation S under the Securities Act of 1933, which exempts securities offered and sold outside the United States from registration. Such securities cannot be sold in the United States without either an effective registration statement filed pursuant to Securities Act of 1933, or pursuant to an exemption from registration. These securities have been deemed liquid under guidelines approved by the Fund's Board of Trustees. At period end, the aggregate market value of those securities was $581,055, representing 2.04% of net assets. |
See Notes to Financial Statements.
| Semi-Annual Report | March 31, 2024 | 13 |
| Centre Funds | Statements of Assets and Liabilities |
March 31, 2024 (Unaudited)
| Centre American Select Equity Fund | Centre Global Infrastructure Fund | |||||||
| ASSETS: | ||||||||
| Investments, at value | $ | 387,730,440 | $ | 28,594,085 | ||||
| Cash | 128,638 | 5,923 | ||||||
| Receivable for dividends | 630,129 | 86,107 | ||||||
| Deposit with broker for options | 13,942 | – | ||||||
| Receivable for fund shares sold | 240,057 | – | ||||||
| Prepaid and other assets | 28,735 | 1,280 | ||||||
| Total Assets | 388,771,941 | 28,687,395 | ||||||
| LIABILITIES: | ||||||||
| Payable to investment adviser | 240,326 | 15,302 | ||||||
| Payable to custodian | – | 150,174 | ||||||
| Payable to administrator | 44,022 | 6,794 | ||||||
| Payable to transfer agent | 19,364 | 8,137 | ||||||
| Payable for fund shares redeemed | 304,392 | 2,326 | ||||||
| Accrued 12b-1 and service fees | 56,172 | 13,718 | ||||||
| Payable for custodian fees | 5,687 | 2,967 | ||||||
| Payable for printing | 24,289 | 2,319 | ||||||
| Payable for legal and audit fees | 12,766 | 8,180 | ||||||
| Payable to trustees | 40,379 | 2,040 | ||||||
| Payable under the Chief Compliance Officer Services Agreement | 11,552 | 858 | ||||||
| Other payables | 22,833 | 7,926 | ||||||
| Total Liabilities | 781,782 | 220,741 | ||||||
| NET ASSETS | $ | 387,990,159 | $ | 28,466,654 | ||||
| NET ASSETS CONSIST OF: | ||||||||
| Paid-in capital | $ | 275,679,850 | $ | 51,862,571 | ||||
| Total distributable earnings/(accumulated deficit) | 112,310,309 | (23,395,917 | ) | |||||
| NET ASSETS | $ | 387,990,159 | $ | 28,466,654 | ||||
| INVESTMENTS, AT COST | $ | 278,035,732 | $ | 23,359,197 | ||||
| PRICING OF SHARES | ||||||||
| Investor Class | ||||||||
| Net Assets | $ | 206,805,185 | $ | 24,904,063 | ||||
| Shares outstanding | 12,647,154 | 2,377,129 | ||||||
| Net Asset Value, offering and redemption price per share | $ | 16.35 | $ | 10.48 | ||||
| Institutional Class | ||||||||
| Net Assets | $ | 181,184,974 | $ | 3,562,591 | ||||
| Shares outstanding | 10,747,746 | 339,853 | ||||||
| Net Asset Value, offering and redemption price per share | $ | 16.86 | $ | 10.48 | ||||
See Notes to Financial Statements.
| 14 | centrefunds.com |
| Centre Funds | Statements of Operations |
For the Six Months Ended March 31, 2024 (Unaudited)
| Centre American Select Equity Fund | Centre Global Infrastructure Fund | |||||||
| INVESTMENT INCOME: | ||||||||
| Dividends | $ | 3,716,136 | $ | 583,531 | ||||
| Foreign taxes withheld | – | (34,756 | ) | |||||
| Total Investment Income | 3,716,136 | 548,775 | ||||||
| EXPENSES: | ||||||||
| Investment advisory fees | 1,423,980 | 119,930 | ||||||
| Administration fees | 138,373 | 14,750 | ||||||
| Transfer agent fees | 64,578 | 22,222 | ||||||
| Custodian fees | 29,057 | 9,192 | ||||||
| Legal fees | 25,035 | 1,873 | ||||||
| Audit and tax fees | 7,871 | 7,930 | ||||||
| Trustees' fees and expenses | 65,593 | 4,923 | ||||||
| Registration/filing fees | 32,912 | 19,391 | ||||||
| 12b-1 fees (Investor Class) | 253,765 | 30,645 | ||||||
| Shareholder service fees | ||||||||
| Investor Class | 111,657 | 8,581 | ||||||
| Institutional Class | 70,686 | 1,481 | ||||||
| Printing fees | 31,558 | 2,650 | ||||||
| Chief Compliance Officer services fees | 34,049 | 2,617 | ||||||
| Miscellaneous expenses | 16,113 | 2,605 | ||||||
| Total expenses before waivers | 2,305,227 | 248,790 | ||||||
| Fees waived/reimbursed by investment adviser (Investor Class) (Note 5) | – | (27,532 | ) | |||||
| Fees waived/reimbursed by investment adviser (Institutional Class) (Note 5) | (24,960 | ) | (6,930 | ) | ||||
| Net Expenses | 2,280,267 | 214,328 | ||||||
| Net Investment Income | 1,435,869 | 334,447 | ||||||
| REALIZED AND UNREALIZED GAIN/(LOSS) ON INVESTMENTS, DERIVATIVES AND FOREIGN CURRENCIES: | ||||||||
| Net realized gain on investments and derivatives | 15,350,268 | 59,775 | ||||||
| Net realized loss on written option contracts | (3,371,977 | ) | – | |||||
| Net realized loss on foreign currencies | – | (514 | ) | |||||
| Total realized gain | 11,978,291 | 59,261 | ||||||
| Net change in unrealized appreciation on investments and derivatives | 44,790,381 | 3,544,528 | ||||||
| Net change in unrealized appreciation on foreign currencies | – | 770 | ||||||
| Total change in unrealized appreciation | 44,790,381 | 3,545,298 | ||||||
| NET REALIZED AND UNREALIZED GAIN ON INVESTMENTS, DERIVATIVES AND FOREIGN CURRENCIES: | 56,768,672 | 3,604,559 | ||||||
| NET INCREASE IN NET ASSETS RESULTING FROM OPERATIONS | $ | 58,204,541 | $ | 3,939,006 | ||||
See Notes to Financial Statements.
| Semi-Annual Report | March 31, 2024 | 15 |
| Centre American Select Equity Fund | Statements of Changes in Net Assets |
| For The Six Months Ended March 31, 2024 (Unaudited) | For The Year Ended September 30, 2023 | |||||||
| OPERATIONS: | ||||||||
| Net investment income | $ | 1,435,869 | $ | 2,228,318 | ||||
| Net realized gain | 11,978,291 | 4,647,641 | ||||||
| Net change in unrealized appreciation | 44,790,381 | 41,900,268 | ||||||
| Net increase in net assets resulting from operations | 58,204,541 | 48,776,227 | ||||||
| DISTRIBUTIONS TO SHAREHOLDERS: | ||||||||
| Investor | (5,126,535 | ) | (3,010,568 | ) | ||||
| Institutional | (4,505,366 | ) | (1,781,935 | ) | ||||
| Total distributions | (9,631,901 | ) | (4,792,503 | ) | ||||
| CAPITAL SHARE TRANSACTIONS: | ||||||||
| Investor Class | ||||||||
| Proceeds from sale of shares | 6,535,861 | 57,188,009 | ||||||
| Shares issued in reinvestment of distributions | 4,900,829 | 2,912,852 | ||||||
| Cost of shares redeemed | (39,883,152 | ) | (123,800,290 | ) | ||||
| Redemption fees | 3,831 | 87,031 | ||||||
| Net decrease from capital share transactions | (28,442,631 | ) | (63,612,398 | ) | ||||
| Institutional Class | ||||||||
| Proceeds from sale of shares | 42,927,911 | 153,571,169 | ||||||
| Shares issued in reinvestment of distributions | 4,204,322 | 1,715,622 | ||||||
| Cost of shares redeemed | (59,171,803 | ) | (98,299,656 | ) | ||||
| Redemption fees | 6,776 | 28,546 | ||||||
| Net increase/(decrease) from capital share transactions | (12,032,794 | ) | 57,015,681 | |||||
| Net increase in net assets | 8,097,215 | 37,387,007 | ||||||
| NET ASSETS: | ||||||||
| Beginning of period | 379,892,944 | 342,505,937 | ||||||
| End of period | $ | 387,990,159 | $ | 379,892,944 | ||||
| OTHER INFORMATION: | ||||||||
| Share Transactions: | ||||||||
| Investor Class | ||||||||
| Beginning shares | 14,565,719 | 18,950,131 | ||||||
| Shares sold | 428,587 | 4,083,896 | ||||||
| Shares issued in reinvestment of dividends | 326,070 | 219,507 | ||||||
| Shares redeemed | (2,673,222 | ) | (8,687,815 | ) | ||||
| Ending shares | 12,647,154 | 14,565,719 | ||||||
| Institutional Class | ||||||||
| Beginning shares | 11,477,969 | 7,521,817 | ||||||
| Shares sold | 2,810,050 | 10,570,779 | ||||||
| Shares issued in reinvestment of dividends | 271,422 | 125,963 | ||||||
| Shares redeemed | (3,811,695 | ) | (6,740,590 | ) | ||||
| Ending shares | 10,747,746 | 11,477,969 | ||||||
See Notes to Financial Statements.
| 16 | centrefunds.com |
| Centre Global Infrastructure Fund | Statements of Changes in Net Assets |
| For The Six Months Ended March 31, 2024 (Unaudited) | For The Year Ended September 30, 2023 | |||||||
| OPERATIONS: | ||||||||
| Net investment income | $ | 334,447 | $ | 649,345 | ||||
| Net realized gain | 59,261 | 133,568 | ||||||
| Net change in unrealized appreciation | 3,545,298 | 1,377,063 | ||||||
| Net increase in net assets resulting from operations | 3,939,006 | 2,159,976 | ||||||
| DISTRIBUTIONS TO SHAREHOLDERS: | ||||||||
| Investor | (257,451 | ) | (462,866 | ) | ||||
| Institutional | (45,390 | ) | (84,955 | ) | ||||
| Total distributions | (302,841 | ) | (547,821 | ) | ||||
| CAPITAL SHARE TRANSACTIONS: | ||||||||
| Investor Class | ||||||||
| Proceeds from sale of shares | 45,925 | 178,584 | ||||||
| Shares issued in reinvestment of distributions | 204,139 | 363,361 | ||||||
| Cost of shares redeemed | (2,714,686 | ) | (4,947,770 | ) | ||||
| Net decrease from capital share transactions | (2,464,622 | ) | (4,405,826 | ) | ||||
| Institutional Class | ||||||||
| Proceeds from sale of shares | 278,199 | 445,392 | ||||||
| Shares issued in reinvestment of distributions | 42,645 | 80,242 | ||||||
| Cost of shares redeemed | (786,154 | ) | (1,731,473 | ) | ||||
| Redemption fees | – | 164 | ||||||
| Net decrease from capital share transactions | (465,310 | ) | (1,205,675 | ) | ||||
| Net increase/(decrease) in net assets | 706,233 | (3,999,345 | ) | |||||
| NET ASSETS: | ||||||||
| Beginning of period | 27,760,421 | 31,759,766 | ||||||
| End of period | $ | 28,466,654 | $ | 27,760,421 | ||||
| OTHER INFORMATION: | ||||||||
| Share Transactions: | ||||||||
| Investor Class | ||||||||
| Beginning shares | 2,630,385 | 3,085,768 | ||||||
| Shares sold | 4,734 | 18,398 | ||||||
| Shares issued in reinvestment of dividends | 20,547 | 37,554 | ||||||
| Shares redeemed | (278,537 | ) | (511,334 | ) | ||||
| Ending shares | 2,377,129 | 2,630,385 | ||||||
| Institutional Class | ||||||||
| Beginning shares | 385,820 | 507,023 | ||||||
| Shares sold | 28,257 | 46,499 | ||||||
| Shares issued in reinvestment of dividends | 4,295 | 8,288 | ||||||
| Shares redeemed | (78,519 | ) | (175,990 | ) | ||||
| Ending shares | 339,853 | 385,820 | ||||||
See Notes to Financial Statements.
| Semi-Annual Report | March 31, 2024 | 17 |
| Centre American Select Equity Fund | Financial Highlights |
| Investor Class | For a share outstanding throughout the periods presented. |
For the Six Months Ended March 31, 2024 (Unaudited) | For the Year Ended September 30, 2023 | For the Year Ended September 30, 2022 | For the Year Ended September 30, 2021 | For the Year Ended September 30, 2020 | For the Year Ended September 30, 2019 | |||||||||||||||||||
| NET ASSET VALUE, BEGINNING OF PERIOD | $ | 14.40 | $ | 12.84 | $ | 14.73 | $ | 11.88 | $ | 10.55 | $ | 13.63 | ||||||||||||
| INCOME/(LOSS) FROM INVESTMENT OPERATIONS: | ||||||||||||||||||||||||
| Net investment income(a) | 0.05 | 0.06 | 0.11 | 0.02 | 0.10 | 0.04 | ||||||||||||||||||
| Net realized and unrealized gain/(loss) on investments | 2.29 | 1.67 | 0.27 | 3.40 | 2.25 | (0.96 | ) | |||||||||||||||||
| Total income/(loss) from investment operations | 2.34 | 1.73 | 0.38 | 3.42 | 2.35 | (0.92 | ) | |||||||||||||||||
| DISTRIBUTIONS: | ||||||||||||||||||||||||
| Net investment income | (0.17 | ) | (0.05 | ) | (0.14 | ) | (0.11 | ) | (0.02 | ) | (0.03 | ) | ||||||||||||
| Net realized gains on investments | (0.22 | ) | (0.13 | ) | (2.15 | ) | (0.46 | ) | (1.00 | ) | (2.13 | ) | ||||||||||||
| Total distributions | (0.39 | ) | (0.18 | ) | (2.29 | ) | (0.57 | ) | (1.02 | ) | (2.16 | ) | ||||||||||||
| REDEMPTION FEES ADDED TO PAID-IN CAPITAL (NOTE 4) | 0.00 | (b) | 0.01 | 0.02 | 0.00 | (b) | 0.00 | (b) | 0.00 | (b) | ||||||||||||||
| NET INCREASE/(DECREASE) IN NET ASSET VALUE | 1.95 | 1.56 | (1.89 | ) | 2.85 | 1.33 | (3.08 | ) | ||||||||||||||||
| NET ASSET VALUE, END OF PERIOD | $ | 16.35 | $ | 14.40 | $ | 12.84 | $ | 14.73 | $ | 11.88 | $ | 10.55 | ||||||||||||
| Total Return(c) | 16.47 | % | 13.70 | % | 1.23 | % | 29.60 | % | 23.82 | % | (5.12 | %) | ||||||||||||
| SUPPLEMENTAL DATA: | ||||||||||||||||||||||||
| Net assets, end of period (000) | $ | 206,805 | $ | 209,752 | $ | 243,353 | $ | 138,985 | $ | 151,342 | $ | 104,838 | ||||||||||||
| RATIOS TO AVERAGE NET ASSETS: | ||||||||||||||||||||||||
| Net investment income including reimbursement/waiver | 0.61 | %(d) | 0.43 | % | 0.78 | % | 0.17 | % | 0.93 | % | 0.32 | % | ||||||||||||
| Operating expenses excluding reimbursement/waiver | 1.34 | %(d) | 1.36 | % | 1.46 | % | 1.44 | % | 1.56 | % | 1.58 | % | ||||||||||||
| Operating expenses including reimbursement/waiver | 1.34 | %(d) | 1.36 | % | 1.46 | % | 1.46 | % | 1.47 | % | 1.45 | % | ||||||||||||
| PORTFOLIO TURNOVER RATE | 28 | %(e) | 93 | % | 138 | % | 86 | % | 94 | % | 114 | % | ||||||||||||
| (a) | Calculated using the average shares method. |
| (b) | Less than $0.005 per share. |
| (c) | Total returns would have been lower had certain expenses not been waived during the period. Returns shown do not reflect the deduction of taxes that a shareholder would pay on fund distributions or the redemption of fund shares. |
| (d) | Annualized. |
| (e) | Portfolio turnover rate for periods less than one full year have not been annualized. |
See Notes to Financial Statements.
| 18 | centrefunds.com |
| Centre American Select Equity Fund | Financial Highlights |
| Institutional Class | For a share outstanding throughout the periods presented. |
For the Six Months Ended March 31, 2024 (Unaudited) | For the Year Ended September 30, 2023 | For the Year Ended September 30, 2022 | For the Year Ended September 30, 2021 | For the Year Ended September 30, 2020 | For the Year Ended September 30, 2019 | |||||||||||||||||||
| NET ASSET VALUE, BEGINNING OF PERIOD | $ | 14.82 | $ | 13.18 | $ | 15.01 | $ | 12.06 | $ | 10.66 | $ | 13.68 | ||||||||||||
| INCOME/(LOSS) FROM INVESTMENT OPERATIONS: | ||||||||||||||||||||||||
| Net investment income(a) | 0.07 | 0.12 | 0.18 | 0.09 | 0.20 | 0.09 | ||||||||||||||||||
| Net realized and unrealized gain/(loss) on investments | 2.37 | 1.72 | 0.30 | 3.45 | 2.23 | (0.95 | ) | |||||||||||||||||
| Total income/(loss) from investment operations | 2.44 | 1.84 | 0.48 | 3.54 | 2.43 | (0.86 | ) | |||||||||||||||||
| DISTRIBUTIONS: | ||||||||||||||||||||||||
| Net investment income | (0.18 | ) | (0.07 | ) | (0.16 | ) | (0.13 | ) | (0.03 | ) | (0.03 | ) | ||||||||||||
| Net realized gains on investments | (0.22 | ) | (0.13 | ) | (2.15 | ) | (0.46 | ) | (1.00 | ) | (2.13 | ) | ||||||||||||
| Total distributions | (0.40 | ) | (0.20 | ) | (2.31 | ) | (0.59 | ) | (1.03 | ) | (2.16 | ) | ||||||||||||
| REDEMPTION FEES ADDED TO PAID-IN CAPITAL (NOTE 4) | 0.00 | (b) | 0.00 | (b) | 0.00 | (b) | 0.00 | (b) | 0.00 | (b) | 0.00 | (b) | ||||||||||||
| NET INCREASE/(DECREASE) IN NET ASSET VALUE | 2.04 | 1.64 | (1.83 | ) | 2.95 | 1.40 | (3.02 | ) | ||||||||||||||||
| NET ASSET VALUE, END OF PERIOD | $ | 16.86 | $ | 14.82 | $ | 13.18 | $ | 15.01 | $ | 12.06 | $ | 10.66 | ||||||||||||
| Total Return(c) | 16.70 | % | 14.11 | % | 1.78 | % | 30.18 | % | 24.42 | % | (4.61 | %) | ||||||||||||
| SUPPLEMENTAL DATA: | ||||||||||||||||||||||||
| Net assets, end of period (000) | $ | 181,185 | $ | 170,141 | $ | 99,153 | $ | 15,861 | $ | 11,682 | $ | 2,932 | ||||||||||||
| RATIOS TO AVERAGE NET ASSETS: | ||||||||||||||||||||||||
| Net investment income including reimbursement/waiver | 0.93 | %(d) | 0.81 | % | 1.24 | % | 0.65 | % | 1.73 | % | 0.84 | % | ||||||||||||
| Operating expenses excluding reimbursement/waiver | 1.06 | %(d) | 1.08 | % | 1.05 | % | 1.16 | % | 1.26 | % | 1.29 | % | ||||||||||||
| Operating expenses including reimbursement/waiver | 1.04 | %(d) | 0.98 | % | 0.98 | % | 0.98 | % | 0.99 | % | 0.95 | % | ||||||||||||
| PORTFOLIO TURNOVER RATE | 28 | %(e) | 93 | % | 138 | % | 86 | % | 94 | % | 114 | % | ||||||||||||
| (a) | Calculated using the average shares method. |
| (b) | Less than $0.005 per share. |
| (c) | Total returns would have been lower had certain expenses not been waived during the period. Returns shown do not reflect the deduction of taxes that a shareholder would pay on fund distributions or the redemption of fund shares. |
| (d) | Annualized. |
| (e) | Portfolio turnover rate for periods less than one full year have not been annualized. |
See Notes to Financial Statements.
| Semi-Annual Report | March 31, 2024 | 19 |
| Centre Global Infrastructure Fund | Financial Highlights |
| Investor Class | For a share outstanding throughout the periods presented. |
For the Six Months Ended March 31, 2024 (Unaudited) | For the Year Ended September 30, 2023 | For the Year Ended September 30, 2022 | For the Year Ended September 30, 2021 | For the Year Ended September 30, 2020 | For the Year Ended September 30, 2019 | |||||||||||||||||||
| NET ASSET VALUE, BEGINNING OF PERIOD | $ | 9.20 | $ | 8.84 | $ | 10.14 | $ | 8.76 | $ | 10.18 | $ | 9.64 | ||||||||||||
| INCOME/(LOSS) FROM INVESTMENT OPERATIONS: | ||||||||||||||||||||||||
| Net investment income(a) | 0.11 | 0.19 | 0.19 | 0.18 | 0.25 | 0.22 | ||||||||||||||||||
| Net realized and unrealized gain/(loss) on investments | 1.27 | 0.33 | (1.25 | ) | 1.39 | (1.41 | ) | 0.57 | ||||||||||||||||
| Total income/(loss) from investment operations | 1.38 | 0.52 | (1.06 | ) | 1.57 | (1.16 | ) | 0.79 | ||||||||||||||||
| DISTRIBUTIONS: | ||||||||||||||||||||||||
| Net investment income | (0.10 | ) | (0.16 | ) | (0.24 | ) | (0.19 | ) | (0.26 | ) | (0.25 | ) | ||||||||||||
| Tax return of capital | – | – | (0.00 | )(b) | – | – | – | |||||||||||||||||
| Total distributions | (0.10 | ) | (0.16 | ) | (0.24 | ) | (0.19 | ) | (0.26 | ) | (0.25 | ) | ||||||||||||
| REDEMPTION FEES ADDED TO PAID-IN CAPITAL (NOTE 4) | – | – | 0.00 | (c) | 0.00 | (c) | 0.00 | (c) | 0.00 | (c) | ||||||||||||||
| NET INCREASE/(DECREASE) IN NET ASSET VALUE | 1.28 | 0.36 | (1.30 | ) | 1.38 | (1.42 | ) | 0.54 | ||||||||||||||||
| NET ASSET VALUE, END OF PERIOD | $ | 10.48 | $ | 9.20 | $ | 8.84 | $ | 10.14 | $ | 8.76 | $ | 10.18 | ||||||||||||
| Total Return(d) | 15.11 | % | 5.85 | % | (10.77 | %) | 18.00 | % | (11.49 | %) | 8.41 | % | ||||||||||||
| SUPPLEMENTAL DATA: | ||||||||||||||||||||||||
| Net assets, end of period (000) | $ | 24,904 | $ | 24,208 | $ | 27,275 | $ | 34,594 | $ | 35,527 | $ | 28,879 | ||||||||||||
| RATIOS TO AVERAGE NET ASSETS: | ||||||||||||||||||||||||
| Net investment income including reimbursement/waiver | 2.32 | %(e) | 1.98 | % | 1.89 | % | 1.79 | % | 2.62 | % | 2.28 | % | ||||||||||||
| Operating expenses excluding reimbursement/waiver | 1.79 | %(e) | 1.76 | % | 1.75 | % | 1.74 | % | 1.89 | % | 2.29 | % | ||||||||||||
| Operating expenses including reimbursement/waiver | 1.57 | %(e) | 1.57 | % | 1.57 | % | 1.50 | %(f) | 1.28 | %(g) | 1.30 | %(h) | ||||||||||||
| PORTFOLIO TURNOVER RATE | 5 | %(i) | 18 | % | 39 | % | 25 | % | 75 | % | 233 | % | ||||||||||||
| (a) | Calculated using the average shares method. |
| (b) | Less than $(0.005) per share. |
| (c) | Less than $0.005 per share. |
| (d) | Total returns are for the period indicated and have not been annualized. Total returns would have been lower had certain expenses not been waived during the period. Returns shown do not reflect the deduction of taxes that a shareholder would pay on fund distributions or the redemption of fund shares. |
| (e) | Annualized. |
| (f) | Effective January 28, 2021, the net expense limitation changed from 1.05% to 1.25%, excluding, among other fees and expenses, 12B-1 fees and shareholder service fees. |
| (g) | Effective July 21, 2020, the net expense limitation changed from 1.25% to 1.05%, excluding, among other fees and expenses, 12b-1 fees and shareholder service fees. |
| (h) | Effective July 22, 2019, the net expense limitation changed from 1.05% to 1.25%, including, among other fees and expenses, 12b-1 fees and shareholder service fees. |
| (i) | Portfolio turnover rate for periods less than one full year have not been annualized. |
See Notes to Financial Statements.
| 20 | centrefunds.com |
| Centre Global Infrastructure Fund | Financial Highlights |
| Institutional Class | For a share outstanding throughout the periods presented. |
For the Six Months Ended March 31, 2024 (Unaudited) | For the Year Ended September 30, 2023 | For the Year Ended September 30, 2022 | For the Year Ended September 30, 2021 | For the Year Ended September 30, 2020 | For the Year Ended September 30, 2019 | |||||||||||||||||||
| NET ASSET VALUE, BEGINNING OF PERIOD | $ | 9.21 | $ | 8.84 | $ | 10.15 | $ | 8.77 | $ | 10.20 | $ | 9.67 | ||||||||||||
| INCOME/(LOSS) FROM INVESTMENT OPERATIONS: | ||||||||||||||||||||||||
| Net investment income(a) | 0.13 | 0.23 | 0.23 | 0.21 | 0.26 | 0.24 | ||||||||||||||||||
| Net realized and unrealized gain/(loss) on investments | 1.26 | 0.34 | (1.26 | ) | 1.40 | (1.40 | ) | 0.57 | ||||||||||||||||
| Total income/(loss) from investment operations | 1.39 | 0.57 | (1.03 | ) | 1.61 | (1.14 | ) | 0.81 | ||||||||||||||||
| DISTRIBUTIONS: | ||||||||||||||||||||||||
| Net investment income | (0.12 | ) | (0.20 | ) | (0.28 | ) | (0.23 | ) | (0.29 | ) | (0.28 | ) | ||||||||||||
| Tax return of capital | – | – | (0.00 | )(b) | – | – | – | |||||||||||||||||
| Total distributions | (0.12 | ) | (0.20 | ) | (0.28 | ) | (0.23 | ) | (0.29 | ) | (0.28 | ) | ||||||||||||
| REDEMPTION FEES ADDED TO PAID-IN CAPITAL (NOTE 4) | – | 0.00 | (c) | 0.00 | (c) | 0.00 | (c) | 0.00 | (c) | – | ||||||||||||||
| NET INCREASE/(DECREASE) IN NET ASSET VALUE | 1.27 | 0.37 | (1.31 | ) | 1.38 | (1.43 | ) | 0.53 | ||||||||||||||||
| NET ASSET VALUE, END OF PERIOD | $ | 10.48 | $ | 9.21 | $ | 8.84 | $ | 10.15 | $ | 8.77 | $ | 10.20 | ||||||||||||
| Total Return(d) | 15.21 | % | 6.38 | % | (10.51 | %) | 18.35 | % | (11.30 | %) | 8.59 | % | ||||||||||||
| SUPPLEMENTAL DATA: | ||||||||||||||||||||||||
| Net assets, end of period (000) | $ | 3,563 | $ | 3,553 | $ | 4,484 | $ | 5,932 | $ | 6,243 | $ | 23,663 | ||||||||||||
| RATIOS TO AVERAGE NET ASSETS: | ||||||||||||||||||||||||
| Net investment income including reimbursement/waiver | 2.71 | %(e) | 2.36 | % | 2.28 | % | 2.10 | % | 2.60 | % | 2.48 | % | ||||||||||||
| Operating expenses excluding reimbursement/waiver | 1.55 | %(e) | 1.48 | % | 1.51 | % | 1.51 | % | 1.63 | % | 1.61 | % | ||||||||||||
| Operating expenses including reimbursement/waiver | 1.18 | %(e) | 1.18 | % | 1.18 | % | 1.20 | % | 1.02 | %(f) | 1.01 | %(g) | ||||||||||||
| PORTFOLIO TURNOVER RATE | 5 | %(h) | 18 | % | 39 | % | 25 | % | 75 | % | 233 | % | ||||||||||||
| (a) | Calculated using the average shares method. |
| (b) | Less than $(0.005) per share. |
| (c) | Less than $0.005 per share. |
| (d) | Total returns are for the period indicated and have not been annualized. Total returns would have been lower had certain expenses not been waived during the period. Returns shown do not reflect the deduction of taxes that a shareholder would pay on fund distributions or the redemption of fund shares. |
| (e) | Annualized. |
| (f) | Effective July 21, 2020, the net expense limitation changed from 1.00% to 1.10%, excluding, among other fees and expenses, 12b-1 fees and shareholder service fees. |
| (g) | Effective July 22, 2019, the net expense limitation changed from 1.10% to 1.00%, including, among other fees and expenses, 12b-1 fees and shareholder service fees. |
| (h) | Portfolio turnover rate for periods less than one full year have not been annualized. |
See Notes to Financial Statements.
| Semi-Annual Report | March 31, 2024 | 21 |
| Centre Funds | Notes to Financial Statements |
March 31, 2024 (Unaudited)
1. ORGANIZATION
Centre Funds (the “Trust”) was organized on March 17, 2011, as a Delaware statutory trust and is registered as an open-end management investment company under the Investment Company Act of 1940, as amended (the “1940 Act”). Prior to January 17, 2014, the Trust was known as Drexel Hamilton Mutual Funds. The Trust currently offers shares of beneficial interest (“shares”) of Centre American Select Equity Fund (the “American Select Equity Fund") and Centre Global Infrastructure Fund (the “Infrastructure Fund”) (each individually a "Fund" and collectively, the “Funds”). The affairs of the Trust are overseen by a Board of Trustees (the “Board” or the “Trustees”). The Declaration of Trust permits the Trustees to create additional series of the Trust and share classes.
Information in the accompanying Funds’ financial statements pertain to the Investor Class and Institutional Class shares offered by each of the Funds. All classes of shares have identical rights to earnings, assets, and voting privileges, except for class-specific expenses and exclusive rights to vote on matters affecting only individual classes.
2. SIGNIFICANT ACCOUNTING POLICIES
The following is a summary of significant accounting policies followed by the Funds in the preparation of the Financial Statements. These policies are in conformity with accounting principles generally accepted in the United States of America (“GAAP”). Each Fund is an investment company and accordingly follows the investment company accounting and reporting guidance of the Financial Accounting Standards Board Accounting Standard Codification Topic 946 Financial Services – Investment Companies, including Accounting Standards Update 2013-08.
| (a) | The Funds present or record their investments at fair value. Portfolio securities traded on a securities exchange or quoted by NASDAQ are valued at the last sale price on the principal exchange on which they are traded at the time the securities are valued, or, if not traded on that day, are valued at the closing bid price. In the case of portfolio securities listed on the NASDAQ, valuation is determined by using the NASDAQ Official Closing Price. Securities traded in the OTC market and not quoted by NASDAQ are valued at their last sale price or, if there is no available price, the last bid price quoted by brokers that make markets in the securities as of the close of regular trading hours on the day the securities are being valued. Foreign securities are valued on the basis of quotations from the primary market in which they are traded, and are translated from the local currency into U.S. dollars using exchange rates as of the close of regular trading (normally 4:00 p.m. Eastern time) on the New York Stock Exchange (the “Exchange”) or using methods determined by the Board. Short-term instruments with maturities of 60 days or less are valued at the price supplied by an approved independent pricing source. Options contracts listed for trading on a securities exchange or board of trade shall be valued at the mean of the highest bid and lowest asked quotation across the exchanges on which the option is traded. Futures contracts are ordinarily valued at the closing settlement price on the exchange on which they are primarily traded or based upon the current settlement price for a like instrument acquired on the day on which the instrument is being valued. Securities and other assets for which quotations are not readily available or deemed unreliable are valued at their fair value using methods determined by the Board. Fair valuation of a particular security is an inherently subjective process, with no single standard to utilize when determining a security’s fair value. As such, different mutual funds could reasonably arrive at a different fair value price for the same security. In each case where a security is fair valued, consideration is given to the facts and circumstances relevant to the particular situation. This consideration includes reviewing various factors set forth in the pricing procedures adopted by the Board and other factors as warranted. In making a fair value determination, factors that may be considered, among others, may include: the type and structure of the security; unusual events or circumstances relating to the security’s issuer; general market conditions; prior day’s valuation; fundamental analytical data; size of the holding; cost of the security on the date of purchase; nature and duration of any restriction on disposition; trading activities; and prices of similar securities or financial instruments. If a Fund invests in shares of other open-end mutual funds, including Money Market Funds, (each, an “Underlying Fund”), the Fund calculates the net asset value of its shares using the reported net asset value of the applicable Underlying Fund. For each Underlying Fund, the net asset value per share for a class of shares is determined as of the close of the Exchange on each day the Exchange is open by dividing the value of the Underlying Fund’s net assets attributable to that class by the number of outstanding shares of that class on that day. |
| (b) | The per share net asset value (the “NAV”) of each Fund is calculated as of the close of regular trading on the Exchange (normally 4:00 p.m. Eastern time) each day the Exchange is open. The per share NAV is calculated by deducting from the Fund’s assets, the Fund’s liabilities, and then dividing the resulting net assets by the total number of shares outstanding, rounded to the nearest cent. The purchase price and redemption price per share is equal to the next determined NAV per share. Redemption of shares of American Select Equity Fund and Infrastructure Fund are subject to a redemption fee of 2% if redeemed within 90 days of purchase. |
| (c) | The Trust treats each Fund as a separate entity for Federal income tax purposes. Each Fund intends to continue to qualify each year as a “regulated investment company” under Subchapter M of the Internal Revenue Code of 1986, as amended (the “Code”). By so qualifying, each Fund will not be subject to Federal income taxes to the extent that it distributes substantially all of its taxable or tax-exempt income, if any, for its tax year ending September 30. In addition, by distributing in each calendar year substantially all of its net investment income, capital gains and certain other amounts, if any, each Fund will not be subject to a Federal excise tax. Therefore, no provision is made by the Funds for Federal income or excise taxes. Withholding taxes on foreign dividends are paid or provided for in accordance with the applicable country’s tax rules and rates. |
| 22 | centrefunds.com |
| Centre Funds | Notes to Financial Statements |
March 31, 2024 (Unaudited)
As of and during the six-month period ended March 31, 2024, the Funds did not have a liability for any unrecognized tax benefits in the accompanying financial statements. The Funds recognize the interest and penalties, if any, related to the unrecognized tax benefits as income tax expense in the Statements of Operations. During the six-month period ended March 31, 2024, the Funds did not incur any interest or penalties.
| (d) | Net realized gains and losses on investments are computed on the identified cost basis. Dividend income is recognized on the ex-dividend date or for certain foreign securities, as soon as information is available, and interest income is recognized on an accrual basis. The Funds amortize premium and accrete discount on investments utilizing the effective interest method. Foreign dividend income may be subject to foreign withholding taxes. |
| (e) | A restricted security is a security that has been purchased through a private offering and cannot be resold to the general public without prior registration under the Securities Act of 1933, as amended (the “1933 Act”), or pursuant to the resale limitations provided by Rule 144 under the 1933 Act, or an exemption from the registration requirements of the 1933 Act. Whether a restricted security is illiquid is determined pursuant to guidelines established by the Board. Not all restricted securities are considered to be illiquid. As of March 31, 2024, the Funds did not hold any illiquid or restricted securities. |
| (f) | The accompanying financial statements were prepared in accordance with GAAP, which require the use of estimates and assumptions made by management. These may affect the reported amounts of assets and liabilities and disclosure of contingent assets and liabilities at the date of the financial statements and the reported amounts of increases and decreases in net assets from operations during the reporting period. Actual results could differ from those estimates. |
| (g) | Each Fund bears expenses incurred specifically by such Fund, as well as its pro rata portion of Trust expenses, which may be allocated on the basis of relative net assets or the nature of the services performed relative to applicability to each Fund. Expenses that are specific to a Fund or class of shares of a Fund are charged directly to that Fund or share class. All of the realized and unrealized gains and losses and net investment income of a Fund, other than class-specific expenses, are allocated daily to each class in proportion to its average daily net assets. Fees payable under the distribution (Rule 12b-1) plan and shareholder services plan are charged to each respective fund or share class. |
| (h) | The Funds intend to distribute to shareholders all of their net income and/or capital gains on an annual basis. Income and capital gains distributions are determined in accordance with income tax regulations, which may differ from GAAP. Distributions to shareholders are recorded on the ex-dividend date. |
| (i) | A Fund may directly purchase securities of foreign issuers. Investing in securities of foreign issuers involves special risks not typically associated with investing in securities of U.S. issuers. The risks include possible reevaluation of currencies, the inability to repatriate foreign currency, less complete financial information about companies and possible future adverse political and economic developments. Moreover, securities of many foreign issuers and their markets may be less liquid and their prices more volatile than those of securities of comparable U.S. issuers. |
| (j) | The Fund’s investments in infrastructure-related companies may result in a relatively large percentage of its assets invested in issuers within a specific industry or sector. To the extent that the Fund’s investments are focused in such a sector, the Fund will be subject to the market or economic factors affecting such sector, including adverse economic, business, political, regulatory or environmental developments, to a greater extent than if the Fund’s investments were more diversified among various different sectors. |
| (k) | The books and records of the Funds are maintained in U.S. dollars. Investment valuations and other assets and liabilities initially expressed in foreign currencies are converted each business day into U.S. dollars based upon current exchange rates. The portion of realized and unrealized gains or losses on investments due to fluctuations in foreign currency exchange rates is not separately disclosed and is not included in net realized and net change in unrealized gains or losses on foreign currencies. |
| (l) | Idle cash may be swept into various overnight demand deposits and is classified as cash and cash equivalents on the Statements of Assets and Liabilities. The Funds maintain cash in bank deposit accounts which, at times, may exceed United States federally insured limits. Amounts swept overnight are available on the next business day. |
3. FAIR VALUE MEASUREMENTS
The Funds normally use third-party pricing services to obtain market quotations for their portfolio investments. Securities and other assets for which representative market quotations are not readily available or which cannot be accurately valued using the Trust’s normal pricing procedures are valued at fair value as determined in good faith under policies approved by the Trustees. Fair value pricing may be used, for example, in situations where (i) an exchange-traded portfolio security is so thinly traded that there have been no transactions for that security over an extended period of time or the validity of a market quotation received is questionable; (ii) the exchange on which the portfolio security is principally traded closes early; or (iii) trading of the portfolio security is halted during the day and does not resume prior to the NAV calculation.
| Semi-Annual Report | March 31, 2024 | 23 |
| Centre Funds | Notes to Financial Statements |
March 31, 2024 (Unaudited)
The inputs used in determining the fair value of each Fund’s investments are summarized into three levels, as described in the following hierarchy:
| Level 1 - | Unadjusted quoted prices in active markets for identical, unrestricted assets or liabilities that a Fund has the ability to access at the measurement date. |
| Level 2 - | Quoted prices which are not active, quoted prices for similar assets or liabilities in active markets or inputs other than quoted prices that are observable (either directly or indirectly). |
| Level 3 - | Significant unobservable prices or inputs (including the oversight of the Board and Centre Asset Management, LLC (the “Adviser”) in determining the fair value of investments) where there is little or no market activity for the asset or liability at measurement date. |
The inputs or methodology used for valuing securities are not necessarily an indication of the risk associated with investing in those securities.
The following is a summary of each Fund’s investments in the fair value hierarchy as of March 31, 2024:
Centre American Select Equity Fund
| Investments in Securities at Value(a) | Level 1 - Quoted Prices | Level 2 - Other Significant Observable Inputs | Level 3 - Significant Unobservable Inputs | Total | ||||||||||||
| Common Stocks | $ | 384,890,749 | $ | – | $ | – | $ | 384,890,749 | ||||||||
| Purchased Options | 1,594,950 | – | – | 1,594,950 | ||||||||||||
| Short Term Investments | 1,244,741 | – | – | 1,244,741 | ||||||||||||
| Total | $ | 387,730,440 | $ | – | $ | – | $ | 387,730,440 | ||||||||
Centre Global Infrastructure Fund
| Investments in Securities at Value(a) | Level 1 - Quoted Prices | Level 2 - Other Significant Observable Inputs | Level 3 - Significant Unobservable Inputs | Total | ||||||||||||
| Common Stocks | $ | 28,363,723 | $ | – | $ | – | $ | 28,363,723 | ||||||||
| Short Term Investments | 230,362 | – | – | 230,362 | ||||||||||||
| Total | $ | 28,594,085 | $ | – | $ | – | $ | 28,594,085 | ||||||||
| (a) | For detailed descriptions of sectors, industries, and countries, see the accompanying Schedules of Investments. |
Derivative Financial Instruments
A Fund may invest its assets in derivatives and other instruments to help manage interest rate exposure, protect the Fund’s assets, or enhance returns. A Fund may also be exposed to certain exchange-traded derivative products, such as exchange-traded futures and options that are fully collateralized by cash or securities, for temporary cash management or investment transition purposes, or to hedge the risks of existing positions or overall capital protection.
Derivative Risk: One or both Funds may use derivatives, such as exchange-traded options and futures that are related to stock market or bond indexes, foreign exchange, fixed income or other securities or be exposed to exchange-traded derivative products. Loss may result from a Fund’s investments in exchange-traded futures and options. The value of derivatives in which a Fund may invest may rise or fall more rapidly than other investments. Other risks of investments in derivatives include imperfect correlation between the value of these instruments and the underlying assets; risks of default by the other party to the derivative transactions; risk that the transactions may result in losses that offset gains in portfolio positions; and risks that the derivative transactions may not be liquid. Derivatives, such as exchange-traded futures and options, contain “inherent” leverage because derivative contracts may give rise to an obligation on the part of a Fund for future payment or liabilities that are larger than the initial margin or premiums required to establish such positions. Combined with the volatility of derivatives prices, the leveraged nature of derivatives trading could cause a Fund to sustain large and sudden losses. The use of derivatives, such as futures and options, can lead to losses, including those magnified by leverage, particularly when derivatives are used to enhance return rather than mitigate risk. Correlation risk is the risk that changes in the value of the derivative may not correlate perfectly with the underlying asset, rate or index. Certain derivative instruments may be difficult to sell when the Adviser believes it would be appropriate to do so.
Derivatives may have little or no initial cash investment relative to their market value exposure and therefore can produce significant gains or losses in excess of their cost. This use of embedded leverage may allow a Fund to increase its market value exposure relative to its net assets and can substantially increase the volatility of the Fund’s performance.
Additional associated risks from investing in derivatives also exist and potentially could have significant effects on the valuation of the derivatives held by a Fund. Typically, a Fund may attempt to increase or decrease exposure to the risks associated with the securities or other traditional investments in which it invests. The risks associated with a Fund’s use of derivative instruments, including but not limited to volatility risk, correlation risk, segregation risk, and hedging risks, are additional risks that a Fund does not typically seek to increase or decrease exposure to. Examples of these associated risks are liquidity risk, which is the risk that a Fund will not be able to sell the derivative in the open market in a timely manner, and counterparty credit risk, which is the risk that the counterparty will not fulfill its obligation to the Fund.
| 24 | centrefunds.com |
| Centre Funds | Notes to Financial Statements |
March 31, 2024 (Unaudited)
Option Writing/Purchasing
A Fund may write or purchase option contracts to adjust risk and return of its overall investment positions, subject to any restrictions set forth in the Fund’s prospectus. When a Fund writes or purchases an option, an amount equal to the premium received or paid by the Fund is recorded as a liability or an asset and is subsequently adjusted to the current market value of the option written or purchased. Premiums received or paid from writing or purchasing options that expire unexercised are treated by a Fund on the expiration date as realized gains or losses. The difference between the premium and the amount paid or received on affecting a closing purchase or sale transaction, including brokerage commissions, is also treated as a realized gain or loss. If an option is exercised, the premium paid or received is netted to the cost of the purchase or proceeds from the sale in determining whether a Fund has realized a gain or loss on investment transactions. Risks from entering into option transactions arise from, among other things, the potential inability of counterparties to meet the terms.
Futures
A Fund may use futures subject to any restrictions set forth in the Fund’s prospectus. A Fund may also be exposed to exchange-traded futures that are fully collateralized by cash or securities, for temporary cash management or investment transition purposes, or to hedge the risks of existing positions. To the extent that the Fund uses derivatives for temporary cash management, investment transition purposes, managing duration or to hedge the risks of existing positions, the Fund will be subject to the risks associated with such transactions. During the six-month perod ended March 31, 2024, the Funds did not invest in futures contracts.
| Risk Exposure | Derivatives Statements of Assets and Liabilities Location | Fair Value | ||||
| Centre American Select Equity Fund | ||||||
| Equity Contracts (Purchased Options) | Investments, at value | $ | 1,594,950 | |||
| $ | 1,594,950 | |||||
The effect of derivative instruments on the Statements of Operations for six-month period ended March 31, 2024 (Net realized gain/(loss) on purchased options contracts are included in Net realized gain/(loss) on investments within the Statements of Operations):
| Derivatives | Location of Gains/(Loss) On Derivatives Recognized In Income | Realized Gain/(Loss) on Derivatives Recognized in Income | Change in Unrealized Gain/ (Loss) on Derivatives Recognized in Income | |||||||
| Centre American Select Equity Fund | ||||||||||
| Equity Contracts (Purchased Options) | Net realized gain/(loss) on investments/Net change in unrealized appreciation/(depreciation) on investments | $ | – | $ | (1,387,856 | ) | ||||
| $ | – | $ | (1,387,856 | ) | ||||||
Volume of Derivative Instruments for the Funds during the six-month period ended March 31, 2024, was as follows:
| Derivative Type | Unit of Measurement | Monthly Average | ||||
| Centre American Select Equity Fund | ||||||
| Purchased Option Contracts | Notional value of contracts outstanding | $ | 384,207,041 | |||
During the ordinary course of business, the Funds may enter into transactions subject to enforceable netting agreements or other similar arrangements (“netting agreements”). Generally, the right to offset in netting agreements allows the Funds to offset any exposure to a specific counterparty with any collateral received or delivered to that counterparty based on the terms of the agreement. Generally, the Funds manage their cash collateral and securities collateral on a counterparty basis. The Funds do not have an offsetting agreement with the counterparty for option contracts.
| Semi-Annual Report | March 31, 2024 | 25 |
| Centre Funds | Notes to Financial Statements |
March 31, 2024 (Unaudited)
4. BENEFICIAL INTEREST TRANSACTIONS
On March 31, 2024, there was an unlimited number of shares of beneficial interest authorized for each Fund. Transactions in shares of beneficial interest are shown in the Statements of Changes in Net Assets.
Shares of American Select Equity Fund and Infrastructure Fund that are redeemed within 90 days of purchase may incur a 2% redemption fee deducted from the redemption amount. For the six-month period ended March 31, 2024, redemption fees retained by the Funds are disclosed in the Statements of Changes in Net Assets.
Beneficial Ownership: The beneficial ownership, either directly or indirectly, of more than 25% of the voting securities of a Fund creates a presumption of control of the Fund under Section 2(a)(9) of the 1940 Act. As of March 31, 2024, the following entities owned beneficially more than 25% of each Fund’s outstanding shares. The shares may be held under omnibus accounts (whereby the transactions of two or more shareholders are combined and carried in the name of the originating broker rather than designated separately). Any transaction by these investors could have a material impact on the share class.
| Centre American Select Equity Fund | Percentage |
| Charles Schwab & Co. Inc. | 30.49% |
5. INVESTMENT ADVISORY AGREEMENTS AND RELATED-PARTY TRANSACTIONS
The Adviser serves as the investment adviser to each Fund pursuant to an Investment Advisory Agreement with the Trust on behalf of the Fund.
As compensation for the investment advisory services provided to the Funds, the Adviser is entitled to receive monthly compensation, subject to waivers, based on each Fund’s average daily net assets at the annual rate of:
| Fund | Management Fee Rate |
| Centre American Select Equity Fund (total net assets less than or equal to $1 billion) | 0.75% |
| Centre American Select Equity Fund (total net assets over $1 billion) | 0.70% |
| Centre Global Infrastructure Fund | 0.85% |
American Select Equity Fund
The Adviser has contractually agreed to reduce its advisory fees and/or reimburse other expenses of the Fund for not less than one year and until the next following effective date of the post-effective amendment to the registration statement of Centre Funds relating to the Fund (on or about January 29, 2025) to the extent necessary to limit the total operating expenses of the Fund including (but not limited to) investment advisory fees of the Adviser, but excluding, as applicable, any front-end or contingent deferred sales loads, taxes, leverage interest, distribution/service (Rule 12b-1) fees, shareholder services fees, brokerage commissions, acquired fund fees and expenses, (except that, if an acquired fund is an underlying fund managed by the Adviser and such acquired fund is not subject to an effective expense limitation or fee waiver agreement at any time during the term of this Agreement, then, for that time, the operating expenses of each class of shares of the Fund shall not exclude the amount of advisory fees included in such acquired fund’s fees and expenses to which the Fund would otherwise be subject), expenses incurred in connection with any merger or reorganization, and extraordinary expenses (such as litigation and other expenses not incurred in the ordinary course of the Fund’s business) to an annual rate of 1.10% of the average daily net assets of the Investor Class shares and 0.95% of the average daily net assets of the Institutional Class shares (the “Expense Limitation Agreement”). The Expense Limitation Agreement may be terminated at any time, and without payment of any penalty, by the Board of Trustees of the Trust (the “Board”), on behalf of the Fund, upon 60 days’ written notice to the Adviser, but may not be terminated by the Adviser without the consent of the Board. No recoupment will be made more than three years after the date that the applicable amount was initially waived or reimbursed by the Adviser, and the recoupment may not cause the Fund to exceed the then-existing expense limitation for that class at the time such waiver or reimbursement was made.
Infrastructure Fund
The Adviser has contractually agreed to reduce its advisory fees and/or reimburse other expenses of the Fund for an initial period of not less than one year and until the next following effective date of the post-effective amendment to the registration statement of Centre Funds relating to the Fund (on or about January 29, 2025) incorporating the Fund’s financial statements for that fiscal year to the extent necessary to limit the total operating expenses of the Fund, including (but not limited to) investment advisory fees of the Adviser, but excluding, as applicable, any front-end or contingent deferred sales loads, taxes, leverage interest, distribution/service (Rule 12b-1) fees, shareholder services fees, brokerage commissions, acquired fund fees and expenses, (except that, if an acquired fund is an underlying fund managed by the Adviser and such acquired fund is not subject to an effective expense limitation or fee waiver agreement at any time during the term of this Agreement, then, for that time, the operating expenses of each class of shares of the Fund shall not exclude the amount of advisory fees included in such acquired fund’s fees and expenses to which the Fund would otherwise be subject), expenses incurred in connection with any merger or reorganization, and extraordinary expenses (such as litigation and other expenses not incurred in the ordinary course of the Fund’s business) to an annual rate of 1.25% of the average daily net assets of the Investor Class shares and 1.10% of the average daily net assets of the Institutional Class shares. The Expense Limitation Agreement may be terminated at any time, and without payment of any penalty, by the Board, on behalf of the Fund, upon 60 days’ written notice to the Adviser, but may not be terminated by the Adviser without the consent of the Board. No recoupment will be made more than three years after the date that the applicable amount was initially waived or reimbursed by the Adviser, and the recoupment may not cause the Fund to exceed the then-existing expense limitation for that class at the time such waiver or reimbursement was made.
| 26 | centrefunds.com |
| Centre Funds | Notes to Financial Statements |
March 31, 2024 (Unaudited)
During the six-month period ended March 31, 2024, the fee waivers and/or reimbursements were as follows:
| Fund | Fees Waived and/or Reimbursed by Adviser | |||
| Centre American Select Equity Fund | ||||
| Investor | $ | – | ||
| Institutional | 24,960 | |||
| Centre Global Infrastructure Fund | ||||
| Investor | 27,532 | |||
| Institutional | 6,930 | |||
As of March 31, 2024, the balances of recoupable expenses for each Fund were as follows:
| Fund | Expires 2024 | Expires 2025 | Expires 2026 | Expires 2027 | Total | |||||||||||||||
| Centre American Select Equity Fund | ||||||||||||||||||||
| Investor | $ | – | $ | – | $ | – | $ | – | $ | – | ||||||||||
| Institutional | 14,180 | 18,989 | 112,170 | 59,485 | 204,824 | |||||||||||||||
| Centre Global Infrastructure Fund | ||||||||||||||||||||
| Investor | $ | 29,230 | $ | 47,066 | $ | 48,479 | $ | 27,532 | $ | 152,307 | ||||||||||
| Institutional | 9,641 | 15,683 | 12,126 | 6,930 | 44,380 | |||||||||||||||
ALPS Fund Services, Inc. (“ALPS”) serves as administrator to the Funds. ALPS receives a monthly fee paid by the Funds subject to a minimum monthly fee and is reimbursed for certain out-of-pocket expenses. Pursuant to an administrative agreement with the Trust, ALPS provides operational services to the Funds including, but not limited to fund accounting and fund administration services and general assistance in each Fund’s operations.
ALPS, pursuant to a transfer agency and services agreement with the Trust, serves as transfer agent for the Funds. Under the transfer agency and services agreement, ALPS receives an annual minimum fee per Fund and a fee based upon each shareholder account and its account activity and is reimbursed for certain out-of-pocket expenses.
ALPS, pursuant to a chief compliance officer services agreement with the Trust, provides chief compliance officer services to the Funds. Additionally, ALPS provides services in monitoring and testing the policies and procedures of the Trust in conjunction with requirements under Rule 38a-1 under the 1940 Act. ALPS receives an annual fee for these services and is reimbursed for certain out-of-pocket expenses, pursuant to the chief compliance officer services agreement.
The Trust has adopted a plan pursuant to Rule 12b-1 under the 1940 Act (the “Plan”). The Plan permits the Trust, on behalf of Investor Class shares of the Funds, to pay up to 0.25% per year to one or more entities for services rendered and expenses borne in connection with providing shareholder or distribution services with respect to the Investor class shares of each Fund.
The Trust has also adopted a shareholder services plan for certain non-distribution shareholder services provided by financial intermediaries. With respect to each Fund, the shareholder services plan authorizes annual payment of up to 0.15% of the average daily net assets attributable to Investor Class shares of the Fund, and up to 0.10% of the average daily net assets attributable to Institutional Class shares of the Fund.
ALPS Distributors, Inc. (the “Distributor”) acts as the principal underwriter of the Funds pursuant to a distribution agreement with the Trust. No payments were retained by the Distributor by the Funds during the six-month period ended March 31, 2024.
Officers of the Trust and Trustees who are “interested persons” of the Trust or the Adviser receive no salary or fees from the Trust. Each Trustee who is not an “interested person” receives an annual retainer of $30,000 paid quarterly. The Trust reimburses each Trustee and Officer for his or her travel and other expenses relating to attendance at Board meetings.
One Trustee is an officer of the Trust, and serves as Managing Director and Chief Investment Officer of the Adviser.
| Semi-Annual Report | March 31, 2024 | 27 |
| Centre Funds | Notes to Financial Statements |
March 31, 2024 (Unaudited)
6. FEDERAL INCOME TAX AND TAX BASIS INFORMATION
As of and during the six-month period ended March 31, 2024, no Fund had a liability for any unrecognized tax benefits. The Funds file U.S. Federal, state, and local tax returns as required. The Funds’ tax returns are subject to examination by the relevant tax authorities until expiration of the applicable statute of limitations, which is generally three years after the filing of the tax return but which can be extended to six years in certain circumstances. Tax returns for open years have incorporated no uncertain tax positions that require a provision for income taxes.
Components of Distributable Earnings on a Tax Basis: At September 30, 2023, permanent differences in book and tax accounting were reclassified. These differences had no effect on net assets and were primarily attributed to C-corporation character reclassifications and non-deductible excise tax paid.
As of September 30, 2023, the components of distributable earnings on a tax basis were as follows:
| Fund | Accumulated Capital Gains/(Losses) and Other (Losses) | Ordinary Income Undistributed | Net Unrealized Appreciation/ (Depreciation) | Other Cumulative Effect of Timing Differences | Total Accumulated Earnings/(Deficit) | |||||||||||||||
| Centre American Select Equity Fund | $ | 2,524,929 | $ | 1,666,016 | $ | 59,548,004 | $ | (1,280 | ) | $ | 63,737,669 | |||||||||
| Centre Global Infrastructure Fund | (27,866,559 | ) | – | 834,477 | – | (27,032,082 | ) | |||||||||||||
Elective Deferrals: Capital Losses and specified ordinary losses arising in the post-October period of the current fiscal year may be deferred to the next fiscal year if the fund elects to defer the recognition of these losses. When this election is made, any losses recognized during the period are treated as having occurred on the first day of the next fiscal year separate from and in addition to the application of normal capital loss carry forwards as described below.
The Funds elect to defer to the period ending September 30, 2024, capital losses recognized during the period November 1, 2022 - September 30, 2023 in the amount of:
| Fund | Amount | |||
| Centre Global Infrastructure Fund | $ | 10,418 | ||
Under current law, capital losses maintain their character as short-term or long-term and are carried forward to the next tax year without expiration. As of the current fiscal year end, the following amounts are available as carry forwards to the next tax year:
| Fund | Short-Term | Long-Term | ||||||
| Centre Global Infrastructure Fund | $ | 12,693,880 | $ | 15,162,261 | ||||
Distributions to Shareholders: The Centre American Select Equity Fund normally pays dividends and net investment income, if any, on an annual basis and the Centre Global Infrastructure Fund, intends to make monthly income distributions. Each Fund normally distributes capital gains, if any, on an annual basis. Income dividend distributions are derived from interest and other income each Fund receives from its investments, including distributions of short term capital gains. Capital gain distributions are derived from gains realized when each Fund sells a security it has owned for more than one year. Each Fund may make additional distributions and dividends at other times if the Adviser believes doing so may be necessary for each Fund to avoid or reduce taxes. Net investment income/ (loss) and net realized gain/ (loss) may differ for financial statement and tax purposes. The amounts and characteristics of tax basis distributable earnings/ (accumulated losses) are finalized at fiscal year-end.
The tax character of distributions paid for the fiscal year ended September 30, 2023 were as follows:
| Distributions Paid From: | Ordinary Income | Long-Term Capital Gains | ||||||
| Centre American Select Equity Fund | $ | 1,332,413 | $ | 3,460,090 | ||||
| Centre Global Infrastructure Fund | 547,821 | – | ||||||
| 28 | centrefunds.com |
| Centre Funds | Notes to Financial Statements |
March 31, 2024 (Unaudited)
Unrealized Appreciation and Depreciation on Investments: The amount of net unrealized appreciation/(depreciation) and the cost of investment securities for tax purposes, including short-term securities at March 31, 2024 are displayed in the table below. The difference between book and tax basis unrealized appreciation/(depreciation) for the Funds is primarily attributable to wash sales, mark-to-market on options and certain other investments.
Net unrealized appreciation/depreciation of investments based on federal tax cost were as follows:
Tax Cost of Investments | Gross Unrealized Appreciation | Gross Unrealized Depreciation | Net Tax Unrealized Appreciation/(Depreciation) on Investments | |||||||||||||
| Centre American Select Equity Fund | $ | 278,035,732 | $ | 112,454,522 | $ | (2,759,814 | ) | $ | 109,694,708 | |||||||
| Centre Global Infrastructure Fund | 23,359,197 | 6,419,705 | (1,184,817 | ) | 5,234,888 | |||||||||||
7. PURCHASES AND SALES OF INVESTMENT SECURITIES
For the six-month period ended March 31, 2024, the aggregate cost of purchases and proceeds from sales of investment securities (excluding any U.S. Government Obligations, short-term securities, and purchased options and futures) were as follows:
| Fund | Purchases of Securities | Proceeds From Sales of Securities | ||||||
| Centre American Select Equity Fund | $ | 106,607,185 | $ | 158,641,329 | ||||
| Centre Global Infrastructure Fund | 1,530,128 | 4,443,701 | ||||||
8. INDEMNIFICATIONS
Under the Trust’s organizational documents, its officers and Trustees are indemnified against certain liabilities relating to their duties to the Trust. Additionally, in the ordinary course of business, the Trust enters into contracts with service providers that may contain general indemnification clauses. The Trust’s maximum exposure under these arrangements is unknown, as this would involve future claims that may be made against the Trust that have not yet occurred.
9. SUBSEQUENT EVENTS
The Funds have evaluated the need for disclosures and/or adjustments resulting from subsequent events through the date the financial statements were issued. Based on this evaluation, no adjustments were required to the financial statements as of March 31, 2024.
| Semi-Annual Report | March 31, 2024 | 29 |
| Centre Funds | Additional Information |
March 31, 2024 (Unaudited)
PROXY VOTING GUIDELINES AND RECORDS
A description of the policies and procedures that the Funds use to determine how to vote proxies relating to portfolio securities and information regarding how the Funds voted proxies during the most recent 12-month period ended June 30, is available without charge, upon request, by (1) calling the Funds at 1-855-298-4236 and (2) on the U.S. Securities and Exchange Commission’s (“SEC”) website at http://www.sec.gov.
PORTFOLIO HOLDINGS DISCLOSURE POLICY
The Trust files, with regard to each Fund, with the SEC a complete schedule of investments for the first and third quarters of each fiscal year as an exhibit to its reports on Form N-PORT. The Funds’ first and third fiscal quarters end on December 31 and June 30. Form N-PORT reports are available on the SEC’s website at http://www.sec.gov. You may also obtain copies by calling the Funds at 1-855-298-4236.
TAX DESIGNATIONS
Qualified Dividend Income
The percentage of ordinary income dividends distributed during the calendar year ended December 31, 2023 are designated as qualified dividend income (QDI) as defined in Section 1(h)(11) of the Internal Revenue Code in the following percentages:
| Amount | |
| Centre American Select Equity Fund | 100.00% |
| Centre Global Infrastructure Fund | 100.00% |
Dividends Received Deduction
For corporate shareholders, the following ordinary dividends paid during the calendar year ended December 31, 2023 qualify for the corporate dividends received deduction:
| Amount | |
| Centre American Select Equity Fund | 100.00% |
| Centre Global Infrastructure Fund | 89.15% |
Pursuant to Section 852(b)(3) of the Internal Revenue Code, the following amounts were designated as long-term capital gain dividends:
| Amount | |
| Centre American Select Equity Fund | $ 5,309,230 |
| 30 | centrefunds.com |
Page Intentionally Left Blank

| (b) | Not Applicable to the Registrant |
Item 2. Code of Ethics.
Not applicable to semi-annual report.
Item 3. Audit Committee Financial Expert.
Not applicable to semi-annual report.
Item 4. Principal Accountant Fees and Services.
Not applicable to semi-annual report.
Item 5. Audit Committee of Listed Registrants.
Not applicable to the Registrant.
Item 6. Schedule of Investments.
| (a) | The Registrant’s “Schedule I – Investments in securities of unaffiliated issuers” (as set forth in 17 CFR 210.12-12) is included in Item 1 of this Form N-CSR. |
| (b) | Not applicable to the Registrant. |
Item 7. Reserved.
Item 8. Reserved.
Item 9. Reserved.
Item 10. Reserved.
Item 11. Reserved.
Item 12. Disclosure of Proxy Voting Policies and Procedures for Closed-End Management Investment Companies.
Not applicable to the Registrant.
Item 13. Portfolio Managers of Closed-End Management Investment Companies.
Not applicable to the Registrant.
Item 14. Purchases of Equity Securities by Closed-End Management Investment Company and Affiliated Purchasers.
Not applicable to the Registrant.
Item 15. Submission of Matters to a Vote of Security Holders.
None.
Item 16. Controls and Procedures.
| (a) | The Registrant’s principal executive officer and principal financial officer have evaluated the Registrant’s disclosure controls and procedures (as defined in Rule 30a-3(c) under the Investment Company Act of 1940, as amended) within 90 days of this filing and have concluded that the Registrant’s disclosure controls and procedures were effective as of that date. |
| (b) | There was no change in the Registrant’s internal control over financial reporting (as defined in Rule 30a-3(d) under the Investment Company Act of 1940, as amended) during the second fiscal quarter of the period covered by this report that has materially affected, or is reasonably likely to materially affect, the Registrant’s internal control over financial reporting. |
Item 17. Disclosure of Securities Lending Activities for Closed-End Management Investment Companies.
Not applicable.
Item 18. Recovery of Erroneously Awarded Compensation.
| (a) | Not Applicable. |
| (b) | Not Applicable. |
Item 19. Exhibits.
| (a)(1) | None. |
| (a)(2) | Not applicable to semi-annual report. |
SIGNATURES
Pursuant to the requirements of the Securities Exchange Act of 1934 and the Investment Company Act of 1940, the Registrant has duly caused this report to be signed on its behalf by the undersigned, thereunto duly authorized.
CENTRE FUNDS
| By: | /s/ James A. Abate | |
| James A. Abate | ||
| President (Principal Executive Officer) | ||
| Date: | May 30, 2024 |
Pursuant to the requirements of the Securities Exchange Act of 1934 and the Investment Company Act of 1940, this report has been signed below by the following persons on behalf of the Registrant and in the capacities and on the dates indicated.
| By: | /s/ James A. Abate | |
| James A. Abate | ||
| President (Principal Executive Officer) | ||
| Date: | May 30, 2024 |
| By: | /s/ James A. Abate | |
| James A. Abate | ||
| Treasurer (Principal Financial Officer) | ||
| Date: | May 30, 2024 |
Exhibit 99.Cert
I, James A. Abate, President and Principal Executive Officer of Centre Funds (the “Registrant”), certify that:
| 1. | I have reviewed this report on Form N-CSR of the Registrant; |
| 2. | Based on my knowledge, this report does not contain any untrue statement of a material fact or omit to state a material fact necessary to make the statements made, in light of the circumstances under which such statements were made, not misleading with respect to the period covered by this report; |
| 3. | Based on my knowledge, the financial statements, and other financial information included in this report, fairly present in all material respects the financial condition, results of operations, changes in net assets, and cash flows (if the financial statements are required to include a statement of cash flows) of the Registrant as of, and for, the periods presented in this report; |
| 4. | The Registrant’s other certifying officer and I are responsible for establishing and maintaining disclosure controls and procedures (as defined in Rule 30a-3(c) under the Investment Company Act of 1940) and internal control over financial reporting (as defined in Rule 30a-3(d) under the Investment Company Act of 1940) for the Registrant and have: |
| (a) | Designed such disclosure controls and procedures, or caused such disclosure controls and procedures to be designed under our supervision, to ensure that material information relating to the Registrant, including its consolidated subsidiaries, is made known to us by others within those entities, particularly during the period in which this report is being prepared; |
| (b) | Designed such internal control over financial reporting, or caused such internal control over financial reporting to be designed under our supervision, to provide reasonable assurance regarding the reliability of financial reporting and the preparation of financial statements for external purposes in accordance with generally accepted accounting principles; |
| (c) | Evaluated the effectiveness of the Registrant’s disclosure controls and procedures and presented in this report our conclusions about the effectiveness of the disclosure controls and procedures, as of a date within 90 days prior to the filing date of this report based on such evaluation; and |
| (d) | Disclosed in this report any change in the Registrant’s internal control over financial reporting that occurred during the period covered by this report that has materially affected, or is reasonably likely to materially affect, the Registrant’s internal control over financial reporting; and |
| 5. | The Registrant’s other certifying officer and I have disclosed to the Registrant’s auditors and the audit committee of the Registrant’s board of trustees (or persons performing the equivalent functions): |
| (a) | All significant deficiencies and material weaknesses in the design or operation of internal control over financial reporting which are reasonably likely to adversely affect the Registrant’s ability to record, process, summarize, and report financial information; and |
| (b) | Any fraud, whether or not material, that involves management or other employees who have a significant role in the Registrant’s internal control over financial reporting. |
| By: | /s/ James A. Abate | |
| James A. Abate | ||
| President (Principal Executive Officer) | ||
| Date: | May 30, 2024 |
I, James A. Abate, Treasurer and Principal Financial Officer, of the Centre Funds (the “Registrant”), certify that:
| 1. | I have reviewed this report on Form N-CSR of the Registrant; |
| 2. | Based on my knowledge, this report does not contain any untrue statement of a material fact or omit to state a material fact necessary to make the statements made, in light of the circumstances under which such statements were made, not misleading with respect to the period covered by this report; |
| 3. | Based on my knowledge, the financial statements, and other financial information included in this report, fairly present in all material respects the financial condition, results of operations, changes in net assets, and cash flows (if the financial statements are required to include a statement of cash flows) of the Registrant as of, and for, the periods presented in this report; |
| 4. | The Registrant’s other certifying officer and I are responsible for establishing and maintaining disclosure controls and procedures (as defined in Rule 30a-3(c) under the Investment Company Act of 1940) and internal control over financial reporting (as defined in Rule 30a-3(d) under the Investment Company Act of 1940) for the Registrant and have: |
| (a) | Designed such disclosure controls and procedures, or caused such disclosure controls and procedures to be designed under our supervision, to ensure that material information relating to the Registrant, including its consolidated subsidiaries, is made known to us by others within those entities, particularly during the period in which this report is being prepared; |
| (b) | Designed such internal control over financial reporting, or caused such internal control over financial reporting to be designed under our supervision, to provide reasonable assurance regarding the reliability of financial reporting and the preparation of financial statements for external purposes in accordance with generally accepted accounting principles; |
| (c) | Evaluated the effectiveness of the Registrant’s disclosure controls and procedures and presented in this report our conclusions about the effectiveness of the disclosure controls and procedures, as of a date within 90 days prior to the filing date of this report based on such evaluation; and |
| (d) | Disclosed in this report any change in the Registrant’s internal control over financial reporting that occurred during the period covered by this report that has materially affected, or is reasonably likely to materially affect, the Registrant’s internal control over financial reporting; and |
| 5. | The Registrant’s other certifying officer and I have disclosed to the Registrant’s auditors and the audit committee of the Registrant’s board of trustees (or persons performing the equivalent functions): |
| (a) | All significant deficiencies and material weaknesses in the design or operation of internal control over financial reporting which are reasonably likely to adversely affect the Registrant’s ability to record, process, summarize, and report financial information; and |
| (b) | Any fraud, whether or not material, that involves management or other employees who have a significant role in the Registrant’s internal control over financial reporting. |
| By: | /s/ James A. Abate | |
| James A. Abate | ||
| Treasurer (Principal Financial Officer) | ||
| Date: | May 30, 2024 |
Exhibit 99.906 Cert
This certification is furnished pursuant to Section 906 of the Sarbanes-Oxley Act of 2002, 18 U.S.C. § 1350, and accompanies the report on Form N-CSR for the period ended March 31, 2024 of the Centre Funds (the “Registrant”).
I, James A. Abate, the President and Principal Executive Officer of the Company, certify that:
| (i) | the Form N-CSR fully complies with the requirements of Section 13(a) or Section 15(d), as applicable, of the Securities Exchange Act of 1934 (15 U.S.C. 78m or 78o(d)); and |
| (ii) | the information contained in the Form N-CSR fairly presents, in all material respects, the financial condition and results of operations of the Registrant. |
A signed original of this written statement required by Section 906, or other document authenticating, acknowledging or otherwise adopting the signature that appears in typed form within the electronic form of this written statement required by Section 906, has been provided to the Registrant and will be retained by the Registrant and furnished to the Securities and Exchange Commission or its staff upon request.
| Dated: | May 30, 2024 | |
| By: | /s/ James A. Abate | |
| James A. Abate | ||
| President (Principal Executive Officer) |
This certification is furnished pursuant to Section 906 of the Sarbanes-Oxley Act of 2002, 18 U.S.C. § 1350, and accompanies the report on Form N-CSR for the period ended March 31, 2024 of the Centre Funds (the “Registrant”).
I, James A. Abate, Treasurer and Principal Financial Officer of the Company, certify that:
| (i) | the Form N-CSR fully complies with the requirements of Section 13(a) or Section 15(d), as applicable of the Securities Exchange Act of 1934 (15 U.S.C. 78m or 78o(d)); and |
| (ii) | the information contained in the Form N-CSR fairly presents, in all material respects, the financial condition and results of operations of the Registrant. |
A signed original of this written statement required by Section 906, or other document authenticating, acknowledging or otherwise adopting the signature that appears in typed form within the electronic form of this written statement required by Section 906, has been provided to the Registrant and will be retained by the Registrant and furnished to the Securities and Exchange Commission or its staff upon request.
| Dated: | May 30, 2024 | |
| By: | /s/ James A. Abate | |
| James A. Abate | ||
| Treasurer (Principal Financial Officer) |