
UNITED STATES
SECURITIES AND EXCHANGE COMMISSION
Washington, D.C. 20549
FORM N-CSR
CERTIFIED SHAREHOLDER REPORT OF REGISTERED
MANAGEMENT INVESTMENT COMPANIES
Investment Company Act file number: 811-09253
Allspring Funds Trust
(Exact name of registrant as specified in charter)
1415 Vantage Park Drive, 3rd Floor, Charlotte, NC 28203
(Address of principal executive offices) (Zip code)
Matthew Prasse
Allspring Funds Management, LLC
1415 Vantage Park Drive, 3rd Floor, Charlotte, NC 28203
(Name and address of agent for service)
Registrant’s telephone number, including area code: 800-222-8222
Date of fiscal year end: October 31
Registrant is making a filing for 8 of its series: Allspring CoreBuilder Shares-Series EM, Allspring Emerging Markets Equity Fund, Allspring Emerging Markets Equity Income Fund, Allspring Global Long/Short Equity Fund, Allspring International Equity Fund, Allspring Special Global Small Cap Fund, Allspring Special International Small Cap Fund, and Allspring U.S. Long/Short Equity Fund.
Date of reporting period: October 31, 2023
ITEM 1. REPORT TO STOCKHOLDERS

| Notice to Shareholders |
| Beginning in July 2024, the Fund will be required by the
Securities and Exchange Commission to send shareholders a paper copy of a
new tailored shareholder report in place of the full shareholder report that you are now receiving. The tailored shareholder report will contain concise information about the Fund, including certain expense and performance
information and fund statistics. If you wish to receive this new tailored shareholder
report electronically, please follow the instructions on the back cover
of this report. |
| Other information that is currently included in the shareholder
report, such as the Fund’s financial statements, will be available
online and upon request, free of charge, in paper or electronic format. |
| Investment objective |
The Fund seeks to achieve long-term capital appreciation and current income. |
| Manager |
Allspring Funds Management, LLC |
| Subadviser |
Allspring Global Investments, LLC |
| Portfolio manager |
Alison Shimada, Elaine Tse |
| Average annual total returns (%) as of October 31, 2023 | ||||
| |
|
|
Expense ratios1 (%) | |
| |
Inception date |
Since inception |
Gross |
Net2 |
| Allspring Managed Account CoreBuilder® Shares - Series EM (ACBEX) |
11-16-2022 |
0.66 |
0.21 |
0.00 |
| MSCI EM Index (Net) (USD)3 |
– |
-0.31
* |
– |
– |
| | |
| * |
Based on the Fund’s inception date. |
| 1 |
Reflects the expense ratios as stated in the most recent prospectus. The expense ratios shown are subject to change and may differ from the annualized expense ratios
shown in the Financial Highlights of this report. |
| 2 |
Generally, no ordinary fees or expenses are charged to the Fund. Allspring Funds Management, LLC has contractually committed to irrevocably absorb and pay or
reimburse all ordinary operating expenses of the Fund, except portfolio
transactions or other investment related costs (e.g., commissions), fees payable for services provided by the Fund’s securities lending agent (if any), interest, taxes, leverage expenses and other expenses not incurred in the ordinary course of the
Fund’s business. This commitment has an indefinite term. |
| 3 |
The Morgan Stanley Capital International (MSCI) Emerging Markets (EM) Index (Net) (USD) is a free-float-adjusted market-capitalization-weighted index that is designed to
measure the equity market performance of emerging markets. Source: MSCI. MSCI makes no express or implied warranties
or representations and shall have no liability whatsoever with respect to
any MSCI data contained herein. The MSCI data may not be further redistributed or used as a basis for other indices or any securities or financial products. This report is not approved, reviewed, or produced by MSCI. You cannot invest directly in an index. |
| Growth of $10,000 investment as of October 31, 20231 |
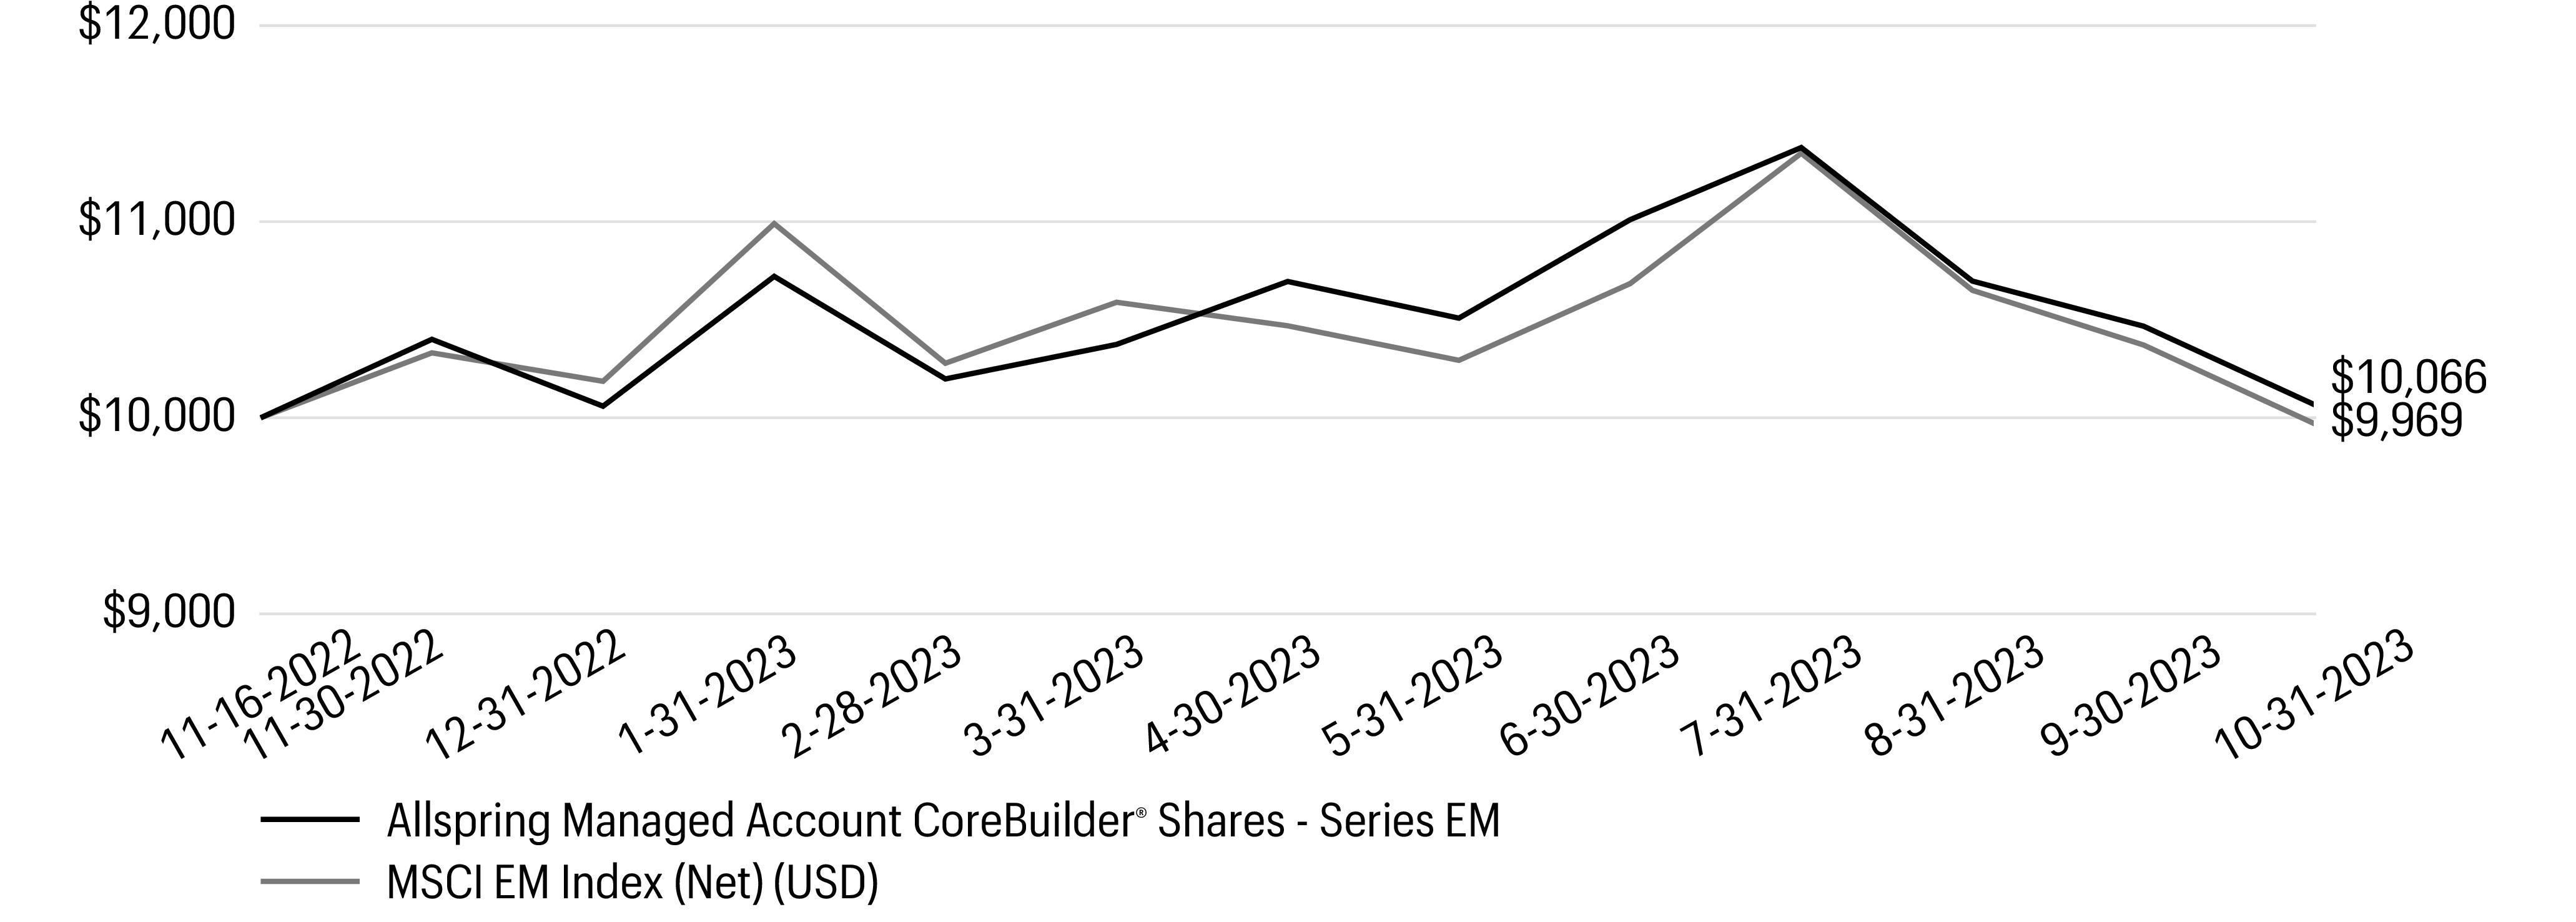
| 1 |
The chart compares the performance of the Fund since inception with the MSCI EM Index (Net) (USD). The chart assumes a hypothetical investment of $10,000
investment and reflects all operating expenses of the Fund.
|
| Ten largest holdings (%) as of October 31, 20231 | |
| Samsung Electronics Co. Ltd., Preferred stock |
6.33 |
| Samsung Electronics Co. Ltd. |
6.28 |
| Mahindra & Mahindra Ltd. |
5.91 |
| ICICI Bank Ltd. |
4.89 |
| HDFC Bank Ltd. |
4.84 |
| Reliance Industries Ltd. GDR |
4.44 |
| Midea Group Co. Ltd. Class A |
3.57 |
| Dr. Reddy’s Laboratories Ltd. |
3.45 |
| Arabian Drilling Co. |
2.15 |
| Bank Polska Kasa Opieki SA |
2.15 |
| 1 |
Figures represent the percentage of the Fund’s net assets. Holdings are subject to change and may have changed since the date specified. |
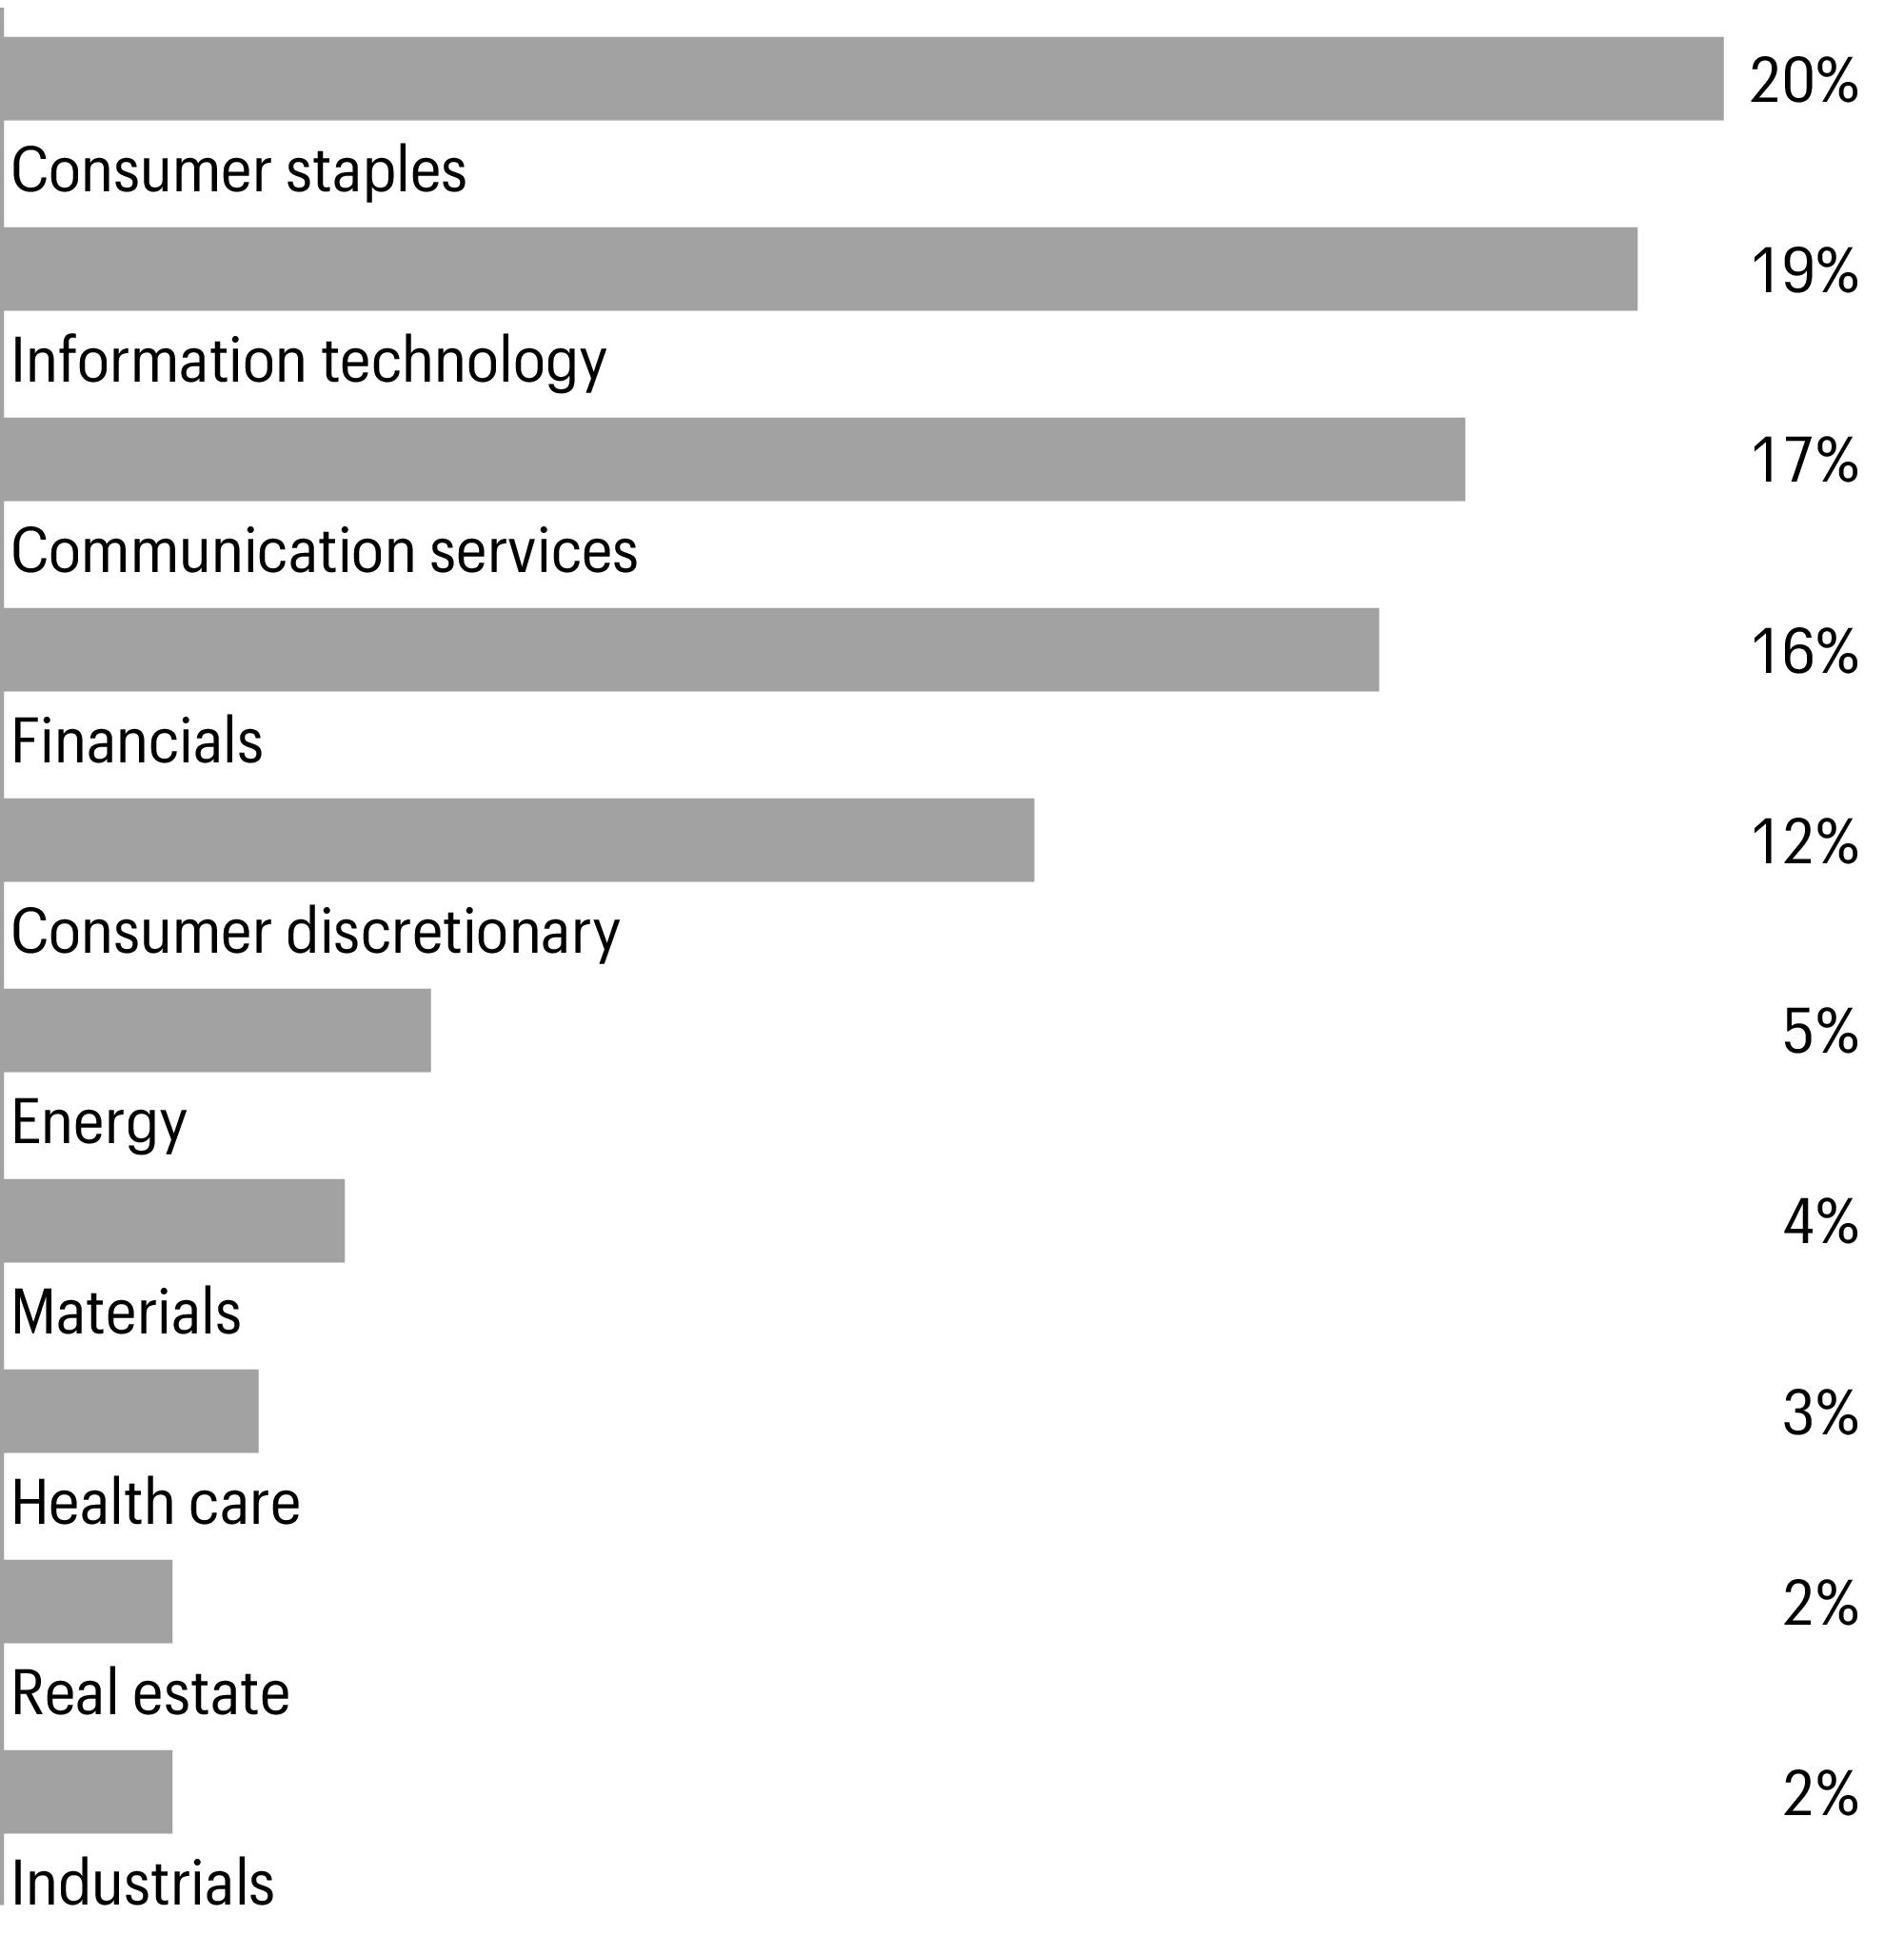
| Sector allocation as of October 31, 20231 |
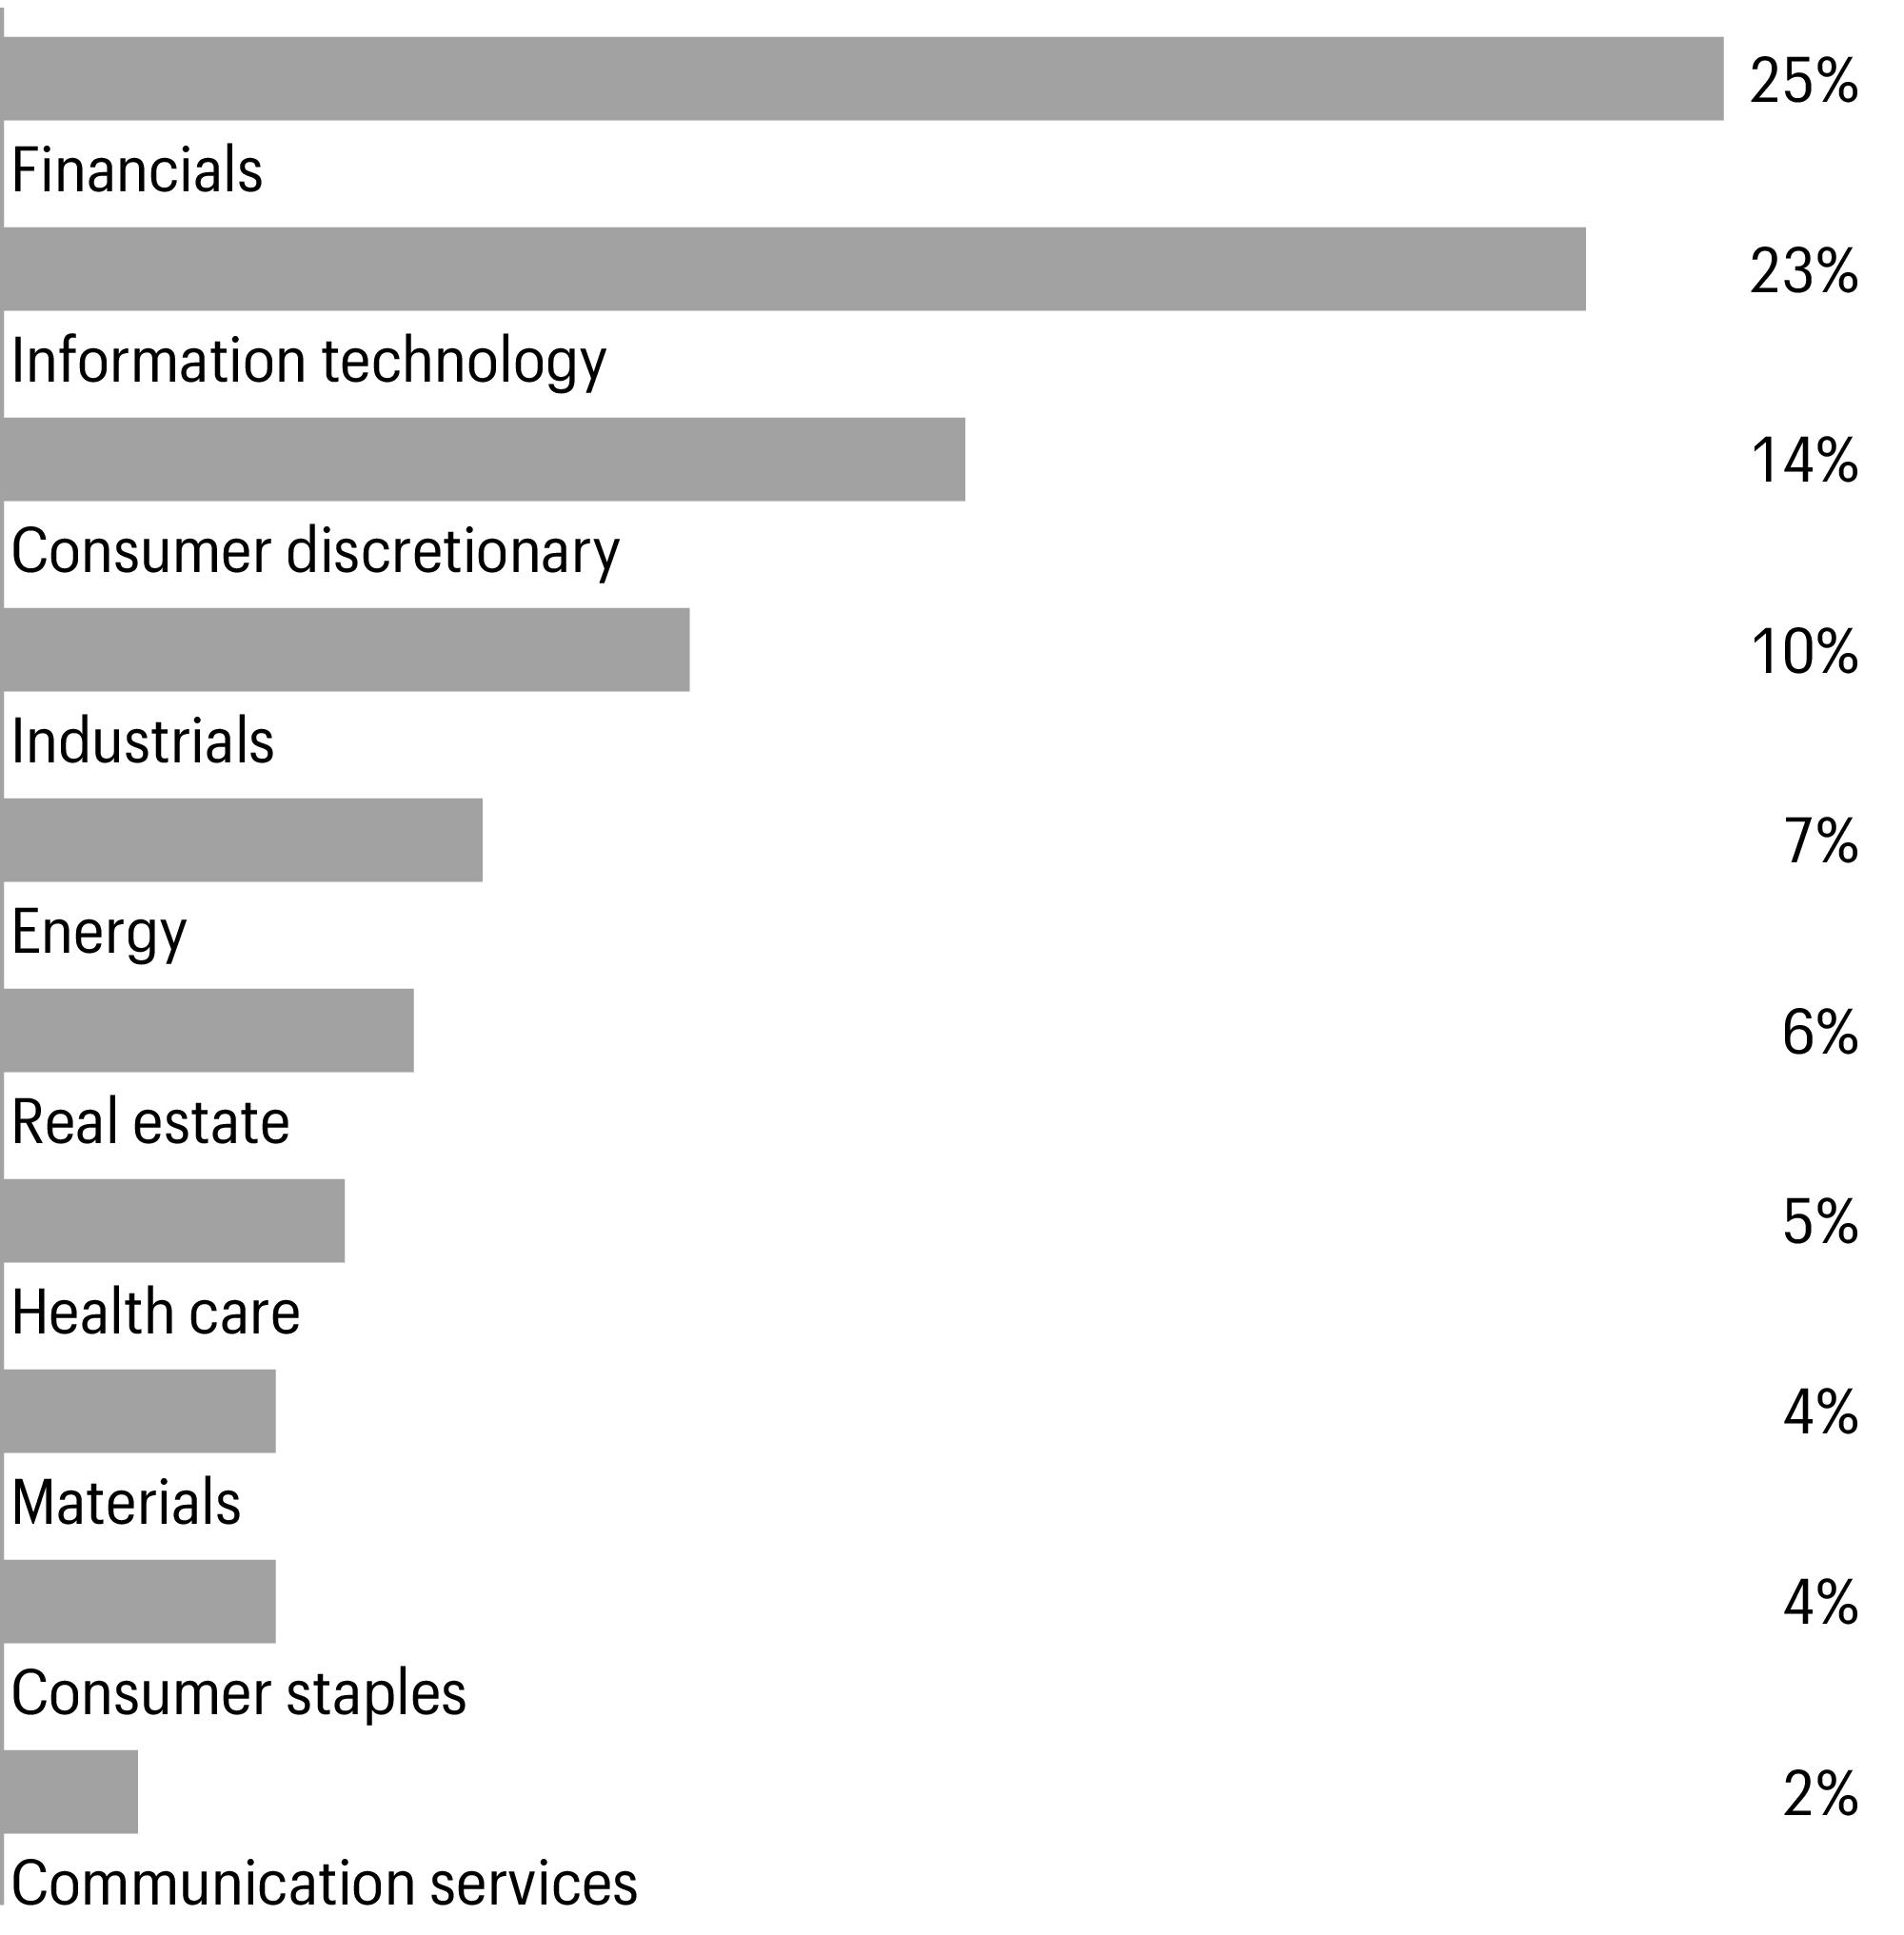
| 1 |
Figures represent the percentage of the Fund’s long-term investments. Allocations are subject to change and may have changed since the date specified. |
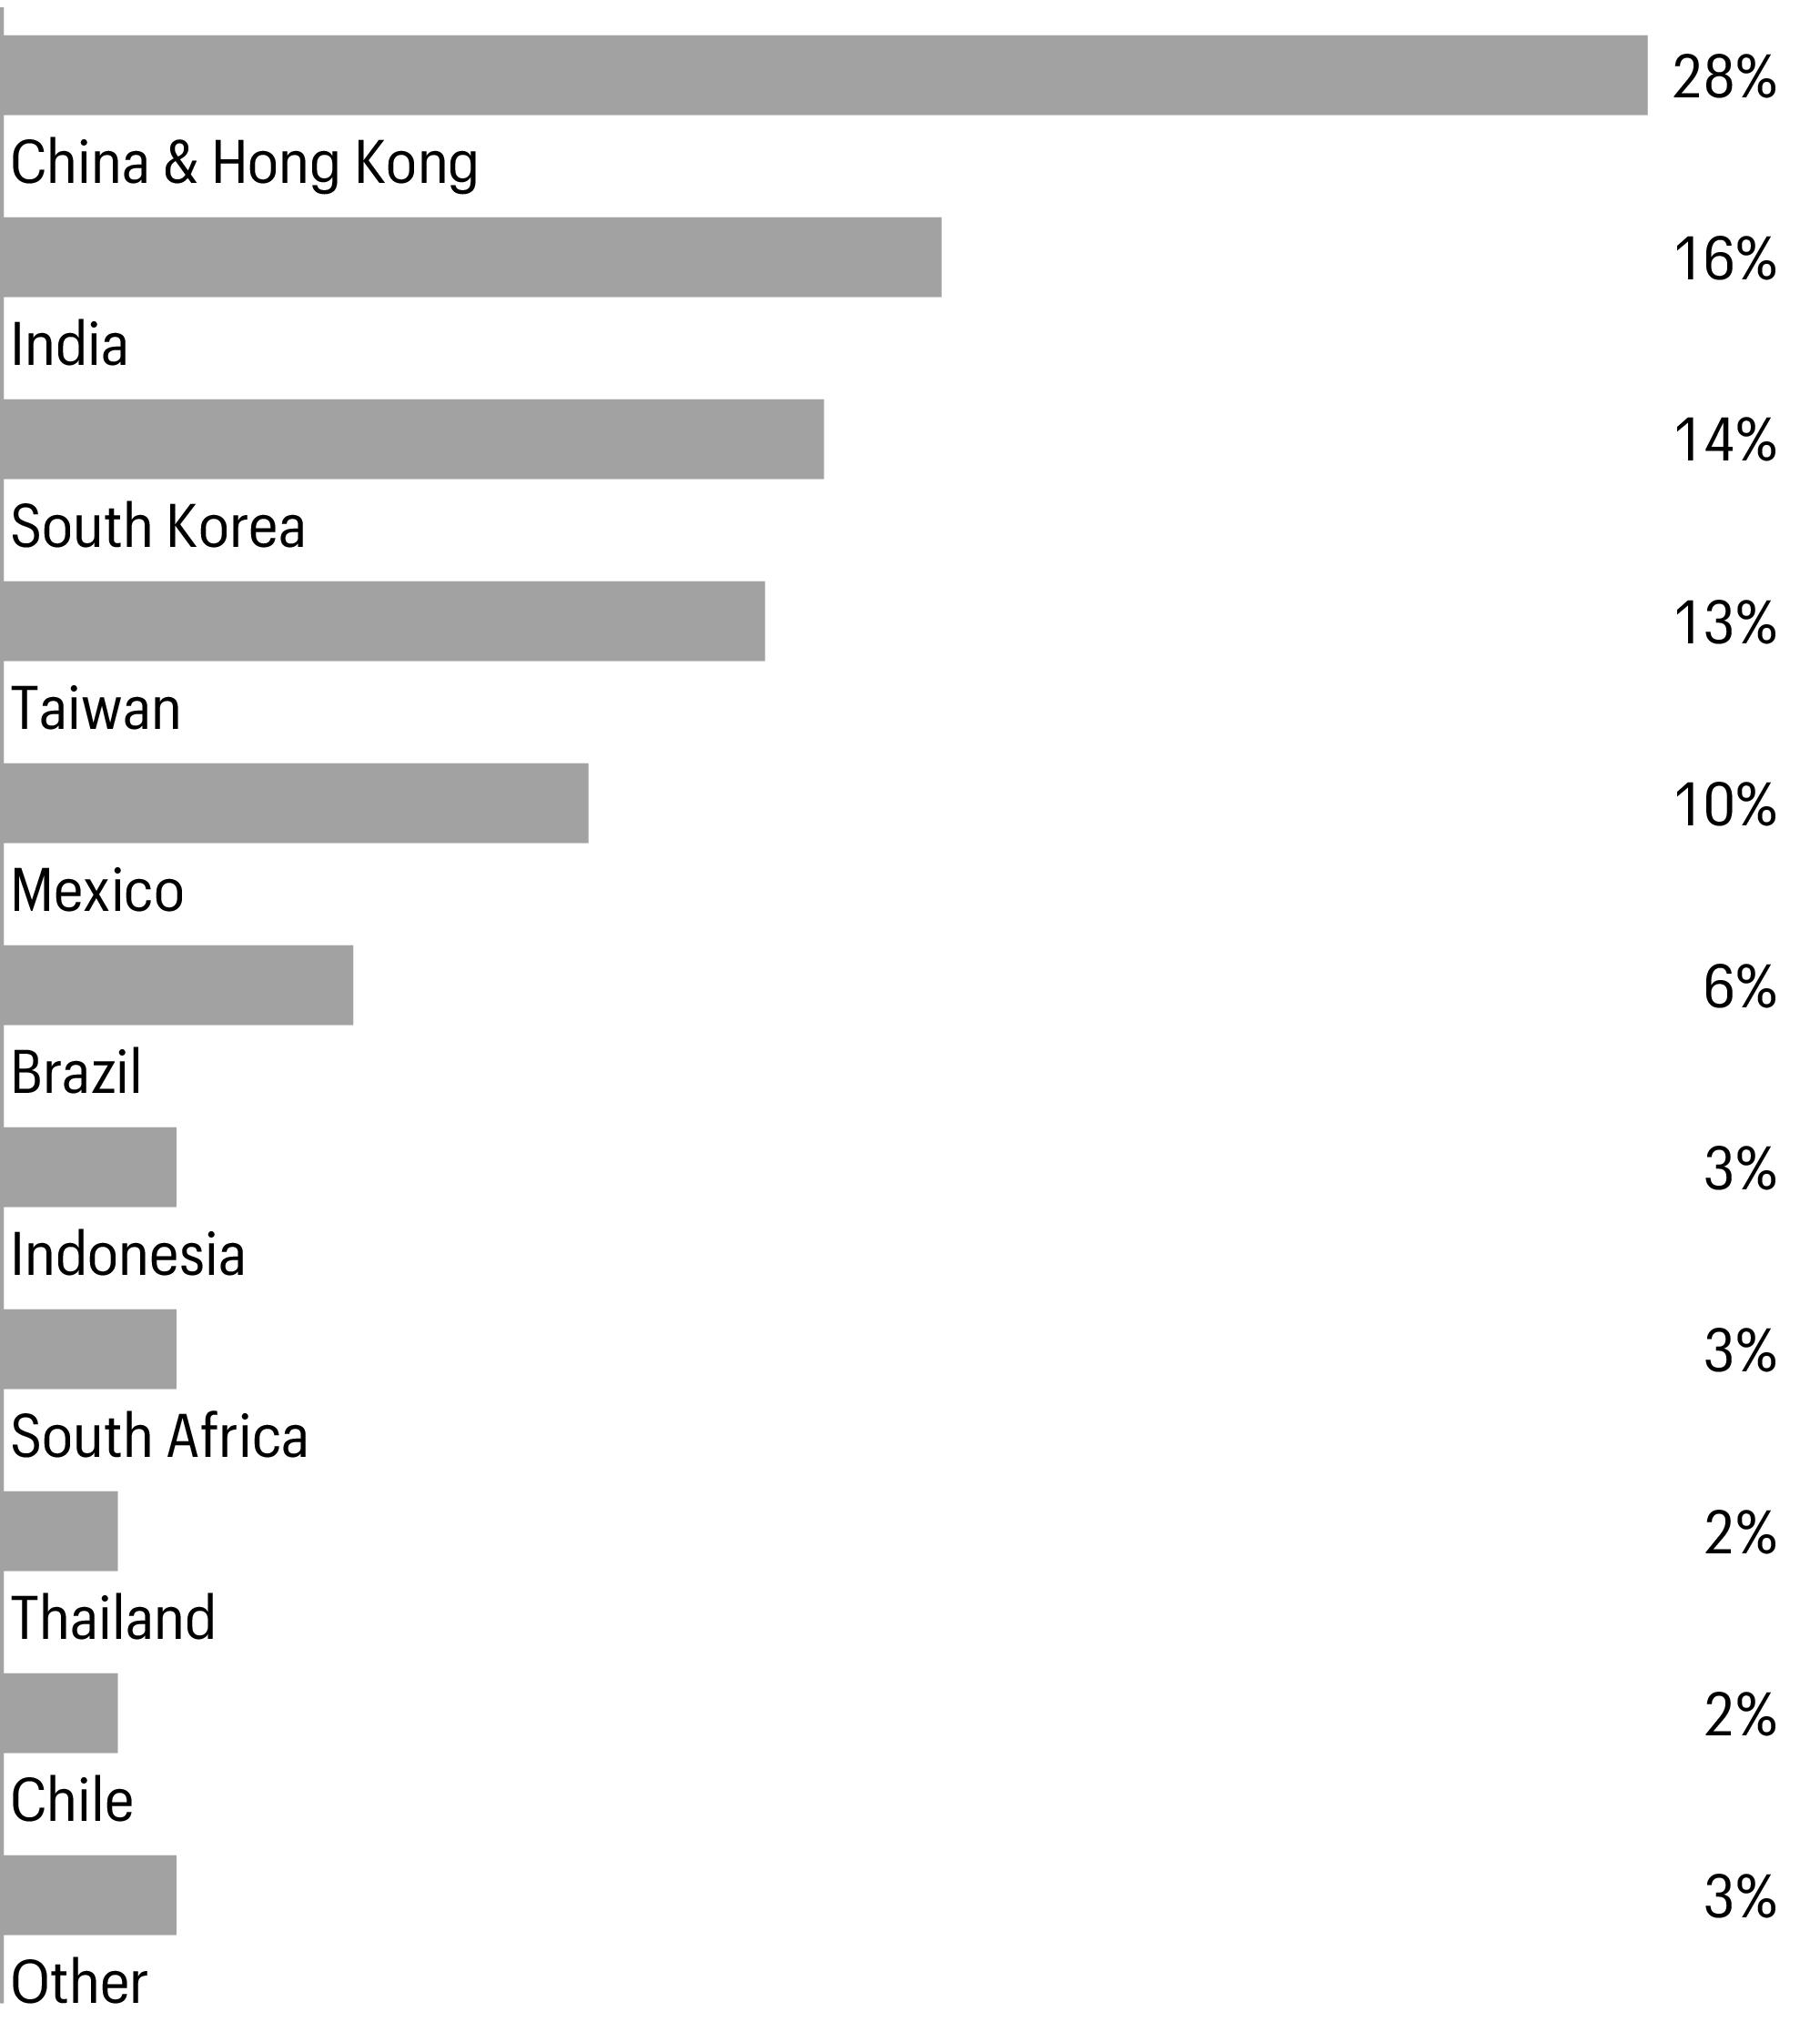
| Geographic allocation as of October 31, 20231 |
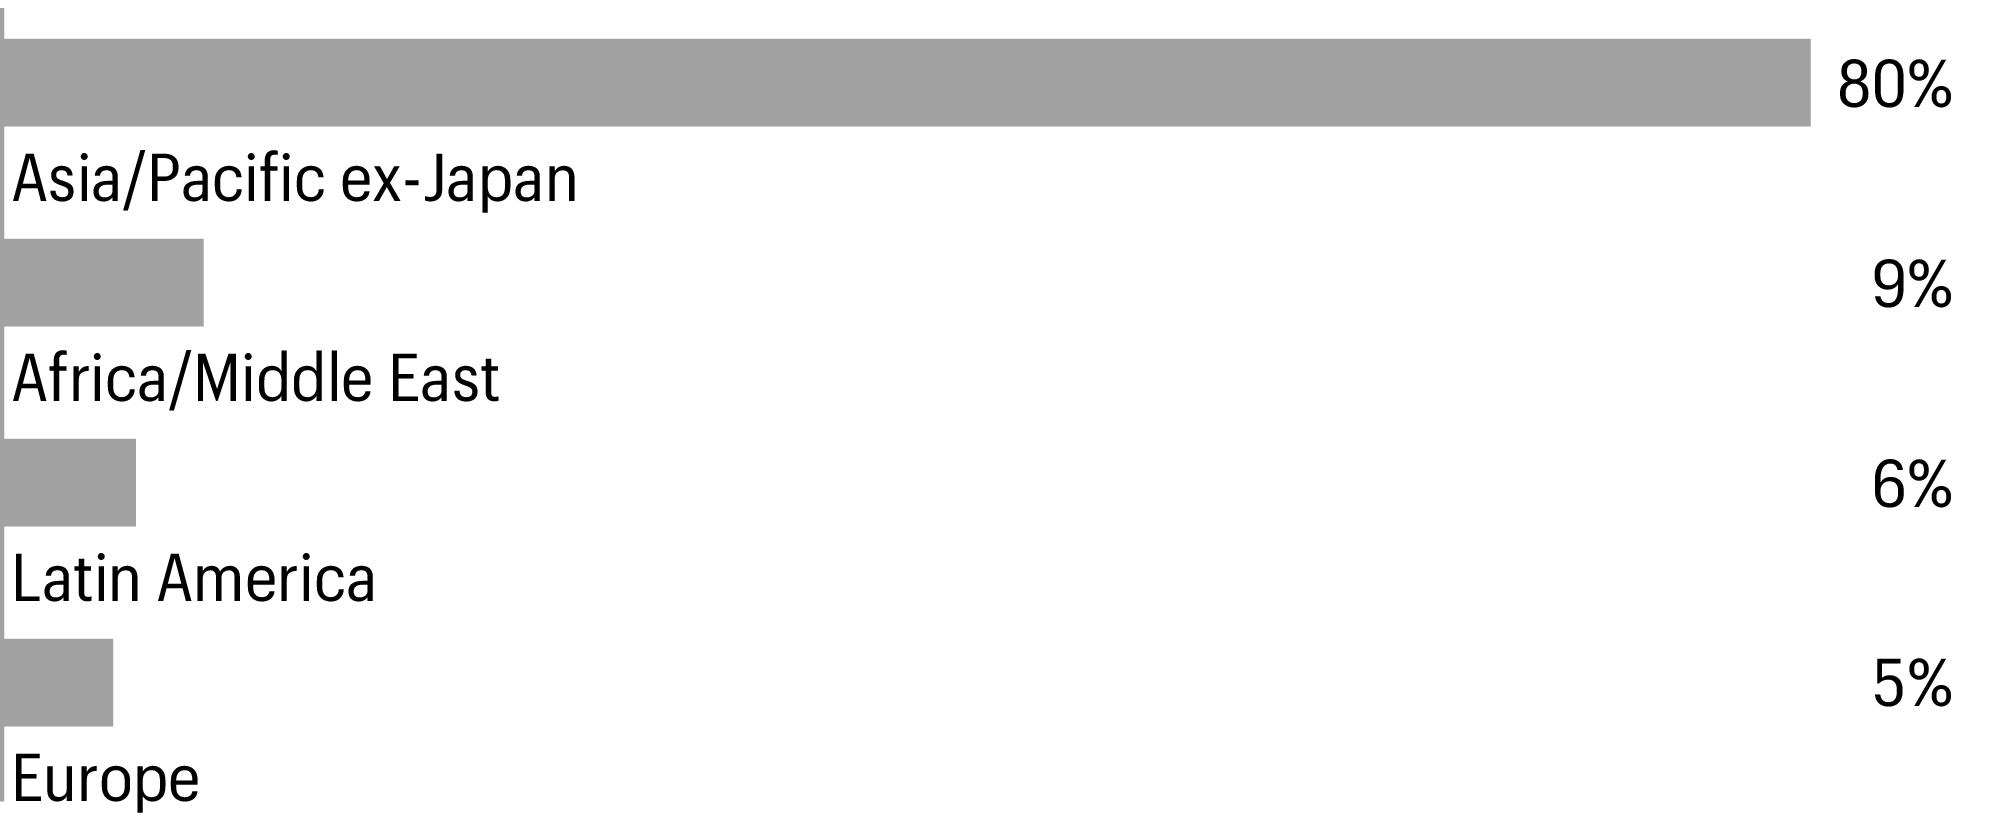
| 1 |
Figures represent the percentage of the Fund’s long-term investments. Allocations are subject to change and may have changed since the date specified. |
| |
Beginning
account value
5-1-2023 |
Ending
account value
10-31-2023 |
Expenses
paid during
the period1 |
Annualized net
expense ratio |
| Actual |
$1,000.00 |
$941.15 |
$0.00 2 |
0.00
%2 |
| Hypothetical (5% return before expenses) |
$1,000.00
|
$1,025.21
|
$0.00
2 |
0.00 %2 |
| 1 |
Expenses paid is equal to the annualized net expense ratio multiplied by the average account value over the period, multiplied by 184 divided by 365 (to reflect the
one-half-year period). |
| 2 |
Generally, no ordinary fees or expenses are charged to the Fund. Allspring Funds Management, LLC has contractually committed to irrevocably absorb and pay or
reimburse all ordinary operating expenses of the Fund, except portfolio
transactions or other investment related costs (e.g., commissions), fees payable for services provided by the Fund’s securities lending agent (if any), interest, taxes, leverage expenses and other expenses not incurred in the ordinary course of the
Fund’s business. This commitment has an indefinite term. |
| |
|
|
|
Shares |
Value | |
| Common stocks: 90.09% |
|
|
|
|
|
|
| Brazil: 3.42% |
|
|
|
|
|
|
| B3 SA - Brasil Bolsa Balcao (Financials, Capital markets) |
|
|
|
|
31,800 |
$70,011 |
| Banco BTG Pactual SA (Financials, Capital markets) |
|
|
|
|
14,400 |
84,542 |
| |
|
|
|
|
|
154,553 |
| Chile: 1.03% |
|
|
|
|
|
|
| Cencosud SA (Consumer staples, Consumer staples distribution & retail) |
|
|
|
|
28,608 |
46,348 |
| China: 14.79% |
|
|
|
|
|
|
| Baoshan Iron & Steel Co. Ltd. Class A (Materials, Metals & mining) |
|
|
|
|
50,500 |
43,199 |
| China Communications Services Corp. Ltd. Class H (Industrials, Construction & engineering) |
|
|
|
|
126,000 |
51,537 |
| China Resources Land Ltd. (Real estate, Real estate management & development) |
|
|
|
|
16,000 |
59,890 |
| China State Construction International Holdings Ltd. (Industrials, Construction & engineering) |
|
|
|
|
75,410 |
80,775 |
| China Tower Corp. Ltd. Class H (Communication services, Diversified telecommunication services)144A |
|
|
|
|
742,000 |
69,192 |
| Hengli Petrochemical Co. Ltd. Class A (Materials,
Chemicals)† |
|
|
|
|
37,600 |
75,322 |
| Inner Mongolia Yili Industrial Group Co. Ltd. Class A (Consumer staples, Food products) |
|
|
|
|
18,600 |
69,728 |
| Midea Group Co. Ltd. Class A (Consumer discretionary, Household durables) |
|
|
|
|
22,300 |
161,319 |
| Zhejiang NHU Co. Ltd. Class A (Health care, Pharmaceuticals) |
|
|
|
|
25,600 |
56,603 |
| |
|
|
|
|
|
667,565 |
| Greece: 2.48% |
|
|
|
|
|
|
| Hellenic Telecommunications Organization SA (Communication services, Diversified telecommunication services) |
|
|
|
|
3,043 |
42,652 |
| National Bank of Greece SA (Financials, Banks)† |
|
|
|
|
12,090 |
69,244 |
| |
|
|
|
|
|
111,896 |
| India: 23.53% |
|
|
|
|
|
|
| Dr. Reddy’s Laboratories Ltd. ADR (Health care, Pharmaceuticals) |
|
|
|
|
2,393 |
155,856 |
| HDFC Bank Ltd. ADR (Financials, Banks) |
|
|
|
|
3,863 |
218,453 |
| ICICI Bank Ltd. ADR (Financials, Banks) |
|
|
|
|
9,956 |
220,924 |
| Mahindra & Mahindra Ltd. GDR (Consumer discretionary, Automobiles) |
|
|
|
|
15,085 |
267,004 |
| Reliance Industries Ltd. GDR (Energy, Oil, gas & consumable
fuels)144A |
|
|
|
|
3,665 |
200,248 |
| |
|
|
|
|
|
1,062,485 |
| Indonesia: 1.68% |
|
|
|
|
|
|
| Bank Negara Indonesia Persero Tbk PT (Financials, Banks) |
|
|
|
|
251,800 |
75,990 |
| Malaysia: 0.94% |
|
|
|
|
|
|
| RHB Bank Bhd (Financials, Banks) |
|
|
|
|
36,278 |
42,493 |
| Mexico: 0.99% |
|
|
|
|
|
|
| Fibra Uno Administracion SA de CV (Real estate, Diversified REITs) |
|
|
|
|
29,400 |
44,698 |
| Philippines: 1.17% |
|
|
|
|
|
|
| Bank of the Philippine Islands (Financials, Banks) |
|
|
|
|
29,828 |
52,832 |
| |
|
|
|
Shares |
Value | |
| Poland: 2.58% |
|
|
|
|
|
|
| Bank Polska Kasa Opieki SA (Financials, Banks) |
|
|
|
|
3,191 |
$96,965 |
| LPP SA (Consumer discretionary, Textiles, apparel & luxury goods) |
|
|
|
|
6 |
19,316
|
| |
|
|
|
|
|
116,281 |
| Qatar: 1.13% |
|
|
|
|
|
|
| Industries Qatar QSC (Industrials, Industrial conglomerates) |
|
|
|
|
15,141 |
50,864 |
| Saudi Arabia: 4.90% |
|
|
|
|
|
|
| Al Rajhi Bank (Financials, Banks) |
|
|
|
|
2,534 |
45,360 |
| Arabian Drilling Co. (Energy, Energy equipment &
services)† |
|
|
|
|
2,077 |
97,107 |
| Saudi Awwal Bank (Financials, Banks) |
|
|
|
|
4,721 |
42,154 |
| United International Transportation Co. (Industrials, Ground transportation) |
|
|
|
|
2,050 |
36,774
|
| |
|
|
|
|
|
221,395 |
| Singapore: 4.72% |
|
|
|
|
|
|
| BOC Aviation Ltd. (Industrials, Trading companies &
distributors)144A |
|
|
|
|
8,900 |
54,736 |
| Capitaland India Trust (Real estate, Real estate management & development) |
|
|
|
|
121,000 |
84,841 |
| Yangzijiang Shipbuilding Holdings Ltd. (Industrials, Machinery) |
|
|
|
|
69,500 |
73,669
|
| |
|
|
|
|
|
213,246 |
| South Korea: 9.70% |
|
|
|
|
|
|
| Doosan Bobcat, Inc. (Industrials, Machinery) |
|
|
|
|
1,446 |
41,545 |
| Fila Holdings Corp. (Consumer discretionary, Textiles, apparel & luxury goods) |
|
|
|
|
1,939 |
51,343 |
| Kia Corp. (Consumer discretionary, Automobiles) |
|
|
|
|
1,071 |
61,188 |
| Samsung Electronics Co. Ltd. (Information technology, Technology hardware, storage & peripherals) |
|
|
|
|
5,699 |
283,667
|
| |
|
|
|
|
|
437,743 |
| Taiwan: 12.99% |
|
|
|
|
|
|
| Advanced Energy Solution Holding Co. Ltd. (Industrials, Electrical equipment) |
|
|
|
|
2,000 |
38,083 |
| Advantech Co. Ltd. (Information technology, Technology hardware, storage & peripherals) |
|
|
|
|
4,399 |
45,177 |
| Cathay Financial Holding Co. Ltd. (Financials,
Insurance)† |
|
|
|
|
46,000 |
62,424 |
| Chroma ATE, Inc. (Information technology, Electronic equipment, instruments & components) |
|
|
|
|
13,000 |
87,849 |
| E Ink Holdings, Inc. (Information technology, Electronic equipment, instruments & components) |
|
|
|
|
11,340 |
59,003 |
| MediaTek, Inc. (Information technology, Semiconductors & semiconductor equipment)† |
|
|
|
|
3,000 |
78,298 |
| momo.com, Inc. (Consumer discretionary, Broadline retail) |
|
|
|
|
2,760 |
45,503 |
| Realtek Semiconductor Corp. (Information technology, Semiconductors & semiconductor equipment) |
|
|
|
|
5,000 |
62,314 |
| Tripod Technology Corp. (Information technology, Electronic equipment, instruments & components) |
|
|
|
|
10,000 |
51,196 |
| Vanguard International Semiconductor Corp. (Information technology, Semiconductors & semiconductor equipment) |
|
|
|
|
26,000 |
56,465
|
| |
|
|
|
|
|
586,312 |
| Thailand: 1.03% |
|
|
|
|
|
|
| Thai Beverage PCL (Consumer staples, Beverages) |
|
|
|
|
118,100 |
46,647 |
| |
|
|
|
Shares |
Value | |
| United Arab Emirates: 3.01% |
|
|
|
|
|
|
| Abu Dhabi Commercial Bank PJSC (Financials, Banks) |
|
|
|
|
19,903 |
$43,512 |
| Aldar Properties PJSC (Real estate, Real estate management & development) |
|
|
|
|
65,178 |
92,275 |
| |
|
|
|
|
|
135,787 |
| Total common stocks (Cost $4,158,812) |
|
|
|
|
|
4,067,135 |
| |
|
Dividend rate |
|
|
| |
| Preferred stocks: 7.67% |
|
|
|
|
|
|
| South Korea: 7.67% |
|
|
|
|
|
|
| LG Chem Ltd. (Materials, Chemicals) |
|
7.40 |
|
|
291 |
60,777 |
| Samsung Electronics Co. Ltd. (Information technology, Technology hardware, storage & peripherals) |
|
0.27 |
|
|
7,154 |
285,622 |
| Total preferred stocks (Cost $395,575) |
|
|
|
|
|
346,399 |
| |
|
Yield |
|
|
| |
| Short-term investments: 1.79% |
|
|
|
|
|
|
| Investment companies: 1.79% |
|
|
|
|
|
|
| Allspring Government Money Market Fund Select
Class♠∞ |
|
5.29 % |
|
|
80,580 |
80,580 |
| Total short-term investments (Cost $80,580) |
|
|
|
|
|
80,580 |
| Total investments in securities (Cost $4,634,967) |
99.55 % |
|
|
|
|
4,494,114 |
| Other assets and liabilities, net |
0.45 |
|
|
|
|
20,505 |
| Total net assets |
100.00 % |
|
|
|
|
$4,514,619 |
| 144A |
The security may be resold in transactions exempt from registration, normally to qualified institutional buyers, pursuant to Rule 144A under the Securities Act of
1933. |
| † |
Non-income-earning security |
| ♠ |
The issuer of the security is an affiliated person of the Fund as defined in the Investment Company Act of 1940. |
| ∞ |
The rate represents the 7-day annualized yield at period end. |
| Abbreviations: | |
| ADR |
American depositary receipt |
| GDR |
Global depositary receipt |
| REIT |
Real estate investment trust |
| |
Value, beginning of period |
Purchases |
Sales
proceeds |
Net
realized
gains
(losses) |
Net
change in
unrealized
gains
(losses) |
Value,
end of
period |
Shares,
end
of period |
Income
from
affiliated
securities |
| Short-term investments |
|
|
|
|
|
|
|
|
| Allspring Government Money Market Fund Select Class |
$0 |
$6,440,966 |
$(6,360,386 ) |
$0 |
$0 |
$80,580 |
80,580 |
$12,565 |
| Assets |
|
| Investments in unaffiliated securities, at value (cost $4,554,387) |
$4,413,534 |
| Investments in affiliated securities, at value (cost $80,580) |
80,580 |
| Foreign currency, at value (cost $4,664) |
4,648 |
| Receivable for investments sold |
23,612 |
| Receivable for dividends |
4,971 |
| Receivable from manager |
703 |
| Prepaid expenses and other assets |
6,062 |
| Total assets |
4,534,110 |
| Liabilities |
|
| Payable for investments purchased |
19,378 |
| Accrued expenses and other liabilities |
113 |
| Total liabilities |
19,491 |
| Total net assets |
$4,514,619 |
| Net assets consist of |
|
| Paid-in capital |
$4,612,628 |
| Total distributable loss |
(98,009
) |
| Total net assets |
$4,514,619 |
| Computation of net asset value per share |
|
| Net assets |
$4,514,619 |
| Shares outstanding1
|
230,126 |
| Net asset value per share |
$19.62
|
| Investment income |
|
| Dividends (net of foreign withholdings taxes of $19,480) |
$123,950 |
| Income from affiliated securities |
12,565 |
| Interest |
10 |
| Total investment income |
136,525 |
| Expenses |
|
| Custody and accounting fees |
7,552 |
| Professional fees |
83,141 |
| Registration fees |
52,850 |
| Shareholder report expenses |
5,494 |
| Trustees’ fees and expenses |
23,902 |
| Other fees and expenses |
3,940 |
| Total expenses |
176,879 |
| Less: Fee waivers and/or expense reimbursements |
(176,879
) |
| Net expenses |
0 |
| Net investment income |
136,525 |
| Realized and unrealized gains (losses) on investments |
|
| Net realized gains (losses) on |
|
| Unaffiliated securities |
37,758 |
| Foreign currency and foreign currency translations |
(7,724 ) |
| Net realized gains on investments |
30,034 |
| Net change in unrealized gains (losses) on |
|
| Unaffiliated securities |
(140,853
) |
| Foreign currency and foreign currency translations |
3 |
| Net change in unrealized gains (losses) on investments |
(140,850
) |
| Net realized and unrealized gains (losses) on investments |
(110,816
) |
| Net increase in net assets resulting from operations |
$25,709 |
| |
year ended October 31, 20231
| |
| Operations |
|
|
| Net investment income |
|
$136,525 |
| Net realized gains on investments |
|
30,034 |
| Net change in unrealized gains (losses) on investments |
|
(140,850 ) |
| Net increase in net assets resulting from operations |
|
25,709 |
| Distributions to shareholders from |
|
|
| Net investment income and net realized gains |
|
(123,718 ) |
| Capital share transactions |
Shares |
|
| Proceeds from shares sold |
224,911 |
4,502,070 |
| Reinvestment of distributions |
5,215 |
110,558 |
| Net increase in net assets resulting from capital share transactions |
|
4,612,628 |
| Total increase in net assets |
|
4,514,619 |
| Net assets |
|
|
| Beginning of period |
|
0 |
| End of period |
|
$4,514,619 |
| |
Year ended October 31 |
| |
20231 |
| Net asset value, beginning of period |
$20.00 |
| Net investment income |
0.61
2 |
| Net realized and unrealized gains (losses) on investments |
(0.44 ) |
| Total from investment operations |
0.17 |
| Distributions to shareholders from |
|
| Net investment income |
(0.55 ) |
| Net asset value, end of period |
$19.62 |
| Total
return3 |
0.66 % |
| Ratios to average net assets (annualized) |
|
| Gross expenses |
3.95 % |
| Net expenses |
0.00
%4 |
| Net investment income |
3.05 % |
| Supplemental data |
|
| Portfolio turnover rate |
92 % |
| Net assets, end of period (000s omitted) |
$4,515
|
| 1 |
For the period from November 16, 2022 (commencement of operations) to October 31, 2023 |
| 2 |
Calculated based upon average shares outstanding |
| 3 |
Returns for periods of less than one year are not annualized. |
| 4 |
The manager has contractually committed to irrevocably absorb and pay or reimburse all ordinary operating expenses of the Fund, except portfolio transactions or other
investment-related costs (e.g., commissions), fees payable for services
provided by the Fund’s securities lending agent (if any), interest, taxes, leverage expenses, and other expenses not incurred in the ordinary course of the Fund’s business. This commitment has an indefinite term. |
| Gross unrealized gains |
$183,619 |
| Gross unrealized losses |
(336,004 ) |
| Net unrealized losses |
$(152,385
) |
| |
Quoted prices
(Level 1) |
Other significant
observable inputs
(Level 2) |
Significant
unobservable inputs
(Level 3) |
Total |
| Assets |
|
|
|
|
| Investments in: |
|
|
|
|
| Common stocks |
|
|
|
|
| Brazil |
$154,554
|
$0
|
$0 |
$154,554
|
| Chile |
46,348 |
0 |
0 |
46,348 |
| China |
0 |
667,565 |
0 |
667,565 |
| Greece |
0 |
111,896 |
0 |
111,896 |
| India |
862,237 |
200,248 |
0 |
1,062,485 |
| Indonesia |
0 |
75,990 |
0 |
75,990 |
| Malaysia |
0 |
42,493 |
0 |
42,493 |
| Mexico |
44,698 |
0 |
0 |
44,698 |
| Philippines |
52,832 |
0 |
0 |
52,832 |
| Poland |
19,316 |
96,965 |
0 |
116,281 |
| Qatar |
0 |
50,864 |
0 |
50,864 |
| Saudi Arabia |
97,107 |
124,288 |
0 |
221,395 |
| Singapore |
84,841 |
128,404 |
0 |
213,245 |
| South Korea |
0 |
437,743 |
0 |
437,743 |
| Taiwan |
0 |
586,312 |
0 |
586,312 |
| Thailand |
0 |
46,647 |
0 |
46,647 |
| United Arab Emirates |
135,787 |
0 |
0 |
135,787 |
| Preferred stocks |
|
|
|
|
| South Korea |
0 |
346,399 |
0 |
346,399 |
| Short-term investments |
|
|
|
|
| Investment companies |
80,580 |
0 |
0 |
80,580 |
| Total assets |
$1,578,300 |
$2,915,814 |
$0 |
$4,494,114 |
| Undistributed
ordinary
income |
Unrealized
losses |
| $54,373 |
$(152,382 ) |

| Creditable
foreign taxes
paid |
Per share
amount |
Foreign
income as % of
ordinary income
distributions |
| $147,513 |
$0.0741 |
100 % |
| Name and
year of birth |
Position held and
length of service |
Principal occupations during past five years or
longer |
Current other
public company
or
investment
company
directorships |
| William R.
Ebsworth
(Born 1957) |
Trustee,
since 2015 |
Retired. From 1984 to 2013, equities analyst, portfolio manager, research
director and chief investment officer at Fidelity
Management and Research Company in Boston, Tokyo, and Hong
Kong, and retired in 2013 as Chief Investment Officer of Fidelity
Strategic Advisers, Inc. where he led a team of investment
professionals managing client assets. Prior thereto, Board member of Hong Kong Securities Clearing Co., Hong Kong Options Clearing Corp., the Thailand International
Fund, Ltd., Fidelity Investments Life Insurance Company, and Empire
Fidelity Investments Life Insurance Company. Audit
Committee Chair and Investment Committee Chair of the Vincent
Memorial Hospital Foundation (non-profit organization). Mr. Ebsworth is a CFA
charterholder. |
N/A |
| Jane A.
Freeman
(Born 1953) |
Trustee,
since 2015;
Chair Liaison,
since 2018 |
Retired. From 2012 to 2014 and 1999 to 2008, Chief Financial Officer of
Scientific Learning Corporation. From 2008 to 2012, Ms.
Freeman provided consulting services related to strategic
business projects. Prior to 1999, Portfolio Manager at Rockefeller &
Co. and Scudder, Stevens & Clark. Board member of the
Harding Loevner Funds from 1996 to 2014, serving as both Lead
Independent Director and chair of the Audit Committee. Board member of
the Russell Exchange Traded Funds Trust from 2011 to 2012
and the chair of the Audit Committee. Ms. Freeman is also an
inactive Chartered Financial Analyst. |
N/A |
| Isaiah
Harris, Jr.
(Born 1952) |
Trustee,
since 2009;
Audit Committee
Chair,
since 2019 |
Retired. Member of the Advisory Board of CEF of East Central Florida.
Chairman of the Board of CIGNA Corporation from 2009 to
2021, and Director from 2005 to 2008. From 2003 to 2011,
Director of Deluxe Corporation. Prior thereto, President and CEO of
BellSouth Advertising and Publishing Corp. from 2005 to
2007, President and CEO of BellSouth Enterprises from 2004 to
2005 and President of BellSouth Consumer Services from 2000 to 2003.
Emeritus member of the Iowa State University Foundation
Board of Governors. Emeritus Member of the Advisory board of
Iowa State University School of Business. Advisory Board Member, Palm
Harbor Academy (private school). Advisory Board Member,
Fellowship of Christian Athletes. Mr. Harris is a certified public
accountant (inactive status). |
N/A |
| David F.
Larcker
(Born 1950) |
Trustee,
since 2009 |
Distinguished Visiting Fellow at the Hoover Institution since 2022. James
Irvin Miller Professor of Accounting at the Graduate School
of Business (Emeritus), Stanford University, Director of the
Corporate Governance Research Initiative and Senior Faculty of The Rock
Center for Corporate Governance since 2006. From 2005 to
2008, Professor of Accounting at the Graduate School of
Business, Stanford University. Prior thereto, Ernst & Young Professor
of Accounting at The Wharton School, University of Pennsylvania
from 1985 to 2005. |
N/A |
| Olivia S.
Mitchell
(Born 1953) |
Trustee,
since 2006;
Nominating and
Governance
Committee Chair,
since 2018 |
International Foundation of Employee Benefit Plans Professor since 1993,
Wharton School of the University of Pennsylvania. Director
of Wharton’s Pension Research Council and Boettner Center on Pensions & Retirement Research, and Research Associate at the National Bureau of Economic
Research. Previously taught at Cornell University from 1978 to 1993.
|
N/A |
| Timothy J.
Penny
(Born 1951) |
Trustee,
since 1996;
Chair,
since 2018 |
President and Chief Executive Officer of Southern Minnesota Initiative
Foundation, a non-profit organization, since 2007. Vice
Chair of the Economic Club of Minnesota, since 2007. Co-Chair of the Committee for a Responsible Federal Budget, since 1995. Member of the Board of Trustees of
NorthStar Education Finance, Inc., a non-profit organization, from
2007-2022. Senior Fellow of the University of Minnesota Humphrey
Institute from 1995 to 2017. |
N/A |
| Name and
year of birth |
Position held and
length of service |
Principal occupations during past five years or
longer |
Current other
public company
or
investment
company
directorships |
| James G.
Polisson
(Born 1959) |
Trustee,
since 2018 |
Retired. Chief Marketing Officer, Source (ETF) UK Services, Ltd, from
2015 to 2017. From 2012 to 2015, Principal of The Polisson
Group, LLC, a management consulting, corporate advisory and
principal investing company. Chief Executive Officer and Managing
Director at Russell Investments, Global Exchange Traded
Funds from 2010 to 2012. Managing Director of Barclays
Global Investors from 1998 to 2010 and Global Chief Marketing Officer for
iShares and Barclays Global Investors from 2000 to 2010.
Trustee of the San Francisco Mechanics’ Institute, a non- profit organization, from 2013 to 2015. Board member of the Russell Exchange Traded Fund Trust
from 2011 to 2012. Director of Barclays Global Investors Holdings
Deutschland GmbH from 2006 to 2009. Mr. Polisson is an
attorney and has a retired status with the Massachusetts and District of Columbia Bar Associations. |
N/A |
| Pamela Wheelock (Born 1959) |
Trustee, since January 2020; previously Trustee from January 2018 to July 2019 |
Retired. Executive and Senior Financial leadership positions in the public, private and nonprofit
sectors. Interim President and CEO, McKnight Foundation, 2020. Interim
Commissioner, Minnesota Department of Human Services, 2019.
Chief Operating Officer, Twin Cities Habitat for Humanity,
2017-2019. Vice President for University Services, University of Minnesota, 2012- 2016. Interim President and CEO, Blue Cross and Blue Shield of Minnesota, 2011-2012. Executive
Vice-President and Chief Financial Officer, Minnesota Wild, 2002-2008.
Commissioner, Minnesota Department of Finance, 1999-2002.
Chair of the Board of Directors of Destination Medical Center
Corporation. Board member of the Minnesota Wild Foundation. |
N/A |
| Name and
year of birth |
Position held and
length of
service |
Principal occupations during past five years or
longer |
| Andrew Owen
(Born 1960) |
President,
since 2017 |
President and Chief Executive Officer of Allspring Funds Management, LLC
since 2017 and Head of Global Fund Governance of Allspring
Global Investments since 2022. Prior thereto, co-president of Galliard Capital Management, LLC, an affiliate of Allspring Funds Management, LLC, from 2019 to 2022 and Head of Affiliated
Managers, Allspring Global Investments, from 2014 to 2019 and Executive
Vice President responsible for marketing, investments and product
development for Allspring Funds Management, LLC, from 2009 to 2014. |
| Jeremy DePalma
(Born 1974) |
Treasurer,
since 2012
(for certain funds in
the Fund Complex);
since 2021 (for
the remaining funds
in the Complex) |
Senior Vice President of Allspring Funds Management, LLC since 2009.
Senior Vice President of Evergreen Investment Management
Company, LLC from 2008 to 2010 and head of the Fund Reporting and Control Team within Fund Administration from 2005 to 2010.
|
| Christopher Baker
(Born 1976) |
Chief Compliance
Officer,
since 2022 |
Global Chief Compliance Officer for Allspring Global Investments since
2022. Prior thereto, Chief Compliance Officer for State
Street Global Advisors from 2018 to 2021. Senior Compliance Officer for the State Street divisions of Alternative Investment Solutions, Sector Solutions, and Global Marketing from 2015 to 2018. From 2010 to 2015
Vice President, Global Head of Investment and Marketing Compliance for State
Street Global Advisors. |
| Matthew Prasse (Born 1983) |
Chief Legal Officer, since 2022; Secretary, since 2021 |
Senior Counsel of the Allspring Legal Department since 2021. Senior Counsel of the Wells Fargo Legal Department
from 2018 to 2021. Previously, Counsel for Barings LLC from 2015 to 2018.
Prior to joining Barings, Associate at Morgan, Lewis & Bockius
LLP from 2008 to 2015. |

| 2 | |
| 6 | |
| 10 | |
| 11 | |
| 18 | |
| 20 | |
| 22 | |
| 23 | |
| 28 | |
| 34 | |
| 35 |


| Notice to Shareholders |
| Beginning in July 2024, the Fund will be required by the
Securities and Exchange Commission to send shareholders a paper copy of a
new tailored shareholder report in place of the full shareholder report that you are now receiving. The tailored shareholder report will contain concise information about the Fund, including certain expense and performance
information and fund statistics. If you wish to receive this new tailored shareholder
report electronically, please follow the instructions on the back cover
of this report. |
| Other information that is currently included in the shareholder
report, such as the Fund’s financial statements, will be available
online and upon request, free of charge, in paper or electronic format. |
| Investment objective |
The Fund seeks long-term capital appreciation. |
| Manager |
Allspring Funds Management, LLC |
| Subadviser |
Allspring Global Investments, LLC |
| Portfolio managers |
Derrick Irwin, CFA, Richard Peck, CFA, Yi (Jerry) Zhang, Ph.D.,
CFA |
| Average annual total returns (%) as of October 31, 2023 | |||||||||
| |
|
Including sales charge |
Excluding sales charge |
Expense ratios1 (%) | |||||
| |
Inception date |
1 year |
5 year |
10 year |
1 year |
5 year |
10 year |
Gross |
Net2 |
| Class A (EMGAX) |
9-6-1994 |
3.37 |
-0.02 |
-0.08 |
9.67 |
1.17 |
0.51 |
1.53 |
1.43 |
| Class C (EMGCX) |
9-6-1994 |
7.77 |
0.44 |
-0.08 |
8.77 |
0.44 |
-0.08 |
2.28 |
2.18 |
| Class R6 (EMGDX) |
6-28-2013 |
– |
– |
– |
10.09 |
1.60 |
0.95 |
1.11 |
1.01 |
| Administrator Class (EMGYX) |
9-6-1994 |
– |
– |
– |
9.70 |
1.47 |
0.72 |
1.46 |
1.36 |
| Institutional Class (EMGNX) |
7-30-2010 |
– |
– |
– |
10.01 |
1.52 |
0.88 |
1.21 |
1.11 |
| MSCI EM Index (Net) (USD)3 |
– |
– |
– |
– |
10.80 |
1.59 |
1.19 |
– |
– |
| | |
| 1 |
Reflects the expense ratios as stated in the most recent prospectuses. The expense ratios shown are subject to change and may differ from the annualized expense ratios
shown in the Financial Highlights of this report. |
| 2 |
The manager has contractually committed through February 29, 2024 (February 28, 2025 for Class A and C), to waive fees and/or reimburse expenses to the extent
necessary to cap total annual fund operating expenses after fee waivers at
1.43% for Class A, 2.18% for Class C, 1.01% for Class R6, 1.36% for Administrator Class and 1.11% for Institutional Class. Brokerage commissions, stamp duty fees, interest, taxes, acquired fund fees and expenses (if any), and extraordinary expenses are excluded
from the expense caps. Prior to or after the commitment expiration date,
the caps may be increased or the commitment to maintain the caps may be terminated only with the approval of the Board of Trustees. Without these caps, the Fund’s returns would have been lower. The expense ratio paid by an investor is the net expense ratio
(the total annual fund operating expenses after fee waivers) as stated in the
prospectuses. |
| 3 |
The Morgan Stanley Capital International (MSCI) Emerging Markets (EM) Index (Net) (USD) is a free-float-adjusted market-capitalization-weighted index that is designed to
measure the equity market performance of emerging markets. Source: MSCI. MSCI makes no express or implied warranties
or representations and shall have no liability whatsoever with respect to
any MSCI data contained herein. The MSCI data may not be further redistributed or used as a basis for other indices or any securities or financial products. This report is not approved, reviewed, or produced by MSCI. You cannot invest directly in an index. |
| CFA® and Chartered Financial Analyst® are trademarks owned by CFA Institute. |
| Growth of $10,000 investment as of October 31, 20231 |
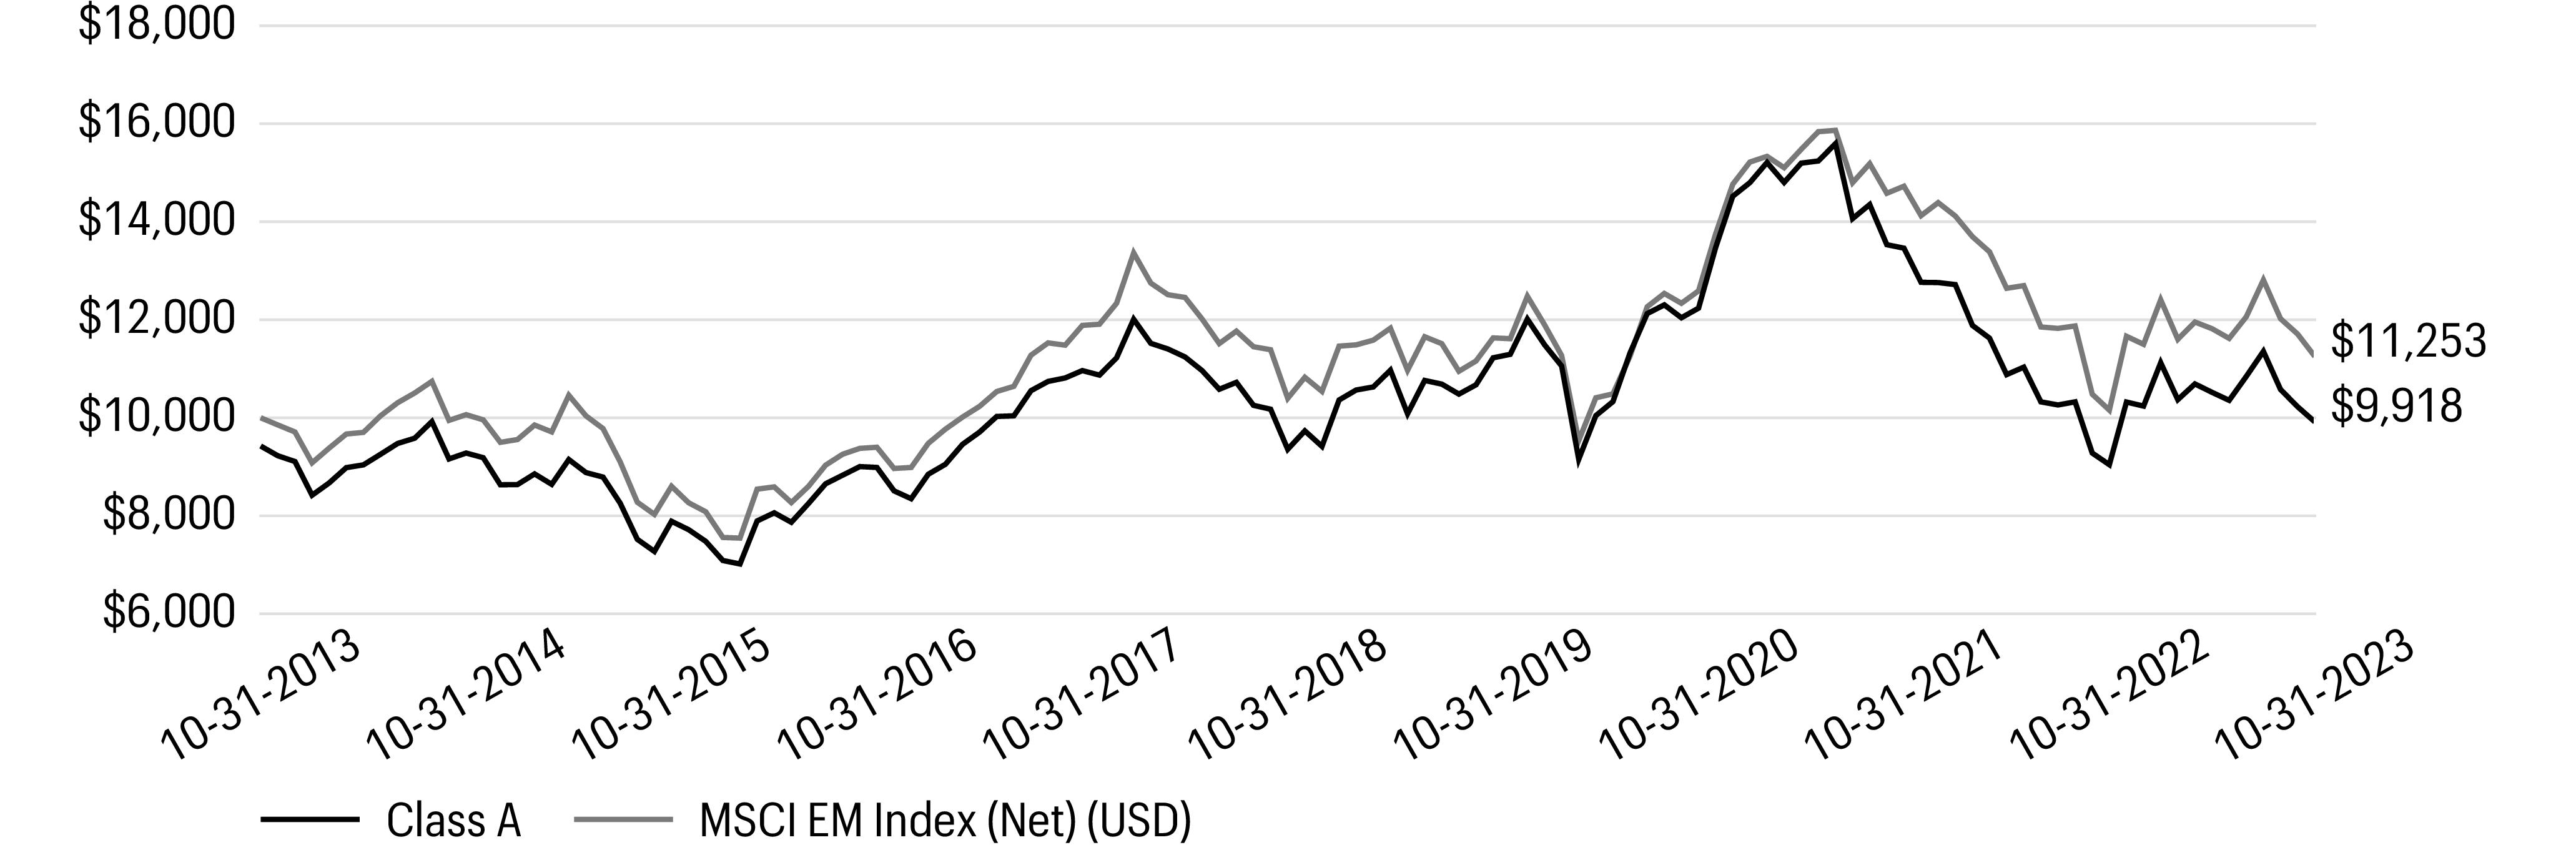
| 1 |
The chart compares the performance of Class A shares for the most recent ten years with the MSCI EM Index (Net) (USD). The chart assumes a hypothetical investment of
$10,000 in Class A shares and reflects all operating expenses and assumes the
maximum initial sales charge of 5.75%. |
| Ten largest holdings (%) as of October 31, 20231 | |
| Samsung Electronics Co. Ltd. |
6.20 |
| Taiwan Semiconductor Manufacturing Co. Ltd. ADR |
4.94 |
| Tencent Holdings Ltd. |
4.23 |
| Fomento Economico Mexicano SAB de CV |
3.81 |
| Reliance Industries Ltd. GDR |
3.56 |
| Taiwan Semiconductor Manufacturing Co. Ltd. |
3.20 |
| AIA Group Ltd. |
2.19 |
| Alibaba Group Holding Ltd. |
2.17 |
| Fibra Uno Administracion SA de CV |
2.13 |
| WH Group Ltd. |
2.12 |
| 1 |
Figures represent the percentage of the Fund’s net assets. Holdings are subject to change and may have changed since the date specified. |
| Sector allocation as of October 31, 20231 |
| 1 |
Figures represent the percentage of the Fund’s long-term investments. Allocations are subject to change and may have changed since the date specified. |
| Country allocation as of October 31, 20231 |
| 1 |
Figures represent the percentage of the Fund’s long-term investments. Allocations are subject to change and may have changed since the date specified. |
| |
Beginning account value 5-1-2023 |
Ending account value 10-31-2023 |
Expenses paid during the period1
|
Annualized net expense ratio |
| Class A |
|
|
|
|
| Actual |
$1,000.00 |
$942.89 |
$6.86 |
1.40 % |
| Hypothetical (5% return before expenses) |
$1,000.00 |
$1,018.15 |
$7.12 |
1.40 % |
| Class C |
|
|
|
|
| Actual |
$1,000.00 |
$938.80 |
$10.65 |
2.18 % |
| Hypothetical (5% return before expenses) |
$1,000.00 |
$1,014.22 |
$11.07 |
2.18 % |
| Class R6 |
|
|
|
|
| Actual |
$1,000.00 |
$944.31 |
$4.95 |
1.01 % |
| Hypothetical (5% return before expenses) |
$1,000.00 |
$1,020.11 |
$5.14 |
1.01 % |
| Administrator Class |
|
|
|
|
| Actual |
$1,000.00 |
$942.85 |
$6.61 |
1.35 % |
| Hypothetical (5% return before expenses) |
$1,000.00 |
$1,018.40 |
$6.87 |
1.35 % |
| Institutional Class |
|
|
|
|
| Actual |
$1,000.00 |
$944.31 |
$5.44 |
1.11 % |
| Hypothetical (5% return before expenses) |
$1,000.00
|
$1,019.61
|
$5.65
|
1.11 % |
| 1 |
Expenses paid is equal to the annualized net expense ratio of each class multiplied by the average account value over the period, multiplied by 184 divided by 365 (to
reflect the one-half-year period). |
| |
|
|
|
Shares |
Value | |
| Common stocks: 97.02% |
|
|
|
|
|
|
| Brazil: 5.18% |
|
|
|
|
|
|
| Atacadao SA (Consumer staples, Consumer staples distribution & retail) |
|
|
|
|
8,727,000 |
$15,526,591 |
| B3 SA - Brasil Bolsa Balcao (Financials, Capital markets) |
|
|
|
|
20,185,515 |
44,440,763 |
| Banco Bradesco SA ADR (Financials, Banks) |
|
|
|
|
5,976,276 |
16,673,810 |
| BRF SA ADR (Consumer staples, Food products)† |
|
|
|
|
3,969,115 |
8,216,068 |
| Cia Brasileira de Aluminio (Materials, Metals & mining) |
|
|
|
|
4,652,600 |
3,506,695 |
| Diagnosticos da America SA (Health care, Health care providers & services) |
|
|
|
|
3,700,673 |
7,112,515 |
| Hapvida Participacoes e Investimentos SA (Health care, Health care providers & services)144A† |
|
|
|
|
33,701,316 |
24,665,613 |
| Lojas Renner SA (Consumer discretionary, Specialty retail) |
|
|
|
|
8,956,892 |
21,780,433 |
| Magazine Luiza SA (Consumer discretionary, Broadline
retail)† |
|
|
|
|
22,599,800 |
5,961,766 |
| Multiplan Empreendimentos Imobiliarios SA (Real estate, Real estate management & development) |
|
|
|
|
1,696,906 |
8,326,762 |
| Petroleo Brasileiro SA ADR (Energy, Oil, gas & consumable fuels) |
|
|
|
|
562,079 |
8,431,185 |
| Raia Drogasil SA (Consumer staples, Consumer staples distribution & retail) |
|
|
|
|
2,046,720 |
10,473,621 |
| Suzano SA (Materials, Paper & forest products) |
|
|
|
|
646,000 |
6,607,670 |
| Zamp SA (Consumer discretionary, Hotels, restaurants &
leisure)† |
|
|
|
|
2,855,794 |
3,596,825 |
| |
|
|
|
|
|
185,320,317 |
| Chile: 1.67% |
|
|
|
|
|
|
| Banco Santander Chile ADR (Financials, Banks) |
|
|
|
|
1,190,492 |
20,714,561 |
| Falabella SA (Consumer discretionary, Broadline retail)†
|
|
|
|
|
19,096,599 |
38,901,310 |
| |
|
|
|
|
|
59,615,871 |
| China: 22.02% |
|
|
|
|
|
|
| Agora, Inc. ADR (Information technology, Software)†
|
|
|
|
|
1,224,765 |
3,600,809 |
| Alibaba Group Holding Ltd. (Consumer discretionary, Broadline retail)† |
|
|
|
|
2,930,000 |
30,164,563 |
| Alibaba Group Holding Ltd. ADR (Consumer discretionary, Broadline retail)† |
|
|
|
|
940,837 |
77,656,686 |
| Bilibili, Inc. ADR (Communication services,
Entertainment)† |
|
|
|
|
2,098,150 |
28,178,154 |
| China Literature Ltd. (Communication services, Media)144A† |
|
|
|
|
4,716,168 |
15,881,600 |
| China Meidong Auto Holdings Ltd. (Consumer discretionary, Specialty retail) |
|
|
|
|
12,373,400 |
6,635,743 |
| FinVolution Group ADR (Financials, Consumer finance) |
|
|
|
|
4,401,985 |
20,821,389 |
| GreenTree Hospitality Group Ltd. ADR (Consumer discretionary, Hotels, restaurants & leisure)† |
|
|
|
|
2,531,768 |
11,190,415 |
| Hua Medicine (Health care, Pharmaceuticals)144A† |
|
|
|
|
8,733,136 |
1,754,914 |
| Kingdee International Software Group Co. Ltd. (Information technology, Software)† |
|
|
|
|
14,400,000 |
19,106,896 |
| Li Ning Co. Ltd. (Consumer discretionary, Textiles, apparel & luxury goods) |
|
|
|
|
10,365,207 |
31,763,172 |
| Meituan Class B (Consumer discretionary, Hotels, restaurants & leisure)144A† |
|
|
|
|
4,709,070 |
66,751,087 |
| Shandong Weigao Group Medical Polymer Co. Ltd. Class H (Health care, Health care equipment & supplies) |
|
|
|
|
35,410,600 |
32,867,825 |
| |
|
|
|
Shares |
Value | |
| China(continued) |
|
|
|
|
|
|
| Tencent Holdings Ltd. (Communication services, Interactive media & services)† |
|
|
|
|
4,092,700 |
$151,465,630 |
| Tencent Music Entertainment Group ADR (Communication services, Entertainment)† |
|
|
|
|
4,556,603 |
33,080,938 |
| Tongdao Liepin Group (Communication services, Interactive media & services)† |
|
|
|
|
1,636,260 |
1,202,205 |
| Trip.com Group Ltd. ADR (Consumer discretionary, Hotels, restaurants & leisure)† |
|
|
|
|
945,178 |
32,136,052 |
| Tsingtao Brewery Co. Ltd. Class H (Consumer staples, Beverages) |
|
|
|
|
5,122,500 |
38,846,615 |
| Vipshop Holdings Ltd. ADR (Consumer discretionary, Broadline retail)† |
|
|
|
|
3,018,967 |
43,050,469 |
| Want Want China Holdings Ltd. (Consumer staples, Food products) |
|
|
|
|
76,125,800 |
47,301,485 |
| Weibo Corp. ADR (Communication services, Interactive media & services)† |
|
|
|
|
2,101,212 |
24,857,338 |
| Wuxi Biologics Cayman, Inc. (Health care, Life sciences tools & services)144A† |
|
|
|
|
3,493,500 |
21,721,668 |
| Xiaomi Corp. Class B (Information technology, Technology hardware, storage & peripherals)144A† |
|
|
|
|
20,471,900 |
36,706,582 |
| Zepp Health Corp. ADR (Information technology, Electronic equipment, instruments & components)♠† |
|
|
|
|
2,439,291 |
2,512,470 |
| Zhou Hei Ya International Holdings Co. Ltd. (Consumer staples, Food products)144A† |
|
|
|
|
25,612,726 |
8,451,605 |
| |
|
|
|
|
|
787,706,310 |
| Colombia: 0.35% |
|
|
|
|
|
|
| Bancolombia SA ADR (Financials, Banks) |
|
|
|
|
499,100 |
12,667,158 |
| Hong Kong: 4.95% |
|
|
|
|
|
|
| AIA Group Ltd. (Financials, Insurance) |
|
|
|
|
9,017,500 |
78,306,192 |
| Johnson Electric Holdings Ltd. (Consumer discretionary, Automobile components) |
|
|
|
|
4,183,050 |
5,189,087 |
| Sun Art Retail Group Ltd. (Consumer staples, Consumer staples distribution & retail) |
|
|
|
|
84,455,400 |
17,829,374 |
| WH Group Ltd. (Consumer staples, Food products)144A |
|
|
|
|
126,938,195 |
75,811,670 |
| |
|
|
|
|
|
177,136,323 |
| India: 15.28% |
|
|
|
|
|
|
| Axis Bank Ltd. (Financials, Banks) |
|
|
|
|
3,301,923 |
38,962,053 |
| Bajaj Finance Ltd. (Financials, Consumer finance) |
|
|
|
|
153,281 |
13,798,268 |
| Bharti Airtel Ltd. (Communication services, Wireless telecommunication services) |
|
|
|
|
5,019,052 |
55,122,278 |
| Bharti Airtel Ltd. (Partly Paid) (Communication services, Wireless telecommunication services) |
|
|
|
|
347,789 |
2,240,699 |
| Dalmia Bharat Ltd. (Materials, Construction materials) |
|
|
|
|
624,658 |
15,793,652 |
| Fortis Healthcare Ltd. (Health care, Health care providers & services)† |
|
|
|
|
5,334,970 |
20,695,484 |
| HDFC Bank Ltd. (Financials, Banks) |
|
|
|
|
4,074,376 |
72,297,887 |
| HDFC Bank Ltd. ADR (Financials, Banks) |
|
|
|
|
368,752 |
20,852,926 |
| IDFC First Bank Ltd. (Financials, Banks)† |
|
|
|
|
9,124,275 |
9,067,265 |
| |
|
|
|
Shares |
Value | |
| India(continued) |
|
|
|
|
|
|
| Indus Towers Ltd. (Communication services, Diversified telecommunication services)† |
|
|
|
|
2,043,851 |
$4,229,487 |
| ITC Ltd. (Consumer staples, Tobacco) |
|
|
|
|
13,732,027 |
70,686,165 |
| JM Financial Ltd. (Financials, Capital markets) |
|
|
|
|
8,071,429 |
7,924,087 |
| Kotak Mahindra Bank Ltd. (Financials, Banks) |
|
|
|
|
1,027,262 |
21,474,734 |
| Max Financial Services Ltd. (Financials, Insurance)†
|
|
|
|
|
895,389 |
9,834,304 |
| Reliance Industries Ltd. (Energy, Oil, gas & consumable fuels) |
|
|
|
|
450,000 |
12,374,000 |
| Reliance Industries Ltd. GDR (Energy, Oil, gas & consumable fuels)144A |
|
|
|
|
2,332,274 |
127,430,789 |
| SBI Life Insurance Co. Ltd. (Financials, Insurance)144A |
|
|
|
|
964,273 |
15,837,449 |
| UltraTech Cement Ltd. (Materials, Construction materials) |
|
|
|
|
274,000 |
27,729,887 |
| |
|
|
|
|
|
546,351,414 |
| Indonesia: 3.07% |
|
|
|
|
|
|
| Astra International Tbk PT (Industrials, Industrial conglomerates) |
|
|
|
|
79,651,000 |
28,975,405 |
| Bank Central Asia Tbk PT (Financials, Banks) |
|
|
|
|
62,747,500 |
34,568,890 |
| Telkom Indonesia Persero Tbk PT (Communication services, Diversified telecommunication services) |
|
|
|
|
73,500,000 |
16,112,356 |
| Telkom Indonesia Persero Tbk PT ADR (Communication services, Diversified telecommunication services) |
|
|
|
|
1,377,471 |
30,304,362 |
| |
|
|
|
|
|
109,961,013 |
| Luxembourg: 0.61% |
|
|
|
|
|
|
| InPost SA (Industrials, Air freight & logistics)†
|
|
|
|
|
2,222,122 |
21,987,435 |
| Mexico: 10.05% |
|
|
|
|
|
|
| America Movil SAB de CV ADR (Communication services, Wireless telecommunication services) |
|
|
|
|
3,667,304 |
60,877,246 |
| Becle SAB de CV (Consumer staples, Beverages) |
|
|
|
|
14,809,921 |
26,204,253 |
| Cemex SAB de CV ADR (Materials, Construction materials)†
|
|
|
|
|
3,865,872 |
23,079,256 |
| Fibra Uno Administracion SA de CV (Real estate, Diversified REITs) |
|
|
|
|
49,968,804 |
75,968,990 |
| Fomento Economico Mexicano SAB de CV ADR (Consumer staples, Beverages) |
|
|
|
|
1,202,387 |
136,362,709 |
| Grupo Financiero Banorte SAB de CV Class O (Financials, Banks) |
|
|
|
|
2,383,566 |
19,308,881 |
| Sitios Latinoamerica SAB de CV (Communication services, Diversified telecommunication services)† |
|
|
|
|
4,152,304 |
1,450,969 |
| Wal-Mart de Mexico SAB de CV (Consumer staples, Consumer staples distribution & retail) |
|
|
|
|
4,472,900 |
16,026,920 |
| |
|
|
|
|
|
359,279,224 |
| Nigeria: 0.07% |
|
|
|
|
|
|
| IHS Holding Ltd. (Communication services, Diversified telecommunication services)† |
|
|
|
|
493,367 |
2,427,366 |
| Peru: 0.15% |
|
|
|
|
|
|
| Cia de Minas Buenaventura SAA ADR (Materials, Metals & mining) |
|
|
|
|
677,263 |
5,485,830 |
| Philippines: 0.66% |
|
|
|
|
|
|
| ACEN Corp. (Utilities, Independent power and renewable electricity producers) |
|
|
|
|
1,884,654 |
176,374 |
| |
|
|
|
Shares |
Value | |
| Philippines(continued) |
|
|
|
|
|
|
| Ayala Corp. (Industrials, Industrial conglomerates) |
|
|
|
|
837,624 |
$8,955,675 |
| San Miguel Food & Beverage, Inc. (Consumer staples, Food products) |
|
|
|
|
3,495,810 |
3,136,001 |
| SM Investments Corp. (Industrials, Industrial
conglomerates)† |
|
|
|
|
812,873 |
11,488,568 |
| |
|
|
|
|
|
23,756,618 |
| Russia: 0.00% |
|
|
|
|
|
|
| LUKOIL PJSC (Acquired 4-9-2002, cost $16,145,227) (Energy, Oil, gas & consumable fuels)♦†˃ |
|
|
|
|
340,179 |
0 |
| Ozon Holdings PLC ADR (Acquired 11-24-2020, cost $2,412,000) (Consumer discretionary, Broadline retail)♦‡†˃« |
|
|
|
|
80,400 |
0 |
| Sberbank of Russia PJSC (Acquired 8-18-2011, cost $17,232,150) (Financials, Banks)♦†˃ |
|
|
|
|
6,000,456 |
0
|
| |
|
|
|
|
|
0 |
| Singapore: 0.42% |
|
|
|
|
|
|
| Sea Ltd. ADR (Communication services, Entertainment)†
|
|
|
|
|
357,740 |
14,917,758 |
| South Africa: 2.97% |
|
|
|
|
|
|
| MTN Group Ltd. (Communication services, Wireless telecommunication services) |
|
|
|
|
4,988,543 |
24,351,852 |
| Shoprite Holdings Ltd. (Consumer staples, Consumer staples distribution & retail) |
|
|
|
|
3,571,500 |
45,766,940 |
| Standard Bank Group Ltd. (Financials, Banks) |
|
|
|
|
2,147,090 |
21,069,419 |
| Tiger Brands Ltd. (Consumer staples, Food products) |
|
|
|
|
1,631,933 |
15,108,665 |
| |
|
|
|
|
|
106,296,876 |
| South Korea: 13.15% |
|
|
|
|
|
|
| KT Corp. (Communication services, Diversified telecommunication services) |
|
|
|
|
335,000 |
8,104,374 |
| KT Corp. ADR (Communication services, Diversified telecommunication services) |
|
|
|
|
4,534,713 |
54,779,333 |
| KT&G Corp. (Consumer staples, Tobacco) |
|
|
|
|
352,091 |
22,211,056 |
| LG Chem Ltd. (Materials, Chemicals) |
|
|
|
|
62,109 |
20,355,733 |
| NAVER Corp. (Communication services, Interactive media & services) |
|
|
|
|
248,500 |
34,741,079 |
| Samsung Electronics Co. Ltd. (Information technology, Technology hardware, storage & peripherals) |
|
|
|
|
4,454,800 |
221,737,127 |
| Samsung Life Insurance Co. Ltd. (Financials, Insurance) |
|
|
|
|
710,337 |
38,030,955 |
| SK Hynix, Inc. (Information technology, Semiconductors & semiconductor equipment) |
|
|
|
|
553,500 |
48,067,101 |
| SK Telecom Co. Ltd. (Communication services, Wireless telecommunication services) |
|
|
|
|
424,000 |
15,461,979 |
| SK Telecom Co. Ltd. ADR (Communication services, Wireless telecommunication services) |
|
|
|
|
340,000 |
6,888,400 |
| |
|
|
|
|
|
470,377,137 |
| Taiwan: 12.53% |
|
|
|
|
|
|
| 104 Corp. (Industrials, Professional services)† |
|
|
|
|
1,655,000 |
10,179,513 |
| |
|
|
|
Shares |
Value | |
| Taiwan(continued) |
|
|
|
|
|
|
| MediaTek, Inc. (Information technology, Semiconductors & semiconductor equipment)† |
|
|
|
|
1,910,881 |
$49,872,756 |
| President Chain Store Corp. (Consumer staples, Consumer staples distribution & retail)† |
|
|
|
|
3,220,000 |
25,613,002 |
| Taiwan Semiconductor Manufacturing Co. Ltd. (Information technology, Semiconductors & semiconductor equipment) |
|
|
|
|
7,005,224 |
114,412,863 |
| Taiwan Semiconductor Manufacturing Co. Ltd. ADR (Information technology, Semiconductors & semiconductor equipment) |
|
|
|
|
2,045,552 |
176,551,593 |
| Uni-President Enterprises Corp. (Consumer staples, Food products) |
|
|
|
|
34,012,368 |
71,356,171 |
| |
|
|
|
|
|
447,985,898 |
| Thailand: 2.43% |
|
|
|
|
|
|
| PTT Exploration & Production PCL (Energy, Oil, gas & consumable fuels) |
|
|
|
|
1,933,139 |
8,828,311 |
| PTT PCL (Energy, Oil, gas & consumable fuels) |
|
|
|
|
22,759,000 |
20,938,503 |
| SCB X PCL (Financials, Banks) |
|
|
|
|
8,405,100 |
22,886,445 |
| Thai Beverage PCL (Consumer staples, Beverages) |
|
|
|
|
86,427,000 |
34,136,945 |
| |
|
|
|
|
|
86,790,204 |
| United States: 1.46% |
|
|
|
|
|
|
| MercadoLibre, Inc. (Consumer discretionary, Broadline
retail)† |
|
|
|
|
25,116 |
31,162,426 |
| Southern Copper Corp. (Materials, Metals & mining) |
|
|
|
|
282,191 |
20,007,342 |
| Uxin Ltd. Class A (Consumer discretionary, Specialty
retail)♦† |
|
|
|
|
23,979,831 |
975,188 |
| |
|
|
|
|
|
52,144,956 |
| Total common stocks (Cost $3,066,162,503) |
|
|
|
|
|
3,470,207,708 |
| |
|
Interest rate |
Maturity date |
Principal |
| |
| Convertible Debentures: 0.00% |
|
|
|
|
|
|
| Brazil: 0.00% |
|
|
|
|
|
|
| Lupatech SA Series 1 (Energy, Oil & gas
services)♦† |
|
6.50 % |
4-15-2049 |
$ |
303,000 |
0 |
| Total convertible debentures (Cost $160,691) |
|
|
|
|
|
0 |
| |
|
Dividend rate |
|
Shares |
| |
| Preferred stocks: 0.24% |
|
|
|
|
|
|
| Brazil: 0.24% |
|
|
|
|
|
|
| Petroleo Brasileiro SA (Energy, Oil, gas & consumable fuels) |
|
0.12 |
|
|
1,272,900 |
8,770,872 |
| Total preferred stocks (Cost $7,897,430) |
|
|
|
|
|
8,770,872 |
| |
|
|
Expiration
date |
Shares |
Value | |
| Warrants: 0.00% |
|
|
|
|
|
|
| Brazil: 0.00% |
|
|
|
|
|
|
| Diagnosticos da America SA (Health care, Health care providers & services)♦† |
|
|
4-30-2025 |
|
72,020 |
$16,999 |
| Total warrants (Cost $0) |
|
|
|
|
|
16,999 |
| |
|
Yield |
|
|
| |
| Short-term investments: 2.89% |
|
|
|
|
|
|
| Investment companies: 2.89% |
|
|
|
|
|
|
| Allspring Government Money Market Fund Select
Class♠∞ |
|
5.29 % |
|
|
103,234,358 |
103,234,358 |
| Total short-term investments (Cost $103,234,358) |
|
|
|
|
|
103,234,358 |
| Total investments in securities (Cost $3,177,454,982) |
100.15 % |
|
|
|
|
3,582,229,937 |
| Other assets and liabilities, net |
(0.15 ) |
|
|
|
|
(5,445,161 ) |
| Total net assets |
100.00 % |
|
|
|
|
$3,576,784,776 |
| † |
Non-income-earning security |
| 144A |
The security may be resold in transactions exempt from registration, normally to qualified institutional buyers, pursuant to Rule 144A under the Securities Act of
1933. |
| ♠ |
The issuer of the security is an affiliated person of the Fund as defined in the Investment Company Act of 1940. |
| ♦ |
The security is fair valued in accordance with procedures approved by the Board of Trustees. |
| ˃ |
Restricted security as to resale, excluding Rule 144A securities. The Fund held restricted securities with an aggregate current value of $0 (original an aggregate
cost of $35,789,377), representing 0.00% of its net assets as of period
end. |
| ‡ |
Security is valued using significant unobservable inputs. |
| « |
This security is on loan pending return from the lending agent. |
| ∞ |
The rate represents the 7-day annualized yield at period end. |
| Abbreviations: | |
| ADR |
American depositary receipt |
| GDR |
Global depositary receipt |
| REIT |
Real estate investment trust |
| |
Value, beginning of period |
Purchases |
Sales
proceeds |
Net
realized
gains
(losses) |
Net
change in
unrealized
gains
(losses) |
Value,
end of
period |
Shares,
end
of period |
Income
from
affiliated
securities |
| Common stocks |
|
|
|
|
|
|
|
|
| Zepp Health Corp. ADR† |
$3,000,328 |
$0 |
$0 |
$0 |
$(487,858 ) |
$2,512,470 |
2,439,291 |
$0 |
| Short-term investments |
|
|
|
|
|
|
|
|
| Allspring Government Money Market Fund Select Class |
113,703,486 |
420,516,493 |
(430,985,621 ) |
0 |
0 |
103,234,358 |
103,234,358 |
5,446,935 |
| Investments in affiliates no longer held at end of period |
|
|
|
|
|
|
|
|
| Securities Lending Cash Investments LLC |
38,056,633 |
225,700,376 |
(263,757,266 ) |
257 |
0 |
0 |
0 |
987,949 1 |
| |
|
|
|
$257 |
$(487,858
) |
$105,746,828 |
|
$6,434,884 |
| † |
Non-income-earning security |
| 1 |
Amount shown represents income before fees and rebates. |
| Assets |
|
| Investments in unaffiliated securities, at value (cost $3,049,201,711) |
$3,476,483,109 |
| Investments in affiliated securities, at value (cost $128,253,271) |
105,746,828 |
| Cash |
7,081 |
| Cash collateral for securities on loan |
1,386,900 |
| Foreign currency, at value (cost $8,536,153) |
7,307,740 |
| Receivable for investments sold |
4,567,300 |
| Receivable for Fund shares sold |
4,356,974 |
| Receivable for dividends |
3,737,177 |
| Prepaid expenses and other assets |
218,417 |
| Total assets |
3,603,811,526 |
| Liabilities |
|
| Contingent tax liability |
16,088,489 |
| Payable for Fund shares redeemed |
3,532,572 |
| Management fee payable |
2,883,879 |
| Custody and accounting fees payable |
1,730,316 |
| Payable upon receipt of securities loaned |
1,386,400 |
| Payable for investments purchased |
872,128 |
| Administration fees payable |
377,770 |
| Distribution fee payable |
2,862 |
| Accrued expenses and other liabilities |
152,334 |
| Total liabilities |
27,026,750 |
| Total net assets |
$3,576,784,776 |
| Net assets consist of |
|
| Paid-in capital |
$3,641,831,259 |
| Total distributable loss |
(65,046,483
) |
| Total net assets |
$3,576,784,776 |
| Computation of net asset value and offering price per share |
|
| Net assets–Class A |
$140,305,794 |
| Shares outstanding–Class A1
|
6,389,624 |
| Net asset value per share–Class A |
$21.96 |
| Maximum offering price per share – Class A2 |
$23.30 |
| Net assets–Class C |
$4,372,606 |
| Shares outstanding–Class C1
|
241,531 |
| Net asset value per share–Class C |
$18.10 |
| Net assets–Class R6 |
$371,407,765 |
| Shares outstanding–Class R61
|
16,223,151 |
| Net asset value per share–Class R6 |
$22.89 |
| Net assets–Administrator Class |
$36,100,547 |
| Shares outstanding–Administrator
Class1 |
1,551,981 |
| Net asset value per share–Administrator Class |
$23.26 |
| Net assets–Institutional Class |
$3,024,598,064 |
| Shares outstanding–Institutional
Class1 |
132,161,976 |
| Net asset value per share–Institutional Class |
$22.89
|
| Investment income |
|
| Dividends (net of foreign withholdings taxes of $12,908,207) |
$93,403,525 |
| Income from affiliated securities |
5,648,939 |
| Interest (net of foreign withholding taxes of $58) |
37,173 |
| Total investment income |
99,089,637 |
| Expenses |
|
| Management fee |
39,778,556 |
| Administration fees |
|
| Class A |
319,912 |
| Class C |
11,070 |
| Class R6 |
122,107 |
| Administrator Class |
57,415 |
| Institutional Class |
4,279,716 |
| Shareholder servicing fees |
|
| Class A |
387,037 |
| Class C |
13,299 |
| Administrator Class |
108,736 |
| Distribution fee |
|
| Class C |
39,853 |
| Custody and accounting fees |
2,659,720 |
| Professional fees |
154,836 |
| Registration fees |
160,815 |
| Shareholder report expenses |
667,472 |
| Trustees’ fees and expenses |
19,975 |
| Other fees and expenses |
149,716 |
| Total expenses |
48,930,235 |
| Less: Fee waivers and/or expense reimbursements |
|
| Fund-level |
(5,075,907
) |
| Class A |
(38,207
) |
| Class C |
(130 ) |
| Class R6 |
(26,052
) |
| Administrator Class |
(2,756 ) |
| Institutional Class |
(220,626
) |
| Net expenses |
43,566,557 |
| Net investment income |
55,523,080 |
| Realized and unrealized gains (losses) on investments |
|
| Net realized gains (losses) on |
|
| Unaffiliated securities |
$(283,377,767 ) |
| Affiliated securities |
257 |
| Foreign currency and foreign currency translations |
(344,540
) |
| Net realized losses on investments |
(283,722,050
) |
| Net change in unrealized gains (losses) on |
|
| Unaffiliated securities (net of deferred foreign capital gains tax of $2,622,375) |
601,652,696 |
| Affiliated securities |
(487,858
) |
| Foreign currency and foreign currency translations |
(73,832
) |
| Net change in unrealized gains (losses) on investments |
601,091,006
|
| Net realized and unrealized gains (losses) on investments |
317,368,956
|
| Net increase in net assets resulting from operations |
$372,892,036 |
| |
Year ended October 31, 2023 |
Year ended October 31, 2022 | ||
| Operations |
|
|
|
|
| Net investment income |
|
$55,523,080 |
|
$49,464,076 |
| Net realized losses on investments |
|
(283,722,050 ) |
|
(157,619,252 ) |
| Net change in unrealized gains (losses) on investments |
|
601,091,006 |
|
(1,751,750,563
) |
| Net increase (decrease) in net assets resulting from operations |
|
372,892,036 |
|
(1,859,905,739 ) |
| Distributions to shareholders from |
|
|
|
|
| Net investment income and net realized gains |
|
|
|
|
| Class A |
|
(1,206,336 ) |
|
(523,337 ) |
| Class R6 |
|
(5,221,911 ) |
|
(3,926,921 ) |
| Administrator Class |
|
(408,773 ) |
|
(226,378 ) |
| Institutional Class |
|
(38,037,723 ) |
|
(29,592,408 ) |
| Total distributions to shareholders |
|
(44,874,743
) |
|
(34,269,044 ) |
| Capital share transactions |
Shares |
|
Shares |
|
| Proceeds from shares sold |
|
|
|
|
| Class A |
526,956 |
12,429,497 |
522,651 |
13,494,450 |
| Class C |
10,989 |
211,779 |
16,918 |
350,881 |
| Class R6 |
2,816,191 |
68,449,429 |
4,238,704 |
110,361,263 |
| Administrator Class |
169,953 |
4,205,464 |
238,489 |
6,392,265 |
| Institutional Class |
26,992,809 |
652,959,509 |
40,883,064 |
1,076,015,019 |
| |
|
738,255,678 |
|
1,206,613,878 |
| Reinvestment of distributions |
|
|
|
|
| Class A |
48,589 |
1,102,474 |
17,202 |
485,624 |
| Class R6 |
185,248 |
4,366,293 |
113,499 |
3,332,328 |
| Administrator Class |
16,841 |
404,511 |
7,483 |
223,655 |
| Institutional Class |
1,598,910 |
37,718,277 |
998,541 |
29,327,151 |
| |
|
43,591,555 |
|
33,368,758 |
| Payment for shares redeemed |
|
|
|
|
| Class A |
(1,123,006 ) |
(25,992,556 ) |
(1,332,931 ) |
(33,898,169 ) |
| Class C |
(103,550 ) |
(1,984,353 ) |
(174,207 ) |
(3,663,650 ) |
| Class R6 |
(4,292,148 ) |
(105,617,539 ) |
(3,896,910 ) |
(101,644,199 ) |
| Administrator Class |
(557,436 ) |
(13,911,202 ) |
(772,810 ) |
(20,890,449 ) |
| Institutional Class |
(37,538,966 ) |
(911,083,142 ) |
(70,531,121 ) |
(1,854,111,980
) |
| |
|
(1,058,588,792
) |
|
(2,014,208,447 ) |
| Net decrease in net assets resulting from capital share transactions |
|
(276,741,559
) |
|
(774,225,811
) |
| Total increase (decrease) in net assets |
|
51,275,734 |
|
(2,668,400,594 ) |
| Net assets |
|
|
|
|
| Beginning of period |
|
3,525,509,042 |
|
6,193,909,636 |
| End of period |
|
$3,576,784,776 |
|
$3,525,509,042 |
| |
Year ended October 31 | ||||
| Class A |
2023 |
2022 |
2021 |
2020 |
2019 |
| Net asset value, beginning of period |
$20.18 |
$30.11 |
$27.39 |
$25.29 |
$21.16 |
| Net investment income (loss) |
0.26
1 |
0.18
1 |
(0.07
)1 |
0.00
2 |
0.10 |
| Payment from affiliate |
0.00 |
0.00 |
0.00 |
0.00
2 |
0.00 |
| Net realized and unrealized gains (losses) on investments |
1.70 |
(10.04 ) |
2.81 |
2.28 |
4.11 |
| Total from investment operations |
1.96 |
(9.86 ) |
2.74 |
2.28 |
4.21 |
| Distributions to shareholders from |
|
|
|
|
|
| Net investment income |
(0.18 ) |
(0.07 ) |
(0.02 ) |
(0.18 ) |
(0.08 ) |
| Net asset value, end of period |
$21.96 |
$20.18 |
$30.11 |
$27.39 |
$25.29 |
| Total
return3 |
9.67 % |
(32.82
)% |
10.00
% |
9.03
%4 |
19.95
% |
| Ratios to average net assets (annualized) |
|
|
|
|
|
| Gross expenses |
1.57 % |
1.54 % |
1.48 % |
1.54 % |
1.57 % |
| Net expenses |
1.42 % |
1.43 % |
1.46 % |
1.52 % |
1.57 % |
| Net investment income (loss) |
1.12 % |
0.69 % |
(0.21 )% |
0.13 % |
0.43 % |
| Supplemental data |
|
|
|
|
|
| Portfolio turnover rate |
4 % |
5 % |
9 % |
12 % |
8 % |
| Net assets, end of period (000s omitted) |
$140,306
|
$139,997 |
$232,735 |
$210,393 |
$227,811 |
| 1 |
Calculated based upon average shares outstanding |
| 2 |
Amount is less than $0.005. |
| 3 |
Total return calculations do not include any sales charges. |
| 4 |
During the year ended October 31, 2020, the Fund received a payment from an affiliate that had an impact of less than 0.005% on total return. |
| |
Year ended October 31 | ||||
| Class C |
2023 |
2022 |
2021 |
2020 |
2019 |
| Net asset value, beginning of period |
$16.64 |
$24.95 |
$22.86 |
$21.09 |
$17.71 |
| Net investment income (loss) |
0.07
1 |
(0.02
)1 |
(0.27
)1 |
(0.14
)1 |
(0.07
)1 |
| Payment from affiliate |
0.00 |
0.00 |
0.00 |
0.04 |
0.00 |
| Net realized and unrealized gains (losses) on investments |
1.39 |
(8.29 ) |
2.36 |
1.87 |
3.45 |
| Total from investment operations |
1.46 |
(8.31 ) |
2.09 |
1.77 |
3.38 |
| Net asset value, end of period |
$18.10 |
$16.64 |
$24.95 |
$22.86 |
$21.09 |
| Total
return2 |
8.77 % |
(33.31
)% |
9.14
% |
8.39
%3 |
19.09
% |
| Ratios to average net assets (annualized) |
|
|
|
|
|
| Gross expenses |
2.32 % |
2.28 % |
2.23 % |
2.29 % |
2.32 % |
| Net expenses |
2.19 % |
2.19 % |
2.22 % |
2.28 % |
2.32 % |
| Net investment income (loss) |
0.34 % |
(0.11 )% |
(0.98 )% |
(0.64 )% |
(0.37 )% |
| Supplemental data |
|
|
|
|
|
| Portfolio turnover rate |
4 % |
5 % |
9 % |
12 % |
8 % |
| Net assets, end of period (000s omitted) |
$4,373
|
$5,558 |
$12,260 |
$20,149 |
$29,484 |
| 1 |
Calculated based upon average shares outstanding |
| 2 |
Total return calculations do not include any sales charges. |
| 3 |
During the year ended October 31, 2020, the Fund received a payment from an affiliate which had a 0.18% impact on the total return. |
| |
Year ended October 31 | ||||
| Class R6 |
2023 |
2022 |
2021 |
2020 |
2019 |
| Net asset value, beginning of period |
$21.06 |
$31.45 |
$28.59 |
$26.39 |
$22.10 |
| Net investment income |
0.37
1 |
0.30
1 |
0.08
1 |
0.17 |
0.22
1 |
| Net realized and unrealized gains (losses) on investments |
1.76 |
(10.47 ) |
2.92 |
2.33 |
4.27 |
| Total from investment operations |
2.13 |
(10.17 ) |
3.00 |
2.50 |
4.49 |
| Distributions to shareholders from |
|
|
|
|
|
| Net investment income |
(0.30 ) |
(0.22 ) |
(0.14 ) |
(0.30 ) |
(0.20 ) |
| Net asset value, end of period |
$22.89 |
$21.06 |
$31.45 |
$28.59 |
$26.39 |
| Total return |
10.09 % |
(32.53
)% |
10.47
% |
9.49
% |
20.50
% |
| Ratios to average net assets (annualized) |
|
|
|
|
|
| Gross expenses |
1.15 % |
1.11 % |
1.05 % |
1.11 % |
1.14 % |
| Net expenses |
1.01 % |
1.01 % |
1.04 % |
1.11 % |
1.14 % |
| Net investment income |
1.54 % |
1.13 % |
0.23 % |
0.55 % |
0.88 % |
| Supplemental data |
|
|
|
|
|
| Portfolio turnover rate |
4 % |
5 % |
9 % |
12 % |
8 % |
| Net assets, end of period (000s omitted) |
$371,408
|
$368,845 |
$536,456 |
$324,637 |
$351,829 |
| 1 |
Calculated based upon average shares outstanding |
| |
Year ended October 31 | ||||
| Administrator Class |
2023 |
2022 |
2021 |
2020 |
2019 |
| Net asset value, beginning of period |
$21.39 |
$31.89 |
$29.01 |
$26.50 |
$22.18 |
| Net investment income (loss) |
0.30
1 |
0.20
1 |
(0.05
)1 |
0.05
1 |
0.13
1 |
| Payment from affiliate |
0.00 |
0.00 |
0.00 |
0.31 |
0.00 |
| Net realized and unrealized gains (losses) on investments |
1.78 |
(10.60 ) |
2.97 |
2.35 |
4.30 |
| Total from investment operations |
2.08 |
(10.40 ) |
2.92 |
2.71 |
4.43 |
| Distributions to shareholders from |
|
|
|
|
|
| Net investment income |
(0.21 ) |
(0.10 ) |
(0.04 ) |
(0.20 ) |
(0.11 ) |
| Net asset value, end of period |
$23.26 |
$21.39 |
$31.89 |
$29.01 |
$26.50 |
| Total return |
9.70 % |
(32.73
)%2 |
10.09
% |
10.25
%3 |
20.09
% |
| Ratios to average net assets (annualized) |
|
|
|
|
|
| Gross expenses |
1.49 % |
1.45 % |
1.40 % |
1.46 % |
1.49 % |
| Net expenses |
1.35 % |
1.36 % |
1.38 % |
1.43 % |
1.46 % |
| Net investment income (loss) |
1.20 % |
0.75 % |
(0.13 )% |
0.20 % |
0.54 % |
| Supplemental data |
|
|
|
|
|
| Portfolio turnover rate |
4 % |
5 % |
9 % |
12 % |
8 % |
| Net assets, end of period (000s omitted) |
$36,101
|
$41,117 |
$78,118 |
$73,888 |
$104,869 |
| 1 |
Calculated based upon average shares outstanding |
| 2 |
During the year ended October 31, 2022, the Fund received payments from a service provider which had a 0.04% impact on the total return. |
| 3 |
During the year ended October 31, 2020, the Fund received a payment from an affiliate which had a 1.16% impact on the total return. |
| |
Year ended October 31 | ||||
| Institutional Class |
2023 |
2022 |
2021 |
2020 |
2019 |
| Net asset value, beginning of period |
$21.05 |
$31.42 |
$28.57 |
$26.38 |
$22.10 |
| Net investment income |
0.35
1 |
0.27
1 |
0.04
1 |
0.14 |
0.19 |
| Net realized and unrealized gains (losses) on investments |
1.76 |
(10.45 ) |
2.92 |
2.34 |
4.28 |
| Total from investment operations |
2.11 |
(10.18 ) |
2.96 |
2.48 |
4.47 |
| Distributions to shareholders from |
|
|
|
|
|
| Net investment income |
(0.27 ) |
(0.19 ) |
(0.11 ) |
(0.29 ) |
(0.19 ) |
| Net asset value, end of period |
$22.89 |
$21.05 |
$31.42 |
$28.57 |
$26.38 |
| Total return |
10.01 % |
(32.60
)% |
10.39
% |
9.42
% |
20.40
% |
| Ratios to average net assets (annualized) |
|
|
|
|
|
| Gross expenses |
1.25 % |
1.21 % |
1.15 % |
1.21 % |
1.25 % |
| Net expenses |
1.11 % |
1.11 % |
1.14 % |
1.18 % |
1.19 % |
| Net investment income |
1.43 % |
1.03 % |
0.12 % |
0.49 % |
0.81 % |
| Supplemental data |
|
|
|
|
|
| Portfolio turnover rate |
4 % |
5 % |
9 % |
12 % |
8 % |
| Net assets, end of period (000s omitted) |
$3,024,598
|
$2,969,992 |
$5,334,340 |
$3,984,940 |
$3,475,314 |
| 1 |
Calculated based upon average shares outstanding |
| Gross unrealized gains |
$1,076,643,173 |
| Gross unrealized losses |
(734,587,373 ) |
| Net unrealized gains |
$342,055,800 |
| |
Quoted prices
(Level 1) |
Other significant
observable inputs
(Level 2) |
Significant
unobservable inputs
(Level 3) |
Total |
| Assets |
|
|
|
|
| Investments in: |
|
|
|
|
| Common stocks |
|
|
|
|
| Brazil |
$185,320,317
|
$0
|
$0 |
$185,320,317
|
| Chile |
20,714,561 |
38,901,310 |
0 |
59,615,871 |
| China |
277,084,720 |
510,621,590 |
0 |
787,706,310 |
| Colombia |
12,667,158 |
0 |
0 |
12,667,158 |
| Hong Kong |
0 |
177,136,323 |
0 |
177,136,323 |
| India |
20,852,926 |
525,498,488 |
0 |
546,351,414 |
| Indonesia |
30,304,362 |
79,656,651 |
0 |
109,961,013 |
| Luxembourg |
0 |
21,987,435 |
0 |
21,987,435 |
| Mexico |
359,279,224 |
0 |
0 |
359,279,224 |
| Nigeria |
2,427,366 |
0 |
0 |
2,427,366 |
| Peru |
5,485,830 |
0 |
0 |
5,485,830 |
| Philippines |
3,136,001 |
20,620,617 |
0 |
23,756,618 |
| Russia |
0 |
0 |
0 |
0 |
| Singapore |
14,917,758 |
0 |
0 |
14,917,758 |
| South Africa |
91,188,211 |
15,108,665 |
0 |
106,296,876 |
| South Korea |
61,667,733 |
408,709,404 |
0 |
470,377,137 |
| Taiwan |
186,731,106 |
261,254,792 |
0 |
447,985,898 |
| Thailand |
0 |
86,790,204 |
0 |
86,790,204 |
| United States |
51,169,768 |
975,188 |
0 |
52,144,956 |
| Convertible debentures |
0 |
0 |
0 |
0 |
| Preferred stocks |
|
|
|
|
| Brazil |
8,770,872 |
0 |
0 |
8,770,872 |
| Warrants |
|
|
|
|
| Brazil |
0 |
16,999 |
0 |
16,999 |
| Short-term investments |
|
|
|
|
| Investment companies |
103,234,358 |
0 |
0 |
103,234,358 |
| Total assets |
$1,434,952,271 |
$2,147,277,666 |
$0 |
$3,582,229,937 |
| Average daily net assets |
Management fee |
| First $1 billion |
1.050 % |
| Next $1 billion |
1.025 |
| Next $2 billion |
1.000 |
| Next $1 billion |
0.975 |
| Next $3 billion |
0.965 |
| Next $2 billion |
0.955 |
| Over $10 billion |
0.945 |
| |
Class-level
administration fee |
| Class A |
0.20 % |
| Class C |
0.20 |
| Class R6 |
0.03 |
| Administrator Class |
0.13 |
| Institutional Class |
0.13 |
| |
EXPENSE RATIO CAPS |
| Class A |
1.43 % |
| Class C |
2.18 |
| Class R6 |
1.01 |
| Administrator Class |
1.36 |
| Institutional Class |
1.11 |
| Undistributed
ordinary
income |
Unrealized
gains |
Capital loss
carryforward |
| $43,608,432 |
$340,815,445 |
$(447,868,267 ) |

| Creditable
foreign taxes
paid |
Per share
amount |
Foreign
income as % of
ordinary income
distributions |
| $13,524,662 |
$0.0864 |
100 % |
| Name and
year of birth |
Position held and
length of service* |
Principal occupations during past five years or
longer |
Current other
public company
or
investment
company
directorships |
| William R.
Ebsworth
(Born 1957) |
Trustee,
since 2015 |
Retired. From 1984 to 2013, equities analyst, portfolio manager, research
director and chief investment officer at Fidelity
Management and Research Company in Boston, Tokyo, and Hong
Kong, and retired in 2013 as Chief Investment Officer of Fidelity
Strategic Advisers, Inc. where he led a team of investment
professionals managing client assets. Prior thereto, Board member of Hong Kong Securities Clearing Co., Hong Kong Options Clearing Corp., the Thailand International
Fund, Ltd., Fidelity Investments Life Insurance Company, and Empire
Fidelity Investments Life Insurance Company. Audit
Committee Chair and Investment Committee Chair of the Vincent
Memorial Hospital Foundation (non-profit organization). Mr. Ebsworth is a CFA
charterholder. |
N/A |
| Jane A.
Freeman
(Born 1953) |
Trustee,
since 2015;
Chair Liaison,
since 2018 |
Retired. From 2012 to 2014 and 1999 to 2008, Chief Financial Officer of
Scientific Learning Corporation. From 2008 to 2012, Ms.
Freeman provided consulting services related to strategic
business projects. Prior to 1999, Portfolio Manager at Rockefeller &
Co. and Scudder, Stevens & Clark. Board member of the
Harding Loevner Funds from 1996 to 2014, serving as both Lead
Independent Director and chair of the Audit Committee. Board member of
the Russell Exchange Traded Funds Trust from 2011 to 2012
and the chair of the Audit Committee. Ms. Freeman is also an
inactive Chartered Financial Analyst. |
N/A |
| Isaiah
Harris, Jr.
(Born 1952) |
Trustee,
since 2009;
Audit Committee
Chair,
since 2019 |
Retired. Member of the Advisory Board of CEF of East Central Florida.
Chairman of the Board of CIGNA Corporation from 2009 to
2021, and Director from 2005 to 2008. From 2003 to 2011,
Director of Deluxe Corporation. Prior thereto, President and CEO of
BellSouth Advertising and Publishing Corp. from 2005 to
2007, President and CEO of BellSouth Enterprises from 2004 to
2005 and President of BellSouth Consumer Services from 2000 to 2003.
Emeritus member of the Iowa State University Foundation
Board of Governors. Emeritus Member of the Advisory board of
Iowa State University School of Business. Advisory Board Member, Palm
Harbor Academy (private school). Advisory Board Member,
Fellowship of Christian Athletes. Mr. Harris is a certified public
accountant (inactive status). |
N/A |
| David F.
Larcker
(Born 1950) |
Trustee,
since 2009 |
Distinguished Visiting Fellow at the Hoover Institution since 2022. James
Irvin Miller Professor of Accounting at the Graduate School
of Business (Emeritus), Stanford University, Director of the
Corporate Governance Research Initiative and Senior Faculty of The Rock
Center for Corporate Governance since 2006. From 2005 to
2008, Professor of Accounting at the Graduate School of
Business, Stanford University. Prior thereto, Ernst & Young Professor
of Accounting at The Wharton School, University of Pennsylvania
from 1985 to 2005. |
N/A |
| Olivia S.
Mitchell
(Born 1953) |
Trustee,
since 2006;
Nominating and
Governance
Committee Chair,
since 2018 |
International Foundation of Employee Benefit Plans Professor since 1993,
Wharton School of the University of Pennsylvania. Director
of Wharton’s Pension Research Council and Boettner Center on Pensions & Retirement Research, and Research Associate at the National Bureau of Economic
Research. Previously taught at Cornell University from 1978 to 1993.
|
N/A |
| Timothy J.
Penny
(Born 1951) |
Trustee,
since 1996;
Chair,
since 2018 |
President and Chief Executive Officer of Southern Minnesota Initiative
Foundation, a non-profit organization, since 2007. Vice
Chair of the Economic Club of Minnesota, since 2007. Co-Chair of the Committee for a Responsible Federal Budget, since 1995. Member of the Board of Trustees of
NorthStar Education Finance, Inc., a non-profit organization, from
2007-2022. Senior Fellow of the University of Minnesota Humphrey
Institute from 1995 to 2017. |
N/A |
| Name and
year of birth |
Position held and
length of service* |
Principal occupations during past five years or
longer |
Current other
public company
or
investment
company
directorships |
| James G.
Polisson
(Born 1959) |
Trustee,
since 2018 |
Retired. Chief Marketing Officer, Source (ETF) UK Services, Ltd, from
2015 to 2017. From 2012 to 2015, Principal of The Polisson
Group, LLC, a management consulting, corporate advisory and
principal investing company. Chief Executive Officer and Managing
Director at Russell Investments, Global Exchange Traded
Funds from 2010 to 2012. Managing Director of Barclays
Global Investors from 1998 to 2010 and Global Chief Marketing Officer for
iShares and Barclays Global Investors from 2000 to 2010.
Trustee of the San Francisco Mechanics’ Institute, a non- profit organization, from 2013 to 2015. Board member of the Russell Exchange Traded Fund Trust
from 2011 to 2012. Director of Barclays Global Investors Holdings
Deutschland GmbH from 2006 to 2009. Mr. Polisson is an
attorney and has a retired status with the Massachusetts and District of Columbia Bar Associations. |
N/A |
| Pamela Wheelock (Born 1959) |
Trustee, since January 2020; previously Trustee from January 2018 to July 2019 |
Retired. Executive and Senior Financial leadership positions in the public, private and nonprofit
sectors. Interim President and CEO, McKnight Foundation, 2020. Interim
Commissioner, Minnesota Department of Human Services, 2019.
Chief Operating Officer, Twin Cities Habitat for Humanity,
2017-2019. Vice President for University Services, University of Minnesota, 2012- 2016. Interim President and CEO, Blue Cross and Blue Shield of Minnesota, 2011-2012. Executive
Vice-President and Chief Financial Officer, Minnesota Wild, 2002-2008.
Commissioner, Minnesota Department of Finance, 1999-2002.
Chair of the Board of Directors of Destination Medical Center
Corporation. Board member of the Minnesota Wild Foundation. |
N/A |
| * |
Length of service dates reflect the Trustee’s commencement of service with the Trust’s predecessor entities, where applicable. |
| Name and
year of birth |
Position held and
length of
service |
Principal occupations during past five years or
longer |
| Andrew Owen
(Born 1960) |
President,
since 2017 |
President and Chief Executive Officer of Allspring Funds Management, LLC
since 2017 and Head of Global Fund Governance of Allspring
Global Investments since 2022. Prior thereto, co-president of Galliard Capital Management, LLC, an affiliate of Allspring Funds Management, LLC, from 2019 to 2022 and Head of Affiliated
Managers, Allspring Global Investments, from 2014 to 2019 and Executive
Vice President responsible for marketing, investments and product
development for Allspring Funds Management, LLC, from 2009 to 2014. |
| Jeremy DePalma
(Born 1974) |
Treasurer,
since 2012
(for certain funds in
the Fund Complex);
since 2021 (for
the remaining funds
in the Complex) |
Senior Vice President of Allspring Funds Management, LLC since 2009.
Senior Vice President of Evergreen Investment Management
Company, LLC from 2008 to 2010 and head of the Fund Reporting and Control Team within Fund Administration from 2005 to 2010.
|
| Christopher Baker
(Born 1976) |
Chief Compliance
Officer,
since 2022 |
Global Chief Compliance Officer for Allspring Global Investments since
2022. Prior thereto, Chief Compliance Officer for State
Street Global Advisors from 2018 to 2021. Senior Compliance Officer for the State Street divisions of Alternative Investment Solutions, Sector Solutions, and Global Marketing from 2015 to 2018. From 2010 to 2015
Vice President, Global Head of Investment and Marketing Compliance for State
Street Global Advisors. |
| Matthew Prasse (Born 1983) |
Chief Legal Officer, since 2022; Secretary, since 2021 |
Senior Counsel of the Allspring Legal Department since 2021. Senior Counsel of the Wells Fargo Legal Department
from 2018 to 2021. Previously, Counsel for Barings LLC from 2015 to 2018.
Prior to joining Barings, Associate at Morgan, Lewis & Bockius
LLP from 2008 to 2015. |


| 2 | |
| 6 | |
| 11 | |
| 12 | |
| 17 | |
| 19 | |
| 21 | |
| 23 | |
| 28 | |
| 34 | |
| 35 |


| Notice to Shareholders |
| Beginning in July 2024, the Fund will be required by the
Securities and Exchange Commission to send shareholders a paper copy of a
new tailored shareholder report in place of the full shareholder report that you are now receiving. The tailored shareholder report will contain concise information about the Fund, including certain expense and performance
information and fund statistics. If you wish to receive this new tailored shareholder
report electronically, please follow the instructions on the back cover
of this report. |
| Other information that is currently included in the shareholder
report, such as the Fund’s financial statements, will be available
online and upon request, free of charge, in paper or electronic format. |
| Investment objective |
The Fund seeks to achieve long-term capital appreciation and current income. |
| Manager |
Allspring Funds Management, LLC |
| Subadviser |
Allspring Global Investments, LLC |
| Portfolio manager |
Alison Shimada, Elaine Tse |
| Average annual total returns (%) as of October 31, 2023 | |||||||||
| |
|
Including sales charge |
Excluding sales charge |
Expense ratios1 (%) | |||||
| |
Inception date |
1 year |
5 year |
10 year |
1 year |
5 year |
10 year |
Gross |
Net2 |
| Class A (EQIAX) |
5-31-2012 |
3.42 |
-0.24 |
-0.02 |
9.72 |
0.95 |
0.57 |
1.70 |
1.55 |
| Class C (EQICX) |
5-31-2012 |
7.79 |
0.16 |
-0.03 |
8.79 |
0.16 |
-0.03 |
2.45 |
2.30 |
| Class R6 (EQIRX)3 |
9-30-2015 |
– |
– |
– |
10.10 |
1.33 |
0.99 |
1.27 |
1.17 |
| Administrator Class (EQIDX) |
5-31-2012 |
– |
– |
– |
9.75 |
1.03 |
0.72 |
1.62 |
1.45 |
| Institutional Class (EQIIX) |
5-31-2012 |
– |
– |
– |
9.95 |
1.26 |
0.94 |
1.37 |
1.22 |
| MSCI EM Index (Net) (USD)4 |
– |
– |
– |
– |
10.80 |
1.59 |
1.19 |
– |
– |
| MSCI EM High Dividend Yield Index (Net) (USD)5
|
– |
– |
– |
– |
16.86 |
0.61 |
-0.25 |
– |
– |
| | |
| 1 |
Reflects the expense ratios as stated in the most recent prospectuses. The expense ratios shown are subject to change and may differ from the annualized expense ratios
shown in the Financial Highlights of this report. |
| 2 |
The manager has contractually committed through February 29, 2024, to waive fees and/or reimburse expenses to the extent necessary to cap total annual fund operating
expenses after fee waivers at 1.55% for Class A, 2.30% for Class C, 1.17%
for Class R6, 1.45% for Administrator Class and 1.22% for Institutional Class. Brokerage commissions, stamp duty fees, interest, taxes, acquired fund fees and expenses (if any), and extraordinary expenses are excluded from the expense caps. Prior to or after
the commitment expiration date, the caps may be increased or the
commitment to maintain the caps may be terminated only with the approval of the Board of Trustees. Without these caps, the Fund’s returns would have been lower. The expense ratio paid by an investor is the net expense ratio (the total annual fund operating
expenses after fee waivers) as stated in the
prospectuses. |
| 3 |
Historical performance shown for the Class R6 shares prior to their inception reflects the performance of the Institutional Class shares, and includes the higher
expenses applicable to the Institutional Class shares. If these expenses had not
been included, returns for the Class R6 shares would be higher. |
| 4 |
The Morgan Stanley Capital International (MSCI) Emerging Markets (EM) Index (Net) (USD) is a free-float-adjusted market-capitalization-weighted index that is designed to
measure the equity market performance of emerging markets. Source: MSCI. MSCI makes no express or implied warranties
or representations and shall have no liability whatsoever with respect to
any MSCI data contained herein. The MSCI data may not be further redistributed or used as a basis for other indices or any securities or financial products. This report is not approved, reviewed, or produced by MSCI. You cannot invest directly in an index. |
| 5 |
The MSCI EM High Dividend Yield Index (Net) (USD) is based on the MSCI EM Index, its parent index, and includes large and mid-cap stocks. The index is designed to
reflect the performance of equities in the parent index (excluding REITs)
with higher dividend income and quality characteristics than average dividend yields that are both sustainable and persistent. The index also applies quality screens and reviews 12-month past performance to omit stocks with potentially deteriorating fundamentals that
could force them to cut or reduce dividends. You cannot invest directly in an
index. |
| Growth of $10,000 investment as of October 31, 20231 |
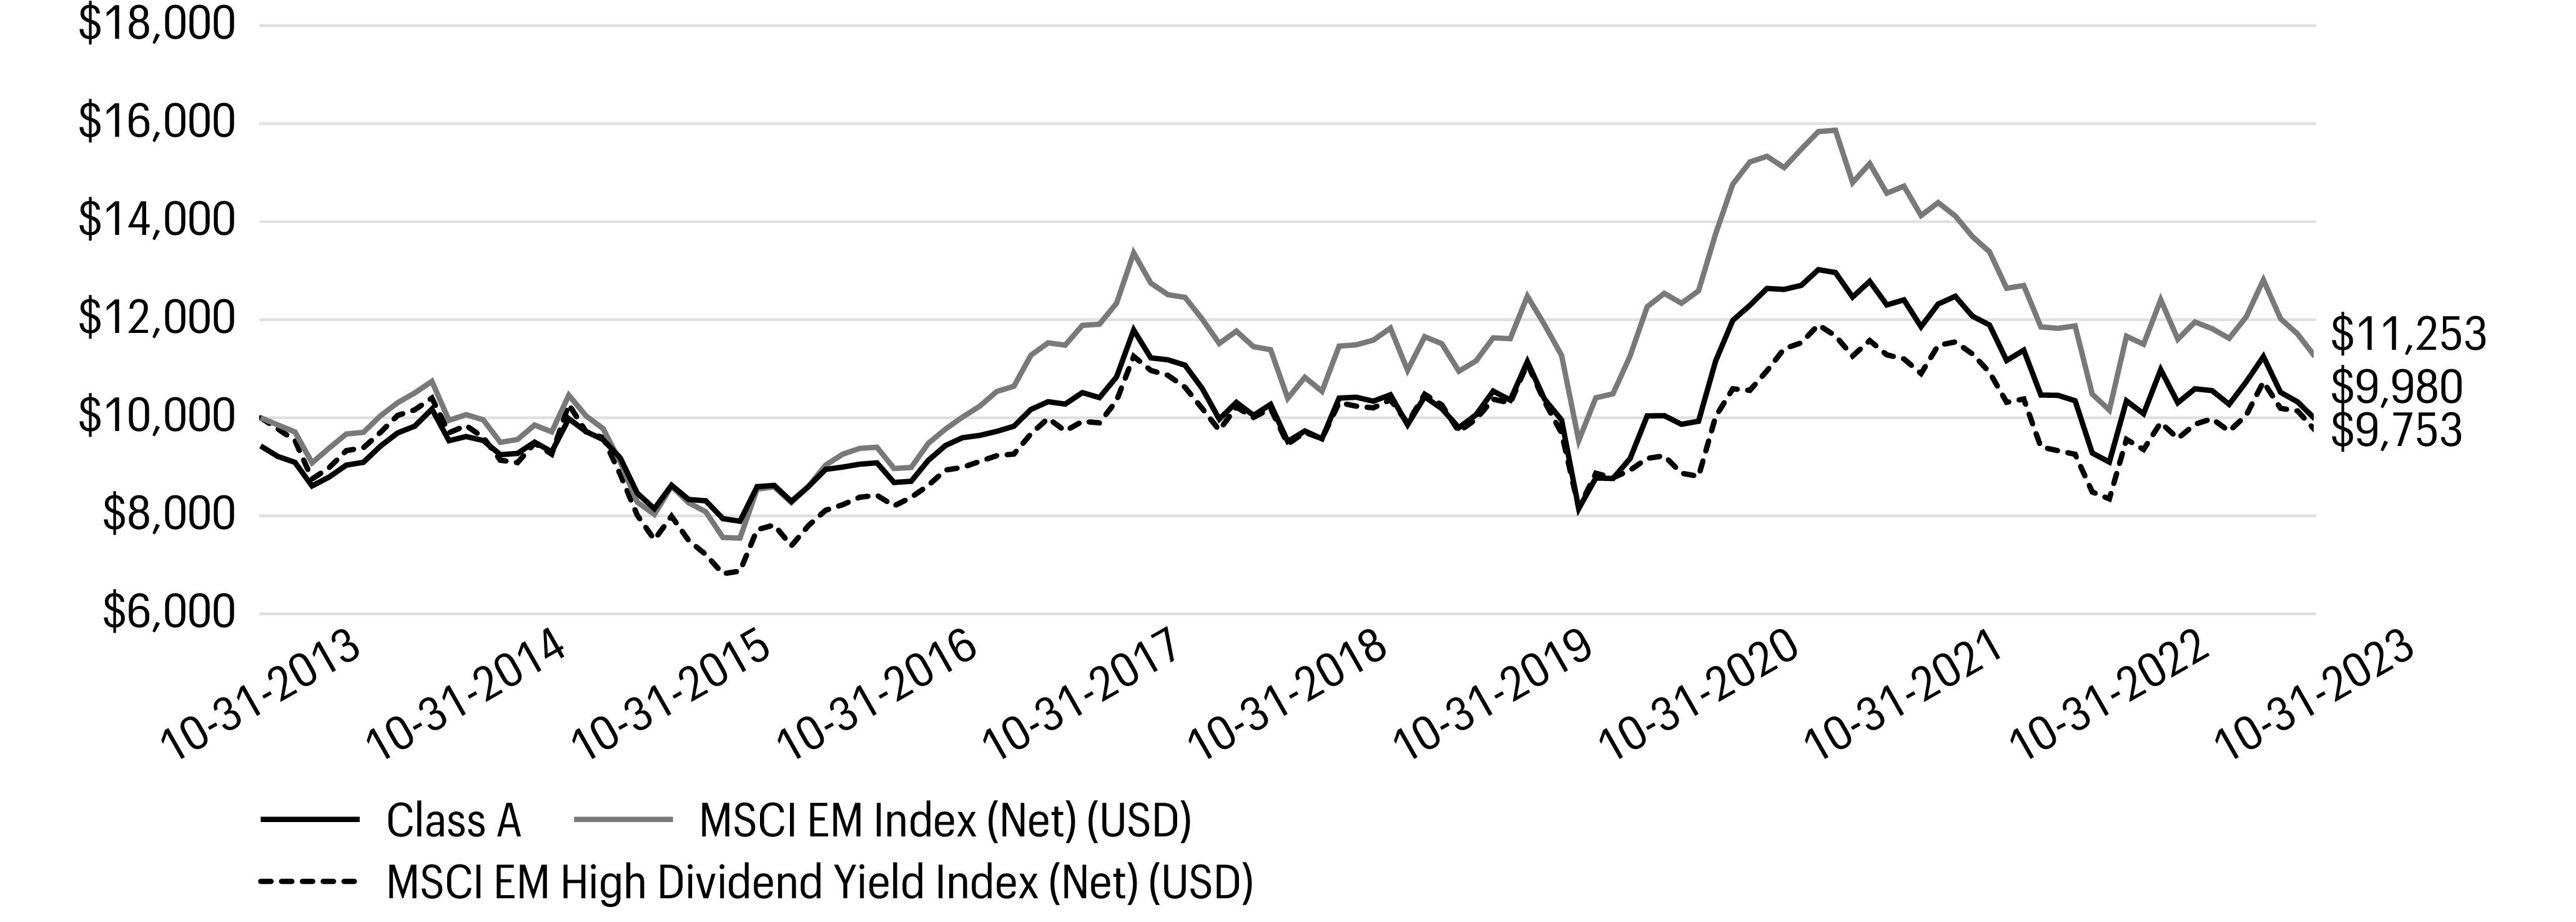
| 1 |
The chart compares the performance of Class A shares for the most recent ten years with the MSCI EM Index (Net) (USD) and MSCI EM High Dividend Yield Index (Net) (USD).
The chart assumes a hypothetical investment of $10,000 in Class A shares and
reflects all operating expenses and assumes the maximum initial sales charge of 5.75%. |
| Ten largest holdings (%) as of October 31, 20231 | |
| Taiwan Semiconductor Manufacturing Co. Ltd. |
7.72 |
| Tencent Holdings Ltd. |
4.30 |
| Samsung Electronics Co. Ltd., Preferred stock |
3.22 |
| Samsung Electronics Co. Ltd. |
3.12 |
| Alibaba Group Holding Ltd. |
3.00 |
| Lenovo Group Ltd. |
1.86 |
| Midea Group Co. Ltd. Class A |
1.76 |
| China Construction Bank Corp. Class H |
1.73 |
| Bajaj Auto Ltd. |
1.66 |
| Power Grid Corp. of India Ltd. |
1.66 |
| 1 |
Figures represent the percentage of the Fund’s net assets. Holdings are subject to change and may have changed since the date specified. |
| Sector allocation as of October 31, 20231 |
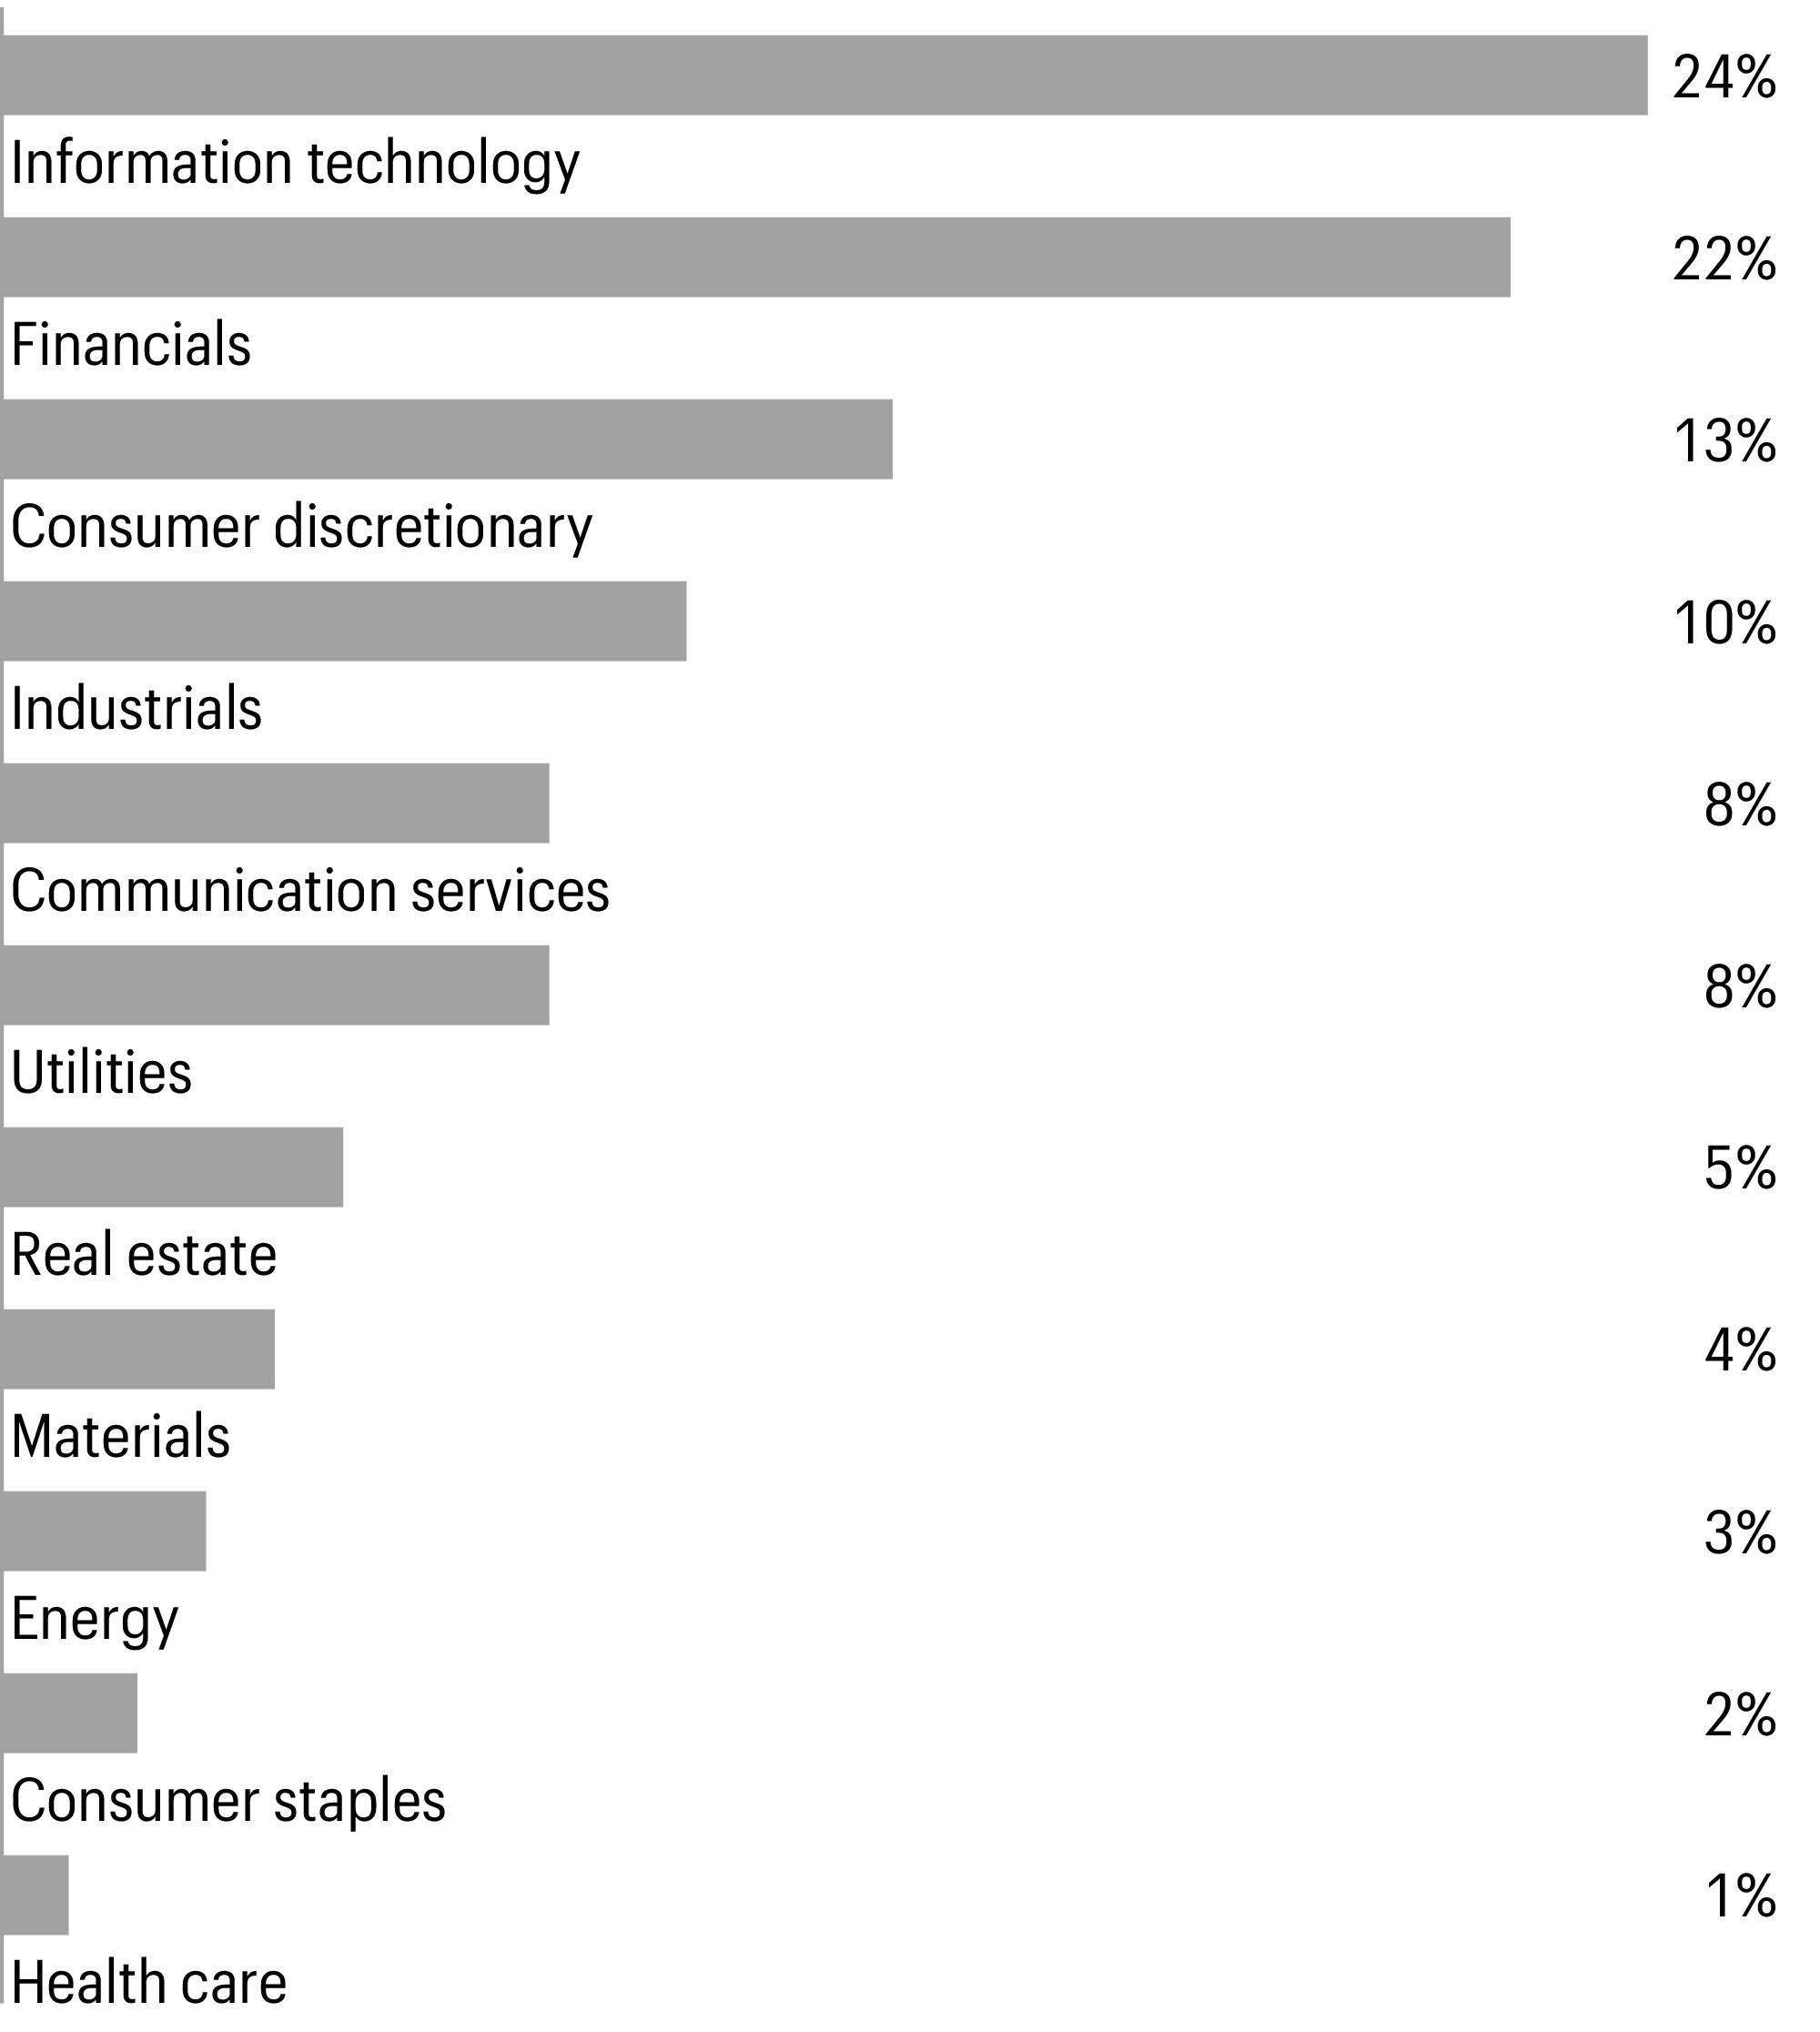
| 1 |
Figures represent the percentage of the Fund’s long-term investments. These amounts are subject to change and may have changed since the date specified. |
| Country allocation as of October 31, 20231 |
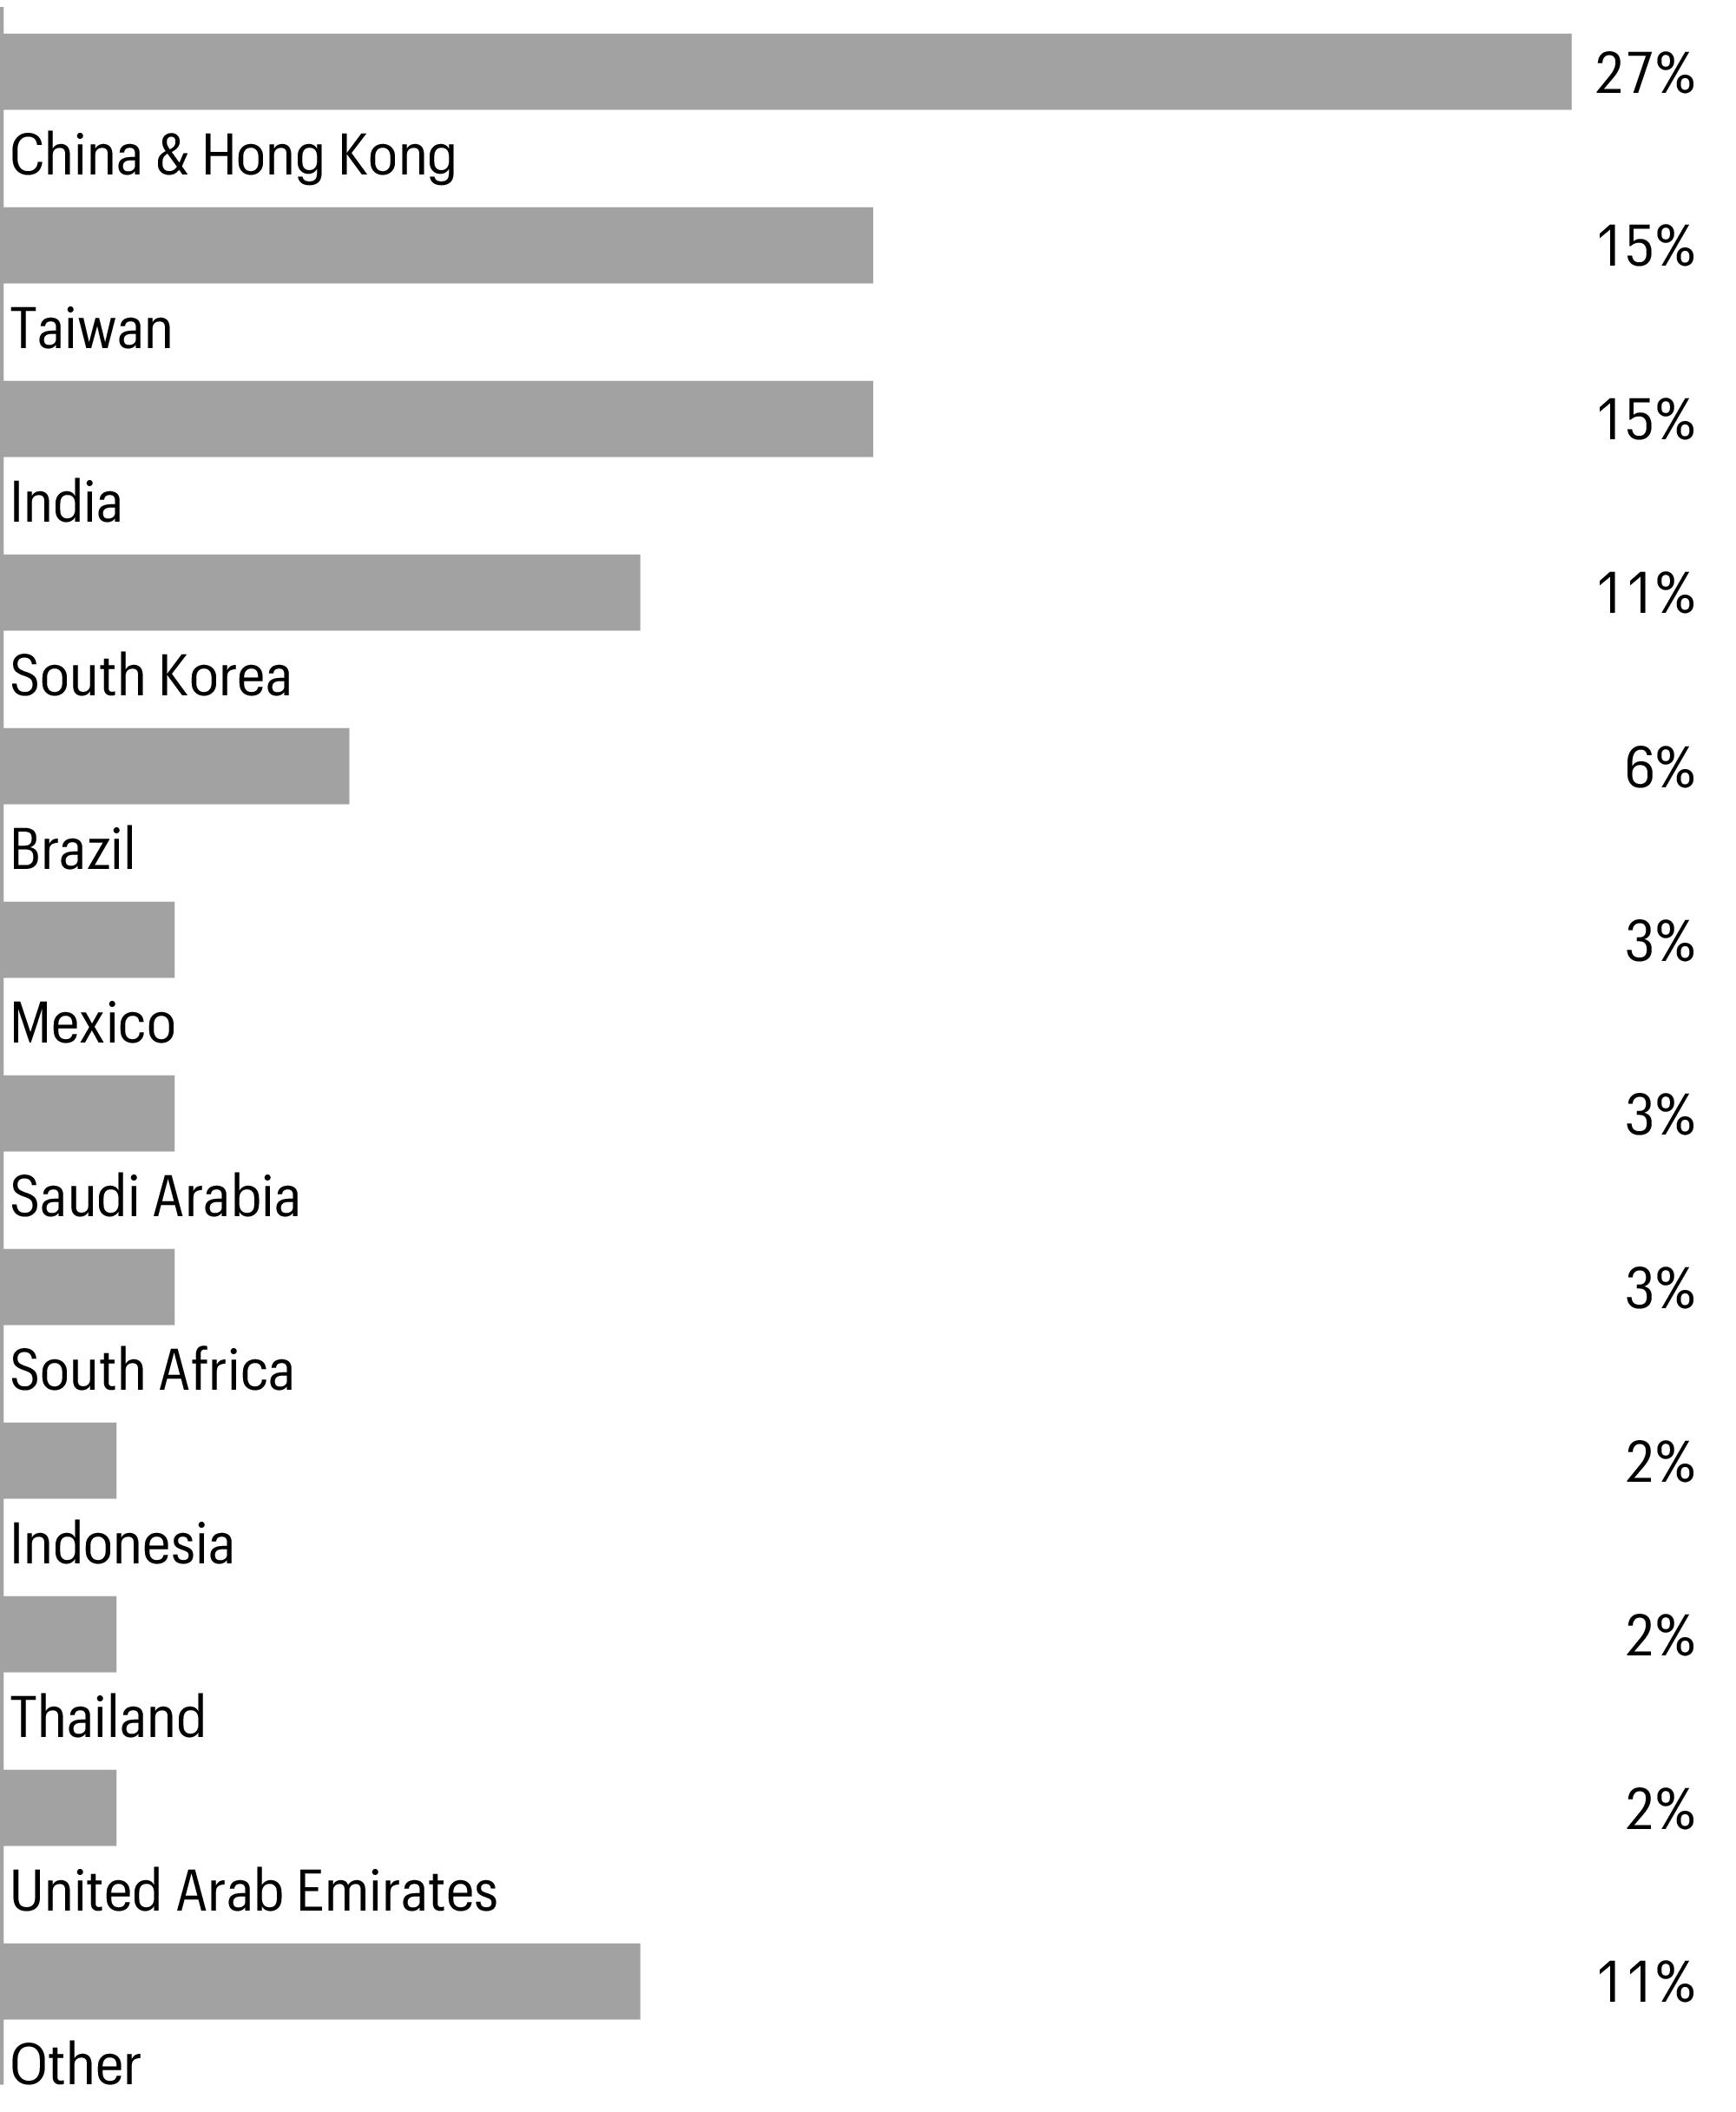
| 1 |
Figures represent the percentage of the Fund’s long-term investments. These amounts are subject to change and may have changed since the date specified. |
| |
Beginning account value 5-1-2023 |
Ending account value 10-31-2023 |
Expenses paid during the period1
|
Annualized net expense ratio |
| Class A |
|
|
|
|
| Actual |
$1,000.00 |
$945.65 |
$7.16 |
1.46 % |
| Hypothetical (5% return before expenses) |
$1,000.00 |
$1,017.85 |
$7.43 |
1.46 % |
| Class C |
|
|
|
|
| Actual |
$1,000.00 |
$941.61 |
$11.26 |
2.30 % |
| Hypothetical (5% return before expenses) |
$1,000.00 |
$1,013.61 |
$11.67 |
2.30 % |
| Class R6 |
|
|
|
|
| Actual |
$1,000.00 |
$946.68 |
$5.74 |
1.17 % |
| Hypothetical (5% return before expenses) |
$1,000.00 |
$1,019.31 |
$5.96 |
1.17 % |
| Administrator Class |
|
|
|
|
| Actual |
$1,000.00 |
$945.55 |
$7.11 |
1.45 % |
| Hypothetical (5% return before expenses) |
$1,000.00 |
$1,017.90 |
$7.38 |
1.45 % |
| Institutional Class |
|
|
|
|
| Actual |
$1,000.00 |
$946.35 |
$5.99 |
1.22 % |
| Hypothetical (5% return before expenses) |
$1,000.00
|
$1,019.06
|
$6.21
|
1.22 % |
| 1 |
Expenses paid is equal to the annualized net expense ratio of each class multiplied by the average account value over the period, multiplied by 184 divided by 365 (to
reflect the one-half-year period). |
| |
|
|
|
Shares |
Value | |
| Common stocks: 91.85% |
|
|
|
|
|
|
| Brazil: 5.43% |
|
|
|
|
|
|
| B3 SA - Brasil Bolsa Balcao (Financials, Capital markets) |
|
|
|
|
968,800 |
$2,132,926 |
| Banco BTG Pactual SA (Financials, Capital markets) |
|
|
|
|
463,072 |
2,718,685 |
| Cia Paranaense de Energia (Utilities, Electric utilities) |
|
|
|
|
1,335,500 |
2,082,021 |
| Embraer SA ADR (Industrials, Aerospace & defense)†
|
|
|
|
|
206,016 |
2,871,863 |
| Petroleo Brasileiro SA ADR (Energy, Oil, gas & consumable fuels) |
|
|
|
|
250,552 |
3,465,134 |
| Vale SA (Materials, Metals & mining) |
|
|
|
|
180,400 |
2,468,905 |
| |
|
|
|
|
|
15,739,534 |
| Chile: 1.10% |
|
|
|
|
|
|
| Cencosud SA (Consumer staples, Consumer staples distribution & retail) |
|
|
|
|
931,513 |
1,509,155 |
| Sociedad Quimica y Minera de Chile SA ADR (Industrials, Electrical equipment) |
|
|
|
|
34,523 |
1,670,913 |
| |
|
|
|
|
|
3,180,068 |
| China: 23.79% |
|
|
|
|
|
|
| Alibaba Group Holding Ltd. (Consumer discretionary, Broadline
retail)† |
|
|
|
|
846,200 |
8,711,691 |
| ANTA Sports Products Ltd. (Consumer discretionary, Textiles, apparel & luxury goods) |
|
|
|
|
179,000 |
2,024,398 |
| Baidu, Inc. Class A (Communication services, Interactive media &
services)† |
|
|
|
|
233,194 |
3,061,558 |
| Baoshan Iron & Steel Co. Ltd. Class A (Materials, Metals & mining) |
|
|
|
|
1,623,110 |
1,388,452 |
| China Communications Services Corp. Ltd. Class H (Industrials, Construction & engineering) |
|
|
|
|
4,304,000 |
1,760,449 |
| China Construction Bank Corp. Class H (Financials, Banks) |
|
|
|
|
8,854,000 |
5,007,450 |
| China Resources Land Ltd. (Real estate, Real estate management & development) |
|
|
|
|
505,000 |
1,890,269 |
| China State Construction International Holdings Ltd. (Industrials, Construction & engineering) |
|
|
|
|
2,482,000 |
2,658,568 |
| China Tower Corp. Ltd. Class H (Communication services, Diversified telecommunication services)144A |
|
|
|
|
24,086,000 |
2,246,036 |
| Chow Tai Fook Jewellery Group Ltd. (Consumer discretionary, Specialty retail) |
|
|
|
|
1,681,400 |
2,374,345 |
| ENN Energy Holdings Ltd. (Utilities, Gas utilities) |
|
|
|
|
284,600 |
2,155,885 |
| Hengli Petrochemical Co. Ltd. Class A (Materials,
Chemicals)† |
|
|
|
|
1,211,991 |
2,427,933 |
| Industrial & Commercial Bank of China Ltd. Class H (Financials, Banks) |
|
|
|
|
9,931,000 |
4,759,377 |
| Inner Mongolia Yili Industrial Group Co. Ltd. Class A (Consumer staples, Food products) |
|
|
|
|
579,178 |
2,171,227 |
| JD.com, Inc. Class A (Consumer discretionary, Broadline retail) |
|
|
|
|
178,150 |
2,264,849 |
| Midea Group Co. Ltd. Class A (Consumer discretionary, Household durables) |
|
|
|
|
707,158 |
5,115,603 |
| Ping An Insurance Group Co. of China Ltd. Class H (Financials, Insurance) |
|
|
|
|
601,000 |
3,048,558 |
| Sinopharm Group Co. Ltd. Class H (Health care, Health care providers & services) |
|
|
|
|
668,400 |
1,598,333 |
| Tencent Holdings Ltd. (Communication services, Interactive media & services)† |
|
|
|
|
337,200 |
12,479,344 |
| Zhejiang NHU Co. Ltd. Class A (Health care, Pharmaceuticals) |
|
|
|
|
848,621 |
1,876,352 |
| |
|
|
|
|
|
69,020,677 |
| Colombia: 0.69% |
|
|
|
|
|
|
| Ecopetrol SA ADR (Energy, Oil, gas & consumable fuels) |
|
|
|
|
169,782 |
2,005,126 |
| |
|
|
|
Shares |
Value | |
| Greece: 1.25% |
|
|
|
|
|
|
| Hellenic Telecommunications Organization SA (Communication services, Diversified telecommunication services) |
|
|
|
|
100,382 |
$1,406,993 |
| National Bank of Greece SA (Financials, Banks)† |
|
|
|
|
386,449 |
2,213,329 |
| |
|
|
|
|
|
3,620,322 |
| Hong Kong: 2.48% |
|
|
|
|
|
|
| ASMPT Ltd. (Information technology, Semiconductors & semiconductor equipment) |
|
|
|
|
213,800 |
1,810,789 |
| Lenovo Group Ltd. (Information technology, Technology hardware, storage & peripherals) |
|
|
|
|
4,630,000 |
5,388,076 |
| |
|
|
|
|
|
7,198,865 |
| India: 14.65% |
|
|
|
|
|
|
| Ashok Leyland Ltd. (Industrials, Machinery) |
|
|
|
|
1,767,827 |
3,564,244 |
| Bajaj Auto Ltd. (Consumer discretionary, Automobiles) |
|
|
|
|
75,668 |
4,826,923 |
| Bank of Baroda (Financials, Banks) |
|
|
|
|
834,904 |
1,968,636 |
| Embassy Office Parks REIT (Real estate, Office REITs) |
|
|
|
|
1,218,130 |
4,559,790 |
| GAIL India Ltd. (Utilities, Gas utilities) |
|
|
|
|
2,996,791 |
4,302,852 |
| Infosys Ltd. (Information technology, IT services) |
|
|
|
|
276,284 |
4,543,702 |
| LIC Housing Finance Ltd. (Financials, Financial services) |
|
|
|
|
724,832 |
3,999,671 |
| Mahanagar Gas Ltd. (Utilities, Gas utilities) |
|
|
|
|
328,767 |
4,076,677 |
| NHPC Ltd. (Utilities, Independent power and renewable electricity producers) |
|
|
|
|
6,146,245 |
3,706,415 |
| Power Finance Corp. Ltd. (Financials, Financial services) |
|
|
|
|
724,668 |
2,146,099 |
| Power Grid Corp. of India Ltd. (Utilities, Electric utilities) |
|
|
|
|
1,981,754 |
4,813,156 |
| |
|
|
|
|
|
42,508,165 |
| Indonesia: 2.18% |
|
|
|
|
|
|
| Bank Mandiri Persero Tbk PT (Financials, Banks) |
|
|
|
|
10,763,300 |
3,845,211 |
| Bank Negara Indonesia Persero Tbk PT (Financials, Banks) |
|
|
|
|
8,250,128 |
2,489,778 |
| |
|
|
|
|
|
6,334,989 |
| Luxembourg: 0.61% |
|
|
|
|
|
|
| Samsonite International SA (Consumer discretionary, Textiles, apparel & luxury goods)144A† |
|
|
|
|
568,500 |
1,760,711 |
| Malaysia: 0.47% |
|
|
|
|
|
|
| RHB Bank Bhd (Financials, Banks) |
|
|
|
|
1,163,932 |
1,363,316 |
| Mexico: 3.11% |
|
|
|
|
|
|
| America Movil SAB de CV ADR (Communication services, Wireless telecommunication services) |
|
|
|
|
76,407 |
1,268,356 |
| Corp. Inmobiliaria Vesta SAB de CV ADR (Real estate, Real estate management & development)† |
|
|
|
|
58,257 |
1,831,600 |
| Fibra Uno Administracion SA de CV (Real estate, Diversified REITs) |
|
|
|
|
944,900 |
1,436,558 |
| Grupo Aeroportuario del Sureste SAB de CV ADR (Industrials, Transportation infrastructure) |
|
|
|
|
7,034 |
1,520,821 |
| Grupo Financiero Banorte SAB de CV Class O (Financials, Banks) |
|
|
|
|
198,900 |
1,611,257 |
| Wal-Mart de Mexico SAB de CV (Consumer staples, Consumer staples distribution & retail) |
|
|
|
|
376,491 |
1,349,011 |
| |
|
|
|
|
|
9,017,603 |
| |
|
|
|
Shares |
Value | |
| Panama: 0.51% |
|
|
|
|
|
|
| Copa Holdings SA Class A (Industrials, Passenger airlines) |
|
|
|
|
18,254 |
$1,490,439 |
| Peru: 0.50% |
|
|
|
|
|
|
| Credicorp Ltd. (Financials, Banks) |
|
|
|
|
11,552 |
1,443,538 |
| Philippines: 0.55% |
|
|
|
|
|
|
| Bank of the Philippine Islands (Financials, Banks) |
|
|
|
|
895,337 |
1,585,854 |
| Poland: 1.32% |
|
|
|
|
|
|
| Bank Polska Kasa Opieki SA (Financials, Banks) |
|
|
|
|
106,345 |
3,231,524 |
| LPP SA (Consumer discretionary, Textiles, apparel & luxury goods) |
|
|
|
|
183 |
589,139
|
| |
|
|
|
|
|
3,820,663 |
| Qatar: 0.55% |
|
|
|
|
|
|
| Industries Qatar QSC (Industrials, Industrial conglomerates) |
|
|
|
|
478,998 |
1,609,120 |
| Russia: 0.00% |
|
|
|
|
|
|
| Alrosa PJSC (Acquired 5-6-2021, cost $1,726,284) (Materials, Metals & mining)♦†˃ |
|
|
|
|
1,142,750 |
0 |
| Saudi Arabia: 2.46% |
|
|
|
|
|
|
| Al Rajhi Bank (Financials, Banks) |
|
|
|
|
81,578 |
1,460,292 |
| Arabian Drilling Co. (Energy, Energy equipment &
services)† |
|
|
|
|
66,865 |
3,126,165 |
| Saudi Awwal Bank (Financials, Banks) |
|
|
|
|
151,983 |
1,357,072 |
| United International Transportation Co. (Industrials, Ground transportation) |
|
|
|
|
66,897 |
1,200,039 |
| |
|
|
|
|
|
7,143,568 |
| Singapore: 1.44% |
|
|
|
|
|
|
| BOC Aviation Ltd. (Industrials, Trading companies &
distributors)144A |
|
|
|
|
297,400 |
1,829,034 |
| Yangzijiang Shipbuilding Holdings Ltd. (Industrials, Machinery) |
|
|
|
|
2,200,800 |
2,332,811 |
| |
|
|
|
|
|
4,161,845 |
| South Africa: 2.44% |
|
|
|
|
|
|
| Bidvest Group Ltd. (Industrials, Industrial conglomerates) |
|
|
|
|
121,406 |
1,718,477 |
| Naspers Ltd. Class N (Consumer discretionary, Broadline
retail)† |
|
|
|
|
8,419 |
1,314,213 |
| Sanlam Ltd. (Financials, Insurance) |
|
|
|
|
436,530 |
1,531,105 |
| Standard Bank Group Ltd. (Financials, Banks) |
|
|
|
|
256,442 |
2,516,469 |
| |
|
|
|
|
|
7,080,264 |
| South Korea: 6.77% |
|
|
|
|
|
|
| Doosan Bobcat, Inc. (Industrials, Machinery) |
|
|
|
|
45,798 |
1,315,823 |
| Fila Holdings Corp. (Consumer discretionary, Textiles, apparel & luxury goods) |
|
|
|
|
62,623 |
1,658,207 |
| KB Financial Group, Inc. (Financials, Banks) |
|
|
|
|
72,442 |
2,761,361 |
| Kia Corp. (Consumer discretionary, Automobiles) |
|
|
|
|
34,541 |
1,973,377 |
| Samsung Electronics Co. Ltd. (Information technology, Technology hardware, storage & peripherals) |
|
|
|
|
181,766 |
9,047,380 |
| SK Telecom Co. Ltd. (Communication services, Wireless telecommunication services) |
|
|
|
|
78,688 |
2,869,510 |
| |
|
|
|
|
|
19,625,658 |
| |
|
|
|
Shares |
Value | |
| Taiwan: 14.83% |
|
|
|
|
|
|
| Advanced Energy Solution Holding Co. Ltd. (Industrials, Electrical equipment) |
|
|
|
|
72,000 |
$1,370,980 |
| Advantech Co. Ltd. (Information technology, Technology hardware, storage & peripherals) |
|
|
|
|
127,085 |
1,305,129 |
| ASE Technology Holding Co. Ltd. (Information technology, Semiconductors & semiconductor equipment) |
|
|
|
|
682,000 |
2,387,668 |
| Cathay Financial Holding Co. Ltd. (Financials,
Insurance)† |
|
|
|
|
1,454,000 |
1,973,150 |
| Chroma ATE, Inc. (Information technology, Electronic equipment, instruments & components) |
|
|
|
|
415,000 |
2,804,403 |
| E Ink Holdings, Inc. (Information technology, Electronic equipment, instruments & components) |
|
|
|
|
368,000 |
1,914,748 |
| MediaTek, Inc. (Information technology, Semiconductors & semiconductor equipment)† |
|
|
|
|
93,000 |
2,427,240 |
| momo.com, Inc. (Consumer discretionary, Broadline retail) |
|
|
|
|
83,900 |
1,383,211 |
| Realtek Semiconductor Corp. (Information technology, Semiconductors & semiconductor equipment) |
|
|
|
|
146,000 |
1,819,578 |
| Taiwan Semiconductor Manufacturing Co. Ltd. (Information technology, Semiconductors & semiconductor equipment) |
|
|
|
|
1,372,000 |
22,408,198 |
| Tripod Technology Corp. (Information technology, Electronic equipment, instruments & components) |
|
|
|
|
289,000 |
1,479,567 |
| Vanguard International Semiconductor Corp. (Information technology, Semiconductors & semiconductor equipment) |
|
|
|
|
805,000 |
1,748,235 |
| |
|
|
|
|
|
43,022,107 |
| Thailand: 1.81% |
|
|
|
|
|
|
| Bangkok Bank PCL (Financials, Banks) |
|
|
|
|
864,600 |
3,781,585 |
| Thai Beverage PCL (Consumer staples, Beverages) |
|
|
|
|
3,748,600 |
1,480,622 |
| |
|
|
|
|
|
5,262,207 |
| United Arab Emirates: 1.54% |
|
|
|
|
|
|
| Abu Dhabi Commercial Bank PJSC (Financials, Banks) |
|
|
|
|
640,281 |
1,399,798 |
| Aldar Properties PJSC (Real estate, Real estate management & development) |
|
|
|
|
2,164,692 |
3,064,633 |
| |
|
|
|
|
|
4,464,431 |
| United States: 1.37% |
|
|
|
|
|
|
| Southern Copper Corp. (Materials, Metals & mining) |
|
|
|
|
27,616 |
1,957,974 |
| Yum China Holdings, Inc. (Consumer discretionary, Hotels, restaurants & leisure) |
|
|
|
|
38,500 |
2,017,479 |
| |
|
|
|
|
|
3,975,453 |
| Total common stocks (Cost $248,705,253) |
|
|
|
|
|
266,434,523 |
| |
|
Dividend rate |
|
|
| |
| Preferred stocks: 4.74% |
|
|
|
|
|
|
| Brazil: 0.85% |
|
|
|
|
|
|
| Itau Unibanco Holding SA (Financials, Banks) |
|
0.00 |
|
|
464,000 |
2,468,286 |
| |
|
Dividend
rate |
|
Shares |
Value | |
| South Korea: 3.89% |
|
|
|
|
|
|
| LG Chem Ltd. (Materials, Chemicals) |
|
7.40 |
|
|
9,379 |
$1,958,859 |
| Samsung Electronics Co. Ltd. (Information technology, Technology hardware, storage & peripherals) |
|
0.27 |
|
|
233,946 |
9,340,225 |
| |
|
|
|
|
|
11,299,084 |
| Total preferred stocks (Cost $14,150,591) |
|
|
|
|
|
13,767,370 |
| |
|
Yield |
|
|
| |
| Short-term investments: 2.84% |
|
|
|
|
|
|
| Investment companies: 2.84% |
|
|
|
|
|
|
| Allspring Government Money Market Fund Select
Class♠∞ |
|
5.29 % |
|
|
8,229,693 |
8,229,693 |
| Total short-term investments (Cost $8,229,693) |
|
|
|
|
|
8,229,693 |
| Total investments in securities (Cost $271,085,537) |
99.43 % |
|
|
|
|
288,431,586 |
| Other assets and liabilities, net |
0.57 |
|
|
|
|
1,648,097 |
| Total net assets |
100.00 % |
|
|
|
|
$290,079,683 |
| † |
Non-income-earning security |
| 144A |
The security may be resold in transactions exempt from registration, normally to qualified institutional buyers, pursuant to Rule 144A under the Securities Act of
1933. |
| ♦ |
The security is fair valued in accordance with procedures approved by the Board of Trustees. |
| ˃ |
Restricted security as to resale, excluding Rule 144A securities. The Fund held a restricted security with current value of $0 (original cost of $1,726,284),
representing 0.00% of its net assets as of period end. |
| ♠ |
The issuer of the security is an affiliated person of the Fund as defined in the Investment Company Act of 1940. |
| ∞ |
The rate represents the 7-day annualized yield at period end. |
| Abbreviations: | |
| ADR |
American depositary receipt |
| REIT |
Real estate investment trust |
| |
Value, beginning of period |
Purchases |
Sales
proceeds |
Net
realized
gains
(losses) |
Net
change in
unrealized
gains
(losses) |
Value,
end of
period |
Shares,
end
of period |
Income
from
affiliated
securities |
| Short-term investments |
|
|
|
|
|
|
|
|
| Allspring Government Money Market Fund Select Class |
$10,320,765 |
$128,952,110 |
$(131,043,182 ) |
$0 |
$0 |
$8,229,693 |
8,229,693 |
$394,552 |
| Assets |
|
| Investments in unaffiliated securities, at value (cost $262,855,844) |
$280,201,893 |
| Investments in affiliated securities, at value (cost $8,229,693) |
8,229,693 |
| Cash |
182 |
| Foreign currency, at value (cost $830,014) |
828,702 |
| Receivable for investments sold |
2,069,320 |
| Receivable for dividends |
756,846 |
| Receivable for Fund shares sold |
63,251 |
| Prepaid expenses and other assets |
64,442 |
| Total assets |
292,214,329 |
| Liabilities |
|
| Payable for investments purchased |
1,105,801 |
| Contingent tax liability |
281,896 |
| Management fee payable |
216,328 |
| Payable for Fund shares redeemed |
208,251 |
| Custody and accounting fees payable |
180,564 |
| Administration fees payable |
34,474 |
| Distribution fees payable |
1,611 |
| Accrued expenses and other liabilities |
105,721 |
| Total liabilities |
2,134,646 |
| Total net assets |
$290,079,683 |
| Net assets consist of |
|
| Paid-in capital |
$335,964,218 |
| Total distributable loss |
(45,884,535
) |
| Total net assets |
$290,079,683 |
| Computation of net asset value and offering price per share |
|
| Net assets–Class A |
$62,296,446 |
| Shares outstanding–Class A1
|
6,431,604 |
| Net asset value per share–Class A |
$9.69 |
| Maximum offering price per share – Class A2 |
$10.28 |
| Net assets–Class C |
$2,485,823 |
| Shares outstanding–Class C1
|
258,101 |
| Net asset value per share–Class C |
$9.63 |
| Net assets–Class R6 |
$27,721,935 |
| Shares outstanding–Class R61
|
2,866,651 |
| Net asset value per share–Class R6 |
$9.67 |
| Net assets–Administrator Class |
$1,483,678 |
| Shares outstanding–Administrator
Class1 |
152,001 |
| Net asset value per share–Administrator Class |
$9.76 |
| Net assets–Institutional Class |
$196,091,801 |
| Shares outstanding–Institutional
Class1 |
20,213,316 |
| Net asset value per share–Institutional Class |
$9.70
|
| Investment income |
|
| Dividends (net of foreign withholdings taxes of $1,465,781) |
$11,483,008 |
| Income from non-cash dividends |
734,124 |
| Income from affiliated securities |
394,552 |
| Interest (net of foreign withholding taxes of $8) |
3,965 |
| Total investment income |
12,615,649 |
| Expenses |
|
| Management fee |
3,362,973 |
| Administration fees |
|
| Class A |
143,383 |
| Class C |
6,353 |
| Class R |
192 1 |
| Class R6 |
9,239 |
| Administrator Class |
2,281 |
| Institutional Class |
279,762 |
| Shareholder servicing fees |
|
| Class A |
173,229 |
| Class C |
7,645 |
| Class R |
229 1 |
| Administrator Class |
3,787 |
| Distribution fees |
|
| Class C |
22,935 |
| Class R |
185 1 |
| Custody and accounting fees |
208,506 |
| Professional fees |
126,827 |
| Registration fees |
78,241 |
| Shareholder report expenses |
54,258 |
| Trustees’ fees and expenses |
22,918 |
| Other fees and expenses |
67,485 |
| Total expenses |
4,570,428 |
| Less: Fee waivers and/or expense reimbursements |
|
| Fund-level |
(257,488 ) |
| Class A |
(66,380 ) |
| Class C |
(1,444 ) |
| Administrator Class |
(698 ) |
| Institutional Class |
(116,921 ) |
| Net expenses |
4,127,497 |
| Net investment income |
8,488,152 |
| Realized and unrealized gains (losses) on investments |
|
| Net realized losses on |
|
| Unaffiliated securities |
$(16,509,234 ) |
| Foreign currency and foreign currency translations |
(188,006 ) |
| Net realized losses on investments |
(16,697,240
) |
| Net change in unrealized gains (losses) on |
|
| Unaffiliated securities (net of deferred foreign capital gains tax of $256,660) |
37,655,331 |
| Foreign currency and foreign currency translations |
398 |
| Net change in unrealized gains (losses) on investments |
37,655,729 |
| Net realized and unrealized gains (losses) on investments |
20,958,489 |
| Net increase in net assets resulting from operations |
$29,446,641 |
| |
Year ended October 31, 2023 |
Year ended October 31, 2022 | ||
| Operations |
|
|
|
|
| Net investment income |
|
$8,488,152 |
|
$8,976,628 |
| Net realized losses on investments |
|
(16,697,240 ) |
|
(19,091,790 ) |
| Net change in unrealized gains (losses) on investments |
|
37,655,729 |
|
(91,809,626 ) |
| Net increase (decrease) in net assets resulting from operations |
|
29,446,641 |
|
(101,924,788 ) |
| Distributions to shareholders from |
|
|
|
|
| Net investment income and net realized gains |
|
|
|
|
| Class A |
|
(1,537,618 ) |
|
(2,272,980 ) |
| Class C |
|
(41,933 ) |
|
(105,651 ) |
| Class R |
|
(1,389
)1 |
|
(3,642 ) |
| Class R6 |
|
(816,800 ) |
|
(1,156,899 ) |
| Administrator Class |
|
(39,226 ) |
|
(63,004 ) |
| Institutional Class |
|
(5,482,344 ) |
|
(7,016,165 ) |
| Total distributions to shareholders |
|
(7,919,310
) |
|
(10,618,341 ) |
| Capital share transactions |
Shares |
|
Shares |
|
| Proceeds from shares sold |
|
|
|
|
| Class A |
355,960 |
3,665,775 |
478,576 |
5,382,246 |
| Class C |
18,026 |
184,185 |
17,333 |
182,650 |
| Class R |
2,528
1 |
25,872
1 |
2,890 |
32,427 |
| Class R6 |
209,687 |
2,143,968 |
81,243 |
849,396 |
| Administrator Class |
262,573 |
2,752,535 |
12,000 |
117,480 |
| Institutional Class |
5,327,777 |
54,723,173 |
6,508,814 |
72,889,767 |
| |
|
63,495,508 |
|
79,453,966 |
| Reinvestment of distributions |
|
|
|
|
| Class A |
142,319 |
1,466,445 |
195,730 |
2,176,934 |
| Class C |
4,035 |
41,577 |
9,051 |
101,754 |
| Class R |
136
1 |
1,389
1 |
323 |
3,590 |
| Class R6 |
64,003 |
657,488 |
84,772 |
942,060 |
| Administrator Class |
3,743 |
38,872 |
5,280 |
59,134 |
| Institutional Class |
504,072 |
5,197,163 |
601,019 |
6,657,509 |
| |
|
7,402,934 |
|
9,940,981 |
| Payment for shares redeemed |
|
|
|
|
| Class A |
(1,073,652 ) |
(11,016,635 ) |
(1,113,452 ) |
(12,636,350 ) |
| Class C |
(142,159 ) |
(1,443,334 ) |
(220,162 ) |
(2,489,013 ) |
| Class R |
(763
)1 |
(7,955
)1 |
(2,050 ) |
(22,845 ) |
| Class R6 |
(542,643 ) |
(5,625,702 ) |
(483,719 ) |
(5,843,316 ) |
| Administrator Class |
(308,193 ) |
(3,224,088 ) |
(17,837 ) |
(203,790 ) |
| Institutional Class |
(6,672,426 ) |
(68,199,395 ) |
(4,499,368 ) |
(50,418,552 ) |
| |
|
(89,517,109 ) |
|
(71,613,866 ) |
| |
Year ended October 31, 2023 |
Year ended October 31, 2022 | ||
| |
Shares |
|
Shares |
|
| Share conversions |
|
|
|
|
| Class A |
14,724 2 |
$159,851 2 |
0 |
$0 |
| Class R |
(14,702 )2
|
(159,851
)2 |
0 |
0 |
| |
|
0 |
|
0 |
| Net increase (decrease) in net assets resulting from capital share transactions |
|
(18,618,667
) |
|
17,781,081 |
| Total increase (decrease) in net assets |
|
2,908,664 |
|
(94,762,048 ) |
| Net assets |
|
|
|
|
| Beginning of period |
|
287,171,019 |
|
381,933,067 |
| End of period |
|
$290,079,683 |
|
$287,171,019 |
| |
Year ended October 31 | ||||
| Class A |
2023 |
2022 |
2021 |
2020 |
2019 |
| Net asset value, beginning of period |
$9.03 |
$12.67 |
$10.33 |
$11.21 |
$10.33 |
| Net investment income |
0.25
1 |
0.27
1 |
0.24 |
0.20 |
0.24 |
| Net realized and unrealized gains (losses) on investments |
0.64 |
(3.59 ) |
2.34 |
(0.85 ) |
0.86 |
| Total from investment operations |
0.89 |
(3.32 ) |
2.58 |
(0.65 ) |
1.10 |
| Distributions to shareholders from |
|
|
|
|
|
| Net investment income |
(0.23 ) |
(0.32 ) |
(0.24 ) |
(0.23 ) |
(0.22 ) |
| Net asset value, end of period |
$9.69 |
$9.03 |
$12.67 |
$10.33 |
$11.21 |
| Total
return2 |
9.72 % |
(26.67
)% |
24.93
% |
(5.83
)% |
10.78
% |
| Ratios to average net assets (annualized) |
|
|
|
|
|
| Gross expenses |
1.68 % |
1.70 % |
1.63 % |
1.65 % |
1.69 % |
| Net expenses |
1.51 % |
1.54 % |
1.54 % |
1.52 % |
1.62 % |
| Net investment income |
2.43 % |
2.34 % |
1.88 % |
2.10 % |
2.12 % |
| Supplemental data |
|
|
|
|
|
| Portfolio turnover rate |
68 % |
50 % |
73 % |
92 % |
73 % |
| Net assets, end of period (000s omitted) |
$62,296
|
$63,130 |
$94,152 |
$83,889 |
$20,017 |
| 1 |
Calculated based upon average shares outstanding |
| 2 |
Total return calculations do not include any sales charges. |
| |
Year ended October 31 | ||||
| Class C |
2023 |
2022 |
2021 |
2020 |
2019 |
| Net asset value, beginning of period |
$8.98 |
$12.59 |
$10.26 |
$11.15 |
$10.27 |
| Net investment income |
0.16
1 |
0.18
1 |
0.11 |
0.11 |
0.15 |
| Net realized and unrealized gains (losses) on investments |
0.64 |
(3.56 ) |
2.36 |
(0.85 ) |
0.87 |
| Total from investment operations |
0.80 |
(3.38 ) |
2.47 |
(0.74 ) |
1.02 |
| Distributions to shareholders from |
|
|
|
|
|
| Net investment income |
(0.15 ) |
(0.23 ) |
(0.14 ) |
(0.15 ) |
(0.14 ) |
| Net asset value, end of period |
$9.63 |
$8.98 |
$12.59 |
$10.26 |
$11.15 |
| Total
return2 |
8.79 % |
(27.27
)% |
24.00
% |
(6.69
)% |
10.01
% |
| Ratios to average net assets (annualized) |
|
|
|
|
|
| Gross expenses |
2.43 % |
2.43 % |
2.37 % |
2.40 % |
2.44 % |
| Net expenses |
2.30 % |
2.30 % |
2.30 % |
2.31 % |
2.37 % |
| Net investment income |
1.55 % |
1.55 % |
1.07 % |
1.03 % |
1.30 % |
| Supplemental data |
|
|
|
|
|
| Portfolio turnover rate |
68 % |
50 % |
73 % |
92 % |
73 % |
| Net assets, end of period (000s omitted) |
$2,486
|
$3,396 |
$7,203 |
$8,138 |
$11,958 |
| 1 |
Calculated based upon average shares outstanding |
| 2 |
Total return calculations do not include any sales charges. |
| |
Year ended October 31 | ||||
| Class R6 |
2023 |
2022 |
2021 |
2020 |
2019 |
| Net asset value, beginning of period |
$9.02 |
$12.67 |
$10.33 |
$11.23 |
$10.34 |
| Net investment income |
0.28
1 |
0.31
1 |
0.26 |
0.24 |
0.31
1 |
| Net realized and unrealized gains (losses) on investments |
0.64 |
(3.59 ) |
2.37 |
(0.87 ) |
0.85 |
| Total from investment operations |
0.92 |
(3.28 ) |
2.63 |
(0.63 ) |
1.16 |
| Distributions to shareholders from |
|
|
|
|
|
| Net investment income |
(0.27 ) |
(0.37 ) |
(0.29 ) |
(0.27 ) |
(0.27 ) |
| Net asset value, end of period |
$9.67 |
$9.02 |
$12.67 |
$10.33 |
$11.23 |
| Total return |
10.10 % |
(26.49
)% |
25.44
% |
(5.60
)% |
11.34
% |
| Ratios to average net assets (annualized) |
|
|
|
|
|
| Gross expenses |
1.25 % |
1.26 % |
1.19 % |
1.22 % |
1.26 % |
| Net expenses |
1.17 % |
1.17 % |
1.15 % |
1.16 % |
1.17 % |
| Net investment income |
2.77 % |
2.72 % |
2.00 % |
2.27 % |
2.81 % |
| Supplemental data |
|
|
|
|
|
| Portfolio turnover rate |
68 % |
50 % |
73 % |
92 % |
73 % |
| Net assets, end of period (000s omitted) |
$27,722
|
$28,296 |
$43,761 |
$73,969 |
$83,481 |
| 1 |
Calculated based upon average shares outstanding |
| |
Year ended October 31 | ||||
| Administrator Class |
2023 |
2022 |
2021 |
2020 |
2019 |
| Net asset value, beginning of period |
$9.10 |
$12.78 |
$10.41 |
$11.31 |
$10.41 |
| Net investment income |
0.26
1 |
0.28
1 |
0.22
1 |
0.20
1 |
0.25
1 |
| Net realized and unrealized gains (losses) on investments |
0.64 |
(3.63 ) |
2.40 |
(0.87 ) |
0.89 |
| Total from investment operations |
0.90 |
(3.35 ) |
2.62 |
(0.67 ) |
1.14 |
| Distributions to shareholders from |
|
|
|
|
|
| Net investment income |
(0.24 ) |
(0.33 ) |
(0.25 ) |
(0.23 ) |
(0.24 ) |
| Net asset value, end of period |
$9.76 |
$9.10 |
$12.78 |
$10.41 |
$11.31 |
| Total return |
9.75 % |
(26.65
)% |
25.03
% |
(5.89
)% |
11.01
% |
| Ratios to average net assets (annualized) |
|
|
|
|
|
| Gross expenses |
1.57 % |
1.55 % |
1.52 % |
1.56 % |
1.61 % |
| Net expenses |
1.45 % |
1.43 % |
1.45 % |
1.45 % |
1.45 % |
| Net investment income |
2.48 % |
2.44 % |
1.75 % |
1.92 % |
2.24 % |
| Supplemental data |
|
|
|
|
|
| Portfolio turnover rate |
68 % |
50 % |
73 % |
92 % |
73 % |
| Net assets, end of period (000s omitted) |
$1,484
|
$1,765 |
$2,484 |
$3,842 |
$4,686 |
| 1 |
Calculated based upon average shares outstanding |
| |
Year ended October 31 | ||||
| Institutional Class |
2023 |
2022 |
2021 |
2020 |
2019 |
| Net asset value, beginning of period |
$9.05 |
$12.70 |
$10.35 |
$11.24 |
$10.35 |
| Net investment income |
0.28
1 |
0.30
1 |
0.28 |
0.19
1 |
0.28 |
| Net realized and unrealized gains (losses) on investments |
0.63 |
(3.60 ) |
2.35 |
(0.82 ) |
0.87 |
| Total from investment operations |
0.91 |
(3.30 ) |
2.63 |
(0.63 ) |
1.15 |
| Distributions to shareholders from |
|
|
|
|
|
| Net investment income |
(0.26 ) |
(0.35 ) |
(0.28 ) |
(0.26 ) |
(0.26 ) |
| Net asset value, end of period |
$9.70 |
$9.05 |
$12.70 |
$10.35 |
$11.24 |
| Total return |
9.95 % |
(26.44
)% |
25.27
% |
(5.63
)% |
11.24
% |
| Ratios to average net assets (annualized) |
|
|
|
|
|
| Gross expenses |
1.35 % |
1.37 % |
1.30 % |
1.33 % |
1.36 % |
| Net expenses |
1.22 % |
1.22 % |
1.22 % |
1.22 % |
1.22 % |
| Net investment income |
2.72 % |
2.68 % |
2.21 % |
1.85 % |
2.54 % |
| Supplemental data |
|
|
|
|
|
| Portfolio turnover rate |
68 % |
50 % |
73 % |
92 % |
73 % |
| Net assets, end of period (000s omitted) |
$196,092
|
$190,468 |
$234,185 |
$202,705 |
$471,068 |
| 1 |
Calculated based upon average shares outstanding |
| Gross unrealized gains |
$36,434,830 |
| Gross unrealized losses |
(24,969,321 ) |
| Net unrealized gains |
$11,465,509 |
| |
Quoted prices
(Level 1) |
Other significant
observable inputs
(Level 2) |
Significant
unobservable inputs
(Level 3) |
Total |
| Assets |
|
|
|
|
| Investments in: |
|
|
|
|
| Common stocks |
|
|
|
|
| Brazil |
$15,739,534
|
$0
|
$0 |
$15,739,534
|
| Chile |
3,180,068 |
0 |
0 |
3,180,068 |
| China |
0 |
69,020,677 |
0 |
69,020,677 |
| Colombia |
2,005,126 |
0 |
0 |
2,005,126 |
| Greece |
0 |
3,620,322 |
0 |
3,620,322 |
| Hong Kong |
0 |
7,198,865 |
0 |
7,198,865 |
| India |
8,636,467 |
33,871,698 |
0 |
42,508,165 |
| Indonesia |
0 |
6,334,989 |
0 |
6,334,989 |
| Luxembourg |
0 |
1,760,711 |
0 |
1,760,711 |
| Malaysia |
0 |
1,363,316 |
0 |
1,363,316 |
| Mexico |
9,017,603 |
0 |
0 |
9,017,603 |
| Panama |
1,490,439 |
0 |
0 |
1,490,439 |
| Peru |
1,443,538 |
0 |
0 |
1,443,538 |
| Philippines |
1,585,854 |
0 |
0 |
1,585,854 |
| Poland |
589,139 |
3,231,524 |
0 |
3,820,663 |
| Qatar |
0 |
1,609,120 |
0 |
1,609,120 |
| Russia |
0 |
0 |
0 |
0 |
| Saudi Arabia |
3,126,165 |
4,017,403 |
0 |
7,143,568 |
| Singapore |
0 |
4,161,845 |
0 |
4,161,845 |
| South Africa |
7,080,264 |
0 |
0 |
7,080,264 |
| South Korea |
0 |
19,625,658 |
0 |
19,625,658 |
| Taiwan |
0 |
43,022,107 |
0 |
43,022,107 |
| Thailand |
0 |
5,262,207 |
0 |
5,262,207 |
| United Arab Emirates |
4,464,431 |
0 |
0 |
4,464,431 |
| United States |
1,957,974 |
2,017,479 |
0 |
3,975,453 |
| Preferred stocks |
|
|
|
|
| Brazil |
2,468,286 |
0 |
0 |
2,468,286 |
| South Korea |
0 |
11,299,084 |
0 |
11,299,084 |
| Short-term investments |
|
|
|
|
| Investment companies |
8,229,693 |
0 |
0 |
8,229,693 |
| Total assets |
$71,014,581 |
$217,417,005 |
$0 |
$288,431,586 |
| Average daily net assets |
Management fee |
| First $1 billion |
1.050 % |
| Next $1 billion |
1.025 |
| Next $2 billion |
1.000 |
| Next $1 billion |
0.975 |
| Next $3 billion |
0.965 |
| Next $2 billion |
0.955 |
| Over $10 billion |
0.945 |
| |
Class-level
administration fee |
| Class A |
0.20 % |
| Class C |
0.20 |
| Class R |
0.21 |
| Class R6 |
0.03 |
| Administrator Class |
0.13 |
| Institutional Class |
0.13 |
| |
EXPENSE RATIO CAPS |
| Class A |
1.55 % |
| Class C |
2.30 |
| Class R6 |
1.17 |
| Administrator Class |
1.45 |
| Institutional Class |
1.22 |
| Undistributed
ordinary
income |
Unrealized
gains |
Capital loss
carryforward |
| $774,508 |
$11,443,011 |
$(58,102,053 ) |

| Creditable
foreign taxes
paid |
Per share
amount |
Foreign
income as % of
ordinary income
distributions |
| $1,310,056 |
$0.0438 |
100 % |
| Name and
year of birth |
Position held and
length of service* |
Principal occupations during past five years or
longer |
Current other
public company
or
investment
company
directorships |
| William R.
Ebsworth
(Born 1957) |
Trustee,
since 2015 |
Retired. From 1984 to 2013, equities analyst, portfolio manager, research
director and chief investment officer at Fidelity
Management and Research Company in Boston, Tokyo, and Hong
Kong, and retired in 2013 as Chief Investment Officer of Fidelity
Strategic Advisers, Inc. where he led a team of investment
professionals managing client assets. Prior thereto, Board member of Hong Kong Securities Clearing Co., Hong Kong Options Clearing Corp., the Thailand International
Fund, Ltd., Fidelity Investments Life Insurance Company, and Empire
Fidelity Investments Life Insurance Company. Audit
Committee Chair and Investment Committee Chair of the Vincent
Memorial Hospital Foundation (non-profit organization). Mr. Ebsworth is a CFA
charterholder. |
N/A |
| Jane A.
Freeman
(Born 1953) |
Trustee,
since 2015;
Chair Liaison,
since 2018 |
Retired. From 2012 to 2014 and 1999 to 2008, Chief Financial Officer of
Scientific Learning Corporation. From 2008 to 2012, Ms.
Freeman provided consulting services related to strategic
business projects. Prior to 1999, Portfolio Manager at Rockefeller &
Co. and Scudder, Stevens & Clark. Board member of the
Harding Loevner Funds from 1996 to 2014, serving as both Lead
Independent Director and chair of the Audit Committee. Board member of
the Russell Exchange Traded Funds Trust from 2011 to 2012
and the chair of the Audit Committee. Ms. Freeman is also an
inactive Chartered Financial Analyst. |
N/A |
| Isaiah
Harris, Jr.
(Born 1952) |
Trustee,
since 2009;
Audit Committee
Chair,
since 2019 |
Retired. Member of the Advisory Board of CEF of East Central Florida.
Chairman of the Board of CIGNA Corporation from 2009 to
2021, and Director from 2005 to 2008. From 2003 to 2011,
Director of Deluxe Corporation. Prior thereto, President and CEO of
BellSouth Advertising and Publishing Corp. from 2005 to
2007, President and CEO of BellSouth Enterprises from 2004 to
2005 and President of BellSouth Consumer Services from 2000 to 2003.
Emeritus member of the Iowa State University Foundation
Board of Governors. Emeritus Member of the Advisory board of
Iowa State University School of Business. Advisory Board Member, Palm
Harbor Academy (private school). Advisory Board Member,
Fellowship of Christian Athletes. Mr. Harris is a certified public
accountant (inactive status). |
N/A |
| David F.
Larcker
(Born 1950) |
Trustee,
since 2009 |
Distinguished Visiting Fellow at the Hoover Institution since 2022. James
Irvin Miller Professor of Accounting at the Graduate School
of Business (Emeritus), Stanford University, Director of the
Corporate Governance Research Initiative and Senior Faculty of The Rock
Center for Corporate Governance since 2006. From 2005 to
2008, Professor of Accounting at the Graduate School of
Business, Stanford University. Prior thereto, Ernst & Young Professor
of Accounting at The Wharton School, University of Pennsylvania
from 1985 to 2005. |
N/A |
| Olivia S.
Mitchell
(Born 1953) |
Trustee,
since 2006;
Nominating and
Governance
Committee Chair,
since 2018 |
International Foundation of Employee Benefit Plans Professor since 1993,
Wharton School of the University of Pennsylvania. Director
of Wharton’s Pension Research Council and Boettner Center on Pensions & Retirement Research, and Research Associate at the National Bureau of Economic
Research. Previously taught at Cornell University from 1978 to 1993.
|
N/A |
| Timothy J.
Penny
(Born 1951) |
Trustee,
since 1996;
Chair,
since 2018 |
President and Chief Executive Officer of Southern Minnesota Initiative
Foundation, a non-profit organization, since 2007. Vice
Chair of the Economic Club of Minnesota, since 2007. Co-Chair of the Committee for a Responsible Federal Budget, since 1995. Member of the Board of Trustees of
NorthStar Education Finance, Inc., a non-profit organization, from
2007-2022. Senior Fellow of the University of Minnesota Humphrey
Institute from 1995 to 2017. |
N/A |
| Name and
year of birth |
Position held and
length of service* |
Principal occupations during past five years or
longer |
Current other
public company
or
investment
company
directorships |
| James G.
Polisson
(Born 1959) |
Trustee,
since 2018 |
Retired. Chief Marketing Officer, Source (ETF) UK Services, Ltd, from
2015 to 2017. From 2012 to 2015, Principal of The Polisson
Group, LLC, a management consulting, corporate advisory and
principal investing company. Chief Executive Officer and Managing
Director at Russell Investments, Global Exchange Traded
Funds from 2010 to 2012. Managing Director of Barclays
Global Investors from 1998 to 2010 and Global Chief Marketing Officer for
iShares and Barclays Global Investors from 2000 to 2010.
Trustee of the San Francisco Mechanics’ Institute, a non- profit organization, from 2013 to 2015. Board member of the Russell Exchange Traded Fund Trust
from 2011 to 2012. Director of Barclays Global Investors Holdings
Deutschland GmbH from 2006 to 2009. Mr. Polisson is an
attorney and has a retired status with the Massachusetts and District of Columbia Bar Associations. |
N/A |
| Pamela Wheelock (Born 1959) |
Trustee, since January 2020; previously Trustee from January 2018 to July 2019 |
Retired. Executive and Senior Financial leadership positions in the public, private and nonprofit
sectors. Interim President and CEO, McKnight Foundation, 2020. Interim
Commissioner, Minnesota Department of Human Services, 2019.
Chief Operating Officer, Twin Cities Habitat for Humanity,
2017-2019. Vice President for University Services, University of Minnesota, 2012- 2016. Interim President and CEO, Blue Cross and Blue Shield of Minnesota, 2011-2012. Executive
Vice-President and Chief Financial Officer, Minnesota Wild, 2002-2008.
Commissioner, Minnesota Department of Finance, 1999-2002.
Chair of the Board of Directors of Destination Medical Center
Corporation. Board member of the Minnesota Wild Foundation. |
N/A |
| * |
Length of service dates reflect the Trustee’s commencement of service with the Trust’s predecessor entities, where applicable. |
| Name and
year of birth |
Position held and
length of
service |
Principal occupations during past five years or
longer |
| Andrew Owen
(Born 1960) |
President,
since 2017 |
President and Chief Executive Officer of Allspring Funds Management, LLC
since 2017 and Head of Global Fund Governance of Allspring
Global Investments since 2022. Prior thereto, co-president of Galliard Capital Management, LLC, an affiliate of Allspring Funds Management, LLC, from 2019 to 2022 and Head of Affiliated
Managers, Allspring Global Investments, from 2014 to 2019 and Executive
Vice President responsible for marketing, investments and product
development for Allspring Funds Management, LLC, from 2009 to 2014. |
| Jeremy DePalma
(Born 1974) |
Treasurer,
since 2012
(for certain funds in
the Fund Complex);
since 2021 (for
the remaining funds
in the Complex) |
Senior Vice President of Allspring Funds Management, LLC since 2009.
Senior Vice President of Evergreen Investment Management
Company, LLC from 2008 to 2010 and head of the Fund Reporting and Control Team within Fund Administration from 2005 to 2010.
|
| Christopher Baker
(Born 1976) |
Chief Compliance
Officer,
since 2022 |
Global Chief Compliance Officer for Allspring Global Investments since
2022. Prior thereto, Chief Compliance Officer for State
Street Global Advisors from 2018 to 2021. Senior Compliance Officer for the State Street divisions of Alternative Investment Solutions, Sector Solutions, and Global Marketing from 2015 to 2018. From 2010 to 2015
Vice President, Global Head of Investment and Marketing Compliance for State
Street Global Advisors. |
| Matthew Prasse (Born 1983) |
Chief Legal Officer, since 2022; Secretary, since 2021 |
Senior Counsel of the Allspring Legal Department since 2021. Senior Counsel of the Wells Fargo Legal Department
from 2018 to 2021. Previously, Counsel for Barings LLC from 2015 to 2018.
Prior to joining Barings, Associate at Morgan, Lewis & Bockius
LLP from 2008 to 2015. |


| 2 | |
| 6 | |
| 10 | |
| 11 | |
| 21 | |
| 22 | |
| 24 | |
| 25 | |
| 26 | |
| 30 | |
| 37 | |
| 38 |


| Notice to Shareholders |
| Beginning in July 2024, the Fund will be required by the
Securities and Exchange Commission to send shareholders a paper copy of a
new tailored shareholder report in place of the full shareholder report that you are now receiving. The tailored shareholder report will contain concise information about the Fund, including certain expense and performance
information and fund statistics. If you wish to receive this new tailored shareholder
report electronically, please follow the instructions on the back cover
of this report. |
| Other information that is currently included in the shareholder
report, such as the Fund’s financial statements, will be available
online and upon request, free of charge, in paper or electronic format. |
| Investment objective |
The Fund seeks long-term capital appreciation. |
| Manager |
Allspring Funds Management, LLC |
| Subadviser |
Allspring Global Investments, LLC |
| Portfolio managers |
Harindra de Silva, Ph.D., CFA, David Krider, CFA |
| Average annual total returns (%) as of October 31, 2023 | |||||||||
| |
|
Including sales charge |
Excluding sales charge |
Expense ratios1 (%) | |||||
| |
Inception date |
1 year |
5 year |
Since 1-6-2014 |
1 year |
5 year |
Since 1-6-2014 |
Gross |
Net2 |
| Class A (AGAQX)3 |
12-12-2014 |
-4.42 |
-0.32 |
2.96 |
1.42 |
0.87 |
3.58 |
2.33 |
2.24 |
| Class C (ASGCX)4 |
12-16-2022 |
0.11 |
0.81 |
3.55 |
1.11 |
0.81 |
3.55 |
3.08 |
2.99 |
| Class R6 (AGAWX)5 |
12-12-2014 |
– |
– |
– |
1.77 |
1.27 |
3.95 |
1.91 |
1.82 |
| Institutional Class (AGAZX)6
|
12-12-2014 |
– |
– |
– |
1.66 |
1.19 |
3.87 |
2.01 |
1.92 |
| MSCI World Index (Net) (USD)7
|
– |
– |
– |
– |
10.48 |
8.27 |
7.39 |
– |
– |
| Global Long/Short Equity Blended Index8 |
– |
– |
– |
– |
7.88 |
5.41 |
4.51 |
– |
– |
| ICE BofA 3-Month
U.S. Treasury Bill Index9 |
– |
– |
– |
– |
4.80 |
1.78 |
1.18 |
– |
– |
| | |
| 1 |
Reflects the expense ratios as stated in the most recent prospectuses. The expense ratios shown are subject to change and may differ from the annualized expense ratios
shown in the Financial Highlights of this report. |
| 2 |
The manager has contractually committed through February 28, 2025, to waive fees and/or reimburse expenses to the extent necessary to cap total annual fund operating
expenses after fee waivers at 1.72% for Class A, 2.47% for Class C, 1.30%
for Class R6 and 1.40% for Institutional Class. Brokerage commissions, stamp duty fees, interest, taxes, acquired fund fees and expenses (if any), expenses from dividends and interest on short positions, and extraordinary expenses are excluded from the expense caps.
Prior to or after the commitment expiration date, the caps may be
increased or the commitment to maintain the caps may be terminated only with the approval of the Board of Trustees. Without these caps, the Fund’s returns would have been lower. The expense ratio paid by an investor is the net expense ratio (the total annual
fund operating expenses after fee waivers) as stated in the
prospectuses. |
| 3 |
Historical performance shown for the Class A shares prior to December 16, 2022, is based on the performance of the Investor Class shares of the Fund’s predecessor,
361 Global Long/Short Equity Fund (the “Predecessor Fund”),
and for the period prior to December 12, 2014, is based on the performance of a predecessor account, the Analytic Global Long/Short Equity Fund, L.P., a limited partnership incepted on January 6, 2014 that was reorganized into the Predecessor Fund on December 12, 2014
(the “Predecessor Account”). Performance of the Predecessor
Account reflects the higher expenses applicable to it and returns would have been higher if adjusted to reflect Predecessor Fund expenses. The Predecessor Account was not registered under the Investment Company Act of 1940 (the “1940 Act”), and was not subject
to certain restrictions imposed by the 1940 Act. If the Predecessor Account had
been registered under the 1940 Act, performance may have been adversely affected. |
| 4 |
Historical performance for the Class C shares prior to their inception reflects the performance of the Class A shares and is not adjusted to reflect the higher expenses
applicable to the Class C shares. If these expenses had been included, returns
would be lower. |
| 5 |
Historical performance shown for the Class R6 shares prior to December 16, 2022 is based on the performance of Class Y shares of the Fund’s predecessor, 361 Global
Long/Short Equity Fund (the “Predecessor Fund”), and for the
period prior to December 12, 2014, is based on the performance of a predecessor account, the Analytic Global Long/Short Equity Fund, L.P., a limited partnership incepted on January 6, 2014 that was reorganized into the Predecessor Fund on December 12, 2014 (the
“Predecessor Account”). Performance of the Predecessor Account
reflects the higher expenses applicable to it and returns would have been higher if adjusted to reflect Predecessor Fund expenses. The Predecessor Account was not registered under the Investment Company Act of 1940 (the “1940 Act”), and was not subject to
certain restrictions imposed by the 1940 Act. If the Predecessor Account had been
registered under the 1940 Act, performance may have been adversely affected. |
| CFA® and Chartered Financial Analyst® are trademarks owned by CFA Institute. |
| Growth of $10,000 investment as of October 31, 20231 |
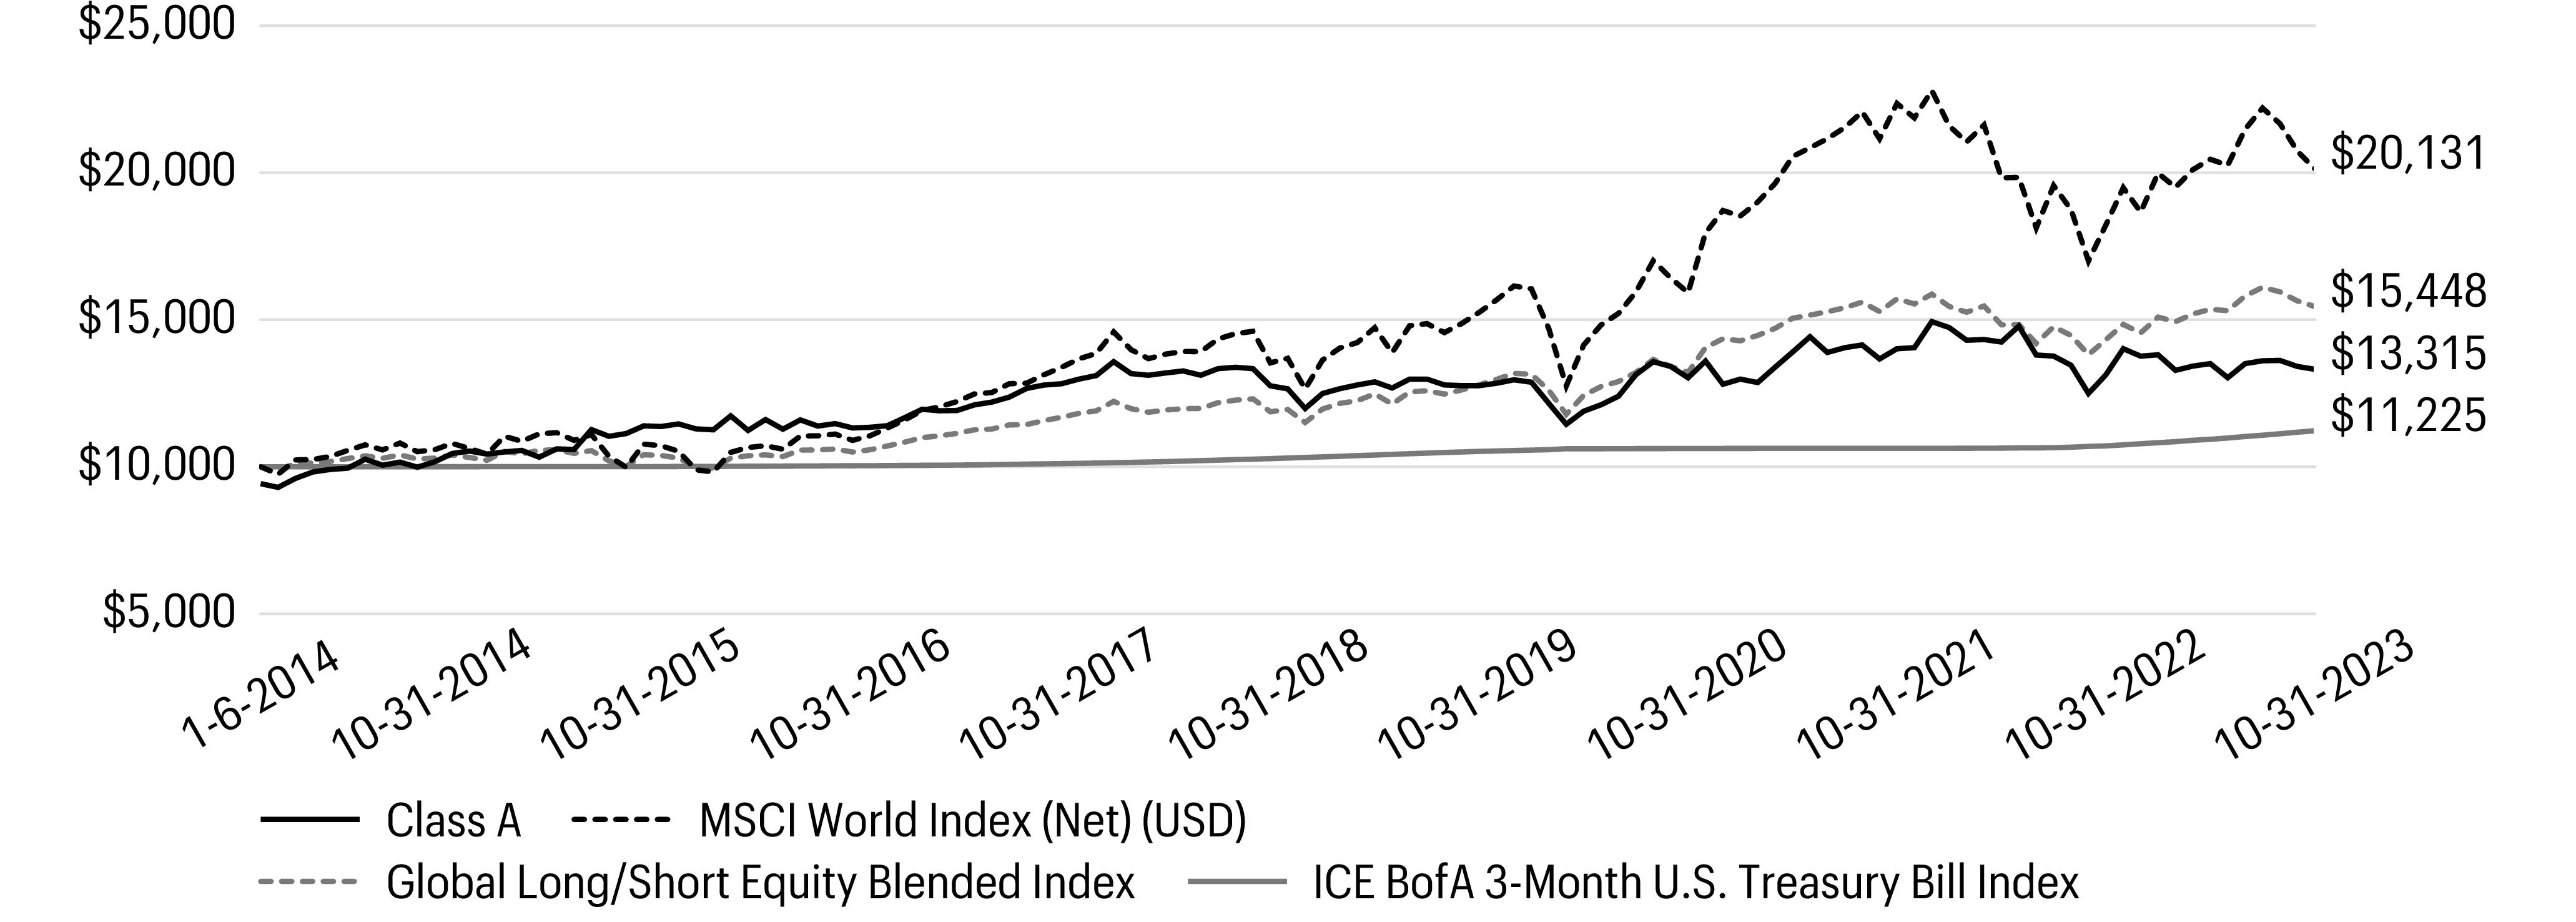
| 1 |
The chart compares the performance of Class A shares since January 6, 2014 with the MSCI World Index (Net) (USD), Global Long/Short Equity Blended Index and
ICE BofA 3-Month U.S. Treasury Bill Index. The chart assumes a
hypothetical investment of $10,000 in Class A shares and reflects all operating expenses and assumes the maximum initial sales charge of 5.75%. |
| Footnotes continued from previous page | |
| 6 |
Historical performance shown for the Institutional Class shares prior to December 16, 2022, is based on the performance of Class I shares of the Fund’s
predecessor, 361 Global Long/Short Equity Fund (the “Predecessor
Fund”), and for the period prior to December 12, 2014, is based on the performance of a predecessor account, the Analytic Global Long/Short Equity Fund, L.P., a limited partnership incepted on January 6, 2014 that was reorganized into the Predecessor Fund on December 12, 2014
(the “Predecessor Account”). Performance of the Predecessor
Account reflects the higher expenses applicable to it and returns would have been higher if adjusted to reflect Predecessor Fund expenses. The Predecessor Account was not registered under the Investment Company Act of 1940 (the “1940 Act”) and was not subject
to certain restrictions imposed by the 1940 Act. If the Predecessor Account had
been registered under the 1940 Act, performance may have been adversely affected. |
| 7 |
The Morgan Stanley Capital International (MSCI) World Index (Net) (USD) is a free-float-adjusted market-capitalization-weighted index that is designed to measure the
equity market performance of developed markets. Source: MSCI. MSCI makes no express or implied warranties
or representations and shall have no liability whatsoever with respect to
any MSCI data contained herein. The MSCI data may not be further redistributed or used as a basis for other indices or any securities or financial products. This report is not approved, reviewed, or produced by MSCI. You cannot invest directly in an index. |
| 8 |
Source: Allspring Funds Management, LLC. The Global Long/Short Equity Blended Index is composed of 50% of the MSCI World Index (Net) (USD) and 50% of the ICE BofA
3-Month U.S. Treasury Bill Index. You cannot invest directly in an
index. |
| 9 |
The ICE BofA 3-Month U.S. Treasury Bill Index is an unmanaged index that is comprised of a single U.S. Treasury issue with approximately three months to final maturity,
purchased at the beginning of each month and held for one full month. You cannot
invest directly in an index. Copyright 2023. ICE Data Indices, LLC. All rights reserved. |
| Ten largest Long Positions (%) as of October 31, 20231 | |
| Gilead Sciences, Inc. |
2.87 |
| Verizon Communications, Inc. |
2.76 |
| Kimberly-Clark Corp. |
2.69 |
| Apple, Inc. |
2.47 |
| CK Hutchison Holdings Ltd. |
2.38 |
| CVS Health Corp. |
2.11 |
| Chubu Electric Power Co., Inc. |
1.93 |
| Lockheed Martin Corp. |
1.91 |
| Alphabet, Inc. Class C |
1.86 |
| Alphabet, Inc. Class A |
1.85 |
| 1 |
Figures represent the percentage of the Fund’s net assets. Holdings are subject to change and may have changed since the date specified. |
| Five largest short positions (%) as of October 31, 20231 | |
| Eisai Co. Ltd. |
(1.24 ) |
| Airbus SE |
(1.22 ) |
| Western Digital Corp. |
(1.14 ) |
| Edenred SE |
(1.12 ) |
| Cellnex Telecom SA |
(1.03 ) |
| 1 |
Figures represent the percentage of the Fund’s net assets. Holdings are subject to change and may have changed since the date specified. |
| Sector Allocation for Long and Short positions as of October 31, 20231 | ||
| |
Long (%) |
Short (%) |
| Industrials |
18 |
(13 ) |
| Consumer staples |
14 |
(1 ) |
| Health care |
13 |
(17 ) |
| Information technology |
12 |
(9 ) |
| Financials |
11 |
(11 ) |
| Communication services |
10 |
(15 ) |
| Consumer discretionary |
9 |
(10 ) |
| Materials |
5 |
(6 ) |
| Energy |
3 |
(10 ) |
| Utilities |
3 |
(3 ) |
| Real estate |
2 |
(5 ) |
| 1 |
Figures represent the percentage of the Fund’s long and short positions. Allocations are subject to change and may have changed since the date specified. |
| Country Allocation for Long and Short positions as of October 31, 20231 | ||
| |
Long (%) |
Short (%) |
| United States |
60 |
(48 ) |
| Japan |
9 |
(8 ) |
| Germany |
6 |
(5 ) |
| United Kingdom |
6 |
(3 ) |
| Canada |
3 |
(5 ) |
| China & Hong Kong |
3 |
0 |
| France |
2 |
(5 ) |
| Italy |
2 |
(2 ) |
| Netherlands |
2 |
(8 ) |
| Spain |
2 |
(6 ) |
| Sweden |
2 |
(4 ) |
| Australia |
1 |
(1 ) |
| Denmark |
1 |
(1 ) |
| Switzerland |
1 |
0 |
| Curacao |
0 |
(3 ) |
| Luxembourg |
0 |
(1 ) |
| 1 |
Figures represent the percentage of the Fund’s long and short positions. Allocations are subject to change and may have changed since the date specified. |
| |
Beginning account value 5-1-2023 |
Ending account value 10-31-2023 |
Expenses paid during the period1
|
Annualized net expense ratio |
| Class A |
|
|
|
|
| Actual |
$1,000.00 |
$985.77 |
$12.46 |
2.49 % |
| Hypothetical (5% return before expenses) |
$1,000.00 |
$1,012.65 |
$12.63 |
2.49 % |
| Class C |
|
|
|
|
| Actual |
$1,000.00 |
$984.75 |
$12.96 |
2.59 % |
| Hypothetical (5% return before expenses) |
$1,000.00 |
$1,012.15 |
$13.14 |
2.59 % |
| Class R6 |
|
|
|
|
| Actual |
$1,000.00 |
$987.73 |
$10.67 |
2.13 % |
| Hypothetical (5% return before expenses) |
$1,000.00 |
$1,014.47 |
$10.82 |
2.13 % |
| Institutional Class |
|
|
|
|
| Actual |
$1,000.00 |
$986.81 |
$10.72 |
2.14 % |
| Hypothetical (5% return before expenses) |
$1,000.00
|
$1,014.42
|
$10.87
|
2.14 % |
| 1 |
Expenses paid is equal to the annualized net expense ratio of each class multiplied by the average account value over the period, multiplied by 184 divided by 365 (to
reflect the one-half-year period). |
| |
|
|
|
Shares |
Value | |
| Long positions: 106.83% Common stocks: 99.83% |
|
|
|
|
|
|
| Australia: 0.75% |
|
|
|
|
|
|
| Helia Group Ltd. (Financials, Financial services) |
|
|
|
|
216,707 |
$498,371 |
| Rio Tinto Ltd. (Materials, Metals & mining) |
|
|
|
|
42,101 |
3,144,863 |
| |
|
|
|
|
|
3,643,234 |
| Belgium: 0.25% |
|
|
|
|
|
|
| Ageas SA (Financials, Insurance) |
|
|
|
|
31,002 |
1,190,875 |
| Canada: 3.11% |
|
|
|
|
|
|
| Aecon Group, Inc. (Industrials, Construction & engineering) |
|
|
|
|
101,000 |
742,888 |
| Empire Co. Ltd. Class A (Consumer staples, Consumer staples distribution & retail) |
|
|
|
|
103,100 |
2,825,167 |
| Fairfax Financial Holdings Ltd. (Financials, Insurance) |
|
|
|
|
2,100 |
1,747,585 |
| Imperial Oil Ltd. (Energy, Oil, gas & consumable fuels) |
|
|
|
|
44,800 |
2,553,123 |
| Kinross Gold Corp. (Materials, Metals & mining) |
|
|
|
|
170,400 |
889,631 |
| Manulife Financial Corp. (Financials, Insurance) |
|
|
|
|
59,300 |
1,032,271 |
| Open Text Corp. (Information technology, Software) |
|
|
|
|
134,900 |
4,503,963 |
| Power Corp. of Canada (Financials, Insurance) |
|
|
|
|
16,200 |
390,295 |
| Spartan Delta Corp. (Energy, Oil, gas & consumable fuels) |
|
|
|
|
121,900 |
392,049 |
| |
|
|
|
|
|
15,076,972 |
| Denmark: 0.84% |
|
|
|
|
|
|
| Danske Bank AS (Financials, Banks) |
|
|
|
|
17,477 |
409,988 |
| Novo Nordisk AS Class B (Health care, Pharmaceuticals) |
|
|
|
|
37,858 |
3,652,396 |
| |
|
|
|
|
|
4,062,384 |
| France: 1.63% |
|
|
|
|
|
|
| Carrefour SA (Consumer staples, Consumer staples distribution & retail) |
|
|
|
|
112,222 |
1,967,416 |
| Eurazeo SE (Financials, Financial services) |
|
|
|
|
71,892 |
4,053,031 |
| Renault SA (Consumer discretionary, Automobiles) |
|
|
|
|
17,947 |
629,656 |
| Societe Generale SA (Financials, Banks) |
|
|
|
|
54,927 |
1,234,307 |
| |
|
|
|
|
|
7,884,410 |
| Germany: 4.98% |
|
|
|
|
|
|
| Commerzbank AG (Financials, Banks) |
|
|
|
|
692,041 |
7,464,046 |
| Daimler Truck Holding AG (Industrials, Machinery) |
|
|
|
|
101,260 |
3,181,612 |
| Deutsche Bank AG (Financials, Capital markets) |
|
|
|
|
431,503 |
4,748,497 |
| Heidelberg Materials AG (Materials, Construction materials) |
|
|
|
|
120,030 |
8,713,378 |
| |
|
|
|
|
|
24,107,533 |
| Hong Kong: 3.16% |
|
|
|
|
|
|
| Jardine Matheson Holdings Ltd. (Industrials, Industrial conglomerates) |
|
|
|
|
120,600 |
4,886,846 |
| New World Development Co. Ltd. (Real estate, Real estate management & development) |
|
|
|
|
1,177,000 |
2,160,170 |
| |
|
|
|
Shares |
Value | |
| Hong Kong(continued) |
|
|
|
|
|
|
| Swire Pacific Ltd. Class A (Real estate, Real estate management & development) |
|
|
|
|
241,000 |
$1,539,469 |
| WH Group Ltd. (Consumer staples, Food products)144A |
|
|
|
|
11,235,500 |
6,710,210 |
| |
|
|
|
|
|
15,296,695 |
| Ireland: 0.33% |
|
|
|
|
|
|
| Johnson Controls International PLC (Industrials, Building
products)# |
|
|
|
|
32,767 |
1,606,238 |
| Italy: 1.85% |
|
|
|
|
|
|
| Intesa Sanpaolo SpA (Financials, Banks) |
|
|
|
|
1,198,375 |
3,122,715 |
| UniCredit SpA (Financials, Banks) |
|
|
|
|
233,670 |
5,858,016 |
| |
|
|
|
|
|
8,980,731 |
| Japan: 8.89% |
|
|
|
|
|
|
| Central Glass Co. Ltd. (Industrials, Building products) |
|
|
|
|
13,400 |
253,963 |
| Chubu Electric Power Co., Inc. (Utilities, Electric utilities) |
|
|
|
|
773,500 |
9,347,087 |
| JFE Holdings, Inc. (Materials, Metals & mining) |
|
|
|
|
457,500 |
6,374,285 |
| Komatsu Ltd. (Industrials, Machinery) |
|
|
|
|
58,600 |
1,346,416 |
| Marubeni Corp. (Industrials, Trading companies & distributors) |
|
|
|
|
72,200 |
1,055,692 |
| Mitsubishi Corp. (Industrials, Trading companies & distributors) |
|
|
|
|
81,500 |
3,799,167 |
| Mitsubishi UFJ Financial Group, Inc. (Financials, Banks) |
|
|
|
|
631,800 |
5,300,263 |
| Mitsui & Co. Ltd. (Industrials, Trading companies & distributors) |
|
|
|
|
79,100 |
2,874,823 |
| Nomura Holdings, Inc. (Financials, Capital markets) |
|
|
|
|
807,100 |
3,118,155 |
| Sumitomo Corp. (Industrials, Trading companies & distributors) |
|
|
|
|
282,100 |
5,545,426 |
| Toyota Tsusho Corp. (Industrials, Trading companies & distributors) |
|
|
|
|
76,000 |
4,045,958 |
| |
|
|
|
|
|
43,061,235 |
| Netherlands: 2.03% |
|
|
|
|
|
|
| AerCap Holdings NV (Industrials, Trading companies & distributors)†# |
|
|
|
|
48,129 |
2,989,774 |
| Stellantis NV (Consumer discretionary, Automobiles) |
|
|
|
|
366,018 |
6,838,074 |
| |
|
|
|
|
|
9,827,848 |
| Singapore: 0.18% |
|
|
|
|
|
|
| Hafnia Ltd. (Energy, Oil, gas & consumable fuels) |
|
|
|
|
132,003 |
867,458 |
| Spain: 1.64% |
|
|
|
|
|
|
| Repsol SA (Energy, Oil, gas & consumable fuels) |
|
|
|
|
541,426 |
7,927,639 |
| Sweden: 2.55% |
|
|
|
|
|
|
| Essity AB Class B (Consumer staples, Household products) |
|
|
|
|
113,472 |
2,587,372 |
| Securitas AB Class B (Industrials, Commercial services &
supplies)† |
|
|
|
|
735,481 |
5,891,502 |
| Volvo AB Class A (Industrials, Machinery) |
|
|
|
|
60,175 |
1,206,466 |
| Volvo AB Class B (Industrials, Machinery) |
|
|
|
|
134,704 |
2,669,185 |
| |
|
|
|
|
|
12,354,525 |
| Switzerland: 1.58% |
|
|
|
|
|
|
| Adecco Group AG (Industrials, Professional services) |
|
|
|
|
23,589 |
892,691 |
| Holcim AG (Materials, Construction materials) |
|
|
|
|
63,425 |
3,921,426 |
| |
|
|
|
Shares |
Value | |
| Switzerland(continued) |
|
|
|
|
|
|
| Roche Holding AG (Health care, Pharmaceuticals) |
|
|
|
|
6,239 |
$1,700,197 |
| Swatch Group AG (Consumer discretionary, Textiles, apparel & luxury goods) |
|
|
|
|
23,765 |
1,150,957 |
| |
|
|
|
|
|
7,665,271 |
| United Kingdom: 5.81% |
|
|
|
|
|
|
| 3i Group PLC (Financials, Capital markets) |
|
|
|
|
5,528 |
130,337 |
| Bank of Georgia Group plc (Financials, Banks) |
|
|
|
|
39,134 |
1,583,928 |
| Barclays PLC (Financials, Banks) |
|
|
|
|
94,261 |
151,293 |
| Centrica PLC (Utilities, Multi-utilities) |
|
|
|
|
2,354,045 |
4,506,339 |
| CK Hutchison Holdings Ltd. (Industrials, Industrial conglomerates) |
|
|
|
|
2,275,500 |
11,519,226 |
| Coca-Cola Europacific Partners PLC (Consumer staples, Beverages)#
|
|
|
|
|
73,313 |
4,289,544 |
| HSBC Holdings PLC (Financials, Banks) |
|
|
|
|
298,881 |
2,158,045 |
| Unilever PLC (Consumer staples, Personal care products) |
|
|
|
|
65,079 |
3,082,182 |
| Vodafone Group PLC (Communication services, Wireless telecommunication services) |
|
|
|
|
791,620 |
728,716 |
| |
|
|
|
|
|
28,149,610 |
| United States: 60.25% |
|
|
|
|
|
|
| AbbVie, Inc. (Health care, Biotechnology)# |
|
|
|
|
16,024 |
2,262,268 |
| AdaptHealth Corp. (Health care, Health care providers &
services)†# |
|
|
|
|
25,470 |
186,695 |
| Adeia, Inc. (Information technology, Software)# |
|
|
|
|
42,890 |
361,563 |
| Adobe, Inc. (Information technology, Software)†# |
|
|
|
|
3,549 |
1,888,281 |
| Alphabet, Inc. Class A (Communication services, Interactive media & services)†# |
|
|
|
|
72,196 |
8,958,080 |
| Alphabet, Inc. Class C (Communication services, Interactive media & services)†# |
|
|
|
|
71,859 |
9,003,933 |
| Altria Group, Inc. (Consumer staples, Tobacco)# |
|
|
|
|
118,909 |
4,776,575 |
| A-Mark Precious Metals, Inc. (Financials, Financial services)#
|
|
|
|
|
99,710 |
2,700,147 |
| AMC Networks, Inc. Class A (Communication services, Media)†# |
|
|
|
|
38,058 |
449,084 |
| Amgen, Inc. (Health care, Biotechnology)# |
|
|
|
|
3,731 |
954,017 |
| Amkor Technology, Inc. (Information technology, Semiconductors & semiconductor equipment)# |
|
|
|
|
5,200 |
108,472 |
| Apple, Inc. (Information technology, Technology hardware, storage & peripherals)# |
|
|
|
|
69,943 |
11,944,166 |
| Archer-Daniels-Midland Co. (Consumer staples, Food products)#
|
|
|
|
|
1,553 |
111,148 |
| Arrow Electronics, Inc. (Information technology, Electronic equipment, instruments & components)†# |
|
|
|
|
48,766 |
5,530,552 |
| AT&T, Inc. (Communication services, Diversified telecommunication services)# |
|
|
|
|
263,965 |
4,065,061 |
| Axcelis Technologies, Inc. (Information technology, Semiconductors & semiconductor equipment)†# |
|
|
|
|
5,877 |
749,318 |
| Bandwidth, Inc. Class A (Communication services, Diversified telecommunication services)†# |
|
|
|
|
73,364 |
778,392 |
| Bank of New York Mellon Corp. (Financials, Capital markets)#
|
|
|
|
|
107,765 |
4,580,012 |
| Beazer Homes USA, Inc. (Consumer discretionary, Household durables)†# |
|
|
|
|
115,101 |
2,784,293 |
| Best Buy Co., Inc. (Consumer discretionary, Specialty retail)#
|
|
|
|
|
50,334 |
3,363,318 |
| Bristol-Myers Squibb Co. (Health care, Pharmaceuticals)# |
|
|
|
|
140,777 |
7,254,239 |
| |
|
|
|
Shares |
Value | |
| United States(continued) |
|
|
|
|
|
|
| Broadcom, Inc. (Information technology, Semiconductors & semiconductor equipment)# |
|
|
|
|
2,163 |
$1,819,883 |
| Builders FirstSource, Inc. (Industrials, Building products)†# |
|
|
|
|
24,292 |
2,636,168 |
| Campbell Soup Co. (Consumer staples, Food products)# |
|
|
|
|
18,339 |
741,079 |
| Catalyst Pharmaceuticals, Inc. (Health care, Biotechnology)†# |
|
|
|
|
196,243 |
2,435,376 |
| Caterpillar, Inc. (Industrials, Machinery)# |
|
|
|
|
30,444 |
6,881,866 |
| Centene Corp. (Health care, Health care providers &
services)†# |
|
|
|
|
102,841 |
7,093,972 |
| Cisco Systems, Inc. (Information technology, Communications equipment)# |
|
|
|
|
17,639 |
919,521 |
| Clearway Energy, Inc. Class A (Utilities, Independent power and renewable electricity producers)# |
|
|
|
|
70,005 |
1,426,002 |
| Clorox Co. (Consumer staples, Household products)# |
|
|
|
|
43,801 |
5,155,378 |
| Conagra Brands, Inc. (Consumer staples, Food products)# |
|
|
|
|
25,975 |
710,676 |
| Consolidated Edison, Inc. (Utilities, Multi-utilities)# |
|
|
|
|
11,842 |
1,039,609 |
| CVS Health Corp. (Health care, Health care providers &
services)# |
|
|
|
|
147,724 |
10,194,433 |
| D.R. Horton, Inc. (Consumer discretionary, Household durables)#
|
|
|
|
|
59,523 |
6,214,201 |
| Dream Finders Homes, Inc. Class A (Consumer discretionary, Household durables)†# |
|
|
|
|
29,891 |
588,554 |
| eBay, Inc. (Consumer discretionary, Broadline retail)# |
|
|
|
|
21,583 |
846,701 |
| Ebix, Inc. (Information technology, Software)# |
|
|
|
|
81,749 |
497,851 |
| Emergent BioSolutions, Inc. (Health care, Biotechnology)†# |
|
|
|
|
281,822 |
589,008 |
| Enphase Energy, Inc. (Information technology, Semiconductors & semiconductor equipment)†# |
|
|
|
|
3,710 |
295,242 |
| Ford Motor Co. (Consumer discretionary, Automobiles)# |
|
|
|
|
158,855 |
1,548,836 |
| Fortinet, Inc. (Information technology, Software)†# |
|
|
|
|
52,100 |
2,978,557 |
| Fox Corp. Class A (Communication services, Media)# |
|
|
|
|
117,406 |
3,567,968 |
| General Motors Co. (Consumer discretionary, Automobiles)# |
|
|
|
|
52,686 |
1,485,745 |
| Gilead Sciences, Inc. (Health care, Biotechnology)# |
|
|
|
|
176,809 |
13,886,579 |
| Gray Television, Inc. (Communication services, Media)# |
|
|
|
|
114,925 |
749,311 |
| Green Brick Partners, Inc. (Consumer discretionary, Household durables)†# |
|
|
|
|
21,211 |
820,866 |
| Halozyme Therapeutics, Inc. (Health care, Biotechnology)†# |
|
|
|
|
75,621 |
2,561,283 |
| Hewlett Packard Enterprise Co. (Information technology, Technology hardware, storage & peripherals)# |
|
|
|
|
170,742 |
2,626,012 |
| HF Sinclair Corp. (Energy, Oil, gas & consumable fuels)#
|
|
|
|
|
967 |
53,552 |
| Humana, Inc. (Health care, Health care providers & services)#
|
|
|
|
|
2,935 |
1,537,030 |
| Incyte Corp. (Health care, Biotechnology)†# |
|
|
|
|
12,461 |
672,022 |
| International Seaways, Inc. (Energy, Oil, gas & consumable
fuels)# |
|
|
|
|
86,700 |
4,169,403 |
| Invesco Ltd. (Financials, Capital markets)# |
|
|
|
|
109,445 |
1,419,502 |
| Janus International Group, Inc. (Industrials, Building
products)†# |
|
|
|
|
93,984 |
879,690 |
| Kimberly-Clark Corp. (Consumer staples, Household products)#
|
|
|
|
|
108,714 |
13,006,543 |
| Kraft Heinz Co. (Consumer staples, Food products)# |
|
|
|
|
195,466 |
6,149,360 |
| Kroger Co. (Consumer staples, Consumer staples distribution & retail)# |
|
|
|
|
4,679 |
212,286 |
| Lennar Corp. Class A (Consumer discretionary, Household
durables)# |
|
|
|
|
39,062 |
4,167,134 |
| Lennox International, Inc. (Industrials, Building products)#
|
|
|
|
|
5,051 |
1,871,598 |
| Lockheed Martin Corp. (Industrials, Aerospace & defense)#
|
|
|
|
|
20,376 |
9,263,745 |
| Lumen Technologies, Inc. (Communication services, Diversified telecommunication services)†# |
|
|
|
|
1,306,990 |
1,908,205 |
| |
|
|
|
Shares |
Value | |
| United States(continued) |
|
|
|
|
|
|
| Medical Properties Trust, Inc. (Real estate, Health care REITs)#
|
|
|
|
|
365,092 |
$1,745,140 |
| Meta Platforms, Inc. Class A (Communication services, Interactive media & services)†# |
|
|
|
|
2,303 |
693,825 |
| Microchip Technology, Inc. (Information technology, Semiconductors & semiconductor equipment)# |
|
|
|
|
37,746 |
2,690,912 |
| Microsoft Corp. (Information technology, Software)# |
|
|
|
|
15,110 |
5,108,842 |
| Molson Coors Beverage Co. Class B (Consumer staples, Beverages)#
|
|
|
|
|
125,302 |
7,238,697 |
| Netflix, Inc. (Communication services, Entertainment)†# |
|
|
|
|
1,978 |
814,323 |
| NVIDIA Corp. (Information technology, Semiconductors & semiconductor equipment)# |
|
|
|
|
18,499 |
7,543,892 |
| Oracle Corp. (Information technology, Software)# |
|
|
|
|
3,584 |
370,586 |
| Owens Corning (Industrials, Building products)# |
|
|
|
|
46,877 |
5,314,445 |
| PACCAR, Inc. (Industrials, Machinery)# |
|
|
|
|
40,734 |
3,361,777 |
| Public Storage (Real estate, Specialized REITs)# |
|
|
|
|
18,224 |
4,350,251 |
| PulteGroup, Inc. (Consumer discretionary, Household durables)#
|
|
|
|
|
90,112 |
6,631,342 |
| QUALCOMM, Inc. (Information technology, Semiconductors & semiconductor equipment)# |
|
|
|
|
21,086 |
2,298,163 |
| Shutterstock, Inc. (Communication services, Interactive media & services)# |
|
|
|
|
71,797 |
2,920,702 |
| Super Micro Computer, Inc. (Information technology, Technology hardware, storage & peripherals)†# |
|
|
|
|
2,204 |
527,792 |
| United Natural Foods, Inc. (Consumer staples, Consumer staples distribution & retail)†# |
|
|
|
|
17,081 |
249,041 |
| United Therapeutics Corp. (Health care, Biotechnology)†# |
|
|
|
|
25,321 |
5,643,038 |
| Valero Energy Corp. (Energy, Oil, gas & consumable fuels)#
|
|
|
|
|
3,929 |
498,983 |
| Veralto Corp. (Industrials, Commercial services &
supplies)†# |
|
|
|
|
1,417 |
97,773 |
| VeriSign, Inc. (Information technology, IT services)†# |
|
|
|
|
40,128 |
8,011,956 |
| Verizon Communications, Inc. (Communication services, Diversified telecommunication services)# |
|
|
|
|
380,395 |
13,363,276 |
| Viatris, Inc. (Health care, Pharmaceuticals)# |
|
|
|
|
426,764 |
3,798,200 |
| Wabash National Corp. (Industrials, Machinery)# |
|
|
|
|
133,588 |
2,763,936 |
| Walgreens Boots Alliance, Inc. (Consumer staples, Consumer staples distribution & retail)# |
|
|
|
|
335,808 |
7,078,833 |
| Zymeworks, Inc. (Health care, Biotechnology)†# |
|
|
|
|
33,987 |
238,589 |
| |
|
|
|
|
|
291,784,675 |
| Total common stocks (Cost $502,585,564) |
|
|
|
|
|
483,487,333 |
| |
|
Dividend rate |
|
|
| |
| Preferred stocks: 0.90% |
|
|
|
|
|
|
| Germany: 0.90% |
|
|
|
|
|
|
| Bayerische Motoren Werke AG (Consumer discretionary, Automobiles) |
|
9.01 |
|
|
10,030 |
852,847 |
| Schaeffler AG (Consumer discretionary, Automobile components) |
|
0.48 |
|
|
42,789 |
222,077 |
| Volkswagen AG (Consumer discretionary, Automobiles) |
|
9.26 |
|
|
31,063 |
3,294,252 |
| Total preferred stocks (Cost $5,152,366) |
|
|
|
|
|
4,369,176 |
| |
|
|
Expiration
date |
Shares |
Value | |
| Warrants: 0.00% |
|
|
|
|
|
|
| Canada: 0.00% |
|
|
|
|
|
|
| Constellation Software, Inc. (Information technology,
Software)♦† |
|
|
3-31-2040 |
|
800 |
$0 |
| Total warrants (Cost $0) |
|
|
|
|
|
0 |
| |
|
Yield |
|
|
| |
| Short-term investments: 6.10% |
|
|
|
|
|
|
| Investment companies: 6.10% |
|
|
|
|
|
|
| Allspring Government Money Market Fund Select
Class♠∞ |
|
5.29 % |
|
|
29,550,411 |
29,550,411 |
| Total short-term investments (Cost $29,550,411) |
|
|
|
|
|
29,550,411 |
| Total investments in securities (Cost $537,288,341) |
106.83 % |
|
|
|
|
517,406,920 |
| |
|
|
|
|
| |
| Securities sold short: (29.40)% |
|
|
|
|
|
|
| Common stocks: (29.27)% |
|
|
|
|
|
|
| Australia: (0.44)% |
|
|
|
|
|
|
| BrainChip Holdings Ltd. (Information technology,
Software)† |
|
|
|
|
(1,963,779 ) |
(195,210 ) |
| De Grey Mining Ltd. (Materials, Metals & mining)†
|
|
|
|
|
(2,573,961 ) |
(1,934,594 ) |
| |
|
|
|
|
|
(2,129,804 ) |
| Canada: (1.57)% |
|
|
|
|
|
|
| Ballard Power Systems, Inc. (Industrials, Electrical
equipment)† |
|
|
|
|
(187,599 ) |
(626,345 ) |
| Filo Corp. (Materials, Metals & mining)† |
|
|
|
|
(108,900 ) |
(1,418,233 ) |
| Ivanhoe Mines Ltd. Class A (Materials, Metals &
mining)† |
|
|
|
|
(68,300 ) |
(503,354 ) |
| Lithium Americas Argentina Corp. (Materials, Metals &
mining)† |
|
|
|
|
(130,900 ) |
(723,997 ) |
| Lithium Americas Corp. (Materials, Metals & mining)†
|
|
|
|
|
(130,900 ) |
(878,802 ) |
| NexGen Energy Ltd. (Energy, Oil, gas & consumable
fuels)† |
|
|
|
|
(567,400 ) |
(3,424,653 ) |
| |
|
|
|
|
|
(7,575,384 ) |
| Curacao: (0.77)% |
|
|
|
|
|
|
| Schlumberger NV (Energy, Energy equipment & services) |
|
|
|
|
(66,649 ) |
(3,709,683 ) |
| Denmark: (0.31)% |
|
|
|
|
|
|
| Vestas Wind Systems AS (Industrials, Electrical
equipment)† |
|
|
|
|
(69,813 ) |
(1,513,180 ) |
| France: (1.41)% |
|
|
|
|
|
|
| Edenred SE (Financials, Financial services) |
|
|
|
|
(102,156 ) |
(5,437,914 ) |
| Gecina SA (Real estate, Office REITs) |
|
|
|
|
(14,241 ) |
(1,398,336 ) |
| |
|
|
|
|
|
(6,836,250 ) |
| Germany: (1.35)% |
|
|
|
|
|
|
| adidas AG (Consumer discretionary, Textiles, apparel & luxury goods) |
|
|
|
|
(10,355 ) |
(1,841,199 ) |
| Delivery Hero SE (Consumer discretionary, Hotels, restaurants & leisure)144A† |
|
|
|
|
(53,716 ) |
(1,372,772 ) |
| |
|
|
|
Shares |
Value | |
| Germany(continued) |
|
|
|
|
|
|
| HelloFresh SE (Consumer staples, Consumer staples distribution & retail)† |
|
|
|
|
(26,140 ) |
$(571,765 ) |
| Symrise AG (Materials, Chemicals) |
|
|
|
|
(26,964 ) |
(2,755,432 ) |
| |
|
|
|
|
|
(6,541,168 ) |
| Italy: (0.69)% |
|
|
|
|
|
|
| Amplifon SpA (Health care, Health care providers & services) |
|
|
|
|
(99,160 ) |
(2,802,604 ) |
| Salvatore Ferragamo SpA (Consumer discretionary, Textiles, apparel & luxury goods) |
|
|
|
|
(45,616 ) |
(558,109 ) |
| |
|
|
|
|
|
(3,360,713 ) |
| Japan: (2.36)% |
|
|
|
|
|
|
| Daiichi Sankyo Co. Ltd. (Health care, Pharmaceuticals) |
|
|
|
|
(166,200 ) |
(4,285,333 ) |
| Eisai Co. Ltd. (Health care, Pharmaceuticals) |
|
|
|
|
(113,600 ) |
(6,018,337 ) |
| GMO Payment Gateway, Inc. (Financials, Financial services) |
|
|
|
|
(1,500 ) |
(59,909 ) |
| Septeni Holdings Co. Ltd. (Communication services,
Media)† |
|
|
|
|
(379,700 ) |
(1,067,361 ) |
| |
|
|
|
|
|
(11,430,940 ) |
| Luxembourg: (0.16)% |
|
|
|
|
|
|
| FREYR Battery SA (Industrials, Electrical equipment)†
|
|
|
|
|
(243,310 ) |
(781,025 ) |
| Netherlands: (2.27)% |
|
|
|
|
|
|
| Airbus SE (Industrials, Aerospace & defense) |
|
|
|
|
(44,062 ) |
(5,907,663 ) |
| Argenx SE (Health care, Biotechnology)† |
|
|
|
|
(8,084 ) |
(3,802,565 ) |
| Ferrovial SE (Industrials, Construction & engineering) |
|
|
|
|
(36,016 ) |
(1,083,939 ) |
| Technip Energies NV (Energy, Energy equipment & services) |
|
|
|
|
(9,905 ) |
(217,016 ) |
| |
|
|
|
|
|
(11,011,183 ) |
| Spain: (1.79)% |
|
|
|
|
|
|
| Cellnex Telecom SA (Communication services, Diversified telecommunication services)144A |
|
|
|
|
(170,452 ) |
(5,010,623 ) |
| Corp. ACCIONA Energias Renovables SA (Utilities, Independent power and renewable electricity producers) |
|
|
|
|
(68,887 ) |
(1,864,510 ) |
| EDP Renovaveis SA (Utilities, Independent power and renewable electricity producers) |
|
|
|
|
(94,866 ) |
(1,526,104 ) |
| Solaria Energia y Medio Ambiente SA (Utilities, Independent power and renewable electricity producers)† |
|
|
|
|
(16,196 ) |
(242,949 ) |
| |
|
|
|
|
|
(8,644,186 ) |
| Sweden: (1.07)% |
|
|
|
|
|
|
| EQT AB (Financials, Capital markets) |
|
|
|
|
(126,827 ) |
(2,317,105 ) |
| PowerCell Sweden AB (Industrials, Electrical equipment)†
|
|
|
|
|
(104,867 ) |
(423,686 ) |
| Sagax AB Class B (Real estate, Real estate management & development) |
|
|
|
|
(134,877 ) |
(2,441,667 ) |
| |
|
|
|
|
|
(5,182,458 ) |
| United Kingdom: (0.91)% |
|
|
|
|
|
|
| Ceres Power Holdings PLC (Industrials, Electrical
equipment)† |
|
|
|
|
(135,774 ) |
(326,752 ) |
| ITM Power PLC (Industrials, Electrical equipment)†
|
|
|
|
|
(297,206 ) |
(233,433 ) |
| |
|
|
|
Shares |
Value | |
| United Kingdom(continued) |
|
|
|
|
|
|
| Ocado Group PLC (Consumer staples, Consumer staples distribution & retail)† |
|
|
|
|
(238,634 ) |
$(1,354,275 ) |
| Prudential PLC (Financials, Insurance) |
|
|
|
|
(43,170 ) |
(451,402 ) |
| Segro PLC REIT (Real estate, Industrial REITs) |
|
|
|
|
(235,581 ) |
(2,047,703 ) |
| |
|
|
|
|
|
(4,413,565 ) |
| United States: (14.17)% |
|
|
|
|
|
|
| Alnylam Pharmaceuticals, Inc. (Health care,
Biotechnology)† |
|
|
|
|
(18,381 ) |
(2,790,236 ) |
| American Express Co. (Financials, Consumer finance) |
|
|
|
|
(1,943 ) |
(283,736 ) |
| Bloom Energy Corp. Class A (Industrials, Electrical
equipment)† |
|
|
|
|
(27,009 ) |
(280,894 ) |
| Boeing Co. (Industrials, Aerospace & defense)†
|
|
|
|
|
(3,334 ) |
(622,858 ) |
| Cactus, Inc. Class A (Energy, Energy equipment & services) |
|
|
|
|
(2,606 ) |
(122,326 ) |
| Carvana Co. Class A (Consumer discretionary, Specialty
retail)† |
|
|
|
|
(10,586 ) |
(285,822 ) |
| Ceridian HCM Holding, Inc. (Industrials, Professional
services)† |
|
|
|
|
(14,514 ) |
(929,041 ) |
| ChampionX Corp. (Energy, Energy equipment & services) |
|
|
|
|
(26,204 ) |
(807,083 ) |
| Clear Channel Outdoor Holdings, Inc. (Communication services, Media)† |
|
|
|
|
(387,475 ) |
(426,222 ) |
| Core Laboratories, Inc. (Energy, Energy equipment & services) |
|
|
|
|
(73,374 ) |
(1,571,671 ) |
| Dril-Quip, Inc. (Energy, Energy equipment &
services)† |
|
|
|
|
(7,239 ) |
(156,797 ) |
| Dynex Capital, Inc. (Financials, Mortgage real estate investment trusts (REITs)) |
|
|
|
|
(391,627 ) |
(3,931,935 ) |
| Figs, Inc. Class A (Consumer discretionary, Textiles, apparel & luxury goods)† |
|
|
|
|
(262,993 ) |
(1,449,091 ) |
| Freshpet, Inc. (Consumer staples, Food products)† |
|
|
|
|
(1,888 ) |
(108,371 ) |
| ImmunityBio, Inc. (Health care, Biotechnology)† |
|
|
|
|
(601,060 ) |
(1,887,328 ) |
| Intellia Therapeutics, Inc. (Health care,
Biotechnology)† |
|
|
|
|
(2,755 ) |
(69,013 ) |
| Joby Aviation, Inc. (Industrials, Passenger airlines)†
|
|
|
|
|
(192,306 ) |
(1,013,453 ) |
| Lucid Group, Inc. (Consumer discretionary, Automobiles)†
|
|
|
|
|
(789,194 ) |
(3,251,479 ) |
| Luminar Technologies, Inc. Class A (Consumer discretionary, Automobile components)† |
|
|
|
|
(267,964 ) |
(849,446 ) |
| Micron Technology, Inc. (Information technology, Semiconductors & semiconductor equipment) |
|
|
|
|
(38,183 ) |
(2,553,297 ) |
| MongoDB, Inc. (Information technology, IT services)†
|
|
|
|
|
(6,790 ) |
(2,339,766 ) |
| MP Materials Corp. (Materials, Metals & mining)†
|
|
|
|
|
(34,547 ) |
(566,571 ) |
| Nabors Industries Ltd. (Energy, Energy equipment &
services)† |
|
|
|
|
(470 ) |
(45,891 ) |
| NextDecade Corp. (Energy, Oil, gas & consumable
fuels)† |
|
|
|
|
(222,026 ) |
(974,694 ) |
| NuScale Power Corp. (Industrials, Electrical equipment)†
|
|
|
|
|
(91,134 ) |
(308,033 ) |
| Paylocity Holding Corp. (Industrials, Professional
services)† |
|
|
|
|
(13,379 ) |
(2,400,193 ) |
| Pliant Therapeutics, Inc. (Health care,
Pharmaceuticals)† |
|
|
|
|
(66,421 ) |
(974,396 ) |
| QuantumScape Corp. Class A (Consumer discretionary, Automobile components)† |
|
|
|
|
(317,436 ) |
(1,657,016 ) |
| Rivian Automotive, Inc. Class A (Consumer discretionary, Automobiles)† |
|
|
|
|
(183,303 ) |
(2,973,175 ) |
| Roblox Corp. Class A (Communication services,
Entertainment)† |
|
|
|
|
(150,340 ) |
(4,782,315 ) |
| Snap, Inc. Class A (Communication services, Interactive media & services)† |
|
|
|
|
(456,232 ) |
(4,566,882 ) |
| Snowflake, Inc. Class A (Information technology, IT
services)† |
|
|
|
|
(7,548 ) |
(1,095,441 ) |
| SoFi Technologies, Inc. (Financials, Consumer finance)†
|
|
|
|
|
(20,072 ) |
(151,544 ) |
| Solid Power, Inc. (Consumer discretionary, Automobile
components)† |
|
|
|
|
(175,578 ) |
(231,763 ) |
| |
|
|
|
Shares |
Value | |
| United States(continued) |
|
|
|
|
|
|
| Tellurian, Inc. (Energy, Oil, gas & consumable
fuels)† |
|
|
|
|
(264,249 ) |
$(182,332 ) |
| Tesla, Inc. (Consumer discretionary, Automobiles)†
|
|
|
|
|
(350 ) |
(70,294 ) |
| Toast, Inc. Class A (Financials, Financial services)†
|
|
|
|
|
(188,997 ) |
(3,022,062 ) |
| Trade Desk, Inc. Class A (Communication services,
Media)† |
|
|
|
|
(66,456 ) |
(4,715,718 ) |
| Uranium Energy Corp. (Energy, Oil, gas & consumable
fuels)† |
|
|
|
|
(526,722 ) |
(3,133,996 ) |
| Ventyx Biosciences, Inc. (Health care, Pharmaceuticals)†
|
|
|
|
|
(38,320 ) |
(552,574 ) |
| Virgin Galactic Holdings, Inc. (Industrials, Aerospace &
defense)† |
|
|
|
|
(959,543 ) |
(1,420,124 ) |
| Wayfair, Inc. Class A (Consumer discretionary, Specialty
retail)† |
|
|
|
|
(1,744 ) |
(74,312 ) |
| Western Digital Corp. (Information technology, Technology hardware, storage & peripherals)† |
|
|
|
|
(137,269 ) |
(5,511,350 ) |
| Wolfspeed, Inc. (Information technology, Semiconductors & semiconductor equipment)† |
|
|
|
|
(51,226 ) |
(1,733,488 ) |
| Zillow Group, Inc. Class C (Real estate, Real estate management & development)† |
|
|
|
|
(48,780 ) |
(1,768,275 ) |
| |
|
|
|
|
|
(68,642,304 ) |
| Total common stocks (Cost $(168,674,780)) |
|
|
|
|
|
(141,771,843 ) |
| |
|
Dividend rate |
|
|
|
|
| Preferred stocks: (0.13)% |
|
|
|
|
|
|
| Germany: (0.13)% |
|
|
|
|
|
|
| Sartorius AG (Health care, Life sciences tools & services) |
|
1.52 |
|
|
(2,413 ) |
(604,794 ) |
| Total preferred stocks (Cost $(915,762)) |
|
|
|
|
|
(604,794 ) |
| Total securities sold short (Proceeds $(169,590,542)) |
(29.40 )% |
|
|
|
|
(142,376,637 ) |
| Other assets and liabilities, net |
22.57 |
|
|
|
|
109,286,536 |
| Total net assets |
100.00 % |
|
|
|
|
$484,316,819 |
| 144A |
The security may be resold in transactions exempt from registration, normally to qualified institutional buyers, pursuant to Rule 144A under the Securities Act of
1933. |
| # |
All or a portion of this security is segregated as collateral for securities sold short. |
| † |
Non-income-earning security |
| ♦ |
The security is fair valued in accordance with procedures approved by the Board of Trustees. |
| ♠ |
The issuer of the security is an affiliated person of the Fund as defined in the Investment Company Act of 1940. |
| ∞ |
The rate represents the 7-day annualized yield at period end. |
| Abbreviations: | |
| REIT |
Real estate investment trust |
| |
Value, beginning of period |
Purchases |
Sales
proceeds |
Net
realized
gains
(losses) |
Net
change in
unrealized
gains
(losses) |
Value,
end of
period |
Shares,
end
of period |
Income
from
affiliated
securities |
| Short-term investments |
|
|
|
|
|
|
|
|
| Allspring Government Money Market Fund Select Class |
$0 |
$465,447,043 |
$(435,896,632 ) |
$0 |
$0 |
$29,550,411 |
29,550,411 |
$2,789,262 |
| Assets |
|
| Investments in unaffiliated securities, at value (cost $507,737,930) |
$487,856,509 |
| Investments in affiliated securities, at value (cost $29,550,411) |
29,550,411 |
| Cash deposited with brokers for securities sold short |
145,186,798 |
| Foreign currency, at value (cost $90,560) |
90,718 |
| Receivable for dividends |
2,782,533 |
| Receivable for Fund shares sold |
90,431 |
| Prepaid expenses and other assets |
431,380 |
| Total assets |
665,988,780 |
| Liabilities |
|
| Securities sold short, at value (proceeds $169,590,542) |
142,376,637 |
| Payable for borrowing on margin loan |
36,429,661 |
| Payable for Fund shares redeemed |
1,830,911 |
| Management fee payable |
502,244 |
| Payable for dividends on securities sold short |
198,899 |
| Payable for interest expense on margin loan |
161,568 |
| Administration fees payable |
48,440 |
| Trustees’ fees and expenses payable |
2,760 |
| Distribution fees payable |
195 |
| Accrued expenses and other liabilities |
120,646 |
| Total liabilities |
181,671,961 |
| Total net assets |
$484,316,819 |
| Net assets consist of |
|
| Paid-in capital |
$489,039,867 |
| Total distributable loss |
(4,723,048
) |
| Total net assets |
$484,316,819 |
| Computation of net asset value and offering price per share |
|
| Net assets–Class A |
$3,735,569 |
| Shares outstanding–Class A1
|
337,290 |
| Net asset value per share–Class A |
$11.08 |
| Maximum offering price per share – Class A2 |
$11.76 |
| Net assets–Class C |
$24,223 |
| Shares outstanding–Class C1
|
2,205 |
| Net asset value per share–Class C |
$10.98 |
| Net assets–Class R6 |
$420,946,407 |
| Shares outstanding–Class R61
|
37,352,230 |
| Net asset value per share–Class R6 |
$11.27 |
| Net assets–Institutional Class |
$59,610,620 |
| Shares outstanding–Institutional
Class1 |
5,311,588 |
| Net asset value per share–Institutional Class |
$11.22
|
| Investment income |
|
| Dividends (net of foreign withholdings taxes of $934,521) |
$16,698,845 |
| Interest and rebate income |
4,208,559 |
| Income from affiliated securities |
2,789,262 |
| Total investment income |
23,696,666 |
| Expenses |
|
| Management fee |
7,211,002 |
| Administration fees |
|
| Class A1 |
8,533 |
| Class C2 |
44 |
| Class R61 |
123,669 |
| Institutional Class1
|
100,421 |
| Shareholder servicing fees |
|
| Class A1 |
11,154 |
| Class C2 |
54 |
| Institutional Class1
|
3,122 |
| Distribution fees |
|
| Class A1 |
2,000 |
| Class C2 |
64 |
| Custody and accounting fees |
276,133 |
| Professional fees |
64,541 |
| Registration fees |
105,899 |
| Shareholder report expenses |
62,925 |
| Trustees’ fees and expenses |
22,506 |
| Transfer agent fees |
44,544 |
| Interest expense |
3,457,024 |
| Dividends on securities sold short |
1,770,756 |
| Other fees and expenses |
21,117 |
| Total expenses |
13,285,508 |
| Less: Fee waivers and/or expense reimbursements |
|
| Fund-level |
(285,161 ) |
| Class R61 |
(76,940 ) |
| Institutional Class1
|
(20,646 ) |
| Net expenses |
12,902,761 |
| Net investment income |
10,793,905 |
| Realized and unrealized gains (losses) on investments |
|
| Net realized gains (losses) on |
|
| Unaffiliated securities |
$37,856,654 |
| Securities sold short |
(20,707,272
) |
| Foreign currency and foreign currency translations |
1,609,076 |
| Net realized gains on investments |
18,758,458 |
| Net change in unrealized gains (losses) on |
|
| Unaffiliated securities |
(24,217,915
) |
| Securities sold short |
7,364,738 |
| Foreign currency and foreign currency translations |
76,316 |
| Net change in unrealized gains (losses) on investments |
(16,776,861
) |
| Net realized and unrealized gains (losses) on investments |
1,981,597 |
| Net increase in net assets resulting from operations |
$12,775,502 |
| |
Year ended October 31, 2023 |
Year ended October 31, 2022 | ||
| Operations |
|
|
|
|
| Net investment income |
|
$10,793,905 |
|
$3,460,763 |
| Net realized gains (losses) on investments |
|
18,758,458 |
|
(33,586,810 ) |
| Net change in unrealized gains (losses) on investments |
|
(16,776,861 ) |
|
(10,528,369 ) |
| Net increase (decrease) in net assets resulting from operations |
|
12,775,502 |
|
(40,654,416 ) |
| Distributions to shareholders from |
|
|
|
|
| Net investment income and net realized gains |
|
|
|
|
| Class A1 |
|
(19,120 ) |
|
(287,566 ) |
| Class C |
|
(230
)2 |
|
N/A |
| Class R61 |
|
(4,744,297 ) |
|
(14,471,575 ) |
| Institutional Class1
|
|
(1,036,937 ) |
|
(5,038,971 ) |
| Total distributions to shareholders |
|
(5,800,584
) |
|
(19,798,112 ) |
| Capital share transactions |
Shares |
|
Shares |
|
| Proceeds from shares sold |
|
|
|
|
| Class A1 |
41,544 |
442,978 |
163,649 |
1,957,245 |
| Class C |
2,185
2 |
25,000 2 |
N/A |
N/A |
| Class R61 |
6,264,449 |
71,754,111 |
9,973,003 |
119,323,519 |
| Institutional Class1
|
842,807 |
9,696,802 |
2,369,137 |
28,631,876 |
| |
|
81,918,891 |
|
149,912,640 |
| Reinvestment of distributions |
|
|
|
|
| Class A1 |
1,632 |
18,691 |
23,303 |
277,776 |
| Class C |
20
2 |
230
2 |
N/A |
N/A |
| Class R61 |
266,669 |
3,096,026 |
911,517 |
11,038,477 |
| Institutional Class1
|
78,752 |
911,156 |
370,922 |
4,477,032 |
| |
|
4,026,103 |
|
15,793,285 |
| Payment for shares redeemed |
|
|
|
|
| Class A1 |
(258,650 ) |
(2,915,835 ) |
(429,427 ) |
(5,053,601 ) |
| Class R61 |
(12,392,169 ) |
(141,590,647 ) |
(8,859,879 ) |
(105,371,457 ) |
| Institutional Class1
|
(6,688,345 ) |
(76,410,498 ) |
(5,638,698 ) |
(66,994,687 ) |
| |
|
(220,916,980 ) |
|
(177,419,745 ) |
| Net decrease in net assets resulting from capital share transactions |
|
(134,971,986
) |
|
(11,713,820
) |
| Total decrease in net assets |
|
(127,997,068
) |
|
(72,166,348 ) |
| Net assets |
|
|
|
|
| Beginning of period |
|
612,313,887 |
|
684,480,235 |
| End of period |
|
$484,316,819 |
|
$612,313,887 |
| Cash flows from operating activities |
|
| Net increase in net assets resulting from operations |
$12,775,502 |
| Adjustments to reconcile net increase in net assets from operations to net cash provided
by operating activities |
|
| Purchases of long-term securities |
(2,289,822,552
) |
| Proceeds from the sales of long-term securities |
2,435,614,716 |
| Proceeds from securities sold short |
715,773,667 |
| Purchases to cover short securities |
(766,017,965
) |
| Purchases and sales of short-term securities, net |
49,584,635 |
| Decrease in receivable for dividends |
12,224 |
| Increase in prepaid expenses and other assets |
(398,042
) |
| Increase in trustees’ fees and expenses payable |
1,462 |
| Decrease in management fee payable |
(107,438
) |
| Increase in administration fee payable |
9,729 |
| Decrease in distribution fees payable |
(1,269 ) |
| Decrease in custody and accounting fees payable |
(63,144
) |
| Increase in payable for dividends on securities sold short |
103,373 |
| Increase in payable for interest expense on margin loan |
161,568 |
| Increase in accrued expenses and other liabilities |
22,183 |
| Proceeds from foreign currency transactions |
1,685,392 |
| Net realized gains on unaffiliated securities |
(37,856,654
) |
| Net realized losses on securities sold short |
20,707,272 |
| Net realized gains on foreign currency and foreign currency translations |
(1,609,076
) |
| Net change in unrealized gains (losses) on unaffiliated securities |
24,217,915 |
| Net change in unrealized gains (losses) on securities sold short |
(7,364,738
) |
| Net change in unrealized gain (losses) on foreign currency and foreign currency translations |
(76,316
) |
| Net cash provided by operating activities |
157,352,444 |
| Cash flows from financing activities |
|
| Decrease in margin loan borrowings, net |
(52,470,015
) |
| Proceeds from shares sold |
82,120,186 |
| Cost of shares redeemed |
(219,563,393
) |
| Cash distributions paid |
(1,774,481
) |
| Net cash used in financing activities |
(191,687,703
) |
| Net decrease in cash |
(34,335,259 ) |
| Cash (including foreign currency) |
|
| Beginning of period |
179,612,775 |
| End of period |
$145,277,516 |
| Supplemental cash disclosure |
|
| Cash paid for dividends on securities sold short |
$1,667,383
|
| Cash paid for interest expense |
3,295,456 |
| Supplemental non-cash financing disclosure |
|
| Reinvestment of dividends |
$4,026,103
|
| |
Year ended October 31 | ||||
| Class A |
20231,2 |
20222 |
20212 |
20202 |
20192 |
| Net asset value, beginning of period |
$10.96 |
$12.06 |
$11.21 |
$10.98 |
$11.32 |
| Net investment income (loss) |
0.16
3 |
0.02
3 |
(0.11
)3 |
(0.09
)3 |
0.01
3 |
| Net realized and unrealized gains (losses) on investments |
0.00
4 |
(0.75 ) |
0.96 |
0.32 |
(0.02 ) |
| Total from investment operations |
0.16 |
(0.73 ) |
0.85 |
0.23 |
(0.01 ) |
| Distributions to shareholders from |
|
|
|
|
|
| Net investment income |
(0.04 ) |
0.00 |
0.00 |
0.00 |
0.00 |
| Net realized gains |
0.00 |
(0.37 ) |
0.00 |
0.00 |
(0.33 ) |
| Total distributions to shareholders |
(0.04 ) |
(0.37 ) |
0.00 |
0.00 |
(0.33 ) |
| Net asset value, end of period |
$11.08 |
$10.96 |
$12.06 |
$11.21 |
$10.98 |
| Total
return5 |
1.42 % |
(6.32
)% |
7.58
% |
2.09
% |
0.06
% |
| Ratios to average net assets (annualized) |
|
|
|
|
|
| Gross expenses* |
2.69 % |
2.34 % |
2.77 % |
2.72 % |
2.74 % |
| Net expenses* |
2.63 % |
2.31 % |
2.75 % |
2.67 % |
2.71 % |
| Net investment income (loss)*
|
1.44 % |
0.14 % |
(0.96 )% |
(0.86 )% |
0.06 % |
| Supplemental data |
|
|
|
|
|
| Portfolio turnover rate |
395 % |
464 % |
437 % |
403 % |
220 % |
| Net assets, end of period (000s omitted) |
$3,736
|
$6,059 |
$9,593 |
$11,967 |
$29,320 |
| * |
Ratios include dividends on securities sold short and interest expense as follows: |
| Year ended October 31, 2023 |
0.91% |
| Year ended October 31, 2022 |
0.52% |
| Year ended October 31, 2021 |
0.96% |
| Year ended October 31, 2020 |
0.88% |
| Year ended October 31, 2019 |
0.92% |
| 1 |
For the year ended October 31, 2023, the Fund was audited by KPMG LLP. The previous years were audited by another independent registered public accounting
firm. |
| 2 |
After the close of business on December 16, 2022, the Fund acquired the net assets of 361 Global Long/Short Equity Fund, which became the accounting and
performance survivor in the transaction. The information for the periods prior to December 16,
2022 is that of 361 Global Long/Short Equity Fund Investor Class. |
| 3 |
Calculated based upon average shares outstanding |
| 4 |
Amount is less than $0.005. |
| 5 |
Total return calculations do not include any sales charges. |
| |
Year ended October 31 |
| Class C |
20231 |
| Net asset value, beginning of period |
$11.44 |
| Net investment income |
0.13
2 |
| Net realized and unrealized gains (losses) on investments |
(0.48 ) |
| Total from investment operations |
(0.35 ) |
| Distributions to shareholders from |
|
| Net investment income |
(0.11 ) |
| Net asset value, end of period |
$10.98 |
| Total
return3 |
(3.13 )% |
| Ratios to average net assets (annualized) |
|
| Gross expenses* |
3.03 % |
| Net expenses* |
3.00 % |
| Net investment income* |
1.33 % |
| Supplemental data |
|
| Portfolio turnover rate |
395 % |
| Net assets, end of period (000s omitted) |
$24
|
| * |
Ratios include dividends on securities sold short and interest expense in the amount of 0.91%. |
| 1 |
For the period from December 16, 2022 (commencement of class operations) to October 31, 2023 |
| 2 |
Calculated based upon average shares outstanding |
| 3 |
Total return calculations do not include any sales charges. Returns for periods of less than one year are not annualized. |
| |
Year ended October 31 | ||||
| Class R6 |
20231,2 |
20222 |
20212 |
20202 |
20192 |
| Net asset value, beginning of period |
$11.18 |
$12.24 |
$11.34 |
$11.10 |
$11.39 |
| Net investment income (loss) |
0.22
3 |
0.07
3 |
(0.07
)3 |
(0.05
)3 |
0.05
3 |
| Net realized and unrealized gains (losses) on investments |
(0.02 ) |
(0.76 ) |
0.97 |
0.33 |
(0.01 ) |
| Total from investment operations |
0.20 |
(0.69 ) |
0.90 |
0.28 |
0.04 |
| Distributions to shareholders from |
|
|
|
|
|
| Net investment income |
(0.11 ) |
0.00 |
0.00 |
(0.04 ) |
0.00 |
| Net realized gains |
0.00 |
(0.37 ) |
0.00 |
0.00 |
(0.33 ) |
| Total distributions to shareholders |
(0.11 ) |
(0.37 ) |
0.00 |
(0.04 ) |
(0.33 ) |
| Net asset value, end of period |
$11.27 |
$11.18 |
$12.24 |
$11.34 |
$11.10 |
| Total return |
1.77 % |
(5.89
)% |
7.94
% |
2.54
% |
0.51
% |
| Ratios to average net assets (annualized) |
|
|
|
|
|
| Gross expenses* |
2.29 % |
1.94 % |
2.37 % |
2.32 % |
2.34 % |
| Net expenses* |
2.22 % |
1.91 % |
2.35 % |
2.27 % |
2.31 % |
| Net investment income (loss)*
|
1.90 % |
0.55 % |
(0.56 )% |
(0.46 )% |
0.46 % |
| Supplemental data |
|
|
|
|
|
| Portfolio turnover rate |
395 % |
464 % |
437 % |
403 % |
220 % |
| Net assets, end of period (000s omitted) |
$420,946
|
$482,971 |
$504,335 |
$480,370 |
$510,403 |
| * |
Ratios include dividends on securities sold short and interest expense as follows: |
| Year ended October 31, 2023 |
0.91% |
| Year ended October 31, 2022 |
0.52% |
| Year ended October 31, 2021 |
0.96% |
| Year ended October 31, 2020 |
0.88% |
| Year ended October 31, 2019 |
0.92% |
| 1 |
For the year ended October 31, 2023, the Fund was audited by KPMG LLP. The previous years were audited by another independent registered public accounting
firm. |
| 2 |
After the close of business on December 16, 2022, the Fund acquired the net assets of 361 Global Long/Short Equity Fund, which became the accounting and
performance survivor in the transaction. The information for the periods prior to December 16,
2022 is that of 361 Global Long/Short Equity Fund Class Y. |
| 3 |
Calculated based upon average shares outstanding |
| |
Year ended October 31 | ||||
| Institutional Class |
20231,2 |
20222 |
20212 |
20202 |
20192 |
| Net asset value, beginning of period |
$11.13 |
$12.20 |
$11.30 |
$11.07 |
$11.37 |
| Net investment income (loss) |
0.20
3 |
0.06
3 |
(0.07
)3 |
(0.06
)3 |
0.04
3 |
| Net realized and unrealized gains (losses) on investments |
(0.01 ) |
(0.76 ) |
0.97 |
0.32 |
(0.01 ) |
| Total from investment operations |
0.19 |
0.70 |
0.90 |
0.26 |
0.03 |
| Distributions to shareholders from |
|
|
|
|
|
| Net investment income |
(0.10 ) |
0.00 |
0.00 |
(0.03 ) |
0.00 |
| Net realized gains |
0.00 |
(0.37 ) |
0.00 |
0.00 |
(0.33 ) |
| Total distributions to shareholders |
(0.10 ) |
(0.37 ) |
0.00 |
(0.03 ) |
(0.33 ) |
| Net asset value, end of period |
$11.22 |
$11.13 |
$12.20 |
$11.30 |
$11.07 |
| Total return |
1.66 % |
(6.00
)% |
7.96
% |
2.38
% |
0.42
% |
| Ratios to average net assets (annualized) |
|
|
|
|
|
| Gross expenses* |
2.36 % |
2.02 % |
2.41 % |
2.41 % |
2.42 % |
| Net expenses* |
2.29 % |
1.99 % |
2.39 % |
2.36 % |
2.39 % |
| Net investment income (loss)*
|
1.72 % |
0.47 % |
(0.60 )% |
(0.55 )% |
0.38 % |
| Supplemental data |
|
|
|
|
|
| Portfolio turnover rate |
395 % |
464 % |
437 % |
403 % |
220 % |
| Net assets, end of period (000s omitted) |
$59,611
|
$123,283 |
$170,553 |
$204,510 |
$332,247 |
| * |
Ratios include dividends on securities sold short and interest expense as follows: |
| Year ended October 31, 2023 |
0.91% |
| Year ended October 31, 2022 |
0.52% |
| Year ended October 31, 2021 |
0.96% |
| Year ended October 31, 2020 |
0.88% |
| Year ended October 31, 2019 |
0.92% |
| 1 |
For the year ended October 31, 2023, the Fund was audited by KPMG LLP. The previous years were audited by another independent registered public accounting
firm. |
| 2 |
After the close of business on December 16, 2022, the Fund acquired the net assets of 361 Global Long/Short Equity Fund, which became the accounting and
performance survivor in the transaction. The information for the periods prior to December 16,
2022 is that of 361 Global Long/Short Equity Fund Class I. |
| 3 |
Calculated based upon average shares outstanding |
| Gross unrealized gains |
$50,661,433 |
| Gross unrealized losses |
(49,016,308 ) |
| Net unrealized gains |
$1,645,125 |
| Paid-in
capital |
Total distributable
loss |
| $35,923 |
$(35,923 ) |
| |
Quoted prices
(Level 1) |
Other significant
observable inputs
(Level 2) |
Significant
unobservable inputs
(Level 3) |
Total |
| Assets |
|
|
|
|
| Investments in: |
|
|
|
|
| Common stocks |
|
|
|
|
| Australia |
$0
|
$3,643,234
|
$0 |
$3,643,234
|
| Belgium |
0 |
1,190,875 |
0 |
1,190,875 |
| Canada |
15,076,972 |
0 |
0 |
15,076,972 |
| Denmark |
0 |
4,062,384 |
0 |
4,062,384 |
| France |
0 |
7,884,410 |
0 |
7,884,410 |
| Germany |
0 |
24,107,533 |
0 |
24,107,533 |
| Hong Kong |
0 |
15,296,695 |
0 |
15,296,695 |
| Ireland |
1,606,238 |
0 |
0 |
1,606,238 |
| Italy |
0 |
8,980,731 |
0 |
8,980,731 |
| Japan |
0 |
43,061,235 |
0 |
43,061,235 |
| Netherlands |
2,989,774 |
6,838,074 |
0 |
9,827,848 |
| Singapore |
0 |
867,458 |
0 |
867,458 |
| Spain |
0 |
7,927,639 |
0 |
7,927,639 |
| Sweden |
0 |
12,354,525 |
0 |
12,354,525 |
| Switzerland |
0 |
7,665,271 |
0 |
7,665,271 |
| United Kingdom |
5,873,472 |
22,276,138 |
0 |
28,149,610 |
| United States |
291,784,675 |
0 |
0 |
291,784,675 |
| Preferred stocks |
|
|
|
|
| Germany |
0 |
4,369,176 |
0 |
4,369,176 |
| Warrants |
|
|
|
|
| Canada |
0 |
0 |
0 |
0 |
| Short-term investments |
|
|
|
|
| Investment companies |
29,550,411 |
0 |
0 |
29,550,411 |
| Total assets |
$346,881,542 |
$170,525,378 |
$0 |
$517,406,920 |
| Liabilities |
|
|
|
|
| Securities sold short |
|
|
|
|
| Common stocks |
|
|
|
|
| Australia |
$0
|
$2,129,804
|
$0 |
$2,129,804
|
| Canada |
7,575,384 |
0 |
0 |
7,575,384 |
| Curacao |
3,709,683 |
0 |
0 |
3,709,683 |
| Denmark |
0 |
1,513,180 |
0 |
1,513,180 |
| France |
0 |
6,836,250 |
0 |
6,836,250 |
| Germany |
0 |
6,541,168 |
0 |
6,541,168 |
| Italy |
0 |
3,360,713 |
0 |
3,360,713 |
| Japan |
0 |
11,430,940 |
0 |
11,430,940 |
| Luxembourg |
781,025 |
0 |
0 |
781,025 |
| Netherlands |
0 |
11,011,183 |
0 |
11,011,183 |
| Spain |
1,864,510 |
6,779,676 |
0 |
8,644,186 |
| Sweden |
0 |
5,182,458 |
0 |
5,182,458 |
| United Kingdom |
560,185 |
3,853,380 |
0 |
4,413,565 |
| United States |
68,642,304 |
0 |
0 |
68,642,304 |
| Preferred stocks |
|
|
|
|
| Germany |
0 |
604,794 |
0 |
604,794 |
| Total liabilities |
$83,133,091 |
$59,243,546 |
$0 |
$142,376,637 |
| Average daily net assets |
Management fee |
| First $1 billion |
1.250 % |
| Next $4 billion |
1.225 |
| Over $5 billion |
1.200 |
| |
Class-level
administration fee |
| Class A |
0.20 % |
| Class C |
0.20 |
| Class R6 |
0.03 |
| Institutional Class |
0.13 |
| |
EXPENSE RATIO CAPS |
| Class A |
1.72 % |
| Class C |
2.47 |
| Class R6 |
1.30 |
| Institutional Class |
1.40 |
| |
Year
ended October 31 | |
| |
2023 |
2022 |
| Ordinary income |
$5,800,584 |
$3,285 |
| Long-term capital gain |
0 |
19,794,827 |
| Undistributed
ordinary
income |
Unrealized
gains |
Capital loss
carryforward |
| $12,436,555 |
$1,539,500 |
$(18,699,103 ) |

| Name and
year of birth |
Position held and
length of service* |
Principal occupations during past five years or
longer |
Current other
public company
or
investment
company
directorships |
| William R.
Ebsworth
(Born 1957) |
Trustee,
since 2015 |
Retired. From 1984 to 2013, equities analyst, portfolio manager, research
director and chief investment officer at Fidelity
Management and Research Company in Boston, Tokyo, and Hong
Kong, and retired in 2013 as Chief Investment Officer of Fidelity
Strategic Advisers, Inc. where he led a team of investment
professionals managing client assets. Prior thereto, Board member of Hong Kong Securities Clearing Co., Hong Kong Options Clearing Corp., the Thailand International
Fund, Ltd., Fidelity Investments Life Insurance Company, and Empire
Fidelity Investments Life Insurance Company. Audit
Committee Chair and Investment Committee Chair of the Vincent
Memorial Hospital Foundation (non-profit organization). Mr. Ebsworth is a CFA
charterholder. |
N/A |
| Jane A.
Freeman
(Born 1953) |
Trustee,
since 2015;
Chair Liaison,
since 2018 |
Retired. From 2012 to 2014 and 1999 to 2008, Chief Financial Officer of
Scientific Learning Corporation. From 2008 to 2012, Ms.
Freeman provided consulting services related to strategic
business projects. Prior to 1999, Portfolio Manager at Rockefeller &
Co. and Scudder, Stevens & Clark. Board member of the
Harding Loevner Funds from 1996 to 2014, serving as both Lead
Independent Director and chair of the Audit Committee. Board member of
the Russell Exchange Traded Funds Trust from 2011 to 2012
and the chair of the Audit Committee. Ms. Freeman is also an
inactive Chartered Financial Analyst. |
N/A |
| Isaiah
Harris, Jr.
(Born 1952) |
Trustee,
since 2009;
Audit Committee
Chair,
since 2019 |
Retired. Member of the Advisory Board of CEF of East Central Florida.
Chairman of the Board of CIGNA Corporation from 2009 to
2021, and Director from 2005 to 2008. From 2003 to 2011,
Director of Deluxe Corporation. Prior thereto, President and CEO of
BellSouth Advertising and Publishing Corp. from 2005 to
2007, President and CEO of BellSouth Enterprises from 2004 to
2005 and President of BellSouth Consumer Services from 2000 to 2003.
Emeritus member of the Iowa State University Foundation
Board of Governors. Emeritus Member of the Advisory board of
Iowa State University School of Business. Advisory Board Member, Palm
Harbor Academy (private school). Advisory Board Member,
Fellowship of Christian Athletes. Mr. Harris is a certified public
accountant (inactive status). |
N/A |
| David F.
Larcker
(Born 1950) |
Trustee,
since 2009 |
Distinguished Visiting Fellow at the Hoover Institution since 2022. James
Irvin Miller Professor of Accounting at the Graduate School
of Business (Emeritus), Stanford University, Director of the
Corporate Governance Research Initiative and Senior Faculty of The Rock
Center for Corporate Governance since 2006. From 2005 to
2008, Professor of Accounting at the Graduate School of
Business, Stanford University. Prior thereto, Ernst & Young Professor
of Accounting at The Wharton School, University of Pennsylvania
from 1985 to 2005. |
N/A |
| Olivia S.
Mitchell
(Born 1953) |
Trustee,
since 2006;
Nominating and
Governance
Committee Chair,
since 2018 |
International Foundation of Employee Benefit Plans Professor since 1993,
Wharton School of the University of Pennsylvania. Director
of Wharton’s Pension Research Council and Boettner Center on Pensions & Retirement Research, and Research Associate at the National Bureau of Economic
Research. Previously taught at Cornell University from 1978 to 1993.
|
N/A |
| Timothy J.
Penny
(Born 1951) |
Trustee,
since 1996;
Chair,
since 2018 |
President and Chief Executive Officer of Southern Minnesota Initiative
Foundation, a non-profit organization, since 2007. Vice
Chair of the Economic Club of Minnesota, since 2007. Co-Chair of the Committee for a Responsible Federal Budget, since 1995. Member of the Board of Trustees of
NorthStar Education Finance, Inc., a non-profit organization, from
2007-2022. Senior Fellow of the University of Minnesota Humphrey
Institute from 1995 to 2017. |
N/A |
| Name and
year of birth |
Position held and
length of service* |
Principal occupations during past five years or
longer |
Current other
public company
or
investment
company
directorships |
| James G.
Polisson
(Born 1959) |
Trustee,
since 2018 |
Retired. Chief Marketing Officer, Source (ETF) UK Services, Ltd, from
2015 to 2017. From 2012 to 2015, Principal of The Polisson
Group, LLC, a management consulting, corporate advisory and
principal investing company. Chief Executive Officer and Managing
Director at Russell Investments, Global Exchange Traded
Funds from 2010 to 2012. Managing Director of Barclays
Global Investors from 1998 to 2010 and Global Chief Marketing Officer for
iShares and Barclays Global Investors from 2000 to 2010.
Trustee of the San Francisco Mechanics’ Institute, a non- profit organization, from 2013 to 2015. Board member of the Russell Exchange Traded Fund Trust
from 2011 to 2012. Director of Barclays Global Investors Holdings
Deutschland GmbH from 2006 to 2009. Mr. Polisson is an
attorney and has a retired status with the Massachusetts and District of Columbia Bar Associations. |
N/A |
| Pamela Wheelock (Born 1959) |
Trustee, since January 2020; previously Trustee from January 2018 to July 2019 |
Retired. Executive and Senior Financial leadership positions in the public, private and nonprofit
sectors. Interim President and CEO, McKnight Foundation, 2020. Interim
Commissioner, Minnesota Department of Human Services, 2019.
Chief Operating Officer, Twin Cities Habitat for Humanity,
2017-2019. Vice President for University Services, University of Minnesota, 2012- 2016. Interim President and CEO, Blue Cross and Blue Shield of Minnesota, 2011-2012. Executive
Vice-President and Chief Financial Officer, Minnesota Wild, 2002-2008.
Commissioner, Minnesota Department of Finance, 1999-2002.
Chair of the Board of Directors of Destination Medical Center
Corporation. Board member of the Minnesota Wild Foundation. |
N/A |
| * |
Length of service dates reflect the Trustee’s commencement of service with the Trust’s predecessor entities, where applicable. |
| Name and
year of birth |
Position held and
length of
service |
Principal occupations during past five years or
longer |
| Andrew Owen
(Born 1960) |
President,
since 2017 |
President and Chief Executive Officer of Allspring Funds Management, LLC
since 2017 and Head of Global Fund Governance of Allspring
Global Investments since 2022. Prior thereto, co-president of Galliard Capital Management, LLC, an affiliate of Allspring Funds Management, LLC, from 2019 to 2022 and Head of Affiliated
Managers, Allspring Global Investments, from 2014 to 2019 and Executive
Vice President responsible for marketing, investments and product
development for Allspring Funds Management, LLC, from 2009 to 2014. |
| Jeremy DePalma
(Born 1974) |
Treasurer,
since 2012
(for certain funds in
the Fund Complex);
since 2021 (for
the remaining funds
in the Complex) |
Senior Vice President of Allspring Funds Management, LLC since 2009.
Senior Vice President of Evergreen Investment Management
Company, LLC from 2008 to 2010 and head of the Fund Reporting and Control Team within Fund Administration from 2005 to 2010.
|
| Christopher Baker
(Born 1976) |
Chief Compliance
Officer,
since 2022 |
Global Chief Compliance Officer for Allspring Global Investments since
2022. Prior thereto, Chief Compliance Officer for State
Street Global Advisors from 2018 to 2021. Senior Compliance Officer for the State Street divisions of Alternative Investment Solutions, Sector Solutions, and Global Marketing from 2015 to 2018. From 2010 to 2015
Vice President, Global Head of Investment and Marketing Compliance for State
Street Global Advisors. |
| Matthew Prasse (Born 1983) |
Chief Legal Officer, since 2022; Secretary, since 2021 |
Senior Counsel of the Allspring Legal Department since 2021. Senior Counsel of the Wells Fargo Legal Department
from 2018 to 2021. Previously, Counsel for Barings LLC from 2015 to 2018.
Prior to joining Barings, Associate at Morgan, Lewis & Bockius
LLP from 2008 to 2015. |


| 2 | |
| 6 | |
| 10 | |
| 11 | |
| 14 | |
| 15 | |
| 17 | |
| 19 | |
| 24 | |
| 29 | |
| 30 |


| Notice to Shareholders |
| Beginning in July 2024, the Fund will be required by the
Securities and Exchange Commission to send shareholders a paper copy of a
new tailored shareholder report in place of the full shareholder report that you are now receiving. The tailored shareholder report will contain concise information about the Fund, including certain expense and performance
information and fund statistics. If you wish to receive this new tailored shareholder
report electronically, please follow the instructions on the back cover
of this report. |
| Other information that is currently included in the shareholder
report, such as the Fund’s financial statements, will be available
online and upon request, free of charge, in paper or electronic format. |
| Investment objective |
The Fund seeks long-term capital appreciation. |
| Manager |
Allspring Funds Management, LLC |
| Subadviser |
Allspring Global Investments, LLC |
| Portfolio managers |
Jonathan Drexel, CFA†, Paige Henderson, CFA, CFP†
|
| Average annual total returns (%) as of October 31, 2023 | |||||||||
| |
|
Including sales charge |
Excluding sales charge |
Expense ratios1 (%) | |||||
| |
Inception date |
1 year |
5 year |
10 year |
1 year |
5 year |
10 year |
Gross |
Net2 |
| Class A (WFEAX) |
1-20-1998 |
8.91 |
0.37 |
1.50 |
15.53 |
1.57 |
2.10 |
1.38 |
1.14 |
| Class C (WFEFX) |
3-6-1998 |
13.51 |
0.79 |
1.49 |
14.51 |
0.79 |
1.49 |
2.13 |
1.89 |
| Class R6 (WFEHX)3 |
9-30-2015 |
– |
– |
– |
15.87 |
1.89 |
2.39 |
0.95 |
0.79 |
| Administrator Class (WFEDX) |
7-16-2010 |
– |
– |
– |
15.36 |
1.54 |
2.09 |
1.30 |
1.14 |
| Institutional Class (WFENX) |
3-9-1998 |
– |
– |
– |
15.75 |
1.85 |
2.37 |
1.05 |
0.84 |
| MSCI ACWI ex USA Index (Net)4
|
– |
– |
– |
– |
12.07 |
3.46 |
2.54 |
– |
– |
| MSCI EAFE Index (Net)5 |
– |
– |
– |
– |
14.40 |
4.10 |
3.05 |
– |
– |
| | |
| 1 |
Reflects the expense ratios as stated in the most recent prospectuses. The expense ratios shown are subject to change and may differ from the annualized expense ratios
shown in the Financial Highlights of this report. |
| 2 |
The manager has contractually committed through February 29, 2024, to waive fees and/or reimburse expenses to the extent necessary to cap total annual fund operating
expenses after fee waivers at 1.14% for Class A, 1.89% for Class C, 0.79%
for Class R6, 1.14% for Administrator Class and 0.84% for Institutional Class. Brokerage commissions, stamp duty fees, interest, taxes, acquired fund fees and expenses (if any), and extraordinary expenses are excluded from the expense caps. Prior to or after
the commitment expiration date, the caps may be increased or the
commitment to maintain the caps may be terminated only with the approval of the Board of Trustees. Without these caps, the Fund’s returns would have been lower. The expense ratio paid by an investor is the net expense ratio (the total annual fund operating
expenses after fee waivers) as stated in the
prospectuses. |
| 3 |
Historical performance shown for the Class R6 shares prior to their inception reflects the performance of the Institutional Class shares, and includes the higher
expenses applicable to the Institutional Class shares. If these expenses had not
been included, returns for the Class R6 shares would be higher. |
| 4 |
The Morgan Stanley Capital International (MSCI) All Country World Index (ACWI) ex USA Index (Net) is a free-float-adjusted market-capitalization-weighted index that is
designed to measure the equity market performance of developed and
emerging markets, excluding the U.S. Source: MSCI. MSCI makes no express or implied warranties or representations and shall have no liability whatsoever with respect to any MSCI data contained herein. The MSCI data may not be further redistributed or used as a
basis for other indexes or any securities or financial products. This report is
not approved, reviewed, or produced by MSCI. You cannot invest directly in an index. |
| 5 |
The MSCI Europe, Australasia, Far East (EAFE) Index (Net) is a free-float-adjusted market-capitalization-weighted index that is designed to measure the equity
market performance of developed markets, excluding the U.S. and Canada. You cannot
invest directly in an index. |
| † |
Jonathan Drexel and Paige Henderson became portfolio managers of the Fund on October 20, 2023. |
| CFA® and Chartered Financial Analyst® are trademarks owned by CFA Institute. | |
| Growth of $10,000 investment as of October 31, 20231 |

| 1 |
The chart compares the performance of Class A shares for the most recent ten years with the MSCI ACWI ex USA Index (Net) and MSCI EAFE Index (Net). The chart assumes
a hypothetical investment of $10,000 in Class A shares and reflects all operating
expenses and assumes the maximum initial sales charge of 5.75%. |
| Ten largest holdings (%) as of October 31, 20231 | |
| BAE Systems PLC |
3.11 |
| Samsung Electronics Co. Ltd. |
3.09 |
| Coca-Cola Europacific Partners PLC |
2.97 |
| Shell PLC |
2.97 |
| Sanofi SA |
2.95 |
| TotalEnergies SE |
2.82 |
| Vinci SA |
2.50 |
| ORIX Corp. |
2.46 |
| Deutsche Boerse AG |
2.39 |
| Toyota Motor Corp. |
2.30 |
| 1 |
Figures represent the percentage of the Fund’s net assets. Holdings are subject to change and may have changed since the date specified. |
| Sector allocation as of October 31, 20231 |
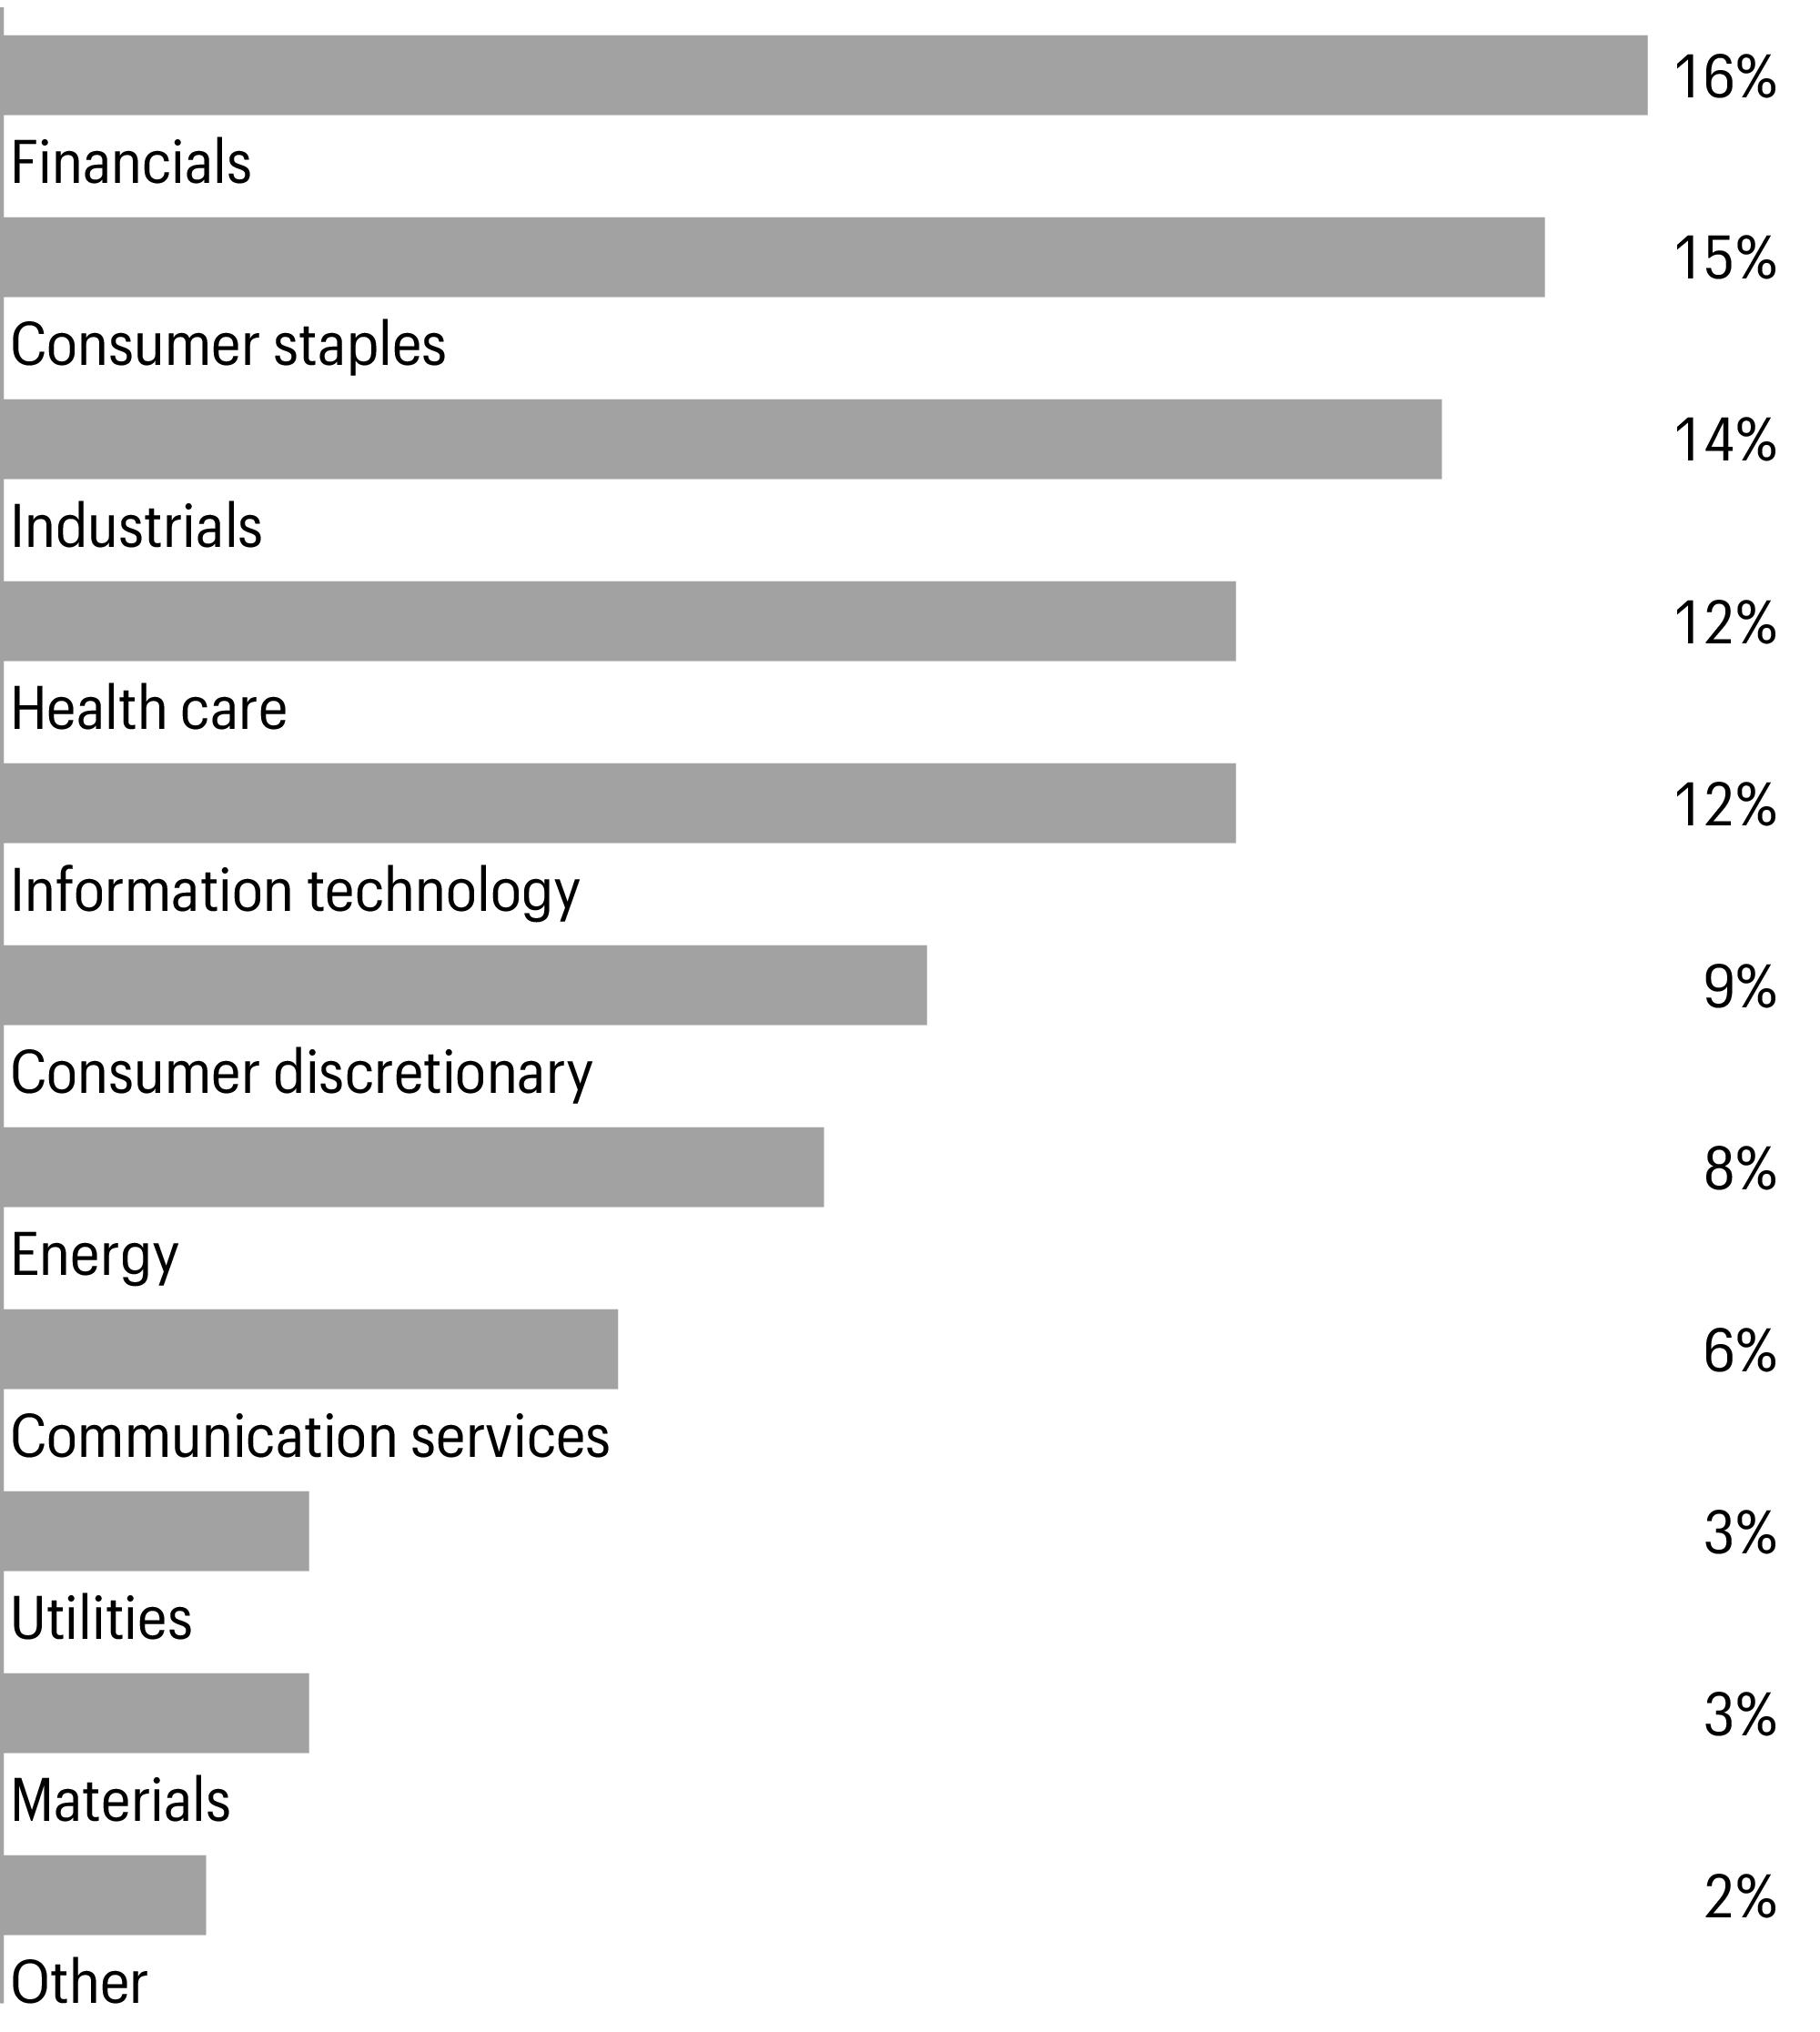
| 1 |
Figures represent the percentage of the Fund’s long-term investments. Allocations are subject to change and may have changed since the date specified. |
| Geographic allocation as of October 31, 20231 |
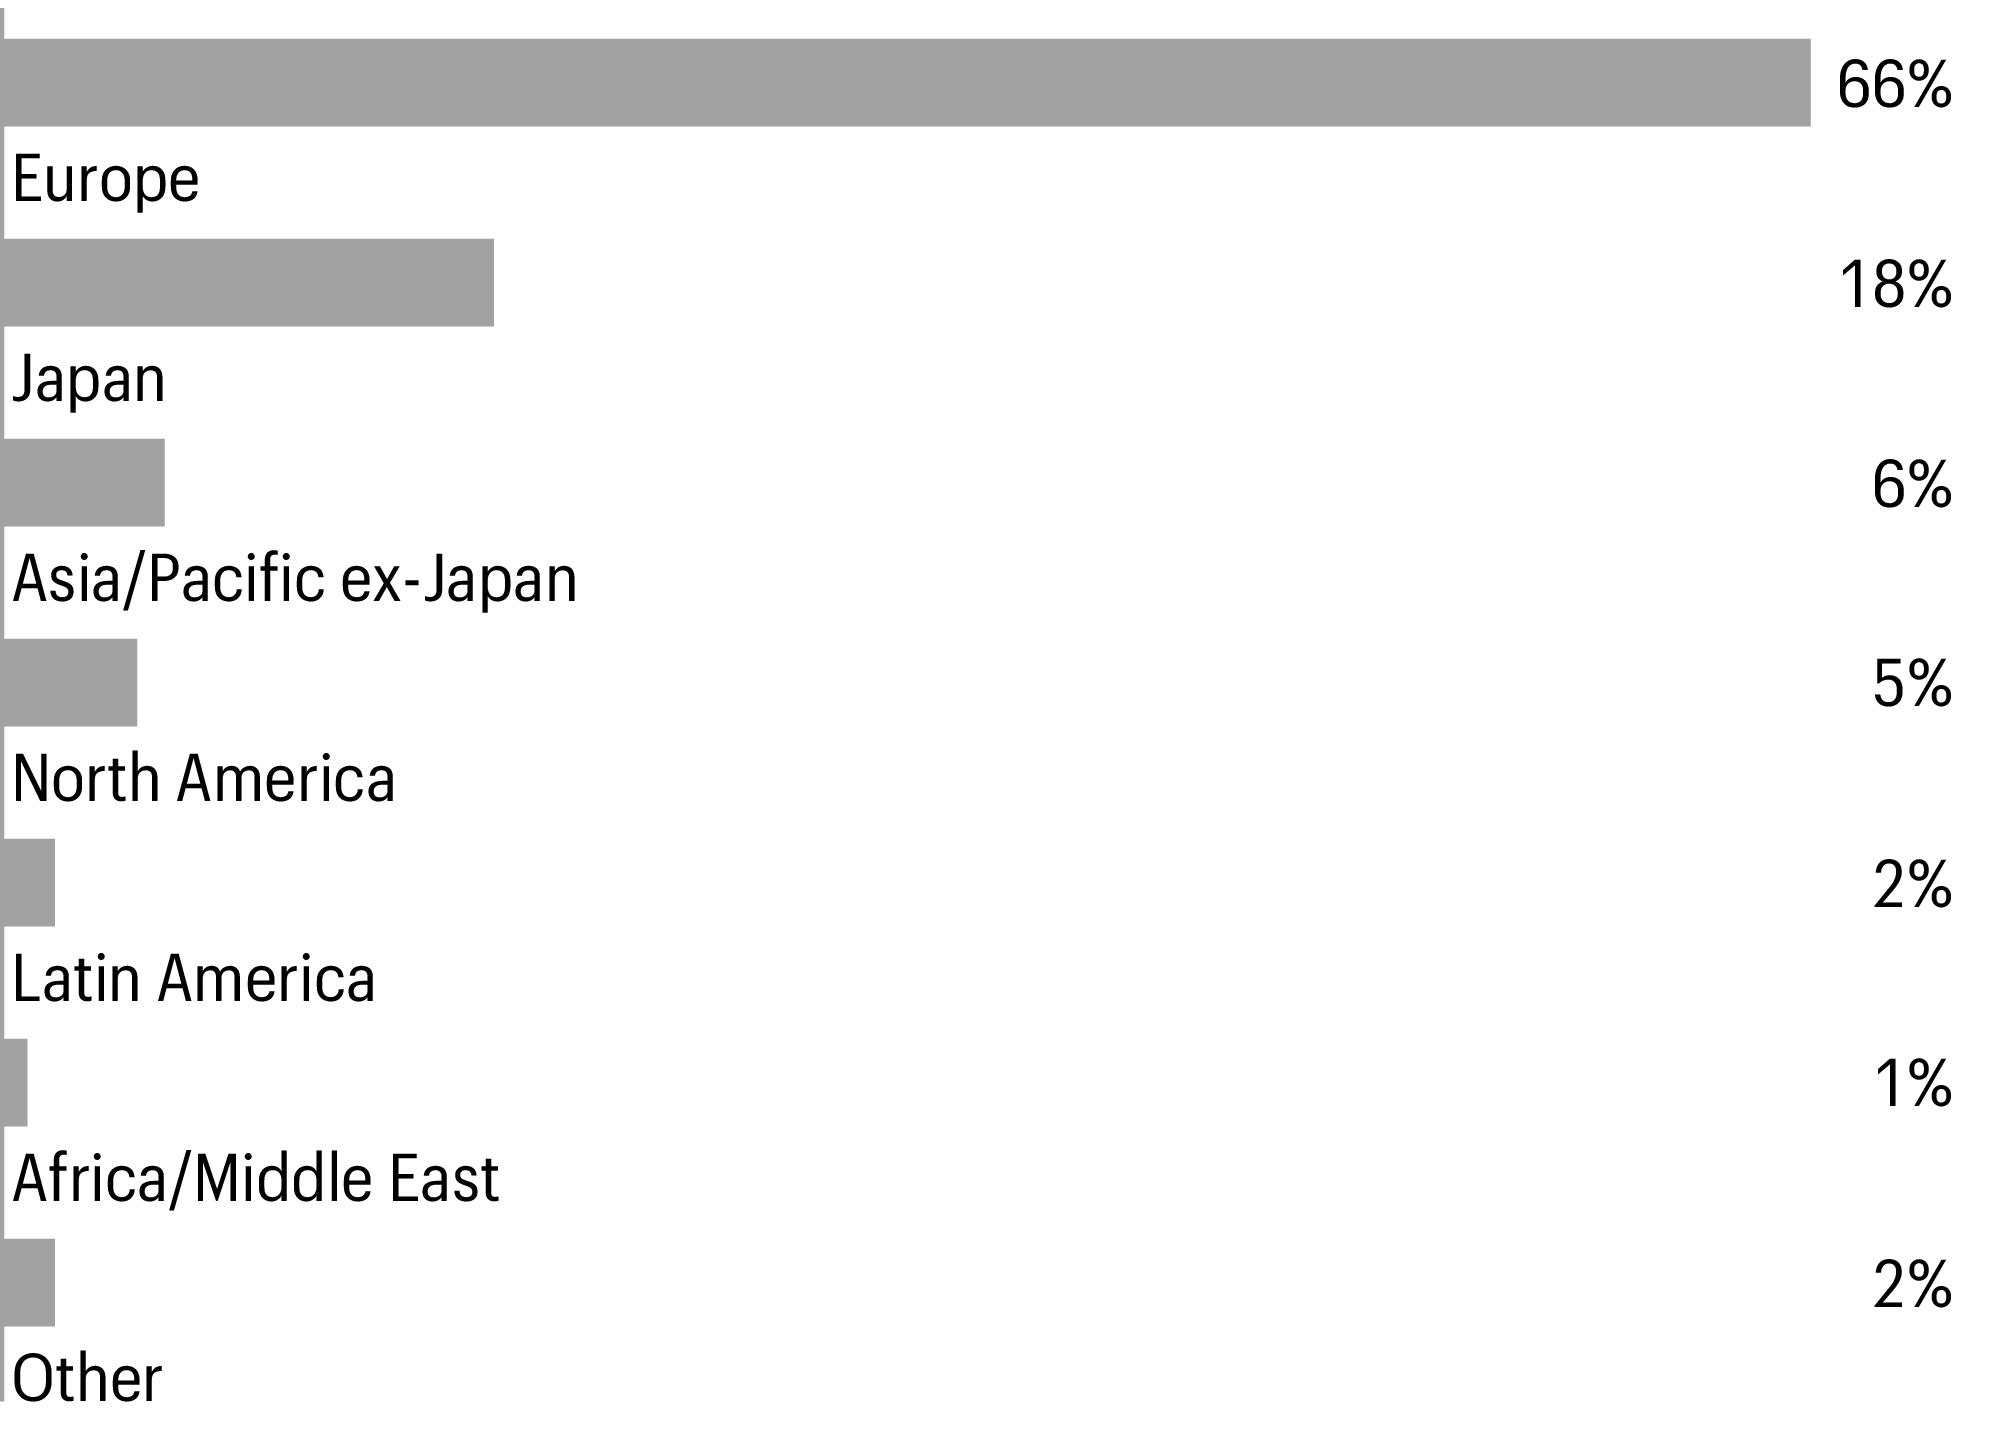
| 1 |
Figures represent the percentage of the Fund’s long-term investments. Allocations are subject to change and may have changed since the date specified. |
| |
Beginning account value 5-1-2023 |
Ending account value 10-31-2023 |
Expenses paid during the period1
|
Annualized net expense ratio |
| Class A |
|
|
|
|
| Actual |
$1,000.00 |
$954.21 |
$5.37 |
1.09 % |
| Hypothetical (5% return before expenses) |
$1,000.00 |
$1,019.71 |
$5.55 |
1.09 % |
| Class C |
|
|
|
|
| Actual |
$1,000.00 |
$950.14 |
$9.24 |
1.88 % |
| Hypothetical (5% return before expenses) |
$1,000.00 |
$1,015.73 |
$9.55 |
1.88 % |
| Class R6 |
|
|
|
|
| Actual |
$1,000.00 |
$955.75 |
$3.85 |
0.78 % |
| Hypothetical (5% return before expenses) |
$1,000.00 |
$1,021.27 |
$3.97 |
0.78 % |
| Administrator Class |
|
|
|
|
| Actual |
$1,000.00 |
$953.03 |
$5.61 |
1.14 % |
| Hypothetical (5% return before expenses) |
$1,000.00 |
$1,019.46 |
$5.80 |
1.14 % |
| Institutional Class |
|
|
|
|
| Actual |
$1,000.00 |
$955.35 |
$4.14 |
0.84 % |
| Hypothetical (5% return before expenses) |
$1,000.00
|
$1,020.97
|
$4.28
|
0.84 % |
| 1 |
Expenses paid is equal to the annualized net expense ratio of each class multiplied by the average account value over the period, multiplied by 184 divided by 365 (to
reflect the one-half-year period). |
| |
|
|
|
Shares |
Value | |
| Common stocks: 95.02% |
|
|
|
|
|
|
| Canada: 3.24% |
|
|
|
|
|
|
| Restaurant Brands International, Inc. (Consumer discretionary, Hotels, restaurants & leisure) |
|
|
|
|
78,559 |
$5,279,165 |
| TC Energy Corp. (Energy, Oil, gas & consumable fuels) |
|
|
|
|
96,125 |
3,311,506 |
| |
|
|
|
|
|
8,590,671 |
| Finland: 2.01% |
|
|
|
|
|
|
| Nordea Bank Abp (Financials, Banks) |
|
|
|
|
505,084 |
5,321,787 |
| France: 21.54% |
|
|
|
|
|
|
| Air Liquide SA (Materials, Chemicals) |
|
|
|
|
35,530 |
6,088,142 |
| AXA SA (Financials, Insurance) |
|
|
|
|
178,714 |
5,295,372 |
| Capgemini SE (Information technology, IT services) |
|
|
|
|
24,775 |
4,378,457 |
| L’Oreal SA (Consumer staples, Personal care products) |
|
|
|
|
13,352 |
5,612,252 |
| LVMH Moet Hennessy Louis Vuitton SE (Consumer discretionary, Textiles, apparel & luxury goods) |
|
|
|
|
6,887 |
4,930,612 |
| Sanofi SA (Health care, Pharmaceuticals) |
|
|
|
|
86,200 |
7,827,498 |
| Schneider Electric SE (Industrials, Electrical equipment) |
|
|
|
|
22,303 |
3,431,479 |
| TotalEnergies SE (Energy, Oil, gas & consumable fuels) |
|
|
|
|
111,854 |
7,478,278 |
| Veolia Environnement SA (Utilities, Multi-utilities) |
|
|
|
|
199,834 |
5,475,531 |
| Vinci SA (Industrials, Construction & engineering) |
|
|
|
|
59,925 |
6,626,172 |
| |
|
|
|
|
|
57,143,793 |
| Germany: 11.54% |
|
|
|
|
|
|
| adidas AG (Consumer discretionary, Textiles, apparel & luxury goods) |
|
|
|
|
29,772 |
5,293,693 |
| Deutsche Boerse AG (Financials, Capital markets) |
|
|
|
|
38,438 |
6,326,761 |
| Deutsche Post AG (Industrials, Air freight & logistics) |
|
|
|
|
99,412 |
3,881,392 |
| Deutsche Telekom AG (Communication services, Diversified telecommunication services) |
|
|
|
|
218,950 |
4,752,017 |
| SAP SE (Information technology, Software) |
|
|
|
|
39,846 |
5,344,637 |
| Siemens AG (Industrials, Industrial conglomerates) |
|
|
|
|
37,814 |
5,017,874 |
| |
|
|
|
|
|
30,616,374 |
| Hong Kong: 1.42% |
|
|
|
|
|
|
| AIA Group Ltd. (Financials, Insurance) |
|
|
|
|
433,400 |
3,763,560 |
| Israel: 1.45% |
|
|
|
|
|
|
| Check Point Software Technologies Ltd. (Information technology,
Software)† |
|
|
|
|
28,722 |
3,855,929 |
| Japan: 17.93% |
|
|
|
|
|
|
| Asahi Group Holdings Ltd. (Consumer staples, Beverages) |
|
|
|
|
128,000 |
4,629,810 |
| FUJIFILM Holdings Corp. (Information technology, Technology hardware, storage & peripherals) |
|
|
|
|
67,100 |
3,670,220 |
| Hitachi Ltd. (Industrials, Industrial conglomerates) |
|
|
|
|
37,400 |
2,370,658 |
| Mitsubishi UFJ Financial Group, Inc. (Financials, Banks) |
|
|
|
|
286,300 |
2,401,813 |
| Nintendo Co. Ltd. (Communication services, Entertainment) |
|
|
|
|
115,000 |
4,751,158 |
| ORIX Corp. (Financials, Financial services) |
|
|
|
|
358,500 |
6,519,801 |
| Seven & i Holdings Co. Ltd. (Consumer staples, Consumer staples distribution & retail) |
|
|
|
|
82,000 |
3,004,373 |
| Sumitomo Mitsui Financial Group, Inc. (Financials, Banks) |
|
|
|
|
116,900 |
5,635,512 |
| |
|
|
|
Shares |
Value | |
| Japan(continued) |
|
|
|
|
|
|
| Takeda Pharmaceutical Co. Ltd. (Health care, Pharmaceuticals) |
|
|
|
|
106,900 |
$2,901,771 |
| Tokyo Electron Ltd. (Information technology, Semiconductors & semiconductor equipment) |
|
|
|
|
42,100 |
5,562,995 |
| Toyota Motor Corp. (Consumer discretionary, Automobiles) |
|
|
|
|
348,400 |
6,094,819 |
| |
|
|
|
|
|
47,542,930 |
| Mexico: 1.49% |
|
|
|
|
|
|
| America Movil SAB de CV Series B (Communication services, Wireless telecommunication services) |
|
|
|
|
4,779,699 |
3,952,816 |
| Netherlands: 4.31% |
|
|
|
|
|
|
| Airbus SE (Industrials, Aerospace & defense) |
|
|
|
|
39,764 |
5,331,404 |
| ING Groep NV (Financials, Banks) |
|
|
|
|
475,205 |
6,092,377 |
| |
|
|
|
|
|
11,423,781 |
| South Korea: 3.90% |
|
|
|
|
|
|
| Samsung Electronics Co. Ltd. GDR (Information technology, Technology hardware, storage & peripherals) |
|
|
|
|
6,551 |
8,191,866 |
| SK Telecom Co. Ltd. (Communication services, Wireless telecommunication services) |
|
|
|
|
59,051 |
2,153,409 |
| |
|
|
|
|
|
10,345,275 |
| Switzerland: 6.11% |
|
|
|
|
|
|
| Nestle SA (Consumer staples, Food products) |
|
|
|
|
55,356 |
5,969,521 |
| Novartis AG (Health care, Pharmaceuticals) |
|
|
|
|
62,713 |
5,871,163 |
| Roche Holding AG (Health care, Pharmaceuticals) |
|
|
|
|
16,901 |
4,355,549 |
| |
|
|
|
|
|
16,196,233 |
| Thailand: 0.15% |
|
|
|
|
|
|
| Minor International PCL (Consumer discretionary, Hotels, restaurants & leisure) |
|
|
|
|
515,500 |
401,719 |
| United Kingdom: 18.34% |
|
|
|
|
|
|
| AstraZeneca PLC (Health care, Pharmaceuticals) |
|
|
|
|
47,063 |
5,892,458 |
| BAE Systems PLC (Industrials, Aerospace & defense) |
|
|
|
|
613,667 |
8,251,589 |
| Coca-Cola Europacific Partners PLC (Consumer staples, Beverages) |
|
|
|
|
134,806 |
7,887,499 |
| Diageo PLC (Consumer staples, Beverages) |
|
|
|
|
160,628 |
6,074,304 |
| National Grid PLC (Utilities, Multi-utilities) |
|
|
|
|
253,531 |
3,022,842 |
| Reckitt Benckiser Group PLC (Consumer staples, Household products) |
|
|
|
|
31,149 |
2,083,059 |
| Shell PLC (Energy, Oil, gas & consumable fuels) |
|
|
|
|
244,599 |
7,882,649 |
| Smith & Nephew PLC (Health care, Health care equipment & supplies) |
|
|
|
|
379,246 |
4,244,187 |
| Unilever PLC (Consumer staples, Personal care products) |
|
|
|
|
69,809 |
3,299,789 |
| |
|
|
|
|
|
48,638,376 |
| United States: 1.59% |
|
|
|
|
|
|
| EOG Resources, Inc. (Energy, Oil, gas & consumable fuels) |
|
|
|
|
17,527 |
2,212,784 |
| Gentex Corp. (Consumer discretionary, Automobile components) |
|
|
|
|
70,347 |
2,017,552 |
| |
|
|
|
|
|
4,230,336 |
| Total common stocks (Cost $243,560,586) |
|
|
|
|
|
252,023,580 |
| |
|
|
|
Shares |
Value | |
| Investment companies: 2.00% |
|
|
|
|
|
|
| United States: 2.00% |
|
|
|
|
|
|
| iShares MSCI EAFE ETF |
|
|
|
|
79,434 |
$5,315,723 |
| Total investment companies (Cost $5,294,149) |
|
|
|
|
|
5,315,723 |
| |
|
Yield |
|
|
| |
| Short-term investments: 1.17% |
|
|
|
|
|
|
| Investment companies: 1.17% |
|
|
|
|
|
|
| Allspring Government Money Market Fund Select
Class♠∞ |
|
5.29 % |
|
|
3,094,072 |
3,094,072 |
| Total short-term investments (Cost $3,094,072) |
|
|
|
|
|
3,094,072 |
| Total investments in securities (Cost $251,948,807) |
98.19 % |
|
|
|
|
260,433,375 |
| Other assets and liabilities, net |
1.81 |
|
|
|
|
4,794,312 |
| Total net assets |
100.00 % |
|
|
|
|
$265,227,687 |
| † |
Non-income-earning security |
| ♠ |
The issuer of the security is an affiliated person of the Fund as defined in the Investment Company Act of 1940. |
| ∞ |
The rate represents the 7-day annualized yield at period end. |
| Abbreviations: | |
| GDR |
Global depositary receipt |
| |
Value, beginning of period |
Purchases |
Sales
proceeds |
Net
realized
gains
(losses) |
Net
change in
unrealized
gains
(losses) |
Value,
end of
period |
Shares,
end
of period |
Income
from
affiliated
securities |
| Short-term investments |
|
|
|
|
|
|
|
|
| Allspring Government Money Market Fund Select Class |
$4,710,469 |
$178,641,229 |
$(180,257,626 ) |
$0 |
$0 |
$3,094,072 |
3,094,072 |
$319,722 |
| Investments in affiliates no longer held at end of period |
|
|
|
|
|
|
|
|
| Securities Lending Cash Investments LLC |
6,780,138 |
24,154,050 |
(30,934,500 ) |
312 |
0 |
0 |
0 |
50,617 1 |
| |
|
|
|
$312 |
$0 |
$3,094,072 |
|
$370,339 |
| 1 |
Amount shown represents income before fees and rebates. |
| Assets |
|
| Investments in unaffiliated securities, at value (cost $248,854,735) |
$257,339,303 |
| Investments in affiliated securities, at value (cost $3,094,072) |
3,094,072 |
| Foreign currency, at value (cost $2,034,351) |
2,033,455 |
| Receivable for investments sold |
35,343,430 |
| Receivable for dividends |
2,622,981 |
| Receivable for Fund shares sold |
141,751 |
| Prepaid expenses and other assets |
4,063 |
| Total assets |
300,579,055 |
| Liabilities |
|
| Payable for investments purchased |
34,795,919 |
| Payable for Fund shares redeemed |
178,092 |
| Management fee payable |
119,239 |
| Administration fees payable |
34,965 |
| Distribution fees payable |
1,276 |
| Accrued expenses and other liabilities |
221,877 |
| Total liabilities |
35,351,368 |
| Total net assets |
$265,227,687 |
| Net assets consist of |
|
| Paid-in capital |
$352,575,339 |
| Total distributable loss |
(87,347,652
) |
| Total net assets |
$265,227,687 |
| Computation of net asset value and offering price per share |
|
| Net assets–Class A |
$110,901,591 |
| Shares outstanding–Class A1
|
9,719,094 |
| Net asset value per share–Class A |
$11.41 |
| Maximum offering price per share – Class A2 |
$12.11 |
| Net assets–Class C |
$1,925,881 |
| Shares outstanding–Class C1
|
169,763 |
| Net asset value per share–Class C |
$11.34 |
| Net assets–Class R6 |
$23,429,497 |
| Shares outstanding–Class R61
|
2,080,317 |
| Net asset value per share–Class R6 |
$11.26 |
| Net assets–Administrator Class |
$7,901,969 |
| Shares outstanding–Administrator
Class1 |
705,047 |
| Net asset value per share–Administrator Class |
$11.21 |
| Net assets–Institutional Class |
$121,068,749 |
| Shares outstanding–Institutional
Class1 |
10,738,069 |
| Net asset value per share–Institutional Class |
$11.27
|
| Investment income |
|
| Dividends (net of foreign withholdings taxes of $965,225) |
$8,302,401 |
| Income from non-cash dividends |
738,975 |
| Income from affiliated securities |
325,504 |
| Interest (net of foreign withholding taxes of $7) |
5,311 |
| Total investment income |
9,372,191 |
| Expenses |
|
| Management fee |
2,554,489 |
| Administration fees |
|
| Class A |
267,834 |
| Class C |
6,260 |
| Class R |
444 1 |
| Class R6 |
13,033 |
| Administrator Class |
11,944 |
| Institutional Class |
174,046 |
| Shareholder servicing fees |
|
| Class A |
323,920 |
| Class C |
7,525 |
| Class R |
528 1 |
| Administrator Class |
22,960 |
| Distribution fees |
|
| Class C |
22,564 |
| Class R |
528 1 |
| Custody and accounting fees |
103,108 |
| Professional fees |
145,389 |
| Registration fees |
201,929 |
| Shareholder report expenses |
59,925 |
| Trustees’ fees and expenses |
23,223 |
| Interest expense |
3,111 |
| Other fees and expenses |
77,207 |
| Total expenses |
4,019,967 |
| Less: Fee waivers and/or expense reimbursements |
|
| Fund-level |
(735,002
) |
| Class A |
(131,755
) |
| Class C |
(2,388 ) |
| Class R6 |
(2,557 ) |
| Administrator Class |
(3 ) |
| Institutional Class |
(72,146
) |
| Net expenses |
3,076,116 |
| Net investment income |
6,296,075 |
| Realized and unrealized gains (losses) on investments |
|
| Net realized gains (losses) on |
|
| Unaffiliated securities |
$7,780,371 |
| Affiliated securities |
312 |
| Foreign currency and foreign currency translations |
(57,488
) |
| Net realized gains on investments |
7,723,195 |
| Net change in unrealized gains (losses) on |
|
| Unaffiliated securities |
34,796,723 |
| Foreign currency and foreign currency translations |
238,676 |
| Net change in unrealized gains (losses) on investments |
35,035,399 |
| Net realized and unrealized gains (losses) on investments |
42,758,594 |
| Net increase in net assets resulting from operations |
$49,054,669 |
| |
Year ended October 31, 2023 |
Year ended October 31, 2022 | ||
| Operations |
|
|
|
|
| Net investment income |
|
$6,296,075 |
|
$6,244,012 |
| Net realized gains (losses) on investments |
|
7,723,195 |
|
(11,970,649 ) |
| Net change in unrealized gains (losses) on investments |
|
35,035,399 |
|
(89,838,466 ) |
| Net increase (decrease) in net assets resulting from operations |
|
49,054,669 |
|
(95,565,103 ) |
| Distributions to shareholders from |
|
|
|
|
| Net investment income and net realized gains |
|
|
|
|
| Class A |
|
(1,968,447 ) |
|
(3,279,726 ) |
| Class C |
|
(20,285 ) |
|
(53,251 ) |
| Class R |
|
(338
)1 |
|
(4,783 ) |
| Class R6 |
|
(806,843 ) |
|
(1,470,779 ) |
| Administrator Class |
|
(146,702 ) |
|
(257,832 ) |
| Institutional Class |
|
(2,478,449 ) |
|
(4,764,928 ) |
| Tax basis return of capital |
|
|
|
|
| Class A |
|
0 |
|
(186,969 ) |
| Class C |
|
0 |
|
(6,168 ) |
| Class R |
|
0
1 |
|
(399 ) |
| Class R6 |
|
0 |
|
(64,599 ) |
| Administrator Class |
|
0 |
|
(14,683 ) |
| Institutional Class |
|
0 |
|
(216,333 ) |
| Total distributions to shareholders |
|
(5,421,064
) |
|
(10,320,450 ) |
| Capital share transactions |
Shares |
|
Shares |
|
| Proceeds from shares sold |
|
|
|
|
| Class A |
687,699 |
8,275,452 |
676,493 |
7,836,254 |
| Class C |
8,623 |
103,233 |
13,684 |
163,351 |
| Class R |
1,796
1 |
21,766 1 |
10,483 |
124,341 |
| Class R6 |
162,362 |
1,878,219 |
317,223 |
3,659,212 |
| Administrator Class |
2,724 |
31,421 |
13,227 |
159,292 |
| Institutional Class |
2,287,400 |
27,318,093 |
1,905,612 |
22,686,107 |
| |
|
37,628,184 |
|
34,628,557 |
| Reinvestment of distributions |
|
|
|
|
| Class A |
159,900 |
1,907,489 |
292,324 |
3,349,903 |
| Class C |
1,637 |
19,566 |
5,164 |
57,567 |
| Class R |
27
1 |
319
1 |
439 |
4,979 |
| Class R6 |
21,784 |
255,898 |
40,633 |
463,617 |
| Administrator Class |
12,377 |
144,944 |
23,834 |
270,025 |
| Institutional Class |
205,449 |
2,417,802 |
424,071 |
4,848,935 |
| |
|
4,746,018 |
|
8,995,026 |
| |
Year ended October 31, 2023 |
Year ended October 31, 2022 | ||
| |
Shares |
|
Shares |
|
| Payment for shares redeemed |
|
|
|
|
| Class A |
(2,779,727 ) |
$(33,500,520 ) |
(2,121,369 ) |
$(24,829,961 ) |
| Class C |
(173,411 ) |
(2,053,907 ) |
(176,928 ) |
(2,107,596 ) |
| Class R |
(2,179 )1
|
(25,637 )1
|
(7,128 ) |
(91,018 ) |
| Class R6 |
(2,375,424 ) |
(28,330,065 ) |
(294,973 ) |
(3,327,619 ) |
| Administrator Class |
(186,919 ) |
(2,208,268 ) |
(282,466 ) |
(3,443,810 ) |
| Institutional Class |
(4,633,013 ) |
(53,927,952 ) |
(4,022,876 ) |
(44,955,655 ) |
| |
|
(120,046,349 ) |
|
(78,755,659 ) |
| Share conversions |
|
|
|
|
| Class A |
28,598 2 |
354,077 2 |
0 |
0 |
| Class R |
(27,860 )2
|
(354,077 )2
|
0 |
0 |
| |
|
0 |
|
0 |
| Net decrease in net assets resulting from capital share transactions |
|
(77,672,147
) |
|
(35,132,076
) |
| Total decrease in net assets |
|
(34,038,542
) |
|
(141,017,629 ) |
| Net assets |
|
|
|
|
| Beginning of period |
|
299,266,229 |
|
440,283,858 |
| End of period |
|
$265,227,687 |
|
$299,266,229 |
| |
Year ended October 31 | ||||
| Class A |
2023 |
2022 |
2021 |
2020 |
2019 |
| Net asset value, beginning of period |
$10.04 |
$13.34 |
$10.43 |
$11.38 |
$11.81 |
| Net investment income |
0.22
1 |
0.16 |
0.23
1 |
0.12 |
0.24
1 |
| Net realized and unrealized gains (losses) on investments |
1.34 |
(3.17 ) |
2.89 |
(0.97 ) |
(0.16 ) |
| Total from investment operations |
1.56 |
(3.01 ) |
3.12 |
(0.85 ) |
0.08 |
| Distributions to shareholders from |
|
|
|
|
|
| Net investment income |
(0.19 ) |
(0.27 ) |
(0.21 ) |
(0.10 ) |
(0.51 ) |
| Tax basis return of capital |
0.00 |
(0.02 ) |
0.00 |
0.00 |
0.00 |
| Total distributions to shareholders |
(0.19 ) |
(0.29 ) |
(0.21 ) |
(0.10 ) |
(0.51 ) |
| Net asset value, end of period |
$11.41 |
$10.04 |
$13.34 |
$10.43 |
$11.38 |
| Total
return2 |
15.53 % |
(22.84
)% |
29.92
% |
(7.54
)% |
0.93
% |
| Ratios to average net assets (annualized) |
|
|
|
|
|
| Gross expenses |
1.45 % |
1.40 % |
1.36 % |
1.48 % |
1.45 % |
| Net expenses |
1.12 % |
1.13 % |
1.13 % |
1.13 % |
1.14 % |
| Net investment income |
1.82 % |
1.50 % |
1.73 % |
1.12 % |
2.13 % |
| Supplemental data |
|
|
|
|
|
| Portfolio turnover rate |
126 % |
58 % |
95 % |
73 % |
49 % |
| Net assets, end of period (000s omitted) |
$110,902
|
$116,735 |
$170,419 |
$62,800 |
$81,110 |
| 1 |
Calculated based upon average shares outstanding |
| 2 |
Total return calculations do not include any sales charges. |
| |
Year ended October 31 | ||||
| Class C |
2023 |
2022 |
2021 |
2020 |
2019 |
| Net asset value, beginning of period |
$9.99 |
$13.22 |
$10.31 |
$11.28 |
$11.57 |
| Net investment income |
0.12
1 |
0.09
1 |
0.09
1 |
0.03
1 |
0.12
1 |
| Net realized and unrealized gains (losses) on investments |
1.32 |
(3.17 ) |
2.89 |
(0.95 ) |
(0.12 ) |
| Total from investment operations |
1.44 |
(3.08 ) |
2.98 |
(0.92 ) |
0.00 |
| Distributions to shareholders from |
|
|
|
|
|
| Net investment income |
(0.09 ) |
(0.13 ) |
(0.07 ) |
(0.05 ) |
(0.29 ) |
| Tax basis return of capital |
0.00 |
(0.02 ) |
0.00 |
0.00 |
0.00 |
| Total distributions to shareholders |
(0.09 ) |
(0.15 ) |
(0.07 ) |
(0.05 ) |
(0.29 ) |
| Net asset value, end of period |
$11.34 |
$9.99 |
$13.22 |
$10.31 |
$11.28 |
| Total
return2 |
14.51 % |
(23.38
)% |
28.94
% |
(8.22
)% |
0.16
% |
| Ratios to average net assets (annualized) |
|
|
|
|
|
| Gross expenses |
2.20 % |
2.14 % |
2.12 % |
2.22 % |
2.19 % |
| Net expenses |
1.89 % |
1.89 % |
1.89 % |
1.89 % |
1.89 % |
| Net investment income |
1.01 % |
0.76 % |
0.72 % |
0.28 % |
1.07 % |
| Supplemental data |
|
|
|
|
|
| Portfolio turnover rate |
126 % |
58 % |
95 % |
73 % |
49 % |
| Net assets, end of period (000s omitted) |
$1,926
|
$3,324 |
$6,490 |
$5,794 |
$10,700 |
| 1 |
Calculated based upon average shares outstanding |
| 2 |
Total return calculations do not include any sales charges. |
| |
Year ended October 31 | ||||
| Class R6 |
2023 |
2022 |
2021 |
2020 |
2019 |
| Net asset value, beginning of period |
$9.92 |
$13.22 |
$10.36 |
$11.31 |
$11.79 |
| Net investment income |
0.26
1 |
0.22 |
0.31 |
0.16 |
0.35 |
| Net realized and unrealized gains (losses) on investments |
1.31 |
(3.16 ) |
2.81 |
(0.96 ) |
(0.23 ) |
| Total from investment operations |
1.57 |
(2.94 ) |
3.12 |
(0.80 ) |
0.12 |
| Distributions to shareholders from |
|
|
|
|
|
| Net investment income |
(0.23 ) |
(0.34 ) |
(0.26 ) |
(0.15 ) |
(0.60 ) |
| Tax basis return of capital |
0.00 |
(0.02 ) |
0.00 |
0.00 |
0.00 |
| Total distributions to shareholders |
(0.23 ) |
(0.36 ) |
(0.26 ) |
(0.15 ) |
(0.60 ) |
| Net asset value, end of period |
$11.26 |
$9.92 |
$13.22 |
$10.36 |
$11.31 |
| Total return |
15.87 % |
(22.56
)% |
30.17
% |
(7.15
)% |
1.27
% |
| Ratios to average net assets (annualized) |
|
|
|
|
|
| Gross expenses |
1.02 % |
0.97 % |
0.95 % |
1.05 % |
1.01 % |
| Net expenses |
0.79 % |
0.79 % |
0.79 % |
0.79 % |
0.81 % |
| Net investment income |
2.23 % |
1.83 % |
1.70 % |
1.51 % |
2.23 % |
| Supplemental data |
|
|
|
|
|
| Portfolio turnover rate |
126 % |
58 % |
95 % |
73 % |
49 % |
| Net assets, end of period (000s omitted) |
$23,429
|
$42,385 |
$55,639 |
$32,011 |
$36,505 |
| 1 |
Calculated based upon average shares outstanding |
| |
Year ended October 31 | ||||
| Administrator Class |
2023 |
2022 |
2021 |
2020 |
2019 |
| Net asset value, beginning of period |
$9.88 |
$13.13 |
$10.28 |
$11.22 |
$11.62 |
| Net investment income |
0.21
1 |
0.18
1 |
0.27
1 |
0.10
1 |
0.23
1 |
| Net realized and unrealized gains (losses) on investments |
1.32 |
(3.14 ) |
2.80 |
(0.94 ) |
(0.14 ) |
| Total from investment operations |
1.53 |
(2.96 ) |
3.07 |
(0.84 ) |
0.09 |
| Distributions to shareholders from |
|
|
|
|
|
| Net investment income |
(0.20 ) |
(0.27 ) |
(0.22 ) |
(0.10 ) |
(0.49 ) |
| Tax basis return of capital |
0.00 |
(0.02 ) |
0.00 |
0.00 |
0.00 |
| Total distributions to shareholders |
(0.20 ) |
(0.29 ) |
(0.22 ) |
(0.10 ) |
(0.49 ) |
| Net asset value, end of period |
$11.21 |
$9.88 |
$13.13 |
$10.28 |
$11.22 |
| Total return |
15.36 % |
(22.81
)% |
29.87
% |
(7.54
)% |
0.98
% |
| Ratios to average net assets (annualized) |
|
|
|
|
|
| Gross expenses |
1.37 % |
1.32 % |
1.26 % |
1.39 % |
1.36 % |
| Net expenses |
1.14 % |
1.14 % |
1.14 % |
1.14 % |
1.14 % |
| Net investment income |
1.76 % |
1.51 % |
2.06 % |
0.98 % |
2.00 % |
| Supplemental data |
|
|
|
|
|
| Portfolio turnover rate |
126 % |
58 % |
95 % |
73 % |
49 % |
| Net assets, end of period (000s omitted) |
$7,902
|
$8,662 |
$14,733 |
$589 |
$1,189 |
| 1 |
Calculated based upon average shares outstanding |
| |
Year ended October 31 | ||||
| Institutional Class |
2023 |
2022 |
2021 |
2020 |
2019 |
| Net asset value, beginning of period |
$9.93 |
$13.22 |
$10.34 |
$11.29 |
$11.76 |
| Net investment income |
0.24
1 |
0.22
1 |
0.25
1 |
0.14
1 |
0.33 |
| Net realized and unrealized gains (losses) on investments |
1.32 |
(3.16 ) |
2.88 |
(0.96 ) |
(0.22 ) |
| Total from investment operations |
1.56 |
(2.94 ) |
3.13 |
(0.82 ) |
0.11 |
| Distributions to shareholders from |
|
|
|
|
|
| Net investment income |
(0.22 ) |
(0.33 ) |
(0.25 ) |
(0.13 ) |
(0.58 ) |
| Tax basis return of capital |
0.00 |
(0.02 ) |
0.00 |
0.00 |
0.00 |
| Total distributions to shareholders |
(0.22 ) |
(0.35 ) |
(0.25 ) |
(0.13 ) |
(0.58 ) |
| Net asset value, end of period |
$11.27 |
$9.93 |
$13.22 |
$10.34 |
$11.29 |
| Total return |
15.75 % |
(22.56
)% |
30.30
% |
(7.28
)% |
1.19
% |
| Ratios to average net assets (annualized) |
|
|
|
|
|
| Gross expenses |
1.12 % |
1.07 % |
1.03 % |
1.15 % |
1.11 % |
| Net expenses |
0.84 % |
0.84 % |
0.84 % |
0.84 % |
0.86 % |
| Net investment income |
2.07 % |
1.79 % |
1.93 % |
1.33 % |
2.27 % |
| Supplemental data |
|
|
|
|
|
| Portfolio turnover rate |
126 % |
58 % |
95 % |
73 % |
49 % |
| Net assets, end of period (000s omitted) |
$121,069
|
$127,869 |
$192,670 |
$86,052 |
$150,749 |
| 1 |
Calculated based upon average shares outstanding |
| Gross unrealized gains |
$9,046,130 |
| Gross unrealized losses |
(2,342,088 ) |
| Net unrealized gains |
$6,704,042 |
| |
Quoted prices
(Level 1) |
Other significant
observable inputs
(Level 2) |
Significant
unobservable inputs
(Level 3) |
Total |
| Assets |
|
|
|
|
| Investments in: |
|
|
|
|
| Common stocks |
|
|
|
|
| Canada |
$8,590,671
|
$0
|
$0 |
$8,590,671
|
| Finland |
0 |
5,321,787 |
0 |
5,321,787 |
| France |
0 |
57,143,793 |
0 |
57,143,793 |
| Germany |
0 |
30,616,374 |
0 |
30,616,374 |
| Hong Kong |
0 |
3,763,560 |
0 |
3,763,560 |
| Israel |
3,855,929 |
0 |
0 |
3,855,929 |
| Japan |
0 |
47,542,930 |
0 |
47,542,930 |
| Mexico |
3,952,816 |
0 |
0 |
3,952,816 |
| Netherlands |
0 |
11,423,781 |
0 |
11,423,781 |
| South Korea |
0 |
10,345,275 |
0 |
10,345,275 |
| Switzerland |
0 |
16,196,233 |
0 |
16,196,233 |
| Thailand |
0 |
401,719 |
0 |
401,719 |
| United Kingdom |
13,270,347 |
35,368,029 |
0 |
48,638,376 |
| United States |
4,230,336 |
0 |
0 |
4,230,336 |
| Investment companies |
5,315,723 |
0 |
0 |
5,315,723 |
| Short-term investments |
|
|
|
|
| Investment companies |
3,094,072 |
0 |
0 |
3,094,072 |
| Total assets |
$42,309,894 |
$218,123,481 |
$0 |
$260,433,375 |
| Average daily net assets |
Management fee |
| First $1 billion |
0.800 % |
| Next $1 billion |
0.750 |
| Next $2 billion |
0.725 |
| Next $1 billion |
0.700 |
| Next $5 billion |
0.690 |
| Over $10 billion |
0.680 |
| |
Class-level
administration fee |
| Class A |
0.20 % |
| Class C |
0.20 |
| Class R |
0.21 |
| Class R6 |
0.03 |
| Administrator Class |
0.13 |
| Institutional Class |
0.13 |
| |
EXPENSE RATIO CAPS |
| Class A |
1.14 % |
| Class C |
1.89 |
| Class R6 |
0.79 |
| Administrator Class |
1.14 |
| Institutional Class |
0.84 |
| |
Year
ended October 31 | |
| |
2023 |
2022 |
| Ordinary income |
$5,421,064 |
$9,831,299 |
| Tax basis return of capital |
0 |
489,151 |
| Undistributed
ordinary
income |
Unrealized
gains |
Capital loss
carryforward |
| $1,343,890 |
$6,502,232 |
$(95,168,644 ) |

| Creditable
foreign taxes
paid |
Per share
amount |
Foreign
income as % of
ordinary income
distributions |
| $976,685 |
$0.0417 |
100 % |
| Name and
year of birth |
Position held and
length of service* |
Principal occupations during past five years or
longer |
Current other
public company
or
investment
company
directorships |
| William R.
Ebsworth
(Born 1957) |
Trustee,
since 2015 |
Retired. From 1984 to 2013, equities analyst, portfolio manager, research
director and chief investment officer at Fidelity
Management and Research Company in Boston, Tokyo, and Hong
Kong, and retired in 2013 as Chief Investment Officer of Fidelity
Strategic Advisers, Inc. where he led a team of investment
professionals managing client assets. Prior thereto, Board member of Hong Kong Securities Clearing Co., Hong Kong Options Clearing Corp., the Thailand International
Fund, Ltd., Fidelity Investments Life Insurance Company, and Empire
Fidelity Investments Life Insurance Company. Audit
Committee Chair and Investment Committee Chair of the Vincent
Memorial Hospital Foundation (non-profit organization). Mr. Ebsworth is a CFA
charterholder. |
N/A |
| Jane A.
Freeman
(Born 1953) |
Trustee,
since 2015;
Chair Liaison,
since 2018 |
Retired. From 2012 to 2014 and 1999 to 2008, Chief Financial Officer of
Scientific Learning Corporation. From 2008 to 2012, Ms.
Freeman provided consulting services related to strategic
business projects. Prior to 1999, Portfolio Manager at Rockefeller &
Co. and Scudder, Stevens & Clark. Board member of the
Harding Loevner Funds from 1996 to 2014, serving as both Lead
Independent Director and chair of the Audit Committee. Board member of
the Russell Exchange Traded Funds Trust from 2011 to 2012
and the chair of the Audit Committee. Ms. Freeman is also an
inactive Chartered Financial Analyst. |
N/A |
| Isaiah
Harris, Jr.
(Born 1952) |
Trustee,
since 2009;
Audit Committee
Chair,
since 2019 |
Retired. Member of the Advisory Board of CEF of East Central Florida.
Chairman of the Board of CIGNA Corporation from 2009 to
2021, and Director from 2005 to 2008. From 2003 to 2011,
Director of Deluxe Corporation. Prior thereto, President and CEO of
BellSouth Advertising and Publishing Corp. from 2005 to
2007, President and CEO of BellSouth Enterprises from 2004 to
2005 and President of BellSouth Consumer Services from 2000 to 2003.
Emeritus member of the Iowa State University Foundation
Board of Governors. Emeritus Member of the Advisory board of
Iowa State University School of Business. Advisory Board Member, Palm
Harbor Academy (private school). Advisory Board Member,
Fellowship of Christian Athletes. Mr. Harris is a certified public
accountant (inactive status). |
N/A |
| David F.
Larcker
(Born 1950) |
Trustee,
since 2009 |
Distinguished Visiting Fellow at the Hoover Institution since 2022. James
Irvin Miller Professor of Accounting at the Graduate School
of Business (Emeritus), Stanford University, Director of the
Corporate Governance Research Initiative and Senior Faculty of The Rock
Center for Corporate Governance since 2006. From 2005 to
2008, Professor of Accounting at the Graduate School of
Business, Stanford University. Prior thereto, Ernst & Young Professor
of Accounting at The Wharton School, University of Pennsylvania
from 1985 to 2005. |
N/A |
| Olivia S.
Mitchell
(Born 1953) |
Trustee,
since 2006;
Nominating and
Governance
Committee Chair,
since 2018 |
International Foundation of Employee Benefit Plans Professor since 1993,
Wharton School of the University of Pennsylvania. Director
of Wharton’s Pension Research Council and Boettner Center on Pensions & Retirement Research, and Research Associate at the National Bureau of Economic
Research. Previously taught at Cornell University from 1978 to 1993.
|
N/A |
| Timothy J.
Penny
(Born 1951) |
Trustee,
since 1996;
Chair,
since 2018 |
President and Chief Executive Officer of Southern Minnesota Initiative
Foundation, a non-profit organization, since 2007. Vice
Chair of the Economic Club of Minnesota, since 2007. Co-Chair of the Committee for a Responsible Federal Budget, since 1995. Member of the Board of Trustees of
NorthStar Education Finance, Inc., a non-profit organization, from
2007-2022. Senior Fellow of the University of Minnesota Humphrey
Institute from 1995 to 2017. |
N/A |
| Name and
year of birth |
Position held and
length of service* |
Principal occupations during past five years or
longer |
Current other
public company
or
investment
company
directorships |
| James G.
Polisson
(Born 1959) |
Trustee,
since 2018 |
Retired. Chief Marketing Officer, Source (ETF) UK Services, Ltd, from
2015 to 2017. From 2012 to 2015, Principal of The Polisson
Group, LLC, a management consulting, corporate advisory and
principal investing company. Chief Executive Officer and Managing
Director at Russell Investments, Global Exchange Traded
Funds from 2010 to 2012. Managing Director of Barclays
Global Investors from 1998 to 2010 and Global Chief Marketing Officer for
iShares and Barclays Global Investors from 2000 to 2010.
Trustee of the San Francisco Mechanics’ Institute, a non- profit organization, from 2013 to 2015. Board member of the Russell Exchange Traded Fund Trust
from 2011 to 2012. Director of Barclays Global Investors Holdings
Deutschland GmbH from 2006 to 2009. Mr. Polisson is an
attorney and has a retired status with the Massachusetts and District of Columbia Bar Associations. |
N/A |
| Pamela Wheelock (Born 1959) |
Trustee, since January 2020; previously Trustee from January 2018 to July 2019 |
Retired. Executive and Senior Financial leadership positions in the public, private and nonprofit
sectors. Interim President and CEO, McKnight Foundation, 2020. Interim
Commissioner, Minnesota Department of Human Services, 2019.
Chief Operating Officer, Twin Cities Habitat for Humanity,
2017-2019. Vice President for University Services, University of Minnesota, 2012- 2016. Interim President and CEO, Blue Cross and Blue Shield of Minnesota, 2011-2012. Executive
Vice-President and Chief Financial Officer, Minnesota Wild, 2002-2008.
Commissioner, Minnesota Department of Finance, 1999-2002.
Chair of the Board of Directors of Destination Medical Center
Corporation. Board member of the Minnesota Wild Foundation. |
N/A |
| * |
Length of service dates reflect the Trustee’s commencement of service with the Trust’s predecessor entities, where applicable. |
| Name and
year of birth |
Position held and
length of
service |
Principal occupations during past five years or
longer |
| Andrew Owen
(Born 1960) |
President,
since 2017 |
President and Chief Executive Officer of Allspring Funds Management, LLC
since 2017 and Head of Global Fund Governance of Allspring
Global Investments since 2022. Prior thereto, co-president of Galliard Capital Management, LLC, an affiliate of Allspring Funds Management, LLC, from 2019 to 2022 and Head of Affiliated
Managers, Allspring Global Investments, from 2014 to 2019 and Executive
Vice President responsible for marketing, investments and product
development for Allspring Funds Management, LLC, from 2009 to 2014. |
| Jeremy DePalma
(Born 1974) |
Treasurer,
since 2012
(for certain funds in
the Fund Complex);
since 2021 (for
the remaining funds
in the Complex) |
Senior Vice President of Allspring Funds Management, LLC since 2009.
Senior Vice President of Evergreen Investment Management
Company, LLC from 2008 to 2010 and head of the Fund Reporting and Control Team within Fund Administration from 2005 to 2010.
|
| Christopher Baker
(Born 1976) |
Chief Compliance
Officer,
since 2022 |
Global Chief Compliance Officer for Allspring Global Investments since
2022. Prior thereto, Chief Compliance Officer for State
Street Global Advisors from 2018 to 2021. Senior Compliance Officer for the State Street divisions of Alternative Investment Solutions, Sector Solutions, and Global Marketing from 2015 to 2018. From 2010 to 2015
Vice President, Global Head of Investment and Marketing Compliance for State
Street Global Advisors. |
| Matthew Prasse (Born 1983) |
Chief Legal Officer, since 2022; Secretary, since 2021 |
Senior Counsel of the Allspring Legal Department since 2021. Senior Counsel of the Wells Fargo Legal Department
from 2018 to 2021. Previously, Counsel for Barings LLC from 2015 to 2018.
Prior to joining Barings, Associate at Morgan, Lewis & Bockius
LLP from 2008 to 2015. |


| 2 | |
| 6 | |
| 10 | |
| 11 | |
| 16 | |
| 17 | |
| 18 | |
| 19 | |
| 23 | |
| 28 | |
| 29 |


| Notice to Shareholders |
| Beginning in July 2024, the Fund will be required by the
Securities and Exchange Commission to send shareholders a paper copy of a
new tailored shareholder report in place of the full shareholder report that you are now receiving. The tailored shareholder report will contain concise information about the Fund, including certain expense and performance
information and fund statistics. If you wish to receive this new tailored shareholder
report electronically, please follow the instructions on the back cover
of this report. |
| Other information that is currently included in the shareholder
report, such as the Fund’s financial statements, will be available
online and upon request, free of charge, in paper or electronic format. |
| Investment objective |
The Fund seeks long-term capital appreciation. |
| Manager |
Allspring Funds Management, LLC |
| Subadviser |
Allspring Global Investments, LLC |
| Portfolio managers |
Stephen Giggie, CFA, Oleg Makhorine, Brian Martin, CFA, James M. Tringas,
CFA, Bryant VanCronkhite, CFA, CPA |
| Average annual total returns (%) as of October 31, 2023 | |||||||||
| |
|
Including sales charge |
Excluding sales charge |
Expense ratios1 (%) | |||||
| |
Inception date |
1 year |
5 year |
10 year |
1 year |
5 year |
10 year |
Gross |
Net2 |
| Class A (EKGAX) |
3-16-1988 |
-4.80 |
1.36 |
4.25 |
1.00 |
2.57 |
4.87 |
1.51 |
1.47 |
| Class C (EKGCX) |
2-1-1993 |
-0.76 |
1.84 |
4.27 |
0.24 |
1.84 |
4.27 |
2.26 |
2.22 |
| Administrator Class (EKGYX) |
1-13-1997 |
– |
– |
– |
1.11 |
2.70 |
5.01 |
1.44 |
1.40 |
| Institutional Class (EKGIX) |
7-30-2010 |
– |
– |
– |
1.34 |
2.94 |
5.27 |
1.19 |
1.15 |
| MSCI World Small Cap Index (Net)3
|
– |
– |
– |
– |
-0.96 |
3.96 |
5.30 |
– |
– |
| S&P Developed SmallCap Index4
|
– |
– |
– |
– |
-0.60 |
4.07 |
5.43 |
– |
– |
| | |
| 1 |
Reflects the expense ratios as stated in the most recent prospectuses. The expense ratios shown are subject to change and may differ from the annualized expense ratios
shown in the Financial Highlights of this report. |
| 2 |
The manager has contractually committed through February 29, 2024 (February 28, 2025 for Class A and C), to waive fees and/or reimburse expenses to the extent
necessary to cap total annual fund operating expenses after fee waivers at
1.47% for Class A, 2.22% for Class C, 1.40% for Administrator Class and 1.15% for Institutional Class. Brokerage commissions, stamp duty fees, interest, taxes, acquired fund fees and expenses (if any), and extraordinary expenses are excluded from the expense
caps. Prior to or after the commitment expiration date, the caps may be
increased or the commitment to maintain the caps may be terminated only with the approval of the Board of Trustees. Without these caps, the Fund’s returns would have been lower. The expense ratio paid by an investor is the net expense ratio (the total annual
fund operating expenses after fee waivers) as stated in the
prospectuses. |
| 3 |
The Morgan Stanley Capital International (MSCI) World Small Cap Index (Net) captures small cap representation across 23 developed markets countries. The index covers
approximately 14% of the free float-adjusted market capitalization in each
country. You cannot invest directly in an index. |
| 4 |
The S&P Developed SmallCap Index is a free-float-adjusted market-capitalization-weighted index designed to measure the equity market performance of
small- capitalization companies located in developed markets. The index is
composed of companies within the bottom 15% of the cumulative market capitalization in developed markets. The index covers all publicly listed equities with float-adjusted market values of U.S. $100 million or more and annual dollar value traded of at least U.S. $50
million in all included countries. You cannot invest directly in an
index. |
| CFA® and Chartered Financial Analyst® are trademarks owned by CFA Institute. |
| Growth of $10,000 investment as of October 31, 20231 |
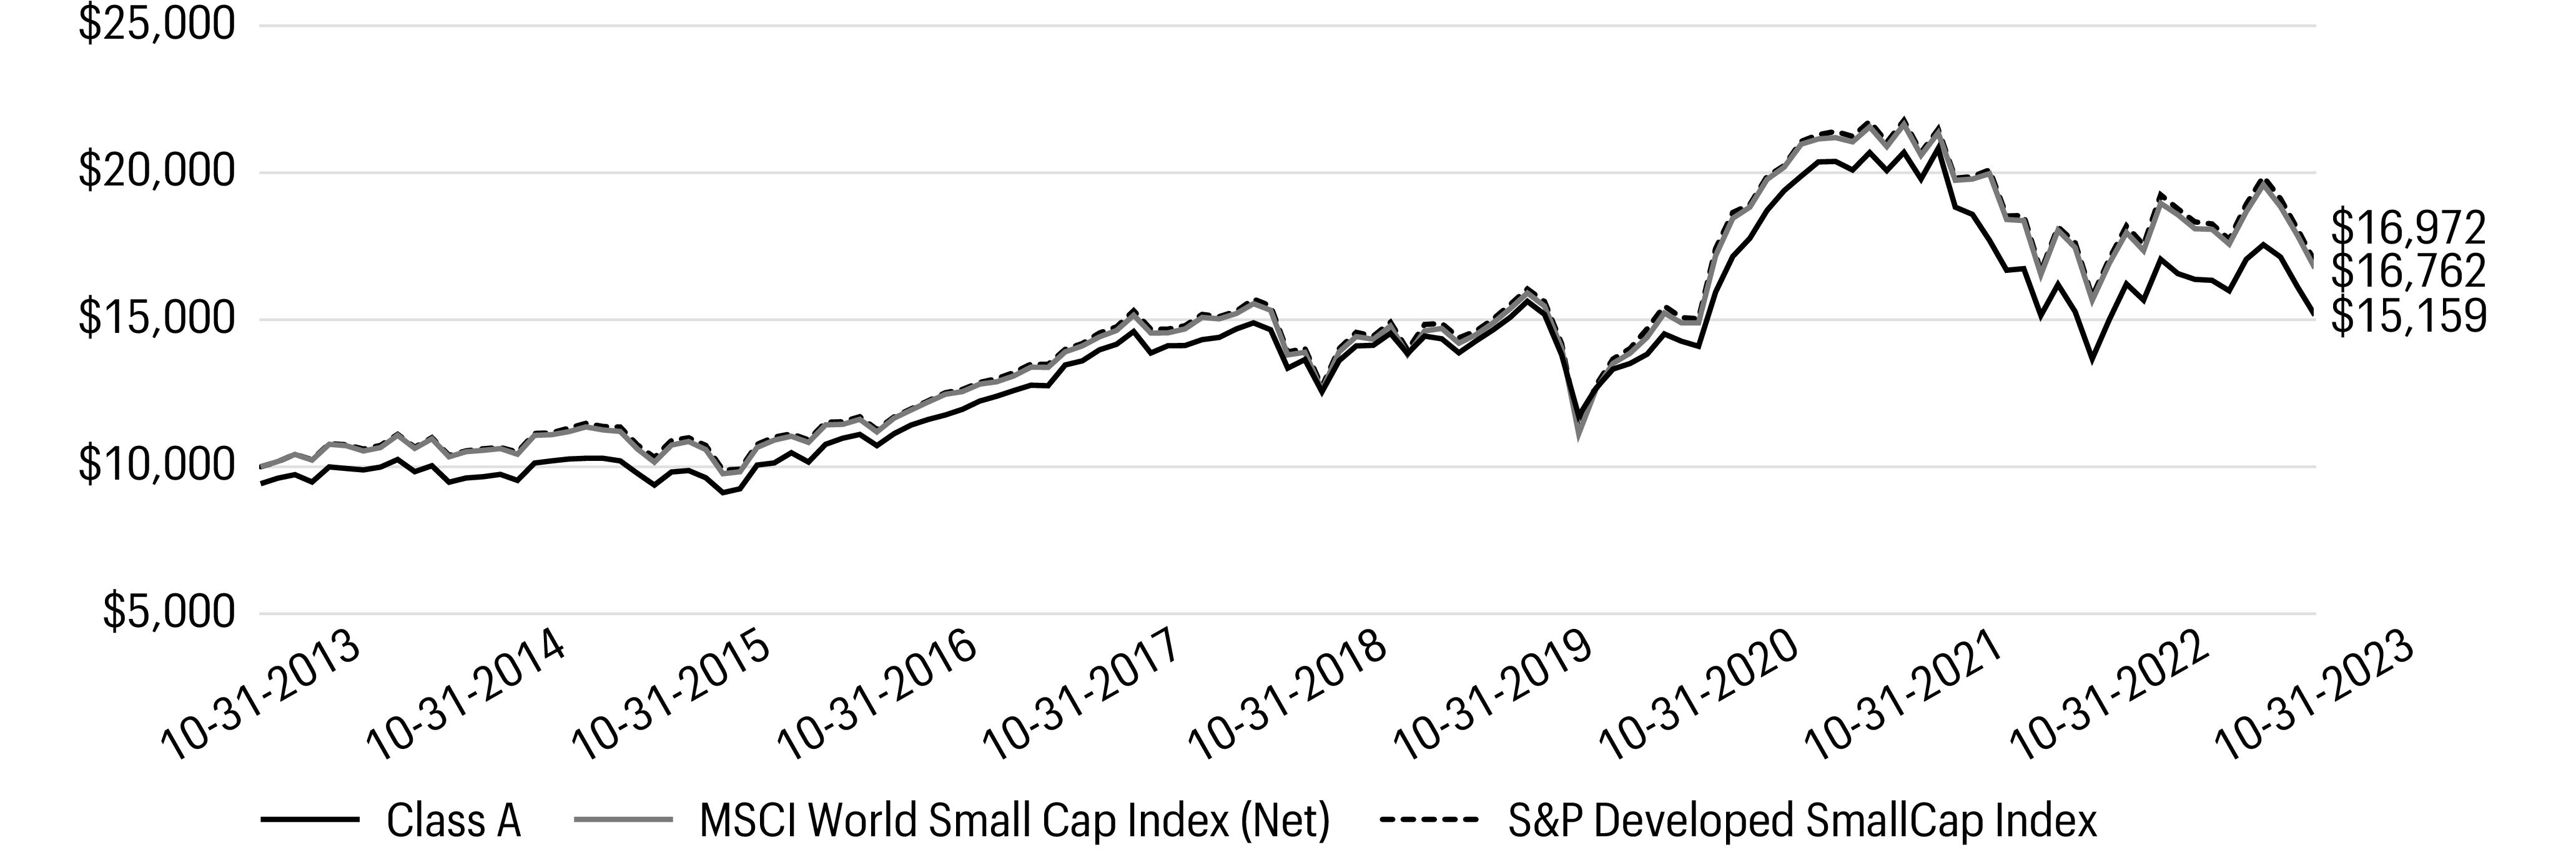
| 1 |
The chart compares the performance of Class A shares for the most recent ten years with the MSCI World Small Cap Index (Net) and S&P Developed SmallCap Index. The
chart assumes a hypothetical investment of $10,000 in Class A shares and reflects
all operating expenses and assumes the maximum initial sales charge of 5.75%. |
| Ten largest holdings (%) as of October 31, 20231 | |
| Innospec, Inc. |
3.84 |
| Gibraltar Industries, Inc. |
3.70 |
| CSW Industrials, Inc. |
2.89 |
| Novanta, Inc. |
2.87 |
| Hanover Insurance Group, Inc. |
2.18 |
| Progress Software Corp. |
2.06 |
| Spectris PLC |
2.02 |
| Alten SA |
1.98 |
| Denny’s Corp. |
1.98 |
| Ansell Ltd. |
1.96 |
| 1 |
Figures represent the percentage of the Fund’s net assets. Holdings are subject to change and may have changed since the date specified. |
| Sector allocation as of October 31, 20231 |
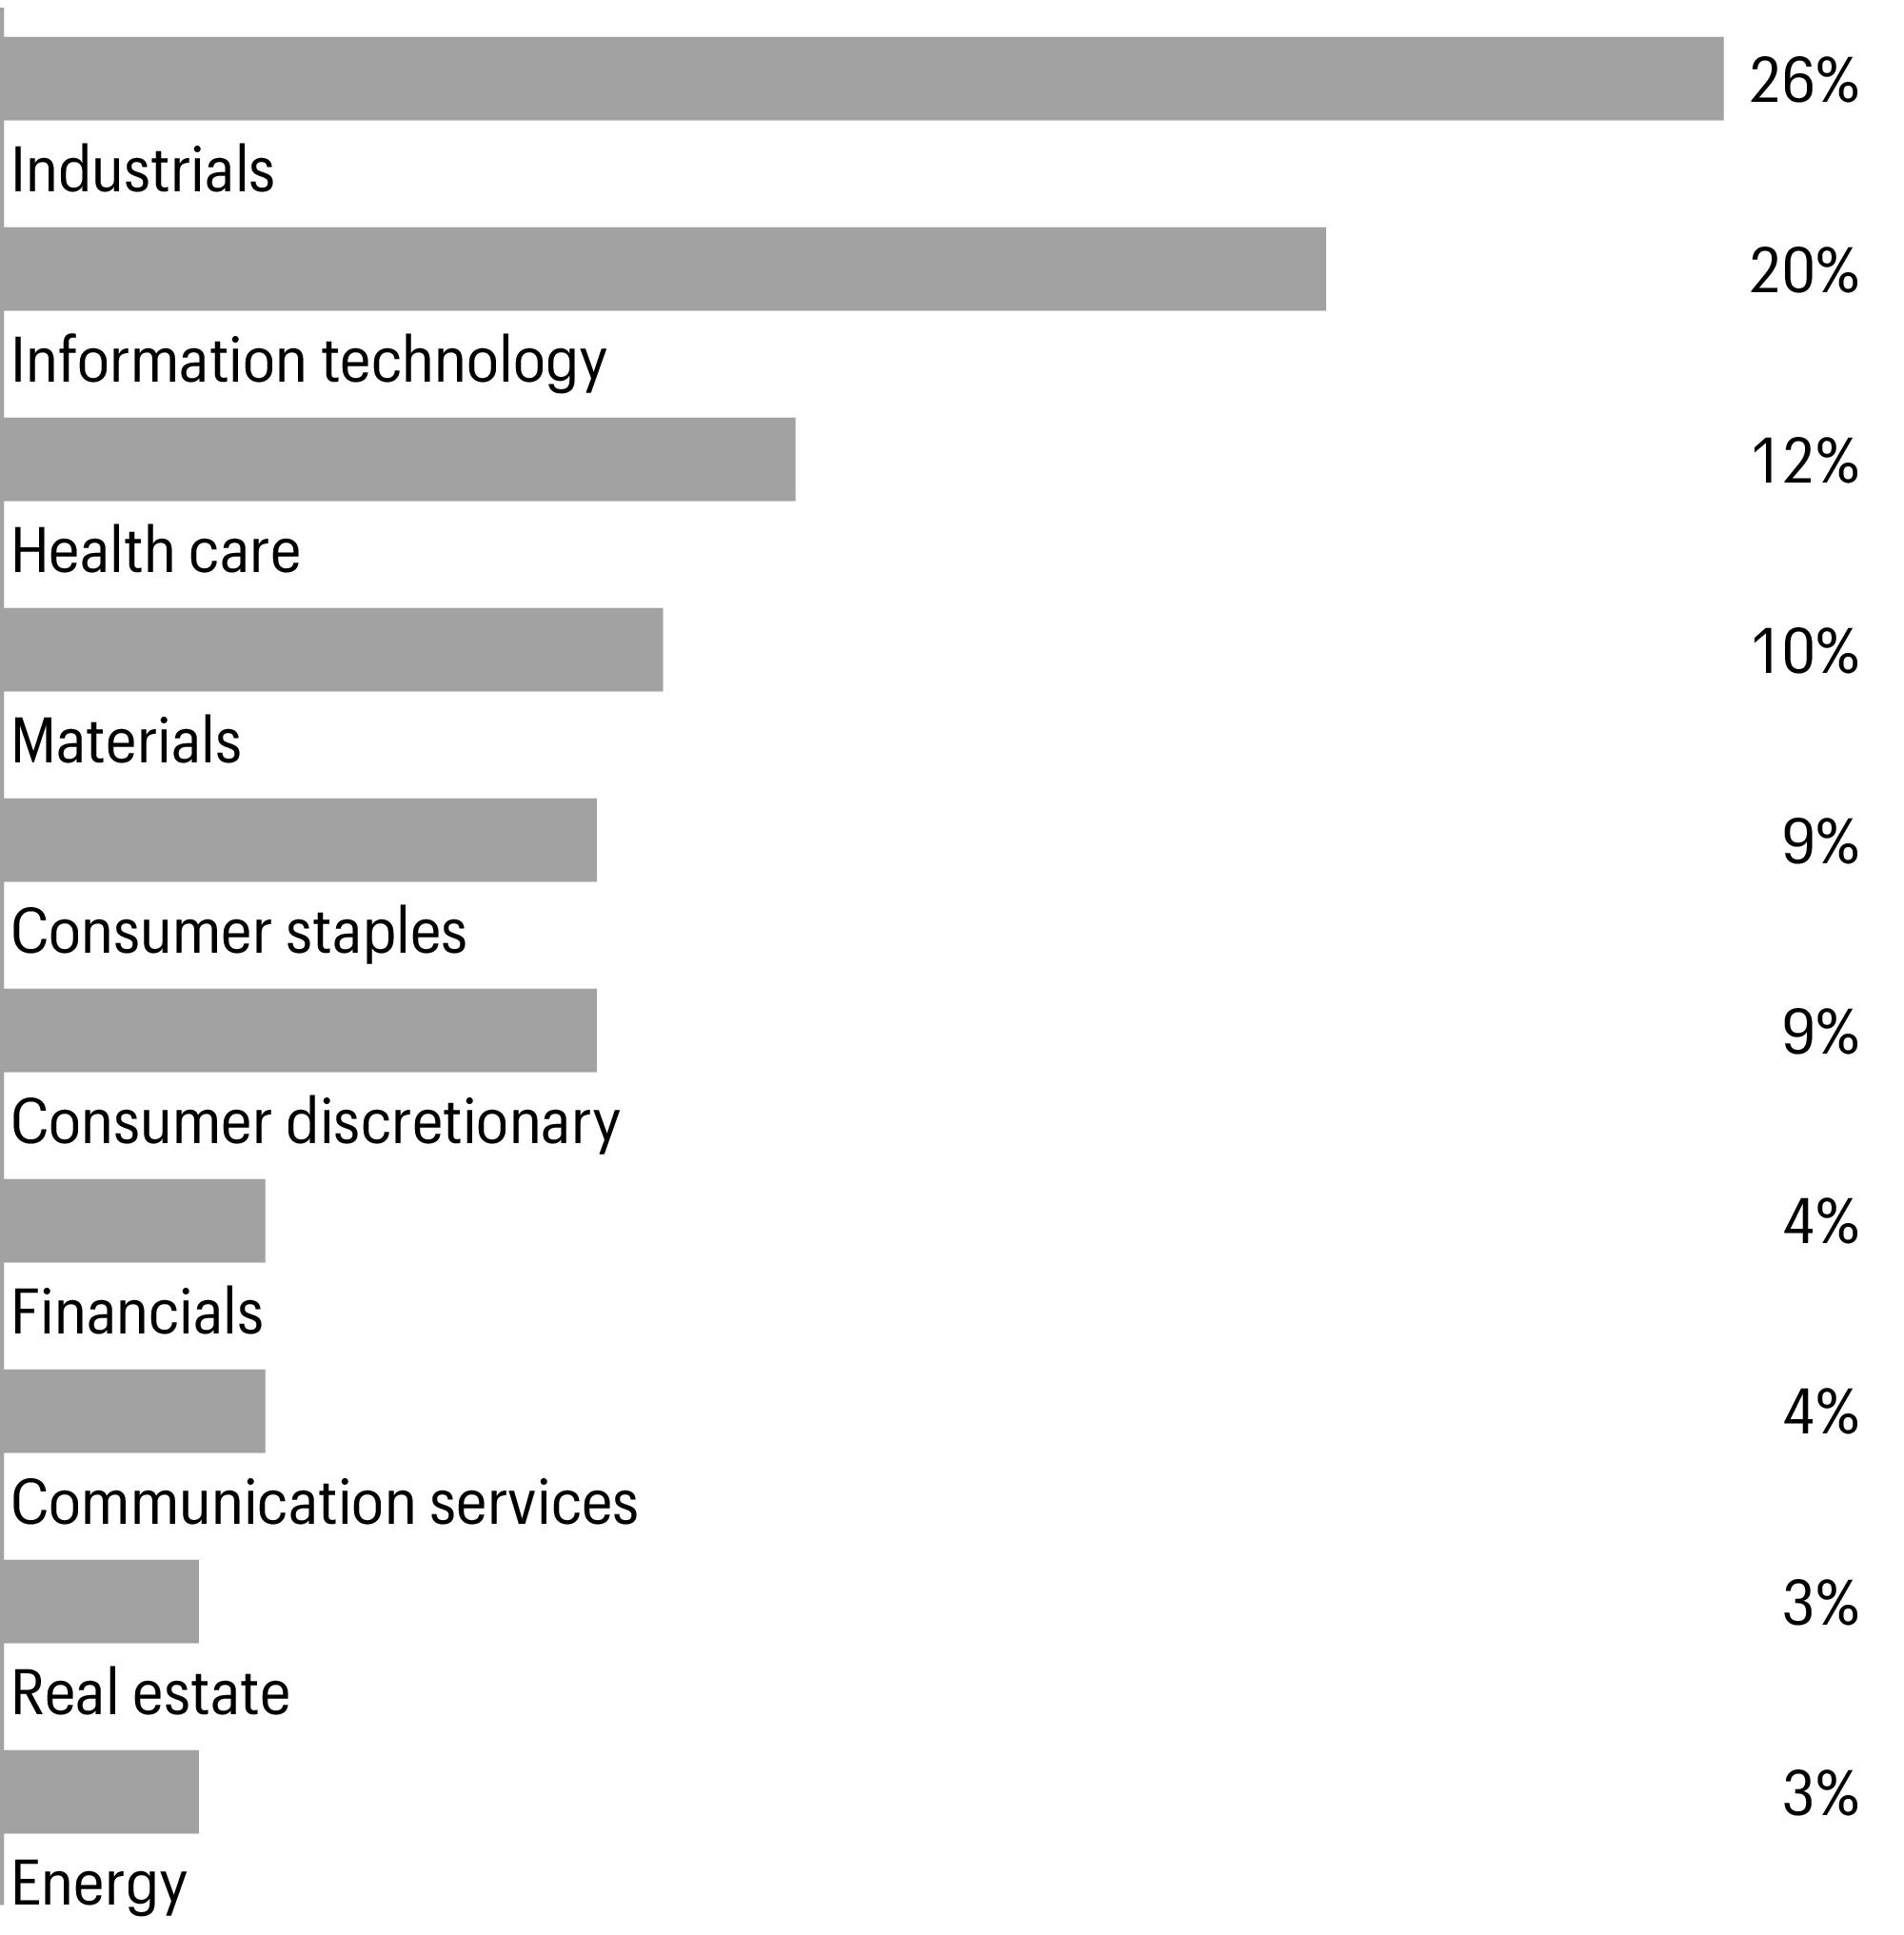
| 1 |
Figures represent the percentage of the Fund’s long-term investments. Allocations are subject to change and may have changed since the date specified. |
| Geographic allocation as of October 31, 20231 |
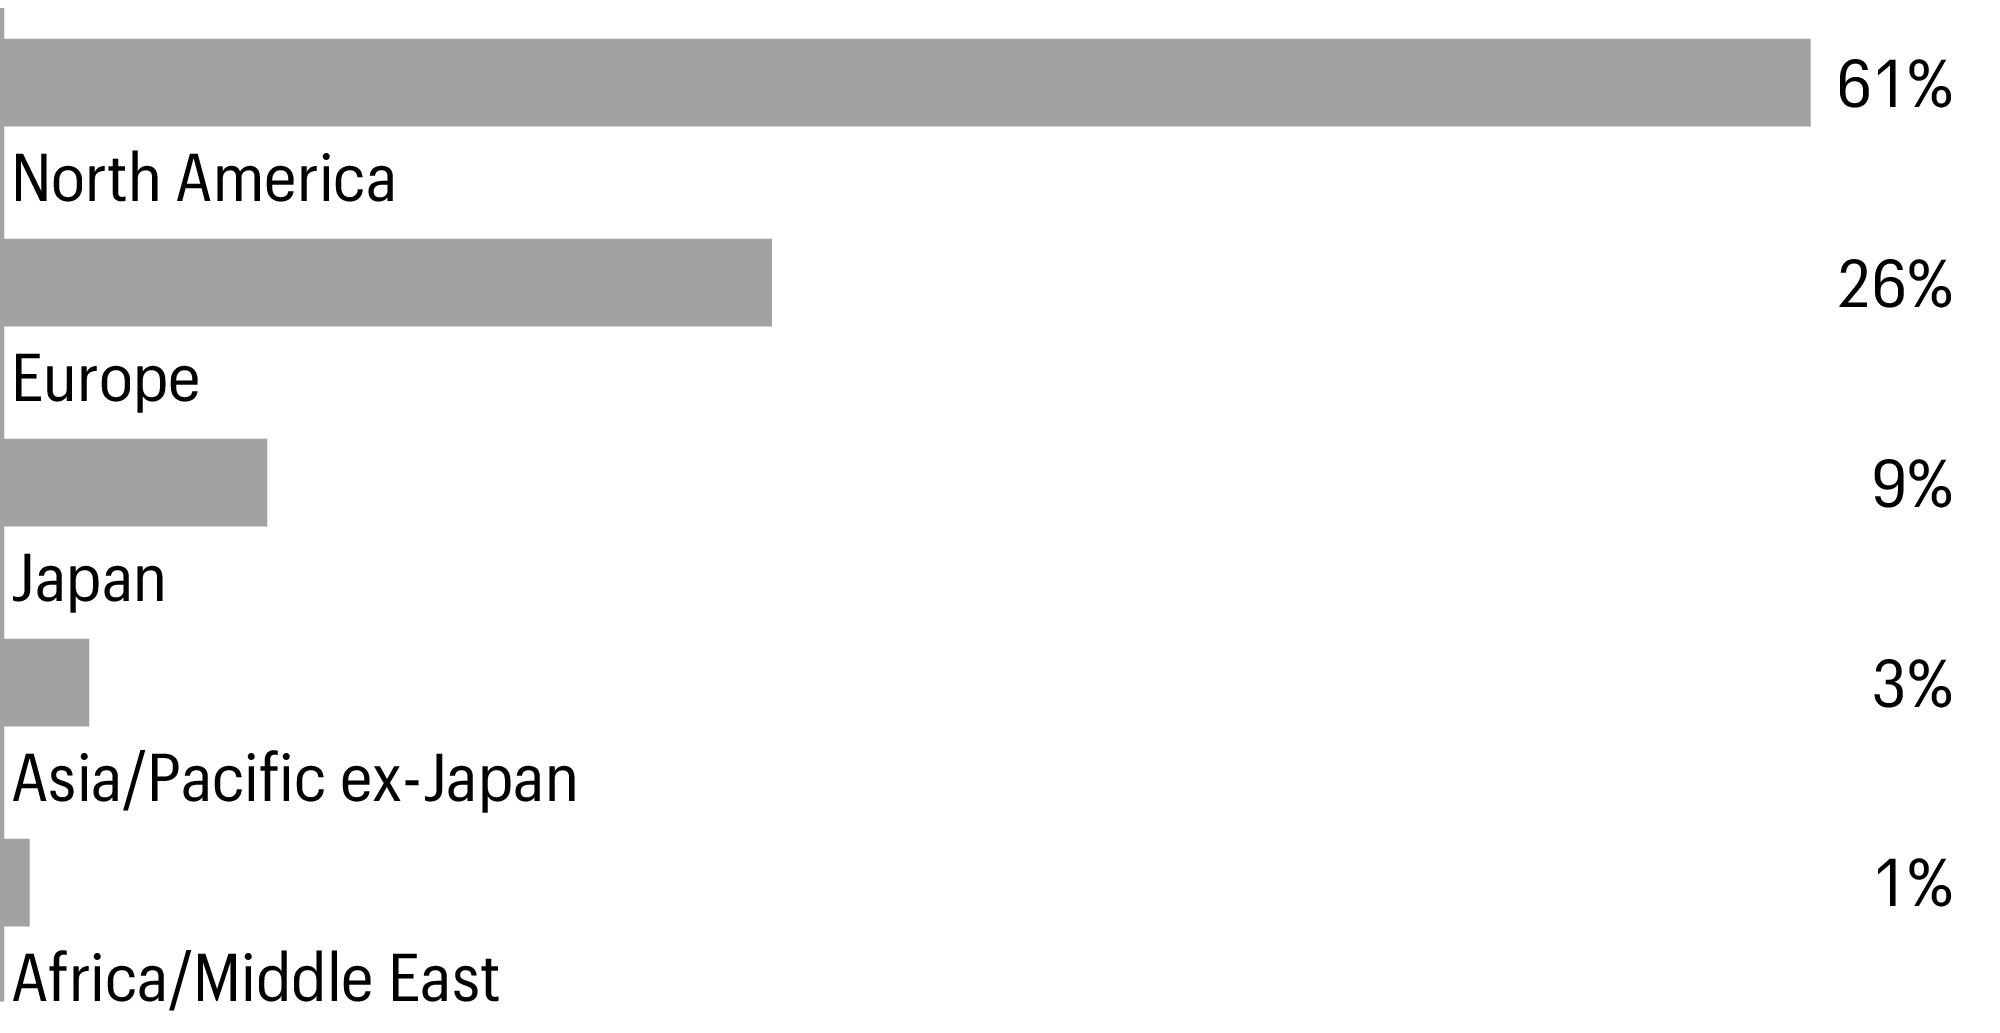
| 1 |
Figures represent the percentage of the Fund’s long-term investments. Allocations are subject to change and may have changed since the date specified. |
| |
Beginning account value 5-1-2023 |
Ending account value 10-31-2023 |
Expenses paid during the period1
|
Annualized net expense ratio |
| Class A |
|
|
|
|
| Actual |
$1,000.00 |
$927.65 |
$7.19 |
1.48 % |
| Hypothetical (5% return before expenses) |
$1,000.00 |
$1,017.75 |
$7.53 |
1.48 % |
| Class C |
|
|
|
|
| Actual |
$1,000.00 |
$923.96 |
$10.81 |
2.23 % |
| Hypothetical (5% return before expenses) |
$1,000.00 |
$1,013.96 |
$11.32 |
2.23 % |
| Administrator Class |
|
|
|
|
| Actual |
$1,000.00 |
$928.11 |
$6.61 |
1.36 % |
| Hypothetical (5% return before expenses) |
$1,000.00 |
$1,018.35 |
$6.92 |
1.36 % |
| Institutional Class |
|
|
|
|
| Actual |
$1,000.00 |
$929.07 |
$5.59 |
1.15 % |
| Hypothetical (5% return before expenses) |
$1,000.00
|
$1,019.41
|
$5.85
|
1.15 % |
| 1 |
Expenses paid is equal to the annualized net expense ratio of each class multiplied by the average account value over the period, multiplied by 184 divided by 365 (to
reflect the one-half-year period). |
| |
|
|
|
Shares |
Value | |
| Common stocks: 97.63% |
|
|
|
|
|
|
| Australia: 3.02% |
|
|
|
|
|
|
| Ansell Ltd. (Health care, Health care equipment & supplies) |
|
|
|
|
191,519 |
$2,587,576 |
| Bapcor Ltd. (Consumer discretionary, Distributors) |
|
|
|
|
130,887 |
445,520 |
| Cettire Ltd. (Consumer discretionary, Specialty retail)†
|
|
|
|
|
140,501 |
229,500 |
| Domino’s Pizza Enterprises Ltd. (Consumer discretionary, Hotels, restaurants & leisure) |
|
|
|
|
18,447 |
597,849 |
| Inghams Group Ltd. (Consumer staples, Food products) |
|
|
|
|
48,738 |
114,151
|
| |
|
|
|
|
|
3,974,596 |
| Belgium: 1.21% |
|
|
|
|
|
|
| Barco NV (Information technology, Electronic equipment, instruments & components) |
|
|
|
|
103,856 |
1,594,595 |
| Canada: 4.55% |
|
|
|
|
|
|
| ATS Corp. (Industrials, Machinery)† |
|
|
|
|
18,500 |
623,003 |
| Canadian Western Bank (Financials, Banks) |
|
|
|
|
18,800 |
372,543 |
| Novanta, Inc. (Information technology, Electronic equipment, instruments & components)† |
|
|
|
|
28,591 |
3,775,728 |
| Primo Water Corp. (Consumer staples, Beverages) |
|
|
|
|
93,535 |
1,220,154 |
| |
|
|
|
|
|
5,991,428 |
| France: 2.50% |
|
|
|
|
|
|
| Alten SA (Information technology, IT services) |
|
|
|
|
22,083 |
2,608,620 |
| Metropole Television SA (Communication services, Media) |
|
|
|
|
54,681 |
685,369
|
| |
|
|
|
|
|
3,293,989 |
| Germany: 4.75% |
|
|
|
|
|
|
| Cancom SE (Information technology, IT services) |
|
|
|
|
29,017 |
724,447 |
| CTS Eventim AG & Co. KGaA (Communication services, Entertainment) |
|
|
|
|
22,389 |
1,355,568 |
| Gerresheimer AG (Health care, Life sciences tools & services) |
|
|
|
|
17,109 |
1,595,811 |
| Krones AG (Industrials, Machinery) |
|
|
|
|
12,690 |
1,236,931 |
| TAG Immobilien AG (Real estate, Real estate management & development)† |
|
|
|
|
123,074 |
1,345,690 |
| |
|
|
|
|
|
6,258,447 |
| Ireland: 0.51% |
|
|
|
|
|
|
| Irish Residential Properties REIT PLC (Real estate, Residential REITs) |
|
|
|
|
705,313 |
679,350 |
| Israel: 0.90% |
|
|
|
|
|
|
| CyberArk Software Ltd. (Information technology,
Software)† |
|
|
|
|
7,229 |
1,182,954 |
| Italy: 2.04% |
|
|
|
|
|
|
| De’ Longhi SpA (Consumer discretionary, Household durables) |
|
|
|
|
23,404 |
523,668 |
| GVS SpA (Industrials, Machinery)144A† |
|
|
|
|
200,195 |
897,358 |
| Interpump Group SpA (Industrials, Machinery) |
|
|
|
|
30,374 |
1,270,067 |
| |
|
|
|
|
|
2,691,093 |
| Japan: 8.99% |
|
|
|
|
|
|
| Aeon Delight Co. Ltd. (Industrials, Commercial services & supplies) |
|
|
|
|
64,900 |
1,431,030 |
| |
|
|
|
Shares |
Value | |
| Japan(continued) |
|
|
|
|
|
|
| Daiseki Co. Ltd. (Industrials, Commercial services & supplies) |
|
|
|
|
33,620 |
$928,500 |
| DTS Corp. (Information technology, IT services) |
|
|
|
|
88,100 |
1,809,432 |
| Fuji Seal International, Inc. (Materials, Containers & packaging) |
|
|
|
|
79,200 |
882,222 |
| Horiba Ltd. (Information technology, Electronic equipment, instruments & components) |
|
|
|
|
15,700 |
793,812 |
| MEITEC Group Holdings, Inc. (Industrials, Professional services) |
|
|
|
|
133,000 |
2,340,812 |
| Nihon Parkerizing Co. Ltd. (Materials, Chemicals) |
|
|
|
|
164,700 |
1,195,323 |
| Orix JREIT, Inc. (Real estate, Office REITs) |
|
|
|
|
1,357 |
1,559,549 |
| Taikisha Ltd. (Industrials, Construction & engineering) |
|
|
|
|
31,000 |
902,091
|
| |
|
|
|
|
|
11,842,771 |
| Netherlands: 0.32% |
|
|
|
|
|
|
| MYT Netherlands Parent BV ADR (Consumer discretionary, Specialty retail)† |
|
|
|
|
45,650 |
132,841 |
| TKH Group NV (Industrials, Electrical equipment) |
|
|
|
|
7,952 |
290,876
|
| |
|
|
|
|
|
423,717 |
| Norway: 0.89% |
|
|
|
|
|
|
| Atea ASA (Information technology, IT services) |
|
|
|
|
68,658 |
714,179 |
| Elopak ASA (Materials, Containers & packaging) |
|
|
|
|
227,156 |
463,627
|
| |
|
|
|
|
|
1,177,806 |
| Spain: 2.11% |
|
|
|
|
|
|
| Vidrala SA (Materials, Containers & packaging) |
|
|
|
|
4,747 |
352,822 |
| Viscofan SA (Consumer staples, Food products) |
|
|
|
|
41,919 |
2,423,170 |
| |
|
|
|
|
|
2,775,992 |
| Sweden: 1.89% |
|
|
|
|
|
|
| Hexpol AB (Materials, Chemicals) |
|
|
|
|
73,615 |
653,336 |
| Loomis AB (Industrials, Commercial services & supplies) |
|
|
|
|
70,846 |
1,840,383 |
| |
|
|
|
|
|
2,493,719 |
| Switzerland: 2.37% |
|
|
|
|
|
|
| Bossard Holding AG Class A (Industrials, Trading companies & distributors) |
|
|
|
|
4,718 |
973,839 |
| Bucher Industries AG (Industrials, Machinery) |
|
|
|
|
2,639 |
942,034 |
| Global Blue Group Holding AG (Information technology, IT
services)† |
|
|
|
|
225,000 |
1,203,750 |
| |
|
|
|
|
|
3,119,623 |
| United Kingdom: 7.32% |
|
|
|
|
|
|
| Britvic PLC (Consumer staples, Beverages) |
|
|
|
|
232,522 |
2,368,345 |
| Domino’s Pizza Group PLC (Consumer discretionary, Hotels, restaurants & leisure) |
|
|
|
|
324,018 |
1,351,998 |
| Elementis PLC (Materials, Chemicals)† |
|
|
|
|
448,350 |
645,446 |
| Lancashire Holdings Ltd. (Financials, Insurance) |
|
|
|
|
150,903 |
1,041,797 |
| Morgan Advanced Materials PLC (Industrials, Machinery) |
|
|
|
|
82,503 |
225,626 |
| Nomad Foods Ltd. (Consumer staples, Food products)†
|
|
|
|
|
66,234 |
915,354 |
| S4 Capital PLC (Communication services, Media)† |
|
|
|
|
418,131 |
323,089 |
| |
|
|
|
Shares |
Value | |
| United Kingdom(continued) |
|
|
|
|
|
|
| Samarkand Group PLC (Consumer discretionary, Broadline
retail)† |
|
|
|
|
660,000 |
$120,330 |
| Spectris PLC (Information technology, Electronic equipment, instruments & components) |
|
|
|
|
70,412 |
2,660,652 |
| |
|
|
|
|
|
9,652,637 |
| United States: 54.26% |
|
|
|
|
|
|
| Ambarella, Inc. (Information technology, Semiconductors & semiconductor equipment)† |
|
|
|
|
17,400 |
782,826 |
| Aris Water Solutions, Inc. Class A (Industrials, Commercial services & supplies) |
|
|
|
|
50,100 |
418,335 |
| AZEK Co., Inc. Class A (Industrials, Building products)†
|
|
|
|
|
25,800 |
675,960 |
| Azenta, Inc. (Health care, Life sciences tools &
services)† |
|
|
|
|
51,633 |
2,346,720 |
| Balchem Corp. (Materials, Chemicals) |
|
|
|
|
11,031 |
1,282,243 |
| Blackbaud, Inc. (Information technology, Software)†
|
|
|
|
|
36,897 |
2,413,064 |
| Brady Corp. Class A (Industrials, Commercial services & supplies) |
|
|
|
|
34,248 |
1,762,402 |
| Cactus, Inc. Class A (Energy, Energy equipment & services) |
|
|
|
|
29,600 |
1,389,424 |
| CBIZ, Inc. (Industrials, Professional services)† |
|
|
|
|
37,499 |
1,948,448 |
| CSW Industrials, Inc. (Industrials, Building products) |
|
|
|
|
21,505 |
3,811,976 |
| Denny’s Corp. (Consumer discretionary, Hotels, restaurants &
leisure)† |
|
|
|
|
302,154 |
2,604,567 |
| E2open Parent Holdings, Inc. (Information technology,
Software)† |
|
|
|
|
146,290 |
422,778 |
| Enovis Corp. (Health care, Health care equipment &
supplies)† |
|
|
|
|
50,182 |
2,303,354 |
| EnPro Industries, Inc. (Industrials, Machinery) |
|
|
|
|
14,700 |
1,632,582 |
| FormFactor, Inc. (Information technology, Semiconductors & semiconductor equipment)† |
|
|
|
|
33,835 |
1,146,330 |
| Gibraltar Industries, Inc. (Industrials, Building
products)† |
|
|
|
|
80,037 |
4,871,052 |
| Globus Medical, Inc. Class A (Health care, Health care equipment & supplies)† |
|
|
|
|
53,587 |
2,449,462 |
| Hanover Insurance Group, Inc. (Financials, Insurance) |
|
|
|
|
24,515 |
2,873,403 |
| Helen of Troy Ltd. (Consumer discretionary, Household
durables)† |
|
|
|
|
26,201 |
2,576,082 |
| Holley, Inc. (Consumer discretionary, Automobile
components)† |
|
|
|
|
335,182 |
1,424,524 |
| Horace Mann Educators Corp. (Financials, Insurance) |
|
|
|
|
19,535 |
619,846 |
| ICU Medical, Inc. (Health care, Health care equipment &
supplies)† |
|
|
|
|
10,640 |
1,043,358 |
| Innospec, Inc. (Materials, Chemicals) |
|
|
|
|
51,648 |
5,061,504 |
| J & J Snack Foods Corp. (Consumer staples, Food products) |
|
|
|
|
16,259 |
2,546,322 |
| Mayville Engineering Co., Inc. (Industrials, Machinery)†
|
|
|
|
|
110,700 |
1,338,363 |
| Progress Software Corp. (Information technology, Software) |
|
|
|
|
52,867 |
2,716,306 |
| Quanex Building Products Corp. (Industrials, Building products) |
|
|
|
|
91,418 |
2,454,573 |
| QuidelOrtho Corp. (Health care, Health care equipment &
supplies)† |
|
|
|
|
19,306 |
1,179,210 |
| Southwestern Energy Co. (Energy, Oil, gas & consumable
fuels)† |
|
|
|
|
286,722 |
2,044,328 |
| Spectrum Brands Holdings, Inc. (Consumer staples, Household products) |
|
|
|
|
32,946 |
2,481,493 |
| Standex International Corp. (Industrials, Machinery) |
|
|
|
|
8,757 |
1,257,243 |
| Stepan Co. (Materials, Chemicals) |
|
|
|
|
24,200 |
1,810,160 |
| Teradata Corp. (Information technology, Software)†
|
|
|
|
|
38,672 |
1,652,068 |
| Varex Imaging Corp. (Health care, Health care equipment &
supplies)† |
|
|
|
|
112,223 |
2,025,625 |
| Vivid Seats, Inc. Class A (Communication services,
Entertainment)† |
|
|
|
|
42,654 |
250,806 |
| |
|
|
|
Shares |
Value | |
| United States(continued) |
|
|
|
|
|
|
| Wendy’s Co. (Consumer discretionary, Hotels, restaurants & leisure) |
|
|
|
|
90,910 |
$1,729,108 |
| Ziff Davis, Inc. (Communication services, Interactive media & services)† |
|
|
|
|
35,912 |
2,171,240 |
| |
|
|
|
|
|
71,517,085 |
| Total common stocks (Cost $123,442,948) |
|
|
|
|
|
128,669,802 |
| |
|
|
Expiration date |
|
| |
| Rights: 0.01% |
|
|
|
|
|
|
| Spain: 0.01% |
|
|
|
|
|
|
| Vidrala SA (Materials, Containers & packaging)†
|
|
|
11-8-2023 |
|
4,747 |
17,504 |
| Total rights (Cost $15,210) |
|
|
|
|
|
17,504 |
| |
|
Yield |
|
|
| |
| Short-term investments: 1.95% |
|
|
|
|
|
|
| Investment companies: 1.95% |
|
|
|
|
|
|
| Allspring Government Money Market Fund Select
Class♠∞ |
|
5.29 % |
|
|
2,568,998 |
2,568,998 |
| Total short-term investments (Cost $2,568,998) |
|
|
|
|
|
2,568,998 |
| Total investments in securities (Cost $126,027,156) |
99.59 % |
|
|
|
|
131,256,304 |
| Other assets and liabilities, net |
0.41 |
|
|
|
|
534,997 |
| Total net assets |
100.00 % |
|
|
|
|
$131,791,301 |
| † |
Non-income-earning security |
| 144A |
The security may be resold in transactions exempt from registration, normally to qualified institutional buyers, pursuant to Rule 144A under the Securities Act of
1933. |
| ♠ |
The issuer of the security is an affiliated person of the Fund as defined in the Investment Company Act of 1940. |
| ∞ |
The rate represents the 7-day annualized yield at period end. |
| Abbreviations: | |
| ADR |
American depositary receipt |
| REIT |
Real estate investment trust |
| |
Value, beginning of period |
Purchases |
Sales
proceeds |
Net
realized
gains
(losses) |
Net
change in
unrealized
gains
(losses) |
Value,
end of
period |
Shares,
end
of period |
Income
from
affiliated
securities |
| Short-term investments |
|
|
|
|
|
|
|
|
| Allspring Government Money Market Fund Select Class |
$3,845,272 |
$31,918,845 |
$(33,195,119 ) |
$0 |
$0 |
$2,568,998 |
2,568,998 |
$154,765 |
| Investments in affiliates no longer held at end of period |
|
|
|
|
|
|
|
|
| Securities Lending Cash Investments LLC |
1,789,962 |
8,923,900 |
(10,713,900 ) |
38 |
0 |
0 |
0 |
40,400 1 |
| |
|
|
|
$38 |
$0 |
$2,568,998 |
|
$195,165 |
| 1 |
Amount shown represents income before fees and rebates. |
| Assets |
|
| Investments in unaffiliated securities, at value (cost $123,458,158) |
$128,687,306 |
| Investments in affiliated securities, at value (cost $2,568,998) |
2,568,998 |
| Cash |
15,813 |
| Foreign currency, at value (cost $5,762) |
5,704 |
| Receivable for dividends |
448,398 |
| Receivable for investments sold |
287,719 |
| Receivable for Fund shares sold |
21,092 |
| Prepaid expenses and other assets |
47,635 |
| Total assets |
132,082,665 |
| Liabilities |
|
| Management fee payable |
93,787 |
| Payable for Fund shares redeemed |
74,008 |
| Custody and accounting fees payable |
36,868 |
| Shareholder report expenses payable |
26,330 |
| Administration fees payable |
20,467 |
| Shareholder servicing fee payable |
20,132 |
| Payable for investments purchased |
12,008 |
| Distribution fee payable |
1,321 |
| Trustees’ fees and expenses payable |
126 |
| Accrued expenses and other liabilities |
6,317 |
| Total liabilities |
291,364 |
| Total net assets |
$131,791,301 |
| Net assets consist of |
|
| Paid-in capital |
$131,033,324 |
| Total distributable earnings |
757,977 |
| Total net assets |
$131,791,301 |
| Computation of net asset value and offering price per share |
|
| Net assets–Class A |
$85,554,359 |
| Shares outstanding–Class A1
|
2,637,454 |
| Net asset value per share–Class A |
$32.44 |
| Maximum offering price per share – Class A2 |
$34.42 |
| Net assets–Class C |
$2,009,933 |
| Shares outstanding–Class C1
|
108,101 |
| Net asset value per share–Class C |
$18.59 |
| Net assets–Administrator Class |
$3,819,798 |
| Shares outstanding–Administrator
Class1 |
109,979 |
| Net asset value per share–Administrator Class |
$34.73 |
| Net assets–Institutional Class |
$40,407,211 |
| Shares outstanding–Institutional
Class1 |
1,159,683 |
| Net asset value per share–Institutional Class |
$34.84
|
| Investment income |
|
| Dividends (net of foreign withholdings taxes of $141,539) |
$1,893,869 |
| Income from affiliated securities |
188,936 |
| Interest |
986 |
| Total investment income |
2,083,791 |
| Expenses |
|
| Management fee |
1,452,823 |
| Administration fees |
|
| Class A |
203,721 |
| Class C |
5,304 |
| Administrator Class |
5,967 |
| Institutional Class |
61,378 |
| Shareholder servicing fees |
|
| Class A |
246,193 |
| Class C |
6,391 |
| Administrator Class |
11,426 |
| Distribution fee |
|
| Class C |
19,176 |
| Custody and accounting fees |
40,506 |
| Professional fees |
92,260 |
| Registration fees |
73,982 |
| Shareholder report expenses |
59,541 |
| Trustees’ fees and expenses |
25,016 |
| Other fees and expenses |
26,143 |
| Total expenses |
2,329,827 |
| Less: Fee waivers and/or expense reimbursements |
|
| Fund-level |
(152,959
) |
| Class A |
(9,111 ) |
| Class C |
(14 ) |
| Administrator Class |
(2,492 ) |
| Institutional Class |
(16,771
) |
| Net expenses |
2,148,480 |
| Net investment loss |
(64,689 ) |
| Realized and unrealized gains (losses) on investments |
|
| Net realized gains (losses) on |
|
| Unaffiliated securities |
(524,476
) |
| Affiliated securities |
38 |
| Foreign currency and foreign currency translations |
(7,041 ) |
| Net realized losses on investments |
(531,479
) |
| Net change in unrealized gains (losses) on |
|
| Unaffiliated securities |
3,789,021 |
| Foreign currency and foreign currency translations |
28,524 |
| Net change in unrealized gains (losses) on investments |
3,817,545 |
| Net realized and unrealized gains (losses) on investments |
3,286,066 |
| Net increase in net assets resulting from operations |
$3,221,377 |
| |
Year ended October 31, 2023 |
Year ended October 31, 2022 | ||
| Operations |
|
|
|
|
| Net investment loss |
|
$(64,689 ) |
|
$(330,937 ) |
| Net realized gains (losses) on investments |
|
(531,479 ) |
|
5,001,254 |
| Net change in unrealized gains (losses) on investments |
|
3,817,545 |
|
(75,202,679 ) |
| Net increase (decrease) in net assets resulting from operations |
|
3,221,377 |
|
(70,532,362 ) |
| Distributions to shareholders from |
|
|
|
|
| Net investment income and net realized gains |
|
|
|
|
| Class A |
|
(4,150,223 ) |
|
(21,661,516 ) |
| Class C |
|
(195,645 ) |
|
(1,019,521 ) |
| Administrator Class |
|
(174,295 ) |
|
(3,849,616 ) |
| Institutional Class |
|
(1,889,603 ) |
|
(17,015,522 ) |
| Total distributions to shareholders |
|
(6,409,766
) |
|
(43,546,175 ) |
| Capital share transactions |
Shares |
|
Shares |
|
| Proceeds from shares sold |
|
|
|
|
| Class A |
63,025 |
2,218,647 |
100,591 |
4,163,801 |
| Class C |
6,055 |
127,665 |
8,990 |
230,911 |
| Administrator Class |
9,490 |
361,614 |
46,944 |
2,282,764 |
| Institutional Class |
135,131 |
5,092,101 |
804,717 |
34,698,558 |
| |
|
7,800,027 |
|
41,376,034 |
| Reinvestment of distributions |
|
|
|
|
| Class A |
112,419 |
3,809,379 |
441,507 |
19,934,037 |
| Class C |
9,988 |
195,259 |
37,210 |
1,006,145 |
| Administrator Class |
4,698 |
170,245 |
78,981 |
3,800,581 |
| Institutional Class |
50,473 |
1,831,661 |
348,182 |
16,723,192 |
| |
|
6,006,544 |
|
41,463,955 |
| Payment for shares redeemed |
|
|
|
|
| Class A |
(441,224 ) |
(15,465,048 ) |
(464,719 ) |
(18,563,699 ) |
| Class C |
(45,504 ) |
(928,758 ) |
(40,650 ) |
(876,811 ) |
| Administrator Class |
(25,559 ) |
(947,722 ) |
(501,601 ) |
(21,079,674 ) |
| Institutional Class |
(362,336 ) |
(13,572,450 ) |
(2,109,462 ) |
(93,030,891 ) |
| |
|
(30,913,978 ) |
|
(133,551,075 ) |
| Net decrease in net assets resulting from capital share transactions |
|
(17,107,407
) |
|
(50,711,086
) |
| Total decrease in net assets |
|
(20,295,796
) |
|
(164,789,623 ) |
| Net assets |
|
|
|
|
| Beginning of period |
|
152,087,097 |
|
316,876,720 |
| End of period |
|
$131,791,301 |
|
$152,087,097 |
| |
Year ended October 31 | ||||
| Class A |
2023 |
2022 |
2021 |
2020 |
2019 |
| Net asset value, beginning of period |
$33.49 |
$54.12 |
$36.87 |
$39.97 |
$39.97 |
| Net investment income (loss) |
(0.05
)1 |
(0.10
)1 |
(0.22
)1 |
(0.10
)1 |
0.18
1 |
| Net realized and unrealized gains (losses) on investments |
0.45 |
(12.76 ) |
17.47 |
(1.29 ) |
3.26 |
| Total from investment operations |
0.40 |
(12.86 ) |
17.25 |
(1.39 ) |
3.44 |
| Distributions to shareholders from |
|
|
|
|
|
| Net investment income |
0.00 |
0.00 |
0.00 |
(0.54 ) |
(0.03 ) |
| Net realized gains |
(1.45 ) |
(7.77 ) |
0.00 |
(1.17 ) |
(3.41 ) |
| Total distributions to shareholders |
(1.45 ) |
(7.77 ) |
0.00 |
(1.71 ) |
(3.44 ) |
| Net asset value, end of period |
$32.44 |
$33.49 |
$54.12 |
$36.87 |
$39.97 |
| Total
return2 |
1.00 % |
(27.48
)% |
46.79
% |
(3.81
)% |
9.75
% |
| Ratios to average net assets (annualized) |
|
|
|
|
|
| Gross expenses |
1.61 % |
1.53 % |
1.49 % |
1.54 % |
1.53 % |
| Net expenses |
1.50 % |
1.52 % |
1.49 % |
1.53 % |
1.53 % |
| Net investment income (loss) |
(0.14 )% |
(0.25 )% |
(0.44 )% |
(0.27 )% |
0.47 % |
| Supplemental data |
|
|
|
|
|
| Portfolio turnover rate |
15 % |
47 % |
53 % |
65 % |
62 % |
| Net assets, end of period (000s omitted) |
$85,554
|
$97,233 |
$152,947 |
$113,234 |
$141,388 |
| 1 |
Calculated based upon average shares outstanding |
| 2 |
Total return calculations do not include any sales charges. |
| |
Year ended October 31 | ||||
| Class C |
2023 |
2022 |
2021 |
2020 |
2019 |
| Net asset value, beginning of period |
$19.92 |
$35.63 |
$24.46 |
$26.68 |
$28.02 |
| Net investment loss |
(0.18
)1 |
(0.24
)1 |
(0.39
)1 |
(0.25
)1 |
(0.07
)1 |
| Payment from affiliate |
0.00 |
0.00 |
0.00 |
0.07 |
0.00 |
| Net realized and unrealized gains (losses) on investments |
0.30 |
(7.70 ) |
11.56 |
(0.87 ) |
2.14 |
| Total from investment operations |
0.12 |
(7.94 ) |
11.17 |
(1.05 ) |
2.07 |
| Distributions to shareholders from |
|
|
|
|
|
| Net realized gains |
(1.45 ) |
(7.77 ) |
0.00 |
(1.17 ) |
(3.41 ) |
| Net asset value, end of period |
$18.59 |
$19.92 |
$35.63 |
$24.46 |
$26.68 |
| Total
return2 |
0.24 % |
(28.04
)% |
45.67
% |
(4.25
)%3 |
8.90
% |
| Ratios to average net assets (annualized) |
|
|
|
|
|
| Gross expenses |
2.36 % |
2.28 % |
2.24 % |
2.29 % |
2.28 % |
| Net expenses |
2.26 % |
2.27 % |
2.24 % |
2.28 % |
2.28 % |
| Net investment loss |
(0.90 )% |
(0.99 )% |
(1.19 )% |
(1.00 )% |
(0.26 )% |
| Supplemental data |
|
|
|
|
|
| Portfolio turnover rate |
15 % |
47 % |
53 % |
65 % |
62 % |
| Net assets, end of period (000s omitted) |
$2,010
|
$2,741 |
$4,704 |
$5,576 |
$7,567 |
| 1 |
Calculated based upon average shares outstanding |
| 2 |
Total return calculations do not include any sales charges. |
| 3 |
During the year ended October 31, 2020, the Fund received a payment from an affiliate which had a 0.28% impact on the total return. |
| |
Year ended October 31 | ||||
| Administrator Class |
2023 |
2022 |
2021 |
2020 |
2019 |
| Net asset value, beginning of period |
$35.72 |
$57.15 |
$38.90 |
$42.06 |
$41.90 |
| Net investment income (loss) |
(0.01
)1 |
(0.14
)1 |
(0.12 ) |
(0.05
)1 |
0.25
1 |
| Payment from affiliate |
0.00 |
0.00 |
0.00 |
0.03 |
0.00 |
| Net realized and unrealized gains (losses) on investments |
0.47 |
(13.52 ) |
18.37 |
(1.36 ) |
3.42 |
| Total from investment operations |
0.46 |
(13.66 ) |
18.25 |
(1.38 ) |
3.67 |
| Distributions to shareholders from |
|
|
|
|
|
| Net investment income |
0.00 |
0.00 |
0.00 |
(0.61 ) |
(0.10 ) |
| Net realized gains |
(1.45 ) |
(7.77 ) |
0.00 |
(1.17 ) |
(3.41 ) |
| Total distributions to shareholders |
(1.45 ) |
(7.77 ) |
0.00 |
(1.78 ) |
(3.51 ) |
| Net asset value, end of period |
$34.73 |
$35.72 |
$57.15 |
$38.90 |
$42.06 |
| Total return |
1.11 % |
(27.41
)% |
46.92
% |
(3.61
)%2 |
9.90
% |
| Ratios to average net assets (annualized) |
|
|
|
|
|
| Gross expenses |
1.54 % |
1.42 % |
1.41 % |
1.46 % |
1.45 % |
| Net expenses |
1.38 % |
1.39 % |
1.39 % |
1.40 % |
1.40 % |
| Net investment income (loss) |
(0.01 )% |
(0.30 )% |
(0.35 )% |
(0.13 )% |
0.63 % |
| Supplemental data |
|
|
|
|
|
| Portfolio turnover rate |
15 % |
47 % |
53 % |
65 % |
62 % |
| Net assets, end of period (000s omitted) |
$3,820
|
$4,335 |
$28,406 |
$20,157 |
$24,746 |
| 1 |
Calculated based upon average shares outstanding |
| 2 |
During the year ended October 31, 2020, the Fund received a payment from an affiliate which had a 0.08% impact on the total return. |
| |
Year ended October 31 | ||||
| Institutional Class |
2023 |
2022 |
2021 |
2020 |
2019 |
| Net asset value, beginning of period |
$35.75 |
$57.05 |
$38.74 |
$41.92 |
$41.80 |
| Net investment income (loss) |
0.08
1 |
0.02
1 |
(0.06 ) |
0.02 |
0.36 |
| Net realized and unrealized gains (losses) on investments |
0.46 |
(13.55 ) |
18.37 |
(1.31 ) |
3.39 |
| Total from investment operations |
0.54 |
(13.53 ) |
18.31 |
(1.29 ) |
3.75 |
| Distributions to shareholders from |
|
|
|
|
|
| Net investment income |
0.00 |
0.00 |
0.00 |
(0.72 ) |
(0.22 ) |
| Net realized gains |
(1.45 ) |
(7.77 ) |
0.00 |
(1.17 ) |
(3.41 ) |
| Total distributions to shareholders |
(1.45 ) |
(7.77 ) |
0.00 |
(1.89 ) |
(3.63 ) |
| Net asset value, end of period |
$34.84 |
$35.75 |
$57.05 |
$38.74 |
$41.92 |
| Total return |
1.34 % |
(27.20
)% |
47.26
% |
(3.42
)% |
10.17
% |
| Ratios to average net assets (annualized) |
|
|
|
|
|
| Gross expenses |
1.29 % |
1.19 % |
1.16 % |
1.21 % |
1.20 % |
| Net expenses |
1.15 % |
1.15 % |
1.15 % |
1.15 % |
1.15 % |
| Net investment income (loss) |
0.21 % |
0.06 % |
(0.12 )% |
0.11 % |
0.86 % |
| Supplemental data |
|
|
|
|
|
| Portfolio turnover rate |
15 % |
47 % |
53 % |
65 % |
62 % |
| Net assets, end of period (000s omitted) |
$40,407
|
$47,779 |
$130,820 |
$87,313 |
$104,011 |
| 1 |
Calculated based upon average shares outstanding |
| Gross unrealized gains |
$24,211,559 |
| Gross unrealized losses |
(20,049,822 ) |
| Net unrealized gains |
$4,161,737 |
| Paid-in
capital |
Total distributable
earnings |
| $(231,018 ) |
$231,018 |
| |
Quoted prices
(Level 1) |
Other significant
observable inputs
(Level 2) |
Significant
unobservable inputs
(Level 3) |
Total |
| Assets |
|
|
|
|
| Investments in: |
|
|
|
|
| Common stocks |
|
|
|
|
| Australia |
$0
|
$3,974,596
|
$0 |
$3,974,596
|
| Belgium |
0 |
1,594,595 |
0 |
1,594,595 |
| Canada |
5,991,428 |
0 |
0 |
5,991,428 |
| France |
0 |
3,293,989 |
0 |
3,293,989 |
| Germany |
0 |
6,258,447 |
0 |
6,258,447 |
| Ireland |
0 |
679,350 |
0 |
679,350 |
| Israel |
1,182,954 |
0 |
0 |
1,182,954 |
| Italy |
0 |
2,691,093 |
0 |
2,691,093 |
| Japan |
0 |
11,842,771 |
0 |
11,842,771 |
| Netherlands |
132,841 |
290,876 |
0 |
423,717 |
| Norway |
1,177,806 |
0 |
0 |
1,177,806 |
| Spain |
0 |
2,775,992 |
0 |
2,775,992 |
| Sweden |
0 |
2,493,719 |
0 |
2,493,719 |
| Switzerland |
1,203,750 |
1,915,873 |
0 |
3,119,623 |
| United Kingdom |
4,551,122 |
5,101,515 |
0 |
9,652,637 |
| United States |
71,517,085 |
0 |
0 |
71,517,085 |
| Rights |
|
|
|
|
| Spain |
0 |
17,504 |
0 |
17,504 |
| Short-term investments |
|
|
|
|
| Investment companies |
2,568,998 |
0 |
0 |
2,568,998 |
| Total assets |
$88,325,984 |
$42,930,320 |
$0 |
$131,256,304 |
| Average daily net assets |
Management fee |
| First $500 million |
0.950 % |
| Next $500 million |
0.925 |
| Next $1 billion |
0.900 |
| Next $2 billion |
0.875 |
| Next $1 billion |
0.850 |
| Next $5 billion |
0.840 |
| Over $10 billion |
0.830 |
| |
Class-level
administration fee |
| Class A |
0.20 % |
| Class C |
0.20 |
| Administrator Class |
0.13 |
| Institutional Class |
0.13 |
| |
EXPENSE RATIO CAPS |
| Class A |
1.47 % |
| Class C |
2.22 |
| Administrator Class |
1.40 |
| Institutional Class |
1.15 |
| |
Year
ended October 31 | |
| |
2023 |
2022 |
| Ordinary income |
$0 |
$27,408,178 |
| Long-term capital gain |
6,409,766 |
16,137,997 |
| Unrealized
gains |
Late-year
ordinary
losses
deferred |
Capital loss
carryforward |
| $4,148,925 |
$(16,508 ) |
$(3,369,786 ) |

| Name and
year of birth |
Position held and
length of service* |
Principal occupations during past five years or
longer |
Current other
public company
or
investment
company
directorships |
| William R.
Ebsworth
(Born 1957) |
Trustee,
since 2015 |
Retired. From 1984 to 2013, equities analyst, portfolio manager, research
director and chief investment officer at Fidelity
Management and Research Company in Boston, Tokyo, and Hong
Kong, and retired in 2013 as Chief Investment Officer of Fidelity
Strategic Advisers, Inc. where he led a team of investment
professionals managing client assets. Prior thereto, Board member of Hong Kong Securities Clearing Co., Hong Kong Options Clearing Corp., the Thailand International
Fund, Ltd., Fidelity Investments Life Insurance Company, and Empire
Fidelity Investments Life Insurance Company. Audit
Committee Chair and Investment Committee Chair of the Vincent
Memorial Hospital Foundation (non-profit organization). Mr. Ebsworth is a CFA
charterholder. |
N/A |
| Jane A.
Freeman
(Born 1953) |
Trustee,
since 2015;
Chair Liaison,
since 2018 |
Retired. From 2012 to 2014 and 1999 to 2008, Chief Financial Officer of
Scientific Learning Corporation. From 2008 to 2012, Ms.
Freeman provided consulting services related to strategic
business projects. Prior to 1999, Portfolio Manager at Rockefeller &
Co. and Scudder, Stevens & Clark. Board member of the
Harding Loevner Funds from 1996 to 2014, serving as both Lead
Independent Director and chair of the Audit Committee. Board member of
the Russell Exchange Traded Funds Trust from 2011 to 2012
and the chair of the Audit Committee. Ms. Freeman is also an
inactive Chartered Financial Analyst. |
N/A |
| Isaiah
Harris, Jr.
(Born 1952) |
Trustee,
since 2009;
Audit Committee
Chair,
since 2019 |
Retired. Member of the Advisory Board of CEF of East Central Florida.
Chairman of the Board of CIGNA Corporation from 2009 to
2021, and Director from 2005 to 2008. From 2003 to 2011,
Director of Deluxe Corporation. Prior thereto, President and CEO of
BellSouth Advertising and Publishing Corp. from 2005 to
2007, President and CEO of BellSouth Enterprises from 2004 to
2005 and President of BellSouth Consumer Services from 2000 to 2003.
Emeritus member of the Iowa State University Foundation
Board of Governors. Emeritus Member of the Advisory board of
Iowa State University School of Business. Advisory Board Member, Palm
Harbor Academy (private school). Advisory Board Member,
Fellowship of Christian Athletes. Mr. Harris is a certified public
accountant (inactive status). |
N/A |
| David F.
Larcker
(Born 1950) |
Trustee,
since 2009 |
Distinguished Visiting Fellow at the Hoover Institution since 2022. James
Irvin Miller Professor of Accounting at the Graduate School
of Business (Emeritus), Stanford University, Director of the
Corporate Governance Research Initiative and Senior Faculty of The Rock
Center for Corporate Governance since 2006. From 2005 to
2008, Professor of Accounting at the Graduate School of
Business, Stanford University. Prior thereto, Ernst & Young Professor
of Accounting at The Wharton School, University of Pennsylvania
from 1985 to 2005. |
N/A |
| Olivia S.
Mitchell
(Born 1953) |
Trustee,
since 2006;
Nominating and
Governance
Committee Chair,
since 2018 |
International Foundation of Employee Benefit Plans Professor since 1993,
Wharton School of the University of Pennsylvania. Director
of Wharton’s Pension Research Council and Boettner Center on Pensions & Retirement Research, and Research Associate at the National Bureau of Economic
Research. Previously taught at Cornell University from 1978 to 1993.
|
N/A |
| Timothy J.
Penny
(Born 1951) |
Trustee,
since 1996;
Chair,
since 2018 |
President and Chief Executive Officer of Southern Minnesota Initiative
Foundation, a non-profit organization, since 2007. Vice
Chair of the Economic Club of Minnesota, since 2007. Co-Chair of the Committee for a Responsible Federal Budget, since 1995. Member of the Board of Trustees of
NorthStar Education Finance, Inc., a non-profit organization, from
2007-2022. Senior Fellow of the University of Minnesota Humphrey
Institute from 1995 to 2017. |
N/A |
| Name and
year of birth |
Position held and
length of service* |
Principal occupations during past five years or
longer |
Current other
public company
or
investment
company
directorships |
| James G.
Polisson
(Born 1959) |
Trustee,
since 2018 |
Retired. Chief Marketing Officer, Source (ETF) UK Services, Ltd, from
2015 to 2017. From 2012 to 2015, Principal of The Polisson
Group, LLC, a management consulting, corporate advisory and
principal investing company. Chief Executive Officer and Managing
Director at Russell Investments, Global Exchange Traded
Funds from 2010 to 2012. Managing Director of Barclays
Global Investors from 1998 to 2010 and Global Chief Marketing Officer for
iShares and Barclays Global Investors from 2000 to 2010.
Trustee of the San Francisco Mechanics’ Institute, a non- profit organization, from 2013 to 2015. Board member of the Russell Exchange Traded Fund Trust
from 2011 to 2012. Director of Barclays Global Investors Holdings
Deutschland GmbH from 2006 to 2009. Mr. Polisson is an
attorney and has a retired status with the Massachusetts and District of Columbia Bar Associations. |
N/A |
| Pamela Wheelock (Born 1959) |
Trustee, since January 2020; previously Trustee from January 2018 to July 2019 |
Retired. Executive and Senior Financial leadership positions in the public, private and nonprofit
sectors. Interim President and CEO, McKnight Foundation, 2020. Interim
Commissioner, Minnesota Department of Human Services, 2019.
Chief Operating Officer, Twin Cities Habitat for Humanity,
2017-2019. Vice President for University Services, University of Minnesota, 2012- 2016. Interim President and CEO, Blue Cross and Blue Shield of Minnesota, 2011-2012. Executive
Vice-President and Chief Financial Officer, Minnesota Wild, 2002-2008.
Commissioner, Minnesota Department of Finance, 1999-2002.
Chair of the Board of Directors of Destination Medical Center
Corporation. Board member of the Minnesota Wild Foundation. |
N/A |
| * |
Length of service dates reflect the Trustee’s commencement of service with the Trust’s predecessor entities, where applicable. |
| Name and
year of birth |
Position held and
length of
service |
Principal occupations during past five years or
longer |
| Andrew Owen
(Born 1960) |
President,
since 2017 |
President and Chief Executive Officer of Allspring Funds Management, LLC
since 2017 and Head of Global Fund Governance of Allspring
Global Investments since 2022. Prior thereto, co-president of Galliard Capital Management, LLC, an affiliate of Allspring Funds Management, LLC, from 2019 to 2022 and Head of Affiliated
Managers, Allspring Global Investments, from 2014 to 2019 and Executive
Vice President responsible for marketing, investments and product
development for Allspring Funds Management, LLC, from 2009 to 2014. |
| Jeremy DePalma
(Born 1974) |
Treasurer,
since 2012
(for certain funds in
the Fund Complex);
since 2021 (for
the remaining funds
in the Complex) |
Senior Vice President of Allspring Funds Management, LLC since 2009.
Senior Vice President of Evergreen Investment Management
Company, LLC from 2008 to 2010 and head of the Fund Reporting and Control Team within Fund Administration from 2005 to 2010.
|
| Christopher Baker
(Born 1976) |
Chief Compliance
Officer,
since 2022 |
Global Chief Compliance Officer for Allspring Global Investments since
2022. Prior thereto, Chief Compliance Officer for State
Street Global Advisors from 2018 to 2021. Senior Compliance Officer for the State Street divisions of Alternative Investment Solutions, Sector Solutions, and Global Marketing from 2015 to 2018. From 2010 to 2015
Vice President, Global Head of Investment and Marketing Compliance for State
Street Global Advisors. |
| Matthew Prasse (Born 1983) |
Chief Legal Officer, since 2022; Secretary, since 2021 |
Senior Counsel of the Allspring Legal Department since 2021. Senior Counsel of the Wells Fargo Legal Department
from 2018 to 2021. Previously, Counsel for Barings LLC from 2015 to 2018.
Prior to joining Barings, Associate at Morgan, Lewis & Bockius
LLP from 2008 to 2015. |


| 2 | |
| 6 | |
| 10 | |
| 11 | |
| 15 | |
| 16 | |
| 17 | |
| 18 | |
| 22 | |
| 27 | |
| 28 |


| Notice to Shareholders |
| Beginning in July 2024, the Fund will be required by the
Securities and Exchange Commission to send shareholders a paper copy of a
new tailored shareholder report in place of the full shareholder report that you are now receiving. The tailored shareholder report will contain concise information about the Fund, including certain expense and performance
information and fund statistics. If you wish to receive this new tailored shareholder
report electronically, please follow the instructions on the back cover
of this report. |
| Other information that is currently included in the shareholder
report, such as the Fund’s financial statements, will be available
online and upon request, free of charge, in paper or electronic format. |
| Investment objective |
The Fund seeks long-term capital appreciation. |
| Manager |
Allspring Funds Management, LLC |
| Subadviser |
Allspring Global Investments, LLC |
| Portfolio managers |
Stephen Giggie, CFA, Oleg Makhorine, James Tringas, CFA, Bryant
VanCronkhite, CFA, CPA |
| Average annual total returns (%) as of October 31, 2023 | |||||||
| |
|
Including sales charge |
Excluding sales charge |
Expense ratios1 (%) | |||
| |
Inception date |
1 year |
Since inception |
1 year |
Since inception |
Gross |
Net2 |
| Class A (ASPAX)3 |
6-1-2022 |
-0.55 |
-0.49 |
5.52 |
0.85 |
1.60 |
1.38 |
| Class C (ACPCX)4 |
6-1-2022 |
4.24 |
0.21 |
5.24 |
0.21 |
2.35 |
2.13 |
| Class R6 (WICRX) |
5-31-2019 |
– |
1.26 |
5.96 |
1.26 |
1.18 |
0.96 |
| Institutional Class (WICIX) |
5-31-2019 |
– |
1.16 |
5.89 |
1.16 |
1.28 |
1.06 |
| MSCI World ex USA Small Cap Index (Net)5
|
– |
– |
– |
5.66 |
2.34
* |
– |
– |
| | |
| * |
Based on the inception date of the oldest Fund class. |
| 1 |
Reflects the expense ratios as stated in the most recent prospectuses, which include the impact of 0.01% in acquired fund fees and expenses. The expense ratios shown
are subject to change and may differ from the annualized expense ratios
shown in the Financial Highlights of this report, which do not include acquired fund fees and expenses. |
| 2 |
The manager has contractually committed through February 29, 2024 (February 28, 2025 for Class A and C), to waive fees and/or reimburse expenses to the extent
necessary to cap total annual fund operating expenses after fee waivers at
1.37% for Class A, 2.12% for Class C, 0.95% for Class R6 and 1.05% for Institutional Class. Brokerage commissions, stamp duty fees, interest, taxes, acquired fund fees and expenses (if any), and extraordinary expenses are excluded from the expense caps. Prior
to or after the commitment expiration date, the caps may be increased or
the commitment to maintain the caps may be terminated only with the approval of the Board of Trustees. Without these caps, the Fund’s returns would have been lower. The expense ratio paid by an investor is the net expense ratio (the total annual fund
operating expenses after fee waivers) as stated in the
prospectuses. |
| 3 |
Historical performance shown for the Class A shares prior to their inception reflects the performance of the Institutional Class shares and includes the higher expenses
applicable to the Class A shares. |
| 4 |
Historical performance shown for the Class C shares prior to their inception reflects the performance of the Institutional Class shares and includes the higher expenses
applicable to the Class C shares. |
| 5 |
The Morgan Stanley Capital International (MSCI) World ex USA Small Cap Index (Net) is a free-float-adjusted market-capitalization-weighted index that is designed to
measure the equity market performance of developed markets excluding the
U.S. Source: MSCI. MSCI makes no
express or implied warranties or representations and shall have no
liability whatsoever with respect to any MSCI data contained herein. The MSCI data may not be further redistributed or used as a basis for other indices or any securities or financial products. This report is not approved, reviewed, or produced by MSCI. You cannot invest directly in an index. |
| CFA® and Chartered Financial Analyst® are trademarks owned by CFA Institute. |
| Growth of $10,000 investment as of October 31, 20231 |
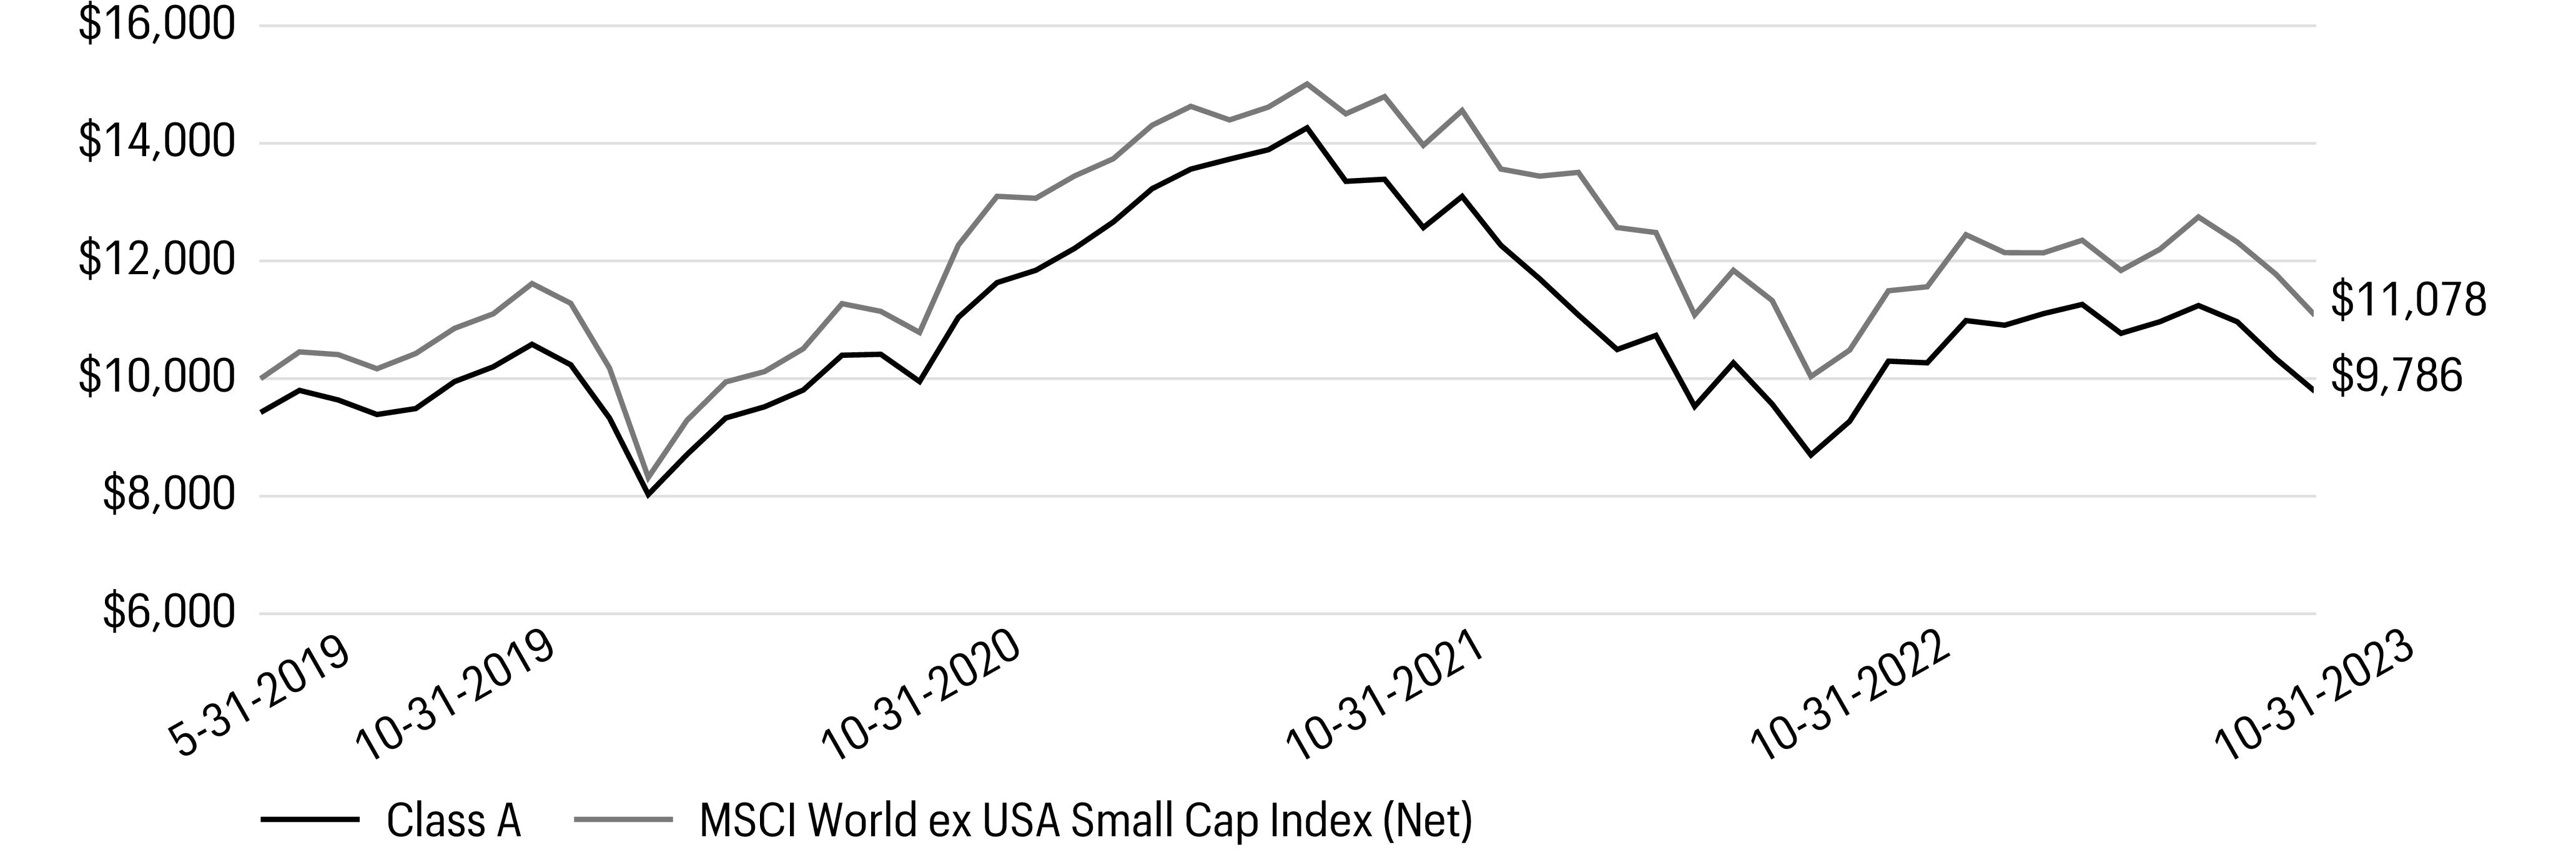
| 1 |
The chart compares the performance of Class A shares since inception of the Institutional Class on May 31, 2019 with the MSCI World ex USA Small Cap Index
(Net). The chart assumes a hypothetical investment of $10,000 in Class A shares
and reflects all operating expenses and assumes the maximum initial sales charge of 5.75%. |
| Ten largest holdings (%) as of October 31, 20231 | |
| Spectris PLC |
3.52 |
| Alten SA |
3.19 |
| Ansell Ltd. |
3.14 |
| Viscofan SA |
2.96 |
| MEITEC Group Holdings, Inc. |
2.89 |
| PrairieSky Royalty Ltd. |
2.70 |
| Orix JREIT, Inc. |
2.54 |
| Aeon Delight Co. Ltd. |
2.51 |
| Britvic PLC |
2.35 |
| DTS Corp. |
2.09 |
| 1 |
Figures represent the percentage of the Fund’s net assets. Holdings are subject to change and may have changed since the date specified. |
| Sector allocation as of October 31, 20231 |
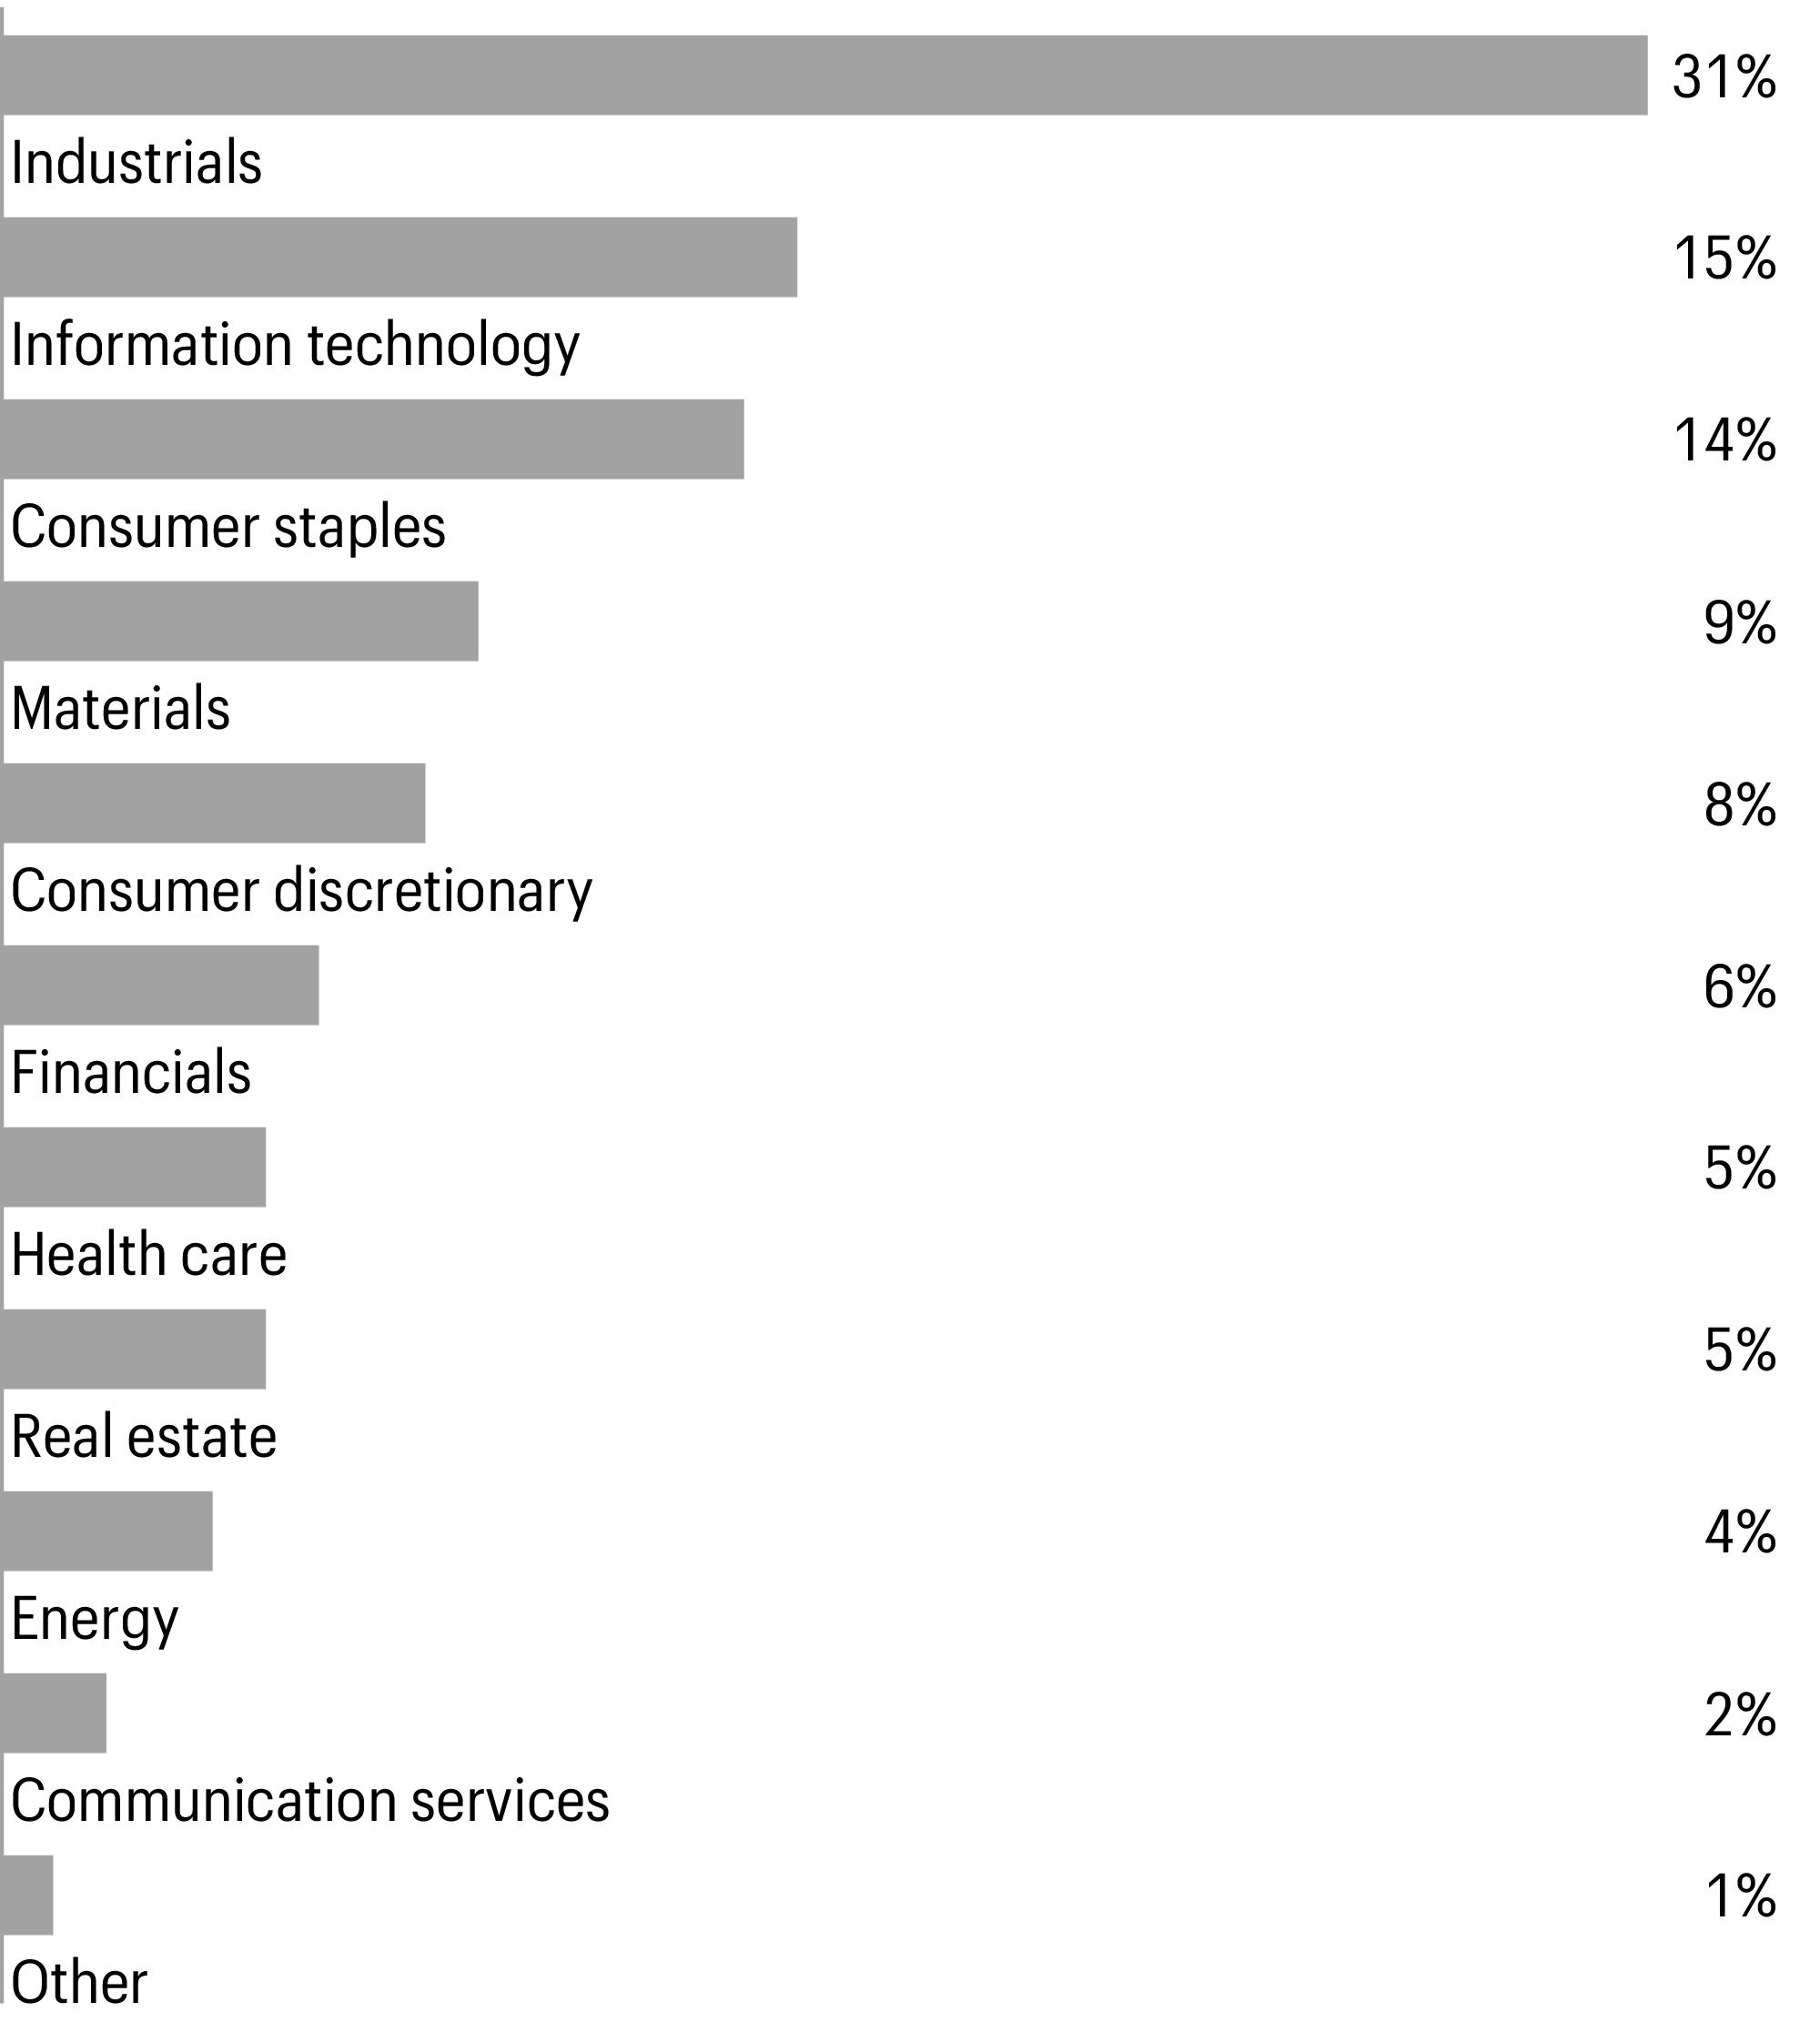
| 1 |
Figures represent the percentage of the Fund’s long-term investments. Allocations are subject to change and may have changed since the date specified. |
| Geographic allocation as of October 31, 20231 |
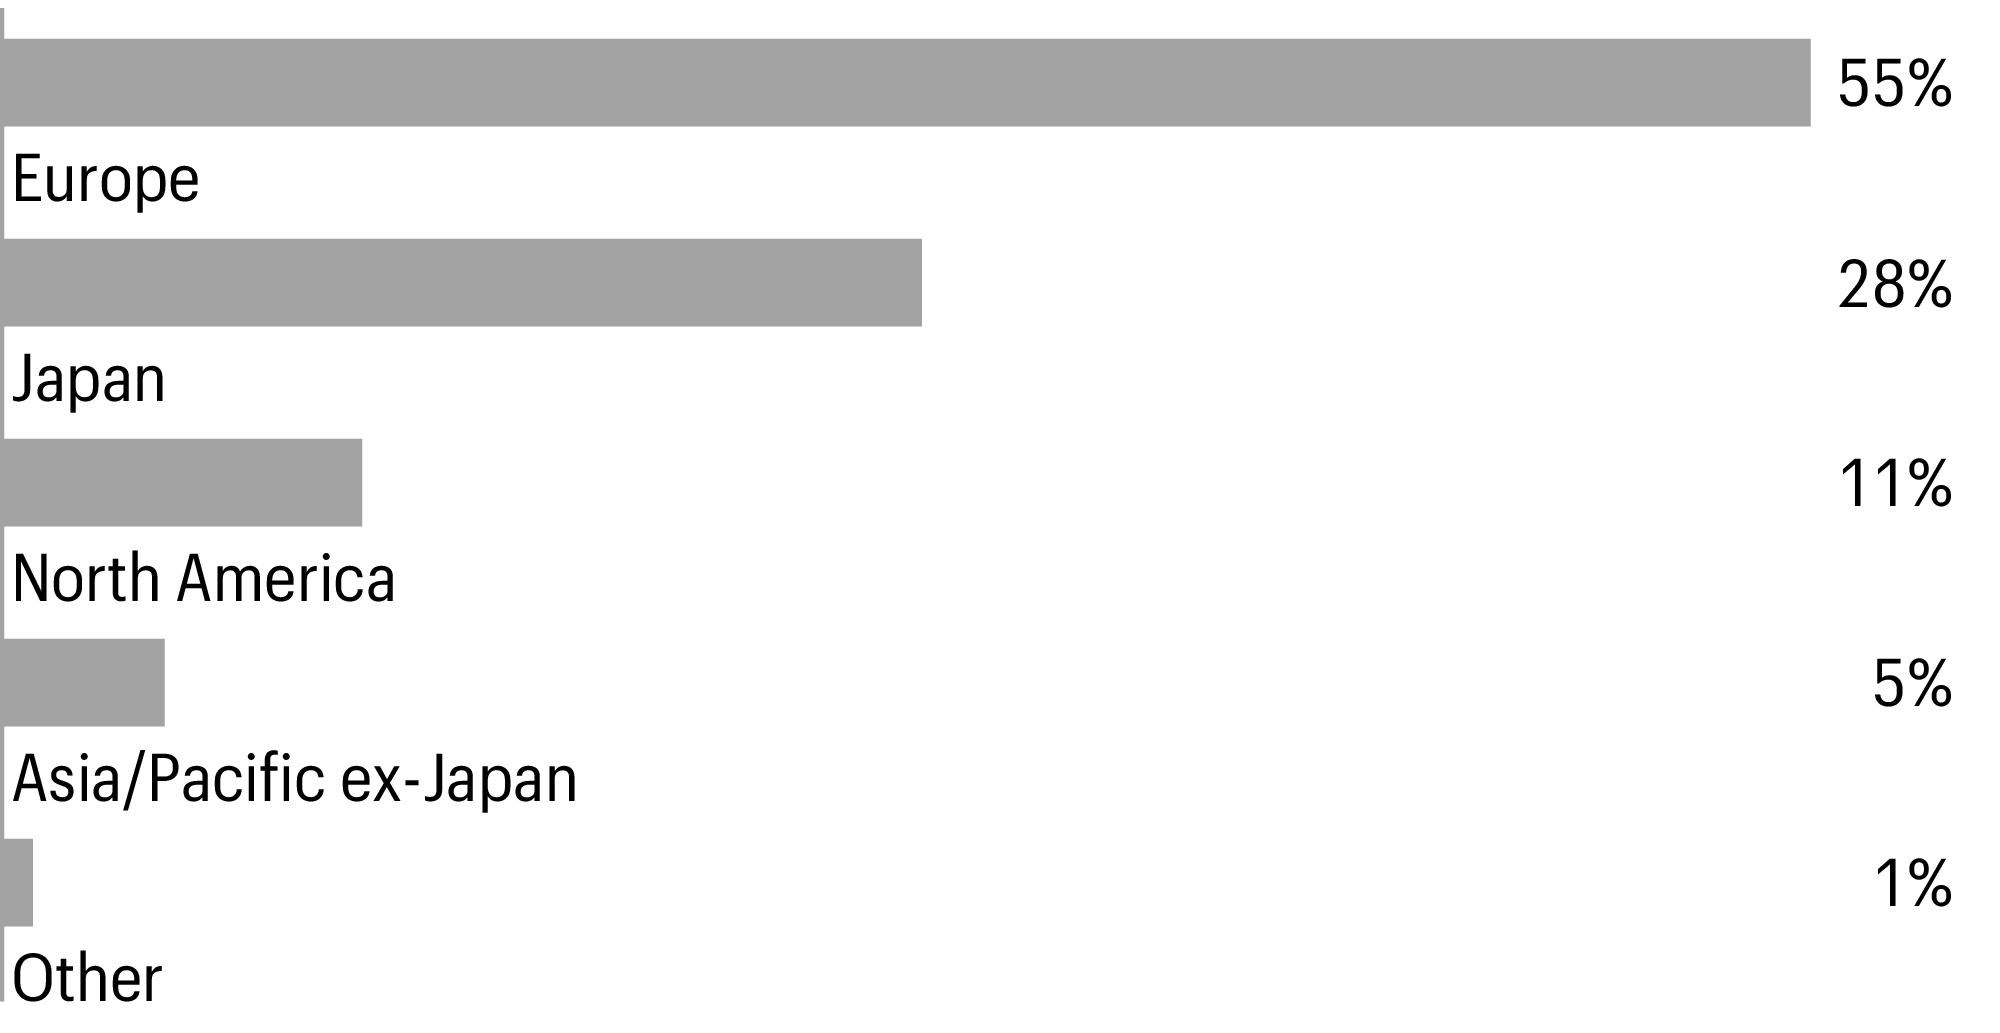
| 1 |
Figures represent the percentage of the Fund’s long-term investments. Allocations are subject to change and may have changed since the date specified. |
| |
Beginning account value 5-1-2023 |
Ending account value 10-31-2023 |
Expenses paid during the period1
|
Annualized net expense ratio |
| Class A |
|
|
|
|
| Actual |
$1,000.00 |
$869.00 |
$6.41 |
1.36 % |
| Hypothetical (5% return before expenses) |
$1,000.00 |
$1,018.35 |
$6.92 |
1.36 % |
| Class C |
|
|
|
|
| Actual |
$1,000.00 |
$867.13 |
$7.95 |
1.69 % |
| Hypothetical (5% return before expenses) |
$1,000.00 |
$1,016.69 |
$8.59 |
1.69 % |
| Class R6 |
|
|
|
|
| Actual |
$1,000.00 |
$869.87 |
$4.48 |
0.95 % |
| Hypothetical (5% return before expenses) |
$1,000.00 |
$1,020.42 |
$4.84 |
0.95 % |
| Institutional Class |
|
|
|
|
| Actual |
$1,000.00 |
$869.98 |
$4.95 |
1.05 % |
| Hypothetical (5% return before expenses) |
$1,000.00
|
$1,019.91
|
$5.35
|
1.05 % |
| 1 |
Expenses paid is equal to the annualized net expense ratio of each class multiplied by the average account value over the period, multiplied by 184 divided by 365 (to
reflect the one-half-year period). |
| |
|
|
|
Shares |
Value | |
| Common stocks: 94.65% |
|
|
|
|
|
|
| Australia: 5.24% |
|
|
|
|
|
|
| Ansell Ltd. (Health care, Health care equipment & supplies) |
|
|
|
|
404,374 |
$5,463,418 |
| Bapcor Ltd. (Consumer discretionary, Distributors) |
|
|
|
|
214,914 |
731,535 |
| Domino’s Pizza Enterprises Ltd. (Consumer discretionary, Hotels, restaurants & leisure) |
|
|
|
|
27,106 |
878,480 |
| Inghams Group Ltd. (Consumer staples, Food products) |
|
|
|
|
118,971 |
278,646 |
| Orora Ltd. (Materials, Containers & packaging) |
|
|
|
|
1,132,322 |
1,774,494 |
| |
|
|
|
|
|
9,126,573 |
| Austria: 0.68% |
|
|
|
|
|
|
| Mayr Melnhof Karton AG (Materials, Containers & packaging) |
|
|
|
|
10,084 |
1,186,368 |
| Belgium: 2.30% |
|
|
|
|
|
|
| Azelis Group NV (Industrials, Trading companies & distributors) |
|
|
|
|
87,008 |
1,483,954 |
| Barco NV (Information technology, Electronic equipment, instruments & components) |
|
|
|
|
164,609 |
2,527,391 |
| |
|
|
|
|
|
4,011,345 |
| Canada: 10.74% |
|
|
|
|
|
|
| ATS Corp. (Industrials, Machinery)† |
|
|
|
|
47,740 |
1,607,686 |
| Canadian Western Bank (Financials, Banks) |
|
|
|
|
158,680 |
3,144,421 |
| Enerplus Corp. (Energy, Oil, gas & consumable fuels) |
|
|
|
|
75,140 |
1,270,617 |
| Finning International, Inc. (Industrials, Trading companies & distributors) |
|
|
|
|
85,160 |
2,281,987 |
| Gildan Activewear, Inc. (Consumer discretionary, Textiles, apparel & luxury goods) |
|
|
|
|
86,660 |
2,461,538 |
| PrairieSky Royalty Ltd. (Energy, Oil, gas & consumable fuels) |
|
|
|
|
267,560 |
4,698,097 |
| Primo Water Corp. (Consumer staples, Beverages) |
|
|
|
|
248,125 |
3,236,763 |
| |
|
|
|
|
|
18,701,109 |
| France: 3.92% |
|
|
|
|
|
|
| Alten SA (Information technology, IT services) |
|
|
|
|
47,008 |
5,552,960 |
| Metropole Television SA (Communication services, Media) |
|
|
|
|
102,036 |
1,278,914 |
| |
|
|
|
|
|
6,831,874 |
| Germany: 7.21% |
|
|
|
|
|
|
| Cancom SE (Information technology, IT services) |
|
|
|
|
90,495 |
2,259,326 |
| CTS Eventim AG & Co. KGaA (Communication services, Entertainment) |
|
|
|
|
30,074 |
1,820,865 |
| Gerresheimer AG (Health care, Life sciences tools & services) |
|
|
|
|
26,296 |
2,452,712 |
| Krones AG (Industrials, Machinery) |
|
|
|
|
28,282 |
2,756,728 |
| Stabilus SE (Industrials, Machinery) |
|
|
|
|
6,899 |
438,058 |
| TAG Immobilien AG (Real estate, Real estate management & development)† |
|
|
|
|
257,754 |
2,818,280 |
| |
|
|
|
|
|
12,545,969 |
| Ireland: 0.64% |
|
|
|
|
|
|
| Irish Residential Properties REIT PLC (Real estate, Residential REITs) |
|
|
|
|
1,153,817 |
1,111,345 |
| |
|
|
|
Shares |
Value | |
| Italy: 6.19% |
|
|
|
|
|
|
| Azimut Holding SpA (Financials, Capital markets) |
|
|
|
|
82,067 |
$1,729,225 |
| Buzzi SpA (Materials, Construction materials) |
|
|
|
|
129,187 |
3,420,765 |
| De’ Longhi SpA (Consumer discretionary, Household durables) |
|
|
|
|
60,236 |
1,347,789 |
| GVS SpA (Industrials, Machinery)144A† |
|
|
|
|
370,260 |
1,659,660 |
| Interpump Group SpA (Industrials, Machinery) |
|
|
|
|
62,668 |
2,620,419 |
| |
|
|
|
|
|
10,777,858 |
| Japan: 26.58% |
|
|
|
|
|
|
| Aeon Delight Co. Ltd. (Industrials, Commercial services & supplies) |
|
|
|
|
198,100 |
4,368,060 |
| Daiseki Co. Ltd. (Industrials, Commercial services & supplies) |
|
|
|
|
121,960 |
3,368,229 |
| DTS Corp. (Information technology, IT services) |
|
|
|
|
176,900 |
3,633,240 |
| Ezaki Glico Co. Ltd. (Consumer staples, Food products) |
|
|
|
|
42,400 |
1,232,448 |
| Fuji Seal International, Inc. (Materials, Containers & packaging) |
|
|
|
|
174,200 |
1,940,444 |
| Horiba Ltd. (Information technology, Electronic equipment, instruments & components) |
|
|
|
|
61,800 |
3,124,687 |
| Hoshizaki Corp. (Industrials, Machinery) |
|
|
|
|
62,300 |
2,011,956 |
| Kamigumi Co. Ltd. (Industrials, Transportation infrastructure) |
|
|
|
|
145,200 |
2,945,607 |
| MEITEC Group Holdings, Inc. (Industrials, Professional services) |
|
|
|
|
285,700 |
5,028,345 |
| Nihon Parkerizing Co. Ltd. (Materials, Chemicals) |
|
|
|
|
219,100 |
1,590,135 |
| Orix JREIT, Inc. (Real estate, Office REITs) |
|
|
|
|
3,852 |
4,426,957 |
| PHC Holdings Corp. (Health care, Health care equipment & supplies) |
|
|
|
|
97,800 |
924,904 |
| San-A Co. Ltd. (Consumer staples, Consumer staples distribution & retail) |
|
|
|
|
90,000 |
2,788,059 |
| Sohgo Security Services Co. Ltd. (Industrials, Commercial services & supplies) |
|
|
|
|
283,000 |
1,657,309 |
| Stanley Electric Co. Ltd. (Consumer discretionary, Automobile components) |
|
|
|
|
171,400 |
2,741,472 |
| Sumitomo Warehouse Co. Ltd. (Industrials, Transportation infrastructure) |
|
|
|
|
139,800 |
2,238,137 |
| Taikisha Ltd. (Industrials, Construction & engineering) |
|
|
|
|
77,900 |
2,266,868 |
| |
|
|
|
|
|
46,286,857 |
| Luxembourg: 0.07% |
|
|
|
|
|
|
| Novem Group SA (Consumer discretionary, Automobile components) |
|
|
|
|
19,526 |
123,504 |
| Netherlands: 1.00% |
|
|
|
|
|
|
| MYT Netherlands Parent BV ADR (Consumer discretionary, Specialty retail)† |
|
|
|
|
93,702 |
272,673 |
| TKH Group NV (Industrials, Electrical equipment) |
|
|
|
|
40,322 |
1,474,937 |
| |
|
|
|
|
|
1,747,610 |
| Norway: 2.67% |
|
|
|
|
|
|
| Atea ASA (Information technology, IT services) |
|
|
|
|
168,897 |
1,756,863 |
| Elopak ASA (Materials, Containers & packaging) |
|
|
|
|
253,436 |
517,265 |
| SpareBank 1 SMN (Financials, Banks) |
|
|
|
|
195,818 |
2,375,960 |
| |
|
|
|
|
|
4,650,088 |
| |
|
|
|
Shares |
Value | |
| Spain: 3.83% |
|
|
|
|
|
|
| Vidrala SA (Materials, Containers & packaging) |
|
|
|
|
20,477 |
$1,521,957 |
| Viscofan SA (Consumer staples, Food products) |
|
|
|
|
89,015 |
5,145,602 |
| |
|
|
|
|
|
6,667,559 |
| Sweden: 3.10% |
|
|
|
|
|
|
| Hexpol AB (Materials, Chemicals) |
|
|
|
|
205,466 |
1,823,519 |
| Loomis AB (Industrials, Commercial services & supplies) |
|
|
|
|
137,364 |
3,568,336 |
| |
|
|
|
|
|
5,391,855 |
| Switzerland: 3.80% |
|
|
|
|
|
|
| Arbonia AG (Industrials, Building products) |
|
|
|
|
154,755 |
1,316,774 |
| Bossard Holding AG Class A (Industrials, Trading companies & distributors) |
|
|
|
|
12,447 |
2,569,178 |
| Bucher Industries AG (Industrials, Machinery) |
|
|
|
|
5,442 |
1,942,610 |
| Montana Aerospace AG (Industrials, Aerospace & defense)144A† |
|
|
|
|
65,514 |
788,278
|
| |
|
|
|
|
|
6,616,840 |
| United Kingdom: 16.68% |
|
|
|
|
|
|
| Britvic PLC (Consumer staples, Beverages) |
|
|
|
|
401,321 |
4,087,641 |
| Domino’s Pizza Group PLC (Consumer discretionary, Hotels, restaurants & leisure) |
|
|
|
|
780,248 |
3,255,664 |
| Elementis PLC (Materials, Chemicals)† |
|
|
|
|
1,072,793 |
1,544,395 |
| IMI PLC (Industrials, Machinery) |
|
|
|
|
104,794 |
1,871,520 |
| Lancashire Holdings Ltd. (Financials, Insurance) |
|
|
|
|
457,686 |
3,159,751 |
| Morgan Advanced Materials PLC (Industrials, Machinery) |
|
|
|
|
229,755 |
628,325 |
| Nomad Foods Ltd. (Consumer staples, Food products)†
|
|
|
|
|
155,690 |
2,151,636 |
| S4 Capital PLC (Communication services, Media)† |
|
|
|
|
963,850 |
744,766 |
| Spectris PLC (Information technology, Electronic equipment, instruments & components) |
|
|
|
|
162,198 |
6,128,962 |
| SSP Group PLC (Consumer discretionary, Hotels, restaurants & leisure)† |
|
|
|
|
874,936 |
1,914,193 |
| Tate & Lyle PLC (Consumer staples, Food products) |
|
|
|
|
465,491 |
3,567,247 |
| |
|
|
|
|
|
29,054,100 |
| Total common stocks (Cost $179,980,306) |
|
|
|
|
|
164,830,854 |
| Investment companies: 0.41% |
|
|
|
|
|
|
| United States: 0.41% |
|
|
|
|
|
|
| iShares MSCI EAFE Small-Cap ETF |
|
|
|
|
13,192 |
709,861 |
| Total investment companies (Cost $702,223) |
|
|
|
|
|
709,861 |
| |
|
|
Expiration date |
|
| |
| Rights: 0.04% |
|
|
|
|
|
|
| Spain: 0.04% |
|
|
|
|
|
|
| Vidrala SA (Materials, Containers & packaging)†
|
|
|
11-8-2023 |
|
20,477 |
75,509 |
| Total rights (Cost $64,870) |
|
|
|
|
|
75,509 |
| |
|
Yield |
|
Shares |
Value | |
| Short-term investments: 4.16% |
|
|
|
|
|
|
| Investment companies: 4.16% |
|
|
|
|
|
|
| Allspring Government Money Market Fund Select
Class♠∞ |
|
5.29 % |
|
|
7,255,327 |
$7,255,327 |
| Total short-term investments (Cost $7,255,327) |
|
|
|
|
|
7,255,327 |
| Total investments in securities (Cost $188,002,726) |
99.26 % |
|
|
|
|
172,871,551 |
| Other assets and liabilities, net |
0.74 |
|
|
|
|
1,280,594 |
| Total net assets |
100.00 % |
|
|
|
|
$174,152,145 |
| † |
Non-income-earning security |
| 144A |
The security may be resold in transactions exempt from registration, normally to qualified institutional buyers, pursuant to Rule 144A under the Securities Act of
1933. |
| ♠ |
The issuer of the security is an affiliated person of the Fund as defined in the Investment Company Act of 1940. |
| ∞ |
The rate represents the 7-day annualized yield at period end. |
| Abbreviations: | |
| ADR |
American depositary receipt |
| REIT |
Real estate investment trust |
| |
Value, beginning of period |
Purchases |
Sales
proceeds |
Net
realized
gains
(losses) |
Net
change in
unrealized
gains
(losses) |
Value,
end of
period |
Shares,
end
of period |
Income
from
affiliated
securities |
| Short-term investments |
|
|
|
|
|
|
|
|
| Allspring Government Money Market Fund Select Class |
$8,959,808 |
$69,379,526 |
$(71,084,007 ) |
$0 |
$0 |
$7,255,327 |
7,255,327 |
$348,783 |
| Investments in affiliates no longer held at end of period |
|
|
|
|
|
|
|
|
| Securities Lending Cash Investments LLC |
2,952,741 |
17,522,825 |
(20,475,598 ) |
34 |
(2 ) |
0 |
0 |
31,755 1 |
| |
|
|
|
$34 |
$(2 )
|
$7,255,327 |
|
$380,538 |
| 1 |
Amount shown represents income before fees and rebates. |
| Assets |
|
| Investments in unaffiliated securities, at value (cost $180,747,399) |
$165,616,224 |
| Investments in affiliated securities, at value (cost $7,255,327) |
7,255,327 |
| Foreign currency, at value (cost $22,089) |
21,867 |
| Receivable for investments sold |
779,626 |
| Receivable for dividends |
691,154 |
| Receivable for Fund shares sold |
62,694 |
| Prepaid expenses and other assets |
115,621 |
| Total assets |
174,542,513 |
| Liabilities |
|
| Payable for investments purchased |
114,404 |
| Custody and accounting fees payable |
95,780 |
| Payable for Fund shares redeemed |
75,043 |
| Management fee payable |
74,172 |
| Administration fees payable |
14,297 |
| Trustees’ fees and expenses payable |
478 |
| Accrued expenses and other liabilities |
16,194 |
| Total liabilities |
390,368 |
| Total net assets |
$174,152,145 |
| Net assets consist of |
|
| Paid-in capital |
$196,658,605 |
| Total distributable loss |
(22,506,460
) |
| Total net assets |
$174,152,145 |
| Computation of net asset value and offering price per share |
|
| Net assets–Class A |
$28,833 |
| Shares outstanding–Class A1
|
2,899 |
| Net asset value per share–Class A |
$9.95 |
| Maximum offering price per share – Class A2 |
$10.56 |
| Net assets–Class C |
$22,655 |
| Shares outstanding–Class C1
|
2,284 |
| Net asset value per share–Class C |
$9.92 |
| Net assets–Class R6 |
$60,317,641 |
| Shares outstanding–Class R61
|
6,056,191 |
| Net asset value per share–Class R6 |
$9.96 |
| Net assets–Institutional Class |
$113,783,016 |
| Shares outstanding–Institutional
Class1 |
11,412,717 |
| Net asset value per share–Institutional Class |
$9.97
|
| Investment income |
|
| Dividends (net of foreign withholdings taxes of $484,732) |
$4,201,339 |
| Income from affiliated securities |
352,894 |
| Interest |
129 |
| Total investment income |
4,554,362 |
| Expenses |
|
| Management fee |
1,744,166 |
| Administration fees |
|
| Class A |
59 |
| Class C |
51 |
| Class R6 |
21,863 |
| Institutional Class |
143,868 |
| Shareholder servicing fees |
|
| Class A |
70 |
| Class C |
62 |
| Distribution fee |
|
| Class C |
32 |
| Custody and accounting fees |
139,203 |
| Professional fees |
87,730 |
| Registration fees |
32,102 |
| Shareholder report expenses |
61,646 |
| Trustees’ fees and expenses |
22,490 |
| Other fees and expenses |
18,073 |
| Total expenses |
2,271,415 |
| Less: Fee waivers and/or expense reimbursements |
|
| Fund-level |
(404,678
) |
| Class A |
(5 ) |
| Institutional Class |
(11,598
) |
| Net expenses |
1,855,134 |
| Net investment income |
2,699,228 |
| Realized and unrealized gains (losses) on investments |
|
| Net realized gains (losses) on |
|
| Unaffiliated securities |
(3,476,980
) |
| Affiliated securities |
34 |
| Foreign currency and foreign currency translations |
(7,851 ) |
| Net realized losses on investments |
(3,484,797
) |
| Net change in unrealized gains (losses) on |
|
| Unaffiliated securities |
10,635,973 |
| Affiliated securities |
(2 ) |
| Foreign currency and foreign currency translations |
(2,246 ) |
| Net change in unrealized gains (losses) on investments |
10,633,725 |
| Net realized and unrealized gains (losses) on investments |
7,148,928 |
| Net increase in net assets resulting from operations |
$9,848,156 |
| |
Year ended October 31, 2023 |
Year ended October 31, 2022 | ||
| Operations |
|
|
|
|
| Net investment income |
|
$2,699,228 |
|
$1,636,664 |
| Net realized losses on investments |
|
(3,484,797 ) |
|
(5,756,709 ) |
| Net change in unrealized gains (losses) on investments |
|
10,633,725 |
|
(25,403,841 ) |
| Net increase (decrease) in net assets resulting from operations |
|
9,848,156 |
|
(29,523,886 ) |
| Distributions to shareholders from |
|
|
|
|
| Net investment income and net realized gains |
|
|
|
|
| Class A |
|
(248 ) |
|
0
1 |
| Class C |
|
(182 ) |
|
0
1 |
| Class R6 |
|
(1,043,071 ) |
|
(801,820 ) |
| Institutional Class |
|
(1,230,408 ) |
|
(2,079 ) |
| Total distributions to shareholders |
|
(2,273,909
) |
|
(803,899 ) |
| Capital share transactions |
Shares |
|
Shares |
|
| Proceeds from shares sold |
|
|
|
|
| Class A |
608 |
6,900 |
2,267
1 |
25,000
1 |
| Class C |
0 |
0 |
2,267
1 |
25,000
1 |
| Class R6 |
847,812 |
9,367,003 |
3,544,181 |
38,873,752 |
| Institutional Class |
4,194,833 |
45,675,976 |
10,832,056 |
110,774,581 |
| |
|
55,049,879 |
|
149,698,333 |
| Reinvestment of distributions |
|
|
|
|
| Class A |
24 |
248 |
0
1 |
0
1 |
| Class C |
17 |
182 |
0
1 |
0
1 |
| Class R6 |
64,723 |
665,359 |
53,931 |
717,191 |
| Institutional Class |
119,457 |
1,230,408 |
156 |
2,079 |
| |
|
1,896,197 |
|
719,270 |
| Payment for shares redeemed |
|
|
|
|
| Class R6 |
(2,333,140 ) |
(25,411,660 ) |
(174,217 ) |
(1,670,741 ) |
| Institutional Class |
(2,826,020 ) |
(30,890,167 ) |
(918,980 ) |
(9,027,493 ) |
| |
|
(56,301,827 ) |
|
(10,698,234 ) |
| Net increase in net assets resulting from capital share transactions |
|
644,249 |
|
139,719,369 |
| Total increase in net assets |
|
8,218,496 |
|
109,391,584 |
| Net assets |
|
|
|
|
| Beginning of period |
|
165,933,649 |
|
56,542,065 |
| End of period |
|
$174,152,145 |
|
$165,933,649 |
| |
Year ended October 31 | |
| Class A |
2023 |
20221 |
| Net asset value, beginning of period |
$9.53 |
$11.03 |
| Net investment income |
0.13
2 |
0.03 |
| Net realized and unrealized gains (losses) on investments |
0.40 |
(1.53 ) |
| Total from investment operations |
0.53 |
(1.50 ) |
| Distributions to shareholders from |
|
|
| Net investment income |
(0.11 ) |
0.00 |
| Net asset value, end of period |
$9.95 |
$9.53 |
| Total
return3 |
5.52 % |
(13.60
)% |
| Ratios to average net assets (annualized) |
|
|
| Gross expenses |
1.60 % |
1.60 % |
| Net expenses |
1.37 % |
1.38 % |
| Net investment income |
1.18 % |
0.69 % |
| Supplemental data |
|
|
| Portfolio turnover rate |
37 % |
26 % |
| Net assets, end of period (000s omitted) |
$29
|
$22 |
| 1 |
For the period from June 1, 2022 (commencement of class operations) to October 31, 2022 |
| 2 |
Calculated based upon average shares outstanding |
| 3 |
Total return calculations do not include any sales charges. Returns for periods of less than one year are not annualized. |
| |
Year ended October 31 | |
| Class C |
2023 |
20221 |
| Net asset value, beginning of period |
$9.50 |
$11.03 |
| Net investment income |
0.09
2 |
0.00
3 |
| Net realized and unrealized gains (losses) on investments |
0.41 |
(1.53 ) |
| Total from investment operations |
0.50 |
(1.53 ) |
| Distributions to shareholders from |
|
|
| Net investment income |
(0.08 ) |
0.00 |
| Net asset value, end of period |
$9.92 |
$9.50 |
| Total
return4 |
5.24 % |
(13.87
)% |
| Ratios to average net assets (annualized) |
|
|
| Gross expenses |
1.73 % |
2.12 % |
| Net expenses |
1.68 % |
1.96 % |
| Net investment income |
0.83 % |
0.06 % |
| Supplemental data |
|
|
| Portfolio turnover rate |
37 % |
26 % |
| Net assets, end of period (000s omitted) |
$23
|
$22 |
| 1 |
For the period from June 1, 2022 (commencement of class operations) to October 31, 2022 |
| 2 |
Calculated based upon average shares outstanding |
| 3 |
Amount is less than $0.005. |
| 4 |
Total return calculations do not include any sales charges. Returns for periods of less than one year are not annualized. |
| |
Year ended October 31 | ||||
| Class R6 |
2023 |
2022 |
2021 |
2020 |
20191 |
| Net asset value, beginning of period |
$9.53 |
$13.91 |
$10.38 |
$10.58 |
$10.00 |
| Net investment income |
0.16
2 |
0.20
2 |
0.06 |
0.09 |
0.05 |
| Net realized and unrealized gains (losses) on investments |
0.41 |
(4.38 ) |
3.56 |
(0.03 ) |
0.53 |
| Total from investment operations |
0.57 |
(4.18 ) |
3.62 |
(0.06 ) |
0.58 |
| Distributions to shareholders from |
|
|
|
|
|
| Net investment income |
(0.14 ) |
(0.07 ) |
(0.05 ) |
(0.15 ) |
0.00 |
| Net realized gains |
0.00 |
(0.13 ) |
(0.04 ) |
(0.11 ) |
0.00 |
| Total distributions to shareholders |
(0.14 ) |
(0.20 ) |
(0.09 ) |
(0.26 ) |
0.00 |
| Net asset value, end of period |
$9.96 |
$9.53 |
$13.91 |
$10.38 |
$10.58 |
| Total
return3 |
5.96 % |
(30.47
)% |
35.04
% |
0.42
% |
5.80
% |
| Ratios to average net assets (annualized) |
|
|
|
|
|
| Gross expenses |
1.17 % |
1.18 % |
1.68 % |
5.69 % |
7.81 % |
| Net expenses |
0.95 % |
0.95 % |
0.95 % |
0.95 % |
0.95 % |
| Net investment income |
1.50 % |
1.85 % |
0.70 % |
0.93 % |
1.24 % |
| Supplemental data |
|
|
|
|
|
| Portfolio turnover rate |
37 % |
26 % |
19 % |
45 % |
14 % |
| Net assets, end of period (000s omitted) |
$60,318
|
$71,264 |
$56,386 |
$5,086 |
$5,183 |
| 1 |
For the period from May 31, 2019 (commencement of class operations) to October 31, 2019 |
| 2 |
Calculated based upon average shares outstanding |
| 3 |
Returns for periods of less than one year are not annualized. |
| |
Year ended October 31 | ||||
| Institutional Class |
2023 |
2022 |
2021 |
2020 |
20191 |
| Net asset value, beginning of period |
$9.53 |
$13.92 |
$10.38 |
$10.57 |
$10.00 |
| Net investment income |
0.16
2 |
0.19
2 |
0.13 |
0.08 |
0.05 |
| Net realized and unrealized gains (losses) on investments |
0.41 |
(4.39 ) |
3.49 |
(0.03 ) |
0.52 |
| Total from investment operations |
0.57 |
(4.20 ) |
3.62 |
0.05 |
0.57 |
| Distributions to shareholders from |
|
|
|
|
|
| Net investment income |
(0.13 ) |
(0.06 ) |
(0.04 ) |
(0.13 ) |
0.00 |
| Net realized gains |
0.00 |
(0.13 ) |
(0.04 ) |
(0.11 ) |
0.00 |
| Total distributions to shareholders |
(0.13 ) |
(0.19 ) |
(0.08 ) |
(0.24 ) |
0.00 |
| Net asset value, end of period |
$9.97 |
$9.53 |
$13.92 |
$10.38 |
$10.57 |
| Total
return3 |
5.89 % |
(30.60
)% |
35.00
% |
0.35
% |
5.70
% |
| Ratios to average net assets (annualized) |
|
|
|
|
|
| Gross expenses |
1.28 % |
1.26 % |
2.73 % |
5.76 % |
7.91 % |
| Net expenses |
1.05 % |
1.05 % |
1.05 % |
1.05 % |
1.05 % |
| Net investment income |
1.45 % |
1.86 % |
1.00 % |
0.83 % |
1.14 % |
| Supplemental data |
|
|
|
|
|
| Portfolio turnover rate |
37 % |
26 % |
19 % |
45 % |
14 % |
| Net assets, end of period (000s omitted) |
$113,783
|
$94,626 |
$156 |
$115 |
$106 |
| 1 |
For the period from May 31, 2019 (commencement of class operations) to October 31, 2019 |
| 2 |
Calculated based upon average shares outstanding |
| 3 |
Returns for periods of less than one year are not annualized. |
| Gross unrealized gains |
$6,473,475 |
| Gross unrealized losses |
(29,228,044 ) |
| Net unrealized losses |
$(22,754,569
) |
| |
Quoted prices
(Level 1) |
Other significant
observable inputs
(Level 2) |
Significant
unobservable inputs
(Level 3) |
Total |
| Assets |
|
|
|
|
| Investments in: |
|
|
|
|
| Common stocks |
|
|
|
|
| Australia |
$0
|
$9,126,573
|
$0 |
$9,126,573
|
| Austria |
0 |
1,186,368 |
0 |
1,186,368 |
| Belgium |
0 |
4,011,345 |
0 |
4,011,345 |
| Canada |
18,701,109 |
0 |
0 |
18,701,109 |
| France |
0 |
6,831,874 |
0 |
6,831,874 |
| Germany |
0 |
12,545,969 |
0 |
12,545,969 |
| Ireland |
0 |
1,111,345 |
0 |
1,111,345 |
| Italy |
0 |
10,777,858 |
0 |
10,777,858 |
| Japan |
0 |
46,286,857 |
0 |
46,286,857 |
| Luxembourg |
0 |
123,504 |
0 |
123,504 |
| Netherlands |
272,673 |
1,474,937 |
0 |
1,747,610 |
| Norway |
2,274,128 |
2,375,960 |
0 |
4,650,088 |
| Spain |
0 |
6,667,559 |
0 |
6,667,559 |
| Sweden |
0 |
5,391,855 |
0 |
5,391,855 |
| Switzerland |
1,316,774 |
5,300,066 |
0 |
6,616,840 |
| United Kingdom |
15,508,793 |
13,545,307 |
0 |
29,054,100 |
| Investment companies |
709,861 |
0 |
0 |
709,861 |
| Rights |
|
|
|
|
| Spain |
0 |
75,509 |
0 |
75,509 |
| Short-term investments |
|
|
|
|
| Investment companies |
7,255,327 |
0 |
0 |
7,255,327 |
| Total assets |
$46,038,665 |
$126,832,886 |
$0 |
$172,871,551 |
| Average daily net assets |
Management fee |
| First $500 million |
0.950 % |
| Next $500 million |
0.925 |
| Next $1 billion |
0.900 |
| Next $2 billion |
0.875 |
| Next $1 billion |
0.850 |
| Next $5 billion |
0.840 |
| Over $10 billion |
0.830 |
| |
Class-level
administration fee |
| Class A |
0.20 % |
| Class C |
0.20 |
| Class R6 |
0.03 |
| Institutional Class |
0.13 |
| |
EXPENSE RATIO CAPS |
| Class A |
1.37 % |
| Class C |
2.12 |
| Class R6 |
0.95 |
| Institutional Class |
1.05 |
| |
Year
ended October 31 | |
| |
2023 |
2022 |
| Ordinary income |
$2,273,909 |
$642,091 |
| Long-term capital gain |
0 |
161,808 |
| Undistributed
ordinary
income |
Unrealized
losses |
Capital loss
carryforward |
| $2,888,544 |
$(22,766,538 ) |
$(2,628,466 ) |

| Creditable
foreign taxes
paid |
Per share
amount |
Foreign
income as % of
ordinary income
distributions |
| $480,858 |
$0.0275 |
100 % |
| Name and
year of birth |
Position held and
length of service* |
Principal occupations during past five years or
longer |
Current other
public company
or
investment
company
directorships |
| William R.
Ebsworth
(Born 1957) |
Trustee,
since 2015 |
Retired. From 1984 to 2013, equities analyst, portfolio manager, research
director and chief investment officer at Fidelity
Management and Research Company in Boston, Tokyo, and Hong
Kong, and retired in 2013 as Chief Investment Officer of Fidelity
Strategic Advisers, Inc. where he led a team of investment
professionals managing client assets. Prior thereto, Board member of Hong Kong Securities Clearing Co., Hong Kong Options Clearing Corp., the Thailand International
Fund, Ltd., Fidelity Investments Life Insurance Company, and Empire
Fidelity Investments Life Insurance Company. Audit
Committee Chair and Investment Committee Chair of the Vincent
Memorial Hospital Foundation (non-profit organization). Mr. Ebsworth is a CFA
charterholder. |
N/A |
| Jane A.
Freeman
(Born 1953) |
Trustee,
since 2015;
Chair Liaison,
since 2018 |
Retired. From 2012 to 2014 and 1999 to 2008, Chief Financial Officer of
Scientific Learning Corporation. From 2008 to 2012, Ms.
Freeman provided consulting services related to strategic
business projects. Prior to 1999, Portfolio Manager at Rockefeller &
Co. and Scudder, Stevens & Clark. Board member of the
Harding Loevner Funds from 1996 to 2014, serving as both Lead
Independent Director and chair of the Audit Committee. Board member of
the Russell Exchange Traded Funds Trust from 2011 to 2012
and the chair of the Audit Committee. Ms. Freeman is also an
inactive Chartered Financial Analyst. |
N/A |
| Isaiah
Harris, Jr.
(Born 1952) |
Trustee,
since 2009;
Audit Committee
Chair,
since 2019 |
Retired. Member of the Advisory Board of CEF of East Central Florida.
Chairman of the Board of CIGNA Corporation from 2009 to
2021, and Director from 2005 to 2008. From 2003 to 2011,
Director of Deluxe Corporation. Prior thereto, President and CEO of
BellSouth Advertising and Publishing Corp. from 2005 to
2007, President and CEO of BellSouth Enterprises from 2004 to
2005 and President of BellSouth Consumer Services from 2000 to 2003.
Emeritus member of the Iowa State University Foundation
Board of Governors. Emeritus Member of the Advisory board of
Iowa State University School of Business. Advisory Board Member, Palm
Harbor Academy (private school). Advisory Board Member,
Fellowship of Christian Athletes. Mr. Harris is a certified public
accountant (inactive status). |
N/A |
| David F.
Larcker
(Born 1950) |
Trustee,
since 2009 |
Distinguished Visiting Fellow at the Hoover Institution since 2022. James
Irvin Miller Professor of Accounting at the Graduate School
of Business (Emeritus), Stanford University, Director of the
Corporate Governance Research Initiative and Senior Faculty of The Rock
Center for Corporate Governance since 2006. From 2005 to
2008, Professor of Accounting at the Graduate School of
Business, Stanford University. Prior thereto, Ernst & Young Professor
of Accounting at The Wharton School, University of Pennsylvania
from 1985 to 2005. |
N/A |
| Olivia S.
Mitchell
(Born 1953) |
Trustee,
since 2006;
Nominating and
Governance
Committee Chair,
since 2018 |
International Foundation of Employee Benefit Plans Professor since 1993,
Wharton School of the University of Pennsylvania. Director
of Wharton’s Pension Research Council and Boettner Center on Pensions & Retirement Research, and Research Associate at the National Bureau of Economic
Research. Previously taught at Cornell University from 1978 to 1993.
|
N/A |
| Timothy J.
Penny
(Born 1951) |
Trustee,
since 1996;
Chair,
since 2018 |
President and Chief Executive Officer of Southern Minnesota Initiative
Foundation, a non-profit organization, since 2007. Vice
Chair of the Economic Club of Minnesota, since 2007. Co-Chair of the Committee for a Responsible Federal Budget, since 1995. Member of the Board of Trustees of
NorthStar Education Finance, Inc., a non-profit organization, from
2007-2022. Senior Fellow of the University of Minnesota Humphrey
Institute from 1995 to 2017. |
N/A |
| Name and
year of birth |
Position held and
length of service* |
Principal occupations during past five years or
longer |
Current other
public company
or
investment
company
directorships |
| James G.
Polisson
(Born 1959) |
Trustee,
since 2018 |
Retired. Chief Marketing Officer, Source (ETF) UK Services, Ltd, from
2015 to 2017. From 2012 to 2015, Principal of The Polisson
Group, LLC, a management consulting, corporate advisory and
principal investing company. Chief Executive Officer and Managing
Director at Russell Investments, Global Exchange Traded
Funds from 2010 to 2012. Managing Director of Barclays
Global Investors from 1998 to 2010 and Global Chief Marketing Officer for
iShares and Barclays Global Investors from 2000 to 2010.
Trustee of the San Francisco Mechanics’ Institute, a non- profit organization, from 2013 to 2015. Board member of the Russell Exchange Traded Fund Trust
from 2011 to 2012. Director of Barclays Global Investors Holdings
Deutschland GmbH from 2006 to 2009. Mr. Polisson is an
attorney and has a retired status with the Massachusetts and District of Columbia Bar Associations. |
N/A |
| Pamela Wheelock (Born 1959) |
Trustee, since January 2020; previously Trustee from January 2018 to July 2019 |
Retired. Executive and Senior Financial leadership positions in the public, private and nonprofit
sectors. Interim President and CEO, McKnight Foundation, 2020. Interim
Commissioner, Minnesota Department of Human Services, 2019.
Chief Operating Officer, Twin Cities Habitat for Humanity,
2017-2019. Vice President for University Services, University of Minnesota, 2012- 2016. Interim President and CEO, Blue Cross and Blue Shield of Minnesota, 2011-2012. Executive
Vice-President and Chief Financial Officer, Minnesota Wild, 2002-2008.
Commissioner, Minnesota Department of Finance, 1999-2002.
Chair of the Board of Directors of Destination Medical Center
Corporation. Board member of the Minnesota Wild Foundation. |
N/A |
| * |
Length of service dates reflect the Trustee’s commencement of service with the Trust’s predecessor entities, where applicable. |
| Name and
year of birth |
Position held and
length of
service |
Principal occupations during past five years or
longer |
| Andrew Owen
(Born 1960) |
President,
since 2017 |
President and Chief Executive Officer of Allspring Funds Management, LLC
since 2017 and Head of Global Fund Governance of Allspring
Global Investments since 2022. Prior thereto, co-president of Galliard Capital Management, LLC, an affiliate of Allspring Funds Management, LLC, from 2019 to 2022 and Head of Affiliated
Managers, Allspring Global Investments, from 2014 to 2019 and Executive
Vice President responsible for marketing, investments and product
development for Allspring Funds Management, LLC, from 2009 to 2014. |
| Jeremy DePalma
(Born 1974) |
Treasurer,
since 2012
(for certain funds in
the Fund Complex);
since 2021 (for
the remaining funds
in the Complex) |
Senior Vice President of Allspring Funds Management, LLC since 2009.
Senior Vice President of Evergreen Investment Management
Company, LLC from 2008 to 2010 and head of the Fund Reporting and Control Team within Fund Administration from 2005 to 2010.
|
| Christopher Baker
(Born 1976) |
Chief Compliance
Officer,
since 2022 |
Global Chief Compliance Officer for Allspring Global Investments since
2022. Prior thereto, Chief Compliance Officer for State
Street Global Advisors from 2018 to 2021. Senior Compliance Officer for the State Street divisions of Alternative Investment Solutions, Sector Solutions, and Global Marketing from 2015 to 2018. From 2010 to 2015
Vice President, Global Head of Investment and Marketing Compliance for State
Street Global Advisors. |
| Matthew Prasse (Born 1983) |
Chief Legal Officer, since 2022; Secretary, since 2021 |
Senior Counsel of the Allspring Legal Department since 2021. Senior Counsel of the Wells Fargo Legal Department
from 2018 to 2021. Previously, Counsel for Barings LLC from 2015 to 2018.
Prior to joining Barings, Associate at Morgan, Lewis & Bockius
LLP from 2008 to 2015. |


| 2 | |
| 6 | |
| 10 | |
| 11 | |
| 25 | |
| 26 | |
| 28 | |
| 29 | |
| 30 | |
| 34 | |
| 39 | |
| 40 |


| Notice to Shareholders |
| Beginning in July 2024, the Fund will be required by the
Securities and Exchange Commission to send shareholders a paper copy of a
new tailored shareholder report in place of the full shareholder report that you are now receiving. The tailored shareholder report will contain concise information about the Fund, including certain expense and performance
information and fund statistics. If you wish to receive this new tailored shareholder
report electronically, please follow the instructions on the back cover
of this report. |
| Other information that is currently included in the shareholder
report, such as the Fund’s financial statements, will be available
online and upon request, free of charge, in paper or electronic format. |
| Investment objective |
The Fund seeks long-term capital appreciation. |
| Adviser |
Allspring Funds Management, LLC |
| Subadviser |
Allspring Global Investments, LLC |
| Portfolio managers |
Ryan Brown, CFA, Harindra de Silva, Ph.D., CFA |
| Average annual total returns (%) as of October 31, 2023 | |||||||||
| |
|
Including sales charge |
Excluding sales charge |
Expense ratios1 (%) | |||||
| |
Inception date |
1 year |
5 year |
Since inception |
1 year |
5 year |
Since inception |
Gross |
Net2 |
| Class A (ADMQX)3 |
3-31-2016 |
-7.58 |
2.93 |
3.65 |
-2.00 |
4.16 |
4.46 |
3.93 |
1.99 |
| Class C (ADSCX)4 |
12-16-2022 |
-3.40 |
4.04 |
4.38 |
-2.56 |
4.04 |
4.38 |
4.68 |
2.74 |
| Class R6 (ASLRX)5 |
12-16-2022 |
– |
– |
4.69 |
-1.68 |
4.41 |
4.69 |
3.51 |
1.57 |
| Institutional Class
(ADMZX)6 |
3-31-2016 |
– |
– |
4.69 |
-1.68 |
4.41 |
4.69 |
3.61 |
1.67 |
| MSCI USA Index (Net) (USD)7
|
– |
– |
– |
– |
9.55 |
10.39 |
11.22
* |
– |
– |
| ICE BofA 3-Month
U.S. Treasury Bill Index8 |
– |
– |
– |
– |
4.80 |
1.78 |
1.51
* |
– |
– |
| U.S. Long/Short Equity Blended Index9 |
– |
– |
– |
– |
7.42 |
6.48 |
6.60
* |
– |
– |
| | |
| * |
Based on the inception date of the oldest Fund class. |
| 1 |
Reflects the expense ratios as stated in the most recent prospectuses. The expense ratios shown are subject to change and may differ from the annualized expense ratios
shown in the Financial Highlights of this report. |
| 2 |
The manager has contractually committed through February 28, 2025, to waive fees and/or reimburse expenses to the extent necessary to cap total annual fund operating
expenses after fee waivers at 1.57% for Class A, 2.32% for Class C, 1.15%
for Class R6 and 1.25% for Institutional Class. Brokerage commissions, stamp duty fees, interest, taxes, acquired fund fees and expenses (if any), expenses from dividends and interest on short positions, and extraordinary expenses are excluded from the expense caps.
Prior to or after the commitment expiration date, the caps may be
increased or the commitment to maintain the caps may be terminated only with the approval of the Board of Trustees. Without these caps, the Fund’s returns would have been lower. The expense ratio paid by an investor is the net expense ratio (the total annual
fund operating expenses after fee waivers) as stated in the
prospectuses. |
| 3 |
Historical performance shown for the Class A shares prior to December 16, 2022 is based on the performance of the Investor Class shares of the Fund’s
predecessor, 361 Domestic Long/Short Equity Fund. |
| 4 |
Historical performance for the Class C shares prior to their inception reflects the performance of the Class A shares and is not adjusted to reflect the higher expenses
applicable to the Class C shares. If these expenses had been included, returns
would be lower. |
| 5 |
Historical performance shown for the Class R6 shares prior to their inception reflects the performance of the Institutional Class shares, and includes the higher
expenses applicable to the Institutional Class shares. If these expenses
had not been included, returns for the Class R6 shares would be higher. Historical performance prior to December 16, 2022 is based on the performance of Class I shares of the Fund’s predecessor, 361 Domestic Long/Short Equity Fund.
|
| 6 |
Historical performance shown for the Institutional Class shares prior to December 16, 2022 is based on the performance of Class I shares of the Fund’s
predecessor, 361 Domestic Long/Short Equity Fund. |
| 7 |
The Morgan Stanley Capital International (MSCI) USA Index (Net) (USD) is a free-float-adjusted market-capitalization-weighted index that is designed to measure large-
and mid-cap U.S. equity market performance. Source: MSCI. MSCI makes no express or implied warranties
or representations and shall have no liability whatsoever with respect to
any MSCI data contained herein. The MSCI data may not be further redistributed or used as a basis for other indices or any securities or financial products. This report is not approved, reviewed, or produced by MSCI. You cannot invest directly in an index. |
| CFA® and Chartered Financial Analyst® are trademarks owned by CFA Institute. |
| Growth of $10,000 investment as of October 31, 20231 |
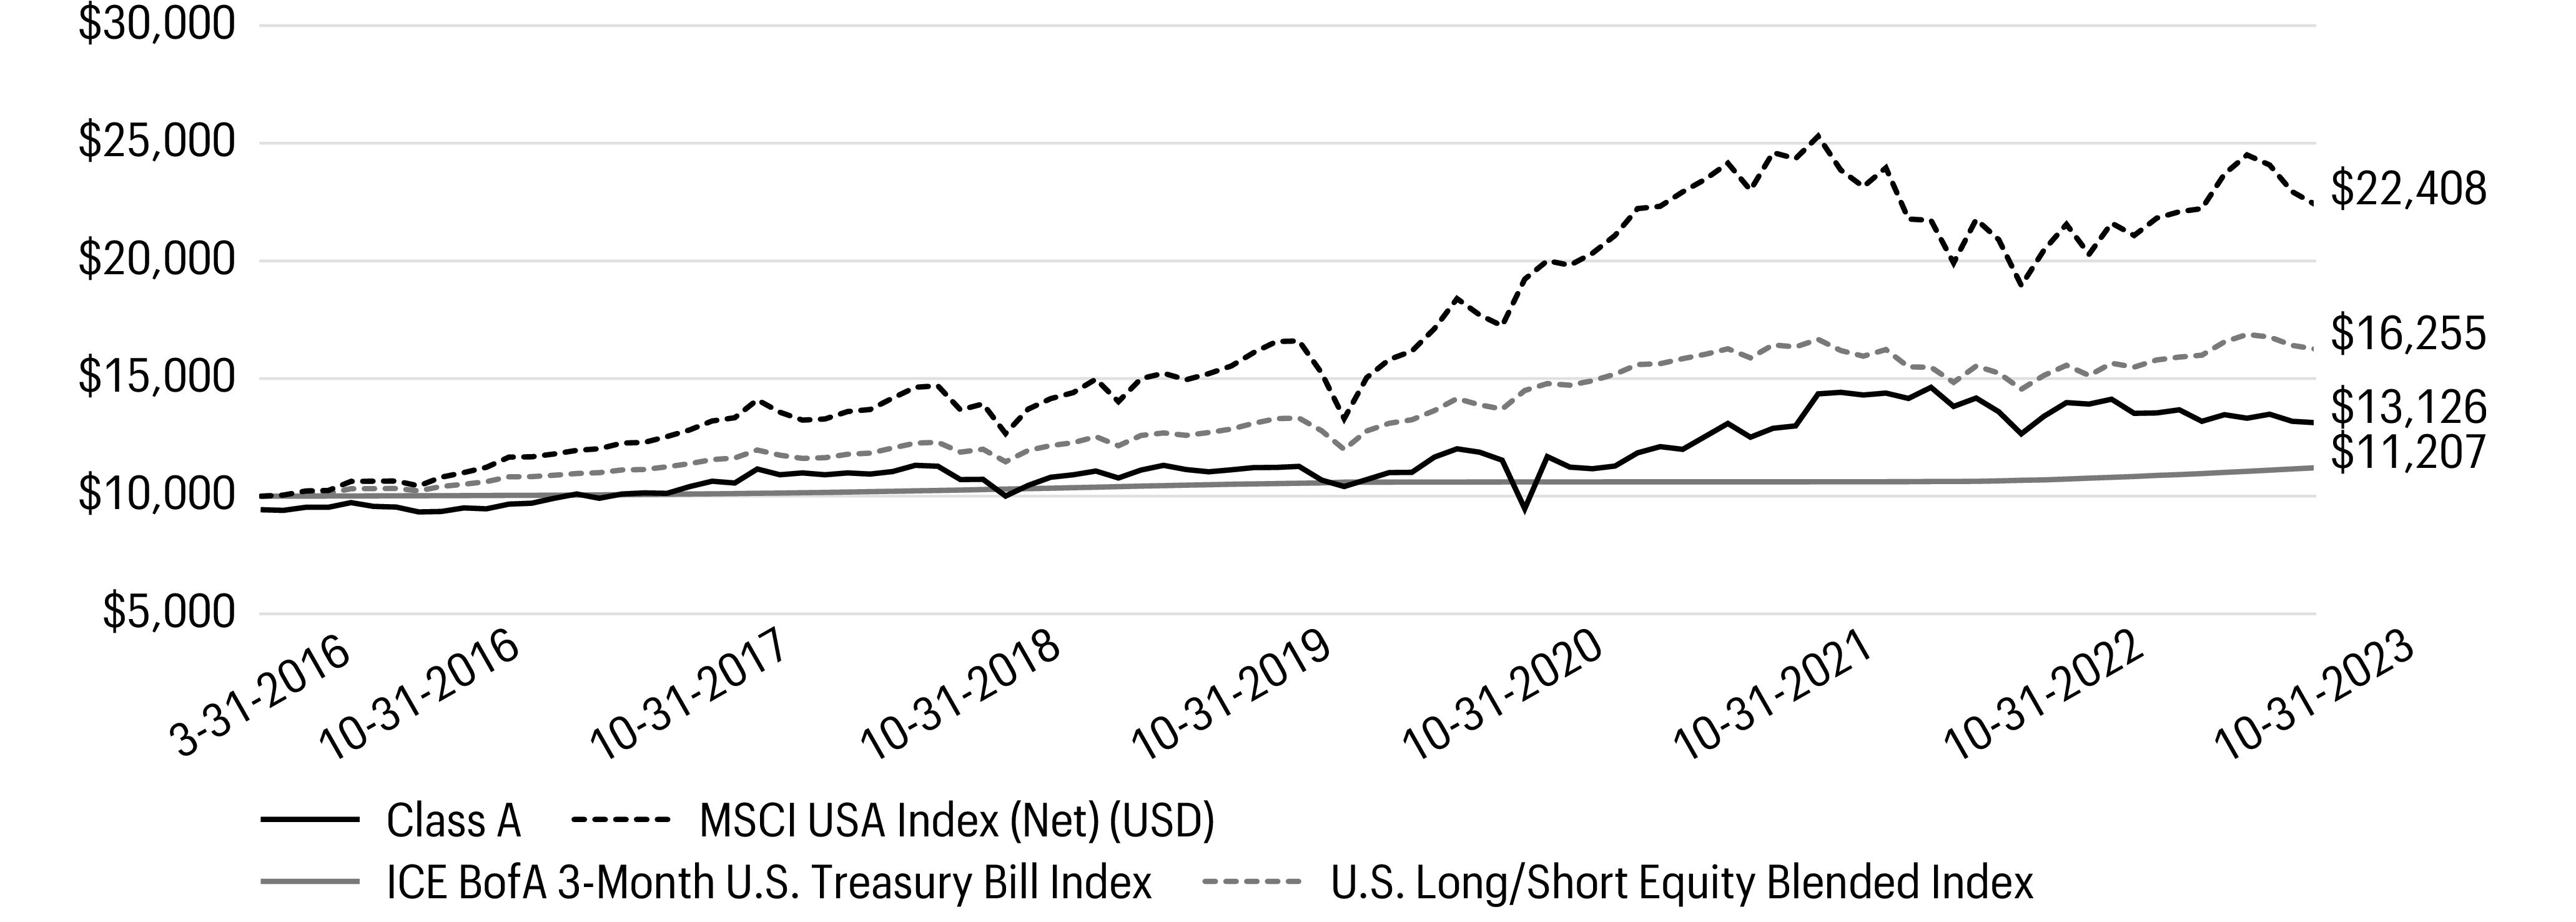
| 1 |
The chart compares the performance of Class A shares since inception with the MSCI USA Index (Net) (USD), ICE BofA 3-Month U.S. Treasury Bill Index and U.S.
Long/Short Equity Blended Index. The chart assumes a hypothetical
investment of $10,000 in Class A shares and reflects all operating expenses and assumes the maximum initial sales charge of 5.75%. |
| Footnotes continued from previous page | |
| 8 |
The ICE BofA 3-Month U.S. Treasury Bill Index is an unmanaged index that is comprised of a single U.S. Treasury issue with approximately three months to final maturity,
purchased at the beginning of each month and held for one full month. You cannot
invest directly in an index. Copyright 2023. ICE Data Indices, LLC. All rights reserved. |
| 9 |
Source: Allspring Funds Management, LLC. The U.S. Long/Short Equity Blended Index is composed of 50% of the MSCI USA Index (Net) (USD) and 50% of the ICE BofA
3-Month U.S. Treasury Bill Index. You cannot invest directly in an
index. |
| Ten largest Long Positions (%) as of October 31, 20231 | |
| Procter & Gamble Co. |
3.54 |
| Microsoft Corp. |
2.79 |
| Gilead Sciences, Inc. |
2.62 |
| Apple, Inc. |
2.43 |
| Cognizant Technology Solutions Corp. Class A |
1.97 |
| QUALCOMM, Inc. |
1.89 |
| Costco Wholesale Corp. |
1.77 |
| Juniper Networks, Inc. |
1.59 |
| Otis Worldwide Corp. |
1.47 |
| EMCOR Group, Inc. |
1.46 |
| 1 |
Figures represent the percentage of the Fund’s net assets. Holdings are subject to change and may have changed since the date specified. |
| Five largest short positions (%) as of October 31, 20231 | |
| RBC Bearings, Inc. |
(1.17 ) |
| Texas Pacific Land Corp. |
(1.13 ) |
| Realty Income Corp. |
(1.11 ) |
| Planet Fitness, Inc. Class A |
(0.96 ) |
| Clarivate PLC |
(0.93 ) |
| 1 |
Figures represent the percentage of the Fund’s net assets. Holdings are subject to change and may have changed since the date specified. |
| Sector Allocation for Long and Short positions as of October 31, 20231 | ||
| |
Long (%) |
Short (%) |
| Information technology |
30 |
(2 ) |
| Consumer staples |
14 |
0 |
| Health care |
14 |
(20 ) |
| Industrials |
14 |
(20 ) |
| Financials |
9 |
(6 ) |
| Consumer discretionary |
6 |
(15 ) |
| Energy |
5 |
(12 ) |
| Communication services |
3 |
(6 ) |
| Materials |
2 |
(9 ) |
| Utilities |
2 |
(3 ) |
| Real estate |
1 |
(7 ) |
| 1 |
Figures represent the percentage of the Fund’s long and short positions. Allocations are subject to change and may have changed since the date specified. |
| |
Beginning account value 5-1-2023 |
Ending account value 10-31-2023 |
Expenses paid during the period1
|
Annualized net expense ratio |
| Class A |
|
|
|
|
| Actual |
$1,000.00 |
$960.16 |
$8.65 |
1.75 % |
| Hypothetical (5% return before expenses) |
$1,000.00 |
$1,016.38 |
$8.89 |
1.75 % |
| Class C |
|
|
|
|
| Actual |
$1,000.00 |
$957.30 |
$13.42 |
2.72 % |
| Hypothetical (5% return before expenses) |
$1,000.00 |
$1,011.49 |
$13.79 |
2.72 % |
| Class R6 |
|
|
|
|
| Actual |
$1,000.00 |
$961.28 |
$8.65 |
1.75 % |
| Hypothetical (5% return before expenses) |
$1,000.00 |
$1,016.38 |
$8.89 |
1.75 % |
| Institutional Class |
|
|
|
|
| Actual |
$1,000.00 |
$961.28 |
$9.64 |
1.95 % |
| Hypothetical (5% return before expenses) |
$1,000.00
|
$1,015.38
|
$9.91
|
1.95 % |
| 1 |
Expenses paid is equal to the annualized net expense ratio of each class multiplied by the average account value over the period, multiplied by 184 divided by 365 (to
reflect the one-half-year period). |
| |
|
|
|
Shares |
Value | |
| Long positions: 103.90% Common stocks: 97.10% |
|
|
|
|
|
|
| Communication services: 2.58% |
|
|
|
|
|
|
| Entertainment: 1.67% |
|
|
|
|
|
|
| Electronic Arts, Inc.# |
|
|
|
|
1,020 |
$126,266 |
| Playtika Holding Corp.†# |
|
|
|
|
6,838 |
57,439 |
| Spotify Technology SA†# |
|
|
|
|
1,064 |
175,304 |
| |
|
|
|
|
|
359,009 |
| Interactive media & services: 0.91% |
|
|
|
|
|
|
| Alphabet, Inc. Class A†# |
|
|
|
|
745 |
92,440 |
| Alphabet, Inc. Class C†# |
|
|
|
|
419 |
52,501 |
| Meta Platforms, Inc. Class A†# |
|
|
|
|
123 |
37,056 |
| Shutterstock, Inc.# |
|
|
|
|
312 |
12,692 |
| |
|
|
|
|
|
194,689 |
| Consumer discretionary: 5.99% |
|
|
|
|
|
|
| Automobiles: 1.08% |
|
|
|
|
|
|
| Harley-Davidson, Inc.# |
|
|
|
|
1,785 |
47,927 |
| Tesla, Inc.†# |
|
|
|
|
382 |
76,721 |
| Thor Industries, Inc.# |
|
|
|
|
1,226 |
107,802 |
| |
|
|
|
|
|
232,450 |
| Broadline retail: 0.46% |
|
|
|
|
|
|
| Amazon.com, Inc.†# |
|
|
|
|
734 |
97,688 |
| Diversified consumer services: 0.35% |
|
|
|
|
|
|
| Grand Canyon Education, Inc.†# |
|
|
|
|
98 |
11,597 |
| H&R Block, Inc.# |
|
|
|
|
1,219 |
50,040 |
| Lincoln Educational Services Corp.†# |
|
|
|
|
1,604 |
13,714 |
| |
|
|
|
|
|
75,351 |
| Hotels, restaurants & leisure: 1.29% |
|
|
|
|
|
|
| Aramark# |
|
|
|
|
2,882 |
77,612 |
| Chipotle Mexican Grill, Inc.†# |
|
|
|
|
15 |
29,133 |
| Domino’s Pizza, Inc.# |
|
|
|
|
31 |
10,509 |
| Marriott International, Inc. Class A# |
|
|
|
|
56 |
10,559 |
| Marriott Vacations Worldwide Corp.# |
|
|
|
|
102 |
9,166 |
| Starbucks Corp.# |
|
|
|
|
947 |
87,351 |
| Texas Roadhouse, Inc. Class A# |
|
|
|
|
108 |
10,966 |
| Travel & Leisure Co.# |
|
|
|
|
850 |
28,926 |
| Yum! Brands, Inc.# |
|
|
|
|
104 |
12,570 |
| |
|
|
|
|
|
276,792 |
| Household durables: 0.30% |
|
|
|
|
|
|
| Beazer Homes USA, Inc.†# |
|
|
|
|
672 |
16,255 |
| D.R. Horton, Inc.# |
|
|
|
|
462 |
48,233 |
| |
|
|
|
|
|
64,488 |
| |
|
|
|
Shares |
Value | |
| Leisure products: 0.09% |
|
|
|
|
|
|
| JAKKS Pacific, Inc.†# |
|
|
|
|
608 |
$10,196 |
| Polaris, Inc.# |
|
|
|
|
110 |
9,506
|
| |
|
|
|
|
|
19,702 |
| Specialty retail: 2.42% |
|
|
|
|
|
|
| Bath & Body Works, Inc.# |
|
|
|
|
295 |
8,747 |
| Best Buy Co., Inc.# |
|
|
|
|
476 |
31,806 |
| Dick’s Sporting Goods, Inc.# |
|
|
|
|
99 |
10,588 |
| Lowe’s Cos., Inc.# |
|
|
|
|
314 |
59,839 |
| Murphy USA, Inc.# |
|
|
|
|
387 |
140,361 |
| TJX Cos., Inc.# |
|
|
|
|
2,262 |
199,215 |
| Ulta Beauty, Inc.†# |
|
|
|
|
178 |
67,873 |
| |
|
|
|
|
|
518,429 |
| Consumer staples: 14.10% |
|
|
|
|
|
|
| Beverages: 1.27% |
|
|
|
|
|
|
| Boston Beer Co., Inc. Class A†# |
|
|
|
|
263 |
87,829 |
| Coca-Cola Co.# |
|
|
|
|
1,120 |
63,269 |
| Molson Coors Beverage Co. Class B# |
|
|
|
|
1,939 |
112,016 |
| PepsiCo, Inc.# |
|
|
|
|
59 |
9,633
|
| |
|
|
|
|
|
272,747 |
| Consumer staples distribution & retail: 3.54% |
|
|
|
|
|
|
| Casey’s General Stores, Inc.# |
|
|
|
|
202 |
54,926 |
| Costco Wholesale Corp.# |
|
|
|
|
687 |
379,526 |
| Kroger Co.# |
|
|
|
|
245 |
11,116 |
| Target Corp.# |
|
|
|
|
1,167 |
129,292 |
| Walmart, Inc.# |
|
|
|
|
1,137 |
185,797 |
| |
|
|
|
|
|
760,657 |
| Food products: 2.09% |
|
|
|
|
|
|
| Archer-Daniels-Midland Co.# |
|
|
|
|
2,682 |
191,951 |
| Bunge Ltd.# |
|
|
|
|
111 |
11,764 |
| Campbell Soup Co.# |
|
|
|
|
437 |
17,659 |
| Dole PLC# |
|
|
|
|
836 |
9,547 |
| Flowers Foods, Inc.# |
|
|
|
|
2,674 |
58,641 |
| Ingredion, Inc.# |
|
|
|
|
622 |
58,207 |
| Kellanova# |
|
|
|
|
579 |
29,222 |
| Pilgrim’s Pride Corp.†# |
|
|
|
|
1,742 |
44,421 |
| Tyson Foods, Inc. Class A# |
|
|
|
|
579 |
26,836 |
| |
|
|
|
|
|
448,248 |
| Household products: 5.90% |
|
|
|
|
|
|
| Church & Dwight Co., Inc.# |
|
|
|
|
600 |
54,564 |
| Clorox Co.# |
|
|
|
|
1,736 |
204,327 |
| Colgate-Palmolive Co.# |
|
|
|
|
1,301 |
97,731 |
| Kimberly-Clark Corp.# |
|
|
|
|
1,250 |
149,550 |
| Procter & Gamble Co.# |
|
|
|
|
5,062 |
759,453 |
| |
|
|
|
|
|
1,265,625 |
| |
|
|
|
Shares |
Value | |
| Personal care products: 0.29% |
|
|
|
|
|
|
| Herbalife Ltd.†# |
|
|
|
|
4,332 |
$61,731 |
| Tobacco: 1.01% |
|
|
|
|
|
|
| Altria Group, Inc.# |
|
|
|
|
5,043 |
202,578 |
| Philip Morris International, Inc.# |
|
|
|
|
38 |
3,388 |
| Vector Group Ltd.# |
|
|
|
|
1,007 |
10,352
|
| |
|
|
|
|
|
216,318 |
| Energy: 4.72% |
|
|
|
|
|
|
| Oil, gas & consumable fuels: 4.72% |
|
|
|
|
|
|
| Ardmore Shipping Corp.# |
|
|
|
|
9,518 |
126,494 |
| Chevron Corp.# |
|
|
|
|
1,131 |
164,821 |
| CONSOL Energy, Inc.# |
|
|
|
|
420 |
38,594 |
| Exxon Mobil Corp.# |
|
|
|
|
1,112 |
117,705 |
| International Seaways, Inc.# |
|
|
|
|
261 |
12,551 |
| Kinder Morgan, Inc.# |
|
|
|
|
748 |
12,118 |
| Marathon Petroleum Corp.# |
|
|
|
|
102 |
15,428 |
| PBF Energy, Inc. Class A# |
|
|
|
|
1,061 |
50,429 |
| Phillips 66# |
|
|
|
|
115 |
13,118 |
| Targa Resources Corp.# |
|
|
|
|
1,097 |
91,720 |
| Teekay Corp.†# |
|
|
|
|
9,432 |
66,307 |
| Teekay Tankers Ltd. Class A# |
|
|
|
|
1,627 |
80,862 |
| Valero Energy Corp.# |
|
|
|
|
1,748 |
221,996
|
| |
|
|
|
|
|
1,012,143 |
| Financials: 8.54% |
|
|
|
|
|
|
| Banks: 0.50% |
|
|
|
|
|
|
| Bank of NT Butterfield & Son Ltd.# |
|
|
|
|
2,263 |
57,163 |
| Financial Institutions, Inc.# |
|
|
|
|
569 |
9,013 |
| Veritex Holdings, Inc.# |
|
|
|
|
2,416 |
41,604
|
| |
|
|
|
|
|
107,780 |
| Capital markets: 1.37% |
|
|
|
|
|
|
| Affiliated Managers Group, Inc.# |
|
|
|
|
451 |
55,365 |
| Cboe Global Markets, Inc.# |
|
|
|
|
825 |
135,209 |
| Evercore, Inc. Class A# |
|
|
|
|
111 |
14,450 |
| Goldman Sachs Group, Inc.# |
|
|
|
|
32 |
9,716 |
| MSCI, Inc. Class A# |
|
|
|
|
23 |
10,846 |
| SEI Investments Co.# |
|
|
|
|
640 |
34,342 |
| Virtu Financial, Inc. Class A# |
|
|
|
|
1,852 |
34,243
|
| |
|
|
|
|
|
294,171 |
| Consumer finance: 0.73% |
|
|
|
|
|
|
| OneMain Holdings, Inc.# |
|
|
|
|
274 |
9,845 |
| PROG Holdings, Inc.†# |
|
|
|
|
508 |
13,914 |
| SLM Corp.# |
|
|
|
|
10,269 |
133,497
|
| |
|
|
|
|
|
157,256 |
| |
|
|
|
Shares |
Value | |
| Financial services: 1.57% |
|
|
|
|
|
|
| Equitable Holdings, Inc.# |
|
|
|
|
1,707 |
$45,355 |
| FleetCor Technologies, Inc.†# |
|
|
|
|
44 |
9,908 |
| NCR Atleos Corp.†# |
|
|
|
|
636 |
14,030 |
| Rocket Cos., Inc. Class A†# |
|
|
|
|
4,464 |
32,989 |
| Western Union Co.# |
|
|
|
|
20,718 |
233,906 |
| |
|
|
|
|
|
336,188 |
| Insurance: 4.28% |
|
|
|
|
|
|
| American Financial Group, Inc.# |
|
|
|
|
173 |
18,919 |
| Aon PLC Class A# |
|
|
|
|
92 |
28,465 |
| Axis Capital Holdings Ltd.# |
|
|
|
|
3,406 |
194,483 |
| First American Financial Corp.# |
|
|
|
|
219 |
11,265 |
| Kinsale Capital Group, Inc.# |
|
|
|
|
30 |
10,017 |
| Loews Corp.# |
|
|
|
|
4,539 |
290,541 |
| Marsh & McLennan Cos., Inc.# |
|
|
|
|
57 |
10,810 |
| Travelers Cos., Inc.# |
|
|
|
|
1,233 |
206,454 |
| W R Berkley Corp.# |
|
|
|
|
2,182 |
147,111 |
| |
|
|
|
|
|
918,065 |
| Mortgage real estate investment trusts (REITs): 0.09% |
|
|
|
|
|
|
| AFC Gamma, Inc.# |
|
|
|
|
816 |
8,633 |
| Chicago Atlantic Real Estate Finance, Inc.# |
|
|
|
|
737 |
10,384 |
| |
|
|
|
|
|
19,017 |
| Health care: 13.42% |
|
|
|
|
|
|
| Biotechnology: 6.58% |
|
|
|
|
|
|
| AbbVie, Inc.# |
|
|
|
|
541 |
76,378 |
| Acadia Pharmaceuticals, Inc.†# |
|
|
|
|
923 |
20,832 |
| ADMA Biologics, Inc.†# |
|
|
|
|
9,510 |
32,144 |
| Alkermes PLC†# |
|
|
|
|
376 |
9,095 |
| Anika Therapeutics, Inc.†# |
|
|
|
|
664 |
12,948 |
| Arcturus Therapeutics Holdings, Inc.†# |
|
|
|
|
735 |
14,039 |
| Ardelyx, Inc.†# |
|
|
|
|
2,287 |
9,034 |
| Catalyst Pharmaceuticals, Inc.†# |
|
|
|
|
4,950 |
61,429 |
| Eagle Pharmaceuticals, Inc.†# |
|
|
|
|
3,000 |
41,190 |
| Exelixis, Inc.†# |
|
|
|
|
2,137 |
44,001 |
| Gilead Sciences, Inc.# |
|
|
|
|
7,158 |
562,189 |
| Halozyme Therapeutics, Inc.†# |
|
|
|
|
414 |
14,022 |
| Incyte Corp.†# |
|
|
|
|
4,342 |
234,164 |
| MacroGenics, Inc.†# |
|
|
|
|
2,107 |
10,999 |
| MiMedx Group, Inc.†# |
|
|
|
|
7,712 |
50,591 |
| Neurocrine Biosciences, Inc.†# |
|
|
|
|
1,377 |
152,764 |
| United Therapeutics Corp.†# |
|
|
|
|
135 |
30,086 |
| Voyager Therapeutics, Inc.†# |
|
|
|
|
3,866 |
25,400 |
| Zymeworks, Inc.†# |
|
|
|
|
1,467 |
10,298 |
| |
|
|
|
|
|
1,411,603 |
| Health care equipment & supplies: 1.17% |
|
|
|
|
|
|
| Embecta Corp.# |
|
|
|
|
1,991 |
30,104 |
| |
|
|
|
Shares |
Value | |
| Health care equipment &
supplies(continued) |
|
|
|
|
|
|
| Hologic, Inc.†# |
|
|
|
|
186 |
$12,307 |
| Integra LifeSciences Holdings Corp.†# |
|
|
|
|
4,545 |
163,438 |
| Semler Scientific, Inc.†# |
|
|
|
|
1,040 |
30,337 |
| Zynex, Inc.†# |
|
|
|
|
1,644 |
14,599 |
| |
|
|
|
|
|
250,785 |
| Health care providers & services: 0.62% |
|
|
|
|
|
|
| Cigna Group# |
|
|
|
|
149 |
46,071 |
| Elevance Health, Inc.# |
|
|
|
|
80 |
36,007 |
| Humana, Inc.# |
|
|
|
|
95 |
49,751 |
| |
|
|
|
|
|
131,829 |
| Life sciences tools & services: 2.24% |
|
|
|
|
|
|
| Agilent Technologies, Inc.# |
|
|
|
|
1,364 |
140,997 |
| Avantor, Inc.†# |
|
|
|
|
6,096 |
106,253 |
| Bruker Corp.# |
|
|
|
|
675 |
38,475 |
| Medpace Holdings, Inc.†# |
|
|
|
|
300 |
72,801 |
| West Pharmaceutical Services, Inc.# |
|
|
|
|
385 |
122,542 |
| |
|
|
|
|
|
481,068 |
| Pharmaceuticals: 2.81% |
|
|
|
|
|
|
| Amneal Pharmaceuticals, Inc.†# |
|
|
|
|
16,534 |
63,987 |
| Amphastar Pharmaceuticals, Inc.†# |
|
|
|
|
450 |
20,372 |
| Jazz Pharmaceuticals PLC†# |
|
|
|
|
463 |
58,810 |
| Merck & Co., Inc.# |
|
|
|
|
1,231 |
126,424 |
| Organon & Co.# |
|
|
|
|
9,713 |
143,655 |
| Perrigo Co. PLC# |
|
|
|
|
600 |
16,584 |
| Pfizer, Inc.# |
|
|
|
|
316 |
9,657 |
| Phibro Animal Health Corp. Class A# |
|
|
|
|
939 |
10,254 |
| SIGA Technologies, Inc.# |
|
|
|
|
14,325 |
73,057 |
| Viatris, Inc.# |
|
|
|
|
8,966 |
79,797 |
| |
|
|
|
|
|
602,597 |
| Industrials: 13.93% |
|
|
|
|
|
|
| Aerospace & defense: 1.34% |
|
|
|
|
|
|
| General Dynamics Corp.# |
|
|
|
|
583 |
140,684 |
| Lockheed Martin Corp.# |
|
|
|
|
267 |
121,389 |
| Northrop Grumman Corp.# |
|
|
|
|
55 |
25,928 |
| |
|
|
|
|
|
288,001 |
| Air freight & logistics: 0.16% |
|
|
|
|
|
|
| CH Robinson Worldwide, Inc.# |
|
|
|
|
405 |
33,141 |
| Building products: 0.05% |
|
|
|
|
|
|
| Masco Corp.# |
|
|
|
|
199 |
10,366 |
| Commercial services & supplies: 0.18% |
|
|
|
|
|
|
| Cintas Corp.# |
|
|
|
|
77 |
39,048 |
| |
|
|
|
Shares |
Value | |
| Construction & engineering: 1.93% |
|
|
|
|
|
|
| AECOM# |
|
|
|
|
127 |
$9,722 |
| EMCOR Group, Inc.# |
|
|
|
|
1,517 |
313,488 |
| Valmont Industries, Inc.# |
|
|
|
|
457 |
89,988 |
| |
|
|
|
|
|
413,198 |
| Ground transportation: 0.96% |
|
|
|
|
|
|
| Landstar System, Inc.# |
|
|
|
|
1,246 |
205,316 |
| Industrial conglomerates: 0.55% |
|
|
|
|
|
|
| General Electric Co.# |
|
|
|
|
1,094 |
118,841 |
| Machinery: 5.52% |
|
|
|
|
|
|
| AGCO Corp.# |
|
|
|
|
1,309 |
150,090 |
| Allison Transmission Holdings, Inc.# |
|
|
|
|
3,550 |
178,991 |
| Donaldson Co., Inc.# |
|
|
|
|
3,676 |
211,958 |
| Gates Industrial Corp. PLC†# |
|
|
|
|
2,322 |
25,356 |
| Hyster-Yale Materials Handling, Inc.# |
|
|
|
|
225 |
9,002 |
| ITT, Inc.# |
|
|
|
|
3,145 |
293,586 |
| Otis Worldwide Corp.# |
|
|
|
|
4,086 |
315,480 |
| |
|
|
|
|
|
1,184,463 |
| Passenger airlines: 0.54% |
|
|
|
|
|
|
| Delta Air Lines, Inc.# |
|
|
|
|
3,717 |
116,156 |
| Professional services: 1.40% |
|
|
|
|
|
|
| CACI International, Inc. Class A†# |
|
|
|
|
82 |
26,630 |
| Genpact Ltd.# |
|
|
|
|
1,089 |
36,525 |
| Leidos Holdings, Inc.# |
|
|
|
|
1,640 |
162,557 |
| ManpowerGroup, Inc.# |
|
|
|
|
836 |
58,495 |
| Robert Half, Inc.# |
|
|
|
|
218 |
16,300 |
| |
|
|
|
|
|
300,507 |
| Trading companies & distributors: 1.30% |
|
|
|
|
|
|
| Ferguson PLC# |
|
|
|
|
93 |
13,969 |
| MSC Industrial Direct Co., Inc. Class A# |
|
|
|
|
832 |
78,832 |
| WW Grainger, Inc.# |
|
|
|
|
254 |
185,377 |
| |
|
|
|
|
|
278,178 |
| Information technology: 28.84% |
|
|
|
|
|
|
| Communications equipment: 4.27% |
|
|
|
|
|
|
| Cisco Systems, Inc.# |
|
|
|
|
3,668 |
191,213 |
| CommScope Holding Co., Inc.†# |
|
|
|
|
16,900 |
25,012 |
| Comtech Telecommunications Corp.# |
|
|
|
|
2,996 |
36,551 |
| F5, Inc.†# |
|
|
|
|
789 |
119,605 |
| Juniper Networks, Inc.# |
|
|
|
|
12,653 |
340,619 |
| Motorola Solutions, Inc.# |
|
|
|
|
725 |
201,883 |
| |
|
|
|
|
|
914,883 |
| Electronic equipment, instruments & components: 1.15% |
|
|
|
|
|
|
| Avnet, Inc.# |
|
|
|
|
779 |
36,091 |
| |
|
|
|
Shares |
Value | |
| Electronic equipment, instruments &
components(continued) |
|
|
|
|
|
|
| Bel Fuse, Inc. Class B# |
|
|
|
|
768 |
$41,610 |
| Daktronics, Inc.†# |
|
|
|
|
3,109 |
29,909 |
| Jabil, Inc.# |
|
|
|
|
431 |
52,927 |
| Richardson Electronics Ltd.# |
|
|
|
|
2,377 |
27,264 |
| Vontier Corp.# |
|
|
|
|
1,963 |
58,026 |
| |
|
|
|
|
|
245,827 |
| IT services: 4.37% |
|
|
|
|
|
|
| Accenture PLC Class A# |
|
|
|
|
256 |
76,055 |
| Amdocs Ltd.# |
|
|
|
|
1,870 |
149,899 |
| Cognizant Technology Solutions Corp. Class A# |
|
|
|
|
6,552 |
422,407 |
| DXC Technology Co.†# |
|
|
|
|
2,876 |
58,009 |
| EPAM Systems, Inc.†# |
|
|
|
|
259 |
56,351 |
| Gartner, Inc.†# |
|
|
|
|
126 |
41,837 |
| Hackett Group, Inc.# |
|
|
|
|
1,526 |
34,015 |
| International Business Machines Corp.# |
|
|
|
|
81 |
11,716 |
| VeriSign, Inc.†# |
|
|
|
|
440 |
87,850 |
| |
|
|
|
|
|
938,139 |
| Semiconductors & semiconductor equipment: 9.04% |
|
|
|
|
|
|
| Allegro MicroSystems, Inc.†# |
|
|
|
|
449 |
11,656 |
| Broadcom, Inc.# |
|
|
|
|
128 |
107,695 |
| Cirrus Logic, Inc.†# |
|
|
|
|
2,714 |
181,648 |
| Diodes, Inc.†# |
|
|
|
|
128 |
8,330 |
| inTEST Corp.†# |
|
|
|
|
4,328 |
55,961 |
| KLA Corp.# |
|
|
|
|
618 |
290,275 |
| Lam Research Corp.# |
|
|
|
|
244 |
143,526 |
| Microchip Technology, Inc.# |
|
|
|
|
620 |
44,200 |
| Monolithic Power Systems, Inc.# |
|
|
|
|
23 |
10,160 |
| NVIDIA Corp.# |
|
|
|
|
655 |
267,109 |
| Photronics, Inc.†# |
|
|
|
|
3,313 |
60,827 |
| Qorvo, Inc.†# |
|
|
|
|
1,936 |
169,245 |
| QUALCOMM, Inc.# |
|
|
|
|
3,718 |
405,225 |
| Skyworks Solutions, Inc.# |
|
|
|
|
1,594 |
138,263 |
| Texas Instruments, Inc.# |
|
|
|
|
323 |
45,869 |
| |
|
|
|
|
|
1,939,989 |
| Software: 6.86% |
|
|
|
|
|
|
| Adeia, Inc.# |
|
|
|
|
3,199 |
26,968 |
| Adobe, Inc.†# |
|
|
|
|
33 |
17,558 |
| Autodesk, Inc.†# |
|
|
|
|
78 |
15,415 |
| Fair Isaac Corp.†# |
|
|
|
|
73 |
61,748 |
| Fortinet, Inc.†# |
|
|
|
|
708 |
40,476 |
| Gen Digital, Inc.# |
|
|
|
|
11,834 |
197,154 |
| LiveRamp Holdings, Inc.†# |
|
|
|
|
751 |
20,773 |
| Manhattan Associates, Inc.†# |
|
|
|
|
111 |
21,643 |
| Microsoft Corp.# |
|
|
|
|
1,769 |
598,117 |
| NCR Voyix Corp.†# |
|
|
|
|
1,272 |
19,449 |
| Oracle Corp.# |
|
|
|
|
938 |
96,989 |
| |
|
|
|
Shares |
Value | |
| Software(continued) |
|
|
|
|
|
|
| Pegasystems, Inc.# |
|
|
|
|
1,032 |
$44,108 |
| PTC, Inc.†# |
|
|
|
|
435 |
61,083 |
| RingCentral, Inc. Class A†# |
|
|
|
|
2,176 |
57,838 |
| ServiceNow, Inc.†# |
|
|
|
|
88 |
51,203 |
| Synopsys, Inc.†# |
|
|
|
|
87 |
40,841 |
| Teradata Corp.†# |
|
|
|
|
2,341 |
100,007 |
| |
|
|
|
|
|
1,471,370 |
| Technology hardware, storage & peripherals: 3.15% |
|
|
|
|
|
|
| Apple, Inc.# |
|
|
|
|
3,051 |
521,020 |
| Hewlett Packard Enterprise Co.# |
|
|
|
|
7,611 |
117,057 |
| HP, Inc.# |
|
|
|
|
1,457 |
38,363 |
| |
|
|
|
|
|
676,440 |
| Materials: 1.86% |
|
|
|
|
|
|
| Construction materials: 0.54% |
|
|
|
|
|
|
| Eagle Materials, Inc.# |
|
|
|
|
761 |
117,125 |
| Containers & packaging: 0.15% |
|
|
|
|
|
|
| Berry Global Group, Inc.# |
|
|
|
|
359 |
19,745 |
| Pactiv Evergreen, Inc.# |
|
|
|
|
1,390 |
11,982 |
| |
|
|
|
|
|
31,727 |
| Metals & mining: 1.17% |
|
|
|
|
|
|
| Arch Resources, Inc.# |
|
|
|
|
70 |
10,558 |
| Nucor Corp.# |
|
|
|
|
180 |
26,602 |
| SSR Mining, Inc.-U.S. Exchange Traded Shares# |
|
|
|
|
7,263 |
100,811 |
| Steel Dynamics, Inc.# |
|
|
|
|
1,061 |
113,007 |
| |
|
|
|
|
|
250,978 |
| Real estate: 1.09% |
|
|
|
|
|
|
| Residential REITs : 0.38% |
|
|
|
|
|
|
| Apartment Income REIT Corp.# |
|
|
|
|
2,775 |
81,058 |
| Specialized REITs : 0.71% |
|
|
|
|
|
|
| American Tower Corp.# |
|
|
|
|
348 |
62,010 |
| Crown Castle, Inc.# |
|
|
|
|
682 |
63,412 |
| Weyerhaeuser Co.# |
|
|
|
|
958 |
27,485 |
| |
|
|
|
|
|
152,907 |
| Utilities: 2.03% |
|
|
|
|
|
|
| Electric utilities: 0.07% |
|
|
|
|
|
|
| Entergy Corp.# |
|
|
|
|
157 |
15,008 |
| Gas utilities: 1.96% |
|
|
|
|
|
|
| National Fuel Gas Co.# |
|
|
|
|
4,358 |
222,040 |
| UGI Corp.# |
|
|
|
|
9,499 |
197,579 |
| |
|
|
|
|
|
419,619 |
| Total common stocks (Cost $21,573,287) |
|
|
|
|
|
20,828,711 |
| |
|
Yield |
|
Shares |
Value | |
| Short-term investments: 6.80% |
|
|
|
|
|
|
| Investment companies: 6.80% |
|
|
|
|
|
|
| Allspring Government Money Market Fund Select
Class♠∞ |
|
5.29 % |
|
|
1,457,821 |
$1,457,821 |
| Total short-term investments (Cost $1,457,821) |
|
|
|
|
|
1,457,821 |
| Total investments in securities (Cost $23,031,108) |
103.90 % |
|
|
|
|
22,286,532 |
| |
|
|
|
|
| |
| Securities sold short: (28.20)% |
|
|
|
|
|
|
| Common stocks: (28.20)% |
|
|
|
|
|
|
| Communication services: (1.74)% |
|
|
|
|
|
|
| Diversified telecommunication services: (1.13)% |
|
|
|
|
|
|
| Anterix, Inc.† |
|
|
|
|
(2,026 ) |
(61,773 ) |
| AST SpaceMobile, Inc.† |
|
|
|
|
(16,744 ) |
(55,423 ) |
| Frontier Communications Parent, Inc.† |
|
|
|
|
(7,036 ) |
(126,085 ) |
| |
|
|
|
|
|
(243,281 ) |
| Entertainment: (0.39)% |
|
|
|
|
|
|
| Roblox Corp. Class A† |
|
|
|
|
(1,982 ) |
(63,047 ) |
| Roku, Inc.† |
|
|
|
|
(351 ) |
(20,909 ) |
| |
|
|
|
|
|
(83,956 ) |
| Media: (0.22)% |
|
|
|
|
|
|
| Cardlytics, Inc.† |
|
|
|
|
(2,357 ) |
(29,203 ) |
| Paramount Global Class A |
|
|
|
|
(611 ) |
(8,493 ) |
| Paramount Global Class B |
|
|
|
|
(817 ) |
(8,889 ) |
| |
|
|
|
|
|
(46,585 ) |
| Consumer discretionary: (4.16)% |
|
|
|
|
|
|
| Automobile components: (0.51)% |
|
|
|
|
|
|
| QuantumScape Corp. Class A† |
|
|
|
|
(12,616 ) |
(65,856 ) |
| Solid Power, Inc.† |
|
|
|
|
(32,528 ) |
(42,937 ) |
| |
|
|
|
|
|
(108,793 ) |
| Automobiles: (0.40)% |
|
|
|
|
|
|
| Lucid Group, Inc.† |
|
|
|
|
(2,802 ) |
(11,544 ) |
| Rivian Automotive, Inc. Class A† |
|
|
|
|
(4,521 ) |
(73,331 ) |
| |
|
|
|
|
|
(84,875 ) |
| Broadline retail: (0.40)% |
|
|
|
|
|
|
| Etsy, Inc.† |
|
|
|
|
(423 ) |
(26,353 ) |
| Kohl’s Corp. |
|
|
|
|
(390 ) |
(8,794 ) |
| Ollie’s Bargain Outlet Holdings, Inc.† |
|
|
|
|
(667 ) |
(51,519 ) |
| |
|
|
|
|
|
(86,666 ) |
| Hotels, restaurants & leisure: (1.43)% |
|
|
|
|
|
|
| Churchill Downs, Inc. |
|
|
|
|
(341 ) |
(37,456 ) |
| DraftKings, Inc. Class A† |
|
|
|
|
(1,078 ) |
(29,774 ) |
| |
|
|
|
Shares |
Value | |
| Hotels, restaurants & leisure(continued)
|
|
|
|
|
|
|
| Norwegian Cruise Line Holdings Ltd.† |
|
|
|
|
(1,719 ) |
$(23,378 ) |
| Penn Entertainment, Inc.† |
|
|
|
|
(532 ) |
(10,496 ) |
| Planet Fitness, Inc. Class A† |
|
|
|
|
(3,729 ) |
(206,102 ) |
| |
|
|
|
|
|
(307,206 ) |
| Household durables: (0.84)% |
|
|
|
|
|
|
| iRobot Corp.† |
|
|
|
|
(469 ) |
(15,444 ) |
| Whirlpool Corp. |
|
|
|
|
(1,583 ) |
(165,519 ) |
| |
|
|
|
|
|
(180,963 ) |
| Leisure products: (0.24)% |
|
|
|
|
|
|
| Hasbro, Inc. |
|
|
|
|
(638 ) |
(28,806 ) |
| Peloton Interactive, Inc. Class A† |
|
|
|
|
(4,614 ) |
(21,962 ) |
| |
|
|
|
|
|
(50,768 ) |
| Specialty retail: (0.24)% |
|
|
|
|
|
|
| Overstock.com, Inc.† |
|
|
|
|
(679 ) |
(10,593 ) |
| RH† |
|
|
|
|
(191 ) |
(41,630 ) |
| |
|
|
|
|
|
(52,223 ) |
| Textiles, apparel & luxury goods: (0.10)% |
|
|
|
|
|
|
| Capri Holdings Ltd.† |
|
|
|
|
(410 ) |
(20,984 ) |
| Energy: (3.35)% |
|
|
|
|
|
|
| Oil, gas & consumable fuels: (3.35)% |
|
|
|
|
|
|
| Diamondback Energy, Inc. |
|
|
|
|
(432 ) |
(69,258 ) |
| Encore Energy Corp.† |
|
|
|
|
(18,430 ) |
(60,819 ) |
| Energy Fuels, Inc.† |
|
|
|
|
(16,482 ) |
(132,021 ) |
| Golar LNG Ltd. |
|
|
|
|
(8,345 ) |
(187,178 ) |
| Texas Pacific Land Corp. |
|
|
|
|
(131 ) |
(241,820 ) |
| Vitesse Energy, Inc. |
|
|
|
|
(1,139 ) |
(26,983 ) |
| |
|
|
|
|
|
(718,079 ) |
| Financials: (1.85)% |
|
|
|
|
|
|
| Banks: (1.30)% |
|
|
|
|
|
|
| Commerce Bancshares, Inc. |
|
|
|
|
(224 ) |
(9,825 ) |
| First Citizens BancShares, Inc. Class A |
|
|
|
|
(136 ) |
(187,780 ) |
| Pinnacle Financial Partners, Inc. |
|
|
|
|
(312 ) |
(19,456 ) |
| Prosperity Bancshares, Inc. |
|
|
|
|
(1,107 ) |
(60,376 ) |
| |
|
|
|
|
|
(277,437 ) |
| Capital markets: (0.13)% |
|
|
|
|
|
|
| Coinbase Global, Inc. Class A† |
|
|
|
|
(235 ) |
(18,123 ) |
| Robinhood Markets, Inc. Class A† |
|
|
|
|
(1,126 ) |
(10,292 ) |
| |
|
|
|
|
|
(28,415 ) |
| Consumer finance: (0.09)% |
|
|
|
|
|
|
| SoFi Technologies, Inc.† |
|
|
|
|
(2,603 ) |
(19,653 ) |
| |
|
|
|
Shares |
Value | |
| Financial services: (0.23)% |
|
|
|
|
|
|
| Affirm Holdings, Inc.† |
|
|
|
|
(2,276 ) |
$(40,080 ) |
| TFS Financial Corp. |
|
|
|
|
(810 ) |
(9,607 ) |
| |
|
|
|
|
|
(49,687 ) |
| Insurance: (0.10)% |
|
|
|
|
|
|
| Brighthouse Financial, Inc.† |
|
|
|
|
(469 ) |
(21,246 ) |
| Health care: (5.61)% |
|
|
|
|
|
|
| Biotechnology: (2.34)% |
|
|
|
|
|
|
| Altimmune, Inc.† |
|
|
|
|
(3,573 ) |
(8,611 ) |
| Apellis Pharmaceuticals, Inc.† |
|
|
|
|
(1,302 ) |
(63,355 ) |
| Bioxcel Therapeutics, Inc.† |
|
|
|
|
(2,187 ) |
(8,781 ) |
| IGM Biosciences, Inc.† |
|
|
|
|
(3,467 ) |
(13,660 ) |
| Intellia Therapeutics, Inc.† |
|
|
|
|
(3,686 ) |
(92,334 ) |
| Karuna Therapeutics, Inc.† |
|
|
|
|
(973 ) |
(162,112 ) |
| Mirati Therapeutics, Inc.† |
|
|
|
|
(1,624 ) |
(90,181 ) |
| Novavax, Inc.† |
|
|
|
|
(5,950 ) |
(39,627 ) |
| Roivant Sciences Ltd.† |
|
|
|
|
(931 ) |
(8,044 ) |
| Seres Therapeutics, Inc.† |
|
|
|
|
(9,682 ) |
(14,813 ) |
| |
|
|
|
|
|
(501,518 ) |
| Health care equipment & supplies: (1.88)% |
|
|
|
|
|
|
| Alphatec Holdings, Inc.† |
|
|
|
|
(4,838 ) |
(44,413 ) |
| Beyond Air, Inc.† |
|
|
|
|
(4,013 ) |
(9,350 ) |
| Glaukos Corp.† |
|
|
|
|
(208 ) |
(14,186 ) |
| Nano-X Imaging Ltd.† |
|
|
|
|
(9,143 ) |
(46,172 ) |
| Neogen Corp.† |
|
|
|
|
(4,308 ) |
(64,146 ) |
| Nevro Corp.† |
|
|
|
|
(1,492 ) |
(21,530 ) |
| Novocure Ltd.† |
|
|
|
|
(5,656 ) |
(75,225 ) |
| OrthoPediatrics Corp.† |
|
|
|
|
(1,479 ) |
(36,176 ) |
| PROCEPT BioRobotics Corp.† |
|
|
|
|
(1,942 ) |
(52,026 ) |
| Pulse Biosciences, Inc.† |
|
|
|
|
(9,042 ) |
(40,870 ) |
| |
|
|
|
|
|
(404,094 ) |
| Health care providers & services: (1.08)% |
|
|
|
|
|
|
| Castle Biosciences, Inc.† |
|
|
|
|
(2,702 ) |
(42,205 ) |
| Guardant Health, Inc.† |
|
|
|
|
(637 ) |
(16,486 ) |
| National Research Corp. |
|
|
|
|
(1,389 ) |
(58,699 ) |
| R1 RCM, Inc.† |
|
|
|
|
(9,724 ) |
(114,646 ) |
| |
|
|
|
|
|
(232,036 ) |
| Health care technology: (0.08)% |
|
|
|
|
|
|
| Certara, Inc.† |
|
|
|
|
(744 ) |
(9,069 ) |
| Teladoc Health, Inc.† |
|
|
|
|
(483 ) |
(7,989 ) |
| |
|
|
|
|
|
(17,058 ) |
| Pharmaceuticals: (0.23)% |
|
|
|
|
|
|
| Cassava Sciences, Inc.† |
|
|
|
|
(1,746 ) |
(35,182 ) |
| |
|
|
|
Shares |
Value | |
| Pharmaceuticals(continued) |
|
|
|
|
|
|
| Phathom Pharmaceuticals, Inc.† |
|
|
|
|
(505 ) |
$(4,696 ) |
| Pliant Therapeutics, Inc.† |
|
|
|
|
(627 ) |
(9,198 ) |
| |
|
|
|
|
|
(49,076 ) |
| Industrials: (5.76)% |
|
|
|
|
|
|
| Aerospace & defense: (0.95)% |
|
|
|
|
|
|
| Axon Enterprise, Inc.† |
|
|
|
|
(337 ) |
(68,913 ) |
| TransDigm Group, Inc.† |
|
|
|
|
(162 ) |
(134,151 ) |
| |
|
|
|
|
|
(203,064 ) |
| Building products: (0.51)% |
|
|
|
|
|
|
| Hayward Holdings, Inc.† |
|
|
|
|
(10,422 ) |
(109,431 ) |
| Commercial services & supplies: (0.24)% |
|
|
|
|
|
|
| LanzaTech Global, Inc.† |
|
|
|
|
(3,336 ) |
(11,743 ) |
| Li-Cycle Holdings Corp.† |
|
|
|
|
(4,182 ) |
(5,604 ) |
| Performant Financial Corp.† |
|
|
|
|
(14,646 ) |
(34,125 ) |
| |
|
|
|
|
|
(51,472 ) |
| Electrical equipment: (0.50)% |
|
|
|
|
|
|
| ChargePoint Holdings, Inc.† |
|
|
|
|
(1,356 ) |
(3,444 ) |
| Plug Power, Inc.† |
|
|
|
|
(17,668 ) |
(104,065 ) |
| |
|
|
|
|
|
(107,509 ) |
| Ground transportation: (0.52)% |
|
|
|
|
|
|
| Avis Budget Group, Inc.† |
|
|
|
|
(163 ) |
(26,536 ) |
| Hertz Global Holdings, Inc.† |
|
|
|
|
(7,248 ) |
(61,101 ) |
| Lyft, Inc. Class A† |
|
|
|
|
(2,703 ) |
(24,786 ) |
| |
|
|
|
|
|
(112,423 ) |
| Machinery: (1.17)% |
|
|
|
|
|
|
| RBC Bearings, Inc.† |
|
|
|
|
(1,136 ) |
(249,738 ) |
| Marine transportation: (0.05)% |
|
|
|
|
|
|
| Himalaya Shipping Ltd.† |
|
|
|
|
(2,195 ) |
(9,965 ) |
| Professional services: (1.82)% |
|
|
|
|
|
|
| Ceridian HCM Holding, Inc.† |
|
|
|
|
(1,193 ) |
(76,364 ) |
| Clarivate PLC† |
|
|
|
|
(31,295 ) |
(199,662 ) |
| Paycor HCM, Inc.† |
|
|
|
|
(5,327 ) |
(114,957 ) |
| |
|
|
|
|
|
(390,983 ) |
| Information technology: (0.45)% |
|
|
|
|
|
|
| Electronic equipment, instruments & components: (0.04)% |
|
|
|
|
|
|
| MicroVision, Inc.† |
|
|
|
|
(4,386 ) |
(8,289 ) |
| Semiconductors & semiconductor equipment: (0.22)% |
|
|
|
|
|
|
| Enphase Energy, Inc.† |
|
|
|
|
(90 ) |
(7,162 ) |
| Wolfspeed, Inc.† |
|
|
|
|
(1,194 ) |
(40,405 ) |
| |
|
|
|
|
|
(47,567 ) |
| |
|
|
|
Shares |
Value | |
| Software: (0.19)% |
|
|
|
|
|
|
| Digimarc Corp.† |
|
|
|
|
(308 ) |
$(7,990 ) |
| SentinelOne, Inc. Class A† |
|
|
|
|
(2,108 ) |
(32,948 ) |
| |
|
|
|
|
|
(40,938 ) |
| Materials: (2.50)% |
|
|
|
|
|
|
| Chemicals: (1.69)% |
|
|
|
|
|
|
| Albemarle Corp. |
|
|
|
|
(55 ) |
(6,973 ) |
| Celanese Corp. |
|
|
|
|
(374 ) |
(42,827 ) |
| Danimer Scientific, Inc.† |
|
|
|
|
(25,281 ) |
(36,152 ) |
| Ginkgo Bioworks Holdings, Inc.† |
|
|
|
|
(53,463 ) |
(73,244 ) |
| International Flavors & Fragrances, Inc. |
|
|
|
|
(2,673 ) |
(182,700 ) |
| PureCycle Technologies, Inc.† |
|
|
|
|
(4,385 ) |
(19,513 ) |
| |
|
|
|
|
|
(361,409 ) |
| Containers & packaging: (0.21)% |
|
|
|
|
|
|
| TriMas Corp. |
|
|
|
|
(1,878 ) |
(45,466 ) |
| Metals & mining: (0.52)% |
|
|
|
|
|
|
| 5E Advanced Materials, Inc.† |
|
|
|
|
(1,419 ) |
(3,192 ) |
| Alcoa Corp. |
|
|
|
|
(2,306 ) |
(59,126 ) |
| MP Materials Corp.† |
|
|
|
|
(3,047 ) |
(49,971 ) |
| |
|
|
|
|
|
(112,289 ) |
| Paper & forest products: (0.08)% |
|
|
|
|
|
|
| Louisiana-Pacific Corp. |
|
|
|
|
(320 ) |
(16,410 ) |
| Real estate: (1.90)% |
|
|
|
|
|
|
| Health care REITs: (0.09)% |
|
|
|
|
|
|
| Healthcare Realty Trust, Inc. Class A |
|
|
|
|
(1,317 ) |
(18,899 ) |
| Real estate management & development: (0.70)% |
|
|
|
|
|
|
| Zillow Group, Inc. Class A† |
|
|
|
|
(1,438 ) |
(51,092 ) |
| Zillow Group, Inc. Class C† |
|
|
|
|
(2,743 ) |
(99,434 ) |
| |
|
|
|
|
|
(150,526 ) |
| Retail REITs : (1.11)% |
|
|
|
|
|
|
| Realty Income Corp. |
|
|
|
|
(5,022 ) |
(237,942 ) |
| Utilities: (0.88)% |
|
|
|
|
|
|
| Electric utilities: (0.88)% |
|
|
|
|
|
|
| Constellation Energy Corp. |
|
|
|
|
(1,590 ) |
(179,543 ) |
| NextEra Energy, Inc. |
|
|
|
|
(167 ) |
(9,736 ) |
| |
|
|
|
|
|
(189,279 ) |
| Total common stocks (Cost $(7,062,630)) |
|
|
|
|
|
(6,048,198 ) |
| Total securities sold short (proceeds $(7,062,630)) |
(28.20 )% |
|
|
|
|
(6,048,198 ) |
| Other assets and liabilities, net |
24.30 |
|
|
|
|
5,213,216 |
| Total net assets |
100.00 % |
|
|
|
|
$21,451,550 |
| # |
All or a portion of this security is segregated as collateral for securities sold short. |
| † |
Non-income-earning security |
| ♠ |
The issuer of the security is an affiliated person of the Fund as defined in the Investment Company Act of 1940. |
| ∞ |
The rate represents the 7-day annualized yield at period end. |
| Abbreviations: | |
| REIT |
Real estate investment trust |
| |
Value, beginning of period |
Purchases |
Sales
proceeds |
Net
realized
gains
(losses) |
Net
change in
unrealized
gains
(losses) |
Value,
end of
period |
Shares,
end
of period |
Income
from
affiliated
securities |
| Short-term investments |
|
|
|
|
|
|
|
|
| Allspring Government Money Market Fund Select Class |
$0 |
$26,706,649 |
$(25,248,828 ) |
$0 |
$0 |
$1,457,821 |
1,457,821 |
$54,454 |
| Assets |
|
| Investments in unaffiliated securities, at value (cost $21,573,287) |
$20,828,711 |
| Investments in affiliated securities, at value (cost $1,457,821) |
1,457,821 |
| Cash deposited with brokers for securities sold short |
6,048,198 |
| Receivable for dividends |
20,849 |
| Receivable from manager |
20,840 |
| Prepaid expenses and other assets |
110,747 |
| Total assets |
28,487,166 |
| Liabilities |
|
| Securities sold short, at value (proceeds $7,062,630) |
6,048,198 |
| Payable for borrowing on margin loan |
967,770 |
| Payable for interest expense on margin loan |
6,352 |
| Administration fees payable |
5,039 |
| Payable for Fund shares redeemed |
3,243 |
| Payable for dividends on securities sold short |
2,225 |
| Distribution fees payable |
5 |
| Accrued expenses and other liabilities |
2,784 |
| Total liabilities |
7,035,616 |
| Total net assets |
$21,451,550 |
| Net assets consist of |
|
| Paid-in capital |
$22,168,420 |
| Total distributable loss |
(716,870
) |
| Total net assets |
$21,451,550 |
| Computation of net asset value and offering price per share |
|
| Net assets–Class A |
$306,524 |
| Shares outstanding–Class A1
|
43,871 |
| Net asset value per share–Class A |
$6.99 |
| Maximum offering price per share – Class A2 |
$7.42 |
| Net assets–Class C |
$23,792 |
| Shares outstanding–Class C1
|
3,425 |
| Net asset value per share–Class C |
$6.95 |
| Net assets–Class R6 |
$192,105 |
| Shares outstanding–Class R61
|
26,667 |
| Net asset value per share–Class R6 |
$7.20 |
| Net assets–Institutional Class |
$20,929,129 |
| Shares outstanding–Institutional
Class1 |
2,906,261 |
| Net asset value per share–Institutional Class |
$7.20
|
| Investment income |
|
| Dividends (net of foreign withholdings taxes of $161) |
$234,140 |
| Interest and rebate income |
137,905 |
| Income from affiliated securities |
54,454 |
| Total investment income |
426,499 |
| Expenses |
|
| Management fee |
159,928 |
| Administration fees |
|
| Class A1 |
1,378 |
| Class C2 |
44 |
| Class R62 |
52 |
| Institutional Class1
|
16,858 |
| Shareholder servicing fees |
|
| Class A1 |
1,954 |
| Class C2 |
54 |
| Institutional Class1
|
416 |
| Distribution fees |
|
| Class A1 |
500 |
| Class C2 |
63 |
| Custody and accounting fees |
40,784 |
| Professional fees |
64,048 |
| Registration fees |
66,656 |
| Shareholder report expenses |
18,465 |
| Trustees’ fees and expenses |
21,560 |
| Transfer agent fees |
6,830 |
| Interest expense |
63,236 |
| Dividends on securities sold short |
38,671 |
| Other fees and expenses |
11,752 |
| Total expenses |
513,249 |
| Less: Fee waivers and/or expense reimbursements |
|
| Fund-level |
(222,050
) |
| Class A1 |
(3,832 ) |
| Class C2 |
(16 ) |
| Class R62 |
(51 ) |
| Net expenses |
287,300 |
| Net investment income |
139,199 |
| Realized and unrealized gains (losses) on investments |
|
| Net realized gains (losses) on |
|
| Unaffiliated securities |
$352,944 |
| Securities sold short |
(1,261,499
) |
| Net realized losses on investments |
(908,555
) |
| Net change in unrealized gains (losses) on |
|
| Unaffiliated securities |
(776,625
) |
| Securities sold short |
954,738 |
| Net change in unrealized gains (losses) on investments |
178,113 |
| Net realized and unrealized gains (losses) on investments |
(730,442
) |
| Net decrease in net assets resulting from operations |
$(591,243
) |
| |
Year ended October 31, 2023 |
Year ended October 31, 2022 | ||
| Operations |
|
|
|
|
| Net investment income (loss) |
|
$139,199 |
|
$(46,128 ) |
| Net realized gains (losses) on investments |
|
(908,555 ) |
|
678,428 |
| Net change in unrealized gains (losses) on investments |
|
178,113 |
|
(462,051 ) |
| Net increase (decrease) in net assets resulting from operations |
|
(591,243
) |
|
170,249 |
| Distributions to shareholders from |
|
|
|
|
| Net investment income and net realized gains |
|
|
|
|
| Class A1 |
|
(192,954 ) |
|
(714,276 ) |
| Institutional Class1
|
|
(470,344 ) |
|
(1,148,448 ) |
| Total distributions to shareholders |
|
(663,298
) |
|
(1,862,724 ) |
| Capital share transactions |
Shares |
|
Shares |
|
| Proceeds from shares sold |
|
|
|
|
| Class A1 |
9,202 |
70,865 |
166,466 |
1,465,738 |
| Class C |
3,425
2 |
25,000 2 |
N/A |
N/A |
| Class R6 |
26,667 2 |
200,000 2 |
N/A |
N/A |
| Institutional Class1
|
2,863,944 |
21,278,877 |
268,803 |
2,392,530 |
| |
|
21,574,742 |
|
3,858,268 |
| Reinvestment of distributions |
|
|
|
|
| Class A1 |
23,346 |
169,957 |
79,119 |
653,525 |
| Institutional Class1
|
61,598 |
460,755 |
133,179 |
1,122,699 |
| |
|
630,712 |
|
1,776,224 |
| Payment for shares redeemed |
|
|
|
|
| Class A1 |
(198,726 ) |
(1,483,421 ) |
(244,383 ) |
(2,046,532 ) |
| Institutional Class1
|
(441,376 ) |
(3,324,404 ) |
(533,303 ) |
(5,248,711 ) |
| |
|
(4,807,825 ) |
|
(7,295,243 ) |
| Net increase (decrease) in net assets resulting from capital share transactions |
|
17,397,629 |
|
(1,660,751
) |
| Total increase (decrease) in net assets |
|
16,143,088 |
|
(3,353,226 ) |
| Net assets |
|
|
|
|
| Beginning of period |
|
5,308,462 |
|
8,661,688 |
| End of period |
|
$21,451,550 |
|
$5,308,462 |
| Cash flows from operating activities |
|
| Net decrease in net assets resulting from operations |
$(591,243 ) |
| Adjustments to reconcile net decrease in net assets from operations to net cash used in operating activities |
|
| Purchases of long-term securities |
(62,355,038
) |
| Proceeds from the sales of long-term securities |
47,001,257 |
| Proceeds from securities sold short |
20,820,554 |
| Purchases to cover short securities |
(16,739,989
) |
| Purchases and sales of short-term securities, net |
(1,362,856
) |
| Increase in receivable for dividends |
(6,798 ) |
| Increase in receivable from manager |
(20,840
) |
| Increase in prepaid expenses and other assets |
(78,860
) |
| Decrease in trustees’ fees and expenses payable |
(8,655 ) |
| Decrease in administration fees payable |
(1,010 ) |
| Decrease in distribution fees payable |
(394 ) |
| Decrease in custody and accounting fees payable |
(4,555 ) |
| Decrease in shareholder servicing fees payable |
(2,206 ) |
| Increase in payable for dividends on securities sold short |
315 |
| Increase in payable for interest expense on margin loan |
6,352 |
| Decrease in accrued expenses and other liabilities |
(26,684
) |
| Net realized gains on unaffiliated securities |
(352,944
) |
| Net realized losses on securities sold short |
1,261,499 |
| Net change in unrealized gains (losses) on unaffiliated securities |
776,625 |
| Net change in unrealized gains (losses) on securities sold short |
(954,738
) |
| Net cash used in operating activities |
(12,640,208 ) |
| Cash flows from financing activities |
|
| Decrease in margin loan borrowings, net |
272,908 |
| Proceeds from shares sold |
21,574,742 |
| Cost of shares redeemed |
(4,804,582
) |
| Cash distributions paid |
(32,586
) |
| Net cash provided in financing activities |
17,010,482 |
| Net increase in cash |
4,370,274 |
| Cash |
|
| Beginning of period |
1,677,924 |
| End of period |
$6,048,198 |
| Supplemental cash disclosure |
|
| Cash paid for dividends on securities sold short |
$38,356
|
| Cash paid for interest expense |
56,884 |
| Supplemental non-cash financing disclosure |
|
| Reinvestment of dividends |
$630,712
|
| |
Year ended October 31 | ||||
| Class A |
20231,2 |
20221 |
20211 |
20201 |
20191 |
| Net asset value, beginning of period |
$8.27 |
$11.25 |
$10.51 |
$10.56 |
$10.96 |
| Net investment income (loss) |
0.04
3 |
(0.08
)3 |
(0.14
)3 |
(0.11
)3 |
(0.03
)3 |
| Net realized and unrealized gains (losses) on investments |
(0.16 ) |
0.52 |
1.32 |
0.46 |
0.40 |
| Total from investment operations |
(0.12 ) |
0.44 |
1.18 |
0.35 |
0.37 |
| Distributions to shareholders from |
|
|
|
|
|
| Net realized gains |
(1.16 ) |
(3.42 ) |
(0.44 ) |
(0.40 ) |
(0.77 ) |
| Net asset value, end of period |
$6.99 |
$8.27 |
$11.25 |
$10.51 |
$10.56 |
| Total
return4 |
(2.00 )% |
3.95
% |
11.75
% |
3.43
% |
3.88
% |
| Ratios to average net assets (annualized) |
|
|
|
|
|
| Gross expenses* |
6.21 % |
6.00 % |
4.80 % |
3.27 % |
3.06 % |
| Net expenses* |
2.23 % |
2.21 % |
2.97 % |
2.69 % |
2.83 % |
| Net investment income (loss)*
|
0.47 % |
(0.90 )% |
(1.36 )% |
(1.07 )% |
(0.26 )% |
| Supplemental data |
|
|
|
|
|
| Portfolio turnover rate |
322 % |
418 % |
479 % |
538 % |
332 % |
| Net assets, end of period (000s omitted) |
$307
|
$1,737 |
$2,349 |
$2,631 |
$656 |
| * |
Ratios include dividends on securities sold short and interest expense as follows: |
| Year ended October 31, 2023 |
0.70% |
| Year ended October 31, 2022 |
0.42% |
| Year ended October 31, 2021 |
1.18% |
| Year ended October 31, 2020 |
0.90% |
| Year ended October 31, 2019 |
1.04% |
| 1 |
After the close of business on December 16, 2022, the Fund acquired the net assets of 361 Domestic Long/Short Equity Fund, which became the accounting and
performance survivor in the transaction. The information for the periods prior to December 16,
2022 is that of 361 Domestic Long/Short Equity Fund Investor Class. |
| 2 |
For the year ended October 31, 2023, the Fund was audited by KPMG LLP. The previous years were audited by another independent registered public accounting
firm. |
| 3 |
Calculated based upon average shares outstanding |
| 4 |
Total return calculations do not include any sales charges. |
| |
Year ended October 31 |
| Class C |
20231 |
| Net asset value, beginning of period |
$7.30 |
| Net investment loss |
(0.00
)2,3 |
| Net realized and unrealized gains (losses) on investments |
(0.35 ) |
| Total from investment operations |
(0.35 ) |
| Net asset value, end of period |
$6.95 |
| Total
return4 |
(4.79 )% |
| Ratios to average net assets (annualized) |
|
| Gross expenses* |
4.30 % |
| Net expenses* |
2.92 % |
| Net investment loss* |
(0.00 )% |
| Supplemental data |
|
| Portfolio turnover rate |
322 % |
| Net assets, end of period (000s omitted) |
$24
|
| * |
Ratios include dividends on securities sold short and interest expense in the amount of 0.70%. |
| 1 |
For the period from December 16, 2022 (commencement of class operations) to October 31, 2023 |
| 2 |
Calculated based upon average shares outstanding |
| 3 |
Amount is more than $(0.005). |
| 4 |
Returns for periods of less than one year are not annualized. |
| |
Year ended October 31 |
| Class R6 |
20231 |
| Net asset value, beginning of period |
$7.50 |
| Net investment income |
0.07
2 |
| Net realized and unrealized gains (losses) on investments |
(0.37 ) |
| Total from investment operations |
(0.30 ) |
| Net asset value, end of period |
$7.20 |
| Total
return3 |
(4.00 )% |
| Ratios to average net assets (annualized) |
|
| Gross expenses* |
3.58 % |
| Net expenses* |
1.85 % |
| Net investment income* |
1.07 % |
| Supplemental data |
|
| Portfolio turnover rate |
322 % |
| Net assets, end of period (000s omitted) |
$192
|
| * |
Ratios include dividends on securities sold short and interest expense in the amount of 0.70%. |
| 1 |
For the period from December 16, 2022 (commencement of class operations) to October 31, 2023 |
| 2 |
Calculated based upon average shares outstanding |
| 3 |
Returns for periods of less than one year are not annualized. |
| |
Year ended October 31 | ||||
| Institutional Class |
20231,2 |
20221 |
20211 |
20201 |
20191 |
| Net asset value, beginning of period |
$8.46 |
$11.41 |
$10.62 |
$10.65 |
$11.02 |
| Net investment income (loss) |
0.07
3 |
(0.05
)3 |
(0.11
)3 |
(0.08
)3 |
0.00
3,4 |
| Net realized and unrealized gains (losses) on investments |
(0.17 ) |
0.52 |
1.34 |
0.46 |
0.40 |
| Total from investment operations |
(0.10 ) |
0.47 |
1.23 |
0.38 |
0.40 |
| Distributions to shareholders from |
|
|
|
|
|
| Net investment income |
0.00 |
0.00 |
0.00 |
(0.01 ) |
0.00 |
| Net realized gains |
(1.16 ) |
(3.42 ) |
(0.44 ) |
(0.40 ) |
(0.77 ) |
| Total distributions to shareholders |
(1.16 ) |
(3.42 ) |
(0.44 ) |
(0.41 ) |
(0.77 ) |
| Net asset value, end of period |
$7.20 |
$8.46 |
$11.41 |
$10.62 |
$10.65 |
| Total return |
(1.68 )% |
4.23
% |
12.11
% |
3.71
% |
4.15
% |
| Ratios to average net assets (annualized) |
|
|
|
|
|
| Gross expenses* |
3.36 % |
5.69 % |
4.49 % |
2.99 % |
2.77 % |
| Net expenses* |
1.96 % |
1.90 % |
2.66 % |
2.41 % |
2.54 % |
| Net investment income (loss)*
|
0.99 % |
(0.59 )% |
(1.05 )% |
(0.79 )% |
0.03 % |
| Supplemental data |
|
|
|
|
|
| Portfolio turnover rate |
322 % |
418 % |
479 % |
538 % |
332 % |
| Net assets, end of period (000s omitted) |
$20,929
|
$3,572 |
$6,313 |
$8,108 |
$13,658 |
| * |
Ratios include dividends on securities sold short and interest expense as follows: |
| Year ended October 31, 2023 |
0.70% |
| Year ended October 31, 2022 |
0.42% |
| Year ended October 31, 2021 |
1.18% |
| Year ended October 31, 2020 |
0.90% |
| Year ended October 31, 2019 |
1.04% |
| 1 |
After the close of business on December 16, 2022, the Fund acquired the net assets of 361 Domestic Long/Short Equity Fund, which became the accounting and
performance survivor in the transaction. The information for the periods prior to December 16,
2022 is that of 361 Domestic Long/Short Equity Fund Class I. |
| 2 |
For the year ended October 31, 2023, the Fund was audited by KPMG LLP. The previous years were audited by another independent registered public accounting
firm. |
| 3 |
Calculated based upon average shares outstanding |
| 4 |
Amount is less than $0.005. |
| Gross unrealized gains |
$1,926,716
|
| Gross unrealized losses |
(1,793,108 ) |
| Net unrealized gains |
$133,608 |
| Paid-in
capital |
Total distributable
loss |
| $(95,470 ) |
$95,470 |
| |
Quoted prices
(Level 1) |
Other significant
observable inputs
(Level 2) |
Significant
unobservable inputs
(Level 3) |
Total |
| Assets |
|
|
|
|
| Investments in: |
|
|
|
|
| Common stocks |
|
|
|
|
| Communication services |
$553,698
|
$0
|
$0 |
$553,698
|
| Consumer discretionary |
1,284,900 |
0 |
0 |
1,284,900 |
| Consumer staples |
3,025,326 |
0 |
0 |
3,025,326 |
| Energy |
1,012,143 |
0 |
0 |
1,012,143 |
| Financials |
1,832,477 |
0 |
0 |
1,832,477 |
| Health care |
2,877,882 |
0 |
0 |
2,877,882 |
| Industrials |
2,987,215 |
0 |
0 |
2,987,215 |
| Information technology |
6,186,648 |
0 |
0 |
6,186,648 |
| Materials |
399,830 |
0 |
0 |
399,830 |
| Real estate |
233,965 |
0 |
0 |
233,965 |
| Utilities |
434,627 |
0 |
0 |
434,627 |
| Short-term investments |
|
|
|
|
| Investment companies |
1,457,821 |
0 |
0 |
1,457,821 |
| Total assets |
$22,286,532 |
$0 |
$0 |
$22,286,532 |
| Liabilities | ||||
| Securities sold short |
|
|
|
|
| Common stocks |
|
|
|
|
| Communication services |
$373,822
|
$0
|
$0 |
$373,822
|
| Consumer discretionary |
892,478 |
0 |
0 |
892,478 |
| Energy |
718,079 |
0 |
0 |
718,079 |
| Financials |
396,438 |
0 |
0 |
396,438 |
| Health care |
1,203,782 |
0 |
0 |
1,203,782 |
| Industrials |
1,234,585 |
0 |
0 |
1,234,585 |
| Information technology |
96,794 |
0 |
0 |
96,794 |
| Materials |
535,574 |
0 |
0 |
535,574 |
| Real estate |
407,367 |
0 |
0 |
407,367 |
| Utilities |
189,279 |
0 |
0 |
189,279 |
| Total liabilities |
$6,048,198 |
$0 |
$0 |
$6,048,198 |
| Average daily net assets |
Management fee |
| First $1 billion |
1.100 % |
| Next $4 billion |
1.075 |
| Next $5 billion |
1.050 |
| Over $10 billion |
1.025 |
| |
Class-level
administration fee |
| Class A |
0.20 % |
| Class C |
0.20 |
| Class R6 |
0.03 |
| Institutional Class |
0.13 |
| |
EXPENSE RATIO CAPS |
| Class A |
1.57 % |
| Class C |
2.32 |
| Class R6 |
1.15 |
| Institutional Class |
1.25 |
| |
Year
ended October 31 | |
| |
2023 |
2022 |
| Ordinary income |
$511,507 |
$1,177,790 |
| Long-term capital gain |
54,685 |
684,934 |
| Unrealized
gains |
Capital loss
carryforward |
| $133,608 |
$(850,478 ) |

| Name and
year of birth |
Position held and
length of service* |
Principal occupations during past five years or
longer |
Current other
public company
or
investment
company
directorships |
| William R.
Ebsworth
(Born 1957) |
Trustee,
since 2015 |
Retired. From 1984 to 2013, equities analyst, portfolio manager, research
director and chief investment officer at Fidelity
Management and Research Company in Boston, Tokyo, and Hong
Kong, and retired in 2013 as Chief Investment Officer of Fidelity
Strategic Advisers, Inc. where he led a team of investment
professionals managing client assets. Prior thereto, Board member of Hong Kong Securities Clearing Co., Hong Kong Options Clearing Corp., the Thailand International
Fund, Ltd., Fidelity Investments Life Insurance Company, and Empire
Fidelity Investments Life Insurance Company. Audit
Committee Chair and Investment Committee Chair of the Vincent
Memorial Hospital Foundation (non-profit organization). Mr. Ebsworth is a CFA
charterholder. |
N/A |
| Jane A.
Freeman
(Born 1953) |
Trustee,
since 2015;
Chair Liaison,
since 2018 |
Retired. From 2012 to 2014 and 1999 to 2008, Chief Financial Officer of
Scientific Learning Corporation. From 2008 to 2012, Ms.
Freeman provided consulting services related to strategic
business projects. Prior to 1999, Portfolio Manager at Rockefeller &
Co. and Scudder, Stevens & Clark. Board member of the
Harding Loevner Funds from 1996 to 2014, serving as both Lead
Independent Director and chair of the Audit Committee. Board member of
the Russell Exchange Traded Funds Trust from 2011 to 2012
and the chair of the Audit Committee. Ms. Freeman is also an
inactive Chartered Financial Analyst. |
N/A |
| Isaiah
Harris, Jr.
(Born 1952) |
Trustee,
since 2009;
Audit Committee
Chair,
since 2019 |
Retired. Member of the Advisory Board of CEF of East Central Florida.
Chairman of the Board of CIGNA Corporation from 2009 to
2021, and Director from 2005 to 2008. From 2003 to 2011,
Director of Deluxe Corporation. Prior thereto, President and CEO of
BellSouth Advertising and Publishing Corp. from 2005 to
2007, President and CEO of BellSouth Enterprises from 2004 to
2005 and President of BellSouth Consumer Services from 2000 to 2003.
Emeritus member of the Iowa State University Foundation
Board of Governors. Emeritus Member of the Advisory board of
Iowa State University School of Business. Advisory Board Member, Palm
Harbor Academy (private school). Advisory Board Member,
Fellowship of Christian Athletes. Mr. Harris is a certified public
accountant (inactive status). |
N/A |
| David F.
Larcker
(Born 1950) |
Trustee,
since 2009 |
Distinguished Visiting Fellow at the Hoover Institution since 2022. James
Irvin Miller Professor of Accounting at the Graduate School
of Business (Emeritus), Stanford University, Director of the
Corporate Governance Research Initiative and Senior Faculty of The Rock
Center for Corporate Governance since 2006. From 2005 to
2008, Professor of Accounting at the Graduate School of
Business, Stanford University. Prior thereto, Ernst & Young Professor
of Accounting at The Wharton School, University of Pennsylvania
from 1985 to 2005. |
N/A |
| Olivia S.
Mitchell
(Born 1953) |
Trustee,
since 2006;
Nominating and
Governance
Committee Chair,
since 2018 |
International Foundation of Employee Benefit Plans Professor since 1993,
Wharton School of the University of Pennsylvania. Director
of Wharton’s Pension Research Council and Boettner Center on Pensions & Retirement Research, and Research Associate at the National Bureau of Economic
Research. Previously taught at Cornell University from 1978 to 1993.
|
N/A |
| Timothy J.
Penny
(Born 1951) |
Trustee,
since 1996;
Chair,
since 2018 |
President and Chief Executive Officer of Southern Minnesota Initiative
Foundation, a non-profit organization, since 2007. Vice
Chair of the Economic Club of Minnesota, since 2007. Co-Chair of the Committee for a Responsible Federal Budget, since 1995. Member of the Board of Trustees of
NorthStar Education Finance, Inc., a non-profit organization, from
2007-2022. Senior Fellow of the University of Minnesota Humphrey
Institute from 1995 to 2017. |
N/A |
| Name and
year of birth |
Position held and
length of service* |
Principal occupations during past five years or
longer |
Current other
public company
or
investment
company
directorships |
| James G.
Polisson
(Born 1959) |
Trustee,
since 2018 |
Retired. Chief Marketing Officer, Source (ETF) UK Services, Ltd, from
2015 to 2017. From 2012 to 2015, Principal of The Polisson
Group, LLC, a management consulting, corporate advisory and
principal investing company. Chief Executive Officer and Managing
Director at Russell Investments, Global Exchange Traded
Funds from 2010 to 2012. Managing Director of Barclays
Global Investors from 1998 to 2010 and Global Chief Marketing Officer for
iShares and Barclays Global Investors from 2000 to 2010.
Trustee of the San Francisco Mechanics’ Institute, a non- profit organization, from 2013 to 2015. Board member of the Russell Exchange Traded Fund Trust
from 2011 to 2012. Director of Barclays Global Investors Holdings
Deutschland GmbH from 2006 to 2009. Mr. Polisson is an
attorney and has a retired status with the Massachusetts and District of Columbia Bar Associations. |
N/A |
| Pamela Wheelock (Born 1959) |
Trustee, since January 2020; previously Trustee from January 2018 to July 2019 |
Retired. Executive and Senior Financial leadership positions in the public, private and nonprofit
sectors. Interim President and CEO, McKnight Foundation, 2020. Interim
Commissioner, Minnesota Department of Human Services, 2019.
Chief Operating Officer, Twin Cities Habitat for Humanity,
2017-2019. Vice President for University Services, University of Minnesota, 2012- 2016. Interim President and CEO, Blue Cross and Blue Shield of Minnesota, 2011-2012. Executive
Vice-President and Chief Financial Officer, Minnesota Wild, 2002-2008.
Commissioner, Minnesota Department of Finance, 1999-2002.
Chair of the Board of Directors of Destination Medical Center
Corporation. Board member of the Minnesota Wild Foundation. |
N/A |
| * |
Length of service dates reflect the Trustee’s commencement of service with the Trust’s predecessor entities, where applicable. |
| Name and
year of birth |
Position held and
length of
service |
Principal occupations during past five years or
longer |
| Andrew Owen
(Born 1960) |
President,
since 2017 |
President and Chief Executive Officer of Allspring Funds Management, LLC
since 2017 and Head of Global Fund Governance of Allspring
Global Investments since 2022. Prior thereto, co-president of Galliard Capital Management, LLC, an affiliate of Allspring Funds Management, LLC, from 2019 to 2022 and Head of Affiliated
Managers, Allspring Global Investments, from 2014 to 2019 and Executive
Vice President responsible for marketing, investments and product
development for Allspring Funds Management, LLC, from 2009 to 2014. |
| Jeremy DePalma
(Born 1974) |
Treasurer,
since 2012
(for certain funds in
the Fund Complex);
since 2021 (for
the remaining funds
in the Complex) |
Senior Vice President of Allspring Funds Management, LLC since 2009.
Senior Vice President of Evergreen Investment Management
Company, LLC from 2008 to 2010 and head of the Fund Reporting and Control Team within Fund Administration from 2005 to 2010.
|
| Christopher Baker
(Born 1976) |
Chief Compliance
Officer,
since 2022 |
Global Chief Compliance Officer for Allspring Global Investments since
2022. Prior thereto, Chief Compliance Officer for State
Street Global Advisors from 2018 to 2021. Senior Compliance Officer for the State Street divisions of Alternative Investment Solutions, Sector Solutions, and Global Marketing from 2015 to 2018. From 2010 to 2015
Vice President, Global Head of Investment and Marketing Compliance for State
Street Global Advisors. |
| Matthew Prasse (Born 1983) |
Chief Legal Officer, since 2022; Secretary, since 2021 |
Senior Counsel of the Allspring Legal Department since 2021. Senior Counsel of the Wells Fargo Legal Department
from 2018 to 2021. Previously, Counsel for Barings LLC from 2015 to 2018.
Prior to joining Barings, Associate at Morgan, Lewis & Bockius
LLP from 2008 to 2015. |


ITEM 2. CODE OF ETHICS
(a) As of the end of the period covered by the report, Allspring Funds Trust has adopted a code of ethics that applies to its President and Treasurer. A copy of the code of ethics is filed as an exhibit to this Form N-CSR.
(c) During the period covered by this report, there were no amendments to the provisions of the code of ethics adopted in Item 2(a) above.
(d) During the period covered by this report, there were no implicit or explicit waivers to the provisions of the code of ethics adopted in Item 2(a) above.
ITEM 3. AUDIT COMMITTEE FINANCIAL EXPERT
The Board of Trustees of Allspring Funds Trust has determined that Isaiah Harris is an audit committee financial expert, as defined in Item 3 of Form N-CSR. Mr. Harris is independent for purposes of Item 3 of Form N-CSR.
ITEM 4. PRINCIPAL ACCOUNTANT FEES AND SERVICES
(a), (b), (c), (d) The following table presents aggregate fees billed in each of the last two fiscal years for services rendered to the Registrant by the Registrant’s principal accountant. These fees were billed to the registrant and were approved by the Registrant’s audit committee.
| Fiscal year ended October 31, 2023 |
Fiscal year ended October 31, 2022 |
|||||||
| Audit fees |
$ | 368,530 | $ | 213,200 | ||||
| Audit-related fees |
— | — | ||||||
| Tax fees (1) |
$ | 39,640 | $ | 30,155 | ||||
| All other fees |
— | — | ||||||
|
|
|
|
|
|||||
| $ | 408,170 | $ | 243,355 | |||||
| (1) | Tax fees consist of fees for tax compliance, tax advice, tax planning and excise tax. |
(e)(1) The Chair of the Audit Committees is authorized to pre-approve: (1) audit services for the mutual funds of Allspring Funds Trust; (2) non-audit tax or compliance consulting or training services provided to the Funds by the independent auditors (“Auditors”) if the fees for any particular engagement are not anticipated to exceed $50,000; and (3) non-audit tax or compliance consulting or training services provided by the Auditors to a Fund’s investment adviser and its controlling entities (where pre-approval is required because the engagement relates directly to the operations and financial reporting of the Fund) if the fee to the Auditors for any particular engagement is not anticipated to exceed $50,000. For any such pre-approval sought from the Chair, Management shall prepare a brief description of the proposed services.
If the Chair approves of such service, he or she shall sign the statement prepared by Management. Such written statement shall be presented to the full Committees at their next regularly scheduled meetings.
(e)(2) Not applicable.
(f) Not applicable.
3
(g) Not applicable.
(h) Not applicable.
(i) Not applicable.
(j) Not applicable.
ITEM 5. AUDIT COMMITTEE OF LISTED REGISTRANTS
Not applicable.
ITEM 6. INVESTMENTS
A Portfolio of Investments for the series of Allspring Funds Trust is included as part of the report to shareholders filed under Item 1 of this Form.
ITEM 7. DISCLOSURE OF PROXY VOTING POLICIES AND PROCEDURES FOR CLOSED-END MANAGEMENT INVESTMENT COMPANIES
Not applicable.
ITEM 8. PORTFOLIO MANAGERS OF CLOSED-END MANAGEMENT INVESTMENT COMPANIES
Not applicable.
ITEM 9. PURCHASES OF EQUITY SECURITIES BY CLOSED-END MANAGEMENT INVESTMENT COMPANY AND AFFILIATED PURCHASERS
Not applicable.
ITEM 10. SUBMISSION OF MATTERS TO A VOTE OF SECURITY HOLDERS
There have been no material changes to the procedures by which shareholders may recommend nominees to the registrant’s Board of Trustees that have been implemented since the registrant’s last provided disclosure in response to the requirements of this Item.
ITEM 11. CONTROLS AND PROCEDURES
(a) The President and Treasurer have concluded that the Allspring Funds Trust disclosure controls and procedures (as defined in Rule 30a-3(c) under the Investment Company Act of 1940) provide reasonable assurances that material information relating to the registrant is made known to them by the appropriate persons based on their evaluation of these controls and procedures as of a date within 90 days of the filing of this report.
(b) There were no significant changes in the registrant’s internal control over financial reporting (as defined in Rule 30a-3(d) under the Investment Company Act of 1940) that occurred during the period covered by this report that materially affected, or is reasonably likely to materially affect, the registrant’s internal control over financial reporting.
4
ITEM 12. DISCLOSURES OF SECURITIES LENDING ACTIVITES FOR CLOSED-END MANAGEMENT INVESTMENT COMPANIES
Not applicable.
ITEM 13. EXHIBITS
| (a)(1) | Code of Ethics. | |
| (a)(2) | Certifications pursuant to Section 302 of the Sarbanes-Oxley Act of 2002. | |
| (a)(3) | Not applicable. | |
| (a)(4) | Not applicable. | |
| (b) | Certifications pursuant to Section 906 of the Sarbanes-Oxley Act of 2002. | |
5
SIGNATURES
Pursuant to the requirements of the Securities Exchange Act of 1934 and the Investment Company Act of 1940, the registrant has duly caused this report to be signed on its behalf by the undersigned, thereunto duly authorized.
| Allspring Funds Trust | ||
| By: | /s/ Andrew Owen | |
| Andrew Owen | ||
| President | ||
| Date: December 27, 2023 | ||
Pursuant to the requirements of the Securities Exchange Act of 1934 and the Investment Company Act of 1940, this report has been signed below by the following persons on behalf of the registrant and in the capacities and on the date indicated.
| Allspring Funds Trust | ||
| By: | /s/ Andrew Owen | |
| Andrew Owen | ||
| President | ||
| Date: December 27, 2023 | ||
| By: | /s/Jeremy DePalma | |
| Jeremy DePalma | ||
| Treasurer | ||
| Date: December 27, 2023 | ||
Exhibit 13(a)(1)
Allspring Funds Trust
Allspring Master Trust
Allspring Variable Trust
Allspring Global Dividend Opportunity Fund
Allspring Income Opportunities Fund
Allspring Multi-Sector Income Fund
Allspring Utilities and High-Income Fund
Joint Code of Ethics for Principal Executive Officer and Senior Financial Officers
| I. | Covered Officers / Purpose of the Code |
This Code of Ethics (“Code”) of Allspring Funds Trust, Allspring Master Trust and Allspring Variable Trust, Allspring Global Dividend Opportunity Fund, Allspring Income Opportunities Fund, Allspring Multi-Sector Income Fund and Allspring Utilities and High Income Fund (collectively, the “Trusts” and each, “a Trust”) applies to each Trust’s Principal Executive Officer, Principal Financial Officer and any other Trust officer’s listed on Exhibit A (the “Covered Officers”) for the purpose of promoting:
| • | honest and ethical conduct, including the ethical handling of actual or apparent conflicts of interest between personal and professional relationships; |
| • | full, fair, accurate, timely and understandable financial disclosure in reports and documents that a Trust files with, or submits to, the Securities and Exchange Commission (“SEC”) and in other public communications made by the Trust; |
| • | compliance with applicable laws and governmental rules and regulations; |
| • | the prompt internal reporting of violations of the Code to an appropriate person or persons identified in the Code; and |
| • | accountability for adherence to the Code. |
Each Covered Officer should adhere to a high standard of business ethics and should be sensitive to situations that may give rise to actual as well as apparent conflicts of interest.
| II. | Covered Officers Should Handle Ethically Both Actual and Apparent Conflicts of Interest |
Overview. A “conflict of interest” occurs when a Covered Officer’s private interest interferes with the interests of, or his or her service to, a Trust. For example, a conflict of interest would arise if a Covered Officer, or a member of his or her family, receives improper personal benefits as a result of his or her position with the Trust. Certain conflicts of interest arise out of the relationships between Covered Officers and the Trust and already are subject to conflict of interest provisions in the Investment Company Act of 1940 (“Investment Company Act”) and the Investment Advisers Act of 1940 (“Investment Advisers Act”). For example, Covered Officers may not individually engage in certain transactions (such as the purchase or sale of securities or other property) with the Trust because of their status as “affiliated persons” of the Trust. The compliance programs and procedures of the Trust and Allspring Funds Management, LLC (the “Adviser”) are designed to prevent, or identify and correct, violations of these provisions. This Code does not, and is not intended to, repeat or replace these programs and procedures, and such conflicts fall outside of the parameters of this Code.
1
Although typically not presenting an opportunity for improper personal benefit, conflicts arise from, or as a result of, the contractual relationship between the Trust and the Adviser, of which the Covered Officers are also officers or employees. As a result, this Code recognizes that the Covered Officers will, in the normal course of their duties (whether formally for the Trust or for the Adviser, or for both), be involved in establishing policies and implementing decisions that will have different effects on the Adviser and the Trust. The participation of the Covered Officers in such activities is inherent in the contractual relationship between the Trust and the Adviser and is consistent with the performance by the Covered Officers of their duties as officers of the Trust. Each Covered Officer recognizes that, as an officer of a Trust, he or she has a duty to act in the best interests of the Trust and its shareholders. If a Covered Officer believes that his or her responsibilities as an officer or employee of the Adviser are likely to materially compromise his or her objectivity or his or her ability to perform the duties of his or her role as an officer of the Trust, he or she should consult with the Chief Legal Officer. Under appropriate circumstances, a Covered Officer should also consider whether to present the matter to the Board. In addition, it is recognized by the Trust’s Board of Trustees (“Board”) that the Covered Officers may also be officers or employees of one or more other investment companies covered by this or other codes.
Other conflicts of interest are covered by the Code, even if such conflicts of interest are not subject to provisions in the Investment Company Act and the Investment Advisers Act. The following list provides examples of conflicts of interest under the Code, but Covered Officers should keep in mind that these examples are not exhaustive. The overarching principle is that the personal interest of a Covered Officer should not be placed improperly before the interest of the Trust.
* * * *
Each Covered Officer must:
| • | not use his or her personal influence or personal relationships improperly to influence investment decisions or financial reporting by a Trust whereby the Covered Officer would benefit personally to the detriment of the Trust; |
| • | not cause the Trust to take action, or fail to take action, for the individual personal benefit of the Covered Officer rather than the benefit of a Trust; |
| • | not use material non-public knowledge of portfolio transactions made or contemplated for the Trust to trade personally or cause others to trade personally in contemplation of the market effect of such transactions; |
| • | not retaliate against any other Covered Officer or any employee of a Trust or its affiliated persons for reports of potential violations that are made in good faith; and |
| • | not engage in personal, business or professional relationships or dealings that would impair his or her independence of judgment or adversely affect the performance of his or her duties in the best interests of the Trust and their shareholders. |
There are some conflict of interest situations that should always be approved in advance by the Chief Legal Officer of the Trust (the “Chief Legal Officer”) if material. Examples of these include:
2
| • | service as a director on the board of any public or private for-profit company (provided, however, that a Covered Officer who is employed by another company (e.g., Allspring) may serve as a director of such company or any entity, controlling, controlled by, or under common control with, such company); |
| • | acquiring a financial interest in any company that provides services to the Trust (provided, however, that a Covered Officer who is employed by another company (e.g., Allspring) may have an ownership interest in his or her employer or the employer’s parent company); |
| • | the receipt of any entertainment or gifts from any person or company with which the Trust has current or prospective business dealings unless such entertainment is business-related, reasonable in cost, appropriate as to time and place, and not so frequent as to raise any question of impropriety; |
| • | any consulting or employment relationship with any of the Trust’s service providers, other than with the primary employer of the Covered Officer; and |
| • | a direct or indirect financial interest in commissions, transaction charges or spreads paid by the Trust for effecting portfolio transactions or for selling or redeeming shares, other than an interest arising from the Covered Officer’s primary employment, such as compensation or equity ownership. |
| III. | Disclosure and Compliance |
Each Covered Officer should familiarize himself or herself with the disclosure requirements generally applicable to the Trust.
Each Covered Officer should not knowingly misrepresent, or cause others to misrepresent, facts about the Trust to others, whether within or outside the Trust, including to the Board and the Trust’s auditors, and to governmental regulators and self-regulatory organizations.
Each Covered Officer should, to the extent appropriate within his or her area of responsibility, consult with other officers and employees of the Trust and the Adviser with the goal of promoting full, fair, accurate, timely and understandable disclosure in the reports and documents the Trust files with, or submits to, the SEC and in other public communications made by the Trust.
It is the responsibility of each Covered Officer to promote compliance with the standards and restrictions imposed by applicable laws, rules and regulations.
Each Covered Officer should, consistent with his or her responsibilities, exercise appropriate supervision over and assist relevant Trust service providers in developing financial information and other disclosure that complies with relevant law and presents information in a clear, comprehensible and complete manner.
Each Covered Officer is responsible for the accuracy of the records and reports that he or she is responsible for maintaining. The books and records of the Trust shall meet the highest standards and accurately reflect the true nature of the transactions they record. The Covered Officers must not create false or misleading documents or accounting, financial or electronic records for any purpose, and must not direct any other person to do so. If a Covered Officer becomes aware that information filed with the SEC or made available to the public contains any false or misleading information or omits to disclose necessary information, he shall promptly report it to Chief Legal Officer for a determination as to what, if any, corrective action is necessary or appropriate.
3
No undisclosed or unrecorded account or fund shall be established for any purpose. No false or misleading entries shall be made in a Trust’s books or records for any reason. No disbursement of a Trust’s assets shall be made without adequate supporting documentation or for any purpose other than as described in the Trust’s documents or contracts.
A Trust will maintain and preserve for a period of not less than six (6) years from the date such action is taken, the first two (2) years in an easily accessible place, a copy of the information or materials supplied to the Board: (i) that provided the basis for any amendment or waiver to this Code, and (ii) relating to any violation of the Code and sanctions imposed for such violation, together with a written record of the approval or action taken by the Board.
| IV. | Reporting and Accountability |
Each Covered Officer must:
| • | upon adoption of the Code (or thereafter upon becoming a Covered Officer), affirm in writing (in the form attached to this Code) to the Board that he or she has received, read, and understands the Code; |
| • | annually thereafter affirm in writing (in the form attached to this Code) to the Board that he or she has complied with the requirements of the Code; and |
| • | notify the Chief Legal Officer of the Trust promptly if he or she knows of any violation of this Code. Failure to do so is itself a violation of this Code. |
The Chief Legal Officer is responsible for applying this Code to specific situations in which questions are presented under it and has the authority to interpret this Code in any particular situation. While the Chief Legal Officer in authorized to interpret this Code, an approval of a situation that is expressly prohibited by this Code is deemed to be a “waiver” and can be approved only by the Board.
The Trust will follow these procedures in investigating and enforcing this Code:
| • | the Chief Legal Officer will take all appropriate action to investigate any potential violations reported to him or her; |
| • | if, after such investigation, the Chief Legal Officer believes that no violation has occurred, the Chief Legal Officer is not required to take any further action; |
| • | any matter that the Chief Legal Officer believes is a violation will be reported to the Board; |
| • | if the Board concurs that a violation has occurred, it will consider appropriate action, which may include review of, and appropriate modifications to, applicable policies and procedures; notification to appropriate personnel of the Adviser; or a recommendation to dismiss the Covered Officer; |
| • | the Board will be responsible for granting waivers, as appropriate (a “waiver” is the approval of a situation that is expressly prohibited by this Code); and |
4
| • | any changes to or waivers of this Code will, to the extent required, be disclosed as provided by SEC rules. |
| V. | Other Policies and Procedures |
This Code shall be the sole code of ethics adopted by the Trusts for purposes of Section 406 of the Sarbanes-Oxley Act and the rules and forms applicable to registered investment companies thereunder. Insofar as other policies or procedures of the Trusts or the Adviser govern or purport to govern the behavior or activities of the Covered Officers who are subject to this Code, they are superseded by this Code to the extent that they overlap or conflict with the provisions of this Code. The codes of ethics adopted by the Trusts and the Adviser under Rule 17j-1 under the Investment Company Act are separate requirements applying to the Covered Officers and others, and are not part of this Code.
| VI. | Amendments |
Any amendments to this Code, other than amendments to Exhibit A, must be approved or ratified by a majority vote of the Board, including a majority of independent Trustees.
| VII. | Confidentiality |
All reports and records prepared or maintained pursuant to this Code will be considered confidential and shall be maintained and protected accordingly. Except upon request of the SEC or another regulatory agency, or as otherwise required by law or this Code, such matters shall not be disclosed to anyone other than Board and its counsel.
| VIII. | Internal Use |
The Code is intended solely for the internal use by each Trust and does not constitute an admission, by or on behalf of any Trust, as to any fact, circumstance, or legal conclusion.
| IX. | Disclosure of Code of Ethics to the Public |
Pursuant to Item 2(f) of Form N-CSR the registrant is required to disclose the Code of Ethics per one of the methods listed below:
| (1) | File with the Commission, pursuant to Item 13(a)(1), a copy of its code of ethics that applies to the registrant’s principal executive officer, principal financial officer, principal accounting officer or controller, or persons performing similar functions, as an exhibit to its annual report on this Form N-CSR; |
| (2) | Post the text of such code of ethics on its Internet website and disclose, in its most recent report on this Form N- CSR, its Internet address and the fact that it has posted such code of ethics on its Internet website; or |
| (3) | Undertake in its most recent report on this Form N-CSR to provide to any person without charge, upon request, a copy of such code of ethics and explain the manner in which such request may be made. |
5
| X. | Interpretation of Code |
This Code will not be interpreted or applied in any manner that would violate the legal rights of any Covered Officer as an employee under applicable law. For example, nothing in this Code or the Exhibits attached hereto prohibits or in any way restricts any Covered Officer from reporting possible violations of law or regulation to, otherwise communicating directly with, cooperating with or providing information to any governmental or regulatory body or any self-regulatory organization or making other disclosures that are protected under applicable law or regulations of the SEC or any other governmental or regulatory body or self-regulatory organization. A Covered Officer does not need prior authorization of the Trust or Adviser before taking any such action and is not required to inform the Trust or Adviser if he or she chooses to take such action.
Amended: January 31, 2022
6
Exhibit A
Persons Covered by the Code
Andrew Owen, President of each Trust
Jeremy DePalma, Treasurer of each Trust
Exhibit A amended: January 31, 2022
7
Exhibit 13(a)(2)
CERTIFICATION
I, Andrew Owen, certify that:
1. I have reviewed this report on Form N-CSR of Allspring Funds Trust on behalf of the following series: Allspring CoreBuilder Shares-Series EM, Allspring Emerging Markets Equity Fund, Allspring Emerging Markets Equity Income Fund, Allspring Global Long/Short Equity Fund, Allspring International Equity Fund, Allspring Special Global Small Cap Fund, Allspring Special International Small Cap Fund, and Allspring U.S. Long/Short Equity Fund;
2. Based on my knowledge, this report does not contain any untrue statement of a material fact or omit to state a material fact necessary to make the statements made, in light of the circumstances under which such statements were made, not misleading with respect to the period covered by this report;
3. Based on my knowledge, the financial statements, and other financial information included in this report, fairly present in all material respects the financial condition, results of operations, changes in net assets, and cash flows (if the financial statements are required to include a statement of cash flows) of the registrant as of, and for, the periods presented in this report;
4. The registrant’s other certifying officers and I are responsible for establishing and maintaining disclosure controls and procedures (as defined in Rule 30a-3(c) under the Investment Company Act of 1940) and internal control over financial reporting (as defined in Rule 30a-3(d) under the Investment Company Act of 1940) for the registrant and have:
a) designed such disclosure controls and procedures or caused such disclosure controls and procedures to be designed under our supervision, to ensure that material information relating to the registrant, including its consolidated subsidiaries, is made known to us by others within those entities, particularly during the period in which this report is being prepared;
b) designed such internal control over financial reporting, or caused such internal control over financial reporting to be designed under our supervision, to provide reasonable assurance regarding the reliability of financial reporting and the preparation of financial statements for external purposes in accordance with generally accepted accounting principles;
c) evaluated the effectiveness of the registrant’s disclosure controls and procedures and presented in this report our conclusions about the effectiveness of the disclosure controls and procedures, as of a date within 90 days prior to the filing of this report based on such evaluation; and
d) disclosed in this report any change in the registrant’s internal controls over financial reporting that occurred during the period covered by this report that has materially affected, or is reasonably likely to materially affect, the registrant’s internal control over financial reporting; and
5. The registrant’s other certifying officers and I have disclosed to the registrant’s auditors and the audit committee of the registrant’s Board of Trustees (or persons performing the equivalent functions):
a) all significant deficiencies and material weaknesses in the design or operation of internal controls over financial reporting which are reasonably likely to adversely affect the registrant’s ability to record, process, summarize, and report financial information; and
b) any fraud, whether or not material, that involves management or other employees who have a significant role in the registrant’s internal controls over financial reporting.
| Date: December 27, 2023 |
| /s/ Andrew Owen |
| Andrew Owen |
| President |
| Allspring Funds Trust |
CERTIFICATION
I, Jeremy DePalma, certify that:
1. I have reviewed this report on Form N-CSR of Allspring Funds Trust on behalf of the following series: Allspring CoreBuilder Shares-Series EM, Allspring Emerging Markets Equity Fund, Allspring Emerging Markets Equity Income Fund, Allspring Global Long/Short Equity Fund, Allspring International Equity Fund, Allspring Special Global Small Cap Fund, Allspring Special International Small Cap Fund, and Allspring U.S. Long/Short Equity Fund;
2. Based on my knowledge, this report does not contain any untrue statement of a material fact or omit to state a material fact necessary to make the statements made, in light of the circumstances under which such statements were made, not misleading with respect to the period covered by this report;
3. Based on my knowledge, the financial statements, and other financial information included in this report, fairly present in all material respects the financial condition, results of operations, changes in net assets, and cash flows (if the financial statements are required to include a statement of cash flows) of the registrant as of, and for, the periods presented in this report;
4. The registrant’s other certifying officers and I are responsible for establishing and maintaining disclosure controls and procedures (as defined in Rule 30a-3(c) under the Investment Company Act of 1940) and internal control over financial reporting (as defined in Rule 30a-3(d) under the Investment Company Act of 1940) for the registrant and have:
a) designed such disclosure controls and procedures or caused such disclosure controls and procedures to be designed under our supervision, to ensure that material information relating to the registrant, including its consolidated subsidiaries, is made known to us by others within those entities, particularly during the period in which this report is being prepared;
b) designed such internal control over financial reporting, or caused such internal control over financial reporting to be designed under our supervision, to provide reasonable assurance regarding the reliability of financial reporting and the preparation of financial statements for external purposes in accordance with generally accepted accounting principles;
c) evaluated the effectiveness of the registrant’s disclosure controls and procedures and presented in this report our conclusions about the effectiveness of the disclosure controls and procedures, as of a date within 90 days prior to the filing of this report based on such evaluation; and
d) disclosed in this report any change in the registrant’s internal controls over financial reporting that occurred during the period covered by this report that has materially affected, or is reasonably likely to materially affect, the registrant’s internal control over financial reporting; and
5. The registrant’s other certifying officers and I have disclosed to the registrant’s auditors and the audit committee of the registrant’s Board of Trustees (or persons performing the equivalent functions):
a) all significant deficiencies in the design or operation of internal controls over financial reporting which are reasonably likely to adversely affect the registrant’s ability to record, process, summarize, and report financial information; and
b) any fraud, whether or not material, that involves management or other employees who have a significant role in the registrant’s internal controls over financial reporting.
| Date: December 27, 2023 |
| /s/ Jeremy DePalma |
| Jeremy DePalma |
| Treasurer |
| Allspring Funds Trust |
Exhibit 13(b)
SECTION 906 CERTIFICATION
Pursuant to 18 U.S.C. § 1350, the undersigned officer of Allspring Funds Trust, hereby certifies, to the best of his knowledge, that the registrant’s report on Form N-CSR for the year ended October 31, 2023 (the “Report”) fully complies with the requirements of Section 13(a) or Section 15(d), as applicable, of the Securities Exchange Act of 1934 and that the information contained in the Report fairly presents, in all material respects, the financial condition and results of operations of the registrant.
Date: December 27, 2023
| By: | /s/ Andrew Owen | |
| Andrew Owen | ||
| President | ||
| Allspring Funds Trust |
This certification is being furnished to the Securities and Exchange Commission pursuant to Rule 30a-2(b) under the Investment Company Act of 1940, as amended, and 18 U.S.C. Section 1350 and is not being filed as part of the Form N-CSR with the Securities and Exchange Commission.
SECTION 906 CERTIFICATION
Pursuant to 18 U.S.C. § 1350, the undersigned officer of Allspring Funds Trust, hereby certifies, to the best of his knowledge, that the registrant’s report on Form N-CSR for the year ended October 31, 2023 (the “Report”) fully complies with the requirements of Section 13(a) or Section 15(d), as applicable, of the Securities Exchange Act of 1934 and that the information contained in the Report fairly presents, in all material respects, the financial condition and results of operations of the registrant.
Date: December 27, 2023
| By: | /s/ Jeremy DePalma | |
| Jeremy DePalma | ||
| Treasurer | ||
| Allspring Funds Trust |
This certification is being furnished to the Securities and Exchange Commission pursuant to Rule 30a-2(b) under the Investment Company Act of 1940, as amended, and 18 U.S.C. Section 1350 and is not being filed as part of the Form N-CSR with the Securities and Exchange Commission.