Exhibit (c)(1)

PRELIMINARY BACKGROUND MATERIALS Project Panda Presentation to the Special Committee of the Board of Directors June 18, 2022
SECURITIES AND EXCHANGE COMMISSION
WASHINGTON, D.C. 20549
SCHEDULE 13E-3
RULE 13E-3 TRANSACTION STATEMENT UNDER SECTION 13(E)
OF THE SECURITIES ACT OF 1934
PZENA INVESTMENT MANAGEMENT, INC.
(Name of the Issuer)
Pzena Investment Management, Inc.
Pzena Investment Management, LLC
Panda Merger Sub, LLC
(Names of Persons Filing Statement)
Class A Common Stock, par value $0.01 per share
(Title of Class of Securities)
74731Q103
(CUSIP Number of Class of Securities)
| Joan Berger | Richard S. Pzena | |
| Pzena Investment Management, Inc. | Pzena Investment Management, LLC | |
| 320 Park Avenue, 8th Floor | 320 Park Avenue, 8th Floor | |
| New York, NY 10022 | New York, NY 10022 | |
| (212) 355-1600 | (212) 355-1600 |
(Name, Address, and Telephone Numbers of Person Authorized to Receive Notices and Communications on Behalf of the Persons Filing Statement)
With copies to
| Andrew J. Nussbaum Nicholas G. Demmo |
Scott Golenbock Milbank LLP | |
| Wachtell, Lipton, Rosen & Katz | 55 Hudson Yards | |
| 51 West 52nd Street | New York, NY 10011-2163 | |
| New York, NY 10019 | (212) 553-5000 | |
| (212) 403-1000 |
This statement is filed in connection with (check the appropriate box):
| a. | ☒ | The filing of solicitation materials or an information statement subject to Regulation 14A, Regulation 14C or Rule 13e-3(c) under the Securities Exchange Act of 1934. | ||
| b. | ☐ | The filing of a registration statement under the Securities Act of 1933. | ||
| c. | ☐ | A tender offer. | ||
| d. | ☐ | None of the above. | ||
Check the following box if the soliciting materials or information statement referred to in checking box (a) are preliminary copies: ☒
Introduction
This Transaction Statement on Schedule 13E-3 (which we refer to as this “Transaction Statement”) is being filed with the U.S. Securities and Exchange Commission (which we refer to as the “SEC”) pursuant to Section 13(e) of the Securities Exchange Act of 1934, as amended (which we refer to, together with the rules and regulations promulgated thereunder, as the “Exchange Act”), by (1) Pzena Investment Management, Inc., a Delaware corporation (which we refer to as “PZN” or the “Company”); (2) Pzena Investment Management, LLC, a Delaware limited liability company (which we refer to as “PIM, LLC”); and (3) Panda Merger Sub, LLC , a Delaware limited liability company and a wholly owned subsidiary of PIM, LLC (which we refer to as “Merger Sub”). The persons filing this Transaction Statement are collectively referred to as the “Filing Persons”.
This Transaction Statement relates to the Agreement and Plan of Merger, dated as of July 26, 2022 (which we refer to, as it may be amended from time to time, as the “merger agreement”), by and among the Company, PIM, LLC and Merger Sub. If the merger agreement is adopted by the Company’s stockholders and the other conditions under the merger agreement are either satisfied or waived, the Company will be merged with and into Merger Sub (which we refer to as the “merger”), with Merger Sub surviving the merger as a wholly owned subsidiary of PIM, LLC. At the effective time of the merger, (1) each outstanding share of Class A common stock, par value $0.01 per share, of the Company (which we refer to as “PZN Class A common stock”) (other than (x) shares PZN Class A common stock that are to be cancelled in accordance with the merger agreement and (y) shares of PZN Class A common stock that are owned by stockholders of the Company who did not vote in favor of the adoption of the merger agreement and who have perfected and have not withdrawn a demand for appraisal rights pursuant to Section 262 of the DGCL) will be converted into the right to receive $9.60 in cash per share, without interest (which we refer to as the “merger consideration”) and (2) each outstanding share of Class B common stock, par value $0.000001 per share, of the Company (which we refer to as “PZN Class B common stock”) will be automatically cancelled and the holders thereof will not receive the merger consideration. Following the completion of the merger, the PZN Class A common stock will be delisted from the New York Stock Exchange, will be deregistered under the Exchange Act and will cease to be publicly traded.
The board of directors of the Company (which we refer to as the “Board”) formed a special committee (which we refer to as the “Special Committee”) consisting solely of independent and disinterested directors to, among other things, evaluate the merger. After reviewing the terms of the merger agreement with its independent legal and financial advisors, the Special Committee unanimously determined that the transactions contemplated by the merger agreement, including the merger, are fair to and in the best interests of the Company and the holders of PZN Class A common stock, and unanimously recommended that the Board approve the merger agreement and that the Company’s stockholders vote for the adoption of the merger agreement.
Based on the Special Committee’s recommendation, the Board (other than five directors who recused themselves due to their affiliation with PIM, LLC and/or their interests in the transaction) has determined that the transactions contemplated by the merger agreement, including the merger, are fair to and in the best interests of the Company and the holders of PZN Class A common stock; has approved and declared advisable the merger agreement and transactions contemplated thereby; and has recommended that the Company’s stockholders vote for the adoption of the merger agreement and for the other proposals described in the Proxy Statement (as defined below).
The merger cannot be completed unless both (1) the holders of a majority of the total number of votes of Company common stock outstanding and (2) the holders of a majority of the outstanding shares of PZN Class A common stock not owned, directly or indirectly, by PIM, LLC, Merger Sub or any holder of PZN Class B common stock vote in favor of the adoption of the merger agreement.
Concurrently with the filing of this Transaction Statement, the Company is filing a proxy statement (which we refer to as the “Proxy Statement”) under Regulation 14A of the Exchange Act with the SEC, pursuant to which the Company is soliciting proxies from stockholders of the Company in connection with the merger. The Proxy Statement is attached hereto as Exhibit (a)(1). A copy of the merger agreement is attached to the Proxy Statement as Annex A and is incorporated herein by reference. As of the date hereof, the Proxy Statement is in preliminary form, and is subject to completion or amendment. Terms used but not defined in this Transaction Statement have the meanings assigned to them in the Proxy Statement.
Pursuant to General Instruction F to Schedule 13E-3, the information in the Proxy Statement, including all annexes thereto, is expressly incorporated by reference herein in its entirety, and responses to each item herein are qualified in their entirety by the information contained in the Proxy Statement. The cross-references below are being supplied pursuant to General Instruction G to Schedule 13E-3 and show the location in the Proxy Statement of the information required to be included in response to the items of Schedule 13E-3.
While each of the Filing Persons acknowledges that the merger is a going private transaction for purposes of Rule 13e-3 under the Exchange Act, the filing of this Transaction Statement shall not be construed as an admission by any Filing Person, or by any affiliate of a Filing Person, that the Company is “controlled” by any of the Filing Persons and/or their respective affiliates.
All information contained in, or incorporated by reference into, this Transaction Statement concerning each Filing Person has been supplied by such Filing Person.
Item 1. Summary Term Sheet (Regulation M-A Item 1001)
The information set forth in the Proxy Statement under the following captions is incorporated herein by reference:
“Summary Term Sheet”
“Questions and Answers About the Special Meeting and the Merger”
Item 2. Subject Company Information (Regulation M-A Item 1002)
(a) Name and address. The Company’s name, and the address and telephone number of its principal executive offices are:
Pzena Investment Management, Inc.
320 Park Avenue, 8th Floor
New York, New York 10022
(212) 355-1600
(b) Securities. The information set forth in the Proxy Statement under the following captions is incorporated herein by reference:
“Questions and Answers About the Special Meeting and the Merger—How many votes do I have?”
“The Special Meeting—Record Date and Quorum”
(c) Trading market and price. The information set forth in the Proxy Statement under the following caption is incorporated herein by reference:
“Other Important Information Regarding the Company—Market Price of Class A Common Stock and Dividends”
(d) Dividends. The information set forth in the Proxy Statement under the following caption is incorporated herein by reference:
“Other Important Information Regarding the Company—Market Price of Class A Common Stock and Dividends”
(e) Prior public offerings. Not applicable.
2
(f) Prior stock purchases. The information set forth in the Proxy Statement under the following caption is incorporated herein by reference:
“Other Important Information Regarding the Company—Certain Transactions in the Shares of Common Stock”
Item 3. Identity and Background of Filing Person (Regulation M-A Item 1003)
(a) – (b) Name and Address of Each Filing Person; Business and Background of Entities. The information set forth in the Proxy Statement under the following captions is incorporated herein by reference:
“Summary Term Sheet—Parties to the Merger”
“Parties to the Merger”
“Other Important Information Regarding the Company—Directors and Executive Officers of the Company”
“Other Important Information Regarding PIM, LLC”
“Where You Can Find More Information”
(c) Business and Background of Natural Persons. The information set forth in the Proxy Statement under the following captions is incorporated herein by reference:
“Other Important Information Regarding the Company—Directors and Executive Officers of the Company”
“Other Important Information Regarding PIM, LLC”
“Where You Can Find More Information”
Item 4. Terms of the Transaction (Regulation M-A Item 1004)
(a) Material terms.
(1) Tender offer. Not applicable
(2) Merger or Similar Transactions.
(i) The information set forth in the Proxy Statement under the following captions is incorporated herein by reference:
“Summary Term Sheet”
“Questions and Answers About the Special Meeting and the Merger”
“Special Factors—Certain Effects of the Merger”
“Special Factors—Background of the Merger”
“Special Factors—Effective Time of the Merger”
“Special Factors—Payment of Merger Consideration”
“The Merger Agreement—Closing and Effective Time of the Merger”
“The Merger Agreement—Treatment of Common Stock and Company Equity Awards”
“The Merger Agreement—Conditions to the Merger”
(ii) The information set forth in the Proxy Statement under the following captions is incorporated herein by reference:
“Summary Term Sheet”
“Questions and Answers About the Special Meeting and the Merger”
3
“Special Factors—Certain Effects of the Merger”
“Special Factors—Payment of Merger Consideration”
“The Merger Agreement—Treatment of Common Stock and Company Equity Awards”
(iii) The information set forth in the Proxy Statement under the following captions is incorporated herein by reference:
“Special Factors—Reasons for the Merger; Recommendation of the Special Committee and the Board; Fairness of the Merger”
“Special Factors—Position of PIM, LLC as to the Fairness of the Merger”
“Special Factors—Purpose and Reasons of PIM, LLC for the Merger”
“Special Factors—Plans for the Company After the Merger”
“Special Factors—Opinion of Ardea Partners LP”
“Special Factors—Opinion of CastleOak Securities, L.P.”
“Special Factors—Unaudited Prospective Financial Information of the Company”
(iv) The information set forth in the Proxy Statement under the following captions is incorporated herein by reference:
“Questions and Answers About the Special Meeting and the Merger”
“The Merger Agreement—Stockholders Meeting”
“The Special Meeting—Vote Required”
“The Special Meeting—Management Stockholders’ Obligation to Vote in Favor of the Merger”
(v) The information set forth in the Proxy Statement under the following captions is incorporated herein by reference:
“Summary Term Sheet”
“Special Factors—Certain Effects of the Merger”
“Special Factors—Interests of Executive Officers and Directors of the Company in the Merger”
(vi) The information set forth in the Proxy Statement under the following caption is incorporated herein by reference:
“Special Factors—Accounting Treatment”
(vii) The information set forth in the Proxy Statement under the following caption is incorporated herein by reference:
“Special Factors—Material U.S. Federal Income Tax Consequences of the Merger”
(c) Different terms. The information set forth in the Proxy Statement under the following captions is incorporated herein by reference:
“Summary Term Sheet”
“Questions and Answers About the Special Meeting and the Merger”
“Special Factors—Certain Effects of the Merger”
“Special Factors—Interests of Executive Officers and Directors of the Company in the Merger”
“The Merger Agreement—Treatment of Common Stock and Company Equity Awards”
“The Voting Agreement”
4
(d) Appraisal rights. The information set forth in the Proxy Statement under the following captions is incorporated herein by reference:
“Summary Term Sheet”
“Questions and Answers About the Special Meeting and the Merger”
“Special Factors—Appraisal Rights”
(e) Provisions for unaffiliated security holders. The information set forth in the Proxy Statement under the following caption is incorporated herein by reference:
“Special Factors—Provisions for Unaffiliated Stockholders”
(f) Eligibility for listing or trading. Not applicable.
Item 5. Past Contacts, Transactions, Negotiations and Agreements (Regulation M-A Item 1005)
(a)(1) – (2) Transactions. The information set forth in the Proxy Statement under the following captions is incorporated herein by reference:
“Summary Term Sheet”
“Special Factors—Background of the Merger”
“Special Factors—Certain Effects of the Merger”
“Special Factors—Interests of Executive Officers and Directors of the Company in the Merger”
“The Merger Agreement—Treatment of Common Stock and Company Equity Awards”
“Other Important Information Regarding the Company—Certain Transactions in the Shares of Common Stock”
“The Voting Agreement”
(b) – (c) Significant corporate events; Negotiations or contacts. The information set forth in the Proxy Statement under the following captions is incorporated herein by reference:
“Summary Term Sheet”
“Special Factors—Background of the Merger”
“Special Factors—Reasons for the Merger; Recommendation of the Special Committee and the Board; Fairness of the Merger”
“Special Factors—Position of PIM, LLC as to the Fairness of the Merger”
“Special Factors—Purpose and Reasons of PIM, LLC for the Merger”
“Special Factors—Interests of Executive Officers and Directors of the Company in the Merger”
“Special Factors—Financing of the Merger”
“The Merger Agreement”
“The Voting Agreement”
Annex A—Agreement and Plan of Merger
Annex E—Voting Agreement
(e) Agreements involving the subject company’s securities. The information set forth in the Proxy Statement under the following captions is incorporated herein by reference:
“Summary Term Sheet”
5
“Questions and Answers About the Special Meeting and the Merger”
“Special Factors—Background of the Merger”
“Special Factors—Plans for the Company After the Merger”
“Special Factors—Financing of the Merger”
“The Merger Agreement”
“The Voting Agreement”
“The Special Meeting—Vote Required”
“The Special Meeting—Management Stockholders’ Obligation to Vote in Favor of the Merger”
“Other Important Information Regarding the Company—Certain Transactions in the Shares of Common Stock”
Annex A—Agreement and Plan of Merger
Annex E—Voting Agreement
Item 6. Purposes of the Transaction, and Plans or Proposals (Regulation M-A Item 1006)
(b) Use of securities acquired. The information set forth in the Proxy Statement under the following captions is incorporated herein by reference:
“Summary Term Sheet”
“Questions and Answers About the Special Meeting and the Merger”
“Special Factors—Plans for the Company After the Merger”
“Special Factors—Certain Effects of the Merger”
“Special Factors—Certain Effects of the Merger for PIM, LLC”
“Special Factors—Certain Effects on the Company if the Merger Is Not Completed”
“Special Factors—Payment of Merger Consideration”
“The Merger Agreement—Treatment of Common Stock and Company Equity Awards”
“Delisting and Deregistration of Common Stock”
(c)(1) – (8) Plans. The information set forth in the Proxy Statement under the following captions is incorporated herein by reference:
“Summary Term Sheet”
“Questions and Answers About the Special Meeting and the Merger”
“Special Factors—Background of the Merger”
“Special Factors—Reasons for the Merger; Recommendation of the Special Committee and the Board; Fairness of the Merger”
“Special Factors—Position of PIM, LLC as to the Fairness of the Merger”
“Special Factors—Purpose and Reasons of PIM, LLC for the Merger”
“Special Factors—Plans for the Company After the Merger”
“Special Factors—Certain Effects of the Merger”
“Special Factors—Certain Effects of the Merger for PIM, LLC”
“Special Factors—Certain Effects on the Company if the Merger Is Not Completed”
6
“Special Factors—Interests of Executive Officers and Directors of the Company in the Merger”
“Special Factors—Financing of the Merger”
“The Voting Agreement”
“The Merger Agreement—Effects of the Merger; Directors and Officers; Articles of Incorporation; Bylaws”
“The Merger Agreement—Closing and Effective Time of the Merger”
“The Merger Agreement—Treatment of Common Stock and Company Equity Awards”
“The Merger Agreement—Conduct of PIM, LLC Pending the Merger”
“Other Important Information Regarding the Company—Market Price of Class A Common Stock and Dividends”
“Other Important Information Regarding the Company—Directors and Executive Officers of the Company”
“Delisting and Deregistration of Common Stock”
Annex A—Agreement and Plan of Merger
Item 7. Purposes, Alternatives, Reasons and Effects (Regulation M-A Item 1013)
(a) Purposes. The information set forth in the Proxy Statement under the following captions is incorporated herein by reference:
“Summary Term Sheet”
“Questions and Answers About the Special Meeting and the Merger”
“Special Factors—Background of the Merger”
“Special Factors—Reasons for the Merger; Recommendation of the Special Committee and the Board; Fairness of the Merger”
“Special Factors—Position of PIM, LLC as to the Fairness of the Merger”
“Special Factors—Purpose and Reasons of PIM, LLC for the Merger”
“Special Factors—Plans for the Company After the Merger”
“Special Factors—Certain Effects of the Merger”
“Special Factors—Certain Effects of the Merger for PIM, LLC”
(b) Alternatives. The information set forth in the Proxy Statement under the following captions is incorporated herein by reference:
“Special Factors—Background of the Merger”
“Special Factors—Reasons for the Merger; Recommendation of the Special Committee and the Board; Fairness of the Merger”
“Special Factors—Position of PIM, LLC as to the Fairness of the Merger”
“Special Factors—Purpose and Reasons of PIM, LLC for the Merger”
(c) Reasons. The information set forth in the Proxy Statement under the following captions is incorporated herein by reference:
“Special Factors—Background of the Merger”
“Special Factors—Reasons for the Merger; Recommendation of the Special Committee and the Board; Fairness of the Merger”
7
“Special Factors—Position of PIM, LLC as to the Fairness of the Merger”
“Special Factors—Purpose and Reasons of PIM, LLC for the Merger”
“Special Factors—Opinion of Ardea Partners LP”
“Special Factors—Opinion of CastleOak Securities, L.P.”
“Special Factors—Unaudited Prospective Financial Information of the Company”
“Special Factors—Certain Effects of the Merger”
“Special Factors—Certain Effects of the Merger for PIM, LLC”
Annex B – Opinion of Ardea Partners LP
Annex C – Opinion of CastleOak Securities, L.P.
(d) Effects. The information set forth in the Proxy Statement under the following captions is incorporated herein by reference:
“Summary Term Sheet”
“Questions and Answers About the Special Meeting and the Merger”
“Special Factors—Background of the Merger”
“Special Factors—Reasons for the Merger; Recommendation of the Special Committee and the Board; Fairness of the Merger”
“Special Factors—Position of PIM, LLC as to the Fairness of the Merger”
“Special Factors—Purpose and Reasons of PIM, LLC for the Merger”
“Special Factors—Plans for the Company After the Merger”
“Special Factors—Certain Effects of the Merger”
“Special Factors—Certain Effects of the Merger for PIM, LLC”
“Special Factors—Certain Effects on the Company if the Merger Is Not Completed”
“Special Factors—Interests of Executive Officers and Directors of the Company in the Merger”
“Special Factors—Material U.S. Federal Income Tax Consequences of the Merger”
“Special Factors—Accounting Treatment”
“Special Factors—Financing of the Merger”
“Special Factors—Fees and Expenses”
“Special Factors—Payment of Merger Consideration”
“The Merger Agreement—Effects of the Merger; Directors and Officers; Articles of Incorporation; Bylaws”
“The Merger Agreement—Treatment of Common Stock and Company Equity Awards”
“The Merger Agreement—Conduct of PIM, LLC Pending the Merger”
“Other Important Information Regarding the Company—Market Price of Class A Common Stock and Dividends”
“Delisting and Deregistration of Common Stock”
Annex A—Agreement and Plan of Merger
8
Item 8. Fairness of the Transaction (Regulation M-A Item 1014)
(a) – (b) Fairness; Factors considered in determining fairness. The information set forth in the Proxy Statement under the following captions is incorporated herein by reference:
“Summary Term Sheet”
“Questions and Answers About the Special Meeting and the Merger”
“Special Factors—Background of the Merger”
“Special Factors—Reasons for the Merger; Recommendation of the Special Committee and the Board; Fairness of the Merger”
“Special Factors—Position of PIM, LLC as to the Fairness of the Merger”
“Special Factors—Opinion of Ardea Partners LP”
“Special Factors—Opinion of CastleOak Securities, L.P.”
“Special Factors—Purpose and Reasons of PIM, LLC for the Merger”
“Special Factors—Certain Effects of the Merger”
“Special Factors—Interests of Executive Officers and Directors of the Company in the Merger”
Annex B – Opinion of Ardea Partners LP
Annex C – Opinion of CastleOak Securities, L.P.
Presentation of Ardea Partners LP to the Special Committee of the Board of Directors, dated as of June 18, 2022, is attached hereto as Exhibit (c)(1) and is incorporated herein by reference.
Presentation of Ardea Partners LP to the Special Committee of the Board of Directors, dated as of July 6, 2022, is attached hereto as Exhibit (c)(2) and is incorporated herein by reference.
Presentation of Ardea Partners LP to the Special Committee of the Board of Directors, dated as of July 26, 2022 (and presented on July 25, 2022), is attached hereto as Exhibit (c)(3) and is incorporated herein by reference.
Presentation of Ardea Partners LP to the Special Committee of the Board of Directors, dated as of July 26, 2022, is attached hereto as Exhibit (c)(4) and is incorporated herein by reference.
Presentation of CastleOak Securities, L.P. to the Special Committee of the Board of Directors, dated as of July 6, 2022, is attached hereto as Exhibit (c)(5) and is incorporated herein by reference.
Presentation of CastleOak Securities, L.P. to the Special Committee of the Board of Directors, dated as of July 25, 2022, is attached hereto as Exhibit (c)(6) and is incorporated herein by reference.
(c) Approval of security holders. The information set forth in the Proxy Statement under the following captions is incorporated herein by reference:
“Summary Term Sheet”
“Questions and Answers About the Special Meeting and the Merger”
“Special Factors—Reasons for the Merger; Recommendation of the Special Committee and the Board; Fairness of the Merger”
“Special Factors—Position of PIM, LLC as to the Fairness of the Merger”
“The Merger Agreement—Conditions to the Merger”
“The Special Meeting—Vote Required”
Annex A—Agreement and Plan of Merger
9
(d) Unaffiliated representative. The information set forth in the Proxy Statement under the following captions is incorporated herein by reference:
“Special Factors—Background of the Merger”
“Special Factors—Reasons for the Merger; Recommendation of the Special Committee and the Board; Fairness of the Merger”
“Special Factors—Position of PIM, LLC as to the Fairness of the Merger”
“Special Factors—Opinion of Ardea Partners LP”
“Special Factors—Opinion of CastleOak Securities, L.P.”
(e) Approval of directors. The information set forth in the Proxy Statement under the following captions is incorporated herein by reference:
“Summary Term Sheet”
“Questions and Answers About the Special Meeting and the Merger”
“Special Factors—Background of the Merger”
“Special Factors—Reasons for the Merger; Recommendation of the Special Committee and the Board; Fairness of the Merger”
“Special Factors—Position of PIM, LLC as to the Fairness of the Merger”
“Special Factors—Opinion of Ardea Partners LP”
“Special Factors—Opinion of CastleOak Securities, L.P.”
“Special Factors—Interests of Executive Officers and Directors of the Company in the Merger”
“The Merger (The Merger Agreement Proposal—Proposal 1)”
(f) Other offers. Not applicable.
Item 9. Reports, Opinions, Appraisals and Negotiations (Regulation M-A Item 1015)
(a) – (c) Report, opinion or appraisal; Preparer and summary of the report, opinion or appraisal; Availability of documents. The information set forth in the Proxy Statement under the following captions is incorporated herein by reference:
“Summary Term Sheet”
“Questions and Answers About the Special Meeting and the Merger”
“Special Factors—Background of the Merger”
“Special Factors—Reasons for the Merger; Recommendation of the Special Committee and the Board; Fairness of the Merger”
“Special Factors—Position of PIM, LLC as to the Fairness of the Merger”
“Special Factors—Opinion of Ardea Partners LP”
“Special Factors—Opinion of CastleOak Securities, L.P.”
“Where You Can Find More Information”
Annex B – Opinion of Ardea Partners LP
Annex C – Opinion of CastleOak Securities, L.P.
Presentation of Ardea Partners LP to the Special Committee of the Board of Directors, dated as of June 18, 2022, is attached hereto as Exhibit (c)(1) and is incorporated herein by reference.
10
Presentation of Ardea Partners LP to the Special Committee of the Board of Directors, dated as of July 6, 2022, is attached hereto as Exhibit (c)(2) and is incorporated herein by reference.
Presentation of Ardea Partners LP to the Special Committee of the Board of Directors, dated as of July 26, 2022 (and presented on July 25, 2022), is attached hereto as Exhibit (c)(3) and is incorporated herein by reference.
Presentation of Ardea Partners LP to the Special Committee of the Board of Directors, dated as of July 26, 2022, is attached hereto as Exhibit (c)(4) and is incorporated herein by reference.
Presentation of CastleOak Securities, L.P. to the Special Committee of the Board of Directors, dated as of July 6, 2022, is attached hereto as Exhibit (c)(5) and is incorporated herein by reference.
Presentation of CastleOak Securities, L.P. to the Special Committee of the Board of Directors, dated as of July 25, 2022, is attached hereto as Exhibit (c)(6) and is incorporated herein by reference.
The reports, opinions or appraisals referenced in this Item 9 will be made available for inspection and copying at the principal executive offices of the Company during its regular business hours by any interested equity security holder of the Company or representative who has been so designated in writing.
Item 10. Source and Amounts of Funds or Other Consideration (Regulation M-A Item 1007)
(a) – (b) Source of funds; Conditions. The information set forth in the Proxy Statement under the following captions is incorporated herein by reference:
“Summary Term Sheet”
“Special Factors—Financing of the Merger”
“The Merger Agreement—Financing”
Senior Credit Facility Commitment Letter, dated as of July 26, 2022, by and between, JPMorgan Chase Bank, N.A. and Pzena Investment Management, LLC. (filed as Exhibit 10.2 to Pzena Investment Management, Inc.’s Current Report on Form 8-K, filed July 28, 2022 and incorporated herein by reference), is attached hereto as Exhibit (b)(1) and is incorporated herein by reference.
(c) Expenses. The information set forth in the Proxy Statement under the following captions is incorporated herein by reference:
“Summary Term Sheet”
“Questions and Answers About the Special Meeting and the Merger”
“Special Factors—Fees and Expenses”
“The Merger Agreement—Termination”
“The Merger Agreement—PIM, LLC Termination Fee”
“The Merger Agreement—Expenses”
“The Special Meeting—Solicitation of Proxies; Payment of Solicitation Expenses”
(d) Borrowed funds. The information set forth in the Proxy Statement under the following captions is incorporated herein by reference:
“Special Factors—Financing of the Merger”
“The Merger Agreement—Financing”
Senior Credit Facility Commitment Letter, dated as of July 26, 2022, by and between, JPMorgan Chase Bank, N.A. and Pzena Investment Management, LLC. (filed as Exhibit 10.2 to Pzena Investment Management, Inc.’s Current Report on Form 8-K, filed July 28, 2022 and incorporated herein by reference), is attached hereto as Exhibit (b)(1) and is incorporated herein by reference.
11
Item 11. Interest in Securities of the Subject Company (Regulation M-A Item 1008)
(a) Securities ownership. The information set forth in the Proxy Statement under the following captions is incorporated herein by reference:
“Special Factors—Interests of Executive Officers and Directors of the Company in the Merger”
“Other Important Information Regarding the Company—Security Ownership of Certain Beneficial Owners and Management”
(b) Securities transactions. The information set forth in the Proxy Statement under the following captions is incorporated herein by reference:
“Other Important Information Regarding the Company—Certain Transactions in the Shares of Common Stock”
Item 12. The Solicitation or Recommendation (Regulation M-A Item 1012)
(d) Intent to tender or vote in a going-private transaction. The information set forth in the Proxy Statement under the following captions is incorporated herein by reference:
“Summary Term Sheet”
“Questions and Answers About the Special Meeting and the Merger”
“Special Factors—Reasons for the Merger; Recommendation of the Special Committee and the Board; Fairness of the Merger”
“Special Factors—Position of PIM, LLC as to the Fairness of the Merger”
“Special Factors—Purpose and Reasons of PIM, LLC for the Merger”
“Special Factors—Management Stockholders’ Obligation to Vote in Favor of the Merger”
“The Special Meeting—Vote Required”
“The Voting Agreement”
Annex E—Voting Agreement
(e) Recommendation of others. The information set forth in the Proxy Statement under the following captions is incorporated herein by reference:
“Summary Term Sheet”
“Questions and Answers About the Special Meeting and the Merger”
“Special Factors—Background of the Merger”
“Special Factors—Reasons for the Merger; Recommendation of the Special Committee and the Board; Fairness of the Merger”
“Special Factors—Position of PIM, LLC as to the Fairness of the Merger”
“Special Factors—Purpose and Reasons of PIM, LLC for the Merger”
“The Merger (The Merger Agreement Proposal—Proposal 1)”
Item 13. Financial Information (Regulation M-A Item 1010)
(a) Financial statements. The audited consolidated financial statements set forth in Item 8 of the Company’s Annual Report on Form 10-K for the fiscal year ended December 31, 2021 and the financial statements set forth in Item 1 of the Company’s Quarterly Report on Form 10-Q for the quarterly period ended June 30, 2022 are incorporated herein by reference.
12
The information set forth in the Proxy Statement under the following captions is incorporated herein by reference:
“Special Factors—Certain Effects of the Merger”
“Special Factors—Unaudited Prospective Financial Information of the Company”
“Other Important Information Regarding the Company—Book Value per Share”
“Where You Can Find More Information”
(b) Pro forma information. Not applicable.
Item 14. Persons/Assets, Retained, Employed, Compensated or Used (Regulation M-A Item 1009)
(a) – (b) Solicitations or recommendations; Employees and corporate assets. The information set forth in the Proxy Statement under the following captions is incorporated herein by reference:
“Summary Term Sheet”
“Questions and Answers About the Special Meeting and the Merger”
“Special Factors—Background of the Merger”
“Special Factors—Fees and Expenses”
“The Special Meeting—Solicitation of Proxies; Payment of Solicitation Expenses”
Item 15. Additional Information (Regulation M-A Item 1011)
(b) Golden Parachute Compensation. The information set forth in the Proxy Statement under the following captions is incorporated herein by reference:
“Summary Term Sheet”
“Special Factors—Interests of Executive Officers and Directors of the Company in the Merger—Golden Parachute Compensation”
“Merger-Related Executive Compensation Arrangement (The Merger-Related Compensation Proposal—Proposal 3)”
(c) Other material information. The information set forth in the Proxy Statement, including all annexes thereto, is incorporated herein by reference.
Item 16. Exhibits (Regulation M-A Item 1016)
(a)(1) Preliminary Proxy Statement of Pzena Investment Management, Inc. (the “Proxy Statement”) (incorporated herein by reference to the Schedule 14A filed concurrently with the SEC).
(a)(2) Form of Proxy Card.*
(a)(3) Letter to Stockholders (incorporated herein by reference to the Proxy Statement).
(a)(4) Notice of Special Meeting of Stockholders (incorporated herein by reference to the Proxy Statement).
(a)(5) Press Release, dated July 26, 2022 (incorporated herein by reference to Exhibit 99.1 to the Company’s Current Report on Form 8-K, filed July 26, 2022).
(b)(1) Senior Credit Facility Commitment Letter, dated as of July 26, 2022, by and between, JPMorgan Chase Bank, N.A. and Pzena Investment Management, LLC. (incorporated herein by reference to Exhibit 10.2 to the Company’s Current Report on Form 8-K, filed July 28, 2022).
13
(c)(1) Presentation of Ardea Partners LP to the Special Committee of the Board of Directors, dated as of June 18, 2022.
(c)(2) Presentation of Ardea Partners LP to the Special Committee of the Board of Directors, dated as of July 6, 2022.
(c)(3) Presentation of Ardea Partners LP to the Special Committee of the Board of Directors, dated as of July 26, 2022 (and presented on July 25, 2022).
(c)(4) Presentation of Ardea Partners LP to the Special Committee of the Board of Directors, dated as of July 26, 2022.
(c)(5) Presentation of CastleOak Securities, L.P. to the Special Committee of the Board of Directors, dated as of July 6, 2022.
(c)(6) Presentation of CastleOak Securities, L.P. to the Special Committee of the Board of Directors, dated as of July 25, 2022.
(c)(7) Opinion of Ardea Partners LP, dated July 26, 2022 (incorporated herein by reference to Annex B of the Proxy Statement).
(c)(8) Opinion of CastleOak Securities, L.P. dated July 26, 2022 (incorporated herein by reference to Annex C of the Proxy Statement).
(d)(1) Agreement and Plan of Merger, dated as of July 26, 2022, by and among Pzena Investment Management, LLC, Panda Merger Sub, LLC, and Pzena Investment Management, Inc. (incorporated herein by reference to Annex A of the Proxy Statement).
(d)(2) Voting Agreement, dated as of July 26, 2022, by and among Pzena Investment Management, Inc., Richard S. Pzena, John P. Goetz, William L. Lipsey, Chenyu Caroline Cai, and Allison Fisch (incorporated herein by reference to Annex E of the Proxy Statement).
(d)(3) Class B Stockholders’ Agreement, dated as of October 30, 2007, by and among Pzena Investment Management, Inc. and the Class B Stockholders named therein (incorporated herein by reference to Exhibit 4.5 to the Company’s Annual Report on Form 10-K for the fiscal year ended December 31, 2021, filed on March 9, 2022.
(f) Section 262 of the General Corporation Law of the State of Delaware (incorporated herein by reference to Annex D of the Proxy Statement).
(g) None.
107 Filing Fee Table.
| * | To be filed by amendment |
14
SIGNATURE
After due inquiry and to the best of each of the undersigned’s knowledge and belief, each of the undersigned certifies that the information set forth in this statement is true, complete and correct.
Dated as of August 22, 2022
| PZENA INVESTMENT MANAGEMENT, INC. | ||||
| By: | /s/ Richard S. Pzena | |||
| Name: | Richard S. Pzena | |||
| Title: | Chief Executive Officer | |||
| PZENA INVESTMENT MANAGEMENT, LLC
By: Pzena Investment Management, Inc., its Managing Member | ||||
| By: | /s/ Richard S. Pzena | |||
| Name: | Richard S. Pzena | |||
| Title: | Chief Executive Officer | |||
| PANDA MERGER SUB, LLC | ||||
| By: Pzena Investment Management, LLC, its Managing Member
By: Pzena Investment Management, Inc., its Managing Member | ||||
| By: | /s/ Richard S. Pzena | |||
| Name: | Richard S. Pzena | |||
| Title: | Chief Executive Officer | |||
[Signature Page to SC 13e-3]
Exhibit (c)(1)
PRELIMINARY BACKGROUND MATERIALS Project Panda Presentation to the Special Committee of the Board of Directors June 18, 2022
PRELIMINARY BACKGROUND MATERIALS Agenda Items 1 Summary of Proposals 2 Trading Overview 3 Premiums and Multiples Overview 4 Selected Valuation Benchmarks A Appendix June 2022 2
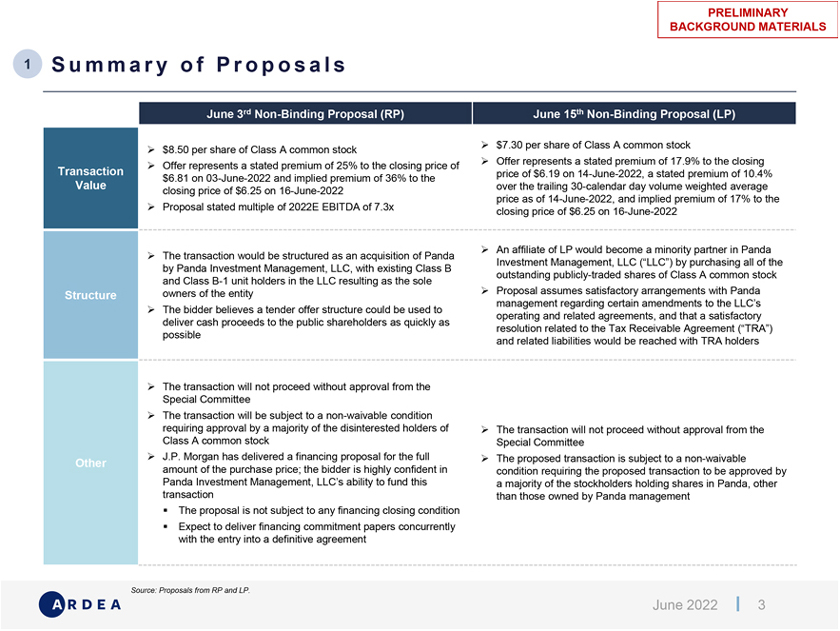
PRELIMINARY BACKGROUND MATERIALS 1 Summary of Proposals $8.50 per share of Class A common stock $7.30 per share of Class A common stock Offer represents a stated premium of 25% to the closing price of Offer represents a stated premium of 17.9% to the closing $6.81 on 03-June-2022 and implied premium of 36% to the price of $6.19 on 14-June-2022, a stated premium of 10.4% over the trailing 30-calendar day volume weighted average closing price of $6.25 on 16-June-2022 price as of 14-June-2022, and implied premium of 17% to the Proposal stated multiple of 2022E EBITDA of 7.3x closing price of $6.25 on 16-June-2022 An affiliate of LP would become a minority partner in Panda The transaction would be structured as an acquisition of Panda Investment Management, LLC (“LLC”) by purchasing all of the by Panda Investment Management, LLC, with existing Class B outstanding publicly-traded shares of Class A common stock and Class B-1 unit holders in the LLC resulting as the sole owners of the entity Proposal assumes satisfactory arrangements with Panda management regarding certain amendments to the LLC’s The bidder believes a tender offer structure could be used to operating and related agreements, and that a satisfactory deliver cash proceeds to the public shareholders as quickly as resolution related to the Tax Receivable Agreement (“TRA”) possible and related liabilities would be reached with TRA holders The transaction will not proceed without approval from the Special Committee The transaction will be subject to a non-waivable condition requiring approval by a majority of the disinterested holders of The transaction will not proceed without approval from the Class A common stock Special Committee J.P. Morgan has delivered a financing proposal for the full The proposed transaction is subject to a non-waivable amount of the purchase price; the bidder is highly confident in condition requiring the proposed transaction to be approved by Panda Investment Management, LLC’s ability to fund this a majority of the stockholders holding shares in Panda, other transaction than those owned by Panda management The proposal is not subject to any financing closing condition Expect to deliver financing commitment papers concurrently with the entry into a definitive agreement Source: Proposals from RP and LP. June 2022 3
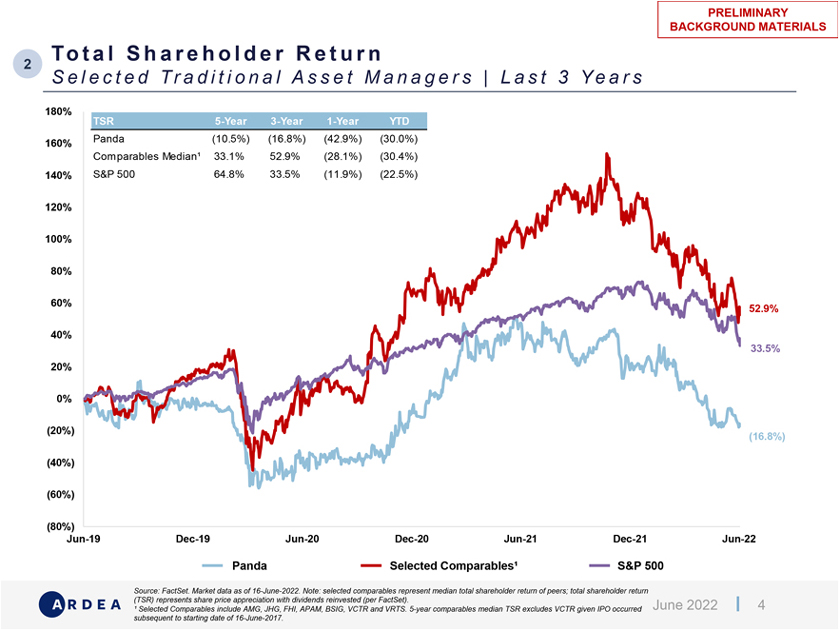
PRELIMINARY BACKGROUND MATERIALS Total Share holder Return 2 Selected Traditional Asset Managers | Last 3 Years 180% 160% Panda (10.5%) (16.8%) (42.9%) (30.0%) Comparables Median¹ 33.1% 52.9% (28.1%) (30.4%) 140% S&P 500 64.8% 33.5% (11.9%) (22.5%) 120% 100% 80% 60% 52.9% 40% 33.5% 20% 0% (20%) (16.8%) (40%) (60%) (80%) Jun-19 Dec-19 Jun-20 Dec-20 Jun-21 Dec-21 Jun-22 Panda Selected Comparables¹ S&P 500 Source: FactSet. Market data as of 16-June-2022. Note: selected comparables represent median total shareholder return of peers; total shareholder return (TSR) represents share price appreciation with dividends reinvested (per FactSet). June 2022 4 ¹ Selected Comparables include AMG, JHG, FHI, APAM, BSIG, VCTR and VRTS. 5-year comparables median TSR excludes VCTR given IPO occurred subsequent to starting date of 16-June-2017.
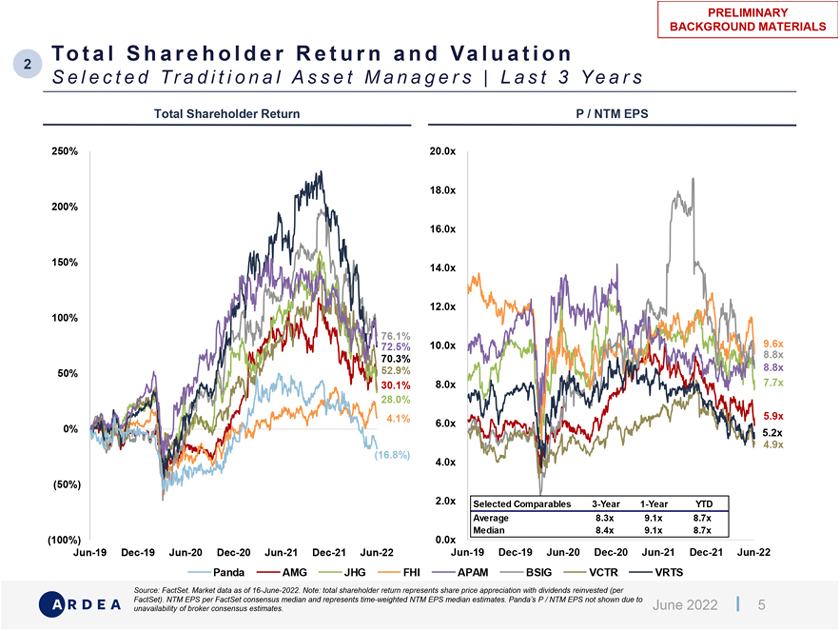
PRELIMINARY BACKGROUND MATERIALS Total Share holder Return and Valuation Selected Traditional Asset Managers | Last 3 Years Total Shareholder Return P / NTM EPS 250% 20.0x 18.0x 200% 16.0x 150% 14.0x 12.0x 100% 76.1% 72.5% 10.0x 9.6x 70.3% 8.8x 52.9% 8.8x 50% 7.7x 30.1% 8.0x 28.0% 4.1% 5.9x 6.0x 0% 5.2x 4.9x (16.8%) 4.0x (50%) 2.0x Selected Comparables 3-Year 1-Year YTD Average 8.3x 9.1x 8.7x Median 8.4x 9.1x 8.7x (100%) 0.0x Jun-19 Dec-19 Jun-20 Dec-20 Jun-21 Dec-21 Jun-22 Jun-19 Dec-19 Jun-20 Dec-20 Jun-21 Dec-21 Jun-22 Panda AMG JHG FHI APAM BSIG VCTR VRTS Source: FactSet. Market data as of 16-June-2022. Note: total shareholder return represents share price appreciation with dividends reinvested (per FactSet). NTM EPS per FactSet consensus median and represents time-weighted NTM EPS median estimates. Panda’s P / NTM EPS not shown due to June 2022 5 unavailability of broker consensus estimates.
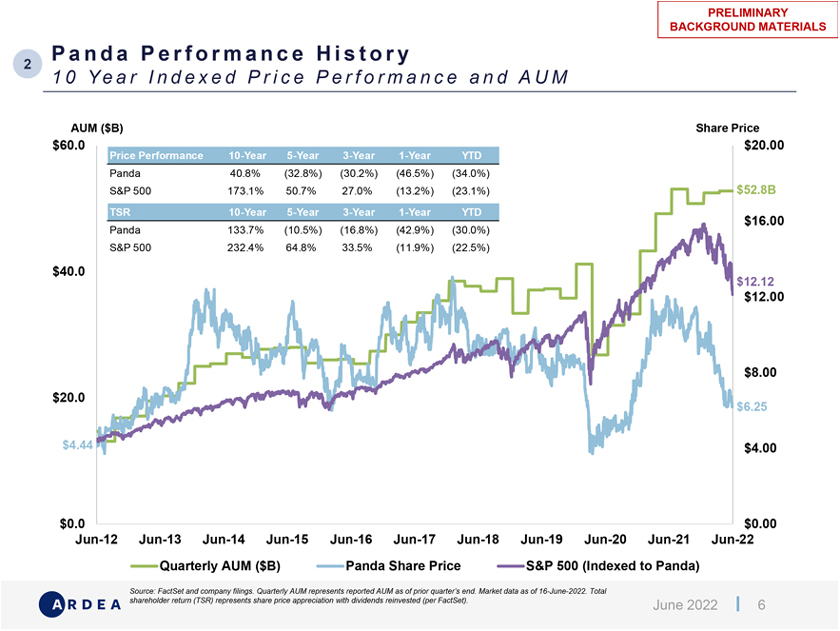
PRELIMINARY BACKGROUND MATERIALS Panda Performance History 2 10 Year Indexed Price Performance and AUM AUM ($B) Share Price $60.0 Price Performance 10-Year 5-Year 3-Year 1-Year YTD $20.00 Panda 40.8% (32.8%) (30.2%) (46.5%) (34.0%) S&P 500 173.1% 50.7% 27.0% (13.2%) (23.1%) $52.8B TSR 10-Year 5-Year 3-Year 1-Year YTD $16.00 Panda 133.7% (10.5%) (16.8%) (42.9%) (30.0%) S&P 500 232.4% 64.8% 33.5% (11.9%) (22.5%) $40.0 $12.12 $12.00 $8.00 $20.0 $6.25 $4.44 $4.00 $0.0 $0.00 Jun-12 Jun-13 Jun-14 Jun-15 Jun-16 Jun-17 Jun-18 Jun-19 Jun-20 Jun-21 Jun-22 Quarterly AUM ($B) Panda Share Price S&P 500 (Indexed to Panda) Source: FactSet and company filings. Quarterly AUM represents reported AUM as of prior quarter’s end. Market data as of 16-June-2022. Total shareholder return (TSR) represents share price appreciation with dividends reinvested (per FactSet). June 2022 6
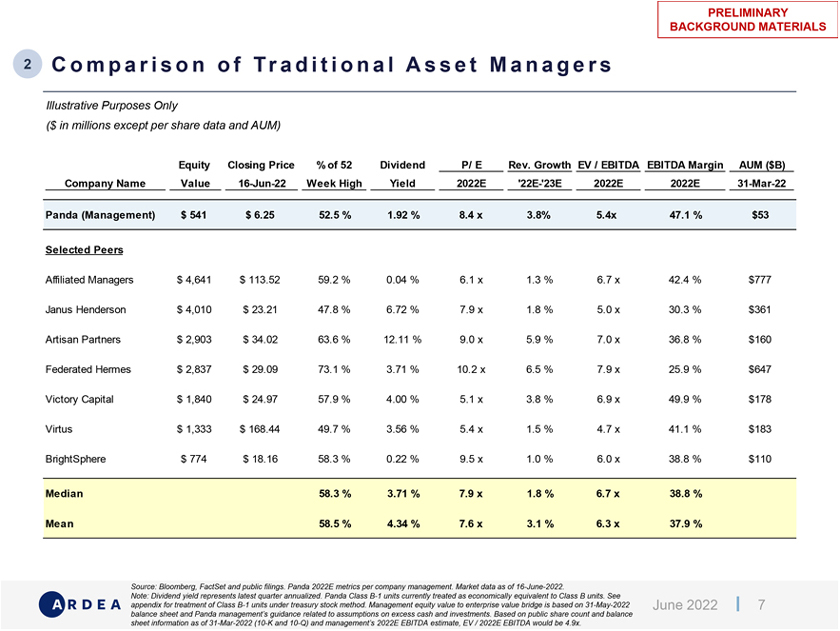
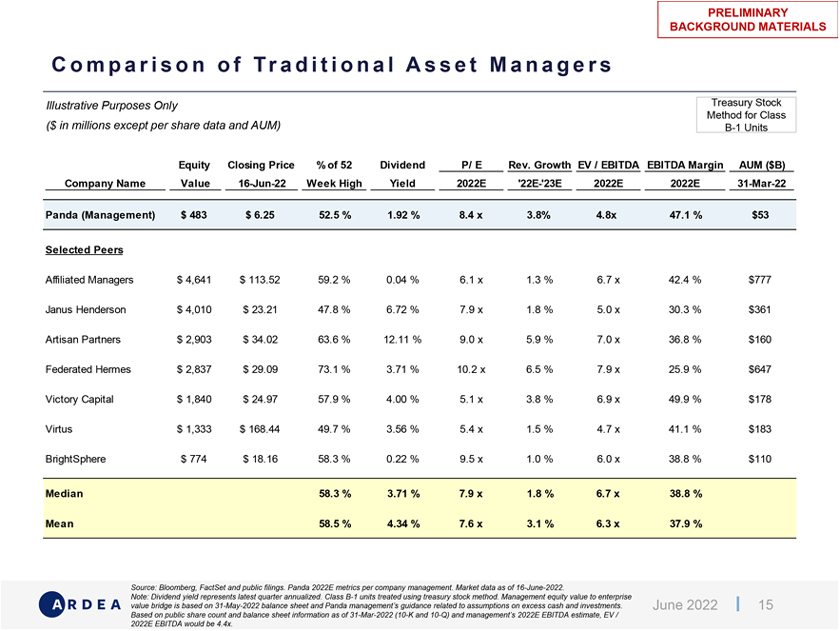
PRELIMINARY BACKGROUND MATERIALS 2 comparison of Traditional Asset Managers Illustrative Purposes Only ($ in millions except per share data and AUM) Equity Closing Price % of 52 Dividend P/ E Rev. Growth EV / EBITDA EBITDA Margin AUM ($B) Company Name Value 16-Jun-22 Week High Yield 2022E ‘22E-‘23E 2022E 2022E 31-Mar-22 Panda (Management) $ 541 $ 6.25 52.5 % 1.92 % 8.4 x 3.8% 5.4x 47.1 % $53 Selected Peers Affiliated Managers $ 4,641 $ 113.52 59.2 % 0.04 % 6.1 x 1.3 % 6.7 x 42.4 % $777 Janus Henderson $ 4,010 $ 23.21 47.8 % 6.72 % 7.9 x 1.8 % 5.0 x 30.3 % $361 Artisan Partners $ 2,903 $ 34.02 63.6 % 12.11 % 9.0 x 5.9 % 7.0 x 36.8 % $160 Federated Hermes $ 2,837 $ 29.09 73.1 % 3.71 % 10.2 x 6.5 % 7.9 x 25.9 % $647 Victory Capital $ 1,840 $ 24.97 57.9 % 4.00 % 5.1 x 3.8 % 6.9 x 49.9 % $178 Virtus $ 1,333 $ 168.44 49.7 % 3.56 % 5.4 x 1.5 % 4.7 x 41.1 % $183 BrightSphere $ 774 $ 18.16 58.3 % 0.22 % 9.5 x 1.0 % 6.0 x 38.8 % $110 Median 58.3 % 3.71 % 7.9 x 1.8 % 6.7 x 38.8 % Mean 58.5 % 4.34 % 7.6 x 3.1 % 6.3 x 37.9 % Source: Bloomberg, FactSet and public filings. Panda 2022E metrics per company management. Market data as of 16-June-2022. Note: Dividend yield represents latest quarter annualized. Panda Class B-1 units currently treated as economically equivalent to Class B units. See appendix for treatment of Class B-1 units under treasury stock method. Management equity value to enterprise value bridge is based on 31-May-2022 June 2022 7 balance sheet and Panda management’s guidance related to assumptions on excess cash and investments. Based on public share count and balance sheet information as of 31-Mar-2022 (10-K and 10-Q) and management’s 2022E EBITDA estimate, EV / 2022E EBITDA would be 4.9x.
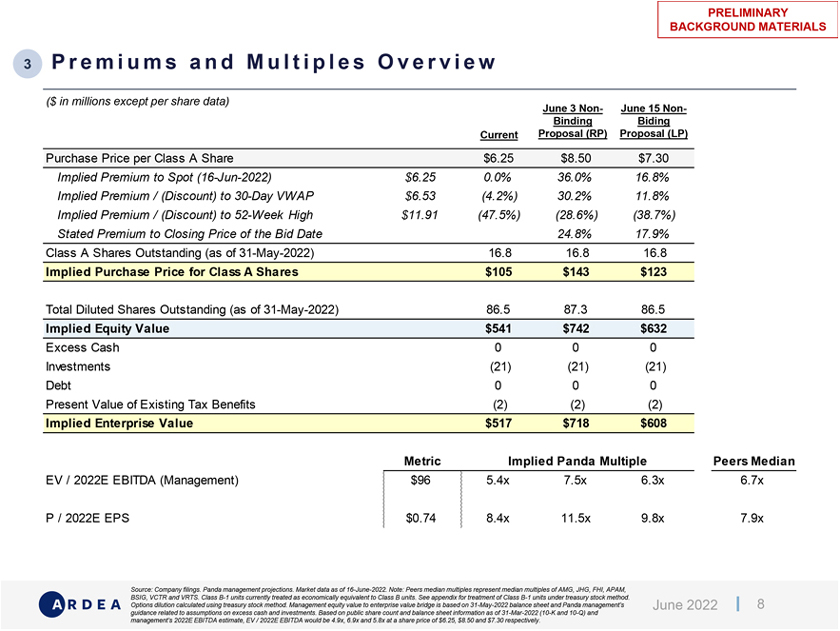
PRELIMINARY BACKGROUND MATERIALS 3 Premiums and Multiples Overview ($ in millions except per share data) June 3 Non- June 15 Non-Binding Biding Current Proposal (RP) Proposal (LP) Purchase Price per Class A Share $6.25 $8.50 $7.30 Implied Premium to Spot (16-Jun-2022) $6.25 0.0% 36.0% 16.8% Implied Premium / (Discount) to 30-Day VWAP $6.53 (4.2%) 30.2% 11.8% Implied Premium / (Discount) to 52-Week High $11.91 (47.5%) (28.6%) (38.7%) Stated Premium to Closing Price of the Bid Date 24.8% 17.9% Class A Shares Outstanding (as of 31-May-2022) 16.8 16.8 16.8 Implied Purchase Price for Class A Shares $105 $143 $123 Total Diluted Shares Outstanding (as of 31-May-2022) 86.5 87.3 86.5 Implied Equity Value $541 $742 $632 Excess Cash 0 0 0 Investments (21) (21) (21) Debt 0 0 0 Present Value of Existing Tax Benefits (2) (2) (2) Implied Enterprise Value $517 $718 $608 Metric Implied Panda Multiple Peers Median EV / 2022E EBITDA (Management) $96 5.4x 7.5x 6.3x 6.7x P / 2022E EPS $0.74 8.4x 11.5x 9.8x 7.9x Source: Company filings. Panda management projections. Market data as of 16-June-2022. Note: Peers median multiples represent median multiples of AMG, JHG, FHI, APAM, BSIG, VCTR and VRTS. Class B-1 units currently treated as economically equivalent to Class B units. See appendix for treatment of Class B-1 units under treasury stock method. Options dilution calculated using treasury stock method. Management equity value to enterprise value bridge is based on 31-May-2022 balance sheet and Panda management’s June 2022 8 guidance related to assumptions on excess cash and investments. Based on public share count and balance sheet information as of 31-Mar-2022 (10-K and 10-Q) and management’s 2022E EBITDA estimate, EV / 2022E EBITDA would be 4.9x, 6.9x and 5.8x at a share price of $6.25, $8.50 and $7.30 respectively.
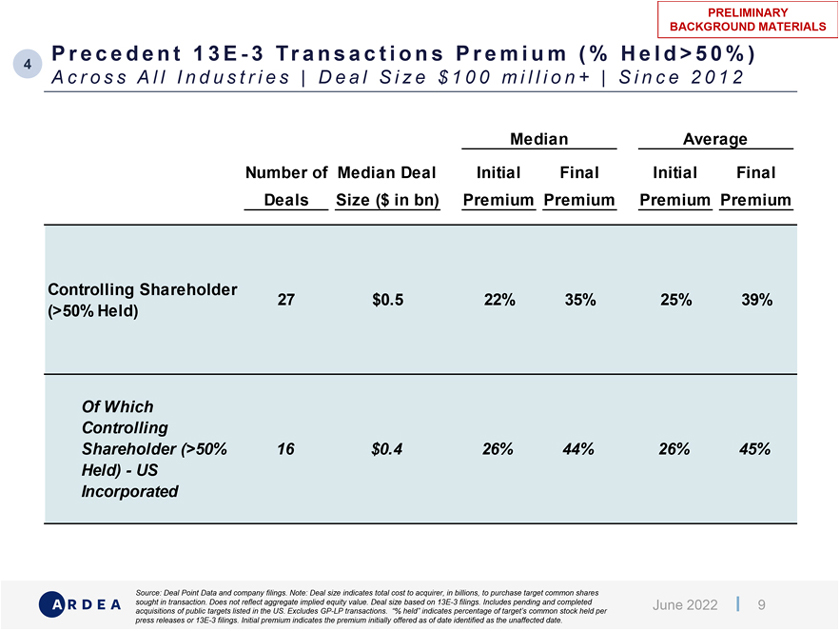
PRELIMINARY BACKGROUND MATERIALS Precedent 13 E-3 TRANSACTIONS Premium (% Held 50%) 4 Across All Industries | Deal Size $ 100 million + | Since 2012 Median Average Number of Median Deal Initial Final Initial Final Deals Size ($ in bn) Premium Premium Premium Premium Controlling Shareholder 27 $0.5 22% 35% 25% 39% (>50% Held) Of Which Controlling Shareholder (>50% 16 $0.4 26% 44% 26% 45% Held)—US Incorporated Source: Deal Point Data and company filings. Note: Deal size indicates total cost to acquirer, in billions, to purchase target common shares sought in transaction. Does not reflect aggregate implied equity value. Deal size based on 13E-3 filings. Includes pending and completed June 2022 9 acquisitions of public targets listed in the US. Excludes GP-LP transactions. “% held” indicates percentage of target’s common stock held per press releases or 13E-3 filings. Initial premium indicates the premium initially offered as of date identified as the unaffected date.

PRELIMINARY BACKGROUND MATERIALS Selected Traditional Asset Management Change of 4 Con trol Transactions (AUM and Implied Purchase Price in billions) Annoucement Implied Purchase Purchase Price Implied Referenced Year Date Target Buyer Target AUM Price (100%) as % of AUM Multiple Multiple 1 2022 Apr-22 Manning & Napier Callodine Group $21 $0.3 1.4% 6.4x EV / LTM EBITDA As Reported EV / 1H 2021A 2 Thompson, Siegel 2021 May-21 Pendal Group 25 0.3 1.3% 7.6x Annualized EBITDA (Excluding & Walmsley Synergies) 3 As Reported Headline Acquisition 2020 Dec-20 Waddell & Reed Macquarie / LPL 131 1.7 1.3% 10.0x EV / EBITDA Barrow, Hanley, 2020 4 Jul-20 Mewhinney & Perpetual 44 0.4 1.0% 8.0x As Reported EV / Pro Forma EBITDA Strauss As Reported EV / EBITDA 5 USAA Asset 2018 Nov-18 Victory Capital 69 0.9 1.2% 6.9x (Excluding Earnout, Expected Management Synergies and Tax Benefit) Hermes 6 Federated As Reported EV / 2017A EBITDA 2018 Apr-18 Investment 45 0.6 1.3% 12.8x Investors (Post Minority Interest) Management Median 1.3% 7.8 x Mean 1.3% 8.6 x Source: Company filings. Please see appendix for detailed footnotes. June 2022 10
PRELIMINARY BACKGROUND MATERIALS A Appendix June 2022 11

PRELIMINARY BACKGROUND MATERIALS Summary of Financials ( 1 / 2 ) Revenue ($M) YoY Growth: 30.4% 8.7% (1.8%) (8.0%) 43.8% 2.4% 3.8% 3.7% 1.4% 2.5% 2.2% $220 $223 $228 $233 $199 $204 $212 $141 $154 $151 $139 2017A 2018A 2019A 2020A 2021A 2022E 2023E 2024E 2025E 2026E 2027E EBITDA ($M) Margin: 49.6% 51.9% 31.0% 40.7% 53.7% 47.1% 46.6% 45.5% 45.0% 44.7% 44.5% $107 $96 $99 $100 $100 $102 $104 $70 $80 $47 $56 2017A 2018A 2019A 2020A 2021A 2022E 2023E 2024E 2025E 2026E 2027E Diluted EPS $1.00 $0.77 $0.74 $0.83 $0.83 $0.81 $0.82 $0.82 $0.46 $0.52 $0.40 2017A 2018A 2019A 2020A 2021A 2022E 2023E 2024E 2025E 2026E 2027E Source: Company filings and Panda management projections. June 2022 12

PRELIMINARY BACKGROUND MATERIALS Summary of Financials ( 2 / 2 ) Year-End Assets Under Management ($B) YoY Growth: 28.3% (13.2%) 23.4% 5.1% 21.2% (0.6%) 6.8% 4.5% 4.1% 3.8% 3.4% $60.6 $62.9 $65.0 $55.7 $58.2 $43.3 $52.5 $52.2 $38.5 $41.2 $33.4 2017A 2018A 2019A 2020A 2021A 2022E 2023E 2024E 2025E 2026E 2027E Net Flows ($B) % of AUM¹: 5.7% 2.6% 2.4% 1.2% 1.8% 5.8% 1.9% (0.5%) (0.9%) (1.2%) (1.6%) $3.1 $1.7 $1.0 $0.8 $0.8 $1.0 $0.5 ($0.3) ($0.5) ($0.7) ($1.0) 2017A 2018A 2019A 2020A 2021A 2022E 2023E 2024E 2025E 2026E 2027E Market Performance ($B) % of AUM¹: 22.7% (15.8%) 20.7% 1.7% 22.2% (6.5%) 5.0% 5.0% 5.0% 5.0% 5.0% $9.6 $6.8 $6.9 $2.6 $2.8 $2.9 $3.0 $3.1 $0.7 ($6.1) ($3.4) 2017A 2018A 2019A 2020A 2021A 2022E 2023E 2024E 2025E 2026E 2027E Source: Company filings and Panda management projections. ¹ As % of AUM as of the beginning of the fiscal year. June 2022 13
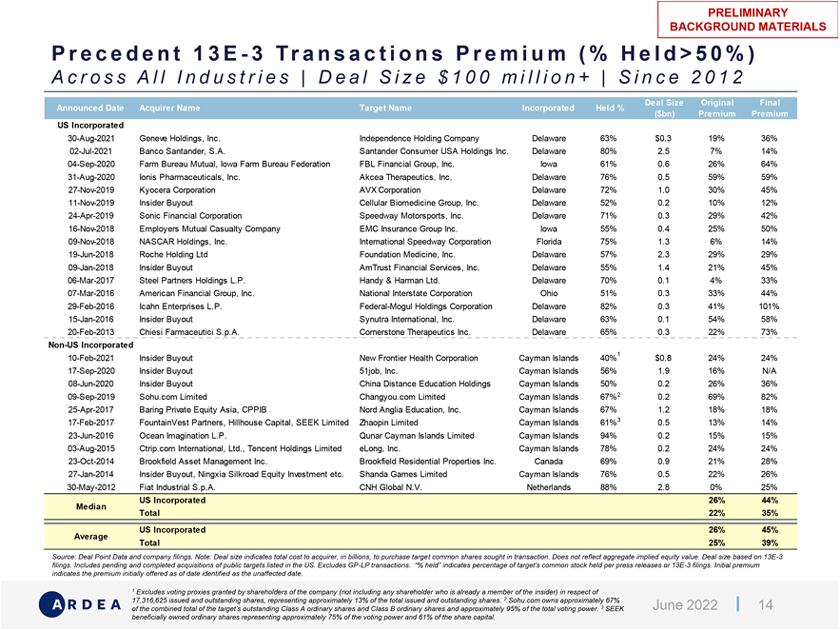
PRELIMINARY BACKGROUND MATERIALS Precedent 13 E—3 Transactions Premium ( % Held > 5 0 % ) Across All Industries | Deal Size $ 1 0 0 million + | Since 2012 US Incorporated 30-Aug-2021 Geneve Holdings, Inc. Independence Holding Company Delaware 63% $0.3 19% 36% 02-Jul-2021 Banco Santander, S.A. Santander Consumer USA Holdings Inc. Delaware 80% 2.5 7% 14% 04-Sep-2020 Farm Bureau Mutual, Iowa Farm Bureau Federation FBL Financial Group, Inc. Iowa 61% 0.6 26% 64% 31-Aug-2020 Ionis Pharmaceuticals, Inc. Akcea Therapeutics, Inc. Delaware 76% 0.5 59% 59% 27-Nov-2019 Kyocera Corporation AVX Corporation Delaware 72% 1.0 30% 45% 11-Nov-2019 Insider Buyout Cellular Biomedicine Group, Inc. Delaware 52% 0.2 10% 12% 24-Apr-2019 Sonic Financial Corporation Speedway Motorsports, Inc. Delaware 71% 0.3 29% 42% 16-Nov-2018 Employers Mutual Casualty Company EMC Insurance Group Inc. Iowa 55% 0.4 25% 50% 09-Nov-2018 NASCAR Holdings, Inc. International Speedway Corporation Florida 75% 1.3 6% 14% 19-Jun-2018 Roche Holding Ltd Foundation Medicine, Inc. Delaware 57% 2.3 29% 29% 09-Jan-2018 Insider Buyout AmTrust Financial Services, Inc. Delaware 55% 1.4 21% 45% 06-Mar-2017 Steel Partners Holdings L.P. Handy & Harman Ltd. Delaware 70% 0.1 4% 33% 07-Mar-2016 American Financial Group, Inc. National Interstate Corporation Ohio 51% 0.3 33% 44% 29-Feb-2016 Icahn Enterprises L.P. Federal-Mogul Holdings Corporation Delaware 82% 0.3 41% 101% 15-Jan-2016 Insider Buyout Synutra International, Inc. Delaware 63% 0.1 54% 58% 20-Feb-2013 Chiesi Farmaceutici S.p.A. Cornerstone Therapeutics Inc. Delaware 65% 0.3 22% 73% Non-US Incorporated 10-Feb-2021 Insider Buyout New Frontier Health Corporation Cayman Islands 40%1 $0.8 24% 24% 17-Sep-2020 Insider Buyout 51job, Inc. Cayman Islands 56% 1.9 16% N/A 08-Jun-2020 Insider Buyout China Distance Education Holdings Cayman Islands 50% 0.2 26% 36% 09-Sep-2019 Sohu.com Limited Changyou.com Limited Cayman Islands 67%2 0.2 69% 82% 25-Apr-2017 Baring Private Equity Asia, CPPIB Nord Anglia Education, Inc. Cayman Islands 67% 1.2 18% 18% 17-Feb-2017 FountainVest Partners, Hillhouse Capital, SEEK Limited Zhaopin Limited Cayman Islands 61%3 0.5 13% 14% 23-Jun-2016 Ocean Imagination L.P. Qunar Cayman Islands Limited Cayman Islands 94% 0.2 15% 15% 03-Aug-2015 Ctrip.com International, Ltd., Tencent Holdings Limited eLong, Inc. Cayman Islands 78% 0.2 24% 24% 23-Oct-2014 Brookfield Asset Management Inc. Brookfield Residential Properties Inc. Canada 69% 0.9 21% 28% 27-Jan-2014 Insider Buyout, Ningxia Silkroad Equity Investment etc. Shanda Games Limited Cayman Islands 76% 0.5 22% 26% 30-May-2012 Fiat Industrial S.p.A. CNH Global N.V. Netherlands 88% 2.8 0% 25% US Incorporated 26% 44% Median Total 22% 35% US Incorporated 26% 45% Average Total 25% 39% Source: Deal Point Data and company filings. Note: Deal size indicates total cost to acquirer, in billions, to purchase target common shares sought in transaction. Does not reflect aggregate implied equity value. Deal size based on 13E-3 filings. Includes pending and completed acquisitions of public targets listed in the US. Excludes GP-LP transactions. “% held” indicates percentage of target’s common stock held per press releases or 13E-3 filings. Initial premium indicates the premium initially offered as of date identified as the unaffected date. 1 Excludes voting proxies granted by shareholders of the company (not including any shareholder who is already a member of the insider) in respect of 17,316,625 issued and outstanding shares, representing approximately 13% of the total issued and outstanding shares. 2 Sohu.com owns approximately 67% of the combined total of the target’s outstanding Class A ordinary shares and Class B ordinary shares and approximately 95% of the total voting power. 3 SEEK June 2022 14 beneficially owned ordinary shares representing approximately 75% of the voting power and 61% of the share capital.
PRELIMINARY BACKGROUND MATERIALS Comparison of Traditional Asset Managers Illustrative Purposes Only Treasury Stock ($ in millions except per share data and AUM) Method for Class B-1 Units Equity Closing Price % of 52 Dividend P/ E Rev. Growth EV / EBITDA EBITDA Margin AUM ($B) Company Name Value 16-Jun-22 Week High Yield 2022E ‘22E-‘23E 2022E 2022E 31-Mar-22 Panda (Management) $ 483 $ 6.25 52.5 % 1.92 % 8.4 x 3.8% 4.8x 47.1 % $53 Selected Peers Affiliated Managers $ 4,641 $ 113.52 59.2 % 0.04 % 6.1 x 1.3 % 6.7 x 42.4 % $777 Janus Henderson $ 4,010 $ 23.21 47.8 % 6.72 % 7.9 x 1.8 % 5.0 x 30.3 % $361 Artisan Partners $ 2,903 $ 34.02 63.6 % 12.11 % 9.0 x 5.9 % 7.0 x 36.8 % $160 Federated Hermes $ 2,837 $ 29.09 73.1 % 3.71 % 10.2 x 6.5 % 7.9 x 25.9 % $647 Victory Capital $ 1,840 $ 24.97 57.9 % 4.00 % 5.1 x 3.8 % 6.9 x 49.9 % $178 Virtus $ 1,333 $ 168.44 49.7 % 3.56 % 5.4 x 1.5 % 4.7 x 41.1 % $183 BrightSphere $ 774 $ 18.16 58.3 % 0.22 % 9.5 x 1.0 % 6.0 x 38.8 % $110 Median 58.3 % 3.71 % 7.9 x 1.8 % 6.7 x 38.8 % Mean 58.5 % 4.34 % 7.6 x 3.1 % 6.3 x 37.9 % Source: Bloomberg, FactSet and public filings. Panda 2022E metrics per company management. Market data as of 16-June-2022. Note: Dividend yield represents latest quarter annualized. Class B-1 units treated using treasury stock method. Management equity value to enterprise value bridge is based on 31-May-2022 balance sheet and Panda management’s guidance related to assumptions on excess cash and investments. June 2022 15 Based on public share count and balance sheet information as of 31-Mar-2022 (10-K and 10-Q) and management’s 2022E EBITDA estimate, EV / 2022E EBITDA would be 4.4x.
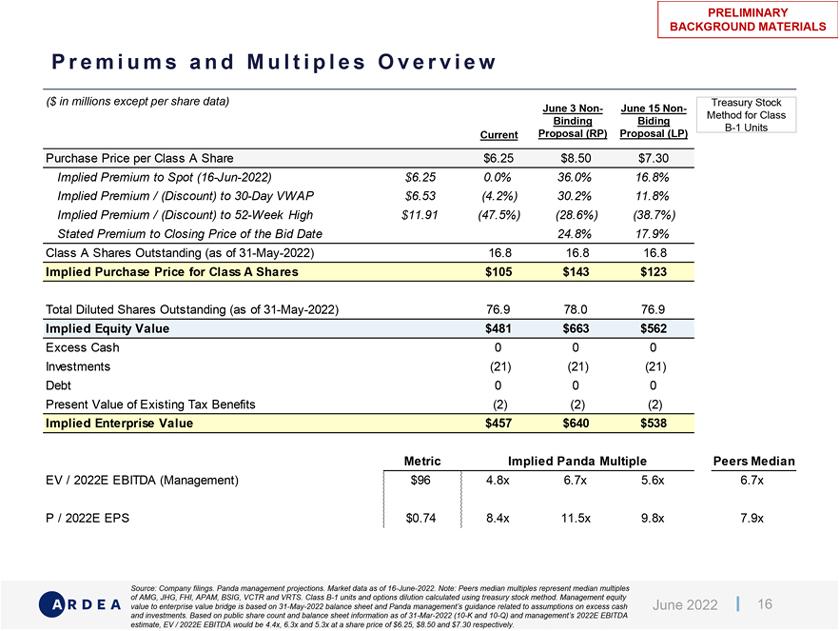
PRELIMINARY BACKGROUND MATERIALS Premium sand Multiples Overview ($ in millions except per share data) Treasury Stock June 3 Non- June 15 Non- Method for Class Binding Biding B-1 Units Current Proposal (RP) Proposal (LP) Purchase Price per Class A Share $6.25 $8.50 $7.30 Implied Premium to Spot (16-Jun-2022) $6.25 0.0% 36.0% 16.8% Implied Premium / (Discount) to 30-Day VWAP $6.53 (4.2%) 30.2% 11.8% Implied Premium / (Discount) to 52-Week High $11.91 (47.5%) (28.6%) (38.7%) Stated Premium to Closing Price of the Bid Date 24.8% 17.9% Class A Shares Outstanding (as of 31-May-2022) 16.8 16.8 16.8 Implied Purchase Price for Class A Shares $105 $143 $123 Total Diluted Shares Outstanding (as of 31-May-2022) 76.9 78.0 76.9 Implied Equity Value $481 $663 $562 Excess Cash 0 0 0 Investments (21) (21) (21) Debt 0 0 0 Present Value of Existing Tax Benefits (2) (2) (2) Implied Enterprise Value $457 $640 $538 Metric Implied Panda Multiple Peers Median EV / 2022E EBITDA (Management) $96 4.8x 6.7x 5.6x 6.7x P / 2022E EPS $0.74 8.4x 11.5x 9.8x 7.9x Source: Company filings. Panda management projections. Market data as of 16-June-2022. Note: Peers median multiples represent median multiples of AMG, JHG, FHI, APAM, BSIG, VCTR and VRTS. Class B-1 units and options dilution calculated using treasury stock method. Management equity 16 value to enterprise value bridge is based on 31-May-2022 balance sheet and Panda management’s guidance related to assumptions on excess cash June 2022 and investments. Based on public share count and balance sheet information as of 31-Mar-2022 (10-K and 10-Q) and management’s 2022E EBITDA estimate, EV / 2022E EBITDA would be 4.4x, 6.3x and 5.3x at a share price of $6.25, $8.50 and $7.30 respectively.
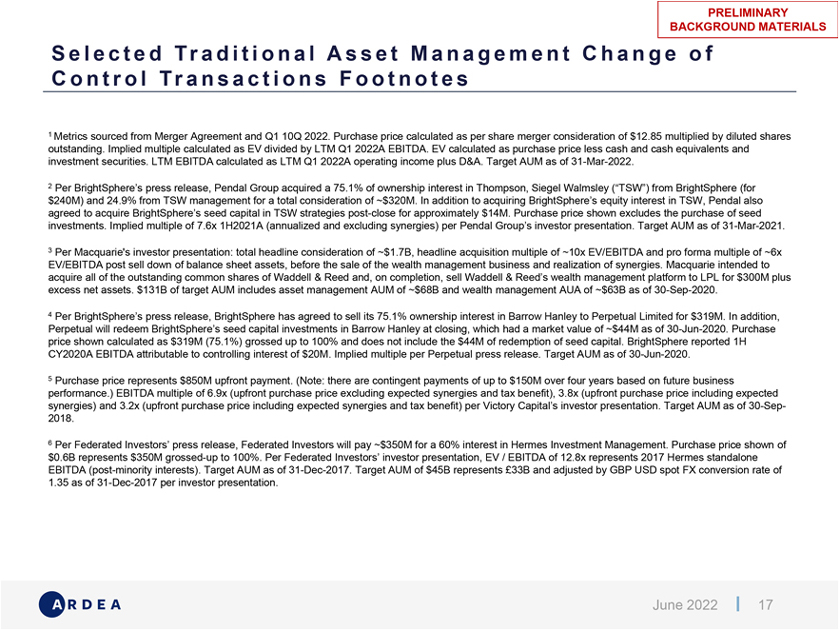
PRELIMINARY BACKGROUND MATERIALS Selected Traditional Asset Management Change of Control Transactions Footnotes 1 Metrics sourced from Merger Agreement and Q1 10Q 2022. Purchase price calculated as per share merger consideration of $12.85 multiplied by diluted shares outstanding. Implied multiple calculated as EV divided by LTM Q1 2022A EBITDA. EV calculated as purchase price less cash and cash equivalents and investment securities. LTM EBITDA calculated as LTM Q1 2022A operating income plus D&A. Target AUM as of 31-Mar-2022. 2 Per BrightSphere’s press release, Pendal Group acquired a 75.1% of ownership interest in Thompson, Siegel Walmsley (“TSW”) from BrightSphere (for $240M) and 24.9% from TSW management for a total consideration of $320M. In addition to acquiring BrightSphere’s equity interest in TSW, Pendal also agreed to acquire BrightSphere’s seed capital in TSW strategies post-close for approximately $14M. Purchase price shown excludes the purchase of seed investments. Implied multiple of 7.6x 1H2021A (annualized and excluding synergies) per Pendal Group’s investor presentation. Target AUM as of 31-Mar-2021. 3 Per Macquarie’s investor presentation: total headline consideration of $1.7B, headline acquisition multiple of 10x EV/EBITDA and pro forma multiple of 6x EV/EBITDA post sell down of balance sheet assets, before the sale of the wealth management business and realization of synergies. Macquarie intended to acquire all of the outstanding common shares of Waddell & Reed and, on completion, sell Waddell & Reed’s wealth management platform to LPL for $300M plus excess net assets. $131B of target AUM includes asset management AUM of $68B and wealth management AUA of $63B as of 30-Sep-2020. 4 Per BrightSphere’s press release, BrightSphere has agreed to sell its 75.1% ownership interest in Barrow Hanley to Perpetual Limited for $319M. In addition, Perpetual will redeem BrightSphere’s seed capital investments in Barrow Hanley at closing, which had a market value of $44M as of 30-Jun-2020. Purchase price shown calculated as $319M (75.1%) grossed up to 100% and does not include the $44M of redemption of seed capital. BrightSphere reported 1H CY2020A EBITDA attributable to controlling interest of $20M. Implied multiple per Perpetual press release. Target AUM as of 30-Jun-2020. 5 Purchase price represents $850M upfront payment. (Note: there are contingent payments of up to $150M over four years based on future business performance.) EBITDA multiple of 6.9x (upfront purchase price excluding expected synergies and tax benefit), 3.8x (upfront purchase price including expected synergies) and 3.2x (upfront purchase price including expected synergies and tax benefit) per Victory Capital’s investor presentation. Target AUM as of 30-Sep-2018. 6 Per Federated Investors’ press release, Federated Investors will pay $350M for a 60% interest in Hermes Investment Management. Purchase price shown of $0.6B represents $350M grossed-up to 100%. Per Federated Investors’ investor presentation, EV / EBITDA of 12.8x represents 2017 Hermes standalone EBITDA (post-minority interests). Target AUM as of 31-Dec-2017. Target AUM of $45B represents Ł33B and adjusted by GBP USD spot FX conversion rate of 1.35 as of 31-Dec-2017 per investor presentation. June 2022 17

DISCLAIMER Ardea Partners LP (“Ardea”) has prepared and provided these materials and Ardea’s related oral presentation (collectively, the “Confidential Information”) solely for the information and assistance of the Special Committee of the Board of Directors of Panda (the “Company”) in connection with their consideration of the matters referred to herein. Without Ardea’s prior written consent, the Confidential Information, and Ardea’s preparation and provision of such Confidential Information, may not be used for any other purpose or disclosed or otherwise referred to in any manner. The Confidential Information is (a) for discussion purposes only and (b) speaks only as of the date it is given, reflecting prevailing economic, monetary, market and other conditions as in effect on, and the information made available to Ardea as of, such date. Ardea assumes no responsibility for updating or revising the Confidential Information. The views expressed herein are subject to change based upon a number of factors, including economic, monetary, market and other conditions and the Company’s and any prospective counterparty’s business and prospects. Analyses based upon forecasts of future results are not necessarily indicative of actual future results, which may be significantly more or less favorable than suggested by these analyses, and Ardea does not assume responsibility if future results are materially different from those forecast. The Confidential Information is incomplete without reference to, and should be viewed solely in conjunction with, the oral briefing provided by Ardea, if any. The Confidential Information has been prepared using publicly available information and information in reports, due diligence materials, forecasts, projections and other materials provided by or on behalf of the Company and/or any prospective counterparty. Ardea does not assume responsibility for and has relied on, without independent verification, the accuracy and completeness of such information. Ardea has not, and does not, provide advice for tax, legal, regulatory or accounting matters and the Company will remain solely responsible for all aspects of due diligence in connection with the Transaction and the commercial assumptions on which any advice provided by Ardea is based. The Confidential Information does not address the underlying business decision of the Company to engage in any transaction or the relative merits of any strategic alternatives referred to herein as compared to any other alternative that may be available to the Company. Ardea and its affiliates and/or their respective employees, as well as investment funds in which any of them may have a financial interest, may at any time, directly or indirectly, hold long or short positions and may trade or otherwise effect transactions for their own accounts or the accounts of customers, in debt or equity securities, senior loans and/or derivative products relating to the Company or its affiliates, potential parties to a Transaction and their affiliates or persons that are competitors, customers or suppliers of the Company. Nothing herein or any previous or existing relationship between the Company and Ardea will be deemed to create a fiduciary duty or fiduciary or agency relationship between Ardea and the Company, its security holders, affiliates, employees or creditors. June 2022 18
Exhibit (c)(2)

PRELIMINARY BACKGROUND MATERIALS Project Panda Presentation to the Special Committee of the Board of Directors July 6, 2022
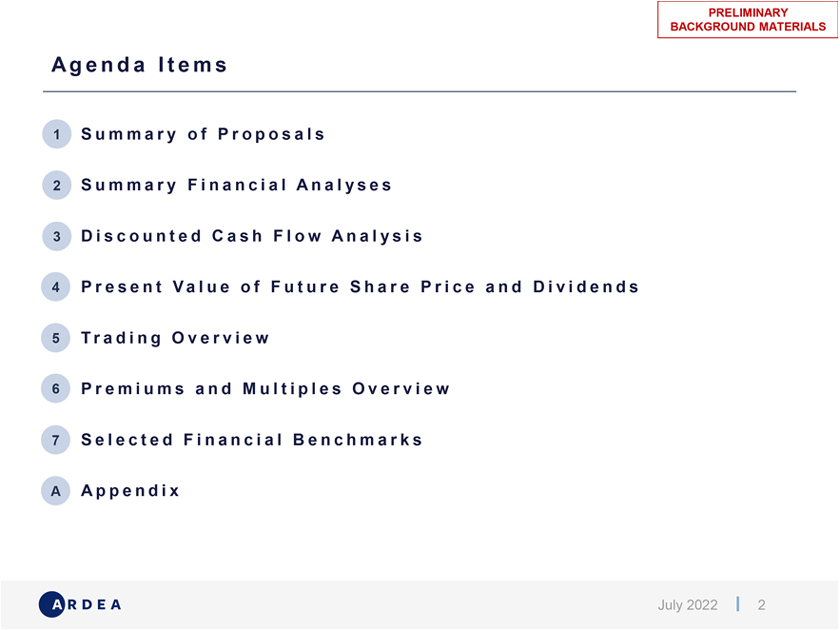
Agenda Items–ª1 Summary of Proposals â–ª2 Summary Financial Analyses â–ª 3 Discounted Cash Flow Analysis â–ª4 Present Value of Future Share Price and Dividends â–ª5 Trading Overview â–ª 6 Premiums and Multiples Overview â–ª 7 Selected Financial Benchmarks â–ª A Appendix July 2022 2
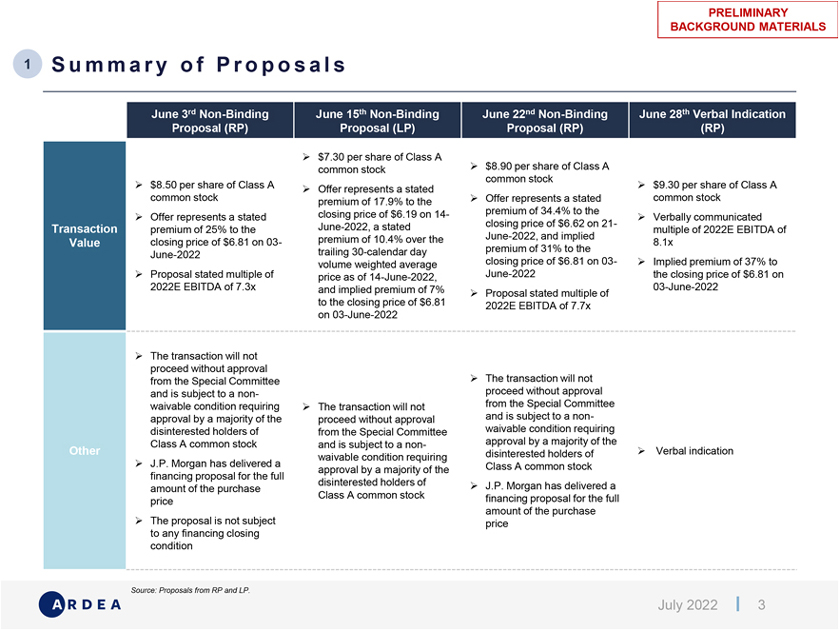
PRELIMINARY BACKGROUND MATERIALS 1 Summary of Proposals N June 3rd Non-Binding June 15th Non-Binding June 22nd Non-Binding June 28th Verbal Indication Proposal (RP) Proposal (LP) Proposal (RP) (RP) ? $7.30 per share of Class A ? $8.90 per share of Class A common stock common stock ? $8.50 per share of Class A ?Offer represents a stated ? $9.30 per share of Class A common stock premium of 17.9% to the ?Offer represents a stated common stock closing price of $6.19 on 14- premium of 34.4% to the ? Offer represents a stated ? Verbally communicated June-2022, a stated closing price of $6.62 on 21-Transaction premium of 25% to the multiple of 2022E EBITDA of premium of 10.4% over the June-2022, and implied Value closing price of $6.81 on 03- 8.1x trailing 30-calendar day premium of 31% to the June-2022 volume weighted average closing price of $6.81 on 03- ? Implied premium of 37% to ? Proposal stated multiple of price as of 14-June-2022, June-2022 the closing price of $6.81 on 2022E EBITDA of 7.3x and implied premium of 7% 03-June-2022 to the closing price of $6.81 ? Proposal stated multiple of on 03-June-2022 2022E EBITDA of 7.7x ? The transaction will not proceed without approval from the Special Committee ? The transaction will not and is subject to a non- proceed without approval waivable condition requiring ? The transaction will not from the Special Committee approval by a majority of the proceed without approval and is subject to a non-disinterested holders of from the Special Committee waivable condition requiring Class A common stock and is subject to a non- approval by a majority of the ? Other disinterested holders of Verbal indication waivable condition requiring ? J.P. Morgan has delivered a Class A common stock approval by a majority of the financing proposal for the full disinterested holders of ? J.P. Morgan has delivered a amount of the purchase Class A common stock financing proposal for the full price amount of the purchase ? The proposal is not subject price to any financing closing condition Source: Proposals from RP and LP. July 2022 3
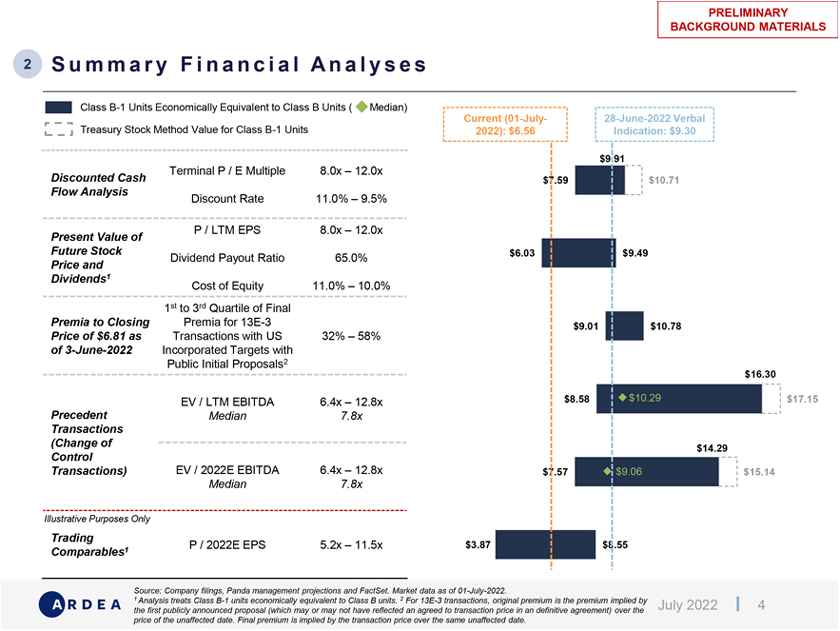
PRELIMINARY BACKGROUND MATERIALS 2 Summary Financial Analyses Class B-1 Units Economically Equivalent to Class B Units ( Median) Current (01-July- 28-June-2022 Verbal Treasury Stock Method Value for Class B-1 Units 2022): $6.56 Indication: $9.30 $9.91 Terminal P / E Multiple 8.0x – 12.0x Discounted Cash $7.59 $10.71 Flow Analysis Discount Rate 11.0% – 9.5% P / LTM EPS 8.0x – 12.0x Present Value of Future Stock $6.03 $9.49 Dividend Payout Ratio 65.0% Price and Dividends1 Cost of Equity 11.0% – 10.0% 1st to 3rd Quartile of Final Premia to Closing Premia for 13E-3 $9.01 $10.78 Price of $6.81 as Transactions with US 32% – 58% of 3-June-2022 Incorporated Targets with Public Initial Proposals2 $16.30 EV / LTM EBITDA 6.4x – 12.8x $8.58 $10.29 $17.15 Precedent Median 7.8x Transactions (Change of $14.29 Control Transactions) EV / 2022E EBITDA 6.4x – 12.8x $7.57 $9.06 $15.14 Median 7.8x Illustrative Purposes Only Trading P / 2022E EPS 5.2x – 11.5x $3.87 $8.55 Comparables1 Source: Company filings, Panda management projections and FactSet. Market data as of 01-July-2022. 1 Analysis treats Class B-1 units economically equivalent to Class B units. 2 For 13E-3 transactions, original premium is the premium implied by July 2022 4 the first publicly announced proposal (which may or may not have reflected an agreed to transaction price in an definitive agreement) over the price of the unaffected date. Final premium is implied by the transaction price over the same unaffected date.
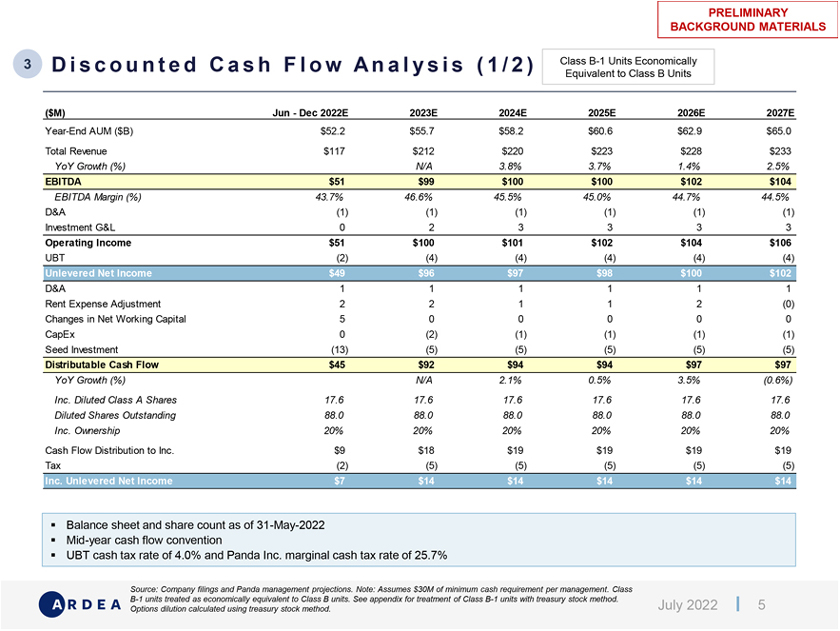
PRELIMINARY BACKGROUND MATERIALS PRELIMINARY BACKGROUND MATERIALS 3 Discounted Cash Flow Analysis ( 1 / 2 ) Class B-1 Units Economically Equivalent to Class B Units ($M) Jun—Dec 2022E 2023E 2024E 2025E 2026E 2027E Year-End AUM ($B) $52.2 $55.7 $58.2 $60.6 $62.9 $65.0 Total Revenue $117 $212 $220 $223 $228 $233 YoY Growth (%) N/A 3.8% 3.7% 1.4% 2.5% EBITDA $51 $99 $100 $100 $102 $104 EBITDA Margin (%) 43.7% 46.6% 45.5% 45.0% 44.7% 44.5% D&A (1) (1) (1) (1) (1) (1) Investment G&L 0 2 3 3 3 3 Operating Income $51 $100 $101 $102 $104 $106 UBT (2) (4) (4) (4) (4) (4) Unlevered Net Income $49 $96 $97 $98 $100 $102 D&A 1 1 1 1 1 1 Rent Expense Adjustment 2 2 1 1 2 (0) Changes in Net Working Capital 5 0 0 0 0 0 CapEx 0 (2) (1) (1) (1) (1) Seed Investment (13) (5) (5) (5) (5) (5) Distributable Cash Flow $45 $92 $94 $94 $97 $97 YoY Growth (%) N/A 2.1% 0.5% 3.5% (0.6%) Inc. Diluted Class A Shares 17.6 17.6 17.6 17.6 17.6 17.6 Diluted Shares Outstanding 88.0 88.0 88.0 88.0 88.0 88.0 Inc. Ownership 20% 20% 20% 20% 20% 20% Cash Flow Distribution to Inc. $9 $18 $19 $19 $19 $19 Tax (2) (5) (5) (5) (5) (5) Inc. Unlevered Net Income $7 $14 $14 $14 $14 $14 ? Balance sheet and share count as of 31-May-2022 ? Mid-year cash flow convention ? UBT cash tax rate of 4.0% and Panda Inc. marginal cash tax rate of 25.7% Source: Company filings and Panda management projections. Note: Assumes $30M of minimum cash requirement per management. Class B-1 units treated as economically equivalent to Class B units. See appendix for treatment of Class B-1 units with treasury stock method. July 2022 5 Options dilution calculated using treasury stock method.
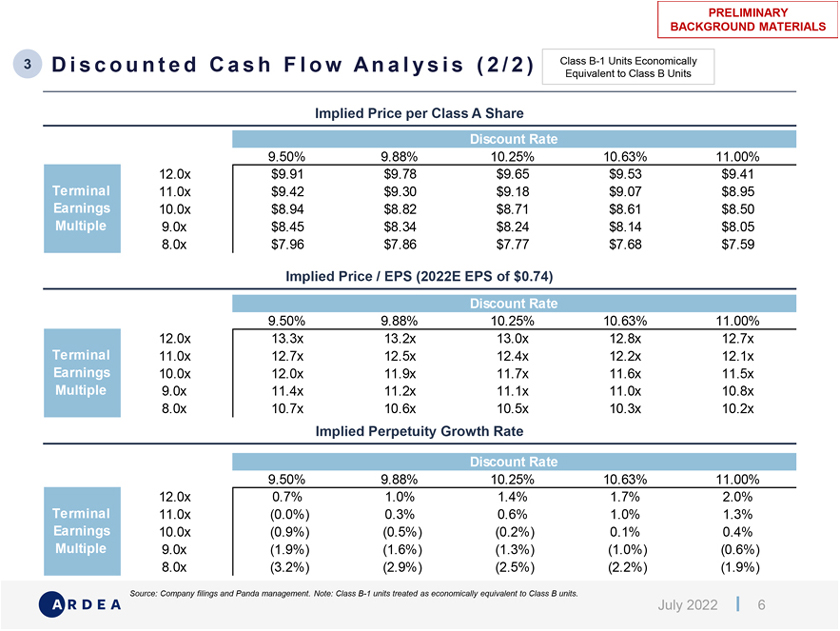
PRELIMINARY BACKGROUND MATERIALS 3 D i s c o u n t e d C a s h F l o w A n a l y s i s ( 2 / 2 ) Class B-1 Units Economically Equivalent to Class B Units Implied Price per Class A Share Discount Rate $8.7 9.50% 9.88% 10.25% 10.63% 11.00% 12.0x $9.91 $9.78 $9.65 $9.53 $9.41 Terminal 11.0x $9.42 $9.30 $9.18 $9.07 $8.95 Earnings 10.0x $8.94 $8.82 $8.71 $8.61 $8.50 Multiple 9.0x $8.45 $8.34 $8.24 $8.14 $8.05 8.0x $7.96 $7.86 $7.77 $7.68 $7.59 Implied Price / EPS (2022E EPS of $0.74) Discount Rate 9.50% 9.88% 10.25% 10.63% 11.00% 12.0x 13.3x 13.2x 13.0x 12.8x 12.7x Terminal 11.0x 12.7x 12.5x 12.4x 12.2x 12.1x Earnings 10.0x 12.0x 11.9x 11.7x 11.6x 11.5x Multiple 9.0x 11.4x 11.2x 11.1x 11.0x 10.8x 8.0x 10.7x 10.6x 10.5x 10.3x 10.2x Implied Perpetuity Growth Rate Discount Rate ($0.0) 9.50% 9.88% 10.25% 10.63% 11.00% 12.0x 0.7% 1.0% 1.4% 1.7% 2.0% Terminal 11.0x (0.0%) 0.3% 0.6% 1.0% 1.3% Earnings 10.0x (0.9%) (0.5%) (0.2%) 0.1% 0.4% Multiple 9.0x (1.9%) (1.6%) (1.3%) (1.0%) (0.6%) 8.0x (3.2%) (2.9%) (2.5%) (2.2%) (1.9%) Source: Company filings and Panda management. Note: Class B-1 units treated as economically equivalent to Class B units. July 2022 6
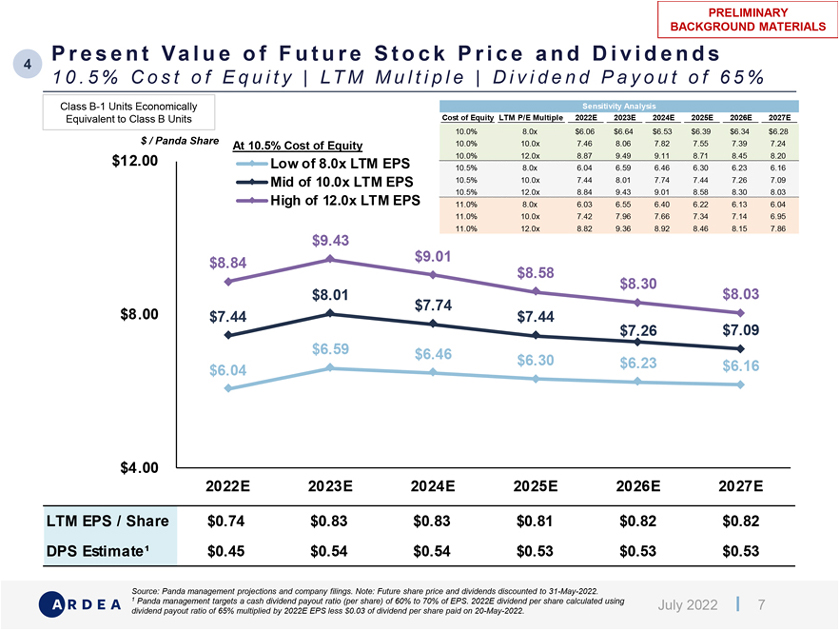
BACKGROUND MATERIALS PRELIMINARY BACKGROUND MATERIALS P r e s e n t Va l u e o f F u t u r e S t o c k P r i c e a n d D i v i d e n d s 4 1 0 . 5 % C o s t o f E q u i t y | LT M M u l t i p l e | D i v i d e n d P a y o u t o f 6 5 % Class B-1 Units Economically Sensitivity Analysis Equivalent to Class B Units Cost of Equity LTM P/E Multiple 2022E 2023E 2024E 2025E 2026E 2027E 10.0% 8.0x $6.06 $6.64 $6.53 $6.39 $6.34 $6.28 $ / Panda Share At 10.5% Cost of Equity 10.0% 10.0x 7.46 8.06 7.82 7.55 7.39 7.24 $12.00 10.0% 12.0x 8.87 9.49 9.11 8.71 8.45 8.20 Low of 8.0x LTM EPS 10.5% 8.0x 6.04 6.59 6.46 6.30 6.23 6.16 Mid of 10.0x LTM EPS 10.5% 10.0x 7.44 8.01 7.74 7.44 7.26 7.09 10.5% 12.0x 8.84 9.43 9.01 8.58 8.30 8.03 High of 12.0x LTM EPS 11.0% 8.0x 6.03 6.55 6.40 6.22 6.13 6.04 11.0% 10.0x 7.42 7.96 7.66 7.34 7.14 6.95 11.0% 12.0x 8.82 9.36 8.92 8.46 8.15 7.86 $9.43 $8.84 $9.01 $8.58 $8.30 $8.01 $8.03 $7.74 $8.00 $7.44 $7.44 $7.26 $7.09 $6.59 $6.46 $6.30 $6.23 $6.16 $6.04 $4.00 2022E 2023E 2024E 2025E 2026E 2027E LTM EPS / Share $0.74 $0.83 $0.83 $0.81 $0.82 $0.82 DPS Estimate¹ $0.45 $0.54 $0.54 $0.53 $0.53 $0.53 Source: Panda management projections and company filings. Note: Future share price and dividends discounted to 31-May-2022. 1 Panda management targets a cash dividend payout ratio (per share) of 60% to 70% of EPS. 2022E dividend per share calculated using July 2022 7 dividend payout ratio of 65% multiplied by 2022E EPS less $0.03 of dividend per share paid on 20-May-2022.
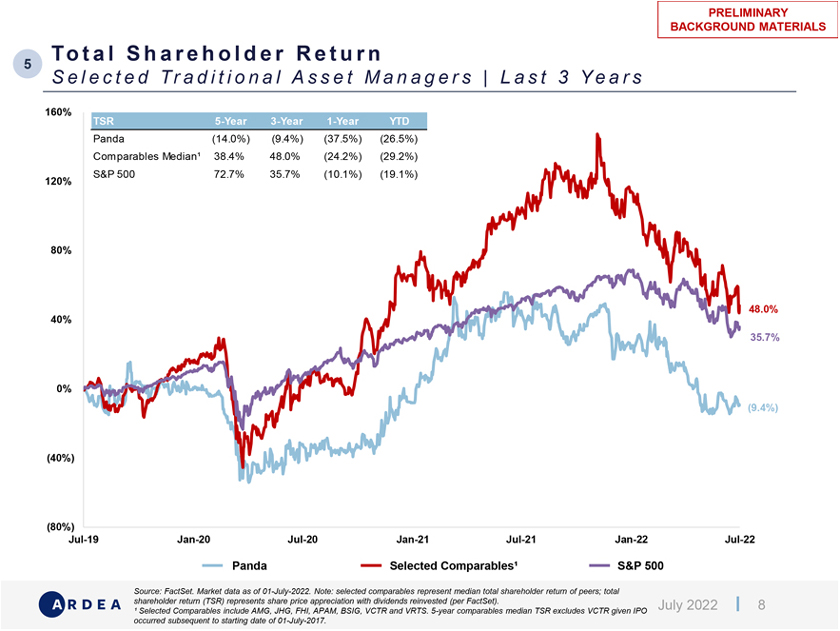
PRELIMINARY BACKGROUND MATERIALS To t a l S h a r e h o l d e r R e t u r n 5 S e l e c t e d Tr a d i t i o n a l A s s e t M a n a g e r s | L a s t 3 Y e a r s 160% TSR 5-Year 3-Year 1-Year YTD Panda (14.0%) (9.4%) (37.5%) (26.5%) Comparables Median¹ 38.4% 48.0% (24.2%) (29.2%) S&P 500 72.7% 35.7% (10.1%) (19.1%) 120% 80% 48.0% 40% 35.7% 0% (9.4%) (40%) (80%) Jul-19 Jan-20 Jul-20 Jan-21 Jul-21 Jan-22 Jul-22 Panda Selected Comparables¹ S&P 500 Source: FactSet. Market data as of 01-July-2022. Note: selected comparables represent median total shareholder return of peers; total shareholder return (TSR) represents share price appreciation with dividends reinvested (per FactSet). July 2022 8 ¹ Selected Comparables include AMG, JHG, FHI, APAM, BSIG, VCTR and VRTS. 5-year comparables median TSR excludes VCTR given IPO occurred subsequent to starting date of 01-July-2017.
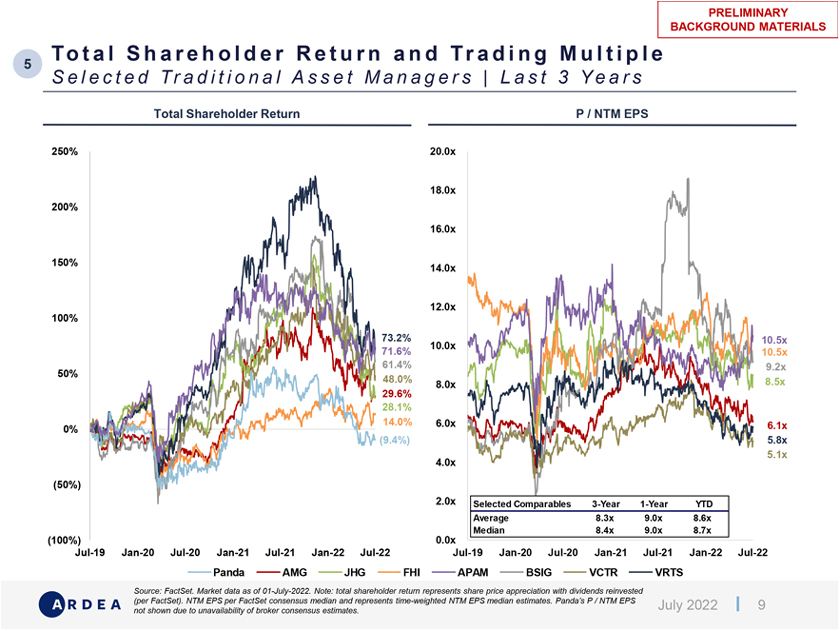
PRELIMINARY BACKGROUND MATERIALS To t a l S h a r e h o l d e r R e t u r n a n d Tr a d i n g M u l t i p l e 5 S e l e c t e d Tr a d i t i o n a l A s s e t M a n a g e r s | L a s t 3 Y e a r s Total Shareholder Return P / NTM EPS 250% 20.0x 18.0x 200% 16.0x 150% 14.0x 12.0x 100% 73.2% 10.5x 10.0x 71.6% 10.5x 50% 61.4% 9.2x 48.0% 8.5x 29.6% 8.0x 28.1% 14.0% 6.0x 6.1x 0% (9.4%) 5.8x 5.1x 4.0x (50%) 2.0x Selected Comparables 3-Year 1-Year YTD Average 8.3x 9.0x 8.6x Median 8.4x 9.0x 8.7x (100%) 0.0x Jul-19 Jan-20 Jul-20 Jan-21 Jul-21 Jan-22 Jul-22 Jul-19 Jan-20 Jul-20 Jan-21 Jul-21 Jan-22 Jul-22 Panda AMG JHG FHI APAM BSIG VCTR VRTS Source: FactSet. Market data as of 01-July-2022. Note: total shareholder return represents share price appreciation with dividends reinvested (per FactSet). NTM EPS per FactSet consensus median and represents time-weighted NTM EPS median estimates. Panda’s P / NTM EPS July 2022 9 not shown due to unavailability of broker consensus estimates.
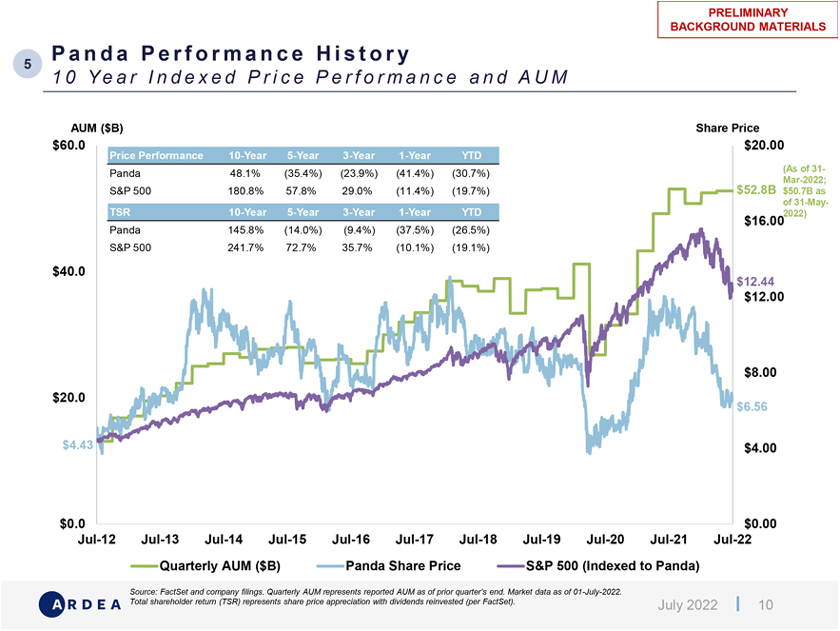
PRELIMINARY BACKGROUND MATERIALS P a n d a P e r f o r m a n c e H i s t o r y 5 1 0 Y e a r I n d e x e d P r i c e P e r f o r m a n c e a n d A U M AUM ($B) Share Price $60.0 Price Performance 10-Year 5-Year 3-Year 1-Year YTD $20.00 Panda 48.1% (35.4%) (23.9%) (41.4%) (30.7%) (As of 31-$52.8B Mar-2022; S&P 500 180.8% 57.8% 29.0% (11.4%) (19.7%) $50.7B as of 31-May- TSR 10-Year 5-Year 3-Year 1-Year YTD 2022) $16.00 Panda 145.8% (14.0%) (9.4%) (37.5%) (26.5%) S&P 500 241.7% 72.7% 35.7% (10.1%) (19.1%) $40.0 $12.44 $12.00 $8.00 $20.0 $6.56 $4.43 $4.00 $0.0 $0.00 Jul-12 Jul-13 Jul-14 Jul-15 Jul-16 Jul-17 Jul-18 Jul-19 Jul-20 Jul-21 Jul-22 Quarterly AUM ($B) Panda Share Price S&P 500 (Indexed to Panda) Source: FactSet and company filings. Quarterly AUM represents reported AUM as of prior quarter’s end. Market data as of 01-July-2022. Total shareholder return (TSR) represents share price appreciation with dividends reinvested (per FactSet). July 2022 10
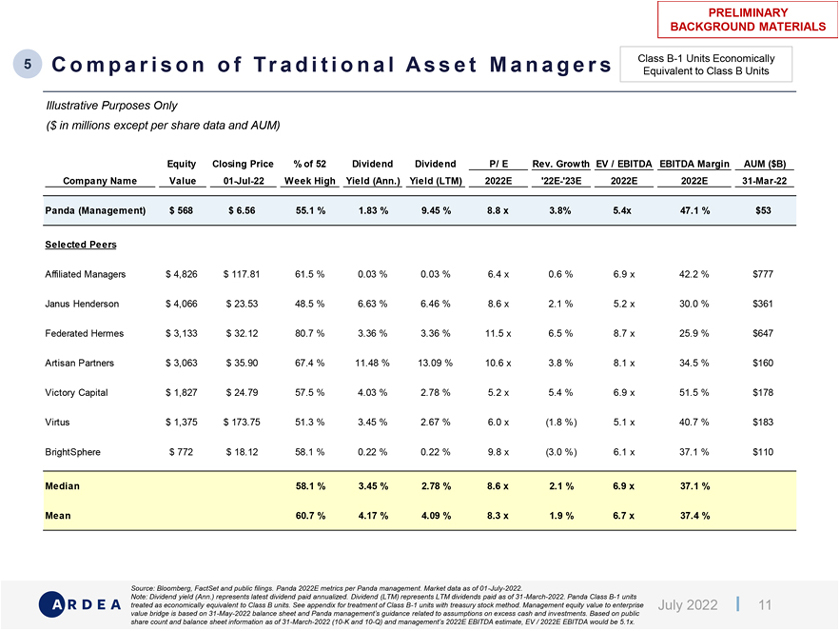
PRELIMINARY BACKGROUND MATERIALS 5 C o m p a r i s o n o f Tr a d i t i o n a l A s s e t M a n a g e r s Class B-1 Units Economically Equivalent to Class B Units Illustrative Purposes Only ($ in millions except per share data and AUM) Equity Closing Price % of 52 Dividend Dividend P/ E Rev. Growth EV / EBITDA EBITDA Margin AUM ($B) Company Name Value 01-Jul-22 Week High Yield (Ann.) Yield (LTM) 2022E ‘22E-‘23E 2022E 2022E 31-Mar-22 Panda (Management) $ 568 $ 6.56 55.1 % 1.83 % 9.45 % 8.8 x 3.8% 5.4x 47.1 % $53 Selected Peers Affiliated Managers $ 4,826 $ 117.81 61.5 % 0.03 % 0.03 % 6.4 x 0.6 % 6.9 x 42.2 % $777 Janus Henderson $ 4,066 $ 23.53 48.5 % 6.63 % 6.46 % 8.6 x 2.1 % 5.2 x 30.0 % $361 Federated Hermes $ 3,133 $ 32.12 80.7 % 3.36 % 3.36 % 11.5 x 6.5 % 8.7 x 25.9 % $647 Artisan Partners $ 3,063 $ 35.90 67.4 % 11.48 % 13.09 % 10.6 x 3.8 % 8.1 x 34.5 % $160 Victory Capital $ 1,827 $ 24.79 57.5 % 4.03 % 2.78 % 5.2 x 5.4 % 6.9 x 51.5 % $178 Virtus $ 1,375 $ 173.75 51.3 % 3.45 % 2.67 % 6.0 x (1.8 %) 5.1 x 40.7 % $183 BrightSphere $ 772 $ 18.12 58.1 % 0.22 % 0.22 % 9.8 x (3.0 %) 6.1 x 37.1 % $110 Median 58.1 % 3.45 % 2.78 % 8.6 x 2.1 % 6.9 x 37.1 % Mean 60.7 % 4.17 % 4.09 % 8.3 x 1.9 % 6.7 x 37.4 % Source: Bloomberg, FactSet and public filings. Panda 2022E metrics per Panda management. Market data as of 01-July-2022. Note: Dividend yield (Ann.) represents latest dividend paid annualized. Dividend (LTM) represents LTM dividends paid as of 31-March-2022. Panda Class B-1 units treated as economically equivalent to Class B units. See appendix for treatment of Class B-1 units with treasury stock method. Management equity value to enterprise July 2022 11 value bridge is based on 31-May-2022 balance sheet and Panda management’s guidance related to assumptions on excess cash and investments. Based on public share count and balance sheet information as of 31-March-2022 (10-K and 10-Q) and management’s 2022E EBITDA estimate, EV / 2022E EBITDA would be 5.1x.
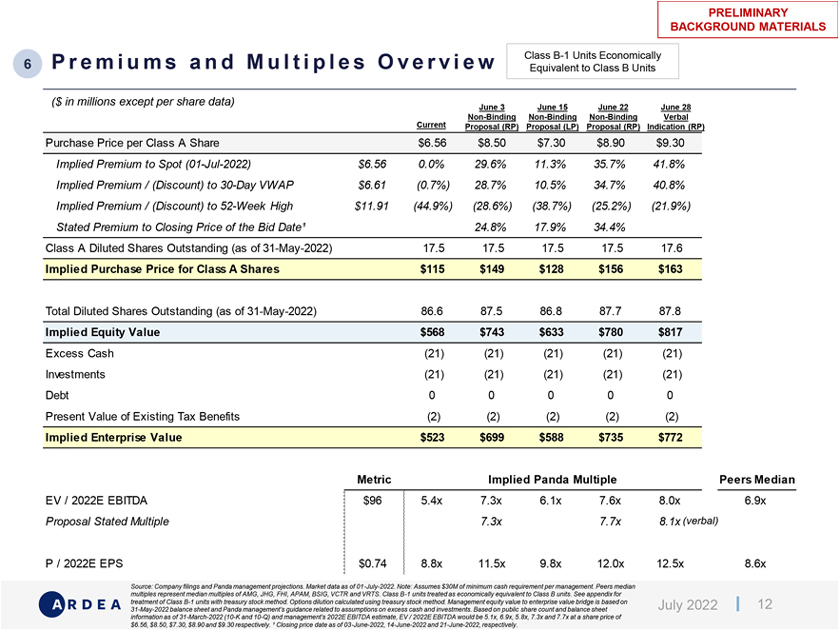
PRELIMINARY BACKGROUND MATERIALS Class B-1 Units Economically 6 P r e m i u m s a n d M u l t i p l e s O v e r v i e w Equivalent to Class B Units ($ in millions except per share data) June 3 June 15 June 22 June 28 Non-Binding Non-Binding Non-Binding Verbal Current Proposal (RP) Proposal (LP) Proposal (RP) Indication (RP) Purchase Price per Class A Share $6.56 $8.50 $7.30 $8.90 $9.30 Implied Premium to Spot (01-Jul-2022) $6.56 0.0% 29.6% 11.3% 35.7% 41.8% Implied Premium / (Discount) to 30-Day VWAP $6.61 (0.7%) 28.7% 10.5% 34.7% 40.8% Implied Premium / (Discount) to 52-Week High $11.91 (44.9%) (28.6%) (38.7%) (25.2%) (21.9%) Stated Premium to Closing Price of the Bid Date¹ 24.8% 17.9% 34.4% Class A Diluted Shares Outstanding (as of 31-May-2022) 17.5 17.5 17.5 17.5 17.6 Implied Purchase Price for Class A Shares $115 $149 $128 $156 $163 Total Diluted Shares Outstanding (as of 31-May-2022) 86.6 87.5 86.8 87.7 87.8 Implied Equity Value $568 $743 $633 $780 $817 Excess Cash (21) (21) (21) (21) (21) Investments (21) (21) (21) (21) (21) Debt 0 0 0 0 0 Present Value of Existing Tax Benefits (2) (2) (2) (2) (2) Implied Enterprise Value $523 $699 $588 $735 $772 Metric Implied Panda Multiple Peers Median EV / 2022E EBITDA $96 5.4x 7.3x 6.1x 7.6x 8.0x 6.9x Proposal Stated Multiple 7.3x 7.7x 8.1x (verbal) P / 2022E EPS $0.74 8.8x 11.5x 9.8x 12.0x 12.5x 8.6x Source: Company filings and Panda management projections. Market data as of 01-July-2022. Note: Assumes $30M of minimum cash requirement per management. Peers median multiples represent median multiples of AMG, JHG, FHI, APAM, BSIG, VCTR and VRTS. Class B-1 units treated as economically equivalent to Class B units. See appendix for treatment of Class B-1 units with treasury stock method. Options dilution calculated using treasury stock method. Management equity value to enterprise value bridge is based on July 2022 12 31-May-2022 balance sheet and Panda management’s guidance related to assumptions on excess cash and investments. Based on public share count and balance sheet information as of 31-March-2022 (10-K and 10-Q) and management’s 2022E EBITDA estimate, EV / 2022E EBITDA would be 5.1x, 6.9x, 5.8x, 7.3x and 7.7x at a share price of $6.56, $8.50, $7.30, $8.90 and $9.30 respectively. ¹ Closing price date as of 03-June-2022, 14-June-2022 and 21-June-2022, respectively.
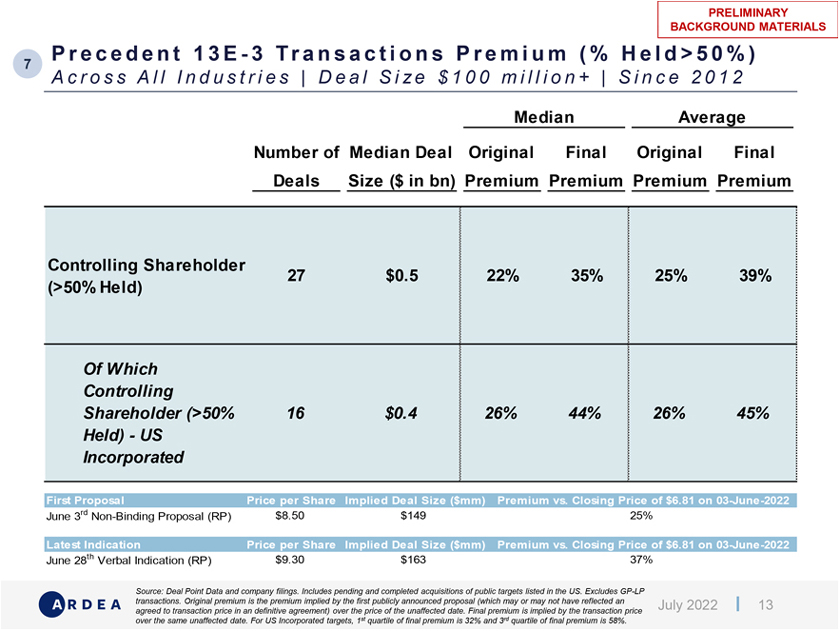
PRELIMINARY BACKGROUND MATERIALS P r e c e d e n t 1 3 E—3 Tr a n s a c t i o n s P r e m i u m ( % H e l d > 5 0 % ) 7 A c r o s s A l l I n d u s t r i e s | D e a l S i z e $ 1 0 0 m i l l i o n + | S i n c e 2 0 1 2 Median Average Number of Median Deal Original Final Original Final Deals Size ($ in bn) Premium Premium Premium Premium Controlling Shareholder 27 $0.5 22% 35% 25% 39% (>50% Held) Of Which Controlling Shareholder (>50% 16 $0.4 26% 44% 26% 45% Held)—US Incorporated First Proposal Price per Share Implied Deal Size ($mm) Premium vs. Closing Price of $6.81 on 03-June-2022 June 3rd Non-Binding Proposal (RP) $8.50 $149 25% Latest Indication Price per Share Implied Deal Size ($mm) Premium vs. Closing Price of $6.81 on 03-June-2022 June 28th Verbal Indication (RP) $9.30 $163 37% Source: Deal Point Data and company filings. Includes pending and completed acquisitions of public targets listed in the US. Excludes GP-LP transactions. Original premium is the premium implied by the first publicly announced proposal (which may or may not have reflected an July 2022 13 agreed to transaction price in an definitive agreement) over the price of the unaffected date. Final premium is implied by the transaction price over the same unaffected date. For US Incorporated targets, 1st quartile of final premium is 32% and 3rd quartile of final premium is 58%.
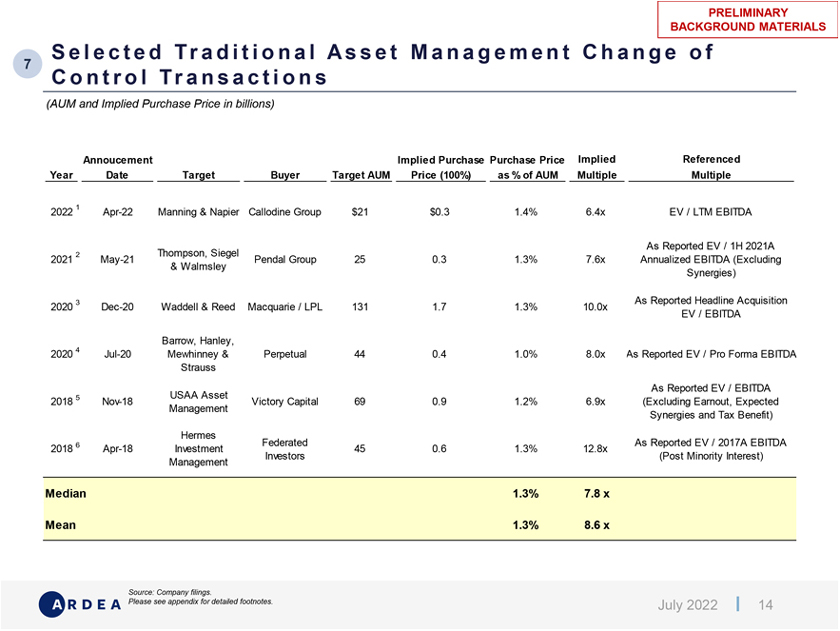
PRELIMINARY BACKGROUND MATERIALS S e l e c t e d Tr a d i t i o n a l A s s e t M a n a g e m e n t C h a n g e o f 7 C o n t r o l Tr a n s a c t i o n s (AUM and Implied Purchase Price in billions) Annoucement Implied Purchase Purchase Price Implied Referenced Year Date Target Buyer Target AUM Price (100%) as % of AUM Multiple Multiple 1 2022 Apr-22 Manning & Napier Callodine Group $21 $0.3 1.4% 6.4x EV / LTM EBITDA As Reported EV / 1H 2021A 2 Thompson, Siegel 2021 May-21 Pendal Group 25 0.3 1.3% 7.6x Annualized EBITDA (Excluding & Walmsley Synergies) 3 As Reported Headline Acquisition 2020 Dec-20 Waddell & Reed Macquarie / LPL 131 1.7 1.3% 10.0x EV / EBITDA Barrow, Hanley, 2020 4 Jul-20 Mewhinney & Perpetual 44 0.4 1.0% 8.0x As Reported EV / Pro Forma EBITDA Strauss As Reported EV / EBITDA 5 USAA Asset 2018 Nov-18 Victory Capital 69 0.9 1.2% 6.9x (Excluding Earnout, Expected Management Synergies and Tax Benefit) Hermes 6 Federated As Reported EV / 2017A EBITDA 2018 Apr-18 Investment 45 0.6 1.3% 12.8x Investors (Post Minority Interest) Management Median 1.3% 7.8 x Mean 1.3% 8.6 x Source: Company filings. Please see appendix for detailed footnotes. July 2022 14

PRELIMINARY BACKGROUND MATERIALS A A p p e n d i x July 2022 15
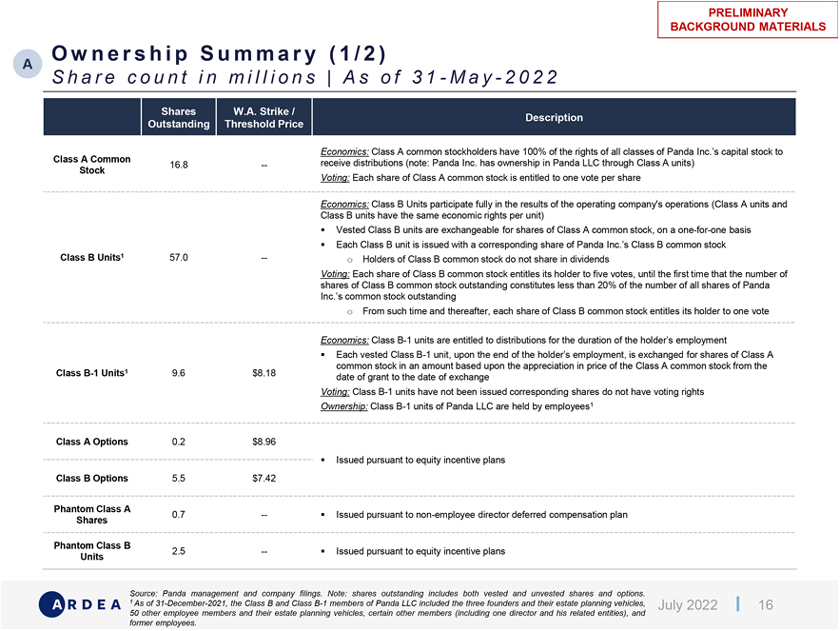
PRELIMINARY BACKGROUND MATERIALS O w n e r s h i p S u m m a r y ( 1 / 2 ) A S h a r e c o u n t i n m i l l i o n s | A s o f 3 1—M a y—2 0 2 2 Shares W.A. Strike / Description Outstanding Threshold Price Economics: Class A common stockholders have 100% of the rights of all classes of Panda Inc.’s capital stock to Class A Common receive distributions (note: Panda Inc. has ownership in Panda LLC through Class A units) 16.8 — Stock Voting: Each share of Class A common stock is entitled to one vote per share Economics: Class B Units participate fully in the results of the operating company’s operations (Class A units and Class B units have the same economic rights per unit) ? Vested Class B units are exchangeable for shares of Class A common stock, on a one-for-one basis ? Each Class B unit is issued with a corresponding share of Panda Inc.’s Class B common stock Class B Units1 57.0 — o Holders of Class B common stock do not share in dividends Voting: Each share of Class B common stock entitles its holder to five votes, until the first time that the number of shares of Class B common stock outstanding constitutes less than 20% of the number of all shares of Panda Inc.’s common stock outstanding o From such time and thereafter, each share of Class B common stock entitles its holder to one vote Economics: Class B-1 units are entitled to distributions for the duration of the holder’s employment ? Each vested Class B-1 unit, upon the end of the holder’s employment, is exchanged for shares of Class A common stock in an amount based upon the appreciation in price of the Class A common stock from the Class B-1 Units1 9.6 $8.18 date of grant to the date of exchange Voting: Class B-1 units have not been issued corresponding shares do not have voting rights Ownership: Class B-1 units of Panda LLC are held by employees1 Class A Options 0.2 $8.96 ? Issued pursuant to equity incentive plans Class B Options 5.5 $7.42 Phantom Class A 0.7 — ? Issued pursuant to non-employee director deferred compensation plan Shares Phantom Class B 2.5 — ? Issued pursuant to equity incentive plans Units Source: Panda management and company filings. Note: shares outstanding includes both vested and unvested shares and options. 1 As of 31-December-2021, the Class B and Class B-1 members of Panda LLC included the three founders and their estate planning vehicles, July 2022 16 50 other employee members and their estate planning vehicles, certain other members (including one director and his related entities), and former employees.
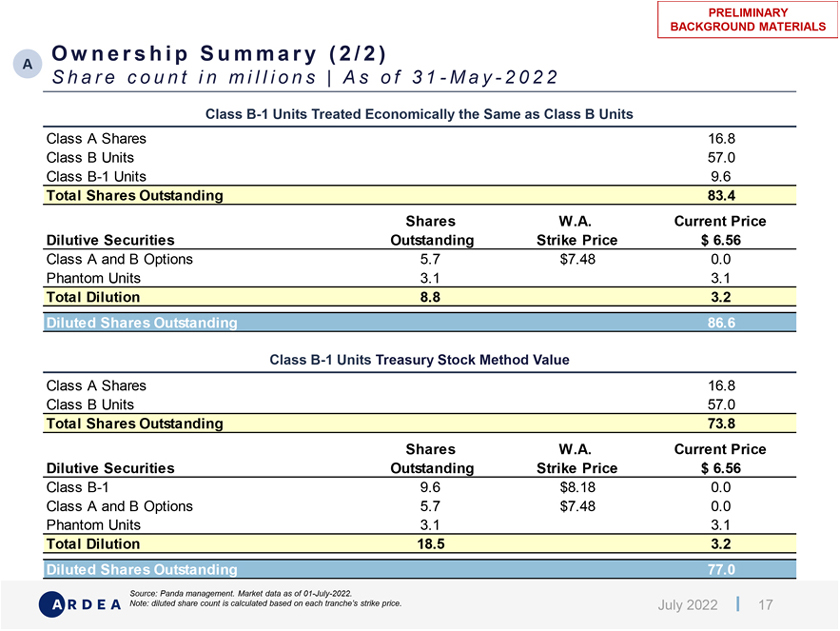
PRELIMINARY BACKGROUND MATERIALS O w n e r s h i p S u m m a r y ( 2 / 2 ) A S h a r e c o u n t i n m i l l i o n s | A s o f 3 1—M a y—2 0 2 2 Class B-1 Units Treated Economically the Same as Class B Units Class A Shares 16.8 Class B Units 57.0 Class B-1 Units 9.6 Total Shares Outstanding 83.4 Shares W.A. Current Price Dilutive Securities Outstanding Strike Price $ 6.56 Class A and B Options 5.7 $7.48 0.0 Phantom Units 3.1 3.1 Total Dilution 8.8 3.2 Diluted Shares Outstanding 86.6 Class B-1 Units Treasury Stock Method Value Class A Shares 16.8 Class B Units 57.0 Total Shares Outstanding 73.8 Shares W.A. Current Price Dilutive Securities Outstanding Strike Price $ 6.56 Class B-1 9.6 $8.18 0.0 Class A and B Options 5.7 $7.48 0.0 Phantom Units 3.1 3.1 Total Dilution 18.5 3.2 Diluted Shares Outstanding 77.0 Source: Panda management. Market data as of 01-July-2022. Note: diluted share count is calculated based on each tranche’s strike price. July 2022 17
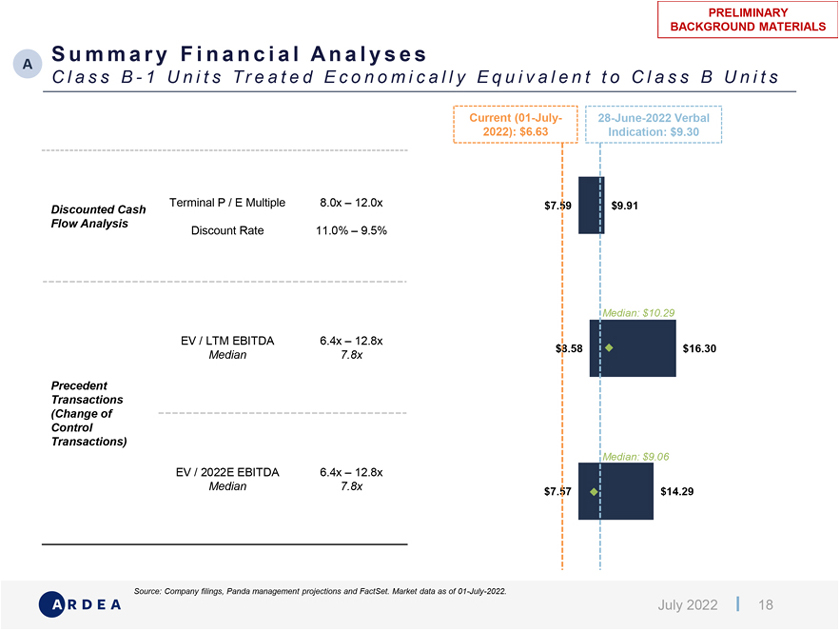
PRELIMINARY BACKGROUND MATERIALS S u m m a r y F i n a n c i a l A n a l y s e s A C l a s s B—1 U n i t s T r e a t e d E c o n o m i c a l l y E q u i v a l e n t t o C l a s s B U n i t s Current (01-July- 28-June-2022 Verbal 2022): $6.63 Indication: $9.30 Terminal P / E Multiple 8.0x – 12.0x $7.59 $9.91 Discounted Cash Flow Analysis Discount Rate 11.0% – 9.5% Median: $10.29 EV / LTM EBITDA 6.4x – 12.8x $8.58 $16.30 Median 7.8x Precedent Transactions (Change of Control Transactions) Median: $9.06 EV / 2022E EBITDA 6.4x – 12.8x Median 7.8x $7.57 $14.29 Source: Company filings, Panda management projections and FactSet. Market data as of 01-July-2022. July 2022 18
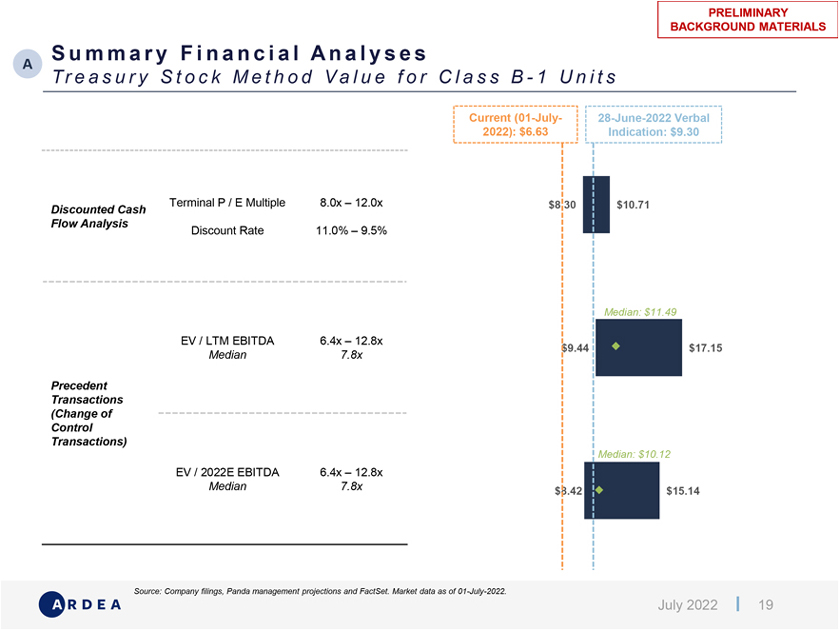
PRELIMINARY BACKGROUND MATERIALS S u m m a r y F i n a n c i a l A n a l y s e s A Tr e a s u r y S t o c k M e t h o d V a l u e f o r C l a s s B—1 U n i t s Current (01-July- 28-June-2022 Verbal 2022): $6.63 Indication: $9.30 Terminal P / E Multiple 8.0x – 12.0x $8.30 $10.71 Discounted Cash Flow Analysis Discount Rate 11.0% – 9.5% Median: $11.49 EV / LTM EBITDA 6.4x – 12.8x $9.44 $17.15 Median 7.8x Precedent Transactions (Change of Control Transactions) Median: $10.12 EV / 2022E EBITDA 6.4x – 12.8x Median 7.8x $8.42 $15.14 Source: Company filings, Panda management projections and FactSet. Market data as of 01-July-2022. July 2022 19
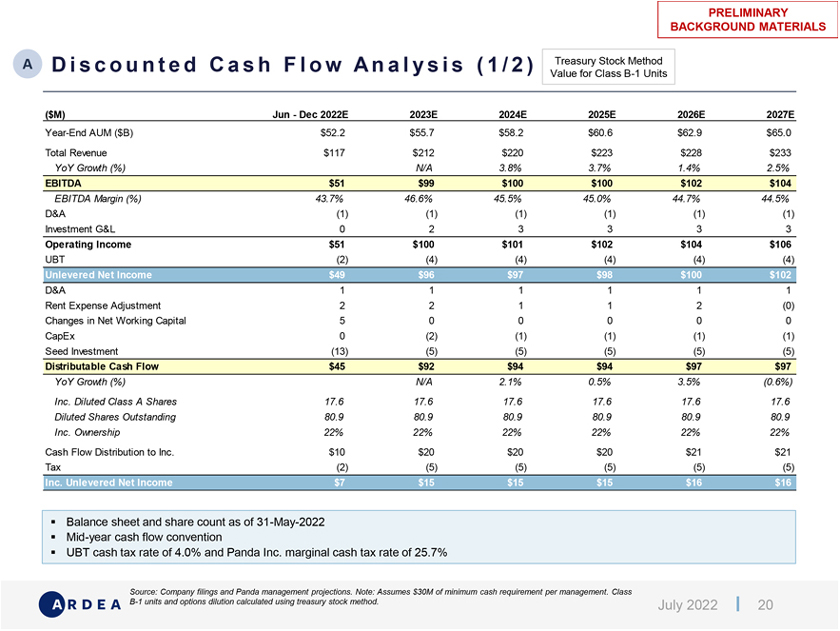
PRELIMINARY BACKGROUND MATERIALS A D i s c o u n t e d C a s h F l o w A n a l y s i s ( 1 / 2 ) Treasury Stock Method Value for Class B-1 Units ($M) Jun—Dec 2022E 2023E 2024E 2025E 2026E 2027E Year-End AUM ($B) $52.2 $55.7 $58.2 $60.6 $62.9 $65.0 Total Revenue $117 $212 $220 $223 $228 $233 YoY Growth (%) N/A 3.8% 3.7% 1.4% 2.5% EBITDA $51 $99 $100 $100 $102 $104 EBITDA Margin (%) 43.7% 46.6% 45.5% 45.0% 44.7% 44.5% D&A (1) (1) (1) (1) (1) (1) Investment G&L 0 2 3 3 3 3 Operating Income $51 $100 $101 $102 $104 $106 UBT (2) (4) (4) (4) (4) (4) Unlevered Net Income $49 $96 $97 $98 $100 $102 D&A 1 1 1 1 1 1 Rent Expense Adjustment 2 2 1 1 2 (0) Changes in Net Working Capital 5 0 0 0 0 0 CapEx 0 (2) (1) (1) (1) (1) Seed Investment (13) (5) (5) (5) (5) (5) Distributable Cash Flow $45 $92 $94 $94 $97 $97 YoY Growth (%) N/A 2.1% 0.5% 3.5% (0.6%) Inc. Diluted Class A Shares 17.6 17.6 17.6 17.6 17.6 17.6 Diluted Shares Outstanding 80.9 80.9 80.9 80.9 80.9 80.9 Inc. Ownership 22% 22% 22% 22% 22% 22% Cash Flow Distribution to Inc. $10 $20 $20 $20 $21 $21 Tax (2) (5) (5) (5) (5) (5) Inc. Unlevered Net Income $7 $15 $15 $15 $16 $16 ? Balance sheet and share count as of 31-May-2022 ? Mid-year cash flow convention ? UBT cash tax rate of 4.0% and Panda Inc. marginal cash tax rate of 25.7% Source: Company filings and Panda management projections. Note: Assumes $30M of minimum cash requirement per management. Class B-1 units and options dilution calculated using treasury stock method. July 2022 20
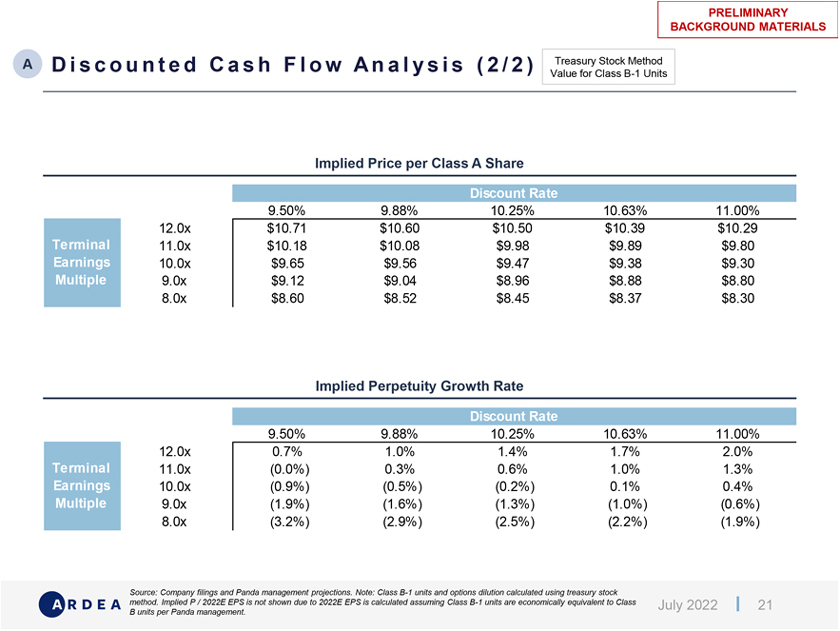
PRELIMINARY BACKGROUND MATERIALS A D i s c o u n t e d C a s h F l o w A n a l y s i s ( 2 / 2 ) Treasury Stock Method Value for Class B-1 Units Implied Price per Class A Share Discount Rate $9.5 9.50% 9.88% 10.25% 10.63% 11.00% 12.0x $10.71 $10.60 $10.50 $10.39 $10.29 Terminal 11.0x $10.18 $10.08 $9.98 $9.89 $9.80 Earnings 10.0x $9.65 $9.56 $9.47 $9.38 $9.30 Multiple 9.0x $9.12 $9.04 $8.96 $8.88 $8.80 8.0x $8.60 $8.52 $8.45 $8.37 $8.30 Implied Perpetuity Growth Rate Discount Rate ($0.0) 9.50% 9.88% 10.25% 10.63% 11.00% 12.0x 0.7% 1.0% 1.4% 1.7% 2.0% Terminal 11.0x (0.0%) 0.3% 0.6% 1.0% 1.3% Earnings 10.0x (0.9%) (0.5%) (0.2%) 0.1% 0.4% Multiple 9.0x (1.9%) (1.6%) (1.3%) (1.0%) (0.6%) 8.0x (3.2%) (2.9%) (2.5%) (2.2%) (1.9%) Source: Company filings and Panda management projections. Note: Class B-1 units and options dilution calculated using treasury stock method. Implied P / 2022E EPS is not shown due to 2022E EPS is calculated assuming Class B-1 units are economically equivalent to Class July 2022 21 B units per Panda management.
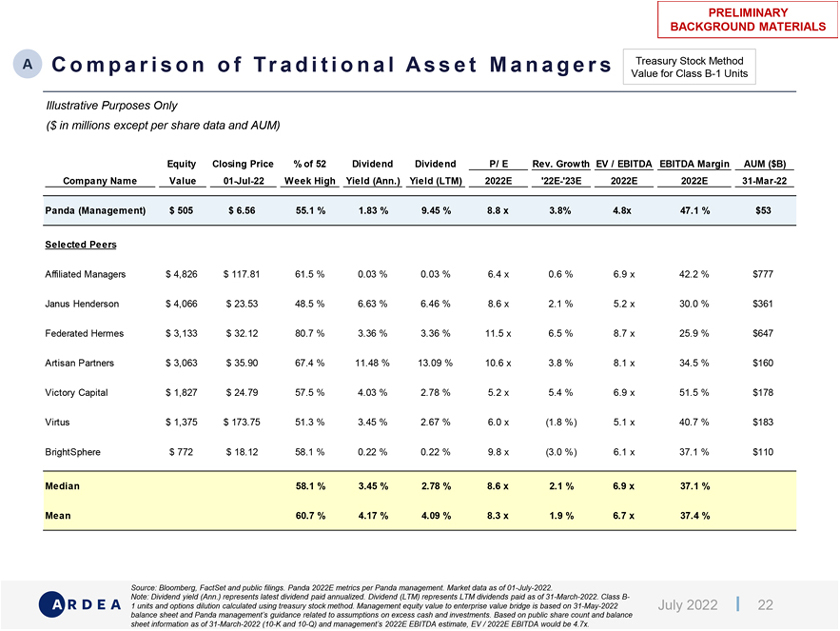
PRELIMINARY BACKGROUND MATERIALS A C o m p a r i s o n o f Tr a d i t i o n a l A s s e t M a n a g e r s Treasury Stock Method Value for Class B-1 Units Illustrative Purposes Only ($ in millions except per share data and AUM) Equity Closing Price % of 52 Dividend Dividend P/ E Rev. Growth EV / EBITDA EBITDA Margin AUM ($B) Company Name Value 01-Jul-22 Week High Yield (Ann.) Yield (LTM) 2022E ‘22E-‘23E 2022E 2022E 31-Mar-22 Panda (Management) $ 505 $ 6.56 55.1 % 1.83 % 9.45 % 8.8 x 3.8% 4.8x 47.1 % $53 Selected Peers Affiliated Managers $ 4,826 $ 117.81 61.5 % 0.03 % 0.03 % 6.4 x 0.6 % 6.9 x 42.2 % $777 Janus Henderson $ 4,066 $ 23.53 48.5 % 6.63 % 6.46 % 8.6 x 2.1 % 5.2 x 30.0 % $361 Federated Hermes $ 3,133 $ 32.12 80.7 % 3.36 % 3.36 % 11.5 x 6.5 % 8.7 x 25.9 % $647 Artisan Partners $ 3,063 $ 35.90 67.4 % 11.48 % 13.09 % 10.6 x 3.8 % 8.1 x 34.5 % $160 Victory Capital $ 1,827 $ 24.79 57.5 % 4.03 % 2.78 % 5.2 x 5.4 % 6.9 x 51.5 % $178 Virtus $ 1,375 $ 173.75 51.3 % 3.45 % 2.67 % 6.0 x (1.8 %) 5.1 x 40.7 % $183 BrightSphere $ 772 $ 18.12 58.1 % 0.22 % 0.22 % 9.8 x (3.0 %) 6.1 x 37.1 % $110 Median 58.1 % 3.45 % 2.78 % 8.6 x 2.1 % 6.9 x 37.1 % Mean 60.7 % 4.17 % 4.09 % 8.3 x 1.9 % 6.7 x 37.4 % Source: Bloomberg, FactSet and public filings. Panda 2022E metrics per Panda management. Market data as of 01-July-2022. Note: Dividend yield (Ann.) represents latest dividend paid annualized. Dividend (LTM) represents LTM dividends paid as of 31-March-2022. Class B- 1 units and options dilution calculated using treasury stock method. Management equity value to enterprise value bridge is based on 31-May-2022 July 2022 22 balance sheet and Panda management’s guidance related to assumptions on excess cash and investments. Based on public share count and balance sheet information as of 31-March-2022 (10-K and 10-Q) and management’s 2022E EBITDA estimate, EV / 2022E EBITDA would be 4.7x.
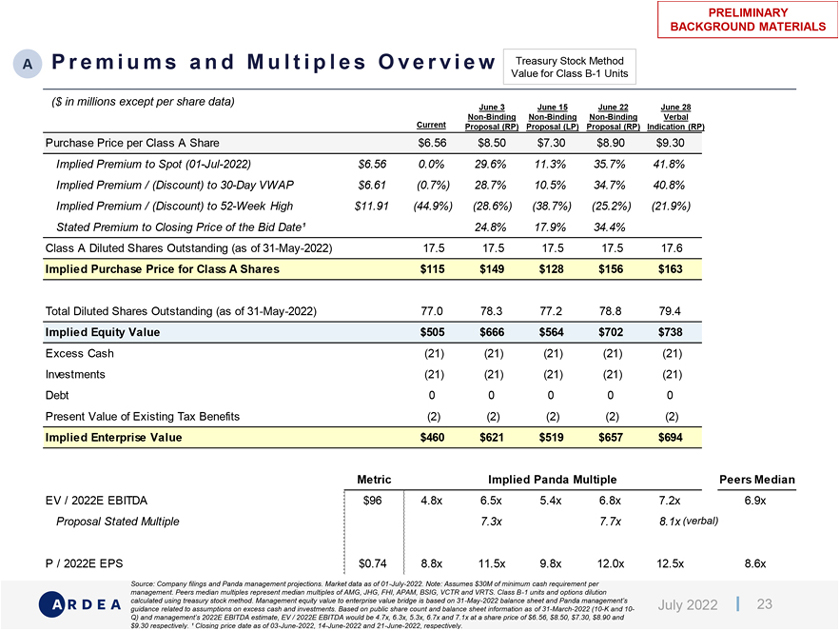
PRELIMINARY BACKGROUND MATERIALS A P r e m i u m s a n d M u l t i p l e s O v e r v i e w Treasury Stock Method Value for Class B-1 Units ($ in millions except per share data) June 3 June 15 June 22 June 28 Non-Binding Non-Binding Non-Binding Verbal Current Proposal (RP) Proposal (LP) Proposal (RP) Indication (RP) Purchase Price per Class A Share $6.56 $8.50 $7.30 $8.90 $9.30 Implied Premium to Spot (01-Jul-2022) $6.56 0.0% 29.6% 11.3% 35.7% 41.8% Implied Premium / (Discount) to 30-Day VWAP $6.61 (0.7%) 28.7% 10.5% 34.7% 40.8% Implied Premium / (Discount) to 52-Week High $11.91 (44.9%) (28.6%) (38.7%) (25.2%) (21.9%) Stated Premium to Closing Price of the Bid Date¹ 24.8% 17.9% 34.4% Class A Diluted Shares Outstanding (as of 31-May-2022) 17.5 17.5 17.5 17.5 17.6 Implied Purchase Price for Class A Shares $115 $149 $128 $156 $163 Total Diluted Shares Outstanding (as of 31-May-2022) 77.0 78.3 77.2 78.8 79.4 Implied Equity Value $505 $666 $564 $702 $738 Excess Cash (21) (21) (21) (21) (21) Investments (21) (21) (21) (21) (21) Debt 0 0 0 0 0 Present Value of Existing Tax Benefits (2) (2) (2) (2) (2) Implied Enterprise Value $460 $621 $519 $657 $694 Metric Implied Panda Multiple Peers Median EV / 2022E EBITDA $96 4.8x 6.5x 5.4x 6.8x 7.2x 6.9x Proposal Stated Multiple 7.3x 7.7x 8.1x (verbal) P / 2022E EPS $0.74 8.8x 11.5x 9.8x 12.0x 12.5x 8.6x Source: Company filings and Panda management projections. Market data as of 01-July-2022. Note: Assumes $30M of minimum cash requirement per management. Peers median multiples represent median multiples of AMG, JHG, FHI, APAM, BSIG, VCTR and VRTS. Class B-1 units and options dilution calculated using treasury stock method. Management equity value to enterprise value bridge is based on 31-May-2022 balance sheet and Panda management’s July 2022 23 guidance related to assumptions on excess cash and investments. Based on public share count and balance sheet information as of 31-March-2022 (10-K and 10- Q) and management’s 2022E EBITDA estimate, EV / 2022E EBITDA would be 4.7x, 6.3x, 5.3x, 6.7x and 7.1x at a share price of $6.56, $8.50, $7.30, $8.90 and $9.30 respectively. ą Closing price date as of 03-June-2022, 14-June-2022 and 21-June-2022, respectively.
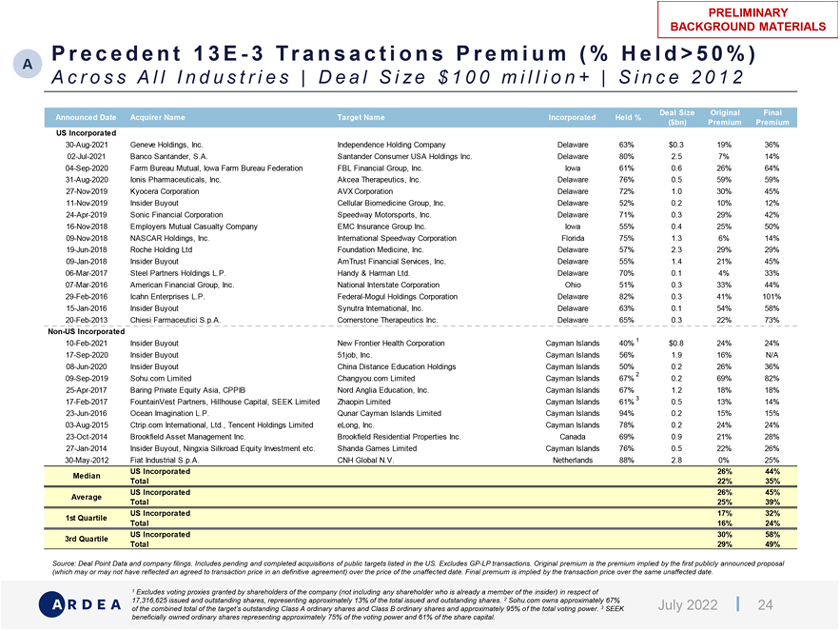
PRELIMINARY BACKGROUND MATERIALSA P r e c e d e n t 1 3 E—3 Tr a n s a c t i o n s P r e m i u m ( % H e l d > 5 0 % ) A c r o s s A l l I n d u s t r i e s | D e a l S i z e $ 1 0 0 m i l l i o n + | S i n c e 2 0 1 2 Announced Date Acquirer Name Target Name Incorporated Held % Deal Size Original Final ($bn) Premium Premium US Incorporated 30-Aug-2021 Geneve Holdings, Inc. Independence Holding Company Delaware 63% $0.3 19% 36% 02-Jul-2021 Banco Santander, S.A. Santander Consumer USA Holdings Inc. Delaware 80% 2.5 7% 14% 04-Sep-2020 Farm Bureau Mutual, Iowa Farm Bureau Federation FBL Financial Group, Inc. Iowa 61% 0.6 26% 64% 31-Aug-2020 Ionis Pharmaceuticals, Inc. Akcea Therapeutics, Inc. Delaware 76% 0.5 59% 59% 27-Nov-2019 Kyocera Corporation AVX Corporation Delaware 72% 1.0 30% 45% 11-Nov-2019 Insider Buyout Cellular Biomedicine Group, Inc. Delaware 52% 0.2 10% 12% 24-Apr-2019 Sonic Financial Corporation Speedway Motorsports, Inc. Delaware 71% 0.3 29% 42% 16-Nov-2018 Employers Mutual Casualty Company EMC Insurance Group Inc. Iowa 55% 0.4 25% 50% 09-Nov-2018 NASCAR Holdings, Inc. International Speedway Corporation Florida 75% 1.3 6% 14% 19-Jun-2018 Roche Holding Ltd Foundation Medicine, Inc. Delaware 57% 2.3 29% 29% 09-Jan-2018 Insider Buyout AmTrust Financial Services, Inc. Delaware 55% 1.4 21% 45% 06-Mar-2017 Steel Partners Holdings L.P. Handy & Harman Ltd. Delaware 70% 0.1 4% 33% 07-Mar-2016 American Financial Group, Inc. National Interstate Corporation Ohio 51% 0.3 33% 44% 29-Feb-2016 Icahn Enterprises L.P. Federal-Mogul Holdings Corporation Delaware 82% 0.3 41% 101% 15-Jan-2016 Insider Buyout Synutra International, Inc. Delaware 63% 0.1 54% 58% 20-Feb-2013 Chiesi Farmaceutici S.p.A. Cornerstone Therapeutics Inc. Delaware 65% 0.3 22% 73% Non-US Incorporated 10-Feb-2021 Insider Buyout New Frontier Health Corporation Cayman Islands 40% 1 $0.8 24% 24% 17-Sep-2020 Insider Buyout 51job, Inc. Cayman Islands 56% 1.9 16% N/A 08-Jun-2020 Insider Buyout China Distance Education Holdings Cayman Islands 50% 0.2 26% 36% 09-Sep-2019 Sohu.com Limited Changyou.com Limited Cayman Islands 67% 2 0.2 69% 82% 25-Apr-2017 Baring Private Equity Asia, CPPIB Nord Anglia Education, Inc. Cayman Islands 67% 1.2 18% 18% 17-Feb-2017 FountainVest Partners, Hillhouse Capital, SEEK Limited Zhaopin Limited Cayman Islands 61% 3 0.5 13% 14% 23-Jun-2016 Ocean Imagination L.P. Qunar Cayman Islands Limited Cayman Islands 94% 0.2 15% 15% 03-Aug-2015 Ctrip.com International, Ltd., Tencent Holdings Limited eLong, Inc. Cayman Islands 78% 0.2 24% 24% 23-Oct-2014 Brookfield Asset Management Inc. Brookfield Residential Properties Inc. Canada 69% 0.9 21% 28% 27-Jan-2014 Insider Buyout, Ningxia Silkroad Equity Investment etc. Shanda Games Limited Cayman Islands 76% 0.5 22% 26% 30-May-2012 Fiat Industrial S.p.A. CNH Global N.V. Netherlands 88% 2.8 0% 25% Median US Incorporated 26% 44% Total 22% 35% Average US Incorporated 26% 45% Total 25% 39% 1st Quartile US Incorporated 17% 32% Total 16% 24% 3rd Quartile US Incorporated 30% 58% Total 29% 49% Source: Deal Point Data and company filings. Includes pending and completed acquisitions of public targets listed in the US. Excludes GP-LP transactions. Original premium is the premium implied by the first publicly announced proposal (which may or may not have reflected an agreed to transaction price in an definitive agreement) over the price of the unaffected date. Final premium is implied by the transaction price over the same unaffected date. 1 Excludes voting proxies granted by shareholders of the company (not including any shareholder who is already a member of the insider) in respect of 17,316,625 issued and outstanding shares, representing approximately 13% of the total issued and outstanding shares. 2 Sohu.com owns approximately 67% July 2022 24 of the combined total of the target’s outstanding Class A ordinary shares and Class B ordinary shares and approximately 95% of the total voting power. 3 SEEK beneficially owned ordinary shares representing approximately 75% of the voting power and 61% of the share capital.
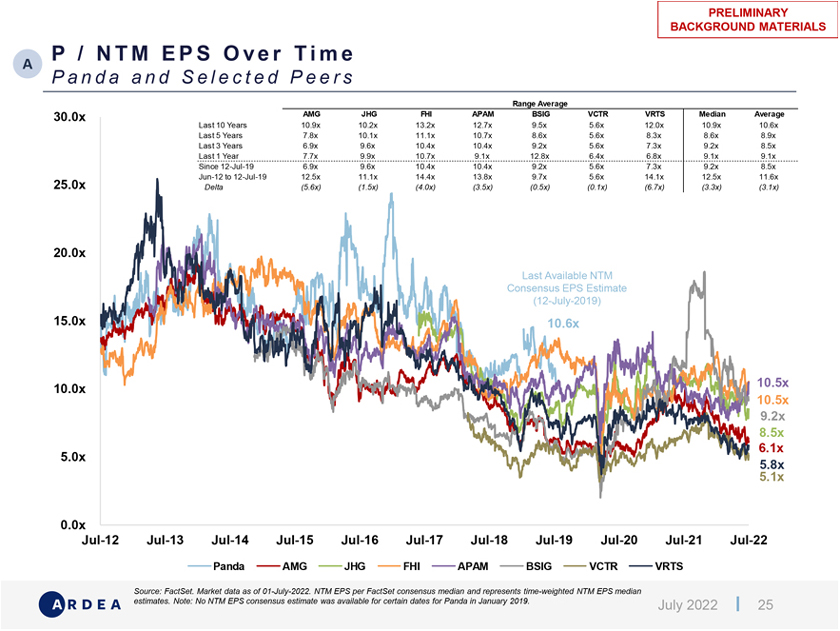
PRELIMINARY BACKGROUND MATERIALS P / N T M E P S O v e r T i m e A P a n d a a n d S e l e c t e d P e e r s Range Average 30.0x AMG JHG FHI APAM BSIG VCTR VRTS Median Average Last 10 Years 10.9x 10.2x 13.2x 12.7x 9.5x 5.6x 12.0x 10.9x 10.6x Last 5 Years 7.8x 10.1x 11.1x 10.7x 8.6x 5.6x 8.3x 8.6x 8.9x Last 3 Years 6.9x 9.6x 10.4x 10.4x 9.2x 5.6x 7.3x 9.2x 8.5x Last 1 Year 7.7x 9.9x 10.7x 9.1x 12.8x 6.4x 6.8x 9.1x 9.1x Since 12-Jul-19 6.9x 9.6x 10.4x 10.4x 9.2x 5.6x 7.3x 9.2x 8.5x Jun-12 to 12-Jul-19 12.5x 11.1x 14.4x 13.8x 9.7x 5.6x 14.1x 12.5x 11.6x 25.0x Delta (5.6x) (1.5x) (4.0x) (3.5x) (0.5x) (0.1x) (6.7x) (3.3x) (3.1x) 20.0x Last Available NTM Consensus EPS Estimate (12-July-2019) 15.0x 10.6x 10.5x 10.0x 10.5x 9.2x 8.5x 6.1x 5.0x 5.8x 5.1x 0.0x Jul-12 Jul-13 Jul-14 Jul-15 Jul-16 Jul-17 Jul-18 Jul-19 Jul-20 Jul-21 Jul-22 Panda AMG JHG FHI APAM BSIG VCTR VRTS Source: FactSet. Market data as of 01-July-2022. NTM EPS per FactSet consensus median and represents time-weighted NTM EPS median estimates. Note: No NTM EPS consensus estimate was available for certain dates for Panda in January 2019. July 2022 25
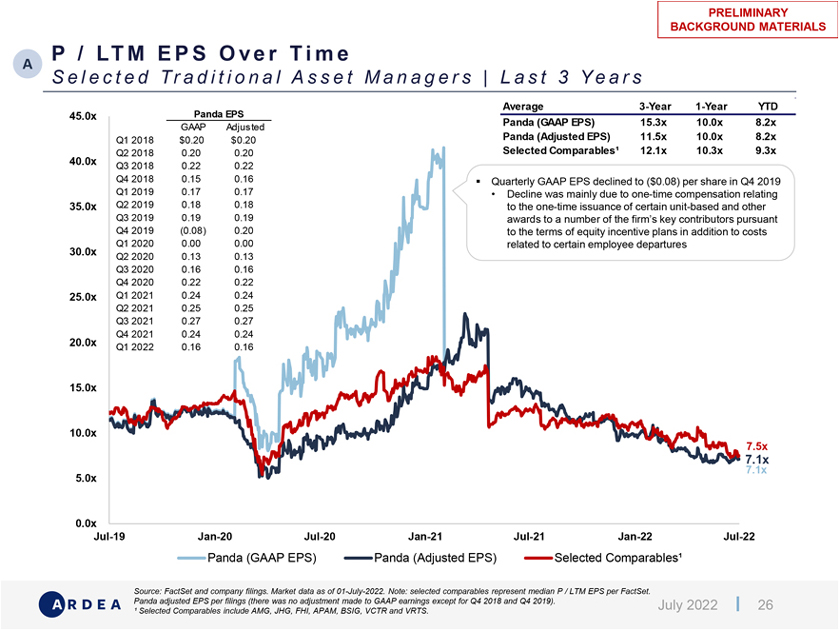
PRELIMINARY BACKGROUND MATERIALSP / LT M E P S O v e r T i m e A S e l e c t e d Tr a d i t i o n a l A s s e t M a n a g e r s | L a s t 3 Y e a r s Average 3-Year 1-Year YTD 45.0x Panda EPS Panda (GAAP EPS) 15.3x 10.0x 8.2x GAAP Adjusted Panda (Adjusted EPS) 11.5x 10.0x 8.2x Q1 2018 $0.20 $0.20 Q2 2018 0.20 0.20 Selected Comparables¹ 12.1x 10.3x 9.3x 40.0x Q3 2018 0.22 0.22 Q4 2018 0.15 0.16 ? Quarterly GAAP EPS declined to ($0.08) per share in Q4 2019 Q1 2019 0.17 0.17 Decline was mainly due to one-time compensation relating 35.0x Q2 2019 0.18 0.18 to the one-time issuance of certain unit-based and other Q3 2019 0.19 0.19 awards to a number of the firm’s key contributors pursuant Q4 2019 (0.08) 0.20 to the terms of equity incentive plans in addition to costs Q1 2020 0.00 0.00 related to certain employee departures 30.0x Q2 2020 0.13 0.13 Q3 2020 0.16 0.16 Q4 2020 0.22 0.22 25.0x Q1 2021 0.24 0.24 Q2 2021 0.25 0.25 Q3 2021 0.27 0.27 Q4 2021 0.24 0.24 20.0x Q1 2022 0.16 0.16 15.0x 10.0x 7.5x 7.1x 7.1x 5.0x 0.0x Jul-19 Jan-20 Jul-20 Jan-21 Jul-21 Jan-22 Jul-22 Panda (GAAP EPS) Panda (Adjusted EPS) Selected Comparables¹ Source: FactSet and company filings. Market data as of 01-July-2022. Note: selected comparables represent median P / LTM EPS per FactSet. Panda adjusted EPS per filings (there was no adjustment made to GAAP earnings except for Q4 2018 and Q4 2019). July 2022 26 ¹ Selected Comparables include AMG, JHG, FHI, APAM, BSIG, VCTR and VRTS.
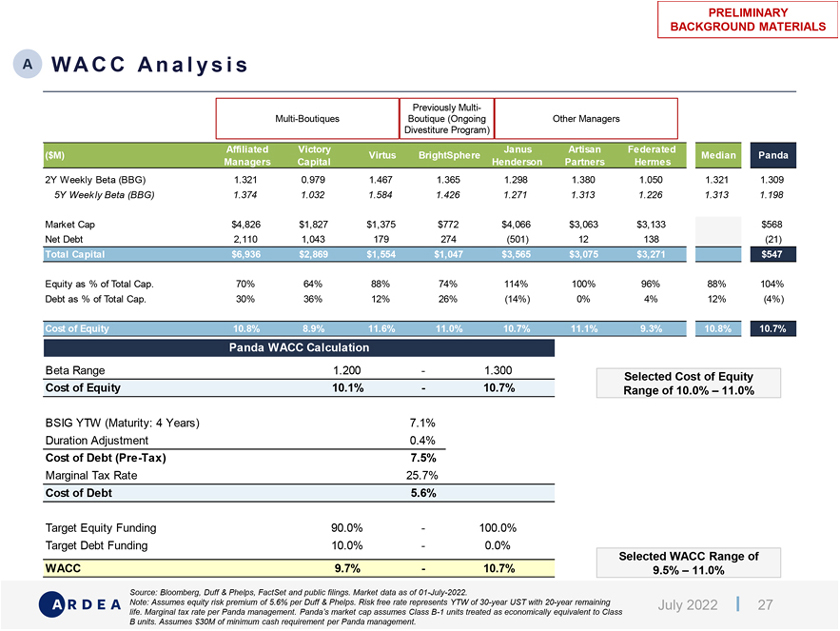
PRELIMINARY BACKGROUND MATERIALSA WA C C A n a l y s i s Previously Multi- Multi-Boutiques Boutique (Ongoing Other Managers Divestiture Program) Affiliated Victory Janus Artisan Federated ($M) Virtus BrightSphere Median Panda Managers Capital Henderson Partners Hermes 2Y Weekly Beta (BBG) 1.321 0.979 1.467 1.365 1.298 1.380 1.050 1.321 1.309 5Y Week ly Beta (BBG) 1.374 1.032 1.584 1.426 1.271 1.313 1.226 1.313 1.198 Market Cap $4,826 $1,827 $1,375 $772 $4,066 $3,063 $3,133 $568 Net Debt 2,110 1,043 179 274 (501) 12 138 (21) Total Capital $6,936 $2,869 $1,554 $1,047 $3,565 $3,075 $3,271 $547 Equity as % of Total Cap. 70% 64% 88% 74% 114% 100% 96% 88% 104% Debt as % of Total Cap. 30% 36% 12% 26% (14%) 0% 4% 12% (4%) Cost of Equity 10.8% 8.9% 11.6% 11.0% 10.7% 11.1% 9.3% 10.8% 10.7% Panda WACC Calculation Beta Range 1.200—1.300 Selected Cost of Equity Cost of Equity 10.1%—10.7% Range of 10.0% – 11.0% BSIG YTW (Maturity: 4 Years) 7.1% Duration Adjustment 0.4% Cost of Debt (Pre-Tax) 7.5% Marginal Tax Rate 25.7% Cost of Debt 5.6% Target Equity Funding 90.0%—100.0% Target Debt Funding 10.0%—0.0% Selected WACC Range of WACC 9.7%—10.7% 9.5% – 11.0% Source: Bloomberg, Duff & Phelps, FactSet and public filings. Market data as of 01-July-2022. Note: Assumes equity risk premium of 5.6% per Duff & Phelps. Risk free rate represents YTW of 30-year UST with 20-year remaining July 2022 27 life. Marginal tax rate per Panda management. Panda’s market cap assumes Class B-1 units treated as economically equivalent to Class B units. Assumes $30M of minimum cash requirement per Panda management.
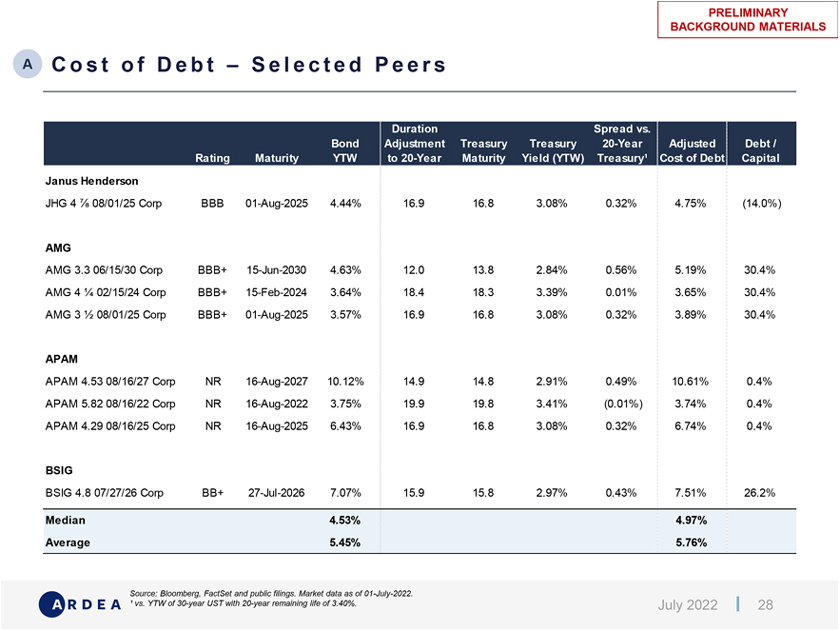
PRELIMINARY BACKGROUND MATERIALSA C o s t o f D e b t – S e l e c t e d P e e r s Duration Spread vs. Bond Adjustment Treasury Treasury 20-Year Adjusted Debt / Rating Maturity YTW to 20-Year Maturity Yield (YTW) Treasury¹ Cost of Debt Capital Janus Henderson JHG 4 7⁄8 08/01/25 Corp BBB 01-Aug-2025 4.44% 16.9 16.8 3.08% 0.32% 4.75% (14.0%) AMG AMG 3.3 06/15/30 Corp BBB+ 15-Jun-2030 4.63% 12.0 13.8 2.84% 0.56% 5.19% 30.4% AMG 4 1⁄4 02/15/24 Corp BBB+ 15-Feb-2024 3.64% 18.4 18.3 3.39% 0.01% 3.65% 30.4% AMG 3 08/01/25 Corp BBB+ 01-Aug-2025 3.57% 16.9 16.8 3.08% 0.32% 3.89% 30.4% APAM APAM 4.53 08/16/27 Corp NR 16-Aug-2027 10.12% 14.9 14.8 2.91% 0.49% 10.61% 0.4% APAM 5.82 08/16/22 Corp NR 16-Aug-2022 3.75% 19.9 19.8 3.41% (0.01%) 3.74% 0.4% APAM 4.29 08/16/25 Corp NR 16-Aug-2025 6.43% 16.9 16.8 3.08% 0.32% 6.74% 0.4% BSIG BSIG 4.8 07/27/26 Corp BB+ 27-Jul-2026 7.07% 15.9 15.8 2.97% 0.43% 7.51% 26.2% Median 4.53% 4.97% Average 5.45% 5.76% Source: Bloomberg, FactSet and public filings. Market data as of 01-July-2022. ¹ vs. YTW of 30-year UST with 20-year remaining life of 3.40%. July 2022 28
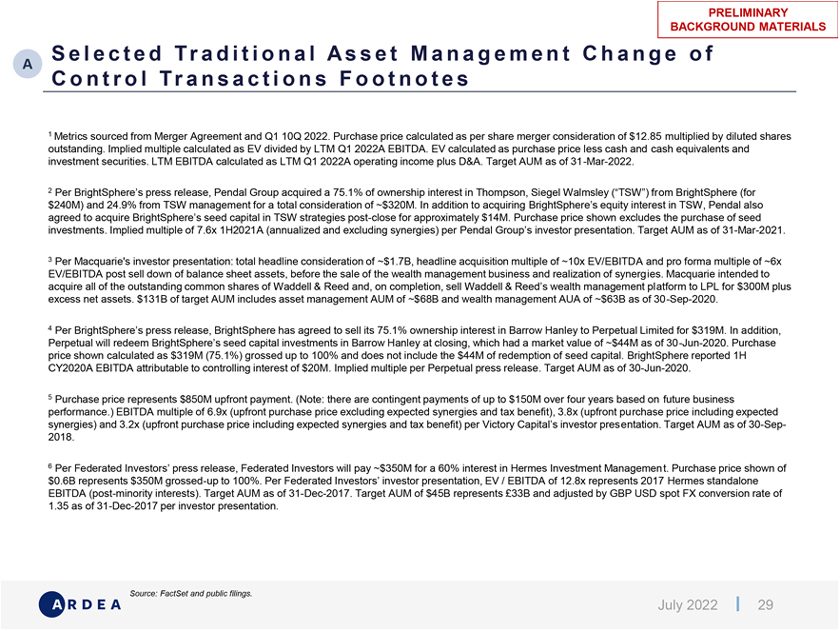
PRELIMINARY BACKGROUND MATERIALSS e l e c t e d Tr a d i t i o n a l A s s e t M a n a g e m e n t C h a n g e o f A C o n t r o l Tr a n s a c t i o n s F o o t n o t e s 1 Metrics sourced from Merger Agreement and Q1 10Q 2022. Purchase price calculated as per share merger consideration of $12.85 multiplied by diluted shares outstanding. Implied multiple calculated as EV divided by LTM Q1 2022A EBITDA. EV calculated as purchase price less cash and cash equivalents and investment securities. LTM EBITDA calculated as LTM Q1 2022A operating income plus D&A. Target AUM as of 31-Mar-2022. 2 Per BrightSphere’s press release, Pendal Group acquired a 75.1% of ownership interest in Thompson, Siegel Walmsley (“TSW”) from BrightSphere (for $240M) and 24.9% from TSW management for a total consideration of ~$320M. In addition to acquiring BrightSphere’s equity interest in TSW, Pendal also agreed to acquire BrightSphere’s seed capital in TSW strategies post-close for approximately $14M. Purchase price shown excludes the purchase of seed investments. Implied multiple of 7.6x 1H2021A (annualized and excluding synergies) per Pendal Group’s investor presentation. Target AUM as of 31-Mar-2021. 3 Per Macquarie’s investor presentation: total headline consideration of ~$1.7B, headline acquisition multiple of ~10x EV/EBITDA and pro forma multiple of ~6x EV/EBITDA post sell down of balance sheet assets, before the sale of the wealth management business and realization of synergies. Macquarie intended to acquire all of the outstanding common shares of Waddell & Reed and, on completion, sell Waddell & Reed’s wealth management platform to LPL for $300M plus excess net assets. $131B of target AUM includes asset management AUM of ~$68B and wealth management AUA of ~$63B as of 30-Sep-2020. 4 Per BrightSphere’s press release, BrightSphere has agreed to sell its 75.1% ownership interest in Barrow Hanley to Perpetual Limited for $319M. In addition, Perpetual will redeem BrightSphere’s seed capital investments in Barrow Hanley at closing, which had a market value of ~$44M as of 30-Jun-2020. Purchase price shown calculated as $319M (75.1%) grossed up to 100% and does not include the $44M of redemption of seed capital. BrightSphere reported 1H CY2020A EBITDA attributable to controlling interest of $20M. Implied multiple per Perpetual press release. Target AUM as of 30-Jun-2020. 5 Purchase price represents $850M upfront payment. (Note: there are contingent payments of up to $150M over four years based on future business performance.) EBITDA multiple of 6.9x (upfront purchase price excluding expected synergies and tax benefit), 3.8x (upfront purchase price including expected synergies) and 3.2x (upfront purchase price including expected synergies and tax benefit) per Victory Capital’s investor presentation. Target AUM as of 30-Sep-2018. 6 Per Federated Investors’ press release, Federated Investors will pay ~$350M for a 60% interest in Hermes Investment Management. Purchase price shown of $0.6B represents $350M grossed-up to 100%. Per Federated Investors’ investor presentation, EV / EBITDA of 12.8x represents 2017 Hermes standalone EBITDA (post-minority interests). Target AUM as of 31-Dec-2017. Target AUM of $45B represents Ł33B and adjusted by GBP USD spot FX conversion rate of 1.35 as of 31-Dec-2017 per investor presentation. Source: FactSet and public filings. July 2022 29
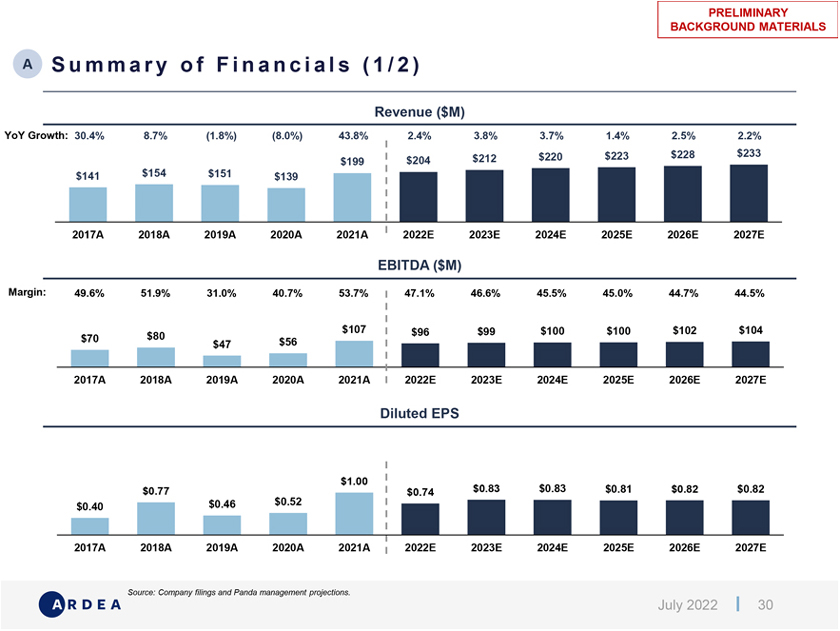
PRELIMINARY BACKGROUND MATERIALSA S u m m a r y o f F i n a n c i a l s ( 1 / 2 ) Revenue ($M) YoY Growth: 30.4% 8.7% (1.8%) (8.0%) 43.8% 2.4% 3.8% 3.7% 1.4% 2.5% 2.2% $220 $223 $228 $233 $199 $204 $212 $141 $154 $151 $139 2017A 2018A 2019A 2020A 2021A 2022E 2023E 2024E 2025E 2026E 2027E EBITDA ($M) Margin: 49.6% 51.9% 31.0% 40.7% 53.7% 47.1% 46.6% 45.5% 45.0% 44.7% 44.5% $107 $96 $99 $100 $100 $102 $104 $70 $80 $47 $56 2017A 2018A 2019A 2020A 2021A 2022E 2023E 2024E 2025E 2026E 2027E Diluted EPS $1.00 $0.77 $0.74 $0.83 $0.83 $0.81 $0.82 $0.82 $0.46 $0.52 $0.40 2017A 2018A 2019A 2020A 2021A 2022E 2023E 2024E 2025E 2026E 2027E Source: Company filings and Panda management projections. July 2022 30
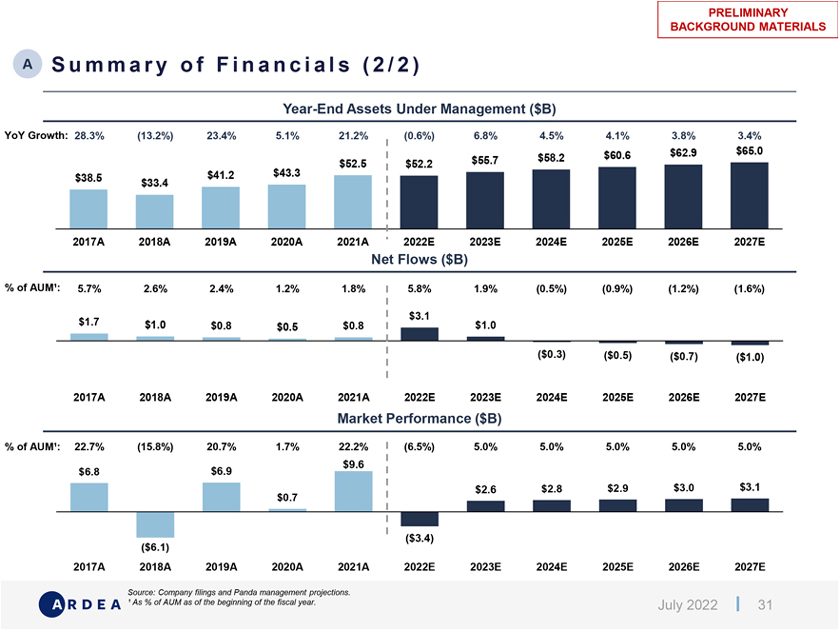
PRELIMINARY BACKGROUND MATERIALSA S u m m a r y o f F i n a n c i a l s ( 2 / 2 ) Year-End Assets Under Management ($B) YoY Growth: 28.3% (13.2%) 23.4% 5.1% 21.2% (0.6%) 6.8% 4.5% 4.1% 3.8% 3.4% $60.6 $62.9 $65.0 $55.7 $58.2 $43.3 $52.5 $52.2 $38.5 $41.2 $33.4 2017A 2018A 2019A 2020A 2021A 2022E 2023E 2024E 2025E 2026E 2027E Net Flows ($B) % of AUM¹: 5.7% 2.6% 2.4% 1.2% 1.8% 5.8% 1.9% (0.5%) (0.9%) (1.2%) (1.6%) $3.1 $1.7 $1.0 $0.8 $0.8 $1.0 $0.5 ($0.3) ($0.5) ($0.7) ($1.0) 2017A 2018A 2019A 2020A 2021A 2022E 2023E 2024E 2025E 2026E 2027E Market Performance ($B) % of AUM¹: 22.7% (15.8%) 20.7% 1.7% 22.2% (6.5%) 5.0% 5.0% 5.0% 5.0% 5.0% $9.6 $6.8 $6.9 $2.6 $2.8 $2.9 $3.0 $3.1 $0.7 ($6.1) ($3.4) 2017A 2018A 2019A 2020A 2021A 2022E 2023E 2024E 2025E 2026E 2027E Source: Company filings and Panda management projections. ¹ As % of AUM as of the beginning of the fiscal year. July 2022 31
D I S C L A I M E R Ardea Partners LP (“Ardea”) has prepared and provided these materials and Ardea’s related oral presentation (collectively, the “Confidential Information”) solely for the information and assistance of the Special Committee of the Board of Directors of Panda (the “Company”) in connection with their consideration of the matters referred to herein. Without Ardea’s prior written consent, the Confidential Information, and Ardea’s preparation and provision of such Confidential Information, may not be used for any other purpose or disclosed or otherwise referred to in any manner. The Confidential Information is (a) for discussion purposes only and (b) speaks only as of the date it is given, reflecting prevailing economic, monetary, market and other conditions as in effect on, and the information made available to Ardea as of, such date. Ardea assumes no responsibility for updating or revising the Confidential Information. The views expressed herein are subject to change based upon a number of factors, including economic, monetary, market and other conditions and the Company’s and any prospective counterparty’s business and prospects. Analyses based upon forecasts of future results are not necessarily indicative of actual future results, which may be significantly more or less favorable than suggested by these analyses, and Ardea does not assume responsibility if future results are materially different from those forecast. The Confidential Information is incomplete without reference to, and should be viewed solely in conjunction with, the oral briefing provided by Ardea, if any. The Confidential Information has been prepared using publicly available information and information in reports, due diligence materials, forecasts, projections and other materials provided by or on behalf of the Company and/or any prospective counterparty. Ardea does not assume responsibility for and has relied on, without independent verification, the accuracy and completeness of such information. Ardea has not, and does not, provide advice for tax, legal, regulatory or accounting matters and the Company will remain solely responsible for all aspects of due diligence in connection with the Transaction and the commercial assumptions on which any advice provided by Ardea is based. The Confidential Information does not address the underlying business decision of the Company to engage in any transaction or the relative merits of any strategic alternatives referred to herein as compared to any other alternative that may be available to the Company. Ardea and its affiliates and/or their respective employees, as well as investment funds in which any of them may have a financial interest, may at any time, directly or indirectly, hold long or short positions and may trade or otherwise effect transactions for their own accounts or the accounts of customers, in debt or equity securities, senior loans and/or derivative products relating to the Company or its affiliates, potential parties to a Transaction and their affiliates or persons that are competitors, customers or suppliers of the Company. Nothing herein or any previous or existing relationship between the Company and Ardea will be deemed to create a fiduciary duty or fiduciary or agency relationship between Ardea and the Company, its security holders, affiliates, employees or creditors. July 2022 32
Exhibit (c)(3)

HIGHLY CONFIDENTIAL P r o j e c t P a n d a P r e s e n t a t i o n t o t h e S p e c i a l C o m m i t t e e o f t h e B o a r d o f D i r e c t o r s July 26, 2022
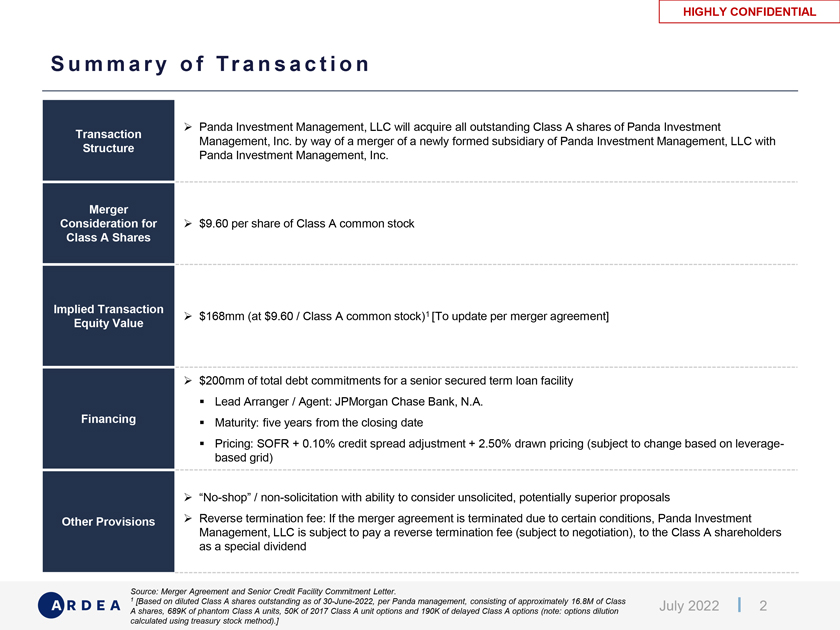
HIGHLY CONFIDENTIAL Summary of Transaction Panda Investment Management, LLC will acquire all outstanding Class A shares of Panda Investment Transaction Management, Inc. by way of a merger of a newly formed subsidiary of Panda Investment Management, LLC with Structure Panda Investment Management, Inc. Merger Consideration for $9.60 per share of Class A common stock Class A Shares Implied Transaction Equity Value $168mm (at $9.60 / Class A common stock)1 [To update per merger agreement] $200mm of total debt commitments for a senior secured term loan facility â–ª Lead Arranger / Agent: JPMorgan Chase Bank, N.A. Financing â–ª Maturity: five years from the closing date â–ª Pricing: SOFR + 0.10% credit spread adjustment + 2.50% drawn pricing (subject to change based on leverage-based grid) “No-shop” / non-solicitation with ability to consider unsolicited, potentially superior proposals Other Provisions Reverse termination fee: If the merger agreement is terminated due to certain conditions, Panda Investment Management, LLC is subject to pay a reverse termination fee (subject to negotiation), to the Class A shareholders as a special dividend Source: Merger Agreement and Senior Credit Facility Commitment Letter. 1 [Based on diluted Class A shares outstanding as of 30-June-2022, per Panda management, consisting of approximately 16.8M of Class July 2022 2 A shares, 689K of phantom Class A units, 50K of 2017 Class A unit options and 190K of delayed Class A options (note: options dilution calculated using treasury stock method).]
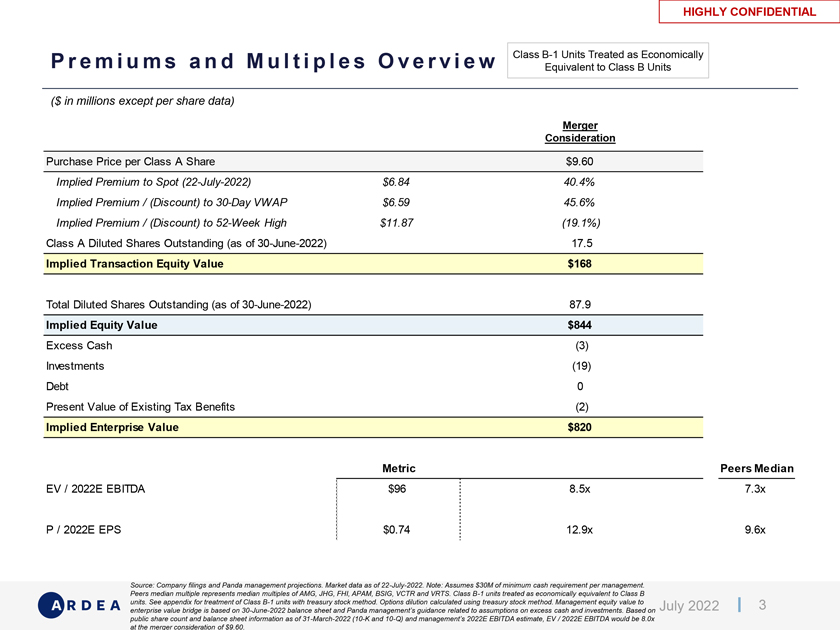
HIGHLY CONFIDENTIAL P r e m i u m s a n d M u l t i p l e s O v e r v i e w Class B-1 Units Treated as Economically Equivalent to Class B Units ($ in millions except per share data) Merger Consideration Purchase Price per Class A Share $9.60 Implied Premium to Spot (22-July-2022) $6.84 40.4% Implied Premium / (Discount) to 30-Day VWAP $6.59 45.6% Implied Premium / (Discount) to 52-Week High $11.87 (19.1%) Class A Diluted Shares Outstanding (as of 30-June-2022) 17.5 Implied Transaction Equity Value $168 Total Diluted Shares Outstanding (as of 30-June-2022) 87.9 Implied Equity Value $844 Excess Cash (3) Investments (19) Debt 0 Present Value of Existing Tax Benefits (2) Implied Enterprise Value $820 Metric Peers Median EV / 2022E EBITDA $96 8.5x 7.3x P / 2022E EPS $0.74 12.9x 9.6x Source: Company filings and Panda management projections. Market data as of 22-July-2022. Note: Assumes $30M of minimum cash requirement per management. Peers median multiple represents median multiples of AMG, JHG, FHI, APAM, BSIG, VCTR and VRTS. Class B-1 units treated as economically equivalent to Class B units. See appendix for treatment of Class B-1 units with treasury stock method. Options dilution calculated using treasury stock method. Management equity value to July 2022 3 enterprise value bridge is based on 30-June-2022 balance sheet and Panda management’s guidance related to assumptions on excess cash and investments. Based on public share count and balance sheet information as of 31-March-2022 (10-K and 10-Q) and management’s 2022E EBITDA estimate, EV / 2022E EBITDA would be 8.0x at the merger consideration of $9.60.
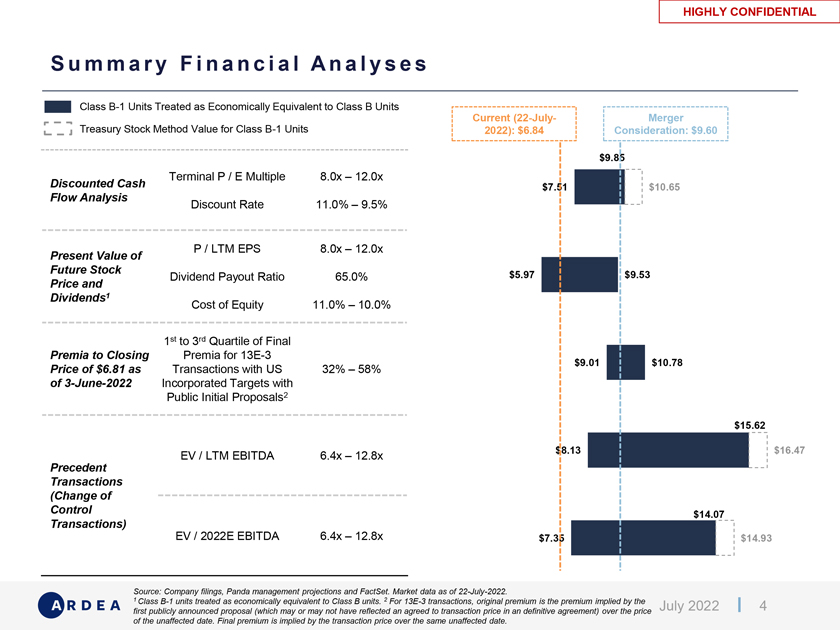
HIGHLY CONFIDENTIAL HIGHLY CONFIDENTIAL S u m m a r y F i n a n c i a l A n a l y s e s Class B-1 Units Treated as Economically Equivalent to Class B Units Current (22-July- Merger Treasury Stock Method Value for Class B-1 Units 2022): $6.84 Consideration: $9.60 $9.85 Terminal P / E Multiple 8.0x – 12.0x Discounted Cash $7.51 $10.65 Flow Analysis Discount Rate 11.0% – 9.5% P / LTM EPS 8.0x – 12.0x Present Value of Future Stock Dividend Payout Ratio 65.0% $5.97 $9.53 Price and Dividends1 Cost of Equity 11.0% – 10.0% 1st to 3rd Quartile of Final Premia to Closing Premia for 13E-3 $9.01 $10.78 Price of $6.81 as Transactions with US 32% – 58% of 3-June-2022 Incorporated Targets with Public Initial Proposals2 $15.62 $8.13 $16.47 EV / LTM EBITDA 6.4x – 12.8x Precedent Transactions (Change of Control $14.07 Transactions) EV / 2022E EBITDA 6.4x – 12.8x $7.35 $14.93 Source: Company filings, Panda management projections and FactSet. Market data as of 22-July-2022. 1 Class B-1 units treated as economically equivalent to Class B units. 2 For 13E-3 transactions, original premium is the premium implied by the July 2022 4 first publicly announced proposal (which may or may not have reflected an agreed to transaction price in an definitive agreement) over the price of the unaffected date. Final premium is implied by the transaction price over the same unaffected date.

HIGHLY CONFIDENTIAL D i s c o u n t e d C a s h F l o w A n a l y s i s O u t p u t s Class B-1 Units Treated as Economically Equivalent to Class B Units Implied Price per Class A Share Discount Rate $8.6 9.50% 9.88% 10.25% 10.63% 11.00% 12.0x $9.85 $9.72 $9.59 $9.47 $9.35 Terminal 11.0x $9.36 $9.24 $9.12 $9.01 $8.89 Earnings 10.0x $8.86 $8.75 $8.65 $8.54 $8.43 Multiple 9.0x $8.37 $8.27 $8.17 $8.07 $7.97 8.0x $7.88 $7.78 $7.69 $7.60 $7.51 Implied Price / EPS (2022E EPS of $0.74) Discount Rate 9.50% 9.88% 10.25% 10.63% 11.00% 12.0x 13.3x 13.1x 12.9x 12.8x 12.6x Terminal 11.0x 12.6x 12.4x 12.3x 12.1x 12.0x Earnings 10.0x 11.9x 11.8x 11.6x 11.5x 11.4x Multiple 9.0x 11.3x 11.1x 11.0x 10.9x 10.7x 8.0x 10.6x 10.5x 10.4x 10.2x 10.1x Implied Perpetuity Growth Rate Discount Rate ($0.0) 9.50% 9.88% 10.25% 10.63% 11.00% 12.0x 0.7% 1.0% 1.4% 1.7% 2.0% Terminal 11.0x (0.0%) 0.3% 0.6% 1.0% 1.3% Earnings 10.0x (0.9%) (0.5%) (0.2%) 0.1% 0.4% Multiple 9.0x (1.9%) (1.6%) (1.3%) (1.0%) (0.6%) 8.0x (3.2%) (2.9%) (2.5%) (2.2%) (1.9%) Source: Company filings and Panda management. Note: Class B-1 units treated as economically equivalent to Class B units. July 2022 5

HIGHLY CONFIDENTIAL P r e s e n t Va l u e o f F u t u r e S t o c k P r i c e a n d D i v i d e n d s 1 0 . 5 % C o s t o f E q u i t y | LT M M u l t i p l e | D i v i d e n d P a y o u t o f 6 5 % Class B-1 Units Treated as Economically Equivalent to Class B Units $ / Panda Share At 10.5% Cost of Equity $12.00 Low of 8.0x LTM EPS Mid of 10.0x LTM EPS High of 12.0x LTM EPS $9.47 $8.90 $9.03 $8.57 $8.27 $8.04 $7.98 $7.74 $8.00 $7.49 $7.42 $7.23 $7.04 $6.61 $6.46 $6.28 $6.08 $6.19 $6.10 $4.00 2022E 2023E 2024E 2025E 2026E 2027E LTM EPS / Share $0.74 $0.83 $0.83 $0.81 $0.82 $0.82 DPS Estimate¹ $0.45 $0.54 $0.54 $0.53 $0.53 $0.53 Source: Panda management projections and company filings. Note: Future share price and dividends discounted to 30-June-2022. 1 Panda management targets a cash dividend payout ratio (per share) of 60% to 70% of EPS. 2022E dividend per share calculated using dividend payout July 2022 6 ratio of 65% multiplied by 2022E EPS less $0.03 of dividend per share paid on 20-May-2022.
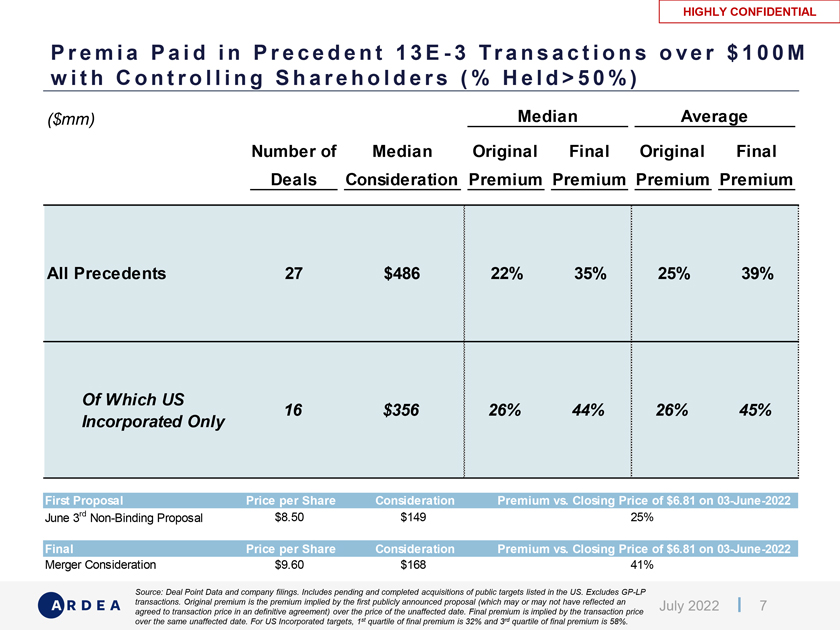
HIGHLY CONFIDENTIAL P r e m i a P a i d i n P r e c e d e n t 1 3 E—3 Tr a n s a c t i o n s o v e r $ 1 0 0 M w i t h C o n t r o l l i n g S h a r e h o l d e r s ( % H e l d > 5 0 % ) ($mm) Median Average Number of Median Original Final Original Final Deals Consideration Premium Premium Premium Premium All Precedents 27 $486 22% 35% 25% 39% Of Which US 16 $356 26% 44% 26% 45% Incorporated Only First Proposal Price per Share Consideration Premium vs. Closing Price of $6.81 on 03-June-2022 June 3rd Non-Binding Proposal $8.50 $149 25% Final Price per Share Consideration Premium vs. Closing Price of $6.81 on 03-June-2022 Merger Consideration $9.60 $168 41% Source: Deal Point Data and company filings. Includes pending and completed acquisitions of public targets listed in the US. Excludes GP-LP transactions. Original premium is the premium implied by the first publicly announced proposal (which may or may not have reflected an July 2022 7 agreed to transaction price in an definitive agreement) over the price of the unaffected date. Final premium is implied by the transaction price over the same unaffected date. For US Incorporated targets, 1st quartile of final premium is 32% and 3rd quartile of final premium is 58%.

HIGHLY CONFIDENTIAL S e l e c t e d Tr a d i t i o n a l A s s e t M a n a g e m e n t C h a n g e o f C o n t r o l Tr a n s a c t i o n s (AUM and Implied Purchase Price in billions) Annoucement Implied Purchase Purchase Price Implied Referenced Year Date Target Buyer Target AUM Price (100%) as % of AUM Multiple Multiple 1 2022 Apr-22 Manning & Napier Callodine Group $21 $0.3 1.4% 6.4x EV / LTM EBITDA As Reported EV / 1H 2021A 2 Thompson, Siegel 2021 May-21 Pendal Group 25 0.3 1.3% 7.6x Annualized EBITDA (Excluding & Walmsley Synergies) 3 As Reported Headline Acquisition 2020 Dec-20 Waddell & Reed Macquarie / LPL 131 1.7 1.3% 10.0x EV / EBITDA Barrow, Hanley, 2020 4 Jul-20 Mewhinney & Perpetual 44 0.4 1.0% 8.0x As Reported EV / Pro Forma EBITDA Strauss As Reported EV / EBITDA 5 USAA Asset 2018 Nov-18 Victory Capital 69 0.9 1.2% 6.9x (Excluding Earnout, Expected Management Synergies and Tax Benefit) Hermes 6 Federated As Reported EV / 2017A EBITDA 2018 Apr-18 Investment 45 0.6 1.3% 12.8x Investors (Post Minority Interest) Management Median 1.3% 7.8 x Mean 1.3% 8.6 x Source: Company filings. Please see appendix for detailed footnotes. July 2022 8
A A p p e n d i x July 2022 9

HIGHLY CONFIDENTIAL P r e m i u m s a n d M u l t i p l e s O v e r v i e w Treasury Stock Method Value for Class B-1 Units ($ in millions except per share data) Merger Consideration Purchase Price per Class A Share $9.60 Implied Premium to Spot (22-July-2022) $6.84 40.4% Implied Premium / (Discount) to 30-Day VWAP $6.59 45.6% Implied Premium / (Discount) to 52-Week High $11.87 (19.1%) Class A Diluted Shares Outstanding (as of 30-June-2022) 17.5 Implied Transaction Equity Value $168 Total Diluted Shares Outstanding (as of 30-June-2022) 79.7 Implied Equity Value $765 Excess Cash (3) Investments (19) Debt 0 Present Value of Existing Tax Benefits (2) Implied Enterprise Value $741 Metric Peers Median EV / 2022E EBITDA $96 7.7x 7.3x P / 2022E EPS $0.74 12.9x 9.6x Source: Company filings and Panda management projections. Market data as of 22-July-2022. Note: Assumes $30M of minimum cash requirement per management. Peers median multiple represents median multiples of AMG, JHG, FHI, APAM, BSIG, VCTR and VRTS. Class B-1 units and options dilution calculated using treasury stock method. Management equity value to enterprise value bridge is based on 30-June-2022 balance sheet and Panda management’s July 2022 10 guidance related to assumptions on excess cash and investments. Based on public share count and balance sheet information as of 31-March-2022 (10-K and 10- Q) and management’s 2022E EBITDA estimate, EV / 2022E EBITDA would be 7.4x at the merger consideration of $9.60.
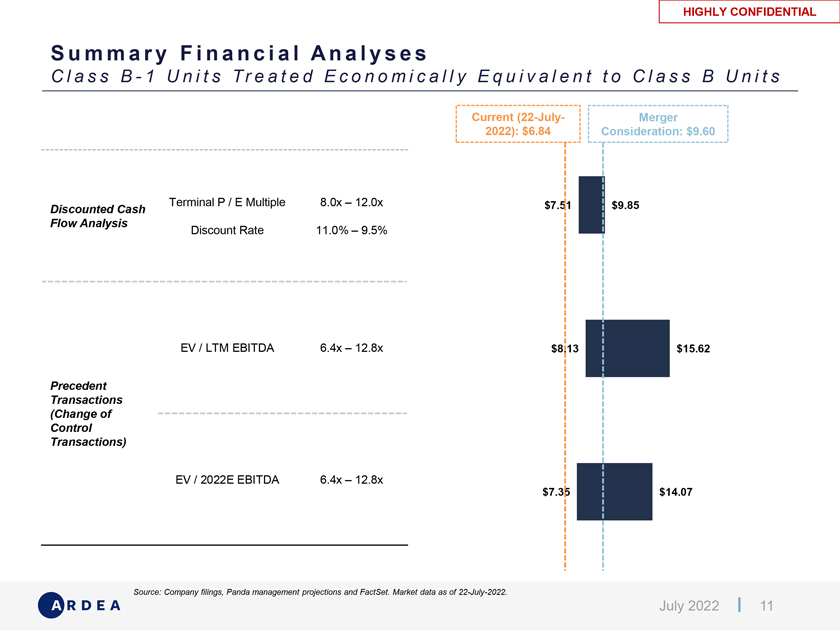
HIGHLY CONFIDENTIAL S u m m a r y F i n a n c i a l A n a l y s e s C l a s s B—1 U n i t s T r e a t e d E c o n o m i c a l l y E q u i v a l e n t t o C l a s s B U n i t s Current (22-July- Merger 2022): $6.84 Consideration: $9.60 Terminal P / E Multiple 8.0x – 12.0x $7.51 $9.85 Discounted Cash Flow Analysis Discount Rate 11.0% – 9.5% EV / LTM EBITDA 6.4x – 12.8x $8.13 $15.62 Precedent Transactions (Change of Control Transactions) EV / 2022E EBITDA 6.4x – 12.8x $7.35 $14.07 Source: Company filings, Panda management projections and FactSet. Market data as of 22-July-2022. July 2022 11
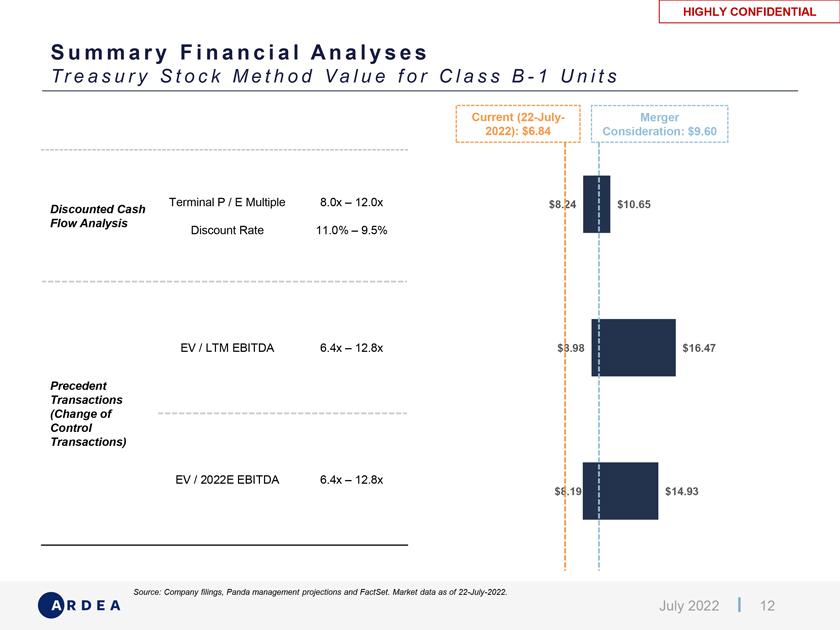
HIGHLY CONFIDENTIAL S u m m a r y F i n a n c i a l A n a l y s e s Tr e a s u r y S t o c k M e t h o d V a l u e f o r C l a s s B—1 U n i t s Current (22-July- Merger 2022): $6.84 Consideration: $9.60 Terminal P / E Multiple 8.0x – 12.0x $8.24 $10.65 Discounted Cash Flow Analysis Discount Rate 11.0% – 9.5% EV / LTM EBITDA 6.4x – 12.8x $8.98 $16.47 Precedent Transactions (Change of Control Transactions) EV / 2022E EBITDA 6.4x – 12.8x $8.19 $14.93 Source: Company filings, Panda management projections and FactSet. Market data as of 22-July-2022. July 2022 12

HIGHLY CONFIDENTIAL D i s c o u n t e d C a s h F l o w A n a l y s i s I n p u t s Class B-1 Units Treated as Economically Equivalent to Class B Units ($M) Jul—Dec 2022E 2023E 2024E 2025E 2026E 2027E Year-End AUM ($B) $52.2 $55.7 $58.2 $60.6 $62.9 $65.0 Total Revenue $103 $212 $220 $223 $228 $233 YoY Growth (%) N/A 3.8% 3.7% 1.4% 2.5% EBITDA $44 $99 $100 $100 $102 $104 EBITDA Margin (%) 43.2% 46.6% 45.5% 45.0% 44.7% 44.5% D&A (1) (1) (1) (1) (1) (1) Investment G&L 8 2 3 3 3 3 Operating Income $51 $100 $101 $102 $104 $106 UBT (2) (4) (4) (4) (4) (4) Unlevered Net Income $49 $96 $97 $98 $100 $102 D&A 1 1 1 1 1 1 Rent Expense Adjustment 2 2 1 1 2 (0) Changes in Net Working Capital 4 0 0 0 0 0 CapEx (0) (2) (1) (1) (1) (1) Seed Investment 0 (5) (5) (5) (5) (5) Distributable Cash Flow $56 $92 $94 $94 $97 $97 YoY Growth (%) N/A 2.1% 0.5% 3.5% (0.6%) Inc. Diluted Class A Shares 17.5 17.5 17.5 17.5 17.5 17.5 Diluted Shares Outstanding 87.9 87.9 87.9 87.9 87.9 87.9 Inc. Ownership 20% 20% 20% 20% 20% 20% Cash Flow Distribution to Inc. $11 $18 $19 $19 $19 $19 Tax (3) (5) (5) (5) (5) (5) Inc. Unlevered Net Income $8 $14 $14 $14 $14 $14 â–ª Balance sheet and share count as of 30-June-2022 â–ª Mid-year cash flow convention â–ª UBT cash tax rate of 4.0% and Panda Inc. marginal cash tax rate of 25.7% Source: Company filings and Panda management projections. Note: Assumes $30M of minimum cash requirement per management. Class B-1 units treated as economically equivalent to Class B units. July 2022 13

HIGHLY CONFIDENTIAL D i s c o u n t e d C a s h F l o w A n a l y s i s I n p u t s Treasury Stock Method Value for Class B-1 Units ($M) Jul—Dec 2022E 2023E 2024E 2025E 2026E 2027E Year-End AUM ($B) $52.2 $55.7 $58.2 $60.6 $62.9 $65.0 Total Revenue $103 $212 $220 $223 $228 $233 YoY Growth (%) N/A 3.8% 3.7% 1.4% 2.5% EBITDA $44 $99 $100 $100 $102 $104 EBITDA Margin (%) 43.2% 46.6% 45.5% 45.0% 44.7% 44.5% D&A (1) (1) (1) (1) (1) (1) Investment G&L 8 2 3 3 3 3 Operating Income $51 $100 $101 $102 $104 $106 UBT (2) (4) (4) (4) (4) (4) Unlevered Net Income $49 $96 $97 $98 $100 $102 D&A 1 1 1 1 1 1 Rent Expense Adjustment 2 2 1 1 2 (0) Changes in Net Working Capital 4 0 0 0 0 0 CapEx (0) (2) (1) (1) (1) (1) Seed Investment 0 (5) (5) (5) (5) (5) Distributable Cash Flow $56 $92 $94 $94 $97 $97 YoY Growth (%) N/A 2.1% 0.5% 3.5% (0.6%) Inc. Diluted Class A Shares 17.5 17.5 17.5 17.5 17.5 17.5 Diluted Shares Outstanding 79.7 79.7 79.7 79.7 79.7 79.7 Inc. Ownership 22% 22% 22% 22% 22% 22% Cash Flow Distribution to Inc. $12 $20 $21 $21 $21 $21 Tax (3) (5) (5) (5) (5) (5) Inc. Unlevered Net Income $9 $15 $15 $15 $16 $16 Balance sheet and share count as of 30-June-2022 Mid-year cash flow convention UBT cash tax rate of 4.0% and Panda Inc. marginal cash tax rate of 25.7% Source: Company filings and Panda management projections. Note: Assumes $30M of minimum cash requirement per management. Class B-1 units and options dilution calculated using treasury stock method. July 2022 14
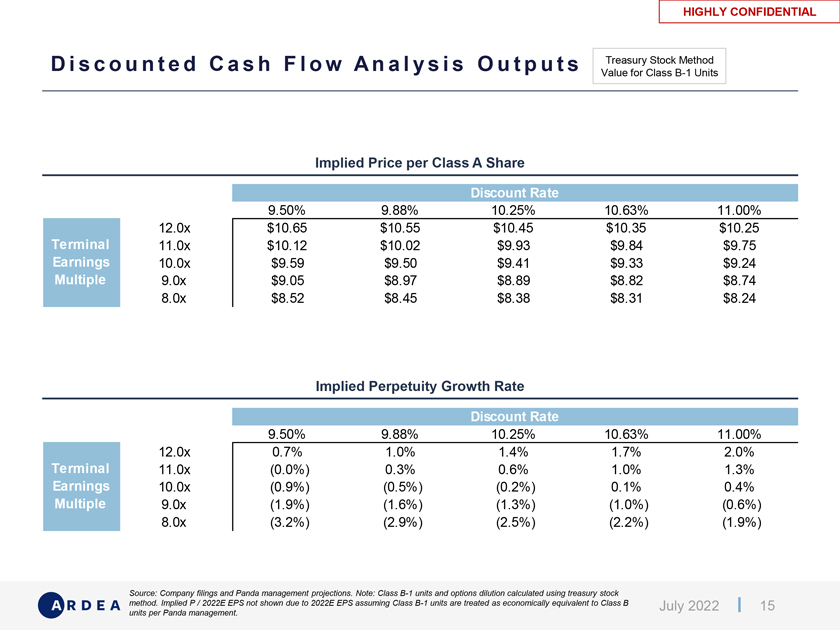
HIGHLY CONFIDENTIAL D i s c o u n t e d C a s h F l o w A n a l y s i s O u t p u t s Treasury Stock Method Value for Class B-1 Units Implied Price per Class A Share Discount Rate $9.4 9.50% 9.88% 10.25% 10.63% 11.00% 12.0x $10.65 $10.55 $10.45 $10.35 $10.25 Terminal 11.0x $10.12 $10.02 $9.93 $9.84 $9.75 Earnings 10.0x $9.59 $9.50 $9.41 $9.33 $9.24 Multiple 9.0x $9.05 $8.97 $8.89 $8.82 $8.74 8.0x $8.52 $8.45 $8.38 $8.31 $8.24 Implied Perpetuity Growth Rate Discount Rate ($0.0) 9.50% 9.88% 10.25% 10.63% 11.00% 12.0x 0.7% 1.0% 1.4% 1.7% 2.0% Terminal 11.0x (0.0%) 0.3% 0.6% 1.0% 1.3% Earnings 10.0x (0.9%) (0.5%) (0.2%) 0.1% 0.4% Multiple 9.0x (1.9%) (1.6%) (1.3%) (1.0%) (0.6%) 8.0x (3.2%) (2.9%) (2.5%) (2.2%) (1.9%) Source: Company filings and Panda management projections. Note: Class B-1 units and options dilution calculated using treasury stock method. Implied P / 2022E EPS not shown due to 2022E EPS assuming Class B-1 units are treated as economically equivalent to Class B July 2022 15 units per Panda management.
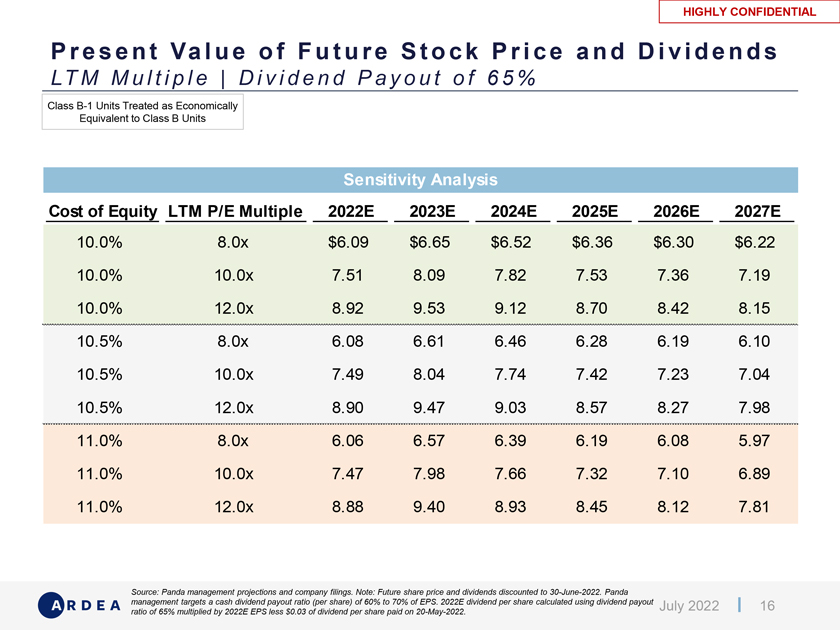
HIGHLY CONFIDENTIAL P r e s e n t Va l u e o f F u t u r e S t o c k P r i c e a n d D i v i d e n d s LT M M u l t i p l e | D i v i d e n d P a y o u t o f 6 5 % Class B-1 Units Treated as Economically Equivalent to Class B Units Sensitivity Analysis Cost of Equity LTM P/E Multiple 2022E 2023E 2024E 2025E 2026E 2027E 10.0% 8.0x $6.09 $6.65 $6.52 $6.36 $6.30 $6.22 10.0% 10.0x 7.51 8.09 7.82 7.53 7.36 7.19 10.0% 12.0x 8.92 9.53 9.12 8.70 8.42 8.15 10.5% 8.0x 6.08 6.61 6.46 6.28 6.19 6.10 10.5% 10.0x 7.49 8.04 7.74 7.42 7.23 7.04 10.5% 12.0x 8.90 9.47 9.03 8.57 8.27 7.98 11.0% 8.0x 6.06 6.57 6.39 6.19 6.08 5.97 11.0% 10.0x 7.47 7.98 7.66 7.32 7.10 6.89 11.0% 12.0x 8.88 9.40 8.93 8.45 8.12 7.81 Source: Panda management projections and company filings. Note: Future share price and dividends discounted to 30-June-2022. Panda management targets a cash dividend payout ratio (per share) of 60% to 70% of EPS. 2022E dividend per share calculated using dividend payout July 2022 16 ratio of 65% multiplied by 2022E EPS less $0.03 of dividend per share paid on 20-May-2022.
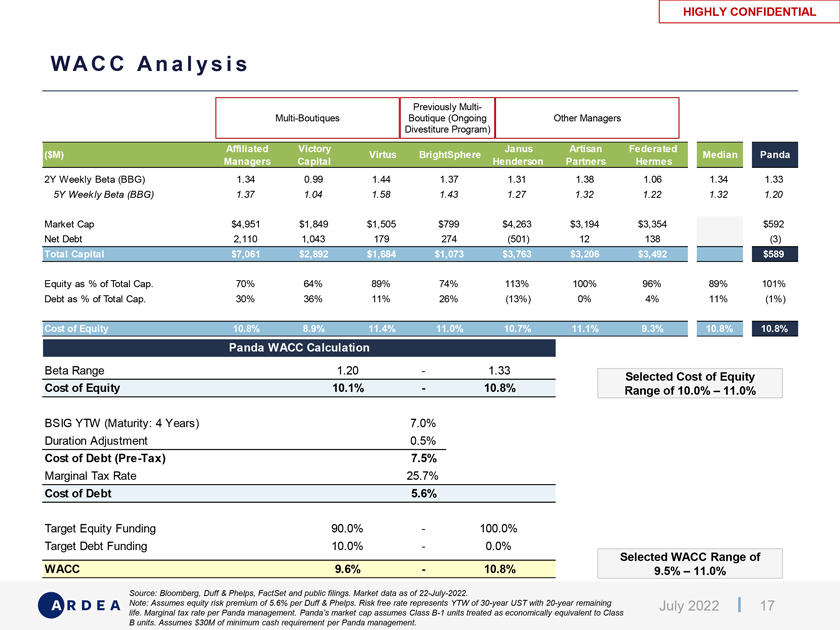
HIGHLY CONFIDENTIAL WA C C A n a l y s i s Previously Multi- Multi-Boutiques Boutique (Ongoing Other Managers Divestiture Program) Affiliated Victory Janus Artisan Federated ($M) Virtus BrightSphere Median Panda Managers Capital Henderson Partners Hermes 2Y Weekly Beta (BBG) 1.34 0.99 1.44 1.37 1.31 1.38 1.06 1.34 1.33 5Y Week ly Beta (BBG) 1.37 1.04 1.58 1.43 1.27 1.32 1.22 1.32 1.20 Market Cap $4,951 $1,849 $1,505 $799 $4,263 $3,194 $3,354 $592 Net Debt 2,110 1,043 179 274 (501) 12 138 (3) Total Capital $7,061 $2,892 $1,684 $1,073 $3,763 $3,206 $3,492 $589 Equity as % of Total Cap. 70% 64% 89% 74% 113% 100% 96% 89% 101% Debt as % of Total Cap. 30% 36% 11% 26% (13%) 0% 4% 11% (1%) Cost of Equity 10.8% 8.9% 11.4% 11.0% 10.7% 11.1% 9.3% 10.8% 10.8% Panda WACC Calculation Beta Range 1.20—1.33 Selected Cost of Equity Cost of Equity 10.1%—10.8% Range of 10.0% – 11.0% BSIG YTW (Maturity: 4 Years) 7.0% Duration Adjustment 0.5% Cost of Debt (Pre-Tax) 7.5% Marginal Tax Rate 25.7% Cost of Debt 5.6% Target Equity Funding 90.0%—100.0% Target Debt Funding 10.0%—0.0% Selected WACC Range of WACC 9.6%—10.8% 9.5% – 11.0% Source: Bloomberg, Duff & Phelps, FactSet and public filings. Market data as of 22-July-2022. Note: Assumes equity risk premium of 5.6% per Duff & Phelps. Risk free rate represents YTW of 30-year UST with 20-year remaining July 2022 17 life. Marginal tax rate per Panda management. Panda’s market cap assumes Class B-1 units treated as economically equivalent to Class B units. Assumes $30M of minimum cash requirement per Panda management.
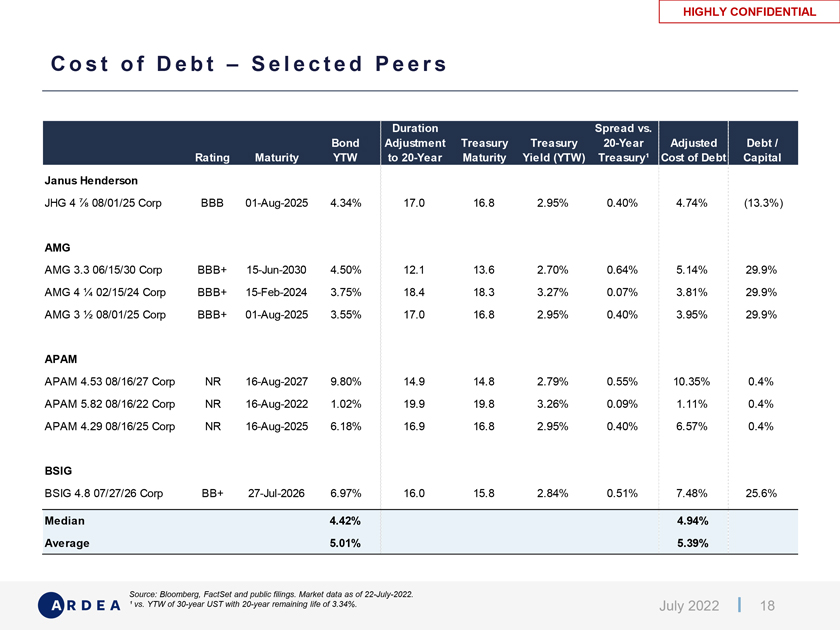
HIGHLY CONFIDENTIAL C o s t o f D e b t – S e l e c t e d P e e r s Duration Spread vs. Bond Adjustment Treasury Treasury 20-Year Adjusted Debt / Rating Maturity YTW to 20-Year Maturity Yield (YTW) Treasury¹ Cost of Debt Capital Janus Henderson JHG 4 08/01/25 Corp BBB 01-Aug-2025 4.34% 17.0 16.8 2.95% 0.40% 4.74% (13.3%) AMG AMG 3.3 06/15/30 Corp BBB+ 15-Jun-2030 4.50% 12.1 13.6 2.70% 0.64% 5.14% 29.9% AMG 4 1⁄4 02/15/24 Corp BBB+ 15-Feb-2024 3.75% 18.4 18.3 3.27% 0.07% 3.81% 29.9% AMG 3 1⁄2 08/01/25 Corp BBB+ 01-Aug-2025 3.55% 17.0 16.8 2.95% 0.40% 3.95% 29.9% APAM APAM 4.53 08/16/27 Corp NR 16-Aug-2027 9.80% 14.9 14.8 2.79% 0.55% 10.35% 0.4% APAM 5.82 08/16/22 Corp NR 16-Aug-2022 1.02% 19.9 19.8 3.26% 0.09% 1.11% 0.4% APAM 4.29 08/16/25 Corp NR 16-Aug-2025 6.18% 16.9 16.8 2.95% 0.40% 6.57% 0.4% BSIG BSIG 4.8 07/27/26 Corp BB+ 27-Jul-2026 6.97% 16.0 15.8 2.84% 0.51% 7.48% 25.6% Median 4.42% 4.94% Average 5.01% 5.39% Source: Bloomberg, FactSet and public filings. Market data as of 22-July-2022. ¹ vs. YTW of 30-year UST with 20-year remaining life of 3.34%. July 2022 18

HIGHLY CONFIDENTIAL P r e c e d e n t 1 3 E—3 Tr a n s a c t i o n s P r e m i u m ( % H e l d > 5 0 % ) D e a l S i z e $ 1 0 0 m i l l i o n + | S i n c e 2 0 1 2 Consideration Original Final Announced Date Acquirer Name Target Name Incorporated Held % ($bn) Premium Premium US Incorporated 30-Aug-2021 Geneve Holdings, Inc. Independence Holding Company Delaware 63% $0.3 19% 36% 02-Jul-2021 Banco Santander, S.A. Santander Consumer USA Holdings Inc. Delaware 80% 2.5 7% 14% 04-Sep-2020 Farm Bureau Mutual, Iowa Farm Bureau Federation FBL Financial Group, Inc. Iowa 61% 0.6 26% 64% 31-Aug-2020 Ionis Pharmaceuticals, Inc. Akcea Therapeutics, Inc. Delaware 76% 0.5 59% 59% 27-Nov-2019 Kyocera Corporation AVX Corporation Delaware 72% 1.0 30% 45% 11-Nov-2019 Insider Buyout Cellular Biomedicine Group, Inc. Delaware 52% 0.2 10% 12% 24-Apr-2019 Sonic Financial Corporation Speedway Motorsports, Inc. Delaware 71% 0.3 29% 42% 16-Nov-2018 Employers Mutual Casualty Company EMC Insurance Group Inc. Iowa 55% 0.4 25% 50% 09-Nov-2018 NASCAR Holdings, Inc. International Speedway Corporation Florida 75% 1.3 6% 14% 19-Jun-2018 Roche Holding Ltd Foundation Medicine, Inc. Delaware 57% 2.3 29% 29% 09-Jan-2018 Insider Buyout AmTrust Financial Services, Inc. Delaware 55% 1.4 21% 45% 06-Mar-2017 Steel Partners Holdings L.P. Handy & Harman Ltd. Delaware 70% 0.1 4% 33% 07-Mar-2016 American Financial Group, Inc. National Interstate Corporation Ohio 51% 0.3 33% 44% 29-Feb-2016 Icahn Enterprises L.P. Federal-Mogul Holdings Corporation Delaware 82% 0.3 41% 101% 15-Jan-2016 Insider Buyout Synutra International, Inc. Delaware 63% 0.1 54% 58% 20-Feb-2013 Chiesi Farmaceutici S.p.A. Cornerstone Therapeutics Inc. Delaware 65% 0.3 22% 73% Non-US Incorporated 10-Feb-2021 Insider Buyout New Frontier Health Corporation Cayman Islands 40%1 $0.8 24% 24% 17-Sep-2020 Insider Buyout 51job, Inc. Cayman Islands 56% 1.9 16% N/A 08-Jun-2020 Insider Buyout China Distance Education Holdings Cayman Islands 50% 0.2 26% 36% 09-Sep-2019 Sohu.com Limited Changyou.com Limited Cayman Islands 67%2 0.2 69% 82% 25-Apr-2017 Baring Private Equity Asia, CPPIB Nord Anglia Education, Inc. Cayman Islands 67% 1.2 18% 18% 17-Feb-2017 FountainVest Partners, Hillhouse Capital, SEEK Limited Zhaopin Limited Cayman Islands 61%3 0.5 13% 14% 23-Jun-2016 Ocean Management Qunar Cayman Islands Limited Cayman Islands 94% 0.2 15% 15% 03-Aug-2015 Ctrip.com International, Ltd., Tencent Holdings Limited eLong, Inc. Cayman Islands 78% 0.2 24% 24% 23-Oct-2014 Brookfield Asset Management Inc. Brookfield Residential Properties Inc. Canada 69% 0.9 21% 28% 27-Jan-2014 Insider Buyout, Ningxia Silkroad Equity Investment etc. Shanda Games Limited Cayman Islands 76% 0.5 22% 26% 30-May-2012 Fiat Industrial S.p.A. CNH Global N.V. Netherlands 88% 2.8 0% 25% US Incorporated 26% 44% Median Total 22% 35% US Incorporated 26% 45% Average Total 25% 39% US Incorporated 17% 32% 1st Quartile Total 16% 24% US Incorporated 30% 58% 3rd Quartile Total 29% 49% Source: Deal Point Data and company filings. Includes pending and completed acquisitions of public targets listed in the US. Excludes GP-LP transactions. Announced date reflects the date of the first publicly announced proposal. Original premium is the premium implied by the first publicly announced proposal (which may or may not have reflected an agreed to transaction price in an definitive agreement) over the price of the unaffected date. Final premium is implied by the transaction price over the same unaffected date. 1 Excludes voting proxies granted by shareholders of the company (not including any shareholder who is already a member of the insider) in respect of 17,316,625 issued and outstanding shares, representing approximately 13% of the total issued and outstanding shares. 2 Sohu.com owns approximately 67% of the combined total of the target’s outstanding Class A ordinary shares and Class B ordinary July 2022 19 shares and approximately 95% of the total voting power. 3 SEEK beneficially owned ordinary shares representing approximately 75% of the voting power and 61% of the share capital.
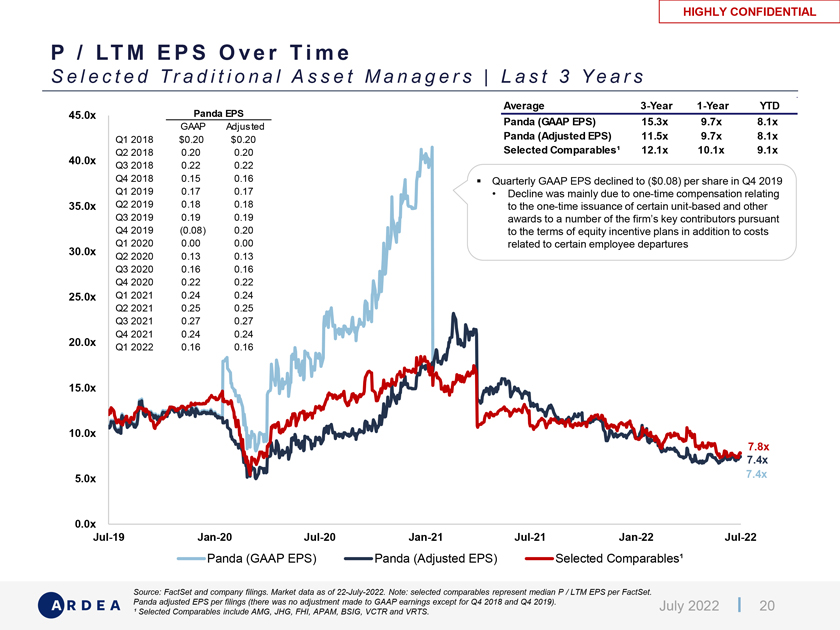
HIGHLY CONFIDENTIAL P / LT M E P S O v e r T i m e S e l e c t e d Tr a d i t i o n a l A s s e t M a n a g e r s | L a s t 3 Y e a r s Average 3-Year 1-Year YTD 45.0x Panda EPS Panda (GAAP EPS) 15.3x 9.7x 8.1x GAAP Adjusted Panda (Adjusted EPS) 11.5x 9.7x 8.1x Q1 2018 $0.20 $0.20 Q2 2018 0.20 0.20 Selected Comparables¹ 12.1x 10.1x 9.1x 40.0x Q3 2018 0.22 0.22 Q4 2018 0.15 0.16 Quarterly GAAP EPS declined to ($0.08) per share in Q4 2019 Q1 2019 0.17 0.17 • Decline was mainly due to one-time compensation relating 35.0x Q2 2019 0.18 0.18 to the one-time issuance of certain unit-based and other Q3 2019 0.19 0.19 awards to a number of the firm’s key contributors pursuant Q4 2019 (0.08) 0.20 to the terms of equity incentive plans in addition to costs Q1 2020 0.00 0.00 related to certain employee departures 30.0x Q2 2020 0.13 0.13 Q3 2020 0.16 0.16 Q4 2020 0.22 0.22 25.0x Q1 2021 0.24 0.24 Q2 2021 0.25 0.25 Q3 2021 0.27 0.27 Q4 2021 0.24 0.24 20.0x Q1 2022 0.16 0.16 15.0x 10.0x 7.8x 7.4x 5.0x 7.4x 0.0x Jul-19 Jan-20 Jul-20 Jan-21 Jul-21 Jan-22 Jul-22 Panda (GAAP EPS) Panda (Adjusted EPS) Selected Comparables¹ Source: FactSet and company filings. Market data as of 22-July-2022. Note: selected comparables represent median P / LTM EPS per FactSet. Panda adjusted EPS per filings (there was no adjustment made to GAAP earnings except for Q4 2018 and Q4 2019). July 2022 20 ¹ Selected Comparables include AMG, JHG, FHI, APAM, BSIG, VCTR and VRTS.
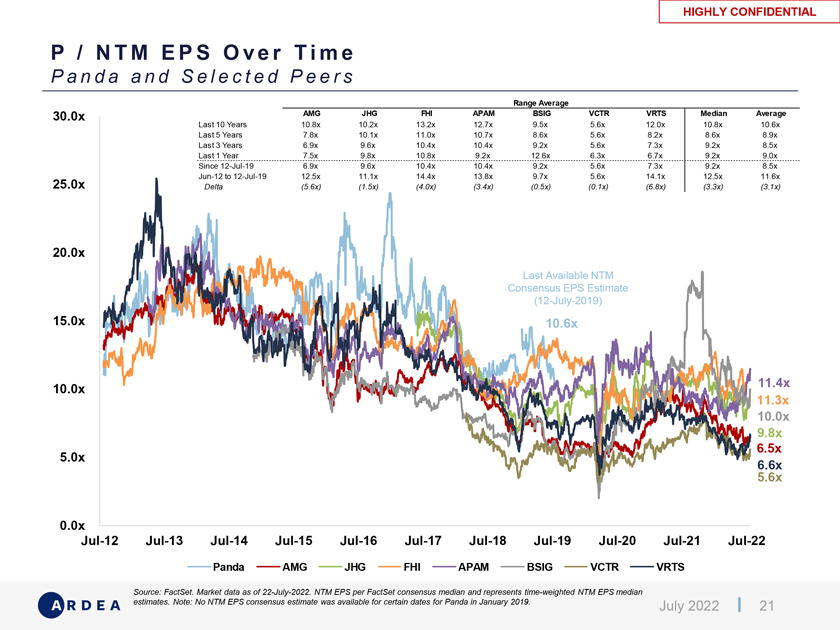
HIGHLY CONFIDENTIAL P / N T M E P S O v e r T i m e P a n d a a n d S e l e c t e d P e e r s Range Average 30.0x AMG JHG FHI APAM BSIG VCTR VRTS Median Average Last 10 Years 10.8x 10.2x 13.2x 12.7x 9.5x 5.6x 12.0x 10.8x 10.6x Last 5 Years 7.8x 10.1x 11.0x 10.7x 8.6x 5.6x 8.2x 8.6x 8.9x Last 3 Years 6.9x 9.6x 10.4x 10.4x 9.2x 5.6x 7.3x 9.2x 8.5x Last 1 Year 7.5x 9.8x 10.8x 9.2x 12.6x 6.3x 6.7x 9.2x 9.0x Since 12-Jul-19 6.9x 9.6x 10.4x 10.4x 9.2x 5.6x 7.3x 9.2x 8.5x Jun-12 to 12-Jul-19 12.5x 11.1x 14.4x 13.8x 9.7x 5.6x 14.1x 12.5x 11.6x 25.0x Delta (5.6x) (1.5x) (4.0x) (3.4x) (0.5x) (0.1x) (6.8x) (3.3x) (3.1x) 20.0x Last Available NTM Consensus EPS Estimate (12-July-2019) 15.0x 10.6x 11.4x 10.0x 11.3x 10.0x 9.8x 6.5x 5.0x 6.6x 5.6x 0.0x Jul-12 Jul-13 Jul-14 Jul-15 Jul-16 Jul-17 Jul-18 Jul-19 Jul-20 Jul-21 Jul-22 Panda AMG JHG FHI APAM BSIG VCTR VRTS Source: FactSet. Market data as of 22-July-2022. NTM EPS per FactSet consensus median and represents time-weighted NTM EPS median estimates. Note: No NTM EPS consensus estimate was available for certain dates for Panda in January 2019. July 2022 21
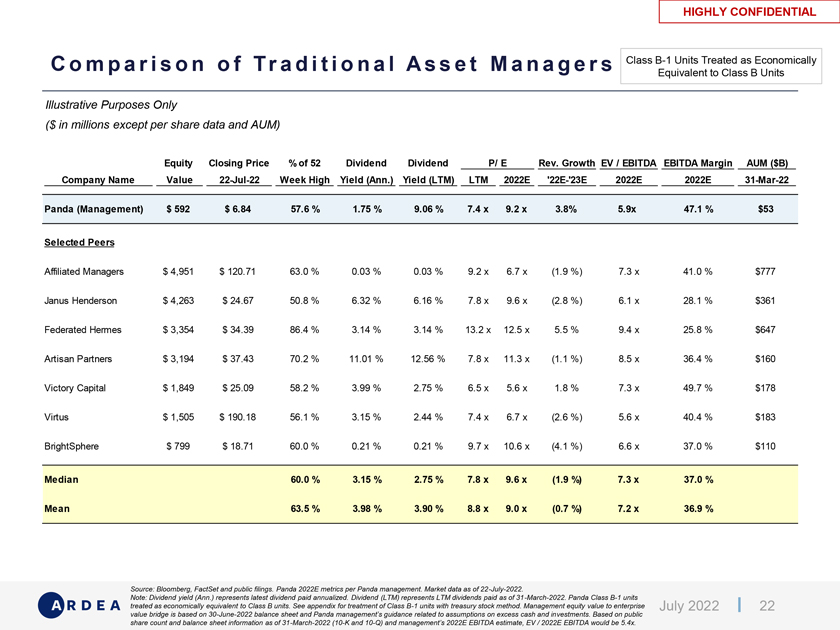
HIGHLY CONFIDENTIAL C o m p a r i s o n o f Tr a d i t i o n a l A s s e t M a n a g e r s Class B-1 Units Treated as Economically Equivalent to Class B Units Illustrative Purposes Only ($ in millions except per share data and AUM) Equity Closing Price % of 52 Dividend Dividend P/ E Rev. Growth EV / EBITDA EBITDA Margin AUM ($B) Company Name Value 22-Jul-22 Week High Yield (Ann.) Yield (LTM) LTM 2022E ‘22E-‘23E 2022E 2022E 31-Mar-22 Panda (Management) $ 592 $ 6.84 57.6 % 1.75 % 9.06 % 7.4 x 9.2 x 3.8% 5.9x 47.1 % $53 Selected Peers Affiliated Managers $ 4,951 $ 120.71 63.0 % 0.03 % 0.03 % 9.2 x 6.7 x (1.9 %) 7.3 x 41.0 % $777 Janus Henderson $ 4,263 $ 24.67 50.8 % 6.32 % 6.16 % 7.8 x 9.6 x (2.8 %) 6.1 x 28.1 % $361 Federated Hermes $ 3,354 $ 34.39 86.4 % 3.14 % 3.14 % 13.2 x 12.5 x 5.5 % 9.4 x 25.8 % $647 Artisan Partners $ 3,194 $ 37.43 70.2 % 11.01 % 12.56 % 7.8 x 11.3 x (1.1 %) 8.5 x 36.4 % $160 Victory Capital $ 1,849 $ 25.09 58.2 % 3.99 % 2.75 % 6.5 x 5.6 x 1.8 % 7.3 x 49.7 % $178 Virtus $ 1,505 $ 190.18 56.1 % 3.15 % 2.44 % 7.4 x 6.7 x (2.6 %) 5.6 x 40.4 % $183 BrightSphere $ 799 $ 18.71 60.0 % 0.21 % 0.21 % 9.7 x 10.6 x (4.1 %) 6.6 x 37.0 % $110 Median 60.0 % 3.15 % 2.75 % 7.8 x 9.6 x (1.9 %) 7.3 x 37.0 % Mean 63.5 % 3.98 % 3.90 % 8.8 x 9.0 x (0.7 %) 7.2 x 36.9 % Source: Bloomberg, FactSet and public filings. Panda 2022E metrics per Panda management. Market data as of 22-July-2022. Note: Dividend yield (Ann.) represents latest dividend paid annualized. Dividend (LTM) represents LTM dividends paid as of 31-March-2022. Panda Class B-1 units treated as economically equivalent to Class B units. See appendix for treatment of Class B-1 units with treasury stock method. Management equity value to enterprise July 2022 22 value bridge is based on 30-June-2022 balance sheet and Panda management’s guidance related to assumptions on excess cash and investments. Based on public share count and balance sheet information as of 31-March-2022 (10-K and 10-Q) and management’s 2022E EBITDA estimate, EV / 2022E EBITDA would be 5.4x.
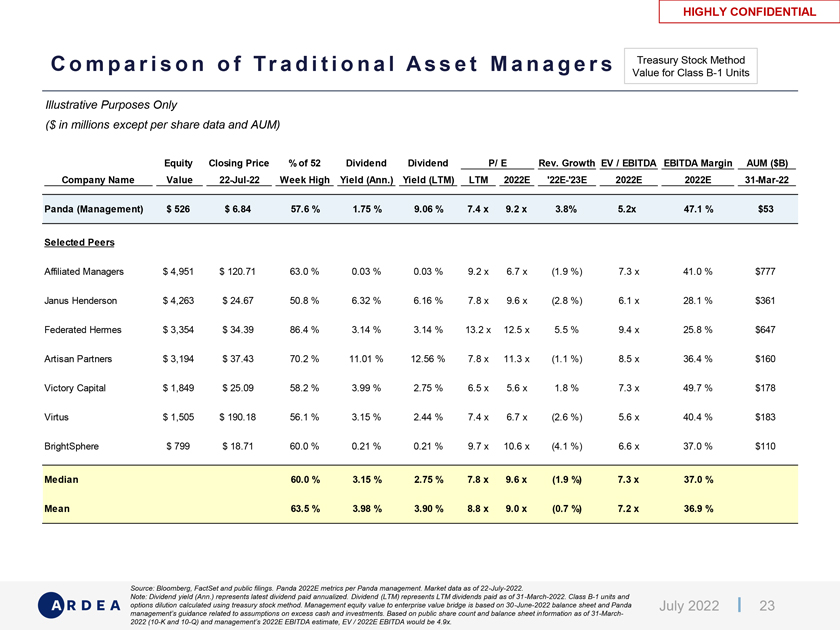
HIGHLY CONFIDENTIAL C o m p a r i s o n o f Tr a d i t i o n a l A s s e t M a n a g e r s Treasury Stock Method Value for Class B-1 Units Illustrative Purposes Only ($ in millions except per share data and AUM) Equity Closing Price % of 52 Dividend Dividend P/ E Rev. Growth EV / EBITDA EBITDA Margin AUM ($B) Company Name Value 22-Jul-22 Week High Yield (Ann.) Yield (LTM) LTM 2022E ‘22E-‘23E 2022E 2022E 31-Mar-22 Panda (Management) $ 526 $ 6.84 57.6 % 1.75 % 9.06 % 7.4 x 9.2 x 3.8% 5.2x 47.1 % $53 Selected Peers Affiliated Managers $ 4,951 $ 120.71 63.0 % 0.03 % 0.03 % 9.2 x 6.7 x (1.9 %) 7.3 x 41.0 % $777 Janus Henderson $ 4,263 $ 24.67 50.8 % 6.32 % 6.16 % 7.8 x 9.6 x (2.8 %) 6.1 x 28.1 % $361 Federated Hermes $ 3,354 $ 34.39 86.4 % 3.14 % 3.14 % 13.2 x 12.5 x 5.5 % 9.4 x 25.8 % $647 Artisan Partners $ 3,194 $ 37.43 70.2 % 11.01 % 12.56 % 7.8 x 11.3 x (1.1 %) 8.5 x 36.4 % $160 Victory Capital $ 1,849 $ 25.09 58.2 % 3.99 % 2.75 % 6.5 x 5.6 x 1.8 % 7.3 x 49.7 % $178 Virtus $ 1,505 $ 190.18 56.1 % 3.15 % 2.44 % 7.4 x 6.7 x (2.6 %) 5.6 x 40.4 % $183 BrightSphere $ 799 $ 18.71 60.0 % 0.21 % 0.21 % 9.7 x 10.6 x (4.1 %) 6.6 x 37.0 % $110 Median 60.0 % 3.15 % 2.75 % 7.8 x 9.6 x (1.9 %) 7.3 x 37.0 % Mean 63.5 % 3.98 % 3.90 % 8.8 x 9.0 x (0.7 %) 7.2 x 36.9 % Source: Bloomberg, FactSet and public filings. Panda 2022E metrics per Panda management. Market data as of 22-July-2022. Note: Dividend yield (Ann.) represents latest dividend paid annualized. Dividend (LTM) represents LTM dividends paid as of 31-March-2022. Class B-1 units and options dilution calculated using treasury stock method. Management equity value to enterprise value bridge is based on 30-June-2022 balance sheet and Panda July 2022 23 management’s guidance related to assumptions on excess cash and investments. Based on public share count and balance sheet information as of 31-March-2022 (10-K and 10-Q) and management’s 2022E EBITDA estimate, EV / 2022E EBITDA would be 4.9x.

HIGHLY CONFIDENTIAL S e l e c t e d Tr a d i t i o n a l A s s e t M a n a g e m e n t C h a n g e o f C o n t r o l Tr a n s a c t i o n s F o o t n o t e s 1 Metrics sourced from Merger Agreement and Q1 10Q 2022. Purchase price calculated as per share merger consideration of $12.85 multiplied by diluted shares outstanding. Implied multiple calculated as EV divided by LTM Q1 2022A EBITDA. EV calculated as purchase price less cash and cash equivalents and investment securities. LTM EBITDA calculated as LTM Q1 2022A operating income plus D&A. Target AUM as of 31-Mar-2022. 2 Per BrightSphere’s press release, Pendal Group acquired a 75.1% of ownership interest in Thompson, Siegel Walmsley (“TSW”) from BrightSphere (for $240M) and 24.9% from TSW management for a total consideration of ~$320M. In addition to acquiring BrightSphere’s equity interest in TSW, Pendal also agreed to acquire BrightSphere’s seed capital in TSW strategies post-close for approximately $14M. Purchase price shown excludes the purchase of seed investments. Implied multiple of 7.6x 1H2021A (annualized and excluding synergies) per Pendal Group’s investor presentation. Target AUM as of 31-Mar-2021. 3 Per Macquarie’s investor presentation: total headline consideration of ~$1.7B, headline acquisition multiple of ~10x EV/EBITDA and pro forma multiple of ~6x EV/EBITDA post sell down of balance sheet assets, before the sale of the wealth management business and realization of synergies. Macquarie intended to acquire all of the outstanding common shares of Waddell & Reed and, on completion, sell Waddell & Reed’s wealth management platform to LPL for $300M plus excess net assets. $131B of target AUM includes asset management AUM of ~$68B and wealth management AUA of ~$63B as of 30-Sep-2020. 4 Per BrightSphere’s press release, BrightSphere has agreed to sell its 75.1% ownership interest in Barrow Hanley to Perpetual Limited for $319M. In addition, Perpetual will redeem BrightSphere’s seed capital investments in Barrow Hanley at closing, which had a market value of ~$44M as of 30-Jun-2020. Purchase price shown calculated as $319M (75.1%) grossed up to 100% and does not include the $44M of redemption of seed capital. BrightSphere reported 1H CY2020A EBITDA attributable to controlling interest of $20M. Implied multiple per Perpetual press release. Target AUM as of 30-Jun-2020. 5 Purchase price represents $850M upfront payment. (Note: there are contingent payments of up to $150M over four years based on future business performance.) EBITDA multiple of 6.9x (upfront purchase price excluding expected synergies and tax benefit), 3.8x (upfront purchase price including expected synergies) and 3.2x (upfront purchase price including expected synergies and tax benefit) per Victory Capital’s investor presentation. Target AUM as of 30-Sep-2018. 6 Per Federated Investors’ press release, Federated Investors will pay ~$350M for a 60% interest in Hermes Investment Management. Purchase price shown of $0.6B represents $350M grossed-up to 100%. Per Federated Investors’ investor presentation, EV / EBITDA of 12.8x corresponds to 2017 Hermes standalone EBITDA (post-minority interests). Target AUM as of 31-Dec-2017. Target AUM of $45B represents Ł33B adjusted by GBP USD spot FX conversion rate of 1.35 as of 31-Dec-2017 per investor presentation. Source: Company filings. July 2022 24
D I S C L A I M E R Ardea Partners LP (“Ardea”) has prepared and provided these materials and Ardea’s related oral presentation (collectively, the “Confidential Information”) solely for the information and assistance of the Special Committee of the Board of Directors of Panda (the “Company”) in connection with their consideration of the matters referred to herein. Without Ardea’s prior written consent, the Confidential Information, and Ardea’s preparation and provision of such Confidential Information, may not be used for any other purpose or disclosed or otherwise referred to in any manner. The Confidential Information is (a) for discussion purposes only and (b) speaks only as of the date it is given, reflecting prevailing economic, monetary, market and other conditions as in effect on, and the information made available to Ardea as of, such date. Ardea assumes no responsibility for updating or revising the Confidential Information. The views expressed herein are subject to change based upon a number of factors, including economic, monetary, market and other conditions and the Company’s and any prospective counterparty’s business and prospects. Analyses based upon forecasts of future results are not necessarily indicative of actual future results, which may be significantly more or less favorable than suggested by these analyses, and Ardea does not assume responsibility if future results are materially different from those forecast. The Confidential Information is incomplete without reference to, and should be viewed solely in conjunction with, the oral briefing provided by Ardea, if any. The Confidential Information has been prepared using publicly available information and information in reports, due diligence materials, forecasts, projections and other materials provided by or on behalf of the Company and/or any prospective counterparty. Ardea does not assume responsibility for and has relied on, without independent verification, the accuracy and completeness of such information. Ardea has not, and does not, provide advice for tax, legal, regulatory or accounting matters and the Company will remain solely responsible for all aspects of due diligence in connection with the Transaction and the commercial assumptions on which any advice provided by Ardea is based. The Confidential Information does not address the underlying business decision of the Company to engage in any transaction or the relative merits of any strategic alternatives referred to herein as compared to any other alternative that may be available to the Company. Ardea and its affiliates and/or their respective employees, as well as investment funds in which any of them may have a financial interest, may at any time, directly or indirectly, hold long or short positions and may trade or otherwise effect transactions for their own accounts or the accounts of customers, in debt or equity securities, senior loans and/or derivative products relating to the Company or its affiliates, potential parties to a Transaction and their affiliates or persons that are competitors, customers or suppliers of the Company. Nothing herein or any previous or existing relationship between the Company and Ardea will be deemed to create a fiduciary duty or fiduciary or agency relationship between Ardea and the Company, its security holders, affiliates, employees or creditors. July 2022 25
Exhibit (c)(4)

HIGHLY CONFIDENTIAL P r o j e c t P a n d a P r e s e n t a t i o n t o t h e S p e c i a l C o m m i t t e e o f t h e B o a r d o f D i r e c t o r s July 26, 2022
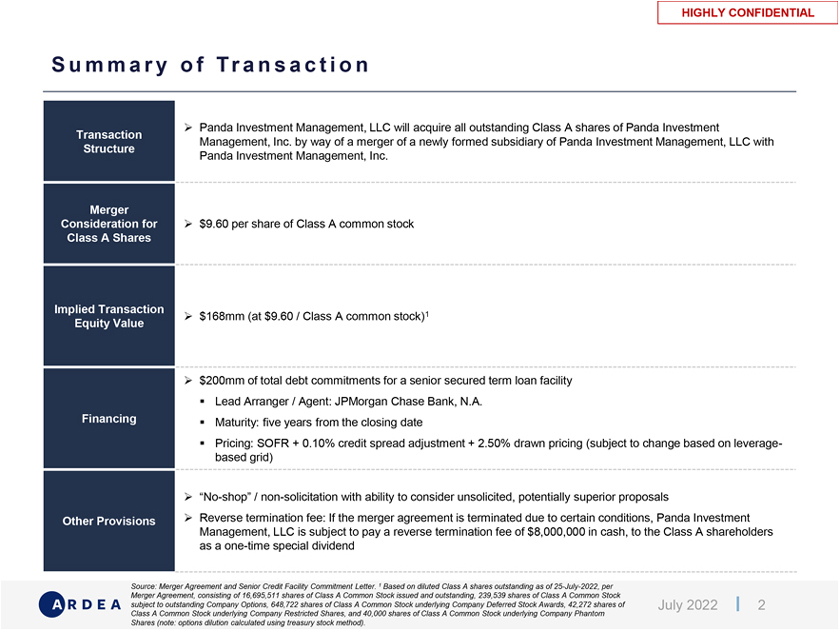
HIGHLY CONFIDENTIAL S u m m a r y o f Tr a n s a c t i o n ➢ Panda Investment Management, LLC will acquire all outstanding Class A shares of Panda Investment Transaction Management, Inc. by way of a merger of a newly formed subsidiary of Panda Investment Management, LLC with Structure Panda Investment Management, Inc. Merger Consideration for ➢ $9.60 per share of Class A common stock Class A Shares Implied Transaction Equity Value ➢ $168mm (at $9.60 / Class A common stock)1 ➢ $200mm of total debt commitments for a senior secured term loan facility â–ª Lead Arranger / Agent: JPMorgan Chase Bank, N.A. Financing â–ª Maturity: five years from the closing date â–ª Pricing: SOFR + 0.10% credit spread adjustment + 2.50% drawn pricing (subject to change based on leverage-based grid) ➢ “No-shop” / non-solicitation with ability to consider unsolicited, potentially superior proposals Other Provisions ➢ Reverse termination fee: If the merger agreement is terminated due to certain conditions, Panda Investment Management, LLC is subject to pay a reverse termination fee of $8,000,000 in cash, to the Class A shareholders as a one-time special dividend Source: Merger Agreement and Senior Credit Facility Commitment Letter. 1 Based on diluted Class A shares outstanding as of 25-July-2022, per Merger Agreement, consisting of 16,695,511 shares of Class A Common Stock issued and outstanding, 239,539 shares of Class A Common Stock subject to outstanding Company Options, 648,722 shares of Class A Common Stock underlying Company Deferred Stock Awards, 42,272 shares of July 2022 2 Class A Common Stock underlying Company Restricted Shares, and 40,000 shares of Class A Common Stock underlying Company Phantom Shares (note: options dilution calculated using treasury stock method).

HIGHLY CONFIDENTIAL P r e m i u m s a n d M u l t i p l e s O v e r v i e w Class B-1 Units Treated as Economically Equivalent to Class B Units ($ in millions except per share data) Merger Consideration Purchase Price per Class A Share $9.60 Implied Premium to Spot (22-July-2022) $6.84 40.4% Implied Premium / (Discount) to 30-Day VWAP $6.59 45.6% Implied Premium / (Discount) to 52-Week High $11.87 (19.1%) Class A Diluted Shares Outstanding (as of 30-June-2022) 17.5 Implied Transaction Equity Value $168 Total Diluted Shares Outstanding (as of 30-June-2022) 87.9 Implied Equity Value $844 Excess Cash (3) Investments (19) Debt 0 Present Value of Existing Tax Benefits (2) Implied Enterprise Value $820 Metric Peers Median EV / 2022E EBITDA $96 8.5x 7.3x P / 2022E EPS $0.74 12.9x 9.6x Source: Company filings and Panda management projections. Market data as of 22-July-2022. Note: Assumes $30M of minimum cash requirement per management. Peers median multiple represents median multiples of AMG, JHG, FHI, APAM, BSIG, VCTR and VRTS. Class B-1 units treated as economically equivalent to Class B units. See appendix for treatment of Class B-1 units with treasury stock method. Options dilution calculated using treasury stock method. Management equity value to July 2022 3 enterprise value bridge is based on 30-June-2022 balance sheet and Panda management’s guidance related to assumptions on excess cash and investments. Based on public share count and balance sheet information as of 31-March-2022 (10-K and 10-Q) and management’s 2022E EBITDA estimate, EV / 2022E EBITDA would be 8.0x at the merger consideration of $9.60.
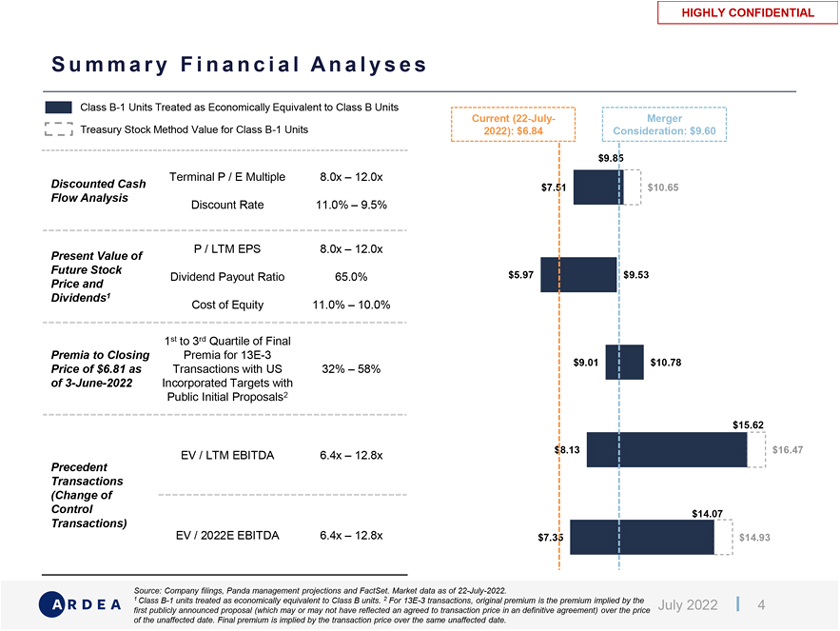
HIGHLY CONFIDENTIAL S u m m a r y F i n a n c i a l A n a l y s e s Class B-1 Units Treated as Economically Equivalent to Class B Units Current (22-July- Merger Treasury Stock Method Value for Class B-1 Units 2022): $6.84 Consideration: $9.60 $9.85 Terminal P / E Multiple 8.0x – 12.0x Discounted Cash $7.51 $10.65 Flow Analysis Discount Rate 11.0% – 9.5% P / LTM EPS 8.0x – 12.0x Present Value of Future Stock Dividend Payout Ratio 65.0% $5.97 $9.53 Price and Dividends1 Cost of Equity 11.0% – 10.0% 1st to 3rd Quartile of Final Premia to Closing Premia for 13E-3 $9.01 $10.78 Price of $6.81 as Transactions with US 32% – 58% of 3-June-2022 Incorporated Targets with Public Initial Proposals2 $15.62 $8.13 $16.47 EV / LTM EBITDA 6.4x – 12.8x Precedent Transactions (Change of Control $14.07 Transactions) EV / 2022E EBITDA 6.4x – 12.8x $7.35 $14.93 Source: Company filings, Panda management projections and FactSet. Market data as of 22-July-2022. 1 Class B-1 units treated as economically equivalent to Class B units. 2 For 13E-3 transactions, original premium is the premium implied by the July 2022 4 first publicly announced proposal (which may or may not have reflected an agreed to transaction price in an definitive agreement) over the price of the unaffected date. Final premium is implied by the transaction price over the same unaffected date.
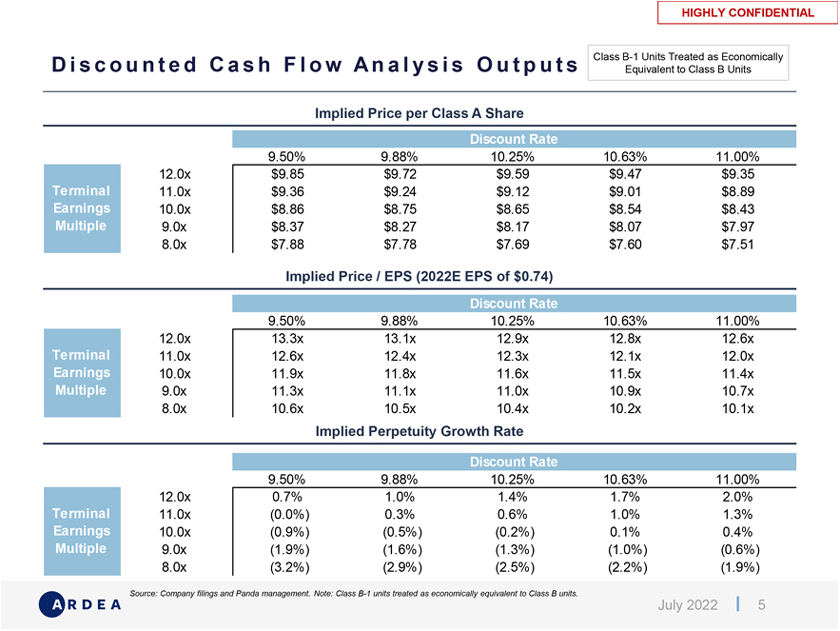
HIGHLY CONFIDENTIAL D i s c o u n t e d C a s h F l o w A n a l y s i s O u t p u t s Class B-1 Units Treated as Economically Equivalent to Class B Units Implied Price per Class A Share Discount Rate $8.6 9.50% 9.88% 10.25% 10.63% 11.00% 12.0x $9.85 $9.72 $9.59 $9.47 $9.35 Terminal 11.0x $9.36 $9.24 $9.12 $9.01 $8.89 Earnings 10.0x $8.86 $8.75 $8.65 $8.54 $8.43 Multiple 9.0x $8.37 $8.27 $8.17 $8.07 $7.97 8.0x $7.88 $7.78 $7.69 $7.60 $7.51 Implied Price / EPS (2022E EPS of $0.74) Discount Rate 9.50% 9.88% 10.25% 10.63% 11.00% 12.0x 13.3x 13.1x 12.9x 12.8x 12.6x Terminal 11.0x 12.6x 12.4x 12.3x 12.1x 12.0x Earnings 10.0x 11.9x 11.8x 11.6x 11.5x 11.4x Multiple 9.0x 11.3x 11.1x 11.0x 10.9x 10.7x 8.0x 10.6x 10.5x 10.4x 10.2x 10.1x Implied Perpetuity Growth Rate Discount Rate ($0.0) 9.50% 9.88% 10.25% 10.63% 11.00% 12.0x 0.7% 1.0% 1.4% 1.7% 2.0% Terminal 11.0x (0.0%) 0.3% 0.6% 1.0% 1.3% Earnings 10.0x (0.9%) (0.5%) (0.2%) 0.1% 0.4% Multiple 9.0x (1.9%) (1.6%) (1.3%) (1.0%) (0.6%) 8.0x (3.2%) (2.9%) (2.5%) (2.2%) (1.9%) Source: Company filings and Panda management. Note: Class B-1 units treated as economically equivalent to Class B units. July 2022 5
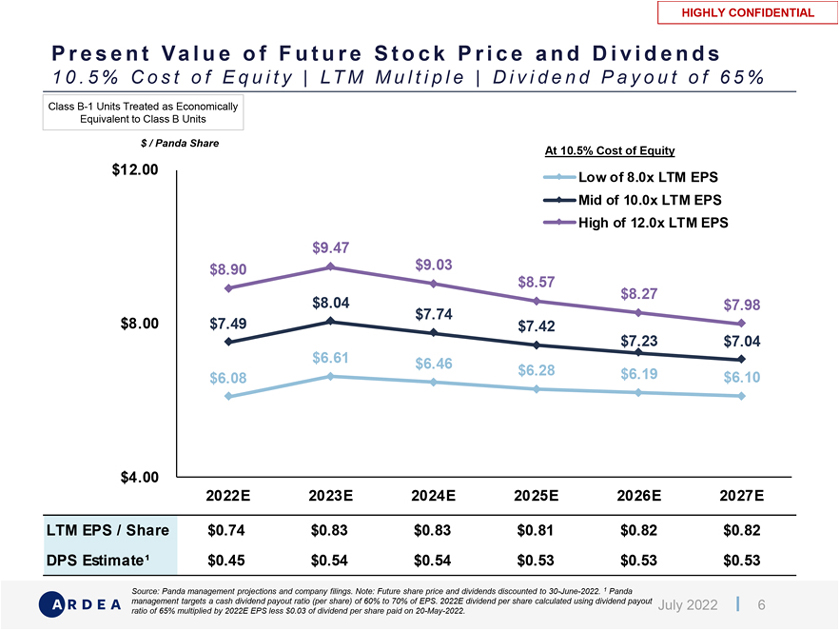
HIGHLY CONFIDENTIAL P r e s e n t Va l u e o f F u t u r e S t o c k P r i c e a n d D i v i d e n d s 1 0 . 5 % C o s t o f E q u i t y | LT M M u l t i p l e | D i v i d e n d P a y o u t o f 6 5 % Class B-1 Units Treated as Economically Equivalent to Class B Units $ / Panda Share At 10.5% Cost of Equity $12.00 Low of 8.0x LTM EPS Mid of 10.0x LTM EPS High of 12.0x LTM EPS $9.47 $8.90 $9.03 $8.57 $8.27 $8.04 $7.98 $7.74 $8.00 $7.49 $7.42 $7.23 $7.04 $6.61 $6.46 $6.28 $6.08 $6.19 $6.10 $4.00 2022E 2023E 2024E 2025E 2026E 2027E LTM EPS / Share $0.74 $0.83 $0.83 $0.81 $0.82 $0.82 DPS Estimate¹ $0.45 $0.54 $0.54 $0.53 $0.53 $0.53 Source: Panda management projections and company filings. Note: Future share price and dividends discounted to 30-June-2022. 1 Panda management targets a cash dividend payout ratio (per share) of 60% to 70% of EPS. 2022E dividend per share calculated using dividend payout July 2022 6 ratio of 65% multiplied by 2022E EPS less $0.03 of dividend per share paid on 20-May-2022.
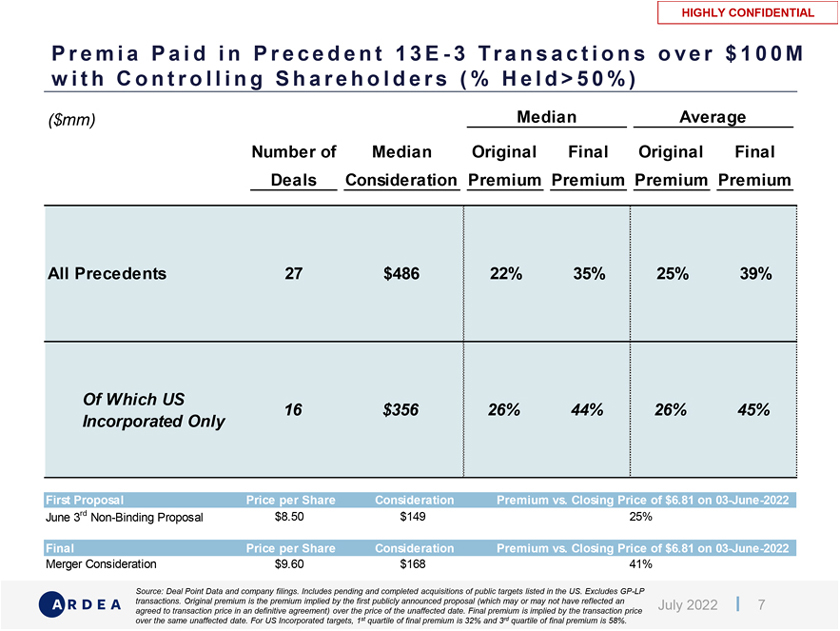
HIGHLY CONFIDENTIAL P r e m i a P a i d i n P r e c e d e n t 1 3 E—3 Tr a n s a c t i o n s o v e r $ 1 0 0 M w i t h C o n t r o l l i n g S h a r e h o l d e r s ( % H e l d > 5 0 % ) ($mm) Median Average Number of Median Original Final Original Final Deals Consideration Premium Premium Premium Premium All Precedents 27 $486 22% 35% 25% 39% Of Which US 16 $356 26% 44% 26% 45% Incorporated Only First Proposal Price per Share Consideration Premium vs. Closing Price of $6.81 on 03-June-2022 June 3rd Non-Binding Proposal $8.50 $149 25% Final Price per Share Consideration Premium vs. Closing Price of $6.81 on 03-June-2022 Merger Consideration $9.60 $168 41% Source: Deal Point Data and company filings. Includes pending and completed acquisitions of public targets listed in the US. Excludes GP-LP transactions. Original premium is the premium implied by the first publicly announced proposal (which may or may not have reflected an July 2022 7 agreed to transaction price in an definitive agreement) over the price of the unaffected date. Final premium is implied by the transaction price over the same unaffected date. For US Incorporated targets, 1st quartile of final premium is 32% and 3rd quartile of final premium is 58%.
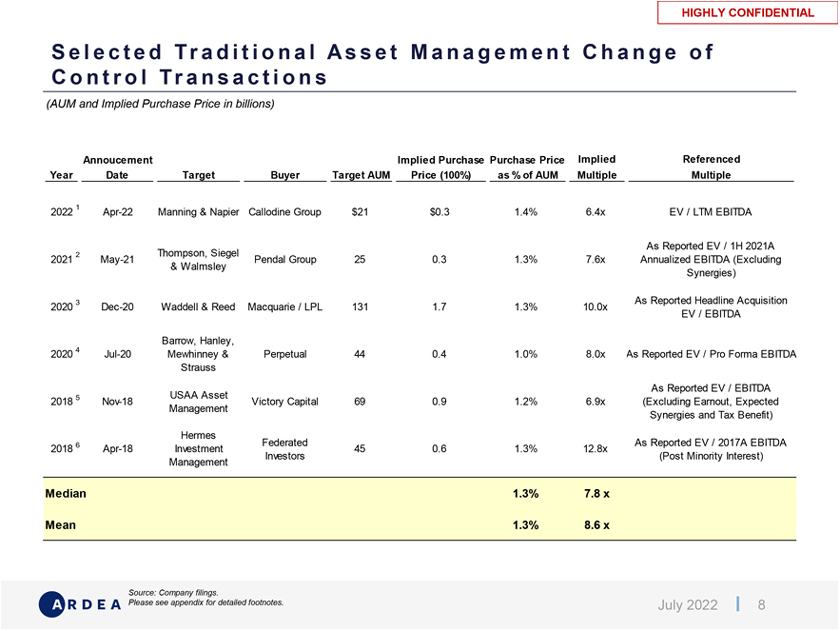
HIGHLY CONFIDENTIAL S e l e c t e d Tr a d i t i o n a l A s s e t M a n a g e m e n t C h a n g e o f C o n t r o l Tr a n s a c t i o n s (AUM and Implied Purchase Price in billions) Annoucement Implied Purchase Purchase Price Implied Referenced Year Date Target Buyer Target AUM Price (100%) as % of AUM Multiple Multiple 1 2022 Apr-22 Manning & Napier Callodine Group $21 $0.3 1.4% 6.4x EV / LTM EBITDA As Reported EV / 1H 2021A 2 Thompson, Siegel 2021 May-21 Pendal Group 25 0.3 1.3% 7.6x Annualized EBITDA (Excluding & Walmsley Synergies) 3 As Reported Headline Acquisition 2020 Dec-20 Waddell & Reed Macquarie / LPL 131 1.7 1.3% 10.0x EV / EBITDA Barrow, Hanley, 2020 4 Jul-20 Mewhinney & Perpetual 44 0.4 1.0% 8.0x As Reported EV / Pro Forma EBITDA Strauss As Reported EV / EBITDA 5 USAA Asset 2018 Nov-18 Victory Capital 69 0.9 1.2% 6.9x (Excluding Earnout, Expected Management Synergies and Tax Benefit) Hermes 6 Federated As Reported EV / 2017A EBITDA 2018 Apr-18 Investment 45 0.6 1.3% 12.8x Investors (Post Minority Interest) Management Median 1.3% 7.8 x Mean 1.3% 8.6 x Source: Company filings. Please see appendix for detailed footnotes. July 2022 8

A Appendix July 2022 9
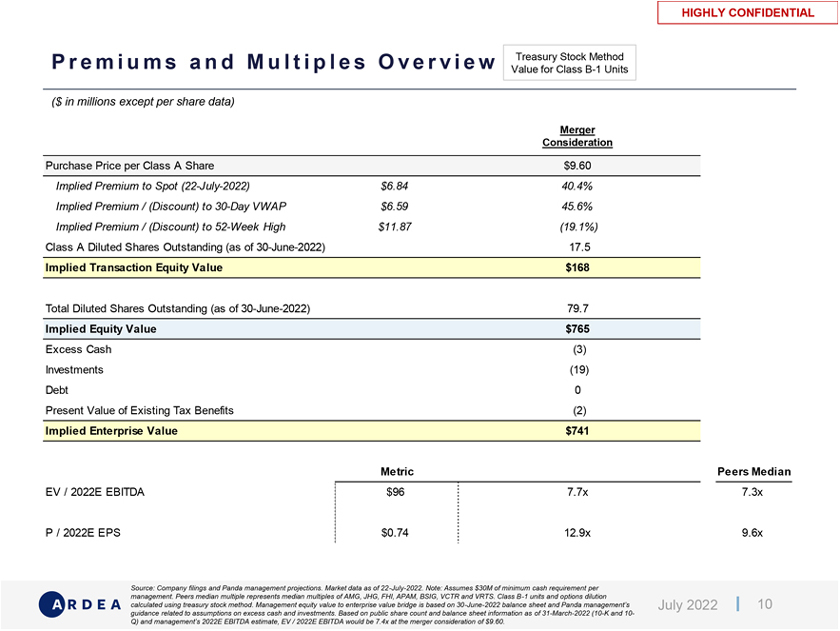
HIGHLY CONFIDENTIAL Premiums and Multiples Overview Treasury Stock Method Value for Class B-1 Units ($ in millions except per share data) Merger Consideration Purchase Price per Class A Share $9.60 Implied Premium to Spot (22-July-2022) $6.84 40.4% Implied Premium / (Discount) to 30-Day VWAP $6.59 45.6% Implied Premium / (Discount) to 52-Week High $11.87 (19.1%) Class A Diluted Shares Outstanding (as of 30-June-2022) 17.5 Implied Transaction Equity Value $168 Total Diluted Shares Outstanding (as of 30-June-2022) 79.7 Implied Equity Value $765 Excess Cash (3) Investments (19) Debt 0 Present Value of Existing Tax Benefits (2) Implied Enterprise Value $741 Metric Peers Median EV / 2022E EBITDA $96 7.7x 7.3x P / 2022E EPS $0.74 12.9x 9.6x Source: Company filings and Panda management projections. Market data as of 22-July-2022. Note: Assumes $30M of minimum cash requirement per management. Peers median multiple represents median multiples of AMG, JHG, FHI, APAM, BSIG, VCTR and VRTS. Class B-1 units and options dilution calculated using treasury stock method. Management equity value to enterprise value bridge is based on 30-June-2022 balance sheet and Panda management’s July 2022 10 guidance related to assumptions on excess cash and investments. Based on public share count and balance sheet information as of 31-March-2022 (10-K and 10- Q) and management’s 2022E EBITDA estimate, EV / 2022E EBITDA would be 7.4x at the merger consideration of $9.60.

HIGHLY CONFIDENTIAL S u m m a r y F i n a n c i a l A n a l y s e s C l a s s B—1 U n i t s T r e a t e d E c o n o m i c a l l y E q u i v a l e n tto Class B Units Current (22-July- Merger 2022): $6.84 Consideration: $9.60 Terminal P / E Multiple 8.0x – 12.0x $7.51 $9.85 Discounted Cash Flow Analysis Discount Rate 11.0% – 9.5% EV / LTM EBITDA 6.4x – 12.8x $8.13 $15.62 Precedent Transactions (Change of Control Transactions) EV / 2022E EBITDA 6.4x – 12.8x $7.35 $14.07 Source: Company filings, Panda management projections and FactSet. Market data as of 22-July-2022. July 2022 11
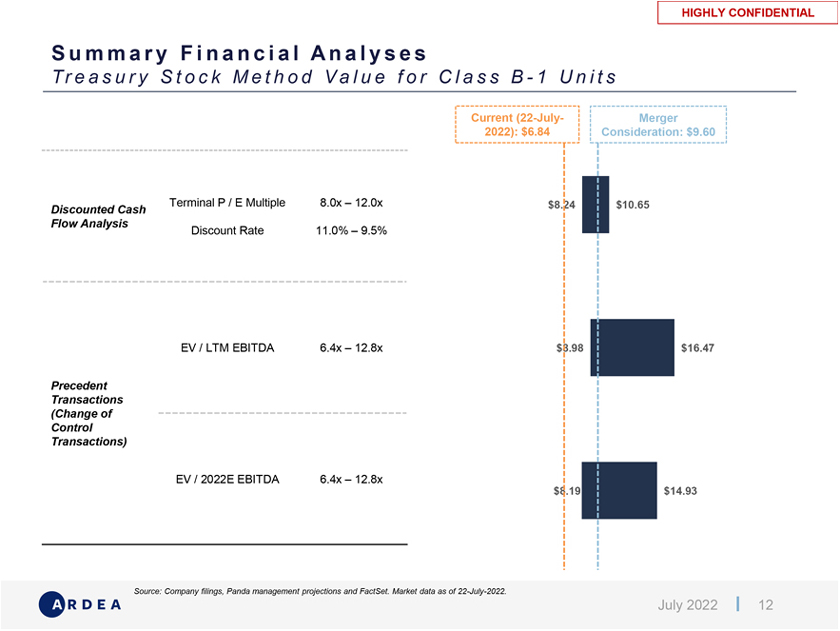
HIGHLY CONFIDENTIAL S u m m a r y F i n a n c i a l A n a l y s e s Tr e a s u r y S t o c k M e t h o d V a l u e f o r C l a s s B—1 U n i t s Current (22-July- Merger 2022): $6.84 Consideration: $9.60 Terminal P / E Multiple 8.0x – 12.0x $8.24 $10.65 Discounted Cash Flow Analysis Discount Rate 11.0% – 9.5% EV / LTM EBITDA 6.4x – 12.8x $8.98 $16.47 Precedent Transactions (Change of Control Transactions) EV / 2022E EBITDA 6.4x – 12.8x $8.19 $14.93 Source: Company filings, Panda management projections and FactSet. Market data as of 22-July-2022. July 2022 12
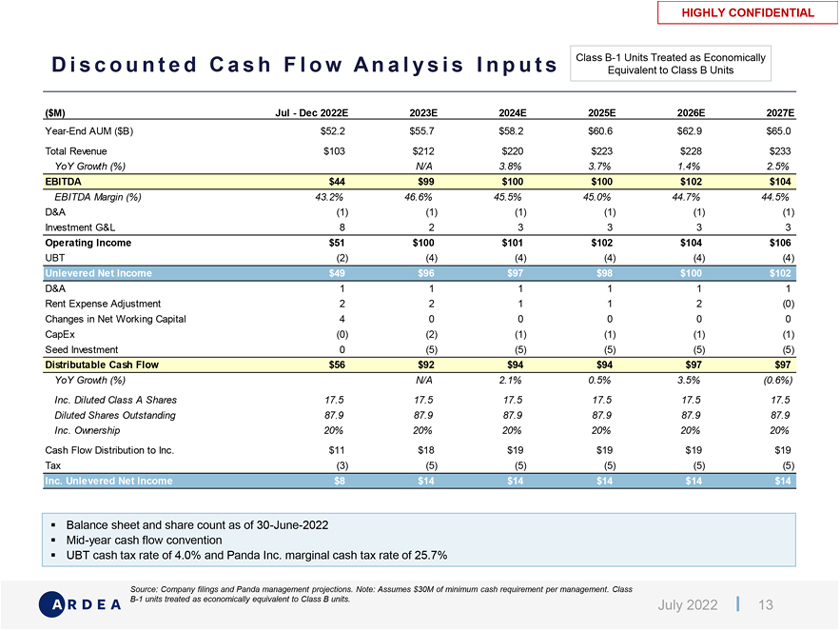
HIGHLY CONFIDENTIAL D i s c o u n t e d C a s h F l o w A n a l y s i s I n p u t s Class B-1 Units Treated as Economically Equivalent to Class B Units ($M) Jul—Dec 2022E 2023E 2024E 2025E 2026E 2027E Year-End AUM ($B) $52.2 $55.7 $58.2 $60.6 $62.9 $65.0 Total Revenue $103 $212 $220 $223 $228 $233 YoY Growth (%) N/A 3.8% 3.7% 1.4% 2.5% EBITDA $44 $99 $100 $100 $102 $104 EBITDA Margin (%) 43.2% 46.6% 45.5% 45.0% 44.7% 44.5% D&A (1) (1) (1) (1) (1) (1) Investment G&L 8 2 3 3 3 3 Operating Income $51 $100 $101 $102 $104 $106 UBT (2) (4) (4) (4) (4) (4) Unlevered Net Income $49 $96 $97 $98 $100 $102 D&A 1 1 1 1 1 1 Rent Expense Adjustment 2 2 1 1 2 (0) Changes in Net Working Capital 4 0 0 0 0 0 CapEx (0) (2) (1) (1) (1) (1) Seed Investment 0 (5) (5) (5) (5) (5) Distributable Cash Flow $56 $92 $94 $94 $97 $97 YoY Growth (%) N/A 2.1% 0.5% 3.5% (0.6%) Inc. Diluted Class A Shares 17.5 17.5 17.5 17.5 17.5 17.5 Diluted Shares Outstanding 87.9 87.9 87.9 87.9 87.9 87.9 Inc. Ownership 20% 20% 20% 20% 20% 20% Cash Flow Distribution to Inc. $11 $18 $19 $19 $19 $19 Tax (3) (5) (5) (5) (5) (5) Inc. Unlevered Net Income $8 $14 $14 $14 $14 $14 â–ª Balance sheet and share count as of 30-June-2022 â–ª Mid-year cash flow convention â–ª UBT cash tax rate of 4.0% and Panda Inc. marginal cash tax rate of 25.7% Source: Company filings and Panda management projections. Note: Assumes $30M of minimum cash requirement per management. Class B-1 units treated as economically equivalent to Class B units. July 2022 13

HIGHLY CONFIDENTIAL D i s c o u n t e d C a s h F l o w A n a l y s i s I n p u t s Treasury Stock Method Value for Class B-1 Units ($M) Jul—Dec 2022E 2023E 2024E 2025E 2026E 2027E Year-End AUM ($B) $52.2 $55.7 $58.2 $60.6 $62.9 $65.0 Total Revenue $103 $212 $220 $223 $228 $233 YoY Growth (%) N/A 3.8% 3.7% 1.4% 2.5% EBITDA $44 $99 $100 $100 $102 $104 EBITDA Margin (%) 43.2% 46.6% 45.5% 45.0% 44.7% 44.5% D&A (1) (1) (1) (1) (1) (1) Investment G&L 8 2 3 3 3 3 Operating Income $51 $100 $101 $102 $104 $106 UBT (2) (4) (4) (4) (4) (4) Unlevered Net Income $49 $96 $97 $98 $100 $102 D&A 1 1 1 1 1 1 Rent Expense Adjustment 2 2 1 1 2 (0) Changes in Net Working Capital 4 0 0 0 0 0 CapEx (0) (2) (1) (1) (1) (1) Seed Investment 0 (5) (5) (5) (5) (5) Distributable Cash Flow $56 $92 $94 $94 $97 $97 YoY Growth (%) N/A 2.1% 0.5% 3.5% (0.6%) Inc. Diluted Class A Shares 17.5 17.5 17.5 17.5 17.5 17.5 Diluted Shares Outstanding 79.7 79.7 79.7 79.7 79.7 79.7 Inc. Ownership 22% 22% 22% 22% 22% 22% Cash Flow Distribution to Inc. $12 $20 $21 $21 $21 $21 Tax (3) (5) (5) (5) (5) (5) Inc. Unlevered Net Income $9 $15 $15 $15 $16 $16 â–ª Balance sheet and share count as of 30-June-2022 â–ª Mid-year cash flow convention â–ª UBT cash tax rate of 4.0% and Panda Inc. marginal cash tax rate of 25.7% Source: Company filings and Panda management projections. Note: Assumes $30M of minimum cash requirement per management. Class B-1 units and options dilution calculated using treasury stock method. July 2022 14
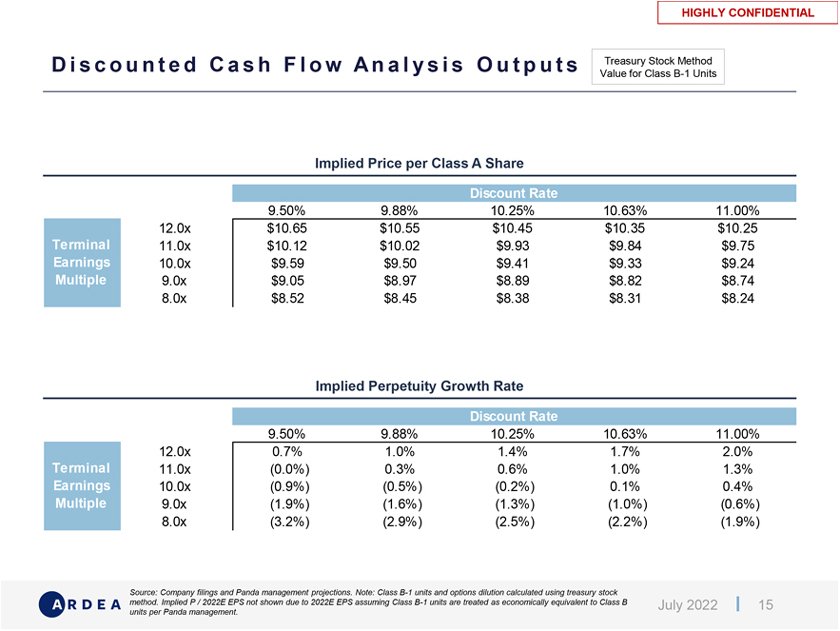
HIGHLY CONFIDENTIAL D i s c o u n t e d C a s h F l o w A n a l y s i s O u t p u t s Treasury Stock Method Value for Class B-1 Units Implied Price per Class A Share Discount Rate $9.4 9.50% 9.88% 10.25% 10.63% 11.00% 12.0x $10.65 $10.55 $10.45 $10.35 $10.25 Terminal 11.0x $10.12 $10.02 $9.93 $9.84 $9.75 Earnings 10.0x $9.59 $9.50 $9.41 $9.33 $9.24 Multiple 9.0x $9.05 $8.97 $8.89 $8.82 $8.74 8.0x $8.52 $8.45 $8.38 $8.31 $8.24 Implied Perpetuity Growth Rate Discount Rate ($0.0) 9.50% 9.88% 10.25% 10.63% 11.00% 12.0x 0.7% 1.0% 1.4% 1.7% 2.0% Terminal 11.0x (0.0%) 0.3% 0.6% 1.0% 1.3% Earnings 10.0x (0.9%) (0.5%) (0.2%) 0.1% 0.4% Multiple 9.0x (1.9%) (1.6%) (1.3%) (1.0%) (0.6%) 8.0x (3.2%) (2.9%) (2.5%) (2.2%) (1.9%) Source: Company filings and Panda management projections. Note: Class B-1 units and options dilution calculated using treasury stock method. Implied P / 2022E EPS not shown due to 2022E EPS assuming Class B-1 units are treated as economically equivalent to Class B July 2022 15 units per Panda management.
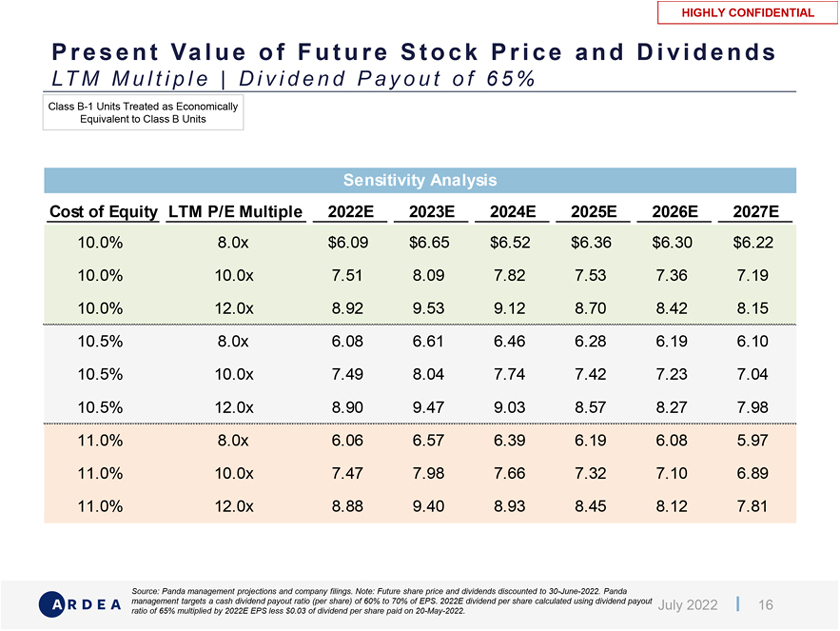
HIGHLY CONFIDENTIAL P r e s e n t Va l u e o f F u t u r e S t o c k P r i c e a n d D i v i d e n d s LT M M u l t i p l e | D i v i d e n d P a y o u t o f 6 5 % Class B-1 Units Treated as Economically Equivalent to Class B Units Sensitivity Analysis Cost of Equity LTM P/E Multiple 2022E 2023E 2024E 2025E 2026E 2027E 10.0% 8.0x $6.09 $6.65 $6.52 $6.36 $6.30 $6.22 10.0% 10.0x 7.51 8.09 7.82 7.53 7.36 7.19 10.0% 12.0x 8.92 9.53 9.12 8.70 8.42 8.15 10.5% 8.0x 6.08 6.61 6.46 6.28 6.19 6.10 10.5% 10.0x 7.49 8.04 7.74 7.42 7.23 7.04 10.5% 12.0x 8.90 9.47 9.03 8.57 8.27 7.98 11.0% 8.0x 6.06 6.57 6.39 6.19 6.08 5.97 11.0% 10.0x 7.47 7.98 7.66 7.32 7.10 6.89 11.0% 12.0x 8.88 9.40 8.93 8.45 8.12 7.81 Source: Panda management projections and company filings. Note: Future share price and dividends discounted to 30-June-2022. Panda management targets a cash dividend payout ratio (per share) of 60% to 70% of EPS. 2022E dividend per share calculated using dividend payout July 2022 16 ratio of 65% multiplied by 2022E EPS less $0.03 of dividend per share paid on 20-May-2022.
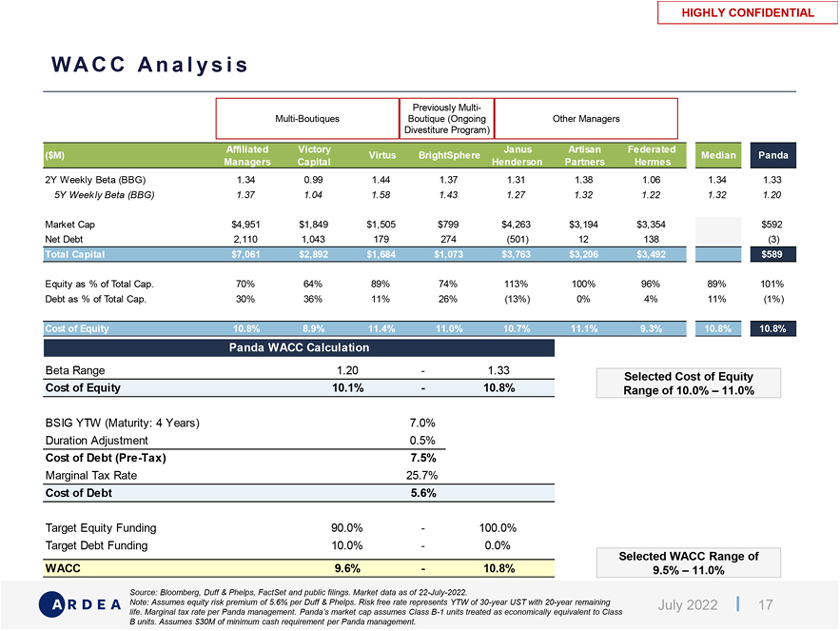
HIGHLY CONFIDENTIAL WA C C A n a l y s i s Previously Multi- Multi-Boutiques Boutique (Ongoing Other Managers Divestiture Program) Affiliated Victory Janus Artisan Federated ($M) Virtus BrightSphere Median Panda Managers Capital Henderson Partners Hermes 2Y Weekly Beta (BBG) 1.34 0.99 1.44 1.37 1.31 1.38 1.06 1.34 1.33 5Y Week ly Beta (BBG) 1.37 1.04 1.58 1.43 1.27 1.32 1.22 1.32 1.20 Market Cap $4,951 $1,849 $1,505 $799 $4,263 $3,194 $3,354 $592 Net Debt 2,110 1,043 179 274 (501) 12 138 (3) Total Capital $7,061 $2,892 $1,684 $1,073 $3,763 $3,206 $3,492 $589 Equity as % of Total Cap. 70% 64% 89% 74% 113% 100% 96% 89% 101% Debt as % of Total Cap. 30% 36% 11% 26% (13%) 0% 4% 11% (1%) Cost of Equity 10.8% 8.9% 11.4% 11.0% 10.7% 11.1% 9.3% 10.8% 10.8% Panda WACC Calculation Beta Range 1.20—1.33 Selected Cost of Equity Cost of Equity 10.1%—10.8% Range of 10.0% – 11.0% BSIG YTW (Maturity: 4 Years) 7.0% Duration Adjustment 0.5% Cost of Debt (Pre-Tax) 7.5% Marginal Tax Rate 25.7% Cost of Debt 5.6% Target Equity Funding 90.0%—100.0% Target Debt Funding 10.0%—0.0% Selected WACC Range of WACC 9.6%—10.8% 9.5% – 11.0% Source: Bloomberg, Duff & Phelps, FactSet and public filings. Market data as of 22-July-2022. Note: Assumes equity risk premium of 5.6% per Duff & Phelps. Risk free rate represents YTW of 30-year UST with 20-year remaining July 2022 17 life. Marginal tax rate per Panda management. Panda’s market cap assumes Class B-1 units treated as economically equivalent to Class B units. Assumes $30M of minimum cash requirement per Panda management.

HIGHLY CONFIDENTIAL C o s t o f D e b t – S e l e c t e d P e e r s Duration Spread vs. Bond Adjustment Treasury Treasury 20-Year Adjusted Debt / Rating Maturity YTW to 20-Year Maturity Yield (YTW) Treasury¹ Cost of Debt Capital Janus Henderson JHG 4 7⁄8 08/01/25 Corp BBB 01-Aug-2025 4.34% 17.0 16.8 2.95% 0.40% 4.74% (13.3%) AMG AMG 3.3 06/15/30 Corp BBB+ 15-Jun-2030 4.50% 12.1 13.6 2.70% 0.64% 5.14% 29.9% AMG 4 1⁄4 02/15/24 Corp BBB+ 15-Feb-2024 3.75% 18.4 18.3 3.27% 0.07% 3.81% 29.9% AMG 3 1⁄2 08/01/25 Corp BBB+ 01-Aug-2025 3.55% 17.0 16.8 2.95% 0.40% 3.95% 29.9% APAM APAM 4.53 08/16/27 Corp NR 16-Aug-2027 9.80% 14.9 14.8 2.79% 0.55% 10.35% 0.4% APAM 5.82 08/16/22 Corp NR 16-Aug-2022 1.02% 19.9 19.8 3.26% 0.09% 1.11% 0.4% APAM 4.29 08/16/25 Corp NR 16-Aug-2025 6.18% 16.9 16.8 2.95% 0.40% 6.57% 0.4% BSIG BSIG 4.8 07/27/26 Corp BB+ 27-Jul-2026 6.97% 16.0 15.8 2.84% 0.51% 7.48% 25.6% Median 4.42% 4.94% Average 5.01% 5.39% Source: Bloomberg, FactSet and public filings. Market data as of 22-July-2022. ¹ vs. YTW of 30-year UST with 20-year remaining life of 3.34%. July 2022 18
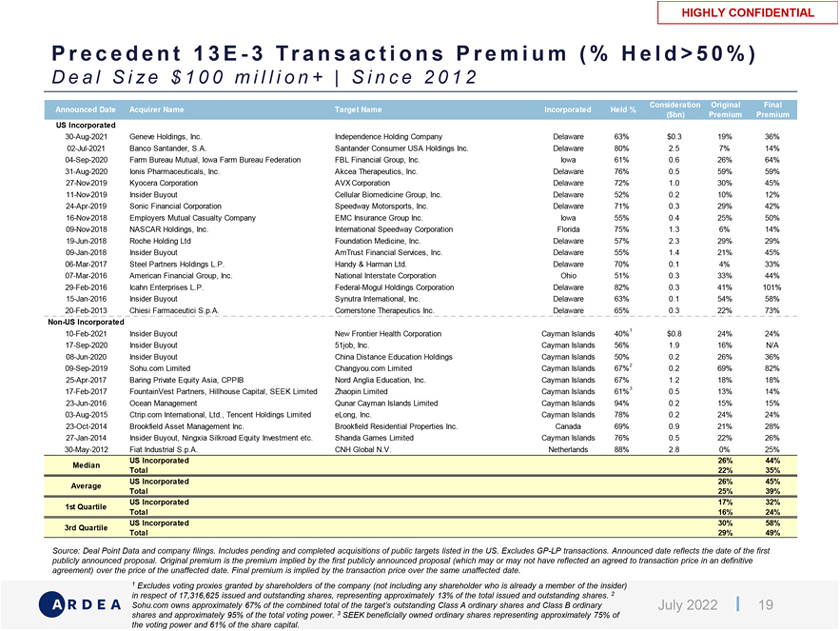
HIGHLY CONFIDENTIAL P r e c e d e n t 1 3 E—3 Tr a n s a c t i o n s P r e m i u m ( % H e l d > 5 0 % ) D e a l S i z e $ 1 0 0 m i l l i o n + | S i n c e 2 0 1 2 Consideration Original Final Announced Date Acquirer Name Target Name Incorporated Held % ($bn) Premium Premium US Incorporated 30-Aug-2021 Geneve Holdings, Inc. Independence Holding Company Delaware 63% $0.3 19% 36% 02-Jul-2021 Banco Santander, S.A. Santander Consumer USA Holdings Inc. Delaware 80% 2.5 7% 14% 04-Sep-2020 Farm Bureau Mutual, Iowa Farm Bureau Federation FBL Financial Group, Inc. Iowa 61% 0.6 26% 64% 31-Aug-2020 Ionis Pharmaceuticals, Inc. Akcea Therapeutics, Inc. Delaware 76% 0.5 59% 59% 27-Nov-2019 Kyocera Corporation AVX Corporation Delaware 72% 1.0 30% 45% 11-Nov-2019 Insider Buyout Cellular Biomedicine Group, Inc. Delaware 52% 0.2 10% 12% 24-Apr-2019 Sonic Financial Corporation Speedway Motorsports, Inc. Delaware 71% 0.3 29% 42% 16-Nov-2018 Employers Mutual Casualty Company EMC Insurance Group Inc. Iowa 55% 0.4 25% 50% 09-Nov-2018 NASCAR Holdings, Inc. International Speedway Corporation Florida 75% 1.3 6% 14% 19-Jun-2018 Roche Holding Ltd Foundation Medicine, Inc. Delaware 57% 2.3 29% 29% 09-Jan-2018 Insider Buyout AmTrust Financial Services, Inc. Delaware 55% 1.4 21% 45% 06-Mar-2017 Steel Partners Holdings L.P. Handy & Harman Ltd. Delaware 70% 0.1 4% 33% 07-Mar-2016 American Financial Group, Inc. National Interstate Corporation Ohio 51% 0.3 33% 44% 29-Feb-2016 Icahn Enterprises L.P. Federal-Mogul Holdings Corporation Delaware 82% 0.3 41% 101% 15-Jan-2016 Insider Buyout Synutra International, Inc. Delaware 63% 0.1 54% 58% 20-Feb-2013 Chiesi Farmaceutici S.p.A. Cornerstone Therapeutics Inc. Delaware 65% 0.3 22% 73% Non-US Incorporated 10-Feb-2021 Insider Buyout New Frontier Health Corporation Cayman Islands 40%1 $0.8 24% 24% 17-Sep-2020 Insider Buyout 51job, Inc. Cayman Islands 56% 1.9 16% N/A 08-Jun-2020 Insider Buyout China Distance Education Holdings Cayman Islands 50% 0.2 26% 36% 09-Sep-2019 Sohu.com Limited Changyou.com Limited Cayman Islands 67%2 0.2 69% 82% 25-Apr-2017 Baring Private Equity Asia, CPPIB Nord Anglia Education, Inc. Cayman Islands 67% 1.2 18% 18% 17-Feb-2017 FountainVest Partners, Hillhouse Capital, SEEK Limited Zhaopin Limited Cayman Islands 61%3 0.5 13% 14% 23-Jun-2016 Ocean Management Qunar Cayman Islands Limited Cayman Islands 94% 0.2 15% 15% 03-Aug-2015 Ctrip.com International, Ltd., Tencent Holdings Limited eLong, Inc. Cayman Islands 78% 0.2 24% 24% 23-Oct-2014 Brookfield Asset Management Inc. Brookfield Residential Properties Inc. Canada 69% 0.9 21% 28% 27-Jan-2014 Insider Buyout, Ningxia Silkroad Equity Investment etc. Shanda Games Limited Cayman Islands 76% 0.5 22% 26% 30-May-2012 Fiat Industrial S.p.A. CNH Global N.V. Netherlands 88% 2.8 0% 25% US Incorporated 26% 44% Median Total 22% 35% US Incorporated 26% 45% Average Total 25% 39% US Incorporated 17% 32% 1st Quartile Total 16% 24% US Incorporated 30% 58% 3rd Quartile Total 29% 49% Source: Deal Point Data and company filings. Includes pending and completed acquisitions of public targets listed in the US. Excludes GP-LP transactions. Announced date reflects the date of the first publicly announced proposal. Original premium is the premium implied by the first publicly announced proposal (which may or may not have reflected an agreed to transaction price in an definitive agreement) over the price of the unaffected date. Final premium is implied by the transaction price over the same unaffected date. 1 Excludes voting proxies granted by shareholders of the company (not including any shareholder who is already a member of the insider) in respect of 17,316,625 issued and outstanding shares, representing approximately 13% of the total issued and outstanding shares. 2 Sohu.com owns approximately 67% of the combined total of the target’s outstanding Class A ordinary shares and Class B ordinary July 2022 19 shares and approximately 95% of the total voting power. 3 SEEK beneficially owned ordinary shares representing approximately 75% of the voting power and 61% of the share capital.

HIGHLY CONFIDENTIAL P / LT M E P S O v e r T i m e S e l e c t e d Tr a d i t i o n a l A s s e t M a n a g e r s | L a s t 3 Y e a r s Average 3-Year 1-Year YTD 45.0x Panda EPS Panda (GAAP EPS) 15.3x 9.7x 8.1x GAAP Adjusted Panda (Adjusted EPS) 11.5x 9.7x 8.1x Q1 2018 $0.20 $0.20 Q2 2018 0.20 0.20 Selected Comparables¹ 12.1x 10.1x 9.1x 40.0x Q3 2018 0.22 0.22 Q4 2018 0.15 0.16 â–ª Quarterly GAAP EPS declined to ($0.08) per share in Q4 2019 Q1 2019 0.17 0.17 • Decline was mainly due to one-time compensation relating 35.0x Q2 2019 0.18 0.18 to the one-time issuance of certain unit-based and other Q3 2019 0.19 0.19 awards to a number of the firm’s key contributors pursuant Q4 2019 (0.08) 0.20 to the terms of equity incentive plans in addition to costs Q1 2020 0.00 0.00 related to certain employee departures 30.0x Q2 2020 0.13 0.13 Q3 2020 0.16 0.16 Q4 2020 0.22 0.22 25.0x Q1 2021 0.24 0.24 Q2 2021 0.25 0.25 Q3 2021 0.27 0.27 Q4 2021 0.24 0.24 20.0x Q1 2022 0.16 0.16 15.0x 10.0x 7.8x 7.4x 5.0x 7.4x 0.0x Jul-19 Jan-20 Jul-20 Jan-21 Jul-21 Jan-22 Jul-22 Panda (GAAP EPS) Panda (Adjusted EPS) Selected Comparables¹ Source: FactSet and company filings. Market data as of 22-July-2022. Note: selected comparables represent median P / LTM EPS per FactSet. Panda adjusted EPS per filings (there was no adjustment made to GAAP earnings except for Q4 2018 and Q4 2019). July 2022 20 ¹ Selected Comparables include AMG, JHG, FHI, APAM, BSIG, VCTR and VRTS.
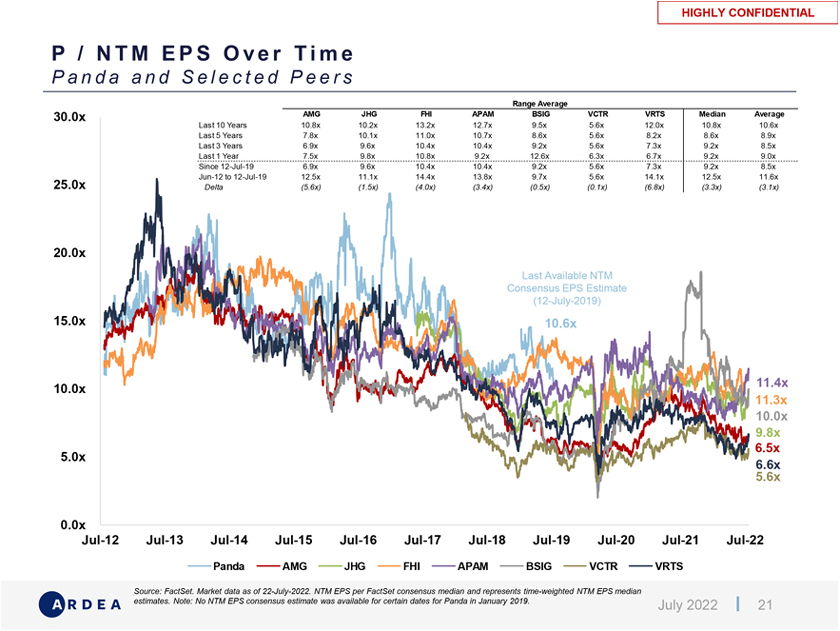
HIGHLY CONFIDENTIAL P / N T M E P S O v e r T i m e P a n d a a n d S e l e c t e d P e e r s Range Average 30.0x AMG JHG FHI APAM BSIG VCTR VRTS Median Average Last 10 Years 10.8x 10.2x 13.2x 12.7x 9.5x 5.6x 12.0x 10.8x 10.6x Last 5 Years 7.8x 10.1x 11.0x 10.7x 8.6x 5.6x 8.2x 8.6x 8.9x Last 3 Years 6.9x 9.6x 10.4x 10.4x 9.2x 5.6x 7.3x 9.2x 8.5x Last 1 Year 7.5x 9.8x 10.8x 9.2x 12.6x 6.3x 6.7x 9.2x 9.0x Since 12-Jul-19 6.9x 9.6x 10.4x 10.4x 9.2x 5.6x 7.3x 9.2x 8.5x Jun-12 to 12-Jul-19 12.5x 11.1x 14.4x 13.8x 9.7x 5.6x 14.1x 12.5x 11.6x 25.0x Delta (5.6x) (1.5x) (4.0x) (3.4x) (0.5x) (0.1x) (6.8x) (3.3x) (3.1x) 20.0x Last Available NTM Consensus EPS Estimate (12-July-2019) 15.0x 10.6x 11.4x 10.0x 11.3x 10.0x 9.8x 6.5x 5.0x 6.6x 5.6x 0.0x Jul-12 Jul-13 Jul-14 Jul-15 Jul-16 Jul-17 Jul-18 Jul-19 Jul-20 Jul-21 Jul-22 Panda AMG JHG FHI APAM BSIG VCTR VRTS Source: FactSet. Market data as of 22-July-2022. NTM EPS per FactSet consensus median and represents time-weighted NTM EPS median estimates. Note: No NTM EPS consensus estimate was available for certain dates for Panda in January 2019. July 2022 21
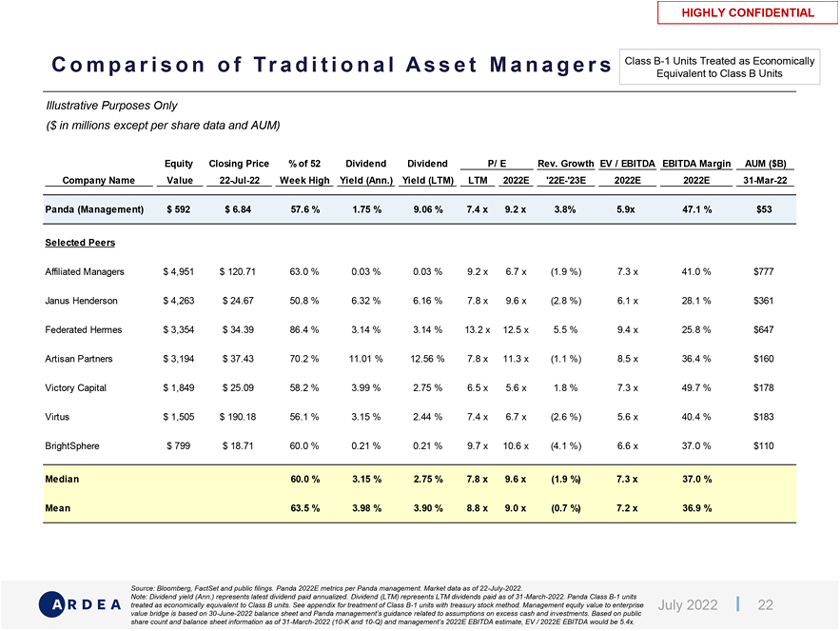
HIGHLY CONFIDENTIAL C o m p a r i s o n o f Tr a d i t i o n a l A s s e t M a n a g e r s Class B-1 Units Treated as Economically Equivalent to Class B Units Illustrative Purposes Only ($ in millions except per share data and AUM) Equity Closing Price % of 52 Dividend Dividend P/ E Rev. Growth EV / EBITDA EBITDA Margin AUM ($B) Company Name Value 22-Jul-22 Week High Yield (Ann.) Yield (LTM) LTM 2022E ‘22E-‘23E 2022E 2022E 31-Mar-22 Panda (Management) $ 592 $ 6.84 57.6 % 1.75 % 9.06 % 7.4 x 9.2 x 3.8% 5.9x 47.1 % $53 Selected Peers Affiliated Managers $ 4,951 $ 120.71 63.0 % 0.03 % 0.03 % 9.2 x 6.7 x (1.9 %) 7.3 x 41.0 % $777 Janus Henderson $ 4,263 $ 24.67 50.8 % 6.32 % 6.16 % 7.8 x 9.6 x (2.8 %) 6.1 x 28.1 % $361 Federated Hermes $ 3,354 $ 34.39 86.4 % 3.14 % 3.14 % 13.2 x 12.5 x 5.5 % 9.4 x 25.8 % $647 Artisan Partners $ 3,194 $ 37.43 70.2 % 11.01 % 12.56 % 7.8 x 11.3 x (1.1 %) 8.5 x 36.4 % $160 Victory Capital $ 1,849 $ 25.09 58.2 % 3.99 % 2.75 % 6.5 x 5.6 x 1.8 % 7.3 x 49.7 % $178 Virtus $ 1,505 $ 190.18 56.1 % 3.15 % 2.44 % 7.4 x 6.7 x (2.6 %) 5.6 x 40.4 % $183 BrightSphere $ 799 $ 18.71 60.0 % 0.21 % 0.21 % 9.7 x 10.6 x (4.1 %) 6.6 x 37.0 % $110 Median 60.0 % 3.15 % 2.75 % 7.8 x 9.6 x (1.9 %) 7.3 x 37.0 % Mean 63.5 % 3.98 % 3.90 % 8.8 x 9.0 x (0.7 %) 7.2 x 36.9 % Source: Bloomberg, FactSet and public filings. Panda 2022E metrics per Panda management. Market data as of 22-July-2022. Note: Dividend yield (Ann.) represents latest dividend paid annualized. Dividend (LTM) represents LTM dividends paid as of 31-March-2022. Panda Class B-1 units treated as economically equivalent to Class B units. See appendix for treatment of Class B-1 units with treasury stock method. Management equity value to enterprise July 2022 22 value bridge is based on 30-June-2022 balance sheet and Panda management’s guidance related to assumptions on excess cash and investments. Based on public share count and balance sheet information as of 31-March-2022 (10-K and 10-Q) and management’s 2022E EBITDA estimate, EV / 2022E EBITDA would be 5.4x.
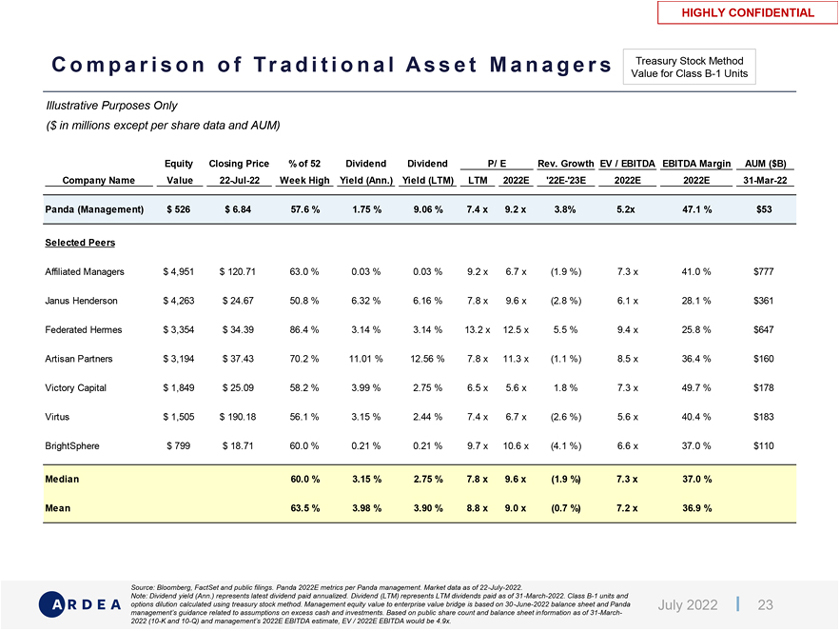
HIGHLY CONFIDENTIAL C o m p a r i s o n o f Tr a d i t i o n a l A s s e t M a n a g e r s Treasury Stock Method Value for Class B-1 Units Illustrative Purposes Only ($ in millions except per share data and AUM) Equity Closing Price % of 52 Dividend Dividend P/ E Rev. Growth EV / EBITDA EBITDA Margin AUM ($B) Company Name Value 22-Jul-22 Week High Yield (Ann.) Yield (LTM) LTM 2022E ‘22E-‘23E 2022E 2022E 31-Mar-22 Panda (Management) $ 526 $ 6.84 57.6 % 1.75 % 9.06 % 7.4 x 9.2 x 3.8% 5.2x 47.1 % $53 Selected Peers Affiliated Managers $ 4,951 $ 120.71 63.0 % 0.03 % 0.03 % 9.2 x 6.7 x (1.9 %) 7.3 x 41.0 % $777 Janus Henderson $ 4,263 $ 24.67 50.8 % 6.32 % 6.16 % 7.8 x 9.6 x (2.8 %) 6.1 x 28.1 % $361 Federated Hermes $ 3,354 $ 34.39 86.4 % 3.14 % 3.14 % 13.2 x 12.5 x 5.5 % 9.4 x 25.8 % $647 Artisan Partners $ 3,194 $ 37.43 70.2 % 11.01 % 12.56 % 7.8 x 11.3 x (1.1 %) 8.5 x 36.4 % $160 Victory Capital $ 1,849 $ 25.09 58.2 % 3.99 % 2.75 % 6.5 x 5.6 x 1.8 % 7.3 x 49.7 % $178 Virtus $ 1,505 $ 190.18 56.1 % 3.15 % 2.44 % 7.4 x 6.7 x (2.6 %) 5.6 x 40.4 % $183 BrightSphere $ 799 $ 18.71 60.0 % 0.21 % 0.21 % 9.7 x 10.6 x (4.1 %) 6.6 x 37.0 % $110 Median 60.0 % 3.15 % 2.75 % 7.8 x 9.6 x (1.9 %) 7.3 x 37.0 % Mean 63.5 % 3.98 % 3.90 % 8.8 x 9.0 x (0.7 %) 7.2 x 36.9 % Source: Bloomberg, FactSet and public filings. Panda 2022E metrics per Panda management. Market data as of 22-July-2022. Note: Dividend yield (Ann.) represents latest dividend paid annualized. Dividend (LTM) represents LTM dividends paid as of 31-March-2022. Class B-1 units and options dilution calculated using treasury stock method. Management equity value to enterprise value bridge is based on 30-June-2022 balance sheet and Panda July 2022 23 management’s guidance related to assumptions on excess cash and investments. Based on public share count and balance sheet information as of 31-March-2022 (10-K and 10-Q) and management’s 2022E EBITDA estimate, EV / 2022E EBITDA would be 4.9x.
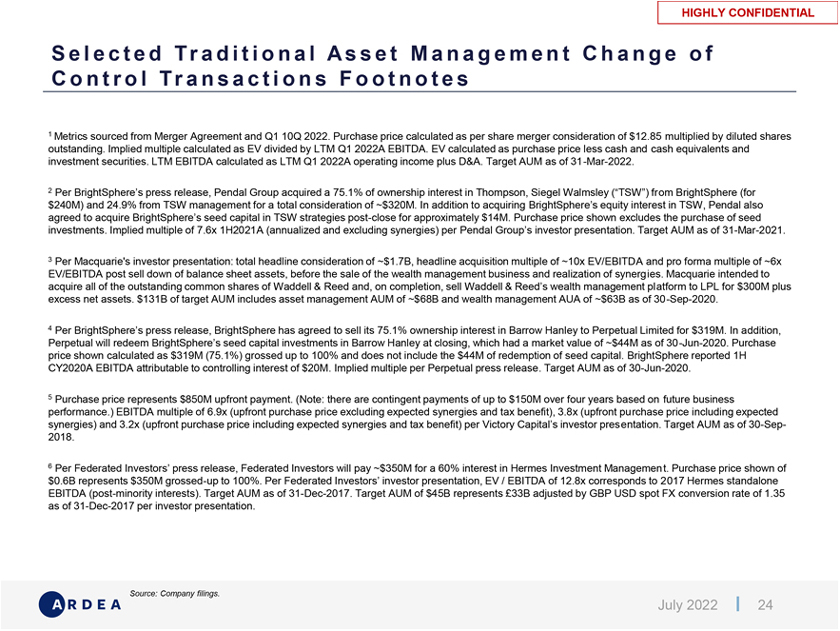
HIGHLY CONFIDENTIAL S e l e c t e d Tr a d i t i o n a l A s s e t M a n a g e m e n t C h a n g e o f C o n t r o l Tr a n s a c t i o n s F o o t n o t e s 1 Metrics sourced from Merger Agreement and Q1 10Q 2022. Purchase price calculated as per share merger consideration of $12.85 multiplied by diluted shares outstanding. Implied multiple calculated as EV divided by LTM Q1 2022A EBITDA. EV calculated as purchase price less cash and cash equivalents and investment securities. LTM EBITDA calculated as LTM Q1 2022A operating income plus D&A. Target AUM as of 31-Mar-2022. 2 Per BrightSphere’s press release, Pendal Group acquired a 75.1% of ownership interest in Thompson, Siegel Walmsley (“TSW”) from BrightSphere (for $240M) and 24.9% from TSW management for a total consideration of ~$320M. In addition to acquiring BrightSphere’s equity interest in TSW, Pendal also agreed to acquire BrightSphere’s seed capital in TSW strategies post-close for approximately $14M. Purchase price shown excludes the purchase of seed investments. Implied multiple of 7.6x 1H2021A (annualized and excluding synergies) per Pendal Group’s investor presentation. Target AUM as of 31-Mar-2021. 3 Per Macquarie’s investor presentation: total headline consideration of ~$1.7B, headline acquisition multiple of ~10x EV/EBITDA and pro forma multiple of ~6x EV/EBITDA post sell down of balance sheet assets, before the sale of the wealth management business and realization of synergies. Macquarie intended to acquire all of the outstanding common shares of Waddell & Reed and, on completion, sell Waddell & Reed’s wealth management platform to LPL for $300M plus excess net assets. $131B of target AUM includes asset management AUM of ~$68B and wealth management AUA of ~$63B as of 30-Sep-2020. 4 Per BrightSphere’s press release, BrightSphere has agreed to sell its 75.1% ownership interest in Barrow Hanley to Perpetual Limited for $319M. In addition, Perpetual will redeem BrightSphere’s seed capital investments in Barrow Hanley at closing, which had a market value of ~$44M as of 30-Jun-2020. Purchase price shown calculated as $319M (75.1%) grossed up to 100% and does not include the $44M of redemption of seed capital. BrightSphere reported 1H CY2020A EBITDA attributable to controlling interest of $20M. Implied multiple per Perpetual press release. Target AUM as of 30-Jun-2020. 5 Purchase price represents $850M upfront payment. (Note: there are contingent payments of up to $150M over four years based on future business performance.) EBITDA multiple of 6.9x (upfront purchase price excluding expected synergies and tax benefit), 3.8x (upfront purchase price including expected synergies) and 3.2x (upfront purchase price including expected synergies and tax benefit) per Victory Capital’s investor presentation. Target AUM as of 30-Sep-2018. 6 Per Federated Investors’ press release, Federated Investors will pay ~$350M for a 60% interest in Hermes Investment Management. Purchase price shown of $0.6B represents $350M grossed-up to 100%. Per Federated Investors’ investor presentation, EV / EBITDA of 12.8x corresponds to 2017 Hermes standalone EBITDA (post-minority interests). Target AUM as of 31-Dec-2017. Target AUM of $45B represents Ł33B adjusted by GBP USD spot FX conversion rate of 1.35 as of 31-Dec-2017 per investor presentation. Source: Company filings. July 2022 24

D I S C L A I M E R Ardea Partners LP (“Ardea”) has prepared and provided these materials and Ardea’s related oral presentation (collectively, the “Confidential Information”) solely for the information and assistance of the Special Committee of the Board of Directors of Panda (the “Company”) in connection with their consideration of the matters referred to herein. Without Ardea’s prior written consent, the Confidential Information, and Ardea’s preparation and provision of such Confidential Information, may not be used for any other purpose or disclosed or otherwise referred to in any manner. The Confidential Information is (a) for discussion purposes only and (b) speaks only as of the date it is given, reflecting prevailing economic, monetary, market and other conditions as in effect on, and the information made available to Ardea as of, such date. Ardea assumes no responsibility for updating or revising the Confidential Information. The views expressed herein are subject to change based upon a number of factors, including economic, monetary, market and other conditions and the Company’s and any prospective counterparty’s business and prospects. Analyses based upon forecasts of future results are not necessarily indicative of actual future results, which may be significantly more or less favorable than suggested by these analyses, and Ardea does not assume responsibility if future results are materially different from those forecast. The Confidential Information is incomplete without reference to, and should be viewed solely in conjunction with, the oral briefing provided by Ardea, if any. The Confidential Information has been prepared using publicly available information and information in reports, due diligence materials, forecasts, projections and other materials provided by or on behalf of the Company and/or any prospective counterparty. Ardea does not assume responsibility for and has relied on, without independent verification, the accuracy and completeness of such information. Ardea has not, and does not, provide advice for tax, legal, regulatory or accounting matters and the Company will remain solely responsible for all aspects of due diligence in connection with the Transaction and the commercial assumptions on which any advice provided by Ardea is based. The Confidential Information does not address the underlying business decision of the Company to engage in any transaction or the relative merits of any strategic alternatives referred to herein as compared to any other alternative that may be available to the Company. Ardea and its affiliates and/or their respective employees, as well as investment funds in which any of them may have a financial interest, may at any time, directly or indirectly, hold long or short positions and may trade or otherwise effect transactions for their own accounts or the accounts of customers, in debt or equity securities, senior loans and/or derivative products relating to the Company or its affiliates, potential parties to a Transaction and their affiliates or persons that are competitors, customers or suppliers of the Company. Nothing herein or any previous or existing relationship between the Company and Ardea will be deemed to create a fiduciary duty or fiduciary or agency relationship between Ardea and the Company, its security holders, affiliates, employees or creditors. July 2022 25

PRELIMINARY BACKGROUND MATERIALS Honesty | Integrity | Performance Exhibit (c)(5) Project Panda Presentation to the Special Committee of the Board of Directors 6 July 2022 www.castleoaklp.com
PRELIMINARY BACKGROUND MATERIALS Table of Contents Preliminary Valuation Summary p. 2 Preliminary DCF Analysis p. 5 Selected Public Market Comparisons p. 11 Selected Private Market Transactions p. 16 Appendix p. 19 1

Honesty | Integrity | Performance Preliminary Valuation Summary www.castleoaklp.com 2 2
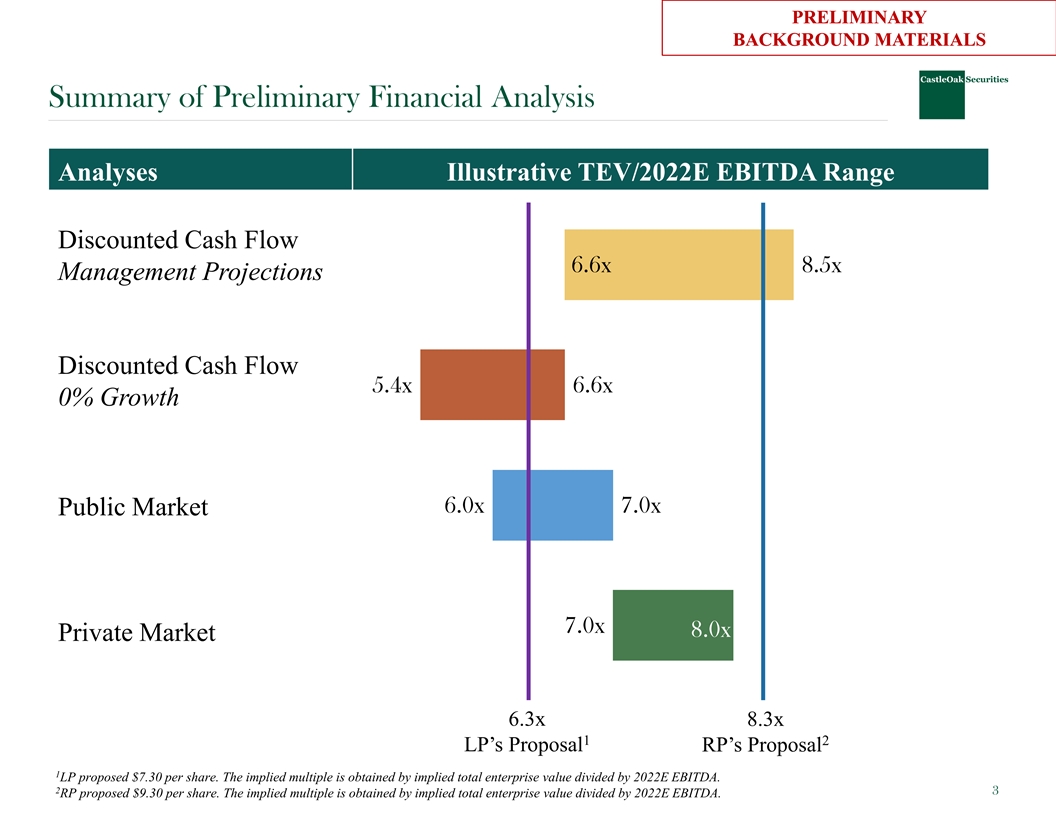
P PR RELI ELIM MI IN NA AR RY Y BA BAC CKGR KGROU OUN ND D M MA ATER TERI IA ALS LS Summary of Preliminary Financial Analysis Analyses Illustrative TEV/2022E EBITDA Range Discounted Cash Flow 6.6x 8.5x Management Projections Discounted Cash Flow 5.4x 6.6x 0% Growth 6.0x 7.0x Public Market 7.0x 8.0x Private Market 6.3x 8.3x 1 2 LP’s Proposal RP’s Proposal 1 LP proposed $7.30 per share. The implied multiple is obtained by implied total enterprise value divided by 2022E EBITDA. 2 3 RP proposed $9.30 per share. The implied multiple is obtained by implied total enterprise value divided by 2022E EBITDA.
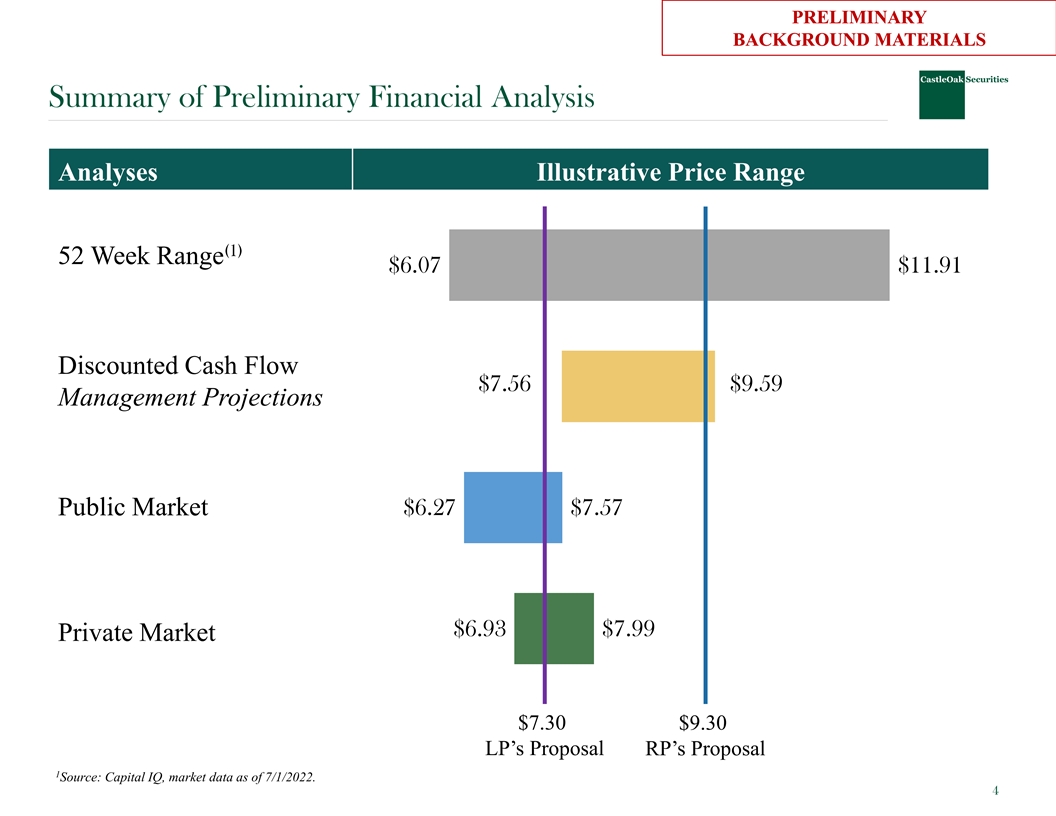
P PR RELI ELIM MI IN NA AR RY Y BA BAC CKGR KGROU OUN ND D M MA ATER TERI IA ALS LS Summary of Preliminary Financial Analysis Analyses Illustrative Price Range (1) 52 Week Range $6.07 $11.91 Discounted Cash Flow $7.56 $9.59 Management Projections $6.27 $7.57 Public Market $6.93 $7.99 Private Market $7.30 $9.30 LP’s Proposal RP’s Proposal 1 Source: Capital IQ, market data as of 7/1/2022. 4
Honesty | Integrity | Performance Preliminary DCF Analysis www.castleoaklp.com 5 5
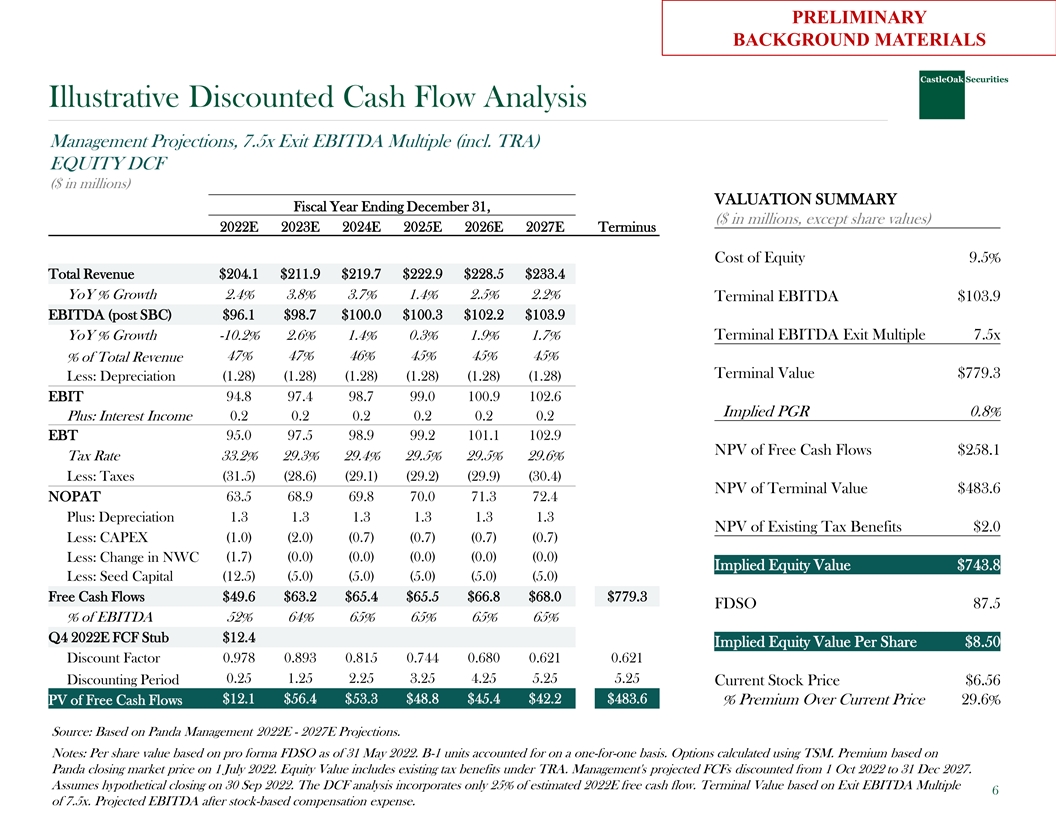
PRELIMINARY BACKGROUND MATERIALS Illustrative Discounted Cash Flow Analysis Management Projections, 7.5x Exit EBITDA Multiple (incl. TRA) EQUITY DCF ($ in millions) VALUATION SUMMARY Fiscal Year Ending December 31, ($ in millions, except share values) 2022E 2023E 2024E 2025E 2026E 2027E Terminus Cost of Equity 9.5% Total Revenue $204.1 $211.9 $219.7 $222.9 $228.5 $233.4 YoY % Growth 2.4% 3.8% 3.7% 1.4% 2.5% 2.2% Terminal EBITDA $103.9 EBITDA (post SBC) $96.1 $98.7 $100.0 $100.3 $102.2 $103.9 YoY % Growth -10.2% 2.6% 1.4% 0.3% 1.9% 1.7% Terminal EBITDA Exit Multiple 7.5x 47% 47% 46% 45% 45% 45% % of Total Revenue Terminal Value $779.3 Less: Depreciation (1.28) (1.28) (1.28) (1.28) (1.28) (1.28) EBIT 94.8 97.4 98.7 99.0 100.9 102.6 Implied PGR 0.8% Plus: Interest Income 0.2 0.2 0.2 0.2 0.2 0.2 EBT 95.0 97.5 98.9 99.2 101.1 102.9 NPV of Free Cash Flows $258.1 Tax Rate 33.2% 29.3% 29.4% 29.5% 29.5% 29.6% Less: Taxes (31.5) (28.6) (29.1) (29.2) (29.9) (30.4) NPV of Terminal Value $483.6 NOPAT 63.5 68.9 69.8 70.0 71.3 72.4 Plus: Depreciation 1.3 1.3 1.3 1.3 1.3 1.3 NPV of Existing Tax Benefits $2.0 Less: CAPEX (1.0) (2.0) (0.7) (0.7) (0.7) (0.7) (1.7) (0.0) (0.0) (0.0) (0.0) (0.0) Less: Change in NWC Implied Equity Value $743.8 Less: Seed Capital (12.5) (5.0) (5.0) (5.0) (5.0) (5.0) Free Cash Flows $49.6 $63.2 $65.4 $65.5 $66.8 $68.0 $779.3 FDSO 87.5 % of EBITDA 52% 64% 65% 65% 65% 65% Q4 2022E FCF Stub $12.4 Implied Equity Value Per Share $8.50 Discount Factor 0.978 0.893 0.815 0.744 0.680 0.621 0.621 0.25 1.25 2.25 3.25 4.25 5.25 5.25 Discounting Period Current Stock Price $6.56 $12.1 $56.4 $53.3 $48.8 $45.4 $42.2 $483.6 PV of Free Cash Flows % Premium Over Current Price 29.6% Source: Based on Panda Management 2022E - 2027E Projections. Notes: Per share value based on pro forma FDSO as of 31 May 2022. B-1 units accounted for on a one-for-one basis. Options calculated using TSM. Premium based on Panda closing market price on 1 July 2022. Equity Value includes existing tax benefits under TRA. Management's projected FCFs discounted from 1 Oct 2022 to 31 Dec 2027. Assumes hypothetical closing on 30 Sep 2022. The DCF analysis incorporates only 25% of estimated 2022E free cash flow. Terminal Value based on Exit EBITDA Multiple 6 of 7.5x. Projected EBITDA after stock-based compensation expense.
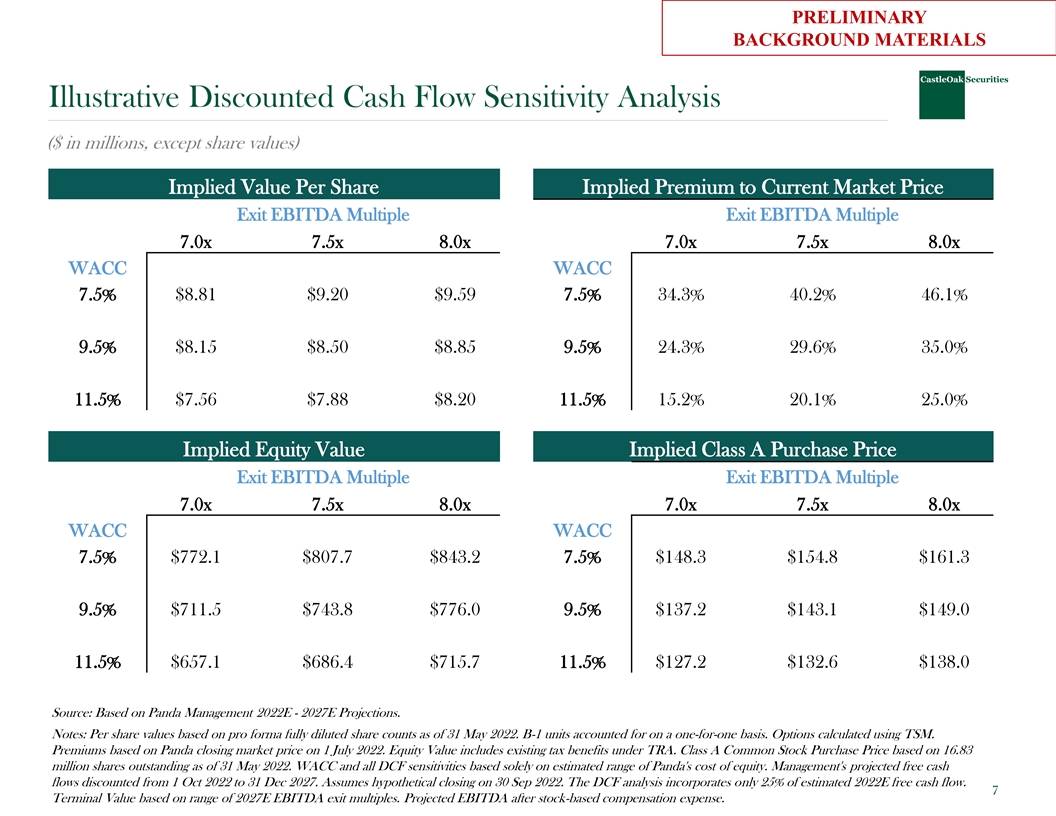
PRELIMINARY BACKGROUND MATERIALS Illustrative Discounted Cash Flow Sensitivity Analysis ($ in millions, except share values) Implied Value Per Share Implied Premium to Current Market Price Exit EBITDA Multiple Exit EBITDA Multiple 7.0x 7.5x 8.0x 7.0x 7.5x 8.0x WACC WACC 7.5% $8.81 $9.20 $9.59 7.5% 34.3% 40.2% 46.1% 9.5% $8.15 $8.50 $8.85 9.5% 24.3% 29.6% 35.0% 11.5% $7.56 $7.88 $8.20 11.5% 15.2% 20.1% 25.0% Implied Equity Value Implied Class A Purchase Price Exit EBITDA Multiple Exit EBITDA Multiple 7.0x 7.5x 8.0x 7.0x 7.5x 8.0x WACC WACC 7.5% $772.1 $807.7 $843.2 7.5% $148.3 $154.8 $161.3 9.5% $711.5 $743.8 $776.0 9.5% $137.2 $143.1 $149.0 11.5% $657.1 $686.4 $715.7 11.5% $127.2 $132.6 $138.0 Source: Based on Panda Management 2022E - 2027E Projections. Notes: Per share values based on pro forma fully diluted share counts as of 31 May 2022. B-1 units accounted for on a one-for-one basis. Options calculated using TSM. Premiums based on Panda closing market price on 1 July 2022. Equity Value includes existing tax benefits under TRA. Class A Common Stock Purchase Price based on 16.83 million shares outstanding as of 31 May 2022. WACC and all DCF sensitivities based solely on estimated range of Panda's cost of equity. Management's projected free cash flows discounted from 1 Oct 2022 to 31 Dec 2027. Assumes hypothetical closing on 30 Sep 2022. The DCF analysis incorporates only 25% of estimated 2022E free cash flow. 7 Terminal Value based on range of 2027E EBITDA exit multiples. Projected EBITDA after stock-based compensation expense.
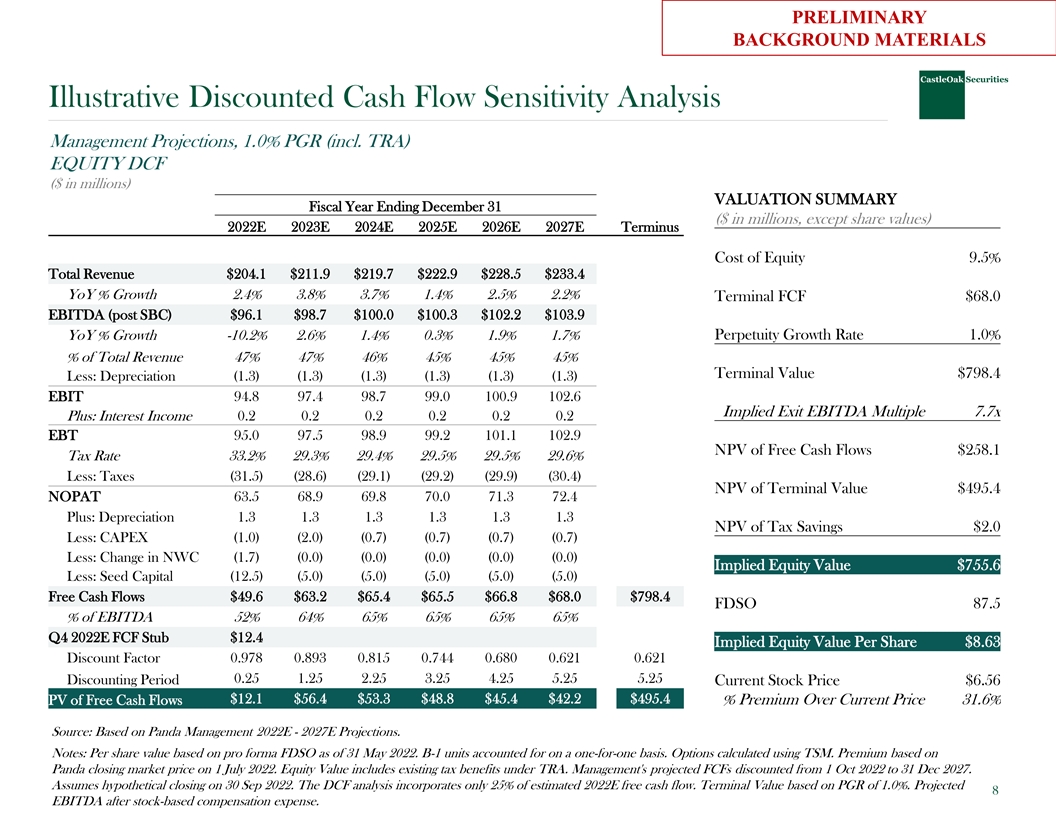
PRELIMINARY BACKGROUND MATERIALS Illustrative Discounted Cash Flow Sensitivity Analysis Management Projections, 1.0% PGR (incl. TRA) EQUITY DCF ($ in millions) VALUATION SUMMARY Fiscal Year Ending December 31 ($ in millions, except share values) 2022E 2023E 2024E 2025E 2026E 2027E Terminus Cost of Equity 9.5% Total Revenue $204.1 $211.9 $219.7 $222.9 $228.5 $233.4 YoY % Growth 2.4% 3.8% 3.7% 1.4% 2.5% 2.2% Terminal FCF $68.0 EBITDA (post SBC) $96.1 $98.7 $100.0 $100.3 $102.2 $103.9 YoY % Growth -10.2% 2.6% 1.4% 0.3% 1.9% 1.7% Perpetuity Growth Rate 1.0% % of Total Revenue 47% 47% 46% 45% 45% 45% Terminal Value $798.4 Less: Depreciation (1.3) (1.3) (1.3) (1.3) (1.3) (1.3) EBIT 94.8 97.4 98.7 99.0 100.9 102.6 Implied Exit EBITDA Multiple 7.7x Plus: Interest Income 0.2 0.2 0.2 0.2 0.2 0.2 EBT 95.0 97.5 98.9 99.2 101.1 102.9 NPV of Free Cash Flows $258.1 Tax Rate 33.2% 29.3% 29.4% 29.5% 29.5% 29.6% Less: Taxes (31.5) (28.6) (29.1) (29.2) (29.9) (30.4) NPV of Terminal Value $495.4 NOPAT 63.5 68.9 69.8 70.0 71.3 72.4 Plus: Depreciation 1.3 1.3 1.3 1.3 1.3 1.3 NPV of Tax Savings $2.0 Less: CAPEX (1.0) (2.0) (0.7) (0.7) (0.7) (0.7) Less: Change in NWC (1.7) (0.0) (0.0) (0.0) (0.0) (0.0) Implied Equity Value $755.6 Less: Seed Capital (12.5) (5.0) (5.0) (5.0) (5.0) (5.0) Free Cash Flows $49.6 $63.2 $65.4 $65.5 $66.8 $68.0 $798.4 FDSO 87.5 % of EBITDA 52% 64% 65% 65% 65% 65% Q4 2022E FCF Stub $12.4 Implied Equity Value Per Share $8.63 Discount Factor 0.978 0.893 0.815 0.744 0.680 0.621 0.621 0.25 1.25 2.25 3.25 4.25 5.25 5.25 Discounting Period Current Stock Price $6.56 $12.1 $56.4 $53.3 $48.8 $45.4 $42.2 $495.4 PV of Free Cash Flows % Premium Over Current Price 31.6% Source: Based on Panda Management 2022E - 2027E Projections. Notes: Per share value based on pro forma FDSO as of 31 May 2022. B-1 units accounted for on a one-for-one basis. Options calculated using TSM. Premium based on Panda closing market price on 1 July 2022. Equity Value includes existing tax benefits under TRA. Management's projected FCFs discounted from 1 Oct 2022 to 31 Dec 2027. Assumes hypothetical closing on 30 Sep 2022. The DCF analysis incorporates only 25% of estimated 2022E free cash flow. Terminal Value based on PGR of 1.0%. Projected 8 EBITDA after stock-based compensation expense.
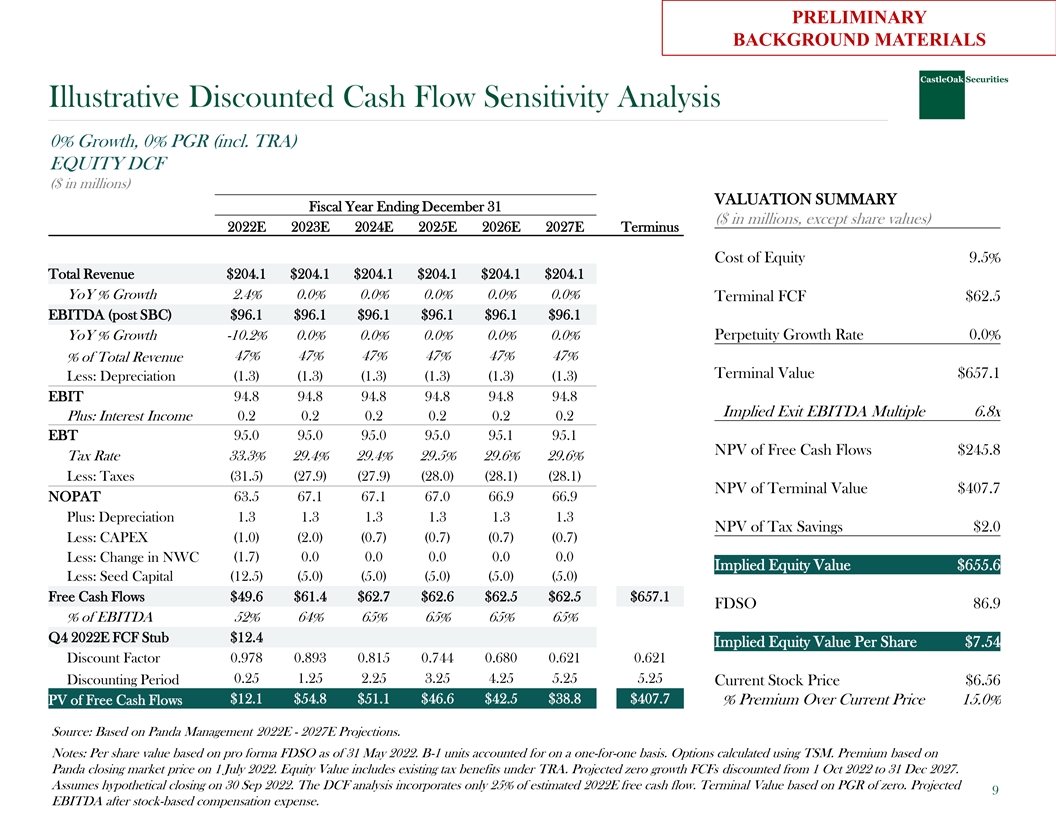
PRELIMINARY BACKGROUND MATERIALS Illustrative Discounted Cash Flow Sensitivity Analysis 0% Growth, 0% PGR (incl. TRA) EQUITY DCF ($ in millions) VALUATION SUMMARY Fiscal Year Ending December 31 ($ in millions, except share values) 2022E 2023E 2024E 2025E 2026E 2027E Terminus Cost of Equity 9.5% Total Revenue $204.1 $204.1 $204.1 $204.1 $204.1 $204.1 YoY % Growth 2.4% 0.0% 0.0% 0.0% 0.0% 0.0% Terminal FCF $62.5 EBITDA (post SBC) $96.1 $96.1 $96.1 $96.1 $96.1 $96.1 YoY % Growth -10.2% 0.0% 0.0% 0.0% 0.0% 0.0% Perpetuity Growth Rate 0.0% 47% 47% 47% 47% 47% 47% % of Total Revenue Terminal Value $657.1 Less: Depreciation (1.3) (1.3) (1.3) (1.3) (1.3) (1.3) EBIT 94.8 94.8 94.8 94.8 94.8 94.8 Implied Exit EBITDA Multiple 6.8x Plus: Interest Income 0.2 0.2 0.2 0.2 0.2 0.2 EBT 95.0 95.0 95.0 95.0 95.1 95.1 NPV of Free Cash Flows $245.8 Tax Rate 33.3% 29.4% 29.4% 29.5% 29.6% 29.6% Less: Taxes (31.5) (27.9) (27.9) (28.0) (28.1) (28.1) NPV of Terminal Value $407.7 NOPAT 63.5 67.1 67.1 67.0 66.9 66.9 Plus: Depreciation 1.3 1.3 1.3 1.3 1.3 1.3 NPV of Tax Savings $2.0 Less: CAPEX (1.0) (2.0) (0.7) (0.7) (0.7) (0.7) (1.7) 0.0 0.0 0.0 0.0 0.0 Less: Change in NWC Implied Equity Value $655.6 Less: Seed Capital (12.5) (5.0) (5.0) (5.0) (5.0) (5.0) Free Cash Flows $49.6 $61.4 $62.7 $62.6 $62.5 $62.5 $657.1 FDSO 86.9 % of EBITDA 52% 64% 65% 65% 65% 65% Q4 2022E FCF Stub $12.4 Implied Equity Value Per Share $7.54 Discount Factor 0.978 0.893 0.815 0.744 0.680 0.621 0.621 0.25 1.25 2.25 3.25 4.25 5.25 5.25 Discounting Period Current Stock Price $6.56 $12.1 $54.8 $51.1 $46.6 $42.5 $38.8 $407.7 PV of Free Cash Flows % Premium Over Current Price 15.0% Source: Based on Panda Management 2022E - 2027E Projections. Notes: Per share value based on pro forma FDSO as of 31 May 2022. B-1 units accounted for on a one-for-one basis. Options calculated using TSM. Premium based on Panda closing market price on 1 July 2022. Equity Value includes existing tax benefits under TRA. Projected zero growth FCFs discounted from 1 Oct 2022 to 31 Dec 2027. Assumes hypothetical closing on 30 Sep 2022. The DCF analysis incorporates only 25% of estimated 2022E free cash flow. Terminal Value based on PGR of zero. Projected 9 EBITDA after stock-based compensation expense.
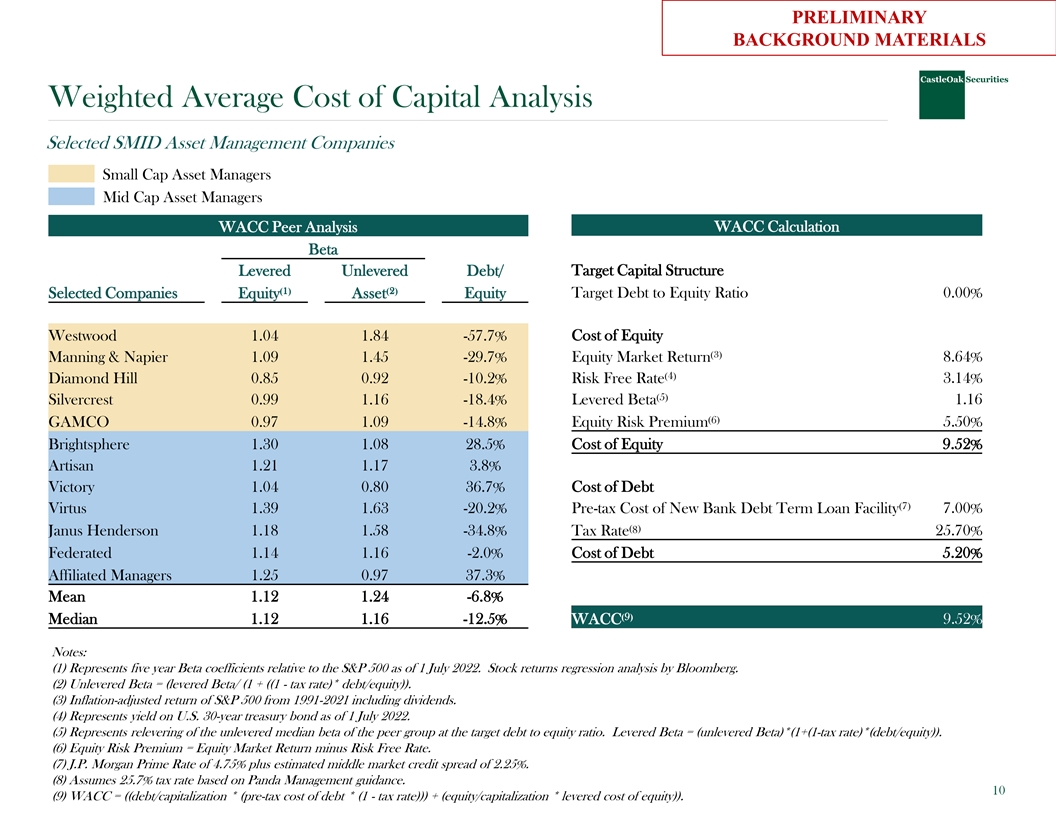
PRELIMINARY BACKGROUND MATERIALS Weighted Average Cost of Capital Analysis Selected SMID Asset Management Companies Small Cap Asset Managers Mid Cap Asset Managers WACC Peer Analysis WACC Calculation Beta Levered Unlevered Debt/ Target Capital Structure Target Debt to Equity Ratio 0.00% Selected Companies Equity⁽¹⁾ Asset⁽²⁾ Equity Cost of Equity Westwood 1.04 1.84 -57.7% 8.64% Manning & Napier 1.09 1.45 -29.7% Equity Market Return⁽³⁾ 4 3.14% Diamond Hill 0.85 0.92 -10.2% Risk Free Rate⁽ ⁾ 5 Levered Beta 1.16 Silvercrest 0.99 1.16 -18.4% ⁽ ⁾ 6 GAMCO 0.97 1.09 -14.8% Equity Risk Premium 5.50% ⁽ ⁾ Brightsphere 1.30 1.08 28.5% Cost of Equity 9.52% Artisan 1.21 1.17 3.8% Victory 1.04 0.80 36.7% Cost of Debt 7 Virtus 1.39 1.63 -20.2% Pre-tax Cost of New Bank Debt Term Loan Facility⁽ ⁾ 7.00% 8 Janus Henderson 1.18 1.58 -34.8% Tax Rate⁽ ⁾ 25.70% Federated 1.14 1.16 -2.0% Cost of Debt 5.20% Affiliated Managers 1.25 0.97 37.3% Mean 1.12 1.24 -6.8% 9 Median 1.12 1.16 -12.5% WACC⁽⁾ 9.52% Notes: (1) Represents five year Beta coefficients relative to the S&P 500 as of 1 July 2022. Stock returns regression analysis by Bloomberg. (2) Unlevered Beta = (levered Beta/ (1 + ((1 - tax rate)* debt/equity)). (3) Inflation-adjusted return of S&P 500 from 1991-2021 including dividends. (4) Represents yield on U.S. 30-year treasury bond as of 1 July 2022. (5) Represents relevering of the unlevered median beta of the peer group at the target debt to equity ratio. Levered Beta = (unlevered Beta)*(1+(1-tax rate)*(debt/equity)). (6) Equity Risk Premium = Equity Market Return minus Risk Free Rate. (7) J.P. Morgan Prime Rate of 4.75% plus estimated middle market credit spread of 2.25%. (8) Assumes 25.7% tax rate based on Panda Management guidance. 10 (9) WACC = ((debt/capitalization * (pre-tax cost of debt * (1 - tax rate))) + (equity/capitalization * levered cost of equity)).

Honesty | Integrity | Performance Selected Public Market Comparisons www.castleoaklp.com 11 11
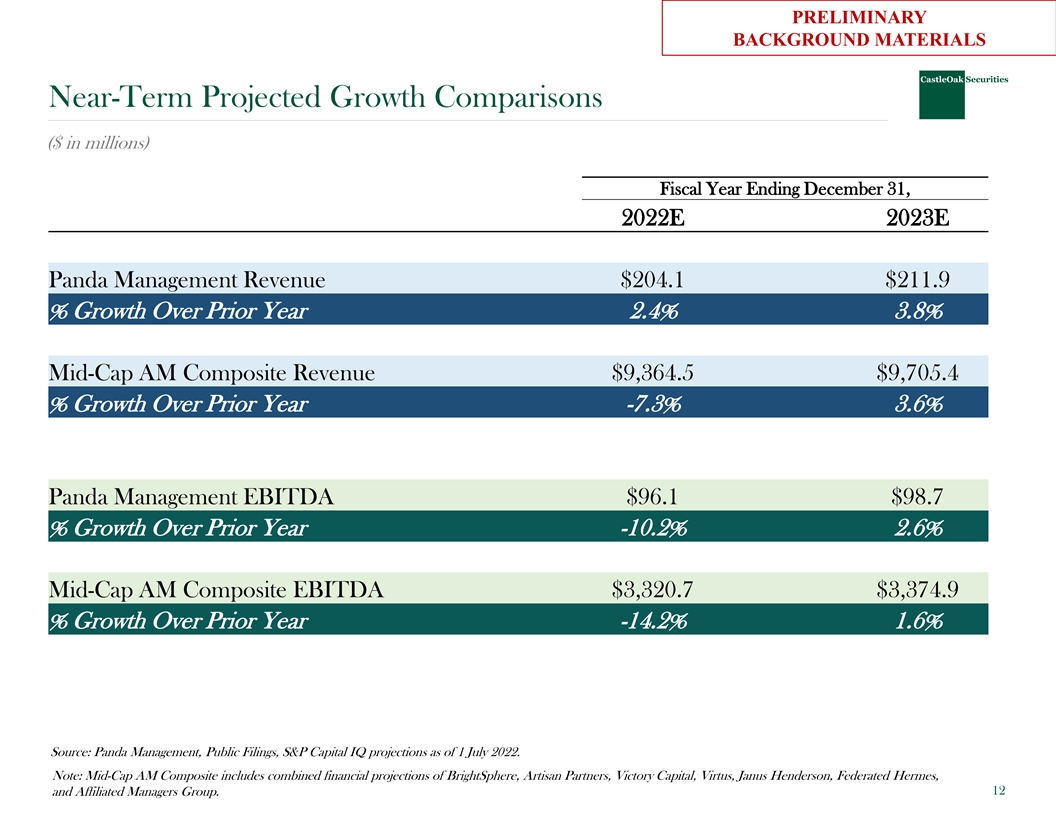
PRELIMINARY BACKGROUND MATERIALS Near-Term Projected Growth Comparisons ($ in millions) Fiscal Year Ending December 31, 2022E 2023E Panda Management Revenue $204.1 $211.9 % Growth Over Prior Year 2.4% 3.8% Mid-Cap AM Composite Revenue $9,364.5 $9,705.4 % Growth Over Prior Year -7.3% 3.6% Panda Management EBITDA $96.1 $98.7 % Growth Over Prior Year -10.2% 2.6% Mid-Cap AM Composite EBITDA $3,320.7 $3,374.9 % Growth Over Prior Year -14.2% 1.6% Source: Panda Management, Public Filings, S&P Capital IQ projections as of 1 July 2022. Note: Mid-Cap AM Composite includes combined financial projections of BrightSphere, Artisan Partners, Victory Capital, Virtus, Janus Henderson, Federated Hermes, 12 and Affiliated Managers Group.
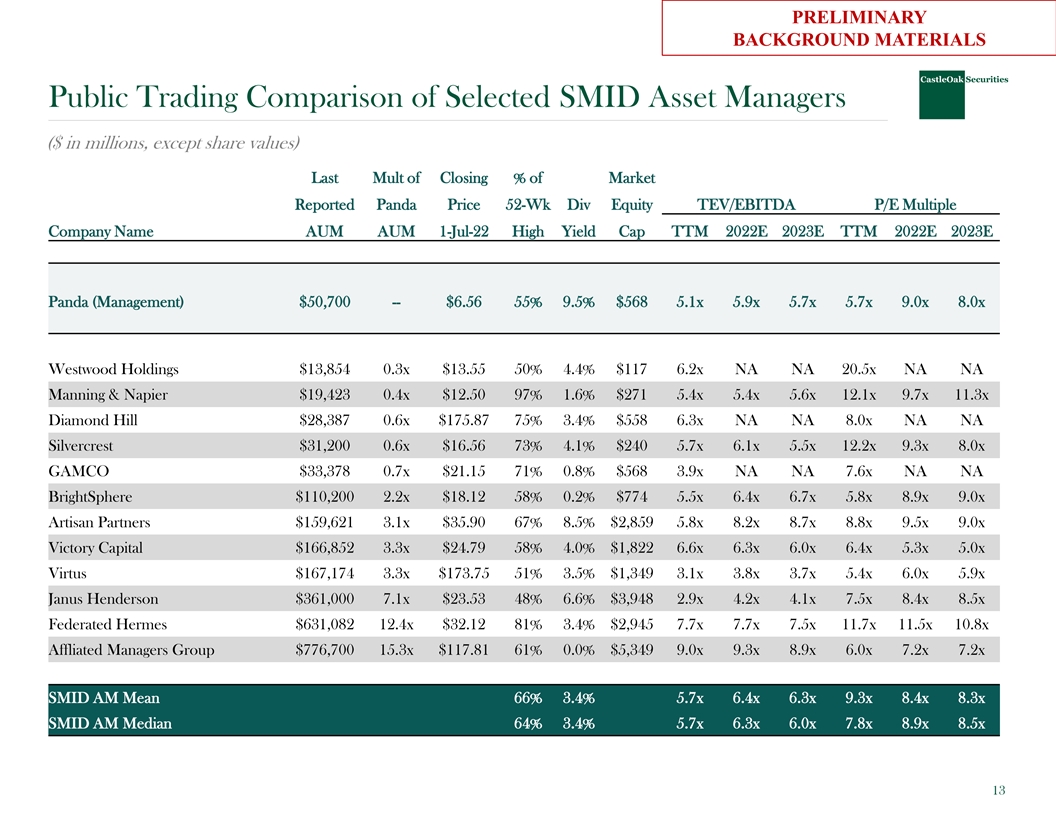
PRELIMINARY BACKGROUND MATERIALS Public Trading Comparison of Selected SMID Asset Managers ($ in millions, except share values) Last Mult of Closing % of Market Reported Panda Price 52-Wk Div Equity TEV/EBITDA P/E Multiple Company Name AUM AUM 1-Jul-22 High Yield Cap TTM 2022E 2023E TTM 2022E 2023E Panda (Management) $50,700 -- $6.56 55% 9.5% $568 5.1x 5.9x 5.7x 5.7x 9.0x 8.0x Westwood Holdings $13,854 0.3x $13.55 50% 4.4% $117 6.2x NA NA 20.5x NA NA Manning & Napier $19,423 0.4x $12.50 97% 1.6% $271 5.4x 5.4x 5.6x 12.1x 9.7x 11.3x Diamond Hill $28,387 0.6x $175.87 75% 3.4% $558 6.3x NA NA 8.0x NA NA Silvercrest $31,200 0.6x $16.56 73% 4.1% $240 5.7x 6.1x 5.5x 12.2x 9.3x 8.0x GAMCO $33,378 0.7x $21.15 71% 0.8% $568 3.9x NA NA 7.6x NA NA BrightSphere $110,200 2.2x $18.12 58% 0.2% $774 5.5x 6.4x 6.7x 5.8x 8.9x 9.0x Artisan Partners $159,621 3.1x $35.90 67% 8.5% $2,859 5.8x 8.2x 8.7x 8.8x 9.5x 9.0x Victory Capital $166,852 3.3x $24.79 58% 4.0% $1,822 6.6x 6.3x 6.0x 6.4x 5.3x 5.0x Virtus $167,174 3.3x $173.75 51% 3.5% $1,349 3.1x 3.8x 3.7x 5.4x 6.0x 5.9x Janus Henderson $361,000 7.1x $23.53 48% 6.6% $3,948 2.9x 4.2x 4.1x 7.5x 8.4x 8.5x Federated Hermes $631,082 12.4x $32.12 81% 3.4% $2,945 7.7x 7.7x 7.5x 11.7x 11.5x 10.8x Affliated Managers Group $776,700 15.3x $117.81 61% 0.0% $5,349 9.0x 9.3x 8.9x 6.0x 7.2x 7.2x SMID AM Mean 66% 3.4% 5.7x 6.4x 6.3x 9.3x 8.4x 8.3x SMID AM Median 64% 3.4% 5.7x 6.3x 6.0x 7.8x 8.9x 8.5x 13
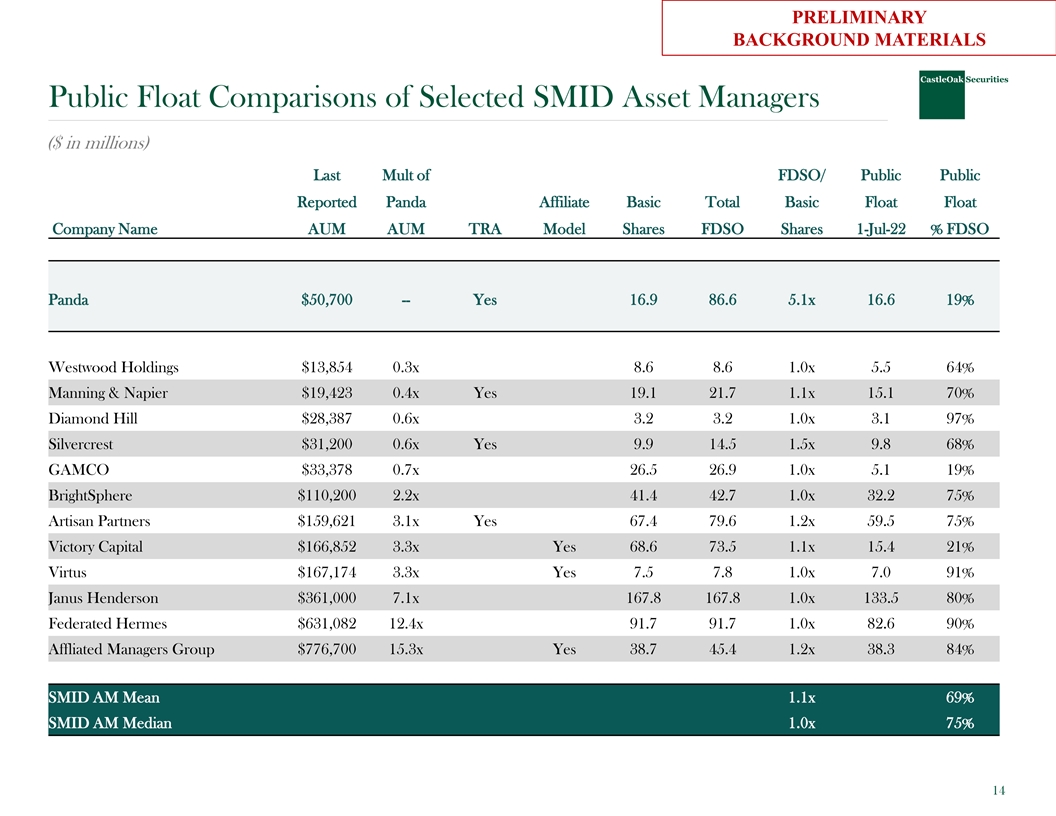
PRELIMINARY BACKGROUND MATERIALS Public Float Comparisons of Selected SMID Asset Managers ($ in millions) Last Mult of FDSO/ Public Public Reported Panda Affiliate Basic Total Basic Float Float Company Name AUM AUM TRA Model Shares FDSO Shares 1-Jul-22 % FDSO Panda $50,700 -- Yes 16.9 86.6 5.1x 16.6 19% Westwood Holdings $13,854 0.3x 8.6 8.6 1.0x 5.5 64% Manning & Napier $19,423 0.4x Yes 19.1 21.7 1.1x 15.1 70% Diamond Hill $28,387 0.6x 3.2 3.2 1.0x 3.1 97% Silvercrest $31,200 0.6x Yes 9.9 14.5 1.5x 9.8 68% GAMCO $33,378 0.7x 26.5 26.9 1.0x 5.1 19% BrightSphere $110,200 2.2x 41.4 42.7 1.0x 32.2 75% Artisan Partners $159,621 3.1x Yes 67.4 79.6 1.2x 59.5 75% Victory Capital $166,852 3.3x Yes 68.6 73.5 1.1x 15.4 21% Virtus $167,174 3.3x Yes 7.5 7.8 1.0x 7.0 91% Janus Henderson $361,000 7.1x 167.8 167.8 1.0x 133.5 80% Federated Hermes $631,082 12.4x 91.7 91.7 1.0x 82.6 90% Affliated Managers Group $776,700 15.3x Yes 38.7 45.4 1.2x 38.3 84% SMID AM Mean 1.1x 69% SMID AM Median 1.0x 75% 14
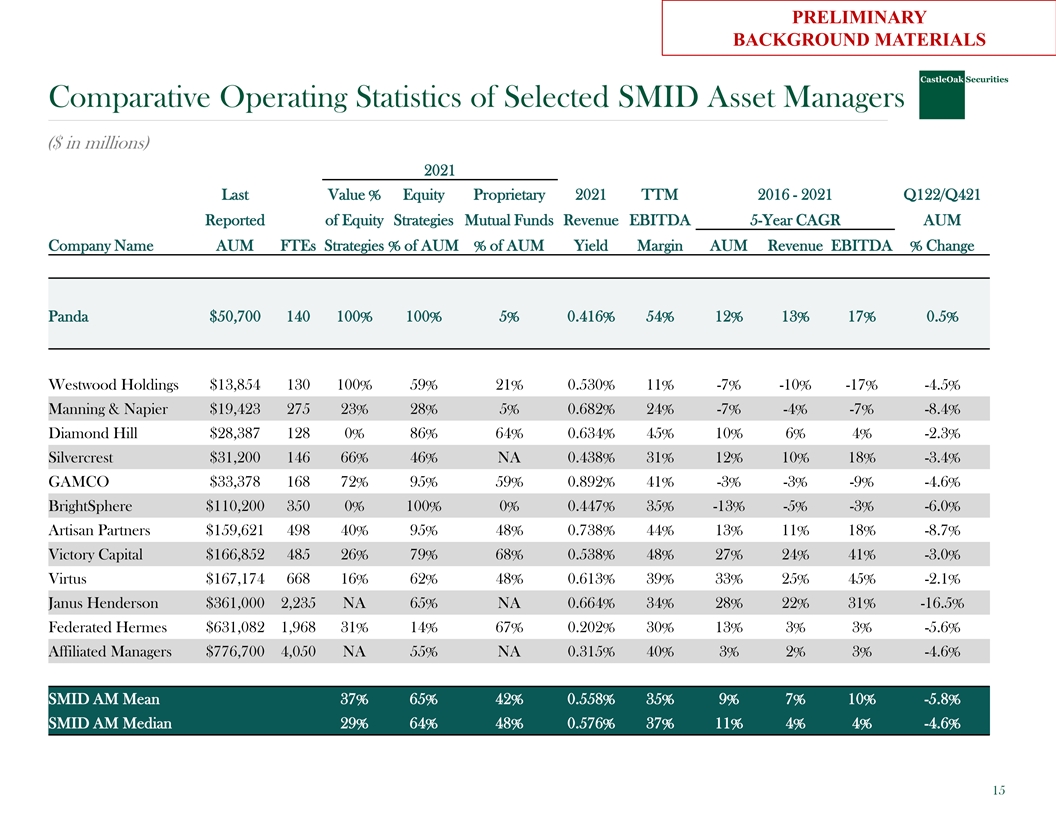
PRELIMINARY BACKGROUND MATERIALS Comparative Operating Statistics of Selected SMID Asset Managers ($ in millions) 2021 Last Value % Equity Proprietary 2021 TTM 2016 - 2021 Q122/Q421 Reported of Equity Strategies Mutual Funds Revenue EBITDA 5-Year CAGR AUM Company Name AUM FTEs Strategies % of AUM % of AUM Yield Margin AUM Revenue EBITDA % Change Panda $50,700 140 100% 100% 5% 0.416% 54% 12% 13% 17% 0.5% Westwood Holdings $13,854 130 100% 59% 21% 0.530% 11% -7% -10% -17% -4.5% Manning & Napier $19,423 275 23% 28% 5% 0.682% 24% -7% -4% -7% -8.4% Diamond Hill $28,387 128 0% 86% 64% 0.634% 45% 10% 6% 4% -2.3% Silvercrest $31,200 146 66% 46% NA 0.438% 31% 12% 10% 18% -3.4% GAMCO $33,378 168 72% 95% 59% 0.892% 41% -3% -3% -9% -4.6% BrightSphere $110,200 350 0% 100% 0% 0.447% 35% -13% -5% -3% -6.0% Artisan Partners $159,621 498 40% 95% 48% 0.738% 44% 13% 11% 18% -8.7% Victory Capital $166,852 485 26% 79% 68% 0.538% 48% 27% 24% 41% -3.0% Virtus $167,174 668 16% 62% 48% 0.613% 39% 33% 25% 45% -2.1% Janus Henderson $361,000 2,235 NA 65% NA 0.664% 34% 28% 22% 31% -16.5% Federated Hermes $631,082 1,968 31% 14% 67% 0.202% 30% 13% 3% 3% -5.6% Affiliated Managers $776,700 4,050 NA 55% NA 0.315% 40% 3% 2% 3% -4.6% SMID AM Mean 37% 65% 42% 0.558% 35% 9% 7% 10% -5.8% SMID AM Median 29% 64% 48% 0.576% 37% 11% 4% 4% -4.6% 15

Honesty | Integrity | Performance Selected Private Market Transactions www.castleoaklp.com 16 16
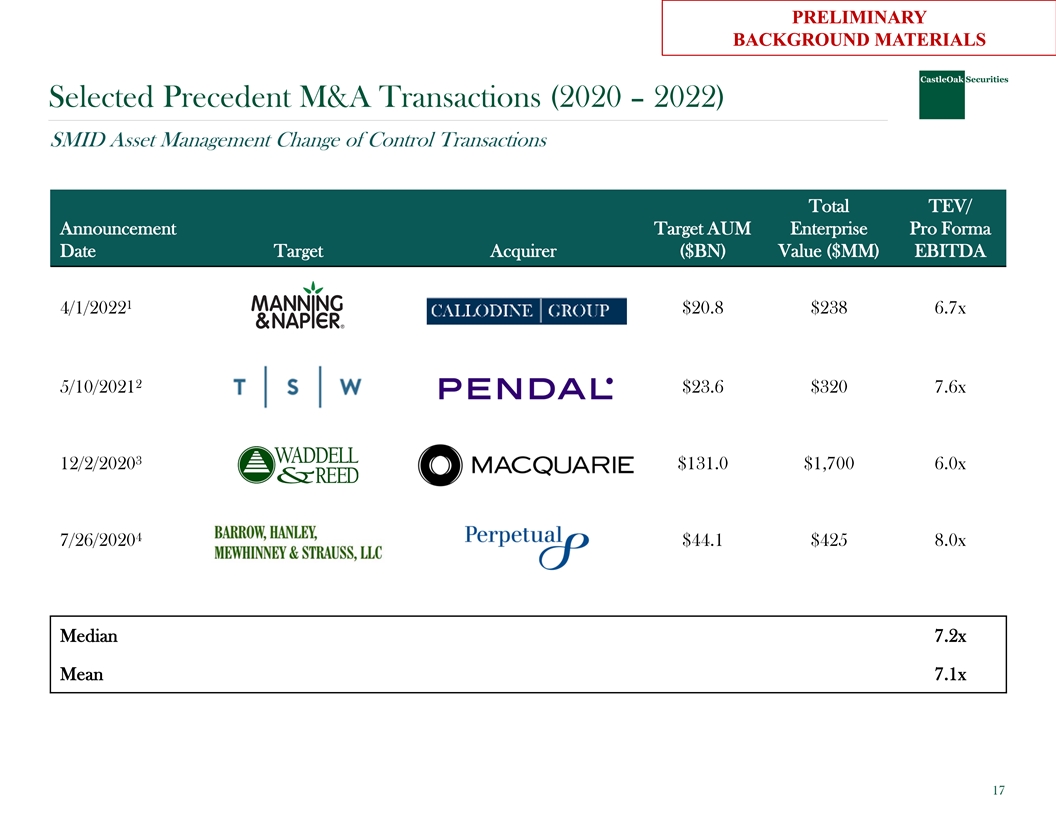
P PR RELI ELIM MI IN NA AR RY Y BA BAC CKGR KGROU OUN ND D M MA ATER TERI IA ALS LS Selected Precedent M&A Transactions (2020 – 2022) SMID Asset Management Change of Control Transactions Total TEV/ Announcement Target AUM Enterprise Pro Forma Date Target Acquirer ($BN) Value ($MM) EBITDA 1 4/1/2022 $20.8 $238 6.7x 2 5/10/2021 $23.6 $320 7.6x 3 12/2/2020 $131.0 $1,700 6.0x 4 7/26/2020 $44.1 $425 8.0x Median 7.2x Mean 7.1x 17
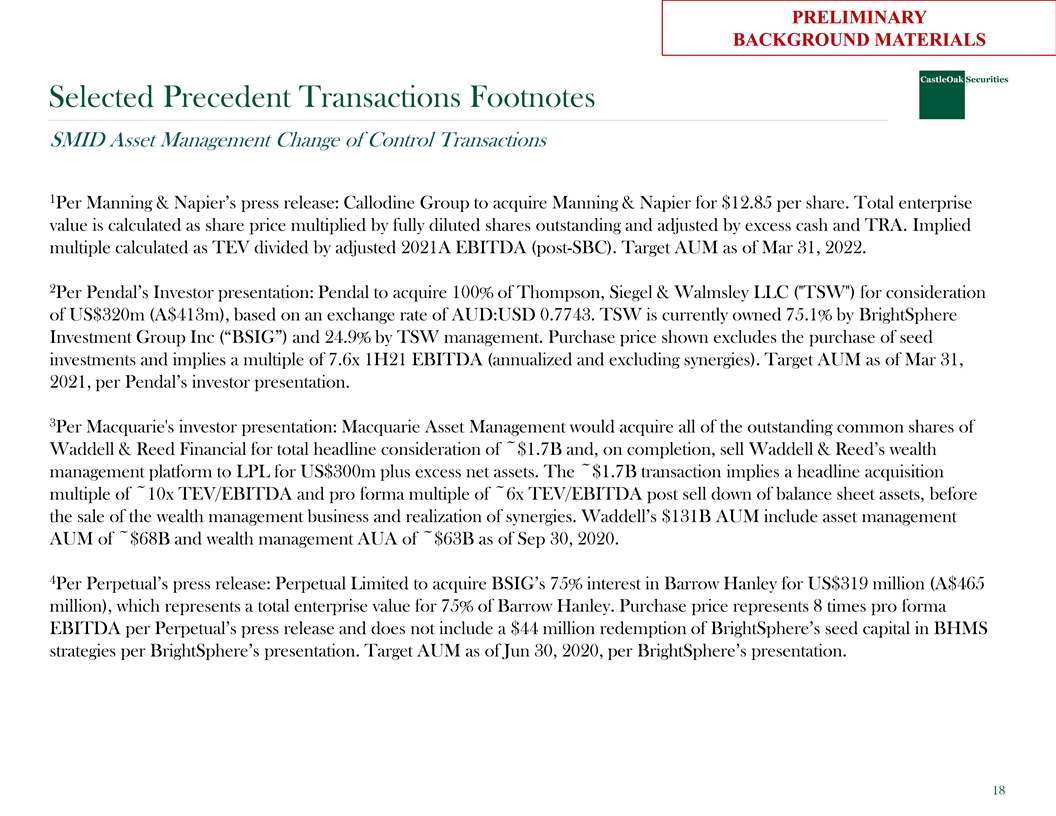
P PR RELI ELIM MI IN NA AR RY Y BA BAC CKGR KGROU OUN ND D M MA ATER TERI IA ALS LS Selected Precedent Transactions Footnotes SMID Asset Management Change of Control Transactions 1 Per Manning & Napier’s press release: Callodine Group to acquire Manning & Napier for $12.85 per share. Total enterprise value is calculated as share price multiplied by fully diluted shares outstanding and adjusted by excess cash and TRA. Implied multiple calculated as TEV divided by adjusted 2021A EBITDA (post-SBC). Target AUM as of Mar 31, 2022. 2 Per Pendal’s Investor presentation: Pendal to acquire 100% of Thompson, Siegel & Walmsley LLC ( TSW ) for consideration of US$320m (A$413m), based on an exchange rate of AUD:USD 0.7743. TSW is currently owned 75.1% by BrightSphere Investment Group Inc (“BSIG”) and 24.9% by TSW management. Purchase price shown excludes the purchase of seed investments and implies a multiple of 7.6x 1H21 EBITDA (annualized and excluding synergies). Target AUM as of Mar 31, 2021, per Pendal’s investor presentation. 3 Per Macquarie's investor presentation: Macquarie Asset Management would acquire all of the outstanding common shares of Waddell & Reed Financial for total headline consideration of ~$1.7B and, on completion, sell Waddell & Reed’s wealth management platform to LPL for US$300m plus excess net assets. The ~$1.7B transaction implies a headline acquisition multiple of ~10x TEV/EBITDA and pro forma multiple of ~6x TEV/EBITDA post sell down of balance sheet assets, before the sale of the wealth management business and realization of synergies. Waddell’s $131B AUM include asset management AUM of ~$68B and wealth management AUA of ~$63B as of Sep 30, 2020. 4 Per Perpetual’s press release: Perpetual Limited to acquire BSIG’s 75% interest in Barrow Hanley for US$319 million (A$465 million), which represents a total enterprise value for 75% of Barrow Hanley. Purchase price represents 8 times pro forma EBITDA per Perpetual’s press release and does not include a $44 million redemption of BrightSphere’s seed capital in BHMS strategies per BrightSphere’s presentation. Target AUM as of Jun 30, 2020, per BrightSphere’s presentation. 18

Honesty | Integrity | Performance Appendix www.castleoaklp.com 19 19
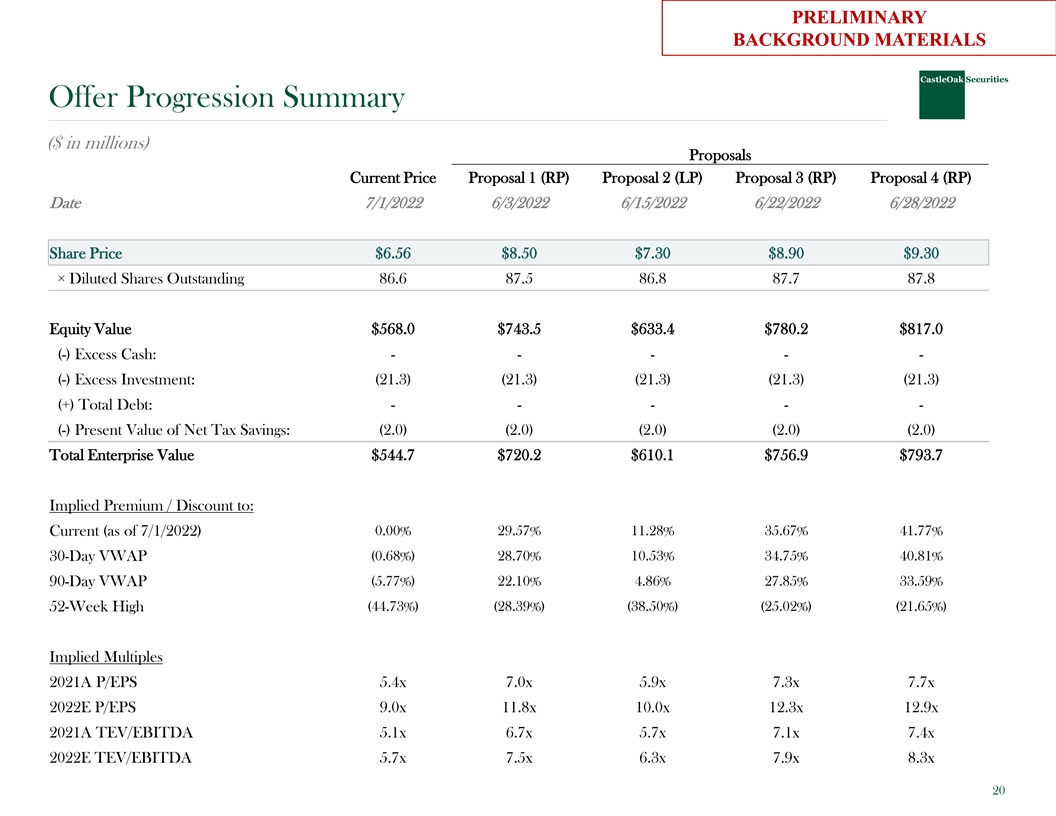
P PR RELI ELIM MI IN NA AR RY Y BA BAC CKGR KGROU OUN ND D M MA ATER TERI IA ALS LS Offer Progression Summary ($ in millions) Proposals Current Price Proposal 1 (RP) Proposal 2 (LP) Proposal 3 (RP) Proposal 4 (RP) Date 7/1/2022 6/3/2022 6/15/2022 6/22/2022 6/28/2022 Share Price $6.56 $8.50 $7.30 $8.90 $9.30 × Diluted Shares Outstanding 86.6 87.5 86.8 87.7 87.8 Equity Value $568.0 $743.5 $633.4 $780.2 $817.0 (-) Excess Cash: - - - - - (-) Excess Investment: (21.3) (21.3) (21.3) (21.3) (21.3) (+) Total Debt: - - - - - (-) Present Value of Net Tax Savings: (2.0) (2.0) (2.0) (2.0) (2.0) Total Enterprise Value $544.7 $720.2 $610.1 $756.9 $793.7 Implied Premium / Discount to: Current (as of 7/1/2022) 0.00% 29.57% 11.28% 35.67% 41.77% 30-Day VWAP (0.68%) 28.70% 10.53% 34.75% 40.81% (5.77%) 22.10% 4.86% 27.85% 33.59% 90-Day VWAP (44.73%) (28.39%) (38.50%) (25.02%) (21.65%) 52-Week High Implied Multiples 2021A P/EPS 5.4x 7.0x 5.9x 7.3x 7.7x 2022E P/EPS 9.0x 11.8x 10.0x 12.3x 12.9x 2021A TEV/EBITDA 5.1x 6.7x 5.7x 7.1x 7.4x 2022E TEV/EBITDA 5.7x 7.5x 6.3x 7.9x 8.3x 20
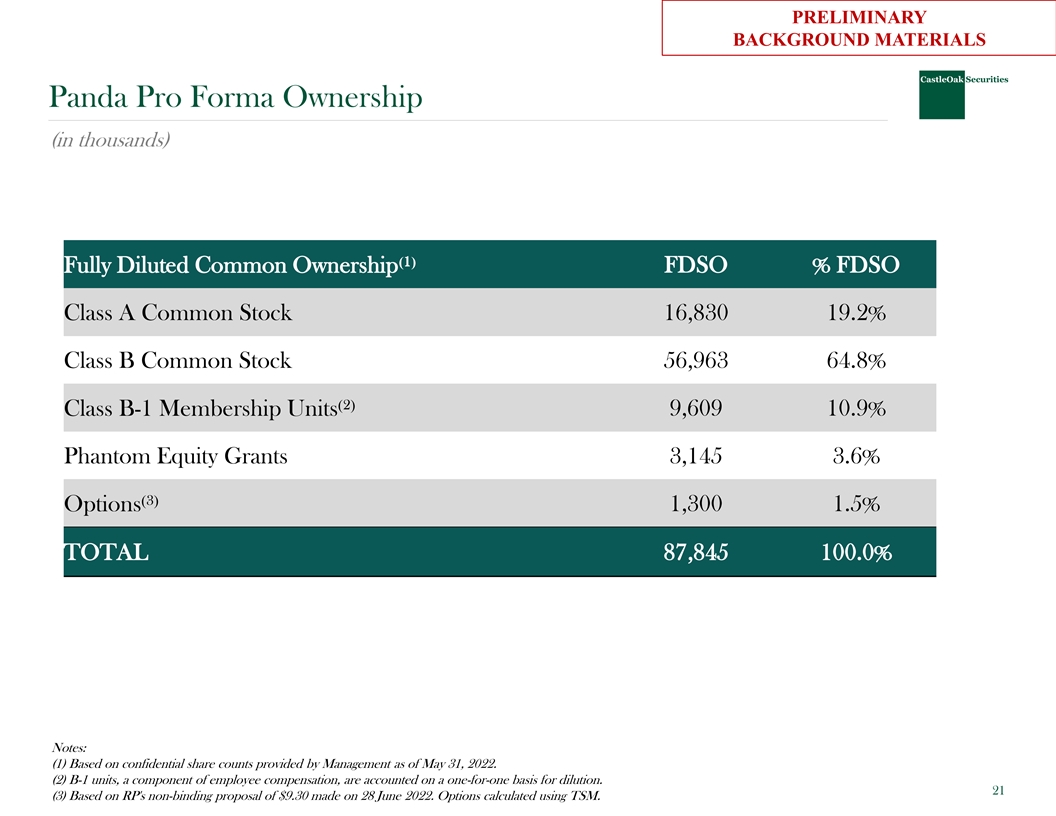
PRELIMINARY BACKGROUND MATERIALS Panda Pro Forma Ownership (in thousands) FDSO % FDSO Fully Diluted Common Ownership⁽¹⁾ Class A Common Stock 16,830 19.2% Class B Common Stock 56,963 64.8% Class B-1 Membership Units⁽²⁾ 9,609 10.9% Phantom Equity Grants 3,145 3.6% Options⁽³⁾ 1,300 1.5% TOTAL 87,845 100.0% Notes: (1) Based on confidential share counts provided by Management as of May 31, 2022. (2) B-1 units, a component of employee compensation, are accounted on a one-for-one basis for dilution. 21 (3) Based on RP's non-binding proposal of $9.30 made on 28 June 2022. Options calculated using TSM.
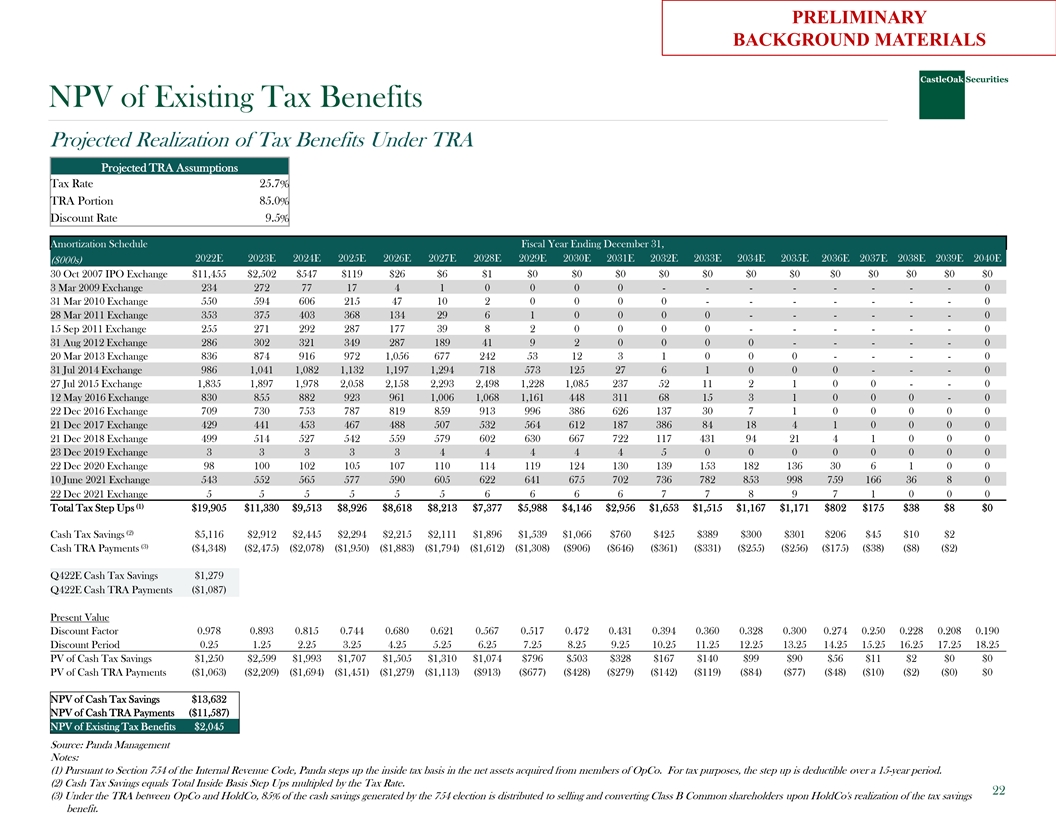
PRELIMINARY BACKGROUND MATERIALS NPV of Existing Tax Benefits Projected Realization of Tax Benefits Under TRA Projected TRA Assumptions Tax Rate 25.7% TRA Portion 85.0% Discount Rate 9.5% Amortization Schedule Fiscal Year Ending December 31, 2022E 2023E 2024E 2025E 2026E 2027E 2028E 2029E 2030E 2031E 2032E 2033E 2034E 2035E 2036E 2037E 2038E 2039E 2040E ($000s) 30 Oct 2007 IPO Exchange $11,455 $2,502 $547 $119 $26 $6 $1 $0 $0 $0 $0 $0 $0 $0 $0 $0 $0 $0 $0 3 Mar 2009 Exchange 234 272 77 17 4 1 0 0 0 0 - - - - - - - - 0 31 Mar 2010 Exchange 550 594 606 215 47 10 2 0 0 0 0 - - - - - - - 0 28 Mar 2011 Exchange 353 375 403 368 134 29 6 1 0 0 0 0 - - - - - - 0 15 Sep 2011 Exchange 255 271 292 287 177 39 8 2 0 0 0 0 - - - - - - 0 31 Aug 2012 Exchange 286 302 321 349 287 189 41 9 2 0 0 0 0 - - - - - 0 20 Mar 2013 Exchange 836 874 916 972 1,056 677 242 53 12 3 1 0 0 0 - - - - 0 31 Jul 2014 Exchange 986 1,041 1,082 1,132 1,197 1,294 718 573 125 27 6 1 0 0 0 - - - 0 27 Jul 2015 Exchange 1,835 1,897 1,978 2,058 2,158 2,293 2,498 1,228 1,085 237 52 11 2 1 0 0 - - 0 12 May 2016 Exchange 830 855 882 923 961 1,006 1,068 1,161 448 311 68 15 3 1 0 0 0 - 0 22 Dec 2016 Exchange 709 730 753 787 819 859 913 996 386 626 137 30 7 1 0 0 0 0 0 21 Dec 2017 Exchange 429 441 453 467 488 507 532 564 612 187 386 84 18 4 1 0 0 0 0 21 Dec 2018 Exchange 499 514 527 542 559 579 602 630 667 722 117 431 94 21 4 1 0 0 0 23 Dec 2019 Exchange 3 3 3 3 3 4 4 4 4 4 5 0 0 0 0 0 0 0 0 22 Dec 2020 Exchange 98 100 102 105 107 110 114 119 124 130 139 153 182 136 30 6 1 0 0 10 June 2021 Exchange 543 552 565 577 590 605 622 641 675 702 736 782 853 998 759 166 36 8 0 22 Dec 2021 Exchange 5 5 5 5 5 5 6 6 6 6 7 7 8 9 7 1 0 0 0 (1) Total Tax Step Ups $19,905 $11,330 $9,513 $8,926 $8,618 $8,213 $7,377 $5,988 $4,146 $2,956 $1,653 $1,515 $1,167 $1,171 $802 $175 $38 $8 $0 (2) Cash Tax Savings $5,116 $2,912 $2,445 $2,294 $2,215 $2,111 $1,896 $1,539 $1,066 $760 $425 $389 $300 $301 $206 $45 $10 $2 (3) Cash TRA Payments ($4,348) ($2,475) ($2,078) ($1,950) ($1,883) ($1,794) ($1,612) ($1,308) ($906) ($646) ($361) ($331) ($255) ($256) ($175) ($38) ($8) ($2) Q422E Cash Tax Savings $1,279 Q422E Cash TRA Payments ($1,087) Present Value Discount Factor 0.978 0.893 0.815 0.744 0.680 0.621 0.567 0.517 0.472 0.431 0.394 0.360 0.328 0.300 0.274 0.250 0.228 0.208 0.190 Discount Period 0.25 1.25 2.25 3.25 4.25 5.25 6.25 7.25 8.25 9.25 10.25 11.25 12.25 13.25 14.25 15.25 16.25 17.25 18.25 PV of Cash Tax Savings $1,250 $2,599 $1,993 $1,707 $1,505 $1,310 $1,074 $796 $503 $328 $167 $140 $99 $90 $56 $11 $2 $0 $0 PV of Cash TRA Payments ($1,063) ($2,209) ($1,694) ($1,451) ($1,279) ($1,113) ($913) ($677) ($428) ($279) ($142) ($119) ($84) ($77) ($48) ($10) ($2) ($0) $0 NPV of Cash Tax Savings $13,632 NPV of Cash TRA Payments ($11,587) NPV of Existing Tax Benefits $2,045 Source: Panda Management Notes: (1) Pursuant to Section 754 of the Internal Revenue Code, Panda steps up the inside tax basis in the net assets acquired from members of OpCo. For tax purposes, the step up is deductible over a 15-year period. (2) Cash Tax Savings equals Total Inside Basis Step Ups multipled by the Tax Rate. 22 (3) Under the TRA between OpCo and HoldCo, 85% of the cash savings generated by the 754 election is distributed to selling and converting Class B Common shareholders upon HoldCo's realization of the tax savings benefit.
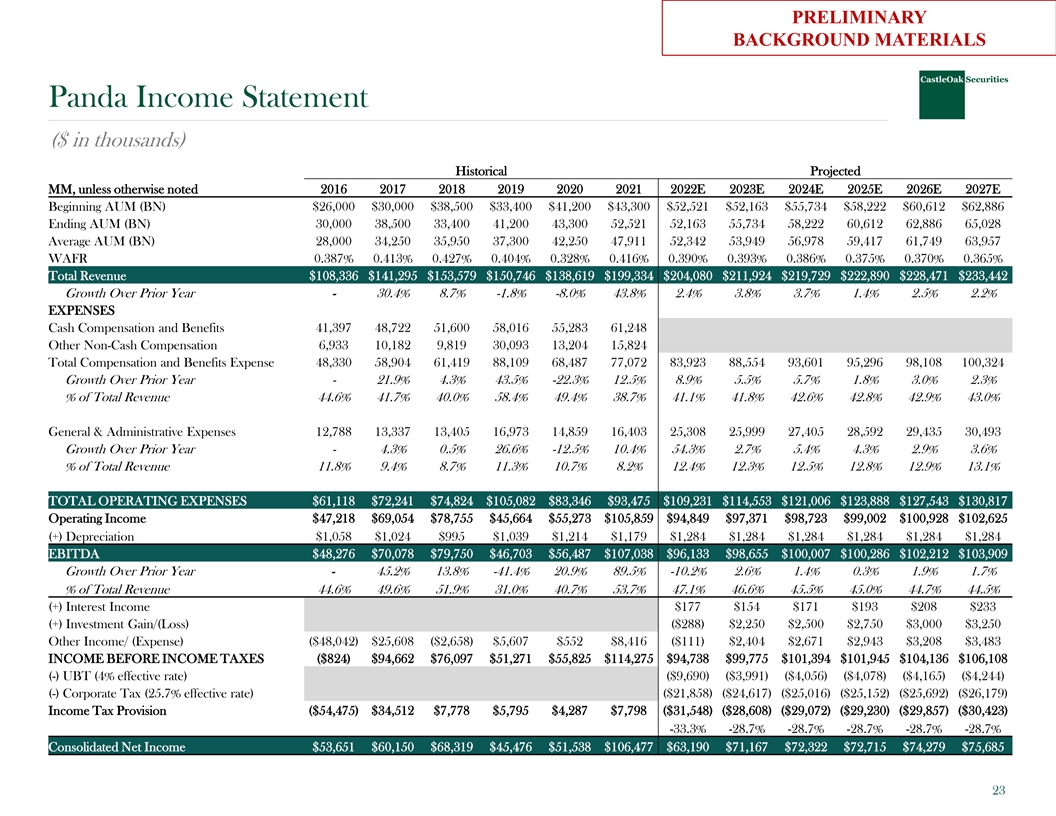
PRELIMINARY BACKGROUND MATERIALS Panda Income Statement ($ in thousands) Historical Projected MM, unless otherwise noted 2016 2017 2018 2019 2020 2021 2022E 2023E 2024E 2025E 2026E 2027E Beginning AUM (BN) $26,000 $30,000 $38,500 $33,400 $41,200 $43,300 $52,521 $52,163 $55,734 $58,222 $60,612 $62,886 Ending AUM (BN) 30,000 38,500 33,400 41,200 43,300 52,521 52,163 55,734 58,222 60,612 62,886 65,028 Average AUM (BN) 28,000 34,250 35,950 37,300 42,250 47,911 52,342 53,949 56,978 59,417 61,749 63,957 WAFR 0.387% 0.413% 0.427% 0.404% 0.328% 0.416% 0.390% 0.393% 0.386% 0.375% 0.370% 0.365% Total Revenue $108,336 $141,295 $153,579 $150,746 $138,619 $199,334 $204,080 $211,924 $219,729 $222,890 $228,471 $233,442 Growth Over Prior Year - 30.4% 8.7% -1.8% -8.0% 43.8% 2.4% 3.8% 3.7% 1.4% 2.5% 2.2% EXPENSES Cash Compensation and Benefits 41,397 48,722 51,600 58,016 55,283 61,248 Other Non-Cash Compensation 6,933 10,182 9,819 30,093 13,204 15,824 Total Compensation and Benefits Expense 48,330 58,904 61,419 88,109 68,487 77,072 83,923 88,554 93,601 95,296 98,108 100,324 Growth Over Prior Year - 21.9% 4.3% 43.5% -22.3% 12.5% 8.9% 5.5% 5.7% 1.8% 3.0% 2.3% % of Total Revenue 44.6% 41.7% 40.0% 58.4% 49.4% 38.7% 41.1% 41.8% 42.6% 42.8% 42.9% 43.0% General & Administrative Expenses 12,788 13,337 13,405 16,973 14,859 16,403 25,308 25,999 27,405 28,592 29,435 30,493 Growth Over Prior Year - 4.3% 0.5% 26.6% -12.5% 10.4% 54.3% 2.7% 5.4% 4.3% 2.9% 3.6% % of Total Revenue 11.8% 9.4% 8.7% 11.3% 10.7% 8.2% 12.4% 12.3% 12.5% 12.8% 12.9% 13.1% TOTAL OPERATING EXPENSES $61,118 $72,241 $74,824 $105,082 $83,346 $93,475 $109,231 $114,553 $121,006 $123,888 $127,543 $130,817 Operating Income $47,218 $69,054 $78,755 $45,664 $55,273 $105,859 $94,849 $97,371 $98,723 $99,002 $100,928 $102,625 (+) Depreciation $1,058 $1,024 $995 $1,039 $1,214 $1,179 $1,284 $1,284 $1,284 $1,284 $1,284 $1,284 EBITDA $48,276 $70,078 $79,750 $46,703 $56,487 $107,038 $96,133 $98,655 $100,007 $100,286 $102,212 $103,909 Growth Over Prior Year - 45.2% 13.8% -41.4% 20.9% 89.5% -10.2% 2.6% 1.4% 0.3% 1.9% 1.7% % of Total Revenue 44.6% 49.6% 51.9% 31.0% 40.7% 53.7% 47.1% 46.6% 45.5% 45.0% 44.7% 44.5% (+) Interest Income $177 $154 $171 $193 $208 $233 (+) Investment Gain/(Loss) ($288) $2,250 $2,500 $2,750 $3,000 $3,250 Other Income/ (Expense) ($48,042) $25,608 ($2,658) $5,607 $552 $8,416 ($111) $2,404 $2,671 $2,943 $3,208 $3,483 INCOME BEFORE INCOME TAXES ($824) $94,662 $76,097 $51,271 $55,825 $114,275 $94,738 $99,775 $101,394 $101,945 $104,136 $106,108 (-) UBT (4% effective rate) ($9,690) ($3,991) ($4,056) ($4,078) ($4,165) ($4,244) (-) Corporate Tax (25.7% effective rate) ($21,858) ($24,617) ($25,016) ($25,152) ($25,692) ($26,179) Income Tax Provision ($54,475) $34,512 $7,778 $5,795 $4,287 $7,798 ($31,548) ($28,608) ($29,072) ($29,230) ($29,857) ($30,423) -33.3% -28.7% -28.7% -28.7% -28.7% -28.7% Consolidated Net Income $53,651 $60,150 $68,319 $45,476 $51,538 $106,477 $63,190 $71,167 $72,322 $72,715 $74,279 $75,685 23
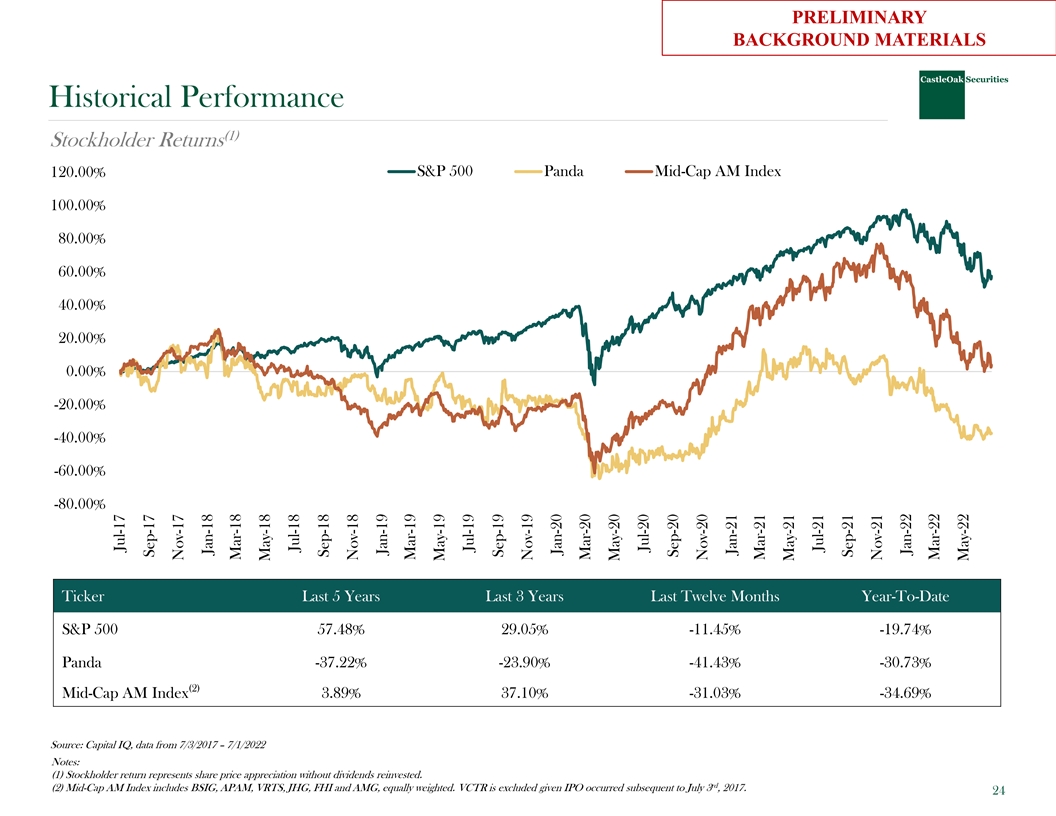
PRELIMINARY BACKGROUND MATERIALS Historical Performance (1) Stockholder Returns S&P 500 Panda Mid-Cap AM Index 120.00% 100.00% 80.00% 60.00% 40.00% 20.00% 0.00% -20.00% -40.00% -60.00% -80.00% Ticker Last 5 Years Last 3 Years Last Twelve Months Year-To-Date S&P 500 57.48% 29.05% -11.45% -19.74% Panda -37.22% -23.90% -41.43% -30.73% (2) Mid-Cap AM Index 3.89% 37.10% -31.03% -34.69% Source: Capital IQ, data from 7/3/2017 – 7/1/2022 Notes: (1) Stockholder return represents share price appreciation without dividends reinvested. rd (2) Mid-Cap AM Index includes BSIG, APAM, VRTS, JHG, FHI and AMG, equally weighted. VCTR is excluded given IPO occurred subsequent to July 3 , 2017. 24 Jul-17 Sep-17 Nov-17 Jan-18 Mar-18 May-18 Jul-18 Sep-18 Nov-18 Jan-19 Mar-19 May-19 Jul-19 Sep-19 Nov-19 Jan-20 Mar-20 May-20 Jul-20 Sep-20 Nov-20 Jan-21 Mar-21 May-21 Jul-21 Sep-21 Nov-21 Jan-22 Mar-22 May-22
PRELIMINARY BACKGROUND MATERIALS Legal Disclaimer By accepting this presentation, the recipient agrees to be bound by the following obligations and limitations. This document is confidential and has been prepared for informational purposes only. This document is not to be construed as a recommendation, an offer to sell or a solicitation of an offer to buy any securities. Any dissemination, distribution or reproduction of this document is strictly prohibited without the consent of CastleOak Securities, L.P. The information herein is obtained from sources deemed reliable, but its accuracy and completeness cannot be guaranteed, and is subject to change without notice. Purpose. This presentation has been prepared by CastleOak Securities, L.P. (“CastleOak ) for the exclusive use of the party to whom CastleOak delivers this presentation (together with its subsidiaries and affiliates, hereinafter the Recipient ). No independent verification. The information in this presentation has been obtained from the Recipient and other publicly available sources and has not been independently verified by CastleOak or any of its employees or partners (“Representatives”). No representation or warranty. No representation, warranty, or undertaking, either express or implied, is or will be given by CastleOak or its representatives as to or in relation to the accuracy, completeness, reliability or sufficiency of the information contained in this presentation or as to the reasonableness of any assumption contained in this presentation. No liability. By accepting receipt of this presentation, the Recipient acknowledges and agrees that to the maximum extent permitted by law and except in the case of fraud, each of CastleOak and its Representatives expressly disclaims any and all liability that may arise from this presentation, or any other written or oral information provided in connection with this presentation, and any errors contained therein and/or omissions therefrom, or from relying on or any use of the contents of this presentation or otherwise in connection with this presentation. Forecasts. The valuations, projections, estimates, forecasts, targets, prospects, returns and/or opinions (including, without limitation, projections of revenue, expense, net income and stock performance) contained herein involve elements of subjective judgment and analysis. Any opinions expressed in this presentation are subject to change without notice and may differ from or be contrary to opinions expressed by other business areas or groups of CastleOak as a result of using different assumptions and criteria. This presentation may contain forward-looking statements. CastleOak gives no undertaking and is under no obligation to update these forward-looking statements for events or circumstances that occur subsequent to the date of this presentation. Nothing contained herein is, or shall be relied upon as, a promise or representation as to the past or future, or that any of the estimates or projections contained herein will be achieved. No duty to update. This presentation speaks as at the date hereof (unless an earlier date is otherwise indicated in the presentation) and in furnishing this presentation, no obligation is undertaken nor is any representation or undertaking given by CastleOak or its Representatives to provide the Recipient with additional information or to update, revise or reaffirm the information in this presentation or to correct any inaccuracies therein which may become apparent. Information or education only. This presentation has been prepared solely for informational or educational purposes and does not suggest taking or refraining from any action. It does not constitute or contain an invitation, solicitation or an offer to buy or sell any securities or related financial instruments or any assets, business, or undertakings described herein. No advice given. The Recipient should not construe the contents of this presentation as legal, tax, accounting or investment advice or a recommendation. The Recipient should consult its own counsel, tax and financial advisors as to legal and related matters concerning any transaction described herein. This presentation does not purport to be all-inclusive or to contain all of the information that the Recipient may require or request upon due diligence if it wishes to proceed further. No investment, divestment or other financial decisions or actions should be based on the information in this presentation. This presentation should not be viewed as an investment recommendation because it is provided as part of the general marketing and advertising activities of CastleOak. No distribution. This presentation has been prepared on a confidential basis solely for your use and benefit; provided that you and any of your employees, representatives, or other agents may disclose to any and all persons, without limitation of any kind, the tax treatment and tax structure of the transaction and all materials of any kind (including opinions or other tax analyses) that are provided to you relating to such tax treatment and tax structure. Distribution of this presentation to any person other than you and those persons retained to advise you, who agree to maintain the confidentiality of this material and be bound by the limitations outlined herein, is unauthorized. CastleOak specifically prohibits the redistribution or reproduction of this presentation in whole or in part without the prior written permission of CastleOak and CastleOak accepts no liability whatsoever for the actions of third parties in this respect. 25

Exhibit (c)(6) Honesty | Integrity | Performance Project Panda Confidential Presentation to the Special Committee of the Board of Directors 25 July 2022 www.castleoaklp.com
CONFIDENTIAL Table of Contents Valuation Summary p. 2 DCF Analysis p. 5 Selected Public Market Comparisons p. 11 Selected Private Market Transactions p. 18 Appendix p. 21 1

Honesty | Integrity | Performance Valuation Summary www.castleoaklp.com 2 2
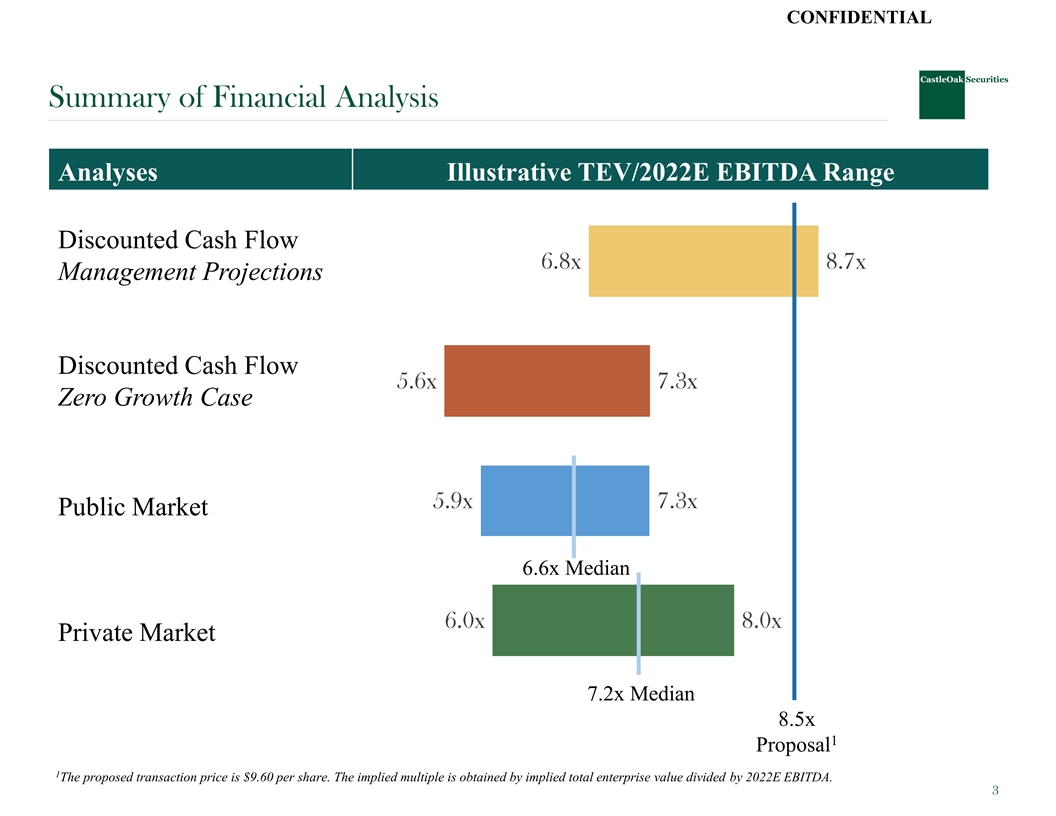
CONFIDENTIAL Summary of Financial Analysis Analyses Illustrative TEV/2022E EBITDA Range Discounted Cash Flow 6.8x 8.7x Management Projections Discounted Cash Flow 5.6x 7.3x Zero Growth Case 5.9x 7.3x Public Market 6.6x Median 6.0x 8.0x Private Market 7.2x Median 8.5x 1 Proposal 1 The proposed transaction price is $9.60 per share. The implied multiple is obtained by implied total enterprise value divided by 2022E EBITDA. 3
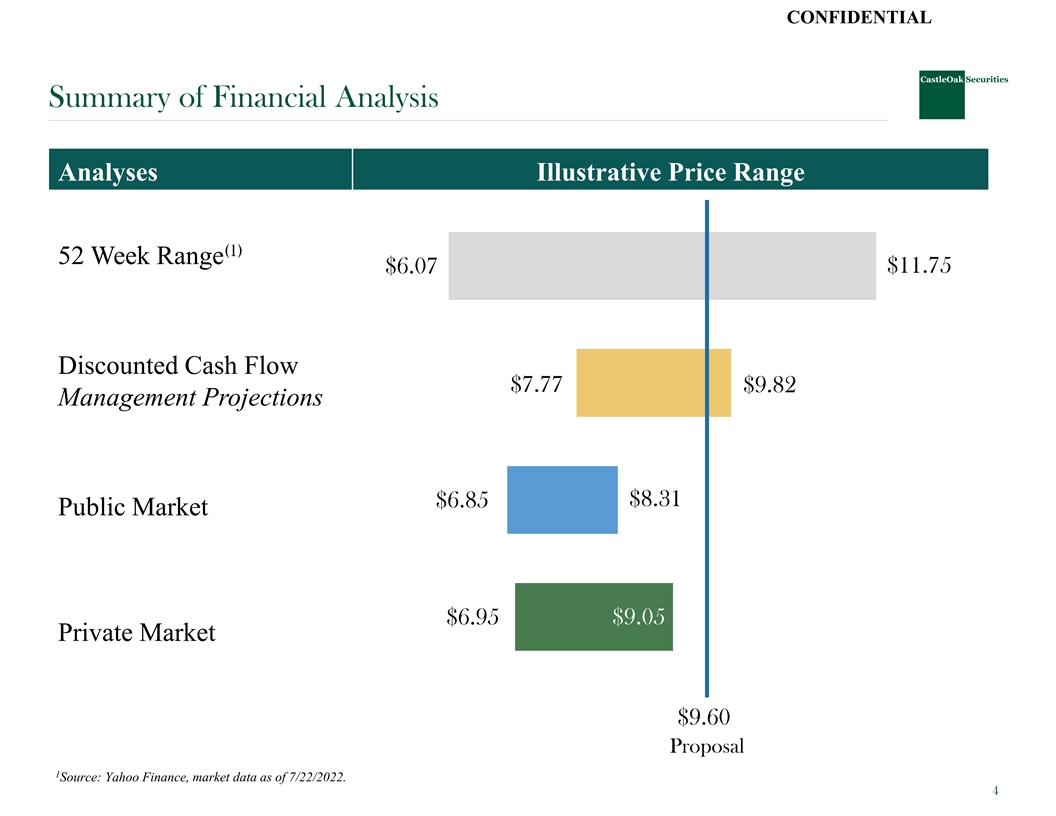
CONFIDENTIAL Summary of Financial Analysis Analyses Illustrative Price Range (1) 52 Week Range $6.07 $11.75 Discounted Cash Flow $7.77 $9.82 Management Projections $8.31 $6.85 Public Market $9.05 $6.95 $9.04 Private Market $9.60 Proposal 1 Source: Yahoo Finance, market data as of 7/22/2022. 4

Honesty | Integrity | Performance DCF Analysis www.castleoaklp.com 5 5
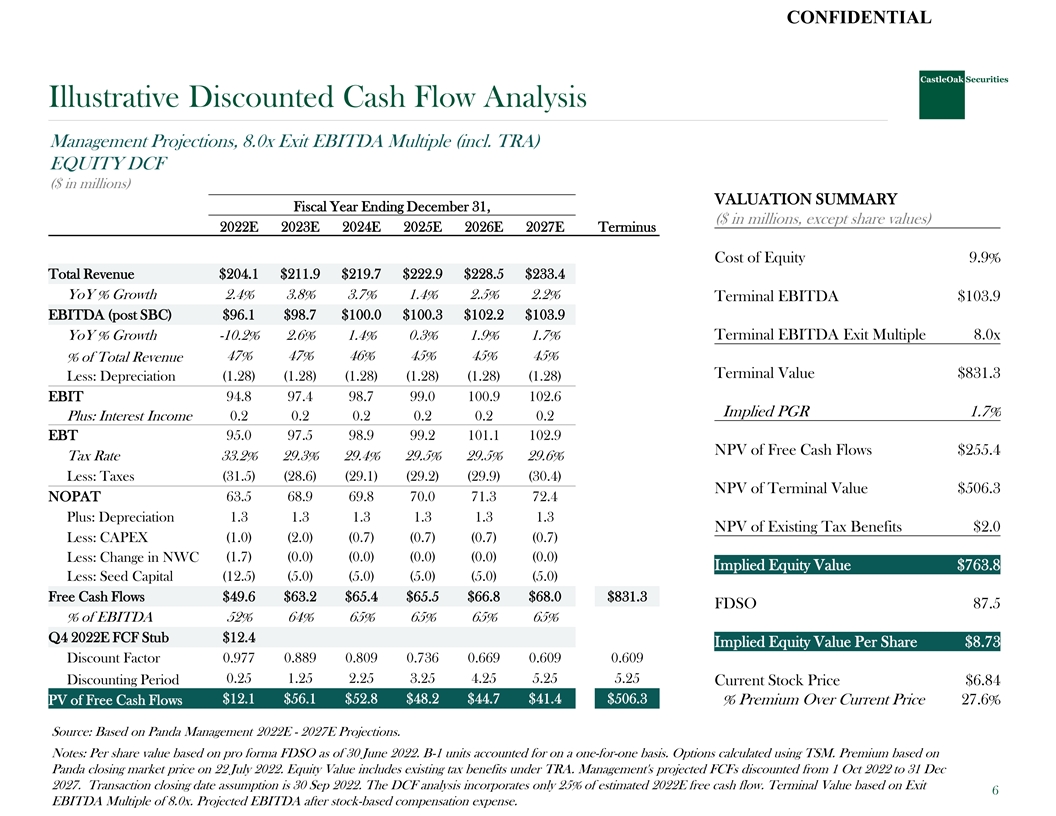
CONFIDENTIAL Illustrative Discounted Cash Flow Analysis Management Projections, 8.0x Exit EBITDA Multiple (incl. TRA) EQUITY DCF ($ in millions) VALUATION SUMMARY Fiscal Year Ending December 31, ($ in millions, except share values) 2022E 2023E 2024E 2025E 2026E 2027E Terminus Cost of Equity 9.9% Total Revenue $204.1 $211.9 $219.7 $222.9 $228.5 $233.4 YoY % Growth 2.4% 3.8% 3.7% 1.4% 2.5% 2.2% Terminal EBITDA $103.9 EBITDA (post SBC) $96.1 $98.7 $100.0 $100.3 $102.2 $103.9 YoY % Growth -10.2% 2.6% 1.4% 0.3% 1.9% 1.7% Terminal EBITDA Exit Multiple 8.0x 47% 47% 46% 45% 45% 45% % of Total Revenue Terminal Value $831.3 Less: Depreciation (1.28) (1.28) (1.28) (1.28) (1.28) (1.28) EBIT 94.8 97.4 98.7 99.0 100.9 102.6 Implied PGR 1.7% Plus: Interest Income 0.2 0.2 0.2 0.2 0.2 0.2 EBT 95.0 97.5 98.9 99.2 101.1 102.9 NPV of Free Cash Flows $255.4 Tax Rate 33.2% 29.3% 29.4% 29.5% 29.5% 29.6% Less: Taxes (31.5) (28.6) (29.1) (29.2) (29.9) (30.4) NPV of Terminal Value $506.3 NOPAT 63.5 68.9 69.8 70.0 71.3 72.4 Plus: Depreciation 1.3 1.3 1.3 1.3 1.3 1.3 NPV of Existing Tax Benefits $2.0 Less: CAPEX (1.0) (2.0) (0.7) (0.7) (0.7) (0.7) (1.7) (0.0) (0.0) (0.0) (0.0) (0.0) Less: Change in NWC Implied Equity Value $763.8 Less: Seed Capital (12.5) (5.0) (5.0) (5.0) (5.0) (5.0) Free Cash Flows $49.6 $63.2 $65.4 $65.5 $66.8 $68.0 $831.3 FDSO 87.5 % of EBITDA 52% 64% 65% 65% 65% 65% Q4 2022E FCF Stub $12.4 Implied Equity Value Per Share $8.73 Discount Factor 0.977 0.889 0.809 0.736 0.669 0.609 0.609 0.25 1.25 2.25 3.25 4.25 5.25 5.25 Discounting Period Current Stock Price $6.84 $12.1 $56.1 $52.8 $48.2 $44.7 $41.4 $506.3 PV of Free Cash Flows % Premium Over Current Price 27.6% Source: Based on Panda Management 2022E - 2027E Projections. Notes: Per share value based on pro forma FDSO as of 30 June 2022. B-1 units accounted for on a one-for-one basis. Options calculated using TSM. Premium based on Panda closing market price on 22 July 2022. Equity Value includes existing tax benefits under TRA. Management's projected FCFs discounted from 1 Oct 2022 to 31 Dec 2027. Transaction closing date assumption is 30 Sep 2022. The DCF analysis incorporates only 25% of estimated 2022E free cash flow. Terminal Value based on Exit 6 EBITDA Multiple of 8.0x. Projected EBITDA after stock-based compensation expense.
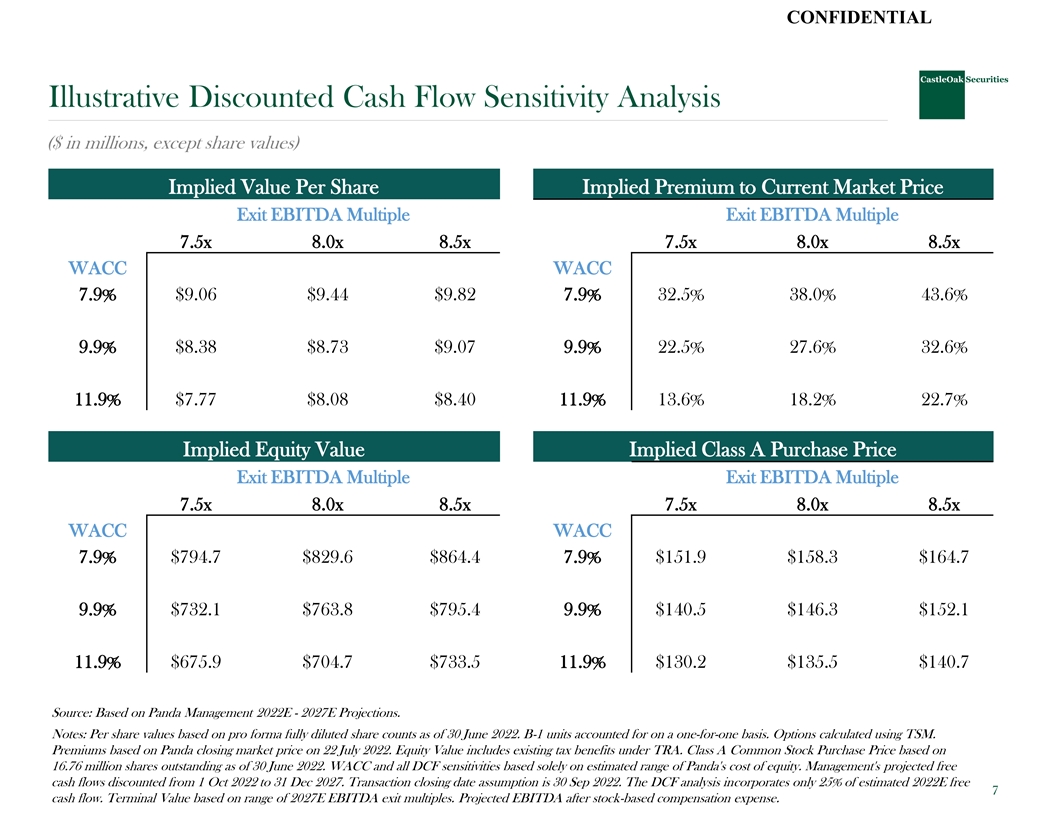
CONFIDENTIAL Illustrative Discounted Cash Flow Sensitivity Analysis ($ in millions, except share values) Implied Value Per Share Implied Premium to Current Market Price Exit EBITDA Multiple Exit EBITDA Multiple 7.5x 8.0x 8.5x 7.5x 8.0x 8.5x WACC WACC 7.9% $9.06 $9.44 $9.82 7.9% 32.5% 38.0% 43.6% 9.9% $8.38 $8.73 $9.07 9.9% 22.5% 27.6% 32.6% 11.9% $7.77 $8.08 $8.40 11.9% 13.6% 18.2% 22.7% Implied Equity Value Implied Class A Purchase Price Exit EBITDA Multiple Exit EBITDA Multiple 7.5x 8.0x 8.5x 7.5x 8.0x 8.5x WACC WACC 7.9% $794.7 $829.6 $864.4 7.9% $151.9 $158.3 $164.7 9.9% $732.1 $763.8 $795.4 9.9% $140.5 $146.3 $152.1 11.9% $675.9 $704.7 $733.5 11.9% $130.2 $135.5 $140.7 Source: Based on Panda Management 2022E - 2027E Projections. Notes: Per share values based on pro forma fully diluted share counts as of 30 June 2022. B-1 units accounted for on a one-for-one basis. Options calculated using TSM. Premiums based on Panda closing market price on 22 July 2022. Equity Value includes existing tax benefits under TRA. Class A Common Stock Purchase Price based on 16.76 million shares outstanding as of 30 June 2022. WACC and all DCF sensitivities based solely on estimated range of Panda's cost of equity. Management's projected free cash flows discounted from 1 Oct 2022 to 31 Dec 2027. Transaction closing date assumption is 30 Sep 2022. The DCF analysis incorporates only 25% of estimated 2022E free 7 cash flow. Terminal Value based on range of 2027E EBITDA exit multiples. Projected EBITDA after stock-based compensation expense.
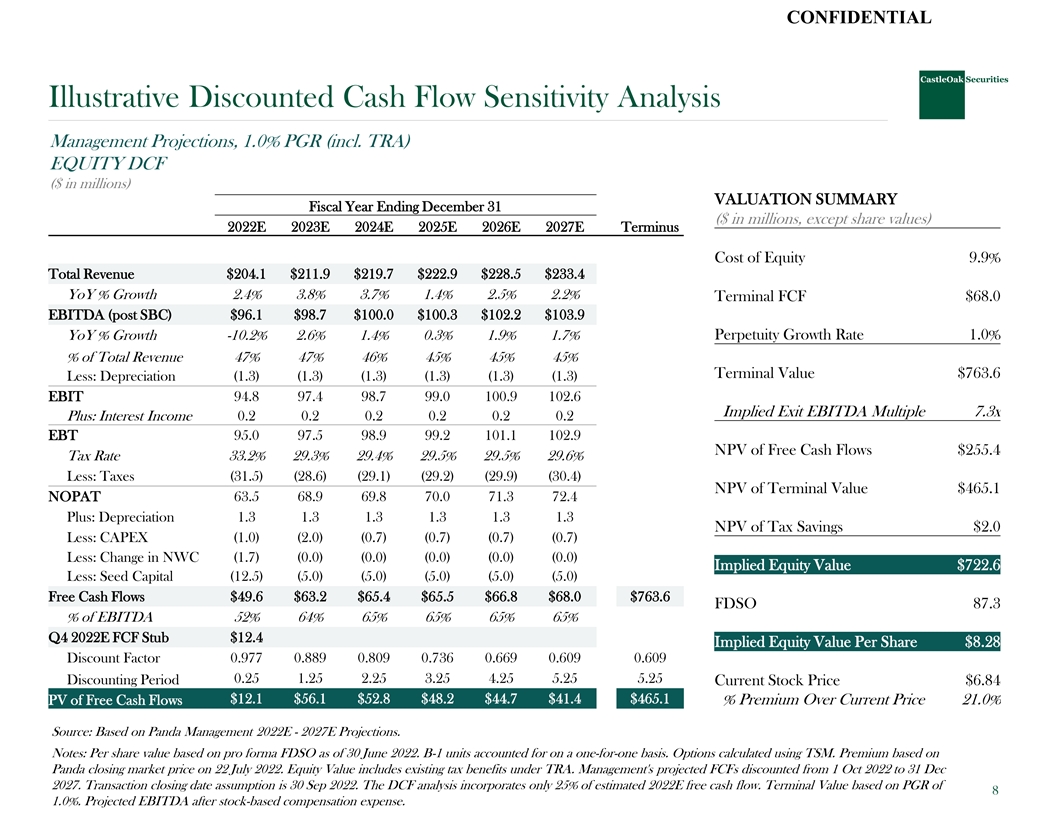
CONFIDENTIAL Illustrative Discounted Cash Flow Sensitivity Analysis Management Projections, 1.0% PGR (incl. TRA) EQUITY DCF ($ in millions) VALUATION SUMMARY Fiscal Year Ending December 31 ($ in millions, except share values) 2022E 2023E 2024E 2025E 2026E 2027E Terminus Cost of Equity 9.9% Total Revenue $204.1 $211.9 $219.7 $222.9 $228.5 $233.4 YoY % Growth 2.4% 3.8% 3.7% 1.4% 2.5% 2.2% Terminal FCF $68.0 EBITDA (post SBC) $96.1 $98.7 $100.0 $100.3 $102.2 $103.9 YoY % Growth -10.2% 2.6% 1.4% 0.3% 1.9% 1.7% Perpetuity Growth Rate 1.0% % of Total Revenue 47% 47% 46% 45% 45% 45% Terminal Value $763.6 Less: Depreciation (1.3) (1.3) (1.3) (1.3) (1.3) (1.3) EBIT 94.8 97.4 98.7 99.0 100.9 102.6 Implied Exit EBITDA Multiple 7.3x Plus: Interest Income 0.2 0.2 0.2 0.2 0.2 0.2 EBT 95.0 97.5 98.9 99.2 101.1 102.9 NPV of Free Cash Flows $255.4 Tax Rate 33.2% 29.3% 29.4% 29.5% 29.5% 29.6% Less: Taxes (31.5) (28.6) (29.1) (29.2) (29.9) (30.4) NPV of Terminal Value $465.1 NOPAT 63.5 68.9 69.8 70.0 71.3 72.4 Plus: Depreciation 1.3 1.3 1.3 1.3 1.3 1.3 NPV of Tax Savings $2.0 Less: CAPEX (1.0) (2.0) (0.7) (0.7) (0.7) (0.7) Less: Change in NWC (1.7) (0.0) (0.0) (0.0) (0.0) (0.0) Implied Equity Value $722.6 Less: Seed Capital (12.5) (5.0) (5.0) (5.0) (5.0) (5.0) Free Cash Flows $49.6 $63.2 $65.4 $65.5 $66.8 $68.0 $763.6 FDSO 87.3 % of EBITDA 52% 64% 65% 65% 65% 65% Q4 2022E FCF Stub $12.4 Implied Equity Value Per Share $8.28 Discount Factor 0.977 0.889 0.809 0.736 0.669 0.609 0.609 0.25 1.25 2.25 3.25 4.25 5.25 5.25 Discounting Period Current Stock Price $6.84 $12.1 $56.1 $52.8 $48.2 $44.7 $41.4 $465.1 PV of Free Cash Flows % Premium Over Current Price 21.0% Source: Based on Panda Management 2022E - 2027E Projections. Notes: Per share value based on pro forma FDSO as of 30 June 2022. B-1 units accounted for on a one-for-one basis. Options calculated using TSM. Premium based on Panda closing market price on 22 July 2022. Equity Value includes existing tax benefits under TRA. Management's projected FCFs discounted from 1 Oct 2022 to 31 Dec 2027. Transaction closing date assumption is 30 Sep 2022. The DCF analysis incorporates only 25% of estimated 2022E free cash flow. Terminal Value based on PGR of 8 1.0%. Projected EBITDA after stock-based compensation expense.
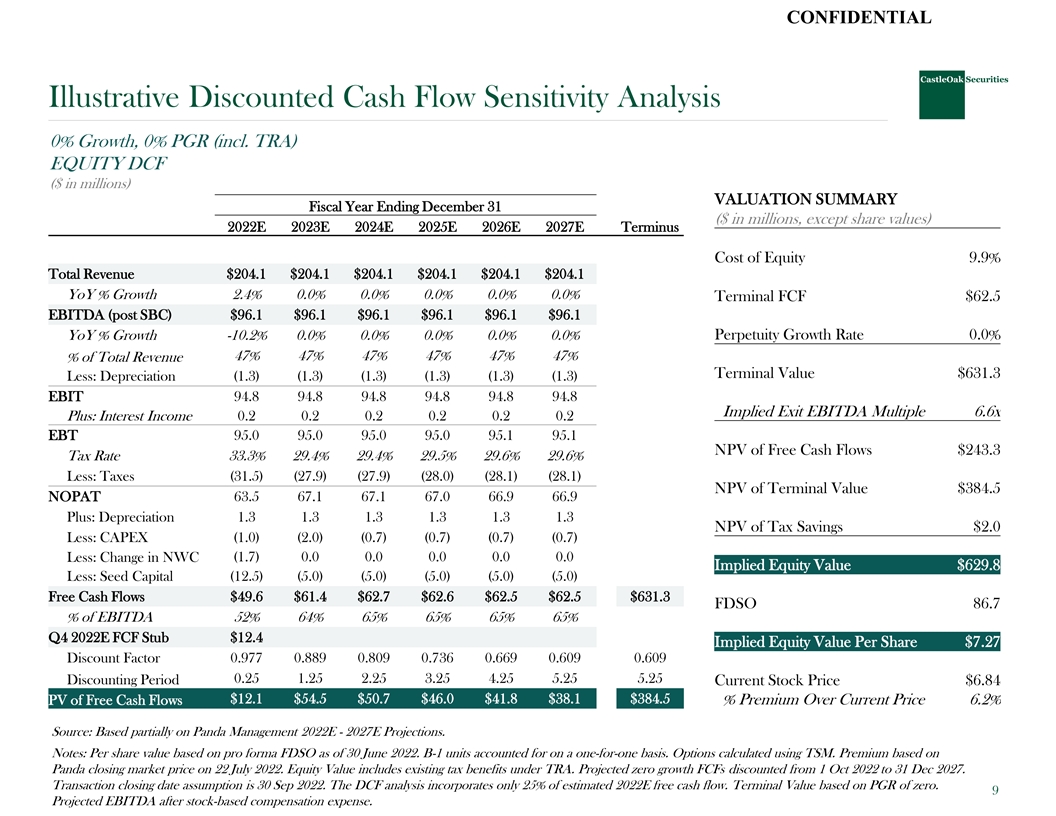
CONFIDENTIAL Illustrative Discounted Cash Flow Sensitivity Analysis 0% Growth, 0% PGR (incl. TRA) EQUITY DCF ($ in millions) VALUATION SUMMARY Fiscal Year Ending December 31 ($ in millions, except share values) 2022E 2023E 2024E 2025E 2026E 2027E Terminus Cost of Equity 9.9% Total Revenue $204.1 $204.1 $204.1 $204.1 $204.1 $204.1 YoY % Growth 2.4% 0.0% 0.0% 0.0% 0.0% 0.0% Terminal FCF $62.5 EBITDA (post SBC) $96.1 $96.1 $96.1 $96.1 $96.1 $96.1 YoY % Growth -10.2% 0.0% 0.0% 0.0% 0.0% 0.0% Perpetuity Growth Rate 0.0% 47% 47% 47% 47% 47% 47% % of Total Revenue Terminal Value $631.3 Less: Depreciation (1.3) (1.3) (1.3) (1.3) (1.3) (1.3) EBIT 94.8 94.8 94.8 94.8 94.8 94.8 Implied Exit EBITDA Multiple 6.6x Plus: Interest Income 0.2 0.2 0.2 0.2 0.2 0.2 EBT 95.0 95.0 95.0 95.0 95.1 95.1 NPV of Free Cash Flows $243.3 Tax Rate 33.3% 29.4% 29.4% 29.5% 29.6% 29.6% Less: Taxes (31.5) (27.9) (27.9) (28.0) (28.1) (28.1) NPV of Terminal Value $384.5 NOPAT 63.5 67.1 67.1 67.0 66.9 66.9 Plus: Depreciation 1.3 1.3 1.3 1.3 1.3 1.3 NPV of Tax Savings $2.0 Less: CAPEX (1.0) (2.0) (0.7) (0.7) (0.7) (0.7) (1.7) 0.0 0.0 0.0 0.0 0.0 Less: Change in NWC Implied Equity Value $629.8 Less: Seed Capital (12.5) (5.0) (5.0) (5.0) (5.0) (5.0) Free Cash Flows $49.6 $61.4 $62.7 $62.6 $62.5 $62.5 $631.3 FDSO 86.7 % of EBITDA 52% 64% 65% 65% 65% 65% Q4 2022E FCF Stub $12.4 Implied Equity Value Per Share $7.27 Discount Factor 0.977 0.889 0.809 0.736 0.669 0.609 0.609 0.25 1.25 2.25 3.25 4.25 5.25 5.25 Discounting Period Current Stock Price $6.84 $12.1 $54.5 $50.7 $46.0 $41.8 $38.1 $384.5 PV of Free Cash Flows % Premium Over Current Price 6.2% Source: Based partially on Panda Management 2022E - 2027E Projections. Notes: Per share value based on pro forma FDSO as of 30 June 2022. B-1 units accounted for on a one-for-one basis. Options calculated using TSM. Premium based on Panda closing market price on 22 July 2022. Equity Value includes existing tax benefits under TRA. Projected zero growth FCFs discounted from 1 Oct 2022 to 31 Dec 2027. Transaction closing date assumption is 30 Sep 2022. The DCF analysis incorporates only 25% of estimated 2022E free cash flow. Terminal Value based on PGR of zero. 9 Projected EBITDA after stock-based compensation expense.
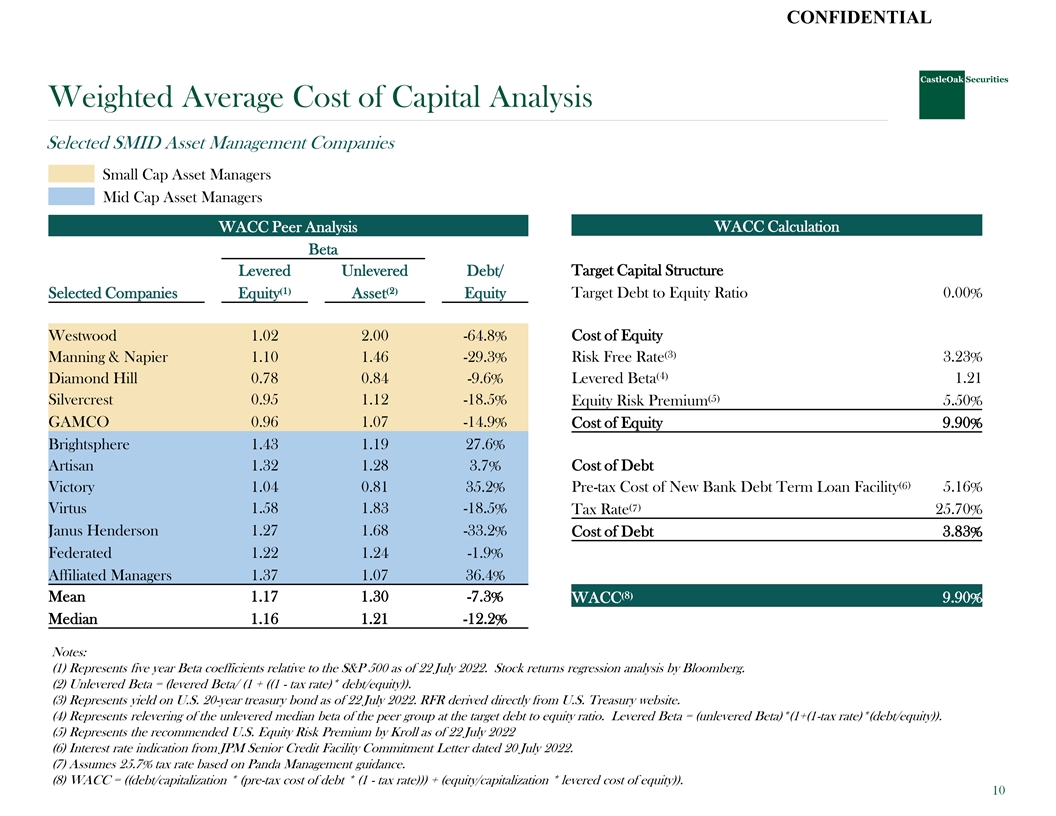
CONFIDENTIAL Weighted Average Cost of Capital Analysis Selected SMID Asset Management Companies Small Cap Asset Managers Mid Cap Asset Managers WACC Peer Analysis WACC Calculation Beta Levered Unlevered Debt/ Target Capital Structure Target Debt to Equity Ratio 0.00% Selected Companies Equity⁽¹⁾ Asset⁽²⁾ Equity Cost of Equity Westwood 1.02 2.00 -64.8% 3 3.23% Manning & Napier 1.10 1.46 -29.3% Risk Free Rate⁽⁾ 4 1.21 Diamond Hill 0.78 0.84 -9.6% Levered Beta⁽⁾ 5 Silvercrest 0.95 1.12 -18.5% Equity Risk Premium 5.50% ⁽⁾ GAMCO 0.96 1.07 -14.9% Cost of Equity 9.90% Brightsphere 1.43 1.19 27.6% Artisan 1.32 1.28 3.7% Cost of Debt 6 Victory 1.04 0.81 35.2% Pre-tax Cost of New Bank Debt Term Loan Facility⁽⁾ 5.16% 7 Virtus 1.58 1.83 -18.5% Tax Rate⁽⁾ 25.70% Janus Henderson 1.27 1.68 -33.2% Cost of Debt 3.83% Federated 1.22 1.24 -1.9% Affiliated Managers 1.37 1.07 36.4% 8 Mean 1.17 1.30 -7.3% WACC⁽⁾ 9.90% Median 1.16 1.21 -12.2% Notes: (1) Represents five year Beta coefficients relative to the S&P 500 as of 22 July 2022. Stock returns regression analysis by Bloomberg. (2) Unlevered Beta = (levered Beta/ (1 + ((1 - tax rate)* debt/equity)). (3) Represents yield on U.S. 20-year treasury bond as of 22 July 2022. RFR derived directly from U.S. Treasury website. (4) Represents relevering of the unlevered median beta of the peer group at the target debt to equity ratio. Levered Beta = (unlevered Beta)*(1+(1-tax rate)*(debt/equity)). (5) Represents the recommended U.S. Equity Risk Premium by Kroll as of 22 July 2022 (6) Interest rate indication from JPM Senior Credit Facility Commitment Letter dated 20 July 2022. (7) Assumes 25.7% tax rate based on Panda Management guidance. (8) WACC = ((debt/capitalization * (pre-tax cost of debt * (1 - tax rate))) + (equity/capitalization * levered cost of equity)). 10

Honesty | Integrity | Performance Selected Public Market Comparisons www.castleoaklp.com 11 11
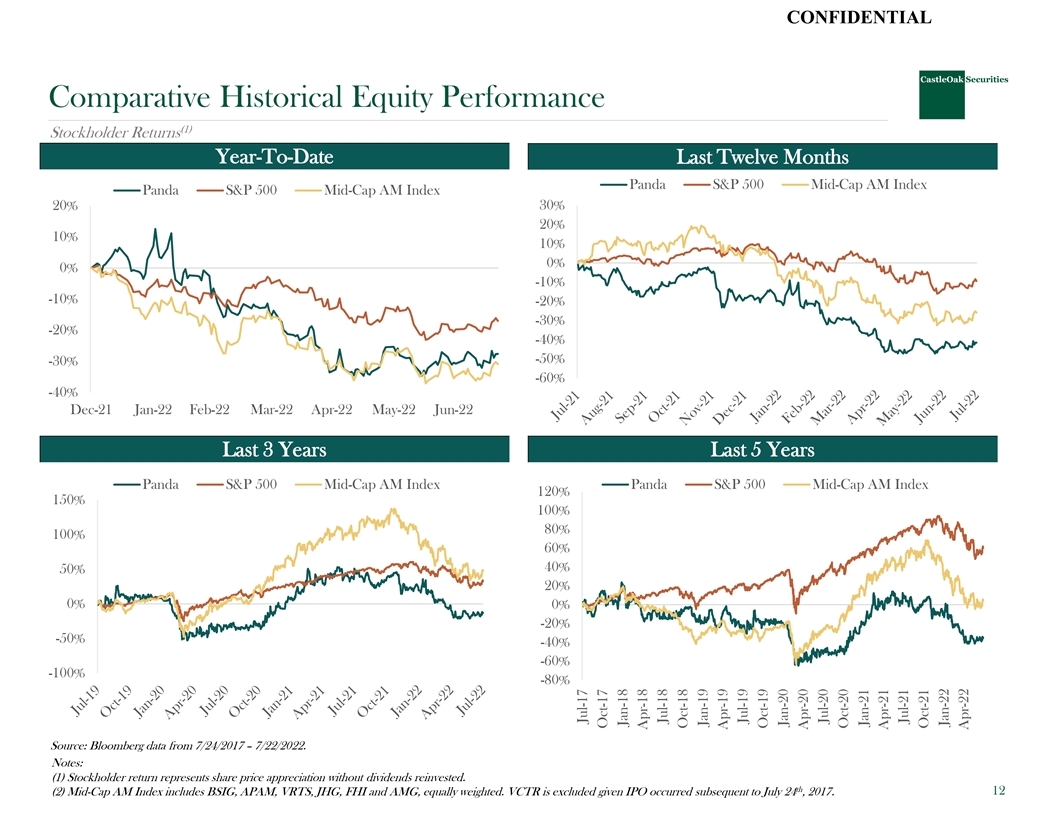
CONFIDENTIAL Comparative Historical Equity Performance (1) Stockholder Returns Year-To-Date Last Twelve Months Panda S&P 500 Mid-Cap AM Index Panda S&P 500 Mid-Cap AM Index 30% 20% 20% 10% 10% 0% 0% -10% -10% -20% -30% -20% -40% -50% -30% -60% -40% Dec-21 Jan-22 Feb-22 Mar-22 Apr-22 May-22 Jun-22 Last 3 Years Last 5 Years Panda S&P 500 Mid-Cap AM Index Panda S&P 500 Mid-Cap AM Index 120% 150% 100% 80% 100% 60% 40% 50% 20% 0% 0% -20% -50% -40% -60% -100% -80% Source: Bloomberg data from 7/24/2017 – 7/22/2022. Notes: (1) Stockholder return represents share price appreciation without dividends reinvested. th 12 (2) Mid-Cap AM Index includes BSIG, APAM, VRTS, JHG, FHI and AMG, equally weighted. VCTR is excluded given IPO occurred subsequent to July 24 , 2017. Jul-17 Oct-17 Jan-18 Apr-18 Jul-18 Oct-18 Jan-19 Apr-19 Jul-19 Oct-19 Jan-20 Apr-20 Jul-20 Oct-20 Jan-21 Apr-21 Jul-21 Oct-21 Jan-22 Apr-22
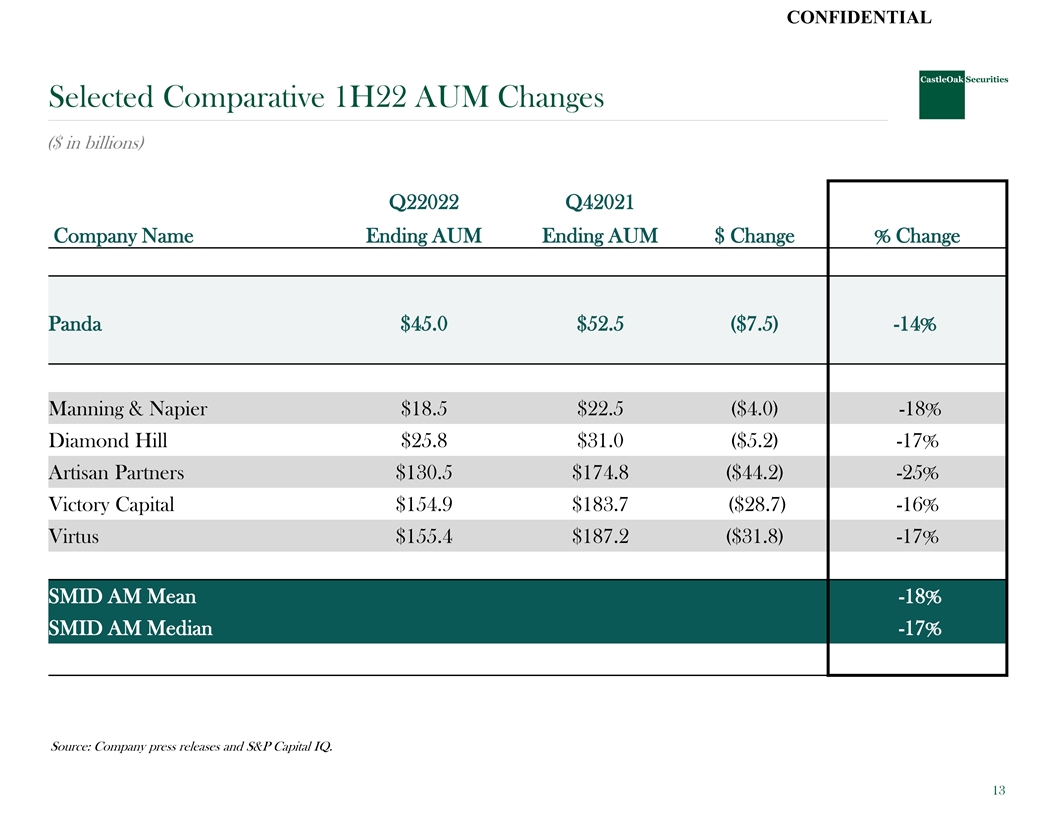
CONFIDENTIAL Selected Comparative 1H22 AUM Changes ($ in billions) Q22022 Q42021 Company Name Ending AUM Ending AUM $ Change % Change Panda $45.0 $52.5 ($7.5) -14% Manning & Napier $18.5 $22.5 ($4.0) -18% Diamond Hill $25.8 $31.0 ($5.2) -17% Artisan Partners $130.5 $174.8 ($44.2) -25% Victory Capital $154.9 $183.7 ($28.7) -16% Virtus $155.4 $187.2 ($31.8) -17% SMID AM Mean -18% SMID AM Median -17% Source: Company press releases and S&P Capital IQ. 13
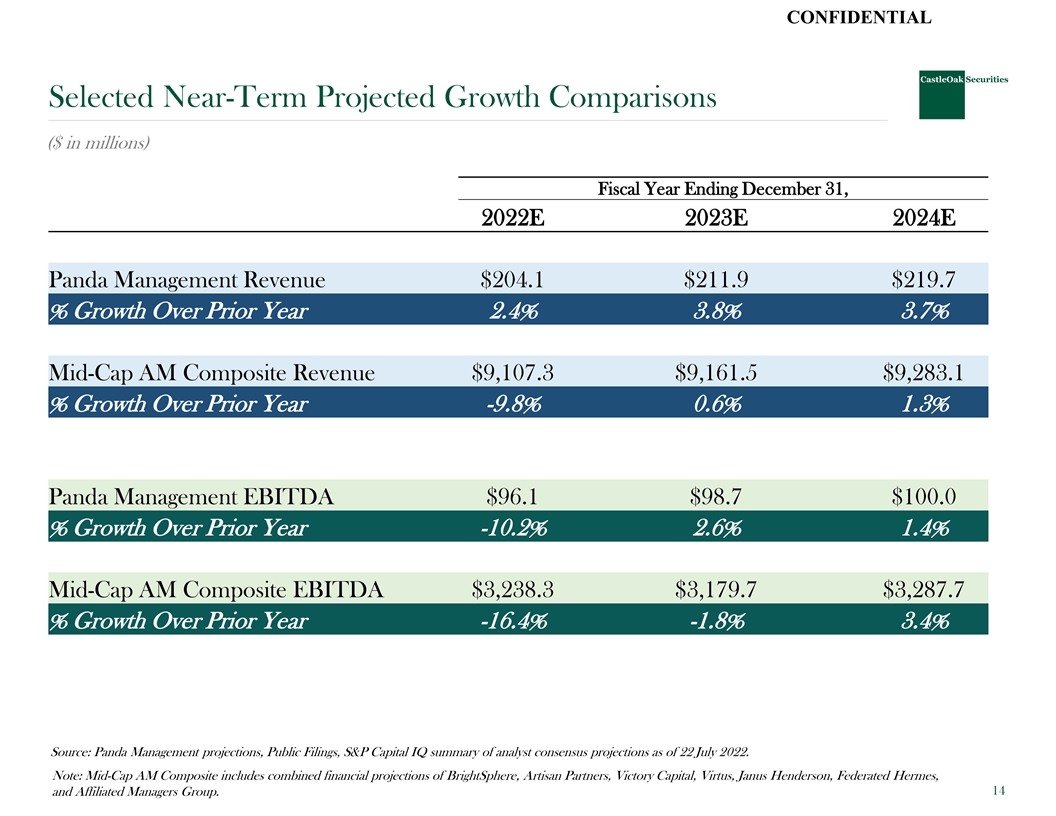
CONFIDENTIAL Selected Near-Term Projected Growth Comparisons ($ in millions) Fiscal Year Ending December 31, 2022E 2023E 2024E Panda Management Revenue $204.1 $211.9 $219.7 % Growth Over Prior Year 2.4% 3.8% 3.7% Mid-Cap AM Composite Revenue $9,107.3 $9,161.5 $9,283.1 % Growth Over Prior Year -9.8% 0.6% 1.3% Panda Management EBITDA $96.1 $98.7 $100.0 % Growth Over Prior Year -10.2% 2.6% 1.4% Mid-Cap AM Composite EBITDA $3,238.3 $3,179.7 $3,287.7 % Growth Over Prior Year -16.4% -1.8% 3.4% Source: Panda Management projections, Public Filings, S&P Capital IQ summary of analyst consensus projections as of 22 July 2022. Note: Mid-Cap AM Composite includes combined financial projections of BrightSphere, Artisan Partners, Victory Capital, Virtus, Janus Henderson, Federated Hermes, 14 and Affiliated Managers Group.
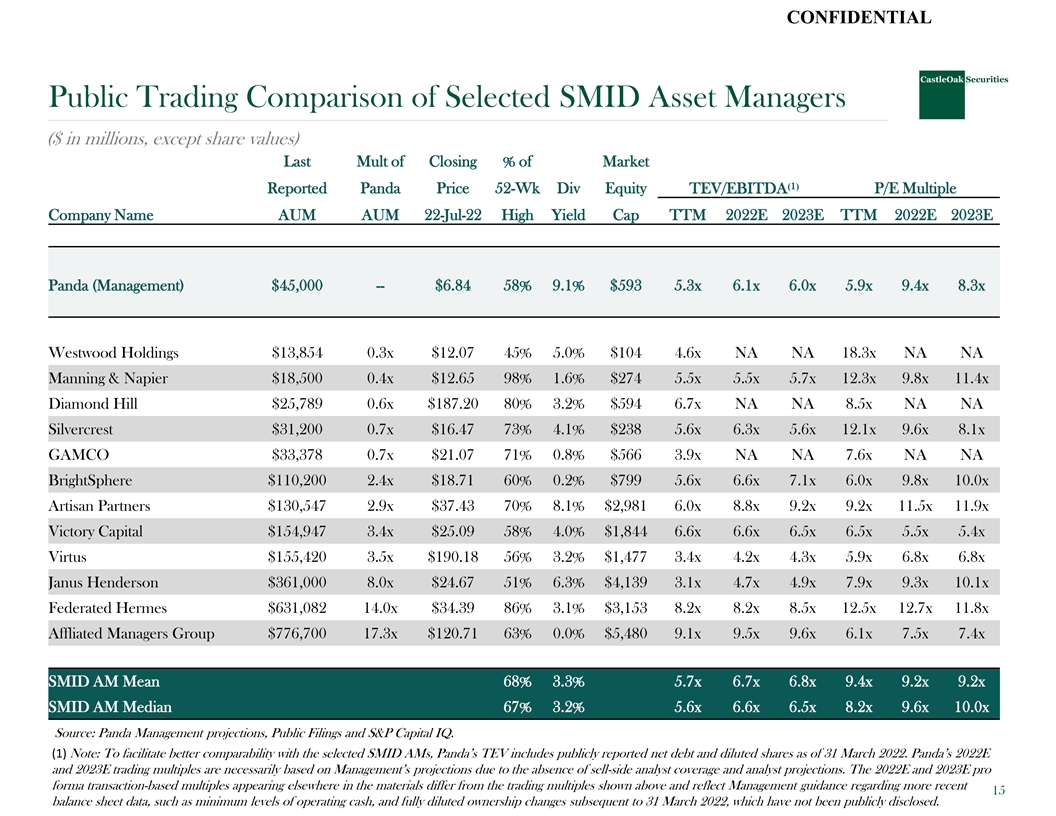
CONFIDENTIAL Public Trading Comparison of Selected SMID Asset Managers ($ in millions, except share values) Last Mult of Closing % of Market Reported Panda Price 52-Wk Div Equity TEV/EBITDA⁽¹⁾ P/E Multiple Company Name AUM AUM 22-Jul-22 High Yield Cap TTM 2022E 2023E TTM 2022E 2023E Panda (Management) $45,000 -- $6.84 58% 9.1% $593 5.3x 6.1x 6.0x 5.9x 9.4x 8.3x Westwood Holdings $13,854 0.3x $12.07 45% 5.0% $104 4.6x NA NA 18.3x NA NA Manning & Napier $18,500 0.4x $12.65 98% 1.6% $274 5.5x 5.5x 5.7x 12.3x 9.8x 11.4x Diamond Hill $25,789 0.6x $187.20 80% 3.2% $594 6.7x NA NA 8.5x NA NA Silvercrest $31,200 0.7x $16.47 73% 4.1% $238 5.6x 6.3x 5.6x 12.1x 9.6x 8.1x GAMCO $33,378 0.7x $21.07 71% 0.8% $566 3.9x NA NA 7.6x NA NA BrightSphere $110,200 2.4x $18.71 60% 0.2% $799 5.6x 6.6x 7.1x 6.0x 9.8x 10.0x Artisan Partners $130,547 2.9x $37.43 70% 8.1% $2,981 6.0x 8.8x 9.2x 9.2x 11.5x 11.9x Victory Capital $154,947 3.4x $25.09 58% 4.0% $1,844 6.6x 6.6x 6.5x 6.5x 5.5x 5.4x Virtus $155,420 3.5x $190.18 56% 3.2% $1,477 3.4x 4.2x 4.3x 5.9x 6.8x 6.8x Janus Henderson $361,000 8.0x $24.67 51% 6.3% $4,139 3.1x 4.7x 4.9x 7.9x 9.3x 10.1x Federated Hermes $631,082 14.0x $34.39 86% 3.1% $3,153 8.2x 8.2x 8.5x 12.5x 12.7x 11.8x Affliated Managers Group $776,700 17.3x $120.71 63% 0.0% $5,480 9.1x 9.5x 9.6x 6.1x 7.5x 7.4x SMID AM Mean 68% 3.3% 5.7x 6.7x 6.8x 9.4x 9.2x 9.2x SMID AM Median 67% 3.2% 5.6x 6.6x 6.5x 8.2x 9.6x 10.0x Source: Panda Management projections, Public Filings and S&P Capital IQ. (1) Note: To facilitate better comparability with the selected SMID AMs, Panda’s TEV includes publicly reported net debt and diluted shares as of 31 March 2022. Panda’s 2022E and 2023E trading multiples are necessarily based on Management’s projections due to the absence of sell-side analyst coverage and analyst projections. The 2022E and 2023E pro forma transaction-based multiples appearing elsewhere in the materials differ from the trading multiples shown above and reflect Management guidance regarding more recent 15 balance sheet data, such as minimum levels of operating cash, and fully diluted ownership changes subsequent to 31 March 2022, which have not been publicly disclosed.
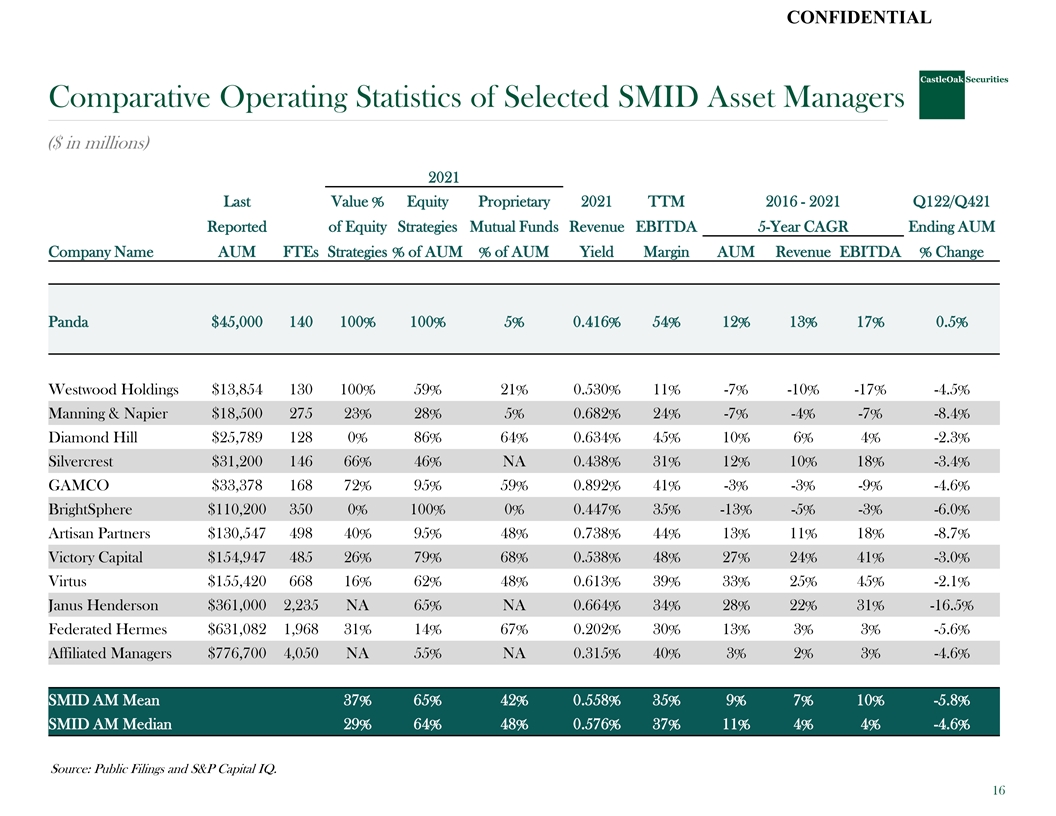
CONFIDENTIAL Comparative Operating Statistics of Selected SMID Asset Managers ($ in millions) 2021 Last Value % Equity Proprietary 2021 TTM 2016 - 2021 Q122/Q421 Reported of Equity Strategies Mutual Funds Revenue EBITDA 5-Year CAGR Ending AUM Company Name AUM FTEs Strategies % of AUM % of AUM Yield Margin AUM Revenue EBITDA % Change Panda $45,000 140 100% 100% 5% 0.416% 54% 12% 13% 17% 0.5% Westwood Holdings $13,854 130 100% 59% 21% 0.530% 11% -7% -10% -17% -4.5% Manning & Napier $18,500 275 23% 28% 5% 0.682% 24% -7% -4% -7% -8.4% Diamond Hill $25,789 128 0% 86% 64% 0.634% 45% 10% 6% 4% -2.3% Silvercrest $31,200 146 66% 46% NA 0.438% 31% 12% 10% 18% -3.4% GAMCO $33,378 168 72% 95% 59% 0.892% 41% -3% -3% -9% -4.6% BrightSphere $110,200 350 0% 100% 0% 0.447% 35% -13% -5% -3% -6.0% Artisan Partners $130,547 498 40% 95% 48% 0.738% 44% 13% 11% 18% -8.7% Victory Capital $154,947 485 26% 79% 68% 0.538% 48% 27% 24% 41% -3.0% Virtus $155,420 668 16% 62% 48% 0.613% 39% 33% 25% 45% -2.1% Janus Henderson $361,000 2,235 NA 65% NA 0.664% 34% 28% 22% 31% -16.5% Federated Hermes $631,082 1,968 31% 14% 67% 0.202% 30% 13% 3% 3% -5.6% Affiliated Managers $776,700 4,050 NA 55% NA 0.315% 40% 3% 2% 3% -4.6% SMID AM Mean 37% 65% 42% 0.558% 35% 9% 7% 10% -5.8% SMID AM Median 29% 64% 48% 0.576% 37% 11% 4% 4% -4.6% Source: Public Filings and S&P Capital IQ. 16
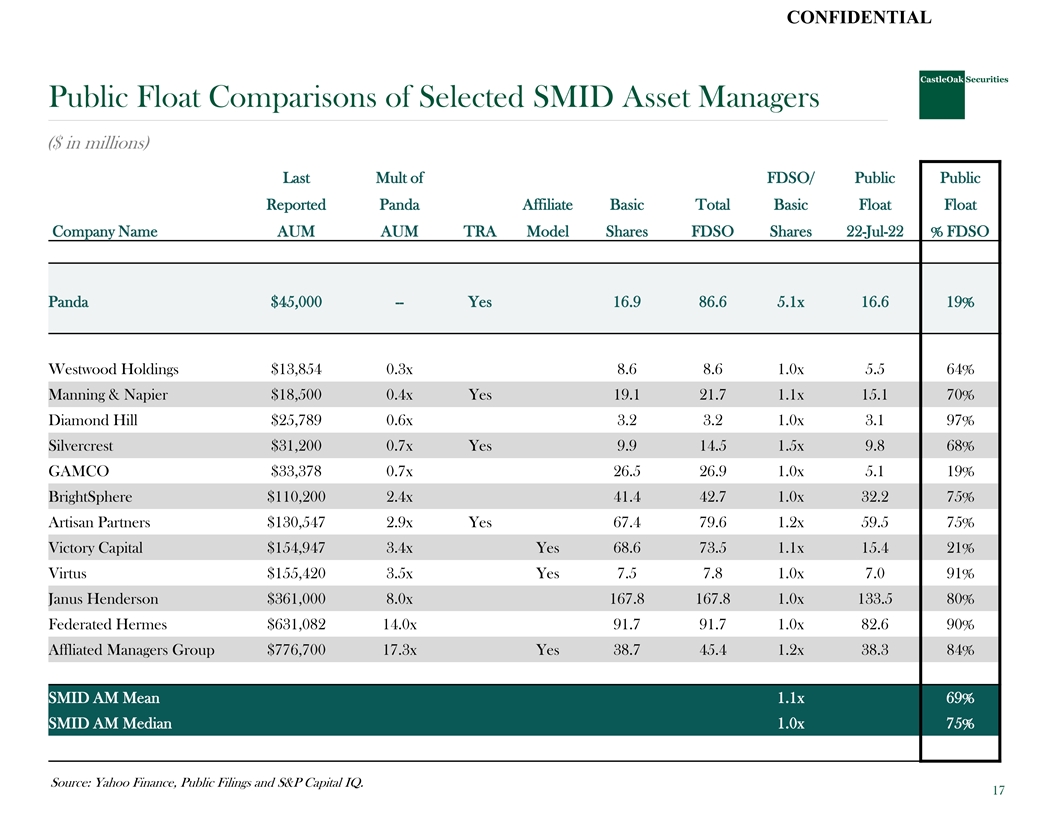
CONFIDENTIAL Public Float Comparisons of Selected SMID Asset Managers ($ in millions) Last Mult of FDSO/ Public Public Reported Panda Affiliate Basic Total Basic Float Float Company Name AUM AUM TRA Model Shares FDSO Shares 22-Jul-22 % FDSO Panda $45,000 -- Yes 16.9 86.6 5.1x 16.6 19% Westwood Holdings $13,854 0.3x 8.6 8.6 1.0x 5.5 64% Manning & Napier $18,500 0.4x Yes 19.1 21.7 1.1x 15.1 70% Diamond Hill $25,789 0.6x 3.2 3.2 1.0x 3.1 97% Silvercrest $31,200 0.7x Yes 9.9 14.5 1.5x 9.8 68% GAMCO $33,378 0.7x 26.5 26.9 1.0x 5.1 19% BrightSphere $110,200 2.4x 41.4 42.7 1.0x 32.2 75% Artisan Partners $130,547 2.9x Yes 67.4 79.6 1.2x 59.5 75% Victory Capital $154,947 3.4x Yes 68.6 73.5 1.1x 15.4 21% Virtus $155,420 3.5x Yes 7.5 7.8 1.0x 7.0 91% Janus Henderson $361,000 8.0x 167.8 167.8 1.0x 133.5 80% Federated Hermes $631,082 14.0x 91.7 91.7 1.0x 82.6 90% Affliated Managers Group $776,700 17.3x Yes 38.7 45.4 1.2x 38.3 84% SMID AM Mean 1.1x 69% SMID AM Median 1.0x 75% Source: Yahoo Finance, Public Filings and S&P Capital IQ. 17

Honesty | Integrity | Performance Selected Private Market Transactions www.castleoaklp.com 18 18
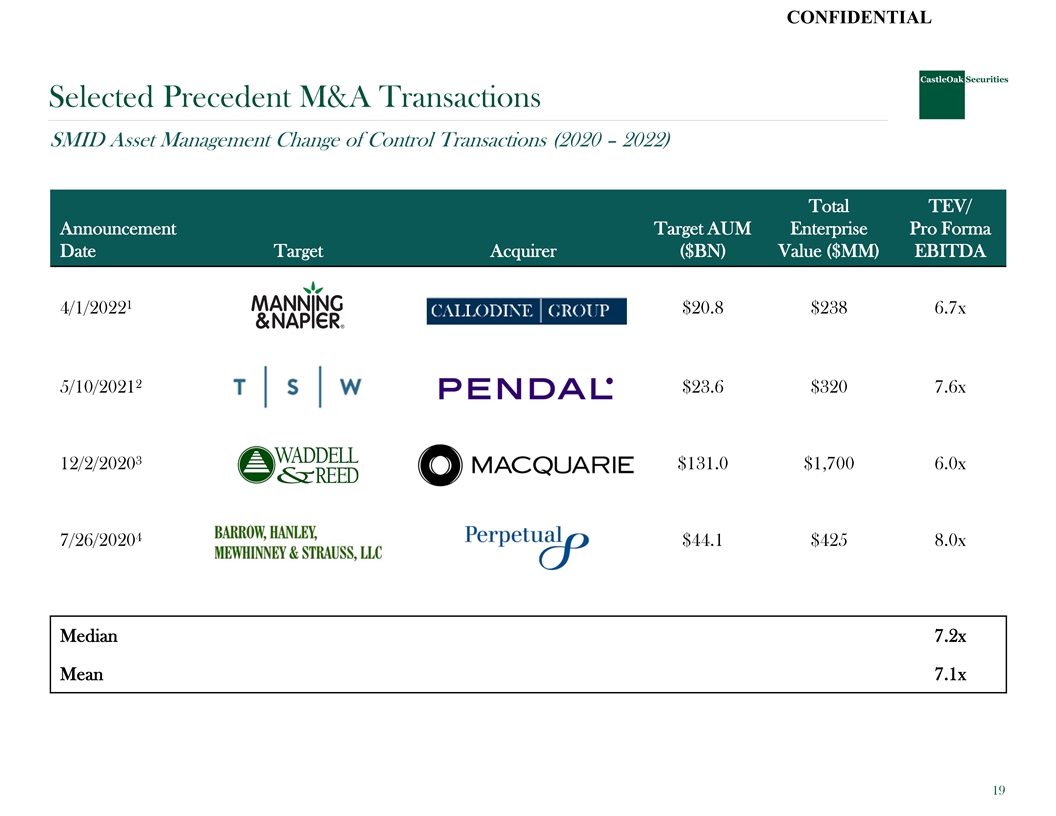
CONFIDENTIAL Selected Precedent M&A Transactions SMID Asset Management Change of Control Transactions (2020 – 2022) Total TEV/ Announcement Target AUM Enterprise Pro Forma Date Target Acquirer ($BN) Value ($MM) EBITDA 1 4/1/2022 $20.8 $238 6.7x 2 5/10/2021 $23.6 $320 7.6x 3 12/2/2020 $131.0 $1,700 6.0x 4 7/26/2020 $44.1 $425 8.0x Median 7.2x Mean 7.1x 19
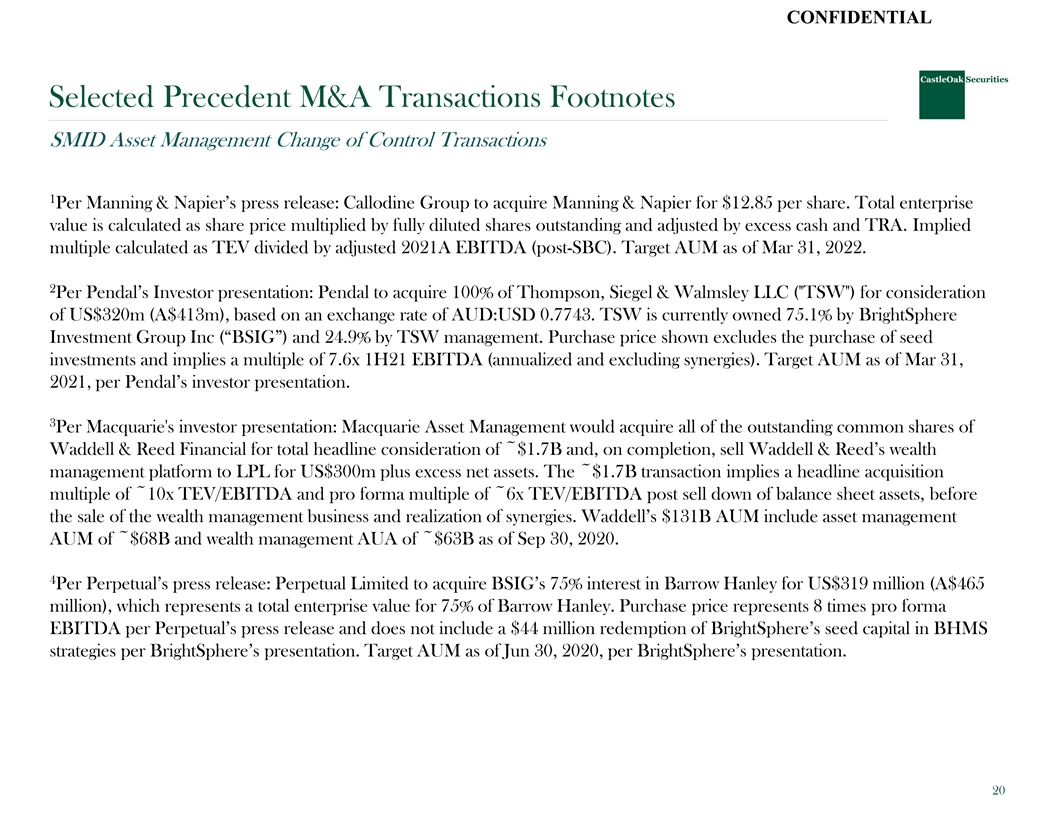
CONFIDENTIAL Selected Precedent M&A Transactions Footnotes SMID Asset Management Change of Control Transactions 1 Per Manning & Napier’s press release: Callodine Group to acquire Manning & Napier for $12.85 per share. Total enterprise value is calculated as share price multiplied by fully diluted shares outstanding and adjusted by excess cash and TRA. Implied multiple calculated as TEV divided by adjusted 2021A EBITDA (post-SBC). Target AUM as of Mar 31, 2022. 2 Per Pendal’s Investor presentation: Pendal to acquire 100% of Thompson, Siegel & Walmsley LLC ( TSW ) for consideration of US$320m (A$413m), based on an exchange rate of AUD:USD 0.7743. TSW is currently owned 75.1% by BrightSphere Investment Group Inc (“BSIG”) and 24.9% by TSW management. Purchase price shown excludes the purchase of seed investments and implies a multiple of 7.6x 1H21 EBITDA (annualized and excluding synergies). Target AUM as of Mar 31, 2021, per Pendal’s investor presentation. 3 Per Macquarie's investor presentation: Macquarie Asset Management would acquire all of the outstanding common shares of Waddell & Reed Financial for total headline consideration of ~$1.7B and, on completion, sell Waddell & Reed’s wealth management platform to LPL for US$300m plus excess net assets. The ~$1.7B transaction implies a headline acquisition multiple of ~10x TEV/EBITDA and pro forma multiple of ~6x TEV/EBITDA post sell down of balance sheet assets, before the sale of the wealth management business and realization of synergies. Waddell’s $131B AUM include asset management AUM of ~$68B and wealth management AUA of ~$63B as of Sep 30, 2020. 4 Per Perpetual’s press release: Perpetual Limited to acquire BSIG’s 75% interest in Barrow Hanley for US$319 million (A$465 million), which represents a total enterprise value for 75% of Barrow Hanley. Purchase price represents 8 times pro forma EBITDA per Perpetual’s press release and does not include a $44 million redemption of BrightSphere’s seed capital in BHMS strategies per BrightSphere’s presentation. Target AUM as of Jun 30, 2020, per BrightSphere’s presentation. 20

Honesty | Integrity | Performance Appendix www.castleoaklp.com 21 21
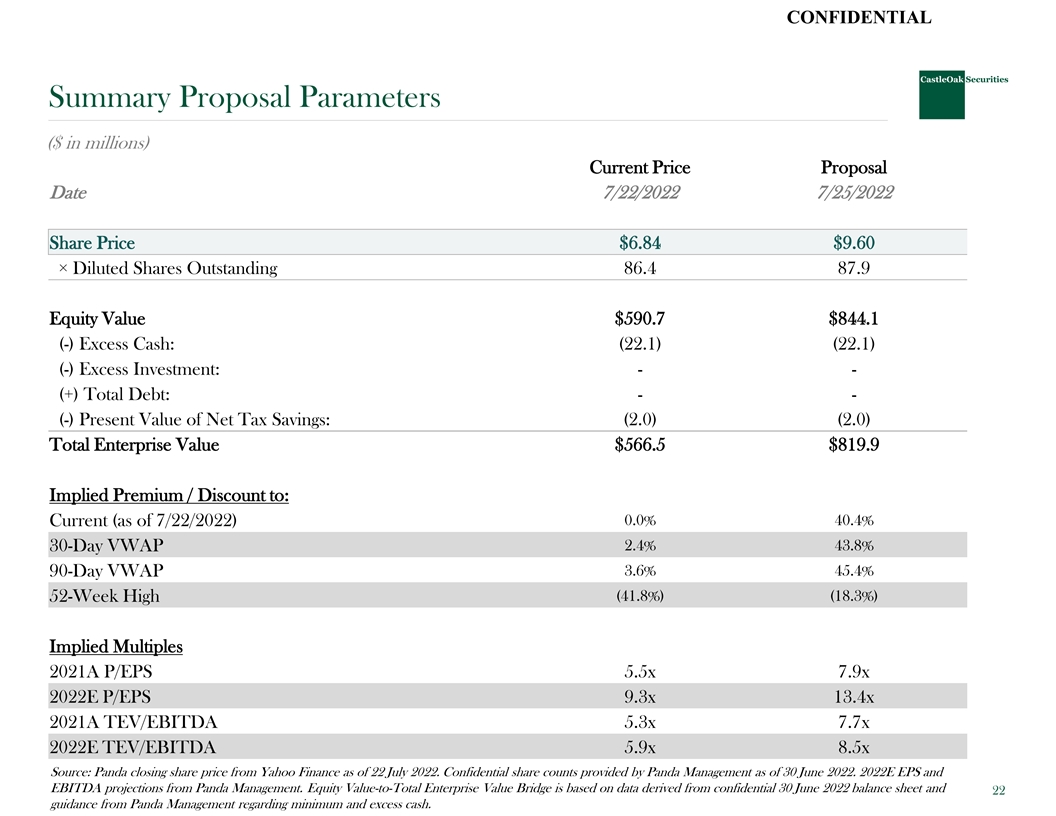
CONFIDENTIAL Summary Proposal Parameters ($ in millions) Current Price Proposal Date 7/22/2022 7/25/2022 Share Price $6.84 $9.60 × Diluted Shares Outstanding 86.4 87.9 Equity Value $590.7 $844.1 (-) Excess Cash: (22.1) (22.1) (-) Excess Investment: - - (+) Total Debt: - - (-) Present Value of Net Tax Savings: (2.0) (2.0) Total Enterprise Value $566.5 $819.9 Implied Premium / Discount to: 0.0% 40.4% Current (as of 7/22/2022) 2.4% 43.8% 30-Day VWAP 3.6% 45.4% 90-Day VWAP (41.8%) (18.3%) 52-Week High Implied Multiples 2021A P/EPS 5.5x 7.9x 2022E P/EPS 9.3x 13.4x 2021A TEV/EBITDA 5.3x 7.7x 2022E TEV/EBITDA 5.9x 8.5x Source: Panda closing share price from Yahoo Finance as of 22 July 2022. Confidential share counts provided by Panda Management as of 30 June 2022. 2022E EPS and EBITDA projections from Panda Management. Equity Value-to-Total Enterprise Value Bridge is based on data derived from confidential 30 June 2022 balance sheet and 22 guidance from Panda Management regarding minimum and excess cash.
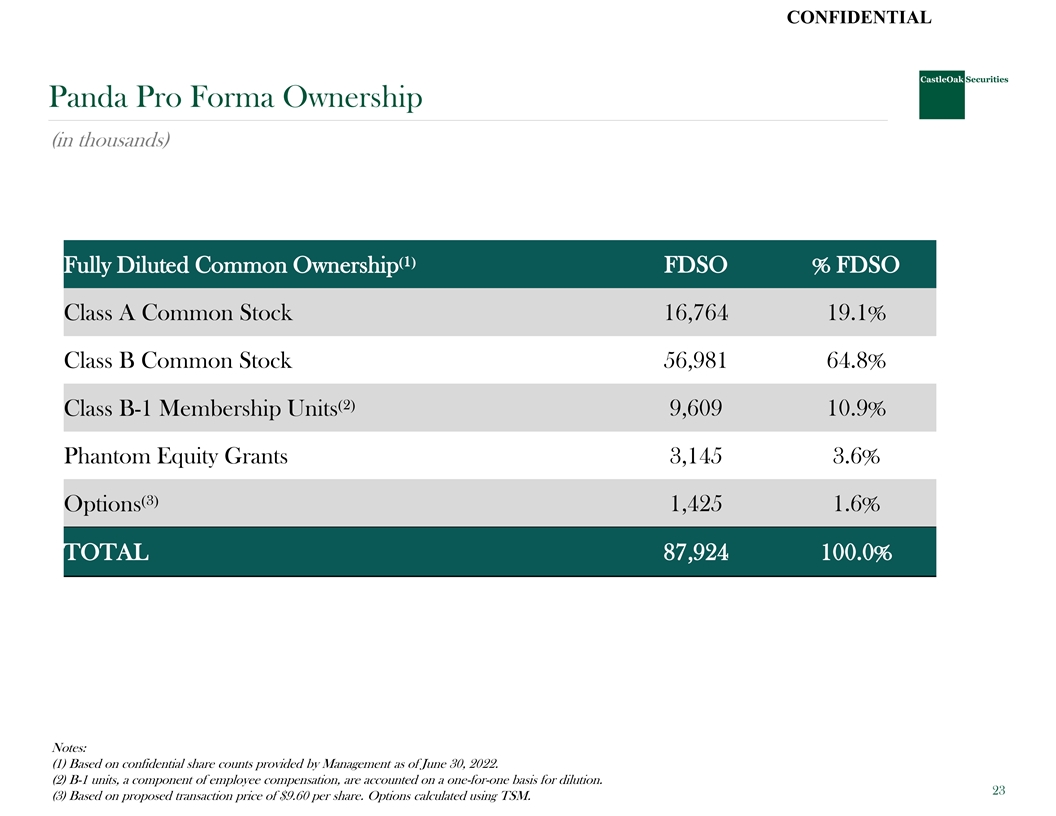
CONFIDENTIAL Panda Pro Forma Ownership (in thousands) FDSO % FDSO Fully Diluted Common Ownership⁽¹⁾ Class A Common Stock 16,764 19.1% Class B Common Stock 56,981 64.8% Class B-1 Membership Units⁽²⁾ 9,609 10.9% Phantom Equity Grants 3,145 3.6% Options⁽³⁾ 1,425 1.6% TOTAL 87,924 100.0% Notes: (1) Based on confidential share counts provided by Management as of June 30, 2022. (2) B-1 units, a component of employee compensation, are accounted on a one-for-one basis for dilution. 23 (3) Based on proposed transaction price of $9.60 per share. Options calculated using TSM.
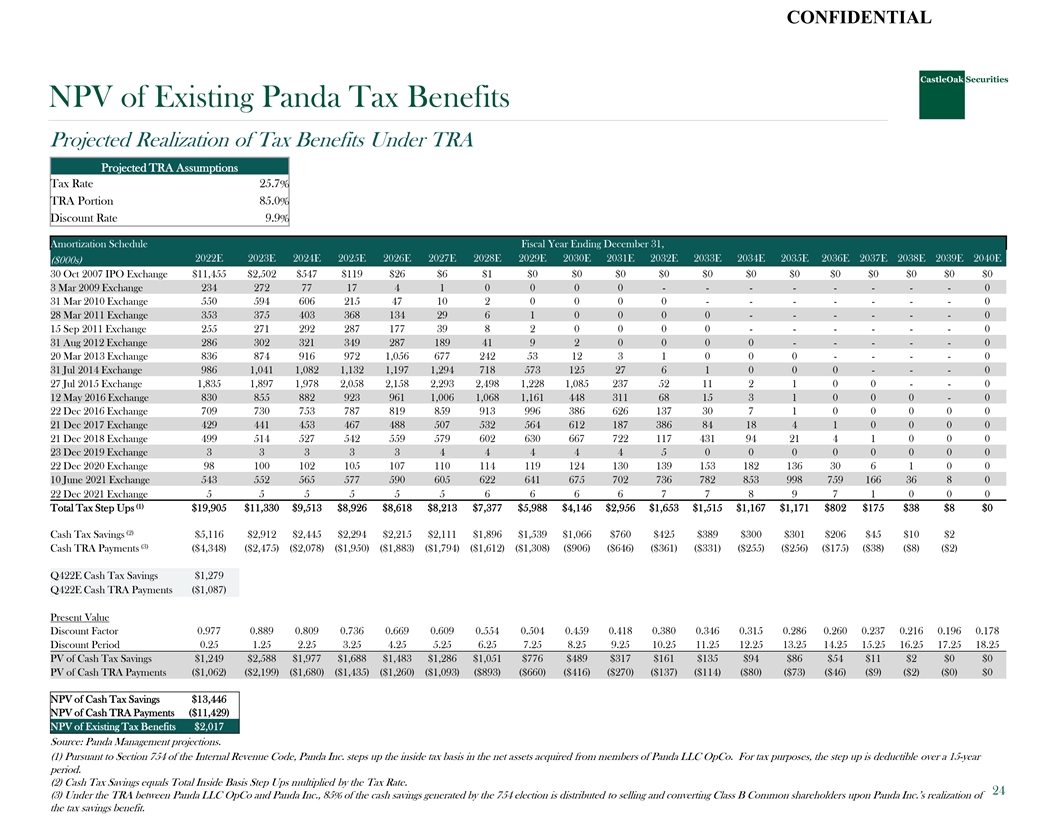
CONFIDENTIAL NPV of Existing Panda Tax Benefits Projected Realization of Tax Benefits Under TRA Projected TRA Assumptions Tax Rate 25.7% TRA Portion 85.0% Discount Rate 9.9% Amortization Schedule Fiscal Year Ending December 31, 2022E 2023E 2024E 2025E 2026E 2027E 2028E 2029E 2030E 2031E 2032E 2033E 2034E 2035E 2036E 2037E 2038E 2039E 2040E ($000s) 30 Oct 2007 IPO Exchange $11,455 $2,502 $547 $119 $26 $6 $1 $0 $0 $0 $0 $0 $0 $0 $0 $0 $0 $0 $0 3 Mar 2009 Exchange 234 272 77 17 4 1 0 0 0 0 - - - - - - - - 0 31 Mar 2010 Exchange 550 594 606 215 47 10 2 0 0 0 0 - - - - - - - 0 28 Mar 2011 Exchange 353 375 403 368 134 29 6 1 0 0 0 0 - - - - - - 0 15 Sep 2011 Exchange 255 271 292 287 177 39 8 2 0 0 0 0 - - - - - - 0 31 Aug 2012 Exchange 286 302 321 349 287 189 41 9 2 0 0 0 0 - - - - - 0 20 Mar 2013 Exchange 836 874 916 972 1,056 677 242 53 12 3 1 0 0 0 - - - - 0 31 Jul 2014 Exchange 986 1,041 1,082 1,132 1,197 1,294 718 573 125 27 6 1 0 0 0 - - - 0 27 Jul 2015 Exchange 1,835 1,897 1,978 2,058 2,158 2,293 2,498 1,228 1,085 237 52 11 2 1 0 0 - - 0 12 May 2016 Exchange 830 855 882 923 961 1,006 1,068 1,161 448 311 68 15 3 1 0 0 0 - 0 22 Dec 2016 Exchange 709 730 753 787 819 859 913 996 386 626 137 30 7 1 0 0 0 0 0 21 Dec 2017 Exchange 429 441 453 467 488 507 532 564 612 187 386 84 18 4 1 0 0 0 0 21 Dec 2018 Exchange 499 514 527 542 559 579 602 630 667 722 117 431 94 21 4 1 0 0 0 23 Dec 2019 Exchange 3 3 3 3 3 4 4 4 4 4 5 0 0 0 0 0 0 0 0 22 Dec 2020 Exchange 98 100 102 105 107 110 114 119 124 130 139 153 182 136 30 6 1 0 0 10 June 2021 Exchange 543 552 565 577 590 605 622 641 675 702 736 782 853 998 759 166 36 8 0 22 Dec 2021 Exchange 5 5 5 5 5 5 6 6 6 6 7 7 8 9 7 1 0 0 0 (1) Total Tax Step Ups $19,905 $11,330 $9,513 $8,926 $8,618 $8,213 $7,377 $5,988 $4,146 $2,956 $1,653 $1,515 $1,167 $1,171 $802 $175 $38 $8 $0 (2) Cash Tax Savings $5,116 $2,912 $2,445 $2,294 $2,215 $2,111 $1,896 $1,539 $1,066 $760 $425 $389 $300 $301 $206 $45 $10 $2 (3) Cash TRA Payments ($4,348) ($2,475) ($2,078) ($1,950) ($1,883) ($1,794) ($1,612) ($1,308) ($906) ($646) ($361) ($331) ($255) ($256) ($175) ($38) ($8) ($2) Q422E Cash Tax Savings $1,279 Q422E Cash TRA Payments ($1,087) Present Value Discount Factor 0.977 0.889 0.809 0.736 0.669 0.609 0.554 0.504 0.459 0.418 0.380 0.346 0.315 0.286 0.260 0.237 0.216 0.196 0.178 Discount Period 0.25 1.25 2.25 3.25 4.25 5.25 6.25 7.25 8.25 9.25 10.25 11.25 12.25 13.25 14.25 15.25 16.25 17.25 18.25 PV of Cash Tax Savings $1,249 $2,588 $1,977 $1,688 $1,483 $1,286 $1,051 $776 $489 $317 $161 $135 $94 $86 $54 $11 $2 $0 $0 PV of Cash TRA Payments ($1,062) ($2,199) ($1,680) ($1,435) ($1,260) ($1,093) ($893) ($660) ($416) ($270) ($137) ($114) ($80) ($73) ($46) ($9) ($2) ($0) $0 NPV of Cash Tax Savings $13,446 NPV of Cash TRA Payments ($11,429) NPV of Existing Tax Benefits $2,017 Source: Panda Management projections. (1) Pursuant to Section 754 of the Internal Revenue Code, Panda Inc. steps up the inside tax basis in the net assets acquired from members of Panda LLC OpCo. For tax purposes, the step up is deductible over a 15-year period. (2) Cash Tax Savings equals Total Inside Basis Step Ups multiplied by the Tax Rate. 24 (3) Under the TRA between Panda LLC OpCo and Panda Inc., 85% of the cash savings generated by the 754 election is distributed to selling and converting Class B Common shareholders upon Panda Inc.’s realization of the tax savings benefit.
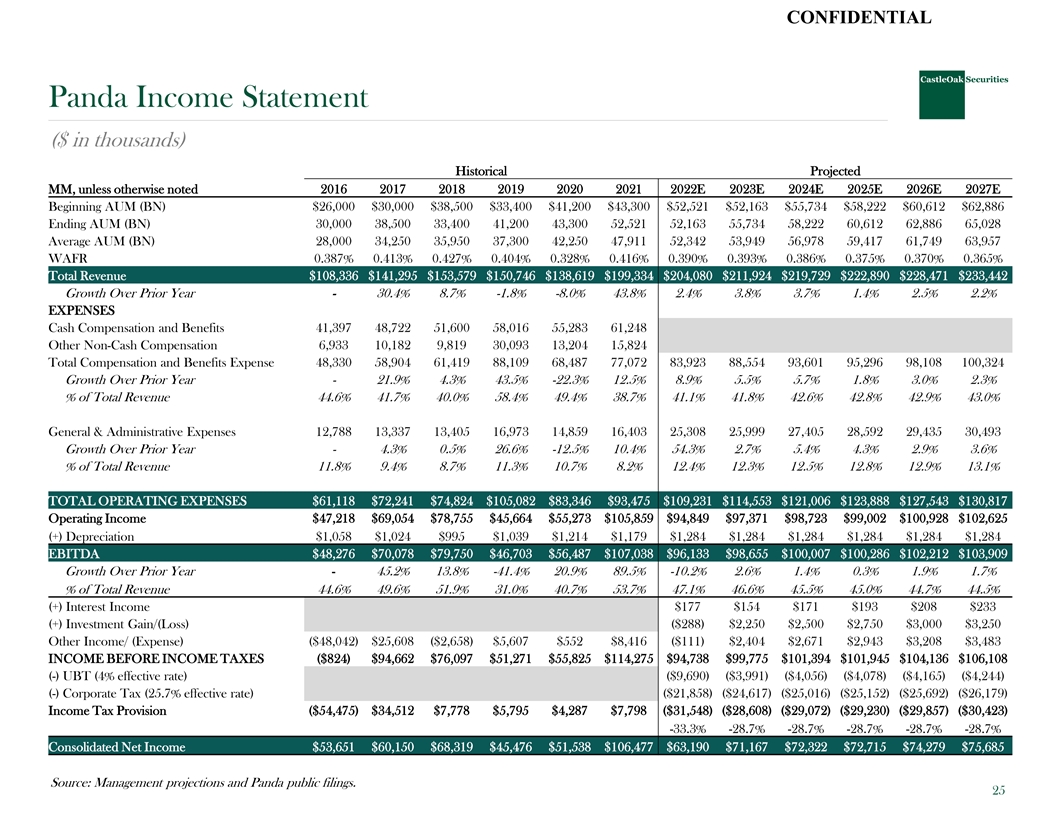
CONFIDENTIAL Panda Income Statement ($ in thousands) Historical Projected MM, unless otherwise noted 2016 2017 2018 2019 2020 2021 2022E 2023E 2024E 2025E 2026E 2027E Beginning AUM (BN) $26,000 $30,000 $38,500 $33,400 $41,200 $43,300 $52,521 $52,163 $55,734 $58,222 $60,612 $62,886 Ending AUM (BN) 30,000 38,500 33,400 41,200 43,300 52,521 52,163 55,734 58,222 60,612 62,886 65,028 Average AUM (BN) 28,000 34,250 35,950 37,300 42,250 47,911 52,342 53,949 56,978 59,417 61,749 63,957 WAFR 0.387% 0.413% 0.427% 0.404% 0.328% 0.416% 0.390% 0.393% 0.386% 0.375% 0.370% 0.365% Total Revenue $108,336 $141,295 $153,579 $150,746 $138,619 $199,334 $204,080 $211,924 $219,729 $222,890 $228,471 $233,442 Growth Over Prior Year - 30.4% 8.7% -1.8% -8.0% 43.8% 2.4% 3.8% 3.7% 1.4% 2.5% 2.2% EXPENSES Cash Compensation and Benefits 41,397 48,722 51,600 58,016 55,283 61,248 Other Non-Cash Compensation 6,933 10,182 9,819 30,093 13,204 15,824 Total Compensation and Benefits Expense 48,330 58,904 61,419 88,109 68,487 77,072 83,923 88,554 93,601 95,296 98,108 100,324 Growth Over Prior Year - 21.9% 4.3% 43.5% -22.3% 12.5% 8.9% 5.5% 5.7% 1.8% 3.0% 2.3% % of Total Revenue 44.6% 41.7% 40.0% 58.4% 49.4% 38.7% 41.1% 41.8% 42.6% 42.8% 42.9% 43.0% General & Administrative Expenses 12,788 13,337 13,405 16,973 14,859 16,403 25,308 25,999 27,405 28,592 29,435 30,493 Growth Over Prior Year - 4.3% 0.5% 26.6% -12.5% 10.4% 54.3% 2.7% 5.4% 4.3% 2.9% 3.6% % of Total Revenue 11.8% 9.4% 8.7% 11.3% 10.7% 8.2% 12.4% 12.3% 12.5% 12.8% 12.9% 13.1% TOTAL OPERATING EXPENSES $61,118 $72,241 $74,824 $105,082 $83,346 $93,475 $109,231 $114,553 $121,006 $123,888 $127,543 $130,817 Operating Income $47,218 $69,054 $78,755 $45,664 $55,273 $105,859 $94,849 $97,371 $98,723 $99,002 $100,928 $102,625 (+) Depreciation $1,058 $1,024 $995 $1,039 $1,214 $1,179 $1,284 $1,284 $1,284 $1,284 $1,284 $1,284 EBITDA $48,276 $70,078 $79,750 $46,703 $56,487 $107,038 $96,133 $98,655 $100,007 $100,286 $102,212 $103,909 Growth Over Prior Year - 45.2% 13.8% -41.4% 20.9% 89.5% -10.2% 2.6% 1.4% 0.3% 1.9% 1.7% % of Total Revenue 44.6% 49.6% 51.9% 31.0% 40.7% 53.7% 47.1% 46.6% 45.5% 45.0% 44.7% 44.5% (+) Interest Income $177 $154 $171 $193 $208 $233 (+) Investment Gain/(Loss) ($288) $2,250 $2,500 $2,750 $3,000 $3,250 Other Income/ (Expense) ($48,042) $25,608 ($2,658) $5,607 $552 $8,416 ($111) $2,404 $2,671 $2,943 $3,208 $3,483 INCOME BEFORE INCOME TAXES ($824) $94,662 $76,097 $51,271 $55,825 $114,275 $94,738 $99,775 $101,394 $101,945 $104,136 $106,108 (-) UBT (4% effective rate) ($9,690) ($3,991) ($4,056) ($4,078) ($4,165) ($4,244) (-) Corporate Tax (25.7% effective rate) ($21,858) ($24,617) ($25,016) ($25,152) ($25,692) ($26,179) Income Tax Provision ($54,475) $34,512 $7,778 $5,795 $4,287 $7,798 ($31,548) ($28,608) ($29,072) ($29,230) ($29,857) ($30,423) -33.3% -28.7% -28.7% -28.7% -28.7% -28.7% Consolidated Net Income $53,651 $60,150 $68,319 $45,476 $51,538 $106,477 $63,190 $71,167 $72,322 $72,715 $74,279 $75,685 Source: Management projections and Panda public filings. 25
CONFIDENTIAL Legal Disclaimer By accepting this presentation, the recipient agrees to be bound by the following obligations and limitations. This document is confidential and has been prepared for informational purposes only. This document is not to be construed as a recommendation, an offer to sell or a solicitation of an offer to buy any securities. Any dissemination, distribution or reproduction of this document is strictly prohibited without the consent of CastleOak Securities, L.P. The information herein is obtained from sources deemed reliable, but its accuracy and completeness cannot be guaranteed, and is subject to change without notice. Purpose. This presentation has been prepared by CastleOak Securities, L.P. (“CastleOak ) for the exclusive use of the party to whom CastleOak delivers this presentation (together with its subsidiaries and affiliates, hereinafter the Recipient ). No independent verification. The information in this presentation has been obtained from the Recipient and other publicly available sources and has not been independently verified by CastleOak or any of its employees or partners (“Representatives”). No representation or warranty. No representation, warranty, or undertaking, either express or implied, is or will be given by CastleOak or its representatives as to or in relation to the accuracy, completeness, reliability or sufficiency of the information contained in this presentation or as to the reasonableness of any assumption contained in this presentation. No liability. By accepting receipt of this presentation, the Recipient acknowledges and agrees that to the maximum extent permitted by law and except in the case of fraud, each of CastleOak and its Representatives expressly disclaims any and all liability that may arise from this presentation, or any other written or oral information provided in connection with this presentation, and any errors contained therein and/or omissions therefrom, or from relying on or any use of the contents of this presentation or otherwise in connection with this presentation. Forecasts. The valuations, projections, estimates, forecasts, targets, prospects, returns and/or opinions (including, without limitation, projections of revenue, expense, net income and stock performance) contained herein involve elements of subjective judgment and analysis. Any opinions expressed in this presentation are subject to change without notice and may differ from or be contrary to opinions expressed by other business areas or groups of CastleOak as a result of using different assumptions and criteria. This presentation may contain forward-looking statements. CastleOak gives no undertaking and is under no obligation to update these forward-looking statements for events or circumstances that occur subsequent to the date of this presentation. Nothing contained herein is, or shall be relied upon as, a promise or representation as to the past or future, or that any of the estimates or projections contained herein will be achieved. No duty to update. This presentation speaks as at the date hereof (unless an earlier date is otherwise indicated in the presentation) and in furnishing this presentation, no obligation is undertaken nor is any representation or undertaking given by CastleOak or its Representatives to provide the Recipient with additional information or to update, revise or reaffirm the information in this presentation or to correct any inaccuracies therein which may become apparent. Information or education only. This presentation has been prepared solely for informational or educational purposes and does not suggest taking or refraining from any action. It does not constitute or contain an invitation, solicitation or an offer to buy or sell any securities or related financial instruments or any assets, business, or undertakings described herein. No advice given. The Recipient should not construe the contents of this presentation as legal, tax, accounting or investment advice or a recommendation. The Recipient should consult its own counsel, tax and financial advisors as to legal and related matters concerning any transaction described herein. This presentation does not purport to be all-inclusive or to contain all of the information that the Recipient may require or request upon due diligence if it wishes to proceed further. No investment, divestment or other financial decisions or actions should be based on the information in this presentation. This presentation should not be viewed as an investment recommendation because it is provided as part of the general marketing and advertising activities of CastleOak. No distribution. This presentation has been prepared on a confidential basis solely for your use and benefit; provided that you and any of your employees, representatives, or other agents may disclose to any and all persons, without limitation of any kind, the tax treatment and tax structure of the transaction and all materials of any kind (including opinions or other tax analyses) that are provided to you relating to such tax treatment and tax structure. Distribution of this presentation to any person other than you and those persons retained to advise you, who agree to maintain the confidentiality of this material and be bound by the limitations outlined herein, is unauthorized. CastleOak specifically prohibits the redistribution or reproduction of this presentation in whole or in part without the prior written permission of CastleOak and CastleOak accepts no liability whatsoever for the actions of third parties in this respect. 26
Exhibit 107
Calculation of Filing Fee Table
Table 1 - Transaction Valuation
| Transaction valuation |
Fee Rate |
Amount of Filing Fee | ||||
| Fees to be Paid |
$166,885,614(1) | .0000927 | $15,470(2) | |||
| Fees Previously Paid |
$15,470 | $15,470(3) | ||||
| Total Transaction Valuation |
$166,885,614 | |||||
| Total Fees Due for Filing |
$0 | |||||
| Total Fees Previously Paid |
$15,470 | |||||
| Total Fee Offsets |
$15,470 | |||||
|
Net Fee Due |
$0 | |||||
Table 2 – Fee Offset Claims and Sources
| Registrant or Filer Name |
Form or Filing Type |
File Number |
Initial Filing Date |
Filing Date |
Fee Offset Claimed |
Fee Paid Fee | ||||||||
| Fee Offset Claims |
PREM 14A |
001-33761 | August 22, 2022 |
$15,470 | ||||||||||
| Fee Offset Sources |
Pzena Investment Management, Inc. |
PREM 14A |
001-33761 | August 22, 2022 |
$15,470(3) | |||||||||
| (1) | Estimated solely for the purposes of calculating the filing fee, as of August 18, 2022, the underlying value of the transaction was calculated based on the sum of (a) the product of 16,696,696 shares of Class A common stock, par value $0.01 per share, of Pzena Investment Management, Inc. (the “Company”) multiplied by the per share merger consideration of $9.60; (b) the product of 189,539 shares of Company Class A common stock underlying in-the-money Company stock options and $1.95 (which is the difference between the per share merger consideration of $9.60 and the weighted average exercise price of the in-the-money Company stock options of $7.65); and (c) the product of 648,722 shares of Company Class A common stock underlying outstanding deferred stock units corresponding to a share of Company Class A common stock and the per share merger consideration of $9.60. |
| (2) | The amount of the filing fee, calculated in accordance with Exchange Act Rule 0-11(b)(1) and the Securities and Exchange Commission Fee Rate Advisory #1 for Fiscal Year 2022, was calculated by multiplying $166,885,614 by .0000927. |
| (3) | The Company previously paid $15,470 upon the filing of its Preliminary Proxy Statement on Schedule 14A on August 22, 2022 in connection with the transaction reported hereby. |