UNITED STATES
SECURITIES AND EXCHANGE COMMISSION
Washington, D.C. 20549
FORM N-CSR
CERTIFIED SHAREHOLDER REPORT OF REGISTERED
MANAGEMENT INVESTMENT COMPANIES
Investment Company Act file number 811-10027
STATE FARM MUTUAL FUND TRUST
(Exact name of registrant as specified in charter)
| One State Farm Plaza | 61710-0001 | |
| Bloomington, IL | ||
| (Address of principal executive offices) | (Zip code) | |
| Paul J. Smith | Alan Goldberg | |
| One State Farm Plaza | Stradley Ronon Stevens & Young | |
| Bloomington, Illinois 61710-0001 | 191 North Wacker Dr., Suite 1601 | |
| Chicago, Illinois 60606 | ||
(Names and addresses of agents for service)
Registrant’s telephone number, including area code: 1-800-447-4930
Date of fiscal year end: 12/31/2017
Date of reporting period: 06/30/2017
| ITEM 1. | REPORTS TO STOCKHOLDERS. |
Before investing, consider the Funds’ investment objectives, risks, charges and expenses. Contact State Farm VP Management Corp. (1-800-447-4930) for a prospectus or summary prospectus containing this and other information. Read it carefully.
Investing involves risk, including potential for loss.
A description of the policies and procedures that the Funds use to determine how to vote proxies relating to portfolio securities, and information regarding how the Funds voted proxies relating to portfolio securities during the most recent 12 month period ended June 30, are available without charge upon request at 1-800-447-4930 and at sec.gov.
The Funds file complete schedules of portfolio holdings for each Fund with the Securities and Exchange Commission (the “Commission”) for the first and third quarters of each fiscal year on Form N-Q. The Funds’ Forms N-Q are available on the Commission’s website at sec.gov. The Funds’ Forms N-Q may be reviewed and copied at the Commission’s Public Reference Room in Washington, D.C., and information on the operation of the Public Reference Room may be obtained by calling 1-800-SEC-0330. The Funds make the information on Form N-Q available to shareholders upon request without charge at 1-800-447-4930.
Any website referenced in this report is an inactive textual reference only, and information contained in or otherwise accessible through that website does not form a part of, and is not incorporated by reference into, this report.
The Funds may send one copy of each annual report, semi-annual report, prospectus, and proxy statement to an address shared by more than one shareholder, a practice commonly referred to as “householding” delivery of these documents. If the Fund documents you receive are being householded but you would like to receive individual copies of these documents, contact us to request individual delivery by writing to State Farm Investment Management Corp., P.O. Box 219548, Kansas City, Missouri 64121-9548 or by calling us at 1-800-447-4930. We will begin sending individual copies within 30 days after we receive notice that you have revoked your consent.
State Farm LifePath Funds are target-date portfolios that provide a diversified exposure to equities, fixed income, and/or cash for those investors who have a specific date in mind (in this case years 2020, 2030, 2040, or 2050) for retirement or another goal. The target date is the approximate date when investors plan to start withdrawing assets. The investment objectives of each LifePath Fund are adjusted over time to become more conservative as the target date approaches. The principal value of the LifePath Fund(s) is not guaranteed at any time, including at the target date.
Automatic Investment Plan (AIP)1
State Farm Mutual Funds allow you to make regular investments in a Fund with an Automatic Investment Plan through an electronic transfer of funds from your bank/credit union account. If you wish to begin an Automatic Investment Plan, the minimum amount required for initial investment is $1,000 per Fund and subsequent investments is $50. Please consider signing up today for AIP by calling 1-800-447-4930 for assistance.
Electronic Delivery
As a State Farm Mutual Funds shareholder, we wish to remind you that you can elect to have future Annual Reports, Semi-Annual Reports, Prospectuses, statements, and tax forms delivered electronically rather than receiving large, bulky paper reports through the mail. This is a great way to help reduce internal fund costs related to printing and mailing these materials as well as a way to be environmentally friendly. Please consider signing up for electronic delivery today by going on statefarm.com or by calling 1-800-447-4930 for assistance.
Service is only a phone call away
Fund prices are available to you 24 hours a day, 7 days a week.
Representatives are available 8 a.m.—6 p.m. Central Time Monday through Friday (except holidays)
1-800-447-4930
Visit our website at statefarm.com
State Farm VP Management Corp.
(Underwriter and Distributor of Securities Products)
One State Farm Plaza
Bloomington, Illinois 61710-0001
1-800-447-4930
| 1 | Automatic investment plans do not assure a profit or protect against loss. |
Message to Shareholders of State Farm Mutual Fund Trust
Dear Shareholders,
Thank you for investing with State Farm Mutual Funds®. Enclosed is the Semi-Annual Report for the 6-month period ended June 30, 2017, for the State Farm Mutual Fund Trust (“the Trust”). We encourage your review and consideration of this entire report.
State Farm Investment Management Corp. has consistently maintained a long-term, disciplined approach to managing investment risk and providing competitive investment products that can help you, our valued shareholder, with your investment goals.1 We believe that remaining focused on your long-term goals and maintaining an appropriate asset allocation mix are important elements in pursuing investment success.2
Market Review
During the 6-month period ended June 30, 2017, U.S. equity and fixed income markets experienced positive returns, while international equities generated even stronger gains.
Beginning the calendar year at a period low of 2,238, U.S. equity markets (as represented by the S&P 500® Index3) staged a series of uneven climbs before ending June 2017 at 2,423. Along the way, the S&P 500 Index set multiple closing price highs, including a new record of 2,453 on June 19. During this 6-month timeframe, U.S. equities entered the ninth year of their current bull market run while posting a 9.34% total return, including dividends.
Stocks rose sharply over the first two months of the year — the S&P 500 Index delivered 1.90% and 3.97% total returns in January and February, respectively — as investors digested news of expanding fourth-quarter (October — December) corporate profits, rising consumer confidence levels, and an acceleration in global growth. However, with March came signs of market headwinds. Congressional Republicans failed to pass a health care plan to replace the Affordable Care Act, raising questions regarding the new administration’s ability to achieve its other pro-growth policy goals. Pockets of anxiety regarding the health of the U.S. economy also appeared during this time, as did a sense of increased geopolitical uncertainty around the world. Together, these concerns put downward pressure on stocks, with the S&P 500 Index pulling back as it moved into early April. However, U.S. equities soon rebounded, charting a generally upward
| 1 | Investing involves risk, including potential for loss. |
| 2 | Asset allocation cannot guarantee a profit or protect against a loss in a declining market. |
| 3 | Source: Standard and Poor’s. The S&P 500 Index is a capitalization-weighted measure of common stocks of 500 large U.S. companies. It is not possible to invest directly in an index. Past performance does not guarantee future results. |
| 4 | Source: Bloomberg. The Russell Midcap Index measures the performance of the mid-cap segment of the U.S. equity universe. The Russell Midcap is a subset of the Russell 1000 Index. It includes approximately 800 of the smallest securities of the Russell 1000 Index based on a combination of their market cap and current index membership. The Russell Midcap represents approximately 31% of the total market capitalization of the Russell 1000 companies. It is not possible to invest directly in an index. Past performance does not guarantee future results. |
| 5 | Source: Bloomberg. The Russell 2000 Index measures the performance of the small-cap segment of the U.S. equity universe. The Russell 2000 is a subset of the Russell 3000 Index representing approximately 8% of the total market capitalization of that index. It includes approximately 2000 of the smallest securities of the Russell 3000 Index based on a combination of their market cap and current index membership. The stocks of small companies are more volatile than the stocks of larger, more established companies. It is not possible to invest directly in an index. Past performance does not guarantee future results. |
1
Message to Shareholders of State Farm Mutual Fund Trust (continued)
course through period end. During this time, stocks were buoyed by news of robust first-quarter (January — March) corporate earnings, a strong April jobs report, and an unemployment rate that ticked down to 4.3% in May, its lowest level since 2001.
Results were even stronger in the international equity markets. Signs of improving economic growth around the world and continued monetary stimulus measures helped to make global stocks — especially in emerging market countries — attractive to investors. Through June 2017, the MSCI EAFE Free® Index, MSCI All Country World Index (ACWI) ex-U.S. Index and MSCI Emerging Markets Index provided total returns of 13.81%, 14.10% and 18.43%, respectively.6 Within the MSCI EAFE Free Index, Austria paced top performers with a 32.76% return, while Norway turned in the lowest at 5.60%. Emerging markets extended the gains registered last year — the MSCI Emerging Markets Index ended with an 11.19% total return for calendar year 2016 — as Poland and Turkey led that Index through the first six months of 2017 with 33.78% and 32.21% returns, respectively. Meanwhile, after Russia’s stock market surged in late 2016 — in part on the prospect of the Trump U.S. administration lifting economic sanctions — the first six months of 2017 provided a different narrative. Through June 2017, Russia’s –14.18% return ended as the weakest among emerging market countries, as hopes diminished through the period for a sanctions reprieve and crude oil prices remained relatively low.7
Among major fixed income indices, the Bloomberg Barclays U.S. Aggregate Bond Index and the Bloomberg Barclays Municipal Bond Index posted total returns of 2.27% and 3.57%, respectively, as price increases added to bond coupon income.8 The U.S. Treasury yield curve flattened as shorter-term (3-month and 2-year) yields rose over the period while longer-term (10-year) yields decreased. Following on the heels of the Federal Reserve’s (the “Fed”) December 2016 interest rate increase, 3-month U.S. Treasury yields began the period at 0.51% and remained relatively stable through February, ranging between a period low of 0.50% and 0.55%.9 Those yields surged almost 0.20% within the first week of March alone, however, when better-than-anticipated economic news raised investors’ expectations for another Fed rate hike. As the Fed subsequently announced its second (March) and third (June) increases in seven months — ultimately raising its key interest rate target range to 1.00% — 1.25% — yields on 3-month Treasuries navigated a gradual ascent through June to end the 6-month period at 1.03%. Similarly, after starting January at 1.20% and moving between 1.12% and 1.27% over the first two months of the year, 2-year Treasury yields increased in early March, reaching a period high of 1.40% later that month before eventually settling at 1.38% on June 30, 2017.
During the period, further increases in the yields on both short- and long-term Treasuries were moderated by continued strong market demand. With the European Central Bank, Bank of Japan, and other foreign central banks maintaining their respective monetary stimulus measures, global bond yields remained low through June 2017. Consequently, fixed income investors continued to seek out the relatively higher returns found in U.S. Treasuries, exerting downward pressure on their yields. Longer-term U.S. Treasury yields were also negatively impacted by some concern — particularly in the latter half of the period — around the pace of U.S. economic growth and level of inflation. As a result, yields on 10-year Treasuries began January 2017 at 2.45% and after tracking within a relatively tight range of 2.14% (period low) and 2.62% (period high), ended June 2017 lower at 2.31%.
| 6 | Source: Bloomberg. The MSCI Europe, Australasia and Far East Free (EAFE Free) Index currently measures the performance of stock markets of Europe, Australia, New Zealand, Israel, and the Far East. The MSCI All Country World Index (ex-U.S.) (MSCI ACWI ex-U.S. Index) is a free float adjusted market capitalization index that is designed to measure equity market performance in global developed and emerging markets, excluding the United States. As of June 30, 2017, the MSCI ACWI ex-U.S. Index consisted of 45 developed and emerging market country indices. The MSCI Emerging Markets Index is a float-adjusted market capitalization index designed to measure equity market performance in global emerging markets. Foreign securities involve risks not normally associated with investing in the U.S., including higher trading and custody costs, less stringent accounting, legal and reporting practices, potential for political and economic instability, and the fluctuation and potential regulation of currency exchange and exchange rates, all of which are magnified in emerging markets. It is not possible to invest directly in an index. Past performance does not guarantee future results. |
| 7 | Returns are reported in U.S. dollar terms for the MSCI EAFE Free Index, MSCI ACWI ex-US Index, and MSCI Emerging Markets Index. |
| 8 | Source: Bloomberg. The Bloomberg Barclays U.S. Aggregate Bond Index represents debt securities in the U.S. investment grade fixed rate taxable bond market, including government and corporate debt securities, mortgage pass-through debt securities and asset-backed debt securities with maturities greater than one year. The Bloomberg Barclays Municipal Bond Index is representative of the tax-exempt bond market and is made up of investment grade municipal bonds issued after 12/31/90 having a remaining maturity of at least one year. Bonds have historically been less volatile than stocks, but are sensitive to changes in interest rates. It is not possible to invest directly in an index. Past performance does not guarantee future results. |
| 9 | Source: The U.S. Department of the Treasury. A 3-month U.S. Treasury Bill is a debt obligation issued by the U.S. Treasury that has a term of 92 days or less.A 2-year U.S. Treasury Note and a 10-year U.S. Treasury Note are debt obligations issued by the U.S. Treasury with maturities of 2 and 10 years, respectively, and that pay interest every six months. U.S. Treasury securities are backed by the full faith and credit of the U.S. government and are guaranteed only as to the prompt payment of principal and interest, and are subject to market risks if sold prior to maturity. Bonds have historically been less volatile than stocks, but are sensitive to changes in interest rates. Past performance does not guarantee future results. |
2
Message to Shareholders of State Farm Mutual Fund Trust (continued)
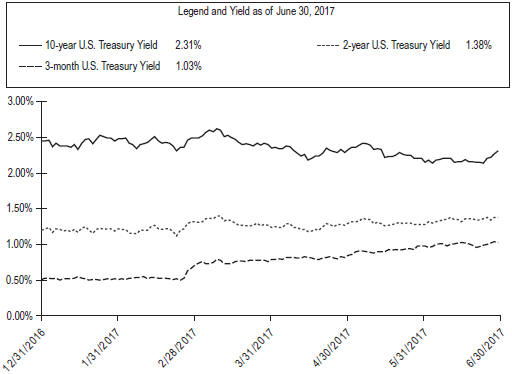
Source: The U.S. Department of the Treasury (treasury.gov)
Look for a detailed discussion of factors that impacted the performance of the Funds during the time frame of January 1, 2017, through December 31, 2017, in the State Farm Mutual Fund Trust Annual Report.
On behalf of the entire State Farm Mutual Funds team, thank you for your continued business and allowing us to help serve your investment needs.
| Sincerely, |
|
|
| Joe R. Monk Jr. |
| Senior Vice President |
| State Farm Investment Management Corp. |
3
State Farm Equity Fund
Fund Composition*
(unaudited)
| * | Illustrated by sector and based on total net assets as of June 30, 2017. Please refer to the Schedule of Investments later in this report for details concerning Fund holdings. |
State Farm Small/Mid Cap Equity Fund
Fund Composition*
(unaudited)
| * | Illustrated by sector and security type and based on total net assets as of June 30, 2017. Please refer to the Schedule of Investments later in this report for details concerning Fund holdings. |
State Farm International Equity Fund
Fund Composition*
(unaudited)
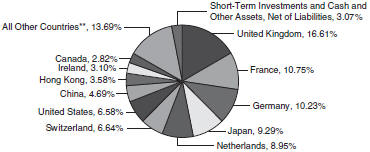
| * | Illustrated by country and based on total net assets as of June 30, 2017. Please refer to the Schedule of Investments later in this report for details concerning Fund holdings. |
| ** | Represents 13 other countries, each of which represents less than 2% of net assets. |
4
Portfolio Summary (continued)
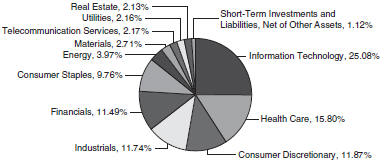
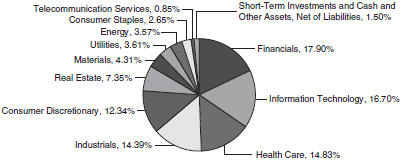
State Farm S&P 500 Index Fund
Fund Composition*
(unaudited)

| * | Illustrated by sector and based on total net assets as of June 30, 2017. Please refer to the Schedule of Investments later in this report for details concerning Fund holdings. |
State Farm Small Cap Index Fund
Fund Composition*
(unaudited)
| * | Illustrated by sector and based on total net assets as of June 30, 2017. Please refer to the Schedule of Investments later in this report for details concerning Fund holdings. |
State Farm International Index Fund
Fund Composition*
(unaudited)
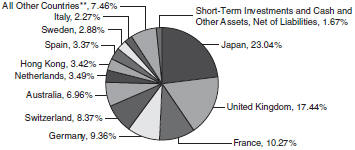
| * | Illustrated by country and based on total net assets as of June 30, 2017. Please refer to the Schedule of Investments later in this report for details concerning Fund holdings. |
| ** | Represents 10 other countries, each of which represents less than 2% of net assets. |
5
Portfolio Summary (continued)
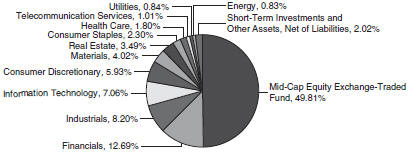
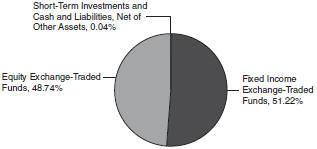
State Farm Equity and Bond Fund
Fund Composition*
(unaudited)
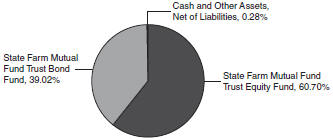
| * | Illustrated by security type and based on total net assets as of June 30, 2017. Please refer to the Schedule of Investments later in this report for details concerning Fund holdings. |
State Farm Bond Fund
Fund Composition*
(unaudited)

| * | Illustrated by security type and based on total net assets as of June 30, 2017. Please refer to the Schedule of Investments later in this report for details concerning Fund holdings. |
State Farm Tax Advantaged Bond Fund
Fund Composition*
(unaudited)
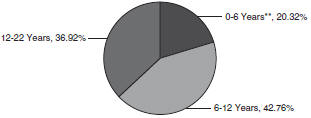
| * | Illustrated by maturity and based on total investments as of June 30, 2017. Please refer to the Schedule of Investments later in this report for details concerning Fund holdings. |
| ** | Includes a 0.43% allocation to the JPMorgan U.S. Government Money Market Fund Capital Shares. |
6
Portfolio Summary (continued)
State Farm Money Market Fund
Fund Composition*
(unaudited)

| * | Illustrated by security type and based on total net assets as of June 30, 2017. Please refer to the Schedule of Investments later in this report for details concerning Fund holdings. |
State Farm LifePath Retirement Fund
Fund Composition*
(unaudited)

| * | Illustrated by security type and based on total net assets as of June 30, 2017. Please refer to the Schedule of Investments later in this report for details concerning Fund holdings. |
State Farm LifePath 2020 Fund
Fund Composition*
(unaudited)
| * | Illustrated by security type and based on total net assets as of June 30, 2017. Please refer to the Schedule of Investments later in this report for details concerning Fund holdings. |
7
Portfolio Summary (continued)
State Farm LifePath 2030 Fund
Fund Composition*
(unaudited)

| * | Illustrated by security type and based on total net assets as of June 30, 2017. Please refer to the Schedule of Investments later in this report for details concerning Fund holdings. |
State Farm LifePath 2040 Fund
Fund Composition*
(unaudited)

| * | Illustrated by security type and based on total net assets as of June 30, 2017. Please refer to the Schedule of Investments later in this report for details concerning Fund holdings. |
State Farm LifePath 2050 Fund
Fund Composition*
(unaudited)

| * | Illustrated by security type and based on total net assets as of June 30, 2017. Please refer to the Schedule of Investments later in this report for details concerning Fund holdings. |
8
As a shareholder of a Fund, you incur two types of costs: (1) transaction costs, including sales charges (loads) on purchase payments and certain redemptions; and (2) ongoing costs, including management fees; distribution and service (12b-1) fees; shareholder servicing fees; and other Fund expenses. The Example in the following table for each Fund below is intended to help you understand your ongoing costs (in dollars) of investing in a Fund and to compare these costs with the ongoing costs of investing in other mutual funds.
The Example is based on an investment of $1,000 invested at the beginning of the period and held for the entire period as stated in the table for each Fund.
Actual Expenses
The Actual information in the table under each Fund name below provides information about actual account values and actual expenses for each Class of shares. You may use the information in this line, together with the amount you invested, to estimate the expenses that you paid over the period. Simply divide your account value for a Fund Class by $1,000 (for example, an $8,600 account value divided by $1,000 = 8.6), then multiply the result by the number in the Actual information line under the heading entitled “Expenses Paid During Period” for the applicable Fund Class to estimate the expenses you paid on your account for that Fund Class during the period. If your account has multiple Fund positions, add up the results calculated for each Fund position by Class within your account to estimate the expenses you paid on your total account value. A potential account fee of $10 per calendar quarter is not included in the expenses shown in the table. This fee will be charged to an account holding Class A, Class B, Premier, Legacy Class B or Institutional shares (other than a SEP IRA, SIMPLE IRA, Archer Medical Savings Account, Tax Sheltered Account under §403(b)(7) of the Internal Revenue Code or an account held under other employer-sponsored qualified retirement plans) if the balance in the account falls below $5,000 at the close of business on the second business day of the last month of the calendar quarter, unless the account has been open for less than a year as of the second business day of the last month of the calendar quarter. You should consider any account fee you incurred when estimating the total ongoing expenses paid over the period and the impact of this fee on your ending account value. This additional fee has the effect of reducing investment returns.
Hypothetical Example for Comparison Purposes
The Hypothetical information in the table under each Fund name below provides information about hypothetical account values and hypothetical expenses based on the Fund’s actual expense ratio by Class and an assumed rate of return of 5% per year before expenses, which is not the actual return of the Class indicated. The hypothetical account values and expenses may not be used to estimate the actual ending account balance or expenses you paid for the period. You may use this information to compare the ongoing costs of investing in the Fund and other funds. To do so, compare this 5% hypothetical example with the 5% hypothetical examples that appear in the shareholder reports of the other funds. A potential account fee of $10 per calendar quarter is not included in the expenses shown in the table. This fee will be charged to an account holding Class A, Class B, Premier, Legacy Class B or Institutional shares (other than a SEP IRA, SIMPLE IRA, Archer Medical Savings Account, Tax Sheltered Account under §403(b)(7) of the Internal Revenue Code or an account held under other employer-sponsored qualified retirement plans) if the balance in the account falls below $5,000 at the close of business on the second business day of the last month of the calendar quarter, unless the account has been open for less than a year as of the second business day of the last month of the calendar quarter. You should consider any account fee that you incurred when estimating the total ongoing expenses paid over the period and the impact of this fee on your ending account value. This additional fee has the effect of increasing the costs of investing.
Please note that the expenses shown in the tables are meant to highlight your ongoing costs only and do not reflect any transactional costs, such as sales charges (loads) applicable to Class A, Class B, Premier, and Legacy Class B shares. Therefore, the Hypothetical information in the table under each Fund name is useful in comparing ongoing costs only, and will not help you determine the relative total costs of owning different funds. In addition, if these transactional costs were included, your costs would have been higher.
9
State Farm Equity Fund 3
| Beginning Account Value January 1, 2017 |
Ending Account Value June 30, 2017 |
Annualized Expense Ratio Based on the Period January 1, 2017 to June 30, 2017 |
Expenses Paid During Period January 1, 2017 to June 30, 20171 |
|||||||||||||
| Actual |
||||||||||||||||
| Class A Shares |
$ | 1,000.00 | $ | 1,092.67 | 1.02 | % | $ | 5.29 | ||||||||
| Class B Shares |
$ | 1,000.00 | $ | 1,090.32 | 1.37 | % | $ | 7.10 | ||||||||
| Premier Shares |
$ | 1,000.00 | $ | 1,092.59 | 0.92 | % | $ | 4.77 | ||||||||
| Legacy Class B Shares |
$ | 1,000.00 | $ | 1,090.72 | 1.24 | % | $ | 6.43 | ||||||||
| Institutional Shares |
$ | 1,000.00 | $ | 1,093.25 | 0.90 | % | $ | 4.67 | ||||||||
| Class R-1 Shares |
$ | 1,000.00 | $ | 1,091.59 | 1.22 | % | $ | 6.33 | ||||||||
| Class R-2 Shares |
$ | 1,000.00 | $ | 1,091.79 | 1.11 | % | $ | 5.76 | ||||||||
| Class R-3 Shares |
$ | 1,000.00 | $ | 1,093.15 | 0.97 | % | $ | 5.03 | ||||||||
|
|
|
|
|
|
|
|
|
|||||||||
| Hypothetical (5% return before expenses) |
||||||||||||||||
| Class A Shares |
$ | 1,000.00 | $ | 1,019.74 | 1.02 | % | $ | 5.11 | ||||||||
| Class B Shares |
$ | 1,000.00 | $ | 1,018.00 | 1.37 | % | $ | 6.85 | ||||||||
| Premier Shares |
$ | 1,000.00 | $ | 1,020.23 | 0.92 | % | $ | 4.61 | ||||||||
| Legacy Class B Shares |
$ | 1,000.00 | $ | 1,018.65 | 1.24 | % | $ | 6.21 | ||||||||
| Institutional Shares |
$ | 1,000.00 | $ | 1,020.33 | 0.90 | % | $ | 4.51 | ||||||||
| Class R-1 Shares |
$ | 1,000.00 | $ | 1,018.74 | 1.22 | % | $ | 6.11 | ||||||||
| Class R-2 Shares |
$ | 1,000.00 | $ | 1,019.29 | 1.11 | % | $ | 5.56 | ||||||||
| Class R-3 Shares |
$ | 1,000.00 | $ | 1,019.98 | 0.97 | % | $ | 4.86 | ||||||||
|
|
|
|
|
|
|
|
|
|||||||||
State Farm Small/Mid Cap Equity Fund 3
| Beginning Account Value January 1, 2017 |
Ending Account Value June 30, 2017 |
Annualized Expense Ratio Based on the Period January 1, 2017 to June 30, 2017 |
Expenses Paid During Period January 1, 2017 to June 30, 20171 |
|||||||||||||
| Actual |
||||||||||||||||
| Class A Shares |
$ | 1,000.00 | $ | 1,025.77 | 1.17 | % | $ | 5.88 | ||||||||
| Class B Shares |
$ | 1,000.00 | $ | 1,023.49 | 1.52 | % | $ | 7.63 | ||||||||
| Premier Shares |
$ | 1,000.00 | $ | 1,026.34 | 1.07 | % | $ | 5.38 | ||||||||
| Legacy Class B Shares |
$ | 1,000.00 | $ | 1,024.12 | 1.37 | % | $ | 6.88 | ||||||||
| Institutional Shares |
$ | 1,000.00 | $ | 1,025.83 | 1.04 | % | $ | 5.22 | ||||||||
| Class R-1 Shares |
$ | 1,000.00 | $ | 1,024.67 | 1.36 | % | $ | 6.83 | ||||||||
| Class R-2 Shares |
$ | 1,000.00 | $ | 1,025.66 | 1.26 | % | $ | 6.33 | ||||||||
| Class R-3 Shares |
$ | 1,000.00 | $ | 1,025.33 | 1.11 | % | $ | 5.57 | ||||||||
|
|
|
|
|
|
|
|
|
|||||||||
| Hypothetical (5% return before expenses) |
||||||||||||||||
| Class A Shares |
$ | 1,000.00 | $ | 1,018.99 | 1.17 | % | $ | 5.86 | ||||||||
| Class B Shares |
$ | 1,000.00 | $ | 1,017.26 | 1.52 | % | $ | 7.60 | ||||||||
| Premier Shares |
$ | 1,000.00 | $ | 1,019.49 | 1.07 | % | $ | 5.36 | ||||||||
| Legacy Class B Shares |
$ | 1,000.00 | $ | 1,018.00 | 1.37 | % | $ | 6.85 | ||||||||
| Institutional Shares |
$ | 1,000.00 | $ | 1,019.64 | 1.04 | % | $ | 5.21 | ||||||||
| Class R-1 Shares |
$ | 1,000.00 | $ | 1,018.05 | 1.36 | % | $ | 6.80 | ||||||||
| Class R-2 Shares |
$ | 1,000.00 | $ | 1,018.55 | 1.26 | % | $ | 6.31 | ||||||||
| Class R-3 Shares |
$ | 1,000.00 | $ | 1,019.29 | 1.11 | % | $ | 5.56 | ||||||||
|
|
|
|
|
|
|
|
|
|||||||||
10
State Farm International Equity Fund 3
| Beginning Account Value January 1, 2017 |
Ending Account Value June 30, 2017 |
Annualized Expense Ratio Based on the Period January 1, 2017 to June 30, 2017 |
Expenses Paid During Period January 1, 2017 to June 30, 20171 |
|||||||||||||
| Actual |
||||||||||||||||
| Class A Shares |
$ | 1,000.00 | $ | 1,204.61 | 1.36 | % | $ | 7.43 | ||||||||
| Class B Shares |
$ | 1,000.00 | $ | 1,202.67 | 1.69 | % | $ | 9.23 | ||||||||
| Premier Shares |
$ | 1,000.00 | $ | 1,204.37 | 1.25 | % | $ | 6.83 | ||||||||
| Legacy Class B Shares |
$ | 1,000.00 | $ | 1,203.44 | 1.55 | % | $ | 8.47 | ||||||||
| Institutional Shares |
$ | 1,000.00 | $ | 1,205.36 | 1.24 | % | $ | 6.78 | ||||||||
| Class R-1 Shares |
$ | 1,000.00 | $ | 1,203.44 | 1.55 | % | $ | 8.47 | ||||||||
| Class R-2 Shares |
$ | 1,000.00 | $ | 1,204.02 | 1.45 | % | $ | 7.92 | ||||||||
| Class R-3 Shares |
$ | 1,000.00 | $ | 1,205.56 | 1.31 | % | $ | 7.16 | ||||||||
|
|
|
|
|
|
|
|
|
|||||||||
| Hypothetical (5% return before expenses) |
||||||||||||||||
| Class A Shares |
$ | 1,000.00 | $ | 1,018.05 | 1.36 | % | $ | 6.80 | ||||||||
| Class B Shares |
$ | 1,000.00 | $ | 1,016.41 | 1.69 | % | $ | 8.45 | ||||||||
| Premier Shares |
$ | 1,000.00 | $ | 1,018.60 | 1.25 | % | $ | 6.26 | ||||||||
| Legacy Class B Shares |
$ | 1,000.00 | $ | 1,017.11 | 1.55 | % | $ | 7.75 | ||||||||
| Institutional Shares |
$ | 1,000.00 | $ | 1,018.65 | 1.24 | % | $ | 6.21 | ||||||||
| Class R-1 Shares |
$ | 1,000.00 | $ | 1,017.11 | 1.55 | % | $ | 7.75 | ||||||||
| Class R-2 Shares |
$ | 1,000.00 | $ | 1,017.60 | 1.45 | % | $ | 7.25 | ||||||||
| Class R-3 Shares |
$ | 1,000.00 | $ | 1,018.30 | 1.31 | % | $ | 6.56 | ||||||||
|
|
|
|
|
|
|
|
|
|||||||||
State Farm S&P 500 Index Fund 3
| Beginning Account Value January 1, 2017 |
Ending Account Value June 30, 2017 |
Annualized Expense Ratio Based on the Period January 1, 2017 to June 30, 2017 |
Expenses Paid During Period January 1, 2017 to June 30, 20171 |
|||||||||||||
| Actual |
||||||||||||||||
| Class A Shares |
$ | 1,000.00 | $ | 1,090.37 | 0.52 | % | $ | 2.70 | ||||||||
| Class B Shares |
$ | 1,000.00 | $ | 1,088.48 | 0.88 | % | $ | 4.56 | ||||||||
| Premier Shares |
$ | 1,000.00 | $ | 1,091.07 | 0.42 | % | $ | 2.18 | ||||||||
| Legacy Class B Shares |
$ | 1,000.00 | $ | 1,089.46 | 0.74 | % | $ | 3.83 | ||||||||
| Institutional Shares |
$ | 1,000.00 | $ | 1,091.34 | 0.39 | % | $ | 2.02 | ||||||||
| Class R-1 Shares |
$ | 1,000.00 | $ | 1,089.45 | 0.71 | % | $ | 3.68 | ||||||||
| Class R-2 Shares |
$ | 1,000.00 | $ | 1,089.87 | 0.61 | % | $ | 3.16 | ||||||||
| Class R-3 Shares |
$ | 1,000.00 | $ | 1,090.96 | 0.46 | % | $ | 2.38 | ||||||||
|
|
|
|
|
|
|
|
|
|||||||||
| Hypothetical (5% return before expenses) |
||||||||||||||||
| Class A Shares |
$ | 1,000.00 | $ | 1,022.22 | 0.52 | % | $ | 2.61 | ||||||||
| Class B Shares |
$ | 1,000.00 | $ | 1,020.43 | 0.88 | % | $ | 4.41 | ||||||||
| Premier Shares |
$ | 1,000.00 | $ | 1,022.71 | 0.42 | % | $ | 2.11 | ||||||||
| Legacy Class B Shares |
$ | 1,000.00 | $ | 1,021.12 | 0.74 | % | $ | 3.71 | ||||||||
| Institutional Shares |
$ | 1,000.00 | $ | 1,022.86 | 0.39 | % | $ | 1.96 | ||||||||
| Class R-1 Shares |
$ | 1,000.00 | $ | 1,021.27 | 0.71 | % | $ | 3.56 | ||||||||
| Class R-2 Shares |
$ | 1,000.00 | $ | 1,021.77 | 0.61 | % | $ | 3.06 | ||||||||
| Class R-3 Shares |
$ | 1,000.00 | $ | 1,022.51 | 0.46 | % | $ | 2.31 | ||||||||
|
|
|
|
|
|
|
|
|
|||||||||
11
State Farm Small Cap Index Fund 3
| Beginning Account Value January 1, 2017 |
Ending Account Value June 30, 2017 |
Annualized Expense Ratio Based on the Period January 1, 2017 to June 30, 2017 |
Expenses Paid During Period January 1, 2017 to June 30, 20171 |
|||||||||||||
| Actual |
||||||||||||||||
| Class A Shares |
$ | 1,000.00 | $ | 1,046.97 | 0.60 | % | $ | 3.05 | ||||||||
| Class B Shares |
$ | 1,000.00 | $ | 1,046.43 | 0.88 | % | $ | 4.47 | ||||||||
| Premier Shares |
$ | 1,000.00 | $ | 1,048.02 | 0.50 | % | $ | 2.54 | ||||||||
| Legacy Class B Shares |
$ | 1,000.00 | $ | 1,046.77 | 0.81 | % | $ | 4.11 | ||||||||
| Institutional Shares |
$ | 1,000.00 | $ | 1,048.38 | 0.48 | % | $ | 2.44 | ||||||||
| Class R-1 Shares |
$ | 1,000.00 | $ | 1,046.51 | 0.80 | % | $ | 4.06 | ||||||||
| Class R-2 Shares |
$ | 1,000.00 | $ | 1,046.97 | 0.70 | % | $ | 3.55 | ||||||||
| Class R-3 Shares |
$ | 1,000.00 | $ | 1,047.76 | 0.55 | % | $ | 2.79 | ||||||||
|
|
|
|
|
|
|
|
|
|||||||||
| Hypothetical (5% return before expenses) |
||||||||||||||||
| Class A Shares |
$ | 1,000.00 | $ | 1,021.82 | 0.60 | % | $ | 3.01 | ||||||||
| Class B Shares |
$ | 1,000.00 | $ | 1,020.43 | 0.88 | % | $ | 4.41 | ||||||||
| Premier Shares |
$ | 1,000.00 | $ | 1,022.32 | 0.50 | % | $ | 2.51 | ||||||||
| Legacy Class B Shares |
$ | 1,000.00 | $ | 1,020.78 | 0.81 | % | $ | 4.06 | ||||||||
| Institutional Shares |
$ | 1,000.00 | $ | 1,022.41 | 0.48 | % | $ | 2.41 | ||||||||
| Class R-1 Shares |
$ | 1,000.00 | $ | 1,020.83 | 0.80 | % | $ | 4.01 | ||||||||
| Class R-2 Shares |
$ | 1,000.00 | $ | 1,021.32 | 0.70 | % | $ | 3.51 | ||||||||
| Class R-3 Shares |
$ | 1,000.00 | $ | 1,022.07 | 0.55 | % | $ | 2.76 | ||||||||
|
|
|
|
|
|
|
|
|
|||||||||
State Farm International Index Fund 3
| Beginning Account Value January 1, 2017 |
Ending Account Value June 30, 2017 |
Annualized Expense Ratio Based on the Period January 1, 2017 to June 30, 2017 |
Expenses Paid During Period January 1, 2017 to June 30, 20171 |
|||||||||||||
| Actual |
||||||||||||||||
| Class A Shares |
$ | 1,000.00 | $ | 1,142.72 | 0.72 | % | $ | 3.83 | ||||||||
| Class B Shares |
$ | 1,000.00 | $ | 1,140.61 | 1.05 | % | $ | 5.57 | ||||||||
| Premier Shares |
$ | 1,000.00 | $ | 1,142.99 | 0.62 | % | $ | 3.29 | ||||||||
| Legacy Class B Shares |
$ | 1,000.00 | $ | 1,142.07 | 0.91 | % | $ | 4.83 | ||||||||
| Institutional Shares |
$ | 1,000.00 | $ | 1,143.39 | 0.60 | % | $ | 3.19 | ||||||||
| Class R-1 Shares |
$ | 1,000.00 | $ | 1,141.54 | 0.91 | % | $ | 4.83 | ||||||||
| Class R-2 Shares |
$ | 1,000.00 | $ | 1,142.06 | 0.81 | % | $ | 4.30 | ||||||||
| Class R-3 Shares |
$ | 1,000.00 | $ | 1,143.25 | 0.67 | % | $ | 3.56 | ||||||||
|
|
|
|
|
|
|
|
|
|||||||||
| Hypothetical (5% return before expenses) |
||||||||||||||||
| Class A Shares |
$ | 1,000.00 | $ | 1,021.22 | 0.72 | % | $ | 3.61 | ||||||||
| Class B Shares |
$ | 1,000.00 | $ | 1,019.59 | 1.05 | % | $ | 5.26 | ||||||||
| Premier Shares |
$ | 1,000.00 | $ | 1,021.72 | 0.62 | % | $ | 3.11 | ||||||||
| Legacy Class B Shares |
$ | 1,000.00 | $ | 1,020.28 | 0.91 | % | $ | 4.56 | ||||||||
| Institutional Shares |
$ | 1,000.00 | $ | 1,021.82 | 0.60 | % | $ | 3.01 | ||||||||
| Class R-1 Shares |
$ | 1,000.00 | $ | 1,020.28 | 0.91 | % | $ | 4.56 | ||||||||
| Class R-2 Shares |
$ | 1,000.00 | $ | 1,020.78 | 0.81 | % | $ | 4.06 | ||||||||
| Class R-3 Shares |
$ | 1,000.00 | $ | 1,021.47 | 0.67 | % | $ | 3.36 | ||||||||
|
|
|
|
|
|
|
|
|
|||||||||
12
State Farm Equity and Bond Fund 2,3
| Beginning Account Value January 1, 2017 |
Ending Account Value June 30, 2017 |
Annualized Expense Ratio Based on the Period January 1, 2017 to June 30, 2017 |
Expenses Paid During Period January 1, 2017 to June 30, 20171 |
|||||||||||||
| Actual |
||||||||||||||||
| Class A Shares |
$ | 1,000.00 | $ | 1,063.39 | 0.12 | % | $ | 0.61 | ||||||||
| Class B Shares |
$ | 1,000.00 | $ | 1,061.62 | 0.47 | % | $ | 2.40 | ||||||||
| Premier Shares |
$ | 1,000.00 | $ | 1,064.50 | 0.02 | % | $ | 0.10 | ||||||||
| Legacy Class B Shares |
$ | 1,000.00 | $ | 1,062.46 | 0.32 | % | $ | 1.64 | ||||||||
| Institutional Shares |
$ | 1,000.00 | $ | 1,063.90 | 0.00 | % | $ | 0.00 | ||||||||
| Class R-1 Shares |
$ | 1,000.00 | $ | 1,062.34 | 0.32 | % | $ | 1.64 | ||||||||
| Class R-2 Shares |
$ | 1,000.00 | $ | 1,062.77 | 0.22 | % | $ | 1.13 | ||||||||
| Class R-3 Shares |
$ | 1,000.00 | $ | 1,064.39 | 0.07 | % | $ | 0.36 | ||||||||
|
|
|
|
|
|
|
|
|
|||||||||
| Hypothetical (5% return before expenses) |
||||||||||||||||
| Class A Shares |
$ | 1,000.00 | $ | 1,024.20 | 0.12 | % | $ | 0.60 | ||||||||
| Class B Shares |
$ | 1,000.00 | $ | 1,022.46 | 0.47 | % | $ | 2.36 | ||||||||
| Premier Shares |
$ | 1,000.00 | $ | 1,024.70 | 0.02 | % | $ | 0.10 | ||||||||
| Legacy Class B Shares |
$ | 1,000.00 | $ | 1,023.21 | 0.32 | % | $ | 1.61 | ||||||||
| Institutional Shares |
$ | 1,000.00 | $ | 1,024.79 | 0.00 | % | $ | 0.00 | ||||||||
| Class R-1 Shares |
$ | 1,000.00 | $ | 1,023.21 | 0.32 | % | $ | 1.61 | ||||||||
| Class R-2 Shares |
$ | 1,000.00 | $ | 1,023.70 | 0.22 | % | $ | 1.10 | ||||||||
| Class R-3 Shares |
$ | 1,000.00 | $ | 1,024.45 | 0.07 | % | $ | 0.35 | ||||||||
|
|
|
|
|
|
|
|
|
|||||||||
State Farm Bond Fund 3
| Beginning Account Value January 1, 2017 |
Ending Account Value June 30, 2017 |
Annualized Expense Ratio Based on the Period January 1, 2017 to June 30, 2017 |
Expenses Paid During Period January 1, 2017 to June 30, 20171 |
|||||||||||||
| Actual |
||||||||||||||||
| Class A Shares |
$ | 1,000.00 | $ | 1,019.52 | 0.53 | % | $ | 2.65 | ||||||||
| Class B Shares |
$ | 1,000.00 | $ | 1,018.53 | 0.73 | % | $ | 3.65 | ||||||||
| Premier Shares |
$ | 1,000.00 | $ | 1,020.02 | 0.43 | % | $ | 2.15 | ||||||||
| Legacy Class B Shares |
$ | 1,000.00 | $ | 1,019.41 | 0.75 | % | $ | 3.76 | ||||||||
| Institutional Shares |
$ | 1,000.00 | $ | 1,021.06 | 0.40 | % | $ | 2.00 | ||||||||
| Class R-1 Shares |
$ | 1,000.00 | $ | 1,018.54 | 0.71 | % | $ | 3.55 | ||||||||
| Class R-2 Shares |
$ | 1,000.00 | $ | 1,019.05 | 0.62 | % | $ | 3.10 | ||||||||
| Class R-3 Shares |
$ | 1,000.00 | $ | 1,020.70 | 0.47 | % | $ | 2.35 | ||||||||
|
|
|
|
|
|
|
|
|
|||||||||
| Hypothetical (5% return before expenses) |
||||||||||||||||
| Class A Shares |
$ | 1,000.00 | $ | 1,022.17 | 0.53 | % | $ | 2.66 | ||||||||
| Class B Shares |
$ | 1,000.00 | $ | 1,021.17 | 0.73 | % | $ | 3.66 | ||||||||
| Premier Shares |
$ | 1,000.00 | $ | 1,022.66 | 0.43 | % | $ | 2.16 | ||||||||
| Legacy Class B Shares |
$ | 1,000.00 | $ | 1,021.08 | 0.75 | % | $ | 3.76 | ||||||||
| Institutional Shares |
$ | 1,000.00 | $ | 1,022.81 | 0.40 | % | $ | 2.01 | ||||||||
| Class R-1 Shares |
$ | 1,000.00 | $ | 1,021.27 | 0.71 | % | $ | 3.56 | ||||||||
| Class R-2 Shares |
$ | 1,000.00 | $ | 1,021.72 | 0.62 | % | $ | 3.11 | ||||||||
| Class R-3 Shares |
$ | 1,000.00 | $ | 1,022.46 | 0.47 | % | $ | 2.36 | ||||||||
|
|
|
|
|
|
|
|
|
|||||||||
13
State Farm Tax Advantaged Bond Fund 3
| Beginning Account Value January 1, 2017 |
Ending Account Value June 30, 2017 |
Annualized Expense Ratio Based on the Period January 1, 2017 to June 30, 2017 |
Expenses Paid During Period January 1, 2017 to June 30, 20171 |
|||||||||||||
| Actual |
||||||||||||||||
| Class A Shares |
$ | 1,000.00 | $ | 1,027.22 | 0.53 | % | $ | 2.66 | ||||||||
| Class B Shares |
$ | 1,000.00 | $ | 1,026.20 | 0.74 | % | $ | 3.72 | ||||||||
| Premier Shares |
$ | 1,000.00 | $ | 1,027.73 | 0.43 | % | $ | 2.16 | ||||||||
| Legacy Class B Shares |
$ | 1,000.00 | $ | 1,026.19 | 0.74 | % | $ | 3.72 | ||||||||
|
|
|
|
|
|
|
|
|
|||||||||
| Hypothetical (5% return before expenses) |
||||||||||||||||
| Class A Shares |
$ | 1,000.00 | $ | 1,022.17 | 0.53 | % | $ | 2.66 | ||||||||
| Class B Shares |
$ | 1,000.00 | $ | 1,021.12 | 0.74 | % | $ | 3.71 | ||||||||
| Premier Shares |
$ | 1,000.00 | $ | 1,022.66 | 0.43 | % | $ | 2.16 | ||||||||
| Legacy Class B Shares |
$ | 1,000.00 | $ | 1,021.12 | 0.74 | % | $ | 3.71 | ||||||||
|
|
|
|
|
|
|
|
|
|||||||||
State Farm Money Market Fund 3
| Beginning Account Value January 1, 2017 |
Ending Account Value June 30, 2017 |
Annualized Expense Ratio Based on the Period January 1, 2017 to June 30, 2017 |
Expenses Paid During Period January 1, 2017 to June 30, 20171 |
|||||||||||||
| Actual |
||||||||||||||||
| Class A Shares |
$ | 1,000.00 | $ | 1,000.62 | 0.50 | % | $ | 2.48 | ||||||||
| Class B Shares |
$ | 1,000.00 | $ | 1,000.49 | 0.53 | % | $ | 2.63 | ||||||||
| Premier Shares |
$ | 1,000.00 | $ | 1,001.13 | 0.40 | % | $ | 1.98 | ||||||||
| Legacy Class B Shares |
$ | 1,000.00 | $ | 1,000.49 | 0.53 | % | $ | 2.63 | ||||||||
| Institutional Shares |
$ | 1,000.00 | $ | 1,000.01 | 0.42 | % | $ | 2.08 | ||||||||
| Class R-1 Shares |
$ | 1,000.00 | $ | 1,000.37 | 0.55 | % | $ | 2.73 | ||||||||
| Class R-2 Shares |
$ | 1,000.00 | $ | 1,000.37 | 0.55 | % | $ | 2.73 | ||||||||
| Class R-3 Shares |
$ | 1,000.00 | $ | 1,000.67 | 0.49 | % | $ | 2.43 | ||||||||
|
|
|
|
|
|
|
|
|
|||||||||
| Hypothetical (5% return before expenses) |
||||||||||||||||
| Class A Shares |
$ | 1,000.00 | $ | 1,022.32 | 0.50 | % | $ | 2.51 | ||||||||
| Class B Shares |
$ | 1,000.00 | $ | 1,022.17 | 0.53 | % | $ | 2.66 | ||||||||
| Premier Shares |
$ | 1,000.00 | $ | 1,022.81 | 0.40 | % | $ | 2.01 | ||||||||
| Legacy Class B Shares |
$ | 1,000.00 | $ | 1,022.17 | 0.53 | % | $ | 2.66 | ||||||||
| Institutional Shares |
$ | 1,000.00 | $ | 1,022.71 | 0.42 | % | $ | 2.11 | ||||||||
| Class R-1 Shares |
$ | 1,000.00 | $ | 1,022.07 | 0.55 | % | $ | 2.76 | ||||||||
| Class R-2 Shares |
$ | 1,000.00 | $ | 1,022.07 | 0.55 | % | $ | 2.76 | ||||||||
| Class R-3 Shares |
$ | 1,000.00 | $ | 1,022.36 | 0.49 | % | $ | 2.46 | ||||||||
|
|
|
|
|
|
|
|
|
|||||||||
14
State Farm LifePath Retirement Fund 2,3
| Beginning Account Value January 1, 2017 |
Ending Account Value June 30, 2017 |
Annualized Expense Ratio Based on the Period January 1, 2017 to June 30, 2017 |
Expenses Paid During Period January 1, 2017 to June 30, 20171 |
|||||||||||||
| Actual |
||||||||||||||||
| Class A Shares |
$ | 1,000.00 | $ | 1,049.33 | 0.67 | % | $ | 3.40 | ||||||||
| Class B Shares |
$ | 1,000.00 | $ | 1,047.43 | 1.03 | % | $ | 5.23 | ||||||||
| Premier Shares |
$ | 1,000.00 | $ | 1,050.28 | 0.57 | % | $ | 2.90 | ||||||||
| Legacy Class B Shares |
$ | 1,000.00 | $ | 1,049.05 | 0.88 | % | $ | 4.47 | ||||||||
| Institutional Shares |
$ | 1,000.00 | $ | 1,050.41 | 0.54 | % | $ | 2.75 | ||||||||
| Class R-1 Shares |
$ | 1,000.00 | $ | 1,048.99 | 0.87 | % | $ | 4.42 | ||||||||
| Class R-2 Shares |
$ | 1,000.00 | $ | 1,049.94 | 0.76 | % | $ | 3.86 | ||||||||
| Class R-3 Shares |
$ | 1,000.00 | $ | 1,050.08 | 0.61 | % | $ | 3.10 | ||||||||
|
|
|
|
|
|
|
|
|
|||||||||
| Hypothetical (5% return before expenses) |
||||||||||||||||
| Class A Shares |
$ | 1,000.00 | $ | 1,021.47 | 0.67 | % | $ | 3.36 | ||||||||
| Class B Shares |
$ | 1,000.00 | $ | 1,019.69 | 1.03 | % | $ | 5.16 | ||||||||
| Premier Shares |
$ | 1,000.00 | $ | 1,021.97 | 0.57 | % | $ | 2.86 | ||||||||
| Legacy Class B Shares |
$ | 1,000.00 | $ | 1,020.43 | 0.88 | % | $ | 4.41 | ||||||||
| Institutional Shares |
$ | 1,000.00 | $ | 1,022.12 | 0.54 | % | $ | 2.71 | ||||||||
| Class R-1 Shares |
$ | 1,000.00 | $ | 1,020.48 | 0.87 | % | $ | 4.36 | ||||||||
| Class R-2 Shares |
$ | 1,000.00 | $ | 1,021.03 | 0.76 | % | $ | 3.81 | ||||||||
| Class R-3 Shares |
$ | 1,000.00 | $ | 1,021.77 | 0.61 | % | $ | 3.06 | ||||||||
|
|
|
|
|
|
|
|
|
|||||||||
State Farm LifePath 2020 Fund 2,3
| Beginning Account Value January 1, 2017 |
Ending Account Value June 30, 2017 |
Annualized Expense Ratio Based on the Period January 1, 2017 to June 30, 2017 |
Expenses Paid During Period January 1, 2017 to June 30, 20171 |
|||||||||||||
| Actual |
||||||||||||||||
| Class A Shares |
$ | 1,000.00 | $ | 1,057.29 | 0.66 | % | $ | 3.37 | ||||||||
| Class B Shares |
$ | 1,000.00 | $ | 1,055.39 | 1.02 | % | $ | 5.20 | ||||||||
| Premier Shares |
$ | 1,000.00 | $ | 1,057.58 | 0.56 | % | $ | 2.86 | ||||||||
| Legacy Class B Shares |
$ | 1,000.00 | $ | 1,057.04 | 0.88 | % | $ | 4.49 | ||||||||
| Institutional Shares |
$ | 1,000.00 | $ | 1,057.89 | 0.54 | % | $ | 2.76 | ||||||||
| Class R-1 Shares |
$ | 1,000.00 | $ | 1,056.89 | 0.86 | % | $ | 4.39 | ||||||||
| Class R-2 Shares |
$ | 1,000.00 | $ | 1,056.85 | 0.76 | % | $ | 3.88 | ||||||||
| Class R-3 Shares |
$ | 1,000.00 | $ | 1,058.01 | 0.61 | % | $ | 3.11 | ||||||||
|
|
|
|
|
|
|
|
|
|||||||||
| Hypothetical (5% return before expenses) |
||||||||||||||||
| Class A Shares |
$ | 1,000.00 | $ | 1,021.52 | 0.66 | % | $ | 3.31 | ||||||||
| Class B Shares |
$ | 1,000.00 | $ | 1,019.74 | 1.02 | % | $ | 5.11 | ||||||||
| Premier Shares |
$ | 1,000.00 | $ | 1,022.02 | 0.56 | % | $ | 2.81 | ||||||||
| Legacy Class B Shares |
$ | 1,000.00 | $ | 1,020.43 | 0.88 | % | $ | 4.41 | ||||||||
| Institutional Shares |
$ | 1,000.00 | $ | 1,022.12 | 0.54 | % | $ | 2.71 | ||||||||
| Class R-1 Shares |
$ | 1,000.00 | $ | 1,020.53 | 0.86 | % | $ | 4.31 | ||||||||
| Class R-2 Shares |
$ | 1,000.00 | $ | 1,021.03 | 0.76 | % | $ | 3.81 | ||||||||
| Class R-3 Shares |
$ | 1,000.00 | $ | 1,021.77 | 0.61 | % | $ | 3.06 | ||||||||
|
|
|
|
|
|
|
|
|
|||||||||
15
State Farm LifePath 2030 Fund 2,3
| Beginning Account Value January 1, 2017 |
Ending Account Value June 30, 2017 |
Annualized Expense Ratio Based on the Period January 1, 2017 to June 30, 2017 |
Expenses Paid During Period January 1, 2017 to June 30, 20171 |
|||||||||||||
| Actual |
||||||||||||||||
| Class A Shares |
$ | 1,000.00 | $ | 1,076.18 | 0.66 | % | $ | 3.40 | ||||||||
| Class B Shares |
$ | 1,000.00 | $ | 1,075.76 | 0.77 | % | $ | 3.96 | ||||||||
| Premier Shares |
$ | 1,000.00 | $ | 1,076.82 | 0.56 | % | $ | 2.88 | ||||||||
| Legacy Class B Shares |
$ | 1,000.00 | $ | 1,074.98 | 0.88 | % | $ | 4.53 | ||||||||
| Institutional Shares |
$ | 1,000.00 | $ | 1,077.03 | 0.54 | % | $ | 2.78 | ||||||||
| Class R-1 Shares |
$ | 1,000.00 | $ | 1,075.28 | 0.86 | % | $ | 4.43 | ||||||||
| Class R-2 Shares |
$ | 1,000.00 | $ | 1,076.39 | 0.75 | % | $ | 3.86 | ||||||||
| Class R-3 Shares |
$ | 1,000.00 | $ | 1,076.29 | 0.61 | % | $ | 3.14 | ||||||||
|
|
|
|
|
|
|
|
|
|||||||||
| Hypothetical (5% return before expenses) |
||||||||||||||||
| Class A Shares |
$ | 1,000.00 | $ | 1,021.52 | 0.66 | % | $ | 3.31 | ||||||||
| Class B Shares |
$ | 1,000.00 | $ | 1,020.98 | 0.77 | % | $ | 3.86 | ||||||||
| Premier Shares |
$ | 1,000.00 | $ | 1,022.02 | 0.56 | % | $ | 2.81 | ||||||||
| Legacy Class B Shares |
$ | 1,000.00 | $ | 1,020.43 | 0.88 | % | $ | 4.41 | ||||||||
| Institutional Shares |
$ | 1,000.00 | $ | 1,022.12 | 0.54 | % | $ | 2.71 | ||||||||
| Class R-1 Shares |
$ | 1,000.00 | $ | 1,020.53 | 0.86 | % | $ | 4.31 | ||||||||
| Class R-2 Shares |
$ | 1,000.00 | $ | 1,021.08 | 0.75 | % | $ | 3.76 | ||||||||
| Class R-3 Shares |
$ | 1,000.00 | $ | 1,021.77 | 0.61 | % | $ | 3.06 | ||||||||
|
|
|
|
|
|
|
|
|
|||||||||
State Farm LifePath 2040 Fund 2,3
| Beginning Account Value January 1, 2017 |
Ending Account Value June 30, 2017 |
Annualized Expense Ratio Based on the Period January 1, 2017 to June 30, 2017 |
Expenses Paid During Period January 1, 2017 to June 30, 20171 |
|||||||||||||
| Actual |
||||||||||||||||
| Class A Shares |
$ | 1,000.00 | $ | 1,092.04 | 0.67 | % | $ | 3.48 | ||||||||
| Class B Shares |
$ | 1,000.00 | $ | 1,091.69 | 0.77 | % | $ | 3.99 | ||||||||
| Premier Shares |
$ | 1,000.00 | $ | 1,092.99 | 0.56 | % | $ | 2.91 | ||||||||
| Legacy Class B Shares |
$ | 1,000.00 | $ | 1,091.80 | 0.88 | % | $ | 4.56 | ||||||||
| Institutional Shares |
$ | 1,000.00 | $ | 1,093.16 | 0.54 | % | $ | 2.80 | ||||||||
| Class R-1 Shares |
$ | 1,000.00 | $ | 1,091.81 | 0.86 | % | $ | 4.46 | ||||||||
| Class R-2 Shares |
$ | 1,000.00 | $ | 1,092.17 | 0.76 | % | $ | 3.94 | ||||||||
| Class R-3 Shares |
$ | 1,000.00 | $ | 1,092.78 | 0.61 | % | $ | 3.17 | ||||||||
|
|
|
|
|
|
|
|
|
|||||||||
| Hypothetical (5% return before expenses) |
||||||||||||||||
| Class A Shares |
$ | 1,000.00 | $ | 1,021.47 | 0.67 | % | $ | 3.36 | ||||||||
| Class B Shares |
$ | 1,000.00 | $ | 1,020.98 | 0.77 | % | $ | 3.86 | ||||||||
| Premier Shares |
$ | 1,000.00 | $ | 1,022.02 | 0.56 | % | $ | 2.81 | ||||||||
| Legacy Class B Shares |
$ | 1,000.00 | $ | 1,020.43 | 0.88 | % | $ | 4.41 | ||||||||
| Institutional Shares |
$ | 1,000.00 | $ | 1,022.12 | 0.54 | % | $ | 2.71 | ||||||||
| Class R-1 Shares |
$ | 1,000.00 | $ | 1,020.53 | 0.86 | % | $ | 4.31 | ||||||||
| Class R-2 Shares |
$ | 1,000.00 | $ | 1,021.03 | 0.76 | % | $ | 3.81 | ||||||||
| Class R-3 Shares |
$ | 1,000.00 | $ | 1,021.77 | 0.61 | % | $ | 3.06 | ||||||||
|
|
|
|
|
|
|
|
|
|||||||||
16
State Farm LifePath 2050 Fund 2,3
| Beginning Account Value January 1, 2017 |
Ending Account Value June 30, 2017 |
Annualized Expense Ratio Based on the Period January 1, 2017 to June 30, 2017 |
Expenses Paid During Period January 1, 2017 to June 30, 20171 |
|||||||||||||
| Actual |
||||||||||||||||
| Class A Shares |
$ | 1,000.00 | $ | 1,098.19 | 0.69 | % | $ | 3.59 | ||||||||
| Premier Shares |
$ | 1,000.00 | $ | 1,099.43 | 0.59 | % | $ | 3.07 | ||||||||
| Class R-1 Shares |
$ | 1,000.00 | $ | 1,098.00 | 0.88 | % | $ | 4.58 | ||||||||
| Class R-2 Shares |
$ | 1,000.00 | $ | 1,097.91 | 0.78 | % | $ | 4.06 | ||||||||
|
|
|
|
|
|
|
|
|
|||||||||
| Hypothetical (5% return before expenses) |
||||||||||||||||
| Class A Shares |
$ | 1,000.00 | $ | 1,021.37 | 0.69 | % | $ | 3.46 | ||||||||
| Premier Shares |
$ | 1,000.00 | $ | 1,021.87 | 0.59 | % | $ | 2.96 | ||||||||
| Class R-1 Shares |
$ | 1,000.00 | $ | 1,020.43 | 0.88 | % | $ | 4.41 | ||||||||
| Class R-2 Shares |
$ | 1,000.00 | $ | 1,020.93 | 0.78 | % | $ | 3.91 | ||||||||
|
|
|
|
|
|
|
|
|
|||||||||
| 1 | Expenses are equal to the applicable Fund’s annualized expense ratio (provided in the table), multiplied by the average account value over the period, multiplied by 181/365 (to reflect the one-half year period). |
| 2 | The expense examples do not reflect acquired fund fees and expenses. |
| 3 | Restated Expense Example Tables: Effective April 1, 2017, for each Fund, State Farm VP Management Corp. agreed to waive all distribution and service (12b-1) fees for Class A, Class B, Premier, Legacy Class B, Class R-1 and Class R-2 shares. In addition, effective May 1, 2017, State Farm Investment Management Corp. agreed to waive 0.29% of management fees for the State Farm Small/Mid Cap Equity Fund. The restated examples reflect expenses as if (1) the 12b-1 fee waiver had been in effect for all Funds, and (2) the management fee waiver had been in effect for the State Farm Small/Mid Cap Equity Fund, throughout the entire period from January 1, 2017 to June 30, 2017 as follows: |
State Farm Equity Fund
| Beginning Account Value January 1, 2017 |
Ending Account Value June 30, 2017 |
Annualized Expense Ratio Based on the Period January 1, 2017 to June 30, 2017 |
Expenses Paid During Period January 1, 2017 to June 30, 2017* |
|||||||||||||
| Actual |
||||||||||||||||
| Class A Shares |
$ | 1,000.00 | $ | 1,093.35 | 0.90 | % | $ | 4.67 | ||||||||
| Class B Shares |
$ | 1,000.00 | $ | 1,092.87 | 0.90 | % | $ | 4.67 | ||||||||
| Premier Shares |
$ | 1,000.00 | $ | 1,093.27 | 0.80 | % | $ | 4.15 | ||||||||
| Legacy Class B Shares |
$ | 1,000.00 | $ | 1,092.47 | 0.90 | % | $ | 4.67 | ||||||||
| Class R-1 Shares |
$ | 1,000.00 | $ | 1,092.94 | 0.97 | % | $ | 5.03 | ||||||||
| Class R-2 Shares |
$ | 1,000.00 | $ | 1,092.60 | 0.97 | % | $ | 5.03 | ||||||||
|
|
|
|
|
|
|
|
|
|||||||||
| Hypothetical (5% return before expenses) |
||||||||||||||||
| Class A Shares |
$ | 1,000.00 | $ | 1,020.33 | 0.90 | % | $ | 4.51 | ||||||||
| Class B Shares |
$ | 1,000.00 | $ | 1,020.33 | 0.90 | % | $ | 4.51 | ||||||||
| Premier Shares |
$ | 1,000.00 | $ | 1,020.83 | 0.80 | % | $ | 4.01 | ||||||||
| Legacy Class B Shares |
$ | 1,000.00 | $ | 1,020.33 | 0.90 | % | $ | 4.51 | ||||||||
| Class R-1 Shares |
$ | 1,000.00 | $ | 1,019.98 | 0.97 | % | $ | 4.86 | ||||||||
| Class R-2 Shares |
$ | 1,000.00 | $ | 1,019.98 | 0.97 | % | $ | 4.86 | ||||||||
|
|
|
|
|
|
|
|
|
|||||||||
17
State Farm Small/Mid Cap Equity Fund
| Beginning Account Value January 1, 2017 |
Ending Account Value June 30, 2017 |
Annualized Expense Ratio Based on the Period January 1, 2017 to June 30, 2017 |
Expenses Paid During Period January 1, 2017 to June 30, 2017* |
|||||||||||||
| Actual |
||||||||||||||||
| Class A Shares |
$ | 1,000.00 | $ | 1,027.38 | 0.85 | % | $ | 4.27 | ||||||||
| Class B Shares |
$ | 1,000.00 | $ | 1,026.86 | 0.85 | % | $ | 4.27 | ||||||||
| Premier Shares |
$ | 1,000.00 | $ | 1,027.95 | 0.75 | % | $ | 3.77 | ||||||||
| Legacy Class B Shares |
$ | 1,000.00 | $ | 1,026.74 | 0.85 | % | $ | 4.27 | ||||||||
| Institutional Shares |
$ | 1,000.00 | $ | 1,026.81 | 0.85 | % | $ | 4.27 | ||||||||
| Class R-1 Shares |
$ | 1,000.00 | $ | 1,026.91 | 0.92 | % | $ | 4.62 | ||||||||
| Class R-2 Shares |
$ | 1,000.00 | $ | 1,027.40 | 0.92 | % | $ | 4.62 | ||||||||
| Class R-3 Shares |
$ | 1,000.00 | $ | 1,026.30 | 0.92 | % | $ | 4.62 | ||||||||
|
|
|
|
|
|
|
|
|
|||||||||
| Hypothetical (5% return before expenses) |
||||||||||||||||
| Class A Shares |
$ | 1,000.00 | $ | 1,020.58 | 0.85 | % | $ | 4.26 | ||||||||
| Class B Shares |
$ | 1,000.00 | $ | 1,020.58 | 0.85 | % | $ | 4.26 | ||||||||
| Premier Shares |
$ | 1,000.00 | $ | 1,021.08 | 0.75 | % | $ | 3.76 | ||||||||
| Legacy Class B Shares |
$ | 1,000.00 | $ | 1,020.58 | 0.85 | % | $ | 4.26 | ||||||||
| Institutional Shares |
$ | 1,000.00 | $ | 1,020.58 | 0.85 | % | $ | 4.26 | ||||||||
| Class R-1 Shares |
$ | 1,000.00 | $ | 1,020.23 | 0.92 | % | $ | 4.61 | ||||||||
| Class R-2 Shares |
$ | 1,000.00 | $ | 1,020.23 | 0.92 | % | $ | 4.61 | ||||||||
| Class R-3 Shares |
$ | 1,000.00 | $ | 1,020.23 | 0.92 | % | $ | 4.61 | ||||||||
|
|
|
|
|
|
|
|
|
|||||||||
State Farm International Equity Fund
| Beginning Account Value January 1, 2017 |
Ending Account Value June 30, 2017 |
Annualized Expense Ratio Based on the Period January 1, 2017 to June 30, 2017 |
Expenses Paid During Period January 1, 2017 to June 30, 2017* |
|||||||||||||
| Actual |
||||||||||||||||
| Class A Shares |
$ | 1,000.00 | $ | 1,205.36 | 1.24 | % | $ | 6.78 | ||||||||
| Class B Shares |
$ | 1,000.00 | $ | 1,205.49 | 1.24 | % | $ | 6.78 | ||||||||
| Premier Shares |
$ | 1,000.00 | $ | 1,205.11 | 1.14 | % | $ | 6.23 | ||||||||
| Legacy Class B Shares |
$ | 1,000.00 | $ | 1,205.37 | 1.24 | % | $ | 6.78 | ||||||||
| Class R-1 Shares |
$ | 1,000.00 | $ | 1,204.92 | 1.31 | % | $ | 7.16 | ||||||||
| Class R-2 Shares |
$ | 1,000.00 | $ | 1,204.91 | 1.31 | % | $ | 7.16 | ||||||||
|
|
|
|
|
|
|
|
|
|||||||||
| Hypothetical (5% return before expenses) |
||||||||||||||||
| Class A Shares |
$ | 1,000.00 | $ | 1,018.65 | 1.24 | % | $ | 6.21 | ||||||||
| Class B Shares |
$ | 1,000.00 | $ | 1,018.65 | 1.24 | % | $ | 6.21 | ||||||||
| Premier Shares |
$ | 1,000.00 | $ | 1,019.14 | 1.14 | % | $ | 5.71 | ||||||||
| Legacy Class B Shares |
$ | 1,000.00 | $ | 1,018.65 | 1.24 | % | $ | 6.21 | ||||||||
| Class R-1 Shares |
$ | 1,000.00 | $ | 1,018.30 | 1.31 | % | $ | 6.56 | ||||||||
| Class R-2 Shares |
$ | 1,000.00 | $ | 1,018.30 | 1.31 | % | $ | 6.56 | ||||||||
|
|
|
|
|
|
|
|
|
|||||||||
18
State Farm S&P 500 Index Fund
| Beginning Account Value January 1, 2017 |
Ending Account Value June 30, 2017 |
Annualized Expense Ratio Based on the Period January 1, 2017 to June 30, 2017 |
Expenses Paid During Period January 1, 2017 to June 30, 2017* |
|||||||||||||
| Actual |
||||||||||||||||
| Class A Shares |
$ | 1,000.00 | $ | 1,091.04 | 0.39 | % | $ | 2.02 | ||||||||
| Class B Shares |
$ | 1,000.00 | $ | 1,091.03 | 0.39 | % | $ | 2.02 | ||||||||
| Premier Shares |
$ | 1,000.00 | $ | 1,091.74 | 0.29 | % | $ | 1.50 | ||||||||
| Legacy Class B Shares |
$ | 1,000.00 | $ | 1,091.21 | 0.39 | % | $ | 2.02 | ||||||||
| Class R-1 Shares |
$ | 1,000.00 | $ | 1,090.79 | 0.46 | % | $ | 2.38 | ||||||||
| Class R-2 Shares |
$ | 1,000.00 | $ | 1,090.68 | 0.46 | % | $ | 2.38 | ||||||||
|
|
|
|
|
|
|
|
|
|||||||||
| Hypothetical (5% return before expenses) |
||||||||||||||||
| Class A Shares |
$ | 1,000.00 | $ | 1,022.86 | 0.39 | % | $ | 1.96 | ||||||||
| Class B Shares |
$ | 1,000.00 | $ | 1,022.86 | 0.39 | % | $ | 1.96 | ||||||||
| Premier Shares |
$ | 1,000.00 | $ | 1,023.36 | 0.29 | % | $ | 1.45 | ||||||||
| Legacy Class B Shares |
$ | 1,000.00 | $ | 1,022.86 | 0.39 | % | $ | 1.96 | ||||||||
| Class R-1 Shares |
$ | 1,000.00 | $ | 1,022.51 | 0.46 | % | $ | 2.31 | ||||||||
| Class R-2 Shares |
$ | 1,000.00 | $ | 1,022.51 | 0.46 | % | $ | 2.31 | ||||||||
|
|
|
|
|
|
|
|
|
|||||||||
State Farm Small Cap Index Fund
| Beginning Account Value January 1, 2017 |
Ending Account Value June 30, 2017 |
Annualized Expense Ratio Based on the Period January 1, 2017 to June 30, 2017 |
Expenses Paid During Period January 1, 2017 to June 30, 2017* |
|||||||||||||
| Actual |
||||||||||||||||
| Class A Shares |
$ | 1,000.00 | $ | 1,047.61 | 0.48 | % | $ | 2.44 | ||||||||
| Class B Shares |
$ | 1,000.00 | $ | 1,048.49 | 0.48 | % | $ | 2.44 | ||||||||
| Premier Shares |
$ | 1,000.00 | $ | 1,048.67 | 0.38 | % | $ | 1.93 | ||||||||
| Legacy Class B Shares |
$ | 1,000.00 | $ | 1,048.45 | 0.48 | % | $ | 2.44 | ||||||||
| Class R-1 Shares |
$ | 1,000.00 | $ | 1,047.80 | 0.55 | % | $ | 2.79 | ||||||||
| Class R-2 Shares |
$ | 1,000.00 | $ | 1,047.74 | 0.55 | % | $ | 2.79 | ||||||||
|
|
|
|
|
|
|
|
|
|||||||||
| Hypothetical (5% return before expenses) |
||||||||||||||||
| Class A Shares |
$ | 1,000.00 | $ | 1,022.41 | 0.48 | % | $ | 2.41 | ||||||||
| Class B Shares |
$ | 1,000.00 | $ | 1,022.41 | 0.48 | % | $ | 2.41 | ||||||||
| Premier Shares |
$ | 1,000.00 | $ | 1,022.91 | 0.38 | % | $ | 1.91 | ||||||||
| Legacy Class B Shares |
$ | 1,000.00 | $ | 1,022.41 | 0.48 | % | $ | 2.41 | ||||||||
| Class R-1 Shares |
$ | 1,000.00 | $ | 1,022.07 | 0.55 | % | $ | 2.76 | ||||||||
| Class R-2 Shares |
$ | 1,000.00 | $ | 1,022.07 | 0.55 | % | $ | 2.76 | ||||||||
|
|
|
|
|
|
|
|
|
|||||||||
19
State Farm International Index Fund
| Beginning Account Value January 1, 2017 |
Ending Account Value June 30, 2017 |
Annualized Expense Ratio Based on the Period January 1, 2017 to June 30, 2017 |
Expenses Paid During Period January 1, 2017 to June 30, 2017* |
|||||||||||||
| Actual |
||||||||||||||||
| Class A Shares |
$ | 1,000.00 | $ | 1,143.43 | 0.60 | % | $ | 3.19 | ||||||||
| Class B Shares |
$ | 1,000.00 | $ | 1,143.28 | 0.60 | % | $ | 3.19 | ||||||||
| Premier Shares |
$ | 1,000.00 | $ | 1,143.69 | 0.50 | % | $ | 2.66 | ||||||||
| Legacy Class B Shares |
$ | 1,000.00 | $ | 1,143.90 | 0.60 | % | $ | 3.19 | ||||||||
| Class R-1 Shares |
$ | 1,000.00 | $ | 1,142.94 | 0.67 | % | $ | 3.56 | ||||||||
| Class R-2 Shares |
$ | 1,000.00 | $ | 1,142.91 | 0.67 | % | $ | 3.56 | ||||||||
|
|
|
|
|
|
|
|
|
|||||||||
| Hypothetical (5% return before expenses) |
||||||||||||||||
| Class A Shares |
$ | 1,000.00 | $ | 1,021.82 | 0.60 | % | $ | 3.01 | ||||||||
| Class B Shares |
$ | 1,000.00 | $ | 1,021.82 | 0.60 | % | $ | 3.01 | ||||||||
| Premier Shares |
$ | 1,000.00 | $ | 1,022.32 | 0.50 | % | $ | 2.51 | ||||||||
| Legacy Class B Shares |
$ | 1,000.00 | $ | 1,021.82 | 0.60 | % | $ | 3.01 | ||||||||
| Class R-1 Shares |
$ | 1,000.00 | $ | 1,021.47 | 0.67 | % | $ | 3.36 | ||||||||
| Class R-2 Shares |
$ | 1,000.00 | $ | 1,021.47 | 0.67 | % | $ | 3.36 | ||||||||
|
|
|
|
|
|
|
|
|
|||||||||
State Farm Equity and Bond Fund **
| Beginning Account Value January 1, 2017 |
Ending Account Value June 30, 2017 |
Annualized Expense Ratio Based on the Period January 1, 2017 to June 30, 2017 |
Expenses Paid During Period January 1, 2017 to June 30, 2017* |
|||||||||||||
| Actual |
||||||||||||||||
| Class A Shares |
$ | 1,000.00 | $ | 1,064.04 | 0.00 | % | $ | 0.00 | ||||||||
| Class B Shares |
$ | 1,000.00 | $ | 1,064.11 | 0.00 | % | $ | 0.00 | ||||||||
| Premier Shares |
$ | 1,000.00 | $ | 1,065.15 | -0.10 | % | -$ | 0.51 | ||||||||
| Legacy Class B Shares |
$ | 1,000.00 | $ | 1,064.16 | 0.00 | % | $ | 0.00 | ||||||||
| Class R-1 Shares |
$ | 1,000.00 | $ | 1,063.65 | 0.07 | % | $ | 0.36 | ||||||||
| Class R-2 Shares |
$ | 1,000.00 | $ | 1,063.56 | 0.07 | % | $ | 0.36 | ||||||||
|
|
|
|
|
|
|
|
|
|||||||||
| Hypothetical (5% return before expenses) |
||||||||||||||||
| Class A Shares |
$ | 1,000.00 | $ | 1,024.79 | 0.00 | % | $ | 0.00 | ||||||||
| Class B Shares |
$ | 1,000.00 | $ | 1,024.79 | 0.00 | % | $ | 0.00 | ||||||||
| Premier Shares |
$ | 1,000.00 | $ | 1,025.29 | -0.10 | % | -$ | 0.50 | ||||||||
| Legacy Class B Shares |
$ | 1,000.00 | $ | 1,024.79 | 0.00 | % | $ | 0.00 | ||||||||
| Class R-1 Shares |
$ | 1,000.00 | $ | 1,024.45 | 0.07 | % | $ | 0.35 | ||||||||
| Class R-2 Shares |
$ | 1,000.00 | $ | 1,024.45 | 0.07 | % | $ | 0.35 | ||||||||
|
|
|
|
|
|
|
|
|
|||||||||
20
State Farm Bond Fund
| Beginning Account Value January 1, 2017 |
Ending Account Value June 30, 2017 |
Annualized Expense Ratio Based on the Period January 1, 2017 to June 30, 2017 |
Expenses Paid During Period January 1, 2017 to June 30, 2017* |
|||||||||||||
| Actual |
||||||||||||||||
| Class A Shares |
$ | 1,000.00 | $ | 1,020.15 | 0.40 | % | $ | 2.00 | ||||||||
| Class B Shares |
$ | 1,000.00 | $ | 1,020.16 | 0.40 | % | $ | 2.00 | ||||||||
| Premier Shares |
$ | 1,000.00 | $ | 1,020.65 | 0.30 | % | $ | 1.50 | ||||||||
| Legacy Class B Shares |
$ | 1,000.00 | $ | 1,021.05 | 0.40 | % | $ | 2.00 | ||||||||
| Class R-1 Shares |
$ | 1,000.00 | $ | 1,019.80 | 0.47 | % | $ | 2.35 | ||||||||
| Class R-2 Shares |
$ | 1,000.00 | $ | 1,019.81 | 0.47 | % | $ | 2.35 | ||||||||
|
|
|
|
|
|
|
|
|
|||||||||
| Hypothetical (5% return before expenses) |
||||||||||||||||
| Class A Shares |
$ | 1,000.00 | $ | 1,022.81 | 0.40 | % | $ | 2.01 | ||||||||
| Class B Shares |
$ | 1,000.00 | $ | 1,022.81 | 0.40 | % | $ | 2.01 | ||||||||
| Premier Shares |
$ | 1,000.00 | $ | 1,023.31 | 0.30 | % | $ | 1.51 | ||||||||
| Legacy Class B Shares |
$ | 1,000.00 | $ | 1,022.81 | 0.40 | % | $ | 2.01 | ||||||||
| Class R-1 Shares |
$ | 1,000.00 | $ | 1,022.46 | 0.47 | % | $ | 2.36 | ||||||||
| Class R-2 Shares |
$ | 1,000.00 | $ | 1,022.46 | 0.47 | % | $ | 2.36 | ||||||||
|
|
|
|
|
|
|
|
|
|||||||||
State Farm Tax Advantaged Bond Fund
| Beginning Account Value January 1, 2017 |
Ending Account Value June 30, 2017 |
Annualized Expense Ratio Based on the Period January 1, 2017 to June 30, 2017 |
Expenses Paid During Period January 1, 2017 to June 30, 2017* |
|||||||||||||
| Actual |
||||||||||||||||
| Class A Shares |
$ | 1,000.00 | $ | 1,027.86 | 0.41 | % | $ | 2.06 | ||||||||
| Class B Shares |
$ | 1,000.00 | $ | 1,027.85 | 0.41 | % | $ | 2.06 | ||||||||
| Premier Shares |
$ | 1,000.00 | $ | 1,028.37 | 0.31 | % | $ | 1.56 | ||||||||
| Legacy Class B Shares |
$ | 1,000.00 | $ | 1,027.84 | 0.41 | % | $ | 2.06 | ||||||||
|
|
|
|
|
|
|
|
|
|||||||||
| Hypothetical (5% return before expenses) |
||||||||||||||||
| Class A Shares |
$ | 1,000.00 | $ | 1,022.76 | 0.41 | % | $ | 2.06 | ||||||||
| Class B Shares |
$ | 1,000.00 | $ | 1,022.76 | 0.41 | % | $ | 2.06 | ||||||||
| Premier Shares |
$ | 1,000.00 | $ | 1,023.26 | 0.31 | % | $ | 1.56 | ||||||||
| Legacy Class B Shares |
$ | 1,000.00 | $ | 1,022.76 | 0.41 | % | $ | 2.06 | ||||||||
|
|
|
|
|
|
|
|
|
|||||||||
21
State Farm Money Market Fund
| Beginning Account Value January 1, 2017 |
Ending Account Value June 30, 2017 |
Annualized Expense Ratio Based on the Period January 1, 2017 to June 30, 2017 |
Expenses Paid During Period January 1, 2017 to June 30, 2017* |
|||||||||||||
| Actual |
||||||||||||||||
| Class A Shares |
$ | 1,000.00 | $ | 1,000.82 | 0.42 | % | $ | 2.08 | ||||||||
| Class B Shares |
$ | 1,000.00 | $ | 1,000.69 | 0.42 | % | $ | 2.08 | ||||||||
| Premier Shares |
$ | 1,000.00 | $ | 1,001.50 | 0.32 | % | $ | 1.59 | ||||||||
| Legacy Class B Shares |
$ | 1,000.00 | $ | 1,000.69 | 0.42 | % | $ | 2.08 | ||||||||
| Class R-1 Shares |
$ | 1,000.00 | $ | 1,000.40 | 0.49 | % | $ | 2.43 | ||||||||
| Class R-2 Shares |
$ | 1,000.00 | $ | 1,000.40 | 0.49 | % | $ | 2.43 | ||||||||
|
|
|
|
|
|
|
|
|
|||||||||
| Hypothetical (5% return before expenses) |
||||||||||||||||
| Class A Shares |
$ | 1,000.00 | $ | 1,022.71 | 0.42 | % | $ | 2.11 | ||||||||
| Class B Shares |
$ | 1,000.00 | $ | 1,022.71 | 0.42 | % | $ | 2.11 | ||||||||
| Premier Shares |
$ | 1,000.00 | $ | 1,023.21 | 0.32 | % | $ | 1.61 | ||||||||
| Legacy Class B Shares |
$ | 1,000.00 | $ | 1,022.71 | 0.42 | % | $ | 2.11 | ||||||||
| Class R-1 Shares |
$ | 1,000.00 | $ | 1,022.36 | 0.49 | % | $ | 2.46 | ||||||||
| Class R-2 Shares |
$ | 1,000.00 | $ | 1,022.36 | 0.49 | % | $ | 2.46 | ||||||||
|
|
|
|
|
|
|
|
|
|||||||||
State Farm LifePath Retirement Fund **
| Beginning Account Value January 1, 2017 |
Ending Account Value June 30, 2017 |
Annualized Expense Ratio Based on the Period January 1, 2017 to June 30, 2017 |
Expenses Paid During Period January 1, 2017 to June 30, 2017* |
|||||||||||||
| Actual |
||||||||||||||||
| Class A Shares |
$ | 1,000.00 | $ | 1,049.98 | 0.54 | % | $ | 2.74 | ||||||||
| Class B Shares |
$ | 1,000.00 | $ | 1,049.89 | 0.54 | % | $ | 2.74 | ||||||||
| Premier Shares |
$ | 1,000.00 | $ | 1,050.92 | 0.44 | % | $ | 2.24 | ||||||||
| Legacy Class B Shares |
$ | 1,000.00 | $ | 1,050.73 | 0.54 | % | $ | 2.75 | ||||||||
| Class R-1 Shares |
$ | 1,000.00 | $ | 1,050.29 | 0.61 | % | $ | 3.10 | ||||||||
| Class R-2 Shares |
$ | 1,000.00 | $ | 1,050.72 | 0.61 | % | $ | 3.10 | ||||||||
|
|
|
|
|
|
|
|
|
|||||||||
| Hypothetical (5% return before expenses) |
||||||||||||||||
| Class A Shares |
$ | 1,000.00 | $ | 1,022.12 | 0.54 | % | $ | 2.71 | ||||||||
| Class B Shares |
$ | 1,000.00 | $ | 1,022.12 | 0.54 | % | $ | 2.71 | ||||||||
| Premier Shares |
$ | 1,000.00 | $ | 1,022.61 | 0.44 | % | $ | 2.21 | ||||||||
| Legacy Class B Shares |
$ | 1,000.00 | $ | 1,022.12 | 0.54 | % | $ | 2.71 | ||||||||
| Class R-1 Shares |
$ | 1,000.00 | $ | 1,021.77 | 0.61 | % | $ | 3.06 | ||||||||
| Class R-2 Shares |
$ | 1,000.00 | $ | 1,021.77 | 0.61 | % | $ | 3.06 | ||||||||
|
|
|
|
|
|
|
|
|
|||||||||
22
State Farm LifePath 2020 Fund **
| Beginning Account Value January 1, 2017 |
Ending Account Value June 30, 2017 |
Annualized Expense Ratio Based on the Period January 1, 2017 to June 30, 2017 |
Expenses Paid During Period January 1, 2017 to June 30, 2017* |
|||||||||||||
| Actual |
||||||||||||||||
| Class A Shares |
$ | 1,000.00 | $ | 1,057.94 | 0.54 | % | $ | 2.76 | ||||||||
| Class B Shares |
$ | 1,000.00 | $ | 1,057.87 | 0.54 | % | $ | 2.76 | ||||||||
| Premier Shares |
$ | 1,000.00 | $ | 1,058.23 | 0.44 | % | $ | 2.25 | ||||||||
| Legacy Class B Shares |
$ | 1,000.00 | $ | 1,058.73 | 0.54 | % | $ | 2.76 | ||||||||
| Class R-1 Shares |
$ | 1,000.00 | $ | 1,058.20 | 0.61 | % | $ | 3.11 | ||||||||
| Class R-2 Shares |
$ | 1,000.00 | $ | 1,057.63 | 0.61 | % | $ | 3.11 | ||||||||
|
|
|
|
|
|
|
|
|
|||||||||
| Hypothetical (5% return before expenses) |
||||||||||||||||
| Class A Shares |
$ | 1,000.00 | $ | 1,022.12 | 0.54 | % | $ | 2.71 | ||||||||
| Class B Shares |
$ | 1,000.00 | $ | 1,022.12 | 0.54 | % | $ | 2.71 | ||||||||
| Premier Shares |
$ | 1,000.00 | $ | 1,022.61 | 0.44 | % | $ | 2.21 | ||||||||
| Legacy Class B Shares |
$ | 1,000.00 | $ | 1,022.12 | 0.54 | % | $ | 2.71 | ||||||||
| Class R-1 Shares |
$ | 1,000.00 | $ | 1,021.77 | 0.61 | % | $ | 3.06 | ||||||||
| Class R-2 Shares |
$ | 1,000.00 | $ | 1,021.77 | 0.61 | % | $ | 3.06 | ||||||||
|
|
|
|
|
|
|
|
|
|||||||||
State Farm LifePath 2030 Fund **
| Beginning Account Value January 1, 2017 |
Ending Account Value June 30, 2017 |
Annualized Expense Ratio Based on the Period January 1, 2017 to June 30, 2017 |
Expenses Paid During Period January 1, 2017 to June 30, 2017* |
|||||||||||||
| Actual |
||||||||||||||||
| Class A Shares |
$ | 1,000.00 | $ | 1,076.85 | 0.54 | % | $ | 2.78 | ||||||||
| Class B Shares |
$ | 1,000.00 | $ | 1,076.95 | 0.54 | % | $ | 2.78 | ||||||||
| Premier Shares |
$ | 1,000.00 | $ | 1,077.48 | 0.44 | % | $ | 2.27 | ||||||||
| Legacy Class B Shares |
$ | 1,000.00 | $ | 1,076.71 | 0.54 | % | $ | 2.78 | ||||||||
| Class R-1 Shares |
$ | 1,000.00 | $ | 1,076.60 | 0.61 | % | $ | 3.14 | ||||||||
| Class R-2 Shares |
$ | 1,000.00 | $ | 1,077.19 | 0.61 | % | $ | 3.14 | ||||||||
|
|
|
|
|
|
|
|
|
|||||||||
| Hypothetical (5% return before expenses) |
||||||||||||||||
| Class A Shares |
$ | 1,000.00 | $ | 1,022.12 | 0.54 | % | $ | 2.71 | ||||||||
| Class B Shares |
$ | 1,000.00 | $ | 1,022.12 | 0.54 | % | $ | 2.71 | ||||||||
| Premier Shares |
$ | 1,000.00 | $ | 1,022.61 | 0.44 | % | $ | 2.21 | ||||||||
| Legacy Class B Shares |
$ | 1,000.00 | $ | 1,022.12 | 0.54 | % | $ | 2.71 | ||||||||
| Class R-1 Shares |
$ | 1,000.00 | $ | 1,021.77 | 0.61 | % | $ | 3.06 | ||||||||
| Class R-2 Shares |
$ | 1,000.00 | $ | 1,021.77 | 0.61 | % | $ | 3.06 | ||||||||
|
|
|
|
|
|
|
|
|
|||||||||
23
State Farm LifePath 2040 Fund **
| Beginning Account Value January 1, 2017 |
Ending Account Value June 30, 2017 |
Annualized Expense Ratio Based on the Period January 1, 2017 to June 30, 2017 |
Expenses Paid During Period January 1, 2017 to June 30, 2017* |
|||||||||||||
| Actual |
||||||||||||||||
| Class A Shares |
$ | 1,000.00 | $ | 1,092.72 | 0.54 | % | $ | 2.80 | ||||||||
| Class B Shares |
$ | 1,000.00 | $ | 1,092.90 | 0.54 | % | $ | 2.80 | ||||||||
| Premier Shares |
$ | 1,000.00 | $ | 1,093.67 | 0.44 | % | $ | 2.28 | ||||||||
| Legacy Class B Shares |
$ | 1,000.00 | $ | 1,093.55 | 0.54 | % | $ | 2.80 | ||||||||
| Class R-1 Shares |
$ | 1,000.00 | $ | 1,093.16 | 0.61 | % | $ | 3.17 | ||||||||
| Class R-2 Shares |
$ | 1,000.00 | $ | 1,092.97 | 0.61 | % | $ | 3.17 | ||||||||
|
|
|
|
|
|
|
|
|
|||||||||
| Hypothetical (5% return before expenses) |
||||||||||||||||
| Class A Shares |
$ | 1,000.00 | $ | 1,022.12 | 0.54 | % | $ | 2.71 | ||||||||
| Class B Shares |
$ | 1,000.00 | $ | 1,022.12 | 0.54 | % | $ | 2.71 | ||||||||
| Premier Shares |
$ | 1,000.00 | $ | 1,022.61 | 0.44 | % | $ | 2.21 | ||||||||
| Legacy Class B Shares |
$ | 1,000.00 | $ | 1,022.12 | 0.54 | % | $ | 2.71 | ||||||||
| Class R-1 Shares |
$ | 1,000.00 | $ | 1,021.77 | 0.61 | % | $ | 3.06 | ||||||||
| Class R-2 Shares |
$ | 1,000.00 | $ | 1,021.77 | 0.61 | % | $ | 3.06 | ||||||||
|
|
|
|
|
|
|
|
|
|||||||||
State Farm LifePath 2050 Fund **
| Beginning Account Value January 1, 2017 |
Ending Account Value June 30, 2017 |
Annualized Expense Ratio Based on the Period January 1, 2017 to June 30, 2017 |
Expenses Paid During Period January 1, 2017 to June 30, 2017* |
|||||||||||||
| Actual |
||||||||||||||||
| Class A Shares |
$ | 1,000.00 | $ | 1,098.87 | 0.57 | % | $ | 2.97 | ||||||||
| Premier Shares |
$ | 1,000.00 | $ | 1,100.10 | 0.47 | % | $ | 2.45 | ||||||||
| Class R-1 Shares |
$ | 1,000.00 | $ | 1,099.36 | 0.64 | % | $ | 3.33 | ||||||||
| Class R-2 Shares |
$ | 1,000.00 | $ | 1,098.72 | 0.64 | % | $ | 3.33 | ||||||||
|
|
|
|
|
|
|
|
|
|||||||||
| Hypothetical (5% return before expenses) |
||||||||||||||||
| Class A Shares |
$ | 1,000.00 | $ | 1,021.97 | 0.57 | % | $ | 2.86 | ||||||||
| Premier Shares |
$ | 1,000.00 | $ | 1,022.46 | 0.47 | % | $ | 2.36 | ||||||||
| Class R-1 Shares |
$ | 1,000.00 | $ | 1,021.62 | 0.64 | % | $ | 3.21 | ||||||||
| Class R-2 Shares |
$ | 1,000.00 | $ | 1,021.62 | 0.64 | % | $ | 3.21 | ||||||||
|
|
|
|
|
|
|
|
|
|||||||||
| * | Expenses are equal to the applicable Fund’s annualized expense ratio (provided in the table), multiplied by the average account value over the period, multiplied by 181/365 (to reflect the one-half year period). |
| ** | The expense examples do not reflect acquired fund fees and expenses. |
24
Board Approval of Investment Advisory and Sub-Advisory Agreements
At a meeting of the Board of Trustees (the “Board”) of State Farm Mutual Fund Trust (“Mutual Fund Trust”) held on June 16, 2017, all of the Trustees present, including those Trustees present who were not interested persons of Mutual Fund Trust as defined by Section 2(a)(19) of the Investment Company Act of 1940, as amended (the “Independent Trustees”), considered whether (i) to approve continuation of the Investment Advisory and Management Services Agreement between State Farm Investment Management Corp. (“SFIMC”) and Mutual Fund Trust (the “Advisory Agreement”), on behalf of its fifteen separate series (each a “Fund,” and together the “Funds”), (ii) to approve continuation of the Investment Sub-Advisory Agreement between SFIMC, Mutual Fund Trust and Westwood Management Corp. (“Westwood”) with respect to the State Farm Equity Fund (the “Equity Fund”), (iii) to approve continuation of the Investment Sub-Advisory Agreement between SFIMC, Mutual Fund Trust and Marsico Capital Management, LLC (“Marsico”) with respect to the State Farm International Equity Fund (the “International Equity Fund”), (iv) to approve continuation of the Investment Sub-Advisory Agreement between SFIMC, Mutual Fund Trust and Northern Cross, LLC (“Northern Cross”) with respect to the International Equity Fund, (v) to approve continuation of the Investment Sub-Advisory Agreement between SFIMC, Mutual Fund Trust and Bridgeway Capital Management, Inc. (“Bridgeway”) with respect to the State Farm Small/Mid Cap Equity Fund (the “Small/Mid Cap Equity Fund”) and the Equity Fund, (vi) to approve continuation of the Investment Sub-Advisory Agreement between SFIMC, Mutual Fund Trust and BlackRock Fund Advisors (“BlackRock”) with respect to the State Farm S&P 500 Index Fund (the “S&P 500 Index Fund”), the State Farm Small Cap Index Fund (the “Small Cap Index Fund”), the State Farm International Index Fund (the “International Index Fund”), the State Farm LifePath Retirement Fund (the “LifePath Retirement Fund”), the State Farm LifePath 2020 Fund (the “LifePath 2020 Fund”), the State Farm LifePath 2030 Fund (the “LifePath 2030 Fund”), the State Farm LifePath 2040 Fund (the “LifePath 2040 Fund”) and the State Farm LifePath 2050 Fund (the “LifePath 2050 Fund”). Together, the sub-advisory agreements between SFIMC and Westwood, Marsico, Northern Cross, Bridgeway and BlackRock will be referred to as the “Sub-Advisory Agreements.”
Pursuant to the Sub-Advisory Agreements, SFIMC has hired sub-advisers for eleven of the Funds. With respect to the Small/Mid Cap Equity Fund, Bridgeway sub-advises approximately 50% of the Fund’s portfolio and SFIMC invests the other portion of that Fund’s portfolio. Each sub-adviser is responsible for the day-to-day management of the investments or a portion of the investments of the applicable Fund. The eleven sub-advised Funds and their sub-advisers are listed below:
|
Fund |
Sub-Adviser(s) | |
| Equity Fund |
Westwood and Bridgeway | |
| Small/Mid Cap Equity Fund |
Bridgeway (approximately one-half of the portfolio) | |
| S&P 500 Index Fund |
BlackRock | |
| International Equity Fund |
Marsico and Northern Cross | |
| Small Cap Index Fund |
BlackRock | |
| International Index Fund |
BlackRock | |
| LifePath Retirement Fund |
BlackRock | |
| LifePath 2020 Fund |
BlackRock | |
| LifePath 2030 Fund |
BlackRock | |
| LifePath 2040 Fund |
BlackRock | |
| LifePath 2050 Fund |
BlackRock | |
Prior to the June 16, 2017 meeting, independent legal counsel to the Independent Trustees sent Westwood, Marsico, Northern Cross, Bridgeway and BlackRock (collectively the “Sub-Advisers”) and SFIMC a request for information to be provided to the Board prior to the Board’s consideration of continuing the Sub-Advisory Agreements and the Advisory Agreement. The Sub-Advisers and SFIMC provided materials to the Board responding to those requests during the first quarter of the year.
At the Board’s request, SFIMC subsequently provided the Board with additional information that the Board believed would be useful in evaluating whether to approve continuation of the Advisory Agreement and the Sub-Advisory Agreements. Prior to the June 16th meeting, the Board also received a report prepared by Strategic Insight, an independent fund tracking organization (the “Strategic Insight Report”), relating to the performance and expenses of the Funds. In addition, the Board received and reviewed a memorandum from legal counsel to Mutual Fund Trust and its Independent Trustees regarding their responsibilities (particularly the Independent Trustees’ responsibilities) in considering the continuation of the Advisory and Sub-Advisory Agreements.
The Independent Trustees also considered contract review materials at meetings held on March 17, 2017 and May 24, 2017, during which SFIMC management responded to specific questions from the Independent Trustees and provided follow-up information. The Board also considered information received throughout the year. The Independent Trustees discussed all of this material extensively among themselves and with their independent legal counsel, and with the other Board members, after which the Board considered
25
various factors described below, no one of which alone was considered dispositive. However, the material factors and conclusions that formed the basis for the Board’s determination to approve the continuation of the agreements are discussed separately below.
Investment Performance
The Board considered each Fund’s investment performance. Among other things, the Board examined the performance of each Fund over various time periods as compared to the performance of one or more benchmark indexes, as well as the returns of one or more appropriate Morningstar Category Average composite(s), which includes all open-end funds within that category as assigned by Morningstar, Inc., without any modifications. The performance of the Funds is discussed below for certain periods (three-, five- and 10-year periods) ending on March 31, 2017.
The Board considered that the performance of the S&P 500 Index Fund, the Small Cap Index Fund and the International Index Fund closely tracked the performance of their benchmark indexes, excluding Fund expenses, with each Fund having a minimal level of tracking error. The Board concluded that the performance of those three Funds over the periods reviewed was acceptable.
The Board considered the performance of the Equity Fund, including as compared to its applicable Morningstar Category Average composite. SFIMC management explained to the Board that the relative performance of the Equity Fund lagged during the ten-year time period because of a change in the way the Equity Fund was managed during the period and because of the performance of a previous sub-adviser to the Equity Fund. SFIMC management explained to the Board that the Equity Fund ranked in the top one-half of its Morningstar Category Average composite for the three- and five-year periods. The Board considered the performance of the Small/ Mid Cap Equity Fund, which lagged during the three-, five- and ten-year time periods. SFIMC management explained that it has attempted to address the relative underperformance of the Small/Mid Cap Equity Fund by recommending that the Board terminate Rainier Investment Management, LLC (“Rainier”) as a sub-adviser to approximately one-half of the assets of that Fund. The Board previously had agreed with management’s recommendation to terminate Rainier as sub-adviser to the Small/Mid Cap Equity Fund, and that termination had become effective May 1, 2017. The Board considered that the performance of the International Equity Fund for the five-year period lagged, but the amount of International Equity Fund’s underperformance during that period was minimal. The Board concluded that the performance of these three Funds over the periods reviewed was acceptable.
The Board reviewed the performance of the Tax Advantaged Bond Fund, the Bond Fund, the Money Market Fund and the Equity and Bond Fund. The Tax Advantaged Bond Fund outperformed its applicable Morningstar Category Average composite over the three-, five-and 10-year time frames. The performance of the Bond Fund surpassed its applicable Morningstar Category Average composite over the three-year time frame, and the performance of the Bond Fund was in the third quartile compared to its applicable Morningstar Category Average composite over the five- and ten-year time frames. The performance of the Money Market Fund was competitive with this Fund’s benchmark and the narrow performance range of its Morningstar Category Average composite. The Board considered that the performance of the Equity and Bond Fund, noting that compared to its Morningstar Category Average composite the Fund ranked in the top quartile for the three- and five-year periods. After extensive discussion of this and other performance information, the Board concluded that the investment performance of these Funds over the periods reviewed was acceptable.
The Board reviewed the performance of the LifePath Retirement, LifePath 2020, LifePath 2030, LifePath 2040 and LifePath 2050 Funds (collectively the “LifePath Funds”) for the one-, three-, five- and ten-year periods. The Board considered each LifePath Fund’s performance compared to its Morningstar Category Average composite. SFIMC management informed the Board that each LifePath Fund, other than the LifePath Retirement Fund, had one or more periods of underperformance. However, SFIMC management also explained to the Board that the amount of underperformance by a LifePath Fund in any one period was relatively small. After extensively reviewing all of this and other performance information, the Board concluded that the LifePath Funds’ performance over the periods reviewed was acceptable.
Fees and Expenses
The Board also examined the fee structure and expense ratio of each Fund, including in comparison to a peer group of funds with comparable investment objectives, investment strategies, asset size and load structures, and evaluated the relative rankings of each Fund’s net total, net management and net operating expenses within those peer groups. SFIMC management explained that to maintain a stable $1.00/share net asset value for the Money Market Fund, SFIMC and State Farm VP Management Corp., distributor of the Funds’ shares, have continued waiving fees each is entitled to receive from that Fund. The Board also took note that SFIMC does not manage any institutional clients, and that it only manages the Funds, and the assets of other State Farm-sponsored mutual funds. In connection with examining the fee structure and expense ratio of each Fund, the Board also considered the amount of profits earned (or losses incurred) by SFIMC in providing advisory services to each Fund, as well as the methodology by which that profit (or loss) was calculated.
The Board considered that the net total expenses of each Fund within Mutual Fund Trust, except the Money Market Fund, had ranked in one of the top three quartiles of its respective peer group. The Board then considered that the Money Market Fund had ranked in the bottom quartile of its respective peer group. The Board considered that the net total expenses of this Fund were only 0.03% higher
26
than the net total expenses of a peer fund in the third quartile. Considering all this information and other information provided by SFIMC, the Board concluded that the advisory fees, which directly or indirectly are part of each Fund’s fee structure and expense ratio, were reasonable.
The Board examined the fees that SFIMC pays to each Sub-Adviser pursuant to the Sub-Advisory Agreements, including the breakpoints in fees that result when a Fund’s assets increase. SFIMC management indicated to the Board its belief that the sub-advisory fees were competitive in the marketplace. After considering this information, the Board concluded that the sub-advisory fees were reasonable.
Nature, Extent and Quality of Services
The Board considered the nature, extent and quality of the advisory and sub-advisory services provided by SFIMC and the Sub-Advisers to the Funds, as applicable. The Board considered the general reputation, financial resources, and business activities of SFIMC and each Sub-Adviser, as well as the education and experience of the teams responsible for managing the Funds at each organization, and concluded that each organization’s investment management team has a satisfactory, long-term track record. After considering all of this information, the Board concluded that SFIMC and the Sub-Advisers each had more than sufficient resources and expertise to continue to manage or sub-advise the Funds, and that given the past experience of each, these organizations would be able to continue to provide satisfactory services to Mutual Fund Trust. Finally, the Board considered the view of Mutual Fund Trust’s Chief Compliance Officer that the compliance policies and procedures of SFIMC and the Sub-Advisers were reasonably designed to prevent and detect violations of the federal securities laws.
Economies of Scale/Other Benefits
The Board next discussed the extent to which economies of scale will be realized as each Fund grows and whether each Fund’s fee levels reflect economies of scale for the benefit of the Fund. SFIMC explained to the Board that economies of scale occur when a mutual fund’s expenses per unit, such as per dollar invested in the fund, decrease as the fund increases in size. One way a mutual fund achieves economies of scale is to lower the average cost per unit by spreading fixed costs over a larger asset base. As the assets of a Fund grow, the Fund’s fixed costs will be spread over a larger asset base, so the Fund’s expense levels per unit will reflect economies of scale for the benefit of the Fund. The Board also considered that the Advisory Agreement and the Sub-Advisory Agreements include breakpoints for several of the Funds. Breakpoints are reductions in the level of advisory or sub-advisory fees as the level of assets within a Fund grows. The Board considered that these breakpoints can lead to economies of scale for Fund shareholders as Fund assets increase. The Board also noted that, to achieve certain breakpoints, assets of certain Funds would be aggregated with assets of mutual funds from another trust advised by SFIMC.
The Board next discussed whether SFIMC or a Sub-Adviser derives (or would derive) any other direct or indirect benefits from serving as investment adviser or investment sub-adviser to the Funds. The Board noted that BlackRock, as sub-adviser, may select a broker that is an affiliated person of BlackRock to execute securities transactions for the Funds sub-advised by BlackRock. When this occurs, a Fund sub-advised by BlackRock will pay brokerage commissions to an affiliated person of BlackRock. Other than potentially paying brokerage commissions to an affiliated person of BlackRock, SFIMC indicated to the Board that it was not aware of any ancillary or other benefits (other than fees) that SFIMC or a Sub-Adviser (and each organization’s respective affiliates, if any) receive (or would receive) for providing various services to Mutual Fund Trust, particularly because other than noted above these organizations do not execute securities trades on behalf of the Funds through an affiliated broker-dealer. The Board concluded that the lack of any ancillary or so-called “fallout” benefits enables SFIMC and the Sub-Advisers to manage assets of the Funds in a manner that appears to minimize conflicts of interest.
Based on the Board’s deliberations and their evaluation of the information provided by SFIMC and the Sub-Advisers, the Board, including all of the Independent Trustees present at the Board meeting, unanimously approved the:
| • | Continuation of the Advisory Agreement for all Funds through June 30, 2018, and |
| • | Continuation of each Existing Sub-Advisory Agreement through June 30, 2018. |
27
STATE FARM MUTUAL FUND TRUST EQUITY FUND
SCHEDULE OF INVESTMENTS
June 30, 2017
(Unaudited)
| 28 | See accompanying notes to financial statements. |
STATE FARM MUTUAL FUND TRUST EQUITY FUND
SCHEDULE OF INVESTMENTS (continued)
June 30, 2017
(Unaudited)
| See accompanying notes to financial statements. | 29 |
STATE FARM MUTUAL FUND TRUST SMALL/MID CAP EQUITY FUND
SCHEDULE OF INVESTMENTS
June 30, 2017
(Unaudited)
| 30 | See accompanying notes to financial statements. |
STATE FARM MUTUAL FUND TRUST SMALL/MID CAP EQUITY FUND
SCHEDULE OF INVESTMENTS (continued)
June 30, 2017
(Unaudited)
| See accompanying notes to financial statements. | 31 |
STATE FARM MUTUAL FUND TRUST INTERNATIONAL EQUITY FUND
SCHEDULE OF INVESTMENTS
June 30, 2017
(Unaudited)
| 32 | See accompanying notes to financial statements. |
STATE FARM MUTUAL FUND TRUST INTERNATIONAL EQUITY FUND
SCHEDULE OF INVESTMENTS (continued)
June 30, 2017
(Unaudited)
| See accompanying notes to financial statements. | 33 |
STATE FARM MUTUAL FUND TRUST INTERNATIONAL EQUITY FUND
SCHEDULE OF INVESTMENTS (continued)
June 30, 2017
(Unaudited)
| 34 | See accompanying notes to financial statements. |
STATE FARM MUTUAL FUND TRUST S&P 500 INDEX FUND
SCHEDULE OF INVESTMENTS
June 30, 2017
(Unaudited)
| See accompanying notes to financial statements. | 35 |
STATE FARM MUTUAL FUND TRUST S&P 500 INDEX FUND
SCHEDULE OF INVESTMENTS (continued)
June 30, 2017
(Unaudited)
| 36 | See accompanying notes to financial statements. |
STATE FARM MUTUAL FUND TRUST S&P 500 INDEX FUND
SCHEDULE OF INVESTMENTS (continued)
June 30, 2017
(Unaudited)
| See accompanying notes to financial statements. | 37 |
STATE FARM MUTUAL FUND TRUST S&P 500 INDEX FUND
SCHEDULE OF INVESTMENTS (continued)
June 30, 2017
(Unaudited)
| 38 | See accompanying notes to financial statements. |
STATE FARM MUTUAL FUND TRUST S&P 500 INDEX FUND
SCHEDULE OF INVESTMENTS (continued)
June 30, 2017
(Unaudited)
| See accompanying notes to financial statements. | 39 |
STATE FARM MUTUAL FUND TRUST S&P 500 INDEX FUND
SCHEDULE OF INVESTMENTS (continued)
June 30, 2017
(Unaudited)
OPEN FUTURES CONTRACTS
| Description |
Contracts Purchased |
Expiration | Notional Value |
Market Value |
Unrealized Gain (Loss) |
|||||||||||||||
| S&P 500 Mini Index |
438 | September 2017 | $ | 53,203,526 | $ | 53,017,710 | ($ | 185,816 | ) | |||||||||||
| 40 | See accompanying notes to financial statements. |
STATE FARM MUTUAL FUND TRUST SMALL CAP INDEX FUND
SCHEDULE OF INVESTMENTS
June 30, 2017
(Unaudited)
| See accompanying notes to financial statements. | 41 |
STATE FARM MUTUAL FUND TRUST SMALL CAP INDEX FUND
SCHEDULE OF INVESTMENTS (continued)
June 30, 2017
(Unaudited)
| 42 | See accompanying notes to financial statements. |
STATE FARM MUTUAL FUND TRUST SMALL CAP INDEX FUND
SCHEDULE OF INVESTMENTS (continued)
June 30, 2017
(Unaudited)
| See accompanying notes to financial statements. | 43 |
STATE FARM MUTUAL FUND TRUST SMALL CAP INDEX FUND
SCHEDULE OF INVESTMENTS (continued)
June 30, 2017
(Unaudited)
| 44 | See accompanying notes to financial statements. |
STATE FARM MUTUAL FUND TRUST SMALL CAP INDEX FUND
SCHEDULE OF INVESTMENTS (continued)
June 30, 2017
(Unaudited)
| See accompanying notes to financial statements. | 45 |
STATE FARM MUTUAL FUND TRUST SMALL CAP INDEX FUND
SCHEDULE OF INVESTMENTS (continued)
June 30, 2017
(Unaudited)
| 46 | See accompanying notes to financial statements. |
STATE FARM MUTUAL FUND TRUST SMALL CAP INDEX FUND
SCHEDULE OF INVESTMENTS (continued)
June 30, 2017
(Unaudited)
| See accompanying notes to financial statements. | 47 |
STATE FARM MUTUAL FUND TRUST SMALL CAP INDEX FUND
SCHEDULE OF INVESTMENTS (continued)
June 30, 2017
(Unaudited)
| 48 | See accompanying notes to financial statements. |
STATE FARM MUTUAL FUND TRUST SMALL CAP INDEX FUND
SCHEDULE OF INVESTMENTS (continued)
June 30, 2017
(Unaudited)
| See accompanying notes to financial statements. | 49 |
STATE FARM MUTUAL FUND TRUST SMALL CAP INDEX FUND
SCHEDULE OF INVESTMENTS (continued)
June 30, 2017
(Unaudited)
| 50 | See accompanying notes to financial statements. |
STATE FARM MUTUAL FUND TRUST SMALL CAP INDEX FUND
SCHEDULE OF INVESTMENTS (continued)
June 30, 2017
(Unaudited)
| See accompanying notes to financial statements. | 51 |
STATE FARM MUTUAL FUND TRUST SMALL CAP INDEX FUND
SCHEDULE OF INVESTMENTS (continued)
June 30, 2017
(Unaudited)
| 52 | See accompanying notes to financial statements. |
STATE FARM MUTUAL FUND TRUST SMALL CAP INDEX FUND
SCHEDULE OF INVESTMENTS (continued)
June 30, 2017
(Unaudited)
| See accompanying notes to financial statements. | 53 |
STATE FARM MUTUAL FUND TRUST SMALL CAP INDEX FUND
SCHEDULE OF INVESTMENTS (continued)
June 30, 2017
(Unaudited)
| 54 | See accompanying notes to financial statements. |
STATE FARM MUTUAL FUND TRUST SMALL CAP INDEX FUND
SCHEDULE OF INVESTMENTS (continued)
June 30, 2017
(Unaudited)
| See accompanying notes to financial statements. | 55 |
STATE FARM MUTUAL FUND TRUST SMALL CAP INDEX FUND
SCHEDULE OF INVESTMENTS (continued)
June 30, 2017
(Unaudited)
| 56 | See accompanying notes to financial statements. |
STATE FARM MUTUAL FUND TRUST SMALL CAP INDEX FUND
SCHEDULE OF INVESTMENTS (continued)
June 30, 2017
(Unaudited)
| See accompanying notes to financial statements. | 57 |
STATE FARM MUTUAL FUND TRUST SMALL CAP INDEX FUND
SCHEDULE OF INVESTMENTS (continued)
June 30, 2017
(Unaudited)
| 58 | See accompanying notes to financial statements. |
STATE FARM MUTUAL FUND TRUST SMALL CAP INDEX FUND
SCHEDULE OF INVESTMENTS (continued)
June 30, 2017
(Unaudited)
OPEN FUTURES CONTRACTS
| Description |
Contracts Purchased |
Expiration | Notional Value |
Market Value | Unrealized Gain (Loss) |
|||||||||||||||
| Russell 2000 Mini Index |
110 | September 2017 | $ | 7,700,160 | $ | 7,778,650 | $ | 78,490 | ||||||||||||
| See accompanying notes to financial statements. | 59 |
STATE FARM MUTUAL FUND TRUST INTERNATIONAL INDEX FUND
SCHEDULE OF INVESTMENTS
June 30, 2017
(Unaudited)
| 60 | See accompanying notes to financial statements. |
STATE FARM MUTUAL FUND TRUST INTERNATIONAL INDEX FUND
SCHEDULE OF INVESTMENTS (continued)
June 30, 2017
(Unaudited)
| See accompanying notes to financial statements. | 61 |
STATE FARM MUTUAL FUND TRUST INTERNATIONAL INDEX FUND
SCHEDULE OF INVESTMENTS (continued)
June 30, 2017
(Unaudited)
| 62 | See accompanying notes to financial statements. |
STATE FARM MUTUAL FUND TRUST INTERNATIONAL INDEX FUND
SCHEDULE OF INVESTMENTS (continued)
June 30, 2017
(Unaudited)
| See accompanying notes to financial statements. | 63 |
STATE FARM MUTUAL FUND TRUST INTERNATIONAL INDEX FUND
SCHEDULE OF INVESTMENTS (continued)
June 30, 2017
(Unaudited)
| 64 | See accompanying notes to financial statements. |
STATE FARM MUTUAL FUND TRUST INTERNATIONAL INDEX FUND
SCHEDULE OF INVESTMENTS (continued)
June 30, 2017
(Unaudited)
| See accompanying notes to financial statements. | 65 |
STATE FARM MUTUAL FUND TRUST INTERNATIONAL INDEX FUND
SCHEDULE OF INVESTMENTS (continued)
June 30, 2017
(Unaudited)
| 66 | See accompanying notes to financial statements. |
STATE FARM MUTUAL FUND TRUST INTERNATIONAL INDEX FUND
SCHEDULE OF INVESTMENTS (continued)
June 30, 2017
(Unaudited)
| See accompanying notes to financial statements. | 67 |
STATE FARM MUTUAL FUND TRUST INTERNATIONAL INDEX FUND
SCHEDULE OF INVESTMENTS (continued)
June 30, 2017
(Unaudited)
| 68 | See accompanying notes to financial statements. |
STATE FARM MUTUAL FUND TRUST INTERNATIONAL INDEX FUND
SCHEDULE OF INVESTMENTS (continued)
June 30, 2017
(Unaudited)
| See accompanying notes to financial statements. | 69 |
STATE FARM MUTUAL FUND TRUST INTERNATIONAL INDEX FUND
SCHEDULE OF INVESTMENTS (continued)
June 30, 2017
(Unaudited)
OPEN FUTURES CONTRACTS
| Description |
Contracts Purchased |
Expiration | Notional Value |
Market Value |
Unrealized Gain (Loss) |
|||||||||||||||
| ASX SPI 200 Index |
5 | September 2017 | $ | 549,126 | $ | 542,728 | ($ | 6,398 | ) | |||||||||||
| Euro Stoxx 50 |
40 | September 2017 | 1,617,575 | 1,567,486 | (50,089 | ) | ||||||||||||||
| FTSE 100 Index |
11 | September 2017 | 1,069,018 | 1,037,629 | (31,389 | ) | ||||||||||||||
| Nikkei 225 Index |
12 | September 2017 | 1,068,718 | 1,066,904 | (1,814 | ) | ||||||||||||||
|
|
|
|||||||||||||||||||
| Total |
$ | (89,690 | ) | |||||||||||||||||
|
|
|
|||||||||||||||||||
| 70 | See accompanying notes to financial statements. |
STATE FARM MUTUAL FUND TRUST EQUITY AND BOND FUND
SCHEDULE OF INVESTMENTS
June 30, 2017
(Unaudited)
| (a) | As of June 30, 2017, investments in issuers considered to be affiliates of the Equity and Bond Fund for purposes of Section 2(a)(3) of the Investment Company Act of 1940, as amended, were as follows: |
| For the six months ended June 30, 2017 |
||||||||||||||||||||||||||||
| Security |
Shares Held at December 31, 2016 |
Shares Purchased |
Shares Sold |
Shares Held at June 30, 2017 |
Value at June 30, 2017 |
Income Dividends |
Realized Gain (Loss) on Sales |
|||||||||||||||||||||
| State Farm Mutual Fund Trust Bond Fund Institutional Shares |
13,200,046 | 26,715 | — | 13,226,761 | $ | 148,933,324 | $ | 1,904,664 | $ | — | ||||||||||||||||||
| State Farm Mutual Fund Trust Equity Fund Institutional Shares |
23,800,137 | — | 1,083,202 | 22,716,935 | 231,712,740 | — | 56,482 | |||||||||||||||||||||
|
|
|
|
|
|
|
|||||||||||||||||||||||
| $ | 380,646,064 | $ | 1,904,664 | $ | 56,482 | |||||||||||||||||||||||
|
|
|
|
|
|
|
|||||||||||||||||||||||
| See accompanying notes to financial statements. | 71 |
STATE FARM MUTUAL FUND TRUST BOND FUND
SCHEDULE OF INVESTMENTS
June 30, 2017
(Unaudited)
| 72 | See accompanying notes to financial statements. |
STATE FARM MUTUAL FUND TRUST BOND FUND
SCHEDULE OF INVESTMENTS (continued)
June 30, 2017
(Unaudited)
| See accompanying notes to financial statements. | 73 |
STATE FARM MUTUAL FUND TRUST BOND FUND
SCHEDULE OF INVESTMENTS (continued)
June 30, 2017
(Unaudited)
| 74 | See accompanying notes to financial statements. |
STATE FARM MUTUAL FUND TRUST BOND FUND
SCHEDULE OF INVESTMENTS (continued)
June 30, 2017
(Unaudited)
| See accompanying notes to financial statements. | 75 |
STATE FARM MUTUAL FUND TRUST BOND FUND
SCHEDULE OF INVESTMENTS (continued)
June 30, 2017
(Unaudited)
| 76 | See accompanying notes to financial statements. |
STATE FARM MUTUAL FUND TRUST BOND FUND
SCHEDULE OF INVESTMENTS (continued)
June 30, 2017
(Unaudited)
| See accompanying notes to financial statements. | 77 |
STATE FARM MUTUAL FUND TRUST BOND FUND
SCHEDULE OF INVESTMENTS (continued)
June 30, 2017
(Unaudited)
| 78 | See accompanying notes to financial statements. |
STATE FARM MUTUAL FUND TRUST BOND FUND
SCHEDULE OF INVESTMENTS (continued)
June 30, 2017
(Unaudited)
| See accompanying notes to financial statements. | 79 |
STATE FARM MUTUAL FUND TRUST BOND FUND
SCHEDULE OF INVESTMENTS (continued)
June 30, 2017
(Unaudited)
| 80 | See accompanying notes to financial statements. |
STATE FARM MUTUAL FUND TRUST BOND FUND
SCHEDULE OF INVESTMENTS (continued)
June 30, 2017
(Unaudited)
| See accompanying notes to financial statements. | 81 |
STATE FARM MUTUAL FUND TRUST BOND FUND
SCHEDULE OF INVESTMENTS (continued)
June 30, 2017
(Unaudited)
| 82 | See accompanying notes to financial statements. |
STATE FARM MUTUAL FUND TRUST BOND FUND
SCHEDULE OF INVESTMENTS (continued)
June 30, 2017
(Unaudited)
| See accompanying notes to financial statements. | 83 |
STATE FARM MUTUAL FUND TRUST TAX ADVANTAGED BOND FUND
SCHEDULE OF INVESTMENTS
June 30, 2017
(Unaudited)
| Coupon rate |
Maturity date | Rating (a) | Principal amount |
Value | ||||||||||||||||
| Long-term Municipal Bonds (98.19%) |
||||||||||||||||||||
| Alabama (2.48%) |
||||||||||||||||||||
| City of Tuscaloosa, Alabama, General Obligation Warrants, Series 2010-A |
4.750 | % | 07/01/2024 | Aa1 | $ | 1,025,000 | $ | 1,108,343 | ||||||||||||
| City of Madison (Alabama), General Obligation School Warrants, Series 2009 |
5.250 | % | 02/01/2026 | Aa2 | 100,000 | 106,310 | ||||||||||||||
| City of Madison (Alabama), General Obligation School Warrants, Series 2009 (Prerefunded to 02-01-2019 @ 100) (b) |
5.250 | % | 02/01/2026 | NR | 400,000 | 425,628 | ||||||||||||||
| City of Florence (Alabama), Water and Sewer Revenue Warrants, Series 2011 |
5.000 | % | 08/15/2028 | A1 | 940,000 | 1,040,101 | ||||||||||||||
| City of Athens, Alabama, Electric Revenue Warrants, Series 2015 |
4.000 | % | 06/01/2029 | A+ | 695,000 | 737,138 | ||||||||||||||
| City of Madison (Alabama), General Obligation School Warrants, Series 2009 |
5.125 | % | 02/01/2030 | Aa2 | 475,000 | 503,054 | ||||||||||||||
| City of Madison (Alabama), General Obligation School Warrants, Series 2009 (Prerefunded to 02-01-2019 @ 100) (b) |
5.125 | % | 02/01/2030 | NR | 1,830,000 | 1,943,698 | ||||||||||||||
| City of Athens, Alabama, Electric Revenue Warrants, Series 2015 |
4.000 | % | 06/01/2030 | A+ | 720,000 | 759,514 | ||||||||||||||
| City of Madison (Alabama), General Obligation School Warrants, Series 2009 |
5.250 | % | 02/01/2031 | Aa2 | 210,000 | 222,978 | ||||||||||||||
| City of Madison (Alabama), General Obligation School Warrants, Series 2009 (Prerefunded to 02-01-2019 @ 100) (b) |
5.250 | % | 02/01/2031 | NR | 790,000 | 840,615 | ||||||||||||||
| City of Athens, Alabama, Electric Revenue Warrants, Series 2015 |
4.250 | % | 06/01/2031 | A+ | 750,000 | 799,365 | ||||||||||||||
| City of Athens, Alabama, Electric Revenue Warrants, Series 2015 |
4.500 | % | 06/01/2032 | A+ | 780,000 | 839,834 | ||||||||||||||
| The Board of Trustees of the University of Alabama, University of Alabama at Birmingham, General Revenue Bonds, Series 2016-B |
5.000 | % | 10/01/2034 | Aa2 | 3,000,000 | 3,515,100 | ||||||||||||||
|
|
|
|||||||||||||||||||
| 12,841,678 | ||||||||||||||||||||
|
|
|
|||||||||||||||||||
| Alaska (1.93%) |
||||||||||||||||||||
| Municipality of Anchorage, Alaska, Senior Lien Electric Revenue Bonds, 2009 Series A (Tax-Exempt) |
4.000 | % | 12/01/2020 | A+ | 1,000,000 | 1,058,770 | ||||||||||||||
| Municipality of Anchorage, Alaska, Senior Lien Electric Revenue Bonds, 2009 Series A (Tax-Exempt) |
5.000 | % | 12/01/2022 | A+ | 2,220,000 | 2,404,859 | ||||||||||||||
| Matanuska-Susitna Borough, Alaska, General Obligation School Bonds, 2009 Series A (Prerefunded to 07-01-2019 @ 100) (b) |
5.000 | % | 07/01/2029 | Aa2 | 1,035,000 | 1,113,660 | ||||||||||||||
| Matanuska-Susitna Borough, Alaska, General Obligation Transportation System Bonds, 2014 Series A |
5.000 | % | 08/01/2033 | AA+ | 1,200,000 | 1,401,792 | ||||||||||||||
| Municipality of Anchorage, Alaska, 2016 General Obligation Bonds, Series B, (Schools) |
5.000 | % | 09/01/2033 | AAA | 800,000 | 940,504 | ||||||||||||||
| Municipality of Anchorage, Alaska, 2016 General Obligation Bonds, Series A, (General Purpose) |
5.000 | % | 09/01/2034 | AAA | 1,225,000 | 1,433,679 | ||||||||||||||
| Municipality of Anchorage, Alaska, 2016 General Obligation Bonds, Series B, (Schools) |
5.000 | % | 09/01/2034 | AAA | 1,365,000 | 1,597,528 | ||||||||||||||
|
|
|
|||||||||||||||||||
| 9,950,792 | ||||||||||||||||||||
|
|
|
|||||||||||||||||||
| Arizona (8.23%) |
||||||||||||||||||||
| Tucson Unified School District No. 1 of Pima County, Arizona, Refunding Bonds, Tax-Exempt Series 2011 |
5.000 | % | 07/01/2021 | Aa3 | 1,140,000 | 1,300,466 | ||||||||||||||
| City of Phoenix, Civic Improvement Corporation, Senior Lien Wastewater System Revenue Refunding Bonds, Series 2008 |
5.500 | % | 07/01/2023 | Aa2 | 1,000,000 | 1,044,350 | ||||||||||||||
| Scottsdale Unified School District No. 48 of Maricopa County, Arizona, School Improvement Bonds, Project of 2010, Series B (2012) |
4.000 | % | 07/01/2023 | AA | 1,000,000 | 1,092,730 | ||||||||||||||
| Sedona-Oak Creek Joint Unified School District No. 9 of Coconino and Yavapai Counties, Arizona, School Improvement Bonds, Project of 2007, Series B (2009) (Economically Defeased to 07-01-2019 @ 100) (b) |
5.000 | % | 07/01/2023 | A+ | 1,460,000 | 1,570,960 | ||||||||||||||
| Tucson Unified School District No. 1 of Pima County, Arizona, Refunding Bonds, Tax-Exempt Series 2011 |
5.000 | % | 07/01/2023 | Aa3 | 800,000 | 931,104 | ||||||||||||||
| Pima County, Arizona, Sewer System Revenue Obligations, Series 2012A |
5.000 | % | 07/01/2024 | AA | 1,140,000 | 1,330,403 | ||||||||||||||
| Tucson Unified School District No. 1 of Pima County, Arizona, Refunding Bonds, Tax-Exempt Series 2011 |
4.000 | % | 07/01/2024 | Aa3 | 300,000 | 332,700 | ||||||||||||||
| Peoria Unified School District No. 11 of Maricopa County, Arizona, Refunding Bonds, Series 2012 |
4.000 | % | 07/01/2025 | A2 | 1,500,000 | 1,631,280 | ||||||||||||||
| Phoenix Union High School District No. 210 of Maricopa County, Arizona, School Improvement Bonds, Project of 2011, Tax-Exempt Series A (2012) |
4.000 | % | 07/01/2025 | Aa2 | 1,100,000 | 1,218,789 | ||||||||||||||
| Pima County, Arizona, Sewer System Revenue Obligations, Series 2012A |
5.000 | % | 07/01/2025 | AA | 2,000,000 | 2,332,980 | ||||||||||||||
| Scottsdale Unified School District No. 48 of Maricopa County, Arizona, School Improvement Bonds, Project of 2010, Series B (2012) |
4.250 | % | 07/01/2025 | AA | 2,000,000 | 2,190,900 | ||||||||||||||
| 84 | See accompanying notes to financial statements. |
STATE FARM MUTUAL FUND TRUST TAX ADVANTAGED BOND FUND
SCHEDULE OF INVESTMENTS (continued)
June 30, 2017
(Unaudited)
| Coupon rate |
Maturity date | Rating (a) | Principal amount |
Value | ||||||||||||||||
| Long-term Municipal Bonds (Cont.) |
||||||||||||||||||||
| Arizona (Cont.) |
||||||||||||||||||||
| Phoenix Union High School District No. 210 of Maricopa County, Arizona, School Improvement Bonds, Project of 2011, Tax-Exempt Series A (2012) |
4.000 | % | 07/01/2026 | Aa2 | $ | 500,000 | $ | 550,975 | ||||||||||||
| Pima County, Arizona, General Obligation Bonds, Series 2012A |
4.000 | % | 07/01/2026 | AA- | 2,015,000 | 2,211,362 | ||||||||||||||
| Pima County, Arizona, Sewer System Revenue Obligations, Series 2012A |
5.000 | % | 07/01/2026 | AA | 1,725,000 | 2,011,298 | ||||||||||||||
| Amphitheater Unified School District No. 10 of Pima County, Arizona, School Improvement Bonds, Project of 2007, Series B (2009) (Bank Qualified) (Economically Defeased to 07-01-2019 @ 100) (b) |
5.000 | % | 07/01/2027 | A+ | 2,000,000 | 2,152,000 | ||||||||||||||
| City of Phoenix, Arizona, Various Purpose General Obligation Bonds, Series 2012A |
4.000 | % | 07/01/2027 | Aa1 | 2,000,000 | 2,181,960 | ||||||||||||||
| Pima County, Arizona, Sewer System Revenue Obligations, Series 2012A |
5.000 | % | 07/01/2027 | AA | 1,000,000 | 1,165,450 | ||||||||||||||
| Pinal County Community College District of Pinal County, Arizona, General Obligation Bonds, Project of 2008, Series B (2012) |
4.500 | % | 07/01/2027 | AA- | 2,480,000 | 2,731,422 | ||||||||||||||
| Paradise Valley Unified School District No. 69 of Maricopa County, Arizona, School Improvement Bonds, Project of 2011 Series A (2012) |
4.000 | % | 07/01/2028 | Aa2 | 4,165,000 | 4,550,138 | ||||||||||||||
| Pima County, Arizona, General Obligation Bonds, Series 2013A |
4.000 | % | 07/01/2028 | AA- | 3,000,000 | 3,288,960 | ||||||||||||||
| Paradise Valley Unified School District No. 69 of Maricopa County, Arizona, School Improvement Bonds, Project of 2011 Series A (2012) |
4.000 | % | 07/01/2029 | Aa2 | 2,000,000 | 2,179,000 | ||||||||||||||
| Marana Unified School District No. 6 of Pima County, Arizona, School Improvement Bonds, Project of 2014, Series B (2016) |
4.000 | % | 07/01/2030 | A | 1,450,000 | 1,598,292 | ||||||||||||||
| Salt River Project Agricultural Improvement and Power District, Arizona, Salt River Project Electric System Refunding Revenue Bonds, 2016 Series A |
5.000 | % | 01/01/2034 | AA | 2,480,000 | 2,947,678 | ||||||||||||||
|
|
|
|||||||||||||||||||
| 42,545,197 | ||||||||||||||||||||
|
|
|
|||||||||||||||||||
| Arkansas (3.31%) |
||||||||||||||||||||
| Beaver Water District of Benton and Washington Counties, Arkansas, Water Refunding Revenue Bonds, Series 2010 |
4.000 | % | 11/15/2021 | AA+ | 1,000,000 | 1,088,430 | ||||||||||||||
| Board of Trustees of the University of Arkansas, Various Facility Revenue Bonds, (Fayetteville Campus), Refunding Series 2015A |
3.000 | % | 11/01/2023 | Aa2 | 1,000,000 | 1,078,190 | ||||||||||||||
| Cabot School District No. 4 of Lonoke County, Arkansas, Refunding Bonds |
3.500 | % | 02/01/2028 | NR | 655,000 | 657,738 | ||||||||||||||
| State of Arkansas, Higher Education General Obligation Bonds, Refunding Series 2015 |
4.000 | % | 06/01/2029 | AA | 5,605,000 | 6,164,771 | ||||||||||||||
| Board of Trustees of the University of Arkansas, Various Facility Revenue Bonds (Fayetteville Campus), Series 2012B |
5.000 | % | 11/01/2029 | Aa2 | 1,935,000 | 2,229,236 | ||||||||||||||
| Rogers School District No. 30 of Benton County, Arkansas Refunding Bonds |
4.000 | % | 02/01/2030 | NR | 1,000,000 | 1,047,190 | ||||||||||||||
| City of Rogers, Arkansas, Water Revenue Refunding Bonds, Series 2016 |
4.000 | % | 11/01/2030 | Aa2 | 505,000 | 548,248 | ||||||||||||||
| Rogers School District No. 30 of Benton County, Arkansas Refunding Bonds |
4.000 | % | 02/01/2031 | NR | 1,395,000 | 1,397,916 | ||||||||||||||
| City of Little Rock, Arkansas, Sewer Refunding Revenue Bonds, Series 2015 |
5.000 | % | 10/01/2033 | Aa3 | 2,500,000 | 2,904,600 | ||||||||||||||
|
|
|
|||||||||||||||||||
| 17,116,319 | ||||||||||||||||||||
|
|
|
|||||||||||||||||||
| California (4.31%) |
||||||||||||||||||||
| Grossmont Healthcare District, San Diego County, California, General Obligation Bonds, 2006 Election, 2007 Series A (Prerefunded to 07-15-2017 @ 100) (b) |
5.000 | % | 07/15/2020 | Aaa | 900,000 | 900,945 | ||||||||||||||
| Santa Barbara County, California, Santa Barbara Schools Financing Authority, 2007 General Obligation Revenue Bonds, Series B |
4.750 | % | 08/01/2024 | Aa2 | 1,000,000 | 1,002,440 | ||||||||||||||
| State of California, Various Purpose General Obligation Bonds |
5.500 | % | 03/01/2026 | Aa3 | 1,300,000 | 1,337,258 | ||||||||||||||
| Marin Community College District, (Marin County, California), Election of 2004 General Obligation Bonds, Series C |
4.250 | % | 08/01/2027 | Aa1 | 1,440,000 | 1,581,394 | ||||||||||||||
| Atascadero Unified School District, (San Luis Obispo County, California) General Obligation Bonds, 2010 Election, Series B |
5.000 | % | 08/01/2029 | Aa3 | 1,395,000 | 1,647,411 | ||||||||||||||
| Ventura County Community College District (Ventura County, California) Election of 2002 General Obligation Bonds, Series C (Prerefunded to 08-01-2018 @ 100) (b) |
5.500 | % | 08/01/2029 | Aa2 | 1,000,000 | 1,048,510 | ||||||||||||||
| Atascadero Unified School District, (San Luis Obispo County, California) General Obligation Bonds, 2010 Election, Series B |
5.000 | % | 08/01/2030 | Aa3 | 1,000,000 | 1,177,360 | ||||||||||||||
| Palomar Community College District, (San Diego County, California), 2015 General Obligation Refunding Bonds |
5.000 | % | 05/01/2031 | AA | 1,500,000 | 1,775,325 | ||||||||||||||
| Sequoia Union High School District, (County of San Mateo, State of California), General Obligation Bonds, Election of 2014, Series 2016 |
3.000 | % | 07/01/2031 | AA | 2,000,000 | 1,977,440 | ||||||||||||||
| See accompanying notes to financial statements. | 85 |
STATE FARM MUTUAL FUND TRUST TAX ADVANTAGED BOND FUND
SCHEDULE OF INVESTMENTS (continued)
June 30, 2017
(Unaudited)
| Coupon rate |
Maturity date | Rating (a) | Principal amount |
Value | ||||||||||||||||
| Long-term Municipal Bonds (Cont.) |
||||||||||||||||||||
| California (Cont.) |
||||||||||||||||||||
| Atascadero Unified School District, (San Luis Obispo County, California) General Obligation Bonds, 2010 Election, Series B |
5.000 | % | 08/01/2031 | Aa3 | $ | 840,000 | $ | 987,185 | ||||||||||||
| Newark Unified School District, (Alameda County, California), General Obligation Bonds, Election of 2011, Series C |
3.000 | % | 08/01/2031 | Aa3 | 980,000 | 960,106 | ||||||||||||||
| Santa Monica-Malibu Unified School District, (Los Angeles County, California), Election of 2012 General Obligation Bonds, Series B |
5.000 | % | 07/01/2032 | AA | 1,920,000 | 2,274,701 | ||||||||||||||
| East Side Union High School District, (Santa Clara County, California), 2015 General Obligation Refunding Bonds |
5.000 | % | 08/01/2032 | A+ | 1,000,000 | 1,169,700 | ||||||||||||||
| East Side Union High School District, (Santa Clara County, California), 2015 General Obligation Refunding Bonds |
5.000 | % | 08/01/2033 | A+ | 1,000,000 | 1,164,960 | ||||||||||||||
| Sonoma County Junior College District, (Sonoma, Mendocino and Marin Counties, California), Election of 2014 General Obligation Bonds, Series A |
5.000 | % | 08/01/2034 | AA- | 2,780,000 | 3,261,941 | ||||||||||||||
|
|
|
|||||||||||||||||||
| 22,266,676 | ||||||||||||||||||||
|
|
|
|||||||||||||||||||
| Colorado (2.48%) |
||||||||||||||||||||
| El Paso County School District No. 20 (Academy), El Paso County, Colorado, General Obligation Refunding Bonds, Series 2012 |
4.000 | % | 12/15/2022 | Aa2 | 1,000,000 | 1,108,850 | ||||||||||||||
| Cherry Creek School District No. 5, (Arapahoe County, Colorado), General Obligation Bonds, Series 2012B |
3.000 | % | 12/15/2024 | AA | 965,000 | 1,024,251 | ||||||||||||||
| El Paso County School District No. 20 (Academy), El Paso County, Colorado, General Obligation Refunding Bonds, Series 2012 |
4.000 | % | 12/15/2024 | Aa2 | 1,350,000 | 1,484,109 | ||||||||||||||
| Jefferson County School District No. R-1, (in Jefferson and Broomfield Counties, Colorado), General Obligation Refunding Bonds, Series 2012 |
3.500 | % | 12/15/2024 | AA- | 395,000 | 429,882 | ||||||||||||||
| Cherry Creek School District No. 5, (Arapahoe County, Colorado), General Obligation Bonds, Series 2009 |
5.000 | % | 12/15/2025 | AA | 1,185,000 | 1,251,964 | ||||||||||||||
| El Paso County School District No. 20 (Academy), El Paso County, Colorado, General Obligation Refunding Bonds, Series 2012 |
4.000 | % | 12/15/2025 | Aa2 | 1,385,000 | 1,516,353 | ||||||||||||||
| City and County of Denver, Colorado, Master Resolution Water Revenue Bonds, Series 2012A |
4.000 | % | 12/15/2026 | Aaa | 1,230,000 | 1,329,692 | ||||||||||||||
| Apex Park and Recreation District, Jefferson County, Colorado, General Obligation Bonds, Series 2016 |
5.000 | % | 12/01/2033 | Aa2 | 1,500,000 | 1,779,285 | ||||||||||||||
| Adams 12 Five Star Schools, Adams County and the City and County of Broomfield, Colorado, General Obligation Bonds, Series 2016B |
5.000 | % | 12/15/2036 | A+ | 2,500,000 | 2,915,125 | ||||||||||||||
|
|
|
|||||||||||||||||||
| 12,839,511 | ||||||||||||||||||||
|
|
|
|||||||||||||||||||
| Connecticut (2.46%) |
||||||||||||||||||||
| Town of New Canaan, Connecticut, General Obligation Refunding Bonds, Series C |
4.000 | % | 04/01/2021 | Aaa | 1,010,000 | 1,058,611 | ||||||||||||||
| Town of New Canaan, Connecticut, General Obligation Refunding Bonds, Issue of 2010, Series A |
4.000 | % | 06/15/2023 | Aaa | 1,230,000 | 1,264,612 | ||||||||||||||
| City of Stamford, Connecticut, General Obligation Bonds, Issue of 2013 |
3.000 | % | 02/01/2029 | Aa1 | 750,000 | 762,975 | ||||||||||||||
| State of Connecticut Health and Educational Facilities Authority, Revenue Bonds, Yale University Issue, Series 2016A (c) |
2.000 | % | 07/01/2042 | Aaa | 10,000,000 | 9,615,500 | ||||||||||||||
|
|
|
|||||||||||||||||||
| 12,701,698 | ||||||||||||||||||||
|
|
|
|||||||||||||||||||
| Delaware (0.68%) |
||||||||||||||||||||
| New Castle County, Delaware, General Obligation Bonds, Series 2012B |
4.000 | % | 07/15/2026 | Aaa | 2,045,000 | 2,257,107 | ||||||||||||||
| The City of Wilmington, Delaware, General Obligation Bonds, Series of 2008A (Prerefunded to 12-01-2018 @ 100) (b) |
5.000 | % | 12/01/2028 | NR | 1,120,000 | 1,181,757 | ||||||||||||||
| The City of Wilmington, Delaware, General Obligation Bonds, Series of 2008A (Prerefunded to 12-01-2018 @ 100) (b) |
5.000 | % | 12/01/2028 | Aa2 | 50,000 | 52,757 | ||||||||||||||
|
|
|
|||||||||||||||||||
| 3,491,621 | ||||||||||||||||||||
|
|
|
|||||||||||||||||||
| Florida (3.94%) |
||||||||||||||||||||
| State of Florida, Department of Transportation, Turnpike Revenue Bonds, Series 2010B |
5.000 | % | 07/01/2024 | Aa2 | 3,130,000 | 3,502,157 | ||||||||||||||
| City of Winter Park, Florida, Water and Sewer Refunding and Improvement Revenue Bonds, Series 2009 |
4.250 | % | 12/01/2024 | AA- | 1,000,000 | 1,072,760 | ||||||||||||||
| City of Tallahassee, Florida, Consolidated Utility Systems Revenue Bonds, Series 2007 |
5.000 | % | 10/01/2027 | AA | 1,700,000 | 1,716,337 | ||||||||||||||
| 86 | See accompanying notes to financial statements. |
STATE FARM MUTUAL FUND TRUST TAX ADVANTAGED BOND FUND
SCHEDULE OF INVESTMENTS (continued)
June 30, 2017
(Unaudited)
| Coupon rate |
Maturity date | Rating (a) | Principal amount |
Value | ||||||||||||||||
| Long-term Municipal Bonds (Cont.) |
||||||||||||||||||||
| Florida (Cont.) |
||||||||||||||||||||
| Palm Beach County, Florida, Water and Sewer Revenue Refunding Bonds, Series 2013 |
5.000 | % | 10/01/2029 | Aaa | $ | 1,750,000 | $ | 2,077,758 | ||||||||||||
| Broward County, Florida Water and Sewer Utility Revenue Refunding Bonds, Series 2015A |
5.000 | % | 10/01/2030 | Aa1 | 1,400,000 | 1,670,508 | ||||||||||||||
| Palm Beach County, Florida, Water and Sewer Revenue Refunding Bonds, Series 2013 |
5.000 | % | 10/01/2030 | Aaa | 1,960,000 | 2,323,266 | ||||||||||||||
| City of Pembroke Pines, Florida, General Obligation Bonds, Series 2015 |
5.000 | % | 09/01/2032 | Aa2 | 2,500,000 | 2,954,275 | ||||||||||||||
| Central Florida Expressway Authority, Senior Lien Refunding Revenue Bonds, Series 2016B |
5.000 | % | 07/01/2033 | A2 | 2,500,000 | 2,906,250 | ||||||||||||||
| City of Riviera Beach (Florida), Utility Special District, Water and Sewer Revenue Bonds, Series 2016 |
5.000 | % | 10/01/2033 | A+ | 1,845,000 | 2,142,285 | ||||||||||||||
|
|
|
|||||||||||||||||||
| 20,365,596 | ||||||||||||||||||||
|
|
|
|||||||||||||||||||
| Georgia (0.89%) |
||||||||||||||||||||
| Fulton County, Georgia, Water and Sewerage Revenue Refunding Bonds, Series 2011 |
5.000 | % | 01/01/2025 | Aa2 | 2,000,000 | 2,246,320 | ||||||||||||||
| Spalding County Water and Sewerage Facilities Authority (Georgia), Revenue Bonds, Series 2008 (Prerefunded to 09-01-2018 @ 100) (b) |
6.125 | % | 09/01/2028 | A1 | 1,000,000 | 1,058,580 | ||||||||||||||
| Fayette County, Georgia, Water Revenue Bonds, Series 2009 (Prerefunded to 10-01-2019 @ 100) (b) |
4.750 | % | 10/01/2029 | Aa2 | 1,205,000 | 1,300,749 | ||||||||||||||
|
|
|
|||||||||||||||||||
| 4,605,649 | ||||||||||||||||||||
|
|
|
|||||||||||||||||||
| Hawaii (0.42%) |
||||||||||||||||||||
| State of Hawaii, Highway Revenue Bonds, Series 2008 (Prerefunded to 01-01-2019 @ 100) (b) |
6.000 | % | 01/01/2029 | Aa2 | 2,000,000 | 2,145,300 | ||||||||||||||
|
|
|
|||||||||||||||||||
| Idaho (1.05%) |
||||||||||||||||||||
| School District No. 271 (Coeur d’Alene), Kootenai County, State of Idaho, General Obligation Bonds, Series 2012B |
4.000 | % | 09/15/2022 | Aa2 | 2,280,000 | 2,570,928 | ||||||||||||||
| Independent School District of Boise City, Ada and Boise Counties, Idaho, General Obligation Bonds, Series 2007 (Prerefunded to 08-01-2017 @ 100) (b) |
4.750 | % | 08/01/2024 | AA | 1,430,000 | 1,433,818 | ||||||||||||||
| Bonneville County, State of Idaho, School District No. 91 (Idaho Falls), General Obligation Bonds, Series 2012A |
5.000 | % | 09/15/2028 | Aa3 | 1,220,000 | 1,427,156 | ||||||||||||||
|
|
|
|||||||||||||||||||
| 5,431,902 | ||||||||||||||||||||
|
|
|
|||||||||||||||||||
| Indiana (2.08%) |
||||||||||||||||||||
| City of Fort Wayne, Indiana, Sewage Works Revenue Bonds of 2010 |
4.500 | % | 08/01/2025 | A1 | 1,000,000 | 1,081,510 | ||||||||||||||
| Hamilton Southeastern Consolidated School Building Corporation, Hamilton County, Indiana, Unlimited Ad Valorem Property Tax First Mortgage Bonds, Series 2015F |
5.000 | % | 07/15/2031 | AA- | 1,735,000 | 2,018,464 | ||||||||||||||
| Indiana Housing and Community Development Authority, Single Family Mortgage Revenue Bonds, 2008 Series A |
6.250 | % | 07/01/2033 | Aaa | 50,000 | 50,552 | ||||||||||||||
| Perry Township Multischool Building Corporation of 1996, Indianapolis, Indiana, Unlimited Ad Valorem Property Tax First Mortgage Bonds, Series 2016 |
5.000 | % | 07/15/2033 | A+ | 1,890,000 | 2,199,903 | ||||||||||||||
| New Albany-Floyd County School Building Corporation, Ad Valorem Property Tax First Mortgage Bonds, Series 2017, (Floyd County, Indiana) |
5.000 | % | 07/15/2034 | A+ | 2,920,000 | 3,408,604 | ||||||||||||||
| Valparaiso Multi-Schools Building Corporation, (Porter County, Indiana), Unlimited Ad Valorem Property Tax First Mortgage Bonds, Series 2015 |
5.000 | % | 07/15/2034 | A+ | 1,720,000 | 1,974,268 | ||||||||||||||
|
|
|
|||||||||||||||||||
| 10,733,301 | ||||||||||||||||||||
|
|
|
|||||||||||||||||||
| Iowa (1.68%) |
||||||||||||||||||||
| City of Des Moines, Iowa, General Obligation Refunding Bonds, Series 2010B, (Urban Renewal) |
4.000 | % | 06/01/2021 | Aa2 | 350,000 | 358,897 | ||||||||||||||
| Board of Regents, State of Iowa, Academic Building Revenue Bonds, Series S.U.I. 2012 (The State University of Iowa) |
3.000 | % | 07/01/2022 | AA | 1,510,000 | 1,619,173 | ||||||||||||||
| City of Des Moines, Iowa, General Obligation Refunding Bonds, Series 2010B, (Urban Renewal) |
4.000 | % | 06/01/2023 | Aa2 | 1,410,000 | 1,442,627 | ||||||||||||||
| City of Des Moines, Iowa, General Obligation Bonds, Series 2016A |
2.375 | % | 06/01/2030 | Aa2 | 1,825,000 | 1,669,291 | ||||||||||||||
| Des Moines Metropolitan, Wastewater Reclamation Authority, Sewer Revenue Refunding Bonds, Series 2013B |
4.000 | % | 06/01/2030 | Aa3 | 3,400,000 | 3,597,540 | ||||||||||||||
|
|
|
|||||||||||||||||||
| 8,687,528 | ||||||||||||||||||||
|
|
|
|||||||||||||||||||
| See accompanying notes to financial statements. | 87 |
STATE FARM MUTUAL FUND TRUST TAX ADVANTAGED BOND FUND
SCHEDULE OF INVESTMENTS (continued)
June 30, 2017
(Unaudited)
| Coupon rate |
Maturity date | Rating (a) | Principal amount |
Value | ||||||||||||||||
| Long-term Municipal Bonds (Cont.) |
||||||||||||||||||||
| Kansas (2.17%) |
||||||||||||||||||||
| City of Wichita, Kansas, Water and Sewer Utility Revenue Bonds, Series 2009A (Prerefunded to 10-01-2019 @ 100) (b) |
5.000 | % | 10/01/2030 | AA- | $ | 1,400,000 | $ | 1,518,958 | ||||||||||||
| Unified School District No. 512, Johnson County, Kansas, (Shawnee Mission), General Obligation Refunding and Improvement Bonds, Series 2015-A |
5.000 | % | 10/01/2031 | Aaa | 2,630,000 | 3,120,890 | ||||||||||||||
| Unified School District No. 233, Johnson County, Kansas (Olathe), General Obligation School Bonds, Series 2016A |
4.000 | % | 09/01/2032 | Aa2 | 2,500,000 | 2,676,425 | ||||||||||||||
| Unified School District No. 233, Johnson County, Kansas (Olathe), General Obligation School Bonds, Series 2016A |
4.000 | % | 09/01/2033 | Aa2 | 2,500,000 | 2,666,425 | ||||||||||||||
| Unified School District No. 497, Douglas County, Kansas, (Lawrence), General Obligation Refunding and Improvement Bonds, Series 2016-A |
5.000 | % | 09/01/2035 | Aa2 | 1,065,000 | 1,230,064 | ||||||||||||||
|
|
|
|||||||||||||||||||
| 11,212,762 | ||||||||||||||||||||
|
|
|
|||||||||||||||||||
| Kentucky (0.76%) |
||||||||||||||||||||
| Northern Kentucky University, General Receipts Bonds, 2007 Series A (Prerefunded to 09-01-2017 @ 100) (b) |
4.300 | % | 09/01/2026 | A | 2,545,000 | 2,558,183 | ||||||||||||||
| Northern Kentucky Water District Revenue Bonds, 2013 Series A |
4.125 | % | 02/01/2031 | Aa3 | 1,255,000 | 1,347,933 | ||||||||||||||
|
|
|
|||||||||||||||||||
| 3,906,116 | ||||||||||||||||||||
|
|
|
|||||||||||||||||||
| Louisiana (0.03%) |
||||||||||||||||||||
| Parish-Wide School District of Ascension Parish, Louisiana, General Obligation School Bonds, Series 2013 |
3.000 | % | 03/01/2025 | AA | 160,000 | 167,896 | ||||||||||||||
|
|
|
|||||||||||||||||||
| Maryland (0.94%) |
||||||||||||||||||||
| Howard County, Maryland, Consolidated Public Improvement Bonds, 2012 Series A (Prerefunded to 02-15-2020 @100) (b) |
4.000 | % | 02/15/2023 | Aaa | 1,845,000 | 1,981,696 | ||||||||||||||
| Howard County, Maryland, Metropolitan District Bonds, 2012 Series A |
4.000 | % | 02/15/2032 | Aaa | 2,790,000 | 2,900,010 | ||||||||||||||
|
|
|
|||||||||||||||||||
| 4,881,706 | ||||||||||||||||||||
|
|
|
|||||||||||||||||||
| Massachusetts (1.01%) |
||||||||||||||||||||
| Town of Carlisle, Massachusetts, General Obligation Municipal Purpose Loan of 2012 Bonds, Unlimited Tax |
3.000 | % | 11/15/2025 | Aa1 | 465,000 | 479,410 | ||||||||||||||
| Town of Carlisle, Massachusetts, General Obligation Municipal Purpose Loan of 2012 Bonds, Unlimited Tax |
3.000 | % | 11/15/2026 | Aa1 | 215,000 | 220,323 | ||||||||||||||
| Town of Carlisle, Massachusetts, General Obligation Municipal Purpose Loan of 2012 Bonds, Unlimited Tax |
3.000 | % | 11/15/2027 | Aa1 | 190,000 | 193,654 | ||||||||||||||
| Town of Georgetown, Massachusetts, General Obligation School Bonds |
4.000 | % | 05/01/2031 | Aa2 | 900,000 | 959,229 | ||||||||||||||
| The Commonwealth of Massachusetts, General Obligation Bonds, Consolidated Loan of 2014, Series A |
5.000 | % | 12/01/2034 | AA | 1,000,000 | 1,141,680 | ||||||||||||||
| The Commonwealth of Massachusetts, Commonwealth Transportation Fund Revenue Bonds, (Accelerated Bridge Program), 2013 Series A |
5.000 | % | 06/01/2035 | Aa1 | 2,000,000 | 2,247,360 | ||||||||||||||
|
|
|
|||||||||||||||||||
| 5,241,656 | ||||||||||||||||||||
|
|
|
|||||||||||||||||||
| Michigan (5.37%) |
||||||||||||||||||||
| Traverse City Area Public Schools, Counties of Grand Traverse, Leelanau and Benzie, State of Michigan, 2010 School Building and Site Bonds (General Obligation - Unlimited Tax) |
3.500 | % | 05/01/2020 | AA- | 900,000 | 950,265 | ||||||||||||||
| City of Petoskey, County of Emmet, State of Michigan, Water Supply and Sewage Disposal System Revenue and Revenue Refunding Bonds, Series 2011 |
5.000 | % | 02/01/2023 | AA- | 720,000 | 803,002 | ||||||||||||||
| City of Petoskey, County of Emmet, State of Michigan, Water Supply and Sewage Disposal System Revenue and Revenue Refunding Bonds, Series 2011 |
5.000 | % | 02/01/2024 | AA- | 225,000 | 250,855 | ||||||||||||||
| East Grand Rapids Public Schools, County of Kent, State of Michigan, 2012 Refunding Bonds, (General Obligation - Unlimited Tax) |
4.000 | % | 05/01/2024 | A+ | 1,625,000 | 1,723,280 | ||||||||||||||
| Howell Public Schools, County of Livingston, State of Michigan, 2012 Refunding Bonds, (General Obligation - Unlimited Tax) |
4.250 | % | 05/01/2025 | A+ | 2,760,000 | 3,054,602 | ||||||||||||||
| East Grand Rapids Public Schools, County of Kent, State of Michigan, 2012 Refunding Bonds, (General Obligation - Unlimited Tax) |
4.000 | % | 05/01/2027 | A+ | 1,600,000 | 1,676,032 | ||||||||||||||
| Plymouth-Canton Community Schools, Counties of Wayne and Washtenaw, State of Michigan, 2012 Refunding Bonds, Series A, (General Obligation - Unlimited Tax) |
4.000 | % | 05/01/2027 | Aa3 | 4,240,000 | 4,558,890 | ||||||||||||||
| 88 | See accompanying notes to financial statements. |
STATE FARM MUTUAL FUND TRUST TAX ADVANTAGED BOND FUND
SCHEDULE OF INVESTMENTS (continued)
June 30, 2017
(Unaudited)
| Coupon rate |
Maturity date | Rating (a) | Principal amount |
Value | ||||||||||||||||
| Long-term Municipal Bonds (Cont.) |
||||||||||||||||||||
| Michigan (Cont.) |
||||||||||||||||||||
| Birmingham Public Schools, County of Oakland, State of Michigan, 2013 Refunding Bonds, (General Obligation - Unlimited Tax) |
4.000 | % | 05/01/2029 | AA+ | $ | 3,545,000 | $ | 3,817,291 | ||||||||||||
| East Grand Rapids Public Schools, County of Kent, State of Michigan, 2014 Refunding Bonds, Series A |
5.000 | % | 05/01/2029 | A+ | 1,000,000 | 1,135,010 | ||||||||||||||
| East Grand Rapids Public Schools, County of Kent, State of Michigan, 2014 Refunding Bonds, Series A |
5.000 | % | 05/01/2030 | A+ | 750,000 | 846,292 | ||||||||||||||
| Hamilton Community Schools, County of Allegan, State of Michigan, 2015 Refunding Bonds, (General Obligation - Unlimited Tax) |
5.000 | % | 05/01/2030 | AA- | 885,000 | 1,015,493 | ||||||||||||||
| East Grand Rapids Public Schools, County of Kent, State of Michigan, 2014 Refunding Bonds, Series A |
5.000 | % | 05/01/2031 | A+ | 1,000,000 | 1,123,790 | ||||||||||||||
| Mattawan Consolidated School, Counties of Van Buren and Kalamazoo, State of Michigan, 2015 School Building and Site Bonds, Series I, (General Obligation - Unlimited Tax) |
5.000 | % | 05/01/2031 | A+ | 1,000,000 | 1,143,680 | ||||||||||||||
| Zeeland Public Schools, Counties of Ottawa and Allegan, State of Michigan, 2015 School Building and Site Bonds, Series A, (General Obligation - Unlimited Tax) |
5.000 | % | 05/01/2031 | A | 1,535,000 | 1,749,793 | ||||||||||||||
| Plymouth-Canton Community Schools, Counties of Wayne and Washtenaw, State of Michigan, 2013 School Building and Site Bonds, Series A, (General Obligation - Unlimited Tax) |
4.000 | % | 05/01/2032 | A+ | 2,900,000 | 3,067,997 | ||||||||||||||
| Plymouth-Canton Community Schools, Counties of Wayne and Washtenaw, State of Michigan, 2013 School Building and Site Bonds, Series A, (General Obligation - Unlimited Tax) |
4.000 | % | 05/01/2033 | A+ | 800,000 | 842,400 | ||||||||||||||
|
|
|
|||||||||||||||||||
| 27,758,672 | ||||||||||||||||||||
|
|
|
|||||||||||||||||||
| Minnesota (0.85%) |
||||||||||||||||||||
| State of Minnesota, General Obligation State Various Purpose Bonds, Series 2009H |
4.500 | % | 11/01/2024 | Aa1 | 185,000 | 198,524 | ||||||||||||||
| State of Minnesota, General Obligation State Various Purpose Bonds, Series 2009H (Prerefunded to 11-01-2019 @ 100) (b) |
4.500 | % | 11/01/2024 | NR | 815,000 | 877,494 | ||||||||||||||
| City of Rochester, Minnesota, General Obligation Waste Water Revenue Refunding Bonds, Series 2012A |
4.000 | % | 02/01/2026 | Aaa | 2,500,000 | 2,736,750 | ||||||||||||||
| Independent School District No. 276, Minnetonka, Minnesota, General Obligation Refunding Bonds, Series 2013H |
4.000 | % | 02/01/2026 | Aaa | 500,000 | 554,400 | ||||||||||||||
|
|
|
|||||||||||||||||||
| 4,367,168 | ||||||||||||||||||||
|
|
|
|||||||||||||||||||
| Mississippi (0.74%) |
||||||||||||||||||||
| Mississippi Development Bank, Special Obligation Bonds, Series 2010A, (City of Jackson, Mississippi General Obligation Refunding Project) |
5.000 | % | 03/01/2020 | Baa2 | 1,000,000 | 1,092,590 | ||||||||||||||
| Mississippi Development Bank, Special Obligation Bonds, Series 2010A, (City of Jackson, Mississippi General Obligation Refunding Project) |
5.000 | % | 03/01/2021 | Baa2 | 1,000,000 | 1,089,030 | ||||||||||||||
| Madison County School District, Madison County, Mississippi, General Obligation Refunding Bonds, Series 2012 |
4.000 | % | 04/15/2023 | Aa2 | 1,480,000 | 1,637,605 | ||||||||||||||
|
|
|
|||||||||||||||||||
| 3,819,225 | ||||||||||||||||||||
|
|
|
|||||||||||||||||||
| Missouri (1.77%) |
||||||||||||||||||||
| The School District of Columbia, Boone County, State of Missouri, General Obligation Refunding and Improvement Bonds, Series 2012 |
4.000 | % | 03/01/2026 | Aa1 | 2,490,000 | 2,728,741 | ||||||||||||||
| Joplin Schools, Joplin, Missouri, General Obligation School Building Bonds, (Missouri Direct Deposit Program), Series 2012 |
4.000 | % | 03/01/2028 | A+ | 2,750,000 | 2,981,660 | ||||||||||||||
| The School District of Springfield R-XII, Springfield, Missouri, General Obligation School Building Bonds, (Missouri Direct Deposit Program), Series 2013 |
5.000 | % | 03/01/2032 | AA | 1,000,000 | 1,161,760 | ||||||||||||||
| Reorganized School District No. 7 of Jackson County, Missouri, (Lee’s Summit R-7), General Obligation School Building Bonds, Series 2016 |
5.000 | % | 03/01/2036 | AA+ | 2,000,000 | 2,294,080 | ||||||||||||||
|
|
|
|||||||||||||||||||
| 9,166,241 | ||||||||||||||||||||
|
|
|
|||||||||||||||||||
| Montana (0.91%) |
||||||||||||||||||||
| State of Montana, General Obligation Bonds, (Drinking Water State Revolving Fund Program), Series 2005F |
4.750 | % | 07/15/2018 | AA | 315,000 | 315,914 | ||||||||||||||
| See accompanying notes to financial statements. | 89 |
STATE FARM MUTUAL FUND TRUST TAX ADVANTAGED BOND FUND
SCHEDULE OF INVESTMENTS (continued)
June 30, 2017
(Unaudited)
| Coupon rate |
Maturity date | Rating (a) | Principal amount |
Value | ||||||||||||||||
| Long-term Municipal Bonds (Cont.) |
||||||||||||||||||||
| Montana (Cont.) |
||||||||||||||||||||
| School District No. 7 (Bozeman), Gallatin County, Montana, General Obligation School Building Bonds, Series 2013 |
4.000 | % | 06/01/2023 | Aa2 | $ | 180,000 | $ | 199,215 | ||||||||||||
| City of Billings, Montana, General Obligation Bonds, Series 2012 |
4.000 | % | 07/01/2026 | Aa2 | 265,000 | 286,902 | ||||||||||||||
| City of Billings, Montana, General Obligation Bonds, Series 2012 |
4.000 | % | 07/01/2027 | Aa2 | 525,000 | 565,871 | ||||||||||||||
| City of Billings, Montana, General Obligation Bonds, Series 2012 |
4.000 | % | 07/01/2028 | Aa2 | 655,000 | 703,129 | ||||||||||||||
| School District No. 4 (Hellgate), Missoula County, Montana, General Obligation School Building Bonds, Series 2017 |
5.000 | % | 06/15/2034 | A+ | 505,000 | 580,947 | ||||||||||||||
| School District No. 4 (Hellgate), Missoula County, Montana, General Obligation School Building Bonds, Series 2017 |
5.250 | % | 06/15/2035 | A+ | 880,000 | 1,037,494 | ||||||||||||||
| School District No. 4 (Hellgate), Missoula County, Montana, General Obligation School Building Bonds, Series 2017 |
5.250 | % | 06/15/2036 | A+ | 855,000 | 1,007,216 | ||||||||||||||
|
|
|
|||||||||||||||||||
| 4,696,688 | ||||||||||||||||||||
|
|
|
|||||||||||||||||||
| Nebraska (2.37%) |
||||||||||||||||||||
| Douglas County School District 0010, (Elkhorn Public Schools), General Obligation Refunding Bonds, Series 2011 |
4.000 | % | 12/15/2021 | AA- | 1,140,000 | 1,262,527 | ||||||||||||||
| Douglas County School District 0010, (Elkhorn Public Schools), General Obligation Refunding Bonds, Series 2011 |
5.000 | % | 12/15/2027 | AA- | 1,850,000 | 2,117,029 | ||||||||||||||
| Omaha Public Power District (Nebraska) Electric System Revenue Bonds, 2008 Series A (Prerefunded to 02-01-2018 @ 100) (b) |
5.500 | % | 02/01/2028 | Aa2 | 1,500,000 | 1,538,835 | ||||||||||||||
| Douglas County School District 0010, (Elkhorn Public Schools), General Obligation Bonds, Series 2012B |
4.000 | % | 01/15/2030 | AA- | 1,930,000 | 2,058,229 | ||||||||||||||
| Sarpy County School District 0037, In the State of Nebraska, (Gretna Public Schools), General Obligation School Building and Refunding Bonds, Series 2015 |
5.000 | % | 12/15/2031 | A+ | 725,000 | 838,854 | ||||||||||||||
| Hall County School District 0002, In the State of Nebraska, (Grand Island Public Schools), General Obligation Bonds, Series 2014 |
5.000 | % | 12/15/2032 | AA- | 2,000,000 | 2,342,020 | ||||||||||||||
| Sarpy County School District 0037, In the State of Nebraska, (Gretna Public Schools), General Obligation School Building and Refunding Bonds, Series 2015 |
5.000 | % | 12/15/2032 | A+ | 850,000 | 978,673 | ||||||||||||||
| Sarpy County School District 0037, In the State of Nebraska, (Gretna Public Schools), General Obligation School Building and Refunding Bonds, Series 2015 |
5.000 | % | 12/15/2033 | A+ | 970,000 | 1,112,154 | ||||||||||||||
|
|
|
|||||||||||||||||||
| 12,248,321 | ||||||||||||||||||||
|
|
|
|||||||||||||||||||
| New Jersey (3.72%) |
||||||||||||||||||||
| The Board of Education of the Township of South Brunswick in the County of Middlesex, New Jersey, Refunding School Bonds |
3.000 | % | 12/01/2021 | AA+ | 580,000 | 616,418 | ||||||||||||||
| Middlesex County Improvement Authority, (County of Middlesex, State of New Jersey), County-Guaranteed Open Space Trust Fund Revenue Bonds, Series 2009A |
4.000 | % | 12/15/2021 | Aa2 | 1,205,000 | 1,284,132 | ||||||||||||||
| The County of Morris, New Jersey, General Obligation Bonds, Series 2012 B |
2.000 | % | 12/15/2023 | Aaa | 215,000 | 218,210 | ||||||||||||||
| The Board of Education of the Warren Hills Regional School District in the County of Warren, New Jersey, Refunding School Bonds, Series 2012 |
4.000 | % | 02/15/2024 | AA | 1,390,000 | 1,534,365 | ||||||||||||||
| The Board of Education of the Township of North Brunswick in the County of Middlesex, New Jersey, Refunding School Bonds |
4.250 | % | 01/15/2025 | AA | 2,200,000 | 2,422,134 | ||||||||||||||
| Township of Parsippany-Troy Hills, In the County of Morris, New Jersey, General Obligation Refunding Bonds, Series 2012 |
4.000 | % | 07/15/2025 | AA | 1,390,000 | 1,542,636 | ||||||||||||||
| The Board of Education of the Warren Hills Regional School District in the County of Warren, New Jersey, Refunding School Bonds, Series 2012 |
4.000 | % | 02/15/2026 | AA | 1,485,000 | 1,623,328 | ||||||||||||||
| The Board of Education of the Township of Bernards in the County of Somerset, New Jersey, Refunding School Bonds, Series 2013 |
4.000 | % | 07/15/2026 | AAA | 850,000 | 958,392 | ||||||||||||||
| Refunding School Bonds, Series 2012 B, The Board of Education of the Borough of Madison, in the County of Morris, New Jersey |
4.000 | % | 12/15/2026 | AA+ | 1,440,000 | 1,597,982 | ||||||||||||||
| The Board of Education of the Somerset Hills School District in the County of Somerset, New Jersey, Refunding School Bonds, Series 2012 |
4.000 | % | 03/15/2027 | Aa1 | 1,110,000 | 1,204,772 | ||||||||||||||
| The Board of Education of the Township of Wyckoff in the County of Bergen, New Jersey, Refunding School Bonds |
4.000 | % | 04/01/2027 | AA+ | 1,415,000 | 1,575,730 | ||||||||||||||
| The Board of Education of the Township of Bernards in the County of Somerset, New Jersey, Refunding School Bonds, Series 2013 |
4.000 | % | 07/15/2027 | AAA | 630,000 | 706,885 | ||||||||||||||
| Refunding School Bonds, Series 2012 B, The Board of Education of the Borough of Madison, in the County of Morris, New Jersey |
4.000 | % | 12/15/2027 | AA+ | 1,495,000 | 1,651,676 | ||||||||||||||
| 90 | See accompanying notes to financial statements. |
STATE FARM MUTUAL FUND TRUST TAX ADVANTAGED BOND FUND
SCHEDULE OF INVESTMENTS (continued)
June 30, 2017
(Unaudited)
| Coupon rate |
Maturity date | Rating (a) | Principal amount |
Value | ||||||||||||||||
| Long-term Municipal Bonds (Cont.) |
||||||||||||||||||||
| New Jersey (Cont.) |
||||||||||||||||||||
| The Board of Education of the Somerset Hills School District in the County of Somerset, New Jersey, Refunding School Bonds, Series 2012 |
4.000 | % | 03/15/2028 | Aa1 | $ | 920,000 | $ | 995,974 | ||||||||||||
| The Board of Education of the Township of Livingston, In the County of Essex, New Jersey, Refunding School Bonds |
4.500 | % | 07/15/2033 | AA+ | 1,160,000 | 1,293,783 | ||||||||||||||
|
|
|
|||||||||||||||||||
| 19,226,417 | ||||||||||||||||||||
|
|
|
|||||||||||||||||||
| New Mexico (1.53%) |
||||||||||||||||||||
| Santa Fe Public School District, Santa Fe County, New Mexico, General Obligation Bonds, Series 2012 |
3.000 | % | 08/01/2022 | Aa2 | 1,750,000 | 1,867,950 | ||||||||||||||
| Las Cruces School District No. 2, General Obligation School Building Bonds, Series 2011A |
4.000 | % | 08/01/2023 | Aa3 | 1,700,000 | 1,824,355 | ||||||||||||||
| City of Albuquerque, New Mexico, General Obligation General Purpose Bonds, Series 2012A |
4.000 | % | 07/01/2024 | Aa1 | 2,500,000 | 2,654,700 | ||||||||||||||
| City of Santa Fe, New Mexico, Water Utility System / Capital Outlay Gross Receipts Tax Revenue Bonds, Series 2009A (Tax-Exempt) (Prerefunded to 06-01-2019 @ 100) (b) |
5.000 | % | 06/01/2025 | AAA | 470,000 | 504,785 | ||||||||||||||
| Albuquerque Bernalillo County Water Utility Authority, Joint Water and Sewer System Improvement Revenue Bonds, Series 2008A (Prerefunded to 07-01-2018 @ 100) (b) |
5.000 | % | 07/01/2030 | Aa2 | 1,000,000 | 1,039,450 | ||||||||||||||
|
|
|
|||||||||||||||||||
| 7,891,240 | ||||||||||||||||||||
|
|
|
|||||||||||||||||||
| New York (1.97%) |
||||||||||||||||||||
| County of Saratoga, New York, Public Improvement (Serial) Bonds, Series 2010B (Economically Defeased to 07-15-2017 @ 100) (b) |
4.000 | % | 07/15/2021 | AA+ | 430,000 | 430,340 | ||||||||||||||
| County of Suffolk, New York, Public Improvement Serial Bonds - 2009 Series C (Economically Defeased to 10-15-2019 @ 100) (b) |
4.000 | % | 10/15/2021 | A3 | 1,000,000 | 1,064,730 | ||||||||||||||
| East Hampton Union Free School District, Suffolk County, New York, School District Serial Bonds - 2009 |
4.000 | % | 06/15/2022 | Aa1 | 1,285,000 | 1,349,777 | ||||||||||||||
| Miller Place Union Free School District in the Town of Brookhaven, Suffolk County, New York, School District Serial Bonds - 2010 |
4.000 | % | 02/15/2025 | Aa2 | 685,000 | 695,028 | ||||||||||||||
| County of Saratoga, New York, Public Improvement (Serial) Bonds, Series 2010B (Economically Defeased to 07-15-2017 @ 100) (b) |
4.000 | % | 07/15/2025 | AA+ | 510,000 | 510,403 | ||||||||||||||
| County of Suffolk, New York, Public Improvement Serial Bonds - 2008 Series B (b) |
5.000 | % | 11/01/2027 | A3 | 1,000,000 | 1,047,690 | ||||||||||||||
| The Port Authority of New York and New Jersey Consolidated Bonds, One Hundred Fifty-Third Series |
4.750 | % | 07/15/2030 | Aa3 | 1,000,000 | 1,035,120 | ||||||||||||||
| The Port Authority of New York and New Jersey Consolidated Bonds, One Hundred Seventy-Ninth Series |
5.000 | % | 12/01/2032 | Aa3 | 1,000,000 | 1,174,840 | ||||||||||||||
| New York City, Municipal Water Finance Authority, Water and Sewer System Second General Resolution Revenue Bonds, Fiscal 2014 Series DD |
5.000 | % | 06/15/2035 | Aa1 | 2,500,000 | 2,887,375 | ||||||||||||||
|
|
|
|||||||||||||||||||
| 10,195,303 | ||||||||||||||||||||
|
|
|
|||||||||||||||||||
| North Carolina (3.05%) |
||||||||||||||||||||
| City of Fayetteville, North Carolina, Public Works Commission, Revenue Refunding Bonds, Series 2009A |
5.000 | % | 03/01/2024 | Aa2 | 1,355,000 | 1,439,457 | ||||||||||||||
| County of Wake, North Carolina, General Obligation Public Improvement Bonds, Series 2011 |
4.000 | % | 04/01/2024 | Aaa | 2,000,000 | 2,170,340 | ||||||||||||||
| City of Charlotte, North Carolina, General Obligation Refunding Bonds, Series 2009B |
4.000 | % | 06/01/2024 | Aaa | 1,265,000 | 1,320,445 | ||||||||||||||
| State of North Carolina, General Obligation Public Improvement Bonds, Series 2010A (Prerefunded to 05-01-2020 @ 100) (b) |
4.000 | % | 05/01/2026 | Aaa | 1,000,000 | 1,076,510 | ||||||||||||||
| City of Charlotte, North Carolina, Water and Sewer System Revenue Bonds, Series 2009B |
4.250 | % | 07/01/2026 | Aaa | 1,500,000 | 1,615,455 | ||||||||||||||
| City of Asheville, North Carolina, Water System Revenue Bonds, Series 2007 (Prerefunded to 08-01-2017 @ 100) (b) |
4.750 | % | 08/01/2026 | Aa2 | 195,000 | 195,521 | ||||||||||||||
| City of Raleigh, North Carolina, General Obligation Public Improvement Bonds, Series 2012B (Prerefunded to 04-01-2022 @ 100) (b) |
4.000 | % | 04/01/2027 | Aaa | 4,000,000 | 4,476,840 | ||||||||||||||
| City of Charlotte, North Carolina, Water and Sewer System Revenue Bonds, Series 2009B |
5.000 | % | 07/01/2027 | Aaa | 1,500,000 | 1,668,105 | ||||||||||||||
| City of Asheville, North Carolina, Water System Revenue Bonds, Series 2007 (Prerefunded to 08-01-2017 @ 100) (b) |
4.750 | % | 08/01/2027 | Aa2 | 300,000 | 300,801 | ||||||||||||||
| City of Durham, North Carolina, General Obligation Bonds, Series 2012A |
3.000 | % | 07/01/2028 | Aaa | 455,000 | 469,487 | ||||||||||||||
| City of Charlotte, North Carolina, Water and Sewer System Revenue Bonds, Series 2008 |
5.000 | % | 07/01/2038 | Aaa | 1,000,000 | 1,035,530 | ||||||||||||||
|
|
|
|||||||||||||||||||
| 15,768,491 | ||||||||||||||||||||
|
|
|
|||||||||||||||||||
| See accompanying notes to financial statements. | 91 |
STATE FARM MUTUAL FUND TRUST TAX ADVANTAGED BOND FUND
SCHEDULE OF INVESTMENTS (continued)
June 30, 2017
(Unaudited)
| Coupon rate |
Maturity date | Rating (a) | Principal amount |
Value | ||||||||||||||||
| Long-term Municipal Bonds (Cont.) |
||||||||||||||||||||
| North Dakota (0.27%) |
||||||||||||||||||||
| West Fargo Public School District No. 6, Cass County, North Dakota, General Obligation School Building Bonds, Series 2011 |
4.000 | % | 05/01/2026 | Aa3 | $ | 1,300,000 | $ | 1,397,604 | ||||||||||||
|
|
|
|||||||||||||||||||
| Ohio (3.32%) |
||||||||||||||||||||
| Board of Education, City School District of the City of Cincinnati, County of Hamilton, Ohio, Classroom Facilities Construction and Improvement Refunding Bonds, Series 2006 (Voted General Obligation Unlimited Tax) |
5.250 | % | 12/01/2022 | AA- | 900,000 | 1,064,754 | ||||||||||||||
| Columbus City School District, Franklin County, Ohio, School Facilities Construction and Improvement Bonds, Series 2009-B (General Obligation - Unlimited Tax) (Prerefunded to 12-01-2019 @ 100) (b) |
5.000 | % | 12/01/2023 | Aa2 | 1,000,000 | 1,090,970 | ||||||||||||||
| South-Western City School District, Franklin and Pickaway Counties, Ohio, School Facilities Construction and Improvement Bonds, Series 2012 (General Obligation - Unlimited Tax) |
4.000 | % | 12/01/2025 | AA- | 1,315,000 | 1,432,088 | ||||||||||||||
| Miami University, (A State University of Ohio), General Receipts Revenue and Refunding Bonds, Series 2011 |
5.000 | % | 09/01/2026 | Aa3 | 1,000,000 | 1,134,330 | ||||||||||||||
| City of Columbus, Ohio, General Obligation Bonds, Various Purpose Unlimited Tax Bonds, Series 2012A |
4.000 | % | 02/15/2027 | Aaa | 1,500,000 | 1,642,680 | ||||||||||||||
| Plain Local School District (Stark County), Ohio, General Obligation (Unlimited Tax), School Improvement Refunding Bonds, Series 2011A |
4.500 | % | 11/01/2027 | AA- | 2,000,000 | 2,190,240 | ||||||||||||||
| City of Cincinnati, Ohio, Water System Revenue Bonds, Series 2012A (Prerefunded 12-01-2021 @100) (b) |
4.000 | % | 12/01/2028 | Aaa | 2,520,000 | 2,811,362 | ||||||||||||||
| City of North Ridgeville, Ohio, General Obligation, Fire Station Bonds, Series 2016, (Unlimited Tax) |
4.000 | % | 12/01/2028 | Aa1 | 700,000 | 768,509 | ||||||||||||||
| Olentangy Local School District, Delaware and Franklin Counties, Ohio, Refunding Bonds, Series 2013B, (Tax-Exempt), (General Obligation-Unlimited Tax) |
4.000 | % | 12/01/2028 | Aa1 | 1,870,000 | 2,051,558 | ||||||||||||||
| Olentangy Local School District, Delaware and Franklin Counties, Ohio, Refunding Bonds, Series 2013B, (Tax-Exempt), (General Obligation-Unlimited Tax) |
4.000 | % | 12/01/2029 | Aa1 | 1,680,000 | 1,830,545 | ||||||||||||||
| Fairfield City School District, County of Butler, Ohio, School Improvement Unlimited Tax, General Obligation Bonds, Series 2014 |
5.000 | % | 11/01/2031 | Aa3 | 960,000 | 1,132,013 | ||||||||||||||
|
|
|
|||||||||||||||||||
| 17,149,049 | ||||||||||||||||||||
|
|
|
|||||||||||||||||||
| Oklahoma (1.20%) |
||||||||||||||||||||
| City of Tulsa, Oklahoma, General Obligation Bonds, Series 2013 |
4.000 | % | 03/01/2023 | AA | 2,500,000 | 2,664,600 | ||||||||||||||
| Oklahoma Turnpike Authority, Oklahoma Turnpike System, Second Senior Revenue Bonds, Series 2011B |
5.000 | % | 01/01/2026 | Aa3 | 1,000,000 | 1,122,070 | ||||||||||||||
| City of Oklahoma City, Oklahoma, General Obligation Bonds, Series 2008 (Prerefunded to 03-01-2018 @ 100) (b) |
5.000 | % | 03/01/2027 | Aaa | 400,000 | 410,672 | ||||||||||||||
| Oklahoma Turnpike Authority, Oklahoma Turnpike System, Second Senior Revenue Bonds, Series 2011B |
5.000 | % | 01/01/2028 | Aa3 | 770,000 | 859,536 | ||||||||||||||
| Grand River Dam Authority, Revenue Bonds, Series 2014A |
5.000 | % | 06/01/2031 | A1 | 1,000,000 | 1,167,230 | ||||||||||||||
|
|
|
|||||||||||||||||||
| 6,224,108 | ||||||||||||||||||||
|
|
|
|||||||||||||||||||
| Oregon (3.30%) |
||||||||||||||||||||
| City of Portland, Oregon, First Lien Water System Revenue and Refunding Bonds, 2010 Series A (Tax Exempt) |
4.000 | % | 05/01/2021 | Aaa | 1,070,000 | 1,150,015 | ||||||||||||||
| City of Portland, Oregon, Second Lien Sewer System Revenue and Refunding Bonds, 2008 Series B (Prerefunded to 06-15-2018 @ 100) (b) |
5.000 | % | 06/15/2022 | Aa3 | 1,825,000 | 1,894,824 | ||||||||||||||
| City of Portland, Oregon, Second Lien Sewer System Revenue and Refunding Bonds, 2008 Series B (Prerefunded to 06-15-2018 @ 100) (b) |
5.000 | % | 06/15/2023 | Aa3 | 1,375,000 | 1,427,608 | ||||||||||||||
| City of Portland, Oregon, First Lien Water System Revenue Bonds, 2011 Series A |
4.000 | % | 05/01/2024 | Aaa | 1,500,000 | 1,633,425 | ||||||||||||||
| State of Oregon, State Board of Higher Education, General Obligation Bonds, 2007 Series F (Tax Exempt) |
4.625 | % | 08/01/2024 | Aa1 | 570,000 | 571,476 | ||||||||||||||
| State of Oregon, State Board of Higher Education, General Obligation Bonds, 2007 Refunding Series G (Tax Exempt) |
4.625 | % | 08/01/2024 | Aa1 | 330,000 | 330,855 | ||||||||||||||
| State of Oregon, State Board of Higher Education, General Obligation Bonds, 2009 Series A (Prerefunded to 08-01-2018 @ 100) (b) |
5.750 | % | 08/01/2024 | Aa1 | 575,000 | 604,101 | ||||||||||||||
| 92 | See accompanying notes to financial statements. |
STATE FARM MUTUAL FUND TRUST TAX ADVANTAGED BOND FUND
SCHEDULE OF INVESTMENTS (continued)
June 30, 2017
(Unaudited)
| Coupon rate |
Maturity date | Rating (a) | Principal amount |
Value | ||||||||||||||||
| Long-term Municipal Bonds (Cont.) |
||||||||||||||||||||
| Oregon (Cont.) |
||||||||||||||||||||
| North Clackamas School District No. 12, Clackamas County, Oregon, General Obligation Refunding Bonds, Series 2014 |
5.000 | % | 06/15/2029 | A+ | $ | 3,585,000 | $ | 4,289,058 | ||||||||||||
| Oregon Trail School District No. 46, Clackamas County, Oregon, General Obligation Bonds, Series 2009 (Prerefunded 06-15-2019 @100) (b) |
5.000 | % | 06/15/2029 | AA- | 1,000,000 | 1,074,510 | ||||||||||||||
| State of Oregon, State Board of Higher Education, General Obligation Bonds, 2009 Series A (Prerefunded to 08-01-2018 @ 100) (b) |
5.750 | % | 08/01/2029 | Aa1 | 940,000 | 987,573 | ||||||||||||||
| Central Lincoln People’s Utility District, Oregon, Electric System Revenue Bonds, Series 2016 |
5.000 | % | 12/01/2033 | AA- | 400,000 | 465,148 | ||||||||||||||
| Central Lincoln People’s Utility District, Oregon, Electric System Revenue Bonds, Series 2016 |
5.000 | % | 12/01/2034 | AA- | 400,000 | 463,200 | ||||||||||||||
| Central Lincoln People’s Utility District, Oregon, Electric System Revenue Bonds, Series 2016 |
5.000 | % | 12/01/2035 | AA- | 415,000 | 477,561 | ||||||||||||||
| State of Oregon, General Obligation Bonds, 2012 Series I, (ODOT Project - Tax-Exempt) |
5.000 | % | 05/01/2037 | Aa1 | 1,500,000 | 1,710,180 | ||||||||||||||
|
|
|
|||||||||||||||||||
| 17,079,534 | ||||||||||||||||||||
|
|
|
|||||||||||||||||||
| Pennsylvania (3.32%) |
||||||||||||||||||||
| County of Berks, Pennsylvania, General Obligation Bonds, Series of 2013 |
5.000 | % | 11/15/2025 | Aa1 | 860,000 | 963,914 | ||||||||||||||
| Township of Cranberry, Butler County, Pennsylvania, General Obligation Bonds, Series of 2011 |
4.500 | % | 03/01/2026 | Aa1 | 2,575,000 | 2,829,256 | ||||||||||||||
| County of Chester, Commonwealth of Pennsylvania, General Obligation Bonds, Series of 2011 |
4.000 | % | 11/15/2026 | Aaa | 1,465,000 | 1,601,421 | ||||||||||||||
| County of Berks, Pennsylvania, General Obligation Bonds, Series of 2013 |
5.000 | % | 11/15/2027 | Aa1 | 950,000 | 1,064,124 | ||||||||||||||
| County of Berks, Pennsylvania, General Obligation Bonds, Series of 2013 |
5.000 | % | 11/15/2028 | Aa1 | 995,000 | 1,113,485 | ||||||||||||||
| Township of Hampden, (Cumberland County, Pennsylvania), General Obligation Bonds, Series of 2012 |
5.000 | % | 05/15/2029 | AA | 980,000 | 1,092,249 | ||||||||||||||
| Township of Hampden, (Cumberland County, Pennsylvania), General Obligation Bonds, Series of 2012 (Prerefunded to 11-15-2020 @ 100) (b) |
5.000 | % | 05/15/2029 | NR | 200,000 | 224,448 | ||||||||||||||
| County of Northampton, Commonwealth of Pennsylvania, General Obligation Bonds, Series B of 2012 (Tax-Exempt) |
5.000 | % | 10/01/2030 | AA | 1,500,000 | 1,740,420 | ||||||||||||||
| Township of Hampden, (Cumberland County, Pennsylvania), General Obligation Bonds, Series of 2012 |
5.000 | % | 05/15/2031 | AA | 870,000 | 970,563 | ||||||||||||||
| Township of Hampden, (Cumberland County, Pennsylvania), General Obligation Bonds, Series of 2012 (Prerefunded to 11-15-2020 @ 100) (b) |
5.000 | % | 05/15/2031 | NR | 185,000 | 207,614 | ||||||||||||||
| The Municipal Authority of the Borough of West View, (Allegheny County, Pennsylvania), Water Revenue Bonds, Series of 2014 |
5.000 | % | 11/15/2031 | AA | 1,000,000 | 1,187,000 | ||||||||||||||
| Township of Hampden, (Cumberland County, Pennsylvania), General Obligation Bonds, Series of 2012 |
5.000 | % | 05/15/2032 | AA | 1,375,000 | 1,527,721 | ||||||||||||||
| Township of Hampden, (Cumberland County, Pennsylvania), General Obligation Bonds, Series of 2012 (Prerefunded to 11-15-2020 @ 100) (b) |
5.000 | % | 05/15/2032 | NR | 285,000 | 319,838 | ||||||||||||||
| North Penn Water Authority, Water Revenue Bonds, Series of 2015 |
5.000 | % | 11/01/2033 | Aa3 | 975,000 | 1,115,878 | ||||||||||||||
| North Penn Water Authority, Water Revenue Bonds, Series of 2015 |
5.000 | % | 11/01/2034 | Aa3 | 1,075,000 | 1,225,296 | ||||||||||||||
|
|
|
|||||||||||||||||||
| 17,183,227 | ||||||||||||||||||||
|
|
|
|||||||||||||||||||
| Rhode Island (0.44%) |
||||||||||||||||||||
| Town of Westerly, Rhode Island, General Obligation Refunding Bonds, 2012 Series B |
4.000 | % | 08/15/2024 | Aa3 | 2,050,000 | 2,268,079 | ||||||||||||||
|
|
|
|||||||||||||||||||
| South Carolina (4.67%) |
||||||||||||||||||||
| Renewable Water Resources, South Carolina, Sewer System Refunding Revenue Bonds, Series 2012 |
5.000 | % | 01/01/2024 | AA | 2,500,000 | 2,866,525 | ||||||||||||||
| School District of Beaufort County, South Carolina, General Obligation Refunding Bonds, Series 2012B |
4.000 | % | 03/01/2024 | AA | 1,800,000 | 1,987,812 | ||||||||||||||
| Fort Mill School District No. 4 of York County, South Carolina, General Obligation Advanced Refunding Bonds, Series 2012A |
4.000 | % | 03/01/2026 | Aa2 | 2,620,000 | 2,883,389 | ||||||||||||||
| South Carolina Public Service Authority, Revenue Obligations, Series 2008, Tax-Exempt Series A (Prerefunded to 01-01-2019 @ 100) (b) |
5.375 | % | 01/01/2028 | NR | 3,380,000 | 3,594,461 | ||||||||||||||
| South Carolina Public Service Authority, Revenue Obligations, Series 2008, Tax-Exempt Series A (Prerefunded to 01-01-2019 @ 100) (b) |
5.375 | % | 01/01/2028 | A1 | 120,000 | 127,614 | ||||||||||||||
| See accompanying notes to financial statements. | 93 |
STATE FARM MUTUAL FUND TRUST TAX ADVANTAGED BOND FUND
SCHEDULE OF INVESTMENTS (continued)
June 30, 2017
(Unaudited)
| Coupon rate |
Maturity date | Rating (a) | Principal amount |
Value | ||||||||||||||||
| Long-term Municipal Bonds (Cont.) |
||||||||||||||||||||
| South Carolina (Cont.) |
||||||||||||||||||||
| Fort Mill School District No. 4 of York County, South Carolina, General Obligation Advanced Refunding Bonds, Series 2012A |
4.000 | % | 03/01/2028 | Aa2 | $ | 2,850,000 | $ | 3,100,002 | ||||||||||||
| Fort Mill School District No. 4 of York County, South Carolina, General Obligation Bonds, Series 2013A |
4.000 | % | 03/01/2028 | Aa2 | 1,525,000 | 1,662,494 | ||||||||||||||
| City of Columbia, South Carolina, Waterworks and Sewer System Refunding Revenue Bonds, Series 2012 |
5.000 | % | 02/01/2030 | Aa1 | 1,000,000 | 1,145,430 | ||||||||||||||
| Spartanburg Sanitary Sewer District, South Carolina, Sewer System Refunding Convertible Bonds, Series 2013B |
5.000 | % | 03/01/2032 | A1 | 3,585,000 | 4,101,383 | ||||||||||||||
| Town of Fort Mill, South Carolina, Waterworks and Sewer System, Improvement Revenue Bonds, Series 2015 |
5.000 | % | 12/01/2032 | AA- | 305,000 | 355,142 | ||||||||||||||
| Town of Fort Mill, South Carolina, Waterworks and Sewer System, Improvement Revenue Bonds, Series 2015 |
5.000 | % | 12/01/2033 | AA- | 640,000 | 743,974 | ||||||||||||||
| Town of Fort Mill, South Carolina, Waterworks and Sewer System, Improvement Revenue Bonds, Series 2015 |
5.000 | % | 12/01/2034 | AA- | 670,000 | 777,113 | ||||||||||||||
| Town of Fort Mill, South Carolina, Waterworks and Sewer System, Improvement Revenue Bonds, Series 2015 |
5.000 | % | 12/01/2035 | AA- | 705,000 | 813,175 | ||||||||||||||
|
|
|
|||||||||||||||||||
| 24,158,514 | ||||||||||||||||||||
|
|
|
|||||||||||||||||||
| Tennessee (2.34%) |
||||||||||||||||||||
| Wilson County, Tennessee, General Obligation Refunding Bonds, Series 2012 |
5.000 | % | 04/01/2023 | AA+ | 2,000,000 | 2,311,880 | ||||||||||||||
| The Hallsdale-Powell Utility District of Knox County, Tennessee, Waterworks and Sewer Revenue Refunding Bonds, Series 2013 |
3.000 | % | 04/01/2025 | AA | 1,260,000 | 1,310,841 | ||||||||||||||
| The Metropolitan Government of Nashville and Davidson County (Tennessee), General Obligation Refunding Bonds, Series 2016 (Prerefunded to 07-01-2022 @ 100) (b) |
4.000 | % | 07/01/2025 | NR | 190,000 | 213,516 | ||||||||||||||
| The Metropolitan Government of Nashville and Davidson County (Tennessee), General Obligation Refunding Bonds, Series 2016 |
4.000 | % | 07/01/2025 | Aa2 | 810,000 | 892,993 | ||||||||||||||
| State of Tennessee, General Obligation Bonds, 2012 Refunding Series A |
4.000 | % | 08/01/2025 | Aaa | 5,000,000 | 5,587,200 | ||||||||||||||
| City of Knoxville, Tennessee, Wastewater System Revenue Bonds, Series 2014A |
4.000 | % | 04/01/2031 | Aa2 | 825,000 | 866,448 | ||||||||||||||
| City of Knoxville, Tennessee, Wastewater System Revenue Bonds, Series 2014A |
4.000 | % | 04/01/2032 | Aa2 | 850,000 | 890,536 | ||||||||||||||
|
|
|
|||||||||||||||||||
| 12,073,414 | ||||||||||||||||||||
|
|
|
|||||||||||||||||||
| Texas (2.57%) |
||||||||||||||||||||
| City of Austin, Texas, (Travis and Williamson Counties), Water and Wastewater System Revenue Refunding Bonds, Series 2009A |
5.000 | % | 11/15/2026 | Aa2 | 2,000,000 | 2,175,680 | ||||||||||||||
| Trinity River Authority of Texas, (Tarrant County Water Project) Improvement Revenue Bonds, Series 2008 (Prerefunded to 02-01-2018 @ 100) (b) |
5.750 | % | 02/01/2027 | Aa3 | 1,500,000 | 1,540,950 | ||||||||||||||
| Carrollton-Farmers Branch Independent School District (Dallas and Denton Counties, Texas), Unlimited Tax School Building and Refunding Bonds, Series 2012 |
4.000 | % | 02/15/2028 | Aa1 | 2,000,000 | 2,165,140 | ||||||||||||||
| Lake Travis Independent School District, Unlimited Tax School Building Bonds, Series 2012 |
5.000 | % | 02/15/2029 | AA+ | 2,365,000 | 2,652,868 | ||||||||||||||
| Carrollton-Farmers Branch Independent School District (Dallas and Denton Counties, Texas), Unlimited Tax School Building Bonds, Series 2013A |
4.000 | % | 02/15/2030 | Aa1 | 1,000,000 | 1,067,750 | ||||||||||||||
| Lake Travis Independent School District, Unlimited Tax School Building Bonds, Series 2012 |
5.000 | % | 02/15/2031 | AA+ | 1,565,000 | 1,751,392 | ||||||||||||||
| City of Fort Worth, Texas, (Tarrant, Denton, Parker, Johnson and Wise Counties, Texas), Water and Sewer System Revenue Refunding and Improvement Bonds, Series 2016 |
5.000 | % | 02/15/2033 | Aa1 | 1,650,000 | 1,919,066 | ||||||||||||||
|
|
|
|||||||||||||||||||
| 13,272,846 | ||||||||||||||||||||
|
|
|
|||||||||||||||||||
| Utah (0.56%) |
||||||||||||||||||||
| Board of Education of Canyons School District, Utah, General Obligation Bonds, (Utah School Bond Guaranty Program), Series 2011 |
4.000 | % | 06/15/2023 | Aaa | 1,000,000 | 1,091,720 | ||||||||||||||
| Jordan Valley Water Conservancy District, Water Revenue and Refunding Bonds, Series 2014A |
5.000 | % | 10/01/2029 | AA+ | 75,000 | 81,130 | ||||||||||||||
| Jordan Valley Water Conservancy District, Water Revenue and Refunding Bonds, Series 2014A (Prerefunded to 10-01-2019 @ 100) (b) |
5.000 | % | 10/01/2029 | NR | 425,000 | 460,619 | ||||||||||||||
| Weber Basin Water Conservancy District, Water Revenue Bonds, Series 2013B |
4.250 | % | 04/01/2033 | AA+ | 1,195,000 | 1,268,600 | ||||||||||||||
|
|
|
|||||||||||||||||||
| 2,902,069 | ||||||||||||||||||||
|
|
|
|||||||||||||||||||
| 94 | See accompanying notes to financial statements. |
STATE FARM MUTUAL FUND TRUST TAX ADVANTAGED BOND FUND
SCHEDULE OF INVESTMENTS (continued)
June 30, 2017
(Unaudited)
| Coupon rate |
Maturity date | Rating (a) | Principal amount |
Value | ||||||||||||||||
| Long-term Municipal Bonds (Cont.) |
||||||||||||||||||||
| Virginia (2.84%) |
||||||||||||||||||||
| Fairfax County Water Authority, Water Refunding Revenue Bonds, Series 1997 |
5.000 | % | 04/01/2021 | Aaa | $ | 735,000 | $ | 793,036 | ||||||||||||
| Virginia Public School Authority, Special Obligation School Financing Bonds, Prince William County Series 2012 (Prerefunded to 07-15-2021 @ 100) (b) |
4.500 | % | 07/15/2024 | Aaa | 3,285,000 | 3,702,819 | ||||||||||||||
| Loudoun County, Virginia, General Obligation Public Improvement Bonds, Series 2011A |
4.000 | % | 12/01/2026 | Aaa | 1,065,000 | 1,140,530 | ||||||||||||||
| Loudoun County, Virginia, General Obligation Public Improvement Bonds, Series 2011A (Prerefunded to 12-01-2020 @ 100) (b) |
4.000 | % | 12/01/2026 | NR | 330,000 | 359,792 | ||||||||||||||
| City of Norfolk, Virginia, Water Revenue Bonds, Series 2013 |
5.000 | % | 11/01/2029 | Aa2 | 1,790,000 | 2,020,266 | ||||||||||||||
| City of Norfolk, Virginia, Water Revenue Bonds, Series 2013 |
5.000 | % | 11/01/2030 | Aa2 | 1,880,000 | 2,118,854 | ||||||||||||||
| City of Norfolk, Virginia, Water Revenue Bonds, Series 2013 |
5.000 | % | 11/01/2031 | Aa2 | 1,975,000 | 2,223,574 | ||||||||||||||
| City of Norfolk, Virginia, Water Revenue Bonds, Series 2013 |
5.000 | % | 11/01/2032 | Aa2 | 2,075,000 | 2,333,690 | ||||||||||||||
|
|
|
|||||||||||||||||||
| 14,692,561 | ||||||||||||||||||||
|
|
|
|||||||||||||||||||
| Washington (5.01%) |
||||||||||||||||||||
| Bellevue School District No. 405, King County, Washington, Unlimited Tax General Obligation Refunding Bonds, 2012B |
3.000 | % | 12/01/2023 | AA+ | 3,600,000 | 3,863,700 | ||||||||||||||
| Lake Washington School District No. 414, King County, Washington, Unlimited Tax General Obligation Bonds, 2008 (Prerefunded to 12-01-2018 @ 100) (b) |
5.000 | % | 12/01/2025 | AA+ | 2,000,000 | 2,111,720 | ||||||||||||||
| Public Utility District No. 1 of Clark County, Washington, Water System Revenue Bonds, Series 2008 (Prerefunded to 07-01-2018 @ 100) (b) |
5.000 | % | 01/01/2028 | AA- | 680,000 | 706,826 | ||||||||||||||
| College Place School District No. 250, Walla Walla County, Washington, Unlimited Tax General Obligation Bonds, Series 2012 |
4.250 | % | 12/01/2028 | A1 | 2,445,000 | 2,710,307 | ||||||||||||||
| Public Utility District No. 1 of Clark County, Washington, Water System Revenue Bonds, Series 2008 (Prerefunded to 07-01-2018 @ 100) (b) |
5.125 | % | 01/01/2029 | AA- | 445,000 | 463,103 | ||||||||||||||
| City of Tacoma, Washington, Solid Waste Revenue Refunding Bonds, 2016B |
5.000 | % | 12/01/2030 | A1 | 1,600,000 | 1,882,528 | ||||||||||||||
| Public Utility District No. 1 of Douglas County, Washington, Electric Distribution System Revenue and Refunding Bonds, Series 2012 |
5.000 | % | 12/01/2030 | Aa3 | 1,325,000 | 1,536,417 | ||||||||||||||
| Public Utility District No. 1 of Cowlitz County, Washington, Production System Revenue Refunding Bonds, 2014 |
5.000 | % | 09/01/2031 | A1 | 2,205,000 | 2,529,223 | ||||||||||||||
| City of Pasco, Washington, Water and Sewer Improvement and Refunding Revenue Bonds, 2015 |
5.000 | % | 12/01/2031 | AA- | 295,000 | 338,055 | ||||||||||||||
| Public Utility District No. 1 of Clark County, Washington, Water System Revenue Bonds, Series 2014 |
5.000 | % | 01/01/2032 | AA- | 1,100,000 | 1,263,713 | ||||||||||||||
| City of Pasco, Washington, Water and Sewer Improvement and Refunding Revenue Bonds, 2015 |
5.000 | % | 12/01/2032 | AA- | 375,000 | 427,939 | ||||||||||||||
| City of Pasco, Washington, Water and Sewer Improvement and Refunding Revenue Bonds, 2015 |
5.000 | % | 12/01/2033 | AA- | 865,000 | 982,995 | ||||||||||||||
| Lake Washington School District No. 414, King County, Washington, Unlimited Tax General Obligation and Refunding Bonds, 2016 |
4.000 | % | 12/01/2033 | AA+ | 4,875,000 | 5,249,351 | ||||||||||||||
| Public Utility District No. 1 of Clark County, Washington, Generating System Revenue and Refunding Bonds, Series 2016 |
5.000 | % | 01/01/2034 | A | 1,585,000 | 1,820,943 | ||||||||||||||
|
|
|
|||||||||||||||||||
| 25,886,820 | ||||||||||||||||||||
|
|
|
|||||||||||||||||||
| West Virginia (3.25%) |
||||||||||||||||||||
| West Virginia University Board of Governors, University Improvement Revenue Bonds, (West Virginia University Projects), 2011 Series B |
5.000 | % | 10/01/2022 | A | 2,200,000 | 2,510,948 | ||||||||||||||
| The Board of Education of the County of Manongalia (West Virginia), Public School Refunding Bonds, Series 2012 |
4.250 | % | 05/01/2027 | AA- | 2,260,000 | 2,471,785 | ||||||||||||||
| West Virginia University Board of Governors, University Improvement Revenue Bonds, (West Virginia University Projects), 2011 Series B |
4.750 | % | 10/01/2027 | A | 2,240,000 | 2,500,534 | ||||||||||||||
| The Board of Education of the County of Manongalia (West Virginia), Public School Refunding Bonds, Series 2012 |
4.375 | % | 05/01/2028 | AA- | 2,350,000 | 2,570,054 | ||||||||||||||
| West Virginia University Board of Governors, University Improvement Revenue Bonds, (West Virginia University Projects), 2011 Series B |
4.750 | % | 10/01/2028 | A | 2,595,000 | 2,890,103 | ||||||||||||||
| The Board of Education of the County of Braxton (West Virginia), Public School Refunding Bonds, Series 2016 |
5.000 | % | 05/01/2029 | AA- | 535,000 | 624,575 | ||||||||||||||
| The Board of Education of the County of Braxton (West Virginia), Public School Refunding Bonds, Series 2016 |
2.500 | % | 05/01/2029 | AA- | 350,000 | 320,884 | ||||||||||||||
| See accompanying notes to financial statements. | 95 |
STATE FARM MUTUAL FUND TRUST TAX ADVANTAGED BOND FUND
SCHEDULE OF INVESTMENTS (continued)
June 30, 2017
(Unaudited)
| Coupon rate |
Maturity date | Rating (a) | Principal amount |
Value | ||||||||||||||||
| Long-term Municipal Bonds (Cont.) |
||||||||||||||||||||
| West Virginia (Cont.) |
||||||||||||||||||||
| The Board of Education of the County of Manongalia (West Virginia), Public School Refunding Bonds, Series 2012 |
5.000 | % | 05/01/2030 | AA- | $ | 2,555,000 | $ | 2,905,418 | ||||||||||||
|
|
|
|||||||||||||||||||
| 16,794,301 | ||||||||||||||||||||
|
|
|
|||||||||||||||||||
| Wisconsin (1.97%) |
||||||||||||||||||||
| Fox Valley Technical College District, Wisconsin, General Obligation School Facilities Bonds, Series 2012C |
3.000 | % | 12/01/2023 | Aaa | 1,925,000 | 2,059,805 | ||||||||||||||
| School District of Elmbrook, Waukesha County, Wisconsin, General Obligation School Building and Improvement Bonds (Prerefunded to 04-01-2018 @ 100) (b) |
5.000 | % | 04/01/2028 | Aaa | 850,000 | 875,560 | ||||||||||||||
| City of Oshkosh, Wisconsin, Storm Water Utility Revenue Bonds, Series 2013A |
4.000 | % | 05/01/2029 | A1 | 2,495,000 | 2,621,796 | ||||||||||||||
| Ellsworth Community School District, Pierce County, Wisconsin, General Obligation Refunding Bonds |
3.500 | % | 04/01/2030 | Aa3 | 795,000 | 827,436 | ||||||||||||||
| Ellsworth Community School District, Pierce County, Wisconsin, General Obligation Refunding Bonds |
4.000 | % | 04/01/2031 | Aa3 | 430,000 | 460,371 | ||||||||||||||
| Ellsworth Community School District, Pierce County, Wisconsin, General Obligation Refunding Bonds |
4.000 | % | 04/01/2032 | Aa3 | 970,000 | 1,034,214 | ||||||||||||||
| Central Brown County Water Authority, Wisconsin, Water System Revenue Refunding Bonds, Series 2014A |
5.000 | % | 11/01/2032 | A+ | 2,000,000 | 2,312,200 | ||||||||||||||
|
|
|
|||||||||||||||||||
| 10,191,382 | ||||||||||||||||||||
|
|
|
|||||||||||||||||||
| Total Long-term Municipal Bonds |
||||||||||||||||||||
| (cost $491,083,198) |
507,544,178 | |||||||||||||||||||
|
|
|
|||||||||||||||||||
| Short-term Municipal Variable Rate Demand Notes (0.38%) |
||||||||||||||||||||
| New York (0.38%) |
||||||||||||||||||||
| New York City Municipal Water Finance Authority, Water and Sewer System Second General Resolution Revenue Bonds, Adjustable Rate, Fiscal 2015 Series BB, Fiscal 2015 Subseries BB-1 (d) |
0.970 | % | 06/15/2049 | AA+ | 1,975,000 | 1,975,000 | ||||||||||||||
|
|
|
|||||||||||||||||||
| Total Short-term Municipal Variable Rate Demand Notes |
||||||||||||||||||||
| (cost $1,975,000) |
1,975,000 | |||||||||||||||||||
|
|
|
|||||||||||||||||||
| Shares | Value | |||||||
| Short-term Investments (0.43%) |
||||||||
| JPMorgan U.S. Government Money Market Fund Capital Shares |
2,212,560 | $ | 2,212,560 | |||||
|
|
|
|||||||
| Total Short-term Investments |
||||||||
| (cost $2,212,560) |
2,212,560 | |||||||
|
|
|
|||||||
| TOTAL INVESTMENTS (99.00%) |
||||||||
| (cost $495,270,758) |
511,731,738 | |||||||
| OTHER ASSETS, NET OF LIABILITIES (1.00%) |
5,143,252 | |||||||
|
|
|
|||||||
| NET ASSETS (100.00%) |
$ | 516,874,990 | ||||||
|
|
|
|||||||
| (a) | Ratings are not audited and represent the lower of Moody’s or S&P issuer specific ratings. |
| (b) | Advanced Refunded Bonds are backed by an escrow or trust containing U.S. Government, U.S. Government Agency or other securities to support the timely payment of principal and interest. |
| (c) | Rate shown is fixed until mandatory tender date of July 1, 2026. |
| (d) | Rate shown is as of June 30, 2017. |
NR - Not Rated
| 96 | See accompanying notes to financial statements. |
STATE FARM MUTUAL FUND TRUST MONEY MARKET FUND
SCHEDULE OF INVESTMENTS
June 30, 2017
(Unaudited)
| See accompanying notes to financial statements. | 97 |
STATE FARM MUTUAL FUND TRUST LIFEPATH RETIREMENT FUND
SCHEDULE OF INVESTMENTS
June 30, 2017
(Unaudited)
| 98 | See accompanying notes to financial statements. |
STATE FARM MUTUAL FUND TRUST LIFEPATH 2020 FUND
SCHEDULE OF INVESTMENTS
June 30, 2017
(Unaudited)
| See accompanying notes to financial statements. | 99 |
STATE FARM MUTUAL FUND TRUST LIFEPATH 2030 FUND
SCHEDULE OF INVESTMENTS
June 30, 2017
(Unaudited)
As of June 30, 2017, investment in an issuer considered to be an affiliate of the LifePath 2030 Fund for purposes of Section 2(a)(3) of the Investment Company Act of 1940, as amended, was as follows:
|
|
||||||||||||||||||||||||||||
| For the six months ended June 30, 2017 |
||||||||||||||||||||||||||||
|
|
|
|||||||||||||||||||||||||||
| Security | Shares Held at December 31, 2016 |
Shares Purchased |
Shares Sold |
Shares Held at June 30, 2017 |
Value at June 30, 2017 |
Income Dividends |
Realized Gain (Loss) on Sales |
|||||||||||||||||||||
|
|
||||||||||||||||||||||||||||
| iShares Cohen & Steers REIT ETF |
1,773,798 | 81,207 | 21,992 | 1,833,013 | $ | 185,354,275 | $ | 2,820,339 | $ | (22,914 | ) | |||||||||||||||||
| 100 | See accompanying notes to financial statements. |
STATE FARM MUTUAL FUND TRUST LIFEPATH 2040 FUND
SCHEDULE OF INVESTMENTS
June 30, 2017
(Unaudited)
As of June 30, 2017, investment in an issuer considered to be an affiliate of the LifePath 2040 Fund for purposes of Section 2(a)(3) of the Investment Company Act of 1940, as amended, was as follows:
|
|
||||||||||||||||||||||||||||
| For the six months ended June 30, 2017 |
||||||||||||||||||||||||||||
|
|
|
|||||||||||||||||||||||||||
| Security | Shares Held at December 31, 2016 |
Shares Purchased |
Shares Sold |
Shares Held at June 30, 2017 |
Value at June 30, 2017 |
Income Dividends |
Realized Gain (Loss) on Sales |
|||||||||||||||||||||
|
|
||||||||||||||||||||||||||||
| iShares Cohen & Steers REIT ETF |
1,980,848 | 139,335 | 30,606 | 2,089,577 | $ | 211,298,026 | $ | 3,200,483 | $ | (162,823 | ) | |||||||||||||||||
| See accompanying notes to financial statements. | 101 |
STATE FARM MUTUAL FUND TRUST LIFEPATH 2050 FUND
SCHEDULE OF INVESTMENTS
June 30, 2017
(Unaudited)
| 102 | See accompanying notes to financial statements. |
(This page intentionally left blank.)
103
STATEMENTS OF ASSETS AND LIABILITIES
June 30, 2017
(Unaudited)
| Equity Fund |
Small/ Mid Cap Equity Fund |
International Equity Fund |
||||||||||
| Assets |
||||||||||||
| Investments in affiliated securities at identified cost |
$ | — | — | — | ||||||||
| Investments in unaffiliated securities at identified cost |
482,206,517 | 272,548,074 | 117,781,049 | |||||||||
| Foreign currencies at cost |
— | — | 31,173 | |||||||||
|
|
|
|
|
|
|
|||||||
| Investments in affiliated securities at market value |
$ | — | — | — | ||||||||
| Investments in unaffiliated securities at market value |
598,078,512 | 291,245,989 | 148,491,283 | |||||||||
| Cash |
— | — | 19,802 | |||||||||
| Cash pledged as collateral for open futures contracts |
— | — | — | |||||||||
| Foreign currencies at value |
— | — | 31,108 | |||||||||
| Foreign currencies pledged for open futures contracts at value |
— | — | — | |||||||||
| Receivable for: |
||||||||||||
| Dividends and interest |
282,672 | 134,893 | 285,261 | |||||||||
| Shares of the Fund sold |
99,926 | 51,215 | 69,639 | |||||||||
| Securities sold |
6,133,906 | 1,698,942 | 2,275,180 | |||||||||
| SFIMC |
— | 63 | — | |||||||||
| Variation margin on futures contracts |
— | — | — | |||||||||
| Prepaid expenses |
29,299 | 32,894 | 28,529 | |||||||||
|
|
|
|
|
|
|
|||||||
| Total assets |
604,624,315 | 293,163,996 | 151,200,802 | |||||||||
|
|
|
|
|
|
|
|||||||
| Liabilities and Net Assets |
||||||||||||
| Distributions to shareholders |
— | — | — | |||||||||
| Payable for: |
||||||||||||
| Shares of the Fund redeemed |
71,879 | 27,021 | 40,985 | |||||||||
| Securities Purchased |
7,879,614 | 312,356 | 1,517,695 | |||||||||
| Trustees’ fees and expenses |
3,436 | 2,074 | 407 | |||||||||
| Variation margin on futures contracts |
— | — | — | |||||||||
| Due to bank |
— | 43,830 | — | |||||||||
| Due to affiliates |
415,558 | 179,534 | 137,949 | |||||||||
| Accrued liabilities |
60,771 | 61,465 | 67,812 | |||||||||
|
|
|
|
|
|
|
|||||||
| Total liabilities |
8,431,258 | 626,280 | 1,764,848 | |||||||||
|
|
|
|
|
|
|
|||||||
| Net assets applicable to shares outstanding of common stock |
$ | 596,193,057 | 292,537,716 | 149,435,954 | ||||||||
|
|
|
|
|
|
|
|||||||
| Analysis of Net Assets |
||||||||||||
| Paid-in-capital |
$ | 443,749,834 | 240,756,782 | 120,672,162 | ||||||||
| Accumulated net realized gain (loss) |
34,156,290 | 32,584,811 | (1,599,404 | ) | ||||||||
| Net unrealized appreciation (depreciation) |
115,871,995 | 18,697,915 | 30,713,267 | |||||||||
| Accumulated undistributed net investment income (loss) |
2,414,938 | 498,208 | (350,071 | ) | ||||||||
|
|
|
|
|
|
|
|||||||
| Net assets applicable to shares outstanding |
$ | 596,193,057 | 292,537,716 | 149,435,954 | ||||||||
|
|
|
|
|
|
|
|||||||
| Fund shares outstanding: |
||||||||||||
| Class A Shares |
13,189,105 | 7,589,821 | 3,226,269 | |||||||||
| Class B Shares |
235,322 | 1,039,504 | 896,603 | |||||||||
| Premier Shares |
13,349,580 | 9,118,334 | 4,754,140 | |||||||||
| Legacy Class B Shares |
402,204 | 854,549 | 882,526 | |||||||||
| Institutional Shares |
29,008,517 | 3,860,916 | 1,785,173 | |||||||||
| Class R-1 Shares |
258,098 | 313,215 | 204,371 | |||||||||
| Class R-2 Shares |
1,410,450 | 973,023 | 478,738 | |||||||||
| Class R-3 Shares |
144,760 | 249,093 | 177,451 | |||||||||
| Net assets applicable to shares outstanding: |
||||||||||||
| Class A Shares |
$ | 133,674,172 | 93,682,878 | 38,742,324 | ||||||||
| Class B Shares |
2,358,664 | 11,779,217 | 10,478,506 | |||||||||
| Premier Shares |
141,719,670 | 110,113,873 | 57,719,066 | |||||||||
| Legacy Class B Shares |
4,256,984 | 9,437,654 | 10,491,883 | |||||||||
| Institutional Shares |
295,832,907 | 49,089,415 | 21,685,692 | |||||||||
| Class R-1 Shares |
2,614,042 | 3,641,451 | 2,429,727 | |||||||||
| Class R-2 Shares |
14,259,125 | 11,666,296 | 5,735,350 | |||||||||
| Class R-3 Shares |
1,477,493 | 3,126,932 | 2,153,406 | |||||||||
| Net asset value: |
||||||||||||
| Class A Shares |
$ | 10.14 | 12.34 | 12.01 | ||||||||
| Class B Shares |
10.02 | 11.33 | 11.69 | |||||||||
| Premier Shares |
10.62 | 12.08 | 12.14 | |||||||||
| Legacy Class B Shares |
10.58 | 11.04 | 11.89 | |||||||||
| Institutional Shares |
10.20 | 12.71 | 12.15 | |||||||||
| Class R-1 Shares |
10.13 | 11.63 | 11.89 | |||||||||
| Class R-2 Shares |
10.11 | 11.99 | 11.98 | |||||||||
| Class R-3 Shares |
10.21 | 12.55 | 12.14 | |||||||||
| Maximum offering price: |
||||||||||||
| Class A Shares |
$ | 10.67 | 12.99 | 12.64 | ||||||||
| Premier Shares |
11.18 | 12.72 | 12.78 | |||||||||
| 104 | See accompanying notes to financial statements. |
| S&P 500 Index Fund |
Small Cap Index Fund |
International Index Fund |
Equity and Bond Fund |
Bond Fund |
Tax Advantaged Bond Fund |
Money Market Fund |
||||||||||||||||||||
| — | — | — | 317,987,615 | — | — | — | ||||||||||||||||||||
| 792,773,817 | 371,298,447 | 212,523,162 | — | 819,913,659 | 495,270,758 | 339,827,709 | ||||||||||||||||||||
| — | — | 3,830,630 | — | — | — | — | ||||||||||||||||||||
|
|
|
|
|
|
|
|
|
|
|
|
|
|
|
|||||||||||||
| — | — | — | 380,646,064 | — | — | — | ||||||||||||||||||||
| 1,435,002,101 | 512,486,380 | 276,146,110 | — | 830,728,872 | 511,731,738 | 339,827,709 | ||||||||||||||||||||
| — | — | — | 611,826 | — | — | — | ||||||||||||||||||||
| 1,978,000 | 399,000 | — | — | — | — | — | ||||||||||||||||||||
| — | — | 3,618,662 | — | — | — | — | ||||||||||||||||||||
| — | — | 241,617 | — | — | — | — | ||||||||||||||||||||
| 1,415,249 | 559,458 | 1,090,680 | 324,561 | 5,650,441 | 5,836,150 | 649 | ||||||||||||||||||||
| 352,775 | 121,569 | 56,872 | 39,934 | 118,335 | 42,232 | 226,943 | ||||||||||||||||||||
| — | 42,021 | 3,326 | — | — | — | — | ||||||||||||||||||||
| — | — | — | 224,061 | — | — | — | ||||||||||||||||||||
| 21,966 | — | — | — | — | — | — | ||||||||||||||||||||
| 47,470 | 46,651 | 27,349 | 2,794 | 31,295 | 33,092 | 31,661 | ||||||||||||||||||||
|
|
|
|
|
|
|
|
|
|
|
|
|
|
|
|||||||||||||
| 1,438,817,561 | 513,655,079 | 281,184,616 | 381,849,240 | 836,528,943 | 517,643,212 | 340,086,962 | ||||||||||||||||||||
|
|
|
|
|
|
|
|
|
|
|
|
|
|
|
|||||||||||||
| — | — | — | — | 384,851 | 203,852 | 854 | ||||||||||||||||||||
| 344,513 | 66,507 | 62,612 | 82,699 | 1,001,222 | 378,547 | 229,738 | ||||||||||||||||||||
| 578,538 | 469,225 | — | — | — | — | — | ||||||||||||||||||||
| 4,649 | 1,997 | 2,800 | 2,571 | 5,246 | 4,099 | 2,903 | ||||||||||||||||||||
| — | 20,471 | 91,546 | — | — | — | — | ||||||||||||||||||||
| 421,186 | 7,865 | — | — | — | — | — | ||||||||||||||||||||
| 416,106 | 166,719 | 102,366 | 4,082 | 231,457 | 128,686 | 120,457 | ||||||||||||||||||||
| 155,922 | 152,411 | 202,689 | 50,396 | 81,784 | 53,038 | 51,453 | ||||||||||||||||||||
|
|
|
|
|
|
|
|
|
|
|
|
|
|
|
|||||||||||||
| 1,920,914 | 885,195 | 462,013 | 139,748 | 1,704,560 | 768,222 | 405,405 | ||||||||||||||||||||
|
|
|
|
|
|
|
|
|
|
|
|
|
|
|
|||||||||||||
| 1,436,896,647 | 512,769,884 | 280,722,603 | 381,709,492 | 834,824,383 | 516,874,990 | 339,681,557 | ||||||||||||||||||||
|
|
|
|
|
|
|
|
|
|
|
|
|
|
|
|||||||||||||
| 772,870,496 | 345,291,563 | 241,306,153 | 305,524,451 | 822,763,725 | 500,833,377 | 339,681,557 | ||||||||||||||||||||
| 11,090,672 | 24,151,838 | (26,890,681) | 13,310,246 | 1,245,445 | (419,367) | — | ||||||||||||||||||||
| 642,042,468 | 141,266,423 | 63,582,275 | 62,658,449 | 10,815,213 | 16,460,980 | — | ||||||||||||||||||||
| 10,893,011 | 2,060,060 | 2,724,856 | 216,346 | — | — | — | ||||||||||||||||||||
|
|
|
|
|
|
|
|
|
|
|
|
|
|
|
|||||||||||||
| 1,436,896,647 | 512,769,884 | 280,722,603 | 381,709,492 | 834,824,383 | 516,874,990 | 339,681,557 | ||||||||||||||||||||
|
|
|
|
|
|
|
|
|
|
|
|
|
|
|
|||||||||||||
| 29,122,201 | 9,728,152 | 6,510,295 | 11,402,336 | 17,265,507 | 8,217,586 | 108,529,885 | ||||||||||||||||||||
| 477,619 | 790,566 | 867,653 | 1,226,117 | 859,626 | 188,887 | 287,361 | ||||||||||||||||||||
| 33,996,818 | 10,858,321 | 9,237,696 | 13,686,016 | 30,915,697 | 35,198,890 | 128,876,436 | ||||||||||||||||||||
| 790,112 | 1,449,961 | 1,089,149 | 1,854,079 | 167,765 | 9,812 | 310,000 | ||||||||||||||||||||
| 11,963,953 | 5,452,439 | 3,939,113 | 3,087,241 | 23,540,255 | 80,614,419 | |||||||||||||||||||||
| 517,077 | 228,127 | 262,317 | 323,226 | 357,817 | 4,598,182 | |||||||||||||||||||||
| 1,432,300 | 549,681 | 683,409 | 652,726 | 854,210 | 14,725,709 | |||||||||||||||||||||
| 227,774 | 173,016 | 180,724 | 158,646 | 155,696 | 1,739,574 | |||||||||||||||||||||
| 530,499,309 | 171,349,712 | 80,259,442 | 133,651,515 | 194,456,155 | 97,462,991 | 108,529,887 | ||||||||||||||||||||
| 8,753,491 | 13,538,812 | 10,700,604 | 14,386,598 | 9,673,660 | 2,239,850 | 287,361 | ||||||||||||||||||||
| 623,256,124 | 189,576,474 | 113,734,430 | 162,265,143 | 348,435,187 | 417,055,797 | 128,876,435 | ||||||||||||||||||||
| 14,625,684 | 24,657,120 | 13,480,926 | 22,017,256 | 1,891,698 | 116,352 | 309,992 | ||||||||||||||||||||
| 220,082,428 | 96,889,617 | 48,670,599 | 36,248,899 | 264,973,525 | 80,614,417 | |||||||||||||||||||||
| 9,448,130 | 4,003,675 | 3,237,081 | 3,737,182 | 4,029,825 | 4,598,181 | |||||||||||||||||||||
| 26,051,464 | 9,679,689 | 8,404,673 | 7,561,665 | 9,610,363 | 14,725,710 | |||||||||||||||||||||
| 4,180,017 | 3,074,785 | 2,234,848 | 1,841,234 | 1,753,970 | 1,739,574 | |||||||||||||||||||||
| 18.22 | 17.61 | 12.33 | 11.72 | 11.26 | 11.86 | 1.00 | ||||||||||||||||||||
| 18.33 | 17.13 | 12.33 | 11.73 | 11.25 | 11.86 | 1.00 | ||||||||||||||||||||
| 18.33 | 17.46 | 12.31 | 11.86 | 11.27 | 11.85 | 1.00 | ||||||||||||||||||||
| 18.51 | 17.01 | 12.38 | 11.88 | 11.28 | 11.86 | 1.00 | ||||||||||||||||||||
| 18.40 | 17.77 | 12.36 | 11.74 | 11.26 | 1.00 | |||||||||||||||||||||
| 18.27 | 17.55 | 12.34 | 11.56 | 11.26 | 1.00 | |||||||||||||||||||||
| 18.19 | 17.61 | 12.30 | 11.58 | 11.25 | 1.00 | |||||||||||||||||||||
| 18.35 | 17.77 | 12.37 | 11.61 | 11.27 | 1.00 | |||||||||||||||||||||
| 19.18 | 18.54 | 12.98 | 12.34 | 11.61 | 12.23 | 1.00 | ||||||||||||||||||||
| 19.29 | 18.38 | 12.96 | 12.48 | 11.62 | 12.22 | 1.00 | ||||||||||||||||||||
| See accompanying notes to financial statements. | 105 |
STATE FARM MUTUAL FUND TRUST
STATEMENTS OF ASSETS AND LIABILITIES
June 30, 2017
(Unaudited)
| LifePath Retirement Fund |
LifePath 2020 Fund |
LifePath 2030 Fund |
LifePath 2040 Fund |
LifePath 2050 Fund |
||||||||||||||||
| Assets |
||||||||||||||||||||
| Investments in affiliated securities at identified cost |
$ | — | — | 154,571,692 | 181,676,103 | — | ||||||||||||||
| Investments in unaffiliated securities at identified cost |
1,168,642,438 | 1,985,750,223 | 1,975,417,916 | 1,402,214,139 | 383,169,429 | |||||||||||||||
| Foreign currencies at cost |
620 | 1,407 | 1,964 | 1,783 | 388 | |||||||||||||||
|
|
|
|
|
|
|
|
|
|
|
|||||||||||
| Investments in affiliated securities at market value |
$ | — | — | 185,354,275 | 211,298,026 | — | ||||||||||||||
| Investments in unaffiliated securities at market value |
1,244,196,312 | 2,147,924,455 | 2,180,451,591 | 1,585,448,015 | 435,083,432 | |||||||||||||||
| Foreign currencies at value |
789 | 1,791 | 2,501 | 2,271 | 494 | |||||||||||||||
| Receivable for: |
||||||||||||||||||||
| Dividends and interest |
187 | 468 | 725 | 1,448 | 400 | |||||||||||||||
| Shares of the Fund sold |
271,545 | 280,104 | 630,147 | 593,216 | 194,787 | |||||||||||||||
| Securities sold |
583,971 | 22,032,984 | 10,972,737 | 7,121,587 | — | |||||||||||||||
| Prepaid expenses |
39,783 | 45,147 | 63,532 | 49,486 | 34,199 | |||||||||||||||
|
|
|
|
|
|
|
|
|
|
|
|||||||||||
| Total assets |
1,245,092,587 | 2,170,284,949 | 2,377,475,508 | 1,804,514,049 | 435,313,312 | |||||||||||||||
|
|
|
|
|
|
|
|
|
|
|
|||||||||||
| Liabilities and Net Assets |
||||||||||||||||||||
| Distributions to shareholders |
49,949 | — | — | — | — | |||||||||||||||
| Payable for: |
||||||||||||||||||||
| Shares of the Fund redeemed |
403,041 | 988,913 | 866,543 | 526,884 | 276,063 | |||||||||||||||
| Securities purchased |
— | 21,281,670 | 11,017,517 | 7,395,579 | 340,109 | |||||||||||||||
| Trustees’ fees and expenses |
5,142 | 4,084 | — | — | 2,480 | |||||||||||||||
| Due to affiliates |
480,573 | 847,773 | 949,013 | 741,118 | 182,697 | |||||||||||||||
| Accrued liabilities |
86,961 | 143,049 | 111,209 | 140,895 | 57,342 | |||||||||||||||
|
|
|
|
|
|
|
|
|
|
|
|||||||||||
| Total liabilities |
1,025,666 | 23,265,489 | 12,944,282 | 8,804,476 | 858,691 | |||||||||||||||
|
|
|
|
|
|
|
|
|
|
|
|||||||||||
| Net assets applicable to shares outstanding of common stock |
$ | 1,244,066,921 | 2,147,019,460 | 2,364,531,226 | 1,795,709,573 | 434,454,621 | ||||||||||||||
|
|
|
|
|
|
|
|
|
|
|
|||||||||||
| Analysis of Net Assets |
||||||||||||||||||||
| Paid-in-capital |
1,170,956,427 | 1,961,722,662 | 2,106,238,193 | 1,568,134,717 | 379,723,865 | |||||||||||||||
| Accumulated net realized gain (loss) |
(8,344,654 | ) | 10,029,352 | 7,747,678 | 3,701,074 | 271,858 | ||||||||||||||
| Net unrealized appreciation (depreciation) |
75,554,043 | 162,174,617 | 235,816,795 | 212,856,286 | 51,914,109 | |||||||||||||||
| Accumulated undistributed net investment income (loss) |
5,901,105 | 13,092,829 | 14,728,560 | 11,017,496 | 2,544,789 | |||||||||||||||
|
|
|
|
|
|
|
|
|
|
|
|||||||||||
| Net assets applicable to shares outstanding |
$ | 1,244,066,921 | 2,147,019,460 | 2,364,531,226 | 1,795,709,573 | 434,454,621 | ||||||||||||||
|
|
|
|
|
|
|
|
|
|
|
|||||||||||
| Fund shares outstanding: |
||||||||||||||||||||
| Class A Shares |
29,404,388 | 56,836,867 | 66,173,666 | 52,749,847 | 25,896,277 | |||||||||||||||
| Class B Shares |
519,281 | 1,394,040 | 1,806,313 | 1,718,402 | ||||||||||||||||
| Premier Shares |
55,291,922 | 68,475,207 | 57,273,700 | 25,867,767 | 9,194,814 | |||||||||||||||
| Legacy Class B Shares |
247,020 | 655,579 | 632,638 | 586,034 | ||||||||||||||||
| Institutional Shares |
8,165,674 | 14,446,851 | 17,398,438 | 21,142,525 | ||||||||||||||||
| Class R-1 Shares |
543,687 | 1,281,582 | 2,076,905 | 1,527,864 | 931,839 | |||||||||||||||
| Class R-2 Shares |
1,949,299 | 4,275,382 | 4,947,977 | 3,740,554 | 1,686,873 | |||||||||||||||
| Class R-3 Shares |
132,904 | 204,199 | 295,512 | 421,339 | ||||||||||||||||
| Net assets applicable to shares outstanding: |
||||||||||||||||||||
| Class A Shares |
$ | 374,155,789 | 828,778,324 | 1,037,909,259 | 876,382,100 | 298,449,481 | ||||||||||||||
| Class B Shares |
6,649,074 | 20,188,391 | 28,220,353 | 28,444,084 | ||||||||||||||||
| Premier Shares |
719,614,255 | 993,670,411 | 899,213,206 | 431,838,117 | 105,766,349 | |||||||||||||||
| Legacy Class B Shares |
3,236,398 | 9,595,641 | 9,977,704 | 9,827,743 | ||||||||||||||||
| Institutional Shares |
106,288,708 | 211,258,911 | 274,832,762 | 354,754,244 | ||||||||||||||||
| Class R-1 Shares |
6,942,199 | 18,567,643 | 32,341,737 | 25,252,287 | 10,750,070 | |||||||||||||||
| Class R-2 Shares |
25,452,771 | 61,981,413 | 77,366,321 | 62,066,151 | 19,488,721 | |||||||||||||||
| Class R-3 Shares |
1,727,727 | 2,978,726 | 4,669,884 | 7,144,847 | ||||||||||||||||
| Net asset value: |
||||||||||||||||||||
| Class A Shares |
$ | 12.72 | 14.58 | 15.68 | 16.61 | 11.52 | ||||||||||||||
| Class B Shares |
12.80 | 14.48 | 15.62 | 16.55 | ||||||||||||||||
| Premier Shares |
13.01 | 14.51 | 15.70 | 16.69 | 11.50 | |||||||||||||||
| Legacy Class B Shares |
13.10 | 14.64 | 15.77 | 16.77 | ||||||||||||||||
| Institutional Shares |
13.02 | 14.62 | 15.80 | 16.78 | ||||||||||||||||
| Class R-1 Shares |
12.77 | 14.49 | 15.57 | 16.53 | 11.54 | |||||||||||||||
| Class R-2 Shares |
13.06 | 14.50 | 15.64 | 16.59 | 11.55 | |||||||||||||||
| Class R-3 Shares |
13.00 | 14.59 | 15.80 | 16.96 | ||||||||||||||||
| Maximum offering price: |
||||||||||||||||||||
| Class A Shares |
$ | 13.39 | 15.35 | 16.51 | 17.48 | 12.13 | ||||||||||||||
| Premier Shares |
13.69 | 15.27 | 16.53 | 17.57 | 12.11 | |||||||||||||||
| 106 | See accompanying notes to financial statements. |
(This page intentionally left blank.)
107
STATEMENTS OF OPERATIONS
Six months ended June 30, 2017
(Unaudited)
| Equity Fund |
Small/ Mid Cap Equity Fund |
International Equity Fund |
S&P 500 Index Fund |
Small Cap Index Fund |
||||||||||||||||
| Investment Income: |
||||||||||||||||||||
| Dividends from affiliated investments |
$ | — | — | — | — | — | ||||||||||||||
| Dividends from unaffiliated investments |
4,876,655 | 2,134,989 | 1,662,631 | 13,755,305 | 3,538,702 | |||||||||||||||
| Interest |
24,200 | 19,979 | 8,944 | 164,789 | 28,497 | |||||||||||||||
| Tax-exempt interest |
— | — | — | — | — | |||||||||||||||
|
|
|
|
|
|
|
|
|
|
|
|||||||||||
| 4,900,855 | 2,154,968 | 1,671,575 | 13,920,094 | 3,567,199 | ||||||||||||||||
| Less: foreign withholding taxes |
— | (640 | ) | (145,816 | ) | — | (431 | ) | ||||||||||||
|
|
|
|
|
|
|
|
|
|
|
|||||||||||
| Total investment income |
4,900,855 | 2,154,328 | 1,525,759 | 13,920,094 | 3,566,768 | |||||||||||||||
| Expenses: |
||||||||||||||||||||
| Investment advisory and management fees |
1,752,563 | 1,166,730 | 551,029 | 720,112 | 334,323 | |||||||||||||||
| Shareholder services fees |
668,179 | 316,439 | 149,284 | 1,458,490 | 539,855 | |||||||||||||||
| Distribution fees Class A |
164,392 | 116,650 | 45,594 | 651,499 | 212,098 | |||||||||||||||
| Distribution fees Class B |
11,554 | 55,601 | 45,913 | 43,148 | 52,942 | |||||||||||||||
| Distribution fees Premier |
171,100 | 136,648 | 65,643 | 749,161 | 228,447 | |||||||||||||||
| Distribution fees Legacy Class B |
15,468 | 31,318 | 31,601 | 52,356 | 79,384 | |||||||||||||||
| Distribution fees Class R-1 |
7,189 | 9,213 | 6,051 | 24,297 | 10,193 | |||||||||||||||
| Distribution fees Class R-2 |
20,818 | 17,728 | 7,775 | 38,462 | 14,722 | |||||||||||||||
| Regulatory fees |
50,587 | 47,856 | 46,060 | 58,175 | 48,996 | |||||||||||||||
| Reports to shareholders |
35,134 | 35,903 | 20,192 | 91,912 | 68,607 | |||||||||||||||
| Audit fees |
18,348 | 12,848 | 15,922 | 14,950 | 18,348 | |||||||||||||||
| Trustees’ fees and expenses |
13,191 | 7,091 | 2,836 | 27,869 | 10,711 | |||||||||||||||
| Professional fees |
6,786 | 4,482 | 6,043 | 12,612 | 7,192 | |||||||||||||||
| Custodian fees |
5,507 | 10,915 | 30,296 | 9,050 | 33,249 | |||||||||||||||
| Errors and omissions insurance |
2,003 | 952 | 443 | 4,398 | 2,552 | |||||||||||||||
| ICI dues |
2,590 | 1,194 | 624 | 5,740 | 1,913 | |||||||||||||||
| Securities valuation fees |
1,091 | 1,562 | 5,692 | 4,116 | 16,860 | |||||||||||||||
| Fidelity bond expense |
293 | 145 | 29 | 617 | 215 | |||||||||||||||
| Excise tax |
— | 5,500 | — | — | — | |||||||||||||||
| License index fees |
— | — | — | 59,507 | 32,779 | |||||||||||||||
|
|
|
|
|
|
|
|
|
|
|
|||||||||||
| Total expenses |
2,946,793 | 1,978,775 | 1,031,027 | 4,026,471 | 1,713,386 | |||||||||||||||
| Less: expense reimbursement for distribution fees (a)(b) |
(197,788 | ) | (183,082 | ) | (106,375 | ) | (791,832 | ) | (300,929 | ) | ||||||||||
| Less: additional expense reimbursements from affiliates |
(424 | ) | (141,178 | ) | — | — | — | |||||||||||||
|
|
|
|
|
|
|
|
|
|
|
|||||||||||
| Net expenses |
2,748,581 | 1,654,515 | 924,652 | 3,234,639 | 1,412,457 | |||||||||||||||
|
|
|
|
|
|
|
|
|
|
|
|||||||||||
| Net investment income (loss) |
2,152,274 | 499,813 | 601,107 | 10,685,455 | 2,154,311 | |||||||||||||||
| Realized and unrealized gain (loss): |
||||||||||||||||||||
| Net realized gain (loss) on sales of affiliated investments |
— | — | — | — | — | |||||||||||||||
| Net realized gain (loss) on sales of unaffiliated investments |
30,123,758 | 31,724,538 | 7,918,824 | 2,346,361 | 21,385,198 | |||||||||||||||
| Net realized gain (loss) on foreign currency transactions |
— | — | (3,246 | ) | — | — | ||||||||||||||
| Net realized gain (loss) on futures contracts |
— | — | — | 5,738,378 | 253,958 | |||||||||||||||
| Change in net unrealized gain (loss) on open futures contracts |
— | — | — | (849,339 | ) | 114,400 | ||||||||||||||
| Change in net unrealized appreciation (depreciation) on affiliated investments |
|
— |
— | — | — | — | ||||||||||||||
| Change in net unrealized appreciation (depreciation) on unaffiliated investments and foreign currency transactions |
19,502,607 | (24,710,363 | ) | 16,956,811 | 102,980,768 | (395,557 | ) | |||||||||||||
|
|
|
|
|
|
|
|
|
|
|
|||||||||||
| Net realized and unrealized gain (loss) on investments |
49,626,365 | 7,014,175 | 24,872,389 | 110,216,168 | 21,357,999 | |||||||||||||||
|
|
|
|
|
|
|
|
|
|
|
|||||||||||
| Net change in net assets resulting from operations |
$ | 51,778,639 | 7,513,988 | 25,473,496 | 120,901,623 | 23,512,310 | ||||||||||||||
|
|
|
|
|
|
|
|
|
|
|
|||||||||||
| (a) | For the Money Market Fund, this amount includes $7,297 of additional voluntary fee waivers from VP Management Corp. See Note 6 under Expense Reduction Agreements. |
| (b) | Effective April 1, 2017, for each Fund, VP Management Corp. agreed to waive all distribution and service (12b-1) fees for Class A, Class B, Premier, Legacy Class B, Class R-1 and Class R-2 shares. |
| 108 | See accompanying notes to financial statements. |
| International Index Fund |
Equity and Bond Fund |
Bond Fund |
Tax Advantaged Bond Fund |
Money Market Fund |
LifePath Retirement Fund |
LifePath 2020 Fund |
LifePath 2030 Fund |
LifePath 2040 Fund |
LifePath 2050 Fund |
|||||||||||||||||||||||||||||
| — | 1,904,664 | — | — | — | — | — | 2,820,339 | 3,200,483 | — | |||||||||||||||||||||||||||||
| 5,908,796 | — | — | — | — | 10,900,355 | 18,723,861 | 17,716,842 | 12,426,138 | 3,830,374 | |||||||||||||||||||||||||||||
| — | — | 12,594,235 | 13,324 | 1,103,840 | 1,377 | 2,603 | 5,419 | 6,282 | 2,318 | |||||||||||||||||||||||||||||
| — | — | — | 7,955,429 | — | — | — | — | — | — | |||||||||||||||||||||||||||||
|
|
|
|
|
|
|
|
|
|
|
|
|
|
|
|
|
|
|
|
|
|||||||||||||||||||
| 5,908,796 | 1,904,664 | 12,594,235 | 7,968,753 | 1,103,840 | 10,901,732 | 18,726,464 | 20,542,600 | 15,632,903 | 3,832,692 | |||||||||||||||||||||||||||||
| (510,813) | — | — | — | — | 47,217 | 111,628 | 147,223 | 131,290 | 25,074 | |||||||||||||||||||||||||||||
|
|
|
|
|
|
|
|
|
|
|
|
|
|
|
|
|
|
|
|
|
|||||||||||||||||||
| 5,397,983 | 1,904,664 | 12,594,235 | 7,968,753 | 1,103,840 | 10,948,949 | 18,838,092 | 20,689,823 | 15,764,193 | 3,857,766 | |||||||||||||||||||||||||||||
| 193,387 | — | 420,984 | 262,202 | 177,282 | 1,653,183 | 2,821,870 | 3,053,455 | 2,292,451 | 550,081 | |||||||||||||||||||||||||||||
| 283,955 | 4,586 | 880,876 | 444,548 | 381,599 | 1,211,669 | 2,202,208 | 2,484,980 | 1,989,683 | 479,532 | |||||||||||||||||||||||||||||
| 97,419 | 165,873 | 248,141 | 124,994 | 85,048 | 474,029 | 1,038,621 | 1,279,283 | 1,067,553 | 358,803 | |||||||||||||||||||||||||||||
| 48,196 | 66,874 | 31,854 | 7,706 | 796 | 33,850 | 99,808 | 65,183 | 66,249 | — | |||||||||||||||||||||||||||||
| 133,378 | 197,380 | 442,109 | 527,392 | 103,776 | 895,197 | 1,214,579 | 1,077,372 | 505,037 | 122,507 | |||||||||||||||||||||||||||||
| 41,736 | 70,735 | 6,943 | 404 | 967 | 11,430 | 34,251 | 35,219 | 34,774 | — | |||||||||||||||||||||||||||||
| 7,557 | 9,229 | 9,770 | — | 9,256 | 17,532 | 49,131 | 87,160 | 65,107 | 25,846 | |||||||||||||||||||||||||||||
| 12,025 | 11,411 | 14,088 | — | 15,318 | 39,600 | 93,051 | 109,840 | 88,095 | 28,767 | |||||||||||||||||||||||||||||
| 50,215 | 73,030 | 54,606 | 38,389 | 57,725 | 51,312 | 61,271 | 58,836 | 59,786 | 19,112 | |||||||||||||||||||||||||||||
| 40,705 | 29,829 | 49,961 | 13,984 | 30,177 | 58,405 | 96,745 | 118,899 | 99,169 | 54,047 | |||||||||||||||||||||||||||||
| 18,329 | 17,852 | 24,795 | 24,795 | 20,332 | 15,925 | 17,133 | 16,579 | 16,793 | 16,577 | |||||||||||||||||||||||||||||
| 5,457 | 8,976 | 19,935 | 13,414 | 9,224 | 25,776 | 42,535 | 34,909 | 27,150 | 5,298 | |||||||||||||||||||||||||||||
| 20,579 | 5,356 | 9,249 | 6,100 | 5,455 | 10,380 | 20,144 | 20,889 | 16,423 | 5,818 | |||||||||||||||||||||||||||||
| 64,190 | — | 7,587 | 3,095 | 1,578 | 3,554 | 2,353 | 3,603 | 2,205 | 2,592 | |||||||||||||||||||||||||||||
| 838 | 1,287 | 3,028 | 1,917 | 1,315 | 4,518 | 3,996 | 8,681 | 5,305 | 1,671 | |||||||||||||||||||||||||||||
| 1,171 | — | 4,033 | 2,631 | 1,673 | 5,940 | 9,783 | 9,893 | 7,178 | 1,461 | |||||||||||||||||||||||||||||
| 17,557 | — | 45,127 | 48,597 | 2,976 | 181 | 96 | 83 | 139 | 83 | |||||||||||||||||||||||||||||
| 114 | 182 | 420 | 265 | 178 | 244 | 1,462 | 992 | 727 | 210 | |||||||||||||||||||||||||||||
| — | — | — | — | — | — | — | — | — | — | |||||||||||||||||||||||||||||
| 52,490 | — | — | — | — | — | — | — | — | — | |||||||||||||||||||||||||||||
|
|
|
|
|
|
|
|
|
|
|
|
|
|
|
|
|
|
|
|
|
|||||||||||||||||||
| 1,089,298 | 662,600 | 2,273,506 | 1,520,433 | 904,675 | 4,512,725 | 7,809,037 | 8,465,856 | 6,343,824 | 1,672,405 | |||||||||||||||||||||||||||||
| (175,801) | (264,379) | (374,871) | (328,410) | (111,815) | (736,549) | (1,274,651) | (1,350,409) | (933,528) | (276,234) | |||||||||||||||||||||||||||||
| (5,478) | (215,463) | — | — | (140) | — | — | — | — | — | |||||||||||||||||||||||||||||
|
|
|
|
|
|
|
|
|
|
|
|
|
|
|
|
|
|
|
|
|
|||||||||||||||||||
| 908,019 | 182,758 | 1,898,635 | 1,192,023 | 792,720 | 3,776,176 | 6,534,386 | 7,115,447 | 5,410,296 | 1,396,171 | |||||||||||||||||||||||||||||
|
|
|
|
|
|
|
|
|
|
|
|
|
|
|
|
|
|
|
|
|
|||||||||||||||||||
| 4,489,964 | 1,721,906 | 10,695,600 | 6,776,730 | 311,120 | 7,172,773 | 12,303,706 | 13,574,376 | 10,353,897 | 2,461,595 | |||||||||||||||||||||||||||||
| — | 56,482 | — | — | — | — | — | (22,914) | (162,823) | — | |||||||||||||||||||||||||||||
| 4,368,014 | — | 995,578 | 616,057 | — | 6,702,738 | 8,395,565 | 6,882,873 | 2,909,929 | 291,325 | |||||||||||||||||||||||||||||
| 31,634 | — | — | — | — | 580 | 1,339 | 1,821 | 1,650 | 106 | |||||||||||||||||||||||||||||
| 184,064 | — | — | — | — | — | — | — | — | — | |||||||||||||||||||||||||||||
| (97,672) | — | — | — | — | — | — | — | — | — | |||||||||||||||||||||||||||||
| |
— |
21,539,786 | — | — | — | — | — | 2,739,902 | 3,254,366 | — | ||||||||||||||||||||||||||||
| 26,509,547 | |
— |
5,473,530 | 6,974,372 | — | 47,730,337 | 99,635,219 | 147,042,183 | 136,892,124 | 36,296,383 | ||||||||||||||||||||||||||||
|
|
|
|
|
|
|
|
|
|
|
|
|
|
|
|
|
|
|
|
|
|||||||||||||||||||
| 30,995,587 | 21,596,268 | 6,469,108 | 7,590,429 | — | 54,433,655 | 108,032,123 | 156,643,865 | 142,895,246 | 36,587,814 | |||||||||||||||||||||||||||||
|
|
|
|
|
|
|
|
|
|
|
|
|
|
|
|
|
|
|
|
|
|||||||||||||||||||
| 35,485,551 | 23,318,174 | 17,164,708 | 14,367,159 | 311,120 | 61,606,428 | 120,335,829 | 170,218,241 | 153,249,143 | 39,049,409 | |||||||||||||||||||||||||||||
|
|
|
|
|
|
|
|
|
|
|
|
|
|
|
|
|
|
|
|
|
|||||||||||||||||||
| See accompanying notes to financial statements. | 109 |
STATEMENTS OF CHANGES IN NET ASSETS
| Equity Fund |
||||||||
| Six months ended June 30, 2017 (Unaudited) and the year ended December 31, 2016 |
2017 | 2016 | ||||||
| From operations: |
||||||||
| Net investment income (loss) |
$ | 2,152,274 | 3,548,361 | |||||
| Net realized gain (loss) |
30,123,758 | 30,060,125 | ||||||
| Change in net unrealized appreciation or depreciation |
19,502,607 | 9,843,937 | ||||||
|
|
|
|
|
|||||
| Net change in net assets resulting from operations |
51,778,639 | 43,452,423 | ||||||
| Distributions to shareholders from and in excess of: |
||||||||
| Net investment income: |
||||||||
| Class A Shares |
(3,175 | ) | (591,008 | ) | ||||
| Class B Shares |
— | — | ||||||
| Premier Shares |
3,411 | (651,876 | ) | |||||
| Legacy Class B Shares |
— | — | ||||||
| Institutional Shares |
(103 | ) | (2,028,362 | ) | ||||
| Class R-1 Shares |
— | (4,607 | ) | |||||
| Class R-2 Shares |
— | (42,573 | ) | |||||
| Class R-3 Shares |
— | (10,086 | ) | |||||
|
|
|
|
|
|||||
| 133 | (3,328,512 | ) | ||||||
| Net realized gain: |
||||||||
| Class A Shares |
— | (7,674,228 | ) | |||||
| Class B Shares |
— | (142,872 | ) | |||||
| Premier Shares |
— | (7,131,325 | ) | |||||
| Legacy Class B Shares |
— | (292,374 | ) | |||||
| Institutional Shares |
— | (16,563,643 | ) | |||||
| Class R-1 Shares |
— | (156,880 | ) | |||||
| Class R-2 Shares |
— | (774,321 | ) | |||||
| Class R-3 Shares |
— | (86,678 | ) | |||||
|
|
|
|
|
|||||
| — | (32,822,321 | ) | ||||||
|
|
|
|
|
|||||
| Total distributions to shareholders |
133 | (36,150,833 | ) | |||||
| From Fund share transactions: |
||||||||
| Proceeds from shares sold |
21,782,538 | 245,017,078 | ||||||
| Reinvestment of distributions |
(2,650 | ) | 21,219,246 | |||||
|
|
|
|
|
|||||
| 21,779,888 | 266,236,324 | |||||||
| Less payments for shares redeemed |
(44,337,070 | ) | (230,441,621 | ) | ||||
|
|
|
|
|
|||||
| Net increase (decrease) in net assets from Fund share transactions |
(22,557,182 | ) | 35,794,703 | |||||
|
|
|
|
|
|||||
| Total increase (decrease) in net assets |
29,221,590 | 43,096,293 | ||||||
|
|
|
|
|
|||||
| Net assets: |
||||||||
| Beginning of period |
566,971,467 | 523,875,174 | ||||||
|
|
|
|
|
|||||
| End of period* |
$ | 596,193,057 | 566,971,467 | |||||
|
|
|
|
|
|||||
| * Including accumulated undistributed net investment income (loss) |
$ | 2,414,938 | 262,531 | |||||
|
|
|
|
|
|||||
| 110 | See accompanying notes to financial statements. |
| Small/ Mid Cap Equity Fund |
International Equity Fund |
S&P 500 Index Fund |
Small Cap Index Fund |
|||||||||||||||||||||||||||
| 2017 | 2016 | 2017 | 2016 | 2017 | 2016 | 2017 | 2016 | |||||||||||||||||||||||
| 499,813 | (169,025) | 601,107 | 141,316 | 10,685,455 | 18,850,053 | 2,154,311 | 3,167,701 | |||||||||||||||||||||||
| 31,724,538 | 3,130,929 | 7,915,578 | (1,515,088) | 8,084,739 | 14,150,118 | 21,639,156 | 16,901,845 | |||||||||||||||||||||||
| (24,710,363) | 29,271,756 | 16,956,811 | (6,054,546) | 102,131,429 | 102,267,974 | (281,157) | 65,292,519 | |||||||||||||||||||||||
|
|
|
|
|
|
|
|
|
|
|
|
|
|
|
|
|
|||||||||||||||
| 7,513,988 | 32,233,660 | 25,473,496 | (7,428,318) | 120,901,623 | 135,268,145 | 23,512,310 | 85,362,065 | |||||||||||||||||||||||
| (1,656) | 917 | — | 27 | (9,345) | (7,550,440) | (2,261) | (1,069,191) | |||||||||||||||||||||||
| — | — | — | — | — | (65,897) | — | (18,787) | |||||||||||||||||||||||
| 67 | (990) | — | (1) | (728) | (8,748,091) | 1,993 | (1,162,529) | |||||||||||||||||||||||
| (29) | 4 | — | — | — | (164,925) | — | (66,445) | |||||||||||||||||||||||
| 13 | (28,754) | 3 | (13,406) | 1,714 | (3,362,119) | 52 | (736,660) | |||||||||||||||||||||||
| — | — | — | — | — | (112,578) | — | (14,345) | |||||||||||||||||||||||
| — | — | — | — | — | (334,866) | — | (47,415) | |||||||||||||||||||||||
| — | (672) | — | (297) | — | (56,700) | — | (18,600) | |||||||||||||||||||||||
|
|
|
|
|
|
|
|
|
|
|
|
|
|
|
|
|
|||||||||||||||
| (1,605) | (29,495) | 3 | (13,677) | (8,359) | (20,395,616) | (216) | (3,133,972) | |||||||||||||||||||||||
| — | (783,801) | — | — | — | (4,085,538) | — | (5,484,732) | |||||||||||||||||||||||
| — | (106,834) | — | — | — | (74,194) | — | (449,528) | |||||||||||||||||||||||
| — | (919,147) | — | — | — | (4,419,217) | — | (5,840,336) | |||||||||||||||||||||||
| — | (92,050) | — | — | — | (138,053) | — | (845,734) | |||||||||||||||||||||||
| — | (396,353) | — | — | — | (1,550,967) | — | (2,911,764) | |||||||||||||||||||||||
| — | (32,088) | — | — | — | (75,469) | — | (135,255) | |||||||||||||||||||||||
| — | (99,680) | — | — | — | (196,547) | — | (318,290) | |||||||||||||||||||||||
| — | (24,227) | — | — | — | (26,676) | — | (79,758) | |||||||||||||||||||||||
|
|
|
|
|
|
|
|
|
|
|
|
|
|
|
|
|
|||||||||||||||
| — | (2,454,180) | — | — | — | (10,566,661) | — | (16,065,397) | |||||||||||||||||||||||
|
|
|
|
|
|
|
|
|
|
|
|
|
|
|
|
|
|||||||||||||||
| (1,605) | (2,483,675) | 3 | (13,677) | (8,359) | (30,962,277) | (216) | (19,199,369) | |||||||||||||||||||||||
| 16,537,100 | 124,592,449 | 6,425,331 | 45,404,952 | 118,199,672 | 881,284,742 | 30,042,866 | 210,121,493 | |||||||||||||||||||||||
| 1,605 | 1,982,711 | (3) | 10,849 | 7,320 | 30,763,744 | (128) | 15,882,087 | |||||||||||||||||||||||
|
|
|
|
|
|
|
|
|
|
|
|
|
|
|
|
|
|||||||||||||||
| 16,538,705 | 126,575,160 | 6,425,328 | 45,415,801 | 118,206,992 | 912,048,486 | 30,042,738 | 226,003,580 | |||||||||||||||||||||||
| (24,080,395) | (131,399,498) | (8,009,596) | (50,884,029) | (139,861,490) | (842,109,731) | (38,551,455) | (218,630,685) | |||||||||||||||||||||||
|
|
|
|
|
|
|
|
|
|
|
|
|
|
|
|
|
|||||||||||||||
| (7,541,690) | (4,824,338) | (1,584,268) | (5,468,228) | (21,654,498) | 69,938,755 | (8,508,717) | 7,372,895 | |||||||||||||||||||||||
|
|
|
|
|
|
|
|
|
|
|
|
|
|
|
|
|
|||||||||||||||
| (29,307) | 24,925,647 | 23,889,231 | (12,910,223) | 99,238,766 | 174,244,623 | 15,003,377 | 73,535,591 | |||||||||||||||||||||||
|
|
|
|
|
|
|
|
|
|
|
|
|
|
|
|
|
|||||||||||||||
| 292,567,023 | 267,641,376 | 125,546,723 | 138,456,946 | 1,337,657,881 | 1,163,413,258 | 497,766,507 | 424,230,916 | |||||||||||||||||||||||
|
|
|
|
|
|
|
|
|
|
|
|
|
|
|
|
|
|||||||||||||||
| 292,537,716 | 292,567,023 | 149,435,954 | 125,546,723 | 1,436,896,647 | 1,337,657,881 | 512,769,884 | 497,766,507 | |||||||||||||||||||||||
|
|
|
|
|
|
|
|
|
|
|
|
|
|
|
|
|
|||||||||||||||
| 498,208 | — | (350,071) | (951,181) | 10,893,011 | 215,915 | 2,060,060 | (94,035) | |||||||||||||||||||||||
|
|
|
|
|
|
|
|
|
|
|
|
|
|
|
|
|
|||||||||||||||
| See accompanying notes to financial statements. | 111 |
STATE FARM MUTUAL FUND TRUST
STATEMENTS OF CHANGES IN NET ASSETS
| International Index Fund |
||||||||
| Six months ended June 30, 2017 (Unaudited) and the year ended December 31, 2016 |
2017 | 2016 | ||||||
| From operations: |
||||||||
| Net investment income (loss) |
$ | 4,489,964 | 5,732,891 | |||||
| Net realized gain (loss) |
4,583,712 | (3,537,995 | ) | |||||
| Change in net unrealized appreciation or depreciation |
26,411,875 | (1,488,251 | ) | |||||
|
|
|
|
|
|||||
| Net change in net assets resulting from operations |
35,485,551 | 706,645 | ||||||
| Distributions to shareholders from and in excess of: |
||||||||
| Net investment income: |
||||||||
| Class A Shares |
49 | (1,807,267 | ) | |||||
| Class B Shares |
— | (170,182 | ) | |||||
| Premier Shares |
(48 | ) | (2,538,430 | ) | ||||
| Legacy Class B Shares |
— | (250,618 | ) | |||||
| Institutional Shares |
625 | (1,123,565 | ) | |||||
| Class R-1 Shares |
— | (62,155 | ) | |||||
| Class R-2 Shares |
— | (173,849 | ) | |||||
| Class R-3 Shares |
— | (52,183 | ) | |||||
|
|
|
|
|
|||||
| 626 | (6,178,249 | ) | ||||||
| Net realized gain: |
||||||||
| Class A Shares |
— | — | ||||||
| Class B Shares |
— | — | ||||||
| Premier Shares |
— | — | ||||||
| Legacy Class B Shares |
— | — | ||||||
| Institutional Shares |
— | — | ||||||
| Class R-1 Shares |
— | — | ||||||
| Class R-2 Shares |
— | — | ||||||
| Class R-3 Shares |
— | — | ||||||
|
|
|
|
|
|||||
| — | — | |||||||
|
|
|
|
|
|||||
| Total distributions to shareholders |
626 | (6,178,249 | ) | |||||
| From Fund share transactions: |
||||||||
| Proceeds from shares sold |
16,361,250 | 120,197,981 | ||||||
| Reinvestment of distributions |
(365 | ) | 4,877,839 | |||||
|
|
|
|
|
|||||
| 16,360,885 | 125,075,820 | |||||||
| Less payments for shares redeemed |
(22,447,461 | ) | (127,324,668 | ) | ||||
|
|
|
|
|
|||||
| Net increase (decrease) in net assets from Fund share transactions |
(6,086,576 | ) | (2,248,848 | ) | ||||
|
|
|
|
|
|||||
| Total increase (decrease) in net assets |
29,399,601 | (7,720,452 | ) | |||||
|
|
|
|
|
|||||
| Net assets: |
||||||||
| Beginning of period |
251,323,002 | 259,043,454 | ||||||
|
|
|
|
|
|||||
| End of period* |
$ | 280,722,603 | 251,323,002 | |||||
|
|
|
|
|
|||||
| * Including accumulated undistributed net investment income (loss) |
$ | 2,724,856 | (1,765,734 | ) | ||||
|
|
|
|
|
|||||
| 112 | See accompanying notes to financial statements. |
| Equity and Bond Fund |
Bond Fund |
Tax Advantaged Bond Fund |
Money Market Fund |
|||||||||||||||||||||||||||
| 2017 | 2016 | 2017 | 2016 | 2017 | 2016 | 2017 | 2016 | |||||||||||||||||||||||
| 1,721,906 | 4,275,034 | 10,695,600 | 20,305,505 | 6,776,730 | 12,988,172 | 311,120 | 3,231 | |||||||||||||||||||||||
| 56,482 | 13,253,972 | 995,578 | 621,535 | 616,057 | 821,497 | — | — | |||||||||||||||||||||||
| 21,539,786 | 3,565,761 | 5,473,530 | 1,209,131 | 6,974,372 | (12,139,337) | — | — | |||||||||||||||||||||||
|
|
|
|
|
|
|
|
|
|
|
|
|
|
|
|
|
|||||||||||||||
| 23,318,174 | 21,094,767 | 17,164,708 | 22,136,171 | 14,367,159 | 1,670,332 | 311,120 | 3,231 | |||||||||||||||||||||||
| (595,135) | (1,530,448) | (2,445,082) | (6,833,251) | (1,252,079) | (5,753,657) | (69,205) | — | |||||||||||||||||||||||
| (40,467) | (67,629) | (110,933) | (199,736) | (27,307) | (60,869) | (137) | — | |||||||||||||||||||||||
| (709,304) | (1,787,702) | (4,534,375) | (6,398,758) | (5,495,918) | (7,169,709) | (151,491) | (45) | |||||||||||||||||||||||
| (75,980) | (168,374) | (23,953) | (54,623) | (1,426) | (3,937) | (161) | — | |||||||||||||||||||||||
| (181,752) | (504,512) | (3,403,599) | (6,466,679) | — | — | (81,647) | (3,166) | |||||||||||||||||||||||
| (13,213) | (32,045) | (44,477) | (72,795) | — | — | (1,776) | — | |||||||||||||||||||||||
| (30,404) | (80,079) | (111,393) | (230,264) | — | — | (5,554) | — | |||||||||||||||||||||||
| (8,871) | (24,512) | (21,788) | (49,399) | — | — | (1,149) | (20) | |||||||||||||||||||||||
|
|
|
|
|
|
|
|
|
|
|
|
|
|
|
|
|
|||||||||||||||
| (1,655,126) | (4,195,301) | (10,695,600) | (20,305,505) | (6,776,730) | (12,988,172) | (311,120) | (3,231) | |||||||||||||||||||||||
| — | (4,302,017) | — | (118,756) | — | — | — | — | |||||||||||||||||||||||
| — | (463,026) | — | (5,782) | — | — | — | — | |||||||||||||||||||||||
| — | (4,970,482) | — | (208,264) | — | — | — | — | |||||||||||||||||||||||
| — | (714,486) | — | (1,399) | — | — | — | — | |||||||||||||||||||||||
| — | (1,174,456) | — | (147,904) | — | — | — | — | |||||||||||||||||||||||
| — | (119,020) | — | (2,135) | — | — | — | — | |||||||||||||||||||||||
| — | (245,100) | — | (5,563) | — | — | — | — | |||||||||||||||||||||||
| — | (59,458) | — | (980) | — | — | — | — | |||||||||||||||||||||||
|
|
|
|
|
|
|
|
|
|
|
|
|
|
|
|
|
|||||||||||||||
| — | (12,048,045) | — | (490,783) | — | — | — | — | |||||||||||||||||||||||
|
|
|
|
|
|
|
|
|
|
|
|
|
|
|
|
|
|||||||||||||||
| (1,655,126) | (16,243,346) | (10,695,600) | (20,796,288) | (6,776,730) | (12,988,172) | (311,120) | (3,231) | |||||||||||||||||||||||
| 21,283,906 | 230,780,107 | 37,140,267 | 565,933,636 | 21,138,921 | 507,177,772 | 121,092,141 | 675,197,990 | |||||||||||||||||||||||
| 1,407,082 | 13,558,640 | 8,406,766 | 15,882,058 | 5,572,757 | 10,182,547 | 304,510 | 3,188 | |||||||||||||||||||||||
|
|
|
|
|
|
|
|
|
|
|
|
|
|
|
|
|
|||||||||||||||
| 22,690,988 | 244,338,747 | 45,547,033 | 581,815,694 | 26,711,678 | 517,360,319 | 121,396,651 | 675,201,178 | |||||||||||||||||||||||
| (32,223,043) | (218,345,186) | (78,789,838) | (520,141,344) | (62,021,741) | (490,356,338) | (162,513,774) | (641,120,285) | |||||||||||||||||||||||
|
|
|
|
|
|
|
|
|
|
|
|
|
|
|
|
|
|||||||||||||||
| (9,532,055) | 25,993,561 | (33,242,805) | 61,674,350 | (35,310,063) | 27,003,981 | (41,117,123) | 34,080,893 | |||||||||||||||||||||||
|
|
|
|
|
|
|
|
|
|
|
|
|
|
|
|
|
|||||||||||||||
| 12,130,993 | 30,844,982 | (26,773,697) | 63,014,233 | (27,719,634) | 15,686,141 | (41,117,123) | 34,080,893 | |||||||||||||||||||||||
|
|
|
|
|
|
|
|
|
|
|
|
|
|
|
|
|
|||||||||||||||
| 369,578,499 | 338,733,517 | 861,598,080 | 798,583,847 | 544,594,624 | 528,908,483 | 380,798,680 | 346,717,787 | |||||||||||||||||||||||
|
|
|
|
|
|
|
|
|
|
|
|
|
|
|
|
|
|||||||||||||||
| 381,709,492 | 369,578,499 | 834,824,383 | 861,598,080 | 516,874,990 | 544,594,624 | 339,681,557 | 380,798,680 | |||||||||||||||||||||||
|
|
|
|
|
|
|
|
|
|
|
|
|
|
|
|
|
|||||||||||||||
| 216,346 | 149,566 | — | — | — | — | — | — | |||||||||||||||||||||||
|
|
|
|
|
|
|
|
|
|
|
|
|
|
|
|
|
|||||||||||||||
| See accompanying notes to financial statements. | 113 |
STATE FARM MUTUAL FUND TRUST
STATEMENTS OF CHANGES IN NET ASSETS
| LifePath Retirement Fund |
||||||||
| Six months ended June 30, 2017 (Unaudited) and the year ended December 31, 2016 |
2017 | 2016 | ||||||
| From operations: |
||||||||
| Net investment income |
$ | 7,172,773 | 18,541,219 | |||||
| Net realized gain (loss) |
6,703,318 | (626,352 | ) | |||||
| Change in net unrealized appreciation or depreciation |
47,730,337 | 45,774,802 | ||||||
|
|
|
|
|
|||||
| Net change in net assets resulting from operations |
61,606,428 | 63,689,669 | ||||||
| Distributions to shareholders from and in excess of: |
||||||||
| Net investment income: |
||||||||
| Class A Shares |
(2,097,435 | ) | (6,156,396 | ) | ||||
| Class B Shares |
(26,894 | ) | (58,462 | ) | ||||
| Premier Shares |
(4,211,775 | ) | (10,318,079 | ) | ||||
| Legacy Class B Shares |
(13,614 | ) | (40,305 | ) | ||||
| Institutional Shares |
(637,062 | ) | (1,732,493 | ) | ||||
| Class R-1 Shares |
(32,104 | ) | (80,895 | ) | ||||
| Class R-2 Shares |
(126,339 | ) | (343,167 | ) | ||||
| Class R-3 Shares |
(10,087 | ) | (29,890 | ) | ||||
|
|
|
|
|
|||||
| (7,155,310 | ) | (18,759,687 | ) | |||||
| Net realized gain: |
||||||||
| Class A Shares |
— | — | ||||||
| Class B Shares |
— | — | ||||||
| Premier Shares |
— | — | ||||||
| Legacy Class B Shares |
— | — | ||||||
| Institutional Shares |
— | — | ||||||
| Class R-1 Shares |
— | — | ||||||
| Class R-2 Shares |
— | — | ||||||
| Class R-3 Shares |
— | — | ||||||
|
|
|
|
|
|||||
| — | — | |||||||
|
|
|
|
|
|||||
| Total distributions to shareholders |
(7,155,310 | ) | (18,759,687 | ) | ||||
| From Fund share transactions: |
||||||||
| Proceeds from shares sold |
55,275,705 | 915,559,360 | ||||||
| Reinvestment of distributions |
7,087,056 | 18,576,726 | ||||||
|
|
|
|
|
|||||
| 62,362,761 | 934,136,086 | |||||||
| Less payments for shares redeemed |
(127,471,028 | ) | (977,473,687 | ) | ||||
|
|
|
|
|
|||||
| Net increase (decrease) in net assets from Fund share transactions |
(65,108,267 | ) | (43,337,601 | ) | ||||
|
|
|
|
|
|||||
| Total increase (decrease) in net assets |
(10,657,149 | ) | 1,592,381 | |||||
|
|
|
|
|
|||||
| Net assets: |
||||||||
| Beginning of period |
1,254,724,070 | 1,253,131,689 | ||||||
|
|
|
|
|
|||||
| End of period* |
$ | 1,244,066,921 | 1,254,724,070 | |||||
|
|
|
|
|
|||||
| * Including accumulated undistributed net investment income (loss) |
$ | 5,901,105 | 5,883,642 | |||||
|
|
|
|
|
|||||
| 114 | See accompanying notes to financial statements. |
| LifePath 2020 Fund |
LifePath 2030 Fund |
LifePath 2040 Fund |
LifePath 2050 Fund |
|||||||||||||||||||||||||||
| 2017 | 2016 | 2017 | 2016 | 2017 | 2016 | 2017 | 2016 | |||||||||||||||||||||||
| 12,303,706 | 32,199,647 | 13,574,376 | 35,468,209 | 10,353,897 | 27,605,871 | 2,461,595 | 6,301,255 | |||||||||||||||||||||||
| 8,396,904 | 1,653,127 | 6,861,780 | 897,599 | 2,748,756 | 954,947 | 291,431 | 17,851 | |||||||||||||||||||||||
| 99,635,219 | 82,462,982 | 149,782,085 | 103,617,601 | 140,146,490 | 87,511,716 | 36,296,383 | 21,799,414 | |||||||||||||||||||||||
|
|
|
|
|
|
|
|
|
|
|
|
|
|
|
|
|
|||||||||||||||
| 120,335,829 | 116,315,756 | 170,218,241 | 139,983,409 | 153,249,143 | 116,072,534 | 39,049,409 | 28,118,520 | |||||||||||||||||||||||
| (15,433) | (14,968,633) | (2,562) | (19,154,144) | (24,632) | (15,026,374) | (1,449) | (4,968,701) | |||||||||||||||||||||||
| (142) | (243,554) | (25) | (504,165) | — | (471,338) | — | — | |||||||||||||||||||||||
| (1,904) | (19,901,807) | (371) | (17,397,589) | 38,785 | (7,208,087) | (194) | (1,901,972) | |||||||||||||||||||||||
| — | (158,328) | — | (165,308) | — | (146,295) | — | — | |||||||||||||||||||||||
| (634) | (4,369,589) | 443 | (5,527,534) | (1,085) | (6,551,556) | — | — | |||||||||||||||||||||||
| — | (322,582) | — | (570,767) | — | (371,135) | — | (159,745) | |||||||||||||||||||||||
| — | (1,100,712) | — | (1,306,774) | — | (994,850) | — | (314,717) | |||||||||||||||||||||||
| — | (72,170) | — | (95,353) | — | (126,196) | — | — | |||||||||||||||||||||||
|
|
|
|
|
|
|
|
|
|
|
|
|
|
|
|
|
|||||||||||||||
| (18,113) | (41,137,375) | (2,515) | (44,721,634) | 13,068 | (30,895,831) | (1,643) | (7,345,135) | |||||||||||||||||||||||
| — | (16,895,610) | — | (19,386,774) | (1,462) | (14,841,413) | — | (3,990,387) | |||||||||||||||||||||||
| — | (446,599) | — | (569,148) | — | (544,957) | — | — | |||||||||||||||||||||||
| — | (19,318,365) | — | (15,588,602) | — | (6,687,671) | — | (1,321,484) | |||||||||||||||||||||||
| — | (234,914) | — | (222,936) | — | (205,842) | — | — | |||||||||||||||||||||||
| — | (4,083,237) | — | (4,782,133) | — | (5,644,824) | — | — | |||||||||||||||||||||||
| — | (411,410) | — | (658,896) | — | (453,232) | — | (145,418) | |||||||||||||||||||||||
| — | (1,237,813) | — | (1,335,126) | — | (1,009,173) | — | (258,519) | |||||||||||||||||||||||
| — | (69,902) | — | (83,865) | — | (111,754) | — | — | |||||||||||||||||||||||
|
|
|
|
|
|
|
|
|
|
|
|
|
|
|
|
|
|||||||||||||||
| — | (42,697,850) | — | (42,627,480) | (1,462) | (29,498,866) | — | (5,715,808) | |||||||||||||||||||||||
|
|
|
|
|
|
|
|
|
|
|
|
|
|
|
|
|
|||||||||||||||
| (18,113) | (83,835,225) | (2,515) | (87,349,114) | 11,606 | (60,394,697) | (1,643) | (13,060,943) | |||||||||||||||||||||||
| 120,463,279 | 1,331,482,644 | 160,971,702 | 1,244,541,196 | 129,696,265 | 748,115,551 | 43,128,647 | 184,840,684 | |||||||||||||||||||||||
| 20,292 | 83,462,452 | 2,094 | 86,991,415 | (9,602) | 60,187,233 | 767 | 12,747,017 | |||||||||||||||||||||||
|
|
|
|
|
|
|
|
|
|
|
|
|
|
|
|
|
|||||||||||||||
| 120,483,571 | 1,414,945,096 | 160,973,796 | 1,331,532,611 | 129,686,663 | 808,302,784 | 43,129,414 | 197,587,701 | |||||||||||||||||||||||
| (208,514,456) | (1,399,042,798) | (202,174,669) | (1,195,821,948) | (140,723,298) | (694,348,600) | (38,655,843) | (139,997,450) | |||||||||||||||||||||||
|
|
|
|
|
|
|
|
|
|
|
|
|
|
|
|
|
|||||||||||||||
| (88,030,885) | 15,902,298 | (41,200,873) | 135,710,663 | (11,036,635) | 113,954,184 | 4,473,571 | 57,590,251 | |||||||||||||||||||||||
|
|
|
|
|
|
|
|
|
|
|
|
|
|
|
|
|
|||||||||||||||
| 32,286,831 | 48,382,829 | 129,014,853 | 188,344,958 | 142,224,114 | 169,632,021 | 43,521,337 | 72,647,828 | |||||||||||||||||||||||
|
|
|
|
|
|
|
|
|
|
|
|
|
|
|
|
|
|||||||||||||||
| 2,114,732,629 | 2,066,349,800 | 2,235,516,373 | 2,047,171,415 | 1,653,485,459 | 1,483,853,438 | 390,933,284 | 318,285,456 | |||||||||||||||||||||||
|
|
|
|
|
|
|
|
|
|
|
|
|
|
|
|
|
|||||||||||||||
| 2,147,019,460 | 2,114,732,629 | 2,364,531,226 | 2,235,516,373 | 1,795,709,573 | 1,653,485,459 | 434,454,621 | 390,933,284 | |||||||||||||||||||||||
|
|
|
|
|
|
|
|
|
|
|
|
|
|
|
|
|
|||||||||||||||
| 13,092,829 | 807,236 | 14,728,560 | 1,156,699 | 11,017,496 | 650,531 | 2,544,789 | 84,837 | |||||||||||||||||||||||
|
|
|
|
|
|
|
|
|
|
|
|
|
|
|
|
|
|||||||||||||||
| See accompanying notes to financial statements. | 115 |
NOTES TO FINANCIAL STATEMENTS
(Unaudited)
| 1. | Investment Objective |
State Farm Mutual Fund Trust (the “Trust”) has 15 separate investment portfolios (the “Funds”). The Trust is registered under the Investment Company Act of 1940 as an open-end, management investment company. Each Fund has its own investment objective, investment policies, restrictions, and attendant risks and is diversified as defined in the Investment Company Act of 1940. Each Fund follows the accounting and reporting guidance in Financial Accounting Standards Board (“FASB”) Accounting Standards Codification 946, “Financial Services-Investment Companies.” State Farm Investment Management Corp. (“SFIMC”) is the Trust’s investment adviser.
The State Farm Equity Fund (the “Equity Fund”) seeks long-term growth of capital. The Equity Fund seeks to achieve this objective by investing, under normal circumstances, at least 80% of its net assets (plus any borrowings for investment purposes) in stocks of large capitalization companies.
The State Farm Small/Mid Cap Equity Fund (the “Small/Mid Cap Equity Fund”) seeks long-term growth of capital. For approximately one-half of the Fund’s portfolio, the Fund primarily invests under normal circumstances at least 80% of its net assets (plus any borrowings for investment purposes) in stocks of small capitalization companies. For the remaining approximately one-half of the Fund’s portfolio, the Fund invests in shares of the iShares Core S&P Mid-Cap ETF.
The performance of the Small/Mid Cap Equity Fund is directly affected by the performance of its underlying investments. The Small/Mid Cap Equity Fund through its investment in the iShares Core S&P Mid-Cap ETF is subject to the risks of the iShares Core S&P Mid-Cap ETF. As of June 30, 2017, the Small/ Mid Cap Equity Fund invested 49.70% of its total assets in the iShares Core S&P ETF. Financial statements for the iShares Core S&P Mid-Cap ETF are available, without charge, on the SEC’s website at sec.gov.
The State Farm International Equity Fund (the “International Equity Fund”) seeks long-term growth of capital. The International Equity Fund invests its assets primarily in securities issued by foreign companies.
The State Farm S&P 500 Index Fund (the “S&P 500 Index Fund”) seeks to provide investment results that correspond to the total return of publicly traded common stocks in the aggregate, as represented by the S&P 500®1 Index. Under normal operating conditions, the S&P 500 Index Fund seeks to invest at least 90% of its total assets in substantially all of the securities that make up the S&P 500 Index in proportions that match, approximately, the weightings of the S&P 500 Index. The S&P 500 Index tracks the common stock performance of 500 large U.S. companies.
The State Farm Small Cap Index Fund (the “Small Cap Index Fund”) seeks to match as closely as practicable, before fees and expenses, the performance of the Russell 2000® Small Stock Index (the “Russell 2000”)2. Under normal operating conditions, the Small Cap Index Fund seeks to invest at least 90% of its net assets in stocks that are represented in the Russell 2000 Index in weights that approximate the relative composition of the securities contained in the index. The Russell 2000 tracks the common stock performance of about 2,000 small U.S. companies.
The State Farm International Index Fund (the “International Index Fund”) seeks to match as closely as practicable, before fees and expenses, the performance of an international portfolio of common stocks represented by the MSCI Europe, Australasia and Far East Free Index (the “EAFE® Free”)3. Under normal operating conditions, the International Index Fund seeks to invest at least 90% of its net assets in stocks that are represented in the EAFE Free Index in weights that approximate the relative composition of the securities contained in the index. The EAFE Free is a capitalization-weighted index that currently includes stocks of companies in 15 European countries, Australia, New Zealand, Israel, Hong Kong, Japan and Singapore.
The State Farm Equity and Bond Fund (the “Equity and Bond Fund”) seeks long-term growth of principal while providing some current income. The Equity and Bond Fund invests in the Institutional shares of the State Farm Equity Fund and State Farm Bond Fund of the Trust.
The State Farm Bond Fund (the “Bond Fund”) seeks to realize over a period of years the highest yield consistent with investing in investment grade bonds. Under normal circumstances, the Fund typically invests at least 80% of its net assets plus any borrowings in investment grade bonds or bonds determined to be of comparable quality by SFIMC.
The State Farm Tax Advantaged Bond Fund (the “Tax Advantaged Bond Fund”) seeks as high a rate of income exempt from federal income taxes as is consistent with prudent investment management. The Tax Advantaged Bond Fund normally invests so that either (1) 80% or more of the Tax Advantaged Bond Fund’s net investment income is exempt from regular federal income tax or (2) 80% or more of the Tax Advantaged Bond Fund’s net assets are invested in securities that produce income exempt from regular federal income tax.
The State Farm Money Market Fund (the “Money Market Fund”) seeks to maximize current income to the extent consistent with the preservation of capital and maintenance of liquidity. Under normal conditions, the Money Market Fund invests its assets primarily (at least 99.5%) in debt securities issued or guaranteed by the U.S. government, or by U.S. government agencies or instrumentalities, cash, and repurchase agreements fully collateralized by U.S. Treasury and U.S. government securities.
The State Farm LifePath® Retirement Fund (the “LifePath Retirement Fund”)4 seeks to provide for retirement outcomes based on quantitatively measured risk. In pursuit of this objective, the LifePath Retirement Fund will be broadly diversified across global asset classes.
The State Farm LifePath 2020 Fund (the “LifePath 2020 Fund”) seeks to provide for retirement outcomes based on quantitatively measured risk. In pursuit of this objective, the LifePath 2020 Fund will be broadly diversified across global asset classes, with asset allocations becoming more conservative over time.
116
STATE FARM MUTUAL FUND TRUST
NOTES TO FINANCIAL STATEMENTS (continued)
(Unaudited)
The State Farm LifePath 2030 Fund (the “LifePath 2030 Fund”) seeks to provide for retirement outcomes based on quantitatively measured risk. In pursuit of this objective, the LifePath 2030 Fund will be broadly diversified across global asset classes, with asset allocations becoming more conservative over time.
The State Farm LifePath 2040 Fund (the “LifePath 2040 Fund”) seeks to provide for retirement outcomes based on quantitatively measured risk. In pursuit of this objective, the LifePath 2040 Fund will be broadly diversified across global asset classes, with asset allocations becoming more conservative over time.
The State Farm LifePath 2050 Fund (the “LifePath 2050 Fund”) seeks to provide for retirement outcomes based on quantitatively measured risk. In pursuit of this objective, the LifePath 2050 Fund will be broadly diversified across global asset classes, with asset allocations becoming more conservative over time.
The LifePath Retirement, LifePath 2020, LifePath 2030, LifePath 2040 and LifePath 2050 Funds are collectively defined as the “LifePath Funds.” Each LifePath Fund invests its assets primarily in a combination of equity (including real estate investment trusts) and bond exchange-traded funds (“ETFs”) and a money market fund (the “LifePath Underlying Funds”) in proportion to each Fund’s own comprehensive investment strategy. The LifePath Funds attempt to manage the investment risk in each strategy for investors whose time horizons correspond to the decade in the LifePath Fund’s name, except for the LifePath Retirement Fund which is designed for investors who are currently withdrawing, or who plan to begin withdrawing, a substantial portion of their investment in the near future.
The performance of a LifePath Fund is directly affected by the performance of its LifePath Underlying Funds. In addition, the LifePath Funds, through their investments in the LifePath Underlying Funds, are subject to the risks of the LifePath Underlying Funds. As of June 30, 2017 the LifePath Funds invested 25% or more of their total assets in the following LifePath Underlying Funds:
| Fund | iShares Russell 1000 ETF | iShares Core U.S. Aggregate Bond ETF | ||
| LifePath Retirement Fund |
— | 51.10% | ||
| LifePath 2020 Fund |
26.19% | 43.63% | ||
| LifePath 2030 Fund |
37.68% | — | ||
| LifePath 2040 Fund |
47.05% | — | ||
| LifePath 2050 Fund |
49.56% | — |
Financial statements for the LifePath Underlying Funds noted in the preceding table are available, without charge, on the SEC’s website at sec.gov.
| 2. | Significant Accounting Policies |
The following is a summary of significant accounting policies followed by the Funds in the preparation of their financial statements in accordance with U.S. generally accepted accounting principles (“GAAP”).
Multi-class Fund Structure
Each Fund, other than the Tax Advantaged Bond Fund and LifePath 2050 Fund, offers eight classes of shares. The Tax Advantaged Bond Fund offers four classes of shares: Class A, Premier, Class B and Legacy Class B. The LifePath 2050 Fund offers four classes of shares: Class A, Premier, Class R-1 and Class R-2. Effective May 1, 2015, Class B shares and Legacy Class B shares are no longer available for purchase by new investors or by existing shareholders. Fund shareholders who own Class B shares or Legacy Class B shares may continue to exchange those shares for Class B or Legacy Class B shares of other Funds but may not purchase new Class B or Legacy Class B shares after May 1, 2015. Except for new investments in the Money Market Fund, Class A and Premier shares are offered to investors subject to an initial sales charge. The maximum offering price for Class A and Premier shares of each Fund, other than the Money Market Fund, the Bond Fund and the Tax Advantaged Bond Fund, is computed by dividing the Net Asset Value (“NAV”) by
0.95. The maximum offering price for Class A and Premier shares of the Bond Fund and the Tax Advantaged Bond Fund is computed by dividing the NAV by 0.97. Class B and Legacy Class B shares are offered without an initial sales charge, but are subject to higher ongoing expenses than Class A and Premier shares and a contingent deferred sales charge payable upon certain redemptions. Class B and Legacy Class B shares automatically convert to Class A or Premier shares depending upon the value of the account and related accounts at the time of conversion eight years after issuance. Institutional shares are offered to institutional investors, including certain insurance companies, defined contribution plans and defined benefit plans, and may be used as a funding vehicle for certain IRAs. Class R-1, R-2 and R-3 shares are available for purchase or exchange only by certain qualified purchasers as defined in the prospectus for Class R-1, R-2, and R-3 shares. Institutional, Class R-1, R-2 and R-3 shares are not subject to an initial sales charge or a contingent deferred sales charge.
Effective May 23, 2016, Legacy Class A shares were renamed Premier shares. Premier shares are available to shareholders with account balance(s) equal to or greater than $100,000. Specifically, effective May 23, 2016:
117
STATE FARM MUTUAL FUND TRUST
NOTES TO FINANCIAL STATEMENTS (continued)
(Unaudited)
| • | Legacy Class A shareholders with account balance(s) in Legacy Class A and/or Class A shares with a total value equal to or greater than $100,000 converted to Premier shares. |
| • | Legacy Class A shareholders with account balance(s) in Legacy Class A and/or Class A shares with a total value less than $100,000 converted to Class A shares. |
| • | Class A shareholders with account balance(s) in Class A shares with a total value equal to or greater than $100,000 converted to Premier shares. |
Effective April 1, 2017, State Farm VP Management Corp. (“VP Management Corp.”) agreed to waive the receipt of sales charges for Class A, Premier, Class B and Legacy Class B shares. VP Management Corp. will discontinue waiving the receipt of sales charges if and when VP Management Corp. permits its Registered Representatives to resume their sales and servicing roles with respect to Fund shares and Fund shareholders.
Investment income and certain Fund level expenses and expense reductions, if any, are borne pro rata on the basis of fair value of settled shares outstanding for the Bond, Tax Advantaged Bond and Money Market Funds and, indirectly, the Equity and Bond Fund, and relative net assets for all other Funds. Realized and unrealized gains and losses are borne pro rata on the basis of relative net assets for all Funds. However, each class bears certain expenses unique to that class such as distribution services and certain other class specific expenses. Differences in class expenses may result in the payment of different per share dividends by class. All shares of the Funds have equal rights with respect to voting subject to class specific arrangements.
Fund Share Valuation
The offering price of the shares of each Fund, other than Money Market Fund, is its NAV, plus an initial sales charge on the Class A and Premier shares. The offering price of the Money Market Fund and all Funds’ Class B, Legacy Class B, Institutional, Class R-1, Class R-2 and Class R-3 shares is the NAV. A separate NAV is calculated for each class of each Fund.
The NAV for each class of each Fund is determined as of the time of the close of regular session trading on the New York Stock Exchange (“NYSE”) (usually at 3:00 p.m., Central Time) on each day when the NYSE is open for business. Shares of the Funds will not be priced on days when the NYSE is closed.
Securities Valuation
All investments in securities are recorded at their fair value. For more information refer to Note 3 Securities Valuation.
Securities Transactions and Investment Income
For financial reporting purposes, security transactions are accounted for on trade date (date the order to buy or sell is executed). Dividend income is recorded on the ex-dividend date, except that certain dividends from foreign securities are recorded as soon as the information is available to the Funds. Interest income is recorded on the accrual basis and includes amortization of premiums and accretion of discounts on money market instruments and long-term debt instruments. Realized gains and losses from security transactions are reported on an identified cost basis.
Expenses
Expenses arising in connection with a specific Fund are allocated to that Fund. Expenses arising in connection with a specific share class are allocated to that class. Common Trust expenses are generally allocated between the Funds in proportion to each Fund’s relative net assets.
Income Taxes and Distributions to Shareholders
Each Fund is a separate taxpayer for federal income tax purposes. It is the Funds’ policy to comply with the provisions of Subchapter M of the Internal Revenue Code applicable to regulated investment companies and, in the manner provided therein, to distribute substantially all of their taxable income, including any net realized gain on sales of investments reportable for federal income tax purposes.
For more information refer to Note 5 Income Taxes and Distributions to Shareholders.
Foreign Currency Translation
Investment securities and other assets and liabilities denominated in a foreign currency are translated into U.S. dollars at the prevailing foreign exchange rates at June 30, 2017. Purchases and sales of investment securities and income and expense items denominated in foreign currencies are translated into U.S. dollars at the prevailing foreign exchange rates on the respective dates of transactions. That portion of realized and unrealized gains and losses on investments that results from fluctuations in foreign currency exchange rates is not separately disclosed but is included with realized and unrealized gains and losses on investment securities.
Use of Estimates
The preparation of financial statements in conformity with GAAP requires management to make estimates and assumptions that affect the amounts reported in the financial statements and accompanying notes. Actual results could differ from those estimates.
118
STATE FARM MUTUAL FUND TRUST
NOTES TO FINANCIAL STATEMENTS (continued)
(Unaudited)
Commitments and Contingencies
In the normal course of business, the Trust enters into contracts on behalf of the Funds that may contain provisions for general indemnifications. Each Fund’s maximum exposure under these indemnification provisions is unknown, as this would involve future claims that may be made against each Fund that are not known at this time. However, based on past experience, the Funds believe the risk of loss from these indemnification provisions is remote.
Securities Purchased on a “When-issued” Basis
The Tax Advantaged Bond Fund may purchase municipal bonds on a “when-issued” basis. Delivery and payment for these securities may be a month or more after the purchase date, during which time such securities are subject to market fluctuations. The Tax Advantaged Bond Fund identifies and holds specific liquid assets with a market value at least equal to the amount of the when-issued purchase commitments in order to ensure that it can meet those commitments. It is possible that the securities will never be issued and the commitment canceled. At June 30, 2017, the Tax Advantaged Bond Fund did not have any when-issued securities.
Short Sales
The S&P 500 Index Fund, Small Cap Index Fund and the International Index Fund may enter into covered short sale transactions to dispose of certain securities received as part of involuntary corporate actions (e.g., corporate mergers, spin-offs, distributions) that are no longer included in the respective benchmark indices. These transactions are designed to help minimize the impact these non-index securities have on the overall performance of these Funds.
New Accounting Pronouncement
In October 2016, the U.S. Securities and Exchange Commission adopted new rules and amendments to modernize reporting and disclosure of information by registered investment companies. Amendments to Regulation S-X include standardized, enhanced disclosure about derivatives in investment company financial statements and changes to rules governing the form and content of such financial statements. The amendments to Regulation S-X are effective for reporting periods ending after August 1, 2017. At this time, management is evaluating the impact these Regulation S-X amendments may have on the Trust’s financial statements, if any.
| 3. | Securities Valuation |
Investments are valued at fair value pursuant to valuation procedures approved by the Trust’s Board of Trustees (the “Board”). The valuation procedures assign to SFIMC the responsibility for determining fair value using the processes and factors as outlined in the valuation procedures. If SFIMC cannot determine fair value based on the valuation procedures, the Board or the Executive Committee of the Board will determine fair value.
Fair value is defined as the price that the Funds would receive to sell an asset or pay to transfer a liability in an orderly transaction between market participants at the measurement date. A three-tier hierarchy is used to classify fair value measurements for disclosure purposes. The three-tier hierarchy of inputs is summarized in three broad levels as follows:
| • | Level 1 - Unadjusted quoted prices in active markets that are accessible to the Funds for identical assets or liabilities. |
| • | Level 2 - Inputs other than quoted prices included within Level 1 that are observable for the asset or liability, either directly or indirectly. These inputs may include quoted prices for the identical instrument on an inactive market, quoted prices for similar instruments in active markets, interest rates, yield curves and credit spreads. For assets or liabilities with a specified (contractual) term, a Level 2 input must be observable for substantially the full term of the asset or liability. |
| • | Level 3 - Unobservable inputs for the asset or liability to the extent that relevant observable inputs are not available. These inputs, based on the best information available in the circumstances, would include reasonably available information about the assumptions that a market participant would use in valuing the asset or liability and might include SFIMC’s own data. |
To the extent that valuation is based on models or inputs that are less observable or unobservable in the market, the determination of fair value requires more judgment. Accordingly, the degree of judgment exercised in determining fair value is greatest for instruments categorized in Level 3.
The inputs used to measure the fair value of an asset or liability might be categorized within different levels of the fair value hierarchy. In those cases, the fair value measurement is categorized in its entirety in the same level of the fair value hierarchy as the lowest level input that is significant to the entire measurement. Changes in valuation techniques may result in transfers into or out of an assigned level within the fair value hierarchy. The end of the reporting period method is used for determining when transfers between levels of the fair value hierarchy are deemed to have occurred.
Stocks, closed-end registered investment companies and ETFs traded on securities exchanges, or in an over-the-counter (“OTC”) market in which transaction prices are reported, are valued at the last sales price on the day of valuation or, if there are no reported sales on that day, at the last reported bid price for the day. Stocks traded on NASDAQ are valued at the NASDAQ Official Closing Price. Long-term debt securities and U.S. Treasury bills are generally valued using quotations provided by an independent pricing service. All of the securities of the Money Market Fund and short-term debt securities with remaining maturities of 60 days or less (other than U.S. Treasury bills) held by any of the other Funds are generally valued on an amortized cost basis, which approximates market value. Investments in open-end investment companies are valued each day based on the closing net asset value
119
STATE FARM MUTUAL FUND TRUST
NOTES TO FINANCIAL STATEMENTS (continued)
(Unaudited)
of the respective fund. Futures contracts are valued at the settlement price established each day on the exchange on which they are traded. Spot and forward foreign currency contracts are valued daily using quoted forward exchange rates. Short sales, if any, are valued at market value.
Portfolio securities that are primarily traded on foreign securities exchanges (“foreign securities”) are valued at the closing values of such securities on the respective exchange where each security is primarily traded. SFIMC may determine that a market quotation for a foreign security held by a Fund is not reliable because of events or circumstances that have occurred between the time of the market quotation and the time the net asset value of the Fund is calculated (“subsequent event”). A subsequent event might include company-specific developments, a development that might affect an entire market or region, a potential global development or a significant change in one or more U.S. securities indices. If SFIMC determines that the market quotation for a foreign security is not reliable, SFIMC may use an independent statistical fair value service to assist in determining value, or SFIMC may determine the foreign security’s value in SFIMC’s reasonable judgment.
For securities other than foreign securities, for which market prices are not readily available or are considered unreliable, SFIMC is required to obtain bid price quotations from brokers or dealers in the securities. If SFIMC cannot obtain a quotation for the security or if SFIMC believes the quotation does not represent the security’s fair value, then SFIMC will determine the security’s value in SFIMC’s reasonable judgment.
In determining a value based on reasonable judgment, SFIMC may use different methodologies, including multiple of earnings, multiple of book value, discount from market of a similar freely traded security or, for debt securities, yield to maturity. Other factors SFIMC may consider in determining value for a security include, but are not limited to, fundamental analytical data relating to the security, the nature and duration of any restrictions on disposition of the security, the last traded price of the security, significant global or regional events such as political unrest, natural disasters, and war, and significant movements in major market indices, ETFs, index futures or other financial instruments in the U.S. or other markets. All securities valued based on SFIMC’s reasonable judgment are subsequently reported to the Board on a quarterly basis.
SFIMC reviews the pricing methodologies of the Funds’ approved pricing vendors, including understanding a vendor’s key inputs and assumptions in valuing securities. SFIMC also engages in transaction back-testing with respect to portfolio securities sold by the Funds to compare unrealized gains and losses to realized gains and losses.
The inputs or methodology used for valuing securities are not necessarily an indication of the risk associated with investing in those securities. The following is a summary of the inputs used to value each Fund’s assets and liabilities as of June 30, 2017:
| Investments in Securities |
Derivative Instruments |
|||||||||||||||||||||||||||||||||||
|
Fund |
Level 1 |
Level 2 |
Level 3 |
Total |
Level 1 |
Level 2 |
Level 3 |
Total |
||||||||||||||||||||||||||||
| Equity Fund |
$ | — | $ | — | $ | — | $ | — | ||||||||||||||||||||||||||||
| Common Stocks (a) |
$ | 589,492,751 | $ | — | $ | — | $ | 589,492,751 | ||||||||||||||||||||||||||||
| Short-term Investments |
8,585,761 | — | — | 8,585,761 | ||||||||||||||||||||||||||||||||
| Small/Mid Cap Equity Fund |
— | — | — | — | ||||||||||||||||||||||||||||||||
| Common Stocks (a) |
140,930,759 | — | — | 140,930,759 | ||||||||||||||||||||||||||||||||
| Exchange-Traded Funds |
145,706,782 | — | — | 145,706,782 | ||||||||||||||||||||||||||||||||
| Short-term Investments |
4,608,448 | — | — | 4,608,448 | ||||||||||||||||||||||||||||||||
| International Equity Fund |
— | — | — | — | ||||||||||||||||||||||||||||||||
| Common Stocks (a) |
144,600,955 | 12,563 | — | 144,613,518 | ||||||||||||||||||||||||||||||||
| Preferred Stocks (a) |
232,133 | — | — | 232,133 | ||||||||||||||||||||||||||||||||
| Short-term Investments |
3,645,632 | — | — | 3,645,632 | ||||||||||||||||||||||||||||||||
| S&P 500 Index Fund |
(185,816 | ) | — | — | (185,816 | ) | ||||||||||||||||||||||||||||||
| Common Stocks (a) |
1,384,354,142 | — | — | 1,384,354,142 | ||||||||||||||||||||||||||||||||
| Short-term Investments |
50,647,959 | — | — | 50,647,959 | ||||||||||||||||||||||||||||||||
| Small Cap Index Fund |
78,490 | — | — | 78,490 | ||||||||||||||||||||||||||||||||
| Common Stocks (a) |
504,975,833 | 112,487 | 0 | 505,088,320 | ||||||||||||||||||||||||||||||||
| Short-term Investments |
7,398,060 | — | — | 7,398,060 | ||||||||||||||||||||||||||||||||
| International Index Fund |
(89,690 | ) | — | — | (89,690 | ) | ||||||||||||||||||||||||||||||
| Common Stocks (a) |
273,841,116 | 742,623 | 0 | 274,583,739 | ||||||||||||||||||||||||||||||||
| Preferred Stocks (a) |
1,463,714 | — | — | 1,463,714 | ||||||||||||||||||||||||||||||||
| Short-term Investments |
98,657 | — | — | 98,657 | ||||||||||||||||||||||||||||||||
| Equity and Bond Fund |
— | — | — | — | ||||||||||||||||||||||||||||||||
| Registered Investment Companies |
380,646,064 | — | — | 380,646,064 | ||||||||||||||||||||||||||||||||
|
(a) Industry classification and/or country is disclosed in the Schedules of Investments. |
| |||||||||||||||||||||||||||||||||||
120
STATE FARM MUTUAL FUND TRUST
NOTES TO FINANCIAL STATEMENTS (continued)
(Unaudited)
| Investments in Securities |
Derivative Instruments |
|||||||||||||||||||||||||||||||||||
|
Fund |
Level 1 |
Level 2 |
Level 3 |
Total |
Level 1 |
Level 2 |
Level 3 |
Total |
||||||||||||||||||||||||||||
| Bond Fund |
$ | — | $ | — | $ | — | $ | — | ||||||||||||||||||||||||||||
| Corporate Bonds (a) |
— | $ | 566,686,700 | — | $ | 566,686,700 | ||||||||||||||||||||||||||||||
| Agency Commercial Mortgage-Backed Securities |
— | 111,058,683 | — | 111,058,683 | ||||||||||||||||||||||||||||||||
| Agency Mortgage-Backed Securities |
— | 27,368,027 | — | 27,368,027 | ||||||||||||||||||||||||||||||||
| Agency Notes & Bonds |
— | 2,237,509 | — | 2,237,509 | ||||||||||||||||||||||||||||||||
| U.S. Treasury Obligations |
— | 111,033,121 | — | 111,033,121 | ||||||||||||||||||||||||||||||||
| Short-term Investments |
12,344,832 | — | — | 12,344,832 | ||||||||||||||||||||||||||||||||
| Tax Advantaged Bond Fund |
— | — | — | — | ||||||||||||||||||||||||||||||||
| Long-term Municipal Bonds |
— | 507,544,178 | — | 507,544,178 | ||||||||||||||||||||||||||||||||
| Short-term Municipal Variable Rate Demand Notes |
— | 1,975,000 | — | 1,975,000 | ||||||||||||||||||||||||||||||||
| Short-term Investments |
2,215,560 | — | — | 2,212,560 | ||||||||||||||||||||||||||||||||
| Money Market Fund |
— | — | — | — | ||||||||||||||||||||||||||||||||
| Short-term Investments |
5,098,657 | 334,729,052 | — | 339,827,709 | ||||||||||||||||||||||||||||||||
| LifePath Retirement Fund |
— | — | — | — | ||||||||||||||||||||||||||||||||
| Exchange-Traded Funds |
1,243,570,955 | — | — | 1,243,570,955 | ||||||||||||||||||||||||||||||||
| Short-term Investments |
625,357 | — | — | 625,357 | ||||||||||||||||||||||||||||||||
| LifePath 2020 Fund |
— | — | — | — | ||||||||||||||||||||||||||||||||
| Exchange-Traded Funds |
2,146,153,917 | — | — | 2,146,153,917 | ||||||||||||||||||||||||||||||||
| Short-term Investments |
1,770,538 | — | — | 1,770,538 | ||||||||||||||||||||||||||||||||
| LifePath 2030 Fund |
— | — | — | — | ||||||||||||||||||||||||||||||||
| Exchange-Traded Funds |
2,363,106,616 | — | — | 2,363,106,616 | ||||||||||||||||||||||||||||||||
| Short-term Investments |
2,699,250 | — | — | 2,699,250 | ||||||||||||||||||||||||||||||||
| LifePath 2040 Fund |
— | — | — | — | ||||||||||||||||||||||||||||||||
| Exchange-Traded Funds |
1,793,640,680 | — | — | 1,793,640,680 | ||||||||||||||||||||||||||||||||
| Short-term Investments |
3,105,361 | — | — | 3,105,361 | ||||||||||||||||||||||||||||||||
| LifePath 2050 Fund |
— | — | — | — | ||||||||||||||||||||||||||||||||
| Exchange-Traded Funds |
433,921,325 | — | — | 433,921,325 | ||||||||||||||||||||||||||||||||
| Short-term Investments |
1,162,107 | — | — | 1,162,107 | ||||||||||||||||||||||||||||||||
|
(a) Industry classification and/or country is disclosed in the Schedules of Investments. |
| |||||||||||||||||||||||||||||||||||
On December 31, 2016, the International Equity Fund and International Index Fund used data provided by an independent statistical fair value service to fair value common stocks and preferred stocks primarily traded on exchanges that closed before the regular close of trading of the New York Stock Exchange in accordance with valuation procedures approved by the Trust’s Board of Trustees, and were therefore valued using Level 2 inputs. On June 30, 2017, all of the common stocks and preferred stocks in the International Equity Fund and International Index Fund (except for International Index Fund’s holdings listed on the Tel-Aviv Stock Exchange which did not trade on the last day of the period because the exchange was closed), were valued at last traded price because the Trust’s valuation procedures did not require the use of the independent statistical fair value service. Accordingly, using the end of the reporting period method for determining when transfers between levels are recognized, common stocks valued on June 30, 2017 at $92,394,214 were transferred from Level 2 to Level 1 in the International Equity Fund and $265,843,105 of common stocks and preferred stocks were transferred from Level 2 to Level 1 in the International Index Fund.
On December 31, 2016, a security in the Small Cap Index Fund was valued at last traded price. On June 30, 2017, the same security halted trading and was therefore valued using Level 2 inputs. Accordingly, using the end of the reporting period method for determining when transfers between levels are recognized, $73,189 of common stock was transferred from Level 1 to Level 2 in Small Cap Index Fund.
For the remaining Funds, there were no transfers of securities between Level 1 and Level 2 as of June 30, 2017 as compared to December 31, 2016.
121
STATE FARM MUTUAL FUND TRUST
NOTES TO FINANCIAL STATEMENTS (continued)
(Unaudited)
The following is a reconciliation of investments in which significant unobservable inputs (Level 3) were used in determining fair value:
| Small Cap Index Fund Investments in Securities (a) |
||||||||||
| Balance as of December 31, 2016 |
$ | 46,177 | ||||||||
| Realized gain (loss) |
46,469 | |||||||||
| Change in unrealized appreciation (depreciation) |
(46,177 | ) | ||||||||
| Purchases |
— | |||||||||
| Issuances |
— | |||||||||
| Sales |
(46,469 | ) | ||||||||
| Transfers in |
— | |||||||||
| Transfers out |
— | |||||||||
|
|
|
|||||||||
| Balance as of June 30, 2017 |
$ | — | ||||||||
|
|
|
|||||||||
|
(a) Using the end of the reporting period method for determining when transfers between levels are recognized. |
||||||||||
The International Index Fund did not hold any Level 3 securities valued at other than zero as of December 31, 2016 or for the six months ended June 30, 2017. The remaining Funds (other than the Small Cap Index Fund, as noted in the preceding table) did not hold any Level 3 securities as of December 31, 2016 or for the six months ended June 30, 2017.
Derivative instruments, such as futures and foreign currency contracts, are valued at the unrealized appreciation (depreciation) of the instrument. For more information, see Note 4 Derivative Instruments.
| 4. | Derivative Instruments |
The S&P 500 Index Fund, Small Cap Index Fund and International Index Fund are subject to equity price risk in the normal course of pursuing their investment objectives. These Funds entered into stock index futures contracts to gain exposure to market fluctuations, as the use of these instruments was more efficient or cost effective than actually buying the underlying securities. These contracts obligated those Funds to make or take delivery of a derivative instrument or the cash value of a securities index at a specified future date at a specified price. Realized and unrealized gains and losses from these contracts are reflected in the Statements of Operations. Unrealized gains and losses on open futures contracts are reflected as a component of net unrealized appreciation (depreciation) in the Statements of Assets and Liabilities, and in other assets in the Schedules of Investments. Margin requirements are established by the broker or clearing house for exchange-traded and centrally cleared futures contracts. Daily fluctuations in the margin requirements for futures contracts are recorded as variation margin receivable or payable on the Statements of Assets and Liabilities. Upon entering into a futures contract, these Funds bore the risk of futures contracts’ prices moving unexpectedly, in which case, the Funds might not have been able to achieve the anticipated benefits of the futures contract and might realize a loss. With futures, there is minimal counterparty credit risk to a Fund since futures are exchange traded and the exchange’s clearing house, as the ultimate counterparty to all exchange traded futures, guarantees the futures against default.
The International Equity and International Index Funds are subject to foreign currency exchange risk in the normal course of pursuing their investment objectives. In an attempt to decrease exposure to this risk, the International Index Fund engaged in portfolio hedging with the objective to protect against variations in exchange rates. Portfolio hedging involved selling forward foreign currency contracts with respect to the actual or anticipated portfolio security position denominated or quoted in the particular currency. Realized and unrealized gains and losses on forward foreign currency contracts are reflected in the Statements of Operations. Unrealized gains and losses on forward foreign currency contracts are reflected as a component of net unrealized appreciation (depreciation) in the Statements of Assets and Liabilities, and in other assets in the Schedule of Investments. These Funds bore the market risk that arises from changes in foreign currency rates and the credit risk should a counterparty fail to perform under such contracts, and as a result, might realize a loss.
122
STATE FARM MUTUAL FUND TRUST
NOTES TO FINANCIAL STATEMENTS (continued)
(Unaudited)
As of June 30, 2017, the fair values of derivative instruments, which are also disclosed in the Schedules of Investments, were as follows:
| Asset Derivatives | Liability Derivatives | |||||||||||||
|
Fund |
Derivatives not accounted for as hedging instruments |
Statements of Assets and Liabilities Location |
Value | Statements of Assets and Liabilities Location |
Value | |||||||||
| Variation Margin; | Variation Margin; | |||||||||||||
| S&P 500 Index Fund |
Stock Index Futures Contracts |
Analysis of Net Assets - Net Unrealized Appreciation |
$ | — | Analysis of Net Assets - Net Unrealized Depreciation |
$ | 185,816 | (a) | ||||||
|
|
|
|
|
|||||||||||
| Total |
$ | — | $ | 185,816 | ||||||||||
|
|
|
|
|
|||||||||||
| Variation Margin; | Variation Margin; | |||||||||||||
| Small Cap Index Fund |
Stock Index Futures Contracts |
Analysis of Net Assets - Net Unrealized Appreciation |
$ | 78,490 | (a) | Analysis of Net Assets - Net Unrealized Depreciation |
$ | — | ||||||
|
|
|
|
|
|||||||||||
| Total |
$ | 78,490 | $ | — | ||||||||||
|
|
|
|
|
|||||||||||
| Variation Margin; | Variation Margin; | |||||||||||||
| International Index Fund |
Stock Index Futures Contracts |
Analysis of Net Assets- Net Unrealized Appreciation |
$ | — | Analysis of Net Assets - Net Unrealized Depreciation |
$ | 89,690 | (a) | ||||||
|
|
|
|
|
|||||||||||
| Total |
$ | — | $ | 89,690 | ||||||||||
|
|
|
|
|
|||||||||||
|
(a) Represents cumulative unrealized gain or loss on futures contracts. Variation margin disclosed on the Statements of Assets and Liabilities is for the last day of the period. |
| |||||||||||||
As of June 30, 2017, the effect of derivative instruments on the Statements of Operations was as follows:
|
Fund |
Derivatives not accounted for as hedging instruments |
Amount of Realized Gain (Loss) on Derivatives Recognized in Income |
Change in Unrealized Appreciation (Depreciation) on Derivatives Recognized in Income |
|||||||
| S&P 500 Index Fund |
Stock Index Futures Contracts | $ | 5,738,378 | $ | (849,339 | ) | ||||
| Small Cap Index Fund |
Stock Index Futures Contracts | 253,958 | 114,400 | |||||||
| International Index Fund |
Stock Index Futures Contracts | 184,064 | (97,672 | ) | ||||||
As of June 30, 2017, the average quarterly balance of outstanding derivative instruments was as follows:
| Futures Contracts | ||||||||
|
Fund |
Average Number of Contracts Purchased |
Average Notional Value of Contracts Purchased |
||||||
| S&P 500 Index Fund |
500 | $ | 58,222,898 | |||||
| Small Cap Index Fund |
134 | 9,234,777 | ||||||
| International Index Fund |
45 | 2,689,604 | ||||||
In order to better define its contractual rights and to secure rights that will help a Fund mitigate its counterparty risk, the International Equity Fund and International Index Fund may enter into an International Swaps and Derivatives Association, Inc. Master Agreement (“ISDA Master Agreement”) or similar agreement with their derivative contract counterparties. An ISDA Master Agreement is a bilateral agreement between a Fund and a counterparty that governs OTC derivatives, including certain forward foreign exchange contracts, and typically contains, among other things, collateral posting terms and netting provisions in the event of a default and/or termination event. Under an ISDA Master Agreement, a Fund may, under certain circumstances, offset with the counterparty certain derivative financial instruments’ payables and receivables to create a single net payment. The provisions of the ISDA Master Agreement typically permit a single net payment in the event of a default (close-out netting) or similar event, including the bankruptcy or insolvency of the counterparty. Note, however, that bankruptcy or insolvency laws of a particular jurisdiction may impose restrictions on or prohibitions against the right of offset in bankruptcy, insolvency or other events.
123
STATE FARM MUTUAL FUND TRUST
NOTES TO FINANCIAL STATEMENTS (continued)
(Unaudited)
Collateral and margin requirements differ by type of derivative. Brokers can ask for margin in excess of the minimum in certain circumstances. Collateral terms are contract-specific for OTC derivatives (foreign currency exchange contracts). For financial reporting purposes, cash and non-cash collateral that has been pledged to cover obligations of a Fund, if any, are noted in the Schedules of Investments. The Funds attempt to mitigate counterparty risk by only entering into agreements with counterparties that they believe to be of good standing and by monitoring the financial stability of those counterparties.
Additionally, the netting of assets and liabilities is based on contractual netting/set-off provisions in the ISDA Master Agreement; however, in the event of a default or insolvency of a counterparty, a court could determine that such rights are not enforceable.
The Funds did not invest in any portfolio securities or enter into any derivative transactions with gross exposure on the Statement of Assets and Liabilities that could be netted subject to netting agreements as of June 30, 2017.
| 5. | Income Taxes and Distributions to Shareholders |
As of December 31, 2016, the Trust’s management has completed a review of uncertain tax positions taken by the Funds and determined that no tax liability was required for unrecognized tax benefits, and no additional disclosures were needed. Generally, the tax authorities can initiate examinations of tax returns within the three year period beginning on the date such returns are filed. As a result, some tax returns are still open and subject to examination. In addition, as of December 31, 2016, management is not aware of any tax positions for which it is reasonably possible that the total amounts of unrecognized tax benefits will significantly change for the period ending December 31, 2017.
As of June 30, 2017, aggregate securities holdings’ unrealized gains and losses based on cost for federal income tax purposes for the Funds were as follows:
|
Fund |
Cost of Investments for Federal Tax Purposes |
Gross Unrealized Appreciation |
Gross Unrealized (Depreciation) |
Net Unrealized Appreciation (Depreciation) |
||||||||||||
| Equity Fund |
$ | 482,685,915 | $ | 130,491,681 | $ | (15,099,084 | ) | $ | 115,392,597 | |||||||
| Small/Mid Cap Equity Fund |
272,548,074 | 24,925,357 | (6,227,442 | ) | 18,697,915 | |||||||||||
| International Equity Fund |
119,504,002 | 31,443,316 | (2,456,035 | ) | 28,987,281 | |||||||||||
| S&P 500 Index Fund |
792,785,301 | 657,522,465 | (15,305,665 | ) | 642,216,800 | |||||||||||
| Small Cap Index Fund |
371,758,205 | 179,252,068 | (38,523,893 | ) | 140,728,175 | |||||||||||
| International Index Fund |
218,393,281 | 87,626,362 | (29,873,533 | ) | 57,752,829 | |||||||||||
| Equity and Bond Fund |
317,991,478 | 62,654,586 | — | 62,654,586 | ||||||||||||
| Bond Fund |
819,913,659 | 15,272,555 | (4,457,342 | ) | 10,815,213 | |||||||||||
| Tax Advantaged Bond Fund |
495,270,758 | 18,111,290 | (1,650,310 | ) | 16,460,980 | |||||||||||
| Money Market Fund |
339,827,709 | — | — | — | ||||||||||||
| LifePath Retirement Fund |
1,169,584,199 | 74,612,113 | — | 74,612,113 | ||||||||||||
| LifePath 2020 Fund |
1,988,091,273 | 159,833,182 | — | 159,833,182 | ||||||||||||
| LifePath 2030 Fund |
2,131,618,209 | 234,796,628 | (608,971 | ) | 234,187,657 | |||||||||||
| LifePath 2040 Fund |
1,585,271,067 | 211,744,302 | (269,328 | ) | 211,474,974 | |||||||||||
| LifePath 2050 Fund |
383,612,131 | 51,471,301 | — | 51,471,301 | ||||||||||||
The differences, if any, between the cost of investments for federal income tax purposes and the cost of investments reflected on the Schedules of Investments may relate to one or more of the following: return of capital transactions, mark-to-market of Passive Foreign Investment Companies (“PFICs”), mark-to-market of non-PFICs, wash sales, partnership distributive share adjustments and deemed dividend distributions.
The Equity Fund, Small/Mid Cap Equity Fund, International Equity Fund, S&P 500 Index Fund, Small Cap Index Fund, International Index Fund, Equity and Bond Fund, LifePath 2020 Fund, LifePath 2030 Fund, LifePath 2040 Fund and LifePath 2050 Fund declare and pay dividend and capital gain distributions, if any, at least annually.
The Bond Fund, Tax Advantaged Bond Fund and Money Market Fund declare dividends daily and distribute dividends monthly on the last business day of the month. Capital gain distributions on these Funds, if any, are paid at least annually.
The LifePath Retirement Fund declares and distributes dividends quarterly and capital gain distributions, if any, at least annually.
124
STATE FARM MUTUAL FUND TRUST
NOTES TO FINANCIAL STATEMENTS (continued)
(Unaudited)
After utilizing capital loss carryforwards to offset realized capital gains in 2016, the following Funds had unused capital loss carryforwards available for federal income tax purposes to be applied against future capital gains, if any. Future capital loss carryforward utilization in any given year may be subject to Internal Revenue Code limitations. As of December 31, 2016, if not applied, the carryforwards will expire as follows:
| Utilized in 2016 |
Year of Expiration | Non Expiring | Total Capital Loss Carryforwards |
|||||||||||||||||||||
|
Fund |
2017 | 2018 | Short-term | Long-term | ||||||||||||||||||||
| International Equity Fund |
$ | — | $ | 1,253,931 | $ | 2,909,152 | $ | 2,950,353 | $ | 273,793 | $ | 7,387,229 | ||||||||||||
| International Index Fund |
— | 7,747,891 | 4,077,752 | 730,702 | 12,189,493 | 24,745,838 | ||||||||||||||||||
| Tax Advantaged Bond Fund |
991,173 | — | — | 865,748 | — | 865,748 | ||||||||||||||||||
| LifePath Retirement Fund |
1,096,397 | — | — | 13,192,658 | 205,501 | 13,398,159 | ||||||||||||||||||
The International Index Fund had a capital loss carryforward of $5,140,621 that expired in 2016 and was reclassified from accumulated net realized gain (loss) to paid in capital on the Statement of Assets and Liabilities.
Capital losses incurred on or after January 1, 2011 are permitted to carry forward indefinitely. These losses must be utilized prior to losses incurred before January 1, 2011. Therefore, any losses incurred prior to 2011 may be more likely to expire unused.
As of December 31, 2016, in accordance with federal tax regulations, the components of distributable earnings on a tax basis were as follows:
|
Fund |
Undistributed Ordinary Income |
Undistributed Long-term Gain |
Unrealized Appreciation (Depreciation) |
Accumulated Capital and Other Losses |
Total | |||||||||||||||
| Equity Fund |
$ | 914,579 | $ | 3,863,836 | $ | 95,886,036 | $ | — | $ | 100,664,451 | ||||||||||
| Small/Mid Cap Equity Fund |
— | 1,710,856 | 42,557,695 | — | 44,268,551 | |||||||||||||||
| International Equity Fund |
141,823 | — | 11,531,443 | (8,382,973 | ) | 3,290,293 | ||||||||||||||
| S&P 500 Index Fund |
1,515,127 | 2,202,335 | 539,415,425 | — | 543,132,887 | |||||||||||||||
| Small Cap Index Fund |
105,550 | 2,720,234 | 141,140,443 | — | 143,966,227 | |||||||||||||||
| International Index Fund |
62,243 | — | 31,100,120 | (27,232,090 | ) | 3,930,273 | ||||||||||||||
| Equity and Bond Fund |
163,040 | 13,241,857 | 41,117,096 | — | 54,521,993 | |||||||||||||||
| Bond Fund |
— | 249,867 | 5,341,683 | — | 5,591,550 | |||||||||||||||
| Tax Advantaged Bond Fund |
— | — | 9,486,608 | (1,035,424 | ) | 8,451,184 | ||||||||||||||
| Money Market Fund |
— | — | — | — | — | |||||||||||||||
| LifePath Retirement Fund |
5,883,642 | — | 26,173,894 | (13,398,159 | ) | 18,659,377 | ||||||||||||||
| LifePath 2020 Fund |
1,183,934 | 2,643,194 | 61,151,954 | — | 64,979,082 | |||||||||||||||
| LifePath 2030 Fund |
1,156,699 | 2,089,902 | 84,830,706 | — | 88,077,307 | |||||||||||||||
| LifePath 2040 Fund |
698,045 | 1,991,733 | 71,624,329 | — | 74,314,107 | |||||||||||||||
| LifePath 2050 Fund |
237,525 | 166,267 | 15,279,198 | — | 15,682,990 | |||||||||||||||
The difference between these amounts and the undistributed net investment income reported on the Statements of Assets and Liabilities as of December 31, 2016 relates to one or more of the following: short-term capital gains, foreign currency contracts, mark-to-market of PFICs, mark-to-market of non-PFICs, post-October loss deferrals, and return of capital transactions.
From November 1, 2016 through December 31, 2016, the International Equity Fund incurred $35,094 in specified losses and $960,650 in realized losses, the International Index Fund incurred $132,772 in specified losses and $2,353,480 in realized losses and the Tax Advantaged Bond Fund incurred $169,676 in realized losses. As permitted by the Internal Revenue Code, the Funds intend to elect to defer these losses and treat them as arising on January 1, 2017.
The timing and characterization of certain income and capital gain distributions are determined annually in accordance with federal income tax regulations, which may differ from GAAP. These differences are primarily due to differing treatment for futures contracts, the timing of the recognition of net realized losses, net operating losses, the timing of Fund distributions, and foreign currency transactions. As a result, net investment income and net realized gain or loss on investment transactions for a reporting period may differ from distributions during such period. Accordingly, each Fund may periodically make reclassifications among certain of its capital accounts without impacting its net asset value.
125
STATE FARM MUTUAL FUND TRUST
NOTES TO FINANCIAL STATEMENTS (continued)
(Unaudited)
As of December 31, 2016, these reclassifications were as follows:
|
Fund |
Paid in Capital |
Accumulated Net Realized Gain (Loss) |
Net Unrealized Appreciation (Depreciation) |
Accumulated Undistributed Net Investment Income (Loss) |
||||||||||||
| Equity Fund |
$ | — | $ | 6,127 | $ | — | $ | (6,127 | ) | |||||||
| Small/Mid Cap Equity Fund |
(146,647 | ) | (32,508 | ) | — | 179,155 | ||||||||||
| International Equity Fund |
— | 18,682 | — | (18,682 | ) | |||||||||||
| S&P 500 Index Fund |
(9,672 | ) | (650,320 | ) | — | 659,992 | ||||||||||
| Small Cap Index Fund |
— | 43,473 | — | (43,473 | ) | |||||||||||
| International Index Fund |
(5,140,641 | ) | 4,876,543 | — | 264,098 | |||||||||||
| Equity and Bond Fund |
— | (128 | ) | — | 128 | |||||||||||
| LifePath Retirement Fund |
2 | (25,899 | ) | — | 25,897 | |||||||||||
| LifePath 2020 Fund |
(4 | ) | (66,407 | ) | — | 66,411 | ||||||||||
| LifePath 2030 Fund |
3 | (65,911 | ) | — | 65,908 | |||||||||||
| LifePath 2040 Fund |
(262,272 | ) | (82,559 | ) | — | 344,831 | ||||||||||
| LifePath 2050 Fund |
1 | (20,046 | ) | — | 20,045 | |||||||||||
The tax character of distributions was designated as follows for the year ended December 31, 2016.
|
2016 |
Tax Exempt Income |
Ordinary Income |
Long-term Capital Gain |
Total | ||||||||||||
| S&P 500 Index Fund |
$ | — | $ | 21,300,240 | $ | 9,662,037 | $ | 30,962,277 | ||||||||
| Small Cap Index Fund |
— | 3,255,231 | 15,944,138 | 19,199,369 | ||||||||||||
| Bond Fund |
— | 20,305,909 | 490,379 | 20,796,288 | ||||||||||||
| Tax Advantaged Bond Fund |
12,975,805 | 12,367 | — | 12,988,172 | ||||||||||||
For the remaining Funds, the tax distributions of ordinary income and long-term capital gains were the same as the distributions from net investment income and capital gains reflected in the Statement of Changes in Net Assets for the year ended December 31, 2016.
126
STATE FARM MUTUAL FUND TRUST
NOTES TO FINANCIAL STATEMENTS (continued)
(Unaudited)
| 6. | Fees and Other Transactions with Affiliates |
Investment Advisory and Management Services Agreement
The Trust has entered into an investment advisory and management services agreement with SFIMC, which serves as the Trust’s investment adviser and conducts the business and affairs of the Trust. Each Fund pays SFIMC an investment advisory and management services fee based upon that Fund’s average daily net assets. The fee is accrued daily and paid to SFIMC monthly.
| Equity Fund |
0.60% | Tax Advantaged Bond Fund |
0.10% | |||
| Small/Mid Cap Equity Fund |
0.80% | Money Market Fund |
0.10% | |||
| International Equity Fund |
0.80% | LifePath Retirement Fund (c) |
0.28% on the first $5 billion | |||
| S&P 500 Index Fund (a)(b) |
0.13% on the first $500 million | 0.24% on the next $10 billion | ||||
| 0.12% on the next $250 million | 0.21% on amounts exceeding $15 billion | |||||
| 0.11% on the next $250 million | LifePath 2020 Fund (c) |
0.28% on the first $5 billion | ||||
| 0.085% on the next $2 billion | 0.24% on the next $10 billion | |||||
| 0.06% on amounts exceeding $3 billion | 0.21% on amounts exceeding $15 billion | |||||
| Small Cap Index Fund (a)(b) |
0.15% on the first $150 million | LifePath 2030 Fund (c) |
0.28% on the first $5 billion | |||
| 0.13% on the next $850 million | 0.24% on the next $10 billion | |||||
| 0.105% on the next $2 billion | 0.21% on amounts exceeding $15 billion | |||||
| 0.08% on amounts exceeding $3 billion | LifePath 2040 Fund (c) |
0.28% on the first $5 billion | ||||
| International Index Fund (a)(b) |
0.16% on the first $150 million | 0.24% on the next $10 billion | ||||
| 0.14% on the next $850 million | 0.21% on amounts exceeding $15 billion | |||||
| 0.115% on the next $2 billion | LifePath 2050 Fund (c) |
0.28% on the first $5 billion | ||||
| 0.09% on amounts exceeding $3 billion | 0.24% on the next $10 billion | |||||
| Equity and Bond Fund |
None | 0.21% on amounts exceeding $15 billion | ||||
| Bond Fund |
0.10% | |||||
|
(a) Through April 30, 2016, the investment advisory and management services fees for the S&P 500 Index Fund, Small Cap Index Fund and International Index Fund were 0.18%, 0.33% and 0.48%, respectively. | ||||||
|
(b) For purposes of calculating the breakpoints in the preceding table, the assets of the following funds are combined: Large Cap Equity Index Fund of the State Farm Variable Product Trust and the S&P 500 Index Fund; Small Cap Equity Index Fund of the State Farm Variable Product Trust and the Small Cap Index Fund; International Equity Index Fund of the State Farm Variable Product Trust and the International Index Fund. | ||||||
|
(c) The assets of all of the LifePath Funds are aggregated for purposes of calculating the investment advisory and management services fee applicable to each LifePath Fund. | ||||||
SFIMC does not receive an investment advisory and management services fee for performing its services for the Equity and Bond Fund. However, SFIMC receives investment advisory and management services fees from managing the underlying funds into which the Equity and Bond Fund invests. The Equity and Bond Fund pays no sales loads or similar compensation to SFIMC to acquire shares of each Fund in which it invests. Because the underlying funds have varied expenses and fee levels and the Equity and Bond Fund may own different proportions of the underlying funds at different times, the amount of fees and expenses incurred indirectly by the Equity and Bond Fund will vary.
SFIMC has engaged Bridgeway Capital Management, Inc. (“Bridgeway”) and Westwood Management Corp. (“Westwood”) as the investment sub-advisers to provide day-to-day portfolio management for the Equity Fund; Bridgeway as the investment sub-adviser to provide day-to-day portfolio management for approximately one-half of the Small/Mid Cap Equity Fund; Marsico Capital Management, LLC (“Marsico”) and Northern Cross, LLC (“Northern Cross”) as the investment sub-advisers to provide day-to-day portfolio management for the International Equity Fund and BlackRock Fund Advisors (“BlackRock”) as the investment sub-adviser to provide day-to-day portfolio management for the LifePath Funds, S&P 500 Index Fund, Small Cap Index Fund and International Index Fund. Effective May 1, 2017, Rainier Investment Management, LLC (“Rainier”) ceased serving as investment sub-adviser to the Small/ Mid Cap Equity Fund.
In accordance with the investment objective of the Fund or Funds each sub-advises, Bridgeway, Westwood, Marsico, Northern Cross and BlackRock determine which securities to buy and sell, select the brokers and dealers to effect the transactions, and negotiate commissions. Bridgeway’s, Westwood’s, Rainier’s, Marsico’s, Northern Cross’s, BlackRock’s, and Northern Trust’s sub-advisory fees for managing the respective portfolios are paid by SFIMC. No additional advisory fees are charged to the Funds for the services of the sub-advisers.
127
STATE FARM MUTUAL FUND TRUST
NOTES TO FINANCIAL STATEMENTS (continued)
(Unaudited)
For the six months ended June 30, 2017, the following fees were earned by Bridgeway, Westwood, Rainier, Marsico, Northern Cross and BlackRock for providing sub-advisory services (although not all amounts indicated were paid during that period):
|
Fund |
Bridgeway | Westwood | Rainier (a)(b) | Marsico | Northern Cross |
BlackRock | ||||||||||||||||||
| Equity Fund |
$ | 596,350 | $ | 475,832 | $ | — | $ | — | $ | — | $ | — | ||||||||||||
| Small/Mid Cap Equity Fund |
430,609 | — | 272,991 | — | — | — | ||||||||||||||||||
| International Equity Fund |
— | — | — | 173,480 | 205,488 | — | ||||||||||||||||||
| S&P 500 Index Fund |
— | — | — | — | — | 112,141 | ||||||||||||||||||
| Small Cap Index Fund |
— | — | — | — | — | 84,186 | ||||||||||||||||||
| International Index Fund |
— | — | — | — | — | 60,332 | ||||||||||||||||||
| LifePath Retirement Fund |
— | — | — | — | — | 164,080 | ||||||||||||||||||
| LifePath 2020 Fund |
— | — | — | — | — | 280,202 | ||||||||||||||||||
| LifePath 2030 Fund |
— | — | — | — | — | 303,256 | ||||||||||||||||||
| LifePath 2040 Fund |
— | — | — | — | — | 227,679 | ||||||||||||||||||
| LifePath 2050 Fund |
— | — | — | — | — | 54,645 | ||||||||||||||||||
|
|
|
|
|
|
|
|
|
|
|
|
|
|||||||||||||
| Total Sub-Advisory Fees |
$ | 1,026,959 | $ | 475,832 | $ | 272,991 | $ | 173,480 | $ | 205,488 | $ | 1,286,521 | ||||||||||||
| (a) A majority of the outstanding voting securities of Rainier Investment Management, LLC was acquired by Manning & Napier Group, LLC on April 30, 2016. |
| |||||||||||||||||||||||
|
(b) Effective May 1, 2017, Rainier ceased serving as investment sub-adviser to the Small/Mid Cap Equity Fund. |
| |||||||||||||||||||||||
Distribution and Shareholder Services Agreements
The Trust has entered into a distribution and service plan pursuant to Rule 12b-1 under the Investment Company Act of 1940, as amended, with VP Management Corp. Under terms of this plan, each Fund pays VP Management Corp. an annual fee based on a specified percentage of average daily net assets, up to the following amounts (not all Funds offer all classes shown):
|
Fund |
Class A | Class B | Premier | Legacy Class B |
Class R-1 | Class R-2 | ||||||||||||||||||
| Small Cap Index Fund |
0.25 | % | 0.80 | % | 0.25 | % | 0.65 | % | 0.50 | % | 0.30 | % | ||||||||||||
| Bond Fund |
0.25 | % | 0.65 | % | 0.25 | % | 0.65 | % | 0.50 | % | 0.30 | % | ||||||||||||
| Tax Advantaged Bond Fund |
0.25 | % | 0.65 | % | 0.25 | % | 0.65 | % | ||||||||||||||||
| Money Market Fund |
0.15 | % | 0.55 | % | 0.15 | % | 0.55 | % | 0.40 | % | 0.20 | % | ||||||||||||
| LifePath 2030 Fund |
0.25 | % | 0.45 | % | 0.25 | % | 0.65 | % | 0.50 | % | 0.30 | % | ||||||||||||
| LifePath 2040 Fund |
0.25 | % | 0.45 | % | 0.25 | % | 0.65 | % | 0.50 | % | 0.30 | % | ||||||||||||
| All Other Funds |
0.25 | % | 0.95 | % | 0.25 | % | 0.65 | % | 0.50 | % | 0.30 | % | ||||||||||||
Effective April 1, 2017, for each Fund, VP Management Corp. agreed to waive all distribution and service (12b-1) fees for Class A, Class B, Premier, Legacy Class B, Class R-1 and Class R-2 shares.
128
STATE FARM MUTUAL FUND TRUST
NOTES TO FINANCIAL STATEMENTS (continued)
(Unaudited)
The annual fee amount is payable to VP Management Corp. by each Fund only to the extent VP Management Corp. has incurred distribution expenses to be reimbursed. Any distribution expenses incurred by VP Management Corp. and not otherwise reimbursed by the Funds under the distribution plan can be carried forward and reimbursed in a later time period in amounts not to exceed the annual fee percentages outlined above. At June 30, 2017, VP Management Corp. had not been reimbursed for the following amounts (the TOTAL below is the cumulative amount of unreimbursed distribution expenses incurred since the commencement of operations of the Trust, although the total amount incurred by Fund depends upon the timing of commencement of the applicable section of the distribution plan for each such Fund and its classes):
| Equity Fund |
$ | 12,390,293 | Tax Advantaged Bond Fund |
$ | 19,628,730 | |||||
| Small/Mid Cap Equity Fund |
11,739,942 | Money Market Fund |
18,261,877 | |||||||
| International Equity Fund |
9,015,338 | LifePath Retirement Fund |
21,507,340 | |||||||
| S&P 500 Index Fund |
34,420,974 | LifePath 2020 Fund |
40,323,937 | |||||||
| Small Cap Index Fund |
17,998,782 | LifePath 2030 Fund |
32,024,719 | |||||||
| International Index Fund |
13,127,293 | LifePath 2040 Fund |
22,789,782 | |||||||
| Equity and Bond Fund |
14,309,028 | LifePath 2050 Fund |
3,313,885 | |||||||
|
|
|
|||||||||
| Bond Fund |
23,706,174 | TOTAL |
$ | 294,558,094 | ||||||
The Trust has a separate shareholder services agreement with SFIMC. Each Fund, except the Equity and Bond Fund, pays SFIMC a fee of 0.25% of average daily net assets of Class A, Class B, Legacy Class B and Institutional shares and, for the current year, 0.32% of Class R-1, Class R-2 and Class R-3 shares. Effective May 21, 2016, the Premier shares of each Fund, except the Equity and Bond Fund, pays SFIMC a fee of 0.15% of average daily net assets. Prior to May 21, 2016, the Premier shares of each Fund were the Legacy Class A shares and, except for the Equity and Bond Fund, paid SFIMC a fee of 0.25% of average daily net assets. The Equity and Bond Fund does not directly pay SFIMC any shareholder services fee for Class A, Class B, Premier, Legacy Class B or Institutional shares and, for the current year, directly pays 0.07% of average daily net assets of Class R-1, Class R-2 and Class R-3 shares. However, SFIMC receives a shareholder services fee from managing the Equity Fund and Bond Fund into which the Equity and Bond Fund invests. Additionally, SFIMC receives proceeds from the account fee imposed on certain shareholders of the Trust which is paid by redeeming shares from the shareholder’s account.
129
STATE FARM MUTUAL FUND TRUST
NOTES TO FINANCIAL STATEMENTS (continued)
(Unaudited)
Expense Reduction Agreements
For all Funds, SFIMC has contractually agreed to reimburse each Class if, and to the extent, the Class’s total annual operating expenses exceed the percentage of each Class’s average daily net assets (“expense reimbursement threshold” or “ERT”) indicated in the table below, excluding acquired fund fees and expenses. The ERTs in the table are based on applicable maximum possible fees and expenses. Any increase or decrease in 12b-1 distribution fees for a share class of a Fund will increase or decrease the applicable ERT by a corresponding amount. With respect to the Equity and Bond Fund, SFIMC has contractually agreed to reimburse all expenses directly incurred by each Class other than 12b-1 distribution fees, shareholder services fees directly incurred by the Fund and acquired fund fees and expenses. SFIMC may not discontinue these agreements to reimburse each class before April 30, 2018, without the consent of the Board. Prior-year reimbursements and waivers, if any, are not subject to recapture. Effective May 23, 2016, Legacy Class A shares were renamed Premier shares.
Effective April 1, 2017, the ERT for each Fund was as follows (except for the Small/Mid Cap Equity Fund which was effective May 1, 2017):
|
Fund |
Class A | Class B | Premier | Legacy Class B |
Institutional | Class R-1 | Class R-2 | Class R-3 | ||||||||||||||||||||||||
| Equity Fund |
0.95 | % | 0.95 | % | 0.85 | % | 0.95 | % | 0.95 | % | 1.02 | % | 1.02 | % | 1.02 | % | ||||||||||||||||
| Small/Mid Cap Equity Fund (a) |
0.86 | % | 0.86 | % | 0.76 | % | 0.86 | % | 0.86 | % | 0.93 | % | 0.93 | % | 0.93 | % | ||||||||||||||||
| International Equity Fund |
1.25 | % | 1.25 | % | 1.15 | % | 1.25 | % | 1.25 | % | 1.32 | % | 1.32 | % | 1.32 | % | ||||||||||||||||
| S&P 500 Index Fund |
0.48 | % | 0.48 | % | 0.38 | % | 0.48 | % | 0.48 | % | 0.55 | % | 0.55 | % | 0.55 | % | ||||||||||||||||
| Small Cap Index Fund |
0.50 | % | 0.50 | % | 0.40 | % | 0.50 | % | 0.50 | % | 0.57 | % | 0.57 | % | 0.57 | % | ||||||||||||||||
| International Index Fund |
0.61 | % | 0.61 | % | 0.51 | % | 0.61 | % | 0.61 | % | 0.68 | % | 0.68 | % | 0.68 | % | ||||||||||||||||
| Equity and Bond Fund |
0.00 | % | 0.00 | % | (0.10 | )% | 0.00 | % | 0.00 | % | 0.07 | % | 0.07 | % | 0.07 | % | ||||||||||||||||
| Bond Fund |
0.45 | % | 0.45 | % | 0.35 | % | 0.45 | % | 0.45 | % | 0.52 | % | 0.52 | % | 0.52 | % | ||||||||||||||||
| Tax Advantaged Bond Fund |
0.45 | % | 0.45 | % | 0.35 | % | 0.45 | % | — | — | — | — | ||||||||||||||||||||
| Money Market Fund |
0.45 | % | 0.45 | % | 0.35 | % | 0.45 | % | 0.45 | % | 0.52 | % | 0.52 | % | 0.52 | % | ||||||||||||||||
| LifePath Retirement Fund |
0.63 | % | 0.63 | % | 0.53 | % | 0.63 | % | 0.63 | % | 0.70 | % | 0.70 | % | 0.70 | % | ||||||||||||||||
| LifePath 2020 Fund |
0.63 | % | 0.63 | % | 0.53 | % | 0.63 | % | 0.63 | % | 0.70 | % | 0.70 | % | 0.70 | % | ||||||||||||||||
| LifePath 2030 Fund |
0.63 | % | 0.63 | % | 0.53 | % | 0.63 | % | 0.63 | % | 0.70 | % | 0.70 | % | 0.70 | % | ||||||||||||||||
| LifePath 2040 Fund |
0.63 | % | 0.63 | % | 0.53 | % | 0.63 | % | 0.63 | % | 0.70 | % | 0.70 | % | 0.70 | % | ||||||||||||||||
| LifePath 2050 Fund |
0.63 | % | — | 0.53 | % | — | — | 0.70 | % | 0.70 | % | — | ||||||||||||||||||||
|
(a) From April 1, 2017 to April 30, 2017, the ERT for Small/Mid Cap Equity Fund Class A, Class B, Premier, Legacy Class B, Class R-1 and Class R-2 was 1.15%, 1.15%, 1.05%, 1.15%, 1.22%, and 1.22%, respectively. |
| |||||||||||||||||||||||||||||||
Effective May 1, 2017, SFIMC contractually agreed to waive 0.29% of investment advisory and management services fees for each share class of the Small/Mid Cap Equity Fund producing a net fee of 0.51% (0.80% — 0.29%). SFIMC may not discontinue this waiver before April 30, 2018, without the consent of the Board.
Effective April 1, 2017, for each Fund, VP Management Corp. agreed to waive all distribution and service (12b-1) fees for Class A, Class B, Premier, Legacy Class B, Class R-1 and Class R-2 shares as noted in the Distribution and Shareholder Services Agreements table. This arrangement is voluntary and may be eliminated by VP Management Corp. at any time.
130
STATE FARM MUTUAL FUND TRUST
NOTES TO FINANCIAL STATEMENTS (continued)
(Unaudited)
Prior to April 1, 2017, the ERT for each Fund were as follows:
|
Fund |
Class A | Class B | Premier | Legacy Class B |
Institutional | Class R-1 | Class R-2 | Class R-3 | ||||||||||||||||||||||||
| Equity Fund (a) |
1.20 | % | 1.90 | % | 1.10 | % | 1.60 | % | 0.95 | % | 1.52 | % | 1.32 | % | 1.02 | % | ||||||||||||||||
| Small/Mid Cap Equity Fund (a) |
1.40 | % | 2.10 | % | 1.30 | % | 1.80 | % | 1.15 | % | 1.72 | % | 1.52 | % | 1.22 | % | ||||||||||||||||
| International Equity Fund (a) |
1.50 | % | 2.20 | % | 1.40 | % | 1.90 | % | 1.25 | % | 1.82 | % | 1.62 | % | 1.32 | % | ||||||||||||||||
| S&P 500 Index Fund (b)(c) |
0.73 | % | 1.43 | % | 0.63 | % | 1.13 | % | 0.48 | % | 1.05 | % | 0.85 | % | 0.55 | % | ||||||||||||||||
| Small Cap Index Fund (c)(d) |
0.75 | % | 1.30 | % | 0.65 | % | 1.15 | % | 0.50 | % | 1.07 | % | 0.87 | % | 0.57 | % | ||||||||||||||||
| International Index Fund (c)(e) |
0.86 | % | 1.56 | % | 0.76 | % | 1.26 | % | 0.61 | % | 1.18 | % | 0.98 | % | 0.68 | % | ||||||||||||||||
| Equity and Bond Fund (a) |
0.25 | % | 0.95 | % | 0.15 | % | 0.65 | % | — | 0.57 | % | 0.37 | % | 0.07 | % | |||||||||||||||||
| Bond Fund (a) |
0.70 | % | 1.10 | % | 0.60 | % | 1.10 | % | 0.45 | % | 1.02 | % | 0.82 | % | 0.52 | % | ||||||||||||||||
| Tax Advantaged Bond Fund (a) |
0.70 | % | 1.10 | % | 0.60 | % | 1.10 | % | ||||||||||||||||||||||||
| Money Market Fund (a) |
0.60 | % | 1.00 | % | 0.50 | % | 1.00 | % | 0.45 | % | 0.92 | % | 0.72 | % | 0.52 | % | ||||||||||||||||
| LifePath Retirement Fund (f) |
0.88 | % | 1.58 | % | 0.78 | % | 1.28 | % | 0.63 | % | 1.20 | % | 1.00 | % | 0.70 | % | ||||||||||||||||
| LifePath 2020 Fund (f) |
0.88 | % | 1.58 | % | 0.78 | % | 1.28 | % | 0.63 | % | 1.20 | % | 1.00 | % | 0.70 | % | ||||||||||||||||
| LifePath 2030 Fund (f) |
0.88 | % | 1.08 | % | 0.78 | % | 1.28 | % | 0.63 | % | 1.20 | % | 1.00 | % | 0.70 | % | ||||||||||||||||
| LifePath 2040 Fund (f) |
0.88 | % | 1.08 | % | 0.78 | % | 1.28 | % | 0.63 | % | 1.20 | % | 1.00 | % | 0.70 | % | ||||||||||||||||
| LifePath 2050 Fund (f) |
0.88 | % | 0.78 | % | 1.20 | % | 1.00 | % | ||||||||||||||||||||||||
| (a) Through May 20, 2016, the ERT for the Premier shares of the Equity Fund, Small/Mid Cap Equity Fund, International Equity Fund, Equity and Bond Fund, Bond Fund, Tax Advantaged Bond Fund and Money Market Fund was 1.20%, 1.40%, 1.50%, 0.25%, 0.70%, 0.70% and 0.60%, respectively. |
| |||||||||||||||||||||||||||||||
| (b) Through April 30, 2016, the ERT for the S&P 500 Index Fund Class A, Class B, Legacy Class B, Institutional, Class R-1, Class R-2, and Class R-3 was 0.78%, 1.48%, 1.18%, 0.53%, 1.10%, 0.90% and 0.60%. |
| |||||||||||||||||||||||||||||||
| (c) Through April 30, 2016, the ERT for the Premier shares of the S&P 500 Index Fund, Small Cap Index Fund and International Index Fund was 0.78%, 0.93%. and 1.18%. From May 1, 2016 to May 20, 2016, the ERT for the Premier shares of the S&P 500 Index Fund, Small Cap Index Fund and International Index Fund was 0.73%, 0.75% and 0.86%. |
| |||||||||||||||||||||||||||||||
| (d) Through April 30, 2016, the ERT for Small Cap Index Fund Class A, Class B, Legacy Class B, Institutional, Class R-1, Class R-2 and Class R-3 was 0.93%, 1.48%, 1.33%, 0.68%, 1.25%, 1.05%, and 0.75%. |
| |||||||||||||||||||||||||||||||
| (e) Through April 30, 2016, the ERT for International Index Fund Class A, Class B, Legacy Class B, Institutional, Class R-1, Class R-2 and Class R-3 was 1.18%, 1.88%, 1.58%, 0.93%, 1.50%, 1.30% and 1.00%. |
| |||||||||||||||||||||||||||||||
|
(f) From January 1, 2016 to May 20, 2016, the ERT for the Premier shares of each of the LifePath Retirement Fund, LifePath 2020 Fund, LifePath 2030 Fund and LifePath 2040 Fund was 0.88%. |
| |||||||||||||||||||||||||||||||
Effective May 21, 2016, to ensure that the Premier shares of the Equity and Bond Fund are subject to a shareholder services fee of 0.15% of average daily net assets of the Equity and Bond Fund through its investment in the Institutional shares of the Equity Fund and Bond Fund, SFIMC agreed to waive fees in the amount of 0.10% of the average daily net assets of Equity and Bond Fund Premier shares. This SFIMC waiver may be terminated by SFIMC with 60 days notice to the Trust.
SFIMC and VP Management Corp. have agreed to waive their fees to the extent necessary to prevent the Money Market Fund’s net investment income from decreasing below zero. This arrangement is voluntary and may be eliminated by SFIMC or VP Management Corp. at any time.
Related Party Disclosure
As of June 30, 2017, State Farm Mutual Automobile Insurance Company (“Auto Company”), the parent company of SFIMC, owned more than 10% of the outstanding shares of each Class of the following Funds:
|
Fund |
Class A | Class B | Premier | Legacy Class B |
Institutional | Class R-1 | Class R-2 | Class R-3 | ||||||||||||||||||||||||
| Small/Mid Cap Equity Fund |
11.61 | % | 84.76 | % | 20.80 | % | 79.30 | % | — | 36.32 | % | 11.69 | % | 45.67 | % | |||||||||||||||||
| International Equity Fund |
26.13 | % | 94.04 | % | 38.80 | % | 94.84 | % | 19.01 | % | 58.81 | % | 25.11 | % | 67.73 | % | ||||||||||||||||
| Small Cap Index Fund |
— | 83.99 | % | 19.11 | % | 82.87 | % | — | 36.14 | % | 15.00 | % | 47.65 | % | ||||||||||||||||||
| International Index Fund |
11.78 | % | 88.38 | % | 20.34 | % | 89.78 | % | — | 42.03 | % | 16.13 | % | 61.01 | % | |||||||||||||||||
| Equity and Bond Fund |
— | 81.64 | % | 10.22 | % | 82.11 | % | — | 33.89 | % | 16.78 | % | 69.04 | % | ||||||||||||||||||
| Bond Fund |
— | 57.53 | % | — | — | — | 26.34 | % | 11.03 | % | 60.54 | % | ||||||||||||||||||||
| LifePath 2050 Fund |
— | — | — | — | — | 10.73 | % | — | — | |||||||||||||||||||||||
131
STATE FARM MUTUAL FUND TRUST
NOTES TO FINANCIAL STATEMENTS (continued)
(Unaudited)
Line of Credit
Auto Company, the parent company of SFIMC, has entered into a Line of Credit Agreement with the Trust. Under that agreement, a Fund may request and Auto Company, in its complete discretion, may lend money to a Fund for up to 30 days on an unsecured basis. The S&P 500 Index Fund, Small Cap Index Fund and International Index Fund may not borrow money from Auto Company under the agreement. Auto Company will not lend more than $50 million at any one time to the Funds and to the other mutual funds advised by SFIMC. Under the agreement, a Fund will pay interest to Auto Company on any outstanding loan at a benchmark interest rate that approximates the rate that creditworthy corporate issuers pay on short-term commercial paper. The Funds did not borrow under the Line of Credit Agreement during the six months ended June 30, 2017.
Officers and Trustees
Certain officers and/or trustees of the Trust are also officers and/or directors of SFIMC. The Trust made no payments to its officers or trustees except for trustees’ fees paid to or accrued for the Trust’s independent trustees.
| 7. | Investment Transactions |
For the six months ended June 30, 2017, investment transactions (exclusive of short-term instruments) were as follows:
|
Fund |
Purchases (excluding U.S. Government Obligations) |
Sales/ Maturities (excluding U.S. Government Obligations) |
Purchases of U.S. Government Obligations |
Sales/ Maturities of U.S. Government Obligations |
||||||||||||
| Equity Fund |
$ | 172,721,311 | $ | 191,321,561 | $ | — | $ | — | ||||||||
| Small/Mid Cap Equity Fund |
222,518,621 | 229,523,333 | — | — | ||||||||||||
| International Equity Fund |
39,711,215 | 42,143,936 | — | — | ||||||||||||
| S&P 500 Index Fund |
22,756,664 | 21,148,029 | — | — | ||||||||||||
| Small Cap Index Fund |
55,402,539 | 62,685,422 | — | — | ||||||||||||
| International Index Fund |
3,913,243 | 7,882,613 | — | — | ||||||||||||
| Equity and Bond Fund |
300,000 | 10,750,000 | — | — | ||||||||||||
| Bond Fund |
53,502,385 | 85,740,066 | 5,003,516 | 5,000,000 | ||||||||||||
| Tax Advantaged Bond Fund |
4,021,468 | 30,356,683 | — | — | ||||||||||||
| LifePath Retirement Fund |
19,532,301 | (a) | 83,298,156 | (a) | — | — | ||||||||||
| LifePath 2020 Fund |
69,838,606 | (a) | 146,725,389 | (a) | — | — | ||||||||||
| LifePath 2030 Fund |
61,175,893 | (a) | 91,728,122 | (a) | — | — | ||||||||||
| LifePath 2040 Fund |
44,986,753 | (a) | 48,353,231 | (a) | — | — | ||||||||||
| LifePath 2050 Fund |
14,202,460 | (a) | 8,956,406 | (a) | — | — | ||||||||||
|
(a) Purchases and sales relate primarily to investments in iShares ETFs. BlackRock, as subadviser to the LifePath Funds, is an affiliate of the LifePath Funds. BlackRock or its affiliates serve as the investment adviser to each of the iShares ETFs. |
| |||||||||||||||
Cross trades for the six months ended June 30, 2017 were executed by the S&P 500 Index Fund pursuant to Rule 17a-7 under the Investment Company Act of 1940 with other mutual funds that are affiliated with BlackRock, but are not part of the State Farm family of funds. Cross trading is the buying or selling of portfolio securities between funds. At its regularly scheduled quarterly meetings, the Board of Trustees reviews such transactions as of the most recent calendar quarter for compliance with the requirements and restrictions set forth by Rule 17a-7.
132
STATE FARM MUTUAL FUND TRUST
NOTES TO FINANCIAL STATEMENTS (continued)
(Unaudited)
| 8. | Fund Share Transactions |
At June 30, 2017, the Funds were authorized to issue an unlimited number of shares (no par value) in an unlimited number of classes. Proceeds and payments on Fund shares as shown in the Statements of Changes in Net Assets are in respect of the following number of shares and dollars by class (effective May 23, 2016, Legacy Class A shares were renamed Premier shares):
Six months ended June 30, 2017:
| Class A Dollar Amounts | Class A Share Amounts | |||||||||||||||||||||||||||||||
| 2017 |
Sales | Reinvestments | Redemptions | Net | Sales | Reinvestments | Redemptions | Net | ||||||||||||||||||||||||
| Equity Fund |
$ | 6,310,331 | $ | 3,175 | $ | 13,121,544 | $ | (6,808,038 | ) | 646,325 | 338 | 1,339,394 | (692,731 | ) | ||||||||||||||||||
| Small/Mid Cap Equity Fund |
6,048,794 | 1,656 | 8,598,314 | (2,547,864 | ) | 494,963 | 137 | 703,014 | (207,914 | ) | ||||||||||||||||||||||
| International Equity Fund |
1,383,520 | (1 | ) | 3,374,885 | (1,991,366 | ) | 124,442 | — | 304,762 | (180,320 | ) | |||||||||||||||||||||
| S&P 500 Index Fund |
35,754,924 | 9,340 | 55,563,010 | (19,798,746 | ) | 2,033,410 | 553 | 3,146,468 | (1,112,505 | ) | ||||||||||||||||||||||
| Small Cap Index Fund |
8,441,028 | 2,259 | 15,924,607 | (7,481,320 | ) | 493,429 | 132 | 927,802 | (434,241 | ) | ||||||||||||||||||||||
| International Index Fund |
4,201,402 | 772 | 9,321,805 | (5,119,631 | ) | 364,963 | 72 | 801,401 | (436,366 | ) | ||||||||||||||||||||||
| Equity and Bond Fund |
7,724,021 | 540,126 | 13,912,853 | (5,648,706 | ) | 673,122 | 45,833 | 1,209,679 | (490,724 | ) | ||||||||||||||||||||||
| Bond Fund |
10,339,007 | 2,343,733 | 25,273,572 | (12,590,832 | ) | 922,355 | 208,454 | 2,252,003 | (1,121,194 | ) | ||||||||||||||||||||||
| Tax Advantaged Bond Fund |
2,977,803 | 1,168,838 | 14,177,663 | (10,031,022 | ) | 252,774 | 99,032 | 1,204,096 | (852,290 | ) | ||||||||||||||||||||||
| Money Market Fund |
37,032,183 | 67,964 | 49,315,393 | (12,215,246 | ) | 37,032,182 | 67,962 | 49,315,392 | (12,215,248 | ) | ||||||||||||||||||||||
| LifePath Retirement Fund |
16,297,935 | 2,091,350 | 48,387,841 | (29,998,556 | ) | 1,304,386 | 165,130 | 3,864,784 | (2,395,268 | ) | ||||||||||||||||||||||
| LifePath 2020 Fund |
39,897,551 | 19,657 | 93,462,621 | (53,545,413 | ) | 2,803,345 | 1,425 | 6,552,369 | (3,747,599 | ) | ||||||||||||||||||||||
| LifePath 2030 Fund |
58,964,777 | 1,833 | 108,062,026 | (49,095,416 | ) | 3,880,431 | 126 | 7,097,483 | (3,216,926 | ) | ||||||||||||||||||||||
| LifePath 2040 Fund |
51,991,055 | 23,074 | 79,267,884 | (27,253,755 | ) | 3,242,964 | 1,517 | 4,928,296 | (1,683,815 | ) | ||||||||||||||||||||||
| LifePath 2050 Fund |
26,147,248 | 593 | 27,597,672 | (1,449,831 | ) | 2,362,404 | 57 | 2,483,089 | (120,628 | ) | ||||||||||||||||||||||
| Class B Dollar Amounts | Class B Share Amounts | |||||||||||||||||||||||||||||||
| 2017 |
Sales | Reinvestments | Redemptions | Net | Sales | Reinvestments | Redemptions | Net | ||||||||||||||||||||||||
| Equity Fund |
— | — | $ | 298,159 | $ | (298,159 | ) | — | — | 30,524 | (30,524 | ) | ||||||||||||||||||||
| Small/Mid Cap Equity Fund |
4,804 | — | 354,019 | (349,215 | ) | 426 | — | 31,572 | (31,146 | ) | ||||||||||||||||||||||
| International Equity Fund |
— | — | 111,615 | (111,615 | ) | — | — | 10,566 | (10,566 | ) | ||||||||||||||||||||||
| S&P 500 Index Fund |
68,483 | — | 1,423,045 | (1,354,562 | ) | 3,927 | — | 80,024 | (76,097 | ) | ||||||||||||||||||||||
| Small Cap Index Fund |
14,175 | — | 360,055 | (345,880 | ) | 856 | — | 21,580 | (20,724 | ) | ||||||||||||||||||||||
| International Index Fund |
— | — | 244,833 | (244,833 | ) | — | — | 21,270 | (21,270 | ) | ||||||||||||||||||||||
| Equity and Bond Fund |
5,173 | 7,421 | 263,550 | (250,956 | ) | 463 | 629 | 23,009 | (21,917 | ) | ||||||||||||||||||||||
| Bond Fund |
10,444 | 47,879 | 573,462 | (515,139 | ) | 942 | 4,260 | 51,126 | (45,924 | ) | ||||||||||||||||||||||
| Tax Advantaged Bond Fund |
— | 25,918 | 290,696 | (264,778 | ) | — | 2,195 | 24,577 | (22,382 | ) | ||||||||||||||||||||||
| Money Market Fund |
154,239 | 133 | 214,622 | (60,250 | ) | 154,238 | 133 | 214,622 | (60,251 | ) | ||||||||||||||||||||||
| LifePath Retirement Fund |
7,148 | 26,846 | 1,237,541 | (1,203,547 | ) | 572 | 2,097 | 97,993 | (95,324 | ) | ||||||||||||||||||||||
| LifePath 2020 Fund |
12,486 | 147 | 2,889,469 | (2,876,836 | ) | 899 | 11 | 203,890 | (202,980 | ) | ||||||||||||||||||||||
| LifePath 2030 Fund |
75,604 | 2 | 3,676,568 | (3,600,962 | ) | 5,064 | 1 | 242,086 | (237,021 | ) | ||||||||||||||||||||||
| LifePath 2040 Fund |
12,602 | — | 4,516,404 | (4,503,802 | ) | 812 | — | 282,315 | (281,503 | ) | ||||||||||||||||||||||
133
STATE FARM MUTUAL FUND TRUST
NOTES TO FINANCIAL STATEMENTS (continued)
(Unaudited)
| Premier Shares Dollar Amounts | Premier Shares Share Amounts | |||||||||||||||||||||||||||||||
| 2017 |
Sales | Reinvestments | Redemptions | Net | Sales | Reinvestments | Redemptions | Net | ||||||||||||||||||||||||
| Equity Fund |
$ | 8,654,984 | $ | (5,928 | ) | $ | 10,292,220 | $ | (1,643,164 | ) | 843,502 | (602 | ) | 1,004,347 | (161,447 | ) | ||||||||||||||||
| Small/Mid Cap Equity Fund |
5,624,425 | (67 | ) | 7,266,193 | (1,641,835 | ) | 468,821 | (6 | ) | 606,657 | (137,842 | ) | ||||||||||||||||||||
| International Equity Fund |
2,960,097 | — | 2,209,112 | 750,985 | 264,156 | — | 199,403 | 64,753 | ||||||||||||||||||||||||
| S&P 500 Index Fund |
53,587,389 | (306 | ) | 52,020,331 | 1,566,752 | 3,022,087 | (18 | ) | 2,936,076 | 85,993 | ||||||||||||||||||||||
| Small Cap Index Fund |
12,791,085 | (2,335 | ) | 11,827,672 | 961,078 | 752,100 | (138 | ) | 697,438 | 54,524 | ||||||||||||||||||||||
| International Index Fund |
7,650,932 | (501 | ) | 7,976,535 | (326,104 | ) | 663,046 | (47 | ) | 693,666 | (30,667 | ) | ||||||||||||||||||||
| Equity and Bond Fund |
10,683,434 | 628,397 | 11,699,070 | (387,239 | ) | 918,901 | 52,719 | 1,004,581 | (32,961 | ) | ||||||||||||||||||||||
| Bond Fund |
17,754,882 | 4,363,586 | 41,010,431 | (18,891,963 | ) | 1,582,779 | 387,813 | 3,652,669 | (1,682,077 | ) | ||||||||||||||||||||||
| Tax Advantaged Bond Fund |
18,161,118 | 4,376,583 | 47,533,357 | (24,995,656 | ) | 1,546,056 | 371,193 | 4,041,984 | (2,124,735 | ) | ||||||||||||||||||||||
| Money Market Fund |
53,135,386 | 147,662 | 77,103,912 | (23,820,864 | ) | 53,135,386 | 147,662 | 77,103,912 | (23,820,864 | ) | ||||||||||||||||||||||
| LifePath Retirement Fund |
30,833,567 | 4,149,809 | 64,067,890 | (29,084,514 | ) | 2,411,173 | 320,434 | 5,002,848 | (2,271,241 | ) | ||||||||||||||||||||||
| LifePath 2020 Fund |
59,882,246 | 404 | 77,855,917 | (17,973,267 | ) | 4,225,653 | 29 | 5,493,489 | (1,267,807 | ) | ||||||||||||||||||||||
| LifePath 2030 Fund |
71,712,465 | 375 | 56,928,672 | 14,784,168 | 4,712,500 | 25 | 3,732,390 | 980,135 | ||||||||||||||||||||||||
| LifePath 2040 Fund |
41,551,728 | (33,616 | ) | 21,296,481 | 20,221,631 | 2,569,795 | (2,201 | ) | 1,322,345 | 1,245,249 | ||||||||||||||||||||||
| LifePath 2050 Fund |
11,603,972 | 174 | 5,457,898 | 6,146,248 | 1,045,642 | 17 | 493,499 | 552,160 | ||||||||||||||||||||||||
| Legacy Class B Dollar Amounts | Legacy Class B Share Amounts | |||||||||||||||||||||||||||||||
| 2017 |
Sales | Reinvestments | Redemptions | Net | Sales | Reinvestments | Redemptions | Net | ||||||||||||||||||||||||
| Equity Fund |
— | — | $ | 1,434,971 | $ | (1,434,971 | ) | — | — | 140,198 | (140,198 | ) | ||||||||||||||||||||
| Small/Mid Cap Equity Fund |
19,514 | 29 | 752,668 | (733,125 | ) | 1,790 | 3 | 68,761 | (66,968 | ) | ||||||||||||||||||||||
| International Equity Fund |
750 | — | 194,627 | (193,877 | ) | 66 | — | 17,832 | (17,766 | ) | ||||||||||||||||||||||
| S&P 500 Index Fund |
53,460 | — | 4,424,726 | (4,371,266 | ) | 3,000 | — | 246,596 | (243,596 | ) | ||||||||||||||||||||||
| Small Cap Index Fund |
67,183 | — | 1,359,400 | (1,292,217 | ) | 4,096 | — | 82,214 | (78,118 | ) | ||||||||||||||||||||||
| International Index Fund |
12,840 | — | 395,689 | (382,849 | ) | 1,140 | — | 33,970 | (32,830 | ) | ||||||||||||||||||||||
| Equity and Bond Fund |
— | 13,551 | 864,516 | (850,965 | ) | — | 1,134 | 74,436 | (73,302 | ) | ||||||||||||||||||||||
| Bond Fund |
11,971 | 23,601 | 594,184 | (558,612 | ) | 1,067 | 2,095 | 52,865 | (49,703 | ) | ||||||||||||||||||||||
| Tax Advantaged Bond Fund |
— | 1,418 | 20,025 | (18,607 | ) | — | 120 | 1,700 | (1,580 | ) | ||||||||||||||||||||||
| Money Market Fund |
162,887 | 159 | 201,464 | (38,418 | ) | 162,887 | 159 | 201,464 | (38,418 | ) | ||||||||||||||||||||||
| LifePath Retirement Fund |
12,388 | 13,611 | 785,305 | (759,306 | ) | 965 | 1,040 | 60,925 | (58,920 | ) | ||||||||||||||||||||||
| LifePath 2020 Fund |
200 | — | 2,665,006 | (2,664,806 | ) | 14 | — | 186,403 | (186,389 | ) | ||||||||||||||||||||||
| LifePath 2030 Fund |
22,164 | — | 2,563,657 | (2,541,493 | ) | 1,468 | — | 167,323 | (165,855 | ) | ||||||||||||||||||||||
| LifePath 2040 Fund |
9,869 | — | 2,699,296 | (2,689,427 | ) | 609 | — | 166,616 | (166,007 | ) | ||||||||||||||||||||||
134
STATE FARM MUTUAL FUND TRUST
NOTES TO FINANCIAL STATEMENTS (continued)
(Unaudited)
| Institutional Shares Dollar Amounts | Institutional Shares Share Amounts | |||||||||||||||||||||||||||||||
| 2017 |
Sales | Reinvestments | Redemptions | Net | Sales | Reinvestments | Redemptions | Net | ||||||||||||||||||||||||
| Equity Fund |
$ | 4,907,816 | $ | 103 | $ | 16,356,752 | $ | (11,448,833 | ) | 502,813 | 11 | 1,655,142 | (1,152,318 | ) | ||||||||||||||||||
| Small/Mid Cap Equity Fund |
3,234,235 | (13 | ) | 5,032,967 | (1,798,745 | ) | 257,798 | (1 | ) | 399,447 | (141,650 | ) | ||||||||||||||||||||
| International Equity Fund |
1,303,205 | (2 | ) | 1,178,006 | 125,197 | 116,204 | — | 105,695 | 10,509 | |||||||||||||||||||||||
| S&P 500 Index Fund |
22,888,576 | (1,714 | ) | 19,242,320 | 3,644,542 | 1,294,025 | (101 | ) | 1,086,376 | 207,548 | ||||||||||||||||||||||
| Small Cap Index Fund |
6,597,745 | (52 | ) | 6,345,503 | 252,190 | 381,082 | (3 | ) | 367,765 | 13,314 | ||||||||||||||||||||||
| International Index Fund |
3,417,474 | (636 | ) | 3,009,276 | 407,562 | 293,928 | (59 | ) | 259,708 | 34,161 | ||||||||||||||||||||||
| Equity and Bond Fund |
1,879,914 | 180,870 | 4,066,389 | (2,005,605 | ) | 163,650 | 15,315 | 353,020 | (174,055 | ) | ||||||||||||||||||||||
| Bond Fund |
7,281,746 | 1,489,163 | 9,578,806 | (807,897 | ) | 649,937 | 132,484 | 854,135 | (71,714 | ) | ||||||||||||||||||||||
| Money Market Fund |
27,619,656 | 80,229 | 30,271,708 | (2,571,823 | ) | 27,619,656 | 80,229 | 30,271,708 | (2,571,823 | ) | ||||||||||||||||||||||
| LifePath Retirement Fund |
5,939,813 | 636,910 | 7,560,481 | (983,758 | ) | 465,033 | 49,202 | 589,217 | (74,982 | ) | ||||||||||||||||||||||
| LifePath 2020 Fund |
10,978,475 | 84 | 15,762,168 | (4,783,609 | ) | 771,284 | 6 | 1,102,256 | (330,966 | ) | ||||||||||||||||||||||
| LifePath 2030 Fund |
15,779,313 | (116 | ) | 13,997,286 | 1,781,911 | 1,032,177 | (8 | ) | 916,805 | 115,364 | ||||||||||||||||||||||
| LifePath 2040 Fund |
24,281,630 | 940 | 19,374,612 | 4,907,958 | 1,504,748 | 61 | 1,198,721 | 306,088 | ||||||||||||||||||||||||
| Class R-1 Dollar Amounts | Class R-1 Share Amounts | |||||||||||||||||||||||||||||||
| 2017 |
Sales | Reinvestments | Redemptions | Net | Sales | Reinvestments | Redemptions | Net | ||||||||||||||||||||||||
| Equity Fund |
$ | 355,951 | — | $ | 739,214 | $ | (383,263 | ) | 36,787 | — | 74,285 | (37,498 | ) | |||||||||||||||||||
| Small/Mid Cap Equity Fund |
294,368 | — | 427,301 | (132,933 | ) | 25,437 | — | 37,336 | (11,899 | ) | ||||||||||||||||||||||
| International Equity Fund |
170,037 | — | 507,535 | (337,498 | ) | 15,670 | — | 46,225 | (30,555 | ) | ||||||||||||||||||||||
| S&P 500 Index Fund |
1,473,516 | — | 2,329,549 | (856,033 | ) | 83,773 | — | 131,354 | (47,581 | ) | ||||||||||||||||||||||
| Small Cap Index Fund |
305,658 | — | 672,166 | (366,508 | ) | 17,825 | — | 39,345 | (21,520 | ) | ||||||||||||||||||||||
| International Index Fund |
220,652 | — | 289,648 | (68,996 | ) | 18,701 | — | 25,228 | (6,527 | ) | ||||||||||||||||||||||
| Equity and Bond Fund |
251,800 | 8,723 | 306,432 | (45,909 | ) | 22,301 | 750 | 26,980 | (3,929 | ) | ||||||||||||||||||||||
| Bond Fund |
607,674 | 32,260 | 455,768 | 184,166 | 54,059 | 2,868 | 40,586 | 16,341 | ||||||||||||||||||||||||
| Money Market Fund |
941,868 | 1,743 | 1,065,228 | (121,617 | ) | 941,868 | 1,743 | 1,065,228 | (121,617 | ) | ||||||||||||||||||||||
| LifePath Retirement Fund |
538,682 | 32,104 | 1,001,713 | (430,927 | ) | 42,949 | 2,520 | 79,633 | (34,164 | ) | ||||||||||||||||||||||
| LifePath 2020 Fund |
2,213,554 | — | 4,931,432 | (2,717,878 | ) | 156,257 | — | 346,771 | (190,514 | ) | ||||||||||||||||||||||
| LifePath 2030 Fund |
3,484,742 | — | 8,045,388 | (4,560,646 | ) | 231,501 | — | 525,757 | (294,256 | ) | ||||||||||||||||||||||
| LifePath 2040 Fund |
3,050,903 | — | 5,333,521 | (2,282,618 | ) | 192,121 | — | 330,562 | (138,441 | ) | ||||||||||||||||||||||
| LifePath 2050 Fund |
1,793,730 | — | 1,932,342 | (138,612 | ) | 162,047 | — | 173,861 | (11,814 | ) | ||||||||||||||||||||||
135
STATE FARM MUTUAL FUND TRUST
NOTES TO FINANCIAL STATEMENTS (continued)
(Unaudited)
| Class R-2 Dollar Amounts | Class R-2 Share Amounts | |||||||||||||||||||||||||||||||
| 2017 |
Sales | Reinvestments | Redemptions | Net | Sales | Reinvestments | Redemptions | Net | ||||||||||||||||||||||||
| Equity Fund |
$ | 1,477,477 | — | $ | 1,842,118 | $ | (364,641 | ) | 150,042 | — | 186,662 | (36,620 | ) | |||||||||||||||||||
| Small/Mid Cap Equity Fund |
1,098,613 | — | 1,504,206 | (405,593 | ) | 92,881 | — | 126,570 | (33,689 | ) | ||||||||||||||||||||||
| International Equity Fund |
547,700 | — | 416,131 | 131,569 | 48,384 | — | 36,847 | 11,537 | ||||||||||||||||||||||||
| S&P 500 Index Fund |
3,792,631 | — | 4,723,831 | (931,200 | ) | 214,832 | — | 267,066 | (52,234 | ) | ||||||||||||||||||||||
| Small Cap Index Fund |
1,236,296 | — | 1,935,508 | (699,212 | ) | 72,246 | — | 112,514 | (40,268 | ) | ||||||||||||||||||||||
| International Index Fund |
801,380 | — | 1,131,000 | (329,620 | ) | 69,297 | — | 97,792 | (28,495 | ) | ||||||||||||||||||||||
| Equity and Bond Fund |
713,012 | 25,257 | 1,047,787 | (309,518 | ) | 62,831 | 2,168 | 91,325 | (26,326 | ) | ||||||||||||||||||||||
| Bond Fund |
1,061,749 | 98,029 | 1,243,346 | (83,568 | ) | 94,664 | 8,727 | 110,954 | (7,563 | ) | ||||||||||||||||||||||
| Money Market Fund |
1,955,329 | 5,471 | 4,275,034 | (2,314,234 | ) | 1,955,330 | 5,471 | 4,275,034 | (2,314,233 | ) | ||||||||||||||||||||||
| LifePath Retirement Fund |
1,535,282 | 126,339 | 4,083,155 | (2,421,534 | ) | 119,563 | 9,714 | 316,301 | (187,024 | ) | ||||||||||||||||||||||
| LifePath 2020 Fund |
7,334,162 | — | 10,120,805 | (2,786,643 | ) | 517,060 | — | 710,771 | (193,711 | ) | ||||||||||||||||||||||
| LifePath 2030 Fund |
10,444,487 | — | 8,305,042 | 2,139,445 | 683,063 | — | 543,796 | 139,267 | ||||||||||||||||||||||||
| LifePath 2040 Fund |
8,106,056 | — | 7,679,940 | 426,116 | 503,093 | — | 479,294 | 23,799 | ||||||||||||||||||||||||
| LifePath 2050 Fund |
3,583,697 | — | 3,667,931 | (84,234 | ) | 323,045 | — | 326,359 | (3,314 | ) | ||||||||||||||||||||||
| Class R-3 Dollar Amounts | Class R-3 Share Amounts | |||||||||||||||||||||||||||||||
| 2017 |
Sales | Reinvestments | Redemptions | Net | Sales | Reinvestments | Redemptions | Net | ||||||||||||||||||||||||
| Equity Fund |
$ | 75,979 | — | $ | 252,092 | $ | (176,113 | ) | 7,690 | — | 25,467 | (17,777 | ) | |||||||||||||||||||
| Small/Mid Cap Equity Fund |
212,347 | — | 144,727 | 67,620 | 17,179 | — | 11,676 | 5,503 | ||||||||||||||||||||||||
| International Equity Fund |
60,022 | — | 17,685 | 42,337 | 5,247 | — | 1,541 | 3,706 | ||||||||||||||||||||||||
| S&P 500 Index Fund |
580,693 | — | 134,678 | 446,015 | 32,890 | — | 7,513 | 25,377 | ||||||||||||||||||||||||
| Small Cap Index Fund |
589,696 | — | 126,544 | 463,152 | 34,781 | — | 7,377 | 27,404 | ||||||||||||||||||||||||
| International Index Fund |
56,570 | — | 78,675 | (22,105 | ) | 4,787 | — | 6,848 | (2,061 | ) | ||||||||||||||||||||||
| Equity and Bond Fund |
26,552 | 2,737 | 62,446 | (33,157 | ) | 2,326 | 235 | 5,475 | (2,914 | ) | ||||||||||||||||||||||
| Bond Fund |
72,794 | 8,515 | 60,269 | 21,040 | 6,488 | 757 | 5,419 | 1,826 | ||||||||||||||||||||||||
| Money Market Fund |
90,593 | 1,149 | 66,413 | 25,329 | 90,594 | 1,149 | 66,413 | 25,330 | ||||||||||||||||||||||||
| LifePath Retirement Fund |
110,890 | 10,087 | 347,102 | (226,125 | ) | 8,671 | 781 | 26,609 | (17,157 | ) | ||||||||||||||||||||||
| LifePath 2020 Fund |
144,605 | — | 827,038 | (682,433 | ) | 10,117 | — | 58,343 | (48,226 | ) | ||||||||||||||||||||||
| LifePath 2030 Fund |
488,150 | — | 596,030 | (107,880 | ) | 31,935 | — | 39,170 | (7,235 | ) | ||||||||||||||||||||||
| LifePath 2040 Fund |
692,422 | — | 555,160 | 137,262 | 42,396 | — | 33,243 | 9,153 | ||||||||||||||||||||||||
136
STATE FARM MUTUAL FUND TRUST
NOTES TO FINANCIAL STATEMENTS (continued)
(Unaudited)
The following reflects the conversion of shares between classes (reflected as Sales and Redemptions) for the six months ended June 30, 2017 (effective May 23, 2016, Legacy Class A shares were renamed Premier shares).
|
Fund |
Class A Dollar Amounts from Class B |
Class A Share Amounts from Class B |
Class A Dollar Amounts from Premier |
Class A Share Amounts from Premier |
Class A Dollar Amounts from Legacy Class B |
Class A Share Amounts from Legacy Class B |
Class A Dollar Amounts from Class R-2 |
Class A Share Amounts from Class R-2 |
||||||||||||||||||||||||
| Equity Fund |
$ | 191,885 | 19,439 | $ | — | — | $ | 898,888 | 91,893 | $ | 224,932 | 22,176 | ||||||||||||||||||||
| Small/Mid Cap Equity Fund |
170,791 | 13,999 | — | — | 452,802 | 37,050 | 288,788 | 23,511 | ||||||||||||||||||||||||
| International Equity Fund |
57,418 | 5,211 | — | — | 120,643 | 10,934 | 31,613 | 2,630 | ||||||||||||||||||||||||
| S&P 500 Index Fund |
870,014 | 49,212 | — | — | 3,475,486 | 196,835 | 1,111,615 | 60,718 | ||||||||||||||||||||||||
| Small Cap Index Fund |
204,578 | 11,927 | 4,184 | 294 | 1,100,030 | 64,242 | 380,072 | 21,781 | ||||||||||||||||||||||||
| International Index Fund |
151,313 | 13,130 | — | — | 302,863 | 26,181 | 104,103 | 8,695 | ||||||||||||||||||||||||
| Equity and Bond Fund |
134,252 | 11,703 | — | — | 647,766 | 56,412 | 448,375 | 38,177 | ||||||||||||||||||||||||
| Bond Fund |
237,417 | 21,145 | — | — | 323,157 | 28,767 | 12,639 | 1,116 | ||||||||||||||||||||||||
| Tax Advantaged Bond Fund |
19,645 | 1,652 | — | — | 11,784 | 1,000 | — | — | ||||||||||||||||||||||||
| Money Market Fund |
13,155 | 13,155 | — | — | 72,744 | 72,744 | 878,298 | 878,298 | ||||||||||||||||||||||||
| LifePath Retirement Fund |
715,679 | 56,942 | — | — | 555,556 | 44,341 | 76,606 | 5,980 | ||||||||||||||||||||||||
| LifePath 2020 Fund |
1,754,640 | 122,917 | — | — | 2,004,441 | 140,706 | 3,032,594 | 211,303 | ||||||||||||||||||||||||
| LifePath 2030 Fund |
2,291,970 | 150,022 | — | — | 1,946,263 | 127,749 | 1,418,706 | 90,306 | ||||||||||||||||||||||||
| LifePath 2040 Fund |
3,050,682 | 189,765 | — | — | 2,136,943 | 133,281 | 921,706 | 55,742 | ||||||||||||||||||||||||
| LifePath 2050 Fund |
— | — | — | — | — | — | 343,613 | 29,776 | ||||||||||||||||||||||||
|
Fund |
Premier Dollar Amounts from Class A |
Premier Share Amounts from Class A |
Class R-2 Dollar Amounts from Class R-1 |
Class R-2 Share Amounts from Class R-1 |
||||||||||||
| Equity Fund |
$ | 5,256,105 | 508,702 | $ | 619,266 | 62,064 | ||||||||||
| Small/Mid Cap Equity Fund |
3,145,686 | 262,156 | 364,339 | 30,946 | ||||||||||||
| International Equity Fund |
1,606,003 | 142,279 | 194,989 | 16,627 | ||||||||||||
| S&P 500 Index Fund |
24,676,016 | 1,387,721 | 1,242,332 | 70,222 | ||||||||||||
| Small Cap Index Fund |
5,982,908 | 350,315 | 399,181 | 23,300 | ||||||||||||
| International Index Fund |
3,823,533 | 328,819 | 202,335 | 17,626 | ||||||||||||
| Equity and Bond Fund |
5,632,839 | 480,768 | 178,344 | 15,568 | ||||||||||||
| Bond Fund |
7,841,479 | 698,058 | 170,528 | 15,134 | ||||||||||||
| Tax Advantaged Bond Fund |
5,390,992 | 459,468 | — | — | ||||||||||||
| Money Market Fund |
6,389,548 | 6,389,548 | 63,758 | 63,758 | ||||||||||||
| LifePath Retirement Fund |
15,286,845 | 1,190,453 | 360,724 | 27,996 | ||||||||||||
| LifePath 2020 Fund |
31,867,230 | 2,237,449 | 3,022,610 | 211,801 | ||||||||||||
| LifePath 2030 Fund |
45,437,800 | 2,977,291 | 5,402,646 | 350,958 | ||||||||||||
| LifePath 2040 Fund |
29,612,670 | 1,827,413 | 3,103,393 | 190,752 | ||||||||||||
| LifePath 2050 Fund |
7,380,623 | 660,854 | 948,413 | 85,209 | ||||||||||||
137
STATE FARM MUTUAL FUND TRUST
NOTES TO FINANCIAL STATEMENTS (continued)
(Unaudited)
Year ended December 31, 2016 (effective May 23, 2016, Legacy Class A shares were renamed Premier shares; since commencement of investment operations on May 16, 2016 for the LifePath 2050 Fund Premier Shares):
| Class A Dollar Amounts | Class A Share Amounts | |||||||||||||||||||||||||||||||
| 2016 |
Sales | Reinvestments | Redemptions | Net | Sales | Reinvestments | Redemptions | Net | ||||||||||||||||||||||||
| Equity Fund |
$ | 97,727,895 | $ | 8,251,976 | $ | 115,601,587 | $ | (9,621,716 | ) | 10,825,906 | 877,869 | 12,744,735 | (1,040,960 | ) | ||||||||||||||||||
| Small/Mid Cap Equity Fund |
55,568,590 | 693,861 | 65,774,570 | (9,512,119 | ) | 5,247,606 | 57,341 | 6,148,539 | (843,592 | ) | ||||||||||||||||||||||
| International Equity Fund |
19,314,236 | (27 | ) | 27,797,125 | (8,482,916 | ) | 1,886,116 | (3 | ) | 2,712,314 | (826,201 | ) | ||||||||||||||||||||
| S&P 500 Index Fund |
400,821,445 | 11,612,982 | 441,114,896 | (28,680,469 | ) | 25,821,185 | 687,158 | 28,260,707 | (1,752,364 | ) | ||||||||||||||||||||||
| Small Cap Index Fund |
114,980,068 | 6,100,964 | 87,418,308 | 33,662,724 | 8,038,470 | 357,622 | 5,993,934 | 2,402,158 | ||||||||||||||||||||||||
| International Index Fund |
51,721,758 | 1,601,607 | 66,409,528 | (13,086,163 | ) | 4,846,207 | 149,404 | 6,203,707 | (1,208,096 | ) | ||||||||||||||||||||||
| Equity and Bond Fund |
100,343,113 | 5,310,121 | 124,114,449 | (18,461,215 | ) | 9,132,675 | 477,540 | 11,259,147 | (1,648,932 | ) | ||||||||||||||||||||||
| Bond Fund |
155,343,887 | 6,272,157 | 368,598,918 | (206,982,874 | ) | 13,595,853 | 549,170 | 32,229,839 | (18,084,816 | ) | ||||||||||||||||||||||
| Tax Advantaged Bond Fund |
74,705,167 | 4,594,610 | 420,615,436 | (341,315,659 | ) | 6,199,617 | 381,538 | 34,804,822 | (28,223,667 | ) | ||||||||||||||||||||||
| Money Market Fund |
298,596,227 | — | 365,292,020 | (66,695,793 | ) | 298,596,227 | — | 365,292,019 | (66,695,792 | ) | ||||||||||||||||||||||
| LifePath Retirement Fund |
227,057,809 | 6,124,967 | 719,912,647 | (486,729,871 | ) | 19,014,825 | 502,063 | 60,265,438 | (40,748,550 | ) | ||||||||||||||||||||||
| LifePath 2020 Fund |
418,502,527 | 31,690,897 | 958,268,927 | (508,075,503 | ) | 30,341,990 | 2,298,105 | 69,387,400 | (36,747,305 | ) | ||||||||||||||||||||||
| LifePath 2030 Fund |
441,859,764 | 38,281,572 | 823,063,727 | (342,922,391 | ) | 30,725,018 | 2,627,425 | 57,172,447 | (23,820,004 | ) | ||||||||||||||||||||||
| LifePath 2040 Fund |
344,414,524 | 29,735,813 | 392,323,230 | (18,172,893 | ) | 23,265,306 | 1,955,017 | 26,409,992 | (1,189,669 | ) | ||||||||||||||||||||||
| LifePath 2050 Fund |
81,095,129 | 8,905,321 | 124,873,480 | (34,873,030 | ) | 7,985,994 | 848,931 | 12,288,901 | (3,453,976 | ) | ||||||||||||||||||||||
| Class B Dollar Amounts | Class B Share Amounts | |||||||||||||||||||||||||||||||
| 2016 |
Sales | Reinvestments | Redemptions | Net | Sales | Reinvestments | Redemptions | Net | ||||||||||||||||||||||||
| Equity Fund |
$ | 210 | $ | 142,528 | $ | 561,111 | $ | (418,373 | ) | 23 | 15,309 | 61,974 | (46,642 | ) | ||||||||||||||||||
| Small/Mid Cap Equity Fund |
7,264 | 18,798 | 504,966 | (478,904 | ) | 749 | 1,689 | 50,901 | (48,463 | ) | ||||||||||||||||||||||
| International Equity Fund |
— | — | 219,164 | (219,164 | ) | — | — | 22,175 | (22,175 | ) | ||||||||||||||||||||||
| S&P 500 Index Fund |
101,778 | 139,798 | 2,288,044 | (2,046,468 | ) | 6,297 | 8,209 | 144,484 | (129,978 | ) | ||||||||||||||||||||||
| Small Cap Index Fund |
32,184 | 82,400 | 644,775 | (530,191 | ) | 2,008 | 4,961 | 44,244 | (37,275 | ) | ||||||||||||||||||||||
| International Index Fund |
2,792 | 23,012 | 429,156 | (403,352 | ) | 268 | 2,141 | 40,146 | (37,737 | ) | ||||||||||||||||||||||
| Equity and Bond Fund |
7,764 | 101,917 | 572,638 | (462,957 | ) | 738 | 9,149 | 51,583 | (41,696 | ) | ||||||||||||||||||||||
| Bond Fund |
94,258 | 95,901 | 948,732 | (758,573 | ) | 8,245 | 8,395 | 83,107 | (66,467 | ) | ||||||||||||||||||||||
| Tax Advantaged Bond Fund |
16,122 | 48,432 | 4,100,421 | (4,035,867 | ) | 1,335 | 4,030 | 339,157 | (333,792 | ) | ||||||||||||||||||||||
| Money Market Fund |
457,512 | — | 468,107 | (10,595 | ) | 457,512 | — | 468,106 | (10,594 | ) | ||||||||||||||||||||||
| LifePath Retirement Fund |
36,002 | 58,341 | 2,719,591 | (2,625,248 | ) | 3,093 | 4,727 | 225,328 | (217,508 | ) | ||||||||||||||||||||||
| LifePath 2020 Fund |
45,626 | 689,571 | 6,180,299 | (5,445,102 | ) | 3,363 | 50,260 | 449,736 | (396,113 | ) | ||||||||||||||||||||||
| LifePath 2030 Fund |
43,315 | 1,071,763 | 7,632,345 | (6,517,267 | ) | 2,950 | 73,813 | 528,088 | (451,325 | ) | ||||||||||||||||||||||
| LifePath 2040 Fund |
74,153 | 1,015,498 | 8,331,082 | (7,241,431 | ) | 5,108 | 66,985 | 560,065 | (487,972 | ) | ||||||||||||||||||||||
138
STATE FARM MUTUAL FUND TRUST
NOTES TO FINANCIAL STATEMENTS (continued)
(Unaudited)
| Premier Shares Dollar Amounts | Premier Shares Share Amounts | |||||||||||||||||||||||||||||||
| 2016 |
Sales | Reinvestments | Redemptions | Net | Sales | Reinvestments | Redemptions | Net | ||||||||||||||||||||||||
| Equity Fund |
$ | 100,803,560 | $ | 7,629,477 | $ | 91,518,347 | $ | 16,914,690 | 10,639,379 | 775,351 | 9,669,592 | 1,745,138 | ||||||||||||||||||||
| Small/Mid Cap Equity Fund |
58,118,714 | 727,514 | 51,455,730 | 7,390,498 | 5,550,943 | 61,502 | 4,964,044 | 648,401 | ||||||||||||||||||||||||
| International Equity Fund |
22,977,367 | — | 17,957,048 | 5,020,319 | 2,216,302 | — | 1,733,765 | 482,537 | ||||||||||||||||||||||||
| S&P 500 Index Fund |
428,228,194 | 12,992,438 | 352,359,492 | 88,861,140 | 27,159,979 | 764,263 | 22,454,754 | 5,469,488 | ||||||||||||||||||||||||
| Small Cap Index Fund |
81,858,205 | 5,575,231 | 111,290,009 | (23,856,573 | ) | 5,645,791 | 329,896 | 7,820,625 | (1,844,938 | ) | ||||||||||||||||||||||
| International Index Fund |
60,925,256 | 1,992,114 | 48,705,033 | 14,212,337 | 5,690,234 | 186,178 | 4,549,377 | 1,327,035 | ||||||||||||||||||||||||
| Equity and Bond Fund |
121,150,651 | 5,896,759 | 83,705,183 | 43,342,227 | 10,869,182 | 524,651 | 7,517,296 | 3,876,537 | ||||||||||||||||||||||||
| Bond Fund |
361,225,800 | 6,240,361 | 121,277,420 | 246,188,741 | 31,519,594 | 544,704 | 10,605,690 | 21,458,608 | ||||||||||||||||||||||||
| Tax Advantaged Bond Fund |
432,449,880 | 5,536,781 | 65,144,538 | 372,842,123 | 35,834,354 | 462,042 | 5,470,090 | 30,826,306 | ||||||||||||||||||||||||
| Money Market Fund |
292,309,402 | 42 | 203,139,661 | 89,169,783 | 292,309,402 | 42 | 203,139,661 | 89,169,783 | ||||||||||||||||||||||||
| LifePath Retirement Fund |
658,332,666 | 10,166,778 | 221,414,416 | 447,085,028 | 53,670,788 | 811,969 | 17,969,552 | 36,513,205 | ||||||||||||||||||||||||
| LifePath 2020 Fund |
865,886,124 | 39,028,837 | 378,916,960 | 525,998,001 | 62,793,561 | 2,844,667 | 27,368,662 | 38,269,566 | ||||||||||||||||||||||||
| LifePath 2030 Fund |
741,296,637 | 32,890,060 | 313,501,272 | 460,685,425 | 51,275,757 | 2,255,832 | 21,668,841 | 31,862,748 | ||||||||||||||||||||||||
| LifePath 2040 Fund |
323,932,330 | 13,822,558 | 231,569,826 | 106,185,062 | 21,732,979 | 905,184 | 15,574,710 | 7,063,453 | ||||||||||||||||||||||||
| LifePath 2050 Fund |
92,107,999 | 3,033,548 | 7,508,365 | 87,633,182 | 9,059,906 | 290,014 | 707,266 | 8,642,654 | ||||||||||||||||||||||||
| Legacy Class B Dollar Amounts | Legacy Class B Share Amounts | |||||||||||||||||||||||||||||||
| 2016 |
Sales | Reinvestments | Redemptions | Net | Sales | Reinvestments | Redemptions | Net | ||||||||||||||||||||||||
| Equity Fund |
$ | 33,196 | $ | 292,374 | $ | 1,768,483 | $ | (1,442,913 | ) | 3,400 | 29,743 | 184,637 | (151,494 | ) | ||||||||||||||||||
| Small/Mid Cap Equity Fund |
(105 | ) | 24,312 | 1,029,309 | (1,005,102 | ) | (10 | ) | 2,243 | 105,887 | (103,654 | ) | ||||||||||||||||||||
| International Equity Fund |
— | — | 273,651 | (273,651 | ) | — | — | 27,105 | (27,105 | ) | ||||||||||||||||||||||
| S&P 500 Index Fund |
151,940 | 302,947 | 6,541,830 | (6,086,943 | ) | 9,472 | 17,623 | 409,625 | (382,530 | ) | ||||||||||||||||||||||
| Small Cap Index Fund |
(107 | ) | 189,596 | 2,160,868 | (1,971,379 | ) | (6 | ) | 11,498 | 150,954 | (139,462 | ) | ||||||||||||||||||||
| International Index Fund |
47 | 31,634 | 627,351 | (595,670 | ) | 4 | 2,935 | 58,541 | (55,602 | ) | ||||||||||||||||||||||
| Equity and Bond Fund |
8,646 | 180,900 | 1,618,171 | (1,428,625 | ) | 791 | 16,046 | 144,111 | (127,274 | ) | ||||||||||||||||||||||
| Bond Fund |
64,432 | 55,778 | 1,076,483 | (956,273 | ) | 5,599 | 4,875 | 94,240 | (83,766 | ) | ||||||||||||||||||||||
| Tax Advantaged Bond Fund |
6,603 | 2,724 | 495,943 | (486,616 | ) | 550 | 226 | 41,070 | (40,294 | ) | ||||||||||||||||||||||
| Money Market Fund |
370,936 | — | 665,763 | (294,827 | ) | 370,936 | — | 665,763 | (294,827 | ) | ||||||||||||||||||||||
| LifePath Retirement Fund |
26,866 | 40,305 | 2,056,831 | (1,989,660 | ) | 2,182 | 3,199 | 166,645 | (161,264 | ) | ||||||||||||||||||||||
| LifePath 2020 Fund |
55,952 | 393,068 | 5,161,726 | (4,712,706 | ) | 3,981 | 28,380 | 372,124 | (339,763 | ) | ||||||||||||||||||||||
| LifePath 2030 Fund |
107,922 | 388,146 | 4,739,692 | (4,243,624 | ) | 7,125 | 26,458 | 326,736 | (293,153 | ) | ||||||||||||||||||||||
| LifePath 2040 Fund |
20,045 | 351,481 | 4,525,468 | (4,153,942 | ) | 1,397 | 22,883 | 300,913 | (276,633 | ) | ||||||||||||||||||||||
139
STATE FARM MUTUAL FUND TRUST
NOTES TO FINANCIAL STATEMENTS (continued)
(Unaudited)
| Institutional Shares Dollar Amounts | Institutional Shares Share Amounts | |||||||||||||||||||||||||||||||
| 2016 |
Sales | Reinvestments | Redemptions | Net | Sales | Reinvestments | Redemptions | Net | ||||||||||||||||||||||||
| Equity Fund |
$ | 42,393,285 | $ | 3,827,904 | $ | 14,709,106 | $ | 31,512,083 | 4,637,082 | 405,070 | 1,560,212 | 3,481,940 | ||||||||||||||||||||
| Small/Mid Cap Equity Fund |
7,839,455 | 396,032 | 8,300,991 | (65,504 | ) | 682,348 | 31,722 | 744,214 | (30,144 | ) | ||||||||||||||||||||||
| International Equity Fund |
2,073,802 | 10,785 | 2,651,860 | (567,273 | ) | 201,549 | 1,077 | 256,416 | (53,790 | ) | ||||||||||||||||||||||
| S&P 500 Index Fund |
38,811,107 | 4,912,959 | 27,248,890 | 16,475,176 | 2,443,811 | 288,141 | 1,698,879 | 1,033,073 | ||||||||||||||||||||||||
| Small Cap Index Fund |
10,227,573 | 3,480,554 | 13,426,458 | 281,669 | 667,863 | 202,360 | 876,999 | (6,776 | ) | |||||||||||||||||||||||
| International Index Fund |
5,529,818 | 1,026,486 | 7,926,378 | (1,370,074 | ) | 512,593 | 95,576 | 729,192 | (121,023 | ) | ||||||||||||||||||||||
| Equity and Bond Fund |
6,470,722 | 1,672,499 | 5,682,913 | 2,460,308 | 583,850 | 150,173 | 514,286 | 219,737 | ||||||||||||||||||||||||
| Bond Fund |
43,169,197 | 2,933,994 | 22,061,931 | 24,041,260 | 3,779,274 | 256,775 | 1,932,524 | 2,103,525 | ||||||||||||||||||||||||
| Money Market Fund |
68,388,948 | 3,126 | 59,056,038 | 9,336,036 | 68,388,948 | 3,126 | 59,056,038 | 9,336,036 | ||||||||||||||||||||||||
| LifePath Retirement Fund |
19,365,308 | 1,732,392 | 20,835,559 | 262,141 | 1,575,599 | 138,556 | 1,694,169 | 19,986 | ||||||||||||||||||||||||
| LifePath 2020 Fund |
24,644,994 | 8,449,418 | 28,336,361 | 4,758,051 | 1,762,367 | 611,391 | 2,023,373 | 350,385 | ||||||||||||||||||||||||
| LifePath 2030 Fund |
30,331,519 | 10,309,528 | 23,910,122 | 16,730,925 | 2,076,446 | 702,762 | 1,633,071 | 1,146,137 | ||||||||||||||||||||||||
| LifePath 2040 Fund |
50,068,797 | 12,195,935 | 35,456,454 | 26,808,278 | 3,323,869 | 794,548 | 2,340,052 | 1,778,365 | ||||||||||||||||||||||||
| Class R-1 Dollar Amounts | Class R-1 Share Amounts | |||||||||||||||||||||||||||||||
| 2016 |
Sales | Reinvestments | Redemptions | Net | Sales | Reinvestments | Redemptions | Net | ||||||||||||||||||||||||
| Equity Fund |
$ | 1,023,134 | $ | 161,330 | $ | 922,401 | $ | 262,063 | 110,635 | 17,163 | 98,012 | 29,786 | ||||||||||||||||||||
| Small/Mid Cap Equity Fund |
639,451 | 20,665 | 763,950 | (103,834 | ) | 62,088 | 1,811 | 74,564 | (10,665 | ) | ||||||||||||||||||||||
| International Equity Fund |
328,945 | — | 353,000 | (24,055 | ) | 32,808 | — | 34,526 | (1,718 | ) | ||||||||||||||||||||||
| S&P 500 Index Fund |
4,306,654 | 187,831 | 3,696,137 | 798,348 | 272,595 | 11,068 | 228,999 | 54,664 | ||||||||||||||||||||||||
| Small Cap Index Fund |
904,226 | 98,765 | 682,370 | 320,621 | 61,586 | 5,803 | 45,751 | 21,638 | ||||||||||||||||||||||||
| International Index Fund |
460,886 | 36,250 | 486,333 | 10,803 | 42,678 | 3,372 | 45,418 | 632 | ||||||||||||||||||||||||
| Equity and Bond Fund |
674,112 | 99,148 | 439,037 | 334,223 | 61,847 | 9,035 | 40,162 | 30,720 | ||||||||||||||||||||||||
| Bond Fund |
1,409,045 | 52,672 | 1,016,742 | 444,975 | 123,711 | 4,607 | 89,018 | 39,300 | ||||||||||||||||||||||||
| Money Market Fund |
3,026,780 | — | 3,481,215 | (454,435 | ) | 3,026,780 | — | 3,481,215 | (454,435 | ) | ||||||||||||||||||||||
| LifePath Retirement Fund |
3,311,024 | 80,886 | 3,467,955 | (76,045 | ) | 276,104 | 6,590 | 284,144 | (1,450 | ) | ||||||||||||||||||||||
| LifePath 2020 Fund |
6,846,598 | 730,064 | 7,591,737 | (15,075 | ) | 495,384 | 53,251 | 547,291 | 1,344 | |||||||||||||||||||||||
| LifePath 2030 Fund |
10,389,292 | 1,229,228 | 9,566,430 | 2,052,090 | 721,207 | 84,891 | 660,681 | 145,417 | ||||||||||||||||||||||||
| LifePath 2040 Fund |
9,582,901 | 823,975 | 10,135,486 | 271,390 | 644,710 | 54,424 | 673,199 | 25,935 | ||||||||||||||||||||||||
| LifePath 2050 Fund |
4,974,518 | 270,044 | 2,966,750 | 2,277,812 | 487,164 | 25,694 | 288,965 | 223,893 | ||||||||||||||||||||||||
140
STATE FARM MUTUAL FUND TRUST
NOTES TO FINANCIAL STATEMENTS (continued)
(Unaudited)
| Class R-2 Dollar Amounts | Class R-2 Share Amounts | |||||||||||||||||||||||||||||||
| 2016 |
Sales | Reinvestments | Redemptions | Net | Sales | Reinvestments | Redemptions | Net | ||||||||||||||||||||||||
| Equity Fund |
$ | 2,606,783 | $ | 816,893 | $ | 4,885,898 | $ | (1,462,222 | ) | 285,977 | 87,089 | 537,641 | (164,575 | ) | ||||||||||||||||||
| Small/Mid Cap Equity Fund |
2,033,523 | 88,313 | 3,130,354 | (1,008,518 | ) | 190,707 | 7,510 | 301,285 | (103,068 | ) | ||||||||||||||||||||||
| International Equity Fund |
614,402 | — | 1,502,401 | (887,999 | ) | 59,990 | — | 147,560 | (87,570 | ) | ||||||||||||||||||||||
| S&P 500 Index Fund |
7,683,161 | 531,413 | 8,434,803 | (220,229 | ) | 485,192 | 31,482 | 528,502 | (11,828 | ) | ||||||||||||||||||||||
| Small Cap Index Fund |
1,857,470 | 312,898 | 2,537,817 | (367,449 | ) | 123,517 | 18,341 | 169,389 | (27,531 | ) | ||||||||||||||||||||||
| International Index Fund |
1,407,767 | 146,375 | 2,539,192 | (985,050 | ) | 131,544 | 13,680 | 233,908 | (88,684 | ) | ||||||||||||||||||||||
| Equity and Bond Fund |
1,935,377 | 271,142 | 2,176,488 | 30,031 | 176,405 | 24,669 | 197,730 | 3,344 | ||||||||||||||||||||||||
| Bond Fund |
4,291,151 | 208,606 | 4,583,901 | (84,144 | ) | 374,506 | 18,252 | 400,959 | (8,201 | ) | ||||||||||||||||||||||
| Money Market Fund |
11,516,679 | — | 8,400,082 | 3,116,597 | 11,516,679 | — | 8,400,082 | 3,116,597 | ||||||||||||||||||||||||
| LifePath Retirement Fund |
7,172,263 | 343,167 | 6,758,502 | 756,928 | 581,379 | 27,355 | 543,052 | 65,682 | ||||||||||||||||||||||||
| LifePath 2020 Fund |
14,956,936 | 2,338,525 | 13,990,881 | 3,304,580 | 1,083,399 | 170,446 | 1,000,577 | 253,268 | ||||||||||||||||||||||||
| LifePath 2030 Fund |
19,477,263 | 2,641,900 | 13,185,794 | 8,933,369 | 1,344,360 | 181,824 | 896,023 | 630,161 | ||||||||||||||||||||||||
| LifePath 2040 Fund |
18,397,572 | 2,004,023 | 11,399,841 | 9,001,754 | 1,218,822 | 131,931 | 758,412 | 592,341 | ||||||||||||||||||||||||
| LifePath 2050 Fund |
6,663,038 | 538,104 | 4,648,855 | 2,552,287 | 643,979 | 51,151 | 453,010 | 242,120 | ||||||||||||||||||||||||
| Class R-3 Dollar Amounts | Class R-3 Share Amounts | |||||||||||||||||||||||||||||||
| 2016 |
Sales | Reinvestments | Redemptions | Net | Sales | Reinvestments | Redemptions | Net | ||||||||||||||||||||||||
| Equity Fund |
$ | 429,015 | $ | 96,764 | $ | 474,688 | $ | 51,091 | 45,239 | 10,229 | 52,049 | 3,419 | ||||||||||||||||||||
| Small/Mid Cap Equity Fund |
385,557 | 13,216 | 439,628 | (40,855 | ) | 33,754 | 1,074 | 41,164 | (6,336 | ) | ||||||||||||||||||||||
| International Equity Fund |
96,200 | 91 | 129,780 | (33,489 | ) | 9,317 | 9 | 12,822 | (3,496 | ) | ||||||||||||||||||||||
| S&P 500 Index Fund |
1,180,463 | 83,376 | 425,639 | 838,200 | 74,144 | 4,899 | 26,945 | 52,098 | ||||||||||||||||||||||||
| Small Cap Index Fund |
261,874 | 41,679 | 470,080 | (166,527 | ) | 17,496 | 2,422 | 32,285 | (12,367 | ) | ||||||||||||||||||||||
| International Index Fund |
149,657 | 20,361 | 201,697 | (31,679 | ) | 13,867 | 1,894 | 18,762 | (3,001 | ) | ||||||||||||||||||||||
| Equity and Bond Fund |
189,722 | 26,154 | 36,307 | 179,569 | 17,468 | 2,376 | 3,225 | 16,619 | ||||||||||||||||||||||||
| Bond Fund |
335,866 | 22,589 | 577,217 | (218,762 | ) | 29,356 | 1,971 | 51,162 | (19,835 | ) | ||||||||||||||||||||||
| Money Market Fund |
531,506 | 20 | 617,399 | (85,873 | ) | 531,506 | 20 | 617,399 | (85,873 | ) | ||||||||||||||||||||||
| LifePath Retirement Fund |
257,422 | 29,890 | 308,186 | (20,874 | ) | 21,007 | 2,395 | 25,160 | (1,758 | ) | ||||||||||||||||||||||
| LifePath 2020 Fund |
543,887 | 142,072 | 595,907 | 90,052 | 38,888 | 10,302 | 42,060 | 7,130 | ||||||||||||||||||||||||
| LifePath 2030 Fund |
1,035,484 | 179,218 | 222,566 | 992,136 | 70,332 | 12,208 | 15,206 | 67,334 | ||||||||||||||||||||||||
| LifePath 2040 Fund |
1,625,229 | 237,950 | 607,213 | 1,255,966 | 106,035 | 15,332 | 40,532 | 80,835 | ||||||||||||||||||||||||
141
STATE FARM MUTUAL FUND TRUST
NOTES TO FINANCIAL STATEMENTS (continued)
(Unaudited)
The following reflects the conversion of shares between classes (reflected as Sales and Redemptions) for the year ended December 31, 2016 (effective May 23, 2016, Legacy Class A shares were renamed Premier shares).
|
Fund |
Class A Dollar Amounts from Class B |
Class A Share Amounts from Class B |
Class A Dollar Amounts from Premier |
Class A Share Amounts from Premier |
Class A Dollar Amounts from Legacy Class B |
Class A Share Amounts from Legacy Class B |
Class A Dollar Amounts from Class R-2 |
Class A Share Amounts from Class R-2 |
||||||||||||||||||||||||
| Equity Fund |
$ | 269,321 | 29,729 | $ | 75,435,846 | 8,372,458 | $ | 710,906 | 74,649 | $ | 384,360 | 40,633 | ||||||||||||||||||||
| Small/Mid Cap Equity Fund |
311,459 | 29,124 | 41,728,612 | 3,951,573 | 450,533 | 39,313 | 856,644 | 77,669 | ||||||||||||||||||||||||
| International Equity Fund |
132,776 | 13,143 | 14,128,792 | 1,377,075 | 111,634 | 10,946 | 169,838 | 16,178 | ||||||||||||||||||||||||
| S&P 500 Index Fund |
1,327,424 | 84,232 | 283,759,203 | 18,318,864 | 2,691,429 | 163,460 | 1,701,202 | 105,709 | ||||||||||||||||||||||||
| Small Cap Index Fund |
411,513 | 27,480 | 94,495,065 | 6,640,553 | 864,133 | 53,869 | 871,674 | 55,713 | ||||||||||||||||||||||||
| International Index Fund |
272,365 | 25,494 | 37,032,124 | 3,467,427 | 234,461 | 21,527 | 431,456 | 39,380 | ||||||||||||||||||||||||
| Equity and Bond Fund |
252,874 | 22,726 | 65,771,605 | 5,990,128 | 603,855 | 53,267 | 46,964 | 4,175 | ||||||||||||||||||||||||
| Bond Fund |
429,339 | 37,561 | 71,600,201 | 6,258,759 | 320,578 | 27,970 | 188,138 | 16,216 | ||||||||||||||||||||||||
| Tax Advantaged Bond Fund |
45,390 | 3,763 | 9,740,962 | 805,705 | 11,524 | 965 | — | — | ||||||||||||||||||||||||
| Money Market Fund |
97,108 | 97,108 | 42,714,104 | 42,714,104 | 73,971 | 73,971 | 213,331 | 213,331 | ||||||||||||||||||||||||
| LifePath Retirement Fund |
1,446,168 | 120,613 | 129,557,308 | 10,850,696 | 616,153 | 50,247 | 799,509 | 64,935 | ||||||||||||||||||||||||
| LifePath 2020 Fund |
3,412,579 | 246,346 | 253,591,423 | 18,402,861 | 1,821,510 | 128,027 | 1,485,263 | 104,112 | ||||||||||||||||||||||||
| LifePath 2030 Fund |
4,405,119 | 303,401 | 232,566,629 | 16,218,036 | 1,838,870 | 123,183 | 2,271,068 | 152,309 | ||||||||||||||||||||||||
| LifePath 2040 Fund |
4,871,894 | 325,409 | 194,903,047 | 13,222,731 | 1,834,987 | 118,678 | 1,472,591 | 95,457 | ||||||||||||||||||||||||
| LifePath 2050 Fund |
— | — | — | — | — | — | 1,086,121 | 104,581 | ||||||||||||||||||||||||
|
Fund |
Premier Dollar Amounts from Class A |
Premier Share Amounts from Class A |
Premier Dollar Amounts from Legacy Class B |
Premier Share Amounts from Legacy Class B |
||||||||||||
| Equity Fund |
$ | 91,948,338 | 9,724,942 | $ | 555,563 | 59,944 | ||||||||||
| Small/Mid Cap Equity Fund |
51,234,502 | 4,915,769 | 285,254 | 28,823 | ||||||||||||
| International Equity Fund |
21,042,407 | 2,028,967 | 81,904 | 8,045 | ||||||||||||
| S&P 500 Index Fund |
368,583,356 | 23,485,749 | 2,060,296 | 136,187 | ||||||||||||
| Small Cap Index Fund |
69,301,901 | 4,820,383 | 708,482 | 52,234 | ||||||||||||
| International Index Fund |
54,337,360 | 5,080,159 | 240,016 | 22,872 | ||||||||||||
| Equity and Bond Fund |
106,726,775 | 9,594,867 | 502,525 | 45,926 | ||||||||||||
| Bond Fund |
319,381,617 | 27,883,355 | 438,598 | 38,526 | ||||||||||||
| Tax Advantaged Bond Fund |
387,294,740 | 32,087,968 | 16,529 | 1,370 | ||||||||||||
| Money Market Fund |
144,967,308 | 144,967,308 | 83,748 | 83,748 | ||||||||||||
| LifePath Retirement Fund |
601,703,109 | 49,134,387 | 619,907 | 51,363 | ||||||||||||
| LifePath 2020 Fund |
803,309,820 | 58,335,152 | 1,787,405 | 132,441 | ||||||||||||
| LifePath 2030 Fund |
677,200,622 | 46,946,036 | 1,561,380 | 111,358 | ||||||||||||
| LifePath 2040 Fund |
296,212,429 | 19,898,617 | 1,494,389 | 103,788 | ||||||||||||
| LifePath 2050 Fund |
85,068,626 | 8,391,127 | — | — | ||||||||||||
142
STATE FARM MUTUAL FUND TRUST
NOTES TO FINANCIAL STATEMENTS (continued)
(Unaudited)
|
Fund |
Class R-1 Dollar Amounts from Premier |
Class R-1 Share Amounts from Premier |
Class R-2 Dollar Amounts from Premier |
Class R-2 Share Amounts from Premier |
Class R-2 Dollar Amounts from Class R-1 |
Class R-2 Share Amounts from Class R-1 |
Class R-3 Dollar Amounts from Institutional |
Class R-3 Share Amounts from Institutional |
||||||||||||||||||||||||
| Equity Fund |
$ | 31,600 | 3,446 | $ | 29,338 | 3,206 | $ | 422,091 | 43,986 | $ | 105,097 | 11,374 | ||||||||||||||||||||
| Small/Mid Cap Equity Fund |
15,623 | 1,541 | 13,225 | 1,267 | 279,036 | 26,282 | 39,730 | 3,645 | ||||||||||||||||||||||||
| International Equity Fund |
3,716 | 357 | 934 | 89 | 93,911 | 9,064 | — | — | ||||||||||||||||||||||||
| S&P 500 Index Fund |
109,377 | 6,936 | 83,293 | 5,305 | 1,405,864 | 85,899 | — | — | ||||||||||||||||||||||||
| Small Cap Index Fund |
1,563 | 107 | 17,544 | 1,202 | 203,495 | 13,370 | — | — | ||||||||||||||||||||||||
| International Index Fund |
480 | 44 | 6,532 | 594 | 96,726 | 9,061 | — | — | ||||||||||||||||||||||||
| Equity and Bond Fund |
3,982 | 364 | 125,937 | 11,470 | 146,481 | 13,351 | 30,906 | 2,807 | ||||||||||||||||||||||||
| Bond Fund |
36,078 | 3,143 | 77,376 | 6,752 | 228,700 | 19,937 | 73,934 | 6,440 | ||||||||||||||||||||||||
| Tax Advantaged Bond Fund |
— | — | — | — | — | — | — | — | ||||||||||||||||||||||||
| Money Market Fund |
22,976 | 22,976 | 52,169 | 52,169 | 802,383 | 802,383 | 4,389 | 4,389 | ||||||||||||||||||||||||
| LifePath Retirement Fund |
13,509 | 1,116 | 14,543 | 1,175 | 1,713,835 | 137,130 | — | — | ||||||||||||||||||||||||
| LifePath 2020 Fund |
30,127 | 2,172 | 124,130 | 8,937 | 3,296,054 | 237,482 | — | — | ||||||||||||||||||||||||
| LifePath 2030 Fund |
75,384 | 5,202 | 94,252 | 6,478 | 4,169,438 | 285,513 | — | — | ||||||||||||||||||||||||
| LifePath 2040 Fund |
34,467 | 2,304 | 34,182 | 2,274 | 6,283,001 | 410,946 | 16,258 | 1,059 | ||||||||||||||||||||||||
| LifePath 2050 Fund |
— | — | — | — | 1,468,213 | 139,157 | — | — | ||||||||||||||||||||||||
| (1) | The S&P 500 Index is a product of S&P Dow Jones Indices LLC (“SPDJI”), and has been licensed for use by State Farm Mutual Fund Trust (“Licensee”). Standard & Poor’s®, S&P® and S&P 500® are registered trademarks of Standard & Poor’s Financial Services LLC (“S&P”); Dow Jones® is a registered trademark of Dow Jones Trademark Holdings LLC (“Dow Jones”); and these trademarks have been licensed for use by SPDJI and sublicensed for certain purposes by Licensee. Licensee’s products are not sponsored, endorsed, sold or promoted by SPDJI, Dow Jones, S&P, their respective affiliates, and none of such parties make any representation regarding the advisability of investing in such product(s) nor do they have any liability for any errors, omissions, or interruptions of the S&P 500 Index. |
| (2) | Russell Investment Group (“Russell”) is the source and owner of the trademarks, service marks and copyrights related to the Russell 2000® Index. Russell® is a trademark of Russell. The State Farm Small Cap Index Fund (the “Fund”) is not sponsored, endorsed, sold or promoted by, nor in any way affiliated with Russell. Russell is not responsible for and has not reviewed the Fund nor any associated literature or publications and Russell makes no representation or warranty, express or implied, as to their accuracy, or completeness, or otherwise. |
| (3) | The EAFE® Free Index is a trademark, service mark and the exclusive property of Morgan Stanley Capital International, Inc. (“MSCI”) and its affiliates and has been licensed for use by the State Farm Mutual Fund Trust (the “Trust”). The State Farm International Index Fund (the “Fund”), based on the EAFE Free Index, has not been passed on by MSCI as to its legality or suitability, and is not issued, sponsored, endorsed, sold or promoted by MSCI. MSCI makes no warranties and bears no liability with respect to the Fund. MSCI has no responsibility for and does not participate in the management of the Fund assets or sale of the Fund shares. The Trust’s Statement of Additional Information contains a more detailed description of the limited relationship MSCI has with the Trust and the Fund. |
| (4) | LifePath is a registered trademark of BlackRock Institutional Trust Company, N.A. |
143
The financial highlights table is intended to help you understand the financial performance of each Fund’s share classes for the past five years, or if the performance information is not available for these periods, since the share class’ inception. Certain information reflects financial results for a single Fund share. The total returns within each table represent the rate that an investor would have earned (or lost) on an investment in the Fund (assuming reinvestment of all dividends and distributions).
STATE FARM MUTUAL FUND TRUST EQUITY FUND
(For a share outstanding throughout each period)
| Income from investment operations | Less distributions | |||||||||||||||||||||||||||
| Net asset value, beginning of period |
Net investment income (loss) (a) |
Net gain (loss) on investments (both realized and unrealized) |
Total from investment operations |
Net investment income (b) |
Net realized gain |
Total distributions |
||||||||||||||||||||||
| Class A Shares |
||||||||||||||||||||||||||||
| Six months ended |
$ | 9.28 | $ | 0.03 | $ | 0.83 | $ | 0.86 | $ | — | $ | — | $ | — | ||||||||||||||
| Year ended 12/31/2016 |
9.17 | 0.05 | 0.67 | 0.72 | (0.04 | ) | (0.57 | ) | (0.61 | ) | ||||||||||||||||||
| Year ended 12/31/2015 |
9.73 | 0.05 | 0.03 | 0.08 | (0.06 | ) | (0.58 | ) | (0.64 | ) | ||||||||||||||||||
| Year ended 12/31/2014 |
8.62 | 0.05 | 1.25 | 1.30 | (0.06 | ) | (0.13 | ) | (0.19 | ) | ||||||||||||||||||
| Year ended 12/31/2013 |
6.53 | 0.04 | 2.09 | 2.13 | (0.04 | ) | — | (0.04 | ) | |||||||||||||||||||
| Year ended 12/31/2012 |
5.69 | 0.07 | 0.84 | 0.91 | (0.07 | ) | — | (0.07 | ) | |||||||||||||||||||
| Class B Shares |
||||||||||||||||||||||||||||
| Six months ended |
9.19 | 0.01 | 0.82 | 0.83 | — | — | — | |||||||||||||||||||||
| Year ended 12/31/2016 |
9.12 | (0.02 | ) | 0.66 | 0.64 | — | (0.57 | ) | (0.57 | ) | ||||||||||||||||||
| Year ended 12/31/2015 |
9.68 | (0.01 | ) | 0.03 | 0.02 | — | (0.58 | ) | (0.58 | ) | ||||||||||||||||||
| Year ended 12/31/2014 |
8.59 | (0.02 | ) | 1.24 | 1.22 | — | (0.13 | ) | (0.13 | ) | ||||||||||||||||||
| Year ended 12/31/2013 |
6.53 | (0.02 | ) | 2.08 | 2.06 | — | — | — | ||||||||||||||||||||
| Year ended 12/31/2012 |
5.68 | 0.02 | 0.85 | 0.87 | (0.02 | ) | — | (0.02 | ) | |||||||||||||||||||
| Premier Shares (g) |
||||||||||||||||||||||||||||
| Six months ended |
9.72 | 0.04 | 0.86 | 0.90 | — | — | — | |||||||||||||||||||||
| Year ended 12/31/2016 |
9.58 | 0.06 | 0.70 | 0.76 | (0.05 | ) | (0.57 | ) | (0.62 | ) | ||||||||||||||||||
| Year ended 12/31/2015 |
10.12 | 0.06 | 0.03 | 0.09 | (0.05 | ) | (0.58 | ) | (0.63 | ) | ||||||||||||||||||
| Year ended 12/31/2014 |
8.96 | 0.05 | 1.29 | 1.34 | (0.05 | ) | (0.13 | ) | (0.18 | ) | ||||||||||||||||||
| Year ended 12/31/2013 |
6.79 | 0.04 | 2.17 | 2.21 | (0.04 | ) | — | (0.04 | ) | |||||||||||||||||||
| Year ended 12/31/2012 |
5.90 | 0.07 | 0.88 | 0.95 | (0.06 | ) | — | (0.06 | ) | |||||||||||||||||||
| Legacy Class B Shares |
||||||||||||||||||||||||||||
| Six months ended |
9.70 | 0.02 | 0.86 | 0.88 | — | — | — | |||||||||||||||||||||
| Year ended 12/31/2016 |
9.56 | 0.01 | 0.70 | 0.71 | — | (0.57 | ) | (0.57 | ) | |||||||||||||||||||
| Year ended 12/31/2015 |
10.10 | 0.02 | 0.02 | 0.04 | — | (0.58 | ) | (0.58 | ) | |||||||||||||||||||
| Year ended 12/31/2014 |
8.93 | 0.01 | 1.29 | 1.30 | — | (0.13 | ) | (0.13 | ) | |||||||||||||||||||
| Year ended 12/31/2013 |
6.77 | 0.01 | 2.15 | 2.16 | — | — | — | |||||||||||||||||||||
| Year ended 12/31/2012 |
5.88 | 0.04 | 0.88 | 0.92 | (0.03 | ) | — | (0.03 | ) | |||||||||||||||||||
| Institutional Shares |
||||||||||||||||||||||||||||
| Six months ended |
9.33 | 0.04 | 0.83 | 0.87 | — | — | — | |||||||||||||||||||||
| Year ended 12/31/2016 |
9.22 | 0.07 | 0.68 | 0.75 | (0.07 | ) | (0.57 | ) | (0.64 | ) | ||||||||||||||||||
| Year ended 12/31/2015 |
9.77 | 0.08 | 0.03 | 0.11 | (0.08 | ) | (0.58 | ) | (0.66 | ) | ||||||||||||||||||
| Year ended 12/31/2014 |
8.65 | 0.07 | 1.25 | 1.32 | (0.07 | ) | (0.13 | ) | (0.20 | ) | ||||||||||||||||||
| Year ended 12/31/2013 |
6.56 | 0.06 | 2.09 | 2.15 | (0.06 | ) | — | (0.06 | ) | |||||||||||||||||||
| Year ended 12/31/2012 |
5.71 | 0.08 | 0.85 | 0.93 | (0.08 | ) | — | (0.08 | ) | |||||||||||||||||||
| Class R-1 Shares |
||||||||||||||||||||||||||||
| Six months ended |
9.28 | 0.02 | 0.83 | 0.85 | — | — | — | |||||||||||||||||||||
| Year ended 12/31/2016 |
9.18 | 0.02 | 0.67 | 0.69 | (0.02 | ) | (0.57 | ) | (0.59 | ) | ||||||||||||||||||
| Year ended 12/31/2015 |
9.73 | 0.02 | 0.04 | 0.06 | (0.03 | ) | (0.58 | ) | (0.61 | ) | ||||||||||||||||||
| Year ended 12/31/2014 |
8.63 | 0.02 | 1.23 | 1.25 | (0.02 | ) | (0.13 | ) | (0.15 | ) | ||||||||||||||||||
| Year ended 12/31/2013 |
6.53 | 0.01 | 2.09 | 2.10 | — | — | — | |||||||||||||||||||||
| Year ended 12/31/2012 |
5.69 | 0.05 | 0.84 | 0.89 | (0.05 | ) | — | (0.05 | ) | |||||||||||||||||||
| Class R-2 Shares |
||||||||||||||||||||||||||||
| Six months ended |
9.26 | 0.03 | 0.82 | 0.85 | — | — | — | |||||||||||||||||||||
| Year ended 12/31/2016 |
9.16 | 0.04 | 0.66 | 0.70 | (0.03 | ) | (0.57 | ) | (0.60 | ) | ||||||||||||||||||
| Year ended 12/31/2015 |
9.71 | 0.04 | 0.03 | 0.07 | (0.04 | ) | (0.58 | ) | (0.62 | ) | ||||||||||||||||||
| Year ended 12/31/2014 |
8.60 | 0.04 | 1.24 | 1.28 | (0.04 | ) | (0.13 | ) | (0.17 | ) | ||||||||||||||||||
| Year ended 12/31/2013 |
6.52 | 0.03 | 2.08 | 2.11 | (0.03 | ) | — | (0.03 | ) | |||||||||||||||||||
| Year ended 12/31/2012 |
5.68 | 0.06 | 0.84 | 0.90 | (0.06 | ) | — | (0.06 | ) | |||||||||||||||||||
| Class R-3 Shares |
||||||||||||||||||||||||||||
| Six months ended |
9.34 | 0.04 | 0.83 | 0.87 | — | — | — | |||||||||||||||||||||
| Year ended 12/31/2016 |
9.24 | 0.07 | 0.67 | 0.74 | (0.07 | ) | (0.57 | ) | (0.64 | ) | ||||||||||||||||||
| Year ended 12/31/2015 |
9.77 | 0.08 | 0.03 | 0.11 | (0.06 | ) | (0.58 | ) | (0.64 | ) | ||||||||||||||||||
| Year ended 12/31/2014 |
8.65 | 0.06 | 1.26 | 1.32 | (0.07 | ) | (0.13 | ) | (0.20 | ) | ||||||||||||||||||
| Year ended 12/31/2013 |
6.56 | 0.05 | 2.08 | 2.13 | (0.04 | ) | — | (0.04 | ) | |||||||||||||||||||
| Year ended 12/31/2012 |
5.70 | 0.08 | 0.86 | 0.94 | (0.08 | ) | — | (0.08 | ) | |||||||||||||||||||
| (a) | Average shares outstanding for the period were used to calculate net investment income per share. |
| (b) | Net investment income distribution represents less than $0.01 per share for Legacy Class B shares in 2014. |
| (c) | Total return is not annualized for periods that are less than a full year and does not reflect the effect of sales charge for Class A, Class B, Premier and Legacy Class B shares. All other classes do not have a sales charge. |
| (d) | Determined on an annualized basis for periods that are less than a full year. |
| (e) | The expense ratios include the effect of expense reduction changes. |
| (f) | Unaudited. |
| (g) | Effective May 23, 2016, Legacy Class A shares were renamed Premier shares. |
| 144 | See accompanying notes to financial statements. |
| Ratios/supplemental data | ||||||||||||||||||||||||||||||
| Average Net Asset ratios assuming expense reductions |
Average Net Asset ratios absent expense reductions |
|||||||||||||||||||||||||||||
| Net asset value, end of period |
Total return (c) | Net assets, end of period (millions) |
Expenses (d) (e) | Net investment income (loss) (d) |
Expenses (d) | Net investment income (loss) (d) |
Portfolio turnover rate (d) |
|||||||||||||||||||||||
| $ |
10.14 |
9.27 | % | $ | 133.7 | 1.02 | % | 0.66 | % | 1.15 | % | 0.53 | % | 60 | % | |||||||||||||||
| 9.28 | 7.81 | 128.8 | 1.15 | 0.52 | 1.15 | 0.52 | 57 | |||||||||||||||||||||||
| 9.17 | 0.74 | 136.9 | 1.15 | 0.54 | 1.15 | 0.54 | 52 | |||||||||||||||||||||||
| 9.73 | 14.95 | 116.4 | 1.16 | 0.52 | 1.16 | 0.52 | 51 | |||||||||||||||||||||||
| 8.62 | 32.63 | 83.3 | 1.17 | 0.48 | 1.17 | 0.48 | 69 | |||||||||||||||||||||||
| 6.53 | 15.93 | 52.4 | 1.18 | 1.06 | 1.18 | 1.06 | 56 | |||||||||||||||||||||||
| |
10.02 |
9.03 | 2.4 | 1.37 | 0.31 | 1.85 | (0.17 | ) | 60 | |||||||||||||||||||||
| 9.19 | 6.94 | 2.4 | 1.85 | (0.17 | ) | 1.85 | (0.17 | ) | 57 | |||||||||||||||||||||
| 9.12 | 0.17 | 2.8 | 1.85 | (0.14 | ) | 1.85 | (0.14 | ) | 52 | |||||||||||||||||||||
| 9.68 | 14.13 | 3.2 | 1.86 | (0.17 | ) | 1.86 | (0.17 | ) | 51 | |||||||||||||||||||||
| 8.59 | 31.55 | 2.8 | 1.86 | (0.21 | ) | 1.86 | (0.21 | ) | 69 | |||||||||||||||||||||
| 6.53 | 15.35 | 5.1 | 1.88 | 0.34 | 1.88 | 0.34 | 56 | |||||||||||||||||||||||
| |
10.62 |
9.26 | 141.7 | 0.92 | 0.76 | 1.05 | 0.63 | 60 | ||||||||||||||||||||||
| 9.72 | 7.87 | 131.3 | 1.08 | 0.58 | 1.08 | 0.58 | 57 | |||||||||||||||||||||||
| 9.58 | 0.84 | 112.7 | 1.15 | 0.56 | 1.15 | 0.56 | 52 | |||||||||||||||||||||||
| 10.12 | 14.88 | 114.5 | 1.16 | 0.53 | 1.16 | 0.53 | 51 | |||||||||||||||||||||||
| 8.96 | 32.50 | 102.1 | 1.17 | 0.47 | 1.17 | 0.47 | 69 | |||||||||||||||||||||||
| 6.79 | 16.14 | 79.1 | 1.18 | 1.03 | 1.18 | 1.03 | 56 | |||||||||||||||||||||||
| |
10.58 |
9.07 | 4.3 | 1.24 | 0.44 | 1.55 | 0.13 | 60 | ||||||||||||||||||||||
| 9.70 | 7.35 | 5.3 | 1.55 | 0.13 | 1.55 | 0.13 | 57 | |||||||||||||||||||||||
| 9.56 | 0.36 | 6.6 | 1.55 | 0.18 | 1.55 | 0.18 | 52 | |||||||||||||||||||||||
| 10.10 | 14.53 | 8.9 | 1.56 | 0.14 | 1.56 | 0.14 | 51 | |||||||||||||||||||||||
| 8.93 | 31.91 | 10.0 | 1.57 | 0.07 | 1.57 | 0.07 | 69 | |||||||||||||||||||||||
| 6.77 | 15.62 | 9.9 | 1.58 | 0.60 | 1.58 | 0.60 | 56 | |||||||||||||||||||||||
| |
10.20 |
9.32 | 295.8 | 0.90 | 0.78 | 0.90 | 0.78 | 60 | ||||||||||||||||||||||
| 9.33 | 8.04 | 281.5 | 0.90 | 0.77 | 0.90 | 0.77 | 57 | |||||||||||||||||||||||
| 9.22 | 1.06 | 246.1 | 0.90 | 0.80 | 0.90 | 0.80 | 52 | |||||||||||||||||||||||
| 9.77 | 15.24 | 235.2 | 0.91 | 0.78 | 0.91 | 0.78 | 51 | |||||||||||||||||||||||
| 8.65 | 32.74 | 205.4 | 0.92 | 0.72 | 0.92 | 0.72 | 69 | |||||||||||||||||||||||
| 6.56 | 16.28 | 153.4 | 0.93 | 1.29 | 0.93 | 1.29 | 56 | |||||||||||||||||||||||
| |
10.13 |
9.16 | 2.6 | 1.22 | 0.46 | 1.47 | 0.21 | 60 | ||||||||||||||||||||||
| 9.28 | 7.40 | 2.7 | 1.47 | 0.20 | 1.47 | 0.20 | 57 | |||||||||||||||||||||||
| 9.18 | 0.54 | 2.4 | 1.47 | 0.23 | 1.47 | 0.23 | 52 | |||||||||||||||||||||||
| 9.73 | 14.45 | 2.3 | 1.48 | 0.21 | 1.48 | 0.21 | 51 | |||||||||||||||||||||||
| 8.63 | 32.16 | 2.1 | 1.48 | 0.16 | 1.48 | 0.16 | 69 | |||||||||||||||||||||||
| 6.53 | 15.61 | 2.7 | 1.50 | 0.73 | 1.50 | 0.73 | 56 | |||||||||||||||||||||||
| |
10.11 |
9.18 | 14.3 | 1.11 | 0.57 | 1.27 | 0.41 | 60 | ||||||||||||||||||||||
| 9.26 | 7.57 | 13.4 | 1.27 | 0.40 | 1.27 | 0.40 | 57 | |||||||||||||||||||||||
| 9.16 | 0.70 | 14.8 | 1.27 | 0.43 | 1.27 | 0.43 | 52 | |||||||||||||||||||||||
| 9.71 | 14.85 | 14.2 | 1.28 | 0.40 | 1.28 | 0.40 | 51 | |||||||||||||||||||||||
| 8.60 | 32.35 | 11.2 | 1.29 | 0.36 | 1.29 | 0.36 | 69 | |||||||||||||||||||||||
| 6.52 | 15.82 | 9.9 | 1.30 | 0.95 | 1.30 | 0.95 | 56 | |||||||||||||||||||||||
| |
10.21 |
9.31 | 1.5 | 0.97 | 0.72 | 0.97 | 0.72 | 60 | ||||||||||||||||||||||
| 9.34 | 7.88 | 1.5 | 0.97 | 0.70 | 0.97 | 0.70 | 57 | |||||||||||||||||||||||
| 9.24 | 1.10 | 1.5 | 0.97 | 0.75 | 0.97 | 0.75 | 52 | |||||||||||||||||||||||
| 9.77 | 15.15 | 2.3 | 0.98 | 0.71 | 0.98 | 0.71 | 51 | |||||||||||||||||||||||
| 8.65 | 32.55 | 2.2 | 0.98 | 0.65 | 0.98 | 0.65 | 69 | |||||||||||||||||||||||
| 6.56 | 16.42 | 2.3 | 1.00 | 1.22 | 1.00 | 1.22 | 56 | |||||||||||||||||||||||
| See accompanying notes to financial statements. | 145 |
STATE FARM MUTUAL FUND TRUST SMALL/MID CAP EQUITY FUND
(For a share outstanding throughout each period)
| Income from investment operations | Less distributions | |||||||||||||||||||||||||||
| Net asset value, beginning of period |
Net investment income (loss) (a)(b) |
Net gain (loss) on investments (both realized and unrealized) |
Total from investment operations |
Net investment income (c) |
Net realized gain |
Total distributions |
||||||||||||||||||||||
| Class A Shares |
||||||||||||||||||||||||||||
| Six months ended |
$ | 12.03 | $ | 0.02 | $ | 0.29 | $ | 0.31 | $ | — | $ | — | $ | — | ||||||||||||||
| Year ended 12/31/2016 |
10.79 | (0.01 | ) | 1.35 | 1.34 | — | (0.10 | ) | (0.10 | ) | ||||||||||||||||||
| Year ended 12/31/2015 |
11.81 | 0.02 | (0.59 | ) | (0.57 | ) | (0.01 | ) | (0.44 | ) | (0.45 | ) | ||||||||||||||||
| Year ended 12/31/2014 |
12.71 | (0.03 | ) | 0.57 | 0.54 | — | (1.44 | ) | (1.44 | ) | ||||||||||||||||||
| Year ended 12/31/2013 |
10.49 | (0.05 | ) | 3.62 | 3.57 | (0.03 | ) | (1.32 | ) | (1.35 | ) | |||||||||||||||||
| Year ended 12/31/2012 |
8.99 | 0.05 | 1.45 | 1.50 | — | — | — | |||||||||||||||||||||
| Class B Shares |
||||||||||||||||||||||||||||
| Six months ended |
11.07 | — | 0.26 | 0.26 | — | — | — | |||||||||||||||||||||
| Year ended 12/31/2016 |
10.00 | (0.08 | ) | 1.25 | 1.17 | — | (0.10 | ) | (0.10 | ) | ||||||||||||||||||
| Year ended 12/31/2015 |
11.04 | (0.06 | ) | (0.54 | ) | (0.60 | ) | — | (0.44 | ) | (0.44 | ) | ||||||||||||||||
| Year ended 12/31/2014 |
12.04 | (0.10 | ) | 0.54 | 0.44 | — | (1.44 | ) | (1.44 | ) | ||||||||||||||||||
| Year ended 12/31/2013 |
10.02 | (0.11 | ) | 3.45 | 3.34 | — | (1.32 | ) | (1.32 | ) | ||||||||||||||||||
| Year ended 12/31/2012 |
8.65 | (0.02 | ) | 1.39 | 1.37 | — | — | — | ||||||||||||||||||||
| Premier Shares (h) |
||||||||||||||||||||||||||||
| Six months ended |
11.77 | 0.02 | 0.29 | 0.31 | — | — | — | |||||||||||||||||||||
| Year ended 12/31/2016 |
10.55 | — | 1.32 | 1.32 | — | (0.10 | ) | (0.10 | ) | |||||||||||||||||||
| Year ended 12/31/2015 |
11.55 | 0.02 | (0.57 | ) | (0.55 | ) | (0.01 | ) | (0.44 | ) | (0.45 | ) | ||||||||||||||||
| Year ended 12/31/2014 |
12.46 | (0.03 | ) | 0.56 | 0.53 | — | (1.44 | ) | (1.44 | ) | ||||||||||||||||||
| Year ended 12/31/2013 |
10.31 | (0.05 | ) | 3.55 | 3.50 | (0.03 | ) | (1.32 | ) | (1.35 | ) | |||||||||||||||||
| Year ended 12/31/2012 |
8.83 | 0.05 | 1.43 | 1.48 | — | — | — | |||||||||||||||||||||
| Legacy Class B Shares |
||||||||||||||||||||||||||||
| Six months ended |
10.78 | 0.01 | 0.25 | 0.26 | — | — | — | |||||||||||||||||||||
| Year ended 12/31/2016 |
9.71 | (0.05 | ) | 1.22 | 1.17 | — | (0.10 | ) | (0.10 | ) | ||||||||||||||||||
| Year ended 12/31/2015 |
10.70 | (0.03 | ) | (0.52 | ) | (0.55 | ) | — | (0.44 | ) | (0.44 | ) | ||||||||||||||||
| Year ended 12/31/2014 |
11.69 | (0.08 | ) | 0.53 | 0.45 | — | (1.44 | ) | (1.44 | ) | ||||||||||||||||||
| Year ended 12/31/2013 |
9.75 | (0.09 | ) | 3.35 | 3.26 | — | (1.32 | ) | (1.32 | ) | ||||||||||||||||||
| Year ended 12/31/2012 |
8.39 | 0.01 | 1.35 | 1.36 | — | — | — | |||||||||||||||||||||
| Institutional Shares |
||||||||||||||||||||||||||||
| Six months ended |
12.39 | 0.03 | 0.29 | 0.32 | — | — | — | |||||||||||||||||||||
| Year ended 12/31/2016 |
11.08 | 0.02 | 1.40 | 1.42 | (0.01 | ) | (0.10 | ) | (0.11 | ) | ||||||||||||||||||
| Year ended 12/31/2015 |
12.11 | 0.05 | (0.60 | ) | (0.55 | ) | (0.04 | ) | (0.44 | ) | (0.48 | ) | ||||||||||||||||
| Year ended 12/31/2014 |
12.96 | — | 0.59 | 0.59 | — | (1.44 | ) | (1.44 | ) | |||||||||||||||||||
| Year ended 12/31/2013 |
10.68 | (0.02 | ) | 3.68 | 3.66 | (0.06 | ) | (1.32 | ) | (1.38 | ) | |||||||||||||||||
| Year ended 12/31/2012 |
9.13 | 0.08 | 1.47 | 1.55 | — | — | — | |||||||||||||||||||||
| Class R-1 Shares |
||||||||||||||||||||||||||||
| Six months ended |
11.35 | 0.01 | 0.27 | 0.28 | — | — | — | |||||||||||||||||||||
| Year ended 12/31/2016 |
10.21 | (0.04 | ) | 1.28 | 1.24 | — | (0.10 | ) | (0.10 | ) | ||||||||||||||||||
| Year ended 12/31/2015 |
11.22 | (0.02 | ) | (0.55 | ) | (0.57 | ) | — | (0.44 | ) | (0.44 | ) | ||||||||||||||||
| Year ended 12/31/2014 |
12.18 | (0.07 | ) | 0.55 | 0.48 | — | (1.44 | ) | (1.44 | ) | ||||||||||||||||||
| Year ended 12/31/2013 |
10.11 | (0.09 | ) | 3.48 | 3.39 | — | (1.32 | ) | (1.32 | ) | ||||||||||||||||||
| Year ended 12/31/2012 |
8.69 | 0.02 | 1.40 | 1.42 | — | — | — | |||||||||||||||||||||
| Class R-2 Shares |
||||||||||||||||||||||||||||
| Six months ended |
11.69 | 0.01 | 0.29 | 0.30 | — | — | — | |||||||||||||||||||||
| Year ended 12/31/2016 |
10.50 | (0.02 | ) | 1.31 | 1.29 | — | (0.10 | ) | (0.10 | ) | ||||||||||||||||||
| Year ended 12/31/2015 |
11.50 | — | (0.56 | ) | (0.56 | ) | — | (0.44 | ) | (0.44 | ) | |||||||||||||||||
| Year ended 12/31/2014 |
12.43 | (0.05 | ) | 0.56 | 0.51 | — | (1.44 | ) | (1.44 | ) | ||||||||||||||||||
| Year ended 12/31/2013 |
10.29 | (0.06 | ) | 3.54 | 3.48 | (0.02 | ) | (1.32 | ) | (1.34 | ) | |||||||||||||||||
| Year ended 12/31/2012 |
8.83 | 0.04 | 1.42 | 1.46 | — | — | — | |||||||||||||||||||||
| Class R-3 Shares |
||||||||||||||||||||||||||||
| Six months ended |
12.24 | 0.02 | 0.29 | 0.31 | — | — | — | |||||||||||||||||||||
| Year ended 12/31/2016 |
10.95 | 0.01 | 1.38 | 1.39 | — | (0.10 | ) | (0.10 | ) | |||||||||||||||||||
| Year ended 12/31/2015 |
11.97 | 0.04 | (0.59 | ) | (0.55 | ) | (0.03 | ) | (0.44 | ) | (0.47 | ) | ||||||||||||||||
| Year ended 12/31/2014 |
12.84 | (0.01 | ) | 0.58 | 0.57 | — | (1.44 | ) | (1.44 | ) | ||||||||||||||||||
| Year ended 12/31/2013 |
10.59 | (0.03 | ) | 3.65 | 3.62 | (0.05 | ) | (1.32 | ) | (1.37 | ) | |||||||||||||||||
| Year ended 12/31/2012 |
9.06 | 0.07 | 1.46 | 1.53 | — | — | — | |||||||||||||||||||||
| (a) | Average shares outstanding for the period were used to calculate net investment income per share. |
| (b) | Net investment income represents less than $0.01 per share for Class B shares in 2017, Premier shares in 2016, Class R-2 shares in 2015 and Institutional shares in 2014. |
| (c) | Net investment income distribution represents less than $0.01 per share for Class R-3 shares in 2016 and Class R-2 shares in 2015. |
| (d) | Total return is not annualized for periods that are less than a full year and does not reflect the effect of sales charge for Class A, Class B, Premier and Legacy Class B shares. All other classes do not have a sales charge. |
| (e) | Determined on an annualized basis for periods that are less than a full year. |
| (f) | The expense ratios include the effect of expense reduction changes. |
| (g) | Unaudited. |
| (h) | Effective May 23, 2016, Legacy Class A shares were renamed Premier shares. |
| 146 | See accompanying notes to financial statements. |
| Ratios/supplemental data | ||||||||||||||||||||||||||||||
| Average Net Asset ratios assuming expense reductions |
Average Net Asset ratios absent expense reductions |
|||||||||||||||||||||||||||||
| Net asset value, end of period |
Total return (d) | Net assets, end of period (millions) |
Expenses (e) (f) | Net investment income (loss) (e) |
Expenses (e) | Net investment income (loss) (e) |
Portfolio turnover rate (e) |
|||||||||||||||||||||||
| $ |
12.34 |
|
2.58 | % | $ | 93.7 | 1.17 | % | 0.31 | % | 1.39 | % | 0.09 | % | 157 | % | ||||||||||||||
| 12.03 | 12.41 | 93.8 | 1.39 | (0.08 | ) | 1.39 | (0.08 | ) | 104 | |||||||||||||||||||||
| 10.79 | (4.82 | ) | 93.2 | 1.39 | 0.14 | 1.39 | 0.14 | 120 | ||||||||||||||||||||||
| 11.81 | 4.13 | 90.7 | 1.40 | (0.26 | ) | 1.40 | (0.26 | ) | 102 | |||||||||||||||||||||
| 12.71 | 34.04 | 80.2 | 1.40 | (0.41 | ) | 1.40 | (0.41 | ) | 116 | |||||||||||||||||||||
| 10.49 | 16.69 | 50.4 | 1.40 | 0.55 | 1.42 | 0.53 | 91 | |||||||||||||||||||||||
| |
11.33 |
|
2.35 | 11.8 | 1.52 | (0.04 | ) | 2.09 | (0.61 | ) | 157 | |||||||||||||||||||
| 11.07 | 11.69 | 11.8 | 2.09 | (0.78 | ) | 2.09 | (0.78 | ) | 104 | |||||||||||||||||||||
| 10.00 | (5.46 | ) | 11.2 | 2.09 | (0.55 | ) | 2.09 | (0.55 | ) | 120 | ||||||||||||||||||||
| 11.04 | 3.54 | 12.8 | 1.98 | (0.84 | ) | 1.98 | (0.84 | ) | 102 | |||||||||||||||||||||
| 12.04 | 33.33 | 13.6 | 1.90 | (0.91 | ) | 1.90 | (0.91 | ) | 116 | |||||||||||||||||||||
| 10.02 | 15.84 | 10.9 | 2.10 | (0.18 | ) | 2.12 | (0.20 | ) | 91 | |||||||||||||||||||||
| |
12.08 |
|
2.63 | 110.1 | 1.07 | 0.41 | 1.29 | 0.19 | 157 | |||||||||||||||||||||
| 11.77 | 12.51 | 108.9 | 1.32 | (0.02 | ) | 1.32 | (0.02 | ) | 104 | |||||||||||||||||||||
| 10.55 | (4.77 | ) | 90.8 | 1.39 | 0.14 | 1.39 | 0.14 | 120 | ||||||||||||||||||||||
| 11.55 | 4.13 | 98.1 | 1.39 | (0.26 | ) | 1.39 | (0.26 | ) | 102 | |||||||||||||||||||||
| 12.46 | 33.92 | 98.1 | 1.40 | (0.42 | ) | 1.40 | (0.42 | ) | 116 | |||||||||||||||||||||
| 10.31 | 16.76 | 75.7 | 1.40 | 0.52 | 1.42 | 0.50 | 91 | |||||||||||||||||||||||
| |
11.04 |
|
2.41 | 9.4 | 1.37 | 0.10 | 1.79 | (0.32 | ) | 157 | ||||||||||||||||||||
| 10.78 | 12.04 | 9.9 | 1.79 | (0.48 | ) | 1.79 | (0.48 | ) | 104 | |||||||||||||||||||||
| 9.71 | (5.17 | ) | 10.0 | 1.79 | (0.25 | ) | 1.79 | (0.25 | ) | 120 | ||||||||||||||||||||
| 10.70 | 3.73 | 12.0 | 1.79 | (0.66 | ) | 1.79 | (0.66 | ) | 102 | |||||||||||||||||||||
| 11.69 | 33.42 | 14.2 | 1.80 | (0.82 | ) | 1.80 | (0.82 | ) | 116 | |||||||||||||||||||||
| 9.75 | 16.21 | 12.8 | 1.80 | 0.07 | 1.82 | 0.05 | 91 | |||||||||||||||||||||||
| |
12.71 |
|
2.58 | 49.1 | 1.04 | 0.43 | 1.14 | 0.33 | 157 | |||||||||||||||||||||
| 12.39 | 12.81 | 49.6 | 1.14 | 0.17 | 1.14 | 0.17 | 104 | |||||||||||||||||||||||
| 11.08 | (4.56 | ) | 44.7 | 1.14 | 0.39 | 1.14 | 0.39 | 120 | ||||||||||||||||||||||
| 12.11 | 4.44 | 46.8 | 1.14 | (0.01 | ) | 1.14 | (0.01 | ) | 102 | |||||||||||||||||||||
| 12.96 | 34.25 | 45.1 | 1.15 | (0.16 | ) | 1.15 | (0.16 | ) | 116 | |||||||||||||||||||||
| 10.68 | 16.98 | 32.4 | 1.15 | 0.79 | 1.17 | 0.77 | 91 | |||||||||||||||||||||||
| |
11.63 |
|
2.47 | 3.6 | 1.36 | 0.11 | 1.71 | (0.24 | ) | 157 | ||||||||||||||||||||
| 11.35 | 12.14 | 3.7 | 1.71 | (0.40 | ) | 1.71 | (0.40 | ) | 104 | |||||||||||||||||||||
| 10.21 | (5.11 | ) | 3.4 | 1.71 | (0.18 | ) | 1.71 | (0.18 | ) | 120 | ||||||||||||||||||||
| 11.22 | 3.83 | 3.3 | 1.71 | (0.58 | ) | 1.71 | (0.58 | ) | 102 | |||||||||||||||||||||
| 12.18 | 33.53 | 3.7 | 1.72 | (0.74 | ) | 1.72 | (0.74 | ) | 116 | |||||||||||||||||||||
| 10.11 | 16.34 | 3.2 | 1.72 | 0.17 | 1.74 | 0.15 | 91 | |||||||||||||||||||||||
| |
11.99 |
|
2.57 | 11.7 | 1.26 | 0.21 | 1.51 | (0.04 | ) | 157 | ||||||||||||||||||||
| 11.69 | 12.28 | 11.8 | 1.51 | (0.20 | ) | 1.51 | (0.20 | ) | 104 | |||||||||||||||||||||
| 10.50 | (4.88 | ) | 11.7 | 1.51 | 0.03 | 1.51 | 0.03 | 120 | ||||||||||||||||||||||
| 11.50 | 3.98 | 11.9 | 1.52 | (0.38 | ) | 1.52 | (0.38 | ) | 102 | |||||||||||||||||||||
| 12.43 | 33.78 | 10.5 | 1.52 | (0.52 | ) | 1.52 | (0.52 | ) | 116 | |||||||||||||||||||||
| 10.29 | 16.53 | 9.1 | 1.52 | 0.45 | 1.54 | 0.43 | 91 | |||||||||||||||||||||||
| |
12.55 |
|
2.53 | 3.1 | 1.11 | 0.38 | 1.21 | 0.28 | 157 | |||||||||||||||||||||
| 12.24 | 12.71 | 3.0 | 1.21 | 0.10 | 1.21 | 0.10 | 104 | |||||||||||||||||||||||
| 10.95 | (4.60 | ) | 2.7 | 1.21 | 0.32 | 1.21 | 0.32 | 120 | ||||||||||||||||||||||
| 11.97 | 4.33 | 2.8 | 1.21 | (0.08 | ) | 1.21 | (0.08 | ) | 102 | |||||||||||||||||||||
| 12.84 | 34.19 | 2.8 | 1.22 | (0.23 | ) | 1.22 | (0.23 | ) | 116 | |||||||||||||||||||||
| 10.59 | 16.89 | 2.1 | 1.22 | 0.72 | 1.24 | 0.70 | 91 | |||||||||||||||||||||||
| See accompanying notes to financial statements. | 147 |
STATE FARM MUTUAL FUND TRUST INTERNATIONAL EQUITY FUND
(For a share outstanding throughout each period)
| Income from investment operations | Less distributions | |||||||||||||||||||||||||||
| Net asset value, beginning of period |
Net investment income (loss) (a) (b) |
Net gain (loss) on investments (both realized and unrealized) |
Total from investment operations |
Net investment income (c) |
Net realized gain |
Total distributions |
||||||||||||||||||||||
| Class A Shares |
||||||||||||||||||||||||||||
| Six months ended 06/30/2017 (h) |
$ | 9.97 | $ | 0.05 | $ | 1.99 | $ | 2.04 | $ | — | $ | — | $ | — | ||||||||||||||
| Year ended 12/31/2016 |
10.55 | 0.02 | (0.60 | ) | (0.58 | ) | — | — | — | |||||||||||||||||||
| Year ended 12/31/2015 |
10.63 | 0.01 | (0.07 | ) | (0.06 | ) | (0.02 | ) | — | (0.02 | ) | |||||||||||||||||
| Year ended 12/31/2014 |
11.42 | 0.03 | (0.75 | ) | (0.72 | ) | (0.07 | ) | — | (0.07 | ) | |||||||||||||||||
| Year ended 12/31/2013 |
9.82 | 0.06 | 1.66 | 1.72 | (0.12 | ) | — | (0.12 | ) | |||||||||||||||||||
| Year ended 12/31/2012 |
8.28 | 0.09 | 1.45 | 1.54 | — | — | — | |||||||||||||||||||||
| Class B Shares |
||||||||||||||||||||||||||||
| Six months ended 06/30/2017 (h) |
9.72 | 0.03 | 1.94 | 1.97 | — | — | — | |||||||||||||||||||||
| Year ended 12/31/2016 |
10.35 | (0.06 | ) | (0.57 | ) | (0.63 | ) | — | — | — | ||||||||||||||||||
| Year ended 12/31/2015 |
10.48 | (0.06 | ) | (0.07 | ) | (0.13 | ) | — | — | — | ||||||||||||||||||
| Year ended 12/31/2014 |
11.27 | (0.04 | ) | (0.75 | ) | (0.79 | ) | — | — | — | ||||||||||||||||||
| Year ended 12/31/2013 |
9.69 | 0.02 | 1.64 | 1.66 | (0.08 | ) | — | (0.08 | ) | |||||||||||||||||||
| Year ended 12/31/2012 |
8.23 | 0.03 | 1.43 | 1.46 | — | — | — | |||||||||||||||||||||
| Premier Shares (i) |
||||||||||||||||||||||||||||
| Six months ended 06/30/2017 (h) |
10.08 | 0.05 | 2.01 | 2.06 | — | — | — | |||||||||||||||||||||
| Year ended 12/31/2016 |
10.65 | 0.02 | (0.59 | ) | (0.57 | ) | — | — | — | |||||||||||||||||||
| Year ended 12/31/2015 |
10.72 | 0.01 | (0.06 | ) | (0.05 | ) | (0.02 | ) | — | (0.02 | ) | |||||||||||||||||
| Year ended 12/31/2014 |
11.53 | 0.03 | (0.77 | ) | (0.74 | ) | (0.07 | ) | — | (0.07 | ) | |||||||||||||||||
| Year ended 12/31/2013 |
9.91 | 0.06 | 1.68 | 1.74 | (0.12 | ) | — | (0.12 | ) | |||||||||||||||||||
| Year ended 12/31/2012 |
8.35 | 0.09 | 1.47 | 1.56 | — | — | — | |||||||||||||||||||||
| Legacy Class B Shares |
||||||||||||||||||||||||||||
| Six months ended 06/30/2017 (h) |
9.88 | 0.04 | 1.97 | 2.01 | — | — | — | |||||||||||||||||||||
| Year ended 12/31/2016 |
10.49 | (0.03 | ) | (0.58 | ) | (0.61 | ) | — | — | — | ||||||||||||||||||
| Year ended 12/31/2015 |
10.59 | (0.03 | ) | (0.07 | ) | (0.10 | ) | — | — | — | ||||||||||||||||||
| Year ended 12/31/2014 |
11.38 | (0.02 | ) | (0.75 | ) | (0.77 | ) | (0.02 | ) | — | (0.02 | ) | ||||||||||||||||
| Year ended 12/31/2013 |
9.79 | 0.02 | 1.64 | 1.66 | (0.07 | ) | — | (0.07 | ) | |||||||||||||||||||
| Year ended 12/31/2012 |
8.29 | 0.05 | 1.45 | 1.50 | — | — | — | |||||||||||||||||||||
| Institutional Shares |
||||||||||||||||||||||||||||
| Six months ended 06/30/2017 (h) |
10.08 | 0.05 | 2.02 | 2.07 | — | — | — | |||||||||||||||||||||
| Year ended 12/31/2016 |
10.64 | 0.04 | (0.59 | ) | (0.55 | ) | (0.01 | ) | — | (0.01 | ) | |||||||||||||||||
| Year ended 12/31/2015 |
10.72 | 0.04 | (0.07 | ) | (0.03 | ) | (0.05 | ) | — | (0.05 | ) | |||||||||||||||||
| Year ended 12/31/2014 |
11.53 | 0.06 | (0.77 | ) | (0.71 | ) | (0.10 | ) | — | (0.10 | ) | |||||||||||||||||
| Year ended 12/31/2013 |
9.91 | 0.09 | 1.67 | 1.76 | (0.14 | ) | — | (0.14 | ) | |||||||||||||||||||
| Year ended 12/31/2012 |
8.33 | 0.11 | 1.47 | 1.58 | — | — | — | |||||||||||||||||||||
| Class R-1 Shares |
||||||||||||||||||||||||||||
| Six months ended 06/30/2017 (h) |
9.88 | 0.03 | 1.98 | 2.01 | — | — | — | |||||||||||||||||||||
| Year ended 12/31/2016 |
10.48 | (0.02 | ) | (0.58 | ) | (0.60 | ) | — | — | — | ||||||||||||||||||
| Year ended 12/31/2015 |
10.57 | (0.03 | ) | (0.06 | ) | (0.09 | ) | — | — | — | ||||||||||||||||||
| Year ended 12/31/2014 |
11.36 | — | (0.76 | ) | (0.76 | ) | (0.03 | ) | — | (0.03 | ) | |||||||||||||||||
| Year ended 12/31/2013 |
9.77 | 0.03 | 1.64 | 1.67 | (0.08 | ) | — | (0.08 | ) | |||||||||||||||||||
| Year ended 12/31/2012 |
8.26 | 0.06 | 1.45 | 1.51 | — | — | — | |||||||||||||||||||||
| Class R-2 Shares |
||||||||||||||||||||||||||||
| Six months ended 06/30/2017 (h) |
9.95 | 0.04 | 1.99 | 2.03 | — | — | — | |||||||||||||||||||||
| Year ended 12/31/2016 |
10.54 | — | (0.59 | ) | (0.59 | ) | — | — | — | |||||||||||||||||||
| Year ended 12/31/2015 |
10.61 | — | (0.06 | ) | (0.06 | ) | (0.01 | ) | — | (0.01 | ) | |||||||||||||||||
| Year ended 12/31/2014 |
11.41 | 0.01 | (0.75 | ) | (0.74 | ) | (0.06 | ) | — | (0.06 | ) | |||||||||||||||||
| Year ended 12/31/2013 |
9.81 | 0.04 | 1.67 | 1.71 | (0.11 | ) | — | (0.11 | ) | |||||||||||||||||||
| Year ended 12/31/2012 |
8.29 | 0.08 | 1.44 | 1.52 | — | — | — | |||||||||||||||||||||
| Class R-3 Shares |
||||||||||||||||||||||||||||
| Six months ended 06/30/2017 (h) |
10.07 | 0.05 | 2.02 | 2.07 | — | — | — | |||||||||||||||||||||
| Year ended 12/31/2016 |
10.64 | 0.03 | (0.60 | ) | (0.57 | ) | — | — | — | |||||||||||||||||||
| Year ended 12/31/2015 |
10.71 | 0.03 | (0.06 | ) | (0.03 | ) | (0.04 | ) | — | (0.04 | ) | |||||||||||||||||
| Year ended 12/31/2014 |
11.52 | 0.05 | (0.77 | ) | (0.72 | ) | (0.09 | ) | — | (0.09 | ) | |||||||||||||||||
| Year ended 12/31/2013 |
9.90 | 0.08 | 1.68 | 1.76 | (0.14 | ) | — | (0.14 | ) | |||||||||||||||||||
| Year ended 12/31/2012 |
8.33 | 0.11 | 1.46 | 1.57 | — | — | — | |||||||||||||||||||||
| (a) | Average shares outstanding for the period were used to calculate net investment income per share. |
| (b) | Net investment income represents less than $0.01 per share for Class R-2 shares in 2016 and 2015 and Class R-1 shares in 2014. |
| (c) | Net investment income distribution represents less than $0.01 per share for Class R-3 shares in 2016 and Class B shares in 2014. |
| (d) | Total return is not annualized for periods that are less than a full year and does not reflect the effect of sales charge for Class A, Class B, Premier and Legacy Class B shares. All other classes do not have a sales charge. |
| (e) | Determined on an annualized basis for periods that are less than a full year. |
| (f) | The expense ratios include the effect of expense reduction changes. |
| (g) | Net investment income (loss) represents less than 0.005% per share for Class R-2 shares in 2016. |
| (h) | Unaudited. |
| (i) | Effective May 23, 2016, Legacy Class A shares were renamed Premier shares. |
| 148 | See accompanying notes to financial statements. |
| Ratios/supplemental data | ||||||||||||||||||||||||||||||
| Average Net Asset ratios assuming expense reductions |
Average Net Asset ratios absent expense reductions |
|||||||||||||||||||||||||||||
| Net asset value, end of period |
Total return (d) | Net assets, end of period (millions) |
Expenses (e) (f) | Net investment income (loss) (e) (g) |
Expenses (e) | Net investment income (loss) (e) (g) |
Portfolio turnover rate (e) |
|||||||||||||||||||||||
| $ |
12.01 |
|
20.46 | % | $ | 38.7 | 1.36 | % | 0.85 | % | 1.49 | % | 0.72 | % | 59 | % | ||||||||||||||
| 9.97 | (5.50 | ) | 34.0 | 1.50 | 0.19 | 1.53 | 0.16 | 103 | ||||||||||||||||||||||
| 10.55 | (0.53 | ) | 44.6 | 1.50 | 0.08 | 1.52 | 0.06 | 124 | ||||||||||||||||||||||
| 10.63 | (6.29 | ) | 41.3 | 1.50 | 0.24 | 1.54 | 0.20 | 96 | ||||||||||||||||||||||
| 11.42 | 17.53 | 41.0 | 1.50 | 0.56 | 1.53 | 0.53 | 77 | |||||||||||||||||||||||
| 9.82 | 18.60 | 30.0 | 1.50 | 0.99 | 1.55 | 0.94 | 47 | |||||||||||||||||||||||
| |
11.69 |
|
20.27 | 10.5 | 1.69 | 0.53 | 2.19 | 0.03 | 59 | |||||||||||||||||||||
| 9.72 | (6.09 | ) | 8.8 | 2.20 | (0.57 | ) | 2.22 | (0.59 | ) | 103 | ||||||||||||||||||||
| 10.35 | (1.24 | ) | 9.6 | 2.20 | (0.60 | ) | 2.22 | (0.62 | ) | 124 | ||||||||||||||||||||
| 10.48 | (6.97 | ) | 9.9 | 2.11 | (0.35 | ) | 2.15 | (0.39 | ) | 96 | ||||||||||||||||||||
| 11.27 | 17.16 | 10.8 | 1.85 | 0.24 | 1.88 | 0.21 | 77 | |||||||||||||||||||||||
| 9.69 | 17.74 | 9.2 | 2.20 | 0.30 | 2.25 | 0.25 | 47 | |||||||||||||||||||||||
| |
12.14 |
|
20.44 | 57.7 | 1.25 | 0.97 | 1.39 | 0.83 | 59 | |||||||||||||||||||||
| 10.08 | (5.35 | ) | 47.3 | 1.44 | 0.15 | 1.45 | 0.14 | 103 | ||||||||||||||||||||||
| 10.65 | (0.47 | ) | 44.8 | 1.50 | 0.11 | 1.52 | 0.09 | 124 | ||||||||||||||||||||||
| 10.72 | (6.43 | ) | 46.9 | 1.50 | 0.26 | 1.54 | 0.22 | 96 | ||||||||||||||||||||||
| 11.53 | 17.53 | 51.2 | 1.50 | 0.59 | 1.53 | 0.56 | 77 | |||||||||||||||||||||||
| 9.91 | 18.68 | 44.5 | 1.50 | 1.00 | 1.55 | 0.95 | 47 | |||||||||||||||||||||||
| |
11.89 |
|
20.34 | 10.5 | 1.55 | 0.67 | 1.89 | 0.33 | 59 | |||||||||||||||||||||
| 9.88 | (5.82 | ) | 8.9 | 1.90 | (0.27 | ) | 1.92 | (0.29 | ) | 103 | ||||||||||||||||||||
| 10.49 | (0.94 | ) | 9.7 | 1.90 | (0.30 | ) | 1.92 | (0.32 | ) | 124 | ||||||||||||||||||||
| 10.59 | (6.73 | ) | 10.1 | 1.90 | (0.14 | ) | 1.94 | (0.18 | ) | 96 | ||||||||||||||||||||
| 11.38 | 16.99 | 11.5 | 1.90 | 0.20 | 1.93 | 0.17 | 77 | |||||||||||||||||||||||
| 9.79 | 18.09 | 10.7 | 1.90 | 0.61 | 1.95 | 0.56 | 47 | |||||||||||||||||||||||
| |
12.15 |
|
20.54 | 21.7 | 1.24 | 0.99 | 1.24 | 0.99 | 59 | |||||||||||||||||||||
| 10.08 | (5.19 | ) | 17.9 | 1.25 | 0.39 | 1.27 | 0.37 | 103 | ||||||||||||||||||||||
| 10.64 | (0.29 | ) | 19.5 | 1.25 | 0.35 | 1.27 | 0.33 | 124 | ||||||||||||||||||||||
| 10.72 | (6.19 | ) | 19.1 | 1.25 | 0.50 | 1.29 | 0.46 | 96 | ||||||||||||||||||||||
| 11.53 | 17.81 | 20.3 | 1.25 | 0.83 | 1.28 | 0.80 | 77 | |||||||||||||||||||||||
| 9.91 | 18.97 | 17.1 | 1.25 | 1.25 | 1.30 | 1.20 | 47 | |||||||||||||||||||||||
| |
11.89 |
|
20.34 | 2.4 | 1.55 | 0.62 | 1.81 | 0.36 | 59 | |||||||||||||||||||||
| 9.88 | (5.73 | ) | 2.3 | 1.82 | (0.18 | ) | 1.84 | (0.20 | ) | 103 | ||||||||||||||||||||
| 10.48 | (0.85 | ) | 2.5 | 1.82 | (0.24 | ) | 1.84 | (0.26 | ) | 124 | ||||||||||||||||||||
| 10.57 | (6.71 | ) | 2.4 | 1.82 | (0.04 | ) | 1.86 | (0.08 | ) | 96 | ||||||||||||||||||||
| 11.36 | 17.14 | 2.9 | 1.82 | 0.27 | 1.85 | 0.24 | 77 | |||||||||||||||||||||||
| 9.77 | 18.28 | 2.5 | 1.82 | 0.69 | 1.87 | 0.64 | 47 | |||||||||||||||||||||||
| |
11.98 |
|
20.40 | 5.7 | 1.45 | 0.78 | 1.61 | 0.62 | 59 | |||||||||||||||||||||
| 9.95 | (5.60 | ) | 4.7 | 1.62 | 0.03 | 1.65 | 0.00 | 103 | ||||||||||||||||||||||
| 10.54 | (0.59 | ) | 5.8 | 1.62 | (0.01 | ) | 1.64 | (0.03 | ) | 124 | ||||||||||||||||||||
| 10.61 | (6.48 | ) | 6.2 | 1.62 | 0.10 | 1.66 | 0.06 | 96 | ||||||||||||||||||||||
| 11.41 | 17.40 | 5.8 | 1.62 | 0.40 | 1.65 | 0.37 | 77 | |||||||||||||||||||||||
| 9.81 | 18.34 | 5.9 | 1.62 | 0.87 | 1.67 | 0.82 | 47 | |||||||||||||||||||||||
| |
12.14 |
|
20.56 | 2.2 | 1.31 | 0.92 | 1.31 | 0.92 | 59 | |||||||||||||||||||||
| 10.07 | (5.34 | ) | 1.8 | 1.32 | 0.30 | 1.34 | 0.28 | 103 | ||||||||||||||||||||||
| 10.64 | (0.29 | ) | 1.9 | 1.32 | 0.29 | 1.34 | 0.27 | 124 | ||||||||||||||||||||||
| 10.71 | (6.25 | ) | 2.1 | 1.32 | 0.43 | 1.36 | 0.39 | 96 | ||||||||||||||||||||||
| 11.52 | 17.74 | 2.2 | 1.32 | 0.76 | 1.35 | 0.73 | 77 | |||||||||||||||||||||||
| 9.90 | 18.85 | 1.9 | 1.32 | 1.20 | 1.37 | 1.15 | 47 | |||||||||||||||||||||||
| See accompanying notes to financial statements. | 149 |
STATE FARM MUTUAL FUND TRUST S&P 500 INDEX FUND
(For a share outstanding throughout each period)
| Income from investment operations | Less distributions | |||||||||||||||||||||||||||
| Net asset value, beginning of period |
Net investment income (loss) (a) (b) |
Net gain (loss) on investments (both realized and unrealized) |
Total from investment operations |
Net investment income |
Net realized gain |
Total distributions |
||||||||||||||||||||||
| Class A Shares |
||||||||||||||||||||||||||||
| Six months ended |
$ | 16.71 | $ | 0.13 | $ | 1.38 | $ | 1.51 | $ | — | $ | — | $ | — | ||||||||||||||
| Year ended 12/31/2016 |
15.37 | 0.24 | 1.49 | 1.73 | (0.25 | ) | (0.14 | ) | (0.39 | ) | ||||||||||||||||||
| Year ended 12/31/2015 |
15.52 | 0.21 | (0.11 | ) | 0.10 | (0.21 | ) | (0.04 | ) | (0.25 | ) | |||||||||||||||||
| Year ended 12/31/2014 |
13.91 | 0.18 | 1.61 | 1.79 | (0.18 | ) | — | (0.18 | ) | |||||||||||||||||||
| Year ended 12/31/2013 |
10.72 | 0.16 | 3.20 | 3.36 | (0.17 | ) | — | (0.17 | ) | |||||||||||||||||||
| Year ended 12/31/2012 |
9.45 | 0.16 | 1.27 | 1.43 | (0.16 | ) | — | (0.16 | ) | |||||||||||||||||||
| Class B Shares |
||||||||||||||||||||||||||||
| Six months ended |
16.84 | 0.10 | 1.39 | 1.49 | — | — | — | |||||||||||||||||||||
| Year ended 12/31/2016 |
15.48 | 0.12 | 1.50 | 1.62 | (0.12 | ) | (0.14 | ) | (0.26 | ) | ||||||||||||||||||
| Year ended 12/31/2015 |
15.60 | 0.09 | (0.10 | ) | (0.01 | ) | (0.07 | ) | (0.04 | ) | (0.11 | ) | ||||||||||||||||
| Year ended 12/31/2014 |
13.98 | 0.08 | 1.60 | 1.68 | (0.06 | ) | — | (0.06 | ) | |||||||||||||||||||
| Year ended 12/31/2013 |
10.76 | 0.07 | 3.20 | 3.27 | (0.05 | ) | — | (0.05 | ) | |||||||||||||||||||
| Year ended 12/31/2012 |
9.48 | 0.09 | 1.27 | 1.36 | (0.08 | ) | — | (0.08 | ) | |||||||||||||||||||
| Premier Shares (h) |
||||||||||||||||||||||||||||
| Six months ended |
16.80 | 0.14 | 1.39 | 1.53 | — | — | — | |||||||||||||||||||||
| Year ended 12/31/2016 |
15.46 | 0.25 | 1.50 | 1.75 | (0.27 | ) | (0.14 | ) | (0.41 | ) | ||||||||||||||||||
| Year ended 12/31/2015 |
15.60 | 0.21 | (0.11 | ) | 0.10 | (0.20 | ) | (0.04 | ) | (0.24 | ) | |||||||||||||||||
| Year ended 12/31/2014 |
13.98 | 0.18 | 1.61 | 1.79 | (0.17 | ) | — | (0.17 | ) | |||||||||||||||||||
| Year ended 12/31/2013 |
10.76 | 0.16 | 3.22 | 3.38 | (0.16 | ) | — | (0.16 | ) | |||||||||||||||||||
| Year ended 12/31/2012 |
9.48 | 0.16 | 1.27 | 1.43 | (0.15 | ) | — | (0.15 | ) | |||||||||||||||||||
| Legacy Class B Shares |
||||||||||||||||||||||||||||
| Six months ended |
16.99 | 0.11 | 1.41 | 1.52 | — | — | — | |||||||||||||||||||||
| Year ended 12/31/2016 |
15.61 | 0.17 | 1.51 | 1.68 | (0.16 | ) | (0.14 | ) | (0.30 | ) | ||||||||||||||||||
| Year ended 12/31/2015 |
15.73 | 0.14 | (0.10 | ) | 0.04 | (0.12 | ) | (0.04 | ) | (0.16 | ) | |||||||||||||||||
| Year ended 12/31/2014 |
14.08 | 0.12 | 1.62 | 1.74 | (0.09 | ) | — | (0.09 | ) | |||||||||||||||||||
| Year ended 12/31/2013 |
10.82 | 0.11 | 3.24 | 3.35 | (0.09 | ) | — | (0.09 | ) | |||||||||||||||||||
| Year ended 12/31/2012 |
9.52 | 0.11 | 1.28 | 1.39 | (0.09 | ) | — | (0.09 | ) | |||||||||||||||||||
| Institutional Shares |
||||||||||||||||||||||||||||
| Six months ended |
16.86 | 0.14 | 1.40 | 1.54 | — | — | — | |||||||||||||||||||||
| Year ended 12/31/2016 |
15.51 | 0.28 | 1.50 | 1.78 | (0.29 | ) | (0.14 | ) | (0.43 | ) | ||||||||||||||||||
| Year ended 12/31/2015 |
15.65 | 0.25 | (0.11 | ) | 0.14 | (0.24 | ) | (0.04 | ) | (0.28 | ) | |||||||||||||||||
| Year ended 12/31/2014 |
14.02 | 0.22 | 1.62 | 1.84 | (0.21 | ) | — | (0.21 | ) | |||||||||||||||||||
| Year ended 12/31/2013 |
10.79 | 0.20 | 3.22 | 3.42 | (0.19 | ) | — | (0.19 | ) | |||||||||||||||||||
| Year ended 12/31/2012 |
9.51 | 0.19 | 1.27 | 1.46 | (0.18 | ) | — | (0.18 | ) | |||||||||||||||||||
| Class R-1 Shares |
||||||||||||||||||||||||||||
| Six months ended |
16.77 | 0.11 | 1.39 | 1.50 | — | — | — | |||||||||||||||||||||
| Year ended 12/31/2016 |
15.44 | 0.19 | 1.48 | 1.67 | (0.20 | ) | (0.14 | ) | (0.34 | ) | ||||||||||||||||||
| Year ended 12/31/2015 |
15.59 | 0.15 | (0.10 | ) | 0.05 | (0.16 | ) | (0.04 | ) | (0.20 | ) | |||||||||||||||||
| Year ended 12/31/2014 |
13.97 | 0.13 | 1.61 | 1.74 | (0.12 | ) | — | (0.12 | ) | |||||||||||||||||||
| Year ended 12/31/2013 |
10.75 | 0.12 | 3.21 | 3.33 | (0.11 | ) | — | (0.11 | ) | |||||||||||||||||||
| Year ended 12/31/2012 |
9.47 | 0.13 | 1.27 | 1.40 | (0.12 | ) | — | (0.12 | ) | |||||||||||||||||||
| Class R-2 Shares |
||||||||||||||||||||||||||||
| Six months ended |
16.69 | 0.12 | 1.38 | 1.50 | — | — | — | |||||||||||||||||||||
| Year ended 12/31/2016 |
15.35 | 0.22 | 1.49 | 1.71 | (0.23 | ) | (0.14 | ) | (0.37 | ) | ||||||||||||||||||
| Year ended 12/31/2015 |
15.50 | 0.19 | (0.11 | ) | 0.08 | (0.19 | ) | (0.04 | ) | (0.23 | ) | |||||||||||||||||
| Year ended 12/31/2014 |
13.89 | 0.16 | 1.60 | 1.76 | (0.15 | ) | — | (0.15 | ) | |||||||||||||||||||
| Year ended 12/31/2013 |
10.70 | 0.15 | 3.19 | 3.34 | (0.15 | ) | — | (0.15 | ) | |||||||||||||||||||
| Year ended 12/31/2012 |
9.43 | 0.15 | 1.26 | 1.41 | (0.14 | ) | — | (0.14 | ) | |||||||||||||||||||
| Class R-3 Shares |
||||||||||||||||||||||||||||
| Six months ended |
16.82 | 0.14 | 1.39 | 1.53 | — | — | — | |||||||||||||||||||||
| Year ended 12/31/2016 |
15.48 | 0.27 | 1.50 | 1.77 | (0.29 | ) | (0.14 | ) | (0.43 | ) | ||||||||||||||||||
| Year ended 12/31/2015 |
15.62 | 0.23 | (0.10 | ) | 0.13 | (0.23 | ) | (0.04 | ) | (0.27 | ) | |||||||||||||||||
| Year ended 12/31/2014 |
14.00 | 0.20 | 1.61 | 1.81 | (0.19 | ) | — | (0.19 | ) | |||||||||||||||||||
| Year ended 12/31/2013 |
10.78 | 0.19 | 3.22 | 3.41 | (0.19 | ) | — | (0.19 | ) | |||||||||||||||||||
| Year ended 12/31/2012 |
9.50 | 0.18 | 1.27 | 1.45 | (0.17 | ) | — | (0.17 | ) | |||||||||||||||||||
| (a) | Average shares outstanding for the period were used to calculate net investment income per share. |
| (b) | Net amounts and ratios reflect the Fund’s proportionate share of income and expenses of the Master Portfolio through May 11, 2012. |
| (c) | Total return is not annualized for periods that are less than a full year and does not reflect the effect of sales charge for Class A, Class B, Premier and Legacy Class B shares. All other classes do not have a sales charge. |
| (d) | Determined on an annualized basis for periods that are less than a full year. |
| (e) | The expense ratios include the effect of expense reduction changes. |
| (f) | The 2012 portfolio turnover rate reflects the period from May 12, 2012 to December 31, 2012 and excludes in-kind contribution of portfolio securities received on May 12, 2012. Prior to May 12, 2012, the S&P 500 Index Fund invested all of its assets in its corresponding Master Portfolio. The portfolio turnover rate of the Master Portfolio for the period January 1, 2012 through May 11, 2012 was 5%. |
| (g) | Unaudited. |
| (h) | Effective May 23, 2016, Legacy Class A shares were renamed Premier shares. |
| 150 | See accompanying notes to financial statements. |
| Ratios/supplemental data | ||||||||||||||||||||||||||||||
| Average Net Asset ratios assuming expense reductions |
Average Net Asset ratios absent expense reductions |
|||||||||||||||||||||||||||||
| Net asset value, end of period |
Total return (c) | Net assets, end of period (millions) |
Expenses (b) (d) (e) | Net investment income (loss) (b) (d) |
Expenses (b) (d) | Net investment income (loss) (b) (d) |
Portfolio turnover rate (d) (f) |
|||||||||||||||||||||||
|
$ |
18.22 |
|
9.04 | % | $ | 530.5 | 0.52 | % | 1.48 | % | 0.64 | % | 1.36 | % | 3 | % | ||||||||||||||
| 16.71 | 11.21 | 505.1 | 0.68 | 1.49 | 0.68 | 1.49 | 3 | |||||||||||||||||||||||
| 15.37 | 0.64 | 491.5 | 0.73 | 1.31 | 0.73 | 1.31 | 3 | |||||||||||||||||||||||
| 15.52 | 12.84 | 382.7 | 0.74 | 1.25 | 0.74 | 1.25 | 2 | |||||||||||||||||||||||
| 13.91 | 31.46 | 273.3 | 0.75 | 1.30 | 0.75 | 1.30 | 3 | |||||||||||||||||||||||
| 10.72 | 15.02 | 154.6 | 0.76 | 1.54 | 0.76 | 1.54 | 2 | |||||||||||||||||||||||
|
|
18.33 |
|
8.85 | 8.8 | 0.88 | 1.12 | 1.34 | 0.66 | 3 | |||||||||||||||||||||
| 16.84 | 10.42 | 9.3 | 1.38 | 0.79 | 1.38 | 0.79 | 3 | |||||||||||||||||||||||
| 15.48 | (0.06 | ) | 10.6 | 1.43 | 0.60 | 1.43 | 0.60 | 3 | ||||||||||||||||||||||
| 15.60 | 12.04 | 12.6 | 1.44 | 0.54 | 1.44 | 0.54 | 2 | |||||||||||||||||||||||
| 13.98 | 30.41 | 13.0 | 1.44 | 0.59 | 1.44 | 0.59 | 3 | |||||||||||||||||||||||
| 10.76 | 14.37 | 18.5 | 1.47 | 0.83 | 1.47 | 0.83 | 2 | |||||||||||||||||||||||
|
|
18.33 |
|
9.11 | 623.3 | 0.42 | 1.58 | 0.54 | 1.46 | 3 | |||||||||||||||||||||
| 16.80 | 11.25 | 569.8 | 0.61 | 1.55 | 0.61 | 1.55 | 3 | |||||||||||||||||||||||
| 15.46 | 0.64 | 439.8 | 0.73 | 1.31 | 0.73 | 1.31 | 3 | |||||||||||||||||||||||
| 15.60 | 12.79 | 446.6 | 0.74 | 1.25 | 0.74 | 1.25 | 2 | |||||||||||||||||||||||
| 13.98 | 31.42 | 406.0 | 0.75 | 1.30 | 0.75 | 1.30 | 3 | |||||||||||||||||||||||
| 10.76 | 15.13 | 315.1 | 0.77 | 1.53 | 0.77 | 1.53 | 2 | |||||||||||||||||||||||
|
|
18.51 |
|
8.95 | 14.6 | 0.74 | 1.26 | 1.04 | 0.96 | 3 | |||||||||||||||||||||
| 16.99 | 10.73 | 17.6 | 1.08 | 1.09 | 1.08 | 1.09 | 3 | |||||||||||||||||||||||
| 15.61 | 0.22 | 22.1 | 1.13 | 0.90 | 1.13 | 0.90 | 3 | |||||||||||||||||||||||
| 15.73 | 12.35 | 29.9 | 1.14 | 0.85 | 1.14 | 0.85 | 2 | |||||||||||||||||||||||
| 14.08 | 30.97 | 37.0 | 1.14 | 0.91 | 1.14 | 0.91 | 3 | |||||||||||||||||||||||
| 10.82 | 14.63 | 40.2 | 1.17 | 1.10 | 1.17 | 1.10 | 2 | |||||||||||||||||||||||
|
|
18.40 |
|
9.13 | 220.1 | 0.39 | 1.60 | 0.39 | 1.60 | 3 | |||||||||||||||||||||
| 16.86 | 11.45 | 198.2 | 0.43 | 1.73 | 0.43 | 1.73 | 3 | |||||||||||||||||||||||
| 15.51 | 0.90 | 166.3 | 0.48 | 1.56 | 0.48 | 1.56 | 3 | |||||||||||||||||||||||
| 15.65 | 13.10 | 148.6 | 0.49 | 1.50 | 0.49 | 1.50 | 2 | |||||||||||||||||||||||
| 14.02 | 31.73 | 117.4 | 0.50 | 1.55 | 0.50 | 1.55 | 3 | |||||||||||||||||||||||
| 10.79 | 15.37 | 82.5 | 0.52 | 1.78 | 0.52 | 1.78 | 2 | |||||||||||||||||||||||
|
|
18.27 |
|
8.94 | 9.4 | 0.71 | 1.28 | 0.96 | 1.03 | 3 | |||||||||||||||||||||
| 16.77 | 10.78 | 9.5 | 1.00 | 1.16 | 1.00 | 1.16 | 3 | |||||||||||||||||||||||
| 15.44 | 0.31 | 7.9 | 1.05 | 0.99 | 1.05 | 0.99 | 3 | |||||||||||||||||||||||
| 15.59 | 12.45 | 6.9 | 1.06 | 0.93 | 1.06 | 0.93 | 2 | |||||||||||||||||||||||
| 13.97 | 31.01 | 8.1 | 1.07 | 0.99 | 1.07 | 0.99 | 3 | |||||||||||||||||||||||
| 10.75 | 14.77 | 6.5 | 1.09 | 1.20 | 1.09 | 1.20 | 2 | |||||||||||||||||||||||
|
|
18.19 |
|
8.99 | 26.1 | 0.61 | 1.38 | 0.76 | 1.23 | 3 | |||||||||||||||||||||
| 16.69 | 11.09 | 24.8 | 0.80 | 1.37 | 0.80 | 1.37 | 3 | |||||||||||||||||||||||
| 15.35 | 0.51 | 23.0 | 0.85 | 1.19 | 0.85 | 1.19 | 3 | |||||||||||||||||||||||
| 15.50 | 12.69 | 20.2 | 0.86 | 1.13 | 0.86 | 1.13 | 2 | |||||||||||||||||||||||
| 13.89 | 31.22 | 19.4 | 0.86 | 1.19 | 0.86 | 1.19 | 3 | |||||||||||||||||||||||
| 10.70 | 14.98 | 15.7 | 0.89 | 1.42 | 0.89 | 1.42 | 2 | |||||||||||||||||||||||
|
|
18.35 |
|
9.10 | 4.2 | 0.46 | 1.53 | 0.46 | 1.53 | 3 | |||||||||||||||||||||
| 16.82 | 11.36 | 3.4 | 0.49 | 1.66 | 0.49 | 1.66 | 3 | |||||||||||||||||||||||
| 15.48 | 0.83 | 2.3 | 0.55 | 1.49 | 0.55 | 1.49 | 3 | |||||||||||||||||||||||
| 15.62 | 12.95 | 2.1 | 0.56 | 1.42 | 0.56 | 1.42 | 2 | |||||||||||||||||||||||
| 14.00 | 31.61 | 3.5 | 0.57 | 1.49 | 0.57 | 1.49 | 3 | |||||||||||||||||||||||
| 10.78 | 15.32 | 2.5 | 0.59 | 1.72 | 0.59 | 1.72 | 2 | |||||||||||||||||||||||
| See accompanying notes to financial statements. | 151 |
STATE FARM MUTUAL FUND TRUST SMALL CAP INDEX FUND
(For a share outstanding throughout each period)
| Income from investment operations | Less distributions | |||||||||||||||||||||||||||
| Net asset value, beginning of period |
Net investment income (loss) (a) (b) |
Net gain (loss) on investments (both realized and unrealized) |
Total from investment operations |
Net investment income |
Net realized gain |
Total distributions |
||||||||||||||||||||||
| Class A Shares |
||||||||||||||||||||||||||||
| Six months ended |
$ | 16.82 | $ | 0.07 | $ | 0.72 | $ | 0.79 | $ | — | $ | — | $ | — | ||||||||||||||
| Year ended 12/31/2016 |
14.52 | 0.10 | 2.87 | 2.97 | (0.11 | ) | (0.56 | ) | (0.67 | ) | ||||||||||||||||||
| Year ended 12/31/2015 |
16.23 | 0.06 | (0.90 | ) | (0.84 | ) | (0.07 | ) | (0.80 | ) | (0.87 | ) | ||||||||||||||||
| Year ended 12/31/2014 |
16.54 | 0.05 | 0.61 | 0.66 | (0.05 | ) | (0.92 | ) | (0.97 | ) | ||||||||||||||||||
| Year ended 12/31/2013 |
12.65 | 0.03 | 4.72 | 4.75 | (0.06 | ) | (0.80 | ) | (0.86 | ) | ||||||||||||||||||
| Year ended 12/31/2012 |
11.35 | 0.13 | 1.59 | 1.72 | (0.11 | ) | (0.31 | ) | (0.42 | ) | ||||||||||||||||||
| Class B Shares |
||||||||||||||||||||||||||||
| Six months ended |
16.37 | 0.05 | 0.71 | 0.76 | — | — | — | |||||||||||||||||||||
| Year ended 12/31/2016 |
14.16 | 0.02 | 2.77 | 2.79 | (0.02 | ) | (0.56 | ) | (0.58 | ) | ||||||||||||||||||
| Year ended 12/31/2015 |
15.88 | (0.04 | ) | (0.88 | ) | (0.92 | ) | — | (0.80 | ) | (0.80 | ) | ||||||||||||||||
| Year ended 12/31/2014 |
16.25 | (0.04 | ) | 0.59 | 0.55 | — | (0.92 | ) | (0.92 | ) | ||||||||||||||||||
| Year ended 12/31/2013 |
12.46 | (0.05 | ) | 4.64 | 4.59 | — | (0.80 | ) | (0.80 | ) | ||||||||||||||||||
| Year ended 12/31/2012 |
11.18 | 0.04 | 1.57 | 1.61 | (0.02 | ) | (0.31 | ) | (0.33 | ) | ||||||||||||||||||
| Premier Shares (g) |
||||||||||||||||||||||||||||
| Six months ended |
16.66 | 0.08 | 0.72 | 0.80 | — | — | — | |||||||||||||||||||||
| Year ended 12/31/2016 |
14.38 | 0.11 | 2.84 | 2.95 | (0.11 | ) | (0.56 | ) | (0.67 | ) | ||||||||||||||||||
| Year ended 12/31/2015 |
16.08 | 0.06 | (0.90 | ) | (0.84 | ) | (0.06 | ) | (0.80 | ) | (0.86 | ) | ||||||||||||||||
| Year ended 12/31/2014 |
16.39 | 0.05 | 0.61 | 0.66 | (0.05 | ) | (0.92 | ) | (0.97 | ) | ||||||||||||||||||
| Year ended 12/31/2013 |
12.53 | 0.03 | 4.68 | 4.71 | (0.05 | ) | (0.80 | ) | (0.85 | ) | ||||||||||||||||||
| Year ended 12/31/2012 |
11.24 | 0.13 | 1.57 | 1.70 | (0.10 | ) | (0.31 | ) | (0.41 | ) | ||||||||||||||||||
| Legacy Class B Shares |
||||||||||||||||||||||||||||
| Six months ended |
16.25 | 0.05 | 0.71 | 0.76 | — | — | — | |||||||||||||||||||||
| Year ended 12/31/2016 |
14.05 | 0.04 | 2.76 | 2.80 | (0.04 | ) | (0.56 | ) | (0.60 | ) | ||||||||||||||||||
| Year ended 12/31/2015 |
15.73 | — | (0.88 | ) | (0.88 | ) | — | (0.80 | ) | (0.80 | ) | |||||||||||||||||
| Year ended 12/31/2014 |
16.08 | (0.01 | ) | 0.58 | 0.57 | — | (0.92 | ) | (0.92 | ) | ||||||||||||||||||
| Year ended 12/31/2013 |
12.31 | (0.03 | ) | 4.60 | 4.57 | — | (0.80 | ) | (0.80 | ) | ||||||||||||||||||
| Year ended 12/31/2012 |
11.05 | 0.07 | 1.55 | 1.62 | (0.05 | ) | (0.31 | ) | (0.36 | ) | ||||||||||||||||||
| Institutional Shares |
||||||||||||||||||||||||||||
| Six months ended |
16.95 | 0.08 | 0.74 | 0.82 | — | — | — | |||||||||||||||||||||
| Year ended 12/31/2016 |
14.62 | 0.14 | 2.89 | 3.03 | (0.14 | ) | (0.56 | ) | (0.70 | ) | ||||||||||||||||||
| Year ended 12/31/2015 |
16.34 | 0.10 | (0.92 | ) | (0.82 | ) | (0.10 | ) | (0.80 | ) | (0.90 | ) | ||||||||||||||||
| Year ended 12/31/2014 |
16.64 | 0.09 | 0.62 | 0.71 | (0.09 | ) | (0.92 | ) | (1.01 | ) | ||||||||||||||||||
| Year ended 12/31/2013 |
12.71 | 0.07 | 4.75 | 4.82 | (0.09 | ) | (0.80 | ) | (0.89 | ) | ||||||||||||||||||
| Year ended 12/31/2012 |
11.39 | 0.16 | 1.60 | 1.76 | (0.13 | ) | (0.31 | ) | (0.44 | ) | ||||||||||||||||||
| Class R-1 Shares |
||||||||||||||||||||||||||||
| Six months ended |
16.77 | 0.05 | 0.73 | 0.78 | — | — | — | |||||||||||||||||||||
| Year ended 12/31/2016 |
14.49 | 0.06 | 2.84 | 2.90 | (0.06 | ) | (0.56 | ) | (0.62 | ) | ||||||||||||||||||
| Year ended 12/31/2015 |
16.19 | 0.01 | (0.90 | ) | (0.89 | ) | (0.01 | ) | (0.80 | ) | (0.81 | ) | ||||||||||||||||
| Year ended 12/31/2014 |
16.51 | — | 0.60 | 0.60 | — | (0.92 | ) | (0.92 | ) | |||||||||||||||||||
| Year ended 12/31/2013 |
12.63 | (0.01 | ) | 4.70 | 4.69 | (0.01 | ) | (0.80 | ) | (0.81 | ) | |||||||||||||||||
| Year ended 12/31/2012 |
11.32 | 0.09 | 1.59 | 1.68 | (0.06 | ) | (0.31 | ) | (0.37 | ) | ||||||||||||||||||
| Class R-2 Shares |
||||||||||||||||||||||||||||
| Six months ended |
16.82 | 0.06 | 0.73 | 0.79 | — | — | — | |||||||||||||||||||||
| Year ended 12/31/2016 |
14.52 | 0.09 | 2.85 | 2.94 | (0.08 | ) | (0.56 | ) | (0.64 | ) | ||||||||||||||||||
| Year ended 12/31/2015 |
16.22 | 0.04 | (0.89 | ) | (0.85 | ) | (0.05 | ) | (0.80 | ) | (0.85 | ) | ||||||||||||||||
| Year ended 12/31/2014 |
16.53 | 0.03 | 0.61 | 0.64 | (0.03 | ) | (0.92 | ) | (0.95 | ) | ||||||||||||||||||
| Year ended 12/31/2013 |
12.64 | 0.01 | 4.72 | 4.73 | (0.04 | ) | (0.80 | ) | (0.84 | ) | ||||||||||||||||||
| Year ended 12/31/2012 |
11.34 | 0.11 | 1.59 | 1.70 | (0.09 | ) | (0.31 | ) | (0.40 | ) | ||||||||||||||||||
| Class R-3 Shares |
||||||||||||||||||||||||||||
| Six months ended |
16.96 | 0.07 | 0.74 | 0.81 | — | — | — | |||||||||||||||||||||
| Year ended 12/31/2016 |
14.63 | 0.13 | 2.89 | 3.02 | (0.13 | ) | (0.56 | ) | (0.69 | ) | ||||||||||||||||||
| Year ended 12/31/2015 |
16.34 | 0.09 | (0.91 | ) | (0.82 | ) | (0.09 | ) | (0.80 | ) | (0.89 | ) | ||||||||||||||||
| Year ended 12/31/2014 |
16.64 | 0.08 | 0.62 | 0.70 | (0.08 | ) | (0.92 | ) | (1.00 | ) | ||||||||||||||||||
| Year ended 12/31/2013 |
12.71 | 0.06 | 4.75 | 4.81 | (0.08 | ) | (0.80 | ) | (0.88 | ) | ||||||||||||||||||
| Year ended 12/31/2012 |
11.40 | 0.15 | 1.60 | 1.75 | (0.13 | ) | (0.31 | ) | (0.44 | ) | ||||||||||||||||||
| (a) | Average shares outstanding for the period were used to calculate net investment income per share. |
| (b) | Net investment income represents less than $0.01 per share for Legacy Class B shares in 2015 and Class R-1 shares in 2014. |
| (c) | Total return is not annualized for periods that are less than a full year and does not reflect the effect of sales charge for Class A, Class B, Premier and Legacy Class B shares. All other classes do not have a sales charge. |
| (d) | Determined on an annualized basis for periods that are less than a full year. |
| (e) | The expense ratios include the effect of expense reduction changes. |
| (f) | Unaudited. |
| (g) | Effective May 23, 2016, Legacy Class A shares were renamed Premier shares. |
| 152 | See accompanying notes to financial statements. |
| Ratios/supplemental data | ||||||||||||||||||||||||||||||
| Average Net Asset ratios assuming expense reductions |
Average Net Asset ratios absent expense reductions |
|||||||||||||||||||||||||||||
| Net asset value, end of period |
Total return (c) | Net assets, end of period (millions) |
Expenses (d) (e) | Net investment income (loss) (d) |
Expenses (d) | Net investment income (loss) (d) |
Portfolio turnover rate (d) |
|||||||||||||||||||||||
| $ |
17.61 |
4.70 | % | $ | 171.3 | 0.60 | % | 0.82 | % | 0.73 | % | 0.69 | % | 23 | % | |||||||||||||||
| 16.82 | 20.36 | 170.9 | 0.78 | 0.68 | 0.80 | 0.66 | 19 | |||||||||||||||||||||||
| 14.52 | (5.31 | ) | 112.7 | 0.93 | 0.38 | 0.93 | 0.38 | 15 | ||||||||||||||||||||||
| 16.23 | 3.99 | 105.3 | 0.93 | 0.31 | 0.94 | 0.30 | 16 | |||||||||||||||||||||||
| 16.54 | 37.57 | 87.0 | 0.94 | 0.23 | 0.96 | 0.21 | 14 | |||||||||||||||||||||||
| 12.65 | 15.22 | 51.5 | 0.95 | 1.05 | 0.98 | 1.02 | 14 | |||||||||||||||||||||||
| |
17.13 |
4.64 | 13.5 | 0.88 | 0.55 | 1.28 | 0.15 | 23 | ||||||||||||||||||||||
| 16.37 | 19.65 | 13.3 | 1.34 | 0.15 | 1.36 | 0.13 | 19 | |||||||||||||||||||||||
| 14.16 | (5.89 | ) | 12.0 | 1.59 | (0.27 | ) | 1.59 | (0.27 | ) | 15 | ||||||||||||||||||||
| 15.88 | 3.36 | 14.0 | 1.50 | (0.25 | ) | 1.50 | (0.25 | ) | 16 | |||||||||||||||||||||
| 16.25 | 36.84 | 14.4 | 1.49 | (0.33 | ) | 1.51 | (0.35 | ) | 14 | |||||||||||||||||||||
| 12.46 | 14.48 | 10.7 | 1.65 | 0.33 | 1.68 | 0.30 | 14 | |||||||||||||||||||||||
| |
17.46 |
4.80 | 189.6 | 0.50 | 0.92 | 0.63 | 0.79 | 23 | ||||||||||||||||||||||
| 16.66 | 20.44 | 180.0 | 0.74 | 0.77 | 0.75 | 0.76 | 19 | |||||||||||||||||||||||
| 14.38 | (5.33 | ) | 181.9 | 0.93 | 0.39 | 0.93 | 0.39 | 15 | ||||||||||||||||||||||
| 16.08 | 3.99 | 199.7 | 0.93 | 0.31 | 0.94 | 0.30 | 16 | |||||||||||||||||||||||
| 16.39 | 37.63 | 200.6 | 0.94 | 0.21 | 0.96 | 0.19 | 14 | |||||||||||||||||||||||
| 12.53 | 15.26 | 150.6 | 0.95 | 1.02 | 0.98 | 0.99 | 14 | |||||||||||||||||||||||
| |
17.01 |
4.68 | 24.7 | 0.81 | 0.63 | 1.13 | 0.31 | 23 | ||||||||||||||||||||||
| 16.25 | 19.88 | 24.8 | 1.19 | 0.30 | 1.21 | 0.28 | 19 | |||||||||||||||||||||||
| 14.05 | (5.70 | ) | 23.4 | 1.33 | 0.00 | 1.33 | 0.00 | 15 | ||||||||||||||||||||||
| 15.73 | 3.52 | 28.6 | 1.33 | (0.08 | ) | 1.34 | (0.09 | ) | 16 | |||||||||||||||||||||
| 16.08 | 37.14 | 32.9 | 1.34 | (0.19 | ) | 1.36 | (0.21 | ) | 14 | |||||||||||||||||||||
| 12.31 | 14.72 | 29.3 | 1.35 | 0.58 | 1.38 | 0.55 | 14 | |||||||||||||||||||||||
| |
17.77 |
4.84 | 96.9 | 0.48 | 0.94 | 0.48 | 0.94 | 23 | ||||||||||||||||||||||
| 16.95 | 20.65 | 92.2 | 0.54 | 0.95 | 0.56 | 0.93 | 19 | |||||||||||||||||||||||
| 14.62 | (5.12 | ) | 79.6 | 0.68 | 0.63 | 0.68 | 0.63 | 15 | ||||||||||||||||||||||
| 16.34 | 4.24 | 82.4 | 0.68 | 0.56 | 0.69 | 0.55 | 16 | |||||||||||||||||||||||
| 16.64 | 37.96 | 78.7 | 0.69 | 0.47 | 0.71 | 0.45 | 14 | |||||||||||||||||||||||
| 12.71 | 15.60 | 54.1 | 0.70 | 1.27 | 0.73 | 1.24 | 14 | |||||||||||||||||||||||
| |
17.55 |
4.65 | 4.0 | 0.80 | 0.63 | 1.05 | 0.38 | 23 | ||||||||||||||||||||||
| 16.77 | 19.93 | 4.2 | 1.11 | 0.37 | 1.13 | 0.35 | 19 | |||||||||||||||||||||||
| 14.49 | (5.59 | ) | 3.3 | 1.25 | 0.08 | 1.25 | 0.08 | 15 | ||||||||||||||||||||||
| 16.19 | 3.61 | 3.7 | 1.25 | (0.01 | ) | 1.26 | (0.02 | ) | 16 | |||||||||||||||||||||
| 16.51 | 37.25 | 4.2 | 1.26 | (0.10 | ) | 1.28 | (0.12 | ) | 14 | |||||||||||||||||||||
| 12.63 | 14.88 | 3.2 | 1.27 | 0.71 | 1.30 | 0.68 | 14 | |||||||||||||||||||||||
| |
17.61 |
4.70 | 9.7 | 0.70 | 0.72 | 0.85 | 0.57 | 23 | ||||||||||||||||||||||
| 16.82 | 20.19 | 9.9 | 0.91 | 0.57 | 0.93 | 0.55 | 19 | |||||||||||||||||||||||
| 14.52 | (5.42 | ) | 9.0 | 1.05 | 0.27 | 1.05 | 0.27 | 15 | ||||||||||||||||||||||
| 16.22 | 3.89 | 9.0 | 1.05 | 0.18 | 1.06 | 0.17 | 16 | |||||||||||||||||||||||
| 16.53 | 37.44 | 8.9 | 1.06 | 0.10 | 1.08 | 0.08 | 14 | |||||||||||||||||||||||
| 12.64 | 15.09 | 6.8 | 1.07 | 0.93 | 1.10 | 0.90 | 14 | |||||||||||||||||||||||
| |
17.77 |
4.78 | 3.1 | 0.55 | 0.87 | 0.55 | 0.87 | 23 | ||||||||||||||||||||||
| 16.96 | 20.56 | 2.5 | 0.61 | 0.88 | 0.63 | 0.86 | 19 | |||||||||||||||||||||||
| 14.63 | (5.12 | ) | 2.3 | 0.75 | 0.57 | 0.75 | 0.57 | 15 | ||||||||||||||||||||||
| 16.34 | 4.15 | 2.4 | 0.75 | 0.49 | 0.76 | 0.48 | 16 | |||||||||||||||||||||||
| 16.64 | 37.86 | 2.5 | 0.76 | 0.40 | 0.78 | 0.38 | 14 | |||||||||||||||||||||||
| 12.71 | 15.44 | 1.9 | 0.77 | 1.24 | 0.80 | 1.21 | 14 | |||||||||||||||||||||||
| See accompanying notes to financial statements. | 153 |
STATE FARM MUTUAL FUND TRUST INTERNATIONAL INDEX FUND
(For a share outstanding throughout each period)
| Income from investment operations | Less distributions | |||||||||||||||||||||||||||
| Net asset value, beginning of period |
Net investment income (loss) (a) |
Net gain (loss) on investments (both realized and unrealized) |
Total from investment operations |
Net investment income |
Net realized gain |
Total distributions |
||||||||||||||||||||||
| Class A Shares |
||||||||||||||||||||||||||||
| Six months ended |
$ | 10.79 | $ | 0.19 | $ | 1.35 | $ | 1.54 | $ | — | $ | — | $ | — | ||||||||||||||
| Year ended 12/31/2016 |
11.03 | 0.25 | (0.23 | ) | 0.02 | (0.26 | ) | — | (0.26 | ) | ||||||||||||||||||
| Year ended 12/31/2015 |
11.40 | 0.20 | (0.38 | ) | (0.18 | ) | (0.19 | ) | — | (0.19 | ) | |||||||||||||||||
| Year ended 12/31/2014 |
12.49 | 0.30 | (1.10 | ) | (0.80 | ) | (0.29 | ) | — | (0.29 | ) | |||||||||||||||||
| Year ended 12/31/2013 |
10.55 | 0.21 | 1.95 | 2.16 | (0.22 | ) | — | (0.22 | ) | |||||||||||||||||||
| Year ended 12/31/2012 |
9.19 | 0.22 | 1.38 | 1.60 | (0.24 | ) | — | (0.24 | ) | |||||||||||||||||||
| Class B Shares |
||||||||||||||||||||||||||||
| Six months ended |
10.81 | 0.17 | 1.35 | 1.52 | — | — | — | |||||||||||||||||||||
| Year ended 12/31/2016 |
11.06 | 0.17 | (0.23 | ) | (0.06 | ) | (0.19 | ) | — | (0.19 | ) | |||||||||||||||||
| Year ended 12/31/2015 |
11.42 | 0.13 | (0.39 | ) | (0.26 | ) | (0.10 | ) | — | (0.10 | ) | |||||||||||||||||
| Year ended 12/31/2014 |
12.50 | 0.24 | (1.10 | ) | (0.86 | ) | (0.22 | ) | — | (0.22 | ) | |||||||||||||||||
| Year ended 12/31/2013 |
10.57 | 0.15 | 1.93 | 2.08 | (0.15 | ) | — | (0.15 | ) | |||||||||||||||||||
| Year ended 12/31/2012 |
9.20 | 0.15 | 1.39 | 1.54 | (0.17 | ) | — | (0.17 | ) | |||||||||||||||||||
| Premier Shares (f) |
||||||||||||||||||||||||||||
| Six months ended |
10.77 | 0.20 | 1.34 | 1.54 | — | — | — | |||||||||||||||||||||
| Year ended 12/31/2016 |
11.02 | 0.24 | (0.21 | ) | 0.03 | (0.28 | ) | — | (0.28 | ) | ||||||||||||||||||
| Year ended 12/31/2015 |
11.39 | 0.21 | (0.39 | ) | (0.18 | ) | (0.19 | ) | — | (0.19 | ) | |||||||||||||||||
| Year ended 12/31/2014 |
12.47 | 0.31 | (1.10 | ) | (0.79 | ) | (0.29 | ) | — | (0.29 | ) | |||||||||||||||||
| Year ended 12/31/2013 |
10.53 | 0.21 | 1.94 | 2.15 | (0.21 | ) | — | (0.21 | ) | |||||||||||||||||||
| Year ended 12/31/2012 |
9.17 | 0.22 | 1.38 | 1.60 | (0.24 | ) | — | (0.24 | ) | |||||||||||||||||||
| Legacy Class B Shares |
||||||||||||||||||||||||||||
| Six months ended |
10.84 | 0.18 | 1.36 | 1.54 | — | — | — | |||||||||||||||||||||
| Year ended 12/31/2016 |
11.09 | 0.20 | (0.23 | ) | (0.03 | ) | (0.22 | ) | — | (0.22 | ) | |||||||||||||||||
| Year ended 12/31/2015 |
11.45 | 0.16 | (0.38 | ) | (0.22 | ) | (0.14 | ) | — | (0.14 | ) | |||||||||||||||||
| Year ended 12/31/2014 |
12.53 | 0.27 | (1.12 | ) | (0.85 | ) | (0.23 | ) | — | (0.23 | ) | |||||||||||||||||
| Year ended 12/31/2013 |
10.58 | 0.17 | 1.94 | 2.11 | (0.16 | ) | — | (0.16 | ) | |||||||||||||||||||
| Year ended 12/31/2012 |
9.21 | 0.18 | 1.38 | 1.56 | (0.19 | ) | — | (0.19 | ) | |||||||||||||||||||
| Institutional Shares |
||||||||||||||||||||||||||||
| Six months ended |
10.81 | 0.20 | 1.35 | 1.55 | — | — | — | |||||||||||||||||||||
| Year ended 12/31/2016 |
11.05 | 0.27 | (0.21 | ) | 0.06 | (0.30 | ) | — | (0.30 | ) | ||||||||||||||||||
| Year ended 12/31/2015 |
11.42 | 0.24 | (0.39 | ) | (0.15 | ) | (0.22 | ) | — | (0.22 | ) | |||||||||||||||||
| Year ended 12/31/2014 |
12.51 | 0.34 | (1.11 | ) | (0.77 | ) | (0.32 | ) | — | (0.32 | ) | |||||||||||||||||
| Year ended 12/31/2013 |
10.57 | 0.24 | 1.94 | 2.18 | (0.24 | ) | — | (0.24 | ) | |||||||||||||||||||
| Year ended 12/31/2012 |
9.19 | 0.25 | 1.39 | 1.64 | (0.26 | ) | — | (0.26 | ) | |||||||||||||||||||
| Class R-1 Shares |
||||||||||||||||||||||||||||
| Six months ended |
10.81 | 0.18 | 1.35 | 1.53 | — | — | — | |||||||||||||||||||||
| Year ended 12/31/2016 |
11.05 | 0.21 | (0.22 | ) | (0.01 | ) | (0.23 | ) | — | (0.23 | ) | |||||||||||||||||
| Year ended 12/31/2015 |
11.42 | 0.17 | (0.39 | ) | (0.22 | ) | (0.15 | ) | — | (0.15 | ) | |||||||||||||||||
| Year ended 12/31/2014 |
12.50 | 0.28 | (1.12 | ) | (0.84 | ) | (0.24 | ) | — | (0.24 | ) | |||||||||||||||||
| Year ended 12/31/2013 |
10.56 | 0.18 | 1.93 | 2.11 | (0.17 | ) | — | (0.17 | ) | |||||||||||||||||||
| Year ended 12/31/2012 |
9.19 | 0.19 | 1.38 | 1.57 | (0.20 | ) | — | (0.20 | ) | |||||||||||||||||||
| Class R-2 Shares |
||||||||||||||||||||||||||||
| Six months ended |
10.77 | 0.19 | 1.34 | 1.53 | — | — | — | |||||||||||||||||||||
| Year ended 12/31/2016 |
11.01 | 0.23 | (0.22 | ) | 0.01 | (0.25 | ) | — | (0.25 | ) | ||||||||||||||||||
| Year ended 12/31/2015 |
11.38 | 0.19 | (0.38 | ) | (0.19 | ) | (0.18 | ) | — | (0.18 | ) | |||||||||||||||||
| Year ended 12/31/2014 |
12.46 | 0.29 | (1.09 | ) | (0.80 | ) | (0.28 | ) | — | (0.28 | ) | |||||||||||||||||
| Year ended 12/31/2013 |
10.53 | 0.19 | 1.94 | 2.13 | (0.20 | ) | — | (0.20 | ) | |||||||||||||||||||
| Year ended 12/31/2012 |
9.17 | 0.21 | 1.38 | 1.59 | (0.23 | ) | — | (0.23 | ) | |||||||||||||||||||
| Class R-3 Shares |
||||||||||||||||||||||||||||
| Six months ended |
10.82 | 0.20 | 1.35 | 1.55 | — | — | — | |||||||||||||||||||||
| Year ended 12/31/2016 |
11.06 | 0.26 | (0.21 | ) | 0.05 | (0.29 | ) | — | (0.29 | ) | ||||||||||||||||||
| Year ended 12/31/2015 |
11.44 | 0.23 | (0.40 | ) | (0.17 | ) | (0.21 | ) | — | (0.21 | ) | |||||||||||||||||
| Year ended 12/31/2014 |
12.52 | 0.34 | (1.11 | ) | (0.77 | ) | (0.31 | ) | — | (0.31 | ) | |||||||||||||||||
| Year ended 12/31/2013 |
10.58 | 0.23 | 1.94 | 2.17 | (0.23 | ) | — | (0.23 | ) | |||||||||||||||||||
| Year ended 12/31/2012 |
9.20 | 0.24 | 1.40 | 1.64 | (0.26 | ) | — | (0.26 | ) | |||||||||||||||||||
| (a) | Average shares outstanding for the period were used to calculate net investment income per share. |
| (b) | Total return is not annualized for periods that are less than a full year and does not reflect the effect of sales charge for Class A, Class B, Premier and Legacy Class B shares. All other classes do not have a sales charge. |
| (c) | Determined on an annualized basis for periods that are less than a full year. |
| (d) | The expense ratios include the effect of expense reduction changes. |
| (e) | Unaudited. |
| (f) | Effective May 23, 2016, Legacy Class A shares were renamed Premier shares. |
| 154 | See accompanying notes to financial statements. |
| Ratios/supplemental data | ||||||||||||||||||||||||||||||
| Average Net Asset ratios assuming expense reductions |
Average Net Asset ratios absent expense reductions |
|||||||||||||||||||||||||||||
| Net asset value, end of period |
Total return (b) | Net assets, end of period (millions) |
Expenses (c) (d) | Net investment income (loss) (c) |
Expenses (c) | Net investment income (loss) (c) |
Portfolio turnover rate (c) |
|||||||||||||||||||||||
| $ |
12.33 |
|
14.27 | % | $ | 80.3 | 0.72 | % | 3.32 | % | 0.85 | % | 3.19 | % | 3 | % | ||||||||||||||
| 10.79 | 0.23 | 75.0 | 0.96 | 2.35 | 0.98 | 2.33 | 6 | |||||||||||||||||||||||
| 11.03 | (1.67 | ) | 89.9 | 1.18 | 1.73 | 1.20 | 1.71 | 2 | ||||||||||||||||||||||
| 11.40 | (6.33 | ) | 77.1 | 1.18 | 2.44 | 1.21 | 2.41 | 2 | ||||||||||||||||||||||
| 12.49 | 20.44 | 68.7 | 1.19 | 1.81 | 1.23 | 1.77 | 1 | |||||||||||||||||||||||
| 10.55 | 17.41 | 47.8 | 1.20 | 2.23 | 1.26 | 2.17 | 4 | |||||||||||||||||||||||
| |
12.33 |
14.06 | 10.7 | 1.05 | 3.00 | 1.55 | 2.50 | 3 | ||||||||||||||||||||||
| 10.81 | (0.52 | ) | 9.6 | 1.65 | 1.56 | 1.68 | 1.53 | 6 | ||||||||||||||||||||||
| 11.06 | (2.28 | ) | 10.2 | 1.88 | 1.07 | 1.90 | 1.05 | 2 | ||||||||||||||||||||||
| 11.42 | (6.93 | ) | 11.1 | 1.75 | 1.95 | 1.77 | 1.93 | 2 | ||||||||||||||||||||||
| 12.50 | 19.71 | 12.3 | 1.71 | 1.33 | 1.75 | 1.29 | 1 | |||||||||||||||||||||||
| 10.57 | 16.74 | 10.3 | 1.90 | 1.55 | 1.96 | 1.49 | 4 | |||||||||||||||||||||||
| |
12.31 |
|
14.30 | 113.7 | 0.62 | 3.45 | 0.75 | 3.32 | 3 | |||||||||||||||||||||
| 10.77 | 0.28 | 99.8 | 0.88 | 2.24 | 0.90 | 2.22 | 6 | |||||||||||||||||||||||
| 11.02 | (1.63 | ) | 87.5 | 1.18 | 1.76 | 1.20 | 1.74 | 2 | ||||||||||||||||||||||
| 11.39 | (6.39 | ) | 90.4 | 1.18 | 2.51 | 1.21 | 2.48 | 2 | ||||||||||||||||||||||
| 12.47 | 20.43 | 98.4 | 1.19 | 1.84 | 1.23 | 1.80 | 1 | |||||||||||||||||||||||
| 10.53 | 17.43 | 83.4 | 1.20 | 2.25 | 1.26 | 2.19 | 4 | |||||||||||||||||||||||
| |
12.38 |
|
14.21 | 13.5 | 0.91 | 3.14 | 1.25 | 2.80 | 3 | |||||||||||||||||||||
| 10.84 | (0.22 | ) | 12.2 | 1.36 | 1.86 | 1.38 | 1.84 | 6 | ||||||||||||||||||||||
| 11.09 | (2.06 | ) | 13.1 | 1.58 | 1.37 | 1.60 | 1.35 | 2 | ||||||||||||||||||||||
| 11.45 | (6.71 | ) | 14.4 | 1.58 | 2.16 | 1.61 | 2.13 | 2 | ||||||||||||||||||||||
| 12.53 | 19.92 | 17.9 | 1.59 | 1.47 | 1.63 | 1.43 | 1 | |||||||||||||||||||||||
| 10.58 | 16.96 | 17.9 | 1.60 | 1.88 | 1.66 | 1.82 | 4 | |||||||||||||||||||||||
| |
12.36 |
|
14.34 | 48.7 | 0.60 | 3.47 | 0.60 | 3.47 | 3 | |||||||||||||||||||||
| 10.81 | 0.52 | 42.2 | 0.70 | 2.52 | 0.73 | 2.49 | 6 | |||||||||||||||||||||||
| 11.05 | (1.45 | ) | 44.5 | 0.93 | 2.00 | 0.95 | 1.98 | 2 | ||||||||||||||||||||||
| 11.42 | (6.11 | ) | 42.8 | 0.93 | 2.76 | 0.96 | 2.73 | 2 | ||||||||||||||||||||||
| 12.51 | 20.63 | 44.4 | 0.94 | 2.09 | 0.98 | 2.05 | 1 | |||||||||||||||||||||||
| 10.57 | 17.88 | 35.0 | 0.95 | 2.50 | 1.01 | 2.44 | 4 | |||||||||||||||||||||||
| |
12.34 |
|
14.15 | 3.2 | 0.91 | 3.13 | 1.17 | 2.87 | 3 | |||||||||||||||||||||
| 10.81 | (0.04 | ) | 2.9 | 1.27 | 1.93 | 1.29 | 1.91 | 6 | ||||||||||||||||||||||
| 11.05 | (2.05 | ) | 3.0 | 1.50 | 1.44 | 1.52 | 1.42 | 2 | ||||||||||||||||||||||
| 11.42 | (6.65 | ) | 3.1 | 1.50 | 2.28 | 1.53 | 2.25 | 2 | ||||||||||||||||||||||
| 12.50 | 19.97 | 3.7 | 1.51 | 1.54 | 1.55 | 1.50 | 1 | |||||||||||||||||||||||
| 10.56 | 17.13 | 3.4 | 1.52 | 1.98 | 1.58 | 1.92 | 4 | |||||||||||||||||||||||
| |
12.30 |
|
14.21 | 8.4 | 0.81 | 3.25 | 0.97 | 3.09 | 3 | |||||||||||||||||||||
| 10.77 | 0.10 | 7.7 | 1.08 | 2.18 | 1.10 | 2.16 | 6 | |||||||||||||||||||||||
| 11.01 | (1.72 | ) | 8.8 | 1.30 | 1.58 | 1.32 | 1.56 | 2 | ||||||||||||||||||||||
| 11.38 | (6.49 | ) | 7.5 | 1.30 | 2.31 | 1.33 | 2.28 | 2 | ||||||||||||||||||||||
| 12.46 | 20.23 | 7.4 | 1.31 | 1.69 | 1.35 | 1.65 | 1 | |||||||||||||||||||||||
| 10.53 | 17.30 | 6.8 | 1.32 | 2.10 | 1.38 | 2.04 | 4 | |||||||||||||||||||||||
| |
12.37 |
|
14.33 | 2.2 | 0.67 | 3.38 | 0.67 | 3.38 | 3 | |||||||||||||||||||||
| 10.82 | 0.46 | 2.0 | 0.77 | 2.42 | 0.79 | 2.40 | 6 | |||||||||||||||||||||||
| 11.06 | (1.53 | ) | 2.1 | 1.00 | 1.94 | 1.02 | 1.92 | 2 | ||||||||||||||||||||||
| 11.44 | (6.18 | ) | 2.1 | 1.00 | 2.69 | 1.03 | 2.66 | 2 | ||||||||||||||||||||||
| 12.52 | 20.53 | 2.3 | 1.01 | 2.00 | 1.05 | 1.96 | 1 | |||||||||||||||||||||||
| 10.58 | 17.81 | 1.9 | 1.02 | 2.42 | 1.08 | 2.36 | 4 | |||||||||||||||||||||||
| See accompanying notes to financial statements. | 155 |
STATE FARM MUTUAL FUND TRUST EQUITY AND BOND FUND
(For a share outstanding throughout each period)
| Income from investment operations | Less distributions | |||||||||||||||||||||||||||
| Net asset value, beginning of period |
Net investment income (loss) (a) |
Net gain (loss) on investments (both realized and unrealized) |
Total from investment operations |
Net investment income |
Net realized gain |
Total distributions |
||||||||||||||||||||||
| Class A Shares |
||||||||||||||||||||||||||||
| Six months ended 06/30/2017 (g) |
$ | 11.07 | $ | 0.05 | $ | 0.65 | $ | 0.70 | $ | (0.05 | ) | $ | — | $ | (0.05 | ) | ||||||||||||
| Year ended 12/31/2016 |
10.92 | 0.13 | 0.52 | 0.65 | (0.13 | ) | (0.37 | ) | (0.50 | ) | ||||||||||||||||||
| Year ended 12/31/2015 |
11.04 | 0.15 | (0.05 | ) | 0.10 | (0.14 | ) | (0.08 | ) | (0.22 | ) | |||||||||||||||||
| Year ended 12/31/2014 |
10.07 | 0.14 | 0.99 | 1.13 | (0.14 | ) | (0.02 | ) | (0.16 | ) | ||||||||||||||||||
| Year ended 12/31/2013 |
8.67 | 0.12 | 1.40 | 1.52 | (0.12 | ) | — | (0.12 | ) | |||||||||||||||||||
| Year ended 12/31/2012 |
7.94 | 0.14 | 0.73 | 0.87 | (0.14 | ) | — | (0.14 | ) | |||||||||||||||||||
| Class B Shares |
||||||||||||||||||||||||||||
| Six months ended 06/30/2017 (g) |
11.08 | 0.03 | 0.65 | 0.68 | (0.03 | ) | — | (0.03 | ) | |||||||||||||||||||
| Year ended 12/31/2016 |
10.94 | 0.05 | 0.51 | 0.56 | (0.05 | ) | (0.37 | ) | (0.42 | ) | ||||||||||||||||||
| Year ended 12/31/2015 |
11.05 | 0.06 | (0.03 | ) | 0.03 | (0.06 | ) | (0.08 | ) | (0.14 | ) | |||||||||||||||||
| Year ended 12/31/2014 |
10.08 | 0.07 | 0.99 | 1.06 | (0.07 | ) | (0.02 | ) | (0.09 | ) | ||||||||||||||||||
| Year ended 12/31/2013 |
8.69 | 0.07 | 1.38 | 1.45 | (0.06 | ) | — | (0.06 | ) | |||||||||||||||||||
| Year ended 12/31/2012 |
7.95 | 0.08 | 0.74 | 0.82 | (0.08 | ) | — | (0.08 | ) | |||||||||||||||||||
| Premier Shares (h) |
||||||||||||||||||||||||||||
| Six months ended 06/30/2017 (g) |
11.19 | 0.06 | 0.66 | 0.72 | (0.05 | ) | — | (0.05 | ) | |||||||||||||||||||
| Year ended 12/31/2016 |
11.04 | 0.15 | 0.51 | 0.66 | (0.14 | ) | (0.37 | ) | (0.51 | ) | ||||||||||||||||||
| Year ended 12/31/2015 |
11.14 | 0.14 | (0.02 | ) | 0.12 | (0.14 | ) | (0.08 | ) | (0.22 | ) | |||||||||||||||||
| Year ended 12/31/2014 |
10.16 | 0.14 | 1.00 | 1.14 | (0.14 | ) | (0.02 | ) | (0.16 | ) | ||||||||||||||||||
| Year ended 12/31/2013 |
8.75 | 0.12 | 1.40 | 1.52 | (0.11 | ) | — | (0.11 | ) | |||||||||||||||||||
| Year ended 12/31/2012 |
8.01 | 0.14 | 0.74 | 0.88 | (0.14 | ) | — | (0.14 | ) | |||||||||||||||||||
| Legacy Class B Shares |
||||||||||||||||||||||||||||
| Six months ended 06/30/2017 (g) |
11.22 | 0.04 | 0.66 | 0.70 | (0.04 | ) | — | (0.04 | ) | |||||||||||||||||||
| Year ended 12/31/2016 |
11.06 | 0.09 | 0.53 | 0.62 | (0.09 | ) | (0.37 | ) | (0.46 | ) | ||||||||||||||||||
| Year ended 12/31/2015 |
11.17 | 0.10 | (0.04 | ) | 0.06 | (0.09 | ) | (0.08 | ) | (0.17 | ) | |||||||||||||||||
| Year ended 12/31/2014 |
10.19 | 0.09 | 1.00 | 1.09 | (0.09 | ) | (0.02 | ) | (0.11 | ) | ||||||||||||||||||
| Year ended 12/31/2013 |
8.77 | 0.08 | 1.41 | 1.49 | (0.07 | ) | — | (0.07 | ) | |||||||||||||||||||
| Year ended 12/31/2012 |
8.03 | 0.10 | 0.74 | 0.84 | (0.10 | ) | — | (0.10 | ) | |||||||||||||||||||
| Institutional Shares |
||||||||||||||||||||||||||||
| Six months ended 06/30/2017 (g) |
11.09 | 0.06 | 0.65 | 0.71 | (0.06 | ) | — | (0.06 | ) | |||||||||||||||||||
| Year ended 12/31/2016 |
10.94 | 0.16 | 0.52 | 0.68 | (0.16 | ) | (0.37 | ) | (0.53 | ) | ||||||||||||||||||
| Year ended 12/31/2015 |
11.05 | 0.17 | (0.03 | ) | 0.14 | (0.17 | ) | (0.08 | ) | (0.25 | ) | |||||||||||||||||
| Year ended 12/31/2014 |
10.08 | 0.16 | 0.99 | 1.15 | (0.16 | ) | (0.02 | ) | (0.18 | ) | ||||||||||||||||||
| Year ended 12/31/2013 |
8.68 | 0.14 | 1.40 | 1.54 | (0.14 | ) | — | (0.14 | ) | |||||||||||||||||||
| Year ended 12/31/2012 |
7.95 | 0.16 | 0.73 | 0.89 | (0.16 | ) | — | (0.16 | ) | |||||||||||||||||||
| Class R-1 Shares |
||||||||||||||||||||||||||||
| Six months ended 06/30/2017 (g) |
10.92 | 0.04 | 0.64 | 0.68 | (0.04 | ) | — | (0.04 | ) | |||||||||||||||||||
| Year ended 12/31/2016 |
10.79 | 0.10 | 0.50 | 0.60 | (0.10 | ) | (0.37 | ) | (0.47 | ) | ||||||||||||||||||
| Year ended 12/31/2015 |
10.90 | 0.11 | (0.03 | ) | 0.08 | (0.11 | ) | (0.08 | ) | (0.19 | ) | |||||||||||||||||
| Year ended 12/31/2014 |
9.95 | 0.10 | 0.97 | 1.07 | (0.10 | ) | (0.02 | ) | (0.12 | ) | ||||||||||||||||||
| Year ended 12/31/2013 |
8.57 | 0.08 | 1.38 | 1.46 | (0.08 | ) | — | (0.08 | ) | |||||||||||||||||||
| Year ended 12/31/2012 |
7.84 | 0.11 | 0.73 | 0.84 | (0.11 | ) | — | (0.11 | ) | |||||||||||||||||||
| Class R-2 Shares |
||||||||||||||||||||||||||||
| Six months ended 06/30/2017 (g) |
10.94 | 0.04 | 0.65 | 0.69 | (0.05 | ) | — | (0.05 | ) | |||||||||||||||||||
| Year ended 12/31/2016 |
10.80 | 0.12 | 0.51 | 0.63 | (0.12 | ) | (0.37 | ) | (0.49 | ) | ||||||||||||||||||
| Year ended 12/31/2015 |
10.92 | 0.13 | (0.04 | ) | 0.09 | (0.13 | ) | (0.08 | ) | (0.21 | ) | |||||||||||||||||
| Year ended 12/31/2014 |
9.96 | 0.13 | 0.98 | 1.11 | (0.13 | ) | (0.02 | ) | (0.15 | ) | ||||||||||||||||||
| Year ended 12/31/2013 |
8.58 | 0.11 | 1.37 | 1.48 | (0.10 | ) | — | (0.10 | ) | |||||||||||||||||||
| Year ended 12/31/2012 |
7.86 | 0.13 | 0.72 | 0.85 | (0.13 | ) | — | (0.13 | ) | |||||||||||||||||||
| Class R-3 Shares |
||||||||||||||||||||||||||||
| Six months ended 06/30/2017 (g) |
10.96 | 0.05 | 0.66 | 0.71 | (0.06 | ) | — | (0.06 | ) | |||||||||||||||||||
| Year ended 12/31/2016 |
10.82 | 0.15 | 0.51 | 0.66 | (0.15 | ) | (0.37 | ) | (0.52 | ) | ||||||||||||||||||
| Year ended 12/31/2015 |
10.94 | 0.16 | (0.04 | ) | 0.12 | (0.16 | ) | (0.08 | ) | (0.24 | ) | |||||||||||||||||
| Year ended 12/31/2014 |
9.98 | 0.15 | 0.98 | 1.13 | (0.15 | ) | (0.02 | ) | (0.17 | ) | ||||||||||||||||||
| Year ended 12/31/2013 |
8.59 | 0.13 | 1.39 | 1.52 | (0.13 | ) | — | (0.13 | ) | |||||||||||||||||||
| Year ended 12/31/2012 |
7.87 | 0.15 | 0.72 | 0.87 | (0.15 | ) | — | (0.15 | ) | |||||||||||||||||||
| (a) | Average shares outstanding for the period were used to calculate net investment income per share. |
| (b) | Total return is not annualized for periods that are less than a full year and does not reflect the effect of sales charge for Class A, Class B, Premier and Legacy Class B shares. All other classes do not have a sales charge. |
| (c) | Determined on an annualized basis for periods that are less than a full year. |
| (d) | Expense ratios relate to the Equity and Bond Fund only and do not reflect acquired fund fees and expenses. |
| (e) | The expense ratios include the effect of expense reduction changes. |
| (f) | Portfolio turnover rate rounds to less than 1% for 2017. |
| (g) | Unaudited. |
| (h) | Effective May 23, 2016, Legacy Class A shares were renamed Premier shares. |
| 156 | See accompanying notes to financial statements. |
| Ratios/supplemental data | ||||||||||||||||||||||||||||||
| Average Net Asset ratios assuming expense reductions |
Average Net Asset ratios absent expense reductions |
|||||||||||||||||||||||||||||
| Net asset value, end of period |
Total return (b) | Net assets, end of period (millions) |
Expenses (c) (d) (e) | Net investment income (loss) (c) |
Expenses (c) (d) | Net investment income (loss) (c) |
Portfolio turnover rate (c) (f) |
|||||||||||||||||||||||
| $ |
11.72 |
6.34 | % | $ | 133.7 | 0.12 | % | 0.89 | % | 0.32 | % | 0.69 | % | 0 | % | |||||||||||||||
| 11.07 | 5.99 | 131.7 | 0.25 | 1.16 | 0.31 | 1.10 | 2 | |||||||||||||||||||||||
| 10.92 | 0.90 | 147.9 | 0.25 | 1.34 | 0.31 | 1.28 | 1 | |||||||||||||||||||||||
| 11.04 | 11.20 | 113.8 | 0.25 | 1.35 | 0.33 | 1.27 | 1 | |||||||||||||||||||||||
| 10.07 | 17.53 | 82.6 | 0.25 | 1.30 | 0.34 | 1.21 | 0 | |||||||||||||||||||||||
| 8.67 | 10.98 | 52.2 | 0.25 | 1.69 | 0.35 | 1.59 | 1 | |||||||||||||||||||||||
| |
11.73 |
6.16 | 14.4 | 0.47 | 0.55 | 1.02 | 0.00 | 0 | ||||||||||||||||||||||
| 11.08 | 5.17 | 13.8 | 0.95 | 0.49 | 1.01 | 0.43 | 2 | |||||||||||||||||||||||
| 10.94 | 0.27 | 14.1 | 0.95 | 0.58 | 1.02 | 0.51 | 1 | |||||||||||||||||||||||
| 11.05 | 10.53 | 14.4 | 0.87 | 0.67 | 0.96 | 0.58 | 1 | |||||||||||||||||||||||
| 10.08 | 16.74 | 12.8 | 0.79 | 0.70 | 0.88 | 0.61 | 0 | |||||||||||||||||||||||
| 8.69 | 10.32 | 10.4 | 0.95 | 0.93 | 1.05 | 0.83 | 1 | |||||||||||||||||||||||
| |
11.86 |
6.45 | 162.3 | 0.02 | 0.99 | 0.22 | 0.79 | 0 | ||||||||||||||||||||||
| 11.19 | 5.97 | 153.5 | 0.18 | 1.32 | 0.31 | 1.19 | 2 | |||||||||||||||||||||||
| 11.04 | 1.04 | 108.6 | 0.25 | 1.28 | 0.32 | 1.21 | 1 | |||||||||||||||||||||||
| 11.14 | 11.19 | 111.2 | 0.25 | 1.29 | 0.33 | 1.21 | 1 | |||||||||||||||||||||||
| 10.16 | 17.46 | 101.9 | 0.25 | 1.22 | 0.34 | 1.13 | 0 | |||||||||||||||||||||||
| 8.75 | 11.00 | 88.3 | 0.25 | 1.62 | 0.35 | 1.52 | 1 | |||||||||||||||||||||||
| |
11.88 |
6.25 | 22.0 | 0.32 | 0.69 | 0.72 | 0.29 | 0 | ||||||||||||||||||||||
| 11.22 | 5.60 | 21.6 | 0.65 | 0.78 | 0.71 | 0.72 | 2 | |||||||||||||||||||||||
| 11.06 | 0.54 | 22.7 | 0.65 | 0.87 | 0.72 | 0.80 | 1 | |||||||||||||||||||||||
| 11.17 | 10.71 | 24.8 | 0.65 | 0.87 | 0.73 | 0.79 | 1 | |||||||||||||||||||||||
| 10.19 | 17.06 | 24.8 | 0.65 | 0.80 | 0.74 | 0.71 | 0 | |||||||||||||||||||||||
| 8.77 | 10.51 | 24.0 | 0.65 | 1.18 | 0.75 | 1.08 | 1 | |||||||||||||||||||||||
| |
11.74 |
6.39 | 36.2 | 0.00 | 1.01 | 0.07 | 0.94 | 0 | ||||||||||||||||||||||
| 11.09 | 6.26 | 36.2 | 0.00 | 1.46 | 0.06 | 1.40 | 2 | |||||||||||||||||||||||
| 10.94 | 1.22 | 33.3 | 0.00 | 1.56 | 0.07 | 1.49 | 1 | |||||||||||||||||||||||
| 11.05 | 11.44 | 29.3 | 0.00 | 1.54 | 0.08 | 1.46 | 1 | |||||||||||||||||||||||
| 10.08 | 17.78 | 24.5 | 0.00 | 1.49 | 0.09 | 1.40 | 0 | |||||||||||||||||||||||
| 8.68 | 11.23 | 19.7 | 0.00 | 1.90 | 0.10 | 1.80 | 1 | |||||||||||||||||||||||
| |
11.56 |
6.23 | 3.7 | 0.32 | 0.70 | 0.64 | 0.38 | 0 | ||||||||||||||||||||||
| 10.92 | 5.59 | 3.6 | 0.57 | 0.89 | 0.63 | 0.83 | 2 | |||||||||||||||||||||||
| 10.79 | 0.68 | 3.2 | 0.57 | 0.99 | 0.64 | 0.92 | 1 | |||||||||||||||||||||||
| 10.90 | 10.79 | 2.9 | 0.57 | 0.97 | 0.65 | 0.89 | 1 | |||||||||||||||||||||||
| 9.95 | 17.07 | 2.5 | 0.57 | 0.86 | 0.66 | 0.77 | 0 | |||||||||||||||||||||||
| 8.57 | 10.78 | 2.6 | 0.57 | 1.32 | 0.67 | 1.22 | 1 | |||||||||||||||||||||||
| |
11.58 |
6.28 | 7.6 | 0.22 | 0.80 | 0.44 | 0.58 | 0 | ||||||||||||||||||||||
| 10.94 | 5.86 | 7.4 | 0.37 | 1.05 | 0.43 | 0.99 | 2 | |||||||||||||||||||||||
| 10.80 | 0.78 | 7.3 | 0.37 | 1.17 | 0.44 | 1.10 | 1 | |||||||||||||||||||||||
| 10.92 | 11.11 | 6.9 | 0.37 | 1.21 | 0.45 | 1.13 | 1 | |||||||||||||||||||||||
| 9.96 | 17.33 | 5.3 | 0.37 | 1.13 | 0.46 | 1.04 | 0 | |||||||||||||||||||||||
| 8.58 | 10.82 | 4.5 | 0.37 | 1.48 | 0.47 | 1.38 | 1 | |||||||||||||||||||||||
| |
11.61 |
6.44 | 1.8 | 0.07 | 0.94 | 0.14 | 0.87 | 0 | ||||||||||||||||||||||
| 10.96 | 6.17 | 1.8 | 0.07 | 1.39 | 0.13 | 1.33 | 2 | |||||||||||||||||||||||
| 10.82 | 1.07 | 1.6 | 0.07 | 1.47 | 0.14 | 1.40 | 1 | |||||||||||||||||||||||
| 10.94 | 11.39 | 1.6 | 0.07 | 1.47 | 0.15 | 1.39 | 1 | |||||||||||||||||||||||
| 9.98 | 17.76 | 1.5 | 0.07 | 1.40 | 0.16 | 1.31 | 0 | |||||||||||||||||||||||
| 8.59 | 11.14 | 1.3 | 0.07 | 1.80 | 0.17 | 1.70 | 1 | |||||||||||||||||||||||
| See accompanying notes to financial statements. | 157 |
STATE FARM MUTUAL FUND TRUST BOND FUND
(For a share outstanding throughout each period)
| Income from investment operations | Less distributions | |||||||||||||||||||||||||||
| Net asset value, beginning of period |
Net investment income (loss) |
Net gain (loss) on investments (both realized and unrealized) |
Total from investment operations |
Net investment income |
Net realized gain (a) |
Total distributions |
||||||||||||||||||||||
| Class A Shares |
||||||||||||||||||||||||||||
| Six months ended 06/30/2017 (e) |
$ | 11.18 | $ | 0.14 | $ | 0.08 | $ | 0.22 | $ | (0.14 | ) | $ | — | $ | (0.14 | ) | ||||||||||||
| Year ended 12/31/2016 |
11.13 | 0.26 | 0.06 | 0.32 | (0.26 | ) | (0.01 | ) | (0.27 | ) | ||||||||||||||||||
| Year ended 12/31/2015 |
11.32 | 0.28 | (0.18 | ) | 0.10 | (0.28 | ) | (0.01 | ) | (0.29 | ) | |||||||||||||||||
| Year ended 12/31/2014 |
10.99 | 0.28 | 0.33 | 0.61 | (0.28 | ) | — | (0.28 | ) | |||||||||||||||||||
| Year ended 12/31/2013 |
11.78 | 0.29 | (0.71 | ) | (0.42 | ) | (0.29 | ) | (0.08 | ) | (0.37 | ) | ||||||||||||||||
| Year ended 12/31/2012 |
11.65 | 0.31 | 0.13 | 0.44 | (0.31 | ) | — | (0.31 | ) | |||||||||||||||||||
| Class B Shares |
||||||||||||||||||||||||||||
| Six months ended 06/30/2017 (e) |
11.17 | 0.13 | 0.08 | 0.21 | (0.13 | ) | — | (0.13 | ) | |||||||||||||||||||
| Year ended 12/31/2016 |
11.12 | 0.21 | 0.06 | 0.27 | (0.21 | ) | (0.01 | ) | (0.22 | ) | ||||||||||||||||||
| Year ended 12/31/2015 |
11.31 | 0.23 | (0.18 | ) | 0.05 | (0.23 | ) | (0.01 | ) | (0.24 | ) | |||||||||||||||||
| Year ended 12/31/2014 |
10.98 | 0.24 | 0.33 | 0.57 | (0.24 | ) | — | (0.24 | ) | |||||||||||||||||||
| Year ended 12/31/2013 |
11.78 | 0.24 | (0.72 | ) | (0.48 | ) | (0.24 | ) | (0.08 | ) | (0.32 | ) | ||||||||||||||||
| Year ended 12/31/2012 |
11.65 | 0.26 | 0.13 | 0.39 | (0.26 | ) | — | (0.26 | ) | |||||||||||||||||||
| Premier Shares (f) |
||||||||||||||||||||||||||||
| Six months ended 06/30/2017 (e) |
11.19 | 0.14 | 0.08 | 0.22 | (0.14 | ) | — | (0.14 | ) | |||||||||||||||||||
| Year ended 12/31/2016 |
11.14 | 0.27 | 0.06 | 0.33 | (0.27 | ) | (0.01 | ) | (0.28 | ) | ||||||||||||||||||
| Year ended 12/31/2015 |
11.32 | 0.28 | (0.17 | ) | 0.11 | (0.28 | ) | (0.01 | ) | (0.29 | ) | |||||||||||||||||
| Year ended 12/31/2014 |
11.00 | 0.28 | 0.32 | 0.60 | (0.28 | ) | — | (0.28 | ) | |||||||||||||||||||
| Year ended 12/31/2013 |
11.79 | 0.29 | (0.71 | ) | (0.42 | ) | (0.29 | ) | (0.08 | ) | (0.37 | ) | ||||||||||||||||
| Year ended 12/31/2012 |
11.66 | 0.31 | 0.13 | 0.44 | (0.31 | ) | — | (0.31 | ) | |||||||||||||||||||
| Legacy Class B Shares |
||||||||||||||||||||||||||||
| Six months ended 06/30/2017 (e) |
11.19 | 0.13 | 0.09 | 0.22 | (0.13 | ) | — | (0.13 | ) | |||||||||||||||||||
| Year ended 12/31/2016 |
11.15 | 0.21 | 0.05 | 0.26 | (0.21 | ) | (0.01 | ) | (0.22 | ) | ||||||||||||||||||
| Year ended 12/31/2015 |
11.33 | 0.23 | (0.17 | ) | 0.06 | (0.23 | ) | (0.01 | ) | (0.24 | ) | |||||||||||||||||
| Year ended 12/31/2014 |
11.00 | 0.24 | 0.33 | 0.57 | (0.24 | ) | — | (0.24 | ) | |||||||||||||||||||
| Year ended 12/31/2013 |
11.80 | 0.24 | (0.72 | ) | (0.48 | ) | (0.24 | ) | (0.08 | ) | (0.32 | ) | ||||||||||||||||
| Year ended 12/31/2012 |
11.67 | 0.26 | 0.13 | 0.39 | (0.26 | ) | — | (0.26 | ) | |||||||||||||||||||
| Institutional Shares |
||||||||||||||||||||||||||||
| Six months ended 06/30/2017 (e) |
11.17 | 0.14 | 0.09 | 0.23 | (0.14 | ) | — | (0.14 | ) | |||||||||||||||||||
| Year ended 12/31/2016 |
11.13 | 0.29 | 0.05 | 0.34 | (0.29 | ) | (0.01 | ) | (0.30 | ) | ||||||||||||||||||
| Year ended 12/31/2015 |
11.31 | 0.30 | (0.17 | ) | 0.13 | (0.30 | ) | (0.01 | ) | (0.31 | ) | |||||||||||||||||
| Year ended 12/31/2014 |
10.98 | 0.31 | 0.33 | 0.64 | (0.31 | ) | — | (0.31 | ) | |||||||||||||||||||
| Year ended 12/31/2013 |
11.78 | 0.32 | (0.72 | ) | (0.40 | ) | (0.32 | ) | (0.08 | ) | (0.40 | ) | ||||||||||||||||
| Year ended 12/31/2012 |
11.65 | 0.33 | 0.13 | 0.46 | (0.33 | ) | — | (0.33 | ) | |||||||||||||||||||
| Class R-1 Shares |
||||||||||||||||||||||||||||
| Six months ended 06/30/2017 (e) |
11.18 | 0.13 | 0.08 | 0.21 | (0.13 | ) | — | (0.13 | ) | |||||||||||||||||||
| Year ended 12/31/2016 |
11.13 | 0.22 | 0.06 | 0.28 | (0.22 | ) | (0.01 | ) | (0.23 | ) | ||||||||||||||||||
| Year ended 12/31/2015 |
11.32 | 0.24 | (0.18 | ) | 0.06 | (0.24 | ) | (0.01 | ) | (0.25 | ) | |||||||||||||||||
| Year ended 12/31/2014 |
10.99 | 0.25 | 0.33 | 0.58 | (0.25 | ) | — | (0.25 | ) | |||||||||||||||||||
| Year ended 12/31/2013 |
11.78 | 0.25 | (0.71 | ) | (0.46 | ) | (0.25 | ) | (0.08 | ) | (0.33 | ) | ||||||||||||||||
| Year ended 12/31/2012 |
11.65 | 0.27 | 0.13 | 0.40 | (0.27 | ) | — | (0.27 | ) | |||||||||||||||||||
| Class R-2 Shares |
||||||||||||||||||||||||||||
| Six months ended 06/30/2017 (e) |
11.17 | 0.13 | 0.08 | 0.21 | (0.13 | ) | — | (0.13 | ) | |||||||||||||||||||
| Year ended 12/31/2016 |
11.12 | 0.25 | 0.06 | 0.31 | (0.25 | ) | (0.01 | ) | (0.26 | ) | ||||||||||||||||||
| Year ended 12/31/2015 |
11.30 | 0.26 | (0.17 | ) | 0.09 | (0.26 | ) | (0.01 | ) | (0.27 | ) | |||||||||||||||||
| Year ended 12/31/2014 |
10.98 | 0.27 | 0.32 | 0.59 | (0.27 | ) | — | (0.27 | ) | |||||||||||||||||||
| Year ended 12/31/2013 |
11.77 | 0.27 | (0.71 | ) | (0.44 | ) | (0.27 | ) | (0.08 | ) | (0.35 | ) | ||||||||||||||||
| Year ended 12/31/2012 |
11.64 | 0.29 | 0.13 | 0.42 | (0.29 | ) | — | (0.29 | ) | |||||||||||||||||||
| Class R-3 Shares |
||||||||||||||||||||||||||||
| Six months ended 06/30/2017 (e) |
11.18 | 0.14 | 0.09 | 0.23 | (0.14 | ) | — | (0.14 | ) | |||||||||||||||||||
| Year ended 12/31/2016 |
11.14 | 0.28 | 0.05 | 0.33 | (0.28 | ) | (0.01 | ) | (0.29 | ) | ||||||||||||||||||
| Year ended 12/31/2015 |
11.32 | 0.30 | (0.17 | ) | 0.13 | (0.30 | ) | (0.01 | ) | (0.31 | ) | |||||||||||||||||
| Year ended 12/31/2014 |
10.99 | 0.30 | 0.33 | 0.63 | (0.30 | ) | — | (0.30 | ) | |||||||||||||||||||
| Year ended 12/31/2013 |
11.79 | 0.31 | (0.72 | ) | (0.41 | ) | (0.31 | ) | (0.08 | ) | (0.39 | ) | ||||||||||||||||
| Year ended 12/31/2012 |
11.66 | 0.33 | 0.13 | 0.46 | (0.33 | ) | — | (0.33 | ) | |||||||||||||||||||
| (a) | Net realized gain distributions represent less than $0.01 per share for all classes in 2014. |
| (b) | Total return is not annualized for periods that are less than a full year and does not reflect the effect of sales charge for Class A, Class B, Premier and Legacy Class B shares. All other classes do not have a sales charge. |
| (c) | Determined on an annualized basis for periods that are less than a full year. |
| (d) | The expense ratios include the effect of expense reduction changes. |
| (e) | Unaudited. |
| (f) | Effective May 23, 2016, Legacy Class A shares were renamed Premier shares. |
| 158 | See accompanying notes to financial statements. |
| Ratios/supplemental data | ||||||||||||||||||||||||||||||
| Average Net Asset ratios assuming expense reductions |
Average Net Asset ratios absent expense reductions |
|||||||||||||||||||||||||||||
| Net asset value, end of period |
Total return (b) | Net assets, end of period (millions) |
Expenses (c) (d) | Net investment income (loss) (c) |
Expenses (c) | Net investment income (loss) (c) |
Portfolio turnover rate (c) |
|||||||||||||||||||||||
| $ |
11.26 |
|
1.95 | % | $ | 194.5 | 0.53 | % | 2.46 | % | 0.65 | % | 2.34 | % | 14 | % | ||||||||||||||
| 11.18 | 2.81 | 205.5 | 0.65 | 2.28 | 0.65 | 2.28 | 5 | |||||||||||||||||||||||
| 11.13 | 0.81 | 406.0 | 0.65 | 2.43 | 0.65 | 2.43 | 9 | |||||||||||||||||||||||
| 11.32 | 5.64 | 356.5 | 0.66 | 2.51 | 0.66 | 2.51 | 10 | |||||||||||||||||||||||
| 10.99 | (3.61 | ) | 333.0 | 0.66 | 2.52 | 0.66 | 2.52 | 21 | ||||||||||||||||||||||
| 11.78 | 3.77 | 368.6 | 0.66 | 2.57 | 0.66 | 2.57 | 8 | |||||||||||||||||||||||
| |
11.25 |
1.85 | 9.7 | 0.73 | 2.26 | 1.05 | 1.94 | 14 | ||||||||||||||||||||||
| 11.17 | 2.40 | 10.1 | 1.05 | 1.87 | 1.05 | 1.87 | 5 | |||||||||||||||||||||||
| 11.12 | 0.41 | 10.8 | 1.05 | 2.03 | 1.05 | 2.03 | 9 | |||||||||||||||||||||||
| 11.31 | 5.22 | 11.8 | 1.06 | 2.11 | 1.06 | 2.11 | 10 | |||||||||||||||||||||||
| 10.98 | (4.08 | ) | 11.9 | 1.06 | 2.13 | 1.06 | 2.13 | 21 | ||||||||||||||||||||||
| 11.78 | 3.36 | 12.4 | 1.06 | 2.20 | 1.06 | 2.20 | 8 | |||||||||||||||||||||||
| |
11.27 |
2.00 | 348.4 | 0.43 | 2.56 | 0.55 | 2.44 | 14 | ||||||||||||||||||||||
| 11.19 | 2.87 | 364.6 | 0.57 | 2.33 | 0.57 | 2.33 | 5 | |||||||||||||||||||||||
| 11.14 | 0.90 | 124.1 | 0.65 | 2.44 | 0.65 | 2.44 | 9 | |||||||||||||||||||||||
| 11.32 | 5.54 | 128.8 | 0.66 | 2.51 | 0.66 | 2.51 | 10 | |||||||||||||||||||||||
| 11.00 | (3.60 | ) | 131.1 | 0.66 | 2.52 | 0.66 | 2.52 | 21 | ||||||||||||||||||||||
| 11.79 | 3.77 | 153.3 | 0.66 | 2.60 | 0.66 | 2.60 | 8 | |||||||||||||||||||||||
| |
11.28 |
1.94 | 1.9 | 0.75 | 2.24 | 1.05 | 1.94 | 14 | ||||||||||||||||||||||
| 11.19 | 2.31 | 2.4 | 1.05 | 1.87 | 1.05 | 1.87 | 5 | |||||||||||||||||||||||
| 11.15 | 0.50 | 3.4 | 1.05 | 2.04 | 1.05 | 2.04 | 9 | |||||||||||||||||||||||
| 11.33 | 5.22 | 4.9 | 1.06 | 2.12 | 1.06 | 2.12 | 10 | |||||||||||||||||||||||
| 11.00 | (4.07 | ) | 7.4 | 1.06 | 2.10 | 1.06 | 2.10 | 21 | ||||||||||||||||||||||
| 11.80 | 3.36 | 22.8 | 1.06 | 2.21 | 1.06 | 2.21 | 8 | |||||||||||||||||||||||
| |
11.26 |
2.11 | 265.0 | 0.40 | 2.59 | 0.40 | 2.59 | 14 | ||||||||||||||||||||||
| 11.17 | 2.97 | 263.8 | 0.40 | 2.52 | 0.40 | 2.52 | 5 | |||||||||||||||||||||||
| 11.13 | 1.15 | 239.3 | 0.40 | 2.68 | 0.40 | 2.68 | 9 | |||||||||||||||||||||||
| 11.31 | 5.91 | 212.9 | 0.41 | 2.76 | 0.41 | 2.76 | 10 | |||||||||||||||||||||||
| 10.98 | (3.45 | ) | 185.7 | 0.41 | 2.78 | 0.41 | 2.78 | 21 | ||||||||||||||||||||||
| 11.78 | 4.03 | 175.9 | 0.41 | 2.84 | 0.41 | 2.84 | 8 | |||||||||||||||||||||||
| |
11.26 |
1.85 | 4.0 | 0.71 | 2.28 | 0.97 | 2.02 | 14 | ||||||||||||||||||||||
| 11.18 | 2.48 | 3.8 | 0.97 | 1.95 | 0.97 | 1.95 | 5 | |||||||||||||||||||||||
| 11.13 | 0.49 | 3.4 | 0.97 | 2.12 | 0.97 | 2.12 | 9 | |||||||||||||||||||||||
| 11.32 | 5.30 | 3.5 | 0.98 | 2.19 | 0.98 | 2.19 | 10 | |||||||||||||||||||||||
| 10.99 | (3.91 | ) | 3.7 | 0.98 | 2.20 | 0.98 | 2.20 | 21 | ||||||||||||||||||||||
| 11.78 | 3.44 | 4.4 | 0.98 | 2.28 | 0.98 | 2.28 | 8 | |||||||||||||||||||||||
| |
11.25 |
1.91 | 9.6 | 0.62 | 2.37 | 0.77 | 2.22 | 14 | ||||||||||||||||||||||
| 11.17 | 2.69 | 9.6 | 0.77 | 2.15 | 0.77 | 2.15 | 5 | |||||||||||||||||||||||
| 11.12 | 0.78 | 9.7 | 0.77 | 2.32 | 0.77 | 2.32 | 9 | |||||||||||||||||||||||
| 11.30 | 5.42 | 8.0 | 0.78 | 2.39 | 0.78 | 2.39 | 10 | |||||||||||||||||||||||
| 10.98 | (3.73 | ) | 8.1 | 0.78 | 2.41 | 0.78 | 2.41 | 21 | ||||||||||||||||||||||
| 11.77 | 3.65 | 8.6 | 0.78 | 2.47 | 0.78 | 2.47 | 8 | |||||||||||||||||||||||
| |
11.27 |
2.07 | 1.8 | 0.47 | 2.52 | 0.47 | 2.52 | 14 | ||||||||||||||||||||||
| 11.18 | 2.90 | 1.7 | 0.47 | 2.44 | 0.47 | 2.44 | 5 | |||||||||||||||||||||||
| 11.14 | 1.08 | 1.9 | 0.47 | 2.62 | 0.47 | 2.62 | 9 | |||||||||||||||||||||||
| 11.32 | 5.83 | 1.9 | 0.48 | 2.69 | 0.48 | 2.69 | 10 | |||||||||||||||||||||||
| 10.99 | (3.51 | ) | 1.8 | 0.48 | 2.70 | 0.48 | 2.70 | 21 | ||||||||||||||||||||||
| 11.79 | 3.96 | 2.2 | 0.48 | 2.78 | 0.48 | 2.78 | 8 | |||||||||||||||||||||||
| See accompanying notes to financial statements. | 159 |
STATE FARM MUTUAL FUND TRUST TAX ADVANTAGED BOND FUND
(For a share outstanding throughout each period)
| Income from investment operations | Less distributions | |||||||||||||||||||||||||||
| Net asset value, beginning of period |
Net investment income (loss) |
Net gain (loss) on investments (both realized and unrealized) |
Total from investment operations (a) |
Net investment income |
Net realized gain (b) |
Total distributions |
||||||||||||||||||||||
| Class A Shares |
||||||||||||||||||||||||||||
| Six months ended 06/30/2017 (g) |
$ | 11.69 | $ | 0.15 | $ | 0.17 | $ | 0.32 | $ | (0.15 | ) | $ | — | $ | (0.15 | ) | ||||||||||||
| Year ended 12/31/2016 |
11.92 | 0.28 | (0.23 | ) | 0.05 | (0.28 | ) | — | (0.28 | ) | ||||||||||||||||||
| Year ended 12/31/2015 |
11.88 | 0.29 | 0.04 | 0.33 | (0.29 | ) | — | (0.29 | ) | |||||||||||||||||||
| Year ended 12/31/2014 |
11.23 | 0.32 | 0.65 | 0.97 | (0.32 | ) | — | (0.32 | ) | |||||||||||||||||||
| Year ended 12/31/2013 |
11.95 | 0.31 | (0.72 | ) | (0.41 | ) | (0.31 | ) | — | (0.31 | ) | |||||||||||||||||
| Year ended 12/31/2012 |
11.68 | 0.30 | 0.27 | 0.57 | (0.30 | ) | — | (0.30 | ) | |||||||||||||||||||
| Class B Shares |
||||||||||||||||||||||||||||
| Six months ended 06/30/2017 (g) |
11.69 | 0.14 | 0.17 | 0.31 | (0.14 | ) | — | (0.14 | ) | |||||||||||||||||||
| Year ended 12/31/2016 |
11.91 | 0.22 | (0.22 | ) | — | (0.22 | ) | — | (0.22 | ) | ||||||||||||||||||
| Year ended 12/31/2015 |
11.87 | 0.24 | 0.04 | 0.28 | (0.24 | ) | — | (0.24 | ) | |||||||||||||||||||
| Year ended 12/31/2014 |
11.22 | 0.28 | 0.65 | 0.93 | (0.28 | ) | — | (0.28 | ) | |||||||||||||||||||
| Year ended 12/31/2013 |
11.95 | 0.26 | (0.73 | ) | (0.47 | ) | (0.26 | ) | — | (0.26 | ) | |||||||||||||||||
| Year ended 12/31/2012 |
11.68 | 0.26 | 0.27 | 0.53 | (0.26 | ) | — | (0.26 | ) | |||||||||||||||||||
| Premier Shares (h) |
||||||||||||||||||||||||||||
| Six months ended 06/30/2017 (g) |
11.68 | 0.15 | 0.17 | 0.32 | (0.15 | ) | — | (0.15 | ) | |||||||||||||||||||
| Year ended 12/31/2016 |
11.90 | 0.28 | (0.22 | ) | 0.06 | (0.28 | ) | — | (0.28 | ) | ||||||||||||||||||
| Year ended 12/31/2015 |
11.86 | 0.29 | 0.04 | 0.33 | (0.29 | ) | — | (0.29 | ) | |||||||||||||||||||
| Year ended 12/31/2014 |
11.21 | 0.32 | 0.65 | 0.97 | (0.32 | ) | — | (0.32 | ) | |||||||||||||||||||
| Year ended 12/31/2013 |
11.93 | 0.31 | (0.72 | ) | (0.41 | ) | (0.31 | ) | — | (0.31 | ) | |||||||||||||||||
| Year ended 12/31/2012 |
11.66 | 0.30 | 0.27 | 0.57 | (0.30 | ) | — | (0.30 | ) | |||||||||||||||||||
| Legacy Class B Shares |
||||||||||||||||||||||||||||
| Six months ended 06/30/2017 (g) |
11.69 | 0.13 | 0.17 | 0.30 | (0.13 | ) | — | (0.13 | ) | |||||||||||||||||||
| Year ended 12/31/2016 |
11.90 | 0.22 | (0.21 | ) | 0.01 | (0.22 | ) | — | (0.22 | ) | ||||||||||||||||||
| Year ended 12/31/2015 |
11.86 | 0.24 | 0.04 | 0.28 | (0.24 | ) | — | (0.24 | ) | |||||||||||||||||||
| Year ended 12/31/2014 |
11.21 | 0.28 | 0.65 | 0.93 | (0.28 | ) | — | (0.28 | ) | |||||||||||||||||||
| Year ended 12/31/2013 |
11.93 | 0.26 | (0.72 | ) | (0.46 | ) | (0.26 | ) | — | (0.26 | ) | |||||||||||||||||
| Year ended 12/31/2012 |
11.66 | 0.26 | 0.27 | 0.53 | (0.26 | ) | — | (0.26 | ) | |||||||||||||||||||
| (a) | Total from investment operations represents less than $0.01 per share for Class B shares in 2016. |
| (b) | Net realized gain distributions represent less than $0.01 per share for all classes in 2012. |
| (c) | Total return is not annualized for periods that are less than a full year and does not reflect the effect of sales charges. |
| (d) | Total return represents less than 0.005% per share for Class B shares in 2016. |
| (e) | Determined on an annualized basis for periods that are less than a full year. |
| (f) | The expense ratios include the effect of expense reduction changes. |
| (g) | Unaudited. |
| (h) | Effective May 23, 2016, Legacy Class A shares were renamed Premier shares. |
| 160 | See accompanying notes to financial statements. |
| Net asset value, end of period |
Total return (c) (d) | Ratios/supplemental data | ||||||||||||||||||||||||||||
| Net assets, end of period (millions) |
Average Net Asset ratios assuming expense reductions |
Average Net Asset ratios absent expense reductions |
Portfolio turnover rate (e) |
|||||||||||||||||||||||||||
| Expenses (e) (f) | Net investment income (loss) (e) |
Expenses (e) | Net investment income (loss) (e) |
|||||||||||||||||||||||||||
|
$ |
11.86 |
|
2.72 | % | $ | 97.5 | 0.53 | % | 2.50 | % | 0.66 | % | 2.37 | % | 2 | % | ||||||||||||||
| 11.69 | 0.36 | 106.0 | 0.65 | 2.31 | 0.65 | 2.31 | 8 | |||||||||||||||||||||||
| 11.92 | 2.80 | 444.5 | 0.66 | 2.42 | 0.66 | 2.42 | 4 | |||||||||||||||||||||||
| 11.88 | 8.75 | 422.2 | 0.66 | 2.77 | 0.66 | 2.77 | 6 | |||||||||||||||||||||||
| 11.23 | (3.45 | ) | 388.2 | 0.67 | 2.68 | 0.67 | 2.68 | 14 | ||||||||||||||||||||||
| 11.95 | 4.97 | 453.5 | 0.66 | 2.53 | 0.66 | 2.53 | 3 | |||||||||||||||||||||||
|
|
11.86 |
|
2.62 | 2.2 | 0.74 | 2.30 | 1.06 | 1.98 | 2 | |||||||||||||||||||||
| 11.69 | 0.00 | 2.5 | 1.05 | 1.87 | 1.05 | 1.87 | 8 | |||||||||||||||||||||||
| 11.91 | 2.39 | 6.5 | 1.06 | 2.03 | 1.06 | 2.03 | 4 | |||||||||||||||||||||||
| 11.87 | 8.33 | 6.9 | 1.06 | 2.37 | 1.06 | 2.37 | 6 | |||||||||||||||||||||||
| 11.22 | (3.92 | ) | 6.6 | 1.07 | 2.29 | 1.07 | 2.29 | 14 | ||||||||||||||||||||||
| 11.95 | 4.55 | 7.0 | 1.06 | 2.16 | 1.06 | 2.16 | 3 | |||||||||||||||||||||||
|
|
11.85 |
|
2.77 | 417.1 | 0.43 | 2.61 | 0.56 | 2.48 | 2 | |||||||||||||||||||||
| 11.68 | 0.48 | 435.9 | 0.56 | 2.35 | 0.56 | 2.35 | 8 | |||||||||||||||||||||||
| 11.90 | 2.80 | 77.3 | 0.66 | 2.43 | 0.66 | 2.43 | 4 | |||||||||||||||||||||||
| 11.86 | 8.76 | 86.0 | 0.66 | 2.77 | 0.66 | 2.77 | 6 | |||||||||||||||||||||||
| 11.21 | (3.46 | ) | 81.3 | 0.67 | 2.69 | 0.67 | 2.69 | 14 | ||||||||||||||||||||||
| 11.93 | 4.98 | 91.6 | 0.66 | 2.57 | 0.66 | 2.57 | 3 | |||||||||||||||||||||||
|
|
11.86 |
|
2.62 | 0.1 | 0.74 | 2.30 | 1.06 | 1.98 | 2 | |||||||||||||||||||||
| 11.69 | 0.06 | 0.1 | 1.05 | 1.85 | 1.05 | 1.85 | 8 | |||||||||||||||||||||||
| 11.90 | 2.39 | 0.6 | 1.06 | 2.04 | 1.06 | 2.04 | 4 | |||||||||||||||||||||||
| 11.86 | 8.33 | 0.8 | 1.06 | 2.38 | 1.06 | 2.38 | 6 | |||||||||||||||||||||||
| 11.21 | (3.85 | ) | 1.0 | 1.05 | 2.12 | 1.05 | 2.12 | 14 | ||||||||||||||||||||||
| 11.93 | 4.56 | 16.7 | 1.06 | 2.18 | 1.06 | 2.18 | 3 | |||||||||||||||||||||||
| See accompanying notes to financial statements. | 161 |
STATE FARM MUTUAL FUND TRUST MONEY MARKET FUND
(For a share outstanding throughout each period)
| Income from investment operations | Less distributions | |||||||||||||||||||||||
| Net asset value, beginning of period |
Net investment income (a) |
Net gain (loss) on investments (both realized and unrealized) (b) |
Total from investment operations |
Net investment income (a) |
Total distributions |
|||||||||||||||||||
| Class A Shares |
||||||||||||||||||||||||
| Six months ended 06/30/2017 (i) |
$ | 1.00 | $ | — | $ | — | $ | — | $ | — | $ | — | ||||||||||||
| Year ended 12/31/2016 |
1.00 | — | — | — | — | — | ||||||||||||||||||
| Year ended 12/31/2015 |
1.00 | — | — | — | — | — | ||||||||||||||||||
| Year ended 12/31/2014 |
1.00 | — | — | — | — | — | ||||||||||||||||||
| Year ended 12/31/2013 |
1.00 | — | — | — | — | — | ||||||||||||||||||
| Year ended 12/31/2012 |
1.00 | — | — | — | — | — | ||||||||||||||||||
| Class B Shares |
||||||||||||||||||||||||
| Six months ended 06/30/2017 (i) |
1.00 | — | — | — | — | — | ||||||||||||||||||
| Year ended 12/31/2016 |
1.00 | — | — | — | — | — | ||||||||||||||||||
| Year ended 12/31/2015 |
1.00 | — | — | — | — | — | ||||||||||||||||||
| Year ended 12/31/2014 |
1.00 | — | — | — | — | — | ||||||||||||||||||
| Year ended 12/31/2013 |
1.00 | — | — | — | — | — | ||||||||||||||||||
| Year ended 12/31/2012 |
1.00 | — | — | — | — | — | ||||||||||||||||||
| Premier Shares (j) |
||||||||||||||||||||||||
| Six months ended 06/30/2017 (i) |
1.00 | — | — | — | — | — | ||||||||||||||||||
| Year ended 12/31/2016 |
1.00 | — | — | — | — | — | ||||||||||||||||||
| Year ended 12/31/2015 |
1.00 | — | — | — | — | — | ||||||||||||||||||
| Year ended 12/31/2014 |
1.00 | — | — | — | — | — | ||||||||||||||||||
| Year ended 12/31/2013 |
1.00 | — | — | — | — | — | ||||||||||||||||||
| Year ended 12/31/2012 |
1.00 | — | — | — | — | — | ||||||||||||||||||
| Legacy Class B Shares |
||||||||||||||||||||||||
| Six months ended 06/30/2017 (i) |
1.00 | — | — | — | — | — | ||||||||||||||||||
| Year ended 12/31/2016 |
1.00 | — | — | — | — | — | ||||||||||||||||||
| Year ended 12/31/2015 |
1.00 | — | — | — | — | — | ||||||||||||||||||
| Year ended 12/31/2014 |
1.00 | — | — | — | — | — | ||||||||||||||||||
| Year ended 12/31/2013 |
1.00 | — | — | — | — | — | ||||||||||||||||||
| Year ended 12/31/2012 |
1.00 | — | — | — | — | — | ||||||||||||||||||
| Institutional Shares |
||||||||||||||||||||||||
| Six months ended 06/30/2017 (i) |
1.00 | — | — | — | — | — | ||||||||||||||||||
| Year ended 12/31/2016 |
1.00 | — | — | — | — | — | ||||||||||||||||||
| Year ended 12/31/2015 |
1.00 | — | — | — | — | — | ||||||||||||||||||
| Year ended 12/31/2014 |
1.00 | — | — | — | — | — | ||||||||||||||||||
| Year ended 12/31/2013 |
1.00 | — | — | — | — | — | ||||||||||||||||||
| Year ended 12/31/2012 |
1.00 | — | — | — | — | — | ||||||||||||||||||
| Class R-1 Shares |
||||||||||||||||||||||||
| Six months ended 06/30/2017 (i) |
1.00 | — | — | — | — | — | ||||||||||||||||||
| Year ended 12/31/2016 |
1.00 | — | — | — | — | — | ||||||||||||||||||
| Year ended 12/31/2015 |
1.00 | — | — | — | — | — | ||||||||||||||||||
| Year ended 12/31/2014 |
1.00 | — | — | — | — | — | ||||||||||||||||||
| Year ended 12/31/2013 |
1.00 | — | — | — | — | — | ||||||||||||||||||
| Year ended 12/31/2012 |
1.00 | — | — | — | — | — | ||||||||||||||||||
| Class R-2 Shares |
||||||||||||||||||||||||
| Six months ended 06/30/2017 (i) |
1.00 | — | — | — | — | — | ||||||||||||||||||
| Year ended 12/31/2016 |
1.00 | — | — | — | — | — | ||||||||||||||||||
| Year ended 12/31/2015 |
1.00 | — | — | — | — | — | ||||||||||||||||||
| Year ended 12/31/2014 |
1.00 | — | — | — | — | — | ||||||||||||||||||
| Year ended 12/31/2013 |
1.00 | — | — | — | — | — | ||||||||||||||||||
| Year ended 12/31/2012 |
1.00 | — | — | — | — | — | ||||||||||||||||||
| Class R-3 Shares |
||||||||||||||||||||||||
| Six months ended 06/30/2017 (i) |
1.00 | — | — | — | — | — | ||||||||||||||||||
| Year ended 12/31/2016 |
1.00 | — | — | — | — | — | ||||||||||||||||||
| Year ended 12/31/2015 |
1.00 | — | — | — | — | — | ||||||||||||||||||
| Year ended 12/31/2014 |
1.00 | — | — | — | — | — | ||||||||||||||||||
| Year ended 12/31/2013 |
1.00 | — | — | — | — | — | ||||||||||||||||||
| Year ended 12/31/2012 |
1.00 | — | — | — | — | — | ||||||||||||||||||
| (a) | Net investment income and distributions represent less than $0.01 per share for all classes in 2017, Premier, Institutional and Class R-3 shares in 2016, and Institutional and Class R-3 shares in 2015, 2014, 2013 and 2012. |
| (b) | Net gain (loss) on investments represents less than $0.01 per share for all classes in 2013. |
| (c) | Total return represents less than 0.005% per share for Premier, Institutional and Class R-3 shares in 2016, and Institutional and Class R-3 shares in 2014, 2013 and 2012. |
| (d) | Total return is not annualized for periods that are less than a full year and does not reflect the effect of sales charge for Class B and Legacy Class B shares. All other classes do not have a sales charge. |
| (e) | Determined on an annualized basis for periods that are less than a full year. |
| 162 | See accompanying notes to financial statements. |
| Ratios/supplemental data | ||||||||||||||||||||||||||
| Average Net Asset ratios assuming expense reductions |
Average Net Asset ratios absent expense reductions |
|||||||||||||||||||||||||
| Net asset value, end of period |
Total return (c) (d) | Net assets, end of period (millions) |
Expenses (e) (f) (g) |
Net investment income (e) (h) |
Expenses (e) | Net investment income (e) |
||||||||||||||||||||
| $ |
1.00 |
|
0.06 | % | $ | 108.5 | 0.50 | % | 0.12 | % | 0.57 | % | 0.05 | % | ||||||||||||
| 1.00 | 0.00 | 120.7 | 0.32 | 0.00 | 0.57 | (0.25 | ) | |||||||||||||||||||
| 1.00 | 0.00 | 187.4 | 0.10 | 0.00 | 0.62 | (0.52 | ) | |||||||||||||||||||
| 1.00 | 0.00 | 153.3 | 0.07 | 0.00 | 0.59 | (0.52 | ) | |||||||||||||||||||
| 1.00 | 0.00 | 164.2 | 0.09 | 0.00 | 0.59 | (0.50 | ) | |||||||||||||||||||
| 1.00 | 0.00 | 119.8 | 0.11 | 0.00 | 0.59 | (0.48 | ) | |||||||||||||||||||
| |
1.00 |
|
0.05 | 0.3 | 0.53 | 0.09 | 0.97 | (0.35 | ) | |||||||||||||||||
| 1.00 | 0.00 | 0.3 | 0.32 | 0.00 | 0.97 | (0.65 | ) | |||||||||||||||||||
| 1.00 | 0.00 | 0.4 | 0.10 | 0.00 | 1.03 | (0.93 | ) | |||||||||||||||||||
| 1.00 | 0.00 | 0.5 | 0.07 | 0.00 | 0.99 | (0.92 | ) | |||||||||||||||||||
| 1.00 | 0.00 | 0.7 | 0.09 | 0.00 | 0.99 | (0.90 | ) | |||||||||||||||||||
| 1.00 | 0.00 | 3.1 | 0.11 | 0.00 | 0.99 | (0.88 | ) | |||||||||||||||||||
| |
1.00 |
|
0.11 | 128.9 | 0.40 | 0.22 | 0.47 | 0.15 | ||||||||||||||||||
| 1.00 | 0.00 | 152.7 | 0.31 | 0.00 | 0.48 | (0.17 | ) | |||||||||||||||||||
| 1.00 | 0.00 | 63.5 | 0.10 | 0.00 | 0.63 | (0.53 | ) | |||||||||||||||||||
| 1.00 | 0.00 | 64.9 | 0.07 | 0.00 | 0.59 | (0.52 | ) | |||||||||||||||||||
| 1.00 | 0.00 | 71.0 | 0.09 | 0.00 | 0.59 | (0.50 | ) | |||||||||||||||||||
| 1.00 | 0.00 | 75.4 | 0.11 | 0.00 | 0.59 | (0.48 | ) | |||||||||||||||||||
| |
1.00 |
|
0.05 | 0.3 | 0.53 | 0.09 | 0.97 | (0.35 | ) | |||||||||||||||||
| 1.00 | 0.00 | 0.3 | 0.32 | 0.00 | 0.97 | (0.65 | ) | |||||||||||||||||||
| 1.00 | 0.00 | 0.6 | 0.10 | 0.00 | 1.02 | (0.92 | ) | |||||||||||||||||||
| 1.00 | 0.00 | 1.1 | 0.07 | 0.00 | 0.99 | (0.92 | ) | |||||||||||||||||||
| 1.00 | 0.00 | 2.0 | 0.09 | 0.00 | 0.99 | (0.90 | ) | |||||||||||||||||||
| 1.00 | 0.00 | 5.2 | 0.11 | 0.00 | 0.99 | (0.88 | ) | |||||||||||||||||||
| |
1.00 |
|
0.10 | 80.6 | 0.42 | 0.20 | 0.42 | 0.20 | ||||||||||||||||||
| 1.00 | 0.00 | 83.2 | 0.31 | 0.00 | 0.42 | (0.11 | ) | |||||||||||||||||||
| 1.00 | 0.01 | 73.9 | 0.10 | 0.01 | 0.48 | (0.37 | ) | |||||||||||||||||||
| 1.00 | 0.00 | 63.8 | 0.07 | 0.00 | 0.44 | (0.37 | ) | |||||||||||||||||||
| 1.00 | 0.00 | 59.2 | 0.09 | 0.00 | 0.44 | (0.35 | ) | |||||||||||||||||||
| 1.00 | 0.00 | 59.5 | 0.11 | 0.00 | 0.44 | (0.33 | ) | |||||||||||||||||||
| |
1.00 |
|
0.04 | 4.6 | 0.55 | 0.08 | 0.89 | (0.26 | ) | |||||||||||||||||
| 1.00 | 0.00 | 4.7 | 0.32 | 0.00 | 0.89 | (0.57 | ) | |||||||||||||||||||
| 1.00 | 0.00 | 5.2 | 0.10 | 0.00 | 0.94 | (0.84 | ) | |||||||||||||||||||
| 1.00 | 0.00 | 4.2 | 0.07 | 0.00 | 0.91 | (0.84 | ) | |||||||||||||||||||
| 1.00 | 0.00 | 4.6 | 0.09 | 0.00 | 0.91 | (0.82 | ) | |||||||||||||||||||
| 1.00 | 0.00 | 5.6 | 0.11 | 0.00 | 0.91 | (0.80 | ) | |||||||||||||||||||
| |
1.00 |
|
0.04 | 14.7 | 0.55 | 0.07 | 0.69 | (0.07 | ) | |||||||||||||||||
| 1.00 | 0.00 | 17.0 | 0.32 | 0.00 | 0.69 | (0.37 | ) | |||||||||||||||||||
| 1.00 | 0.00 | 13.9 | 0.11 | 0.00 | 0.75 | (0.64 | ) | |||||||||||||||||||
| 1.00 | 0.00 | 13.0 | 0.07 | 0.00 | 0.71 | (0.64 | ) | |||||||||||||||||||
| 1.00 | 0.00 | 14.4 | 0.09 | 0.00 | 0.71 | (0.62 | ) | |||||||||||||||||||
| 1.00 | 0.00 | 17.4 | 0.11 | 0.00 | 0.71 | (0.60 | ) | |||||||||||||||||||
| |
1.00 |
|
0.07 | 1.7 | 0.49 | 0.13 | 0.49 | 0.13 | ||||||||||||||||||
| 1.00 | 0.00 | 1.7 | 0.32 | 0.00 | 0.49 | (0.17 | ) | |||||||||||||||||||
| 1.00 | 0.01 | 1.8 | 0.10 | 0.01 | 0.55 | (0.44 | ) | |||||||||||||||||||
| 1.00 | 0.00 | 2.0 | 0.07 | 0.00 | 0.51 | (0.44 | ) | |||||||||||||||||||
| 1.00 | 0.00 | 1.5 | 0.09 | 0.00 | 0.51 | (0.42 | ) | |||||||||||||||||||
| 1.00 | 0.00 | 2.2 | 0.11 | 0.00 | 0.51 | (0.40 | ) | |||||||||||||||||||
| (f) | The expense ratios include the effect of expense reduction changes. |
| (g) | The expense ratios include the effect of the voluntary fee waivers by SFIMC and VP Management Corp. described in Note 6 under Expense Reduction Agreements. |
| (h) | Net investment income represents less than 0.005% per share for Premier, Institutional and Class R-3 shares in 2016, and Institutional and Class R-3 shares in 2014, 2013 and 2012. |
| (i) | Unaudited. |
| (j) | Effective May 23, 2016, Legacy Class A shares were renamed Premier shares. |
| See accompanying notes to financial statements. | 163 |
STATE FARM MUTUAL FUND TRUST LIFEPATH RETIREMENT FUND
(For a share outstanding throughout each period)
| Income from investment operations | Less distributions | |||||||||||||||||||||||||||
| Net asset value, beginning of period |
Net investment income (loss) (a) (b) |
Net gain (loss) on investments (both realized and unrealized) |
Total from investment operations |
Net investment income |
Net realized gain |
Total distributions |
||||||||||||||||||||||
| Class A Shares |
||||||||||||||||||||||||||||
| Six months ended 06/30/2017 (h) |
$ | 12.19 | $ | 0.07 | $ | 0.53 | $ | 0.60 | $ | (0.07 | ) | $ | — | $ | (0.07 | ) | ||||||||||||
| Year ended 12/31/2016 |
11.75 | 0.14 | 0.47 | 0.61 | (0.17 | ) | — | (0.17 | ) | |||||||||||||||||||
| Year ended 12/31/2015 |
12.15 | 0.17 | (0.38 | ) | (0.21 | ) | (0.14 | ) | (0.05 | ) | (0.19 | ) | ||||||||||||||||
| Year ended 12/31/2014 |
12.37 | 0.15 | 0.40 | 0.55 | (0.15 | ) | (0.62 | ) | (0.77 | ) | ||||||||||||||||||
| Year ended 12/31/2013 |
12.20 | 0.13 | 0.57 | 0.70 | (0.13 | ) | (0.40 | ) | (0.53 | ) | ||||||||||||||||||
| Year ended 12/31/2012 |
11.69 | 0.17 | 0.80 | 0.97 | (0.19 | ) | (0.27 | ) | (0.46 | ) | ||||||||||||||||||
| Class B Shares |
||||||||||||||||||||||||||||
| Six months ended 06/30/2017 (h) |
12.27 | 0.04 | 0.54 | 0.58 | (0.05 | ) | — | (0.05 | ) | |||||||||||||||||||
| Year ended 12/31/2016 |
11.83 | 0.08 | 0.45 | 0.53 | (0.09 | ) | — | (0.09 | ) | |||||||||||||||||||
| Year ended 12/31/2015 |
12.23 | 0.08 | (0.38 | ) | (0.30 | ) | (0.05 | ) | (0.05 | ) | (0.10 | ) | ||||||||||||||||
| Year ended 12/31/2014 |
12.45 | 0.08 | 0.40 | 0.48 | (0.08 | ) | (0.62 | ) | (0.70 | ) | ||||||||||||||||||
| Year ended 12/31/2013 |
12.27 | 0.09 | 0.58 | 0.67 | (0.09 | ) | (0.40 | ) | (0.49 | ) | ||||||||||||||||||
| Year ended 12/31/2012 |
11.75 | 0.10 | 0.81 | 0.91 | (0.12 | ) | (0.27 | ) | (0.39 | ) | ||||||||||||||||||
| Premier Shares (i) |
||||||||||||||||||||||||||||
| Six months ended 06/30/2017 (h) |
12.46 | 0.08 | 0.55 | 0.63 | (0.08 | ) | — | (0.08 | ) | |||||||||||||||||||
| Year ended 12/31/2016 |
12.02 | 0.22 | 0.41 | 0.63 | (0.19 | ) | — | (0.19 | ) | |||||||||||||||||||
| Year ended 12/31/2015 |
12.43 | 0.17 | (0.39 | ) | (0.22 | ) | (0.14 | ) | (0.05 | ) | (0.19 | ) | ||||||||||||||||
| Year ended 12/31/2014 |
12.64 | 0.16 | 0.40 | 0.56 | (0.15 | ) | (0.62 | ) | (0.77 | ) | ||||||||||||||||||
| Year ended 12/31/2013 |
12.44 | 0.13 | 0.59 | 0.72 | (0.12 | ) | (0.40 | ) | (0.52 | ) | ||||||||||||||||||
| Year ended 12/31/2012 |
11.91 | 0.17 | 0.81 | 0.98 | (0.18 | ) | (0.27 | ) | (0.45 | ) | ||||||||||||||||||
| Legacy Class B Shares |
||||||||||||||||||||||||||||
| Six months ended 06/30/2017 (h) |
12.54 | 0.05 | 0.57 | 0.62 | (0.06 | ) | — | (0.06 | ) | |||||||||||||||||||
| Year ended 12/31/2016 |
12.09 | 0.12 | 0.45 | 0.57 | (0.12 | ) | — | (0.12 | ) | |||||||||||||||||||
| Year ended 12/31/2015 |
12.49 | 0.11 | (0.38 | ) | (0.27 | ) | (0.08 | ) | (0.05 | ) | (0.13 | ) | ||||||||||||||||
| Year ended 12/31/2014 |
12.69 | 0.10 | 0.41 | 0.51 | (0.09 | ) | (0.62 | ) | (0.71 | ) | ||||||||||||||||||
| Year ended 12/31/2013 |
12.49 | 0.08 | 0.59 | 0.67 | (0.07 | ) | (0.40 | ) | (0.47 | ) | ||||||||||||||||||
| Year ended 12/31/2012 |
11.95 | 0.12 | 0.81 | 0.93 | (0.12 | ) | (0.27 | ) | (0.39 | ) | ||||||||||||||||||
| Institutional Shares |
||||||||||||||||||||||||||||
| Six months ended 06/30/2017 (h) |
12.47 | 0.08 | 0.55 | 0.63 | (0.08 | ) | — | (0.08 | ) | |||||||||||||||||||
| Year ended 12/31/2016 |
12.02 | 0.21 | 0.45 | 0.66 | (0.21 | ) | — | (0.21 | ) | |||||||||||||||||||
| Year ended 12/31/2015 |
12.43 | 0.20 | (0.39 | ) | (0.19 | ) | (0.17 | ) | (0.05 | ) | (0.22 | ) | ||||||||||||||||
| Year ended 12/31/2014 |
12.64 | 0.19 | 0.41 | 0.60 | (0.19 | ) | (0.62 | ) | (0.81 | ) | ||||||||||||||||||
| Year ended 12/31/2013 |
12.44 | 0.16 | 0.59 | 0.75 | (0.15 | ) | (0.40 | ) | (0.55 | ) | ||||||||||||||||||
| Year ended 12/31/2012 |
11.92 | 0.20 | 0.80 | 1.00 | (0.21 | ) | (0.27 | ) | (0.48 | ) | ||||||||||||||||||
| Class R-1 Shares |
||||||||||||||||||||||||||||
| Six months ended 06/30/2017 (h) |
12.23 | 0.06 | 0.54 | 0.60 | (0.06 | ) | — | (0.06 | ) | |||||||||||||||||||
| Year ended 12/31/2016 |
11.80 | 0.13 | 0.44 | 0.57 | (0.14 | ) | — | (0.14 | ) | |||||||||||||||||||
| Year ended 12/31/2015 |
12.20 | 0.13 | (0.38 | ) | (0.25 | ) | (0.10 | ) | (0.05 | ) | (0.15 | ) | ||||||||||||||||
| Year ended 12/31/2014 |
12.42 | 0.11 | 0.40 | 0.51 | (0.11 | ) | (0.62 | ) | (0.73 | ) | ||||||||||||||||||
| Year ended 12/31/2013 |
12.24 | 0.09 | 0.58 | 0.67 | (0.09 | ) | (0.40 | ) | (0.49 | ) | ||||||||||||||||||
| Year ended 12/31/2012 |
11.72 | 0.13 | 0.80 | 0.93 | (0.14 | ) | (0.27 | ) | (0.41 | ) | ||||||||||||||||||
| Class R-2 Shares |
||||||||||||||||||||||||||||
| Six months ended 06/30/2017 (h) |
12.50 | 0.06 | 0.56 | 0.62 | (0.06 | ) | — | (0.06 | ) | |||||||||||||||||||
| Year ended 12/31/2016 |
12.06 | 0.16 | 0.44 | 0.60 | (0.16 | ) | — | (0.16 | ) | |||||||||||||||||||
| Year ended 12/31/2015 |
12.46 | 0.16 | (0.38 | ) | (0.22 | ) | (0.13 | ) | (0.05 | ) | (0.18 | ) | ||||||||||||||||
| Year ended 12/31/2014 |
12.67 | 0.14 | 0.41 | 0.55 | (0.14 | ) | (0.62 | ) | (0.76 | ) | ||||||||||||||||||
| Year ended 12/31/2013 |
12.48 | 0.11 | 0.59 | 0.70 | (0.11 | ) | (0.40 | ) | (0.51 | ) | ||||||||||||||||||
| Year ended 12/31/2012 |
11.94 | 0.15 | 0.83 | 0.98 | (0.17 | ) | (0.27 | ) | (0.44 | ) | ||||||||||||||||||
| Class R-3 Shares |
||||||||||||||||||||||||||||
| Six months ended 06/30/2017 (h) |
12.45 | 0.07 | 0.55 | 0.62 | (0.07 | ) | — | (0.07 | ) | |||||||||||||||||||
| Year ended 12/31/2016 |
12.01 | 0.20 | 0.44 | 0.64 | (0.20 | ) | — | (0.20 | ) | |||||||||||||||||||
| Year ended 12/31/2015 |
12.42 | 0.19 | (0.38 | ) | (0.19 | ) | (0.17 | ) | (0.05 | ) | (0.22 | ) | ||||||||||||||||
| Year ended 12/31/2014 |
12.63 | 0.18 | 0.40 | 0.58 | (0.17 | ) | (0.62 | ) | (0.79 | ) | ||||||||||||||||||
| Year ended 12/31/2013 |
12.43 | 0.15 | 0.60 | 0.75 | (0.15 | ) | (0.40 | ) | (0.55 | ) | ||||||||||||||||||
| Year ended 12/31/2012 |
11.90 | 0.19 | 0.81 | 1.00 | (0.20 | ) | (0.27 | ) | (0.47 | ) | ||||||||||||||||||
| (a) | Average shares outstanding for the period were used to calculate net investment income per share. |
| (b) | Through October 30, 2015, net amounts and ratios reflected the Fund’s proportionate share of income and expenses of the Master Portfolio and indirect proportionate share of the expenses of the Active Stock Master Portfolio, Total International ex U.S. Index Master Portfolio, CoreAlpha Bond Master Portfolio, International Tilts Master Portfolio, Master Small Cap Index Series and Large Cap Index Master Portfolio (collectively the “Underlying Master Portfolios”); but did not reflect indirect proportionate share of the expenses of the other registered investment companies in which the Master Portfolio invested. |
| (c) | Total return is not annualized for periods that are less than a full year and does not reflect the effect of sales charge for Class A, Class B, Premier and Legacy Class B shares. All other classes do not have a sales charge. |
| (d) | Determined on an annualized basis for periods that are less than a full year. |
| 164 | See accompanying notes to financial statements. |
| Ratios/supplemental data | ||||||||||||||||||||||||||||||
| Average Net Asset ratios assuming expense reductions |
Average Net Asset ratios absent expense reductions |
|||||||||||||||||||||||||||||
| Net asset value, end of period |
Total return (c) | Net assets, end of period (millions) |
Expenses (b) (d) (e) (f) |
Net investment income (loss) (b) (d) |
Expenses (b) (d) (f) |
Net investment income (loss) (b) (d) |
Portfolio turnover rate (d) (g) |
|||||||||||||||||||||||
| $ |
12.72 |
4.93 | % | $ | 374.2 | 0.67 | % | 1.08 | % | 0.79 | % | 0.96 | % | 3 | % | |||||||||||||||
| 12.19 | 5.18 | 387.6 | 0.80 | 1.17 | 0.80 | 1.17 | 7 | |||||||||||||||||||||||
| 11.75 | (1.67 | ) | 852.1 | 1.04 | 1.37 | 1.35 | 1.06 | 83 | ||||||||||||||||||||||
| 12.15 | 4.53 | 780.7 | 1.07 | 1.21 | 1.46 | 0.82 | 14 | |||||||||||||||||||||||
| 12.37 | 5.80 | 652.2 | 1.07 | 1.02 | 1.45 | 0.64 | 17 | |||||||||||||||||||||||
| 12.20 | 8.31 | 483.2 | 1.14 | 1.37 | 1.45 | 1.06 | 4 | |||||||||||||||||||||||
| |
12.80 |
4.74 | 6.6 | 1.03 | 0.70 | 1.49 | 0.24 | 3 | ||||||||||||||||||||||
| 12.27 | 4.49 | 7.5 | 1.50 | 0.67 | 1.50 | 0.67 | 7 | |||||||||||||||||||||||
| 11.83 | (2.40 | ) | 9.8 | 1.75 | 0.62 | 2.07 | 0.30 | 83 | ||||||||||||||||||||||
| 12.23 | 3.87 | 12.7 | 1.66 | 0.61 | 2.05 | 0.22 | 14 | |||||||||||||||||||||||
| 12.45 | 5.51 | 12.7 | 1.37 | 0.72 | 1.75 | 0.34 | 17 | |||||||||||||||||||||||
| 12.27 | 7.65 | 11.4 | 1.69 | 0.81 | 2.00 | 0.50 | 4 | |||||||||||||||||||||||
| |
13.01 |
5.03 | 719.6 | 0.57 | 1.19 | 0.69 | 1.07 | 3 | ||||||||||||||||||||||
| 12.46 | 5.26 | 717.4 | 0.71 | 1.79 | 0.71 | 1.79 | 7 | |||||||||||||||||||||||
| 12.02 | (1.74 | ) | 253.1 | 1.05 | 1.35 | 1.36 | 1.04 | 83 | ||||||||||||||||||||||
| 12.43 | 4.48 | 277.5 | 1.07 | 1.21 | 1.46 | 0.82 | 14 | |||||||||||||||||||||||
| 12.64 | 5.81 | 282.7 | 1.07 | 1.02 | 1.45 | 0.64 | 17 | |||||||||||||||||||||||
| 12.44 | 8.29 | 276.9 | 1.14 | 1.36 | 1.45 | 1.05 | 4 | |||||||||||||||||||||||
| |
13.10 |
4.90 | 3.2 | 0.88 | 0.84 | 1.19 | 0.53 | 3 | ||||||||||||||||||||||
| 12.54 | 4.73 | 3.8 | 1.20 | 0.95 | 1.20 | 0.95 | 7 | |||||||||||||||||||||||
| 12.09 | (2.10 | ) | 5.6 | 1.45 | 0.90 | 1.77 | 0.58 | 83 | ||||||||||||||||||||||
| 12.49 | 4.07 | 9.0 | 1.47 | 0.80 | 1.85 | 0.42 | 14 | |||||||||||||||||||||||
| 12.69 | 5.39 | 14.7 | 1.48 | 0.60 | 1.86 | 0.22 | 17 | |||||||||||||||||||||||
| 12.49 | 7.85 | 23.2 | 1.54 | 0.93 | 1.85 | 0.62 | 4 | |||||||||||||||||||||||
| |
13.02 |
5.04 | 106.3 | 0.54 | 1.22 | 0.54 | 1.22 | 3 | ||||||||||||||||||||||
| 12.47 | 5.49 | 102.7 | 0.54 | 1.69 | 0.54 | 1.69 | 7 | |||||||||||||||||||||||
| 12.02 | (1.49 | ) | 98.8 | 0.79 | 1.61 | 1.11 | 1.29 | 83 | ||||||||||||||||||||||
| 12.43 | 4.76 | 96.7 | 0.82 | 1.46 | 1.21 | 1.07 | 14 | |||||||||||||||||||||||
| 12.64 | 6.15 | 89.8 | 0.82 | 1.27 | 1.20 | 0.89 | 17 | |||||||||||||||||||||||
| 12.44 | 8.47 | 78.5 | 0.89 | 1.62 | 1.20 | 1.31 | 4 | |||||||||||||||||||||||
| |
12.77 |
4.90 | 6.9 | 0.87 | 0.88 | 1.11 | 0.64 | 3 | ||||||||||||||||||||||
| 12.23 | 4.80 | 7.1 | 1.11 | 1.08 | 1.11 | 1.08 | 7 | |||||||||||||||||||||||
| 11.80 | (1.99 | ) | 6.8 | 1.36 | 1.04 | 1.68 | 0.72 | 83 | ||||||||||||||||||||||
| 12.20 | 4.16 | 6.6 | 1.39 | 0.89 | 1.78 | 0.50 | 14 | |||||||||||||||||||||||
| 12.42 | 5.50 | 6.4 | 1.39 | 0.70 | 1.77 | 0.32 | 17 | |||||||||||||||||||||||
| 12.24 | 8.00 | 5.8 | 1.46 | 1.03 | 1.77 | 0.72 | 4 | |||||||||||||||||||||||
| |
13.06 |
4.99 | 25.5 | 0.76 | 0.99 | 0.91 | 0.84 | 3 | ||||||||||||||||||||||
| 12.50 | 5.00 | 26.7 | 0.91 | 1.32 | 0.91 | 1.32 | 7 | |||||||||||||||||||||||
| 12.06 | (1.84 | ) | 25.0 | 1.16 | 1.26 | 1.47 | 0.95 | 83 | ||||||||||||||||||||||
| 12.46 | 4.44 | 23.6 | 1.19 | 1.09 | 1.58 | 0.70 | 14 | |||||||||||||||||||||||
| 12.67 | 5.64 | 19.9 | 1.19 | 0.89 | 1.57 | 0.51 | 17 | |||||||||||||||||||||||
| 12.48 | 8.14 | 19.1 | 1.26 | 1.23 | 1.57 | 0.92 | 4 | |||||||||||||||||||||||
| |
13.00 |
5.01 | 1.7 | 0.61 | 1.13 | 0.61 | 1.13 | 3 | ||||||||||||||||||||||
| 12.45 | 5.34 | 1.9 | 0.61 | 1.60 | 0.61 | 1.60 | 7 | |||||||||||||||||||||||
| 12.01 | (1.55 | ) | 1.8 | 0.87 | 1.52 | 1.18 | 1.21 | 83 | ||||||||||||||||||||||
| 12.42 | 4.68 | 1.8 | 0.89 | 1.39 | 1.28 | 1.00 | 14 | |||||||||||||||||||||||
| 12.63 | 6.09 | 1.7 | 0.89 | 1.20 | 1.27 | 0.82 | 17 | |||||||||||||||||||||||
| 12.43 | 8.44 | 1.6 | 0.96 | 1.53 | 1.27 | 1.22 | 4 | |||||||||||||||||||||||
| (e) | The expense ratios include the effect of expense reduction changes. |
| (f) | Effective October 31, 2015, expense ratios relate to the Fund only and do not reflect acquired fund fees and expenses. |
| (g) | The 2015 portfolio turnover rate reflects the period from November 2, 2015 to December 31, 2015 and excludes in-kind contribution of portfolio securities received after the close of business on October 30, 2015. Through October 30, 2015, the LifePath Retirement Fund invested all of its assets in its corresponding Master Portfolio. The portfolio turnover rate of the Master Portfolio for the period January 1, 2015 to October 30, 2015 was 16%. For the period January 1, 2015 to October 30, 2015, and years ended 2014 and 2013, included the purchases and sales of the Underlying Master Portfolios, BlackRock Commodity Strategies Fund, BlackRock Emerging Markets Fund, Inc. and iShares exchange-traded funds. For the year ended 2012, excluded the purchases and sales of the Underlying Master Portfolios, BlackRock Commodity Strategies Fund and BlackRock Emerging Markets Fund, Inc. If these transactions had been included to conform to the 2015, 2014 and 2013 presentation, portfolio turnover rate would have been 13% for the year ended 2012. |
| (h) | Unaudited. |
| (i) | Effective May 23, 2016, Legacy Class A shares were renamed Premier shares. |
| See accompanying notes to financial statements. | 165 |
STATE FARM MUTUAL FUND TRUST LIFEPATH 2020 FUND
(For a share outstanding throughout each period)
| Income from investment operations | Less distributions | |||||||||||||||||||||||||||
| Net asset value, beginning of period |
Net investment income (loss) (a)(b) |
Net gain (loss) on investments (both realized and unrealized) |
Total from investment operations |
Net investment income |
Net realized gain |
Total distributions |
||||||||||||||||||||||
| Class A Shares |
||||||||||||||||||||||||||||
| Six months ended |
$ | 13.79 | $ | 0.08 | $ | 0.71 | $ | 0.79 | $ | — | $ | — | $ | — | ||||||||||||||
| Year ended 12/31/2016 |
13.57 | 0.18 | 0.59 | 0.77 | (0.26 | ) | (0.29 | ) | (0.55 | ) | ||||||||||||||||||
| Year ended 12/31/2015 |
14.06 | 0.20 | (0.46 | ) | (0.26 | ) | (0.17 | ) | (0.06 | ) | (0.23 | ) | ||||||||||||||||
| Year ended 12/31/2014 |
14.45 | 0.18 | 0.50 | 0.68 | (0.17 | ) | (0.90 | ) | (1.07 | ) | ||||||||||||||||||
| Year ended 12/31/2013 |
13.91 | 0.17 | 1.13 | 1.30 | (0.17 | ) | (0.59 | ) | (0.76 | ) | ||||||||||||||||||
| Year ended 12/31/2012 |
12.79 | 0.20 | 1.15 | 1.35 | (0.21 | ) | (0.02 | ) | (0.23 | ) | ||||||||||||||||||
| Class B Shares |
||||||||||||||||||||||||||||
| Six months ended |
13.72 | 0.05 | 0.71 | 0.76 | — | — | — | |||||||||||||||||||||
| Year ended 12/31/2016 |
13.50 | 0.10 | 0.57 | 0.67 | (0.16 | ) | (0.29 | ) | (0.45 | ) | ||||||||||||||||||
| Year ended 12/31/2015 |
13.97 | 0.09 | (0.45 | ) | (0.36 | ) | (0.05 | ) | (0.06 | ) | (0.11 | ) | ||||||||||||||||
| Year ended 12/31/2014 |
14.36 | 0.07 | 0.50 | 0.57 | (0.06 | ) | (0.90 | ) | (0.96 | ) | ||||||||||||||||||
| Year ended 12/31/2013 |
13.82 | 0.07 | 1.13 | 1.20 | (0.07 | ) | (0.59 | ) | (0.66 | ) | ||||||||||||||||||
| Year ended 12/31/2012 |
12.72 | 0.10 | 1.14 | 1.24 | (0.12 | ) | (0.02 | ) | (0.14 | ) | ||||||||||||||||||
| Premier Shares (i) |
||||||||||||||||||||||||||||
| Six months ended |
13.72 | 0.09 | 0.70 | 0.79 | — | — | — | |||||||||||||||||||||
| Year ended 12/31/2016 |
13.53 | 0.25 | 0.53 | 0.78 | (0.30 | ) | (0.29 | ) | (0.59 | ) | ||||||||||||||||||
| Year ended 12/31/2015 |
14.01 | 0.20 | (0.45 | ) | (0.25 | ) | (0.17 | ) | (0.06 | ) | (0.23 | ) | ||||||||||||||||
| Year ended 12/31/2014 |
14.40 | 0.18 | 0.49 | 0.67 | (0.16 | ) | (0.90 | ) | (1.06 | ) | ||||||||||||||||||
| Year ended 12/31/2013 |
13.86 | 0.17 | 1.13 | 1.30 | (0.17 | ) | (0.59 | ) | (0.76 | ) | ||||||||||||||||||
| Year ended 12/31/2012 |
12.74 | 0.20 | 1.15 | 1.35 | (0.21 | ) | (0.02 | ) | (0.23 | ) | ||||||||||||||||||
| Legacy Class B Shares |
||||||||||||||||||||||||||||
| Six months ended |
13.85 | 0.06 | 0.73 | 0.79 | — | — | — | |||||||||||||||||||||
| Year ended 12/31/2016 |
13.63 | 0.14 | 0.56 | 0.70 | (0.19 | ) | (0.29 | ) | (0.48 | ) | ||||||||||||||||||
| Year ended 12/31/2015 |
14.09 | 0.13 | (0.44 | ) | (0.31 | ) | (0.09 | ) | (0.06 | ) | (0.15 | ) | ||||||||||||||||
| Year ended 12/31/2014 |
14.45 | 0.12 | 0.50 | 0.62 | (0.08 | ) | (0.90 | ) | (0.98 | ) | ||||||||||||||||||
| Year ended 12/31/2013 |
13.88 | 0.10 | 1.14 | 1.24 | (0.08 | ) | (0.59 | ) | (0.67 | ) | ||||||||||||||||||
| Year ended 12/31/2012 |
12.74 | 0.13 | 1.15 | 1.28 | (0.12 | ) | (0.02 | ) | (0.14 | ) | ||||||||||||||||||
| Institutional Shares |
||||||||||||||||||||||||||||
| Six months ended |
13.82 | 0.09 | 0.71 | 0.80 | — | — | — | |||||||||||||||||||||
| Year ended 12/31/2016 |
13.61 | 0.24 | 0.57 | 0.81 | (0.31 | ) | (0.29 | ) | (0.60 | ) | ||||||||||||||||||
| Year ended 12/31/2015 |
14.10 | 0.23 | (0.46 | ) | (0.23 | ) | (0.20 | ) | (0.06 | ) | (0.26 | ) | ||||||||||||||||
| Year ended 12/31/2014 |
14.49 | 0.22 | 0.49 | 0.71 | (0.20 | ) | (0.90 | ) | (1.10 | ) | ||||||||||||||||||
| Year ended 12/31/2013 |
13.93 | 0.20 | 1.15 | 1.35 | (0.20 | ) | (0.59 | ) | (0.79 | ) | ||||||||||||||||||
| Year ended 12/31/2012 |
12.81 | 0.23 | 1.15 | 1.38 | (0.24 | ) | (0.02 | ) | (0.26 | ) | ||||||||||||||||||
| Class R-1 Shares |
||||||||||||||||||||||||||||
| Six months ended |
13.71 | 0.06 | 0.72 | 0.78 | — | — | — | |||||||||||||||||||||
| Year ended 12/31/2016 |
13.51 | 0.16 | 0.56 | 0.72 | (0.23 | ) | (0.29 | ) | (0.52 | ) | ||||||||||||||||||
| Year ended 12/31/2015 |
14.00 | 0.15 | (0.46 | ) | (0.31 | ) | (0.12 | ) | (0.06 | ) | (0.18 | ) | ||||||||||||||||
| Year ended 12/31/2014 |
14.39 | 0.13 | 0.50 | 0.63 | (0.12 | ) | (0.90 | ) | (1.02 | ) | ||||||||||||||||||
| Year ended 12/31/2013 |
13.84 | 0.12 | 1.14 | 1.26 | (0.12 | ) | (0.59 | ) | (0.71 | ) | ||||||||||||||||||
| Year ended 12/31/2012 |
12.73 | 0.15 | 1.15 | 1.30 | (0.17 | ) | (0.02 | ) | (0.19 | ) | ||||||||||||||||||
| Class R-2 Shares |
||||||||||||||||||||||||||||
| Six months ended |
13.72 | 0.07 | 0.71 | 0.78 | — | — | — | |||||||||||||||||||||
| Year ended 12/31/2016 |
13.52 | 0.19 | 0.56 | 0.75 | (0.26 | ) | (0.29 | ) | (0.55 | ) | ||||||||||||||||||
| Year ended 12/31/2015 |
14.00 | 0.18 | (0.45 | ) | (0.27 | ) | (0.15 | ) | (0.06 | ) | (0.21 | ) | ||||||||||||||||
| Year ended 12/31/2014 |
14.40 | 0.16 | 0.50 | 0.66 | (0.16 | ) | (0.90 | ) | (1.06 | ) | ||||||||||||||||||
| Year ended 12/31/2013 |
13.86 | 0.15 | 1.13 | 1.28 | (0.15 | ) | (0.59 | ) | (0.74 | ) | ||||||||||||||||||
| Year ended 12/31/2012 |
12.75 | 0.18 | 1.15 | 1.33 | (0.20 | ) | (0.02 | ) | (0.22 | ) | ||||||||||||||||||
| Class R-3 Shares |
||||||||||||||||||||||||||||
| Six months ended |
13.79 | 0.08 | 0.72 | 0.80 | — | — | — | |||||||||||||||||||||
| Year ended 12/31/2016 |
13.59 | 0.23 | 0.56 | 0.79 | (0.30 | ) | (0.29 | ) | (0.59 | ) | ||||||||||||||||||
| Year ended 12/31/2015 |
14.07 | 0.22 | (0.45 | ) | (0.23 | ) | (0.19 | ) | (0.06 | ) | (0.25 | ) | ||||||||||||||||
| Year ended 12/31/2014 |
14.46 | 0.21 | 0.49 | 0.70 | (0.19 | ) | (0.90 | ) | (1.09 | ) | ||||||||||||||||||
| Year ended 12/31/2013 |
13.90 | 0.19 | 1.15 | 1.34 | (0.19 | ) | (0.59 | ) | (0.78 | ) | ||||||||||||||||||
| Year ended 12/31/2012 |
12.76 | 0.22 | 1.16 | 1.38 | (0.22 | ) | (0.02 | ) | (0.24 | ) | ||||||||||||||||||
| (a) | Average shares outstanding for the period were used to calculate net investment income per share. |
| (b) | Through October 30, 2015, net amounts and ratios reflected the Fund’s proportionate share of income and expenses of the Master Portfolio and indirect proportionate share of the expenses of the Active Stock Master Portfolio, Total International ex U.S. Index Master Portfolio, CoreAlpha Bond Master Portfolio, International Tilts Master Portfolio, Master Small Cap Index Series and Large Cap Index Master Portfolio (collectively the “Underlying Master Portfolios”); but did not reflect indirect proportionate share of the expenses of the other registered investment companies in which the Master Portfolio invested. |
| (c) | Total return is not annualized for periods that are less than a full year and does not reflect the effect of sales charge for Class A, Class B, Premier and Legacy Class B shares. All other classes do not have a sales charge. |
| (d) | Determined on an annualized basis for periods that are less than a full year. |
| (e) | The expense ratios include the effect of expense reduction changes. |
| (f) | Effective October 31, 2015, expense ratios relate to the Fund only and do not reflect acquired fund fees and expenses. |
| 166 | See accompanying notes to financial statements. |
| Ratios/supplemental data | ||||||||||||||||||||||||||||||
| Average Net Asset ratios assuming expense reductions |
Average Net Asset ratios absent expense reductions |
|||||||||||||||||||||||||||||
| Net asset value, end of period |
Total return (c) | Net assets, end of period (millions) |
Expenses (b) (d) (e) (f) |
Net investment income (loss) (b) (d) |
Expenses (b) (d) (f) | Net investment income (loss) (b) (d) |
Portfolio turnover rate (d) (g) |
|||||||||||||||||||||||
| $ |
14.58 |
5.73 | % | $ | 828.8 | 0.66 | % | 1.10 | % | 0.79 | % | 0.97 | % | 7 | % | |||||||||||||||
| 13.79 | 5.63 | 835.4 | 0.79 | 1.31 | 0.79 | 1.31 | 9 | |||||||||||||||||||||||
| 13.57 | (1.86 | ) | 1,320.9 | 1.03 | 1.43 | 1.36 | 1.10 | 81 | ||||||||||||||||||||||
| 14.06 | 4.73 | 1,212.0 | 1.05 | 1.21 | 1.46 | 0.80 | 21 | |||||||||||||||||||||||
| 14.45 | 9.34 | 989.9 | 1.04 | 1.18 | 1.44 | 0.78 | 19 | |||||||||||||||||||||||
| 13.91 | 10.59 | 727.4 | 1.11 | 1.47 | 1.45 | 1.13 | 5 | |||||||||||||||||||||||
| |
14.48 |
5.54 | 20.2 | 1.02 | 0.72 | 1.49 | 0.25 | 7 | ||||||||||||||||||||||
| 13.72 | 4.93 | 21.9 | 1.49 | 0.74 | 1.49 | 0.74 | 9 | |||||||||||||||||||||||
| 13.50 | (2.57 | ) | 26.9 | 1.73 | 0.67 | 2.07 | 0.33 | 81 | ||||||||||||||||||||||
| 13.97 | 3.97 | 32.9 | 1.75 | 0.51 | 2.16 | 0.10 | 21 | |||||||||||||||||||||||
| 14.36 | 8.66 | 32.8 | 1.74 | 0.46 | 2.15 | 0.05 | 19 | |||||||||||||||||||||||
| 13.82 | 9.75 | 28.4 | 1.81 | 0.75 | 2.15 | 0.41 | 5 | |||||||||||||||||||||||
| |
14.51 |
5.76 | 993.7 | 0.56 | 1.22 | 0.69 | 1.09 | 7 | ||||||||||||||||||||||
| 13.72 | 5.74 | 956.6 | 0.71 | 1.82 | 0.71 | 1.82 | 9 | |||||||||||||||||||||||
| 13.53 | (1.83 | ) | 425.8 | 1.03 | 1.40 | 1.37 | 1.06 | 81 | ||||||||||||||||||||||
| 14.01 | 4.71 | 453.9 | 1.05 | 1.21 | 1.46 | 0.80 | 21 | |||||||||||||||||||||||
| 14.40 | 9.32 | 434.3 | 1.04 | 1.16 | 1.45 | 0.75 | 19 | |||||||||||||||||||||||
| 13.86 | 10.59 | 399.0 | 1.11 | 1.45 | 1.45 | 1.11 | 5 | |||||||||||||||||||||||
| |
14.64 |
5.70 | 9.6 | 0.88 | 0.84 | 1.19 | 0.53 | 7 | ||||||||||||||||||||||
| 13.85 | 5.16 | 11.7 | 1.19 | 1.01 | 1.19 | 1.01 | 9 | |||||||||||||||||||||||
| 13.63 | (2.22 | ) | 16.1 | 1.43 | 0.95 | 1.78 | 0.60 | 81 | ||||||||||||||||||||||
| 14.09 | 4.30 | 22.6 | 1.45 | 0.80 | 1.86 | 0.39 | 21 | |||||||||||||||||||||||
| 14.45 | 8.90 | 33.6 | 1.45 | 0.71 | 1.85 | 0.31 | 19 | |||||||||||||||||||||||
| 13.88 | 10.11 | 46.9 | 1.52 | 1.00 | 1.85 | 0.67 | 5 | |||||||||||||||||||||||
| |
14.62 |
5.79 | 211.3 | 0.54 | 1.24 | 0.54 | 1.24 | 7 | ||||||||||||||||||||||
| 13.82 | 5.93 | 204.2 | 0.54 | 1.75 | 0.54 | 1.75 | 9 | |||||||||||||||||||||||
| 13.61 | (1.62 | ) | 196.4 | 0.78 | 1.66 | 1.12 | 1.32 | 81 | ||||||||||||||||||||||
| 14.10 | 4.95 | 197.0 | 0.80 | 1.46 | 1.21 | 1.05 | 21 | |||||||||||||||||||||||
| 14.49 | 9.69 | 171.4 | 0.79 | 1.41 | 1.20 | 1.00 | 19 | |||||||||||||||||||||||
| 13.93 | 10.80 | 145.4 | 0.86 | 1.70 | 1.20 | 1.36 | 5 | |||||||||||||||||||||||
| |
14.49 |
5.69 | 18.6 | 0.86 | 0.88 | 1.11 | 0.63 | 7 | ||||||||||||||||||||||
| 13.71 | 5.29 | 20.2 | 1.11 | 1.15 | 1.11 | 1.15 | 9 | |||||||||||||||||||||||
| 13.51 | (2.20 | ) | 19.9 | 1.35 | 1.09 | 1.68 | 0.76 | 81 | ||||||||||||||||||||||
| 14.00 | 4.37 | 17.7 | 1.37 | 0.88 | 1.78 | 0.47 | 21 | |||||||||||||||||||||||
| 14.39 | 9.07 | 17.5 | 1.36 | 0.83 | 1.77 | 0.42 | 19 | |||||||||||||||||||||||
| 13.84 | 10.16 | 16.4 | 1.43 | 1.14 | 1.77 | 0.80 | 5 | |||||||||||||||||||||||
| |
14.50 |
5.69 | 62.0 | 0.76 | 1.02 | 0.91 | 0.87 | 7 | ||||||||||||||||||||||
| 13.72 | 5.51 | 61.3 | 0.91 | 1.38 | 0.91 | 1.38 | 9 | |||||||||||||||||||||||
| 13.52 | (1.93 | ) | 57.0 | 1.15 | 1.28 | 1.49 | 0.94 | 81 | ||||||||||||||||||||||
| 14.00 | 4.58 | 58.3 | 1.17 | 1.09 | 1.58 | 0.68 | 21 | |||||||||||||||||||||||
| 14.40 | 9.21 | 45.2 | 1.16 | 1.03 | 1.57 | 0.62 | 19 | |||||||||||||||||||||||
| 13.86 | 10.43 | 40.8 | 1.23 | 1.35 | 1.57 | 1.01 | 5 | |||||||||||||||||||||||
| |
14.59 |
5.80 | 3.0 | 0.61 | 1.11 | 0.61 | 1.11 | 7 | ||||||||||||||||||||||
| 13.79 | 5.79 | 3.5 | 0.61 | 1.67 | 0.61 | 1.67 | 9 | |||||||||||||||||||||||
| 13.59 | (1.66 | ) | 3.3 | 0.85 | 1.55 | 1.19 | 1.21 | 81 | ||||||||||||||||||||||
| 14.07 | 4.88 | 4.4 | 0.87 | 1.40 | 1.28 | 0.99 | 21 | |||||||||||||||||||||||
| 14.46 | 9.58 | 2.9 | 0.87 | 1.34 | 1.27 | 0.94 | 19 | |||||||||||||||||||||||
| 13.90 | 10.77 | 2.7 | 0.94 | 1.59 | 1.28 | 1.25 | 5 | |||||||||||||||||||||||
| (g) | The 2015 portfolio turnover rate reflects the period from November 2, 2015 to December 31, 2015 and excludes in-kind contribution of portfolio securities received after the close of business on October 30, 2015. Through October 30, 2015, the LifePath 2020 Fund invested all of its assets in its corresponding Master Portfolio. The portfolio turnover rate of the Master Portfolio for the period January 1, 2015 to October 30, 2015 was 14%. For the period January 1, 2015 to October 30, 2015, and years ended 2014 and 2013, included the purchases and sales of the Underlying Master Portfolios, BlackRock Commodity Strategies Fund, BlackRock Emerging Markets Fund, Inc. and iShares exchange-traded funds. For the year ended 2012, excluded the purchases and sales of the Underlying Master Portfolios, BlackRock Commodity Strategies Fund and BlackRock Emerging Markets Fund, Inc. If these transactions had been included to conform to the 2015, 2014 and 2013 presentation, portfolio turnover rate would have been 15% for the year ended 2012. |
| (h) | Unaudited. |
| (i) | Effective May 23, 2016, Legacy Class A shares were renamed Premier shares. |
| See accompanying notes to financial statements. | 167 |
STATE FARM MUTUAL FUND TRUST LIFEPATH 2030 FUND
(For a share outstanding throughout each period)
| Income from investment operations | Less distributions | |||||||||||||||||||||||||||
| Net asset value, beginning of period |
Net investment income (loss) (a) (b) |
Net gain (loss) on investments (both realized and unrealized) |
Total from investment operations |
Net investment income |
Net realized gain |
Total distributions |
||||||||||||||||||||||
| Class A Shares |
||||||||||||||||||||||||||||
| Six months ended |
$ | 14.57 | $ | 0.09 | $ | 1.02 | $ | 1.11 | $ | — | $ | — | $ | — | ||||||||||||||
| Year ended 12/31/2016 |
14.20 | 0.21 | 0.74 | 0.95 | (0.29 | ) | (0.29 | ) | (0.58 | ) | ||||||||||||||||||
| Year ended 12/31/2015 |
14.73 | 0.23 | (0.52 | ) | (0.29 | ) | (0.17 | ) | (0.07 | ) | (0.24 | ) | ||||||||||||||||
| Year ended 12/31/2014 |
15.27 | 0.19 | 0.57 | 0.76 | (0.17 | ) | (1.13 | ) | (1.30 | ) | ||||||||||||||||||
| Year ended 12/31/2013 |
14.22 | 0.20 | 1.70 | 1.90 | (0.21 | ) | (0.64 | ) | (0.85 | ) | ||||||||||||||||||
| Year ended 12/31/2012 |
12.82 | 0.21 | 1.41 | 1.62 | (0.22 | ) | — | (0.22 | ) | |||||||||||||||||||
| Class B Shares |
||||||||||||||||||||||||||||
| Six months ended |
14.52 | 0.07 | 1.03 | 1.10 | — | — | — | |||||||||||||||||||||
| Year ended 12/31/2016 |
14.15 | 0.19 | 0.73 | 0.92 | (0.26 | ) | (0.29 | ) | (0.55 | ) | ||||||||||||||||||
| Year ended 12/31/2015 |
14.66 | 0.13 | (0.51 | ) | (0.38 | ) | (0.06 | ) | (0.07 | ) | (0.13 | ) | ||||||||||||||||
| Year ended 12/31/2014 |
15.20 | 0.08 | 0.56 | 0.64 | (0.05 | ) | (1.13 | ) | (1.18 | ) | ||||||||||||||||||
| Year ended 12/31/2013 |
14.16 | 0.09 | 1.69 | 1.78 | (0.10 | ) | (0.64 | ) | (0.74 | ) | ||||||||||||||||||
| Year ended 12/31/2012 |
12.77 | 0.11 | 1.40 | 1.51 | (0.12 | ) | — | (0.12 | ) | |||||||||||||||||||
| Premier Shares (i) |
||||||||||||||||||||||||||||
| Six months ended |
14.58 | 0.09 | 1.03 | 1.12 | — | — | — | |||||||||||||||||||||
| Year ended 12/31/2016 |
14.23 | 0.29 | 0.67 | 0.96 | (0.32 | ) | (0.29 | ) | (0.61 | ) | ||||||||||||||||||
| Year ended 12/31/2015 |
14.76 | 0.22 | (0.52 | ) | (0.30 | ) | (0.16 | ) | (0.07 | ) | (0.23 | ) | ||||||||||||||||
| Year ended 12/31/2014 |
15.29 | 0.19 | 0.58 | 0.77 | (0.17 | ) | (1.13 | ) | (1.30 | ) | ||||||||||||||||||
| Year ended 12/31/2013 |
14.23 | 0.20 | 1.70 | 1.90 | (0.20 | ) | (0.64 | ) | (0.84 | ) | ||||||||||||||||||
| Year ended 12/31/2012 |
12.83 | 0.21 | 1.40 | 1.61 | (0.21 | ) | — | (0.21 | ) | |||||||||||||||||||
| Legacy Class B Shares |
||||||||||||||||||||||||||||
| Six months ended |
14.67 | 0.06 | 1.04 | 1.10 | — | — | — | |||||||||||||||||||||
| Year ended 12/31/2016 |
14.28 | 0.16 | 0.73 | 0.89 | (0.21 | ) | (0.29 | ) | (0.50 | ) | ||||||||||||||||||
| Year ended 12/31/2015 |
14.79 | 0.15 | (0.51 | ) | (0.36 | ) | (0.08 | ) | (0.07 | ) | (0.15 | ) | ||||||||||||||||
| Year ended 12/31/2014 |
15.30 | 0.12 | 0.58 | 0.70 | (0.08 | ) | (1.13 | ) | (1.21 | ) | ||||||||||||||||||
| Year ended 12/31/2013 |
14.21 | 0.12 | 1.72 | 1.84 | (0.11 | ) | (0.64 | ) | (0.75 | ) | ||||||||||||||||||
| Year ended 12/31/2012 |
12.79 | 0.15 | 1.40 | 1.55 | (0.13 | ) | — | (0.13 | ) | |||||||||||||||||||
| Institutional Shares |
||||||||||||||||||||||||||||
| Six months ended |
14.67 | 0.10 | 1.03 | 1.13 | — | — | — | |||||||||||||||||||||
| Year ended 12/31/2016 |
14.30 | 0.27 | 0.72 | 0.99 | (0.33 | ) | (0.29 | ) | (0.62 | ) | ||||||||||||||||||
| Year ended 12/31/2015 |
14.83 | 0.26 | (0.52 | ) | (0.26 | ) | (0.20 | ) | (0.07 | ) | (0.27 | ) | ||||||||||||||||
| Year ended 12/31/2014 |
15.36 | 0.23 | 0.58 | 0.81 | (0.21 | ) | (1.13 | ) | (1.34 | ) | ||||||||||||||||||
| Year ended 12/31/2013 |
14.29 | 0.24 | 1.71 | 1.95 | (0.24 | ) | (0.64 | ) | (0.88 | ) | ||||||||||||||||||
| Year ended 12/31/2012 |
12.88 | 0.25 | 1.41 | 1.66 | (0.25 | ) | — | (0.25 | ) | |||||||||||||||||||
| Class R-1 Shares |
||||||||||||||||||||||||||||
| Six months ended |
14.48 | 0.07 | 1.02 | 1.09 | — | — | — | |||||||||||||||||||||
| Year ended 12/31/2016 |
14.13 | 0.19 | 0.70 | 0.89 | (0.25 | ) | (0.29 | ) | (0.54 | ) | ||||||||||||||||||
| Year ended 12/31/2015 |
14.66 | 0.18 | (0.52 | ) | (0.34 | ) | (0.12 | ) | (0.07 | ) | (0.19 | ) | ||||||||||||||||
| Year ended 12/31/2014 |
15.20 | 0.14 | 0.56 | 0.70 | (0.11 | ) | (1.13 | ) | (1.24 | ) | ||||||||||||||||||
| Year ended 12/31/2013 |
14.16 | 0.15 | 1.69 | 1.84 | (0.16 | ) | (0.64 | ) | (0.80 | ) | ||||||||||||||||||
| Year ended 12/31/2012 |
12.76 | 0.16 | 1.41 | 1.57 | (0.17 | ) | — | (0.17 | ) | |||||||||||||||||||
| Class R-2 Shares |
||||||||||||||||||||||||||||
| Six months ended |
14.53 | 0.08 | 1.03 | 1.11 | — | — | — | |||||||||||||||||||||
| Year ended 12/31/2016 |
14.18 | 0.22 | 0.70 | 0.92 | (0.28 | ) | (0.29 | ) | (0.57 | ) | ||||||||||||||||||
| Year ended 12/31/2015 |
14.71 | 0.21 | (0.52 | ) | (0.31 | ) | (0.15 | ) | (0.07 | ) | (0.22 | ) | ||||||||||||||||
| Year ended 12/31/2014 |
15.26 | 0.17 | 0.57 | 0.74 | (0.16 | ) | (1.13 | ) | (1.29 | ) | ||||||||||||||||||
| Year ended 12/31/2013 |
14.20 | 0.17 | 1.71 | 1.88 | (0.18 | ) | (0.64 | ) | (0.82 | ) | ||||||||||||||||||
| Year ended 12/31/2012 |
12.81 | 0.20 | 1.40 | 1.60 | (0.21 | ) | — | (0.21 | ) | |||||||||||||||||||
| Class R-3 Shares |
||||||||||||||||||||||||||||
| Six months ended |
14.68 | 0.09 | 1.03 | 1.12 | — | — | — | |||||||||||||||||||||
| Year ended 12/31/2016 |
14.31 | 0.27 | 0.72 | 0.99 | (0.33 | ) | (0.29 | ) | (0.62 | ) | ||||||||||||||||||
| Year ended 12/31/2015 |
14.84 | 0.24 | (0.52 | ) | (0.28 | ) | (0.18 | ) | (0.07 | ) | (0.25 | ) | ||||||||||||||||
| Year ended 12/31/2014 |
15.37 | 0.22 | 0.58 | 0.80 | (0.20 | ) | (1.13 | ) | (1.33 | ) | ||||||||||||||||||
| Year ended 12/31/2013 |
14.29 | 0.22 | 1.72 | 1.94 | (0.22 | ) | (0.64 | ) | (0.86 | ) | ||||||||||||||||||
| Year ended 12/31/2012 |
12.87 | 0.23 | 1.42 | 1.65 | (0.23 | ) | — | (0.23 | ) | |||||||||||||||||||
| (a) | Average shares outstanding for the period were used to calculate net investment income per share. |
| (b) | Through October 30, 2015, net amounts and ratios reflected the Fund’s proportionate share of income and expenses of the Master Portfolio and indirect proportionate share of the expenses of the Active Stock Master Portfolio, Total International ex U.S. Index Master Portfolio, CoreAlpha Bond Master Portfolio, International Tilts Master Portfolio, Master Small Cap Index Series and Large Cap Index Master Portfolio (collectively the “Underlying Master Portfolios”); but did not reflect indirect proportionate share of the expenses of the other registered investment companies in which the Master Portfolio invested. |
| (c) | Total return is not annualized for periods that are less than a full year and does not reflect the effect of sales charge for Class A, Class B, Premier and Legacy Class B shares. All other classes do not have a sales charge. |
| (d) | Determined on an annualized basis for periods that are less than a full year. |
| (e) | The expense ratios include the effect of expense reduction changes. |
| (f) | Effective October 31, 2015, expense ratios relate to the Fund only and do not reflect acquired fund fees and expenses. |
| 168 | See accompanying notes to financial statements. |
| Ratios/supplemental data | ||||||||||||||||||||||||||||||
| Average Net Asset ratios assuming expense reductions |
Average Net Asset ratios absent expense reductions |
|||||||||||||||||||||||||||||
| Net asset value, end of |
Total return (c) | Net assets, end of period (millions) |
Expenses (b) (d) (e) (f) |
Net investment income (loss) (b) (d) |
Expenses (b) (d) (f) |
Net investment income (loss) (b) (d) |
Portfolio turnover rate (d) (g) |
|||||||||||||||||||||||
| $ |
15.68 |
|
7.62 | % | $ | 1,037.9 | 0.66 | % | 1.12 | % | 0.79 | % | 0.99 | % | 5 | % | ||||||||||||||
| 14.57 | 6.65 | 1,011.2 | 0.79 | 1.46 | 0.79 | 1.46 | 7 | |||||||||||||||||||||||
| 14.20 | (1.99 | ) | 1,323.7 | 1.00 | 1.52 | 1.36 | 1.16 | 81 | ||||||||||||||||||||||
| 14.73 | 4.90 | 1,153.7 | 1.02 | 1.22 | 1.47 | 0.77 | 33 | |||||||||||||||||||||||
| 15.27 | 13.40 | 927.4 | 1.02 | 1.34 | 1.45 | 0.91 | 22 | |||||||||||||||||||||||
| 14.22 | 12.61 | 657.8 | 1.10 | 1.54 | 1.46 | 1.18 | 5 | |||||||||||||||||||||||
| |
15.62 |
|
7.58 | 28.2 | 0.77 | 0.99 | 0.99 | 0.77 | 5 | |||||||||||||||||||||
| 14.52 | 6.46 | 29.7 | 0.99 | 1.34 | 0.99 | 1.34 | 7 | |||||||||||||||||||||||
| 14.15 | (2.60 | ) | 35.3 | 1.59 | 0.86 | 1.96 | 0.49 | 81 | ||||||||||||||||||||||
| 14.66 | 4.21 | 42.8 | 1.72 | 0.51 | 2.17 | 0.06 | 33 | |||||||||||||||||||||||
| 15.20 | 12.58 | 41.8 | 1.73 | 0.62 | 2.16 | 0.19 | 22 | |||||||||||||||||||||||
| 14.16 | 11.84 | 34.4 | 1.80 | 0.83 | 2.16 | 0.47 | 5 | |||||||||||||||||||||||
| |
15.70 |
|
7.68 | 899.2 | 0.56 | 1.25 | 0.69 | 1.12 | 5 | |||||||||||||||||||||
| 14.58 | 6.75 | 820.7 | 0.71 | 2.00 | 0.71 | 2.00 | 7 | |||||||||||||||||||||||
| 14.23 | (2.03 | ) | 347.7 | 1.00 | 1.48 | 1.37 | 1.11 | 81 | ||||||||||||||||||||||
| 14.76 | 4.98 | 362.1 | 1.02 | 1.21 | 1.47 | 0.76 | 33 | |||||||||||||||||||||||
| 15.29 | 13.34 | 341.8 | 1.03 | 1.31 | 1.46 | 0.88 | 22 | |||||||||||||||||||||||
| 14.23 | 12.56 | 296.6 | 1.10 | 1.52 | 1.46 | 1.16 | 5 | |||||||||||||||||||||||
| |
15.77 |
|
7.50 | 10.0 | 0.88 | 0.84 | 1.19 | 0.53 | 5 | |||||||||||||||||||||
| 14.67 | 6.25 | 11.7 | 1.19 | 1.11 | 1.19 | 1.11 | 7 | |||||||||||||||||||||||
| 14.28 | (2.43 | ) | 15.6 | 1.41 | 1.03 | 1.78 | 0.66 | 81 | ||||||||||||||||||||||
| 14.79 | 4.54 | 21.6 | 1.42 | 0.80 | 1.87 | 0.35 | 33 | |||||||||||||||||||||||
| 15.30 | 12.91 | 30.5 | 1.43 | 0.82 | 1.86 | 0.39 | 22 | |||||||||||||||||||||||
| 14.21 | 12.15 | 41.5 | 1.50 | 1.06 | 1.85 | 0.71 | 5 | |||||||||||||||||||||||
| |
15.80 |
|
7.70 | 274.8 | 0.54 | 1.27 | 0.54 | 1.27 | 5 | |||||||||||||||||||||
| 14.67 | 6.94 | 253.5 | 0.54 | 1.87 | 0.54 | 1.87 | 7 | |||||||||||||||||||||||
| 14.30 | (1.76 | ) | 230.7 | 0.75 | 1.75 | 1.11 | 1.39 | 81 | ||||||||||||||||||||||
| 14.83 | 5.23 | 221.5 | 0.77 | 1.47 | 1.22 | 1.02 | 33 | |||||||||||||||||||||||
| 15.36 | 13.63 | 191.9 | 0.78 | 1.57 | 1.21 | 1.14 | 22 | |||||||||||||||||||||||
| 14.29 | 12.86 | 153.5 | 0.85 | 1.78 | 1.21 | 1.42 | 5 | |||||||||||||||||||||||
| |
15.57 |
|
7.53 | 32.3 | 0.86 | 0.91 | 1.11 | 0.66 | 5 | |||||||||||||||||||||
| 14.48 | 6.29 | 34.3 | 1.11 | 1.29 | 1.11 | 1.29 | 7 | |||||||||||||||||||||||
| 14.13 | (2.30 | ) | 31.4 | 1.32 | 1.20 | 1.68 | 0.84 | 81 | ||||||||||||||||||||||
| 14.66 | 4.59 | 25.8 | 1.34 | 0.89 | 1.79 | 0.44 | 33 | |||||||||||||||||||||||
| 15.20 | 12.99 | 24.9 | 1.34 | 1.01 | 1.77 | 0.58 | 22 | |||||||||||||||||||||||
| 14.16 | 12.32 | 19.8 | 1.42 | 1.19 | 1.78 | 0.83 | 5 | |||||||||||||||||||||||
| |
15.64 |
|
7.64 | 77.4 | 0.75 | 1.06 | 0.91 | 0.90 | 5 | |||||||||||||||||||||
| 14.53 | 6.50 | 69.9 | 0.91 | 1.52 | 0.91 | 1.52 | 7 | |||||||||||||||||||||||
| 14.18 | (2.11 | ) | 59.2 | 1.12 | 1.40 | 1.48 | 1.04 | 81 | ||||||||||||||||||||||
| 14.71 | 4.79 | 52.3 | 1.14 | 1.10 | 1.59 | 0.65 | 33 | |||||||||||||||||||||||
| 15.26 | 13.23 | 41.7 | 1.15 | 1.15 | 1.58 | 0.72 | 22 | |||||||||||||||||||||||
| 14.20 | 12.45 | 40.4 | 1.22 | 1.43 | 1.58 | 1.07 | 5 | |||||||||||||||||||||||
| |
15.80 |
|
7.63 | 4.7 | 0.61 | 1.18 | 0.61 | 1.18 | 5 | |||||||||||||||||||||
| 14.68 | 6.90 | 4.4 | 0.61 | 1.87 | 0.61 | 1.87 | 7 | |||||||||||||||||||||||
| 14.31 | (1.88 | ) | 3.4 | 0.83 | 1.62 | 1.19 | 1.26 | 81 | ||||||||||||||||||||||
| 14.84 | 5.15 | 4.4 | 0.84 | 1.40 | 1.29 | 0.95 | 33 | |||||||||||||||||||||||
| 15.37 | 13.56 | 3.7 | 0.85 | 1.47 | 1.28 | 1.04 | 22 | |||||||||||||||||||||||
| 14.29 | 12.85 | 3.5 | 0.92 | 1.69 | 1.28 | 1.33 | 5 | |||||||||||||||||||||||
| (g) | The 2015 portfolio turnover rate reflects the period from November 2, 2015 to December 31, 2015 and excludes in-kind contribution of portfolio securities received after the close of business on October 30, 2015. Through October 30, 2015, the LifePath 2030 Fund invested all of its assets in its corresponding Master Portfolio. The portfolio turnover rate of the Master Portfolio for the period January 1, 2015 to October 30, 2015 was 15%. For the period January 1, 2015 to October 30, 2015, and years ended 2014 and 2013, included the purchases and sales of the Underlying Master Portfolios, BlackRock Commodity Strategies Fund, BlackRock Emerging Markets Fund, Inc. and iShares exchange-traded funds. For the year ended 2012, excluded the purchases and sales of the Underlying Master Portfolios, BlackRock Commodity Strategies Fund and BlackRock Emerging Markets Fund, Inc. If these transactions had been included to conform to the 2015, 2014 and 2013 presentation, portfolio turnover rate would have been 16% for the year ended 2012. |
| (h) | Unaudited. |
| (i) | Effective May 23, 2016, Legacy Class A shares were renamed Premier shares. |
| See accompanying notes to financial statements. | 169 |
STATE FARM MUTUAL FUND TRUST LIFEPATH 2040 FUND
(For a share outstanding throughout each period)
| Income from investment operations | Less distributions | |||||||||||||||||||||||||||
| Net asset value, beginning of period |
Net investment income (loss) (a)(b) |
Net gain (loss) on investments (both realized and unrealized) |
Total from investment operations |
Net investment income |
Net realized gain |
Total distributions |
||||||||||||||||||||||
| Class A Shares |
||||||||||||||||||||||||||||
| Six months ended |
$ | 15.21 | $ | 0.09 | $ | 1.31 | $ | 1.40 | $ | — | $ | — | $ | — | ||||||||||||||
| Year ended 12/31/2016 |
14.68 | 0.25 | 0.85 | 1.10 | (0.29 | ) | (0.28 | ) | (0.57 | ) | ||||||||||||||||||
| Year ended 12/31/2015 |
15.31 | 0.24 | (0.58 | ) | (0.34 | ) | (0.21 | ) | (0.08 | ) | (0.29 | ) | ||||||||||||||||
| Year ended 12/31/2014 |
15.99 | 0.20 | 0.62 | 0.82 | (0.18 | ) | (1.32 | ) | (1.50 | ) | ||||||||||||||||||
| Year ended 12/31/2013 |
14.46 | 0.23 | 2.18 | 2.41 | (0.23 | ) | (0.65 | ) | (0.88 | ) | ||||||||||||||||||
| Year ended 12/31/2012 |
12.85 | 0.22 | 1.62 | 1.84 | (0.23 | ) | — | (0.23 | ) | |||||||||||||||||||
| Class B Shares |
||||||||||||||||||||||||||||
| Six months ended |
15.16 | 0.08 | 1.31 | 1.39 | — | — | — | |||||||||||||||||||||
| Year ended 12/31/2016 |
14.62 | 0.21 | 0.85 | 1.06 | (0.24 | ) | (0.28 | ) | (0.52 | ) | ||||||||||||||||||
| Year ended 12/31/2015 |
15.22 | 0.14 | (0.56 | ) | (0.42 | ) | (0.10 | ) | (0.08 | ) | (0.18 | ) | ||||||||||||||||
| Year ended 12/31/2014 |
15.90 | 0.08 | 0.62 | 0.70 | (0.06 | ) | (1.32 | ) | (1.38 | ) | ||||||||||||||||||
| Year ended 12/31/2013 |
14.40 | 0.11 | 2.16 | 2.27 | (0.12 | ) | (0.65 | ) | (0.77 | ) | ||||||||||||||||||
| Year ended 12/31/2012 |
12.80 | 0.12 | 1.61 | 1.73 | (0.13 | ) | — | (0.13 | ) | |||||||||||||||||||
| Premier Shares (i) |
||||||||||||||||||||||||||||
| Six months ended |
15.27 | 0.10 | 1.32 | 1.42 | — | — | — | |||||||||||||||||||||
| Year ended 12/31/2016 |
14.74 | 0.29 | 0.83 | 1.12 | (0.31 | ) | (0.28 | ) | (0.59 | ) | ||||||||||||||||||
| Year ended 12/31/2015 |
15.36 | 0.24 | (0.57 | ) | (0.33 | ) | (0.21 | ) | (0.08 | ) | (0.29 | ) | ||||||||||||||||
| Year ended 12/31/2014 |
16.03 | 0.20 | 0.63 | 0.83 | (0.18 | ) | (1.32 | ) | (1.50 | ) | ||||||||||||||||||
| Year ended 12/31/2013 |
14.50 | 0.22 | 2.18 | 2.40 | (0.22 | ) | (0.65 | ) | (0.87 | ) | ||||||||||||||||||
| Year ended 12/31/2012 |
12.88 | 0.22 | 1.62 | 1.84 | (0.22 | ) | — | (0.22 | ) | |||||||||||||||||||
| Legacy Class B Shares |
||||||||||||||||||||||||||||
| Six months ended |
15.36 | 0.07 | 1.34 | 1.41 | — | — | — | |||||||||||||||||||||
| Year ended 12/31/2016 |
14.80 | 0.18 | 0.86 | 1.04 | (0.20 | ) | (0.28 | ) | (0.48 | ) | ||||||||||||||||||
| Year ended 12/31/2015 |
15.41 | 0.17 | (0.58 | ) | (0.41 | ) | (0.12 | ) | (0.08 | ) | (0.20 | ) | ||||||||||||||||
| Year ended 12/31/2014 |
16.05 | 0.13 | 0.64 | 0.77 | (0.09 | ) | (1.32 | ) | (1.41 | ) | ||||||||||||||||||
| Year ended 12/31/2013 |
14.50 | 0.14 | 2.20 | 2.34 | (0.14 | ) | (0.65 | ) | (0.79 | ) | ||||||||||||||||||
| Year ended 12/31/2012 |
12.87 | 0.16 | 1.62 | 1.78 | (0.15 | ) | — | (0.15 | ) | |||||||||||||||||||
| Institutional Shares |
||||||||||||||||||||||||||||
| Six months ended |
15.35 | 0.10 | 1.33 | 1.43 | — | — | — | |||||||||||||||||||||
| Year ended 12/31/2016 |
14.81 | 0.30 | 0.85 | 1.15 | (0.33 | ) | (0.28 | ) | (0.61 | ) | ||||||||||||||||||
| Year ended 12/31/2015 |
15.44 | 0.28 | (0.59 | ) | (0.31 | ) | (0.24 | ) | (0.08 | ) | (0.32 | ) | ||||||||||||||||
| Year ended 12/31/2014 |
16.11 | 0.24 | 0.63 | 0.87 | (0.22 | ) | (1.32 | ) | (1.54 | ) | ||||||||||||||||||
| Year ended 12/31/2013 |
14.56 | 0.27 | 2.19 | 2.46 | (0.26 | ) | (0.65 | ) | (0.91 | ) | ||||||||||||||||||
| Year ended 12/31/2012 |
12.93 | 0.26 | 1.63 | 1.89 | (0.26 | ) | — | (0.26 | ) | |||||||||||||||||||
| Class R-1 Shares |
||||||||||||||||||||||||||||
| Six months ended |
15.14 | 0.07 | 1.32 | 1.39 | — | — | — | |||||||||||||||||||||
| Year ended 12/31/2016 |
14.61 | 0.20 | 0.84 | 1.04 | (0.23 | ) | (0.28 | ) | (0.51 | ) | ||||||||||||||||||
| Year ended 12/31/2015 |
15.25 | 0.20 | (0.59 | ) | (0.39 | ) | (0.17 | ) | (0.08 | ) | (0.25 | ) | ||||||||||||||||
| Year ended 12/31/2014 |
15.92 | 0.15 | 0.62 | 0.77 | (0.12 | ) | (1.32 | ) | (1.44 | ) | ||||||||||||||||||
| Year ended 12/31/2013 |
14.41 | 0.17 | 2.17 | 2.34 | (0.18 | ) | (0.65 | ) | (0.83 | ) | ||||||||||||||||||
| Year ended 12/31/2012 |
12.80 | 0.17 | 1.62 | 1.79 | (0.18 | ) | — | (0.18 | ) | |||||||||||||||||||
| Class R-2 Shares |
||||||||||||||||||||||||||||
| Six months ended |
15.19 | 0.09 | 1.31 | 1.40 | — | — | — | |||||||||||||||||||||
| Year ended 12/31/2016 |
14.68 | 0.25 | 0.82 | 1.07 | (0.28 | ) | (0.28 | ) | (0.56 | ) | ||||||||||||||||||
| Year ended 12/31/2015 |
15.30 | 0.22 | (0.57 | ) | (0.35 | ) | (0.19 | ) | (0.08 | ) | (0.27 | ) | ||||||||||||||||
| Year ended 12/31/2014 |
15.99 | 0.18 | 0.62 | 0.80 | (0.17 | ) | (1.32 | ) | (1.49 | ) | ||||||||||||||||||
| Year ended 12/31/2013 |
14.46 | 0.20 | 2.18 | 2.38 | (0.20 | ) | (0.65 | ) | (0.85 | ) | ||||||||||||||||||
| Year ended 12/31/2012 |
12.85 | 0.21 | 1.61 | 1.82 | (0.21 | ) | — | (0.21 | ) | |||||||||||||||||||
| Class R-3 Shares |
||||||||||||||||||||||||||||
| Six months ended |
15.52 | 0.10 | 1.34 | 1.44 | — | — | — | |||||||||||||||||||||
| Year ended 12/31/2016 |
14.97 | 0.30 | 0.85 | 1.15 | (0.32 | ) | (0.28 | ) | (0.60 | ) | ||||||||||||||||||
| Year ended 12/31/2015 |
15.60 | 0.28 | (0.59 | ) | (0.31 | ) | (0.24 | ) | (0.08 | ) | (0.32 | ) | ||||||||||||||||
| Year ended 12/31/2014 |
16.26 | 0.24 | 0.63 | 0.87 | (0.21 | ) | (1.32 | ) | (1.53 | ) | ||||||||||||||||||
| Year ended 12/31/2013 |
14.70 | 0.25 | 2.21 | 2.46 | (0.25 | ) | (0.65 | ) | (0.90 | ) | ||||||||||||||||||
| Year ended 12/31/2012 |
13.05 | 0.24 | 1.65 | 1.89 | (0.24 | ) | — | (0.24 | ) | |||||||||||||||||||
| (a) | Average shares outstanding for the period were used to calculate net investment income per share. |
| (b) | Through October 30, 2015, net amounts and ratios reflected the Fund’s proportionate share of income and expenses of the Master Portfolio and indirect proportionate share of the expenses of the Active Stock Master Portfolio, Total International ex U.S. Index Master Portfolio, CoreAlpha Bond Master Portfolio, International Tilts Master Portfolio, Master Small Cap Index Series and Large Cap Index Master Portfolio (collectively the “Underlying Master Portfolios”); but did not reflect indirect proportionate share of the expenses of the other registered investment companies in which the Master Portfolio invested. |
| (c) | Total return is not annualized for periods that are less than a full year and does not reflect the effect of sales charge for Class A, Class B, Premier and Legacy Class B shares. All other classes do not have a sales charge. |
| (d) | Determined on an annualized basis for periods that are less than a full year. |
| (e) | The expense ratios include the effect of expense reduction changes. |
| (f) | Effective October 31, 2015, expense ratios relate to the Fund only and do not reflect acquired fund fees and expenses. |
| 170 | See accompanying notes to financial statements. |
| Ratios/supplemental data | ||||||||||||||||||||||||||||||
| Average Net Asset ratios assuming expense reductions |
Average Net Asset ratios absent expense reductions |
|||||||||||||||||||||||||||||
| Net asset value, end of period |
Total return (c) | Net assets, end of period (millions) |
Expenses (b) (d) (e) (f) |
Net investment income (loss) (b) (d) |
Expenses (b) (d) (f) |
Net investment income (loss) (b) (d) |
Portfolio turnover rate (d) (g) |
|||||||||||||||||||||||
| $ |
16.61 |
|
9.20 | % | $ | 876.4 | 0.67 | % | 1.15 | % | 0.79 | % | 1.03 | % | 5 | % | ||||||||||||||
| 15.21 | 7.47 | 827.8 | 0.80 | 1.68 | 0.80 | 1.68 | 6 | |||||||||||||||||||||||
| 14.68 | (2.21 | ) | 816.4 | 0.98 | 1.58 | 1.36 | 1.20 | 80 | ||||||||||||||||||||||
| 15.31 | 5.12 | 719.1 | 1.01 | 1.23 | 1.47 | 0.77 | 42 | |||||||||||||||||||||||
| 15.99 | 16.65 | 579.2 | 1.01 | 1.47 | 1.46 | 1.02 | 26 | |||||||||||||||||||||||
| 14.46 | 14.29 | 407.1 | 1.09 | 1.60 | 1.47 | 1.22 | 4 | |||||||||||||||||||||||
| |
16.55 |
|
9.17 | 28.4 | 0.77 | 0.98 | 0.99 | 0.76 | 5 | |||||||||||||||||||||
| 15.16 | 7.29 | 30.3 | 1.00 | 1.42 | 1.00 | 1.42 | 6 | |||||||||||||||||||||||
| 14.62 | (2.76 | ) | 36.4 | 1.57 | 0.91 | 1.96 | 0.52 | 80 | ||||||||||||||||||||||
| 15.22 | 4.38 | 44.1 | 1.71 | 0.52 | 2.17 | 0.06 | 42 | |||||||||||||||||||||||
| 15.90 | 15.75 | 41.7 | 1.72 | 0.73 | 2.17 | 0.28 | 26 | |||||||||||||||||||||||
| 14.40 | 13.52 | 34.0 | 1.79 | 0.88 | 2.17 | 0.50 | 4 | |||||||||||||||||||||||
| |
16.69 |
|
9.30 | 431.8 | 0.56 | 1.29 | 0.69 | 1.16 | 5 | |||||||||||||||||||||
| 15.27 | 7.58 | 375.9 | 0.72 | 1.93 | 0.72 | 1.93 | 6 | |||||||||||||||||||||||
| 14.74 | (2.18 | ) | 258.8 | 0.99 | 1.54 | 1.37 | 1.16 | 80 | ||||||||||||||||||||||
| 15.36 | 5.13 | 264.3 | 1.01 | 1.22 | 1.47 | 0.76 | 42 | |||||||||||||||||||||||
| 16.03 | 16.56 | 249.1 | 1.02 | 1.43 | 1.47 | 0.98 | 26 | |||||||||||||||||||||||
| 14.50 | 14.29 | 210.0 | 1.09 | 1.57 | 1.47 | 1.19 | 4 | |||||||||||||||||||||||
| |
16.77 |
|
9.18 | 9.8 | 0.88 | 0.83 | 1.19 | 0.52 | 5 | |||||||||||||||||||||
| 15.36 | 7.04 | 11.6 | 1.20 | 1.18 | 1.20 | 1.18 | 6 | |||||||||||||||||||||||
| 14.80 | (2.64 | ) | 15.2 | 1.39 | 1.07 | 1.78 | 0.68 | 80 | ||||||||||||||||||||||
| 15.41 | 4.76 | 20.4 | 1.41 | 0.80 | 1.87 | 0.34 | 42 | |||||||||||||||||||||||
| 16.05 | 16.09 | 28.1 | 1.42 | 0.93 | 1.87 | 0.48 | 26 | |||||||||||||||||||||||
| 14.50 | 13.81 | 33.8 | 1.49 | 1.12 | 1.87 | 0.74 | 4 | |||||||||||||||||||||||
| |
16.78 |
|
9.32 | 354.8 | 0.54 | 1.29 | 0.54 | 1.29 | 5 | |||||||||||||||||||||
| 15.35 | 7.75 | 319.8 | 0.54 | 1.98 | 0.54 | 1.98 | 6 | |||||||||||||||||||||||
| 14.81 | (1.98 | ) | 282.3 | 0.73 | 1.81 | 1.11 | 1.43 | 80 | ||||||||||||||||||||||
| 15.44 | 5.37 | 265.5 | 0.76 | 1.48 | 1.22 | 1.02 | 42 | |||||||||||||||||||||||
| 16.11 | 16.90 | 221.4 | 0.77 | 1.69 | 1.22 | 1.24 | 26 | |||||||||||||||||||||||
| 14.56 | 14.59 | 170.7 | 0.84 | 1.84 | 1.22 | 1.46 | 4 | |||||||||||||||||||||||
| |
16.53 |
|
9.18 | 25.3 | 0.86 | 0.92 | 1.11 | 0.67 | 5 | |||||||||||||||||||||
| 15.14 | 7.14 | 25.2 | 1.11 | 1.33 | 1.11 | 1.33 | 6 | |||||||||||||||||||||||
| 14.61 | (2.55 | ) | 24.0 | 1.30 | 1.29 | 1.68 | 0.91 | 80 | ||||||||||||||||||||||
| 15.25 | 4.79 | 18.5 | 1.33 | 0.90 | 1.79 | 0.44 | 42 | |||||||||||||||||||||||
| 15.92 | 16.27 | 18.4 | 1.34 | 1.11 | 1.79 | 0.66 | 26 | |||||||||||||||||||||||
| 14.41 | 13.92 | 15.3 | 1.41 | 1.26 | 1.79 | 0.88 | 4 | |||||||||||||||||||||||
| |
16.59 |
|
9.22 | 62.1 | 0.76 | 1.08 | 0.91 | 0.93 | 5 | |||||||||||||||||||||
| 15.19 | 7.29 | 56.5 | 0.91 | 1.66 | 0.91 | 1.66 | 6 | |||||||||||||||||||||||
| 14.68 | (2.27 | ) | 45.9 | 1.10 | 1.44 | 1.48 | 1.06 | 80 | ||||||||||||||||||||||
| 15.30 | 4.96 | 43.9 | 1.13 | 1.12 | 1.59 | 0.66 | 42 | |||||||||||||||||||||||
| 15.99 | 16.48 | 33.9 | 1.14 | 1.28 | 1.58 | 0.84 | 26 | |||||||||||||||||||||||
| 14.46 | 14.15 | 30.7 | 1.21 | 1.47 | 1.59 | 1.09 | 4 | |||||||||||||||||||||||
| |
16.96 |
|
9.28 | 7.1 | 0.61 | 1.21 | 0.61 | 1.21 | 5 | |||||||||||||||||||||
| 15.52 | 7.68 | 6.4 | 0.61 | 1.96 | 0.61 | 1.96 | 6 | |||||||||||||||||||||||
| 14.97 | (2.02 | ) | 5.0 | 0.80 | 1.76 | 1.18 | 1.38 | 80 | ||||||||||||||||||||||
| 15.60 | 5.32 | 4.3 | 0.83 | 1.41 | 1.29 | 0.95 | 42 | |||||||||||||||||||||||
| 16.26 | 16.71 | 3.5 | 0.84 | 1.61 | 1.29 | 1.16 | 26 | |||||||||||||||||||||||
| 14.70 | 14.50 | 3.0 | 0.91 | 1.73 | 1.29 | 1.35 | 4 | |||||||||||||||||||||||
| (g) | The 2015 portfolio turnover rate reflects the period from November 2, 2015 to December 31, 2015 and excludes in-kind contribution of portfolio securities received after the close of business on October 30, 2015. Through October 30, 2015, the LifePath 2040 Fund invested all of its assets in its corresponding Master Portfolio. The portfolio turnover rate of the Master Portfolio for the period January 1, 2015 to October 30, 2015 was 13%. For the period January 1, 2015 to October 30, 2015, and years ended 2014 and 2013, included the purchases and sales of the Underlying Master Portfolios, BlackRock Commodity Strategies Fund, BlackRock Emerging Markets Fund, Inc. and iShares exchange-traded funds. For the year ended 2012, excluded the purchases and sales of the Underlying Master Portfolios, BlackRock Commodity Strategies Fund and BlackRock Emerging Markets Fund, Inc. If these transactions had been included to conform to the 2015, 2014 and 2013 presentation, portfolio turnover rate would have been 14% for the year ended 2012. |
| (h) | Unaudited. |
| (i) | Effective May 23, 2016, Legacy Class A shares were renamed Premier shares. |
| See accompanying notes to financial statements. | 171 |
STATE FARM MUTUAL FUND TRUST LIFEPATH 2050 FUND
(For a share outstanding throughout each period)
| Income from investment operations | Less distributions | |||||||||||||||||||||||||||
| Net asset value, beginning of period |
Net investment income (loss) (a) (b) |
Net gain (loss) on investments (both realized and unrealized) |
Total from investment operations |
Net investment income |
Net realized gain |
Total distributions |
||||||||||||||||||||||
| Class A Shares |
||||||||||||||||||||||||||||
| Six months ended |
$ | 10.49 | $ | 0.06 | $ | 0.97 | $ | 1.03 | $ | — | $ | — | $ | — | ||||||||||||||
| Year ended 12/31/2016 |
10.06 | 0.17 | 0.62 | 0.79 | (0.20 | ) | (0.16 | ) | (0.36 | ) | ||||||||||||||||||
| Year ended 12/31/2015 |
10.46 | 0.16 | (0.40 | ) | (0.24 | ) | (0.12 | ) | (0.04 | ) | (0.16 | ) | ||||||||||||||||
| Year ended 12/31/2014 |
10.79 | 0.13 | 0.46 | 0.59 | (0.12 | ) | (0.80 | ) | (0.92 | ) | ||||||||||||||||||
| Year ended 12/31/2013 |
9.63 | 0.17 | 1.69 | 1.86 | (0.15 | ) | (0.55 | ) | (0.70 | ) | ||||||||||||||||||
| Year ended 12/31/2012 |
8.60 | 0.15 | 1.19 | 1.34 | (0.14 | ) | (0.17 | ) | (0.31 | ) | ||||||||||||||||||
| Premier Shares |
||||||||||||||||||||||||||||
| Six months ended |
10.46 | 0.07 | 0.97 | 1.04 | — | — | — | |||||||||||||||||||||
| Period ended 12/31/2016 (i) |
10.20 | 0.18 | 0.47 | 0.65 | (0.23 | ) | (0.16 | ) | (0.39 | ) | ||||||||||||||||||
| Class R-1 Shares |
||||||||||||||||||||||||||||
| Six months ended |
10.51 | 0.05 | 0.98 | 1.03 | — | — | — | |||||||||||||||||||||
| Year ended 12/31/2016 |
10.09 | 0.15 | 0.60 | 0.75 | (0.17 | ) | (0.16 | ) | (0.33 | ) | ||||||||||||||||||
| Year ended 12/31/2015 |
10.49 | 0.13 | (0.40 | ) | (0.27 | ) | (0.09 | ) | (0.04 | ) | (0.13 | ) | ||||||||||||||||
| Year ended 12/31/2014 |
10.83 | 0.10 | 0.44 | 0.54 | (0.08 | ) | (0.80 | ) | (0.88 | ) | ||||||||||||||||||
| Year ended 12/31/2013 |
9.66 | 0.13 | 1.70 | 1.83 | (0.11 | ) | (0.55 | ) | (0.66 | ) | ||||||||||||||||||
| Year ended 12/31/2012 |
8.62 | 0.12 | 1.20 | 1.32 | (0.11 | ) | (0.17 | ) | (0.28 | ) | ||||||||||||||||||
| Class R-2 Shares |
||||||||||||||||||||||||||||
| Six months ended |
10.52 | 0.06 | 0.97 | 1.03 | — | — | — | |||||||||||||||||||||
| Year ended 12/31/2016 |
10.10 | 0.17 | 0.60 | 0.77 | (0.19 | ) | (0.16 | ) | (0.35 | ) | ||||||||||||||||||
| Year ended 12/31/2015 |
10.50 | 0.15 | (0.40 | ) | (0.25 | ) | (0.11 | ) | (0.04 | ) | (0.15 | ) | ||||||||||||||||
| Year ended 12/31/2014 |
10.84 | 0.12 | 0.45 | 0.57 | (0.11 | ) | (0.80 | ) | (0.91 | ) | ||||||||||||||||||
| Year ended 12/31/2013 |
9.66 | 0.14 | 1.71 | 1.85 | (0.12 | ) | (0.55 | ) | (0.67 | ) | ||||||||||||||||||
| Year ended 12/31/2012 |
8.63 | 0.14 | 1.19 | 1.33 | (0.13 | ) | (0.17 | ) | (0.30 | ) | ||||||||||||||||||
| (a) | Average shares outstanding for the period were used to calculate net investment income per share. |
| (b) | Through October 30, 2015, net amounts and ratios reflected the Fund’s proportionate share of income and expenses of the Master Portfolio and indirect proportionate share of the expenses of the Active Stock Master Portfolio, Total International ex U.S. Index Master Portfolio, CoreAlpha Bond Master Portfolio, International Tilts Master Portfolio, Master Small Cap Index Series and Large Cap Index Master Portfolio (collectively the “Underlying Master Portfolios”); but did not reflect indirect proportionate share of the expenses of the other registered investment companies in which the Master Portfolio invested. |
| (c) | Total return is not annualized for periods that are less than a full year and does not reflect the effect of sales charge for Class A and Premier shares. All other classes do not have a sales charge. |
| (d) | Determined on an annualized basis for periods that are less than a full year. |
| (e) | The expense ratios include the effect of expense reduction changes. |
| (f) | Effective October 31, 2015, expense ratios relate to the Fund only and do not reflect acquired fund fees and expenses. |
| (g) | The 2015 portfolio turnover rate reflects the period from November 2, 2015 to December 31, 2015 and excludes in-kind contribution of portfolio securities received after the close of business on October 30, 2015. Through October 30, 2015, the LifePath 2050 Fund invested all of its assets in its corresponding Master Portfolio. The portfolio turnover rate of the Master Portfolio for the period January 1, 2015 to October 30, 2015 was 26%. For the period January 1, 2015 to October 30, 2015, and years ended 2014 and 2013, included the purchases and sales of the Underlying Master Portfolios, BlackRock Commodity Strategies Fund, BlackRock Emerging Markets Fund, Inc. and iShares exchange-traded funds. For the year ended 2012, excluded the purchases and sales of the Underlying Master Portfolios, BlackRock Commodity Strategies Fund and BlackRock Emerging Markets Fund, Inc. If these transactions had been included to conform to the 2015, 2014 and 2013 presentation, portfolio turnover rate would have been 15% for the year ended 2012. |
| (h) | Unaudited. |
| (i) | For all the data, except for the portfolio turnover rate which is for the entire year, the period is from commencement of investment operations May 16, 2016. |
| 172 | See accompanying notes to financial statements. |
| Ratios/supplemental data | ||||||||||||||||||||||||||||||
| Average Net Asset ratios assuming expense reductions |
Average Net Asset ratios absent expense reductions |
|||||||||||||||||||||||||||||
| Net asset value, end of period |
Total return (c) | Net assets, end of period (millions) |
Expenses (b) (d) (e) (f) |
Net investment income (loss) (b) (d) |
Expenses (b) (d) (f) |
Net investment income (loss) (b) (d) |
Portfolio turnover rate (d) (g) |
|||||||||||||||||||||||
| $ |
11.52 |
9.82 | % | $ | 298.4 | 0.69 | % | 1.17 | % | 0.82 | % | 1.04 | % | 4 | % | |||||||||||||||
| 10.49 | 7.80 | 272.8 | 0.82 | 1.61 | 0.82 | 1.61 | 5 | |||||||||||||||||||||||
| 10.06 | (2.35 | ) | 296.4 | 1.01 | 1.57 | 1.44 | 1.14 | 81 | ||||||||||||||||||||||
| 10.46 | 5.40 | 239.4 | 1.04 | 1.20 | 1.53 | 0.71 | 48 | |||||||||||||||||||||||
| 10.79 | 19.34 | 170.7 | 1.08 | 1.60 | 1.56 | 1.12 | 28 | |||||||||||||||||||||||
| 9.63 | 15.54 | 104.3 | 1.14 | 1.61 | 1.60 | 1.15 | 5 | |||||||||||||||||||||||
| |
11.50 |
|
9.94 | 105.8 | 0.59 | 1.30 | 0.72 | 1.17 | 4 | |||||||||||||||||||||
| 10.46 | 6.32 | 90.4 | 0.43 | 1.75 | 0.43 | 1.75 | 5 | |||||||||||||||||||||||
| |
11.54 |
|
9.80 | 10.8 | 0.88 | 0.97 | 1.14 | 0.71 | 4 | |||||||||||||||||||||
| 10.51 | 7.45 | 9.9 | 1.13 | 1.47 | 1.13 | 1.47 | 5 | |||||||||||||||||||||||
| 10.09 | (2.61 | ) | 7.3 | 1.33 | 1.26 | 1.76 | 0.83 | 81 | ||||||||||||||||||||||
| 10.49 | 4.94 | 5.5 | 1.36 | 0.87 | 1.85 | 0.38 | 48 | |||||||||||||||||||||||
| 10.83 | 19.02 | 4.6 | 1.40 | 1.26 | 1.88 | 0.78 | 28 | |||||||||||||||||||||||
| 9.66 | 15.29 | 3.5 | 1.46 | 1.27 | 1.92 | 0.81 | 5 | |||||||||||||||||||||||
| |
11.55 |
|
9.79 | 19.5 | 0.78 | 1.06 | 0.94 | 0.90 | 4 | |||||||||||||||||||||
| 10.52 | 7.62 | 17.8 | 0.94 | 1.65 | 0.94 | 1.65 | 5 | |||||||||||||||||||||||
| 10.10 | (2.43 | ) | 14.6 | 1.13 | 1.47 | 1.56 | 1.04 | 81 | ||||||||||||||||||||||
| 10.50 | 5.20 | 11.5 | 1.16 | 1.08 | 1.65 | 0.59 | 48 | |||||||||||||||||||||||
| 10.84 | 19.21 | 7.5 | 1.21 | 1.32 | 1.68 | 0.85 | 28 | |||||||||||||||||||||||
| 9.66 | 15.37 | 4.9 | 1.26 | 1.52 | 1.72 | 1.06 | 5 | |||||||||||||||||||||||
| See accompanying notes to financial statements. | 173 |
| P.O. Box 219548 Kansas City, MO 64121-9548 |
U.S. POSTAGE PAID LANCASTER, PA PERMIT NO. 1275 |
|||||||||||||
|
PRESORTED STANDARD | ||||||||||||||
|
Not FDIC Insured |
• May Lose Value • No Bank Guarantee |
|||
|
There is no assurance that the Funds will achieve their investment objectives. Investment return and principal value will fluctuate and Fund shares, when redeemed, may be worth more or less than their original cost. State Farm Mutual Funds are not insurance products. |
||||
| 8-2017 | ||||||||
| 120-6345 b.16-CH | AP2017/08/9816 | Printed in U.S.A. |
| ITEM 2. | CODE OF ETHICS. |
Disclosure information pursuant to Item 2 is not applicable.
Registrant hereby undertakes to provide a copy of the code of ethics that applies to the registrants’ principal executive officer, principal financial officer, principal accounting officer or controller, or persons performing similar functions to any person upon request, without charge. To request a copy of the code of ethics, contact the registrant at 1-800-447-4930.
| ITEM 3. | AUDIT COMMITTEE FINANCIAL EXPERT. |
Not applicable.
| ITEM 4. | PRINCIPAL ACCOUNTANT FEES AND SERVICES. |
Not applicable.
| ITEM 5. | AUDIT COMMITTEE OF LISTED REGISTRANTS. |
Not applicable.
| ITEM 6. | INVESTMENTS. |
(a) The information required by this Item 6(a) is included as part of the report to shareholders under Item 1 of this Form N-CSR.
(b) Not applicable.
| ITEM 7. | DISCLOSURE OF PROXY VOTING POLICIES AND PROCEDURES FOR CLOSED-END MANAGEMENT INVESTMENT COMPANIES. |
Not applicable.
| ITEM 8. | PORTFOLIO MANAGERS OF CLOSED-END MANAGEMENT INVESTMENT COMPANIES. |
Not applicable.
| ITEM 9. | PURCHASES OF EQUITY SECURITIES BY CLOSED-END MANAGEMENT INVESTMENT COMPANY AND AFFILIATED PURCHASERS. |
Not applicable.
| ITEM 10. | SUBMISSION OF MATTERS TO A VOTE OF SECURITY HOLDERS. |
There were no material changes to the procedures by which shareholders may recommend nominees to the State Farm Mutual Fund Trust Board of Trustees.
| ITEM 11. | CONTROLS AND PROCEDURES. |
(a) The registrant’s principal executive officer and principal financial officer evaluated the effectiveness of the registrant’s disclosure controls and procedures (as defined in Rule 30a-3(c) under the Investment Company Act of 1940 (the “Act”) (17 CFR 270.30a-3(c))) as of a date within 90 days of the filing date of this report (the “Evaluation Date”), and based on their evaluation as of the Evaluation Date of these controls and procedures as required by Rule 30a-3(b) under the Act (17 CFR 270.30a-3(b)) and Rules 13a-15(b) or 15d-15(b) under the Securities Exchange Act of 1934 (17 CFR 240.13a-15(b) or 240.15d-15(b)) (as applicable), concluded that the registrant’s disclosure controls and procedures are effective.
(b) No change in the registrant’s internal control over financial reporting (as defined in Rule 30a-3(d) under the Act (17 CFR 270.30a-3(d))) occurred during the second fiscal quarter of the period covered by this report that has materially affected, or is reasonably likely to materially affect, the registrant’s internal control over financial reporting.
| ITEM 12. | EXHIBITS. |
(a)(1) Not applicable.
(a)(2) A separate certification for each principal executive officer and principal financial officer of the registrant as required by Rule 30a-2(a) under the Act (17 CFR 270.30a-2(a)): Attached hereto as EX-99.CERT.
(a)(3) Not applicable.
(b) Certification of principal executive officer and principal financial officer as required by Rule 30a-2(b) under the Act (17 CFR 270.30a-2(b)), Rule 13a-14(b) or Rule 15d-14(b) under the Securities Exchange Act of 1934 (17 CFR 240.13a-14(b) or 240.15d-14(b))(as applicable), and Section 1350 of Chapter 63 of Title 18 of the United States Code (18 U.S.C. 1350): Attached hereto as EX-99.906CERT.
SIGNATURES
Pursuant to the requirements of the Securities Exchange Act of 1934 and the Investment Company Act of 1940, the registrant has duly caused this report to be signed on its behalf by the undersigned, thereunto duly authorized.
State Farm Mutual Fund Trust
| By | /s/ Joe R. Monk Jr. | |
| Joe R. Monk Jr. | ||
| President |
| Date | August 23, 2017 |
Pursuant to the requirements of the Securities Exchange Act of 1934 and the Investment Company Act of 1940, this report has been signed below by the following persons on behalf of the registrant and in the capacities and on the dates indicated.
| By | /s/ Joe R. Monk Jr. | |
| Joe R. Monk Jr. | ||
| President |
| Date | August 23, 2017 |
| By | /s/ Paul J. Smith | |
| Paul J. Smith | ||
| Senior Vice President and Treasurer |
| Date | August 23, 2017 |
EX-99.CERT
I, Joe R. Monk, Jr., certify that:
1. I have reviewed this report on Form N-CSR of the State Farm Mutual Fund Trust;
2. Based on my knowledge, this report does not contain any untrue statement of a material fact or omit to state a material fact necessary to make the statements made, in light of the circumstances under which such statements were made, not misleading with respect to the period covered by this report;
3. Based on my knowledge, the financial statements, and other financial information included in this report, fairly present in all material respects the financial condition, results of operations, changes in net assets, and cash flows (if the financial statements are required to include a statement of cash flows) of the registrant as of, and for, the periods presented in this report;
4. The registrant’s other certifying officer(s) and I are responsible for establishing and maintaining disclosure controls and procedures (as defined in Rule 30a-3(c) under the Investment Company Act of 1940) and internal control over financial reporting (as defined in Rule 30a-3(d) under the Investment Company Act of 1940) for the registrant and have:
(a) Designed such disclosure controls and procedures, or caused such disclosure controls and procedures to be designed under our supervision, to ensure that material information relating to the registrant, including its consolidated subsidiaries, is made known to us by others within those entities, particularly during the period in which this report is being prepared;
(b) Designed such internal control over financial reporting, or caused such internal control over financial reporting to be designed under our supervision, to provide reasonable assurance regarding the reliability of financial reporting and the preparation of financial statements for external purposes in accordance with generally accepted accounting principles;
(c) Evaluated the effectiveness of the registrant’s disclosure controls and procedures and presented in this report our conclusions about the effectiveness of the disclosure controls and procedures, as of a date within 90 days prior to the filing date of this report based on such evaluation; and
(d) Disclosed in this report any change in the registrant’s internal control over financial reporting that occurred during the second fiscal quarter of the period covered by this report that has materially affected, or is reasonably likely to materially affect, the registrant’s internal control over financial reporting; and
5. The registrant’s other certifying officer(s) and I have disclosed to the registrant’s auditors and the audit committee of the registrant’s board of directors (or persons performing the equivalent functions):
(a) All significant deficiencies and material weaknesses in the design or operation of internal control over financial reporting which are reasonably likely to adversely affect the registrant’s ability to record, process, summarize, and report financial information; and
(b) Any fraud, whether or not material, that involves management or other employees who have a significant role in the registrant’s internal control over financial reporting.
| Date: August 23, 2017 |
| /s/ Joe R. Monk Jr. |
| Joe R. Monk Jr. |
| President |
EX-99.CERT
I, Paul J. Smith, certify that:
1. I have reviewed this report on Form N-CSR of the State Farm Mutual Fund Trust;
2. Based on my knowledge, this report does not contain any untrue statement of a material fact or omit to state a material fact necessary to make the statements made, in light of the circumstances under which such statements were made, not misleading with respect to the period covered by this report;
3. Based on my knowledge, the financial statements, and other financial information included in this report, fairly present in all material respects the financial condition, results of operations, changes in net assets, and cash flows (if the financial statements are required to include a statement of cash flows) of the registrant as of, and for, the periods presented in this report;
4. The registrant’s other certifying officer(s) and I are responsible for establishing and maintaining disclosure controls and procedures (as defined in Rule 30a-3(c) under the Investment Company Act of 1940) and internal control over financial reporting (as defined in Rule 30a-3(d) under the Investment Company Act of 1940) for the registrant and have:
(a) Designed such disclosure controls and procedures, or caused such disclosure controls and procedures to be designed under our supervision, to ensure that material information relating to the registrant, including its consolidated subsidiaries, is made known to us by others within those entities, particularly during the period in which this report is being prepared;
(b) Designed such internal control over financial reporting, or caused such internal control over financial reporting to be designed under our supervision, to provide reasonable assurance regarding the reliability of financial reporting and the preparation of financial statements for external purposes in accordance with generally accepted accounting principles;
(c) Evaluated the effectiveness of the registrant’s disclosure controls and procedures and presented in this report our conclusions about the effectiveness of the disclosure controls and procedures, as of a date within 90 days prior to the filing date of this report based on such evaluation; and
(d) Disclosed in this report any change in the registrant’s internal control over financial reporting that occurred during the second fiscal quarter of the period covered by this report that has materially affected, or is reasonably likely to materially affect, the registrant’s internal control over financial reporting; and
5. The registrant’s other certifying officer(s) and I have disclosed to the registrant’s auditors and the audit committee of the registrant’s board of directors (or persons performing the equivalent functions):
(a) All significant deficiencies and material weaknesses in the design or operation of internal control over financial reporting which are reasonably likely to adversely affect the registrant’s ability to record, process, summarize, and report financial information; and
(b) Any fraud, whether or not material, that involves management or other employees who have a significant role in the registrant’s internal control over financial reporting.
| Date: August 23, 2017 |
| /s/ Paul J. Smith |
| Paul J. Smith |
| Senior Vice President and Treasurer |
EX-99.906CERT
CERTIFICATION
Pursuant to Section 906
of the Sarbanes-Oxley Act of 2002
Pursuant to Section 906 of the Sarbanes-Oxley Act of 2002 (Subsections (a) and (b) of Section 1350, Chapter 63 of Title 18, United States Code), each of the undersigned officers of the State Farm Mutual Fund Trust (the “registrant”), hereby certifies, to such officer’s knowledge, that:
| 1. | The registrant’s report on Form N-CSR filed with the Securities and Exchange Commission for the period ended June 30, 2017 (the “Report”), fully complies with the requirements of Section 13(a) or 15(d), as applicable, of the Securities Exchange Act of 1934; and |
| 2. | The information contained in the Report fairly presents, in all material respects, the financial condition and results of operations of the registrant. |
| Dated: August 23, 2017 |
| /s/ Joe R. Monk Jr. |
| Joe R. Monk Jr. |
| President |
| /s/ Paul J. Smith |
| Paul J. Smith |
| Senior Vice President and Treasurer |
The foregoing certification is not being filed as part of the Report nor as a separate disclosure document.