Exhibit 99.1
Hong Kong Exchanges and Clearing Limited and The Stock Exchange of Hong Kong Limited take no responsibility for the contents of this announcement, make no representation as to its accuracy or completeness and expressly disclaim any liability whatsoever for any loss howsoever arising from or in reliance upon the whole or any part of the contents of this announcement.
2022 ANNUAL RESULTS ANNOUNCEMENT
| § 1 | IMPORTANT MESSAGE |
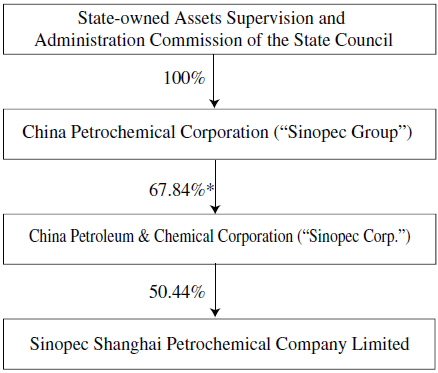
| I. | The Board of Directors and the Supervisory Committee of Sinopec Shanghai Petrochemical Company Limited(the “Company” or “SPC”) as well as its Directors, Supervisors and senior management warrant the truthfulness, accuracy and completeness of the information contained in the 2022 annual results announcement, and warrant that there are no false representations or misleading statements contained in, or material omissions from, the 2022 annual report of the Company, and accept legal responsibility. |
| II. | Director(s) who has/have not attended in person the Board meeting for approving the 2022 Annual Report is/are: |
| Name of Director |
Position |
Reasons for Absence |
Name of Proxy | |||
| Peng Kun | Non-Executive Director | Business Engagement | Wan Tao |
| III. | The financial statements for the year ended 31 December 2022 (the “Reporting Period”), prepared under the People’s Republic of China (“PRC” or “China”)’s Accounting Standards (“CAS”) as well as the International Financial Reporting Standards (“IFRS”), were audited by KPMG Huazhen LLP and KPMG, respectively, and both firms have issued unqualified opinions on the financial statements in their auditors’ reports. |
| IV. | Mr. Wan Tao, Chairman and the responsible person of the Company; Mr. Du Jun, Directors, Vice President and Chief Financial Officer in charge of the accounting work; and Ms. Yang Yating, person in charge of the Accounting Department (Accounting Chief) and General Manager of Finance Department hereby warrant the truthfulness, accuracy and completeness of the financial statements contained in the 2022 annual results announcement. |
- 1 -