4.8 10266 9762 10000 10702 10000 11034 10941 10057 11169 9649.87 11310 10000 10227.76 10454 10766.21 10666 10726.83 10879 11076.68 9950.408197 9730.543526 10110.63421 9944.913655 10140 11040 10304 10382.68826 10884.53729 10969.65578 11321.03429 11489 10200 11053 10190 10084 11337 10700 10602 4.5 10924 43.7 10000 11112 11006 82.7 11196 10476 10962 0.4 3.4 11214 10216 11636 10326 9910.99 10693 10000 7.6 8.2 11282 6.9 1.6 9588.08 10950 10700 2.3 32.4 10180 84.6 8.9 10000 7.8 11331 0.0 1.0 0001388485 false N-1A 0001388485 fvt:BloombergIntermediateUSGovernmentCreditBondIndexMember 2022-09-06 2022-09-06 0001388485 fvt:BloombergUSAggregateBondIndexMember 2022-09-06 2022-09-06 0001388485 fvt:C000237818Member 2022-09-06 2022-09-06 0001388485 fvt:BloombergIntermediateUSGovernmentCreditBondIndexMember 2022-09-06 2025-09-30 0001388485 fvt:BloombergUSAggregateBondIndexMember 2022-09-06 2025-09-30 0001388485 fvt:C000237818Member 2022-09-06 2025-09-30 0001388485 fvt:BloombergIntermediateUSGovernmentCreditBondIndexMember 2022-09-07 2022-09-30 0001388485 fvt:BloombergUSAggregateBondIndexMember 2022-09-07 2022-09-30 0001388485 fvt:C000237818Member 2022-09-07 2022-09-30 0001388485 fvt:BloombergIntermediateUSGovernmentCreditBondIndexMember 2022-09-07 2023-03-31 0001388485 fvt:BloombergUSAggregateBondIndexMember 2022-09-07 2023-03-31 0001388485 fvt:C000237818Member 2022-09-07 2023-03-31 0001388485 fvt:BloombergIntermediateUSGovernmentCreditBondIndexMember 2022-09-07 2023-09-30 0001388485 fvt:BloombergUSAggregateBondIndexMember 2022-09-07 2023-09-30 0001388485 fvt:C000237818Member 2022-09-07 2023-09-30 0001388485 fvt:BloombergIntermediateUSGovernmentCreditBondIndexMember 2022-09-07 2024-03-31 0001388485 fvt:BloombergUSAggregateBondIndexMember 2022-09-07 2024-03-31 0001388485 fvt:C000237818Member 2022-09-07 2024-03-31 0001388485 fvt:BloombergIntermediateUSGovernmentCreditBondIndexMember 2022-09-07 2024-09-30 0001388485 fvt:BloombergUSAggregateBondIndexMember 2022-09-07 2024-09-30 0001388485 fvt:C000237818Member 2022-09-07 2024-09-30 0001388485 fvt:BloombergIntermediateUSGovernmentCreditBondIndexMember 2022-09-07 2025-03-31 0001388485 fvt:BloombergUSAggregateBondIndexMember 2022-09-07 2025-03-31 0001388485 fvt:C000237818Member 2022-09-07 2025-03-31 0001388485 fvt:BloombergIntermediateUSGovernmentCreditBondIndexMember 2022-09-07 2025-09-30 0001388485 fvt:BloombergUSAggregateBondIndexMember 2022-09-07 2025-09-30 0001388485 fvt:C000237818Member 2022-09-07 2025-09-30 0001388485 fvt:BloombergCaliforniaMunicipalInterShort110YearIndexMember 2022-10-03 2022-10-03 0001388485 fvt:BloombergMunicipalBondIndexMember 2022-10-03 2022-10-03 0001388485 fvt:BloombergMunicipalInterShort110YearIndexMember 2022-10-03 2022-10-03 0001388485 fvt:C000237820Member 2022-10-03 2022-10-03 0001388485 fvt:C000237822Member 2022-10-03 2022-10-03 0001388485 fvt:BloombergCaliforniaMunicipalInterShort110YearIndexMember 2022-10-03 2025-09-30 0001388485 fvt:BloombergMunicipalBondIndexMember 2022-10-03 2025-09-30 0001388485 fvt:BloombergMunicipalInterShort110YearIndexMember 2022-10-03 2025-09-30 0001388485 fvt:C000237820Member 2022-10-03 2025-09-30 0001388485 fvt:C000237822Member 2022-10-03 2025-09-30 0001388485 fvt:BloombergCaliforniaMunicipalInterShort110YearIndexMember 2022-10-04 2023-03-31 0001388485 fvt:BloombergMunicipalBondIndexMember 2022-10-04 2023-03-31 0001388485 fvt:BloombergMunicipalInterShort110YearIndexMember 2022-10-04 2023-03-31 0001388485 fvt:C000237820Member 2022-10-04 2023-03-31 0001388485 fvt:C000237822Member 2022-10-04 2023-03-31 0001388485 fvt:BloombergCaliforniaMunicipalInterShort110YearIndexMember 2022-10-04 2024-03-31 0001388485 fvt:BloombergMunicipalBondIndexMember 2022-10-04 2024-03-31 0001388485 fvt:BloombergMunicipalInterShort110YearIndexMember 2022-10-04 2024-03-31 0001388485 fvt:C000237820Member 2022-10-04 2024-03-31 0001388485 fvt:C000237822Member 2022-10-04 2024-03-31 0001388485 fvt:BloombergCaliforniaMunicipalInterShort110YearIndexMember 2022-10-04 2024-09-30 0001388485 fvt:BloombergMunicipalBondIndexMember 2022-10-04 2024-09-30 0001388485 fvt:BloombergMunicipalInterShort110YearIndexMember 2022-10-04 2024-09-30 0001388485 fvt:C000237820Member 2022-10-04 2024-09-30 0001388485 fvt:C000237822Member 2022-10-04 2024-09-30 0001388485 fvt:BloombergCaliforniaMunicipalInterShort110YearIndexMember 2022-10-04 2025-03-31 0001388485 fvt:BloombergMunicipalBondIndexMember 2022-10-04 2025-03-31 0001388485 fvt:BloombergMunicipalInterShort110YearIndexMember 2022-10-04 2025-03-31 0001388485 fvt:C000237820Member 2022-10-04 2025-03-31 0001388485 fvt:C000237822Member 2022-10-04 2025-03-31 0001388485 fvt:BloombergCaliforniaMunicipalInterShort110YearIndexMember 2022-10-04 2025-09-30 0001388485 fvt:BloombergMunicipalBondIndexMember 2022-10-04 2025-09-30 0001388485 fvt:BloombergMunicipalInterShort110YearIndexMember 2022-10-04 2025-09-30 0001388485 fvt:C000237820Member 2022-10-04 2025-09-30 0001388485 fvt:C000237822Member 2022-10-04 2025-09-30 0001388485 2024-10-01 2025-09-30 0001388485 fvt:BloombergCaliforniaMunicipalInterShort110YearIndexMember 2022-10-04 2023-09-30 0001388485 fvt:BloombergMunicipalBondIndexMember 2022-10-04 2023-09-30 0001388485 fvt:BloombergMunicipalInterShort110YearIndexMember 2022-10-04 2023-09-30 0001388485 fvt:C000237820Member 2022-10-04 2023-09-30 0001388485 fvt:C000237822Member 2022-10-04 2023-09-30 0001388485 fvt:BloombergCaliforniaMunicipalInterShort110YearIndexMember 2024-10-01 2025-09-30 0001388485 fvt:BloombergIntermediateUSGovernmentCreditBondIndexMember 2024-10-01 2025-09-30 0001388485 fvt:BloombergMunicipalBondIndexMember 2024-10-01 2025-09-30 0001388485 fvt:BloombergMunicipalInterShort110YearIndexMember 2024-10-01 2025-09-30 0001388485 fvt:BloombergUSAggregateBondIndexMember 2024-10-01 2025-09-30 0001388485 fvt:C000237818Member 2024-10-01 2025-09-30 0001388485 fvt:C000237820Member 2024-10-01 2025-09-30 0001388485 fvt:C000237822Member 2024-10-01 2025-09-30 0001388485 fvt:C000237818Member 2025-09-30 0001388485 fvt:C000237818Member us-gaap:AssetBackedSecuritiesMember 2025-09-30 0001388485 fvt:C000237818Member us-gaap:CorporateBondSecuritiesMember 2025-09-30 0001388485 fvt:C000237818Member fvt:OtherAssetsInExcessOfLiabilitiesMember 2025-09-30 0001388485 fvt:C000237818Member us-gaap:OtherInvestmentsMember 2025-09-30 0001388485 fvt:C000237818Member fvt:PreferredsMember 2025-09-30 0001388485 fvt:C000237818Member fvt:USTreasuryObligationsMember 2025-09-30 0001388485 fvt:C000237820Member 2025-09-30 0001388485 fvt:C000237820Member fvt:LiabilitiesInExcessOfOtherAssetsMember 2025-09-30 0001388485 fvt:C000237820Member us-gaap:MunicipalBondsMember 2025-09-30 0001388485 fvt:C000237820Member us-gaap:OtherInvestmentsMember 2025-09-30 0001388485 fvt:C000237820Member fvt:PreferredsMember 2025-09-30 0001388485 fvt:C000237820Member fvt:USTreasuryObligationsMember 2025-09-30 0001388485 fvt:C000237822Member 2025-09-30 0001388485 fvt:C000237822Member us-gaap:AssetBackedSecuritiesMember 2025-09-30 0001388485 fvt:C000237822Member us-gaap:CorporateBondSecuritiesMember 2025-09-30 0001388485 fvt:C000237822Member fvt:LiabilitiesInExcessOfOtherAssetsMember 2025-09-30 0001388485 fvt:C000237822Member us-gaap:MunicipalBondsMember 2025-09-30 0001388485 fvt:C000237822Member us-gaap:OtherInvestmentsMember 2025-09-30 0001388485 fvt:C000237822Member fvt:PreferredsMember 2025-09-30 iso4217:USDiso4217:USDxbrli:sharesxbrli:purexbrli:sharesutr:Dfvt:Holding
UNITED STATES
SECURITIES AND EXCHANGE COMMISSION
Washington, D.C. 20549
FORM N-CSR
CERTIFIED SHAREHOLDER REPORT OF REGISTERED MANAGEMENT INVESTMENT COMPANIES
Investment Company Act file number
(Exact name of registrant as specified in charter)
103 Bellevue Parkway
Wilmington, DE 19809
(Address of principal executive offices) (ZIP code)
Joel L. Weiss
FundVantage Trust
1636 N. Cedar Crest Blvd.
Suite #161
Allentown, PA 18104
(Name and address of agent for service)
Registrant's telephone number, including area code:
Date of reporting period:
Item 1. Report to Stockholders.
(a) The registrant’s annual report transmitted to shareholders pursuant to Rule 30e-1 under the Investment Company Act of 1940 is as follows:
Ambrus Core Bond Fund
Institutional Class | TTRBX
Annual Shareholder Report — September 30, 2025
This annual shareholder report contains important information about the Ambrus Core Bond Fund (the “Fund”) for the period of October 1, 2024 to September 30, 2025. You can find additional information about the Fund at https://www.ambrusfunds.com/ambrus‑core‑bond‑fund/. You can also request this information by contacting us at (833) 996‑2101.
What were the Fund costs for the last year?
(Based on a hypothetical $10,000 investment)
| Fund (Class) |
Costs of a $10,000 investment |
Costs paid as a percentage
of a $10,000 investment |
Ambrus Core Bond Fund
(Institutional Class / TTRBX) |
$51 |
0.50% |
Management's Discussion of Fund Performance
Summary of Results
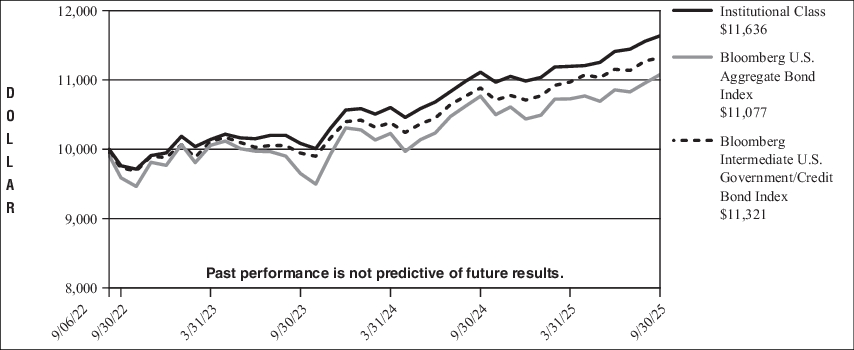
Over the trailing one-year, the Ambrus Core Bond Fund returned 4.71% versus its index, the Bloomberg Intermediate Government/Credit Bond Index, which returned 4.01%, for outperformance of 0.70%. Outperformance was driven by positive attribution effects across asset allocation and security selection, with yield curve positioning detracting from performance.
Top Contributors to Performance
-
An overweight to corporate credit contributed positively to performance, as investment-grade credit spreads compressed from +129 basis points to +114 basis points over the reporting period
-
The Fund benefited from active management between asset classes, as the Fund’s exposure to corporates and preferreds increased from a low of 43.5% in February 2025 to a high of 60.9% in June 2025 to take advantage of the distress in credit markets
-
Security selection within corporate bonds contributed positively to performance, as the corporate bonds held by the Fund outperformed those held by the benchmark
Top Detractors to Performance
-
Yield curve positioning detracted from performance, as the Fund was underweight (relative to the benchmark) shorter maturity government bonds and overweight longer maturity government bonds
-
During the reporting period, shorter maturity government bond yields declined, while longer maturity government bond yields increased
Fund Performance
The following is a comparison of the change in value of a $10,000 investment in Ambrus Core Bond Fund’s Institutional Class vs. the Bloomberg U.S. Aggregate Bond Index and the Bloomberg Intermediate U.S. Government/Credit Bond Index.
Growth of $10,000
For the period September 6, 2022* through September 30, 2025
| Average Annual Total Returns |
1 Year |
Since inception |
| Institutional Class |
4.71% |
5.05%* |
| Bloomberg U.S. Aggregate Bond Index |
2.88% |
3.38%** |
| Bloomberg Intermediate U.S. Government/Credit Bond Index |
4.01% |
4.11%** |
| * |
The Ambrus Core Bond Fund commenced operations on September 6, 2022. |
| ** |
Benchmark performance is from the commencement date of the Fund Class only and is not the commencement date of the benchmark itself. |
All returns represent past performance which is no guarantee of future results. Current performance may be higher or lower than the performance shown. The investment return and principal value of an investment will fluctuate so that an investor’s shares, when redeemed, may be worth more or less than their original cost. The above table and graph do not reflect the deduction of taxes that a shareholder would pay on fund distributions or the redemption of shares. Please visit https://www.ambrusfunds.com/ambrus‑core‑bond‑fund/ for performance data current to the most recent month-end.
Key Fund Statistics
The following table outlines key Fund statistics that you should pay attention to.
| Fund net assets |
$494,711,448 |
| Total number of portfolio holdings |
162 |
| Total advisory fee paid, net |
$1,800,365 |
| Portfolio turnover rate as of the end of the reporting period |
71% |
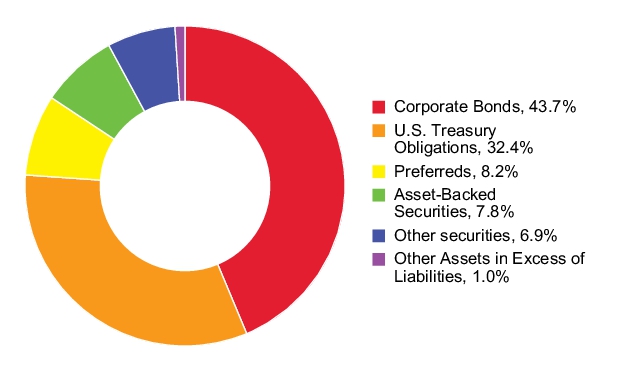
Portfolio Holdings Summary Table (as of September 30, 2025)
The following table presents a summary of the portfolio composition of the Fund, as a percentage of net assets:
Material Fund changes during the period
There were no material changes to the Fund.
Changes in and Disagreements with Accountants
There were no disagreements with accountants.
Availability of Additional Information
You can find additional information about the Fund, including the Fund’s prospectus, financial information, holdings and proxy voting information, at https://www.ambrusfunds.com/ambrus-core-bond-fund/.
Householding
To reduce Fund expenses, only one copy of most shareholder documents may be mailed to shareholders with multiple accounts at the same residential address. Unless we are notified otherwise, we may continue to send only one copy of these materials for as long as they remain a shareholder of the Fund. If you would like to receive individual mailings, please contact the Fund at (833) 996-2101, or contact your financial intermediary. Your instructions will typically be effective within 30 days of receipt by the Fund or your financial intermediary.
Ambrus Core Bond Fund Institutional Class (TTRBX)
Annual Shareholder Report — September 30, 2025
TTRBX-09/25-AR
Ambrus Tax-Conscious
California Bond Fund
Institutional Class | TCCBX
Annual Shareholder Report — September 30, 2025
This annual shareholder report contains important information about the Ambrus Tax-Conscious California Bond Fund (the “Fund”) for the period of October 1, 2024 to September 30, 2025. You can find additional information about the Fund at https://www.ambrusfunds.com/ambrus‑tax‑conscious‑california‑bond‑fund/. You can also request this information by contacting us at (833) 996‑2101.
What were the Fund costs for the last year?
(Based on a hypothetical $10,000 investment)
| Fund (Class) |
Costs of a $10,000 investment |
Costs paid as a percentage
of a $10,000 investment |
Ambrus Tax-Conscious California Bond Fund
(Institutional Class / TCCBX) |
$50 |
0.50% |
Management's Discussion of Fund Performance
Summary of Results
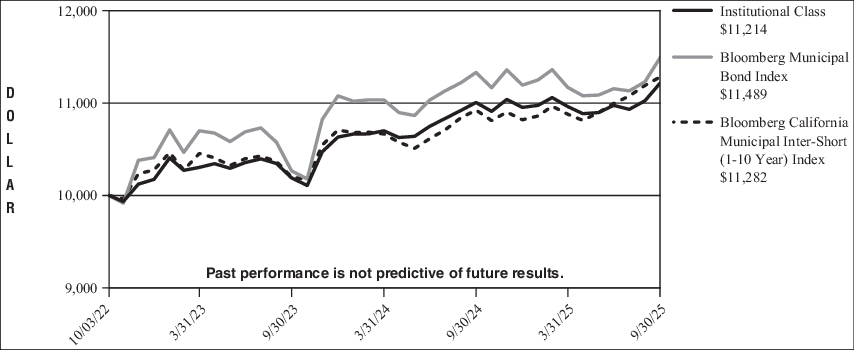
Over the trailing one-year, the Ambrus Tax-Conscious California Bond Fund returned 1.88% versus its index, the Bloomberg California Municipal Inter-Short (1-10 Year) Bond Index, which returned 3.28%, for underperformance of -1.40%. Underperformance was primarily driven by negative attribution effects from yield curve positioning and an overweight to callable bonds.
Top Contributors to Performance
Top Detractors to Performance
-
Yield curve positioning detracted from performance, as the Fund was overweight longer duration municipal bonds, (specifically within the 15-25 year maturity range) which underperformed shorter duration municipal bonds
-
Over the reporting period, the AAA-rated 1-year municipal bond yields decreased by 21 basis points, while AAA-rated 20-year municipal bond yields rose by 75 basis points
-
An overweight to callable bonds (relative to the index) also detracted from performance, as callable bonds underperformed bonds without call structures (“bullet” bonds) due to elevated interest rate volatility
Fund Performance
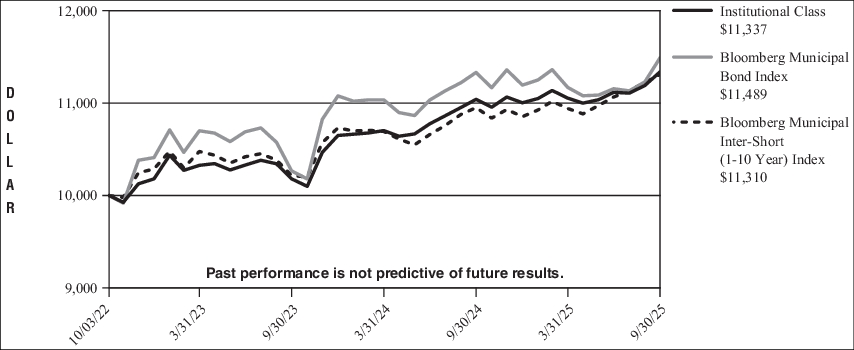
The following is a comparison of the change in value of a $10,000 investment in Ambrus Tax-Conscious California Bond Fund’s Institutional Class vs. the Bloomberg Municipal Bond Index and the Bloomberg California Municipal Inter-Short (1-10 Year) Index.
Growth of $10,000
For the period October 3, 2022* through September 30, 2025
| Average Annual Total Returns |
1 Year |
Since inception |
| Institutional Class |
1.88% |
3.89%* |
| Bloomberg Municipal Bond Index |
1.39% |
4.74%** |
| Bloomberg California Municipal Inter-Short (1-10 Year) Index |
3.28% |
4.10%** |
| * |
The Ambrus Tax-Conscious California Bond Fund commenced operations on October 3, 2022. |
| ** |
Benchmark performance is from the commencement date of the Fund Class only and is not the commencement date of the benchmark itself. |
All returns represent past performance which is no guarantee of future results. Current performance may be higher or lower than the performance shown. The investment return and principal value of an investment will fluctuate so that an investor’s shares, when redeemed, may be worth more or less than their original cost. The above table and graph do not reflect the deduction of taxes that a shareholder would pay on fund distributions or the redemption of shares. Please visit https://www.ambrusfunds.com/ambrus‑tax‑conscious‑california‑bond‑fund/ for performance data current to the most recent month-end.
Key Fund Statistics
The following table outlines key Fund statistics that you should pay attention to.
| Fund net assets |
$431,587,684 |
| Total number of portfolio holdings |
308 |
| Total advisory fee paid, net |
$1,449,985 |
| Portfolio turnover rate as of the end of the reporting period |
26% |
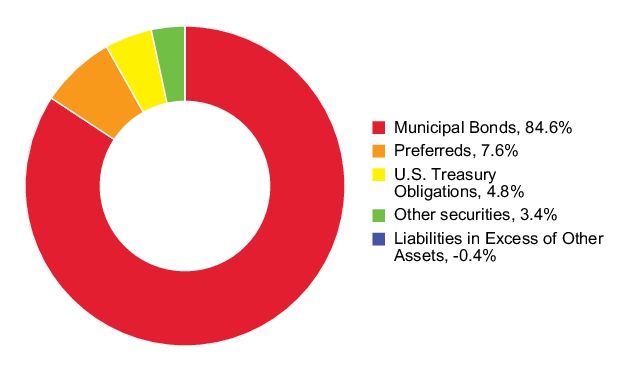
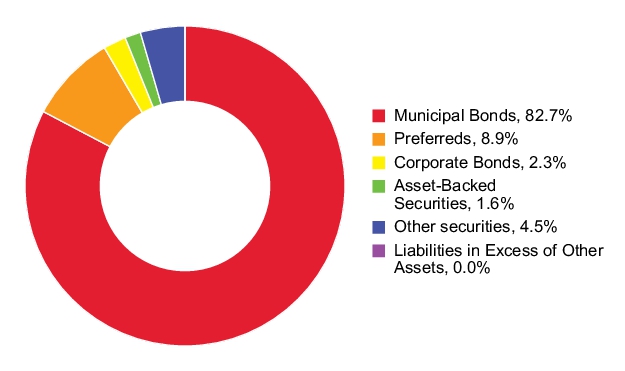
Portfolio Holdings Summary Table (as of September 30, 2025)
The following table presents a summary of the portfolio composition of the Fund, as a percentage of net assets:
Material Fund changes during the period
There were no material changes to the Fund.
Changes in and Disagreements with Accountants
There were no disagreements with accountants.
Availability of Additional Information
You can find additional information about the Fund, including the Fund’s prospectus, financial information, holdings and proxy voting information, at https://www.ambrusfunds.com/ambrus-tax-conscious-california-bond-fund/.
Householding
To reduce Fund expenses, only one copy of most shareholder documents may be mailed to shareholders with multiple accounts at the same residential address. Unless we are notified otherwise, we may continue to send only one copy of these materials for as long as they remain a shareholder of the Fund. If you would like to receive individual mailings, please contact the Fund at (833) 996-2101, or contact your financial intermediary. Your instructions will typically be effective within 30 days of receipt by the Fund or your financial intermediary.
Ambrus Tax-Conscious California Bond Fund Institutional Class (TCCBX)
Annual Shareholder Report — September 30, 2025
TCCBX-09/25-AR
Ambrus Tax-Conscious
National Bond Fund
Institutional Class | TCNBX
Annual Shareholder Report — September 30, 2025
This annual shareholder report contains important information about the Ambrus Tax-Conscious National Bond Fund (the “Fund”) for the period of October 1, 2024 to September 30, 2025. You can find additional information about the Fund at https://www.ambrusfunds.com/ambrus‑tax‑conscious‑national‑bond‑fund/. You can also request this information by contacting us at (833) 996‑2101.
What were the Fund costs for the last year?
(Based on a hypothetical $10,000 investment)
| Fund (Class) |
Costs of a $10,000 investment |
Costs paid as a percentage
of a $10,000 investment |
Ambrus Tax-Conscious National Bond Fund
(Institutional Class / TCNBX) |
$51 |
0.50% |
Management's Discussion of Fund Performance
Summary of Results
Over the trailing one-year, the Ambrus Tax-Conscious National Bond Fund returned 2.70% versus its index, the Bloomberg Municipal Inter-Short (1-10 Year) Bond Index, which returned 3.29%, for an underperformance of -0.59%.
Top Contributors to Performance
Top Detractors to Performance
-
Yield curve positioning detracted from performance, as the Fund was overweight longer duration municipal bonds, (specifically within the 15-25 year maturity range) which underperformed shorter duration municipal bonds
-
Over the reporting period, the AAA-rated 1-year municipal bond yields decreased by 21 basis points, while AAA-rated 20-year municipal bond yields rose by 75 basis points
-
An overweight to callable bonds (relative to the index) also detracted from performance, as callable bonds underperformed bonds without call structures (“bullet” bonds) due to elevated interest rate volatility
Fund Performance
The following is a comparison of the change in value of a $10,000 investment in Ambrus Tax-Conscious National Bond Fund’s Institutional Class vs. the Bloomberg Municipal Bond Index and the Bloomberg Municipal Inter-Short (1-10 Year) Index.
Growth of $10,000
For the period October 3, 2022* through September 30, 2025
| Average Annual Total Returns |
1 Year |
Since inception |
| Institutional Class |
2.70% |
4.27%* |
| Bloomberg Municipal Bond Index |
1.39% |
4.74%** |
| Bloomberg Municipal Inter-Short (1-10 Year) Index |
3.29% |
4.19%** |
| * |
The Ambrus Tax-Conscious National Bond Fund commenced operations on October 3, 2022. |
| ** |
Benchmark performance is from the commencement date of the Fund Class only and is not the commencement date of the benchmark itself. |
All returns represent past performance which is no guarantee of future results. Current performance may be higher or lower than the performance shown. The investment return and principal value of an investment will fluctuate so that an investor’s shares, when redeemed, may be worth more or less than their original cost. The above table and graph do not reflect the deduction of taxes that a shareholder would pay on fund distributions or the redemption of shares. Please visit https://www.ambrusfunds.com/ambrus‑tax‑conscious‑national‑bond‑fund/ for performance data current to the most recent month-end.
Key Fund Statistics
The following table outlines key Fund statistics that you should pay attention to.
| Fund net assets |
$404,045,744 |
| Total number of portfolio holdings |
329 |
| Total advisory fee paid, net |
$1,349,263 |
| Portfolio turnover rate as of the end of the reporting period |
26% |
Portfolio Holdings Summary Table (as of September 30, 2025)
The following table presents a summary of the portfolio composition of the Fund, as a percentage of net assets:
Material Fund changes during the period
There were no material changes to the Fund.
Changes in and Disagreements with Accountants
There were no disagreements with accountants.
Availability of Additional Information
You can find additional information about the Fund, including the Fund’s prospectus, financial information, holdings and proxy voting information, at https://www.ambrusfunds.com/ambrus-tax-conscious-national-bond-fund/.
Householding
To reduce Fund expenses, only one copy of most shareholder documents may be mailed to shareholders with multiple accounts at the same residential address. Unless we are notified otherwise, we may continue to send only one copy of these materials for as long as they remain a shareholder of the Fund. If you would like to receive individual mailings, please contact the Fund at (833) 996-2101, or contact your financial intermediary. Your instructions will typically be effective within 30 days of receipt by the Fund or your financial intermediary.
Ambrus Tax-Conscious National Bond Fund Institutional Class (TCNBX)
Annual Shareholder Report — September 30, 2025
TCNBX-09/25-AR
Item 2. Code of Ethics.
| |
(a) |
The registrant, as of the end of the period covered by this report, has adopted a code of ethics that applies to the Registrant’s principal executive officer, principal financial officer, principal accounting officer or controller, or persons performing similar functions, regardless of whether these individuals are employed by the registrant or a third party (the “Code of Ethics”). |
| |
(c) |
There have been no amendments, during the period covered by this report, to a provision of the code of ethics that applies to the Registrant’s principal executive officer, principal financial officer, principal accounting officer or controller, or persons performing similar functions, regardless of whether these individuals are employed by the Registrant or a third party, and that relates to any element of the code of ethics description. |
| |
(d) |
The registrant has not granted any waivers, including an implicit waiver, from a provision of the code of ethics that applies to the registrant’s principal executive officer, principal financial officer, principal accounting officer or controller, or persons performing similar functions, regardless of whether these individuals are employed by the registrant or a third party, that relates to one or more of the items set forth in paragraph (b) of this item’s instructions. |
| |
(f) |
A copy of the Code of Ethics is filed as an Exhibit. |
Item 3. Audit Committee Financial Expert.
The Audit Committee of the Board of Trustees currently is comprised of Robert J. Christian, Iqbal Mansur, Nicholas M. Marsini, Jr., Nancy B. Wolcott and Stephen M. Wynne, each of whom is considered “independent” within the meaning set forth under Item 3 of Form N-CSR. As of the end of the period covered by the report, the Registrant’s Board of Trustees has determined that Mr. Wynne is an “audit committee financial expert” as such term is defined by Item 3 of Form N-CSR.
The Registrant’s Board of Trustees has determined that Mr. Wynne acquired the attributes necessary to be considered an audit committee financial expert through his experience as a chief executive officer (and other senior-level accounting and/or financial positions) of several large financial institutions and because he has co-authored a text book on mutual fund accounting.
Item 4. Principal Accountant Fees and Services.
Audit Fees
| |
(a) |
The aggregate fees billed for each of the last two fiscal years for professional services rendered by the principal accountant for the audit of the registrant’s annual financial statements or services that are normally provided by the accountant in connection with statutory and regulatory filings or |
| |
engagements for those fiscal years were $85,000 for the fiscal year ending September 30, 2025 and $99,545 for the fiscal year ending September 30, 2024. |
Audit-Related Fees
| |
(b) |
The aggregate fees billed in each of the last two fiscal years for assurance and related services by the principal accountant that are reasonably related to the performance of the audit of the registrant’s financial statements and are not reported under paragraph (a) of this Item are $0 for the fiscal year ending September 30, 2025 and $0 for the fiscal year ending September 30, 2024. |
Tax Fees
| |
(c) |
The aggregate fees billed in each of the last two fiscal years for professional services rendered by the principal accountant for tax compliance, tax advice, and tax planning were $0 for the fiscal year ending September 30, 2025 and $0 for the fiscal year ending September 30, 2024. |
All Other Fees
| |
(d) |
The aggregate fees billed in each of the last two fiscal years for products and services provided by the principal accountant, other than the services reported in paragraphs (a) through (c) of this Item are $0 for the fiscal year ending September 30, 2025 and $0 for the fiscal year ending September 30, 2024. |
| |
(e)(1) |
Disclose the audit committee’s pre-approval policies and procedures described in paragraph (c)(7) of Rule 2-01 of Regulation S-X. |
The Registrant’s Audit Committee Charter requires the Audit Committee to (i) (a) approve prior to appointment the engagement of independent registered public accounting firm to annually audit and provide their opinion on the Registrant’s financial statements, (b) recommend to the Independent Trustees the selection, retention or termination of the Registrant’s independent registered public accounting firm and, (c) in connection therewith, to review and evaluate matters potentially affecting the independence and capabilities of the independent registered public accounting firm; and (ii) to approve prior to appointment the engagement of the independent registered public accounting firm to provide other audit services to the Registrant, or to provide non-audit services to the Registrant, its series, an investment adviser to its series or any entity controlling, controlled by, or under common control with an investment adviser to its series (“adviser-affiliate”) that provides ongoing services to the Registrant if the engagement relates directly to the operations and financial reporting of the Registrant. The Audit Committee will not approve non-audit services that the Audit Committee believes may impair the independence of the Registrant’s independent registered public accountant. The Audit Committee may delegate, to the extent permitted by law, pre-approved responsibilities to one or more members of the Audit Committee who shall report to the full Audit Committee.
| |
(e)(2) |
The percentage of services described in each of paragraphs (b) through (d) of this Item that were approved by the audit committee pursuant to paragraph (c)(7)(i)(C) of Rule 2-01 of Regulation S-X are as follows: |
(b) 0%
(c) 0%
(d) Not applicable
| |
(g) |
The aggregate non-audit fees billed by the registrant’s accountant for services rendered to the registrant, and rendered to the registrant’s investment adviser (not including any sub-adviser whose role is primarily portfolio management and is subcontracted with or overseen by another investment adviser), and any entity controlling, controlled by, or under common control with the adviser that provides ongoing services to the registrant for each of the last two fiscal years of the registrant were $0 for the fiscal year ending September 30, 2025 and $0 for the fiscal year ending September 30, 2024. |
Item 5. Audit Committee of Listed Registrants.
Item 6. Investments.
| |
(a) |
The Registrant’s “Schedule I – Investments in securities of unaffiliated issuers” as of the close of the reporting period is included as part of the Annual Financials and Additional Information filed under Item 7 of this form. |
Item 7. Financial Statements and Financial Highlights for Open-End Management Investment Companies.
| Ambrus Core Bond Fund |
| Ambrus Tax-Conscious California Bond Fund |
| Ambrus Tax-Conscious National Bond Fund |
of
FundVantage Trust
Annual Financials and Additional Information
September 30, 2025
This report is submitted for the general information of shareholders and is not authorized for distribution to prospective investors unless preceded or accompanied by a current prospectus.
AMBRUS CORE BOND FUND
Portfolio of Investments
September 30, 2025
| |
Par
Value |
|
Value |
| CORPORATE BONDS — 43.7% |
| Communications — 0.5% |
| AT&T, Inc., 7.125%, 12/15/31 |
$ 500,000 |
|
$ 560,513 |
| Warnermedia Holdings, Inc., 4.279%, 3/15/32 |
2,033,000 |
|
1,865,278 |
| |
|
|
2,425,791 |
| Consumer Discretionary — 7.5% |
| BorgWarner, Inc., 4.95%, 8/15/29 |
1,000,000 |
|
1,021,551 |
| Brunswick Corp., 2.40%, 8/18/31 |
3,000,000 |
|
2,609,765 |
| Darden Restaurants, Inc., 6.30%, 10/10/33 |
1,925,000 |
|
2,085,940 |
| Ford Motor Credit Co., LLC, 4.271%, 1/9/27 |
1,500,000 |
|
1,488,416 |
| General Motors Financial Co., Inc., 5.634% (SOFR + 1.29%), 1/7/30(a) |
1,500,000 |
|
1,494,955 |
| Genuine Parts Co., 4.95%, 8/15/29 |
500,000 |
|
509,110 |
| Genuine Parts Co., 1.875%, 11/1/30 |
500,000 |
|
439,906 |
| Hasbro, Inc., 6.05%, 5/14/34 |
2,000,000 |
|
2,093,560 |
| Hyatt Hotels Corp., 5.75%, 3/30/32 |
2,825,000 |
|
2,948,086 |
| Hyundai Capital America, 5.40%, 1/8/31 |
1,000,000 |
|
1,031,808 |
| Hyundai Capital America, 4.75%, 9/26/31 |
2,000,000 |
|
2,005,401 |
| Leggett & Platt, Inc., 4.40%, 3/15/29 |
3,500,000 |
|
3,448,149 |
| Lennar Corp., 5.20%, 7/30/30 |
500,000 |
|
515,360 |
| LKQ Corp., 6.25%, 6/15/33 |
1,000,000 |
|
1,067,735 |
| Masco Corp., 3.50%, 11/15/27 |
1,000,000 |
|
986,315 |
| Nissan Motor Acceptance Co., LLC, 7.05%, 9/15/28 |
1,000,000 |
|
1,040,569 |
| Polaris, Inc., 6.95%, 3/15/29 |
1,000,000 |
|
1,062,057 |
| PVH Corp., 5.50%, 6/13/30 |
2,175,000 |
|
2,217,249 |
| Stellantis Finance US, Inc., 5.625%, 1/12/28 |
1,000,000 |
|
1,018,065 |
| Tapestry, Inc., 3.05%, 3/15/32 |
2,150,000 |
|
1,953,162 |
| VF Corp., 6.00%, 10/15/33 |
2,500,000 |
|
2,403,695 |
| Whirlpool Corp., 5.75%, 3/1/34 |
4,000,000 |
|
3,869,762 |
| |
|
|
37,310,616 |
| Consumer Staple Products — 0.9% |
| Altria Group, Inc., 6.875%, 11/1/33 |
1,000,000 |
|
1,130,808 |
| J M Smucker Co. (The), 6.20%, 11/15/33 |
650,000 |
|
706,952 |
| Kroger Co. (The), 7.70%, 6/1/29 |
2,064,000 |
|
2,299,841 |
| Tyson Foods, Inc., 5.70%, 3/15/34 |
500,000 |
|
527,066 |
| |
|
|
4,664,667 |
| Energy — 2.7% |
| Cheniere Energy Partners LP, 5.95%, 6/30/33 |
1,000,000 |
|
1,059,123 |
| |
Par
Value |
|
Value |
| CORPORATE BONDS — (Continued) |
| Energy — (Continued) |
| Devon Energy Corp., 5.20%, 9/15/34 |
$1,500,000 |
|
$ 1,494,458 |
| Helmerich & Payne, Inc., 2.90%, 9/29/31 |
4,500,000 |
|
3,978,907 |
| Kinder Morgan, Inc., 7.80%, 8/1/31 |
1,500,000 |
|
1,741,614 |
| Phillips 66 Co., 5.25%, 6/15/31 |
1,000,000 |
|
1,038,132 |
| Tosco Corp., 7.80%, 1/1/27 |
500,000 |
|
520,715 |
| Valero Energy Corp., 6.625%, 6/15/37 |
3,000,000 |
|
3,328,095 |
| |
|
|
13,161,044 |
| Financials — 12.1% |
| American Financial Group, Inc., 5.00%, 9/23/35 |
1,525,000 |
|
1,494,957 |
| AmSouth Bancorp, 6.75%, 11/1/25 |
600,000 |
|
600,716 |
| Bank of America Corp., 5.518%, 10/25/35 |
5,000,000 |
|
5,122,360 |
| Bank of New York Mellon Corp. (The), 4.543%, 2/1/29 |
2,000,000 |
|
2,022,984 |
| Bank of New York Mellon Corp. (The), 5.606%, 7/21/39 |
1,500,000 |
|
1,565,095 |
| Broadridge Financial Solutions, Inc., 2.90%, 12/1/29 |
1,300,000 |
|
1,228,593 |
| Capital One Financial Corp., 2.359%, 7/29/32 |
2,000,000 |
|
1,727,425 |
| Capital One Financial Corp., 7.964%, 11/2/34 |
2,000,000 |
|
2,366,254 |
| Carlyle Secured Lending, Inc., 6.75%, 2/18/30 |
2,000,000 |
|
2,081,618 |
| Citadel LP, 6.00%, 1/23/30 |
1,000,000 |
|
1,039,973 |
| Citibank NA, 5.57%, 4/30/34 |
2,000,000 |
|
2,122,174 |
| Equitable Holdings, Inc., 5.594%, 1/11/33 |
1,000,000 |
|
1,052,787 |
| First National of Nebraska, Inc., 7.25%, 6/15/35(b) |
1,000,000 |
|
1,037,752 |
| Fiserv, Inc., 5.45%, 3/15/34 |
500,000 |
|
517,079 |
| FS KKR Capital Corp., 6.125%, 1/15/30 |
3,000,000 |
|
2,988,445 |
| Goldman Sachs Group, Inc. (The), 1.948%, 10/21/27 |
1,300,000 |
|
1,269,682 |
| Goldman Sachs Group, Inc. (The), 6.026% (SOFR + 1.85%), 3/15/28(a) |
500,000 |
|
508,773 |
| Goldman Sachs Group, Inc. (The), 4.482%, 8/23/28 |
1,000,000 |
|
1,006,649 |
| Goldman Sachs Group, Inc. (The), 6.75%, 10/1/37 |
4,000,000 |
|
4,483,344 |
The accompanying notes are an integral part of the financial statements.
AMBRUS CORE BOND FUND
Portfolio of Investments (Continued)
September 30, 2025
| |
Par
Value |
|
Value |
| CORPORATE BONDS — (Continued) |
| Financials — (Continued) |
| Jefferies Financial Group, Inc., 2.625%, 10/15/31 |
$1,000,000 |
|
$ 890,245 |
| JPMorgan Chase & Co., 5.413% (SOFR + 1.18%), 2/24/28(a) |
500,000 |
|
504,837 |
| LPL Holdings, Inc., 6.00%, 5/20/34 |
3,000,000 |
|
3,137,492 |
| Morgan Stanley, 4.35%, 9/8/26 |
800,000 |
|
802,364 |
| Northern Trust Corp., 3.375%, 5/8/32 |
919,000 |
|
900,090 |
| PNC Bank NA, 4.20%, 11/1/25 |
1,000,000 |
|
999,554 |
| Prudential Financial, Inc., 6.50%, 3/15/54 |
4,150,000 |
|
4,446,746 |
| Synchrony Financial, 3.70%, 8/4/26 |
1,050,000 |
|
1,043,540 |
| Synchrony Financial, 2.875%, 10/28/31 |
3,325,000 |
|
2,946,657 |
| Toronto-Dominion Bank (The), 6.35%, 10/31/85 |
500,000 |
|
501,232 |
| US Bancorp, 4.653%, 2/1/29 |
1,000,000 |
|
1,011,282 |
| Verisk Analytics, Inc., 4.50%, 8/15/30 |
1,675,000 |
|
1,681,080 |
| Wells Fargo & Co., 3.584%, 5/22/28 |
300,000 |
|
297,399 |
| Wells Fargo Bank NA, 6.50%, 12/1/28 |
1,000,000 |
|
1,062,491 |
| Western Alliance Bancorp, 3.00%, 6/15/31 |
1,405,000 |
|
1,366,222 |
| Zions Bancorp NA, 3.25%, 10/29/29 |
1,815,000 |
|
1,705,399 |
| Zions Bancorp NA, 6.816%, 11/19/35 |
2,000,000 |
|
2,127,036 |
| |
|
|
59,660,326 |
| Health Care — 2.7% |
| DENTSPLY SIRONA, Inc., 3.25%, 6/1/30 |
4,000,000 |
|
3,681,902 |
| GE HealthCare Technologies, Inc., 4.80%, 1/15/31 |
500,000 |
|
508,503 |
| HCA, Inc., 5.45%, 4/1/31 |
1,000,000 |
|
1,040,134 |
| Humana, Inc., 5.55%, 5/1/35 |
2,000,000 |
|
2,038,856 |
| Pfizer Investment Enterprises Pte Ltd., 4.75%, 5/19/33 |
1,000,000 |
|
1,010,499 |
| UnitedHealth Group, Inc., 6.50%, 6/15/37 |
2,000,000 |
|
2,240,171 |
| UnitedHealth Group, Inc., 3.50%, 8/15/39 |
2,000,000 |
|
1,669,351 |
| Viatris, Inc., 2.30%, 6/22/27 |
1,000,000 |
|
962,864 |
| |
|
|
13,152,280 |
| Industrials — 5.4% |
| Boeing Co. (The), 3.25%, 2/1/35 |
6,000,000 |
|
5,210,139 |
| |
Par
Value |
|
Value |
| CORPORATE BONDS — (Continued) |
| Industrials — (Continued) |
| Honeywell International, Inc., 1.75%, 9/1/31 |
$ 450,000 |
|
$ 390,094 |
| IDEX Corp., 4.95%, 9/1/29 |
500,000 |
|
511,390 |
| J Paul Getty Trust (The), 4.905%, 4/1/35 |
4,000,000 |
|
4,104,911 |
| Jacobs Engineering Group, Inc., 5.90%, 3/1/33 |
1,075,000 |
|
1,137,493 |
| Northrop Grumman Systems Corp., 7.75%, 2/15/31 |
2,000,000 |
|
2,318,581 |
| Paychex, Inc., 5.35%, 4/15/32 |
2,050,000 |
|
2,128,070 |
| RTX Corp., 2.375%, 3/15/32 |
1,500,000 |
|
1,326,038 |
| Ryder System, Inc., 1.75%, 9/1/26 |
1,000,000 |
|
979,249 |
| Ryder System, Inc., 5.375%, 3/15/29 |
500,000 |
|
518,326 |
| Stanley Black & Decker, Inc., 2.30%, 3/15/30 |
4,981,000 |
|
4,537,719 |
| Trimble, Inc., 6.10%, 3/15/33 |
1,500,000 |
|
1,615,840 |
| United Airlines Pass Through Trust, 5.875%, 10/15/27 |
737,554 |
|
758,805 |
| Westinghouse Air Brake Technologies Corp., 5.611%, 3/11/34 |
1,000,000 |
|
1,051,911 |
| |
|
|
26,588,566 |
| Materials — 1.8% |
| Albemarle Corp., 5.05%, 6/1/32 |
3,349,000 |
|
3,309,887 |
| Huntsman International, LLC, 2.95%, 6/15/31 |
5,575,000 |
|
4,706,173 |
| Mosaic Global Holdings, Inc., 7.30%, 1/15/28 |
1,000,000 |
|
1,061,448 |
| |
|
|
9,077,508 |
| Real Estate — 1.7% |
| Americold Realty Operating Partnership LP, REIT, 5.60%, 5/15/32 |
1,000,000 |
|
1,013,086 |
| Hudson Pacific Properties LP, REIT, 4.65%, 4/1/29 |
1,000,000 |
|
931,469 |
| Invitation Homes Operating Partnership LP, REIT, 5.45%, 8/15/30 |
1,000,000 |
|
1,041,132 |
| Jones Lang LaSalle, Inc., REIT, 6.875%, 12/1/28 |
825,000 |
|
886,290 |
| Kilroy Realty LP, REIT, 2.50%, 11/15/32 |
3,700,000 |
|
3,078,299 |
| Vornado Realty LP, REIT, 3.40%, 6/1/31 |
1,500,000 |
|
1,348,264 |
| |
|
|
8,298,540 |
The accompanying notes are an integral part of the financial statements.
AMBRUS CORE BOND FUND
Portfolio of Investments (Continued)
September 30, 2025
| |
Par
Value |
|
Value |
| CORPORATE BONDS — (Continued) |
| Technology — 5.3% |
| Arrow Electronics, Inc., 5.875%, 4/10/34 |
$2,000,000 |
|
$ 2,097,452 |
| Booz Allen Hamilton, Inc., 5.95%, 8/4/33 |
5,175,000 |
|
5,437,415 |
| Concentrix Corp., 6.85%, 8/2/33 |
3,039,000 |
|
3,151,251 |
| Fortinet, Inc., 2.20%, 3/15/31 |
1,000,000 |
|
891,416 |
| Foundry JV Holdco, LLC, 6.30%, 1/25/39(b) |
6,000,000 |
|
6,461,005 |
| Intel Corp., 3.90%, 3/25/30 |
2,000,000 |
|
1,963,001 |
| Kyndryl Holdings, Inc., 6.35%, 2/20/34 |
1,500,000 |
|
1,604,013 |
| Leidos, Inc., 7.125%, 7/1/32 |
2,400,000 |
|
2,690,586 |
| Motorola Solutions, Inc., 2.30%, 11/15/30 |
1,500,000 |
|
1,355,829 |
| Teledyne Technologies, Inc., 2.75%, 4/1/31 |
750,000 |
|
689,456 |
| |
|
|
26,341,424 |
| Utilities — 3.1% |
| AES Corp. (The), 5.80%, 3/15/32 |
3,275,000 |
|
3,392,625 |
| AES Corp. (The), 6.95%, 7/15/55 |
2,000,000 |
|
1,965,638 |
| Dominion Energy, Inc., 6.625%, 5/15/55 |
3,575,000 |
|
3,712,455 |
| PacifiCorp, 6.10%, 8/1/36 |
2,000,000 |
|
2,147,216 |
| Sempra, 5.40%, 8/1/26 |
2,000,000 |
|
2,018,106 |
| Southern California Gas Co., 5.05%, 9/1/34 |
1,500,000 |
|
1,527,164 |
| Southwestern Electric Power Co., 5.30%, 4/1/33 |
500,000 |
|
512,470 |
| |
|
|
15,275,674 |
TOTAL CORPORATE BONDS
(Cost $207,341,441) |
|
|
215,956,436 |
| U.S. TREASURY OBLIGATIONS — 32.4% |
| United States Treasury Bonds, |
|
|
|
| 1.75%, 8/15/41 |
3,875,000 |
|
2,628,567 |
| 1.375%, 8/15/50 |
9,000,000 |
|
4,522,676 |
United States Treasury Floating Rate Notes,
4.143% (3 Month U.S. Treasury Money Market Yield + 25 bps), 1/31/26(a) |
50,250,000 |
|
50,250,865 |
| United States Treasury Notes, |
|
|
|
| 1.625%, 9/30/26 |
8,500,000 |
|
8,328,521 |
| 4.125%, 9/30/27 |
3,500,000 |
|
3,534,658 |
| 3.75%, 4/15/28 |
65,500,000 |
|
65,720,039 |
| |
Par
Value |
|
Value |
| U.S. TREASURY OBLIGATIONS — (Continued) |
| 4.125%, 11/30/31 |
$10,500,000 |
|
$ 10,653,604 |
| 3.50%, 2/15/33 |
15,000,000 |
|
14,568,750 |
U.S. TREASURY OBLIGATIONS
(Cost $159,683,637) |
|
160,207,680 |
| |
Par Value/
Shares |
|
| PREFERREDS — 8.2% |
| Consumer Discretionary — 0.4% |
| General Motors Financial Co., Inc., 5.75%, 9/30/27(c) |
2,050,000 |
2,034,291 |
| Energy — 0.4% |
| BP Capital Markets PLC, 6.45%, 12/1/33 |
2,000,000 |
2,138,132 |
| Financials — 7.4% |
| Bank of America Corp., 6.625%, 5/1/30 |
3,700,000 |
3,854,809 |
| Bank of New York Mellon Corp. (The), 3.70%, 3/20/26(c) |
740,000 |
733,487 |
| Bank of New York Mellon Corp. (The), 4.625%, 9/20/26 |
1,625,000 |
1,615,785 |
| Bank of New York Mellon Corp. (The), 6.15%, 3/20/30(c) |
13,500 |
347,895 |
| Bank of New York Mellon Corp. (The), 6.30%, 3/20/30 |
1,500,000 |
1,544,299 |
| Bank of New York Mellon Corp. (The), 5.95%, 12/20/30(c) |
1,000,000 |
1,011,952 |
| Citigroup, Inc., 4.00%, 12/10/25(c) |
2,400,000 |
2,393,735 |
| Citigroup, Inc., 7.625%, 11/15/28(c) |
2,150,000 |
2,260,643 |
| Citigroup, Inc., 6.75%, 2/15/30 |
2,835,000 |
2,887,246 |
| Citigroup, Inc., 6.875%, 8/15/30(c) |
1,850,000 |
1,908,405 |
| Goldman Sachs Group, Inc. (The), 6.125%, 11/10/34 |
5,375,000 |
5,462,847 |
| KKR & Co., Inc., 6.875%, 6/1/65 |
100,000 |
2,595,000 |
| Morgan Stanley, 6.875%, 1/15/26(c) |
39,395 |
990,784 |
| Northern Trust Corp., 4.60%, 10/1/26(c) |
1,550,000 |
1,543,858 |
| State Street Corp., 5.35%, 3/15/26(c) |
20,000 |
465,200 |
| State Street Corp., 6.70%, 9/15/29 |
1,000,000 |
1,045,864 |
| State Street Corp., 6.45%, 9/15/30 |
2,800,000 |
2,892,254 |
| Wells Fargo & Co., 3.90%, 3/15/26(c) |
300,000 |
297,432 |
| Wells Fargo & Co., 6.85%, 9/15/29 |
2,550,000 |
2,684,630 |
| |
|
36,536,125 |
TOTAL PREFERREDS
(Cost $38,939,863) |
|
40,708,548 |
The accompanying notes are an integral part of the financial statements.
AMBRUS CORE BOND FUND
Portfolio of Investments (Concluded)
September 30, 2025
| |
Par
Value |
|
Value |
| ASSET-BACKED SECURITIES — 7.8% |
| Fannie Mae Pool, 6.00%, 5/1/53 |
$ 689,504 |
|
$ 709,109 |
| Fannie Mae Pool, 7.00%, 7/1/54 |
2,918,891 |
|
3,069,297 |
| Fannie Mae Pool, 6.00%, 8/1/54 |
4,018,971 |
|
4,118,511 |
| Freddie Mac Pool, 6.50%, 12/1/53 |
3,990,239 |
|
4,148,175 |
| Freddie Mac Pool, 6.00%, 6/1/54 |
8,077,424 |
|
8,261,610 |
| Freddie Mac Pool, 7.00%, 7/1/54 |
1,898,186 |
|
1,993,695 |
| Ginnie Mae II Pool, 7.00%, 4/20/54 |
4,352,430 |
|
4,500,515 |
| Ginnie Mae II Pool, 6.50%, 7/20/54 |
6,623,119 |
|
6,817,119 |
| Ginnie Mae II Pool, 6.00%, 2/20/55 |
5,022,448 |
|
5,114,485 |
TOTAL ASSET-BACKED SECURITIES
(Cost $38,369,796) |
|
|
38,732,516 |
| MUNICIPAL BONDS — 0.6% |
| California — 0.4% |
City & County of San Francisco GO, Series C,
6.03%, 6/15/29 |
2,000,000 |
|
2,107,402 |
| Michigan — 0.2% |
Detroit GO, Series B,
3.11%, 4/1/28 |
1,000,000 |
|
969,652 |
TOTAL MUNICIPAL BONDS
(Cost $3,035,528) |
|
|
3,077,054 |
| |
Number
of Shares |
|
| EXCHANGE TRADED FUNDS — 4.7% |
| iShares 0-5 Year TIPS Bond ETF |
150,000 |
15,504,000 |
| SPDR Portfolio High Yield Bond ETF |
320,000 |
7,660,800 |
TOTAL EXCHANGE TRADED FUNDS
(Cost $22,419,185) |
|
23,164,800 |
| SHORT-TERM INVESTMENT — 1.6% |
| Dreyfus Government Cash Management Fund, Institutional Shares, 4.04%(d) |
7,938,723 |
7,938,723 |
| |
| |
TOTAL SHORT-TERM INVESTMENT
(Cost $7,938,723) |
|
7,938,723 |
| |
| |
TOTAL INVESTMENTS - 99.0%
(Cost $477,728,173) |
|
489,785,757 |
| OTHER ASSETS IN EXCESS OF LIABILITIES - 1.0% |
|
4,925,691 |
| NET ASSETS - 100.0% |
|
$494,711,448 |
| (a) |
Variable or Floating rate security. Rate shown is the rate in effect as of period end. Certain variable rate securities are not based on a published reference rate and spread, rather are determined by the issuer or agent and are based on current market conditions. Reference rate is as of reset date, which may vary by security. These securities may not indicate a reference rate and/or spread in their description. |
| (b) |
Securities exempt from registration under Rule 144A of the Securities Act of 1933, as amended. These securities were purchased in accordance with the guidelines approved by the Fund’s Board of Trustees and may be resold, in transactions exempt from registration, to qualified institutional buyers. At September 30, 2025, these securities amounted to $7,498,757 or 1.52% of net assets. These securities have been determined by the Fund's adviser to be liquid securities. |
| (c) |
Non-voting shares. |
| (d) |
Rate disclosed is the 7-day yield at September 30, 2025. |
| ETF |
Exchange-Traded Fund |
| GO |
General Obligation |
| LLC |
Limited Liability Company |
| LP |
Limited Partnership |
| PLC |
Public Limited Company |
| REIT |
Real Estate Investment Trust |
| SOFR |
Secured Overnight Financing Rate |
| SPDR |
Standard & Poor's Depository Receipt |
| TIPS |
Treasury Inflation-Protected Securities |
The accompanying notes are an integral part of the financial statements.
AMBRUS TAX-CONSCIOUS CALIFORNIA BOND FUND
Portfolio of Investments
September 30, 2025
| |
Par
Value |
|
Value |
| MUNICIPAL BONDS — 85.0% |
| California — 73.1% |
Albany Unified School District GO, Series B, Callable 08/01/26 at 100,
5.00%, 8/1/43 |
$1,000,000 |
|
$ 1,014,813 |
Alhambra Unified School District GO, Series B, Callable 08/01/32 at 100,
5.25%, 8/1/47 |
705,000 |
|
748,185 |
Anaheim Housing & Public Improvements Authority Revenue, Series A, Callable 10/01/30 at 100,
5.50%, 10/1/55 |
3,605,000 |
|
3,792,270 |
Anaheim Housing & Public Improvements Authority Revenue, Series B, Refunding, Callable 10/01/30 at 100,
5.25%, 10/1/47 |
1,785,000 |
|
1,865,615 |
Antioch Unified School District GO, Series B, OID, Callable 10/31/25 at 100,
4.00%, 8/1/40, (BAM Insured) |
635,000 |
|
632,044 |
Atwater Elementary School District, Callable 12/01/34 at 100,
5.00%, 12/1/44, (AG Insured) |
700,000 |
|
742,374 |
Azusa, Callable 09/01/28 at 100,
5.00%, 9/1/44, (AG Insured) |
2,070,000 |
|
2,109,719 |
Berkeley Joint Powers Financing Authority Revenue, OID, Refunding, Callable 10/31/25 at 100,
3.00%, 10/1/27 |
25,000 |
|
25,007 |
Brea Water Utility Revenue, Refunding, Callable 07/01/29 at 100,
3.00%, 7/1/38 |
800,000 |
|
719,530 |
Cabrillo Unified School District GO, Series A, Callable 08/01/26 at 100,
5.00%, 8/1/48 |
625,000 |
|
633,071 |
California Community Choice Financing Authority Revenue, Callable 05/01/29 at 100,
5.00%, 7/1/53(a) |
2,965,000 |
|
3,149,851 |
| |
Par
Value |
|
Value |
| MUNICIPAL BONDS — (Continued) |
| California — (Continued) |
California Community Choice Financing Authority Revenue, Series A-1, Callable 05/01/28 at 100,
4.00%, 5/1/53(a) |
$ 500,000 |
|
$ 511,940 |
California Community Choice Financing Authority Revenue, Series B-1, Callable 05/01/31 at 101,
4.00%, 2/1/52(a) |
3,755,000 |
|
3,850,731 |
California Community Choice Financing Authority Revenue, Series E-1, Callable 12/01/30 at 100,
5.00%, 2/1/54(a) |
1,775,000 |
|
1,910,525 |
California Community Choice Financing Authority Revenue, Series F, Callable 08/01/32 at 100,
5.00%, 2/1/55(a) |
4,400,000 |
|
4,794,597 |
California Community Choice Financing Authority Revenue, Series G, Callable 01/01/30 at 100,
5.25%, 11/1/54(a) |
2,000,000 |
|
2,169,582 |
California Community Choice Financing Authority Revenue , Callable 09/01/27 at 101,
4.00%, 10/1/52(a) |
900,000 |
|
920,767 |
California Community Choice Financing Authority Revenue , Series C, Callable 07/01/32 at 100,
5.00%, 8/1/55(a) |
4,000,000 |
|
4,314,716 |
California Community Choice Financing Authority Revenue , Series D, Callable 06/01/32 at 100,
5.00%, 2/1/55(a) |
2,000,000 |
|
2,197,132 |
California Community Choice Financing Authority Revenue , Series G, Callable 05/01/32 at 100,
5.00%, 11/1/55(a) |
3,000,000 |
|
3,177,994 |
The accompanying notes are an integral part of the financial statements.
AMBRUS TAX-CONSCIOUS CALIFORNIA BOND FUND
Portfolio of Investments (Continued)
September 30, 2025
| |
Par
Value |
|
Value |
| MUNICIPAL BONDS — (Continued) |
| California — (Continued) |
California Educational Facilities Authority Revenue, Series A, Callable 10/01/28 at 100,
5.00%, 10/1/43 |
$3,230,000 |
|
$ 3,264,423 |
California Educational Facilities Authority Revenue, Series A, Callable 10/01/28 at 100,
5.00%, 10/1/48 |
70,000 |
|
70,495 |
California Educational Facilities Authority Revenue, Series A, Callable 10/01/28 at 100,
5.00%, 10/1/53 |
4,545,000 |
|
4,564,715 |
California Educational Facilities Authority Revenue, Series A, Refunding, Callable 04/01/27 at 100,
5.00%, 4/1/42 |
260,000 |
|
260,976 |
California Educational Facilities Authority Revenue, Series A, Refunding, Callable 04/01/27 at 100,
5.00%, 4/1/47 |
25,000 |
|
25,026 |
California Educational Facilities Authority Revenue, Series U-7,
5.00%, 6/1/46 |
100,000 |
|
114,934 |
California Educational Facilities Authority Revenue , Series A, Callable 10/01/28 at 100,
5.00%, 10/1/46 |
5,110,000 |
|
5,157,141 |
California Enterprise Development Authority Revenue, Callable 11/01/27 at 100,
5.00%, 11/1/34 |
215,000 |
|
223,897 |
California Health Facilities Financing Authority Revenue, Refunding, Callable 04/01/26 at 100,
5.00%, 4/1/27, (CA MTG Insured) |
5,000 |
|
5,070 |
California Health Facilities Financing Authority Revenue, Refunding, Callable 11/15/27 at 100,
5.00%, 11/15/38 |
250,000 |
|
257,482 |
California Health Facilities Financing Authority Revenue, Refunding, Callable 11/15/27 at 100,
5.00%, 11/15/48 |
25,000 |
|
25,160 |
| |
Par
Value |
|
Value |
| MUNICIPAL BONDS — (Continued) |
| California — (Continued) |
California Health Facilities Financing Authority Revenue, Series A, Callable 05/01/34 at 100,
5.00%, 11/1/49 |
$2,840,000 |
|
$ 2,983,149 |
California Health Facilities Financing Authority Revenue, Series A, Callable 06/01/34 at 100,
5.25%, 12/1/44 |
1,030,000 |
|
1,063,268 |
California Health Facilities Financing Authority Revenue, Series A, Callable 06/01/34 at 100,
5.00%, 12/1/45 |
885,000 |
|
915,569 |
California Health Facilities Financing Authority Revenue, Series A, Callable 06/01/34 at 100,
5.25%, 12/1/49 |
2,445,000 |
|
2,578,758 |
California Health Facilities Financing Authority Revenue, Series A, Callable 08/15/26 at 100,
5.00%, 8/15/34 |
410,000 |
|
417,151 |
California Health Facilities Financing Authority Revenue, Series A, Callable 10/31/25 at 100,
4.00%, 10/1/28 |
100,000 |
|
100,096 |
California Health Facilities Financing Authority Revenue, Series A-2, Refunding, Callable 11/01/27 at 100,
4.00%, 11/1/44 |
4,000,000 |
|
3,710,920 |
California Health Facilities Financing Authority Revenue , Callable 11/15/27 at 100,
5.00%, 11/15/56 |
3,000,000 |
|
3,015,815 |
California Health Facilities Financing Authority Revenue , Series A, Refunding, Callable 10/01/26 at 100,
4.00%, 10/1/35 |
1,195,000 |
|
1,196,580 |
California Infrastructure & Economic Development Bank Revenue, Callable 05/15/28 at 100,
5.00%, 5/15/47 |
1,130,000 |
|
1,150,818 |
California Infrastructure & Economic Development Bank Revenue, Callable 08/01/29 at 100,
5.00%, 8/1/44 |
2,875,000 |
|
2,973,613 |
The accompanying notes are an integral part of the financial statements.
AMBRUS TAX-CONSCIOUS CALIFORNIA BOND FUND
Portfolio of Investments (Continued)
September 30, 2025
| |
Par
Value |
|
Value |
| MUNICIPAL BONDS — (Continued) |
| California — (Continued) |
California Infrastructure & Economic Development Bank Revenue, Callable 08/01/29 at 100,
5.00%, 8/1/49 |
$4,555,000 |
|
$ 4,670,423 |
California Infrastructure & Economic Development Bank Revenue, Refunding, Callable 11/01/26 at 100,
5.00%, 5/1/28 |
20,000 |
|
20,523 |
California Infrastructure & Economic Development Bank Revenue, Series B, Callable 11/01/34 at 100,
5.00%, 11/1/54 |
850,000 |
|
855,947 |
California Municipal Finance Authority,
4.00%, 9/1/30 |
95,000 |
|
95,621 |
California Municipal Finance Authority Revenue, Callable 09/01/32 at 100,
5.25%, 9/1/41, (CA MTG Insured) |
470,000 |
|
513,456 |
California Municipal Finance Authority Revenue, Callable 09/01/32 at 100,
5.25%, 9/1/44, (CA MTG Insured) |
700,000 |
|
748,790 |
California Municipal Finance Authority Revenue, Callable 09/01/32 at 100,
5.25%, 9/1/54, (CA MTG Insured) |
1,100,000 |
|
1,154,992 |
California Municipal Finance Authority Revenue, Callable 11/15/28 at 100,
5.00%, 5/15/36, (BAM-TCRS Insured) |
500,000 |
|
522,462 |
California Municipal Finance Authority Revenue, Refunding, Callable 10/01/28 at 100,
5.00%, 10/1/35 |
1,000,000 |
|
1,030,465 |
California Municipal Finance Authority Revenue, Series A,
5.00%, 2/1/31 |
420,000 |
|
455,840 |
California Municipal Finance Authority Revenue, Series A, Callable 02/01/27 at 100,
3.20%, 9/1/45, (HUD SECT 8 Insured)(a) |
1,250,000 |
|
1,251,994 |
| |
Par
Value |
|
Value |
| MUNICIPAL BONDS — (Continued) |
| California — (Continued) |
California Municipal Finance Authority Revenue, Series A, Callable 06/01/27 at 100,
5.00%, 6/1/42 |
$1,000,000 |
|
$ 1,016,516 |
California Municipal Finance Authority Revenue, Series A, Callable 10/01/29 at 100,
5.00%, 10/1/44 |
500,000 |
|
514,231 |
California Municipal Finance Authority Revenue, Series B, Refunding, Callable 01/01/28 at 100,
5.00%, 1/1/42 |
2,040,000 |
|
2,041,658 |
California Municipal Finance Authority Revenue , Series A, Refunding, Callable 05/01/29 at 100,
5.00%, 5/1/49 |
1,840,000 |
|
1,869,544 |
California Municipal Finance Authority Revenue , Series A, Refunding, Callable 10/21/25 at 100,
4.00%, 10/1/40 |
1,125,000 |
|
1,124,956 |
California Public Finance Authority Revenue, Series A, Callable 07/15/32 at 100,
5.00%, 7/15/46 |
3,150,000 |
|
3,304,162 |
California School Finance Authority Revenue, Callable 08/01/28 at 100,
5.00%, 8/1/42(b) |
125,000 |
|
123,067 |
California School Finance Authority Revenue, Series A, Callable 07/01/27 at 100,
5.00%, 7/1/37(b) |
25,000 |
|
25,355 |
California State GO,
5.00%, 8/1/26(c) |
4,120,000 |
|
4,212,605 |
California State GO, Callable 08/01/35 at 100,
5.00%, 8/1/44(c) |
400,000 |
|
432,929 |
California State GO, Refunding, Callable 08/01/26 at 100,
4.00%, 8/1/35 |
1,000,000 |
|
1,003,212 |
California State GO, Refunding, Callable 10/31/25 at 100,
4.00%, 11/1/44 |
1,000,000 |
|
967,604 |
The accompanying notes are an integral part of the financial statements.
AMBRUS TAX-CONSCIOUS CALIFORNIA BOND FUND
Portfolio of Investments (Continued)
September 30, 2025
| |
Par
Value |
|
Value |
| MUNICIPAL BONDS — (Continued) |
| California — (Continued) |
California State GO, Refunding, Callable 10/31/25 at 100,
5.00%, 8/1/45 |
$ 500,000 |
|
$ 500,425 |
California State GO, Series CV, Callable 12/01/33 at 100,
3.80%, 12/1/43 |
2,775,000 |
|
2,569,776 |
California State Public Works Board Revenue, Callable 10/01/26 at 100,
4.00%, 10/1/28 |
530,000 |
|
536,786 |
California State University Revenue, Series A, Refunding, Callable 11/01/25 at 100,
5.00%, 11/1/43 |
965,000 |
|
966,939 |
California State University Revenue, Series A, Refunding, Callable 11/01/28 at 100,
5.00%, 11/1/43 |
1,900,000 |
|
1,954,787 |
California State University Revenue, Series A, Unrefunded portion, Callable 11/01/25 at 100,
5.00%, 11/1/43 |
35,000 |
|
35,004 |
California State University Revenue, Series A, Unrefunded portion, Callable 11/01/25 at 100,
5.00%, 11/1/47 |
15,000 |
|
14,999 |
California Statewide Communities Development Authority Revenue, Callable 01/01/28 at 100,
5.00%, 1/1/48 |
5,485,000 |
|
5,551,496 |
California Statewide Communities Development Authority Revenue, Callable 02/01/28 at 100,
5.00%, 8/1/29 |
300,000 |
|
312,923 |
California Statewide Communities Development Authority Revenue, Refunding,
5.00%, 3/1/28 |
100,000 |
|
104,601 |
California Statewide Communities Development Authority Revenue, Refunding, Callable 03/01/28 at 100,
5.00%, 3/1/33 |
160,000 |
|
165,861 |
| |
Par
Value |
|
Value |
| MUNICIPAL BONDS — (Continued) |
| California — (Continued) |
California Statewide Communities Development Authority Revenue, Series A, OID, Refunding, Callable 03/01/26 at 100,
4.125%, 3/1/34 |
$1,015,000 |
|
$ 1,015,748 |
Chowchilla Elementary School District GO, Callable 08/01/26 at 100,
5.00%, 8/1/43 |
580,000 |
|
588,447 |
City & County of San Francisco Community Facilities District No 2014-1, Series A,
5.00%, 9/1/27 |
145,000 |
|
151,805 |
City & County of San Francisco GO, Series C,
6.03%, 6/15/29 |
3,630,000 |
|
3,824,934 |
City & County of San Francisco GO, Series C,
6.26%, 6/15/30 |
4,150,000 |
|
4,461,069 |
City & County of San Francisco Revenue, Series 2, Callable 08/01/28 at 100,
3.35%, 8/1/29(a) |
1,015,000 |
|
1,029,775 |
City of Lake Elsinore, Callable 09/01/31 at 103,
5.00%, 9/1/35 |
50,000 |
|
53,477 |
City of Lake Elsinore, Callable 09/01/31 at 103,
5.00%, 9/1/39 |
100,000 |
|
105,168 |
City of Lake Elsinore, Callable 09/01/31 at 103,
5.00%, 9/1/44 |
575,000 |
|
587,035 |
Coachella Valley Unified School District, OID, Refunding, Callable 10/21/25 at 100,
3.50%, 9/1/28, (BAM Insured) |
50,000 |
|
50,027 |
Coachella Valley Unified School District GO, OID, Refunding, Callable 10/21/25 at 100,
4.00%, 8/1/27, (BAM Insured) |
5,000 |
|
5,004 |
Colusa Unified School District GO, Callable 10/31/25 at 100,
4.00%, 5/1/34, (AG Insured) |
510,000 |
|
510,218 |
The accompanying notes are an integral part of the financial statements.
AMBRUS TAX-CONSCIOUS CALIFORNIA BOND FUND
Portfolio of Investments (Continued)
September 30, 2025
| |
Par
Value |
|
Value |
| MUNICIPAL BONDS — (Continued) |
| California — (Continued) |
Compton Unified School District GO, Series B, Callable 06/01/27 at 100,
4.00%, 6/1/32, (BAM Insured) |
$ 140,000 |
|
$ 142,957 |
Concord, OID, Refunding, Callable 04/01/31 at 100,
2.00%, 4/1/38 |
920,000 |
|
707,788 |
Department of Veterans Affairs Veteran's Farm & Home Purchase Program Revenue, Series A,
1.25%, 6/1/27 |
40,000 |
|
38,551 |
Desert Sands Unified School District, Callable 09/01/30 at 103,
5.00%, 9/1/44, (BAM Insured) |
100,000 |
|
106,364 |
Desert Sands Unified School District, Callable 09/01/30 at 103,
5.00%, 9/10/49, (BAM Insured) |
185,000 |
|
193,900 |
Desert Sands Unified School District, Callable 09/01/30 at 103,
5.00%, 9/1/54, (BAM Insured) |
425,000 |
|
443,232 |
Downey Unified School District GO, Series C, OID, Callable 08/01/31 at 100,
2.00%, 8/1/42, (AG Insured) |
25,000 |
|
16,693 |
East Side Union High School District GO, Series A, OID, Refunding, Callable 08/01/26 at 100,
2.125%, 8/1/29 |
50,000 |
|
48,541 |
East Side Union High School District GO, Series B, Refunding,
5.25%, 2/1/26, (NATL Insured) |
20,000 |
|
20,189 |
Eastern Municipal Water District Financing Authority Revenue, Series B, Unrefunded portion, Callable 07/01/26 at 100,
4.00%, 7/1/35 |
250,000 |
|
251,019 |
Escondido Union School District GO, Series B, Callable 08/01/27 at 100,
4.00%, 8/1/47 |
1,150,000 |
|
1,095,423 |
Fillmore Wastewater Revenue, Refunding, Callable 05/01/27 at 100,
5.00%, 5/1/47, (AG Insured) |
1,175,000 |
|
1,186,143 |
| |
Par
Value |
|
Value |
| MUNICIPAL BONDS — (Continued) |
| California — (Continued) |
Folsom Cordova Unified School District School Facilities Improvement Dist No 5 GO, OID, Refunding, Callable 10/01/25 at 100,
4.00%, 10/1/40 |
$1,780,000 |
|
$ 1,780,000 |
Folsom Cordova Unified School District School Facilities Improvement Dist No 5 GO, Series A, OID, Unrefunded portion, Callable 10/21/25 at 100,
4.00%, 10/1/40 |
545,000 |
|
537,812 |
Folsom Cordova Unified School District School Facilities Improvement Dist No 5 GO, Series B, Callable 10/01/26 at 100,
4.25%, 10/1/41 |
1,500,000 |
|
1,499,651 |
Fontana Redevelopment Agency Successor Agency, Series A, Refunding, Callable 10/01/27 at 100,
5.00%, 10/1/34 |
695,000 |
|
721,607 |
Fremont Unified School District/Alameda County GO, Series B, Callable 10/21/25 at 100,
4.00%, 8/1/40 |
1,875,000 |
|
1,874,927 |
Fresno Unified School District GO, Series B, Refunding, Callable 08/01/26 at 100,
4.00%, 8/1/46 |
780,000 |
|
725,268 |
Glendale Water Revenue, OID, Callable 10/31/25 at 100,
3.50%, 2/1/42 |
135,000 |
|
116,900 |
Golden State Tobacco Securitization Corp. Revenue, Refunding, Callable 12/01/31 at 100,
5.00%, 6/1/51 |
2,000,000 |
|
1,974,230 |
Golden State Tobacco Securitization Corp. Revenue, Series A-1, Refunding,
2.687%, 6/1/30 |
190,000 |
|
174,876 |
The accompanying notes are an integral part of the financial statements.
AMBRUS TAX-CONSCIOUS CALIFORNIA BOND FUND
Portfolio of Investments (Continued)
September 30, 2025
| |
Par
Value |
|
Value |
| MUNICIPAL BONDS — (Continued) |
| California — (Continued) |
Golden State Tobacco Securitization Corp. Revenue, Series A-1, Refunding,
2.787%, 6/1/31 |
$2,875,000 |
|
$ 2,596,178 |
Hayward Unified School District, Callable 08/01/27 at 100,
5.25%, 8/1/47 |
1,435,000 |
|
1,449,834 |
Hayward Unified School District, Callable 08/01/27 at 100,
5.25%, 8/1/52 |
1,000,000 |
|
1,009,104 |
Hayward Unified School District GO, Refunding, Callable 08/01/28 at 100,
4.00%, 8/1/43, (BAM Insured) |
550,000 |
|
537,318 |
Hesperia Public Financing Authority Revenue, OID, Callable 10/31/25 at 100,
3.625%, 10/1/42 |
225,000 |
|
192,139 |
Imperial Community College District GO, Series A, Callable 08/01/33 at 100,
5.25%, 8/1/53, (AG Insured) |
900,000 |
|
953,663 |
Independent Cities Finance Authority Revenue , Refunding, Callable 05/15/29 at 100,
5.00%, 5/15/48 |
925,000 |
|
932,432 |
Inglewood Unified School District GO, Series B, Callable 08/01/26 at 100,
5.00%, 8/1/38, (BAM Insured) |
1,505,000 |
|
1,522,724 |
Irvine Facilities Financing Authority, Series A, Callable 09/01/33 at 100,
5.00%, 9/1/48, (BAM Insured) |
1,730,000 |
|
1,809,963 |
Irvine Facilities Financing Authority Revenue, Callable 05/01/26 at 100,
5.25%, 5/1/43 |
2,275,000 |
|
2,287,148 |
Irvine Ranch Water District Water Service Corp., Callable 08/01/26 at 100,
5.25%, 2/1/46 |
2,000,000 |
|
2,026,663 |
Kern High School District GO, Series E, OID,
2.00%, 8/1/27 |
100,000 |
|
98,458 |
| |
Par
Value |
|
Value |
| MUNICIPAL BONDS — (Continued) |
| California — (Continued) |
Lancaster Financing Authority Revenue, Series A, Callable 05/01/34 at 100,
5.00%, 5/1/54, (BAM Insured) |
$3,000,000 |
|
$ 3,144,247 |
Lemoore Union Elementary School District, OID, Callable 11/01/25 at 100,
3.00%, 5/1/40, (BAM Insured) |
25,000 |
|
20,529 |
Live Oak Elementary School District/Santa Cruz County GO, Series A, Callable 08/01/32 at 100,
5.00%, 8/1/44, (BAM Insured) |
340,000 |
|
360,855 |
Lodi Unified School District GO, Series 2020, Callable 08/01/27 at 100,
4.00%, 8/1/40 |
20,000 |
|
20,024 |
Long Beach Unified School District GO, Series E, Callable 08/01/26 at 100,
4.00%, 8/1/44, (BAM-TCRS Insured) |
275,000 |
|
264,436 |
Los Angeles County Development Authority Revenue, Series C, Callable 09/01/28 at 100,
3.35%, 9/1/59(a) |
1,123,000 |
|
1,137,405 |
Los Angeles County Facilities, Inc. Revenue , Series A, Unrefunded portion, Callable 12/01/28 at 100,
5.00%, 12/1/51 |
4,000,000 |
|
4,081,772 |
Los Angeles County Public Works Financing Authority Revenue, Series D, Refunding, Callable 12/01/25 at 100,
5.00%, 12/1/32 |
150,000 |
|
150,511 |
Los Angeles County Public Works Financing Authority Revenue, Series H, Refunding, Callable 12/01/34 at 100,
5.50%, 12/1/53 |
400,000 |
|
435,298 |
Los Angeles County Schools Regionalized Business Services Corp., Series A-3, OID, Refunding, Callable 10/31/25 at 100,
3.75%, 9/1/26, (AG Insured) |
10,000 |
|
10,009 |
The accompanying notes are an integral part of the financial statements.
AMBRUS TAX-CONSCIOUS CALIFORNIA BOND FUND
Portfolio of Investments (Continued)
September 30, 2025
| |
Par
Value |
|
Value |
| MUNICIPAL BONDS — (Continued) |
| California — (Continued) |
Los Angeles Department of Airports Revenue, Refunding, Callable 05/15/29 at 100,
5.00%, 5/15/43 |
$2,000,000 |
|
$ 2,067,036 |
Los Angeles Department of Airports Revenue, Series E, Callable 11/15/28 at 100,
5.00%, 5/15/49 |
250,000 |
|
255,060 |
Los Angeles Department of Water & Power Revenue, Series A, Callable 01/01/27 at 100,
5.00%, 7/1/47 |
3,090,000 |
|
3,100,971 |
Los Angeles Department of Water & Power Revenue, Series B, Refunding, Callable 01/01/27 at 100,
5.25%, 7/1/39 |
2,200,000 |
|
2,231,501 |
Los Angeles Department of Water & Power Water System Revenue, Series A, Refunding, Callable 01/01/26 at 100,
5.00%, 7/1/46 |
1,755,000 |
|
1,755,577 |
Los Angeles Department of Water & Power Water System Revenue, Series A, Refunding, Callable 01/01/27 at 100,
5.00%, 7/1/44 |
3,250,000 |
|
3,265,023 |
Los Angeles Department of Water & Power Water System Revenue, Series A, Refunding, Callable 07/01/33 at 100,
5.00%, 7/1/49 |
540,000 |
|
557,871 |
Los Angeles Department of Water & Power Water System Revenue, Series D, Refunding, Callable 07/01/32 at 100,
5.00%, 7/1/39 |
795,000 |
|
852,353 |
Los Angeles Housing Authority Revenue, Series A,
3.75%, 4/1/34, (FNMA COLL Insured) |
1,250,000 |
|
1,248,822 |
Los Angeles Housing Authority Revenue, Series A, Refunding, Callable 06/01/26 at 100,
4.00%, 6/1/27, (HUD SECT 8 Insured) |
5,000 |
|
5,054 |
| |
Par
Value |
|
Value |
| MUNICIPAL BONDS — (Continued) |
| California — (Continued) |
Los Angeles Housing Authority Revenue, Series C,
3.75%, 4/1/34, (FNMA COLL Insured) |
$1,775,000 |
|
$ 1,802,972 |
Los Angeles Housing Authority Revenue , Series B, Callable 02/01/28 at 100,
3.25%, 2/1/29(a) |
1,000,000 |
|
1,010,064 |
Los Angeles Municipal Improvement Corp. Revenue, Series B, Refunding, Callable 11/01/26 at 100,
5.00%, 11/1/36 |
375,000 |
|
381,325 |
Los Angeles Unified School District GO, Series A, Callable 10/31/25 at 100,
4.00%, 7/1/40 |
3,000,000 |
|
2,999,988 |
Los Angeles Unified School District GO, Series B, Refunding, Callable 07/01/26 at 100,
3.00%, 7/1/32 |
1,220,000 |
|
1,218,199 |
Los Angeles Unified School District GO, Series B-1, Callable 01/01/28 at 100,
5.25%, 7/1/42 |
870,000 |
|
894,676 |
Lucia Mar Unified School District GO, Series A, OID, Callable 08/01/27 at 100,
4.00%, 8/1/46 |
1,000,000 |
|
959,354 |
Lucia Mar Unified School District GO, Series B, Callable 08/01/28 at 100,
5.00%, 8/1/42 |
535,000 |
|
550,357 |
Marin Healthcare District GO, Callable 10/31/25 at 100,
4.00%, 8/1/40 |
1,000,000 |
|
999,953 |
Menlo Park City School District GO, Series A, Callable 07/01/33 at 100,
5.00%, 7/1/45 |
1,410,000 |
|
1,511,409 |
Modesto Irrigation District Revenue, Series A, Callable 10/01/33 at 100,
5.25%, 10/1/48 |
550,000 |
|
591,050 |
The accompanying notes are an integral part of the financial statements.
AMBRUS TAX-CONSCIOUS CALIFORNIA BOND FUND
Portfolio of Investments (Continued)
September 30, 2025
| |
Par
Value |
|
Value |
| MUNICIPAL BONDS — (Continued) |
| California — (Continued) |
Montebello Public Financing Authority Revenue, Series A, Callable 06/01/26 at 100,
5.00%, 6/1/46 |
$1,175,000 |
|
$ 1,178,006 |
Moraga Elementary School District GO, Series A, Callable 08/01/32 at 100,
5.00%, 8/1/49 |
1,990,000 |
|
2,097,068 |
M-S-R Energy Authority Revenue, Series A,
7.00%, 11/1/34 |
4,000,000 |
|
4,856,957 |
Norco Community Redevelopment Agency Successor Agency, OID, Refunding, Callable 10/31/25 at 100,
3.25%, 3/1/28, (BAM Insured) |
620,000 |
|
620,067 |
Norman Y Mineta San Jose International Airport SJC Revenue, Series B, Refunding, Callable 03/01/27 at 100,
5.00%, 3/1/42 |
755,000 |
|
766,129 |
Oakdale Joint Unified School District GO, Series A, OID, Callable 08/01/35 at 100,
4.75%, 8/1/54 |
25,000 |
|
25,267 |
Oakland Unified School District/Alameda County GO, Refunding, Callable 08/01/26 at 100,
5.00%, 8/1/30, (BAM-TCRS Insured) |
1,100,000 |
|
1,122,416 |
Oxnard Union High School District, OID, Callable 06/01/29 at 100,
2.25%, 6/1/39, (AG Insured) |
330,000 |
|
254,578 |
Oxnard Union High School District GO, Series B, Callable 08/01/28 at 100,
5.00%, 8/1/45 |
1,000,000 |
|
1,020,455 |
Palomar Health GO, Series B, Refunding, Callable 08/01/26 at 100,
4.00%, 8/1/33 |
200,000 |
|
184,802 |
Patterson Joint Unified School District GO, Series A, Callable 08/01/26 at 100,
5.00%, 8/1/37, (BAM Insured) |
2,470,000 |
|
2,507,647 |
| |
Par
Value |
|
Value |
| MUNICIPAL BONDS — (Continued) |
| California — (Continued) |
Perris Public Financing Authority, Series B, OID, Refunding, Callable 10/31/25 at 100,
3.75%, 10/1/31 |
$1,620,000 |
|
$ 1,620,715 |
Piedmont Unified School District GO, Series C, OID, Callable 08/01/31 at 100,
2.125%, 8/1/41 |
455,000 |
|
329,271 |
Pittsburg Successor Agency Redevelopment Agency, Series A, Refunding,
5.00%, 9/1/26, (AG Insured) |
100,000 |
|
102,183 |
Pittsburg Unified School District Financing Authority Revenue, Callable 09/01/28 at 100,
5.00%, 9/1/47, (AG Insured) |
630,000 |
|
641,861 |
Pittsburg Unified School District GO, Refunding, Callable 08/01/26 at 100,
4.00%, 8/1/34 |
580,000 |
|
581,928 |
Pomona Revenue, Series BE, Refunding, Callable 05/01/27 at 100,
5.00%, 5/1/47 |
495,000 |
|
501,380 |
Poway Redevelopment Agency Successor Agency, Series A, Refunding, Callable 12/15/25 at 100,
5.00%, 6/15/28 |
2,190,000 |
|
2,201,400 |
Poway Unified School District Public Financing Authority, Series A, Refunding, Callable 09/01/32 at 100,
5.00%, 9/1/36 |
705,000 |
|
784,727 |
Poway Unified School District Public Financing Authority, Series B, Refunding, Callable 09/01/30 at 100,
5.00%, 9/1/35 |
750,000 |
|
813,684 |
Poway Unified School District Public Financing Authority, Series B, Refunding, Callable 09/01/30 at 100,
5.00%, 9/1/36 |
215,000 |
|
231,427 |
The accompanying notes are an integral part of the financial statements.
AMBRUS TAX-CONSCIOUS CALIFORNIA BOND FUND
Portfolio of Investments (Continued)
September 30, 2025
| |
Par
Value |
|
Value |
| MUNICIPAL BONDS — (Continued) |
| California — (Continued) |
Ravenswood City School District GO, Callable 08/01/26 at 100,
5.00%, 8/1/35 |
$ 745,000 |
|
$ 757,146 |
Regents of the University of California Medical Center Pooled Revenue, Series L, Refunding, Callable 05/15/26 at 100,
4.00%, 5/15/37 |
960,000 |
|
962,120 |
Regents of the University of California Medical Center Pooled Revenue, Series P, Callable 05/15/32 at 100,
5.00%, 5/15/47 |
2,050,000 |
|
2,119,569 |
River Islands Public Financing Authority, Series 1, Refunding, Callable 09/01/29 at 103,
5.00%, 9/1/42, (AG Insured) |
3,370,000 |
|
3,586,827 |
Riverside Community College District, Callable 10/21/25 at 100,
5.00%, 6/1/37 |
210,000 |
|
210,213 |
Riverside Community College District, Callable 10/21/25 at 100,
5.00%, 6/1/38 |
255,000 |
|
255,226 |
Riverside Community College District, Callable 10/21/25 at 100,
5.00%, 6/1/39 |
325,000 |
|
325,265 |
Riverside Community College District, Callable 10/21/25 at 100,
5.25%, 6/1/43 |
1,670,000 |
|
1,671,131 |
Riverside Community College District, Callable 10/21/25 at 100,
5.25%, 6/1/49 |
2,000,000 |
|
2,001,100 |
Riverside County Redevelopment Successor Agency, Series A, CAB, OID, Refunding, Callable 10/01/26 at 100,
5.00%, 10/1/31, (BAM Insured) |
500,000 |
|
512,364 |
Riverside County Redevelopment Successor Agency, Series A, CAB, OID, Refunding, Callable 10/01/26 at 100,
5.00%, 10/1/41, (BAM Insured) |
1,090,000 |
|
1,098,007 |
Riverside Electric Revenue,
7.455%, 10/1/30 |
2,065,000 |
|
2,234,290 |
| |
Par
Value |
|
Value |
| MUNICIPAL BONDS — (Continued) |
| California — (Continued) |
Riverside Unified School District, OID, Callable 09/01/31 at 103,
5.00%, 9/1/45 |
$ 415,000 |
|
$ 420,820 |
Robla School District GO, Series A, Callable 08/01/27 at 100,
5.00%, 8/1/44, (AG Insured) |
800,000 |
|
815,109 |
Roseville Joint Union High School District GO, Series C, Callable 02/01/27 at 100,
5.00%, 8/1/46 |
2,425,000 |
|
2,438,286 |
Sacramento Area Flood Control Agency, Refunding, Callable 10/01/26 at 100,
5.00%, 10/1/36 |
505,000 |
|
511,553 |
Sacramento City Unified School District GO, Series A, Callable 08/01/30 at 100,
5.50%, 8/1/52, (BAM Insured) |
2,000,000 |
|
2,111,481 |
Sacramento County Airport System Revenue, Series B, Refunding, Callable 07/01/26 at 100,
5.00%, 7/1/41 |
500,000 |
|
504,397 |
Sacramento Transient Occupancy Tax Revenue, Series A, Callable 06/01/28 at 100,
5.00%, 6/1/36 |
2,170,000 |
|
2,272,415 |
Sacramento Transient Occupancy Tax Revenue, Series A, Callable 06/01/28 at 100,
5.00%, 6/1/48 |
240,000 |
|
244,505 |
Sacramento Transient Occupancy Tax Revenue, Series C, Callable 06/01/28 at 100,
5.00%, 6/1/43 |
650,000 |
|
666,475 |
Sacramento Transient Occupancy Tax Revenue, Series C, Callable 06/01/28 at 100,
5.00%, 6/1/48 |
3,175,000 |
|
3,232,999 |
San Diego County Regional Airport Authority Revenue, Series A, Callable 07/01/31 at 100,
5.00%, 7/1/46 |
1,530,000 |
|
1,593,687 |
The accompanying notes are an integral part of the financial statements.
AMBRUS TAX-CONSCIOUS CALIFORNIA BOND FUND
Portfolio of Investments (Continued)
September 30, 2025
| |
Par
Value |
|
Value |
| MUNICIPAL BONDS — (Continued) |
| California — (Continued) |
San Diego County Regional Airport Authority Revenue, Series A, Refunding, Callable 07/01/29 at 100,
5.00%, 7/1/44 |
$1,170,000 |
|
$ 1,207,036 |
San Diego Public Facilities Financing Authority Revenue, Series A, Refunding, Callable 08/01/28 at 100,
5.00%, 8/1/43 |
2,655,000 |
|
2,737,122 |
San Diego Unified School District GO, Series I, Callable 07/01/27 at 100,
5.00%, 7/1/47 |
2,020,000 |
|
2,048,629 |
San Diego Unified School District GO, Series K-2, OID, CAB, Callable 07/01/27 at 77,
0.00%, 7/1/34(d) |
2,750,000 |
|
1,982,818 |
San Francisco City & County Airport Comm-San Francisco International Airport Revenue, Series A, AMT, Unrefunded portion, Callable 05/01/27 at 100,
5.00%, 5/1/47 |
1,785,000 |
|
1,789,009 |
San Francisco City & County Airport Comm-San Francisco International Airport Revenue, Series B, AMT, Refunding, Callable 05/01/26 at 100,
5.00%, 5/1/41 |
1,100,000 |
|
1,102,262 |
San Francisco City & County Airport Comm-San Francisco International Airport Revenue, Series B, Refunding, Callable 05/01/29 at 100,
5.00%, 5/1/49 |
6,675,000 |
|
6,828,709 |
San Francisco City & County Airport Comm-San Francisco International Airport Revenue, Series F, Refunding, Callable 05/01/29 at 100,
5.00%, 5/1/50 |
2,025,000 |
|
2,069,556 |
| |
Par
Value |
|
Value |
| MUNICIPAL BONDS — (Continued) |
| California — (Continued) |
San Francisco City & County Public Utilities Commission Power Revenue, Series A, Callable 10/31/25 at 100,
5.00%, 11/1/35 |
$ 115,000 |
|
$ 115,128 |
San Francisco City & County Public Utilities Commission Wastewater Revenue, Series A, Callable 10/31/25 at 100,
4.00%, 10/1/39 |
1,875,000 |
|
1,868,110 |
San Francisco City & County Public Utilities Commission Wastewater Revenue, Series A, Callable 10/31/25 at 100,
4.00%, 10/1/40 |
500,000 |
|
494,508 |
San Francisco City & County Public Utilities Commission Wastewater Revenue, Series B, Refunding, Callable 10/31/25 at 100,
4.00%, 10/1/46 |
2,650,000 |
|
2,487,323 |
San Francisco City & County Redevelopment Agency Successor Agency, Series A, Refunding, Callable 08/01/26 at 100,
5.00%, 8/1/36 |
150,000 |
|
151,897 |
San Francisco Public Utilities Commission Water Revenue, Refunding, Callable 11/01/33 at 100,
5.25%, 11/1/48 |
4,855,000 |
|
5,199,707 |
San Jose Revenue, Series C, Callable 04/01/35 at 100,
3.90%, 10/1/35, (FNMA COLL Insured) |
2,975,000 |
|
3,042,937 |
San Mateo Joint Powers Financing Authority Revenue, Series A, Callable 07/15/28 at 100,
5.00%, 7/15/43 |
2,250,000 |
|
2,324,566 |
San Mateo Union High School District GO, Series D, Callable 09/01/33 at 100,
5.00%, 9/1/43(c) |
975,000 |
|
1,057,889 |
The accompanying notes are an integral part of the financial statements.
AMBRUS TAX-CONSCIOUS CALIFORNIA BOND FUND
Portfolio of Investments (Continued)
September 30, 2025
| |
Par
Value |
|
Value |
| MUNICIPAL BONDS — (Continued) |
| California — (Continued) |
Sanger Unified School District, Refunding, Callable 06/01/29 at 100,
5.00%, 6/1/45, (AG Insured) |
$1,900,000 |
|
$ 1,945,466 |
Santa Clara Unified School District GO, Callable 07/01/26 at 100,
3.00%, 7/1/35 |
1,150,000 |
|
1,129,532 |
Santa Clara Valley Water District Revenue, Series A, Refunding, Callable 06/01/30 at 100,
5.00%, 6/1/50 |
765,000 |
|
788,380 |
Santa Clarita Public Finance Authority Revenue, Series B, OID, Refunding, Callable 10/01/26 at 100,
2.00%, 10/1/27 |
20,000 |
|
19,600 |
Santa Cruz City Elementary School District GO, Series C, Callable 08/01/30 at 100,
2.00%, 8/1/36 |
695,000 |
|
572,509 |
Santa Monica Community College District GO, Series A, Callable 08/01/28 at 100,
5.00%, 8/1/43 |
750,000 |
|
770,357 |
Santa Monica Public Financing Authority Revenue, Callable 07/01/27 at 100,
5.00%, 7/1/42 |
3,690,000 |
|
3,761,077 |
Santa Monica-Malibu Unified School District GO, Series A, Callable 08/01/33 at 100,
5.00%, 8/1/50 |
2,175,000 |
|
2,278,263 |
Selma Unified School District GO, Series A, Callable 08/01/31 at 100,
5.25%, 8/1/48, (BAM Insured) |
430,000 |
|
455,858 |
Shasta Joint Powers Financing Authority Revenue, Series A, OID, Refunding, Callable 10/31/25 at 100,
3.00%, 4/1/26, (AG Insured) |
10,000 |
|
10,002 |
South Tahoe Public Utility District Water Revenue, Callable 08/01/34 at 100,
5.00%, 8/1/54 |
50,000 |
|
52,348 |
| |
Par
Value |
|
Value |
| MUNICIPAL BONDS — (Continued) |
| California — (Continued) |
Southern California Public Power Authority Revenue, Series A,
5.25%, 11/1/27 |
$ 380,000 |
|
$ 392,395 |
Southern California Water Replenishment District Revenue, Callable 08/01/28 at 100,
5.00%, 8/1/48 |
250,000 |
|
254,779 |
Southern California Water Replenishment District Revenue, Refunding, Callable 10/21/25 at 100,
4.00%, 8/1/45 |
1,600,000 |
|
1,545,801 |
State of California GO, Callable 03/01/30 at 100,
3.00%, 3/1/46, (BAM-TCRS Insured) |
280,000 |
|
224,010 |
State of California GO, Callable 04/01/32 at 100,
5.00%, 4/1/47 |
1,725,000 |
|
1,809,976 |
State of California GO, Refunding, Callable 04/01/29 at 100,
5.00%, 10/1/42 |
2,805,000 |
|
2,913,623 |
State of California GO, Refunding, Callable 09/01/26 at 100,
5.00%, 9/1/45 |
250,000 |
|
252,462 |
Stockton Unified School District, Refunding, Callable 02/01/28 at 100,
5.00%, 2/1/35 |
2,060,000 |
|
2,142,323 |
Sweetwater Union High School District GO, Refunding, Callable 02/01/26 at 100,
4.00%, 8/1/42, (BAM-TCRS Insured) |
1,500,000 |
|
1,481,760 |
Tobacco Securitization Authority of Southern California Revenue, Refunding, Callable 12/01/29 at 100,
5.00%, 6/1/35 |
250,000 |
|
260,566 |
Town of Mammoth Lakes, Callable 06/01/34 at 100,
5.00%, 6/1/44, (BAM Insured) |
500,000 |
|
534,718 |
Travis Unified School District, Refunding, Callable 10/31/25 at 100,
5.00%, 9/1/29, (AG Insured) |
20,000 |
|
20,042 |
The accompanying notes are an integral part of the financial statements.
AMBRUS TAX-CONSCIOUS CALIFORNIA BOND FUND
Portfolio of Investments (Continued)
September 30, 2025
| |
Par
Value |
|
Value |
| MUNICIPAL BONDS — (Continued) |
| California — (Continued) |
Turlock Irrigation District Revenue, Refunding, Callable 01/01/30 at 100,
5.00%, 1/1/41 |
$ 195,000 |
|
$ 204,548 |
University of California Revenue, Series AZ, Refunding, Callable 05/15/28 at 100,
5.00%, 5/15/43 |
745,000 |
|
762,303 |
University of California Revenue, Series M, Callable 05/15/27 at 100,
5.00%, 5/15/42 |
1,620,000 |
|
1,645,696 |
University of California Revenue, Series Q, Refunding, Callable 05/15/31 at 100,
5.00%, 5/15/46 |
2,930,000 |
|
3,072,044 |
Vacaville Unified School District GO, Series C, Callable 08/01/26 at 100,
5.00%, 8/1/42 |
785,000 |
|
797,343 |
Victor Valley Transit Authority, Refunding, Callable 07/01/26 at 100,
5.00%, 7/1/30 |
20,000 |
|
20,416 |
Washington Township Health Care District GO, Series B, OID, Callable 10/21/25 at 100,
5.00%, 8/1/43 |
30,000 |
|
30,004 |
Washington Township Health Care District GO, Series DT, Refunding, Callable 08/01/26 at 100,
4.00%, 8/1/29 |
10,000 |
|
10,108 |
Washington Township Health Care District Revenue, Series A, Refunding,
5.00%, 7/1/28 |
350,000 |
|
368,685 |
West Hollywood Public Financing Authority Revenue, Series A, Callable 04/01/30 at 100,
5.00%, 4/1/44 |
795,000 |
|
826,142 |
Western Placer Unified School District GO, Series B, Callable 08/01/26 at 100,
5.00%, 8/1/43 |
355,000 |
|
359,760 |
| |
Par
Value |
|
Value |
| MUNICIPAL BONDS — (Continued) |
| California — (Continued) |
Whittier Union High School District GO, CAB, OID, Refunding, Callable 08/01/26 at 85,
0.00%, 8/1/31(d) |
$ 570,000 |
|
$ 475,610 |
William S Hart Union High School District GO, Series C, OID, Callable 10/31/25 at 100,
3.50%, 8/1/38 |
480,000 |
|
465,667 |
Yuba Levee Financing Authority Revenue, Series A, Refunding, Callable 09/01/26 at 100,
5.00%, 9/1/29, (BAM Insured) |
20,000 |
|
20,498 |
Yuba Levee Financing Authority Revenue, Series A, Refunding, Callable 09/01/26 at 100,
5.00%, 9/1/30, (BAM Insured) |
25,000 |
|
25,624 |
| |
|
|
315,558,025 |
| Connecticut — 1.2% |
Connecticut Housing Finance Authority Revenue, Series 1, Refunding, Callable 11/15/28 at 100,
2.60%, 11/15/34 |
750,000 |
|
671,773 |
Connecticut State Health & Educational Facilities Authority Revenue, Callable 10/21/25 at 100,
5.00%, 7/1/45 |
650,000 |
|
650,091 |
Connecticut State Health & Educational Facilities Authority Revenue, Series L, Refunding, Callable 10/31/25 at 100,
5.00%, 7/1/45 |
1,500,000 |
|
1,500,276 |
State of Connecticut Special Tax Revenue, Series A, Callable 09/01/26 at 100,
4.00%, 9/1/35 |
2,500,000 |
|
2,507,556 |
| |
|
|
5,329,696 |
| Illinois — 1.4% |
Illinois Finance Authority Revenue, Refunding, Callable 10/31/25 at 100,
3.90%, 3/1/30 |
5,000,000 |
|
5,001,063 |
The accompanying notes are an integral part of the financial statements.
AMBRUS TAX-CONSCIOUS CALIFORNIA BOND FUND
Portfolio of Investments (Continued)
September 30, 2025
| |
Par
Value |
|
Value |
| MUNICIPAL BONDS — (Continued) |
| Illinois — (Continued) |
Illinois Finance Authority Revenue, Series A, Callable 08/15/32 at 100,
5.00%, 8/15/52 |
$ 400,000 |
|
$ 405,036 |
Lake County School District No 1 Winthrop Harbor GO, Refunding, Callable 02/01/26 at 100,
4.00%, 2/1/32 |
380,000 |
|
381,327 |
| |
|
|
5,787,426 |
| Iowa — 0.0% |
Iowa Finance Authority Revenue, Series C, Refunding, Callable 10/21/25 at 100,
5.00%, 2/15/32 |
150,000 |
|
150,380 |
| Michigan — 0.4% |
Michigan State Building Authority Revenue, Series I, Refunding, Callable 10/15/25 at 100,
5.00%, 10/15/45 |
1,500,000 |
|
1,501,357 |
| Minnesota — 0.0% |
Minneapolis Revenue, Series A, Refunding, Callable 11/15/25 at 100,
5.00%, 11/15/26 |
100,000 |
|
100,194 |
| Missouri — 0.9% |
Missouri Joint Municipal Electric Utility Commission Revenue , Series A, Refunding, Callable 06/01/26 at 100,
5.00%, 12/1/40 |
2,500,000 |
|
2,523,771 |
Monarch-Chesterfield Levee District, Refunding, Callable 10/31/25 at 100,
5.00%, 3/1/40 |
1,385,000 |
|
1,385,477 |
| |
|
|
3,909,248 |
| New Hampshire — 0.2% |
Dover GO, Series A, Callable 06/15/26 at 100,
3.00%, 6/15/31 |
1,000,000 |
|
1,000,231 |
| |
Par
Value |
|
Value |
| MUNICIPAL BONDS — (Continued) |
| New York — 0.2% |
New York City Housing Development Corp. Revenue, Series 1,
3.45%, 11/1/28, (REMIC FHA 542c Insured) |
$ 345,000 |
|
$ 351,222 |
New York City Housing Development Corp. Revenue, Series 2A, Callable 10/21/25 at 100,
3.40%, 11/1/62, (REMIC FHA 542c Insured)(a) |
350,000 |
|
350,034 |
| |
|
|
701,256 |
| Ohio — 1.5% |
State of Ohio Revenue, Series A, Refunding, Callable 01/15/26 at 100,
5.00%, 1/15/41 |
1,800,000 |
|
1,802,491 |
Toledo Water System Revenue, Callable 11/15/26 at 100,
5.00%, 11/15/41 |
3,575,000 |
|
3,599,451 |
University of Akron/The Revenue, Series A, Refunding, Callable 07/01/26 at 100,
5.00%, 1/1/38 |
1,100,000 |
|
1,104,849 |
| |
|
|
6,506,791 |
| Oklahoma — 0.6% |
University of Oklahoma/The Revenue, Series C, Callable 10/31/25 at 100,
5.00%, 7/1/38 |
2,610,000 |
|
2,612,484 |
| Oregon — 0.3% |
Seaside School District No 10 GO, Series A, CAB, OID, Callable 06/15/27 at 51,
0.00%, 6/15/42, (SCH BD GTY Insured)(d) |
3,000,000 |
|
1,330,273 |
| Pennsylvania — 1.9% |
Bellefonte Area School District GO, Series A, Refunding, Callable 05/15/32 at 100,
5.00%, 5/15/48, (ST AID WITHHLDG Insured) |
2,125,000 |
|
2,206,788 |
North Penn School District GO, Callable 03/01/30 at 100,
5.00%, 3/1/50, (ST AID WITHHLDG Insured) |
1,600,000 |
|
1,620,831 |
The accompanying notes are an integral part of the financial statements.
AMBRUS TAX-CONSCIOUS CALIFORNIA BOND FUND
Portfolio of Investments (Continued)
September 30, 2025
| |
Par
Value |
|
Value |
| MUNICIPAL BONDS — (Continued) |
| Pennsylvania — (Continued) |
Pennsylvania Economic Development Financing Authority Revenue, AMT, OID, Callable 12/31/32 at 100,
5.00%, 12/31/57, (AG Insured) |
$ 630,000 |
|
$ 634,778 |
Pennsylvania Turnpike Commission Revenue , Series 1, Callable 06/01/26 at 100,
5.00%, 12/1/41 |
2,615,000 |
|
2,634,589 |
Philadelphia GO, Refunding, Callable 08/01/27 at 100,
5.00%, 8/1/37 |
1,130,000 |
|
1,160,889 |
| |
|
|
8,257,875 |
| South Carolina — 0.7% |
Orangeburg County Facilities Corp. Revenue, Refunding, Callable 12/01/27 at 100,
5.00%, 12/1/30 |
1,560,000 |
|
1,612,815 |
South Carolina Ports Authority Revenue, Series A, Callable 07/01/29 at 100,
5.00%, 7/1/54 |
1,250,000 |
|
1,263,392 |
| |
|
|
2,876,207 |
| Texas — 1.6% |
El Paso GO, Callable 08/15/26 at 100,
5.00%, 8/15/42 |
1,500,000 |
|
1,510,840 |
Harris Toll Road County Revenue, Series A, Senior Series, Refunding, Callable 02/15/28 at 100,
5.00%, 8/15/43 |
2,815,000 |
|
2,873,839 |
Texas Municipal Gas Acquisition & Supply Corp. III Revenue, Refunding,
5.00%, 12/15/27 |
500,000 |
|
518,891 |
Texas Municipal Gas Acquisition & Supply Corp. IV Revenue, Series B, Callable 07/01/33 at 100,
5.50%, 1/1/54(a) |
1,750,000 |
|
1,971,375 |
| |
|
|
6,874,945 |
| |
Par
Value |
|
Value |
| MUNICIPAL BONDS — (Continued) |
| Washington — 1.0% |
Bellevue GO, Refunding, Callable 10/21/25 at 100,
4.00%, 12/1/31 |
$2,315,000 |
|
$ 2,316,390 |
King County Sewer Revenue, Series A, Refunding, Callable 01/01/26 at 100,
4.00%, 7/1/40 |
2,000,000 |
|
1,975,107 |
| |
|
|
4,291,497 |
TOTAL MUNICIPAL BONDS
(Cost $368,873,398) |
|
|
366,787,885 |
| |
Par Value/
Shares |
|
| PREFERREDS — 7.6% |
| Consumer Discretionary — 0.2% |
| General Motors Financial Co., Inc., 5.75%, 9/30/27(e) |
875,000 |
868,295 |
| Energy — 0.2% |
| BP Capital Markets PLC, 6.45%, 12/1/33 |
1,000,000 |
1,069,066 |
| Financials — 7.2% |
| Bank of America Corp., 6.625%, 5/1/30 |
2,950,000 |
3,073,429 |
| Bank of New York Mellon Corp. (The), 3.70%, 3/20/26(e) |
850,000 |
842,519 |
| Bank of New York Mellon Corp. (The), 4.625%, 9/20/26 |
875,000 |
870,038 |
| Bank of New York Mellon Corp. (The), 6.15%, 3/20/30(e) |
13,250 |
341,452 |
| Bank of New York Mellon Corp. (The), 6.30%, 3/20/30 |
1,500,000 |
1,544,299 |
| Citigroup, Inc., 4.00%, 12/10/25(e) |
1,850,000 |
1,845,171 |
| Citigroup, Inc., 7.625%, 11/15/28(e) |
1,550,000 |
1,629,766 |
| Citigroup, Inc., 6.75%, 2/15/30 |
2,800,000 |
2,851,601 |
| Citigroup, Inc., 6.875%, 8/15/30(e) |
1,525,000 |
1,573,145 |
| Goldman Sachs Group, Inc. (The), 6.125%, 11/10/34 |
4,300,000 |
4,370,278 |
| KKR & Co., Inc., 6.875%, 6/1/65 |
150,000 |
3,892,500 |
| Morgan Stanley, 6.875%, 1/15/26(e) |
41,519 |
1,044,203 |
| Northern Trust Corp., 4.60%, 10/1/26(e) |
1,700,000 |
1,693,263 |
| State Street Corp., 5.35%, 3/15/26(e) |
20,000 |
465,200 |
| State Street Corp., 6.45%, 9/15/30 |
2,200,000 |
2,272,486 |
The accompanying notes are an integral part of the financial statements.
AMBRUS TAX-CONSCIOUS CALIFORNIA BOND FUND
Portfolio of Investments (Continued)
September 30, 2025
| |
Par Value/
Shares |
|
Value |
| PREFERREDS — (Continued) |
| Financials — (Continued) |
| Wells Fargo & Co., 3.90%, 3/15/26(e) |
$ 350,000 |
|
$ 347,003 |
| Wells Fargo & Co., 6.85%, 9/15/29 |
2,350,000 |
|
2,474,070 |
| |
|
|
31,130,423 |
TOTAL PREFERREDS
(Cost $31,681,375) |
|
|
33,067,784 |
| |
Par
Value |
|
| U.S. TREASURY OBLIGATIONS — 4.9% |
United States Treasury Floating Rate Notes,
4.143% (3 Month U.S. Treasury Money Market Yield + 25 bps), 1/31/26(a) |
21,000,000 |
21,000,362 |
U.S. TREASURY OBLIGATIONS
(Cost $21,007,527) |
21,000,362 |
| CORPORATE BONDS — 0.5% |
| Financials — 0.4% |
| Zions Bancorp NA, 6.816%, 11/19/35 |
1,500,000 |
1,595,277 |
| Real Estate — 0.1% |
| Hudson Pacific Properties LP, REIT, 4.65%, 4/1/29 |
500,000 |
465,734 |
TOTAL CORPORATE BONDS
(Cost $1,932,004) |
|
2,061,011 |
| |
Number
of Shares |
|
| EXCHANGE TRADED FUNDS — 1.1% |
| SPDR Portfolio High Yield Bond ETF |
200,000 |
4,788,000 |
TOTAL EXCHANGE TRADED FUNDS
(Cost $4,591,706) |
|
4,788,000 |
| |
Number
of Shares |
|
Value |
| SHORT-TERM INVESTMENT — 1.3% |
| Dreyfus Government Cash Management Fund, Institutional Shares, 4.04%(f) |
5,777,841 |
|
$ 5,777,841 |
| |
| |
TOTAL SHORT-TERM INVESTMENT
(Cost $5,777,841) |
|
|
5,777,841 |
| |
| |
TOTAL INVESTMENTS - 100.4%
(Cost $433,863,851) |
|
|
433,482,883 |
| LIABILITIES IN EXCESS OF OTHER ASSETS - (0.4)% |
|
|
(1,895,199) |
| NET ASSETS - 100.0% |
|
|
$431,587,684 |
| (a) |
Variable or Floating rate security. Rate shown is the rate in effect as of period end. Certain variable rate securities are not based on a published reference rate and spread, rather are determined by the issuer or agent and are based on current market conditions. Reference rate is as of reset date, which may vary by security. These securities may not indicate a reference rate and/or spread in their description. |
| (b) |
Securities exempt from registration under Rule 144A of the Securities Act of 1933, as amended. These securities were purchased in accordance with the guidelines approved by the Fund’s Board of Trustees and may be resold, in transactions exempt from registration, to qualified institutional buyers. At September 30, 2025, these securities amounted to $148,422 or 0.03% of net assets. These securities have been determined by the Fund's adviser to be liquid securities. |
| (c) |
Securities purchased on a when-issued basis. Rates do not take effect until settlement date. |
| (d) |
Zero coupon bond. |
| (e) |
Non-voting shares. |
| (f) |
Rate disclosed is the 7-day yield at September 30, 2025. |
| AG |
Assured Guaranty |
| AMT |
Alternative Minimum Tax |
| BAM |
Build America Mutual |
| BAM-TCRS |
Build America Mutual-Transferable Custodial Receipts |
| CA MTG |
California Mortgage |
| CAB |
Capital Appreciation Bond |
| COLL |
Collateral |
| ETF |
Exchange-Traded Fund |
| FNMA |
Federal National Mortgage Association |
| GO |
General Obligation |
| HUD SECT 8 |
Housing and Urban Development Section 8 |
The accompanying notes are an integral part of the financial statements.
AMBRUS TAX-CONSCIOUS CALIFORNIA BOND FUND
Portfolio of Investments (Concluded)
September 30, 2025
| LP |
Limited Partnership |
| NATL |
National Public Finance Guarantee Corp. |
| OID |
Original Issue Discount |
| PLC |
Public Limited Company |
| REIT |
Real Estate Investment Trust |
| REMIC FHA 542c |
Real Estate Mortgage Investment Conduit Federal Housing Administration Section 542c |
| SCH BD GTY |
School Board Guaranty |
| SPDR |
Standard & Poor's Depository Receipt |
| ST AID WITHHLDG |
State Aid Withholding |
The accompanying notes are an integral part of the financial statements.
AMBRUS TAX-CONSCIOUS NATIONAL BOND FUND
Portfolio of Investments
September 30, 2025
| |
Par
Value |
|
Value |
| MUNICIPAL BONDS — 82.7% |
| Alabama — 2.2% |
Birmingham-Jefferson Civic Center Authority, Series B, Callable 07/01/28 at 100,
5.00%, 7/1/43 |
$1,750,000 |
|
$ 1,762,125 |
Black Belt Energy Gas District Revenue, Series D,
5.00%, 11/1/26 |
1,000,000 |
|
1,017,507 |
Black Belt Energy Gas District Revenue, Series D, Callable 08/01/34 at 100,
5.00%, 3/1/55(a) |
2,150,000 |
|
2,346,093 |
Jefferson County Revenue, Refunding, Callable 03/15/27 at 100,
5.00%, 9/15/34 |
850,000 |
|
864,559 |
Marshall County GO,
5.00%, 11/1/26 |
95,000 |
|
97,512 |
Marshall County GO,
5.00%, 11/1/27 |
105,000 |
|
110,340 |
Southeast Energy Authority A Cooperative District Revenue, Series A, Callable 07/01/28 at 101,
4.00%, 11/1/51(a) |
1,665,000 |
|
1,706,626 |
Southeast Energy Authority A Cooperative District Revenue, Series B,
4.00%, 6/1/31 |
525,000 |
|
535,863 |
UAB Medicine Finance Authority Revenue, Series B-2, Refunding, Callable 03/01/27 at 100,
5.00%, 9/1/34 |
500,000 |
|
513,103 |
| |
|
|
8,953,728 |
| Arizona — 0.5% |
Graham County Jail District Revenue, Callable 10/31/25 at 100,
5.00%, 7/1/35 |
1,000,000 |
|
1,000,894 |
Phoenix Civic Improvement Corp. Revenue, Series A, Callable 07/01/29 at 100,
5.00%, 7/1/33 |
1,000,000 |
|
1,070,518 |
| |
|
|
2,071,412 |
| |
Par
Value |
|
Value |
| MUNICIPAL BONDS — (Continued) |
| California — 4.1% |
California Community Choice Financing Authority Revenue, Series B-1, Callable 05/01/31 at 101,
4.00%, 2/1/52(a) |
$2,000,000 |
|
$ 2,050,989 |
California Municipal Finance Authority Revenue, Callable 09/01/32 at 100,
5.25%, 9/1/54, (CA MTG Insured) |
1,000,000 |
|
1,049,993 |
Escondido Union School District GO, Series B, Callable 08/01/27 at 100,
4.00%, 8/1/47 |
1,000,000 |
|
952,541 |
Folsom Cordova Unified School District School Facilities Improvement Dist No 5 GO, OID, Refunding, Callable 10/01/25 at 100,
4.00%, 10/1/40 |
845,000 |
|
845,000 |
Folsom Cordova Unified School District School Facilities Improvement Dist No 5 GO, Series A, OID, Unrefunded portion, Callable 10/21/25 at 100,
4.00%, 10/1/40 |
255,000 |
|
251,637 |
Los Angeles Department of Water & Power Revenue, Series A, Callable 01/01/27 at 100,
5.00%, 7/1/47 |
1,000,000 |
|
1,003,551 |
Los Angeles Department of Water & Power Water System Revenue, Series A, Refunding, Callable 01/01/27 at 100,
5.00%, 7/1/44 |
1,990,000 |
|
1,999,199 |
Merced City School District GO, Callable 08/01/28 at 100,
5.00%, 8/1/48 |
1,870,000 |
|
1,902,248 |
M-S-R Energy Authority Revenue, Series A,
7.00%, 11/1/34 |
1,400,000 |
|
1,699,935 |
Natomas Unified School District GO, OID, Callable 08/01/26 at 100,
3.00%, 8/1/43, (AG Insured) |
950,000 |
|
752,052 |
The accompanying notes are an integral part of the financial statements.
AMBRUS TAX-CONSCIOUS NATIONAL BOND FUND
Portfolio of Investments (Continued)
September 30, 2025
| |
Par
Value |
|
Value |
| MUNICIPAL BONDS — (Continued) |
| California — (Continued) |
Sacramento Transient Occupancy Tax Revenue, Series C, Callable 06/01/28 at 100,
5.00%, 6/1/48 |
$1,115,000 |
|
$ 1,135,368 |
San Francisco City & County Airport Comm-San Francisco International Airport Revenue, Series B, Refunding, Callable 05/01/29 at 100,
5.00%, 5/1/49 |
2,000,000 |
|
2,046,055 |
Turlock Unified School District GO, OID, Callable 08/01/26 at 100,
3.00%, 8/1/42 |
1,000,000 |
|
819,991 |
| |
|
|
16,508,559 |
| Colorado — 3.0% |
Bradburn Metropolitan District No 3 GO, Refunding, Callable 12/01/26 at 100,
4.50%, 12/1/36, (AG Insured) |
700,000 |
|
708,924 |
City & County of Denver Airport System Revenue, Series B, Refunding, Callable 11/15/32 at 100,
5.00%, 11/15/47 |
750,000 |
|
774,990 |
Colorado Health Facilities Authority Revenue, Callable 05/15/28 at 100,
5.00%, 11/15/48 |
1,830,000 |
|
1,853,322 |
Colorado Health Facilities Authority Revenue, Series A, Refunding, Callable 05/15/26 at 100,
5.00%, 11/15/41 |
1,255,000 |
|
1,260,907 |
Colorado Health Facilities Authority Revenue, Series A, Refunding, Callable 11/01/29 at 100,
5.00%, 11/1/44 |
875,000 |
|
885,106 |
Colorado School of Mines Revenue, Series A, Callable 12/01/27 at 100,
5.00%, 12/1/42 |
505,000 |
|
512,373 |
Colorado School of Mines Revenue, Series B, Callable 12/01/27 at 100,
5.00%, 12/1/42 |
3,000,000 |
|
3,043,802 |
| |
Par
Value |
|
Value |
| MUNICIPAL BONDS — (Continued) |
| Colorado — (Continued) |
Colorado State, Callable 12/15/32 at 100,
6.00%, 12/15/41 |
$ 750,000 |
|
$ 854,033 |
Colorado State, Series A, Callable 12/15/28 at 100,
5.00%, 12/15/37 |
200,000 |
|
209,442 |
Fossil Ridge Metropolitan District No 3 GO, Callable 12/01/30 at 103,
5.00%, 12/1/45, (BAM Insured) |
300,000 |
|
311,874 |
Park Creek Metropolitan District Revenue, Series A, Senior Series, Refunding, Callable 12/01/25 at 100,
5.00%, 12/1/34 |
255,000 |
|
255,447 |
Riverdale Ranch Metropolitan District GO, Refunding, Callable 03/01/30 at 103,
5.25%, 12/1/45, (AG Insured) |
250,000 |
|
264,018 |
Town of Breckenridge, Callable 12/01/32 at 100,
5.00%, 12/1/42 |
300,000 |
|
315,792 |
Trails at Crowfoot Metropolitan District No 3 GO, Series A, Refunding, Callable 06/01/34 at 100,
5.00%, 12/1/39, (AG Insured) |
520,000 |
|
550,109 |
Waterstone Metropolitan District No 1 GO, Series A, Senior Series, Refunding, Callable 06/01/30 at 103,
5.25%, 12/1/45, (AG Insured) |
250,000 |
|
261,755 |
| |
|
|
12,061,894 |
| Connecticut — 0.9% |
Connecticut State Health & Educational Facilities Authority Revenue, Callable 10/21/25 at 100,
5.00%, 7/1/45 |
500,000 |
|
500,070 |
The accompanying notes are an integral part of the financial statements.
AMBRUS TAX-CONSCIOUS NATIONAL BOND FUND
Portfolio of Investments (Continued)
September 30, 2025
| |
Par
Value |
|
Value |
| MUNICIPAL BONDS — (Continued) |
| Connecticut — (Continued) |
Connecticut State Health & Educational Facilities Authority Revenue, Series L, Refunding, Callable 10/31/25 at 100,
5.00%, 7/1/45 |
$2,460,000 |
|
$ 2,460,452 |
State of Connecticut Special Tax Revenue, Series A, Callable 09/01/26 at 100,
4.00%, 9/1/34 |
625,000 |
|
627,776 |
| |
|
|
3,588,298 |
| Delaware — 0.2% |
Delaware State Housing Authority Revenue, Series A,
3.35%, 1/1/27, (GNMA/FNMA/FHLMC Insured) |
100,000 |
|
100,568 |
Delaware State Housing Authority Revenue, Series A,
3.35%, 7/1/27, (GNMA/FNMA/FHLMC Insured) |
305,000 |
|
307,665 |
Delaware State Housing Authority Revenue, Series A,
3.375%, 1/1/28, (GNMA/FNMA/FHLMC Insured) |
80,000 |
|
80,889 |
Delaware State Housing Authority Revenue, Series A,
3.40%, 7/1/28, (GNMA/FNMA/FHLMC Insured) |
180,000 |
|
181,965 |
| |
|
|
671,087 |
| District of Columbia — 1.5% |
District of Columbia GO, Series A, Callable 06/01/28 at 100,
5.00%, 6/1/43 |
540,000 |
|
550,126 |
District of Columbia GO, Series D, Callable 06/01/27 at 100,
5.00%, 6/1/42 |
1,400,000 |
|
1,416,281 |
District of Columbia Revenue, Refunding, Callable 01/15/26 at 100,
5.00%, 7/15/40 |
1,000,000 |
|
1,003,010 |
District of Columbia Water & Sewer Authority Revenue, Series A, Callable 10/01/29 at 100,
5.00%, 10/1/44 |
685,000 |
|
701,453 |
| |
Par
Value |
|
Value |
| MUNICIPAL BONDS — (Continued) |
| District of Columbia — (Continued) |
Washington Metropolitan Area Transit Authority Dedicated Revenue, Series A, Callable 07/15/30 at 100,
5.00%, 7/15/45 |
$ 500,000 |
|
$ 515,345 |
Washington Metropolitan Area Transit Authority Revenue, Series B, Callable 07/01/27 at 100,
5.00%, 7/1/42 |
2,000,000 |
|
2,033,896 |
| |
|
|
6,220,111 |
| Florida — 3.9% |
Central Florida Expressway Authority Revenue, Senior Series, Refunding, Callable 07/01/28 at 100,
5.00%, 7/1/48 |
575,000 |
|
583,689 |
Clearwater Water & Sewer Revenue, Refunding, Callable 12/01/26 at 100,
5.00%, 12/1/35 |
1,015,000 |
|
1,040,651 |
Escambia County Housing Finance Authority Revenue,
3.80%, 6/1/27(a) |
1,500,000 |
|
1,508,246 |
Florida Housing Finance Corp. Revenue, Series 1,
2.95%, 7/1/27, (GNMA/FNMA/FHLMC Insured) |
450,000 |
|
451,264 |
Florida Housing Finance Corp. Revenue, Series 1,
3.00%, 1/1/28, (GNMA/FNMA/FHLMC Insured) |
200,000 |
|
200,601 |
Florida Housing Finance Corp. Revenue, Series 1,
3.00%, 7/1/28, (GNMA/FNMA/FHLMC Insured) |
235,000 |
|
235,843 |
Florida Housing Finance Corp. Revenue, Series 1,
3.10%, 1/1/29, (GNMA/FNMA/FHLMC Insured) |
710,000 |
|
716,204 |
Florida Housing Finance Corp. Revenue, Series 1,
3.125%, 7/1/29, (GNMA/FNMA/FHLMC Insured) |
410,000 |
|
414,406 |
The accompanying notes are an integral part of the financial statements.
AMBRUS TAX-CONSCIOUS NATIONAL BOND FUND
Portfolio of Investments (Continued)
September 30, 2025
| |
Par
Value |
|
Value |
| MUNICIPAL BONDS — (Continued) |
| Florida — (Continued) |
Lakeland Department of Electric Utilities Revenue, Refunding, Callable 04/01/26 at 100,
2.75%, 10/1/28 |
$ 250,000 |
|
$ 247,240 |
Miami-Dade County Educational Facilities Authority Revenue, Series A, Callable 04/01/28 at 100,
5.00%, 4/1/48 |
1,000,000 |
|
1,007,203 |
Miami-Dade County Educational Facilities Authority Revenue, Series A, Callable 04/01/28 at 100,
5.00%, 4/1/53 |
1,415,000 |
|
1,424,654 |
Miami-Dade County Revenue, CAB, OID, Refunding, Callable 10/01/26 at 82,
0.00%, 10/1/32, (BAM-TCRS Insured)(b) |
4,425,000 |
|
3,431,696 |
Pasco County Revenue, Callable 03/01/33 at 100,
5.75%, 9/1/54, (AG Insured) |
570,000 |
|
608,447 |
Tampa Bay Water Revenue, Series A, Callable 10/01/34 at 100,
5.25%, 10/1/54 |
3,000,000 |
|
3,187,132 |
Wildwood Utility Dependent District Revenue, Callable 10/01/31 at 100,
5.00%, 10/1/41, (BAM Insured) |
795,000 |
|
836,950 |
| |
|
|
15,894,226 |
| Hawaii — 0.9% |
Honolulu City & County GO, Series A, Callable 09/01/27 at 100,
4.00%, 9/1/40 |
2,000,000 |
|
1,988,577 |
Honolulu City & County GO, Series A, Refunding, Callable 10/01/25 at 100,
5.00%, 10/1/37 |
1,770,000 |
|
1,770,000 |
| |
|
|
3,758,577 |
| |
Par
Value |
|
Value |
| MUNICIPAL BONDS — (Continued) |
| Illinois — 5.5% |
Chicago O'Hare International Airport Revenue, Series B, Senior Series, Refunding, Callable 01/01/26 at 100,
5.00%, 1/1/41 |
$ 745,000 |
|
$ 745,684 |
Chicago O'Hare International Airport Revenue, Series B, Senior Series, Refunding, Callable 01/01/29 at 100,
5.00%, 1/1/48 |
785,000 |
|
791,629 |
Chicago O'Hare International Airport Revenue, Series B, Senior Series, Refunding, Callable 01/01/34 at 100,
5.25%, 1/1/53 |
1,250,000 |
|
1,307,532 |
Chicago O'Hare International Airport Revenue, Series D, Senior Series, Callable 01/01/27 at 100,
5.25%, 1/1/42 |
60,000 |
|
60,750 |
Chicago O'Hare International Airport Revenue, Series D, Senior Series, Callable 01/01/27 at 100,
5.00%, 1/1/47 |
100,000 |
|
100,379 |
Chicago O'Hare International Airport Revenue, Series D, Senior Series, Callable 01/01/27 at 100,
5.00%, 1/1/52 |
3,000,000 |
|
3,006,898 |
Chicago Transit Authority Sales Tax Receipts Fund Revenue, Callable 12/01/26 at 100,
5.00%, 12/1/46 |
4,075,000 |
|
4,086,367 |
Chicago Waterworks Revenue, Series 2017-2, Refunding, Callable 11/01/27 at 100,
5.00%, 11/1/33, (AG Insured) |
350,000 |
|
361,992 |
Illinois Finance Authority Revenue, Refunding, Callable 10/31/25 at 100,
3.90%, 3/1/30 |
2,000,000 |
|
2,000,425 |
Illinois Finance Authority Revenue, Series A, Callable 08/15/32 at 100,
5.00%, 8/15/52 |
600,000 |
|
607,554 |
The accompanying notes are an integral part of the financial statements.
AMBRUS TAX-CONSCIOUS NATIONAL BOND FUND
Portfolio of Investments (Continued)
September 30, 2025
| |
Par
Value |
|
Value |
| MUNICIPAL BONDS — (Continued) |
| Illinois — (Continued) |
Illinois Finance Authority Revenue, Series A, Refunding, Callable 08/15/31 at 100,
5.00%, 8/15/35 |
$1,190,000 |
|
$ 1,291,453 |
Illinois Housing Development Authority Revenue, Series G, Callable 04/01/32 at 100,
5.00%, 10/1/46, (GNMA/FNMA/FHLMC COLL Insured) |
400,000 |
|
405,827 |
Illinois State GO, OID, Callable 05/01/30 at 100,
5.50%, 5/1/39 |
85,000 |
|
90,260 |
Illinois State Toll Highway Authority Revenue, Series A, Callable 01/01/28 at 100,
5.00%, 1/1/42 |
990,000 |
|
1,007,281 |
Illinois State Toll Highway Authority Revenue, Series B, Callable 01/01/26 at 100,
5.00%, 1/1/40 |
1,500,000 |
|
1,503,148 |
Illinois State Toll Highway Authority Revenue, Series B, Senior Series, Callable 07/01/26 at 100,
5.00%, 1/1/41 |
600,000 |
|
603,282 |
Macon County School District No 61 Decatur GO,
4.00%, 12/1/28, (AG Insured) |
600,000 |
|
616,601 |
State of Illinois GO, Callable 06/01/26 at 100,
4.00%, 6/1/32 |
830,000 |
|
832,471 |
State of Illinois GO, OID, Callable 01/01/26 at 100,
3.75%, 1/1/34, (AG Insured) |
1,075,000 |
|
1,075,371 |
State of Illinois GO, Series A, Callable 03/01/31 at 100,
4.00%, 3/1/38 |
1,000,000 |
|
970,678 |
Western Illinois University Revenue, Refunding,
4.00%, 4/1/28, (BAM Insured) |
875,000 |
|
890,611 |
| |
|
|
22,356,193 |
| Indiana — 1.4% |
Indiana Finance Authority Revenue, Series A, Refunding, Callable 10/31/25 at 100,
5.00%, 2/1/31 |
305,000 |
|
305,373 |
| |
Par
Value |
|
Value |
| MUNICIPAL BONDS — (Continued) |
| Indiana — (Continued) |
Indiana Municipal Power Agency Revenue, Series C, Refunding, Callable 07/01/26 at 100,
5.00%, 1/1/37 |
$ 500,000 |
|
$ 504,711 |
Indianapolis Local Public Improvement Bond Bank Revenue, Series A, Callable 02/01/29 at 100,
5.00%, 2/1/44 |
1,000,000 |
|
1,021,557 |
Northern Indiana Commuter Transportation District Revenue, Callable 07/01/26 at 100,
5.00%, 7/1/41 |
3,360,000 |
|
3,363,495 |
Sunman-Dearborn High School Building Corp. Revenue, Callable 07/15/33 at 100,
5.00%, 1/15/44, (ST INTERCEPT Insured) |
600,000 |
|
624,719 |
| |
|
|
5,819,855 |
| Iowa — 0.7% |
Iowa Finance Authority Revenue, Series A, Refunding,
1.15%, 7/1/29, (GNMA/FNMA/FHLMC Insured) |
250,000 |
|
228,464 |
Iowa Finance Authority Revenue, Series C, Refunding, Callable 10/21/25 at 100,
5.00%, 2/15/32 |
500,000 |
|
501,268 |
Iowa State Board of Regents Revenue, Refunding, Callable 09/01/29 at 100,
2.00%, 9/1/31 |
1,000,000 |
|
906,831 |
PEFA, Inc. Revenue, Callable 06/01/26 at 101,
5.00%, 9/1/49(a) |
1,295,000 |
|
1,317,875 |
| |
|
|
2,954,438 |
| Kansas — 1.1% |
Douglas County Unified School District No 348 Baldwin City GO, Refunding, Callable 09/01/31 at 100,
5.00%, 9/1/43, (AG Insured) |
380,000 |
|
391,241 |
The accompanying notes are an integral part of the financial statements.
AMBRUS TAX-CONSCIOUS NATIONAL BOND FUND
Portfolio of Investments (Continued)
September 30, 2025
| |
Par
Value |
|
Value |
| MUNICIPAL BONDS — (Continued) |
| Kansas — (Continued) |
Douglas County Unified School District No 348 Baldwin City GO, Refunding, Callable 09/01/31 at 100,
5.00%, 9/1/44, (AG Insured) |
$ 800,000 |
|
$ 821,831 |
University of Kansas Hospital Authority Revenue, Refunding, Callable 10/21/25 at 100,
5.00%, 9/1/33 |
500,000 |
|
500,453 |
University of Kansas Hospital Authority Revenue, Refunding, Callable 10/21/25 at 100,
5.00%, 9/1/45 |
2,500,000 |
|
2,500,682 |
| |
|
|
4,214,207 |
| Louisiana — 0.2% |
Shreveport Water & Sewer Revenue, Refunding, Callable 12/01/25 at 100,
5.00%, 12/1/35, (AG Insured) |
815,000 |
|
817,406 |
| Maine — 0.1% |
Portland General Airport Revenue, Refunding,
5.00%, 7/1/28 |
330,000 |
|
349,861 |
| Maryland — 1.0% |
Baltimore Revenue, Series A, Callable 01/01/27 at 100,
5.00%, 7/1/46 |
2,650,000 |
|
2,665,206 |
Baltimore Revenue, Series A, Callable 01/01/27 at 100,
5.00%, 7/1/46 |
1,375,000 |
|
1,382,890 |
| |
|
|
4,048,096 |
| Massachusetts — 1.6% |
Commonwealth of Massachusetts GO, Series C, Callable 05/01/29 at 100,
5.00%, 5/1/47 |
1,375,000 |
|
1,408,978 |
| |
Par
Value |
|
Value |
| MUNICIPAL BONDS — (Continued) |
| Massachusetts — (Continued) |
Massachusetts Bay Transportation Authority Sales Tax Revenue, Series A-2, Refunding, Callable 07/01/27 at 100,
5.00%, 7/1/39 |
$3,500,000 |
|
$ 3,575,733 |
Massachusetts School Building Authority Revenue, Series B, Senior Series, Callable 11/15/26 at 100,
5.00%, 11/15/46 |
1,470,000 |
|
1,476,812 |
| |
|
|
6,461,523 |
| Michigan — 2.8% |
Grand Rapids Public Schools GO, Callable 05/01/29 at 100,
5.00%, 11/1/41, (AG Insured) |
1,000,000 |
|
1,031,244 |
Karegnondi Water Authority Revenue, Refunding, Callable 11/01/27 at 100,
5.00%, 11/1/41 |
1,125,000 |
|
1,142,210 |
Karegnondi Water Authority Revenue, Refunding, Callable 11/01/27 at 100,
5.00%, 11/1/45 |
710,000 |
|
715,138 |
Lansing Board of Water & Light Revenue, Series A, Refunding, Callable 07/01/29 at 100,
5.00%, 7/1/44 |
500,000 |
|
510,475 |
Michigan Finance Authority Revenue, Refunding, Callable 11/15/26 at 100,
5.00%, 11/15/37 |
2,000,000 |
|
2,023,877 |
Michigan Finance Authority Revenue, Series A, Refunding, Callable 12/01/29 at 100,
5.00%, 12/1/41 |
100,000 |
|
103,159 |
Michigan Finance Authority Revenue, Series B, Refunding, Callable 10/14/25 at 100,
5.00%, 7/1/34 |
855,000 |
|
855,718 |
Michigan State Building Authority Revenue, Series I, Refunding, Callable 10/15/25 at 100,
5.00%, 10/15/45 |
2,000,000 |
|
2,001,809 |
The accompanying notes are an integral part of the financial statements.
AMBRUS TAX-CONSCIOUS NATIONAL BOND FUND
Portfolio of Investments (Continued)
September 30, 2025
| |
Par
Value |
|
Value |
| MUNICIPAL BONDS — (Continued) |
| Michigan — (Continued) |
Michigan State Building Authority Revenue, Series I, Refunding, Callable 10/15/26 at 100,
5.00%, 10/15/46 |
$1,000,000 |
|
$ 1,005,522 |
Michigan State Building Authority Revenue, Series I, Refunding, Callable 10/15/32 at 100,
5.00%, 10/15/47 |
500,000 |
|
518,310 |
Wayne County Airport Authority Revenue, Series D, Callable 12/01/25 at 100,
5.00%, 12/1/45 |
500,000 |
|
500,129 |
Wayne State University Revenue, Series A, Refunding,
5.00%, 11/15/26 |
680,000 |
|
698,035 |
| |
|
|
11,105,626 |
| Minnesota — 0.4% |
Edina Independent School District No 273 GO, Series A, Callable 02/01/28 at 100,
2.00%, 2/1/30, (SD CRED PROG Insured) |
150,000 |
|
141,850 |
Minneapolis Revenue, Series A, Refunding, Callable 11/15/25 at 100,
5.00%, 11/15/26 |
100,000 |
|
100,194 |
Minneapolis-St Paul Metropolitan Airports Commission Revenue, Series A, Refunding, Callable 07/01/29 at 100,
5.00%, 1/1/44 |
1,500,000 |
|
1,529,699 |
| |
|
|
1,771,743 |
| Mississippi — 0.8% |
Medical Center Educational Building Corp. Revenue, Refunding, Callable 06/01/27 at 100,
5.00%, 6/1/47 |
1,000,000 |
|
1,004,619 |
Mississippi Home Corp. Revenue, Series C,
3.95%, 12/1/31, (GNMA/FNMA/FHLMC Insured) |
815,000 |
|
847,465 |
| |
Par
Value |
|
Value |
| MUNICIPAL BONDS — (Continued) |
| Mississippi — (Continued) |
Mississippi Home Corp. Revenue, Series C,
4.00%, 6/1/32, (GNMA/FNMA/FHLMC Insured) |
$ 350,000 |
|
$ 361,078 |
State of Mississippi Gaming Tax Revenue, Series E, Callable 10/31/25 at 100,
5.00%, 10/15/34 |
915,000 |
|
915,862 |
| |
|
|
3,129,024 |
| Missouri — 1.4% |
Jasper County Reorganized School District No R-IX Carthage, Refunding,
4.00%, 4/1/27 |
40,000 |
|
40,613 |
Missouri Joint Municipal Electric Utility Commission Revenue , Series A, Refunding, Callable 06/01/26 at 100,
5.00%, 12/1/40 |
2,500,000 |
|
2,523,771 |
Missouri State Environmental Improvement & Energy Resources Authority Revenue, Series C, Refunding, Callable 06/12/27 at 102,
2.75%, 9/1/33 |
1,000,000 |
|
925,198 |
Monarch-Chesterfield Levee District, Refunding, Callable 10/31/25 at 100,
5.00%, 3/1/40 |
1,100,000 |
|
1,100,379 |
St Louis County Reorganized School District No R-6 GO, Refunding, Callable 02/01/27 at 100,
2.00%, 2/1/32 |
505,000 |
|
460,363 |
St Louis Municipal Finance Corp. Revenue, OID, Refunding, Callable 10/01/27 at 100,
3.50%, 10/1/37, (AG Insured) |
555,000 |
|
527,059 |
| |
|
|
5,577,383 |
| Nebraska — 2.2% |
Central Plains Energy Project Revenue, Series 1, Callable 07/01/29 at 100,
5.00%, 5/1/53(a) |
2,100,000 |
|
2,233,276 |
The accompanying notes are an integral part of the financial statements.
AMBRUS TAX-CONSCIOUS NATIONAL BOND FUND
Portfolio of Investments (Continued)
September 30, 2025
| |
Par
Value |
|
Value |
| MUNICIPAL BONDS — (Continued) |
| Nebraska — (Continued) |
Central Plains Energy Project Revenue, Series A, Refunding, Callable 08/01/29 at 100,
5.00%, 5/1/54(a) |
$1,000,000 |
|
$ 1,071,767 |
Nebraska Public Power District Revenue, Series D, Refunding, Callable 01/01/26 at 100,
5.00%, 1/1/46 |
2,470,000 |
|
2,471,554 |
Otoe County School District No 501 GO, Callable 06/26/29 at 100,
5.00%, 12/15/42 |
700,000 |
|
720,447 |
York School District GO, Callable 12/23/29 at 100,
5.00%, 12/15/50 |
2,115,000 |
|
2,160,734 |
| |
|
|
8,657,778 |
| Nevada — 1.4% |
Clark County Department of Aviation Revenue, Series A-2, Refunding, Callable 07/01/27 at 100,
5.00%, 7/1/40 |
550,000 |
|
559,185 |
Las Vegas Convention & Visitors Authority Revenue, Series B, Callable 07/01/32 at 100,
5.25%, 7/1/49 |
4,435,000 |
|
4,633,658 |
Nevada Housing Division Revenue, Series E, Senior Series, Callable 10/01/33 at 100,
7.50%, 4/1/49, (GNMA/FNMA/FHLMC Insured) |
500,000 |
|
601,760 |
| |
|
|
5,794,603 |
| New Hampshire — 0.5% |
Dover GO, Series A, Callable 06/15/26 at 100,
3.00%, 6/15/31 |
1,000,000 |
|
1,000,231 |
New Hampshire Business Finance Authority Revenue, Series A,
5.00%, 8/1/31 |
305,000 |
|
331,928 |
New Hampshire Health and Education Facilities Authority Act Revenue, Refunding, Callable 10/31/25 at 100,
5.00%, 7/1/40 |
750,000 |
|
750,382 |
| |
|
|
2,082,541 |
| |
Par
Value |
|
Value |
| MUNICIPAL BONDS — (Continued) |
| New Jersey — 0.5% |
Atlantic City GO, Series A, Refunding, Callable 03/01/27 at 100,
5.00%, 3/1/32, (BAM ST AID WITHHLDG Insured) |
$ 250,000 |
|
$ 257,502 |
Borough of South Plainfield, Series B, Refunding,
4.00%, 8/7/26 |
1,621,500 |
|
1,639,097 |
Garden State Preservation Trust Revenue, Series A,
5.75%, 11/1/28, (AG Insured) |
190,000 |
|
199,394 |
| |
|
|
2,095,993 |
| New York — 8.4% |
Berlin Central School District,
4.00%, 8/21/26, (ST AID WITHHLDG Insured) |
10,000 |
|
10,089 |
Empire State Development Corp. Revenue, Refunding, Callable 09/15/30 at 100,
5.00%, 3/15/43 |
1,195,000 |
|
1,235,828 |
Hudson Yards Infrastructure Corp. Revenue, Series A, Refunding, Callable 02/15/27 at 100,
5.00%, 2/15/42 |
4,165,000 |
|
4,222,235 |
Long Island Power Authority Revenue, Series B, Refunding, Callable 09/01/26 at 100,
5.00%, 9/1/46 |
1,000,000 |
|
1,000,251 |
Metropolitan Transportation Authority Revenue, Series 1, OID, Refunding, Callable 05/15/30 at 100,
5.00%, 11/15/50 |
1,500,000 |
|
1,512,881 |
Metropolitan Transportation Authority Revenue, Series C-1, Refunding,
5.00%, 11/15/25 |
15,000 |
|
15,036 |
Metropolitan Transportation Authority Revenue, Series C-1, Refunding, Callable 11/15/26 at 100,
5.00%, 11/15/32 |
165,000 |
|
168,645 |
Montgomery County, Refunding,
3.75%, 7/31/26 |
2,190,000 |
|
2,208,199 |
The accompanying notes are an integral part of the financial statements.
AMBRUS TAX-CONSCIOUS NATIONAL BOND FUND
Portfolio of Investments (Continued)
September 30, 2025
| |
Par
Value |
|
Value |
| MUNICIPAL BONDS — (Continued) |
| New York — (Continued) |
New York City Housing Development Corp. Revenue, Series 2A, Callable 10/21/25 at 100,
3.40%, 11/1/62, (REMIC FHA 542c Insured)(a) |
$ 150,000 |
|
$ 150,015 |
New York City Municipal Water Finance Authority Revenue, Series AA-3, Refunding, Callable 12/15/32 at 100,
5.00%, 6/15/47 |
1,550,000 |
|
1,607,160 |
New York City Municipal Water Finance Authority Revenue, Series EE, Refunding, Callable 06/15/27 at 100,
5.00%, 6/15/38 |
385,000 |
|
395,097 |
New York City Transitional Finance Authority Future Tax Secured Revenue, Series D-S, Callable 11/01/30 at 100,
4.00%, 11/1/45 |
1,000,000 |
|
939,578 |
New York Convention Center Development Corp. Revenue, Refunding, Callable 11/15/25 at 100,
5.00%, 11/15/40 |
2,500,000 |
|
2,501,987 |
New York GO, Series 1, Callable 12/01/26 at 100,
5.00%, 12/1/38 |
100,000 |
|
101,214 |
New York GO, Series B, Callable 10/01/32 at 100,
5.25%, 10/1/39 |
700,000 |
|
765,264 |
New York GO, Series B-1, Callable 10/01/32 at 100,
5.25%, 10/1/47 |
1,000,000 |
|
1,051,462 |
New York State Dormitory Authority Revenue, OID, Callable 07/01/35 at 100,
5.00%, 7/1/45 |
3,000,000 |
|
3,019,519 |
New York State Dormitory Authority Revenue, Series 1,
5.50%, 7/1/31, (AG Insured) |
2,500,000 |
|
2,732,023 |
New York State Dormitory Authority Revenue, Series A, Callable 09/15/26 at 100,
5.00%, 3/15/36 |
375,000 |
|
381,344 |
| |
Par
Value |
|
Value |
| MUNICIPAL BONDS — (Continued) |
| New York — (Continued) |
New York State Dormitory Authority Revenue, Series A, Refunding, Callable 03/15/32 at 100,
5.00%, 3/15/46 |
$2,140,000 |
|
$ 2,209,850 |
New York State Thruway Authority Revenue, Series A, Junior Series, Callable 01/01/26 at 100,
5.00%, 1/1/41 |
1,920,000 |
|
1,920,968 |
Orange County GO, Series A, Callable 10/31/25 at 100,
2.00%, 6/15/26 |
15,000 |
|
14,886 |
Port Authority of New York & New Jersey Revenue, Refunding, Callable 09/01/28 at 100,
5.00%, 9/1/48 |
1,000,000 |
|
1,015,886 |
Town of Ossining, Refunding,
3.75%, 7/30/26 |
1,749,344 |
|
1,763,734 |
Triborough Bridge & Tunnel Authority Revenue, Series A, Callable 05/15/27 at 100,
5.00%, 11/15/42 |
2,000,000 |
|
2,025,090 |
Triborough Bridge & Tunnel Authority Revenue, Series A, Callable 05/15/27 at 100,
5.00%, 11/15/47 |
1,100,000 |
|
1,108,601 |
| |
|
|
34,076,842 |
| North Dakota — 0.2% |
North Dakota Housing Finance Agency Revenue, Series A, Callable 07/01/33 at 100,
3.875%, 7/1/35 |
730,000 |
|
735,383 |
| Ohio — 2.8% |
American Municipal Power, Inc. Revenue, Series A, Refunding, Callable 02/15/26 at 100,
5.00%, 2/15/46 |
750,000 |
|
749,949 |
Greene County GO, Refunding, Callable 12/01/25 at 100,
1.25%, 12/1/31 |
1,245,000 |
|
1,057,282 |
Louisville City School District GO, Refunding,
1.00%, 12/1/25, (SD CRED PROG Insured) |
25,000 |
|
24,883 |
The accompanying notes are an integral part of the financial statements.
AMBRUS TAX-CONSCIOUS NATIONAL BOND FUND
Portfolio of Investments (Continued)
September 30, 2025
| |
Par
Value |
|
Value |
| MUNICIPAL BONDS — (Continued) |
| Ohio — (Continued) |
State of Ohio Revenue, Series A, Refunding, Callable 01/15/26 at 100,
5.00%, 1/15/41 |
$2,000,000 |
|
$ 2,002,767 |
Toledo Water System Revenue, Callable 11/15/26 at 100,
5.00%, 11/15/41 |
4,750,000 |
|
4,782,488 |
University of Akron/The Revenue, Series A, Refunding, Callable 07/01/26 at 100,
5.00%, 1/1/38 |
900,000 |
|
903,967 |
Whitehall City School District GO, Refunding, Callable 12/01/25 at 100,
3.50%, 12/1/30, (SD CRED PROG Insured) |
665,000 |
|
665,552 |
Whitehall City School District GO, Series A, Refunding, Callable 12/01/25 at 100,
3.50%, 12/1/30, (SD CRED PROG Insured) |
705,000 |
|
705,586 |
Whitehall City School District GO, Series B, Refunding, Callable 12/01/25 at 100,
3.50%, 12/1/30, (SD CRED PROG Insured) |
590,000 |
|
590,490 |
| |
|
|
11,482,964 |
| Oklahoma — 0.8% |
Lawton Industrial Development Authority Revenue, Series A, Refunding, Callable 07/01/33 at 100,
5.00%, 7/1/40 |
500,000 |
|
534,770 |
University of Oklahoma/The Revenue, Series C, Callable 10/31/25 at 100,
5.00%, 7/1/38 |
2,800,000 |
|
2,802,664 |
| |
|
|
3,337,434 |
| Oregon — 0.9% |
Aurora GO, Callable 06/01/34 at 100,
5.25%, 6/1/45, (BAM Insured) |
500,000 |
|
529,793 |
| |
Par
Value |
|
Value |
| MUNICIPAL BONDS — (Continued) |
| Oregon — (Continued) |
Oregon Coast Community College District GO, CAB, OID, Callable 06/15/34 at 100,
5.00%, 6/15/41, (SCH BD GTY Insured) |
$ 200,000 |
|
$ 217,741 |
Oregon Coast Community College District GO, CAB, OID, Callable 06/15/34 at 100,
5.00%, 6/15/42, (SCH BD GTY Insured) |
200,000 |
|
215,770 |
Seaside School District No 10 GO, Series A, CAB, OID, Callable 06/15/27 at 51,
0.00%, 6/15/42, (SCH BD GTY Insured)(b) |
2,485,000 |
|
1,101,910 |
Woodburn Rural Fire Protection District GO, Callable 06/15/34 at 100,
5.25%, 6/15/44, (BAM Insured) |
1,340,000 |
|
1,420,626 |
| |
|
|
3,485,840 |
| Pennsylvania — 8.0% |
Abington School District GO, Series A, Callable 10/01/27 at 100,
4.00%, 10/1/39, (ST AID WITHHLDG Insured) |
500,000 |
|
496,053 |
Allegheny County Sanitary Authority Revenue, Callable 06/01/28 at 100,
5.00%, 6/1/43 |
815,000 |
|
832,964 |
Allentown GO, Series A, OID, Callable 10/31/25 at 100,
3.125%, 10/1/27, (BAM Insured) |
5,000 |
|
5,001 |
Commonwealth of Pennsylvania, Series A, Refunding, Callable 01/30/28 at 100,
5.00%, 7/1/43 |
2,000,000 |
|
2,036,330 |
Commonwealth of Pennsylvania GO,
5.00%, 10/1/25 |
750,000 |
|
750,000 |
Cumberland County Municipal Authority Revenue, Callable 11/01/29 at 100,
4.00%, 11/1/37 |
850,000 |
|
828,391 |
The accompanying notes are an integral part of the financial statements.
AMBRUS TAX-CONSCIOUS NATIONAL BOND FUND
Portfolio of Investments (Continued)
September 30, 2025
| |
Par
Value |
|
Value |
| MUNICIPAL BONDS — (Continued) |
| Pennsylvania — (Continued) |
Eastern Lebanon County School District GO, Refunding, Callable 11/15/30 at 100,
5.00%, 5/15/45, (BAM Insured)(c) |
$ 475,000 |
|
$ 488,105 |
Erie Sewer Authority Revenue, Callable 12/01/33 at 100,
5.00%, 12/1/43, (BAM Insured)(c) |
1,400,000 |
|
1,453,813 |
Hollidaysburg Area School District GO, Callable 09/15/33 at 100,
5.00%, 3/15/42, (ST AID WITHHLDG Insured)(c) |
235,000 |
|
248,389 |
Hollidaysburg Area School District GO, Callable 09/15/33 at 100,
5.00%, 3/15/43, (ST AID WITHHLDG Insured)(c) |
250,000 |
|
262,373 |
Hollidaysburg Area School District GO, Callable 09/15/33 at 100,
5.00%, 3/15/44, (ST AID WITHHLDG Insured)(c) |
250,000 |
|
261,414 |
Hollidaysburg Area School District GO, Callable 09/15/33 at 100,
5.00%, 3/15/45, (ST AID WITHHLDG Insured)(c) |
200,000 |
|
208,034 |
Interboro School District GO, Callable 08/15/34 at 100,
5.00%, 8/15/42, (AG ST AID WITHHLDG Insured) |
230,000 |
|
243,506 |
Interboro School District GO, Callable 08/15/34 at 100,
5.00%, 8/15/43, (AG ST AID WITHHLDG Insured) |
255,000 |
|
267,589 |
Interboro School District GO, Callable 08/15/34 at 100,
5.00%, 8/15/44, (AG ST AID WITHHLDG Insured) |
100,000 |
|
104,231 |
Lancaster County Hospital Authority Revenue, Callable 11/01/29 at 100,
5.00%, 11/1/41 |
750,000 |
|
768,783 |
Lancaster County Hospital Authority Revenue, Refunding, Callable 08/15/26 at 100,
5.00%, 8/15/42 |
2,050,000 |
|
2,061,491 |
| |
Par
Value |
|
Value |
| MUNICIPAL BONDS — (Continued) |
| Pennsylvania — (Continued) |
Lehigh County General Purpose Authority Revenue, Series A, Refunding,
4.00%, 11/1/25 |
$ 150,000 |
|
$ 150,022 |
Moon Area School District GO, Series B, Callable 11/15/33 at 100,
5.00%, 5/15/45, (ST AID WITHHLDG Insured)(c) |
250,000 |
|
261,228 |
North Penn School District GO, Callable 03/01/30 at 100,
5.00%, 3/1/50, (ST AID WITHHLDG Insured) |
1,775,000 |
|
1,798,109 |
Pennsylvania Economic Development Financing Authority Revenue, AMT, Callable 12/31/32 at 100,
5.50%, 6/30/42, (AG Insured) |
1,000,000 |
|
1,061,963 |
Pennsylvania Economic Development Financing Authority Revenue, AMT, Callable 12/31/32 at 100,
6.00%, 6/30/61 |
500,000 |
|
524,980 |
Pennsylvania Economic Development Financing Authority Revenue, AMT, OID, Callable 12/31/32 at 100,
5.00%, 12/31/57, (AG Insured) |
500,000 |
|
503,792 |
Pennsylvania Turnpike Commission Oil Franchise Tax Revenue, Series A, Callable 12/01/28 at 100,
5.25%, 12/1/44 |
500,000 |
|
509,169 |
Pennsylvania Turnpike Commission Revenue, Series 2, Refunding, Callable 06/01/32 at 100,
5.00%, 12/1/45(a) |
850,000 |
|
959,397 |
Pennsylvania Turnpike Commission Revenue , Series 1, Callable 06/01/26 at 100,
5.00%, 12/1/41 |
500,000 |
|
503,745 |
Philadelphia Authority for Industrial Development Revenue, Callable 06/01/27 at 100,
5.00%, 12/1/34 |
100,000 |
|
103,191 |
The accompanying notes are an integral part of the financial statements.
AMBRUS TAX-CONSCIOUS NATIONAL BOND FUND
Portfolio of Investments (Continued)
September 30, 2025
| |
Par
Value |
|
Value |
| MUNICIPAL BONDS — (Continued) |
| Pennsylvania — (Continued) |
Philadelphia Gas Works Co. Revenue, Series A, Refunding, Callable 08/01/34 at 100,
5.25%, 8/1/54, (AG Insured) |
$2,165,000 |
|
$ 2,270,392 |
Philadelphia GO, Refunding, Callable 08/01/27 at 100,
5.00%, 8/1/37 |
2,500,000 |
|
2,568,339 |
Philadelphia Housing Authority Revenue, Callable 05/01/27 at 100,
5.00%, 5/1/31 |
615,000 |
|
638,310 |
School District of Philadelphia/The GO, Series F, Unrefunded portion, Callable 09/01/26 at 100,
5.00%, 9/1/30, (ST AID WITHHLDG Insured) |
5,960,000 |
|
6,051,835 |
Upper St Clair Township School District GO, Callable 10/01/28 at 100,
5.00%, 10/1/44, (BAM ST AID WITHHLDG Insured) |
1,000,000 |
|
1,017,274 |
Westmoreland County Municipal Authority Revenue, Callable 08/15/33 at 100,
5.00%, 8/15/45, (AG Insured) |
1,135,000 |
|
1,187,727 |
Westmoreland County Municipal Authority Revenue, Callable 08/15/33 at 100,
5.00%, 8/15/49, (AG Insured) |
350,000 |
|
361,578 |
Wilson School District GO, Series D, Refunding, Callable 05/15/33 at 100,
5.00%, 5/15/44, (ST AID WITHHLDG Insured)(c) |
500,000 |
|
527,083 |
| |
|
|
32,314,601 |
| South Carolina — 0.7% |
South Carolina Ports Authority Revenue, Series A, Callable 07/01/29 at 100,
5.00%, 7/1/54 |
1,250,000 |
|
1,263,391 |
| |
Par
Value |
|
Value |
| MUNICIPAL BONDS — (Continued) |
| South Carolina — (Continued) |
South Carolina Public Service Authority Revenue, Series A, Refunding, Callable 06/01/26 at 100,
5.00%, 12/1/34 |
$1,000,000 |
|
$ 1,011,030 |
South Carolina Transportation Infrastructure Bank Revenue, Series A, Refunding, Callable 10/31/25 at 100,
2.00%, 10/1/26 |
355,000 |
|
351,537 |
| |
|
|
2,625,958 |
| South Dakota — 0.4% |
South Dakota Housing Development Authority Revenue, Series A, Refunding,
3.00%, 11/1/28, (GNMA/FNMA/FHLMC COLL Insured) |
450,000 |
|
451,781 |
South Dakota Housing Development Authority Revenue, Series A, Refunding,
3.05%, 5/1/29, (GNMA/FNMA/FHLMC COLL Insured) |
250,000 |
|
251,954 |
South Dakota Housing Development Authority Revenue, Series A, Refunding,
3.10%, 11/1/29, (GNMA/FNMA/FHLMC COLL Insured) |
250,000 |
|
252,637 |
South Dakota Housing Development Authority Revenue, Series A, Refunding,
3.20%, 5/1/30, (GNMA/FNMA/FHLMC COLL Insured) |
250,000 |
|
252,277 |
South Dakota Housing Development Authority Revenue, Series A, Refunding,
3.30%, 11/1/30, (GNMA/FNMA/FHLMC COLL Insured) |
500,000 |
|
507,138 |
| |
|
|
1,715,787 |
The accompanying notes are an integral part of the financial statements.
AMBRUS TAX-CONSCIOUS NATIONAL BOND FUND
Portfolio of Investments (Continued)
September 30, 2025
| |
Par
Value |
|
Value |
| MUNICIPAL BONDS — (Continued) |
| Tennessee — 4.4% |
Knoxville Electric System Revenue, Series HH, Refunding,
3.10%, 7/1/27 |
$2,555,000 |
|
$ 2,578,276 |
Metropolitan Government Nashville & Davidson County Health & Educational Facs Bd Revenue, Callable 07/01/26 at 100,
5.00%, 7/1/35 |
490,000 |
|
494,446 |
Metropolitan Government Nashville & Davidson County Health & Educational Facs Bd Revenue, Callable 07/01/26 at 100,
5.00%, 7/1/40 |
775,000 |
|
778,396 |
Metropolitan Government Nashville & Davidson County Health & Educational Facs Bd Revenue, Refunding, Callable 10/01/34 at 100,
5.00%, 10/1/54 |
3,100,000 |
|
3,240,981 |
Metropolitan Government of Nashville & Davidson County Electric Revenue, Series A, Callable 05/15/27 at 100,
5.00%, 5/15/42 |
1,100,000 |
|
1,111,755 |
Metropolitan Government of Nashville & Davidson County Water & Sewer Revenue Revenue, Series B, Refunding, Callable 07/01/27 at 100,
5.00%, 7/1/46 |
3,695,000 |
|
3,730,653 |
Metropolitan Nashville Airport Authority/The Revenue, Series A, Callable 07/01/30 at 100,
5.00%, 7/1/44 |
4,015,000 |
|
4,139,674 |
Metropolitan Nashville Airport Authority/The Revenue, Series A, Callable 07/01/30 at 100,
5.00%, 7/1/54 |
1,000,000 |
|
1,011,165 |
Putnam County GO, OID, Refunding, Callable 10/21/25 at 100,
2.00%, 4/1/26 |
100,000 |
|
99,414 |
Shelby County Health Educational & Housing Facilities Board Revenue, Series B, Refunding,
5.00%, 9/1/44(a) |
500,000 |
|
542,219 |
| |
|
|
17,726,979 |
| |
Par
Value |
|
Value |
| MUNICIPAL BONDS — (Continued) |
| Texas — 10.3% |
Audubon Municipal Utility District No 1 GO, Callable 09/01/30 at 100,
5.00%, 9/1/42, (BAM Insured) |
$ 505,000 |
|
$ 517,209 |
Austin Electric Utility Revenue, Series A, Refunding, Callable 11/15/25 at 100,
5.00%, 11/15/45 |
1,000,000 |
|
999,856 |
Austin Water & Wastewater System Revenue, Refunding, Callable 11/15/26 at 100,
5.00%, 11/15/41 |
1,095,000 |
|
1,105,078 |
Bexar County GO, Callable 06/15/27 at 100,
5.00%, 6/15/42 |
2,000,000 |
|
2,027,219 |
Chambers County Improvement District No 2 GO, OID, Callable 12/01/26 at 100,
2.125%, 12/1/31 |
500,000 |
|
447,290 |
Chambers County Justice Center Public Facilities Corp. Revenue, Callable 06/01/33 at 100,
5.00%, 6/1/41 |
2,135,000 |
|
2,235,632 |
Chambers County Justice Center Public Facilities Corp. Revenue, Callable 06/01/33 at 100,
5.50%, 6/1/55 |
955,000 |
|
1,007,206 |
Del Rio GO, Callable 06/01/26 at 100,
5.00%, 6/1/36, (AG Insured) |
600,000 |
|
606,130 |
Denton Utility System Revenue, Callable 12/01/26 at 100,
5.00%, 12/1/34 |
100,000 |
|
102,180 |
El Paso GO, Callable 08/15/26 at 100,
5.00%, 8/15/42 |
2,000,000 |
|
2,014,453 |
Floresville Electric Light & Power System Revenue, Callable 08/15/28 at 100,
5.00%, 8/15/43 |
1,840,000 |
|
1,862,286 |
Fort Bend County Levee Improvement District No 19 GO, OID, Callable 10/31/25 at 100,
3.50%, 9/1/34, (AG Insured) |
530,000 |
|
519,113 |
The accompanying notes are an integral part of the financial statements.
AMBRUS TAX-CONSCIOUS NATIONAL BOND FUND
Portfolio of Investments (Continued)
September 30, 2025
| |
Par
Value |
|
Value |
| MUNICIPAL BONDS — (Continued) |
| Texas — (Continued) |
Fountainhead Municipal Utility District GO, Callable 10/31/25 at 100,
2.00%, 8/1/26, (NATL Insured) |
$ 175,000 |
|
$ 172,849 |
Harris County Municipal Utility District No 287 GO, Series A, OID, Callable 03/01/27 at 100,
1.50%, 3/1/31, (AG Insured) |
100,000 |
|
89,067 |
Harris County Revenue, Series A, Senior Series, Refunding, Callable 08/15/26 at 100,
5.00%, 8/15/47 |
3,000,000 |
|
3,001,172 |
Harris Toll Road County Revenue, Series A, Senior Series, Refunding, Callable 02/15/28 at 100,
5.00%, 8/15/43 |
3,000,000 |
|
3,062,706 |
Kaufman County Municipal Utility District No 14 GO, Callable 10/31/25 at 100,
2.00%, 3/1/27, (BAM Insured) |
40,000 |
|
39,200 |
Lower Colorado River Authority Revenue, Refunding, Callable 05/15/30 at 100,
5.00%, 5/15/41 |
100,000 |
|
103,289 |
McCamey Independent School District GO, Callable 02/15/28 at 100,
5.00%, 2/15/44, (PSF-GTD Insured) |
250,000 |
|
253,966 |
Parker County GO, Callable 02/15/27 at 100,
5.00%, 2/15/42 |
5,500,000 |
|
5,571,030 |
Port Arthur Independent School District GO, Series B, OID, Refunding, Callable 10/31/25 at 100,
3.00%, 2/15/27 |
25,000 |
|
25,005 |
Port Arthur Independent School District GO, Series E, Refunding, Callable 08/15/26 at 100,
4.00%, 2/15/35 |
2,000,000 |
|
2,006,609 |
San Antonio Electric & Gas Systems Revenue, Refunding, Callable 08/01/26 at 100,
4.00%, 2/1/34 |
1,000,000 |
|
1,007,696 |
| |
Par
Value |
|
Value |
| MUNICIPAL BONDS — (Continued) |
| Texas — (Continued) |
San Jacinto Community College District GO, Series A, Callable 02/15/29 at 100,
5.00%, 2/15/49 |
$3,000,000 |
|
$ 3,054,414 |
Sanger GO, Callable 05/15/26 at 100,
4.00%, 5/15/37, (BAM Insured) |
1,000,000 |
|
1,001,246 |
Southwest Houston Redevelopment Authority, Series B, Refunding, Callable 09/01/27 at 100,
5.00%, 9/1/35, (AG Insured) |
205,000 |
|
212,571 |
Texas Municipal Gas Acquisition & Supply Corp. III Revenue, Refunding,
5.00%, 12/15/27 |
500,000 |
|
518,891 |
Texas Municipal Gas Acquisition & Supply Corp. III Revenue, Refunding,
5.00%, 12/15/29 |
4,750,000 |
|
5,059,234 |
Texas Municipal Gas Acquisition & Supply Corp. III Revenue, Refunding,
5.00%, 12/15/32 |
1,050,000 |
|
1,143,105 |
Texas Municipal Gas Acquisition & Supply Corp. IV Revenue, Series B, Callable 07/01/33 at 100,
5.50%, 1/1/54(a) |
1,750,000 |
|
1,971,375 |
| |
|
|
41,737,077 |
| Utah — 1.3% |
Jordan Valley Water Conservancy District Revenue, Series A, Callable 10/01/28 at 100,
5.00%, 10/1/49 |
1,000,000 |
|
1,013,363 |
Utah Transit Authority Revenue, Refunding, Callable 06/15/26 at 100,
4.00%, 12/15/31 |
4,050,000 |
|
4,082,365 |
| |
|
|
5,095,728 |
| Vermont — 0.1% |
University of Vermont and State Agricultural College Revenue, Refunding, Callable 10/01/27 at 100,
5.00%, 10/1/43 |
470,000 |
|
478,715 |
The accompanying notes are an integral part of the financial statements.
AMBRUS TAX-CONSCIOUS NATIONAL BOND FUND
Portfolio of Investments (Continued)
September 30, 2025
| |
Par
Value |
|
Value |
| MUNICIPAL BONDS — (Continued) |
| Washington — 2.7% |
Bellevue GO, Refunding, Callable 10/21/25 at 100,
4.00%, 12/1/31 |
$2,500,000 |
|
$ 2,501,501 |
King County Public Hospital District No 1 GO, Refunding, Callable 12/01/28 at 100,
5.00%, 12/1/43 |
1,200,000 |
|
1,216,695 |
King County Sewer Revenue, Series A, Refunding, Callable 01/01/26 at 100,
4.00%, 7/1/40 |
3,000,000 |
|
2,962,661 |
Pacific County Public Healthcare Services District No 3 GO, Callable 12/01/33 at 100,
5.25%, 12/1/44 |
1,130,000 |
|
1,175,802 |
Spokane Public Facilities District Revenue, Callable 06/01/27 at 100,
5.00%, 12/1/41 |
1,600,000 |
|
1,607,733 |
Tacoma Electric System Revenue, Series A, Refunding, Callable 10/21/25 at 100,
4.00%, 1/1/42 |
1,000,000 |
|
949,792 |
Washington State GO, Series A, Callable 08/01/31 at 100,
5.00%, 8/1/43 |
340,000 |
|
356,564 |
| |
|
|
10,770,748 |
| Wisconsin — 1.1% |
Mauston School District GO, Refunding, Callable 03/01/28 at 100,
1.70%, 3/1/35, (AG Insured) |
505,000 |
|
402,144 |
Milwaukee Sewerage System Revenue, Series S-5, Refunding, Callable 10/31/25 at 100,
4.00%, 6/1/29 |
330,000 |
|
330,256 |
Public Finance Authority Revenue, Refunding, Callable 06/01/30 at 100,
5.00%, 6/1/38 |
35,000 |
|
36,486 |
Village of Mount Pleasant, Series A, Callable 04/01/28 at 100,
5.00%, 4/1/48, (MORAL OBLG Insured) |
650,000 |
|
657,737 |
| |
Par
Value |
|
Value |
| MUNICIPAL BONDS — (Continued) |
| Wisconsin — (Continued) |
Wisconsin Health & Educational Facilities Authority Revenue, Refunding, Callable 10/01/26 at 100,
5.00%, 10/1/41 |
$2,000,000 |
|
$ 2,017,032 |
Wisconsin Health & Educational Facilities Authority Revenue, Series A, OID,
3.625%, 11/1/29 |
820,000 |
|
824,193 |
Wisconsin Housing & Economic Development Authority Housing Revenue,
3.60%, 11/1/26, (HUD SECT 8 Insured) |
265,000 |
|
265,975 |
| |
|
|
4,533,823 |
| Wyoming — 1.8% |
Wyoming Community Development Authority Revenue, Series 1, Refunding,
3.00%, 6/1/28 |
1,300,000 |
|
1,304,543 |
Wyoming Community Development Authority Revenue, Series 1, Refunding,
3.05%, 12/1/28 |
1,430,000 |
|
1,437,912 |
Wyoming Community Development Authority Revenue, Series 1, Refunding,
3.10%, 6/1/29 |
1,495,000 |
|
1,509,475 |
Wyoming Community Development Authority Revenue, Series 3, Callable 12/01/33 at 100,
6.25%, 12/1/55 |
2,500,000 |
|
2,812,615 |
| |
|
|
7,064,545 |
TOTAL MUNICIPAL BONDS
(Cost $335,053,874) |
|
|
334,146,586 |
| |
Par Value/
Shares |
|
| PREFERREDS — 8.9% |
| Consumer Discretionary — 0.3% |
| General Motors Financial Co., Inc., 5.75%, 9/30/27(d) |
1,175,000 |
1,165,996 |
| Energy — 0.3% |
| BP Capital Markets PLC, 6.45%, 12/1/33 |
1,000,000 |
1,069,066 |
The accompanying notes are an integral part of the financial statements.
AMBRUS TAX-CONSCIOUS NATIONAL BOND FUND
Portfolio of Investments (Continued)
September 30, 2025
| |
Par Value/
Shares |
|
Value |
| PREFERREDS — (Continued) |
| Financials — 8.3% |
| Bank of America Corp., 6.625%, 5/1/30 |
$2,600,000 |
|
$ 2,708,785 |
| Bank of New York Mellon Corp. (The), 3.70%, 3/20/26(d) |
1,410,000 |
|
1,397,590 |
| Bank of New York Mellon Corp. (The), 4.625%, 9/20/26 |
700,000 |
|
696,030 |
| Bank of New York Mellon Corp. (The), 6.15%, 3/20/30(d) |
13,250 |
|
341,453 |
| Bank of New York Mellon Corp. (The), 6.30%, 3/20/30 |
1,500,000 |
|
1,544,300 |
| Bank of New York Mellon Corp. (The), 5.95%, 12/20/30(d) |
1,000,000 |
|
1,011,952 |
| Citigroup, Inc., 4.00%, 12/10/25(d) |
2,725,000 |
|
2,717,887 |
| Citigroup, Inc., 7.625%, 11/15/28(d) |
1,750,000 |
|
1,840,058 |
| Citigroup, Inc., 6.75%, 2/15/30 |
1,900,000 |
|
1,935,015 |
| Citigroup, Inc., 6.875%, 8/15/30(d) |
1,400,000 |
|
1,444,198 |
| Goldman Sachs Group, Inc. (The), 6.125%, 11/10/34 |
4,325,000 |
|
4,395,686 |
| KKR & Co., Inc., 6.875%, 6/1/65 |
150,000 |
|
3,892,500 |
| Morgan Stanley, 6.875%, 1/15/26(d) |
64,395 |
|
1,619,534 |
| Northern Trust Corp., 4.60%, 10/1/26(d) |
2,620,000 |
|
2,609,617 |
| State Street Corp., 5.35%, 3/15/26(d) |
25,000 |
|
581,500 |
| State Street Corp., 6.45%, 9/15/30 |
2,100,000 |
|
2,169,191 |
| Wells Fargo & Co., 3.90%, 3/15/26(d) |
350,000 |
|
347,003 |
| Wells Fargo & Co., 6.85%, 9/15/29 |
2,350,000 |
|
2,474,071 |
| |
|
|
33,726,370 |
TOTAL PREFERREDS
(Cost $34,380,297) |
|
|
35,961,432 |
| |
Par
Value |
|
| CORPORATE BONDS — 2.3% |
| Consumer Discretionary — 0.4% |
| VF Corp., 6.00%, 10/15/33 |
1,500,000 |
1,442,217 |
| Financials — 0.5% |
| Western Alliance Bancorp, 3.00%, 6/15/31 |
500,000 |
486,200 |
| Zions Bancorp NA, 6.816%, 11/19/35 |
1,500,000 |
1,595,277 |
| |
|
2,081,477 |
| Materials — 0.2% |
| Huntsman International, LLC, 2.95%, 6/15/31 |
1,000,000 |
844,157 |
| |
Par
Value |
|
Value |
| CORPORATE BONDS — (Continued) |
| Real Estate — 0.1% |
| Hudson Pacific Properties LP, REIT, 4.65%, 4/1/29 |
$ 500,000 |
|
$ 465,734 |
| Kilroy Realty LP, REIT, 2.50%, 11/15/32 |
150,000 |
|
124,796 |
| |
|
|
590,530 |
| Technology — 1.1% |
| Foundry JV Holdco, LLC, 6.30%, 1/25/39(e) |
4,000,000 |
|
4,307,337 |
TOTAL CORPORATE BONDS
(Cost $8,857,829) |
|
|
9,265,718 |
| ASSET-BACKED SECURITIES — 1.6% |
| Fannie Mae Pool, 6.00%, 5/1/53 |
1,017,839 |
|
1,046,780 |
| Freddie Mac Pool, 7.00%, 7/1/54 |
1,542,276 |
|
1,619,877 |
| Ginnie Mae II Pool, 6.50%, 7/20/54 |
3,641,625 |
|
3,748,294 |
TOTAL ASSET-BACKED SECURITIES
(Cost $6,362,921) |
|
|
6,414,951 |
| U.S. TREASURY OBLIGATIONS — 1.4% |
United States Treasury Floating Rate Notes,
4.143% (3 Month U.S. Treasury Money Market Yield + 25 bps), 1/31/26(a) |
5,950,000 |
|
5,950,102 |
U.S. TREASURY OBLIGATIONS
(Cost $5,951,978) |
|
5,950,102 |
| |
Number
of Shares |
|
| EXCHANGE TRADED FUNDS — 1.3% |
| SPDR Portfolio High Yield Bond ETF |
215,000 |
5,147,100 |
TOTAL EXCHANGE TRADED FUNDS
(Cost $4,931,660) |
|
5,147,100 |
The accompanying notes are an integral part of the financial statements.
AMBRUS TAX-CONSCIOUS NATIONAL BOND FUND
Portfolio of Investments (Concluded)
September 30, 2025
| |
Number
of Shares |
|
Value |
| SHORT-TERM INVESTMENT — 1.8% |
| Dreyfus Government Cash Management Fund, Institutional Shares, 4.04%(f) |
7,179,143 |
|
$ 7,179,143 |
| |
| |
TOTAL SHORT-TERM INVESTMENT
(Cost $7,179,143) |
|
|
7,179,143 |
| |
| |
TOTAL INVESTMENTS - 100.0%
(Cost $402,717,702) |
|
|
404,065,032 |
| LIABILITIES IN EXCESS OF OTHER ASSETS - (0.0)% |
|
|
(19,288) |
| NET ASSETS - 100.0% |
|
|
$404,045,744 |
| (a) |
Variable or Floating rate security. Rate shown is the rate in effect as of period end. Certain variable rate securities are not based on a published reference rate and spread, rather are determined by the issuer or agent and are based on current market conditions. Reference rate is as of reset date, which may vary by security. These securities may not indicate a reference rate and/or spread in their description. |
| (b) |
Zero coupon bond. |
| (c) |
Securities purchased on a when-issued basis. Rates do not take effect until settlement date. |
| (d) |
Non-voting shares. |
| (e) |
Securities exempt from registration under Rule 144A of the Securities Act of 1933, as amended. These securities were purchased in accordance with the guidelines approved by the Fund’s Board of Trustees and may be resold, in transactions exempt from registration, to qualified institutional buyers. At September 30, 2025, these securities amounted to $4,307,337 or 1.07% of net assets. These securities have been determined by the Fund's adviser to be liquid securities. |
| (f) |
Rate disclosed is the 7-day yield at September 30, 2025. |
| AG |
Assured Guaranty |
| AMT |
Alternative Minimum Tax |
| BAM |
Build America Mutual |
| BAM-TCRS |
Build America Mutual-Transferable Custodial Receipts |
| CA MTG |
California Mortgage |
| CAB |
Capital Appreciation Bond |
| COLL |
Collateral |
| ETF |
Exchange-Traded Fund |
| FHLMC |
Federal Home Loan Mortgage Corp. |
| FNMA |
Federal National Mortgage Association |
| GNMA |
Government National Mortgage Association |
| GO |
General Obligation |
| HUD SECT 8 |
Housing and Urban Development Section 8 |
| LLC |
Limited Liability Company |
| LP |
Limited Partnership |
| MORAL OBLG |
Moral Obligation |
| NATL |
National Public Finance Guarantee Corp. |
| OID |
Original Issue Discount |
| PLC |
Public Limited Company |
| PSF-GTD |
Permanent School Fund Guaranteed |
| REIT |
Real Estate Investment Trust |
| REMIC FHA 542c |
Real Estate Mortgage Investment Conduit Federal Housing Administration Section 542c |
| SCH BD GTY |
School Board Guaranty |
| SD CRED PROG |
State School District Credit Enhancement Program |
| SPDR |
Standard & Poor's Depository Receipt |
| ST AID WITHHLDG |
State Aid Withholding |
| ST INTERCEPT |
State Intercept |
The accompanying notes are an integral part of the financial statements.
AMBRUS FUNDS
Statements of Assets and Liabilities
September 30, 2025
| |
Ambrus Core
Bond Fund |
|
Ambrus Tax-Conscious
California Bond Fund |
|
Ambrus Tax-Conscious
National Bond Fund |
| Assets |
|
|
|
|
|
| Investments, at value |
$489,785,757 |
|
$433,482,883 |
|
$404,065,032 |
| Receivables: |
|
|
|
|
|
| Dividends and interest |
5,029,278 |
|
5,450,868 |
|
4,682,873 |
| Capital shares sold |
1,940,801 |
|
25,653 |
|
358,854 |
| Prepaid expenses and other assets |
38,796 |
|
790 |
|
39,575 |
| Total Assets |
496,794,632 |
|
438,960,194 |
|
409,146,334 |
| Liabilities |
|
|
|
|
|
| Payables: |
|
|
|
|
|
| Capital shares redeemed |
1,820,219 |
|
1,428,612 |
|
1,176,279 |
| Investment adviser |
166,224 |
|
137,757 |
|
133,111 |
| Administration and accounting fees |
37,058 |
|
40,502 |
|
38,983 |
| Audit fees |
28,333 |
|
28,334 |
|
28,334 |
| Due to custodian |
6 |
|
7 |
|
— |
| Investments purchased |
— |
|
5,704,425 |
|
3,692,952 |
| Distributions to shareholders |
— |
|
23 |
|
196 |
| Accrued expenses |
31,344 |
|
32,850 |
|
30,735 |
| Total Liabilities |
2,083,184 |
|
7,372,510 |
|
5,100,590 |
| Contingencies and Commitments (Note 2) |
— |
|
— |
|
— |
| Net Assets |
$494,711,448 |
|
$431,587,684 |
|
$404,045,744 |
| Net Assets Consisted of: |
|
|
|
|
|
| Capital stock, $0.01 par value |
$488,823 |
|
$429,193 |
|
$399,553 |
| Paid-in capital |
482,484,699 |
|
432,374,624 |
|
402,511,828 |
| Total distributable earnings/(loss) |
11,737,926 |
|
(1,216,133) |
|
1,134,363 |
| Net Assets |
$494,711,448 |
|
$431,587,684 |
|
$404,045,744 |
| Institutional Class: |
|
|
|
|
|
| Net assets |
$494,711,448 |
|
$431,587,684 |
|
$404,045,744 |
| Shares outstanding |
48,882,342 |
|
42,919,291 |
|
39,955,266 |
| Net asset value, offering and redemption price per share |
$10.12 |
|
$10.06 |
|
$10.11 |
| Investments, at cost |
$477,728,173 |
|
$433,863,851 |
|
$402,717,702 |
The accompanying notes are an integral part of the financial statements.
AMBRUS FUNDS
Statements of Operations
For the Year Ended September 30, 2025
| |
Ambrus Core
Bond Fund |
|
Ambrus Tax-Conscious
California Bond Fund |
|
Ambrus Tax-Conscious
National Bond Fund |
| Investment income |
|
|
|
|
|
| Interest |
$20,685,405 |
|
$14,212,895 |
|
$13,893,032 |
| Dividends |
1,529,574 |
|
901,813 |
|
817,330 |
| Total investment income |
22,214,979 |
|
15,114,708 |
|
14,710,362 |
| Expenses |
|
|
|
|
|
| Advisory fees(Note 2) |
1,731,272 |
|
1,453,089 |
|
1,350,441 |
| Administration and accounting fees(Note 2) |
94,055 |
|
106,087 |
|
102,598 |
| Trustees’ and officers’ fees(Note 2) |
61,195 |
|
51,229 |
|
48,537 |
| Transfer agent fees(Note 2) |
43,558 |
|
73,524 |
|
39,485 |
| Legal fees |
40,012 |
|
34,079 |
|
32,978 |
| Custodian fees(Note 2) |
32,418 |
|
26,882 |
|
25,654 |
| Audit fees |
28,333 |
|
28,334 |
|
28,334 |
| Printing fees |
23,935 |
|
23,543 |
|
23,374 |
| Registration and filing fees |
15,467 |
|
428 |
|
15,467 |
| Other expenses |
24,751 |
|
22,270 |
|
22,361 |
| Total expenses before recoupments, waivers and/or reimbursements |
2,094,996 |
|
1,819,465 |
|
1,689,229 |
| Less: recoupments, waivers and/or reimbursements(Note 2) |
69,093 |
|
(3,104) |
|
(1,178) |
| Net expenses after recoupments, waivers and/or reimbursements |
2,164,089 |
|
1,816,361 |
|
1,688,051 |
| Net investment income |
20,050,890 |
|
13,298,347 |
|
13,022,311 |
| Net realized and unrealized gain/(loss) from investments: |
|
|
|
|
|
| Net realized gain/(loss) from investments |
649,761 |
|
(530,082) |
|
411,345 |
| Net change in unrealized appreciation/(depreciation) on investments |
2,056,510 |
|
(4,222,485) |
|
(3,065,740) |
| Net realized and unrealized gain/(loss) on investments |
2,706,271 |
|
(4,752,567) |
|
(2,654,395) |
| Net increase in net assets resulting from operations |
$22,757,161 |
|
$8,545,780 |
|
$10,367,916 |
The accompanying notes are an integral part of the financial statements.
AMBRUS FUNDS
Statements of Changes in Net Assets
| |
Ambrus Core Bond Fund |
| |
For the Year
Ended
September 30, 2025 |
|
For the Year
Ended
September 30, 2024 |
| Net increase in net assets from operations: |
|
|
|
| Net investment income |
$20,050,890 |
|
$11,915,488 |
| Net realized gains from investments |
649,761 |
|
583,168 |
| Net change in unrealized appreciation on investments |
2,056,510 |
|
12,469,508 |
| Net increase in net assets resulting from operations |
22,757,161 |
|
24,968,164 |
| Less dividends and distributions to shareholders from: |
|
|
|
| Total distributable earnings: |
|
|
|
| Institutional Class |
(20,050,788) |
|
(11,915,440) |
| Net decrease in net assets from dividends and distributions to shareholders |
(20,050,788) |
|
(11,915,440) |
| Increase in net assets derived from capital share transactions (Note 4) |
141,225,567 |
|
177,794,967 |
| Total increase in net assets |
143,931,940 |
|
190,847,691 |
| Net assets |
|
|
|
| Beginning of year |
350,779,508 |
|
159,931,817 |
| End of year |
$494,711,448 |
|
$350,779,508 |
The accompanying notes are an integral part of the financial statements.
AMBRUS FUNDS
Statements of Changes in Net Assets (Continued)
| |
Ambrus Tax-Conscious California Bond Fund |
| |
For the Year
Ended
September 30, 2025 |
|
For the Year
Ended
September 30, 2024 |
| Net increase/(decrease) in net assets from operations: |
|
|
|
| Net investment income |
$13,298,347 |
|
$7,998,785 |
| Net realized gains/(losses) from investments |
(530,082) |
|
329,456 |
| Net change in unrealized appreciation/(depreciation) on investments |
(4,222,485) |
|
6,844,728 |
| Net increase in net assets resulting from operations |
8,545,780 |
|
15,172,969 |
| Less dividends and distributions to shareholders from: |
|
|
|
| Total distributable earnings: |
|
|
|
| Institutional Class |
(13,298,652) |
|
(7,998,215) |
| Net decrease in net assets from dividends and distributions to shareholders |
(13,298,652) |
|
(7,998,215) |
| Increase in net assets derived from capital share transactions (Note 4) |
140,451,189 |
|
153,295,161 |
| Total increase in net assets |
135,698,317 |
|
160,469,915 |
| Net assets |
|
|
|
| Beginning of year |
295,889,367 |
|
135,419,452 |
| End of year |
$431,587,684 |
|
$295,889,367 |
The accompanying notes are an integral part of the financial statements.
AMBRUS FUNDS
Statements of Changes in Net Assets (Concluded)
| |
Ambrus Tax-Conscious National Bond Fund |
| |
For the Year
Ended
September 30, 2025 |
|
For the Year
Ended
September 30, 2024 |
| Net increase/(decrease) in net assets from operations: |
|
|
|
| Net investment income |
$13,022,311 |
|
$9,444,042 |
| Net realized gains from investments |
411,345 |
|
486,525 |
| Net change in unrealized appreciation/(depreciation) on investments |
(3,065,740) |
|
8,855,068 |
| Net increase in net assets resulting from operations |
10,367,916 |
|
18,785,635 |
| Less dividends and distributions to shareholders from: |
|
|
|
| Total distributable earnings: |
|
|
|
| Institutional Class |
(13,021,982) |
|
(9,444,362) |
| Net decrease in net assets from dividends and distributions to shareholders |
(13,021,982) |
|
(9,444,362) |
| Increase in net assets derived from capital share transactions (Note 4) |
109,445,013 |
|
107,185,381 |
| Total increase in net assets |
106,790,947 |
|
116,526,654 |
| Net assets |
|
|
|
| Beginning of year |
297,254,797 |
|
180,728,143 |
| End of year |
$404,045,744 |
|
$297,254,797 |
The accompanying notes are an integral part of the financial statements.
AMBRUS FUNDS
AMBRUS CORE BOND FUND
Financial Highlights
Contained below is per share operating performance data for Institutional Class shares outstanding, total investment return, ratios to average net assets and other supplemental data for the respective period. The total returns in the table represent the rate that an investor would have earned or lost on an investment in the Fund (assuming reinvestment of all dividends and distributions). This information has been derived from information provided in the financial statements and should be read in conjunction with the financial statements and the notes thereto.
| |
Institutional Class |
| |
For the
Year Ended
September 30,
2025 |
|
For the
Year Ended
September 30,
2024 |
|
For the
Year Ended
September 30,
2023 |
|
For the Period from
September 6, 2022*
to September 30,
2022 |
| Per Share Operating Performance |
|
|
|
|
|
|
|
| Net asset value, beginning of year/period |
$10.12 |
|
$9.62 |
|
$9.74 |
|
$10.00 |
| Net investment income(1) |
0.46 |
|
0.46 |
|
0.45 |
|
0.02 |
| Net realized and unrealized gain/(loss) on investments |
— |
|
0.50 |
|
(0.13) |
|
(0.26) |
| Total from investment operations |
0.46 |
|
0.96 |
|
0.32 |
|
(0.24) |
| Dividends and distributions to shareholders from: |
|
|
|
|
|
|
|
| Net investment income |
(0.46) |
|
(0.46) |
|
(0.44) |
|
(0.02) |
| Net asset value, end of year/period |
$10.12 |
|
$10.12 |
|
$9.62 |
|
$9.74 |
| Total investment return(2) |
4.71% |
|
10.20% |
|
3.29% |
|
(2.38)% |
| Ratios/Supplemental Data |
|
|
|
|
|
|
|
| Net assets, end of year/period (in 000s) |
$494,711 |
|
$350,780 |
|
$159,932 |
|
$4,880 |
| Ratio of expenses to average net assets with recoupments, waivers, and/or reimbursements, if any |
0.50% |
|
0.50% |
|
0.50% |
|
0.50%(3) |
| Ratio of expenses to average net assets without recoupments, waivers and/or reimbursements, if any(4) |
0.48% |
|
0.52% |
|
0.70% |
|
10.81%(3) |
| Ratio of net investment income to average net assets |
4.63% |
|
4.64% |
|
4.63% |
|
3.31%(3) |
| Portfolio turnover rate |
71% |
|
32% |
|
107% |
|
1%(5) |
| * |
The Ambrus Core Bond Fund commenced operations on September 6, 2022. |
| (1) |
The selected per share data was calculated using the average shares outstanding method for the year. |
| (2) |
Total investment return is calculated assuming a purchase of shares on the first day and a sale of shares on the last day of each period reported and includes reinvestments of dividends and distributions, if any. Total returns for periods less than one year are not annualized. |
| (3) |
Annualized. |
| (4) |
During the period, certain fees were waived and/or reimbursed; or recouped, if any. If such fee waivers and/or reimbursements or recoupments had not occurred, the ratios would have been as indicated (See Note 2). |
| (5) |
Not annualized. |
The accompanying notes are an integral part of the financial statements.
AMBRUS FUNDS
AMBRUS TAX-CONSCIOUS CALIFORNIA BOND FUND
Financial Highlights (Continued)
Contained below is per share operating performance data for Institutional Class shares outstanding, total investment return, ratios to average net assets and other supplemental data for the respective period. The total returns in the table represent the rate that an investor would have earned or lost on an investment in the Fund (assuming reinvestment of all dividends and distributions). This information has been derived from information provided in the financial statements and should be read in conjunction with the financial statements and the notes thereto.
| |
Institutional Class |
| |
For the
Year Ended
September 30,
2025 |
|
For the
Year Ended
September 30,
2024 |
|
For the Period from
October 3, 2022*
to September 30,
2023 |
| Per Share Operating Performance |
|
|
|
|
|
| Net asset value, beginning of year/period |
$10.24 |
|
$9.84 |
|
$10.00 |
| Net investment income(1) |
0.37 |
|
0.37 |
|
0.36 |
| Net realized and unrealized gain/(loss) on investments |
(0.18) |
|
0.41 |
|
(0.17) |
| Total from investment operations |
0.19 |
|
0.78 |
|
0.19 |
| Dividends and distributions to shareholders from: |
|
|
|
|
|
| Net investment income |
(0.37) |
|
(0.38) |
|
(0.35) |
| Net asset value, end of year/period |
$10.06 |
|
$10.24 |
|
$9.84 |
| Total investment return(2) |
1.88% |
|
8.00% |
|
1.90% |
| Ratios/Supplemental Data |
|
|
|
|
|
| Net assets, end of year/period (in 000s) |
$431,588 |
|
$295,889 |
|
$135,419 |
| Ratio of expenses to average net assets with recoupments, waivers, and/or reimbursements, if any |
0.50% |
|
0.50% |
|
0.50%(3) |
| Ratio of expenses to average net assets without recoupments, waivers and/or reimbursements, if any(4) |
0.50% |
|
0.54% |
|
0.69%(3) |
| Ratio of net investment income to average net assets |
3.66% |
|
3.72% |
|
3.58%(3) |
| Portfolio turnover rate |
26% |
|
39% |
|
28%(5) |
| * |
The Ambrus Tax-Conscious California Bond Fund commenced operations on October 3, 2022. |
| (1) |
The selected per share data was calculated using the average shares outstanding method for the year. |
| (2) |
Total investment return is calculated assuming a purchase of shares on the first day and a sale of shares on the last day of each period reported and includes reinvestments of dividends and distributions, if any. Total returns for periods less than one year are not annualized. |
| (3) |
Annualized. |
| (4) |
During the period, certain fees were waived and/or reimbursed; or recouped, if any. If such fee waivers and/or reimbursements or recoupments had not occurred, the ratios would have been as indicated (See Note 2). |
| (5) |
Not annualized. |
The accompanying notes are an integral part of the financial statements.
AMBRUS FUNDS
AMBRUS TAX-CONSCIOUS NATIONAL BOND FUND
Financial Highlights (Concluded)
Contained below is per share operating performance data for Institutional Class shares outstanding, total investment return, ratios to average net assets and other supplemental data for the respective period. The total returns in the table represent the rate that an investor would have earned or lost on an investment in the Fund (assuming reinvestment of all dividends and distributions). This information has been derived from information provided in the financial statements and should be read in conjunction with the financial statements and the notes thereto.
| |
Institutional Class |
| |
For the
Year Ended
September 30,
2025 |
|
For the
Year Ended
September 30,
2024 |
|
For the Period from
October 3, 2022*
to September 30,
2023 |
| Per Share Operating Performance |
|
|
|
|
|
| Net asset value, beginning of year/period |
$10.23 |
|
$9.81 |
|
$10.00 |
| Net investment income(1) |
0.39 |
|
0.39 |
|
0.38 |
| Net realized and unrealized gain/(loss) on investments |
(0.12) |
|
0.43 |
|
(0.20) |
| Total from investment operations |
0.27 |
|
0.82 |
|
0.18 |
| Dividends and distributions to shareholders from: |
|
|
|
|
|
| Net investment income |
(0.39) |
|
(0.40) |
|
(0.37) |
| Net asset value, end of year/period |
$10.11 |
|
$10.23 |
|
$9.81 |
| Total investment return(2) |
2.70% |
|
8.45% |
|
1.80% |
| Ratios/Supplemental Data |
|
|
|
|
|
| Net assets, end of year/period (in 000s) |
$404,046 |
|
$297,255 |
|
$180,728 |
| Ratio of expenses to average net assets |
0.50% |
|
0.50% |
|
0.50%(3) |
| Ratio of expenses to average net assets without waivers(4) |
0.50% |
|
0.54% |
|
0.65%(3) |
| Ratio of net investment income to average net assets |
3.86% |
|
3.92% |
|
3.77%(3) |
| Portfolio turnover rate |
26% |
|
36% |
|
32%(5) |
| * |
The Ambrus Tax-Conscious National Bond Fund commenced operations on October 3, 2022. |
| (1) |
The selected per share data was calculated using the average shares outstanding method for the year. |
| (2) |
Total investment return is calculated assuming a purchase of shares on the first day and a sale of shares on the last day of each period reported and includes reinvestments of dividends and distributions, if any. Total returns for periods less than one year are not annualized. |
| (3) |
Annualized. |
| (4) |
During the period, certain fees were waived and/or reimbursed. If such fee waivers and/or reimbursements had not occurred, the ratios would have been as indicated (See Note 2). |
| (5) |
Not annualized. |
The accompanying notes are an integral part of the financial statements.
AMBRUS FUNDS
Notes to Financial Statements
September 30, 2025
1. Organization and Significant Accounting Policies
The Ambrus Core Bond Fund, Ambrus Tax-Conscious California Bond Fund and Ambrus Tax-Conscious National Bond Fund (each a “Fund” and together the “Funds”) are diversified, open-end management investment companies registered under the Investment Company Act of 1940, as amended, (the “1940 Act”), which commenced investment operations on September 6, 2022, October 3, 2022 and October 3, 2022, respectively. The Funds are separate series of FundVantage Trust (the “Trust”) which was organized as a Delaware statutory trust on August 28, 2006. The Trust is a “series trust” authorized to issue an unlimited number of separate series or classes of shares of beneficial interest. Each series is treated as a separate entity for certain matters under the 1940 Act, and for other purposes, and a shareholder of one series is not deemed to be a shareholder of any other series. Two separate classes of shares, Investor Class and Institutional Class, are offered for the Funds. As of September 30, 2025, Investor Class shares have not been issued on the Funds.
The Funds are investment companies and follow accounting and reporting guidance in the Financial Accounting Standards Board Accounting Standards Codification Topic 946.
Portfolio Valuation – Each Fund's net asset value (“NAV”) is calculated once daily at the close of regular trading hours on the New York Stock Exchange (“NYSE”) (typically 4:00 p.m. Eastern time) on each day the NYSE is open. Securities held by the Funds are valued using the closing price or the last sale price on a national securities exchange or the National Association of Securities Dealers Automatic Quotation System (“NASDAQ”) market system where they are primarily traded. The Funds' equity securities listed on any national exchange market system will be valued at the last sale price. Equity securities traded in the over-the-counter (“OTC”) market are valued at their closing sale or official closing price. If there were no transactions on that day, securities traded principally on an exchange will be valued at the mean of the last bid and ask prices prior to the market close. Fixed income securities are valued based on market quotations, which are furnished by an independent pricing service. Fixed income securities having remaining maturities of 60 days or less are generally valued at amortized cost, provided such amount approximates fair value. Securities that do not have a readily available current market value are valued in good faith by the Adviser as “valuation designee” under the oversight of the Trust's Board of Trustees. Relying on prices supplied by pricing services or dealers or using fair valuation may result in values that are higher or lower than the values used by other investment companies and investors to price the same investments. The Adviser has adopted written policies and procedures for valuing securities and other assets in circumstances where market quotes are not readily available. In the event that market quotes are not readily available, and the security or asset cannot be valued pursuant to one of the valuation methods, the value of the security or asset will be determined in good faith by the Adviser pursuant to its policies and procedures. On a quarterly basis, the Adviser's fair valuation determinations will be reviewed by the Trust's Board of Trustees. Prices for equity securities normally are supplied by an independent pricing service approved by the Trust’s Board of Trustees. Investments in other open-end investment companies are valued based on the NAV of such investment companies (which may use fair value pricing as disclosed in their prospectuses).
Fair Value Measurements — The inputs and valuation techniques used to measure fair value of the Funds’ investments are summarized into three levels as described in the hierarchy below:
• Level 1 — unadjusted quoted prices in active markets for identical securities;
• Level 2 — other significant observable inputs (including quoted prices for similar securities, interest rates, prepayment speeds, credit risk, etc.); and
• Level 3 — significant unobservable inputs (including the Funds’ own assumptions in determining the fair value of investments).
The fair value of a Fund’s bonds are generally based on quotes received from brokers or independent pricing services. Bonds with quotes that are based on actual trades with a sufficient level of activity on or near the measurement date are classified as Level 2 assets.
The inputs or methodology used for valuing securities are not necessarily an indication of the risk associated with investing in those securities. Transfers in and out are recognized at the value at the end of the period.
AMBRUS FUNDS
Notes to Financial Statements (Continued)
September 30, 2025
Significant events (such as movement in the U.S. securities market, or other regional and local developments) may occur between the time that foreign markets close (where the security is principally traded) and the time that each Fund calculates its NAV (generally, the close of the NYSE) which may impact the value of securities traded in these foreign markets. As a result, each Fund fair values foreign securities using an independent pricing service which considers the correlation of the trading patterns of the foreign security to the intraday trading in the U.S. markets for investments such as American Depositary Receipts, financial futures, exchange traded funds and certain indexes as well as prices for similar securities. Such fair valuations are categorized as Level 2 in the hierarchy.
Securities listed on a non-U.S. exchange are generally fair valued daily by an independent fair value pricing service approved by the Board of Trustees and categorized as Level 2 investments within the hierarchy. The fair valuations for these securities may not be the same as quoted or published prices of the securities on their primary markets. Securities for which daily fair value prices from the independent fair value pricing service are not available are generally valued at the last quoted sale price at the close of an exchange on which the security is traded and categorized as Level 1 investments within the hierarchy. Values of foreign securities, currencies, and other assets and liabilities denominated in foreign currencies are translated into U.S. dollars at the exchange rate of said currencies against the U.S. dollar, as of valuation time, as provided by an independent pricing service approved by the Board of Trustees.
The valuations for fixed income securities are typically the prices supplied by independent third-party pricing services, which may use market prices or broker/dealer quotations or a variety of valuation techniques and methodologies. The independent third-party pricing services use inputs that are observable such as issuer details, interest rates, yield curves, prepayment speeds, credit risks/spreads, default rates and quoted prices for similar securities. To the extent that these inputs are observable, the fair value of fixed income securities would be categorized as Level 2; otherwise the fair values would be categorized as Level 3.
The following is a summary of the inputs used, as of September 30, 2025, in valuing each Fund's investments carried at fair value:
| Funds |
|
Total
Value at
09/30/25 |
|
Level 1
Quoted
Price |
|
Level 2
Other
Significant
Observable
Inputs |
|
Level 3
Significant
Unobservable
Inputs |
| Ambrus Core Bond Fund |
|
|
|
|
|
|
| Assets |
|
|
|
|
|
|
|
|
| Corporate Bonds |
|
$215,956,436 |
|
$— |
|
$215,956,436 |
|
$— |
| U.S. Treasury Obligations |
|
160,207,680 |
|
— |
|
160,207,680 |
|
— |
| Preferreds |
|
|
|
|
|
|
|
|
| Financials |
|
36,536,125 |
|
4,398,879 |
|
32,137,246 |
|
— |
| Consumer Discretionary |
|
2,034,291 |
|
— |
|
2,034,291 |
|
— |
| Energy |
|
2,138,132 |
|
— |
|
2,138,132 |
|
— |
| Asset-Backed Securities |
|
38,732,516 |
|
— |
|
38,732,516 |
|
— |
| Municipal Bonds |
|
3,077,054 |
|
— |
|
3,077,054 |
|
— |
| Exchange Traded Funds |
|
23,164,800 |
|
23,164,800 |
|
— |
|
— |
| Short-Term Investment |
|
7,938,723 |
|
7,938,723 |
|
— |
|
— |
| Total Assets |
|
$489,785,757 |
|
$35,502,402 |
|
$454,283,355 |
|
$— |
| Ambrus Tax-Conscious California Bond Fund |
|
|
|
|
|
|
| Assets |
|
|
|
|
|
|
|
|
| Municipal Bonds |
|
$366,787,885 |
|
$— |
|
$366,787,885 |
|
$— |
| Preferreds |
|
|
|
|
|
|
|
|
| Financials |
|
31,130,423 |
|
5,743,355 |
|
25,387,068 |
|
— |
| Consumer Discretionary |
|
868,295 |
|
— |
|
868,295 |
|
— |
| Energy |
|
1,069,066 |
|
— |
|
1,069,066 |
|
— |
AMBRUS FUNDS
Notes to Financial Statements (Continued)
September 30, 2025
| Funds |
|
Total
Value at
09/30/25 |
|
Level 1
Quoted
Price |
|
Level 2
Other
Significant
Observable
Inputs |
|
Level 3
Significant
Unobservable
Inputs |
| U.S. Treasury Obligations |
|
$21,000,362 |
|
$— |
|
$21,000,362 |
|
$— |
| Corporate Bonds |
|
2,061,011 |
|
— |
|
2,061,011 |
|
— |
| Exchange Traded Funds |
|
4,788,000 |
|
4,788,000 |
|
— |
|
— |
| Short-Term Investment |
|
5,777,841 |
|
5,777,841 |
|
— |
|
— |
| Total Assets |
|
$433,482,883 |
|
$16,309,196 |
|
$417,173,687 |
|
$— |
| Ambrus Tax-Conscious National Bond Fund |
|
|
|
|
|
|
| Assets |
|
|
|
|
|
|
|
|
| Municipal Bonds |
|
$334,146,586 |
|
$— |
|
$334,146,586 |
|
$— |
| Preferreds |
|
|
|
|
|
|
|
|
| Financials |
|
33,726,370 |
|
6,434,987 |
|
27,291,383 |
|
— |
| Consumer Discretionary |
|
1,165,996 |
|
— |
|
1,165,996 |
|
— |
| Energy |
|
1,069,066 |
|
— |
|
1,069,066 |
|
— |
| Corporate Bonds |
|
9,265,718 |
|
— |
|
9,265,718 |
|
— |
| Asset-Backed Securities |
|
6,414,951 |
|
— |
|
6,414,951 |
|
— |
| U.S. Treasury Obligations |
|
5,950,102 |
|
— |
|
5,950,102 |
|
— |
| Exchange Traded Funds |
|
5,147,100 |
|
5,147,100 |
|
— |
|
— |
| Short-Term Investment |
|
7,179,143 |
|
7,179,143 |
|
— |
|
— |
| Total Assets |
|
$404,065,032 |
|
$18,761,230 |
|
$385,303,802 |
|
$— |
At the end of each quarter, management evaluates the classification of Levels 1, 2 and 3 assets and liabilities. Various factors are considered, such as changes in liquidity from the prior reporting period; whether or not a broker is willing to execute at the quoted price; the depth and consistency of prices from third-party pricing services; and the existence of contemporaneous, observable trades in the market. Additionally, management evaluates the classification of Level 1 and Level 2 assets and liabilities on a quarterly basis for changes in listings or delistings on national exchanges.
Due to the inherent uncertainty of determining the fair value of investments that do not have a readily available market value, the fair value of the Funds’ investments may fluctuate from period to period. Additionally, the fair value of investments may differ significantly from the values that would have been used had a ready market existed for such investments and may differ materially from the values the Funds may ultimately realize. Further, such investments may be subject to legal and other restrictions on resale or otherwise less liquid than publicly traded securities.
For fair valuations using significant unobservable inputs, U.S. generally accepted accounting principles (“U.S. GAAP”) require the Funds to present a reconciliation of the beginning to ending balances for reported market values that present changes attributable to total realized and unrealized gains or losses, purchase and sales, and transfers in and out of Level 3 during the period. A reconciliation of Level 3 investments is presented only when the Funds had an amount of Level 3 investments at the end of the reporting period that was meaningful in relation to its net assets. The amounts and reasons for all transfers in and out of Level 3 are disclosed when the Funds had an amount of transfers during the reporting period that was meaningful in relation to its net assets as of the end of the reporting period.
For the year ended September 30, 2025, there were no transfers in or out of Level 3.
Use of Estimates — The preparation of financial statements in conformity with U.S. GAAP requires management to make estimates and assumptions that affect the amounts reported in the financial statements and accompanying notes at the date of the financial statements and the reported amounts of revenues and expenses during the period. Actual results could differ from those estimates and those differences could be material.
AMBRUS FUNDS
Notes to Financial Statements (Continued)
September 30, 2025
Investment Transactions, Investment Income and Expenses — Investment transactions are recorded on trade date for financial statement preparation purposes. Realized gains and losses on investments sold are recorded on the identified cost basis. Gains and losses on principal paydowns from mortgage-backed securities are recorded as interest income on the Statements of Operations. Interest income is recorded on the accrual basis. Accretion of discounts and amortization of premiums are recorded on a daily basis using the effective yield method except for short term securities, which records discounts and premiums on a straight-line basis. Dividends are recorded on the ex-dividend date. Estimated components of distributions received from real estate investment trusts may be considered income, return of capital distributions or capital gain distributions. Return of capital distributions are recorded as a reduction of cost of the related investments. General expenses of the Trust are generally allocated to each Fund under methodologies approved by the Board of Trustees. Expenses directly attributable to a particular Fund in the Trust are charged directly to that Fund. The Funds’ investment income, expenses (other than class-specific expenses) and unrealized and realized gains and losses are allocated daily to each class of shares based upon the relative proportion of net assets of each class at the beginning of the day.
Cash and Cash Equivalents — Cash and cash equivalents, if any, include cash and overnight investments in interest-bearing demand deposits with a financial institution with original maturities of three months or less. Each Fund maintains deposits with a high quality financial institution in an amount that is in excess of federally insured limits.
Dividends and Distributions to Shareholders — Dividends from net investment income are declared daily and paid monthly to shareholders. Distributions, if any, of net short-term capital gain and net capital gain (the excess of net long-term capital gain over the short-term capital loss) realized by each Fund, after deducting any available capital loss carryovers are declared and paid to its shareholders annually. Income dividends and capital gain distributions are determined in accordance with U.S. federal income tax regulations, which may differ from U.S. GAAP. These book to tax differences are either considered temporary or permanent in nature. To the extent these differences are permanent in nature, (e.g., distribution reclassifications), such amounts are reclassified within the composition of net assets based on their federal tax basis treatment; temporary differences (e.g., wash sales) do not require a reclassification. Dividends and distributions, which exceed earnings and profits for the full year for tax purposes, will be reported as a tax return of capital.
U.S. Tax Status — No provision is made for U.S. income taxes as it is each Fund's intention to continue to qualify for and elect the tax treatment applicable to regulated investment companies under Subchapter M of the Internal Revenue Code of 1986, as amended (“Internal Revenue Code”), and make the requisite distributions to its shareholders which will be sufficient to relieve it from U.S. income and excise taxes.
Other — In the normal course of business, the Funds may enter into contracts that provide general indemnifications. The Funds’ maximum exposure under these arrangements is dependent on claims that may be made against the Funds in the future, and therefore, cannot be estimated; however, based on experience, the risk of material loss for such claims is considered remote.
Debt Investment Risk — Debt investments are affected primarily by the financial condition of the companies or other entities that have issued them and by changes in interest rates. There is a risk that an issuer of each Fund's debt investments may not be able to meet its financial obligations (e. g., may not be able to make principal and/or interest payments when they are due or otherwise default on other financial terms) and/or seek bankruptcy protection. Securities such as high-yield bonds, e.g., bonds with low credit ratings by Moody's (Ba or lower) or Standard & Poor's (BB and lower) or if unrated are of comparable quality as determined by the Adviser, are especially subject to credit risk during periods of economic uncertainty or during economic downturns and are more likely to default on their interest and/or principal payments than higher rated securities. Debt investments may be affected by changes in interest rates. With fixed rate securities, a rise in interest rates typically causes a fall in values. The yield earned by the Fund will vary with changes in interest rates. Debt investments with longer durations tend to be more sensitive to changes in interest rates, making them more volatile than debt investments with shorter durations or floating or adjustable interest rates. The value of debt investments may fall when interest rates rise.
Concentration of Credit Risk — The Ambrus Tax-Conscious California Bond Fund primarily invests in debt obligations issued by the state of California and its political subdivisions, agencies, and public authorities to obtain funds for various public purposes. The Fund is more susceptible to factors adversely affecting issues of California municipal securities than is a municipal bond fund that is not concentrated in these issuers.
AMBRUS FUNDS
Notes to Financial Statements (Continued)
September 30, 2025
Segment Reporting — In accordance with the FASB Accounting Standards Update (ASU) 2023-07, Segment Reporting (Topic 280): Improvements to Reportable Segment Disclosures, each Fund has evaluated its business activities and determined that it operates as a single reportable segment.
The Chief Operating Decision Maker (“CODM”) is the Investment Committee of the Adviser and the Principal Executive Officer (“PEO”) and the Principal Financial Officer (“PFO”) of the Funds. The CODM has concluded that each Fund operates as a single operating segment since the Funds each have a single investment strategy as disclosed in the prospectus, against which the CODM assesses performance. The financial information provided to and reviewed by the CODM is presented within the Funds’ financial statements.
Recent Accounting Pronouncement — On December 14, 2023, the FASB issued ASU 2023-09, which establishes new income tax disclosure requirements and modifies or eliminates certain existing disclosure provisions. The amendments in this ASU are intended to address investor requests for more transparency about income tax information and to improve the effectiveness of income tax disclosures. ASU 2023-09 applies to all entities that are subject to ASC 740, Income Taxes. The ASU is effective for annual periods beginning after December 15, 2024. Management is currently evaluating the impact of ASU 2023-09 and does not believe it will have a material impact on the Funds’ financial statements.
2. Transactions with Related Parties and Other Service Providers
Whittier Advisors, LLC (“Whittier” or the “Adviser”) serves as investment adviser to the Funds pursuant to an investment advisory agreement with the Trust. For its services, the Adviser is paid a monthly fee at the annual rate based on average daily net assets of the Fund as shown in the table below:
| Ambrus Core Bond Fund |
0.40% |
| Ambrus Tax-Conscious California Bond Fund |
0.40% |
| Ambrus Tax-Conscious National Bond Fund |
0.40% |
The Adviser has contractually agreed to reduce its investment advisory fee and/or reimburse certain expenses of the Funds to the extent necessary to ensure that the Funds' total operating expenses (excluding taxes, fees and expenses attributable to a distribution or service plan adopted by the Trust, interest, extraordinary items, “Acquired Fund Fees and Expenses” and brokerage commissions) do not exceed 0.50% (on an annual basis) through January 31, 2026. The Expense Limitation will remain in place until January 31, 2026, unless the Board of Trustees approves their earlier termination.
The Adviser is entitled to recover, subject to approval by the Board of Trustees, such amounts reduced or reimbursed for a period of up to three (3) years from the date on which the Adviser reduced its compensation and/or assumed expenses for such Fund. The Adviser is permitted to seek reimbursement from a Fund, subject to certain limitations, for fees it waived and Fund expenses it paid to the extent the total annual fund operating expenses do not exceed the limits described above or any lesser limits in effect at the time of reimbursement. No reimbursement will occur unless the Fund's expenses are below the Expense Limitation amount.
During the year ended September 30, 2025, the Adviser recovered fees previously waived and reimbursed in prior fiscal years in the amount of $69,093 for the Ambrus Core Bond Fund.
For the year ended September 30, 2025, the amount of advisory fees earned, recouped and waived and/or reimbursed was as follows:
| |
Gross
Advisory Fee |
|
Recoupments,
Waivers and/or
Reimbursements |
|
Net Advisory Fee |
| Ambrus Core Bond Fund |
$1,731,272 |
|
$69,093 |
|
$1,800,365 |
| Ambrus Tax-Conscious California Bond Fund |
1,453,089 |
|
(3,104) |
|
1,449,985 |
| Ambrus Tax-Conscious National Bond Fund |
1,350,441 |
|
(1,178) |
|
1,349,263 |
AMBRUS FUNDS
Notes to Financial Statements (Continued)
September 30, 2025
As of September 30, 2025, the amount of potential recovery was as follows:
| |
09/30/2026 |
|
09/30/2027 |
|
09/30/2028 |
|
Total |
| Ambrus Core Bond Fund |
$90,755 |
|
$52,933 |
|
$— |
|
$143,688 |
| Ambrus Tax-Conscious California Bond Fund |
118,425 |
|
90,206 |
|
3,104 |
|
211,735 |
| Ambrus Tax-Conscious National Bond Fund |
137,147 |
|
89,232 |
|
1,178 |
|
227,557 |
The Funds have not recorded a commitment or contingent liability at September 30, 2025.
Other Service Providers
The Bank of New York Mellon (“BNY”) serves as administrator and custodian for the Funds. For providing administrative and accounting services, BNY is entitled to receive a monthly fee equal to an annual percentage rate of the Funds’ average daily net assets and is subject to certain minimum monthly fees. For providing certain custodial services, BNY is entitled to receive a monthly fee, subject to certain minimum, and out of pocket expenses.
BNY has the ability to recover fees waived in the prior fiscal year if a Fund terminates its agreements with BNY within three years of commencing operations. As of September 30, 2025, the amount of potential recovery was $30,571 and $23,908 for the Ambrus Tax-Conscious California Bond Fund and Ambrus Tax-Conscious National Bond Fund, respectively. The ability to recover such amounts previously waived expires on October 3, 2025 for the Ambrus Tax-Conscious California Bond Fund and Ambrus Tax-Conscious National Bond Fund.
BNY Mellon Investment Servicing (US) Inc. (the “Transfer Agent”) provides transfer agent services to the Funds. The Transfer Agent is entitled to receive a monthly fee, subject to certain minimum, and out of pocket expenses.
The Trust, on behalf of the Funds, has entered into agreements with financial intermediaries to provide recordkeeping, processing, shareholder communications and other services to customers of the intermediaries investing in the Funds and has agreed to compensate the intermediaries for providing those services. The fees incurred by the Funds for these services are included in Transfer agent fees in the Statements of Operations.
Foreside Funds Distributors LLC (the “Underwriter”) provides principal underwriting services to the Funds pursuant to an underwriting agreement between the Trust and the Underwriter.
Trustees and Officers
The Trust is governed by its Board of Trustees. The Trustees receive compensation in the form of an annual retainer and per meeting fees for their services to the Trust. An employee of BNY serves as the Secretary of the Trust and is not compensated by the Funds or the Trust.
Prior to July 31, 2025, JW Fund Management LLC (“JWFM”) provided a PEO and PFO, to the Trust. Effective August 1, 2025, Tidal ETF Services LLC (“Tidal”) provides a PEO and PFO, to the Trust. Chenery Compliance Group, LLC (“Chenery”) provides the Trust with a Chief Compliance Officer and an Anti-Money Laundering Officer. Tidal and Chenery are compensated for their services provided to the Trust. JWFM was compensated for its services provided to the Trust through July 31, 2025.
3. Investment in Securities
For the year ended September 30, 2025, aggregated purchases and sales of investment securities (excluding short-term investments) of the Funds were as follows:
AMBRUS FUNDS
Notes to Financial Statements (Continued)
September 30, 2025
| |
U.S. Government Securities |
|
Other Securities |
| |
Purchases |
|
Sales |
|
Purchases |
|
Sales |
| Ambrus Core Bond Fund |
$243,660,566 |
|
$219,391,107 |
|
$160,432,453 |
|
$59,155,242 |
| Ambrus Tax-Conscious California Bond Fund |
1,001,043 |
|
5,001,299 |
|
220,847,984 |
|
82,488,701 |
| Ambrus Tax-Conscious National Bond Fund |
9,283,415 |
|
11,353,397 |
|
173,169,295 |
|
72,330,590 |
4. Capital Share Transactions
For the year ended September 30, 2025 and the year ended September 30, 2024, transactions in capital shares (authorized shares unlimited) were as follows:
| |
For the Year Ended
September 30, 2025 |
|
For the Year Ended
September 30, 2024 |
| |
Shares |
|
Amount |
|
Shares |
|
Amount |
| Ambrus Core Bond Fund: |
|
|
|
|
|
|
|
| Institutional Class |
|
|
|
|
|
|
|
| Sales |
19,587,567 |
|
$195,058,561 |
|
20,765,247 |
|
$204,522,311 |
| Reinvestments |
2,006,639 |
|
20,050,788 |
|
1,208,509 |
|
11,915,440 |
| Redemptions |
(7,390,043) |
|
(73,883,782) |
|
(3,919,646) |
|
(38,642,784) |
| Net increase |
14,204,163 |
|
$141,225,567 |
|
18,054,110 |
|
$177,794,967 |
| |
|
|
|
|
|
|
|
| Ambrus Tax-Conscious California Bond Fund: |
|
|
|
|
|
|
|
| Institutional Class |
|
|
|
|
|
|
|
| Sales |
21,253,677 |
|
$212,821,759 |
|
18,933,542 |
|
$191,103,167 |
| Reinvestments |
1,328,030 |
|
13,298,629 |
|
792,767 |
|
7,998,215 |
| Redemptions |
(8,550,334) |
|
(85,669,199) |
|
(4,604,427) |
|
(45,806,221) |
| Net increase |
14,031,373 |
|
$140,451,189 |
|
15,121,882 |
|
$153,295,161 |
| |
|
|
|
|
|
|
|
| Ambrus Tax-Conscious National Bond Fund: |
|
|
|
|
|
|
|
| Institutional Class |
|
|
|
|
|
|
|
| Sales |
15,803,285 |
|
$158,823,874 |
|
13,494,135 |
|
$135,657,809 |
| Reinvestments |
1,294,459 |
|
13,021,786 |
|
938,699 |
|
9,444,362 |
| Redemptions |
(6,206,856) |
|
(62,400,647) |
|
(3,785,859) |
|
(37,916,790) |
| Net increase |
10,890,888 |
|
$109,445,013 |
|
10,646,975 |
|
$107,185,381 |
| |
|
|
|
|
|
|
|
5. Federal Tax Information
The Funds have followed the authoritative guidance on accounting for and disclosure of uncertainty in tax positions, which requires the Funds to determine whether a tax position is more likely than not to be sustained upon examination, including resolution of any related appeals or litigation processes, based on the technical merits of the position. Tax positions not deemed to meet the more-likely-than-not threshold would be recorded as tax benefit or expense in the current year. Each Fund has determined that there was no effect on the financial statements from following this authoritative guidance. In the normal course of business, the Funds are subject to examination by federal, state and local jurisdictions, where applicable, for tax years for which applicable statutes of limitations have not expired.
Distributions are determined in accordance with federal income tax regulations, which may differ in amount or character from net investment income and realized gains for financial reporting purposes. Accordingly, the character of distributions and composition of net assets for tax purposes may differ from those reflected in the accompanying financial statements. To the extent these differences
AMBRUS FUNDS
Notes to Financial Statements (Continued)
September 30, 2025
are permanent, such amounts are reclassified within the components of net assets based on the tax treatment; temporary differences do not require reclassifications. Net assets were not affected by these adjustments. For the year ended September 30, 2025, there were no reclassifications for the Funds.
For the year ended September 30, 2025, the tax character of distributions paid by the Ambrus Core Bond Fund, Ambrus Tax-Conscious California Bond Fund and Ambrus Tax-Conscious National Bond Fund were $20,050,788, $3,278,585 and $3,551,989 of ordinary income dividends and $0, $10,020,044 and $9,469,797 of tax-exempt income, respectively. For the year ended September 30, 2024, the tax character of distributions paid by the Ambrus Core Bond Fund, Ambrus Tax-Conscious California Bond Fund and Ambrus Tax-Conscious National Bond Fund were $11,915,440, $3,100,524 and $3,652,011 of ordinary income dividends and $0, $4,897,691 and $5,792,351 of tax-exempt income, respectively. Distributions from net investment income and short-term capital gains are treated as ordinary income for federal income tax purposes.
As of September 30, 2025, the components of distributable earnings on a tax basis were as follows:
| |
Capital Loss
Carryforward |
|
Undistributed
Ordinary
Income |
|
Undistributed
Tax Exempt |
|
Unrealized
Appreciation/
(Depreciation) |
|
Temporary
Differences |
| Ambrus Core Bond Fund |
$(211,355) |
|
$102 |
|
$— |
|
$11,949,179 |
|
$— |
| Ambrus Tax-Conscious California Bond Fund |
(831,969) |
|
— |
|
301 |
|
(384,442) |
|
(23) |
| Ambrus Tax-Conscious National Bond Fund |
(213,148) |
|
— |
|
525 |
|
1,347,182 |
|
(196) |
The differences between the book and tax basis components of distributable earnings relate primarily to the timing and recognition of income and gains for federal income tax purposes attributable to wash sales.
As of September 30, 2025, the federal tax cost, aggregate gross unrealized appreciation and depreciation of securities held by each Fund were as follows:
| |
|
Federal
Tax Cost |
|
Unrealized
Appreciation |
|
Unrealized
(Depreciation) |
|
Net Unrealized
Appreciation/
(Depreciation) |
| Ambrus Core Bond Fund |
|
$477,836,578 |
|
$12,501,509 |
|
$(552,330) |
|
$11,949,179 |
| Ambrus Tax-Conscious California Bond Fund |
|
433,867,325 |
|
3,444,347 |
|
(3,828,789) |
|
(384,442) |
| Ambrus Tax-Conscious National Bond Fund |
|
402,717,850 |
|
3,834,238 |
|
(2,487,056) |
|
1,347,182 |
Pursuant to federal income tax rules applicable to regulated investment companies, the Funds may elect to treat certain capital losses between November 1 and September 30 and late year ordinary losses ((i) ordinary losses between January 1 and September 30, and (ii) specified ordinary and currency losses between November 1 and September 30) as occurring on the first day of the following tax year. For the year ended September 30, 2025, the Funds had no post October loss deferrals or late year ordinary loss deferrals.
Accumulated capital losses represent net capital loss carryforwards as of September 30, 2025 that may be available to offset future realized capital gains and thereby reduce future capital gains distributions. As of September 30, 2025, the Funds’ capital loss carryforwards, which were comprised of both short-term losses and long-term losses, and had an unlimited period of capital loss carryover were as follows:
| |
Capital Loss Carryforward |
| |
Short-Term |
|
Long-Term |
| Ambrus Core Bond Fund |
$126,000 |
|
$85,355 |
| Ambrus Tax-Conscious California Bond Fund |
165,847 |
|
666,122 |
| Ambrus Tax-Conscious National Bond Fund |
213,148 |
|
— |
For the year ended September 30, 2025, the following Funds utilized capital losses as follows:
AMBRUS FUNDS
Notes to Financial Statements (Concluded)
September 30, 2025
| |
Capital Losses
Utilized |
| Ambrus Core Bond Fund |
$521,330 |
| Ambrus Tax-Conscious National Bond Fund |
275,405 |
6. Subsequent Events
Management has evaluated the impact of all subsequent events on each Fund through the date the financial statements were issued, and has determined that there are no subsequent events requiring recognition or disclosure in the financial statements.
AMBRUS FUNDS
Report of Independent Registered Public Accounting Firm
To the Shareholders of Ambrus Funds and Board of Trustees of FundVantage Trust
Opinion on the Financial Statements
We have audited the accompanying statements of assets and liabilities, including the portfolios of investments, of Ambrus Core Bond Fund, Ambrus Tax-Conscious California Bond Fund, and Ambrus Tax-Conscious National Bond Fund (the “Funds”), each a series of FundVantage Trust, as of September 30, 2025, the related statements of operations and changes in net assets, and financial highlights for the year then ended, and the related notes (collectively referred to as the “financial statements”). In our opinion, the financial statements present fairly, in all material respects, the financial position of each of the Funds as of September 30, 2025, the results of their operations, changes in net assets, and the financial highlights for the year then ended, in conformity with accounting principles generally accepted in the United States of America.
The Funds’ financial statements and financial highlights for the years or periods ended September 30, 2024, and prior, were audited by other auditors whose report dated November 27, 2024, expressed an unqualified opinion on those financial statements and financial highlights.
Basis for Opinion
These financial statements are the responsibility of the Funds’ management. Our responsibility is to express an opinion on the Funds’ financial statements based on our audits. We are a public accounting firm registered with the Public Company Accounting Oversight Board (United States) (“PCAOB”) and are required to be independent with respect to the Funds in accordance with the U.S. federal securities laws and the applicable rules and regulations of the Securities and Exchange Commission and the PCAOB.
We conducted our audits in accordance with the standards of the PCAOB. Those standards require that we plan and perform the audit to obtain reasonable assurance about whether the financial statements are free of material misstatement whether due to error or fraud.
Our audits included performing procedures to assess the risks of material misstatement of the financial statements, whether due to error or fraud, and performing procedures that respond to those risks. Such procedures included examining, on a test basis, evidence regarding the amounts and disclosures in the financial statements. Our procedures included confirmation of securities owned as of September 30, 2025, by correspondence with the custodian and brokers; when replies were not received from brokers, we performed other auditing procedures. Our audits also included evaluating the accounting principles used and significant estimates made by management, as well as evaluating the overall presentation of the financial statements. We believe that our audits provide a reasonable basis for our opinion.
We have served as the Funds’ auditor since 2025.
COHEN & COMPANY, LTD.
Philadelphia, Pennsylvania
November 25, 2025
AMBRUS FUNDS
Shareholder Tax Information
(Unaudited)
The Fund is required by Subchapter M of the Internal Revenue Code of 1986, as amended, to advise their shareholders of the U.S. federal tax status of distributions received by the Fund's shareholders in respect of such fiscal year. During the year ended September 30, 2025, the Ambrus Core Bond Fund, Ambrus Tax-Conscious California Bond Fund and Ambrus Tax-Conscious National Bond Fund paid $20,050,788, $3,278,585 and $3,551,989 of ordinary income dividends and $0, $10,020,044 and $9,469,797 of tax-exempt income, respectively to its shareholders.
The percentage of qualified interest income related dividends not subject to withholding tax for non-resident aliens and foreign corporations received for the Ambrus Core Bond Fund, Ambrus Tax-Conscious California Bond Fund and Ambrus Tax-Conscious National Bond Fund is 95.64%, 21.40% and 23.08%, respectively.
The Ambrus Core Bond Fund, Ambrus Tax-Conscious California Bond Fund and Ambrus Tax-Conscious National Bond Fund designate 0.75%, 5.38% and 6.27%, respectively, of the ordinary income distribution as qualified dividend income pursuant to the Jobs and Growth Tax Relief Reconciliation Act of 2003.
The percentage of ordinary income dividends qualifying for the corporate dividends received deduction for the Ambrus Core Bond Fund, Ambrus Tax-Conscious California Bond Fund and Ambrus Tax-Conscious National Bond Fund are 0.75%, 5.38% and 6.27%, respectively.
A total of 29.05%, 25.41% and 10.37% of the dividends distributed during the fiscal year for the Ambrus Core Bond Fund, Ambrus Tax-Conscious California Bond Fund and Ambrus Tax-Conscious National Bond Fund, respectively, was derived from interest on U.S. government securities, which is generally exempt from state income tax.
All designations are based on financial information available as of the date of this annual report and, accordingly, are subject to change. For each item, it is the intention of the Fund to designate the maximum amount permitted under the Internal Revenue Code of 1986, as amended, and the regulations thereunder.
Because the Fund's fiscal year is not the calendar year, another notification will be sent with respect to calendar year 2024. The second notification, which will reflect the amount, if any, to be used by calendar year taxpayers on their U.S. federal income tax returns, will be made in conjunction with Form 1099-DIV and will be mailed in January 2025.
Foreign shareholders will generally be subject to U.S. withholding tax on the amount of their ordinary income dividends. They will generally not be entitled to a foreign tax credit or deduction for the withholding taxes paid by the Fund, if any.
In general, dividends received by tax-exempt recipients (e.g., IRAs and Keoghs) need not be reported as taxable income for U.S. federal income tax purposes. However, some retirement trusts (e.g., corporate, Keogh and 403(b)(7) plans) may need this information for their annual information reporting.
Shareholders are advised to consult their own tax advisers with respect to the tax consequences of their investment in the Fund.
AMBRUS FUNDS
Other Information
(Unaudited)
Item 8. Changes in and Disagreements with Accountants for Open-End Management Investment Companies.
Not applicable.
Item 9. Proxy Disclosures for Open-End Management Investment Companies.
Not applicable.
Item 10. Remuneration Paid to Directors, Officers, and Others of Open-End Management Investment Companies.
Each Fund’s disclosure of remuneration items is included as part of the Annual Financials and Additional Information.
Item 11. Statement Regarding Basis for Approval of Investment Advisory Contract.
Board Considerations with Respect to the Approval of the Continuation of the Investment Advisory Agreement with Whittier Advisors, LLC
At an in-person meeting held on June 16-17, 2025 (the “Meeting”), the Board of Trustees (the “Board” or the “Trustees”) of FundVantage Trust (the “Trust”), including a majority of the Trustees who are not “interested persons” within the meaning of Section 2(a)(19) of the Investment Company Act of 1940, as amended (the “1940 Act”) (the “Independent Trustees”), unanimously approved the continuation of the Investment Advisory Agreement between Whittier Advisors, LLC (“Whittier” or the “Adviser”) and the Trust (the “Agreement”) on behalf of the Ambrus Tax-Conscious National Bond Fund (“National Bond Fund”), Ambrus Tax-Conscious California Bond Fund (“California Bond Fund”) and Ambrus Core Bond Fund (“Core Bond Fund,” and together with the National Bond Fund and California Bond Fund, the “Ambrus Funds”). At the Meeting, the Board considered the continuation of the Agreement with respect to each Fund for an additional one-year period.
In determining whether to approve the Agreement, the Trustees, including the Independent Trustees, considered information provided by Whittier in response to a request for information in accordance with Section 15(c) of the 1940 Act (the “Whittier 15(c) Response”) regarding (i) the services performed or to be performed by Whittier for the Ambrus Funds, (ii) the composition and qualifications of Whittier’s portfolio management staff, (iii) any potential or actual material conflicts of interest which may arise in connection with the management of the Ambrus Funds, (iv) investment performance, (v) the financial condition of Whittier, (vi) brokerage selection procedures (including soft dollar arrangements, if any), (vii) the procedures for allocating investment opportunities between the Ambrus Funds and other clients, (viii) results of any independent audit or regulatory examination, including any recommendations or deficiencies noted, (ix) any litigation, investigation or administrative proceeding which may have a material impact on Whittier’s ability to service the Ambrus Funds, and (x) compliance with the Ambrus Funds’ investment objectives, policies and practices (including codes of ethics and proxy voting policies), federal securities laws and other regulatory requirements. In addition to the information in the Whittier 15(c) Response, the Trustees received additional information at Board meetings throughout the year covering matters such as the performance of each Ambrus Fund compared against its Refinitiv Category and its benchmark; compliance with the Ambrus Funds’ investment objectives, policies, strategy and limitations; the compliance of portfolio management personnel with applicable codes of ethics; and Whittier’s adherence to pricing procedures as the Ambrus Funds’ Valuation Designee appointed by the Board.
The Board considered additional information provided by representatives from Whittier invited to participate in the Meeting regarding Whittier’s history, performance, investment strategy, and compliance program. Representatives of Whittier responded to questions from the Board. In addition to the foregoing information, the Trustees also considered other factors they believed to be relevant to considering the approval of the Agreement, including the specific matters discussed below. In their deliberations, the Trustees did not identify any particular information that was controlling, and different Trustees may have attributed different weights to the various factors. After deliberating, the Trustees determined that the overall arrangement between the Ambrus Funds and Whittier, as provided by the terms of the Agreement, including the advisory fees under the Agreement, were fair and reasonable in light of the services provided, expenses incurred and such other matters as the Trustees considered relevant.
AMBRUS FUNDS
Other Information (Continued)
(Unaudited)
Based on the Whittier 15(c) Response, the Trustees concluded that (i) the nature, extent and quality of the services provided (or to be provided) by Whittier are appropriate and consistent with the terms of the Agreement, (ii) that the quality of those services has been, and continues to be, consistent with industry norms, (iii) the Ambrus Funds are likely to benefit from the provision of those services, (iv) Whittier has sufficient personnel, with the appropriate skills and experience, to serve the Ambrus Funds effectively and has demonstrated its continuing ability to attract and retain qualified personnel, and (v) the satisfactory nature, extent, and quality of services currently provided to the Ambrus Funds is likely to continue under the Agreement.
The Trustees considered the investment performance for the Ambrus Funds (as applicable) and Whittier. The Trustees reviewed historical performance charts which showed the performance of the Ambrus Funds as compared to their respective benchmark indices and Refinitiv categories for the year-to-date, one-year, two-years and since inception periods ended March 31, 2025, as applicable. The Trustees noted that they also considered performance reports provided at Board meetings throughout the year.
Ambrus Tax-Conscious National Bond Fund. The Trustees noted that the National Bond Fund’s Institutional Class shares outperformed the Bloomberg Municipal Inter-Short (1-10 Year) Index for the one-year and two-year periods ended March 31, 2025, and underperformed for the year-to-date period ended March 31, 2025. They further noted that the National Bond Fund’s Institutional Class shares outperformed the Refinitiv General & Insured Municipal Debt Funds Median for the year-to-date, one-year and two-year periods ended March 31, 2025, and underperformed for the since inception period ended March 31, 2025.
Ambrus Tax-Conscious California Bond Fund. The Trustees noted that the California Bond Fund’s Institutional Class shares outperformed the Bloomberg California Municipal Inter-Short (1-10 Year) Index for the one-year and two-year periods ended March 31, 2025, and underperformed for the year-to-date period ended March 31, 2025. They further noted that the California Bond Fund’s Institutional Class shares outperformed the Refinitiv California Municipal Debt Funds Median for the year-to-date, one-year and two-year periods ended March 31, 2025, and underperformed for the since inception period ended March 31, 2025.
Ambrus Core Bond Fund. The Trustees noted that the Core Bond Fund’s Institutional Class shares outperformed the Bloomberg Intermediate U.S. Government/Credit Bond Index for the two-year and since inception periods ended March 31, 2025, and underperformed for the year-to-date and one-year periods ended March 31, 2025. They further noted that the Core Bond Fund’s Institutional Class shares outperformed the Refinitiv Core Bond Funds Median for the one-year, two-year and since inception periods ended March 31, 2025, and underperformed for the year-to-date period ended March 31, 2025.
The Trustees concluded that the performance of each of the Ambrus Funds, as applicable, was within an acceptable range of performance relative to other mutual funds with similar investment objectives, strategies and policies based on the information provided at the Meeting.
The Trustees noted that the representatives of Whittier had provided information regarding its advisory fees and an analysis of these fees in relation to the services provided to the Ambrus Funds and any other ancillary benefit resulting from Whittier’s relationship with the Ambrus Funds. The Trustees also reviewed information regarding the fees Whittier charges to certain other clients and evaluated explanations provided by Whittier as to differences in fees charged to the Ambrus Funds and other similarly managed accounts, where applicable. The Trustees also reviewed a peer comparison of advisory fees and total expenses for the Ambrus Funds versus those funds in the Ambrus Fund’s applicable Refinitiv category (the “Peer Group”). The Trustees concluded that the advisory fees and services provided by Whittier are consistent with those of other advisers that manage mutual funds with investment objectives, strategies and policies similar to those of the Ambrus Funds as measured by the information provided by Whittier. The Board considered, among other data, the specific factors and related conclusion set forth below with respect to the Ambrus Funds:
Ambrus Tax-Conscious National Bond Fund.The Trustees noted that the contractual advisory fee and net total expense ratio for the National Bond Fund’s Institutional Class shares were higher and lower than the median of the contractual advisory fee and net total expense ratio for those funds in its Peer Group, respectively.
Ambrus Tax-Conscious California Bond Fund. The Trustees noted that the contractual advisory fee and net total expense ratio for the California Bond Fund’s Institutional Class shares were lower than the median of the contractual advisory fee and net total expense ratio for those funds in its Peer Group.
AMBRUS FUNDS
Other Information (Concluded)
(Unaudited)
Ambrus Core Bond Fund. The Trustees noted that the contractual advisory fee and net total expense ratio for the Core Bond Fund’s Institutional Class shares were higher than the median of the contractual advisory fee and net total expense ratio for those funds in its Peer Group.
The Trustees considered the costs of the services provided by Whittier, the compensation and benefits received by Whittier in providing services to the Ambrus Funds, and the profitability and certain additional information related to the financial condition of Whittier. In addition, the Trustees considered any direct or indirect revenues received by affiliates of Whittier.
The Trustees considered the extent to which economies of scale would be realized relative to fee levels as the Ambrus Funds grow, and whether the advisory fee levels reflect those economies of scale for the benefit of shareholders. The Trustees considered and determined that economies of scale for the benefit of shareholders should be achieved if assets of the Ambrus Funds increase because fixed expenses will be spread across a larger asset base. The Trustees also noted that the Ambrus Funds’ advisory fees do not include “breakpoint” reductions in the advisory fee rates at specific asset levels but that Whittier has contractually agreed to waive fees and/or reimburse certain expenses of the Ambrus Funds for the benefit of shareholders.
At the Meeting, after consideration of all the factors and taking into consideration the information presented, the Board, including the Independent Trustees, unanimously approved the continuation of the Agreement for an additional one-year period. In arriving at their decision, the Trustees did not identify any single factor as controlling, but made their determination in light of the information presented to them.
Proxy Voting
Policies and procedures that the Funds use to determine how to vote proxies relating to portfolio securities as well as information regarding how the Funds voted proxies relating to portfolio securities for the most recent 12-month period ended June 30 are available without charge, upon request, by calling (833) 996-2101 and on the Securities and Exchange Commission's (“SEC”) website at http://www.sec.gov.
Quarterly Portfolio Schedules
Each Fund files its complete schedule of portfolio holdings with the SEC for the first and third fiscal quarters of each fiscal year (quarters ended December 31 and June 30) as an exhibit to its reports on Form N-PORT. The Funds' portfolio holdings on Form N-PORT are available on the SEC's website at http://www.sec.gov.
AMBRUS FUNDS
Privacy Notice
(Unaudited)
The privacy of your personal financial information is extremely important to us. When you open an account with us, we collect a significant amount of information from you in order to properly invest and administer your account. We take very seriously the obligation to keep that information private and confidential, and we want you to know how we protect that important information.
We collect nonpublic personal information about you from applications or other forms you complete and from your transactions with us or our affiliates. We do not disclose information about you, or our former clients, to our affiliates or to service providers or other third parties, except as permitted by law. We share only the information required to properly administer your accounts, which enables us to send transaction confirmations, monthly or quarterly statements, financials and tax forms. Even within the Funds and its affiliated entities, a limited number of people who actually service accounts will have access to your personal financial information. Further, we do not share information about our current or former clients with any outside marketing groups or sales entities.
To ensure the highest degree of security and confidentiality, the Funds and its affiliates maintain various physical, electronic and procedural safeguards to protect your personal information. We also apply special measures for authentication of information you request or submit to us on our web site.
If you have questions or comments about our privacy practices, please call us at (833) 996-2101.
Investment Adviser
Whittier Advisors, LLC
4695 MacArthur Court
Suite 1500
Newport Beach, CA 92660
Administrator
The Bank of New York Mellon
103 Bellevue Parkway
Wilmington, DE 19809
Transfer Agent
BNY Mellon Investment Servicing (US) Inc.
500 Ross Street, 154-0520
Pittsburgh, PA 15262
Principal Underwriter
Foreside Funds Distributors LLC
190 Middle Street, Suite 301
Portland, ME 04101
Custodian
The Bank of New York Mellon
240 Greenwich Street
New York, NY 10286
Independent Registered Public Accounting Firm
Cohen & Company, Ltd.
1835 Market St., Suite 310
Philadelphia, PA 19103
Legal Counsel
Troutman Pepper Locke LLP
3000 Two Logan Square
18th and Arch Streets
Philadelphia, PA 19103
Item 8. Changes in and Disagreements with Accountants for Open-End Management Investment Companies.
Not applicable.
Item 9. Proxy Disclosures for Open-End Management Investment Companies.
Not applicable.
Item 10. Remuneration Paid to Directors, Officers, and Others of Open-End Management Investment Companies.
Each Fund’s disclosure of remuneration items is included as part of the Annual Financials and Additional Information filed under Item 7 of this form.
Item 11. Statement Regarding Basis for Approval of Investment Advisory Contract.
At an in-person meeting held on June 16-17, 2025 (the “Meeting”), the Board of Trustees (the “Board” or the “Trustees”) of FundVantage Trust (the “Trust”), including a majority of the Trustees who are not “interested persons” within the meaning of Section 2(a)(19) of the Investment Company Act of 1940, as amended (the “1940 Act”) (the “Independent Trustees”), unanimously approved the continuation of the Investment Advisory Agreement between Whittier Advisors, LLC (“Whittier” or the “Adviser”) and the Trust (the “Agreement”) on behalf of the Ambrus Tax-Conscious National Bond Fund (“National Bond Fund”), Ambrus Tax-Conscious California Bond Fund (“California Bond Fund”) and Ambrus Core Bond Fund (“Core Bond Fund,” and together with the National Bond Fund and California Bond Fund, the “Ambrus Funds”). At the Meeting, the Board considered the continuation of the Agreement with respect to each Fund for an additional one-year period.
In determining whether to approve the Agreement, the Trustees, including the Independent Trustees, considered information provided by Whittier in response to a request for information in accordance with Section 15(c) of the 1940 Act (the “Whittier 15(c) Response”) regarding (i) the services performed or to be performed by Whittier for the Ambrus Funds, (ii) the composition and qualifications of Whittier’s portfolio management staff, (iii) any potential or actual material conflicts of interest which may arise in connection with the management of the Ambrus Funds, (iv) investment performance, (v) the financial condition of Whittier, (vi) brokerage selection procedures (including soft dollar arrangements, if any), (vii) the procedures for allocating investment opportunities between the Ambrus Funds and other clients, (viii) results of any independent audit or regulatory examination, including any recommendations or deficiencies noted, (ix) any litigation, investigation or administrative proceeding which may have a material impact on Whittier’s ability to service the Ambrus Funds, and (x) compliance with the Ambrus Funds’ investment objectives, policies and practices (including codes of ethics and proxy voting policies), federal securities laws and other regulatory requirements. In addition to the information in the Whittier 15(c) Response, the Trustees received additional information at Board meetings throughout the year covering matters such as the performance of each Ambrus Fund compared against its Refinitiv Category and its benchmark; compliance with the Ambrus Funds’ investment objectives, policies, strategy and limitations; the compliance of portfolio management personnel with applicable codes of ethics; and Whittier’s adherence to pricing procedures as the Ambrus Funds’ Valuation Designee appointed by the Board.
The Board considered additional information provided by representatives from Whittier invited to participate in the Meeting regarding Whittier’s history, performance, investment strategy, and compliance
program. Representatives of Whittier responded to questions from the Board. In addition to the foregoing information, the Trustees also considered other factors they believed to be relevant to considering the approval of the Agreement, including the specific matters discussed below. In their deliberations, the Trustees did not identify any particular information that was controlling, and different Trustees may have attributed different weights to the various factors. After deliberating, the Trustees determined that the overall arrangement between the Ambrus Funds and Whittier, as provided by the terms of the Agreement, including the advisory fees under the Agreement, were fair and reasonable in light of the services provided, expenses incurred and such other matters as the Trustees considered relevant.
Based on the Whittier 15(c) Response, the Trustees concluded that (i) the nature, extent and quality of the services provided (or to be provided) by Whittier are appropriate and consistent with the terms of the Agreement, (ii) that the quality of those services has been, and continues to be, consistent with industry norms, (iii) the Ambrus Funds are likely to benefit from the provision of those services, (iv) Whittier has sufficient personnel, with the appropriate skills and experience, to serve the Ambrus Funds effectively and has demonstrated its continuing ability to attract and retain qualified personnel, and (v) the satisfactory nature, extent, and quality of services currently provided to the Ambrus Funds is likely to continue under the Agreement.
The Trustees considered the investment performance for the Ambrus Funds (as applicable) and Whittier. The Trustees reviewed historical performance charts which showed the performance of the Ambrus Funds as compared to their respective benchmark indices and Refinitiv categories for the year-to-date, one-year, two-years and since inception periods ended March 31, 2025, as applicable. The Trustees noted that they also considered performance reports provided at Board meetings throughout the year.
Ambrus Tax-Conscious National Bond Fund. The Trustees noted that the National Bond Fund’s Institutional Class shares outperformed the Bloomberg Municipal Inter-Short (1-10 Year) Index for the one-year and two-year periods ended March 31, 2025, and underperformed for the year-to-date period ended March 31, 2025. They further noted that the National Bond Fund’s Institutional Class shares outperformed the Refinitiv General & Insured Municipal Debt Funds Median for the year-to-date, one-year and two-year periods ended March 31, 2025, and underperformed for the since inception period ended March 31, 2025.
Ambrus Tax-Conscious California Bond Fund. The Trustees noted that the California Bond Fund’s Institutional Class shares outperformed the Bloomberg California Municipal Inter-Short (1-10 Year) Index for the one-year and two-year periods ended March 31, 2025, and underperformed for the year-to-date period ended March 31, 2025. They further noted that the California Bond Fund’s Institutional Class shares outperformed the Refinitiv California Municipal Debt Funds Median for the year-to-date, one-year and two-year periods ended March 31, 2025, and underperformed for the since inception period ended March 31, 2025.
Ambrus Core Bond Fund. The Trustees noted that the Core Bond Fund’s Institutional Class shares outperformed the Bloomberg Intermediate U.S. Government/Credit Bond Index for the two-year and since inception periods ended March 31, 2025, and underperformed for the year-to-date and one-year periods ended March 31, 2025. They further noted that the Core Bond Fund’s Institutional Class shares outperformed the Refinitiv Core Bond Funds Median for the one-year, two-year and since inception periods ended March 31, 2025, and underperformed for the year-to-date period ended March 31, 2025.
The Trustees concluded that the performance of each of the Ambrus Funds, as applicable, was within an acceptable range of performance relative to other mutual funds with similar investment objectives, strategies and policies based on the information provided at the Meeting.
The Trustees noted that the representatives of Whittier had provided information regarding its advisory fees and an analysis of these fees in relation to the services provided to the Ambrus Funds and any other ancillary benefit resulting from Whittier’s relationship with the Ambrus Funds. The Trustees also reviewed information regarding the fees Whittier charges to certain other clients and evaluated explanations provided by Whittier as to differences in fees charged to the Ambrus Funds and other similarly managed accounts, where applicable. The Trustees also reviewed a peer comparison of advisory fees and total expenses for the Ambrus Funds versus those funds in the Ambrus Fund’s applicable Refinitiv category (the “Peer Group”). The Trustees concluded that the advisory fees and services provided by Whittier are consistent with those of other advisers that manage mutual funds with investment objectives, strategies and policies similar to those of the Ambrus Funds as measured by the information provided by Whittier. The Board considered, among other data, the specific factors and related conclusion set forth below with respect to the Ambrus Funds:
Ambrus Tax-Conscious National Bond Fund. The Trustees noted that the contractual advisory fee and net total expense ratio for the National Bond Fund’s Institutional Class shares were higher and lower than the median of the contractual advisory fee and net total expense ratio for those funds in its Peer Group, respectively.
Ambrus Tax-Conscious California Bond Fund. The Trustees noted that the contractual advisory fee and net total expense ratio for the California Bond Fund’s Institutional Class shares were lower than the median of the contractual advisory fee and net total expense ratio for those funds in its Peer Group.
Ambrus Core Bond Fund. The Trustees noted that the contractual advisory fee and net total expense ratio for the Core Bond Fund’s Institutional Class shares were higher than the median of the contractual advisory fee and net total expense ratio for those funds in its Peer Group.
The Trustees considered the costs of the services provided by Whittier, the compensation and benefits received by Whittier in providing services to the Ambrus Funds, and the profitability and certain additional information related to the financial condition of Whittier. In addition, the Trustees considered any direct or indirect revenues received by affiliates of Whittier.
The Trustees considered the extent to which economies of scale would be realized relative to fee levels as the Ambrus Funds grow, and whether the advisory fee levels reflect those economies of scale for the benefit of shareholders. The Trustees considered and determined that economies of scale for the benefit of shareholders should be achieved if assets of the Ambrus Funds increase because fixed expenses will be spread across a larger asset base. The Trustees also noted that the Ambrus Funds’ advisory fees do not include “breakpoint” reductions in the advisory fee rates at specific asset levels but that Whittier has contractually agreed to waive fees and/or reimburse certain expenses of the Ambrus Funds for the benefit of shareholders.
At the Meeting, after consideration of all the factors and taking into consideration the information presented, the Board, including the Independent Trustees, unanimously approved the continuation of the
Agreement for an additional one-year period. In arriving at their decision, the Trustees did not identify any single factor as controlling, but made their determination in light of the information presented to them.
Item 12. Disclosure of Proxy Voting Policies and Procedures for Closed-End Management Investment Companies.
Not applicable.
Item 13. Portfolio Managers of Closed-End Management Investment Companies.
Not applicable.
Item 14. Purchases of Equity Securities by Closed-End Management Investment Company and Affiliated Purchasers.
Not applicable.
Item 15. Submission of Matters to a Vote of Security Holders.
There have been no material changes to the procedures by which the shareholders may recommend nominees to the registrant’s board of trustees.
Item 16. Controls and Procedures.
| |
(a) |
The registrant’s principal executive and principal financial officer have concluded that the registrant’s disclosure controls and procedures (as defined in Rule 30a-3(c) under the Investment Company Act of 1940, as amended (the “1940 Act”)) are effective in design and operation and are sufficient to form the basis of the certifications required by Rule 30a-(2) under the 1940 Act, based on their evaluation of these disclosure controls and procedures as of a date within 90 days of this report on Form N-CSR. |
| |
(b) |
There were no changes in the registrant’s internal control over financial reporting (as defined in Rule 30a-3(d) under the 1940 Act that occurred during the period covered by this report that have materially affected, or are reasonably likely to materially affect, the registrant’s internal control over financial reporting. |
Item 17. Disclosure of Securities Lending Activities for Closed-End Management Investment Companies.
Not applicable.
Item 18. Recovery of Erroneously Awarded Compensation.
Not applicable.
Item 19. Exhibits.
SIGNATURES
Pursuant to the requirements of the Securities Exchange Act of 1934 and the Investment Company Act of 1940, the registrant has duly caused this report to be signed on its behalf by the undersigned, thereunto duly authorized.
|
|
|
| (Registrant) |
|
FundVantage Trust |
|
|
|
|
|
| By (Signature and Title)* |
|
/s/ Joel L. Weiss |
|
|
Joel L. Weiss, President and |
|
|
Chief Executive Officer |
|
|
(principal executive officer) |
Pursuant to the requirements of the Securities Exchange Act of 1934 and the Investment Company Act of 1940, this report has been signed below by the following persons on behalf of the registrant and in the capacities and on the dates indicated.
|
|
|
| By (Signature and Title)* |
|
/s/ Joel L. Weiss |
|
|
Joel L. Weiss, President and |
|
|
Chief Executive Officer |
|
|
(principal executive officer) |
|
|
|
|
|
| By (Signature and Title)* |
|
/s/ Christine S. Catanzaro |
|
|
Christine S. Catanzaro, Treasurer and |
|
|
Chief Financial Officer |
|
|
(principal financial officer) |
* Print the name and title of each signing officer under his or her signature.
EX-99.CODE ETH
FUNDVANTAGE TRUST
CODE
OF ETHICS FOR PRINCIPAL EXECUTIVE AND
FINANCIAL OFFICERS
| I. |
Covered Officers/Purpose of the Code |
This FundVantage Trust (the “Trust”) code of ethics (the “Code”) applies to the Trust’s President and Treasurer
(the “Covered Officers” each of whom are set forth in Exhibit A) for the purpose of promoting:
| |
● |
|
honest and ethical conduct, including the ethical handling of actual or apparent conflicts of interest between
personal and professional relationships; |
| |
● |
|
full, fair, accurate, timely and understandable disclosure in reports and documents that a registrant files with,
or submits to, the Securities and Exchange Commission (“SEC”) and in other public communications made by the Trust; |
| |
● |
|
compliance with applicable laws and governmental rules and regulations; |
| |
● |
|
the prompt internal reporting of violations of the Code to an appropriate person or persons identified in the
Code; and |
| |
● |
|
accountability for adherence to the Code. |
Each Covered Officer should adhere to a high standard of business ethics and should be sensitive to situations that may give rise to actual
as well as apparent conflicts of interest.
| II. |
Covered Officers Honest and Ethical Conduct and Ethically Handling Actual and Apparent Conflicts of Interest
|
Overview. The Covered Officers shall conduct their activities on behalf of the Trust in an honest and
ethical manner. A “conflict of interest” occurs when a Covered Officer’s private interest interferes with the interests of, or his service to, the Trust. For example, a conflict of interest would arise if a Covered Officer, or a
member of his family, receives improper personal benefits as a result of his position with the Trust.
Certain conflicts of interest
arise out of the relationships between Covered Officers and the Trust and already are subject to conflict of interest provisions in the Investment Company Act of 1940 (the “1940 Act”). For example, Covered Officers may not individually
engage in certain transactions (such as the purchase or sale of securities or other property) with the Trust because of their status as “affiliated persons” (as defined in Section 2(a)(3) of the 1940 Act) of the Trust. The
compliance programs and procedures of the Trust, the covered service
providers under Rule 38a-1 of the 1940 Act (“Service Providers”) are designed to prevent, or identify and correct, violations of these
provisions. The Code does not, and is not intended to, repeat or replace these programs and procedures, and such conflicts fall outside of the parameters of the Code.
Although typically not presenting an opportunity for improper personal benefit, conflicts arise from, or as a result of, the contractual
relationship between the Trust and the Service Providers. As a result, the Code recognizes that the Covered Officers will, in the normal course of their duties, be involved in establishing policies and implementing decisions that will have different
effects on Service Providers and the Trust. The participation of the Covered Officers in such activities is inherent in the contractual relationship between the Trust and the investment adviser and is consistent with the performance by the Covered
Officers of their duties as officers of the Trust. Thus, if performed in conformity with the provisions of the 1940 Act, such activities will be deemed to have been handled ethically. In addition, it is recognized by the Trust’s Board of
Trustees (“Board”) that the Covered Officers may also be officers or employees of one or more other investment companies covered by other codes.
Other conflicts of interest are covered by the Code, even if such conflicts of interest are not subject to provisions in the 1940 Act. The
following list provides examples of conflicts of interest under the Code, but Covered Officers should keep in mind that these examples are not exhaustive. The overarching principle is that the personal interests of a Covered Officer should not be
placed improperly before the interests of the Trust.
* * * *
Each Covered Officer must not:
| |
● |
|
use his personal influence or personal relationships improperly to influence investment decisions or financial
reporting by the Trust whereby the Covered Officer would benefit personally to the detriment of the Trust. |
| |
● |
|
cause the Trust to take action, or fail to take action, for the individual personal benefit of the Covered
Officer rather than the benefit of the Trust; and |
| |
● |
|
use material non-public knowledge of portfolio transactions made or
contemplated for the Trust to trade personally or cause others to trade personally in contemplation of the market effect of such transactions. |
There are some conflict of interest situations that should be reviewed by the Trust’s legal counsel, if material. Examples of these
include, but are not limited to:
| |
● |
|
service as a director on the board of any public or private company; |
| |
● |
|
receipt of gifts, in excess of reasonable or business-appropriate; |
| |
● |
|
the receipt of any entertainment from any company with which the Trust has current or prospective business
dealings unless such entertainment is business-related, reasonable in cost, appropriate as to time and place, and not so frequent as to raise any question of impropriety; |
-2-
| |
● |
|
any ownership interest in, or any consulting or employment relationship with, any of the Service Providers or any
affiliated person thereof; and |
| |
● |
|
a direct or indirect financial interest in commissions, transaction charges or spreads paid by the Trust for
effecting portfolio transactions or for selling or redeeming shares other than an interest arising from the Covered Officer’s employment, such as compensation or equity ownership. |
| III. |
Disclosure and Compliance |
| |
● |
|
Each Covered Officer should be familiar with the disclosure requirements generally applicable to the Trust;
|
| |
● |
|
each Covered Officer should not knowingly misrepresent, or cause others to misrepresent, facts about the Trust to
other persons, whether within or outside the Trust, including to the Trust’s Board and independent auditor, and to government regulators and self-regulatory organizations; |
| |
● |
|
each Covered Officer should, to the extent appropriate within his area of responsibility, consult with other
officers and employees of the Trust and the Service Providers with the goal of promoting full, fair, accurate, timely and understandable disclosure in the reports and documents the Trust file with, or submit to, the SEC and in other public
communications made by the Trust; and |
| |
● |
|
it is the responsibility of each Covered Officer to promote compliance with the standards and restrictions
imposed by applicable laws, rules and regulations. |
| IV. |
Reporting and Accountability |
Each Covered Officer must:
| |
● |
|
upon adoption of the Code (or thereafter as applicable, upon becoming a Covered Officer), affirm in writing to
the Board that he or she has received, read, and understands the Code (See Exhibit B for a form of affirmation); |
| |
● |
|
annually affirm to the Board that he or she has complied with the requirements of the Code and report on the
Covered Officer’s affiliations and relationships (see Exhibit C for a form of affirmation); |
-3-
| |
● |
|
not retaliate against any other Covered Officer or any employee of the Trust or its affiliated persons for
reports of potential violations that are made in good faith; and |
| |
● |
|
notify the Trust’s legal counsel promptly if he knows of any violation of the Code. Failure to do so is
itself a violation of the Code. |
The Trust’s legal counsel is responsible for applying the Code to specific
situations in which questions are presented under the Code. The Trust’s legal counsel also has the authority to interpret the Code in any particular situation. However, any approvals or waivers sought by a Covered Officer will be considered by
the independent trustees on the Board.
The Trust will follow these procedures in investigating and enforcing the Code:
| |
● |
|
the Trust’s legal counsel will take all appropriate action to investigate any potential violations reported
to such counsel; |
| |
● |
|
if, after such investigation, the Trust’s legal counsel believes that no violation has occurred, such
counsel is not required to take any further action; |
| |
● |
|
any matter that the Trust’s legal counsel believes is a violation will be reported to the Board;
|
| |
● |
|
The Board will consider appropriate action, which may include review of, and appropriate modifications to,
applicable policies and procedures; notification to appropriate personnel of a Service Provider or its board; or a recommendation to dismiss the Covered Officer; |
| |
● |
|
the Board will be responsible for granting waivers, as appropriate; and |
| |
● |
|
any changes to or waivers of the Code will, to the extent required, be disclosed as provided by SEC rules.
|
| V. |
Other Policies and Procedures |
The Code shall be the sole code of ethics adopted by the Trust for purposes of Section 406 of the Sarbanes-Oxley Act of 2002 and the
rules and forms applicable to registered investment companies thereunder. Insofar as other policies or procedures of the Trust or the Service Providers govern or purport to govern the behavior or activities of the Covered Officers who are subject to
the Code, they are superseded by the Code to the extent that they overlap or conflict with the provisions of the Code. The Trust’s and the Service Providers’ codes of ethics under Rule 17j-1 under
the 1940 Act and the Service Provider’s more detailed policies and procedures are separate requirements applying to the Covered Officers and others, and are not part of the Code.
-4-
Any amendments to the Code, other than amendments to Exhibit A, must be approved or ratified by a majority vote of the Board, including a
majority of independent trustees.
All reports and records prepared or maintained pursuant to the Code will be considered confidential and shall be maintained and protected
accordingly. Except as otherwise required by law or the Code, such matters shall not be disclosed to anyone other than the Board, the Trust’s legal counsel and the Service Providers, as appropriate.
The Code is intended solely for the internal use by the Trust and does not constitute an admission, by or on behalf of the Trust, as to any
fact, circumstance, or legal conclusion.
Adopted as of May 31, 2007.
Amended June 23, 2015 and September 28, 2016
-5-
EXHIBIT A
COVERED OFFICERS UNDER CODE OF ETHICS
|
|
|
|
|
|
|
|
|
Name |
|
Title |
|
|
|
|
Joel L. Weiss |
|
President |
|
|
|
|
Christine S. Catanzaro |
|
Treasurer |
|
|
EXHIBIT B
FUNDVANTAGE TRUST
PRINCIPAL EXECUTIVE AND FINANCIAL OFFICERS CODE OF ETHICS
INITIAL CERTIFICATION
Certification of Compliance with the Principal Executive and Financial Officers Code of Ethics: under the Principal
Executive and Financial Officers Code of Ethics (“Code”) of FundVantage Trust (“Trust”), the President and Treasurer of the Trust are each deemed to be a “Covered Officer.” Covered Officers are subject to the Code
and, upon becoming a Covered Officer, must certify that they have received, read and understand the Code.
You must
respond to the following questions and then submit this form upon completion to the Trust’s Chief Compliance Officer, or his/her delegate. The Code has been attached to this Initial Certification for your reference.
|
|
|
|
I hereby certify and understand that I am a Covered Officer under the Code. |
|
Yes
☐ No ☐ |
| |
|
|
|
I have received, read and understand the Code and I recognize that I am subject to the
requirements of the Code. |
|
Yes
☐ No ☐ |
Please note any exceptions to the above statements:
|
|
|
|
|
|
|
|
|
| Signature: |
|
|
|
|
|
Date: |
|
|
|
|
|
|
|
| Print Name: |
|
|
|
|
|
|
|
|
|
|
|
|
|
| Title: |
|
|
|
|
|
|
|
|
-7-
EXHIBIT C
FUNDVANTAGE TRUST
PRINCIPAL EXECUTIVE AND FINANCIAL OFFICERS CODE OF ETHICS
ANNUAL CERTIFICATION
Certification of Compliance with the Principal Executive and Financial Officers Code of Ethics: under the Principal
Executive and Financial Officers Code of Ethics (“Code”) of FundVantage Trust (“Trust”), the President and Treasurer of the Trust are each deemed to be a “Covered Officer.” Covered Officers are subject to the Code
and, on an annual basis, must (i) certify that they have complied with the Code and (ii) report on any affiliations and relationships.
You must respond to the following questions and then submit this form upon completion to the Trust’s Chief Compliance
Officer, or his/her delegate. The Code has been attached to this Annual Certification for your reference.
|
|
|
|
I hereby certify and understand that I am a Covered Officer. |
|
Yes
☐ No ☐ |
| |
|
|
|
I have read and I understand the Code and I recognize that I am subject to the requirements of the Code. |
|
Yes
☐ No ☐ |
|
I agree that I am in compliance with the Code and any related policy statements. |
|
Yes ☐ No ☐ |
|
I have disclosed all affiliations and relationships that may give rise to a conflict of interest. |
|
Yes ☐ No ☐ |
Please note any exceptions to the above statements:
|
|
|
|
|
|
|
|
|
| Signature: |
|
|
|
|
|
Date: |
|
|
|
|
|
|
|
| Print Name: |
|
|
|
|
|
|
|
|
|
|
|
|
|
| Title: |
|
|
|
|
|
|
|
|
-8-
Certification Pursuant to Rule 30a-2(a) under the
1940 Act and Section 302 of the
Sarbanes-Oxley Act
I, Joel L. Weiss, certify that:
| 1. |
I have reviewed this report on Form N-CSR of FundVantage Trust;
|
| 2. |
Based on my knowledge, this report does not contain any untrue statement of a material fact or omit to state
a material fact necessary to make the statements made, in light of the circumstances under which such statements were made, not misleading with respect to the period covered by this report; |
| 3. |
Based on my knowledge, the financial statements, and other financial information included in this report,
fairly present in all material respects the financial condition, results of operations, changes in net assets, and cash flows (if the financial statements are required to include a statement of cash flows) of the registrant as of, and for, the
periods presented in this report; |
| 4. |
The registrant’s other certifying officer(s) and I are responsible for establishing and maintaining
disclosure controls and procedures (as defined in Rule 30a-3(c) under the Investment Company Act of 1940) and internal control over financial reporting (as defined in Rule
30a-3(d) under the Investment Company Act of 1940) for the registrant and have: |
| |
(a) |
Designed such disclosure controls and procedures, or caused such disclosure controls and procedures to be
designed under our supervision, to ensure that material information relating to the registrant, including its consolidated subsidiaries, is made known to us by others within those entities, particularly during the period in which this report is
being prepared; |
| |
(b) |
Designed such internal control over financial reporting, or caused such internal control over financial
reporting to be designed under our supervision, to provide reasonable assurance regarding the reliability of financial reporting and the preparation of financial statements for external purposes in accordance with generally accepted accounting
principles; |
| |
(c) |
Evaluated the effectiveness of the registrant’s disclosure controls and procedures and presented in
this report our conclusions about the effectiveness of the disclosure controls and procedures, as of a date within 90 days prior to the filing date of this report based on such evaluation; and |
| |
(d) |
Disclosed in this report any change in the registrant’s internal control over financial reporting that
occurred during the period covered by this report that has materially |
| |
affected, or is reasonably likely to materially affect, the registrant’s internal control over financial reporting; and |
| 5. |
The registrant’s other certifying officer(s) and I have disclosed to the registrant’s auditors
and the audit committee of the registrant’s board of directors (or persons performing the equivalent functions): |
| |
(a) |
All significant deficiencies and material weaknesses in the design or operation of internal control over
financial reporting which are reasonably likely to adversely affect the registrant’s ability to record, process, summarize, and report financial information; and |
| |
(b) |
Any fraud, whether or not material, that involves management or other employees who have a significant role
in the registrant’s internal control over financial reporting. |
|
|
|
|
|
| Date: December 5, 2025 |
|
|
|
/s/ Joel L. Weiss |
|
|
|
|
Joel L. Weiss, President and |
|
|
|
|
Chief Executive Officer |
|
|
|
|
(principal executive officer) |
Certification Pursuant to Rule 30a-2(a) under the
1940 Act and Section 302 of the
Sarbanes-Oxley Act
I, Christine S. Catanzaro, certify that:
| 1. |
I have reviewed this report on Form N-CSR of FundVantage Trust;
|
| 2. |
Based on my knowledge, this report does not contain any untrue statement of a material fact or omit to state
a material fact necessary to make the statements made, in light of the circumstances under which such statements were made, not misleading with respect to the period covered by this report; |
| 3. |
Based on my knowledge, the financial statements, and other financial information included in this report,
fairly present in all material respects the financial condition, results of operations, changes in net assets, and cash flows (if the financial statements are required to include a statement of cash flows) of the registrant as of, and for, the
periods presented in this report; |
| 4. |
The registrant’s other certifying officer(s) and I are responsible for establishing and maintaining
disclosure controls and procedures (as defined in Rule 30a-3(c) under the Investment Company Act of 1940) and internal control over financial reporting (as defined in Rule
30a-3(d) under the Investment Company Act of 1940) for the registrant and have: |
| |
(a) |
Designed such disclosure controls and procedures, or caused such disclosure controls and procedures to be
designed under our supervision, to ensure that material information relating to the registrant, including its consolidated subsidiaries, is made known to us by others within those entities, particularly during the period in which this report is
being prepared; |
| |
(b) |
Designed such internal control over financial reporting, or caused such internal control over financial
reporting to be designed under our supervision, to provide reasonable assurance regarding the reliability of financial reporting and the preparation of financial statements for external purposes in accordance with generally accepted accounting
principles; |
| |
(c) |
Evaluated the effectiveness of the registrant’s disclosure controls and procedures and presented in
this report our conclusions about the effectiveness of the disclosure controls and procedures, as of a date within 90 days prior to the filing date of this report based on such evaluation; and |
| |
(d) |
Disclosed in this report any change in the registrant’s internal control over financial reporting that
occurred during the period covered by this report that has materially affected, or is reasonably likely to materially affect, the registrant’s internal control over financial reporting; and |
| 5. |
The registrant’s other certifying officer(s) and I have disclosed to the registrant’s auditors
and the audit committee of the registrant’s board of directors (or persons performing the equivalent functions): |
| |
(a) |
All significant deficiencies and material weaknesses in the design or operation of internal control over
financial reporting which are reasonably likely to adversely affect the registrant’s ability to record, process, summarize, and report financial information; and |
| |
(b) |
Any fraud, whether or not material, that involves management or other employees who have a significant role
in the registrant’s internal control over financial reporting. |
|
|
|
|
|
| Date: December 5, 2025 |
|
|
|
/s/ Christine S. Catanzaro |
|
|
|
|
Christine S. Catanzaro, Treasurer and |
|
|
|
|
Chief Financial Officer |
|
|
|
|
(principal financial officer) |
Certification Pursuant to Rule 30a-2(b) under the
1940 Act and Section 906 of the
Sarbanes-Oxley Act
I, Joel L. Weiss, President and Chief Executive Officer of FundVantage Trust (the “Registrant”), certify that:
| |
1. |
The Form N-CSR of the Registrant (the “Report”) fully
complies with the requirements of Section 13(a) or 15(d) of the Securities Exchange Act of 1934, as amended; and |
| |
2. |
The information contained in the Report fairly presents, in all material respects, the financial condition
and results of operations of the Registrant. |
|
|
|
|
|
| Date: December 5, 2025 |
|
|
|
/s/ Joel L. Weiss |
|
|
|
|
Joel L. Weiss, President and |
|
|
|
|
Chief Executive Officer |
|
|
|
|
(principal executive officer) |
I, Christine S. Catanzaro, Treasurer and Chief Financial Officer of FundVantage Trust (the
“Registrant”), certify that:
| |
1. |
The Form N-CSR of the Registrant (the “Report”) fully
complies with the requirements of Section 13(a) or 15(d) of the Securities Exchange Act of 1934, as amended; and |
| |
2. |
The information contained in the Report fairly presents, in all material respects, the financial condition
and results of operations of the Registrant. |
|
|
|
|
|
| Date: December 5, 2025 |
|
|
|
/s/ Christine S. Catanzaro |
|
|
|
|
Christine S. Catanzaro, Treasurer and |
|
|
|
|
Chief Financial Officer |
|
|
|
|
(principal financial officer) |
v3.25.3
| X |
- DefinitionBoolean flag that is true when the XBRL content amends previously-filed or accepted submission.
| Name: |
dei_AmendmentFlag |
| Namespace Prefix: |
dei_ |
| Data Type: |
xbrli:booleanItemType |
| Balance Type: |
na |
| Period Type: |
duration |
|
| X |
- DefinitionFor the EDGAR submission types of Form 8-K: the date of the report, the date of the earliest event reported; for the EDGAR submission types of Form N-1A: the filing date; for all other submission types: the end of the reporting or transition period. The format of the date is YYYY-MM-DD.
| Name: |
dei_DocumentPeriodEndDate |
| Namespace Prefix: |
dei_ |
| Data Type: |
xbrli:dateItemType |
| Balance Type: |
na |
| Period Type: |
duration |
|
| X |
- DefinitionThe type of document being provided (such as 10-K, 10-Q, 485BPOS, etc). The document type is limited to the same value as the supporting SEC submission type, or the word 'Other'.
| Name: |
dei_DocumentType |
| Namespace Prefix: |
dei_ |
| Data Type: |
dei:submissionTypeItemType |
| Balance Type: |
na |
| Period Type: |
duration |
|
| X |
- DefinitionA unique 10-digit SEC-issued value to identify entities that have filed disclosures with the SEC. It is commonly abbreviated as CIK. Reference 1: http://www.xbrl.org/2003/role/presentationRef
-Publisher SEC
-Name Exchange Act
-Number 240
-Section 12
-Subsection b-2
| Name: |
dei_EntityCentralIndexKey |
| Namespace Prefix: |
dei_ |
| Data Type: |
dei:centralIndexKeyItemType |
| Balance Type: |
na |
| Period Type: |
duration |
|
| X |
- DefinitionOne of: N-1A (Mutual Fund), N-1 (Open-End Separate Account with No Variable Annuities), N-2 (Closed-End Investment Company), N-3 (Separate Account Registered as Open-End Management Investment Company), N-4 (Variable Annuity UIT Separate Account), N-5 (Small Business Investment Company), N-6 (Variable Life UIT Separate Account), S-1 or S-3 (Face Amount Certificate Company), S-6 (UIT, Non-Insurance Product). Reference 1: http://www.xbrl.org/2003/role/presentationRef
-Publisher SEC
-Name Regulation S-T
-Number 232
-Section 313
| Name: |
dei_EntityInvCompanyType |
| Namespace Prefix: |
dei_ |
| Data Type: |
dei:invCompanyType |
| Balance Type: |
na |
| Period Type: |
duration |
|
| X |
- DefinitionThe exact name of the entity filing the report as specified in its charter, which is required by forms filed with the SEC. Reference 1: http://www.xbrl.org/2003/role/presentationRef
-Publisher SEC
-Name Exchange Act
-Number 240
-Section 12
-Subsection b-2
| Name: |
dei_EntityRegistrantName |
| Namespace Prefix: |
dei_ |
| Data Type: |
xbrli:normalizedStringItemType |
| Balance Type: |
na |
| Period Type: |
duration |
|
| X |
- ReferencesReference 1: http://www.xbrl.org/2003/role/presentationRef
-Publisher SEC
-Name Form N-1A
-Section 27A
-Subsection d
-Paragraph 2
-Subparagraph instruction
-Clause 7
| Name: |
oef_ShareholderReportLineItems |
| Namespace Prefix: |
oef_ |
| Data Type: |
xbrli:stringItemType |
| Balance Type: |
na |
| Period Type: |
duration |
|
v3.25.3
Shareholder Report
|
12 Months Ended |
|
Sep. 30, 2025
USD ($)
Holding
|
|---|
| Shareholder Report [Line Items] |
|
| Document Type |
N-CSR
|
| Amendment Flag |
false
|
| Registrant Name |
FundVantage Trust
|
| Entity Central Index Key |
0001388485
|
| Entity Investment Company Type |
N-1A
|
| Document Period End Date |
Sep. 30, 2025
|
| C000237818 [Member] |
|
| Shareholder Report [Line Items] |
|
| Fund Name |
Ambrus Core Bond Fund
|
| Class Name |
Institutional Class
|
| Trading Symbol |
TTRBX
|
| Annual or Semi-Annual Statement [Text Block] |
This annual shareholder report contains important information about the Ambrus Core Bond Fund (the “Fund”) for the period of October 1, 2024 to September 30, 2025.
|
| Shareholder Report Annual or Semi-Annual |
annual shareholder report
|
| Additional Information [Text Block] |
You can find additional information about the Fund at https://www.ambrusfunds.com/ambrus‑core‑bond‑fund/. You can also request this information by contacting us at (833) 996‑2101.
|
| Additional Information Phone Number |
(833) 996‑2101
|
| Additional Information Website |
https://www.ambrusfunds.com/ambrus‑core‑bond‑fund/
|
| Expenses [Text Block] |
What were the Fund costs for the last year? (Based on a hypothetical $10,000 investment)
| Fund (Class) |
Costs of a $10,000 investment |
Costs paid as a percentage
of a $10,000 investment |
Ambrus Core Bond Fund
(Institutional Class / TTRBX) |
$51 |
0.50% |
|
| Expenses Paid, Amount |
$ 51
|
| Expense Ratio, Percent |
0.50%
|
| Factors Affecting Performance [Text Block] |
Management's Discussion of Fund Performance Summary of Results Over the trailing one-year, the Ambrus Core Bond Fund returned 4.71% versus its index, the Bloomberg Intermediate Government/Credit Bond Index, which returned 4.01%, for outperformance of 0.70%. Outperformance was driven by positive attribution effects across asset allocation and security selection, with yield curve positioning detracting from performance. Top Contributors to Performance -
An overweight to corporate credit contributed positively to performance, as investment-grade credit spreads compressed from +129 basis points to +114 basis points over the reporting period -
The Fund benefited from active management between asset classes, as the Fund’s exposure to corporates and preferreds increased from a low of 43.5% in February 2025 to a high of 60.9% in June 2025 to take advantage of the distress in credit markets -
Security selection within corporate bonds contributed positively to performance, as the corporate bonds held by the Fund outperformed those held by the benchmark Top Detractors to Performance -
Yield curve positioning detracted from performance, as the Fund was underweight (relative to the benchmark) shorter maturity government bonds and overweight longer maturity government bonds -
During the reporting period, shorter maturity government bond yields declined, while longer maturity government bond yields increased
|
| Performance Past Does Not Indicate Future [Text] |
All returns represent past performance which is no guarantee of future results.
|
| Line Graph [Table Text Block] |
Fund Performance The following is a comparison of the change in value of a $10,000 investment in Ambrus Core Bond Fund’s Institutional Class vs. the Bloomberg U.S. Aggregate Bond Index and the Bloomberg Intermediate U.S. Government/Credit Bond Index. Growth of $10,000 For the period September 6, 2022* through September 30, 2025
|
| Average Annual Return [Table Text Block] |
| Average Annual Total Returns |
1 Year |
Since inception |
| Institutional Class |
4.71% |
5.05%* |
| Bloomberg U.S. Aggregate Bond Index |
2.88% |
3.38%** |
| Bloomberg Intermediate U.S. Government/Credit Bond Index |
4.01% |
4.11%** |
| * |
The Ambrus Core Bond Fund commenced operations on September 6, 2022. |
| ** |
Benchmark performance is from the commencement date of the Fund Class only and is not the commencement date of the benchmark itself. |
|
| Performance Inception Date |
Sep. 06, 2022
|
| No Deduction of Taxes [Text Block] |
The above table and graph do not reflect the deduction of taxes that a shareholder would pay on fund distributions or the redemption of shares.
|
| Updated Performance Information Location [Text Block] |
Please visit https://www.ambrusfunds.com/ambrus‑core‑bond‑fund/ for performance data current to the most recent month-end.
|
| Net Assets |
$ 494,711,448
|
| Holdings Count | Holding |
162
|
| Advisory Fees Paid, Amount |
$ 1,800,365
|
| Investment Company Portfolio Turnover |
71.00%
|
| Additional Fund Statistics [Text Block] |
Key Fund Statistics The following table outlines key Fund statistics that you should pay attention to.
| Fund net assets |
$494,711,448 |
| Total number of portfolio holdings |
162 |
| Total advisory fee paid, net |
$1,800,365 |
| Portfolio turnover rate as of the end of the reporting period |
71% |
|
| Holdings [Text Block] |
Portfolio Holdings Summary Table (as of September 30, 2025) The following table presents a summary of the portfolio composition of the Fund, as a percentage of net assets: Portfolio Composition
|
| Material Fund Change [Text Block] |
Material Fund changes during the period There were no material changes to the Fund.
|
| Accountant Change Disagreements [Text Block] |
Changes in and Disagreements with Accountants There were no disagreements with accountants.
|
| C000237820 [Member] |
|
| Shareholder Report [Line Items] |
|
| Fund Name |
Ambrus Tax-ConsciousCalifornia Bond Fund
|
| Class Name |
Institutional Class
|
| Trading Symbol |
TCCBX
|
| Annual or Semi-Annual Statement [Text Block] |
This annual shareholder report contains important information about the Ambrus Tax-Conscious California Bond Fund (the “Fund”) for the period of October 1, 2024 to September 30, 2025.
|
| Shareholder Report Annual or Semi-Annual |
annual shareholder report
|
| Additional Information [Text Block] |
You can find additional information about the Fund at https://www.ambrusfunds.com/ambrus‑tax‑conscious‑california‑bond‑fund/. You can also request this information by contacting us at (833) 996‑2101.
|
| Additional Information Phone Number |
(833) 996‑2101
|
| Additional Information Website |
https://www.ambrusfunds.com/ambrus‑tax‑conscious‑california‑bond‑fund/
|
| Expenses [Text Block] |
What were the Fund costs for the last year? (Based on a hypothetical $10,000 investment)
| Fund (Class) |
Costs of a $10,000 investment |
Costs paid as a percentage
of a $10,000 investment |
Ambrus Tax-Conscious California Bond Fund
(Institutional Class / TCCBX) |
$50 |
0.50% |
|
| Expenses Paid, Amount |
$ 50
|
| Expense Ratio, Percent |
0.50%
|
| Factors Affecting Performance [Text Block] |
Management's Discussion of Fund Performance Summary of Results Over the trailing one-year, the Ambrus Tax-Conscious California Bond Fund returned 1.88% versus its index, the Bloomberg California Municipal Inter-Short (1-10 Year) Bond Index, which returned 3.28%, for underperformance of -1.40%. Underperformance was primarily driven by negative attribution effects from yield curve positioning and an overweight to callable bonds. Top Contributors to Performance Top Detractors to Performance -
Yield curve positioning detracted from performance, as the Fund was overweight longer duration municipal bonds, (specifically within the 15-25 year maturity range) which underperformed shorter duration municipal bonds -
Over the reporting period, the AAA-rated 1-year municipal bond yields decreased by 21 basis points, while AAA-rated 20-year municipal bond yields rose by 75 basis points -
An overweight to callable bonds (relative to the index) also detracted from performance, as callable bonds underperformed bonds without call structures (“bullet” bonds) due to elevated interest rate volatility
|
| Performance Past Does Not Indicate Future [Text] |
All returns represent past performance which is no guarantee of future results.
|
| Line Graph [Table Text Block] |
Fund Performance The following is a comparison of the change in value of a $10,000 investment in Ambrus Tax-Conscious California Bond Fund’s Institutional Class vs. the Bloomberg Municipal Bond Index and the Bloomberg California Municipal Inter-Short (1-10 Year) Index. Growth of $10,000 For the period October 3, 2022* through September 30, 2025
|
| Average Annual Return [Table Text Block] |
| Average Annual Total Returns |
1 Year |
Since inception |
| Institutional Class |
1.88% |
3.89%* |
| Bloomberg Municipal Bond Index |
1.39% |
4.74%** |
| Bloomberg California Municipal Inter-Short (1-10 Year) Index |
3.28% |
4.10%** |
| * |
The Ambrus Tax-Conscious California Bond Fund commenced operations on October 3, 2022. |
| ** |
Benchmark performance is from the commencement date of the Fund Class only and is not the commencement date of the benchmark itself. |
|
| Performance Inception Date |
Oct. 03, 2022
|
| No Deduction of Taxes [Text Block] |
The above table and graph do not reflect the deduction of taxes that a shareholder would pay on fund distributions or the redemption of shares.
|
| Updated Performance Information Location [Text Block] |
Please visit https://www.ambrusfunds.com/ambrus‑tax‑conscious‑california‑bond‑fund/ for performance data current to the most recent month-end.
|
| Net Assets |
$ 431,587,684
|
| Holdings Count | Holding |
308
|
| Advisory Fees Paid, Amount |
$ 1,449,985
|
| Investment Company Portfolio Turnover |
26.00%
|
| Additional Fund Statistics [Text Block] |
Key Fund Statistics The following table outlines key Fund statistics that you should pay attention to.
| Fund net assets |
$431,587,684 |
| Total number of portfolio holdings |
308 |
| Total advisory fee paid, net |
$1,449,985 |
| Portfolio turnover rate as of the end of the reporting period |
26% |
|
| Holdings [Text Block] |
Portfolio Holdings Summary Table (as of September 30, 2025) The following table presents a summary of the portfolio composition of the Fund, as a percentage of net assets: Portfolio Composition
|
| Material Fund Change [Text Block] |
Material Fund changes during the period There were no material changes to the Fund.
|
| Accountant Change Disagreements [Text Block] |
Changes in and Disagreements with Accountants There were no disagreements with accountants.
|
| C000237822 [Member] |
|
| Shareholder Report [Line Items] |
|
| Fund Name |
Ambrus Tax-ConsciousNational Bond Fund
|
| Class Name |
Institutional Class
|
| Trading Symbol |
TCNBX
|
| Annual or Semi-Annual Statement [Text Block] |
This annual shareholder report contains important information about the Ambrus Tax-Conscious National Bond Fund (the “Fund”) for the period of October 1, 2024 to September 30, 2025.
|
| Shareholder Report Annual or Semi-Annual |
annual shareholder report
|
| Additional Information [Text Block] |
You can find additional information about the Fund at https://www.ambrusfunds.com/ambrus‑tax‑conscious‑national‑bond‑fund/. You can also request this information by contacting us at (833) 996‑2101.
|
| Additional Information Phone Number |
(833) 996‑2101
|
| Additional Information Website |
https://www.ambrusfunds.com/ambrus‑tax‑conscious‑national‑bond‑fund/
|
| Expenses [Text Block] |
What were the Fund costs for the last year? (Based on a hypothetical $10,000 investment)
| Fund (Class) |
Costs of a $10,000 investment |
Costs paid as a percentage
of a $10,000 investment |
Ambrus Tax-Conscious National Bond Fund
(Institutional Class / TCNBX) |
$51 |
0.50% |
|
| Expenses Paid, Amount |
$ 51
|
| Expense Ratio, Percent |
0.50%
|
| Factors Affecting Performance [Text Block] |
Management's Discussion of Fund Performance Summary of Results Over the trailing one-year, the Ambrus Tax-Conscious National Bond Fund returned 2.70% versus its index, the Bloomberg Municipal Inter-Short (1-10 Year) Bond Index, which returned 3.29%, for an underperformance of -0.59%. Top Contributors to Performance Top Detractors to Performance -
Yield curve positioning detracted from performance, as the Fund was overweight longer duration municipal bonds, (specifically within the 15-25 year maturity range) which underperformed shorter duration municipal bonds -
Over the reporting period, the AAA-rated 1-year municipal bond yields decreased by 21 basis points, while AAA-rated 20-year municipal bond yields rose by 75 basis points -
An overweight to callable bonds (relative to the index) also detracted from performance, as callable bonds underperformed bonds without call structures (“bullet” bonds) due to elevated interest rate volatility
|
| Performance Past Does Not Indicate Future [Text] |
All returns represent past performance which is no guarantee of future results.
|
| Line Graph [Table Text Block] |
Fund Performance The following is a comparison of the change in value of a $10,000 investment in Ambrus Tax-Conscious National Bond Fund’s Institutional Class vs. the Bloomberg Municipal Bond Index and the Bloomberg Municipal Inter-Short (1-10 Year) Index. Growth of $10,000 For the period October 3, 2022* through September 30, 2025
|
| Average Annual Return [Table Text Block] |
| Average Annual Total Returns |
1 Year |
Since inception |
| Institutional Class |
2.70% |
4.27%* |
| Bloomberg Municipal Bond Index |
1.39% |
4.74%** |
| Bloomberg Municipal Inter-Short (1-10 Year) Index |
3.29% |
4.19%** |
| * |
The Ambrus Tax-Conscious National Bond Fund commenced operations on October 3, 2022. |
| ** |
Benchmark performance is from the commencement date of the Fund Class only and is not the commencement date of the benchmark itself. |
|
| Performance Inception Date |
Oct. 03, 2022
|
| No Deduction of Taxes [Text Block] |
The above table and graph do not reflect the deduction of taxes that a shareholder would pay on fund distributions or the redemption of shares.
|
| Updated Performance Information Location [Text Block] |
Please visit https://www.ambrusfunds.com/ambrus‑tax‑conscious‑national‑bond‑fund/ for performance data current to the most recent month-end.
|
| Net Assets |
$ 404,045,744
|
| Holdings Count | Holding |
329
|
| Advisory Fees Paid, Amount |
$ 1,349,263
|
| Investment Company Portfolio Turnover |
26.00%
|
| Additional Fund Statistics [Text Block] |
Key Fund Statistics The following table outlines key Fund statistics that you should pay attention to.
| Fund net assets |
$404,045,744 |
| Total number of portfolio holdings |
329 |
| Total advisory fee paid, net |
$1,349,263 |
| Portfolio turnover rate as of the end of the reporting period |
26% |
|
| Holdings [Text Block] |
Portfolio Holdings Summary Table (as of September 30, 2025) The following table presents a summary of the portfolio composition of the Fund, as a percentage of net assets: Portfolio Composition
|
| Material Fund Change [Text Block] |
Material Fund changes during the period There were no material changes to the Fund.
|
| Accountant Change Disagreements [Text Block] |
Changes in and Disagreements with Accountants There were no disagreements with accountants.
|
| X |
- DefinitionBoolean flag that is true when the XBRL content amends previously-filed or accepted submission.
| Name: |
dei_AmendmentFlag |
| Namespace Prefix: |
dei_ |
| Data Type: |
xbrli:booleanItemType |
| Balance Type: |
na |
| Period Type: |
duration |
|
| X |
- DefinitionFor the EDGAR submission types of Form 8-K: the date of the report, the date of the earliest event reported; for the EDGAR submission types of Form N-1A: the filing date; for all other submission types: the end of the reporting or transition period. The format of the date is YYYY-MM-DD.
| Name: |
dei_DocumentPeriodEndDate |
| Namespace Prefix: |
dei_ |
| Data Type: |
xbrli:dateItemType |
| Balance Type: |
na |
| Period Type: |
duration |
|
| X |
- DefinitionThe type of document being provided (such as 10-K, 10-Q, 485BPOS, etc). The document type is limited to the same value as the supporting SEC submission type, or the word 'Other'.
| Name: |
dei_DocumentType |
| Namespace Prefix: |
dei_ |
| Data Type: |
dei:submissionTypeItemType |
| Balance Type: |
na |
| Period Type: |
duration |
|
| X |
- DefinitionA unique 10-digit SEC-issued value to identify entities that have filed disclosures with the SEC. It is commonly abbreviated as CIK. Reference 1: http://www.xbrl.org/2003/role/presentationRef
-Publisher SEC
-Name Exchange Act
-Number 240
-Section 12
-Subsection b-2
| Name: |
dei_EntityCentralIndexKey |
| Namespace Prefix: |
dei_ |
| Data Type: |
dei:centralIndexKeyItemType |
| Balance Type: |
na |
| Period Type: |
duration |
|
| X |
- DefinitionOne of: N-1A (Mutual Fund), N-1 (Open-End Separate Account with No Variable Annuities), N-2 (Closed-End Investment Company), N-3 (Separate Account Registered as Open-End Management Investment Company), N-4 (Variable Annuity UIT Separate Account), N-5 (Small Business Investment Company), N-6 (Variable Life UIT Separate Account), S-1 or S-3 (Face Amount Certificate Company), S-6 (UIT, Non-Insurance Product). Reference 1: http://www.xbrl.org/2003/role/presentationRef
-Publisher SEC
-Name Regulation S-T
-Number 232
-Section 313
| Name: |
dei_EntityInvCompanyType |
| Namespace Prefix: |
dei_ |
| Data Type: |
dei:invCompanyType |
| Balance Type: |
na |
| Period Type: |
duration |
|
| X |
- DefinitionThe exact name of the entity filing the report as specified in its charter, which is required by forms filed with the SEC. Reference 1: http://www.xbrl.org/2003/role/presentationRef
-Publisher SEC
-Name Exchange Act
-Number 240
-Section 12
-Subsection b-2
| Name: |
dei_EntityRegistrantName |
| Namespace Prefix: |
dei_ |
| Data Type: |
xbrli:normalizedStringItemType |
| Balance Type: |
na |
| Period Type: |
duration |
|
| X |
- DefinitionTrading symbol of an instrument as listed on an exchange.
| Name: |
dei_TradingSymbol |
| Namespace Prefix: |
dei_ |
| Data Type: |
dei:tradingSymbolItemType |
| Balance Type: |
na |
| Period Type: |
duration |
|
| X |
- ReferencesReference 1: http://www.xbrl.org/2003/role/presentationRef
-Publisher SEC
-Name Form N-1A
-Section 27A
-Subsection h
-Paragraph 2
| Name: |
oef_AccountantChngDisagreementsTextBlock |
| Namespace Prefix: |
oef_ |
| Data Type: |
dtr-types:textBlockItemType |
| Balance Type: |
na |
| Period Type: |
duration |
|
| X |
- ReferencesReference 1: http://www.xbrl.org/2003/role/presentationRef
-Publisher SEC
-Name Form N-1A
-Section 27A
-Subsection e
| Name: |
oef_AddlFundStatisticsTextBlock |
| Namespace Prefix: |
oef_ |
| Data Type: |
dtr-types:textBlockItemType |
| Balance Type: |
na |
| Period Type: |
duration |
|
| X |
- ReferencesReference 1: http://www.xbrl.org/2003/role/presentationRef
-Publisher SEC
-Name Form N-1A
-Section 27A
-Subsection b
-Paragraph instruction
-Subparagraph 2
| Name: |
oef_AddlInfoPhoneNumber |
| Namespace Prefix: |
oef_ |
| Data Type: |
xbrli:stringItemType |
| Balance Type: |
na |
| Period Type: |
duration |
|
| X |
- ReferencesReference 1: http://www.xbrl.org/2003/role/presentationRef
-Publisher SEC
-Name Form N-1A
-Section 27A
-Subsection b
-Paragraph 4
| Name: |
oef_AddlInfoTextBlock |
| Namespace Prefix: |
oef_ |
| Data Type: |
dtr-types:textBlockItemType |
| Balance Type: |
na |
| Period Type: |
duration |
|
| X |
- ReferencesReference 1: http://www.xbrl.org/2003/role/presentationRef
-Publisher SEC
-Name Form N-1A
-Section 27A
-Subsection b
-Paragraph instruction
-Subparagraph 2
| Name: |
oef_AddlInfoWebsite |
| Namespace Prefix: |
oef_ |
| Data Type: |
xbrli:stringItemType |
| Balance Type: |
na |
| Period Type: |
duration |
|
| X |
- ReferencesReference 1: http://www.xbrl.org/2003/role/presentationRef
-Publisher SEC
-Name Form N-1A
-Section 27A
-Subsection e
| Name: |
oef_AdvisoryFeesPaidAmt |
| Namespace Prefix: |
oef_ |
| Data Type: |
xbrli:monetaryItemType |
| Balance Type: |
na |
| Period Type: |
duration |
|
| X |
- ReferencesReference 1: http://www.xbrl.org/2003/role/presentationRef
-Publisher SEC
-Name Form N-1A
-Section 27A
-Subsection b
-Paragraph 3
| Name: |
oef_AnnlOrSemiAnnlStatementTextBlock |
| Namespace Prefix: |
oef_ |
| Data Type: |
dtr-types:textBlockItemType |
| Balance Type: |
na |
| Period Type: |
duration |
|
| X |
- ReferencesReference 1: http://www.xbrl.org/2003/role/presentationRef
-Publisher SEC
-Name Form N-1A
-Section 27A
-Subsection d
-Paragraph 2
-Subparagraph instruction
-Clause 7
| Name: |
oef_AvgAnnlRtrTableTextBlock |
| Namespace Prefix: |
oef_ |
| Data Type: |
dtr-types:textBlockItemType |
| Balance Type: |
na |
| Period Type: |
duration |
|
| X |
- ReferencesReference 1: http://www.xbrl.org/2003/role/presentationRef
-Publisher SEC
-Name Form N-1A
-Section 27A
-Subsection b
-Paragraph instruction
-Subparagraph 2
| Name: |
oef_ClassName |
| Namespace Prefix: |
oef_ |
| Data Type: |
dei:securityTitleItemType |
| Balance Type: |
na |
| Period Type: |
duration |
|
| X |
- ReferencesReference 1: http://www.xbrl.org/2003/role/presentationRef
-Publisher SEC
-Name Form N-1A
-Section 27A
-Subsection c
-Paragraph iii
| Name: |
oef_ExpenseRatioPct |
| Namespace Prefix: |
oef_ |
| Data Type: |
dtr-types:percentItemType |
| Balance Type: |
na |
| Period Type: |
duration |
|
| X |
- ReferencesReference 1: http://www.xbrl.org/2003/role/presentationRef
-Publisher SEC
-Name Form N-1A
-Section 27A
-Subsection c
-Paragraph ii
| Name: |
oef_ExpensesPaidAmt |
| Namespace Prefix: |
oef_ |
| Data Type: |
xbrli:monetaryItemType |
| Balance Type: |
na |
| Period Type: |
duration |
|
| X |
- ReferencesReference 1: http://www.xbrl.org/2003/role/presentationRef
-Publisher SEC
-Name Form N-1A
-Section 27A
-Subsection c
| Name: |
oef_ExpensesTextBlock |
| Namespace Prefix: |
oef_ |
| Data Type: |
dtr-types:textBlockItemType |
| Balance Type: |
na |
| Period Type: |
duration |
|
| X |
- ReferencesReference 1: http://www.xbrl.org/2003/role/presentationRef
-Publisher SEC
-Name Form N-1A
-Section 27A
-Subsection d
-Paragraph 1
| Name: |
oef_FactorsAffectingPerfTextBlock |
| Namespace Prefix: |
oef_ |
| Data Type: |
dtr-types:textBlockItemType |
| Balance Type: |
na |
| Period Type: |
duration |
|
| X |
- ReferencesReference 1: http://www.xbrl.org/2003/role/presentationRef
-Publisher SEC
-Name Form N-1A
-Section 27A
-Subsection b
-Paragraph 1
| Name: |
oef_FundName |
| Namespace Prefix: |
oef_ |
| Data Type: |
xbrli:normalizedStringItemType |
| Balance Type: |
na |
| Period Type: |
duration |
|
| X |
- ReferencesReference 1: http://www.xbrl.org/2003/role/presentationRef
-Publisher SEC
-Name Form N-1A
-Section 27A
-Subsection e
| Name: |
oef_HoldingsCount |
| Namespace Prefix: |
oef_ |
| Data Type: |
xbrli:integerItemType |
| Balance Type: |
na |
| Period Type: |
instant |
|
| X |
- ReferencesReference 1: http://www.xbrl.org/2003/role/presentationRef
-Publisher SEC
-Name Form N-1A
-Section 27A
-Subsection f
| Name: |
oef_HoldingsTableTextBlock |
| Namespace Prefix: |
oef_ |
| Data Type: |
dtr-types:textBlockItemType |
| Balance Type: |
na |
| Period Type: |
duration |
|
| X |
- ReferencesReference 1: http://www.xbrl.org/2003/role/presentationRef
-Publisher SEC
-Name Form N-1A
-Section 27A
-Subsection d
-Paragraph 2
| Name: |
oef_LineGraphTableTextBlock |
| Namespace Prefix: |
oef_ |
| Data Type: |
dtr-types:textBlockItemType |
| Balance Type: |
na |
| Period Type: |
duration |
|
| X |
- ReferencesReference 1: http://www.xbrl.org/2003/role/presentationRef
-Publisher SEC
-Name Form N-1A
-Section 27A
-Subsection g
| Name: |
oef_MaterialFundChngTextBlock |
| Namespace Prefix: |
oef_ |
| Data Type: |
dtr-types:textBlockItemType |
| Balance Type: |
na |
| Period Type: |
duration |
|
| X |
- ReferencesReference 1: http://www.xbrl.org/2003/role/presentationRef
-Publisher SEC
-Name Form N-1A
-Section 27A
-Subsection d
-Paragraph 2
-Subparagraph iii
-Clause B
| Name: |
oef_NoDeductionOfTaxesTextBlock |
| Namespace Prefix: |
oef_ |
| Data Type: |
dtr-types:textBlockItemType |
| Balance Type: |
na |
| Period Type: |
duration |
|
| X |
- ReferencesReference 1: http://www.xbrl.org/2003/role/presentationRef
-Publisher SEC
-Name Form N-1A
-Section 27A
-Subsection d
-Paragraph 2
-Subparagraph i
| Name: |
oef_PerfInceptionDate |
| Namespace Prefix: |
oef_ |
| Data Type: |
xbrli:dateItemType |
| Balance Type: |
na |
| Period Type: |
duration |
|
| X |
- ReferencesReference 1: http://www.xbrl.org/2003/role/presentationRef
-Publisher SEC
-Name Form N-1A
-Section 27A
-Subsection b
-Paragraph 3
| Name: |
oef_ShareholderReportAnnualOrSemiAnnual |
| Namespace Prefix: |
oef_ |
| Data Type: |
oef:shareholderReportTypeItemType |
| Balance Type: |
na |
| Period Type: |
duration |
|
| X |
- ReferencesReference 1: http://www.xbrl.org/2003/role/presentationRef
-Publisher SEC
-Name Form N-1A
-Section 27A
-Subsection d
-Paragraph 2
-Subparagraph instruction
-Clause 7
| Name: |
oef_ShareholderReportLineItems |
| Namespace Prefix: |
oef_ |
| Data Type: |
xbrli:stringItemType |
| Balance Type: |
na |
| Period Type: |
duration |
|
| X |
- ReferencesReference 1: http://www.xbrl.org/2003/role/presentationRef
-Publisher SEC
-Name Form N-1A
-Section 27A
-Subsection d
-Paragraph 2
-Subparagraph instruction
-Clause 15
| Name: |
oef_UpdPerfInfoLocationTextBlock |
| Namespace Prefix: |
oef_ |
| Data Type: |
dtr-types:textBlockItemType |
| Balance Type: |
na |
| Period Type: |
duration |
|
| X |
- DefinitionAmount of net assets (liabilities). Reference 1: http://fasb.org/us-gaap/role/ref/legacyRef
-Name Accounting Standards Codification
-Section 50
-Paragraph 1
-SubTopic 30
-Topic 205
-Publisher FASB
-URI https://asc.fasb.org/1943274/2147479910/205-30-50-1
| Name: |
us-gaap_AssetsNet |
| Namespace Prefix: |
us-gaap_ |
| Data Type: |
xbrli:monetaryItemType |
| Balance Type: |
debit |
| Period Type: |
instant |
|
| X |
- DefinitionPercentage of lesser of purchase or sale of portfolio securities to average value of portfolio securities owned. Reference 1: http://www.xbrl.org/2009/role/commonPracticeRef
-Topic 946
-SubTopic 205
-Name Accounting Standards Codification
-Section 50
-Paragraph 27
-Publisher FASB
-URI https://asc.fasb.org/1943274/2147478494/946-205-50-27
| Name: |
us-gaap_InvestmentCompanyPortfolioTurnover |
| Namespace Prefix: |
us-gaap_ |
| Data Type: |
dtr-types:percentItemType |
| Balance Type: |
na |
| Period Type: |
duration |
|
| X |
- Details
| Name: |
oef_ClassAxis=fvt_C000237818Member |
| Namespace Prefix: |
|
| Data Type: |
na |
| Balance Type: |
|
| Period Type: |
|
|
| X |
- Details
| Name: |
oef_ClassAxis=fvt_C000237820Member |
| Namespace Prefix: |
|
| Data Type: |
na |
| Balance Type: |
|
| Period Type: |
|
|
| X |
- Details
| Name: |
oef_ClassAxis=fvt_C000237822Member |
| Namespace Prefix: |
|
| Data Type: |
na |
| Balance Type: |
|
| Period Type: |
|
|
v3.25.3
Shareholder Report, Line Graph (Details) - USD ($)
|
|
|
1 Months Ended |
6 Months Ended |
7 Months Ended |
12 Months Ended |
13 Months Ended |
18 Months Ended |
19 Months Ended |
24 Months Ended |
25 Months Ended |
30 Months Ended |
31 Months Ended |
36 Months Ended |
37 Months Ended |
Oct. 03, 2022 |
Sep. 06, 2022 |
Sep. 30, 2022 |
Mar. 31, 2023 |
Mar. 31, 2023 |
Sep. 30, 2025 |
Sep. 30, 2023 |
Sep. 30, 2023 |
Mar. 31, 2024 |
Mar. 31, 2024 |
Sep. 30, 2024 |
Sep. 30, 2024 |
Mar. 31, 2025 |
Mar. 31, 2025 |
Sep. 30, 2025 |
Sep. 30, 2025 |
| C000237818 [Member] |
|
|
|
|
|
|
|
|
|
|
|
|
|
|
|
|
| Account Value [Line Items] |
|
|
|
|
|
|
|
|
|
|
|
|
|
|
|
|
| Line Graph and Table Measure Name |
|
|
|
|
|
Institutional Class
|
|
|
|
|
|
|
|
|
|
|
| Accumulated Value |
|
$ 10,000
|
$ 9,762
|
|
$ 10,140
|
|
|
$ 10,084
|
|
$ 10,602
|
|
$ 11,112
|
|
$ 11,196
|
|
$ 11,636
|
| C000237820 [Member] |
|
|
|
|
|
|
|
|
|
|
|
|
|
|
|
|
| Account Value [Line Items] |
|
|
|
|
|
|
|
|
|
|
|
|
|
|
|
|
| Line Graph and Table Measure Name |
|
|
|
|
|
Institutional Class
|
|
|
|
|
|
|
|
|
|
|
| Accumulated Value |
$ 10,000
|
|
|
$ 10,304
|
|
|
$ 10,190
|
|
$ 10,700
|
|
$ 11,006
|
|
$ 10,962
|
|
$ 11,214
|
|
| C000237822 [Member] |
|
|
|
|
|
|
|
|
|
|
|
|
|
|
|
|
| Account Value [Line Items] |
|
|
|
|
|
|
|
|
|
|
|
|
|
|
|
|
| Line Graph and Table Measure Name |
|
|
|
|
|
Institutional Class
|
|
|
|
|
|
|
|
|
|
|
| Accumulated Value |
10,000
|
|
|
10,326
|
|
|
10,180
|
|
10,702
|
|
11,040
|
|
11,053
|
|
11,337
|
|
| Bloomberg Intermediate U S Government Credit Bond Index [Member] |
|
|
|
|
|
|
|
|
|
|
|
|
|
|
|
|
| Account Value [Line Items] |
|
|
|
|
|
|
|
|
|
|
|
|
|
|
|
|
| Line Graph and Table Measure Name |
|
|
|
|
|
Bloomberg Intermediate U.S. Government/Credit Bond Index
|
|
|
|
|
|
|
|
|
|
|
| Accumulated Value |
|
9,950.408197
|
9,730.543526
|
|
10,110.63421
|
|
|
9,944.913655
|
|
10,382.68826
|
|
10,884.53729
|
|
10,969.65578
|
|
11,321.03429
|
| Bloomberg U S Aggregate Bond Index [Member] |
|
|
|
|
|
|
|
|
|
|
|
|
|
|
|
|
| Account Value [Line Items] |
|
|
|
|
|
|
|
|
|
|
|
|
|
|
|
|
| Line Graph and Table Measure Name |
|
|
|
|
|
Bloomberg U.S. Aggregate Bond Index
|
|
|
|
|
|
|
|
|
|
|
| Accumulated Value |
|
$ 9,910.99
|
$ 9,588.08
|
|
$ 10,057
|
|
|
$ 9,649.87
|
|
$ 10,227.76
|
|
$ 10,766.21
|
|
$ 10,726.83
|
|
$ 11,076.68
|
| Bloomberg Municipal Bond Index [Member] |
|
|
|
|
|
|
|
|
|
|
|
|
|
|
|
|
| Account Value [Line Items] |
|
|
|
|
|
|
|
|
|
|
|
|
|
|
|
|
| Line Graph and Table Measure Name |
|
|
|
|
|
Bloomberg Municipal Bond Index
|
|
|
|
|
|
|
|
|
|
|
| Accumulated Value |
10,000
|
|
|
10,700
|
|
|
10,266
|
|
11,034
|
|
11,331
|
|
11,169
|
|
11,489
|
|
| Bloomberg California Municipal Inter Short 1 10 Year Index [Member] |
|
|
|
|
|
|
|
|
|
|
|
|
|
|
|
|
| Account Value [Line Items] |
|
|
|
|
|
|
|
|
|
|
|
|
|
|
|
|
| Line Graph and Table Measure Name |
|
|
|
|
|
Bloomberg California Municipal Inter-Short (1-10 Year) Index
|
|
|
|
|
|
|
|
|
|
|
| Accumulated Value |
10,000
|
|
|
10,454
|
|
|
10,200
|
|
10,666
|
|
10,924
|
|
10,879
|
|
11,282
|
|
| Bloomberg Municipal Inter Short 1 10 Year Index [Member] |
|
|
|
|
|
|
|
|
|
|
|
|
|
|
|
|
| Account Value [Line Items] |
|
|
|
|
|
|
|
|
|
|
|
|
|
|
|
|
| Line Graph and Table Measure Name |
|
|
|
|
|
Bloomberg Municipal Inter-Short (1-10 Year) Index
|
|
|
|
|
|
|
|
|
|
|
| Accumulated Value |
$ 10,000
|
|
|
$ 10,476
|
|
|
$ 10,216
|
|
$ 10,693
|
|
$ 10,950
|
|
$ 10,941
|
|
$ 11,310
|
|
| X |
- ReferencesReference 1: http://www.xbrl.org/2003/role/presentationRef
-Publisher SEC
-Name Form N-1A
-Section 27A
-Subsection d
-Paragraph 2
-Subparagraph i
| Name: |
oef_AccmVal |
| Namespace Prefix: |
oef_ |
| Data Type: |
xbrli:monetaryItemType |
| Balance Type: |
na |
| Period Type: |
duration |
|
| X |
- ReferencesReference 1: http://www.xbrl.org/2003/role/presentationRef
-Publisher SEC
-Name Form N-1A
-Section 27A
-Subsection d
-Paragraph 2
| Name: |
oef_AccountValueLineItems |
| Namespace Prefix: |
oef_ |
| Data Type: |
xbrli:stringItemType |
| Balance Type: |
na |
| Period Type: |
duration |
|
| X |
- ReferencesReference 1: http://www.xbrl.org/2003/role/presentationRef
-Publisher SEC
-Name Form N-1A
-Section 27A
-Subsection d
-Paragraph 2
-Subparagraph i
| Name: |
oef_LineGraphAndTableMeasureName |
| Namespace Prefix: |
oef_ |
| Data Type: |
xbrli:stringItemType |
| Balance Type: |
na |
| Period Type: |
duration |
|
| X |
- Details
| Name: |
oef_ClassAxis=fvt_C000237818Member |
| Namespace Prefix: |
|
| Data Type: |
na |
| Balance Type: |
|
| Period Type: |
|
|
| X |
- Details
| Name: |
oef_ClassAxis=fvt_C000237820Member |
| Namespace Prefix: |
|
| Data Type: |
na |
| Balance Type: |
|
| Period Type: |
|
|
| X |
- Details
| Name: |
oef_ClassAxis=fvt_C000237822Member |
| Namespace Prefix: |
|
| Data Type: |
na |
| Balance Type: |
|
| Period Type: |
|
|
| X |
- Details
| Name: |
oef_BroadBasedIndexAxis=fvt_BloombergUSAggregateBondIndexMember |
| Namespace Prefix: |
|
| Data Type: |
na |
| Balance Type: |
|
| Period Type: |
|
|
| X |
- Details
| Name: |
oef_BroadBasedIndexAxis=fvt_BloombergMunicipalBondIndexMember |
| Namespace Prefix: |
|
| Data Type: |
na |
| Balance Type: |
|
| Period Type: |
|
|
| X |
- Details
| Name: |
oef_BroadBasedIndexAxis=fvt_BloombergCaliforniaMunicipalInterShort110YearIndexMember |
| Namespace Prefix: |
|
| Data Type: |
na |
| Balance Type: |
|
| Period Type: |
|
|
| X |
- Details
| Name: |
oef_BroadBasedIndexAxis=fvt_BloombergMunicipalInterShort110YearIndexMember |
| Namespace Prefix: |
|
| Data Type: |
na |
| Balance Type: |
|
| Period Type: |
|
|
v3.25.3
Shareholder Report, Average Annual Return (Details)
|
12 Months Ended |
36 Months Ended |
37 Months Ended |
Sep. 30, 2025 |
Sep. 30, 2025 |
Sep. 30, 2025 |
| C000237818 [Member] |
|
|
|
|
|
| Average Annual Return [Line Items] |
|
|
|
|
|
| Line Graph and Table Measure Name |
Institutional Class
|
|
|
|
|
| Average Annual Return, Percent |
4.71%
|
|
|
5.05%
|
[1] |
| C000237820 [Member] |
|
|
|
|
|
| Average Annual Return [Line Items] |
|
|
|
|
|
| Line Graph and Table Measure Name |
Institutional Class
|
|
|
|
|
| Average Annual Return, Percent |
1.88%
|
3.89%
|
[2] |
|
|
| C000237822 [Member] |
|
|
|
|
|
| Average Annual Return [Line Items] |
|
|
|
|
|
| Line Graph and Table Measure Name |
Institutional Class
|
|
|
|
|
| Average Annual Return, Percent |
2.70%
|
4.27%
|
[3] |
|
|
| Bloomberg Intermediate U S Government Credit Bond Index [Member] |
|
|
|
|
|
| Average Annual Return [Line Items] |
|
|
|
|
|
| Line Graph and Table Measure Name |
Bloomberg Intermediate U.S. Government/Credit Bond Index
|
|
|
|
|
| Average Annual Return, Percent |
4.01%
|
|
|
4.11%
|
[4] |
| Bloomberg U S Aggregate Bond Index [Member] |
|
|
|
|
|
| Average Annual Return [Line Items] |
|
|
|
|
|
| Line Graph and Table Measure Name |
Bloomberg U.S. Aggregate Bond Index
|
|
|
|
|
| Average Annual Return, Percent |
2.88%
|
|
|
3.38%
|
[4] |
| Bloomberg Municipal Bond Index [Member] |
|
|
|
|
|
| Average Annual Return [Line Items] |
|
|
|
|
|
| Line Graph and Table Measure Name |
Bloomberg Municipal Bond Index
|
|
|
|
|
| Average Annual Return, Percent |
1.39%
|
4.74%
|
[5] |
|
|
| Bloomberg California Municipal Inter Short 1 10 Year Index [Member] |
|
|
|
|
|
| Average Annual Return [Line Items] |
|
|
|
|
|
| Line Graph and Table Measure Name |
Bloomberg California Municipal Inter-Short (1-10 Year) Index
|
|
|
|
|
| Average Annual Return, Percent |
3.28%
|
4.10%
|
[5] |
|
|
| Bloomberg Municipal Inter Short 1 10 Year Index [Member] |
|
|
|
|
|
| Average Annual Return [Line Items] |
|
|
|
|
|
| Line Graph and Table Measure Name |
Bloomberg Municipal Inter-Short (1-10 Year) Index
|
|
|
|
|
| Average Annual Return, Percent |
3.29%
|
4.19%
|
[6] |
|
|
|
|
| X |
- ReferencesReference 1: http://www.xbrl.org/2003/role/presentationRef
-Publisher SEC
-Name Form N-1A
-Section 4
-Subsection b
-Paragraph 2
-Subparagraph iii
| Name: |
oef_AverageAnnualReturnLineItems |
| Namespace Prefix: |
oef_ |
| Data Type: |
xbrli:stringItemType |
| Balance Type: |
na |
| Period Type: |
duration |
|
| X |
- ReferencesReference 1: http://www.xbrl.org/2003/role/presentationRef
-Publisher SEC
-Name Form N-1A
-Section 27A
-Subsection d
-Paragraph 2
-Subparagraph instruction
-Clause 7
| Name: |
oef_AvgAnnlRtrPct |
| Namespace Prefix: |
oef_ |
| Data Type: |
dtr-types:percentItemType |
| Balance Type: |
na |
| Period Type: |
duration |
|
| X |
- ReferencesReference 1: http://www.xbrl.org/2003/role/presentationRef
-Publisher SEC
-Name Form N-1A
-Section 27A
-Subsection d
-Paragraph 2
-Subparagraph i
| Name: |
oef_LineGraphAndTableMeasureName |
| Namespace Prefix: |
oef_ |
| Data Type: |
xbrli:stringItemType |
| Balance Type: |
na |
| Period Type: |
duration |
|
| X |
- Details
| Name: |
oef_ClassAxis=fvt_C000237818Member |
| Namespace Prefix: |
|
| Data Type: |
na |
| Balance Type: |
|
| Period Type: |
|
|
| X |
- Details
| Name: |
oef_ClassAxis=fvt_C000237820Member |
| Namespace Prefix: |
|
| Data Type: |
na |
| Balance Type: |
|
| Period Type: |
|
|
| X |
- Details
| Name: |
oef_ClassAxis=fvt_C000237822Member |
| Namespace Prefix: |
|
| Data Type: |
na |
| Balance Type: |
|
| Period Type: |
|
|
| X |
- Details
| Name: |
oef_BroadBasedIndexAxis=fvt_BloombergUSAggregateBondIndexMember |
| Namespace Prefix: |
|
| Data Type: |
na |
| Balance Type: |
|
| Period Type: |
|
|
| X |
- Details
| Name: |
oef_BroadBasedIndexAxis=fvt_BloombergMunicipalBondIndexMember |
| Namespace Prefix: |
|
| Data Type: |
na |
| Balance Type: |
|
| Period Type: |
|
|
| X |
- Details
| Name: |
oef_BroadBasedIndexAxis=fvt_BloombergCaliforniaMunicipalInterShort110YearIndexMember |
| Namespace Prefix: |
|
| Data Type: |
na |
| Balance Type: |
|
| Period Type: |
|
|
| X |
- Details
| Name: |
oef_BroadBasedIndexAxis=fvt_BloombergMunicipalInterShort110YearIndexMember |
| Namespace Prefix: |
|
| Data Type: |
na |
| Balance Type: |
|
| Period Type: |
|
|
v3.25.3
| X |
- ReferencesReference 1: http://www.xbrl.org/2003/role/presentationRef
-Publisher SEC
-Name Form N-1A
-Section 27A
-Subsection f
| Name: |
oef_HoldingsLineItems |
| Namespace Prefix: |
oef_ |
| Data Type: |
xbrli:stringItemType |
| Balance Type: |
na |
| Period Type: |
duration |
|
| X |
- ReferencesReference 1: http://www.xbrl.org/2003/role/presentationRef
-Publisher SEC
-Name Form N-1A
-Section 27A
-Subsection f
| Name: |
oef_PctOfNav |
| Namespace Prefix: |
oef_ |
| Data Type: |
dtr-types:percentItemType |
| Balance Type: |
na |
| Period Type: |
instant |
|
| X |
- Details
| Name: |
oef_ClassAxis=fvt_C000237818Member |
| Namespace Prefix: |
|
| Data Type: |
na |
| Balance Type: |
|
| Period Type: |
|
|
| X |
- Details
| Name: |
us-gaap_InvestmentTypeAxis=fvt_OtherAssetsInExcessOfLiabilitiesMember |
| Namespace Prefix: |
|
| Data Type: |
na |
| Balance Type: |
|
| Period Type: |
|
|
| X |
- Details
| Name: |
us-gaap_InvestmentTypeAxis=fvt_PreferredsMember |
| Namespace Prefix: |
|
| Data Type: |
na |
| Balance Type: |
|
| Period Type: |
|
|
| X |
- Details
| Name: |
us-gaap_InvestmentTypeAxis=fvt_USTreasuryObligationsMember |
| Namespace Prefix: |
|
| Data Type: |
na |
| Balance Type: |
|
| Period Type: |
|
|
| X |
- Details
| Name: |
us-gaap_InvestmentTypeAxis=us-gaap_AssetBackedSecuritiesMember |
| Namespace Prefix: |
|
| Data Type: |
na |
| Balance Type: |
|
| Period Type: |
|
|
| X |
- Details
| Name: |
us-gaap_InvestmentTypeAxis=us-gaap_CorporateBondSecuritiesMember |
| Namespace Prefix: |
|
| Data Type: |
na |
| Balance Type: |
|
| Period Type: |
|
|
| X |
- Details
| Name: |
us-gaap_InvestmentTypeAxis=us-gaap_OtherInvestmentsMember |
| Namespace Prefix: |
|
| Data Type: |
na |
| Balance Type: |
|
| Period Type: |
|
|
| X |
- Details
| Name: |
oef_ClassAxis=fvt_C000237820Member |
| Namespace Prefix: |
|
| Data Type: |
na |
| Balance Type: |
|
| Period Type: |
|
|
| X |
- Details
| Name: |
us-gaap_InvestmentTypeAxis=us-gaap_MunicipalBondsMember |
| Namespace Prefix: |
|
| Data Type: |
na |
| Balance Type: |
|
| Period Type: |
|
|
| X |
- Details
| Name: |
us-gaap_InvestmentTypeAxis=fvt_LiabilitiesInExcessOfOtherAssetsMember |
| Namespace Prefix: |
|
| Data Type: |
na |
| Balance Type: |
|
| Period Type: |
|
|
| X |
- Details
| Name: |
oef_ClassAxis=fvt_C000237822Member |
| Namespace Prefix: |
|
| Data Type: |
na |
| Balance Type: |
|
| Period Type: |
|
|
{
"version": "2.2",
"instance": {
"d15885dncsr.htm": {
"nsprefix": "fvt",
"nsuri": "http://www.polencapital.com/20251120",
"dts": {
"inline": {
"local": [
"d15885dncsr.htm"
]
},
"schema": {
"local": [
"fvt-20251120.xsd"
],
"remote": [
"http://www.xbrl.org/2003/xbrl-instance-2003-12-31.xsd",
"http://www.xbrl.org/2003/xbrl-linkbase-2003-12-31.xsd",
"http://www.xbrl.org/2003/xl-2003-12-31.xsd",
"http://www.xbrl.org/2003/xlink-2003-12-31.xsd",
"http://www.xbrl.org/2005/xbrldt-2005.xsd",
"http://www.xbrl.org/2006/ref-2006-02-27.xsd",
"http://www.xbrl.org/lrr/arcrole/deprecated-2009-12-16.xsd",
"http://www.xbrl.org/lrr/role/negated-2009-12-16.xsd",
"http://www.xbrl.org/lrr/role/reference-2009-12-16.xsd",
"https://www.xbrl.org/2020/extensible-enumerations-2.0.xsd",
"https://www.xbrl.org/dtr/type/2020-01-21/types.xsd",
"https://www.xbrl.org/dtr/type/2024-01-31/types.xsd",
"https://xbrl.fasb.org/srt/2025/elts/srt-2025.xsd",
"https://xbrl.fasb.org/srt/2025/elts/srt-roles-2025.xsd",
"https://xbrl.fasb.org/srt/2025/elts/srt-types-2025.xsd",
"https://xbrl.fasb.org/us-gaap/2025/elts/us-gaap-2025.xsd",
"https://xbrl.fasb.org/us-gaap/2025/elts/us-roles-2025.xsd",
"https://xbrl.fasb.org/us-gaap/2025/elts/us-types-2025.xsd",
"https://xbrl.sec.gov/country/2025/country-2025.xsd",
"https://xbrl.sec.gov/country/2025/country-2025_def.xsd",
"https://xbrl.sec.gov/dei/2025/dei-2025.xsd",
"https://xbrl.sec.gov/oef/2025/oef-2025.xsd",
"https://xbrl.sec.gov/oef/2025/oef-2025_lab.xsd",
"https://xbrl.sec.gov/oef/2025/oef-sr-2025.xsd",
"https://xbrl.sec.gov/stpr/2025/stpr-2025.xsd"
]
}
},
"keyStandard": 36,
"keyCustom": 0,
"axisStandard": 3,
"axisCustom": 0,
"memberStandard": 4,
"memberCustom": 12,
"hidden": {
"total": 79,
"http://xbrl.sec.gov/oef/2025": 76,
"http://xbrl.sec.gov/dei/2025": 3
},
"contextCount": 96,
"entityCount": 1,
"segmentCount": 16,
"elementCount": 140,
"unitCount": 6,
"baseTaxonomies": {
"http://xbrl.sec.gov/oef/2025": 172,
"http://xbrl.sec.gov/dei/2025": 9,
"http://fasb.org/us-gaap/2025": 6
},
"report": {
"R1": {
"role": "http://xbrl.sec.gov/oef/role/NcsrCover",
"longName": "030000 - Disclosure - Form N-CSR Cover",
"shortName": "Form N-CSR Cover",
"isDefault": "true",
"groupType": "disclosure",
"subGroupType": "",
"menuCat": "Cover",
"order": "1",
"firstAnchor": {
"contextRef": "DefaultContext",
"name": "dei:DocumentType",
"unitRef": null,
"xsiNil": "false",
"lang": "en-US",
"decimals": null,
"ancestors": [
"div",
"div",
"div",
"div",
"div",
"div",
"div",
"body",
"html"
],
"reportCount": 1,
"baseRef": "d15885dncsr.htm",
"first": true
},
"uniqueAnchor": null
},
"R2": {
"role": "http://xbrl.sec.gov/oef/role/ShareholderReport",
"longName": "030001 - Disclosure - Shareholder Report",
"shortName": "Shareholder Report",
"isDefault": "false",
"groupType": "disclosure",
"subGroupType": "",
"menuCat": "Notes",
"order": "2",
"firstAnchor": {
"contextRef": "DefaultContext",
"name": "dei:DocumentType",
"unitRef": null,
"xsiNil": "false",
"lang": "en-US",
"decimals": null,
"ancestors": [
"div",
"div",
"div",
"div",
"div",
"div",
"div",
"body",
"html"
],
"reportCount": 1,
"baseRef": "d15885dncsr.htm",
"first": true
},
"uniqueAnchor": {
"contextRef": "FY2025_C000237818Member",
"name": "oef:FundName",
"unitRef": null,
"xsiNil": "false",
"lang": "en-US",
"decimals": null,
"ancestors": [
"div",
"div",
"div",
"div",
"div",
"div",
"div",
"div",
"div",
"body",
"html"
],
"reportCount": 1,
"baseRef": "d15885dncsr.htm",
"unique": true
}
},
"R3": {
"role": "http://xbrl.sec.gov/oef/role/ShareholderReportLineGraphDetails",
"longName": "040010 - Disclosure - Shareholder Report, Line Graph (Details)",
"shortName": "Shareholder Report, Line Graph (Details)",
"isDefault": "false",
"groupType": "disclosure",
"subGroupType": "details",
"menuCat": "Details",
"order": "3",
"firstAnchor": {
"contextRef": "FY2025_C000237818Member",
"name": "oef:LineGraphAndTableMeasureName",
"unitRef": null,
"xsiNil": "false",
"lang": "en-US",
"decimals": null,
"ancestors": [
"td",
"tr",
"table",
"oef:AvgAnnlRtrTableTextBlock",
"div",
"div",
"div",
"div",
"div",
"div",
"div",
"body",
"html"
],
"reportCount": 1,
"baseRef": "d15885dncsr.htm",
"first": true
},
"uniqueAnchor": null
},
"R4": {
"role": "http://xbrl.sec.gov/oef/role/ShareholderReportAverageAnnualReturnDetails",
"longName": "040015 - Disclosure - Shareholder Report, Average Annual Return (Details)",
"shortName": "Shareholder Report, Average Annual Return (Details)",
"isDefault": "false",
"groupType": "disclosure",
"subGroupType": "details",
"menuCat": "Details",
"order": "4",
"firstAnchor": {
"contextRef": "FY2025_C000237818Member",
"name": "oef:LineGraphAndTableMeasureName",
"unitRef": null,
"xsiNil": "false",
"lang": "en-US",
"decimals": null,
"ancestors": [
"td",
"tr",
"table",
"oef:AvgAnnlRtrTableTextBlock",
"div",
"div",
"div",
"div",
"div",
"div",
"div",
"body",
"html"
],
"reportCount": 1,
"baseRef": "d15885dncsr.htm",
"first": true
},
"uniqueAnchor": {
"contextRef": "FY2025_C000237818Member",
"name": "oef:AvgAnnlRtrPct",
"unitRef": "pure",
"xsiNil": "false",
"lang": null,
"decimals": "4",
"ancestors": [
"td",
"tr",
"table",
"oef:AvgAnnlRtrTableTextBlock",
"div",
"div",
"div",
"div",
"div",
"div",
"div",
"body",
"html"
],
"reportCount": 1,
"baseRef": "d15885dncsr.htm",
"unique": true
}
},
"R5": {
"role": "http://xbrl.sec.gov/oef/role/ShareholderReportHoldingsDetails",
"longName": "040020 - Disclosure - Shareholder Report, Holdings (Details)",
"shortName": "Shareholder Report, Holdings (Details)",
"isDefault": "false",
"groupType": "disclosure",
"subGroupType": "details",
"menuCat": "Details",
"order": "5",
"firstAnchor": null,
"uniqueAnchor": null
}
},
"tag": {
"oef_AccmVal": {
"xbrltype": "monetaryItemType",
"nsuri": "http://xbrl.sec.gov/oef/2025",
"localname": "AccmVal",
"presentation": [
"http://xbrl.sec.gov/oef/role/ShareholderReportLineGraphDetails"
],
"lang": {
"en-us": {
"role": {
"label": "Accumulated Value"
}
}
},
"auth_ref": [
"r38"
]
},
"oef_AccountValueLineItems": {
"xbrltype": "stringItemType",
"nsuri": "http://xbrl.sec.gov/oef/2025",
"localname": "AccountValueLineItems",
"presentation": [
"http://xbrl.sec.gov/oef/role/ShareholderReportLineGraphDetails"
],
"lang": {
"en-us": {
"role": {
"label": "Account Value [Line Items]"
}
}
},
"auth_ref": [
"r37"
]
},
"oef_AccountValueTable": {
"xbrltype": "stringItemType",
"nsuri": "http://xbrl.sec.gov/oef/2025",
"localname": "AccountValueTable",
"presentation": [
"http://xbrl.sec.gov/oef/role/ShareholderReportLineGraphDetails"
],
"lang": {
"en-us": {
"role": {
"label": "Account Value [Table]"
}
}
},
"auth_ref": [
"r37"
]
},
"oef_AccountValueTableAbstract": {
"xbrltype": "stringItemType",
"nsuri": "http://xbrl.sec.gov/oef/2025",
"localname": "AccountValueTableAbstract",
"lang": {
"en-us": {
"role": {
"label": "Account Value Table [Abstract]"
}
}
},
"auth_ref": [
"r37"
]
},
"oef_AccountantChngDate": {
"xbrltype": "dateItemType",
"nsuri": "http://xbrl.sec.gov/oef/2025",
"localname": "AccountantChngDate",
"presentation": [
"http://xbrl.sec.gov/oef/role/ShareholderReport"
],
"lang": {
"en-us": {
"role": {
"label": "Accountant Change Date"
}
}
},
"auth_ref": [
"r61"
]
},
"oef_AccountantChngDisagreementsTextBlock": {
"xbrltype": "textBlockItemType",
"nsuri": "http://xbrl.sec.gov/oef/2025",
"localname": "AccountantChngDisagreementsTextBlock",
"presentation": [
"http://xbrl.sec.gov/oef/role/ShareholderReport"
],
"lang": {
"en-us": {
"role": {
"label": "Accountant Change Disagreements [Text Block]"
}
}
},
"auth_ref": [
"r62"
]
},
"oef_AccountantChngStatementTextBlock": {
"xbrltype": "textBlockItemType",
"nsuri": "http://xbrl.sec.gov/oef/2025",
"localname": "AccountantChngStatementTextBlock",
"presentation": [
"http://xbrl.sec.gov/oef/role/ShareholderReport"
],
"lang": {
"en-us": {
"role": {
"label": "Accountant Change Statement [Text Block]"
}
}
},
"auth_ref": [
"r61"
]
},
"oef_AdditionalIndexAxis": {
"xbrltype": "stringItemType",
"nsuri": "http://xbrl.sec.gov/oef/2025",
"localname": "AdditionalIndexAxis",
"presentation": [
"http://xbrl.sec.gov/oef/role/ShareholderReportAverageAnnualReturnDetails",
"http://xbrl.sec.gov/oef/role/ShareholderReportLineGraphDetails"
],
"lang": {
"en-us": {
"role": {
"label": "Additional Index [Axis]"
}
}
},
"auth_ref": [
"r37"
]
},
"oef_AdditionalIndexDomain": {
"xbrltype": "domainItemType",
"nsuri": "http://xbrl.sec.gov/oef/2025",
"localname": "AdditionalIndexDomain",
"presentation": [
"http://xbrl.sec.gov/oef/role/ShareholderReportAverageAnnualReturnDetails",
"http://xbrl.sec.gov/oef/role/ShareholderReportLineGraphDetails"
],
"lang": {
"en-us": {
"role": {
"label": "Additional Index [Domain]"
}
}
},
"auth_ref": [
"r37"
]
},
"oef_AddlFundStatisticsSignificanceOrLimitsTextBlock": {
"xbrltype": "textBlockItemType",
"nsuri": "http://xbrl.sec.gov/oef/2025",
"localname": "AddlFundStatisticsSignificanceOrLimitsTextBlock",
"presentation": [
"http://xbrl.sec.gov/oef/role/ShareholderReport"
],
"lang": {
"en-us": {
"role": {
"label": "Additional Fund Statistics Significance or Limits [Text Block]"
}
}
},
"auth_ref": [
"r51"
]
},
"oef_AddlFundStatisticsTextBlock": {
"xbrltype": "textBlockItemType",
"nsuri": "http://xbrl.sec.gov/oef/2025",
"localname": "AddlFundStatisticsTextBlock",
"presentation": [
"http://xbrl.sec.gov/oef/role/ShareholderReport"
],
"lang": {
"en-us": {
"role": {
"label": "Additional Fund Statistics [Text Block]"
}
}
},
"auth_ref": [
"r50"
]
},
"oef_AddlInfoEmail": {
"xbrltype": "stringItemType",
"nsuri": "http://xbrl.sec.gov/oef/2025",
"localname": "AddlInfoEmail",
"presentation": [
"http://xbrl.sec.gov/oef/role/ShareholderReport"
],
"lang": {
"en-us": {
"role": {
"label": "Additional Information Email"
}
}
},
"auth_ref": [
"r29"
]
},
"oef_AddlInfoPhoneNumber": {
"xbrltype": "stringItemType",
"nsuri": "http://xbrl.sec.gov/oef/2025",
"localname": "AddlInfoPhoneNumber",
"presentation": [
"http://xbrl.sec.gov/oef/role/ShareholderReport"
],
"lang": {
"en-us": {
"role": {
"label": "Additional Information Phone Number"
}
}
},
"auth_ref": [
"r29"
]
},
"oef_AddlInfoTextBlock": {
"xbrltype": "textBlockItemType",
"nsuri": "http://xbrl.sec.gov/oef/2025",
"localname": "AddlInfoTextBlock",
"presentation": [
"http://xbrl.sec.gov/oef/role/ShareholderReport"
],
"lang": {
"en-us": {
"role": {
"label": "Additional Information [Text Block]"
}
}
},
"auth_ref": [
"r27"
]
},
"oef_AddlInfoWebsite": {
"xbrltype": "stringItemType",
"nsuri": "http://xbrl.sec.gov/oef/2025",
"localname": "AddlInfoWebsite",
"presentation": [
"http://xbrl.sec.gov/oef/role/ShareholderReport"
],
"lang": {
"en-us": {
"role": {
"label": "Additional Information Website"
}
}
},
"auth_ref": [
"r29"
]
},
"oef_AdvisoryFeesPaidAmt": {
"xbrltype": "monetaryItemType",
"nsuri": "http://xbrl.sec.gov/oef/2025",
"localname": "AdvisoryFeesPaidAmt",
"presentation": [
"http://xbrl.sec.gov/oef/role/ShareholderReport"
],
"lang": {
"en-us": {
"role": {
"label": "Advisory Fees Paid, Amount"
}
}
},
"auth_ref": [
"r50"
]
},
"dei_AmendmentDescription": {
"xbrltype": "stringItemType",
"nsuri": "http://xbrl.sec.gov/dei/2025",
"localname": "AmendmentDescription",
"presentation": [
"http://xbrl.sec.gov/oef/role/NcsrCover",
"http://xbrl.sec.gov/oef/role/ShareholderReport"
],
"lang": {
"en-us": {
"role": {
"label": "Amendment Description",
"documentation": "Description of changes contained within amended document."
}
}
},
"auth_ref": []
},
"dei_AmendmentFlag": {
"xbrltype": "booleanItemType",
"nsuri": "http://xbrl.sec.gov/dei/2025",
"localname": "AmendmentFlag",
"presentation": [
"http://xbrl.sec.gov/oef/role/NcsrCover",
"http://xbrl.sec.gov/oef/role/ShareholderReport"
],
"lang": {
"en-us": {
"role": {
"label": "Amendment Flag",
"documentation": "Boolean flag that is true when the XBRL content amends previously-filed or accepted submission."
}
}
},
"auth_ref": []
},
"oef_AnnlOrSemiAnnlStatementTextBlock": {
"xbrltype": "textBlockItemType",
"nsuri": "http://xbrl.sec.gov/oef/2025",
"localname": "AnnlOrSemiAnnlStatementTextBlock",
"presentation": [
"http://xbrl.sec.gov/oef/role/ShareholderReport"
],
"lang": {
"en-us": {
"role": {
"label": "Annual or Semi-Annual Statement [Text Block]"
}
}
},
"auth_ref": [
"r26"
]
},
"us-gaap_AssetBackedSecuritiesMember": {
"xbrltype": "domainItemType",
"nsuri": "http://fasb.org/us-gaap/2025",
"localname": "AssetBackedSecuritiesMember",
"presentation": [
"http://xbrl.sec.gov/oef/role/ShareholderReportHoldingsDetails"
],
"lang": {
"en-us": {
"role": {
"label": "Asset-Backed Securities [Member]",
"documentation": "Securities that are primarily serviced by the cash flows of a discrete pool of receivables or other financial assets for example, but not limited to, credit card receivables, car loans, recreational vehicle loans, and mobile home loans."
}
}
},
"auth_ref": [
"r18",
"r19",
"r20",
"r67",
"r68",
"r69"
]
},
"us-gaap_AssetsNet": {
"xbrltype": "monetaryItemType",
"nsuri": "http://fasb.org/us-gaap/2025",
"localname": "AssetsNet",
"crdr": "debit",
"presentation": [
"http://xbrl.sec.gov/oef/role/ShareholderReport"
],
"lang": {
"en-us": {
"role": {
"label": "Net Assets",
"documentation": "Amount of net assets (liabilities)."
}
}
},
"auth_ref": [
"r0"
]
},
"oef_AverageAnnualReturnAbstract": {
"xbrltype": "stringItemType",
"nsuri": "http://xbrl.sec.gov/oef/2025",
"localname": "AverageAnnualReturnAbstract",
"lang": {
"en-us": {
"role": {
"label": "Average Annual Return:"
}
}
},
"auth_ref": [
"r65"
]
},
"oef_AverageAnnualReturnLineItems": {
"xbrltype": "stringItemType",
"nsuri": "http://xbrl.sec.gov/oef/2025",
"localname": "AverageAnnualReturnLineItems",
"presentation": [
"http://xbrl.sec.gov/oef/role/ShareholderReportAverageAnnualReturnDetails"
],
"lang": {
"en-us": {
"role": {
"label": "Average Annual Return [Line Items]"
}
}
},
"auth_ref": [
"r65"
]
},
"oef_AverageAnnualReturnTable": {
"xbrltype": "stringItemType",
"nsuri": "http://xbrl.sec.gov/oef/2025",
"localname": "AverageAnnualReturnTable",
"presentation": [
"http://xbrl.sec.gov/oef/role/ShareholderReportAverageAnnualReturnDetails"
],
"lang": {
"en-us": {
"role": {
"label": "Average Annual Return [Table]"
}
}
},
"auth_ref": [
"r65"
]
},
"oef_AvgAnnlRtrPct": {
"xbrltype": "percentItemType",
"nsuri": "http://xbrl.sec.gov/oef/2025",
"localname": "AvgAnnlRtrPct",
"presentation": [
"http://xbrl.sec.gov/oef/role/ShareholderReportAverageAnnualReturnDetails"
],
"lang": {
"en-us": {
"role": {
"label": "Average Annual Return, Percent"
}
}
},
"auth_ref": [
"r44"
]
},
"oef_AvgAnnlRtrTableTextBlock": {
"xbrltype": "textBlockItemType",
"nsuri": "http://xbrl.sec.gov/oef/2025",
"localname": "AvgAnnlRtrTableTextBlock",
"presentation": [
"http://xbrl.sec.gov/oef/role/ShareholderReport"
],
"lang": {
"en-us": {
"role": {
"label": "Average Annual Return [Table Text Block]"
}
}
},
"auth_ref": [
"r44"
]
},
"fvt_BloombergCaliforniaMunicipalInterShort110YearIndexMember": {
"xbrltype": "domainItemType",
"nsuri": "http://www.polencapital.com/20251120",
"localname": "BloombergCaliforniaMunicipalInterShort110YearIndexMember",
"presentation": [
"http://xbrl.sec.gov/oef/role/ShareholderReportAverageAnnualReturnDetails",
"http://xbrl.sec.gov/oef/role/ShareholderReportLineGraphDetails"
],
"lang": {
"en-us": {
"role": {
"label": "Bloomberg California Municipal Inter Short 1 10 Year Index [Member]"
}
}
},
"auth_ref": []
},
"fvt_BloombergIntermediateUSGovernmentCreditBondIndexMember": {
"xbrltype": "domainItemType",
"nsuri": "http://www.polencapital.com/20251120",
"localname": "BloombergIntermediateUSGovernmentCreditBondIndexMember",
"presentation": [
"http://xbrl.sec.gov/oef/role/ShareholderReportAverageAnnualReturnDetails",
"http://xbrl.sec.gov/oef/role/ShareholderReportLineGraphDetails"
],
"lang": {
"en-us": {
"role": {
"label": "Bloomberg Intermediate U S Government Credit Bond Index [Member]"
}
}
},
"auth_ref": []
},
"fvt_BloombergMunicipalBondIndexMember": {
"xbrltype": "domainItemType",
"nsuri": "http://www.polencapital.com/20251120",
"localname": "BloombergMunicipalBondIndexMember",
"presentation": [
"http://xbrl.sec.gov/oef/role/ShareholderReportAverageAnnualReturnDetails",
"http://xbrl.sec.gov/oef/role/ShareholderReportLineGraphDetails"
],
"lang": {
"en-us": {
"role": {
"label": "Bloomberg Municipal Bond Index [Member]"
}
}
},
"auth_ref": []
},
"fvt_BloombergMunicipalInterShort110YearIndexMember": {
"xbrltype": "domainItemType",
"nsuri": "http://www.polencapital.com/20251120",
"localname": "BloombergMunicipalInterShort110YearIndexMember",
"presentation": [
"http://xbrl.sec.gov/oef/role/ShareholderReportAverageAnnualReturnDetails",
"http://xbrl.sec.gov/oef/role/ShareholderReportLineGraphDetails"
],
"lang": {
"en-us": {
"role": {
"label": "Bloomberg Municipal Inter Short 1 10 Year Index [Member]"
}
}
},
"auth_ref": []
},
"fvt_BloombergUSAggregateBondIndexMember": {
"xbrltype": "domainItemType",
"nsuri": "http://www.polencapital.com/20251120",
"localname": "BloombergUSAggregateBondIndexMember",
"presentation": [
"http://xbrl.sec.gov/oef/role/ShareholderReportAverageAnnualReturnDetails",
"http://xbrl.sec.gov/oef/role/ShareholderReportLineGraphDetails"
],
"lang": {
"en-us": {
"role": {
"label": "Bloomberg U S Aggregate Bond Index [Member]"
}
}
},
"auth_ref": []
},
"oef_BroadBasedIndexAxis": {
"xbrltype": "stringItemType",
"nsuri": "http://xbrl.sec.gov/oef/2025",
"localname": "BroadBasedIndexAxis",
"presentation": [
"http://xbrl.sec.gov/oef/role/ShareholderReportAverageAnnualReturnDetails",
"http://xbrl.sec.gov/oef/role/ShareholderReportLineGraphDetails"
],
"lang": {
"en-us": {
"role": {
"label": "Broad Based Index [Axis]"
}
}
},
"auth_ref": [
"r37"
]
},
"oef_BroadBasedIndexDomain": {
"xbrltype": "domainItemType",
"nsuri": "http://xbrl.sec.gov/oef/2025",
"localname": "BroadBasedIndexDomain",
"presentation": [
"http://xbrl.sec.gov/oef/role/ShareholderReportAverageAnnualReturnDetails",
"http://xbrl.sec.gov/oef/role/ShareholderReportLineGraphDetails"
],
"lang": {
"en-us": {
"role": {
"label": "Broad Based Index [Domain]"
}
}
},
"auth_ref": [
"r37"
]
},
"fvt_C000237818Member": {
"xbrltype": "domainItemType",
"nsuri": "http://www.polencapital.com/20251120",
"localname": "C000237818Member",
"presentation": [
"http://xbrl.sec.gov/oef/role/ShareholderReport",
"http://xbrl.sec.gov/oef/role/ShareholderReportAverageAnnualReturnDetails",
"http://xbrl.sec.gov/oef/role/ShareholderReportHoldingsDetails",
"http://xbrl.sec.gov/oef/role/ShareholderReportLineGraphDetails"
],
"lang": {
"en-us": {
"role": {
"label": "C000237818 [Member]",
"terseLabel": "Institutional Class"
}
}
},
"auth_ref": []
},
"fvt_C000237820Member": {
"xbrltype": "domainItemType",
"nsuri": "http://www.polencapital.com/20251120",
"localname": "C000237820Member",
"presentation": [
"http://xbrl.sec.gov/oef/role/ShareholderReport",
"http://xbrl.sec.gov/oef/role/ShareholderReportAverageAnnualReturnDetails",
"http://xbrl.sec.gov/oef/role/ShareholderReportHoldingsDetails",
"http://xbrl.sec.gov/oef/role/ShareholderReportLineGraphDetails"
],
"lang": {
"en-us": {
"role": {
"label": "C000237820 [Member]"
}
}
},
"auth_ref": []
},
"fvt_C000237822Member": {
"xbrltype": "domainItemType",
"nsuri": "http://www.polencapital.com/20251120",
"localname": "C000237822Member",
"presentation": [
"http://xbrl.sec.gov/oef/role/ShareholderReport",
"http://xbrl.sec.gov/oef/role/ShareholderReportAverageAnnualReturnDetails",
"http://xbrl.sec.gov/oef/role/ShareholderReportHoldingsDetails",
"http://xbrl.sec.gov/oef/role/ShareholderReportLineGraphDetails"
],
"lang": {
"en-us": {
"role": {
"label": "C000237822 [Member]"
}
}
},
"auth_ref": []
},
"oef_ClassAxis": {
"xbrltype": "stringItemType",
"nsuri": "http://xbrl.sec.gov/oef/2025",
"localname": "ClassAxis",
"presentation": [
"http://xbrl.sec.gov/oef/role/ShareholderReport",
"http://xbrl.sec.gov/oef/role/ShareholderReportAverageAnnualReturnDetails",
"http://xbrl.sec.gov/oef/role/ShareholderReportHoldingsDetails",
"http://xbrl.sec.gov/oef/role/ShareholderReportLineGraphDetails"
],
"lang": {
"en-us": {
"role": {
"label": "Class [Axis]"
}
}
},
"auth_ref": [
"r24"
]
},
"oef_ClassName": {
"xbrltype": "securityTitleItemType",
"nsuri": "http://xbrl.sec.gov/oef/2025",
"localname": "ClassName",
"presentation": [
"http://xbrl.sec.gov/oef/role/ShareholderReport"
],
"lang": {
"en-us": {
"role": {
"label": "Class Name"
}
}
},
"auth_ref": [
"r29"
]
},
"us-gaap_CorporateBondSecuritiesMember": {
"xbrltype": "domainItemType",
"nsuri": "http://fasb.org/us-gaap/2025",
"localname": "CorporateBondSecuritiesMember",
"presentation": [
"http://xbrl.sec.gov/oef/role/ShareholderReportHoldingsDetails"
],
"lang": {
"en-us": {
"role": {
"label": "Corporate Bond Securities [Member]",
"documentation": "This category includes information about long-term debt securities that are issued by either a domestic or foreign corporate business entity with a date certain promise of repayment and a return to the holder for the time value of money (for example, variable or fixed interest, original issue discount)."
}
}
},
"auth_ref": []
},
"dei_CoverAbstract": {
"xbrltype": "stringItemType",
"nsuri": "http://xbrl.sec.gov/dei/2025",
"localname": "CoverAbstract",
"lang": {
"en-us": {
"role": {
"documentation": "Cover page."
}
}
},
"auth_ref": []
},
"oef_CreditQualityAxis": {
"xbrltype": "stringItemType",
"nsuri": "http://xbrl.sec.gov/oef/2025",
"localname": "CreditQualityAxis",
"presentation": [
"http://xbrl.sec.gov/oef/role/ShareholderReportHoldingsDetails"
],
"lang": {
"en-us": {
"role": {
"label": "Credit Quality [Axis]"
}
}
},
"auth_ref": [
"r52"
]
},
"oef_CreditQualityDomain": {
"xbrltype": "domainItemType",
"nsuri": "http://xbrl.sec.gov/oef/2025",
"localname": "CreditQualityDomain",
"presentation": [
"http://xbrl.sec.gov/oef/role/ShareholderReportHoldingsDetails"
],
"lang": {
"en-us": {
"role": {
"label": "Credit Quality [Domain]"
}
}
},
"auth_ref": [
"r52"
]
},
"oef_CreditQualityExplanationTextBlock": {
"xbrltype": "textBlockItemType",
"nsuri": "http://xbrl.sec.gov/oef/2025",
"localname": "CreditQualityExplanationTextBlock",
"presentation": [
"http://xbrl.sec.gov/oef/role/ShareholderReport"
],
"lang": {
"en-us": {
"role": {
"label": "Credit Quality Explanation [Text Block]"
}
}
},
"auth_ref": [
"r52"
]
},
"srt_CreditRatingAMBestDomain": {
"xbrltype": "domainItemType",
"nsuri": "http://fasb.org/srt/2025",
"localname": "CreditRatingAMBestDomain",
"presentation": [
"http://xbrl.sec.gov/oef/role/ShareholderReportHoldingsDetails"
],
"auth_ref": [
"r17",
"r70"
]
},
"oef_CreditRatingsSelectionTextBlock": {
"xbrltype": "textBlockItemType",
"nsuri": "http://xbrl.sec.gov/oef/2025",
"localname": "CreditRatingsSelectionTextBlock",
"presentation": [
"http://xbrl.sec.gov/oef/role/ShareholderReport"
],
"lang": {
"en-us": {
"role": {
"label": "Credit Ratings Selection [Text Block]"
}
}
},
"auth_ref": [
"r52"
]
},
"oef_DistOfCapitalTextBlock": {
"xbrltype": "textBlockItemType",
"nsuri": "http://xbrl.sec.gov/oef/2025",
"localname": "DistOfCapitalTextBlock",
"presentation": [
"http://xbrl.sec.gov/oef/role/ShareholderReport"
],
"lang": {
"en-us": {
"role": {
"label": "Distribution of Capital [Text Block]"
}
}
},
"auth_ref": [
"r46"
]
},
"dei_DocumentPeriodEndDate": {
"xbrltype": "dateItemType",
"nsuri": "http://xbrl.sec.gov/dei/2025",
"localname": "DocumentPeriodEndDate",
"presentation": [
"http://xbrl.sec.gov/oef/role/NcsrCover",
"http://xbrl.sec.gov/oef/role/ShareholderReport"
],
"lang": {
"en-us": {
"role": {
"label": "Document Period End Date",
"documentation": "For the EDGAR submission types of Form 8-K: the date of the report, the date of the earliest event reported; for the EDGAR submission types of Form N-1A: the filing date; for all other submission types: the end of the reporting or transition period. The format of the date is YYYY-MM-DD."
}
}
},
"auth_ref": []
},
"dei_DocumentType": {
"xbrltype": "submissionTypeItemType",
"nsuri": "http://xbrl.sec.gov/dei/2025",
"localname": "DocumentType",
"presentation": [
"http://xbrl.sec.gov/oef/role/NcsrCover",
"http://xbrl.sec.gov/oef/role/ShareholderReport"
],
"lang": {
"en-us": {
"role": {
"label": "Document Type",
"documentation": "The type of document being provided (such as 10-K, 10-Q, 485BPOS, etc). The document type is limited to the same value as the supporting SEC submission type, or the word 'Other'."
}
}
},
"auth_ref": []
},
"dei_EntityCentralIndexKey": {
"xbrltype": "centralIndexKeyItemType",
"nsuri": "http://xbrl.sec.gov/dei/2025",
"localname": "EntityCentralIndexKey",
"presentation": [
"http://xbrl.sec.gov/oef/role/NcsrCover",
"http://xbrl.sec.gov/oef/role/ShareholderReport"
],
"lang": {
"en-us": {
"role": {
"label": "Entity Central Index Key",
"documentation": "A unique 10-digit SEC-issued value to identify entities that have filed disclosures with the SEC. It is commonly abbreviated as CIK."
}
}
},
"auth_ref": [
"r22"
]
},
"dei_EntityDomain": {
"xbrltype": "domainItemType",
"nsuri": "http://xbrl.sec.gov/dei/2025",
"localname": "EntityDomain",
"presentation": [
"http://xbrl.sec.gov/oef/role/ShareholderReportAverageAnnualReturnDetails"
],
"lang": {
"en-us": {
"role": {
"label": "Series",
"documentation": "All the names of the entities being reported upon in a document. Any legal structure used to conduct activities or to hold assets. Some examples of such structures are corporations, partnerships, limited liability companies, grantor trusts, and other trusts. This item does not include business and geographical segments which are included in the geographical or business segments domains."
}
}
},
"auth_ref": []
},
"dei_EntityInvCompanyType": {
"xbrltype": "invCompanyType",
"nsuri": "http://xbrl.sec.gov/dei/2025",
"localname": "EntityInvCompanyType",
"presentation": [
"http://xbrl.sec.gov/oef/role/NcsrCover",
"http://xbrl.sec.gov/oef/role/ShareholderReport"
],
"lang": {
"en-us": {
"role": {
"label": "Entity Investment Company Type",
"documentation": "One of: N-1A (Mutual Fund), N-1 (Open-End Separate Account with No Variable Annuities), N-2 (Closed-End Investment Company), N-3 (Separate Account Registered as Open-End Management Investment Company), N-4 (Variable Annuity UIT Separate Account), N-5 (Small Business Investment Company), N-6 (Variable Life UIT Separate Account), S-1 or S-3 (Face Amount Certificate Company), S-6 (UIT, Non-Insurance Product)."
}
}
},
"auth_ref": [
"r66"
]
},
"dei_EntityRegistrantName": {
"xbrltype": "normalizedStringItemType",
"nsuri": "http://xbrl.sec.gov/dei/2025",
"localname": "EntityRegistrantName",
"presentation": [
"http://xbrl.sec.gov/oef/role/NcsrCover",
"http://xbrl.sec.gov/oef/role/ShareholderReport"
],
"lang": {
"en-us": {
"role": {
"label": "Registrant Name",
"documentation": "The exact name of the entity filing the report as specified in its charter, which is required by forms filed with the SEC."
}
}
},
"auth_ref": [
"r22"
]
},
"oef_EtfDiscountNumDays": {
"xbrltype": "integerItemType",
"nsuri": "http://xbrl.sec.gov/oef/2025",
"localname": "EtfDiscountNumDays",
"presentation": [
"http://xbrl.sec.gov/oef/role/ShareholderReport"
],
"lang": {
"en-us": {
"role": {
"label": "ETF Discount, Number of Days"
}
}
},
"auth_ref": [
"r47"
]
},
"oef_EtfPastPerfTextBlock": {
"xbrltype": "textBlockItemType",
"nsuri": "http://xbrl.sec.gov/oef/2025",
"localname": "EtfPastPerfTextBlock",
"presentation": [
"http://xbrl.sec.gov/oef/role/ShareholderReport"
],
"lang": {
"en-us": {
"role": {
"label": "ETF Past Performance [Text Block]"
}
}
},
"auth_ref": [
"r49"
]
},
"oef_EtfPremiumDiscountTextBlock": {
"xbrltype": "textBlockItemType",
"nsuri": "http://xbrl.sec.gov/oef/2025",
"localname": "EtfPremiumDiscountTextBlock",
"presentation": [
"http://xbrl.sec.gov/oef/role/ShareholderReport"
],
"lang": {
"en-us": {
"role": {
"label": "ETF Premium Discount [Text Block]"
}
}
},
"auth_ref": [
"r47"
]
},
"oef_EtfPremiumNumDays": {
"xbrltype": "integerItemType",
"nsuri": "http://xbrl.sec.gov/oef/2025",
"localname": "EtfPremiumNumDays",
"presentation": [
"http://xbrl.sec.gov/oef/role/ShareholderReport"
],
"lang": {
"en-us": {
"role": {
"label": "ETF Premium, Number of Days"
}
}
},
"auth_ref": [
"r47"
]
},
"oef_EtfPurchaseExplanationTextBlock": {
"xbrltype": "textBlockItemType",
"nsuri": "http://xbrl.sec.gov/oef/2025",
"localname": "EtfPurchaseExplanationTextBlock",
"presentation": [
"http://xbrl.sec.gov/oef/role/ShareholderReport"
],
"lang": {
"en-us": {
"role": {
"label": "ETF Purchase Explanation [Text Block]"
}
}
},
"auth_ref": [
"r48"
]
},
"oef_ExpenseRatioPct": {
"xbrltype": "percentItemType",
"nsuri": "http://xbrl.sec.gov/oef/2025",
"localname": "ExpenseRatioPct",
"presentation": [
"http://xbrl.sec.gov/oef/role/ShareholderReport"
],
"lang": {
"en-us": {
"role": {
"label": "Expense Ratio, Percent"
}
}
},
"auth_ref": [
"r32"
]
},
"oef_ExpensesExclExtraordinaryExpensesPct": {
"xbrltype": "percentItemType",
"nsuri": "http://xbrl.sec.gov/oef/2025",
"localname": "ExpensesExclExtraordinaryExpensesPct",
"presentation": [
"http://xbrl.sec.gov/oef/role/ShareholderReport"
],
"lang": {
"en-us": {
"role": {
"label": "Expenses Excluding Extraordinary Expenses, Percent"
}
}
},
"auth_ref": [
"r35"
]
},
"oef_ExpensesPaidAmt": {
"xbrltype": "monetaryItemType",
"nsuri": "http://xbrl.sec.gov/oef/2025",
"localname": "ExpensesPaidAmt",
"presentation": [
"http://xbrl.sec.gov/oef/role/ShareholderReport"
],
"lang": {
"en-us": {
"role": {
"label": "Expenses Paid, Amount"
}
}
},
"auth_ref": [
"r31"
]
},
"oef_ExpensesRepresentBothMasterAndFeeder": {
"xbrltype": "stringItemType",
"nsuri": "http://xbrl.sec.gov/oef/2025",
"localname": "ExpensesRepresentBothMasterAndFeeder",
"presentation": [
"http://xbrl.sec.gov/oef/role/ShareholderReport"
],
"lang": {
"en-us": {
"role": {
"label": "Expenses Represent Both Master and Feeder [Text]"
}
}
},
"auth_ref": [
"r33",
"r63"
]
},
"oef_ExpensesShortPeriodFnTextBlock": {
"xbrltype": "textBlockItemType",
"nsuri": "http://xbrl.sec.gov/oef/2025",
"localname": "ExpensesShortPeriodFnTextBlock",
"presentation": [
"http://xbrl.sec.gov/oef/role/ShareholderReport"
],
"lang": {
"en-us": {
"role": {
"label": "Expenses Short Period Footnote [Text Block]"
}
}
},
"auth_ref": [
"r34"
]
},
"oef_ExpensesTextBlock": {
"xbrltype": "textBlockItemType",
"nsuri": "http://xbrl.sec.gov/oef/2025",
"localname": "ExpensesTextBlock",
"presentation": [
"http://xbrl.sec.gov/oef/role/ShareholderReport"
],
"lang": {
"en-us": {
"role": {
"label": "Expenses [Text Block]"
}
}
},
"auth_ref": [
"r30"
]
},
"oef_ExposureBasisExplanationTextBlock": {
"xbrltype": "textBlockItemType",
"nsuri": "http://xbrl.sec.gov/oef/2025",
"localname": "ExposureBasisExplanationTextBlock",
"presentation": [
"http://xbrl.sec.gov/oef/role/ShareholderReport"
],
"lang": {
"en-us": {
"role": {
"label": "Exposure Basis Explanation [Text Block]"
}
}
},
"auth_ref": [
"r52"
]
},
"srt_ExternalCreditRatingFitchMember": {
"xbrltype": "domainItemType",
"nsuri": "http://fasb.org/srt/2025",
"localname": "ExternalCreditRatingFitchMember",
"presentation": [
"http://xbrl.sec.gov/oef/role/ShareholderReportHoldingsDetails"
],
"auth_ref": [
"r17",
"r70"
]
},
"srt_ExternalCreditRatingMoodysMember": {
"xbrltype": "domainItemType",
"nsuri": "http://fasb.org/srt/2025",
"localname": "ExternalCreditRatingMoodysMember",
"presentation": [
"http://xbrl.sec.gov/oef/role/ShareholderReportHoldingsDetails"
],
"auth_ref": [
"r17",
"r70"
]
},
"srt_ExternalCreditRatingStandardPoorsMember": {
"xbrltype": "domainItemType",
"nsuri": "http://fasb.org/srt/2025",
"localname": "ExternalCreditRatingStandardPoorsMember",
"presentation": [
"http://xbrl.sec.gov/oef/role/ShareholderReportHoldingsDetails"
],
"auth_ref": [
"r17",
"r70"
]
},
"oef_ExtraordinaryExpensesFnTextBlock": {
"xbrltype": "textBlockItemType",
"nsuri": "http://xbrl.sec.gov/oef/2025",
"localname": "ExtraordinaryExpensesFnTextBlock",
"presentation": [
"http://xbrl.sec.gov/oef/role/ShareholderReport"
],
"lang": {
"en-us": {
"role": {
"label": "Extraordinary Expenses Footnote [Text Block]"
}
}
},
"auth_ref": [
"r35"
]
},
"oef_FactorsAffectingPerfTextBlock": {
"xbrltype": "textBlockItemType",
"nsuri": "http://xbrl.sec.gov/oef/2025",
"localname": "FactorsAffectingPerfTextBlock",
"presentation": [
"http://xbrl.sec.gov/oef/role/ShareholderReport"
],
"lang": {
"en-us": {
"role": {
"label": "Factors Affecting Performance [Text Block]"
}
}
},
"auth_ref": [
"r36"
]
},
"oef_FundName": {
"xbrltype": "normalizedStringItemType",
"nsuri": "http://xbrl.sec.gov/oef/2025",
"localname": "FundName",
"presentation": [
"http://xbrl.sec.gov/oef/role/ShareholderReport"
],
"lang": {
"en-us": {
"role": {
"label": "Fund Name"
}
}
},
"auth_ref": [
"r25"
]
},
"oef_GeographicRegionAxis": {
"xbrltype": "stringItemType",
"nsuri": "http://xbrl.sec.gov/oef/2025",
"localname": "GeographicRegionAxis",
"presentation": [
"http://xbrl.sec.gov/oef/role/ShareholderReportHoldingsDetails"
],
"lang": {
"en-us": {
"role": {
"label": "Geographic Region [Axis]"
}
}
},
"auth_ref": [
"r52"
]
},
"oef_GeographicRegionDomain": {
"xbrltype": "domainItemType",
"nsuri": "http://xbrl.sec.gov/oef/2025",
"localname": "GeographicRegionDomain",
"presentation": [
"http://xbrl.sec.gov/oef/role/ShareholderReportHoldingsDetails"
],
"lang": {
"en-us": {
"role": {
"label": "Geographic Region [Domain]"
}
}
},
"auth_ref": [
"r52"
]
},
"oef_HoldingsAbstract": {
"xbrltype": "stringItemType",
"nsuri": "http://xbrl.sec.gov/oef/2025",
"localname": "HoldingsAbstract",
"lang": {
"en-us": {
"role": {
"label": "Holdings [Abstract]"
}
}
},
"auth_ref": [
"r52"
]
},
"oef_HoldingsCount": {
"xbrltype": "integerItemType",
"nsuri": "http://xbrl.sec.gov/oef/2025",
"localname": "HoldingsCount",
"presentation": [
"http://xbrl.sec.gov/oef/role/ShareholderReport"
],
"lang": {
"en-us": {
"role": {
"label": "Holdings Count"
}
}
},
"auth_ref": [
"r50"
]
},
"oef_HoldingsLineItems": {
"xbrltype": "stringItemType",
"nsuri": "http://xbrl.sec.gov/oef/2025",
"localname": "HoldingsLineItems",
"presentation": [
"http://xbrl.sec.gov/oef/role/ShareholderReportHoldingsDetails"
],
"lang": {
"en-us": {
"role": {
"label": "Holdings [Line Items]"
}
}
},
"auth_ref": [
"r52"
]
},
"oef_HoldingsTable": {
"xbrltype": "stringItemType",
"nsuri": "http://xbrl.sec.gov/oef/2025",
"localname": "HoldingsTable",
"presentation": [
"http://xbrl.sec.gov/oef/role/ShareholderReportHoldingsDetails"
],
"lang": {
"en-us": {
"role": {
"label": "Holdings [Table]"
}
}
},
"auth_ref": [
"r52"
]
},
"oef_HoldingsTableTextBlock": {
"xbrltype": "textBlockItemType",
"nsuri": "http://xbrl.sec.gov/oef/2025",
"localname": "HoldingsTableTextBlock",
"presentation": [
"http://xbrl.sec.gov/oef/role/ShareholderReport"
],
"lang": {
"en-us": {
"role": {
"label": "Holdings [Text Block]"
}
}
},
"auth_ref": [
"r52"
]
},
"oef_InabilityToMeetDistLevelTextBlock": {
"xbrltype": "textBlockItemType",
"nsuri": "http://xbrl.sec.gov/oef/2025",
"localname": "InabilityToMeetDistLevelTextBlock",
"presentation": [
"http://xbrl.sec.gov/oef/role/ShareholderReport"
],
"lang": {
"en-us": {
"role": {
"label": "Inability to Meet Distribution Level [Text Block]"
}
}
},
"auth_ref": [
"r46"
]
},
"oef_IndustrySectorAxis": {
"xbrltype": "stringItemType",
"nsuri": "http://xbrl.sec.gov/oef/2025",
"localname": "IndustrySectorAxis",
"presentation": [
"http://xbrl.sec.gov/oef/role/ShareholderReportHoldingsDetails"
],
"lang": {
"en-us": {
"role": {
"label": "Industry Sector [Axis]"
}
}
},
"auth_ref": [
"r52"
]
},
"oef_IndustrySectorDomain": {
"xbrltype": "domainItemType",
"nsuri": "http://xbrl.sec.gov/oef/2025",
"localname": "IndustrySectorDomain",
"presentation": [
"http://xbrl.sec.gov/oef/role/ShareholderReportHoldingsDetails"
],
"lang": {
"en-us": {
"role": {
"label": "Industry Sector [Domain]"
}
}
},
"auth_ref": [
"r52"
]
},
"us-gaap_InvestmentCompanyPortfolioTurnover": {
"xbrltype": "percentItemType",
"nsuri": "http://fasb.org/us-gaap/2025",
"localname": "InvestmentCompanyPortfolioTurnover",
"presentation": [
"http://xbrl.sec.gov/oef/role/ShareholderReport"
],
"lang": {
"en-us": {
"role": {
"label": "Investment Company Portfolio Turnover",
"documentation": "Percentage of lesser of purchase or sale of portfolio securities to average value of portfolio securities owned."
}
}
},
"auth_ref": [
"r71"
]
},
"us-gaap_InvestmentTypeAxis": {
"xbrltype": "stringItemType",
"nsuri": "http://fasb.org/us-gaap/2025",
"localname": "InvestmentTypeAxis",
"presentation": [
"http://xbrl.sec.gov/oef/role/ShareholderReportHoldingsDetails"
],
"lang": {
"en-us": {
"role": {
"label": "Investment Type [Axis]",
"documentation": "Information by type of investments."
}
}
},
"auth_ref": [
"r1",
"r2",
"r3",
"r4",
"r5",
"r6",
"r7",
"r8",
"r9",
"r10",
"r11",
"r12",
"r13",
"r14",
"r15",
"r16",
"r21"
]
},
"us-gaap_InvestmentTypeCategorizationMember": {
"xbrltype": "domainItemType",
"nsuri": "http://fasb.org/us-gaap/2025",
"localname": "InvestmentTypeCategorizationMember",
"presentation": [
"http://xbrl.sec.gov/oef/role/ShareholderReportHoldingsDetails"
],
"lang": {
"en-us": {
"role": {
"documentation": "Asset obtained to generate income or appreciate in value."
}
}
},
"auth_ref": [
"r1",
"r2",
"r3",
"r4",
"r5",
"r6",
"r7",
"r8",
"r9",
"r10",
"r11",
"r12",
"r13",
"r14",
"r15",
"r16",
"r21"
]
},
"oef_LargestHoldingAxis": {
"xbrltype": "stringItemType",
"nsuri": "http://xbrl.sec.gov/oef/2025",
"localname": "LargestHoldingAxis",
"presentation": [
"http://xbrl.sec.gov/oef/role/ShareholderReportHoldingsDetails"
],
"lang": {
"en-us": {
"role": {
"label": "Largest Holding [Axis]"
}
}
},
"auth_ref": [
"r52"
]
},
"oef_LargestHoldingsDomain": {
"xbrltype": "domainItemType",
"nsuri": "http://xbrl.sec.gov/oef/2025",
"localname": "LargestHoldingsDomain",
"presentation": [
"http://xbrl.sec.gov/oef/role/ShareholderReportHoldingsDetails"
],
"lang": {
"en-us": {
"role": {
"label": "Largest Holdings [Domain]"
}
}
},
"auth_ref": [
"r52"
]
},
"oef_LargestHoldingsTableTextBlock": {
"xbrltype": "textBlockItemType",
"nsuri": "http://xbrl.sec.gov/oef/2025",
"localname": "LargestHoldingsTableTextBlock",
"presentation": [
"http://xbrl.sec.gov/oef/role/ShareholderReport"
],
"lang": {
"en-us": {
"role": {
"label": "Largest Holdings [Text Block]"
}
}
},
"auth_ref": [
"r52"
]
},
"dei_LegalEntityAxis": {
"xbrltype": "stringItemType",
"nsuri": "http://xbrl.sec.gov/dei/2025",
"localname": "LegalEntityAxis",
"presentation": [
"http://xbrl.sec.gov/oef/role/ShareholderReportAverageAnnualReturnDetails"
],
"lang": {
"en-us": {
"role": {
"label": "Series [Axis]",
"documentation": "The set of legal entities associated with a report."
}
}
},
"auth_ref": []
},
"fvt_LiabilitiesInExcessOfOtherAssetsMember": {
"xbrltype": "domainItemType",
"nsuri": "http://www.polencapital.com/20251120",
"localname": "LiabilitiesInExcessOfOtherAssetsMember",
"presentation": [
"http://xbrl.sec.gov/oef/role/ShareholderReportHoldingsDetails"
],
"lang": {
"en-us": {
"role": {
"label": "Liabilities in Excess of Other Assets [Member]"
}
}
},
"auth_ref": []
},
"oef_LineGraphAndTableMeasureName": {
"xbrltype": "stringItemType",
"nsuri": "http://xbrl.sec.gov/oef/2025",
"localname": "LineGraphAndTableMeasureName",
"presentation": [
"http://xbrl.sec.gov/oef/role/ShareholderReportAverageAnnualReturnDetails",
"http://xbrl.sec.gov/oef/role/ShareholderReportLineGraphDetails"
],
"lang": {
"en-us": {
"role": {
"label": "Line Graph and Table Measure Name"
}
}
},
"auth_ref": [
"r38"
]
},
"oef_LineGraphTableTextBlock": {
"xbrltype": "textBlockItemType",
"nsuri": "http://xbrl.sec.gov/oef/2025",
"localname": "LineGraphTableTextBlock",
"presentation": [
"http://xbrl.sec.gov/oef/role/ShareholderReport"
],
"lang": {
"en-us": {
"role": {
"label": "Line Graph [Table Text Block]"
}
}
},
"auth_ref": [
"r37"
]
},
"oef_MaterialChngDate": {
"xbrltype": "dateItemType",
"nsuri": "http://xbrl.sec.gov/oef/2025",
"localname": "MaterialChngDate",
"presentation": [
"http://xbrl.sec.gov/oef/role/ShareholderReport"
],
"lang": {
"en-us": {
"role": {
"label": "Material Change Date"
}
}
},
"auth_ref": [
"r42"
]
},
"oef_MaterialChngDescriptionTextBlock": {
"xbrltype": "textBlockItemType",
"nsuri": "http://xbrl.sec.gov/oef/2025",
"localname": "MaterialChngDescriptionTextBlock",
"presentation": [
"http://xbrl.sec.gov/oef/role/ShareholderReport"
],
"lang": {
"en-us": {
"role": {
"label": "Material Change Description [Text Block]"
}
}
},
"auth_ref": [
"r42"
]
},
"oef_MaterialFundChngAdviserTextBlock": {
"xbrltype": "textBlockItemType",
"nsuri": "http://xbrl.sec.gov/oef/2025",
"localname": "MaterialFundChngAdviserTextBlock",
"presentation": [
"http://xbrl.sec.gov/oef/role/ShareholderReport"
],
"lang": {
"en-us": {
"role": {
"label": "Material Fund Change Adviser [Text Block]"
}
}
},
"auth_ref": [
"r59"
]
},
"oef_MaterialFundChngExpensesTextBlock": {
"xbrltype": "textBlockItemType",
"nsuri": "http://xbrl.sec.gov/oef/2025",
"localname": "MaterialFundChngExpensesTextBlock",
"presentation": [
"http://xbrl.sec.gov/oef/role/ShareholderReport"
],
"lang": {
"en-us": {
"role": {
"label": "Material Fund Change Expenses [Text Block]"
}
}
},
"auth_ref": [
"r56"
]
},
"oef_MaterialFundChngNameTextBlock": {
"xbrltype": "textBlockItemType",
"nsuri": "http://xbrl.sec.gov/oef/2025",
"localname": "MaterialFundChngNameTextBlock",
"presentation": [
"http://xbrl.sec.gov/oef/role/ShareholderReport"
],
"lang": {
"en-us": {
"role": {
"label": "Material Fund Change Name [Text Block]"
}
}
},
"auth_ref": [
"r54"
]
},
"oef_MaterialFundChngNoticeTextBlock": {
"xbrltype": "textBlockItemType",
"nsuri": "http://xbrl.sec.gov/oef/2025",
"localname": "MaterialFundChngNoticeTextBlock",
"presentation": [
"http://xbrl.sec.gov/oef/role/ShareholderReport"
],
"lang": {
"en-us": {
"role": {
"label": "Material Fund Change Notice [Text Block]"
}
}
},
"auth_ref": [
"r28"
]
},
"oef_MaterialFundChngObjectivesTextBlock": {
"xbrltype": "textBlockItemType",
"nsuri": "http://xbrl.sec.gov/oef/2025",
"localname": "MaterialFundChngObjectivesTextBlock",
"presentation": [
"http://xbrl.sec.gov/oef/role/ShareholderReport"
],
"lang": {
"en-us": {
"role": {
"label": "Material Fund Change Objectives [Text Block]"
}
}
},
"auth_ref": [
"r55"
]
},
"oef_MaterialFundChngRisksChngTextBlock": {
"xbrltype": "textBlockItemType",
"nsuri": "http://xbrl.sec.gov/oef/2025",
"localname": "MaterialFundChngRisksChngTextBlock",
"presentation": [
"http://xbrl.sec.gov/oef/role/ShareholderReport"
],
"lang": {
"en-us": {
"role": {
"label": "Material Fund Change Risks Change [Text Block]"
}
}
},
"auth_ref": [
"r58"
]
},
"oef_MaterialFundChngStrategiesTextBlock": {
"xbrltype": "textBlockItemType",
"nsuri": "http://xbrl.sec.gov/oef/2025",
"localname": "MaterialFundChngStrategiesTextBlock",
"presentation": [
"http://xbrl.sec.gov/oef/role/ShareholderReport"
],
"lang": {
"en-us": {
"role": {
"label": "Material Fund Change Strategies [Text Block]"
}
}
},
"auth_ref": [
"r57"
]
},
"oef_MaterialFundChngTextBlock": {
"xbrltype": "textBlockItemType",
"nsuri": "http://xbrl.sec.gov/oef/2025",
"localname": "MaterialFundChngTextBlock",
"presentation": [
"http://xbrl.sec.gov/oef/role/ShareholderReport"
],
"lang": {
"en-us": {
"role": {
"label": "Material Fund Change [Text Block]"
}
}
},
"auth_ref": [
"r53"
]
},
"oef_MaturityAxis": {
"xbrltype": "stringItemType",
"nsuri": "http://xbrl.sec.gov/oef/2025",
"localname": "MaturityAxis",
"presentation": [
"http://xbrl.sec.gov/oef/role/ShareholderReportHoldingsDetails"
],
"lang": {
"en-us": {
"role": {
"label": "Maturity [Axis]"
}
}
},
"auth_ref": [
"r52"
]
},
"oef_MaturityDomain": {
"xbrltype": "domainItemType",
"nsuri": "http://xbrl.sec.gov/oef/2025",
"localname": "MaturityDomain",
"presentation": [
"http://xbrl.sec.gov/oef/role/ShareholderReportHoldingsDetails"
],
"lang": {
"en-us": {
"role": {
"label": "Maturity [Domain]"
}
}
},
"auth_ref": [
"r52"
]
},
"us-gaap_MunicipalBondsMember": {
"xbrltype": "domainItemType",
"nsuri": "http://fasb.org/us-gaap/2025",
"localname": "MunicipalBondsMember",
"presentation": [
"http://xbrl.sec.gov/oef/role/ShareholderReportHoldingsDetails"
],
"lang": {
"en-us": {
"role": {
"label": "Municipal Bonds [Member]",
"documentation": "Long-term debt securities issued by state, city or local governments or the agencies operated by state, city or local governments."
}
}
},
"auth_ref": []
},
"oef_NoDeductionOfTaxesTextBlock": {
"xbrltype": "textBlockItemType",
"nsuri": "http://xbrl.sec.gov/oef/2025",
"localname": "NoDeductionOfTaxesTextBlock",
"presentation": [
"http://xbrl.sec.gov/oef/role/ShareholderReport"
],
"lang": {
"en-us": {
"role": {
"label": "No Deduction of Taxes [Text Block]"
}
}
},
"auth_ref": [
"r39"
]
},
"dei_NoTradingSymbolFlag": {
"xbrltype": "trueItemType",
"nsuri": "http://xbrl.sec.gov/dei/2025",
"localname": "NoTradingSymbolFlag",
"presentation": [
"http://xbrl.sec.gov/oef/role/ShareholderReport"
],
"lang": {
"en-us": {
"role": {
"label": "No Trading Symbol Flag",
"documentation": "Boolean flag that is true only for a security having no trading symbol."
}
}
},
"auth_ref": []
},
"fvt_OtherAssetsInExcessOfLiabilitiesMember": {
"xbrltype": "domainItemType",
"nsuri": "http://www.polencapital.com/20251120",
"localname": "OtherAssetsInExcessOfLiabilitiesMember",
"presentation": [
"http://xbrl.sec.gov/oef/role/ShareholderReportHoldingsDetails"
],
"lang": {
"en-us": {
"role": {
"label": "Other Assets in excess of Liabilities [Member]"
}
}
},
"auth_ref": []
},
"oef_OtherCategory1Axis": {
"xbrltype": "stringItemType",
"nsuri": "http://xbrl.sec.gov/oef/2025",
"localname": "OtherCategory1Axis",
"presentation": [
"http://xbrl.sec.gov/oef/role/ShareholderReportHoldingsDetails"
],
"lang": {
"en-us": {
"role": {
"label": "Other Category 1 [Axis]"
}
}
},
"auth_ref": [
"r52"
]
},
"oef_OtherCategory1Domain": {
"xbrltype": "domainItemType",
"nsuri": "http://xbrl.sec.gov/oef/2025",
"localname": "OtherCategory1Domain",
"presentation": [
"http://xbrl.sec.gov/oef/role/ShareholderReportHoldingsDetails"
],
"lang": {
"en-us": {
"role": {
"label": "Other Category 1 [Domain]"
}
}
},
"auth_ref": [
"r52"
]
},
"oef_OtherCategory2Axis": {
"xbrltype": "stringItemType",
"nsuri": "http://xbrl.sec.gov/oef/2025",
"localname": "OtherCategory2Axis",
"presentation": [
"http://xbrl.sec.gov/oef/role/ShareholderReportHoldingsDetails"
],
"lang": {
"en-us": {
"role": {
"label": "Other Category 2 [Axis]"
}
}
},
"auth_ref": [
"r52"
]
},
"oef_OtherCategory2Domain": {
"xbrltype": "domainItemType",
"nsuri": "http://xbrl.sec.gov/oef/2025",
"localname": "OtherCategory2Domain",
"presentation": [
"http://xbrl.sec.gov/oef/role/ShareholderReportHoldingsDetails"
],
"lang": {
"en-us": {
"role": {
"label": "Other Category 2 [Domain]"
}
}
},
"auth_ref": [
"r52"
]
},
"us-gaap_OtherInvestmentsMember": {
"xbrltype": "domainItemType",
"nsuri": "http://fasb.org/us-gaap/2025",
"localname": "OtherInvestmentsMember",
"presentation": [
"http://xbrl.sec.gov/oef/role/ShareholderReportHoldingsDetails"
],
"lang": {
"en-us": {
"role": {
"label": "Other Investments [Member]",
"documentation": "Primary financial statement caption encompassing other investments."
}
}
},
"auth_ref": []
},
"fvt_OtherSecuritiesMember": {
"xbrltype": "domainItemType",
"nsuri": "http://www.polencapital.com/20251120",
"localname": "OtherSecuritiesMember",
"presentation": [
"http://xbrl.sec.gov/oef/role/ShareholderReportHoldingsDetails"
],
"lang": {
"en-us": {
"role": {
"label": "Other Securities [Member]"
}
}
},
"auth_ref": []
},
"oef_PctOfNav": {
"xbrltype": "percentItemType",
"nsuri": "http://xbrl.sec.gov/oef/2025",
"localname": "PctOfNav",
"presentation": [
"http://xbrl.sec.gov/oef/role/ShareholderReportHoldingsDetails"
],
"lang": {
"en-us": {
"role": {
"label": "Percent of Net Asset Value"
}
}
},
"auth_ref": [
"r52"
]
},
"oef_PctOfNetLongExposure": {
"xbrltype": "percentItemType",
"nsuri": "http://xbrl.sec.gov/oef/2025",
"localname": "PctOfNetLongExposure",
"presentation": [
"http://xbrl.sec.gov/oef/role/ShareholderReportHoldingsDetails"
],
"lang": {
"en-us": {
"role": {
"label": "Percent of Net Long Exposure"
}
}
},
"auth_ref": [
"r52"
]
},
"oef_PctOfNetShortExposure": {
"xbrltype": "percentItemType",
"nsuri": "http://xbrl.sec.gov/oef/2025",
"localname": "PctOfNetShortExposure",
"presentation": [
"http://xbrl.sec.gov/oef/role/ShareholderReportHoldingsDetails"
],
"lang": {
"en-us": {
"role": {
"label": "Percent of Net Short Exposure"
}
}
},
"auth_ref": [
"r52"
]
},
"oef_PctOfTotalInv": {
"xbrltype": "percentItemType",
"nsuri": "http://xbrl.sec.gov/oef/2025",
"localname": "PctOfTotalInv",
"presentation": [
"http://xbrl.sec.gov/oef/role/ShareholderReportHoldingsDetails"
],
"lang": {
"en-us": {
"role": {
"label": "Percent of Total Investments"
}
}
},
"auth_ref": [
"r52"
]
},
"oef_PctOfTotalLongExposure": {
"xbrltype": "percentItemType",
"nsuri": "http://xbrl.sec.gov/oef/2025",
"localname": "PctOfTotalLongExposure",
"presentation": [
"http://xbrl.sec.gov/oef/role/ShareholderReportHoldingsDetails"
],
"lang": {
"en-us": {
"role": {
"label": "Percent of Total Long Exposure"
}
}
},
"auth_ref": [
"r52"
]
},
"oef_PctOfTotalShortExposure": {
"xbrltype": "percentItemType",
"nsuri": "http://xbrl.sec.gov/oef/2025",
"localname": "PctOfTotalShortExposure",
"presentation": [
"http://xbrl.sec.gov/oef/role/ShareholderReportHoldingsDetails"
],
"lang": {
"en-us": {
"role": {
"label": "Percent of Total Short Exposure"
}
}
},
"auth_ref": [
"r52"
]
},
"oef_PerfInceptionDate": {
"xbrltype": "dateItemType",
"nsuri": "http://xbrl.sec.gov/oef/2025",
"localname": "PerfInceptionDate",
"presentation": [
"http://xbrl.sec.gov/oef/role/ShareholderReport"
],
"lang": {
"en-us": {
"role": {
"label": "Performance Inception Date"
}
}
},
"auth_ref": [
"r38"
]
},
"oef_PerfTableMarketIndexChngdTextBlock": {
"xbrltype": "textBlockItemType",
"nsuri": "http://xbrl.sec.gov/oef/2025",
"localname": "PerfTableMarketIndexChngdTextBlock",
"presentation": [
"http://xbrl.sec.gov/oef/role/ShareholderReport"
],
"lang": {
"en-us": {
"role": {
"label": "Performance Table Market Index Changed [Text Block]"
}
}
},
"auth_ref": [
"r45"
]
},
"oef_PerformancePastDoesNotIndicateFuture": {
"xbrltype": "stringItemType",
"nsuri": "http://xbrl.sec.gov/oef/2025",
"localname": "PerformancePastDoesNotIndicateFuture",
"presentation": [
"http://xbrl.sec.gov/oef/role/ShareholderReport"
],
"lang": {
"en-us": {
"role": {
"label": "Performance Past Does Not Indicate Future [Text]"
}
}
},
"auth_ref": [
"r40",
"r64"
]
},
"fvt_PreferredsMember": {
"xbrltype": "domainItemType",
"nsuri": "http://www.polencapital.com/20251120",
"localname": "PreferredsMember",
"presentation": [
"http://xbrl.sec.gov/oef/role/ShareholderReportHoldingsDetails"
],
"lang": {
"en-us": {
"role": {
"label": "Preferreds [Member]"
}
}
},
"auth_ref": []
},
"oef_PreviousInvestmentAdviserTextBlock": {
"xbrltype": "textBlockItemType",
"nsuri": "http://xbrl.sec.gov/oef/2025",
"localname": "PreviousInvestmentAdviserTextBlock",
"presentation": [
"http://xbrl.sec.gov/oef/role/ShareholderReport"
],
"lang": {
"en-us": {
"role": {
"label": "Previous Investment Adviser [Text Block]"
}
}
},
"auth_ref": [
"r41"
]
},
"oef_PriorMarketIndexComparisonTextBlock": {
"xbrltype": "textBlockItemType",
"nsuri": "http://xbrl.sec.gov/oef/2025",
"localname": "PriorMarketIndexComparisonTextBlock",
"presentation": [
"http://xbrl.sec.gov/oef/role/ShareholderReport"
],
"lang": {
"en-us": {
"role": {
"label": "Prior Market Index Comparison [Text Block]"
}
}
},
"auth_ref": [
"r45"
]
},
"oef_SalesLoadAxis": {
"xbrltype": "stringItemType",
"nsuri": "http://xbrl.sec.gov/oef/2025",
"localname": "SalesLoadAxis",
"presentation": [
"http://xbrl.sec.gov/oef/role/ShareholderReportAverageAnnualReturnDetails"
],
"lang": {
"en-us": {
"role": {
"label": "Sales Load [Axis]"
}
}
},
"auth_ref": [
"r44"
]
},
"dei_SecurityExchangeName": {
"xbrltype": "edgarExchangeCodeItemType",
"nsuri": "http://xbrl.sec.gov/dei/2025",
"localname": "SecurityExchangeName",
"presentation": [
"http://xbrl.sec.gov/oef/role/ShareholderReport"
],
"lang": {
"en-us": {
"role": {
"label": "Security Exchange Name",
"terseLabel": "Exchange",
"documentation": "Name of the Exchange on which a security is registered."
}
}
},
"auth_ref": [
"r23"
]
},
"oef_ShareClassDomain": {
"xbrltype": "domainItemType",
"nsuri": "http://xbrl.sec.gov/oef/2025",
"localname": "ShareClassDomain",
"presentation": [
"http://xbrl.sec.gov/oef/role/ShareholderReport",
"http://xbrl.sec.gov/oef/role/ShareholderReportAverageAnnualReturnDetails",
"http://xbrl.sec.gov/oef/role/ShareholderReportHoldingsDetails",
"http://xbrl.sec.gov/oef/role/ShareholderReportLineGraphDetails"
],
"lang": {
"en-us": {
"role": {
"label": "Share Classes"
}
}
},
"auth_ref": [
"r24"
]
},
"oef_ShareholderReportAbstract": {
"xbrltype": "stringItemType",
"nsuri": "http://xbrl.sec.gov/oef/2025",
"localname": "ShareholderReportAbstract",
"lang": {
"en-us": {
"role": {
"label": "Shareholder Report [Abstract]"
}
}
},
"auth_ref": [
"r44"
]
},
"oef_ShareholderReportAnnualOrSemiAnnual": {
"xbrltype": "shareholderReportTypeItemType",
"nsuri": "http://xbrl.sec.gov/oef/2025",
"localname": "ShareholderReportAnnualOrSemiAnnual",
"presentation": [
"http://xbrl.sec.gov/oef/role/ShareholderReport"
],
"lang": {
"en-us": {
"role": {
"label": "Shareholder Report Annual or Semi-Annual"
}
}
},
"auth_ref": [
"r26"
]
},
"oef_ShareholderReportLineItems": {
"xbrltype": "stringItemType",
"nsuri": "http://xbrl.sec.gov/oef/2025",
"localname": "ShareholderReportLineItems",
"presentation": [
"http://xbrl.sec.gov/oef/role/NcsrCover",
"http://xbrl.sec.gov/oef/role/ShareholderReport"
],
"lang": {
"en-us": {
"role": {
"label": "Shareholder Report [Line Items]"
}
}
},
"auth_ref": [
"r44"
]
},
"oef_ShareholderReportTable": {
"xbrltype": "stringItemType",
"nsuri": "http://xbrl.sec.gov/oef/2025",
"localname": "ShareholderReportTable",
"presentation": [
"http://xbrl.sec.gov/oef/role/NcsrCover",
"http://xbrl.sec.gov/oef/role/ShareholderReport"
],
"lang": {
"en-us": {
"role": {
"label": "Shareholder Report [Table]"
}
}
},
"auth_ref": [
"r44"
]
},
"oef_SummaryOfChngLegendTextBlock": {
"xbrltype": "textBlockItemType",
"nsuri": "http://xbrl.sec.gov/oef/2025",
"localname": "SummaryOfChngLegendTextBlock",
"presentation": [
"http://xbrl.sec.gov/oef/role/ShareholderReport"
],
"lang": {
"en-us": {
"role": {
"label": "Summary of Change Legend [Text Block]"
}
}
},
"auth_ref": [
"r60"
]
},
"dei_TradingSymbol": {
"xbrltype": "tradingSymbolItemType",
"nsuri": "http://xbrl.sec.gov/dei/2025",
"localname": "TradingSymbol",
"presentation": [
"http://xbrl.sec.gov/oef/role/ShareholderReport"
],
"lang": {
"en-us": {
"role": {
"label": "Trading Symbol",
"terseLabel": "Ticker",
"documentation": "Trading symbol of an instrument as listed on an exchange."
}
}
},
"auth_ref": []
},
"fvt_USTreasuryObligationsMember": {
"xbrltype": "domainItemType",
"nsuri": "http://www.polencapital.com/20251120",
"localname": "USTreasuryObligationsMember",
"presentation": [
"http://xbrl.sec.gov/oef/role/ShareholderReportHoldingsDetails"
],
"lang": {
"en-us": {
"role": {
"label": "U S Treasury Obligations [Member]"
}
}
},
"auth_ref": []
},
"oef_UpdPerfInfoLocationTextBlock": {
"xbrltype": "textBlockItemType",
"nsuri": "http://xbrl.sec.gov/oef/2025",
"localname": "UpdPerfInfoLocationTextBlock",
"presentation": [
"http://xbrl.sec.gov/oef/role/ShareholderReport"
],
"lang": {
"en-us": {
"role": {
"label": "Updated Performance Information Location [Text Block]"
}
}
},
"auth_ref": [
"r43"
]
},
"oef_UpdProspectusEmailAddress": {
"xbrltype": "stringItemType",
"nsuri": "http://xbrl.sec.gov/oef/2025",
"localname": "UpdProspectusEmailAddress",
"presentation": [
"http://xbrl.sec.gov/oef/role/ShareholderReport"
],
"lang": {
"en-us": {
"role": {
"label": "Updated Prospectus Email Address"
}
}
},
"auth_ref": [
"r60"
]
},
"oef_UpdProspectusPhoneNumber": {
"xbrltype": "stringItemType",
"nsuri": "http://xbrl.sec.gov/oef/2025",
"localname": "UpdProspectusPhoneNumber",
"presentation": [
"http://xbrl.sec.gov/oef/role/ShareholderReport"
],
"lang": {
"en-us": {
"role": {
"label": "Updated Prospectus Phone Number"
}
}
},
"auth_ref": [
"r60"
]
},
"oef_UpdProspectusWebAddress": {
"xbrltype": "stringItemType",
"nsuri": "http://xbrl.sec.gov/oef/2025",
"localname": "UpdProspectusWebAddress",
"presentation": [
"http://xbrl.sec.gov/oef/role/ShareholderReport"
],
"lang": {
"en-us": {
"role": {
"label": "Updated Prospectus Web Address"
}
}
},
"auth_ref": [
"r60"
]
},
"oef_WithSalesLoadMember": {
"xbrltype": "domainItemType",
"nsuri": "http://xbrl.sec.gov/oef/2025",
"localname": "WithSalesLoadMember",
"presentation": [
"http://xbrl.sec.gov/oef/role/ShareholderReportAverageAnnualReturnDetails"
],
"lang": {
"en-us": {
"role": {
"label": "With Sales Load [Member]"
}
}
},
"auth_ref": [
"r44"
]
},
"oef_WithoutSalesLoadMember": {
"xbrltype": "domainItemType",
"nsuri": "http://xbrl.sec.gov/oef/2025",
"localname": "WithoutSalesLoadMember",
"presentation": [
"http://xbrl.sec.gov/oef/role/ShareholderReportAverageAnnualReturnDetails"
],
"lang": {
"en-us": {
"role": {
"label": "Without Sales Load [Member]"
}
}
},
"auth_ref": [
"r44"
]
}
}
}
},
"std_ref": {
"r0": {
"role": "http://fasb.org/us-gaap/role/ref/legacyRef",
"Name": "Accounting Standards Codification",
"Section": "50",
"Paragraph": "1",
"SubTopic": "30",
"Topic": "205",
"Publisher": "FASB",
"URI": "https://asc.fasb.org/1943274/2147479910/205-30-50-1"
},
"r1": {
"role": "http://www.xbrl.org/2003/role/disclosureRef",
"Topic": "946",
"SubTopic": "210",
"Name": "Accounting Standards Codification",
"Section": "50",
"Paragraph": "1",
"Subparagraph": "(b)(1)",
"Publisher": "FASB",
"URI": "https://asc.fasb.org/1943274/2147478795/946-210-50-1"
},
"r2": {
"role": "http://www.xbrl.org/2003/role/disclosureRef",
"Topic": "946",
"SubTopic": "210",
"Name": "Accounting Standards Codification",
"Section": "50",
"Paragraph": "1",
"Subparagraph": "(c)(1)",
"Publisher": "FASB",
"URI": "https://asc.fasb.org/1943274/2147478795/946-210-50-1"
},
"r3": {
"role": "http://www.xbrl.org/2003/role/disclosureRef",
"Topic": "946",
"SubTopic": "210",
"Name": "Accounting Standards Codification",
"Section": "50",
"Paragraph": "1",
"Subparagraph": "(c)(2)",
"Publisher": "FASB",
"URI": "https://asc.fasb.org/1943274/2147478795/946-210-50-1"
},
"r4": {
"role": "http://www.xbrl.org/2003/role/disclosureRef",
"Topic": "946",
"SubTopic": "210",
"Name": "Accounting Standards Codification",
"Section": "50",
"Paragraph": "6",
"Subparagraph": "(a)(1)",
"Publisher": "FASB",
"URI": "https://asc.fasb.org/1943274/2147478795/946-210-50-6"
},
"r5": {
"role": "http://www.xbrl.org/2003/role/disclosureRef",
"Topic": "946",
"SubTopic": "210",
"Name": "Accounting Standards Codification",
"Section": "50",
"Paragraph": "6",
"Subparagraph": "(c)",
"Publisher": "FASB",
"URI": "https://asc.fasb.org/1943274/2147478795/946-210-50-6"
},
"r6": {
"role": "http://www.xbrl.org/2003/role/disclosureRef",
"Topic": "946",
"SubTopic": "320",
"Name": "Accounting Standards Codification",
"Section": "S99",
"Paragraph": "1",
"Subparagraph": "(SX 210.12-12(Column A)(Footnote 1))",
"Publisher": "FASB",
"URI": "https://asc.fasb.org/1943274/2147477271/946-320-S99-1"
},
"r7": {
"role": "http://www.xbrl.org/2003/role/disclosureRef",
"Topic": "946",
"SubTopic": "320",
"Name": "Accounting Standards Codification",
"Section": "S99",
"Paragraph": "1",
"Subparagraph": "(SX 210.12-12(Column C)(Footnote 5))",
"Publisher": "FASB",
"URI": "https://asc.fasb.org/1943274/2147477271/946-320-S99-1"
},
"r8": {
"role": "http://www.xbrl.org/2003/role/disclosureRef",
"Topic": "946",
"SubTopic": "320",
"Name": "Accounting Standards Codification",
"Section": "S99",
"Paragraph": "2",
"Subparagraph": "(SX 210.12-12A(Column C)(Footnote 4))",
"Publisher": "FASB",
"URI": "https://asc.fasb.org/1943274/2147477271/946-320-S99-2"
},
"r9": {
"role": "http://www.xbrl.org/2003/role/disclosureRef",
"Topic": "946",
"SubTopic": "320",
"Name": "Accounting Standards Codification",
"Section": "S99",
"Paragraph": "3",
"Subparagraph": "(SX 210.12-12B(Column A)(Footnote 7))",
"Publisher": "FASB",
"URI": "https://asc.fasb.org/1943274/2147477271/946-320-S99-3"
},
"r10": {
"role": "http://www.xbrl.org/2003/role/disclosureRef",
"Topic": "946",
"SubTopic": "320",
"Name": "Accounting Standards Codification",
"Section": "S99",
"Paragraph": "3",
"Subparagraph": "(SX 210.12-12B(Column C)(Footnote 2))",
"Publisher": "FASB",
"URI": "https://asc.fasb.org/1943274/2147477271/946-320-S99-3"
},
"r11": {
"role": "http://www.xbrl.org/2003/role/disclosureRef",
"Topic": "946",
"SubTopic": "320",
"Name": "Accounting Standards Codification",
"Section": "S99",
"Paragraph": "5D",
"Subparagraph": "(SX 210.12-13D(Column A)(Footnote 2)(i))",
"Publisher": "FASB",
"URI": "https://asc.fasb.org/1943274/2147477271/946-320-S99-5D"
},
"r12": {
"role": "http://www.xbrl.org/2003/role/disclosureRef",
"Topic": "946",
"SubTopic": "320",
"Name": "Accounting Standards Codification",
"Section": "S99",
"Paragraph": "6",
"Subparagraph": "(SX 210.12-14(Column F)(Footnote 7))",
"Publisher": "FASB",
"URI": "https://asc.fasb.org/1943274/2147477271/946-320-S99-6"
},
"r13": {
"role": "http://www.xbrl.org/2003/role/disclosureRef",
"Topic": "946",
"SubTopic": "320",
"Name": "Accounting Standards Codification",
"Section": "S99",
"Paragraph": "7",
"Subparagraph": "(SX 210.12-15(Column A))",
"Publisher": "FASB",
"URI": "https://asc.fasb.org/1943274/2147477271/946-320-S99-7"
},
"r14": {
"role": "http://www.xbrl.org/2003/role/disclosureRef",
"Topic": "946",
"SubTopic": "320",
"Name": "Accounting Standards Codification",
"Section": "S99",
"Paragraph": "7",
"Subparagraph": "(SX 210.12-15(Column B))",
"Publisher": "FASB",
"URI": "https://asc.fasb.org/1943274/2147477271/946-320-S99-7"
},
"r15": {
"role": "http://www.xbrl.org/2003/role/disclosureRef",
"Topic": "946",
"SubTopic": "320",
"Name": "Accounting Standards Codification",
"Section": "S99",
"Paragraph": "7",
"Subparagraph": "(SX 210.12-15(Column C))",
"Publisher": "FASB",
"URI": "https://asc.fasb.org/1943274/2147477271/946-320-S99-7"
},
"r16": {
"role": "http://www.xbrl.org/2003/role/disclosureRef",
"Topic": "946",
"SubTopic": "320",
"Name": "Accounting Standards Codification",
"Section": "S99",
"Paragraph": "7",
"Subparagraph": "(SX 210.12-15(Column D))",
"Publisher": "FASB",
"URI": "https://asc.fasb.org/1943274/2147477271/946-320-S99-7"
},
"r17": {
"role": "http://www.xbrl.org/2003/role/exampleRef",
"Topic": "326",
"SubTopic": "20",
"Name": "Accounting Standards Codification",
"Section": "55",
"Paragraph": "15",
"Subparagraph": "(b)",
"Publisher": "FASB",
"URI": "https://asc.fasb.org/1943274/2147479294/326-20-55-15"
},
"r18": {
"role": "http://www.xbrl.org/2003/role/exampleRef",
"Topic": "715",
"SubTopic": "20",
"Name": "Accounting Standards Codification",
"Section": "50",
"Paragraph": "1",
"Subparagraph": "(d)(ii)",
"Publisher": "FASB",
"URI": "https://asc.fasb.org/1943274/2147480506/715-20-50-1"
},
"r19": {
"role": "http://www.xbrl.org/2003/role/exampleRef",
"Topic": "715",
"SubTopic": "20",
"Name": "Accounting Standards Codification",
"Section": "50",
"Paragraph": "5",
"Subparagraph": "(c)(ii)",
"Publisher": "FASB",
"URI": "https://asc.fasb.org/1943274/2147480506/715-20-50-5"
},
"r20": {
"role": "http://www.xbrl.org/2003/role/exampleRef",
"Topic": "860",
"SubTopic": "30",
"Name": "Accounting Standards Codification",
"Section": "55",
"Paragraph": "4",
"Publisher": "FASB",
"URI": "https://asc.fasb.org/1943274/2147481395/860-30-55-4"
},
"r21": {
"role": "http://www.xbrl.org/2003/role/exampleRef",
"Topic": "946",
"SubTopic": "210",
"Name": "Accounting Standards Codification",
"Section": "55",
"Paragraph": "1",
"Publisher": "FASB",
"URI": "https://asc.fasb.org/1943274/2147477439/946-210-55-1"
},
"r22": {
"role": "http://www.xbrl.org/2003/role/presentationRef",
"Publisher": "SEC",
"Name": "Exchange Act",
"Number": "240",
"Section": "12",
"Subsection": "b-2"
},
"r23": {
"role": "http://www.xbrl.org/2003/role/presentationRef",
"Publisher": "SEC",
"Name": "Exchange Act",
"Number": "240",
"Section": "12",
"Subsection": "d1-1"
},
"r24": {
"role": "http://www.xbrl.org/2003/role/presentationRef",
"Publisher": "SEC",
"Name": "Form N-1A",
"Section": "1",
"Subsection": "a",
"Paragraph": "1"
},
"r25": {
"role": "http://www.xbrl.org/2003/role/presentationRef",
"Publisher": "SEC",
"Name": "Form N-1A",
"Section": "27A",
"Subsection": "b",
"Paragraph": "1"
},
"r26": {
"role": "http://www.xbrl.org/2003/role/presentationRef",
"Publisher": "SEC",
"Name": "Form N-1A",
"Section": "27A",
"Subsection": "b",
"Paragraph": "3"
},
"r27": {
"role": "http://www.xbrl.org/2003/role/presentationRef",
"Publisher": "SEC",
"Name": "Form N-1A",
"Section": "27A",
"Subsection": "b",
"Paragraph": "4"
},
"r28": {
"role": "http://www.xbrl.org/2003/role/presentationRef",
"Publisher": "SEC",
"Name": "Form N-1A",
"Section": "27A",
"Subsection": "b",
"Paragraph": "5"
},
"r29": {
"role": "http://www.xbrl.org/2003/role/presentationRef",
"Publisher": "SEC",
"Name": "Form N-1A",
"Section": "27A",
"Subsection": "b",
"Paragraph": "instruction",
"Subparagraph": "2"
},
"r30": {
"role": "http://www.xbrl.org/2003/role/presentationRef",
"Publisher": "SEC",
"Name": "Form N-1A",
"Section": "27A",
"Subsection": "c"
},
"r31": {
"role": "http://www.xbrl.org/2003/role/presentationRef",
"Publisher": "SEC",
"Name": "Form N-1A",
"Section": "27A",
"Subsection": "c",
"Paragraph": "ii"
},
"r32": {
"role": "http://www.xbrl.org/2003/role/presentationRef",
"Publisher": "SEC",
"Name": "Form N-1A",
"Section": "27A",
"Subsection": "c",
"Paragraph": "iii"
},
"r33": {
"role": "http://www.xbrl.org/2003/role/presentationRef",
"Publisher": "SEC",
"Name": "Form N-1A",
"Section": "27A",
"Subsection": "c",
"Paragraph": "instruction",
"Sentence": "1",
"Clause": "b"
},
"r34": {
"role": "http://www.xbrl.org/2003/role/presentationRef",
"Publisher": "SEC",
"Name": "Form N-1A",
"Section": "27A",
"Subsection": "c",
"Paragraph": "instruction",
"Subparagraph": "1",
"Clause": "c"
},
"r35": {
"role": "http://www.xbrl.org/2003/role/presentationRef",
"Publisher": "SEC",
"Name": "Form N-1A",
"Section": "27A",
"Subsection": "c",
"Paragraph": "instruction",
"Subparagraph": "1",
"Clause": "d"
},
"r36": {
"role": "http://www.xbrl.org/2003/role/presentationRef",
"Publisher": "SEC",
"Name": "Form N-1A",
"Section": "27A",
"Subsection": "d",
"Paragraph": "1"
},
"r37": {
"role": "http://www.xbrl.org/2003/role/presentationRef",
"Publisher": "SEC",
"Name": "Form N-1A",
"Section": "27A",
"Subsection": "d",
"Paragraph": "2"
},
"r38": {
"role": "http://www.xbrl.org/2003/role/presentationRef",
"Publisher": "SEC",
"Name": "Form N-1A",
"Section": "27A",
"Subsection": "d",
"Paragraph": "2",
"Subparagraph": "i"
},
"r39": {
"role": "http://www.xbrl.org/2003/role/presentationRef",
"Publisher": "SEC",
"Name": "Form N-1A",
"Section": "27A",
"Subsection": "d",
"Paragraph": "2",
"Subparagraph": "iii",
"Clause": "B"
},
"r40": {
"role": "http://www.xbrl.org/2003/role/presentationRef",
"Publisher": "SEC",
"Name": "Form N-1A",
"Section": "27A",
"Subsection": "d",
"Paragraph": "2",
"Subparagraph": "iiii",
"Clause": "A"
},
"r41": {
"role": "http://www.xbrl.org/2003/role/presentationRef",
"Publisher": "SEC",
"Name": "Form N-1A",
"Section": "27A",
"Subsection": "d",
"Paragraph": "2",
"Subparagraph": "instruction",
"Clause": "12"
},
"r42": {
"role": "http://www.xbrl.org/2003/role/presentationRef",
"Publisher": "SEC",
"Name": "Form N-1A",
"Section": "27A",
"Subsection": "d",
"Paragraph": "2",
"Subparagraph": "instruction",
"Clause": "14"
},
"r43": {
"role": "http://www.xbrl.org/2003/role/presentationRef",
"Publisher": "SEC",
"Name": "Form N-1A",
"Section": "27A",
"Subsection": "d",
"Paragraph": "2",
"Subparagraph": "instruction",
"Clause": "15"
},
"r44": {
"role": "http://www.xbrl.org/2003/role/presentationRef",
"Publisher": "SEC",
"Name": "Form N-1A",
"Section": "27A",
"Subsection": "d",
"Paragraph": "2",
"Subparagraph": "instruction",
"Clause": "7"
},
"r45": {
"role": "http://www.xbrl.org/2003/role/presentationRef",
"Publisher": "SEC",
"Name": "Form N-1A",
"Section": "27A",
"Subsection": "d",
"Paragraph": "2",
"Subparagraph": "instruction",
"Clause": "8"
},
"r46": {
"role": "http://www.xbrl.org/2003/role/presentationRef",
"Publisher": "SEC",
"Name": "Form N-1A",
"Section": "27A",
"Subsection": "d",
"Paragraph": "3"
},
"r47": {
"role": "http://www.xbrl.org/2003/role/presentationRef",
"Publisher": "SEC",
"Name": "Form N-1A",
"Section": "27A",
"Subsection": "d",
"Paragraph": "4"
},
"r48": {
"role": "http://www.xbrl.org/2003/role/presentationRef",
"Publisher": "SEC",
"Name": "Form N-1A",
"Section": "27A",
"Subsection": "d",
"Paragraph": "4",
"Subparagraph": "instruction",
"Clause": "3"
},
"r49": {
"role": "http://www.xbrl.org/2003/role/presentationRef",
"Publisher": "SEC",
"Name": "Form N-1A",
"Section": "27A",
"Subsection": "d",
"Paragraph": "4",
"Subparagraph": "instruction",
"Clause": "4"
},
"r50": {
"role": "http://www.xbrl.org/2003/role/presentationRef",
"Publisher": "SEC",
"Name": "Form N-1A",
"Section": "27A",
"Subsection": "e"
},
"r51": {
"role": "http://www.xbrl.org/2003/role/presentationRef",
"Publisher": "SEC",
"Name": "Form N-1A",
"Section": "27A",
"Subsection": "e",
"Paragraph": "instruction",
"Subparagraph": "6"
},
"r52": {
"role": "http://www.xbrl.org/2003/role/presentationRef",
"Publisher": "SEC",
"Name": "Form N-1A",
"Section": "27A",
"Subsection": "f"
},
"r53": {
"role": "http://www.xbrl.org/2003/role/presentationRef",
"Publisher": "SEC",
"Name": "Form N-1A",
"Section": "27A",
"Subsection": "g"
},
"r54": {
"role": "http://www.xbrl.org/2003/role/presentationRef",
"Publisher": "SEC",
"Name": "Form N-1A",
"Section": "27A",
"Subsection": "g",
"Paragraph": "1"
},
"r55": {
"role": "http://www.xbrl.org/2003/role/presentationRef",
"Publisher": "SEC",
"Name": "Form N-1A",
"Section": "27A",
"Subsection": "g",
"Paragraph": "2"
},
"r56": {
"role": "http://www.xbrl.org/2003/role/presentationRef",
"Publisher": "SEC",
"Name": "Form N-1A",
"Section": "27A",
"Subsection": "g",
"Paragraph": "3"
},
"r57": {
"role": "http://www.xbrl.org/2003/role/presentationRef",
"Publisher": "SEC",
"Name": "Form N-1A",
"Section": "27A",
"Subsection": "g",
"Paragraph": "4"
},
"r58": {
"role": "http://www.xbrl.org/2003/role/presentationRef",
"Publisher": "SEC",
"Name": "Form N-1A",
"Section": "27A",
"Subsection": "g",
"Paragraph": "5"
},
"r59": {
"role": "http://www.xbrl.org/2003/role/presentationRef",
"Publisher": "SEC",
"Name": "Form N-1A",
"Section": "27A",
"Subsection": "g",
"Paragraph": "6"
},
"r60": {
"role": "http://www.xbrl.org/2003/role/presentationRef",
"Publisher": "SEC",
"Name": "Form N-1A",
"Section": "27A",
"Subsection": "g",
"Paragraph": "instruction",
"Subparagraph": "2"
},
"r61": {
"role": "http://www.xbrl.org/2003/role/presentationRef",
"Publisher": "SEC",
"Name": "Form N-1A",
"Section": "27A",
"Subsection": "h",
"Paragraph": "1"
},
"r62": {
"role": "http://www.xbrl.org/2003/role/presentationRef",
"Publisher": "SEC",
"Name": "Form N-1A",
"Section": "27A",
"Subsection": "h",
"Paragraph": "2"
},
"r63": {
"role": "http://www.xbrl.org/2003/role/presentationRef",
"Publisher": "SEC",
"Name": "Form N-1A",
"Section": "3",
"Subsection": "instruction",
"Paragraph": "1",
"Subparagraph": "d",
"Sentence": "i"
},
"r64": {
"role": "http://www.xbrl.org/2003/role/presentationRef",
"Publisher": "SEC",
"Name": "Form N-1A",
"Section": "4",
"Subsection": "b",
"Paragraph": "2",
"Subparagraph": "i"
},
"r65": {
"role": "http://www.xbrl.org/2003/role/presentationRef",
"Publisher": "SEC",
"Name": "Form N-1A",
"Section": "4",
"Subsection": "b",
"Paragraph": "2",
"Subparagraph": "iii"
},
"r66": {
"role": "http://www.xbrl.org/2003/role/presentationRef",
"Publisher": "SEC",
"Name": "Regulation S-T",
"Number": "232",
"Section": "313"
},
"r67": {
"role": "http://www.xbrl.org/2009/role/commonPracticeRef",
"Topic": "320",
"SubTopic": "10",
"Name": "Accounting Standards Codification",
"Section": "50",
"Paragraph": "3",
"Publisher": "FASB",
"URI": "https://asc.fasb.org/1943274/2147481800/320-10-50-3"
},
"r68": {
"role": "http://www.xbrl.org/2009/role/commonPracticeRef",
"Topic": "320",
"SubTopic": "10",
"Name": "Accounting Standards Codification",
"Section": "50",
"Paragraph": "5",
"Subparagraph": "(f)",
"Publisher": "FASB",
"URI": "https://asc.fasb.org/1943274/2147481800/320-10-50-5"
},
"r69": {
"role": "http://www.xbrl.org/2009/role/commonPracticeRef",
"Topic": "320",
"SubTopic": "10",
"Name": "Accounting Standards Codification",
"Section": "50",
"Paragraph": "5B",
"Publisher": "FASB",
"URI": "https://asc.fasb.org/1943274/2147481800/320-10-50-5B"
},
"r70": {
"role": "http://www.xbrl.org/2009/role/commonPracticeRef",
"Topic": "326",
"SubTopic": "20",
"Name": "Accounting Standards Codification",
"Section": "50",
"Paragraph": "5",
"Subparagraph": "(b)",
"Publisher": "FASB",
"URI": "https://asc.fasb.org/1943274/2147479319/326-20-50-5"
},
"r71": {
"role": "http://www.xbrl.org/2009/role/commonPracticeRef",
"Topic": "946",
"SubTopic": "205",
"Name": "Accounting Standards Codification",
"Section": "50",
"Paragraph": "27",
"Publisher": "FASB",
"URI": "https://asc.fasb.org/1943274/2147478494/946-205-50-27"
}
}
}