| | | | | | | | | | | | | | | | | |
| | | Date | | Strategic Contribution |
| | | | |
| | | | | |
| Wine and Spirits segment | | | | |
| | | | | |
| | | | | |
| Lodi Distribution Center2022 Wine Divestiture | | DecemberOctober
20212022 | | AcquisitionDivestiture of a previously leased distribution facility located in Lodi, California; consistent with our strategic focus to invest in infrastructure that enables our business to growcertain of our mainstream and premium wine brands and related inventory; supported our focus on consumer-led premiumization trends. |
| My Favorite NeighborAustin Cocktails | | NovemberApril
20212022 | | Acquisition of super-luxury, DTC-focused wine business as well as certain wholesale sourced brandsa portfolio of small batch, RTD cocktails; supported our focus on meeting the evolving needs of consumers. |
| Lingua Franca | | March
2022 | | Acquisition of a collection of Oregon-based luxury wines, a vineyard, and a production facility; supported our focus on consumer-led premiumization trends and meeting the evolving needs of our consumers. |
|
| | | | | |
For further information about our significant Fiscal 20222023, Fiscal 20212022, and Fiscal 20202021 transactions, refer to (i) “Overview” within MD&A and (ii) NotesNote 2 and 5.
| | | | | |
Constellation Brands, Inc. FY 2023 Form 10-K
| #WORTHREACHINGFOR I 2 |
| | | | | | | | |
| PART I | ITEM 1. BUSINESS | Table of Contents |
Business segments
We have four reportable segments: (i) Beer, (ii) Wine and Spirits, (iii) Corporate Operations and Other, and (iv) Canopy. The business segments reflect how our operations are managed, how resources are allocated, how operating performance is evaluated by senior management, and the structure of our internal financial reporting. Our ownership interest in Canopy allows us to exercise significant influence, but not control, and, therefore, we account for our investment in Canopy under the equity method. Amounts included below for the Canopy segment represent 100% of Canopy’s reported results on a two-month lag, prepared in accordance with U.S. GAAP, and converted from Canadian dollars to U.S. dollars. Although we own less than 100% of the outstanding shares of Canopy, 100% of its results are included in the information below and subsequently eliminated to reconcile to our consolidated financial statements.
| | | | | |
| Constellation Brands, Inc. FY 2022 Form 10-K | #WORTHREACHINGFOR I 2 |
If the Canopy Transaction is completed, including conversion of our Canopy common shares into Exchangeable Shares, we expect our internal management financial reporting to consist of two business divisions: (i) Beer and (ii) Wine and Spirits and we will report our operating results in three segments: (i) Beer, (ii) Wine and Spirits, and (iii) Corporate Operations and Other.
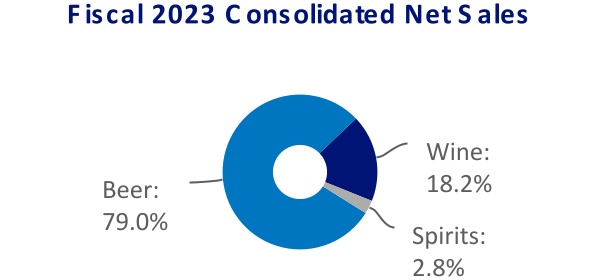
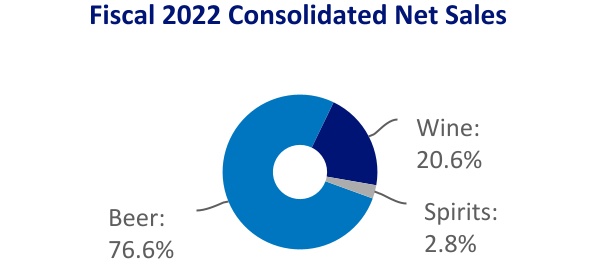
We report net sales in two reportable segments, as Canopy is eliminated in consolidation, as follows:
| | | | | | | | | | | | | | | | | | | |
| For the Years Ended | | | | | | |
| February 28,
20222023 | | | | February 28,
20212022 | | | | | | |
| (in millions) | | | | | | | | | | | |
| Beer | $ | 67,751465.60 | | | | | $ | 6,074751.6 | | | | | | | |
| Wine and Spirits: | | | | | | | | | | | |
| Wine | 1,819722.37 | | | | | 21,208819.43 | | | | | | | |
| Spirits | 249264.89 | | | | | 331249.98 | | | | | | | |
| Total Wine and Spirits | 21,069987.16 | | | | | 2,540069.31 | | | | | | | |
| Canopy | 444339.3 | | | | | 378444.63 | | | | | | | |
| Consolidation and Eliminations | (444339.3) | | | | | (378444.63) | | | | | | | |
| Consolidated Net Sales | $ | 89,820452.76 | | | | | $ | 8,614820.97 | | | | | | | |
Beer segment
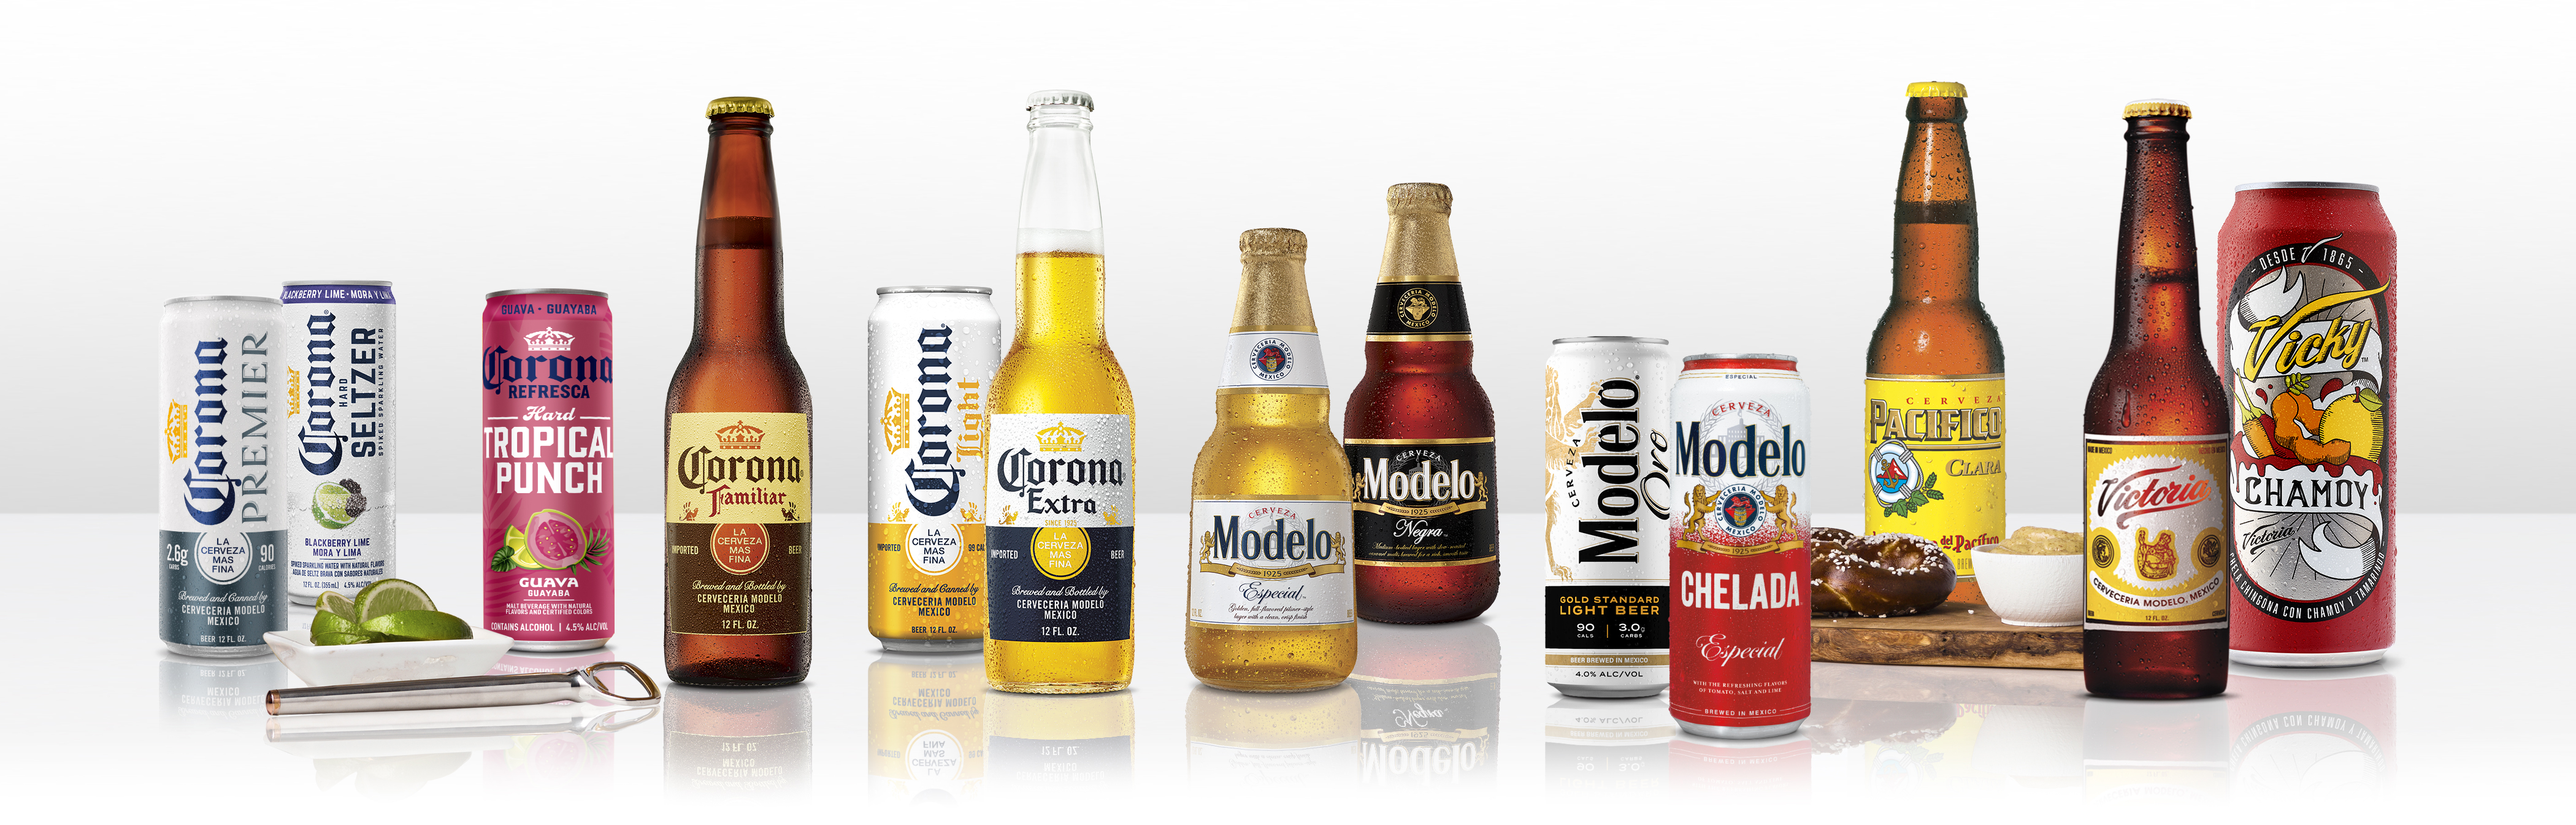
We are the #1 brewer and seller of imported beer in the U.S. market. We are also the leader in the high-end segment of the U.S. beer market, which includes the imported, craft, and ABA categories. We have the exclusive right to import, market, and sell the following Mexican brands in all 50 states of the U.S.:
| | | | | | | | | | | | | | | | | | | | | | | |
| Corona Brand Family | | Modelo Brand Family | | Other Import BrandsVictoria Brand Family | | Other Import Brand |
Corona Extra | Corona Light | | Modelo Especial | | Victoria | | Pacifico |
Corona Premier | Corona Refresca | | Modelo Negra | | Victoria Vicky Chamoy | | |
Corona Familiar | Corona Hard Seltzer | | Modelo Chelada | | |
| | | | | | | | | |
| | | | | |
Constellation Brands, Inc. FY 2023 Form 10-K | #WORTHREACHINGFOR I 3 |
| | | | | | | | |
| PART I | ITEM 1. BUSINESS | Table of Contents |
WeNotable achievements in the U.S. include the following: (i) we have nine of the 15 top-selling imported beer brands in the U.S. , (ii) Modelo Especial is the best-selling imported beer, and second best-selling beer overall, and the fastest-growing major imported beer brand in the U.S. (iii) Corona Extra is the second largest imported beer and fifthfourth best-selling beer overall in the U.S, and (iv) Pacifico is the fastest growing major beer brand.
In the past nine10 years we have increased our production capacity in Mexico by fourfold allowing us the opportunity to further expand our leadership position in the high-end segment of the U.S. beer market. Since the 2013 acquisition of the imported beer business, we have invested overapproximately $56.64 billion in the Mexico Beer Projects, with approximatelyover $800750 million spent during Fiscal 20222023. In earlyDuring Fiscal 2022, we completed part of a planned expansion project at the Obregon Brewery. This project increased our total production capacity to2023, our brewery optimization and productivity initiatives unlocked incremental capacity from our existing footprint, increasing total capacity from approximately 39 million hectoliters, which contributed to satisfying our medium-term capacity needs. We expect to spend an
| | | | | |
| Constellation Brands, Inc. FY 2022 Form 10-K | #WORTHREACHINGFOR I 3 |
additional $5approximately 42 million hectoliters. We expect to spend an additional $4.0 billion to $54.5 billion over Fiscal 20232024 through Fiscal 2026, with the majority of spend expected to occur in the first three fiscal years of that timeframe. Expansion, optimization, and/or construction activities continue underat our breweries in Mexico Beer Projects to support expected future business needs. For further information about our Mexico Beer Projects, refer to (i) “Production” below, (ii) MD&A, and (iii) Note 7.
We are also building on the success of our leading import brand families through our innovation strategy. Our Modelo Chelada brands have become an important growth contributor to our portfolio as the leading chelada in the U.S. beer market. WeIn Fiscal 2023, we continued to build on this successful innovation platform inwith Fiscal 2022the launch withof a new entrant,(i) multipack of Modelo Chelada Piña Picante, which was launched Limón y Sal, (ii) Modelo Chelada variety pack, (iii) new Modelo Chelada flavor, Naranja Picosa, and (iv) Vicky Chamoy, Victoria’s first line extension. Additionally, we announced the following two brand extensions that launched nationally in August 2021 and is already a top share gainer among imported brands. Toearly Fiscal 2024: (i) Modelo Oro, a light and low-calorie Mexican beer, to capitalize on the robust growth of the high-end ABAbeer category, we launched and (ii) Corona Refresca in Fiscal 2020 and Corona Hard Seltzer in Fiscal 2021. In Fiscal 2022, we expanded Corona Hard Seltzer into new flavors and restaged our variety packs with consumer-preferred thematic offerings and enhanced flavor profiles. Additionally, we are continuing efforts focused on increasing distribution of products in can, draft, single-serve,Non-Alcoholic, to adhere to consumer trends in the rapidly growing betterment space focused on no- and larger package size formats.
In December 2021, we entered into a brand authorization agreement with Coca-Cola in the U.S. to extend its FRESCA® brand into the beverage alcohol category for the anticipated launch of RTD vodka spritz and tequila paloma cocktails in Fiscal 2023. We intend to include the net sales and operating results of these products in our Beer segment.
 low-alcohol products.
Wine and Spirits segment
We are a leading, higher-end wine and spirits company in the U.S. market, with a portfolio that includes higher-margin, higher-growth wine and spirits brands. Our wine portfolio is supported by grapes purchased from independent growers, primarily in the U.S. and New Zealand, and vineyard holdings in the U.S., New Zealand, and Italy. Our wine and spirits are primarily marketed in the U.S. and exported toalso sold in Canada and other major world markets.
In the U.S., we have nine, New Zealand, and other major world markets.
| | | | | |
Constellation Brands, Inc. FY 2023 Form 10-K | #WORTHREACHINGFOR I 4 |
| | | | | | | | |
| PART I | ITEM 1. BUSINESS | Table of Contents |
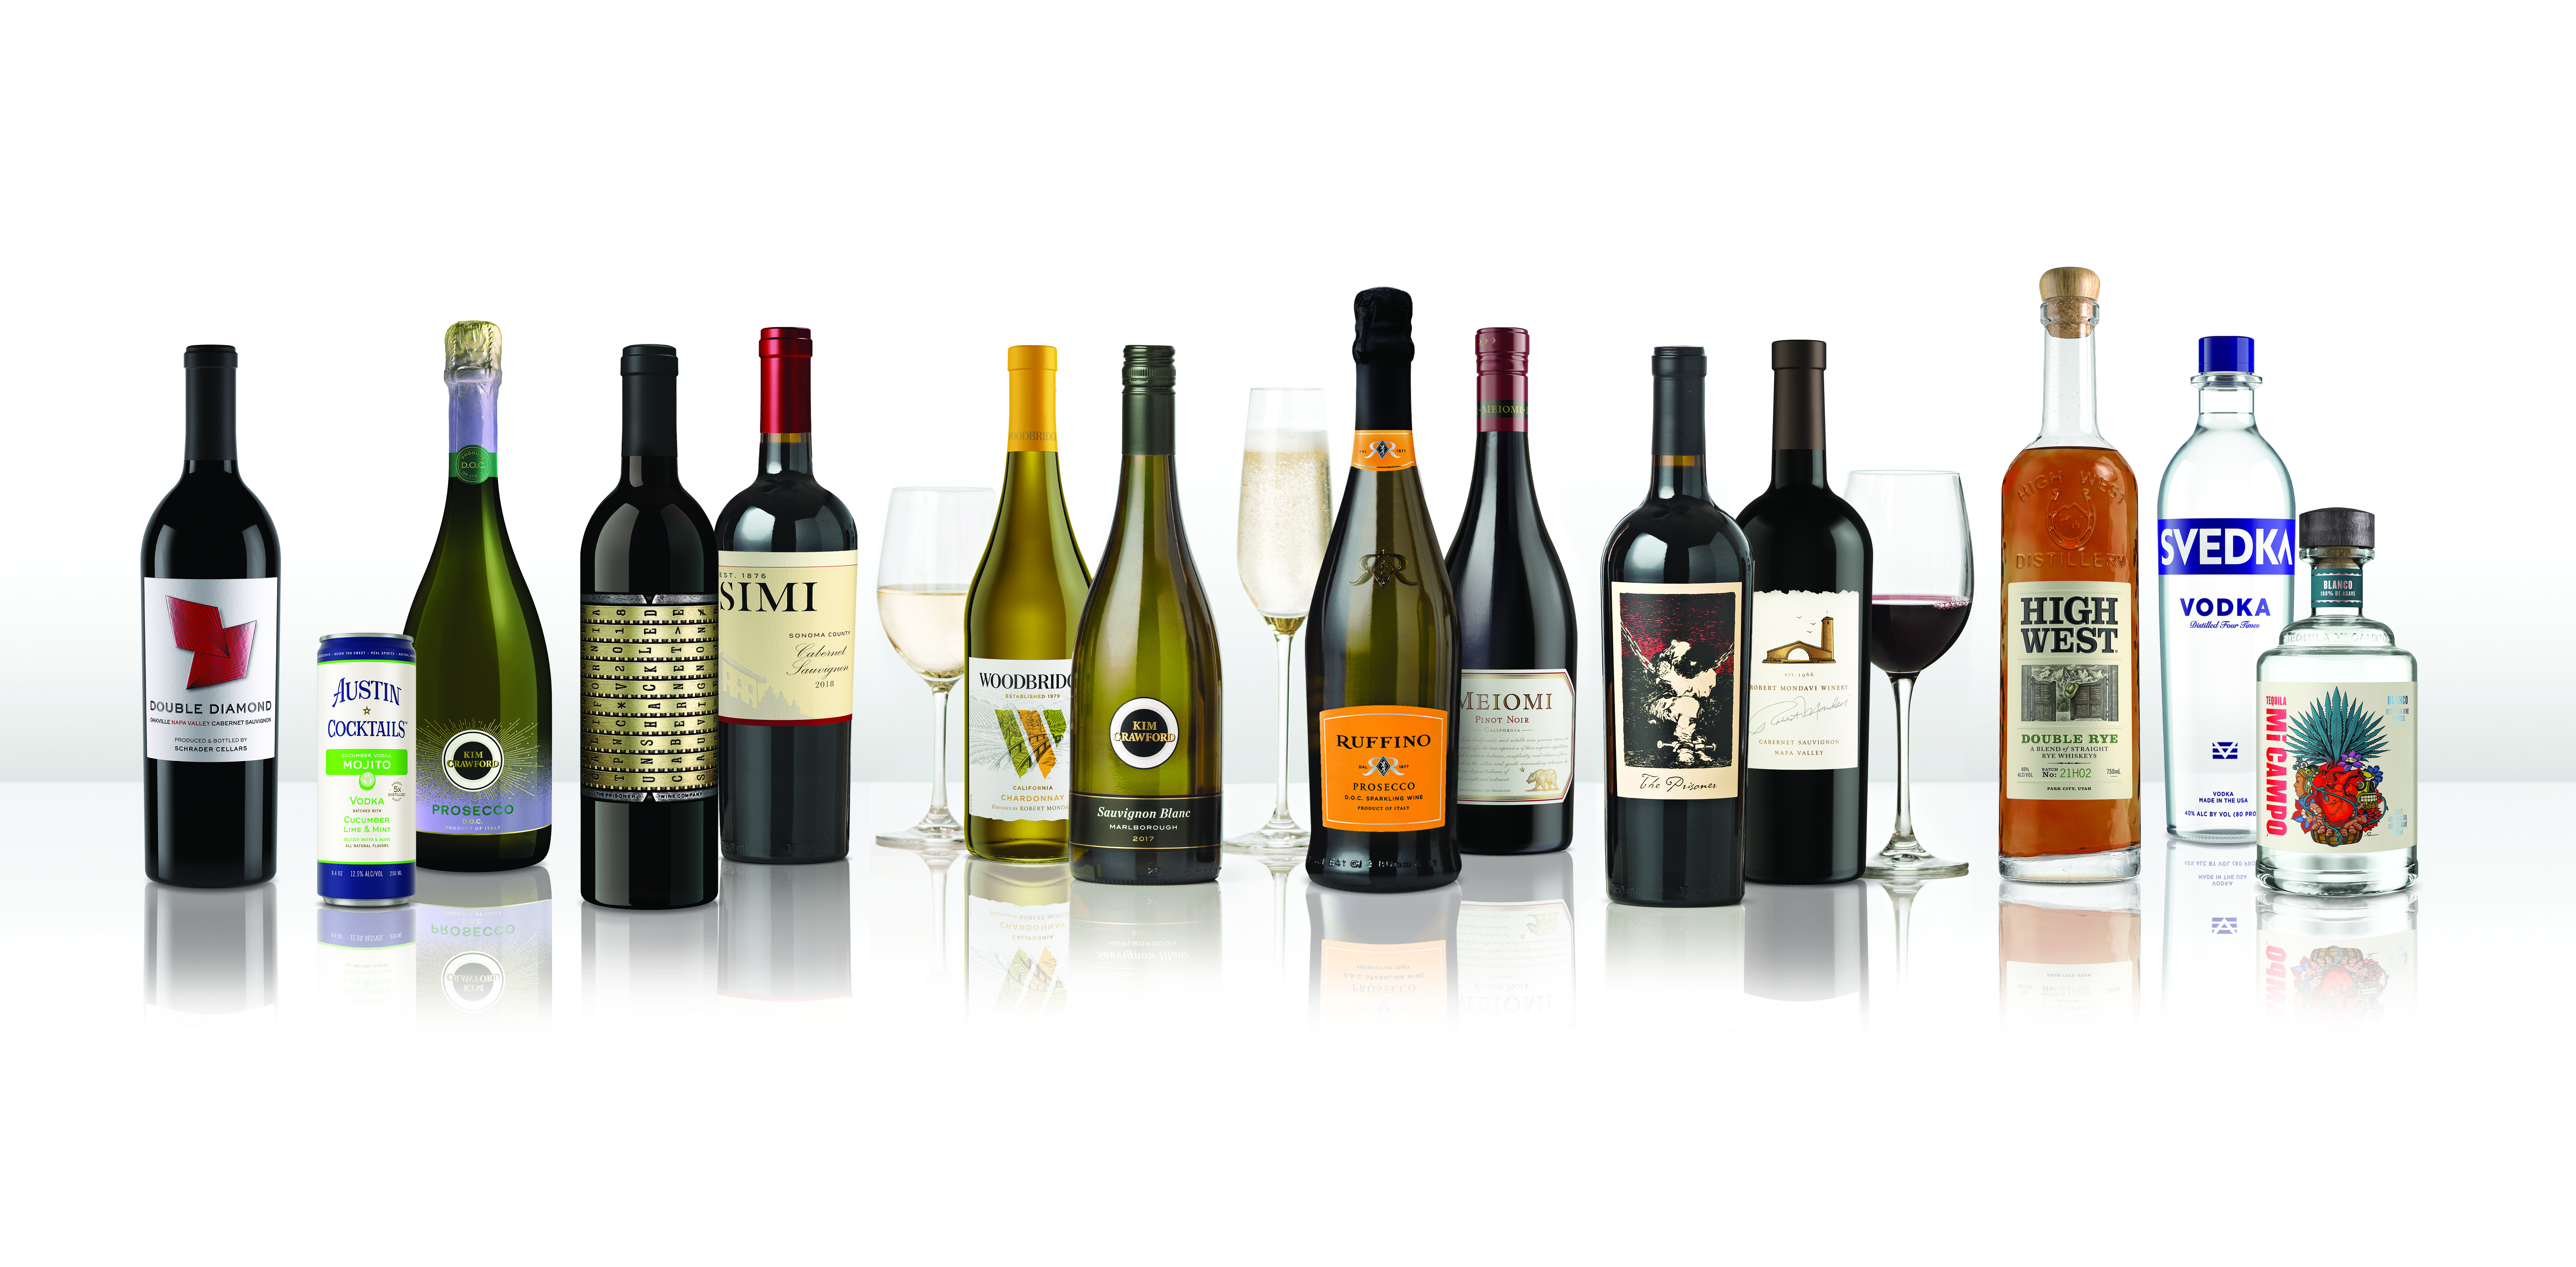
In the U.S., we have seven of the 100 top-selling highhigher-end wine brands, with Meiomi and Kim Crawford achieving the fifthfourth and eighth spots, respectively. Some of our well-known wine and spirits brands and portfolio of brands include:
| | | | | | | | | | | | | | | | | | | | |
| Wine Brands | | Wine Portfolio of Brands | | Spirits Brands |
7 Moons | Meiomi | | Charles Smith | | Casa Noble | Mi CAMPO |
Cook’s California Champagne | Mount Veeder | | My Favorite Neighbor | | Copper & KingsCasa Noble | Nelson’s Green BrierMi CAMPO |
Cooper & ThiefKim Crawford | Ruffino | | Robert Mondavi Winery | | High WestCopper & Kings | SVEDKANelson’s Green Brier |
Crafters UnionMeiomi | SIMI | | Schrader | | | |
Kim CrawfordHigh West | The Dreaming TreeSVEDKA |
| | | The Prisoner Wine Company | | | |
In Fiscal 20222023, our fine wine and craft spirits brands delivered solid shipment growth, driven primarily by The Prisoner Wine Company brands and High West, as well as by strong gainsperformance in our DTC, 3-tier eCommerce channels,
| | | | | |
| Constellation Brands, Inc. FY 2022 Form 10-K | #WORTHREACHINGFOR I 4 |
hospitality, (including hospitality) and international businesses. The focus for ourmarkets. Our mainstream and premium brands is on maintaininghave maintained market share, while continuing to deliver growth through premium wine brands, such as Meiomi and Kim Crawford, consistent with our consumer-led premiumization strategy. Our wine and spirits business delivered strong gains in 3-tier eCommerce and outperformed the broader market in this channel.
Over the last few years, we have been increasing our investment in supportdevelopment of on-trend product innovation as we believe this is one of the key drivers of overall beverage alcohol category growth. We have launched several innovations that are creating momentum and driving growth for the business, including varietal line extensions, such as The Prisoner cabernet sauvignonKim Crawford Sparkling Prosecco and chardonnay varietals, Woodbridge spirits barrel aged varietals, Meiomi cabernet sauvignon, and SVEDKA and High West pre-mixed cocktails in the RTD space. Additionally, we recently extended some of our well-known brands through betterment lines, such as Kim Crawford Illuminate, and new package formats, such as Woodbridge 3-liter boxMeiomi Red Blend, both of which were leaders among new brands in Fiscal 2023.
Corporate Operations and Other segment
The Corporate Operations and Other segment includes traditional corporate-related items including costs of executive management, corporate development, corporate finance, corporate growth and strategy, human resources, internal audit, investor relations, IT, legal, and public relations, and information technology, as well as our investments made through our corporate venture capital function.
Canopy segment
The Canopy Equity Method Investment makes up the Canopy segment.
For further information regarding net sales and operating income (loss) of our business segments and geographic areas, see refer to (i) MD&A and (ii) Note 22.
Marketing and distribution
To focus on their respective product categories, build brand equity, and increase sales, we employ full-time, in-house marketing, sales, and customer service functions for our Beer and Wine and Spirits segments. These functions engage in a range of marketing activities and strategies, including market research, consumer and trade advertising, price promotions, point-of-sale materials, event sponsorship, on-premise promotions, and public relations. Where opportunities exist, particularly with national accounts in the U.S., we leverage our sales and marketing skills across the organizationactivations, and public relations.
When we advertise our products to consumers, we use a combination of methods to forecast the number of advertising impressions made on individuals at or above the legal drinking age. Through our media placement agencies, we leverage recognized audience measurement services such as Nielsen and ComScore to measure audience composition data on a regular and frequent basis. This data helps us to ensure that our advertising placements are purchased in media outlets and audience buying platforms (i.e., programmatic digital buys) that are primarily targeted toward legal drinking age consumers and, when appropriate, specifically targeted to audiences that are age-verified as of the legal drinking age. Our Global Code of Responsible Practices for Beverage Alcohol Advertising and Marketing provides the fundamental framework for responsible brand advertising and marketing that helps ensure our messages are directed at legal drinking age consumers.
| | | | | |
Constellation Brands, Inc. FY 2023 Form 10-K | #WORTHREACHINGFOR I 5 |
| | | | | | | | |
| PART I | ITEM 1. BUSINESS | Table of Contents |
In Fiscal 2023, we joined Responsibility.org, a not-for-profit that aims to empower adults to make a lifetime of responsible alcohol choices, as a member company. In collaboration with Responsibility.org we updated our brand websites to redirect a visitor who self-identifies as being under the legal drinking age to Responsibility.org for information on prevention of underage drinking, ending drunk driving, and drinking responsibly.
In Fiscal 2023, we had zero:
•instances of non-compliance with industry or regulatory labeling and/or marketing codes; and
•monetary losses as a result of legal proceedings associated with marketing and/or labeling practice.
In the U.S., our products are primarily distributed by wholesale distributors, which generally have separate distribution networks for (i) our beer portfolio and (ii) our wine and spirits portfolio. In addition, in states where the government acts as the distributor, we distribute our products through state alcohol beverage control agencies, which set the retail prices of our products. As is the case with all other beverage alcohol companies, products sold through these agencies are subject to obtaining and maintaining listings to sell our products in that agency’s state. State governments can also affect prices paid by consumers for our products through the imposition of taxes.
Trademarks and distribution agreements
Trademarks are an important aspect of our business. We sell products under a number of trademarks, which we own or use under license. We also have various licenses and distribution agreements for the sale, or the production and sale, of our products, and products of others. These licenses and distribution agreements have varying terms and durations.
Within the Beer segment, we have an exclusive sub-license to use trademarks related to our Mexican beer brands in the U.S. This sub-license agreement is perpetual.
| | | | | |
| Constellation Brands, Inc. FY 2022 Form 10-K | #WORTHREACHINGFOR I 5 |
Competition
The beverage alcohol industry is highly competitive. We compete on the basis of quality, price, brand recognition and reputation, and distribution strength. Our beverage alcohol products compete with other alcoholic and non-alcoholic beverages for consumer purchases, as well as shelf space in retail stores, restaurant presence, and wholesaler attention. We compete with numerous multinational producers and distributors of beverage alcohol products, some of which have greater resources than we do. Our principal competitors include:
| | | | | |
| Beer | Anheuser-Busch InBev, The Boston Beer Company, Heineken, Mark Anthony, Molson Coors |
| |
| Wine | Deutsch Family Wine & Spirits, Duckhorn Portfolio, E. & J. Gallo Winery, Ste. Michelle Wine Estates, Treasury Wine Estates, Trinchero Family Estates, The Wine Group |
| |
| Spirits | Bacardi USA, Beam Suntory, Brown-Forman, Diageo, Fifth Generation, Pernod Ricard, Sazerac Company |
Canopy operates in the recreationaladult-use and medicinal cannabis markets and, in their largest market, they compete with numerous licensed producers and distributors as well as illegal growers and retailers of cannabis products. In the recreationaladult-use market, Canopy competes on the basis of quality, price, brand recognition, consistency, and variety of cannabis products whereas these same competitive factors apply in the medicinal market as well as physician familiarity.
Production
As of February 28, 20222023, our production capacity at our Mexican breweries was approximately 3942 million hectoliters. By the end of Fiscal 2026, we expect to increase our capacity in Mexico to approximately 6467 to 6972 million hectoliters to support the growth of our Mexican beer brands. This includes the planned construction of the Southeast MexicoVeracruz Brewery where there is ample water and we will have a skilled workforce to meet our long-term needs, as well as continued expansion, optimization, and/or construction at our current brewery locations in Nava and Obregonbreweries in Mexico. For further information on these expansion, optimization, and/or construction activities, refer to (i) MD&A and (ii) Note 7. We are continuing to
| | | | | |
Constellation Brands, Inc. FY 2023 work with government officials in Mexico to determine next steps for our suspended Mexicali Brewery construction project.Form 10-K | #WORTHREACHINGFOR I 6 |
| | | | | | | | |
| PART I | ITEM 1. BUSINESS | Table of Contents |
Our Daleville facility, located in Roanoke, Virginia,Facility supports our craft and specialtybeer business in addition to our domestic innovation initiatives. In Fiscal March 2023, we expect to produce FRESCATM Mixed RTD cocktails using real spirits at this facilityentered into a definitive agreement to sell the Daleville Facility. For further information on this transaction, refer to (i) “Overview” within MD&A and (ii) Note 5.
In the U.S., we operate 12 wineries using many varieties of grapes grown principally in the Napa, Sonoma, Monterey, and San Joaquin regions of California as well as the Willamette Valley region of Oregon. We also operate two wineries in New Zealand and sixfive wineries in Italy. Grapes are normally crushed in August through November in the U.S. and Italy, and in February through May in New Zealand and stored as wine until packaged for sale under our brand names or sold in bulk. The inventories of wine are usually at their highest levels during and after the crush of each year’s grape harvest and are reduced as sold throughout the year. In Fiscal 2023, we acquired an additional U.S. winery in Oregon. For further information on this acquisition, refer to (i) “Overview” within MD&A and (ii) Note 2.
We currently operate fourfive distilleries in the U.S. for the production of our spirits;: two facilities for High West whiskey, and one facility each for Copper & Kings American brandies, and one facility for Nelson’s Green Brier bourbon and whiskey products, and Austin Cocktails RTDs. The requirements for grains and bulk spirits used in the production of our spirits are purchased from various suppliers.
Certain of our wines and spirits must be aged for multiple years. Therefore, our inventories of wines and spirits may be larger in relation to sales and total assets than in many other businesses.
| | | | | |
| Constellation Brands, Inc. FY 2022 Form 10-K | #WORTHREACHINGFOR I 6 |
Resources and availability of production materials
Resources and availability of production materials
The principal components in the production of our Mexican and craft beer brands include water; agricultural products, such as yeast and grains; and packaging materials, which include glass, aluminum, and cardboard.
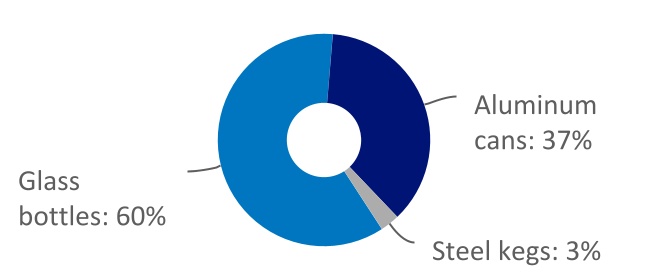
For our Mexican beer brands, packaging materials are the largest cost component of production, with glass bottles representing the largest cost component of our packaging materials.
For Fiscal 20222023, the package format mix of our Mexican beer volume sold in the U.S. was as follows:
As part of our efforts to solidify our beer glass sourcing strategy over the long-term, we formed an equally-owned joint venture with Owens-Illinois, one of the leading manufacturers of glass containers in the world. The joint venture owns a state-of-the-art Glass Plant adjacent to our Nava Brewery in Mexico. The Glass Plant currently has five operational glass furnaces which supplysupplies nearly 60% of the total annual glass bottle supply for our Mexican beer brands. We also have long-term glass supply agreements with other glass producers.
The Nava and Obregoncurrent Mexican breweries each receive water originating from separate and distinct aquifers. We believe we have adequate access to water to support thethese breweries’ ongoing requirements, as well as future requirements after the completion of planned expansion, optimization, and/or construction activities. BothThese breweries employ comprehensive water management practices that focus on water efficiency and wastewater treatment operations to reuse water consumed as part of the production process.
The principal components in the production of our wine and spirits products are agricultural products, such as grapes and grain, and packaging materials, primarily glass.
Most of our annual grape requirements are satisfied by grower purchases from each year’s harvest which normally begins in August and runs through November in the U.S. and Italy, and begins in February and runs through May in New Zealand. We receive grapes from approximately 150590 independent growers located in the U.S. and 5550 independent growers in New Zealand and Italy. We enter into purchase agreements with a majority of these growers with pricing that generally varies year-to-year and is largely based on then-current market prices.
As of February 28, 2022 | | | | | |
Constellation Brands, Inc. FY 2023 Form 10-K | #WORTHREACHINGFOR I 7 |
| | | | | | | | |
| PART I | ITEM 1. BUSINESS | Table of Contents |
As of February 28, 2023, we owned or leased approximately 1718,800200 acres of land and vineyards, either fully bearing or under development, in the U.S., New Zealand, and Italy. This acreage supplies only a small percentage of our overall total grape needs for wine production. However, most of this acreage is used to supply a large portion of the grapes used for the production of certain of our higher-end wines. We continue to consider the purchase or lease of additional vineyards, and additional land for vineyard plantings, to supplement our grape supply.
All of our owned and leased vineyards in California (U.S.) routinely adhere to documented water management plans as required by Sustainable Grape Growing Certifications including the California Sustainable Winegrowing Alliance and Fish Friendly Farming. We use the guidance of these plans to identify the designated beneficial use of the water body based on grape growing goals set before the growing season that account for soil types, slopes, irrigation water availability and quality, and energy efficiency.
We believe that we have adequate sources of grape supplies to meet our sales expectations. However, when demand for certain wine products exceeds expectations, we look to source the extra requirements from the bulk wine markets around the world.
The distilled spirits manufactured and imported by us require various agricultural products, neutral grain spirits, and bulk spirits, which we fulfill through purchases from various sources by contractual arrangement and through purchases on the open market. We believe that adequate supplies of the aforementioned products are available at the present time.
We utilize glass and polyethylene terephthalate bottles and other materials such as caps, corks, capsules, labels, wine bags, and cardboard cartons in the bottling and packaging of our wine and spirits products. After grape purchases, glass bottles are the largest component of our cost of product sold. In the U.S., the glass bottle industry is highly concentrated with only a small number of producers. We have traditionally obtained, and
| | | | | |
| Constellation Brands, Inc. FY 2022 Form 10-K | #WORTHREACHINGFOR I 7 |
continue to obtain, our glass requirements from a limited number of producers under long-term supply arrangements. Currently, one producer supplies most of our glass container requirements for our U.S. operations. We have been able to satisfy our requirements with respect to the foregoing and consider our sources of supply to be adequate at this time.
Government regulations
We are subject to a range of laws and regulations in the countries in which we operate. Where we produce products, we are subject to environmental laws and regulations, and may be required to obtain environmental and alcohol beverage permits and licenses to operate our facilities. Where we market and sell products, we may be subject to laws and regulations on brand registration, packaging and labeling, distribution methods and relationships, pricing and price changes, sales promotions, advertising, and public relations. The countries in which we operate impose duties, excise taxes, and other taxes on beverage alcohol products, and on certain raw materials used to produce our beverage alcohol products, in varying amounts. We are also subject to rules and regulations relating to changes in officers or directors, ownership, or control.
We believe we are in compliance in all material respects with all applicable governmental laws and regulations in the countries in which we operate. We also believe that the cost of administration and compliance with, and liability under, such laws and regulations does not have, and is not expected to have, a material adverse impact on our financial condition, results of operations, or cash flows.
As part of our brewery expansion efforts and commitment to making a positive impact on the communities where we operate, we plan to continue working with local authorities and community-based organizations on sustainability initiatives that benefit local residents. Critical local projects have been identified through community collaboration and input and guidance from third-party water restoration organizations. For example, to improve water quality in the Nava area, we have partnered with Pronatura Noreste, investing in a 10-year project that we expect will help restore the Bravo Conchos basin in the Serranía del Burro. In Obregon, we have worked with local organizations to construct three dams along the Yaqui Valley canal that help improve water management efficiency, recovering volumes of water that play a vital role in the sustainability of the region. This is in addition to other benefits we provide, including local job creation and fueling economic development. We plan to work with local authorities in areas near the Southeast Mexico Brewery on similar initiativesand/or cash flows.
Seasonality
The beverage alcohol industry is subject to seasonality in each major category. As a result, in response to wholesaler and retailer demand which precedes consumer purchases, our beer sales are typically highest during the first and second quarters of our fiscal year, which correspond to the Spring and Summer periods in the U.S. Our wine and spirits sales are typically highest during the third quarter of our fiscal year, primarily due to seasonal holiday buying.
| | | | | |
Constellation Brands, Inc. FY 2023 Form 10-K |
For Fiscal 2021, our beer net sales were higher in the second and third quarters as inventory levels in our distribution channels were replenished following a COVID-19 related production slowdown at our major breweries in Mexico earlier in the year. #WORTHREACHINGFOR I 8 |
| | | | | | | | |
| PART I | ITEM 1. BUSINESS | Table of Contents |
ESG
During the course of our history, we have been committed to safeguarding our environment, making a positive difference in our communities, and advocating for responsible consumption of beverage alcohol products. OurWe believe our ESG strategy is aligned withenables us to our business goals andbetter meet stakeholder interestsexpectations, reflects our Company values, and more directly addressesaddress pressing environmental and societal needs. Specifically, that are important to our communities, consumers, and employees. Specifically, we have focused on areas where we believe we have the greatest opportunities to make meaningful, positive impacts for people and the planet, and we dedicate our resources towards:
Serving as good stewards of our environment and natural resources
– Modeling water stewardship for our industry; and reducing GHG emissions through energy conservation and renewable energy initiatives
Enhancing social equity within our industry and communities
– Championing the professional development and advancement of women in beverage alcohol industry and our communities; and enhancing economic development and prosperity in disadvantaged communities
| | | | | |
| Constellation Brands, Inc. FY 2022 Form 10-K | #WORTHREACHINGFOR I 8 |
; and championing an inclusive culture within our organization, characterized by diversity in background and thought, which reflects our consumers and the communities where we live and work
Promoting responsible beverage alcohol consumption – Empowering
Ensuring the responsible promotion and marketing of our products; and empowering adults to make responsible choices in their alcohol (substance) consumption by supporting fact-based education, engagement programs, and policies
During Fiscal 2023 we published our 2022 we took the following steps to advance our ESG strategy by key area:
Serving as good stewards of our environment and natural resources
•developed aESG Impact Report and took the following steps to advance our ESG strategy by key area:
Serving as good stewards of our environment and natural resources
•held an interactive virtual presentation by The Nature Conservancy to recognize Earth Day, which is celebrated annually around the world on April 22. Topics discussed included global water challenges, The Nature Conservancy’s water security strategies, how companies like ours can lead in the water space, and how each of us as individuals, families, and communities can preserve our planet. Approximately 500 employees from around the globe attended the virtual presentation
•in support of a multi-year collaboration with The Nature Conservancy, we pledged an additional $500,000 over the next two years for their Dynamic Water Management program
•signed a separate two-year commitment of $400,000 in total contributions to The Nature Conservancy to help fund collaborative conservation projects focused on improving the quantity and quality of inflows to the Rio Grande, helping to provide adequate and safe water supply for downstream users, including in Piedras Negras, Coahuila – a local community near our operations in Mexico
•employees and community members came together to remove approximately 1,400 pounds of debris and recyclables from local beaches in support of the second year of Corona’s Protect Our Beaches initiative, in partnership with Oceanic Global and United by Blue
•completed a two-phase water infrastructure project in the city of Zaragoza, a neighboring community near the Nava Brewery, designed to enhance access to quality water for local residents. We provided funding to update infrastructure serving the majority of the city’s residents that was losing a significant amount of water flowing through its pipelines
•maintained our Carbon Disclosure Project ratings of Water A- and Climate B for calendar 2022
Enhancing social equity within our industry and communities
•in response to the Russian invasion of Ukraine, created the Ukraine Humanitarian Support Fund and matched employee donations 2:1. The fund supported United Help Ukraine, a nonprofit organization committed to providing humanitarian aid, including food and medical supplies, to Ukrainians during this conflict. Together with our employees, we raised more than $100,000 in total donations
| | | | | |
Constellation Brands, Inc. FY 2023 Form 10-K | #WORTHREACHINGFOR I 9 |
| | | | | | | | |
| PART I | ITEM 1. BUSINESS | Table of Contents |
•collaborated with UnidosUS in Spring 2022 to host informational sessions in English and Spanish to help winery employees understand the various housing and financial education benefits available to them through our Company and UnidosUS. Following the success of those events, additional locations requested informational sessions which were held later in the fiscal year
•began supporting an initiative, as a member of Distilled Spirits Council of the United States, to develop a pipeline of talent from the Black community that seeks to fill 1,800 roles from internships to executive levels within the spirits industry over the next 10 years
•engaged six minority depository institutions as participants in the August 2022 Term Credit Agreement which provide opportunities often unavailable to smaller community banks including access to grow funded assets, diversify their loan portfolios, and develop broader relationships with corporate treasury teams
•in celebration of Black History Month, we virtually hosted over 400 employees with guest speaker Anthony Ray Hinton, a community educator for the Equal Justice Initiative, to share his story of being wrongfully convicted and a survivor of 30 years on Alabama’s death row and discuss the changes that need to be made to prevent similar injustices from happening to others within Black and African American communities
Promoting responsible beverage alcohol consumption
•in collaboration with Responsibility.org, we updated our brand websites to redirect a visitor who self-identifies as being under the legal drinking age to Responsibility.org for information on prevention of underage drinking, ending drunk driving, and drinking responsibly
•in collaboration with Responsibility.org, leading up to the U.S. federal holiday, Labor Day, as well as end-of-year holiday and Super Bowl Sunday we continued our responsibility education efforts, sharing responsible consumption tips and information on lower-alcohol and non-alcoholic product options on our Company intranet and through our Company social media channels to help our employees and consumers make informed choices during their celebrations
•together with the Corona Family of Brands, we partnered with the Washington Regional Alcohol Program and Lyft to provide safe rides home for adults celebrating Halloween in the metro-Washington area
In connection with our strategy to serve as good stewards of our environment and natural resources, we developed water conservation and GHG emissions reduction targets. As of February 28, 2023:
•we have surpassed our target to restore approximately 1.1 billion gallons of water withdrawals from criticallocal watersheds, while improving accessibility and improvequality of water accessibility in disadvantagedfor communities where we operate between the periods Fiscal 2023 to Fiscal 2025; and
•developed a targetwe are on track to reduce Scope 1 (direct) and Scope 2 (indirect) GHG emissions by 15% between the periods Fiscal 2020 to Fiscal 2025
revised the Board of Directors’ Corporate Governance and Responsibility Committee Charter to include oversight of environmental, sustainability, and social responsibility programs and goals
•completed an assessment to identify and prioritize ESG issues that are most important to our wine and spirits business
•donated $200,000 to The Nature Conservancy’s Resilient Watershed Project
Enhancing social equity within our industry and communities
•five of our eight Focus on Female Founder and Focus On Minority Founder participants grew ahead of their respective categories. Our shared sales team helped drive growth between approximately 160% to 420% in key markets for Austin Cocktails, Durham Distillery, La Fête du Rosé, and Catoctin Creek
•our AASCEND BRG and CSR team created the 2022 Martin Luther King Jr./Black History Month Fund allowing employees the opportunity to lend their support by contributing to community organizations that focus on social equity. Employee and company matched donations went to the Equal Justice Initiative, Facing History and Ourselves, and the Southern Poverty Law Center
•our company support of Dress for Success Worldwide, an organization whose mission is to empower women to achieve economic independence, helped more than 1.2 million women worldwide (80,000 in the U.S.) work towards self-sufficiency. Direct dollars to affiliates in our major office locations helped more than 3,500 women work toward job placement and career advancement goals
•made a $1.75 million multi-year commitment to the National Restaurant Association Education Foundation's “Restaurants Advance” campaign in support of rebuilding the industry workforce
•contributed $500,000 to UnidosUS to strengthen Hispanic families’ financial security through financial empowerment and home ownership programs
Promoting responsible beverage alcohol consumption
•made a minority investment in HopWTR, an adaptogen and nootropics-based non-alcoholic product line
•implemented a six-week wellness challenge that provided an opportunity for employees to learn more about conscious consumption and how our portfolio of brands plays a critical role
•promoted conscious consumption throughout our company social media platforms during culturally relevant moments and holidays such as New Year’s Eve and the Super Bowl
For further information about our ESG advancements refer to (i) “Human capital resources” below and (ii) “Capital resources” within MD&A.
As part of our brewery expansion efforts and commitment to making a positive impact on the communities where we operate, we plan to continue working with local authorities and community-based organizations on sustainability initiatives that benefit local residents. Critical local projects have been identified through community collaboration and input and guidance from third-party water restoration organizations. For example, and as outlined above, as part of our efforts to improve access to water, the Nava Brewery coordinated with the Coahuila state government to improve both the water infrastructure and availability in the city of Zaragoza, a neighboring community near the Nava Brewery. This two-phase project was completed in Fiscal 2023 and improves accessibility to quality water for local residents. In Obregon, we have worked with local organizations to construct three dams along the Yaqui Valley irrigation canal that help improve water management efficiency, recovering volumes of water year over year. These efforts continue to play a vital role in the sustainability of the region. This is in addition to other benefits we provide, including local job creation and fueling economic development. We are currently working with local authorities in areas near the Veracruz Brewery to identify and implement similar initiatives.
For further information about our ESG advancements refer to (i) “Human capital resources” below and (ii) “Capital resources” within MD&A.
| | | | | |
Constellation Brands, Inc. FY 20222023 Form 10-K | #WORTHREACHINGFOR I 910 |
| | | | | | | | |
| PART I | ITEM 1. BUSINESS | Table of Contents |
Human capital resources
As of MarchFebruary 3128, 20222023, we had approximately 10,000700 employees, including approximately 1,200300 employees through our equally-owned joint venture with Owens-Illinois. The number of employees may change throughout the year, as we employ additional workers during the grape crushing seasons. Approximately 20% of the employees are covered by collective bargaining agreements. Collective bargaining agreements expiring within one year are minimal. We consider our employee relations generally to be good.
Employee geographic data is as follows:
COVID-19 response
We have an existing Crisis Management Committee that, since January 2020, has been closely monitoring the impact of the virus that causes COVID-19 on our business and our workforce. In March 2020, the WHO recognized COVID-19 as a pandemic. In response, we implemented various measures to reduce the spread of the virus including working from home, restricting visitors to our production locations, splitting our production workforces, reducing the on-site production workforce levels, screening workers before they enter facilities, enforcing social distancing, and encouraging employees to adhere to prevention measures recommended by the CDC and the WHO. To incentivize U.S. employees to receive COVID-19 vaccines, we provided a one-time employee protection bonus to all full-time and part-time U.S. employees who submitted proof of being fully vaccinated or had approved exemptions. In Mexico, COVID-19 vaccines were not as readily available as in the U.S. We created programs to facilitate access through free, voluntary on-site clinics and local vaccination sites for our employees, including those at the Glass Plant, their families, as well as for other local Nava and Obregon businesses. These efforts contributed to achieving an employee vaccination rate of more than 98% at our Nava and Obregon breweries. Additionally, our Chief Medical Officer provides ongoing health-related advice and expertise to our executive officers, Crisis Management Committee, and human resources leadership teams as they make decisions designed to protect the health and safety of our workforce. The preventative measures we have implemented may be modified and/or discontinued as government agencies issue new guidance, including due to fluctuations in COVID-19 case levels.
We value the contributions of our workforce and considered the impacts the pandemic would have on their well-being. For our production workforce, where employees were not able to work due to temporary facility closures or illness, we protected their pay to ensure they had a continued paycheck. For our hospitality employees, we recognized a material portion of their pay comes from customer gratuities and we paid these employees an equivalent value during the necessary time away. Our non-production workforce is able to work remotely using various technology tools. As part of the remote office approach, we provide reimbursement for home office support ensuring our employees have the resources needed to be effective. We have a formal COVID-19 policy and offer various programs to assist our employees, including engaging with third-party wellness providers to host dedicated sessions on mental and physical well-being, and increased flexibility and resources surrounding personal and family commitments.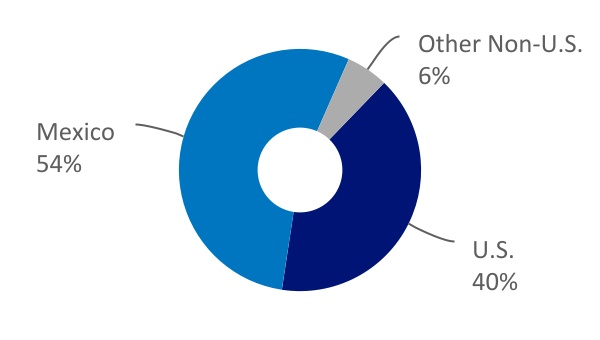
Diversity, equity, and inclusion
Our DEI strategic priorities are as follows:
Cultivate a best-in-class, diverse, and equitable workforce
– one that reflects the universe of consumers that exist and the communities in which we live and serve
workFoster a winning inclusive culture, inclusive
work culture
– create a more equitable experience for underrepresented groups; harness the benefits of diversity and inclusivity
Enhance social equity
– extend our influence to enhance social equity within the beverage alcohol industry and communities in which we live and servework
| | | | | |
| Constellation Brands, Inc. FY 2022 Form 10-K | #WORTHREACHINGFOR I 10 |
We provide opportunities for our employees to advance our DEI strategic priorities through a growing community of BRGs. Our BRGs are supported at the highest level with sponsorships from our executives. See “Information about our Executive Officers” below. Each BRG is tasked with making a business impact on behalf of the represented group and welcomes allies. In Fiscal 20222023, approximately 60% of our U.S. salaried employees were members of one or more BRG.
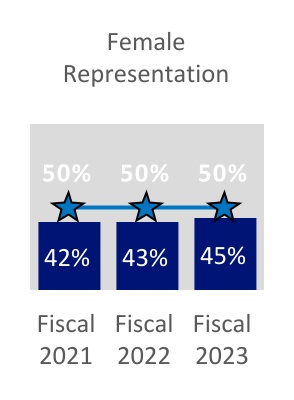
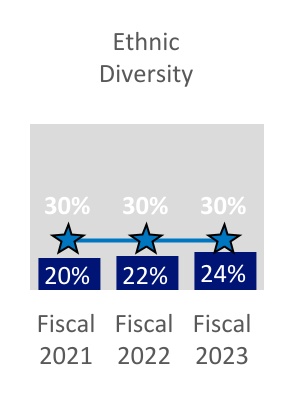
Monitoring human capital metrics is a key component in seeking to ensuringensure we are executing on our strategy and making progress against our DEI objectives and goals. In Fiscal 2022, we revised our Board of Directors’ Human Resource Committee Charter to specially address oversight of employee DEI matters. We measure gender and ethnic representation to understand diversity at various levels across the organization, assess progress over time, and drive continuous improvement. We have established goals to enhance both gender representation and overall ethnic diversity among our U.S. salaried population to 50% and 30%, respectively, by Fiscal 2026. Our self-disclosed, U.S. salaried employee information is as follows:
Additionally, in Fiscal 2022, we launchedutilize a DEI growth dashboard for our U.S. salaried employee base, centered around identifying and addressing workforce diversity representation opportunities, utilizing 2020 U.S. Census data as a benchmark. This dashboard is shared with our executives and with certain committees of the Board of Directors on a quarterlysemi-annual basis enabling them to monitor the progress made and to provide guidance on necessary next steps to attain our representation goals. We also assess metrics throughout the human resource lifecycle to identify potential bias and barriers in our processes, including talent acquisition, turnover, engagement scores, or participation in BRG events.
Compensation and benefits
We strive to provide pay, benefits, and services that meet the needs of our employees. There are four components of compensation: (i) base pay, (ii) long-term incentives dependent on a number of factors such as geographic location and management level which can include restricted stock units, stock options, and performance share units, (iii) short-term incentives, and (iv) recognition awards. Base
| | | | | |
Constellation Brands, Inc. FY 2023 Form 10-K | #WORTHREACHINGFOR I 11 |
| | | | | | | | |
| PART I | ITEM 1. BUSINESS | Table of Contents |
performance share units, (iii) short-term incentives, and (iv) recognition awards. Base and incentive compensation is reviewed on an annual basis ensuring it is competitive in the market and gives employees opportunities to earn more for exceeding expectations. Our total rewards program also offers valuable benefits, tools, and resources designed to help employees stay healthy and well, while achieving security, growth, satisfaction, and success.
Professional development
Building diverse talent pipelines, delivering best-in-class people development, and championing professional advancement are key components of our human capital strategy which is designed to position our business for long-term growth. In Fiscal 20222023, we spent approximately $17 million in development and training costs, including the delivery of one executive development program, four leadership development programs, and threefour women’s focused development programs through the University of Constellation Brands, our learning and development center. In October 2022, we launched the first wave of a formal career development mentoring program. More than 900 employees from across the organization enrolled and we kicked off the program with over 400 matched relationships. We are committed to offering programs, resources, and experiences that empower employees to grow their careers and keep reaching for what’s next, both personally and professionally.
Succession planning
We have a comprehensive succession planning process, led by our human resources team and overseen by the Human Resources Committee of our Board of Directors. In addition to the Human Resources Committee’s enhanced focus on executive, senior leader, and high-potential employee succession, our full Board of Directors is also involved in Chief Executive Officer succession planning and succession and people development for the broader employee population. As part of the succession planning process, we review and discuss potential successors to key roles and examine backgrounds, capabilities, and appropriate developmental opportunities.
| | | | | |
| Constellation Brands, Inc. FY 2022 Form 10-K | #WORTHREACHINGFOR I 11 |
Employee engagement
We assess employee engagement through targeted pulse surveys, which provide feedback on a variety of topics, such as company direction and strategy, resources, support, work environment preferencesenablement, empowerment, and well-being. During calendar year 2021,2022, we conducted a company-wide engagement survey where we had a response rate of 76% to our survey83% and an engagement measurement of 8688% across our surveyed population.
Safety
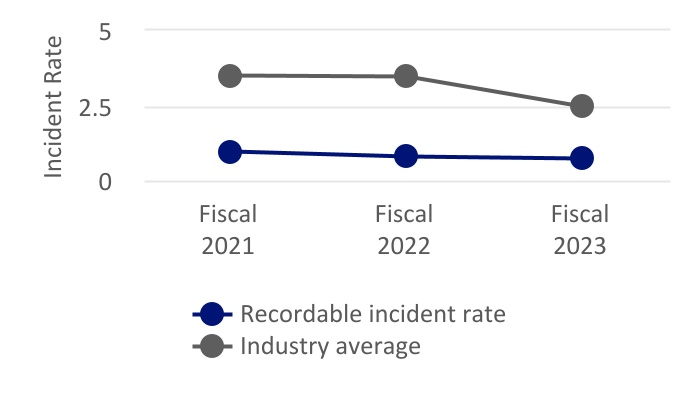
We are committed to ensuring the safety of our employees. Our global EHS policy defines our dedication to providing a safe and healthy working environment and developing a culture where all employees take responsibility for their own safety as well as the safety of others while minimizing our impact on the environment in the communities where we live and work. With a focus on continuous improvement, we are developing more robust EHS management systems, strengthening employee awareness and training, and ensuring senior leadership engagement on safety. Work-related injuries resulting from the production of our beer, wine, and spirits products are well below industry average. Our recordable incident rate as compared to the industry average are as follows:
| | | | | | | | | | | | | | | | | |
| For the Years Ended | | |
| February 28,
2022 | | February 28, 2021 | | Percent
Change |
Recordable incident rate (1) | 0.79 | | 0.95 | | (17%) |
Industry average (2) | 3.45 | | 3.50 | | |
(1)Defined as total number of worldwide Constellation
The recordable incident rate is defined as total number of worldwide CBI work-related injuries (cases beyond first aid) per 100 full-time employees.
(2)Calculated The industry average is calculated by taking the weighted average of the most recent (20202021) U.S. Bureau of Labor Statistics data for wineries, breweries, and distilleries based on our portfolio mix onin February 2023, February 2022, and February 2021 for the years ended February 28, 2023, February 28, 2022, and February 28, 2021, respectively.
| | | | | |
Constellation Brands, Inc. FY 2023 Form 10-K | #WORTHREACHINGFOR I 12 |
| | | | | | | | |
| PART I | ITEM 1. BUSINESS | Table of Contents |
Empowering our employees to give back
Giving back to our communities is a value instilled by our founder, Marvin Sands, and remains core to our company’s DNA. We empower our employees to engage in the communities where they live and work in a variety of ways, including volunteering time and through a charitable matching program available to all U.S. employees.
We match donations ranging from a maximum of $5,000 to $50,000 per year, depending on management level, to charitable organizations.
| | |
| $511.89 million |
Fiscal 20222023 corporate charitable contributions, including company match of employee donations |
| | | | | |
| Constellation Brands, Inc. FY 2022 Form 10-K | #WORTHREACHINGFOR I 12 |
Information about our Executive Officers
Executive officers of the Company are generally chosen or elected to their positions annually and hold office until the earlier of their removal or resignation or until their successors are chosen and qualified. Information with respect to our executive officers as of April 2120, 20222023, is as follows:
| | | | | |
| William A. Newlands, age 6364, is the President and Chief Executive Officer of the Company. He has served as Chief Executive Officer of the Company and as a director since March 2019 and as President since February 2018. He served as Chief Operating Officer from January 2017 through February 2019 and as Executive Vice President of the Company from January 2015 until February 2018. From January 2016 to January 2017 he performed the role of President, Wine & Spirits Division and from January 2015 through January 2016 he performed the role of Chief Growth Officer. Mr. Newlands joined the Company in January 2015. Prior to that he served from October 2011 until August 2014 as Senior Vice President and President, North America of |
Beam Inc., as Senior Vice President and President, North America of Beam Global Spirits & Wine, Inc. from December 2010 to October 2011, and as Senior Vice President and President, USA of Beam Global Spirits & Wine, Inc. from February 2008 to December 2010. Beam Inc., a producer and seller of branded distilled spirits products, merged with a subsidiary of Suntory Holding Limited, a Japanese company, in 2014. Prior to October 2011, Beam Global Spirits & Wine, Inc. was the spirits operating segment of Fortune Brands, Inc., which was a leading consumer products company that made and sold branded consumer products worldwide in the distilled spirits, home and security, and golf markets. |
| | | | | |
| Robert SandsBRG , age 63, is the Executive Chairman of the Board of the Company, having served in the role since March 2019 and as a director since January 1990. Previously, he served as Chief Executive Officer of the Company from July 2007 through February 2019. Mr. Sands also served as President of the Company from December 2002 to February 2018, as Chief Operating Officer from December 2002 to July 2007, as Group President from April 2000 through December 2002, as Chief Executive Officer, International from December 1998 through April 2000, as Executive Vice President from October 1993 through April 2000, as General Counsel from June 1986 through May 2000, and as Vice President from June 1990 through October 1993. He is the brother of Richard Sands.sponsorship - ECP supporting our early career professionals |
| | | | | |
| Richard Sands, Ph.D., age 71, is the Executive Vice Chairman of the Board of the Company, having served in the role since March 2019. He previously served as Chairman of the Board of the Company from September 1999 through February 2019. He has been employed by the Company in various capacities since 1979. He has served as a director since 1982. He served as Chief Executive Officer from October 1993 to July 2007, as President from May 1986 to December 2002, as Chief Operating Officer from May 1986 to October 1993, and as Executive Vice President from 1982 to May 1986. He is the brother of Robert Sands. |
| | | | | |
| James O. Bourdeau, age 5758, is the Executive Vice President and Chief Legal Officer of the Company, having served in the role since December 2017 and as the Company’s Secretary since April 2017. Prior to that, he served as the Company’s Senior Vice President and General Counsel, Corporate Development, having performed that role from September 2014 until December 2017. Before joining the Company in September 2014, Mr. Bourdeau was an attorney with the law firm of Nixon Peabody LLP from July 2000 through September 2014, and a partner from February 2005 through September 2014. Mr. Bourdeau was associated with another law firm from 1995 to 2000. |
BRG sponsorship - Stellar PRIDE supporting our LGBTQ+ community |
| | | | | |
| K. Kristann Carey, age 53, is the Executive Vice President and Chief Human Resources Officer of the Company, having served in the role since May 2022. Prior to that, she served as the Company’s Senior Vice President, Human Resources, Beer Division, having performed that role from February 2019 until May 2022. From July 2018 until December 2020, she performed the role of Chief Diversity Officer. From July 2017 until January 2019, she served as Chief Compliance Officer and from November 2015 until January 2019, she served as Senior Vice President and General Counsel, Beer Division. From June 2013 until November 2015, she served as Vice President and Associate General Counsel, Beer Division. Before joining the Company, Ms. Carey |
served in roles of increasing responsibility with McDonald’s Corporation from January 2005 until June 2013, most recently as Senior Counsel. Prior to joining McDonald’s Corporation, she worked at the law firms of Seyfarth Shaw LLP from January 2003 through January 2005 and Cassiday, Schade & Gloor LLP from October 1998 until January 2003. |
BRG sponsorship - ¡SALUD! supporting Hispanic and Latinx employees and communities |
| | | | | |
Constellation Brands, Inc. FY 20222023 Form 10-K | #WORTHREACHINGFOR I 13 |
| | | | | | | | |
| PART I | ITEM 1. BUSINESS | Table of Contents |
| | | | | |
| Garth Hankinson, age 5455, is the Executive Vice President and Chief Financial Officer of the Company, having served in the role since January 2020. Prior to that, he served as the Company’s Senior Vice President, Corporate Development, a position he had been in since February 2016, where he was responsible for leading all of the Company’s financial planning, reporting, and analysis activities, as well as all efforts related to mergers, acquisitions, ventures investments, and strategic alliances. From October 2009 until February 2016, he served as the Vice President, Corporate Development of the Company. From October 2007 until October 2009, Mr. Hankinson served as the Vice President, Business Development for Constellation’s prior |
Canadian business, Constellation Brands Canada, Inc., which was a Canadian subsidiary of the Company during that time. From March 2004 until October 2007, he served as the Director of Corporate Development. |
BRG sponsorship - VALORValor supporting veterans, service members, first responders, and their families |
| | | | | |
| Robert Hanson, age 5960, is the Executive Vice President and President, Wine & Spirits Division of the Company, having served in the role since June 2019. Prior to that, he served as Chief Executive Officer of John Hardy Global Limited, a luxury jewelry brand, from August 2014 to June 2019. He continued to serve as its Chairman of the Board until July 2020. He served as Chief Executive Officer and a Director of American Eagle Outfitters, Inc., a leading global specialty retailer of clothing, accessories, and personal care products from January 2012 to January 2014. He served Levi Strauss & Co. from 1988 to 2011 in a variety of important leadership roles across multiple brands where he led cross-functional teams, including merchandising, product |
development, multi-channel operations, marketing and creative teams, in addition to a full support staff. Mr. Hanson’s roles at Levi’s included serving as Global President of the Levi’s Brand from 2010 to 2011; President, Levi’s Strauss Americas/North America from 2006 to 2010; President, Levi’s Brand U.S. from 2001 to 2006; and President/Vice President, Levi’s Europe/Africa/Middle East from 1998 to 2001. |
BRG sponsorship - Win.Inspire.Support.Elevate. supporting our female community |
| | | | | |
| Thomas M. Kane, age 61, is the Executive Vice President and Chief Human Resources Officer of the Company, having served in the role since joining the Company in May 2013 through his retirement from such role, which will be effective May 9, 2022. Mr. Kane previously served as Senior Vice President, Human Resources and Government Relations of Armstrong World Industries, Inc., a global producer of flooring products and ceiling systems, from February 2012 to May 2013, he served as its Senior Vice President, Human Resources from August 2010 to February 2012 and served as its Chief Compliance Officer from February 2011 to February 2012. Prior to that, Mr. Kane served as Global Vice President, Human Resources for Black & Decker |
Power Tools, a manufacturer of power and hand tools, from 2002 to 2010. From 1999 to 2002 Mr. Kane served as Global HR leader of GE Specialty Materials, a large manufacturer of silicone products. |
BRG sponsorship - Win.Inspire.Support.Elevate. supporting our female community |
| | | | | |
| Constellation Brands, Inc. FY 2022 Form 10-K | #WORTHREACHINGFOR I 14 |
| | | | | |
| Michael McGrew, age 48WISE supporting our female community |
| | | | | |
| Michael McGrew, age 49, has been an Executive Vice President of the Company since April 2020. Beginning December 2020, Mr. McGrew has performed the role of Executive Vice President, and Chief Communications, CSR, and Diversity Officer of the Company. Mr. McGrew joined Constellation Brands in 2014 as Senior Director, Communications for the Company’s Beer Division. He was promoted to Vice President, Communications – Beer Division in 2016 and assumed the role of Vice President, Corporate Communications in 2017. Prior to joining Constellation Brands, he held a number of roles with increasing responsibility at Grainger, then a $9 billion global provider of industrial supplies and equipment. While at Grainger, from 2011 to |
2013 Mr. McGrew served as Director, U.S. Business Communications, from January 2013 to October 2013 he served as Senior Director, U.S. Business & Global Supply Chain Communications and from October 2013 to September 2014 he served as Senior Director, Communications – Americas, among other roles of increasing responsibility. |
BRG sponsorships - ASIAA supporting employees and communities of Asian descent SAGE supporting experienced career professionals |
| | | | | |
| Mallika Monteiro, age 4344, has been an Executive Vice President of the Company since October 2019. Beginning March 2021, Ms. Monteiro has performed the role of Executive Vice President, and Chief Growth, Strategy, and Digital Officer. From October 2019 to February 2021 she performed the role of Executive Vice President, Chief Growth and Strategy Officer and from October 2018 to September 2019, she performed the role of Senior Vice President, Chief Growth Officer. She joined Constellation in October 2016 as Vice President, Beer Innovation and was given additional responsibilities as Chief of Staff to the Company's Executive Management Committee in AugustJuly 2018. Prior to joining Constellation, from July 2014 to September 2016, |
Ms. Monteiro was a Senior Marketing Director at Anheuser Busch InBev. Prior to joining Anheuser Busch InBev, she served in roles of increasing responsibility with Beam Suntory Inc., including as Associate Brand Manager - Jim Beam from July 2007 to June 2009, Brand Manager - Cognac from July 2009 to December 2011, and Senior Brand Manager - Vodka, from January 2012 to June 2014. |
BRG sponsorship - ConstellationCPN Parents Network |
supporting parents and caregivers | | | | | |
Constellation Brands, Inc. FY 2023 Form 10-K | #WORTHREACHINGFOR I 14 |
| | | | | | | | |
| PART I | ITEM 1. BUSINESS | Table of Contents |
| | | | | |
| James A. Sabia, Jr., age 6061, is the Company’s Executive Vice President and President, Beer Division as well as President of Crown, having performed these roles since January 2022 and February 2022, respectively. He has been an Executive Vice President of the Company since May 2018. From March 2021 through January 2022 he served as Executive Vice President, Managing Director, Beer Division. From May 2018 through March 2021 he performed the role of Executive Vice President, Chief Marketing Officer. He joined the Company in August 2007 as Vice President, Marketing for the Company’s spirits business. Since then, he has served in roles of increasing responsibility with the Company. Since 2009, he has served as the Chief Marketing |
Officer of the Company’s Beer Division. From 2009 to June 2013, Mr. Sabia was employed by Crown, of which the Company owned a 50% interest and was the Company’s beer business during that period. In June 2013, the Company acquired the remaining 50% of Crown, which became a wholly-owned indirect subsidiary of the Company on that date. Prior to joining the Company, Mr. Sabia was with Molson Coors Brewing Company for 17 years. |
BRG sponsorship - AfricanAASCEND Americans Strengthening Constellation’s Engagement, Networking, & Developmentsupporting Black and African American employees and communities |
Company Information
Our website is https://www.cbrands.com, and our investor relations website is https://ir.cbrands.com. Our filings with the SEC, including our Form 10-K, quarterly reports on Form 10-Q, current reports on Form 8-K and amendments to those reports, filed or furnished pursuant to Section 13(a) or 15(d) of the Exchange Act, are accessible free of charge on our investor relations website as soon as reasonably practicable after we electronically file such material with, or furnish it to, the SEC. The SEC maintains a website, https://www.sec.gov, that contains reports, proxy, and information statements, and other information regarding issuers, such as ourselves, that file electronically with the SEC.
| | | | | |
| Constellation Brands, Inc. FY 2022 Form 10-K | #WORTHREACHINGFOR I 15 |
We have adopted a Chief Executive Officer and Senior Financial Executive Code of Ethics that specifically applies to our chief executive officer, our principal financial officer, and our controller, and is available on our investor relations website. This Chief Executive Officer and Senior Financial Executive Code of Ethics meets the requirements as set forth in the Exchange Act, Item 406 of Regulation S-K. We also have adopted a Code of Business Conduct and Ethics that applies to all employees, directors, and officers, including each person who is subject to the Chief Executive Officer and Senior Financial Executive Code of Ethics. The Code of Business Conduct and Ethics is available on our website, together with our Global Code of Responsible Practices for Beverage Alcohol Advertising and Marketing, at https://www.cbrands.com/story/policies.is available on our website under “Our Policies.” Copies of these materials are available in print to any stockholder who requests them. Stockholders should direct such requests in writing to Investor Relations Department, Constellation Brands, Inc., 207 High Point Drive, Building 100, Victor, New York 14564, or by telephoning our Investor Center at 1-888-922-2150.
Our Board of Directors Corporate Governance Guidelines and the Charters of the Board’s Audit Committee, Human Resources Committee (which serves as the Board’s compensation committee), and Corporate Governance, Nominating, and Responsibility Committee (which serves as the Board’s nominating committee) are accessible on our investor relations website. Amendments to, and waivers granted to our directors and executive officers under, our codes of ethics, if any, will be posted in this area of our investor relations website.
The information regarding our websites and their content is for your convenience only. The content of our websites is not deemed to be incorporated by reference in this reportForm 10-K or filed with the SEC.
| | | | | |
Constellation Brands, Inc. FY 20222023 Form 10-K | #WORTHREACHINGFOR I 1615 |
| | | | | | | | |
| PART I | ITEM 1A. RISK FACTORS | Table of Contents |
Item 1A. Risk Factors
In addition to information discussed elsewhere in this reportForm 10-K, you should carefully consider the following factors, as well as additional factors not presently known to us or that we currently deem to be immaterial, which could materially affect our business, liquidity, financial condition, and/or results of operations in present and/or future periods. The following factors are organized under relevant headings; however, they may be relevant to other headings as well.
Operational Risks
Supply of quality water, agricultural, and other raw materials, certain raw and packaging materials purchased under supply contracts; supply chain disruptions and inflation; limited group of glass bottle suppliers; supply chain disruptions
The quality and quantity of water available for use is important to the supply of our agricultural raw materials and our ability to operate our business. Water is a limited resource in many parts of the world. and ifIf climate patterns change and droughts continue or become more severe or other restrictions on currently available water resources are imposed, there may be a scarcity of water or poor water quality which may affect our and our suppliers’ operations, increase production costs, or impose capacity constraints. We are dependent on sufficient amounts of quality water for operation of our breweries, wineries, and distilleries, as well as to irrigate our vineyards and conduct our other operations. The suppliers of the agricultural raw materials we purchase are also dependent upon sufficient supplies of quality water for their vineyards and fields. If water available to our or our suppliers’ operations becomes scarce or the quality of that water deteriorates, we may incur increased production costs or face manufacturing constraints. In addition, water purification and waste treatment infrastructure limitations could increase costs or constrain operation of our production facilities and vineyards. A substantial reduction in water supplies could result in material losses of grape crops and vines or other crops, such as corn, barley, or hops, which could lead to a shortage of our product supply.
We have substantial brewery operations in Mexico, brewery operations in Texas, Virginia, and Florida, and substantial wine operations in the U.S. (primarily in California), New Zealand, and Italy. as well as brewery and distillery operations in the U.S. Although certain areas in California have recently experienced flooding, the state has endured and continuesmay continue to experience prolonged drought conditions which have resulted in the imposition of certain restrictions on water usage,. and ifIf these conditions or restrictions persist and/or increase in severity, it could have an adverse effect upon those operations. Our Navacurrent Mexican breweries are each, and the Veracruz Brewery iswill be, sourced from a single water supply. Although we anticipate our operations will have adequate sources of quality water to support their ongoing requirements, there is no guarantee that the originating from separate and distinct aquifers. The sources of water, methods of water delivery, water quality, or water requirements will notto support our ongoing requirements may change materially in the future. We may incur additional expenses for improving water delivery, quality, and efficiency as well as for securing additional water sources.
Our breweries, the Glass Plant, our wineries, and our distilleries use a large volume of agricultural and other raw materials to produce theirour products. These include corn starch and sugars, malt, hops, fruits, yeast, and water for our breweries; soda ash and silica sand for the Glass Plant; grapes and water for our wineries; and grain and water for our distilleries. Our breweries, wineries, and distilleries all use large amounts of various packaging materials, including glass, aluminum, cardboard, and other paper products. Our production facilities also use electricity, natural gas, and diesel fuel in their operations. Certain raw materials and packaging materials are purchased under contracts of varying maturities. The supply, on-time availability, and price of raw, packaging, and other materials, packaging materialsenergy, and energy canother commodities have been and may continue to be affected by many factors beyond our control, including supply chain disruptions, inflationary pressures, market demand, global geopolitical events and military conflicts, such as repercussions from the recent conflict in Ukraine (including on certain commodities, such as aluminum, corn, crude oil, natural gas, and steel)Russian invasion of Ukraine, droughts, storms, and other weather conditionsevents, or natural or man-made eventsdisasters, economic factors affecting growth decisions, plant diseases, and theft. Inflationary pressures, including for material costs, energy, commodities, supply chain logistics,For example, we have experienced a lack of availability and labor, mayincreased costs of ocean freight shipping containers and delays at sea and land ports which has impacted and could continue to negatively impact us,our distribution and we may be unable to pass along rising costs to consumers through increased selling pricesproduction capabilities.
Our breweries, wineries, and distilleries are also dependent upon an adequate supply of glass bottles,. and weWe have experienced glass bottle purchasing shortages, particularly for brown glass used for certain of our Mexican beer brands. Glass bottle costs are one of our largest components of cost of product sold. The Glass Plant produces a majority of the total annual glass bottle supply for our Mexican beer brands, and we currently have a small number of other suppliers of glass bottles for our Mexican beer brands. In the U.S., glass bottles have only a small number of producers. Currently, one producer supplies a majority of our glass container requirements for
| | | | | |
| Constellation Brands, Inc. FY 2022 Form 10-K | #WORTHREACHINGFOR I 17 |
have a small number of other suppliers of glass bottles for our Mexican beer brands. In the U.S., glass bottles have only a small
| | | | | |
Constellation Brands, Inc. FY 2023 Form 10-K | #WORTHREACHINGFOR I 16 |
| | | | | | | | |
| PART I | ITEM 1A. RISK FACTORS | Table of Contents |
number of producers. Currently, one producer supplies a majority of our glass container requirements for our U.S. wine and spirits operations while a different producer supplies the glass bottles for our craft beer operations.
Supply chain disruptions, such as lack of availability and increased costs of ocean freight shipping containers and delays at sea and/or land ports, could continue to impact our distribution and production capabilities. To the extent any of the foregoing factors (i) increases the costs of our finished products orand we are unable or choose not to pass along such rising costs to consumers through increased selling prices or (ii) leads to a shortage of our product supply or inventory levels, we could experience a material adverse effect on our business, liquidity, financial condition, and/or results of operations.
Reliance upon complex information systems and third-party global networks; cyber-attacks; not realizing benefits of our new global ERPcyberattacks
We depend on information technologyIT to enable us to operate efficiently and interface with customers and suppliers, maintain financial accuracy and efficiency, and effect accurate and timely governmental reporting. If we do not allocate and effectively manage the resources necessary to build and sustain the proper technology infrastructure, including our global ERP, we could be subject to transaction errors, processing inefficiencies, increased costs, loss of customers, business disruptions, loss of or damage to intellectual property through security breach, or penalties associated with the failure to timely file governmental reports. We recognize that many, and/or other difficulties. Many groups on a worldwide basis have experienced increases in electronic security breaches, cyber-attackscyberattacks, and other hacking activities such as denial of service, malware, and ransomware, and there is the possibility of retaliatory cyber-attackscyberattacks, including by state-sponsored organizations, stemming from geopolitical and economic responses to Russia’s invasion of Ukraine. As with all large information technologyIT systems, we have been a target of cyberattackers and other hacking activities and our systems could be penetrated by increasingly sophisticated outside parties intent on extracting confidential or proprietary information, corrupting our information, disrupting our business processes, engaging in the unauthorized use of strategic information about us or our employees, customers, or consumers, or demanding monetary payment. Such unauthorized access could disrupt our operations and could result in various costs and adverse consequences, including the loss of assets or revenues, litigation, regulatory actions, remediation costs, increased cyber-securitycybersecurity protection costs, damage to our reputation, harm to our employees, or the failure by us to retain or attract customers following such an event.
We have outsourced various functions to third-party service providers and may outsource other functions in the future. We rely on such third-parties to provide services on a timely and effective basis, but we do not ultimately control their performance. In addition, our distributors, wholesalers, suppliers, joint venture partners, and other external business partners utilize their own information technologyIT systems that are subject to similar risks to us as described above. Their failure to perform as expected or as required by contract, or a cyber-attackadditional cyberattacks on them that disrupts their systems, could result in significant disruptions and costs to our operations or, in the case of third-party service providers, a penetration of our systems.
In Fiscal 2022, we completed the implementation of a new global ERP across our business units using a phased approach. We designed the ERP to accurately maintain our financial records, enhance operational functionality, and provide timely information to our management team related to the operation of the business. We plan to make enhancements to the ERP and associated processes and tools, which will continue to require the investment of personnel and financial resources. If our ERP does not operate as intended or the anticipated benefits from this implementation are not fully realized, we may experience delays, increased costs, and other difficulties that may interfere with being able to operate our business and the effectiveness of our internal control over financial reporting could be adversely affected.
To the extent any of the foregoing factors result in significant disruptions and costs to our operations or reduce the effectiveness of our internal control over financial reporting, weit could have a material adverse effect on our business, liquidity, financial condition, and/or results of operations.
Economic and other uncertainties associated with our international operations
Our products are produced and sold in numerous countries, we have employees in various countries, and weWe have production facilities currently in the U.S., Mexico, New Zealand, and Italy.
and employees in various countries, and our products are sold in numerous countries. The countries in which we operate impose duties, excise taxes, and/or other taxes on beverage alcohol products, and/or on certain raw materials used to produce our beverage alcohol products, in varying amounts.
| | | | | |
| Constellation Brands, Inc. FY 2022 Form 10-K | #WORTHREACHINGFOR I 18 |
Governmental bodies may propose changes to international trade agreements, treaties, tariffs, taxes, and other government rules and regulations including but not limited to environmental treaties and regulations. The recentEscalating geopolitical tensions, including from the military conflict in Ukraine and escalating geopolitical tensions resulting from such conflict, have resulted and may continue to result in sanctions, tariffs, and import-export restrictions which. These activities, when combined with any retaliatory actions that may be taken by other countries, including Russia, could cause further inflationary pressures and economic and supply chain disruptions (including impacts on prices and supply of certain commodities, such as aluminum, corn, crude oil, natural gas, and steel). Significant increases in import and excise duties or other taxes on, or that impact, beverage alcohol products as well as any tariffs, particularly on imports from Mexico and any retaliatory tariffs imposed by the Mexican government, could have a material adverse effect on our business, liquidity, financial condition, and/or results of operations.
In addition, governmental agencies extensively regulate the beverage alcohol products industry concerning such matters as licensing, warehousing, trade and pricing practices, permitted and required labeling, advertising
| | | | | |
Constellation Brands, Inc. FY 2023 Form 10-K | #WORTHREACHINGFOR I 17 |
| | | | | | | | |
| PART I | ITEM 1A. RISK FACTORS | Table of Contents |
advertising, and relations with wholesalers and retailers. Certain regulations also require warning labels and signage. We may be subject to new or revised regulations or, increased licensing fees, requirements, or taxes, or regulatory enforcement actions. Additionally, various jurisdictions may seek to adopt significant additional product labeling or warning requirements or limitations on the marketing or sale of our products because of what our products contain or allegations that our products cause adverse health effects. If these types of requirements become applicable to one or more of our major products under current or future environmental or health laws or regulations, they may inhibit sales of such products.
These uncertainties and changes, as well as the decisions, policies, and economic strength of our suppliers and distributors, could have a material adverse effect on our business, liquidity, financial condition, and/or results of operations.
Dependence on limited facilities for production of our Mexican beer brands, and; facility expansion, optimization, and construction issuesactivities
We are dependent on our Nava and Obregoncurrent Mexican breweries as our sole sources of supply to fulfill our Mexican beer brands product’ production requirements, both now as well as for the near-term.
Expansion, optimization, and/or construction activities continue at our Nava and Obregon breweries, and we are exploring construction of the Southeast Mexico Brewery. We have suspended Mexicali Brewery construction activities following a negative result from a public consultation held in Mexico. We continue to work with Mexican government officials to (i) determine next steps for our suspended Mexicali Brewery construction project, (ii) pursue various forms of recovery for capitalized costs and additional expenses incurred in establishing the Mexicali Brewery, and (iii) explore options to add further capacity elsewhere in Mexico, including the construction of the Southeast Mexico Brewery, to meet our long-term needs. These are multi-billion-dollar activities,breweries in Mexico. These are multi-billion-dollar activities with risks of completion delays, cost overruns, and further asset impairments., Theresuch isas alsothe no assuranceprior impairment of any recovery with respect tocertain long-lived assets at the suspended Mexicali Brewery. canceled Mexicali Brewery. We may not achieve the intended financial and operational benefits of these investments, including if we develop excess capacity that outpaces demand for our Mexican beer brands. We are pursuing the sale of the remaining assets at the Mexicali Brewery after exploring various options; however, we may not be successful in completing any such sale or obtaining other forms of recovery.
Expansion and optimization of current production facilities and construction of new production facilities are subject to various regulatory and developmental risks, including but not limited to: (i) our ability to obtain timely certificate authorizations, necessary approvals and permits from regulatory agencies at all or on terms that are acceptable to us; (ii) potential changes in federal, state, and local laws and regulations, including environmental requirements, that prevent a project from proceeding or increase the anticipated cost of the project; (iii) our inability to acquire rights-of-way or land or water rights on a timely basis on terms that are acceptable to us; or (iv) our inability to acquire the necessary energy supplies, including electricity, natural gas, and diesel fuel; or (v) a halt or delay in expansion, optimization, or construction activities due to COVID-19. Any of these or other unanticipated events could halt or delay the expansion, optimization, or construction of our production facilities.
We may not be able to satisfy our product supply requirements for the Mexican beer brands in the event of (i) a significant disruption or the partial or total destruction of the Nava or Obregoncurrent Mexican breweries or the Glass Plant, (ii) difficulty shipping raw materials and product into or out of the U.S., or (iii) a temporary inability to produce our product due to closure or lower production levels of one or more of our current Mexican breweries, including as a result of COVID-19. Also, if the contemplated expansion, optimization, and/or construction activities at the
| | | | | |
| Constellation Brands, Inc. FY 2022 Form 10-K | #WORTHREACHINGFOR I 19 |
Nava and Obregon breweries and construction of additional brewery capacity. Also, if the contemplated expansion, optimization, and/or construction activities at our breweries in Mexico are abandoned or not otherwise completed by their targeted completion dates, we may not be able to produce sufficient quantities of our Mexican beer to satisfy our needs in the future. Under such circumstances, we may be unable to obtain our Mexican beer at a reasonable price from another source, if at all. A significant disruption at our Nava or Obregoncurrent Mexican breweries, or the Glass Plant, even on a short-term basis, could impair our ability to produce and ship products to market on a timely basis. Alternative facilities with sufficient capacity or capabilities may not readily be available, may cost substantially more, or may take a significant time to start production, any of which could have a material adverse effect on our product supply, business, liquidity, financial condition, and/or results of operations.
Operational disruptions or catastrophic loss to breweries, wineries, other production facilities, or distribution systems
All of our Mexican beer brands product supply is currentlyproducts are produced at our Nava and Obregoncurrent Mexican breweries. Many of the workers at these breweries are covered by collective bargaining agreements. The Glass Plant has five operational glass furnaces which produceproduces a majority of the total annual glass bottle supply for our Mexican beer brands. Several of our vineyards and production and distribution facilities, including certain California and Oregon wineries, are in areas prone to seismic activity. Additionally, we have various vineyards and wineries in California and Oregon which have recently experienced wildfires, landslides, and/or landslides.
severe winter storms.
| | | | | |
Constellation Brands, Inc. FY 2023 Form 10-K | #WORTHREACHINGFOR I 18 |
| | | | | | | | |
| PART I | ITEM 1A. RISK FACTORS | Table of Contents |
If any of these or other of our properties and production facilities were to experience a significant operational disruption or catastrophic loss, it could delay or disrupt production, shipments, and revenue, and result in potentially significant expenses to repair or replace these properties or find suitable alternative providers. Also, our production facilities are asset intensive. As our operations are concentrated in a limited number of production and distribution facilities, we are more likely to experience a significant operational disruption or catastrophic loss in any one location from acts of war or terrorism, fires, floods, earthquakes, severe winter storms or frosts, hurricanes, pandemicsnatural or man-made disasters, public health crises, labor strikes or other labor activities, cyber-attackscyberattacks and other attempts to penetrate our or our third-party service providers’ information technologyIT systems or the information technologyIT used by our non-production employees who work remotely during the COVID-19 pandemic,, or unavailability of raw or packaging materials, or other natural or man-made events. Geopolitical and economic responses to Russia’s invasion of Ukraine could continue to impact global energy prices and supply, particularly for crude oil and natural gas, as well as result in retaliatory cyber-attacks. If a significant operational disruption or catastrophic loss were to occur, we could breach agreements, our reputation could be harmed, and our business, liquidity, financial condition, and/or results of operations could be adversely affected by, among other items, higher maintenance charges, unexpected capital spending, or product supply constraints.
Our insurance policies do not cover certain types of catastrophes and may not cover certain events such as pandemics. Economic conditions and uncertainties in global markets may adversely affect the cost and other terms upon which we are able to obtain property damage and business interruption insurance. If our insurance coverage is adversely affected, or to the extent we have elected to self-insure, we may be at greater risk that we may experience an adverse impact to our business, liquidity, financial condition, and/or results of operations.
COVID-19 or other pandemics, outbreaks of communicable infections or diseases, or other public health concerns in the markets in which our consumers or employees live and/or in which we or our distributors, retailers, and suppliers operate
Disease outbreaks, including the COVID-19 pandemic, and other public health conditions have resulted and could continue to result in disruptions and damage to our business caused by potential negative consumer purchasing behavior as well as disruption to our supply chains, production processes, and operations. Consumer purchasing behavior may be impacted by reduced consumption by consumers who may not be able to leave home or otherwise shop in a normal manner as a result of governmental containment actions, quarantines, or other cancellations of public events and other opportunities to purchase our products, from bar, restaurant, and venue closures or capacity restrictions, or from a reduction in consumer discretionary income due to reduced or limited work and layoffs. Supply disruption may result from restrictions on the ability of employees and others in the supply chain to travel and work, such as caused by quarantine or individual illness, or which may result from border closures imposed by governments to deter the spread of communicable infection or disease, or determinations by us or our suppliers or distributors to temporarily suspend operations in affected areas, or other actions which restrict the ability to distribute our products or which may otherwise negatively impact our ability to
| | | | | |
| Constellation Brands, Inc. FY 2022 Form 10-K | #WORTHREACHINGFOR I 20 |
produce, package, and ship our products, for our distributors to distribute our products, or for our suppliers to provide us our raw materials. Ports or channels of entry may be closed or operate at only a portion of capacity, or transportation of product within a region or country may be limited, if workers are unable to report to work due to travel restrictions or personal illness. Our operations and the operations of our suppliers may become less efficient or otherwise become negatively impacted if our executive leaders or other personnel critical to our operations are unable to work or if a significant percentage of the workforce is unable to work or is required to work remotely. A prolonged quarantine or border closure could result in temporary or longer-term disruptions of sales patterns, consumption and trade patterns, supply chains, production processes, and operations. A widespread health crisis, such as the COVID-19 pandemic, could negatively affect the economies and financial markets of many countries resulting in a global economic downturn which could negatively impact demand for our products and our ability to borrow money. Any of these events could have a material adverse effect on our business, liquidity, financial condition, and/or results of operations.
Climate change; environmental regulatory compliance and emissions and stewardship targets
Our business depends upon agricultural activity and naturalClimate change; ESG regulatory compliance; failure to meet emissions, stewardship, and other ESG targets
Our business depends upon agricultural activity and natural and human capital resources. There has been much public discussion related to concerns that carbon dioxide and other GHGs in the atmosphereGHGs may have an adverse impact on global temperatures, weather patterns, and the frequency and severity of extreme weather and natural disasters. Severe weather events and natural disasters, such as our experiences with drought, flooding, and/or wildfires in California, and Oregon, or Washington, an unexpected severe winter stormstorms in California, Texas, or Mexico, or a late frostfrosts or flooding in New Zealand, and climate change may negatively affect agricultural productivity in the regions from which we presently source our various agricultural raw materials or the energy supply powering our production facilities. Decreased availability of our raw materials may increase our cost of product sold. Severe weather events and natural disasters or changes in thetheir frequency or intensity of weather events or natural disasters can also impact product quality and; disrupt our supply chains, which may affect production operations, insurance cost and coverage, as well asand delivery of our products to wholesalers, retailers, and consumers. Natural disasters such as severe storms, floods, and earthquakes may also ; and negatively impactaffect the ability of consumers to purchase our products.
The landscape related to ESG regulation, compliance, and reporting is constantly evolving, including expanding in scope and complexity. For example, the SEC and the European Commission have published proposed or final rules that would require significantly increased disclosures related to climate change. We may experience significant future increases in the costs associated with environmental regulatory compliance for ESG matters, including fees, licenses, reporting, and the cost of capital improvements for our operating facilities to meet environmental regulatory requirements. , as well as to address other regulations, standards, frameworks, and ratings from various governmental entities and other stakeholders or activist campaigns. We have disclosed targets related to restoration of water withdrawals, Scope 1 and Scope 2 GHG emissions, and enhancing social equity within our industry and communities, and we may disclose new or updated ESG-related targets in the future. The achievement of such targets along with our broader value chain engagement efforts have required and will continue to require us and in some cases third parties with which we do business, such as our suppliers, to make investments and allocate resources.
In addition, we may be party to various environmental remediation obligations arising in the normal course of our business or relating to historical activities of businesses we acquire. Due to regulatory complexities, governmental or contractual requirements, uncertainties inherent in litigation, and the risk of unidentified contaminants inat our current and former properties, the potential exists for remediation, liability, indemnification, and other costs to differ materially from the costs that we have estimated. We may also incur costs associated with environmental compliance arising from events we cannot control, such as unusually severe floods, hurricanes, earthquakes, or fires. We havenatural disasters. We may also disclosed targets related to restoration of water withdrawals and Scope 1 and Scope 2 GHG emissions, the achievement of which will require us to make investments and allocate resources. We cannot assure that we have allottednot allot sufficient resources to attain, and/or thatmay wenot ultimately will achieve, theseour ESG targets, or thatand our costs in relation to any of the foregoing matters will not exceed our projections, which could have a material adverse effect upon our business, liquidity, financial condition, and/or results of operations.may exceed our projections, which could have a material adverse effect upon our business, liquidity, financial condition, and/or results of operations.
| | | | | |
Constellation Brands, Inc. FY 2023 Form 10-K | #WORTHREACHINGFOR I 19 |
| | | | | | | | |
| PART I | ITEM 1A. RISK FACTORS | Table of Contents |
Reliance on wholesale distributors, major retailers, and government agencies
Local market structures and distribution channels vary worldwide. Within our primary market in the U.S., we offer a range of beverage alcohol products with generally separate distribution networks utilized for our beer portfolio and our wine and spirits portfolio. In the U.S., we sell our products principally to wholesalers for resale to retail outlets and directly to government agencies. We have an exclusive arrangement with one wholesaler that generates a large portion of our branded U.S. wine and spirits net sales, and we have one wholesaler for our beer portfolio which, through multiple entities, represents roughly one-fifth of our consolidated net sales. Wholesalers and retailers of our products offer products which compete directly with our products for retail shelf space, promotional support and consumer purchases, and wholesalers or retailers may give higher priority to products of our competitors. The replacement or poor performance of our major wholesalers, retailers, or government agencies could result in temporary or longer-term sales disruptions or could have a material adverse effect on our business, liquidity, financial condition, and/or results of operations.
| | | | | |
| Constellation Brands, Inc. FY 2022 Form 10-K | #WORTHREACHINGFOR I 21 |
Contamination and degradation of product quality from diseases, pests, and weather and climateother conditions
Contamination, whether arising accidentally or through deliberate third-party action, or other events that harm the integrity or consumer support for our brands, could adversely affect sales. Various diseases, pests, fungi, viruses, drought, frosts, wildfires, and certain other weather conditions or the effects of climate conditions, such as smoke taint from wildfiressustained during the 2020 U.S. wildfires or the late frost experienced in New Zealand in calendar 2021, could affect the quality and quantity of barley, hops, grapes, and other agricultural raw materials available, decreasing and decrease the supply and quality of our products. Similarly, power disruptions due to weather conditions could adversely impact our production processes and the quality of our products. We cannot guarantee that we and/or our suppliers of agricultural raw materials willmay not succeed in preventing contamination in existing and/or future vineyards, fields, or fieldsproduction facilities. Future government restrictions regarding the use of certain materials used in growing grapes or other agricultural raw materials may increase vineyard costs and/or reduce production of grapes or other crops. It is also possible that a supplier may not provide materials or product components which meet our required standards or may falsify documentation associated with the fulfillment of those requirements.
Product contamination or tampering or the failure to maintain our standards for product quality, safety, and integrity, including with respect to raw materials, naturally occurring compounds, packaging materials, or product components obtained from suppliers, may also reduce demand for our products or cause production and delivery disruptions. Contaminants or other defects in raw materials, packaging materials, or product components purchased from third parties and used in the production of our beer, wine, or spirits products, or defects in the fermentation or distillation process could lead to low beverage quality as well as illness among, or injury to, consumers of our products and may result in reduced sales of the affected brand or all our brands.
If any of our products become unsafe or unfit for consumption, are misbranded, or cause injury, we may have to engage in aadditional product recallrecalls and/or be subject to liability and incur additional costs. A widespread product recall,Widespread or multiple product recalls, or a significant product liability judgment could cause our products to be unavailable for a period, which could reduce consumer demand and brand equity and result in reputational harm.
Marijuana or regulatory action could cause our products to be unavailable for a period, which could reduce consumer demand and brand equity and result in reputational harm.
Outbreaks of communicable infections or diseases, pandemics, or other widespread public health crises in the markets in which our consumers or employees live and/or in which we or our distributors, retailers, and suppliers operate
Communicable disease outbreaks, including the COVID-19 pandemic, and other widespread public health crises have resulted and could continue to result in disruptions and damage to our business caused by potential negative consumer purchasing behavior as well as disruption to our supply chains, production processes, and operations. Consumer purchasing behavior may be impacted by reduced consumption if consumers are unable to leave home or otherwise shop in a normal manner as a result of containment actions or other cancellations of public events and other opportunities to purchase our products, from venue closures or capacity restrictions, or from a reduction in consumer discretionary income due to reduced or limited work and layoffs. Supply disruption may result from restrictions on the ability of employees and others in the supply chain to travel and work, which may result from quarantines, individual illnesses, or border closures imposed by governments to deter the spread of communicable infections or diseases; determinations by us or our suppliers or distributors to temporarily
| | | | | |
Constellation Brands, Inc. FY 2023 Form 10-K | #WORTHREACHINGFOR I 20 |
| | | | | | | | |
| PART I | ITEM 1A. RISK FACTORS | Table of Contents |
suspend operations in affected areas; or other actions which restrict or otherwise negatively impact our ability to produce, package, and ship our products, our distributors’ ability to distribute our products, or our suppliers’ ability to provide us with raw, packaging, and other materials. Channels of entry may be closed or operate at reduced capacity, or transportation of product within a region or country may be limited, including due to travel restrictions or personal illness of workers. Our operations and the operations of our suppliers may become less efficient or otherwise be negatively impacted if our or their executive management or other key operational personnel are unable to work or if a significant percentage of our workforce is unable to work at all or at their normal production or other facility. A prolonged quarantine or border closure could result in temporary or longer-term disruptions of sales patterns, consumption and trade patterns, supply chains, production processes, and/or operations. Another widespread health crisis or the reemergence of severe COVID-19 pandemic conditions could negatively affect the economies and financial markets of many countries resulting in a global economic downturn which could negatively impact demand for our products and our ability to borrow money. Any of these events could have a material adverse effect on our business, liquidity, financial condition, and/or results of operations.
Cannabis is currently illegal under U.S. federal law and in other jurisdictions; we do not control Canopy’s business or operations
The ability of Canopy to achieve its business objectives is contingent, in part, upon the legality of the cannabis industry, Canopy’s compliance with regulatory requirements enacted by various governmental authorities, and Canopy obtaining all regulatory approvals, where necessary, for the production and sale of its products. The laws and regulations governing medicinal and recreationaladult-use cannabis are still developing, including in ways that we may not foresee. Canopy’s success will depend on, among other things, the ability of Canopy to operate successfully in the cannabis market space and the presence of sufficient retail outlets. There are also concerns about health issues associated with certain types of form factors for cannabis products, such as those used in inhalables. These issues may result in a less robust consumer demand for certain form factors. There is no assurance aA robust cannabis consumer market willmay not develop consistent with our expectations, or that consumers willmay choose not to purchase any Canopy products. Although the Agriculture Improvement Act of 2018 has takentook hemp and hemp derived cannabinoids out of the most restrictive class of controlled substances, marijuana iscannabis remains a schedule-1Schedule I controlled substance in the U.S. andthat is currently illegal under U.S. federal law. Even in those U.S. states in which the recreationaladult-use and/or medicinal use of marijuanacannabis has been legalized, its use remains a violation of U.S. federal law. Since U.S. federal laws criminalizing the use of marijuana preempt state laws that legalize its use, continuationContinuation of U.S. federal law in its current state regarding marijuana would likelycannabis could limit the expansion of Canopy’s business into the U.S. Similar issues of illegality apply in other countries. Any amendment to or replacement of existing laws to make them more onerous, or delays in amending or replacing existing laws to liberalize the legal possession and use of cannabis, or delays in obtaining, or the failure to obtain, any necessary regulatory approvals may significantly delay or negatively impact Canopy’s markets, products, and sales initiatives and could have a material adverse effect on Canopy’s business, liquidity, financial condition, and/or results of operations. Were that to occur, we may not be able to recover the value of our. Our investment in Canopy could affect consumer perception of our existing brands and our reputation with various constituencies.
We currently have the right to nominate four members of the Canopy board of directors. While we do not control Canopy’s business or operations, we do rely on Canopy’s internal controls and procedures for operation of that business. Nevertheless, our current financing arrangements require us to certify, among other things, that to our knowledge (i) Canopy is properly licensed and operating in accordance with Canadian laws in all material respects;
| | | | | |
| Constellation Brands, Inc. FY 2022 Form 10-K | #WORTHREACHINGFOR I 22 |
(ii) Canopy does not knowingly or intentionally purchase, manufacture, distribute, import, and/or sell marijuana, or any other controlled substance in or from the U.S. or any other jurisdiction, in each case, where such purchase, manufacture, distribution, importation, or sale of marijuana or such other controlled substance is illegal, except in compliance with all applicable federal, state, local, or foreign laws, rules, and regulations; and (iii) Canopy does not knowingly or intentionally partner with, invest in, or distribute marijuana or any other controlled substance to any third-party that knowingly or intentionally purchases, sells, manufactures, or distributes marijuana or any other controlled substance in the U.S. or any other jurisdiction, in each case, where such purchase, sale, manufacture, or distribution of marijuana or such other controlled substance is illegal, except in compliance with all applicable federal, state, local, or foreign laws, rules, and regulations. Were we to know thatIf Canopy waswere to knowingly or intentionally violatingviolate any of these applicable laws and we became aware of such violation, we would be unable to make the required certification under our financing arrangements, which could lead to a default under those financing arrangements.
current financing arrangements, which could lead to a default under those financing arrangements.
| | | | | |
Constellation Brands, Inc. FY 2023 Form 10-K | #WORTHREACHINGFOR I 21 |
| | | | | | | | |
| PART I | ITEM 1A. RISK FACTORS | Table of Contents |
Strategic Risks
Potential decline in the consumption of products we sell; dependence on sales of our Mexican beer brands
Our business depends upon consumers’ consumption of our beer, wine, and spirits brands, and sales of our Mexican beer brands in the U.S. are a significant portion of our business. Consumer preferences, behaviors, and sentiment may shift due to a variety of factors, including changes in taste preferences and leisure, dining, and beverage purchasing and consumption patterns, demographic or social trends, trends involving demographics and ESG matters, changing market dynamics including consumer-led premiumization and betterment trends, and perceived value, and public health policies put into effect to mitigate the spread of COVID-19. Further, a limited or general decline in consumption in one or more of our product categories could occur in the future due to a variety of factors, including:
•a general decline in economic or geopolitical conditions;
•inflation, including the impact of reduced discretionary income of consumers available to purchase our products and increased commodities and other costs;
•concern about the health consequences of consuming beverage alcohol products, including betterment trends, and about drinking and driving or other safety considerations;
•a general decline in the consumption of beverage alcohol products in on-premise establishments, which mayincluding as a result fromof stricter laws relating to driving while under the influence of alcohol;
•the increased activity offrom anti-alcohol groups or other bodies, such as the World Health Organization, advocating measures designed to reduce the consumption of beverage alcohol products, such as the WHOor require more stringent labeling;
•increased federal, state, provincial, and foreign excise, or other taxes on beverage alcohol products and possible restrictions on beverage alcohol advertising and marketing;
•increased regulation restricting the purchase or consumption of beverage alcohol products;
•inflation, including the impact of reduced discretionary income of consumers available to purchase our products and increased commodities costs; and
•wars, health epidemicsdisease outbreaks or pandemics, quarantines, weather, and natural or man-made disasters.
If these or any other factors cause a decline in the growth rate, amount, or profitability of our sales of the Mexican beer brands in the U.S. or any material shift in consumer preferences, behaviors, and tastesentiment in our major markets away from our beer, wine, and spirits brands, and our Mexican beer brands in particular, or from the categories in which they compete, it could adversely affect our business, liquidity, financial condition, and/or results of operations.
Acquisition, divestiture, investment, and NPD strategies
From time to time, we acquire businesses, assets, or securities of companies that we believe will provide a strategic fit with our business. We integrate acquired businesses with our existing operations; our overall internal control over financial reporting processes; and our financial, operations, and information systems. If the financial performance of our business, as supplemented by the assets and businesses acquired, does not meet our expectations, it may make it more difficult for us to service our debt obligations and our results of operations may fail to meet market expectations. We may not effectively assimilate the business or product offerings of acquired companies into our business or within the anticipated costs or timeframes, retain key customers and suppliers or key employees of acquired businesses, or successfully implement our business plan for the combined business. In addition, our final determinations and appraisals of the estimated fair value of assets acquired and liabilities assumed in our acquisitions may vary materially from earlier estimates and we may fail to fully realize anticipated cost savings, growth opportunities, or other potential synergies. We cannot assure that theThe fair value of acquired businesses or investments will remain constant.
| | | | | |
| Constellation Brands, Inc. FY 2022 Form 10-K | #WORTHREACHINGFOR I 23 |
We maymay not remain constant.
We also divest ourselves of businesses, assets, or securities of companies from time to time, including those that we believe no longer provide a strategic fit with our business. We may provide various indemnifications in connection with divestitures of businesses or assets. The amount of contingent consideration, if any, received in divestitures, including in the Wine and Spirits Divestitures, may vary based on various factors including actual future brand performance. Divestitures of portions of our business may also result in costs stranded in our remaining business. Delays in developing or implementing plans to address such costs could delay or prevent the accomplishment of our financial objectives. The amount of contingent consideration, if any, received in divestitures may also vary based on various factors including actual future brand performance.
We have also acquired or retained ownership interests in companies which we do not control, such as our joint venture to operate the Glass Plant, our interest in Canopy, and investments made through our corporate venture capital function, and we have acquired control of companies which we do not wholly own, such as our 75% interest in Nelson’s Green Brier
| | | | | |
Constellation Brands, Inc. FY 2023 Form 10-K | #WORTHREACHINGFOR I 22 |
| | | | | | | | |
| PART I | ITEM 1A. RISK FACTORS | Table of Contents |
75% interest in Nelson’s Green Brier Distillery, LLC. Our joint venture partners or the other parties that hold the remaining ownership interests in companies which we do not control may at any time have economic, business, or legal interests or goals that are inconsistent with our goals or the goals of the joint ventures or those companies. Our joint venture arrangements and the arrangements through which we acquired or hold our other equity or membership interests may require us to, among other matters, to pay certain costs, to make capital investments, to fulfill alone our joint venture partners’ obligations, or to purchase other parties’ interests. The entities in which we have an interest may be subject to litigation which may have an adverse impact on their ability to do business or under which they may incur costs and expenses which could have a material adverse impact on their operations or financial condition which, in turn, could negatively impact the value of our investment.
We previously increased our investment in Canopy through exercise of our warrants in Canopy and we may further increase our investment in the future. While we will not develop, distribute, manufacture, or sell cannabis products in the U.S., or anywhere else in the world, unless legally permissible to do so at all governmental levels in the particular jurisdiction, this investment could affect consumer perception of our existing brands and our reputation with various constituencies.
In addition, our continued success depends, in part, on our ability to develop new products. The launch and ongoing success of new productsNPDs are inherently uncertain, especially with respect to consumer appeal and our ability to deliver optimized marketing in an evolving and dynamic media landscape. A new product launch can give rise to a variety of costs. An unsuccessful launch, among other things, can affect consumer perception of existing brands and our reputation. Unsuccessful implementation or short-lived popularity of our product innovations has resulted and may in the future result in inventory write-offs and other costs.
We cannot assure that we willmay not realize the expected benefits of acquisitions, divestitures, investments, or new productsNPDs. We have recognized impairment losses and/or write-offs in connection with acquired and divested businesses and investments, and we may do so again in the future. We also cannot assure thatFurthermore, our acquisitions, investments, or joint ventures willmay not be profitable, or thatour forecasts regarding acquisition, divestiture, or investment activities willmay not be accurate, or that the internal control over financial reporting of entities which we must consolidate as a result of our investment activities but do not control or wholly own willmay not be as robust as our internal control over financial reporting. Our failure to adequately manage the risks associated with acquisitions, divestitures, investments, or new products, or the failure of an entity in which we have an equity or membership interest, could have a material adverse effect on our business, liquidity, financial condition, and/or results of operations.
Our Canopy investment is dependent upon an emerging market and legal sales of cannabis products
The legal cannabis market is an emerging market. The legislative framework pertaining to the Canadian cannabis market, as well as cannabis markets in other countries, is uncertain. The success of the Canopy transactions will depend on, among other things, the ability of Canopy to create a strong platform to operate successfully in the cannabis market space, consumer demand for its products, and the presence of sufficient retail outlets. There is no assurance a robust cannabis consumer market will develop consistent with our expectations or that consumers will purchase any Canopy products.
The changing legal landscape and the lack of consumer market data makes it difficult to predict the pace at which the cannabis market may grow, if at all, and the products that consumers will purchase in the cannabis marketplace. For example, the Canadian Cannabis Act prohibits testimonials, lifestyle branding and packaging that is appealing to youth. The restrictions on advertising, marketing, and the use of logos and brand names could have
| | | | | |
| Constellation Brands, Inc. FY 2022 Form 10-K | #WORTHREACHINGFOR I 24 |
a material adverse effect on Canopy’s business, liquidity, financial condition, and/or results of operations, and our investment in Canopy. Additionally, Canopy must rely on its own market research and internal data to forecast sales as detailed forecasts may not be fully available at this early stage in the cannabis industry in Canada and globally. Market research relating to the adult-use recreational legal cannabis industry is in its early stages and, as such, trends can only be forecasted.
A failure in the demand for Canopy’s products to materialize as a result of competition, consumer desire, competition from legal and illegal market entrants or other products, or other factors could have a material adverse effect on Canopy’s business, liquidity, financial condition, and/or results of operations. The changing legal landscape and the lack of consumer market data makes it difficult to predict the pace at which the cannabis market may grow, if at all, and the products that consumers will purchase in the cannabis marketplaceNPDs, or the failure of an entity in which we have an equity or membership interest, could have a material adverse effect on our business, liquidity, financial condition, and/or results of operations.
Dependence upon trademarks and proprietary rights, failure to protect our intellectual property rights
Our future success depends significantly on our ability to protect our current and future brands and products and to defend our intellectual property rights. We have been granted numerous trademark registrations and use certain trademarks under license covering our brands and products, and we have filed, and expect to continue to file or have filed on our behalf, trademark applications seeking to protect newly developed brands and products. We cannot be sure that trademark registrations will be issued with respect to any of such trademark applications. We could also, by omission, fail to timely renew or protect a trademark and our competitors could challenge, invalidate, or circumvent any existing or future trademarks issued to, or licensed by, us. Several of our subsidiaries
Our subsidiaries CB Brand Strategies, LLC, Crown Imports LLC, and Compañía Cervecera de Coahuila, S. de R.L. de C.V. are defendants in a lawsuit originally filed in U.S. District Court for the Southern District of New York inon February 15, 2021, and most recently amended in December 2021on March 16, 2022, by Cervecería Modelo de México, S. de R.L. de C.V. and Trademarks Grupo Modelo, S. de R.L. de C.V., which alleges, among other things, that our sublicensesub-license of the trademarks for our Mexican beer brands should not permit us to use the Corona brand name on our Corona Hard Seltzer or the Modelo brand name on our Modelo Ranch Water. While weOn August 5, 2022, both the plaintiffs and the defendants filed motions for summary judgment. On November 3, 2022, the court denied our motion for summary judgment. On December 13, 2022, the court denied plaintiffs’ motion for summary judgment. At a trial in March 2023, the jury returned a unanimous verdict in our favor on all counts in the plaintiffs’ complaint, and the court entered judgment dismissing the complaint on March 15, 2023. On April 12, 2023, the plaintiffs filed a motion for judgment as a matter of law or, in the alternative, for a new trial with the court, which motion was denied on April 14, 2023. While we continue to believe this lawsuit is without merit, iflitigation is inherently unpredictable and subject to substantial uncertainties and unfavorable developments and resolutions could occur. In addition, our cost of defending this litigation has been and could continue to be substantial. If we are not successful, we may not be able to market our hard seltzer productCorona Hard Seltzer in its current formulation under the Corona brand name or our ranch waterModelo Ranch Water product in its current formulation under the Modelo brand name and we may be required to pay damage awards, each of which may have an adverse effect on our business and financial condition. We , liquidity, financial condition and/or results of operations.
| | | | | |
Constellation Brands, Inc. FY 2023 Form 10-K | #WORTHREACHINGFOR I 23 |
| | | | | | | | |
| PART I | ITEM 1A. RISK FACTORS | Table of Contents |
We have been and may continue to be subject to other litigation related to our trademarks and intellectual property rights. A substantial adverse judgment or other unfavorable resolution of these matters or our failure to otherwise protect our intellectual property rights could have a material adverse effect on our business, liquidity, financial condition, and/or results of operations.
Financial Risks
Indebtednessas well as the costs associated with such activities could have a material adverse effect on our business, liquidity, financial condition, and/or results of operations.
The Canopy Transaction, which is designed to capitalize on U.S. cannabis market opportunities, may significantly alter our relationship with and investment in Canopy
If the Canopy Transaction is completed and we exchange our Canopy common shares for Exchangeable Shares and terminate certain legacy agreements with Canopy, we and Canopy will no longer be able to derive benefits from our strategic relationship. The Exchangeable Shares will not carry (i) voting rights which will limit our ability to exert influence over Canopy (as will the termination of our rights under the investor rights agreement and the resignations of our nominees to Canopy’s board of directors) or (ii) rights to receive dividends or other rights upon dissolution of Canopy which will limit our right to derive economic benefits from our investment in Canopy if it declares dividends or dissolves and we continue to hold Exchangeable Shares. Furthermore, we expect to no longer apply the equity method of accounting to our investment in Canopy, which may subject our financial statements to additional volatility as we expect to account for the Exchangeable Shares at fair value. In connection with exchanging our Canopy common shares for Exchangeable Shares, we will also surrender our November 2018 Canopy Warrants to Canopy for cancellation, and therefore, we will not realize an opportunity to increase our ownership in Canopy if its stock price were to recover prior to their expiration. The perception of the Canopy Transaction by members of the investment community, whether or not it is completed, and the potential that Canopy may not remain listed on the stock exchanges it is currently listed on may result in a decrease in the value of Canopy’s common stock and further impair its liquidity and marketability. If the Canopy Transaction is not completed for any reason, including if Canopy fails to receive the requisite shareholder approval for the Canopy Amendment, Canopy will have expended substantial time and resources that could otherwise have been spent on Canopy’s existing businesses and the pursuit of other opportunities that could have been beneficial to Canopy. Canopy may not fully realize the anticipated benefits of the Canopy Transaction if it is completed. To the extent any of the foregoing factors impact Canopy, it could have a material adverse effect on Canopy’s business, liquidity, financial condition, and/or results of operations. Were that to occur, we may not be able to recover the remaining value of our investment in Canopy.
In addition, if the Canopy Transaction is completed and the October 2022 Credit Agreement Amendments become effective, our financing arrangements will (i) restrict repayment of the loans under our credit agreements with proceeds derived, directly or indirectly, from Canopy prior to the Specified Time, (ii) restrict the use of proceeds from the loans under our credit agreements, directly or indirectly, for any investment in, transaction with, or to fund the activities of or business with Canopy prior to the Specified Time, and (iii) provide that we will not convert any of our outstanding Exchangeable Shares for Canopy common shares or own any Canopy common shares until the Specified Time. If the foregoing obligations become effective and we do not comply with them, we could trigger an event of default under such debt facilities or agreements. In such an event, the holders of our debt could elect to declare as due and payable all amounts outstanding under those instruments. An event of default could also result in events of default under other debt facilities or agreements that contain cross-acceleration or cross-default provisions, which could permit counterparties thereunder to exercise remedies. If that occurred, we might not have available funds to satisfy our repayment obligations.
Our Canopy investment is dependent upon an emerging market and legal sales of cannabis products
The legal cannabis market is an emerging market. The legislative framework pertaining to the Canadian cannabis market, as well as cannabis markets in the U.S. and other countries, is uncertain. Canopy’s success will depend on, among other things, its ability to create a strong platform to operate successfully in the cannabis market space and consumer demand for its products. A robust cannabis consumer market may not develop consistent with our expectations, or consumers may choose not to purchase Canopy products.
The changing legal landscape and the limited amount of consumer market data makes it difficult to predict the pace at which the cannabis market may grow, if at all, and the products that consumers will purchase in the cannabis marketplace. For example, the Canadian Cannabis Act prohibits testimonials, lifestyle branding, and packaging that is appealing to youth. The restrictions on advertising, marketing, and the use of logos and brand names could have a material adverse effect on Canopy’s business, liquidity, financial condition, and/or results of
| | | | | |
Constellation Brands, Inc. FY 2023 Form 10-K | #WORTHREACHINGFOR I 24 |
| | | | | | | | |
| PART I | ITEM 1A. RISK FACTORS | Table of Contents |
operations, and our investment in Canopy. Additionally, Canopy must rely largely on its own market research and internal data to forecast industry trends and statistics as detailed forecasts may not be fully available from other sources. A failure in the demand for Canopy’s products to materialize as a result of consumer desire, competition from legal and illegal market entrants or other products, or other factors could have a material adverse effect on Canopy’s business, liquidity, financial condition, and/or results of operations and our investment in Canopy.
Financial Risks
Indebtedness and interest rate fluctuations
We have incurred indebtedness to finance investments and acquisitions, refinance other indebtedness, fund beer operations expansion, optimization, and construction activities, pay cash dividends, and repurchase shares of our common stock. In the future, we may continue to incur additional indebtedness for any or all of these activities as well as to fund other general corporate purposes. We cannot assure that our business willare exposed to risks associated with interest rate fluctuations, and we have recently experienced a rising interest rate environment. We could experience further changes in our ability to manage fluctuations in interest rates, including for our variable interest rate debt outstanding or if we need to refinance indebtedness. In addition, our business may not generate sufficient cash flow from operations to meet all our debt service requirements;, return value to stockholders such as through payment of dividends or repurchase of shares of our common stock;, and fund our general corporate and capital requirements.
Our current and future debt service obligations and covenants could have important consequences. These consequences include, or may include, the following:
•our ability to obtain financing for future working capital needs or, investments/, acquisitions, or other purposes may be limited;
•our funds available for operations, expansions, and construction, dividends, or other distributions, or share repurchases may be reduced because we dedicate a significant portion of our cash flow from operations to the payment of principal and interest on our indebtedness;
•our ability to conduct our business could be limited by restrictive covenants; and
•our vulnerability to adverse economic conditions may be greater than less leveraged competitors and, thus, our ability to withstand competitive pressures may be limited.
Additionally, any failure to meet required payments on our debt, or failure to comply with any covenants in the instruments governing our debt, could result in an event of default under the terms of those instruments and a downgrade to our credit ratings. A downgrade in our credit ratings would increase our borrowing costs and
| | | | | |
| Constellation Brands, Inc. FY 2022 Form 10-K | #WORTHREACHINGFOR I 25 |
to our credit ratings would increase our borrowing costs and could affect our ability to issue commercial paper. Certain of our debt facilities also contain change of control provisions which, if triggered, may result in an acceleration of our obligation to repay the debt. In addition, certain of our current and future debt and derivative financial instruments have, or in the future, could have interest rates that are tied to reference rates, such as SOFR. The volatility and availability of such reference rates, including establishment of alternative reference rates, is out of our control. Changes to or the unavailability of such rates or the manner for calculation of such reference rates, could result in increases to the cost of our debt.
If we do not comply with the obligations contained in our senior credit facility, our existing or future indentures, or other loan agreements, we could be in default under such debt facilities or agreements. In such an event, the holders of our debt could elect to declare as due and payable all amounts outstanding under those instruments. AAn event of default could also require the immediate repayment of outstanding obligationsresult in events of default under other debt facilities or agreements that contain cross-acceleration or cross-default provisions, which could permit counterparties thereunder to exercise remedies. If that occurred, we might not have available funds to satisfy our repayment obligations.
Securities measured at fair value
The value of the warrants and convertible debt we hold in Canopy through our subsidiaries is subject to the volatility of the market price of Canopy’s common stock. This volatility subjects our financial statements to Accounting for Canopy securities and potential additional impairment of Canopy Equity Method Investment
We currently account for our investment in Canopy under the equity method and recognize our equity in Canopy’s earnings or losses on a two-month lag. There may be an additional impairment of our Canopy Equity Method Investment if Canopy’s stock price does not recover above our carrying value in the near-term. In the event the Canopy Transaction and the transactions contemplated by the Consent Agreement are completed and we elect to convert our Canopy common shares into Exchangeable Shares, we expect to no longer apply the equity method to our investment in Canopy, which we expect will instead be accounted for at fair value. This may subject
| | | | | |
Constellation Brands, Inc. FY 2023 Form 10-K | #WORTHREACHINGFOR I 25 |
| | | | | | | | |
| PART I | ITEM 1A. RISK FACTORS | Table of Contents |
our financial statements to additional volatility. The market pricebecause the value of Canopy’s common stock has experienced significant volatility, and that volatility may continue in the future and may alsoour Exchangeable Shares, including any received if we exchange our 2023 Canopy Promissory Note for Exchangeable Shares, would be subject to wide fluctuations in response to many factors beyond the control of Canopy, or of us. These factorsvolatility factors that include, but are not limited to:
•actual or anticipated fluctuations in Canopy’s reported results of operations or financial position, including due to aanother significant impairment of goodwill, or intangible assets, or other long-lived assets or other long-lived assets;
•adverse market conditions;
•recommendations and reports by securities and industry analysts;
•impactthe outcome of COVID-19 onthe Canopy’s operations, revenues, Transaction and ability to access financial markets as well as, on the cannabis industry generallyrelated transactions;
•significant acquisitions, investments, and/or equity issuances, asset sales, or other divestitures by Canopy;
•changes in the performance or market valuations of companies in Canopy’s industry;
•announcement of developments and material events by Canopy or its competitors;
•fluctuations in the costs of vital production materials and services;
•addition or departure of Canopy executive officers or other key personnel;
•speculative trading activity by certain investors;
•news reports relating to trends, concerns, technological, or competitive developments, regulatory changes and other related issues in Canopy’s industry or target markets;
•legal and regulatory changes affecting the cannabis industry generally and Canopy’s business and operations; and
•administrative obligations associated with Health Canada requirements and compliance with all associated rules and regulations including, but not limited to, the Canadian Cannabis Act.
We currently account for our investment in Canopy under the equity method. There may be a future impairment of our Canopy Equity Method Investment if Canopy’s stock price remains below our carrying value of that investment and does not recover in the near-term or if our expectations about Canopy’s prospective results and cash flows decline, which could be influenced by a variety of factors including those listed above. We recognize our equity in Canopy’s earnings on a two-month lag primarily because of the availability of Canopy’s financial results since Canopy’s fiscal year ends annually March 31 while our fiscal year ends annually on the last day of February.
Canopy’s corporate governance and valuation
Canopy’s business is subject to evolving corporate governance and public disclosure regulations that may from time to time increase both Canopy’s compliance costs and the risk of its non-compliance. These include changing rules and regulations promulgated by a number of governmental and self-regulated organizations, including, but not limited to, the Canadian Securities Administrators, the TSX, the International Accounting Standards Board, the SEC, and Nasdaq. These rules continue to evolve in scope and complexity creating new requirements for Canopy. Canopy is required to comply with applicable Nasdaq listing standards and SOX requirements. In the future, Canopy’s internal controls may not be adequate, or Canopy may not be able to
| | | | | |
| Constellation Brands, Inc. FY 2022 Form 10-K | #WORTHREACHINGFOR I 26 |
maintain adequate and effective internal controls over financial reporting as required by SOX, or on an ongoing basis if standards are modified, supplemented, or amended from time to time. If not maintained, investors could lose confidence in the reliability of its financial statements, which could harm Canopy’s business and have a negative impact on the trading price or market value of Canopy securities.
In addition, we record as equity in earnings our proportional share of Canopy’s results of operations. We could have a material weakness in the event the proportional share of Canopy’s results of operations that we record contains an error as a result of an error in Canopy’s financial statements that we do not detect.
Although we do not control Canopy, we do currently have significant influence over Canopy. If we controlled Canopy, we would have to consolidate Canopy into our financial statements, and if Canopy had a material weakness, we would inherit Canopy’s material weakness through consolidation. In such an event, even if Canopy’s financial statements were correct, the fact that Canopy had a material weakness could result in a material weakness for us.
Class action or other litigation relating to abuse of our products, the misuse of our products, product liability, or marketing or sales practices, including product labeling
There has been public attention directed at the beverage alcohol industry, which we believe is due to concern over problemsconcerns related to harmful use of alcohol, including drinking and driving, underage drinking, and health consequences from the misuse of alcohol. We could be exposed to lawsuits relating to product liability or marketing or sales practices, including product labeling. Adverse developments in lawsuits concerning these types ofrelated to such matters or a significant decline in the social acceptability of beverage alcohol products that may result from lawsuits could have a material adverse effect on our business, liquidity, financial condition, and/or results of operations.
| | | | | |
Constellation Brands, Inc. FY 2023 Form 10-K | #WORTHREACHINGFOR I 26 |
| | | | | | | | |
| PART I | ITEM 1A. RISK FACTORS | Table of Contents |
Other Risks
Control by theThe Reclassification may Sands family; Proposal from the Sands family to declassify our common stocknot benefit us or our stockholders
Our Class B Stock is principally heldThe long-term impacts of the Reclassification are still unknown, and the Reclassification may not result in an increase in stockholder value or improve the liquidity and marketability of our equity. If the Reclassification is not viewed favorably by members of the Sands familyinvestment community, either directly or through entities controlled by members of the Sands family. Holders of Class A Stock are entitled to one vote per share and holders of Class B Stock are entitled to 10 votes per share. Holders of Class 1 Stock generally do not have voting rights. The stock ownership of the Sands family and entities controlled by members of the Sands family represents a majority of the combined voting power of all classes of our common stock as of the date of this Form 10-K, voting as a single class. Consequently, the Sands family currently has the power to elect a majority of our directors and approve actions requiring the approval of the stockholders of the Company voting as a single class.
On April 2, 2022, we received the Proposal which proposes that each share of Class B Stock would be converted into 1.35 shares of Class A Stock. It is expected that the Sands family and entities controlled by members of the Sands family will continue to be our largest stockholder if a transaction were consummated on the terms proposed. Our Board of Directors has established a Special Committee to evaluate the Proposal. Any definitive agreement with the Sands family and entities controlled by members of the Sands family with respect to the potential transaction must be approved by the Special Committeeit may cause a decrease in the value of our Class A Stock and impair its liquidity and marketability. Furthermore, securities markets worldwide have recently experienced significant price and volume fluctuations. This market volatility, as well as our Board of Directors. Pursuant to the terms of the Proposal, any potential transaction would also require the approval of holders of a majority of the shares of Class A Stock that do not also hold shares of Class B Stock. We cannot assure you that a definitive agreement will be entered into, including because the Special Committee or the Board of Directors does not approve any such transaction, or what the ultimate terms of any such agreement may be. In addition, even if an agreement is approved by the Special Committee and the Board of Directors, a transaction still may not be completed if such transaction is not approved by the holders of a majority of the shares of Class A Stock that do not also hold shares of Class Bgeneral economic, market, or political conditions, could cause a reduction in the market price and liquidity of shares of our Class A Stock.
The Sands family and entities controlled by members of the Sands family have pledged shares of Class A Stock and Class BSands Family Stockholder Class A Stock ownership and Board of Directors nomination rights
Until the date that is five years after the Effective Time and so long as the Sands Family Stockholders, collectively, have beneficial or record ownership of at least 10% of the issued and outstanding shares of Class A Stock, our Board of Directors will, subject to the procedures and limitations set forth in the Reclassification Agreement, nominate two individuals designated by WildStar for election to our Board of Directors at any annual meeting of our stockholders at which directors are to be elected (or otherwise in connection with any action by written consent pursuant to which a majority of the Board of Directors will be elected). So long as the Sands Family Stockholders, collectively, have beneficial or record ownership of less than 10% but at least 9,239,463.1 shares of Class A Stock, as may be adjusted by any stock dividend, stock split, stock combination, or similar transaction, the Board of Directors will, subject to the procedures and limitations set forth in the Reclassification Agreement, nominate one individual designated by WildStar for election to the Board of Directors at any annual meeting of our stockholders at which directors are to be elected (or otherwise in connection with any action by written consent pursuant to which a majority of the Board of Directors will be elected).
The amount of Class A Stock currently held by the Sands Family Stockholders, together with the foregoing Board of Directors nomination rights, provide the Sands Family Stockholders with significant continued influence over our decisions. The interests of the Sands Family Stockholders with respect to matters potentially or actually involving or affecting us and our other stockholders, such as future acquisitions, financings, and other corporate opportunities and attempts to acquire us, may conflict with the interests of our other stockholders.
Certain Sands Family Stockholders have pledged shares of Class A Stock to secure various credit facilities. In the event of noncompliance with certain covenants under the credit facilities, the financial institutions to which such stock is pledged have certain remedies, including the right to sell the pledged shares (which would require the conversion of Class B Stock into Class A Stock prior to any sales) subject to certain protections afforded to the borrowers and pledgors. The sale by such financial institutions of a substantial amount of the pledged shares could depress, or result in volatility in, the trading price
| | | | | |
| Constellation Brands, Inc. FY 2022 Form 10-K | #WORTHREACHINGFOR I 27 |
of our Class A Stock and/or result in the Sands family and entities controlled by members of the Sands family ceasing to own shares representing a majority of the combined voting power of all classes of our common stock voting as a single class. In addition, if significant stock indices decide to prohibit the inclusion of companies with dual class structures, the price of our Class A Stock could be negatively impacted and could become more volatileof our Class A Stock.
Choice-of-forum provision contained in byin our Amended and Restated By-laws regarding certain stockholder litigation
Our byAmended and Restated By-laws provide that, unless we consent in writing to the selection of an alternative forum, (i) the Court of Chancery of Delaware (or if such court lacks subject matter jurisdiction, the federal district court of Delaware) will be, to the fullest extent permitted by law, be the sole and exclusive forum for any derivative action or proceeding brought on our behalf of the Company; any action asserting a claim of breach of a fiduciary duty owed by any of our current or former directors, officers, or stockholders to the Companyus or our stockholders; any action asserting a claim arising pursuant to any provision of the DGCL, our certificate of incorporationAmended and Restated Charter, or our byAmended and Restated By-laws, or as to which the DGCL confers jurisdiction on the Court of Chancery of Delaware; or any action asserting a claim governed by the internal affairs doctrine, and (ii) the federal district courts of the U.S. will, to the fullest extent permitted by law, be the sole and exclusive forum for any complaint asserting a cause of action arising under the Securities Act.
To the fullest extent permitted by law, this choice-of-forum provision will apply to state and federal law claims, including claims under the federal securities laws (including the Securities Act and the Exchange Act), although our stockholders will not be deemed to have waived our compliance with the federal securities laws and the rules and regulations thereunder. This choice-of-forum provision may increase costs for a stockholder pursuing any such claim, discourage claims, or limit a stockholder’s ability to bring a claim in a judicial forum that such stockholder finds favorable for disputes with us or our directors, officers, other stockholders, or other employees which may discourage such lawsuits even though an action, if successful, might benefit our stockholders. In addition, the courts located in Delaware may reach different judgments or results than would other courts,
| | | | | |
Constellation Brands, Inc. FY 2023 Form 10-K | #WORTHREACHINGFOR I 27 |
| | | | | | | | |
| PART I | ITEM 1A. RISK FACTORS | Table of Contents |
including courts where a stockholder would otherwise choose to bring the action, and such judgments or results may be more favorable to us than to our stockholders. If a court were to find this choice-of-forum provision inapplicable or unenforceable in an action, we may incur additional costs associated with resolving such action in other jurisdictions which could adversely affect our business, liquidity, financial condition, and/or results of operations. Any person or entity purchasing or otherwise acquiring or holding any interest in shares of our capital stock will be deemed to have notice of and consented to the provisions of our by-lawschoice-of-forum provision described above.
General Risks
International operations, worldwide and regional economic trends and financial market conditions, geopolitical uncertainty, interest rate fluctuations, or other governmental rules and regulations
Risks associated with international operations, any of which could have a material adverse effect on our business, liquidity, financial condition, and/or results of operations, include:
•changes in local political, economic, social, and labor conditions in U.S. and international locales;
•potential disruption from wars and military conflicts, including Russia’s invasion of Ukraine, terrorism, civil unrest, kidnapping, and drug-related, workplace, or other types of violence;
•restrictions on foreign ownership and investments or on repatriation of cash earned in countries outside the U.S.;
•import and export requirements and border accessibility;
•protectionist trade policies, sanctions, and tariffs;
•foreign currency exchange rate fluctuations, which may reduce the U.S. dollar value of net sales, earnings, and cash flows from non-U.S. markets or increase our supply chain costs, as measured in U.S. dollars, in those markets;
•a less developed and less certain legal and regulatory environment in some countries, which, among other things, can create uncertainty regarding contract enforcement, intellectual property rights, privacy obligations, real property rights, and liability issues; and
•inadequate levels of compliance with applicable domestic and foreign anti-bribery and anti-corruption laws, including the Foreign Corrupt Practices Act.
Unfavorable global or regional economic conditions, including economic slowdown or recession, instability in the banking sector, and the disruption, volatility, and tightening of credit and capital markets, as well as unemployment, tax increases, governmental spending cuts, or continuing high levels of inflation, could affect consumer spending patterns and
| | | | | |
| Constellation Brands, Inc. FY 2022 Form 10-K | #WORTHREACHINGFOR I 28 |
purchases of our products. These could also create or exacerbate credit issues, cash flow issues, and other financial hardships for us and our suppliers, distributors, retailers, and consumers. The inability of suppliers, distributors, and retailers to access liquidity could impact our ability to produce and distribute our products.
We are also exposed to risks associated with interest rate fluctuations. We could experience changes in our ability to manage fluctuations in interest rates and, accordingly, there can be no assurance that we will be successful in reducing those risks.
We could also be affected by nationalization of our international operations, unstable governments, unfamiliar or biased legal systems, intergovernmental disputes, or animus against the U.S. Any determination that our operations or activities did not comply with applicable U.S. or foreign laws or regulations could result in the imposition of fines and penalties, interruptions of business, terminations of necessary licenses and permits, and other legal and equitable sanctions.
Damage to our reputation
The success of our brands depends upon theconsumers’ positive image that consumers have of those brands, and maintaining a good reputation is critical to selling our branded products. Our reputation could also be impacted negatively by public perception, adverse publicity (whether or not valid, such as the similarity of the name of certain of our brands or trademarks and a type of virus), negative comments in social media, or our responses relating to:
•a perceived or actual failure to maintain high ethical standards and responsible operating practices to achieve our business goals for all our operations and activities, including those related to our ESG and DEI strategies, initiatives, and targets as well as associated reporting regulations, standards, frameworks, and ratings;
•a perceived or actual failure to address concerns relating to the quality, safety, or integrity of our products, including from contamination, whether arising accidentally or through deliberate third-party actionaccidental or deliberate contamination or tampering;
| | | | | |
Constellation Brands, Inc. FY 2023 Form 10-K | #WORTHREACHINGFOR I 28 |
| | | | | | | | |
| PART I | ITEM 1A. RISK FACTORS | Table of Contents |
•actions we may take to enhance or safeguard our reputation and uphold our core values, including changes to our operations, sales, advertising, marketing, and new product development;
•allegations that we, or persons currently or formerly associated with us, have violated applicable laws or regulations, including but not limited to those related to safety, employment, discrimination, harassment, whistle-blowingwhistleblowing, privacy, corporate citizenship, improper business practices, or cyber-securitycybersecurity;
•our environmental impact, including use of agricultural materials, packaging, water and energy use, and waste management; or
•efforts that are perceived as insufficient to promote the responsible use of alcohol or cannabis.
Failure to comply with applicable laws and regulations, maintain an effective system of internal controls, provide accurate and timely financial statement information, or protect our information systems against service interruptions, misappropriation of data, or breaches of security, could also hurt our reputation. Damage to our reputation or loss of consumer confidence in our products for any of these or other reasons could result in decreased demand for our products and could have a material adverse effect on our business, liquidity, financial condition, and/or results of operations, as well as require additional resources to rebuild our reputation, competitive position, and brand equity and renew investor confidence.
Competition
We operate in a highly competitive industry, and our sales and profitability could be negatively affected by numerous factors including:
•our inability to maintain or increase prices or develop new products;
•increases in our advertising or marketing expenditures to maintain our competitive position;
•new entrants in our market or categories, including from the convergence of beverage categories;
•the consolidation of distributors, wholesalers, retailers, suppliers, and suppliersother beverage companies;
•the decision of wholesalers, retailers, or consumers to purchase competitors’ products instead of ours;
•pricing, purchasing, financing, operational, advertising, or promotional decisions made by wholesalers, state and local agencies, and retailers which affect supply of or consumer demand for our products; or
•a general decline in beverage alcohol consumption due to consumer dietary preference changes or consumers substituting legalized marijuana or other similar products in lieu of beverage alcohol; or
•pricing, purchasing, financing, operational, advertising, or promotional decisions made by wholesalers, state and other local agencies, and retailers which could affect their supply of, or consumer demand for, our products.
| | | | | |
| Constellation Brands, Inc. FY 2022 Form 10-K | #WORTHREACHINGFOR I 29 |
cannabis or other similar products in lieu of beverage alcohol.
Our continued success also depends on our ability to attract and retain a high-quality and diverse workforce in a competitive environment for talent and to implement our human capital priorities and initiatives. We could also experience higher than expected selling, general, and administrative expenses if we find it necessary to increase the number offor investment in our personnel or our advertising or marketing expenditures to maintain our competitive position,, including due to employee turnover including as a result, continuing wage inflation, and of the ongoing “great resignation” occurringother emerging employment trends, particularly in the U.S. economy,; to deliver on our human capital priorities and initiatives; or for other reasons. We cannot guarantee that we willmay be ableunable to increase our prices to pass along to our customers any increased costs we incur to our customers.
Intangible assets, such as goodwill and trademarks
We have a significant amount of intangible assets such as goodwill and trademarks and may acquire more intangible assets in the future. Intangible assets are subject to a periodic impairment evaluation under applicable accounting standards. The write-down of any of these intangible assets could have a material adverse effect on our business, liquidity, financial condition, and/or results of operations.
Changes to tax laws, fluctuations in our effective tax rate, accounting for tax positions, the resolution of tax disputes, and changes to accounting standards, elections, assertions, or policies
Changes to federal, state, provincial, local, or foreign tax laws, could result in increased taxes on our products, business, customers, or consumers. Various proposals to increase taxes on beverage alcohol products have been made at the federal and state levels or at other governmental bodies in recent years. Federal, state, provincial, local, or foreign governmental entities may consider increasing taxes upon beverage alcohol products as they explore available alternatives for raising funds, including to offset budget or other deficits.
In addition, significant judgment is required to determine our effective tax rate and evaluate our tax positions. Our provision for income taxes includes a provision for uncertain tax positions. Fluctuations in federal, state, local, and foreign taxes, or a change to uncertain tax positions, including related interest and penalties, may
| | | | | |
Constellation Brands, Inc. FY 2023 Form 10-K | #WORTHREACHINGFOR I 29 |
| | | | | | | | |
| PART I | ITEM 1A. RISK FACTORS | Table of Contents |
impact our effective tax rate and our financial results. When tax matters arise, several years may elapse before such matters are audited and finally resolved. Unfavorable resolution of any tax matter could increase our effective tax rate and resolution of a tax issue may require the use of cash in the year of resolution.
U.S. tax changes or changes in how international corporations are taxed, including changes in how existing tax laws are interpreted or enforced, or changes to accounting standards, elections, or assertions as well as our accounting policies could have a material adverse effect on our business, liquidity, financial condition, and/or results of operations.
Cash dividends and share repurchases are subject to a number of uncertainties, and may affect the price of our common stock
Our capital allocation strategy contemplates quarterly cash dividends and periodic share repurchases under our share repurchase program. We fund our cash dividends and share repurchases through a combination of cash flow from operations, borrowings, and divestiture proceeds. However, we are not required to declare dividends or to make any share repurchases under our share repurchase program. We may discontinue, limit, suspend, increasedelay, or delayincrease our dividends and share repurchases at any time without prior notice. Even if not discontinued, the amount of such dividends and repurchases may be changed, and the amount, timing, and frequency of such dividends and repurchases may vary from historical practice or from our stated expectations. Decisions with respect to dividends and share repurchases are subject to the discretion of our Board of Directors and will be based on a variety of factors. Important factors that could cause us to discontinue, limit, suspend, increasedelay, or delayincrease our cash dividends or share repurchases include market conditions, the price of our common stock, the nature and timing of other investment opportunities, changes in our business strategy, the terms of our financing arrangements, our outlook as to our ability to obtain financing at attractive rates, the impact on our credit ratings, and the availability of cashchanges in laws or regulations, and the availability of cash. The IRA imposes an excise tax of 1% on share repurchases, effective January 1, 2023. The impact of this excise tax will be dependent on the extent of our share repurchases in future periods and could increase our tax liability. The reduction or elimination of our cash dividend, or longer suspension or elimination of our share repurchase program could adversely affect the market pricesprice of our common stock. Additionally, there can be no assurance that any share repurchases willmay not enhance stockholder value because the market pricesprice of our common stock may decline below the levels at which we repurchased shares of common stock, and short-term stock price fluctuations could reduce the program’s effectiveness.
| | | | | |
Constellation Brands, Inc. FY 20222023 Form 10-K | #WORTHREACHINGFOR I 30 |
| | | | | | | | |
| PART I | OTHER KEY INFORMATION | Table of Contents |
Item 2. Properties
We operate breweries, wineries, distilleries, and bottling plants, many of which include warehousing and distribution facilities on the premises, and through a joint venture, we operate a glass production plant. In addition to our principal physical properties described below, certain of our businesses maintain office space for sales and similar activities and offsite warehouse and distribution facilities in a variety of geographic locations.
Our corporate headquarters are located in leased offices in Victor, New York. We plan to relocate our corporate headquarters to a leased office in Rochester, New York in Fiscalcalendar 2024. Our segments also maintain leased office spaces in other locations in the U.S. and internationally.
We believe that our facilities, taken as a whole, are in good condition and working order. Within the Beer segment, we have adequate capacity to meet our current needs and we have undertaken activities to increase our production capacity to address our anticipated future demand. Within the Wine and Spirits segment, we have adequate capacity to meet our needs for the foreseeable future. As of February 28, 20222023, our principal physical properties by segment, excluding Canopy, all of which are owned, consist of:
| | | | | | | | | | | | |
| Beer | | | Wine and Spirits |
|
Breweries •Nava Brewery in Nava, Coahuila, Mexico •Obregon Brewery in Obregon, Sonora, Mexico
Production facility •Glass Plant in Nava, Coahuila, Mexico
| | Wineries •Gonzales Winery in Gonzales, California, U.S. •Mission Bell Winery in Madera, California, U.S. •Woodbridge Winery in Acampo, California, U.S. •Kim Crawford Winery in Marlborough, South Island, New Zealand
Warehouse, distribution, and other production facilities •Lodi Distribution Center in Lodi, California, U.S. •Pontassieve Winery in Florence, Italy |
Within our Wine and Spirits segment, as of February 28, 20222023, we owned, leased, or had interests in approximately 910,700100 acres of vineyards in California (the U.S.), 6,700 acres of vineyards in New Zealand, and 1,400 acres of vineyards in Italy. In Fiscal 2023, we acquired the Lingua Franca business which included a vineyard and a production facility in Oregon (U.S.). For further information on this acquisition, refer to (i) “Overview” within MD&A and (ii) Note 2.
Item 3. Legal Proceedings
For information regarding Legal Proceedings, see Risk Factors and Note 16.
| | | | | |
Constellation Brands, Inc. FY 20222023 Form 10-K | #WORTHREACHINGFOR I 31 |
| | | | | | | | |
| PART II | OTHER KEY INFORMATION | Table of Contents |
Item 5. Market for Registrant’s Common Equity, Related Stockholder Matters, and Issuer Purchases of Equity Securities
Our Class A Stock and Class B Stock tradetrades on the NYSENew York Stock Exchange under the symbolssymbol STZ and STZ.B, respectively. There is no public trading market for our Class 1 Stock. At April 1413, 20222023, the number of holders of record of our Class A Stock, Class B Stock, and Class 1 Stock were 478, 91,495 and 1817, respectively.
For information regarding a recent development related to a proposed declassification of our Class B Stock, dividends, and share repurchase programs, see (i) MD&A and (ii) Note 17.
For information on securities authorized for issuance under our equity compensation plans, see Security Ownership of Certain Beneficial Owners and Management and Related Stockholder Matters under Item 12. of this Form 10-K.
| | | | | |
| dividends and share repurchase programs, see (i) MD&A and (ii) Note 17. |
For information on securities authorized for issuance under our equity compensation plans, see Security Ownership of Certain Beneficial Owners and Management and Related Stockholder Matters under Item 12. of this Form 10-K.
Issuer Purchases of Equity Securities
| | | | | | | | | | | | | | | | | | | | | | | | | | |
| Period | | Total Number
of Shares
Purchased | | Average
Price Paid
Per Share | | Total Number
of Shares
Purchased as
Part of a
Publicly
Announced
Program | | Approximate Dollar Value of Shares that May Yet Be Purchased Under the Program (1) |
| (in millions, except share and per share data) | | | | | | | | |
| December 1 – 31, 2022 | | — | | | $ | — | | | — | | | $ | 1,163.1 | |
| January 1 – 31, 2023 | | 1,326,692 | | | $ | 218.68 | | | 1,326,692 | | | $ | 872.9 | |
| February 1 – 28, 2023 | | 41,801 | | | $ | 227.27 | | | 41,801 | | | $ | 863.4 | |
| Total | | 1,368,493 | | | $ | 218.94 | | | 1,368,493 | | | |
(1)In January 2021, we announced that our Board of Directors authorized the repurchase of up to $2.0 billion of our publicly traded common stock. The Board of Directors did not specify a date upon which the 2021 Authorization would expire. Share repurchases for the periods included herein were effected through open market transactions and exclude the impact of Federal excise tax owed pursuant to the IRA.
| | | | | |
Constellation Brands, Inc. FY 20222023 Form 10-K | #WORTHREACHINGFOR I 32 |
| | | | | | | | |
| PART II | ITEM 7. MD&A | Table of Contents |
Item 7. Management’s Discussion and Analysis of Financial Condition and Results of Operations
Introduction
We have elected to omit discussion on the earliest of the three years covered by the consolidated financial statements presented. Refer to Item 7. “Management’s Discussion and Analysis of Financial Condition and Results of Operations” and “Liquidity and Capital Resources” located in our Form 10-K for the fiscal year ended February 28, 20212022, filed on April 2021, 20212022, for reference to discussion of the fiscal year ended February 2928, 20202021, the earliest of the three fiscal years presented. This MD&A, which should be read in conjunction with our Financial Statements, is organized as follows:
Overview. This section provides a general description of our business, which we believe is important in understanding the results of our operations, financial condition, and potential future trends.
Strategy. This section provides a description of our strategy and a discussion of recent developments, COVID-19 and global supply chain and COVID-19 related impacts, and significant investmentsdivestitures, acquisitions, and divestituresinvestments.
Results of operations. This section provides an analysis of our results of operations presented on a business segment basis. In addition, a brief description of significant transactions and other items that affect the comparability of the results is provided.
Liquidity and capital resources. This section provides an analysis of our cash flows, outstanding debt, liquidity position, and commitments. Included in the analysis of outstanding debt is a discussion of the financial capacity available to fund our ongoingon-going operations and future commitments, as well as a discussion of other financing arrangements.
Critical accounting policies and estimates. This section identifies accounting policies that are considered important to our results of operations and financial condition, require significant judgment, and involve significant management estimates. Our significant accounting policies, including those considered to be critical accounting policies, are summarized in Note 1.
Overview
Our internal management financial reporting consists of three business divisions: (i) Beer, (ii) Wine and Spirits, and (iii) Canopy and we report our operating results in four segments: (i) Beer, (ii) Wine and Spirits, (iii) Corporate Operations and Other, and (iv) Canopy. Our Canopy Equity Method Investment makes up the Canopy segment. If the Canopy Transaction is completed, including conversion of our Canopy common shares into Exchangeable Shares, we expect our internal management financial reporting to consist of two business divisions: (i) Beer and (ii) Wine and Spirits and we will report our operating results in three segments: (i) Beer, (ii) Wine and Spirits, and (iii) Corporate Operations and Other.
In the Beer segment, our portfolio consists of high-end imported beer brands, craft beer, and ABAs. We have an exclusive perpetual brand license to import, market, and sell our Mexican beer portfolio in the U.S. In the Wine and Spirits segment, we sell a portfolio that includes higher-margin, higher-growth wine brands complemented by certain higher-end spirits brands. Amounts included in the Corporate Operations and Other segment consist of costs of executive management, corporate development, corporate finance, corporate growth and strategy, human resources, internal audit, investor relations, IT, legal, and public relations, and information technology, as well as our investments made through our corporate venture capital function. All costs included in the Corporate Operations and Other segment are general costs that are applicable to the consolidated group and are, therefore, not allocated to the other reportable segments. All costs reported within the Corporate Operations and Other segment are not included in our CODM’s evaluation of the operating income (loss) performance of the other reportable segments. The business segments reflect how our operations are managed, how resources are allocated, how operating performance is evaluated by senior management, and the structure of our internal financial reporting.
| | | | | |
Constellation Brands, Inc. FY 20222023 Form 10-K | #WORTHREACHINGFOR I 33 |
| | | | | | | | |
| PART II | ITEM 7. MD&A | Table of Contents |
Strategy
Our business strategy for the Beer segment focuses on upholdingstrengthening our leadership position in the high-end segment of the U.S. beer market and continuing to grow our brands through maintenance of leading margins, enhancements to our results of operations and operating cash flow, and exploring new avenues for growth. This includes continued focus on growing our beer portfolio in the U.S. through expanding distribution for key brands, including within the DTC and 3-tier eCommerce channelschannel, as well as continued expansion, optimization, and/or construction activities forat our breweries in Mexico beer operations. Additionally, in an effort to compete more fully compete in growing sectors of the high-end segment of the U.S. beer market, we have leveraged our innovation capabilities to create new line extensions behind celebrated, trusted brands and package formats that are intended to meet emerging needs.
We have increased our production capacity in Mexico by fourfold since the 2013 acquisition of the imported beer business. In early Fiscal 2022, we completed part of a planned expansion at the Obregon Brewery, increasing our production capacity to approximately 39 million hectoliters. Expansion, optimization, and/or construction activities continue under our Mexico Beer Projects to align with our anticipated future growth expectations. At this time,, and we have suspended all Mexicali Brewery constructionexpect to spend an additional $4.0 billion to $4.5 billion over Fiscal 2024 through Fiscal 2026 on these activities, following a negative result from a public consultation held in Mexico. See “Capital expenditures” below. Additionally, we are pursuing the sale of the remaining assets at the canceled Mexicali Brewery after exploring various options; however, we may not be successful in completing any such sale or obtaining other forms of recovery.
Our business strategy for the Wine and Spirits segment focuses on growing industry-leading, higher-end wine and spirits brands through margin improvements and creation ofbrands, improving margins, and creating operating efficiencies. We focus our investment dollars on (i) building and refreshing existing brands within our portfolio through consumer insights, sensory expertise, and innovation, and (ii) refining our portfolio through targeted acquisitions ofcontinue to refine our portfolio primarily through an enhanced focus on higher-margin, higher-growth wine and spirits brands. We recently reorganized thisOur business is organized into two distinct commercial teams, one focused on our fine wine and craft spirits brands and the other focused on our mainstream and premium brands. While each team has its own distinct strategy, both remain aligned to the goal of accelerating performance by growing organic net sales and expanding margins. AdditionallyIn addition, we continueare advancing our aim to strengthen our leadership position and invest in DTC andbecome a global, omni-channel competitor in line with consumer preferences. Our business continues to progressively expand into DTC channels (including hospitality), 3-tier eCommerce channels, and international markets, while continuing to grow in U.S. 3-tier brick-and-mortar distribution. In markets where it is feasible, we entered into a contractual arrangementsarrangement with Southern Glazer’s Wine and Spirits to consolidate our U.S. distribution in order to obtain dedicated distributor selling resources which focus on our U.S. wine and spirits portfolio to drive organic growth. This U.S. distributor currently represents about 70% of our branded wine and spirits volume in the U.S.
Marketing, sales, and distribution of our products are primarily managed on a geographic basis allowing us to leverage leading market positions. In addition, market dynamics and consumer trends vary across each of our markets. Within our primary market in the U.S., we offer a range of beverage alcohol products across the imported beer, craft beer, ABA, and branded wine, and spirits categories, with generally separate distribution networks utilized for (i) our beer portfolio and (ii) our wine and spirits portfolio. The environment for our products is competitive in each of our markets.
We complement our strategy with our investment in Canopy by expanding our portfolio into adjacent categories. Canopy is a leading cannabis and CPG company with operations in countries across the worldCanada, the U.S., Germany, and certain other global markets. This investment is consistent with our long-term strategy to identify, address, and stay ahead of evolving consumer trends and market dynamics. Our strategic relationship with Canopy is designed to help position it to be successful in cannabis production, branding, and intellectual property. We expect this relationship to continue through the completion of the Canopy Transaction including the conversion of our Canopy common shares into Exchangeable Shares. For further information on our plan to convert our Canopy common stock ownership, see “Canopy segment” below.
We remain committed to our long-term financial model of: growing sales, expanding margins, and increasing cash flow in order to achieve earnings per share growth, maintain as well as our targetedtarget net leverage ratio, and dividend payout ratio; invest to support the growth of our business; and deliver additional returns to stockholders through the payment of dividends and periodic share repurchases. Our results of operations and financial condition have been affected by inflation and, changing prices and we expect these impacts to continue in Fiscal 2023. Our Fiscal 2023 results of operations could also be impacted by, and reductions in discretionary income of consumers available to purchase our products. We intend to pass, as well as other unfavorable global and regional economic conditions, geopolitical events, and military conflicts, such as repercussions from the conflict in Ukraine. We expect some or all of these impacts to continue into Fiscal 2024. We intend to continue to monitor the inflationary environment and the impact on the consumer when we consider passing along rising costs through increasedfurther selling prices, subject to normal competitive conditions. In addition, we continue to identify ongoingprice increases, subject to normal competitive
| | | | | |
Constellation Brands, Inc. FY 2023 Form 10-K | #WORTHREACHINGFOR I 34 |
| | | | | | | | |
| PART II | ITEM 7. MD&A | Table of Contents |
conditions. In addition, we continue to identify on-going cost savings initiatives, including our commodity hedge programand foreign exchange hedging programs. However, there can be no assurancesassurance that we will be able to fully mitigate rising costs through increased selling prices and/or cost savings initiatives. Furthermore, to the extent climate-related severe weather events, such as the 2020 U.S.droughts, floods, wildfires, and/or the late frost in New Zealand,
| | | | | |
| Constellation Brands, Inc. FY 2022 Form 10-K | #WORTHREACHINGFOR I 34 |
frosts, continue to occur or accelerate in future periods, it could have a material impact on our results of operations and financial condition.
Recent Developments
Class B Stock declassification proposal2023 Canopy Promissory Note
In April 2022 2023, we received the Proposal which proposes that each share of Class B Stock would be converted into 1.35 sharesextended the maturity of the remaining C$100.0 million principal amount of Class A Stock. Our Board of Directors has established a Special Committee to evaluateour Canopy Debt Securities by exchanging them for the 2023 Canopy Promissory Note. The 2023 Canopy Promissory Note bears interest at an annual rate of 4.25% and matures on December 31, 2024. Canopy may prepay the Proposal. Any definitive agreement with respect2023 Canopy Promissory Note in whole or in part at any time prior to the potential transaction mustmaturity date. If be approved by the Special Committee as well as our Board of Directors. In addition, pursuant to the termsthe Canopy Amendment is authorized by Canopy’s shareholders, we maintain our intention to negotiate an exchange of the Proposal, any potential transaction would require the approval of holders of a majorityC$100.0 million principal amount of the shares of our Class2023 Canopy Promissory Note A Stock that do not also hold shares of Class B Stockfor Exchangeable Shares, although neither we nor Canopy has any binding obligation to do so.
Other acquisitionsDaleville Facility
During the first quarter of Fiscal In March 2023, we completed the acquisitions of other businesses, consisting of Lingua Franca, which included a collection of luxury wines, a vineyard,entered into a definitive agreement to sell the Daleville Facility. We expect the transaction to close during the three months ending May 31, 2023, subject to required regulatory approvals and a production facility, and the remaining 73% ownership interest in Austin Cocktails, which included a portfolio of small batch, RTD cocktails. The purchase price for each acquisition includes an earn-out based on the performance of the respective brands. The results of operations of these acquired businesses will be reported in the Wine and Spirits segment and will be included in our consolidated results of operations from their respective date of acquisitioncustomary closing conditions. The net cash proceeds from the transaction are expected to be used primarily for general corporate purposes, including retirement of debt.
COVID-19 and Global Supply Chain and COVID-19 Related Impacts
COVID-19 containment measures affected us predominantly in the first half of Fiscal 2021 primarily in the reduction of (i) depletion volume on our products in the on-premise We believe the impact of COVID-19 on our business due to bar and restaurant closures and (ii) shipment volume relatedhas largely diminished at this time; however, uncertainties continue, particularly around disruptions to the reduced production activity at our major breweries in Mexico which we were able to rectify in the second half of Fiscal 2021. The on-premise business has historically been about 10% to 15% of our depletion volume for beer, wine, and spirits. Our on-premise depletion volumes for Fiscal 2022 were, and inglobal supply chain and shifting consumer behaviors. Fiscal 2023 may continue to be, impacted by regional COVID-19 case levels, vaccine immunization rates, new COVID-19 variants, and vaccine efficacy against new COVID-19 variants. Currently, our breweries, wineries, distilleries, and bottling facilities are open and operational.
As reflected in the discussion below, we have seen consumers shift more of their total shopping spend to online channels since the COVID-19 outbreak, which has led to increased eCommerce sales, including DTC, for our business. Fiscal 2022 was impacted by challenges with both global supply chain logistics was, and Fiscal 2024 is expected to continue to be, impacted by challenges with both global supply and transportation which have contributed to lower product inventory levels and higher cost of product sold. For example, wine produced in New Zealand and Italy and subsequently shipped to the U.S. for distribution continues to be affected by the lack of availability and increased costs of ocean freight shipping containers and port delays causing increased storage charges. In addition, during Fiscal 2022, we experienced a brown glass purchasing shortage, which impacted certain of our imported beer brands. This supply returned to normal levels in early Fiscal 2023. To the extent these or similar circumstances continue to occur or accelerate in future periods it could have a material impact on our results of operations.
We have seen consumers shift more of their total shopping spend to online channels since the COVID-19 outbreak, which has led to increased eCommerce sales, including DTC, for our business. COVID-19 may continue to impact consumers’ purchasing and consumption patterns. In response to COVID-19, we have ensured our ongoingon-going liquidity and financial flexibility through cash preservation initiatives, capital management adjustments, and cost control measures. We have used opportunities to defer some payments including certain payroll taxes under the CARES Act afforded to us earlier in the pandemic. We are not able to estimate the long-term impact of COVID-19 on our business, financial condition, results of operations, and/or cash flowdefer some payments including certain payroll taxes. We believe we have sufficient liquidity available from operating cash flow, cash on hand, and availability under our revolving credit facility. We expect to have continued access to capital markets and to be able to continue to return value to stockholders through dividends and periodic share repurchases.
Divestitures, acquisitions, and investments
Wine and Spirits segment
2022 Wine Divestiture
In October 2022, we sold certain of our mainstream and premium wine brands and related inventory. Accordingly, our consolidated results of operations include the results of operations of such mainstream and premium wine brands through the date of divestiture. We received cash proceeds of $96.7 million from the 2022 Wine Divestiture that were utilized primarily to reduce outstanding borrowings. We recognized a net gain of $15.0 million on the sale of business for Fiscal 2023. This gain was included in selling, general, and administrative expenses within our consolidated results.
| | | | | |
Constellation Brands, Inc. FY 20222023 Form 10-K | #WORTHREACHINGFOR I 35 |
Investments, Acquisitions, and Divestitures | | | | | | | | |
| PART II | ITEM 7. MD&A | Table of Contents |
Beer segment
Ballast Point DivestitureAustin Cocktails acquisition
In MarchApril 20202022, we soldacquired the Ballast Point craft beer business, includingremaining 73% ownership interest in Austin Cocktails, which included a numberportfolio of its associated production facilities and brewpubs. Accordingly,small batch, RTD cocktails. This transaction primarily included the acquisition of goodwill and a trademark. The results of operations of Austin Cocktails are reported in the Wine and Spirits segment and have been included in our consolidated results of operations include the results of operations of our Ballast Point craft beer business throughfrom the date of divestitureacquisition.
Wine and Spirits segmentLingua Franca acquisition
In March 2022, we acquired the Lingua Franca business, including a collection of Oregon-based luxury wines, a vineyard, and a production facility. This transaction also included the acquisition of a trademark and inventory. The results of operations of Lingua Franca are reported in the Wine and Spirits segment and have been included in our consolidated results of operations from the date of acquisition.
My Favorite Neighbor acquisition
In November 2021, we acquired the remaining 65% ownership interest in My Favorite Neighbor, which primarily included the acquisition of goodwill, trademarks, inventory, and property, plant, and equipment. The results of operations of My Favorite Neighbor are reported in the Wine and Spirits segment and have been included in our consolidated results of operations from the date of acquisition. In April 2020, we made an initial investment in My Favorite Neighbor that was accounted for under the equity method. We recognized our share of their equity in earnings (losses) in our consolidated financial statements in the Wine and Spirits segment up to the date we acquired the remaining ownership interest. The My Favorite Neighbor investment and subsequent acquisition supported our strategic focus on consumer-led premiumization trends and meeting the evolving needs of our consumers.
Paul Masson Divestiture
In January 2021, we sold the Paul Masson Grande Amber Brandy brand, related inventory, and interests in certain contracts. We received cash proceeds of $267.4 million, net of post-closing adjustments. The net cash proceeds were used for general corporate purposes. We recognized a net gain of $58.4 million on the sale of the business primarily for the year ended February 28, 2021.
Wine and Spirits Divestitures
In January 2021, we sold a portion of our wine and spirits business, including lower-margin, lower-growth wine and spirits brands, related inventory, interests in certain contracts, wineries, vineyards, offices, and facilities. We received net cash proceeds of $538.4 million, net of post-closing adjustments. In addition, we have the potential to earn an incremental $250 million of contingent consideration if certain brand performance targets are met over a two-year period after closing.
In January 2021, we also sold the New Zealand-based Nobilo Wine brand and certain related assets. We received cash proceeds of $129.0 million, net of post-closing adjustments.
The cash proceeds from the Wine and Spirits Divestitures were utilized to reduce outstanding debt and for other general corporate purposes. We recognized a net loss of $33.6 million on the Wine and Spirits Divestitures primarily for the year ended February 28, 2021.
Concentrate Business Divestiture
In December 2020, we sold certain brands used in our concentrates and high-color concentrate business, and certain related intellectual property, inventory, interests in certain contracts, and other assets.
The following presents selected financial information included in our historical consolidated financial statements that are no longer part of our consolidated results of operations following the Paul Masson Divestiture, Wine and Spirits Divestitures, and Concentrate Business Divestiture:
| | | | | |
| Fiscal
2021 |
| (in millions) | |
| Net sales | $ | 642.3 | |
| Gross profit | $ | 252.9 | |
Marketing (1) | $ | 14.5 | |
| |
(1)Included in selling, general, and administrative expenses within our consolidated results of operations.
| | | | | |
| Constellation Brands, Inc. FY 2022 Form 10-K | #WORTHREACHINGFOR I 36 |
Copper & Kings acquisition
In September 2020, we acquired the remaining ownership interest in Copper & Kings which primarily included the acquisition of inventory and property, plant, and equipment. This acquisition included a collection of traditional and craft batch-distilled American brandies and other select spirits. The results of operations of Copper & Kings are reported in the Wine and Spirits segment and have been included in our consolidated results of operations from the date of acquisition.
Empathy Wines acquisition
In June 2020, we acquired Empathy Wines, which primarily included the acquisition of goodwill, trademarks, and inventory. This acquisition, which included a digitally-native wine brand, strengthened our position in the DTC and other eCommerce markets. The results of operations of Empathy Wines are reported in the Wine and Spirits segment and have been included in our consolidated results of operations from the date of acquisition
Our recent divestiture and acquisitions support our strategic focus on consumer-led premiumization trends and meeting the evolving needs of our consumers.
Corporate Operations and Other segment
Corporate investment
In February 2022, we sold an investment made through our corporate venture capital function. We recognized our share of their equity in earnings (losses) in our consolidated financial statements in the Corporate Operations and Other segment up to the date we sold our ownership interest.
Canopy segment
Canopy investment
In May 2020, we exercised the November 2017 Canopy Warrants at an exercise price of C$12.98 per warrant shareWe have evaluated the Canopy Equity Method Investment as of February 28, 2023, and determined that there was not an other-than-temporary impairment. Our conclusion was based primarily on the period of time for which the fair value has been less than the carrying value. We will continue to review the Canopy Equity Method Investment for an other-than-temporary impairment. If Canopy’s stock price does not recover above our carrying value in the near-term, it may result in an additional impairment of our Canopy Equity Method Investment.
In February 2023, Canopy announced the next series of comprehensive steps to align its Canadian cannabis operations and resources in response to continued unfavorable market trends. In connection with these next steps, Canopy disclosed that it expects to record an estimated pre-tax loss of approximately C$425 million to C$525 million in its fourth quarter of fiscal 2023 and in its first half of fiscal 2024 results. We will record our proportional share of Canopy’s estimated pre-tax loss of approximately C$145 million to C$180 million, in our applicable Fiscal 2024 results.
Additionally, we evaluated the Canopy Equity Method Investment as of August 31, 2022, and determined that there was an other-than-temporary impairment. Our conclusion was based on several contributing factors, including: (i) the period of time for which the fair value had been less than the carrying value and the uncertainty surrounding Canopy’s stock price recovering in the near-term, (ii) Canopy recording a significant impairment of goodwill related to its cannabis operations during its three months ended June 30, 2022, and (iii) the uncertainty of U.S. federal cannabis permissibility. As a result, the Canopy Equity Method Investment with a carrying value of $1,695.1 million was written down to its estimated fair value of $634.8 million, resulting in an impairment of $1,060.3 million. This loss from impairment was included in income (loss) from unconsolidated investments within our consolidated results for Fiscal 2023.
| | | | | |
Constellation Brands, Inc. FY 2023 Form 10-K | #WORTHREACHINGFOR I 36 |
| | | | | | | | |
| PART II | ITEM 7. MD&A | Table of Contents |
In July 2022, we received 29.2 million common shares of Canopy following the exchange of C$100.0 million principal amount of our Canopy Debt Securities. This exchange did not significantly change our Canopy ownership percentage.
Plan to convert Canopy common stock ownership
In October 2022, we entered into a Consent Agreement with Canopy pursuant to which we have provided our consent, subject to certain conditions, to the Canopy Transaction. Assuming the completion of the Canopy Transaction and the transactions contemplated by the Consent Agreement and that we elect to convert our Canopy common shares into Exchangeable Shares:
•we intend to surrender our November 2018 Canopy Warrants to Canopy for cancellation;
•we will only have an interest in Exchangeable Shares, which are non-voting and non-participating securities, and our 2023 Canopy Promissory Note (for which we intend to negotiate an exchange of the principal amount for C$245.0 million, or $173.9 million.
For additional information on theseExchangeable Shares, although neither we nor Canopy has any binding obligation to do so);
•we intend to terminate all legacy agreements and commercial arrangements between ourselves and Canopy, including the investor rights agreement but excluding the Consent Agreement and certain termination agreements;
•we will have no further governance rights in relation to Canopy, including rights to nominate members to the board of directors of Canopy, or approval rights related to certain transactions;
•all of our nominees will resign from the board of directors of Canopy; and
•as our investment in Canopy common shares makes up our Canopy Equity Method Investment, we expect to no longer:
◦apply the equity method to our investment in Canopy, which we expect to instead be accounted for at fair value with changes reported in income (loss) from unconsolidated investments within our consolidated results; and
◦have a stand-alone Canopy operating segment as Canopy’s financial results are not expected to be provided to, or reviewed by, our CODM and will not be used to make strategic decisions, allocate resources, or assess performance.
For additional information on recent developments, investments, acquisitions, and divestitures, refer to Notes 2, 7, 10, and 1722.
Results of Operations
Financial Highlights
References to organic throughout the following discussion exclude the impact of the brands divested in January 20212022 Wine Divestiture, as appropriate.
For Fiscal 20222023 compared with Fiscal 2021:2022
•Our results of operations were negatively impacted by (i) anprimarily impacted by (i) a decrease in unrealized net loss from the changes in fair value of our investment in Canopy as compared with the unrealized net gain in Fiscal 2021, (ii) an impairment of long-lived assets for Fiscal 2022 in connection with certain assets at the Mexicali Brewery, (iii) a decrease in Wine and Spirits net sales due largely to the divestituresimprovements within the Beer segment driven by shipment volume growth, and (iv) an increasea decrease in operational costsinventory obsolescence within the Beer segment, driven by a slowdown in the overall hard seltzer category in early Fiscal 2022, partially offset by (i) a Fiscal 2023 impairment of our Canopy Equity Method Investment, (ii) an increase in Beer net sales, as well as a decrease in equity in losses from Canopy’s results.
•Net sales increased 2% as an increase in Beer net sales, driven predominantly by shipment volume growth and favorable impact from pricing, was offset by the decrease in in equity in losses from Canopy’s results primarily driven by their goodwill impairment, (iii) higher operational and logistics costs within both the Beer and Wine and Spirits net sales, due largely to the divestitures.
•Operating income decreased 16% largely due to (isegments, (iv) increase in Beer media investments, (v) the impairment ofimpacts of trademark and other long-lived assets, (ii) the decrease in Wine and Spirits net sales, (iiiasset impairment losses, and (vi) an increase in cost of product sold within the Beer segment,Corporate Operations and (iv) an increase in marketing spend for the Beer segmentOther general and administrative expenses, driven by a planned increase to support the growthDigital Business Acceleration investments and a Fiscal 2022 reversal of our brands, partially offset by the increase in Beer net salesstock-based compensation.
| | | | | |
Constellation Brands, Inc. FY 20222023 Form 10-K | #WORTHREACHINGFOR I 37 |
| | | | | | | | |
| PART II | ITEM 7. MD&A | Table of Contents |
•Net income (loss) attributable to CBI and diluted net income (sales increased 7% largely due to an increase in Beer net sales driven primarily by shipment volume growth and favorable impact from pricing.
•Operating income increased 22% largely due to (i) the impact of the impairment of long-lived assets in connection with certain assets at the Mexicali Brewery for Fiscal 2022 and (ii) improvements within the Beer segment, including the decrease in inventory obsolescence, partially offset by (i) the higher operational and logistics costs, (ii) the increase in Beer media investments, (iii) the trademark and other long-lived asset impairment losses, and (iv) the increase in Corporate Operations and Other general and administrative expenses.
•Net loss attributable to CBI increased due to an increase in loss from unconsolidated investments and higher provision for income taxes as compared to Fiscal 2022, largely offset by the increase in operating income items discussed above. Diluted net loss) per common share attributable to CBI decreased largely dueas compared to the items discussed above, partially offset by Fiscal 2022lower provision for income taxes.
Comparable Adjustments
Management excludes items that affect comparability from its evaluation of the results of each operating segment as these Comparable Adjustments are not reflective of core operations of the segments. Segment operating performance and the incentive compensation of segment management are evaluated based on core segment operating income (loss) which does not include the impact of these Comparable Adjustments.
As more fully described herein and in the related Notes, the Comparable Adjustments that impacted comparability in our segment results for each period are as follows:
| | | | | | | | | | | | | |
| Fiscal
20222023 | | Fiscal
20212022 | | |
| (in millions) | | | | | |
| Cost of product sold | | | | | |
| Settlements of undesignated commodity derivative contracts | $ | (76.7) | | | $ | (35.9) | | | |
| Net gain (loss) on undesignated commodity derivative contracts | $(15.0) | | | 109.9 | | | |
| $Flow through of inventory step-up | 25.1 (4.5) | | | (0.1) | | | |
| Strategic business development costs | (1.2) | | | (2.6) | | | |
| Net flow through of reserved inventory | 121.12 | | | — | | | |
| Settlements of undesignated commodity derivative contracts | (35.9) | | | 31.6 | | | |
| Strategic business development costs | (2.6) | | | (29.8)12.1 | | | |
| Recovery of (loss on) inventory write-down | (1.0) | | | (70.4) | | | |
| Flow through of inventory step-up | (0.1) | | | (0.4) | | | |
| COVID-19 incremental costs | —0.2 | | | (7.6) | | | |
| Accelerated depreciation | — | | | (0.11.0) | | | |
| | | | | |
| | | | | |
| | | | | |
| Total costComparable Adjustments, Cost of product sold | 82.4 (96.0) | | | (51.6)82.4 | | | |
| | | | | |
| Selling, general, and administrative expenses | | | | | |
| Transition services agreements activityImpairments of assets | (66.5) | | | — | | | |
| Costs associated with the Reclassification | (37.8) | | | — | | | |
| Transition services agreements activity | (20.5) | | | (19.2) | | | |
| Restructuring and other strategic business development costs | (9.9) | | | 0.46 | | | |
| Transaction, integration, and other acquisition-related costs | (1.4) | | | (71.64) | | | |
| Restructuring andGain (loss) other strategicon sale of business development costs | 15.0.6 | | | (231.9)7 | | | |
| Net gain (loss) on foreign currency derivative contracts | — | | | (8.0) | | | |
| Impairment of intangible assets | — | | | (6.0) | | | |
| COVID-19 incremental costs | — | | | (4.8) | | | |
| | | | | |
Other gains (losses) | 23.3 | | | (2.3) | | | 14.3 | | | |
| Total sellingComparable Adjustments, Selling, general, and administrative expenses | (2297.38) | | | (3520.6) | | | |
| | | | | |
| Impairment of brewery construction in progress | — | | | (665.9) | | | — | | | |
| Impairment of assets held for sale | — | | | (24.0) | | | |
| Gain (loss) on sale of business | 1.7 | | | 14.2 |
| | | | | |
| Comparable Adjustments, Operating income (loss) | $ | (604193.18) | | | $ | (97604.01) | | | |
| | | | | |
Comparable Adjustments, Income (loss) from unconsolidated investments | $ | (1,488907.27) | | | $ | 265(1,488.2 ) | | | |
| | | | | |
Constellation Brands, Inc. FY 2023 Form 10-K | #WORTHREACHINGFOR I 38 |
| | | | | | | | |
| PART II | ITEM 7. MD&A | Table of Contents |
Cost of product sold
Undesignated commodity derivative contracts
Net gain (loss) on undesignated commodity derivative contracts represents a net gain (loss) from the changes in fair value of undesignated commodity derivative contracts. The net gain (loss) is reported outside of segment operating results until such time that the underlying exposure is recognized in the segment operating results. At settlement, the net gain (loss) from the changes in fair value of the undesignated commodity derivative contracts is reported in the appropriate operating segment, allowing the results of our operating segments to
| | | | | |
| Constellation Brands, Inc. FY 2022 Form 10-K | #WORTHREACHINGFOR I 38 |
reflect the economic effects of the commodity derivative contracts without the resulting unrealized mark to fair value volatility.
Flow through of inventory step-up
In connection with acquisitions, the allocation of purchase price in excess of book value for certain inventories on hand at the date of acquisition is referred to as inventory step-up. Inventory step-up represents an assumed manufacturing profit attributable to the acquired business prior to acquisition.
Net flow through of reserved inventory
We sold reserved inventory previously written down in Fiscal 2021 following the 2020 U.S. wildfires.
Strategic business development costs
We recognized costs primarily in connection with losses on write-downs of excess inventory and contract terminations resulting from our initiatives to optimize our portfolio, gain efficiencies, and reduce our cost structure within the Wine and Spirits segment.
Recovery of (loss on) inventory write-down
We recognized a loss primarily on the write-down of bulk wine inventory and certain grapes as a result of smoke damage sustained during the 2020 U.S. wildfires (Fiscal 2021).
COVID-19 incremental costs
We recognized costs for incremental wages and hazard payments to employees, purchases of personal protective equipment, more frequent and thorough cleaning and sanitization of our facilities, and costs associated with the unused beer keg reimbursement program with distributors.
Selling, general, and administrative expensesSelling, general, and administrative expenses
Impairments of assets
We recognized trademark and other long-lived asset impairment losses in connection with certain continued negative trends within our craft beer business. For additional information, refer to Notes 5 and 7.
Costs associated with the Reclassification
We recognized costs in connection with the Reclassification primarily related to professional and consulting fees, printing and mailing the associated proxy statement/prospectus, all filing and other fees paid to the SEC, and the acceleration of certain commitments. For additional information, refer to Note 17.
Transition services agreements activity
We recognized costs in connection with transition services agreements related to the Wine and Spirits Divestitures (Fiscal 2022).
Transaction, integration, and other acquisition-related costs
We recognized transaction, integration, and other acquisition-related costs in connection with our investments, acquisitions, and divestitures.
Restructuring and other strategic business development costs
We recognized costs primarily in connection with initiatives to optimize our portfolio, gaincertain activities which are intended to streamline, increase efficiencies, and reduce our cost structure within the Wine and Spirits segment (Fiscal 20212023).
Net gainGain (loss) on foreign currency derivative contractssale of business
We recognized a net loss primarily in connection with the settlement of foreign currency forward contracts entered into to fix the U.S. dollar cost of the Maygain on the completion of the 2022 2020 Canopy Investment.
Impairment of intangible assets
We recognized trademark impairment losses related to our Beer segment’s Four Corners craft beer trademark asset. For additional information, refer to Note 7.
COVID-19 incremental costs
We recognized costs for payments to third-party general contractors to maintain their workforce for expansion activities at the Obregon Brewery and recognized costs for incremental wages and hazard payments to employeesWine Divestiture (Fiscal 2023). For additional information, refer to Note 2.
Other gains (losses)
We recognized other gains (losses) primarily in connection with (i) net increase (decrease) in estimated fair values of contingent liabilities associated with prior period acquisitions, (ii) a gain recognized on the remeasurement of our previously held equity interest in My Favorite Neighborinterests to the acquisition-date fair value (Fiscal 2022, (iii) an insurance recovery related to a prior severe weather event (Fiscal 2023)), (iiiv) a property tax settlement (Fiscal 2022), and (iiiv) an adjustment to understated excise tax accruals primarily related to a prior period acquisition (Fiscal 2022), (iv) net increase (decrease) in estimated fair value of contingent liabilities associated with prior period acquisitions (Fiscal 2022, Fiscal 2021), and (v) a gain recognized on the sale of a vineyard (Fiscal 2021).
| | | | | |
| Constellation Brands, Inc. FY 2022 Form 10-K | #WORTHREACHINGFOR I 39 |
Impairment of brewery construction in progress
We recognized an impairment of long-lived assets in connection with certain assets at the Mexicali Brewery. For additional information, refer to Note 7.
Impairment of assets held for sale
We recognized impairments of long-lived assets held for sale in connection with the Wine and Spirits Divestitures and the Concentrate Business Divestiture. For additional information, refer to Note 7.
Gain (loss) on sale of business
We recognized a net gain (loss) primarily on the completion of the Paul Masson Divestiture and the Wine and Spirits Divestitures. For additional information, refer to Note 2Notes 5 and 7.
Income (loss) from unconsolidated investments
We recognized income (loss) primarily from (i) an impairment of our Canopy Equity Method Investment (Fiscal 2023), (ii) comparable adjustments to equity in earnings (losses) from Canopy’s results, (iii) an unrealized gain (loss) from the changes in fair value of our securities measured at fair value, (ii) equity in earnings (losses) from Canopy’s results, including equity in losses from Canopy largely related to costs designed to improve their organizational focus, streamline operations, and align production capability with projected demand, and (iii) a net gain recognized and (iv) a net gain recognized
| | | | | |
Constellation Brands, Inc. FY 2023 Form 10-K | #WORTHREACHINGFOR I 39 |
| | | | | | | | |
| PART II | ITEM 7. MD&A | Table of Contents |
from the sale of an equity method investment made through our corporate venture capital function (Fiscal 2022). For additional information, refer to Notes 7 and 10.
Business Segments
Net sales
| | | | | | | | | | | | | | | | | | | | | | | |
| Fiscal
20222023 | | Fiscal
20212022 | | Dollar
Change | | Percent
Change |
| (in millions) | | | | | | | |
| Beer | $ | 7,465.0 | | | $ | 6,751.6 | | | $ | 6,074.6 | | | $ | 677.0713.4 | | | 11 | % |
| Wine and Spirits: | | | | | | | |
| Wine | 1,722.7 | | | 1,819.3 | | | 2,208.4 | | | (389.1(96.6) | | | (185 | %) |
| Spirits | 264.9 | | | 249.8 | | | 33115.91 | | | (82.1) | | | (256 | %) |
| Total Wine and Spirits | 1,987.6 | | | 2,069.1 | | | 2,540.3 | | | (471.2(81.5) | | | (194 | %) |
| Canopy | 339.3 | | | 444.3 | | | 378.6 (105.0) | | | 65.7 | | | 17(24 | %) |
| Consolidation and eliminations | (339.3) | | | (444.3) | | | (378.6)105.0 | | | (65.7) | | | (1724 | %) |
| Consolidated net sales | $ | 9,452.6 | | | $ | 8,820.7 | | | $ | 8,614631.9 | | | $ | 205.8 | | | 27 | % |
| | | | | | | | | | | | | | | | | | | | | | | | | | |
| Beer segment | | | | | | | |
| Fiscal
20222023 | | Fiscal
20212022 | | Dollar
Change | | Percent
Change |
| (in millions, branded product, 24-pack, 12-ounce case equivalents) | | | | | | |
| Net sales | $ | 7,465.0 | | | $ | 6,751.6 | | | $ | 6,074.6 | | | $ | 677.0713.4 | | | 11 | % |
| | | | | | | | |
| Shipments | 364389.2 | | | 334364.62 | | | | | 86.89 | % |
| | | | | | | |
| | | | | | | | |
| Depletions | | | | | | | 87.95 | % |
The increase in Beer net sales is largely due to (i) $534463.89 million of volume growth within our Mexican beer portfolio, which benefited from continued consumer demand and a return to on-premise, including bars and restaurants, and (ii) $182279.47 million of favorable impact from pricing in select markets within our Mexican beer portfolio, partially offset by $4526.58 million of unfavorable product mix primarily from an increase in on-premise keg sales and a shift in package types. Product inventories in our 3-tier distribution channel returned to more normal levels by the end of Fiscal 2022.
| | | | | |
| Constellation Brands, Inc. FY 2022 Form 10-K | #WORTHREACHINGFOR I 40 |
| | | | | | | | | | | | | | | | | | | | | | | | | | |
| Wine and Spirits segment | | | | | | | |
| Fiscal
20222023 | | Fiscal
20212022 | | Dollar
Change | | Percent
Change |
| (in millions, branded product, 9-liter case equivalents) | | | | | | |
| Net sales | $ | 1,987.6 | | | $ | 2,069.1 | | | $ | 2,540.3 | | | $ | (471.2(81.5) | | | (194 | %) |
| | | | | | | |
| Shipments | | | | | | | |
Total | 2927.91 | | | 4529.09 | | | | | (339.64 | %) |
Organic (1) (2) | 2927.91 | | | 29.14 | | | | | 2(7.78 | %) |
| | | | | | | |
U.S. Domestic | 2623.35 | | | 4126.53 | | | | | (3610.6 | %) |
Organic U.S. Domestic (1) (2) | 2623.35 | | | 25.89 | | | | | 1(9.93 | %) |
| | | | | | | |
| | | | | | | |
Depletions (1) (2) | | | | | | | (53.80 | %) |
(1)Includes an adjustment to remove volume associated with the Wine and Spirits Divestitures for the period March 1, 2020, through January 4, 2021.
(2)Includes an adjustment to remove volume associated with the Paul Masson Divestiture for the period March2022 Wine Divestiture for the period October 16, 20202021, through JanuaryFebruary 1128, 2021.
2022.
| | | | | |
Constellation Brands, Inc. FY 2023 Form 10-K | #WORTHREACHINGFOR I 40 |
| | | | | | | | |
| PART II | ITEM 7. MD&A | Table of Contents |
The decrease in Wine and Spirits net sales is due to $64244.31 million from the divestitures, partially offset by2022 Wine Divestiture and a $17137.14 million increasedecrease in organic net sales. The increasedecrease in organic net sales is driven by (i) a $148.0 million decrease in branded wine and spirits shipment volume, including impacts from global supply chain constraints, partially offset by (i) a $6290.79 million increase from favorable product mix shift, (ii) a $40.317.5 million increase in non-branded net sales driven by DTC, and (iii) $4.1 million of favorable impact from pricing. driven by distributor transition and price increases, (iii) $37.7 million increase primarily from bulk wine and non-branded net sales, and (iv) $28.2 million increaseThe decrease in branded wine and spirits shipment volume and favorable product mix are attributable to our continued focus on growing our brands and an overlap of lower shipment volumes in Fiscal 2021. The increase in organic net sales was negatively impacted by global supply chain logistics and route to market changes. Forthe consumer-led premiumization and mix improvements of our portfolio. The favorable impact from pricing was driven by price increases and higher contractual distributor payments as compared to Fiscal 2022, the organic U.S. shipment volume was ahead of the depletion volume largely driven by a challenging overlap due to consumer pantry loading behavior in the first half of Fiscal 2021 and timing related to transition activities with distributors that occurred at the end of Fiscal 2021largely offset by increases in promotional activity.
| | | | | |
| Canopy segment Our ownership interest in Canopy allows us to exercise significant influence, but not control, and, therefore, we account for our investment in Canopy under the equity method. Amounts included for the Canopy segment represent 100% of Canopy’s reported results on a two-month lag. Accordingly, we recognized our share of Canopy’s earnings (losses) from January through December 20212022, in our Fiscal 20222023 results and January through December 20202021, in our Fiscal 20212022 results. Although we own less than 100% of the outstanding shares of Canopy, 100% of its results are included and subsequently eliminated to reconcile to our consolidated financial statements. See “Income (loss) from unconsolidated investments” below for a discussion of Canopy’s net sales, gross profit (loss), selling, general, and administrative expenses, and operating income (loss). This discussion is based on information Canopy has publicly disclosed. |
Gross profit
| | | | | | | | | | | | | | | | | | | | | | | |
| Fiscal
20222023 | | Fiscal
20212022 | | Dollar
Change | | Percent
Change |
| (in millions) | | | | | | | |
| Beer | $ | 3,937.8 | | | $ | 3,677.0 | | | $ | 3,402260.48 | | | $ | 274.6 | | | 87 | % |
| Wine and Spirits | 927.2 | | | 947.9 | | | 1,115.2 | | | (167.3(20.7) | | | (152 | %) |
| Canopy | (125.7) | | | (18.6) | | | (14107.1) | | | (4.5) | | | (32 | %)NM |
| Consolidation and eliminations | 125.7 | | | 18.6 | | | 14107.1 | | | 4.5 | | | 32 | %NM |
| Comparable Adjustments | (96.0) | | | 82.4 | | | (51178.6) | | | 134.0 4) | | | NM |
| Consolidated gross profit | $ | 4,769.0 | | | $ | 4,707.3 | | | $ | 4,46661.07 | | | $ | 241.3 | | | 5 | %1 | % |
| | | | | |
| The increase in Beer gross profit is primarily due to the $279.7 million favorable impact from pricing and $253.0 million of shipment volume growth, partially offset by $233.2 million of higher cost of product sold and $40.7 million of unfavorable product mix. The higher cost of product sold is largely due to (i) $185.1 million of higher materials costs, including aluminum, glass, malt, cartons, lumber, corn, and steel, driven by inflation and supply chain constraints, (ii) a $42.5 million increase in brewery costs primarily driven by increased utilities, administrative costs, and maintenance, (iii) $40.7 million of higher depreciation, (iv) $34.1 million of increased transportation costs, and (v) $18.3 million of supporting costs, including increased compensation and benefits, IT expenses, and travel, partially offset by (i) $71.9 million of decreased obsolescence primarily from excess inventory of hard seltzers resulting from a slowdown in the overall category in early Fiscal 2022 and (ii) $26.8 million of favorable fixed cost absorption related to increased production levels as compared to Fiscal 2022. |
| | | | | |
Constellation Brands, Inc. FY 20222023 Form 10-K | #WORTHREACHINGFOR I 41 |
| | | | | | | | |
| PART II | ITEM 7. MD&A | Table of Contents |
| | | | | |
| The increase in Beer is primarilydecrease in Wine and Spirits gross profit is due to $301.3 million of shipment volume growth anda decrease of $29.3 million from the 2022 Wine Divestiture, partially offset by an $8.6 million increase in organic gross profit. The increase in organic gross profit is driven by (i) $62.6 million of favorable product mix, (ii) $22.7 million of higher non-branded gross profit, (iii) a $5.0 million favorable foreign currency translation impact, and (iv) the $1824.41 million favorable impact from pricing, partially offset by $200.1(i) a $78.8 million decline in branded wine and spirits shipment volume and (ii) $7.0 million of higher cost of product sold. The higher cost of product sold is predominantly due to higher operational costs including (i) a $78.2 million increase in obsolescence primarily from excess inventory of hard seltzers largely resulting from a slowdown in the overall category, (ii) $66.3 million of brewery costs primarily, driven by higher compensationinflation and benefits, largely resulting from increased headcount to support the growth of our Mexican beer portfolio, and increased utility costs, (iii) $61.5 million of higher material costs, including pallets, cartons, steel, corn, and aluminum, and (iv) $44.3 million of higher depreciation, partially offset by (i) $47.8 million of favorable fixed cost absorption primarily as a result of increased production levels for Fiscal 2022 and (ii) $20.1 million of foreign currency transactional benefits. |
| | | | | |
| The decrease in Wine and Spirits is due to a decrease of $252.9 million from the divestitures, partially offset by a $85.6 million increase in organic gross profit. The increase in organic gross profit is attributable to (i) the $40.3 million of favorable pricing, (ii) $35.7 million increase from favorable product mix shift, and (iii) $9.6 million primarily related to favorable bulk wine and non-branded net sales, partially offset by $2.9 million of higher cost of product sold. The increasedglobal supply chain constraints. The increase in cost of product sold was largely attributable to $29 (i) $30.05 million of increased transportation costs resulting from global supply chain challengesand warehousing costs, including inflation, and route to market changes, partiallyocean freight shipping, and (ii) $10.8 million of higher material costs, including glass and packaging materials, largely offset by (i) $16.5 22.3 million of net favorable fixed cost absorption and (ii) approximately $10 $12.0 million of lower grape raw materials and other cost savings initiatives. The net favorable fixed cost absorption in Fiscal 2022 primarily resulted from the impact of the 2020 U.S. wildfires, partially offset by decreased production levels at certain facilities as a result of a late frost in New Zealand which reduced the grape harvestcost saving initiatives, primarily resulting in lower grape costs. |
Gross profit as a percent of net sales increased todecreased to 50.5% for Fiscal 2023 compared with 53.4% for Fiscal 2022 compared with 51.8% for Fiscal 2021. This decrease was largely due to approximately (i) 150 basis points of favorable change in Comparable Adjustments, (ii) 95 basis points of favorable impact from the lower-margin wine and spirits divestitures, and (iii) 95 basis points of favorable impact from Beer pricing in select markets, partially offset by approximately 220(i) approximately 245 basis points of rate decline from cost of product sold within the Beer segment, driven by the increase in operational costsand logistics costs, (ii) an unfavorable change of approximately 185 basis points in Comparable Adjustments, and (iii) approximately 30 basis points related to unfavorable product mix shift within the Beer segment, partially offset by (i) approximately 135 basis points of favorable impact from Beer pricing in select markets and (ii) favorable product mix shift and favorable impact from non-branded product within the Wine and Spirits segment, each contributing approximately 15 basis points.
Selling, general, and administrative expenses
| | | | | | | | | | | | | | | | | | | | | | | |
| Fiscal
20222023 | | Fiscal
20212022 | | Dollar
Change | | Percent
Change |
| (in millions) | | | | | | | |
| Beer | $ | 1,076.3 | | | $ | 973.7 | | | $ | 908.1 | | | $ | 65102.6 | | | 711 | % |
| Wine and Spirits | 474.1 | | | 477.2 | | | 492.8 | | | (15.6(3.1) | | | (31 | %) |
| Corporate Operations and Other | 277.9 | | | 238.2 | | | 22839.67 | | | 9.6 | | | 417 | % |
| Canopy | 1,980.2 | | | 611.5 | | | 1,481368.97 | | | (870.4) | | | (59 | %)NM |
| Consolidation and eliminations | (1,980.2) | | | (611.5) | | | (1,481368.97) | | | 870.4 | | | 59 | %NM |
| Comparable Adjustments | 2297.38 | | | 3520.6 | | | (13.3)77.2 | | | (37 | %)NM |
| Consolidated selling, general, and administrative expenses | $ | 1,711926.41 | | | $ | 1,665709.17 | | | $ | 46216.34 | | | 313 | % |
| | | | | |
| The increase in Beer is primarily due to $35.3 million of higher marketing spend and $29.3 million of increased general and administrative expenses. The higher marketing spend was driven by our planned investments to support the growth of our Mexican beer portfolio through media and event sponsorships. The increase in general and administrative expenses was primarily driven by increased legal expense, increased depreciation and other costs related to the implementation of a new ERP, unfavorable foreign currency transaction losses, and higher compensation and benefits. |
| | | | | |
| The decrease in Wine and Spirits is primarily due to $14.0 million of lower marketing spend as a result of the divestitures. |
| | | | | |
| The increase in Beer selling, general, and administrative expenses is primarily due to $54.7 million of higher marketing spend and $47.8 million of increased general and administrative expenses. The higher marketing spend was driven by increased sports-related partnerships and planned investments to support the growth of our Mexican beer portfolio. The increase in general and administrative expenses was primarily driven by (i) compensation and benefits, primarily related to incremental headcount to support the growth of our Mexican beer portfolio, (ii) higher travel and meeting costs as compared to Fiscal 2022, and (iii) Mexico Beer Projects strategic asset relocation, partially offset by favorable foreign currency impact. |
| | | | | |
| The decrease in Wine and Spirits selling, general, and administrative expenses is due to $20.3 million of lower marketing spend and a $6.2 million decrease in selling expenses, partially offset by $23.4 million of increased general and administrative expenses. The increase in general and administrative expenses was primarily driven by compensation and benefits, primarily related to higher headcount from our continued focus on expanding into DTC channels and higher-end brands, higher travel as compared to Fiscal 2022, and expenses associated with an initiative to improve our marketing effectiveness, partially offset by favorable foreign currency impact. For Fiscal 2024, we expect marketing spend to be 8% of net sales. |
| | | | | |
Constellation Brands, Inc. FY 20222023 Form 10-K | #WORTHREACHINGFOR I 42 |
| | | | | | | | |
| PART II | ITEM 7. MD&A | Table of Contents |
| | | | | |
| The increase in Corporate Operations and Other selling, general, and administrative expenses is largely due to approximately (i) a $36 million increase in third-party services, primarily driven by our Digital Business Acceleration investments, and (ii) a $9 million increase in compensation and benefits, partially offset by a decrease of approximately $8 million resulting from the completion of an ERP implementation in Fiscal 2022. The increase in compensation and benefits was primarily driven by (i) a Fiscal 2022 reversal of stock-based compensation for a performance award tied to earnings from our investment in Canopy that did not achieve a threshold level of performance and (ii) increased headcount to support our Digital Business Acceleration initiative, partially offset by lower incentive accruals as compared to Fiscal 2022. |
Selling, general, and administrative expenses as a percent of net sales increased to 20.4% for Fiscal 2023 as compared with 19.4% for Fiscal 2022 as compared with 19.3% for Fiscal 2021. The increase is driven largely by approximately 35(i) an unfavorable change in Comparable Adjustments, contributing 75 basis points of rate growth in connection with the wineand (ii) approximately 40 basis points of rate growth from the increase in the Corporate Operations and spirits divestitures, largelyOther segment’s selling, general, and administrative expenses, partially offset by approximately 1525 basis points of rate decline in the Beer segment as the increase in Beer net sales exceeded the increase in selling, general, and administrative expenses and a decrease in the Wine and Spirits segment selling, general, and administrative expenses, which resulted in approximately 10 basis points of rate decline.
Operating income (loss)
| | | | | | | | | | | | | | | | | | | | | | | |
| Fiscal
20222023 | | Fiscal
20212022 | | Dollar
Change | | Percent
Change |
| (in millions) | | | | | | | |
| Beer | $ | 2,861.5 | | | $ | 2,703.3 | | | $ | 158.2,494.3 | | | $ | 209.0 | | | 86 | % |
| Wine and Spirits | 453.1 | | | 470.7 | | | 622.4 | | | (151.7) | | | (24 | %) |
| Corporate Operations and Other | (238.2) | | | (228.6) | | | (9(17.6) | | | (4 | %) |
| CanopyCorporate Operations and Other | (277.9) | | | (238.2) | | | (39.7) | | | (17 | %) |
| Canopy | (2,105.9) | | | (630.1) | | | (1,496475.08) | | | 865.9 | | | 58 | %NM |
| Consolidation and eliminations | 2,105.9 | | | 630.1 | | | 1,496475.08 | | | (865.9) | | | (58 | %)NM |
| Comparable Adjustments | (193.8) | | | (604.1) | | | (97.0) | | | (507.1)410.3 | | | NM |
| Consolidated operating income (loss) | $ | 2,842.9 | | | $ | 2,331.7 | | | $ | 511.2,791.1 | | | $ | (459.4) | | | (1622 | %) |
| | | | | |
| The increase in Beer operating income is largely attributable to the favorable pricing impact, strong shipment volume growth within our Mexican beer portfolio, decreased obsolescence, and favorable pricing impactfixed cost absorption, partially offset by higher operational and logistics costs, marketing spend, and general and administrative expenses, as discussed above, and the unfavorable product mix shift. |
| | | | | |
| The decrease in Wine and Spirits operating income is largely attributable to the divestitures, partially offset by the increase in organic net sales, led by favorable impacts from product mix shift and pricing, bulk wine net sales, anddecline in branded wine and spirits shipment volume growth, the 2022 Wine Divestiture, and increases in general and administrative expenses and cost of product sold, as described above, partially offset the favorable product mix shift, increase in non-branded net sales, lower marketing spend, and the favorable pricing impact. |
| | | | | |
| As previously discussed, the Corporate Operations and Other increase in operating loss is largely due to the increases in consultingFiscal 2023 Digital Business Acceleration investments and third-party servicesincreased compensation and travel expensebenefits, as compared to Fiscal 2021discussed above, partially offset by favorable impacts from the reversal ofdecrease in stock-based compensation and foreign currencyERP-related consulting services. |
| | | | | |
Constellation Brands, Inc. FY 20222023 Form 10-K | #WORTHREACHINGFOR I 43 |
| | | | | | | | |
| PART II | ITEM 7. MD&A | Table of Contents |
Income (loss) from unconsolidated investments
General
| | | | | | | | | | | | | | | | | | | | | | | |
| Fiscal
20222023 | | Fiscal
20212022 | | Dollar
Change | | Percent
Change |
| (in millions) | | | | | | | |
| Impairment of Canopy Equity Method Investment | $ | (1,060.3) | | | $ | — | | | $ | (1,060.3) | | | NM |
| Unrealized net gain (loss) on securities measured at fair value | $(45.9) | | | (1,644.7) | | | $ | 802.01,598.8 | | | $97 | (2,446.7) | | | NM% |
Equity in earnings (losses) from Canopy and related activities (1) | (949.3) | | | (73.6) | | | (679875.07) | | | 605.4 | | | 89 | %NM |
| Equity in earnings (losses) from other equity method investees and related activities | 19.1 | | | 31.8 | | | 27.3 (12.7) | | | 4.5 | | | 16(40 | %) |
Net gain (loss) on sale of unconsolidated investment (2) | 51.0 | | | — | | | 51.0 | | | NM |
(51.0) | | NM |
| $ | (2,036.4) | | | $ | (1,635.5) | | | $ | 150.3 | | | $ | (1,785.8(400.9) | | | NM(25 | %) |
(1)Includes $82.4 million and $359461.4 million of a goodwill impairment related to Canopy’s cannabis operations for Fiscal 2023. Also includes $123.5 million and $82.64 million of costs designed to improve their organizational focus, streamline operations, and align production capability with projected demand for Fiscal 20222023 and Fiscal 20212022, respectively.
(2)Represents the sale of our previously held equity interest in an investment made through our corporate venture capital function.
For additional information regarding our equity method investments, refer to Note 10.
| | | | | |
| Canopy segment Canopy net sales increased todecreased to $339.3 million for Fiscal 2023 from $444.3 million for Fiscal 2022 from $378.6 million for Fiscal 2021. This increasedecrease of $65105.70 million, or 1724%, is primarilylargely attributable to an increase in other consumer product sales and Canadian THC recreational sales. The increase in other consumer product sales largely resulted from (i) sales of sports nutrition beverages and mixes bylower cannabis sales, partially offset by growth in their BioSteel Sports Nutrition Inc., as they expanded their U.S. distribution and introduced new RTD products business. The decline in cannabis sales primarily resulted from decreases in (i) Canadian adult-use cannabis sales volume, largely driven by the continuing impacts of price compression resulting from increased competition, and (ii) medicinal sales of vaporizers bydriven by the January 2022 divestiture of C3, an international pharmaceutical business. Additionally, other consumer products sales in Fiscal 2023 as compared to Fiscal 2022 decreased driven by declines in their Storz & Bickel GmbH & Co. KG also increased due to continued U.S. distribution expansion, partially offset by supply chain challenges and shipping restrictions. Canadian THC recreational sales benefited from Canopy’s Fiscal 2022 acquisitions including the Supreme Cannabis Company, Inc. and AV Cannabis Inc. (“Ace Valley”), partially offset by lower supply of high demand products and unfavorable impacts from product mix shift and pricing. Canopy gross profit (loss) declinedand This Works Products Limited businesses. Canopy gross profit (loss) decreased to $(18.6) million for Fiscal 2022 from $(14.1125.7) million for Fiscal 20212023 from $(18.6) million for Fiscal 2022. This increase in lossdecrease of $4107.5 1 million is primarily driven by (i) highera net increase in inventory write-downs for Fiscal 2022and other charges associated with Canopy’s restructuring actions as compared withto Fiscal 20212022, (ii) decreased net sales and price compression in the Canadian recreational channel and for Canopy’s, now former, international pharmaceutical business, C3, (iii) shifts in businessadult-use channel, (iii) unfavorable product mix, shift, and (iv) unfavorable fixed cost absorption for certain of its businesses, and (v) higher shipping and warehousing costs in North America. The decline in Canopy’s gross profit (loss) was partially offset bya decrease in payroll subsidies received from the Canadian government in Fiscal 2022 pursuant to a COVID-19 relief program. Canopy selling, general, and administrative expenses decreasedincreased $8701,368.47 million primarily from a reduction in (i) assetlargely driven by a $1,353.2 million goodwill impairment and restructuring charges related to its previous year decision to close greenhouse facilities as well as other changes related to its organizational and strategic review of their business, (ii) expected credit losses on financial assets and related charges, (iii) stock-based compensation expense, and (iv) sales and marketing expenses related to their cannabis operations, restructuring costs, and asset impairments for Fiscal 2023, partially offset by a continued focus on reducing costs and the closure of certain research and development facilities in Fiscal 2022. The combination of these factors were the main contributors to the $865.9 1,475.8 million decreaseincrease in operating loss. |
Interest expense
Interest expense decreasedincreased to $398.7 million for Fiscal 2023 as compared to $356.4 million for Fiscal 2022 from $385.7 million for Fiscal 2021. This decreaseincrease of $2942.3 million, or 812%, is due to approximately $1.2 billion of lowerhigher average borrowings, partially offset by of approximately 10$775 million and approximately 20 basis points of higher weighted average interest rates. The lower average borrowings are primarily attributable to the partial repayment of financing entered into, partially offset by an increase in capitalized interest in connection with the November 2018 Canopy TransactionMexico Beer Projects. The higher average borrowings and weighted average interest rates are largely attributable to the August 2022 Term Credit Agreement and borrowings under our commercial paper program which was used to fund the aggregate cash payment to holders of Class B Stock in connection with the Reclassification. For additional information, refer to Notes 12 and 17.
| | | | | |
Constellation Brands, Inc. FY 20222023 Form 10-K | #WORTHREACHINGFOR I 44 |
| | | | | | | | |
| PART II | ITEM 7. MD&A | Table of Contents |
Loss on extinguishment of debt
Loss on extinguishment of debt primarily consists of a make-whole paymentpremium payment and the write-off of debt issuance costs in connection with the May 2022 tender offers of our 3.20% February 2018 Senior Notes and 4.25% May 2013 Senior Notes and make-whole payments in connection with the early redemption of our (i) 2.70% May 3.20% February 2018 Senior Notes and 4.25% May 2013 Senior Notes (Fiscal 2023) and (ii) 2.70% May 2017 Senior Notes and 2.65% November 2017 Senior Notes (Fiscal 2022). and (ii) 2.25% November 2017 senior notes (Fiscal 2021)For additional information, refer to Note 12.
(Provision for) benefit from income taxes
The (provision for) benefit from income taxes decreasedincreased to $(309422.4)1 million for Fiscal 20222023 from $(511309.1)4 million for Fiscal 20212022. Our effective tax rate for Fiscal 20222023 was 99110.70% as compared with 2099.17% for Fiscal 20212022. In comparison to prior year, our taxes were impacted primarily by:
•valuation allowances on a portion ofan increase in the unrealized net loss from the changes in fair value ofvaluation allowance related to our investment in Canopy and Canopy equity in earnings (losses);; and
•a higher income tax benefit from stock-based compensation award activity for Fiscal 2022 from changes in option exercise activity; partially offset by
•a net income tax benefit recognized from the realization of tax losses related to a prior period divestiture; and
•the effective tax rates applicable to our foreign businesses, including the impact of the Fiscal 2022 long-lived asset impairment of brewery construction in progress; and
•a net income tax benefit from stock-based compensation award activity for Fiscal 2022 from changes in option exercise activity.
For additional information, refer to Note 13.
We expect our reported effective tax rate for the next fiscal year to be in the range of 1918% to 21%. Since estimates are not currently available, this20%. This range does not reflect any future changes in the fair value of our Canopy investment measured at fair value and any future equity in earnings (losses) and related activities from the Canopy Equity Method Investmentfrom the Canopy Equity Method Investment and related activities. On August 16, 2022, the IRA was signed into law in the U.S. We do not currently expect the IRA to have a material impact on our financial results, including on our annual effective tax rate and/or overall liquidity.
Net income (loss) attributable to CBI
Net income (loss) attributable to CBI decreased to $(40.4) million for Fiscal 2022 from $1,998increased to $71.0 million for Fiscal 20212023 from $40.4 million for Fiscal 2022. This decreaseincrease of $2,03830.46 million, or 76%, is largely attributable to (i) the impairment of our Canopy Equity Method Investment, (ii) the increase in equity losses from Canopy’s results, and (iii) the increase in the provision for income taxes, partially offset by (i) the decrease in unrealized net loss from the changes in fair value of our investment in Canopy as compared with an unrealized net gain in Fiscal 2021, (ii) anthe impairment of long-lived assets for Fiscal 2022 in connection with certain assets at the Mexicali Brewery, and (iii) the decrease in Wine and Spirits net sales due largely to the divestitures, and (iv) higher operational costs within the Beer segment, partially offset by strong shipment volume growth within the Beer segment and the decrease in the provision for income taxesimprovements within the Beer segment.
Liquidity and Capital Resources
General
Our primary source of liquidity has been cash flow from operating activities. Our ability to consistently generate robust cash flow from our operations is one of our most significant financial strengths; it enables us to invest in our people and our brands, make capital investments and strategic acquisitions, provide a cash dividend program, and from time-to-time, repurchase shares of our common stock. Our largest use of cash in our operations is for purchasing and carrying inventories and carrying seasonal accounts receivable. Historically, we have used this cash flow to repay our short-term borrowings and fund capital expenditures. Additionally, our commercial paper program is used to fund our short-term borrowing requirements and to maintain our access to the capital markets. We use our short-term borrowings, including our commercial paper program, to support our working capital requirements and capital expenditures, among other things.
We seek to maintain adequate liquidity to meet working capital requirements, fund capital expenditures, and repay scheduled principal and interest payments on debt. Absent deterioration of market conditions, we believe that cash flows from operating and financing activities, primarily short-term borrowings, will provide adequate resources to satisfy our working capital, scheduled principal and interest payments on debt, anticipated dividend payments, periodic share will provide adequate resources to satisfy our working capital, scheduled principal and interest payments on debt, anticipated dividend payments, periodic share
| | | | | |
Constellation Brands, Inc. FY 2023 Form 10-K | #WORTHREACHINGFOR I 45 |
| | | | | | | | |
| PART II | ITEM 7. MD&A | Table of Contents |
repurchases, and anticipated capital expenditure requirements for both our short-term and long-term capital needs.
| | | | | |
| Constellation Brands, Inc. FY 2022 Form 10-K | #WORTHREACHINGFOR I 45 |
In December 2021The Reclassification required significant cash outlays during the third quarter of Fiscal 2023. Pursuant to the Reclassification, each share of Class B Stock issued and outstanding immediately prior to the Effective Time was reclassified, exchanged, and converted into one share of Class A Stock and received $64.64 in cash, without interest. The aggregate cash payment to holders of Class B Stock at the Effective Time was $1.5 billion. We utilized our $1.0 billion three-year term loan facility under the August 2022 Term Credit Agreement and borrowings under our commercial paper program to fund the aggregate cash payment to holders of Class B Stock. In addition, we entered into an agreement with a financial institution for payableincurred $37.8 million of non-recurring costs and expenses for Fiscal 2023 in connection with the completion of the Reclassification. In February 2023, we repaid a portion of our indebtedness under the August 2022 Term Credit Agreement with proceeds from the February 2023 Senior Notes. We do not expect the Reclassification to have an ongoing material impact on our liquidity. For additional information, refer to Note 17.
We have an agreement with a financial institution for payment services. Weand planbegan to facilitate a voluntary supply chain finance program through this participating financial institution induring Fiscal 2023. The program will beis available to certain of our suppliers allowing them the option to manage their cash flow. We willare not be a party to the agreements between the participating financial institution and the suppliers in connection with the program. Our rights and obligations to our suppliers, including amounts due and scheduled payment terms, willare not be impacted. We are still evaluating the impact of this program on future liquidity.
As of February 28, 2022,For additional information, refer the exercise of all Canopy warrants held by us would have required a cash outflow of approximately $5.9 billion based on the terms of the November 2018 Canopy Warrantsto Note 16.
Cash Flows
| | | | | | | | | | | | | | | | | | | | | | | |
| Fiscal
20222023 | | Fiscal
20212022 | | Dollar
Change | | Percent
Change |
| (in millions) | | | | | | | |
| Net cash provided by (used in): | | | | | | | |
| Operating activities | $ | 2,756.9 | | | $ | 2,705.4 | | | $ | 2,80651.5 | | | $ | (101.1) | | | (4) | % |
| Investing activities | (999.4) | | | (1,035.8) | | | (87.9)36.4 | | | (947.9) | | | NM |
| Financing activities | (1,819.9) | | | (1,929.5) | | | (2,346.6) | | | 417.1109.6 | | | 18 | % |
| Effect of exchange rate changes on cash and cash equivalents | (3.5) | | | (1.3) | | | 7.2 | | | (8.5(2.2) | | | (118) | % |
| Net increase (decrease) in cash and cash equivalents | $ | (65.9) | | | $ | (261.2) | | | $ | 379195.23 | | | $ | (640.4) | | | (169) | % |
Operating activities
The decreaseincrease in net cash provided by (used in) operating activities consists of:
| | | | | | | | | | | | | | | | | | | | | | | |
| Fiscal
20222023 | | Fiscal
20212022 | | Dollar
Change | | Percent
Change |
| (in millions) | | | | | | | |
| Net income (loss) | $ | (38.5) | | | $ | 1.0 | | | $ | 2,031.8 | | | $ | (2,030.8(39.5) | | | (100) | % |
| Unrealized net (gain) loss on securities measured at fair value | 45.9 | | | 1,644.7 | | | (8021,598.08) | | | 2,446.7 | | | NM |
| Deferred tax provision (benefit) | 207.8 | | | 84.8 | | | 336123.40 | | | (251.6) | | | (75) | % |
| Equity in (earnings) losses of equity method investees and related activities, net of distributed earnings | 971.8 | | | 61.6 | | | 673910.42 | | | (611.8) | | | (91) | % |
| Impairment of brewery construction in progressCanopy Equity Method Investment | 6651,060.93 | | | — | | | 1,060.3 | | | |
| Impairment of long-lived assets | 53.5 | | | 665.9 | | | NM(612.4) | | | |
| Other non-cash adjustments | 730.6 | | | 433.0 | | | 418297.6 | | | 14.4 | | | 3 | % |
| Change in operating assets and liabilities, net of effects from purchase and sale of business | (274.5) | | | (185.6) | | | 148.3 | | | (333(88.9) | | | NM |
| Net cash provided by (used in) operating activities | $ | 2,756.9 | | | $ | 2,705.4 | | | $ | 2,80651.5 | | | $ | (101.1) | | | (4) | % |
| | | | | |
Constellation Brands, Inc. FY 2023 Form 10-K | #WORTHREACHINGFOR I 46 |
| | | | | | | | |
| PART II | ITEM 7. MD&A | Table of Contents |
The net change in operating assets and liabilities was largely driven by (i) higher Fiscal 2022 inventory levels fora net income tax benefit recognized from the Beer andrealization of Wine and Spirits segments as comparedtax losses related to Fiscal 2021 inventory levels which were negatively impacted by climate-related events, (ii) increased accounts receivable for the Beer and Wine and Spirits segments, and (iii) higher income tax payments in Fiscal 2022 as compared to Fiscal 2021. This was partially offset by benefits from (i) a prior period divestiture, (ii) accounts payable primarily attributable to the timing of payments for both the Beer and Wine and Spirits segmentssegment, and (iiiii) an exclusivity payment received in Fiscal 2022 related toconnection with distribution arrangements for our U.S. wine and spirits brand portfolio in Fiscal 2022. These changes were partially offset by the timing of collections for (i) recoverable value-added taxes for the Beer segment and (ii) accounts receivable for the Wine and Spirits segment. Additionally, net cash provided by operating activities benefited from lower income tax payments in Fiscal 2023 as compared to Fiscal 2022.
Investing activities
Net cash used in investing activities for Fiscal 2022 increased2023 decreased to $999.4 million for Fiscal 2023 from $1,035.8 million for Fiscal 2022. This decrease of $36.4 million, or 4%, was primarily due to (i) $99492.91 million of lowerhigher proceeds from sale of business, driven by the 2022 Wine Divestiture, and (ii) $16216.24 million of higher capital expenditures for Fiscal 2022 as compared with Fiscal 2021. The increase in net cash used in investing activities waslower business acquisitions, partially offset by the $17374.94 million exercisefrom the sale of the November 2017 Canopy Warrants in May 2020.
| | | | | |
| Constellation Brands, Inc. FY 2022 Form 10-K | #WORTHREACHINGFOR I 46 |
an investment made through our corporate venture capital function in Fiscal 2022.
Business investments, acquisitions, and divestitures consist primarily of the following:
| | | | | | | | | | | | | | | | | | | | |
| | Investments | | Acquisitions | | Divestitures |
| Fiscal 20222023 | | | | | | |
| | | | •Lingua Franca | | •2022 Wine Divestiture |
| | | | •Austin Cocktails | | |
| | | | | | |
| | | | | | |
| Fiscal 2022 | | | | | | |
| | | | •My Favorite Neighbor | | •Corporate investment |
| Fiscal 2021 | | | | | | |
| | •May 2020 Canopy Investment | | •Copper & Kings | | •Paul Masson Grande Amber Brandy |
| | •My Favorite Neighbor | | •Empathy Wines | | •Wine and Spirits Divestiture |
| | | | | | •Nobilo Wine |
| | | | | | •Concentrates and high-color concentrates |
| | | | | | •Ballast Point |
For additional information on these investments,
| | | | | |
For additional information on these acquisitions, and divestitures, refer to Notes 2, 7, and 10.
Financing activities
The decrease in net cash provided by (used in) financing activities consists of:
| | | | | | | | | | | | | | | | | | | | | | | |
| Fiscal
20222023 | | Fiscal
20212022 | | Dollar
Change | | Percent
Change |
| (in millions) | | | | | | | |
| Net proceeds from (payments of) debt, current and long-term, and related activities | $ | 1,991.3 | | | $ | (81.3) | | | $ | (12,787.8) | | | $ | 1,706.5072.6 | | | 95 | % |
| Dividends paid | (587.7) | | | (573.0) | | | (57514.07) | | | 2.0 | | | 0 | % |
| Purchases of treasury stock | (1,390700.5) | | | — 2) | | | (1,390.5) | | | NM(309.7) | | | |
| Net cash provided by stock-based compensation activities | 32.0 | | | 167.8 | | | 51.2 (135.8) | | | 116.6 | | | NM |
| Distributions to noncontrolling interests | (55.3) | | | (52.5) | | | (352.8) | | | |
| Payment to holders of Class B Stock in connection with the Reclassification | (1,500.0) | | | (17.5)— | | | (501,500.0) | % | | |
| | | | | | | |
| Net cash provided by (used in) financing activities | $ | (1,819.9) | | | $ | (1,929.5) | | | $ | (2,346.6) | | | $ | 417.1109.6 | | | 18 | % |
Debt
Total debt outstanding as of February 28, 2022, amounted to $10,416.5 million, a decrease of $25.8 million from February 28, 2021. This decrease consisted of:
| | | | | |
Constellation Brands, Inc. FY 20222023 Form 10-K | #WORTHREACHINGFOR I 47 |
| | | | | | | | |
| PART II | ITEM 7. MD&A | Table of Contents |
Debt
Total debt outstanding as of February 28, 2023, amounted to $12,461.3 million, an increase of $2,044.8 million from February 28, 2022. This increase consisted of:
| | | | | | | | | | | | | | | | | |
| | Debt repayment | | Debt issuance (1) | |
(1)The August 2022 Term Credit Agreement amount reflects a partial repayment of $500.0 million made in February 2023.
Bank facilities
In June 2021April 2022, the Company and the Administrative Agent and Lender amended the March 2020June 2021 Term Credit Agreement. The principal changechanges effected by the June 2021April 2022 amendment waswere a reduction inthe refinement of certain negative covenants and replacement of LIBOR margin from 0.88% torates with rates based 0.63% from June 1, 2021, through December 31, 2021on term SOFR.
In April 2022, we entered into the 2022 Restatement Agreement that amended and restated the 2020 Credit Agreement. The 2022 Restatement Agreement resulted in (i) the refinance and increase of the existing revolving credit facility from $2.0 billion to $2.25 billion and extension of its maturity to April 14, 2027, (ii) the refinement of certain negative covenants, and (iii) the replacement of LIBOR rates with rates based on term SOFR. There are no borrowings outstanding under the 2022 Credit Agreement.
In April August 2022, the Company and the Administrative Agent and Lender amended the June 2021we entered into the August 2022 Term Credit Agreement. The principal changes effected by the April 2022 amendment were the refinement of certain negative covenants and replacement of LIBOR rates with rates based on term SOFRAugust 2022 Term Credit Agreement provides for a $1.0 billion three-year term loan facility and is not subject to amortization payments, with the balance due and payable on November 10, 2025. In February 2023, we repaid a portion of our indebtedness under the August 2022 Term Credit Agreement with proceeds from the February 2023 Senior Notes.
In October 2022, we entered into the October 2022 Credit Agreement Amendments which revised certain defined terms and covenants in our credit agreements. These amendments will become effective upon (i) the amendment by Canopy of its Articles of Incorporation, (ii) the conversion of our Canopy common shares into Exchangeable Shares, and (iii) the resignation of our nominees from the board of directors of Canopy.
Senior notes
In July 2021May 2022, we issued the 2.25% July 2021May 2022 Senior Notes. Proceeds from this offering, net of discount and debt issuance costs, of $9871,837.21 million were used towards the repaymenta series of our 2.70% May 2017cash tender offers to purchase a portion of the 3.20% February 2018 Senior Notes and 2the 4.6525% November 2017 Senior NotesMay 2013 Senior Notes, the June 2022 redemption of the remaining outstanding balance of the 3.20% February 2018 Senior Notes and the 4.25% May 2013 Senior Notes
| | | | | |
Constellation Brands, Inc. FY 2023 Form 10-K | #WORTHREACHINGFOR I 48 |
| | | | | | | | |
| PART II | ITEM 7. MD&A | Table of Contents |
and a make-whole premium, and for general corporate purposes, including working capital, funding capital expenditures, retirement of debt, and other business opportunities.
In February 2023, we issued the February 2023 Senior Notes. Proceeds from this offering, net of discount and debt issuance, of $497.1 million were used for general corporate purposes, including the repayment of a portion of our indebtedness under our August 2022 Term Credit Agreement.
General
The majority of our outstanding borrowings as of February 28, 20222023, consisted of fixed-rate senior unsecured notes, with maturities ranging from calendar 20232024 to calendar 2050, and a variable-rate senior unsecured term loan facilityfacilities under our June 2021April 2022 Term Credit Agreement and August 2022 Term Credit Agreement with a calendar 2024 and 2025 maturity datedates, respectively, as follows:
Additionally, we have a commercial paper program which provides for the issuance of up to an aggregate principal amount of $2.025 billion of commercial paper, inclusive of a $250.0 million increase implemented in December 2022. Our commercial paper program is backed by unused commitments under our revolving credit facility under our 2022 Credit Agreement. Accordingly, outstanding borrowings under our commercial paper program reduce the amount available under our revolving credit facility.
We do not have purchase commitments from buyers for our commercial paper and, therefore, our ability to issue commercial paper is subject to market demand. If the commercial paper market is not available to us for any reason when commercial paper borrowings mature, we will utilize unused commitments under our revolving credit facility under our 2022 Credit Agreement to repay commercial paper borrowings. We do not expect that
| | | | | |
| Constellation Brands, Inc. FY 2022 Form 10-K | #WORTHREACHINGFOR I 48 |
fluctuations in demand for commercial paper will affect our liquidity given our borrowing capacity available under our revolving credit facility.
We had the following remaining borrowing capacity available under our 2020 Credit Agreement and 2022 Credit Agreement, respectively:
| | | | | | | | | | | |
| February 28,
20222023 | | April 1413,
20222023 |
| (in millions) | | | |
Revolving credit facility (1) | $ | 1,664068.85 | | | $ | 1,678234.04 | |
(1) Net of outstanding revolving credit facility borrowings and outstanding letters of credit under our 2020 Credit Agreement and 2022 Credit Agreement, respectively, and outstanding borrowings under our commercial paper program. (excluding unamortized discount) of $1,169.5 million and $1,003.6 million as of February 28, 2023, and April 13, 2023, respectively.
| | | | | |
Constellation Brands, Inc. FY 2023 Form 10-K | #WORTHREACHINGFOR I 49 |
| | | | | | | | |
| PART II | ITEM 7. MD&A | Table of Contents |
The financial institutions participating in our 2022 Credit Agreement have complied with prior funding requests and we believe they will comply with any future funding requests. However, there can be no assurances that any particular financial institution will continue to do so.
As of February 28, 20222023, we and our subsidiaries were subject to covenants that are contained in our 20202022 Credit Agreement, including those restricting the incurrence of additional subsidiary indebtedness, additional liens, mergers and consolidations, transactions with affiliates, and sale and leaseback transactions, in each case subject to numerous conditions, exceptions, and thresholds. The financial covenants are limited to a minimum interest coverage ratio and a maximum net leverage ratio, both as defined in our 20202022 Credit Agreement. As of February 28, 20222023, under our 20202022 Credit Agreement, the minimum interest coverage ratio was 2.5x and the maximum net leverage ratio was 4.0x.
The representations, warranties, covenants, and events of default set forth in our June 2021April 2022 Term Credit Agreement and our August 2022 Term Credit Agreement are substantially similar to those set forth in our 20202022 Credit Agreement.
Our indentures relating to our outstanding senior notes contain certain covenants, including, but not limited to: (i) a limitation on liens on certain assets, (ii) a limitation on certain sale and leaseback transactions, and (iii) restrictions on mergers, consolidations, and the transfer of all or substantially all of our assets to another person.
As of February 28, 20222023, we were in compliance with our covenants under our 20202022 Credit Agreement, our June 2021April 2022 Term Credit Agreement, our August 2022 Term Credit Agreement, and our indentures, and have met all debt payment obligations.
For further discussion and presentation of our borrowings and available sources of borrowing, refer to Note 12.
Common Stock Dividends
On April 65, 20222023, our Board of Directors declared a quarterly cash dividend of $0.8089 per share of Class A Stock, $0.72 per share of Class B Stock, and $0.7280 per share of Class 1 Stock payable on May 1918, 20222023, to stockholders of record of each class as of the close of business on May 54, 20222023. We expect to return approximately $600650 million to stockholders in Fiscal 20232024 through cash dividends.
We currently expect to continue to pay a regular quarterly cash dividend to stockholders of our common stock in the future, but such payments are subject to approval of our Board of Directors and are dependent upon our financial condition, results of operations, capital requirements, and other factors, including those set forth under Item 1A. “Risk Factors” of this Form 10-K.
| | | | | |
| Constellation Brands, Inc. FY 2022 Form 10-K | #WORTHREACHINGFOR I 49 |
Share Repurchase Program
Our Board of Directors authorized the repurchase of our publicly traded common stock of up to $3.0 billion of our Class A Stock and Class B Stock under the 2018 Authorization and an additional repurchase of up to $2.0 billion of our Class A Stock and Class B Stock under the 2021 Authorization. No shares have been repurchased billion under the 2021 Authorization. The 2018 Authorization was fully utilized as of May 31, 2022.
During Fiscal 20222023, we repurchased 67,179086,015446 shares of Class A Stock pursuant to the 2018 Authorization and 2021 Authorization at an aggregate cost of $1,390700.52 million, excluding the impact of Federal excise tax owed pursuant to the IRA, or an average cost of $225239.0492 per share, through a combination of open market transactions and an ASR. Pursuant to the ASR announced in June 2021, we repurchased 2,240,397 shares of Class A Stock at an average purchase price paid of $223.17 per share. We primarily used cash on hand to pay the purchase price for the repurchased shares.
| | | | | |
On April 7, 2022, we entered into an additional ASR to repurchase $500.0 million of our Class A Stock. We utilized short-term borrowings and cash on hand to pay the dollar value for shares repurchased in this ASR under the 2018 Authorization. Constellation Brands, Inc. FY 2023 Form 10-K |
#WORTHREACHINGFOR I 50
|
| | | | | | | | |
| PART II | ITEM 7. MD&A | Table of Contents |
As of AprilFebruary 2128, 20222023, total shares repurchased under the 2018 Authorization and the 2021 Authorization are as follows:
| | | | | | | | | | | | | | | | | | | |
| | | Class A Common Shares | | |
| Repurchase Authorization | | Dollar Value of Shares Repurchased | | Number of Shares Repurchased | | |
| (in millions, except share data) | | | | | | | |
| 2018 Authorization | $ | 3,000.0 | | | $ | 23,936000.40 | | | 1213,802331,171156 | | |
| 2021 Authorization | $ | 2,000.0 | | | $ | —1,136.6 | | | —4,831,910 | | |
Share repurchases under the 20182021 Authorization and 2021 Authorization may be accomplished at management’s discretion from time to time based on market conditions, our cash and debt position, and other factors as determined by management. Shares may be repurchased through open market or privately negotiated transactions. We may fund future share repurchases with cash generated from operations and/or proceeds from borrowings. Any repurchased shares will become treasury shares, including shares repurchased under the 2018 Authorization and the 2021 Authorization.
We currently expect to continue to repurchase shares in the future, but such repurchases are dependent upon our financial condition, results of operations, capital requirements, and other factors, including those set forth under Item 1A. “Risk Factors” of this Form 10-K.
For additional information, refer to Note 17.
Capital Resources
We have maintained adequate liquidity to meet working capital requirements, fund capital expenditures, and repay scheduled principal and interest payments on debt. Absent deterioration of market conditions, we believe that cash flows from operating and financing activities, primarily short-term borrowings, will provide adequate resources to satisfy our working capital, scheduled principal and interest payments on debt, anticipated dividend payments, periodic share repurchases, and anticipated capital expenditure requirements for both our short-term and long-term capital needs.
| | | | | |
| Constellation Brands, Inc. FY 2022 Form 10-K | #WORTHREACHINGFOR I 50 |
The following sets forth information about our outstanding obligations at February 28, 20222023. For a detailed discussion of the items noted in the following table, refer to Notes 11, 12, 13, 14, 15, and 16.
| | | | | | | | | | | | | | | | | |
| Short-term payments | | Long-term payments | | Total |
| (in millions) | | | | | |
| Contractual obligations: | | | | | |
| Short-term borrowings | $ | 3231,165.03 | | | $ | — | | | $ | 323.01,165.3 | |
| Interest payments on short-term debt | $ | 4.2 | | | $ | — | | | $ | 4.2 | |
| Long-term debt (excluding unamortized debt issuance costs and unamortized discounts) | $ | 60610.4 | | | $ | 11,365.8 | | | $ | 911,563.1 | | | $ | 10,169.9376.2 | |
Interest payments on long-term debt (1) | $ | 375457.36 | | | $ | 3,526848.05 | | | $ | 34,901306.31 | |
| Operating leases | $ | 9596.13 | | | $ | 546503.54 | | | $ | 641599.67 | |
Other long-term liabilities (2) | $ | 6399.17 | | | $ | 353299.15 | | | $ | 416399.2 | |
| Purchase obligations | | | | | |
| Raw materials and supplies | $ | 874597.3 | | | $ | 1,633.3 | | | $ | 2,284230.7 | | | $ | 3,159.0 | |
| Contract services | $ | 222.3 | | | $ | 543.1 | | | $ | 765.4 | |
| | | | 6 | |
Capital expenditures (3) | $ | 272243.57 | | | $ | 217407.3 | | | $ | 489.8 651.0 | |
| Contract services | $ | 168.7 | | | $ | 402.8 | | | $ | 571.5 | |
| | | | | |
| In-process and finished goods inventories | $ | 1930.1 | | | $ | 31.5 | | | $ | 50.6 | |
| Other purchase obligations | $ | 8.8 | | | $ | 1056.9 | | | $ | 1987.7 0 | |
| | | | | |
| | | | | |
Constellation Brands, Inc. FY 2023 Form 10-K | #WORTHREACHINGFOR I 51 |
| | | | | | | | |
| PART II | ITEM 7. MD&A | Table of Contents |
| | | | | | | | | | | | | | | | | |
| Short-term payments | | Long-term payments | | Total |
| (in millions) | | | | | |
| Other: | | | | | |
Return value to stockholdersInvestments in businesses (4) | $ | 1,8424.34 | | | $ | —110.2 | | | $ | 1,842.3 | |
Investments in businesses (5) | $ | 19.8 | | | $ | 131.9 | | | $ | 151.7114.6 | |
(1)Interest payments on long-term debt do not include interest related to finance lease obligations as amounts are not material.
(2)Other long-term liabilities do not include payments for unrecognized tax benefit liabilities of $246326.5 million due to the uncertainty of the timing of future cash flows associated with these unrecognized tax benefit liabilities. In addition, other long-term liabilities do not include expected payments for interest and penalties associated with unrecognized tax benefit liabilities as amounts are not material. For a detailed discussion of these items, refer to Note 13.
(3)Contracts to purchase equipment and services primarily related to the Mexico Beer Projects. For further information about these purchase obligations, refer to “Capital expenditures” below.
(4)Publicly announced intent to return $5 billion in value to stockholders through dividends and share repurchases to be made from Fiscal 2020 through Fiscal 2023. We have returned $3,157.7 million through Fiscal 2022.
(5)Publicly announced intent to invest (i) $100 million in female-founded or led companies through our Focus on Female Founders program over a 10-year period concluding in fiscal 2029 and (ii) $100 million to support minority-owned companies in the beverage alcohol space and related categories through our Focus on Minority Founder Venture program over a 10-year period concluding in fiscal 2031. We have invested $4275.78 million and $59.6 million through Fiscal 20222023 in female-founded or led companies and minority-owned companies, respectively.
| | | | | |
| Constellation Brands, Inc. FY 2022 Form 10-K | #WORTHREACHINGFOR I 51 |
Capital Expenditures
Capital Expenditures
During Fiscal 20222023, we incurred $1,026035.84 million for capital expenditures, including $849813.59 million for the Beer segment primarily for the Mexico Beer Projects.
We plan to spend from $1.32 billion to $1.43 billion for capital expenditures in Fiscal 20232024, including approximately $1.2 billion for the Beer segment associated primarily with the Mexico Beer Projects. The remaining planned Fiscal 20232024 capital expenditures consist of improvements to existing operating facilities and replacements of existing equipment and/or buildings. The Mexico Beer Projects are expected to be substantially completed by Fiscal 2026. Accordingly, for the Beer segment, we expect to spend $5.0 billion to $5.5 billion over Fiscal 2023 through Fiscal 2026, with the majority of spend expected to occur in the first three fiscal years of that timeframe. Management reviews the capital expenditure program periodically and modifies it as required to meet current and projected future business needs.
In fiscal 2017April 2022, we began construction of the Mexicali Brewery. In March 2020, a public consultation was held on the construction of our Mexicali Brewery. Following the negative result of the public consultation, we continue to work with governmentannounced that, with the assistance of the Mexican government and state and local officials in Mexico to (i) determine next steps for our suspended Mexicali Brewery construction project, (ii) pursue various forms of recovery for capitalized costs and additional expenses incurred in establishing the brewery, however, there can be no assurance of any recoveries, and (iii) explore options to add further capacity at other locations in Mexico, including, we acquired land in Veracruz for the construction of the Southeast MexicoVeracruz Brewery where there is ample water and we will have a skilled workforce to meet our long-term needs. The design and construction process for the Veracruz Brewery is underway. See Note 7 for further discussion.
Critical Accounting Policies and Estimates
Our significant accounting policies are more fully described in Note 1. Certain policies are particularly important to the portrayal of our financial position and results of operations and require the application of significant judgment by management to determine appropriate assumptions to be used in certain estimates; as a result, they are subject to an inherent degree of uncertainty. Estimates are based on historical experience, observance of trends in the industry, information provided by our customers and information available from other outside sources, as appropriate. We review estimates to ensure that they appropriately reflect changes in our business on an ongoing basis. Our critical accounting estimates include:
•Equity method investments. We monitor our equity method investments for factors indicating other-than-temporary impairment. We consider several factors when evaluating our investments, including, but not limited to, (i) the period of time for which the fair value has been less than the carrying value, (ii) operating and financial performance of the investee, (iii) the investee’s future business plans and projections, (iv) recent transactions and market valuations of publicly traded companies, where available, (v) discussions with their management, and (vi) our ability and intent to hold the investment until it recovers in value.
| | | | | |
Constellation Brands, Inc. FY 2023 Form 10-K | #WORTHREACHINGFOR I 52 |
| | | | | | | | |
| PART II | ITEM 7. MD&A | Table of Contents |
Canopy Equity Method Investment – monitored for other-than-temporary impairment at each reporting date, or more frequently if events or changes in circumstances indicate that the carrying value of the investment may not be recoverable. As of February 28, 2022, the carrying value of our Canopy Equity Method Investment exceeded the fair value by $1,488.7 million. If Canopy’s stock
| | | | | |
| Constellation Brands, Inc. FY 2022 Form 10-K | #WORTHREACHINGFOR I 52 |
price does not recover above our C$22
As of February 28, 2022, the carrying value of our Canopy Equity Method Investment exceeded the fair value by $1,488.7 million. As of August 31, 2022, we evaluated the Canopy Equity Method Investment and determined there was an other-than-temporary impairment based on several contributing factors, including: (i) the period of time for which the fair value had been less than the carrying value and the uncertainty surrounding Canopy’s stock price recovering in the near-term, (ii) Canopy recording a significant impairment of goodwill related to its cannabis operations during its three months ended June 30, 2022, and (iii) the uncertainty of U.S. federal cannabis permissibility. As a result, the Canopy Equity Method Investment with a carrying value of $1,695.1 million was written down to its estimated fair value of $634.8 million, resulting in an impairment of $1,060.3 million. The estimated fair value was determined based on the closing price of the underlying equity security as of August 31, 2022.
As of February 28, 2023, the carrying value of our Canopy Equity Method Investment exceeded the fair value by $87.4 million. If Canopy’s stock price does not recover above our C$3.3484 carrying value in the near-term, itthere may result inbe an additional impairment of our Canopy Equity Method Investment. There may also be a future impairment of our Canopy Equity Method Investment if our expectations about Canopy’s prospective results and cash flows decline, which could be influenced by a variety of factors including adverse market conditions or if Canopy records a significant impairment of goodwill or intangible or other long-lived assets, makes significant asset sales, or has changes in senior management.
•Fair value of financial instruments. Management’s estimate of fair value requires significant judgment and is subject to a high degree of variability based upon market conditions and the availability of specific information. The fair values of our financial instruments that require the application of significant judgment by management are as follows:
Canopy investment
Equity securities, Warrants – estimated using the Black-Scholes option-pricing model (Level 2 fair value measurement) and Monte Carlo simulations (Level 2 fair value measurement). These valuation models use various market-based inputs, including stock price, remaining contractual term, expected volatility, risk-free interest rate, and expected dividend yield, as applicable. Management applies significant judgment in its determination of expected volatility. We consider both historical and implied volatility levels of the underlying equity security and apply limited consideration of historical peer group volatility levels.
Debt securities, Convertible – estimated using a binomial lattice option-pricing model (Level 2 fair value measurement), which includes an estimate of the credit spread based on market spreads using bond data as of the valuation date. This valuation model uses various market-based inputs, including stock price, remaining term, expected volatility, risk-free interest rate, and expected dividend yield, as applicable.
•Goodwill and other intangible assets. Goodwill and other intangible assets are classified into three categories: (i) goodwill, (ii) intangible assets with definite lives subject to amortization, and (iii) intangible assets with indefinite lives not subject to amortization. For intangible assets with definite lives, impairment testing is required if conditions exist that indicate the carrying value may not be recoverable. For intangible assets with indefinite lives and for goodwill, impairment testing is required at least annually or more frequently if events or circumstances indicate that these assets might be impaired. We may perform a qualitative evaluation prior to a quantitative test to determine if an impairment exists. However, if the results of the qualitative evaluation are inconclusive or suggest an impairment may exist, we must proceed to the quantitative test. The qualitative evaluation is an assessment of factors, including market conditions, industry changes, actual results as compared to forecasted results, or the timing of recent acquisitions and/or divestitures. The quantitative test estimates the fair value utilizing assumptions and projections regarding items such as future cash flows, revenues, earnings, and other factors. The factors and assumptions used reflect management’s estimates and are based on historical trends, projections, and assumptions, including expectations of future economic and competitive conditions that are used in current strategic operating plans, however, these are subject to change as a result of changing market conditions. If these estimates or ; however, these are subject to change as a result of changing market conditions. If these estimates or
| | | | | |
Constellation Brands, Inc. FY 2023 Form 10-K | #WORTHREACHINGFOR I 53 |
| | | | | | | | |
| PART II | ITEM 7. MD&A | Table of Contents |
their related assumptions change in the future, we may be required to recognize an impairment loss for these assets. The recognition of any resulting impairment loss could have a material adverse impact on our financial statements.
We perform annual impairment tests and re-evaluate the useful lives of other intangible assets with indefinite lives at the annual impairment test measurement date of January 1 or when circumstances arise that indicate a possible impairment or change in useful life might exist.
Goodwill – Our reporting units with goodwill include the Beer segment and the Wine and Spirits segment. In the fourth quarter of Fiscal 20222023, we performed our annual goodwill impairment analysis using the qualitativequantitative assessment. We determined it is more likely than not theNo indication of impairment was noted for either of our reporting units, as the estimated fair value of each of our reporting units with goodwill exceeded their carrying value, and therefore no goodwill impairment was recognized related to this test. For Fiscal 2021. Based on this analysis, the reporting unit with the lowest amount of estimated fair value in excess of its carrying value was the Wine and Spirits reporting unit with approximately 26% excess fair value. For Fiscal 2022 and Fiscal 2020, as a
| | | | | |
| Constellation Brands, Inc. FY 2022 Form 10-K | #WORTHREACHINGFOR I 53 |
result of our annual goodwill impairment analyses, we concluded that there were no indications of impairment for either of our reporting units2021, as a result of our annual goodwill impairment analyses, we concluded that there were no indications of impairment for either of our reporting units.
The most significant assumptions used in the discounted cash flow calculation to determine the estimated fair value of our reporting units in connection with the impairment testing are: (i) the discount rate, (ii) the expected long-term growth rate, and (iii) the annual cash flow projections. As of January 1, 2023, if we used a discount rate that was 50 basis points higher, used an expected long-term growth rate that was 50 basis points lower, or used annual cash flow projections that were 100 basis points lower in our impairment testing of goodwill, then the changes individually would not have resulted in the carrying value of the respective reporting unit’s net assets, including its goodwill, exceeding its estimated fair value. Therefore, we did not have any indication of potential impairment.
Other intangible assets – Our intangible assets consist primarily of customer relationships and trademarks obtained through business acquisitions. Customer relationships are amortized over their estimated useful lives. The trademarks that were determined to have indefinite useful lives are not amortized. In the fourth quarter of Fiscal 2022, we performed our annual trademark impairment analysis using both the qualitative and quantitative assessments. No indication of impairment was noted for our trademark units utilizing the qualitative assessment, with the exception of the Four Corners trademark. We proceeded with a quantitative impairment test for the Four Corners trademark as certain continued negative trends indicated the fair value may not exceed its carrying value. When using the quantitative assessment, theUsing the quantitative assessment, our trademarks are evaluated for impairment by comparing the carrying value of the trademarks to their estimated fair value. The estimated fair value of trademarktrademarks is calculated based on an income approach using the relief from royalty method. The most significant assumption used in determining the estimated fair value was the annual revenue projection. No indication of impairment was noted using the quantitative test, as the estimated fair value of the
In the fourth quarter of Fiscal 2023, certain continued negative trends within our Funky Buddha and Four Corners trademark was equal to its $4.0 million carrying amountcraft beer portfolios, including ongoing negative cash flows, resulted in management’s decision to revise our long-term financial forecasts for these portfolios. Accordingly, the Beer segment’s Funky Buddha and Four Corners craft beer businesses recognized $9.0 million and $4.0 million impairment losses, respectively, in connection with the write-off of their trademark assets. Refer to Note 7 for further discussion. Additionally, in connection with our annual trademark analysis, we performed a quantitative assessment for the import beer, wine, and spirits trademarks and concluded that there were no indications of impairment for any of these trademark units.
For Fiscal 2022, as a result of our annual trademark impairment analyses, we concluded that there were no indications of impairment for any of our trademark units. During the fourth quarter of Fiscal 2021, certain negative trends within our Four Corners craft beer portfolio, including slower growth rates and increased competition, resulted in updated long-term financial forecasts indicating lower revenue and cash flow generation for the related portfolio. This change in financial forecasts indicated it was more likely than not the fair value of our indefinite-lived intangible asset associated with the Four Corners trademark might be below its carrying value. Accordingly, we performed a quantitative assessment for impairment. As a result of this assessment, the Beer segment’s Four Corners craft beer business recognized a $6.0 million impairment loss in connection with its trademark asset. During the second quarter of Fiscal 2020, certain continuing negative trends within our Beer segment’s Ballast Point craft beer portfolio, including increased rate of revenue decline and increased competition, indicated that it was more likely than not the fair value of our indefinite-lived intangible asset associated with the Ballast Point craft beer trademarks might be below its carrying value. Accordingly, we performed a quantitative assessment for impairment. As a result of this assessment, the Ballast Point craft beer trademark asset recognized an impairment loss of $11.0 million. Refer to Note 7 for further discussion.
Divestitures – When some, but not all of a reporting unitRefer to Note 7 for further discussion.
The most significant assumptions used in the relief from royalty method to determine the
| | | | | |
Constellation Brands, Inc. FY 2023 Form 10-K | #WORTHREACHINGFOR I 54 |
| | | | | | | | |
| PART II | ITEM 7. MD&A | Table of Contents |
estimated fair value of intangible assets with indefinite lives in connection with impairment testing are: (i) the estimated royalty rate, (ii) the discount rate, (iii) the expected long-term growth rate, and (iv) the annual revenue projections. As of January 1, 2023, if we used a royalty rate that was 50 basis points lower, used a discount rate that was 50 basis points higher, used an expected long-term growth rate that was 50 basis points lower, or used annual revenue projections that were 100 basis points lower in our impairment testing of intangible assets with indefinite lives, then each change individually would not have resulted in any unit of accounting’s carrying value exceeding its estimated fair value.
Divestitures – When some, but not all of a reporting unit that constitutes a business is disposed of, some of the goodwill of the reporting unit should be allocated to the portion of the reporting unit being disposed of, if that portion constitutes a business. The allocation of goodwill is based on the relative fair values of the portion of the reporting unit being disposed of and the portion of the reporting unit remaining. This approach requires a determination of the fair value of both the business being disposed and the businesses retained within the reporting unit.
For Fiscal 2023, our estimate of fair value for the 2022 Wine Divestiture was determined based on the expected proceeds from the transaction. The components sold were a part of the Wine and Spirits segment and were included in that reporting unit through the date of divestiture. Goodwill was allocated to the assets based on the relative fair value of the business being sold compared to the relative fair value of the reporting unit. Goodwill not allocated to assets associated with the divestiture remained in the wine and spirits reporting unit.
For Fiscal 2021, our estimate of fair value for the Paul Masson Divestiture, the Wine and Spirits Divestitures, the Concentrate Business Divestiture, and the Ballast Point Divestiture was determined based on the expected proceeds from the transactions. The components sold were a part of the Wine and Spirits or Beer segment and were included in those reporting units through the date of divestiture. Goodwill was allocated to the assets held for sale based on the relative fair value of the businesses being sold compared to the relative fair value of the reporting unit. Goodwill not allocated to assets associated with the respective divestitures remained in the wine and spirits or beer reporting unit.
•Accounting for income taxes. We estimate our deferred tax assets and liabilities, income taxes payable, provision for income taxes, and unrecognized tax benefit liabilities based upon various factors including, but not limited to, historical pretax operating income, future estimates of pretax operating income, differences between book and tax treatment of various items of income and expense, interpretation of tax laws, and tax planning strategies. We are subject to income taxes in Canada, Mexico, Switzerland, the U.S., and other jurisdictions. We are regularly audited by federal, state, and
| | | | | |
| Constellation Brands, Inc. FY 2022 Form 10-K | #WORTHREACHINGFOR I 54 |
foreign tax authorities, but a number of years may elapse before an uncertain tax position is audited and finally resolved.
We believe all tax positions are fully supported. We recognize tax assets and liabilities in accordance with the FASB guidance for income tax accounting. Accordingly, we recognize a tax benefit from an uncertain tax position when it is more likely than not the position will be sustained upon examination based on the largest benefit that has a greater than 50% likelihood of being realized upon ultimate settlement. Due to the complexity of some of these uncertainties, the ultimate resolution may result in a payment that is materially different from our current estimate of the unrecognized tax benefit liabilities. In addition, changes in existing tax laws or rates could significantly change our current estimate of our unrecognized tax benefit liabilities. These differences will be reflected as increases or decreases to income tax expense in the period in which they are determined. Changes in current estimates, if significant, could have a material adverse impact on our financial statements.
We recognize our deferred tax assets and liabilities based upon the expected future tax outcome of amounts recognized in our results of operations. If necessary, we recognize a valuation allowance on deferred tax assets when it is more likely than not they will not be realized. We evaluate our ability to realize the tax benefits associated with deferred tax assets by assessing the adequacy of future expected taxable income, historical, and projected operating results, and the availability of prudent and projected operating results, and the availability of prudent
| | | | | |
Constellation Brands, Inc. FY 2023 Form 10-K | #WORTHREACHINGFOR I 55 |
| | | | | | | | |
| PART II | ITEM 7. MD&A | Table of Contents |
and feasible tax planning strategies. The realization of deferred tax assets is evaluated by jurisdiction and the realizability of these assets can vary based on the character of the tax attribute and the carryforward periods specific to each jurisdiction. We believe it is more likely than not the results of future operations will generate sufficient taxable income to realize our existing deferred tax assets, net of valuation allowances. Changes in the realizability of our deferred tax assets will be reflected in our effective tax rate in the period in which they are determined.
Change in Accounting Guidance
Accounting guidance adopted for Fiscal 20222023 did not have a material impact on our consolidated financial statements.
| | | | | |
Constellation Brands, Inc. FY 20222023 Form 10-K | #WORTHREACHINGFOR I 5556 |
| | | | | | | | |
| PART II | ITEM 7A. QUANTITATIVE AND QUALITATIVE DISCLOSURES | Table of Contents |
Item 7A. Quantitative and Qualitative Disclosures About Market Risk
As a result of our global operating, investment, acquisition, divestiture, and financing activities, we are exposed to market risk associated with changes in foreign currency exchange rates, commodity prices, interest rates, and equity prices. To manage the volatility relating to these risks, we periodically purchase and/or sell derivative instruments including foreign currency forward and option contracts, commodity swap contracts, interest rate swap contracts, treasury lock contracts, and swap lockPre-issuance hedge contracts. We use derivative instruments to reduce earnings and cash flow volatility resulting from shifts in market rates, as well as to hedge economic exposures. We do not enter into derivative instruments for trading or speculative purposes.
Foreign currency and commodity price risk
Foreign currency derivative instruments are or may be used to hedge existing foreign currency denominated assets and liabilities, forecasted foreign currency denominated sales/purchases to/from third parties as well as intercompany sales/purchases, intercompany principal and interest payments, and in connection with investments, acquisitions, or divestitures outside the U.S. As of February 28, 20222023, we had exposures to foreign currency risk primarily related to the Mexican peso, euro, CanadianCanadian dollar, New Zealand dollar, and New Zealand dollareuro. Approximately 100% of our balance sheet exposures and 7273% of our forecasted transactional exposures for the year ending February 2829, 20232024, were hedged as of February 28, 20222023.
Commodity derivative instruments are or may be used to hedge forecasted commodity purchases from third parties as either economic hedges or accounting hedges. As of February 28, 20222023, exposures to commodity price risk which we are currently hedging include aluminum, corn, diesel fuel, and natural gas prices. Approximately 6977% of our forecasted transactional exposures for the year ending February 2829, 20232024, were hedged as of February 28, 20222023.
We have performed a sensitivity analysis to estimate our exposure to market risk of foreign exchange rates and commodity prices reflecting the impact of a hypothetical 10% adverse change in the applicable market. The volatility of the applicable rates and prices is dependent on many factors which cannot be forecasted with reliable accuracy. Gains or losses from the revaluation or settlement of the related underlying positions would substantially offset such gains or losses on the derivative instruments. The aggregate notional value, estimated fair value, and sensitivity analysis for our open foreign currency and commodity derivative instruments are summarized as follows:
| | | | | | | | | | | | | | | | | | | | | | | | | | | | | | | | | | | |
| Aggregate
Notional Value | | Fair Value,
Net Asset (Liability) | | Increase (Decrease)
in Fair Value – Hypothetical
10% Adverse Change |
| February 28,
2022 | | February 28,
20212023 | | February 28,
2022 | | February 28,
20212023 | | February 28,
2022 | | February 28,
20212023 | | February 28,
2022 |
| (in millions) | | | | | | | | | | | |
| Foreign currency contracts | $ | 2,801.2 | | | $ | 2,360.8 | | | $ | 2,262232.73 | | | $ | 38.6 | | | $ | 66.9 (175.8) | | | $ | (145.1) | | | $ | (129.7) | |
| Commodity derivative contracts | $ | 416.5 | | | $ | 291.1 | | | $ | 221.6 (2.0) | | | $ | 90.1 | | | $ | 1534.95 | | | $ | (35.1) | | | $ | (22.5) | |
Interest rate risk
The estimated fair value of our fixed interest rate debt is subject to interest rate risk, credit risk, and foreign currency risk. In addition, we also have variable interest rate debt outstanding (primarily LIBORSOFR-based), certain of which includes a fixed margin subject to the same risks identified for our fixed interest rate debt.
As of February 28, 2022, we had a $100.0 million outstanding cash flow designated swap lock agreementPre-issuance hedge contract which fixed our fixed 10-year interest rates to minimize interest rate volatility on our future debt issuancesthe May 2022 Senior Notes. We had no other outstanding cash flow designated or undesignated interest rate swap contracts, treasury lock contracts, or swap lockPre-issuance hedge contracts outstanding as of February 28, 20222023, andor February 28, 20212022.
| | | | | |
Constellation Brands, Inc. FY 20222023 Form 10-K | #WORTHREACHINGFOR I 5657 |
| | | | | | | | |
| PART II | ITEM 7A. QUANTITATIVE AND QUALITATIVE DISCLOSURES | Table of Contents |
We have performed a sensitivity analysis to estimate our exposure to market risk of interest rates reflecting the impact of a hypothetical 1% increase in the prevailing interest rates. The volatility of the applicable rates is dependent on many factors which cannot be forecasted with reliable accuracy.
The aggregate notional value, estimated fair value, and sensitivity analysis for our outstanding fixed-rate debt, including current maturities and open interest rate derivative instruments, are summarized as follows:
| | | | | | | | | | | | | | | | | | | | | | | | | | | | | | | | | | | |
| Aggregate
Notional Value | | Fair Value
Net Asset (Liability) | | Increase (Decrease)
in Fair Value –
Hypothetical
1% Rate Increase |
| February 28,
2022 | | February 28,
20212023 | | February 28,
2022 | | February 28,
20212023 | | February 28,
2022 | | February 28,
20212023 | | February 28,
2022 |
| (in millions) | | | | | | | | | | | |
| Fixed interest rate debt | $ | 10,576.2 | | | $ | 9,869.9 | | | $ | 10(9,065.5 436.8) | | | $ | (10,045.3) | | | $ | (11,126586.53) | | | $ | (709.7) | | | $ | (805.3) | |
| | | | | | | | | | | |
| | | | | | | | | | | |
| | | | | | | | | | | |
| Swap lock contractsPre-issuance hedge contracts | $ | — | | | $ | 100.0 | | | $ | — | | | $ | (0.4) | | | $ | — | | | $ | (8.6) | | | $ | — | |
A 1% hypothetical change in the prevailing interest rates would have increased interest expense on our variable interest rate debt by $411.68 million and $124.46 million for the years ended February 28, 20222023, and February 28, 20212022, respectively.
Equity price risk
The estimated fair value of our investment in the November 2018 Canopy Warrants and the Canopy Debt Securities are subject to equity price risk, interest rate risk, credit risk, and foreign currency risk. This investment is recognized at fair value utilizing various option-pricing models and has the potential to fluctuate from, among other items, changes in the quoted market price of the underlying equity security. We manage our equity price risk exposure by closely monitoring the financial condition, performance, and outlook of Canopy.
As of February 28, 20222023, the fair value of our investment in the November 2018 Canopy Warrants and the Canopy Debt Securities was $18269.98 million, with an unrealized net gain (loss) on this investment of $(1,64445.79) million recognized in our results of operations for the year ended February 28, 20222023. We have performed a sensitivity analysis to estimate our exposure to market risk of the equity price reflecting the impact of a hypothetical 10% adverse change in the quoted market price of the underlying equity security. As of February 28, 20222023, such a hypothetical 10% adverse change would have resulted in a decrease in fair value of $100.01 million.
For additional discussion on our market risk, refer to Notes 6 and 7.
| | | | | |
Constellation Brands, Inc. FY 20222023 Form 10-K | #WORTHREACHINGFOR I 5758 |
| | | | | | | | |
| PART II | ITEM 8. FINANCIAL STATEMENTS AND SUPPLEMENTARY DATA | Table of Contents |
Item 8. Financial Statements and Supplementary Data
CONSTELLATION BRANDS, INC. AND SUBSIDIARIES
INDEX TO CONSOLIDATED FINANCIAL STATEMENTS
FEBRUARY 28, 20222023
| | | | | | | | | | | |
| | | Page |
| Management’s Annual Report on Internal Control Over Financial Reporting | |
Reports of Independent Registered Public Accounting Firm (PCAOB ID 185) | |
| Consolidated Balance Sheets | |
| Consolidated Statements of Comprehensive Income (Loss) | |
| Consolidated Statements of Changes in Stockholders’ Equity | |
| Consolidated Statements of Cash Flows | |
| Notes to Consolidated Financial Statements | |
| 1. | Description of Business, Basis of Presentation, and Summary of Significant Accounting Policies | |
| 2. | Acquisitions and Divestitures | |
| 3. | Inventories | |
| 4. | Prepaid Expenses and Other | |
| 5. | Property, Plant, and Equipment | |
| 6. | Derivative Instruments | |
| 7. | Fair Value of Financial Instruments | |
| 8. | Goodwill | |
| 9. | Intangible Assets | |
| 10. | Equity Method Investments | |
| | | |
| 11. | Other Accrued Expenses and Liabilities | |
| 12. | Borrowings | |
| 13. | Income Taxes | |
| 14. | Deferred Income Taxes and Other Liabilities | |
| 15. | Leases | |
| 16. | Commitments and Contingencies | |
| 17. | Stockholders' Equity | |
| 18. | Stock-Based Employee Compensation | |
| 19. | Net Income (Loss) Per Common Share Attributable to CBI | |
| 20. | Accumulated Other Comprehensive Income (Loss) | |
| 21. | Significant Customers and Concentration of Credit Risk | |
| | | |
| 22. | Business Segment Information | |
| | | |
| 23. | Selected Quarterly Financial Information (unaudited) | |
| | | | | |
Constellation Brands, Inc. FY 20222023 Form 10-K | #WORTHREACHINGFOR I 5859 |
| | | | | | | | |
| PART II | ITEM 8. FINANCIAL STATEMENTS AND SUPPLEMENTARY DATA | Table of Contents |
Management’s Annual Report on Internal Control Over Financial Reporting
Management of Constellation Brands, Inc. and subsidiaries (the Company) is responsible for establishing and maintaining an adequate system of internal control over financial reporting. This system is designed to provide reasonable assurance regarding the reliability of financial reporting and the preparation of financial statements for external purposes in accordance with U.S. generally accepted accounting principles.
The Company’s internal control over financial reporting includes those policies and procedures that (i) pertain to the maintenance of records that, in reasonable detail, accurately and fairly reflect the transactions and dispositions of the assets of the Company; (ii) provide reasonable assurance that transactions are recorded as necessary to permit preparation of financial statements in accordance with generally accepted accounting principles, and that receipts and expenditures of the Company are being made only in accordance with authorizations of management and directors of the Company; and (iii) provide reasonable assurance regarding prevention or timely detection of unauthorized acquisition, use, or disposition of the Company’s assets that could have a material effect on the financial statements.
Because of its inherent limitations, a system of internal control over financial reporting can provide only reasonable assurance and may not prevent or detect misstatements. Further, because of changes in conditions, effectiveness of internal controls over financial reporting may vary over time.
Management conducted an evaluation of the effectiveness of the system of internal control over financial reporting based on the framework in Internal Control – Integrated Framework (2013) issued by the Committee of Sponsoring Organizations (COSO) of the Treadway Commission. Based on that evaluation, management concluded that the Company’s internal control over financial reporting was effective as of February 28, 20222023.
The effectiveness of the Company’s internal control over financial reporting has been audited by KPMG LLP, an independent registered public accounting firm, as stated in their report which is included herein.
| | | | | |
Constellation Brands, Inc. FY 20222023 Form 10-K | #WORTHREACHINGFOR I 5960 |
| | | | | | | | |
| PART II | ITEM 8. FINANCIAL STATEMENTS AND SUPPLEMENTARY DATA | Table of Contents |
Report of Independent Registered Public Accounting Firm
To the Stockholders and Board of Directors
Constellation Brands, Inc.:
Opinion on Internal Control Over Financial Reporting
We have audited Constellation Brands, Inc. and subsidiaries’ (the Company) internal control over financial reporting as of February 28, 20222023, based on criteria established in Internal Control - Integrated Framework (2013) issued by the Committee of Sponsoring Organizations of the Treadway Commission. In our opinion, the Company maintained, in all material respects, effective internal control over financial reporting as of February 28, 20222023, based on criteria established in Internal Control - Integrated Framework (2013) issued by the Committee of Sponsoring Organizations of the Treadway Commission.
We also have audited, in accordance with the standards of the Public Company Accounting Oversight Board (United States) (PCAOB), the consolidated balance sheets of the Company as of February 28, 20222023 and February 28, 20212022, the related consolidated statements of comprehensive income (loss), changes in stockholders’ equity, and cash flows for each of the fiscal years in the three-year period ended February 28, 20222023, and the related notes (collectively, the consolidated financial statements), and our report dated April 2120, 20222023 expressed an unqualified opinion on those consolidated financial statements.
Basis for Opinion
The Company’s management is responsible for maintaining effective internal control over financial reporting and for its assessment of the effectiveness of internal control over financial reporting, included in the accompanying Management’s Annual Report on Internal Control Overover Financial Reporting. Our responsibility is to express an opinion on the Company’s internal control over financial reporting based on our audit. We are a public accounting firm registered with the PCAOB and are required to be independent with respect to the Company in accordance with the U.S. federal securities laws and the applicable rules and regulations of the Securities and Exchange Commission and the PCAOB.
We conducted our audit in accordance with the standards of the PCAOB. Those standards require that we plan and perform the audit to obtain reasonable assurance about whether effective internal control over financial reporting was maintained in all material respects. Our audit of internal control over financial reporting included obtaining an understanding of internal control over financial reporting, assessing the risk that a material weakness exists, and testing and evaluating the design and operating effectiveness of internal control based on the assessed risk. Our audit also included performing such other procedures as we considered necessary in the circumstances. We believe that our audit provides a reasonable basis for our opinion.
Definition and Limitations of Internal Control Over Financial Reporting
A company’s internal control over financial reporting is a process designed to provide reasonable assurance regarding the reliability of financial reporting and the preparation of financial statements for external purposes in accordance with generally accepted accounting principles. A company’s internal control over financial reporting includes those policies and procedures that (1) pertain to the maintenance of records that, in reasonable detail, accurately and fairly reflect the transactions and dispositions of the assets of the company; (2) provide reasonable assurance that transactions are recorded as necessary to permit preparation of financial statements in accordance with generally accepted accounting principles, and that receipts and expenditures of the company are being made only in accordance with authorizations of management and directors of the company; and (3) provide reasonable assurance regarding prevention or timely detection of unauthorized acquisition, use, or disposition of the company’s assets that could have a material effect on the financial statements.
| | | | | |
Constellation Brands, Inc. FY 20222023 Form 10-K | #WORTHREACHINGFOR I 6061 |
| | | | | | | | |
| PART II | ITEM 8. FINANCIAL STATEMENTS AND SUPPLEMENTARY DATA | Table of Contents |
Because of its inherent limitations, internal control over financial reporting may not prevent or detect misstatements. Also, projections of any evaluation of effectiveness to future periods are subject to the risk that controls may become inadequate because of changes in conditions, or that the degree of compliance with the policies or procedures may deteriorate.
/s/ KPMG LLP
Rochester, New York
April 2120, 20222023
| | | | | |
Constellation Brands, Inc. FY 20222023 Form 10-K | #WORTHREACHINGFOR I 6162 |
| | | | | | | | |
| PART II | ITEM 8. FINANCIAL STATEMENTS AND SUPPLEMENTARY DATA | Table of Contents |
Report of Independent Registered Public Accounting Firm
To the Stockholders and Board of Directors
Constellation Brands, Inc.:
Opinion on the Consolidated Financial Statements
We have audited the accompanying consolidated balance sheets of Constellation Brands, Inc. and subsidiaries (the Company) as of February 28, 20222023 and February 28, 20212022, the related consolidated statements of comprehensive income (loss), changes in stockholders’ equity, and cash flows for each of the fiscal years in the three-year period ended February 28, 20222023, and the related notes (collectively, the consolidated financial statements). In our opinion, the consolidated financial statements present fairly, in all material respects, the financial position of the Company as of February 28, 20222023 and February 28, 20212022, and the results of its operations and its cash flows for each of the fiscal years in the three-year period ended February 28, 20222023, in conformity with U.S. generally accepted accounting principles.
We also have audited, in accordance with the standards of the Public Company Accounting Oversight Board (United States) (PCAOB), the Company’s internal control over financial reporting as of February 28, 20222023, based on criteria established in Internal Control - Integrated Framework (2013) issued by the Committee of Sponsoring Organizations of the Treadway Commission, and our report dated April 2120, 20222023 expressed an unqualified opinion on the effectiveness of the Company’s internal control over financial reporting.
Basis for Opinion
These consolidated financial statements are the responsibility of the Company’s management. Our responsibility is to express an opinion on these consolidated financial statements based on our audits. We are a public accounting firm registered with the PCAOB and are required to be independent with respect to the Company in accordance with the U.S. federal securities laws and the applicable rules and regulations of the Securities and Exchange Commission and the PCAOB.
We conducted our audits in accordance with the standards of the PCAOB. Those standards require that we plan and perform the audit to obtain reasonable assurance about whether the consolidated financial statements are free of material misstatement, whether due to error or fraud. Our audits included performing procedures to assess the risks of material misstatement of the consolidated financial statements, whether due to error or fraud, and performing procedures that respond to those risks. Such procedures included examining, on a test basis, evidence regarding the amounts and disclosures in the consolidated financial statements. Our audits also included evaluating the accounting principles used and significant estimates made by management, as well as evaluating the overall presentation of the consolidated financial statements. We believe that our audits provide a reasonable basis for our opinion.
Critical Audit MattersMatter
The critical audit mattersmatter communicated below are mattersis a matter arising from the current period audit of the consolidated financial statements that werewas communicated or required to be communicated to the audit committee and that: (1) relaterelates to accounts or disclosures that are material to the consolidated financial statements and (2) involved our especially challenging, subjective, or complex judgments. The communication of a critical audit mattersmatter does not alter in any way our opinion on the consolidated financial statements, taken as a whole, and we are not, by communicating the critical audit mattersmatter below, providing a separate opinionsopinion on the critical audit mattersmatter or on the accounts or disclosures to which they relate.
Other-than-temporary impairment assessment for equity method investment in Canopy
As discussed in Notes 1 and 10 to the consolidated financial statements, the Company had a 36.1% equity method investment in Canopy Growth Corporation (Canopy) as of February 28, 2022. The Company reviews its equity method investment in Canopy for impairment by comparing the fair value of its investment to its carrying value. If the carrying value of the investment exceeds its fair value and the loss in value is other than temporary, the investment is reduced to fair value and the impairment is recognized in the period identified. As of February 28, 2022, the carrying value and fair value of the Company’s equity method investment in Canopy was $2,503.5 million and $1,014.8 million, respectively. The Company
| | | | | |
| Constellation Brands, Inc. FY 2022 Form 10-K | #WORTHREACHINGFOR I 62 |
evaluated its equity method investment in Canopy as of February 28, 2022, and determined that there was not an other-than-temporary impairment. The factors used by the Company to make this determination included: (i) the period of time for which the fair value has been less than the carrying value, (ii) an expectation that Canopy’s financial results will improve, (iii) an expectation that the Canopy stock price will recover in the near-term, and (iv) the Company’s ability and intent to hold the investment until recovery.
We identified the other-than-temporary impairment assessment for the Company’s equity method investment in Canopy as a critical audit matter. A high degree of subjective auditor judgment was required to evaluate the Company’s expectations that Canopy’s financial results will improve and that the Canopy stock price will recover in the near-term.
The following are the primary procedures we performed to address this critical audit matter. We evaluated the design and tested the operating effectiveness of an internal control related to the identification and evaluation of factors used in the Company’s other-than-temporary impairment assessment for its investment in Canopy. We assessed the Company’s expectations that Canopy’s financial results will improve and that the Canopy stock price will recover in the near-term by evaluating whether those expectations were consistent with (i) Canopy’s identification of impairment triggers as of an interim date, (ii) external market, regulatory and industry information, (iii) Canopy’s external communications with investors, and (iv) evidence obtained in other areas of the auditit relates.
Unrecognized tax benefits
As discussed in Notes 1 and 13 to the consolidated financial statements, the Company recognizes a tax benefit from an uncertain tax position when it is more likely than not that the position will be sustained upon examination. The Company has recorded unrecognized tax benefits of $279344.03 million as of February 28, 2022.
2023.
| | | | | |
Constellation Brands, Inc. FY 2023 Form 10-K | #WORTHREACHINGFOR I 63 |
| | | | | | | | |
| PART II | ITEM 8. FINANCIAL STATEMENTS AND SUPPLEMENTARY DATA | Table of Contents |
We identified the evaluation of certain of the Company’s unrecognized tax benefits as a critical audit matter. Specifically, complex auditor judgment, including the involvement of tax and valuation professionals with specialized skills and knowledge, was required in evaluating the Company’s interpretation of tax law and its estimate of the ultimate resolution of its tax positions.
The following are the primary procedures we performed to address this critical audit matter. We evaluated the design and tested the operating effectiveness of certain internal controls related to the Company’s process to evaluate uncertain tax positions. This included controls related to the interpretation of tax law, its application in the liability estimation process, and the review of activity that could result in changes to the Company’s unrecognized tax benefits. We involved tax professionals with specialized skills and knowledge, who assisted in evaluating the Company’s interpretation of tax law and tax authority rulings and in performing an independent assessment of certain of the Company’s tax positions and the amount of unrecognized tax benefit, if any, and comparing the results to the Company’s assessment. We also involved valuation professionals with specialized skills and knowledge, who assisted in assessing certain transfer pricing studies for compliance with applicable laws and regulations.
/s/ KPMG LLP
We have served as the Company’s auditor since 2002.
Rochester, New York
April 2120, 20222023
| | | | | |
Constellation Brands, Inc. FY 20222023 Form 10-K | #WORTHREACHINGFOR I 6364 |
| | | | | | | | |
| PART II | ITEM 8. FINANCIAL STATEMENTS AND SUPPLEMENTARY DATA | Table of Contents |
CONSTELLATION BRANDS, INC. AND SUBSIDIARIES
CONSOLIDATED BALANCE SHEETS
(in millions, except share and per share data)
| | | | | | | | | | | |
| February 28,
20222023 | | February 28,
20212022 |
| ASSETS | | | |
| Current assets: | | | |
| Cash and cash equivalents | $ | 199133.45 | | | $ | 460199.64 | |
| Accounts receivable | 899901.06 | | | 785899.30 | |
| Inventories | 1,573898.27 | | | 1,291573.12 | |
| Prepaid expenses and other | 658562.13 | | | 507658.51 | |
| | | |
| Total current assets | 3,329496.71 | | | 3,044329.57 | |
| Property, plant, and equipment | 6,059865.62 | | | 56,821059.6 | |
| Goodwill | 7,862925.4 | | | 7,793862.54 | |
| Intangible assets | 2,755728.21 | | | 2,732755.12 | |
| Equity method investments | 2,688663.73 | | | 2,788688.47 | |
| Securities measured at fair value | 19193.42 | | | 1,818191.14 | |
| Deferred income taxes | 2,351193.53 | | | 2,492351.5 | |
| | | |
| Other assets | 617697.37 | | | 614617.13 | |
| Total assets | $ | 2524,855662.83 | | | $ | 2725,104855.8 | |
| LIABILITIES AND STOCKHOLDERS’ EQUITY | | | |
| Current liabilities: | | | |
| Short-term borrowings | $ | 3231,165.03 | | | $ | —323.0 | |
| Current maturities of long-term debt | 6059.35 | | | 29605.23 | |
| Accounts payable | 899941.25 | | | 460899.02 | |
| Other accrued expenses and liabilities | 871852.30 | | | 779871.93 | |
| Total current liabilities | 2,698968.83 | | | 12,269698.18 | |
| Long-term debt, less current maturities | 911,488286.25 | | | 109,413488.12 | |
| | | |
| Deferred income taxes and other liabilities | 1,621673.06 | | | 1,493621.50 | |
| Total liabilities | 1315,808928.04 | | | 13,175808.70 | |
Commitments and contingencies (Note 16) | | | |
| CBI stockholders’ equity: | | | |
Preferred Stock, $0.01 par value – Authorized, 1,000,000 shares; Issued, none | — | | | — | |
Class A Stock, $0.01 par value – Authorized, 322,000,000 shares; Issued, 187212,263697,859428 shares and 187,204263,280859 shares, respectively | 2.1.9 | | | 1.9 | |
Class B Stock, $0.01 par value – Authorized, 0 shares and 30,000,000 shares, respectively; Issued, 28,212,3400 shares and 28,270212,288340 shares, respectively | 0.3— | | | 0.3 | |
Class 1 Stock, $0.01 par value – Authorized, 25,000,000 shares; Issued, 222,248,679705 shares and 6122,936248,679 shares, respectively | — | | | — | |
| Additional paid-in capital | 1,808903.90 | | | 1,604808.29 | |
| Retained earnings | 1412,505343.49 | | | 1514,117505.84 | |
| Accumulated other comprehensive income (loss) | (41228.75) | | | (335412.57) | |
| 1514,903277.85 | | | 1615,388903.78 | |
| Less: Treasury stock – | | | |
Class A Stock, at cost, 2229,824498,607426 shares and 1722,070824,550607 shares, respectively | (45,169863.79) | | | (24,787169.67) | |
Class B Stock, at cost, 0 shares and 5,005,800 shares, respectively | (2.2—) | | | (2.2) | |
| (45,171863.9) | | | (24,789171.89) | |
| Total CBI stockholders’ equity | 118,731413.96 | | | 1311,598731.9 | |
| Noncontrolling interests | 315320.93 | | | 330315.29 | |
| Total stockholders’ equity | 128,047733.89 | | | 1312,929047.18 | |
| Total liabilities and stockholders’ equity | $ | 2524,855662.83 | | | $ | 2725,104855.8 | |
The accompanying notes are an integral part of these statements.
| | | | | |
Constellation Brands, Inc. FY 20222023 Form 10-K | #WORTHREACHINGFOR I 6465 |
| | | | | | | | |
| PART II | ITEM 8. FINANCIAL STATEMENTS AND SUPPLEMENTARY DATA | Table of Contents |
CONSTELLATION BRANDS, INC. AND SUBSIDIARIES
CONSOLIDATED STATEMENTS OF COMPREHENSIVE INCOME (LOSS)
(in millions, except per share data)
| | | | | | | | | | | | | | | | | |
| For the Years Ended |
| February 28,
2023 | | February 28,
2022 | | February 28,
2021 | | February 29,
2020 |
| Sales | $ | 9,529.110,177.2 | | | $ | 9,529.1 | | | $ | 9,355.7 | | | $ | 9,113.0 | |
| Excise taxes | (724.6) | | | (708.4) | | | (740.8) | | | (769.5) | |
| Net sales | 8,820.79,452.6 | | | 8,820.7 | | | 8,614.9 | | | 8,343.5 | |
| Cost of product sold | (4,683.6) | | | (4,113.4) | | | (4,148.9) | | | (4,191.6) | |
| Gross profit | 4,707769.30 | | | 4,466707.03 | | | 4,151466.90 | |
| Selling, general, and administrative expenses | (1,711.4) | | | (1,665926.1) | | | (1,621.8709.7) | | | (1,674.9) | |
| Impairment of brewery construction in progress | — | | | (665.9) | | | — | | | — | |
| Impairment of assets held for sale | — | | | (24.0) | | | (449.7) | |
| Gain (loss) on sale of business | 1.7 | | | 14.2 | | | 74.1 |
| | | | | |
| | | | | |
| Operating income (loss) | 2,331842.79 | | | 2,791331.17 | | | 2,154791.51 | |
| Income (loss) from unconsolidated investments | (2,036.4) | | | (1,635.5) | | | 150.3 | | | (2,668.6) | |
| Interest expense | (398.7) | | | (356.4) | | | (385.7) | | | (428.7) | |
| Loss on extinguishment of debt | (24.2) | | | (29.4) | | | (12.8) | | | (2.4) | |
| Income (loss) before income taxes | 310.4383.6 | | | 310.4 | | | 2,542.9 | | | (945.2) | |
| (Provision for) benefit from income taxes | (422.1) | | | (309.4) | | | (511.1) | | | 966.6 | |
| Net income (loss) | (38.5) | | | 1.0 | | | 2,031.8 | | | 21.4 | |
| Net (income) loss attributable to noncontrolling interests | (32.5) | | | (41.4) | | | (33.8) | | | (33.2) | |
| Net income (loss) attributable to CBI | $ | (71.0) | | | $ | (40.4) | | | $ | 1,998.0 | | | $ | (11.8) | |
| | | | | |
| Net income (loss) per common share attributable to CBI: | | | | | |
| Basic – Class A Stock | $ | (0.11) | | | $ | (0.22) | | | $ | 10.44 | | | $ | (0.07) | |
| Basic – Class B Stock | $ | (2.02) | | | $ | (0.20) | | | $ | 9.48 | | | $ | (0.07) | |
| Diluted – Class A Stock | $ | (0.11) | | | $ | (0.22) | | | $ | 10.23 | | | $ | (0.07) | |
| Diluted – Class B Stock | $ | (2.02) | | | $ | (0.20) | | | $ | 9.42 | | | $ | (0.07) | |
| Weighted average common shares outstanding: | | | | | |
| Basic – Class A Stock | 167169.431337 | | | 170167.239431 | | | 168170.329239 | |
| Basic – Class B Stock | 23.225206 | | | 23.280225 | | | 23.313208 | |
| Diluted – Class A Stock | 167169.431337 | | | 195167.308431 | | | 168195.329308 | |
| Diluted – Class B Stock | 23.225206 | | | 23.280225 | | | 23.313208 | |
| Cash dividends declared per common share: | | | | | |
| Class A Stock | $ | 3.0420 | | | $ | 3.0004 | | | $ | 3.00 | |
| Class B Stock | $ | 2.7616 | | | $ | 2.7276 | | | $ | 2.72 | |
| | | | | | | | | | | | | | | | | |
| Comprehensive income (loss): | | | | | |
| Net income (loss) | $ | (38.5) | | | $ | 1.0 | | | $ | 2,031.8 | | | $ | 21.4 | |
| Other comprehensive income (loss), net of income tax effect: | | | | | |
| Foreign currency translation adjustments | 274.6 | | | (40.4) | | | (56.0) | | | 60.8 | |
| Unrealized gain (loss) on cash flow hedges | 188.6 | | | (27.8) | | | (20.9) | | | 40.4 | |
| | | | | |
| Pension/postretirement adjustments | 0.31 | | | (10.63) | | | (01.6) | |
| Share of other comprehensive income (loss) of equity method investments | 5.1 | | | (12.5) | | | (1.8) | | | (10.1) | |
| Other comprehensive income (loss), net of income tax effect | 468.4 | | | (80.4) | | | (80.3) | | | 90.5 | |
| Comprehensive income (loss) | 429.9 | | | (79.4) | | | 1,951.5 | | | 111.9 | |
| Comprehensive (income) loss attributable to noncontrolling interests | (59.7) | | | (38.2) | | | (22.7) | | | (36.1) | |
| Comprehensive income (loss) attributable to CBI | $ | 370.2 | | | $ | (117.6) | | | $ | 1,928.8 | | | $ | 75.8 | |
The accompanying notes are an integral part of these statements.
| | | | | |
Constellation Brands, Inc. FY 20222023 Form 10-K | #WORTHREACHINGFOR I 6566 |
| | | | | | | | |
| PART II | ITEM 8. FINANCIAL STATEMENTS AND SUPPLEMENTARY DATA | Table of Contents |
CONSTELLATION BRANDS, INC. AND SUBSIDIARIES
CONSOLIDATED STATEMENTS OF CHANGES IN STOCKHOLDERS’ EQUITY
(in millions)
| | | | | | | | | | | | | | | | | | | | | | | | | | | | | | | | | | | | | | | | | | | | | | | |
| Stock | | Additional
Paid-in
Capital | | Retained
Earnings | | Accumulated
Other
Comprehensive
Income (Loss) | | Treasury
Stock | | Non-controlling
Interests | | Total |
| Class A | | Class B | |
| Balance at February 2829, 20192020 | $ | 1.9 | | | $ | 0.3 | | | $ | 1,410514.8 | | | $ | 14,276.2 | | | $ | (353.9) | | | $ | (2,784.3) | | | $ | 286.2 | | | $ | 12,837.2 | |
| | | | | | | | | | | | | | | |
| Comprehensive income (loss): | | | | | | | | | | | | | | | |
| Net income (loss) | — | | | — | | | — | | | (11.8) | | | — | | | — | | | 33.2 | | | 21.4 | |
| Other comprehensive income (loss), net of income tax effect | — | | | — | | | — | | | — | | | 87.6 | | | — | | | 2.9 | | | 90.5 | |
| Comprehensive income (loss) | | | | | | | | | | | | | | | 111.9 | |
| | | | | | | | | | | | | | | |
| Repurchase of shares | — | | | — | | | — | | | — | | | — | | | (50.0) | | | — | | | (50.0) | |
| Dividends declared | — | | | — | | | — | | | (569.1) | | | — | | | — | | | — | | | (569.1) | |
| Initial recognition of non-controlling interest | — | | | — | | | — | | | — | | | — | | | — | | | 20.2 | | | 20.2 | |
| | | | | | | | | | | | | | | |
| Shares issued under equity compensation plans | — | | | — | | | 43.8 | | | — | | | — | | | 20.3 | | | — | | | 64.1 | |
| Stock-based compensation | — | | | — | | | 60.0 | | | — | | | — | | | — | | | — | | | 60.0 | |
| | | | | | | | | | | | | | | |
| Balance at February 29, 2020 | 1.9 | | | 0.3 | | | 1,514.6 | | | 13,695.3 | | | 6 | | | $ | 13,695.3 | | | $ | (266.3) | | | $ | (2,814.0) | | | $ | 342.5 | | | $ | 12,474.3 | |
| | | | | | | | | | | | | | | |
| Comprehensive income (loss): | | | | | | | | | | | | | | | |
| Net income (loss) | — | | | — | | | — | | | 1,998.0 | | | — | | | — | | | 33.8 | | | 2,031.8 | |
| Other comprehensive income (loss), net of income tax effect | — | | | — | | | — | | | — | | | (69.2) | | | — | | | (11.1) | | | (80.3) | |
| Comprehensive income (loss) | | | | | | | | | | | | | | | 1,951.5 | |
| | | | | | | | | | | | | | | |
| | | | | | | | | | | | | | | |
| Dividends declared | — | | | — | | | — | | | (575.5) | | | — | | | — | | | — | | | (575.5) | |
| | | | | | | | | | | | | | | |
| Noncontrolling interest distributions | — | | | — | | | — | | | — | | | — | | | — | | | (35.0) | | | (35.0) | |
| | | | | | | | | | | | | | | |
| | | | | | | | | | | | | | | |
| Shares issued under equity compensation plans | — | | | — | | | 27.0 | | | — | | | — | | | 24.2 | | | — | | | 51.2 | |
| Stock-based compensation | — | | | — | | | 62.6 | | | — | | | — | | | — | | | — | | | 62.6 | |
| | | | | | | | | | | | | | | |
| Balance at February 28, 2021 | 1.9 | | | 0.3 | | | 1,604.2 | | | 15,117.8 | | | (335.5) | | | (2,789.8) | | | 330.2 | | | 13,929.1 | |
| | | | | | | | | | | | | | | |
| Comprehensive income (loss): | | | | | | | | | | | | | | | |
| Net income (loss) | — | | | — | | | — | | | (40 | | | 13,929.1 | |
| | | | | | | | | | | | | | | |
| Comprehensive income (loss): | | | | | | | | | | | | | | | |
| Net income (loss) | — | | | — | | | — | | | (40.4) | | | — | | | — | | | 41.4 | | | 1.0 | |
| Other comprehensive income (loss), net of income tax effect | — | | | — | | | — | | | — | | | (77.2) | | | — | | | (3.2) | | | (80.4) | |
| Comprehensive income (loss) | | | | | | | | | | | | | | | (79.4) | |
| | | | | | | | | | | | | | | |
| Repurchase of shares | — | | | — | | | — | | | — | | | — | | | (1,390.5) | | | — | | | (1,390.5) | |
| Dividends declared | — | | | — | | | — | | | (572.0) | | | — | | | — | | | — | | | (572.0) | |
| | | | | | | | | | | | | | | |
| Noncontrolling interest distributions | — | | | — | | | — | | | — | | | — | | | — | | | (52.5) | | | (52.5) | |
| | | | | | | | | | | | | | | |
| Shares issued under equity compensation plans | — | | | — | | | 159.9 | | | — | | | — | | | 8.4 | | | — | | | 168.3 | |
| Stock-based compensation | — | | | — | | | 44.8 | | | — | | | — | | | — | | | — | | | 44.8 | |
| | | | | | | | | | | | | | | |
| Balance at February 28, 2022 | 1.9 | | | 0.3 | | | 1,808.9 | | | 14,505.4 | | | (412.7) | | | (4,171.9) | | | 315.9 | | | 12,047.8 | |
| | | | | | | | | | | | | | | |
| Comprehensive income (loss): | | | | | | | | | | | | | | | |
| Net income (loss) | — | | | — | | | — | | | (71.40) | | | — | | | — | | | 4132.45 | | | (138.05 ) | |
| Other comprehensive income (loss), net of income tax effect | — | | | — | | | — | | | — | | | (77441.2) | | | — | | | (327.2) | | | (80468.4) | |
| Comprehensive income (loss) | | | | | | | | | | | | | | | 429.9 | |
| Reclassification payment | — | | | — | | | — | | | (79.4) | |
| 1,500.0) | | | — | | | — | | | — | | | (1,500.0) | |
| Retirement of treasury shares | — | | | (0.1) | | | — | | | (2.2) | | | | | — | | | 2.3 | | | — | | | — | |
| Conversion of common shares | 0.2 | | | (0.2) | | | — | | | — | | | — | | | — | | | — | | | — | |
| Repurchase of shares | — | | | — | | | — | | | — | | | — | | | (1,390700.52) | | | — | | | (1,390700.52) | |
| Dividends declared | — | | | — | | | — | | | (572588.03) | | | — | | | — | | | — | | | (572588.03) | |
| Noncontrolling interest distributions | — | | | — | | | — | | | — | | | — | | | — | | | (5255.53) | | | (5255.53) | |
| | | | | | | | | | | | | | | |
| | | | | | | | | | | | | | | |
| Shares issued under equity compensation plans | — | | | — | | | 15925.97 | | | — | | | — | | | 85.49 | | | — | | | 16831.36 | |
| Stock-based compensation | — | | | — | | | 4468.84 | | | — | | | — | | | — | | | — | | | 4468.84 | |
| Balance at February 28, 20222023 | $ | 12.1 | | | $ | — | | | $ | 1,903.0 | | | $ | 12,343.9 | | | $ | 028.5 | | | $ | (5,863.9) | | | $ | 320.3 | | | $ | 18,808.9 | | | $ | 14,505.4 | | | $ | (412.7) | | | $ | (4,171.9) | | | $ | 315.9 | | | $ | 12,047.8733.9 | |
The accompanying notes are an integral part of these statements.
| | | | | |
Constellation Brands, Inc. FY 20222023 Form 10-K | #WORTHREACHINGFOR I 6667 |
| | | | | | | | |
| PART II | ITEM 8. FINANCIAL STATEMENTS AND SUPPLEMENTARY DATA | Table of Contents |
| | | | | | | | | | | | | | | | | |
CONSTELLATION BRANDS, INC. AND SUBSIDIARIES CONSOLIDATED STATEMENTS OF CASH FLOWS (in millions) |
| For the Years Ended |
| February 28,
2023 | | February 28,
2022 | | February 28,
2021 | | February 29,
2020 |
| CASH FLOWS FROM OPERATING ACTIVITIES | | | | | |
| Net income (loss) | $ | (38.5) | | | $ | 1.0 | | | $ | 2,031.8 | | | $ | 21.4 | |
| Adjustments to reconcile net income (loss) to net cash provided by operating activities: | | | | | |
| Unrealized net (gain) loss on securities measured at fair value | 1,644.745.9 | | | 1,644.7 | | | (802.0) | | | 2,126.4 | |
| Deferred tax provision (benefit) | 84207.8 | | | 84.8 | | | 336.4 | | | (1,153.7) | |
| Depreciation | 337383.38 | | | 293337.83 | | | 326293.58 | |
| Stock-based compensation | 4468.95 | | | 6344.09 | | | 6063.40 | |
| Equity in (earnings) losses of equity method investees and related activities, net of distributed earnings | 61971.68 | | | 67361.46 | | | 560673.84 | |
| Noncash lease expense | 8189.93 | | | 8381.39 | | | 8883.3 | |
| Impairment and amortization of intangible assets | 516.12 | | | 115.31 | | | 1611.73 | |
| Amortization of debt issuance costs and loss on extinguishment of debt | 3934.90 | | | 2439.39 | | | 1624.13 | |
| Net (gain) loss on sale of unconsolidated investment | — | | | (51.0) | | | — | |
| (0.4) | | | | |
| Impairment of brewery construction in progressCanopy Equity Method Investment | 6651,060.93 | | | — | | | — | |
| Impairment of long-lived assets held for sale | —53.5 | | | 24665.09 | | | 449.7— | |
| (Gain) loss on sale of business | (1.7) | | | (14.2) | | | (74.1) | | | | | |
| | | | | |
| Loss on inventory and related contracts associated with business optimization | — | | | 25.8— | | | 12325.08 | |
| LossGain (loss) on settlement of treasury lockPre-issuance hedge contracts | —20.7 | | | — | | | (29.3) | | | — | |
| | | | | |
| | | | | |
| | | | | |
| | | | | |
| | | | | |
| Change in operating assets and liabilities, net of effects from purchase and sale of business: | | | | | |
| Accounts receivable | (3.9) | | | (114.0) | | | 59.6 | |
| Inventories | (22356.04) | |
| Inventories | (261.3) | | | 193.7 | | | (29.5) | |
| Prepaid expenses and other current assets | 197.9 | | | (113.2) | | | 65.7 | | | 8.1 | |
| Accounts payable | 213.7114.9 | | | 213.7 | | | (95.7) | | | 16.8 | |
| Deferred revenue | 11812.08 | | | —118.0 | | | 1.4— | |
| Other accrued expenses and liabilities | (239.8) | | | (28.8) | | | (75.0) | | | (58.5) | |
| Other | 118.1 | | | (2325.41) | | | (6353.4) | | | 73.7 6) | |
| Total adjustments | 2,704795.4 | | | 7742,704.74 | | | 2,529774.7 | |
| Net cash provided by (used in) operating activities | 2,705756.49 | | | 2,806705.54 | | | 2,551806.15 | |
| | | | | |
| CASH FLOWS FROM INVESTING ACTIVITIES | | | | | |
| Purchase of property, plant, and equipment | (1,035.4) | | | (1,026.8) | | | (864.6) | | | (726.5) | |
| Purchase of business, net of cash acquired | (37.1) | | | (53.5) | | | (19.9) | | | (36.2) | |
| Investments in equity method investees and securities | (30.8) | | | (36.6) | | | (222.4) | | | (48.2) | |
| Proceeds from sale of assets | 46.17 | | | 184.91 | | | 818.39 | |
| Proceeds from sale of unconsolidated investment | 74.4— | | | —74.4 | | | 1.5— | |
| Proceeds from sale of business | 4.696.7 | | | 4.6 | | | 999.5 | | | 269.7 | |
| Other investing activities | 0.5 | | | (2.0) | | | 0.6 | | | 0.4 | |
| Net cash provided by (used in) investing activities | (999.4) | | | (1,035.8) | | | (87.9) | | | (531.0) | |
| | | | | |
| | | | | |
Constellation Brands, Inc. FY 20222023 Form 10-K | #WORTHREACHINGFOR I 6768 |
| | | | | | | | |
| PART II | ITEM 8. FINANCIAL STATEMENTS AND SUPPLEMENTARY DATA | Table of Contents |
| | | | | | | | | | | | | | | | | |
CONSTELLATION BRANDS, INC. AND SUBSIDIARIES CONSOLIDATED STATEMENTS OF CASH FLOWS (in millions) |
| For the Years Ended |
| February 28,
2023 | | February 28,
2022 | | February 28,
2021 | | February 29,
2020 |
| CASH FLOWS FROM FINANCING ACTIVITIES | | | | | |
| Proceeds from issuance of long-term debt | 995.63,344.9 | | | 995.6 | | | 1,194.7 | | | 1,291.3 | |
| Principal payments of long-term debt | (2,159.7) | | | (1,365.3) | | | (2,721.3) | | | (2,195.3) | |
| Net proceeds from (repayments of) short-term borrowings | 323.0842.3 | | | 323.0 | | | (238.9) | | | (552.6) | |
| Dividends paid | (587.7) | | | (573.0) | | | (575.0) | |
| Purchases of treasury stock | (5691,700.2) | |
| Purchase of treasury stock | (1,390.5) | | | — | | | (50.0) | |
| Proceeds from shares issued under equity compensation plans | 17742.64 | | | 58177.96 | | | 7858.29 | |
| Payments of minimum tax withholdings on stock-based payment awards | (10.4) | | | (9.8) | | | (7.7) | | | (14.3) | |
| Payments of debt issuance, debt extinguishment, and other financing costs | (36.2) | | | (34.6) | | | (22.3) | | | (8.2) | |
| | | | | |
| Distributions to noncontrolling interests | (55.3) | | | (52.5) | | | (35.0) | | | — |
| | | | | |
| Payment to holders of contingent considerationClass B Stock in connection with the Reclassification | (—1,500.0 ) | | | — | | | (11.3—) | |
| Net cash provided by (used in) financing activities | (1,819.9) | | | (1,929.5) | | | (2,346.6) | | | (2,031.4) | |
| | | | | |
| Effect of exchange rate changes on cash and cash equivalents | (3.5) | | | (1.3) | | | 7.2 | | | (0.9) | |
| | | | | |
| Net increase (decrease) in cash and cash equivalents | (65.9) | | | (261.2) | | | 379.2 | | | (12.2) | |
| Cash and cash equivalents, beginning of year | 460199.64 | | | 81460.46 | | | 9381.64 | |
| Cash and cash equivalents, end of year | $ | 199133.45 | | | $ | 460199.64 | | | $ | 81460.46 | |
| | | | | |
| SUPPLEMENTAL DISCLOSURES OF CASH FLOW INFORMATION | | | | | |
| Cash paid during the year | | | | | |
| Interest, net of interest capitalized | $ | 368386.53 | | | $ | 418368.5 | | | $ | 448418.95 | |
| Income taxes, net of refunds received | $ | 324129.7 | | | $ | 189324.7 | | | $ | 85189.37 | |
| | | | | |
| Noncash investing and financing activities | | | | | |
| Additions to property, plant, and equipment | $ | 304183.03 | | | $ | 101304.10 | | | $ | 70101.41 | |
| | | | | |
| | | | | |
The accompanying notes are an integral part of these statements.
| | | | | |
Constellation Brands, Inc. FY 20222023 Form 10-K | #WORTHREACHINGFOR I 6869 |
| | | | | | | | |
| PART II | ITEM 8. FINANCIAL STATEMENTS AND SUPPLEMENTARY DATA | Table of Contents |
CONSTELLATION BRANDS, INC. AND SUBSIDIARIES
NOTES TO CONSOLIDATED FINANCIAL STATEMENTS
FEBRUARY 28, 20222023
1. DESCRIPTION OF BUSINESS, BASIS OF PRESENTATION, AND SUMMARY OF SIGNIFICANT ACCOUNTING POLICIES
Description of business
We operate primarily in the beverage alcohol industry with operations in the U.S., Mexico, New Zealand, and Italy producing a powerful portfolio of consumer-connected, high-end imported beer brands, and higher-end wine and spirits brands.
Basis of presentation
Principles of consolidation
Our consolidated financial statements include our accounts and our majority-owned and controlled domestic and foreign subsidiaries. In addition, we have an equally-owned joint venture with Owens-Illinois. The joint venture owns and operates a state-of-the-art glass production plant which provides bottles exclusively for the Nava Brewery. We have determined that we are the primary beneficiary of this variable interest entity and accordingly, the results of operations of the joint venture are reported in the Beer segment and are included in our consolidated results of operations. All intercompany accounts and transactions are eliminated in consolidation.
Equity method investments
If we are not required to consolidate our investment in another entity, we use the equity method when we (i) can exercise significant influence over the other entity and (ii) hold common stock and/or in-substance common stock of the other entity. Under the equity method, investments are carried at cost, plus or minus our equity in the increases and decreases in the investee’s net assets after the date of acquisition. We monitor our equity method investments for factors indicating other-than-temporary impairment. Dividends received from the investee reduce the carrying amount of the investment.
Management’s use of estimates
The preparation of financial statements in conformity with U.S. GAAP requires management to make estimates and assumptions that affect the reported amounts of assets and liabilities and disclosure of contingent assets and liabilities at the date of the financial statements and the reported amounts of revenues and expenses during the reporting period. Actual results could differ from those estimates.
Summary of significant accounting policies
Revenue recognition
Our revenue (referred to in our financial statements as “sales”) consists primarily of the sale of beer, wine, and spirits domestically in the U.S. Sales of products are for cash or otherwise agreed-upon credit terms. Our payment terms vary by location and customer, however, the time period between when revenue is recognized and when payment is due is not significant. Our customers consist primarily of wholesale distributors. Our revenue generating activities have a single performance obligation and are recognized at the point in time when control transfers and our obligation has been fulfilled, which is when the related goods are shipped or delivered to the customer, depending upon the method of distribution, and shipping terms. We have elected to treat shipping as a fulfillment activity. Revenue is measured as the amount of consideration we expect to receive in exchange for the sale of our product. Our sales terms do not allow for a right of return except for matters related to any manufacturing defects on our part. Amounts billed to customers for shipping and handling are included in sales.
As noted, the majority of our revenues are generated from the domestic sale of beer, wine, and spirits to wholesale distributors in the U.S. Our other revenue generating activities include the export of certain of our products to select international markets, as well as the sale of our products through state alcohol beverage control agencies, on-premise, retail locations in certain markets, and 3-tier eCommerce, including and DTC channels. We have evaluated these other revenue generating activities under the disaggregation disclosure criteria and concluded that they are immaterial for separate disclosure. See Note 22 for disclosure of net sales by product type.
| | | | | |
Constellation Brands, Inc. FY 20222023 Form 10-K | #WORTHREACHINGFOR I 6970 |
| | | | | | | | |
| PART II | ITEM 8. FINANCIAL STATEMENTS AND SUPPLEMENTARY DATA | Table of Contents |
Sales reflect reductions attributable to consideration given to customers in various customer incentive programs, including pricing discounts on single transactions, volume discounts, promotional and advertising allowances, coupons, and rebates. This variable consideration is recognized as a reduction of the transaction price based upon expected amounts at the time revenue for the corresponding product sale is recognized. For example, customer promotional discount programs are entered into with certain distributors for certain periods of time. The amount ultimately reimbursed to distributors is determined based upon agreed-upon promotional discounts which are applied to distributors’ sales to retailers. Other common forms of variable consideration include volume rebates for meeting established sales targets, and coupons and mail-in rebates offered to the end consumer. The determination of the reduction of the transaction price for variable consideration requires that we make certain estimates and assumptions that affect the timing and amounts of revenue and liabilities recognized. We estimate this variable consideration by taking into account factors such as the nature of the promotional activity, historical information, and current trends, availability of actual results and expectations of customer and consumer behavior.
Excise taxes remitted to tax authorities are government-imposed excise taxes primarily on our beverage alcohol products. Excise taxes are shown on a separate line item as a reduction of sales and are recognized in our results of operations when the related product sale is recognized. Excise taxes are recognized as a current liability in other accrued expenses and liabilities, with the liability subsequently reduced when the taxes are remitted to the tax authority.
Cost of product sold
The types of costs included in cost of product sold are raw materials, packaging materials, manufacturing costs, plant administrative support and overheads, and freight and warehouse costs (including distribution network costs). Distribution network costs include inbound freight charges and outbound shipping and handling costs, purchasing and receiving costs, inspection costs, and warehousing and internal transfer costs.
Selling, general, and administrative expenses
The types of costs included in selling, general, and administrative expenses consist predominately of advertising and non-manufacturing administrative and overhead costs. Distribution network costs are included in cost of product sold. We expense advertising costs as incurred, shown, or distributed. Advertising expense for the years ended February 28, 2023, February 28, 2022, and February 28, 2021, and February 29, 2020, waswas $860.8 million, $826.4 million, and $805.0 million, and $769.5 million, respectively.
Foreign currency translation
The functional currency of our foreign subsidiaries is generally the respective local currency. The translation from the applicable foreign currencies to U.S. dollars is performed for balance sheet accounts using exchange rates in effect at the balance sheet date and for revenue and expense accounts using a weighted average exchange rate for the period. The resulting translation adjustments are recognized as a component of AOCI. Gains or losses resulting from foreign currency denominated transactions are included in selling, general, and administrative expenses.
Cash and cash equivalents
Cash equivalents consist of highly liquid investments with an original maturity when purchased of three months or less and are stated at cost, which approximates fair value.
Inventories
Inventories are stated at the lower of cost (primarily computed in accordance with the first-in, first-out method) or net realizable value. Elements of cost include materials, labor, and overhead.
Bulk wine inventories are included as in-process inventories within current assets, in accordance with the general practices of the wine industry, although a portion of such inventories may be aged for periods greater than one year. A substantial portion of barreled whiskey and brandy will not be sold within one year because of the duration of the aging process. All barreled whiskey and brandyspirits are classified as in-process inventories and are included in
| | | | | |
Constellation Brands, Inc. FY 20222023 Form 10-K | #WORTHREACHINGFOR I 7071 |
| | | | | | | | |
| PART II | ITEM 8. FINANCIAL STATEMENTS AND SUPPLEMENTARY DATA | Table of Contents |
included in current assets, in accordance with industry practice. Warehousing, insurance, value added taxes, and other carrying charges applicable to barreled whiskey and brandyspirits held for aging are included in inventory costs.
We assess the valuation of our inventories and reduce the carrying value of those inventories that are obsolete or in excess of our forecasted usage to their estimated net realizable value based on analyses and assumptions including, but not limited to, historical usage, future demand, and market requirements.
Property, plant, and equipment
Property, plant, and equipment is stated at cost. Major additions and improvements are recognized as an increase to the property accounts, while maintenance and repairs are expensed as incurred. The cost of properties sold or otherwise disposed of and the related accumulated depreciation are eliminated from the balance sheet accounts at the time of disposal and resulting gains and losses are included as a component of operating income.
Interest incurred relating to expansion, optimization, and construction of facilities is capitalized to construction in progress. We cease the capitalization of interest when construction activities are substantially completed and the facility and related assets are available for their intended use. At this point, construction in progress is transferred to the appropriate asset class.
Depreciation
Depreciation is computed primarily using the straight-line method over the following estimated useful lives:
| | | | | |
| Years |
| Land improvements | 15 to 32 |
| Vineyards | 16 to 26 |
| Buildings and improvements | 10 to 50 |
| Machinery and equipment | 3 to 35 |
| Motor vehicles | 3 to 8 |
Derivative instruments
We enter into derivative instruments to manage our exposure to fluctuations in foreign currency exchange rates, commodity prices, and interest rates. We enter into derivatives for risk management purposes only, including derivatives designated in hedge accounting relationships as well as those derivatives utilized as economic hedges. We do not enter into derivatives for trading or speculative purposes. We recognize all derivatives as either assets or liabilities and measure those instruments at estimated fair value (see Notes 6 and 7). We present our derivative positions gross on our balance sheets.
The change in the fair value of outstanding cash flow hedges is deferred in stockholders’ equity as a component of AOCI. For all periods presented herein, gains or losses deferred in stockholders’ equity as a component of AOCI are recognized in our results of operations in the same period in which the hedged items are recognized and on the same financial statement line item as the hedged items.
Changes in fair values for derivative instruments not designated in a hedge accounting relationship are recognized directly in our results of operations each period and on the same financial statement line item as the hedged item. For purposes of measuring segment operating performance, the net gain (loss) from the changes in fair value of our undesignated commodity derivative contracts, prior to settlement, is reported outside of segment operating results until such time that the underlying exposure is recognized in the segment operating results. Upon settlement, the net gain (loss) from the changes in fair value of the undesignated commodity derivative contracts is reported in the appropriate operating segment, allowing our operating segment results to reflect the economic effects of the commodity derivative contracts without the resulting unrealized mark to fair value volatility.
| | | | | |
Constellation Brands, Inc. FY 20222023 Form 10-K | #WORTHREACHINGFOR I 7172 |
| | | | | | | | |
| PART II | ITEM 8. FINANCIAL STATEMENTS AND SUPPLEMENTARY DATA | Table of Contents |
Cash flows from the settlement of derivatives, including both economic hedges and those designated in hedge accounting relationships, appear on our statements of cash flows in the same categories as the cash flows of the hedged items.
Fair value of financial instruments
We calculate the estimated fair value of financial instruments using quoted market prices whenever available. When quoted market prices are not available, we use standard pricing models for various types of financial instruments (such as forwards, options, swaps, and convertible debt) which take into account the present value of estimated future cash flows (see Note 7).
Goodwill and other intangible assets
Goodwill is allocated to the reporting unit in which the business that created the goodwill resides. A reporting unit is an operating segment, or a business unit one level below that operating segment, for which discrete financial information is prepared and regularly reviewed by segment management. We review our goodwill and indefinite-lived intangible assets annually for impairment, or sooner, if events or changes in circumstances indicate that the carrying amount of an asset may not be recoverable. We use January 1 as our annual impairment test measurement date. Indefinite-lived intangible assets consist principally of trademarks. Intangible assets determined to have a finite life, primarily customer relationships, are amortized over their estimated useful lives and are subject to review for impairment when events or circumstances indicate that the carrying amount of an asset may not be recoverable. Note 9 provides a summary of intangible assets segregated between amortizable and nonamortizable amounts.
Income taxes
We use the asset and liability method of accounting for income taxes. This method accounts for deferred income taxes by applying statutory rates in effect at the balance sheet date to the difference between the financial reporting and tax bases of assets and liabilities. Certain income earned by foreign subsidiaries, GILTI, is subject to GILTI, a U.S. tax on foreign earnings. We treat the tax effect of GILTI as a current period tax expense when incurred. We provide deferred income taxes, consisting primarily of foreign withholding and state taxes, on all applicable unremitted earnings of our foreign subsidiaries. Interest and penalties are recognized as a component of (provision for) benefit from income taxes.
We recognize a tax benefit from an uncertain tax position when it is more likely than not the position will be sustained upon examination. We measure and recognize the tax benefit from such a position based on the largest benefit that has a greater than 50% likelihood of being realized upon ultimate settlement. Due to the complexity of some of these uncertainties, the ultimate resolution may result in a payment that is materially different from our current estimate of the unrecognized tax benefit liabilities. In addition, changes in existing tax laws or rates could significantly change our current estimate of our unrecognized tax benefit liabilities. These differences will be reflected as increases or decreases to income tax expense in the period in which they are determined. Changes in current estimates, if significant, could have a material adverse impact on our financial statements.
Leases
We recognize right-of-use assets and lease liabilities on our balance sheet. We assess service arrangements to determine if an asset is explicitly or implicitly specified in the agreement and if we have the right to control the use of the identified asset.
The right-of-use asset and lease liability are initially measured at the present value of future lease payments, discounted using the interest rate implicit in the lease or, if that rate cannot be readily determined, our secured incremental borrowing rate. The incremental borrowing rates are determined using a portfolio approach based on publicly available information in connection with our unsecured borrowing rates. We elected to recognize expenses for leases with a term of 12 months or less on a straight-line basis over the lease term and not to recognize these short-term leases on the balance sheet.
The right-of-use asset and lease liability are calculated including options to extend or to terminate the lease when we determine that it is reasonably certain that we will exercise those options. In making that
| | | | | |
Constellation Brands, Inc. FY 20222023 Form 10-K | #WORTHREACHINGFOR I 7273 |
| | | | | | | | |
| PART II | ITEM 8. FINANCIAL STATEMENTS AND SUPPLEMENTARY DATA | Table of Contents |
determination, we consider various existing economic and market factors, business strategies as well as the nature, length, and terms of the agreement. Based on our evaluation using these factors, we concluded that the exercise of renewal options or early termination options would not be reasonably certain in determining the lease term at commencement for leases we currently have in place. Assumptions made at the commencement date are re-evaluated upon occurrence of certain events such as a lease modification.
Certain of our contractual arrangements may contain both lease and non-lease components. We elected to measure the lease liability by combining the lease and non-lease components as a single lease component for all asset classes.
Certain of our leases include variable lease payments, including payments that depend on an index or rate, as well as variable payments for items such as raw materials, labor, property taxes, insurance, maintenance, and other operating expenses associated with leased assets. Certain grape purchasing arrangements include variable payments based on actual tonnage and price of grapes. In addition, certain third-party logistics arrangements include variable payments that vary depending on throughput. Such variable lease payments are excluded from the calculation of the right-of-use asset and the lease liability and are recognized in the period in which the obligation is incurred.
Indemnification liabilities
We have indemnified respective parties against certain liabilities that may arise in connection with certain acquisitions and divestitures. Indemnification liabilities are recognized when probable and estimable and included in deferred income taxes and other liabilities (see Note 16).
Stock-based employee compensation
We have two stock-based employee compensation plans (see Note 18). We apply grant date fair-value-based measurement methods in accounting for our stock-based payment arrangements and recognize all costs resulting from stock-based payment transactions, net of expected forfeitures, ratably over the requisite service period. Stock-based awards are subject to specific vesting conditions, generally time vesting, or upon retirement, disability, or death of the employee (as defined by the plan), if earlier. For awards granted to retirement-eligible employees, we recognize compensation expense ratably over the period from the date of grant to the date of retirement-eligibility.
Net income (loss) per common share attributable to CBI
WeEffective November 10, 2022, we have twoone classesclass of common stock with a material number of shares outstanding: Class A Stock and Class B Stock (see Note 17). In addition, we have another class of common stock with an immaterial number of shares outstanding: Class 1 Stock (see Note 17). If we pay a cash dividend on Class B Stock, each share of Class A Stock will receive an amount at least 10% greater than the amount of the cash dividend per share paid on Class B Stock. Class B Stock shares are convertible into shares. Prior to November 10, 2022, we had an additional class of common stock with a material number of shares outstanding: Class B Stock. For additional information on the classes of Class A Stock on a one-to-one basis at any time atcommon stock and the option of the holderReclassification, see Note 17.
We useFor the years ended February 28, 2023, February 28, 2022, and February 28, 2021, we used the two-class method for the computation and presentation of net income (loss) per common share attributable to CBI (hereafter referred to as “net income (loss) per common share”) (see Note 19). The two-class method is an earnings allocation formula that calculates basic and diluted net income (loss) per common share for each class of common stock separately based on dividends declared and participation rights in undistributed earnings as if all such earnings had been distributed during the period. Under the two-class method, Class A Stock iswas assumed to receive a 10% greater participation in undistributed earnings (losses) than Class B Stock, in accordance with the respective minimum dividend rights of each class of stock.
Net income (loss) per common share – basic excludesexcluded the effect of common stock equivalents and iswas computed using the two-class method. Net income (loss) per common share – diluted for Class A Stock reflectsreflected the potential dilution that could result if securities or other contracts to issue common stock were exercised or converted into common stock. Net income (loss) per common share – diluted for Class A Stock is computed using the more dilutive of the if-converted or two-class method. Net income (loss) per common share – diluted for Class A Stock iswas computed using the more dilutive of the if-converted or two-class method. For the years ended February 28, 2023, and February 28, 2022, net income (loss) per common share – diluted for Class A Stock was computed using the two-class method, until such conversion took place pursuant to the Reclassification. Net income (loss) per common
| | | | | |
Constellation Brands, Inc. FY 2023 Form 10-K | #WORTHREACHINGFOR I 74 |
| | | | | | | | |
| PART II | ITEM 8. FINANCIAL STATEMENTS AND SUPPLEMENTARY DATA | Table of Contents |
share – diluted for Class B Stock was computed using the two-class method and did not assume conversion of Class B Stock into shares of Class A Stock. Net income (loss) per common share – diluted for Class A Stock was computed using the if-converted method for the year ended February 28, 2021, and assumes the exercise of stock options using the treasury stock method and the conversion of Class B Stock as this method is
| | | | | |
| Constellation Brands, Inc. FY 2022 Form 10-K | #WORTHREACHINGFOR I 73 |
more dilutive than the two-class method. For the years ended February 28, 2022, and February 29, 2020, net income (loss) per common share – diluted for Class A Stock is computed using the two-class method. Net income (loss) per common share – diluted for Class B Stock is computed using the two-class method and does not assume conversion of Class B Stock into shares of Class A Stockwas more dilutive than the two-class method.
2. ACQUISITIONS AND DIVESTITURES
Acquisitions
Austin Cocktails
In April 2022, we acquired the remaining 73% ownership interest in Austin Cocktails, which included a portfolio of small batch, RTD cocktails. This transaction primarily included the acquisition of goodwill and a trademark. In addition, the purchase price for Austin Cocktails includes an earn-out over five years based on performance. The results of operations of Austin Cocktails are reported in the Wine and Spirits segment and have been included in our consolidated results of operations from the date of acquisition.
Lingua Franca
In March 2022, we acquired the Lingua Franca business, including a collection of Oregon-based luxury wines, a vineyard, and a production facility. This transaction also included the acquisition of a trademark and inventory. In addition, the purchase price for Lingua Franca includes an earn-out over seven years based on performance. The results of operations of Lingua Franca are reported in the Wine and Spirits segment and have been included in our consolidated results of operations from the date of acquisition.
My Favorite Neighbor
In November 2021, we acquired the remaining 65% ownership interest in My Favorite Neighbor, a super-luxury, DTC focused wine business as well as certain wholesale sourceddistributed brands. This transaction primarily included the acquisition of goodwill, trademarks, inventory, and property, plant, and equipment. In addition, the My Favorite Neighbor transaction includes an earn-out over 10 years based on performance, with a 50% minimum guarantee due at the end of the earn-out period. The results of operations of My Favorite Neighbor are reported in the Wine and Spirits segment and have been included in our consolidated results of operations from the date of acquisition.
We recognized a gain of $13.5 million for the year ended February 28, 2022, related to the remeasurement of our previously held 35% equity interest in My Favorite Neighbor to the acquisition-date fair value. This gain is included in selling, general, and administrative expenses within our consolidated results of operations. See Note 10 for further discussion.
Copper & Kings
In September 2020, we acquired the remaining ownership interest in Copper & Kings. This acquisition included a collection of traditional and craft batch-distilled American brandies and other select spirits. The transaction primarily included the acquisition of inventory and property, plant, and equipment. The results of operations of Copper & Kings are reported in the Wine and Spirits segment and have been included in our consolidated results of operations from the date of acquisition.
Empathy Wines
In June 2020, we acquired Empathy Wines, including the acquisition of a digitally-native wine brand which strengthens our position in the DTC and other eCommerce markets. This transaction primarily included the acquisition of goodwill, trademarks, and inventory. In addition, the purchase price for Empathy Wines includes an earn-out over five years based on performance. The results of operations of Empathy Wines are reported in the Wine and Spirits segment and have been included in our consolidated results of operations from the date of acquisition.
| | | | | |
Nelson’s Green BrierConstellation Brands, Inc. FY 2023 Form 10-K | #WORTHREACHINGFOR I 75 |
| | | | | | | | |
| PART II | ITEM 8. FINANCIAL STATEMENTS AND SUPPLEMENTARY DATA | Table of Contents |
Divestitures
In May 20192022 Wine Divestiture
On October 6, 2022, we increased our ownership interest in Tennessee-based Nelson’s Green Brier to 75%, resulting in consolidation of the business and recognition of a 25% noncontrolling interest. This acquisition included a portfolio of craft bourbon and whiskey productssold certain of our mainstream and premium wine brands and related inventory. The fair value ofnet cash proceeds from the business combination was allocated2022 Wine Divestiture were utilized primarily to goodwill, trademarks, inventory, and property, plant, and equipment. Thereduce outstanding borrowings. Prior to the 2022 Wine Divestiture, we recorded the results of operations of Nelson’s Green Brier are reportedthese brands in the Wine and Spirits segment and have been included in our consolidated results of operations from the date of acquisition.
We recognized a gain of $11.8 million for the year ended February 29, 2020, related to the remeasurement of our previously held 20% equity interest in Nelson’s Green Brier to the acquisition-date fair value. This gain is included. The following table summarizes the net gain recognized in connection with this divestiture, for the year ended February 28, 2023: | | | | | | | | | | | |
| (in millions) | |
| Cash received from buyer | $ | 96.7 | |
| Net assets sold | (66.9) | |
| |
Direct costs to sell (1) | (14.8) | |
Gain on sale of business (2) | $ | 15.0 | |
(1)Includes certain contract termination costs.
(2)Included in selling, general, and administrative expenses within our consolidated results of operations.
Divestitures
Paul Masson Divestiture
On January 12, 2021, we sold the Paul Masson Grande Amber Brandy brand, related inventory, and interests in certain contracts. We received cash proceeds of $267.4 million, net of post-closing adjustments, which
| | | | | |
| Constellation Brands, Inc. FY 2022 Form 10-K | #WORTHREACHINGFOR I 74 |
were used for general corporate purposes. Prior to the Paul Masson Divestiture, we recorded the results of operations of our Paul Masson Grande Amber Brandy business in the Wine and Spirits segment. In connection with the Paul Masson Divestiture, we entered into a transition services agreement with Sazerac Company whereby our retained Mission Bell facility will provide certain bulk wine processing services at market rates for a period of up to three years. The following table summarizes the net gain recognized, primarily for the year ended February 28, 2021, in connection with this divestiture:
| | | | | |
| (in millions) | |
| Cash received from buyer | $ | 272.0 | |
| Net assets sold | (206.4) | |
| Contract termination | (4.0) | |
| Direct costs to sell | (3.2) | |
| |
Gain on sale of business (1) | $ | 58.4 | |
(1)Included in selling, general, and administrative expenses within our consolidated results of operations.
Wine and Spirits Divestitures
On January 5, 2021, we sold a portion of our wine and spirits business, including lower-margin, lower growth wine and spirits brands, related inventory, interests in certain contracts, wineries, vineyards, offices, and facilities. We received net cash proceeds of $538.4 million, from the Wine and Spirits Divestiture, net of post-closing adjustments. In addition, we havehad the potential to earn an incremental $250 million of contingent consideration if certain brand performance targets arewere met over a two-year period after closing. As of January 5, 2023, the threshold brand performance targets were not met, accordingly no incremental proceeds in the form of contingent consideration were received.
On January 5, 2021, in a separate, but related transaction with the same buyer, Gallo, we also sold the New Zealand-based Nobilo Wine brand and certain related assets. We received cash proceeds of $129.0 million, from the Nobilo Wine Divestiture, net of post-closing adjustments.
In connection with the Wine and Spirits Divestitures, we entered into certain transition services agreements with Gallo whereby we provide certain cellar, package, and storage services primarily at Mission Bell. We recorded a $13.0 million liability related to the unfavorable transition services agreements, which was included in the net loss on sale of business for the year ended February 28, 2021, and is being amortized over the
| | | | | |
Constellation Brands, Inc. FY 2023 Form 10-K | #WORTHREACHINGFOR I 76 |
| | | | | | | | |
| PART II | ITEM 8. FINANCIAL STATEMENTS AND SUPPLEMENTARY DATA | Table of Contents |
expected term of the contracts to selling, general, and administrative expenses both within our consolidated results of operations.
The cash proceeds from the Wine and Spirits Divestitures were utilized to reduce outstanding debt and for other general corporate purposes. Prior to the Wine and Spirits Divestitures, we recorded the results of operations for this portion of our business in the Wine and Spirits segment. The following table summarizes the net loss recognized, primarily for the year ended February 28, 2021, in connection with these divestitures:
| | | | | |
| (in millions) | |
| Cash received from buyer | $ | 667.4 | |
| Net assets sold | (669.2) | |
| Transition services agreements | (13.0) | |
| Direct costs to sell | (8.5) | |
| AOCI reclassification adjustments, primarily foreign currency translation | (5.1) | |
| Other | (5.2) | |
Loss on sale of business (1) | $ | (33.6) | |
(1)Included in selling, general, and administrative expenses within our consolidated results of operations.
Concentrate Business Divestiture
On December 29, 2020, we sold certain brands used in our concentrates and high-color concentrate business, and certain related intellectual property, inventory, interests in certain contracts, and other assets. Prior to the Concentrate Business Divestiture, we recorded the results of operations of our concentrates and high-color concentrate business in the Wine and Spirits segment.
| | | | | |
| Constellation Brands, Inc. FY 2022 Form 10-K | #WORTHREACHINGFOR I 75 |
Ballast Point Divestiture
On March 2, 2020, we sold the Ballast Point craft beer business, including a number of its associated production facilities and brewpubs. Prior to the Ballast Point Divestiture, we recorded the results of operations of the Ballast Point craft beer business in the Beer segment. We received cash proceeds of $41.1 million, which were primarily utilized to reduce outstanding borrowings.
Black Velvet Divestiture
On November 1, 2019, we sold the Black Velvet Canadian Whisky business and the brand’s associated production facility, along with a subset of Canadian whisky brands produced at that facility, and related inventory. We received cash proceeds of $266.7 million, net of post-closing adjustments, which were utilized to reduce outstanding debt. Prior to the Black Velvet Divestiture, we recorded the results of operations of our Black Velvet Canadian Whisky business in the Wine and Spirits segment. The following table summarizes the net gain recognized, primarily for the year ended February 29, 2020, in connection with this divestiture:
| | | | | |
| (in millions) | |
| Cash received from buyer | $ | 266.7 | |
| Net assets sold | (213.3) | |
| AOCI reclassification adjustments, primarily foreign currency translation | 20.9 | |
| Direct costs to sell | (3.8) | |
| |
| Gain on sale of business | $ | 70.5 | |
Subsequent events
Other acquisitions
During the first quarter of Fiscal 2023, we completed the acquisitions of other businesses, consisting of Lingua Franca, which included a collection of luxury wines, a vineyard, and a production facility, and the remaining 73% ownership interest in Austin Cocktails, which included a portfolio of small batch, RTD cocktails. The purchase price for each acquisition includes an earn-out based on the performance of the respective brands. The results of operations of these acquired businesses will be reported in the Wine and Spirits segment and will be included in our consolidated results of operations from their respective date of acquisition.
Ballast Point Divestiture
On March 2, 2020, we sold the Ballast Point craft beer business, including a number of its associated production facilities and brewpubs. Prior to the Ballast Point Divestiture, we recorded the results of operations of the Ballast Point craft beer business in the Beer segment. We received cash proceeds of $41.1 million, which were primarily utilized to reduce outstanding borrowings.
3. INVENTORIES
The components of inventories are as follows:
| | | | | | | | | | | |
| February 28,
20222023 | | February 28,
20212022 |
| (in millions) | | | |
| Raw materials and supplies | $ | 185245.35 | | | $ | 151185.13 | |
| In-process inventories | 804967.8 | | | 735804.98 | |
| Finished case goods | 583685.14 | | | 404583.1 | |
| $ | 1,573898.27 | | | $ | 1,291573.12 | |
We evaluated the carrying value of certain inventories and recognized the following in cost of product sold within our consolidated results of operations:
| | | | | | | | | | | | | | | | | |
| For the Years Ended |
| February 28,
2023 | | February 28, 2022 (1) | | February 28, 2021 (2) | | February 29, 2020 (3) |
| (in millions) | | | | | |
| Loss on inventory write-down | $ | 23.1 | | | $ | 87.7 | | | $ | 100.7 | |
| | | | Constellation Brands, Inc. FY 2023 Form 10-K | #WORTHREACHINGFOR I 77 |
| | | | | | | | |
| PART II | ITEM 8. FINANCIAL STATEMENTS AND SUPPLEMENTARY DATA | Table of Contents |
(1)We recognized a loss predominantly from excess inventory of hard seltzers, within the Beer segment, largely resulting from a slowdown in the overall category which occurred in early Fiscal 2022.
| | | | | |
| Constellation Brands, Inc. FY 2022 Form 10-K | #WORTHREACHINGFOR I 76 |
(2)We recognized a loss primarily in connection with the write-down of certain grapes, within the Wine and Spirits segment, as a result of smoke damage sustained during the 2020 U.S. wildfires.
(3)We recognized a loss primarily in connection with restructuring and business development costs resulting from our business transformation strategy which aligned our portfolio with consumer-led premiumization trends within the Wine and Spirits segment.
4. PREPAID EXPENSES AND OTHER
The major components of prepaid expenses and other are as follows:
| | | | | | | | | | | |
| February 28,
20222023 | | February 28,
20212022 |
| (in millions) | | | |
| Prepaid taxesDerivative assets | $ | 254136.12 | | | $ | 76.092.6 | |
| Prepaid taxes | 129.5 | | | 254.1 | |
| Value added taxes receivable | 193100.05 | | | 257.8 | |
| Derivative assets | 92.6 | | | 48.7193.0 | |
| Income taxes receivable | 2773.27 | | | 45.427.2 | |
Assets held for sale (1) | 7.7 | | | — | |
| Other | 91114.27 | | | 7991.6 | |
2 |
| $ | 562.3 | | | $ | 658.1 | | | $ | 507.5 | |
(1)Assets held for sale balance at February 28, 2023, includes current assets related to the Mexicali Brewery. See “Mexicali Brewery” within Note 5 for further discussion.
5. PROPERTY, PLANT, AND EQUIPMENT
The major components of property, plant, and equipment are as follows:
| | | | | | | | | | | |
| February 28,
2022 2023 (1) (2) | | February 28,
2021 2022 (3) |
| (in millions) | | | |
| Land and land improvements | $ | 456477.2 | | | $ | 434456.02 | |
| Vineyards | 255243.35 | | | 226255.03 | |
| Buildings and improvements | 1,109800.4 | | | 9831,109.4 | |
| Machinery and equipment | 45,827277.89 | | | 34,696827.98 | |
| Motor vehicles | 140186.01 | | | 131140.30 | |
Construction in progress (1) (2) 4) |
1,272.0 | | | 1,223.2 | | | 2,084.2 | | | 89,011257.91 | | | 78,555011.89 | |
| Less – Accumulated depreciation | (12,952391.39) | | | (1,734952.2) | |
3) |
| $ | 6,865.2 | | | $ | 6,059.6 | | | $ | 5,821.6 | |
(1)The property, plant, and equipment balance at February 28, 2022,excludes Mexicali Brewery amounts reclassified to assets held for sale. See “Mexicali Brewery” below for further discussion.
(2)The property, plant, and equipment balance is net of an impairment of long-lived assets, including the Daleville Facility, of $51.6 million. See “Daleville Facility” below and Note 7 for further discussion.
(3)The property, plant, and equipment balance is net of an impairment of brewery construction in progress of $665.9 million. See Note 7 for further discussion.
(24)Interest costs incurred during the expansion, optimization, and construction of facilities are capitalized to construction in progress. We capitalized interest costs of $2536.35 million, $3125.53 million, and $3731.25 million for the years ended February 28, 20222023, February 28, 20212022, and February 2928, 2020, respectively, primarily due to the Mexico Beer Projects.
2021, respectively, primarily due to the Mexico Beer Projects. | | | | | |
Constellation Brands, Inc. FY 2023 Form 10-K | #WORTHREACHINGFOR I 78 |
| | | | | | | | |
| PART II | ITEM 8. FINANCIAL STATEMENTS AND SUPPLEMENTARY DATA | Table of Contents |
Mexicali Brewery
As of February 28, 2023, we determined the remaining Mexicali Brewery net assets have met held for sale criteria. The carrying value of assets held for sale are included in prepaid expenses and other and other assets within our consolidated balance sheet and we have concluded that no additional impairment existed. We are pursuing the sale of the remaining net assets at the Mexicali Brewery after exploring various options; however, we may not be successful in completing any such sale or obtaining other forms of recovery.
Lodi Distribution Center
In December 2021, we purchased a previously leased wine and spirits distribution facility located in Lodi, California.
| | | | | |
| Constellation Brands, Inc. FY 2022 Form 10-K | #WORTHREACHINGFOR I 77 |
Subsequent event
Daleville Facility
In March 2023, we entered into a definitive agreement to sell the Daleville Facility. We expect the transaction to close during the three months ending May 31, 2023, subject to required regulatory approvals and customary closing conditions. The net cash proceeds from the transaction are expected to be used primarily for general corporate purposes, including retirement of debt.
6. DERIVATIVE INSTRUMENTS
Overview
We are exposed to market risk from changes in foreign currency exchange rates, commodity prices, interest rates, and equity prices that could affect our results of operations and financial condition. The impact on our results and financial position and the amounts reported in our financial statements will vary based upon the currency, commodity, interest rate, and equity market movements during the period, the effectiveness and level of derivative instruments outstanding, and whether they are designated and qualify for hedge accounting.
The estimated fair values of our derivative instruments change with fluctuations in currency rates, commodity prices, interest rates, and/or equity prices and are expected to offset changes in the values of the underlying exposures. Our derivative instruments are held solely to manage our exposures to the aforementioned market risks as part of our normal business operations. We follow strict policies to manage these risks and do not enter into derivative instruments for trading or speculative purposes.
We have an investment in certain equity securities and other rights which provide us with the option to purchase an additional ownership interest in the equity securities of Canopy (see Note 10). This investment is included in securities measured at fair value and is accounted for at fair value, with the net gain (loss) from the changes in fair value of this investment recognized in income (loss) from unconsolidated investments (see Note 7). We expect to no longer have this investment if the Canopy Transaction is completed.
The aggregate notional value of outstanding derivative instruments is as follows:
| | | | | | | | | | | |
| February 28,
20222023 | | February 28,
20212022 |
| (in millions) | | | |
| Derivative instruments designated as hedging instruments | | | |
| Foreign currency contracts | $ | 1,863969.25 | | | $ | 1,558863.02 | |
| | | |
| | | |
| Swap lockPre-issuance hedge contracts | $ | 100.0— | | | $ | —100.0 | |
| | | |
| Derivative instruments not designated as hedging instruments | | | |
| Foreign currency contracts | $ | 497831.67 | | | $ | 704497.76 | |
| Commodity derivative contracts | $ | 291416.15 | | | $ | 221291.61 | |
| | | | | |
Constellation Brands, Inc. FY 2023 Form 10-K | #WORTHREACHINGFOR I 79 |
| | | | | | | | |
| PART II | ITEM 8. FINANCIAL STATEMENTS AND SUPPLEMENTARY DATA | Table of Contents |
Cash flow hedges
Our derivative instruments designated in hedge accounting relationships are designated as cash flow hedges. We are exposed to foreign denominated cash flow fluctuations primarily in connection with third party and intercompany sales and purchases. We primarily use foreign currency forward contracts to hedge certain of these risks. In addition, we utilize interest rate swap, treasury lock, and swap lock contracts periodically to manage our exposure to changes in interest rates. Derivatives managing our cash flow exposures generally mature within three years or less, with a maximum maturity of five years.
To qualify for hedge accounting treatment, the details of the hedging relationship must be formally documented at inception of the arrangement, including the risk management objective, hedging strategy, hedged item, specific risk that is being hedged, the derivative instrument, how effectiveness is being assessed, and how ineffectiveness will be measured. The derivative must be highly effective in offsetting changes in the cash flows of the risk being hedged. Throughout the term of the designated cash flow hedge relationship on at least a quarterly basis, a retrospective evaluation and prospective assessment of hedge effectiveness is performed based on quantitative and qualitative measures. All components of our derivative instruments’ gains or losses are included in the assessment of hedge effectiveness.
When we determine that a derivative instrument which qualified for hedge accounting treatment has ceased to be highly effective as a hedge, we discontinue hedge accounting prospectively. In the event the relationship is no longer effective, we recognize the change in the fair value of the hedging derivative instrument from the date the hedging derivative instrument became no longer effective immediately in our results of
| | | | | |
| Constellation Brands, Inc. FY 2022 Form 10-K | #WORTHREACHINGFOR I 78 |
operations. We also discontinue hedge accounting prospectively when (i) a derivative expires or is sold, terminated, or exercised; (ii) it is no longer probable that the forecasted transaction will occur; or (iii) we determine that designating the derivative as a hedging instrument is no longer appropriate. When we discontinue hedge accounting prospectively, but the original forecasted transaction continues to be probable of occurring, the existing gain or loss of the derivative instrument remains in AOCI and is reclassified into earnings (losses) when the forecasted transaction occurs. When it becomes probable that the forecasted transaction will not occur, any remaining gain or loss in AOCI is recognized immediately in our results of operations.
We expect $1887.2 million of net gains, net of income tax effect, to be reclassified from AOCI to our results of operations within the next 12 months.
Undesignated hedges
Certain of our derivative instruments do not qualify for hedge accounting treatment; for others, we choose not to maintain the required documentation to apply hedge accounting treatment. These undesignated instruments are primarily used to economically hedge our exposure to fluctuations in the value of foreign currency denominated receivables and payables; foreign currency investments, primarily consisting of loans to subsidiaries and foreign-denominated investments, and cash flows related primarily to the repatriation of those loans or investments; and commodity prices, including aluminum, corn, diesel fuel, and natural gas prices. We primarily use foreign currency forward and option contracts, generally less than 12 months in duration, and commodity swap contracts, generally less than 36 months in duration, with a maximum maturity of four years, to hedge some of these risks. In addition, from time to time, we utilize interest rate swap contracts, generally less than six months in duration, to economically hedge our exposure to changes in interest rates associated with the financing of significant investments and acquisitions. Our derivative policy permits the use of undesignated derivatives as approved by senior management.
Credit risk
We are exposed to credit-related losses if the counterparties to our derivative contracts default. This credit risk is limited to the fair value of the derivative contracts. To manage this risk, we contract only with major financial institutions that have earned investment-grade credit ratings and with whom we have standard International Swaps and Derivatives Association agreements which allow for net settlement of the derivative contracts. We have also established counterparty credit guidelines that are regularly monitored. Because of these safeguards, we believe the risk of loss from counterparty default to be immaterial.
| | | | | |
Constellation Brands, Inc. FY 2023 Form 10-K | #WORTHREACHINGFOR I 80 |
| | | | | | | | |
| PART II | ITEM 8. FINANCIAL STATEMENTS AND SUPPLEMENTARY DATA | Table of Contents |
In addition, our derivative instruments are not subject to credit rating contingencies or collateral requirements. As of February 28, 20222023, the estimated fair value of derivative instruments in a net liability position due to counterparties was $2.60 million. If we were required to settle the net liability position under these derivative instruments on February 28, 20222023, we would have had sufficient available liquidity on hand to satisfy this obligation.
| | | | | |
| Constellation Brands, Inc. FY 2022 Form 10-K | #WORTHREACHINGFOR I 79 |
Results of period derivative activity
The estimated fair value and location of our derivative instruments on our balance sheets are as follows (see Note 7):
| | | | | | | | | | | | | | | | | | | | | | | | | | |
| Assets | | Liabilities |
| February 28,
2022 | | February 28,
2021 | 2023 | | February 28,
2022 | | | February 28,
20212023 | | February 28,
2022 |
| (in millions) | | | | | | | | |
| Derivative instruments designated as hedging instruments |
| Foreign currency contracts: |
| Prepaid expenses and other | $ | 28109.61 | | | $ | 3228.06 | | | Other accrued expenses and liabilities | $ | 59.98 | | | $ | 35.59 | |
| Other assets | $ | 25134.15 | | | $ | 4125.31 | | | Deferred income taxes and other liabilities | $ | 83.65 | | | $ | 28.76 | |
| Swap lockPre-issuance hedge contracts: |
| Other assets | $ | — | | | $ | — | | | Deferred income taxes and other liabilities | $ | 0.4— | | | $ | —0.4 | |
|
| | | | | | | | |
| | | | | | | | |
| Derivative instruments not designated as hedging instruments |
| Foreign currency contracts: |
| Prepaid expenses and other | $ | 25.79 | | | $ | 32.37 | | | Other accrued expenses and liabilities | $ | 3.39 | | | $ | 3.53 | |
| | | | | | | | |
| Commodity derivative contracts: |
| Prepaid expenses and other | $ | 6121.32 | | | $ | 1361.43 | | | Other accrued expenses and liabilities | $ | 019.75 | | | $ | 30.97 | |
| Other assets | $ | 294.76 | | | $ | 29.7.8 | | | Deferred income taxes and other liabilities | $ | 08.23 | | | $ | 10.42 | |
The principal effect of our derivative instruments designated in cash flow hedging relationships on our results of operations, as well as OCI, net of income tax effect, is as follows:
| | | | | | | | | | | | | | | | | | | | |
Derivative Instruments in
Designated Cash Flow
Hedging Relationships | | Net
Gain (Loss)
Recognized
in OCI | | Location of Net Gain (Loss)
Reclassified from
AOCI to Income (Loss) | | Net
Gain (Loss)
Reclassified
from AOCI to
Income (Loss) |
| (in millions) | | | | | | |
| For the Year Ended February 28, 2023 | | | | | | |
| Foreign currency contracts | | $ | 221.5 | | | Sales | | $ | (1.3) | |
| | | | Cost of product sold | | 50.8 | |
| | | | | | |
| | | | | | |
| Pre-issuance hedge contracts | | 15.7 | | | Interest expense | | (0.9) | |
| | $ | 237.2 | | | | | $ | 48.6 | |
| | | | | | |
| For the Year Ended February 28, 2022 | | | | | | |
| Foreign currency contracts | | $ | 6.4 | | | Sales | | $ | (1.1) | |
| | | | Cost of product sold | | 37.3 | |
| Swap lock contracts | | (0.3) | | | Interest expense | | — | | | | | | |
| | | | | | |
| Treasury lockPre-issuance hedge contracts | | (—0.3 ) | | | Interest expense | | (2.3) | |
| | $ | 6.1 | | | | | $ | 33.9 | |
| | | | | | |
| | | | | |
Constellation Brands, Inc. FY 2023 Form 10-K | #WORTHREACHINGFOR I 81 |
| | | | | | | | |
| PART II | ITEM 8. FINANCIAL STATEMENTS AND SUPPLEMENTARY DATA | Table of Contents |
| | | | | | | | | | | | | | | | | | | | |
Derivative Instruments in
Designated Cash Flow
Hedging Relationships | | Net
Gain (Loss)
Recognized
in OCI | | Location of Net Gain (Loss)
Reclassified from
AOCI to Income (Loss) | | Net
Gain (Loss)
Reclassified
from AOCI to
Income (Loss) |
| (in millions) | | | | | | |
| For the Year Ended February 28, 2021 | | | | | | |
| Foreign currency contracts | | $ | (31.1) | | | Sales | | $ | 1.4 | |
| | | | Cost of product sold | | (25.4) | |
| | | | | | |
| Interest rate swap contracts | | (0.6) | | | Interest expense | | (1.1) | |
| Treasury lockPre-issuance hedge contracts | | (16.1) | | | Interest expense | | (1.8) | |
| | $ | (47.8) | | | | | $ | (26.9) | |
| | | | | | |
| | | | | |
| Constellation Brands, Inc. FY 2022 Form 10-K | #WORTHREACHINGFOR I 80 |
| | | | | | | | | | | | | | | | | | | | |
Derivative Instruments in
Designated Cash Flow
Hedging Relationships | | Net
Gain (Loss)
Recognized
in OCI | | Location of Net Gain (Loss)
Reclassified from
AOCI to Income (Loss) | | Net
Gain (Loss)
Reclassified
from AOCI to
Income (Loss) |
| (in millions) | | | | | | |
| For the Year Ended February 29, 2020 | | | | | | |
| Foreign currency contracts | | $ | 66.8 | | | Sales | | $ | — | |
| | | | Cost of product sold | | 20.2 | |
| | | | | | |
| Interest rate swap contracts | | (0.5) | | | Interest expense | | — | |
| Treasury lock contracts | | (5.7) | | | Interest expense | | — | |
| | $ | 60.6 | | | | | $ | 20.2 | |
The effect of our undesignated derivative instruments on our results of operations is as follows:
| | | | | | | | | | | | | | | | | | | | |
Derivative Instruments Not
Designated as Hedging Instruments | | | | Location of Net Gain (Loss)
Recognized in Income (Loss) | | Net
Gain (Loss)
Recognized in
Income (Loss) |
| (in millions) | | | | | | |
| For the Year Ended February 28, 2023 | | | | | | |
| Commodity derivative contracts | | | | Cost of product sold | | $ | (15.0) | |
| Foreign currency contracts | | | | Selling, general, and administrative expenses | | (19.8) | |
| | | | | | |
| | | | | | $ | (34.8) | |
| | | | | | |
| For the Year Ended February 28, 2022 | | | | | | |
| Commodity derivative contracts | | | | Cost of product sold | | $ | 109.9 | |
| Foreign currency contracts | | | | Selling, general, and administrative expenses | | (16.7) | |
| | | | | | |
| | | | | | $ | 93.2 | |
| | | | | | |
| For the Year Ended February 28, 2021 | | | | | | |
| Commodity derivative contracts | | | | Cost of product sold | | $ | 25.1 | |
| Foreign currency contracts | | | | Selling, general, and administrative expenses | | (17.4) | |
| | | | | | |
| | | | | | $ | 7.7 | |
| | | | | | |
| For the Year Ended February 29, 2020 | | | | | | |
| Commodity derivative contracts | | | | Cost of product sold | | $ | (49.0) | |
| Foreign currency contracts | | | | Selling, general, and administrative expenses | | (7.8) | |
| | | | | | |
| | | | | | $ | (56.8) | |
7. FAIR VALUE OF FINANCIAL INSTRUMENTS
Authoritative guidance establishes a framework for measuring fair value, including a hierarchy for inputs used in measuring fair value that maximizes the use of observable inputs and minimizes the use of unobservable inputs by requiring that the most observable inputs be used when available. The hierarchy includes three levels:
•Level 1 inputs are quoted prices in active markets for identical assets or liabilities;
•Level 2 inputs include data points that are observable such as quoted prices for similar assets or liabilities in active markets, quoted prices for identical assets or similar assets or liabilities in markets that are not active, and inputs (other than quoted prices) such as volatility, interest rates, and yield curves that are observable for the asset andor liability, either directly or indirectly; and
•Level 3 inputs are unobservable data points for the asset or liability, and include situations where there is little, if any, market activity for the asset or liability.
| | | | | |
Constellation Brands, Inc. FY 20222023 Form 10-K | #WORTHREACHINGFOR I 8182 |
| | | | | | | | |
| PART II | ITEM 8. FINANCIAL STATEMENTS AND SUPPLEMENTARY DATA | Table of Contents |
Fair value methodology
The following methods and assumptions are used to estimate the fair value for each class of our financial instruments:
Foreign currency and commodity derivative contracts
The fair value is estimated using market-based inputs, obtained from independent pricing services, entered into valuation models. These valuation models require various inputs, including contractual terms, market foreign exchange prices, market commodity prices, interest-rate yield curves, and currency volatilities, as applicable (Level 2 fair value measurement).
Interest rate swap, swap lock, and treasury lockPre-issuance hedge contracts
The fair value is estimated based on quoted market prices from respective counterparties. Quotes are corroborated by using discounted cash flow calculations based upon forward interest-rate yield curves, which are obtained from independent pricing services (Level 2 fair value measurement).
Canopy investment
Equity securities, Warrants – The November 2018 Canopy Warrants consist of three tranches of warrants, including 88.5 million Tranche A Warrants expiring November 1, 2023, which are currently exercisable, 38.4 million Tranche B Warrants expiring November 1, 2026, and 12.8 million Tranche C Warrants expiring November 1, 2026. If the Canopy Transaction is completed we intend to surrender the November 2018 Canopy Warrants for cancellation. The inputs used to estimate the fair value of the November 2018 Canopy Warrants are as follows (1) (2):
| | | | | | | | | | | | | | | | | | | | | | | |
| February 28, 20222023 | | February 28, 20212022 |
| Tranche A Warrants (3) | | Tranche B Warrants (4) | | Tranche A Warrants (3) | | Tranche B Warrants (4) |
Exercise price (5) | C$ | 50.40 | | | C$ | 76.68 | | | C$ | 50.40 | | | C$ | 76.68 | |
Valuation date stock price (6) | C$ | 9.043.17 | | | C$ | 3.17 | | | C$ | 9.04 | | | C$ | 41.90 | | | C$ | 41.909.04 | |
Remaining contractual term (7) | 0.7 years | | 3.7 years | | 1.7 years | | 4.7 years | | 2.7 years | | 5.7 years |
Expected volatility (8) | 75100.0 | % | | 100.0 | % | | 75.0 | % | | 70.0 | % | | 7075.0 | % |
Risk-free interest rate (9) | 4.6 | % | | 3.7 | % | | 1.4 | % | | 1.7 | % | | 0.5 | % | | 1.1 | % |
Expected dividend yield (10) | 0.0 | % | | 0.0 | % | | 0.0 | % | | 0.0 | % |
(1)The exercise price for the Tranche C Warrants is based on the VWAP Exercise Price. The Tranche C Warrants are not included in the table as there is no fair value assigned.
(2)In connection with the Acreage Transaction, we obtained other rights which include a share repurchase credit. If Canopy has not purchased the lesser of 27,378,866 Canopy common shares, or C$1,583.0 million worth of Canopy common shares for cancellation between April 18, 2019, and two-years after the full exercise of the Tranche A Warrants, we will be credited an amount that will reduce the aggregate exercise price otherwise payable upon each exercise of the Tranche B Warrants and Tranche C Warrants. The credit will be an amount equal to the difference between C$1,583.0 million and the actual price paid by Canopy in purchasing its common shares for cancellation. The likelihood of receiving the share repurchase credit if we were to fully exercise the Tranche A Warrants is remote, therefore, no fair value has been assigned.
(3)The fair value is estimated using the Black-Scholes option-pricing model (Level 2 fair value measurement).
(4)The fair value is estimated using Monte Carlo simulations (Level 2 fair value measurement).
(5)Based on the exercise price from the applicable underlying agreements.
(6)Based on the closing market price for Canopy common stockshares on the TSX as of the applicable date.
(7)Based on the expiration date of the warrants.
(8)Based on consideration of historical and/or implied volatility levels of the underlying equity security and limited consideration of historical peer group volatility levels.
| | | | | |
Constellation Brands, Inc. FY 2023 Form 10-K | #WORTHREACHINGFOR I 83 |
| | | | | | | | |
| PART II | ITEM 8. FINANCIAL STATEMENTS AND SUPPLEMENTARY DATA | Table of Contents |
(9)Based on the implied yield currently available on Canadian Treasury zero coupon issues with a remaining term equal to the expiration date of the applicable warrants.
(10)Based on historical dividend levels.
| | | | | |
| Constellation Brands, Inc. FY 2022 Form 10-K | #WORTHREACHINGFOR I 82 |
Debt securities, Convertible – We have elected the fair value option to account for the Canopy Debt Securities acquired in June 2018 for C$200.0 million, or $150.5 million. Interest income on the Canopy Debt Securities is calculated using the effective interest method and is recognized separately from the changes in fair value in interest expense. The Canopy Debt Securities have a contractual maturity of five yearsfive years from the date of issuance but may be convertedsettled prior to maturity by either party upon the occurrence of certain events. At settlement, the Canopy Debt Securities can be settled at the option of the issuer, in cash, equity shares of the issuer, or a combination thereof. The fair value is estimated using a binomial lattice option-pricing model (Level 2 fair value measurement), which includes an estimate of the credit spread based on market spreads using bond data as of the valuation date. In April 2023, we extended the maturity of the remaining Canopy Debt Securities by exchanging them for the 2023 Canopy Promissory Note. If the Canopy Amendment is authorized by Canopy’s shareholders, we maintain our intention to negotiate an exchange of the principal amount of the 2023 Canopy Promissory Note for Exchangeable Shares, although neither we nor Canopy has any binding obligation to do so. For additional information, refer to Note 10.
The inputs used to estimate the fair value of the Canopy Debt Securities are as follows:
| | | | | | | | | | | |
| February 28,
20222023 | | February 28,
20212022 |
Conversion price (1) | C$ | 48.17 | | | C$ | 48.17 | |
Valuation date stock price (2) | C$ | 93.0417 | | | C$ | 419.9004 | |
Remaining term (3) | 10.4 years | | 21.4 years |
Expected volatility (4) | 75100.0 | % | | 5775.60 | % |
Risk-free interest rate (5) | 14.46 | % | | 01.4 | % |
Expected dividend yield (6) | 0.0 | % | | 0.0 | % |
(1)Based on the rate which the Canopy Debt Securities may be converted into equity shares, or the equivalent amount of cash, at the option of the issuersettled. In June 2022, the Canopy Debt Securities were amended to remove Canopy’s right to settle the Canopy Debt Securities on conversion into Canopy common shares. As a result, the Canopy Debt Securities may only be settled in cash. Prior to the June 2022 amendment, the Canopy Debt Securities could be settled, at Canopy’s option, in cash, Canopy common shares, or a combination thereof.
(2)Based on the closing market price for Canopy common stockshares on the TSX as of the applicable date.
(3)Based on the contractual maturity date of the notes.
(4)Based on consideration of historical and/or implied volatility levels of the underlying equity security, adjusted for certain risks associated with debt securities, as appropriate.
(5)Based on the implied yield currently available on Canadian Treasury zero coupon issues with a term equal to the remaining contractual term of the Canopy Debt Securities.
(6)Based on historical dividend levels.
Short-term borrowings
Our short-term borrowings consist of our commercial paper program and the revolving credit facility under our senior credit facility. The revolving credit facility is a variable interest rate bearing note with a fixed margin, adjustable based upon our debt rating (as defined in our senior credit facility). For these short-term borrowings the carrying value approximates the fair value.
Long-term debt
The term loanloans under our term credit agreement is aagreements are variable interest rate bearing notenotes with a fixed margin, adjustable based upon our debt rating. The carrying value approximatesvalues approximate the fair value of the term loanloans. The fair value of the remaining fixed interest rate long-term debt is estimated by discounting cash flows using interest rates currently available for debt with similar terms and maturities (Level 2 fair value measurement).
| | | | | |
Constellation Brands, Inc. FY 2023 Form 10-K | #WORTHREACHINGFOR I 84 |
| | | | | | | | |
| PART II | ITEM 8. FINANCIAL STATEMENTS AND SUPPLEMENTARY DATA | Table of Contents |
The carrying amounts of certain of our financial instruments, including cash and cash equivalents, accounts receivable, and accounts payable, approximate fair value as of February 28, 20222023, and February 28, 2021, due to the relatively short maturity of these instruments2022, due to the relatively short maturity of these instruments. As of February 28, 2023, the carrying amount of long-term debt, including the current portion, was $11,296.0 million, compared with an estimated fair value of $10,236.0 million. As of February 28, 2022, the carrying amount of long-term debt, including the current portion, was $10,093.5 million, compared with an estimated fair value of $10,345.3 million. As of February 28, 2021, the carrying amount of long-term debt, including the current portion, was $10,442.3 million, compared with an estimated fair value of $11,580.9 million.
| | | | | |
| Constellation Brands, Inc. FY 2022 Form 10-K | #WORTHREACHINGFOR I 83 |
Recurring basis measurements
The following table presents our financial assets and liabilities measured at estimated fair value on a recurring basis:
| | | | | | | | | | | | | | | | | | | | | | | |
| Fair Value Measurements Using | | |
| Quoted
Prices in
Active
Markets
(Level 1) | | Significant
Other
Observable
Inputs
(Level 2) | | Significant
Unobservable
Inputs
(Level 3) | | Total |
| (in millions) | | | | | | | |
| February 28, 2023 | | | | | | | |
| Assets: | | | | | | | |
| Foreign currency contracts | $ | — | | | $ | 249.5 | | | $ | — | | | $ | 249.5 | |
| Commodity derivative contracts | $ | — | | | $ | 25.8 | | | $ | — | | | $ | 25.8 | |
November 2018 Canopy Warrants (1) | $ | — | | | $ | 0.2 | | | $ | — | | | $ | 0.2 | |
Canopy Debt Securities (1) | $ | — | | | $ | 69.6 | | | $ | — | | | $ | 69.6 | |
| | | | | | | |
| | | | | | | |
| Liabilities: | | | | | | | |
| Foreign currency contracts | $ | — | | | $ | 17.2 | | | $ | — | | | $ | 17.2 | |
| Commodity derivative contracts | $ | — | | | $ | 27.8 | | | $ | — | | | $ | 27.8 | |
| | | | | | | |
| | | | | | | |
| | | | | | | |
| | | | | | | |
| February 28, 2022 | | | | | | | |
| Assets: | | | | | | | |
| Foreign currency contracts | $ | — | | | $ | 56.4 | | | $ | — | | | $ | 56.4 | |
| Commodity derivative contracts | $ | — | | | $ | 91.0 | | | $ | — | | | $ | 91.0 | |
November 2018 Canopy Warrants (1) | $ | — | | | $ | 36.3 | | | $ | — | | | $ | 36.3 | |
Canopy Debt Securities (1) | $ | — | | | $ | 146.6 | | | $ | — | | | $ | 146.6 | |
| | | | | | | |
| | | | | | | |
| Liabilities: | | | | | | | |
| Foreign currency contracts | $ | — | | | $ | 17.8 | | | $ | — | | | $ | 17.8 | |
| Commodity derivative contracts | $ | — | | | $ | 0.9 | | | $ | — | | | $ | 0.9 | |
| | | | | | | |
| | | | | | | |
| Swap lockPre-issuance hedge contracts | $ | — | | | $ | 0.4 | | | $ | — | | | $ | 0.4 | |
| | | | | | | |
| February 28, 2021 | | | | | | | |
| Assets: | | | | | | | |
| Foreign currency contracts | $ | — | | | $ | 76.6 | | | $ | — | | | $ | 76.6 | |
| Commodity derivative contracts | $ | — | | | $ | 21.2 | | | $ | — | | | $ | 21.2 | |
November 2018 Canopy Warrants (1) | $ | — | | | $ | 1,639.7 | | | $ | — | | | $ | 1,639.7 | |
Canopy Debt Securities (1) | $ | — | | | $ | 176.3 | | | $ | — | | | $ | 176.3 | |
| Liabilities: | | | | | | | |
| Foreign currency contracts | $ | — | | | $ | 9.7 | | | $ | — | | | $ | 9.7 | |
| Commodity derivative contracts | $ | — | | | $ | 5.3 | | | $ | — | | | $ | 5.3 | |
| | | | | | | |
| | | | | | | |
| | | | | | | | | | | | | | | | | |
(1) | Unrealized net gain (loss) from the changes in fair value of our securities measured at fair value recognized in income (loss) from unconsolidated investments, are as follows: |
| | | February 28,
2023 | | February 28,
2022 |
| (in millions) | | | |
| | | | |
| November 2018 Canopy Warrants | $ | (36.1) | | | $ | (1,603.4) | |
| Canopy Debt Securities (i) | (9.8) | | | (41.3) | |
| | $ | (45.9) | | | $ | (1,644.7) | |
| | |
| (i) | In July 2022, we received 29.2 million common shares of Canopy through the exchange of C$100.0 million principal amount of our Canopy Debt Securities. We continued to hold Canopy Debt Securities of C$100.0 million principal amount as of February 28, 2023. For additional information, refer to Note 10. |
| | | | | |
Constellation Brands, Inc. FY 20222023 Form 10-K | #WORTHREACHINGFOR I 8485 |
| | | | | | | | |
| PART II | ITEM 8. FINANCIAL STATEMENTS AND SUPPLEMENTARY DATA | Table of Contents |
Nonrecurring basis measurements
The following table presents our assets and liabilities measured at estimated fair value on a nonrecurring basis for which an impairment assessment was performed for the periods presented:
| | | | | | | | | | | | | | | | | | | | | | | |
| Fair Value Measurements Using | | |
| Quoted
Prices in
Active
Markets
(Level 1) | | Significant
Other
Observable
Inputs
(Level 2) | | Significant
Unobservable
Inputs
(Level 3) | | Total Losses |
| (in millions) | | | | | | | |
| For the Year Ended February 28, 2023 | | | | | | | |
| Equity method investments | $ | 398.4 | | | $ | — | | | $ | — | | | $ | 1,060.3 | |
| | | | | | | |
| Long-lived assets | — | | | — | | | 6.3 | | | 53.5 | |
| Trademarks | — | | | — | | | — | | | 13.0 | |
| $ | 398.4 | | | $ | — | | | $ | 6.3 | | | $ | 1,126.8 | |
| | | | | | | |
| For the Year Ended February 28, 2022 | | | | | | | |
| Long-lived assets | $ | — | | | $ | — | | | $ | 20.0 | | | $ | 665.9 | |
| | | | | | | |
| | | | | | | |
| | | | | | | |
| | | | | | | |
| For the Year Ended February 28, 2021 | | | | | | | |
| Long-lived assets held for sale | $ | — | | | $ | — | | | $ | — | | | $ | 24.0 | |
| Trademarks | — | | | — | | | 4.0 | | | 6.0 | |
| $ | — | | | $ | — | | | $ | 4.0 | | | $ | 30.0 | |
| |
Equity method investments
As of August 31, 2022, we evaluated the Canopy Equity Method Investment and determined there was an other-than-temporary impairment based on several contributing factors, including: (i) the period of time for which the fair value had been less than the carrying value and the uncertainty surrounding Canopy’s stock price recovering in the near-term, (ii) Canopy recording a significant impairment of goodwill related to its cannabis operations during its three months ended June 30, 2022, and (iii) the uncertainty of U.S. federal cannabis permissibility. As a result, the Canopy Equity Method Investment with a carrying value of $1,695.1 million was written down to its estimated fair value of $634.8 million, resulting in an impairment of $1,060.3 million. This loss from impairment was included in income (loss) from unconsolidated investments within our consolidated results for the year ended February 28, 2023. The estimated fair value was determined based on the closing price of the underlying equity security as of August 31, 2022. As of February 28, 2023, the estimated fair value was $398.4 million, as such, we evaluated the Canopy Equity Method Investment for an additional other-than-temporary impairment. If Canopy’s stock price does not recover above our carrying value in the near-term there may be a future impairment of the Canopy Equity Method Investment. For additional information, refer to Note 10.
Long-lived assets
For the year ended February 28, 2023, in connection with certain continued negative trends within our Beer segment’s craft beer business, management updated its long-term financial forecasts for this business and determined it was no longer part of the beer asset group. This change in financial forecasts indicated it was more likely than not the fair value of our long-lived assets associated with the craft beer business might be below its carrying value. Accordingly, we performed a quantitative assessment for impairment. As a result, certain long-lived assets with a carrying value of $59.8 million were written down to their estimated fair value of $6.3 million, resulting in a total loss of $53.5 million. This loss was included in selling, general, and administrative expenses within our consolidated results of operations for the year ended February 28, 2023. These assets consisted primarily of property, plant, and equipment, including the Daleville Facility. Our estimated fair value was primarily based on the cash flows expected to be generated by the assets.
| | | | | |
For the Year Ended February 29, 2020 | | | | | | | |
| Long-lived assets held for sale | $ | — | | | $ | — | | | $ | 949.3 | | | $ | 449.7 | |
Trademarks (1) | Constellation Brands, Inc. FY 2023 Form 10-K | — | | | #WORTHREACHINGFOR — | | | I— | | | 11.0 | |
| $ | — | | | $ | — | | | $ | 949.3 | | | $ | 460.7 | |
(1) The balance at February 29, 2020, has been reclassified to assets held for sale (see “Trademarks” below for further discussion).
Long-lived assets
86
| | | | | | | | |
| PART II | ITEM 8. FINANCIAL STATEMENTS AND SUPPLEMENTARY DATA | Table of Contents |
In April 2021, our Board of Directors authorized management to sell or abandon the Mexicali Brewery. Subsequently, management determined that we will be unable to use or repurpose certain assets at the Mexicali Brewery. Accordingly, for the first quarter of Fiscal 2022, long-lived assets with a carrying value of $685.9 million were written down to their estimated fair value of $20.0 million, resulting in an impairment of $665.9 million. This impairment was included in impairment of brewery construction in progress within our consolidated results of operations for the year ended February 28, 2022. Our estimate of fair value was determined based on the expected salvage value of the assets. The Mexicali Brewery is a component of the Beer segment. We continue to workIn April 2022, we announced that, with the assistance of the Mexican government and state and local officials in Mexico to (i) determine next steps for our suspended Mexicali Brewery construction project, (ii) pursue various forms of recovery for capitalized costs and additional expenses incurred in establishing the brewery, however, there can be no assurance of any recoveries, and (iii) explore options to add further capacity at other locations in Mexico, including, we acquired land in Veracruz for the construction of the Southeast MexicoVeracruz Brewery where there is ample water and we will have a skilled workforce to meet our long-term needs. The design and construction process for the Veracruz Brewery is underway. In the medium-term, under normal operating conditions, we have ample capacity at the Nava and Obregonour current Mexican breweries to meet consumer needs based on current growth forecasts and current and planned production capabilities. Expansion, optimization, and/or construction effortsactivities continue at our current brewery locations under ourbreweries in Mexico Beer Projects to align with our anticipated future growth expectations.
Long-lived assets held for sale
For the year ended February 28, 2021, primarily in connection with the Wine and Spirits Divestitures and the Concentrate Business Divestiture, long-lived assets held for sale with a carrying value of $736.4 million were written down to their estimated fair value of $712.4 million, less costs to sell, resulting in a total loss of $24.0 million. This loss was included in impairment of assets held for saleselling, general, and administrative expenses within our consolidated results of operations. These assets consisted primarily of goodwill, intangible assets, and certain winery and vineyard assets which had satisfied the conditions necessary to be classified as held for sale. Our estimated fair value was determined as of November 30, 2020, primarily based on the expected proceeds from the Wine and Spirits
| | | | | |
| Constellation Brands, Inc. FY 2022 Form 10-K | #WORTHREACHINGFOR I 85 |
Divestitures and the Concentrate Business Divestiture, excluding the Divestitures and the Concentrate Business Divestiture, excluding the then-potential contingent consideration, which we will recognize when it is determined to be realizable.
Trademarks
For the year ended February 2928, 20202023, in connection with the Wine and Spirits Divestitures and the Concentrate Business Divestiture, long-livedcertain continued negative trends within our Beer segment’s Funky Buddha and Four Corners craft beer portfolios, management updated its long-term financial forecasts for these portfolios. As a result, the Funky Buddha and Four Corners craft beer trademark assets held for sale with a net carrying value of $1,29113.2 million were written down to their estimated fair value of $908.2 million, less costs to sell, resulting in a total loss0 million were written-off, resulting in an impairment of $40713.0 million. This lossimpairment was included in impairment of assets held for sale within our consolidated results of operations. These assets consisted primarily of goodwill, intangible assets, and certain winery and vineyard assets which had satisfied the conditions necessary to be classified as held for sale. Our estimate of fair value was determined as of February 29, 2020, based on the expected proceeds from the Wine and Spirits Divestitures and the Concentrate Business Divestiture, excluding the contingent consideration.
For the year ended February 29, 2020, in connection with the Ballast Point Divestiture, long-lived assets held for sale with a carrying value of $81.3 million were written down to their estimated fair value of $41.1 million, less costs to sell. As a result, a loss of $42.7 million, inclusive of costs to sell and other losses was included in impairment of assets held for sale for the year ended February 29, 2020. These assets consisted primarily of intangible assets and certain production and warehouse assets which had satisfied the conditions necessary to be classified as held for sale. Our estimate of fair value was determined based on the expected proceeds from the Ballast Point Divestiture as of February 29, 2020. Ballast Point was a component of the Beer segment and was included in our beer reporting unit through the date of divestiture. Accordingly, goodwill was allocated to the Ballast Point assets held for sale based on the relative fair value of the business being sold compared to the relative fair value of the reporting unit. Goodwill not allocated to assets associated with the Ballast Point Divestiture remained in the beer reporting unit.
Trademarksselling, general, and administrative expenses within our consolidated results of operations for the year ended February 28, 2023.
For the year ended February 28, 2021, certain negative trends within our Beer segment’s Four Corners craft beer portfolio, including slower growth rates and increased competition, resulted in updated long-term financial forecasts. The updated forecasts indicated it was more likely than not the fair value of our indefinite-lived intangible asset associated with the Four Corners trademark might be below its carrying value. Accordingly, we performed a quantitative assessment for impairment. As a result of this assessment, the Four Corners trademark asset with a carrying value of $10.0 million was written down to its estimated fair value of $4.0 million, resulting in an impairment of $6.0 million. This impairment was included in selling, general, and administrative expenses within our consolidated results of operations for the year ended February 28, 2021.
For the year ended February 29, 2020, certain continuing negative trends within our Beer segment’s Ballast Point craft beer portfolio, including increased rate of revenue decline and increased competition, indicated that it was more likely than not the fair value of our indefinite-lived intangible asset associated with the Ballast Point craft beer trademark might be below its carrying value. Accordingly, we performed a quantitative assessment for impairment. As a result of this assessment, the Ballast Point craft beer trademark asset with a carrying value of $28.0 million was written down to its estimated fair value of $17.0 million, resulting in an impairment of $11.0 million. This impairment was included in selling, general, and administrative expenses within our consolidated results of operations for the year ended February 29, 2020.
When performing a quantitative assessment for impairment of a trademark asset, we measure the amount of impairment by calculating the amount by which the carrying value of the trademark asset exceeds its estimated fair value. The estimated fair value is determined based on an income approach using the relief from royalty method, which assumes that, in lieu of ownership, a third party would be willing to pay a royalty in order to exploit the related benefits of the trademark asset. The cash flow projections we use to estimate the fair value of our trademark assets involve several assumptions, including (i) projected revenue growth rates, (ii) estimated royalty rates, (iii) after-tax royalty savings expected from ownership of the trademarks, and (iv) discount rates used to derive the estimated fair value of the trademark assets.
| | | | | |
Constellation Brands, Inc. FY 20222023 Form 10-K | #WORTHREACHINGFOR I 8687 |
| | | | | | | | |
| PART II | ITEM 8. FINANCIAL STATEMENTS AND SUPPLEMENTARY DATA | Table of Contents |
8. GOODWILL
The changes in the carrying amount of goodwill are as follows:
| | | | | | | | | | | | | | | | | | | |
| Beer | | Wine and Spirits | | | | Consolidated |
| (in millions) | | | | | | | |
| Balance, February 2928, 2020 | $ | 5,163.4 | | | $ | 2,593.7 | | | | | $ | 7,757.1 | |
Purchase accounting allocations (1) | — | | | 14.3 | | | | | 14.3 | |
| Foreign currency translation adjustments | (38.7) | | | 15.9 | | | | | (22.8) | |
Reclassified from assets held for sale (2) | 0.9 | | | 44.0 | | | | | 44.9 | |
| Balance, February 28, 2021 | 5,125.6 | | | 2021 | $ | 5,125.6 | | | $ | 2,667.9 | | | | | $ | 7,793.5 | |
Purchase accounting allocations (1) (3) | — | | | 79.6 | | | | | 79.6 | |
| Foreign currency translation adjustments | (4.9) | | | (5.8) | | | | | (10.7) | |
| | | | | | | |
| Balance, February 28, 2022 | $ | 5,120.7 | | | $ | 2,741.7 | | | | | $ | 7,862 | 2,741.7 | | | | | 7,862.4 | |
Purchase accounting allocations (2) | — | | | 26.3 | | | | | 26.3 | |
| 2022 Wine Divestiture | — | | | (24.5) | | | | | (24.5) | |
| Foreign currency translation adjustments | 68.2 | | | (7.0) | | | | | 61.2 | |
| Balance, February 28, 2023 | $ | 5,188.9 | | | $ | 2,736.5 | | | | | $ | 7,925.4 | |
(1)PurchasePreliminary purchase accounting allocations associated primarilywith the acquisition of My Favorite Neighbor and purchase accounting allocations associated with the acquisition of Empathy Wines.
(2)Primarily in connection with the Wine and Spirits Divestitures, goodwill associated with the businesses being sold was reclassified from assets held for sale based on the changes to relative fair values of the portion of the business being sold and the remaining wine and spirits and beer portfolios. The relative fair values were determined using the income approach based on assumptions, including projected revenue growth rates, terminal growth rate, and discount rate and other projected financial information.
(3)Preliminary purchase accounting allocations associated with the acquisition ofPurchase accounting allocations associated with the acquisitions of Austin Cocktails, Lingua Franca, and My Favorite Neighbor.
9. INTANGIBLE ASSETS
The major components of intangible assets are as follows:
| | | | | | | | | | | | | | | | | | | | | | | |
| February 28, 2023 | | February 28, 2022 |
| Gross
Carrying
Amount | | Net
Carrying
Amount | | Gross
Carrying
Amount | | Net
Carrying
Amount |
| (in millions) | | | | | | | |
| Amortizable intangible assets | | | | | | | |
| Customer relationships | $ | 85.7 | | | $ | 17.7 | | | $ | 87.1 | | | $ | 21.7 | |
| Other | 20.8 | | | — | | | 20.9 | | | — | |
| Total | $ | 106.5 | | | 17.7 | | | $ | 108.0 | | | 21.7 | |
| | | | | | | |
| Nonamortizable intangible assets | | | | | | | |
| Trademarks | | | 2,710.4 | | | | | 2,733.5 | |
| Total intangible assets | | | $ | 2,728.1 | | | | | $ | 2,755.2 | |
We did not incur costs to renew or extend the term of acquired intangible assets for the years ended February 28, 20222023, February 28, 20212022, and February 2928, 20202021. Net carrying amount represents the gross carrying value net of accumulated amortization. Amortization expense for intangible assets was $53.12 million, $5.31 million, and $5.73 million for the years ended February 28, 2023, February 28, 2022, and February 28, 2021, and February 29, 2020, respectively.
| | | | | |
| Constellation Brands, Inc. FY 2022 Form 10-K | #WORTHREACHINGFOR I 87 |
Estimated amortization expense for each of the five succeeding fiscal years and thereafter is as follows:
| | | | | |
| (in millions) | |
| Fiscal 2023 | $ | 3.2 | |
| Fiscal 2024 | $ | 1.4 | |
| Fiscal 2025 | $ | 1.43 | |
| Fiscal 2026 | $ | 1.43 | |
| Fiscal 2027 | $ | 1.43 | |
| Fiscal 2028 | $ | 1.3 | |
| Thereafter | $ | 1211.91 | |
| | | | | |
Constellation Brands, Inc. FY 2023 Form 10-K | #WORTHREACHINGFOR I 88 |
| | | | | | | | |
| PART II | ITEM 8. FINANCIAL STATEMENTS AND SUPPLEMENTARY DATA | Table of Contents |
10. EQUITY METHOD INVESTMENTS
Our equity method investments are as follows:
| | | | | | | | | | | | | | | | | | | | | | | |
| February 28, 20222023 | | February 28, 20212022 |
| Carrying Value | | Ownership Percentage | | Carrying Value | | Ownership Percentage |
| (in millions) | | | | | | | |
Canopy Equity Method Investment (1) (2) | $ | 485.8 | | | 34.7 | % | | $ | 2,503.5 | | | 36.1 | % | | $ | 2,578.8 | | | 38.1 | % |
| Other equity method investments | 185177.25 | | | 20%-50% | | 209185.62 | | | 20%-50% |
| $ | 2,688663.73 | | | | | $ | 2,788688.47 | | | |
(1)The fair value based on the closing price of the underlying equity security as of February 28, 20222023, and February 28, 2021, was2022, was $398.4 million and $1,014.8 million and, respectively. The balance at February 28, 2023, is net of a $41,679060.3 million, respectively. Refer to discussion below on other-than-temporary impairment considerationsof our Canopy Equity Method Investment (see “Canopy Equity Method Investment” below).
(2)Includes the following:
| | | | | | | | | | | | | | | |
| | |
| | Common Shares | | Purchase Price | | | | |
| (in millions) | | | | | | | |
November 2017 Canopy Investment | 18.9 | | | $ | 130.1 | | | | | |
| November 2018 Canopy Investment | 104.5 | | | 2,740.3 | | | | | |
May 2020 Canopy Investment | 18.9 | | | 173.9 | | | | | |
July 2022 Canopy Investment (i) | 142.329.2 | | | 76.8 | | | | | |
| | 171.5 | | | $ | 3,044121.3 | 1 | | | | | |
(i) | In June 2022, certain holders of Canopy Debt Securities agreed to exchange C$262.6 million aggregate principal amount of their Canopy Debt Securities to Canopy at 99% of principal value for newly issued Canopy common shares. As part of this transaction, we exchanged C$100.0 million principal amount of our Canopy Debt Securities for Canopy common shares which we received in July 2022. This exchange did not significantly change our Canopy ownership percentage. | | | | |
Canopy Equity Method Investment
We complement our beverage alcohol strategy with our investment in Canopy, a leading provider of medicinal and recreationaladult-use cannabis products. Equity in earnings (losses) from the Canopy Equity Method Investment and related activities (see table below) include, among other items, restructuring and other strategic business development costs, the amortizationis determined by recording the effect of the fair value adjustments associated with the definite-lived intangible assets over their estimated useful lives, the flow through of inventory step-up, unrealized gains (losses) associated with changes in our Canopy ownership percentage resulting from periodic equity issuances made by Canopy, and our share of Canopy’s additional loss resulting from the June 2019 Warrant Modification of $409.0 millionbasis differences. Amounts included in our consolidated results of operations for each period are as follows:
| | | | | | | | | | | | | | | | | |
| For the Years Ended |
| February 28,
2023 | | February 28,
2022 | | February 28,
2021 | | February 29,
2020 |
| (in millions) | | | | | |
Equity in earnings (losses) from Canopy and related activities | $ | (73.6) | | | $ | (679.0) | | | $ | (575.9) | |
In June 2019, Canopy shareholders approved the modification of the terms of the warrants originally obtained in November 2018 and certain other rights, and the other required approvals necessary for the
| | | | | |
| Constellation Brands, Inc. FY 2022 Form 10-K | #WORTHREACHINGFOR I 88 |
modifications to be effective were granted. Accordingly, we recognized a $1,176.0 million unrealized gain from unconsolidated investments within our consolidated results of operations for the second quarter of Fiscal 2020 from the June 2019 Warrant Modification. These changes were the result of Canopy’s intention to acquire Acreage upon U.S. federal cannabis legalization, subject to certain conditions. The inputs used to estimate the fair value of the November 2018 Canopy Warrants as of the June 27, 2019 modification date, were as follows:
| | | | | | | | | | | |
| Tranche A Warrants (1) | | Tranche B Warrants (1) |
| Exercise price | $ | 50.40 | | | $ | 76.68 | |
| Valuation date stock price | $ | 53.36 | | | $ | 53.36 | |
| Remaining contractual term | 4.3 years | | 7.3 years |
| Expected volatility | 66.7 | % | | 66.7 | % |
| Risk-free interest rate | 1.4 | % | | 1.4 | % |
| Expected dividend yield | 0.0 | % | | 0.0 | % |
(1)Refer to Note 7 for input descriptions (1)
$ | (949.3) | | | $ | (73.6) | | | $ | (679.0) | | (1)Includes a $461.4 million goodwill impairment related to Canopy’s cannabis operations and $359.6 million of costs designed to improve Canopy’s organizational focus, streamline operations, and align production capability with projected demand for the years ended February 28, 2023, and February 28, 2021, respectively.
In May 2020, we exercised the November 2017 Canopy Warrants at an exercise price of C$12.98 per warrant share for C$245.0 million, or $173.9 million. We entered into foreign currency forward contracts to fix the U.S. dollar cost of the May 2020 Canopy Investment. For the year ended February 28, 2021, we recognized net losses on the foreign currency forward contracts of $7.5 million, in selling, general, and administrative expenses within our consolidated results of operations. The payment at maturity of the derivative instruments is reported as
| | | | | |
Constellation Brands, Inc. FY 2023 Form 10-K | #WORTHREACHINGFOR I 89 |
| | | | | | | | |
| PART II | ITEM 8. FINANCIAL STATEMENTS AND SUPPLEMENTARY DATA | Table of Contents |
cash flows from investing activities in investments in equity method investees and securities for the year ended February 28, 2021.
Canopy has various equity and convertible debt securities outstanding, including primarily equity awards granted to its employees, and options and warrants issued to various third parties, including our November 2018 Canopy Warrants, Canopy Debt Securities, and the Acreage Financial Instrument (a call option for Canopy to acquire 70% of the shares of Acreage, at a fixed exchange ratio and 30% at a floating exchange ratio). As of February 28, 2022, the exercise and/or conversion of certain of these outstanding securities could have a significant effect on our share of Canopy’s reported earnings or losses and our ownership interest in Canopy.
We haveWe evaluated the Canopy Equity Method Investment as of FebruaryAugust 2831, 2022, and determined that there was not an other-than-temporary impairment. Our conclusion was based on several contributing factors, including: (i) the period of time for which the fair value has been less than the carrying value, (ii) an expectation that Canopy’s results will improve, (iii) an expectation that the Canopy stock price will recover in the near-term, and (iv) our ability and intent to hold the investment until that recoveryhad been less than the carrying value and the uncertainty surrounding Canopy’s stock price recovering in the near-term, (ii) Canopy recording a significant impairment of goodwill related to its cannabis operations during its three months ended June 30, 2022, and (iii) the uncertainty of U.S. federal cannabis permissibility.
We have evaluated the Canopy Equity Method Investment as of February 28, 2023, and determined that there was not an other-than-temporary impairment. Our conclusion was based primarily on the period of time for which the fair value has been less than the carrying value. We will continue to review the Canopy Equity Method Investment for an other-than-temporary impairment. If Canopy’s stock price does not recover above our carrying value in the near-term, it may result in an additional impairment of our Canopy Equity Method Investment. There may also be a future impairment of
Canopy has various equity and convertible debt securities outstanding, including primarily equity awards granted to its employees, and options and warrants issued to various third parties, including our November 2018 Canopy Warrants and the Acreage Financial Instrument (a call option for Canopy to acquire up to 100% of the shares of Acreage). As of February 28, 2023, the exercise and/or conversion of certain of these outstanding securities could have a significant effect on our Canopy Equity Method Investment if our expectations aboutshare of Canopy’s prospective resultsreported earnings or losses and cash flows decline, which could be influenced by a variety of factors including adverse market conditions or if Canopy records a significant impairment of goodwill or intangible or other long-lived assets, makes significant asset sales, or has changes in senior managementour ownership interest in Canopy.
The following tables present summarized financial information for Canopy prepared in accordance with U.S. GAAP. We recognize our equity in earnings (losses) for Canopy on a two-month lag. Accordingly, we recognized our share of Canopy’s earnings (losses) for the periods (i) January through December 2022 in our year ended February 28, 2023 results, (ii) January through December 2021 in our year ended February 28, 2022 results, and (iiiii) January through December 2020 in our year ended February 28, 2021 results, and (iii) January through December 2019 in our. The year ended February 2928, 2020 results. The amounts shown represent 100% of2023, includes (i) a goodwill impairment related to Canopy’s financial positioncannabis operations and results of operations, for(ii) substantial costs designed to the respective periods, however, the results of operations for the year ended February 29, 2020, exclude the impact of the June 2019 Warrant Modification Loss because it was recorded by Canopy within equitydrive efficiency and accelerate Canopy’s path to profitability. The year ended February 28, 2021, includes substantial costs designed to improve Canopy’s organizational focus, streamline operations, and align production capability with projected demand.
| | | | | |
| Constellation Brands, Inc. FY 2022 Form 10-K | #WORTHREACHINGFOR I 89 |
The amounts shown represent 100% of Canopy’s financial position and results of operations for the respective periods. | | | | | | | | | | | |
| February 28, 20222023 | | February 28, 20212022 |
| (in millions) | | | |
| Current assets | $ | 1,573865.34 | | | $ | 1,706573.63 | |
| Noncurrent assets | $ | 31,419362.29 | | | $ | 3,251419.52 | |
| Current liabilities | $ | 189500.38 | | | $ | 273189.73 | |
| Noncurrent liabilities | $ | 1,470665.42 | | | $ | 1,308470.84 | |
| Noncontrolling interests | $ | 32.31 | | | $ | 1793.03 | |
| | | | | | | | | | | | | | | | | |
| For the Years Ended |
| February 28,
2023 | | February 28,
2022 | | February 28, 2021 | | February 29,
2020
2021 |
| (in millions) | | | | | |
| Net sales | $ | 339.3 | | | $ | 444.3 | | | $ | 378.6 | | | $ | 290.2 | |
| Gross profit (loss) | $ | (125.7) | | | $ | (18.6) | | | $ | (14.1) | | | $ | 45.4 | |
| Net income (loss) | $ | (2,466.0) | | | $ | (274.3) | | | $ | (1,775.3) | | | $ | (327.0) | |
| Net income (loss) attributable to Canopy | $ | (2,447.9) | | | $ | 328.7 | | | $ | (1,750.0) | | | $ | (312.6) | |
| | | | | |
Constellation Brands, Inc. FY 2023 Form 10-K | #WORTHREACHINGFOR I 90 |
| | | | | | | | |
| PART II | ITEM 8. FINANCIAL STATEMENTS AND SUPPLEMENTARY DATA | Table of Contents |
In February 2023, Canopy announced the next series of comprehensive steps to align its Canadian cannabis operations and resources in response to continued unfavorable market trends. In connection with these next steps, Canopy disclosed that it expects to record an estimated pre-tax loss of approximately C$425 million to C$525 million in its fourth quarter of fiscal 2023 and in its first half of fiscal 2024 results. We will record our proportional share of Canopy’s estimated pre-tax loss of approximately C$145 million to C$180 million, in our applicable Fiscal 2024 results.
Plan to convert Canopy common stock ownership
In October 2022, we entered into a Consent Agreement with Canopy pursuant to which we have provided our consent, subject to certain conditions, to the Canopy Transaction. Canopy only holds non-voting and non-participating exchangeable shares of Canopy USA which are convertible into common shares of Canopy USA. Third-party investors will hold 100% of the common shares of Canopy USA.
In connection with the Canopy Transaction, Canopy has proposed to amend its share capital to (i) create Exchangeable Shares and (ii) restate the rights of Canopy common shares to provide for their conversion into Exchangeable Shares through the Canopy Amendment. Canopy has stated its intention to hold a special meeting of its shareholders to consider the Canopy Amendment. We have entered into a voting support agreement with Canopy to vote in favor of the Canopy Amendment.
If the Canopy Transaction is completed and the Canopy Amendment is authorized by Canopy’s shareholders and adopted by Canopy, we intend, subject to a final decision in our sole discretion, to exercise our right to convert our Canopy common shares into Exchangeable Shares. In April 2023, we extended the maturity of the remaining C$100.0 million principal amount of our Canopy Debt Securities by exchanging them for the 2023 Canopy Promissory Note. See “2023 Canopy Promissory Note” below for further discussion.
Assuming the completion of the Canopy Transaction and the transactions contemplated by the Consent Agreement and that we elect to convert our Canopy common shares into Exchangeable Shares:
•we intend to surrender our November 2018 Canopy Warrants to Canopy for cancellation;
•we will only have an interest in Exchangeable Shares, which are non-voting and non-participating securities, and our 2023 Canopy Promissory Note;
•we intend to terminate all legacy agreements and commercial arrangements between ourselves and Canopy, including the investor rights agreement but excluding the Consent Agreement and certain termination agreements;
•we will have no further governance rights in relation to Canopy, including rights to nominate members to the board of directors of Canopy or approval rights related to certain transactions,
•all of our nominees will resign from the board of directors of Canopy; and
•as our investment in Canopy common shares makes up our Canopy Equity Method Investment, we expect to no longer:
◦apply the equity method to our investment in Canopy, which we expect will instead be accounted for at fair value with changes reported in income (loss) from unconsolidated investments within our consolidated results; and
◦have a stand-alone Canopy operating segment as Canopy’s financial results are not expected to be provided to, or reviewed by, our CODM and will not be used to make strategic decisions, allocate resources, or assess performance.
If we do not convert our Canopy common shares into Exchangeable Shares:
•Canopy and its subsidiaries will not be permitted to exercise any rights to acquire shares and interests in entities carrying on cannabis-related business in the U.S.;
•Canopy USA will be required to exercise its repurchase rights to acquire the interests in Canopy USA held by its third-party investors; and
•we will continue to have all existing rights under our agreements with Canopy that predate the Consent Agreement, including governance rights in respect of Canopy (such as board nomination rights and approval rights in respect of certain transactions).
| | | | | |
Constellation Brands, Inc. FY 2023 Form 10-K | #WORTHREACHINGFOR I 91 |
| | | | | | | | |
| PART II | ITEM 8. FINANCIAL STATEMENTS AND SUPPLEMENTARY DATA | Table of Contents |
Other equity method investments
My Favorite Neighbor
In April 2020, we invested in My Favorite Neighbor, which we accounted for under the equity method. We recognized our share of their equity in earnings (losses) in our consolidated financial statements in the Wine and Spirits segment up to the date we acquired the remaining ownership interest.
Corporate investment
In February 2022, we sold an investment made through our corporate venture capital function. We recognized a $51.0 million gain for the year ended February 28, 2022, related to the sale of our previously held equity interest in this investment. This gain is included in income (loss) from unconsolidated investments within our consolidated results of operations. Additionally, we recognized our share of their equity in earnings (losses) in our consolidated financial statements in the Corporate Operations and Other segment up to the date we sold our ownership interest.
Subsequent event
2023 Canopy Promissory Note
In April 2023, we extended the maturity of the remaining C$100.0 million principal amount of our Canopy Debt Securities by exchanging them for the 2023 Canopy Promissory Note. The 2023 Canopy Promissory Note bears interest at an annual rate of 4.25% and matures on December 31, 2024. Canopy may prepay the 2023 Canopy Promissory Note in whole or in part at any time prior to the maturity date. If the Canopy Amendment is authorized by Canopy’s shareholders, we maintain our intention to negotiate an exchange of the C$100.0 million principal amount of the 2023 Canopy Promissory Note for Exchangeable Shares, although neither we nor Canopy has any binding obligation to do so.
11. OTHER ACCRUED EXPENSES AND LIABILITIES
The major components of other accrued expenses and liabilities are as follows:
| | | | | | | | | | | |
| February 28,
20222023 | | February 28,
20212022 |
| (in millions) | | | |
| Salaries, commissions, and payroll benefits and withholdings | $ | 256231.38 | | | $ | 232256.13 | |
| Promotions and advertising | 172162.36 | | | 159172.93 | |
| Accrued interest | 8599.13 | | | 9385.41 | |
| Operating lease liability | 8081.4 | | | 6880.84 | |
| Accrued excise taxes | 4446.68 | | | 1944.96 | |
| Deferred revenue | 3234.0 | | | 1632.30 | |
| Income taxes payableDerivative liabilities | 2133.52 | | | 24.79.9 | |
| Accrued insurance, property, and other taxes | 31.6 | | | 26.3 | |
| Other | 179131.13 | | | 164.84 | |
| $ | 871852.30 | | | $ | 779871.93 | |
| | | | | |
Constellation Brands, Inc. FY 20222023 Form 10-K | #WORTHREACHINGFOR I 9092 |
| | | | | | | | |
| PART II | ITEM 8. FINANCIAL STATEMENTS AND SUPPLEMENTARY DATA | Table of Contents |
12. BORROWINGS
Borrowings consist of the following:
| | | | | | | | | | | | | | | | | | | | | | | |
| February 28, 20222023 | | February 28,
20212022 |
| Current | | Long-term | | Total | | Total |
| (in millions) | | | | | | | |
| Short-term borrowings | | | | | | | |
| | | | | | | |
| Commercial paper | $ | 3231,165.03 | | | | | | | $ | —323.0 | |
| | | | | | | |
| $ | 3231,165.03 | | | | | | | $ | —323.0 | |
| | | | | | | |
| Long-term debt | | | | | | | |
| | | | | | | |
| Term loan credit facilities | $ | — | | | $ | 300.0799.2 | | | $ | 799.2 | | | $ | 300.0 | | | $ | 454.4 | |
| Senior notes | 599.0— | | | 9,17410,470.6 | | | 10,470.6 | | | 9,773.6 | | | 9,972.4 | |
| Other | 69.35 | | | 13.616.7 | | | 26.2 | | | 19.9 | | | 15.5 | |
| $ | 6059.35 | | | $ | 911,488.2286.5 | | | $ | 11,296.0 | | | $ | 10,093.5 | | | $ | 10,442.3 | |
Bank facilities
In October 2022, (i) the Company, CB International, the Administrative Agent, and certain other lenders agreed to amend the 2022 Credit Agreement, (ii) the Company, the Administrative Agent, and the Lender agreed to amend the April 2022 Term Credit Agreement, and (iii) the Company, the Administrative Agent, and certain other lenders agreed to amend the August 2022 Term Credit Agreement. The October 2022 Credit Agreement Amendments revise certain defined terms and covenants and will become effective upon (i) the amendment by Canopy of its Articles of Incorporation, (ii) the conversion of our Canopy common shares into Exchangeable Shares, and (iii) the resignation of our nominees from the board of directors of Canopy.
Senior credit facility
In March 2020, the Company, CB International, certain of the Company’s subsidiaries as guarantors, the Administrative Agent, and certain other lenders entered into the 2020 Restatement Agreement that amended and restated our then-existing senior credit facility (as amended and restated by the 2020 Restatement Agreement, the 2020 Credit Agreement). The 2020 Credit Agreement provided for an aggregate revolving credit facility of $2.0 billion. The principal changes effected by the 2020 Restatement Agreement were:
•the removal of the subsidiary guarantees and termination of the guarantee agreement;
•the inclusion of the parent guaranty provisions in connection with the termination of the guarantee agreement;
•the removal of certain provisions pertaining to term loans since no term loans are outstanding; and
•the revision of the LIBOR successor rate provisions to permit the use of rates based on the SOFR.
Upon removal of all subsidiary guarantors from our 2020 Credit Agreement, the subsidiary guarantors were automatically released from the indentures relating to our outstanding senior notes. The
In April 2022, the Company, CB International, the Administrative Agent, and certain other lenders entered into the 2022 Restatement Agreement that amended and restated the 2020 Credit Agreement has been superseded by(as amended and restated by the 2022 Restatement Agreement, the 2022 Credit Agreement,). as described below.
The principal changes effected by the 2022 Restatement Agreement were:
•The refinance and increase of the existing revolving credit facility from $2.0 billion to $2.25 billion and extension of its maturity to April 14, 2027;
•The refinement of certain negative covenants; and
•The replacement of LIBOR rates with rates based on term SOFR.
| | | | | |
Constellation Brands, Inc. FY 2023 Form 10-K | #WORTHREACHINGFOR I 93 |
| | | | | | | | |
| PART II | ITEM 8. FINANCIAL STATEMENTS AND SUPPLEMENTARY DATA | Table of Contents |
2020 Term Credit Agreement
In March 2020, the Company, certain of the Company’s subsidiaries as guarantors, the Administrative Agent, and certain other lenders entered into the Term Loan Restatement Agreement that amended and restated our then-existing term credit agreement (as amended and restated by the Term Loan Restatement Agreement, the 2020 Term Credit Agreement). The 2020 Term Credit Agreement provided for aggregate credit facilities of $1.5 billion, consisting of a $500.0 million threethree-year term loan facility and a $1.0 billion fivefive-year term loan facility. During Fiscal 2021, we repaid the outstanding term loan facility borrowings under our 2020 Term Credit Agreement.
June 2021 Term Credit Agreement
In June 2019, the Company and the Administrative Agent and Lender entered into the 2019 Term Credit Agreement. The 2019 Term Credit Agreement provided for the creation of a $491.3 million five-year term loan facility. The Five-Year Term Facility will be repaid in quarterly payments of principal equal to 1.25% of the original aggregate principal amount of the Five-Year Term Facility, with the balance due and payable at maturity.
April 2022 Term Credit Agreement
In March 2020, the Company, certain of the Company’s subsidiaries as guarantors, and the Lender entered into the 2020 Term Loan Restatement Agreement that amended and restated the 2019 Term Credit Agreement (as
| | | | | |
| Constellation Brands, Inc. FY 2022 Form 10-K | #WORTHREACHINGFOR I 91 |
our then-existing term credit agreement (as amended and restated by the 2020 Term Loan Restatement Agreement, the March 2020 Term Credit Agreement). The principal changes effected by the 2020 Term Loan Restatement Agreement were:
•the removal of the subsidiary guarantees and termination of the respective guarantee agreements; and
•the revision of the LIBOR successor rate provisions to permit the use of rates based on SOFR.
In June 2021, the Company and the Administrative Agent and Lender amended the March 2020 Term Credit Agreement. The principal change effected by the amendment was a reduction in LIBOR margin from 0.88% to 0.63% from June 1, 2021 through December 31, 2021. The June
In April 2022, the Company, the Administrative Agent, and the Lender amended the June 2021 Term Credit Agreement has been superseded by(as amended, the 2022 Term Credit Agreement, as described below April 2022 Term Credit Agreement). The principal changes effected by the amendment were the refinement of certain negative covenants and replacement of LIBOR rates with rates based on term SOFR.
August 2022 Term Credit Agreement
In August 2022, the Company, the Administrative Agent, and certain other lenders entered into the August 2022 Term Credit Agreement. The August 2022 Term Credit Agreement provides for a $1.0 billion three-year term loan facility and is not subject to amortization payments, with the balance due and payable three years after the November 10, 2022, funding date. We have the right to prepay the borrowing in whole or in part, without premium or penalty, ahead of its three-year maturity date (as defined in the August 2022 Term Credit Agreement). The proceeds from the August 2022 Term Credit Agreement were used to partially fund the aggregate cash payment to holders of Class B Stock in connection with the Reclassification and to pay related fees as well as fees related to closing the August 2022 Term Credit Agreement. In February 2023, we repaid a portion of our indebtedness under the August 2022 Term Credit Agreement with proceeds from the February 2023 Senior Notes.
General
We and our subsidiaries are subject to covenants that are contained in the 20202022 Credit Agreement, the April 2022 Term Credit Agreement, and the June 2021August 2022 Term Credit Agreement, including those restricting the incurrence of additional subsidiary indebtedness, additional liens, mergers and consolidations, transactions with affiliates, and sale and leaseback transactions, in each case subject to numerous conditions, exceptions, and thresholds. The financial covenants are limited to a minimum interest coverage ratio and a maximum net leverage ratio.
Our senior credit facility permits us to elect, subject to the willingness of existing or new lenders to fund such increase and other customary conditions, to increase the revolving credit commitments. The increased commitments may be an unlimited amount so long as our net leverage ratio, as defined and computed pursuant to our senior credit facility, is no greater than 4.00 to 1.00 4.00 to 1.00 subject to certain limitations for the period defined pursuant to our senior credit facility.
| | | | | |
Constellation Brands, Inc. FY 2023 Form 10-K | #WORTHREACHINGFOR I 94 |
| | | | | | | | |
| PART II | ITEM 8. FINANCIAL STATEMENTS AND SUPPLEMENTARY DATA | Table of Contents |
As of February 28, 20222023, aggregate credit facilities under the 20202022 Credit Agreement, the April 2022 Term Credit Agreement, and the June 2021August 2022 Term Credit Agreement consist of the following:
| | | | | | | | | | | |
| AmountInitial
borrowing
capacity | | Maturity |
| (in millions) | | | |
| 20202022 Credit Agreement | | | |
Revolving credit facility (1) (2) | $ | 2,000250.0 | | | SeptApr 14, 20232027 |
| | | |
| | | |
| | | |
| | | |
| | | |
| June 2021April 2022 Term Credit Agreement | | | |
Five-Year Term Facility (1) (3) | $ | 491.3 | | | Jun 28, 2024 |
| | | |
| August 2022 Term Credit Agreement | | | |
Three-year term facility (1) (3) | $ | 1,000.0 | | | Nov 10, 2025 |
(1)Contractual interest rate varies based on our debt rating (as defined in the respective agreement) and is a function of LIBORSOFR plus a margin and a credit spread adjustment, or the base rate plus a margin, or, in certain circumstances where LIBORSOFR cannot be adequately ascertained or available, an alternative benchmark rate plus a margin.
(2)We and/or CB International are the borrower under the $2,000250.0 million revolving credit facility. Includes a sub-facility for letters of credit of up to $200.0 million.
(3)We are the borrower under the Five-Year Term Facilityterm loan credit agreements.
| | | | | |
| Constellation Brands, Inc. FY 2022 Form 10-K | #WORTHREACHINGFOR I 92 |
As of February 28, 2022
As of February 28, 2023, information with respect to borrowings under the 20202022 Credit Agreement, the April 2022 Term Credit Agreement, and the June 2021August 2022 Term Credit Agreement is as follows:
| | | | | | | | | | | | | | | | | | | | | | | | | | | | | |
| Outstanding
borrowings | | Interest
rate | | LIBORSOFR
margin | | Outstanding
letters of
credit | | Remaining borrowing capacity (1) |
| (in millions) | | | | | | | | | |
| 20202022 Credit Agreement | | | | | | | | | |
| Revolving credit facility | $ | — | | | — | % | | — | % | | $ | 12.20 | | | $ | 1,664068.85 | |
| | | | | | | | | |
| | | | | | | | | |
| | | | | | | | | |
| | | | | | | | | |
| | | | | | | | | |
| June 2021April 2022 Term Credit Agreement | | | | | | | | | |
Five-Year Term Facility (2) | $ | 300.0 | | | 15.05 | % | | 0.88 | % | | | | |
| | | | | | | | | |
| August 2022 Term Credit Agreement | | | | | | | | | |
Three-year term facility (3) | $ | 500.0 | | | 5.8 | % | | 1.13 | % | | | | |
(1)Net of outstanding revolving credit facility borrowings, and outstanding letters of credit under the 20202022 Credit Agreement, and outstanding borrowings under our commercial paper program of $3231,169.05 million (excluding unamortized discount) (see “Commercial paper program” below).
(2)Outstanding term loan facility borrowings are net of unamortized debt issuance costs and reflect a partial prepaymentrepayment of $142.1 million made in June 2021.
(3)Outstanding term loan facility borrowings are net of unamortized debt issuance costs and unamortized discount and reflect a partial repayment of $500.0 million made in February 2023.
Commercial paper program
We have a commercial paper program which provides for the issuance of up to an aggregate principal amount of $2.0 billion of commercial paper25 billion of commercial paper, inclusive of a $250.0 million increase implemented in December 2022. Our commercial paper program is backed by unused commitments under our revolving credit facility under our 2020 Credit Agreement. Accordingly, outstanding borrowings under our commercial paper program reduce the amount available under our revolving credit facility. As of February 28, 2021, we had no outstanding borrowings under our commercial paper program2022 Credit Agreement. Accordingly, outstanding borrowings under our commercial paper program reduce
| | | | | |
Constellation Brands, Inc. FY 2023 Form 10-K | #WORTHREACHINGFOR I 95 |
| | | | | | | | |
| PART II | ITEM 8. FINANCIAL STATEMENTS AND SUPPLEMENTARY DATA | Table of Contents |
the amount available under our revolving credit facility. Information with respect to our outstanding commercial paper borrowings as of February 28, 2022, is as follows:
| | | | | | | |
| | | |
| February 28,
2023 | | February 28,
2022 |
| (in millions) | | | |
Outstanding borrowings (1) | $ | 3231,165.03 | | | $ | 323.0 | |
| Weighted average annual interest rate | 05.53 | % | | 0.5 | % |
| Weighted average remaining term | 425 days | | 4 days |
(1)Outstanding commercial paper borrowings are net of unamortized discount.
Interest rate swap contracts
In June 2019, we entered into interest rate swap agreements, which were designated as cash flow hedges for $375.0 million of our floating LIBOR rate debt. As a result of these hedges, we fixed our interest rates on $375.0 million of our floating LIBOR rate debt at an average rate of 1.9% (exclusive of borrowing margins) from July 1, 2019, through July 1, 2020.
Swap lock and treasury lock contracts
In February 2022, we entered into a swap lock agreementPre-issuance hedge contracts
In February 2022, we entered into a Pre-issuance hedge contract, which was designated as a cash flow hedge. As a resultof February 28, 2022, we havehad hedged the treasury rate volatility on $100.0 million of future debt issuances.
In February In April and March 2020May 2022, we entered into treasury lock agreements, which were designated asadditional cash flow hedgesdesignated Pre-issuance hedge contracts. As a result of these hedgesagreements, we fixed our 10-yearhedged the treasury ratesrate volatility on an additional $500.0 million of future debt issuances at an average rate of 1.2% (exclusive of borrowing margins). In April 2020, prior to the issuance of the 2.875% Senior Notes and 3.75% Senior Notes, we200.0 million of future debt issuances. In May 2022, we terminated and settled all outstanding treasury lockPre-issuance hedge contracts, and recognized an unrealized lossgain, net of income tax effect, of $2115.83 million in accumulated other comprehensive income (loss)AOCI within our consolidated balance sheets. This lossThe gain on Pre-issuance hedge contracts is being amortized over 10 years years, the life of the 4.75% Senior Notes issued in May 2022, to interest expense within our consolidated results of operations. See “Senior notes” below.
| | | | | |
| Constellation Brands, Inc. FY 2022 Form 10-K | #WORTHREACHINGFOR I 93 |
Senior notes
Our outstanding senior notes are as follows:
| | | | | | | | | | | | | | | | | | | | | | | | | | | | | | | | | | | |
| | | Date of | | Outstanding Balance (1) |
| Principal | | Issuance | | Maturity | | Interest
Payments | | February 28,
20222023 | | February 28,
20212022 |
| (in millions) | | | | | | | | | | | |
4.25% Senior Notes (2) (3) (4) | $ | 1,050.0 | | | May 2013 | | May 2023 | | May/Nov | | 1,048.6— | | | 1,047048.5 | |
| | | | | | | | | | 6 | |
4.75% Senior Notes (2) (3) | $ | 400.0 | | | Nov 2014 | | Nov 2024 | | May/Nov | | 398.29 | | | 397398.62 | |
4.75% Senior Notes (2) (3) | $ | 400.0 | | | Dec 2015 | | Dec 2025 | | Jun/Dec | | 397398.52 | | | 396397.95 | |
3.70% Senior Notes (2) (45) | $ | 600.0 | | | Dec 2016 | | Dec 2026 | | Jun/Dec | | 597.17 | | | 596.5 | |
2.70% Senior Notes (2) (5) | $ | 500.0 | | | May 2017 | | May 2022 | | May/Nov | | — | | | 498.8597.1 | |
3.50% Senior Notes (2) (45) | $ | 500.0 | | | May 2017 | | May 2027 | | May/Nov | | 497.27 | | | 496497.52 | |
4.50% Senior Notes (2) (45) | $ | 500.0 | | | May 2017 | | May 2047 | | May/Nov | | 493.46 | | | 493.1 | |
| | | | | | | | | | | |
2.65% Senior Notes (2) (6) | $ | 700.0 | | | Nov 2017 | | Nov 2022 | | May/Nov | | — | | | 697.14 | |
3.20% Senior Notes (2) (45) (6) | $ | 600.0 | | | Feb 2018 | | Feb 2023 | | Feb/Aug | | 599.0— | | | 598599.0 | |
3.60% Senior Notes (2) (45) | $ | 700.0 | | | Feb 2018 | | Feb 2028 | | Feb/Aug | | 695696.74 | | | 695.07 | |
4.10% Senior Notes (2) (45) | $ | 600.0 | | | Feb 2018 | | Feb 2048 | | Feb/Aug | | 592.69 | | | 592.36 | |
4.40% Senior Notes (2) (45) | $ | 500.0 | | | Oct 2018 | | Nov 2025 | | May/Nov | | 497498.30 | | | 496497.63 | |
4.65% Senior Notes (2) (45) | $ | 500.0 | | | Oct 2018 | | Nov 2028 | | May/Nov | | 496.28 | | | 495496.62 | |
5.25% Senior Notes (2) (45) | $ | 500.0 | | | Oct 2018 | | Nov 2048 | | May/Nov | | 493.36 | | | 493.13 | |
3.15% Senior Notes (2) (45) | $ | 800.0 | | | Jul 2019 | | Aug 2029 | | Feb/Aug | | 794795.74 | | | 793794.97 | |
2.875% Senior Notes (2) (45) | $ | 600.0 | | | Apr 2020 | | May 2030 | | May/Nov | | 594595.95 | | | 594.39 | |
3.75% Senior Notes (2) (45) | $ | 600.0 | | | Apr 2020 | | May 2050 | | May/Nov | | 589590.93 | | | 589.69 | |
2.25% Senior Notes (2) (45) | $ | 1,000.0 | | | Jul 2021 | | Aug 2031 | | Feb/Aug | | 988.0989.2 | | | 988.0 | |
3.60% Senior Notes (2) (7) | $ | 550.0 | | | May 2022 | | May 2024 | | May/Nov | | 548.5 | | | — | |
4.35% Senior Notes (2) (5) | $ | 600.0 | | | May 2022 | | May 2027 | | May/Nov | | 597.1 | | | — | |
4.75% Senior Notes (2) (5) | $ | 700.0 | | | May 2022 | | May 2032 | | May/Nov | | 693.7 | | | — | |
5.00% Senior Notes (2) (8) | $ | 500.0 | | | Feb 2023 | | Feb 2026 | | Feb/Aug | | 497.1 | | | — | |
| | | | | | | | | $ | 910,773470.6 | | | $ | 9,972773.46 | |
(1)Amounts are net of unamortized debt issuance costs and unamortized discounts, where applicable.
| | | | | |
Constellation Brands, Inc. FY 2023 Form 10-K | #WORTHREACHINGFOR I 96 |
| | | | | | | | |
| PART II | ITEM 8. FINANCIAL STATEMENTS AND SUPPLEMENTARY DATA | Table of Contents |
(2)Senior unsecured obligations which rank equally in right of payment to all of our existing and future senior unsecured indebtedness.
(3)Redeemable, in whole or in part, at our option at any time at a redemption price equal to 100% of the outstanding principal amount, plus accrued and unpaid interest and a make-whole payment based on the present value of the future payments at the adjusted Treasury Rateapplicable treasury rate plus 50 basis points.
(4)In May 2022, we completed a series of cash tender offers. Cash consideration paid for these purchases was $690.6 million and the carrying amount of the notes was $679.4 million, resulting in a loss on extinguishment of debt of $11.2 million (including an immaterial amount of fees and other costs associated with the tender offers), which is included within our consolidated results. In June 2022, we redeemed the remaining outstanding principal balances prior to maturity, plus accrued and unpaid interest and a make-whole payment of $5.7 million. The make-whole payment is included in loss on extinguishment of debt within our consolidated results of operations.
(5)Redeemable, in whole or in part, at our option at any time prior to the stated redemption date as defined in the indenture, at a redemption price equal to 100% of the outstanding principal amount, plus accrued and unpaid interest and a make-whole payment based on the present value of the future payments at the adjusted Treasury Rateapplicable treasury rate plus the stated basis points as defined in the indenture. On or after the stated redemption date, redeemable, in whole or in part, at our option at any time at a redemption price equal to 100% of the outstanding principal amount, plus accrued and unpaid interest.
| | | | | |
| Constellation Brands, Inc. FY 2022 Form 10-K | #WORTHREACHINGFOR I 94 |
| | | | | | | | | | | |
| Redemption |
| Stated
Redemption
Date | | Stated
Basis
Points |
| 3.70% Senior Notes due December 2026 | Sept 2026 | | 25 |
| 3.50% Senior Notes due May 2027 | Feb 2027 | | 20 |
| 4.50% Senior Notes due May 2047 | Nov 2046 | | 25 |
| 3.20% Senior Notes due February 2023 | Jan 2023 | | 13 |
| 3.60% Senior Notes due February 2028 | Nov 2027 | | 15 |
| 4.10% Senior Notes due February 2048 | Aug 2047 | | 20 |
| 4.40% Senior Notes due November 2025 | Sept 2025 | | 20 |
| 4.65% Senior Notes due November 2028 | Aug 2028 | | 25 |
| 5.25% Senior Notes due November 2048 | May 2048 | | 30 |
| 3.15% Senior Notes due August 2029 | May 2029 | | 20 |
| 2.875% Senior Notes due May 2030 | Feb 2030 | | 35 |
| 3.75% Senior Notes due May 2050 | Nov 2049 | | 40 |
| 2.25% Senior Notes due August 2031 | May 2031 | | 15 |
(5)Redeemed prior to maturity in August 2021| 4.35% Senior Notes due May 2027 | Apr 2027 | | 25 |
| 4.75% Senior Notes due May 2032 | Feb 2032 | | 30 |
(6)In May 2022, we completed a series of cash tender offers. Cash consideration paid for these purchases was $405.3 million and the carrying amount of the notes was $401.2 million, resulting in a loss on extinguishment of debt of $4.1 million (including an immaterial amount of fees and other costs associated with the tender offers), which is included within our consolidated results. In June 2022, we redeemed the remaining outstanding principal balance prior to maturity, plus accrued and unpaid interest and a make-whole payment of $1.8 million. The make-whole payment is included in loss on extinguishment of debt within our consolidated results of operations.
(7)Redeemable, in whole or in part, at our option at any time at a redemption price equal to 100% of the outstanding principal amount, plus accrued and unpaid interest and a make-whole payment of $7.7 million. The make-whole payment is included in loss on extinguishmentbased on the present value of debt within our consolidated results of operationsthe future payments at the applicable treasury rate plus 15 basis points.
(68)Redeemed prior to Redeemable, in whole or in part, at our option at any time prior to February 2, 2024, (two years before the maturity date as defined in August 2021the indenture), at a redemption price equal to 100% of the outstanding principal amount, plus accrued and unpaid interest and a make-whole payment of $18.9 million. The make-whole payment is included in loss on extinguishment of debt within our consolidated results of operations.
100% of the outstanding principal | | | | | |
Constellation Brands, Inc. FY 2023 Form 10-K | #WORTHREACHINGFOR I 97 |
| | | | | | | | |
| PART II | ITEM 8. FINANCIAL STATEMENTS AND SUPPLEMENTARY DATA | Table of Contents |
amount, plus accrued and unpaid interest and a make-whole payment based on the present value of the future payments at the applicable treasury rate plus 20 basis points. On or after February 2, 2024, redeemable, in whole or in part, at our option at any time at a redemption price equal to 100% of the outstanding principal amount, plus accrued and unpaid interest.
Indentures
Our indentures relating to our outstanding senior notes contain certain covenants, including, but not limited to: (i) a limitation on liens on certain assets, (ii) a limitation on certain sale and leaseback transactions, and (iii) restrictions on mergers, consolidations, and the transfer of all or substantially all of our assets to another person.
Subsidiary credit facilities
General
We have additional credit arrangements totaling $6473.5 million and $6164.25 million as of February 28, 20222023, and February 28, 20212022, respectively. As of February 28, 20222023, and February 28, 20212022, amounts outstanding under these arrangements were $1926.92 million and $1519.59 million, respectively, the majority of which is classified as long-term as of the respective date. These arrangements primarily support the financing needs of our domestic and foreign subsidiary operations. Interest rates and other terms of these borrowings vary from country to country, depending on local market conditions.
Debt payments
As of February 28, 20222023, the required principal repayments under long-term debt obligations (excluding unamortized debt issuance costs and unamortized discounts of $5759.70 million and $1821.72 million, respectively) for each of the five succeeding fiscal years and thereafter are as follows:
| | | | | |
| (in millions) | |
| Fiscal 20232024 | $ | 606.8 | |
| Fiscal 2024 | 1,056.210.4 | |
| Fiscal 2025 | 7031,256.93 | |
| Fiscal 2026 | 9021,904.05 | |
| Fiscal 2027 | 600.9603.5 | |
| Fiscal 2028 | 1,801.4 | |
| Thereafter | 65,300800.1 | |
| $ | 1011,169376.9 | |
| | | | | |
| Constellation Brands, Inc. FY 2022 Form 10-K | #WORTHREACHINGFOR I 95 |
Subsequent events
2022 Credit Agreement
In April 2022, the Company, CB International, the Administrative Agent, and certain other lenders entered into the 2022 Restatement Agreement that amended and restated the 2020 Credit Agreement (as amended and restated by the 2022 Restatement Agreement, the 2022 Credit Agreement). The principal changes effected by the 2022 Restatement Agreement were:
•The refinance and increase of the existing revolving credit facility from $2.0 billion to $2.25 billion and extension of its maturity to April 14, 2027;
•The refinement of certain negative covenants; and
•The replacement of LIBOR rates with rates based on term SOFR.
2022 Term Credit Agreement
In April 2022, the Company, the Administrative Agent, and the Lender amended the June 2021 Term Credit Agreement (as amended the 2022 Term Credit Agreement). The principal changes effected by the amendment were the refinement of certain negative covenants and replacement of LIBOR rates with rates based on term SOFR.
Swap lock contracts
During the first quarter of Fiscal 2023, we entered into additional swap lock agreements, which were designated as cash flow hedges, for $150.0 million of future debt issuances. As a result of the additional swap locks, we have hedged the treasury rate volatility on $250.0 million of future debt issuances.
2 |
13. INCOME TAXES
Income (loss) before income taxes was generated as follows:
| | | | | | | | | | | | | | | | | |
| For the Years Ended |
| February 28,
2023 | | February 28,
2022 | | February 28,
2021 | | February 29,
2020 |
| (in millions) | | | | | |
| Domestic | $ | (1,441.6) | | | $ | (1,334.4) | | | $ | 495.2 | | | $ | (2,230.1) | |
| Foreign | 1,825.2 | | | 1,644.8 | | | 2,047.7 | |
| $ | 1,284383.96 | |
| $ | 310.4 | | | $ | 2,542.9 | | | $ | (945.2) | |
| | | | | |
Constellation Brands, Inc. FY 2023 Form 10-K | #WORTHREACHINGFOR I 98 |
| | | | | | | | |
| PART II | ITEM 8. FINANCIAL STATEMENTS AND SUPPLEMENTARY DATA | Table of Contents |
The income tax provision (benefit) consisted of the following:
| | | | | | | | | | | | | | | | | |
| For the Years Ended |
| February 28,
2023 | | February 28,
2022 | | February 28,
2021 | | February 29,
2020 |
| (in millions) | | | | | |
| Current | | | | | |
| Federal | $ | (54.3) | | | $ | 229.3 | | | $ | 74.0 | | |
| $State | 6615.5 | |
| State | 31.4 | | | 19.1 | |
| Foreign | 12253.1 | |
| Foreign | (36.1) | | | 81.6 | | | 108.5 | |
| Total current | 214.3 | | | 224.6 | | | 174.7 | | | 187.1 | |
| | | | | |
| Deferred | | | | | |
| Federal | 82.6 | | | (10.1) | | | 152.8 | | | (459.9) | |
| State | 29.9 | | | (5.5) | | | 28.3 | | | (118.3) | |
| Foreign | 95.3 | | | 100.4 | | | 155.3 | | | (575.5) | |
| Total deferred | 207.8 | | | 84.8 | | | 336.4 | | | (1,153.7) | |
| Income tax provision (benefit) | $ | 422.1 | | | $ | 309.4 | | | $ | 511.1 | | | $ | (966.6) | |
| | | | | |
| Constellation Brands, Inc. FY 2022 Form 10-K | #WORTHREACHINGFOR I 96 |
A reconciliation of the total tax provision (benefit) to the amount computed by applying the statutory U.S. federal income tax rate to income before provision for (benefit from) income taxes is as follows:
| | | | | | | | | | | | | | | | | | | | | | | | | | | | | | | | | | | |
| For the Years Ended |
| February 28, 2023 | | February 28, 2022 | | February 28, 2021 | | February 29, 2020 |
| Amount | | % of
Pretax
Income (Loss) | | Amount | | % of
Pretax
Income (Loss) | | Amount | | % of
Pretax
Income (Loss) |
| (in millions, except % of pretax income (loss) data) | | | | | | | | | | |
| Income tax provision (benefit) at statutory rate | $ | 80.6 | | | 21.0 | % | | $ | 65.2 | | | 21.0 | % | | $ | 534.0 | | | 21.0 | % | |
| $Net income tax benefit from the realization of tax losses related to a prior period divestiture | (198166.54) | | | (21.043.4 | %) | | — | | | — | % | | — | | | — | % |
State and local income taxes, net of federal income tax benefit (1) | 3.4 | | | 0.9 | % | | (77.8) | | | (25.0 | %) | | 39.0 | | | 1.5 | % | | (82.3) | | | 8.7 | % |
| | | | | | | | | | | |
Net income tax provision (benefit) from legislative changes (2) | 10.9 | | | 2.8 | % | | 11.9 | | | 3.8 | % | | 10.9 | | | 0.4 | % | | (547.4) | | | 57.9 | % |
Earnings taxed at other than U.S. statutory rate (3) | (49.2) | | | (12.8 | %) | | (33.2) | | | (10.7 | %) | | (84.4) | | | (3.2 | %) | | (46.5) | | | 5.0 | % |
| | | | | | | | | | | |
Excess tax benefits from stock-based compensation awards (4) | (5.2) | | | (1.4 | %) | | (48.0) | | | (15.5 | %) | | (29.4) | | | (1.2 | %) | | (56.2) | | | 5.9 | % |
Net income tax provision (benefit) recognized for adjustment to valuation allowance (5) | 557.6 | | | 145.4 | % | | 385.5 | | | 124.2 | % | | 27.1 | | | 1.1 | % | | (32.8) | | | 3.5 | % |
| Miscellaneous items, net | (9.6) | | | (2.5 | %) | | 5.8 | | | 1.9 | % | | 13.9 | | | 0.5 | % | | (2.9) | | | 0.3 | % |
| Income tax provision (benefit) at effective rate |
| Income tax provision (benefit) at effective rate | $ | 422.1 | | | 110.0 | % | | $ | 309.4 | | | 99.7 | % | | $ | 511.1 | | | 20.1 | % | | $ | (966.6) | | | 102.3 | % |
(1)Includes differences resulting from adjustments to the current and deferred state effective tax rates.
(2)The yearyears ended February 28, 2023, and February 28, 2022, representsrepresent a net income tax provision resulting from the remeasurement of our deferred tax assets in connection with a legislative update in Switzerland. The year ended February 28, 2021, represents a net income tax provision resulting from initiatives under the CARES Act. The year ended February 29, 2020, represents the recognition of a net income tax benefit resulting from the remeasurement of our deferred tax assets in connection with the September 2019 enactment of tax reform in Switzerland.
(3)Consists of the following (i) difference between the U.S. statutory rate and local jurisdiction tax rates, (ii) the provision for incremental U.S. taxes on earnings of certain foreign subsidiaries offset by foreign tax credits, (iii) the non-U.S. portion of tax provision (benefit) recorded on the unrealized net gain (loss) from the changes in
| | | | | |
Constellation Brands, Inc. FY 2023 Form 10-K | #WORTHREACHINGFOR I 99 |
| | | | | | | | |
| PART II | ITEM 8. FINANCIAL STATEMENTS AND SUPPLEMENTARY DATA | Table of Contents |
fair value of our investment in Canopy, and (iv) the non-U.S. portion of tax benefits recorded on the Canopy equity in earnings (losses) and related activities.
(4)Represents the recognition of the income tax effect of stock-based compensation awards in the income statement when the awards vest or are settled.
(5)Consists primarily of valuation allowances on the unrealized net gain (loss) from changes in fair value ofrelated to our investment in Canopy and Canopy equity in earnings (losses).
Deferred tax assets and liabilities reflect the future income tax effects of temporary differences between the financial statement carrying amounts of existing assets and liabilities and their respective tax bases and are measured using enacted tax rates that apply to taxable income.
| | | | | |
| Constellation Brands, Inc. FY 2022 Form 10-K | #WORTHREACHINGFOR I 97 |
Significant components of deferred tax assets (liabilities) consist of the following:
| | | | | | | | | | | |
| February 28,
20222023 | | February 28,
20212022 |
| (in millions) | | | |
| Deferred tax assets | | | |
| Intangible assets | $ | 2,188021.85 | | | $ | 12,852188.08 | |
| Loss carryforwards | 349360.84 | | | 233349.18 | |
| Stock-based compensation | 2219.97 | | | 3022.19 | |
| Lease liabilities | 6979.03 | | | 8369.10 | |
| Inventory | 5126.80 | | | 2651.68 | |
| | | |
| | | |
| | | |
| | | |
| Investments in unconsolidated investees | 541901.08 | | | 36541.70 | |
| Other accruals | 67175.80 | | | 3367.78 | |
| Gross deferred tax assets | 3,291583.17 | | | 23,295291.31 | |
| Valuation allowances | (5521,091.14) | | | (78552.61) | |
| Deferred tax assets, net | 2,739492.03 | | | 2,216739.70 | |
| | | |
| Deferred tax liabilities | | | |
| Intangible assets | (522555.13) | | | (—522.1 ) | |
| Property, plant, and equipment | (186153.05) | | | (200186.30) | |
| Investments in unconsolidated investees | (58.9—) | | | (—58.9 ) | |
| Provision for unremitted earnings | (2627.02) | | | (2326.0) | |
| | | |
| | | |
| | | |
| Right-of-use assets | (5967.82) | | | (7059.68) | |
| Other accruals | (5065.53) | | | (—50.5 ) | |
| Total deferred tax liabilities | (903868.35) | | | (293903.93) | |
| Deferred tax assets (liabilities), net | $ | 1,835623.78 | | | $ | 1,922835.87 | |
In assessing the realizability of deferred tax assets, we consider whether it is more likely than not that some or all of the deferred tax assets will not be realized. In making this assessment, we consider the projected reversal of deferred tax liabilities and projected future taxable income as well as tax planning strategies. Based upon this assessment, we believe it is more likely than not that we will realize the benefits of these deductible differences, net of any valuation allowances.
As of February 28, 20222023, operating loss carryforwards, which are primarily state and foreign, totaling $3.27 billion are being carried forward in a number of jurisdictions where we are permitted to use tax operating losses from prior periods to reduce future taxable income. Of these operating loss carryforwards, $1.89 billion will expire by fiscal 20292030, $9001.01 millionbillion will expire between fiscal 20302031 and fiscal 20422043, and $500700.0 million may be carried forward indefinitely in certain jurisdictions.
| | | | | |
Constellation Brands, Inc. FY 2023 Form 10-K | #WORTHREACHINGFOR I 100 |
| | | | | | | | |
| PART II | ITEM 8. FINANCIAL STATEMENTS AND SUPPLEMENTARY DATA | Table of Contents |
We have recognized valuation allowances for operating loss carryforwards and other deferred tax assets when we believe it is more likely than not that these items will not be realized. The increase in our valuation allowances as of February 28, 20222023, primarily related to the unrealized net gain (loss) from changes in fair value of our investment in Canopy and Canopy equity in earnings (losses).
| | | | | |
| Constellation Brands, Inc. FY 2022 Form 10-K | #WORTHREACHINGFOR I 98 |
.The liability for income taxes associated with uncertain tax positions, excluding interest and penalties, and a reconciliation of the beginning and ending unrecognized tax benefit liabilities is as follows:
| | | | | | | | | | | | | | | | | |
| For the Years Ended |
| February 28,
2023 | | February 28,
2022 | | February 28,
2021 | | February 29,
2020 |
| (in millions) | | | | | |
| Balance as of March 1 | $ | 236.1 | | | $ | 249.4 | | | $ | 224.3 | |
| Increases as a result of tax positions taken during a prior period | 16.5 | | | 3.1 | | | 11.4 | |
| Decreases as a result of tax positions taken during a prior period | (0.1) | | | (15.4) | | | (14.8) | |
| Increases as a result of tax positions taken during the current period | 29.5 | | | 15.2 | | | 29.0 | |
| Decreases related to settlements with tax authorities | (2.6) | | | (10.2) | | | (0.1) | |
| Decreases related to lapse of applicable statute of limitations | (0.4) | | | (6.0) | | | (0.4) | |
| Balance as of last day of February |
| (in millions) | | | | | |
| Balance as of March 1 | $ | 279.0 | | | $ | 236.1 | | | $ | 249.4 | |
As of February 28, 2022| Increases as a result of tax positions taken during a prior period | 51.5 | | | 16.5 | | | 3.1 | |
| Decreases as a result of tax positions taken during a prior period | (3.4) | | | (0.1) | | | (15.4) | |
| Increases as a result of tax positions taken during the current period | 36.8 | | | 29.5 | | | 15.2 | |
| Decreases related to settlements with tax authorities | (15.2) | | | (2.6) | | | (10.2) | |
| Decreases related to lapse of applicable statute of limitations | (4.4) | | | (0.4) | | | (6.0) | |
| Balance as of last day of February | $ | 344.3 | | | $ | 279.0 | | | $ | 236.1 | |
As of February 28, 2023, and February 28, 20212022, we had $322402.63 million and $268322.96 million, respectively, of unrecognized tax benefit liabilities, including interest and penalties, recognized on our balance sheets. These liabilities are primarily recorded as non-current as of the balance sheet date.
As of February 28, 20222023, and February 28, 20212022, we had $279344.03 million and $236279.10 million, respectively, of unrecognized tax benefit liabilities that, if recognized, would decrease the effective tax rate in the year of resolution.
We file U.S. federal income tax returns and various state, local, and foreign income tax returns. Major tax jurisdictions where we are subject to examination by tax authorities include Canada, Mexico, Switzerland, and the U.S. Various U.S. federal, state and foreign income tax examinations are currently in progress. It is reasonably possible that the liability associated with our unrecognized tax benefit liabilities will increase or decrease within the next 12 months as a result of these examinations or the expiration of statutes of limitation. As of February 28, 20222023, we estimate that unrecognized tax benefit liabilities could change by a range of $1 million to $57 million. With few exceptions, we are no longer subject to U.S. federal, state, local, or foreign income tax examinations for fiscal years prior to February 2829, 20152016.
We provide for additional tax expense based on probable outcomes of ongoing tax examinations and assessments in various jurisdictions. While it is often difficult to predict the outcome or the timing of resolution of any tax matter, we believe the reserves reflect the probable outcome of known tax contingencies. Unfavorable settlement of any particular issue would require the use of cash.
| | | | | |
Constellation Brands, Inc. FY 2023 Form 10-K | #WORTHREACHINGFOR I 101 |
| | | | | | | | |
| PART II | ITEM 8. FINANCIAL STATEMENTS AND SUPPLEMENTARY DATA | Table of Contents |
14. DEFERRED INCOME TAXES AND OTHER LIABILITIES
The major components of deferred income taxes and other liabilities are as follows:
| | | | | | | | | | | |
| February 28,
20222023 | | February 28,
20212022 |
| (in millions) | | | |
| Deferred income taxes | $ | 515569.85 | | | $ | 569515.78 | |
| Operating lease liability | 457417.34 | | | 471457.13 | |
| Unrecognized tax benefit liabilities | 317401.73 | | | 268317.97 | |
| Deferred revenue | 10492.10 | | | 104.1.5 | |
| Long-term income tax payable | 7656.01 | | | 8676.10 | |
| Other | 150137.13 | | | 96150.2 | |
1 |
| $ | 1,673.6 | | | $ | 1,621.0 | | | $ | 1,493.5 | |
| | | | | |
| Constellation Brands, Inc. FY 2022 Form 10-K | #WORTHREACHINGFOR I 99 |
15. LEASES
General
We primarily lease certain vineyards, office and production facilities, warehouses, production equipment, and vehicles. We have concluded that certain grape purchasing arrangements associated with the purchase of grape production yielded from a specified block of a vineyard and certain third-party logistics arrangements contain a lease.
Balance sheet location
A summary of lease right-of-use assets and liabilities are as follows:
| | | | | | | | | | | | | | |
| Balance Sheet Classification | February 28,
20222023 | | February 28,
20212022 |
| (in millions) | | | | |
| Assets | | | | |
| Operating lease | Other assets | $ | 478442.95 | | | $ | 477478.9 | |
| Finance lease | Property, plant, and equipment | 2126.89 | | | 1721.08 | |
| Total right-of-use assets | | $ | 500469.74 | | | $ | 494500.97 | |
| | | | |
| Liabilities | | | | |
| Current: | | | | |
| Operating lease | Other accrued expenses and liabilities | $ | 8081.4 | | | $ | 6880.84 | |
| Finance lease | Current maturities of long-term debt | 69.35 | | | 46.63 | |
| Non-current: | | | | |
| Operating lease | Deferred income taxes and other liabilities | 457417.34 | | | 471457.13 | |
| Finance lease | Long-term debt, less current maturities | 1316.67 | | | 1013.96 | |
| Total lease liabilities | | $ | 557525.60 | | | $ | 555557.46 | |
| | | | | |
Constellation Brands, Inc. FY 2023 Form 10-K | #WORTHREACHINGFOR I 102 |
| | | | | | | | |
| PART II | ITEM 8. FINANCIAL STATEMENTS AND SUPPLEMENTARY DATA | Table of Contents |
Lease cost
The components of total lease cost are as follows:
| | | | | | | | | | | | | | | | | |
| For the Years Ended |
| February 28,
2023 | | February 28,
2022 | | February 28,
2021 | | February 29,
2020 |
| (in millions) | | | | | |
| Operating lease cost | $ | 96.2 | | | $ | 89.5 | | | $ | 93.4 | | | $ | 98.9 | |
| Finance lease cost: | | | | | |
| Amortization of right-of-use assets | 9.2 | | | 5.8 | | | 11.0 | | | 12.2 | |
| Interest on lease liabilities | 1.1 | | | 0.5 | | | 0.5 | | | 0.7 | |
| Short-term lease cost | 6.6 | | | 8.4 | | | 9.2 | |
| Variable lease cost | 8176.65 | |
Variable lease cost (1) | | 202.5 | | | 216.5 | | | 403.3 | |
| Total lease cost | $ | 289.6 | | | $ | 306.7 | | | $ | 330.6 | | | $ | 523.7 | |
(1)Higher variable lease costs for the year ended February 29, 2020, was primarily driven by the transfer of grape purchasing agreements in connection with our Wine and Spirits Divestitures.
| | | | | |
| Constellation Brands, Inc. FY 2022 Form 10-K | #WORTHREACHINGFOR I 100 |
Lease maturities
As of February 28, 20222023, minimum payments due for lease liabilities for each of the five succeeding fiscal years and thereafter are as follows:
| | | | | | | | | | | | | |
| Operating Leases | | Finance Leases | | |
| (in millions) | | | | | |
| Fiscal 20232024 | $ | 9596.13 | | | $ | 7.3 | | | |
| Fiscal 2024 | 89.1 | | | 6.610.9 | | | |
| Fiscal 2025 | 7383.31 | | | 48.21 | | | |
| Fiscal 2026 | 5058.58 | | | 5.2.1 | | | |
| Fiscal 2027 | 4348.02 | | | 0.93.8 | | | |
| Fiscal 2028 | 40.5 | | | 1.4 | | | |
| Thereafter | 290272.68 | | | 0.1 | | | |
Total lease payments (1) | 641599.67 | | | 2129.25 | | | |
| Less: Interest | (103100.9) | | | (13.3) | | | |
| Total lease liabilities | $ | 537498.78 | | | $ | 1926.92 | | | |
(1)Excludes $282.2 million of lease payments, primarily for a warehouse lease, that has been signed but not yet commenced as of February 28, 2023.
Related party transaction
We have entered into a lease for office space with an affiliate of an executive officer and director that has not yet commenced. As of February 28, 2022, the aggregate minimum payments for this operating lease totaled $38.4 million on an undiscounted basis.
a director.
Supplemental information
| | | | | | | | | | | | | | | | | |
| For the Years Ended |
| February 28,
2023 | | February 28,
2022 | | February 28,
2021 | | February 29,
2020 |
| (in millions) | | | | | |
| Cash paid for amounts included in the measurement of lease liabilities: | | | | | |
| Operating cash flows from operating leases | $ | 99.7 | | | $ | 92.7 | | | $ | 93.9 | | | $ | 100.7 | |
| Operating cash flows from finance leases | $ | 1.1 | | | $ | 0.5 | | | $ | 0.5 | | | $ | 0.7 | |
| Financing cash flows from finance leases | $ | 8.8 | | | $ | 5.9 | | | $ | 10.5 | |
| $ | 13.8 | | | | |
| | | | | |
| | | | | |
|
| | | | | |
Constellation Brands, Inc. FY 2023 Form 10-K | #WORTHREACHINGFOR I 103 |
| | | | | | | | |
| PART II | ITEM 8. FINANCIAL STATEMENTS AND SUPPLEMENTARY DATA | Table of Contents |
| | | | | | | | | | | | | | | | | |
| For the Years Ended |
| February 28,
2023 | | February 28,
2022 | | February 28,
2021 |
| (in millions) | | | | | |
| Right-of-use assets obtained in exchange for new lease liabilities: | | | | | |
| Operating leases | $ | 63.2 | | | $ | 93.8 | | | $ | 66.3 | |
| Finance leases | $ | 3410.31 | |
| Finance leases | $ | 10.5 | | | $ | 11.6 | | | $ | 10.7 | |
| | | | | |
| February 28,
2023 | | February 28,
2022 | | February 28,
2021 | | February 29,
2020 |
Weighted-average remaining lease term: (1) | | | | | |
| Operating leases | 11.8 years | | 12.1 years | | 12.8 years | | 11.7 years |
| Finance leases | 3.3 years | | 23.93 years | | 32.29 years |
| | | | | |
| Weighted-average discount rate: | | | | | |
| Operating leases | 3.3 | % | | 3.0 | % | | 3.2 | % |
| Finance leases | 6.3.5 | % |
| Finance leases | 3.4 | % | | 1.2 | % | | 2.6 | % |
(1)Our leases have varying terms with remaining lease terms of up to approximately 30 years. Certain of our lease arrangements provide us with the option to extend or to terminate the lease early.
| | | | | |
| Constellation Brands, Inc. FY 2022 Form 10-K | #WORTHREACHINGFOR I 101 |
16. COMMITMENTS AND CONTINGENCIES
Purchase commitments and contingencies
We have entered into various long-term contracts in the normal course of business for the purchase of (i) certain inventory components, (ii) transportation, marketing, warehousing, and bottling services, (iii) IT contracts, (iv) certain energy requirements, and (v) property, plant, and equipment and related contractor and manufacturing services, (iii) transportation, marketing, and warehousing and bottling services, (iv) IT contracts, and (v) certain energy requirements. As of February 28, 20222023, the estimated aggregate minimum purchase commitments under these contracts are as follows:
| | | | | | | | | | | |
| Type | Length of Commitment | Amount |
| (in millions) | | | |
Raw materials and supplies (1) | Packaging, grapes, hops, corn, and maltshops | through December 2037 | $ | 32,159230.06 | |
| | | |
| Contract services | Transportation, marketing, warehousing, and bottling services, and IT and energy contracts | through December 2030 | 765.4 | |
Capital expenditures (2) | Property, plant, and equipment and contractor and manufacturing services | through January 2024November 2026 | 489.8651.0 | |
| Contract services | Transportation, marketing, IT, warehousing and bottling, and energy contract services | through December 2030 | 571.5 | |
| In-process and finished goods inventories | Bulk wine and spirits, finished wine case goods, and related contracts | through April 2025June 2028 | 5087.60 | |
| Other | Finished wine case goods | through May 2029 | 19.7 | | |
| | | $ | 43,484540.51 | |
(1)Certain grape purchasing arrangements include the purchase of grape production yielded from specified blocks of a vineyard. The actual tonnage and price of grapes that we purchase will vary each year depending on certain factors, including weather, time of harvest, overall market conditions, and the agricultural practices and location of the vineyard. Amounts included herein for the estimated aggregate minimum grape purchase commitments consist of estimates for the purchase of the grapes and the implicit leases of the land. Certain grape purchasing arrangements classified as leases have not resulted in the recognition of right-of-use assets and lease liabilities on our balance sheet due to their variable nature.
(2)Consists of purchase commitments entered into primarily in connection with the Mexico Beer Projects.
| | | | | |
Constellation Brands, Inc. FY 2023 Form 10-K | #WORTHREACHINGFOR I 104 |
| | | | | | | | |
| PART II | ITEM 8. FINANCIAL STATEMENTS AND SUPPLEMENTARY DATA | Table of Contents |
Additionally, we have entered into various contractual arrangements with affiliates of Owens-Illinois, a related party entity, primarily for the purchase of glass bottles used largely in our imported and craft beer portfoliosportfolio. Amounts purchased under these arrangements for the years ended February 28, 2023, February 28, 2022, and February 28, 2021, and February 29, 2020, werewere $131.1 million, $123.5 million, and $154.7 million, and $166.6 million, respectively.
Indemnification liabilities
In connection with prior divestitures, we have indemnified respective parties against certain liabilities that may arise subsequent to the divestiture. As of February 28, 20222023, and February 28, 20212022, these liabilities consist primarily of indemnifications related to certain income tax matters and lease contracts. As of February 28, 20222023, and February 28, 20212022, the carrying amount of our indemnification liabilities was $16.63 million and $1716.0 million, respectively, and is included in deferred income taxes and other liabilities. We do not expect to be required to make material payments under the indemnifications and we believe that the likelihood is remote that the indemnifications could have a material adverse effect on our business, liquidity, financial condition, and/or results of operations.
6 million, respectively, and is included in deferred income taxes and other liabilities. We do not expect to be required to make material payments under the indemnifications and we believe that the likelihood is remote that the indemnifications could have a material adverse effect on our business, liquidity, financial condition, and/or results of operations.
Supply chain finance program
We have an agreement with a financial institution for payment services and began to facilitate a voluntary supply chain finance program through this participating financial institution during Fiscal 2023. The program is available to certain of our suppliers allowing them the option to manage their cash flow. We are not a party to the agreements between the participating financial institution and the suppliers in connection with the program. Our rights and obligations to our suppliers, including amounts due and scheduled payment terms, are not impacted. We account for payments made under the supply chain finance program the same as our other accounts payable, as a reduction to our cash flow from operating activities.
The changes in outstanding obligations under our supply chain finance program are as follows:
| | | | | | | | |
| (in millions) | | |
Balance, February 28, 2022 | | $ | — | |
| Additions | | 12.6 | |
Settlements (1) | | (8.7) | |
Balance, February 28, 2023 (2) | | $ | 3.9 | |
(1)Reflects amounts settled through the supply chain finance program and paid to the financial institution.
(2)Reflects amount payable to the participating financial institution for suppliers who voluntarily participated in the supply chain finance program and was included in accounts payable within our consolidated balance sheet.
Legal matters
In the ordinary course of our business, we are subject to lawsuits, arbitration, claims, and other legal proceedings in connection with our business. Some of the legal actions include claims for substantial or unspecified compensatory and/or punitive damages and/or injunctive relief. A substantial adverse judgment or other unfavorable resolution of these matters could have a material adverse effect on our financial condition, results of operations, or cash flows. Management believes that we have adequate legal defenses with respect to the legal proceedings to which it is a defendant or respondent and that the outcome of these pending proceedings is not likely to have a material adverse effect on our financial condition, results of operations, and/or cash flows. However, we are unable to predict the outcome of these matters.
| | | | | |
| Constellation Brands, Inc. FY 2022 Form 10-K | #WORTHREACHINGFOR I 102 |
Regulatory matters
We are in discussions with various governmental agencies concerning matters raised during regulatory examinations or otherwise subject to such agencies’ inquiry. These matters could result in censures, fines, or other sanctions. Management believes the outcome of any pending regulatory matters will not have a material adverse effect on our financial condition, results of operations, and/or cash flows. However, we are unable to predict the outcome of these matters.
| | | | | |
Constellation Brands, Inc. FY 2023 Form 10-K | #WORTHREACHINGFOR I 105 |
| | | | | | | | |
| PART II | ITEM 8. FINANCIAL STATEMENTS AND SUPPLEMENTARY DATA | Table of Contents |
17. STOCKHOLDERS’ EQUITY
Common stock
WeEffective November 10, 2022, we have twoone classesclass of common stock with a material number of shares outstanding: Class A Stock and Class B Stock. Class B Stock shares are convertible into shares of Class A Stock on a one-to-one basis at any time at the option of the holder. Holders of Class B Stock are entitled to 10 votes per share. Holders of Class A Stock are entitled to one vote per share and a cash dividend premium. If we pay a cash dividend on Class B Stock, each share of Class A Stock will receive an amount at least 10% greater than the amount of the cash dividend per share paid on Class B Stock. In addition, the Board of Directors may declare and pay a dividend on Class A Stock without paying any dividend on Class B Stock. However, our senior credit facility limits the cash dividends that we can pay on our common stock to a fixed amount per quarter but the fixed amount may be exceeded subject to various conditions set forth in the senior credit facility.
In addition, we have a class of common stock with an immaterial number of shares outstanding: Class 1 Stock. Shares of Class 1 Stock generally have no. In addition, we have a class of common stock with an immaterial number of shares outstanding: Class 1 Stock. Shares of Class 1 Stock generally have no voting rights. Class 1 Stock shares are convertible into shares of Class A Stock on a one-to-one basis at any time at the option of the holder, provided that the holder immediately sells the Class A Stock acquired upon conversion. Because shares of Class 1 Stock are convertible into shares of Class A Stock, for each share of Class 1 Stock issued, we must reserve one share of Class A Stock for issuance upon the conversion of the share of Class 1 Stock. Holders of Class 1 Stock do not have any preference as to dividends, but may participate in any dividend if and when declared by the Board of Directors. If we pay a cash dividend on Class 1 Stock, each share of Class A Stock will receive an amount at least 10% greater than the amount of cash dividend per share paid on Class 1 Stock. In addition, the Board of Directors may declare and pay a dividend on Class A Stock without paying a dividend on Class 1 Stock. The
Prior to cash dividends declared andthe Reclassification, we had paid on Class B Stock and Class 1an additional class of common stock with a material number of shares outstanding: Class B Stock. Class B Stock shares were convertible into shares of Class A Stock on a one-to-one basis at any time at the option of the holder. Holders of Class B Stock must always be the samewere entitled to 10 votes per share. See “Reclassification” below for additional information.
The number of shares of common stock issued and treasury stock, and associated share activity, are as follows:
| | | | | | | | | | | | | | | | | | | | | | | | | | | | | |
| Common Stock | | Treasury Stock |
| Class A | | Class B | | Class 1 | | Class A | | Class B |
| Balance at February 28, 2019 | 185,740,178 | | | 28,322,419 | | | 1,149,624 | | | 18,927,966 | | | 5,005,800 | |
| | | | | | | | | |
| Share repurchases | — | | | — | | | — | | | 265,593 | | | — | |
| Conversion of shares | 350,567 | | | (22,213) | | | (328,354) | | | — | | | — | |
| Exercise of stock options | — | | | — | | | 870,957 | | | (747,527) | | | — | |
| Employee stock purchases | — | | | — | | | — | | | (69,324) | | | — | |
| | | | | | | | | |
Vesting of restricted stock units (1) | — | | | — | | | — | | | (91,311) | | | — | |
Vesting of performance share units (1) | — | | | — | | | — | | | (29,015) | | | — | |
| Cancellation of restricted shares | — | | | — | | | — | | | 444 | | | — | |
| Balance at February 29, 2020 | 186,090,745 | | | 28,300,206 | | | 1,692,227 | | | 18,256,826 | | | 5,005,800 | |
| | | | | | | | | |
| | | | | | | | | |
| Conversion of shares | 1,113,535 | | | (29,918) | | | (1,083,617) | | | — | | | — | |
| Exercise of stock options | — | | | — | | | 4,326 | | | (1,020,853) | | | — | |
| Employee stock purchases | — | | | — | | | — | | | (67,801) | | | — | |
| | | | | | | | | |
Vesting of restricted stock units (1) | — | | | — | | | — | | | (80,287) | | | — | |
Vesting of performance share units (1) | — | | | — | | | — | | | (17,335) | | | — | |
| | | | | | | | | |
| Balance at February 28, 2021 | 187,204,280 | | | 28,270,288 | | | 612,936 | | | 17,070,550 | | | 5,005,800 | |
| | | | | | | | | |
| | | | | |
| Constellation Brands, Inc. FY 2022 Form 10-K | #WORTHREACHINGFOR I 103 |
| | | | | | | | | | | | | | | | | | | | | | | | | | | | | |
| Common Stock | | Treasury Stock |
| Class A | | Class B | | Class 1 | | Class A | | Class B |
| Share repurchases | — | | | — | | | — | | | 6,179,015 | | | — | |
| Conversion of shares | 59,579 | | | (57,948) | | | (1,631) | | | — | | | — | |
| Exercise of stock options | — | | | — | | | 1,637,374 | | | (287,873) | | | — | |
| Employee stock purchases | — | | | — | | | — | | | (57,738) | | | — | |
| | | | | | | | | |
Vesting of restricted stock units (1) | — | | | — | | | — | | | (71,413) | | | — | |
Vesting of performance share units (1) | — | | | — | | | — | | | (7,934) | | | — | |
| | | | | | | | | |
| Balance at February 28, 2022 | 187,263,859 | | | 28,212,340 | | | 2,248,679 | | | 22,824,607 | | | 5,005,800 | |
| | | | | | | | | |
| Share repurchases | — | | | — | | | — | | | 7,086,446 | | | — | |
Retirement of shares (2) | — | | | (5,005,800) | | | — | | | — | | | (5,005,800) | |
Conversion of shares (3) | 25,433,569 | | | (23,206,540) | | | (2,227,029) | | | — | | | — | |
| Exercise of stock options | — | | | — | | | 1,055 | | | (262,970) | | | — | |
| Employee stock purchases | — | | | — | | | — | | | (57,284) | | | — | |
| | | | | | | | | |
Vesting of restricted stock units (1) | — | | | — | | | — | | | (76,047) | | | — | |
Vesting of performance share units (1) | — | | | — | | | — | | | (16,326) | | | — | |
| | | | | | | | | |
| Balance at February 28, 2023 | 212,697,428 | | | — | | | 22,705 | | | 29,498,426 | | | — | |
| | | | | |
Constellation Brands, Inc. FY 2023 Form 10-K | #WORTHREACHINGFOR I 106 |
| | | | | | | | |
| PART II | ITEM 8. FINANCIAL STATEMENTS AND SUPPLEMENTARY DATA | Table of Contents |
(1)Net of the following shares withheld to satisfy tax withholding requirements:
| | | | | | | | | | | | | | | | | |
| For the Years Ended |
| February 28,
2023 | | February 28,
2022 | | February 28,
2021 | | February 29,
2020 |
| Restricted Stock Units | 37,494 | | 36,213 | | 37,933 | | 49,900 |
| Performance Share Units | 4,919 | | 4,565 | | 9,433 | | 17,439 |
(2)Shares of our Class B Treasury Stock were retired to authorized and unissued shares of our Class B Stock prior to completing the Reclassification.
(3)Includes shares of Class B Stock issued and outstanding immediately prior to the Effective Time that were reclassified, exchanged, and converted into one share of Class A Stock and the right to receive $64.64 in cash, without interest (see “Reclassification” below).
Stock repurchases
In January 2018, our Board of Directors authorized the repurchase of up to $3.0 billion of our Class A Stock and Classpublicly traded common stock, which B Stock. Inwas fully utilized as of May 31, 2022. Shares repurchased under the 2018 Authorization have become treasury shares.
Additionally, in January 2021, our Board of Directors authorized an additionalthe repurchase of up to $2.0 billion of our Class A Stock and Class B Stockpublicly traded common stock. The Board of Directors did not specify a date upon which these authorizationsthis authorization would expire. Shares may be repurchased through open market or privately negotiated transactions. Shares repurchased under these authorizations willthe 2021 Authorization become treasury shares.
A summary of share repurchase activity is as follows:
| | | | | | | | | | | | | | | | | | | | | | | | | | | | | | | | | | | | | | | |
| | | | | Class A Common Shares Repurchased |
| | | For the Years Ended |
| | February 28, 2023 | | February 28, 2022 | | February 28, 2021 | | February 29, 2020 |
| | | | | Dollar
Value | | Number of
Shares | | Dollar
Value | | Number of
Shares | | Dollar
Value | | Number of
Shares |
| (in millions, except share data) |
| 2018 Authorization | | | | | $ | 563.6 | | | 2,254,536 | | | $ | 1,390.5 | | | 6,179,015 | | | $ | — | | | — | | | $ | 50.0 | | | 265,593 | |
|
2021 Authorization (1) | | | | | —1,136.6 | | | —4,831,910 | | | — | | | — | | | — | | | — | |
| | | | | $ | 1,700.2 | | | 7,086,446 | | | $ | 1,390.5 | | | 6,179,015 | | | $ | — | | | — | | | $ | 50.0 | | | 265,593 | |
(1)
Subsequent events
Stock repurchases
On April 7As of February 28, 2022, we entered into an ASR to repurchase2023, $500.0863.4 million of our Class A Stock. We utilized short-term borrowings and cash on hand to pay the dollar value for shares repurchased in this ASR under the 2018 Authorization. Pursuant to the terms of this ASR, an initial installment of 1.7 million shares of Class A Stock were delivered.
remains available for future share repurchases, excluding the impact of Federal excise tax owed pursuant to the IRA.
As of April 21, 2022Reclassification
In November 2022, we completed the Reclassification at the Effective Time as contemplated by the Reclassification Agreement. Pursuant to the Reclassification, each share of Class B Stock issued and outstanding immediately prior to the Effective Time was reclassified, exchanged, total shares repurchased under our board authorizations are as follows:
| | | | | | | | | | | | | | | | | |
| | | Class A Common Shares |
| Repurchase
Authorization | | Dollar Value
of Shares
Repurchased | | Number of
Shares
Repurchased |
| (in millions, except share data) | | | | | |
| | | | | |
| and converted into one share of Class A Stock and the right to receive $64.64 in cash, without interest. The aggregate cash payment to holders of Class B Stock at the Effective Time was $1.5 billion. We utilized our $1.0 billion delayed draw three-year term loan facility under the August 2022 Term Credit Agreement and borrowings under our commercial paper program to fund the aggregate cash payment to holders of Class B Stock. The issuance of Class A Stock in connection with the Reclassification was registered under the Securities Act pursuant to the Registration Statement on Form S-4. |
Following the completion of the Reclassification, a number of corporate governance changes were implemented, consisting of the following:
•Robert and Richard Sands, who previously served as our Executive Chairman of the Board and Executive Vice Chairman of the Board, respectively, retired from their executive positions;
2018 Authorization
$ | 3,000.0 | | | $ | 2,936.4 | | | 12,802,171 | | 2021 Authorization | $ | 2,000.0 | | | $ | — | | | — |
•Robert Sands became our Non-Executive Chairman of the Board and Richard Sands continues serving as a non-executive Board member; | | | | | |
Constellation Brands, Inc. FY 20222023 Form 10-K | #WORTHREACHINGFOR I 104107 |
| | | | | | | | |
| PART II | ITEM 8. FINANCIAL STATEMENTS AND SUPPLEMENTARY DATA | Table of Contents |
•the Sands Family Stockholders initially have the right to nominate two members to our Board of Directors for the next five years so long as they own 10% or more of the issued and outstanding shares of Class A Stock and to nominate one member to our Board of Directors for the next five years and beyond so long as they own 5% or more of the issued and outstanding shares of Class A Stock;
•holders of Class A Stock are entitled to elect all directors to be elected at future Annual Meetings of Stockholders; and
•certain standstill and lock-up provisions for the Sands Family Stockholders; limitations on the Sands Family Stockholders’, directors’, and officers’ ability to pledge our common stock; a near-term rotation of the lead independent director position; and the transition to a majority vote standard for uncontested director elections.
Common stock dividends
In April 20222023, our Board of Directors declared a quarterly cash dividend of $0.80 per share of Class A Stock, $0.72 per share of Class B Stock, and $0.72 per share of Class 1 Stock payable in the first quarter of Fiscal 2023.
Class B Stock declassification proposal
In April 2022, we received the Proposal which proposes that each share of Class B Stock would be converted into 1.35 shares of Class A Stock. Our Board of Directors has established a Special Committee to evaluate the Proposal. Any definitive agreement with respect to the potential transaction must be approved by the Special Committee as well as our Board of Directors. In addition, pursuant to the terms of the Proposal, any potential transaction would require the approval of holders of a majority of the shares of our Class A Stock that do not also hold shares of Class B Stock89 per share of Class A Stock and $0.80 per share of Class 1 Stock payable in the first quarter of Fiscal 2024.
18. STOCK-BASED EMPLOYEE COMPENSATION
We have two stock-based employee compensation plans (as further discussed below). Total compensation cost recognized for our stock-based awards and income tax benefits related thereto are as follows:
| | | | | | | | | | | | | | | | | |
| For the Years Ended |
| February 28,
2023 | | February 28,
2022 | | February 28,
2021 | | February 29,
2020 |
| (in millions) | | | | | |
| Total compensation cost recognized in our results of operations | $ | 68.5 | | | $ | 44.9 | | | $ | 63.0 | | | $ | 60.4 | |
| Income tax benefit related thereto recognized in our results of operations | $ | 8.0 | | | $ | 6.6 | | | $ | 9.2 | | | $ | 9.5 | |
Long-Term Stock Incentive Plan
Under our Long-Term Stock Incentive Plan, nonqualified stock options, restricted stock, restricted stock units, performance share units, and other stock-based awards may be granted to our employees, officers, and directors. The aggregate number of shares of our Class A Stock and Class 1 Stock available for awards under our Long-Term Stock Incentive Plan is 108,000,000 shares.
The exercise price, vesting period, and term of nonqualified stock options granted are established by the committee administering the plan (the “Committee”). The exercise price of any nonqualified stock option may not be less than the fair market value of our Class A Stock on the date of grant. Nonqualified stock options generally vest and become exercisable over a four-year period from the date of grant and expire as established by the Committee, but not later than 10 years after the grant date.
Grants of restricted stock, restricted stock units, performance share units, and other stock-based awards may contain such vesting periods, terms, conditions, and other requirements as the Committee may establish. Restricted stock and restricted stock unit awards are based on service and generally vest over one to four years from the date of grant. Performance share unit awards are based on service and the satisfaction of certain performance conditions, and vest over a required employee service period, generally from one to three years from the date of grant, which closely matches the performance period. The performance conditions include the achievement of specified financial or operational performance metrics, or market conditions which require the achievement of specified levels of stockholder return relative to other companies as defined in the applicable performance share unit agreement. The actual number of shares to be awarded upon vesting of a performance share unit award will range between 0% and 200% of the target award, based upon the measure of performance as certified by the Committee.
| | | | | |
Constellation Brands, Inc. FY 20222023 Form 10-K | #WORTHREACHINGFOR I 105108 |
| | | | | | | | |
| PART II | ITEM 8. FINANCIAL STATEMENTS AND SUPPLEMENTARY DATA | Table of Contents |
A summary of stock option activity under our Long-Term Stock Incentive Plan is as follows:
| | | | | | | | | | | | | | | | | | | | | | | | | | | | | | | | | | | |
| For the Years Ended |
| February 28, 2023 | | February 28, 2022 | | February 28, 2021 | | February 29, 2020 |
| Number
of
Options | | Weighted
Average
Exercise
Price | | Number
of
Options | | Weighted
Average
Exercise
Price | | Number
of
Options | | Weighted
Average
Exercise
Price |
| Outstanding as of March 1 | 4,399,807 | | | $ | 131.89 | | | 4,525,418 | | | $ | 108.87 | | | 5,691,219 | | | $ | 81.87 | |
| Granted | 513,829 | | | $ | 237.85 | | | 973,286 | | | $ | 154.62 | | | 639,957 | | | $ | 206.76 | |
| Exercised | (1,925,247) | | | $ | 86.92 | | | (1,025,179) | | | $ | 47.42 | | | (1,618,484) | | | $ | 41.77 | |
| Forfeited | (75,917) | | | $ | 192.96 | | | (56,897) | | | $ | 185.59 | | | (175,917) | | | $ | 201.44 | |
| Expired | (6,130) | | | $ | 226.46 | | | (16,821) | | | $ | 221.16 | | | (11,357) | | | $ | 224.07 | |
| Outstanding as of last day of February |
| Number
of
Options | | Weighted
Average
Exercise
Price | | Number
of
Options | | Weighted
Average
Exercise
Price | | Number
of
Options | | Weighted
Average
Exercise
Price |
| Outstanding as of March 1 | 2,906,342 | | | $ | 178.62 | | | 4,399,807 | | | $ | 131.89 | | | 4,525,418 | | | $ | 108.87 | |
| ExercisableGranted | 479,758 | | | $ | 254.00 | | | 513,829 | | | $ | 237.85 | | | 973,286 | | | $ | 154.62 | |
| Exercised | (264,025) | | | $ | 123.55 | | | (1,925,247) | | | $ | 86.92 | | | (1,025,179) | | | $ | 47.42 | |
| Forfeited | (51,102) | | | $ | 218.68 | | | (75,917) | | | $ | 192.96 | | | (56,897) | | | $ | 185.59 | |
| Expired | (3,011) | | | $ | 189.32 | | | (6,130) | | | $ | 226.46 | | | (16,821) | | | $ | 221.16 | |
| Outstanding as of last day of February | 3,067,962 | | | $ | 194.47 | | | 2,906,342 | | | $ | 178.62 | | | 4,399,807 | | | $ | 131.89 | |
| Exercisable | 1,747,884 | | | $ | 179.30 | | | 1,410,693 | | | $ | 161.53 | | | 2,754,888 | | | $ | 104.94 | | | 3,330,164 | | | $ | 75.61 | |
As of February 28, 20222023, the aggregate intrinsic value of our options outstanding and exercisable was $123111.19 million and $7981.81 million, respectively. In addition, the weighted average remaining contractual life for our options outstanding and exercisable was 6.73 years and 5.10 years, respectively.
The fair value of stock options vested, and the intrinsic value of and tax benefit realized from the exercise of stock options, are as follows:
| | | | | | | | | | | | | | | | | |
| For the Years Ended |
| February 28,
2023 | | February 28,
2022 | | February 28,
2021 | | February 29,
2020 |
| (in millions) | | | | | |
| Fair value of stock options vested | $ | 2326.9 | | | $ | 2123.19 | | | $ | 21.1 | |
| Intrinsic value of stock options exercised | $ | 32.6 | | | $ | 269.1 | | | $ | 142.1 | | | $ | 255.0 | |
| Tax benefit realized from stock options exercised | $ | 7.4 | | | $ | 62.9 | | | $ | 33.9 | | | $ | 60.4 | |
The weighted average grant-date fair value of stock options granted and the weighted average inputs used to estimate the fair value on the date of grant using the Black-Scholes option-pricing model are as follows:
| | | | | | | | | | | | | | | | | |
| For the Years Ended |
| February 28,
2023 | | February 28,
2022 | | February 28,
2021 | | February 29,
2020 |
| Grant-date fair value | $ | 73.16 | | | $ | 59.27 | | | $ | 31.26 | | | $ | 44.90 | |
Expected life (1) | 6.3 years | | 6.3 years | | 6.03 years |
Expected volatility (2) | 27.6 | % | | 27.8 | % | | 26.6 | % | | 22.1 | % |
Risk-free interest rate (3) | 3.0 | % | | 1.2 | % | | 0.5 | % | | 2.5 | % |
Expected dividend yield (4) | 1.3 | % | | 1.93 | % | | 1.59 | % |
(1)Based on historical experience of employees’ exercise behavior for similar type awards.
(2)Based primarily on historical volatility levels of our Class A Stock.
(3)Based on the implied yield currently available on U.S. Treasury zero coupon issues with a remaining term equal to the expected life.
(4)Based on the calculated yield on our Class A Stock at date of grant using the current fiscal year projected annualized dividend distribution rate.
| | | | | |
Constellation Brands, Inc. FY 20222023 Form 10-K | #WORTHREACHINGFOR I 106109 |
| | | | | | | | |
| PART II | ITEM 8. FINANCIAL STATEMENTS AND SUPPLEMENTARY DATA | Table of Contents |
A summary of restricted stock unit and performance share unit activity under our Long-Term Stock Incentive Plan is as follows:
| | | | | | | | | | | | | | | | | | | | | | | | | | | | | | | | | | | |
| For the Years Ended |
| February 28, 2023 | | February 28, 2022 | | February 28, 2021 | | February 29, 2020 |
| Number | | Weighted
Average
Grant-Date
Fair Value | | Number | | Weighted
Average
Grant-Date
Fair Value | | Number | | Weighted
Average
Grant-Date
Fair Value |
| Restricted Stock Awards | | | | | | | | | | | |
| Outstanding balance as of March 1, Nonvested | — | | | $ | — | | | — | | | | | | | | | $ | — | | | 3,914 | | |
| | | | | | $ | 214.29 | |
| Granted | — | | | $ | — | | | — | | | | | |
| | | | | | | | | $ | — | | | — | | |
| | | | | | $ | — | |
| Vested | — | | | $ | — | | | — | | | | | |
| | | | | | | | | $ | — | | | (3,470) | | | $ | 214.34 | |
| Forfeited | — | | | $ | — | | | — | | | $ | — | | | (444) | | | $ | 213.85 | |
| Outstanding balance as of last day of February, Nonvested | — | | | $ | — | | | — | | | $ | — | | | — | | | $ | — | |
| | | | | | | | | | | |
| Restricted Stock Units | | | | | | | | | | | |
| Outstanding balance as of March 1, Nonvested | 311,358 | | | $ | 183.74 | | | 271,143 | | | $ | 196.58 | | | 314,252 | | | $ | 181.62 | |
| Granted | 113,686 | | | $ | 236.19 | | | 178,550 | | | $ | 165.57 | | | 138,472 | | | $ | 203.32 | |
| Vested | (107,626) | | | $ | 184.81 | | | (118,220) | | | $ | 185.75 | | | (141,211) | | | $ | 168.68 | |
| Forfeited | (26,247) | | | $ | 196.41 | | | (20,115) | | | $ | 183.77 | | | (40,370) | | | $ | 200.87 | |
| Outstanding balance as of last day of February | | |
| | | | | | | | | | | |
| Restricted Stock Units | | | | | | | | | | | |
| Outstanding balance as of March 1, Nonvested | 291,171 | | | $ | 202.68 | | | 311,358 | | | $ | 183.74 | | | 271,143 | | | $ | 196.58 | |
| | | | | | | | | | | |
| | | | | | | | | | | |
| Performance Share Units | | | | | | | | | | | |
| Outstanding balance as of March 1, Nonvested | 226,463 | | | $ | 223.85 | | | 221,749 | | | $ | 231.49 | | | 259,464 | | | $ | 213.27 | |
| Granted | 27,029 | | | $ | 318.71 | | | 39,781 | | | $ | 202.53 | | | 60,031 | | | $ | 253.72 | |
Performance achievement (1) | (148,495) | | | $ | 210.36 | | | (1,517) | | | $ | 250.30 | | | (17,035) | | | $ | 168.00 | |
| Vested | (12,499) | | | $ | 279.67 | | | (26,768) | | | $ | 250.30 | | | (46,454) | | | $ | 156.80 | |
| Forfeited | (5,857) | | | $ | 229.81 | | | (6,782) | | | $ | 238.06 | | | (34,257) | | | $ | 239.48 | |
| Outstanding balance as of last day of February, Nonvested | | |
| Granted | 128,743 | | | $ | 252.53 | | | 113,686 | | | $ | 236.19 | | | 178,550 | | | $ | 165.57 | |
| Vested | (113,541) | | | $ | 202.64 | | | (107,626) | | | $ | 184.81 | | | (118,220) | | | $ | 185.75 | |
| Forfeited | (14,514) | | | $ | 221.33 | | | (26,247) | | | $ | 196.41 | | | (20,115) | | | $ | 183.77 | |
| Outstanding balance as of last day of February, Nonvested | 291,859 | | | $ | 223.75 | | | 291,171 | | | $ | 202.68 | | | 311,358 | | | $ | 183.74 | |
| | | | | | | | | | | |
| | | | | | | | | | | |
| Performance Share Units | | | | | | | | | | | |
| Outstanding balance as of March 1, Nonvested | 86,641 | | | $ | 268.12 | | | 226,463 | | | $ | 223.85 | | | 221,749 | | | $ | 231.49 | |
(1)Reflects the net number of awards achieved above (below) target levels based on actual performance measured at the end of the performance period.
The fair value of shares vested for our restricted stock | Granted | 32,976 | | | $ | 395.55 | | | 27,029 | | | $ | 318.71 | | | 39,781 | | | $ | 202.53 | |
Performance achievement (1) | (7,415) | | | $ | 316.81 | | | (148,495) | | | $ | 210.36 | | | (1,517) | | | $ | 250.30 | |
| Vested | (21,245) | | | $ | 298.25 | | | (12,499) | | | $ | 279.67 | | | (26,768) | | | $ | 250.30 | |
| Forfeited | (5,308) | | | $ | 323.44 | | | (5,857) | | | $ | 229.81 | | | (6,782) | | | $ | 238.06 | |
| Outstanding balance as of last day of February, Nonvested | 85,649 | | | $ | 302.06 | | | 86,641 | | | $ | 268.12 | | | 226,463 | | | $ | 223.85 | |
(1)Reflects the net number of awards achieved above (below) target levels based on actual performance measured at the end of the performance period.
The fair value of shares vested for our restricted stock unit and performance share unit awards is as follows:
| | | | | | | | | | | | | | | | | |
| For the Years Ended |
| February 28,
2023 | | February 28,
2022 | | February 28,
2021 | | February 29,
2020 |
| (in millions) | | | | | |
| Restricted stock awards | $ | — | | | $ | — | | | $ | 0.7 | | | | | |
| Restricted stock units | $ | 27.9 | | | $ | 25.8 | | | $ | 19.2 | | | $ | 29.9 | |
| Performance share units | $ | 5.2 | | | $ | 3.0 | | | $ | 4.3 | | | $ | 9.9 | |
| | | | | |
Constellation Brands, Inc. FY 20222023 Form 10-K | #WORTHREACHINGFOR I 107110 |
| | | | | | | | |
| PART II | ITEM 8. FINANCIAL STATEMENTS AND SUPPLEMENTARY DATA | Table of Contents |
The weighted average grant-date fair value of performance share units granted with a market condition and the weighted average inputs used to estimate the fair value on the date of grant using the Monte Carlo Simulation model are as follows:
| | | | | | | | | | | | | | | | | |
| For the Years Ended |
| February 28,
2023 | | February 28,
2022 | | February 28,
2021 | | February 29,
2020 |
| Grant-date fair value | $ | 395.47 | | | $ | 318.71 | | | $ | 202.53 | | | $ | 319.56 | |
| Grant-date price | $ | 254.21 | | | $ | 238.31 | | | $ | 153.02 | | | $ | 205.46 | |
| Performance period | 2.9 years | | 2.9 years | | 2.89 years |
Expected volatility (1) | 32.1 | % | | 35.0 | % | | 31.7 | % | | 23.1 | % |
Risk-free interest rate (2) | 2.8 | % | | 0.3 | % | | 0.2 | % | | 2.3 | % |
Expected dividend yield (3) | 0.0 | % | | 0.0 | % | | 0.0 | % |
(1)Based primarily on historical volatility levels of our Class A Stock.
(2)Based on the implied yield currently available on U.S. Treasury zero coupon issues with a remaining term equal to the performance period.
(3)No expected dividend yield as units granted earn dividend equivalents.
Employee Stock Purchase Plan
We have an Employee Stock Purchase Plan under which 9,000,000 shares of Class A Stock may be issued. Under the terms of the plan, eligible employees may purchase shares of our Class A Stock through payroll deductions. The purchase price is the lower of 85% of the fair market value of the stock on the first or last day of the purchase period. For the years ended February 28, 2023, February 28, 2022, and February 28, 2021, and February 29, 2020, employees purchasedemployees purchased 57,284 shares, 57,738 shares, and 67,801 shares, and 69,324 shares, respectively, under this plan.
Other
As of February 28, 20222023, there was $6472.34 million of total unrecognized compensation cost related to nonvested stock-based compensation arrangements granted under our stock-based employee compensation plans. This cost is expected to be recognized in our results of operations over a weighted-average period of 2.2 years. With respect to the issuance of shares under any of our stock-based compensation plans, we have the option to issue authorized but unissued shares or treasury shares.
19. NET INCOME (LOSS) PER COMMON SHARE ATTRIBUTABLE TO CBI
The computation of basic and diluted net income (loss) per common share is as follows:
| | | | | | | | | | | | | | | | | | | | | | | | | | | | | | | | | | | |
| For the Years Ended |
| February 28, 2023 | | February 28, 2022 | | February 28, 2021 | | February 29, 2020 |
| Class A
Stock | | Class B
Stock Stock (1) | | Class A
Stock | | Class B
Stock | | Class A
Stock | | Class B
Stock |
| (in millions, except per share data) | | | | | | | | | | | |
| Net income (loss) attributable to CBI allocated – basic | $ | (24.0) | | | $ | (47.0) | | | $ | (35.8) | | | $ | (4.6) | | | $ | 1,777.2 | | | $ | 220.8 | | | $ | (10.2) | | | $ | (1.6) | |
| Conversion of Class B common shares into Class A common shares | — | | | — | | | 220.8— | | | — | | | —220.8 | | | — | |
| Effect of stock-based awards on allocated net income (loss) | — | | | — | | | — | | | (1.5—) | | | — | | | (—1.5 ) | |
| Net income (loss) attributable to CBI allocated – diluted | $ | (24.0) | | | $ | (47.0) | | | $ | (35.8) | | | $ | (4.6) | | | $ | 1,998.0 | | | $ | 219.3 | | | $ | (10.2) | | | $ | (1.6) | |
| | | | | | | | | | | |
| | | | | |
Constellation Brands, Inc. FY 20222023 Form 10-K | #WORTHREACHINGFOR I 108111 |
| | | | | | | | |
| PART II | ITEM 8. FINANCIAL STATEMENTS AND SUPPLEMENTARY DATA | Table of Contents |
| | | | | | | | | | | | | | | | | | | | | | | | | | | | | | | | | | | |
| For the Years Ended |
| February 28, 2023 | | February 28, 2022 | | February 28, 2021 | | February 29, 2020 |
| Class A
Stock | | Class B
Stock Stock (1) | | Class A
Stock | | Class B
Stock | | Class A
Stock | | Class B
Stock |
| (in millions, except per share data) | | | | | | | | | | | |
| Weighted average common shares outstanding – basic | 169.337 | | | 23.206 | | | 167.431 | | | 23.225 | | | 170.239 | | | 23.280 | | | 168.329 | | | 23.313208 | |
Conversion of Class B common shares into Class A common shares (1) 2) |
— | | | — | | | — | | | — | | | 23.280 | | | — | | Stock-based awards, primarily stock options (2) | — | | | — | |
Stock-based awards, primarily stock options (1) | | — | | | — | | | 1.789 | | | — | | | — | | | — | |
| Weighted average common shares outstanding – diluted | 169.337 | | | 23.206 | | | 167.431 | | | 23.225 | | | 195.308 | | | 23.280 | | | 168.329 | | | 23.313208 | |
| | | | | | | | | | | |
| Net income (loss) per common share attributable to CBI – basic | $ | (0.11) | | | $ | (2.02) | | | $ | (0.22) | | | $ | (0.20) | | | $ | 10.44 | | | $ | 9.48 | | | $ | (0.07) | | | $ | (0.07) | |
| Net income (loss) per common share attributable to CBI – diluted | $ | (0.11) | | | $ | (2.02) | | | $ | (0.22) | | | $ | (0.20) | | | $ | 10.23 | | | $ | 9.42 | | | $ | (0.07) | | | $ | (0.07) | |
| | | | | | | | | | | | | | | | | | | |
(1) | Net income (loss) per common share attributable to CBI for Class B Stock was determined through November 10, 2022, the date the Reclassification was completed. |
(2) | We have excluded the following weighted average common shares outstanding from the calculation of diluted net income (loss) per common share, as the effect of including these would have been anti-dilutive, in millions: |
| | | For the Years Ended | | |
| | | February 28, 20222023 | | February 2928, 2020 | | |
| | (in millions) | | | 2022 | | |
| | | | | | | |
| | Class B Stock | 2316.225149 | | | 23.313225 | | | |
| | Stock-based awards, primarily stock options | 10.566713 | | | 31.239566 | | | |
| | | | | | | |
| | | |
20. ACCUMULATED OTHER COMPREHENSIVE INCOME (LOSS)
Other comprehensive income (loss) attributable to CBI includes the following components:
| | | | | | | | | | | | | | | | | |
| Before Tax
Amount | | Tax (Expense)
Benefit | | Net of Tax
Amount |
| (in millions) | | | | | |
| For the Year Ended February 2928, 20202021 | | | | | |
| Other comprehensive income (loss) attributable to CBI: | | | | | |
| Foreign currency translation adjustments: | | | | | |
| Net gain (loss) | $ | (8351.49 ) | | | $ | — | | | $ | (8351.49 ) | |
| Reclassification adjustmentsAmounts reclassified | (225.61) | | | — | | | (225.61) | |
| Net gain (loss) recognized in other comprehensive income (loss) | (6046.8 ) | | | — | | | (6046.8 ) | |
| Unrealized gain (loss) on cash flow hedges: | | | | | |
| Net derivative gain (loss) | (48.01) | | | 3.2 | | | (6.444.9) | |
| Amounts reclassified | 28.8 | | | 54.4 | |
| Reclassification adjustments | (152.39) | | | (125.7) | | | (17.0)9 | |
| Net gain (loss) recognized in other comprehensive income (loss) | (32.719.3) | | | 0.3 | | | (419.7 | | | 37.4 0) | |
| | | | | |
| | | | | |
| | | | | |
| | | | | |
| Pension/postretirement adjustments: | | | | | |
| Net actuarial gain (loss) | (2.3.1) | | | 0.97 | | | (21.26) | |
| Reclassification adjustmentsAmounts reclassified | 1.8— | | | (0.1—) | | | 1.7— | |
| Net gain (loss) recognized in other comprehensive income (loss) | (12.3) | | | 0.87 | | | (01.56) | |
| | | | | |
Constellation Brands, Inc. FY 20222023 Form 10-K | #WORTHREACHINGFOR I 109112 |
| | | | | | | | |
| PART II | ITEM 8. FINANCIAL STATEMENTS AND SUPPLEMENTARY DATA | Table of Contents |
| | | | | | | | | | | | | | | | | |
| Before Tax
Amount | | Tax (Expense)
Benefit | | Net of Tax
Amount |
| (in millions) | | | | | |
| Share of OCI of equity method investments: | | | | | |
| Net gain (loss) | (1.6) | | | (0.2) | | | (1.8) | |
| Amounts reclassified | — | | | — | | | — | |
| Net gain (loss) recognized in other comprehensive income (loss) | (1.6) | | | (0.2) | | | (1.8) | |
| Other comprehensive income (loss) attributable to CBI | $ | (70.0) | | | $ | 0.8 | | | $ | (69.2) | |
| | | | | |
| For the Year Ended February 28, 2022 | | | | | |
| Other comprehensive income (loss) attributable to CBI: | | | | | |
| Foreign currency translation adjustments: | | | | | |
| Net gain (loss) | $ | (38.9) | | | $ | — | | | $ | (38.9) | |
| Amounts reclassified | — | | | — | | | — | |
| Net gain (loss) recognized in other comprehensive income (loss) | (38.9) | | | — | | | (38.9) | |
| Unrealized gain (loss) on cash flow hedges: | | | | | |
| Net derivative gain (loss) | 12.6 | | | (7.5) | | | 5.1 | |
| Amounts reclassified | (34.0) | | | 2.9 | | | (31.1) | |
| Net gain (loss) recognized in other comprehensive income (loss) | (21.4) | | | (4.6) | | | (26.0) | |
| | | | | |
| | | | | |
| | | | | |
| | | | | |
| Pension/postretirement adjustments: | | | | | |
| Net actuarial gain (loss) | 2.3 | | | (0.6) | | | 1.7 | |
| Amounts reclassified | (2.1) | | | 0.6 | | | (1.5) | |
| Net gain (loss) recognized in other comprehensive income (loss) | 0.2 | | | — | | | 0.2 | |
| Share of OCI of equity method investments: | | | | | |
| Net gain (loss) | (16.2) | | | 3.7 | | | (12.5) | |
| Amounts reclassified | — | | | — | | | — | |
| Net gain (loss) recognized in other comprehensive income (loss) | (16.2) | | | 3.7 | | | (12.5) | |
| Other comprehensive income (loss) attributable to CBI | $ | (76.3) | | | $ | (0.9) | | | $ | (77.2) | |
| | | | | |
| For the Year Ended February 28, 2023 | | | | | |
| Other comprehensive income (loss) attributable to CBI: | | | | | |
| Foreign currency translation adjustments: | | | | | |
| Net gain (loss) | $ | 255.0 | | | $ | — | | | $ | 255.0 | |
| Amounts reclassified | — | | | — | | | — | |
| Net gain (loss) recognized in other comprehensive income (loss) | 255.0 | | | — | | | 255.0 | |
| Unrealized gain (loss) on cash flow hedges: | | | | | |
| Net derivative gain (loss) | 259.3 | | | (33.2) | | | 226.1 | |
| Amounts reclassified | (50.2) | | | 5.1 | | | (45.1) | |
| Net gain (loss) recognized in other comprehensive income (loss) | 209.1 | | | (28.1) | | | 181.0 | |
| | | | | |
| | | | | |
| | | | | |
| | | | | |
| Pension/postretirement adjustments: | | | | | |
| Net actuarial gain (loss) | 0.1 | | | — | | | 0.1 | |
| Amounts reclassified | — | | | — | | | — | |
| Net gain (loss) recognized in other comprehensive income (loss) | 0.1 | | | — | | | 0.1 | |
| | | | | |
Constellation Brands, Inc. FY 20222023 Form 10-K | #WORTHREACHINGFOR I 110113 |
| | | | | | | | |
| PART II | ITEM 8. FINANCIAL STATEMENTS AND SUPPLEMENTARY DATA | Table of Contents |
| | | | | | | | | | | | | | | | | |
| Before Tax
Amount | | Tax (Expense)
Benefit | | Net of Tax
Amount |
| (in millions) | | | | | |
| Share of OCI of equity method investments: | | | | | |
| Net gain (loss) | (16.2) | | | 3.72.6 | | | (12.5)2.5 | | | 5.1 | |
| Reclassification adjustmentsAmounts reclassified | — | | | — | | | — | |
| Net gain (loss) recognized in other comprehensive income (loss) | (16.2) | | | 3.72.6 | | | (12.5)2.5 | | | 5.1 | |
| Other comprehensive income (loss) attributable to CBI | $ | 466.8 | | | $ | (7625.36) | | | $ | (0.9) | | | $ | (77.2)441.2 | |
Accumulated other comprehensive income (loss), net of income tax effect, includes the following components:
| | | | | | | | | | | | | | | | | | | | | | | | | | | | | | | |
| Foreign
Currency
Translation
Adjustments | | Unrealized Net
Gain (Loss)
on Derivative
Instruments | | | | Pension/
Postretirement
Adjustments | | Share of OCI of
Equity Method
Investments | | Accumulated
Other
Comprehensive
Income (Loss) |
| (in millions) | | | | | | | | | | | |
| Balance, February 28, 2021 | $ | (392.5) | | | $ | 43.5 | | | | | $ | (4.2) | | | $ | 17.7 | | | $ | (335.5) | |
| Other comprehensive income (loss): | | | | | | | | | | | |
| Other comprehensive income (loss) before reclassification adjustments | (38.9) | | | 5.1 | | | | | 1.7 | | | (12.5) | | | (44.6) | |
| Amounts reclassified from accumulated other comprehensive income (loss) | — | | | (31.1) | | | | | (1.5) | | | — | | | (32.6) | |
| Other comprehensive income (loss) | (38.9) | | | (26.0) | | | | | 0.2 | | | (12.5) | | | (77.2) | |
| Balance, February 28, 2022 | $ | (431.4) | | | $ | 17.5 | | | | | $ | (4.0) | | | $ | 5.2 | | | $ | (412.7) | |
21. SIGNIFICANT CUSTOMERS AND CONCENTRATION OF CREDIT RISK
Net sales to our 10 largest customers represented approximately half of our net sales for the years ended February 28, 2022| Other comprehensive income (loss): | | | | | | | | | | | |
| Other comprehensive income (loss) before reclassification adjustments | 255.0 | | | 226.1 | | | | | 0.1 | | | 5.1 | | | 486.3 | |
| Amounts reclassified from accumulated other comprehensive income (loss) | — | | | (45.1) | | | | | — | | | — | | | (45.1) | |
| Other comprehensive income (loss) | 255.0 | | | 181.0 | | | | | 0.1 | | | 5.1 | | | 441.2 | |
| Balance, February 28, 2023 | $ | (176.4) | | | $ | 198.5 | | | | | $ | (3.9) | | | $ | 10.3 | | | $ | 28.5 | |
21. SIGNIFICANT CUSTOMERS AND CONCENTRATION OF CREDIT RISK
Net sales to our 10 largest customers represented approximately half of our net sales for the years ended February 28, 2023, February 28, 20212022, and February 2928, 20202021, and are expected to continue to represent a significant portion of our revenues. Net sales to an individual customercustomers which individually amount to 10% or more of our net sales, and the associated amounts receivable from this customerthese customers as a percentage of our accounts receivable, are as follows:
| | | | | | | | | | | | | | | | | |
| For the Years Ended |
| February 28,
2023 | | February 28,
2022 | | February 28,
2021 | | February 29,
2020 |
| Reyes Beer Division entities | | | | | |
| Net sales | 22.7 | % | | 21.0 | % | | 18.6 | % |
| Accounts receivable | 1615.16 | % |
| Accounts receivable | 11.1 | % | | 12.7 | % | | 10.6 | % |
| | | | | |
| Southern Glazer’s Wine and Spirits | | | | | |
| Net sales | 1413.40 | % | | 1014.54 | % | | 10.5 | % |
| Accounts receivable | 24.0 | % | | 35.2 | % | | 28.7 | % | | 27.2 | % |
Net sales for the above customers are primarily reported within the Beer and Wine and Spirits segments, respectively. Our arrangements with certain of our customers may, generally, be terminated by either party with prior notice. The majority of our accounts receivable balance is generated from sales to independent distributors with whom we have a predetermined collection date arranged through electronic funds transfer. We perform ongoing credit evaluations of our customers’ financial position, and management is of the opinion that any risk of significant loss is reduced due to the diversity of our customers and geographic sales area.
| | | | | |
Constellation Brands, Inc. FY 20222023 Form 10-K | #WORTHREACHINGFOR I 111114 |
| | | | | | | | |
| PART II | ITEM 8. FINANCIAL STATEMENTS AND SUPPLEMENTARY DATA | Table of Contents |
22. BUSINESS SEGMENT INFORMATION
Our internal management financial reporting consists of three business divisions: (i) Beer, (ii) Wine and Spirits, and (iii) Canopy and we report our operating results in four segments: (i) Beer, (ii) Wine and Spirits, (iii) Corporate Operations and Other, and (iv) Canopy. The Canopy Equity Method Investment makes up the Canopy segment. If the Canopy Transaction is completed, including conversion of our Canopy common shares into Exchangeable Shares, we expect our internal management financial reporting to consist of two business divisions: (i) Beer and (ii) Wine and Spirits and we will report our operating results in three segments: (i) Beer, (ii) Wine and Spirits, and (iii) Corporate Operations and Other.
In the Beer segment, our portfolio consists of high-end imported beer brands, craft beer, and ABAs. We have an exclusive perpetual brand license to import, market, and sell our Mexican beer portfolio in the U.S. In the Wine and Spirits segment, we sell a portfolio that includes higher-margin, higher-growth wine brands complemented by certain higher-end spirits brands. Amounts included in the Corporate Operations and Other segment consist of costs of executive management, corporate development, corporate finance, corporate growth and strategy, human resources, internal audit, investor relations, IT, legal, and public relations, and information technology, as well as our investments made through our corporate venture capital function. All costs included in the Corporate Operations and Other segment are general costs that are applicable to the consolidated group and are, therefore, not allocated to the other reportable segments. All costs reported within the Corporate Operations and Other segment are not included in our CODM’s evaluation of the operating income (loss) performance of the other reportable segments. The business segments reflect how our operations are managed, how resources are allocated, how operating performance is evaluated by senior management, and the structure of our internal financial reporting. Long-lived tangible assets and total asset information by segment is not provided to, or reviewed by, our CODM as it is not used to make strategic decisions, allocate resources, or assess performance.
In addition, management excludes Comparable Adjustments from its evaluation of the results of each operating segment as these Comparable Adjustments are not reflective of core operations of the segments. Segment operating performance and the incentive compensation of segment management are evaluated based on core segment operating income (loss) which does not include the impact of these Comparable Adjustments.
We evaluate segment operating performance based on operating income (loss) of the respective business units. Comparable Adjustments that impacted comparability in our segment operating income (loss) for each period are as follows:
| | | | | | | | | | | | | | | | | |
| For the Years Ended |
| February 28,
2023 | | February 28,
2022 | | February 28,
2021 | | February 29,
2020 |
| (in millions) | | | | | |
| Cost of product sold | | | | | |
| Net gain (loss) on undesignated commodity derivative contracts | $Settlements of undesignated commodity derivative contracts | $ | (76.7) | | | $ | (35.9) | | | $ | 31.6 | |
| Net gain (loss) on undesignated commodity derivative contracts | (15.0) | | | 109.9 | | | $ | 25.1 | | |
| $Flow through of inventory step-up | (49.0) | |
| Net flow through of reserved inventory | 12.1 | | | — | | | — | |
| Settlements of undesignated commodity derivative contracts | (35.9) | | | 4.5) | | | (310.61 ) | | | (110.74 ) | |
| Strategic business development costs | (1.2) | | | (2.6) | | | (29.8) | |
| Net flow through of reserved inventory | 1.2 | | | (12412.5)1 | | | — | |
| Recovery of (loss on) inventory write-down | 0.2 | | | (1.0) | | | (70.4) | | | 8.6 | |
| Flow through of inventory step-up | (0.1) | | | (0.4) | | | (1.5) | |
| COVID-19 incremental costs | — | | | (7.6—) | | | (—7.6 ) | |
| Accelerated depreciation | — | | | (0.1—) | | | (70.61) | |
| | | | | |
| Total cost of product soldComparable Adjustments, Cost of product sold | (96.0) | | | 82.4 | | | (51.6) | | | (162.3) | |
| | | | | |
| | | | | |
Constellation Brands, Inc. FY 20222023 Form 10-K | #WORTHREACHINGFOR I 112115 |
| | | | | | | | |
| PART II | ITEM 8. FINANCIAL STATEMENTS AND SUPPLEMENTARY DATA | Table of Contents |
| | | | | | | | | | | | | | | | | |
| For the Years Ended |
| February 28,
2023 | | February 28,
2022 | | February 28,
2021 | | February 29,
2020 |
| (in millions) | | | | | |
| Selling, general, and administrative expenses | | | | | |
| Transition services agreements activityImpairment of assets | (66.5) | | | — | | | (6.0) | |
| Costs associated with the Reclassification | (37.8) | | | — | | | — | |
| Transition services agreements activity | (20.5) | | | (19.2) | | | 0.4 | |
| Restructuring and other strategic business development costs | (9.9) | | | — 0.6 | | | (23.9) | |
| Transaction, integration, and other acquisition-related costs | (1.4) | | | (71.64) | | | (97.26) | |
| Restructuring andGain (loss) other strategicon sale of business development costs | 15.0.6 | | | (231.97) | | | (2514.32) | |
| Net gain (loss) on foreign currency derivative contracts | — | | | (8.0) | | | (1.8) | |
| Impairment of intangible assets | — | | | (68.0) | | | (11.0) |
| | | | | |
| COVID-19 incremental costs | — | | | (4.8—) | | | (—4.8 ) | |
| | | | | |
| | | | | |
| | | | | |
Other gains (losses) (1) Impairment of assets held for sale | — | | | — | | | (24.0) | |
Other gains (losses) (1) | 23.3 | | | (2.3) | | | 14.3 | | | 7.3 | |
| Total sellingComparable Adjustments, Selling, general, and administrative expenses | (2297.38) | | | (3520.6) | | | (4045.04) | |
| | | | | |
| Impairment of brewery construction in progress | — | | | (665.9) | | | — | | | — | |
| Impairment of assets held for sale | — | | | (24.0) | | | (449.7) | |
| Gain (loss) on sale of business | 1.7 | | | 14.2 | | | 74.1 | |
| Comparable Adjustments, Operating income (loss) |
| | | | | |
| Comparable Adjustments, Operating income (loss) | $ | (193.8) | | | $ | (604.1) | | | $ | (97.0) | | | $ | (577.9) | |
| | | | | | | | | | | | | | | | | | | | | |
(1) | IncludesPrimarily includes the following: | | | | | | |
| | For the Years Ended | |
| | February 28,
2023 | | February 28,
2022 | | February 28,
2021 | | February 29,
2020 | |
| | | | | | | |
| Adjustment to understated excise tax accruals primarily related to a prior period acquisition | $ | (13.3) | | | $ | — | | | $ | — | | |
| Decrease (increase) in estimated fair value of contingent liabilities associated with prior period acquisitions | (in millions) | | | | | | |
| Decrease (increase) in estimated fair values of contingent liabilities associated with prior period acquisitions | $ | 12.9 | | | $ | (9.6) | | | $ | 9.7 | | |
| Gain from remeasurement of previously held equity method investments | $ | (115.42) | | |
| Increase in our ownership interest in My Favorite Neighbor (Fiscal 2022) and Nelson’s Green Brier (Fiscal 2020) | $ | 13.5 | | | $ | — | | | $ | 11.8 | | |
| Property tax settlementInsurance recovery related to a prior severe weather event | $ | 105.42 | | | $ | — | | | $ | — | | |
| Sale of certain non-core assetsProperty tax settlement | $ | — | | | $ | 8.810.4 | | | $ | — | | |
| Adjustment to understated excise tax accruals primarily related to a prior period acquisition | $ | — | | | $ | (0.3)13.3) | | | $ | — | | |
| | | | | | | |
| RecognitionGain on sale of previously deferred gain upon release of a related guaranteecertain non-core assets | $ | — | | | $ | — | | | $ | 68.28 | | |
| | | | | |
| Constellation Brands, Inc. FY 2022 Form 10-K | #WORTHREACHINGFOR I 113 |
|
The accounting policies of the segments are the same as those described for the Company in the Summary of Significant Accounting Policies in Note 1. Amounts included below for the Canopy segment represent 100% of Canopy’s reported results on a two-month lag, prepared in accordance with U.S. GAAP, and converted from Canadian dollars to U.S. dollars. Although we own less than 100% of the outstanding shares of Canopy, 100% of its results are included in the information below and subsequently eliminated in order to reconcile to our consolidated financial statements. Segment information is as follows:
| | | | | | | | | | | | | | | | | |
| For the Years Ended |
| February 28,
2023 | | February 28,
2022 | | February 28,
2021 | | February 29,
2020 |
| (in millions) | | | | | |
| Beer | | | | | |
| Net sales | $ | 7,465.0 | | | $ | 6,751.6 | | | $ | 6,074.6 | | | $ | 5,615.9 | |
| Segment operating income (loss) | $ | 2,861.5 | | | $ | 2,703.3 | | | $ | 2,494.3 | | | $ | 2,247.9 | |
| | | | | |
| | | | | |
| Capital expenditures | $ | 813.9 | | | $ | 849.5 | | | $ | 693.9 | | | $ | 571.7 | |
| Depreciation and amortization | $ | 285.4 | | | $ | 248.7 | | | $ | 194.7 | |
| $ | 204.3 | |
| | | | |
| | | | | |
Constellation Brands, Inc. FY 2023 Form 10-K | #WORTHREACHINGFOR I 116 |
| | | | | | | | |
| PART II | ITEM 8. FINANCIAL STATEMENTS AND SUPPLEMENTARY DATA | Table of Contents |
| | | | | | | | | | | | | | | | | |
| For the Years Ended |
| February 28,
2023 | | February 28,
2022 | | February 28,
2021 |
| (in millions) | | | | | |
| Wine and Spirits | | | | | |
| Net sales: | | | | | |
| Wine | $ | 1,722.7 | | | $ | 1,819.3 | | | $ | 2,208.4 | | |
| $Spirits | 2,367264.59 | |
| Spirits | 249.8 | | | 331.9 | | | 360.1 | |
| Net sales | $ | 1,987.6 | | | $ | 2,069.1 | | | $ | 2,540.3 | | | $ | 2,727.6 | |
| Segment operating income (loss) | $ | 453.1 | | | $ | 470.7 | | | $ | 622.4 | | | $ | 708.4 | |
| Income (loss) from unconsolidated investments | $ | 41.6 | | | $ | 34.4 | | | $ | 31.7 | | | $ | 36.4 | |
| | | | | |
Equity method investments | (1)$ | 95.4 | | | $ | 97.2 | | | $ | 125.7 | | | $ | 87.7 | |
| | | | | |
| Capital expenditures | $ | 151.8 | | | $ | 154.7 | | | $ | 107.5 | | | $ | 92.7 | |
| Depreciation and amortization | $ | 83.2 | | | $ | 80.7 | | | $ | 89.9 | | | $ | 98.7 | |
| | | | | |
| Corporate Operations and Other | | | | | |
| | | | | |
| Segment operating income (loss) | $ | (277.9) | | | $ | (238.2) | | | $ | (228.6) | | | $ | (223.9) | |
| Income (loss) from unconsolidated investments | $ | (12.0) | | | $ | (3.5) | | | $ | (0.4) | | | $ | (3.2) | |
| | | | | |
| Equity method investments | $ | 82.1 | | | $ | 88.0 | | | $ | 83.9 | | | $ | 94.5 | |
| | | | | |
| Capital expenditures | $ | 69.7 | | | $ | 22.6 | | | $ | 63.2 | | | $ | 62.1 | |
| Depreciation and amortization | $ | 18.4 | | | $ | 13.0 | | | $ | 14.4 | | | $ | 21.6 | |
| | | | | |
| Canopy | | | | | |
| Net sales | $ | 339.3 | | | $ | 444.3 | | | $ | 378.6 | | | $ | 290.2 | |
| Segment operating income (loss) | $ | (2,105.9) | | | $ | (630.1) | | | $ | (1,496.0) | |
| Capital expenditures | $ | (6854.8) | |
| Capital expenditures | $ | 50.4 | | | $ | 172.6 | | | $ | 572.8 | |
| Depreciation and amortization | $ | 72.7 | | | $ | 90.0 | | | $ | 103.3 | | | $ | 81.4 | |
| | | | | |
| Consolidation and Eliminations | | | | | |
| Net sales | $ | (339.3) | | | $ | (444.3) | | | $ | (378.6) | | | $ | (290.2) | |
| Operating income (loss) | $ | 2,105.9 | | | $ | 630.1 | | | $ | 1,496.0 | | | $ | 685.8 | |
| Income (loss) from unconsolidated investments | $ | (158.3) | | | $ | (178.2) | | | $ | (146.2) | | | $ | (221.7) | |
| Equity method investments | $ | 485.8 | | | $ | 2,503.5 | | | $ | 2,578.8 | |
| Capital expenditures | $ | (2,9114.78 ) | |
| Capital expenditures | $ | (50.4) | | | $ | (172.6) | |
| Depreciation and amortization | $ | (57272.87) | |
| Depreciation and amortization | $ | (90.0) | | | $ | (103.3) | | | $ | (81.4) | |
| | | | | |
| | | | | |
| Constellation Brands, Inc. FY 2022 Form 10-K | #WORTHREACHINGFOR I 114 |
| | | | | | | | | | | | | | | | | |
| For the Years Ended |
| February 28,
2022 | | February 28,
2021 | | February 29,
2020 |
| (in millions) |
| | | | | |
| Comparable Adjustments | | | | | |
| | | | | |
| Operating income (loss) | $ | (193.8) | | | $ | (604.1) | | | $ | (97.0) | | | $ | (577.9) | |
| Income (loss) from unconsolidated investments | $ | (1,907.7) | | | $ | (1,488.2) | | | $ | 265.2 | | | $ | (2,480.1) | |
| Depreciation and amortization | $ | — | | | $ | 0.1— | | | $ | 70.61 | |
| | | | | |
| Consolidated | | | | | |
| Net sales | $ | 9,452.6 | | | $ | 8,820.7 | | | $ | 8,614.9 | | | $ | 8,343.5 | |
| Operating income (loss) | $ | 2,842.9 | | | $ | 2,331.7 | | | $ | 2,791.1 | | | $ | 2,154.5 | |
Income (loss) from unconsolidated investments (2) 1) |
$ | (2,036.4) | | | $ | (1,635.5) | | | $ | 150.3 | | | $ | (2,668.6) | | | | | | | |
Equity method investments | (1)$ | 663.3 | | | $ | 2,688.7 | | | $ | 2,788.4 | | | $ | 3,093.9 | |
| | | | | |
| Capital expenditures | $ | 1,035.4 | | | $ | 1,026.8 | | | $ | 864.6 | | | $ | 726.5 | |
| Depreciation and amortization | $ | 387.0 | | | $ | 342.4 | | | $ | 299.1 | |
| | | | Constellation Brands, Inc. FY 2023 Form 10-K | #WORTHREACHINGFOR I 117 |
| | | | | | | | |
| PART II | ITEM 8. FINANCIAL STATEMENTS AND SUPPLEMENTARY DATA | Table of Contents |
| | | | | | | | | | | | | | | | | | | | | | | |
(1) | Income (loss) from unconsolidated investments consists of: | | | | | |
| | | For the Years Ended |
| | February 28,
2023 | | February 28,
2022 | | February 28,
2021 |
| (in millions) | | | | | |
| Impairment of Canopy Equity Method Investment | $ | (1,060.3) | | | $ | — | | | $ | — | |
| Unrealized net gain (loss) on securities measured at fair value | (45.9) | | | (1,644.7) | | | 802.0 | |
| Equity in earnings (losses) from Canopy and related activities | (949.3) | | | (73.6) | | | (679.0) | |
| Equity in earnings (losses) from other equity method investees and related activities | 19.1 | | | 31.8 | | | 27.3 | |
| Net gain (loss) on sale of unconsolidated investment | — | | | 51.0 | | | — | |
| | | | | | |
| | | $ | (2,036.4) | | | $ | (1,635.5) | | | $ | 150.3 | |
Our principal area of operation is in the U.S. Current operations outside the U.S. are in Mexico for the Beer segment and primarily in New Zealand and Italy for the Wine and Spirits segment. Revenues are attributed to countries based on the location of the customer.
Geographic data is as follows:
| | | | | | | | | | | | | | | | | |
| For the Years Ended |
| February 28,
2023 | | February 28,
2022 | | February 28,
2021 | | February 29,
2020 |
| (in millions) | | | | | |
| Net sales | | | | | |
| U.S. | $ | 9,194.5 | | | $ | 8,585.8 | | | $ | 8,396.5 | | | $ | 8,116.2 | |
| Non-U.S. (primarily Canada) and New Zealand) | 258.1 | | | 234.9 | | | 218.4 | |
| $ | 2279,452.36 | |
| $ | 8,820.7 | | | $ | 8,614.9 | | | $ | 8,343.5 | |
| | | | | |
| Constellation Brands, Inc. FY 2022 Form 10-K | #WORTHREACHINGFOR I 115 |
| | | | | | | | | | | |
| February 28,
20222023 | | February 28,
20212022 |
| (in millions) | | | |
| Long-lived tangible assets | | | |
| U.S. | $ | 1,092150.08 | | | $ | 1,005092.30 | |
| Non-U.S. (primarily Mexico) | 5,714.4,967.6 | | | 4,816967.3 | |
6 |
| $ | 6,865.2 | | | $ | 6,059.6 | | | $ | 5,821.6 | |
| | | | | |
Constellation Brands, Inc. FY 2023 Form 10-K | #WORTHREACHINGFOR I 118 |
| | | | | | | | |
| PART II | ITEM 8. FINANCIAL STATEMENTS AND SUPPLEMENTARY DATA | Table of Contents |
23. SELECTED QUARTERLY FINANCIAL INFORMATION (UNAUDITED)
A summary of selected quarterly financial information is as follows:
| | | | | | | | | | | |
| For the Three Months Ended |
| February 28,
2022 2023 (1) | | February 28,
2021 2022 (2) |
| (in millions, except per share data) | | | |
| Net sales | $ | 21,102997.58 | | | $ | 12,953102.05 | |
| Gross profit | $ | 1,132961.62 | | | $ | 9931,132.76 | |
Net income (loss) attributable to CBI (13) | $ | 395223.40 | | | $ | 382395.94 | |
Net income (loss) per common share attributable to CBI (13): | | | |
| Basic – Class A Stock | $ | 21.1121 | | | $ | 2.0011 | |
| Basic – Class B Stock | $ | 1.92 | NA | | $ | 1.8192 | |
| Diluted – Class A Stock | $ | 21.0721 | | | $ | 12.9507 | |
| Diluted – Class B Stock | NA | | $ | 1.91 | | | $ | 1.80 | |
(1)Net income (loss) per common share attributable to CBI – basic has been computed based on the weighted average shares of common stock outstanding during the period. Net income (loss) per common share attributable to CBI – diluted reflects the weighted average shares of common stock plus the effect of dilutive securities outstanding during the period using the treasury stock method. The effect of dilutive securities includes the impact of outstanding stock-based awards. The dilutive computation does not assume conversion, exercise, or contingent issuance of securities that would have an anti-dilutive effect on the net income (loss) per common share attributable to CBI.
(2)Net income (loss) per common share – basic excludes the effect of common stock equivalents and was computed using the two-class method. Net income (loss) per common share – diluted for Class A Stock has been computed using the if-converted method and assumes the exercise of stock options using the treasury stock method and the conversion of Class B Stock as this method is more dilutive than the two-class method. Net income (loss) per common share – diluted for Class B Stock has been computed using the two-class method and does not assume conversion of Class B Stock into shares of Class A Stock.
(3)Includes the following:
| | | | | | | | | | | | | | |
(1) | Includes the following: | | | |
| | For the Three Months Ended |
| | February 28,
20222023 | | February 28,
20212022 |
| (in millions, net of income tax effect) | | | |
| | | Equity in earnings (losses) from Canopy | $ | (69.5) | | | $ | (31.9) | |
| Unrealized net gain (loss) on securities measured at fair value | $ | (135.2) | | | $ | 206.3 | |
| Equity in earnings (losses) from Canopy | $ | (31.96.8) | | | $ | (189135.5) | |
| | | | |
| | | | |
| | | | |
| | | | |
| | | | |
| | | | |
| | | | |
| | | | |
| | | | |
| | | | |
2) | | | | | | |
Constellation Brands, Inc. FY 20222023 Form 10-K | #WORTHREACHINGFOR I 116119 |
| | | | | | | | |
| PART II | OTHER KEY INFORMATION | Table of Contents |
Item 9A. Controls and Procedures
Disclosure controls and procedures
Our Chief Executive Officer and our Chief Financial Officer have concluded, based on their evaluation as of the end of the period covered by this report, that the Company’s “disclosure controls and procedures” (as defined in the Exchange Act Rules 13a-15(e) and 15d-15(e)) are effective to ensure that information required to be disclosed in the reports that we file or submit under the Exchange Act (i) is recorded, processed, summarized and reported within the time periods specified in the SEC’s rules and forms, and (ii) is accumulated and communicated to our management, including our Chief Executive Officer and our Chief Financial Officer, as appropriate to allow timely decisions regarding required disclosure.
Internal control over financial reporting
See page 5960 of this Form 10-K for Management’s Annual Report on Internal Control over Financial Reporting, which is incorporated herein by reference.
See page 6061 of this Form 10-K for the attestation report of KPMG LLP, our independent registered public accounting firm, which is incorporated herein by reference.
Although most of our corporate and non-production workforce are working remotely due to COVID-19, we have not experienced a material impact to our internal control over financial reporting. We continue to monitor the pandemic and its effects on the design and operating effectiveness of our internal controls.
We have completed the implementation of a new global ERP across our business units using a phased approach. As a result of this implementation, certain internal controls over financial reporting have been automated, modified, or implemented to address the new control environment associated with this ERP.
In connection with management’s quarterly evaluation of “internal control over financial reporting” (as defined in the Exchange Act Rules 13a-15(f) and 15d-15(f)), other than the ERP implementation noted above, no otherno changes were identified in our internal control over financial reporting during our fiscal quarter ended February 28, 20222023 (our fourth fiscal quarter) that have materially affected, or are reasonably likely to materially affect, our internal control over financial reporting.
| | | | | |
Constellation Brands, Inc. FY 20222023 Form 10-K | #WORTHREACHINGFOR I 117120 |
| | | | | | | | |
| PART III | OTHER KEY INFORMATION | Table of Contents |
Item 10. Directors, Executive Officers, and Corporate Governance
The information required by this Item (except for the information regarding executive officers required by Item 401 of Regulation S-K which is included in Part I hereof in accordance with General Instruction G(3)) is incorporated herein by reference to the Proxy Statement including under those sections of the Proxy Statement to be titled “Director NomineesProposal 1 - Election of Directors,” “Delinquent Section 16(a) Reports,” and “TheOur Board of Directors and Committees of the Board.” The Proxy Statement will be filed within 120 days after the end of our fiscal year.
We have adopted the Chief Executive Officer and Senior Financial Executive Code of Ethics which is a code of ethics that applies to our chief executive officer and our senior financial officers. The Chief Executive Officer and Senior Financial Executive Code of Ethics is located on our investor relations website at https://ir.cbrands.com. Amendments to, and waivers granted under, our Chief Executive Officer and Senior Financial Executive Code of Ethics, if any, will be posted to our investor relations website as well. We will provide to anyone, without charge, upon request, a copy of such Code of Ethics. Such requests should be directed in writing to Investor Relations Department, Constellation Brands, Inc., 207 High Point Drive, Building 100, Victor, New York 14564 or by telephoning our Investor Center at 1-888-922-2150.
Item 11. Executive Compensation
The information required by this Item is incorporated herein by reference to the Proxy Statement including under those sections of the Proxy Statement to be titled “Executive Compensation,” “Compensation Committee Interlocks and Insider Participation,” and “Director Compensation.” The Proxy Statement will be filed within 120 days after the end of our fiscal year. Notwithstanding the foregoing, the Compensation Committee Report included within the section of the Proxy Statement to be titled “Executive Compensation” is only being “furnished” hereunder and shall not be deemed “filed” with the SEC or subject to the liabilities of Section 18 of the Exchange Act.
Item 12. Security Ownership of Certain Beneficial Owners and Management and Related Stockholder Matters
The information required by this Item is incorporated herein by reference to the Proxy Statement including under that section of the Proxy Statement to be titled “Beneficial Ownership.” The Proxy Statement will be filed within 120 days after the end of our fiscal year.
Securities authorized for issuance under equity compensation plans
The following table sets forth information with respect to our compensation plans under which our equity securities may be issued, as of February 28, 20222023. The equity compensation plans approved by security holders include our Long-Term Stock Incentive Plan and our 1989 Employee Stock Purchase Plan.
| | | | | |
Constellation Brands, Inc. FY 20222023 Form 10-K | #WORTHREACHINGFOR I 118121 |
| | | | | | | | |
| PART III | OTHER KEY INFORMATION | Table of Contents |
Equity Compensation Plan Information
| | | | | | | | | | | | | | | | | | | | | | | |
| Plan Category | | Number of securities to be issued upon exercise of outstanding options, warrants, and rights | | Weighted average exercise price of outstanding options, warrants, and rights | | Number of securities remaining available for future issuance under equity compensation plans (excluding securities reflected in first column) | |
| Equity compensation plans approved by security holders | | 3,370531,795119 | | (1) | $ | 178194.6247 | | (2) | 1110,213596,268849 | | (3) |
| Equity compensation plans not approved by security holders | | — | | | $ | — | | | — | | |
| Total | | 3,370531,795119 | | | $ | 178194.6247 | | | 1110,213596,268849 | | |
(1)Includes 173171,282298 shares of unvested performance share units and 291,171859 shares of unvested restricted stock units under our Long-Term Stock Incentive Plan. The unvested performance share units represent the maximum number of shares to be awarded, which ranges from 100%or up to 200% of the target shares granted. We currently estimate that 60,32130,692 of the target shares granted will be awarded at 140%, and 54,957 of the target shares granted will be awarded between 4550% and 65%, and 26,320 of the target shares granted will not be awarded70% based upon our expectations as of February 28, 20222023, regarding the achievement of specified performance targets.
(2)Excludes unvested performance share units and unvested restricted stock units under our Long-Term Stock Incentive Plan that can be exercised for no consideration.
(3)Includes 1,228170,150866 shares of Class A Stock under our Employee Stock Purchase Plan remaining available for purchase, of which approximately 2932,500100 shares are subject to purchase during the current offering period.
Item 13. Certain Relationships and Related Transactions, and Director Independence
The information required by this Item is incorporated herein by reference to the Proxy Statement including under those sections of the Proxy Statement to be titled “Director NomineesProposal 1 - Election of Directors,” “TheBoard Leadership Structure,” “Our Board of Directors and Committees of the Board,” and “Certain Relationships and Related Transactions.” The Proxy Statement will be filed within 120 days after the end of our fiscal year.
Item 14. Principal Accountant Fees and Services
The information required by this Item is incorporated herein by reference to the Proxy Statement including under that section of the Proxy Statement to be titled “Proposal 2 – Ratification of the Selection of KPMG LLP as Independent Registered Public Accounting FirmAudit Matters.” The Proxy Statement will be filed within 120 days after the end of our fiscal year.
| | | | | |
Constellation Brands, Inc. FY 20222023 Form 10-K | #WORTHREACHINGFOR I 119122 |
| | | | | | | | |
| PART IV | OTHER KEY INFORMATION | Table of Contents |
Item 15. Exhibits and Financial Statement Schedules
1.Financial Statements
The following consolidated financial statements of the Company are submitted herewith:
Management’s Annual Report on Internal Control Over Financial Reporting
Report of Independent Registered Public Accounting Firm – KPMG LLP
Report of Independent Registered Public Accounting Firm – KPMG LLP
Consolidated Balance Sheets – February 28, 20222023, and February 28, 20212022
Consolidated Statements of Comprehensive Income (Loss) for the years ended February 28, 20222023, February 28, 20212022, and February 2928, 20202021
Consolidated Statements of Changes in Stockholders’ Equity for the years ended February 28, 20222023, February 28, 20212022, and February 2928, 20202021
Consolidated Statements of Cash Flows for the years ended February 28, 20222023, February 28, 20212022, and February 2928, 20202021
Notes to Consolidated Financial Statements
2.Financial Statement Schedules
Schedules are not submitted because they are not applicable or not required under Regulation S-X or because the required information is included in the financial statements or notes thereto.
3.Exhibits required to be filed by Item 601 of Regulations S-K
The information called for by this Item is incorporated by reference from the Index to Exhibits included in this Form 10-K.
Item 16. Form 10-K Summary
None.
| | | | | |
Constellation Brands, Inc. FY 2022 Form 10-K | #WORTHREACHINGFOR I 120 |
INDEX TO EXHIBITS
| | | | | |
| Constellation Brands, Inc. FY 2022 Form 10-K | #WORTHREACHINGFOR I 121 |
| | | | | |
| Constellation Brands, Inc. FY 2022 Form 10-K | #WORTHREACHINGFOR I 122 |
| | | | | |
| Constellation Brands, Inc. FY 2022 Form 10-K2023 Form 10-K |
#WORTHREACHINGFOR I 123 |
| | | | | | | | |
| PART IV | OTHER KEY INFORMATION | Table of Contents |
INDEX TO EXHIBITS | | | | | | | | | | | | | | | | | | | | |
| | | | Incorporated by Reference |
| Exhibit No. | | Exhibit Description | | Form | Exhibit | Filing Date |
| 2.1 | | | | 8-K | 2.1 | August 16, 2018 |
| | | | | | |
| 2.2 | | | | 10-Q | 2.2 | January 9, 2019 |
| | | | | | |
| 3.1 | | | | 8-K | 3.1 | November 10, 2022 |
| | | | | |
| 3.2 | | | | 8-K | 3.2 | November 10, 2022 |
| | | | | | |
| 4.1 | | | | 8-K | 4.1 | April 23, 2012 |
| | | | | |
| 4.2 | | | | 8-K | 4.4 | June 11, 2013 |
| | | | | |
| 4.3 | | | | 10-Q | 4.21 | July 10, 2014 |
| | | | | | |
| 4.4 | | | | 8-K | 4.2 | November 7, 2014 |
| | | | | | |
| 4.5 | | | | 8-K | 4.1 | December 8, 2015 |
| | | | | | |
| 4.6 | | | | 10-K | 4.26 | April 25, 2016 |
| | | | | | |
| 4.7 | | | | 8-K | 4.1 | December 6, 2016 |
| | | | | | |
| 4.8 | | | | 8-K | 4.2 | May 9, 2017 |
| | | | | | |
| 4.9 | | | | 8-K | 4.3 | May 9, 2017 |
| | | | | | |
| 4.10 | | | | 8-K | 4.2 | February 7, 2018 |
| | | | | | |
| 4.11 | | | | 8-K | 4.3 | February 7, 2018 |
| | | | | | |
| 4.12 | | | | 8-K | 4.2 | October 29, 2018 |
| | | | | | |
| 4.13 | | | | 8-K | 4.3 | October 29, 2018 |
| | | | | | |
| 4.14 | | | | 8-K | 4.4 | October 29, 2018 |
| | | | | | |
| 4.15 | | | | 8-K | 4.1 | July 29, 2019 |
| | | | | | |
| | | | | |
Constellation Brands, Inc. FY 20222023 Form 10-K | #WORTHREACHINGFOR I 124 |
| | | | | | | | |
| PART IV | OTHER KEY INFORMATION | Table of Contents |
| | | | | | | | | | | | | | | | | | | | |
| | | | Incorporated by Reference |
| Exhibit No. | | Exhibit Description | | Form | Exhibit | Filing Date |
| 4.16 | | | | 8-K | 4.1 | April 27, 2020 |
| | | | | | |
| 4.17 | | | | 8-K | 4.2 | April 27, 2020 |
| | | | | | |
| 4.18 | | | | 8-K | 4.1 | July 26, 2021 |
| | | | | | |
| 4.19 | | | | 8-K | 4.1 | May 9, 2022 |
| | | | | | |
| 4.20 | | | | 8-K | 4.2 | May 9, 2022 |
| | | | | | |
| 4.21 | | | | 8-K | 4.3 | May 9, 2022 |
| | | | | | |
| 4.22 | | | | 8-K | 4.1 | February 2, 2023 |
| | | | | | |
| 4.23 | | Restatement Agreement, dated as of March 26, 2020 by and among the Company, CB International Finance S.à r.l., certain of the Company’s subsidiaries as guarantors, Bank of America, N.A., as Administrative Agent, and the Lenders party thereto, including the Ninth Amended and Restated Credit Agreement dated as of March 26, 2020, by and among the Company, CB International Financing S.à r.l., Bank of America, N.A., as Administrative Agent, and the Lenders party thereto. † | | 8-K | 4.1 | March 31, 2020 |
| | | | | | |
| 4.24 | | 2020 Term Loan Restatement Agreement, dated as of March 26, 2020, by and among the Company, certain of the Company’s subsidiaries as guarantors, Bank of America, N.A., as Administrative Agent and Lender, including the Amended and Restated Term Loan Credit Agreement, dated March 26, 2020, by and between the Company, Bank of America, N.A., as Administrative Agent and Lender. † | | 8-K | 4.3 | March 31, 2020 |
| | | | | | |
| 4.25 | | | | 10-Q | 4.30 | June 30, 2021 |
| | | | | | |
| 4.26 | | Restatement Agreement, dated as of April 14, 2022, by and among the Company, CB International Finance S.à r.l., Bank of America, N.A., as Administrative Agent, and the Lenders party thereto, including the Tenth Amended and Restated Credit Agreement dated as of April 14, 2022, by and among the Company, CB International Finance S.à r.l., Bank of America, N.A., as Administrative Agent, and the Lenders party thereto. † | | 8-K | 4.1 | April 15, 2022 |
| | | | | | |
| 4.27 | | Amendment No. 2, dated as of April 14, 2022, to Amended and Restated Term Loan Credit Agreement, dated as of March 26, 2020, as amended by Amendment No. 1, dated as of June 10, 2021, by and among the Company and Bank of America, N.A., as Administrative Agent and Lender. † | | 8-K | 4.2 | April 15, 2022 |
| | | | | | |
| 4.28 | | | | 8-K | 4.1 | August 9, 2022 |
| | | | | | |
| 4.29 | | Amendment No. 1, dated as of October 18, 2022, to the Term Loan Credit Agreement, dated as of August 9, 2022, by and among the Company, Bank of America, N.A., as Administrative Agent, and the Lenders party thereto. † | | 8-K | 4.1 | October 26, 2022 |
| | | | | | |
| 4.30 | | Amendment No. 1, dated as of October 18, 2022, to Tenth Amended and Restated Credit Agreement, dated as of April 14, 2022, by and among the Company, CB International Finance S.à r.l., Bank of America, N.A., as Administrative Agent, and the Lenders party thereto. † | | 8-K | 4.2 | October 26, 2022 |
| | | | | | |
| | | | | |
Constellation Brands, Inc. FY 20222023 Form 10-K | #WORTHREACHINGFOR I 125 |
* Designates management contract or compensatory plan or arrangement.
† The exhibits, disclosure schedules, and other schedules, as applicable, have been omitted pursuant to Item 601(a)(5) of Regulation S-K. The Company agrees to furnish supplementally a copy of such exhibits, disclosure schedules, and other schedules, as applicable, or any section thereof, to the SEC upon request.
‡ | | | | | | | | |
| PART IV | OTHER KEY INFORMATION | Table of Contents |
| | | | | | | | | | | | | | | | | | | | |
| | | | Incorporated by Reference |
| Exhibit No. | | Exhibit Description | | Form | Exhibit | Filing Date |
| 4.31 | | Amendment No. 3, dated as of October 18, 2022, to Amended and Restated Term Loan Credit Agreement, dated as of March 26, 2020, as amended by Amendment No. 1, dated as of June 10, 2021, and Amendment No. 2, dated as of April 14, 2022, by and among the Company and Bank of America, N.A., as Administrative Agent and Lender. † | | 8-K | 4.3 | October 26, 2022 |
| | | | | | |
| 4.32 | | | | 8-K | 99.3 | November 10, 2022 |
| | | | | | |
| 10.1 | | | | 8-K | 10.4 | July 20, 2017 |
| | | | | | |
| 10.2 | | | | 8-K | 99.1 | April 5, 2012 |
| | | | | |
| 10.3 | | | | 8-K | 10.1 | May 1, 2014 |
| | | | | | |
| 10.4 | | | | 8-K | 10.1 | April 28, 2016 |
| | | | | | |
| 10.5 | | | | 8-K | 10.1 | April 25, 2017 |
| | | | | | |
| 10.6 | | | | 8-K | 10.1 | April 26, 2018 |
| | | | | | |
| 10.7 | | | | 8-K | 10.1 | April 26, 2019 |
| | | | | | |
| 10.8 | | | | 10-Q | 10.5 | July 1, 2020 |
| | | | | | |
| 10.9 | | | | 8-K | 10.2 | April 26, 2018 |
| | | | | | |
| 10.10 | | | | 8-K | 10.2 | April 26, 2019 |
| | | | | | |
| 10.11 | | | | 10-Q | 10.6 | July 1, 2020 |
| | | | | | |
| 10.12 | | | | 8-K | 10.2 | April 23, 2021 |
| | | | | | |
| 10.13 | | | | 8-K | 10.1 | July 26, 2013 |
| | | | | | |
| 10.14 | | | | 10-K | 10.20 | April 28, 2015 |
| | | | | | |
| | | | | |
Constellation Brands, Inc. FY 2023 Form 10-K | #WORTHREACHINGFOR I 126 |
| | | | | | | | |
| PART IV | OTHER KEY INFORMATION | Table of Contents |
| | | | | | | | | | | | | | | | | | | | |
| | | | Incorporated by Reference |
| Exhibit No. | | Exhibit Description | | Form | Exhibit | Filing Date |
| 10.15 | | | | 10-Q | 10.7 | July 1, 2020 |
| | | | | | |
| 10.16 | | | | 8-K | 99.1 | April 22, 2010 |
| | | | | |
| 10.17 | | | | 8-K | 10.3 | July 31, 2012 |
| | | | | | |
| 10.18 | | | | 8-K | 10.1 | July 25, 2014 |
| | | | | | |
| 10.19 | | | | 8-K | 10.1 | July 22, 2016 |
| | | | | | |
| 10.20 | | | | 8-K | 10.1 | July 20, 2017 |
| | | | | | |
| 10.21 | | | | 10-Q | 10.6 | October 3, 2019 |
| | | | | | |
| 10.22 | | | | 10-Q | 10.7 | October 3, 2019 |
| | | | | | |
| 10.23 | | | | 8-K | 10.1 | March 29, 2018 |
| | | | | | |
| 10.24 | | | | 8-K | 10.1 | July 31, 2012 |
| | | | | | |
| 10.25 | | | | 8-K | 10.2 | October 4, 2018 |
| | | | | |
| 10.26 | | | | 10-K | 10.14 | June 1, 1999 |
| | | | | |
| 10.27 | | | | 10-Q | 10 | July 15, 1999 |
| | | | | | |
| 10.28 | | | | 10-K | 10.20 | May 29, 2001 |
| | | | | |
| 10.29 | | | | 8-K | 99.2 | April 13, 2005 |
| | | | | | |
| 10.30 | | | | 8-K | 99.3 | April 13, 2005 |
| | | | | |
| 10.31 | | | | 10-Q | 10.7 | July 10, 2007 |
| | | | | |
| 10.32 | | | | 10-Q | 10.2 | January 9, 2014 |
| | | | | | |
| 10.33 | | | | 8-K | 10.1 | October 4, 2018 |
| | | | | |
| 10.34 | | | | 8-K | 99.1 | May 21, 2008 |
| | | | | |
| 10.35 | | | | 10-Q | 10.3 | January 5, 2023 |
| | | | | | |
| | | | | |
Constellation Brands, Inc. FY 2023 Form 10-K | #WORTHREACHINGFOR I 127 |
| | | | | | | | |
| PART IV | OTHER KEY INFORMATION | Table of Contents |
| | | | | | | | | | | | | | | | | | | | |
| | | | Incorporated by Reference |
| Exhibit No. | | Exhibit Description | | Form | Exhibit | Filing Date |
| 10.36 | | | | 10-K | 10.57 | April 28, 2015 |
| | | | | | |
| 10.37 | | | | 10-Q | 10.6 | June 28, 2019 |
| | | | | | |
| 10.38 | | | | 10-Q | 10.3 | June 29, 2017 |
| | | | | | |
| 10.39 | | | | 8-K | 10.1 | June 30, 2022 |
| | | | | | |
| 10.40 | | | | 10-Q | 10.4 | January 5, 2023 |
| | | | | | |
| 10.41 | | | | | | |
| | | | | | |
| 10.42 | | | | 8-K | 10.1 | November 10, 2022 |
| | | | | | |
| 10.43 | | | | 10-Q | 10.1 | October 6, 2021 |
| | | | | | |
| 10.44 | | | | 8-K | 10.2 | November 10, 2022 |
| | | | | | |
| 10.45 | | | | | | |
| | | | | | |
| 21.1 | | | | | | |
| | | | | | |
| 23.1 | | | | | | |
| | | | | | |
| 31.1 | | | | | | |
| | | | | | |
| 31.2 | | | | | | |
| | | | | | |
| 32.1 | | | | | | |
| | | | | | |
| 32.2 | | | | | | |
| | | | | | |
| 99.1 | | | | 8-K | 99.1 | July 26, 2013 |
| | | | | | |
| 99.2 | | | | 8-K | 99.1 | April 28, 2016 |
| | | | | | |
| 99.3 | | | | 6-K | 99.4 | April 30, 2019 |
| | | | | | |
| 99.4 | | | | 6-K | 99.3 | April 30, 2019 |
| | | | | | |
| 99.5 | | | | 8-K | 99.2 | October 26, 2022 |
| | | | | | |
| | | | | |
Constellation Brands, Inc. FY 2023 Form 10-K | #WORTHREACHINGFOR I 128 |
| | | | | | | | |
| PART IV | OTHER KEY INFORMATION | Table of Contents |
| | | | | | | | | | | | | | | | | | | | |
| | | | Incorporated by Reference |
| Exhibit No. | | Exhibit Description | | Form | Exhibit | Filing Date |
| 101.INS | | XBRL Instance Document - the instance document does not appear in the Interactive Data File because its XBRL tags are embedded within the Inline XBRL document (filed herewith). | | | | |
| | | | | | |
| 101.SCH | | Inline XBRL Taxonomy Extension Schema Document (filed herewith). | | | | |
| | | | | | |
| 101.CAL | | Inline XBRL Taxonomy Extension Calculation Linkbase Document (filed herewith). | | | | |
| | | | | | |
| 101.DEF | | Inline XBRL Taxonomy Extension Definition Linkbase Document (filed herewith). | | | | |
| | | | | | |
| 101.LAB | | Inline XBRL Taxonomy Extension Labels Linkbase Document (filed herewith). | | | | |
| | | | | | |
| 101.PRE | | Inline XBRL Taxonomy Extension Presentation Linkbase Document (filed herewith). | | | | |
| | | | | | |
| 104 | | Cover Page Interactive Data File (formatted as Inline XBRL and contained in Exhibit 101). | | | | |
* Designates management contract or compensatory plan or arrangement.
† The exhibits, disclosure schedules, and other schedules, as applicable, have been omitted pursuant to Item 601(a)(5) of Regulation S-K. The Company agrees to furnish supplementally a copy of such exhibits, disclosure schedules, and other schedules, as applicable, or any section thereof, to the SEC upon request.
+ Portions of this exhibit arehave been redacted pursuant to Item 601(b)(210)(ii) of Regulation S-K.
+ Portions of this exhibit were redacted pursuant to a confidential treatment request filed with and approved by the SEC pursuant to Rule 24b-2 under the Exchange Activ) of Regulation S-K.
The Company agrees, upon request of the SEC, to furnish copies of each instrument that defines the rights of holders of long-term debt of the Company or its subsidiaries that is not filed herewith pursuant to Item 601(b)(4)(iii)(A) because the total amount of long-term debt authorized under such instrument does not exceed 10% of the total assets of the Company and its subsidiaries on a consolidated basis.
| | | | | |
Constellation Brands, Inc. FY 20222023 Form 10-K | #WORTHREACHINGFOR I 126129 |
SIGNATURES
Pursuant to the requirements of Section 13 or 15(d) of the Securities Exchange Act of 1934, the registrant has duly caused this report to be signed on its behalf by the undersigned, thereunto duly authorized.
| | | | | | | | |
| | |
| CONSTELLATION BRANDS, INC. |
| By: |
/s/ William A. Newlands |
| | April 2120, 20222023 |
| | William A. Newlands
President and Chief Executive Officer |
Pursuant to the requirements of the Securities Exchange Act of 1934, this report has been signed below by the following persons on behalf of the registrant and in the capacities and on the dates indicated.
| | | | | | | | |
/s/ William A. Newlands | | /s/ Garth Hankinson |
| April 2120, 20222023 | | April 2120, 20222023 |
William A. Newlands, Director, President
and Chief Executive Officer (principal
executive officer) | | Garth Hankinson, Executive Vice
President and Chief Financial Officer
(principal financial officer and
principal accounting officer)
|
| | |
| /s/ Robert Sands | | /s/ Richard SandsChristy Clark |
| April 2120, 20222023 | | April 2120, 20222023 |
Robert Sands, Director and
Non-Executive Chairman of the Board | | Richard Sands, Director and
Executive Vice Chairman of the Board |
| | |
| /s/ Christy Clark | | /s/ Jennifer M. Daniels |
| April 21, 2022 | | April 21, 2022 |
| Christy Clark, Director | | Jennifer M. DanielsChristy Clark, Director |
| | |
| /s/ Nicholas I. Fink | | Jennifer M. Daniels | /s/ Nicholas I. Fink |
| April 20, 2023 | | April 20, 2023 |
| Jennifer M. Daniels, Director | | Nicholas I. Fink, Director |
| | |
| /s/ Jeremy S. G. Fowden | | /s/ Ernesto M. Hernández |
| April 2120, 20222023 | | April 2120, 2022 |
| Nicholas Fink, Director | | 2023
| Jeremy S. G. Fowden, Director | | Ernesto M. Hernández, Director |
| | |
| | | | | |
Constellation Brands, Inc. FY 20222023 Form 10-K | #WORTHREACHINGFOR I 127130 |
| | | | | | | | |
| /s/ Ernesto M. HernándezSusan Somersille Johnson | | /s/ Susan Somersille JohnsonJames A. Locke III |
| April 2120, 20222023 | | April 2120, 20222023 |
| Ernesto M. HernándezSusan Somersille Johnson, Director | | Susan Somersille JohnsonJames A. Locke III, Director |
| | |
| /s/ James A. Locke IIIJose Manuel Madero Garza | | /s/ Jose Manuel Madero GarzaDaniel J. McCarthy |
| April 2120, 20222023 | | April 2120, 20222023 |
| James A. Locke IIIJose Manuel Madero Garza, Director | | Jose Manuel Madero GarzaDaniel J. McCarthy, Director |
| | |
| /s/ Daniel J. McCarthyRichard Sands | | /s/ Judy A. Schmeling |
| April 2120, 20222023 | | April 2120, 20222023 |
| Daniel J. McCarthyRichard Sands, Director | | Judy A. Schmeling, Director |
| | |
| | | | | |
Constellation Brands, Inc. FY 20222023 Form 10-K | #WORTHREACHINGFOR I 128131 |