Legal Notice and Disclaimer
This valuation report (the “Report”) has been prepared by CBRE Limited (“CBRE”) exclusively for Morgan Stanley Collateral Valuation Team, Morgan Stanley Bank N.A., Morgan Stanley Mortgage Capital Holdings LLC (the “Client”) in accordance with the terms of engagement entered into between CBRE and the client dated 10 March 2021 (“the Instruction”). The Report is confidential to the Client and any other Addressees named herein and the Client and the Addressees may not disclose the Report unless expressly permitted to do so under the Instruction.
Where CBRE has expressly agreed (by way of a reliance letter) that persons other than the Client or the Addressees can rely upon the Report (a “Relying Party” or “Relying Parties”) then CBRE shall have no greater liability to any Relying Party than it would have if such party had been named as a joint client under the Instruction.
CBRE’s maximum aggregate liability to the Client, Addressees and to any Relying Parties howsoever arising under, in connection with or pursuant to this Report and/or the Instruction together, whether in contract, tort, negligence or otherwise shall not exceed the lower of:
| (i) | 25% of the value of the property to which the Instruction relates (as at the valuation date); or |
| (ii) | €100,000,000 [One Hundred Million Euros]. |
Subject to the terms of the Instruction, CBRE shall not be liable for any indirect, special or consequential loss or damage howsoever caused, whether in contract, tort, negligence or otherwise, arising from or in connection with this Report. Nothing in this Report shall exclude liability which cannot be excluded by law.
If you are neither the Client, an Addressee nor a Relying Party then you are viewing this Report on a non-reliance basis and for informational purposes only. You may not rely on the Report for any purpose whatsoever and CBRE shall not be liable for any loss or damage you may suffer (whether direct, indirect or consequential) as a result of unauthorised use of or reliance on this Report. CBRE gives no undertaking to provide any additional information or correct any inaccuracies in the Report.
If another CBRE Group entity contributes to the preparation of the Report, that entity may co-sign the Report purely to confirm its role as contributor. The Client, Relying Party or any other Addressees named herein acknowledge that no duty of care, whether existing under the Instruction or under the Report, shall extend to such CBRE Group entity and the Client, Relying Party or any other Addressees named herein hereby waive any right or recourse against such CBRE Group entity whether arising in contract, tort, negligence or otherwise. CBRE shall remain solely liable to the client in accordance with the terms of the Instruction
None of the information in this Report constitutes advice as to the merits of entering into any form of transaction.
If you do not understand this legal notice then it is recommended that you seek independent legal advice.

CONTENTS
| PART I | VALUATION REPORT | 4 |
| VALUATION REPORT | 5 | |
| SOURCES OF INFORMATION AND SCOPE OF WORKS | 12 | |
| VALUATION ASSUMPTIONS | 15 | |
| PART II | PROPERTY REPORT | 21 |
| PART III | APPENDICES | |
| APPENDIX A | ||
| TERMS OF ENGAGEMENT LETTER | ||
| APPENDIX B | ||
| SCHEUDLE OF VALUES | ||
| APPENDIX C | ||
| MARKET REPORT | ||
| APPENDIX D | ||
| SUMMARY VALUATION REPORT |
VALUATION REPORT
CBRE Limited
St Martins Court
10 Paternoster Row
London EC4M 7HP
| Switchboard | +44 20 7182 2000 | |
| Fax | +44 20 7182 2273 |
| “This report was prepared for and may be relied upon by Morgan Stanley Bank, N.A., Morgan Stanley Mortgage Capital Holdings LLC, as client but we agree that this report will, subject to that incoming party first signing and returning to CBRE a reliance letter, be capable of being relied upon by the following: | ||
| (a) The respective affiliates of Morgan Stanley Bank, N.A.; | ||
| (b) each Finance Party (under and as defined in the Senior Facilities Agreement (defined below)); | ||
| (c) each Finance Party (under and defined in the Mezzanine Facilities Agreement (defined below)); | ||
| (d) each successor, assignee and/or a transferee of any Finance Party under the Senior Facilities Agreement and/or the Mezzanine Facilities Agreement (each as defined below), | ||
| (e) each issuer, bond or note trustee, security trustee, agent, manager, hedging counterparty, liquidity facility provider or other support provider in connection with any securitisation (or any other transaction having a similar effect) of either a senior facility provided under any Senior Facilities Agreement (defined below) or a mezzanine facility provided under any Mezzanine Facilities Agreement (defined below), | ||
|
each an “Addressee” and together the “Addressees” In this Report: |
| (a) “Senior Facilities Agreement” means the senior facilities agreement to be entered into between, amongst others, MLET Pledgeco Sarl as Senior Company, Morgan Stanley Principal Funding, Inc as Senior Arranger, and CBRE Loan Services Limited as Senior Facility Agent and Common Security Agent; and | ||
| (b) “Mezzanine Facilities Agreement” means the mezzanine facilities agreement to be entered into between, amongst others, MLET Mezzco Sarl as Mezzanine Company, Eagle Holdco S.à r.l and Coscile Investment S.à r.l. as Mezzanine Arrangers, and LaSalle Investment Management as Mezzanine Facility Agent and Mezzanine Security Agent.” |
www.cbre.co.uk
Registered in England No 3536032 Registered Office St Martin’s Court 10 Paternoster Row London EC4M 7HP
CBRE Limited is regulated by the RICS
| The Property | The MStar portfolio as summarised in the schedule of capital values. | |
| Property Description | 49 assets located across Germany and The Netherlands, as summarised in the schedule of capital values. The portfolio predominantly includes logistics, warehouse, industrial or light industrial assets either used in part or featuring ancillary office, commercial (including showroom / trade counter), storage or space designated as other. One asset in the portfolio would be considered an office asset (Nieuwegen). | |
| Ownership Purpose | Investment | |
| Instruction | To value the unencumbered freehold and leasehold interest in the Property on the basis of Market Value as at the Valuation date in accordance with the terms of engagement entered into between CBRE and the addressee dated 10 March 2021. | |
| Valuation Date | 01 February 2021 | |
| Capacity of Valuer | External Valuer, as defined in the current version of the RICS Valuation – Global Standards effective from 31 January 2020. | |
| Purpose | Secured Lending purposes only | |
|
Where you have advised us that the valuation is required for your use in a particular secured lending transaction, we consent to its use solely for that transaction. Where you have not
revealed to us details of a particular lending transaction, we consent to its use only in a single secured lending decision.
|
||
| Market Value | €570,010,000 (Five Hundred and Seventy Million and Ten Thousand Euros) exclusive of VAT. | |
| Special Assumption | €469,860,000 (Four Hundred and Sixty Nine Eight Hundred and Sixty Thousand Euros) exclusive of VAT. | |
| Vacant Possession Value | ||
|
Where a property is owned by way of a joint tenancy in a trust for sale, or through an indirect investment structure, our Valuation represents the relevant apportioned percentage of ownership of the value of the whole property, assuming full management control. Our Valuation does not necessarily represent the ‘Market Value’ (as defined in RICS Valuation - Global Standards 2020) of the interests in the indirect investment structure through which the Property is held. |
||
| Our opinion of Market Value is based upon the Scope of Work and Valuation Assumptions attached, and has been primarily derived using comparable recent market transactions on arm’s length terms. We consider the current use of the assets to be highest and best in the absence of more thorough investigations into the feasibility of alternatives which did not form part of the scope of works, this includes assessing the underlying land value. | ||
| We have valued the Properties individually and no account has been taken of any discount or premium that may be negotiated in the market if all or part of the portfolio was to be marketed simultaneously, either in lots or as a whole. |
| VALUATION REPORT | 7 | |
| Market conditions explanatory note: Novel Coronavirus (COVID-19) | The outbreak of the Novel Coronavirus (COVID-19), declared by the World Health Organisation as a “Global Pandemic” on the 11th March 2020, continues to impact many aspects of daily life and the global economy – with some real estate markets having experienced lower levels of transactional activity and liquidity. Travel, movement and operational restrictions have been implemented by many countries. In some cases, “lockdowns” have been applied – in varying degrees – to reflect further ‘waves’ of COVID-19. While these may imply a new stage of the crisis, they are not unprecedented in the same way as the initial impact. | |
| The pandemic and the measures taken to tackle COVID-19 continue to affect economies and real estate markets globally. Nevertheless, as at the valuation date, property markets are mostly functioning again, with transaction volumes and other relevant evidence at levels where enough market evidence exists upon which to base opinions of value. Accordingly – and for the avoidance of doubt – our valuation is not reported as being subject to ‘material valuation uncertainty’, as defined by VPS 3 and VPGA 10 of the RICS Valuation – Global Standards. | ||
| For the avoidance of doubt this explanatory note has been included to ensure transparency and to provide further insight as to the market context under which the valuation opinion was prepared. In recognition of the potential for market conditions to move rapidly in response to changes in the control or future spread of COVID-19, we highlight the importance of the valuation date. | ||
| Rental Income | The valuation we have provided reflects the rental income as at the date of valuation, as set out within this report, which you have confirmed to be correct and comprehensive. It also reflects any issues concerning the anticipated cash-flow that you have advised us of, as set out within this report. Given the uncertainties relating to the Covid-19 virus and the current restrictions on business activities, it is likely that there will be significant rental defaults and/or insolvencies leading to voids and a resulting shortfall in rental income. Should this occur, there will be a negative impact on the value of the subject property | |
| Suitability of the property as security for mortgage purposes | We have not been provided with details of the loan amount and loan terms proposed and therefore cannot comment on the suitability of the property for the proposed loan. We recommend that the Bank provides us with these details for our comment. | |
| Compliance with Valuation Standards | The valuation has been prepared in accordance with the current version of the RICS Valuation – Global Standards (incorporating the International Valuation Standards) and the UK national supplement 2018. | |
| We confirm that we have sufficient current local and national knowledge of the particular property market involved, and have the skills and understanding to undertake the Valuation competently. | ||
| Where the knowledge and skill requirements of the Red Book have been met in aggregate by more than one valuer within CBRE, we confirm that a list of those valuers has been retained within the working papers, together with confirmation that each named valuer complies with the requirements of the Red Book. | ||
| This Valuation is a professional opinion and is expressly not intended to serve as a warranty, assurance or guarantee of any particular value of the subject property. Other valuers may reach different conclusions as to the value of the subject property. This Valuation is for the sole purpose of providing the intended user with |
| VALUATION REPORT | 8 | |
| the valuer’s independent professional opinion of the value of the subject property as at the Valuation date. | ||
| Assumptions | The Property details on which the Valuation is based are as set out in this report. We have made various assumptions as to tenure, letting, taxation, town planning, and the condition and repair of buildings and sites – including ground and groundwater contamination – as set out below. | |
| If any of the information or assumptions on which the Valuation is based are subsequently found to be incorrect, the Valuation figure may also be incorrect and should be reconsidered. | ||
| Variation from Standard Assumptions | None | |
| Special Assumption – Vacant Possession Value | Special Assumptions have been applied. | |
| As requested, we have prepared a valuation of each asset on the special assumption that they are entirely vacant as at the valuation date. | ||
| Special Assumption – Portfolio Sale | As requested, we have prepared a market valuation of the properties under the following assumption of a portfolio sale: | |
| • That that all the properties will be transferred in a single company transaction and as such will not incur any property transfer tax. | ||
| • That other acquisition costs amount to 2.5%. | ||
| • That the subject properties are the company’s sole assets. | ||
| • That the sale of the properties within the company structure will not trigger any latent capital gains tax liabilities. | ||
| • That the company being purchased has no extraordinary responsibilities and is free of any other liabilities. | ||
| • That the company has no employees. | ||
| • That no discount on the purchase price is agreed to reflect any latent capital gains tax liability in the event of future real estate transactions. | ||
| Verification | We recommend that before any financial transaction is entered into based upon these Valuations, you obtain verification of any third-party information contained within our report and the validity of the assumptions we have adopted. | |
| We would advise you that whilst we have valued the Property reflecting current market conditions, there are certain risks which may be, or may become, uninsurable. Before undertaking any financial transaction based upon this Valuation, you should satisfy yourselves as to the current insurance cover and the risks that may be involved should an uninsured loss occur. | ||
| Valuer | The Property has been valued by a valuer who is qualified for the purpose of the Valuation in accordance with the Red Book. | |
| Previous involvement and Conflicts of Interest | As you are aware, we valued the properties on behalf of RBC Europe Limited in December 2019 for secured lending purposes, albeit the instruction was aborted without being finalised. Prior to that we valued the assets for M7 in December 2016. |
| VALUATION REPORT | 9 | |
|
We have disclosed the relevant facts to you and the other clients involved and have received everyone’s confirmation that there is no issue with us valuing these specific assets as part of the instruction. With
the exception of the above, we confirm that we have had no previous material involvement with the property and that copies of our conflict of interest checks have been retained within the working papers.
|
||||
| Reliance | The contents of this Report may only be relied upon by: | |||
| (i) | Addressees of the Report; and | |||
| (ii) | Parties who have received prior written consent from CBRE in the form of a reliance letter; | |||
|
for the specific purpose set out herein and no responsibility is accepted to any third party for the whole or any part of its contents.
|
||||
|
The Valuation shall be disclosed on a non-reliance basis to:
|
||||
|
● The respective agents, trustees and advisers of the Addressees in connection with the transactions described in paragraph 1 above;
|
||||
|
● the respective affiliates, employees, officers, directors and auditors of the Addressees;
|
||||
|
● any prospective purchaser, transferee or assignee of, participant in, or hedge counterparty in respect of, any related loan made under the Senior Facilities
Agreement and/or Mezzanine Facilities Agreement;
|
||||
|
● any servicer of any loan under the Senior Facilities Agreement and/or the Mezzanine Facilities Agreement, and its advisers;
|
||||
|
● any prospective purchaser of any property or shares in an entity that owns any property either directly or indirectly;
|
||||
|
● to any person to whom disclosure is required by law, court order or regulation in connection with legal or arbitration proceedings;
|
||||
|
● any entity that becomes an agent or senior facility agent on behalf of lender-parties to a credit agreement;
|
||||
|
● to any potential issuer of, or potential investor in, commercial mortgage backed securities issued in connection with either a Senior Facilities Agreement
and/or a Mezzanine Facilities Agreement (each a “CMBS Product”);
|
||||
|
● to any rating agency (actually or prospectively) rating any CMBS Product and to any of their respective directors, officers, employees, representatives,
agents, auditors and professional advisers, provided that any such auditor or professional advisor is bound by professional confidentiality obligations to that rating agency;
|
||||
|
● to any person pursuant to the rules of a stock exchange, listing authority or similar body; and
|
||||
|
● any Governmental, banking, taxation or other regulatory authority.
|
||||
| Publication |
Neither the whole nor any part of our report nor any references thereto may be included in any published document, circular or statement nor published in any way without our prior written approval of the form and context in which it will
appear.
|
|||
|
Such publication of, or reference to this report will not be permitted unless it contains a sufficient contemporaneous reference to any departure from the Red Book or the
incorporation of the special assumptions referred to herein.
|
||||
| VALUATION REPORT | 10 | |
| Yours faithfully | Yours faithfully | ||
| Graham MacMillan | Peter Beatty | ||
| Executive Director | Director | ||
| RICS Registered Valuer | RICS Registered Valuer | ||
| For and on behalf of | For and on behalf of | ||
| CBRE Ltd | CBRE Ltd | ||
| +44 (0)20 7182 2699 | +44 (0)20 7182 2288 | ||
| Graham.macmillan@cbre.com | Peter.beatty@cbre.com | ||
| CBRE | |||
| St Martins Court | |||
| 10 Paternoster Row | |||
| London | |||
| EC4M 7HP |
| CBRE – Valuation & Advisory Services | ||
| T: | 020 7182 2000 | |
| F: | 020 7182 2273 | |
| W: | www.cbre.co.uk | |
| VALUATION REPORT | 11 | |
| PORTFOLIO: | MSTAR | ||||||
| ON BEHALF OF: | MORGAN STANLEY | ||||||
| VALUATION DATE: | 01/02/2021 | ||||||
| SCHEDULE OF CAPITAL VALUES | |||||||
| Property Name | Prop ID | Address | Currency | Tenure | Market
Value (01/02/2021) |
Vacant Possession Value (01/02/2021) |
|
| GERMANY | |||||||
| Adam Opel Strasse 12 | deadam | Adam Opel Strasse 12, Frankfurt, 60386, Germany | EUR | Freehold | 28,000,000 | 23,250,000 | |
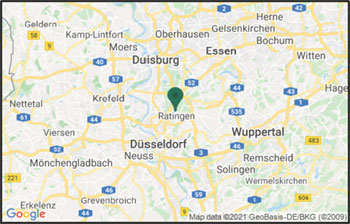
| Aircom Parc | deairc | Aircom Parc, Ratingen, 40880, Germany | EUR | Freehold | 23,075,000 | 19,100,000 | |
| Albert-Einstein-Strasse 1 | dealbe | Albert-Einstein-Strasse 1, Erkrath, 40699, Germany | EUR | Freehold | 19,075,000 | 15,275,000 | |
| Donatusstrasse 127-129 | dedona | Donatusstrasse 127-129, Pulheim, 50259, Germany | EUR | Freehold | 13,500,000 | 10,000,000 | |
| Feldbachacker 4 | defeld | Feldbachacker 4, Dortmund, 44149, Germany | EUR | Freehold | 8,470,000 | 7,090,000 | |
| Feldheider Strasse 37-45 / 38-78 | defelh | Feldheider Strasse 37-45 / 38-78, Erkrath, 40699, Germany | EUR | Freehold | 16,700,000 | 13,125,000 | |
| Fuggerstrasse 2-6 | defugg | Fuggerstrasse 2-6, Neuss, 41468, Germany | EUR | Freehold | 15,450,000 | 12,400,000 | |
| Gewerkenstrasse 13 | degewe | Gewerkenstrasse 13, Herne, 44628, Germany | EUR | Freehold | 3,440,000 | 2,810,000 | |
| Gobietstrasse 8 | degobi | Gobietstrasse 8, Kassel, 34123, Germany | EUR | Freehold | 9,240,000 | 7,880,000 | |
| Graf-Landsberg-Str. 3,5,9 | degraf | Graf-Landsberg-Str. 3,5,9, Neuss, 41460, Germany | EUR | Freehold | 8,720,000 | 7,230,000 | |
| Hamburger Strasse 17-22 | dehamb | Hamburger Strasse 17-22, Dormagen, 41540, Germany | EUR | Freehold | 14,200,000 | 11,650,000 | |
| Harkortstrasse 12-32 | dehark | Harkortstrasse 12-32, Ratingen, 40880, Germany | EUR | Freehold | 8,780,000 | 6,920,000 | |
| Hertzstr. 2 | dehert01 | Hertzstr. 2, Herrenberg, 71083, Germany | EUR | Freehold | 3,480,000 | 2,780,000 | |
| Hertzstr. 4 | dehert02 | Hertzstr. 4, Herrenberg, 71083, Germany | EUR | Freehold | 12,050,000 | 9,870,000 | |
| Im Boden | deimbo | Im Boden, Hattersheim am Main, 65795, Germany | EUR | Freehold | 4,240,000 | 3,440,000 | |
| Josef-Beyerle-Str. 16 | dejose | Josef-Beyerle-Str. 16, Weil der Stadt, 71263, Germany | EUR | Freehold | 8,060,000 | 6,630,000 | |
| Kelterstr. 67 | dekelt | Kelterstr. 67,, Unterensingen, 72669, Germany | EUR | Freehold | 6,040,000 | 5,270,000 | |
| Kohlstrasse 8 | dekohl | Kohlstrasse 8, Koln, 50827, Germany | EUR | Freehold | 22,375,000 | 18,000,000 | |
| Kolenbeekstieg 1, 2-6 | dekole | Kolenbeekstieg 1, 2-6, Stelle, 21435, Germany | EUR | Freehold | 22,800,000 | 18,900,000 | |
| Kornwestheimer Str. 54 | dekorn | Kornwestheimer Str. 54, Korntal-Münchingen, 70825, Germany | EUR | Freehold | 12,475,000 | 10,200,000 | |
| Rontgenstrasse 3/7 | deront | Rontgenstrasse 3/7, Darmstadt, 64291, Germany | EUR | Freehold | 20,050,000 | 14,150,000 | |
| Siemensstr. 25 | desiem | Siemensstr. 25, Korntal-Münchingen, 70825, Germany | EUR | Freehold | 3,460,000 | 3,460,000 | |
| Germany: Sub-Total | - | EUR | 283,680,000 | 229,430,000 | |||
| ON BEHALF OF: | MORGAN STANLEY | ||||||
| VALUATION DATE: | 01/02/2021 | ||||||
| SCHEDULE OF CAPITAL VALUES | |||||||
| Property Name | Prop ID | Address | Currency | Tenure | Market
Value (01/02/2021) |
Vacant Possession Value (01/02/2021) |
|
| NETHERLANDS | |||||||
| Abraham van Stolkweg 62 | nlabst | Abraham van Stolkweg 62, Rotterdam, 3041 JA, Netherlands | EUR | Freehold | 20,475,000 | 17,675,000 | |
| Argonstraat 22-112 | nlargo01 | Argonstraat 22-112, Zoetermeer, 2718 SM, Netherlands | EUR | Freehold | 10,450,000 | 9,000,000 | |
| Argonstraat 116-166 | nlargo02 | Argonstraat 116-166, Zoetermeer, 2718 SM, Netherlands | EUR | Freehold | 3,220,000 | 2,680,000 | |
| Breguetlaan 67 | nlbreg | Breguetlaan 67, Oude Meer, 1438 BD, Netherlands | EUR | Freehold | 23,400,000 | 19,550,000 | |
| Bunsenstraat 13-23 | nlbuns | Bunsenstraat 13-23, Dordrecht, 3316 GC, Netherlands | EUR | Freehold | 6,730,000 | 5,470,000 | |
| Elftweg 32-54 | nlelft | Elftweg 32-54, Raamsdonksveer, 4941 VP, Netherlands | EUR | Freehold | 3,790,000 | 2,910,000 | |
| Energieweg 75-81 | nleneg | Energieweg 75-81, Zoeterwoude, 2382 NH, Netherlands | EUR | Freehold | 3,690,000 | 3,170,000 | |
| Energieweg 39-41 | nlengie | Energieweg 39-41, Zoeterwoude, 2382 NH, Netherlands | EUR | Freehold | 3,440,000 | 2,820,000 | |
| Goeseelsstraat 6-21 | nlgoes | Goeseelsstraat 6-21, Breda, 4817 MV, Netherlands | EUR | Freehold | 3,190,000 | 2,560,000 | |
| Groot Mijdrechtstraat 37-39 | nlgroo | Groot Mijdrechtstraat 37-39, Mijdrecht, 3641 RV, Netherlands | EUR | Freehold | 10,075,000 | 8,660,000 | |
| Haarlemmerstraatweg 81-137 | nlhaar | Haarlemmerstraatweg 81-137, Halfweg, 1165 MK, Netherlands | EUR | Freehold | 27,600,000 | 24,600,000 | |
| Havenweg 23-40/2-8 Martin Over | nlhave | Havenweg 23-40, 2-8 Martin Ovenweg 1-16, Utrecht, 3555 HZ, Netherlands | EUR | Freehold | 9,310,000 | 7,370,000 | |
| Jarmuiden 22-58 | nljarm | Jarmuiden 22-58, Amsterdam, 1046 AD, Netherlands | EUR | Leasehold | 16,150,000 | 12,725,000 | |
| Kamerlingh Onnesweg 2 | nlkame | Kamerlingh Onnesweg 2, Vianen, 4131 PK, Netherlands | EUR | Freehold | 6,560,000 | 6,450,000 | |
| Lakenblekerstraat 30-62 | nllake | Lakenblekerstraat 30-62, Aalsmeer, 1431 GG, Netherlands | EUR | Freehold | 13,225,000 | 11,100,000 | |
| Mon Plaisir 102-104 | nlmonp | Mon Plaisir 102-104, Etten-Leu, 4879 AT, Netherlands | EUR | Freehold | 3,130,000 | 2,770,000 | |
| Nieuwe Hemweg 20-62 | nlnieu | Nieuwe Hemweg 20-62, Amsterdam, 1013 CX, Netherlands | EUR | Leasehold | 14,425,000 | 13,675,000 | |
| Osloweg 1-107 | nloslo | Osloweg 1-107, Groningen, 9723 BE, Netherlands | EUR | Freehold | 31,000,000 | 22,425,000 | |
| Pampuslaan 96 | nlpamp | Pampuslaan 96, Weesp, 1382 JR, Netherlands | EUR | Freehold | 6,280,000 | 5,170,000 | |
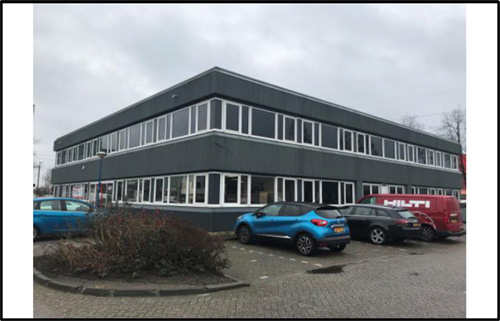
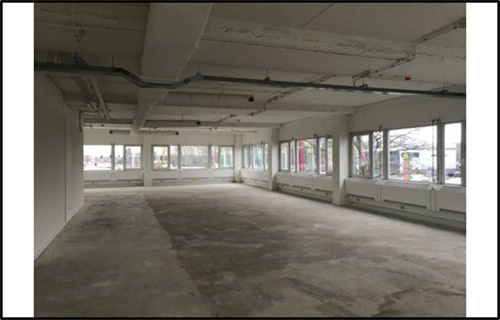
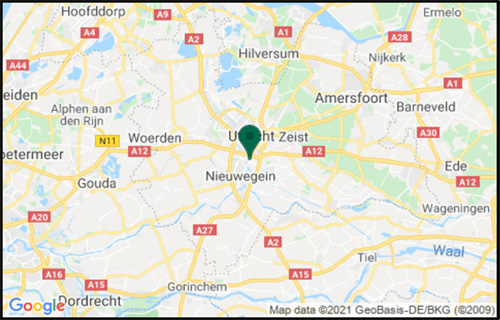
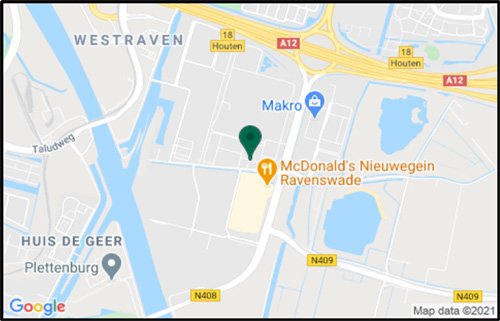
| Ravenswade 54-56 | nlrave | Ravenswade 54-56, Nieuwegein, 3439 LD, Netherlands | EUR | Freehold | 3,220,000 | 2,570,000 | |
| Rijnkade 15-17 | nlrijn | Rijnkade 15-17, Weesp, 1382 GS, Netherlands | EUR | Freehold | 3,770,000 | 3,160,000 | |
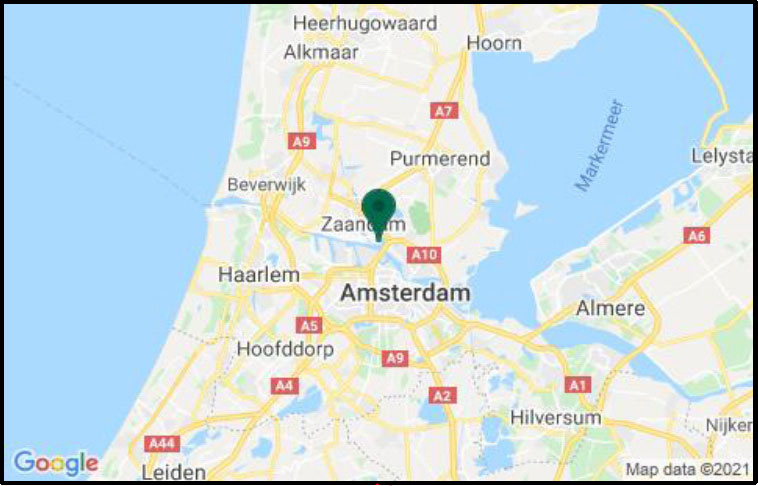
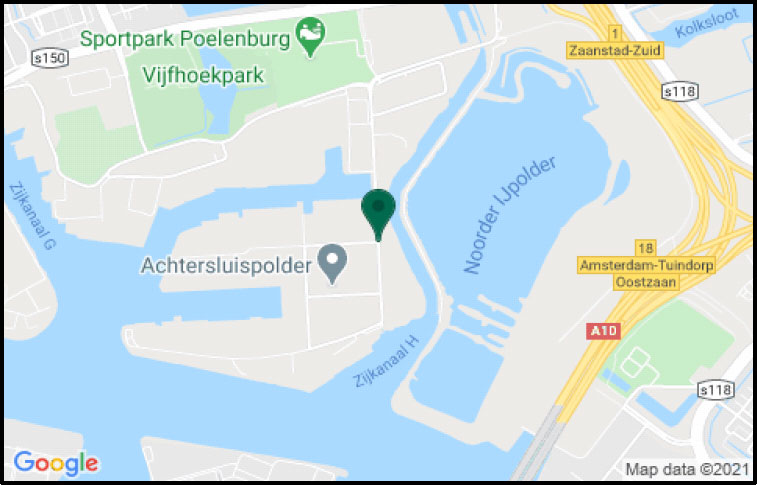
| Sluispolderweg | nlslui | Sluispolderweg, Zaandam, 1505 HJ, Netherlands | EUR | Leasehold | 15,150,000 | 12,300,000 | |
| Stepvelden 1-19 | nlstep | Stepvelden 1-19, Roosendaal, 4704 RM, Netherlands | EUR | Freehold | 5,150,000 | 4,240,000 | |
| Strijkviertel | nlstri | Strijkviertel, Utrecht, 3454 PJ, Netherlands | EUR | Freehold | 9,220,000 | 7,550,000 | |
| Stuttgartstraat | nlstru | Stuttgartstraat, Rotterdam, 3047 AS, Netherlands | EUR | Leasehold | 27,200,000 | 24,575,000 | |
| Weidehek 64-70 | nlweid | Weidehek 64-70, Breda, 4824 AS, Netherlands | EUR | Freehold | 3,230,000 | 2,485,000 | |
| Wilgenkade 5-25 | nlwilg | Wilgenkade 5-25, Houten, 3992 LL, Netherlands | EUR | Freehold | 3,250,000 | 2,770,000 | |
| Netherlands: Sub-Total | EUR | 286,330,000 | 240,430,000 | ||||
| TOTAL | EUR | 570,010,000 | 469,860,000 | ||||
SOURCES OF INFORMATION AND SCOPE OF WORKS
| Sources of Information | We have carried out our work based upon information supplied to us by RBC Europe Limited and Morgan Stanley Bank, N.A., understood to have been prepared by Eastdil, Blackstone and other advisors, as set out within this report, which we have assumed to be correct and comprehensive. | |
| Tenancy and Property Related Information |
| - | Detailed tenancy schedule titled ‘Project MStar – November 2020 TS’ |
| - | Revised tenancy schedule titled ‘MStar_TS_30 11 20 EXT v1’ |
| - | Updated status of expiring leases titled ‘Confidential – Mstar_Lease Status’ |
| - | Schedule confirming physical state of asset since inspection titled ‘Confidential – Mstar_Physical State of Assets’ |
| - | Additional information to supplement the tenancy schedule was provided through a query process. |
| Technical Due Diligence |
| - | TDD capital expenditure sourced from a schedule titled ‘MStar Cash Flows 20210119_DRAFT’. |
| - | Draft TDD schedule prepared by Arcadis dated December 2019 titled ‘Project MStar NL & GE - Risk Schedule & Capex - 11.12.2019’. |
| Legal Due Diligence |
| - | Draft version of a Legal Red Flag Report for the Dutch assets prepared by Loyens Loeff, dated 12 February 2021 for The Blackstone Group International Partners LLP |
| - | Draft version of a Legal Red Flag Report for the German assets prepared by Hengeler Mueller, dated 05 February 2021 for The Blackstone Group International Partners LLP |
| Environmental |
| - | Draft Phase 1 Environmental Review reports prepared by Ambiente Ltd, dated December 2019 and January 2020. | |
| - | Summary of Priority Sites with the schedule titled ‘MLET_NL_DE_Env_Summary_FV_010221’. |
| The Property | Our report contains a brief summary of the Property details on which our Valuation has been based. | ||
| Revaluation without Inspection | As instructed, we have not re-inspected the properties for the purpose of this valuation. A schedule of the most recent inspection dates is maintained within our working papers and can be made available if required. We have also stated the most recent date of inspection (December 2019 and January 2020) within the individual property reports. With the exception of three assets summarised below, the owner has confirmed through provision of a schedule that they are not aware of any material changes to the physical attributes of the properties, or the nature of their location, since the last inspection. We have assumed this advice to be correct. | ||
| SOURCES OF INFORMATION AND SCOPE OF WORKS | 12 |
|
| Asset name | Confirmation of no material change of physical state | Comment | ||||
| Aircom Parc | Not confirmed | Changed the windows due to water leakage. | ||||
| Gobietstrasse 8 | Not confirmed | New Roof is being installed, due to leakage in the roof. | ||||
| Kolenbeekstieg 1, 2-6 | Not confirmed | New Roof, due to leakage in the roof. | ||||
| Areas | We have not measured the Properties but have relied upon the floor areas provided to us by the borrower as set out in this report, which we have assumed to be correct and comprehensive and measured in accordance with the latest edition of the RICS Property Measurement standards. | |
| Environmental Matters | We have been provided with Draft Phase 1 Environmental Review reports prepared by Ambiente Ltd, dated December 2019 and January 2020. We have not been provided with updated version of the same. We have reviewed a schedule (referenced in the sources of information) summarising the Priority sites in relation to the below assets. Based on the asset manager comments included therein and assuming that the corresponding action is taken as stated, we are satisfied that the issues are addressed and have therefore assumed these items would not have a material impact on our opinion of value. |
| Asset | Issue | |
| Groot Mijdrechtstraat 37-39, Mijdrecht | Asbestos removal / remediation or survey undertaken | |
| Osloweg 1-107, Groningen | Asbestos remediation, management plan | |
| Pampuslaan 96,118,126 & Hogeweyselaan 97,101,105,119, Weesp | Asbestos remediation | |
| Sluispolderweg 2, 4 & 8, Zaandam | Asbestos works Remediation of historical contamination | |
| Adam-Opel-Str & Ferdinand-Porsche-Str Frankfurt am Main | Asbestos Management and remediation | |
| Aircom Park, Ratingen | Asbestos Management and remediation | |
| Albert-Einstein-Strasse 1, Erkrath | Decommissioning certificates for 2 disused heating oil USTs | |
| SOURCES OF INFORMATION AND SCOPE OF WORKS | 13 |
|
| Gobietstraße 8, Kassel | Decommission oil fired heating system, underground storage tank and pipework and associated pipes | |
| Im Boden 23, Hattersheim am Main | Asbestos Integrity testing on the heating oil tank | |
| Kelterstrasse 67, Unterensingen | Integrity testing on underground storage tanks and pipework | |
| We have not carried out any investigation into the past or present uses of the Property, nor of any neighbouring land, in order to establish whether there is any potential for contamination and have therefore assumed that none exists. | ||
| Services and Amenities | We understand that all main services including water, drainage, electricity and telephone are available to the property. None of the services have been tested by us. | |
| Repair and Condition | We have seen a copy of Technical Due Diligence costs which we understand were prepared by Arcadis. | |
| Town Planning | To the extent possible, we have made planning enquiries only consulting the respective websites, We cannot, therefore, accept responsibility for incorrect information or for material omissions in the information supplied to us. Based on our understanding, the assets would appear to adhere to their designated use. | |
| Titles, Tenures and Lettings | Details of title/tenure under which the Property is held and of lettings to which it is subject are as supplied to us. We have not generally examined nor had access to all the deeds, leases or other documents relating thereto. Where information from deeds, leases or other documents is recorded in this report, it represents our understanding of the relevant documents. We should emphasise, however, that the interpretation of the documents of title including relevant deeds, leases and planning consents is the responsibility of your legal adviser. | |
| We have not conducted credit enquiries on the financial status of any tenants. We have, however, reflected our general understanding of purchasers’ likely perceptions of the financial status of tenants. |
| SOURCES OF INFORMATION AND SCOPE OF WORKS | 14 |
|
| Capital Values | The Valuation has been prepared on the basis of “Market Value”, which is defined in the Red Book as: | |
| “The estimated amount for which an asset or liability should exchange on the Valuation date between a willing buyer and a willing seller in an arm’s-length transaction, after proper marketing and where the parties had each acted knowledgeably, prudently and without compulsion.” | ||
| The valuation represents the figure that would appear in a hypothetical contract of sale at the valuation date. No adjustment has been made to this figure for any expenses of acquisition or realisation - nor for taxation which might arise in the event of a disposal. | ||
| No account has been taken of any inter-company leases or arrangements, nor of any mortgages, debentures or other charge. | ||
| No account has been taken of the availability or otherwise of capital based Government or European Community grants. | ||
| Rental Values | Unless stated otherwise rental values indicated in our report are those which have been adopted by us as appropriate in assessing the capital value and do accord with the definition of Market Rent in the Red Book, which is as follows: | |
| “The estimated amount for which an interest in real property should be leased on the Valuation date between a willing lessor and a willing lessee on appropriate lease terms in an arm’s-length transaction, after proper marketing and where the parties had each acted knowledgeably, prudently and without compulsion.”. | ||
| The Property | Where appropriate we have regarded the shop fronts of retail and showroom accommodation as forming an integral part of the building. | |
| Landlord’s fixtures such as lifts, escalators, central heating and other normal service installations have been treated as an integral part of the building and are included within our Valuations. | ||
| Process plant and machinery, tenants’ fixtures and specialist trade fittings have been excluded from our Valuations. | ||
| All measurements, areas and ages quoted in our report are approximate. | ||
| Environmental Matters | In the absence of any information to the contrary, we have assumed that: | |
| a) the property is not contaminated and is not adversely affected by any existing or proposed environmental law; | ||
| b) any processes which are carried out on the property which are regulated by environmental legislation are properly licensed by the appropriate authorities. | ||
| c) the property is either not subject to flooding risk or, if it is, that sufficient flood defences are in place and that appropriate building insurance could be obtained at a cost that would not materially affect the capital value. | ||
| d) invasive species such as Japanese Knotweed are not present on the Property. | ||
| VALUATION ASSUMPTIONS | 15 | |
| Repair and Condition | In the absence of any information to the contrary, we have assumed that: | |
| [a] there are no abnormal ground conditions, nor archaeological remains, present which might adversely affect the current or future occupation, development or value of the property; | ||
| [b] the property is free from rot, infestation, structural or latent defect; | ||
| [c] no currently known deleterious or hazardous materials or suspect techniques have been used in the construction of, or subsequent alterations or additions to, the property; and | ||
| [d] the services, and any associated controls or software, are in working order and free from defect. | ||
| We have otherwise had regard to the age and apparent general condition of the property. Comments made in the property details do not purport to express an opinion about, or advise upon, the condition of uninspected parts and should not be taken as making an implied representation or statement about such parts. | ||
| Title, Tenure, Lettings, Planning, Taxation and Statutory & Local Authority requirements | Unless stated otherwise within this report, and in the absence of any information to the contrary, we have assumed that: | |
| (a) the property possesses a good and marketable title free from any onerous or hampering restrictions or conditions; | ||
| (b) the building has been erected either prior to planning control, or in accordance with planning permissions, and has the benefit of permanent planning consents or existing use rights for their current use; | ||
| (c) the property is not adversely affected by town planning or road proposals; | ||
| (d) the building complies with all statutory and local authority requirements including building, fire and health and safety regulations, and that a fire risk assessment and emergency plan are in place; | ||
| (e) all rent reviews are upward only and are to be assessed by reference to full current market rents; | ||
| (f) there are no tenant’s improvements that will materially affect our opinion of the rent that would be obtained on review or renewal; | ||
| (g) tenants will meet their obligations under their leases, and are responsible for insurance, payment of business rates, and all repairs, whether directly or by means of a service charge; | ||
| (h) there are no user restrictions or other restrictive covenants in leases which would adversely affect value; | ||
| (i) where appropriate, permission to assign the interest being valued herein would not be withheld by the landlord where required; | ||
| (j) vacant possession can be given of all accommodation which is unlet or is let on a service occupancy. |
| VALUATION ASSUMPTIONS | 16 | |
VALUATION METHODOLOGY
We have summarised general comments regarding the valuation methodology and approach below, which may in part also be referenced within the individual property reports:
For all assets within the portfolio, we have arrived at our opinion of value adopting the Traditional investment capitalisation method of valuation. Within this approach, we have applied an income weighted average equivalent yield to our opinion of net income, reflecting the comparable evidence within the market for guidance on capital rates and values per sq m. This has been selected as the primary method given the fundamentals of this portfolio providing standard investment assets within the corresponding sector and the specified choice of our selected method was not a requirement within the scope of works. The DCF (Discounted Cashflow) method is an equally suitable alternative, albeit we have not assessed values under this method as part of this instruction.
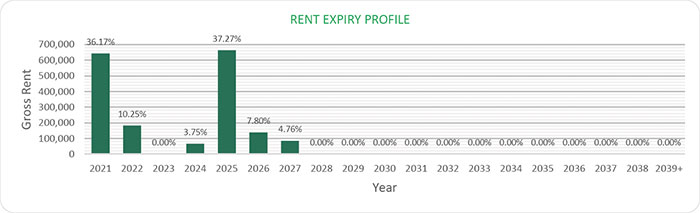
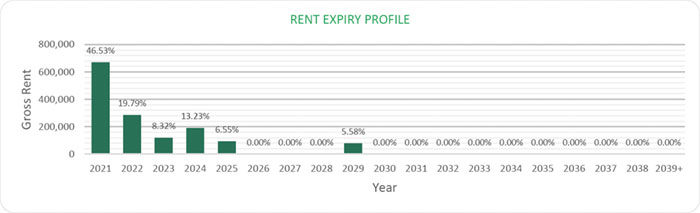
We have based the current tenancy / income profile on the excel schedules provided as summarised within the Source of Information. Upon expiry, we assume that the space would be re-let on similar lease terms at our opinion of Market Rent. The assumptions in relation to voids and costs as summarised below are aligned with common market practice in each jurisdiction. Within the traditional method of valuation, aside from those stated below, we do not allow for extensive or recurring explicit costs within the cashflow given the underlying implicit approach derived from the traditional method of valuation.
As referenced above, we have considered comparable market rental and sales evidence to the extent it is available. Limitations of transparency in this regard, particularly within the German market, can restrict both the number of transactions we are able to reference and the level of available detail. We have provided evidence of which we are aware within the individual property reports, based primarily on a combination of asset type, location, date of the transaction and income profile. The primary check is on yield if we are able to analyse the income credentials, whilst using the capital rate per sq m as either an alternative benchmark or a sense check.
In terms of sale period, we would assume a range of between 6-15 months for the German assets and ranged between 3 to 6 and 9 to 12 months for The Netherlands.
Void, Rent Free and Cost Assumptions
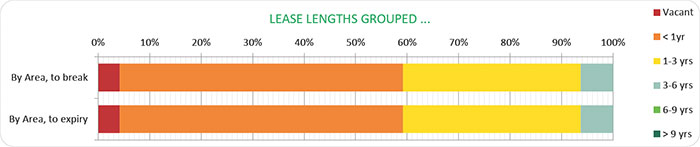
In approaching our valuation, we have adopted current voids over vacant space ranging between 3 and 18 months, inclusive of rent-free allowance. Three assets have a void of between 3 and 6 months reflecting the re-letting prospects, including Stuttgartstraat, Argonstraat 116-166 and Breguetlaan 67, whilst the remainder of assets with vacant space have a current void of at least 12 months. We have only applied explicit voids where we are aware of tenancy risks. This includes adopting an expiry to four assets ranging between 3 and 12 months, including Energieweg 75-81, Havenweg 23-40, Ravenswade 54-56 and Strijkviertel. For the remainder of the portfolio we have not made allowances for explicit expiry voids on short term income given the largely multi-let nature of the portfolio which will likely be accustomed to tenant turnover, with a tendency for short term lease agreements and given the positive occupational sentiment within the Industrial and Logistics sector at present. Where current and expiry voids have been incorporated, an additional allowance for costs as a revenue deduction for the duration of the void has been factored within our valuation as summarised below.
Capital expenses within our valuation include outstanding current rent-free periods or step rent adjustments, based on the rent roll provided, dated 30 November 2020, which we assume to be correct. We have also included the immediate and short-term (0-5 years) capital expenditure requirements as assessed by Arcadis, less 2020 spend, as a one-off capital cost effective from the valuation date. In relation to three of the four assets which are held by way of a leasehold title, we have either allowed for the annual ground rent deduction as a revenue cost (Nieuw Hemweg and Sluispolderweg) or a capital expense to ‘buy off’ the ground rent as a discounted bulk sum in the future (Jarmuiden). Assumptions applied against the current or expiry voids include letting fees as a percentage of rental value upon renewal or re-letting (equating to 10 to 25% of rental value). For the German assets, we have applied a separate Tenant Incentive capital expense as a proportionate rate per sq m (between €10 and €50 per sq m) on renewal or re-letting as would be anticipated within the market.
We have incorporated consistent allowances for general non-recoverable revenue costs within our valuations for each country, as summarised within the individual property reports, in accordance with local market practice
| VALUATION METHODOLOGY | 17 | |
and experience of similar assets. For The Netherlands, this includes allowances for certain explicit costs, whilst German costs are more general. The majority of costs remain unchanged against each property with the exception of Maintenance applied to German assets which varies depending on a combination of perceived asset condition, age of the property and correspondence with the borrower. Maintenance has been deferred by 5 years given the allowance for immediate and short-term capital expenditure. It is therefore not factored within the day 1 cost totals.
| Country | Cost |
| Netherlands & Germany | Management (annual rate equating to 2% of rental value); |
| Netherlands and Germany | Maintenance (Annual rates of €1.75 to €6 per sq m deferred by 5 years); |
| Netherlands | Management Costs on Voids (annual rate equating to 2% of rental value until lease start); |
| Netherlands | Property Tax (annual rate equating to 2% of rental value); |
| Netherlands | Water Tax (annual rate equating to 0.25% of rental value); |
| Netherlands | Insurance (annual rate equating to 1.25% of rental value); |
| Netherlands | Sewage Charge (annual rate equating to 0.25% of rental value; |
| Germany | Other costs (annual rate of 0.5% of rental value); |
| Germany | Non-Recoverable on Voids (monthly rates of €0.50 to €1 per sq m until lease start). |
Purchasers Costs
Assuming a standard property disposal, the total purchasers costs including agents and legal fees, as a proportion of the Market Value, adopted in Netherlands equate to 9% and in Germany equates to a range of between 6.25% and 12%, with variation depending on the specific region.
| VALUATION METHODOLOGY | 18 | |
MARKET VALUE - SPECIAL ASSUMPTION OF A PORTFOLIO SALE
You have also asked us to consider the value should the Portfolio transact as a whole. Portfolio and platform trades have been increasingly common in the market place in recent years, for this asset class in particular. Whether a portfolio holds a premium to individual asset value or not, is specific to individual purchasers. It is very subjective, not something readily evidenced as all purchasers will interpret separately, therefore it is very difficult to quantify. That said, when a portfolio does trade as a whole, it is usually as a corporate structure which would benefit from reduced transaction costs, no asset level transfer tax or equivalent although other costs are incurred. In this case we are able to compare the portfolio trades which have taken place in the market.
With these in mind, we have also valued the portfolio under the special assumption of a corporate portfolio transaction, benefiting from reduced transaction costs – assuming transaction costs equating to 2.5% of Market Value. This would include fees in relation services from advisors including agents, legals and other (including taxation).
On such a basis, the Market Value on the Special Assumption of a Portfolio sale as at the Valuation Date, 01 February 2021 is:
€603,200,000 (Six Hundred and Three Million Two Hundred Thousand Euros) exclusive of VAT.
We are confident that if the portfolio were introduced to the market as a whole there would be a significant level of interest in it, the potential buyers however being different pools of equity to those interested in individual assets.
| MARKET VALUE - SPECIAL ASSUMPTION OF A PORTFOLIO SALE | 19 | |
PROPERTY REPORTS
| PROPERTY ID: | deadam - Adam Opel Strasse 12 | |
| ON BEHALF OF: | MORGAN STANLEY | |
| VALUATION DATE: | 01-Feb-2021 | FINAL |
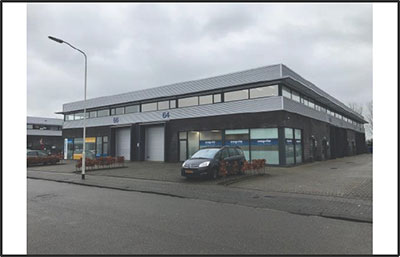
Adam Opel Strasse 12 - Adam Opel Strasse 12, Frankfurt, 60386, Germany


| VALUATION METRICS | (currency - EUR) |
| Metric | Value |
| Market Value | 28,000,000 |
| Market Value (per sq m) | 925 |
| Net Initial Yield | 4.36% |
| Reversionary Yield | 5.38% |
| Equivalent Yield | 4.80% |
| Gross Income (p.a.) | 1,386,502 |
| Gross Income (p.a.) (per sq m) | 46 |
| *Adj. Gross Income | 1,386,502 |
| Adj. Gross Income (per sq m) | 46 |
| Net Income (p.a.) | 1,313,072 |
| Net Income (p.a.) (per sq m) | 43 |
| Gross Rental Value | 1,748,484 |
| Gross Rental Value (per sq m) | 58 |
| Capital Expenditure | -3,506,086 |
| Transaction Costs | 7.51% |
| Over / Under Rented | -3.45% |
KEY FACTS
| Metric | Value | |
| Total Area (sq m) | 30,273 | |
| WAULT to Break by Rent | 2.47 | |
| WAULT to Break by ERV | 2.53 | |
| WAULT to Expiry by Rent | 2.47 | |
| WAULT to Expiry by ERV | 2.53 | |
| Percentage of Vacancy (Area) | 16.36% | |
| Percentage of Vacancy (ERV) | 17.87% | |
| ** | Number of Tenants | 39 |
| Current Voids (months) | 12 | |
| * Adjusted Gross Income equates to the Gross Income excluding any rent free periods | |
| LEASES RANKED BY RENT | ** Total tenant lines within our valuation. May differ to number of individual tenants |
| Printed 09/03/2021 19:42 | |
| PROPERTY ID: | deadam - Adam Opel Strasse 12 | |
| ON BEHALF OF: | MORGAN STANLEY | |
| VALUATION DATE: | 01-Feb-2021 | FINAL |
| Printed 09/03/2021 19:42 | |
| ON BEHALF OF: | MORGAN STANLEY |
| PROJECT NAME: | MSTAR |
PROPERTY REPORT
60386 FRANKFURT, ADAM-OPEL-STRASSE 12
| INSPECTED BY: | INSPECTION DATE: | VALUATION DATE: | PROPERTY TYPE |
| MARIA CHIGRYAY | 13/01/20 | 01/02/21 | WAREHOUSE |
KEY VALUATION FACTORS
| STRENGTHS | WEAKNESSES |
|
■ Strong local economy and above-average purchasing power within macro location;
■ Excellent location within the important logistics region Rhine−Main/Frankfurt;
■ Situated centrally with good connection to road, motorway network and public transportation;
■ Established commercial area within the city;
■ Diversified multi-let income profile. |
■ High vacancy rate of around 16% (by area);
■ Limited third-party usability;
■ Outdated fit-out of let areas does not meet current market requirements;
■ WAULT of less than 3 years.
■ Potential pre-emption right in favour of the City of Frankfurt.
|
| OPPORTUNITIES | THREATS |
|
■ The continuing positive development of the overall economy could lead to an increase in achievable rents;
■ High redevelopment potential due to excellent location with demand from a wide range of sectors;
■ Improvement of income profile by letting vacant spaces and re-letting occupied units on market terms. |
■ Significant capital expenditure could be incurred in the near future (due to advanced building age). |
LOCATION & SITUATION
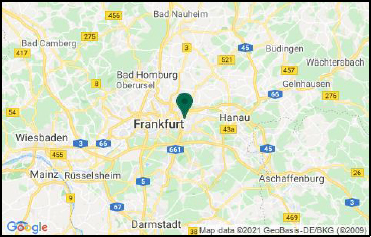
| LOCATION | Frankfurt am Main is considered the most important banking and finance location in Germany. The concentration of firms from this sector has resulted in its leading position on the office market, which was the first in Germany to achieve international status. The city is also dominated by “ Messe Frankfurt”, with its leading international trade fairs in the automotive and book industries among others. Frankfurt Airport serves as a major international hub for freight |
| ON BEHALF OF: | MORGAN STANLEY |
| PROJECT NAME: | MSTAR |
| and passenger traffic and its main operator Fraport is the most important employer in the region. | ||
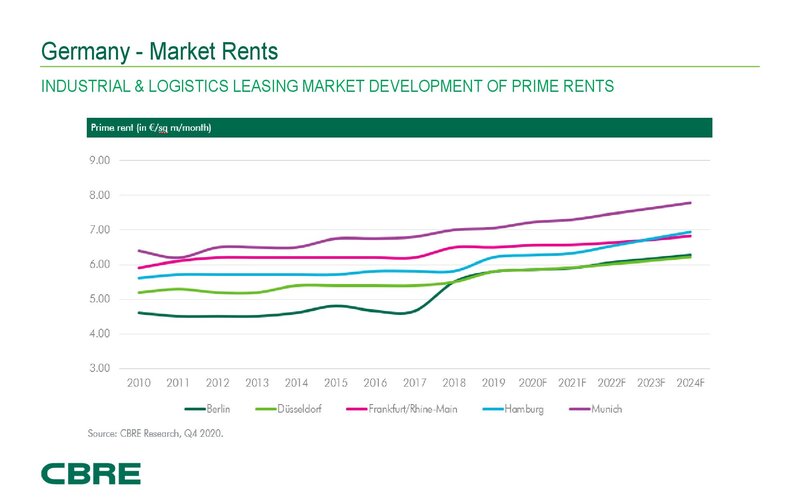
| Frankfurt am Main lies at the centre of the important logistics region Rhine−Main/Frankfurt. With its dense motorway and rail network, two inland ports and most notably the international airport with its large air cargo section, the city itself provides a comprehensive logistics infrastructure. The region benefits considerably from its central location both in Germany and in Europe as a whole. In fact, the Rhine−Main/Frankfurt logistics region compares to the logistics regions of Hamburg and “Bremen and North Sea ports” due to its gateway function – largely benefitting from the airport. The popularity of the region among logistics operators and industrial firms is reflected in limited floor space supply and the rental rates for logistics facilities either in the city area or around the airport, which are the highest in Germany after Munich. The city’s key benefit for the logistics business is its comprehensive infrastructure. Current building activities, by contrast, are concentrated in the suburbs and integrated conurbation. | ||
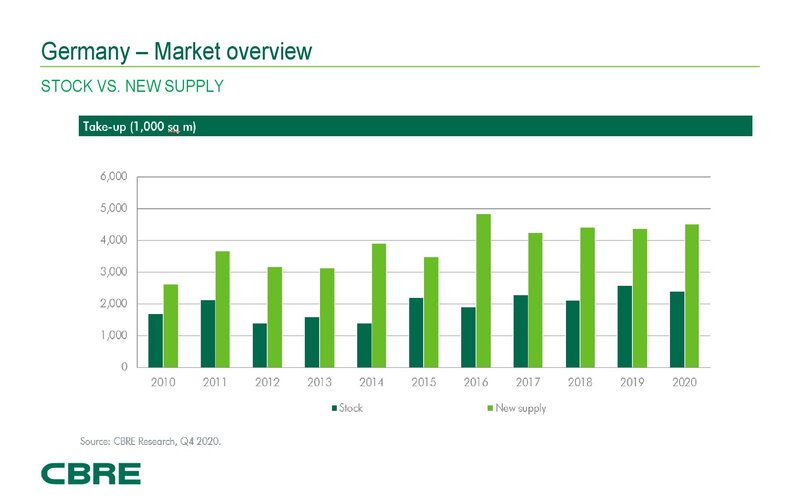
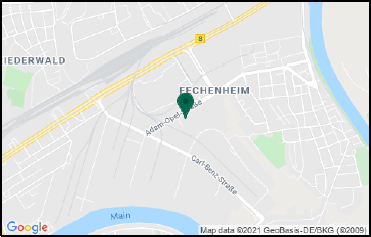
| More than 1.53 million sq m of modern logistics facilities were completed in the logistics region between 2015 and 2019. The commercial areas south of the city and within vicinity of the airport play a very prominent role in this context, but demand for space is also keen on the city’s northern periphery. The most important logistics locations within the city area, apart from the airport, are the districts Fechenheim, Rödelheim, Höchst and Gutleutviertel. | ||
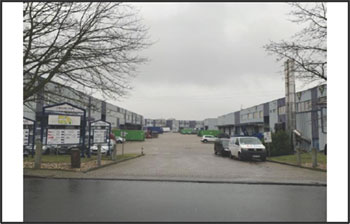
| Within the city of Frankfurt, the subject property is situated in an established commercial area in the Ostend district, which is mainly used for industrial and retail purposes, including numerous showrooms and workshops as well as walk-in stores. The commercial area is centrally located, having the main railway station situated approx. 6.5 km away to the west. | ||
| The motorway connection can be described as good due to the close proximity to the motorway A661. The nearest airport is situated in Frankfurt around 23 km away and reachable in approx. 20 minutes. The airport offers national and international connections. Further, the surroundings offer a number of bus and tram stops. |
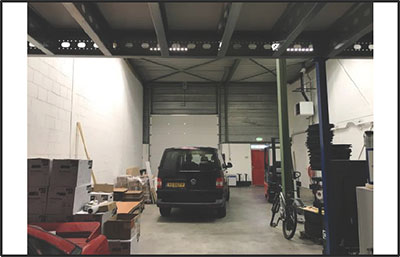
PROPERTY DESCRIPTION
| DESCRIPTION | The current buildings were developed between 1970 and 1974 on agricultural / open land and have been used primarily for storage, wholesale and distribution since construction. The subject property has a total site area of 41,044 sq m, with a total lettable area of 30,273 sq m. | |
|
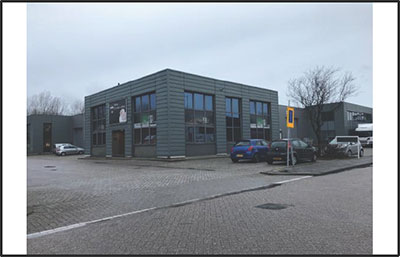
The site covers an area of approx. 4.1 hectares and comprises five warehouse buildings with associated office areas (Warehouses A – E), and one 5-storey office building (in the eastern part of the site). |
||
| Some of the warehouses are equipped with roller shutter doors and loading ramps. The buildings are surrounded by parking and loading areas covered with brick paving. The buildings do not have basements. A currently unused |
| ON BEHALF OF: | MORGAN STANLEY |
| PROJECT NAME: | MSTAR |
|
site-owned railway siding is located to the adjacent south/south west of Warehouses A and C.
The buildings cover approx. 70% of the property. Approx. 25% of the site is covered with brick paving (loading areas and parking) and a further ~5% of the property comprises landscaping (grass and bushes/trees).
Summary of known specification:
|
|||
| Characteristic | Result | ||
| Built / Renovation | 1970 - 1974 | ||
| Eaves Height | 5.4 metres | ||
| No. of loading Doors | n/a | ||
| Loading Door Ratio | n/a | ||
| Yard Depth | Approx. 10 to 20 metres | ||
| Cross-Dock | None | ||
| Warehouse (% of GLA) | 78% | ||
| Site Coverage Ratio | Approx. 70% | ||
| |
Source: Phase I Environmental Review dated December 2019; the information gathered during the site inspection. |
||
| ACCOMMODATION | We have not measured the property, but as instructed, we have relied upon floor areas made available to us. | ||||
| Unit description | Primary use | Status | Area (sq m) | ||
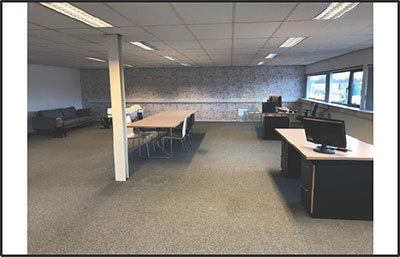
| Office | Office | LET | 3,818.82 | ||
| Office | Office | VACANT | 2,498.74 | ||
| Other | Storage | LET | 235.50 | ||
| Other | Storage | VACANT | 128.00 | ||
| Warehouse | Storage | LET | 21,262.84 | ||
| Warehouse | Storage | VACANT | 2,326.38 | ||
| Total | 30,270.28* | ||||
|
*some areas are subject to rounding in the valuation |
|||||
DUE DILIGENCE
| STATE OF REPAIR | CBRE have not undertaken a structural survey, nor tested the services. The property was subject to an inspection for valuation purposes in early 2020. |
| ON BEHALF OF: | MORGAN STANLEY |
| PROJECT NAME: | MSTAR |
| As you are aware, the property has not been re-inspected for the purposes of this report, nor have we been provided with updated TDD. We have therefore relied on the information provided by the Borrower, including a Capex schedule dated 12 June 2019 and schedule with revised budget of capex dated 19 January 2021. Based on the latter which indicates TDD assessment less completed spend in 2020, we have included the immediate and 2-5 years capex of €3,313,000 within our valuation. | ||
| According to our own limited inspection for valuation purposes, our opinion regarding the state of repair would substantiate the assessment by Arcadis. Based on our impression gained during the inspection, we are of the opinion that the buildings are in a fair condition, in line with the year of construction. | ||
|
ENVIRONMENTAL CONSIDERATIONS |
We have summarised the findings from a schedule provided in relation to ‘Priority sites’ within the front section of this report. | |
|
We have been made aware that although not registered in the register of contaminated sites, indications for potential contamination exist at this property likely in relation to in particular due to their current or former use. If future excavation works are carried out at these Properties, this could lead to additional costs. However, no action is required on the current use of the Properties. As such we have assumed this does not have a material impact on our opinion of value given the valuation is prepared taken the current use into consideration.
According to the Draft Environmental Due Diligence report dated 13 December 2019, prepared by Ambiente Ltd., there are currently no known ground/soil contaminations. However, the following risks for contamination have been identified:
|
||
|
On-site:
● Potential for contamination from currently unused railway sidings adjacent south/south west of warehouses A and C;
● Potential risks from the site having been part of a larger anti-aircraft defence facility (mostly located off-site to the northwest) in WWII.
Off-site:
● Potential for migration of contamination from neighbouring off-site former and current industrial uses, including fuel filling station.
In addition, there is a risk of the following building pollutants:
● Potential for contamination from suspected Made Ground at the property;
● Known asbestos containing materials within the building fabric.
We have been instructed not to make any investigations in relation to the presence or potential presence of contamination in land or buildings or the potential presence of other environmental risk factors and to assume that if investigations were made to an appropriate extent then nothing would be discovered sufficient to affect value. |
| ON BEHALF OF: | MORGAN STANLEY |
| PROJECT NAME: | MSTAR |
| We have not carried out investigation into past uses, either of the properties or of any adjacent lands, to establish whether there is any potential for contamination from such uses or sites, or other environmental risk factors and have therefore assumed that none exists. Should our assumption prove to be incorrect, we reserve the right to amend our valuation accordingly. | ||
| TENURE | We have had sight of the Draft Red Flag Legal Report prepared by Hengeler Mueller, dated 05 February 2021. Based on the information provided, we understand the property is held freehold. | |
|
We understand the property may still be subject to a pre-emption right in favour of the City of Frankfurt whereby they have the option to ‘repurchase’ the property at a price understood to be capped at €5,456,220.63. We understand the ‘priority notice was deleted on 27 April 2018. In the consent declaration (Löschungsbewilligung) dated 19 March 2018 regarding the deletion of the priority notice the city of Frankfurt am Main approved the deletion of the priority notice but did not explicitly waive the contractual repurchase right which, therefore, might still be in place.’ We would highlight that for the purposes of this valuation, the repurchase cap has not been factored within our opinion of value contained herein and highlight as a potential risk.
We also understand that the City of Frankfurt retains an option to access and utilise railway tracks within the site at a cost. Albeit we have assumed this does not impact on the operation of the occupiers nor have a material impact on our value.
In approaching our valuation, we have assumed that there are no onerous legal conditions affecting the property which have a material impact on our opinion of value. |
| ON BEHALF OF: | MORGAN STANLEY |
| PROJECT NAME: | MSTAR |
| INCOME PROFILE | The rental contracts have not been made available to us. The information is based on the rent schedule dated on 20 November 2020. | |
|
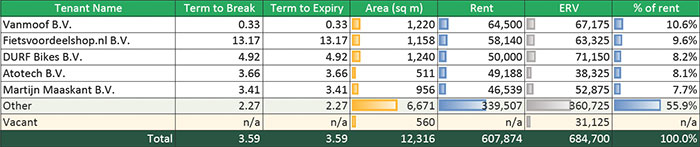
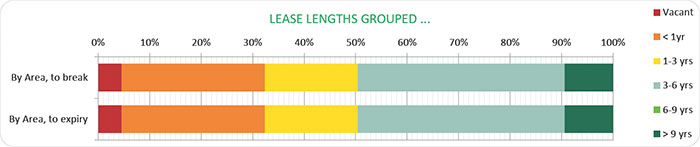
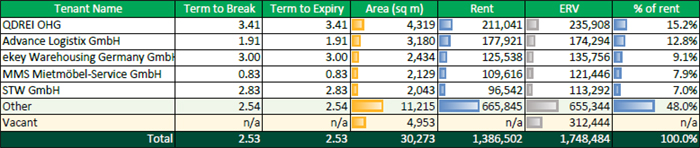
The property is leased to thirty tenants (ABZ International GmbH, Advance Logistix GmbH, ALFAPACK GmbH, Befestigungstechnik Gramm GmbH, Daniel Seddig, Deltec International Courier GmbH, Deutsche BP AG, ekey Warehousing Germany GmbH, Finance Office Frankfurt GmbH, Getränke Quelle Bornheim GmbH, Globe Shopper Activation GmbH, Horst Georg Findt Parkett-Fachgroßhandel, Korfu Foods GmbH & Co.KG, Kramm Büro-Systeme Büro Kramm GmbH, Lebensmittel Import- und Vertriebsgesellschaft Asimex GmbH, Lehmann, Jan, Michael Schmidt, Mikhail Smirnov, Mileway Germany Subco GmbH MMS Mietmöbel-Service GmbH, Ömer Ögüt, Paul Blümler + Elyas El Jazouli, QDREI OHG, reifencom GmbH, Silke Jackels, STW GmbH, VaGo GmbH, vinehouse.de, Wärmetechnik Löwe GmbH, WWD Dienstleistung GmbH). 2,499 sq m of office space, 2,326 sq m of warehouse space and 128 sq m of other space, equalling 16.4% of total space, are vacant.
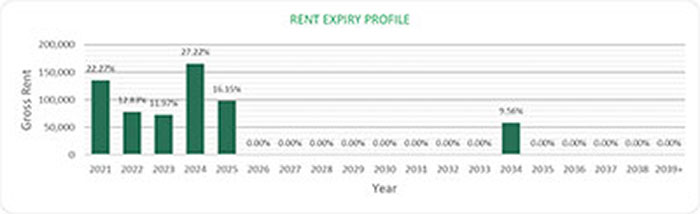
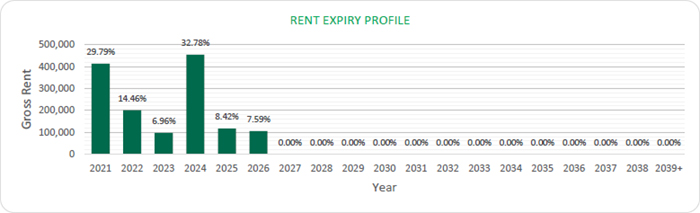
The property has a WAULT of 2.53 years (to breaks) as at the date of valuation. The total gross current rent generated by the property is €1,386,502 per annum whilst our opinion of total gross market rent is €1,748,484 per annum. The property is considered under-rented even after factoring current vacancy.
The main tenant, with about 14% of the total rental space and about 15% of the total rental income, is “QDREI OHG”. |
VALUATION CONSIDERATIONS
|
COSTS AND ADJUSTMENTS
|
Based on the information provided or our knowledge of the market, in approaching our valuation, we made allowances for the following capital and non-recoverable costs. In all cases, we have cited whether they are deducted as at the date of valuation or whether they take effect at a later date.
Capital Expenditure:
|
||||
| Type & Calculation | Source | Effective | Amount | ||
|
Capital Expenditure: Fixed Amount |
Technical Due Diligence |
On Valuation |
€3,313,000 | ||
| No Repeat | |||||
| Rent Free | CBRE Estimate | On Valuation / | €65,445 | ||
| No Repeat | |||||
| Tenant Incentives | CBRE Estimate | On lease start / renewal | €49,530 | ||
| No Repeat | |||||
| Letting Fees: 25%
of Rental Value |
CBRE Estimate | On lease start / renewal |
€78,111 | ||
| ON BEHALF OF: | MORGAN STANLEY |
| PROJECT NAME: | MSTAR |
| No Repeat | |||||
| TOTAL: ON VALUATION |
€3,506,086 | ||||
| Revenue Deductions: | |||||
| Type & Calculation | Source | Effective | Annual Amount | ||
| Maintenance: €2.75 per sq m |
CBRE Estimate | On Valuation + Delay 60 Months In perpetuity |
€83,251 | ||
| Management 2.0% of rental value |
CBRE Estimate | On Valuation In perpetuity |
€ 34,970 | ||
| Void Costs:
€0.50 per sq m |
CBRE Estimate | On Valuation On all voids |
€ 29,718 | ||
|
Other Costs: 0.5% of rental value |
CBRE Estimate | On Valuation In perpetuity |
€ 8,742 | ||
| TOTAL: ON VALUATION |
€73,430 | ||||
| VALUATION METHODOLOGY – MARKET VALUE | We have had regard to the most recent letting transactions and occupational demand for the region within which the subject property is located, including the property itself if of relevance. The rental rates for comparable premises (Warehouse) range between €48.00 and €62.28 per sq m per annum, depending on the duration of lease contract, building specifications and age. Within the evidence table appended, we would highlight the property in and around Frankfurt as being of greatest relevance in terms of property characteristics. | |
| Comparable number two is located in Dreieich and shows similar micro location characteristics. Therefore, the location can be assessed as comparable. The warehouse building has a total lettable area of 4,800 sq m. Similar to the subject property, the comparable premises is well connected to the road and public transportation network. The building is partly outdated and has a similar fit-out to the subject property. We have adopted the following rental rates within our valuation: |
| Use | Letting-Status | Rental Area (sq m) | ERV per sq m | ERV (Total) | ||
| Office | LET | 3,818.82 | €72.00 /sq m pa | €274,955.04 pa | ||
| Office | VACANT | 2,498.74 | €72.00 /sq m pa | €179,909.28 pa | ||
| Other | LET | 235.50 | €54.00 /sq m pa | €12,717.00 pa | ||
| Other | VACANT | 128.00 | €54.00 /sq m pa | €6,912.00 pa | ||
| Warehouse | LET | 21,262.84 | €54.00 /sq m pa | €1,148,193.36 pa | ||
| ON BEHALF OF: | MORGAN STANLEY |
| PROJECT NAME: | MSTAR |
| Warehouse | LET | 2,326.38 | €54.00 /sq m pa | €125,624.52 pa | ||
| Total* | 30,270.28 | €57.76 /sq m pa | €1,748,311.20 pa | |||
|
|
* The total amount of ERV and rental area may differ from the calculation printout due to rounding differences. | |||||
| We have arrived at our opinion of Market Value adopting the Traditional investment capitalisation method of valuation. Within this approach, we apply an income weighted average equivalent yield to our opinion of net income, reflecting the comparable evidence within the market for guidance on capital rates and values per sq m. | ||
| We would like to highlight investment comparable number one, two and three. We would highlight that there is a lack of detail relating to the income profile of the assets and therefore limits on assessing the yield profile. Our principal consideration is therefore on the rate per sq m. There is no further better evidence we are aware of and could highlight in relation to this property. | ||
| The first investment comparable is located in Mannheim with a similar micro location. The distance to the motorway differs only by few minutes by car, which makes the micro location of the properties comparable. The property has a lettable area of around 3,189 sq m and thus not comparable to the subject property in terms of size (with larger lettable area being more favourable). It was sold for approx. EUR 2,890,000 (equating to around EUR 906 per sq m) in Q4 2020. Given the relativity of lot size and resulting buyer pool, we would also cite the third comparable in Fritzlar which is in an inferior location, selling for a capital rate of €912 per sq m but more aligned in total lot size. Whilst it is more dated, investment comparable number two is located in Mannheim and also of relevance. The property has good connections to public transport. The distance to the motorway is 10 minutes by car, meaning the micro location is fairly comparable. The property has a lettable area of around 21,999 sq m and was sold for about EUR 18,000,000 (equating to ~EUR 818 per sq m) in Q2 2019. Due to the micro location and the lot size, we consider the property to be comparable but since the date of sale, the market has continued to improve which should be reflected within our valuation. Based on the above stated facts we have considered these assets in approaching our valuation. | ||
| For the valuation of this asset, we have applied the following Equivalent Yield: | ||
| - 4.8% | ||
| This results in a Net Initial Yield of 4.36% and a capital rate per sq m of €925. The Net Initial Yield is currently being influenced by the level of vacancy. | ||
| On the assumption that there are no unusual factors of which we are unaware and on the basis of the comments and assumptions specified in this report, CBRE is of the opinion that the Market Value (rounded) of the subject property, is: | ||
| €28,000,000 | ||
| (Twenty-eight million Euros) | ||
| The unrounded net capital value is €28,022,976. The gross unrounded capital value is €33,630,785 including €3,506,086 of capital costs and € 2,101,723 purchaser’s costs (7.50%) respectively. |
| ON BEHALF OF: | MORGAN STANLEY |
| PROJECT NAME: | MSTAR |
| Our opinion of Market Value is based upon the Scope of Work and Valuation Assumptions attached and has been primarily derived using comparable recent market transactions on arm’s length terms. | ||
| VALUATION METHODOLOGY – VACANT POSSESSION VALUE | The constituent inputs in terms of rental value and non-recoverable costs largely align with the Market Value approach. The key exception being that we have adopted a special assumption that the property is 100% vacant/non-income producing as at the valuation date. This value is predominantly derived using the traditional investment method of valuation but critically benchmarking the resultant capital rate per sq m against the prevailing evidence. | |
| In approaching our valuation under the Special Assumption that the property is entirely vacant (Vacant Possession Value), we have adopted a total void period of 12 months inclusive of rent free or tenant incentives and targeted an equivalent yield of 5.3%. | ||
| This results in a net rounded value of €23,250,000, equating to €768 per sq m. | ||
| ESTIMATED REINSTATEMENT ASSESSMENT | The property has not been inspected by a suitably qualified building surveyor from CBRE, nor have we carried out a full Reinstatement Cost Assessment. For indicative purposes only we estimate that the reinstatement cost of insurance purposes would be in the region of €50,036,557 (rounded, excl. VAT) on a day one basis, including fees but excluding VAT and inflation. | |
| This figure should be compared with the current sum insured and if a material discrepancy exists we suggest that a full Reinstatement Cost Assessment is carried out. |
| ON BEHALF OF: | MORGAN STANLEY |
| PROJECT NAME: | MSTAR |
RENTAL EVIDENCE
| PROPERTY ADDRESS |
PROPERTY USE |
DATE | TOTAL AREA (SQ M) |
TENANT | LEASE LENGTH (YEARS) |
BREAK OPTION |
RENT (P.A) (€) |
MONTHLY RENTAL RATE PER SQ M (€) |
RELATIVE QUALITY |
| 60386 Frankfurt am Main |
Distribution hall |
Q4 2020 | 3,000 | n/a | n/a | n/a | n/a | 4.00 | Better (directly in the Rhine - Main region) |
| 63303 Dreieich |
Warehouse | Q4 2020 | 4,800 | n/a | n/a | n/a | n/a | 4.85 | Comparable (micro location) |
| 68647 Biblis | Warehouse | Q4 2019 | 66,808 | n/a | n/a | n/a | 3,319,021 | 4.14 | Comparable (micro location) |
| 63293 Neu- Isenburg |
Warehouse | Q4 2019 | 1,365 | n/a | n/a | n/a | 85,032 | 5.19 | Similar (distance to the motorway) |
| 68642 Buerstadt |
Distribution hall |
Q2 2018 | 73,830 | n/a | 10 | n/a | 3,729,891 | 4.21 | Similar (distance to the motorway) |
| ON BEHALF OF: | MORGAN STANLEY |
| PROJECT NAME: | MSTAR |
SALES EVIDENCE
| PROPERTY ADDRESS | PROPERTY USE |
DATE | TOTAL AREA (SQ M) |
WAULT (YEARS) |
PASSING RENT PER ANNUM |
PURCHASE PRICE (€) |
NET INITIAL YIELD (%) |
CAPITAL RATE PER SQ M (€) |
RELATIVE QUALITY |
| 68199 Mannheim |
Warehouse | Q4 2020 | 3,189 | n/a | n/a | 2,890,000 | n/a | 906 | Similar (micro location) |
| 63743 Aschaffenburg |
Warehouse | Q4 2020 | 7,881 | n/a | n/a | 7,950,000 | n/a | 1,009 | Slightly inferior (macro location) |
| 34560 Fritzlar | Warehouse | Q1 2020 | 42,000 | n/a | n/a | 38,304,000 | n/a | 912 | Slightly inferior (macro location) |
| 68159 Mannheim |
Warehouse | Q2 2019 | 21,999 | n/a | n/a | 18,000,000 | n/a | 818 | Similar (micro location) |
| PROPERTY ID: | deairc - Aircom Parc | |
| ON BEHALF OF: | MORGAN STANLEY | |
| VALUATION DATE: | 01-Feb-2021 | FINAL |
Aircom Parc - Aircom Parc, Ratingen, 40880, Germany
| VALUATION METRICS | (currency - EUR) |
| Metric | Value |
| Market Value | 23,075,000 |
| Market Value (per sq m) | 885 |
| Net Initial Yield | 5.51% |
| Reversionary Yield | 6.36% |
| Equivalent Yield | 6.20% |
| Gross Income (p.a.) | 1,442,969 |
| Gross Income (p.a.) (per sq m) | 55 |
| *Adj. Gross Income | 1,442,969 |
| Adj. Gross Income (per sq m) | 55 |
| Net Income (p.a.) | 1,371,731 |
| Net Income (p.a.) (per sq m) | 53 |
| Gross Rental Value | 1,678,080 |
| Gross Rental Value (per sq m) | 64 |
| Capital Expenditure | -655,308 |
| Transaction Costs | 8.00% |
| Over / Under Rented | 7.29% |
| KEY FACTS | ||
| Metric | Value | |
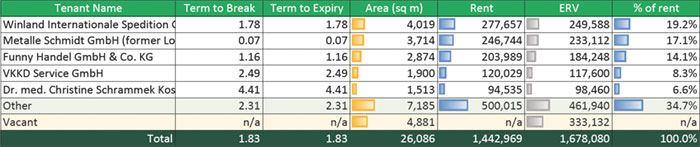
| Total Area (sq m) | 26,086 | |
| WAULT to Break by Rent | 1.83 | |
| WAULT to Break by ERV | 1.83 | |
| WAULT to Expiry by Rent | 1.83 | |
| WAULT to Expiry by ERV | 1.83 | |
| Percentage of Vacancy (Area) | 18.71% | |
| Percentage of Vacancy (ERV) | 19.85% | |
| ** | Number of Tenants | 25 |
| Current Voids (months) | 12 | |
| * Adjusted Gross Income equates to the Gross Income excluding any rent free periods | |
| LEASES RANKED BY RENT | ** Total tenant lines within our valuation. May differ to number of individual tenants |
| Printed 09/03/2021 19:42 | |
| PROPERTY ID: | deairc - Aircom Parc | |
| ON BEHALF OF: | MORGAN STANLEY | |
| VALUATION DATE: | 01-Feb-2021 | FINAL |
| Printed 09/03/2021 19:42 | |
| ON BEHALF OF: | MORGAN STANLEY | |
| PROJECT NAME: | MSTAR | |
PROPERTY REPORT
40885 RATINGEN, SIEMENSSTRASSE 18 (AIRCOM PARK)
| INSPECTED BY: | INSPECTION DATE: | VALUATION DATE: | PROPERTY TYPE |
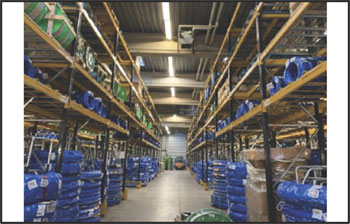
| MARK-PHILIPP HELCK | 08/01/2020 | 01/02/2021 | INDUSTRIAL PARK |
KEY VALUATION FACTORS
| STRENGTHS | WEAKNESSES |
| ■ | Well established commercial / logistics location; | |
| ■ | Risk limitation through multi-tenant concept; | |
| ■ | Good access to the motorways A524 (1.5 km), A52 (4.0 km) and A3 (5.0km); | |
| ■ | Property is more or less let at market rent level. |
| ■ | WAULT of 1.83 years (to breaks); | |
| ■ | Buildings contain asbestos and PCB; | |
| ■ | Vacancy rate of 18.71% (by area). |
| OPPORTUNITIES | THREATS |
| ■ | The continuing positive development of the overall economy could lead to an increase in achievable rents; | |
| ■ | Letting of the vacant office space at market conditions could improve income profile. |
| ■ | Fluctuations in the world economy and the global capital markets could have negative effects on German real estate market purchase prices; | |
| ■ | Potentially high fluctuation and re-letting costs due to short remaining lease terms. |
LOCATION & SITUATION
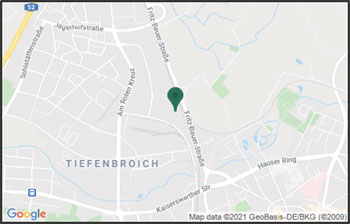
| LOCATION | The city of Ratingen is the largest city in the district of Mettmann and borders on the urban areas of Dusseldorf, Duisburg, Muelheim and Essen. Due to its central location within the Rhine-Ruhr region, Ratingen is very well connected in terms of infrastructure. Ratingen stands out in the Mettmann district as a location specialized in trade and services with international local companies. In addition, Ratingen is considered the region's hotspot for the IT and telecommunications sectors. The relevant logistics locations in the region are located along the A3 and A1 motorways and on the Rhine (Cologne, Duesseldorf, Neuss, Leverkusen). The Ratingen location is, however, benefiting from the increasingly scarce supply of logistics space in the neighbouring markets of Duesseldorf and Duisburg and its proximity to Duesseldorf Airport. | |
|
Ratingen belongs to the logistics region Duisburg/ Lower Rhine. The urban areas in the Duisburg/Lower Rhine region are served by a dense motorway |
| ON BEHALF OF: | MORGAN STANLEY | |
| PROJECT NAME: | MSTAR | |
|
network. This enables the region to supply the Rhineland and provides a rapid connection to Cologne/Bonn and the Ruhr district. The outer suburban areas, too, have adequate access to motorways. As a hinterland hub for containers from seaports, the region is especially well equipped with inland ports and container terminals along the Rhine. The Port of Duisburg (Duisport) is Europe’s largest inland port and Germany’s most important transshipment hub for seaport-hinterland transportation. Equally, the Ports of Emmerich and Neuss, for instance, also have container transshipment facilities. For the transportation of time-critical goods by air freight, the region has access to Duesseldorf Airport which is one of Germany’s busiest cargo airports. All told, the Duisburg/Lower Rhine region has one of the most efficient infrastructures and is one of the most flexible logistics regions in Germany. |
||
|
Within the city of Ratingen, the subject property is situated in an area, which is mainly used for logistic and industrial purposes. The direct surroundings consist of industrial companies, logistics service providers and retailers. |
||
|
The motorway connection can be described as good because of the proximity to the motorways A524, A52 and A3. The next airport is situated in Dusseldorf around 6.5 km away and reachable in approximately 10 minutes. The airport offers national and international connections. |
PROPERTY DESCRIPTION
| DESCRIPTION |
The subject site covers an area of approximately 4.4 hectares and comprises four warehouse buildings. In total, the warehouse properties comprise 19 units each building houses a two-storey frontage with office space. Parking and yard areas are located in front and adjacent to the buildings. |
|
|
Approx. 65% of the property is covered by the building complex. Accessing roads, loading areas and parking spaces (brick paving) cover approx. 30% of the subject site. The remaining 5% are covered with landscaping (lawns and trees) which are predominately located along the boundaries of the site. |
||
|
Located on former agricultural land, the warehouses were constructed in 1978 and were refurbished between 2000 and 2002. The property was used for storage and retail purposes. Further, limited production and workshop activities were undertaken on the site. |
||
|
The warehouse areas are constructed with pre-cast concrete pillars and concrete beams carrying a flat roof made of profiled steel elements. The façade is of trapezoidal metal clads and partly of concrete brick construction. In total, the warehouses comprise 40 loading doors which are mainly oriented to the inner yard area. Two of the properties can be completely encircled. Further, the site is accessed by three gates at the western and southern side which allow bypassing of all properties through the inner yard. A sufficient number of car parking as well as additional lorry parking spaces are located on the site. |
||
|
During the inspection not all parts of the property and the premises were accessible. |
| ON BEHALF OF: | MORGAN STANLEY | |
| PROJECT NAME: | MSTAR | |
| Summary of known specification: | |||
| Characteristic | Result | ||
| Built / Renovation | 1978 / 2000 / 2002 | ||
| Eaves Height | N/A | ||
| No. of loading Doors | 53 | ||
| Loading Door Ratio | 2.47 | ||
| Yard Depth | Approx. 22-36 metres | ||
| Cross-Dock | Front loading | ||
| Warehouse (% of GLA) | 82% | ||
| Site Coverage Ratio | 65% | ||
| Source: Phase I Environmental Review dated January 2020; the information gathered during the site inspection. | |||
| ACCOMMODATION | We have not measured the property, but as instructed, we have relied upon floor areas made available to us. | ||||
| Unit Description | Primary Use | Status | Area (sq m) | ||
| Office | Office | LET | 3,027.09 | ||
| Office | Office | VACANT | 1,639.58 | ||
| Warehouse | Warehouse | VACANT | 3,242 | ||
| Warehouse | Storage/Production | LET | 18,138.57 | ||
| Other | Other | LET | 38.77 | ||
| Total (lettable) | 26,086.01 | ||||
DUE DILIGENCE
| STATE OF REPAIR |
CBRE have not undertaken a structural survey, nor tested the services. The property was subject to an inspection for valuation purposes in early 2020. As you are aware, the property has not been re-inspected for the purposes of this report, nor have we been provided with updated TDD. We have therefore relied on the information provided by the Borrower, including a Capex schedule dated 12 June 2019 and schedule with revised budget of capex dated 19 January 2021. Based on the latter which indicates TDD assessment less completed spend in 2020, we have included the immediate and 2-5 years capex of €450,000 within our valuation. |
|
|
According to our own limited inspection for valuation purposes, our opinion regarding the state of repair would substantiate the assessment by Arcadis. |
| ON BEHALF OF: | MORGAN STANLEY | |
| PROJECT NAME: | MSTAR | |
|
Based on our impression gained during the inspection, we are of the opinion that the buildings are in a fair condition, in line with the year of construction. |
|||
| ENVIRONMENTAL CONSIDERATIONS |
We have summarised the findings from a schedule provided in relation to ‘Priority sites’ within the front section of this report. |
||
|
According to the Draft Environmental Due Diligence report dated 10 January 2020 from Ambiente Ltd. There are currently no known ground/soil contaminations. However, the following risks for contamination have been identified: |
|||
|
On-site |
|||
| ● |
No on-site potential sources of contamination have been identified for the property. |
||
| Off-site | |||
| ● |
Potential for migration of contamination from neighbouring former and current light industrial uses. |
||
|
In addition, there is the risk of the following building pollutants: |
|||
| ● |
Known asbestos containing materials and limited amounts of suspected PCBs within the building fabric. |
||
|
From building operations, the following risks have been identified: |
|||
| ● |
No potential sources of contamination have been identified. |
||
|
We have been instructed not to make any investigations in relation to the presence or potential presence of contamination in land or buildings or the potential presence of other environmental risk factors and to assume that if investigations were made to an appropriate extent then nothing would be discovered sufficient to affect value. |
|||
|
We have not carried out investigation into past uses, either of the properties or of any adjacent lands, to establish whether there is any potential for contamination from such uses or sites, or other environmental risk factors and have therefore assumed that none exists. Should our assumption prove to be incorrect, we reserve the right to amend our valuation accordingly. |
|||
|
TENURE |
We have had sight of the Draft Red Flag Legal Report prepared by Hengeler Mueller, dated 05 February 2021. Based on the information provided, we understand the property is held freehold. |
||
|
We have assumed that there are no onerous legal conditions affecting the property which have a material impact on our opinion of value. |
|||
| ON BEHALF OF: | MORGAN STANLEY | |
| PROJECT NAME: | MSTAR | |
| INCOME PROFILE |
The rental contracts have not been available. The information is based on the rent schedule dated on 30 November 2020. |
|
| The property is leased nine tenants (ALMAMET GmbH, b+s exhibitions GmbH Design und Realisation, Conrad Licht & Rigging Support GmbH, Dr. med. Christine Schrammek Kosmetik GmbH & Co. KG, Energetic Lighting (Germany) GmbH, etaxx Gesellschaft für Unternehmensberatung mbH; Rechtsanwaltspraxis Jens Bude, Funny Handel GmbH & Co. KG, inMusic GmbH, JENOPTIK Industrial Metrology Germany, Leuchtenhalle Ratingen Reck GmbH & Co.KG, Metalle Schmidt GmbH (former Lontana SA)). 1,639 sq m of office space (6.32% of total space) are vacant. | ||
| The property has a short WAULT of 1.83 years (to breaks) from the date of valuation. The total gross current rent generated by the property is €1,442,969 per annum whilst our opinion of the current gross market rent is €1,678,080 per annum. The property is largely shown as rack rented after accounting for current vacancy. | ||
| The main tenant is with about 18% of the total rental space and about 18% of the total rental income is the “b+s exhibitions GmbH Design und Realisation”. The company is registered in Dusseldorf and its business is the interior design and trade fair construction. |
| ON BEHALF OF: | MORGAN STANLEY | |
| PROJECT NAME: | MSTAR | |
| COSTS AND ADJUSTMENTS | Based on the information provided or our knowledge of the market, in approaching our valuation, we made allowances for the following capital and non-recoverable costs. In all cases, we have cited whether they are deducted as at the date of valuation or whether they take effect at a later date. | |||||
| Capital Expenditure: | ||||||
| Type & Calculation | Source | Effective | Amount | |||
| Capital Expenditure: | Technical Due | On Valuation | €450,000 | |||
| Fixed Amount | Diligence | No Repeat | ||||
| Tenant Incentives | CBRE Estimate | On lease start / | €122,025 | |||
| renewal | ||||||
| No Repeat | ||||||
| Letting Fees: 25% of | CBRE Estimate | On lease start / | €83,283 | |||
| Rental Value | renewal | |||||
| No Repeat | ||||||
| TOTAL ON | €655,308 | |||||
| VALUATION | ||||||
| Revenue Deductions: | ||||||
| Type & Calculation | Source | Effective | Annual Amount | |||
| Void costs: | CBRE Estimate | On Valuation | €29,286 | |||
| 0.5% of rental value | On all voids | |||||
| Maintenance: €2.00 | CBRE Estimate | On Valuation + | €52,172 | |||
| per sq m | Delay 60 Months | |||||
| In perpetuity | ||||||
| Management | CBRE Estimate | On Valuation | €33,562 | |||
| 2.0% of rental value | In perpetuity | |||||
| Other Costs: | CBRE Estimate | On Valuation | €8,390 | |||
| 0.5% of rental value | In perpetuity | |||||
| TOTAL: ON | €71,238 | |||||
| VALUATION | ||||||
| ON BEHALF OF: | MORGAN STANLEY | |
| PROJECT NAME: | MSTAR | |
| VALUATION METHODOLOGY – MARKET VALUE | We have had regard to the most recent letting transactions and occupational demand for the region within which the subject property is located, including the property itself if of relevance. The rental rates for comparable premises range between €60.00 and €64.80 per sq m per annum, depending on the duration of lease contract, building specifications and age. | |||||
| Specific evidence of relevance to the asset is appended to this report, indicating a consistent annual rate of €60 per sq m (Warehouse). We have adopted the following rates within our valuation: | ||||||
| Use | Letting-Status | Rental Area (sq m) | ERV per sq m | ERV (Total) | ||
| Office | LET | 3,027.09 | €84.00 /sq m pa | €254,275.56 pa | ||
| Office | VACANT | 1,639.58 | €84.00 /sq m pa | €137,724.72 pa | ||
| Warehouse | LET | 21,380.57 | €60.00 /sq m pa | €1,282,834.20 pa | ||
| Other | LET | 38.77 | €84.00 /sq m pa | €3,256.68 pa | ||
| Total* | 26,086.01 | €64.33 /sq m pa | €1,678,091.16 pa | |||
| * The total amount of ERV and rental area may differ from the calculation printout due to rounding differences. | ||||||
| We have arrived at our opinion of Market Value adopting the Traditional investment capitalisation method of valuation. Within this approach, we apply an income weighted average equivalent yield to our opinion of net income, reflecting the comparable evidence within the market for guidance on capital rates and values per sq m. | ||||||
| We would like to highlight investment comparable number one and three. Investment comparable number one is located in the vicinity of Cologne, in the village of Kerpen. It is near a major city, as well as near a motorway crossing. Thus, the location can be considered as similar. The property has a lettable area of around 3,700 sq m. It was sold for approx. €2,960,000 (equating to around €800 per sq m) in Q1 2020. Due to similar macro location, we consider the property comparable to the subject of valuation. | ||||||
| Investment comparable number three is located in the direct vicinity to the Harbour of Neuss. Neuss is part of the Düsseldorf logistics region. The very good transport infrastructure situation in the Rhine District of Neuss makes Neuss an attractive location for logistics. Therefore, the location can be considered as similar. The property has a lettable area of around 16,300 sq m and was built in 1994. It was sold for approx. €15,000,000 (equating to around €920.25 per sq m) in Q1 2019. Due to the date of construction but similar macro location, we consider the property comparable to the subject of valuation. | ||||||
| For the valuation of this asset, we have applied the following equivalent yield: | ||||||
| - 6.20% | ||||||
| This results in a Net Initial Yield of 5.51% and a capital rate per sq m of €885. | ||||||
| On the assumption that there are no unusual factors of which we are unaware and on the basis of the comments and assumptions specified in this report, CBRE is of the opinion that the Market Value (rounded) of the subject property, is: | ||||||
| ON BEHALF OF: | MORGAN STANLEY | |
| PROJECT NAME: | MSTAR | |
| €23,075,000 | ||
| (twenty-three million seventy-five thousand Euro) | ||
|
The unrounded net capital value is €23,063,100. The gross unrounded capital value is €25,563,456 including €655,308 of capital costs and €1,845,048 purchaser’s costs (8.00%) respectively. |
||
|
Our opinion of Market Value is based upon the Scope of Work and Valuation Assumptions attached and has been primarily derived using comparable recent market transactions on arm’s length terms. |
||
|
VALUATION METHODOLOGY – VACANT POSSESSION VALUE
|
The constituent inputs in terms of rental value and non-recoverable costs largely align with the Market Value approach. The key exception being that we have adopted a special assumption that the property is 100% vacant/non-income producing as at the valuation date. This value is predominantly derived using the traditional investment method of valuation but critically benchmarking the resultant capital rate per sq m against the prevailing evidence. |
|
|
In approaching our valuation under the Special Assumption that the property is entirely vacant (Vacant Possession Value), we have adopted a total void period of 12 months inclusive of rent free or tenant incentives and targeted an equivalent yield of 6.7%. |
||
| This results in a net rounded value of €19,100,000, equating to €732 per sq m. | ||
|
ESTIMATED REINSTATEMENT ASSESSMENT |
The property has not been inspected by a suitably qualified building surveyor from CBRE, nor have we carried out a full Reinstatement Cost Assessment. For indicative purposes only we estimate that the reinstatement cost of insurance purposes would be in the region of €30,541,917 (rounded, excl. VAT) on a day one basis, including fees but excluding VAT and inflation. |
|
|
This figure should be compared with the current sum insured and if a material discrepancy exists we suggest that a full Reinstatement Cost Assessment is carried out. |
||
| ON BEHALF OF: | MORGAN STANLEY | |
| PROJECT NAME: | MSTAR | |
RENTAL EVIDENCE
| PROPERTY ADDRESS | PROPERTY USE | DATE | TOTAL AREA (SQ M) | TENANT | LEASE LENGTH (YEARS) | BREAK OPTION | RENT (P.A) (€) | MONTHLY RENTAL RATE PER SQ M (€) | RELATIVE QUALITY |
| 40885 Ratingen | Warehouse | Q4 2020 | 11,728 | n/a | n/a | n/a | 759,974 | 5.40 | Similar (macro location) |
| 40472 Düsseldorf | Warehouse | Q4 2019 | 3,079 | n/a | n/a | n/a | 184,740 | 5.00 | Similar (distance to the motorway) |
| 40472 Düsseldorf | Warehouse | Q4 2019 | 3,288 | n/a | n/a | n/a | 197,280 | 5.00 | Similar (distance to the motorway) |
| 40880 Ratingen | Warehouse | Q4 2019 | 1,890 | n/a | n/a | n/a | 113,400 | 5.00 | Similar (macro location) |
| ON BEHALF OF: | MORGAN STANLEY | |
| PROJECT NAME: | MSTAR | |
SALES EVIDENCE
| PROPERTY ADDRESS | PROPERTY USE | DATE | TOTAL AREA (SQ M) | PASSING RENT PER ANNUM | PURCHASE PRICE (€) | NET INITIAL YIELD (%) | CAPITAL RATE PER SQ M (€) | RELATIVE QUALITY |
| 50169 Kerpen | Warehouse | Q3 2020 | 3,700 | n/a | 2,960,000 | n/a | 800 | Similar (macro location) |
| 41334 Nettetal | Distribution hall | Q3 2019 | 32,000 | n/a | 27,552,000 | n/a | 861 | Similar (micro location) |
| 41460 Neuss | Distribution hall | Q1 2019 | 16,300 | n/a | 15,000,000 | n/a | 920 | Similar (macro location) |
| 47877 Willich | Warehouse | Q3 2018 | 5,200 | n/a | 4,271,000 | n/a | 821 | Similar (macro location) |
| PROPERTY ID: | dealbe - Albert-Einstein-Strasse 1 | |
| ON BEHALF OF: | MORGAN STANLEY | |
| VALUATION DATE: | 01-Feb-2021 | FINAL |
Albert-Einstein-Strasse 1 - Albert-Einstein-Strasse 1, Erkrath, 40699, Germany
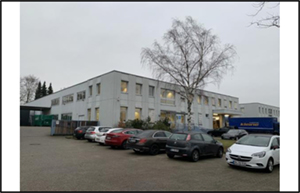 |
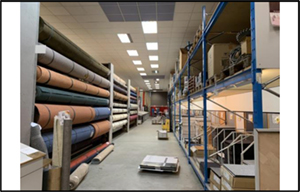 |
|
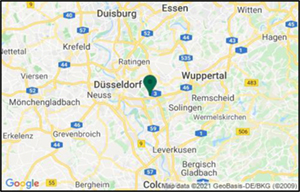 |
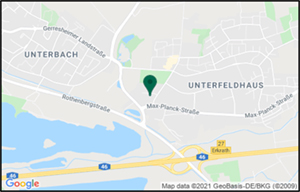 |
| VALUATION METRICS | (currency - EUR) |
| Metric | Value |
| Market Value | 19,075,000 |
| Market Value (per sq m) | 790 |
| Net Initial Yield | 6.68% |
| Reversionary Yield | 6.23% |
| Equivalent Yield | 6.00% |
| Gross Income (p.a.) | 1,413,237 |
| Gross Income (p.a.) (per sq m) | 59 |
| *Adj. Gross Income | 1,413,237 |
| Adj. Gross Income (per sq m) | 59 |
| Net Income (p.a.) | 1,376,785 |
| Net Income (p.a.) (per sq m) | 57 |
| Gross Rental Value | 1,385,622 |
| Gross Rental Value (per sq m) | 57 |
| Capital Expenditure | -1,162,916 |
| Transaction Costs | 8.00% |
| Over / Under Rented | 3.62% |
| KEY FACTS | ||
| Metric | Value | |
| Total Area (sq m) | 24,148 | |
| WAULT to Break by Rent | 2.49 | |
| WAULT to Break by ERV | 2.50 | |
| WAULT to Expiry by Rent | 2.49 | |
| WAULT to Expiry by ERV | 2.50 | |
| Percentage of Vacancy (Area) | 1.25% | |
| Percentage of Vacancy (ERV) | 1.57% | |
| ** | Number of Tenants | 33 |
| Current Voids (months) | 12 | |
| * Adjusted Gross Income equates to the Gross Income excluding any rent free periods | |
| LEASES RANKED BY RENT | ** Total tenant lines within our valuation. May differ to number of individual tenants |
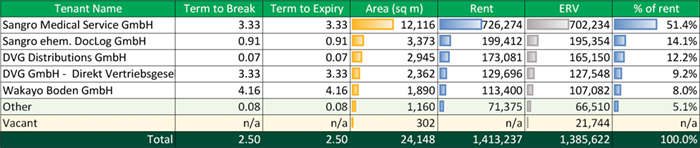
| Printed 09/03/2021 19:42 | |
| PROPERTY ID: | dealbe - Albert-Einstein-Strasse 1 | |
| ON BEHALF OF: | MORGAN STANLEY | |
| VALUATION DATE: | 01-Feb-2021 | FINAL |

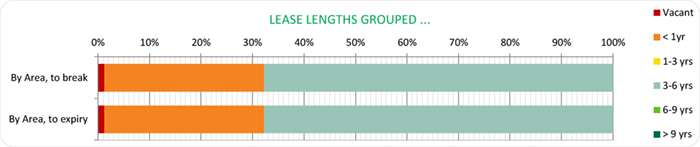
| Printed 09/03/2021 19:42 | |
| ON BEHALF OF: | MORGAN STANLEY |
| PROJECT NAME: | MSTAR |
PROPERTY REPORT
40699 ERKRATH, ALBERT-EINSTEIN-STRASSE 1
| INSPECTED BY: | INSPECTION DATE: | VALUATION DATE: | PROPERTY TYPE |
| MARK-PHILIPP HELCK | 08/01/2020 | 01/02/2021 | WAREHOUSE |
KEY VALUATION FACTORS
| STRENGTHS | WEAKNESSES | |
|
■ The subject property is centrally located in one of Germany’s most important logistic regions “Duisburg / Lower Rhine”;
■ Excellent connection to motorways A3, A46 and A59;
■ Low vacancy rate of below 2%.
|
■ High office share of around 19%;
■ WAULT of less than 3 years.
|
| OPPORTUNITIES | THREATS | |
| ■ The continuing positive development of the overall economy could lead to an increase in achievable rents. |
■ Fluctuations in the world economy and the global capital markets could have negative effects on the German commercial real estate market;
■ High capex could be incurred in mid to long term (due to advanced building age).
|
LOCATION & SITUATION
| LOCATION |
The next largest economically significant city is Ratingen. Ratingen is the largest city in the Mettmann region and borders on the urban areas of Dusseldorf, Duisburg, Muelheim and Essen. Due to its central location within the Rhine- Ruhr region, Erkrath is very well connected in terms of infrastructure. The location, first and foremost Ratingen stands out in the Mettmann district as a location specialized in trade and services with international local companies. In addition, Ratingen is considered the region's hotspot for the IT and telecommunications sectors.
Despite belonging to the logistics region of Dusseldorf, Erkrath only has a limited relevance as a logistics market. The relevant logistics locations in the region are positioned along the A 3 and A 1 as well as on the Rhine rail (Cologne, Dusseldorf, Neuss, Leverkusen). Based in Erkrath and the surrounding area are therefore rather local companies, as well as companies with special freight solutions or transportation lines. |
| ON BEHALF OF: | MORGAN STANLEY |
| PROJECT NAME: | MSTAR |
|
However, the location is benefiting from the increasingly scarce supply of logistics space in the adjacent markets.
Within the city of Erkrath, the subject property is situated in an area, which is mainly used for logistic and industrial purposes. The direct surroundings consist of industrial companies, logistics service providers and retailers.
The motorway connection can be described as excellent due to the close proximity to the motorways A3 and A46. The nearest airport is situated in Dusseldorf around 25 km away and reachable in approx. 25 minutes. The airport offers national and international connections.
|
PROPERTY DESCRIPTION
| DESCRIPTION | The subject property covers an area of approx. 5 hectares and comprises 8 warehouse buildings (A-H) which form three building complexes. | |
| The northern complex contains 3 warehouse buildings (Buildings A, B/C and D). The warehouse structure E/F is located in the south west and comprises 5 units. The buildings G and H form the third building complex located in the southern section of the site. The majority of the buildings comprise two-storey frontages which are oriented to the inner yard of the site. A boiler house is located in the centre of the property. | ||
| Approx. 60% of the site is covered by the building complexes. Accessing roads, loading areas and parking spaces (mainly concrete block paving) cover approx. 30% of the subject site. The remaining ~10% are covered with landscaping (grass, bushes and trees) which are predominately located along the boundaries of the site. | ||
| In 1975, the current buildings A - G as well as the boiler house which form the “Industriepark Erkrath” were constructed on former agricultural land. In 1978, building H was constructed as a carpet outlet. | ||
| The warehouse buildings have been predominately used for distribution, wholesale and storage purposes. Production activities have not been undertaken on the site. | ||
| The warehouse areas are constructed with pre-cast concrete pillars and concrete beams. The flat roofs are of profiled steel elements and are covered with roofing membrane or bitumen sheets. The façades of the warehouses are of trapezoidal metal clad and corrugated metal sheets. Parts of the inner walls are of brick wall construction. The façades of the office buildings are of wash concrete clads or are plastered. | ||
| In total, the warehouse structures comprise 32 loading doors which are mainly oriented towards the inner yard area. The properties are accessed from the eastern part of the site and cannot be encircled. A sufficient number of car and lorry parking spaces are located within the yard and aside the buildings. | ||
| During the inspection not all parts of the property and the premises were accessible. | ||
| Summary of known specification: |
| ON BEHALF OF: | MORGAN STANLEY |
| PROJECT NAME: | MSTAR |
| Characteristic | Result | ||
| Built / Renovation | 1975 / 1978 | ||
| Eaves Height | n/a | ||
| No. of loading Doors | 32 | ||
| Loading Door Ratio | 1.63 | ||
| Yard Depth | Approx. 22-34 metres | ||
| Cross-Dock | None | ||
| Warehouse (% of GLA) | 81% | ||
| Site Coverage Ratio | 60% | ||
|
Source: Phase I Environmental Review dated January 2020; the information gathered during the site inspection. |
|||
| ACCOMMODATION | We have not measured the property, but as instructed, we have relied upon floor areas made available to us. | ||||
| Unit description | Primary use | Status | Area (sq m) | ||
| Warehouse | Logistics | Let | 19,612.96 | ||
| Office | Office | Let | 4,233.00 | ||
| Office | Office | Vacant | 302.00 | ||
| Total | 24,147.96 | ||||
DUE DILIGENCE
| STATE OF REPAIR | CBRE have not undertaken a structural survey, nor tested the services. The property was subject to an inspection for valuation purposes in early 2020. As you are aware, the property has not been re-inspected for the purposes of this report, nor have we been provided with updated TDD. We have therefore relied on the information provided by the Borrower, including a Capex schedule dated 12 June 2019 and schedule with revised budget of capex dated 19 January 2021. Based on the latter which indicates TDD assessment less completed spend in 2020, we have included the immediate and 2-5 years capex of €872,000 within our valuation. | |
| According to our own limited inspection for valuation purposes, our opinion regarding the state of repair would substantiate the assessment by Arcadis. Based on our impression gained during the inspection, we are of the opinion that the buildings are in a fair condition, in line with the year of construction. | ||
| ENVIRONMENTAL
CONSIDERATIONS |
We have summarised the findings from a schedule provided in relation to‘ Priority sites’ within the front section of this report. | |
| According to the Draft Environmental Due Diligence report dated 13 December 2019 by Ambiente Ltd, there are currently no known ground/soil |
| ON BEHALF OF: | MORGAN STANLEY |
| PROJECT NAME: | MSTAR |
| contaminations. However, the following risks for contamination have been identified: | |||
| On-site: | |||
| • | Potential for contamination from multi-let light industrial use / warehousing from c. 1975/78. | ||
| Off-site: | |||
| • | Potential for migration of contamination from neighbouring light industrial uses (E, S). | ||
| In addition, there is a risk of the following building pollutants: | |||
| • | Potentially hazardous building materials (asbestos, AMF, PCB, PAH) within the building fabric. | ||
| From building operations, the following risks have been identified: | |||
| • | Potential leaks and spills from historical storage of heating oil since c. 1975. | ||
| We have been instructed not to make any investigations in relation to the presence or potential presence of contamination in land or buildings or the potential presence of other environmental risk factors and to assume that if investigations were made to an appropriate extent then nothing would be discovered sufficient to affect value. | |||
|
We have not carried out investigation into past uses, either of the properties or of any adjacent lands, to establish whether there is any potential for contamination from such uses or sites, or other environmental risk factors and have therefore assumed that none exists. Should our assumption prove to be incorrect, we reserve the right to amend our valuation accordingly.
|
|||
| TENURE | We have had sight of the Draft Red Flag Legal Report prepared by Hengeler Mueller, dated 05 February 2021. Based on the information provided, we understand the property is held freehold. | |
| We have assumed that there are no onerous legal conditions affecting the property which have a material impact on our opinion of value. | ||
| INCOME PROFILE | We have not been provided with any lease contracts. The following information is based on the rent schedule dated on 30 November 2020. | |
| The property is almost fully let and occupied by 5 tenants, including Wakayo Boden, Sangro, DVG, ARBO and Werbung im Verkehr GmbH. | ||
| The property has a WAULT of 2.49 years (to breaks) as at the date of valuation. The total gross current rent generated by the property is €1,413,237 per annum, whilst our opinion of the gross market rent is €1,385,622 per annum. | ||
|
The main tenant, Sangro Medical Service and Sangro ehem, accounts for over 70% of the total current income. They provide an outpatient customer homecare service with over 150 employees.
|
| ON BEHALF OF: | MORGAN STANLEY |
| PROJECT NAME: | MSTAR |
VALUATION CONSIDERATIONS
|
COSTS AND ADJUSTMENTS
|
Based on the information provided and our knowledge of the market, in approaching our valuation, we made allowances for the following capital and non-recoverable costs. In all cases, we have cited whether they are deducted as at the date of valuation or whether they take effect at a later date.
|
||||
|
Capital Expenditure:
|
|||||
| Type & Calculation | Source | Effective | Amount | ||
| Capital Expenditure: Fixed Amount | Technical Due Diligence | On Valuation No Repeat |
€872,000 | ||
| Tenant Incentives | CBRE Estimate | On lease start /renewal No Repeat |
€7,550 | ||
| Letting Fees: 25% of Rental Value | CBRE Estimate | On lease start /renewal No Repeat |
€5,436 | ||
| Rent Free | CBRE Estimate | On Valuation / No Repeat |
€277,930 | ||
| TOTAL ON VALUATION | €1,162,916 | ||||
|
Revenue Deductions: |
|||||
| Type & Calculation | Source | Effective | Annual Amount | ||
| Maintenance: €2.75 per sq m |
CBRE Estimate | On Valuation + Delay 60 Months In perpetuity |
€66,407 | ||
| Management 2.0% of rental value |
CBRE Estimate | On Valuation In perpetuity |
€27,712.44 | ||
| Void Costs: €0.50 per sq m |
CBRE Estimate | On Valuation On all voids |
€1,812 | ||
| Other Costs: 0.5% of rental value |
CBRE Estimate | On Valuation In perpetuity |
€6,928.11 | ||
| TOTAL: ON VALUATION | €36,453 | ||||
| ON BEHALF OF: | MORGAN STANLEY |
| PROJECT NAME: | MSTAR |
|
VALUATION METHODOLOGY– MARKET VALUE
|
We have had regard to the most recent letting transactions and occupational demand for the region within which the subject property is located, including the property itself if of relevance. The rental rates range between €55.20 and €58.80 per sq m per annum, depending on the duration of lease contracts, building specifications and age.
The second comparable serves as the primary rental evidence. The recorded letting transaction is of a property which is situated in a similar micro location and in close vicinity to the motorway. Therefore, the location can be assessed as very comparable. The property consists of four different building complexes and comprises warehouse, production and office areas with a total of 5,517 sq m. The comparable property also is similar in terms of building quality and fit out. We have adopted the following rental rates within our valuation:
|
|||||
| Use | Letting-Status | Rental Area | ERV per sq m | ERV (Total) | ||
| Office | LET | 4,233.00 sq m | €72.00 /sq m pa | €304,776.00 pa | ||
| Office | VACANT | 302.00 sq m | €72.00 /sq m pa | €21,744.00 pa | ||
| Warehouse | LET | 19,612.96 sq m | €54.00 /sq m pa | €1,059,100.00 pa | ||
| Total* | 24,147.96 sq m | €57.38 /sq m pa | €1,385,620.00 pa | |||
|
* The total amount of ERV and rental area may differ from the calculation printout due to rounding differences.
We have arrived at our opinion of Market Value adopting the traditional investment capitalisation method of valuation. Within this approach, we apply an income weighted average equivalent yield to our opinion of net income, reflecting the comparable evidence within the market for guidance on capital rates and values per sq m.
We would highlight investment comparable number one and two:
The first investment comparable is located in Kerpen. The motorway can be reached within 5 minutes by car. The property has a lettable area of around 3,700 sq m and was sold for approx. EUR 2,960,000 (equating to ~EUR 800 per sq m) in Q3 2020. We consider the property comparable to the subject of valuation, first and foremost, due to the similar location.
Investment comparable number four is located in Dortmund. It is advantageous that a train station is located within immediate vicinity of the property. The motorway can be reached within a few minutes' drive. The premises offers a lettable area of around 3,500 sq m. It was sold for about EUR 2,500,000 (equating to ~EUR 714 per sq m) in Q3 2019. Due to the similar micro location, we consider the transacted property to be comparable to the subject property.
For the valuation of this asset, we have applied the following Equivalent Yield:
- 6.00%
|
||||||
| ON BEHALF OF: | MORGAN STANLEY |
| PROJECT NAME: | MSTAR |
| This results in a Net Initial Yield of 6.68% and a capital rate per sq m of €790. | ||
| On the assumption that there are no unusual factors of which we are unaware and on the basis of the comments and assumptions specified in this report, CBRE is of the opinion that the Market Value (rounded) of the subject property, is: | ||
| €19,075,000 | ||
| (nineteen million seventy-five thousand Euro) | ||
| The unrounded net capital value is €19,083,030. The gross unrounded capital value is €21,772,588 including €1,162,916 of capital costs and €1,526,643 purchaser’s costs (8.00%) respectively. | ||
| Our opinion of Market Value is based upon the Scope of Work and Valuation Assumptions attached and has been primarily derived using comparable recent market transactions on arm’s length terms. | ||
|
VALUATION METHODOLOGY – VACANT POSSESSION VALUE |
The constituent inputs in terms of rental value and non-recoverable costs largely align with the Market Value approach. The key exception being that we have adopted a special assumption that the property is 100% vacant/non-income producing as at the valuation date. This value is predominantly derived using the traditional investment method of valuation but critically benchmarking the resultant capital rate per sq m against the prevailing evidence.
In approaching our valuation under the Special Assumption that the property is entirely vacant (Vacant Possession Value), we have adopted a total void period of 12 months inclusive of rent free or tenant incentives and targeted an equivalent yield of 6.5%.This results in a net rounded value of €15,275,000, equating to €633 per sq m. |
|
|
ESTIMATED REINSTATEMENT ASSESSMENT |
The property has not been inspected by a suitably qualified building surveyor from CBRE, nor have we carried out a full Reinstatement Cost Assessment. For indicative purposes only we estimate that the reinstatement cost of insurance purposes would be in the region of €29,935,924 (rounded, excl. VAT) on a day one basis, including fees but excluding VAT and inflation.
This figure should be compared with the current sum insured and if a material discrepancy exists we suggest that a full Reinstatement Cost Assessment is carried out. |
| ON BEHALF OF: | MORGAN STANLEY |
| PROJECT NAME: | MSTAR |
RENTAL EVIDENCE
| PROPERTY ADDRESS |
PROPERTY USE |
DATE | TOTAL AREA (SQ M) |
TENANT | LEASE LENGTH (YEARS) |
BREAK OPTION |
RENT (P.A) (€) |
MONTHLY RENTAL RATE PER SQ M (€) |
RELATIVE QUALITY |
|
| 40472 Düsseldorf |
Warehouse | Q4 2020 | 3,311 | n/a | n/a | n/a | 182,767 | 4.60 | Similar (distance to the motorway) |
|
| 40721 Hilden |
Warehouse | Q4 2019 | 5,517 | n/a | n/a | n/a | 314,469 | 4.75 | Similar (distance to the motorway) |
|
| 40721 Hilden |
Warehouse | Q4 2019 | 3,086 | n/a | n/a | n/a | 162,940 | 4.40 | Similar (distance to the motorway) |
|
| 40599 Dusseldorf |
Warehouse | Q4 2019 | 4,200 | n/a | n/a | n/a | 246,960 | 4.90 | Similar (distance to the motorway) |
|
| ON BEHALF OF: | MORGAN STANLEY |
| PROJECT NAME: | MSTAR |
SALES EVIDENCE
| PROPERTY ADDRESS |
PROPERTY USE |
DATE | TOTAL AREA (SQ M) |
WAULT (YEARS) |
PASSING RENT PER ANNUM (€) |
PURCHASE PRICE (€) |
NET INITIAL YIELD (%) |
CAPITAL RATE PER SQ M (€) |
RELATIVE QUALITY |
|
| 50169 Kerpen |
Distribution hall |
Q3 2020 | 3,700 | n/a | n/a | 2,960,000 | n/a | 800 | Similar (macro location) |
|
| 50226 Frechen |
Warehouse | Q2 2020 | 9,400 | n/a | n/a | 7,520,000 | n/a | 800 | Similar (macro location) |
|
| 44329 Dortmund |
Distribution hall |
Q3 2019 | 42,610 | n/a | n/a | 32,700,000 | n/a | 767 | Similar (micro location) |
|
| 44147 Dortmund |
Distribution hall |
Q2 2019 | 3,500 | n/a |
n/a
|
2,500,000 | n/a | 714 | Similar (micro location) |
|
| PROPERTY ID: | dedona - Donatusstrasse 127-129 | |
| ON BEHALF OF: | MORGAN STANLEY | |
| VALUATION DATE: | 01-Feb-2021 | FINAL |
Donatusstrasse 127-129 - Donatusstrasse 127-129, Pulheim, 50259, Germany
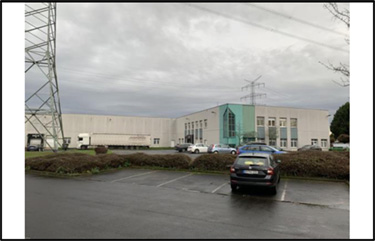 |
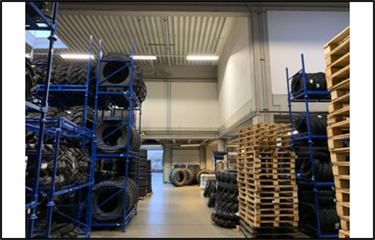 |
|
|
|
||
|
|
 |
| VALUATION METRICS | (currency - EUR) |
| Metric | Value |
| Market Value | 13,500,000 |
| Market Value (per sq m) | 1,085 |
| Net Initial Yield | 3.30% |
| Reversionary Yield | 4.52% |
| Equivalent Yield | 4.40% |
| Gross Income (p.a.) | 521,949 |
| Gross Income (p.a.) (per sq m) | 42 |
| *Adj. Gross Income | 521,949 |
| Adj. Gross Income (per sq m) | 42 |
| Net Income (p.a.) | 484,634 |
| Net Income (p.a.) (per sq m) | 39 |
| Gross Rental Value | 719,787 |
| Gross Rental Value (per sq m) | 58 |
| Capital Expenditure | -316,232 |
| Transaction Costs | 8.99% |
| Over / Under Rented | 0.75% |
KEY FACTS
| Metric | Value | |
| Total Area (sq m) | 12,438 | |
| WAULT to Break by Rent | 1.71 | |
| WAULT to Break by ERV | 1.80 | |
| WAULT to Expiry by Rent | 1.71 | |
| WAULT to Expiry by ERV | 1.80 | |
| Percentage of Vacancy (Area) | 25.89% | |
| Percentage of Vacancy (ERV) | 28.03% | |
| ** | Number of Tenants | 16 |
| Current Voids (months) | 12 | |
| * Adjusted Gross Income equates to the Gross Income excluding any rent free periods | |||
| LEASES RANKED BY RENT | ** Total tenant lines within our valuation. May differ to number of individual tenants |
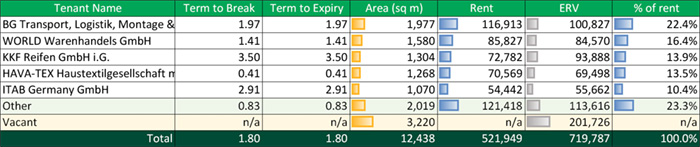
| Printed 09/03/2021 19:42 | |
| PROPERTY ID: | dedona - Donatusstrasse 127-129 | |
| ON BEHALF OF: | MORGAN STANLEY | |
| VALUATION DATE: | 01-Feb-2021 | FINAL |
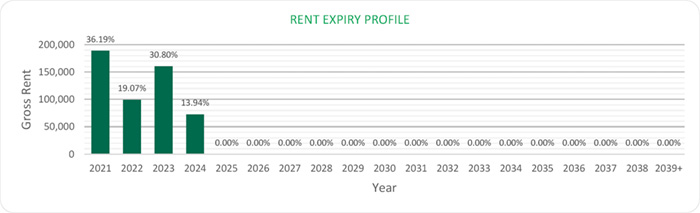

| Printed 09/03/2021 19:42 | |
| ON BEHALF OF: | MORGAN STANLEY |
| PROJECT NAME: | MSTAR |
PROPERTY REPORT
50259 PULHEIM – DONATUSSTRASSE 127-129
| INSPECTED BY: | INSPECTION DATE: | VALUATION DATE: | PROPERTY TYPE |
| MARK-PHILIPP HELCK | 09/01/2020 | 01/02/2021 | INDUSTRIAL PARK |
KEY VALUATION FACTORS
| STRENGTHS | WEAKNESSES |
|
■ The subject property is located in the logistics region Cologne Basin;
■ Good access to the motorways A1 (5.7 km) and A4 (7.2km);
■ Risk limitation through multi-tenant concept. |
■ High vacancy rate of around 26% (by area);
■ WAULT of less than 2 years.
|
| OPPORTUNITIES | THREATS |
|
■ The continuing positive development of the overall economy could lead to an increase in achievable rents;
■ Letting of the vacant spaces at market conditions could improve income profile. |
■ Fluctuations in the world economy and the global capital markets could have negative effects on German real estate market purchase prices;
■ Potential for soil contamination from storage of hazardous goods since 1995. |
LOCATION & SITUATION
| LOCATION | The next largest economically significant city is Cologne. Together with the former federal capital Bonn, Cologne forms the heart of the Cologne-Bonn metropolitan region, which is also part of the Rhine-Ruhr metropolitan region. Cologne is front and centre of the eponymous logistics region. The greater Cologne area represents an important logistics location due to its conveniently accessible location at the intersection of several motorways, railway lines and on the Rhine. In addition to its integration into a dense motorway and railway network (being a central rail hub in continental Europe), Cologne's perks as logistics location include the Cologne/Bonn Airport, the inland port in Cologne-Niehl and the cargo transhipment centre GVZ Cologne-Eifeltor. | |
| Pulheim belongs to the logistics region Cologne Basin. The Cologne Basin is directly adjacent to the Duisburg/Lower Rhine region in the south-west of the federal state of North Rhine-Westphalia and comprises the area between the cities of Cologne, Bonn and Aachen. To the north, the region extends as far as Leverkusen. The boundary with Duisburg/Lower Rhine passes to the north |
| ON BEHALF OF: | MORGAN STANLEY |
| PROJECT NAME: | MSTAR |
| of the town of Dormagen all the way up to the Dutch border. The region’s logistics potential stems from supplying the urban agglomeration and local industry as well as the use of the multimodal infrastructure. This makes the location especially attractive to companies from the retail sector as well as contract and network logistics service providers. | ||
| Within the city of Pulheim, the subject property is situated in an area, which is mainly used for logistic and industrial purposes. The direct surroundings consist of industrial companies, logistic service providers and retailers. | ||
| The motorway connection can be described as good because of the close proximity to the motorway A1. The next airport is situated in Cologne around 30 km away and reachable in approximately 30 minutes. The airport offers national and international connections. |
PROPERTY DESCRIPTION
| DESCRIPTION | The subject property covers an area of approximately 2.1 hectares and comprises an irregular-shaped warehouse complex. In total, the building complex comprises 9 warehouse units as well as two-storey office areas for each of the units. | |
| Approx. 65% of the subject site is covered with the building complex. Access roads (Asphalt), yard areas and parking space cover approx. 25% of the property. Approx. 10% of the site is covered with landscaping mainly located along the property boundaries and before the entrances to the buildings. | ||
| In 1995, the building complex was constructed on former agricultural land and for storage and distribution purposes. | ||
| The warehouse areas are constructed with pre-cast concrete pillars and concrete beams. The roof is of profiled steel elements and is covered with roofing membrane. The façade is covered with wash concrete panels and the warehouse units a separated by brick walls. | ||
| In total, the warehouse building comprises 18 loading doors, i. e. 2 per unit. The loading door are mainly oriented to the encircling road around the property which is accessed in the south of the property. A sufficient number of car parking spaces are located in the northern part of the site as well as along the warehouses. | ||
| During the inspection not all parts of the property and the premises were accessible. | ||
| Summary of known specification: | ||
| Characteristic | Result | ||
| Built / Renovation | 1995 | ||
| Eaves Height | n.a. | ||
| No. of loading Doors | 18 | ||
| Loading Door Ratio | 2.15 | ||
| ON BEHALF OF: | MORGAN STANLEY |
| PROJECT NAME: | MSTAR |
| Yard Depth | Approx. 22-36 metres | ||
| Cross-Dock | Front loading | ||
| Warehouse (% of GLA) | 67% | ||
| Site Coverage Ratio | 65% | ||
| ACCOMMODATION |
Source: Phase I Environmental Review dated January 2020; the information gathered during the site inspection. We have not measured the property, but as instructed, we have relied upon floor areas made available to us. |
| Unit Description | Primary Use | Status | Area (sq m) | ||
| Office | Office | LET | 2,283.00 | ||
| Office | Office | VACANT | 1,785.84 | ||
| Warehouse | Storage/Production | LET | 6,935.28 | ||
| Warehouse | Storage/Production | VACANT | 1,434.32 | ||
| Total (lettable) | 12,438.44 |
DUE DILIGENCE
| STATE OF REPAIR | CBRE have not undertaken a structural survey, nor tested the services. The property was subject to an inspection for valuation purposes in early 2020. As you are aware, the property has not been re-inspected for the purposes of this report, nor have we been provided with updated TDD. We have therefore relied on the information provided by the Borrower, including a Capex schedule dated 12 June 2019 and schedule with revised budget of capex dated 19 January 2021. Based on the latter which indicates TDD assessment less completed spend in 2020, we have included the immediate and 2-5 years capex of €137,000 within our valuation. | |
| According to our own limited inspection for valuation purposes, our opinion regarding the state of repair would substantiate the assessment by Arcadis. Based on our impression gained during the inspection, we are of the opinion that the buildings are in a fair condition, in line with the year of construction. | ||
| ENVIRONMENTAL CONSIDERATIONS |
We have summarised the findings from a schedule provided in relation to ‘Priority sites’ within the front section of this report. | |
| According to the Draft Environmental Due Diligence report dated 10 January 2020 from Ambiente Ltd. There are currently no known ground/soil contaminations. However, the following risks for contamination have been identified: | ||
| On-site |
| ON BEHALF OF: | MORGAN STANLEY |
| PROJECT NAME: | MSTAR |
|
● Potential for contamination from light industrial use of the subject property since c.1995, including storage and use of small quantities of hazardous materials.
Off-site
● Potential for migration of contamination from neighbouring light industrial uses
In addition, there is the risk of the following building pollutants:
● No potential sources of contamination have been identified.
From building operations, the following risks have been identified:
● No potential sources of contamination have been identified. |
||
| We have been instructed not to make any investigations in relation to the presence or potential presence of contamination in land or buildings or the potential presence of other environmental risk factors and to assume that if investigations were made to an appropriate extent then nothing would be discovered sufficient to affect value. | ||
| We have not carried out investigation into past uses, either of the properties or of any adjacent lands, to establish whether there is any potential for contamination from such uses or sites, or other environmental risk factors and have therefore assumed that none exists. Should our assumption prove to be incorrect, we reserve the right to amend our valuation accordingly. | ||
| TENURE | We have had sight of the Draft Red Flag Legal Report prepared by Hengeler Mueller, dated 05 February 2021. Based on the information provided, we understand the property is held freehold. | |
| We have assumed that there are no onerous legal conditions affecting the property which have a material impact on our opinion of value. | ||
| INCOME PROFILE | The rental contracts have not been available. The information is based on the rent schedule dated on 30 November 2020. | |
|
The property is leased to ten tenants (BG Transport GmbH, H.I.B. GmbH, HAVA-TEX Haustextilgesellschaft mbH, ITAB Germany GmbH, JSP Trading GmbH, KKF Reifen GmbH i.G., Revoseal Europe GmbH, WORLD Warenhandels GmbH, Zentralapotheke St. Franziskus-Hospital). 1,786 sq m of office spaces and 1,434 sq m of warehouse spaces (25.88% of total space) are vacant.
|
||
|
The property has a WAULT of 1.71 years (to breaks) from the date of valuation. The total gross current rent generated by the property is €521,949 per annum whilst our opinion of the total gross market rent is €719,787 per annum. The property is largely shown as rack rented after accounting for current vacancy.
|
||
|
The main tenant is with about 16% of the total rental space and about 22% of the total rental income is the “BG Transport GmbH”. The company BG Transport GmbH provides logistics solutions. The Company also offers assembly, removal and construction services. |
| ON BEHALF OF: | MORGAN STANLEY |
| PROJECT NAME: | MSTAR |
VALUATION CONSIDERATIONS
| COSTS AND ADJUSTMENTS | Based on the information provided or our knowledge of the market, in approaching our valuation, we made allowances for the following capital and non-recoverable costs. In all cases, we have cited whether they are deducted as at the date of valuation or whether they take effect at a later date. | |
| Capital Expenditure: | ||
| Type & Calculation | Source | Effective | Amount | ||
| Capital Expenditure: Fixed Amount |
Technical Due Diligence |
On Valuation No Repeat |
€137,000 | ||
| Tenant Incentives | CBRE Estimate | On lease start / renewal No Repeat |
€128,800 | ||
| Letting Fees: 25% of Rental Value |
CBRE Estimate | On lease start / renewal No Repeat |
€50,432 | ||
| TOTAL ON VALUATION |
€316,232 | ||||
| Revenue Deductions: | ||
| Type & Calculation | Source | Effective | Annual Amount | ||
| Maintenance: €3.00 per sq m |
CBRE Estimate | On Valuation + Delay 60 Months | €37,314 | ||
| In perpetuity | |||||
| Management 2.0% of rental value |
CBRE Estimate | On Valuation In perpetuity |
€14,396 | ||
| Void Costs: €6 per sq m |
CBRE Estimate | On Valuation On all voids |
€19,320 | ||
| Other Costs: 0.5% of rental value |
CBRE Estimate | On Valuation In perpetuity |
€3,599 | ||
| TOTAL: ON VALUATION |
€37,315 | ||||
| VALUATION METHODOLOGY – MARKET VALUE |
We have had regard to the most recent letting transactions and occupational demand for the region within which the subject property is located, including the property itself if of relevance. The rental rates range between €51.12 and €58.80 per sq m per annum, depending on the duration of the lease contract, building specifications and |
| ON BEHALF OF: | MORGAN STANLEY |
| PROJECT NAME: | MSTAR |
| age. Within the evidence table appended, we would highlight the properties in Hilden as being of greatest relevance in asset characteristics. | ||
| The second comparable serves as the primary rental evidence. The recorded letting transaction is of a property which is situated in a similar micro location and in close vicinity to the motorway. Therefore, the location can be assessed as very comparable. The property consists of four different building complexes and comprises warehouse, production and office areas with a total of 5,517 sq m. The comparable property also is similar in terms of building quality and fit out. We have adopted the following rental rates within our valuation: | ||
| Use | Letting-Status | Rental Area (sq m) | ERV per sq m | ERV (Total) | ||
| Office | LET | 2,283.00 | €72.00 /sq m pa | €164,376.00 pa | ||
| Office | VACANT | 1,785.84 | €72.00 /sq m pa | €128,580.48 pa | ||
| Warehouse | LET | 6,935.28 | €51.00 /sq m pa | €353,699.28 pa | ||
| Warehouse | VACANT | 1,434.32 | €51.00 /sq m pa | €73,150.32 pa | ||
| Total* | 12,438.44 | €57.87 /sq m pa | €719,806.08 pa | |||
| * The total amount of ERV and rental area may differ from the calculation printout due to rounding differences. | ||
| We have arrived at our opinion of Market Value adopting the Traditional investment capitalisation method of valuation. Within this approach, we apply an income weighted average equivalent yield to our opinion of net income, reflecting the comparable evidence within the market for guidance on capital rates and values per sq m. | ||
| We would like to highlight investment comparable number two and four. The second investment comparable is also in the direct vicinity to the motorway. The location can be considered as similar. The property has a lettable area of around 43,095 sq m. In addition, it was sold for approx. EUR 45,900,000 (equating to around EUR 1,065 per sq m) in Q3 2019. Due to the less intensive macro location in terms of logistics, we consider the property inferior to the subject of valuation. | ||
| Investment comparable four is also located in the direct vicinity to the motorway. The location can be considered as comparable as well. The property has a lettable area of around 9,500 sq m and was sold for about EUR 9,097,200 (equating to around EUR 958 per sq m) in Q4 2018. Due to the similar macro location, we consider the property to be similar. | ||
| For the valuation of this asset, we have applied the following equivalent yield: | ||
| - 4.40% | ||
| This results in a Net Initial Yield of 3.30% and a capital rate per sq m of €1.085. The Net Initial Yield is currently being influenced by the level of vacancy. |
| ON BEHALF OF: | MORGAN STANLEY |
| PROJECT NAME: | MSTAR |
| On the assumption that there are no unusual factors of which we are unaware and on the basis of the comments and assumptions specified in this report, CBRE is of the opinion that the Market Value (rounded) of the subject property, is: | ||
| €13,500,000 | ||
| (thirteen million five hundred thousand Euro) | ||
| The unrounded net capital value is €13,489,229. The gross unrounded capital value is €15,019,492 including €316,232 of capital costs and €1,214,031 purchaser’s costs (9.00%) respectively. | ||
| Our opinion of Market Value is based upon the Scope of Work and Valuation Assumptions attached and has been primarily derived using comparable recent market transactions on arm’s length terms. | ||
| VALUATION METHODOLOGY – VACANT POSSESSION VALUE | The constituent inputs in terms of rental value and non-recoverable costs largely align with the Market Value approach. The key exception being that we have adopted a special assumption that the property is 100% vacant/non-income producing as at the valuation date. This value is predominantly derived using the traditional investment method of valuation but critically benchmarking the resultant capital rate per sq m against the prevailing evidence. | |
| In approaching our valuation under the Special Assumption that the property is entirely vacant (Vacant Possession Value), we have adopted a total void period of 12 months inclusive of rent free or tenant incentives and targeted an equivalent yield of 5.4%. | ||
| This results in a net rounded value of €10,000,000, equating to €804 per sq m. | ||
| ESTIMATED REINSTATEMENT ASSESSMENT | The property has not been inspected by a suitably qualified building surveyor from CBRE, nor have we carried out a full Reinstatement Cost Assessment. For indicative purposes only we estimate that the reinstatement cost of insurance purposes would be in the region of €18,246,079 (rounded, excl. VAT) on a day one basis, including fees but excluding VAT and inflation. | |
| This figure should be compared with the current sum insured and if a material discrepancy exists we suggest that a full Reinstatement Cost Assessment is carried out. |
| ON BEHALF OF: | MORGAN STANLEY |
| PROJECT NAME: | MSTAR |
RENTAL EVIDENCE
| PROPERTY ADDRESS |
PROPERTY USE | DATE | TOTAL AREA (SQ M) |
TENANT | LEASE LENGTH (YEARS) |
BREAK OPTION |
RENT (P.A) (€) |
MONTHLY RENTAL RATE PER SQ M (€) |
RELATIVE QUALITY |
| 40472 Düsseldorf |
Warehouse | Q4 2020 | 3,311 | n/a | n/a | n/a | 182,767 | 4.60 | Slightly superior (macro location) |
| 40721 Hilden | Warehouse | Q4 2019 | 3,086 | n/a | n/a | n/a | 162,940 | 4.40 | Similar (distance to the motorway) |
| 50825 Cologne |
Warehouse | Q4 2019 | 2,133 | n/a | n/a | n/a | 109,039 | 4.26 | Similar to superior (macro location) |
| 40599 Dusseldorf |
Warehouse | Q4 2019 | 4,200 | n/a | n/a | n/a | 246,960 | 4.90 | Slightly superior (macro location) |
| ON BEHALF OF: | MORGAN STANLEY |
| PROJECT NAME: | MSTAR |
SALES EVIDENCE
| PROPERTY ADDRESS |
PROPERTY USE |
DATE | TOTAL AREA | PASSING RENT PER ANNUM |
PURCHASE PRICE |
NET INITIAL YIELD (%) |
CAPITAL RATE PER SQ M |
RELATIVE QUALITY |
| 50126 Bergheim | Distribution hall |
Q3 2020 | 19,404 | n/a | 50,000,000 | n/a | 925 | Similar (micro location) |
| 40885 Ratingen | Distribution hall |
Q3 2019 | 43,095 | n/a | 45,900,000 | n/a | 1,065 | Similar (macro location) |
| 41179 Mönchengladbach |
Distribution hall |
Q2 2019 | 153,084 | n/a | 187,000,000 | n/a | 1,222 | Superior (macro location) |
| 50170 Kerpen | Warehouse | Q4 2018 | 9,500 | 7 | 9,097,200 | n/a | 958 | Similar (macro location) |
| PROPERTY ID: | defeld - Feldbachacker 4 | |
| ON BEHALF OF: | MORGAN STANLEY | |
| VALUATION DATE: | 01-Feb-2021 | FINAL |
Feldbachacker 4 - Feldbachacker 4, Dortmund, 44149, Germany
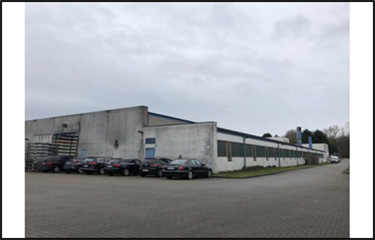 |
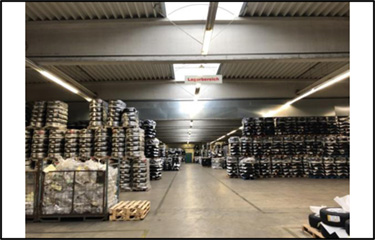 |
|
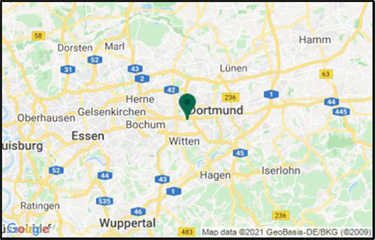 |
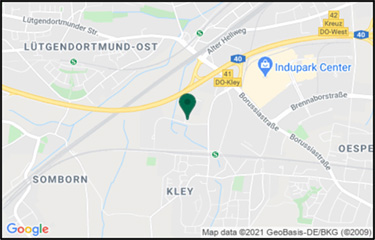 |
| VALUATION METRICS | (currency - EUR) |
| Metric | Value |
| Market Value | 8,470,000 |
| Market Value (per sq m) | 797 |
| Net Initial Yield | 3.25% |
| Reversionary Yield | 5.19% |
| Equivalent Yield | 5.00% |
| Gross Income (p.a.) | 318,927 |
| Gross Income (p.a.) (per sq m) | 30 |
| *Adj. Gross Income | 318,927 |
| Adj. Gross Income (per sq m) | 30 |
| Net Income (p.a.) | 301,538 |
| Net Income (p.a.) (per sq m) | 28 |
| Gross Rental Value | 515,586 |
| Gross Rental Value (per sq m) | 49 |
| Capital Expenditure | -266,625 |
| Transaction Costs | 9.50% |
| Over / Under Rented | -31.57% |
KEY FACTS
| Metric | Value | |
| Total Area (sq m) | 10,625 | |
| WAULT to Break by Rent | 0.91 | |
| WAULT to Break by ERV | 0.91 | |
| WAULT to Expiry by Rent | 0.91 | |
| WAULT to Expiry by ERV | 0.91 | |
| Percentage of Vacancy (Area) | 7.06% | |
| Percentage of Vacancy (ERV) | 9.60% | |
| ** | Number of Tenants | 1 |
| Current Voids (months) | 12 | |
| * Adjusted Gross Income equates to the Gross Income excluding any rent free periods | ||||
| LEASES RANKED BY RENT | ** Total tenant lines within our valuation. May differ to number of individual tenants |
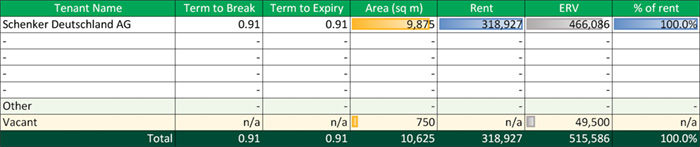
| Printed 09/03/2021 19:42 | |
| PROPERTY ID: | defeld - Feldbachacker 4 | |
| ON BEHALF OF: | MORGAN STANLEY | |
| VALUATION DATE: | 01-Feb-2021 | FINAL |
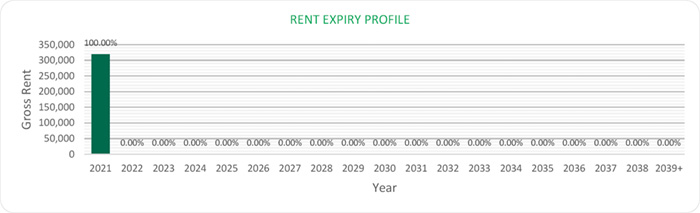
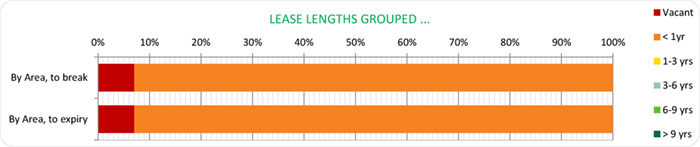
| Printed 09/03/2021 19:42 | |
| ON BEHALF OF: | MORGAN STANLEY |
| PROJECT NAME: | MSTAR |
PROPERTY REPORT
44149 DORTMUND, FELDBACHACKER 4
| INSPECTED BY: | INSPECTION DATE: | VALUATION DATE: | PROPERTY TYPE |
| FLORIAN ECKERVOGT | 09/01/2020 | 01/02/2021 | WAREHOUSE |
KEY VALUATION FACTORS
| STRENGTHS | WEAKNESSES |
|
■ The subject property is located in an established commercial/logistic location.
■ Excellent connection to the motorway network with the motorway junction A40 situated in direct vicinity;
■ Availability of surplus land.
|
■ Building appears to be in poor condition;
■ Outdated fit out;
■ Insufficient number of loading docks;
■ High office share;
■ WAULT of less than 1 years. |
| OPPORTUNITIES | THREATS |
|
■ The continuing positive development of the overall economy could lead to an increase in rents.
■ Letting of the vacant area and extension of the existing lease could increase attractiveness as investment product. |
■ Fluctuations in the world economy and the global capital markets could have negative effects on German real estate market purchase prices.
■ High capital expenditure costs could occur in the future (due to building age). |
LOCATION & SITUATION
| LOCATION |
Dortmund is traditionally regarded as an industrial location with the "trinity" of coal mining, steel production and beer brewing. Dortmund's economy is characterised by structural change from a former mining and processing location to a service location. The Dortmund urban area is affected by the federal motorways A1, A2 and A45 and the A40 as well as various federal roads provide efficient cross-connections. As an ICE stop, Dortmund Central Station is excellently integrated into the national railway network both in a north-south and east-west direction. Dortmund International Airport is located around 12 km outside the city centre on the eastern edge of the city.
|
|
|
Dortmund lies at the heart of the eponymous logistics region. Together with the county of Unna and the city of Hamm, the region is home to quite a number of popular logistics locations. In addition to its proximity to the major consumer markets of the Ruhr metro area and the Rhine valley, its central location in |
| ON BEHALF OF: | MORGAN STANLEY |
| PROJECT NAME: | MSTAR |
| Germany and Europe, Dortmund also benefits from great transport links and the associable advantages for the location. Aside from superb integration into the inter-regional road and rail networks, the city boasts additional transport connections via its regional airport and its inland port. | ||
| Within the city of Dortmund, the subject property is situated in an area, which is mainly used for industrial purposes. The direct surroundings consist of industrial companies and garages. | ||
| The motorway connection can be described as very good because of the close proximity to the motorway A40. The next airport is situated in Dortmund around 20 km away and reachable in approximately 40 minutes. The airport offers national and international connections. |
PROPERTY DESCRIPTION
| DESCRIPTION | The site covers an area of approximately 3.4 hectares and comprises one building with 2-storey section facing south (3-storey in the southwest) and three connected warehouse units to the rear. | |
| An access road and parking area are located to the west of the building, while the loading area and storage yard is located in the northern part of the site. The remain-der of the site area to the north, east and south of the site building comprises undeveloped land (potential development plots). | ||
| A former gatehouse and transformer building are located in the south-western part of the property (by the site entrance). | ||
| The building complex covers 30% of the property. Approximately 10% is used as access roads and car parking (covered with brick paving). The remaining 60% of the property is undeveloped and is predominately covered in grass, together with some bushes and trees. | ||
| The property is located in an area known for former shallow coal mining in the mid/late 19th century. The site was undeveloped, agricultural land prior to the construction of the western section of the current building in 1984. The building was subsequently extended to the east in 1991 and 1994. | ||
|
Summary of known specification: |
||
| Characteristic | Result | ||
| Built / Renovation | 1984 / 1991 / 1994 | ||
| Eaves Height | 6.0 metres | ||
| No. of loading Doors | 3 | ||
| Loading Door Ratio | 0.31 | ||
| Yard Depth | Approx. 26-32 metres | ||
| Cross-Dock | None | ||
| Warehouse (% of GLA) | 87% | ||
| Site Coverage Ratio | 30% | ||
| ON BEHALF OF: | MORGAN STANLEY |
| PROJECT NAME: | MSTAR |
| Source: Phase I Environmental Review dated January 2020; the information gathered during the site inspection. | ||
| ACCOMMODATION | We have not measured the property, but as instructed, we have relied upon floor areas made available to us. |
| Unit description | Primary use | Status | Area (sq m) | ||
| Warehouse | Logistics | Let | 9,200 | ||
| Office | Office | Let | 205 | ||
| Office | Office | Vacant | 750 | ||
| Other | Other | Let | 470 | ||
| Other | External / Yard | Vacant | (31,630) | ||
| Total (lettable) | 10,625 (excl. External) |
DUE DILIGENCE
| STATE OF REPAIR | CBRE have not undertaken a structural survey, nor tested the services. The property was subject to an inspection for valuation purposes in early 2020. As you are aware, the property has not been re-inspected for the purposes of this report, nor have we been provided with updated TDD. We have therefore relied on the information provided by the Borrower, including a Capex schedule dated 12 June 2019 and schedule with revised budget of capex dated 19 January 2021. Based on the latter which indicates TDD assessment less completed spend in 2020, we have included the immediate and 2-5 years capex of €243,000 within our valuation. | |
| According to our own limited inspection for valuation purposes, our opinion regarding the state of repair would substantiate the assessment by Arcadis. Based on our impression gained during the inspection, we are of the opinion that the buildings are in a fair condition, in line with the year of construction. | ||
| ENVIRONMENTAL CONSIDERATIONS |
We have summarised the findings from a schedule provided in relation to ‘Priority sites’ within the front section of this report. | |
| We have been made aware that although not registered in the register of contaminated sites, indications for potential contamination exist at this property likely in relation to in particular due to their current or former use. If future excavation works are carried out at these Properties, this could lead to additional costs. However, no action is required on the current use of the Properties. As such we have assumed this does not have a material impact |
| ON BEHALF OF: | MORGAN STANLEY |
| PROJECT NAME: | MSTAR |
| on our opinion of value given the valuation is prepared taken the current use into consideration. | ||
| According to the Draft Environmental Due Diligence report dated 13/12/2019 from Ambiente Ltd, there are currently no known ground/soil contaminations. However, the following risks for contamination have been identified: | ||
| On-site | ||
| ● Former and current potentially contaminative uses of the property (including spray paint facility and production and car tyre storage and assembly) from c.1983 to the present day. | ||
| Off-site | ||
| ● No significant sources of contamination have been identified. | ||
| In addition, there is the risk of the following building pollutants: | ||
| ● Potential for methane gassing (natural source). | ||
| ● Knownasbestos containing materials. | ||
| From building operations, the following risks have been identified: | ||
| ● No potential sources of contamination have been identified. | ||
| We have been instructed not to make any investigations in relation to the presence or potential presence of contamination in land or buildings or the potential presence of other environmental risk factors and to assume that if investigations were made to an appropriate extent then nothing would be discovered sufficient to affect value. We have not carried out investigation into past uses, either of the properties or of any adjacent lands, to establish whether there is any potential for contamination from such uses or sites, or other environmental risk factors and have therefore assumed that none exists. Should our assumption prove to be incorrect, we reserve the right to amend our valuation accordingly. | ||
| TENURE | We have had sight of the Draft Red Flag Legal Report prepared by Hengeler Mueller, dated 05 February 2021. Based on the information provided, we understand the property is held freehold. | |
|
We have assumed that there are no onerous legal conditions affecting the property which have a material impact on our opinion of value. |
| ON BEHALF OF: | MORGAN STANLEY |
| PROJECT NAME: | MSTAR |
| INCOME PROFILE | The rental contracts have not been made available to us. The information stated below is based on the rent schedule dated on 20 November 2020. | |
| The property is leased to a single tenant (Schenker Deutschland AG). 750.00 sq m of office spaces (7.06% of total space) are vacant. | ||
| The property has a very short WAULT of 0.91 years from the date of valuation. The total gross current rent generated by the property is €318,927 per annum whilst our opinion of the total gross market rent is €515,586 per annum. The property is shown as under-rented after factoring current vacancy. | ||
| The main tenant with about 93% of the total rental space and 100% of the total rental income is the “Schenker Deutschland AG”. The company was founded in 1988. The Company's line of business includes the arranging of transportation of freight and cargo. |
VALUATION CONSIDERATIONS
| COSTS AND ADJUSTMENTS | Based on the information provided or our knowledge of the market, in approaching our valuation, we made allowances for the following capital and non-recoverable costs. In all cases, we have cited whether they are deducted as at the date of valuation or whether they take effect at a later date. | |
|
Capital Expenditure: |
||
| Type & Calculation | Source | Effective | Amount | ||
| Capital Expenditure: Fixed Amount |
Technical Due Diligence |
On Valuation |
€243,000 | ||
| Tenant Incentives | CBRE Estimate |
On lease start / |
€11,250 | ||
| Letting Fees: 25% of Rental Value |
CBRE Estimate |
On lease start / |
€12,375 | ||
| TOTAL ON VALUATION |
€266,625 | ||||
| Revenue Deductions: | ||
| Type & Calculation | Source | Effective | Annual Amount | ||
| Maintenance: €2.00 per sq m |
CBRE Estimate | On Valuation + Delay 60 Months In perpetuity |
€21,250 | ||
| Management | CBRE Estimate | On Valuation | €10,312 | ||
| ON BEHALF OF: | MORGAN STANLEY |
| PROJECT NAME: | MSTAR |
| 2.0% of rental value | In perpetuity | ||||
| Void Costs: €0.50 per sq m | CBRE Estimate | On Valuation On all voids |
€4,500 | ||
| Other Costs: 0.5% of rental value |
CBRE Estimate | On Valuation In perpetuity |
€2,578 | ||
| TOTAL: ON VALUATION |
€17,390 | ||||
| VALUATION METHODOLOGY – MARKET VALUE | We have had regard to the most recent letting transactions and occupational demand for the region within which the subject property is located, including the property itself if of relevance. The rental rates range between €45 and €55.2 per sq m per annum, depending on the duration of the lease contract, building specifications and age. | |
| Within the evidence table appended, we would highlight the property in Dortmund as being of greatest relevance in terms of property characteristics. Comparable number three is located in the similar micro location, in a close vicinity to the motorway. Therefore, the location can be assessed as comparable. The property is an industrial hall with a total of 30,000 sq m of storage and production area. The property also benefits from good public transport connections. We have adopted the following rates across the property: | ||
| Use | Letting-Status | Rental Area | ERV per sq m | ERV (Total) | ||
| External / Yard | VACANT | (31,630.00 sq m) | €0.00 /sq m pa | €0.00 pa | ||
| Office | LET | 205.00 sq m | €66.00 /sq m pa | €13,530.00 pa | ||
| Office | VACANT | 750.00 sq m | €66.00 /sq m pa | €49,500.00 pa | ||
| Other | LET | 470.00 sq m | €46.80 /sq m pa | €21,996.00 pa | ||
| Warehouse | LET | 9,200.00 sq m | €46.80 /sq m pa | €430,560.00 pa | ||
| Total* | 10,625.00 sq m | €48.53 /sq m pa | €515,586.00 pa | |||
| * The total amount of ERV and rental area may differ from the calculation printout due to rounding differences. | ||
| We have arrived at our opinion of Market Value adopting the Traditional investment capitalisation method of valuation. Within this approach, we apply an income weighted average equivalent yield to our opinion of net income, reflecting the comparable evidence within the market for guidance on capital rates and values per sq m. | ||
| The first investment comparable is located in Kerpen. The motorway can be reached within 5 minutes by car. The property has a lettable area of around 3,700 sq m and was sold for approx. EUR 2,960,000 (equating to ~EUR 800 per sq m) in Q3 2020. Due to the similar micro location, we consider the transacted property to be comparable to the subject property. | ||
| Investment comparable number four is located in Dortmund. It benefits from a train station within the immediate vicinity of the property. The motorway can be reached within a few minutes' drive. The premises offers a lettable area of around 3,500 sq m. It was |
| ON BEHALF OF: | MORGAN STANLEY |
| PROJECT NAME: | MSTAR |
|
sold for about EUR 2,500,000 (equating to ~EUR 714 per sq m) in Q3 2019. We consider the property comparable to the subject of valuation, first and foremost, due to the similar location. |
||
|
For the valuation of this asset, we have applied the following equivalent yield: |
||
| - 5.00% | ||
| This results in an Initial Yield of 3.25% and a capital rate per sq m of €797. The Net Initial Yield is currently being influenced by the level of under-rent. | ||
| On the assumption that there are no unusual factors of which we are unaware and on the basis of the comments and assumptions specified in this report, CBRE is of the opinion that the Market Value (rounded) of the subject property, is: | ||
| €8,470,000 | ||
| (eight million four hundred seventy thousand Euro) | ||
| The unrounded net capital value is €8,469,538. The gross unrounded capital value is €9,540,769 including capital costs of €266,625 and €804,606 of purchaser’s costs (9.50%). | ||
| Our opinion of Market Value is based upon the Scope of Work and Valuation Assumptions attached and has been primarily derived using comparable recent market transactions on arm’s length terms. | ||
| VALUATION METHODOLOGY – VACANT POSSESSION VALUE |
The constituent inputs in terms of rental value and non-recoverable costs largely align with the Market Value approach. The key exception being that we have adopted a special assumption that the property is 100% vacant/non-income producing as at the valuation date. This value is predominantly derived using the traditional investment method of valuation but critically benchmarking the resultant capital rate per sq m against the prevailing evidence. | |
| In approaching our valuation under the Special Assumption that the property is entirely vacant (Vacant Possession Value), we have adopted a total void period of 12 months inclusive of rent free or tenant incentives and targeted an equivalent yield of 5.5%. | ||
| This results in a net rounded value of €7,090,000, equating to €667 per sq m. | ||
| ESTIMATED REINSTATEMENT ASSESSMENT |
The property has not been inspected by a suitably qualified building surveyor from CBRE, nor have we carried out a full Reinstatement Cost Assessment. For indicative purposes only we estimate that the reinstatement cost of insurance purposes would be in the region of €11,247,655 (rounded, excl. VAT) on a day one basis, including fees but excluding VAT and inflation. |
|
|
This figure should be compared with the current sum insured and if a material discrepancy exists we suggest that a full Reinstatement Cost Assessment is carried out. |
| ON BEHALF OF: | MORGAN STANLEY |
| PROJECT NAME: | MSTAR |
RENTAL EVIDENCE
| PROPERTY ADDRESS |
PROPERTY USE |
DATE | TOTAL AREA (SQ M) |
TENANT | LEASE LENGTH (YEARS) |
BREAK OPTION |
RENT (P.A) (€) |
MONTHLY RENTAL RATE PER SQ M (€) |
RELATIVE QUALITY |
| 40472 Düsseldorf |
Warehouse | Q4 2020 | 3,311 | n/a | n/a | n/a | 182,767 | 4.60 | Similar (macro location) |
| 58454 Witten |
Distribution hall |
Q4 2019 | 8,920 | n/a | n/a | n/a | 401,400 | 3.75 |
Similar (distance to |
| 44145 Dortmund |
Distribution hall |
Q4 2019 | 30,000 | n/a | n/a | n/a | 1,476,000 | 4.10 | Similar (micro location |
| 44577 Castrop- Rauxel |
Warehouse | Q4 2019 | 24,830 | n/a | 1.50 | n/a | 1,251,432 | 4.20 | Inferior (macro location) |
| ON BEHALF OF: | MORGAN STANLEY |
| PROJECT NAME: | MSTAR |
SALES EVIDENCE
| PROPERTY ADDRESS |
PROPERTY USE | DATE | TOTAL AREA (SQ M) | WAULT (YEARS) |
PASSING RENT PER ANNUM (€) | PURCHASE PRICE (€) |
NET INITIAL
YIELD (%) |
CAPITAL RATE PER SQ M (€) |
RELATIVE QUALITY |
| 50169 Kerpen | Distribution hall | Q3 2020 | 3,700 | n/a | n/a | 2,960,000 | n/a | 800 | Similar (distance to the motorway) |
| 50226 Frechen | Warhouse | Q2 2020 | 9,400 | n/a | n/a | 7,520,000 | n/a | 800 | Inferior (macro location) |
| 44329 Dortmund | Distribution hall |
Q3 2019 | 42,610 | n/a | n/a | 32,700,000 | n/a | 767 | Similar (macro and micro location) |
| 44147 Dortmund | Distribution hall |
Q2 2019 | 3,500 | n/a | n/a | 2,500,000 | n/a | 714 | Similar (macro and micro location) |
| PROPERTY ID: | defelh - Feldheider Strasse 37-45 / 38-78 | |
| ON BEHALF OF: | MORGAN STANLEY | |
| VALUATION DATE: | 01-Feb-2021 | FINAL |
Feldheider Strasse 37-45 / 38-78 - Feldheider Strasse 37-45 / 38-78, Erkrath, 40699, Germany
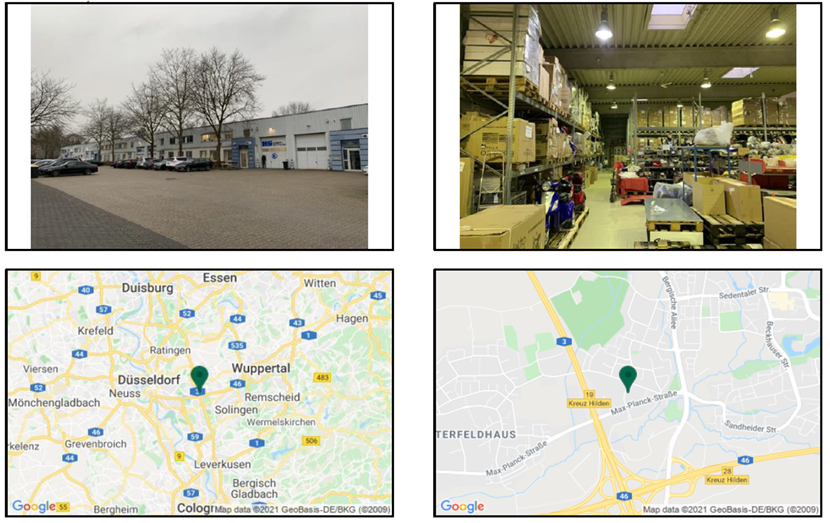
| VALUATION METRICS | (currency - EUR) |
| Metric | Value |
| Market Value | 16,700,000 |
| Market Value (per sq m) | 796 |
| Net Initial Yield | 6.87% |
| Reversionary Yield | 6.30% |
| Equivalent Yield | 6.25% |
| Gross Income (p.a.) | 1,274,865 |
| Gross Income (p.a.) (per sq m) | 61 |
| *Adj. Gross Income | 1,274,865 |
| Adj. Gross Income (per sq m) | 61 |
| Net Income (p.a.) | 1,235,603 |
| Net Income (p.a.) (per sq m) | 59 |
| Gross Rental Value | 1,227,042 |
| Gross Rental Value (per sq m) | 58 |
| Capital Expenditure | -772,024 |
| Transaction Costs | 7.75% |
| Over / Under Rented | 12.75% |
| KEY FACTS | ||
| Metric | Value | |
| Total Area (sq m) | 20,985 | |
| WAULT to Break by Rent | 3.94 | |
| WAULT to Break by ERV | 3.93 | |
| WAULT to Expiry by Rent | 3.94 | |
| WAULT to Expiry by ERV | 3.93 | |
| Percentage of Vacancy (Area) | 6.82% | |
| Percentage of Vacancy (ERV) | 7.85% | |
| ** | Number of Tenants | 53 |
| Current Voids (months) | 12 | |
| * Adjusted Gross Income equates to the Gross Income excluding any rent free periods | |
| LEASES RANKED BY RENT | ** Total tenant lines within our valuation. May differ to number of individual tenants |
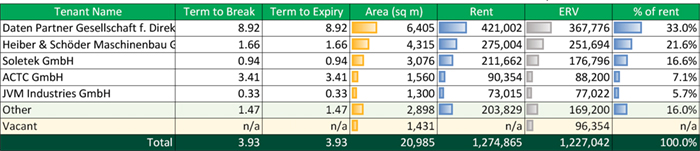
|
Printed 09/03/2021 19:42 |
|
| PROPERTY ID: | defelh - Feldheider Strasse 37-45 / 38-78 | |
| ON BEHALF OF: | MORGAN STANLEY | |
| VALUATION DATE: | 01-Feb-2021 | FINAL |
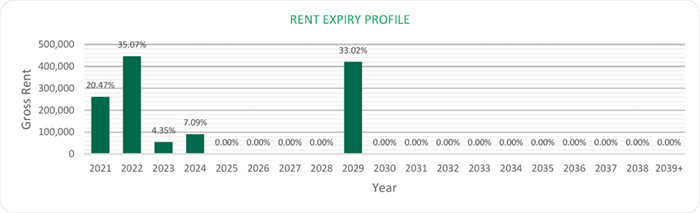
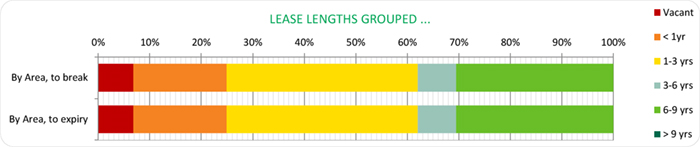
|
Printed 09/03/2021 19:42 |
|
| ON BEHALF OF: | MORGAN STANLEY |
| PROJECT NAME: | MSTAR |
PROPERTY REPORT
40699 ERKRATH, FELDHEIDER STRASSE 37-45/ 38-78
| INSPECTED BY: | INSPECTION DATE: | VALUATION DATE: | PROPERTY TYPE |
| MARK-PHILIPP HELCK | 08/01/2020 | 01/02/2021 | WAREHOUSE |
KEY VALUATION FACTORS
| STRENGTHS | WEAKNESSES |
|
■ The subject property is located in one of the most important German logistics region;
■ Excellent connection to the motorways network, in close vicinity to A3 and A46;
■ Rack rented;
■ High WAULT of around 4 years (to breaks).
|
■ The subject property is located in a less concentrated part of the logistics cluster Duisburg / Lower Rhine;
■ Very high office share of around 24%.
|
| OPPORTUNITIES | THREATS |
|
■ The continuing positive development of the overall economy could lead to an increase in achievable rents;
■ Reduction of vacancy could increase attractiveness as an investment product.
|
■ Fluctuations in the world economy and the global capital markets could have negative effects on the German commercial real estate market;
■ High capex could be incurred in mid- to long- term due to fairly advanced building age. |
LOCATION & SITUATION
| LOCATION |
Ratingen is the largest city in the Mettmann region and borders on the urban areas of Dusseldorf, Duisburg, Muelheim and Essen. Due to its central location within the Rhine-Ruhr region, Erkrath is very well connected in terms of infrastructure. The location, first and foremost Ratingen stands out in the Mettmann district as a location specialized in trade and services with international local companies. In addition, Ratingen is considered the region's hotspot for the IT and telecommunications sectors.
Despite belonging to the logistics region of Dusseldorf, Erkrath has only a limited relevance as a logistics market. The relevant logistics locations in the region are positioned along the A 3 and A 1 as well as on the Rhine rail (Cologne, Dusseldorf, Neuss, Leverkusen). Based in Erkrath and the |
| ON BEHALF OF: | MORGAN STANLEY |
| PROJECT NAME: | MSTAR |
|
surrounding area are therefore rather local companies, as well as companies with special freight solutions or transportation lines.
However, the location is suffering from an increasingly scarce supply of logistics space in the adjacent markets.
Within the city of Erkrath, the subject property is situated in an area, which is mainly used for logistic and industrial purposes. The direct surroundings consist of industrial companies, logistics service providers and retailers.
The motorway connection can be described as excellent due to the close proximity to the motorways A3 and A46. The nearest airport is situated in Dusseldorf around 25 km away and reachable in approximately 25 minutes. The airport offers national and international connections. |
PROPERTY DESCRIPTION
| DESCRIPTION |
The property covers an area of approx. 4 hectares and comprises two plots which are divided by the road Feldheider Straße.
The western plot comprises four warehouse buildings (Buildings A - D) which are grouped around an inner yard. The warehouses feature two-storey office blocks to the front. Building A (Feldheider Straße 46 - 58) is located in the north west, Building B (Feldheider Straße 38 - 44) is located in the north east, Building C (Feldheider Straße 70 - 78) is located to the south east and Building D (Feldheider Straße 60 - 68) is in the south west.
The eastern plot comprises a single warehouse building with a two-storey office frontage (Building E; Feldheider Straße 37 - 45).
The buildings cover around 50% of the site area. Approx. 25% of the site is covered with hardstanding (interlocking concrete pavers) and used for site access, loading areas and parking. The remaining ~25% of the property along the site boundaries comprise landscaping (bushes/trees).
The current buildings were constructed on former agricultural land between 1979 and 1985. The buildings were used for light-industrial and warehouse purposes. The buildings have been partly renovated or refurbished over the time.
The warehouse areas are constructed with pre-cast concrete pillars and concrete beams. The roof is of profiled steel elements and is covered with bitumen sheets. The façades are of trapezoidal metal clads or are covered with wash concrete panels. The warehouse units are separated by concrete wall panels.
In total, the warehouse structures comprise 27 loading doors which are predominately oriented towards the inner yard of the site. A sufficient number of car and lorry parking spaces are located at the yard as well as along the warehouses.
During the inspection not all parts of the property and the premises were accessible.
Summary of known specification: |
| ON BEHALF OF: | MORGAN STANLEY |
| PROJECT NAME: | MSTAR |
| Characteristic | Result | ||
| Built / Renovation | 1979 / 1983 / 1985 | ||
| Eaves Height | n/a | ||
| No. of loading Doors | 27 | ||
| Loading Door Ratio | 1.71 | ||
| Yard Depth | Approx. 18-38 metres | ||
| Cross-Dock | None | ||
| Warehouse (% of GLA) | 75% | ||
| Site Coverage Ratio | 50% | ||
| Source: Phase I Environmental Review dated January 2020; the information gathered during the site inspection. | |||
| ACCOMMODATION | We have not measured the property, but as instructed, we have relied upon floor areas made available to us. |
| Unit description | Primary use | Status | Area (sq m) | ||
| Warehouse | Logistics | Let | 15,398.76 | ||
| Warehouse | Logistics | Vacant | 371.00 | ||
| Office | Office | Let | 3,957.00 | ||
| Office | Office | Vacant | 1,060.00 | ||
| Other | Storage | Let | 197.00 | ||
| Total | 20,983.76* | ||||
| *there may be slight difference caused by rounding compared to the valuation output | |||||
DUE DILIGENCE
| STATE OF REPAIR |
CBRE have not undertaken a structural survey, nor tested the services. The property was subject to an inspection for valuation purposes in early 2020. As you are aware, the property has not been re-inspected for the purposes of this report, nor have we been provided with updated TDD. We have therefore relied on the information provided by the Borrower, including a Capex schedule dated 12 June 2019 and schedule with revised budget of capex dated 19 January 2021. Based on the latter which indicates TDD assessment less completed spend in 2020, we have included the immediate and 2-5 years capex of €700,000 within our valuation.
According to our own limited inspection for valuation purposes, our opinion regarding the state of repair would substantiate the assessment by Arcadis. |
| ON BEHALF OF: | MORGAN STANLEY |
| PROJECT NAME: | MSTAR |
| Based on our impression gained during the inspection, we are of the opinion that the buildings are in a fair condition, in line with the year of construction. | ||
| ENVIRONMENTAL CONSIDERATIONS |
We have summarised the findings from a schedule provided in relation to ‘Priority sites’ within the front section of this report. | |
| We have been made aware that the property is registered in the register of contaminated sites (Altlastenregister) which indicates a contamination or a potential contamination of the Properties, in particular due to their current or former use. If future excavation works are carried out at these Properties, this could lead to additional costs. However, no action is required on the current use of the Properties. As such we have assumed this does not have a material impact on our opinion of value given the valuation is prepared taken the current use into consideration. | ||
| According to the Draft Environmental Due Diligence report dated 13 December 2019, prepared by Ambiente Ltd. there are currently no known ground/soil contaminations. However, the following risks for contamination have been identified: | ||
| On-site: | ||
| ● Potential for contamination from localised area of infill in south east of site (extending off-site); | ||
| ● Potential for contamination from multi-let light industrial use / warehousing of the buildings since construction (1979-1985) including washdown activities and associated storage of hazardous substances. | ||
| Off-site: | ||
| ● Potential for migration of contamination from neighbouring light industrial uses (car repair and public fuel station 70m south) and Made Ground (infilled area extending to south). | ||
| In addition, there is the risk of the following building pollutants: | ||
| ● Potential and known hazardous building materials (asbestos, AMF, PCB) within the building fabric. | ||
| From building operations, the following risks have been identified: | ||
| ● No additional potential sources of contamination have been identified. | ||
| We have been instructed not to make any investigations in relation to the presence or potential presence of contamination in land or buildings or the potential presence of other environmental risk factors and to assume that if investigations were made to an appropriate extent then nothing would be discovered sufficient to affect value. | ||
| We have not carried out investigation into past uses, either of the properties or of any adjacent lands, to establish whether there is any potential for contamination from such uses or sites, or other environmental risk factors and have therefore assumed that none exists. Should our assumption prove to be incorrect, we reserve the right to amend our valuation accordingly. |
| ON BEHALF OF: | MORGAN STANLEY |
| PROJECT NAME: | MSTAR |
| TENURE | We have had sight of the Draft Red Flag Legal Report prepared by Hengeler Mueller, dated 05 February 2021. Based on the information provided, we understand the property is held freehold. | |
| We have assumed that there are no onerous legal conditions affecting the property which have a material impact on our opinion of value. | ||
| INCOME PROFILE | We have not been provided with any lease contracts. The following information is based on the rent schedule dated on 30 November 2020. | |
| The property is leased to eight tenants (ACTC GmbH, CUT Membrane Technoloy GmbH, Daten Partner Gesellschaft f. Direktmark, Heiber & Schoeder Maschinenbau GmbH, JVM Industries GmbH, Sensors Europe GmbH, Soletek GmbH, Votre Choix GmbH i.G). 1,060.00 sq m of office space and 371.00 sq m of warehouse space, equalling 6.82% of the total lettable area are vacant. | ||
| The property has a WAULT of 3.94 years (to breaks) as at the date of valuation. The total gross current rent generated by the property is €1,274,865 per annum whilst our opinion of the total gross market rent is €1,227,042 per annum. The property is shown as over-rented after factoring vacancy. | ||
| The main tenant, with around 31% of the total rental space occupied and generating about 33% of the total rental income, is “Daten Partner Gesellschaft f. Direktmark, Heiber & Schoeder Maschinenbau GmbH”. The company concentrates on the linking of data management, production and postal consolidation. |
VALUATION CONSIDERATIONS
| COSTS AND ADJUSTMENTS |
Based on the information provided and our knowledge of the market, in approaching our valuation, we made allowances for the following capital and non-recoverable costs. In all cases, we have cited whether they are deducted as at the date of valuation or whether they take effect at a later date. | |
| Capital Expenditure: |
| Type & Calculation | Source | Effective | Amount | ||
| Capital Expenditure: | Technical Due | On Valuation | €700,000 | ||
| Fixed Amount | Diligence |
No Repeat |
|||
| Rent Free | CBRE Estimate | On Valuation | €5,006 | ||
| No Repeat | |||||
| Tenant Incentives | CBRE Estimate | On lease start / | €42,930 | ||
| renewal | |||||
| No Repeat | |||||
| Letting Fees: 25% of | CBRE Estimate | On lease start / | €24,089 | ||
| Rental Value | renewal |
| ON BEHALF OF: | MORGAN STANLEY |
| PROJECT NAME: | MSTAR |
| No Repeat | |||||
| TOTAL ON | €772,025 | ||||
| VALUATION | |||||
| Revenue Deductions: | |||||
| Type & Calculation | Source | Effective | Annual Amount | ||
| Maintenance: | CBRE Estimate | On Valuation + | €62,955 | ||
| €3.00 per sq m | Delay 60 Months | ||||
| In perpetuity | |||||
| Management | CBRE Estimate | On Valuation | €24,541 | ||
| 2.0% of rental value | In perpetuity | ||||
| Void Costs: | CBRE Estimate | On Valuation | €8,586 | ||
| €0.50 per sq m | On all voids | ||||
| Other Costs: | CBRE Estimate | On Valuation | €6,135 | ||
| 0.5% of rental value | In perpetuity | ||||
| TOTAL: ON | €39,262 | ||||
| VALUATION |
| VALUATION METHODOLOGY – MARKET VALUE |
We have had regard to the most recent letting transactions and occupational demand for the region within which the subject property is located, including the property itself if of relevance. The rental rates range between €55.20 and €58.80 per sq m per annum, depending on the duration of lease contracts, building specifications and age. | |
| The second comparable serves as the primary rental evidence. The recorded letting transaction is of a property which is situated in a similar micro location and in close vicinity to the motorway. Therefore, the location can be assessed as very comparable. The property consists of four different building complexes and comprises warehouse, production and office areas with a total of 5,517 sq m. The comparable property also is similar in terms of building quality and fit out. We have adopted the following rental rates within our valuation: |
| Use | Letting-Status | Rental Area (sq m) | ERV per sq m | ERV (Total) | ||
| Warehouse | LET | 15,398.76 | €54.00 /sq m pa | €831,533.04 pa | ||
| Warehouse | VACANT | 371.00 | €54.00 /sq m pa | €20,034.00 pa | ||
| Office | LET | 3,957.00 | €72.00 /sq m pa | €284,904.00 pa | ||
| Office | VACANT | 1,060.00 | €72.00 /sq m pa | €76,320.00 pa | ||
| Other | LET | 197.00 | €72.00 /sq m pa | €14,184.00 pa |
| ON BEHALF OF: | MORGAN STANLEY |
| PROJECT NAME: | MSTAR |
| Total* | 20,983.76 sq m | €58.47 /sq m pa | €1,226,975.04 pa |
| * The total amount of ERV and rental area may differ from the calculation printout due to rounding differences. | ||
| We have arrived at our opinion of Market Value adopting the traditional investment capitalisation method of valuation. Within this approach, we apply an income weighted average equivalent yield to our opinion of net income, reflecting the comparable evidence within the market for guidance on capital rates and values per sq m. | ||
| We would highlight investment comparable number one and two: | ||
| The first investment comparable is located in Kerpen. The motorway can be reached within 5 minutes by car. The property has a lettable area of around 3,700 sq m and was sold for approx. EUR 2,960,000 (equating to ~EUR 800 per sq m) in Q3 2020. We consider the property comparable to the subject of valuation, first and foremost, due to the similar location. | ||
| Investment comparable number four is located in Dortmund. A train station is located within immediate vicinity of the property. The motorway can be reached within a few minutes' drive. The property offers a lettable area of around 3,500 sq m. It was sold for about EUR 2,500,000 (equating to ~EUR 714 per sq m) in Q3 2019. Due to the similar micro location, we consider the transacted property to be comparable to the subject property. | ||
| For the valuation of this asset, we have applied the following Equivalent Yield: | ||
| - 6.25% | ||
| This results in a Net Initial Yield of 6.87% and a capital rate per sq m of €796. | ||
| On the assumption that there are no unusual factors of which we are unaware and on the basis of the comments and assumptions specified in this report, CBRE is of the opinion that the Market Value (rounded) of the subject property, is: | ||
| €16,700,000 | ||
| (sixteen million seven hundred thousand Euros) | ||
| The unrounded net capital value is €16,693,908. The gross unrounded capital value is €18,759,710 including €772,024 of capital costs and €1,293,778 purchaser’s costs (7.75%) respectively. | ||
| Our opinion of Market Value is based upon the Scope of Work and Valuation Assumptions attached and has been primarily derived using comparable recent market transactions on arm’s length terms. | ||
| VALUATION METHODOLOGY – VACANT POSSESSION VALUE |
The constituent inputs in terms of rental value and non-recoverable costs largely align with the Market Value approach. The key exception being that we have adopted a special assumption that the property is 100% vacant/non-income producing as at the valuation date. This value is predominantly derived using the traditional investment method of valuation but critically benchmarking the resultant capital rate per sq m against the prevailing evidence.
In approaching our valuation under the Special Assumption that the property is entirely vacant (Vacant Possession Value), we have adopted a total void period of 12 months inclusive of rent free or tenant incentives and targeted an equivalent yield of 6.75%.
This results in a net rounded value of €13,125,000 equating to €625 per sq m.%. |
| ON BEHALF OF: | MORGAN STANLEY |
| PROJECT NAME: | MSTAR |
| ESTIMATED
REINSTATEMENT ASSESSMENT |
The property has not been inspected by a suitably qualified building surveyor from CBRE, nor have we carried out a full Reinstatement Cost Assessment. For indicative purposes only we estimate that the reinstatement cost of insurance purposes would be in the region of €24,568,121(rounded, excl. VAT) on a day one basis, including fees but excluding VAT and inflation.
This figure should be compared with the current sum insured and if a material discrepancy exists we suggest that a full Reinstatement Cost Assessment is carried out. |
| ON BEHALF OF: | MORGAN STANLEY |
| PROJECT NAME: | MSTAR |
RENTAL EVIDENCE
| PROPERTY ADDRESS |
PROPERTY USE |
DATE | TOTAL AREA (SQ M) |
TENANT | LEASE LENGTH (YEARS) |
BREAK OPTION |
RENT (P.A) (€) |
MONTHLY RENTAL RATE PER SQ M (€) |
RELATIVE QUALITY |
| 40472 Düsseldorf |
Warehouse | Q4 2020 | 3,311 | n/a | n/a | n/a | 182,767 | 4.60 | Similar (distance to the motorway) |
| 40721 Hilden |
Warehouse | Q4 2019 | 5,517 | n/a | n/a | n/a | 314,469 | 4.75 | Similar (distance to the motorway) |
| 40721 Hilden |
Warehouse | Q4 2019 | 3,086 | n/a | n/a | n/a | 162,940 | 4.40 | Similar (distance to the motorway) |
| 40599 Dusseldorf |
Warehouse | Q4 2019 | 4,200 | n/a | n/a | n/a | 246,960 | 4.90 | Similar (distance to the motorway) |
| ON BEHALF OF: | MORGAN STANLEY |
| PROJECT NAME: | MSTAR |
SALES EVIDENCE
| PROPERTY ADDRESS |
PROPERTY USE |
DATE | TOTAL AREA (SQ M) |
WAULT (YEARS) |
PASSING RENT PER ANNUM (€) |
PURCHASE PRICE (€) |
NET INITIAL YIELD (%) |
CAPITAL RATE PER SQ M (€) |
RELATIVE QUALITY |
| 50169 Kerpen |
Distribution hall |
Q3 2020 | 3,700 | n/a | n/a | 2,960,000 | n/a | 800 | Similar (macro location) |
| 50226 Frechen |
Warehouse | Q2 2020 | 9,400 | n/a | n/a | 7,520,000 | n/a | 800 | Similar (macro location) |
| 44329 Dortmund |
Distribution hall |
Q3 2019 | 42,610 | n/a | n/a | 32,700,000 | n/a | 767 | Similar (micro location) |
| 44147 Dortmund |
Distribution hall |
Q2 2019 | 3,500 | n/a | n/a | 2,500,000 | n/a | 714 | Similar (micro location) |
| PROPERTY ID: | defugg - Fuggerstrasse 2-6 | |
| ON BEHALF OF: | MORGAN STANLEY | |
| VALUATION DATE: | 01-Feb-2021 | FINAL |
Fuggerstrasse 2-6 - Fuggerstrasse 2-6, Neuss, 41468, Germany
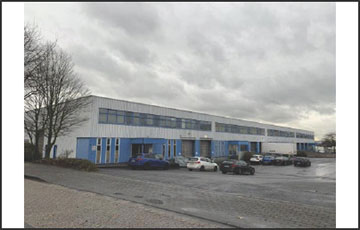 |
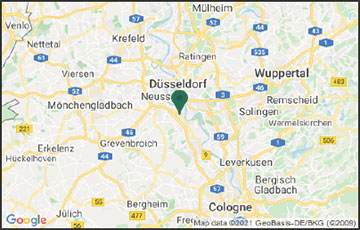 |
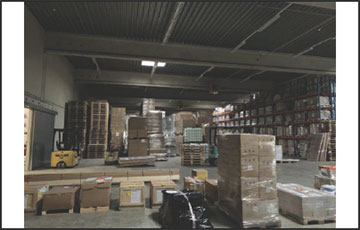 |
 |
| VALUATION METRICS | (currency - EUR) |
| Metric | Value |
| Market Value | 15,450,000 |
| Market Value (per sq m) | 972 |
| Net Initial Yield | 5.11% |
| Reversionary Yield | 5.53% |
| Equivalent Yield | 5.30% |
| Gross Income (p.a.) | 892,654 |
| Gross Income (p.a.) (per sq m) | 56 |
| *Adj. Gross Income | 892,654 |
| Adj. Gross Income (per sq m) | 56 |
| Net Income (p.a.) | 861,211 |
| Net Income (p.a.) (per sq m) | 54 |
| Gross Rental Value | 1,052,519 |
| Gross Rental Value (per sq m) | 66 |
| Capital Expenditure | -865,705 |
| Transaction Costs | 9.00% |
| Over / Under Rented | -8.98% |
| KEY FACTS | ||
| Metric | Value | |
| Total Area (sq m) | 15,887 | |
| WAULT to Break by Rent | 1.76 | |
| WAULT to Break by ERV | 1.82 | |
| WAULT to Expiry by Rent | 1.76 | |
| WAULT to Expiry by ERV | 1.82 | |
| Percentage of Vacancy (Area) | 5.38% | |
| Percentage of Vacancy (ERV) | 6.82% | |
| ** | Number of Tenants | 19 |
| Current Voids (months) | 12 | |
* Adjusted Gross Income equates to the Gross Income excluding any rent free periods
** Total tenant lines within our valuation. May differ to number of individual tenants
| LEASES RANKED BY RENT |
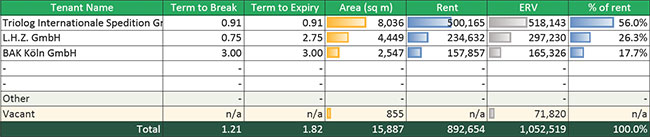
| Printed 09/03/2021 19:42 | |
| PROPERTY ID: | defugg - Fuggerstrasse 2-6 | |
| ON BEHALF OF: | MORGAN STANLEY | |
| VALUATION DATE: | 01-Feb-2021 | FINAL |
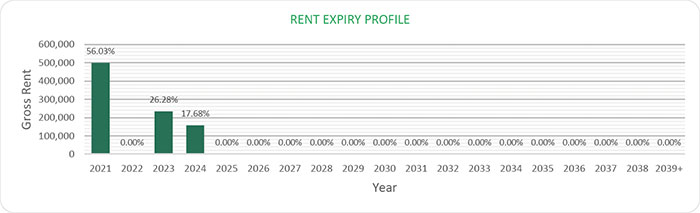
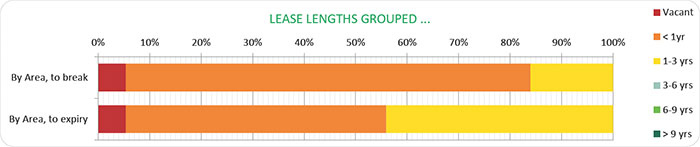
| Printed 09/03/2021 19:42 | |
| ON BEHALF OF: | MORGAN STANLEY |
| PROJECT NAME: | MSTAR |
PROPERTY REPORT
41468 NEUSS – FUGGERSTRASSE 2-6
| INSPECTED BY: | INSPECTION DATE: | VALUATION DATE: | PROPERTY TYPE |
| MARK-PHILIPP HELCK | 09/01/2020 | 01/02/2021 | LOGISTICS |
KEY VALUATION FACTORS
| STRENGTHS | WEAKNESSES |
| ■ | The subject property is located in the logistics region Duisburg/Lower Rhine; |
| ■ | Good access to the motorway A46 (1.5 km) and B9 (0.5 km); |
| ■ | Risk limitation through multi-tenant income profile. |
| ■ | High office share (>15% of rental space); |
| ■ | Anchor tenant accounts for 56% of the total income stream; |
| ■ | Hazardous building materials (asbestos, AMF, PCB) within the building fabric; |
| ■ | WAULT of less than 2 years. |
| OPPORTUNITIES | THREATS |
| ■ | The continuing positive development of the overall economy could lead to an increase in achievable rents; |
| ■ | Letting of the vacant office space at market conditions. |
| ■ | Fluctuations in the world economy and the global capital markets could have negative effects on German real estate market purchase prices. |
LOCATION & SITUATION
| LOCATION | Neuss is the most important centre of the Rhein-Kreis-Neuss region and has also been designated as a medium-sized centre in state planning. The city benefits from its direct proximity to Duesseldorf - both cities merge directly into each other in terms of their urban structures and have close economic ties. The A 57 and A 46 motorways run through Neuss. Neuss also has a Rhine port, which shares a port administration with Dusseldorf. | |
| Neuss is part of the Duisburg/Lower Rhine logistics region. The advantageous transport infrastructure, especially the port, the proximity to Duesseldorf and the airport, but also the motorway network in the Rhine district of Neuss, make Neuss an attractive location for logistics. Some companies have their European central warehouse in Neuss. The largest logistics location is the port in Neuss. | ||
| Within the city of Neuss, the subject property is situated in an area which is mainly used industrial and logistic purposes. The direct surroundings consist of industrial companies, logistics service providers and retailers. |
| ON BEHALF OF: | MORGAN STANLEY |
| PROJECT NAME: | MSTAR |
| The motorway connection can be described as good because of the close proximity to the motorway A46. The next airport is situated in Dusseldorf around 25 km away and reachable in approximately 30 minutes. The airport offers national and international connections. |
PROPERTY DESCRIPTION
| DESCRIPTION | The subject property covers an area of approximately 2.75 hectares and comprises three warehouse buildings with 11 units in total. Each warehouse is attached to two-storey office buildings. | |
| The north-western section of the site is developed with the warehouse Fuggerstraße 2 including 4 units. The warehouse Fuggerstraße 4 is located in the central part of site and contains 3 warehouses. The third warehouse Fuggerstraße 6 is situated in the southwest section of the site and contains 3 units. Parking areas are located in the north of the site. | ||
| The buildings cover approximately 50% of the site area. Approximately 40% of the site is covered with hardstanding (tarmac - access roads, yard areas and parking) and approximately 10% of the property predominately along the site boundaries comprises landscaping (grass, bushes and trees). | ||
| Approx. 65% of the property is covered by the building complex. Accessing roads (tarmac), yard areas and parking spaces cover approx. 40% of the subject site. The remaining 10% are covered with landscaping (grass, bushes and trees) which are predominately located along the site boundaries. | ||
| The current building complex was constructed between 1980 and 1984, on former agricultural land. The warehouses have been used for storage and office purposes and no significant production activities have been undertaken on the property. | ||
| The warehouses are constructed with pre-cast concrete pillars and concrete beams. The roof is of profiled steel elements and is covered with bitumen sheets. The façade is of trapezoidal metal clads and the warehouse units a separated by concrete panels. | ||
| In total, the warehouse buildings comprise 31 loading doors which are either oriented to the center of the site or to the accessing road running in the northeast of the site. The property cannot be encircled. A sufficient number of car parking spaces are located in the front of the warehouses. | ||
| During the inspection not all parts of the property and the premises were accessible. | ||
| Summary of known specification: | ||
| Characteristic | Result | ||
| Built / Renovation | 1980 / 1984 | ||
| Eaves Height | N/A | ||
| No. of loading Doors | 31 | ||
| Loading Door Ratio | 2.38 |
| ON BEHALF OF: | MORGAN STANLEY |
| PROJECT NAME: | MSTAR |
| Yard Depth | Approx. 24-30 metres | ||
| Cross-Dock | Front loading | ||
| Warehouse (% of GLA) | 82% (Rent Roll 11/2020) | ||
| Site Coverage Ratio | 50% |
| Source: Phase I Environmental Review dated January 2020; the information gathered during the site inspection. | ||
| ACCOMMODATION | We have not measured the property, but as instructed, we have relied upon floor areas made available to us. | |
| Unit Description | Primary Use | Status | Area (sq m) | ||
| Office | Office | LET | 1,977.00 | ||
| Office | Office | VACANT | 855.00 | ||
| Warehouse | Logistics | LET | 13,055.00 | ||
| Total (lettable) | 15,887.00 |
DUE DILIGENCE
| STATE OF REPAIR |
CBRE have not undertaken a structural survey, nor tested the services. The property was subject to an inspection for valuation purposes in early 2020. As you are aware, the property has not been re-inspected for the purposes of this report, nor have we been provided with updated TDD. We have therefore relied on the information provided by the Borrower, including a Capex schedule dated 12 June 2019 and schedule with revised budget of capex dated 19 January 2021. Based on the latter which indicates TDD assessment less completed spend in 2020, we have included the immediate and 2-5 years capex of €805,000 within our valuation.
According to our own limited inspection for valuation purposes, our opinion regarding the state of repair would substantiate the assessment by Arcadis. Based on our impression gained during the inspection, we are of the opinion that the buildings are in a fair condition, in line with the year of construction. |
|
|
ENVIRONMENTAL CONSIDERATIONS
|
We have summarised the findings from a schedule provided in relation to ‘Priority sites’ within the front section of this report.
According to the Draft Environmental Due Diligence report dated 10 January 2020 from Ambiente Ltd. There are currently no known ground/soil contaminations. However, the following risks for contamination have been identified:
On-site |
| ON BEHALF OF: | MORGAN STANLEY |
| PROJECT NAME: | MSTAR |
| ● | Potential for contamination from former logistics / warehouse use of the buildings since c. 1980. | ||
| Off-site | |||
| ● | Potential for migration of contamination from neighbouring light industrial uses (metal working industries, car repair, scrap yard, chemicals storage, etc.). | ||
| In addition, there is the risk of the following building pollutants: | |||
| ● | Potential and known hazardous building materials (asbestos, AMF, PCB) within the building fabric. | ||
| From building operations, the following risks have been identified: | |||
| ● | No potential sources of contamination have been identified. | ||
| We have been instructed not to make any investigations in relation to the presence or potential presence of contamination in land or buildings or the potential presence of other environmental risk factors and to assume that if investigations were made to an appropriate extent then nothing would be discovered sufficient to affect value. | ||
| We have not carried out investigation into past uses, either of the properties or of any adjacent lands, to establish whether there is any potential for contamination from such uses or sites, or other environmental risk factors and have therefore assumed that none exists. Should our assumption prove to be incorrect, we reserve the right to amend our valuation accordingly. | ||
| TENURE | We have had sight of the Draft Red Flag Legal Report prepared by Hengeler Mueller, dated 05 February 2021. Based on the information provided, we understand the property is held freehold. | |
| We have assumed that there are no onerous legal conditions affecting the property which have a material impact on our opinion of value. | ||
| INCOME PROFILE |
The rental contracts have not been available. The information is based on the rent schedule dated on 30 November 2020.
The property is leased to three tenants (BAK Köln GmbH, L.H.Z. GmbH, Triolog Internationale Spedition GmbH). 855.00 sq m of office space (5.38% of total space) are vacant.
The property has a WAULT of 1.76 years to breaks from the date of valuation. The total gross current rent generated by the property is €892,654 per annum whilst our opinion of the total gross market rent is €1,052,519 per annum. The property is shown as under-rented after factoring current vacancy.
The main tenant, “Triolog Internationale Spedition GmbH”, accounts for about 51% of the total rental space and about 56% of the total rental income. The company is registered in Neuss and its business is national or international transport, storage or logistics services. |
| ON BEHALF OF: | MORGAN STANLEY |
| PROJECT NAME: | MSTAR |
VALUATION CONSIDERATIONS
| COSTS AND ADJUSTMENTS | Based on the information provided or our knowledge of the market, in approaching our valuation, we made allowances for the following capital and non-recoverable costs. In all cases, we have cited whether they are deducted as at the date of valuation or whether they take effect at a later date. | |
| Capital Expenditure: | ||
| Type & Calculation | Source | Effective | Amount | ||
| Capital Expenditure: Fixed Amount |
Technical Due Diligence |
On Valuation
No Repeat |
€805,000 | ||
| Tenant Incentives | CBRE Estimate |
On lease start /
No Repeat |
€42,750 | ||
| Letting Fees: 25% of Rental Value |
CBRE Estimate |
On lease start /
No Repeat |
€17,955 | ||
| TOTAL ON VALUATION |
€865,705 | ||||
| Revenue Deductions: | |||||
| Type & Calculation | Source | Effective | Annual Amount | ||
| Maintenance: €6.00 per sq m |
CBRE Estimate | On Valuation + Delay 60 Months In perpetuity |
€95,322 | ||
| Management 2.0% of rental value |
CBRE Estimate | On Valuation In perpetuity |
€21,050 | ||
| Void Costs: €0.50 per sq m |
CBRE Estimate | On Valuation On all voids |
€5,130 | ||
| Other Costs: 0.5% of rental value |
CBRE Estimate | On Valuation In perpetuity |
€5,263 | ||
| TOTAL: ON VALUATION |
€31,443 | ||||
| VALUATION METHODOLOGY – MARKET VALUE |
We have had regard to the most recent letting transactions and occupational demand for the region within which the subject property is located, including the property itself if of relevance. The rental rates range between €58.20 and €64.80 per sq m per annum, depending on the duration of the lease contract, building specifications and age. Within the evidence table appended, we would highlight the properties in Neuss as being of greatest relevance in terms of size, lettable area etc. | |
| Comparable number one is located in the similar macro and micro location, in a close vicinity to the motorway. Therefore, the location can be assessed as comparable. The |
| ON BEHALF OF: | MORGAN STANLEY |
| PROJECT NAME: | MSTAR |
| has a lettable area of around 11,728 sq m. We have adopted the following rental rates within our valuation: |
| Use | Letting-Status | Rental Area (sq m) | ERV per sq m | ERV (Total) | ||
| Office | LET | 1,977.00 | €84.00 /sq m pa | €166,068.00 pa | ||
| Office | VACANT | 855.00 | €84.00 /sq m pa | €71,820.00 pa | ||
| Warehouse | LET | 13,055.00 | €62.40 /sq m pa | €814,632.00 pa | ||
| Total* | 15,887.00 | €66.25 /sq m pa | €1,052,520.00 pa |
| * The total amount of ERV and rental area may differ from the calculation printout due to rounding differences. | ||
| We have arrived at our opinion of Market Value adopting the Traditional investment capitalisation method of valuation. Within this approach, we apply an income weighted average equivalent yield to our opinion of net income, reflecting the comparable evidence within the market for guidance on capital rates and values per sq m. | ||
| We would like to highlight investment comparable number one and two. The first property is located in the direct vicinity to the property. The location can be considered as similar to the subject property. The property has a lettable area of around 5,993 sq m. It was sold for approx. €6,100,000 (equating to around €1,018 per sq m) in Q4 2020. The property is in the same macro location but superior micro location. | ||
| Investment comparable two is also located in the direct vicinity the subject property. The location can be considered as comparable. The property has a lettable area of around 5,494 sq m. It was sold for about €4,950,000 (equating to around €901 per sq m) in Q4 2020. Due to the similar macro location, we consider the property to be similar to the subject premises. | ||
| For the valuation of this asset, we have applied the following equivalent yield: | ||
| - 5.30% | ||
| This results in a Net Initial Yield of 5.11% and a capital rate per sq m of €972. | ||
| On the assumption that there are no unusual factors of which we are unaware and on the basis of the comments and assumptions specified in this report, CBRE is of the opinion that the Market Value (rounded) of the subject property, is: | ||
| €15,450,000 | ||
| (fifteen million four hundred fifty thousand Euro) | ||
| The unrounded net capital value is €15,451,450. The gross unrounded capital value is €17,707,786 including €865,705 of capital costs and €1,390,631 purchaser’s costs (9.00%) respectively. | ||
| Our opinion of Market Value is based upon the Scope of Work and Valuation Assumptions attached and has been primarily derived using comparable recent market transactions on arm’s length terms. |
| ON BEHALF OF: | MORGAN STANLEY |
| PROJECT NAME: | MSTAR |
| VALUATION METHODOLOGY – VACANT POSSESSION VALUE |
The constituent inputs in terms of rental value and non-recoverable costs largely align with the Market Value approach. The key exception being that we have adopted a special assumption that the property is 100% vacant/non-income producing as at the valuation date. This value is predominantly derived using the traditional investment method of valuation but critically benchmarking the resultant capital rate per sq m against the prevailing evidence.
In approaching our valuation under the Special Assumption that the property is entirely vacant (Vacant Possession Value), we have adopted a total void period of 12 months inclusive of rent free or tenant incentives and targeted an equivalent yield of 5.8%.
This results in a net rounded value of €12,400,000, equating to €781 per sq m.
|
|
| ESTIMATED REINSTATEMENT ASSESSMENT |
The property has not been inspected by a suitably qualified building surveyor from CBRE, nor have we carried out a full Reinstatement Cost Assessment. For indicative purposes only we estimate that the reinstatement cost of insurance purposes would be in the region of €19,856,210 (rounded, excl. VAT) on a day one basis, including fees but excluding VAT and inflation.
This figure should be compared with the current sum insured and if a material discrepancy exists we suggest that a full Reinstatement Cost Assessment is carried out. |
| ON BEHALF OF: | MORGAN STANLEY |
| PROJECT NAME: | MSTAR |
RENTAL EVIDENCE
| PROPERTY ADDRESS |
PROPERTY USE |
DATE | TOTAL AREA (SQ M) |
TENANT | LEASE LENGTH (YEARS) |
BREAK OPTION |
RENT (P.A) (€) |
MONTHLY RENTAL RATE PER SQ M (€) |
RELATIVE QUALITY |
| 40885 Ratingen |
Warehouse | Q4 2020 | 11,728 | n/a | n/a | n/a | 759,974 | 5.40 | Similar (macro and micro location) |
| 41460 Neuss |
Warehouse | Q4 2019 | 610 | n/a | n/a | n/a | 35,502 | 4.85 | Similar (macro location) |
| 40472 Düsseldorf |
Warehouse | Q4 2019 | 3,079 | n/a | n/a | n/a | 184,740 | 5.00 | Slightly Superior (macro location) |
| 40670 Meerbusch |
Distribution hall |
Q2 2019 | 10,620 | n/a | n/a | n/a | 660,139 | 5.18 | Similar (immediate vincity) |
| ON BEHALF OF: | MORGAN STANLEY |
| PROJECT NAME: | MSTAR |
SALES EVIDENCE
| PROPERTY ADDRESS |
PROPERTY USE |
DATE | TOTAL AREA (SQ M) |
WAULT (YEARS) |
PASSING RENT PER ANNUM (€) |
PURCHASE PRICE (€) |
NET INITIAL YIELD (%) |
CAPITAL RATE PER SQ M (€) |
RELATIVE QUALITY |
| 41066 Moenchengladbach |
Warehouse | Q4 2020 | 5,993 | n/a | n/a | 6,100,000 | n/a | 1,018 | Similar (macro location) |
| 442855 Remscheid |
Industrial estate |
Q4 2020 | 5,494 | n/a | n/a | 4,950,000 | n/a | 901 | Similar (macro and micro location) |
| 53909 Zuelpich | Warehouse | Q3 2020 | 53,999 | n/a | n/a | 50,000,000 | n/a | 926 | Worse (macro and micro location) |
| 41334 Nettetal | Distribution hall |
Q3 2019 | 32,000 | 7 | n/a | 27,552,000 | 4.88 | 861 | Similar to inferior (micro and macro location) |
| PROPERTY ID: | degewe - Gewerkenstrasse 13 | |
| ON BEHALF OF: | MORGAN STANLEY | |
| VALUATION DATE: | 01-Feb-2021 | FINAL |
Gewerkenstrasse 13 - Gewerkenstrasse 13, Herne, 44628, Germany
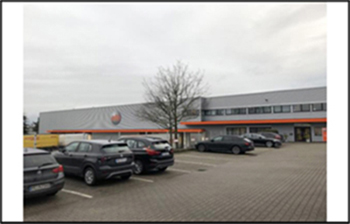 |
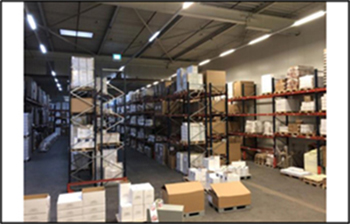 |
|
 |
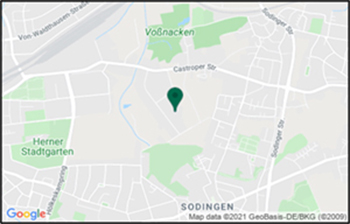 |
| VALUATION METRICS | (currency - EUR) |
| Metric | Value |
| Market Value | 3,440,000 |
| Market Value (per sq m) | 486 |
| Net Initial Yield | 7.16% |
| Reversionary Yield | 6.55% |
| Equivalent Yield | 5.80% |
| Gross Income (p.a.) | 276,000 |
| Gross Income (p.a.) (per sq m) | 39 |
| *Adj. Gross Income | 276,000 |
| Adj. Gross Income (per sq m) | 39 |
| Net Income (p.a.) | 269,323 |
| Net Income (p.a.) (per sq m) | 38 |
| Gross Rental Value | 267,072 |
| Gross Rental Value (per sq m) | 38 |
| Capital Expenditure | -610,000 |
| Transaction Costs | 9.26% |
| Over / Under Rented | 3.34% |
KEY FACTS
| Metric | Value | |
| Total Area (sq m) | 7,072 | |
| WAULT to Break by Rent | 9.92 | |
| WAULT to Break by ERV | 9.92 | |
| WAULT to Expiry by Rent | 9.92 | |
| WAULT to Expiry by ERV | 9.92 | |
| Percentage of Vacancy (Area) | 0.00% | |
| Percentage of Vacancy (ERV) | 0.00% | |
| ** | Number of Tenants | 1 |
| Current Voids (months) | - | |
| * Adjusted Gross Income equates to the Gross Income excluding any rent free periods | |
| LEASES RANKED BY RENT | ** Total tenant lines within our valuation. May differ to number of individual tenants |
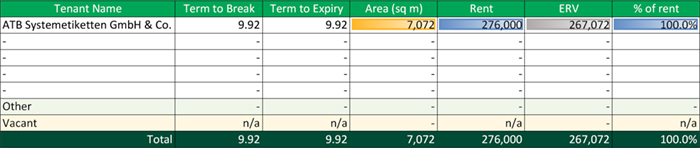
| Printed 09/03/2021 19:42 | |
| PROPERTY ID: | degewe - Gewerkenstrasse 13 | |
| ON BEHALF OF: | MORGAN STANLEY | |
| VALUATION DATE: | 01-Feb-2021 | FINAL |
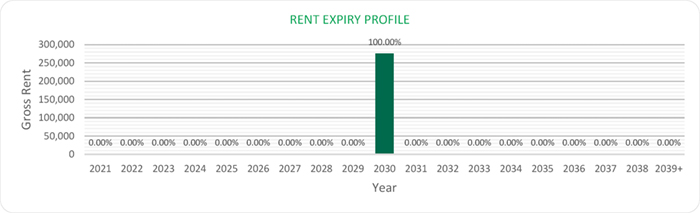
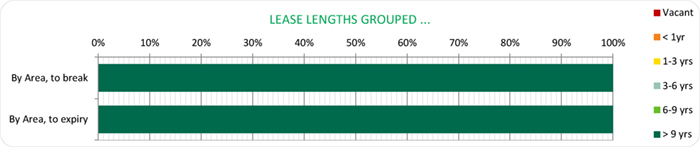
| Printed 09/03/2021 19:42 | |
| ON BEHALF OF: | MORGAN STANLEY |
| PROJECT NAME: | MSTAR |
PROPERTY REPORT
44628 HERNE, GEWERKENSTRASSE 13
| INSPECTED BY: | INSPECTION DATE: | VALUATION DATE: | PROPERTY TYPE |
| FLORIAN ECKERVOGT | 09/01/20 | 01/02/21 | LIGHT INDUSTRIAL |
KEY VALUATION FACTORS
| STRENGTHS | WEAKNESSES | |
|
■ The subject property is located in the major logistics region Eastern Ruhr Area;
■ Good access the motorways A42 (2.8 km), A43 (5.2 km), A2 (11.2 km) and A40 (13.6 km) as well as B235 (6.5 km) and B226 (6.5 km);
■ Fully let;
■ WAULT of around 10 years.
|
■ Single tenant;
■ Building contains asbestos;
■ Limited possibilities for multi-tenant-concept.
|
|
| OPPORTUNITIES | THREATS | |
|
■ The continuing positive development of the overall economy could lead to an increase in achievable rents;
■ Limited availability of land for a potential extension of the Industrial area.
|
■ Fluctuations in the world economy and the global capital markets could have negative effects on the German commercial real estate market;
■ Risk of negative impact on the income stream if tenant vacates the building.
|
LOCATION & SITUATION
| LOCATION |
Herne lies on the northern edge of the Ruhr-Area between the cities of Bochum and Recklinghausen and is also a member of the “Landschaftsverband Westfalen-Lippe” and the “Regionalverband Ruhr”. Today, Herne has the highest population density among the large cities in North Rhine-Westphalia with approx. 3,000 inhabitants per square kilometre. The city, which has long been dominated by mining, is now dominated by public administration, the service sector and crafts. In addition, Herne is well connected to the national transport infrastructure. The federal motorways A42 and A43 lead into the city area and intersect at the Herne motorway junction. |
| ON BEHALF OF: | MORGAN STANLEY |
| PROJECT NAME: | MSTAR |
|
The logistics region Eastern Ruhr-Area is one of the most densely populated regions in Europe. This region stretches from the urban agglomeration comprising the closely set cities of Bochum, Recklinghausen, Dortmund and Wuppertal all the way to the surrounding area in the north and east, from Marl to Hamm and Soest, down to Arnsberg. The size of the urban agglomeration as well as the industry present here generates significant market potential for logistics service providers. National distribution centres operated by trading companies are located in the east of the region, owing to the favourable conditions this location offers for distribution across a widespread area.
Within the city of Herne, the subject property is situated in an area, which is mainly used for industrial and logistic purposes. The immediate surroundings consist of industrial companies and retailers.
The motorway connection can be described as good because of the close proximity to the motorway A42. The next airport is situated in Dortmund around 35 km away and reachable in approximately 45 minutes. The airport offers national and international connections. |
PROPERTY DESCRIPTION
| DESCRIPTION |
The subject property covers an area of approx. 1.6 hectares and comprises a warehouse building with 2 sections as well as office space in a two-storey frontage located in the south.
Parking spaces and covered yard areas are located to the front and the rear side of the property. A sprinkler plant building is situated in the eastern edge of the site.
Approx. 50% of the subject site is covered with buildings. The parking and yard areas covered with brick paving comprise approx. 40% of the site. The remaining ~10% of the property are covered with landscaping (grass and bushes/trees).
Between 1872 and 1978 the site as well as the surrounding area were part of a former coal mine. The mining infrastructure of the former coal mine (i. e. mine shafts, coking plant) were located on other parcels. A gasometer was constructed in the west of the subject site. The remaining site area was undeveloped land.
The current warehouse was constructed in 1982 and extended by the eastern section in 1992. In 2014, a major refurbishment was carried out.
The warehouse is constructed with steel frame construction carrying a flat roof made of profiled steel elements and covered with bitumen sheets. The façade is of trapezoidal metal clad and corrugated metal sheets. Parts of the inner walls are of brick wall construction.
The warehouse structure comprises 8 loading doors on the front side of the property as well as 2 additional loading gates on the rear side, of which one is equipped with a ramp. The property cannot be encircled. A sufficient number of car and lorry parking spaces are located on the site. |
| ON BEHALF OF: | MORGAN STANLEY |
| PROJECT NAME: | MSTAR |
|
Summary of known specification: |
|||
| Characteristic | Result | ||
| Built / Renovation | 1982 / 1992 / 2014 | ||
| Eaves Height | N/A | ||
| No. of loading Doors | 8 | ||
| Loading Door Ratio | 1.36 | ||
| Yard Depth | Approx. 35m | ||
| Cross-Dock | none | ||
| Warehouse (% of GLA) | 83% | ||
| Site Coverage Ratio | 50% | ||
| Source: Phase I Environmental Review dated January 2020; the information gathered during the site inspection. | |||
| ACCOMMODATION | We have not measured the property, but as instructed, we have relied upon floor areas made available to us. |
| Unit Description | Primary Use | Status | Area (sq m) | ||
| Office | Office | LET | 520.00 | ||
| Warehouse | Storage/Production | LET | 5,868.00 | ||
| Other | Other | LET | 684.00 | ||
| Total (Lettable) | 7,072.00 |
DUE DILIGENCE
| STATE OF REPAIR |
CBRE have not undertaken a structural survey, nor tested the services. The property was subject to an inspection for valuation purposes in early 2020. As you are aware, the property has not been re-inspected for the purposes of this report, nor have we been provided with updated TDD. We have therefore relied on the information provided by the Borrower, including a Capex schedule dated 12 June 2019 and schedule with revised budget of capex dated 19 January 2021. Based on the latter which indicates TDD assessment less completed spend in 2020, we have included the immediate and 2-5 years capex of €610,000 within our valuation. |
|
| According to our own limited inspection for valuation purposes, our opinion regarding the state of repair would substantiate the assessment by Arcadis. Based on our impression gained during the inspection, we are of the opinion that the buildings are in a fair condition, in line with the year of construction. |
| ON BEHALF OF: | MORGAN STANLEY |
| PROJECT NAME: | MSTAR |
| ENVIRONMENTAL CONSIDERATIONS |
We have summarised the findings from a schedule provided in relation to ‘Priority sites’ within the front section of this report.
We have been made aware that the property is registered in the register of contaminated sites (Altlastenregister) which indicates a contamination or a potential contamination of the Properties, in particular due to their current or former use. If future excavation works are carried out at these Properties, this could lead to additional costs. However, no action is required on the current use of the Properties. As such we have assumed this does not have a material impact on our opinion of value given the valuation is prepared taken the current use into consideration.
According to the Draft Environmental Due Diligence report dated 10 January 2020 by Ambiente Ltd. there are currently no known ground/soil contaminations. However, the following risks for contamination have been identified: |
||
| On-site: | |||
| ● | Potential for contamination from Made Ground and former industrial use of parts of the property (Gasometer). | ||
| Off-site: | |||
| Potential for migration of contamination from neighbouring former industrial uses (coal mining area). | |||
| In addition, there is the risk of the following building pollutants: | |||
| ● | Known / suspected asbestos containing materials and limited amounts of suspected PCBs within the building fabric. | ||
| From building operations, the following risks have been identified: | |||
| ● | No potential sources of contamination have been identified. | ||
|
We have been instructed not to make any investigations in relation to the presence or potential presence of contamination in land or buildings or the potential presence of other environmental risk factors and to assume that if investigations were made to an appropriate extent then nothing would be discovered sufficient to affect value.
We have not carried out investigation into past uses, either of the properties or of any adjacent lands, to establish whether there is any potential for contamination from such uses or sites, or other environmental risk factors and have therefore assumed that none exists. Should our assumption prove to be incorrect, we reserve the right to amend our valuation accordingly.
|
|||
| TENURE |
We have had sight of the Draft Red Flag Legal Report prepared by Hengeler Mueller, dated 05 February 2021. Based on the information provided, we understand the property is held freehold.
We have assumed that there are no onerous legal conditions affecting the property which have a material impact on our opinion of value. |
||
| ON BEHALF OF: | MORGAN STANLEY |
| PROJECT NAME: | MSTAR |
| INCOME PROFILE | The rental contracts have not been made available to us. The information is based on the rent schedule dated on 30 November 2020. | |
| The property is fully let to a single tenant (ATB Systemetiketten GmbH & Co. KG). | ||
| The property has a WAULT of 9.92 years as at the date of valuation. The total gross current rent generated by the property is €276,000 per annum whilst our opinion of the total gross market rent is €267,072 per annum. The property is shown as slightly over-rented. | ||
| “ATB Systemetiketten GmbH & Co. KG” provides packaging services and offers adhesive labels, banderoles, endless rolls, thermal transfer ribbons, and linerless products for food, cosmetic, pharmaceutical, and personal care industry. The Company mainly serves customers in Germany. |
VALUATION CONSIDERATIONS
|
COSTS AND ADJUSTMENTS
|
Based on the information provided and our knowledge of the market, in approaching our valuation, we made allowances for the following capital and non-recoverable costs. In all cases, we have cited whether they are deducted as at the date of valuation or whether they take effect at a later date.
Capital Expenditure:
|
||||
| Type & Calculation | Source | Effective | Amount | ||
| Capital Expenditure: Fixed Amount | Technical Due Diligence | On Valuation No Repeat |
€610,000 | ||
| Tenant Incentives | CBRE Estimate |
On lease start / renewal
No Repeat
|
n/a | ||
| Letting Fees: 25% of Rental Value | CBRE Estimate |
On lease start / renewal
No Repeat
|
n/a | ||
| TOTAL ON VALUATION | €610,000 | ||||
| Revenue Deductions: | |||||
| Type & Calculation | Source | Effective | Annual Amount | ||
| Maintenance: €2.00 per sq m |
CBRE Estimate |
On Valuation + Delay 60 Months
In perpetuity
|
€14,144 | ||
|
Management
2.0% of rental value |
CBRE Estimate |
On Valuation
In perpetuity
|
€5,341 | ||
| ON BEHALF OF: | MORGAN STANLEY |
| PROJECT NAME: | MSTAR |
| Void Costs: €0.50 per sq m |
CBRE Estimate | On Valuation On all voids | €0 | ||
| Other Costs: 0.5% of rental value |
CBRE Estimate | On Valuation In perpetuity | €1,335 | ||
| TOTAL: ON | €6,676 | ||||
| VALUATION | |||||
|
VALUATION METHODOLOGY
|
We have had regard to the most recent letting transactions and occupational demand for the region within which the subject property is located, including the property itself if of relevance. The rental rates range between €36.00 and €60.00 per sq m per annum, depending on the duration of lease contracts, building specifications and age. Within the evidence table appended, we would like to highlight the property in Herne as being of greatest relevance in terms of asset characteristics.
The first comparable is located in a similar macro location. The property comprises a warehouse with a total area of 6,000 sq m. The property benefits from a good connection to public transport. In addition, it is located within direct proximity to the motorway. We have adopted the following rental rates within our valuation:
|
||||
| Use | Letting-Status | Rental Area | ERV per sq m | ERV (Total) | ||
| Office | LET | 520.00 sq m | €60.00 /sq m pa | €31,200.00 pa | ||
| Other | LET | 684.00 sq m | €36.00 /sq m pa | €24,624.00 pa | ||
| Warehouse | LET | 5,868.00 sq m | €36.00 /sq m pa | €211,248.00 pa | ||
| Total* | 7,072.00 sq m | €37.76 /sq m pa | €267,072.00 pa | |||
|
* The total amount of ERV and rental area may differ from the calculation printout due to rounding differences.
We have arrived at our opinion of Market Value adopting the traditional investment capitalisation method of valuation. Within this approach, we apply an income weighted average equivalent yield to our opinion of net income, reflecting the comparable evidence within the market for guidance on capital rates and values per sq m.
We would like to highlight investment comparable one and two. Investment comparable one is located in Krefeld. Like the subject property, the comparable property is located in the Ruhr area, which is why the macro location can be regarded as similar. The property has a lettable area of around 9,000 sq m. It was sold for approx. €4,200,000 (equating to around €467 per sq m) in Q4 2020. Due to the date of comparable macro location, we consider the property comparable to the subject of our valuation.
Investment comparable number two is located in Iserlohn and therefore in the same macro location as the subject property. The property has a lettable area of around 7,805 sq m and was sold for approx. €3,700,000 (equating to around €474 per
|
| ON BEHALF OF: | MORGAN STANLEY |
| PROJECT NAME: | MSTAR |
|
sq m) in Q4 2020. Since both objects are in close proximity to each other and the price per sq m is within a range, both objects can be considered equal.
For the valuation of this asset, we have applied the following Equivalent Yield:
|
||
| - 5.80% | ||
| This results in a Net Initial Yield of 7.16% and a capital rate per sq m of €486. | ||
| On the assumption that there are no unusual factors of which we are unaware and on the basis of the comments and assumptions specified in this report, CBRE is of the opinion that the Market Value (rounded) of the subject property, is: | ||
| €3,440,000 | ||
| (three million four hundred forty thousand Euros) | ||
| The unrounded net capital value is €3,443,058. The gross unrounded capital value is €4,371,541 including €610,000 of capital costs and €318,483 purchaser’s costs (9.25%) respectively. | ||
| Our opinion of Market Value is based upon the Scope of Work and Valuation Assumptions attached and has been primarily derived using comparable recent market transactions on arm’s length terms. | ||
| VALUATION METHODOLOGY – VACANT POSSESSION VALUE |
The constituent inputs in terms of rental value and non-recoverable costs largely align with the Market Value approach. The key exception being that we have adopted a special assumption that the property is 100% vacant/non-income producing as at the valuation date. This value is predominantly derived using the traditional investment method of valuation but critically benchmarking the resultant capital rate per sq m against the prevailing evidence.
In approaching our valuation under the Special Assumption that the property is entirely vacant (Vacant Possession Value), we have adopted a total void period of 12 months inclusive of rent free or tenant incentives and targeted an equivalent yield of 6.3%.
This results in a net rounded value of €2,810,000, equating to €397 per sq m.
|
|
| ESTIMATED REINSTATEMENT ASSESSMENT |
The property has not been inspected by a suitably qualified building surveyor from CBRE, nor have we carried out a full Reinstatement Cost Assessment. For indicative purposes only we estimate that the reinstatement cost of insurance purposes would be in the region of €8,245,574 (rounded, excl. VAT) on a day one basis, including fees but excluding VAT and inflation.
This figure should be compared with the current sum insured and if a material discrepancy exists we suggest that a full Reinstatement Cost Assessment is carried out. |
| ON BEHALF OF: | MORGAN STANLEY |
| PROJECT NAME: | MSTAR |
RENTAL EVIDENCE
| PROPERTY ADDRESS |
PROPERTY USE |
DATE | TOTAL AREA (SQ M) |
TENANT | LEASE LENGTH (YEARS) |
BREAK OPTION |
RENT (P.A) (€) |
MONTHLY RENTAL RATE PER SQ M (€) |
RELATIVE QUALITY |
| 44623 Herne | Warehouse | Q4 2020 | 6,000 | n/a | n/a | n/a | 198,000 | 2.75 | Similar (distance to the motorway) |
| 44628 Herne | High-bay storage |
Q4 2020 | 5,600 | n/a | n/a | n/a | 221,760 | 3.30 | Similar (distance to the motorway) |
| 48268 Greven | Warehouse | Q4 2019 | 6,732 | n/a | n/a | n/a | 286,783 | 3.55 | Inferior (macro location) |
| 42857 Remscheid |
Distribution hall |
Q2 2019 | 4,695 | n/a | n/a | n/a | 127,217 | 3.11 | Similar (macro location) |
| ON BEHALF OF: | MORGAN STANLEY |
| PROJECT NAME: | MSTAR |
SALES EVIDENCE
| PROPERTY ADDRESS |
PROPERTY USE |
DATE | TOTAL AREA (SQ M) |
WAULT (YEARS) |
PASSING
|
PURCHASE PRICE (€) |
NET INITIAL YIELD (%) |
CAPITAL RATE PER SQ M (€) |
RELATIVE QUALITY |
| 47890 Krefeld |
Warehouse | Q4 2020 | 9,000 | n/a | n/a | 4,200,000 | n/a | 467 | Similar (macro location) |
| 58638 Iserlohn |
Warehouse | Q4 2020 | 7,805 | n/a | n/a | 3,700,000 | n/a | 474 | Similar (macro location) |
| 44805 Bochum |
Warehouse | Q2 2020 | 3,272 | n/a | n/a | 1,531,296 | n/a | 500 | Comparable (macro location) |
| 46395 Bocholt |
Warehouse | Q3 2019 | 1,780 | n/a | n/a | 6,300,000 | 9.52 | 496 | Inferior (macro location) |
| PROPERTY ID: | degobi - Gobietstrasse 8 | |
| ON BEHALF OF: | MORGAN STANLEY | |
| VALUATION DATE: | 01-Feb-2021 | FINAL |
Gobietstrasse 8 - Gobietstrasse 8, Kassel, 34123, Germany
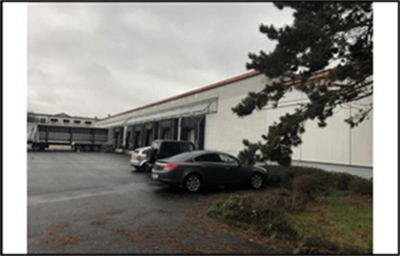
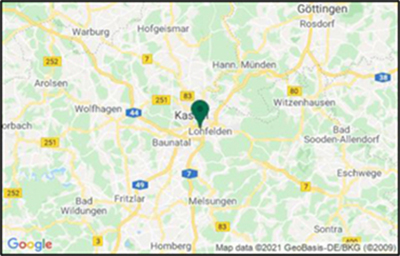
| VALUATION METRICS | (currency - EUR) |
| Metric | Value |
| Market Value | 9,240,000 |
| Market Value (per sq m) | 600 |
| Net Initial Yield | 3.84% |
| Reversionary Yield | 6.51% |
| Equivalent Yield | 5.50% |
| Gross Income (p.a.) | 405,000 |
| Gross Income (p.a.) (per sq m) | 26 |
| *Adj. Gross Income | 405,000 |
| Adj. Gross Income (per sq m) | 26 |
| Net Income (p.a.) | 385,065 |
| Net Income (p.a.) (per sq m) | 25 |
| Gross Rental Value | 701,400 |
| Gross Rental Value (per sq m) | 46 |
| Capital Expenditure | -1,317,600 |
| Transaction Costs | 8.50% |
| Over / Under Rented | -40.00% |
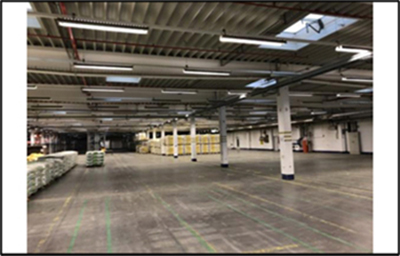

| KEY FACTS | ||
| Metric | Value | |
| Total Area (sq m) | 15,400 | |
| WAULT to Break by Rent | 2.58 | |
| WAULT to Break by ERV | 2.58 | |
| WAULT to Expiry by Rent | 2.58 | |
| WAULT to Expiry by ERV | 2.58 | |
| Percentage of Vacancy (Area) | 2.60% | |
| Percentage of Vacancy (ERV) | 3.76% | |
| ** | Number of Tenants | 5 |
| Current Voids (months) | 12 | |
| * Adjusted Gross Income equates to the Gross Income excluding any rent free periods | |
| LEASES RANKED BY RENT | ** Total tenant lines within our valuation. May differ to number of individual tenants |
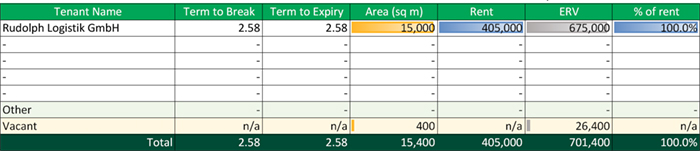
| Printed 09/03/2021 19:43 | |
| PROPERTY ID: | degobi - Gobietstrasse 8 | |
| ON BEHALF OF: | MORGAN STANLEY | |
| VALUATION DATE: | 01-Feb-2021 | FINAL |
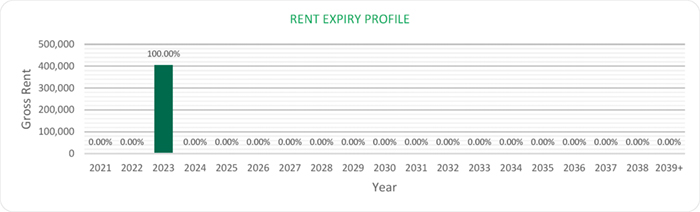
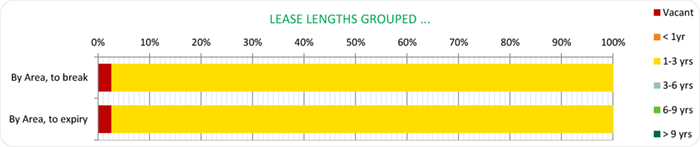
| Printed 09/03/2021 19:43 | |
| ON BEHALF OF: | MORGAN STANLEY |
| PROJECT NAME: | MSTAR |
PROPERTY REPORT
34123 KASSEL – GOBIETSTRASSE 8
| INSPECTED BY: | INSPECTION DATE: | VALUATION DATE: | PROPERTY TYPE |
| MARIA CHIGRYAY | 08/01/2020 | 01/02/2021 | LOGISTICS |
KEY VALUATION FACTORS
| STRENGTHS | WEAKNESSES |
| ■ | The subject property is located in the logistics region Central Germany; |
| ■ | Good access to motorways A49 (1.6 km), A7 (2.6 km), A44 (6.6 km) as well as B83 (1.4 km) and B4 (1.7 km); |
| ■ | WAULT of 2.58 years. |
| ■ | Entire office space vacant (2.6% of total rental area); |
| ■ | Due to the building layout the vacant office space cannot be let to an external tenant; |
| ■ | Buildings contain asbestos; |
| ■ | High outstanding capex-measures; |
| ■ | Single-tenant property. |
| OPPORTUNITIES | THREATS |
| ■ | The continuing positive development of the overall economy could lead to an increase in achievable rents; |
| ■ | Reletting to market terms could improve income stream (due to under-rent). |
| ■ | Fluctuations in the world economy and the global capital markets could have negative effects on German real estate market purchase prices; |
| ■ | Potential leaks and spills from underground storage of heating oil (50,000l tank). |
LOCATION & SITUATION
| LOCATION |
Kassel is located in northern Hesse and serves as the regional centre and administrative headquarters of the administrative district and county of Kassel. Kassel is the third largest city in Hesse and, due to its central location in the Federal Republic of Germany, an important transport hub with very good motorway connections (including A7, A44).
In addition, Kassel is part of the logistics region Central Germany and has developed into an important logistics location in Germany due to its central location in Germany and good transport connections. Well-known internationally operating logistics companies such as Schenker and Logistec are located in the region. |
| ON BEHALF OF: | MORGAN STANLEY |
| PROJECT NAME: | MSTAR |
| Within the city of Kassel, the subject property is situated in an area which is mainly used industrial and logistic purposes. The direct surroundings consist of industrial companies and retailers. | ||
| The motorway connection can be described as good because of the close proximity to the motorway A49. The next airport is situated in Dortmund around 21 km away and reachable in approximately 35 minutes. The airport offers national and international connections. |
PROPERTY DESCRIPTION
| DESCRIPTION |
The warehouses at the site are leased to Rudolph Logistik GmbH and are used for storage and logistics activities. The property covers an area of approximately 2.4 hectares and comprises a single storey L-shaped warehouse building including office sections.
The site was undeveloped land prior to the construction of the current building complex in 1980 (northern/north-eastern part) and 1990 (southern part).
The building complex covers approximately 65% of the property; approximately 20% of the site is covered with tarmac and used for site access, vehicle turning and parking and storage yards. Approximately 10% is unsealed (road gravel, undeveloped land in the southwest). Approximately 5% of the property along the site boundaries comprises landscaping (grass and bushes/trees).
Summary of known specification:
|
| Characteristic | Result | ||
| Built / Renovation | 1980/1990 | ||
| Eaves Height | 3.9 metres | ||
| No. of loading Doors | 18 | ||
| Loading Door Ratio | 1.2 | ||
| Yard Depth | 40 meters | ||
| Cross-Dock | None | ||
| Warehouse (% of GLA) | 97% | ||
| Site Coverage Ratio | 65% |
| Source: Phase I Environmental Review dated December 2019; the information gathered during the site inspection. |
| ON BEHALF OF: | MORGAN STANLEY | |
| PROJECT NAME: | MSTAR | |
| ACCOMMODATION | We have not measured the property, but as instructed, we have relied upon floor areas made available to us. | ||||
| Unit Description | Primary Use | Status | Area (sq m) | ||
| Office | Office | VACANT | 400 | ||
| Warehouse | Logistics | LET | 15,000 | ||
| Total (lettable) | 15,400 | ||||
DUE DILIGENCE
| STATE OF REPAIR |
As you are aware, the property has not been re-inspected for the purposes of this report, nor have we been provided with updated TDD. We have therefore relied on the information provided by the Borrower, including a Capex schedule dated 12 June 2019 and schedule with revised budget of capex dated 19 January 2021. Based on the latter which indicates TDD assessment less completed spend in 2020, we have included the immediate and 2-5 years capex of €1,305,000 within our valuation. |
|
According to our own limited inspection for valuation purposes, our opinion regarding the state of repair would substantiate the assessment by Arcadis. Based on our impression gained during the inspection, we are of the opinion that the buildings are in a fair condition, in line with the year of construction. |
| ENVIRONMENTAL CONSIDERATIONS |
We have summarised the findings from a schedule provided in relation to ‘Priority sites’ within the front section of this report. |
||
|
We have been made aware that the property is registered in the register of contaminated sites (Altlastenregister) which indicates a contamination or a potential contamination of the Properties, in particular due to their current or former use. If future excavation works are carried out at these Properties, this could lead to additional costs. However, no action is required on the current use of the Properties. As such we have assumed this does not have a material impact on our opinion of value given the valuation is prepared taken the current use into consideration. |
|||
| According to the Draft Environmental Due Diligence report dated 10 January 2020 from Ambiente Ltd. There are currently no known ground/soil contaminations. However, the following risks for contamination have been identified: | |||
|
On-site |
|||
| ● |
Former potentially contaminative uses of the property (including a 9,000-litre solvent AST, paint shop and varnishing activities (from c. 1980 - 2004). |
||
| ● | Potential leaks and spills from underground storage of heating oil (50,000 l tank). | ||
| ON BEHALF OF: | MORGAN STANLEY | |
| PROJECT NAME: | MSTAR | |
| Off-site | |||
| ● |
No significant sources of contamination have been identified. |
||
|
In addition, there is the risk of the following building pollutants: |
|||
| ● |
Potential and known asbestos containing materials and limited amounts of suspected PCBs within building installations and fabric of the northern building section. |
||
|
From building operations, the following risks have been identified: |
|||
| ● |
No further potential sources of contamination have been identified. |
||
|
We have been instructed not to make any investigations in relation to the presence or potential presence of contamination in land or buildings or the potential presence of other environmental risk factors and to assume that if investigations were made to an appropriate extent then nothing would be discovered sufficient to affect value. |
|||
|
We have not carried out investigation into past uses, either of the properties or of any adjacent lands, to establish whether there is any potential for contamination from such uses or sites, or other environmental risk factors and have therefore assumed that none exists. Should our assumption prove to be incorrect, we reserve the right to amend our valuation accordingly. |
|||
|
TENURE |
We have had sight of the Draft Red Flag Legal Report prepared by Hengeler Mueller, dated 05 February 2021. Based on the information provided, we understand the property is held freehold. |
||
|
We have assumed that there are no onerous legal conditions affecting the property which have a material impact on our opinion of value.
|
|||
| INCOME PROFILE |
The rental contracts have not been available. The information is based on the rent schedule dated on 30 November 2020. |
||
|
The property is leased to a single tenant (Rudolph Logistik GmbH). 400.00 sq m of office space (2.60% of total space) are vacant. |
|||
| The property has a WAULT of 2.58 years from the date of valuation. The total gross current rent generated by the property is €405,000 per annum whilst our opinion of the total gross market rent is €701,400 per annum. The property is shown as under-rented. | |||
| Rudolph Logistik GmbH is registered in Fritzlar and forms part of the Rudolph Logistics Group which is a global logistics service provider with its headquarters in Baunatal in the centre of Germany. The group of companies is made up of several smaller companies and focuses on the business areas of automotive logistics, system transport, industrial logistics, fulfilment and consumer goods logistics. | |||
| ON BEHALF OF: | MORGAN STANLEY | |
| PROJECT NAME: | MSTAR | |
VALUATION CONSIDERATIONS
| COSTS AND ADJUSTMENTS | Based on the information provided or our knowledge of the market, in approaching our valuation, we made allowances for the following capital and non-recoverable costs. In all cases, we have cited whether they are deducted as at the date of valuation or whether they take effect at a later date. | |||||
| Capital Expenditure: | ||||||
| Type & Calculation | Source | Effective | Amount | |||
| Capital Expenditure: | Technical Due | On Valuation | €1,305,000 | |||
| Fixed Amount | Diligence | No Repeat | ||||
| Tenant Incentives | CBRE Estimate | On lease start / | €6,000 | |||
| renewal | ||||||
| No Repeat | ||||||
| Letting Fees: 25% of | CBRE Estimate | On lease start / | €6,600 | |||
| Rental Value | renewal | |||||
| No Repeat | ||||||
| TOTAL ON | €1,317,600 | |||||
| VALUATION | ||||||
| Revenue Deductions: | ||||||
| Type & Calculation | Source | Effective | Annual Amount | |||
| General Non- Recoverables: | CBRE Estimate | On Valuation | €3,507 | |||
| 0.5% of rental value | In perpetuity | |||||
| Maintenance: €2.00 | CBRE Estimate | On Valuation + | €30,800 | |||
| per sq m | Delay 60 Months | |||||
| In perpetuity | ||||||
| Management | CBRE Estimate | On Valuation | €14,028 | |||
| 2.0% of rental value | In perpetuity | |||||
| Void Costs: €0.50 | CBRE Estimate | On Valuation | €2,400 | |||
| per sq m | On all voids | |||||
| TOTAL: ON | €19,935 | |||||
| VALUATION | ||||||
| VALUATION METHODOLOGY – MARKET VALUE | We have had regard to the most recent letting transactions and occupational demand for the region within which the subject property is located, including the property itself if of relevance. The rental rates range between €45.00 and €66.00 per sq m per annum, depending on the duration of the lease contract, building specifications and age. | |||||
| Available rental evidence from within Kassel and indeed the wider surrounding area is limited. We have therefore refenced a letting from Kassel in addition to peripheral | ||||||
| ON BEHALF OF: | MORGAN STANLEY | |
| PROJECT NAME: | MSTAR | |
| locations with similar characteristics outside of Frankfurt. The rental comparable number three is located in the similar micro location, in a close vicinity to the motorway. Therefore, the location can be assessed as comparable. The property was completed in 1971 and renovated in 2017 and has a lettable area of around 36,785 sq m. It is advantageous that a bus stop is located in the immediate vicinity of the subject property. We have adopted the following rental rates within our valuation: | ||||||
| Use | Letting-Status | Rental Area | ERV per sq m | ERV (Total) | ||
| Office | VACANT | 400.00 sq m | €66.00 /sq m pa | €26,400.00 pa | ||
| Warehouse | LET | 15,000.00 sq m | €45.00 /sq m pa | €675,000.00 pa | ||
| Total* | 15,400.00 sq m | €45.54 /sq m pa | €701,400.00 pa | |||
| * The total amount of ERV and rental area may differ from the calculation printout due to rounding differences. | ||||||
| We have arrived at our opinion of Market Value adopting the Traditional investment capitalisation method of valuation. Within this approach, we apply an income weighted average equivalent yield to our opinion of net income, reflecting the comparable evidence within the market for guidance on capital rates and values per sq m. | ||||||
| We would like to highlight investment comparable one and two. The first investment comparable is also located in the direct vicinity to the motorway. The location can be considered slightly superior. The property has a lettable area of around 5,530 sq m and was sold for approx. €3,000,000 (equating to around €543 per sq m) in Q4 2020. Given the income profile of the subject property, we anticipate the subject property to be superior. | ||||||
| Investment comparable number two is also located in the direct vicinity to the motorway. The location can be considered as superior. The property has a lettable area of around 5,627 sq m. It was sold for about €3,100,000 (equating to around €551 per sq m) in Q4 2020. Given the income profile of the subject property, we anticipate the subject property to be superior. | ||||||
| For the valuation of this asset, we have applied the following equivalent yield: | ||||||
| - 5.50% | ||||||
| This results in a Net Initial Yield of 3.84% and a capital rate per sq m of €600. The Net Initial Yield is currently being influenced by the level of under-rent. | ||||||
| On the assumption that there are no unusual factors of which we are unaware and on the basis of the comments and assumptions specified in this report, CBRE is of the opinion that the Market Value (rounded) of the subject property, is: | ||||||
| €9,240,000 | ||||||
| (nine million and two hundred and fourty thousand Euro) | ||||||
| ON BEHALF OF: | MORGAN STANLEY | |
| PROJECT NAME: | MSTAR | |
|
The unrounded net capital value is €9,240,927. The gross unrounded capital value is €11,344,006 including €1,317,600 of capital costs and €785,480 purchaser’s costs (8.50%) respectively. |
|
|
Our opinion of Market Value is based upon the Scope of Work and Valuation Assumptions attached and has been primarily derived using comparable recent market transactions on arm’s length terms. |
|
|
VALUATION METHODOLOGY – VACANT POSSESSION VALUE
|
The constituent inputs in terms of rental value and non-recoverable costs largely align with the Market Value approach. The key exception being that we have adopted a special assumption that the property is 100% vacant/non-income producing as at the valuation date. This value is predominantly derived using the traditional investment method of valuation but critically benchmarking the resultant capital rate per sq m against the prevailing evidence. |
|
In approaching our valuation under the Special Assumption that the property is entirely vacant (Vacant Possession Value), we have adopted a total void period of 12 months inclusive of rent free or tenant incentives and targeted an equivalent yield of 6%. |
|
| This results in a net rounded value of €7,880,000, equating to €512 per sq m. | |
|
ESTIMATED REINSTATEMENT ASSESSMENT |
The property has not been inspected by a suitably qualified building surveyor from CBRE, nor have we carried out a full Reinstatement Cost Assessment. For indicative purposes only we estimate that the reinstatement cost of insurance purposes would be in the region of €19,852,318 (rounded, excl. VAT) on a day one basis, including fees but excluding VAT and inflation. |
|
This figure should be compared with the current sum insured and if a material discrepancy exists we suggest that a full Reinstatement Cost Assessment is carried out. |
|
| ON BEHALF OF: | MORGAN STANLEY | |
| PROJECT NAME: | MSTAR | |
RENTAL EVIDENCE
| PROPERTY ADDRESS | PROPERTY USE | DATE | TOTAL AREA (SQ M) |
TENANT | LEASE LENGTH (YEARS) | BREAK OPTION | RENT (P.A) (€) | MONTHLY RENTAL RATE PER SQ M (€) | RELATIVE QUALITY |
| 34355 Staufenberg | Warehouse | Q4 2020 | 18,400 | n/a | n/a | n/a | 772,800 | 3.50 | Superior (macro location) |
| 34123 Kassel | Warehouse | Q4 2020 | 6,071 | n/a | n/a | n/a | 316,932 | 4.35 | Similar (immediate vincity) |
| 64521 Gross- Gerau | Warehouse | Q4 2019 | 20,495 | n/a | n/a | n/a | 863,249 | 3.51 | Superior (macro location) |
| 68647 Biblis | Warehouse | Q4 2019 | 66,808 | n/a | n/a | n/a | 3,319,021 | 4.14 | Superior (macro location) |
| ON BEHALF OF: | MORGAN STANLEY | |
| PROJECT NAME: | MSTAR | |
SALES EVIDENCE
| PROPERTY ADDRESS | PROPERTY USE | DATE | TOTAL AREA (SQ M) | PASSING RENT PER ANNUM (€) | PURCHASE PRICE (€) | NET INITIAL YIELD (%) | CAPITAL RATE PER SQ M (€) | RELATIVE QUALITY |
| 57223 Kreuztal | Warehouse | Q4 2020 | 5,530 | n/a | 3,000,000 | n/a | 543 | Superior (macro location) |
| 58511 Luedenscheid | Distribution hall | Q4 2020 | 5,627 | n/a | 3,100,000 | n/a | 551 | Superior (macro location) |
| 65428 Ruesselsheim | Distribution hall | Q2 2019 | 33,000 | n/a | 19,800,000 | n/a | 600 | Superior (macro location) |
| 42329 Wuppertal | Distribution hall | Q1 2020 | 8,700 | n/a | 5,040,000 | 7.14 | 579 | Superior (macro location) |
| PROPERTY ID: | degraf - Graf-Landsberg-Str. 3,5,9 | |
| ON BEHALF OF: | MORGAN STANLEY | |
| VALUATION DATE: | 01-Feb-2021 | FINAL |
Graf-Landsberg-Str. 3,5,9 - Graf-Landsberg-Str. 3,5,9, Neuss, 41460, Germany
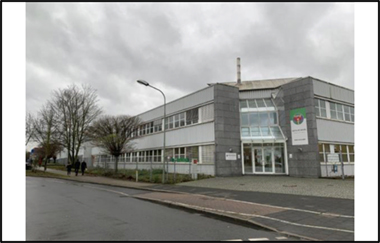
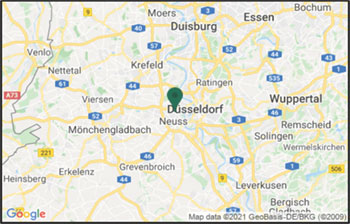
| VALUATION METRICS | (currency - EUR) |
| Metric | Value |
| Market Value | 8,720,000 |
| Market Value (per sq m) | 917 |
| Net Initial Yield | 4.32% |
| Reversionary Yield | 5.57% |
| Equivalent Yield | 5.40% |
| Gross Income (p.a.) | 439,557 |
| Gross Income (p.a.) (per sq m) | 46 |
| *Adj. Gross Income | 439,557 |
| Adj. Gross Income (per sq m) | 46 |
| Net Income (p.a.) | 412,626 |
| Net Income (p.a.) (per sq m) | 43 |
| Gross Rental Value | 569,878 |
| Gross Rental Value (per sq m) | 60 |
| Capital Expenditure | -312,658 |
| Transaction Costs | 9.50% |
| Over / Under Rented | -2.46% |
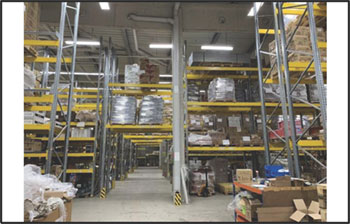
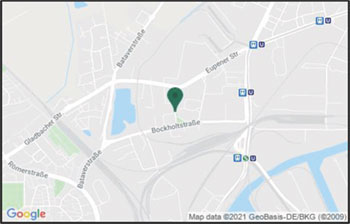
| KEY FACTS | ||
| Metric | Value | |
| Total Area (sq m) | 9,506 | |
| WAULT to Break by Rent | 1.26 | |
| WAULT to Break by ERV | 1.15 | |
| WAULT to Expiry by Rent | 1.26 | |
| WAULT to Expiry by ERV | 1.15 | |
| Percentage of Vacancy (Area) | 22.24% | |
| Percentage of Vacancy (ERV) | 20.92% | |
| ** | Number of Tenants | 6 |
| Current Voids (months) | 12 | |
| * Adjusted Gross Income equates to the Gross Income excluding any rent free periods | |
| LEASES RANKED BY RENT | ** Total tenant lines within our valuation. May differ to number of individual tenants |
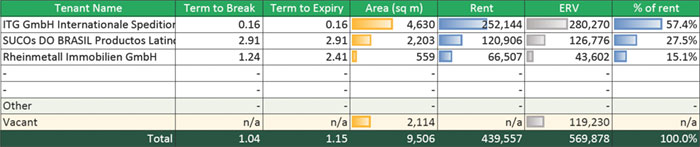
| Printed 09/03/2021 19:43 | |
| PROPERTY ID: | degraf - Graf-Landsberg-Str. 3,5,9 | |
| ON BEHALF OF: | MORGAN STANLEY | |
| VALUATION DATE: | 01-Feb-2021 | FINAL |
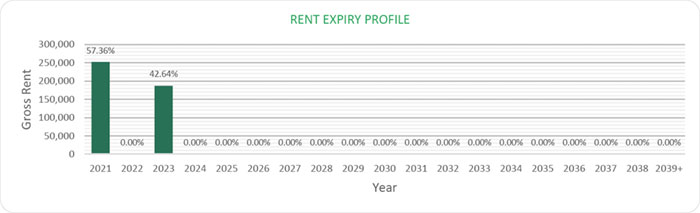
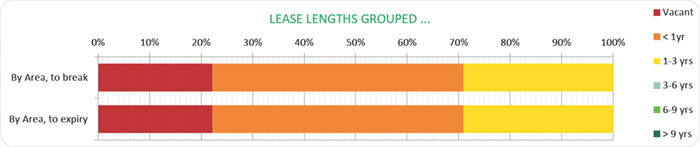
| Printed 09/03/2021 19:43 | |
| ON BEHALF OF: | MORGAN STANLEY | |
| PROJECT NAME: | MSTAR | |
PROPERTY REPORT
41460 NEUSS - GRAF-LANDSBERG-STRASSE 3
| INSPECTED BY: | INSPECTION DATE: | VALUATION DATE: | PROPERTY TYPE |
| MARK-PHILIPP HELCK | 09/01/2020 | 01/02/2021 | LOGISTICS |
KEY VALUATION FACTORS
| STRENGTHS | WEAKNESSES |
| ■ | Risk limitation through multi-tenant concept; | |
| ■ | The subject property is well located in the logistics region Duisburg/Lower Rhine; | |
| ■ | Good access to the motorways A52 (2.0 km) and A57 (6.6 km). |
| ■ | Buildings contain asbestos; | |
| ■ | Anchor tenant produces more than 50% of the income stream; | |
| ■ | High vacancy rate; | |
| ■ | Short WAULT of 1.26 years to breaks. |
| OPPORTUNITIES | THREATS |
| ■ | The continuing positive development of the overall economy could lead to an increase in achievable rents; | |
| ■ | Letting of the vacant warehouse space at market conditions. |
| ■ | Fluctuations in the world economy and the global capital markets could have negative effects on German real estate market purchase prices; | |
| ■ | High re-letting costs and negative impact on the income stream if anchor tenant vacates the property. |
LOCATION & SITUATION
| LOCATION | Neuss is the most important centre of the Rhein-Kreis-Neuss region and has also been designated as a medium-sized centre in state planning. The city benefits from its direct proximity to Duesseldorf - both cities merge directly into each other in terms of their urban structures and have close economic ties. The A57 and A46 motorways run through Neuss. |
|
Neuss is part of the Duisburg/Lower Rhine logistics region. The advantageous transport infrastructure situation, especially the port, the proximity to Duesseldorf and the airport, but also the motorway network in the Rhine district of Neuss, make Neuss an attractive location for logistics. Some companies have their European central warehouse in Neuss. The largest logistics location is the port in Neuss. Within the city of Neuss, the subject property is situated in an area, which is mainly used industrial and logistic purposes. The direct |
| ON BEHALF OF: | MORGAN STANLEY | |
| PROJECT NAME: | MSTAR | |
| surroundings consist of industrial companies, logistic services providers and retailers. | |
|
The motorway connection can be described as good because of the close proximity to the motorway A52. The next airport is situated in Duesseldorf around 15 km away and reachable in approximately 20 minutes. The airport offers national and international connections. |
PROPERTY DESCRIPTION
| DESCRIPTION | The subject property covers an area of approximately 1.85 hectares and comprises three buildings which contain four warehouse units, which are partly attached to two-storey office areas. | ||
| The warehouse buildings are arranged around a central yard. One of the Warehouses is located in the southern part of the site. While warehouse 2 is located in the north-western part, the warehouse comprising two units is located in the north east section of the site. | |||
| Approx. 50% of the site area is covered by the building complex. Accessing roads (brick paved), yard areas and parking spaces cover approx. 40% of the subject site. The remaining 10% are covered with landscaping (grass, bushes and trees) which are predominately located along the site boundaries. | |||
| In 1981. Warehouse 1 was constructed on former agricultural land. This warehouse building was refurbished in 1989. Warehouse 2 was constructed in 1987 and warehouse 3 was erected in 1990. All buildings have been erected for storage purposes. | |||
| The warehouses are constructed with pre-cast concrete pillars and concrete beams. The roof is of profiled steel elements and is covered with bitumen sheets. The façade is of trapezoidal metal clads and sandwich elements. The inner walls are partly made of brick wall construction. | |||
| In total, the building complex comprises 19 loading doors which are mainly oriented to the inner yard area. The site is accessed via two gates which are located in the north and east of the site. Warehouse 3 can be completely encircled while the yard is also connected to the encircling road. A sufficient number of car and lorry parking spaces are located at the yard and in the north of the site. | |||
| During the inspection not all parts of the property and the premises were accessible. | |||
| Summary of known specification: | |||
| Characteristic | Result | ||
| Built / Renovation | 1981 / 1987 / 1989 / 1990 | ||
| Eaves Height | N/A | ||
| No. of loading Doors | 19 | ||
| Loading Door Ratio | 2.9 | ||
| ON BEHALF OF: | MORGAN STANLEY | |
| PROJECT NAME: | MSTAR | |
| Yard Depth | Approx. 40 metres | ||
| Cross-Dock | Front loading | ||
| Warehouse (% of GLA) | 84% | ||
| Site Coverage Ratio | 50% | ||
| Source: Phase I Environmental Review dated January 2020; the information gathered during the site inspection. | |||
| ACCOMMODATION | We have not measured the property, but as instructed, we have relied upon floor areas made available to us. | ||||
| Unit Description | Primary Use | Status | Area (sq m) | ||
| Office | Office | LET | 1,561 | ||
| Warehouse | Logistics | LET | 5,830 | ||
| Warehouse | Logistics | VACANT | 2,114 | ||
| Total (lettable) | 9,505 | ||||
DUE DILIGENCE
| STATE OF REPAIR | CBRE have not undertaken a structural survey, nor tested the services. The property was subject to an inspection for valuation purposes in early 2020. As you are aware, the property has not been re-inspected for the purposes of this report, nor have we been provided with updated TDD. We have therefore relied on the information provided by the Borrower, including a Capex schedule dated 12 June 2019 and schedule with revised budget of capex dated 19 January 2021. Based on the latter which indicates TDD assessment less completed spend in 2020, we have included the immediate and 2-5 years capex of €230,000 within our valuation. |
|
According to our own limited inspection for valuation purposes, our opinion regarding the state of repair would substantiate the assessment by Arcadis. Based on our impression gained during the inspection, we are of the opinion that the buildings are in a fair condition, in line with the year of construction. |
|
| ENVIRONMENTAL CONSIDERATIONS | We have summarised the findings from a schedule provided in relation to ‘Priority sites’ within the front section of this report. |
| We have been made aware that the property is registered in the register of contaminated sites (Altlastenregister) which indicates a contamination or a potential contamination of the Properties, in particular due to their current or former use. If future excavation works are carried out at these Properties, this could lead to additional costs. However, no action is required on the current use of the Properties. As such we have assumed this does not have a material |
| ON BEHALF OF: | MORGAN STANLEY | |
| PROJECT NAME: | MSTAR | |
|
impact on our opinion of value given the valuation is prepared taken the current use into consideration. |
|||
|
According to the Draft Environmental Due Diligence report dated 10 January 2020 from Ambiente Ltd. There are currently no known ground/soil contaminations. However, the following risks for contamination have been identified: |
|||
|
On-site |
|||
| ● |
Potential for contamination from light industrial use of the subject property since c. 1940s. |
||
| ● | Potential of contamination due to presence of Made Ground at the site. | ||
| Off-site | |||
| ● |
Potential for migration of contamination from former and current neighbouring light industrial uses. |
||
|
In addition, there is the risk of the following building pollutants: |
|||
| ● |
Known asbestos containing materials and potential man-made mineral fibres within the building fabric. |
||
|
From building operations, the following risks have been identified: |
|||
| ● |
No potential sources of contamination have been identified. |
||
|
We have been instructed not to make any investigations in relation to the presence or potential presence of contamination in land or buildings or the potential presence of other environmental risk factors and to assume that if investigations were made to an appropriate extent then nothing would be discovered sufficient to affect value. |
|||
|
We have not carried out investigation into past uses, either of the properties or of any adjacent lands, to establish whether there is any potential for contamination from such uses or sites, or other environmental risk factors and have therefore assumed that none exists. Should our assumption prove to be incorrect, we reserve the right to amend our valuation accordingly. |
|||
|
TENURE |
We have had sight of the Draft Red Flag Legal Report prepared by Hengeler Mueller, dated 05 February 2021. Based on the information provided, we understand the property is held freehold. |
||
|
We have assumed that there are no onerous legal conditions affecting the property which have a material impact on our opinion of value. |
|||
| ON BEHALF OF: | MORGAN STANLEY | |
| PROJECT NAME: | MSTAR | |
| INCOME PROFILE | The rental contracts have not been available. The information is based on the rent schedule dated on 30 November 2020. |
| The property is leased to three tenants (ITG GmbH Internationale Spedition und Logistik, Rheinmetall Immobilien GmbH, SUCOs DO BRASIL Productos Latinos GmbH). 2,114.00 sq m of warehouse space (22.24% of total space) are vacant. | |
| The property has a WAULT of 1.26 years (to breaks) from the date of valuation. The total gross current rent generated by the property is €439,557 per annum whilst our opinion of the total gross market rent is €569,878 per annum. The property is shown as slightly over-rented after accounting for vacancy. | |
| The main tenant is with about 51% of the total rental space and about 56% of the total rental income is the “ITG GmbH Internationale Spedition und Logistik”. ITG GmbH Internationale Spedition und Logistik provides logistics services for fashion and textile area. The Company offers solutions including contract logistics, air, truck, and ocean freight, sea and air services, and warehousing. ITG operates in Germany. |
VALUATION CONSIDERATIONS
| COSTS AND ADJUSTMENTS | Based on the information provided or our knowledge of the market, in approaching our valuation, we made allowances for the following capital and non-recoverable costs. In all cases, we have cited whether they are deducted as at the date of valuation or whether they take effect at a later date. | ||||
| Capital Expenditure: | |||||
| Type & Calculation | Source | Effective | Amount | ||
| Capital Expenditure: | Technical Due | On Valuation | €230,000 | ||
| Fixed Amount | Diligence | No Repeat | |||
| Tenant Incentives | CBRE Estimate | On lease start / | €52,850 | ||
| renewal | |||||
| No Repeat | |||||
| Letting Fees: 25% of | CBRE Estimate | On lease start / | €29,808 | ||
| Rental Value | renewal | ||||
| No Repeat | |||||
| TOTAL ON | €312,658 | ||||
| VALUATION | |||||
| ON BEHALF OF: | MORGAN STANLEY | |
| PROJECT NAME: | MSTAR | |
| Revenue Deductions: | |||||
| Type & Calculation | Source | Effective | Annual Amount | ||
| General Non- | CBRE Estimate | On Valuation | €2,849 | ||
| Recoverables: | |||||
| 0.5% of rental value | In perpetuity | ||||
| Maintenance: €2.50 | CBRE Estimate | On Valuation + | €23,765 | ||
| per sq m | Delay 60 | ||||
| Months | |||||
| In perpetuity | |||||
| Management | CBRE Estimate | On Valuation | €11,398 | ||
| 2.0% of rental value | In perpetuity | ||||
| Void Costs: €0.50 | CBRE Estimate | On Valuation | €12,684 | ||
| per sq m | |||||
| On all voids | |||||
| TOTAL: ON | €26,931 | ||||
| VALUATION | |||||
| VALUATION METHODOLOGY – MARKET VALUE | We have had regard to the most recent letting transactions and occupational demand for the region within which the subject property is located, including the property itself if of relevance. The rental rates range between €56.40 and €78.00 per sq m per annum, depending on the duration of the lease contract, building specifications and age. Within the evidence table appended, we would highlight the properties in Neuss as being of greatest relevance in terms of asset characteristics. | |||||
| Comparable number two is located in the similar micro location, in a close vicinity to the motorway. Therefore, the location can be assessed as comparable. The property was completed in 1987 and has a lettable area of around 7,525 sq m. Due to the similar macro location, we consider the property to be similar. We have adopted the following rental rates within our valuation: | ||||||
| Use | Letting-Status | Rental Area | ERV per sq m | ERV (Total) | ||
| Office | LET | 1,561.24 sq m | €78.00 /sq m pa | €121,776.72 pa | ||
| Warehouse | LET | 5,829.97 sq m | €56.40 /sq m pa | €328,810.31 pa | ||
| Warehouse | VACANT | 2,114.00 sq m | €56.40 /sq m pa | €119,229.60 pa | ||
| Total* | 9,505.21 sq m | €59.95 /sq m pa | €569,877.64 pa | |||
| * The total amount of ERV and rental area may differ from the calculation printout due to rounding differences. | ||||||
| We have arrived at our opinion of Market Value adopting the Traditional investment capitalisation method of valuation. Within this approach, we apply an income weighted average equivalent yield to our opinion of net income, reflecting the comparable evidence within the market for guidance on capital rates and values per sq m. | ||||||
| We would like to highlight investment comparable number one and two. The first property is located in the direct vicinity to the property. The location can be | ||||||
| ON BEHALF OF: | MORGAN STANLEY | |
| PROJECT NAME: | MSTAR | |
| considered as similar to the subject property. The property has a lettable area of around 5,993 sq m. It was sold for approx. €6,100,000 (equating to around €1,018 per sq m) in Q4 2020. The property is within the same macro location but superior micro location. | ||||||
| Investment comparable two is also located in the direct vicinity the subject property. The location can be considered as comparable. The property has a lettable area of around 5,494 sq m. It was sold for about €4,950,000 (equating to around €901 per sq m) in Q4 2020. Due to the similar macro location, we consider the property to be similar to the subject premises. | ||||||
| For the valuation of this asset, we have applied the following equivalent yield: | ||||||
| - 5.40% | ||||||
| This results in a Net Initial Yield of 4.32% and a capital rate per sq m of €917. The Net Initial Yield is currently being influenced by the level of vacancy. | ||||||
| On the assumption that there are no unusual factors of which we are unaware and on the basis of the comments and assumptions specified in this report, CBRE is of the opinion that the Market Value (rounded) of the subject property, is: | ||||||
| €8,720,000 | ||||||
| (eight million and seven hundred and twenty thousand Euro) | ||||||
| The unrounded net capital value is €8,715,928. The gross unrounded capital value is €9,856,599 including €312,658 of capital costs and €828,013 purchaser’s costs (9.00%). | ||||||
| Our opinion of Market Value is based upon the Scope of Work and Valuation Assumptions attached and has been primarily derived using comparable recent market transactions on arm’s length terms. | ||||||
| VALUATION METHODOLOGY – VACANT POSSESSION VALUE | The constituent inputs in terms of rental value and non-recoverable costs largely align with the Market Value approach. The key exception being that we have adopted a special assumption that the property is 100% vacant/non-income producing as at the valuation date. This value is predominantly derived using the traditional investment method of valuation but critically benchmarking the resultant capital rate per sq m against the prevailing evidence. | |||||
| In approaching our valuation under the Special Assumption that the property is entirely vacant (Vacant Possession Value), we have adopted a total void period of 12 months inclusive of rent free or tenant incentives and targeted an equivalent yield of 5.9%. | ||||||
| This results in a net rounded value of €7,230,000, equating to €761 per sq m. | ||||||
| ESTIMATED REINSTATEMENT ASSESSMENT | The property has not been inspected by a suitably qualified building surveyor from CBRE, nor have we carried out a full Reinstatement Cost Assessment. For indicative purposes only we estimate that the reinstatement cost of insurance purposes would be in the region of €11,879,993 (rounded, excl. VAT) on a day one basis, including fees but excluding VAT and inflation. | |||||
| This figure should be compared with the current sum insured and if a material discrepancy exists we suggest that a full Reinstatement Cost Assessment is carried out. | ||||||
| ON BEHALF OF: | MORGAN STANLEY | |
| PROJECT NAME: | MSTAR | |
RENTAL EVIDENCE
|
PROPERTY ADDRESS |
PROPERTY USE |
DATE |
TOTAL AREA
|
TENANT |
LEASE LENGTH (YEARS) |
BREAK OPTION |
RENT (P.A) (€) |
MONTHLY RENTAL RATE PER SQ M (€) |
RELATIVE QUALITY |
|
40231 Duesseldorf |
Warehouse | Q4 2020 | 14,570 | n/a | n/a | n/a | 786,780 | 4.50 |
Similar (immediate vincity) |
|
40472 Duesseldorf |
Distribution hall |
Q4 2020 | 18,400 | n/a | n/a | n/a | 1,015,680 | 4.60 |
Similar (immediate vincity) |
|
40670 Meerbusch |
Distribution hall |
Q2 2019 | 10,620 | n/a | n/a | n/a | 660,139 | 5.18 |
Similar (immediate vincity) |
|
46395 Bocholt |
Warehouse | Q2 2019 | 10,000 | n/a | n/a | n/a | 579,600 | 4.83 |
Inferior (macro location) |
| ON BEHALF OF: | MORGAN STANLEY | |
| PROJECT NAME: | MSTAR | |
SALES EVIDENCE
|
PROPERTY ADDRESS |
PROPERTY USE |
DATE |
TOTAL AREA (SQ M) |
WAULT (YEARS) |
PASSING RENT PER ANNUM (€)
|
PURCHASE PRICE (€) |
NET INITIAL YIELD (%) |
CAPITAL RATE PER SQ M (€) |
RELATIVE QUALITY |
|
41066 Moenchengladbach |
Warehouse | Q4 2020 | 5,993 | n/a | n/a | 6,100,000 | n/a | 1,018 |
Similar (macro location) |
| 442855 Remscheid |
Industrial estate |
Q4 2020 | 5,494 | n/a | n/a | 4,950,000 | n/a | 901 |
Similar (macro and micro location) |
| 53909 Zuelpich | Warehouse | Q3 2020 | 53,999 | n/a | n/a | 50,000,000 | n/a | 926 |
Worse (macro and micro location) |
| 41334 Nettetal |
Distribution hall |
Q3 2019 | 32,000 | 7 | n/a | 27,552,000 | 4.88 | 861 |
Similar to inferior (micro and macro location) |
| PROPERTY ID: | dehamb - Hamburger Strasse 17-22 | |
| ON BEHALF OF: | MORGAN STANLEY | |
| VALUATION DATE: | 01-Feb-2021 | FINAL |
Hamburger Strasse 17-22 - Hamburger Strasse 17-22, Dormagen, 41540, Germany
 |
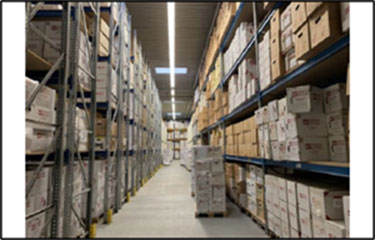 |
|
 |
 |
| VALUATION METRICS | (currency - EUR) |
| Metric | Value |
| Market Value | 14,200,000 |
| Market Value (per sq m) | 992 |
| Net Initial Yield | 4.75% |
| Reversionary Yield | 5.41% |
| Equivalent Yield | 5.40% |
| Gross Income (p.a.) | 769,048 |
| Gross Income (p.a.) (per sq m) | 54 |
| *Adj. Gross Income | 769,048 |
| Adj. Gross Income (per sq m) | 54 |
| Net Income (p.a.) | 726,972 |
| Net Income (p.a.) (per sq m) | 51 |
| Gross Rental Value | 892,488 |
| Gross Rental Value (per sq m) | 62 |
| Capital Expenditure | -144,561 |
| Transaction Costs | 7.75% |
| Over / Under Rented | -1.27% |
KEY FACTS
| Metric | Value | |
| Total Area (sq m) | 14,308 | |
| WAULT to Break by Rent | 2.00 | |
| WAULT to Break by ERV | 1.87 | |
| WAULT to Expiry by Rent | 2.00 | |
| WAULT to Expiry by ERV | 1.87 | |
| Percentage of Vacancy (Area) | 11.51% | |
| Percentage of Vacancy (ERV) | 12.72% | |
| ** | Number of Tenants | 32 |
| Current Voids (months) | 12 | |
| * Adjusted Gross Income equates to the Gross Income excluding any rent free periods | |
| LEASES RANKED BY RENT | ** Total tenant lines within our valuation. May differ to number of individual tenants |
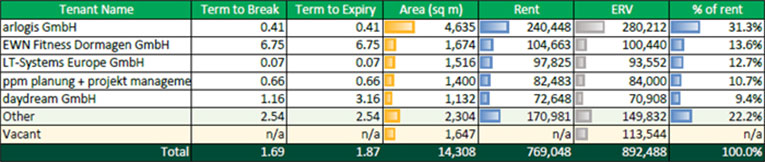
| Printed 09/03/2021 19:43 | |
| PROPERTY ID: | dehamb - Hamburger Strasse 17-22 | |
| ON BEHALF OF: | MORGAN STANLEY | |
| VALUATION DATE: | 01-Feb-2021 | FINAL |
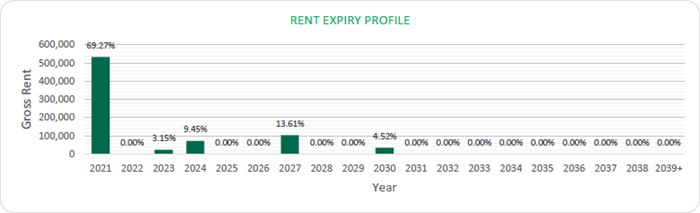
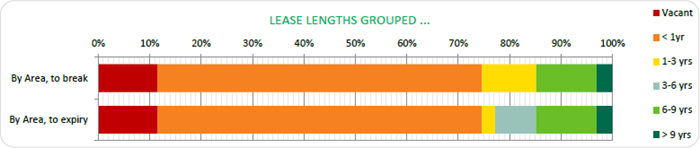
| Printed 09/03/2021 19:43 | |
| ON BEHALF OF: | MORGAN STANLEY |
| PROJECT NAME: | MSTAR |
PROPERTY REPORT
41540 DORMAGEN, HAMBURGER STRASSE 17-22
| INSPECTED BY: | INSPECTION DATE: | VALUATION DATE: | PROPERTY TYPE |
| MARK-PHILIPP HELCK | 09/01/2020 | 01/02/2021 | WAREHOUSE |
KEY VALUATION FACTORS
| STRENGTHS | WEAKNESSES | |
|
■ The subject property is located in a good commercial/logistic location.
■ Excellent connection to the motorway A57 (adjacent to the subject property);
■ Sufficient parking on site;
■ Building appears to be in good condition with only limited maintenance backlog according to the TDD report; ■ Rack rented.
|
■ High vacancy rate of 14.36% by area.
■ Short WAULT of 2.00 years (by rent to breaks).
|
|
| OPPORTUNITIES | THREATS | |
|
■ The continuing positive development of the overall economy could lead to an increase in office rents.
■ Letting of the remaining vacant area will increase attractiveness of the property as an investment product.
|
■ Fluctuations in the world economy and the global capital markets could have negative effects on German real estate market purchase prices.
■ Longer marketing period incl. loss of rent and costs for reletting if anchor tenant vacates the property.
|
LOCATION & SITUATION
| LOCATION | The next largest economically significant city is Neuss. Neuss is the most important centre of the Rhein-Kreis-Neuss region and has also been designated as a medium-sized centre in state planning. The city benefits from its direct proximity to Dusseldorf - both cities merge directly into each other in terms of their urban structures and have close economic ties. The A 57 and A 46 motorways run through Neuss. Neuss also has a Rhine port, which shares a port administration with Dusseldorf. Dormagen is located 20 km southwest and south of Neuss and Dusseldorf respectively. |
| ON BEHALF OF: | MORGAN STANLEY |
| PROJECT NAME: | MSTAR |
|
Dormagen is part of the greater logistics region of Dusseldorf. Dormagen is considered as a very attractive logistics location, Due to its convenient location inside the largest conurbation in Europe with its dense road, rail and waterway network plus an international airport, Dormagen and the greater region of Düsseldorf are well positioned as logistics region. Further the local logistics market has benefit from a high commercial property prices and the short supply in commercial land in Dusseldorf, which is the centre of the subject logistic region.
Within the city of Dormagen, the subject property is situated in a commercial area, which is mainly used for industrial and commercial purposes. The direct surroundings consist of manufacturers and retailers.
The motorway connection can be described as excellent, due to the close proximity to the motorway A57. The next airport is situated in Dusseldorf, around 35 km away and reachable in approximately 35 minutes. The airport offers national and international flight connections.
|
PROPERTY DESCRIPTION
| DESCRIPTION |
The property covers an area of approximately 2.45 hectares and comprises two warehouse buildings (building complex A in the west and building complex B in the east) divided by the street Hamburger Straße in the central part of the property.
Building complex A (Hamburger Straße 18-22) comprises four single-storey warehouse units with attached 2-storey office sections and a partial basement in the north west.
Building complex B (Hamburger Straße 17-21a) comprises seven single-storey warehouse units with two 2-storey office units and does not have a basement. Parking is provided along the site boundaries.
The buildings cover approximately 70% of the property; approximately 15% of the site is covered with brick paving (yard areas and parking). Approximately 15% of the property comprises landscaping (perimeter grass and bushes/trees).
Historically, the site comprised undeveloped agricultural land until 1993/1994, when it was developed with the current site buildings. Since development the site has been used for warehousing and office administration.
|
||
| Summary of known specification: | |||
| Characteristic | Result | ||
| Built / Renovation | 1993 / 1994 | ||
| Eaves Height | c. 5 metres | ||
| No. of loading Doors | 20 | ||
| Loading Door Ratio | 0.8 | ||
| Yard Depth | Approx. 16-26 metres | ||
| ON BEHALF OF: | MORGAN STANLEY |
| PROJECT NAME: | MSTAR |
| Loading-Dock | Front loading | ||
| Warehouse (% of GLA) | 63% | ||
| Site Coverage Ratio | 70% | ||
| Source: Phase I Environmental Review dated January 2020; the information gathered during the site inspection. | |||
| ACCOMMODATION | We have not measured the property, but as instructed, we have relied upon floor areas made available to us. |
| Unit description | Primary Use | Status | Area (sq m) | ||
| Office | Office | Let | 1,608 | ||
| Office | Office | Vacant | 1,226 | ||
| Other | Storage | Let | 2,063 | ||
| Other | Storage | Vacant | 335 | ||
| Warehouse | Storage | Let | 8,991 | ||
| Warehouse | Storage | Vacant | 84 | ||
| Total | 14,307 |
DUE DILIGENCE
| STATE OF REPAIR | CBRE have not undertaken a structural survey, nor tested the services. The property was subject to an inspection for valuation purposes in early 2020. As you are aware, the property has not been re-inspected for the purposes of this report, nor have we been provided with updated TDD. We have therefore relied on the information provided by the Borrower, including a Capex schedule dated 12 June 2019 and schedule with revised budget of capex dated 19 January 2021. Based on the latter which indicates TDD assessment less completed spend in 2020, we have included the immediate and 2-5 years capex of €75,000 within our valuation. | |
| According to our own limited inspection for valuation purposes, our opinion regarding the state of repair would substantiate the assessment by Arcadis. Based on our impression gained during the inspection, we are of the opinion that the buildings are in a fair condition, in line with the year of construction. | ||
| ENVIRONMENTAL CONSIDERATIONS |
We have summarised the findings from a schedule provided in relation to ‘Priority sites’ within the front section of this report.
According to the Draft Environmental Due Diligence report, dated 13 December 2019, by Ambiente Ltd. There are currently no known ground/soil contaminations. However, the following risks for contamination have been identified:
|
| ON BEHALF OF: | MORGAN STANLEY |
| PROJECT NAME: | MSTAR |
| On-site | |||
| ● | Known elevated concentrations of VOCs in ambient air in Building B. | ||
| Off-site | |||
| ● | Potential for soil contamination from public fuel station c. 300m east. | ||
| In addition, there is the risk of the following building pollutants: | |||
| ● | No additional significant potential sources of contamination have been identified. | ||
| From building operations, the following risks have been identified: | |||
| ● | Potential for contamination from light industrial use of the subject property since c.1993 including storage and use of minor quantities of hazardous materials. | ||
|
We have been instructed not to make any investigations in relation to the presence or potential presence of contamination in land or buildings or the potential presence of other environmental risk factors and to assume that if investigations were made to an appropriate extent then nothing would be discovered sufficient to affect value.
We have not carried out investigation into past uses, either of the properties or of any adjacent lands, to establish whether there is any potential for contamination from such uses or sites, or other environmental risk factors and have therefore assumed that none exists. Should our assumption prove to be incorrect, we reserve the right to amend our valuation accordingly.
|
|||
| TENURE |
We have had sight of the Draft Red Flag Legal Report prepared by Hengeler Mueller, dated 05 February 2021. Based on the information provided, we understand the property is held freehold.
We have assumed that there are no onerous legal conditions affecting the property which have a material impact on our opinion of value.
|
||
| ON BEHALF OF: | MORGAN STANLEY |
| PROJECT NAME: | MSTAR |
| INCOME PROFILE |
The rental contracts are not available to us. The information is based on the rent schedule dated on 30 November 2020.
The property is leased to eleven tenants (arlogis GmbH, daydream GmbH, Detector Trade Int. GmbH & Co KG, EWN Fitness GmbH, habermann hoch zwei GmbH, HaPa Logistik GmbH, LT-Systems Europe GmbH, Michael Zilles Zahntechnik, Optic Shop os GmbH, ppm planung + projekt management GmbH, Smart Nüsse und Kerne GmbH). 1,283.00 sq m of office spaces, 417.00 sq m of warehouse spaces, 357.00 sq m of other spaces (14.36% of total space) are vacant.
The property has a WAULT of 2.00 years from the date of valuation. The total gross current rent generated by the property is €769,048 per annum whilst our opinion of the total gross market rent is €892,488 per annum. The property is shown as largely rack rented after accounting for vacancy.
The main tenant is with about 30% of the total rental space and an equal proportion of the total rental income is the “arlogis GmbH”. The company deals with the secure archiving and storage of files and other information carriers. The company offers consulting services for file archiving and document management as well as the digitalisation of files.
|
VALUATION CONSIDERATIONS
|
COSTS AND ADJUSTMENTS
|
Based on the information provided or our knowledge of the market, in approaching our valuation, we made allowances for the following capital and non-recoverable costs. In all cases, we have cited whether they are deducted as at the date of valuation or whether they take effect at a later date.
Capital Expenditure: |
||||
| Type & Calculation | Source | Effective | Amount | ||
| Capital Expenditure: Fixed Amount | Technical Due Diligence | On Valuation No Repeat | €75,000 | ||
| Tenant Incentives | CBRE Estimate |
On lease start / renewal
No Repeat
|
€41,175 | ||
| Letting Fees: 25% of Rental Value | CBRE Estimate |
On lease start / renewal
No Repeat
|
€28,386 | ||
| TOTAL ON VALUATION | €144,561 | ||||
| Revenue Deductions: | |||||
| Type & Calculation | Source | Effective | Annual Amount | ||
| General Non-Recoverables: 0.5% of rental value | CBRE Estimate |
On Valuation
In perpetuity
|
€4,462 | ||
| ON BEHALF OF: | MORGAN STANLEY |
| PROJECT NAME: | MSTAR |
| Maintenance: €3.00 per sq m | CBRE Estimate |
On Valuation + Delay 60 Months
In perpetuity
|
€42,924 | ||
|
Management
2.0% of rental value
|
CBRE Estimate |
On Valuation
In perpetuity
|
€17,850 | ||
| Void Costs: €1 per sq m | CBRE Estimate | Post Valuation End of Event |
€19,764 | ||
| TOTAL: ON | €42,076 | ||||
| VALUATION | |||||
|
VALUATION METHODOLOGY
|
We have had regard to the most recent letting transactions and occupational demand for the region within which the subject property is located, including the property itself if of relevance. The rental rates range between €60 and €72 per sq m per annum, depending on the duration of the lease contract, building specifications and age. Within the evidence table appended, we would highlight the letting evidence number two in Dormagen as being of greatest relevance in terms of asset characteristics.
Comparable number two is located in the similar micro location, in a close vicinity to the motorway. Therefore, the location can be assessed as comparable. The letting evidence comprises a warehouse unit of around 1,088 sq m. We have adopted the following rates across the property:
|
||||
| Use | Letting-Status | Rental Area | ERV per sq m | ERV (Total) | ||
| Office | LET | 1,607.82 sq m | €72.00 /sq m pa | €115,763.00 pa | ||
| Office | VACANT | 1,226.38 sq m | €72.00 /sq m pa | €88,300.00 pa | ||
| Other | LET | 2,062.73 sq m | €60.00 /sq m pa | €123,763.80 pa | ||
| Other | VACANT | 335.00 sq m | €60.00 /sq m pa | €20,100.00 pa | ||
| Warehouse | LET | 8,991.00 sq m | €60.00 /sq m pa | €539,460.00 pa | ||
| Warehouse | VACANT | 84.30 sq m | €60.00 /sq m pa | €5,058.00 pa | ||
| Total* | 14,307.23 sq m | €62.39 /sq m pa | €892,488.00 pa |
|
* The total amount of ERV and rental area may differ from the calculation printout due to rounding differences.
We have arrived at our opinion of Market Value adopting the Traditional investment capitalisation method of valuation. Within this approach, we apply an income weighted average equivalent yield to our opinion of net income, reflecting the comparable evidence within the market for guidance on capital rates and values per sq m.
|
| ON BEHALF OF: | MORGAN STANLEY |
| PROJECT NAME: | MSTAR |
|
We would like to highlight investment comparable number one and two. The first property is located in the direct vicinity to the property. The location can be considered as similar to the subject property. The property has a lettable area of around 5,993 sq m. It was sold for approx. €6,100,000 (equating to around €1,018 per sq m) in Q4 2020. The object is in the same macro location, but since the micro location is worse to evaluate, the other object is slightly stronger.
Investment comparable two is also located in the direct vicinity the subject property. The location can be considered as comparable. The property has a lettable area of around 5,494 sq m. It was sold for about €4,950,000 (equating to around €901 per sq m) in Q4 2020. Due to the similar macro location, we consider the property to be similar to the subject premises.
For the valuation of this asset, we have applied an equivalent yield of
5.40%.
This results in an Initial Yield of 4.75% and a capital rate per sq m of €992, after allowing for purchaser´s costs equating to 7.75%. The Net Initial Yield is currently being influenced by the level of vacancy.
On the assumption that there are no unusual factors of which we are unaware and on the basis of the comments and assumptions specified in this report, CBRE is of the opinion that the Market Value (rounded) of the subject property, is:
|
||
| €14,200,000 | ||
| (fourteen million two hundred-thousand Euro) | ||
| The unrounded net capital value is €14,194,569. The gross unrounded capital value is €15,439,209 including capital costs of €144,561 and €1,100,079 of purchaser’s costs (7.75%). | ||
| Our opinion of Market Value is based upon the Scope of Work and Valuation Assumptions attached and has been primarily derived using comparable recent market transactions on arm’s length terms. | ||
| VALUATION METHODOLOGY – VACANT POSSESSION VALUE |
The constituent inputs in terms of rental value and non-recoverable costs largely align with the Market Value approach. The key exception being that we have adopted a special assumption that the property is 100% vacant/non-income producing as at the valuation date. This value is predominantly derived using the traditional investment method of valuation but critically benchmarking the resultant capital rate per sq m against the prevailing evidence.
In approaching our valuation under the Special Assumption that the property is entirely vacant (Vacant Possession Value), we have adopted a total void period of 12 months inclusive of rent free or tenant incentives and targeted an equivalent yield of 5.9%.
This results in a net rounded value of €11,650,000, equating to €814 per sq m.
|
|
| ESTIMATED REINSTATEMENT ASSESSMENT |
The property has not been inspected by a suitably qualified building surveyor from CBRE, nor have we carried out a full Reinstatement Cost Assessment. For indicative purposes only we estimate that the reinstatement cost of insurance purposes would |
| ON BEHALF OF: | MORGAN STANLEY |
| PROJECT NAME: | MSTAR |
|
be in the region of €17,881,750 (rounded, excl. VAT) on a day one basis, including fees but excluding VAT and inflation.
This figure should be compared with the current sum insured and if a material discrepancy exists we suggest that a full Reinstatement Cost Assessment is carried out. |
| ON BEHALF OF: | MORGAN STANLEY |
| PROJECT NAME: | MSTAR |
RENTAL EVIDENCE
| PROPERTY ADDRESS |
PROPERTY USE |
DATE | TOTAL AREA (SQ M) |
TENANT | LEASE LENGTH (YEARS) |
BREAK OPTION |
RENT (P.A) (€) |
MONTHLY
|
RELATIVE QUALITY |
| 40231 Duesseldorf |
Warehouse | Q4 2020 | 14,570 | n/a | n/a | n/a | 786,780 | 4.50 | Similar (immediate vincity) |
| 40472 Duesseldorf |
Distribution hall |
Q4 2020 | 18,400 | n/a | n/a | n/a | 1,015,680 | 4.60 | Similar (immediate vincity) |
| 40670 Meerbusch |
Distribution hall |
Q2 2019 | 10,620 | n/a | n/a | n/a | 660,139 | 5.18 | Similar (immediate vincity) |
| 46395 Bocholt |
Warehouse | Q2 2019 | 10,000 | n/a | n/a | n/a | 579,600 | 4.83 | Inferior (macro location) |
| ON BEHALF OF: | MORGAN STANLEY |
| PROJECT NAME: | MSTAR |
SALES EVIDENCE
| PROPERTY ADDRESS |
PROPERTY USE |
DATE | TOTAL AREA (SQ M) |
WAULT (YEARS) |
PASSING RENT PER ANNUM (€) |
PURCHASE PRICE (€) |
NET INITIAL YIELD (%) |
CAPITAL RATE PER SQ M (€) |
RELATIVE QUALITY |
| 41066 Moenchengladbach |
Warehouse | Q4 2020 | 5,993 | n/a | n/a | 6,100,000 | n/a | 1,018 | Similar (macro location) |
| 442855 Remscheid | Industrial estate |
Q4 2020 | 5,494 | n/a | n/a | 4,950,000 | n/a | 901 | Similar (macro and micro location) |
| 53909 Zuelpich | Warehouse | Q3 2020 | 53,999 | n/a | n/a | 50,000,000 | n/a | 926 | Worse (macro and micro location) |
| 41334 Nettetal | Distribution hall |
Q3 2019 | 32,000 | 7 | n/a | 27,552,000 | 4.88 | 861 | Similar to inferior (micro and macro location) |
| PROPERTY ID: | dehark - Harkortstrasse 12-32 | |
| ON BEHALF OF: | MORGAN STANLEY | |
| VALUATION DATE: | 01-Feb-2021 | FINAL |
Harkortstrasse 12-32 - Harkortstrasse 12-32, Ratingen, 40880, Germany
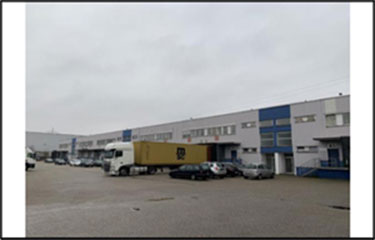 |
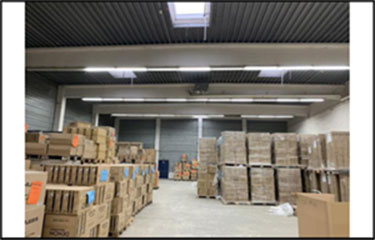 |
|
 |
 |
| VALUATION METRICS | (currency - EUR) |
| Metric | Value |
| Market Value | 8,780,000 |
| Market Value (per sq m) | 683 |
| Net Initial Yield | 7.61% |
| Reversionary Yield | 7.40% |
| Equivalent Yield | 6.25% |
| Gross Income (p.a.) | 752,147 |
| Gross Income (p.a.) (per sq m) | 58 |
| *Adj. Gross Income | 752,147 |
| Adj. Gross Income (per sq m) | 58 |
| Net Income (p.a.) | 728,500 |
| Net Income (p.a.) (per sq m) | 57 |
| Gross Rental Value | 766,572 |
| Gross Rental Value (per sq m) | 60 |
| Capital Expenditure | -1,908,386 |
| Transaction Costs | 9.00% |
| Over / Under Rented | 5.52% |
KEY FACTS
| Metric | Value | |
| Total Area (sq m) | 12,863 | |
| WAULT to Break by Rent | 0.76 | |
| WAULT to Break by ERV | 0.75 | |
| WAULT to Expiry by Rent | 0.76 | |
| WAULT to Expiry by ERV | 0.75 | |
| Percentage of Vacancy (Area) | 5.81% | |
| Percentage of Vacancy (ERV) | 7.02% | |
| ** | Number of Tenants | 7 |
| Current Voids (months) | 12 | |
| * Adjusted Gross Income equates to the Gross Income excluding any rent free periods | |
| LEASES RANKED BY RENT | ** Total tenant lines within our valuation. May differ to number of individual tenants |
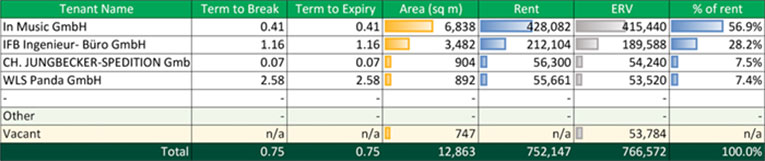
|
Printed 09/03/2021 19:43 |
|
| PROPERTY ID: | dehark - Harkortstrasse 12-32 | |
| ON BEHALF OF: | MORGAN STANLEY | |
| VALUATION DATE: | 01-Feb-2021 | FINAL |
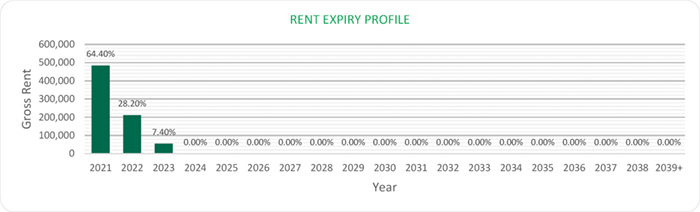
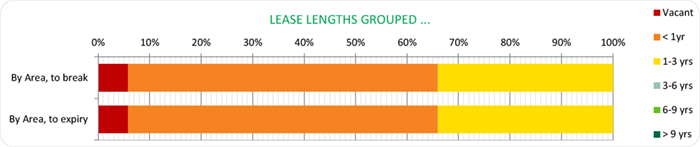
|
Printed 09/03/2021 19:43 |
|
| ON BEHALF OF: | MORGAN STANLEY |
| PROJECT NAME: | MSTAR |
PROPERTY REPORT
40880 RATINGEN – HARKORTSTRASSE 12
| INSPECTED BY: | INSPECTION DATE: | VALUATION DATE: | PROPERTY TYPE |
| MARK-PHILIPP HELCK | 08/01/2020 | 01/02/2021 | LOGISTICS |
KEY VALUATION FACTORS
| STRENGTHS | WEAKNESSES | |
|
■ Risk limitation through multi-tenant concept;
■ Good access to the motorway A52 (2.3 km);
■ Subject property is let approx. at market rent level.
|
■ Short WAULT of only 0.76 years to breaks;
■ Anchor tenant accounts for more than 50% of the total rental income stream;
■ Building contains asbestos;
■ High outstanding capital expenditures.
|
|
| OPPORTUNITIES | THREATS | |
|
■ The continuing positive development of the overall economy could lead to an increase in achievable rents;
■ Letting of vacant office spaces at market conditions could increase income profile.
|
■ Fluctuations in the world economy and the global capital markets could have negative effects on German real estate market purchase prices;
■ Short remaining lease term of anchor tenant might negatively impact the income stream.
|
LOCATION & SITUATION
| LOCATION |
The city of Ratingen is the largest city in the district of Mettmann and borders on the urban areas of Dusseldorf, Duisburg, Muelheim and Essen. Due to its central location within the Rhine-Ruhr region, Ratingen is very well connected in terms of infrastructure. Ratingen stands out in the Mettmann district as a location specialized in trade and services with international local companies. In addition, Ratingen is considered the region's hotspot for the IT and telecommunications sectors.
Ratingen belongs to the logistics region Duisburg/ Lower Rhine. The urban areas in the Duisburg/Lower Rhine region are served by a dense motorway network. This enables the region to supply the Rhineland and provides a rapid connection to Cologne/Bonn and the Ruhr district. The outer suburban areas, too, have adequate access to motorways. As a hinterland hub for containers from seaports, the region is especially well equipped with inland ports and container terminals along the Rhine. The Port of Duisburg (Duisport) is
|
| ON BEHALF OF: | MORGAN STANLEY |
| PROJECT NAME: | MSTAR |
|
Europe’s largest inland port and Germany’s most important transshipment hub for seaport-hinterland transportation. Equally, the Ports of Emmerich and Neuss, for instance, also have container transshipment facilities. For the transportation of time-critical goods by air freight, the region has access to Duesseldorf Airport which is one of Germany’s busiest cargo airports. All told, the Duisburg/Lower Rhine region has one of the most efficient infrastructures and is one of the most flexible logistics regions in Germany.
Within the city of Ratingen, the subject property is situated in an area, which is mainly used for logistic and industrial purposes. The direct surroundings consist of industrial companies, logistics service providers and retailers.
The motorway connection can be described as good because of the proximity to the motorway A52. The next airport is situated in Dusseldorf around 6.5 km away and reachable in approximately 10 minutes. The airport offers national and international connections.
|
PROPERTY DESCRIPTION
| DESCRIPTION |
The subject property covers an area of approx. 2.0 hectares and comprises two warehouse buildings. In total, the building complex houses 11 warehouse units and partly office areas on the 1st storey. Additionally, a railway siding is located on the eastern boundary of the site.
Warehouse property A (Harkortstraße 22-32) is located in the east of the site contain 6 warehouse units as well as office areas. Accordingly, warehouse property B (Harkortstraße 12-20) is located in the west of the site. This building contains 5 warehouse units and further office space.
Approx. 65% of the subject site is covered with buildings. Accessing roads, loading areas and parking spaces (brick paving) cover approx. 30% of the subject site. The remaining 5% are covered with landscaping (lawns and trees) and are located along the boundaries of the site.
Located on former agricultural land, the warehouses were constructed in 1977 and since then predominately used for storage and distribution purposes.
The warehouse areas are constructed with pre-cast concrete pillars and concrete beams. The roof is of profiled steel elements and is covered with bitumen sheets. The façade is of trapezoidal metal clads and the warehouse units a separated by brick walls.
In total, the warehouses comprise 25 loading doors which are mainly oriented to the inner yard area. The western building can be encircled and the eastern building can be bypassed via the yard area. Two accessing gates are located on the western boundary of the site. A sufficient number of car parking as well as additional lorry parking spaces are located at the inner yard and aside of the warehouses.
During the inspection not all parts of the property and the premises were accessible.
Summary of known specification:
|
| ON BEHALF OF: | MORGAN STANLEY |
| PROJECT NAME: | MSTAR |
| Characteristic | Result | ||
| Built / Renovation | 1977 | ||
| Eaves Height | n.a. | ||
| No. of loading Doors | 25 | ||
| Loading Door Ratio | 2.29 | ||
| Yard Depth | Approx. 30 metres | ||
| Cross-Dock | None | ||
| Warehouse (% of GLA) | 85% | ||
| Site Coverage Ratio | 65% | ||
| Source: Phase I Environmental Review dated January 2020; the information gathered during the site inspection. | |||
| ACCOMMODATION | We have not measured the property, but as instructed, we have relied upon floor areas made available to us. |
| Unit Description | Primary Use | Status | Area (sq m) | ||
| Other | (Leer) | LET | 400 | ||
| Office | Office | LET | 819 | ||
| Office | Office | VACANT | 747 | ||
| Warehouse | (Leer) | LET | 10,897 | ||
| Total (lettable) | 12,863 |
DUE DILIGENCE
| STATE OF REPAIR | CBRE have not undertaken a structural survey, nor tested the services. The property was subject to an inspection for valuation purposes in early 2020. As you are aware, the property has not been re-inspected for the purposes of this report, nor have we been provided with updated TDD. We have therefore relied on the information provided by the Borrower, including a Capex schedule dated 12 June 2019 and schedule with revised budget of capex dated 19 January 2021. Based on the latter which indicates TDD assessment less completed spend in 2020, we have included the immediate and 2-5 years capex of €1,880,000 within our valuation. | |
| According to our own limited inspection for valuation purposes, our opinion regarding the state of repair would substantiate the assessment by Arcadis. Based on our impression gained during the inspection, we are of the opinion that the buildings are in a fair condition, in line with the year of construction. |
| ON BEHALF OF: | MORGAN STANLEY |
| PROJECT NAME: | MSTAR |
| ENVIRONMENTAL CONSIDERATIONS |
We have summarised the findings from a schedule provided in relation to ‘Priority sites’ within the front section of this report.
According to the Draft Environmental Due Diligence report dated 10 January 2020 from Ambiente Ltd. There are currently no known ground/soil contaminations. However, the following risks for contamination have been identified:
|
||
| On-site | |||
| ● | Potential for contamination from former operation of a diesel filling station with associated UST at the property and an on-site railway siding. | ||
| Off-site | |||
| ● | Potential for migration of contamination from neighbouring former and current light industrial uses. | ||
| In addition, there is the risk of the following building pollutants: | |||
| ● | Known asbestos containing materials within the building fabric. | ||
| From building operations, the following risks have been identified: | |||
| ● | No potential sources of contamination have been identified. | ||
|
We have been instructed not to make any investigations in relation to the presence or potential presence of contamination in land or buildings or the potential presence of other environmental risk factors and to assume that if investigations were made to an appropriate extent then nothing would be discovered sufficient to affect value.
We have not carried out investigation into past uses, either of the properties or of any adjacent lands, to establish whether there is any potential for contamination from such uses or sites, or other environmental risk factors and have therefore assumed that none exists. Should our assumption prove to be incorrect, we reserve the right to amend our valuation accordingly.
|
|||
| TENURE |
We have had sight of the Draft Red Flag Legal Report prepared by Hengeler Mueller, dated 05 February 2021. Based on the information provided, we understand the property is held freehold.
We have assumed that there are no onerous legal conditions affecting the property which have a material impact on our opinion of value. |
||
| ON BEHALF OF: | MORGAN STANLEY |
| PROJECT NAME: | MSTAR |
| INCOME PROFILE | The rental contracts have not been available. The information is based on the rent schedule dated on 30 November 2020. | |
| The property is leased to four tenants (CH. JUNGBECKER-SPEDITION GmbH, IFB Ingenieur- Büro GmbH, In Music GmbH). 747 sq m of office space and 892 sq m of warehouse space are vacant (12.74%). | ||
| The property has a short WAULT of 0.76 years to breaks from the date of valuation. The total gross current rent generated by the property is €752,147 per annum whilst our opinion of the total gross market rent is €766,572 per annum. The property is shown as slightly over-rented after accounting for vacancy. | ||
| The main tenant is with about 55% of the total rental space and about 61% of the total rental income is the “In music GmbH”. The company is registered in Duesseldorf and its business is the trade and distribution of electronic products. |
VALUATION CONSIDERATIONS
|
COSTS AND ADJUSTMENTS
|
Based on the information provided or our knowledge of the market, in approaching our valuation, we made allowances for the following capital and non-recoverable costs. In all cases, we have cited whether they are deducted as at the date of valuation or whether they take effect at a later date.
Capital Expenditure: |
||||
| Type & Calculation | Source | Effective | Amount | ||
| Capital Expenditure: Fixed Amount | Technical Due Diligence | On Valuation No Repeat | €1,880,000 | ||
| Tenant Incentives | CBRE Estimate |
On lease start / renewal
No Repeat
|
€14,940 | ||
| Letting Fees: 25% of Rental Value | CBRE Estimate |
On lease start / renewal
No Repeat
|
€13,446 | ||
| TOTAL ON VALUATION | €1,908,386 | ||||
|
Revenue Deductions:
|
|||||
| Type & Calculation | Source | Effective | Annual Amount | ||
|
General Non-Recoverables: 0.5% of rental value |
CBRE Estimate |
On Valuation
In perpetuity
|
€3,833 | ||
| ON BEHALF OF: | MORGAN STANLEY |
| PROJECT NAME: | MSTAR |
| Maintenance: €3.00 per sq m | CBRE Estimate | On Valuation + Delay 60 Months In perpetuity | €38,589 | ||
| Management 2.0% of rental value | CBRE Estimate | On Valuation In perpetuity | €15,331 | ||
| Void Costs: €0.50 per sq m | CBRE Estimate | On Valuation On all voids | €4,482 | ||
| TOTAL: ON | €23,646 | ||||
| VALUATION | |||||
|
VALUATION METHODOLOGY
|
We have had regard to the most recent letting transactions and occupational demand for the region within which the subject property is located, including the property itself if of relevance. Within the evidence table appended, we would highlight the properties in Ratingen as being of greatest relevance in terms of asset characteristics.
Comparable number four is located in the similar macro location. Therefore, the location can be assessed as comparable. The property was completed in 1975 and has a lettable area of around 1,890 sq m. It is advantageous that the property is located in an industrial area that is close to two motorways. We have adopted the following rental rates within our valuation:
|
||||
| Use | Letting-Status | Rental Area | ERV per sq m | ERV (Total) | ||
| External | LET | 400.00 sq m | €0.00 /sq m pa | €0.00 pa | ||
| Office | LET | 819.00 sq m | €72.00 /sq m pa | €58,968.00 pa | ||
| Office | VACANT | 747.00 sq m | €72.00 /sq m pa | €53,784.00 pa | ||
| Warehouse | LET | 10,897.00 sq m | €60.00 /sq m pa | €653,820.00 pa | ||
| Total* | 12,862.50 sq m | €59.59 /sq m pa | €766,572.00 pa |
|
* The total amount of ERV and rental area may differ from the calculation printout due to rounding differences.
We have arrived at our opinion of Market Value adopting the Traditional investment capitalisation method of valuation. Within this approach, we apply an income weighted average equivalent yield to our opinion of net income, reflecting the comparable evidence within the market for guidance on capital rates and values per sq m.
We would like to highlight investment comparable number one and two. The first investment comparable is also located in a similar region. The location can be considered as comparable. The property has a lettable area of around 20,000 sq
|
| ON BEHALF OF: | MORGAN STANLEY |
| PROJECT NAME: | MSTAR |
|
m and was sold for approx. EUR 12,000,000 (equating to around EUR 600 per sq m) in Q4 2020.
Investment comparable number two is also located in the direct vicinity to the motorway. The location can be considered as similar. The property has a lettable area of around 10,000 sq m. It was sold for EUR 7,650,000 (equating to around EUR 765 per sq m) in Q2 2020. Due to the similar macro location, we consider the property to be similar.
For the valuation of this asset, we have applied the following equivalent yield:
|
||
| - 6.25% | ||
| This results in a Net Initial Yield of 7.60% and a capital rate per sq m of €683. | ||
| On the assumption that there are no unusual factors of which we are unaware and on the basis of the comments and assumptions specified in this report, CBRE is of the opinion that the Market Value (rounded) of the subject property, is: | ||
| €8,780,000 | ||
| (eight million and seven hundred and eighty thousand Euro) | ||
| The unrounded net capital value is €8,783,582. The gross unrounded capital value is €11,482,490 including €1,908,386 of capital costs and €790,523 purchaser’s costs (9.00%) respectively. | ||
| Our opinion of Market Value is based upon the Scope of Work and Valuation Assumptions attached and has been primarily derived using comparable recent market transactions on arm’s length terms. | ||
| VALUATION METHODOLOGY – VACANT POSSESSION VALUE |
The constituent inputs in terms of rental value and non-recoverable costs largely align with the Market Value approach. The key exception being that we have adopted a special assumption that the property is 100% vacant/non-income producing as at the valuation date. This value is predominantly derived using the traditional investment method of valuation but critically benchmarking the resultant capital rate per sq m against the prevailing evidence.
In approaching our valuation under the Special Assumption that the property is entirely vacant (Vacant Possession Value), we have adopted a total void period of 12 months inclusive of rent free or tenant incentives and targeted an equivalent yield of 6.75%.
This results in a net rounded value of €6,920,000, equating to €538 per sq m.
|
|
| ESTIMATED REINSTATEMENT ASSESSMENT |
The property has not been inspected by a suitably qualified building surveyor from CBRE, nor have we carried out a full Reinstatement Cost Assessment. For indicative purposes only we estimate that the reinstatement cost of insurance purposes would be in the region of €14,591,879 (rounded, excl. VAT) on a day one basis, including fees but excluding VAT and inflation.
This figure should be compared with the current sum insured and if a material discrepancy exists we suggest that a full Reinstatement Cost Assessment is carried out.
|
| ON BEHALF OF: | MORGAN STANLEY |
| PROJECT NAME: | MSTAR |
RENTAL EVIDENCE
| PROPERTY ADDRESS |
PROPERTY USE |
DATE | TOTAL AREA (SQ M) |
TENANT | LEASE LENGTH (YEARS) |
BREAK OPTION |
RENT (P.A) (€) |
MONTHLY
|
RELATIVE QUALITY |
| 40472 Düsseldorf |
Warehouse | 18,400 | 3,200 | n/a | n/a | n/a | 1,015,680 | 4.60 | Inferior
(micro location) |
| 40885 Ratingen |
Warehouse | Q4 2020 | 11,728 | n/a | n/a | n/a | 759,972 | 5.40 | Similar
(in the immediate vicinity of the object) |
| 53842 Troisdorf |
Warehouse | Q3 2019 | 11,819 | n/a | n/a | n/a | 624,043 | 4.40 | Comparable (macro location) worse (micro location) |
| 46395 Bocholt |
Warehouse | Q3 2019 | 10,000 | n/a | n/a | n/a | 579,600 | 4.83 | Inferior
(macro location) |
| ON BEHALF OF: | MORGAN STANLEY |
| PROJECT NAME: | MSTAR |
SALES EVIDENCE
| PROPERTY ADDRESS |
PROPERTY USE |
DATE | TOTAL AREA (SQ M) |
WALT (YEARS) |
PASSING RENT PER ANNUM (€) |
PURCHASE PRICE (€) |
NET INITIAL YIELD (%) |
CAPITAL RATE PER SQ M (€) |
RELATIVE QUALITY |
| 51381 Leverkusen |
Industrial estate |
Q4 2020 | 20,000 | n/a | n/a | 12,000,000 | n/a | 600 | Comparable (macro location) |
| 41334 Nettetal |
Warehouse | Q2 2020 | 10,000 | n/a | n/a | 7,650,000 | 5.80 | 765 | Comparable (macro location) |
| 47809 Krefeld |
Warehouse | Q1 2020 | 10,516 | n/a | n/a | 8,055,740 | 6.67 | 765 | Superior (micro location) |
| 41468 Neuss |
Industrial estate |
Q1 2020 | 30,713 | 4.4 | n/a | 19,100,000 | 5.40 | 622 | Superior (micro location) |
| PROPERTY ID: |
dehert01 - Hertzstr. 2
|
|
| ON BEHALF OF: | MORGAN STANLEY | |
| VALUATION DATE: | 01-Feb-2021 | FINAL |
Hertzstr. 2 - Hertzstr. 2, Herrenberg, 71083, Germany
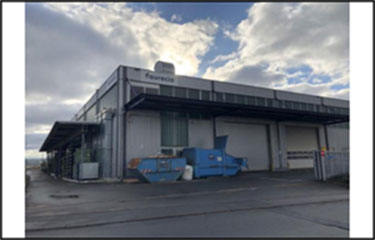 |
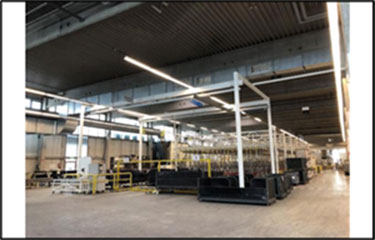 |
|
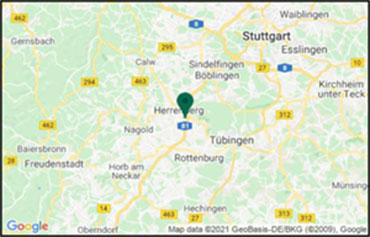 |
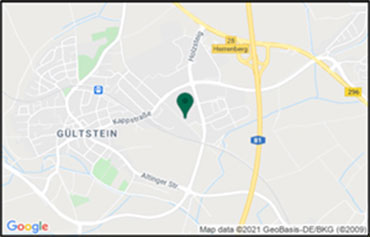 |
| VALUATION METRICS | (currency - EUR) |
| Metric | Value |
| Market Value | 3,480,000 |
| Market Value (per sq m) | 646 |
| Net Initial Yield | 6.40% |
| Reversionary Yield | 5.38% |
| Equivalent Yield | 5.40% |
| Gross Income (p.a.) | 253,239 |
| Gross Income (p.a.) (per sq m) | 47 |
| *Adj. Gross Income | 253,239 |
| Adj. Gross Income (per sq m) | 47 |
| Net Income (p.a.) | 249,716 |
| Net Income (p.a.) (per sq m) | 46 |
| Gross Rental Value | 226,080 |
| Gross Rental Value (per sq m) | 42 |
| Capital Expenditure | -90,770 |
| Transaction Costs | 12.01% |
| Over / Under Rented | 12.67% |
KEY FACTS
| Metric | Value | |
| Total Area (sq m) | 5,383 | |
| WAULT to Break by Rent | 2.93 | |
| WAULT to Break by ERV | 3.05 | |
| WAULT to Expiry by Rent | 2.93 | |
| WAULT to Expiry by ERV | 3.05 | |
| Percentage of Vacancy (Area) | 0.41% | |
| Percentage of Vacancy (ERV) | 0.58% | |
| ** | Number of Tenants | 8 |
| Current Voids (months) | 12 | |
| * Adjusted Gross Income equates to the Gross Income excluding any rent free periods | |
| LEASES RANKED BY RENT | ** Total tenant lines within our valuation. May differ to number of individual tenants |
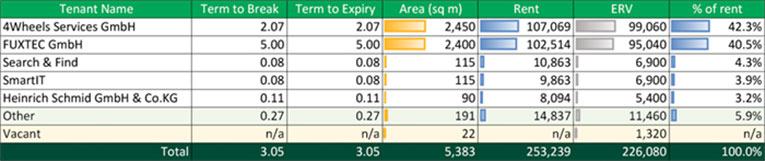
| Printed 09/03/2021 19:43 | |
| PROPERTY ID: | degewe01 - Hertzstr. 2 | |
| ON BEHALF OF: | MORGAN STANLEY | |
| VALUATION DATE: | 01-Feb-2021 | FINAL |

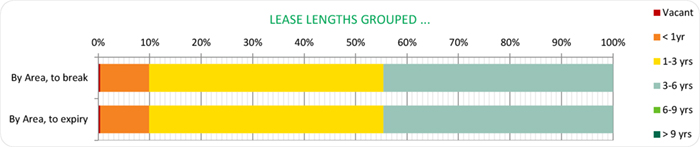
| Printed 09/03/2021 19:43 | |
| ON BEHALF OF: | MORGAN STANLEY |
| PROJECT NAME: | MSTAR |
PROPERTY REPORT
71083 HERRENBERG - HERTZSTRASSE 2
| INSPECTED BY: | INSPECTION DATE: | VALUATION DATE: | PROPERTY TYPE |
| MAREIKE RECK | 07/01/2020 | 01/02/2021 | LIGHT INDUSTRIAL |
KEY VALUATION FACTORS
| STRENGTHS | WEAKNESSES | |
|
■ The subject property is located in the wider logistics region Stuttgart;
■ Good access to motorways A81 (1.4 km) and B296 (0.8 km);
■ Risk reduction due to multi-tenant concept.
|
■ Two anchor tenants produce 85% of the income stream;
■ WAULT of 2.93 years to breaks.
|
|
| OPPORTUNITIES | THREATS | |
|
■ The continuing positive development of the overall economy could lead to an increase in achievable rents;
■ Letting of the vacant office space at market conditions could improve the income profile.
|
■ Fluctuations in the world economy and the global capital markets could have negative effects on the German commercial real estate market.
|
LOCATION & SITUATION
| LOCATION |
The next largest economically significant city is Tuebingen and is a traditional university town on the Neckar River. Its location on the edge of the Schwaebische Alb, only about 40 km southeast of Stuttgart offers good opportunities for economic activity and varied leisure activities. Tübingen does not have a direct motorway connection but is well connected to the national transport infrastructure network via the B27 and B28 federal highways.
Herrenberg belongs to the Stuttgart logistics region. In terms of road transport, the Stuttgart region is well connected to the long-distance national road network via the A6 and A8 motorways in the east-west direction and the A81 for north-south traffic. Around the Stuttgart city area in particular, however, congestion is not uncommon due to heavy traffic. The ports of Stuttgart and Heilbronn constitute two important trimodal traffic centres. Besides having a trimodal container terminal, the Port of Stuttgart also offers transshipment options for rail/road transport services, handling mainly incoming raw materials for local industry as well as the resulting finished products. The |
| ON BEHALF OF: | MORGAN STANLEY |
| PROJECT NAME: | MSTAR |
|
Kornwestheim freight center (GVZ) in the north of Stuttgart, however, is the most efficient terminal in the region. As regards air freight, Stuttgart Airport provides premium air freight services and ranks midfield among German airports in terms of annual freight volume.
Within the city of Herrenberg, the subject property is situated in an area, which is mainly used industrial and logistic purposes. The direct surroundings consist of industrial companies, logistics services providers and retailers.
The motorway connection can be described as good because of the close proximity to the motorway A81. The next airport is situated in Stuttgart around 35 km away and reachable in approximately 40 minutes. The airport offers national and international connections.
|
PROPERTY DESCRIPTION
| DESCRIPTION |
The property covers an area of approximately 1 hectare and comprises a single-storey warehouse building with a three-storey office section in the north east.
The rectangular warehouse comprises three units, two of which to the north west and one large unit to the south east. The building has a flat roof and does not have a basement.
The building complex covers approximately 70% of the site area. Approx. 25% of the site is covered with hardstanding (mostly tarmac and partly interlocking pavers) and a further 5% of the property comprises soft landscaping (bushes/trees) along the site boundaries.
The current site building complex was developed in 1992 on former agricultural land for industrial use. The site subsequently was converted into multi-let units. The roof of the building was extensively refurbished in 2010.
Summary of known specification:
|
||
| Characteristic | Result | ||
| Built / Renovation | 1992 | ||
| Eaves Height | 13 metres | ||
| No. of loading Doors | 6 | ||
| Loading Door Ratio | 1.11 | ||
| Yard Depth | 37-40 metres | ||
| Cross-Dock | No | ||
| Warehouse (% of GLA) | 88% | ||
| Site Coverage Ratio | 70% | ||
| Source: Phase I Environmental Review dated January 2020; the information gathered during the site inspection. | |||
| ACCOMMODATION | We have not measured the property, but as instructed, we have relied upon floor areas made available to us. | ||
| ON BEHALF OF: | MORGAN STANLEY |
| PROJECT NAME: | MSTAR |
| Unit Description | Primary Use | Status | Area (sq m) | ||
| Office | Office | LET | 611 | ||
| Office | Office | VACANT | 22 | ||
| Warehouse | Storage/Production | LET | 4,750 | ||
| Total (lettable) | 5,383 |
DUE DILIGENCE
| STATE OF REPAIR | CBRE have not undertaken a structural survey, nor tested the services. The property was subject to an inspection for valuation purposes in early 2020. As you are aware, the property has not been re-inspected for the purposes of this report, nor have we been provided with updated TDD. We have therefore relied on the information provided by the Borrower, including a Capex schedule dated 12 June 2019 and schedule with revised budget of capex dated 19 January 2021. Based on the latter which indicates TDD assessment less completed spend in 2020, we have included the immediate and 2-5 years capex of 90,000 within our valuation. | ||
| According to our own limited inspection for valuation purposes, our opinion regarding the state of repair would substantiate the assessment by Arcadis. Based on our impression gained during the inspection, we are of the opinion that the buildings are in a fair condition, in line with the year of construction. | |||
| ENVIRONMENTAL CONSIDERATIONS |
We have summarised the findings from a schedule provided in relation to ‘Priority sites’ within the front section of this report.
According to the Draft Environmental Due Diligence report dated 10 January 2020 by Ambiente Ltd. there are currently no known ground/soil contaminations. However, the following risks for contamination have been identified:
|
||
| On-site: | |||
| ● | Potential for contamination from industrial assembly since 1992 and later multi-let light industrial use / warehousing from c. 2007. | ||
| Off-site: | |||
| ● | Potential for migration of contamination from neighbouring light industrial uses. | ||
| In addition, there is the risk of the following building pollutants: | |||
| ● | No potential sources of contamination have been identified. | ||
| From building operations, the following risks have been identified: | |||
| ● | No potential sources of contamination have been identified. | ||
| ON BEHALF OF: | MORGAN STANLEY |
| PROJECT NAME: | MSTAR |
|
We have been instructed not to make any investigations in relation to the presence or potential presence of contamination in land or buildings or the potential presence of other environmental risk factors and to assume that if investigations were made to an appropriate extent then nothing would be discovered sufficient to affect value.
We have not carried out investigation into past uses, either of the properties or of any adjacent lands, to establish whether there is any potential for contamination from such uses or sites, or other environmental risk factors and have therefore assumed that none exists. Should our assumption prove to be incorrect, we reserve the right to amend our valuation accordingly.
|
||
| TENURE |
We have had sight of the Draft Red Flag Legal Report prepared by Hengeler Mueller, dated 05 February 2021. Based on the information provided, we understand the property is held freehold.
We have assumed that there are no onerous legal conditions affecting the property which have a material impact on our opinion of value.
|
|
| INCOME PROFILE | The rental contracts have not been made available to us. The information is solely based on the rental schedule dated 30 November 2020. | |
| The property is leased to six tenants (4Wheels Services GmbH, FUXTEC GmbH, Heinrich Schmid GmbH & Co.KG, Robin Hood Tierheimservice, Search & Find, SmartIT). 110.00 sq m of office space (2.04% of total space) is vacant. | ||
|
The property has a WAULT of 2.93 years as at the date of valuation. The total gross current rent generated by the property is €253,239 per annum whilst our opinion of the total gross market rent is €226,080 per annum. The property is shown as over-rented.
The two main tenants are “4Wheels Services GmbH” with about 46% of the total rental space and about 43% of the total rental income and “FUXTEC GmbH” with about 45% of the total rental space and about 43% of the total rental income.
“4Wheels Services GmbH” specializes in professional wheel and tire management services. The Company offers wheel inspection, industrial delivery of neurons, insurance, and replacement and repair of tire services. “4Wheels Services” serves customers in Germany.
“FUXTEC GmbH” operates as an online store offering mowing machines, grass trimmers, hedge shears, auger, power generator, battery garden tools, batteries, ash vacuum cleaner, garden maintenance, protective gear, spare parts, and other related equipment. “FUXTEC” serves customers in Germany.
|
| ON BEHALF OF: | MORGAN STANLEY |
| PROJECT NAME: | MSTAR |
VALUATION CONSIDERATIONS
|
COSTS AND ADJUSTMENTS
|
Based on the information provided and our knowledge of the market, in approaching our valuation, we made allowances for the following capital and non-recoverable costs. In all cases, we have cited whether they are deducted as at the date of valuation or whether they take effect at a later date.
Capital Expenditure: |
||||
| Type & Calculation | Source | Effective | Amount | ||
| Capital Expenditure: Fixed Amount | Technical Due Diligence |
On Valuation No Repeat |
€90,000 | ||
| Tenant Incentives | CBRE Estimate |
On lease start / renewal
No Repeat
|
€440 | ||
| Letting Fees: 25% of Rental Value | CBRE Estimate |
On lease start / renewal
No Repeat
|
€330 | ||
| TOTAL: ON VALUATION | €90,770 | ||||
| Revenue Deductions: | |||||
| Type & Calculation | Source | Effective | Annual Amount | ||
| General Non- Recoverables: 0.5% of rental value | CBRE Estimate |
On Valuation In perpetuity |
€1,130 | ||
| Maintenance: €2.35 per sq m | CBRE Estimate |
On Valuation + Delay 60 Months
In perpetuity
|
€12,650 | ||
|
Management
1.0% of rental value
|
CBRE Estimate |
On Valuation
In perpetuity
|
€2,261 | ||
| Void Costs: €0.50 per sq m | CBRE Estimate | On Valuation On all voids | €132 | ||
| TOTAL ON | €3,523 | ||||
| VALUATION | |||||
|
VALUATION METHODOLOGY
|
We have had regard to the most recent letting transactions and occupational demand for the region within which the subject property is located, including the property itself if of relevance. Regarding the rental comparables, we would like to point out the first rental comparable which is located in another macro location, which is considered to be slightly inferior. Due to the fact that the micro location is
|
||||
| ON BEHALF OF: | MORGAN STANLEY |
| PROJECT NAME: | MSTAR |
| comparable, the location can be assessed as comparable. The property was completed in 2017 and has a lettable area of 1,714 sq m. It is advantageous that a train station and a bus stop are located in the immediate vicinity of the comparable property. For this particular assets, we have also included an office letting, albeit dated, as an indication of the relative rate to apply across this type of space. Whilst the 2020 the Susan (Unit 8, 1st Floor) letting agreed within the property itself was ahead of this level, this was for a smaller suite and in our opinion ahead of the market. We have adopted the following rental rates within our valuation: |
| Use | Letting-Status | Rental Area | ERV per sq m | ERV (Total) | ||
| Office | LET | 611.00 sq m | €60.00 /sq m pa | €36,660.00 pa | ||
| Office | VACANT | 22.00 sq m | €60.00 /sq m pa | €1,320.00 pa | ||
| Warehouse | LET | 4,750.00 sq m | €39.60 /sq m pa | €188,100.00 pa | ||
| Total* | 5,383.00 sq m | €42.00 /sq m pa | €226,080.00 pa | |||
|
* The total amount of ERV and rental area may differ from the calculation printout due to rounding differences.
We have arrived at our opinion of Market Value adopting the traditional investment capitalisation method of valuation. Within this approach, we apply an income weighted average equivalent yield to our opinion of net income, reflecting the comparable evidence within the market for guidance on capital rates and values per sq m.
We would like to highlight investment comparables number one and two. Investment comparable number one is located within close vicinity Lake Constance. The location can be considered as inferior, as it is not in a logistics region and moreover, it is farther away from a motorway. The property has a lettable area of around 32,808 sq m and was sold for approx. €19,900,000 (equating to €672 per sq m) in Q1 2020. We consider the property to be slightly superior.
The second property is located in Essingen. The motorway can be reached within 20 minutes by car. The property has a lettable area of around 32,808 sq m and was sold for approx. €19,900,000 (equating to €607 per sq m) in Q1 2019. Due to the micro location, we consider the property slightly inferior to the subject of our valuation.
For the valuation of this asset, we have applied the following Equivalent Yield:
- 5.40%
This results in a Net Initial Yield of 6.40% and a capital rate per sq m of €646.
On the assumption that there are no unusual factors of which we are unaware and on the basis of the comments and assumptions specified in this report, CBRE is of the opinion that the Market Value (rounded) of the subject property, is:
€3,480,000
(Three million four hundred and eighty thousand Euros)
|
||||||
| ON BEHALF OF: | MORGAN STANLEY |
| PROJECT NAME: | MSTAR |
| The unrounded net capital value is €3,483,259. The gross unrounded capital value is €3,992,020 including €90,770 of capital costs and €417,991 purchaser’s costs (12.00%) respectively. | ||
| Our opinion of Market Value is based upon the Scope of Work and Valuation Assumptions attached and has been primarily derived using comparable recent market transactions on arm’s length terms. | ||
| VALUATION METHODOLOGY – VACANT POSSESSION VALUE |
The constituent inputs in terms of rental value and non-recoverable costs largely align with the Market Value approach. The key exception being that we have adopted a special assumption that the property is 100% vacant/non-income producing as at the valuation date. This value is predominantly derived using the traditional investment method of valuation but critically benchmarking the resultant capital rate per sq m against the prevailing evidence.
In approaching our valuation under the Special Assumption that the property is entirely vacant (Vacant Possession Value), we have adopted a total void period of 12 months inclusive of rent free or tenant incentives and targeted an equivalent yield of 5.9%.
This results in a net rounded value of €2,780,000, equating to €516 per sq m.
|
|
| ESTIMATED REINSTATEMENT ASSESSMENT |
The property has not been inspected by a suitably qualified building surveyor from CBRE, nor have we carried out a full Reinstatement Cost Assessment. For indicative purposes only we estimate that the reinstatement cost of insurance purposes would be in the region of €5,851,055 (rounded, excl. VAT) on a day one basis, including fees but excluding VAT and inflation.
This figure should be compared with the current sum insured and if a material discrepancy exists we suggest that a full Reinstatement Cost Assessment is carried out.
|
| ON BEHALF OF: | MORGAN STANLEY |
| PROJECT NAME: | MSTAR |
RENTAL EVIDENCE
| PROPERTY ADDRESS |
PROPERTY USE |
DATE | TOTAL AREA (SQ M) |
TENANT | LEASE LENGTH (YEARS) |
BREAK OPTION |
RENT (P.A) (€) |
MONTHLY RENTAL RATE PER SQ M (€) |
RELATIVE QUALITY |
| 72406 Bisingen |
Warehouse | Q1 2020 | 731 | n/a | n/a | n/a | 35,088 | 4.00 | Similar (macro location) |
| 77955 Ettenheim |
Warehouse | Q1 2020 | 26,800 | n/a | n/a | n/a | 1,372,800 | 4.00 | Slightly superior (macro location) |
| 41468 Neuss |
Office | Q4 2018 | 680 | n/a | n/a | n/a | 40,800 | 5.00 | Similar (distance to motorway) |
| 68647 Biblis | Distribution hall |
Q2 2018 | 5,645 | n/a | 6 | n/a | 287,895 | 4.25 | Similar (distance to the motorway) |
| ON BEHALF OF: | MORGAN STANLEY |
| PROJECT NAME: | MSTAR |
SALES EVIDENCE
| PROPERTY ADDRESS |
PROPERTY USE |
DATE | TOTAL AREA (SQ M) |
WAULT (YEARS) |
PASSING RENT PER ANNUM (€) |
PURCHASE PRICE (€) |
NET INITIAL YIELD (%) |
CAPITAL
|
RELATIVE QUALITY |
| 88074 Meckenbeuren |
Warehouse | Q1 2020 | 10,000 | n/a | n/a | 6,720,000 | 7.14 (GIY) | 672 | Inferior (micro and macro location) |
| 73457 Essingen |
Warehouse | Q1 2019 | 32,808 | 7.25 | 1,542,030 | 19,900,000 | n/a | 607 | Slightly inferior (micro location) |
| 78549 Spaichingen |
Warehouse | Q4 2020 | 26,646 | n/a | n/a | 18,500,000 | n/a | 694 | Similar (macro and micro location) |
| 76297 Stutensee |
Warehouse | Q4 2018 | 85,740 | n/a | n/a | 53,434,000 | n/a | 623 | Similar (macro and micro location) |
| PROPERTY ID: | dehert02 - Hertzstr. 4 | |
| ON BEHALF OF: | MORGAN STANLEY | |
| VALUATION DATE: | 01-Feb-2021 | FINAL |
Hertzstr. 4 - Hertzstr. 4, Herrenberg, 71083, Germany
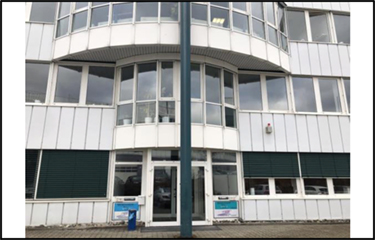 |
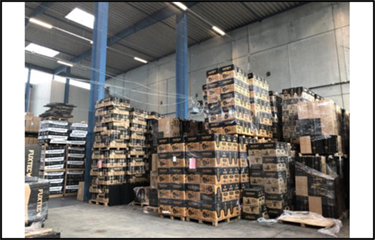 |
|
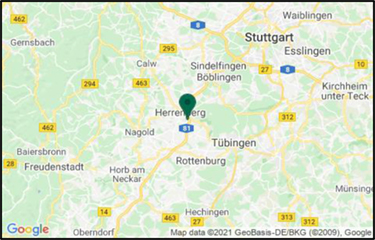 |
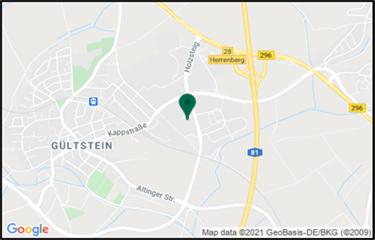 |
| VALUATION METRICS | (currency - EUR) |
| Metric | Value |
| Market Value | 12,050,000 |
| Market Value (per sq m) | 925 |
| Net Initial Yield | 5.37% |
| Reversionary Yield | 5.02% |
| Equivalent Yield | 5.10% |
| Gross Income (p.a.) | 714,654 |
| Gross Income (p.a.) (per sq m) | 55 |
| *Adj. Gross Income | 714,654 |
| Adj. Gross Income (per sq m) | 55 |
| Net Income (p.a.) | 695,590 |
| Net Income (p.a.) (per sq m) | 53 |
| Gross Rental Value | 693,435 |
| Gross Rental Value (per sq m) | 53 |
| Capital Expenditure | -78,496 |
| Transaction Costs | 7.50% |
| Over / Under Rented | 6.51% |
KEY FACTS
| Metric | Value | |
| Total Area (sq m) | 13,034 | |
| WAULT to Break by Rent | 4.43 | |
| WAULT to Break by ERV | 4.39 | |
| WAULT to Expiry by Rent | 4.43 | |
| WAULT to Expiry by ERV | 4.39 | |
| Percentage of Vacancy (Area) | 2.21% | |
| Percentage of Vacancy (ERV) | 3.24% | |
| ** | Number of Tenants | 15 |
| Current Voids (months) | 12 | |
| * Adjusted Gross Income equates to the Gross Income excluding any rent free periods | |
| LEASES RANKED BY RENT | ** Total tenant lines within our valuation. May differ to number of individual tenants |
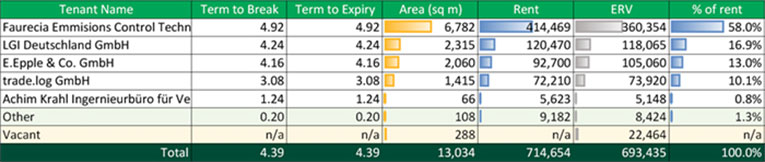
| Printed 09/03/2021 19:43 | |
| PROPERTY ID: | dehert02 - Hertzstr. 4 | |
| ON BEHALF OF: | MORGAN STANLEY | |
| VALUATION DATE: | 01-Feb-2021 | FINAL |
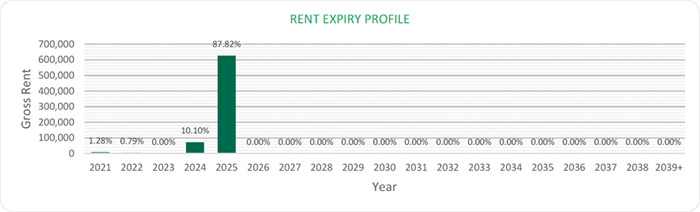
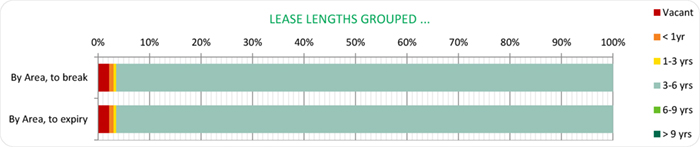
| Printed 09/03/2021 19:43 | |
| ON BEHALF OF: | MORGAN STANLEY |
| PROJECT NAME: | MSTAR |
PROPERTY REPORT
71083 HERRENBERG, HERTZSTR. 4
| INSPECTED BY: | INSPECTION DATE: | VALUATION DATE: | PROPERTY TYPE |
| MAREIKE RECK | 07/01/2020 | 01/02/2021 | LIGHT INDUSTRIAL |
KEY VALUATION FACTORS
| STRENGTHS | WEAKNESSES |
|
■ The subject property is located in the logistics region Stuttgart;
■ Good access to the motorways A81 (1.4 km) and B296 (0.8 km);
■ Risk reduction due to multi-tenant-concept. |
■ The anchor tenant produces more than55% of the income stream;
■ WAULT of 4.43 years. |
| OPPORTUNITIES | THREATS |
|
■ The continuing positive development of the overall economy could lead to an increase in achievable rents;
■ Letting of the vacant office space at market conditions. |
■ Fluctuations in the world economy and the global capital markets could have negative effects on the German commercial real estate market; |
LOCATION & SITUATION
| LOCATION | The next largest economically significant city is Tuebingen which is a traditional university town on the Neckar River. Its location on the edge of the “Schwaebische Alb” only about 40 km southeast of Stuttgart offers good opportunities for economic activity and varied leisure activities. Tuebingen does not have a direct motorway connection but is well connected to the national transport infrastructure network via B27 and B28 federal highways. | |
|
Herrenberg belongs to the Stuttgart logistics region. In terms of road transport, the Stuttgart region is well connected to the long-distance national road network via the A6 and A8 motorways in the east-west direction and the A81 for north-south traffic. Around the Stuttgart city area in particular, however, congestion is not uncommon due to heavy traffic. The ports of Stuttgart and Heilbronn constitute two important trimodal traffic centers. Besides having a trimodal container terminal, the Port of Stuttgart also offers transshipment options for rail/road transport services, handling mainly incoming raw materials for local industry as well as the resulting finished products. The Kornwestheim freight center (GVZ) in the north of Stuttgart, however, is the |
| ON BEHALF OF: | MORGAN STANLEY |
| PROJECT NAME: | MSTAR |
| most efficient terminal in the region. As regards air freight, Stuttgart Airport provides premium air freight services and ranks midfield among German airports in terms of annual freight volume. | ||
| Within the city of Herrenberg, the subject property is situated in an area, which is mainly used industrial and logistic purposes. The direct surroundings consist of industrial companies, logistic services providers and retailers. | ||
| The motorway connection can be described as good because of the close proximity to the motorway A81. The nearest airport is situated in Stuttgart around 35 km away and reachable in approx. 40 minutes. The airport offers national and international connections. |
PROPERTY DESCRIPTION
| DESCRIPTION | The property covers an area of approx. 1.2 hectares and comprises a part two- storey warehouse building with a four-storey office section in the north. | |
| The rectangular warehouse comprises three units, two in the north west and a larger unit in the south east. A vacant residential apartment is located on the top floor of the office section. | ||
| The building complex covers approx. 70% of the site area. Around 25% of the site is covered with hardstanding (mostly tarmac and partly interlocking pavers) and a further ~5% of the property comprises landscaping (bushes/trees) along the site boundaries. | ||
| The current site building was developed in 1992 on former agricultural land for light industrial use (automotive supply and storage of prototype vehicles; no known production activities). | ||
| A paint shop was operated on the site between 1993 and 1999. In 2006 an external goods lift was attached to the south of the warehouse. The roof of the building was extensively refurbished in 2009. It is understood that the site was converted into multi-let units in 2013. | ||
| Summary of known specification: | ||
| Characteristic | Result | ||
| Built / Renovation | 1992 | ||
| Eaves Height | 11 metres | ||
| No. of loading Doors | 8 | ||
| Loading Door Ratio | 0.6 | ||
| Yard Depth | Approx. 20 metres | ||
| Cross-Dock | No | ||
| Warehouse (% of GLA) | 69% | ||
| Site Coverage Ratio | 70% | ||
| Source: Phase I Environmental Review dated January 2020; the information gathered during the site inspection. | |||
| ON BEHALF OF: | MORGAN STANLEY |
| PROJECT NAME: | MSTAR |
| ACCOMMODATION | We have not measured the property, but as instructed, we have relied upon floor areas made available to us. | |
| Unit Description | Primary Use | Status | Area (sq m) | ||
| Office | Office | LET | 775 | ||
| Office | Office | VACANT | 288 | ||
| Warehouse | Storage/Production | LET | 11,971 | ||
| Total (Lettable) | 13,034 | ||||
DUE DILIGENCE
| STATE OF REPAIR | CBRE have not undertaken a structural survey, nor tested the services. The property was subject to an inspection for valuation purposes in early 2020. As you are aware, the property has not been re-inspected for the purposes of this report, nor have we been provided with updated TDD. We have therefore relied on the information provided by the Borrower, including a Capex schedule dated 12 June 2019 and schedule with revised budget of capex dated 19 January 2021. Based on the latter which indicates TDD assessment less completed spend in 2020, we have included the immediate and 2-5 years capex of €70,000 within our valuation. | |
| According to our own limited inspection for valuation purposes, our opinion regarding the state of repair would substantiate the assessment by Arcadis. Based on our impression gained during the inspection, we are of the opinion that the buildings are in a fair condition, in line with the year of construction. | ||
| ENVIRONMENTAL CONSIDERATIONS |
We have summarised the findings from a schedule provided in relation to ‘Priority sites’ within the front section of this report. | |
| We have been made aware that the property is registered in the register of contaminated sites (Altlastenregister) which indicates a contamination or a potential contamination of the Properties, in particular due to their current or former use. If future excavation works are carried out at these Properties, this could lead to additional costs. However, no action is required on the current use of the Properties. As such we have assumed this does not have a material impact on our opinion of value given the valuation is prepared taken the current use into consideration. | ||
| According to the Draft Environmental Due Diligence report dated 10 January 2020 from Ambiente Ltd. there are currently no known ground/soil contaminations. However, the following risks for contamination have been identified: | ||
| On-site: | ||
| ● Potential for contamination from multi-let light industrial use / warehousing since 1992. | ||
| ON BEHALF OF: | MORGAN STANLEY |
| PROJECT NAME: | MSTAR |
|
Off-site:
● Potential for migration of contamination from neighbouring light industrial uses.
In addition, there is the risk of the following building pollutants:
● No potential sources of contamination have been identified. From building operations, the following risks have been identified:
● No potential sources of contamination have been identified. |
||
| We have been instructed not to make any investigations in relation to the presence or potential presence of contamination in land or buildings or the potential presence of other environmental risk factors and to assume that if investigations were made to an appropriate extent then nothing would be discovered sufficient to affect value. | ||
| We have not carried out investigation into past uses, either of the properties or of any adjacent lands, to establish whether there is any potential for contamination from such uses or sites, or other environmental risk factors and have therefore assumed that none exists. Should our assumption prove to be incorrect, we reserve the right to amend our valuation accordingly. | ||
| TENURE | We have had sight of the Draft Red Flag Legal Report prepared by Hengeler Mueller, dated 05 February 2021. Based on the information provided, we understand the property is held freehold. | |
| We have assumed that there are no onerous legal conditions affecting the property which have a material impact on our opinion of value. | ||
| INCOME PROFILE | The rental contracts have not been made available to us. The information is solely based on the rental schedule dated 30 November 2020. | |
|
The property is leased to six tenants (ATU GmbH, E.Epple & Co. GmbH, Faurecia Emmisions Control Technologies Germany GmbH, LGI Deutschland GmbH, OMEGA Immobilien Service GmbH, trade.log GmbH). 288.00 sq m of office space (2.25% of total lettable area) is vacant.
The property has a WAULT of 4.43 years as at the date of valuation. The total gross current rent generated by the property is €714,654 per annum whilst our opinion of the total gross market rent is €693,435 per annum. The property is shown as over-rented.
The main tenant, with around 52% of the total rental space and around 58% of the total rental income, is “Faurecia Emmisions Control Technologies, Germany GmbH”. The company specializes in the engineering and production of automotive solutions. The Company offers products for automotive seating, emissions control technologies, interior systems, and automotive exteriors. Faurecia Emissions Control Technologies Germany operates worldwide. |
| ON BEHALF OF: | MORGAN STANLEY |
| PROJECT NAME: | MSTAR |
VALUATION CONSIDERATIONS
| COSTS AND ADJUSTMENTS | Based on the information provided or our knowledge of the market, in approaching our valuation, we made allowances for the following capital and non-recoverable costs. In all cases, we have cited whether they are deducted as at the date of valuation or whether they take effect at a later date. | |
|
Capital Expenditure: |
||
| Type & Calculation | Source | Effective | Amount | ||
| Capital Expenditure: Fixed Amount |
Technical Due Diligence |
On Valuation |
€70,000 | ||
| Tenant Incentives | CBRE Estimate |
On lease start /
No Repeat |
€2,880 | ||
| Letting Fees: 25% of Rental Value |
CBRE Estimate |
On lease start / No Repeat |
€5,616 | ||
| TOTAL: ON VALUATION |
€78,496 | ||||
|
Revenue Deductions: |
|||||
| Type & Calculation | Source | Effective | Annual Amount | ||
| General Non-Recoverables: 0.5% of rental value |
CBRE Estimate | On Valuation In perpetuity |
€3,467 | ||
| Maintenance: €2.00 per sq m |
CBRE Estimate | On Valuation + Delay 60 Months In perpetuity |
€26,068 | ||
| Management 2.0% of rental value |
CBRE Estimate | On Valuation In perpetuity |
€13,869 | ||
| Void Costs: €0.50 per sq m |
CBRE Estimate | Post Valuation End of Event |
€1,728 | ||
| TOTAL: ON VALUATION |
€19,064 | ||||
| ON BEHALF OF: | MORGAN STANLEY |
| PROJECT NAME: | MSTAR |
| VALUATION METHODOLOGY – MARKET VALUE |
We have had regard to the most recent letting transactions and occupational demand for the region within which the subject property is located, including the property itself if of relevance. Regarding the rental comparables, we would highlight the first rental comparable which is located in another macro location considered slightly inferior. Due to the fact that the micro location is comparable, the overall location can be assessed as comparable. The property was completed in 2017 and has a lettable area of around 5,645 sq m. It is advantageous that a train station and a bus stop is located in the immediate vicinity of the comparable property. Due to the comparable distance to the motorway, we consider the property to be similar. We have adopted the following rental rates within our valuation: | |
| Use | Letting-Status | Rental Area | ERV per sq m | ERV (Total) | ||
| Office | LET | 775.00 sq m €78.00 /sq m pa | €60,450.00 pa | |||
| Office | VACANT | 288.00 sq m €78.00 /sq m pa | €22,464.00 pa | |||
| Other | LET | 3,038.00 sq m €51.00 /sq m pa | €154,938.00 pa | |||
| Warehouse | LET | 8,933.00 sq m €51.00 /sq m pa | €455,583.00 pa | |||
| Total* | 13,034.00 sq m | €53.20 /sq m pa | €693,435.00 pa | |||
|
* The total amount of ERV and rental area may differ from the calculation printout due to rounding differences. |
||||||
|
We have arrived at our opinion of Market Value adopting the Traditional investment capitalisation method of valuation. Within this approach, we apply an income weighted average equivalent yield to our opinion of net income, reflecting the comparable evidence within the market for guidance on capital rates and values per sq m. |
||||||
|
We would highlight investment comparable number one and two: |
||||||
|
The first investment comparable is located in a similar macro location, however, it is not located in the direct vicinity of a motorway. The property has a lettable area of around 23,854 sq m and was sold for approx. €20,000,000 (equating to EUR 838 per sq m) in Q2 2020. Due to the similar macro location, we consider the property to be comparable to the subject of valuation, albeit the lower capital rate per sq m reflects an inferior micro location. |
||||||
|
Investment comparable number two is located within proximity to Stuttgart as well, so the macro location can be considered as similar. The micro location on the other hand can be considered as slightly inferior, as it is in farther distance to a motorway. The property has a lettable area of around 28,000 sq m and was sold for about €22,848,000 (equating to around EUR 816 per sq m) in Q1 2020. Due to the similar macro location, we consider the property to be comparable, albeit the lower capital rate per sq m reflects an inferior micro location. |
||||||
| For the valuation of this asset, we have applied the following equivalent yield: | ||||||
| ON BEHALF OF: | MORGAN STANLEY |
| PROJECT NAME: | MSTAR |
|
- 5.10%
This results in a Net Initial Yield of 5.37% and a capital rate per sq m of €925.
On the assumption that there are no unusual factors of which we are unaware and on the basis of the comments and assumptions specified in this report, CBRE is of the opinion that the Market Value (rounded) of the subject property, is: |
||
| €12,050,000 | ||
| (twelve million and fifty thousand Euros) | ||
| The unrounded net capital value is €12,043,331. The gross unrounded capital value is €13,025,077 including €78,496 of capital costs and €903,251 purchaser’s costs 7.50%) respectively. | ||
| Our opinion of Market Value is based upon the Scope of Work and Valuation Assumptions attached and has been primarily derived using comparable recent market transactions on arm’s length terms. | ||
| VALUATION METHODOLOGY – VACANT POSSESSION VALUE |
The constituent inputs in terms of rental value and non-recoverable costs largely align with the Market Value approach. The key exception being that we have adopted a special assumption that the property is 100% vacant/non-income producing as at the valuation date. This value is predominantly derived using the traditional investment method of valuation but critically benchmarking the resultant capital rate per sq m against the prevailing evidence. | |
| In approaching our valuation under the Special Assumption that the property is entirely vacant (Vacant Possession Value), we have adopted a total void period of 12 months inclusive of rent free or tenant incentives and targeted an equivalent yield of 5.6%. | ||
| This results in a net rounded value of €9,870,000, equating to €757 per sq m. | ||
| ESTIMATED REINSTATEMENT ASSESSMENT |
The property has not been inspected by a suitably qualified building surveyor from CBRE, nor have we carried out a full Reinstatement Cost Assessment. For indicative purposes only we estimate that the reinstatement cost of insurance purposes would be in the region of €18,749,128 (rounded, excl. VAT) on a day one basis, including fees but excluding VAT and inflation.
|
|
| This figure should be compared with the current sum insured and if a material discrepancy exists we suggest that a full Reinstatement Cost Assessment is carried out. |
| ON BEHALF OF: | MORGAN STANLEY |
| PROJECT NAME: | MSTAR |
RENTAL EVIDENCE
| PROPERTY ADDRESS |
PROPERTY USE |
DATE | TOTAL AREA (SQ M) |
TENANT | LEASE LENGTH (YEARS) |
BREAK OPTION |
RENT (P.A) (€) | MONTHLY RENTAL RATE PER SQ M (€) |
RELATIVE QUALITY |
| 72406 Bisingen |
Warehouse | Q1 2020 | 731 | n/a | n/a | n/a | 35,088 | 4.00 | Similar (macro location) |
| 77955 Ettenheim |
Warehouse | Q1 2020 | 26,800 | n/a | n/a | n/a | 1,372,800 | 4.00 | Slightly superior (macro location) |
| 68647 Biblis | Distribution hall |
Q2 2018 | 5,645 | n/a | 6 | n/a | 287,895 | 4.25 | Similar (distance to the motorway) |
| 68642 Buerstadt |
Distribution hall |
Q2 2018 | 5,213 | n/a | 6 | n/a | 265,863 | 4.25 | Similar (micro location) |
| ON BEHALF OF: | MORGAN STANLEY |
| PROJECT NAME: | MSTAR |
SALES EVIDENCE
| PROPERTY ADDRESS |
PROPERTY USE |
DATE | TOTAL AREA (SQ M) |
WAULT (YEARS) |
PASSING RENT PER ANNUM (€) |
PURCHASE PRICE (€) |
NET INITIAL YIELD (%) |
CAPITAL RATE PER SQ M (€) |
RELATIVE QUALITY |
| 89520 Heidenheim |
Distribution hall |
Q2 2020 | 23,854 | n/a | n/a | 20,000,000 | n/a | 838 | Similar to inferior (macro location and distance to motorway) |
| 72805 Lichtenstein |
Warehouse | Q1 2020 | 28,000 | n/a | n/a | 22,848,000 | n/a | 816 | Similar (macro location) |
| 71636 Ludwigsburg |
Warehouse | Q1 2019 | 12,850 | n/a | n/a | 10,300,000 | n/a | 802 | Similar (distance to motorway) |
| 79331 Tenningen |
Production hall |
Q1 2019 | 18,000 | n/a | n/a | 15,000,000 | n/a | 833 | Similar (distance to motorway) |
| PROPERTY ID: | deimbo - Im Boden | |
| ON BEHALF OF: | MORGAN STANLEY | |
| VALUATION DATE: | 01-Feb-2021 | FINAL |
Im Boden - Im Boden, Hattersheim am Main, 65795, Germany
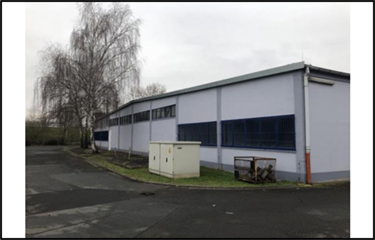 |
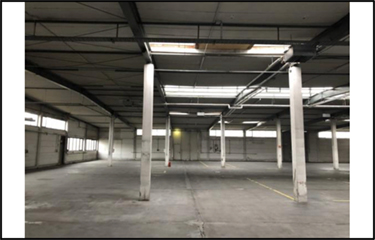 |
|
 |
 |
| VALUATION METRICS | (currency - EUR) |
| Metric | Value |
| Market Value | 4,240,000 |
| Market Value (per sq m) | 893 |
| Net Initial Yield | 5.85% |
| Reversionary Yield | 5.28% |
| Equivalent Yield | 5.10% |
| Gross Income (p.a.) | 279,012 |
| Gross Income (p.a.) (per sq m) | 59 |
| *Adj. Gross Income | 279,012 |
| Adj. Gross Income (per sq m) | 59 |
| Net Income (p.a.) | 272,457 |
| Net Income (p.a.) (per sq m) | 57 |
| Gross Rental Value | 262,200 |
| Gross Rental Value (per sq m) | 55 |
| Capital Expenditure | -259,500 |
| Transaction Costs | 9.99% |
| Over / Under Rented | 6.41% |
KEY FACTS
| Metric | Value | |
| Total Area (sq m) | 4,750 | |
| WAULT to Break by Rent | 3.13 | |
| WAULT to Break by ERV | 3.11 | |
| WAULT to Expiry by Rent | 3.13 | |
| WAULT to Expiry by ERV | 3.11 | |
| Percentage of Vacancy (Area) | 0.00% | |
| Percentage of Vacancy (ERV) | 0.00% | |
| ** | Number of Tenants | 12 |
| Current Voids (months) | - | |
| * Adjusted Gross Income equates to the Gross Income excluding any rent free periods | |
| LEASES RANKED BY RENT | ** Total tenant lines within our valuation. May differ to number of individual tenants |
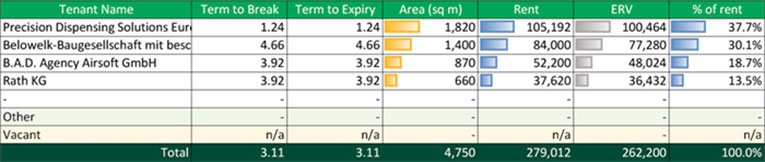
| Printed 09/03/2021 19:43 | |
| PROPERTY ID: | deimbo - Im Boden | |
| ON BEHALF OF: | MORGAN STANLEY | |
| VALUATION DATE: | 01-Feb-2021 | FINAL |
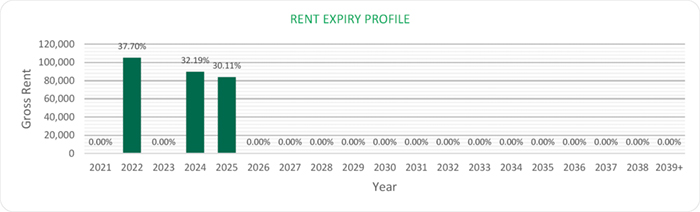
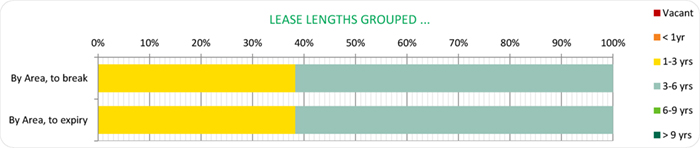
| Printed 09/03/2021 19:42 | |
| ON BEHALF OF: | MORGAN STANLEY |
| PROJECT NAME: | MSTAR |
PROPERTY REPORT
65795 HATTERSHEIM AM MAIN, IM BODEN 23
| INSPECTED BY: | INSPECTION DATE: | VALUATION DATE: | PROPERTY TYPE |
| MARIA CHIGRYAY | 13/01/2020 | 01/02/2021 | WAREHOUSE |
KEY VALUATION FACTORS
| STRENGTHS | WEAKNESSES |
|
■ The subject property is located in a good commercial/logistic location in close proximity to Frankfurt;
■ Good road network connections, in vicinity to the motorway A66;
■ Excellent connection to the international Airport Frankfurt, reachable in 10 minutes driving time. |
■ Rather small building with outdated features;
■ Limited third-party usability;
■ WAULT of around 3.13 years.
|
| THREATS | OPPORTUNITIES |
|
■ The continuing positive development of the overall economy could lead to an increase in achievable rents;
■ Demand for value added / opportunistic assets could increase further due to lack of supply for core products. |
■ Fluctuations in the world economy and the global capital markets could have negative effects on the German commercial real estate market;
■ High capital expenditure could be required in the future (due to advanced building age). |
LOCATION & SITUATION
| LOCATION | The next largest economically significant city is Frankfurt am Main which is considered Germany’s most important banking and finance location. This concentration of sectors has resulted in its leading position on the office market, being the first German city to achieve an international orientation. | |
| Hattersheim lies at the centre of the important logistics region Rhine-Main/Frankfurt. With its dense motorway and rail network, two inland ports and most notably the international airport with its large air cargo section, the city itself provides a comprehensive logistics infrastructure. The region benefits considerably from its central location both in Germany and in Europe as a whole. In fact, the Rhine-Main/Frankfurt logistics region compares to the |
| ON BEHALF OF: | MORGAN STANLEY |
| PROJECT NAME: | MSTAR |
|
logistics regions of Hamburg and "Bremen and North Sea ports" due to its gateway function – largely benefitting from the airport. The popularity of the region among logistics operators and industrial firms is reflected in the short floor space supply and the rent rates for logistics facilities either in the city area or around the airport, which are the highest in Germany after Munich.
Within the city of Hattersheim am Main, the subject property is situated in an established commercial area. The immediate surroundings consist of small warehouses, mainly production facilities and workshops as well as retail stores and discounters.
The motorway connection can be described as very good, because of the proximity to the motorway A66. The Frankfurt international airport is situated only around 10 km away and reachable in 10 minutes driving time. The fourth largest airport in Europe offers national and international connections. |
PROPERTY DESCRIPTION
| DESCRIPTION | The subject property was developed from approx. 1971 on open / agricultural land. The property covers an area of approximately 0.9 hectares and comprises one single-storey warehouse structure divided into 4 units. Warehouse unit 1 is located in the north east and also includes integrated offices and a boiler room/tank room; warehouse unit 2 is located in the north west; warehouse units 3 and 4 are located in the centre and the south of the site respectively, both with integrated office facilities. | |
| The building is surrounded by a service road and car parking is provided along the building/outside area. The warehouse units cover approx. 70% of the total site area. A further ~20% of the site is covered with hardstanding (access road and parking) and approx. 10% of the property along the site boundaries (bushes/trees) and in the south-eastern portion (grassed area) comprises landscaping. | ||
| Summary of known specification: | ||
| Characteristic | Result | ||
| Built / Renovation | 1971 | ||
| Eaves Height | 4.4 metres | ||
| No. of loading Doors | 14 | ||
| Loading Door Ratio | 2.95 | ||
| Yard Depth | Approx. 10 meters | ||
| Cross-Dock | Yes | ||
| Warehouse (% of GLA) | 100% | ||
| Site Coverage Ratio | 70% | ||
| Source: Source: Phase I Environmental Review dated December 2019; the information gathered during the site inspection. | |||
| ON BEHALF OF: | MORGAN STANLEY |
| PROJECT NAME: | MSTAR |
| ACCOMMODATION | We have not measured the property, but as instructed, we have relied upon floor areas made available to us. | |
| Unit description | Primary use | Status | Area (sq m) | ||
| Warehouse | Storage | Let | 4,750.00 | ||
| Total | 4,750.00 | ||||
DUE DILIGENCE
| STATE OF REPAIR | CBRE have not undertaken a structural survey, nor tested the services. The property was subject to an inspection for valuation purposes in early 2020. As you are aware, the property has not been re-inspected for the purposes of this report, nor have we been provided with updated TDD. We have therefore relied on the information provided by the Borrower, including a Capex schedule dated 12 June 2019 and schedule with revised budget of capex dated 19 January 2021. Based on the latter which indicates TDD assessment less completed spend in 2020, we have included the immediate and 2-5 years capex of €175,500 within our valuation. | |
| According to our own limited inspection for valuation purposes, our opinion regarding the state of repair would substantiate the assessment by Arcadis. Based on our impression gained during the inspection, we are of the opinion that the buildings are in a fair condition, in line with the year of construction. | ||
| ENVIRONMENTAL CONSIDERATIONS |
We have summarised the findings from a schedule provided in relation to ‘Priority sites’ within the front section of this report. | |
| We have been made aware that the property is registered in the register of contaminated sites (Altlastenregister) which indicates a contamination or a potential contamination of the Properties, in particular due to their current or former use. If future excavation works are carried out at these Properties, this could lead to additional costs. However, no action is required on the current use of the Properties. As such we have assumed this does not have a material impact on our opinion of value given the valuation is prepared taken the current use into consideration. | ||
| According to the Draft Environmental Due Diligence report dated 13 December 2019, prepared by Ambiente Ltd. there are currently no known ground/soil contaminations. However, the following risks for contamination have been identified: | ||
| On-site: | ||
| ● Potential for contamination from light industrial use of the subject property since c. 1970s. | ||
| Off-site: | ||
| ● Potential for migration of contamination from former and current neighbouring light industrial uses. | ||
| In addition, there is the risk of the following building pollutants: |
| ON BEHALF OF: | MORGAN STANLEY |
| PROJECT NAME: | MSTAR |
| ● Potential and known hazardous building materials within the building fabric. | ||
| From building operations, the following risks have been identified: | ||
| ● Potential leaks and spills form current bulk storage of heating oil (78m³ AST). | ||
| We have been instructed not to make any investigations in relation to the presence or potential presence of contamination in land or buildings or the potential presence of other environmental risk factors and to assume that if investigations were made to an appropriate extent then nothing would be discovered sufficient to affect value. | ||
| We have not carried out investigation into past uses, either of the properties or of any adjacent lands, to establish whether there is any potential for contamination from such uses or sites, or other environmental risk factors and have therefore assumed that none exists. Should our assumption prove to be incorrect, we reserve the right to amend our valuation accordingly. | ||
| TENURE | We have had sight of the Draft Red Flag Legal Report prepared by Hengeler Mueller, dated 05 February 2021. Based on the information provided, we understand the property is held freehold. | |
| We have assumed that there are no onerous legal conditions affecting the property which have a material impact on our opinion of value. | ||
| INCOME PROFILE | The rental contracts have not been made available to us. The information is based on the rent schedule dated on 30 November 2020. | |
|
The property is leased to four tenants (Precision Dispensing Solutions Europe GmbH, Rath KG, B.A.D. Agency Airsoft GmbH, Belowelk-Baugesellschaft mit beschränkter Haftung). There is no vacant space.
The property has a WAULT of 3.13 years as at the date of valuation. The total gross current rent generated by the property is €279,012 per annum whilst our opinion of the total gross market rent is €262,200 per annum. The property is largely shown as rack rented after accounting for vacancy.
The main tenant, with around 38% of the total rental space and around 38% of the total rental income, is “Precision Dispensing Solutions Europe GmbH”. The company was founded in 1961 and its line of business focusses on the wholesale distribution of surgical and other medical instruments, apparatus, and equipment. |
VALUATION CONSIDERATIONS
| COSTS AND ADJUSTMENTS | Based on the information provided and our knowledge of the market, in approaching our valuation, we made allowances for the following capital and non-recoverable costs. In all cases, we have cited whether they are deducted as at the date of valuation or whether they take effect at a later date. | |
| Capital Expenditure: | ||
| ON BEHALF OF: | MORGAN STANLEY |
| PROJECT NAME: | MSTAR |
| Type & Calculation | Source | Effective | Amount | ||
| Capital
Expenditure: Fixed Amount |
Technical Due Diligence |
On Valuation No Repeat |
€175,500 | ||
| Tenant Incentives | CBRE Estimate |
On lease start /
No Repeat |
€0 | ||
| Rent Free: Belowelk- Baugesellschaft mit beschränkter Haftung |
Tenancy Schedule |
On Valuation |
€84,000 | ||
| Letting Fees: 25% of Rental Value |
CBRE Estimate |
On lease start / |
€0 | ||
| TOTAL ON VALUATION |
€259,500 | ||||
| Revenue Deductions: | |||||
| Type & Calculation | Source | Effective | Annual Amount | ||
| General Non- Recoverables: 0.5% of rental value |
CBRE Estimate | On Valuation In perpetuity |
€1,311 | ||
| Maintenance: €2.00 per sq m |
CBRE Estimate | On Valuation + Delay 60 Months |
€9,500 | ||
| In perpetuity | |||||
| Management 2.0% of rental value |
CBRE Estimate | On Valuation In perpetuity |
€5,244 | ||
| Void Costs: €0.50 per sq m |
CBRE Estimate | On Valuation On all voids |
€0 | ||
| TOTAL: ON VALUATION |
€6,555 | ||||
| VALUATION METHODOLOGY – MARKET VALUE |
We have had regard to the most recent letting transactions and occupational demand for the region within which the subject property is located, including the property itself if of relevance. The rental rates range €50.52 – €56.4 per sq m per annum, depending on the duration of lease contracts, building specifications and age. |
|
| We have considered the most recent lettings agreed within the property itself to B.A.D and Belowelk-Baugesellschaft agreed at rents equating to €60 per sq m which, whilst slightly ahead of prevailing evidence, do substantiate our adopted rate below. Referring to the appended table, the first rental comparable is located in close proximity to the subject property. Therefore, the location can be assessed |
| ON BEHALF OF: | MORGAN STANLEY |
| PROJECT NAME: | MSTAR |
| as similar. The object comprises an industrial hall, which was built in 2016. The property has a lettable area of around 5,070 sq m. The property benefits from good public transport connections and good access to the motorway network. We consider this transaction evidence as comparable in terms of location, while the building quality is superior compared to the subject property. We have adopted the following rental rates within our valuation: | ||
| Use | Letting-Status | Rental Area | ERV per sq m | ERV (Total) | ||
| Warehouse | VACANT | 4,750.00 sq m | €55.20 /sq m pa | €262,200.00 pa | ||
| Total* | 4,750.00 sq m | €55.20 /sq m pa | €262,200.00 pa | |||
| * The total amount of ERV and rental area may differ from the calculation printout due to rounding differences. | ||
| We have arrived at our opinion of Market Value adopting the Traditional investment capitalisation method of valuation. Within this approach, we apply an income weighted average equivalent yield to our opinion of net income, reflecting the comparable evidence within the market for guidance on capital rates and values per sq m. | ||
| We would highlight investment comparables number two and three. The first investment comparable is located in Dietzenbach. Due to its farther distance to the motorway, the micro location is slightly inferior. The property has a lettable area of around 11,400 sq m and was sold for approx. EUR 9,000,000 (equating to EUR 789 per sq m) in Q1 2020. Due to its micro location, we consider the property as slightly inferior to the subject of our valuation. | ||
| The second investment comparable is located in Kelsterbach and is therefore located in the immediate vicinity of the subject property which is why the micro location of the properties is comparable. The property has a lettable area of around 2,635 sq m and is therefore comparable to the subject property in terms of size. It was sold for approx. EUR 1,957,729 (equating to around EUR 749 per sq m) in Q1 2020. Based on the above stated facts including the investment volume, similar micro location, and building quality, we consider the property as inferior to the subject of our valuation. | ||
| For the valuation of this asset, we have applied the following Equivalent Yield: | ||
| - 5.10% | ||
| This results in a Net Initial Yield of 5.85% and a capital rate per sq m of €893. The Net Initial Yield is currently being influenced by the level of vacancy. | ||
| On the assumption that there are no unusual factors of which we are unaware and on the basis of the comments and assumptions specified in this report, CBRE is of the opinion that the Market Value (rounded) of the subject property, is: | ||
| €4,240,000 | ||
| (four million two hundred and forty thousand Euros) |
| ON BEHALF OF: | MORGAN STANLEY |
| PROJECT NAME: | MSTAR |
| The unrounded net capital value is €4,235,812. The gross unrounded capital value is €4,918,893 including €259,500 of capital costs and €423,581 purchaser’s costs (10.00%) respectively. | ||
| Our opinion of Market Value is based upon the Scope of Work and Valuation Assumptions attached and has been primarily derived using comparable recent market transactions on arm’s length terms. | ||
| VALUATION METHODOLOGY – VACANT POSSESSION VALUE |
The constituent inputs in terms of rental value and non-recoverable costs largely align with the Market Value approach. The key exception being that we have adopted a special assumption that the property is 100% vacant/non-income producing as at the valuation date. This value is predominantly derived using the traditional investment method of valuation but critically benchmarking the resultant capital rate per sq m against the prevailing evidence. | |
| In approaching our valuation under the Special Assumption that the property is entirely vacant (Vacant Possession Value), we have adopted a total void period of 12 months inclusive of rent free or tenant incentives and targeted an equivalent yield of 5.6%. | ||
| This results in a net rounded value of €3,440,000, equating to €724 per sq m. | ||
| ESTIMATED REINSTATEMENT ASSESSMENT |
The property has not been inspected by a suitably qualified building surveyor from CBRE, nor have we carried out a full Reinstatement Cost Assessment. For indicative purposes only we estimate that the reinstatement cost of insurance purposes would be in the region of €6,020,039 (rounded, excl. VAT) on a day one basis, including fees but excluding VAT and inflation. | |
| This figure should be compared with the current sum insured and if a material discrepancy exists we suggest that a full Reinstatement Cost Assessment is carried out. |
| ON BEHALF OF: | MORGAN STANLEY |
| PROJECT NAME: | MSTAR |
RENTAL EVIDENCE
| PROPERTY ADDRESS |
PROPERTY USE |
DATE | TOTAL AREA (SQ M) |
TENANT | LEASE LENGTH (YEARS) |
BREAK OPTION |
RENT (P.A) (€) |
MONTHLY RENTAL RATE PER SQ M (€) |
RELATIVE QUALITY |
| 63128 Dietzenbach |
Warehouse | Q1 2020 | 11,400 | n/a | n/a | n/a | 642,857 | 4.70 | Inferior (macro location) |
| 65719 Hofheim im Taunus |
Industrial estate |
Q4 2019 | 5,070 | n/a | n/a | n/a | 273,780 | 4.50 | Slightly inferior (distance to the airport) |
| 68642 Buerstadt |
Distribution hall |
Q2 2018 | 31,018 | n/a | 10 | n/a | 1,567,029 | 4.21 | Similar to worse (micro location) |
| 68647 Biblis | Distribution hall |
Q2 2018 | 5,645 | n/a | 6 | n/a | 287,895 | 4.25 | Similar to worse (macro location) |
| ON BEHALF OF: | MORGAN STANLEY |
| PROJECT NAME: | MSTAR |
SALES EVIDENCE
| PROPERTY ADDRESS |
PROPERTY USE |
DATE | TOTAL AREA (SQ M) |
WAULT (YEARS) |
PASSING RENT PER ANNUM (€) |
PURCHASE PRICE (€) |
NET INITIAL YIELD (%) |
CAPITAL RATE PER SQ M (€) |
RELATIVE QUALITY |
| 63128 Dietzenbach |
Warehouse | Q4 2020 | 1,200 | n/a | n/a | 1,050,000 | n/a | 875 | Inferior (macro location) |
| 63128 Dietzenbach |
Warehouse | Q1 2020 | 11,400 | n/a | 642,857 | 9,000,000 | n/a | 789 | Inferior (macro location) |
| 65451 Kelsterbach |
Warehouse | Q1 2020 | 2,635 | n/a | n/a | 1,974,729 | n/a | 749 | Inferior (location, building quality) |
| 68159 Mannheim |
Warehouse | Q2 2019 | 21,999 | n/a | n/a | 18,000,000 | n/a | 818 | Similar (micro location) |
| PROPERTY ID: | dejose - Josef-Beyerle-Str. 16 | |
| ON BEHALF OF: | MORGAN STANLEY | |
| VALUATION DATE: | 01-Feb-2021 | FINAL |
Josef-Beyerle-Str. 16 - Josef-Beyerle-Str. 16, Weil der Stadt, 71263, Germany
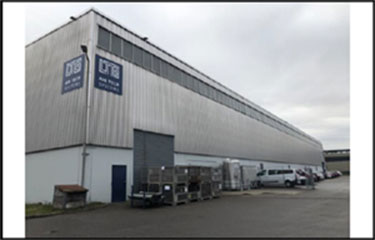 |
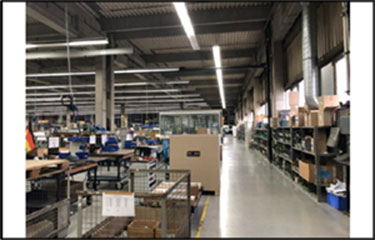 |
|
 |
 |
| VALUATION METRICS | (currency - EUR) |
| Metric | Value |
| Market Value | 8,060,000 |
| Market Value (per sq m) | 794 |
| Net Initial Yield | 6.12% |
| Reversionary Yield | 6.00% |
| Equivalent Yield | 5.80% |
| Gross Income (p.a.) | 551,294 |
| Gross Income (p.a.) (per sq m) | 54 |
| *Adj. Gross Income | 551,294 |
| Adj. Gross Income (per sq m) | 54 |
| Net Income (p.a.) | 537,326 |
| Net Income (p.a.) (per sq m) | 53 |
| Gross Rental Value | 558,738 |
| Gross Rental Value (per sq m) | 55 |
| Capital Expenditure | -340,000 |
| Transaction Costs | 9.00% |
| Over / Under Rented | -1.33% |
|
KEY FACTS |
||
| Metric | Value | |
| Total Area (sq m) | 10,147 | |
| WAULT to Break by Rent | 5.92 | |
| WAULT to Break by ERV | 5.92 | |
| WAULT to Expiry by Rent | 5.92 | |
| WAULT to Expiry by ERV | 5.92 | |
| Percentage of Vacancy (Area) | 0.00% | |
| Percentage of Vacancy (ERV) | 0.00% | |
| ** | Number of Tenants | 2 |
| Current Voids (months) | - | |
| * Adjusted Gross Income equates to the Gross Income excluding any rent free periods | |
| LEASES RANKED BY RENT | ** Total tenant lines within our valuation. May differ to number of individual tenants |
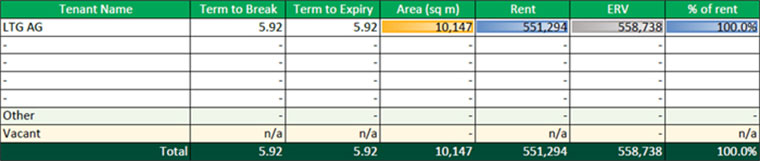
| Printed 09/03/2021 19:43 | |
| PROPERTY ID: | dejose - Josef-Beyerle-Str. 16 | |
| ON BEHALF OF: | MORGAN STANLEY | |
| VALUATION DATE: | 01-Feb-2021 | FINAL |
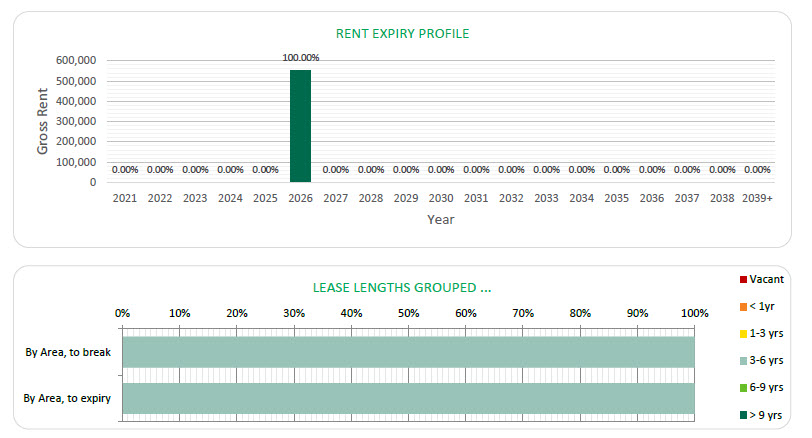
| Printed 09/03/2021 19:43 | |
| ON BEHALF OF: | MORGAN STANLEY |
| PROJECT NAME: | MSTAR |
PROPERTY REPORT
71263 WEIL DER STADT – JOSEF-BEYERLE-STRASSE 16
| INSPECTED BY: | INSPECTION DATE: | VALUATION DATE: | PROPERTY TYPE |
| MAREIKE RECK | 08/01/2020 | 01/02/2021 | LIGHT INDUSTRIAL |
KEY VALUATION FACTORS
| STRENGTHS | WEAKNESSES | |
|
■ The subject property is located within the logistics region Stuttgart;
■ Good road network and public transport connections in vicinity to the motorways A 81 (8.7 km), A8 (11.7 km) and B295 (2 km);
■ Long remaining lease term (5.92 years).
|
■ Expected loss of population of 1.71% between 2020 and 2030 (Source: www.wegweiser-kommune.de);
■ Single tenant;
■ High CapEx Costs.
|
|
| OPPORTUNITIES | THREATS | |
|
■ The continuing positive development of the overall economy could lead to an increase in rents.
■ Reletting to market terms could improve income profile (due to under-rent). |
■ Fluctuations in the world economy and the global capital markets could have negative effects on German real estate market purchase prices.
■ Loss of rent and costs for reletting if tenant vacates the property.
|
| LOCATION & SITUATION |
| LOCATION |
The next largest economically significant city is Stuttgart, the state capital of Baden-Württemberg, is the center of the metropolitan region with the highest export ratio in Germany. It is also the state’s political, economic and cultural centre. The greater Stuttgart area looks back on a long history of mechanical and automotive engineering, with renowned companies and conglomerates domiciled in the area. As a modern services-dominated city, Stuttgart is gaining increasing significance as a place of finance. Going forward, the big-ticket project of moving the central railway station underground and redeveloping the resultant brownfield in urban planning terms (“Stuttgart 21") will certainly have ramifications for the local real estate market.
Compared to other conurbations, the Stuttgart region does not represent a preferred logistics location among the Class A cities despite its favourable site parameters and its great transportation access. Rather, the high concentration |
| ON BEHALF OF: | MORGAN STANLEY |
| PROJECT NAME: | MSTAR |
|
of companies from the automobile industry (Daimler, Porsche), the chemical industry, and the respective suppliers both in Stuttgart proper and in the greater metro area make the city a logistics location of regional significance, other such locations in the region being Ulm and the Rhine-Neckar area. Stuttgart is moreover connected to the German and European inland waterway network via its Neckarhafen inland port, which includes a container ship terminal and a rail-to-road transshipment station. The port area of 100 hectares is home to a number of shipping companies, freight carriers, warehousing and trading companies. Main occupiers of the port include Rhenus, SCT, Duss Terminal Stuttgart Hafen, Reederei Schwaben, Bosch and Daimler, the latter two being the leading industrial companies in the Stuttgart metro region. Comparatively high prices for commercial property ensure that rent rates for warehouse and logistics space remain very stable regardless of the economic cycle. As the Stuttgart logistics market is defined by supplier structures and their short- to medium-term contract relations, the average rent rate is relatively high. Virtually no new trading estates are zoned in the region anymore, and, what is more, there are next to no industrial areas left.
Within the city of Weil der Stadt, the subject property is situated in an area, which is mainly used industrial and logistic purposes. The direct surroundings consist of industrial companies and retailers.
The motorway connection can be described as good because of the proximity to the motorway A81. The next airport is situated in Stuttgart around 35 km away and reachable in approximately 30 minutes. The airport offers national and international connections. |
| PROPERTY DESCRIPTION | ||
| DESCRIPTION |
The property covers an area of approximately 2.1 hectares and comprises a building complex housing a central warehouse / factory section, 2 high-bay warehouses to the north west and south east and a two-storey office section to the west (with social rooms including showers on the upper floor).
A smaller annex to the north east of the warehouse is used as a paint shop (tenant-owned) and for storage of paints and oils.
The buildings do not have a basement. Two storage sheds (storage of spare parts) are located along the northern site boundary.
The buildings cover approximately 60% of the site area. Approximately 30% of the site is covered with hardstanding (tarmac - access road, yard areas and parking) and approximately 10% of the property is landscaped with grassed areas and bushes (predominantly along the north eastern site boundary).
It is understood that the current property was developed on agricultural land in the 1970s. The first construction phase comprised the northern building sections (factory building with office frontage to the south west and a high-bay warehouse section in the north west) which later were extended to the south east. A second high-bay warehouse section to the south east was attached to the existing building complex in 1987.
Summary of known specification: |
|
| ON BEHALF OF: | MORGAN STANLEY |
| PROJECT NAME: | MSTAR |
| Characteristic | Result | ||
| Built / Renovation | 1970s | ||
| Eaves Height | 10.5 metres | ||
| No. of loading Doors | 7 | ||
| Loading Door Ratio | 1.5 | ||
| Yard Depth | c. 5-25 metres | ||
| Cross-Dock | Yes | ||
| Warehouse (% of GLA) | 94% | ||
| Site Coverage Ratio | 60% | ||
| Source: Phase I Environmental Review dated January 2020; the information gathered during the site inspection. | |||
| ACCOMMODATION | We have not measured the property, but as instructed, we have relied upon floor areas made available to us. | ||
| Unit Description | Primary Use | Status | Area (sq m) | ||
| Office | Office | Let | 600 | ||
| Warehouse | Production/Storage | Let | 9,547 | ||
| Total (lettable) | 10,147 | ||||
|
DUE DILIGENCE
|
||
| STATE OF REPAIR |
CBRE have not undertaken a structural survey, nor tested the services. The property was subject to an inspection for valuation purposes in early 2020. As you are aware, the property has not been re-inspected for the purposes of this report, nor have we been provided with updated TDD. We have therefore relied on the information provided by the Borrower, including a Capex schedule dated 12 June 2019 and schedule with revised budget of capex dated 19 January 2021. Based on the latter which indicates TDD assessment less completed spend in 2020, we have included the immediate and 2-5 years capex of €340,000 within our valuation.
According to our own limited inspection for valuation purposes, our opinion regarding the state of repair would substantiate the assessment by Arcadis. Based on our impression gained during the inspection, we are of the opinion that the buildings are in a fair condition, in line with the year of construction.
|
|
|
ENVIRONMENTAL CONSIDERATIONS |
We have summarised the findings from a schedule provided in relation to ‘Priority sites’ within the front section of this report.
According to the Draft Environmental Due Diligence report dated 10 January 2020, prepared by Ambiente Ltd, there are currently no known ground/soil contaminations. However, the following risks for contamination have been identified: |
|
| ON BEHALF OF: | MORGAN STANLEY |
| PROJECT NAME: | MSTAR |
| On-site | |||
| ● | Potential for contamination from light industrial use of the subject property since the 1970s. | ||
| ● | Presumed PAH/hydrocarbon contaminated glue beneath wood flooring in the eastern unit (c.400m²). | ||
| Off-site | |||
| ● | Potential for migration of contamination from former and current neighbouring light industrial uses. | ||
| In addition, there is the risk of the following building pollutants: | |||
| ● | Potential and known hazardous building materials within the building fabric. | ||
| From building operations, the following risks have been identified: | |||
| ● | Potential leaks and spills from current storage of hazardous substances (including bulk heating oil storage, diesel storage, storage of paints and oils). | ||
|
We have been instructed not to make any investigations in relation to the presence or potential presence of contamination in land or buildings or the potential presence of other environmental risk factors and to assume that if investigations were made to an appropriate extent then nothing would be discovered sufficient to affect value.
We have not carried out investigation into past uses, either of the properties or of any adjacent lands, to establish whether there is any potential for contamination from such uses or sites, or other environmental risk factors and have therefore assumed that none exists. Should our assumption prove to be incorrect, we reserve the right to amend our valuation accordingly.
|
|||
| TENURE |
We have had sight of the Draft Red Flag Legal Report prepared by Hengeler Mueller, dated 05 February 2021. Based on the information provided, we understand the property is held freehold.
We understand that the property is encumbered within two easements in relation to what appear to be a ‘light weight construction halls’ and a ‘corrugated metal garage’. Based on the information provided, it would appear that these elements are to be demolished. In approaching our valuation, we have assumed that these specific areas were already excluded from the areas sourced within the tenancy schedule provided.
We have assumed that there are no onerous legal conditions affecting the property which have a material impact on our opinion of value. |
||
| ON BEHALF OF: | MORGAN STANLEY |
| PROJECT NAME: | MSTAR |
| INCOME PROFILE |
We have not been provided with the lease contracts. The following information is based on the rent schedule dated on 30 November 2020.
The property is leased as a single tenant object to LTG AG. The lease started on 01 December 2011 and expires on 31 December 2026. Further extension options are not available.
The property has a WAULT of 5.92 years from the date of valuation. The total gross current rent generated by the property is €551,294 per annum whilst our opinion of the total gross market rent is €558,738 per annum. The property is shown as under-rented.
LTG AG is a German company which is active in the air and climate technology sector. It has subsidies in Germany and the USA as well as sales partners e.g. in Canada, Russia, Australia and various European countries. |
| VALUATION CONSIDERATIONS | |||||
|
COSTS AND ADJUSTMENTS |
Based on the information provided or our knowledge of the market, in approaching our valuation, we made allowances for the following capital and non-recoverable costs. In all cases, we have cited whether they are deducted as at the date of valuation or whether they take effect at a later date. | ||||
| Capital Expenditure: | |||||
| Type & Calculation | Source | Effective | Amount | ||
| Capital Expenditure: Fixed Amount | Technical Due Diligence |
On Valuation
No Repeat
|
€340,000 | ||
| Tenant Incentives | CBRE Estimate |
On lease start / renewal
No Repeat
|
€0 | ||
| Letting Fees: 25% of Rental Value | CBRE Estimate |
On lease start / renewal
No Repeat
|
€0 | ||
| TOTAL ON VALUATION |
€340,000
|
||||
| Revenue Deductions: | |||||
| Type & Calculation | Source | Effective | Annual Amount | ||
| General Non- Recoverables: 0.5% of rental value | CBRE Estimate |
On Valuation
In perpetuity
|
€2,794 | ||
|
Maintenance: €1.75 per sq m
|
CBRE Estimate | On Valuation + Delay 60 Months | €17,757 | ||
| ON BEHALF OF: | MORGAN STANLEY |
| PROJECT NAME: | MSTAR |
| In perpetuity | |||||
|
Management
2.0% of rental value
|
CBRE Estimate |
On Valuation
In perpetuity
|
€11,175 | ||
|
Void Costs: €0.50
per sq m
|
CBRE Estimate |
On Valuation
On all voids
|
€0 | ||
|
TOTAL: ON
VALUATION
|
€13,969 |
| VALUATION METHODOLOGY – MARKET VALUE |
We have had regard to the most recent letting transactions and occupational demand for the region within which the subject property is located, including the property itself if of relevance. The rental rates range between €54.00 and €72.00 per sq m per annum, depending on the duration of the lease contract, building specifications and age.
Comparable number four is located in a slightly better macro location but in a comparable micro location, in a close vicinity to the motorway. Therefore, the location can be assessed as comparable. The property comprises a warehouse with a total area of 879 sq m. In addition, the property benefits from good connections to public transport and the motorway network. We have adopted the following rental rates within our valuation:
|
| Use | Letting-Status | Rental Area | ERV per sq m | ERV (Total) | ||
| Office | LET | 600.00 sq m | €72.00 /sq m pa | €43,200.00 pa | ||
| Warehouse | LET | 9,547.00 sq m | €54.00 /sq m pa | €515,538.00 pa | ||
| Total* | 10,147.00 sq m | €55.06 /sq m pa | €558,738.00 pa |
|
* The total amount of ERV and rental area may differ from the calculation printout due to rounding differences.
We have arrived at our opinion of Market Value adopting the Traditional investment capitalisation method of valuation. Within this approach, we apply an income weighted average equivalent yield to our opinion of net income, reflecting the comparable evidence within the market for guidance on capital rates and values per sq m.
We would like to highlight investment comparables one and two. The first investment comparable is located in a superior macro location, as it is just outside Karlsruhe. It also has a slightly superior micro location and has a shorter distance to the motorway. The property has a lettable area of around 1,000 sq m and was sold for approx. EUR 700,000 (equating to around EUR 700 per sq m) in Q2 2020. We consider this comparable to be similar to the subject, however, we note that the market has strengthened in this sector since this sale.
Investment comparable number two is also located in the vicinity of Stuttgart. The macro location can thus be considered as comparable. The micro location is superior, as the property is in direct proximity to a motorway. The property has a lettable area of around 16,500 sq m and was sold for about EUR 11,880,000 |
| ON BEHALF OF: | MORGAN STANLEY |
| PROJECT NAME: | MSTAR |
|
|
(equating to around EUR 720 per sq m) in Q1 2020. Due to the comparable macro location, we consider the property to be similar, however, we note that the market has strengthened in this sector since this sale.
For the valuation of this asset, we have applied the following equivalent yield: |
|
| - 5.80% | ||
|
This results in a Net Initial Yield of 6.11% and a capital rate per sq m of €794. The Net Initial Yield is currently being influenced by the level of under-rent.
On the assumption that there are no unusual factors of which we are unaware and on the basis of the comments and assumptions specified in this report, CBRE is of the opinion that the Market Value (rounded) of the subject property, is: |
||
| €8,060,000 | ||
| (eight million and sixty thousand Euro) | ||
|
The unrounded net capital value is €8,059,839. The gross unrounded capital value is €9,215,224 including capital costs of €340,000 and €725,385 of purchaser’s costs (9.00%).
Our opinion of Market Value is based upon the Scope of Work and Valuation Assumptions attached and has been primarily derived using comparable recent market transactions on arm’s length terms. |
||
| VALUATION METHODOLOGY – VACANT POSSESSION VALUE |
The constituent inputs in terms of rental value and non-recoverable costs largely align with the Market Value approach. The key exception being that we have adopted a special assumption that the property is 100% vacant/non-income producing as at the valuation date. This value is predominantly derived using the traditional investment method of valuation but critically benchmarking the resultant capital rate per sq m against the prevailing evidence.
In approaching our valuation under the Special Assumption that the property is entirely vacant (Vacant Possession Value), we have adopted a total void period of 12 months inclusive of rent free or tenant incentives and targeted an equivalent yield of 6.3%.
This results in a net rounded value of €6,630,000, equating to €653 per sq m. |
|
| ESTIMATED REINSTATEMENT ASSESSMENT |
The property has not been inspected by a suitably qualified building surveyor from CBRE, nor have we carried out a full Reinstatement Cost Assessment. For indicative purposes only we estimate that the reinstatement cost of insurance purposes would be in the region of €13,828,018 (rounded, excl. VAT) on a day one basis, including fees but excluding VAT and inflation.
This figure should be compared with the current sum insured and if a material discrepancy exists we suggest that a full Reinstatement Cost Assessment is carried out. |
| ON BEHALF OF: | MORGAN STANLEY |
| PROJECT NAME: | MSTAR |
RENTAL EVIDENCE
| PROPERTY ADDRESS |
PROPERTY USE |
DATE | TOTAL AREA (SQ M) |
TENANT | LEASE LENGTH (YEARS) |
BREAK OPTION |
RENT (P.A.) (€) |
MONTHLY RENTAL RATE PER SQ M (€) |
RELATIVE QUALITY |
|
72810 Gomaringen |
Warehouse | Q1 2020 | 285 | n/a | n/a | n/a | 19,152 | 5.60 | Similar (Macro location) |
| 76189 Karlsruhe |
Warehouse | Q1 2020 | 3,700 | n/a | n/a | n/a | 250,416 | 5.64 | Similar (Distance to motorway) |
| 75210 Keltern |
Warehouse | Q1 2020 | 250 | n/a | n/a | n/a | 18,000 | 6.00 | Similar (Macro location) |
| 71254 Ditzingen |
Warehouse | Q1 2020 | 879 | n/a | n/a | n/a | 60,651 | 5.75 | Similar (Macro location) |
| 72406 Bisingen |
Warehouse | Q1 2020 | 731 | n/a | n/a | n/a | 35,088 | 4.00 | Slightly inferior (Macro location) |
| ON BEHALF OF: | MORGAN STANLEY |
| PROJECT NAME: | MSTAR |
SALES EVIDENCE
|
PROPERTY ADDRESS
|
PROPERTY USE | DATE | TOTAL AREA (SQ M) |
PASSING RENT PER ANNUM |
PURCHASE PRICE (€) |
NET INITIAL YIELD (%) |
CAPITAL RATE PER SQ M (€) |
RELATIVE QUALITY |
| 76189 Karlsruhe | Production | Q2 2020 | 1,000 | n/a | 700,000 | n/a | 700 | Slightly superior (macro location) |
|
70771 Leinefeld- Echterdingen |
Light Industrial | Q1 2020 | 16,500 | n/a | 11,880,000 | n/a | 720 | Similar (macro location) |
| 73431 Aalen | Warehouse | Q1 2019 | 9,711 | n/a | 6,600,000 | n/a | 679 | Slightly inferior (macro location) |
|
79395 Neuenburg am Rhein |
Distribution hall | Q3 2018 | 18,000 | n/a | 13,000,000 | n/a | 722 | Similar (distance to the motorway) |
| PROPERTY ID: | dekelt - Kelterstr. 67 | |
| ON BEHALF OF: | MORGAN STANLEY | |
| VALUATION DATE: | 01-Feb-2021 | FINAL |
Kelterstr. 67 - Kelterstr. 67,, Unterensingen, 72669, Germany
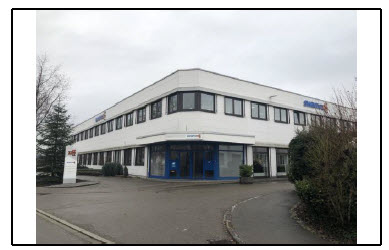 |
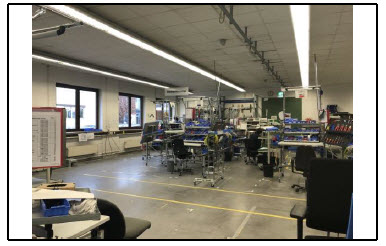 |
|
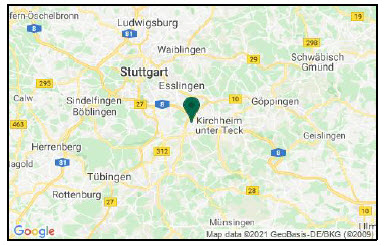 |
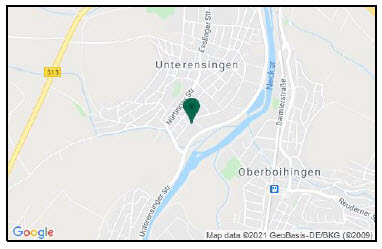 |
| VALUATION METRICS | (currency - EUR) |
| Metric | Value |
| Market Value | 6,040,000 |
| Market Value (per sq m) | 1,334 |
| Net Initial Yield | 6.59% |
| Reversionary Yield | 5.37% |
| Equivalent Yield | 5.80% |
| Gross Income (p.a.) | 443,376 |
| Gross Income (p.a.) (per sq m) | 98 |
| *Adj. Gross Income | 443,376 |
| Adj. Gross Income (per sq m) | 98 |
| Net Income (p.a.) | 433,697 |
| Net Income (p.a.) (per sq m) | 96 |
| Gross Rental Value | 387,174 |
| Gross Rental Value (per sq m) | 85 |
| Capital Expenditure | -36,948 |
| Transaction Costs | 9.00% |
| Over / Under Rented | 14.52% |
| KEY FACTS | ||
| Metric | Value | |
| Total Area (sq m) | 4,529 | |
| WAULT to Break by Rent | 10.16 | |
| WAULT to Break by ERV | 10.16 | |
| WAULT to Expiry by Rent | 10.16 | |
| WAULT to Expiry by ERV | 10.16 | |
| Percentage of Vacancy (Area) | 0.00% | |
| Percentage of Vacancy (ERV) | 0.00% | |
| ** | Number of Tenants | 1 |
| Current Voids (months) | - |
| LEASES RANKED BY RENT |
* Adjusted Gross Income equates to the Gross Income excluding any rent free periods ** Total tenant lines within our valuation. May differ to number of individual tenants |
| Printed 09/03/2021 19:43 | |
| PROPERTY ID: | dekelt - Kelterstr. 67 | |
| ON BEHALF OF: | MORGAN STANLEY | |
| VALUATION DATE: | 01-Feb-2021 | FINAL |
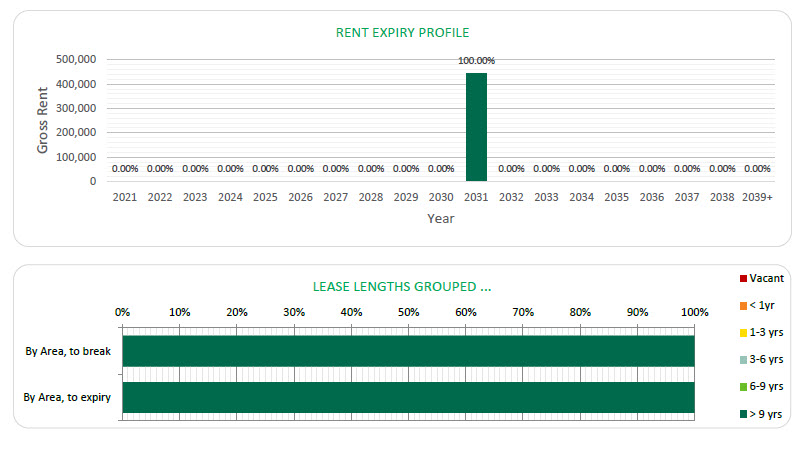
| Printed 09/03/2021 19:43 | |
| ON BEHALF OF: | MORGAN STANLEY |
| PROJECT NAME: | MSTAR |
PROPERTY REPORT
72669 UNTERENSINGEN – KELTERSTRASSE 67
| INSPECTED BY: | INSPECTION DATE: | VALUATION DATE: | PROPERTY TYPE |
| MAREIKE RECK | 07/01/2020 | 01/02/2021 | OFFICE / STORAGE |
KEY VALUATION FACTORS
| STRENGTHS | WEAKNESSES |
|
■ The subject property is located in the logistics region Stuttgart; ■ The subject property is located in the European metropolitan region Stuttgart; ■ Long WAULT of 10.16 years; ■ Vicinity to the motorway A8 (4.9 km); |
■ Underground storage of heating oil(40,000 litre); ■ Single tenant; ■ Subject is built to suit and has limited third party usability. |
| OPPORTUNITIES | THREATS |
|
■ The continuing positive development of the overall economy could lead to an increase in rents; ■ The region as a whole might profit from “Stuttgart 21”, a railway and urban development project in Stuttgart. |
■ Fluctuations in the world economy and the global capital markets could have negative effects on German real estate market purchase prices; ■ Single tenant risk; ■ Loss of rent and costs for reletting if tenant vacates the property; ■ Loss of additional income if tenant vacates the property, due to overrent situation. |
LOCATION & SITUATION
| LOCATION |
Unterensingen is a community in the district of Esslingen and is about 28 km to the southeast of Stuttgart and belongs to the European metropolitan region of Stuttgart. The connection to the traffic infrastructure is provided by the federal motorways A 8 and A 81 in the immediate vicinity. In addition, the city is directly connected to the state capital Stuttgart via the regional rail network.
Compared to other conurbations, the Stuttgart region does not represent a preferred logistics location among the Class A cities despite its favourable site parameters and its great transportation access. Rather, the high concentration of companies from the automobile industry (Daimler, Porsche), the chemical |
| ON BEHALF OF: | MORGAN STANLEY |
| PROJECT NAME: | MSTAR |
| industry, and the respective suppliers both in Stuttgart proper and in the greater metro area make the city a logistics location of regional significance, other such locations in the region being Ulm and the Rhine-Neckar area. Stuttgart is moreover connected to the German and European inland waterway network via its Neckarhafen inland port, which includes a container ship terminal and a rail-to-road transshipment station. The port area of 100 hectares is home to a number of shipping companies, freight carriers, warehousing and trading companies. Main occupiers of the port include Rhenus, SCT, Duss Terminal Stuttgart Hafen, Reederei Schwaben, Bosch and Daimler, the latter two being the leading industrial companies in the Stuttgart metro region. Comparatively high prices for commercial property ensure that rent rates for warehouse and logistics space remain very stable regardless of the economic cycle. As the Stuttgart logistics market is defined by supplier structures and their short- to medium-term contract relations, the average rent rate is relatively high. Virtually no new trading estates are zoned in the region anymore, and, what is more, there are next to no industrial areas left. | ||
| Regarding the office market, compared to the other Class A cities, Stuttgart's office market had been characterised by low–level volatility until the financial crisis. That being said, the market action has gathered momentum in recent years. As a consequence, growing rents, increasing take–ups and significantly declining vacancies could be observed. | ||
| Demand for space has primarily been defined by the industrial/manufacturing sector. Leases signed for small premises of around 1,000 sqm account for roughly 50% of the take up. Both office completions and take–ups on the office market have gone over the last years. The average vacancy rate remains in rapid decline, and is already well below the average of the Class A cities. With a view to the surge in rents in recent years, there is reason to assume that the rent growth will more or less level out in the medium term | ||
| Within the city of Unterensingen, the subject property is situated in an area, which is mainly used industrial and logistic purposes. The direct surroundings consist of industrial companies, gastronomy and retailers. | ||
| The motorway connection can be described as good because of the close proximity to the motorway A8. The next airport is situated in Stuttgart around 18 km away and reachable in approximately 20 minutes. The airport offers national and international connections. |
PROPERTY DESCRIPTION
| DESCRIPTION |
The property covers an area of approximately 0.8 hectares and comprises a 2-storey building housing warehouse/workshop and office areas on the ground floor (with a north western reception area and stairwell) and offices on the first floor arranged around a central roof terrace.
Two garage / storage buildings are located to the east of the warehouse (along north eastern boundary, with a transformer station) and in the central southern yard.
The buildings cover approximately 50% of the site area. Approximately 45% of the site is covered with hardstanding (mostly tarmac and partly concrete |
| ON BEHALF OF: | MORGAN STANLEY |
| PROJECT NAME: | MSTAR |
|
pavers) and approximately 5% of the property along the site boundaries comprises landscaping (bushes/grass).
The current site building and the adjacent transformer/car garage complex in the east was constructed in 1986 on former agricultural land for light industrial uses (traffic control supply, traffic light installations, traffic light supply).
According to available information the eastern section of the property comprised a vehicle washdown area (concrete) until the mid-1990s. Inc.1995 the second central car garage unit was constructed.
Summary of known specification:
|
||||||
| Characteristic | Result | |||||
| Built / Renovation | 1986 | |||||
| Eaves Height | 5 metres | |||||
| No. of loading Doors | 2 | |||||
| Loading Door Ratio | 0.8 | |||||
| Yard Depth | 30 metres | |||||
| Cross-Dock | No | |||||
| Warehouse (% of GLA) | 34% | |||||
| Site Coverage Ratio | 50% | |||||
| Source: Phase I Environmental Review dated January 2020; the information gathered during the site inspection. | ||||||
| ACCOMMODATION | We have not measured the property, but as instructed, we have relied upon floor areas made available to us. | |||||
| Unit Description | Primary Use | Status | Area (sq m) | |||
| Office | Office | LET | 2,971 | |||
| Warehouse | Production | LET | 1,558 | |||
| Total (lettable) | 4,529 | |||||
DUE DILIGENCE
| STATE OF REPAIR | CBRE have not undertaken a structural survey, nor tested the services. The property was subject to an inspection for valuation purposes in early 2020. As you are aware, the property has not been re-inspected for the purposes of this report, nor have we been provided with updated TDD. We have therefore relied on the information provided by the Borrower, including a Capex schedule dated 12 June 2019 and schedule with revised budget of capex dated 19 January 2021. Based on the latter which indicates TDD assessment |
| ON BEHALF OF: | MORGAN STANLEY |
| PROJECT NAME: | MSTAR |
| less completed spend in 2020, we have not allowed for any associated capital expenditure within our valuation. | ||
| Based on our impression gained during the inspection, we are of the opinion that the buildings are in a fair condition, in line with the year of construction. | ||
| ENVIRONMENTAL CONSIDERATIONS | We have summarised the findings from a schedule provided in relation to ‘Priority sites’ within the front section of this report. | |
| According to the Draft Environmental Due Diligence report dated 10 January 2020 from Ambiente Ltd. There are currently no known ground/soil contaminations. However, the following risks for contamination have been identified: | ||
| On-site | ||
| ● Potential for contamination from light industrial use and former car wash since 1986. | ||
| Off-site | ||
| ● Potential for migration of contamination from neighbouring light industrial uses. | ||
| In addition, there is the risk of the following building pollutants: | ||
| ● No potential sources of contamination have been identified. From building operations, the following risks have been identified: | ||
| ● Potential for contamination from underground storage of heating oil (40,000 litre). | ||
| We have been instructed not to make any investigations in relation to the presence or potential presence of contamination in land or buildings or the potential presence of other environmental risk factors and to assume that if investigations were made to an appropriate extent then nothing would be discovered sufficient to affect value. | ||
| We have not carried out investigation into past uses, either of the properties or of any adjacent lands, to establish whether there is any potential for contamination from such uses or sites, or other environmental risk factors and have therefore assumed that none exists. Should our assumption prove to be incorrect, we reserve the right to amend our valuation accordingly. | ||
| TENURE | We have had sight of the Draft Red Flag Legal Report prepared by Hengeler Mueller, dated 05 February 2021. Based on the information provided, we understand the property is held freehold. | |
| We have assumed that there are no onerous legal conditions affecting the property which have a material impact on our opinion of value. |
| ON BEHALF OF: | MORGAN STANLEY |
| PROJECT NAME: | MSTAR |
| INCOME PROFILE | The rental contracts have not been available. The information is based on the rent schedule dated on 30 November 2020. | |
| The property is fully leased to a single tenant (Swarco Traffic Systems GmbH). There are no vacancies. | ||
| The property has a WAULT of 10.16 years from the date of valuation. The total gross current rent generated by the property is €443,376 per annum whilst our opinion of the total gross market rent is € 387,174 per annum. The property is shown as under-rented. | ||
| Swarco Traffic Systems GmbH is the largest company in the SWARCO Group and acts as a system integrator for traffic light systems and intersection controls, motorway and tunnel guidance systems, parking guidance systems and charging infrastructure for electric vehicles, including associated software development. A Germany-wide network of service technicians ensures that the traffic systems are ready for operation and maintained around the clock. |
VALUATION CONSIDERATIONS
| COSTS AND ADJUSTMENTS | Based on the information provided or our knowledge of the market, in approaching our valuation, we made allowances for the following capital and non-recoverable costs. In all cases, we have cited whether they are deducted as at the date of valuation or whether they take effect at a later date. | ||||
| Capital Expenditure: | |||||
| Type & Calculation | Source | Effective | Amount | ||
| Capital Expenditure: Fixed Amount | Technical Due Diligence |
On Valuation
No Repeat |
€0 | ||
| Tenant Incentives | CBRE Estimate |
On lease start /renewal
No Repeat |
€0 | ||
| Letting Fees: 25% of Rental Value | CBRE Estimate |
On lease start /renewal
No Repeat |
€0 | ||
| Rent Free – Swarco Traffic System | CBRE Estimate | CBRE Estimate | €36,948 | ||
| TOTAL ON VALUATION | €36,948 | ||||
| Revenue Deductions: | |||||
| Type & Calculation | Source | Effective | Annual Amount | ||
|
General Non-Recoverables: 0.5% of rental value |
CBRE Estimate |
On Valuation
In perpetuity |
€1,936 | ||
| ON BEHALF OF: | MORGAN STANLEY |
| PROJECT NAME: | MSTAR |
| Maintenance: €5.25 per sq m | CBRE Estimate |
On Valuation + Delay 60 Months
In perpetuity |
€23,777 | ||||
| Management 2.0% of rental value | CBRE Estimate |
On Valuation
In perpetuity |
€7,743 | ||||
| Void Costs: €0.50 per sq m | CBRE Estimate |
On Valuation
On all voids
|
€0 | ||||
| TOTAL: ON VALUATION | €9,679 | ||||||
| VALUATION METHODOLOGY – MARKET VALUE | We have had regard to the most recent letting transactions and occupational demand for the region within which the subject property is located, including the property itself if of relevance. The rental rates range between €45 and €51 per sq m per annum, depending on the duration of the lease contract, building specification and age. | ||||||
| Comparable number two is located in the similar macro location, in a close vicinity to the same motorway. Therefore, the location can be assessed as comparable, albeit there has been upward pressure on rents since the date of this transaction as evidenced by our adopted Warehouse rate. The property comprises a warehouse with a lettable area of around 2,820 sq m. The proximity to public transport is advantageous. We have adopted the following rates across the property: | |||||||
| Use | Letting-Status | Rental Area | ERV per sq m | ERV (Total) | |||
| Office | LET | 2,971.00 sq m | €102.00 /sq m pa | €303,042.00 pa | |||
| Warehouse | LET | 1,558.00 sq m | €54.00 /sq m pa | €84,132.00 pa | |||
| Total* | 4,529.00 sq m | €85.49 /sq m pa | €387,174.00 pa | ||||
| * The total amount of ERV and rental area may differ from the calculation printout due to rounding differences. | |||||||
| The office component distorts the overall blended rent but in isolation the relationship between the warehouse and office rate per sq m is reasonable. | |||||||
| We have arrived at our opinion of Market Value adopting the Traditional investment capitalisation method of valuation. Within this approach, we apply an income weighted average equivalent yield to our opinion of net income, reflecting the comparable evidence within the market for guidance on capital rates and values per sq m. | |||||||
| We would like to highlight investment comparable number one and two. The macro location of the first investment comparable can be considered as superior, as the property is closer to a bigger city. The micro location can be considered as similar. The property has a lettable area of around 23,700 sq m and was sold for approx. EUR 24,316,000 (equating to around EUR 1,026 per sq m) in Q2 2020. Due to the | |||||||
| ON BEHALF OF: | MORGAN STANLEY |
| PROJECT NAME: | MSTAR |
| slightly superior macro location but comparable micro location, we consider the property similar/ slightly inferior to the subject property. | ||
| The second investment comparable is located in the direct vicinity to the motorway too. The micro location can be considered as similar. The property has a lettable area of around 5,483 sq m and was sold for approx. EUR 6,626,732 (equating to around EUR 1,209 per sq m) in Q1 2019. Due to the slightly worse macro location but comparable micro location, we consider the property similar/slightly inferior to the subject property. | ||
| For the valuation of this asset, we have applied the following equivalent yield: | ||
| - 5.80% | ||
| This results in an Initial Yield of 6.28% and a capital rate per sq m of €1,431. The Net Initial Yield is currently being influenced by the level of over-rent. | ||
| On the assumption that there are no unusual factors of which we are unaware and on the basis of the comments and assumptions specified in this report, CBRE is of the opinion that the Market Value (rounded) of the subject property, is: | ||
| €6,040,000 | ||
| (Six million and forty thousand Euros) | ||
| The unrounded net capital value is €6,041,367. The gross unrounded capital value is €6,622,038 including €36,948 of capital costs and €543,723 purchaser’s costs (9.00%). | ||
| Our opinion of Market Value is based upon the Scope of Work and Valuation Assumptions attached and has been primarily derived using comparable recent market transactions on arm’s length terms. | ||
| VALUATION METHODOLOGY – VACANT POSSESSION VALUE |
The constituent inputs in terms of rental value and non-recoverable costs largely align with the Market Value approach. The key exception being that we have adopted a special assumption that the property is 100% vacant/non-income producing as at the valuation date. This value is predominantly derived using the traditional investment method of valuation but critically benchmarking the resultant capital rate per sq m against the prevailing evidence. | |
| In approaching our valuation under the Special Assumption that the property is entirely vacant (Vacant Possession Value), we have adopted a total void period of 12 months inclusive of rent free or tenant incentives and targeted an equivalent yield of 6.3%. | ||
| This results in a net rounded value of €5,270,000, equating to €1,164 per sq m. | ||
| ESTIMATED REINSTATEMENT ASSESSMENT | The property has not been inspected by a suitably qualified building surveyor from CBRE, nor have we carried out a full Reinstatement Cost Assessment. For indicative purposes only we estimate that the reinstatement cost of insurance purposes would be in the region of €7,251,636 (rounded, excl. VAT) on a day one basis, including fees but excluding VAT and inflation. | |
| This figure should be compared with the current sum insured and if a material discrepancy exists we suggest that a full Reinstatement Cost Assessment is carried out. |
| ON BEHALF OF: | MORGAN STANLEY |
| PROJECT NAME: | MSTAR |
| RENTAL EVIDENCE | |||||||||
| PROPERTY
ADDRESS |
PROPERTY USE |
DATE | TOTAL AREA | TENANT | LEASE LENGTH (YEARS) |
BREAK OPTION |
RENT (P.A) | MONTHLY RENTAL RATE PER SQ M |
RELATIVE QUALITY |
| 77955 Ettenheim | Warehouse | Q1 2020 | 26,800 | n/a | n/a | n/a | 1,372,800 | 4.00 | Similar (distance to the motorway) |
| 71332 Waiblingen | Warehouse/Production hall | Q4 2019 | 2,459 | n/a | n/a | n/a | 120,000 | 4.06 | Similar (macro location) |
|
73230
Kirchheim
|
Warehouse/ Production hall |
Q4 2019 | 2,820 | n/a | n/a | n/a | 126,720 | 3.75 | Similar (distance to the motorway) |
| 68647 Biblis |
Distribution hall | Q2 2018 | 5,645 | n/a | 6 | n/a | 287,895 | 4.25 | Similar (distance to the motorway) |
| ON BEHALF OF: | MORGAN STANLEY |
| PROJECT NAME: | MSTAR |
| SALES EVIDENCE |
| PROPERTY ADDRESS |
PROPERTY USE |
DATE | TOTAL AREA (SQ M) |
PASSING RENT PER ANNUM (EUR) |
PURCHASE PRICE € |
NET INITIAL YIELD (%) |
CAPITAL RATE PER SQ M € |
RELATIVE QUALITY |
| 90765 Fürth | Production hall | Q2 2020 | 23,700 | 1,279,800 | 24,316,000 | n/a | 1,026 | Similar to superior (macro location) |
| 78652 Deißlingen |
Cold storage | Q1 2019 | 5,483 | 413,256 | 6,626,732 | 5,7 | 1,209 | Similar to inferior (macro location) |
| 77694 Kehl |
Cold storage | Q1 2019 | 12,861 | 791,452 | 12,691,269 | 5,7 | 987 | Slightly inferior (macro location) |
| 70469 Stuttgart | Production hall | Q4 2018 | 43,000 | n/a | 50,000,000 | n/a | 1,162 | Slightly inferior (micro location) |
| PROPERTY ID: | dekohl - Kohlstrasse 8 | |
| ON BEHALF OF: | MORGAN STANLEY | |
| VALUATION DATE: | 01-Feb-2021 | FINAL |
| Kohlstrasse 8 - Kohlstrasse 8, Koln, 50827, Germany |
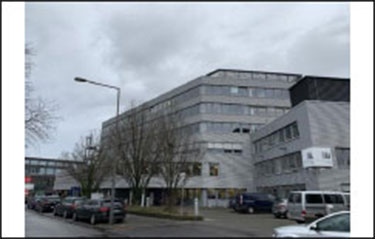 |
 |
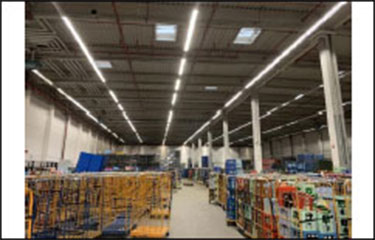 |
 |
| VALUATION METRICS | (currency - EUR) |
| Metric | Value |
| Market Value | 22,375,000 |
| Market Value (per sq m) | 842 |
| Net Initial Yield | 4.30% |
| Reversionary Yield | 4.80% |
| Equivalent Yield | 4.70% |
| Gross Income (p.a.) | 1,052,162 |
| Gross Income (p.a.) (per sq m) | 40 |
| *Adj. Gross Income | 1,052,162 |
| Adj. Gross Income (per sq m) | 40 |
| Net Income (p.a.) | 1,021,349 |
| Net Income (p.a.) (per sq m) | 38 |
| Gross Rental Value | 1,232,285 |
| Gross Rental Value (per sq m) | 46 |
| Capital Expenditure | -504,532 |
| Transaction Costs | 6.25% |
| Over / Under Rented | -14.61% |
| KEY FACTS | ||
| Metric | Value | |
| Total Area (sq m) | 26,572 | |
| WAULT to Break by Rent | 2.40 | |
| WAULT to Break by ERV | 2.29 | |
| WAULT to Expiry by Rent | 2.40 | |
| WAULT to Expiry by ERV | 2.29 | |
| Percentage of Vacancy (Area) | 0.00% | |
| Percentage of Vacancy (ERV) | 0.00% | |
| ** | Number of Tenants | 9 |
| Current Voids (months) | 12 |
| LEASES RANKED BY RENT |
* Adjusted Gross Income equates to the Gross Income excluding any rent free periods ** Total tenant lines within our valuation. May differ to number of individual tenants |
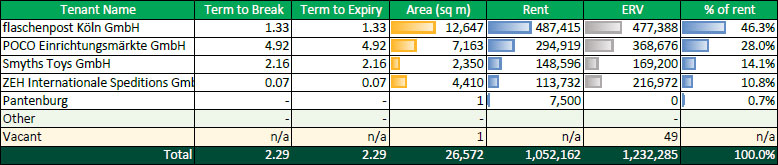
Printed 09/03/2021 19:44
| PROPERTY ID: | dekohl - Kohlstrasse 8 | |
| ON BEHALF OF: | MORGAN STANLEY | |
| VALUATION DATE: | 01-Feb-2021 | FINAL |
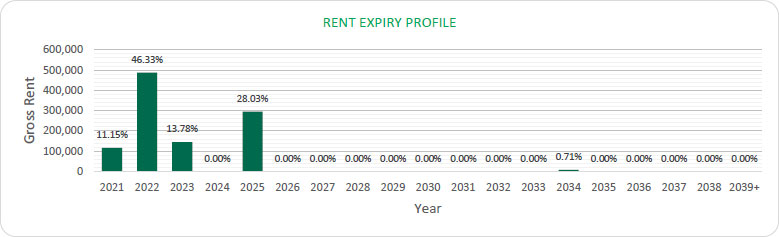
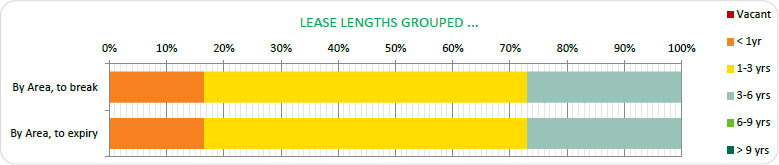
Printed 09/03/2021 19:44
| ON BEHALF OF: | MORGAN STANLEY |
| PROJECT NAME: | MSTAR |
|
PROPERTY REPORT
|
| 50827 COLOGNE, KOEHLSTRASSE 8 |
| INSPECTED BY: | INSPECTION DATE: | VALUATION DATE: | PROPERTY TYPE |
| FLORIAN ECKERVOGT | 19/12/2019 | 01/02/2021 | WAREHOUSE |
KEY VALUATION FACTORS
| STRENGTHS | WEAKNESSES |
|
■ Excellent macro location within one of the most important German logistics region; ■ Attractive location due to an excellent connection to motorways network, railway lines and inland port on the Rhine; ■ The subject property is situated in an established commercial park in close proximity to motorways A57, A1 and B59; ■ Adequate connection to the passenger and cargo airport Cologne / Bonn (travel timeapprox. 25 min); ■ Fully let to multiple tenants. |
■ High office share of around 13%; ■ WAULT of 2.39 years to breaks. |
| OPPORTUNITIES | THREATS |
|
■ The continuing positive development of the overall economy could lead to an increase in achievable rents; ■ Reletting to market terms could improve income profile (due to under-rent). |
■ Fluctuations in the world economy and the global capital markets could have negative effects on the German commercial real estate market; ■ High capital expenditures could occur in the future (due to advanced building age). |
| LOCATION & SITUATION | ||
| LOCATION | Together with the former federal capital Bonn, Cologne forms the heart of the Cologne-Bonn metropolitan region, which is also part of the Rhine-Ruhr metropolitan region. Cologne is one of four megacities in Germany and is in great competition with the nearby state capital of Düsseldorf. The city has a wide range of universities and colleges and is an attractive research location. In addition, Cologne is an important location for media (especially television), | |
| ON BEHALF OF: | MORGAN STANLEY |
| PROJECT NAME: | MSTAR |
|
services and production (including Ford) as well as a trade fair venue and transport hub for rail and ship. Between Cologne and Bonn lies the international airport Cologne/Bonn “Konrad-Adenauer”, one of the largest German commercial airports.
Cologne is front and centre of the eponymous logistics region. The greater Cologne area represents an important logistics location due to its conveniently accessible location at the intersection of several motorways, railway lines and on the Rhine. In addition to its integration into a dense motorway and railway network (being a central rail hub in continental Europe), Cologne's perks as logistics location include the Cologne/Bonn Airport, the inland port in Cologne-Niehl and the cargo transshipment centre GVZ Cologne-Eifeltor.
The Rheinhafen inland port is Germany's second largest inland port, and one of the most important ones in Europe. The Cologne/Bonn Airport is one of Germany's five largest freight airports. The region's logistics sector is focused on companies in the automotive, petroleum and retail industries. Similar to other cities, new developments tend to be outside the city limits. Roughly 600,000 sqm of usable floor space were completed within the logistic region during the past five years (2014 – 2018). The city's importance as an inter-regional hot spot is essentially underlined by its logistics infrastructure and production logistics. Boroughs within Cologne which play a primary role in logistics are Gremberghofen, Ossendorf, Niehl and Godorf.
Within the city of Cologne, the subject property is situated in an established commercial area, dominated by logistic and industrial premises. The immediate vicinity consists of industrial companies, garages and retailers.
The motorway connections can be rated as very good due to the close. proximity to the motorways A57, A1 and B59. The nearest passenger and cargo airport Cologne / Bonn is situated on the opposite side of the city limits, 23.0 km away and reachable in approx. 25 minutes.
|
| PROPERTY DESCRIPTION | ||
|
DESCRIPTION |
The property covers an area of approx. 4.1 hectares and comprises a building complex with five warehouse sections each of which contain 7 units as well as two separate office sections.
An additional former workshop building with a two-storey office frontage is located adjacent to the south-western site boundaries. A former gatekeeper’s building containing a technical supply room in the basement is located in the accessing area in the western part of the property.
Approx. 60% of the property is covered with the building complexes. The site further comprises ~20% of circulation area with brick paving or concrete. Another ~10% of the property is unsealed (road gravel and undeveloped land). The remaining 10% of the property comprises landscaping along the south-western boundaries of the site.
The property was developed in 1972 as part of a trade and commercial centre including the western sections of the current building complex (warehouse units
|
|
| ON BEHALF OF: | MORGAN STANLEY |
| PROJECT NAME: | MSTAR |
|
3, 4, 5 plus the workshop building). The office sections and warehouses 1 and 2 (high-bay warehouse) were erected between 1987 and 1989.
The roof of the older building section was renovated in 2010. The building’s flat roof on top of the warehouse section was equipped with a photovoltaic power plant in 2015.
The warehouse areas are constructed with pre-cast concrete pillars carrying partly timber cross beams and partly concrete beams. The flat roofs are covered with roofing membrane and gravel fill. The façade is of trapezoidal metal clads and sandwich elements or concrete and brick wall construction. The façade of the office buildings is of wash concrete panels and metal clads.
The warehouse structures comprise 45 loading doors in total which are accessed from the northern and southern side of the property. The property can be encircled, and a sufficient number of car and lorry parking spaces are located on the site.
During the inspection not all parts of the property and the premises were accessible.
Summary of known specification: |
| Characteristic | Result | ||
| Built / Renovation | 1972 / 1987 / 1989 / 2010 / 2015 | ||
| Eaves Height | n/a | ||
| No. of Loading Doors | 45 | ||
| Loading Door Ratio | 2.61 | ||
| Yard Depth | Approx. 26-52 metres | ||
| Cross-Dock | Front loading | ||
| Warehouse (% of GLA) | 73% | ||
| Site Coverage Ratio | 60% | ||
| Source: Phase I Environmental Review dated January 2020; the information gathered during the site inspection. | |||
| ACCOMMODATION | We have not measured the property, but as instructed, we have relied upon floor areas made available to us. |
| Unit description | Primary use | Status | Area (sq m) | ||
| Warehouse | Industrial | Let | 17,256 | ||
| Office | Office | Let | 3,063 | ||
| Other | Storage | Let | 3,306 | ||
| Other | Roof | Let | 1 | ||
| Outdoor | Yard | Vacant | 2,944 |
| ON BEHALF OF: | MORGAN STANLEY |
| PROJECT NAME: | MSTAR |
| Total (lettable) | 26,570 |
| DUE DILIGENCE | ||
| STATE OF REPAIR |
CBRE have not undertaken a structural survey, nor tested the services. The property was subject to an inspection for valuation purposes in early 2020. As you are aware, the property has not been re-inspected for the purposes of this report, nor have we been provided with updated TDD. We have therefore relied on the information provided by the Borrower, including a Capex schedule dated 12 June 2019 and schedule with revised budget of capex dated 19 January 2021. Based on the latter which indicates TDD assessment less completed spend in 2020, we have included the immediate and 2-5 years capex of €504,500 within our valuation.
According to our own limited inspection for valuation purposes, our opinion regarding the state of repair would substantiate the assessment by Arcadis. Based on our impression gained during the inspection, we are of the opinion that the buildings are in a fair condition, in line with the year of construction.
|
|
| ENVIRONMENTAL CONSIDERATIONS |
We have summarised the findings from a schedule provided in relation to ‘Priority sites’ within the front section of this report.
We have been made aware that the property is registered in the register of contaminated sites (Altlastenregister) which indicates a contamination or a potential contamination of the Properties, in particular due to their current or former use. If future excavation works are carried out at these Properties, this could lead to additional costs. However, no action is required on the current use of the Properties. As such we have assumed this does not have a material impact on our opinion of value given the valuation is prepared taken the current use into consideration.
According to the Draft Environmental Due Diligence report, dated 13 December 2019, prepared by Ambiente Ltd. There are currently no known ground/soil contaminations. However, the following risks for contamination have been identified: On-site
|
|
| • Potential infill material of former clay pit (Made Ground); | ||
| • Potential for contamination from decommissioned 16,000 litre chambered UST fuel tank (diesel, petrol) of former refuelling facility and from decommissioned 1,000 litre underground waste oil tank of car repair unit in the west of the property; | ||
| • Potential for contamination from light industrial use of the subject property since c. 1972 including car repairs etc. | ||
| Off-site | ||
| • Potential for migration of contamination from neighbouring historical land uses (i.e. potential Made Ground or landfill in former | ||
| ON BEHALF OF: | MORGAN STANLEY |
| PROJECT NAME: | MSTAR |
|
clay / gravel pits, railway track, northern airfield and military activities) and current light industrial use since the 1970s.
In addition, there is the risk of the following building pollutants:
• Potential and known asbestos containing materials within building fabric.
From building operations, the following risks have been identified:
• Potential for leaks and spills from current limited chemical storage at the site.
We have been instructed not to make any investigations in relation to the presence or potential presence of contamination in land or buildings or the potential presence of other environmental risk factors and to assume that if investigations were made to an appropriate extent then nothing would be discovered sufficient to affect value.
We have not carried out investigation into past uses, either of the properties or of any adjacent lands, to establish whether there is any potential for contamination from such uses or sites, or other environmental risk factors and have therefore assumed that none exists. Should our assumption prove to be incorrect, we reserve the right to amend our valuation accordingly.
|
||
| TENURE |
We have had sight of the Draft Red Flag Legal Report prepared by Hengeler Mueller, dated 05 February 2021. Based on the information provided, we understand the property is held freehold.
We have assumed that there are no onerous legal conditions affecting the property which have a material impact on our opinion of value.
|
|
| INCOME PROFILE |
We have not been provided with the rental contracts. The information below is based on the rent schedule dated on 30 November 2020.
The property is fully let to five tenants (flaschenpost Köln GmbH, Pantenburg, POCO Einrichtungsmärkte GmbH, Smyths Toys GmbH, ZEH Internationale Speditions Gmbh & Co KG).
The property has a WAULT of 2.39 years to breaks, as at date of valuation. The total gross current rent generated by the property is €1,052,162 per annum whilst our opinion of the total gross market rent is €1,232,285 per annum. The property is shown as under-rented.
The main tenant with around 41% of the total rental space and around 46% of the total rental income is “flaschenpost Köln GmbH”. The company offers alcoholic and non-alcoholic beverages such as tea and cold beer. “flaschenpost” mainly serves customers in Germany.
|
| ON BEHALF OF: | MORGAN STANLEY |
| PROJECT NAME: | MSTAR |
| VALUATION CONSIDERATIONS | ||
| COSTS AND ADJUSTMENTS |
Based on the information provided and our knowledge of the market, in approaching our valuation, we made allowances for the following capital and non-recoverable costs. In all cases, we have cited whether they are deducted as at the date of valuation or whether they take effect at a later date. | |
| Capital Expenditure: | ||
| Type & Calculation | Source | Effective | Amount | ||
| Capital Expenditure: | Technical Due | On Valuation | €504,500 | ||
| Fixed Amount | Diligence | ||||
| No Repeat | |||||
| Tenant Incentives | CBRE Estimate | On lease start / | €20 | ||
| renewal | |||||
| No Repeat | |||||
| Letting Fees: 25% of | CBRE Estimate | On lease start / | €12 | ||
| Rental Value | renewal | ||||
| No Repeat | |||||
| TOTAL ON VALUATION |
€504,532 | ||||
| Revenue Deductions: | |||||
| Type & Calculation | Source | Effective | Annual Amount | ||
| General Non- | CBRE Estimate | On Valuation | €6,161 | ||
| Recoverables: | |||||
| In perpetuity | |||||
| 0.5% of rental value | |||||
| Maintenance: | CBRE Estimate | On Valuation + | €59,787 | ||
| €2.25 per sq m | Delay 60 Months | ||||
| In perpetuity | |||||
| Management | CBRE Estimate | On Valuation | €24,646 | ||
| 2.0% of rental value | In perpetuity | ||||
| Void Costs: | CBRE Estimate | On Valuation | €6 | ||
| €0.50 per sq m | |||||
| In perpetuity | |||||
| TOTAL: ON VALUATION |
€30,813 |
| ON BEHALF OF: | MORGAN STANLEY |
|
PROJECT NAME: |
MSTAR |
| VALUATION METHODOLOGY– MARKET VALUE |
We have had regard to the most recent letting transactions and occupational demand for the region within which the subject property is located, including the property itself if of relevance. The warehouse rental rates range between €49.20 and €72 per sq m per annum, depending on the duration of the lease contract, building specifications and age. Within the evidence table appended, we would highlight the comparable property in Cologne as being of greatest relevance in terms of asset characteristics. We have not rentalised the yard area given it would not be a reasonable assumption for this asset. The property is otherwise fully let and the most likely 'occupant' of the yard would be an in situ tenant, which does not seem to be the case by way of a formal arrangement at least.
Comparable number two is located in a similar micro location, in close vicinity to the motorway. Therefore, the location can be assessed as comparable. The property was completed in 1972 and has a lettable area of 7,060 sq m. It is advantageous that a bus stop is located in the immediate vicinity of the subject property. We have adopted the following rental rates within our valuation:
|
| Use | Letting-Status | Rental Area | ERV per sq m | ERV (Total) | ||
| Office | LET | 3,062.67 sq m | €72.00 /sq m pa | €220,512.00 pa | ||
| Other | LET | 3,306.59 sq m | €49.20 /sq m pa | €162,684.23 pa | ||
| Roof | LET | 1.00 sq m | €0.00 /sq m pa | €0.00 pa | ||
| Warehouse | LET | 17,256.00 sq m | €49.20 /sq m pa | €848,995.20 pa | ||
| Yard | VACANT | 2,944.00 sq m | €0.00 /sq m pa | €0.00 pa | ||
| Total* | 26,572.26 sq m | €46.37 /sq m pa | €1,232,285.43 pa | |||
|
* The total amount of ERV and rental area may differ from the calculation printout due to rounding differences.
We have arrived at our opinion of Market Value adopting the traditional investment capitalisation method of valuation. Within this approach, we apply an income weighted average equivalent yield to our opinion of net income, reflecting the comparable evidence within the market for guidance on capital rates and values per sq m.
We would highlight investment comparables number two and three. The comparable number two is located south of Bielefeld, near the district of Sennestadt. Similar to the subject
property, there is train stop near the property. Also, there is a motorway |
||||||
| ON BEHALF OF: | MORGAN STANLEY |
| PROJECT NAME: | MSTAR |
|
crossing accessible in a 5-minute drive from the object. The property has a lettable area of around 22,336 sq m and was sold for approx. EUR 24,400,000 (equating to around EUR 1,092 per sq m) in Q3 2019. We consider the property to be superior to the subject of valuation, mainly due to the micro location.
The comparable property number three is located at the suburban fringe of Neuss. It is advantageous that a train station is located near the property. The motorway is accessible in a 6-minute drive from the object. The property was constructed in 1994, has a lettable area of around 16,300 sq m and was sold for approx. EUR 15,000,000 (equating to around EUR 920 per sq m) in Q1 2019. Due to the comparable micro location, we consider the property similar to the subject of valuation.
For the valuation of this asset, we have applied the following Equivalent Yield:
4.70%
This results in a Net Initial Yield of 4.30% and a capital rate per sq m of €842.
On the assumption that there are no unusual factors of which we are unaware and on the basis of the comments and assumptions specified in this report, CBRE is of the opinion that the Market Value (rounded) of the subject property, is:
€22,375,000
(twenty-two million three hundred and seventy-five thousand Euros)
The unrounded net capital value is €22,363,929. The gross unrounded capital value is €24,266,206 including €504,532 of capital costs and €1,397,735 purchaser’s costs (6.25%) respectively.
Our opinion of Market Value is based upon the Scope of Work and Valuation Assumptions attached and has been primarily derived using comparable recent market transactions on arm’s length terms.
|
||
| VALUATION METHODOLOGY– VACANT POSSESSION VALUE |
The constituent inputs in terms of rental value and non-recoverable costs largely align with the Market Value approach. The key exception being that we have adopted a special assumption that the property is 100% vacant/non-income producing as at the valuation date. This value is predominantly derived using the traditional investment method of valuation but critically benchmarking the resultant capital rate per sq m against the prevailing evidence.
In approaching our valuation under the Special Assumption that the property is entirely vacant (Vacant Possession Value), we have adopted a total void period of 12 months inclusive of rent free or tenant incentives and targeted an equivalent yield of 5.3%.
This results in a net rounded value of €18,000,000, equating to €677 per sq m.
|
|
| ESTIMATED REINSTATEMENT ASSESSMENT |
The property has not been inspected by a suitably qualified building surveyor from CBRE, nor have we carried out a full Reinstatement Cost Assessment. For indicative purposes only we estimate that the reinstatement cost of insurance purposes would be in the region of €25,967,228 (rounded, excl. VAT) on a day one basis, including fees but excluding VAT and inflation.
This figure should be compared with the current sum insured and if a material discrepancy exists we suggest that a full Reinstatement Cost Assessment is carried out.
|
| ON BEHALF OF: | MORGAN STANLEY |
| PROJECT NAME: | MSTAR |
| RENTAL EVIDENCE |
| PROPERTY ADDRESS | PROPERTY USE | DATE | TOTAL AREA (SQ M) | TENANT | LEASE LENGTH (YEARS) | BREAK OPTION | RENT (P.A) (€) | MONTHLY RENTAL RATE PER SQ M (€) | RELATIVE QUALITY |
| 50827 Cologne | Warehouse | Q3 2020 | 90 | n/a | n/a | n/a | 4,201 | 3.89 | Similar (distance to the motorway) |
| 50827 Cologne | Warehouse | Q4 2019 | 7,060 | n/a | n/a | n/a | 335,824 | 4.20 | Similar (distance to the motorway) |
| 50739 Cologne | Warehouse | Q4 2019 | 2,150 | n/a | n/a | n/a | 100,620 | 3.90 | Similar (distance to the motorway) |
| 50739 Cologne | Warehouse | Q4 2019 | 2,409 | n/a | n/a | n/a | 118,800 | 4.11 | Similar (distance to the motorway) |
| ON BEHALF OF: | MORGAN STANLEY |
| PROJECT NAME: | MSTAR |
| SALES EVIDENCE |
| PROPERTY ADDRESS | PROPERTY USE | DATE | TOTAL AREA (SQ M) | WAULT (YEARS) | PASSING RENT PER ANNUM (€) | PURCHASE PRICE (€) | NET INITIAL YIELD (%) | CAPITAL RATE PER SQ M (€) | RELATIVE QUALITY |
| 53909 Zülpich | Warehouse | Q3 2020 | 54,000 | n/a | n/a | 50,000,000 | n/a | 926 | Similar (micro location) |
| 45356 Bielefeld | Warehouse | Q3 2019 | 22,336 | 10.1 | n/a | 24,400,000 | n/a | 1,092 | Superior (micro location) |
| 41460 Neuss | Distribution hall | Q1 2019 | 16,300 | n/a | n/a | 15,000,000 | n/a | 920 | Similar (micro location) |
| 33689 Bielefeld | Distribution hall / Cold storage warehouse | Q1 2019 | 10,578 | 10 | 728,928 | 11,457,583 | 6.4 (Gross) | 1,083 | Similar (micro location) |
| PROPERTY ID: | dekole - Kolenbeekstieg 1, 2-6 | |
| ON BEHALF OF: | MORGAN STANLEY | |
| VALUATION DATE: | 01-Feb-2021 | FINAL |
| Kolenbeekstieg 1, 2-6 - Kolenbeekstieg 1, 2-6, Stelle, 21435, Germany |
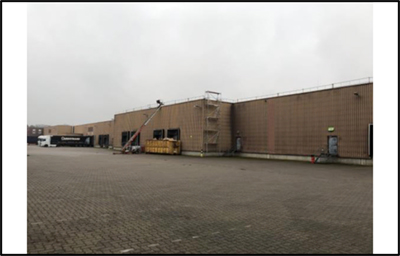 |
 |
|
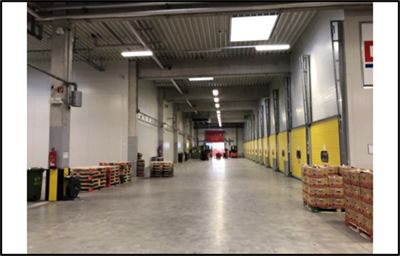 |
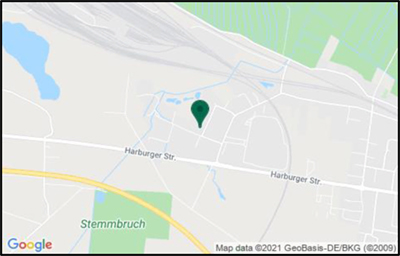 |
| VALUATION METRICS | (currency - EUR) |
| Metric | Value |
| Market Value | 22,800,000 |
| Market Value (per sq m) | 1,177 |
| Net Initial Yield | 4.57% |
| Reversionary Yield | 4.68% |
| Equivalent Yield | 4.50% |
| Gross Income (p.a.) | 1,131,928 |
| Gross Income (p.a.) (per sq m) | 58 |
| *Adj. Gross Income | 1,131,928 |
| Adj. Gross Income (per sq m) | 58 |
| Net Income (p.a.) | 1,106,667 |
| Net Income (p.a.) (per sq m) | 57 |
| Gross Rental Value | 1,191,312 |
| Gross Rental Value (per sq m) | 62 |
| Capital Expenditure | -898,604 |
| Transaction Costs | 6.25% |
| Over / Under Rented | -3.36% |
| KEY FACTS | |
| Metric | Value |
| Total Area (sq m) | 19,366 |
| WAULT to Break by Rent | 3.27 |
| WAULT to Break by ERV | 3.33 |
| WAULT to Expiry by Rent | 3.27 |
| WAULT to Expiry by ERV | 3.33 |
| Percentage of Vacancy (Area) | 1.23% |
| Percentage of Vacancy (ERV) | 1.69% |
| Number of Tenants | 11 |
| Current Voids (months) | 12 |
| * Adjusted Gross Income equates to the Gross Income excluding any rent free periods | |
| LEASES RANKED BY RENT | ** Total tenant lines within our valuation. May differ to number of individual tenants |
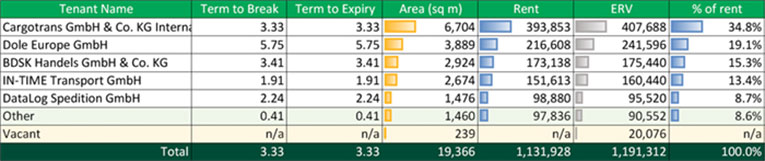
| Printed 09/03/2021 19:44 | |
| PROPERTY ID: | dekole - Kolenbeekstieg 1, 2-6 | |
| ON BEHALF OF: | MORGAN STANLEY | |
| VALUATION DATE: | 01-Feb-2021 | FINAL |
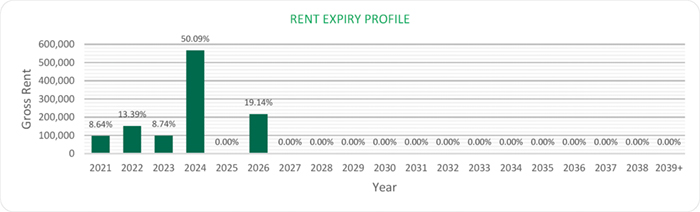
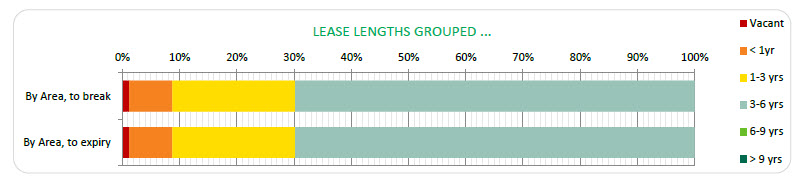
| Printed 09/03/2021 19:44 | |
| ON BEHALF OF: | MORGAN STANLEY |
| PROJECT NAME: | MSTAR |
PROPERTY REPORT
| 21435 STELLE, KOLENBEEKSTIEG 1,2-6 |
| INSPECTED BY: | INSPECTION DATE: | VALUATION DATE: | PROPERTY TYPE |
| ALEXANDER BURKHARD | 03/01/2020 | 01/02/2021 | LOGISTICS |
| KEY VALUATION FACTORS |
| STRENGTHS | WEAKNESSES |
|
■ The subject property is located in the logistics region Hamburg; ■ Fairly secure income stream due to multi-tenant concept; ■ Sufficient loading docks; ■ Access to the motorway A39 in only about 3.2 km. |
■ Higher management requirements through multi-tenant concept; ■ Building contains asbestos; ■ WAULT of 3.27 years to breaks. |
| OPPORTUNITIES | THREATS |
|
■ The continuing positive development of the overall economy could lead to an increase in rents; ■ Letting the vacancies would improve the income stream. |
■ Fluctuations in the world economy and the global capital markets could have negative effects on German real estate market purchase prices; ■ Some short remaining lease terms might negatively impact the income stream. |
| LOCATION & SITUATION | |
| LOCATION | The next largest economically significant city is Hamburg. With around 1.8 million inhabitants, the Hanseatic City of Hamburg is the second largest city in Germany. In addition to the maritime economy and logistics, Hamburg is also an important location for the aviation and food industries. Hamburg is thecentre of the Hamburg metropolitan region with a total population of over 5.3 million and extends to the east and far into the federal state of Mecklenburg-Western Pomerania. Hamburg is well connected to Germany and other European countries through the main railway station with numerous directconnections and the motorways A1, A7, A23, A24 and A25. Hamburg International Airport is the fifth largest airport in Germany. |
| ON BEHALF OF: | MORGAN STANLEY |
| PROJECT NAME: | MSTAR |
| The city of Stelle belongs to the Hamburg logistics region. Due to its status as Germany’s largest universal port and the third largest seaport in Europe, the Hamburg region is an important centre for foreign trade and a gateway forgoods destined for the continental sales markets. Owing to its location, Hamburg also acts as a logistics hub between the North Sea and the Baltic. Asa result, the logistics location is widely used by a range of market players including logistics service providers and trade and industry. | |
| Within the city of Stelle, the subject property is situated in an area, which is mainly used for industrial and logistic purposes. The direct surroundings consist of logistic services providers and retailers. | |
| The motorway connection can be described as good because of the close proximity to the motorway A39. The next airport is situated in Hamburg around 35 km away and reachable in approximately 60 minutes. The airport offers national and international connections. | |
| PROPERTY DESCRIPTION | ||
| DESCRIPTION | The site covers an area of approximately 4.16 hectares and comprises two separate warehouse complexes with attached office areas (total of 8 units). | |
| Building 1 (Kolenbeekstieg 1) is located to the west of Kolenbeekstieg road and Building 2 (Kolenbeekstieg 2-6) to the east. The buildings do not have basements. | ||
| The buildings cover approximately 65% of the property. Approximately 30% of the site is covered with hardstanding (yard areas and parking) and approximately 5% of the property comprises landscaping (grass and bushes/trees). | ||
|
The eastern site building (Kolenbeekstieg 2-6) was developed on former marshland in 1985 for storage purposes. The western building (Kolenbeekstieg 1) was developed on former marshland in 1992 for storage and
distribution use. During construction, the site area was backfilled with sandy material, comprising small amounts of building rubble and slag to provide a suitable development platform.
|
||
| Summary of known specification: | ||
| Characteristic | Result | |
| Built / Renovation | 1985 and 1992 | |
| Eaves Height | c. 6 metres | |
| No. of loading Doors | 32 | |
| Loading Door Ratio | 0.55 | |
| Yard Depth | c. 10-35 metres | |
| Cross-Dock | Yes | |
| Warehouse (% of GLA) | 92% | |
| Site Coverage Ratio | 65% | |
| ON BEHALF OF: | MORGAN STANLEY |
| PROJECT NAME: | MSTAR |
| Source: Phase I Environmental Review dated December 2019; the information gathered during the site inspection. | ||||
| ACCOMMODATION | We have not measured the property, but as instructed, we have relied upon.floor areas made available to us. | |||
| Unit Description | Primary Use | Status | Area (sq m) | |
| Office | Office | LET | 985 | |
| Office | Office | VACANT | 239 | |
| Other | Other | LET | 249 | |
| Warehouse | Logistics | LET | 17,895 | |
| Total (lettable) | 19,368 | |||
| DUE DILIGENCE | |
| STATE OF REPAIR | CBRE have not undertaken a structural survey, nor tested the services. The property was subject to an inspection for valuation purposes in early 2020. As you are aware, the property has not been re-inspected for the purposes of this report, nor have we been provided with updated TDD. We have thereforerelied on the information provided by the Borrower, including a Capexschedule dated 12 June 2019 and schedule with revised budget of capexdated 19 January 2021. Based on the latter which indicates TDD assessment less completed spend in 2020, we have included the immediate and 2-5 years capex of €890,000 within our valuation. |
| According to our own limited inspection for valuation purposes, our opinion regarding the state of repair would substantiate the assessment by Arcadis. Based on our impression gained during the inspection, we are of the opinion that the buildings are in a fair condition, in line with the year of construction. | |
| ENVIRONMENTAL CONSIDERATIONS | We have summarised the findings from a schedule provided in relation to ‘Priority sites’ within the front section of this report. |
| We have been made aware that the property is registered in the register of contaminated sites (Altlastenregister) which indicates a contamination or a potential contamination of the Properties, in particular due to their current orformer use. If future excavation works are carried out at these Properties, this could lead to additional costs. However, no action is required on the currentuse of the Properties. As such we have assumed this does not have a material impact on our opinion of value given the valuation is prepared taken the current use into consideration. | |
| According to the Draft Environmental Due Diligence report dated 10 January 2020 from Ambiente Ltd. There are currently no known ground/soil | |
| ON BEHALF OF: | MORGAN STANLEY |
| PROJECT NAME: | MSTAR |
| contaminations. However, the following risks for contamination have been identified: | ||
| On-site | ||
| ● | Potential for contamination from Made Ground and light industrial use of the property. | |
| Off-site | ||
| ● | Potential for migration of contamination from neighbouring former light industrial uses. | |
| In addition, there is the risk of the following building pollutants: | ||
| ● | Known asbestos containing materials within building fabric. | |
| From building operations, the following risks have been identified: | ||
| ● | No potential sources of contamination have been identified. | |
| We have been instructed not to make any investigations in relation to the presence or potential presence of contamination in land or buildings or the potential presence of other environmental risk factors and to assume that if investigations were made to an appropriate extent then nothing would bediscovered sufficient to affect value. | ||
| We have not carried out investigation into past uses, either of the properties or of any adjacent lands, to establish whether there is any potential for contamination from such uses or sites, or other environmental risk factor sand have therefore assumed that none exists. Should our assumption prove to be incorrect, we reserve the right to amend our valuation accordingly. | ||
| TENURE | We have had sight of the Draft Red Flag Legal Report prepared by Hengeler Mueller, dated 05 February 2021. Based on the information provided, we understand the property is held freehold. | |
| We have assumed that there are no onerous legal conditions affecting the property which have a material impact on our opinion of value. | ||
| ON BEHALF OF: | MORGAN STANLEY |
| PROJECT NAME: | MSTAR |
| INCOME PROFILE | We have not been provided with rental contracts. The information stated below is based on the rent schedule dated on 30 November 2020. |
| The property is leased to six tenants (Ankerkraut GmbH, BDSK Handels GmbH & Co. KG, Cargotrans GmbH & Co. KG Internationale Spedition, DataLog Spedition GmbH, Dole Europe GmbH, IN-TIME Transport GmbH). 239 sq m of office spaces (1.23% of total space) are vacant. | |
| The property has a WAULT of 3.27 years from the date of valuation. The total gross current rent generated by the property is €1,131,928 per annum whilst our opinion of the total gross market rent is €1,191,312 per annum. The property is shown as under-rented even after accounting for current vacancy. | |
| The main tenant is with about 35% of the total rental space and about 35%of the total rental income is the “Cargotrans GmbH & Co. KG Internationale Spedition”. Cargotrans is a medium-sized company and offers services as an international freight forwarder. In addition to transport organisation, customs clearance and warehousing, other value-added services are also included in the range of services. Cargotrans offers transport through shipping companies, airlines, its own vehicles and other logistics partners. |
| VALUATION CONSIDERATIONS | ||||
| COSTS AND ADJUSTMENTS | Based on the information provided or our knowledge of the market, in approaching our valuation, we made allowances for the following capital and non-recoverable costs. In all cases, we have cited whether they are deducted as at the date of valuationor whether they take effect at a later date. | |||
| Capital Expenditure: | ||||
| Type & Calculation | Source | Effective | Amount | |
| Capital Expenditure:Fixed Amount | Technical Due Diligence |
On Valuation
No Repeat |
€890,000 | |
| Tenant Incentives | CBRE Estimate |
On lease start /renewal
No Repeat |
€3,585 | |
| Letting Fees: 25% of Rental Value | CBRE Estimate |
On lease start /renewal
No Repeat |
€5,019 | |
| TOTAL ON VALUATION | €898,604 | |||
| Revenue Deductions: | ||||
| Type & Calculation | Source | Effective | Annual Amount | |
| General Non-Recoverables:0.5% of rental value | CBRE Estimate |
On Valuation
In perpetuity |
€5,957 | |
| ON BEHALF OF: | MORGAN STANLEY |
| PROJECT NAME: | MSTAR |
| Maintenance: €1.80 per sq m |
CBRE Estimate |
On Valuation + |
€34,859 | |||
| Management 1.5% of rental value |
CBRE Estimate |
On Valuation |
€17,870 | |||
| Void Costs:
€0.50 per sq m |
CBRE Estimate |
On Valuation |
€1,434 | |||
| TOTAL: ON VALUATION |
€25,261 | |||||
| VALUATION METHODOLOGY – MARKET VALUE | We have had regard to the most recent letting transactions and occupational demand for the region within which the subject property is located, including the property itself if of relevance. Within the evidence table appended, we would highlight the propertiesin Stelle as being of greatest relevance in terms of asset characteristics. | |||||
| From within the property itself, we would highlight lettings agreed in 2020 at rates of between €66 and €67 per sq m, albeit we envisage these as slightly higher than the prevailing market. With regard to the rental comparables, we would like to highlight the second rental comparable which is located in the similar micro location, in a close vicinity to the motorway. Therefore, the location can be assessed as comparable. The property was completed in 1992 and has a lettable area of around 3,302 sq m, significantly smaller compared to the subject. Smaller premises often achieve higher rental rates per sq m due to economies of scale or quantum. We have adopted the following rates across the property: | ||||||
| Use | Letting-Status | Rental Area | ERV per sq m | ERV (Total) | ||
| Office | LET | 984.57 sq m | €84.00 /sq m pa | €82,703.88 pa | ||
| Office | VACANT | 239.06 sq m | €84.00 /sq m pa | €20,082.72 pa | ||
| Other | LET | 248.29 sq m | €60.00 /sq m pa | € 14,897.40 pa | ||
| Warehouse | LET | 17,895.04 sq m | €60.00 /sq m pa | €1,073,702.40 pa | ||
| Total* | 19,367.12 sq m | €61.52 /sq m pa | €1,191,312.40 pa | |||
| * The total amount of ERV and rental area may differ from the calculation printout due to rounding differences. | ||||||
| We have arrived at our opinion of Market Value adopting the Traditional investment capitalisation method of valuation. Within this approach, we apply an income weighted average equivalent yield to our opinion of net income, reflecting the comparable evidence within the market for guidance on capital rates and values per sq m. | ||||||
| We would like to highlight investment comparable number one and two. We would highlight that there is a lack of detail relating to the income profile of the assets and therefore limits on assessing the yield profile. Our principal consideration is therefore | ||||||
| ON BEHALF OF: | MORGAN STANLEY |
| PROJECT NAME: | MSTAR |
| on the rate per sq m. There is no further better evidence we are aware of and could highlight in relation to this property. The first investment comparable is similar in macro location, as it is just outside Hanover. In terms of micro location, the subject propertyis closer to a motorway than the comparable. However, it can be considered as having comparable features. The property has a lettable area of around 18,000 sq m and was sold for about €23,846,400 (equating to around €1,325 per sq m) in Q1 2020.Due to comparable macro location, we consider the property to be similar. | |
| The second investment comparable is located in the direct vicinity to the motorway and profits from similar location qualities. The property has a lettable area of around 16,300 sq m and was sold for approx. EUR 18,073,400 (equating to around EUR 1,109 per sq m) in Q1 2020. Due to the comparable micro location, we consider the property similar to the subject of valuation. | |
| For the valuation of this asset, we have applied the following equivalent yield: | |
| - 4.50% | |
| This results in a Net Initial Yield of 4.57% and a capital rate per sq m of €1,177. The Net Initial Yield is currently being influenced by the level of vacancy. | |
| On the assumption that there are no unusual factors of which we are unaware and on the basis of the comments and assumptions specified in this report, CBRE is of the opinion that the Market Value (rounded) of the subject property, is: | |
| €22,800,000 | |
| (twenty-two million and eight hundred thousand Euro) | |
| The unrounded net capital value is €22,799,224. The gross unrounded capital value is €25,122,780 including €898,604 capital costs and €1,424,951 purchaser’s costs (6.25%). | |
| Our opinion of Market Value is based upon the Scope of Work and Valuation Assumptions attached and has been primarily derived using comparable recent market transactions on arm’s length terms. | |
| VALUATION METHODOLOGY – VACANT POSSESSION VALUE | The constituent inputs in terms of rental value and non-recoverable costs largely align with the Market Value approach. The key exception being that we have adopted a special assumption that the property is 100% vacant/non-income producing as at the valuation date. This value is predominantly derived using the traditional investment method of valuation but critically benchmarking the resultant capital rate per sq m against the prevailing evidence. |
| In approaching our valuation under the Special Assumption that the property is entirely vacant (Vacant Possession Value), we have adopted a total void period of 12 months inclusive of rent free or tenant incentives and targeted an equivalent yield of 5%. | |
| This results in a net rounded value of €18,900,000, equating to €976 per sq m. | |
| ESTIMATED REINSTATEMENT ASSESSMENT |
The property has not been inspected by a suitably qualified building surveyor from CBRE, nor have we carried out a full Reinstatement Cost Assessment. For indicative purposes only we estimate that the reinstatement cost of insurance purposes would be in the region of €22,613,029 (rounded, excl. VAT) on a day one basis, including fees but excluding VAT and inflation. |
| ON BEHALF OF: | MORGAN STANLEY |
| PROJECT NAME: | MSTAR |
| This figure should be compared with the current sum insured and if a material discrepancy exists we suggest that a full Reinstatement Cost Assessment is carried out. |
| ON BEHALF OF: | MORGAN STANLEY |
| PROJECT NAME: | MSTAR |
| RENTAL EVIDENCE |
| PROPERTY ADDRESS |
PROPERTY USE |
DATE | TOTAL AREA (SQ M] |
TENANT | LEASE LENGTH (YEARS) |
BREAK OPTION |
RENT (P.A) (€) |
MONTHLY RENTAL RATE PER SQ M (€) |
RELATIVE QUALITY |
| 22525 Hamburg |
Warehouse | Q1 2020 | 4,447 | n/a | n/a | n/a | 235,294 | 4.50 | Similar (distance to motorway) but inferior building |
| 21435 Stelle | Warehouse | Q4 2019 | 11,302 | n/a | n/a | n/a | 745,932 | 5.50 | Similar (macro location) |
| 21432 Stelle | Warehouse | Q4 2019 | 3,302 | n/a | n/a | n/a | 214,932 | 5.50 | Similar (macro location) |
| 21435 Stelle | Warehouse | Q4 2019 | 1,186 | n/a | n/a | n/a | 78,276 | 5.50 | Similar (macro location) |
| 21435 Stelle | Warehouse | Q4 2019 | 11,367 | n/a | n/a | n/a | 750,222 | 5.50 | Similar (macro location) |
| ON BEHALF OF: | MORGAN STANLEY |
| PROJECT NAME: | MSTAR |
| SALES EVIDENCE | |||||||||
| PROPERTY ADDRESS |
PROPERTY USE |
DATE | TOTAL AREA (SQ M) |
PASSING RENT PER ANNUM |
WAULT | PURCHASE PRICE (€) |
NET INITIAL YIELD (%) |
CAPITAL RATE PER SQ M (€) |
RELATIVE QUALITY |
|
30179 Hannover |
Warehouse | Q1 2020 | 18,000 | n/a | n/a | 23,846,400 | n/a | 1,325 | Similar (micro location) |
|
30826 Garbsen
|
Warehouse | Q1 2020 | 16,300 | n/a | n/a | 18,073,400 | n/a | 1,109 |
Similar (macro location) |
| 28832 Achim | Warehouse | Q1 2019 | 16,464 | n/a | n/a | 20,546,975 | n/a | 1,248 |
Similar (micro location) |
|
31515 Wunstorf |
Warehouse | Q1 2019 | 10,988 | n/a | n/a | 13,211,519 | n/a | 1,202 |
Similar (similar location) |
| PROPERTY ID: | dekorn - Kornwestheimer Str. 54 | |
| ON BEHALF OF: | MORGAN STANLEY | |
| VALUATION DATE: | 01-Feb-2021 | FINAL |
| |
||
| |
||
Kornwestheimer Str. 54 - Kornwestheimer Str. 54, Korntal-Münchingen, 70825, Germany
|
|
|
|
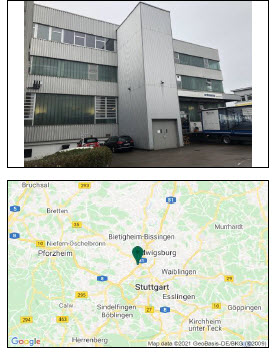 |
|
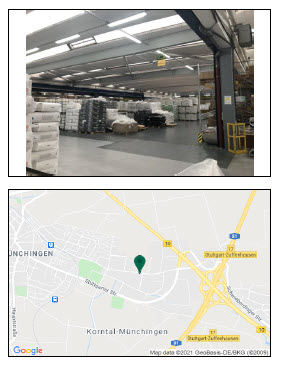 |
|
|
|
|
| VALUATION METRICS | (currency - EUR) |
| Metric | Value |
| Market Value | 12,475,000 |
| Market Value (per sq m) | 992 |
| Net Initial Yield | 4.66% |
| Reversionary Yield | 4.92% |
| Equivalent Yield | 4.70% |
| Gross Income (p.a.) | 643,119 |
| Gross Income (p.a.) (per sq m) | 51 |
| *Adj. Gross Income | 643,119 |
| Adj. Gross Income (per sq m) | 51 |
| Net Income (p.a.) | 625,505 |
| Net Income (p.a.) (per sq m) | 50 |
| Gross Rental Value | 704,556 |
| Gross Rental Value (per sq m) | 56 |
| Capital Expenditure | -471,000 |
| Transaction Costs | 7.50% |
| Over / Under Rented | -8.72% |
| KEY FACTS | ||
| Metric | Value | |
| Total Area (sq m) | 12,574 | |
| WAULT to Break by Rent | 4.83 | |
| WAULT to Break by ERV | 4.85 | |
| WAULT to Expiry by Rent | 4.83 | |
| WAULT to Expiry by ERV | 4.85 | |
| Percentage of Vacancy (Area) | 0.00% | |
| Percentage of Vacancy (ERV) | 0.00% | |
| ** | Number of Tenants | 5 |
| Current Voids (months) | - |
| * Adjusted Gross Income equates to the Gross Income excluding any rent free periods | |
| LEASES RANKED BY RENT | ** Total tenant lines within our valuation. May differ to number of individual tenants |
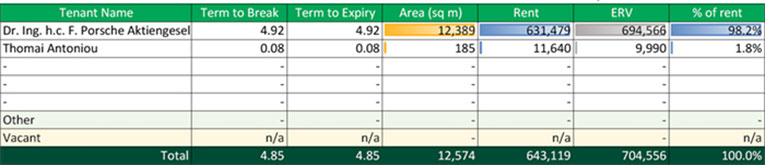
| Printed 09/03/2021 19:44 | |
| PROPERTY ID: | dekorn - Kornwestheimer Str. 54 | |
| ON BEHALF OF: | MORGAN STANLEY | |
| VALUATION DATE: | 01-Feb-2021 | FINAL |
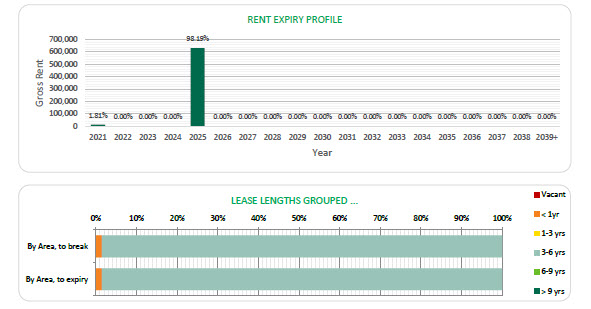
| Printed 09/03/2021 19:44 | |
| ON BEHALF OF: | MORGAN STANLEY | |
| PROJECT NAME: | MSTAR | |
PROPERTY REPORT
70825 KORNTAL-MUENCHINGEN – KORNWESTHEIMER STRASSE 54
| INSPECTED BY: | INSPECTION DATE: | VALUATION DATE: | PROPERTY TYPE |
| MAREIKE RECK | 08/01/2020 | 01/02/2021 | LIGHT INDUSTRIAL |
KEY VALUATION FACTORS
| STRENGTHS | WEAKNESSES | ||
|
■ The subject property is located in the logistics region Stuttgart;
■ Good access to the motorway A81 (1.2 km) and B10 (0.6 km);
■ The subject property is fully let;
|
■ The anchor tenant produces more than 98% of the income stream;
■ Building contains hazardous materials;
■ Few subdivision possibilities for multi-tenant concept;
■ WAULT of 4.83 years to breaks.
|
||
| OPPORTUNITIES | THREATS | ||
|
■ The continuing positive development of the overall economy could lead to an increase
■ Removal of the break option or tenant remains in occupation until expiry;
■ Re-letting at market terms could improve income profile (due to slight under-rent |
■ Fluctuations in the world economy and the global capital markets could have negative effects on German real estate market purchase prices;
■ Potential risk of soil contamination due to storage of heating oil, hydraulic oil and chemicals by the tenant.
|
LOCATION & SITUATION
| LOCATION |
The next largest economically significant city is Stuttgart. The state capital Stuttgart is the centre of the most export-oriented metropolitan region in Germany. It also marks the political, economic and cultural centre of Baden- Wuerttemberg and is with over 630,000 inhabitants the largest city. Stuttgart is regarded as one of the leading German economic centres with a strong dominance of high-tech companies. Key industries include the automotive industry and electrical engineering.
In comparison to other conurbations, the Stuttgart logistics region does not represent a preferred logistics location among the A-cities, despite its favourable location and good traffic connections. |
| ON BEHALF OF: | MORGAN STANLEY | |
| PROJECT NAME: | MSTAR | |
|
Within the city of Korntal-Muenchingen, the subject property is situated in an area, which is mainly used for commercial and industrial purposes. The direct surroundings consist of industrial companies, logistic service providers and retailers.
The motorway connection can be described as good because of the proximity to the motorway A81. The next airport is situated in Stuttgart around 30 km away and reachable in approximately 35 minutes. The airport offers national and international connections.
|
PROPERTY DESCRIPTION
| DESCRIPTION |
The site covers an area of approximately 1 hectare and comprises a building complex with a one to three-storey warehouse / factory building (building units B, C, D as depicted in the above aerial view) and a four-storey office/residential building in the north (building unit A). Building units A and B are fitted with basement levels.
The buildings cover approximately 75% of the site area. Approximately 20% of the site is covered with hardstanding (tarmac) used for access roads and car parking and approximately 5% of the property along the north- eastern site boundary comprises landscaping (grass and bushes/trees).
The property was developed on greenfield land in c.1975-1977 and used as a lamp factory. The original property included a 4-storey office annex with company owned apartments in the south, which was demolished in 1995.
Summary of known specification:
|
||
| Characteristic | Result | ||
| Built / Renovation | 1975-1977 | ||
| Eaves Height | 5.6 metres | ||
| No. of loading Doors | 7 | ||
| Loading Door Ratio | 0.56 | ||
| Yard Depth | Approx. 15 meters | ||
| Cross-Dock | No | ||
| Warehouse (% of GLA) | 78% | ||
| Site Coverage Ratio | 75% | ||
| Source: Phase I Environmental Review dated January 2020; the information gathered during the site inspection. | |||
| ON BEHALF OF: | MORGAN STANLEY | |
| PROJECT NAME: | MSTAR | |
| ACCOMMODATION | We have not measured the property, but as instructed, we have relied upon floor areas made available to us. | ||||
| Unit Description | Primary Use | Status | Area (sq m) | ||
| Office | Office | LET | 1,065 | ||
| Warehouse | Storage/Production | LET | 11,509 | ||
| Total (lettable) | 12,574 | ||||
DUE DILIGENCE
| STATE OF REPAIR |
CBRE have not undertaken a structural survey, nor tested the services. The property was subject to an inspection for valuation purposes in early 2020. As you are aware, the property has not been re-inspected for the purposes of this report, nor have we been provided with updated TDD. We have therefore relied on the information provided by the Borrower, including a Capex schedule dated 12 June 2019 and schedule with revised budget of capex dated 19 January 2021. Based on the latter which indicates TDD assessment less completed spend in 2020, we have included the immediate and 2-5 years capex of €471,000 within our valuation.
According to our own limited inspection for valuation purposes, our opinion regarding the state of repair would substantiate the assessment by Arcadis. Based on our impression gained during the inspection, we are of the opinion that the buildings are in a fair condition, in line with the year of construction.
|
|
| ENVIRONMENTAL CONSIDERATIONS |
We have summarised the findings from a schedule provided in relation to ‘Priority sites’ within the front section of this report.
According to the Draft Environmental Due Diligence report dated 10 January 2020 from Ambiente Ltd. There are currently no known ground/soil contaminations. However, the following risks for contamination have been identified:
On-site
● Potential for contamination from light industrial use of the subject property since c. 1975.
Off-site
● Potential for migration of contamination from neighbouring uses (adjacent logistics sites and fuel station 200m SW).
In addition, there is the risk of the following building pollutants:
● Potential and known hazardous building materials within the building fabric.
From building operations, the following risks have been identified:
|
| ON BEHALF OF: | MORGAN STANLEY | |
| PROJECT NAME: | MSTAR | |
| ● Storage of heating oil (1 x 30,000 litres UST, 1 x 50,000 litres UST), hydraulic oil for lifts (3 x up to 500 litres AST) and limited storage of chemicals by the tenant. | ||
|
We have been instructed not to make any investigations in relation to the presence or potential presence of contamination in land or buildings or the potential presence of other environmental risk factors and to assume that if investigations were made to an appropriate extent then nothing would be discovered sufficient to affect value.
We have not carried out investigation into past uses, either of the properties or of any adjacent lands, to establish whether there is any potential for contamination from such uses or sites, or other environmental risk factors and have therefore assumed that none exists. Should our assumption prove to be incorrect, we reserve the right to amend our valuation accordingly.
|
||
| TENURE |
We have had sight of the Draft Red Flag Legal Report prepared by Hengeler Mueller, dated 05 February 2021. Based on the information provided, we understand the property is held freehold.
We have assumed that there are no onerous legal conditions affecting the property which have a material impact on our opinion of value.
|
|
| INCOME PROFILE |
The rental contracts have not been available. The information is based on the rent schedule dated on 30 November 2020.
The property is leased to two tenants (Dr. Ing. h.c. F. Porsche Aktiengesellschaft, Thomai Antoniou). There are no vacancies.
The property has a WAULT of 4.83 years to the date of valuation. The total gross current rent generated by the property is €634,119 per annum whilst our opinion of the total gross market rent is €704,556 per annum. The property is shown as under-rented.
The main tenant is with about 99% of the total rental space and about 98% of the total rental income is the “Dr. Ing. h.c. F. Porsche Aktiengesellschaft”. Porsche AG is the largest and most traditional Sports Car manufacturer.
|
VALUATION CONSIDERATIONS
| COSTS AND ADJUSTMENTS |
Based on the information provided or our knowledge of the market, in approaching our valuation, we made allowances for the following capital and non-recoverable costs. In all cases, we have cited whether they are deducted as at the date of valuation or whether they take effect at a later date.
Capital Expenditure:
|
||||
| Type & Calculation | Source | Effective | Amount | ||
| Capital Expenditure: Fixed Amount | Technical Due Diligence | On Valuation No Repeat | €471,000 | ||
| Tenant Incentives | CBRE Estimate | On lease start / renewal | €0 | ||
| ON BEHALF OF: | MORGAN STANLEY | |
| PROJECT NAME: | MSTAR | |
| No Repeat | |||||
| Letting Fees: 25% of Rental Value | CBRE Estimate |
On lease start / renewal
No Repeat
|
€0 | ||
| TOTAL ON VALUATION | €471,000 | ||||
| Revenue Deductions: | |||||
| Type & Calculation | Source | Effective | Annual Amount | ||
| General Non- Recoverables: 0.5% of rental value | CBRE Estimate |
On Valuation
In perpetuity
|
€3,523 | ||
| Maintenance: €2.15 per sq m | CBRE Estimate |
On Valuation + Delay 60 Months
In perpetuity
|
€27,034 | ||
| Management 2.0% of rental value | CBRE Estimate |
On Valuation
In perpetuity
|
€14,091 | ||
| Void Costs: €0.50 per sq m | CBRE Estimate |
On Valuation
On all voids
|
€0 | ||
| TOTAL: ON VALUATION | €17,614 |
| VALUATION METHODOLOGY – MARKET VALUE |
We have had regard to the most recent letting transactions and occupational demand for the region within which the subject property is located, including the property itself if of relevance. The rental rates range between €54 and €78 per sq m per annum, depending on the specific details of the letting.
The first rental comparable is located in the similar micro location, in a close vicinity to the motorway. Therefore, the location can be assessed as comparable. The property was completed in 1965 and has a lettable area of around 1,380 sq m. The building can be considered inferior due to age. It is advantageous that a bus stop is located in the immediate vicinity of the subject property. We have adopted the following rental rates within our valuation:
|
|||||
| Use | Letting-Status | Rental Area | ERV per sq m | ERV (Total) | ||
| Office | LET | 1,065.00 sq m | €78.00 /sq m pa | €83,070.00 pa | ||
| Warehouse | LET |
11,509.00 sq m
|
€ 54.00 /sq m pa |
€ 621,486.00 pa |
||
| Total* | 12,574.00 sq m | €56.03 /sq m pa | €704,556.00 pa | |||
| ON BEHALF OF: | MORGAN STANLEY | |
| PROJECT NAME: | MSTAR | |
|
* The total amount of ERV and rental area may differ from the calculation printout due to rounding differences.
We have arrived at our opinion of Market Value adopting the Traditional investment capitalisation method of valuation. Within this approach, we apply an income weighted average equivalent yield to our opinion of net income, reflecting the comparable evidence within the market for guidance on capital rates and values per sq m.
We would like to highlight investment comparable number one and two. Investment comparable one is located in a slightly worse micro and macro location, as it has a longer distance to the motorway. It also is not as close to a bigger city as the subject property. The property has a lettable area of around 14,000 sq m. It was sold for approx. €13,566,000 (equating to around €969 per sq m) in Q1 2020. Due to the worse location, we consider the property slightly worse to the subject of valuation.
Investment comparable two is also located in the vicinity to the motorway. The location can be considered as slightly worse. The property has a lettable area of around 3,500 sq m and was sold for about €3,200,000 (equating to around €914 per sq m) in Q3 2019. Due to the inferior macro location, we consider the property to be slightly worse.
For the valuation of this asset, we have applied the following equivalent yield:
- 4.70%
This results in a Net Initial Yield of 4.66% and a capital rate per sq m of €992.
On the assumption that there are no unusual factors of which we are unaware and on the basis of the comments and assumptions specified in this report, CBRE is of the opinion that the Market Value (rounded) of the subject property, is:
€12,475,000
(twelve million and four hundred seventy-five thousand Euro)
The unrounded net capital value is €12,480,401. The gross unrounded capital value is €13,887,431 including €471,000 of capital costs and €936,030 purchaser’s costs (7.50%) respectively.
Our opinion of Market Value is based upon the Scope of Work and Valuation Assumptions attached and has been primarily derived using comparable recent market transactions on arm’s length terms.
|
||
| VALUATION METHODOLOGY – VACANT POSSESSION VALUE |
The constituent inputs in terms of rental value and non-recoverable costs largely align with the Market Value approach. The key exception being that we have adopted a special assumption that the property is 100% vacant/non-income producing as at the valuation date. This value is predominantly derived using the traditional investment method of valuation but critically benchmarking the resultant capital rate per sq m against the prevailing evidence.
In approaching our valuation under the Special Assumption that the property is entirely vacant (Vacant Possession Value), we have adopted a total void period of 12 months inclusive of rent free or tenant incentives and targeted an equivalent yield of 5.3%.
This results in a net rounded value of €10,200,000, equating to €811 per sq m.
|
| ON BEHALF OF: | MORGAN STANLEY | |
| PROJECT NAME: | MSTAR | |
| ESTIMATED REINSTATEMENT ASSESSMENT |
The property has not been inspected by a suitably qualified building surveyor from CBRE, nor have we carried out a full Reinstatement Cost Assessment. For indicative purposes only we estimate that the reinstatement cost of insurance purposes would be in the region of €16,741,193 (rounded, excl. VAT) on a day one basis, including fees but excluding VAT and inflation.
This figure should be compared with the current sum insured and if a material discrepancy exists we suggest that a full Reinstatement Cost Assessment is carried out.
|
| ON BEHALF OF: | MORGAN STANLEY | |
| PROJECT NAME: | MSTAR | |
RENTAL EVIDENCE
| PROPERTY ADDRESS | PROPERTY USE | DATE | TOTAL AREA | TENANT | LEASE LENGTH (YEARS) | BREAK OPTION | RENT (P.A) | MONTHLY RENTAL RATE PER SQ M | RELATIVE QUALITY |
| 77955 Ettenheim | Warehouse | Q1 2020 | 26,800 | n/a | n/a | n/a | 1,372,800 | 4.00 | Similar (distance to the motorway) |
| 71706 Markgröningen | Warehouse | Q4 2019 | 1,380 | n/a | n/a | n/a | 74,520 | 4.50 | Similar (macro location) |
| 71254 Ditzingen | Warehouse | Q4 2019 | 5,000 | n/a | n/a | n/a | 270,000 | 4.50 | Similar (macro location) |
| 71701 Schieberdingen | Warehouse | Q4 2019 | 1,520 | n/a | n/a | n/a | 76,608 | 4.20 | Similar (distance to the motorway) |
| 71696 Möglingen | Warehouse | Q4 2019 | 1,700 | n/a | n/a | n/a | 91,800 | 4.50 | Similar (distance to the motorway) |
| ON BEHALF OF: | MORGAN STANLEY | |
| PROJECT NAME: | MSTAR | |
SALES EVIDENCE
| PROPERTY ADDRESS | PROPERTY USE | DATE | TOTAL AREA (SQ M) | PASSING RENT PER ANNUM (€) | WAULT | PURCHASE PRICE (€) | NET INITIAL YIELD (%) | CAPITAL RATE PER SQ M (€) | RELATIVE QUALITY |
| 74722 Buchen (Odenwald) | Warehouse | Q1 2020 | 14,000 | 714,000 | n/a | 13,566,000 | n/a | 969 | Slightly worse (macro location) |
| 74628 Rottweil | Warehouse | Q3 2019 | 3,500 | n/a | n/a | 3,200,000 | n/a | 914 | Slightly worse (macro location) |
| 77694 Kehl | Warehouse | Q1 2019 | 12,861 | 791,452 | n/a | 12,691,269 | n/a | 987 | Comparable capital rate per sq m |
| 77836 Rheinmünster | Warehouse | Q4 2018 | 44,795 | 2,418,930 | n/a | 43,541,000 | n/a | 972 | Slightly worse (macro location) |
| PROPERTY ID: | deront - Rontgenstrasse 3/7 | |
| ON BEHALF OF: | MORGAN STANLEY | |
| VALUATION DATE: | 01-Feb-2021 | FINAL |
Rontgenstrasse 3/7 - Rontgenstrasse 3/7, Darmstadt, 64291, Germany
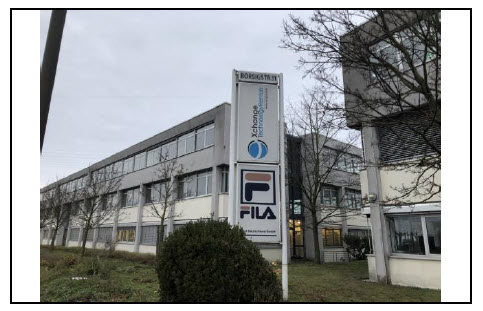 |
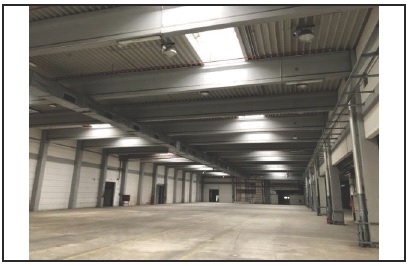 |
 |
 |
| VALUATION METRICS | (currency - EUR) |
| Metric | Value |
| Market Value | 20,050,000 |
| Market Value (per sq m) | 1,016 |
| Net Initial Yield | 2.98% |
| Reversionary Yield | 5.88% |
| Equivalent Yield | 5.50% |
| Gross Income (p.a.) | 726,892 |
| Gross Income (p.a.) (per sq m) | 37 |
| *Adj. Gross Income | 726,892 |
| Adj. Gross Income (per sq m) | 37 |
| Net Income (p.a.) | 640,116 |
| Net Income (p.a.) (per sq m) | 32 |
| Gross Rental Value | 1,347,522 |
| Gross Rental Value (per sq m) | 68 |
| Capital Expenditure | -967,804 |
| Transaction Costs | 7.25% |
| Over / Under Rented | 6.03% |
| KEY FACTS | ||
| Metric | Value | |
| Total Area (sq m) | 19,740 | |
| WAULT to Break by Rent | 3.69 | |
| WAULT to Break by ERV | 4.00 | |
| WAULT to Expiry by Rent | 3.69 | |
| WAULT to Expiry by ERV | 4.00 | |
| Percentage of Vacancy (Area) | 44.82% | |
| Percentage of Vacancy (ERV) | 49.13% | |
| ** | Number of Tenants | 20 |
| Current Voids (months) | 12 | |
| * Adjusted Gross Income equates to the Gross Income excluding any rent free periods | |
| LEASES RANKED BY RENT | ** Total tenant lines within our valuation. May differ to number of individual tenants |
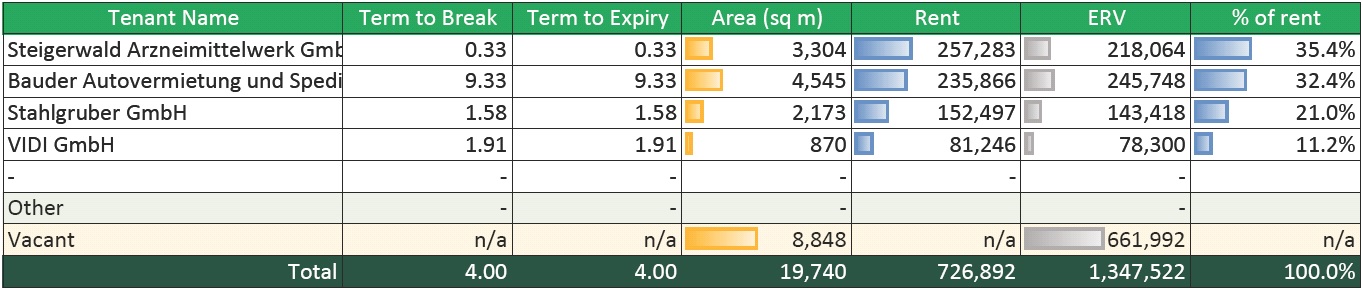 |
| Printed 09/03/2021 19:44 | |
| PROPERTY ID: | deront - Rontgenstrasse 3/7 | |
| ON BEHALF OF: | MORGAN STANLEY | |
| VALUATION DATE: | 01-Feb-2021 | FINAL |
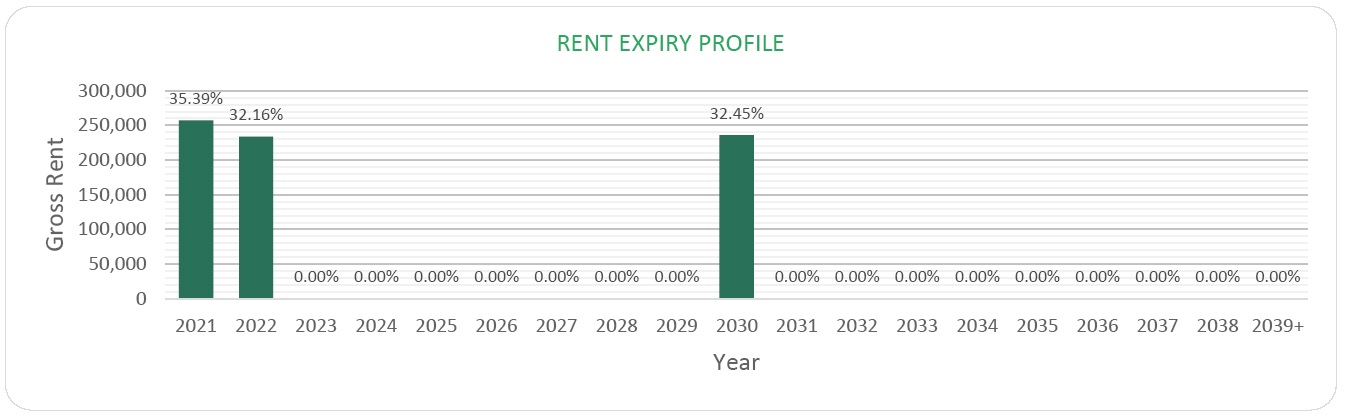 |
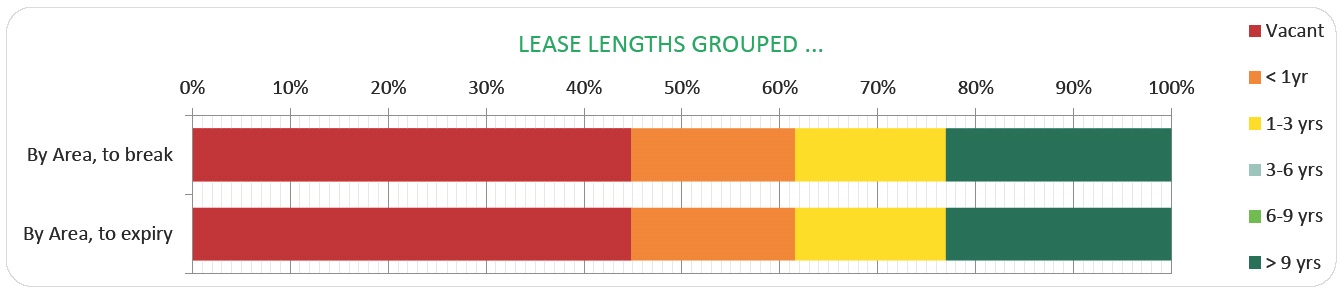 |
| Printed 09/03/2021 19:44 | |
| ON BEHALF OF: | MORGAN STANLEY |
| PROJECT NAME: | MSTAR |
PROPERTY REPORT
64291 DARMSTADT, ROENTGENSTRASSE 3/7
| INSPECTED BY: | INSPECTION DATE: | VALUATION DATE: | PROPERTY TYPE |
| MARIA CHIGRYAY | 13/01/2020 | 01/02/2021 | WAREHOUSE |
KEY VALUATION FACTORS
| STRENGTHS | WEAKNESSES | ||
| ▪ | The subject property is located in a good commercial/logistic location; | ▪ | WALT of 3.69 years; |
| ▪ | Good connection to the motorway network, in vicinity to the motorways A5, A661 and A67; | ▪ | High vacancy rate of around 44.82%; |
| ▪ | Excellent connection to the Frankfurt international airport (driving time of approx15 min). | ▪ | The property is overrented; |
| ▪ | Moderate building quality. | ||
| OPPORTUNITIES | THREATS | ||
| ▪ | The continuing positive development of the overall economy could lead to an increase in achievable rents; | ▪ | Fluctuations in the world economy and the global capital markets could have negative effects on the German commercial real estate market; |
| ▪ | Letting of vacant areas will improve income profile and increase the attractiveness as an investment product. | ▪ | High capital expenditures could occur in the future (due to advanced building age). |
| LOCATION & SITUATION | ||
| LOCATION | The subject property is located in Darmstadt, a city within the economic stronghold region Rhein-Main. Darmstadt is the fourth largest city in Hessen after Frankfurt, Wiesbaden and Kassel. The city is the regional centre, administrative headquarters, and is home to several universities with numerous research facilities and forms the so-called “Engineering Region Darmstadt Rhein-Main-Neckar” with the four surrounding districts. Darmstadt positions itself intensively as the city of science. Due to its location at the intersection of the federal motorways A5 and A67 and the ICE stop, Darmstadt is very well connected to the regional and national transport network and also benefits from its proximity to Frankfurt Airport. | |
| ON BEHALF OF: | MORGAN STANLEY |
| PROJECT NAME: | MSTAR |
| Darmstadt belongs to the Rhine-Main logistics region, a central location within Germany and Europe, combined with an attractive agglomeration, making the region highly appealing for a wide range of logistics tasks. Germany’s major air freight hub, Frankfurt Airport, links the Rhine-Main area to other economic hot spots all over the world. | ||
| The subject property is situated in an established commercial area, which is mainly dominated by commercial and industrial premises. The direct surroundings consist of industrial companies and also retailers. | ||
| The motorway connection can be described as good, due to the proximity to the federal motorways A5, A661 and A67. The next airport is situated in Frankfurt around 25 km away and is reachable in approx. 15 minutes driving time. The airport is the fourth largest airport in Europe according to passenger numbers and offers national and international flight connections. |
PROPERTY DESCRIPTION
| DESCRIPTION |
The property covers an area of approximately 2.97 hectares and comprises several buildings for office and logistics purposes.
The northern site building complex (Roentgenstrasse 7) comprises two attached warehouses with office accomodation.
The southern site building complex (Roentgenstrasse 3) comprises a T-shaped three-storey office building fitted with an underground car park in the southern section and two single-storey warehouse sections attached to the west and east of the office section.
The buildings cover approx. 60% of the site area. Around 30% of the site is covered with hardstanding (brick paved access road, yard areas and parking) and ~10% of the property, predominately along the site boundaries and the southern area of the site, comprises landscaping (grass and bushes/trees)
The northern site building complex located at Roentgenstrasse 7 was constructed in 1989 and was extended with the roofed storage area in 2002.
The southern site building complex located at Roentgenstrasse 3 was constructed in c.1995 for office and storage usage.
Summary of known specification: |
| Characteristic | Result | ||
| Built / Renovation | 1989-1995 / 2002 | ||
| Eaves Height | 7 metres | ||
| No. of loading Doors | 30 | ||
| Loading Door Ratio | 1.80 | ||
| Yard Depth | 100 metres | ||
| Cross-Dock | Yes | ||
| Warehouse | (% of GLA) 83% |
| ON BEHALF OF: | MORGAN STANLEY |
| PROJECT NAME: | MSTAR |
| Site Coverage Ratio | 60% | ||
| Source: Phase I Environmental Review dated December 2019; the | |||
| information gathered during the site inspection. | |||
| ACCOMMODATION | We have not measured the property, but as instructed, we have relied upon floor areas made available to us. |
| Unit description | Primary use | Status | Area (sq m) | ||
| Warehouse | Logistics | Let | 8,955 | ||
| Warehouse | Logistics | Vacant | 5,597 | ||
| Office | Office | Let | 1,050 | ||
| Office | Office | Vacant | 3,251 | ||
| Other | Other | Let | 887 | ||
| Total (lettable) | 19,740 |
DUE DILIGENCE
| STATE OF REPAIR | CBRE have not undertaken a structural survey, nor tested the services. The property was subject to an inspection for valuation purposes in early 2020. As you are aware, the property has not been re-inspected for the purposes of this report, nor have we been provided with updated TDD. We have therefore relied on the information provided by the Borrower, including a Capex schedule dated 12 June 2019 and schedule with revised budget of capex dated 19 January 2021. Based on the latter which indicates TDD assessment less completed spend in 2020, we have included the immediate and 2-5 years capex of €301,000 within our valuation. | |
| According to our own limited inspection for valuation purposes, our opinion regarding the state of repair would substantiate the assessment by Arcadis. Based on our impression gained during the inspection, we are of the opinion that the buildings are in a fair condition, in line with the year of construction. | ||
| ENVIRONMENTAL CONSIDERATIONS |
We have summarised the findings from a schedule provided in relation to ‘Priority sites’ within the front section of this report. | |
| We have been made aware that the property is registered in the register of contaminated sites (Altlastenregister) which indicates a contamination or a potential contamination of the Properties, in particular due to their current or former use. If future excavation works are carried out at these Properties, this could lead to additional costs. However, no action is required on the current use of the Properties. As such we have assumed this does not have a material |
| ON BEHALF OF: | MORGAN STANLEY |
| PROJECT NAME: | MSTAR |
| impact on our opinion of value given the valuation is prepared taken the current use into consideration. | ||
| According to the Draft Environmental Due Diligence report dated 13 December 2019 by Ambiente Ltd. there are currently no known ground/soil contaminations. However, the following risks for contamination have been identified: | ||
| On-site | ||
| • Potential for contamination from storage and handling of pharmaceuticals and associated chemicals. | ||
| Off-site | ||
| • Potential for migration of contamination from former and current neighbouring light industrial uses since approx. the 1970s. | ||
| In addition, there is a risk of the following building pollutants: | ||
| • Potential asbestos containing materials (Roentgenstrasse 7) and artificial mineral fibres (both building complexes) within the building fabric. | ||
| From building operations, the following risks have been identified: | ||
| • Storage of small volumes of hydraulic oil (lift) and diesel (sprinkler pump). | ||
| We have been instructed not to make any investigations in relation to the presence or potential presence of contamination in land or buildings or the potential presence of other environmental risk factors and to assume that if investigations were made to an appropriate extent then nothing would be discovered sufficient to affect value. | ||
| We have not carried out investigation into past uses, either of the properties or of any adjacent lands, to establish whether there is any potential for contamination from such uses or sites, or other environmental risk factors and have therefore assumed that none exists. Should our assumption prove to be incorrect, we reserve the right to amend our valuation accordingly. | ||
| TENURE | We have had sight of the Draft Red Flag Legal Report prepared by Hengeler Mueller, dated 05 February 2021. Based on the information provided, we understand the property is held freehold. | |
| We have assumed that there are no onerous legal conditions affecting the property which have a material impact on our opinion of value. |
| ON BEHALF OF: | MORGAN STANLEY |
| PROJECT NAME: | MSTAR |
| INCOME PROFILE | The rental contracts have not been made available to us. The information is based on the rent schedule dated 30 November 2020. | |
| The property is leased to four tenants (Bauder Autovermietung und Spedition GmbH, Stahlgruber GmbH, Steigerwald Arzneimittelwerk GmbH, VIDI GmbH). 3,251 sq m of office space and 5,597 sq m of warehouse space(44.82% of total space) are vacant. | ||
| The property has a WAULT of 3.69 years as at the date of valuation. The total gross current rent generated by the property is €726,892 per annum whilst our opinion of the total gross market rent is €1,347,522 per annum. The property is shown as over-rented after accounting for the current level of vacancy. | ||
| The main tenant, with around 23% of the total rental space and approx. 32% of the total rental income, is “Bauder Autovermietung und Spedition GmbH”. The company is specialized in household applications handling and freight forwarding. |
VALUATION CONSIDERATIONS
| COSTS AND ADJUSTMENTS |
Based on the information provided and our knowledge of the market, in approaching our valuation, we made allowances for the following capital and non-recoverable costs. In all cases, we have cited whether they are deducted as at the date of valuation or whether they take effect at a later date. | |
| Capital Expenditure: | ||
| Type & Calculation | Source | Effective | Amount | ||
| Capital Expenditure: | Technical Due | On Valuation | €301,000 | ||
| Fixed Amount | Diligence | ||||
| No Repeat | |||||
| Tenant Incentives | CBRE Estimate | On lease start / | €265,440 | ||
| renewal | |||||
| No Repeat | |||||
| Letting Fees: 25% of | CBRE Estimate | On lease start / | €165,498 | ||
| Rental Value | renewal | ||||
| No Repeat | |||||
| Rent Free – Bauder | CBRE Estimate | On Valuation | €235,866 | ||
| Autovermietung und | |||||
| Spedition GmbH | No Repeat | ||||
| TOTAL ON | €967,804 | ||||
| VALUATION |
| Revenue Deductions: | |||||
| Type & Calculation | Source | Effective | Annual Amount |
| ON BEHALF OF: | MORGAN STANLEY |
| PROJECT NAME: | MSTAR |
| General Non- | CBRE Estimate | On Valuation | €6,738 | ||
| Recoverables: | |||||
| In perpetuity | |||||
| 0.5% of rental value | |||||
| Maintenance: | CBRE Estimate | On Valuation + | €49,350 | ||
| €2.50 per sq m | Delay 60 Months | ||||
| In perpetuity | |||||
| Management | CBRE Estimate | On Valuation | €26,950 | ||
| 2.0% of rental value | In perpetuity | ||||
| Void Costs: | CBRE Estimate | On Valuation | €53,088 | ||
| €0.50 per sq m | |||||
| On valuation | |||||
| TOTAL: ON | €86,776 | ||||
| VALUATION | |||||
| VALUATION METHODOLOGY – MARKET VALUE |
We have had regard to the most recent letting transactions and occupational demand for the region within which the subject property is located, including the property itself if of relevance. The rental rates range between €66.00 and €90.00 per sq m per annum, depending on the duration of the lease contract, building specifications and age. Within the evidence table appended, we would highlight the comparable properties in Darmstadt as being of greatest relevance in terms of asset characteristics. | |
| Regarding the rental comparables, we would also like to highlight the first rental comparable which is located in a similar micro location, within close vicinity to the motorway. Therefore, the location can be assessed as comparable. The property comprises a warehouse and has a lettable area of around 11,000 sq m. In addition, the property benefits from good public transport connections and a good connection to the motorway network. We have adopted the following rental rates within our valuation: |
| Use | Letting-Status | Rental Area | ERV per sq m | ERV (Total) | ||
| Office | LET | 1,050.00 sq m | €90.00 /sq m pa | €94,500.00 pa | ||
| Office | VACANT | 3,251.00 sq m | €90.00 /sq m pa | €292,590.00 pa | ||
| Warehouse | LET | 8,955.00 sq m | €66.00 /sq m pa | €591,030.00 pa | ||
| Warehouse | VACANT | 5,597.00 sq m | €66.00 /sq m pa | €369,402.00 pa | ||
| Other | LET | 887 sq m | €00.00 / sq m pa | €00.00 pa | ||
| Total | 19,740.10 sq m | €68.26 /sq m pa | €1,347,522.00 pa |
| We have arrived at our opinion of Market Value adopting the traditional investment capitalisation method of valuation. Within this approach, we apply an income |
| ON BEHALF OF: | MORGAN STANLEY |
| PROJECT NAME: | MSTAR |
| weighted average equivalent yield to our opinion of net income, reflecting the comparable evidence within the market for guidance on capital rates and values per sq m. | ||
| We would highlight investment comparables one and two: | ||
| The first investment comparable is located in Aschaffenburg. The property has a lettable area of around 7,881 sq m and was sold for approx. EUR 7,950,000 (equating to EUR 1,009 per sq m) in Q4 2020. The building condition of the property is rated as better, even though the macro location is similar, this property is superior. | ||
| Investment comparable number two is located in Remscheid. The property is located near Düsseldorf and therefore close to a large city. The location can also be rated as better due to its proximity to the Ruhr area. The property has a lettable area of around 5,494 sq m and was sold for approx. EUR 5,950,000 (equating to EUR 901 per sq m) in Q4 2020. Due to its location, we consider the comparable property to be slightly superior. Both of the aforementioned comparables are smaller than the subject property and as such we would expect an degree of inverse quantum on the capital rate per square metre. | ||
| For the valuation of this asset, we have applied the following Equivalent Yield: | ||
| - 5.50% | ||
| This results in a Net Initial Yield of 2.98% and a capital rate per sq m of €1,016. The Net Initial Yield is currently being influenced by the level of vacancy. | ||
| On the assumption that there are no unusual factors of which we are unaware and on the basis of the comments and assumptions specified in this report, CBRE is of the opinion that the Market Value (rounded) of the subject property, is: | ||
| €20,050,000 | ||
| (twenty million and one fifty thousand Euro) | ||
| The unrounded net capital value is €20,061,854. The gross unrounded capital value is €22,484,142 including €967,804 of capital costs and 1,454,485 purchaser’s costs (7.25%) respectively. | ||
| Our opinion of Market Value is based upon the Scope of Work and Valuation Assumptions attached and has been primarily derived using comparable recent market transactions on arm’s length terms. | ||
| VALUATION METHODOLOGY – VACANT POSSESSION VALUE |
The constituent inputs in terms of rental value and non-recoverable costs largely align with the Market Value approach. The key exception being that we have adopted a special assumption that the property is 100% vacant/non-income producing as at the valuation date. This value is predominantly derived using the traditional investment method of valuation but critically benchmarking the resultant capital rate per sq m against the prevailing evidence. | |
| In approaching our valuation under the Special Assumption that the property is entirely vacant (Vacant Possession Value), we have adopted a total void period of 12 months inclusive of rent free or tenant incentives and targeted an equivalent yield of 7.1%. | ||
| This results in a net rounded value of €14,150,000, equating to €717 per sq m. |
| ON BEHALF OF: | MORGAN STANLEY |
| PROJECT NAME: | MSTAR |
| ESTIMATED REINSTATEMENT ASSESSMENT |
The property has not been inspected by a suitably qualified building surveyor from CBRE, nor have we carried out a full Reinstatement Cost Assessment. For indicative purposes only we estimate that the reinstatement cost of insurance purposes would be in the region of €27,389,293 (rounded, excl. VAT) on a day one basis, including fees but excluding VAT and inflation. |
| This figure should be compared with the current sum insured and if a material discrepancy exists we suggest that a full Reinstatement Cost Assessment is carried out. |
| ON BEHALF OF: | MORGAN STANLEY |
| PROJECT NAME: | MSTAR |
RENTAL EVIDENCE
| PROPERTY ADDRESS |
PROPERTY USE |
DATE | TOTAL AREA (SQ M) |
TENANT | LEASE LENGTH (YEARS) |
BREAK OPTION |
RENT (P.A) (€) |
MONTHLY RENTAL RATE PER SQ M (€) |
RELATIVE QUALITY |
| 64293 Darmstadt |
Warehouse | Q4 2020 | 8,000 | n/a | n/a | n/a | 504,00 | 5.25 | Similar (distance to the motorway) |
| 64293 Darmstadt |
Warehouse | Q4 2020 | 18,500 | n/a | n/a | n/a | 1,165,500 | 5.25 | Similar (distance to the motorway) |
| 63755 Alzenau |
Warehouse | Q4 2019 | 10,696 | n/a | n/a | n/a | 695,668 | 5.42 | Similar (macro location) |
| 60327 Frankfurt am Main |
Warehouse | Q4 2019 | 15,770 | n/a | n/a | n/a | 993,510 | 5.25 | Superior (macro location) |
| ON BEHALF OF: | MORGAN STANLEY |
| PROJECT NAME: | MSTAR |
SALES EVIDENCE
| PROPERTY ADDRESS |
PROPERTY USE |
DATE | TOTAL AREA (SQ M) |
WAULT (YEARS) |
PASSING RENT PER ANNUM (€) |
PURCHASE PRICE (€) |
NET INITIAL YIELD (%) |
CAPITAL RATE PER SQ M (€) |
RELATIVE QUALITY |
| 63743 Aschaffenburg |
Warehouse | Q4 2020 | 7,881 | n/a | n/a | 7,950,000 | n/a | 1,009 | Similar (macro location) |
| 42855 Remscheid |
Warehouse | Q4 2020 | 5,494 | n/a | n/a | 4,950,000 | n/a | 901 | Superior (macro location) |
| 34560 Fritzlar | Warehouse | Q1 2020 | 42,000 | n/a | n/a | 38,304,000 | 5.26 (GIY) | 912 | Inferior (macro location) |
| 64646 Heppenheim |
Warehouse | Q3 2019 | 18,000 | n/a | n/a | 16,416,00 | n/a | 912 | Inferior (macro location) |
| PROPERTY ID: | desiem - Siemensstr. 25 | |
| ON BEHALF OF: | MORGAN STANLEY | |
| VALUATION DATE: | 01-Feb-2021 | FINAL |
Siemensstr. 25 - Siemensstr. 25, Korntal-Münchingen, 70825, Germany
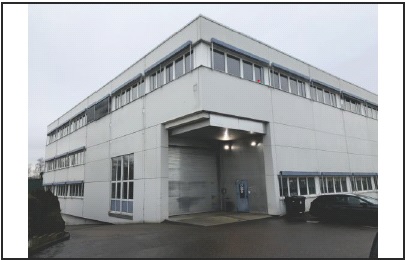
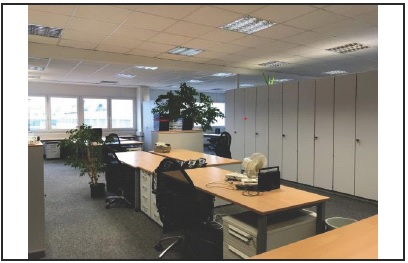
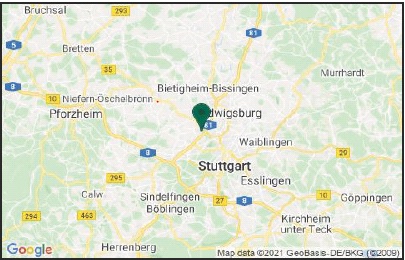
| VALUATION METRICS | (currency - EUR) |
| Metric | Value |
| Market Value | 3,460,000 |
| Market Value (per sq m) | 1,048 |
| Net Initial Yield | 4.65% |
| Reversionary Yield | 4.60% |
| Equivalent Yield | 4.42% |
| Gross Income (p.a.) | 180,277 |
| Gross Income (p.a.) (per sq m) | 55 |
| *Adj. Gross Income | 180,277 |
| Adj. Gross Income (per sq m) | 55 |
| Net Income (p.a.) | 174,515 |
| Net Income (p.a.) (per sq m) | 53 |
| Gross Rental Value | 184,392 |
| Gross Rental Value (per sq m) | 56 |
| Capital Expenditure | -168,008 |
| Transaction Costs | 6.38% |
| Over / Under Rented | 4.98% |
| KEY FACTS | |
| Metric | Value |
| Total Area (sq m) | 3,303 |
| WAULT to Break by Rent | 3.13 |
| WAULT to Break by ERV | 3.32 |
| WAULT to Expiry by Rent | 3.13 |
| WAULT to Expiry by ERV | 3.32 |
| Percentage of Vacancy (Area) | 5.81% |
| Percentage of Vacancy (ERV) | 6.87% |
| Number of Tenants | 2 |
| Current Voids (months) | 12 |
| * Adjusted Gross Income equates to the Gross Income excluding any rent free periods | |
| LEASES RANKED BY RENT | ** Total tenant lines within our valuation. May differ to number of individual tenants |
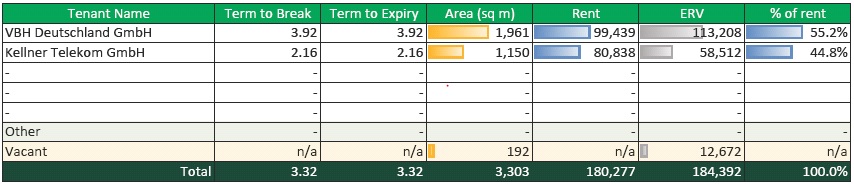
| Printed 09/03/2021 19:44 | |
| PROPERTY ID: | desiem - Siemensstr. 25 | |
| ON BEHALF OF: | MORGAN STANLEY | |
| VALUATION DATE: | 01-Feb-2021 | FINAL |
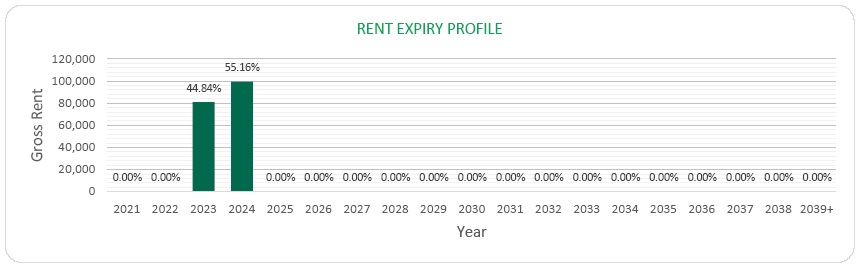
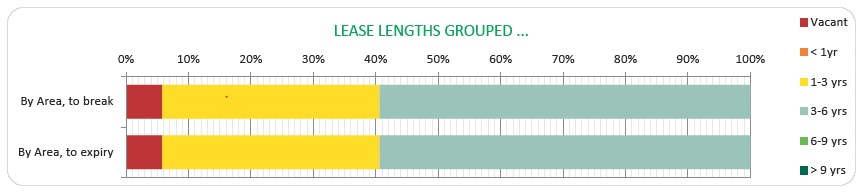
| Printed 09/03/2021 19:44 | |
| ON BEHALF OF: | MORGAN STANLEY |
| PROJECT NAME: | MSTAR |
PROPERTY REPORT
70825 KORNTAL-MUENCHINGEN – SIEMENSSTRASSE 25
| INSPECTED BY: | INSPECTION DATE: | VALUATION DATE: | PROPERTY TYPE |
| MAREIKE RECK | 08/01/2020 | 01/02/2021 | OFFICE/LIGHT INDUSTRIAL |
KEY VALUATION FACTORS
| STRENGTHS | WEAKNESSES | ||
| ■ | The subject property is located in the logistics region Stuttgart; | ■ | No reserve land available; |
| ■ | WAULT of 3.13 years; | ■ | Vacancy rate of 5.81%; |
| ■ | Risk-reduction due to multi-tenant concept; | ||
| ■ | Good access to motorways A81 (1.5 km) and B10 (0,9 km); | ||
| OPPORTUNITIES | THREATS | ||
| ■ | The continuing positive development of the overall economy could lead to an increase in achievable rents; | ■ | Fluctuations in the world economy and the global capital markets could have negative effects on German real estate market purchase prices; |
| ■ | Reletting of vacant office spaces at market level could improve the income stream. | ■ | Negative impact on income stream if a tenant vacates the building. |
| ■ | Proportion of office space if re-let. | ||
LOCATION & SITUATION
| LOCATION |
The next largest economically significant city is Stuttgart. The federal state capital Stuttgart is the centre of the most export-oriented metropolitan region in Germany. It also marks the political, economic and cultural centre of Baden- Wuerttemberg and is with over 630,000 inhabitants the largest city. Stuttgart is regarded as one of the leading German economic centres with a strong dominance of high-tech companies. Key industries include the automotive industry and electrical engineering. In comparison to other conurbations, the Stuttgart logistics region does not represent a preferred logistics location among the A-cities, despite its favourable location and good traffic connections.
|
| ON BEHALF OF: | MORGAN STANLEY |
| PROJECT NAME: | MSTAR |
|
Korntal-Muenchingen ist part of the greater logistics region of Stuttgart. The Stuttgart logistics region encompasses the economic centre of Baden-Wuerttemberg from Reutlingen to Heilbronn. The primary function of the logistics companies located here is supply and disposal logistics for the production industries that are central to this urban agglomeration. The region is also an attractive location from the point of view of regional distribution operations owing to the region’s affluent urban agglomeration.
Within the city of Korntal-Muenchingen, the subject property is situated in an area, which is mainly used for commercial and industrial purposes. The direct surroundings consist of industrial companies, logistic service providers and retailers.
The motorway connection can be described as good because of the proximity to the motorway A81. The next airport is situated in Stuttgart around 30 km away and reachable in approximately 35 minutes. The airport offers national and international connections.
|
PROPERTY DESCRIPTION
| DESCRIPTION | The property covers an area of approximately 0.17 hectares and comprises a 4-storey warehouse and office building with part basement (lift machine room). | ||
| The site is built into a slope with ground floor accessed from the south and the north partially excavated into the slope (i.e. lower ground floor level) and used as a car park. | |||
| The northern section of the first floor comprises a warehouse area (equivalent to 1st and 2nd office floors in the south) with the 3rd floor housing a full office level. | |||
| The building covers approximately 80% of the site area. Approximately 10% of the site is covered with hardstanding (access roads) and approximately 10% of the property along the western site boundary comprises landscaping (grass and bushes/trees). | |||
| It is understood that the current property was developed on agricultural land in 1997. Since development the site was has been used for warehousing and administration purposes. | |||
| Summary of known specification: | |||
| Characteristic | Result | ||
| Built / Renovation | 1997 | ||
| Eaves Height | 6.4 metres | ||
| No. of loading Doors | 1 | ||
| Loading Door Ratio | 0.54 | ||
| Yard Depth | Approx. 8 meters | ||
| Cross-Dock | No | ||
| ON BEHALF OF: | MORGAN STANLEY |
| PROJECT NAME: | MSTAR |
| Warehouse (% of GLA) | 56% | ||||
| Site Coverage Ratio | 80% | ||||
| Source: Phase I Environmental Review dated January 2020; the information gathered during the site inspection. | |||||
| ACCOMMODATION |
We have not measured the property, but as instructed, we have relied upon floor areas made available to us.
|
||||
| Unit Description | Primary Use | Status | Area (sq m) | ||
| Office | Office | LET | 1,150 | ||
| Office | Office | VACANT | 192 | ||
| Warehouse | Storage/Production | LET | 1,961 | ||
| Total (lettable) | 3,303 | ||||
DUE DILIGENCE
| STATE OF REPAIR |
CBRE have not undertaken a structural survey, nor tested the services. The property was subject to an inspection for valuation purposes in early 2020. As you are aware, the property has not been re-inspected for the purposes of this report, nor have we been provided with updated TDD. We have therefore relied on the information provided by the Borrower, including a Capex schedule dated 12 June 2019 and schedule with revised budget of capexdated 19 January 2021. Based on the latter which indicates TDD assessment less completed spend in 2020, we have included the immediate and 2-5 years capex of €161,000 within our valuation.
According to our own limited inspection for valuation purposes, our opinion regarding the state of repair would substantiate the assessment by Arcadis. Based on our impression gained during the inspection, we are of the opinion that the buildings are in a fair condition, in line with the year of construction. |
|
| ENVIRONMENTAL CONSIDERATIONS |
We have summarised the findings from a schedule provided in relation to ‘Priority sites’ within the front section of this report.
|
|
|
According to the Draft Environmental Due Diligence report dated 10 January 2020 from Ambiente Ltd. There are currently no known ground/soil contaminations. However, the following risks for contamination have been identified:
On-site
|
||
| • | No potential on-site sources of contamination have been identified | |
|
Off-site
|
||
| • |
Potential for migration of contamination from neighbouring light industrial uses including a fuel station 150m southwest. |
|
| ON BEHALF OF: | MORGAN STANLEY |
| PROJECT NAME: | MSTAR |
| From building operations, the following risks have been identified: | ||
| • | No potential sources of contamination have been identified. | |
| We have been instructed not to make any investigations in relation to the presence or potential presence of contamination in land or buildings or the potential presence of other environmental risk factors and to assume that if investigations were made to an appropriate extent then nothing would be discovered sufficient to affect value. | ||
|
We have not carried out investigation into past uses, either of the properties or of any adjacent lands, to establish whether there is any potential for contamination from such uses or sites, or other environmental risk factors and have therefore assumed that none exists. Should our assumption prove to be incorrect, we reserve the right to amend our valuation accordingly. |
||
| TENURE | We have had sight of the Draft Red Flag Legal Report prepared by Hengeler Mueller, dated 05 February 2021. Based on the information provided, we understand the property is held freehold. | |
| We have assumed that there are no onerous legal conditions affecting the property which have a material impact on our opinion of value. | ||
| INCOME PROFILE | The rental contracts have not been available. The information is based on the rent schedule dated on 30 November 2020. | |
| The property is leased to two tenants (Kellner Telekom GmbH, VBH Deutschland). 192.00 sq m of office space (5.81% of total space) are vacant. | ||
|
The property has a WAULT of 3.13 years from the date of valuation. The total gross current rent generated by the property is €180,277 per annum whilst our opinion of total gross market rent is €184,392 per annum. The property is therefore shown as largely rack rented.
|
||
|
The main tenant occupies about 59% of the total rental space and about 57% of the total rental income is the “VBH Deutschland GmbH”. VBH is registered in Stuttgart and offers a complete range of products and system solutions for the production and professional installation of windows and doors. |
||
VALUATION CONSIDERATIONS
| COSTS AND ADJUSTMENTS |
Based on the information provided or our knowledge of the market, in approaching our valuation, we made allowances for the following capital and non-recoverable costs. In all cases, we have cited whether they are deducted as at the date of valuation or whether they take effect at a later date.
|
||||
|
Capital Expenditure:
|
|||||
| Type & Calculation | Source | Effective | Amount | ||
| Capital Expenditure: Fixed Amount |
Technical Due Diligence |
On Valuation |
€161,000 | ||
| Tenant Incentives | CBRE Estimate | On lease start / renewal |
€3,840 | ||
| ON BEHALF OF: | MORGAN STANLEY |
| PROJECT NAME: | MSTAR |
| No Repeat | ||||||
| Letting Fees: 25% of Rental Value |
CBRE Estimate | On lease start / renewal No Repeat |
€3,168 | |||
| TOTAL ON VALUATION |
€168,008 | |||||
|
Revenue Deductions: |
||||||
| Type & Calculation | Source | Effective | Annual Amount | |||
| General Non- Recoverables: 0.5% of rental value |
CBRE Estimate | On Valuation In perpetuity |
€922 | |||
| Maintenance: €2.25 per sq m |
CBRE Estimate | On Valuation + Delay 60 Months In perpetuity |
€7,432 | |||
| Management 2.0% of rental value |
CBRE Estimate | On Valuation In perpetuity |
€3,688 | |||
| Void Costs: €0.50 per sq m |
CBRE Estimate | On Valuation On all voids |
€1,152 | |||
| TOTAL: ON VALUATION |
€5,762 | |||||
| VALUATION METHODOLOGY – MARKET VALUE |
We have had regard to the most recent letting transactions and occupational demand for the region within which the subject property is located, including the property itself if of relevance. The rental rates range between €48 per sq m per annum for warehouse and €66 per sq m per annum for office, depending on the duration of the lease contract, building specifications and age. Whilst the level of office space within this property is relatively high as a proportion of the total area, it would appear to suit the current occupiers requirements and whilst it may become a future risk should the tenant vacate, it is not an immediate concern.
We would highlight the first comparable cited within the appended rental evidence table, albeit we are of the opinion that the subject property would be slightly lower over the warehouse space. Whilst the office rates would generally be higher as a proportion of warehouse rental value than we have allowed, in this instance given the ratio of office to warehouse space, we have discounted the uplift applied to the office rental rate at re-let or renewal which does show the current office space income as over-rented. We have adopted the following rental rates within our valuation:
|
|||||
| ON BEHALF OF: | MORGAN STANLEY |
| PROJECT NAME: | MSTAR |
| Use | Letting-Status | Rental Area | ERV per sq m | ERV (Total) | |
| Office | LET | 1,244.00 sq m | €66.00 /sq m pa | €82,104.00 pa | |
| Office | VACANT | 192.00 sq m | €66.00 /sq m pa | €12,672.00 pa | |
| Warehouse | LET | 1,867.00 sq m | €48.00 /sq m pa | €89,616.00 pa | |
| Total* | 3,303.00 sq m | €55.83 /sq m pa | €184,392.00 pa | ||
|
* The total amount of ERV and rental area may differ from the calculation printout due to rounding differences.
We have arrived at our opinion of Market Value adopting the Traditional investment capitalisation method of valuation. Within this approach, we apply an income weighted average equivalent yield to our opinion of net income, reflecting the comparable evidence within the market for guidance on capital rates and values per sq m.
We would highlight investment comparables number one and two. Investment comparable one is located in a worse macro location and therefore has a longer distance to the motorway. The property has a lettable area of around 4,750 sq m. It was sold for approx. €4,500,00 (equating to around €947 per sq m) in Q4 2020. Due to the worse location, we consider this property to be inferior compared to the subject of valuation.
Investment comparable two, these objects are only 20 km away from each other. The location can be considered as comparable. The property has a lettable area of around 3,900 sq m and was constructed in the year 1969. It was sold for approximately €3,700,000 (equating to around € 949 per sq m) in Q4 2020. Due to the year of construction, this object is rated as inferior.
For the valuation of this asset, we have applied the following equivalent yield:
This results in a Net Initial Yield of 4.75% and a capital rate per sq m of €1,048.
On the assumption that there are no unusual factors of which we are unaware and on the basis of the comments and assumptions specified in this report, CBRE is of the opinion that the Market Value (rounded) of the subject property, is:
€3,460,000
(three million four hundred and sixty thousand Euro)
The unrounded net capital value is €3,460,000. The gross unrounded capital value is €3,846,082 including €168,008 of capital costs and €216,357 purchaser’s costs (6.25%) respectively.
Our opinion of Market Value is based upon the Scope of Work and Valuation Assumptions attached and has been primarily derived using comparable recent market transactions on arm’s length terms.
|
|||||
| ON BEHALF OF: | MORGAN STANLEY |
| PROJECT NAME: | MSTAR |
| VALUATION METHODOLOGY – VACANT POSSESSION VALUE: |
The constituent inputs in terms of rental value and non-recoverable costs largely align with the Market Value approach. The key exception being that we have adopted a special assumption that the property is 100% vacant/non-income producing as at the valuation date. This value is predominantly derived using the traditional investment method of valuation but critically benchmarking the resultant capital rate per sq m against the prevailing evidence. |
| In approaching our valuation under the Special Assumption that the property is entirely vacant (Vacant Possession Value), we have adopted a total void period of 12 months inclusive of rent free or tenant incentives and targeted an equivalent yield of 5%. | |
| This results in a net rounded value of €3,460,000, equating to €1,048 per sq m. | |
| ESTIMATED REINSTATEMENT ASSESSMENT |
The property has not been inspected by a suitably qualified building surveyor from CBRE, nor have we carried out a full Reinstatement Cost Assessment. For indicative purposes only we estimate that the reinstatement cost of insurance purposes would be in the region of €4,397,659 (rounded, excl. VAT) on a day one basis, including fees but excluding VAT and inflation.
This figure should be compared with the current sum insured and if a material discrepancy exists we suggest that a full Reinstatement Cost Assessment is carried out.
|
| ON BEHALF OF: | MORGAN STANLEY |
| PROJECT NAME: | MSTAR |
RENTAL EVIDENCE
| PROPERTY ADDRESS |
PROPERTY USE |
DATE | TOTAL
AREA (SQ M) |
TENANT | LEASE LENGTH (YEARS) |
BREAK OPTION |
RENT
(P.A) (€) |
MONTHLY RENTAL RATE PER RATE PER SQ M (€) |
RELATIVE QUALITY |
| 71691 Freiberg am Neckar |
Warehouse | Q4 2020 | 3,500 | n/a | n/a | n/a | 189,000 | 4.50 | Comparable (Macro- and Miro Location) |
| 71063 Sindelfingen |
Distribution hall |
Q4 2019 | 5,795 | Daimler AG | n/a | n/a | 3,765,330 | 4.25 | Comparable (Macro- and Miro Location) |
| 76185 Karlsrue |
Distribution hall |
Q4 2019 | 7,926 | n/a | n/a | n/a | 404,226 | 4.25 | Comparable (macro location) |
| 72770 Reutlingen |
Warehouse | Q4 2019 | 6,865 | n/a | n/a | n/a | 329,520 | 4.00 | Inferior (macro location) |
| ON BEHALF OF: | MORGAN STANLEY |
| PROJECT NAME: | MSTAR |
SALES EVIDENCE
| PROPERTY ADDRESS |
PROPERTY USE |
DATE | TOTAL AREA (SQ M) |
PASSING RENT PER ANNUM (€) |
WAULT | PURCHASE PRICE (€) |
NET INITIAL YIELD (%) |
CAPITAL RATE PER SQ M (€) |
RELATIVE QUALITY |
| 71083 Herrenberg |
Warehouse | Q4 2020 | 4,750 | n/a | n/a | 4,500,000 | n/a | 947 | Worse (Macro location) |
| 71277 Rutesheim |
Warehouse | Q4 2020 | 3,900 | n/a | n/a | 3,700,000 | n/a | 949 | Comparable (macro location) Inferior building quality |
| 79111 Freiburg im Breisgau |
Warehouse | Q1 2020 | 25,800 | n/a | n/a | 30,000,000 | n/a | 1,163 | Worse (macro location) |
| 74722 Buchen |
Warehouse | Q1 2020 | 14,000 | n/a | n/a | 13,566,000 | 5.36 | 969 | Similar (macro location) |
| PROPERTY ID: | nlabst - Abraham van Stolkweg 62 | |
| ON BEHALF OF: | MORGAN STANLEY | |
| VALUATION DATE: | 01-Feb-2021 | FINAL |
Abraham van Stolkweg 62 - Abraham van Stolkweg 62, Rotterdam, 3041 JA, Netherlands
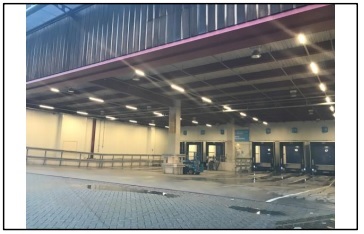 |
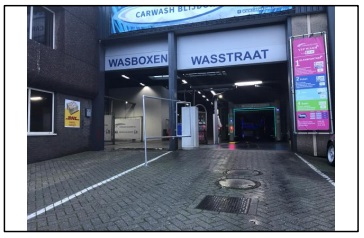 |
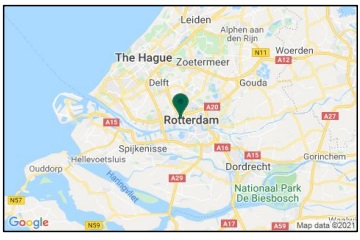 |
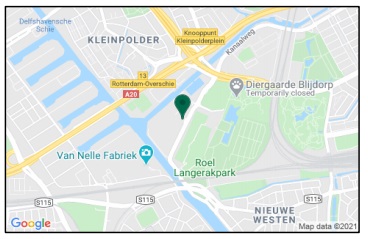 |
| VALUATION METRICS | (currency - EUR) |
| Metric | Value |
| Market Value | 20,475,000 |
| Market Value (per sq m) | 1,128 |
| Net Initial Yield | 5.75% |
| Reversionary Yield | 5.85% |
| Equivalent Yield | 5.75% |
| Gross Income (p.a.) | 1,365,837 |
| Gross Income (p.a.) (per sq m) | 75 |
| *Adj. Gross Income | 1,365,837 |
| Adj. Gross Income (per sq m) | 75 |
| Net Income (p.a.) | 1,283,452 |
| Net Income (p.a.) (per sq m) | 71 |
| Gross Rental Value | 1,462,010 |
| Gross Rental Value (per sq m) | 81 |
| Capital Expenditure | -317,610 |
| Transaction Costs |
9.00% |
| Over / Under Rented | -5.80% |
KEY FACTS
| Metric | Value | |
| Total Area (sq m) | 18,145 | |
| WAULT to Break by Rent | 4.57 | |
| WAULT to Break by ERV | 4.60 | |
| WAULT to Expiry by Rent | 4.57 | |
| WAULT to Expiry by ERV |
4.60 |
|
| Percentage of Vacancy (Area) | 0.56% | |
| Percentage of Vacancy (ERV) | 0.83% | |
| ** | Number of Tenants | 19 |
| Current Voids (months) | 12 | |
* Adjusted Gross Income equates to the Gross Income excluding any rent free periods
** Total tenant lines within our valuation. May differ to number of individual tenants
LEASES RANKED BY RENT
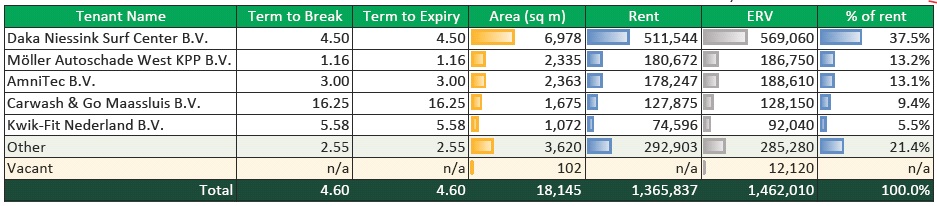 |
|
Printed 09/03/2021 19:45 |
|
| PROPERTY ID: | nlabst - Abraham van Stolkweg 62 | |
| ON BEHALF OF: | MORGAN STANLEY | |
| VALUATION DATE: | 01-Feb-2021 | FINAL |
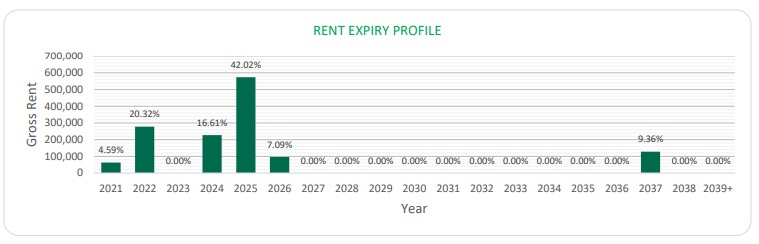 |
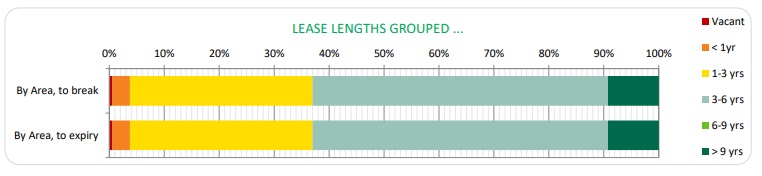 |
| Printed 09/03/2021 19:45 | |
| ON BEHALF OF: | MORGAN STANLEY |
| PROJECT NAME: | MSTAR |
PROPERTY REPORT
ABRAHAM VAN STOLKWEG 62, ROTTERDAM, NETHERLANDS
| INSPECTED BY: | INSPECTION DATE: | VALUATION DATE: | PROPERTY TYPE |
| R.P.A.W.M. VERMEER MSC | 14 JANUARY 2020 | 1 FEBRUARY 2021 | INDUSTRIAL WAREHOUSE |
KEY VALUATION FACTORS
| STRENGTHS | WEAKNESSES | |
|
■ Accessibility by private transport
■ Almost fully let
|
■ Vacancy
■ Right of way
|
|
| OPPORTUNITIES | THREATS | |
|
■ Increasing investor appetite
■ Lease the vacant space
■ Extend lease term with current tenants
■ Small amount of vacancy in the direct surroundings
|
■ Macro-economic uncertainty (i.e. Trade Wars; Brexit)
■ Unclear long-term effects of the Covid-19 outbreak
|
LOCATION & SITUATION
| LOCATION |
Rotterdam is located in the west of The Netherlands in the province of Zuid- Holland and has a population of approximately 650,000. Rotterdam is the second largest city in the Netherlands and provides one of the largest harbour and entrepôt facilities in the world, together with a great concentration of petrol-chemical down-stream refining capacity.
The city is the centre of the shipping, insurance and general transport industries in The Netherlands and forms the largest industrial agglomeration in the country. Among the companies that have their head offices or major operations in Rotterdam are Unilever, Nationale Nederlanden, Robeco, Royal Dutch Shell, Nedlloyd and Vopak.
In terms of communications Rotterdam is at the cross-roads of a number of major motorways and railway lines. The TGV railway line has a stop at Rotterdam Central station and the medium sized Rotterdam Airport “Zestienhoven” provides an excellent link to a number of European business centres. |
| ON BEHALF OF: | MORGAN STANLEY |
| PROJECT NAME: | MSTAR |
PROPERTY DESCRIPTION
| DESCRIPTION |
The subject property comprises a multi-let estate located close to the motorways A13 and A20, near the zoo Diergaarde Blijdorp. The property comprises 18,143 sq m which is divided into 3,840 sq m office space and 14,303 sq m of warehouse space. The property consists of 3 separate buildings, of which some units have been combined. Furthermore, there is a large advertising pole located on the plot.
The building was constructed in 1983, the office is divided over a ground and first floor. The warehouse is located on the ground floor, the clear height of the warehouse is circa 6 metres.
|
||
| Summary of known specification: | |||
| Characteristic | Result | ||
| Built / Renovation | 1983 | ||
| Eaves Height | 6 metres | ||
| No. of loading Doors | 27 (of which some have been transformed to sliding doors but can relatively easy be transformed back) | ||
| Loading Door Ratio | 1:672 | ||
| Yard Depth | 13 metres | ||
| Cross-Dock | Front loading | ||
| Warehouse (% of GLA) | 79% | ||
| Site Coverage Ratio | 53% | ||
|
Source: Schedule provided by client. |
|||
| ACCOMMODATION | We have not measured the property, but as instructed, we have relied upon floor areas made available to us, detailed below and elsewhere within this report. |
Floor Areas
| FLOOR / UNIT | USE | SQ M |
| AmniTec B.V. | Office and Warehouse | 2,363 |
| Avis Budget Autoverhuur B.V. | Office and Warehouse | 603 |
| Bierenko Amsterdam B.V. | Office and Warehouse | 838 |
| Carcleaning Rotterdam v.o.f. | Office and Warehouse | 766 |
| Carwash & Go Maassluis B.V. | Office and Warehouse | 835 |
| Carwash & Go Maassluis B.V. | Office and Warehouse | 840 |
| Daka Niessink Surf Center B.V. | Office and Warehouse | 3,957 |
| Daka Niessink Surf Center B.V. | Office and Warehouse | 788 |
| Daka Niessink Surf Center B.V. | Office and Warehouse | 726 |
| Daka Niessink Surf Center B.V. | Office and Warehouse | 505 |
| Daka Niessink Surf Center B.V. | Office and Warehouse | 491 |
| Daka Niessink Surf Center B.V. | Office and Warehouse | 511 |
| ON BEHALF OF: | MORGAN STANLEY |
| PROJECT NAME: | MSTAR |
| Gapph B.V. (Abraham van Stolkweg) | Vacancy management | - |
| Kwik-Fit Nederland B.V. | Office and Warehouse | 1,072 |
| Lekkerland Vending Services B.V. | Office and Warehouse | 576 |
| Möller Autoschade West KPP B.V. | Office and Warehouse | 2,335 |
| Stichting Leger des Heils Welzijns- en | Land | - |
| Gezondheidszorg | ||
| Tadim B.V. | Office and Warehouse | 267 |
| Vacant | - | - |
| Vacant | Office | 101 |
| Wij Kopen Autos B.V. | Office and Warehouse | 569 |
| TOTAL | - | 18,143 |
DUE DILIGENCE
| STATE OF REPAIR |
CBRE have not undertaken a structural survey, nor tested the services. The property was subject to an inspection for valuation purposes in early 2020. As you are aware, the property has not been re-inspected for the purposes of this report, nor have we been provided with updated TDD. We have therefore relied on the information provided by the Borrower, including a Capex schedule dated 12 June 2019 and schedule with revised budget of capex dated 19 January 2021. Based on the latter which indicates TDD assessment less completed spend in 2020, we have included the immediate and 2-5 years capex of €150,000 within our valuation.
According to our own limited inspection for valuation purposes, our opinion regarding the state of repair would substantiate the assessment by Arcadis. Based on our impression gained during the inspection, we are of the opinion that the buildings are in a fair condition, in line with the year of construction.
|
| ENVIRONMENTAL CONSIDERATIONS |
We have been instructed not to make any investigations in relation to the presence or potential presence of contamination in land or buildings or the potential presence of other environmental risk factors and to assume that if investigations were made to an appropriate extent then nothing would be discovered sufficient to affect value.
We have summarised the findings from a schedule provided in relation to ‘Priority sites’ within the front section of this report.
We have relied on the information provided by the Borrower, including Draft Phase 1 Environmental Review prepared by Ambiente Ltd and dated December 2019. The report summarises that the site is not registered as contaminated land in the Land Register. However, the Evaluation Committee (EC) of the Municipality of Rotterdam has summarised the current contamination situation at the property (and the surrounding area) in its decree dated 19 December 2005. The Committee concluded that the information provided in the historical research report “Historisch orienterend onderzoek A. van Stolkweg/ Houtstraat te Rotterdam, April 2004”, confirmed that the identified contamination at the subject property (and in the surrounding area) are the result of the historical industrial activities which took place between the 1920s and 1983. The Committee |
| ON BEHALF OF: | MORGAN STANLEY |
| PROJECT NAME: | MSTAR |
|
stated that no current risks for public health and the environment are expected.
We have not carried out investigation into past uses, either of the properties or of any adjacent lands, to establish whether there is any potential for contamination from such uses or sites, or other environmental risk factors and have therefore assumed that none exists.
|
| TENURE |
According to the information available from the Land Registry Office (Kadaster) the parcels are held freehold by MLET Netherlands 2 Holding B.V. and registered as follows:
|
|||
| Municipality: | Rotterdam | |||
| Section: | Z | |||
| Numbers: | 4533 | |||
| Total Area: | 30,382 sq m | |||
| Comments | ||||
|
■ There is a right of way to provide access to the public road for the parcels located at the rear of the subject property.
Based on the information provided, we understand the property is held freehold.
We have also had sight of the Draft Red Flag Legal Report prepared by Loyens Loeff, dated 12 February 2021. Based on the information provided, we understand the property is held freehold.
We have assumed that there are no onerous legal conditions affecting the property which have a material impact on our opinion of value.
|
||||
| INCOME PROFILE | The subject property is almost completely let to 12 tenants on a WALL of circa 4.5 years. The vacancy equates to 101 sq m which equals 0.5% of the total lettable floor area. The ERV for the vacancy equates to € 12,120 per annum. The current rental income is € 1,365,837 per annum. The ERV for the leased part is estimated at € 1,449,890. In our opinion the property is therefore circa 6% under rented. The ERV for the entire property equates to € 1,462,010 per annum. |
| ON BEHALF OF: | MORGAN STANLEY |
| PROJECT NAME: | MSTAR |
VALUATION CONSIDERATIONS
|
COSTS AND
|
Based on the information provided or our knowledge of the market, in approaching our valuation, we made allowances for the following capital and non-recoverable costs. In all cases, we have cited whether they are deducted as at the date of valuation or whether they take effect at a later date.
Capital Expenditure: |
||||
| Type & Calculation | Source | Effective | Amount | ||
| Capital Expenditure: Fixed Amount | Technical Due Diligence | On Valuation No Repeat |
€ 150,000 | ||
| Rent Free –Carwash & Go Maassluis | Rent roll | On Valuation No Repeat |
€ 125,000 | ||
| Rent Free – Kwit-Fit Nederland B.V. | Rent roll | On Valuation No Repeat |
€ 12,500 | ||
| Letting Fees: 15% of Rental Value of the vacant space | CBRE Estimate |
On lease start / renewal
No Repeat |
€30,110 | ||
| TOTAL ON VALUATION |
€ 317,610 | ||||
| Revenue Deductions: | |||||
| Type & Calculation | Source | Effective | Annual Amount | ||
| Management: 2.00% of rental value | Valuer Estimate | On Valuation In perpetuity | € 27,559 | ||
| Property tax: 2.00% of rental value | Valuer Estimate | On Valuation In perpetuity | € 29,240 | ||
| Water tax: 0.25% of rental value | Valuer Estimate | On Valuation In perpetuity | € 3,655 | ||
| Insurance: 1.25% of rental value | Valuer Estimate | On Valuation In perpetuity | € 18,275 | ||
| Sewage charge: 0.25% of rental value | Valuer Estimate | On Valuation In perpetuity | € 3,655 | ||
| Maintenance: € 4.00 per sq m | Borrower Estimate | 5 Year Delay In perpetuity |
€ 72,580 | ||
| ON BEHALF OF: | MORGAN STANLEY |
| PROJECT NAME: | MSTAR |
|
Void Costs: 2.00% of the rental value |
Borrower Estimate |
On Valuation On All Voids |
€ 242 | ||
|
TOTAL: ON VALUATION |
€ 82,626 | ||||
|
Void and Rent-Free Allowances:
Regarding the vacant unit, we have allowed for a current void period of 12 months.
|
|||||
|
VALUATION METHODOLOGY
|
We have made the following rental assumptions having regard to the lettings agreed within the subject property, whilst also considering rental rates in the surrounding area: |
| Unit | Area (s qm) |
ERV (€) per S qm (annum) |
Rent pa (€) | ||
| Office | 3,840 | 120 | 460,800 | ||
| Warehouse | 14,303 | 70 |
1,001,210
|
||
| Total | 18,143 | 81 | 1,462,010 |
|
Opinion of Market Rent
We have referenced the most recent lettings agreed within the property itself in arriving at our opinion or rental value. This includes the letting to ODV in late 2020 at a blended rent equating to €81 per sq m. Other lettings in 2020 were agreed above this level. Overall, this justifies the above adopted rents. In relation to the wider market, based on the below-mentioned comparable transactions, the current market trends and our general market knowledge, we have estimated the above-mentioned rental values for the areas in the subject property. The below appended comparables indicate a (blended) range from € 66 per sq m per annum to € 99 per sq m per annum.
The aforementioned rental values produce a total gross rental value of € 1,462,010 per annum or an average of circa € 81 per sq m. The agreed rental income amounts to € 1,365,837 per annum or an average of circa € 76 per sq m per annum corrected for the vacancy. We are of the opinion that the subject property is circa 6% under rented.
Opinion of Valuation Yields
Currently, we witness downward pressure on net initial yields for prime logistics properties due to the high scarcity of good, long leased logistics properties.
Indicative net initial yields for prime logistics property are currently quoting 3.5% and 5.5% for prime industrial estates. Due to favourable dynamics in the occupier market in the Netherlands, with prospects for production and export growth in mind and taking into account the capital available for (real |
| ON BEHALF OF: | MORGAN STANLEY |
| PROJECT NAME: | MSTAR |
|
estate) investments, investor appetite is expected to increase further. This is also expected to put further downward pressure on yields.
Within the evidence table appended, we would highlight the following. The lower end of the yield range is indicated by the property located at Melbournestraat 50-68 in Rotterdam. Quality and characteristics of this asset are superior compared to the subject property. The middle of the range is highlighted by the property located in Berchvliet, Amsterdam. The subject property has a more favourable location but the office/warehouse ratio results in lesser leasing conditions. Overall a similar yield profile is applicable in our opinion.
We have arrived at our opinion of Market Value adopting the Traditional investment capitalisation method of valuation. Within this approach, we apply an income weighted average equivalent yield to our opinion of net income, reflecting the comparable evidence within the market for guidance on capital rates and values per sq m. The NIY’s of the comparable investments range from 5.14% to 6.16% and also taking into account the current market conditions and the WAULT to expiry by current income of circa 4.5 years, we have adopted a split yield approach, targeting the following rates:
- Vacant = 6.25%
- Let = 5.75%
The approach results in a blended equivalent yield of 5.75% and NIY of circa 5.75% which reflects a capital rate per sq m of € 1,128, after allowing for purchaser’s costs equating to 9.00%.
On the assumption that there are no unusual factors of which we are unaware and on the basis of the comments and assumptions specified in this report, CBRE is of the opinion that the Market Value (rounded) of the subject property, is:
€ 20,475,000
(Twenty million four hundred seventy five thousand Euros)
The unrounded net capital value is € 20,469,982. The gross unrounded capital value is € 22,312,280 including € 1,842,299 purchaser’s costs (9.00%).
|
||
| VALUATION METHODOLOGY – VACANT POSSESSION VALUE |
The constituent inputs in terms of rental value and non-recoverable costs largely align with the Market Value approach. The key exception being that we have adopted a special assumption that the property is 100% vacant/non-income producing as at the valuation date. This value is predominantly derived using the traditional investment method of valuation but critically benchmarking the resultant capital rate per sq m against the prevailing evidence.
In approaching our valuation under the Special Assumption that the property is entirely vacant (Vacant Possession Value), we have adopted a total void period of 12 months inclusive of rent free or tenant incentives and targeted an equivalent yield of 6.25%. |
| ON BEHALF OF: | MORGAN STANLEY |
| PROJECT NAME: | MSTAR |
|
This results in a net rounded value of €17,675,000, equating to €974 per sq m.
|
||
| ESTIMATED REINSTATEMENT ASSESSMENT |
The property has not been inspected by a suitably qualified building surveyor from CBRE, nor have we carried out a full Reinstatement Cost Assessment. For indicative purposes only we estimate that the reinstatement cost of insurance purposes would be in the region of €28,135,000 (rounded, excl. VAT) on a day one basis, including fees but excluding VAT and inflation.
This figure should be compared with the current sum insured and if a material discrepancy exists we suggest that a full Reinstatement Cost Assessment is carried out.
|
| ON BEHALF OF: | MORGAN STANLEY |
| PROJECT NAME: | MSTAR |
RENTAL EVIDENCE
| PROPERTY ADDRESS |
PROPERTY USE |
DATE | TOTAL AREA |
TENANT | LEASE LENGTH (YEARS) |
BREAK OPTION |
RENT (P.A) |
RENTAL
|
RELATIVE QUALITY |
| Weerestraat 11, Rotterdam | Warehouse - office | 2020, December | 344 | Unknown | not available | not available | 22,800 | 66.28 | This reference is located in the direct vicinity of the subject property. The lettable area is divided in 135 sq m warehouse, 52 sq m office space and 157 sq m entresol. We are of the opinion that the quality can be considered comparable. |
| Industrieweg 93, Rotterdam | Warehouse - office | 2020, May | 151 | Unknown | not available | not available | 15,000 | 99.34 | This reference can be considered comparable in terms of location and quality. The area is divided in 116 sq m warehouse and 35 sq m office space. |
| Koolhovenstraat 7, Schiedam | Warehouse - office | 2020, July | 350 | Unknown | not available | not available | 33,000 | 94.29 | This reference is located on business estate Spaanse Polder. We are of the opinion that the building quality of this reference can be considered comparable. |
| Innsbruckweg 206-208, Rotterdam | Warehouse - office | 2020, June | 358 | Unknown | not available | not available | 30,000 | 83.80 | We are of the opinion that the location of this reference is comparable to that of the subject property. |
| ON BEHALF OF: | MORGAN STANLEY |
| PROJECT NAME: | MSTAR |
SALES EVIDENCE
| PROPERTY ADDRESS |
PROPERTY USE | DATE | TOTAL AREA |
WAULT (YEARS) |
PASSING RENT PER ANNUM |
PURCHASE PRICE |
NET INITIAL YIELD (%) |
CAPITAL
|
RELATIVE QUALITY |
| Melbournestraat 50-68, Sydneystraat 32- 56, Rotterdam | Industrial/Logistics | 17- 03- 2020 | 5,354 | 2.5 | 401,144 | 6,587,000 | 5.14% | 1,230 | During the transaction, the property was fully let to eleven tenants on a WALL of 2.5 years. The property is slightly under rented, the equivalent yield equates to 5.08. Due to the leasehold situation of the reference property a softer yield for the subject property is appropriate. |
| Berchvliet 3-13, Sierenborch 1, Amsterdam | Industrial/Logistics | 20- 02- 2020 | 6,108 | 3.7 | 549,164 | 8,075,000 | 5.80% | 1,322 | During the transaction, the property was fully let on a WALL of 3.7 years. The equivalent yield amounts to 5.80%. Due to the superior quality and longer WALL of the subject property we are of the opinion a sharper yield is appropriate. |
| Jan Van Krimpenweg 1+ 21-26, Haarlem | Industrial/Logistics | 19- 10- 2020 | 10,503 | 1.0 | 621,655 | 8,400,000 | 6.16% | 800 | This transaction was part of the Vinvest portfolio. During the transaction, the property was fully let to multiple tenants on a weighted average WALL of 7.25 years. The property is in our opinion, slightly under rented (11.56%). The gross initial yield |
| ON BEHALF OF: | MORGAN STANLEY |
| PROJECT NAME: | MSTAR |
| equates to 7.40%. The location and quality of the reference are less. A sharper yield is in our opinion appropriate for the subject property. | |||||||||
| Spectrumlaan 5, Bleiswijk | Industrial/Logistics | 15- 04- 2020 | 8,641 | 2.2 | 557,770 | 8,000,000 | 6.00 | 926 | The reference property is let to Cemex Trescon B.V. with a remaining lease term of 2.2 years. We are of the opinion that, the property is slightly over-rented (approximately 3%). The equivalent yield equates to 5.8%. In our opinion a sharper yield profile is appropriate for the subject property considering location and occupancy. |
| PROPERTY ID: | nlargo01 - Argonstraat 22-112 | |
| ON BEHALF OF: | MORGAN STANLEY | |
| VALUATION DATE: | 01-Feb-2021 | FINAL |
Argonstraat 22-112 - Argonstraat 22-112, Zoetermeer, 2718 SM, Netherlands
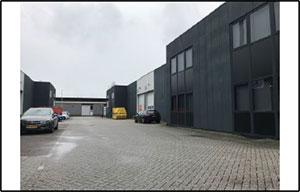 |
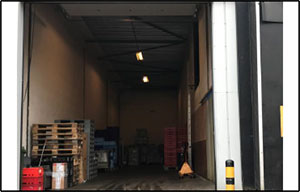 |
|
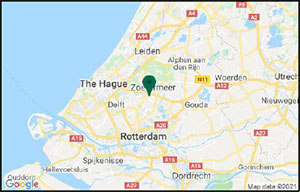 |
 |
| VALUATION METRICS | (currency - EUR) |
| Metric | Value |
| Market Value | 10,450,000 |
| Market Value (per sq m) | 1,080 |
| Net Initial Yield | 6.22% |
| Reversionary Yield | 6.53% |
| Equivalent Yield | 6.50% |
| Gross Income (p.a.) | 755,471 |
| Gross Income (p.a.) (per sq m) | 78 |
| *Adj. Gross Income | 755,471 |
| Adj. Gross Income (per sq m) | 78 |
| Net Income (p.a.) | 709,215 |
| Net Income (p.a.) (per sq m) | 73 |
| Gross Rental Value | 830,585 |
| Gross Rental Value (per sq m) | 86 |
| Capital Expenditure | -78,400 |
| Transaction Costs | 9.01% |
| Over / Under Rented | -9.04% |
| KEY FACTS |
| Metric | Value | |
| Total Area (sq m) | 9,675 | |
| WAULT to Break by Rent | 2.38 | |
| WAULT to Break by ERV | 2.35 | |
| WAULT to Expiry by Rent | 2.38 | |
| WAULT to Expiry by ERV | 2.35 | |
| Percentage of Vacancy (Area) | 0.00% | |
| Percentage of Vacancy (ERV) | 0.00% | |
| ** | Number of Tenants | 21 |
| Current Voids (months) | - | |
| * Adjusted Gross Income equates to the Gross Income excluding any rent free periods | |
| LEASES RANKED BY RENT | ** Total tenant lines within our valuation. May differ to number of individual tenants |
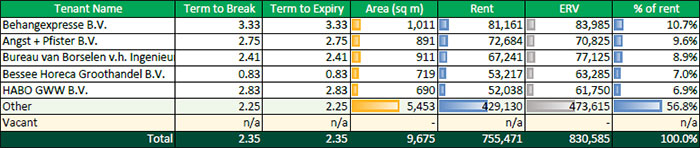
| Printed 09/03/2021 19:45 | |
| PROPERTY ID: | nlargo01 - Argonstraat 22-112 | |
| ON BEHALF OF: | MORGAN STANLEY | |
| VALUATION DATE: | 01-Feb-2021 | FINAL |
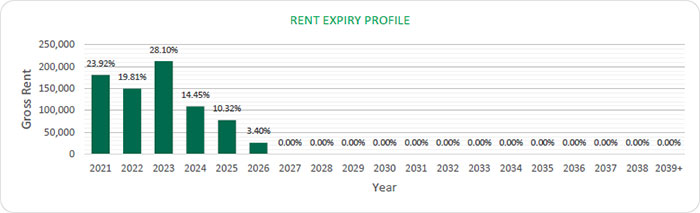
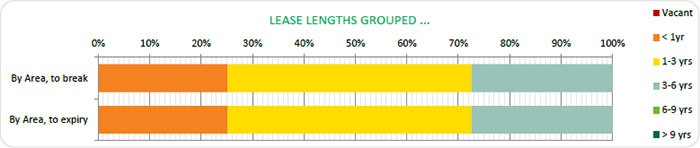
| Printed 09/03/2021 19:45 | |
| ON BEHALF OF: | MORGAN STANLEY |
| PROJECT NAME: | MSTAR |
PROPERTY REPORT
ARGONSTRAAT 22-112, ZOETERMEER, NETHERLANDS
| INSPECTED BY: | INSPECTION DATE: | VALUATION DATE: | PROPERTY TYPE |
| R.P.A.W.M. VERMEER | 14 JANUARY 2020 | 1 FEBRUARY 2021 | INDUSTRIAL WAREHOUSE |
KEY VALUATION FACTORS
| STRENGTHS | WEAKNESSES |
|
■ Fully let ■ Good state of repair ■ Accessibility by private transport |
■ Visibility from the main road ■ Small roads on the parcel |
| OPPORTUNITIES | THREATS |
|
■ Increasing investor appetite ■ Extend lease term with current tenants |
■ Macro-economic uncertainty (i.e. Trade Wars; Brexit) ■ Vacancy in the direct surroundings ■ Uncertainty resulting from the Covid-19 outbreak |
LOCATION & SITUATION
| LOCATION |
Zoetermeer is located in the south east of the province of South Holland. The city is part of the southern side of the “Randstad” and its population consists of approximately 125,000 inhabitants.
Distances from Zoetermeer to other major cities are: 15 kilometres to The Hague, 20 kilometres to Rotterdam, 55 kilometres to Utrecht and 60 kilometres to Amsterdam.
The A12 motorway connects Zoetermeer directly to such cities as The Hague and Utrecht. It is also connected to Rotterdam and Amsterdam by respectively motorways A13 and A4. The rail network has direct links to a total of 14 railway stations and will further improve with the planned Randstadrail connecting Zoetermeer to The Hague and Rotterdam.
|
| ON BEHALF OF: | MORGAN STANLEY |
| PROJECT NAME: | MSTAR |
PROPERTY DESCRIPTION
| DESCRIPTION |
The subject property is located at the Argonstraat in Zoetermeer on business estate Lansinghage, near to the A12 motorway. The subject property comprises in total 9,675 sq m which is divided into 2,624 sq m office space and 7,051 sq m warehouse space. The property consists of two separate building fully surrounded by a private one-way street.
The building was constructed in 1990, the office is divided over a ground and first floor. The warehouse is located on the ground floor, the clear height of the warehouse is circa 8 metres.
Summary of known specification: |
|||
| Characteristic | Result | |||
| Built / Renovation | 2000 | |||
| Eaves Height | 8 metres | |||
| No. of loading Doors | 23 | |||
| Loading Door Ratio | 1:421 | |||
| Yard Depth | 8 metres | |||
| Cross-Dock | Front loading | |||
| Warehouse (% of GLA) | 73% | |||
| Site Coverage Ratio | 60% | |||
| Source: Schedule provided by client. | ||||
| ACCOMMODATION |
We have not measured the property, but as instructed, we have relied upon floor areas made available to us, detailed below and elsewhere within this report.
|
|||
| ON BEHALF OF: | MORGAN STANLEY |
| PROJECT NAME: | MSTAR |
Floor Areas
| FLOOR / UNIT | USE | SQ M |
| Rijncom V.O.F | Office and Warehouse | 557.00 |
| Quality & Service Hydrauliek | Office and Warehouse | 550.00 |
| Kern Nederland B.V. | Office and Warehouse | 292.00 |
| Angst + Pfister B.V. | Office and Warehouse | 891.00 |
| Autotaalglas Nederland B.V. | Office and Warehouse | 440.00 |
| Bureau van Borselen v.h | Office and Warehouse | 911.00 |
| Ingenieursbureau van Borselen B.V. | ||
| HABO GWW B.V. | Office and Warehouse | 690.00 |
| Eneco Warmte & Koude B.V. | Office and Warehouse | 253.00 |
| Watergames & More B.V. | Office and Warehouse | 325.00 |
| Bessee Horeca Groothandel B.V. | Office and Warehouse | 719.00 |
| Constructif B.V. | Office and Warehouse | 286.00 |
| A. Akbulut t.h.o.d.n. Powerdesign | Office and Warehouse | 250.00 |
| Senso Care V.O.F. | Office and Warehouse | 253.00 |
| Wellner Mobiliteit V.O.F. | Office and Warehouse | 330.00 |
| JTH Wallcover Construction B.V. | Office and Warehouse | 320.00 |
| SloanLED Europe B.V. | Office and Warehouse | 285.00 |
| Behangexpresse B.V. | Office and Warehouse | 1,011.00 |
| ProCoatings B.V. | Office and Warehouse | 382.00 |
| E.R. Bandel en F.A. Bandel-Toorop | Office and Warehouse | 250.00 |
| h.o.d.n. Bandel Facilitaire Diensten | ||
| V.O.F. | ||
| Loki Distillers B.V. | Office and Warehouse | 252.00 |
| TOTAL | - | 9,675.00 |
DUE DILIGENCE
| STATE OF REPAIR |
CBRE have not undertaken a structural survey, nor tested the services. The property was subject to an inspection for valuation purposes in early 2020. As you are aware, the property has not been re-inspected for the purposes of this report, nor have we been provided with updated TDD. We have therefore relied on the information provided by the Borrower, including a Capex schedule dated 12 June 2019 and schedule with revised budget of capex dated 19 January 2021. Based on the latter which indicates TDD assessment less completed spend in 2020, we have included the immediate and 2-5 years capex of €22,000 within our valuation.
According to our own limited inspection for valuation purposes, our opinion regarding the state of repair would substantiate the assessment by Arcadis. Based on our impression gained during the inspection, we are of the opinion that the buildings are in a fair condition, in line with the year of construction.
|
| ENVIRONMENTAL CONSIDERATIONS | We have been instructed not to make any investigations in relation to the presence or potential presence of contamination in land or buildings or the potential presence of other environmental risk factors and to assume that if |
| ON BEHALF OF: | MORGAN STANLEY |
| PROJECT NAME: | MSTAR |
|
investigations were made to an appropriate extent then nothing would be discovered sufficient to affect value.
We have summarised the findings from a schedule provided in relation to ‘Priority sites’ within the front section of this report.
We have relied on the information provided by the Borrower, including Draft Phase 1 Environmental Review prepared by Ambiente Ltd and dated December 2019. The report summarises that the site is considered to be suitable for continued current use in terms of ground conditions. No significant environmental risks have been identified within this review.
We have not carried out investigation into past uses, either of the properties or of any adjacent lands, to establish whether there is any potential for contamination from such uses or sites, or other environmental risk factors and have therefore assumed that none exists.
|
| TENURE | According to the information available from the Land Registry Office (Kadaster) the parcels are held freehold by Multi-Let Industrial Property 8 B.V. and registered as follows: | ||
| Municipality: | Zegwaard | ||
| Section: | D | ||
| Numbers: | 2536 and 2537 | ||
| Total Area: | 16,501 sq m | ||
|
Comments
■ There are several restrictions concerning the places of fences resulting from cables and pipes in the ground on a small part of the parcel;
■ Right of way with respect to parcels Zegewaard D 2232 and 2134
We have also had sight of the Draft Red Flag Legal Report prepared by Loyens Loeff, dated 12 February 2021. Based on the information provided, we understand the property is held freehold.
We have assumed that there are no onerous legal conditions affecting the property which have a material impact on our opinion of value.
|
|||
| INCOME PROFILE | The subject property is fully let to 21 tenants on a WALL of 2.33 years. The current rental income is € 755,471. The ERV for the entire property is estimated at € 830,585. In our opinion the property is therefore under rented. | ||
| ON BEHALF OF: | MORGAN STANLEY |
| PROJECT NAME: | MSTAR |
VALUATION CONSIDERATIONS
| COSTS AND ADJUSTMENTS | Based on the information provided or our knowledge of the market, in approaching our valuation, we made allowances for the following capital and non-recoverable costs. In all cases, we have cited whether they are deducted as at the date of valuation or whether they take effect at a later date. |
| Capital Expenditure: | |||||
| Type & Calculation | Source | Effective | Amount | ||
| Capital Expenditure: Fixed Amount |
Technical Due Diligence |
On Valuation |
€ 22,000 | ||
| Rent free – Loki Distillers B.V. |
Rent roll |
On valuation |
€ 21,600 | ||
| Rent free – ODV Zonnepanelen B.V. |
Rent roll | On valuation | € 34,800 | ||
| Letting Fees: 15% of Rental Value of the vacant space |
CBRE Estimate |
On lease start |
€ - | ||
| TOTAL ON VALUATION | € 78,400 | ||||
| Revenue Deductions: | |||||
| Type & Calculation | Source | Effective | Annual Amount | ||
| Management: 2.00% of rental value |
Valuer Estimate |
On Valuation |
€ 15,109 | ||
| Property tax: 2.00% of rental value: |
Valuer Estimate |
On Valuation |
€ 16,612 | ||
| Water tax: 0.25% of rental value |
Valuer Estimate |
On Valuation |
€ 2,076 | ||
| Insurance: 1.25% of rental value |
Valuer Estimate |
On Valuation |
€ 10,382 | ||
| Sewage charge: 0.25% of rental value |
Valuer Estimate |
On Valuation |
€ 2,076 | ||
| Maintenance: € 4.00 per sq m |
Borrower Estimate |
5 Year Delay |
€ 38,700 | ||
| |
|||||
| ON BEHALF OF: | MORGAN STANLEY |
| PROJECT NAME: | MSTAR |
| Management Costs on Voids: 2% of rental value |
Valuer Estimate |
On all voids
In perpetuity |
€ 0 | ||
| TOTAL: ON VALUATION | € 46,255 | ||||
|
Void and Rent-Free Allowances:
On valuation date, the subject property is fully let. We have not received information regarding the termination of any leases. If the property would be offered on the market per valuation date, we believe it would take circa six months to rent out the property.
|
|||||
| VALUATION METHODOLOGY – MARKET VALUE | We have made the following rental assumptions having regard to the lettings agreed within the subject property, whilst also considering rental rates in the surrounding area: | ||||
| Unit | Area (s qm) | ERV (€) per S qm (annum) |
Rent pa (€) | ||
| Office | 2,624.00 | 115 | 301,760 | ||
| Warehouse | 7,051 | 75 | 528,825 | ||
| Total | 9,675 | 86 | 830,585 |
|
Opinion of Market Rent
Based on the below-mentioned comparable transactions, the current market trends and our general market knowledge, we have estimated the above-mentioned rental values for the areas in the subject property. The below appended comparables indicate a (blended) range from € 61 per sq m per annum to € 96 per sq m per annum.
The aforementioned rental values produce a total gross rental value of € 830,585 per annum or an average of circa € 86 per sq m. The agreed rental income amounts to € 755,471 per annum or an average of circa € 78 per sq m per annum. We are therefore of the opinion that the subject property is under-rented.
Opinion of Valuation Yields
Currently, we witness downward pressure on net initial yields for prime logistics properties due to the high scarcity of good, long leased logistics properties.
Indicative net initial yields for prime logistics property are currently quoting 3.5% and 5.5% for prime industrial estates. Due to favourable dynamics in the occupier market in the Netherlands, with prospects for production and export growth in mind and taking into account the capital available for (real estate) investments, investor appetite is expected to increase further. This is also expected to put further downward pressure on yields.
|
| ON BEHALF OF: | MORGAN STANLEY |
| PROJECT NAME: | MSTAR |
|
Within the evidence table appended, we would highlight the following. The lower end of the yield range is indicated by the property located at the Melbournestraat 50-68, Rotterdam. As we are of the opinion that the location of this reference is better, we have allowed for a higher yield profile for the subject property.
The top of the range is highlighted by the property located at the Ringersweg 10 C-D, Bergen op Zoom. However, since the location of the subject property is better we have allowed for a sharper yield profile.
We have arrived at our opinion of Market Value adopting the Traditional investment capitalisation method of valuation. Within this approach, we apply an income weighted average equivalent yield to our opinion of net income, reflecting the comparable evidence within the market for guidance on capital rates and values per sq m. The NIY’s of the comparable investments range from 5.14% to 7.52% and also taking into account the current market conditions, the WAULT to expiry by current income of 2.33 years and the fact that the property is fully let. We have applied an equivalent yield of 6.50%.
The approach results in a net initial yield of circa 6.22% which reflects a capital rate per sq m of € 1,080, after allowing for purchaser’s costs equating to 9.00%.
On the assumption that there are no unusual factors of which we are unaware and on the basis of the comments and assumptions specified in this report, CBRE is of the opinion that the Market Value (rounded) of the subject property, is:
€ 10,450,000
(Ten million four hundred fifty thousand Euros)
The unrounded net capital value is € 10,455,989. The gross unrounded capital value is € 11,397,028 including € 941,039 purchaser’s costs (9.00%).
|
|
| VALUATION METHODOLOGY – VACANT POSSESSION VALUE |
The constituent inputs in terms of rental value and non-recoverable costs largely align with the Market Value approach. The key exception being that we have adopted a special assumption that the property is 100% vacant/non- income producing as at the valuation date. This value is predominantly derived using the traditional investment method of valuation but critically benchmarking the resultant capital rate per sq m against the prevailing evidence.
In approaching our valuation under the Special Assumption that the property is entirely vacant (Vacant Possession Value), we have adopted a total void period of 12 months inclusive of rent free or tenant incentives and targeted an equivalent yield of 7%. This results in a net rounded value of €9,000,000, equating to €930 per sq m.
|
| ESTIMATED REINSTATEMENT ASSESSMENT | The property has not been inspected by a suitably qualified building surveyor from CBRE, nor have we carried out a full Reinstatement Cost Assessment. For indicative purposes only we estimate that the reinstatement cost of |
| ON BEHALF OF: | MORGAN STANLEY |
| PROJECT NAME: | MSTAR |
|
insurance purposes would be in the region of €15,005,000 (rounded, excl. VAT) on a day one basis, including fees but excluding VAT and inflation.
This figure should be compared with the current sum insured and if a material discrepancy exists we suggest that a full Reinstatement Cost Assessment is carried out.
|
| ON BEHALF OF: | MORGAN STANLEY |
| PROJECT NAME: | MSTAR |
RENTAL EVIDENCE
| PROPERTY ADDRESS | PROPERTY USE | DATE | TOTAL AREA | TENANT | LEASE LENGTH(YEARS) | BREAK OPTION | RENT(P.A) | RENTAL RATE PER SQ M | RELATIVE QUALITY |
| Edelgasstraat 262, Zoetermeer |
Industrial | 2020, December | 560 | Unknown | not available | not available | 49,000 | 87.50 | This reference is located in the direct vicinity of the subject property. In addition, we are of the opinion that the quality can be considered comparable. |
| Argonstraat
7a, Zoetermeer |
Industrial | 2020, October | 390 | Unknown | not available | not available | 23,940 | 61.39 | We are of the opinion that the location of this reference is comparable to that of the subject property. However, we are of the opinion that the building quality can be considered inferior. |
| Aluminiumstraat 10-06, Zoetermeer |
Industrial | 2021, January | 199 | Unknown | not available | not available | 19,140 | 96.18 | We are of the opinion that the location of this reference is comparable to that of the subject property. However, we are of the opinion that the building quality can be considered superior since it concerns a newly built property. |
| Kwartsweg
48, Bleiswijk |
Industrial | 2020, July | 853 | Unknown | not available | not available | 60,000 | 70.34 | This reference is located in the direct vicinity of the subject property. In addition, we are of the opinion that the quality can be considered comparable. |
| ON BEHALF OF: | MORGAN STANLEY |
| PROJECT NAME: | MSTAR |
SALES EVIDENCE
| PROPERTY ADDRESS | PROPERTY USE | DATE | TOTAL AREA | WAULT(YEARS) | PASSING RENT PER ANNUM | PURCHASE PRICE | NET INITIAL YIELD(%) | CAPITAL RATE PER SQ M | RELATIVE QUALITY |
| Melbournestraat 50-68, Sydneystraat 32- 56, Rotterdam |
Industrial/Logistics | 17-03-2020 | 5,354 | 2.5 | 401,144 | 6,587,000 | 5.14% | 1,230 | During the transaction, the property was fully let to eleven tenants on a WALL of 2.5 years. The property is slightly under rented, the equivalent yield equates to 5.08. |
| Ringersweg 10 C-D, Bergen op Zoom |
Industrial/Logistics | 30-12-2020 | 406 | 4.3 | 41,000 | 465,000 | 7.52% | 1,145 | The property comprises two industrial units which is part of a multi-tenant business building. During the transaction, the property was fully let to one tenant on a WALL of 4.3 years. |
| Spectrumlaan 5, Bleiswijk |
Industrial/Logistics | 15-04-2020 | 8,641 | 2.2 | 557,770 | 8,000,000 | 6.00 | 926 | The reference property is let to Cemex Trescon B.V. with a remaining lease term of 2.2 years. We are of the opinion that, the property is slightly over-rented (approximately 3%). The equivalent yield equates to 5.8%. |
| Weesperstraat 124-128, Diemen |
Industrial/Logistics | 19-10-2020 | 14,605 | 7.2 | 575,258 | 7,560,000 | 6.19% | 518 | This transaction was part of the Vinvest portfolio. During the transaction, the property was fully let to multiple tenants on a weighted average remaining lease term of 7.18. The property |
| ON BEHALF OF: | MORGAN STANLEY |
| PROJECT NAME: | MSTAR |
| is in our opinion, slightly over rented. The gross initial yield is 7.6%. |
| PROPERTY ID: | nlargo02 - Argonstraat 116-166 | |
| ON BEHALF OF: | MORGAN STANLEY | |
| VALUATION DATE: | 01-Feb-2021 | FINAL |
Argonstraat 116-166 - Argonstraat 116-166, Zoetermeer, 2718 SM, Netherlands
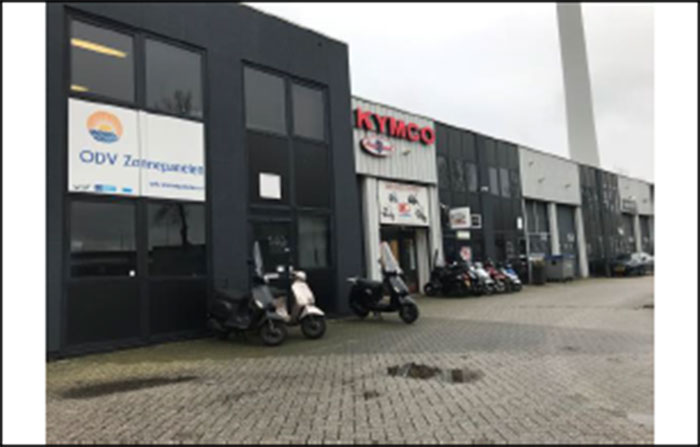
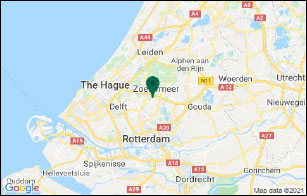
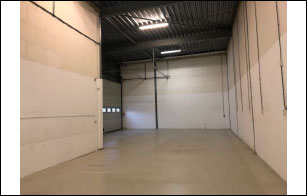
| VALUATION METRICS | (currency - EUR) |
| Metric | Value |
| Market Value | 3,220,000 |
| Market Value (per sq m) | 1,084 |
| Net Initial Yield | 6.05% |
| Reversionary Yield | 6.63% |
| Equivalent Yield | 6.56% |
| Gross Income (p.a.) | 226,810 |
| Gross Income (p.a.) (per sq m) | 76 |
| *Adj. Gross Income | 226,810 |
| Adj. Gross Income (per sq m) | 76 |
| Net Income (p.a.) | 212,200 |
| Net Income (p.a.) (per sq m) | 71 |
| Gross Rental Value | 259,430 |
| Gross Rental Value (per sq m) | 87 |
| Capital Expenditure | -64,588 |
| Transaction Costs | 9.00% |
| Over / Under Rented | -6.35% |
| KEY FACTS | ||
| Metric | Value | |
| Total Area (sq m) | 2,970 | |
| WAULT to Break by Rent | 2.08 | |
| WAULT to Break by ERV | 2.02 | |
| WAULT to Expiry by Rent | 2.08 | |
| WAULT to Expiry by ERV | 2.02 | |
| Percentage of Vacancy (Area) | 5.05% | |
| Percentage of Vacancy (ERV) | 6.65% | |
| ** | Number of Tenants | 13 |
| Current Voids (months) | 6 |
| LEASES RANKED BY RENT |
* Adjusted Gross Income equates to the Gross Income excluding any rent free periods ** Total tenant lines within our valuation. May differ to number of individual tenants |
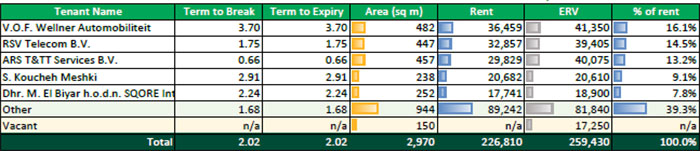
| Printed 09/03/2021 19:45 | |
| PROPERTY ID: | nlargo02 - Argonstraat 116-166 | |
| ON BEHALF OF: | MORGAN STANLEY | |
| VALUATION DATE: | 01-Feb-2021 | FINAL |
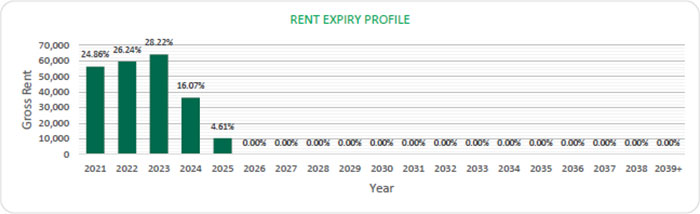
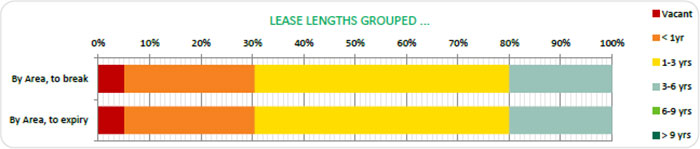
| Printed 09/03/2021 19:45 | |
| ON BEHALF OF: | MORGAN STANLEY |
| PROJECT NAME: | MSTAR |
PROPERTY REPORT
| ARGONSTRAAT 116-166, ZOETERMEER, NETHERLANDS | |||
| INSPECTED BY: | INSPECTION DATE: | VALUATION DATE: | PROPERTY TYPE |
| R.P.A.W.M. VERMEER MSC | 14 JANUARY 2020 | 1 FEBRUARY 2021 | INDUSTRIAL WAREHOUSE |
KEY VALUATION FACTORS
| STRENGTHS | WEAKNESSES | ||
| ■ | Almost fully let | ■ | Visibility from the main road |
| ■ | Good state of repair | ■ | Small roads on the parcel |
| ■ | Accessibility by private transport | ||
| OPPORTUNITIES | THREATS | ||
| ■ | Increasing investor appetite | ■ | Macro-economic uncertainty (i.e. Trade Wars; Brexit) |
| ■ | Extend lease term with current tenants | ■ | Vacancy in the direct surroundings |
| ■ | Lease out the vacancy | ■ | Uncertainty resulting from the Covid-19 outbreak |
LOCATION & SITUATION
| LOCATION |
Zoetermeer is located in the south east of the province of South Holland. The city is part of the southern side of the “Randstad” and its population consists of approximately 125,000 inhabitants.
Distances from Zoetermeer to other major cities are: 15 kilometres to The Hague, 20 kilometres to Rotterdam, 55 kilometres to Utrecht and 60 kilometres to Amsterdam.
The A12 motorway connects Zoetermeer directly to such cities as The Hague and Utrecht. It is also connected to Rotterdam and Amsterdam by respectively motorways A13 and A4. The rail network has direct links to a total of 14 railway stations and will further improve with the planned Randstadrail connecting Zoetermeer to The Hague and Rotterdam.
|
| ON BEHALF OF: | MORGAN STANLEY |
| PROJECT NAME: | MSTAR |
PROPERTY DESCRIPTION
| DESCRIPTION |
The subject property is located at the Argonstraat in Zoetermeer on business estate Lansinghage, near to the A12 motorway. The subject property comprises in total 2,970 sq m which is divided into 917 sq m office space and 2,053 sq m warehouse space. The property is fully surrounded by a private one-way street.
The building was constructed in 1991, the office is divided over a ground and first floor. The warehouse is located on the ground floor, the clear height of the warehouse is circa 8 metres.
|
|
|
Summary of known specification:
|
||
| Characteristic | Result | |
| Built / Renovation | 1991 | |
| Eaves Height | 8 metres | |
| No. of loading Doors | 14 | |
| Loading Door Ratio | 1:212 | |
| Yard Depth | 8 metres | |
| Cross-Dock | Front loading | |
| Warehouse (% of GLA) | 69% | |
| Site Coverage Ratio | 50% | |
| Source: Schedule provided by client. | ||
| ACCOMMODATION | We have not measured the property, but as instructed, we have relied upon floor areas made available to us, detailed below and elsewhere within this report. |
| ON BEHALF OF: | MORGAN STANLEY |
| PROJECT NAME: | MSTAR |
Floor Areas
| FLOOR / UNIT | USE | SQ M |
| ODV Zonnepanelen B.V. | Office and Warehouse | 200.00 |
| V.O.F. Wellner Automobiliteit | Office and Warehouse | 482.00 |
| RSV Telecom B.V. | Office and Warehouse | 447.00 |
| ARS T&TT Services B.V. | Office and Warehouse | 457.00 |
| S. van Bergen h.o.d.n. SVB | Warehouse | 186.00 |
| Automotive Advies & Bemiddeling | ||
| Vacant | Office | 150.00 |
| Dhr. M. El Biyar h.o.d.n. SQORE | Warehouse | 252.00 |
| Interieurbouw | ||
| S. Koucheh Meshki | Office and Warehouse | 127.00 |
| S. Koucheh Meshki | Office and Warehouse | 111.00 |
| Akihito Zoetermeer B.V. | Office and Warehouse | 111.00 |
| De heer S. Koucheh Meshki h.o.d.n. | Office and Warehouse | 111.00 |
| Mega Scoot Hallo Pizza en Car | ||
| Selection | ||
| E.R. Bandel en F.A. Bandel-Toorop | Office and Warehouse | 120.00 |
| h.o.d.n. Bandel Facilitaire Diensten | ||
| V.O.F. | ||
| Dhr. R.A. Knoop h.o.d.n. Fika | Office and Warehouse | 98.00 |
| Hoveniers o.a. | ||
| Elizabeth Craft Designs Inc. | Office and Warehouse | 118.00 |
| TOTAL | - | 2,970.00 |
DUE DILIGENCE
| STATE OF REPAIR |
CBRE have not undertaken a structural survey, nor tested the services. The property was subject to an inspection for valuation purposes in early 2020. As you are aware, the property has not been re-inspected for the purposes of this report, nor have we been provided with updated TDD. We have therefore relied on the information provided by the Borrower, including a Capex schedule dated 12 June 2019 and schedule with revised budget of capex dated 19 January 2021. Based on the latter which indicates TDD assessment less completed spend in 2020, we have included the immediate and 2-5 years capex of €62,000 within our valuation.
According to our own limited inspection for valuation purposes, our opinion regarding the state of repair would substantiate the assessment by Arcadis. Based on our impression gained during the inspection, we are of the opinion that the buildings are in a fair condition, in line with the year of construction.
|
| ENVIRONMENTAL CONSIDERATIONS |
We have been instructed not to make any investigations in relation to the presence or potential presence of contamination in land or buildings or the potential presence of other environmental risk factors and to assume that if investigations were made to an appropriate extent then nothing would be discovered sufficient to affect value. |
| ON BEHALF OF: | MORGAN STANLEY |
| PROJECT NAME: | MSTAR |
|
We have summarised the findings from a schedule provided in relation to ‘Priority sites’ within the front section of this report.
We have relied on the information provided by the Borrower, including Draft Phase 1 Environmental Review prepared by Ambiente Ltd and dated December 2019. The report summarises that the property is not registered as contaminated land in the Kadaster (Land Register) database.
In case a building permit is required (renovation or demolition/ reconstruction), a new site investigation will probably be required for the area involved.
We have not carried out investigation into past uses, either of the properties or of any adjacent lands, to establish whether there is any potential for contamination from such uses or sites, or other environmental risk factors and have therefore assumed that none exists.
|
|
| TENURE |
According to the information available from the Land Registry Office(Kadaster) the parcels are held freehold by MLET Netherlands 2 Holding B.V. and registered as follows:
Municipality: Zegewaard
Section: D
Numbers: 2447
Total Area: 5,472 sq m
Comments
■ Right of way with respect to parcel Zegewaard D 2134;
■ The right with respect to het Elektriciteitsbedrijf Delfland regarding the
construction and maintenance of power lines
We have also had sight of the Draft Red Flag Legal Report prepared by Loyens Loeff, dated 12 February 2021. Based on the information provided, we understand the property is held freehold.
We have assumed that there are no onerous legal conditions affecting the property which have a material impact on our opinion of value.
|
|
INCOME PROFILE
|
The subject property is almost fully let to 13 tenants on a WALL of 2.2 years. Circa 150 sq m office space is currently vacant. The ERV for the entire property equates to € 259,430 per annum. The current rental income is € 226,810. Corrected for the vacancy, we are of the opinion that the property is circa 6% under rented. |
VALUATION CONSIDERATIONS
| COSTS AND ADJUSTMENTS |
Based on the information provided or our knowledge of the market, in approaching our valuation, we made allowances for the following capita land non-recoverable costs. In all cases, we have cited whether they are |
| ON BEHALF OF: | MORGAN STANLEY |
| PROJECT NAME: | MSTAR |
| deducted as at the date of valuation or whether they take effect at a later date. | ||||
| Capital Expenditure: | ||||
| Type & Calculation | Source | Effective | Amount | |
| Capital Expenditure: Fixed Amount |
Technical Due Diligence |
On
Valuation No Repeat |
€ 62,000 | |
| Letting
Fees: 15% of Rental Value of the vacant space |
CBRE Estimate | On lease
start/ renewal No Repeat |
€ 2,588 | |
| TOTAL
ON VALUATION |
€ 64,588 | |||
| Revenue Deductions: | ||||
| Type & Calculation | Source | Effective | Annual Amount | |
| Management: 2.00% of rental value |
Borrower Estimate |
On Valuation |
€ 4,881 | |
| Property tax: 2.00% of rental value |
CBRE Estimate |
On Valuation
In perpetuity |
€ 5,189 | |
| Water tax: 0.25% of rental value |
CBRE Estimate |
On Valuation
In perpetuity |
€ 649 | |
| Insurance: 1.25% of rental value |
CBRE Estimate |
On Valuation
In perpetuity |
€ 3,243 | |
| Sewage charge: 0.25% of rental value |
CBRE Estimate |
On Valuation
In perpetuity |
€ 649 | |
| Maintenance: € 4.00 per sq m |
Borrower Estimate |
5 Year Delay
In perpetuity |
€ 11,880 | |
| Management Costs on Voids: 2% of rental value |
CBRE Estimate |
On all voids
In perpetuity |
€ 345 | |
| TOTAL: ON VALUATION | € 14,956 |
| Void and Rent-Free Allowances: |
| ON BEHALF OF: | MORGAN STANLEY |
| PROJECT NAME: | MSTAR |
| VALUATION
METHODOLOGY – MARKET VALUE |
On valuation date, the subject property is fully let. We have not received information regarding the termination of any leases. If the property would be offered on the market per valuation date, we believe it would take circa six months to rent out the property.
We have made the following rental assumptions having regard to the lettings agreed within the subject property, whilst also considering rental rates in the surrounding area:
|
| Unit | Area (s qm) | ERV (€) per S qm (annum) |
Rent pa (€) | |
| Office | 917 | 115 | 105,455 | |
| Warehouse | 2,053 | 75 | 153,975 | |
| Total | 2,970 | 87 | 259,430 | |
|
Opinion of Market Rent
We have referenced the most recent lettings agreed within the property itself and the nearby Argonstraat 22-112, in arriving at our opinion or rental value. This includes the letting to E.R. Bandel in 2019 at a blended rent equating to over €100 per sq m. The most recent 2020 lettings at 22-112 reflect rates ranging between €81 and €87 per sq m with the upper end justifying the blended rate adopted within our valuation. In relation to other evidence within the market, based on the below-mentioned comparable transactions, the current market trends and our general market knowledge, we have estimated the above-mentioned rental values for the areas in the subject property. The below appended comparables indicate a (blended) range from € 61 per sq m per annum to € 96 per sq m per annum.
The aforementioned rental values produce a total gross rental value of € 259,430 per annum or an average of circa € 87 per sq m. The agreed rental income amounts to € 226,810 per annum or an average of circa € 80 per sq m per annum. We are therefore of the opinion that the subject property is under rented.
Opinion of Valuation Yields
Currently, we witness downward pressure on net initial yields for prime logistics properties due to the high scarcity of good, long leased logistics properties.
Indicative net initial yields for prime logistics property are currently quoting 3.5% and 5.5% for prime industrial estates. Due to favourable dynamics in the occupier market in the Netherlands, with prospects for production and export growth in mind and taking into account the capital available for (real estate) investments, investor appetite is expected to increase further. This is also expected to put further downward pressure on yields.
Within the evidence table appended, we would highlight the following. The lower end of the yield range is indicated by the property located at the
|
||||
| ON BEHALF OF: | MORGAN STANLEY |
| PROJECT NAME: | MSTAR |
|
Melbournestraat 50-68, Rotterdam. As we are of the opinion that the location of this reference is better, we have allowed for a higher yield profile for the subject property.
The top of the range is highlighted by the property located at the Ringersweg 10 C-D, Bergen op Zoom. However, since the location of the subject property is better we allowed for a sharper yield profile.
We have arrived at our opinion of Market Value adopting the Traditional investment capitalisation method of valuation. Within this approach, we apply an income weighted average equivalent yield to our opinion of net income, reflecting the comparable evidence within the market for guidance on capital rates and values per sq m. The NIY’s of the comparable investments range from 5.14% to 7.52% and also taking into account the current market conditions and the WAULT to expiry by current income of 2.17 years. we have adopted a split yield approach, targeting the following rates:
- Vacant = 7.50%
- Let = 6.50%
The approach results in a net initial yield of circa 6.05% which reflects a capital rate per sq m of € 1,084, after allowing for purchaser’s costs equating to 9.00%.
On the assumption that there are no unusual factors of which we are unaware and on the basis of the comments and assumptions specified in this report, CBRE is of the opinion that the Market Value (rounded) of the subject property, is:
€ 3,220,000
(Three million two hundred twenty thousand Euros)
The unrounded net capital value is € 3,218,884. The gross unrounded capital value is € 3,508,584 including € 289,700 purchaser’s costs (9.00%).
|
|
|
VALUATION METHODOLOGY – VACANT POSSESSION VALUE
|
The constituent inputs in terms of rental value and non-recoverable costs largely align with the Market Value approach. The key exception being that we have adopted a special assumption that the property is 100% vacant/non-income producing as at the valuation date. This value is predominantly derived using the traditional investment method of valuation but critically benchmarking the resultant capital rate per sq m against the prevailing evidence.
In approaching our valuation under the Special Assumption that the property is entirely vacant (Vacant Possession Value), we have adopted a total void period of 6 months inclusive of rent free or tenant incentives and targeted an equivalent yield of 7.5%.
This results in a net rounded value of €2,680,000, equating to €902 per sq m.
|
| ESTIMATED REINSTATEMENT ASSESSMENT |
The property has not been inspected by a suitably qualified building surveyor from CBRE, nor have we carried out a full Reinstatement Cost Assessment. For indicative purposes only we estimate that the reinstatement cost of |
| ON BEHALF OF: | MORGAN STANLEY |
| PROJECT NAME: | MSTAR |
|
insurance purposes would be in the region of €4,605,000 (rounded, excl. VAT) on a day one basis, including fees but excluding VAT and inflation.
This figure should be compared with the current sum insured and if a material discrepancy exists we suggest that a full Reinstatement Cost Assessment is carried out. |
| ON BEHALF OF: | MORGAN STANLEY |
| PROJECT NAME: | MSTAR |
RENTAL EVIDENCE
| PROPERTY ADDRESS |
PROPERTY USE |
DATE | TOTAL AREA |
TENANT | LEASE LENGTH (YEARS) |
BREAK OPTION |
RENT (P.A) |
RENTAL RATE PER SQ M |
RELATIVE QUALITY |
| Edelgasstraat 262, Zoetermeer | Industrial | 2020, December | 560 | Unknown | not available | not available | 49,000 | 87.50 | This reference is located in the direct vicinity of the subject property. In addition, we are of the opinion that the quality can be considered comparable. |
| Argonstraat 7a, Zoetermeer | Industrial | 2020, October | 390 | Unknown | not available | not available | 23,940 | 61.39 | We are of the opinion that the location of this reference is comparable to that of the subject property. However, we are of the opinion that the building quality can be considered inferior. |
| Aluminiumstraat 10-06, Zoetermeer | Industrial | 2021, January | 199 | Unknown | not available | not available | 19,140 | 96.18 | We are of the opinion that the location of this reference is comparable to that of the subject property. However, we are of the opinion that the building quality can be considered superior since it concerns a newly built property. |
| Kwartsweg 48, Bleiswijk | Industrial | 2020, July | 853 | Unknown | not available | not available | 60,000 | 70.34 | This reference is located in the direct vicinity of the subject property. In addition, we are of the opinion that the quality can be considered comparable. |
| ON BEHALF OF: | MORGAN STANLEY |
| PROJECT NAME: | MSTAR |
SALES EVIDENCE
| PROPERTY ADDRESS |
PROPERTY USE | DATE | TOTAL AREA |
WAULT (YEARS) |
PASSING RENT PER ANNUM |
PURCHASE PRICE |
NET INITIAL YIELD (%) |
CAPITAL M |
RELATIVE QUALITY |
| Melbournestraat 50-68, Sydneystraat 32- 56, Rotterdam |
Industrial/Logistics | 17-03-2020 | 5,354 | 2.5 | 401,144 | 6,587,000 | 5.14% | 1,230 | During the transaction, the property was fully let to eleven tenants on a WALL of 2.5 years The property is slightly under. rented, the equivalent yield equates to 5.08. |
| Ringersweg 10 C-D, Bergen op Zoom |
Industrial/Logistics | 30-12-2020 | 406 | 4.3 | 41,000 | 465,000 | 7.52% | 1,145 | The property comprises two industrial units which is part of a multi-tenant business building. During the transaction, the property was fully let to one tenant on a WALL of 4.3 years. |
| Spectrumlaan 5, Bleiswijk |
Industrial/Logistics | 15-04-2020 | 8,641 | 2.2 | 557,770 | 8,000,000 | 6.00 | 926 | The reference property is let to Cemex Trescon B.V. with a remaining lease term of 2.2 years. We are of the opinion that, the property is slightly over-rented (approximately 3%). The equivalent yield equates to 5.8%. |
| Weesperstraat 124-128, Diemen |
Industrial/Logistics | 19-10-2020 | 14,605 | 7.2 | 575,258 | 7,560,000 | 6.19% | 518 | This transaction was part of the Vinvest portfolio. During the transaction, the property was fully let to multiple tenants on a weighted average remaining lease term of 7.18. The property is in our opinion, slightly over |
| ON BEHALF OF: | MORGAN STANLEY |
| PROJECT NAME: | MSTAR |
|
rented. The gross initial yield is 7.6%.
|
| PROPERTY ID: | nlbreg - Breguetlaan 67 | |
| ON BEHALF OF: | MORGAN STANLEY | |
| VALUATION DATE: | 01-Feb-2021 | FINAL |
Breguetlaan 67 - Breguetlaan 67, Oude Meer, 1438 BD, Netherlands
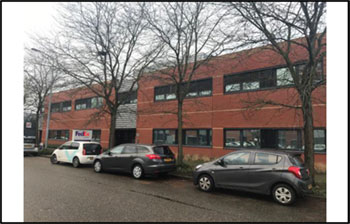 |
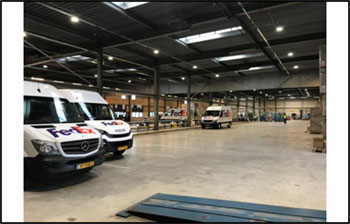 |
|
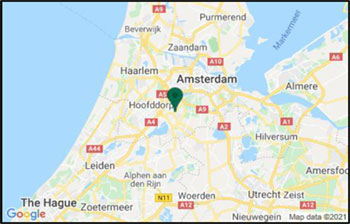 |
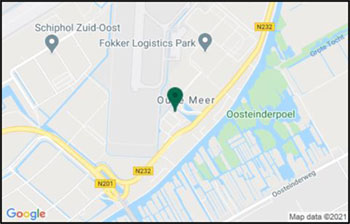 |
| VALUATION METRICS | (currency - EUR) |
| Metric | Value |
| Market Value | 23,400,000 |
| Market Value (per sq m) | 1,381 |
| Net Initial Yield | 4.90% |
| Reversionary Yield | 5.78% |
| Equivalent Yield | 5.71% |
| Gross Income (p.a.) | 1,345,146 |
| Gross Income (p.a.) (per sq m) | 79 |
| *Adj. Gross Income | 1,345,146 |
| Adj. Gross Income (per sq m) | 79 |
| Net Income (p.a.) | 1,249,190 |
| Net Income (p.a.) (per sq m) | 74 |
| Gross Rental Value | 1,636,925 |
| Gross Rental Value (per sq m) | 97 |
| Capital Expenditure | -707,412 |
| Transaction Costs | 9.00% |
| Over / Under Rented | 7.31% |
KEY FACTS
| Metric | Value | |
| Total Area (sq m) | 16,945 | |
| WAULT to Break by Rent | 4.82 | |
| WAULT to Break by ERV | 4.94 | |
| WAULT to Expiry by Rent | 4.82 | |
| WAULT to Expiry by ERV | 4.94 | |
| Percentage of Vacancy (Area) | 22.37% | |
| Percentage of Vacancy (ERV) | 23.42% | |
| ** | Number of Tenants | 21 |
| Current Voids (months) | 6 | |
| * Adjusted Gross Income equates to the Gross Income excluding any rent free periods | |
| LEASES RANKED BY RENT | ** Total tenant lines within our valuation. May differ to number of individual tenants |
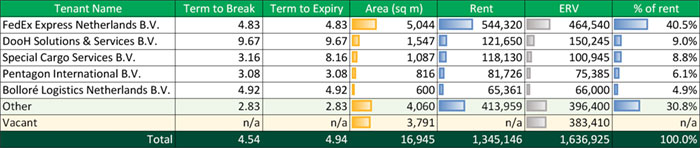
| Printed 09/03/2021 19:45 | |
| PROPERTY ID: | nlbreg - Breguetlaan 67 | |
| ON BEHALF OF: | MORGAN STANLEY | |
| VALUATION DATE: | 01-Feb-2021 | FINAL |
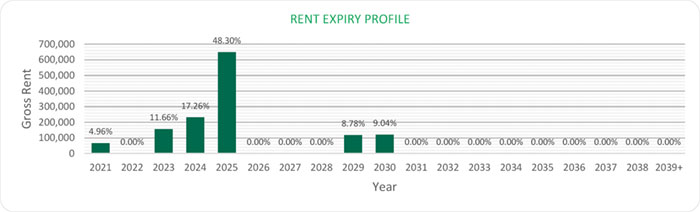 |
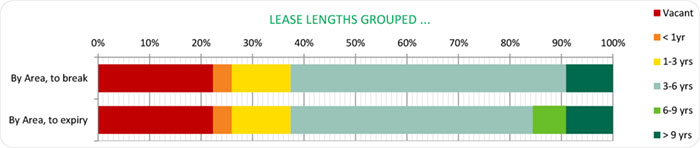 |
| Printed 09/03/2021 19:45 | |
| ON BEHALF OF: | MORGAN STANLEY | |
| PROJECT NAME: | MSTAR |
| SUPROPERTY REPORT |
| BREGUETLAAN 67, OUDE MEER, NETHERLANDS | |||
| INSPECTED BY: | INSPECTION DATE: | VALUATION DATE: | PROPERTY TYPE |
| DEVIN UMMELS | 14 JANUARY 2019 | 1 FEBRUARY 2021 | INDUSTRIAL WAREHOUSE |
| KEY VALUATION FACTORS |
| STRENGTHS | WEAKNESSES |
| ■ Location | ■ Vacancy |
| ■ Quality | ■ Office/warehouse ratio |
| ■ Accessibility |
| OPPORTUNITIES | THREATS |
| ■ Increasing investor appetite | ■ Greenfield developments in the area |
| ■ Lease the vacant space | ■ Macro-economic uncertainty (i.e. Trade Wars; Brexit) |
| ■ Extend lease term with current tenants |
|
LOCATION & SITUATION
|
||
| LOCATION | Oude Meer is a village part of the municipality Haarlemmermeer, which is located in the west of the Netherlands, in the province of Noord-Holland. Oude Meer is located at circa 10 kilometres from Haarlem which is the capital of the province of Noord-Holland. Oude Meer is located at circa 10 kilometres from Amsterdam. The village of Oude Meer has an estimated population of 100 inhabitants. The average disposable income in Oude Meer is above the national average. | |
| The property is located on the Sky Park business park near Schiphol airport. The environment is characterized in particular by business complexes of different scales. There is a strong orientation towards air traffic related logistics activities as well as the presence of data centers. | ||
| ON BEHALF OF: | MORGAN STANLEY | |
| PROJECT NAME: | MSTAR |
| PROPERTY DESCRIPTION |
| DESCRIPTION | The subject property is located at Breguetlaan 67, Oude Meer is a light industrial complex located in the vicinity of Schiphol Airport. The subject property comprises in total circa 16,945 sq m lettable floor area divided over 27 units in five separate buildings. Two buildings comprise offices and three buildings comprise office/warehouse units. Each unit has a small office component and at minimum one overhead door. The construction is of steel columns with façade comprising insulated panels and brickwork and a flat roof presumed to be covered with bitumen. | |
| The building was constructed in 1993, the office is divided over a ground and first floor. The warehouse is located on the ground floor, the clear height of the warehouse is circa 7 metres. | ||
| Summary of known specification: |
| Characteristic | Result | ||
| Built / Renovation | 1993 | ||
| Eaves Height | 7 metres | ||
| Warehouse (% of LFA) | 54% | ||
| Site Coverage Ratio | 88% | ||
| Source: Inspection/BAG Viewer/Kadaster | |||
| ACCOMMODATION | We have not measured the property, but as instructed, we have relied upon floor areas made available to us, detailed below and elsewhere within this report. | |
| Floor Areas | |||
| TENANT | UNIT | USE | SQ M |
| Blygold Schiphol B.V. | Unit 3 | Office/Warehouse | 383 |
| Bollore Logistics Netherlands B.V. | Unit 67 bg | Office/Warehouse | 515 |
| Bolloré Logistics Netherlands B.V. | Unit 67 C, D | Office/Warehouse | 600 |
| DG Packaging B.V. | Unit 23 | Office/Warehouse | 376 |
| DooH Solutions & Services B.V. | Unit 67A | Office/Warehouse | 1,547 |
| Express-Cargo Holland B.V. | Unit 21 | Office/Warehouse | 400 |
| FedEx Express Netherlands B.V. | Unit 25, 37 & 39 | Office/Warehouse | 5,044 |
| HET B.V. | Unit 5 | Office/Warehouse | 403 |
| Hollandia Forwarding B.V. | Unit 14 | Office/Warehouse | 229 |
| IFlex Logistics B.V. i.o. | Unit 13 | Office/Warehouse | 438 |
| Modulex B.V. | Unit 11 | Office/Warehouse | 365 |
| Morrison Express Netherlands B.V. | Unit 10 A | Office/Warehouse | 175 |
| Pentagon International B.V. | Unit 15 | Office/Warehouse | 438 |
| Pentagon International B.V. | Unit 17A | Office/Warehouse | 98 |
| Pentagon International B.V. | Unit 17B | Office/Warehouse | 280 |
| RS Global B.V. | Unit 1 | Office/Warehouse | 338 |
| ON BEHALF OF: | MORGAN STANLEY | |
| PROJECT NAME: | MSTAR |
| Special Cargo Services B.V. | Breguetlaan 67 | Office/Warehouse | 0 |
| Special Cargo Services B.V. | Unit 7 | Office/Warehouse | 405 |
| Special Cargo Services B.V. | Unit 9 | Office/Warehouse | 682 |
| Stamhuis Schiphol B.V. | Unit 19 | Office/Warehouse | 438 |
| TUI Nederland N.V. | Parking 3 | Parking | 0 |
| Vacant | Breguetlaan 20-22 | Office/Warehouse | 921 |
| Vacant | Parking 1 | Parking | 0 |
| Vacant | Parking 2 | Parking | 0 |
| Vacant | Unit 10 B | Office/Warehouse | 322 |
| Vacant | Unit 10 | Office/Warehouse | 270 |
| Vacant | Unit 12 A | Office/Warehouse | 255 |
| Vacant | Unit 12 | Office/Warehouse | 270 |
| Vacant | Unit 14 A | Office/Warehouse | 278 |
| Vacant | Unit 16-18 | Office/Warehouse | 1,049 |
| Vacant | Unit 67 C | Office/Warehouse | 156 |
| Vacant | Unit 8 | Office/Warehouse | 270 |
| TOTAL | - | 16,945 |
DUE DILIGENCE
|
STATE OF REPAIR
|
CBRE have not undertaken a structural survey, nor tested the services. The property was subject to an inspection for valuation purposes in early 2020. As you are aware, the property has not been re-inspected for the purposes of this report, nor have we been provided with updated TDD. We have therefore relied on the information provided by the Borrower, including a Capex schedule dated 12 June 2019 and schedule with revised budget of capex dated 19 January 2021. Based on the latter which indicates TDD assessment less completed spend in 2020, we have included the immediate and 2-5 years capex of €539,250 within our valuation.
According to our own limited inspection for valuation purposes, our opinion regarding the state of repair would substantiate the assessment by Arcadis. Based on our impression gained during the inspection, we are of the opinion that the buildings are in a fair condition, in line with the year of construction. |
|
| ENVIRONMENTAL CONSIDERATIONS |
We have been instructed not to make any investigations in relation to the presence or potential presence of contamination in land or buildings or the potential presence of other environmental risk factors and to assume that if investigations were made to an appropriate extent then nothing would be discovered sufficient to affect value.
We have summarised the findings from a schedule provided in relation to ‘Priority sites’ within the front section of this report.
We have relied on the information provided by the Borrower, including Draft Phase 1 Environmental Review prepared by Ambiente Ltd and dated December 2019. The report summarises that the environmental risk assessment identified a very low potential environmental risk to site users, a |
| ON BEHALF OF: | MORGAN STANLEY |
| PROJECT NAME: | MSTAR |
|
|
low risk to groundwater to ecological and surface water receptors from known residual contamination on site. | |
| The potential environmental risks related to current storage and handling of hazardous materials are assessed to be low to site users, groundwater and surface water and very low to ecological receptors. | ||
| The potential environmental risk from former and current off-site land uses is assessed to be very low. | ||
| We have not carried out investigation into past uses, either of the properties or of any adjacent lands, to establish whether there is any potential for contamination from such uses or sites, or other environmental risk factors and have therefore assumed that none exists. |
| TENURE | According to the information available from the Land Registry Office (Kadaster) the parcels are held freehold by Multi-Let Industrial Property 27 B.V. and registered as follows: | ||
| Municipality: | Haarlemmermeer | ||
| Section: | AK | ||
| Numbers: | 1974; 1986; 1895; 1894; 2917 | ||
| Total Area: | 14,050 sq m | ||
| We have also had sight of the Draft Red Flag Legal Report prepared by Loyens Loeff, dated 12 February 2021. Based on the information provided, we understand the property is held freehold. | ||
| We understand prior written permission of Schiphol Area Development Company N.V. is required for transfer of the property as long as the obligation to start with the construction of the first building within twelve month after issuance of the building permit, has not been met. This provision was included in a deed dated 14 December 1992. Once the building obligation has been fulfilled, permission for transfer is no longer required. We have therefore assumed this option no longer exists. | ||
| We have assumed that there are no onerous legal conditions affecting the property which have a material impact on our opinion of value. |
| ON BEHALF OF: | MORGAN STANLEY |
| PROJECT NAME: | MSTAR |
| INCOME PROFILE | The subject property is partially let to 21 tenants on a WALL of 4.9 years. The vacancy equates to 3,791 metres which equals circa 22% of the total lettable floor area. The ERV for the vacancy equates to € 383,410 per annum. The current rental income is € 1,345,146 per annum. The ERV for the leased part is estimated at € 1,253,515 per annum, we are therefore of the opinion the property is over-rented. The ERV for the entire property equates to € 1,636,928 per annum. | |
| The largest tenant is FedEx Express Netherlands B.V. The tenant produces an annual rental income of €544,320. This equates to 34.5% of the total rental income. FedEx Express Netherlands B.V. is a subsidiary of FEDERAL EXPRESS HOLDING US 5, LLC. A worldwide operating and well-known company. We are therefore of the opinion the tenant provides strong covenant strength. |
| VALUATION CONSIDERATIONS |
|
COSTS AND ADJUSTMENTS |
Based on the information provided or our knowledge of the market, in approaching our valuation, we made allowances for the following capital and non-recoverable costs. In all cases, we have cited whether they are deducted as at the date of valuation or whether they take effect at a later date. | |
| Capital Expenditure: | |||||
| Type & Calculation | Source | Effective | Amount | ||
| Capital Expenditure: Fixed Amount | Technical Due Diligence | On Valuation No Repeat | €539,250 | ||
| Letting Fees: 15% of Rental Value of the vacant space | CBRE Estimate | On lease start/ renewal No Repeat | € 57,512 | ||
| Rent Free - DG Packaging B.V. | Borrower | On Valuation | €2,000 | ||
| Rent Reduction - Special Cargo Services B.V. | Borrower | No Repeat | €3,000 | ||
| Rent Reduction - RS Global B.V. | Borrower | On Valuation | €35,000 | ||
| Rent Reduction - DooH Solutions & Ser | Borrower | No Repeat | €70,650 |
| ON BEHALF OF: | MORGAN STANLEY |
| PROJECT NAME: | MSTAR |
| TOTAL ON VALUATION | €707,412 | ||||
| Revenue Deductions: | |||||
| Type & Calculation | Source | Effective | Annual Amount | ||
| Management: 2.00% of rental value | Borrow Estimate er | On Valuation In perpetuity | € 34,571 | ||
| Property tax: 2.00% of rental value | CBRE Estimate | On Valuation In perpetuity | € 32,739 | ||
| Water tax: 0.25% of rental value | CBRE Estimate | On Valuation In perpetuity | € 4,092 | ||
| Insurance: 1.25% of rental value | CBRE Estimate | On Valuation In perpetuity | € 20,462 | ||
| Sewage charge: 0.25% of rental value | CBRE Estimate | On Valuation In perpetuity | € 4,092 | ||
| Maintenance: € 4.00 per sq m | Borrower Estimate | 5 Year Delay In perpetuity | € 67,780 | ||
| Management Costs on Voids: 2% of rental value | CBRE Estimate | On all voids In perpetuity | € 7,668 | ||
| TOTAL: ON VALUATION | € 103,624 | ||||
| Void and Rent-Free Allowances: | |||||
| Regarding the vacant units, we have allowed for a current void period of 6 months. | |||||
| |
|||||
| VALUATION METHODOLOGY – MARKET VALUE | We have made the following rental assumptions having regard to the lettings agreed within the subject property, whilst also considering rental rates in the surrounding area: | ||||
| Unit | Area (s qm) | ERV (€) per S qm (annum) | Rent pa (€) | ||
| Office | 7,864 | 110 | 865,040 | ||
| Warehouse | 9,081 | 85 | 771,885 | ||
| Total | 16,945 | 97 | 1,636,925 | ||
| ON BEHALF OF: | MORGAN STANLEY |
| PROJECT NAME: | MSTAR |
| Opinion of Market Rent | |
| Based on the below-mentioned comparable transactions, the current market trends and our general market knowledge, we have estimated the above-mentioned rental values for the areas in the subject property. The below appended comparables indicate a (blended) range from € 86 per sq m per annum to € 109 per sq m per annum. | |
| Within the evidence table appended, we would highlight the property in Lemelerbergweg 22, Amsterdam as best comparable and therefore of greatest relevance in terms of similar appearance, state of repair, eaves height and location. | |
| The aforementioned rental values produce a total gross rental value of € 1,636,925 per annum or an average of circa € 97 per sq m. The current rental income amounts to € 1,345,146 per annum or an average of circa € 79 per sq m. We are of the opinion that the subject property is under-rented. | |
| Opinion of Valuation Yields | |
| Currently, we witness downward pressure on net initial yields for prime logistics properties due to the high scarcity of good, long leased logistics properties. | |
| Indicative net initial yields for prime logistics property are currently quoting 3.5% and 5.5% for prime industrial estates. Due to favourable dynamics in the occupier market in the Netherlands, with prospects for production and export growth in mind and taking into account the capital available for (real estate) investments, investor appetite is expected to increase further. This is also expected to put further downward pressure on yields. | |
| Within the evidence table appended, we would highlight the following. The lower end of the yield range is indicated by the property located at Melbournestraat 50-68 in Rotterdam. Quality and characteristics of this asset are superior compared to the subject property. | |
| The middle of the range is highlighted by the property located in Berchvliet, Amsterdam. The subject property has a more favourable location but the office/warehouse ratio results in inferior leasing conditions. Overall a similar yield profile is applicable in our opinion. | |
| We have arrived at our opinion of Market Value adopting the Traditional investment capitalisation method of valuation. Within this approach, we apply an income weighted average equivalent yield to our opinion of net income, reflecting the comparable evidence within the market for guidance on capital rates and values per sq m. The NIY’s of the comparable investments range from 5.14% to 6.16% and also taking into account the current market |
| ON BEHALF OF: | MORGAN STANLEY |
| PROJECT NAME: | MSTAR |
| conditions and the WAULT to expiry by current income of 4.82 years, we have adopted a split yield approach, targeting the following rates: | |
| - Vacant = 6.50% | |
| - Let = 5.50% | |
| The approach results in a blended equivalent yield of 5.70% and NIY of circa 4.90% which reflects a capital rate per sq m of € 1,381, after allowing for purchaser’s costs equating to 9.00%. Whilst the capital rate per sq m would appear to be higher than the available evidence, the blended equivalent yield in this instance is the primary driver, particularly considering the income profile of Berchvliet 3-13. | |
| On the assumption that there are no unusual factors of which we are unaware and on the basis of the comments and assumptions specified in this report, CBRE is of the opinion that the Market Value (rounded) of the subject property, is: | |
| € 23,400,000 | |
| (Twenty-three million four hundred thousand Euro) | |
| The unrounded net capital value is € 25,512,352. The gross unrounded capital value is € 23,405,827 including € 2,106,525 purchaser's costs (9.00%). | |
| VALUATION METHODOLOGY – VACANT POSSESSION VALUE | The constituent inputs in terms of rental value and non-recoverable costs largely align with the Market Value approach. The key exception being that we have adopted a special assumption that the property is 100% vacant/non-income producing as at the valuation date. This value is predominantly derived using the traditional investment method of valuation but critically benchmarking the resultant capital rate per sq m against the prevailing evidence. |
| In approaching our valuation under the Special Assumption that the property is entirely vacant (Vacant Possession Value), we have adopted a total void period of 6 months inclusive of rent free or tenant incentives and targeted an equivalent yield of 6.5%. | |
| This results in a net rounded value of €19,550,000, equating to €1,154 per sq m. | |
| ESTIMATED REINSTATEMENT ASSESSMENT |
The property has not been inspected by a suitably qualified building surveyor from CBRE, nor have we carried out a full Reinstatement Cost Assessment. For indicative purposes only we estimate that the reinstatement cost of insurance purposes would be in the region of €26,280,000 (rounded, excl. VAT) on a day one basis, including fees but excluding VAT and inflation.
This figure should be compared with the current sum insured and if a material discrepancy exists we suggest that a full Reinstatement Cost Assessment is carried out. |
| ON BEHALF OF: | MORGAN STANLEY |
| PROJECT NAME: | MSTAR |
| RENTAL EVIDENCE |
| PROPERTY ADDRESS | PROPERTY USE | DATE | TOTAL AREA | TENANT | LEASE LENGTH (YEARS) | BREAK OPTION | RENT (P.A) | RENTAL RATE PER SQ M | RELATIVE QUALITY |
| Lemelerbergweg 22, Amsterdam | Industrial | 2019, November | 1,074 | ing bank | not available | not available | 100,800 | 93.85 |
Similar quality but a slightly lesser location. Schiphol area has a slight premium.
|
| Bellsingel 51, Schiphol-Rijk | Industrial | 2020, June | 6,304 | TNT | not available | not available | 684,000 | 108.50 | Similar quality but superior property specifications. |
| Chemieweg 103, Uithoorn | Industrial | 2020, March | 135 | onderneming | not available | not available | 13,140 | 97 | Similar quality and characteristics. Slightly smaller units and lesser location. |
| Computerweg 21, Amsterdam | Industrial | 2019, August | 270 | cortina | not available | not available | 23,200 | 85.93 |
Lesser location and therefore higher ERV appropriate for the subject property.
|
| ON BEHALF OF: | MORGAN STANLEY |
| PROJECT NAME: | MSTAR |
| SALES EVIDENCE | |||||||||
| PROPERTY ADDRESS | PROPERTY USE | DATE | TOTAL AREA | WAULT (YEARS) | PASSING RENT PER ANNUM | PURCHASE PRICE | NET INITIAL YIELD (%) | CAPITAL RATE PER SQ M | RELATIVE QUALITY |
| Melbournestraat 50-68, Sydneystraat 32-56, Rotterdam | Industrial/Logistics | 17-03-2020 | 5,354 | 2.5 | 401,144 | 6,587,000 | 5.14% | 1,230 | During the transaction, the property was fully let to eleven tenants on a WALL of 2.5 years. The property is slightly under rented, the equivalent yield equates to 5.08. Due to the leasehold situation of the reference property a softer yield for the subject property is appropriate. |
| Berchvliet 3-13, Sierenborch 1, Amsterdam | Industrial/Logistics | 20-02-2020 | 6,108 | 3.7 | 549,164 | 8,075,000 | 5.80% | 1,322 | During the transaction, the property was fully let on a WALL of 3.7 years. The equivalent yield amounts to 5.80%. Due to the superior quality and longer WALL of the subject property we are of the opinion a sharper yield is appropriate. |
| Jan Van Krimpenweg 1 + 21-26, Haarlem | Industrial/Logistics | 19-10-2020 | 10,503 | 1.0 | 621,655 | 8,400,000 | 6.16% | 800 | This transaction was part of the Vinvest portfolio. During the transaction, the property was fully let to multiple tenants on a weighted average WALL of 7.25 years. The property is in our opinion, slightly under rented (11.56%). The gross initial yield |
| ON BEHALF OF: | MORGAN STANLEY |
| PROJECT NAME: | MSTAR |
| equates to 7.40%. The location and quality of the reference are less. A sharper yield is in our opinion appropriate for the subject property. | |||||||||
| Spectrumlaan 5, Bleiswijk | Industrial/Logistics | 15-04-2020 | 8,641 | 2.2 | 557,770 | 8,000,000 | 6.00 | 926 | The reference property is let to Cemex Trescon B.V. with a remaining lease term of 2.2 years. We are of the opinion that, the property is slightly over-rented (approximately 3%). The equivalent yield equates to 5.8%. In our opinion a similar yield profile is appropriate for the subject property considering location and occupancy. |
| PROPERTY ID: | nlbuns - Bunsenstraat 13-23 | |
| ON BEHALF OF: | MORGAN STANLEY | |
| VALUATION DATE: | 01-Feb-2021 | FINAL |
Bunsenstraat 13-23 - Bunsenstraat 13-23, Dordrecht, 3316 GC, Netherlands
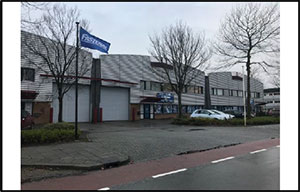 |
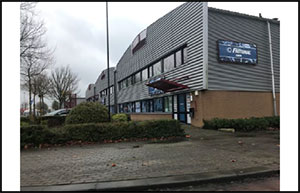 |
|
 |
|
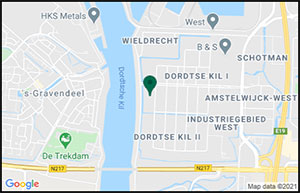
| VALUATION METRICS | (currency - EUR) |
| Metric | Value |
| Market Value | 6,730,000 |
| Market Value (per sq m) | 708 |
| Net Initial Yield | 5.49% |
| Reversionary Yield | 6.17% |
| Equivalent Yield | 6.17% |
| Gross Income (p.a.) | 432,613 |
| Gross Income (p.a.) (per sq m) | 46 |
| *Adj. Gross Income | 432,613 |
| Adj. Gross Income (per sq m) | 46 |
| Net Income (p.a.) | 402,457 |
| Net Income (p.a.) (per sq m) | 42 |
| Gross Rental Value | 520,780 |
| Gross Rental Value (per sq m) | 55 |
| Capital Expenditure | -107,811 |
| Transaction Costs | 9.00% |
| Over / Under Rented | 2.51% |
| KEY FACTS | ||
| Metric | Value | |
| Total Area (sq m) | 9,505 | |
| WAULT to Break by Rent | 1.35 | |
| WAULT to Break by ERV | 1.29 | |
| WAULT to Expiry by Rent | 1.35 | |
| WAULT to Expiry by ERV | 1.29 | |
| Percentage of Vacancy (Area) | 17.13% | |
| Percentage of Vacancy (ERV) | 18.96% | |
| ** | Number of Tenants | 8 |
| Current Voids (months) | 12 | |
| * Adjusted Gross Income equates to the Gross Income excluding any rent free periods | |
| LEASES RANKED BY RENT | ** Total tenant lines within our valuation. May differ to number of individual tenants |
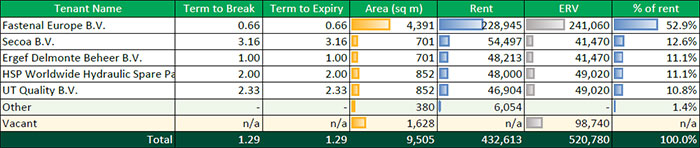
| Printed 09/03/2021 19:45 | |
| PROPERTY ID: | nlbuns - Bunsenstraat 13-23 | |
| ON BEHALF OF: | MORGAN STANLEY | |
| VALUATION DATE: | 01-Feb-2021 | FINAL |
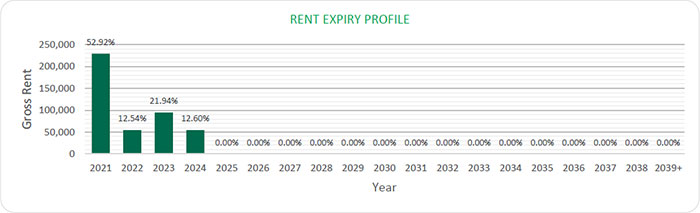
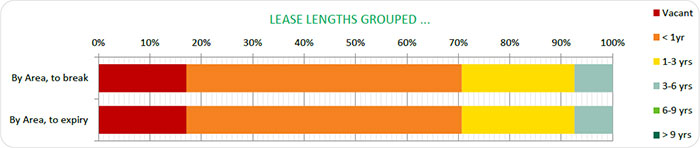
| Printed 09/03/2021 19:45 | |
| ON BEHALF OF: | MORGAN STANLEY |
| PROJECT NAME: | MSTAR |
PROPERTY REPORT
BUNSENSTRAAT 13-23, DORDRECHT, NETHERLANDS
| INSPECTED BY: | INSPECTION DATE: | VALUATION DATE: | PROPERTY TYPE |
| R.P.A.W.M. VERMEER MSC | 14 JANUARY 2020 | 1 FEBRUARY 2021 | INDUSTRIAL WAREHOUSE |
KEY VALUATION FACTORS
| STRENGTHS | WEAKNESSES | |
|
■ Accessibility by private transport
■ State of repair
|
■ Vacancy
■ Constructed to moderate specifications
|
|
| OPPORTUNITIES | THREATS | |
|
■ Increasing investor appetite
■ Lease the vacant space
■ Extend lease term with current tenants
|
■ Macro-economic uncertainty (i.e. Trade Wars; Brexit)
■ Competitive supply in the area
■ Uncertainty resulting from the Covid-19 outbreak
|
LOCATION & SITUATION
| LOCATION | The municipality of Dordrecht is located in the province of South Holland. With a population of about 119,000 in 2021, it is the fourth largest city of the province. The municipality covers the entire Dordrecht Island and is bordered by the rivers Oude Maas, Beneden Merwede, Nieuwe Merwede, Hollands Diep, and Dordtsche Kil. Dordrecht is the largest and most important city in the Drechtsteden. The Drechtsteden are a number of towns and cities bordering each other in the delta area of the rivers Oude Maas, Noord, and Beneden-Merwede in the province of South Holland. The total area of the municipality of Dordrecht is about 99.47 sq km, including 79.01 sq km of land and 20.46 sq km of water. The municipality has a density of about 1,503 per sq km. Accessibility of the municipality of Dordrecht by both private and public transport are good. Dordrecht is connected to the railroad system. There are 3 railway stations: Dordrecht Zuid railway station, Dordrecht Central railway station, and Dordrecht Stadspolders railway station. The motorway A16 and national road N3 run through Dordrecht. Motorway A16 runs from the interchange Terbregseplein in the northeastern part of Rotterdam, towards the |
| ON BEHALF OF: | MORGAN STANLEY |
| PROJECT NAME: | MSTAR |
| Belgian border near Hazeldonk. This motorway has 19 exits including 7 interchanges. The motorway A15 is located just north of Dordrecht. The national road N3 links to the national road N217 to the south and national road N214 to the north. |
PROPERTY DESCRIPTION
| DESCRIPTION |
The subject property comprises a multi-let estate located at the “Dordtse Kil” business estate, near the A16 motorway. The subject property comprises in total 9,505 sq m LFA which is divided into 2,151 sq m office space and 6,974 sq m of warehouse space. The property consists of nine separate units of different sizes. In addition, the property benefits from circa 380 sq m paved outdoor area.
The building was constructed in 1980, the office is divided over a ground and first floor. The warehouse is located on the ground floor, the clear height of the warehouse is circa 8 metres.
|
| Summary of known specification: | |||
| Characteristic | Result | ||
| Built / Renovation | 1980 | ||
| Eaves Height | 8 metres | ||
| No. of loading Doors | 13 | ||
| Loading Door Ratio | 1:702 | ||
| Yard Depth | 9 metres | ||
| Warehouse (% of GLA) | 76% | ||
| Site Coverage Ratio | 61% | ||
| Source: BAG/Inspection/Land registry | |||
| ACCOMMODATION | We have not measured the property, but as instructed, we have relied upon floor areas made available to us, detailed below and elsewhere within this report. |
| ON BEHALF OF: | MORGAN STANLEY |
| PROJECT NAME: | MSTAR |
Floor Areas
| FLOOR / UNIT | USE | SQ M |
| Ergef Delmonte Beheer B.V. | Office and Warehouse | 701.00 |
| Fastenal Europe B.V. | Office and Warehouse | 1,489.00 |
| Fastenal Europe B.V. | Office and Warehouse | 1,451.00 |
| Fastenal Europe B.V. | Office and Warehouse | 1,451.00 |
| HSP Worldwide Hydraulic Spare Parts | Office and Warehouse | 852.00 |
| B.V. | ||
| IJzer en Schroothandel B en S V.O.F. | Ground | 380.00 |
| Secoa B.V. | Office and Warehouse | 701.00 |
| UT Quality B.V. | Office and Warehouse | 852.00 |
| Vacant | Office and Warehouse | 1,628.00 |
| TOTAL | - | 9,505.00 |
DUE DILIGENCE
| STATE OF REPAIR |
CBRE have not undertaken a structural survey, nor tested the services. The property was subject to an inspection for valuation purposes in early 2020. As you are aware, the property has not been re-inspected for the purposes of this report, nor have we been provided with updated TDD. We have therefore relied on the information provided by the Borrower, including a Capex schedule dated 12 June 2019 and schedule with revised budget of capex dated 19 January 2021. Based on the latter which indicates TDD assessment less completed spend in 2020, we have included the immediate and 2-5 years capex of €93,000 within our valuation.
According to our own limited inspection for valuation purposes, our opinion regarding the state of repair would substantiate the assessment by Arcadis. Based on our impression gained during the inspection, we are of the opinion that the buildings are in a fair condition, in line with the year of construction.
|
|
| ENVIRONMENTAL CONSIDERATIONS |
We have been instructed not to make any investigations in relation to the presence or potential presence of contamination in land or buildings or the potential presence of other environmental risk factors and to assume that if investigations were made to an appropriate extent then nothing would be discovered sufficient to affect value.
We have summarised the findings from a schedule provided in relation to ‘Priority sites’ within the front section of this report.
We have relied on the information provided by the Borrower, including Draft Phase 1 Environmental Review prepared by Ambiente Ltd and dated December 2019. The report summarises that the environmental risk assessment identified a very low risk to site users and low risks to groundwater and surface water from current and historical activities at the site.
The potential environmental risk associated with asbestos containing materials is assessed to be moderate to low to site users / maintenance workers. The level of risk reflects the potential severity of the consequence of exposure and can be managed through implementation of the recommendations.
|
| ON BEHALF OF: | MORGAN STANLEY |
| PROJECT NAME: | MSTAR |
|
We have not carried out investigation into past uses, either of the properties or of any adjacent lands, to establish whether there is any potential for contamination from such uses or sites, or other environmental risk factors and have therefore assumed that none exists.
|
| TENURE |
According to the information available from the Land Registry Office (Kadaster) the parcels are held freehold by MLET Netherlands 2 Holding B.V. and registered as follows:
|
|||
| Municipality: | Dordrecht | |||
| Section: | Q | |||
| Numbers: | 5089 | |||
| Total Area: | 13,206 sq m | |||
| Comments | ||||
|
■ The owner is obligated to maintain and preserve the fence surrounding the parcel
Based on the information provided, we understand the property is held freehold.
We have also had sight of the Draft Red Flag Legal Report prepared by Loyens Loeff, dated 12 February 2021. Based on the information provided, we understand the property is held freehold.
We have assumed that there are no onerous legal conditions affecting the property which have a material impact on our opinion of value.
|
||||
| INCOME PROFILE |
The subject property is partially let to 6 tenants on a WALL of 1.25 years. The vacancy equates to 1,628 sq m which equals 17% of the total lettable floor area. The ERV for the vacancy equates to € 98,740 per annum. The current rental income is € 432,613. The ERV for the leased part is estimated at € 422,040. In our opinion the property is therefore slightly over rented. The ERV for the entire property equates to € 520,780 per annum.
There are no specific tenants which account for a significant portion of the total rental income. Overall, we are of the opinion the income profile is good.
|
VALUATION CONSIDERATIONS
|
COSTS AND
|
Based on the information provided or our knowledge of the market, in approaching our valuation, we made allowances for the following capital and non-recoverable costs. In all cases, we have cited whether they are deducted as at the date of valuation or whether they take effect at a later date. |
| ON BEHALF OF: | MORGAN STANLEY |
| PROJECT NAME: | MSTAR |
|
|
Capital Expenditure:
|
||||
| Type & Calculation | Source | Effective | Amount | ||
| Capital Expenditure: Fixed Amount | Technical Due Diligence |
On Valuation
No Repeat |
€ 93,000 | ||
| Letting Fees: 15% of Rental Value the vacant space | CBRE Estimate |
On lease start / renewal
No Repeat
|
€14,811 | ||
| TOTAL ON VALUATION |
€ 107,811 | ||||
| Revenue Deductions: | |||||
| Type & Calculation | Source | Effective | Annual Amount | ||
| Management: 2% of ERV | CBRE estimate |
On Valuation
In perpetuity |
€ 10,627 | ||
| Property tax: 2% of ERV | CBRE estimate |
On Valuation
In perpetuity |
€ 10,416 | ||
| Water tax: 0.25% of ERV | CBRE estimate |
On Valuation
In perpetuity |
€ 1,302 | ||
| Insurance: 1.25% of ERV | CBRE estimate |
On Valuation
In perpetuity |
€ 6,510 | ||
| Sewage charge: 0.25% of ERV | CBRE estimate |
On Valuation
In perpetuity |
€ 1,302 | ||
| Maintenance: € 4.00 per sq m | Borrower Estimate |
5 Year Delay
In perpetuity |
€ 38,020 | ||
| Void Costs: 2% of ERV | Borrower Estimate |
On Valuation
On All Voids |
€ 1,975 | ||
| TOTAL: ON VALUATION | € 32,132 | ||||
|
Void and Rent-Free Allowances:
Regarding the vacant unit, we have allowed for a current void period of 12 months.
|
|||||
|
VALUATION METHODOLOGY
|
We have made the following rental assumptions having regard to the lettings agreed within the subject property, whilst also considering rental rates in the surrounding area: |
| ON BEHALF OF: | MORGAN STANLEY |
| PROJECT NAME: | MSTAR |
| Unit | Area (s qm) |
ERV (€) per S qm (annum) |
Rent pa (€) | ||
| Office | 2,151 | 80 | 172,080 | ||
| Warehouse | 6,974 | 50 | 348,700 | ||
| Total | 9,125 | 57 | 520,780 |
|
Opinion of Market Rent
Based on the below-mentioned comparable transactions, the current market trends and our general market knowledge, we have estimated the above-mentioned rental values for the areas in the subject property. The below appended comparables indicate a (blended) range from € 54 per sq m per annum to € 77 per sq m per annum.
The aforementioned rental values produce a total gross rental value of € 520,780 per annum or an average of circa € 57 per sq m. The agreed rental income amounts to € 432,613 per annum or an average of circa € 58 per sq m per annum. We have estimated the rental value of the leased part at € 422,040 per annum. We are of the opinion that the subject property is more or less let at market rent for the currently leased space.
Opinion of Valuation Yields
Currently, we witness downward pressure on net initial yields for prime logistics properties due to the high scarcity of good, long leased logistics properties.
Indicative net initial yields for prime logistics property are currently quoting 3.5% and 5.5% for prime industrial estates. Due to favourable dynamics in the occupier market in the Netherlands, with prospects for production and export growth in mind and taking into account the capital available for (real estate) investments, investor appetite is expected to increase further. This is also expected to put further downward pressure on yields.
Within the evidence table appended, we would highlight the following. The lower end of the yield range is indicated by the property located at the Melbournestraat 50-68, Rotterdam. As we are of the opinion that the location of this reference is better, we have allowed for a higher yield profile for the subject property.
The top of the range is highlighted by the property located at the Ringersweg 10 C-D, Bergen op Zoom. However, since the location of the subject property is better and given the relative lot size of this asset, we allowed for a sharper yield profile.
We would also highlight the property in Bleiswijk, which has similar fundamentals to this property including the unexpired term and micro location. Though thought to be superior in relation to Macro location and without vacancy which is reflected by the lower equivalent yield compared with the subject property.
|
| ON BEHALF OF: | MORGAN STANLEY |
| PROJECT NAME: | MSTAR |
|
We have arrived at our opinion of Market Value adopting the Traditional investment capitalisation method of valuation. Within this approach, we apply an income weighted average equivalent yield to our opinion of net income, reflecting the comparable evidence within the market for guidance on capital rates and values per sq m. The NIY’s of the comparable investments range from 5.14% to 7.52% and also taking into account the current market conditions and the WAULT to expiry by current income of 1.25 years, we have adopted a split yield approach, targeting the following rates:
- Vacant = 7.00%
- Let = 6.00%
The approach results in a blended equivalent yield of 6.17% and a net initial yield of circa 5.49% which reflects a capital rate per sq m of € 708, after allowing for purchaser’s costs equating to 9.00%.
On the assumption that there are no unusual factors of which we are unaware and on the basis of the comments and assumptions specified in this report, CBRE is of the opinion that the Market Value (rounded) of the subject property, is:
€ 6,730,000
(Six million seven hundred thirty thousand Euros)
The unrounded net capital value is € 6,728,943. The gross unrounded capital value is € 7,334,548 including € 605,605 purchaser’s costs (9.00%).
|
||
| VALUATION METHODOLOGY – VACANT POSSESSION VALUE |
The constituent inputs in terms of rental value and non-recoverable costs largely align with the Market Value approach. The key exception being that we have adopted a special assumption that the property is 100% vacant/non-income producing as at the valuation date. This value is predominantly derived using the traditional investment method of valuation but critically benchmarking the resultant capital rate per sq m against the prevailing evidence.
In approaching our valuation under the Special Assumption that the property is entirely vacant (Vacant Possession Value), we have adopted a total void period of 12 months inclusive of rent free or tenant incentives and targeted an equivalent yield of 7%.
This results in a net rounded value of €5,470,000, equating to €575 per sq m.
|
|
| ESTIMATED REINSTATEMENT ASSESSMENT |
The property has not been inspected by a suitably qualified building surveyor from CBRE, nor have we carried out a full Reinstatement Cost Assessment. For indicative purposes only we estimate that the reinstatement cost of insurance purposes would be in the region of €9,995,000 (rounded, excl. VAT) on a day one basis, including fees but excluding VAT and inflation.
This figure should be compared with the current sum insured and if a material discrepancy exists we suggest that a full Reinstatement Cost Assessment is carried out. |
| ON BEHALF OF: | MORGAN STANLEY |
| PROJECT NAME: | MSTAR |
RENTAL EVIDENCE
| PROPERTY ADDRESS |
PROPERTY USE |
DATE | TOTAL AREA |
TENANT | LEASE LENGTH (YEARS) |
BREAK OPTION |
RENT (P.A) |
RENTAL
|
RELATIVE QUALITY |
| Kamerlingh Onnesweg 10A, Dordrecht | Warehouse - office | 2020, November | 421 | Unknown | not available | not available | 23,400 | 55.58 | Comparable location, and we are of the opinion that the building quality of this reference can be considered comparable as well. |
| Pieter Zeemanweg 73, Dordrecht | Warehouse - office | 2020, July | 364 | Unknown | not available | not available | 19,800 | 54.40 | Comparable location, and we are of the opinion that the building quality of this reference can be considered comparable as well. |
| Robijn 600, Dordrecht | Warehouse - office | 2020, February | 1,807 | Unknown | not available | not available | 140,000 | 77.47 | Higher quality asset and located on a comparable location. |
| Pascalstraat 80, Dordrecht | Warehouse - office | 2020, May | 1,895 | Unknown | not available | not available | 114,000 | 60.16 | Comparable location, and we are of the opinion that the building quality of this reference can be considered comparable as well. |
| ON BEHALF OF: | MORGAN STANLEY |
| PROJECT NAME: | MSTAR |
SALES EVIDENCE
| PROPERTY ADDRESS |
PROPERTY USE |
DATE | TOTAL AREA |
WAULT (YEARS) |
PASSING RENT PER ANNUM |
PURCHASE PRICE |
NET INITIAL YIELD (%) |
CAPITAL
|
RELATIVE
|
| Melbournestraat 50-68, Sydneystraat 32- 56, Rotterdam |
Industrial/ Logistics |
17-03-2020 | 5,354 | 2.5 | 401,144 | 6,587,000 | 5.14% | 1,230 | During the transaction, the property was fully let to eleven tenants on a WALL of 2.5 years. The property is slightly under rented, the equivalent yield equates to 5.08. |
| Ringersweg 10 C-D, Bergen op Zoom |
Industrial/ Logistics |
30-12-2020 | 406 | 4.3 | 41,000 | 465,000 | 7.52% | 1,145 | The property comprises two industrial units which is part of a multi-tenant business building. During the transaction, the property was fully let to one tenant on a WALL of 4.3 years. |
| Spectrumlaan 5, Bleiswijk |
Industrial/ Logistics |
15-04-2020 | 8,641 | 2.2 | 557,770 | 8,000,000 | 6.00 | 926 | The reference property is let to Cemex Trescon B.V. with a remaining lease term of 2.2 years. We are of the opinion that, the property is slightly over-rented (approximately 3%). The equivalent yield equates to 5.8%. |
| Weesperstraat 124-128, Diemen |
Industrial/ Logistics |
19-10-2020 | 14,605 | 7.2 | 575,258 | 7,560,000 | 6.19% | 518 | This transaction was part of the Vinvest portfolio. During the transaction, the property was fully let to multiple tenants on a weighted average remaining lease term of 7.18. The property |
| ON BEHALF OF: | MORGAN STANLEY |
| PROJECT NAME: | MSTAR |
|
is in our opinion, slightly over rented. The gross initial yield is 7.6% |
| PROPERTY ID: | nlelft - Elftweg 32-54 | |
| ON BEHALF OF: | MORGAN STANLEY | |
| VALUATION DATE: | 01-Feb-2021 | FINAL |
Elftweg 32-54 - Elftweg 32-54, Raamsdonksveer, 4941 VP, Netherlands
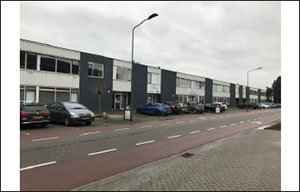 |
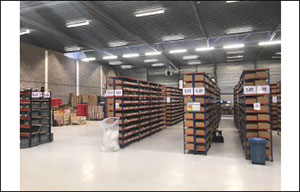 |
|
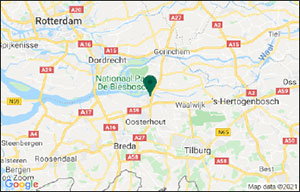 |
 |
| VALUATION METRICS | (currency - EUR) |
| Metric | Value |
| Market Value | 3,790,000 |
| Market Value (per sq m) | 384 |
| Net Initial Yield | 5.26% |
| Reversionary Yield | 8.40% |
| Equivalent Yield | 8.41% |
| Gross Income (p.a.) | 239,573 |
| Gross Income (p.a.) (per sq m) | 24 |
| *Adj. Gross Income | 239,573 |
| Adj. Gross Income (per sq m) | 24 |
| Net Income (p.a.) | 217,046 |
| Net Income (p.a.) (per sq m) | 22 |
| Gross Rental Value | 409,945 |
| Gross Rental Value (per sq m) | 42 |
| Capital Expenditure | -27,723 |
| Transaction Costs | 9.00% |
| Over / Under Rented | -17.90% |
| KEY FACTS | ||
| Metric | Value | |
| Total Area (sq m) | 9,863 | |
| WAULT to Break by Rent | 1.00 | |
| WAULT to Break by ERV | 0.88 | |
| WAULT to Expiry by Rent | 1.00 | |
| WAULT to Expiry by ERV | 0.88 | |
| Percentage of Vacancy (Area) | 28.97% | |
| Percentage of Vacancy (ERV) | 28.82% | |
| ** | Number of Tenants | 9 |
| Current Voids (months) | 12 | |
| * Adjusted Gross Income equates to the Gross Income excluding any rent free periods | |
| LEASES RANKED BY RENT | ** Total tenant lines within our valuation. May differ to number of individual tenants |
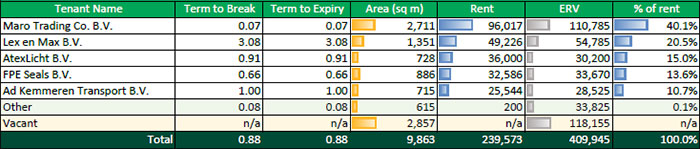
| Printed 09/03/2021 19:46 | |
| PROPERTY ID: | degewe - Gewerkenstrasse 13 | |
| ON BEHALF OF: | MORGAN STANLEY | |
| VALUATION DATE: | 01-Feb-2021 | FINAL |
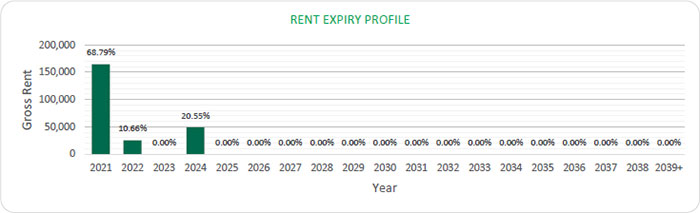
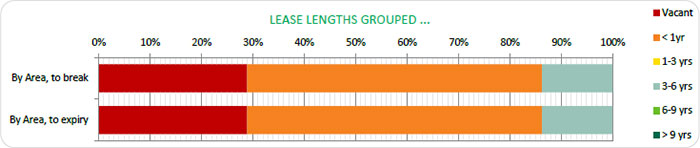
| Printed 09/03/2021 19:46 | |
| ON BEHALF OF: | MORGAN STANLEY |
| PROJECT NAME: | MSTAR |
PROPERTY REPORT
ELFTWEG 32-54, RAAMSDONKSVEER, NETHERLANDS
| INSPECTED BY: | INSPECTION DATE: | VALUATION DATE: | PROPERTY TYPE |
| J. BAKKER | 14-01-2020 | 1 FEBRUARY 2021 | INDUSTRIAL WAREHOUSE |
KEY VALUATION FACTORS
| STRENGTHS | WEAKNESSES | |
|
■ Multi-tenanted
■ Accessibility
■ Quality
|
■ Not located in a G-4 city
■ Four units are vacant
|
|
| OPPORTUNITIES | THREATS | |
|
■ Increasing investor appetite
■ Extend lease term with current tenants
■ Leasing out vacant space
|
■ Macro-economic uncertainty (i.e. Trade Wars; Brexit) |
LOCATION & SITUATION
| LOCATION |
Raamsdonksveer is a village part of the municipality Geertruidenberg, which is located in the south of the Netherlands, in the province of Noord-Brabant. Raamsdonksveer is located at circa 30 kilometers from s-Hertogenbosch which is the capital of the province of Noord-Brabant.
Raamsdonksveer is located at circa 70 kilometers from Amsterdam.
The village of Raamsdonksveer has an estimated population of 12,400 inhabitants. The average disposable income in Raamsdonksveer is approximately equal to the national average.
|
| ON BEHALF OF: | MORGAN STANLEY |
| PROJECT NAME: | MSTAR |
PROPERTY DESCRIPTION
| DESCRIPTION |
The subject property is located at Elftweg 32-54 in Raamsdonksveer and is a light industrial complex located in the “Keizersveer” Business Park, near to the A27 motorway from Utrecht to Breda. The subject property comprises in total 9,863 sq m. The property consists of 13 separate units, each between 477 and 956 sq m divided into warehouse and office space. Four units are vacant at the time of valuation.
The building was constructed in 1980. The warehouse is located on the ground floor, each unit benefits from an overhead door and has office space at the front side of the building divided on the ground and first floor. The eaves height of the warehouse is circa 6 metres.
|
| Summary of known specification: | |||
| Characteristic | Result | ||
| Built / Renovation | 1980 | ||
| Eaves Height | 6 metres | ||
| No. of loading Doors | 1 per unit | ||
| Warehouse (% of GLA) | 93% | ||
|
Source: Inspection/BAG viewer/Environmental review.
|
|||
| ACCOMMODATION | We have not measured the property, but as instructed, we have relied upon floor areas made available to us, detailed below and elsewhere within this report. |
Floor Areas
| FLOOR / UNIT | USE | SQ M |
| Unit 32 | Warehouse and office | 879 |
| Unit 34 | Warehouse and office | 956 |
| Unit 36 | Warehouse and office | 876 |
| Unit 38 | Warehouse and office | 886 |
| Unit 40 | Warehouse and office | 874 |
| Unit 42,1 | Warehouse and office | 477 |
| Unit 42,2 | Warehouse and office | 615 |
| Unit 44 | Warehouse and office | 721 |
| Unit 46 | Warehouse and office | 713 |
| Unit 48 | Warehouse and office | 707 |
| Unit 50 | Warehouse and office | 716 |
| Unit 52 | Warehouse and office | 716 |
| Unit 54 | Warehouse and office | 728 |
| TOTAL | - | 9,863 |
| ON BEHALF OF: | MORGAN STANLEY |
| PROJECT NAME: | MSTAR |
DUE DILIGENCE
| STATE OF REPAIR |
CBRE have not undertaken a structural survey, nor tested the services. The property was subject to an inspection for valuation purposes in early 2020. As you are aware, the property has not been re-inspected for the purposes of this report, nor have we been provided with updated TDD. We have therefore relied on the information provided by the Borrower, including a Capex schedule dated 12 June 2019 and schedule with revised budget of capex dated 19 January 2021. Based on the latter which indicates TDD assessment less completed spend in 2020, we have included the immediate and 2-5 years capex of €10,000 within our valuation.
According to our own limited inspection for valuation purposes, our opinion regarding the state of repair would substantiate the assessment by Arcadis. Based on our impression gained during the inspection, we are of the opinion that the buildings are in a fair condition, in line with the year of construction.
|
|
| ENVIRONMENTAL CONSIDERATIONS |
We have been instructed not to make any investigations in relation to the presence or potential presence of contamination in land or buildings or the potential presence of other environmental risk factors and to assume that if investigations were made to an appropriate extent then nothing would be discovered sufficient to affect value.
We have summarised the findings from a schedule provided in relation to ‘Priority sites’ within the front section of this report.
We have relied on the information provided by the Borrower, including Draft Phase 1 Environmental Review prepared by Ambiente Ltd and dated December 2019. The report summarises that the soil appeared in good condition.
We have not carried out investigation into past uses, either of the properties or of any adjacent lands, to establish whether there is any potential for contamination from such uses or sites, or other environmental risk factors and have therefore assumed that none exists.
|
| ON BEHALF OF: | MORGAN STANLEY |
| PROJECT NAME: | MSTAR |
| TENURE |
According to the information available from the Land Registry Office (Kadaster) the parcels are held freehold by MLET Netherlands 2 Holding B.V. and registered as follows:
|
|||
| Municipality: | Raamsdonksveer | |||
| Section: | K | |||
| Numbers: | 1954 | |||
| Total Area: | 14,103 sq m | |||
|
We have also had sight of the Draft Red Flag Legal Report prepared by Loyens Loeff, dated 12 February 2021. Based on the information provided, we understand the property is held freehold.
We have assumed that there are no onerous legal conditions affecting the property which have a material impact on our opinion of value.
|
||||
| INCOME PROFILE | The subject property is partially let to 6 tenants on a WALL of 0.85 years. There are four vacant units. The current rental income is € 239,573 per annum. The ERV for the leased part is estimated at € 291,790 per annum, we are therefore of the opinion the property is circa 18% under-rented. The ERV for the entire property equates to € 409,945 per annum. | |||
VALUATION CONSIDERATIONS
|
COSTS AND
|
Based on the information provided or our knowledge of the market, in approaching our valuation, we made allowances for the following capital and non-recoverable costs. In all cases, we have cited whether they are deducted as at the date of valuation or whether they take effect at a later date. |
|
Capital Expenditure:
|
|||||
| Type & Calculation | Source | Effective | Amount | ||
| Capital Expenditure: Fixed Amount | Technical Due Diligence |
On Valuation
No Repeat |
€ 10,000 | ||
| Letting Fees: 15% of Rental Value the vacant space | CBRE Estimate |
On lease start
No Repeat |
€ 17,723 | ||
| TOTAL
ON VALUATION |
€27,723 | ||||
| Revenue Deductions: | |||||
| Type & Calculation | Source | Effective | Annual Amount |
| ON BEHALF OF: | MORGAN STANLEY |
| PROJECT NAME: | MSTAR |
| Management: 2% of ERV | CBRE estimate |
On Valuation
In perpetuity |
€7,155 | ||
| Property tax: 2% of ERV | CBRE estimate |
On Valuation
In perpetuity |
€8,199 | ||
| Water tax: 0.25% of ERV | CBRE estimate |
On Valuation
In perpetuity |
€1,025 | ||
| Insurance: 1.25% of ERV | CBRE estimate |
On Valuation
In perpetuity |
€5,124 | ||
| Sewage charge: 0.25% of ERV | CBRE estimate |
On Valuation
In perpetuity |
€1,025 | ||
| Maintenance: € 4.00 per sq m | Borrower Estimate |
5 Year Delay
In perpetuity |
€39,452 | ||
| Void Costs: 2% of ERV | Borrower Estimate |
On Valuation
On All Voids |
€ 2,363 | ||
| TOTAL: ON VALUATION | €24,891 | ||||
|
Void and Rent-Free Allowances:
Currently there are four unit vacant for which we have allowed for 12 months of current void. We are of the opinion relettability is good and have therefore not allowed for a future void period for the running leases.
|
|||||
|
VALUATION METHODOLOGY
|
We have made the following rental assumptions having regard to the lettings agreed within the subject property, whilst also considering rental rates in the surrounding area: |
| Unit | Area (s qm) |
ERV (€)
per S qm
(annum)
|
Rent pa (€) | ||
| Office | 3,238 | 55 | 178,090 | ||
| Warehouse | 6,625 | 35 | 231,875 | ||
| Total | 9,863 | 42 | 409,945 |
|
Opinion of Market Rent
Based on the below-mentioned comparable transactions, the current market trends and our general market knowledge, we have estimated the above-mentioned rental values for the areas in the subject property. The below appended comparables indicate a (blended) range from € 35 per sq m per annum to € 44 per sq m per annum.
|
| ON BEHALF OF: | MORGAN STANLEY |
| PROJECT NAME: | MSTAR |
|
The aforementioned rental values produce a total gross rental value of € 409,945 per annum or an average of circa € 42 per sq m. The agreed rental income amounts to € 239,573 per annum or an average of circa € 24 per sq m. We are of the opinion that the let space is currently under-rented.
Opinion of Valuation Yields
Currently, we witness downward pressure on net initial yields for prime logistics properties due to the high scarcity of good, long leased logistics properties.
Indicative net initial yields for prime logistics property are currently quoting 4.0%. Due to favourable dynamics in the occupier market in the Netherlands, with prospects for production and export growth in mind and taking into account the capital available for (real estate) investments, investor appetite is expected to increase further. This is also expected to put further downward pressure on yields.
Within the evidence table appended, we would highlight the following. The lower end of the yield range is indicated by the property located in Barendrecht. As this property is located at a better location and benefits from more loading docks, we have allowed for a higher yield profile for the subject property.
The high end of the range is highlighted by the property located in Breda this property is fully let but has an inferior building quality.
We have arrived at our opinion of Market Value adopting the Traditional investment capitalisation method of valuation. Within this approach, we apply an income weighted average equivalent yield to our opinion of net income, reflecting the comparable evidence within the market for guidance on capital rates and values per sq m. The NIY’s of the comparable investments range from 6.6% to 8.7% and also taking into account the current market conditions and the WAULT to expiry by current income of 0.85 years, we have adopted a split yield approach, targeting the following rates:
- Let = 7.90%
- Vacant = 10.00%
The approach results in an equivalent yield of 8.41% and a net initial yield of circa 5.26% which reflects a capital rate per sq m of € 384, after allowing for purchaser’s costs equating to 9.00%.
On the assumption that there are no unusual factors of which we are unaware and on the basis of the comments and assumptions specified in this report, CBRE is of the opinion that the Market Value (rounded) of the subject property, is:
€ 3,790,000
(Three million seven hundred ninety thousand Euro)
The unrounded net capital value is € 3,788,363. The gross unrounded capital value is € 4,157,039 including € 340,953, purchaser's costs (9.0%).
|
| ON BEHALF OF: | MORGAN STANLEY |
| PROJECT NAME: | MSTAR |
| VALUATION METHODOLOGY – VACANT POSSESSION VALUE |
The constituent inputs in terms of rental value and non-recoverable costs largely align with the Market Value approach. The key exception being that we have adopted a special assumption that the property is 100% vacant/non-income producing as at the valuation date. This value is predominantly derived using the traditional investment method of valuation but critically benchmarking the resultant capital rate per sq m against the prevailing evidence.
In approaching our valuation under the Special Assumption that the property is entirely vacant (Vacant Possession Value), we have adopted a total void period of 12 months inclusive of rent free or tenant incentives and targeted an equivalent yield of 10%.
This results in a net rounded value of €2,910,000, equating to €295 per sq m.
|
|
| ESTIMATED REINSTATEMENT ASSESSMENT |
The property has not been inspected by a suitably qualified building surveyor from CBRE, nor have we carried out a full Reinstatement Cost Assessment. For indicative purposes only we estimate that the reinstatement cost of insurance purposes would be in the region of €15,295,000 (rounded, excl. VAT) on a day one basis, including fees but excluding VAT and inflation.
This figure should be compared with the current sum insured and if a material discrepancy exists we suggest that a full Reinstatement Cost Assessment is carried out.
|
| ON BEHALF OF: | MORGAN STANLEY |
| PROJECT NAME: | MSTAR |
RENTAL EVIDENCE
| PROPERTY ADDRESS |
PROPERTY USE |
DATE | TOTAL AREA |
TENANT |
LEASE
|
BREAK OPTION |
RENT (P.A) |
RENTAL RATE PER SQ M |
RELATIVE QUALITY |
| Lissenveld 4, Raamsdonkveer | Industrial | 2019, November | 202 | Jansen Hoveniers | not available | not available | 8,950 | 44 | Better quality and a similar location which results in a higher rental value. |
| Zoete Inval 8, Breda | Industrial | 2019, February | 1.850 | ahold | not available | not available | 74.750 | 40,41 | Equal quality, a better location but relatively dated which results in a lower rental value. |
| Rederijweg 45, Oosterhout NB | Industrial | 2019, April | 3.252 | otentic logistics | not available | not available | 112.200 | 34,50 | Equal quality but a larger scale unit which will results in a lower rental value. |
| Industrieweg 69, Waalwijk | Industrial | 2019, October | 930 | make machinegroothandel | not available | not available | 38.000 | 40,86 | Equal quality and location but dated which overall results in a lower rental value. |
| ON BEHALF OF: | MORGAN STANLEY |
| PROJECT NAME: | MSTAR |
SALES EVIDENCE
| PROPERTY ADDRESS |
PROPERTY USE | DATE | TOTA L AREA |
WAULT (YEARS) |
PASSING RENT PER ANNUM |
PURCHASE PRICE |
NET
|
CAPITAL RATE PER SQ M |
RELATIVE QUALITY |
| Delta- Industrieweg 38, 40, 42, Stellendam |
Industrial/ Logistics |
19-6-2019 | 9,407 | 1.4 | 305,967 | 3,500,000 | 8.17% | 372 | The property is currently fully let, although one of the larger tenants (Horeca Handelsonderneming Delta) has served notice to vacate. This tenant occupies 3,000 sq m and is paying less than €30 psm. Our opinion of the ERV equates to € 40 per sq m and therefore this offers reversionary potential for this asset. Due to the difference in building quality and location we expect a comparable capital value at the subject property. |
| Hazeldonk 6550, Breda |
Industrial/ Logistics |
1-7-2019 | 5,368 | 3.2 | 242,312 | 2,600,000 | 8.71% | 484 | The reference property is fully let to two tenants on a WALL of circa 3.2 years. Our opinion of the ERV equates to € 307,750 per annum. In our opinion the property is therefore under rented by circa 11%. Due to the difference in WAULT and location we expect |
| ON BEHALF OF: | MORGAN STANLEY |
| PROJECT NAME: | MSTAR |
| a lower capital rate per sqm over the subject property. | |||||||||
| Visserijweg 2, Oosterhout |
Industrial/ Logistics |
19-10- 2020 | 2,925 | 5.3 | 132,776 | 1,800,000 | 7.38% | 615 | During transaction the property was fully let on a WALL of circa 5.3 years. In our opinion the property is slightly under rented. Due to the difference in location we expect a higher yield at the subject property. |
| Londen 3-7, Barendrecht |
Industrial/ Logistics |
19-10- 2020 | 6,533 | 1.1 | 316,992 | 4,000,000 | 6.64% | 612 | During transaction the property was fully let to one tenant on a WALL of 1.1 years. In our opinion the property is slightly under rented. Due to the difference in location we expect a higher yield at the subject property. |
| PROPERTY ID: | nleneg - Energieweg 75-81 | |
| ON BEHALF OF: | MORGAN STANLEY | |
| VALUATION DATE: | 01-Feb-2021 | FINAL |
Energieweg 75-81 - Energieweg 75-81, Zoeterwoude, 2382 NH, Netherlands
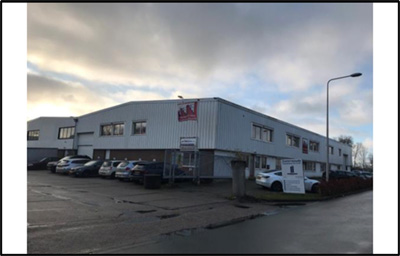 |
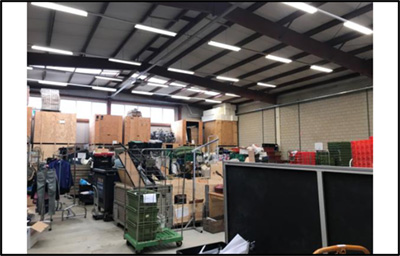 |
|
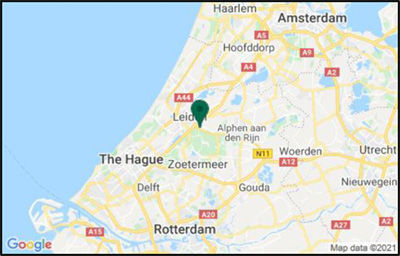 |
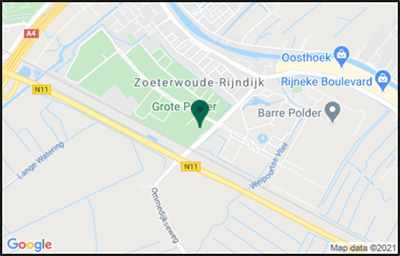 |
| VALUATION METRICS | (currency - EUR) |
| Metrice | Value |
| Market Value | 3,690,000 |
| Market Value (per sq m) | 796 |
| Net Initial Yield | 5.66% |
| Reversionary Yield | 5.73% |
| Equivalent Yield | 5.75% |
| Gross Income (p.a.) | 242,315 |
| Gross Income (p.a.) (per sq m) | 52 |
| *Adj. Gross Income | 242,315 |
| Adj. Gross Income (per sq m) | 52 |
| Net Income (p.a.) | 227,570 |
| Net Income (p.a.) (per sq m) | 49 |
| Gross Rental Value | 263,959 |
| Gross Rental Value (per sq m) | 57 |
| Capital Expenditure | -10,209 |
| Transaction Costs | 8.99% |
| Over / Under Rented | -8.20% |
| KEY FACTS | ||
| Metric | Value | |
| Total Area (sq m) | 4,636 | |
| WAULT to Break by Rent | 2.24 | |
| WAULT to Break by ERV | 2.25 | |
| WAULT to Expiry by Rent | 2.24 | |
| WAULT to Expiry by ERV | 2.25 | |
| Percentage of Vacancy (Area) | 0.00% | |
| Percentage of Vacancy (ERV) | 0.00% | |
| ** | Number of Tenants | 5 |
| Current Voids (months) | - | |
* Adjusted Gross Income equates to the Gross Income excluding any rent free periods
| LEASES RANKED BY RENT | ** Total tenant lines within our valuation. May differ to number of individual tenants |
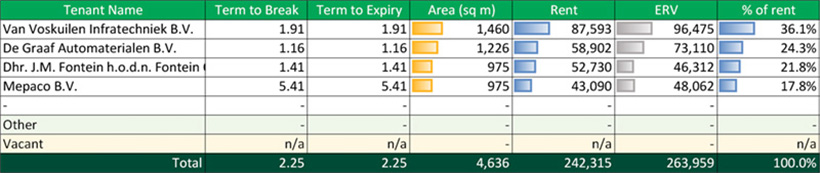
| Printed 09/03/2021 19:46 | |
| PROPERTY ID: | nleneg - Energieweg 75-81 | |
| ON BEHALF OF: | MORGAN STANLEY | |
| VALUATION DATE: | 01-Feb-2021 | FINAL |
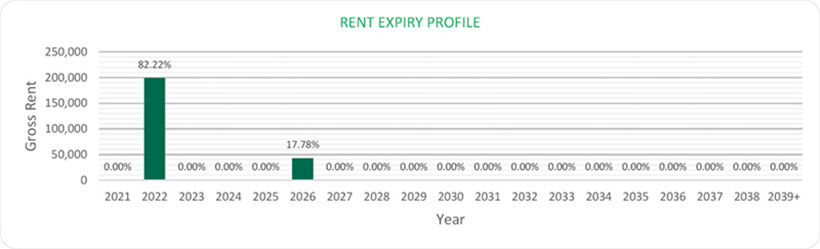
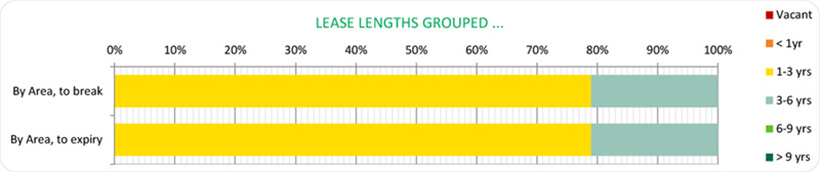
| Printed 09/03/2021 19:46 | |
| ON BEHALF OF: | MORGAN STANLEY |
| PROJECT NAME: | MSTAR |
PROPERTY REPORT
ENERGIEWEG 75-81, ZOETERWOUDE, THE NETHERLANDS
| INSPECTED BY: | INSPECTION DATE: | VALUATION DATE: | PROPERTY TYPE |
| J. NEERINCX | 10 JANUARY 2019 | 1 FEBRUARY 2021 | LIGHT INDUSTRIAL |
| KEY VALUATION FACTORS |
| STRENGTHS | WEAKNESSES | |
| ■ Layout allows multi-tenancy use | ■ Under-rented by circa 8.20% | |
| ■ Multi-tenancy reduces tenant risk | ■ Limited horizontal expansion opportunity | |
| ■ Well accessible by car | ■ Short WALL | |
| ■ Fully let | ■ Pressure on outside terrain due to storageactivities tenants | |
| ■ Long term commitment of tenants with property and location | ||
| OPPORTUNITIES | THREATS |
| ■ Increasing(inter)national investor appetite for light industrial properties | ■ Prolonged economic recession due to outbreak(s) COVID-19 |
| ■ Vertical expansion opportunity(max. building height 21 metres) |
| LOCATION & SITUATION | ||
| LOCATION | The subject property is located in Zoeterwoude which is situated in the western part of the Netherlands in the province South-Holland. Zoeterwoude is located at circa 23 km from The Hague which is the capital city of the province and circa 7 km from Leiden. The total population of Zoeterwoude comprises circa 8,450 inhabitants in June 2019. Zoeterwoude can be reached by the motorway A4 (Amsterdam – Rotterdam) and the provincial road N11 and N206. There are regional and local bus lines offering services in and around the municipality Zoeterwoude. The level of ageing in the municipality is higher than the national average. | |
| ON BEHALF OF: | MORGAN STANLEY |
| PROJECT NAME: | MSTAR |
PROPERTY DESCRIPTION
| DESCRIPTION | The subject property concerns a rectangular light industrial building of 4,636 sq. m LFA located at Energieweg 75-81 in Zoeterwoude. The property was built in 1975 and consists of 1,250 sq. m of office area and 3,386 sq. m of warehouse area. The property is divided into 5 separate units with two storey office frontages to the southeast (and to the northeast of the north-eastern unit). | ||
| The superstructure is of steel and the floors are of concrete. The property is covered with steel panels, brickwork and the roof is slightly pitched and covered with panels as well. | |||
| The office areas are fitted out to market standards with suspended ceilings with integrated lighting, natural ventilation, air-conditioning units, central heating with radiators, sanitary rooms and pantry’s. The warehouse area has an eaves height of approx. 6 metres, a total of 6 electrical overhead doors, gas heaters, fluorescent lighting and natural light domes. We assumed a market conform floor bearing capacity. | |||
| The subject property is situated on a plot of 6,015 sq. m. Sufficient parking area is located along the north-western, north-eastern and south-eastern sides of the building. The outside terrain is covered with concrete plates and is enclosed by a fence. | |||
| Summary of known specification: | |||
| Characteristic | Result | ||
| Built / Renovation | 1975 | ||
| Eaves Height | 6 metres | ||
| No. of loading | Doors 6 | ||
| Warehouse (% of GLA) | 73% | ||
| Site Coverage Ratio | 65% | ||
| Source: Inspection/Land Registry/BAG-Viewer/Environmental Review | |||
| ACCOMMODATION | We have not measured the property, but as instructed, we have relied upon floor areas made available to us, detailed below and elsewhere within this report. | ||
| Floor Areas |
| FLOOR / UNIT | USE | SQ M |
| De Graaf Automaterialen B.V. | Office | 135 |
| De Graaf Automaterialen B.V. | Office and Warehouse | 1,091 |
| Mepaco B.V. | Office and Warehouse | 975 |
| Dhr. J.M. Fontein h.o.d.n. Fontein | Warehouse | 975 |
| Ontruimingen | ||
| Van Voskuilen Woudenberg | Office and Warehouse | 1,460 |
| TOTAL | - | 4,636 |
| ON BEHALF OF: | MORGAN STANLEY |
| PROJECT NAME: | MSTAR |
| DUE DILIGENCE |
| STATE OF REPAIR | CBRE have not undertaken a structural survey, nor tested the services. The property was subject to a limited inspection for the initial valuation purpose. | |
| At the time of our inspection, the property appeared to be in reasonable condition commensurate with its age, use and construction. | ||
| As you are aware, the property has not been re-inspected for the purposes of this report, nor have we been provided with updated TDD. We have therefore relied on the information provided by the Borrower, including a Capex schedule dated 12 June 2019 and schedule with revised budget of capex dated 19 January 2021. Based on the latter which indicates TDD assessment less completed spend in 2020, we have not included any associated capex. | ||
| ENVIRONMENTAL CONSIDERATIONS | We have been instructed not to make any investigations in relation to the presence or potential presence of contamination in land or buildings or the potential presence of other environmental risk factors and to assume that if investigations were made to an appropriate extent then nothing would be discovered sufficient to affect value. | |
| We have summarised the findings from a schedule provided in relation to ‘Priority sites’ within the front section of this report. | ||
| We have relied on the information provided by the Borrower, including Draft Phase 1 Environmental Review prepared by Ambiente Ltd and dated December 2019. The report summarises that it is not expected that significant environmental residual liability would be realised at the property under continued current use | ||
| We have not carried out investigation into past uses, either of the properties or of any adjacent lands, to establish whether there is any potential for contamination from such uses or sites, or other environmental risk factors and have therefore assumed that none exists. |
| ON BEHALF OF: | MORGAN STANLEY |
| PROJECT NAME: | MSTAR |
| TENURE | According to the information available from the Land Registry Office (Kadaster) the parcels are held freehold by MLET Netherlands 2 Holding B.V. and registered as follows: | |
| Municipality: Zoeterwoude | ||
| Section: B | ||
| Numbers: 4704/ 4947 | ||
| Total Area: 6,107 sq. m | ||
| Comments | ||
| ■ The subject’s plots are subject to a right of superficies regarding mains services with OASEN B.V. & Gemeente Zoeterwoude as beneficiaries | ||
| We have also had sight of the Draft Red Flag Legal Report prepared by Loyens Loeff, dated 12 February 2021. Based on the information provided, we understand the property is held freehold. | ||
| We have assumed that there are no onerous legal conditions affecting the property which have a material impact on our opinion of value. | ||
| INCOME PROFILE | The subject property is fully let to four tenants on a gross rent per annum of€ 242,315 and on a WALL of circa 2.25 years. The rental value equates to€ 263,959 per annum. Based on the aforementioned the subject property is circa 8.20% under-rented. The gross rent is relatively evenly divided over the tenants with the largest share derived from tenant Van Voskuilen Woudenberg (36.15%). All tenants have relatively short remaining lease terms, but some such as Mepaco B.V. and Van Voskuilen Woudenberg have let since 1996 and 2008 respectively. The tenants are foremostly locally/regionally operating businesses. Van Voskuilen Woudenberg provides maintenance on gas-, water- and electricity lines. Fontein Ontruimingen operates a second-hand storage facility, tenant Mepaco B.V. manufactures tool suspension systems and tenant De Graaf Automaterialen is a specialist of car parts of the Citroen 2CV. We are of the opinion that the tenants provide adequate covenant strength. |
| VALUATION CONSIDERATIONS | ||||
| COSTS AND ADJUSTMENTS |
Based on the information provided or our knowledge of the market, in approaching our valuation, we made allowances for the following capital and non-recoverable costs. In all cases, we have cited whether they are deducted as at the date of valuation or whether they take effect at a later date
Capital Expenditure:
|
|||
| Type & Calculation | Source | Effective | Amount | |
| ON BEHALF OF: | MORGAN STANLEY |
| PROJECT NAME: | MSTAR |
| Capital Expenditure: Fixed Amount | Technical Due Diligence | On Valuation No Repeat | N/A | ||
| Letting Fees: 15% of Rental Value of the vacant space |
CBRE Estimate |
On lease start / renewal No Repeat |
€ 7,209 | ||
| Rent Free - Dhr. J.M. Fontein h.o.d.n. Fontein Ontruimingen |
Borrower | On Valuation No Repeat | € 3,000 | ||
| TOTAL ON VALUATION |
€ 10,209 | ||||
|
Revenue Deductions: |
|||||
| Type & Calculation | Source | Effective | Annual Amount | ||
| Management: 2% of ERV |
CBRE estimate |
On Valuation
In perpetuity |
€ 4,846 | ||
| Property tax: 2% of ERV |
CBRE estimate |
On Valuation
In perpetuity |
€ 5,279 | ||
| Water tax: 0.25% of ERV | CBRE estimate |
On Valuation
In perpetuity |
€ 660 | ||
| Insurance: 1.25% of ERV | CBRE estimate |
On Valuation
In perpetuity |
€ 3,299 | ||
| Sewage charge: 0.25% of ERV | CBRE estimate |
On Valuation
In perpetuity |
€ 660 | ||
| Maintenance: € 4.00 per sq m | Borrower Estimate |
5 Year Delay
In perpetuity |
€ 18,544 | ||
| Void Costs: 2% of ERV | Borrower Estimate |
On Valuation
On All Voids |
N/A | ||
| TOTAL: ON VALUATION | € 14,744 | ||||
| Void and Rent-Free Allowances: | |||||
| The subject property is fully let as at the valuation date. However, we haveadopted a void period of 3 months after expiry of the lease of tenant MepacoB.V. Since the tenant is a long time tenant of the property and the high probability of lease extension, we have adopted 3 months of void period only Tenant Dhr. J.M. Fontein h.o.d.n. Fontein Ontruimingen receives a rent free | |||||
| ON BEHALF OF: | MORGAN STANLEY |
| PROJECT NAME: | MSTAR |
|
VALUATION METHODOLOGY – MARKET VALUE |
of € 3,000 per valuation date. If the subject would become fully vacant, we would expect a void period of 12 months, including marketing period and incentives.
We have made the following rental assumptions having regard to the lettings agreed within the subject property, whilst also considering rental rates in the surrounding area:
|
||||
| Unit | Area (sq.m) | ERV(€)per sq. m(annum) | Rent pa (€) | ||
| Office | 1,250 | 82.50 | 103,124 | ||
| Warehouse | 3,386 | 47.50 | 160,835 | ||
| Total | 4,636 | 57 | 263,959 | ||
| Opinion of Market Rent | |||||
| Based on the below-mentioned comparable transactions and asking price, the current market trends and our general market knowledge, we have estimated the above-mentioned rental values for the areas in the subject property. The below appended comparables indicate a (blended) range from € 46.50 per sq. m per annum to € 57 per sq. m per annum. We would highlight that the most recent evidence from within the property itself agreed in July 2019 equated to a blended rent of €54 per sq m. In the intervening period, there has been further upward pressure on rents as evidenced by our rate. | |||||
| In addition, within the evidence table appended, we would highlight the property Energieweg 1-17 in Zoeterwoude as best comparable and therefore of greatest relevance in terms of similar appearance, state of repair, clear height and location in Zoeterwoude. We do not anticipate significant negotiation to this quoting rent. | |||||
| The aforementioned rental values produce a total gross rental value of € 263,959 per annum. The subject property is fully let to four tenants on a gross rent per annum of € 242,315. Based on the aforementioned the subject property is circa 8.20% under-rented. | |||||
| Opinion of Valuation Yields | |||||
| Currently, we witness downward pressure on net initial yields for prime light industrial properties due to the high scarcity of good, light industrial properties. | |||||
| Indicative net initial yields for prime light industrial properties are currently quoting 5.75% to 6.00%. Due to relatively favourable dynamics in the occupier market in the Netherlands, with prospects for production and export growth in mind and taking into account the capital available for (real estate) investments, investor appetite is expected to increase further. Given the relatively risk averse profile of light industrial properties, especially in light of alternative real estate assets and the impact of COVID-19, it is expected that yields will compress further. | |||||
| ON BEHALF OF: | MORGAN STANLEY |
| PROJECT NAME: | MSTAR |
| Within the evidence table appended, we would highlight the following. The lower end of the yield range is indicated by the property located at Jan van Galenstraat 59 in Schiedam. As this property is of a higher quality, we have allowed for a higher yield profile for the subject property. | ||
| The higher end of range is highlighted by the property located at Kobaltweg 50 in Utrecht, which was sold under less favourable market conditions. The assessed equivalent yield for this property was 6%, with further compression in the market since this date, we would anticipate a lower adopted yield over the subject property as indicated by the 25bps gap. | ||
| We have arrived at our opinion of Market Value adopting the Traditional investment capitalisation method of valuation. Within this approach, we apply an income weighted average equivalent yield to our opinion of net income, reflecting the comparable evidence within the market for guidance on capital rates and values per sq. m. The NIY’s of the comparable investments range from 5.51% to 6.44%. We have applied an equivalent yield of 5.75%. | ||
| The approach results in a net initial yield of circa 5.66% which reflects a capital rate per sq. m of € 796, after allowing for purchaser’s costs equating to 9.00%. | ||
| On the assumption that there are no unusual factors of which we are unaware and on the basis of the comments and assumptions specified in this report, CBRE is of the opinion that the Market Value (rounded) of the subject property, is: | ||
| € 3,690,000 | ||
| (Three million six hundred and ninety thousand Euros) | ||
| The unrounded net capital value is € 3,687,627. The gross unrounded capital value is € 4,029,722 including € 331,886 purchaser’s costs (9.00. | ||
| VALUATION METHODOLOGY –VACANT POSSESSION VALUE | The constituent inputs in terms of rental value and non-recoverable costs largely align with the Market Value approach. The key exception being that we have adopted a special assumption that the property is 100% vacant/non- income producing as at the valuation date. This value is predominantly derived using the traditional investment method of valuation but critically benchmarking the resultant capital rate per sq m against the prevailing evidence. | |
| In approaching our valuation under the Special Assumption that the property is entirely vacant (Vacant Possession Value), we have adopted a total void period of 12 months inclusive of rent free or tenant incentives and targeted an equivalent yield of 6.25%. This results in a net rounded value of €3,170,000, equating to €684 per sq m. | ||
| ESTIMATED REINSTATEMENT ASSESSMENT | The property has not been inspected by a suitably qualified building surveyor from CBRE, nor have we carried out a full Reinstatement Cost Assessment. For indicative purposes only we estimate that the reinstatement cost of insurance purposes would be in the region of €7,190,000 (rounded, excl. VAT) on a day one basis, including fees but excluding VAT and inflation. |
| ON BEHALF OF: | MORGAN STANLEY |
| PROJECT NAME: | MSTAR |
|
|
This figure should be compared with the current sum insured and if a material discrepancy exists we suggest that a full Reinstatement Cost Assessment is carried out |
| ON BEHALF OF: | MORGAN STANLEY |
| PROJECT NAME: | MSTAR |
| RENTAL EVIDENCE | |||||||||
| PROPERTY ADDRESS | PROPERTY USE | DATE | TOTAL AREA | TENANT | LEASE LENGTH(YEARS) | BREAK OPTION | RENT(P.A) | RENTAL RATE PER SQ M | RELATIVE QUALITY |
| Industrieweg41B, Zoeterwoude | Warehouse - office | 14-1-2020 | 855 | - | - | - | € 42,600 | € 50 | Inferior. The comparable has a somewhat outdated look and is of an inferior state of repair. Consequently we have adopted a higher average market rent. |
| Energieweg18, Zoeterwoude | Warehouse - office | 9-6-2020 | 710 | - | - | - | € 33,000 | € 46.50 | Inferior. The reference property is of similar quality location, but suffers from overdue maintenance. Consequently we have adopted a higher average market rent. |
| Produktieweg22, Zoeterwoude | Warehouse - office | 9-7-2020 | 767 | - | - | - | € 36,000 | € 47 | Inferior. The reference property is located at the same business park as the subject property and therefore benefits from a similar location. The property was built in 1978 and has an inferior state repair. Consequently we have adopted a higher average market rent. |
| Energieweg 47, Zoeterwoude | Warehouse | 5-11-2019 | 900 | - | - | - | € 44,400 | € 49 | Similar. The reference property is located at the same business park as the subject property and therefore benefits from a similar location. The property was built in 1975 and is of a similar quality. We have adopted a higher average market rent since the transaction is slightly dated and market rents have increased meanwhile. |
| ON BEHALF OF: | MORGAN STANLEY |
| PROJECT NAME: | MSTAR |
| Energieweg 1-17, Zoeterwoude | Warehouse – office | For let | 1,400 | - | - | - | € 80,000 | € 57 |
Similar. The reference property is located at the same business park as the subject property and therefore benefits from a similar location. The property was built in 1973 and is of a similar quality.
|
| ON BEHALF OF: | MORGAN STANLEY |
| PROJECT NAME: | MSTAR |
SALES EVIDENCE
| PROPERTY ADDRESS | PROPERTY USE | DATE | TOTAL AREA | WAULT(YEARS) | PASSING RENT PER ANNUM | PURCHASE PRICE | NET INITIAL YIELD(%) | CAPITAL RATE PER SQ M | RELATIVE QUALITY |
| Kobaltweg 50, Utrecht` | Warehouse- office | 19-2-2020 | 6,327 sq. m | 5 | € 365,000 | € 4,675,000 | 6.44% | € 739 |
Inferior. At the time of the transaction the property was fully let. The reference property was sold on an EY of 6.00%, which is higher than the subject property’s. We are of the opinion that the reference’s location at Lage Weide is superior and have taken into account that since the transaction prime yields of light industrial properties have compressed. Consequently, we have adopted a lower yield profile.
|
| Jan van Galenstraat 59, Schiedam | Warehouse- office | 19-2-2020 | 1,470 sq. m | 3 | € 90,309 | € 1,150,000 | 5.51% | € 782 | Superior. At the time of the transaction the property was fully let. The property is held leasehold on a temporary basis which ends on 1 March 2099. The reference is a higher quality building and therefore we have adopted a higher yield profile. |
| Visserijweg 2, Oosterhout | Warehouse- office | 19-10-2020 | 2,925 sq. m | 5.3 | € 132,776 | € 1,800.000 | 6.20% | € 615 |
Inferior. At the time of the transaction the property was fully let. We believe the quality, location and market conditions to be similar. The property was
|
| ON BEHALF OF: | MORGAN STANLEY |
| PROJECT NAME: | MSTAR |
| part of a portfolio which might have resulted in a discount. As a consequence, we have adopted a lower yield profile. | |||||||||
| Rutherfordweg 51, Utrecht | Warehouse- office | 21-8-2020 | 8,319 sq. m | 4 | € 361,911 | € 5,300,000 | 5.67% | € 637 |
Superior. At the time of the transaction the property was fully let. We are of the opinion that the reference’s location at Lage Weide is superior. Consequently, we have adopted a higher yield profile.
|
| PROPERTY ID: | nlengie - Energieweg 39-41 | |
| ON BEHALF OF: | MORGAN STANLEY | |
| VALUATION DATE: | 01-Feb-2021 | FINAL |
| Energieweg 39-41 - Energieweg 39-41, Zoeterwoude, 2382 NH, Netherlands |
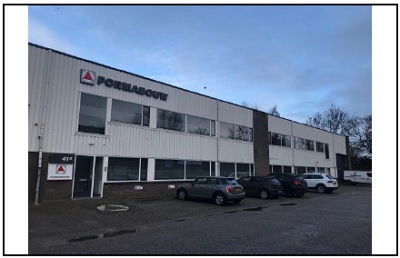 |
 |
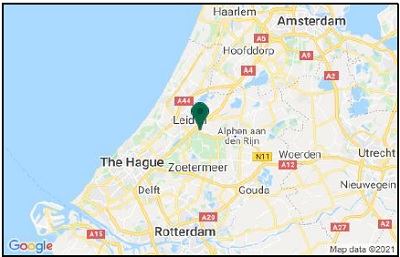 |
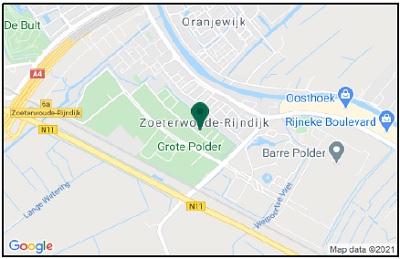 |
| VALUATION METRICS | (currency - EUR) |
| Metric | Value |
| Market Value | 3,440,000 |
| Market Value (per sq m) | 857 |
| Net Initial Yield | 6.51% |
| Reversionary Yield | 5.45% |
| Equivalent Yield | 5.75% |
| Gross Income (p.a.) | 257,789 |
| Gross Income (p.a.) (per sq m) | 64 |
| *Adj. Gross Income | 257,789 |
| Adj. Gross Income (per sq m) | 64 |
| Net Income (p.a.) | 243,867 |
| Net Income (p.a.) (per sq m) | 61 |
| Gross Rental Value | 233,753 |
| Gross Rental Value (per sq m) | 58 |
| Capital Expenditure | -10,000 |
| Transaction Costs | 8.99% |
| Over / Under Rented | 10.28% |
| KEY FACTS | ||
| Metric | Value | |
| Total Area (sq m) | 4,013 | |
| WAULT to Break by Rent | 7.21 | |
| WAULT to Break by ERV | 7.20 | |
| WAULT to Expiry by Rent | 7.21 | |
| WAULT to Expiry by ERV | 7.20 | |
| Percentage of Vacancy (Area) | 0.00% | |
| Percentage of Vacancy (ERV) | 0.00% | |
|
** |
Number of Tenants | 2 |
| Current Voids (months) | - | |
|
* Adjusted Gross Income equates to the Gross Income excluding any rent free periods |
|
|
LEASES RANKED BY RENT |
** Total tenant lines within our valuation. May differ to number of individual tenants |
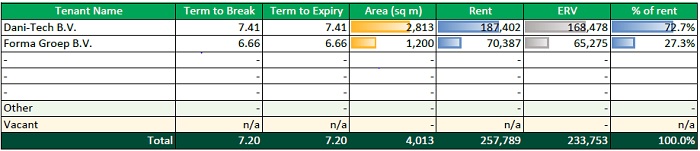
|
Printed 09/03/2021 19:46 |
|
| PROPERTY ID: | nlengie - Energieweg 39-41 | |
| ON BEHALF OF: | MORGAN STANLEY | |
| VALUATION DATE: | 01-Feb-2021 | FINAL |
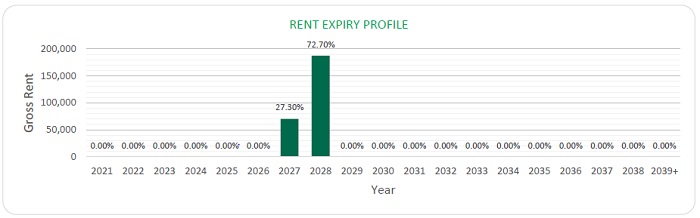
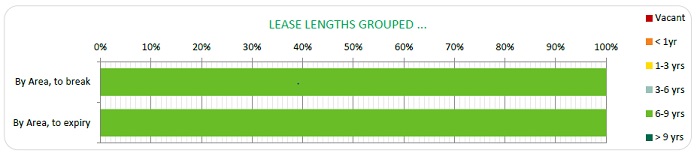
|
Printed 09/03/2021 19:46 |
|
| ON BEHALF OF: | MORGAN STANLEY |
| PROJECT NAME: | MSTAR |
PROPERTY REPORT
| ENERGIEWEG 39-41, ZOETERWOUDE, NETHERLANDS |
| INSPECTED BY: | INSPECTION DATE: | VALUATION DATE: | PROPERTY TYPE |
| J. NEERINCX | 10 JANUARY 2019 | 1 FEBRUARY 2021 | LIGHT INDUSTRIAL |
| KEY VALUATION FACTORS |
| STRENGTHS | WEAKNESSES | ||
| ■ | Well maintained | ■ | Limited horizontal expansion opportunity |
| ■ | Layout allows multi-tenancy use | ■ | Relatively high office ratio (33%) |
| ■ | Multi-tenancy reduces tenant risk | ||
| ■ | Well accessible by car | ||
| ■ | Fully let on a WALL of 7.2 years | ||
| OPPORTUNITIES | THREATS | ||
| ■ | Increasing (inter)national investor appetite for light industrial properties | ■ | Prolonged economic recession due to outbreak(s) COVID-19 |
| ■ | Vertical expansion opportunity (max. building height 13 metres) | ||
|
LOCATION & SITUATION |
||
| LOCATION | The subject property is located in Zoeterwoude which is situated in the western part of the Netherlands in the province South-Holland. Zoeterwoude is located at circa 23 km from The Hague which is the capital city of the province and circa 7 km from Leiden. The total population of Zoeterwoude comprises circa 8,450 inhabitants in June 2019. Zoeterwoude can be reached by the motorway A4 (Amsterdam – Rotterdam) and the provincial road N11 and N206. There are regional and local bus lines offering services in and around the municipality Zoeterwoude. The level of ageing in the municipality is higherthan the national average. | |
| ON BEHALF OF: | MORGAN STANLEY | |
| PROJECT NAME: | MSTAR |
| PROPERTY DESCRIPTION |
| DESCRIPTION |
The subject property concerns a rectangular light industrial building of 4,013 sq. m LFA located at Energieweg 39-41 in Zoeterwoude. The property was built in 1986 and consists of 1,316 sq. m of office area and 2,697 sq. m of warehouse area (of which 130 sq. m mezzanine). The property is divided into 4 separate units which consist of both office area and warehouse area divided over a ground floor and a first floor.
The superstructure is of steel and the floors are of concrete. The property is covered with steel panels and the roof is flat and covered with bitumen.
The office areas are fitted out to market standards with suspended ceilings with integrated lighting, natural ventilation, central heating with radiators, sanitary rooms and pantry’s. The warehouse area has an eaves height of approx. 6 metres, a floor load capacity of 1,500 kg/ sq. m, a total of 5 electrical overhead doors, gas heaters, fluorescent lighting and natural light domes.
The subject property is situated on a rectangular plot of 5,816 sq. m. The outside terrain is paved with clinkers and has sufficient parking spaces.
|
||||
| Summary of known specification: | |||||
| Characteristic | Result | ||||
| Built / Renovation | 1986 | ||||
| Eaves Height | 6 metres | ||||
| No. of loading Doors | 5 | ||||
| Warehouse (% of GLA) | 64% | ||||
| Site Coverage Ratio | 60% | ||||
| Source: Inspection/Land Registry/BAG-Viewer/Environmental Review | |||||
| ACCOMMODATION | We have not measured the property, but as instructed, we have relied upon floor areas made available to us, detailed below and elsewhere within this report. | ||||
| Floor Areas | ||
| FLOOR / UNIT | USE | SQ M |
| Dani-Tech B.V. | Office and warehouse | 2,813 |
| Forma Groep B.V. | Office and Warehouse | 1,200 |
| TOTAL | - | 4,013 |
| ON BEHALF OF: | MORGAN STANLEY |
| PROJECT NAME: | MSTAR |
| DUE DILIGENCE |
| STATE OF REPAIR | CBRE have not undertaken a structural survey, nor tested the services. The property was subject to an inspection for valuation purposes in early 2020. As you are aware, the property has not been re-inspected for the purposes of this report, nor have we been provided with updated TDD. We have therefore relied on the information provided by the Borrower, including a Capex schedule dated 12 June 2019 and schedule with revised budget of capex dated 19 January 2021. Based on the latter which indicates TDD assessment less completed spend in 2020, we have included the immediate and 2-5 years capex of €10,000 within our valuation. | |
| According to our own limited inspection for valuation purposes, our opinion regarding the state of repair would substantiate the assessment by Arcadis. Based on our impression gained during the inspection, we are of the opinion that the buildings are in a fair condition, in line with the year of construction. | ||
|
ENVIRONMENTAL CONSIDERATIONS
|
We have been instructed not to make any investigations in relation to the presence or potential presence of contamination in land or buildings or the potential presence of other environmental risk factors and to assume that if investigations were made to an appropriate extent then nothing would be discovered sufficient to affect value. | |
| We have summarised the findings from a schedule provided in relation to ‘Priority sites’ within the front section of this report. | ||
| We have relied on the information provided by the Borrower, including Draft Phase 1 Environmental Review prepared by Ambiente Ltd and dated December 2019. The report summarises that it is not expected that significant environmental residual liability would be realised at the property under continued current use. The potential environmental risk is assessed as very low to site users and low to groundwater, surface water resources and ecology. | ||
| We have not carried out investigation into past uses, either of the properties or of any adjacent lands, to establish whether there is any potential for contamination from such uses or sites, or other environmental risk factors and have therefore assumed that none exists. | ||
| ON BEHALF OF: | MORGAN STANLEY |
| PROJECT NAME: | MSTAR |
| TENURE | According to the information available from the Land Registry Office (Kadaster) the parcel is held freehold by MLET Netherlands 2 Holding B.V. and registered as follows: | |
| Municipality: Zoeterwoude | ||
| Section: B | ||
| Numbers: 4050 | ||
| Total Area: 5,816 sq. m | ||
| We have also had sight of the Draft Red Flag Legal Report prepared by Loyens Loeff, dated 12 February 2021. Based on the information provided, we understand the property is held freehold. | ||
| We have assumed that there are no onerous legal conditions affecting the property which have a material impact on our opinion of value. | ||
| INCOME PROFILE |
The subject property is fully let to two tenants on a gross rent per annum of € 257,789 and on a WALL of 7.2 years. Tenant Dani-Tech B.V. is the main tenant, accounts for circa 73% of total rent and has an expiration date at 30 June 2028. Tenant Forma Groep B.V. has an expiration date at 30
September 2027. The rental value equates to € 233,753 per annum. Therefore, the subject property is over-rented by 10.4%.
|
|
| Dani-Tech is an industrial company that operates internationally and produces hydraulic and mechanical transmissions and integrated electronics. Forma Groep B.V. is Dutch builder contractor that operates on a national level. We believe the tenants to provide adequate financial security. | ||
| VALUATION CONSIDERATIONS |
|
COSTS AND ADJUSTMENTS
|
Based on the information provided or our knowledge of the market, in approaching our valuation, we made allowances for the following capital and non-recoverable costs. In all cases, we have cited whether they are deducted as at the date of valuation or whether they take effect at a later date. | ||||
| Capital Expenditure: | |||||
| Type & Calculation | Source | Effective | Amount | ||
| Capital Expenditure: Fixed Amount | Technical Due Diligence |
On Valuation
No Repeat |
€10,000 | ||
| Letting Fees: 15% of Rental Value of the vacant space | CBRE Estimate |
On lease start/ renewal
No Repeat |
N/A | ||
| TOTAL ON VALUATION | €10,000 | ||||
| ON BEHALF OF: | MORGAN STANLEY |
| PROJECT NAME: | MSTAR |
| Revenue Deductions: | ||||||||
| Type & Calculation | Source | Effective | Annual Amount | |||||
| Management: 2% of ERV | CBRE estimate |
On Valuation
In perpetuity |
€ 5,156 | |||||
| Property tax: 2% of ERV | CBRE estimate |
On Valuation
In perpetuity |
€ 4,675 | |||||
| Water tax: 0.25% of ERV | CBRE estimate |
On Valuation
In perpetuity |
€ 584 | |||||
| Insurance: 1.25% of ERV | CBRE estimate |
On Valuation
In perpetuity |
€2,922 | |||||
| Sewage charge: 0.25% of ERV | CBRE estimate |
On Valuation
In perpetuity |
€ 584 | |||||
| Maintenance: € 4.00 per sq m | Borrower Estimate |
5 Year Delay
In perpetuity |
€ 16,052 | |||||
| Void Costs: 2% of ERV | Borrower Estimate |
On Valuation
On All Voids |
€ 0 | |||||
| TOTAL:ON VALUATION | € 13,921 | |||||||
|
|
Void and Rent-Free Allowances: |
|||||||
| The subject is fully let on a WALL of 7.2 years. Given the aforementioned we have not adopted a void period. If the subject would become vacant, we would expect a void period of 12 months, including marketing period and incentives. | ||||||||
|
VALUATION METHODOLOGY – MARKET VALUE
|
We have made the following rental assumptions having regard to the lettings agreed within the subject property, whilst also considering rental rates in the surrounding area: | |||||||
| Unit | Area (sq. m) |
ERV (€) per sq. m (annum)
|
Rent pa (€) | |||||
| Office | 1,316 | 82.50 | 108,570 | |||||
| Warehouse | 2,567 | 47.50 | 121,933 | |||||
| Other (mezzanine) | 130 | 25 | 3,250 | |||||
| Total | 4,013 | 58 | 233,753 | |||||
| Opinion of Market Rent | ||||||||
| Based on the below-mentioned comparable transactions and asking price, the current market trends and our general market knowledge, we have estimated the above-mentioned rental values for the areas in the subject | ||||||||
| ON BEHALF OF: | MORGAN STANLEY |
| PROJECT NAME: | MSTAR |
| property. The below appended comparables indicate a (blended) range from € 46.50 per sq. m per annum to € 57 per sq. m per annum. | ||
| We would cite the lettings agreed within the property itself as being of relevance, particularly given general upward pressure on rents since they were agreed in 2017-18. Nonetheless, for this property, we see the property as being slightly over-rented based on the wider market. Within the evidence table appended, we would highlight the property Energieweg 1-17, Zoeterwoude as providing the best evidence. Whilst it is available, it is meaningful and we anticipate interest around the quoting level/ | ||
| The aforementioned rental values produce a total gross rental value of € 233,753 per annum or an average of circa € 58 per sq. m. The agreed rental income amounts to € 257,789 per annum or an average of circa € 64 per sq. m per annum. We are of the opinion that the subject property is over- rented with 10.4%. | ||
| Opinion of Valuation Yields | ||
| Currently, we witness downward pressure on net initial yields for prime light industrial properties due to the high scarcity of good, light industrial properties. | ||
| Indicative net initial yields for prime light industrial properties are currently quoting 5.75% to 6.00%. Due to relatively favourable dynamics in the occupier market in the Netherlands, with prospects for production and export growth in mind and taking into account the capital available for (real estate) investments, investor appetite is expected to increase further. Given the relatively risk averse profile of light industrial properties, especially in light of alternative real estate assets and the impact of COVID-19, it is expected that yields will compress further. | ||
| Within the evidence table appended, we would highlight the following. The lower end of the yield range is indicated by the property located at Jan van Galenstraat 59 in Schiedam. As this property is of a higher quality, we have allowed for a higher yield profile for the subject property. | ||
| The higher end of range is highlighted by the property located at Kobaltweg 50 in Utrecht, which was sold under less favourable market conditions. The assessed equivalent yield for this property was 6%, with further compression in the market since this date, we would anticipate a lower adopted yield over the subject property as indicated by the 25bps gap. | ||
| We have arrived at our opinion of Market Value adopting the Traditional investment capitalisation method of valuation. Within this approach, we apply an income weighted average equivalent yield to our opinion of net income, reflecting the comparable evidence within the market for guidance on capital rates and values per sq. m. The NIY’s of the comparable investments range from 5.51% to 6.44%. We have applied an equivalent yield of 5.75%. | ||
| The approach results in a NIY of 6.51% which reflects a capital rate per sq. m of € 857, after allowing for purchaser’s costs equating to 9.00%. | ||
| ON BEHALF OF: | MORGAN STANLEY |
| PROJECT NAME: | MSTAR |
| On the assumption that there are no unusual factors of which we are unaware and on the basis of the comments and assumptions specified in this report, CBRE is of the opinion that the Market Value (rounded) of the subject property, is: | ||
| € 3,440,000 | ||
| (Three million four hundred forty thousand Euro) | ||
| The unrounded net capital value is € 3,437,628. The gross unrounded capital value is € 3,757,015 including € 309,386 purchaser’s costs (9.00%). | ||
|
VALUATION VACANT POSSESSION
|
The constituent inputs in terms of rental value and non-recoverable costs largely align with the Market Value approach. The key exception being that we have adopted a special assumption that the property is 100% vacant/nonincome producing as at the valuation date. This value is predominantly derived using the traditional investment method of valuation but critically benchmarking the resultant capital rate per sq m against the prevailing evidence. | |
| In approaching our valuation under the Special Assumption that the property is entirely vacant (Vacant Possession Value), we have adopted a total void period of 12 months inclusive of rent free or tenant incentives and targeted an equivalent yield of 6.25%. This results in a net rounded value of €2,820,000, equating to €703 per sq m. | ||
|
ESTIMATED REINSTATEMENT
|
The property has not been inspected by a suitably qualified building surveyor from CBRE, nor have we carried out a full Reinstatement Cost Assessment. For indicative purposes only we estimate that the reinstatement cost of insurance purposes would be in the region of €6,225,000 (rounded, excl. VAT) on a day one basis, including fees but excluding VAT and inflation. | |
| This figure should be compared with the current sum insured and if a material discrepancy exists we suggest that a full Reinstatement Cost Assessment is carried out. |
| ON BEHALF OF: | MORGAN STANLEY |
| PROJECT NAME: | MSTAR |
| RENTAL EVIDENCE |
| PROPERTY ADDRESS | PROPERTY USE | DATE | TOTAL AREA | TENANT | LEASE LENGTH (YEARS) |
BREAK OPTION | RENT (P.A) |
RENTAL RATE PER SQ M | RELATIVE QUALITY |
| Industrieweg 41B, Zoeterwoude |
Warehouse - office |
14-1- 2020 |
855 | - | - | - | € 42,600 | Inferior. The comparable has a somewhat outdated look and is of an inferior state of repair. Consequently we have adopted a higher average market rent. | |
| Energieweg 18, Zoeterwoude |
Warehouse - office |
9-6- 2020 |
710 | - | - | - | € 33,000 | € 46.50 | Inferior. The reference property is ofsimilar quality location, but suffers from overdue maintenance. Consequently we have adopted a higher average market rent. |
| Produktieweg 22, Zoeterwoude |
Warehouse - office |
9-7- 2020 |
767 | - | - | - | € 36,000 | € 47 | Inferior. The reference property is located at the same business park as the subject property and therefore benefits from a similar location. The property wasbuilt in 1978 and has an inferior state repair. Consequently we have adopted a higher average market rent. |
| Energieweg 47, Zoeterwoude |
Warehouse | 5-11- 2019 |
900 | - | - | - | € 44,400 | € 49 | Inferior. The reference property is located at the same business park as the subject property and therefore benefits from a similar location. The property was built in 1975 and is of a similar quality. We have adopted a higher average market rent since the transaction is slightly dated and market rents have increased meanwhile. |
| Energieweg 1- 17, Zoeterwoude |
Warehouse – office |
For let |
1,400 | - | - | - | € 80,000 | € 57 | Similar. The reference property is located at the same business park as the subject property and therefore benefits from a |
| ON BEHALF OF: | MORGAN STANLEY |
| PROJECT NAME: | MSTAR |
| similar location. The property was built in 1973 and is of a similar quality. |
| ON BEHALF OF: | MORGAN STANLEY |
| PROJECT NAME: | MSTAR |
| SALES EVIDENCE |
| PROPERTY ADDRESS | PROPERTY USE | DATE | TOTAL AREA | WAULT(YEARS) | PASSING RENT PER ANNUM | PURCHASE PRICE | NET INITIAL YIELD (%) |
CAPITAL RATE PER SQ M | RELATIVE QUALITY |
| Kobaltweg 50, Utrecht |
Warehouse - office |
19-2- 2020 |
6,327 sq. m |
5 | € 365,000 | € 4,675,000 | 6.44% | € 739 | Inferior. At the time of the transaction the property was fully let. The reference property was sold on an EY of 6.00%, which is higher than the subject property’s. We are of the opinion that the reference’s location at Lage Weide is superior and have taken into account that since the transaction prime yields of light industrial properties have compressed. Consequently, we have adopted a lower yield profile. |
| Jan van Galenstraat 59, Schiedam |
Warehouse - office |
19-2- 2020 |
1,470 sq. m |
3 | € 90,309 | € 1,150,000 | 5.51% | € 782 |
Superior. At the time of the transaction the property was fully let. The property is held leasehold on a temporary basis
which ends on 1 March 2099.
The reference is a higher quality building and therefore we have nadopted a higher yield profile.
|
| Visserijweg 2, Oosterhout |
Warehouse - office |
19- 10- 2020 |
2,925 sq. m |
5.3 | € 132,776 | € 1,800.000 | 6.20% | € 615 | Inferior. At the time of the transaction the property was fully let. We believe the quality, location and market conditions to be similar. The property was |
| ON BEHALF OF: | MORGAN STANLEY |
| PROJECT NAME: | MSTAR |
| part of a portfolio which might have resulted in a discount. As a consequence, we have adopted a lower yield profile. | |||||||||
| Rutherfordweg 51, Utrecht |
Warehouse - office |
21-8- 2020 |
8,319 sq. m |
4 | € 361,911 | € 5,300,000 | 5.67% | € 637 | Superior. At the time of the transaction the property was fully let. We are of the opinion that mthe reference’s location at Lage Weide is superior. Consequently, we have adopted a higher yield profile. |
| PROPERTY ID: | nlgoes - Goeseelsstraat 6-21 | |
| ON BEHALF OF: | MORGAN STANLEY | |
| VALUATION DATE: | 01-Feb-2021 | FINAL |
Goeseelsstraat 6-21 - Goeseelsstraat 6-21, Breda, 4817 MV, Netherlands
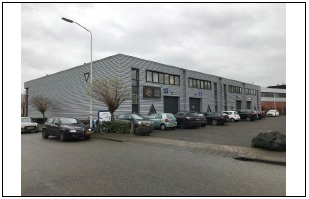 |
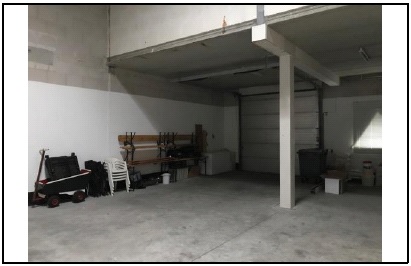 |
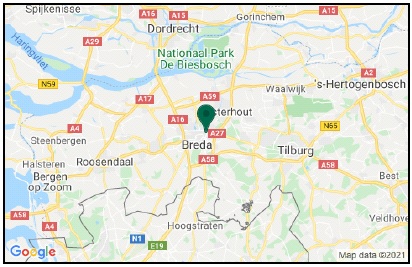 |
 |
| VALUATION METRICS | (currency - EUR) |
| Metric | Value |
| Market Value | 3,190,000 |
| Market Value (per sq m) | 1,084 |
| Net Initial Yield | 6.16% |
| Reversionary Yield | 5.53% |
| Equivalent Yield | 5.60% |
| Gross Income (p.a.) | 226,726 |
| Gross Income (p.a.) (per sq m) | 77 |
| *Adj. Gross Income | 226,726 |
| Adj. Gross Income (per sq m) | 77 |
| Net Income (p.a.) | 214,075 |
| Net Income (p.a.) (per sq m) | 73 |
| Gross Rental Value | 216,450 |
| Gross Rental Value (per sq m) | 74 |
| Capital Expenditure | -22,202 |
| Transaction Costs | 8.99% |
| Over / Under Rented | 4.75% |
KEY FACTS
| Metric | Value | |
| Total Area (sq m) | 2,943 | |
| WAULT to Break by Rent | 1.46 | |
| WAULT to Break by ERV | 1.47 | |
| WAULT to Expiry by Rent | 1.46 | |
| WAULT to Expiry by ERV | 1.47 | |
| Percentage of Vacancy (Area) | 0.00% | |
| Percentage of Vacancy (ERV) | 0.00% | |
| ** | Number of Tenants | 16 |
| Current Voids (months) | - | |
| * | Adjusted Gross Income equates to the Gross Income excluding any rent free periods |
| ** | Total tenant lines within our valuation. May differ to number of individual tenants |
LEASES RANKED BY RENT
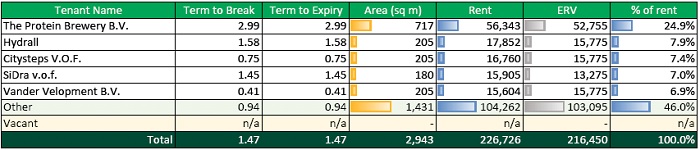 |
| Pritned 09/03/2021 19:46 | |
| PROPERTY ID: | nlgoes - Goeseelsstraat 6-21 | |
| ON BEHALF OF: | MORGAN STANLEY | |
| VALUATION DATE: | 01-Feb-2021 | FINAL |
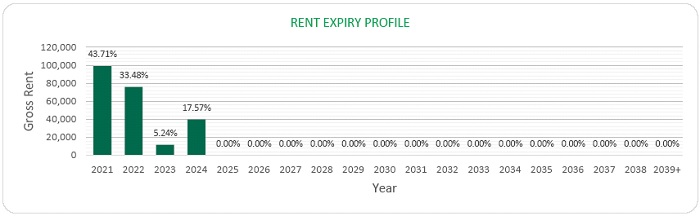 |
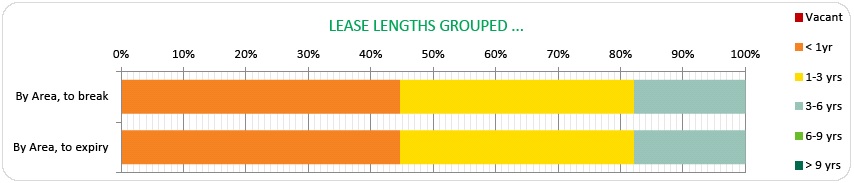 |
| Printed 09/03/2021 19:46 | |
| ON BEHALF OF: | MORGAN STANLEY | |
| PROJECT NAME: | MSTAR |
| PROPERTY REPORT |
| GOESEELSSTRAAT 6-21, BREDA, NETHERLANDS |
| INSPECTED BY: | INSPECTION DATE: | VALUATION DATE: | PROPERTY TYPE |
| J. BAKKER | 14-01-2020 | 1 FEBRUARY 2021 | INDUSTRIAL WAREHOUSE |
| KEY VALUATION FACTORS | |
| STRENGTHS | WEAKNESSES |
|
■ Multi-tenanted
■ Accessibility
■ Quality |
■ Not located in a G-4 city |
| OPPORTUNITIES | THREATS |
|
■ Increasing investor appetite
■ Extend lease term with current tenants |
■ Macro-economic uncertainty(i.e. COVID-19, Trade Wars; Brexit)
|
| LOCATION & SITUATION |
| LOCATION |
The subject property is located in Breda, which is situated in the southwestern part of the Netherlands in the province North Brabant. Breda is one of the major cities of the province and is located at circa 50 km from 's- Hertogenbosch which is the capital city of the province North Brabant and circa 50 km from Rotterdam.
The total population of the Municipality Breda comprises circa 182,000 inhabitants. Breda can be reached by the motorways A58 (Vlissingen - Best), A27 (Almere - Breda) and A16 (Rotterdam - Hazeldonk) and the provincial roads N285, N282 and N263. Breda benefits from its two train stations, which are directly connected to cities in The Netherlands. Additionally, there are many regional and local bus lines offering services in and around the municipality of Breda. In Breda the level of ageing is relatively high in comparison with the national average and rising.
|
| ON BEHALF OF: | MORGAN STANLEY |
| PROJECT NAME: | MSTAR |
| PROPERTY DESCRIPTION |
| DESCRIPTION |
The subject property is located at Goeseelsstraat 6-21 in Breda and is a light industrial complex located in the “Brabantpark” Business Park, near to the A27 motorway and city centre of Breda. The subject property comprises in total 2,943 sq m. The property consists of 15 separate units, each between 175 and 205 sq m divided into warehouse and office space.
The building was constructed in 1997. The warehouse is located on the ground floor, the eaves height of the warehouse is circa 6 metres. |
||
| Summary of known specification: | |||
| Characteristic | Result | ||
| Built / Renovation | 1997 | ||
| Eaves Height | 6 metres | ||
| No. of loading Doors | 1 per unit | ||
| Warehouse (% of GLA) | 93% | ||
| Source: Schedule provided by client. | |||
| ACCOMMODATION | We have not measured the property, but as instructed, we have relied upon floor areas made available to us, detailed below and elsewhere within this report. | ||
| Floor Areas |
| FLOOR / UNIT | USE | SQ M |
| Unit 10 | Warehouse and office | 175 |
| Unit 11 | Warehouse and office | 175 |
| Unit 12 | Warehouse and office | 175 |
| Unit 13 | Warehouse and office | 175 |
| Unit 14 | Warehouse and office | 205 |
| Unit 15 | Warehouse and office | 205 |
| Unit 16 | Warehouse and office | 205 |
| Unit 17 | Warehouse and office | 192 |
| Unit 18 | Warehouse and office | 175 |
| Unit 19 | Warehouse and office | 175 |
| Unit 20 | Warehouse and office | 180 |
| Unit 21 | Warehouse and office | 196 |
| Unit 6 | Warehouse and office | 180 |
| Unit 7 | Warehouse and office | 175 |
| Unit 8 | Warehouse and office | 175 |
| Unit 9 | Warehouse and office | 180 |
| TOTAL | - | 2,943 |
| ON BEHALF OF: | MORGAN STANLEY |
| PROJECT NAME: | MSTAR |
| DUE DILIGENCE |
| STATE OF REPAIR |
CBRE have not undertaken a structural survey, nor tested the services. The property was subject to an inspection for valuation purposes in early 2020. As you are aware, the property has not been re-inspected for the purposes of this report, nor have we been provided with updated TDD. We have therefore relied on the information provided by the Borrower, including a Capex schedule dated 12 June 2019 and schedule with revised budget of capex dated 19 January 2021. Based on the latter which indicates TDD assessment less completed spend in 2020, we have included the immediate and 2-5 years capex of €20,000 within our valuation.
According to our own limited inspection for valuation purposes, our opinion regarding the state of repair would substantiate the assessment by Arcadis. Based on our impression gained during the inspection, we are of the opinion that the buildings are in a fair condition, in line with the year of construction.
|
||
|
ENVIRONMENTAL CONSIDERATIONS |
We have been instructed not to make any investigations in relation to the presence or potential presence of contamination in the land or buildings, or the potential presence of other environmental risk factors and to assume that if investigations were made to an appropriate extent, then nothing would be discovered sufficient to affect value.
We have summarised the findings from a schedule provided in relation to ‘Priority sites’ within the front section of this report.
We have relied on the information provided by the Borrower, including Draft Phase 1 Environmental Review prepared by Ambiente Ltd and dated December 2019. The report summarises that the soil appeared in good condition.
We have not carried out investigation into past uses, either of the properties or of any adjacent lands, to establish whether there is any potential for contamination from such uses or sites, or other environmental risk factors and have therefore assumed that none exists. |
||
| TENURE | According to the information available from the Land Registry Office (Kadaster) the parcels are held freehold by MLET Netherlands 2 Holding B.V. and registered as follows: | ||
| Municipality: | Breda | ||
| Section: | G | ||
| Numbers: | 5067, 5210 | ||
| Total Area: | 3,562 sq m | ||
|
We have also had sight of the Draft Red Flag Legal Report prepared by Loyens Loeff, dated 12 February 2021. Based on the information provided, we understand the property is held freehold.
We have assumed that there are no onerous legal conditions affecting the property which have a material impact on our opinion of value. |
|||
| ON BEHALF OF: | MORGAN STANLEY |
| PROJECT NAME: | MSTAR |
| INCOME PROFILE | The subject property is fully let to 14 tenants on a WALL of 1.45 years. There is no vacancy. The current rental income is € 226,726 per annum. The ERV for the leased part is estimated at € 216,450 per annum, we are therefore of the opinion the property is let at market levels. |
| VALUATION CONSIDERATIONS |
| COSTS AND ADJUSTMENTS |
Based on the information provided or our knowledge of the market, in approaching our valuation, we made allowances for the following capital and non-recoverable costs. In all cases, we have cited whether they are deducted as at the date of valuation or whether they take effect at a later date.
|
||||
|
Capital Expenditure: |
|||||
| Type & Calculation | Source | Effective | Amount | ||
| Capital Expenditure: Fixed Amount | Technical Due Diligence | On Valuation No Repeat | €20,000 | ||
| Letting Fees: 15% of Rental Value of the vacant space | CBRE Estimate | On lease start / renewal No Repeat | € 0 | ||
| Rent Free - De heer X.W.G.H.M. van Dinther tevens h.o.d.n. Flex Verhuizingen | Borrower | On Valuation No Repeat | € 600 | ||
| Rent Free - The Protein Brewery B.V. | Borrower | On Valuation No Repeat | € 1,602 | ||
| TOTAL ON VALUATION | €22,202 | ||||
|
Revenue Deductions: |
|||||
| Type & Calculation | Source | Effective | Annual Amount | ||
| Management: 2% of ERV | CBRE estimate | On Valuation In perpetuity | € 4,535 | ||
| Property tax: 2% of ERV | CBRE estimate | On Valuation In perpetuity | € 4,329 | ||
| Water tax: 0.25% of ERV | CBRE estimate | On Valuation In perpetuity | € 541 | ||
| ON BEHALF OF: | MORGAN STANLEY |
| PROJECT NAME: | MSTAR |
| Insurance: 1.25% of ERV | CBRE estimate | On Valuation In perpetuity | € 2,706 | ||
| Sewage charge: 0.25% of ERV | CBRE estimate | On Valuation In perpetuity | € 541 | ||
| Maintenance: € 4.00 per sq m | Borrower Estimate | 5 Year Delay In perpetuity | € 11,772 | ||
| Void Costs: 2% of ERV | Borrower Estimate | On Valuation On All Voids | € 0 | ||
| TOTAL: ON VALUATION | €12,652 | ||||
|
Void and Rent-Free Allowances:
Currently there is no vacancy. We are of the opinion re-lettability is very good and have therefore not allowed for a future void period for the running leases.
|
|||||
| VALUATION METHODOLOGY – MARKET VALUE | We have made the following rental assumptions having regard to the lettings agreed within the subject property, whilst also considering rental rates in thesurrounding area: | ||||
| Unit | Area (s qm) |
ERV (€) per S qm (annum) |
Rent pa (€) | ||
| Office | 1,213 | 100 | 121,300 | ||
| Warehouse | 1,730 | 55 | 95,150 | ||
| Total | 2,943 | 74 | 216,450 | ||
|
Opinion of Market Rent
Based on the below-mentioned comparable transactions, the current market trends and our general market knowledge, we have estimated the abovementioned rental values for the areas in the subject property. The below appended comparables indicate a (blended) range from € 63 per sq m per annum to € 82 per sq m per annum.
Within the evidence table appended, we would highlight the properties in Breda as best comparable due to the location and therefore of greatest relevance in terms of similar appearance, state of repair, eaves height and location close to the border.
The aforementioned rental values produce a total gross rental value of € 216,450 per annum or an average of circa € 74 per sq m. The agreed rental income amounts to € 226,726 per annum or an average of circa € 77 per sq m per annum. We are of the opinion that the subject property is more or less let at market levels.
|
|||||
| ON BEHALF OF: | MORGAN STANLEY |
| PROJECT NAME: | MSTAR |
|
Opinion of Valuation Yields
Currently, we witness downward pressure on net initial yields for prime logistics properties, due to the high scarcity of good, long leased logistics properties.
Indicative net initial yields for prime logistics property are currently quoting 4.0%. Due to favourable dynamics in the occupier market in the Netherlands, with prospects for production and export growth in mind and taking into account the capital available for (real estate) investments, investor appetite is expected to increase further. This is also expected to put further downward pressure on yields.
Within the evidence table appended, we would highlight the following. The lower end of the yield range is indicated by the property located in Eersel. As this property has a long WAULT, we have allowed for a higher yield profile for the subject property.
The higher end of the range is highlighted by the property located in Bergen op Zoom. Since the subject property has a lower WALL and building quality we allowed for a lower yield.
We have also referenced a sale in Bleiswijk, north of Rotterdam, which has a similar income profile, albeit providing inferior investment product in terms of current demand as reflected by the slightly higher equivalent yield of 5.8%.
We have arrived at our opinion of Market Value through adopting the traditional investment capitalisation method of valuation. Within this approach, we apply an income weighted average equivalent yield to our opinion of net income, reflecting the comparable evidence within the market for guidance on capital rates and values per sq m. The NIY’s of the comparable investments range from 4.0% to 7.3% and also taking into account the current market conditions and the WAULT to expiry by current income of 1.45 years. We have applied an equivalent yield of 5.6%.
The approach results in a net initial yield of circa 6.16% which reflects a capital rate per sq m of € 1,084, after allowing for purchaser’s costs equating to 9.00%.
On the assumption that there are no unusual factors of which we are unaware and on the basis of the comments and assumptions specified in this report, CBRE is of the opinion that the Market Value (rounded) of the subject property, is:
€ 3,190,000
(Three million one hundred ninety thousand Euro)
|
||
| VALUATION METHODOLOGY – VACANT POSSESSION VALUE |
The unrounded net capital value is € 3,186,650. The gross unrounded capital value is € 3,495,650 including € 286,798, purchaser's costs (9.00%).
The constituent inputs in terms of rental value and non-recoverable costs largely align with the Market Value approach. The key exception being that we have adopted a special assumption that the property is 100% vacant/nonincome producing as at the valuation date. This value is predominantly derived using the traditional investment method of valuation but critically
|
| ON BEHALF OF: | MORGAN STANLEY |
| PROJECT NAME: | MSTAR |
|
benchmarking the resultant capital rate per sq m against the prevailing evidence.
In approaching our valuation under the Special Assumption that the property is entirely vacant (Vacant Possession Value), we have adopted a total void period of 12 months inclusive of rent free or tenant incentives and targeted an equivalent yield of 6.40%.
This results in a net rounded value of €2,560,000, equating to €870 per sq m.
|
||
| ESTIMATED REINSTATEMENT ASSESSMENT |
The property has not been inspected by a suitably qualified building surveyor from CBRE, nor have we carried out a full Reinstatement Cost Assessment. For indicative purposes only we estimate that the reinstatement cost of insurance purposes would be in the region of €4,565,000 (rounded, excl. VAT) on a day one basis, including fees but excluding VAT and inflation.
This figure should be compared with the current sum insured and if a material discrepancy exists we suggest that a full Reinstatement Cost Assessment is carried out.
|
| ON BEHALF OF: | MORGAN STANLEY |
| PROJECT NAME: | MSTAR |
| RENTAL EVIDENCE |
| PROPERTY ADDRESS | PROPERTY USE | DATE | TOTAL AREA | TENANT | LEASE LENGTH (YEARS) | BREAK OPTION | RENT (P.A) | RENTAL RATE PER SQ M |
RELATIVE QUALITY |
| Rithmeesterpark 20, Breda | Industrial | 2020, March | 2,140 | Elst Transport | not available | not available | 175,000 | 82 | Better quality which results in a higher rental value. |
| Kalshoven 6, Breda | Industrial | 2020, March | 710 | Middle est Groothandel | not available | not available | 45,000 | 63 | Less quality but which results in a lower rental value. |
| Tweede Industrieweg 4, Made | Industrial | 2019, October | 1.895 | tanis confectionery | not available | not available | 126.000 | 66,49 | Similar quality but, a larger scale unit which results in a lower rental value. |
| Megajoule 5, Klundert | Industrial | 2019, July | 3.993 | arena warehousing | not available | not available | 295.482 | 74,00 | Better quality but and a less attractive location which results in a similar rental value. |
| ON BEHALF OF: | MORGAN STANLEY |
| PROJECT NAME: | MSTAR |
| SALES EVIDENCE |
| PROPERTY ADDRESS | PROPERTY USE | DATE | TOTAL AREA | WAULT (YEARS) |
PASSING RENT PER ANNUM
|
PURCHASE PRICE | NET INITIAL YIELD (%) | CAPITAL RATE PER SQ M |
RELATIVE QUALITY
|
| Poortweg 19, Bergen op Zoom | Industrial/Logistics | 1-4-2019 | 1.167 | 0,3 | 58.030 | 760.645 | 7,13% | 652 | The subject property is partially let to 7 tenants on a weighted average remaining lease term of circa 0.25 years. Circa 9.3% of the property is vacant. The property is more or less rack rented. Due to the difference in WALL the yield of the subject property is lower. |
| Spectrumlaan 5, Bleiswijk | Industrial/Logistics | 15-04- 2020 | 8,641 | 2.2 | 557,770 | 8,000,000 | 6.00 | 926 | The reference property is let to Cemex Trescon B.V. with a remaining lease term of 2.2 years. We are of the opinion that, the property is slightly over-rented (approximately 3%). |
| Eersel, Kerver 25 | Industrial | 22-12- 2020 | 2,586 | 15 | 139,131 | 3,200,000 | 4.04% | 1,237 | The equivalent yield equates to 5.8%. The location of the property sold is inferior, the building quality is comparable. The letting situation is significantly better. We therefore have adopted a higher yield |
| ON BEHALF OF: | MORGAN STANLEY |
| PROJECT NAME: | MSTAR |
|
Visserijweg 2, Oosterhout
|
Industrial/Logistics | 19-10- 2020 | 2,925 | 5.3 | 132,776 | 1,800,000 | 7.38% | 615 | During transaction the property was fully let on a WALL of circa 5.3 years. In our opinion the property is slightly under rented. Due to the difference in building quality we expect a lower yield at the subject property. |
| PROPERTY ID: | nlgroo - Groot Mijdrechtstraat 37-39 | |
| ON BEHALF OF: | MORGAN STANLEY | |
| VALUATION DATE: | 01-Feb-2021 | FINAL |
Groot Mijdrechtstraat 37-39 - Groot Mijdrechtstraat 37-39, Mijdrecht, 3641 RV, Netherlands
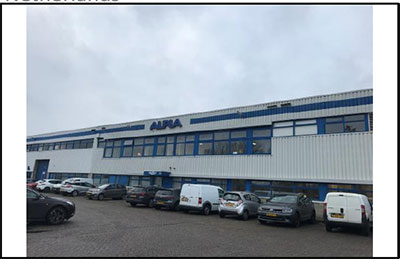
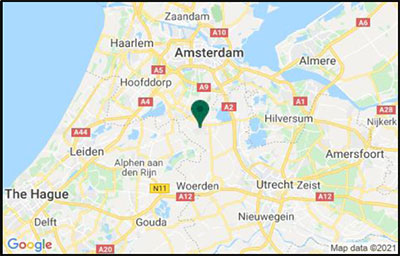
| VALUATION METRICS | (currency - EUR) |
| Metric | Value |
| Market Value | 10,075,000 |
| Market Value (per sq m) | 628 |
| Net Initial Yield | 6.06% |
| Reversionary Yield | 6.26% |
| Equivalent Yield | 6.25% |
| Gross Income (p.a.) | 709,907 |
| Gross Income (p.a.) (per sq m) | 44 |
| *Adj. Gross Income | 709,907 |
| Adj. Gross Income (per sq m) | 44 |
| Net Income (p.a.) | 665,829 |
| Net Income (p.a.) (per sq m) | 42 |
| Gross Rental Value | 796,805 |
| Gross Rental Value (per sq m) | 50 |
| Capital Expenditure | -140,000 |
| Transaction Costs | 9.00% |
| Over / Under Rented | -10.91% |
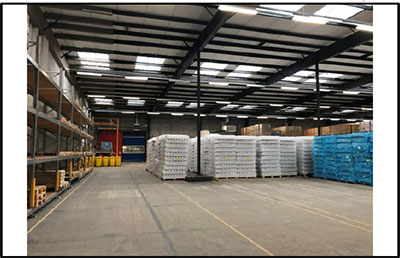
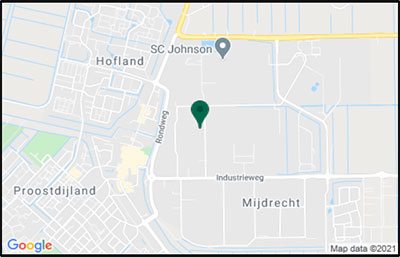
| KEY FACTS | ||
| Metric | Value | |
| Total Area (sq m) | 16,033 | |
| WAULT to Break by Rent | 2.28 | |
| WAULT to Break by ERV | 2.23 | |
| WAULT to Expiry by Rent | 2.28 | |
| WAULT to Expiry by ERV | 2.23 | |
| Percentage of Vacancy (Area) | 0.00% | |
| Percentage of Vacancy (ERV) | 0.00% | |
| ** | Number of Tenants | 6 |
| Current Voids (months) | - | |
| * Adjusted Gross Income equates to the Gross Income excluding any rent free periods | |
| LEASES RANKED BY RENT | ** Total tenant lines within our valuation. May differ to number of individual tenants |
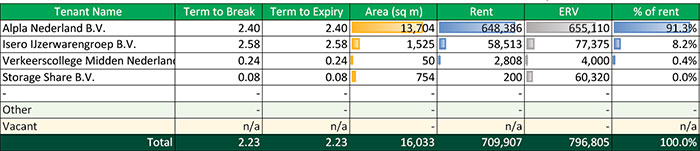
| Printed 09/03/2021 19:46 |
| PROPERTY ID: | nlgroo - Groot Mijdrechtstraat 37-39 | |
| ON BEHALF OF: | MORGAN STANLEY | |
| VALUATION DATE: | 01-Feb-2021 | FINAL |
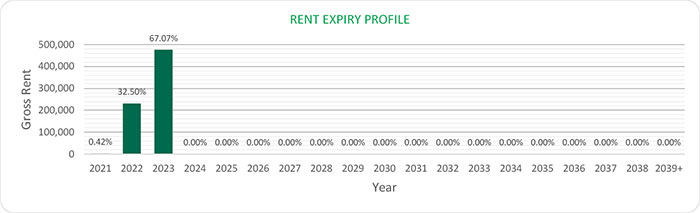
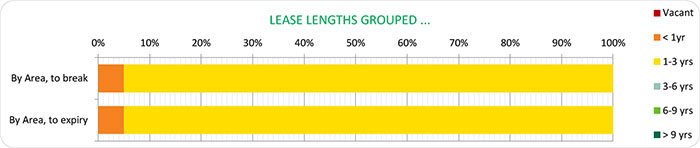
| Printed 09/03/2021 19:46 | |
| ON BEHALF OF: | MORGAN STANLEY |
| PROJECT NAME: | MSTAR |
PROPERTY REPORT
GROOT MIJDRECHTSTRAAT 37-39, MIJDRECHT, NETHERLANDS
| INSPECTED BY: | INSPECTION DATE: | VALUATION DATE: | PROPERTY TYPE |
| DEVIN UMMELS | 14 JANUARY 2019 | 1 FEBRUARY 2021 | INDUSTRIAL WAREHOUSE |
KEY VALUATION FACTORS
| STRENGTHS | WEAKNESSES |
| ■ Fully let | ■ Dated |
| ■ Warehouse/office ratio | ■ Under rented |
| ■ Eaves height |
| OPPORTUNITIES | THREATS |
| ■ Increasing investor appetite | ■ Macro-economic uncertainty (i.e. Trade Wars; Brexit) |
| ■ Extend lease term with current tenants |
LOCATION & SITUATION
|
LOCATION |
The subject property is located in Mijdrecht in the municipality De Ronde Venen in the province Utrecht. | |
| Mijdrecht is situated in the west part of the Netherlands and roughly in between Amsterdam and Utrecht | ||
| The municipality has a population of approximately 42,600 inhabitants of which circa 16,100 live in Mijdrecht and has the largest retail area within the municipality | ||
| The distance from Mijdrecht to other major cities is: 30 kilometres to Amsterdam, 40 kilometres to Utrecht, 55 kilometres to The Hague, and 60 kilometres to Rotterdam. The regional road N201 is situated along Mijdrecht and leads to the A2 motorwat (Utrecht – Amsterdam) which is 7 kilometres east of the town. Mijdrecht does not have a train station it benefits however from regional and local bus lines |
| ON BEHALF OF: | MORGAN STANLEY |
| PROJECT NAME: | MSTAR |
PROPERTY DESCRIPTION
| DESCRIPTION | The subject property is located at Groot Mijdrechtstraat 37-39, Mijdrecht is a warehousing/industrial complex located on the central business estate of Mijdrecht. The subject property comprises in total 16,033 sq m which is divided into 2,152 sq m of office space and 13,881 sq m of logistic space. The property consists of 2 separate units. | ||
| The building was constructed in 1969, the office is divided over a ground and first floor. The warehouse is located on the ground floor, the clear height of the warehouse is circa 8 metres. | |||
| Summary of known specification: | |||
| Characteristic | Result | ||
| Built / Renovation | 1969 | ||
| Eaves Height | 8 metres | ||
| No. of overhead Doors | 10 | ||
| Warehouse (% of LFA) | 86% | ||
| Site Coverage Ratio | 70% | ||
|
Source: Inspection/BAG Viewer/Kadaster
|
|||
| ACCOMMODATION | We have not measured the property, but as instructed, we have relied upon floor areas made available to us, detailed below and elsewhere within this report. | ||
| Floor Areas | |||
| TENANT | UNIT | USE | SQ M |
| Alpla Nederland B.V. | Unit 37B | Office and Warehouse | 3,930 |
| Alpla Nederland B.V. | Unit 39A | Office and Warehouse | 9,774 |
| Isero IJzerwarengroep B.V. | Unit 37A | Office and Warehouse | 1,525 |
| Storage Share B.V. | Unit 37 Office | Office | 718 |
| Storage Share B.V. | Unit 37C1 | Office | 36 |
| Verkeerscollege Midden Nederland B.V. |
Unit 39 | Office | 50 |
| TOTAL | - | 16,033 | |
DUE DILIGENCE
| STATE OF REPAIR | CBRE have not undertaken a structural survey, nor tested the services. The property was subject to an inspection for valuation purposes in early 2020. As you are aware, the property has not been re-inspected for the purposes of this report, nor have we been provided with updated TDD. We have therefore relied on the information provided by the Borrower, including a Capex schedule dated 12 June 2019 and schedule with revised budget of capex dated 19 January 2021. Based on the latter which indicates TDD assessment |
| ON BEHALF OF: | MORGAN STANLEY |
| PROJECT NAME: | MSTAR |
| less completed spend in 2020, we have included the immediate and 2-5 years capex of €140,000 within our valuation. | ||
|
According to our own limited inspection for valuation purposes, our opinion regarding the state of repair would substantiate the assessment by Arcadis. Based on our impression gained during the inspection, we are of the opinion that the buildings are in a fair condition, in line with the year of construction.
|
||
| ENVIRONMENTAL CONSIDERATIONS | We have been instructed not to make any investigations in relation to the presence or potential presence of contamination in land or buildings or the potential presence of other environmental risk factors and to assume that if investigations were made to an appropriate extent then nothing would be discovered sufficient to affect value. | |
| We have summarised the findings from a schedule provided in relation to ‘Priority sites’ within the front section of this report. We have relied on the information provided by the Borrower, including Draft Phase 1 Environmental Review prepared by Ambiente Ltd and dated December 2019. The report summarises that the environmental risk assessment identified a very low risk to site users, a moderate to low risk to groundwater and low risk to surface water from current and historical activities at the site. This risk is considered to be acceptable under continued current use. | ||
| The environmental risk assessment identified a very low risk to site users, a moderate to low risk to groundwater and low risk to surface water from the storage of oil-containing compressor condensate water. This risk can be managed through implementation of the recommendations. | ||
| The potential environmental risk associated with asbestos containing materials is assessed to be moderate to site users / maintenance workers. The level of risk reflects the potential severity of the consequence of exposure and can be managed through implementation of the recommendations. | ||
| The risk from off-site land uses is assessed as very low. | ||
| We have not carried out investigation into past uses, either of the properties or of any adjacent lands, to establish whether there is any potential for contamination from such uses or sites, or other environmental risk factors and have therefore assumed that none exists. |
| ON BEHALF OF: | MORGAN STANLEY |
| PROJECT NAME: | MSTAR |
| TENURE | According to the information available from the Land Registry Office(Kadaster) the parcels are held freehold by MLET Netherlands 2 Holding B.V. and registered as follows: | ||
| Municipality: | Mijdrecht | ||
| Section: | B | ||
| Numbers: | 2310 & 2267 | ||
| Total Area: | 24,428 sq m | ||
| Comments | |||
| ■ There are two easements vested on plot number 2267 regarding access to utilities. | |||
| We have also had sight of the Draft Red Flag Legal Report prepared by Loyens Loeff, dated 12 February 2021. Based on the information provided, we understand the property is held freehold. | |||
| We have assumed that there are no onerous legal conditions affecting the property which have a material impact on our opinion of value. | |||
| INCOME PROFILE | The subject property is fully let to 4 tenants on a WALL of 2.25 years. The current rental income is € 709,907 per annum. The ERV is estimated at € 796,805 per annum, we are therefore of the opinion the property is under rented. Tenant Alpla Nederland B.V. produces the largest amount of income. Circa € 648,000 per annum, which equates to circa 91% of the total rental income. | ||
| Alpla Nederland B.V. is a producer of plastic products and also houses a production facility within the subject property. Alpla was founded in 1955 in Austria and currently operates over 170 plants in 46 countries and employs nearly 21,000 employees. We consider Alpla to be a very good tenant given its global presence. | |||
VALUATION CONSIDERATIONS
| COSTS AND ADJUSTMENTS | Based on the information provided or our knowledge of the market, in approaching our valuation, we made allowances for the following capital and non-recoverable costs. In all cases, we have cited whether they are deducted as at the date of valuation or whether they take effect at a later date. | ||||
| Capital Expenditure: | |||||
| Type & Calculation | Source | Effective | Amount | ||
| Capital Expenditure: Fixed Amount | Technical Due Diligence | On Valuation No Repeat | € 140,000 | ||
| ON BEHALF OF: | MORGAN STANLEY |
| PROJECT NAME: | MSTAR |
|
Letting Fees: 15% of Rental Value of the vacant space |
CBRE Estimate |
On lease start / renewal No Repeat |
N/A | |||
|
TOTAL ON VALUATION |
€ 140,000 | |||||
| Revenue Deductions: | ||||||
| Type & Calculation | Source | Effective | Annual Amount | |||
|
Management: 2% of ERV |
CBRE estimate |
On Valuation In perpetuity |
€ 14,198 | |||
|
Property tax: 2% of ERV |
CBRE estimate |
On Valuation In perpetuity |
€ 15,936 | |||
|
Water tax: 0.25% of ERV |
CBRE estimate |
On Valuation In perpetuity |
€ 1,992 | |||
|
Insurance: 1.25% of ERV |
CBRE estimate |
On Valuation In perpetuity |
€ 9,960 | |||
|
Sewage charge: 0.25% of ERV |
CBRE estimate |
On Valuation In perpetuity |
€ 1,992 | |||
|
Maintenance: € 4.00 per sq m |
Borrower Estimate |
5 Year Delay In perpetuity |
€ 64,132 | |||
|
Void Costs: 2% of ERV |
Borrower Estimate |
On Valuation On All Voids |
€ 0 | |||
|
TOTAL: ON VALUATION |
€ 44,078 | |||||
| Void and Rent-Free Allowances: | ||||||
| Currently there is no vacancy. We are of the opinion relatability is good and have therefore not allowed for a future void period for the running leases. | ||||||
|
VALUATION METHODOLOGY – MARKET VALUE |
We have made the following rental assumptions having regard to the lettings agreed within the subject property, whilst also considering rental rates in the surrounding area: | |||||
| Unit | Area (s qm) |
ERV (€) per S qm (annum) |
Rent pa (€) | |||
| Office | 2,152 | 80 | 172,160 | |||
| Warehouse | 13,881 | 45 | 624,645 | |||
| Total | 16,033 | 50 | 796,805 | |||
| ON BEHALF OF: | MORGAN STANLEY |
| PROJECT NAME: | MSTAR |
| Opinion of Market Rent | ||
| Baailsed on the below-mentioned comparable transactions, the current market trends and our general market knowledge, we have estimated the above-mentioned rental values for the areas in the subject property. The below appended comparables indicate a (blended) range from € 48.50 per sq m per annum to € 85 per sq m per annum. | ||
| Within the evidence table appended, we would highlight the property in Energieweg 47, Zoeterwoude as providing the best evidence albeit considered inferior as reflected in our opinion of adopted rental rates. | ||
| The aforementioned rental values produce a total gross rental value of € 796,805 per annum or an average of circa € 50 per sq m. The agreed rental income amount to € 709,907 per annum or an average of circa € 44 per sq m. We are of the opinion that the subject property is under-rented. | ||
| Opinion of Valuation Yields | ||
| Currently, we witness downward pressure on net initial yields for prime logistics properties due to the high scarcity of good, long leased logistics properties. | ||
| Indicative net initial yields for prime logistics property are currently quoting 3.5% and 5.5% for prime industrial estates. Due to favourable dynamics in the occupier market in the Netherlands, with prospects for production and export growth in mind and taking into account the capital available for (real estate) investments, investor appetite is expected to increase further. This is also expected to put further downward pressure on yields. | ||
| Within the evidence table appended, we would highlight the following. The lower end of the yield range is indicated by the property located at Melbournestraat 50-68 in Rotterdam. Quality and characteristics of this asset are superior compared to the subject property. | ||
| The middle of the range is highlighted by the property located in Berchvliet, Amsterdam. The subject property has a lesser location and occupancy; therefore a softer yield is in our opinion appropriate. | ||
| We have arrived at our opinion of Market Value adopting the Traditional investment capitalisation method of valuation. Within this approach, we apply an income weighted average equivalent yield to our opinion of net income, reflecting the comparable evidence within the market for guidance on capital rates and values per sq m. The NIY’s of the comparable investments range from 5.14% to 6.16%. Considering the subject’s characteristics and market conditions, we have targeted an equivalent yield of 6.25%. In this instance and given we are able to assess income profile of the evidence, the yield takes precedence in our assessment. The capital rate per sq m can seem distorted when drawing comparison to evidence given differences in maximising site potential. | ||
| The approach results in a NIY of circa 6.06% which reflects a capital rate per sq m of € 628, after allowing for purchaser’s costs equating to 9%. |
| ON BEHALF OF: | MORGAN STANLEY |
| PROJECT NAME: | MSTAR |
| On the assumption that there are no unusual factors of which we are unaware and on the basis of the comments and assumptions specified in this report, CBRE is of the opinion that the Market Value (rounded) of the subject property, is: | ||
| € 10,075,000 | ||
| (Ten million seventy five thousand Euros) | ||
| The unrounded net capital value is € 10,072,312. The gross unrounded capital value is € 11,18,820 including € 906,508 purchaser’s costs (9.00%). | ||
|
VALUATION METHODOLOGY – VACANT POSSESSION VALUE |
The constituent inputs in terms of rental value and non-recoverable costs largely align with the Market Value approach. The key exception being that we have adopted a special assumption that the property is 100% vacant/non- income producing as at the valuation date. This value is predominantly derived using the traditional investment method of valuation but critically benchmarking the resultant capital rate per sq m against the prevailing evidence. | |
| In approaching our valuation under the Special Assumption that the property is entirely vacant (Vacant Possession Value), we have adopted a total void period of 12 months inclusive of rent free or tenant incentives and targeted an equivalent yield of 6.75%. | ||
| This results in a net rounded value of €8,660,000, equating to €540 per sq m. | ||
|
ESTIMATED REINSTATEMENT ASSESSMENT |
The property has not been inspected by a suitably qualified building surveyor from CBRE, nor have we carried out a full Reinstatement Cost Assessment. For indicative purposes only we estimate that the reinstatement cost of insurance purposes would be in the region of €24,360,000 (rounded, excl. VAT) on a day one basis, including fees but excluding VAT and inflation.
This figure should be compared with the current sum insured and if a material discrepancy exists we suggest that a full Reinstatement Cost Assessment is carried out. |
| ON BEHALF OF: | MORGAN STANLEY |
| PROJECT NAME: | MSTAR |
| RENTAL EVIDENCE |
| PROPERTYADDRESS |
PROPERTY USE |
DATE |
TOTAL AREA |
TENANT |
LEASE LENGTH(YEARS) |
BREAK OPTION |
RENT (P.A) |
RENTAL RATE PER SQ M |
RELATIVE QUALITY |
|
Conakryweg 2, Amsterdam |
2019, March |
5,256 |
8intetsu world express (kwe) |
not available |
not available |
not available |
308,107 | 58.62 |
Superior quality and location. |
|
Amstelveen, Kalkbranderij 2 |
Industrial |
2020, February |
2,050 | biggym |
not available |
not available |
174,250 | 85 |
Superior quality and location. |
|
Energieweg 47, Zoeterwoude |
Industrial |
2019, October |
890 | verzendloods |
not available |
not available |
43,200 | 48.54 |
Lesser quality asset. Higher ERV is appropriate |
|
Nieuw Vennep, Pesetaweg 77 |
Industrial |
2020, August |
726 |
golicia transport |
not available |
not available |
50,000 | 69 |
Superior quality and location. |
| ON BEHALF OF: | MORGAN STANLEY |
| PROJECT NAME: | MSTAR |
SALES EVIDENCE
|
PROPERTY ADDRESS |
PROPERTY USE | DATE | TOTAL AREA | WAULT (YEARS) | PASSING RENT PER ANNUM | PURCHASE PRICE | NET INITIAL YIELD(%) |
CAPITAL RATE PER SQ M |
RELATIVE QUALITY |
|
Melbournestraat 50-68,Sydneystraat 32-56, Rotterdam |
Industrial/Logistics | 17-03-2020 | 5,354 | 2.5 | 401,144 | 6,587,000 | 5.14% | 1,230 | During the transaction, the property was fully let to eleven tenants on a WALL of 2.5 years. The property is slightly under rented, the equivalent yield equates to 5.08. Due to the leasehold situation of the reference property a softer yield for the subject property is appropriate. |
|
Berchvliet 3-13, Sierenborch 1, Amsterdam |
Industrial/Logistics | 20-02-2020 | 6,108 | 3.7 | 549,164 | 8,075,000 | 5.80% | 1,322 |
During the transaction, the property was fully let on a WALL of 3.7 years. The yield amounts to 5.80%. Due to the superior quality and longer WALL of this property we are of the opinion a sharper yield is appropriate. |
|
Jan Van Krimpenweg 1+ 21-26, Haarlem |
Industrial/Logistics | 19-10-2020 | 10,503 | 1.0 | 621,655 | 8,400,000 | 6.16% | 800 | This transaction was part of the Vinvest portfolio. During thetransaction, the property wasfully let to multiple tenants on a weighted average WALL of 7.25 years. The property is in our opinion, slightly under rented (11.56%). The gross initial yield equates to 7.40%. The locationand quality of the reference are |
| ON BEHALF OF: | MORGAN STANLEY |
| PROJECT NAME: | MSTAR |
|
less. A sharper yield is in our opinion appropriate for the subject property.
|
|||||||||
|
Spectrumlaan 5, Bleiswijk |
Industrial/Logistics | 15-04-2020 | 8,641 | 2.2 | 557,770 | 8,000,000 | 6.00 | 926 |
The reference property is let to Cemex Trescon B.V. with a remaining lease term of 2.2 years. We are of the opinionthat, the property is slightly over-rented (approximately 3%). The equivalent yield equates to 5.8%. In our opinion a softeryield profile is appropriate for the subject property considering location and occupancy. |
| PROPERTY ID: | nlhaar - Haarlemmerstraatweg 81-137 | |
| ON BEHALF OF: | MORGAN STANLEY | |
| VALUATION DATE: | 01-Feb-2021 | FINAL |
Haarlemmerstraatweg 81-137 - Haarlemmerstraatweg 81-137, Halfweg, 1165 MK, Netherlands
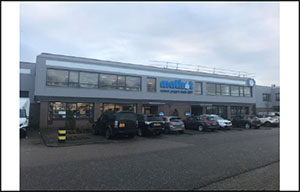 |
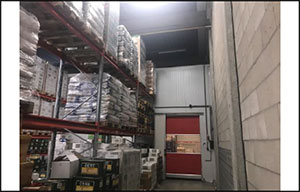 |
|
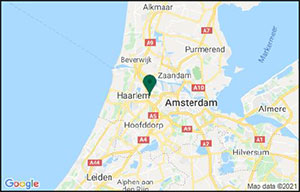 |
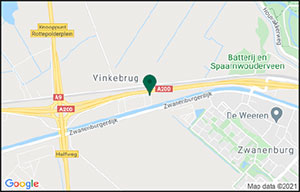 |
| VALUATION METRICS | (currency - EUR) |
| Metric | Value |
| Market Value | 27,600,000 |
| Market Value (per sq m) | 1,080 |
| Net Initial Yield | 4.68% |
| Reversionary Yield | 5.84% |
| Equivalent Yield | 5.50% |
| Gross Income (p.a.) | 1,510,050 |
| Gross Income (p.a.) (per sq m) | 59 |
| *Adj. Gross Income | 1,510,050 |
| Adj. Gross Income (per sq m) | 59 |
| Net Income (p.a.) | 1,405,943 |
| Net Income (p.a.) (per sq m) | 55 |
| Gross Rental Value | 1,970,820 |
| Gross Rental Value (per sq m) | 77 |
| Capital Expenditure | -708,257 |
| Transaction Costs | 9.00% |
| Over / Under Rented | -23.38% |
| KEY FACTS |
| Metric | Value | |
| Total Area (sq m) | 25,551 | |
| WAULT to Break by Rent | 4.13 | |
| WAULT to Break by ERV | 4.12 | |
| WAULT to Expiry by Rent | 4.13 | |
| WAULT to Expiry by ERV | 4.12 | |
| Percentage of Vacancy (Area) | 0.00% | |
| Percentage of Vacancy (ERV) | 0.00% | |
| ** | Number of Tenants | 32 |
| Current Voids (months) | - | |
| * Adjusted Gross Income equates to the Gross Income excluding any rent free periods | |
| LEASES RANKED BY RENT | ** Total tenant lines within our valuation. May differ to number of individual tenants |

| Printed 09/03/2021 19:47 | |
| PROPERTY ID: | nlhaar - Haarlemmerstraatweg 81-137 | |
| ON BEHALF OF: | MORGAN STANLEY | |
| VALUATION DATE: | 01-Feb-2021 | FINAL |
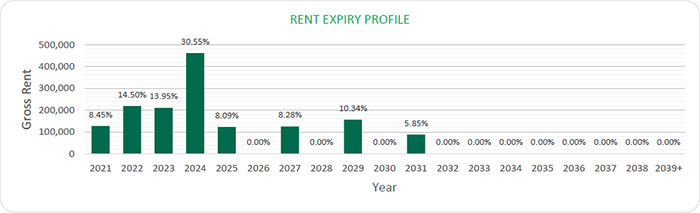
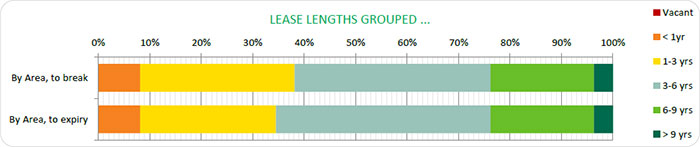
|
Printed 09/03/2021 19:47 |
|
| ON BEHALF OF: | MORGAN STANLEY |
| PROJECT NAME: | MSTAR |
PROPERTY REPORT
Haarlemmerstraatweg 81-137, HALFWEG, NETHERLANDS
| INSPECTED BY: | INSPECTION DATE: | VALUATION DATE: | PROPERTY TYPE |
| DEVIN UMMELS | 14 JANUARY 2020 | 1 FEBRUARY 2021 | INDUSTRIAL WAREHOUSE |
KEY VALUATION FACTORS
| STRENGTHS | WEAKNESSES | |
|
■ Multi-tenanted
■ Accessibility
■ Quality
■ Fully let
|
■ Slightly dated
■ Not located in a G-4 city
|
|
| OPPORTUNITIES | THREATS | |
|
■ Increasing investor appetite
■ Extend lease term with current
|
■ Macro-economic uncertainty (i.e. Trade Wars; Brexit)
|
LOCATION & SITUATION
| LOCATION | The subject property is located in Halfweg, a relatively small sized town with currently approx. 2,300 inhabitants according to the Central Bureau of Statistics (CBS). The town Halfweg is part of the municipality Haarlemmermeer in the province Noord-Holland. Halfweg is located in the north of The Netherlands, near the capital Amsterdam as well as Schiphol Airport. The accessibility of Halfweg by car in general can be qualified as good. The subject property is located near the ‘Rottepolderplein’ interchange, where the A200 and A9 motorways intersect, and also near the A5 and A10. Halfweg is also served by public-transport. Distances from Halfweg to other major Dutch cities are: Amsterdam : 10 kilometres. Utrecht : 50 kilometres. The Hague : 50 kilometres. |
| ON BEHALF OF: | MORGAN STANLEY |
| PROJECT NAME: | MSTAR |
PROPERTY DESCRIPTION
| DESCRIPTION |
The subject property is located at Haarlemmerstraatweg 81-137 in Halfweg and is an industrial complex located in Halfweg alongside the A200 regional road connecting Amsterdam to Haarlem. The subject property comprises in total 25,551 sq m lettable floor area divided over 36 units in three separate buildings. Each unit has a small office component and at minimum one overhead door. The construction is of steel columns with façade comprising insulated panels and a flat roof presumed to be covered with bitumen.
The building was constructed in 1982 and the clear height is circa 7.2 metres. There is ample parking and manoeuvring space available on site. The site is fully fenced and accessible via two gates.
|
||
| Summary of known specification: | |||
| Characteristic | Result | ||
| Built / Renovation | 1982 | ||
| Eaves Height | 7.2 metres | ||
| Warehouse (% of GLA) | 93% (assumption) | ||
| Site Coverage Ratio | 63.8% | ||
| Source: BAG viewer and Kadaster | |||
| ACCOMMODATION | We have not measured the property, but as instructed, we have relied upon floor areas made available to us, detailed below and elsewhere within this report. |
Floor Areas
| Tenant | Use | Unit | Total Area (m² |
| LFA) | |||
| YAYAB.V. | Industrial | Unit81&95 | 1,772 |
| YAYAB.V. | Industrial | Unit97 | 1,170 |
| YAYAB.V. | Industrial | Unit99 | 865 |
| YAYAB.V. | Industrial | Unit101 | 865 |
| YAYAB.V. | Industrial | Unit143 | 765 |
| YAYAB.V. | Industrial | Unit145 | 667 |
| YAYAB.V. | Industrial | Unit147 | 717 |
| WilroffSystemhouseB.V. | Industrial | Unit111 | 936 |
| VOFForeverWorkwear | Industrial | Unit91 | 463 |
| ON BEHALF OF: | MORGAN STANLEY |
| PROJECT NAME: | MSTAR |
| VoestalpineBöhlerWeldingNederla ndB.V. | Industrial | Unit89 | 735 |
| Visser&SmitHanabB.V. | Industrial | Unit113 | 750 |
| SportprijzenKrottB.V. | Industrial | Unit111A | 242 |
| SportprijzenKrottB.V. | Industrial | Unit117 | 726 |
| ReuzadoB.V. | Industrial | Unit103 | 965 |
| ReuzadoB.V. | Industrial | Unit139 | 842 |
| ReuzadoB.V. | Industrial | Unit141 | 766 |
| RepubliQB.V. | Industrial | Unit115&123 | 1,158 |
| PronkErgoB.V. | Industrial | Unit125 | 542 |
| MeubelspuiterijHalfwegB.V. | Industrial | Unit87 | 494 |
| LinssenElektrotechniekB.V. | Industrial | Unit85 | 465 |
| LinearSupplySolutionsLtd. | Industrial | Unit83&93 | 930 |
| JacobsDouweEgbertsPRONLB.V. | Industrial | Unit119 | 617 |
| HetGezondheidshuisMathotB.V. | Industrial | Unit105A | 666 |
| HetGezondheidshuisMathotB.V. | Industrial | Unit105B | 100 |
| HetGezondheidshuisMathotB.V. | Industrial | Unit107 | 767 |
| HetGezondheidshuisMathotB.V. | Industrial | Unit109 | 863 |
| GeorgiaHoldingB.V. | Industrial | Unit121 | 515 |
| Enka Horeca B.V. | Industrial | Unit 137 | 666 |
| Cogent Communications Netherlands B.V. | Industrial | Unit133&35 | 2,559 |
| AbarAutomationB.V. | Industrial | Unit127 | 644 |
| AbarAutomationB.V. | Industrial | Unit129 | 855 |
| AbarAutomationB.V. | Industrial | Unit131 | 464 |
| Total Area | 25,551 |
| ON BEHALF OF: | MORGAN STANLEY |
| PROJECT NAME: | MSTAR |
DUE DILIGENCE
| STATE OF REPAIR |
RE have not undertaken a structural survey, nor tested the services. The property was subject to an inspection for valuation purposes in early 2020. As you are aware, the property has not been re-inspected for the purposes of this report, nor have we been provided with updated TDD. We have therefore relied on the information provided by the Borrower, including a Capex schedule dated 12 June 2019 and schedule with revised budget of capex dated 19 January 2021. Based on the latter which indicates TDD assessment less completed spend in 2020, we have included the immediate and 2-5 years capex of €485,000 within our valuation.
According to our own limited inspection for valuation purposes, our opinion regarding the state of repair would substantiate the assessment by Arcadis. Based on our impression gained during the inspection, we are of the opinion that the buildings are in a fair condition, in line with the year of construction.
|
| ENVIRONMENTAL CONSIDERATIONS |
We have been instructed not to make any investigations in relation to the presence or potential presence of contamination in land or buildings or the
potential presence of other environmental risk factors and to assume that if investigations were made to an appropriate extent then nothing would be discovered sufficient to affect value.
We have summarised the findings from a schedule provided in relation to ‘Priority sites’ within the front section of this report.
We have relied on the information provided by the Borrower, including Draft Phase 1 Environmental Review prepared by Ambiente Ltd and dated December 2019. The report summarises that there is a very low potential risk to the site. The asbestos risk is considered low to moderate. We assume the cost for the removal of the asbestos are covered in the Capex budget.
We have not carried out investigation into past uses, either of the properties or of any adjacent lands, to establish whether there is any potential for contamination from such uses or sites, or other environmental risk factors and have therefore assumed that none exists.
|
| ON BEHALF OF: | MORGAN STANLEY |
| PROJECT NAME: | MSTAR |
| TENURE |
According to the information available from the Land Registry Office (Kadaster) the parcels are held freehold/leasehold by Multi-Let Industrial Property 1 B.V. and registered as follows:
|
|||
| Municipality: | Haarlemmerliede en Spaarnwoude | |||
| Section: | K | |||
| Numbers: | 2709; 2692 & 322 | |||
| Total Area: | 36,814; 4,490 & 1,710 sq m | |||
| Total Area | 43,014 sq m | |||
| Comments | ||||
|
■ Parcels 2692 and 322 are held on a right of superficies from the water board ‘Hoogheemraadschap van Rijnland’. The duration of the right of superficies is 1 January 1983 up to 31 December 2032. General terms ‘rights of superficies Haarlemmermeerpolder 1970’ apply. We see no strategic reason why the water authority would not want to extend the lease. We have assumed in our valuation a new lease term would be agreed.
Part of the property is held on a temporary right of superficies from the water board ‘Hoogheemraadschap van Rijnland’.
We have also had sight of the Draft Red Flag Legal Report prepared by Loyens Loeff, dated 12 February 2021. Based on the information provided, we understand the property is held freehold.
We have assumed that there are no onerous legal conditions affecting the property which have a material impact on our opinion of value.
|
||||
| INCOME PROFILE | subject property is fully let to 32 tenants on a WALL of 4.03 years. The current rental income is € 1,510,050 per annum. The ERV is estimated at € 1,970,820 per annum, we are therefore of the opinion the property is under-rented. The under-rent situation is mainly caused by an increase in demand over the past 2 years and subsequent rise in rental values. There are no specific tenants which account for a significant portion of the total rental income. Overall we are of the opinion the income profile is good. |
VALUATION CONSIDERATIONS
|
COSTS AND
|
Based on the information provided or our knowledge of the market, in approaching our valuation, we made allowances for the following capital and non-recoverable costs. In all cases, we have cited whether they are deducted as at the date of valuation or whether they take effect at a later date.
|
| ON BEHALF OF: | MORGAN STANLEY |
| PROJECT NAME: | MSTAR |
| Capital Expenditure: | |||||
| Type & Calculation | Source | Effective | Amount | ||
| Capital Expenditure: Fixed Amount | Technical Due Diligence | On Valuation No Repeat | € 485,000 | ||
| Letting Fees: 15% of Rental Value of the vacant space | CBRE Estimate | On lease start / renewal No Repeat | - | ||
| Rent Free - Reuzado B.V. | Borrower | On Valuation No Repeat | € 50,000 | ||
| Rent Free - RepubliQ B.V. | Borrower | On Valuation No Repeat | € 120,000 | ||
| Rent Free - Sportprijzen Krott B.V. | Borrower | On Valuation No Repeat | € 53,257 | ||
| TOTAL ON VALUATION |
€ 708,257 | ||||
|
Revenue Deductions:
|
|||||
| Type & Calculation | Source | Effective | Annual Amount | ||
| Management: 2% of ERV | CBRE estimate | On Valuation In perpetuity | € 30,201 | ||
| Property tax: 2% of ERV | CBRE estimate | On Valuation In perpetuity | € 39,416 | ||
| Water tax: 0.25% of ERV | CBRE estimate | On Valuation In perpetuity | € 4,927 | ||
| Insurance: 1.25% of ERV | CBRE estimate | On Valuation In perpetuity | € 24,635 | ||
| Sewage charge: 0.25% of ERV | CBRE estimate | On Valuation In perpetuity | € 4,927 | ||
| Maintenance: € 4.00 per sq m | Borrower Estimate | 5 Year Delay In perpetuity | € 102,204 | ||
| Void Costs: 2% of ERV | Borrower Estimate | On Valuation On All Voids | € 0 | ||
|
TOTAL: ON VALUATION |
€ 104,106 | ||||
| ON BEHALF OF: | MORGAN STANLEY |
| PROJECT NAME: | MSTAR |
|
Void and Rent-Free Allowances:
Currently there is no vacancy. We are of the opinion relettability is very good and have therefore not allowed for a future void period for the running leases.
|
|
VALUATION METHODOLOGY
|
We have made the following rental assumptions having regard to the lettings agreed within the subject property, whilst also considering rental rates in the surrounding area: |
| Unit | Area (s qm) |
ERV (€) per S qm (annum) |
Rent pa (€) | ||
| Office | 6,075 | 100 | 607,500 | ||
| Warehouse | 19,476 | 70 | 1,363,320 | ||
| Total | 25,551 | 77 | 1,970,820 |
|
Opinion of Market Rent
Based on the below-mentioned comparable transactions, the current market trends and our general market knowledge, we have estimated the above-mentioned rental values for the areas in the subject property. The below appended comparables indicate a (blended) range from € 58 per sq m per annum to € 109 per sq m per annum. We would cite the most recent transaction agreed in 2019 to WilroffReitsma B.V., which would justify the above adopted rates
Within the evidence table appended, we would highlight the property at the Computerweg, Amsterdam as the best comparable and therefore of greatest relevance though the transaction is now relatively dated. The market has improved in the intervening period within this location and we would reflect this within our valuation.
The aforementioned rental values produce a total gross rental value of
€ 1,970,820 per annum or an average of circa € 77 per sq m. The agreed rental income amount to € 1,510,050 per annum or an average of circa
€ 58 per sq m. We are of the opinion that the subject property is under-rented.
Opinion of Valuation Yields
Currently, we witness downward pressure on net initial yields for prime logistics properties due to the high scarcity of good, long leased logistics properties.
Indicative net initial yields for prime logistics property are currently quoting 3.5% and 5.5% for prime industrial estates. Due to favourable dynamics in the occupier market in the Netherlands, with prospects for production and export growth in mind and taking into account the capital available for (real estate) investments, investor appetite is expected to increase further. This is also expected to put further downward pressure on yields
|
| ON BEHALF OF: | MORGAN STANLEY |
| PROJECT NAME: | MSTAR |
|
Within the evidence table appended, we would highlight the following. The lower end of the yield range is indicated by the property located at Melbournestraat 50-68 in Rotterdam. Quality and characteristics of this asset are superior compared to the subject property. Whilst the lot size is lower which tends to result in a different buyer pool, this is suitably reflected within our opinion of yield against this sale.
The middle of the range is highlighted by the property located in Berchvliet, Amsterdam. The subject property has a more favourable location but the office/warehouse ratio results in lesser leasing conditions. Overall a similar yield profile is applicable in our opinion.
We have arrived at our opinion of Market Value adopting the Traditional investment capitalisation method of valuation. Within this approach, we apply an income weighted average equivalent yield to our opinion of net income, reflecting the comparable evidence within the market for guidance on capital rates and values per sq m. The NIY’s of the comparable investments range from 5.14% to 6.16%. Having considered the subjects characteristics, together with the market conditions, we have applied an equivalent yield of 5.50%.
The approach results in a Net Initial Yield of circa 4.68% which reflects a capital rate per sq m of € 1,080, after allowing for purchaser’s costs equating to 9%.
On the assumption that there are no unusual factors of which we are unaware and on the basis of the comments and assumptions specified in this report, CBRE is of the opinion that the Market Value (rounded) of the subject property, is:
€ 27,600,000
(Twenty seven million six hundred thousand Euros)
The unrounded net capital value is € 27,589,124. The gross unrounded capital value is €30,780,402 including € 2,483,021 purchaser's costs (9.00%).
|
||
| VALUATION METHODOLOGY – VACANT POSSESSION VALUE |
The constituent inputs in terms of rental value and non-recoverable costs largely align with the Market Value approach. The key exception being that we have adopted a special assumption that the property is 100% vacant/non-income producing as at the valuation date. This value is predominantly derived using the traditional investment method of valuation but critically benchmarking the resultant capital rate per sq m against the prevailing evidence.
In approaching our valuation under the Special Assumption that the property is entirely vacant (Vacant Possession Value), we have adopted a total void period of 12 months inclusive of rent free or tenant incentives and targeted an equivalent yield of 6%.
This results in a net rounded value of €24,600,000, equating to €963 per sq m.
|
| ON BEHALF OF: | MORGAN STANLEY |
| PROJECT NAME: | MSTAR |
| ESTIMATED REINSTATEMENT ASSESSMENT |
The property has not been inspected by a suitably qualified building surveyor from CBRE, nor have we carried out a full Reinstatement Cost Assessment. For indicative purposes only we estimate that the reinstatement cost of insurance purposes would be in the region of €38,820,000 (rounded, excl. VAT) on a day one basis, including fees but excluding VAT and inflation.
This figure should be compared with the current sum insured and if a material discrepancy exists we suggest that a full Reinstatement Cost Assessment is carried out.
|
| ON BEHALF OF: | MORGAN STANLEY |
| PROJECT NAME: | MSTAR |
RENTAL EVIDENCE
| PROPERTY ADDRESS |
PROPERTY USE |
DATE | TOTAL AREA |
TENANT | LEASE LENGTH (YEARS) |
BREAK OPTION |
RENT (P.A) |
RENTAL
|
RELATIVE QUALITY |
| Conakryweg 2, Amsterdam | Industrial | 2019, March | 5,256 | kintetsu world express (kwe) | not available | not available | 308,107 | 58.62 |
Similar quality but, a larger scale unit which results in a lower rental value.
|
| Computerweg 9, Amsterdam | Industrial | 2019, June | 3,000 | floris bouwcenter | not available | not available | 225,000 | 75.00 | Similar quality and size but located more towards Amsterdam, which is considered a better location. |
| Jarmuiden 21, Amsterdam | Industrial | 2019, January | 1,400 | rouwservice | not available | not available | 88,000 | 62.86 | Lesser quality asset, a higher ERV is therefore appropriate in our opinion. |
| Bellsingel 51, Schiphol-Rijk | Industrial | 2020, June | 6,304 | TNT | not available | not available | 684,000 | 108.50 |
Similar quality but superior property specifications.
|
| Chemieweg 103, Uithoorn | Industrial | 2020, March | 135 | onderneming | not available | not available | 13,140 | 97 | Similar quality and characteristics. Slightly smaller units and lesser location. |
| ON BEHALF OF: | MORGAN STANLEY |
| PROJECT NAME: | MSTAR |
SALES EVIDENCE
| PROPERTY ADDRESS |
PROPERTY USE | DATE | TOTAL AREA |
WAULT (YEARS) |
PASSING RENT PER ANNUM |
PURCHASE PRICE |
NET
|
CAPITAL RATE PER SQ M |
RELATIVE QUALITY |
| Melbournestraat 50-68, Sydneystraat 32- 56, Rotterdam |
Industrial/ Logistics |
17- 03- 2020 | 5,354 | 2.5 | 401,144 | 6,587,000 | 5.14% | 1,230 | During the transaction, the property was fully let to eleven tenants on a WALL of 2.5 years. The property is slightly under rented, the equivalent yield equates to 5.08. Due to the leasehold situation of the reference property a softer yield for the subject property is appropriate. |
| Berchvliet 3-13, Sierenborch 1, Amsterdam |
Industrial/ Logistics |
20- 02- 2020 | 6,108 | 3.7 | 549,164 | 8,075,000 | 5.80% | 1,322 | During the transaction, the property was fully let on a WALL of 3.7 years. The yield amounts to 5.80%. Due to the superior quality and longer WALL of the subject property we are of the opinion a sharper yield is appropriate. |
| Jan Van Krimpenweg 1+ 21-26, Haarlem |
Industrial/ Logistics |
19- 10- 2020 | 10,503 | 1.0 | 621,655 | 8,400,000 | 6.16% | 800 | This transaction was part of the Vinvest portfolio. During the transaction, the property was fully let to multiple tenants on a weighted average WALL of 7.25 years. The property is in our opinion, slightly under rented (11.56%). The gross initial yield equates to 7.40%. The location |
| ON BEHALF OF: | MORGAN STANLEY |
| PROJECT NAME: | MSTAR |
| and quality of the reference are less. A sharper yield is in our opinion appropriate for the subject property. | |||||||||
| Spectrumlaan 5, Bleiswijk |
Industrial/ Logistics |
15- 04- 2020 | 8,641 | 2.2 | 557,770 | 8,000,000 | 6.00 | 926 | The reference property is let to Cemex Trescon B.V. with a remaining lease term of 2.2 years. We are of the opinion that, the property is slightly over-rented (approximately 3%). In our opinion a lower yield profile is appropriate for the subject property considering the superior term certain. |
| PROPERTY ID: | nlhave - Havenweg 23-40/2-8 Martin Ovenweg 1-16 | |
| ON BEHALF OF: | MORGAN STANLEY | |
| VALUATION DATE: | 01-Feb-2021 | FINAL |
| Havenweg 23-40/2-8 Martin Ovenweg 1-16 - Havenweg 23-40, 2-8 Martin Ovenweg 1- 16, Utrecht, 3555 HZ, Netherlands |
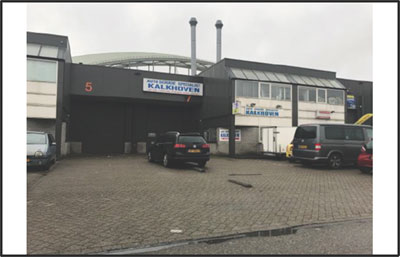
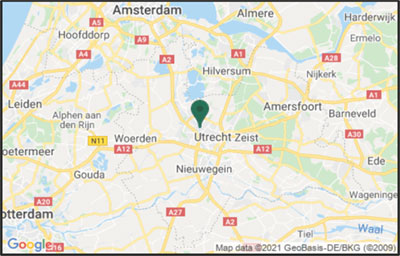
| VALUATION METRICS | (currency - EUR) |
| Metric | Value |
| Market Value | 9,310,000 |
| Market Value (per sq m) | 845 |
| Net Initial Yield | 6.12% |
| Reversionary Yield | 5.85% |
| Equivalent Yield | 5.80% |
| Gross Income (p.a.) | 660,454 |
| Gross Income (p.a.) (per sq m) | 60 |
| *Adj. Gross Income | 660,454 |
| Adj. Gross Income (per sq m) | 60 |
| Net Income (p.a.) | 621,104 |
| Net Income (p.a.) (per sq m) | 56 |
| Gross Rental Value | 676,415 |
| Gross Rental Value (per sq m) | 61 |
| Capital Expenditure | -222,716 |
| Transaction Costs | 9.00% |
| Over / Under Rented | 3.58% |
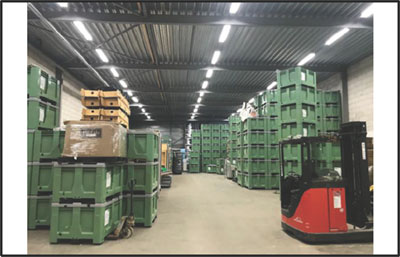

| KEY FACTS | ||
| Metric | Value | |
| Total Area (sq m) | 11,021 | |
| WAULT to Break by Rent | 2.59 | |
| WAULT to Break by ERV | 2.62 | |
| WAULT to Expiry by Rent | 2.59 | |
| WAULT to Expiry by ERV | 2.62 | |
| Percentage of Vacancy (Area) | 4.85% | |
| Percentage of Vacancy (ERV) | 5.73% | |
| ** | Number of Tenants | 21 |
| Current Voids (months) | 12 | |
| * Adjusted Gross Income equates to the Gross Income excluding any rent free periods | |
| LEASES RANKED BY RENT | ** Total tenant lines within our valuation. May differ to number of individual tenants |
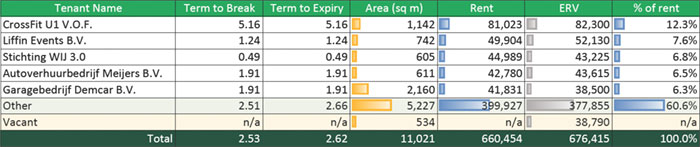
| Printed 09/03/2021 19:47 | |
| PROPERTY ID: | nlhave - Havenweg 23-40/2-8 Martin Ovenweg 1-16 | |
| ON BEHALF OF: | MORGAN STANLEY | |
| VALUATION DATE: | 01-Feb-2021 | FINAL |
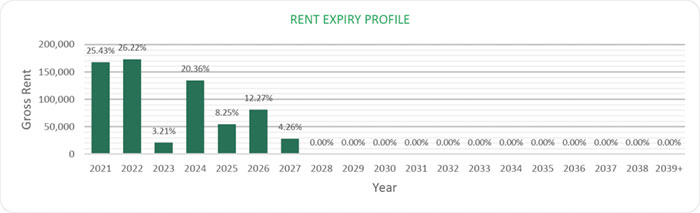
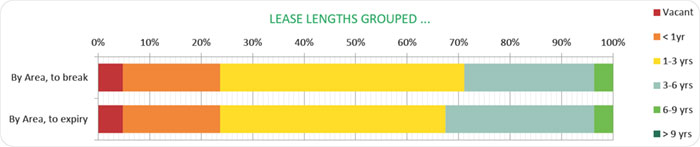
| Printed 09/03/2021 19:47 | |
| ON BEHALF OF: | MORGAN STANLEY |
| PROJECT NAME: | MSTAR |
PROPERTY REPORT
HAVENWEG 23-40, UTRECHT, NETHERLANDS
| INSPECTED BY: | INSPECTION DATE: | VALUATION DATE: | PROPERTY TYPE |
| MAURITS VAN HAARE HEIJMEIJER |
14 JANUARY 2020 | 1 FEBRUARY 2021 | INDUSTRIAL WAREHOUSE |
KEY VALUATION FACTORS
| STRENGTHS | WEAKNESSES | ||
| ■ | Nearly fully let | ■ | (partly) dated appearance |
| ■ | Favourable layout | ■ | Management intensive |
| ■ | Well accessible | ||
| OPPORTUNITIES | THREATS | ||
| ■ | Increasing investor appetite | ■ | Economic uncertainty due to Covid-19 outbreak |
| ■ | Extend lease term with current tenants | ||
LOCATION & SITUATION
| LOCATION | Utrecht is the main city in the province of Utrecht and is strategically located in the geographical centre of The Netherlands. It forms part of the Randstad, the country’s economic heart that also includes the agglomerations of Amsterdam, Rotterdam and The Hague. Utrecht is highly regarded as a centre for services and education and, because of the extensive railway and motorway network, as a major distribution centre. |
| Utrecht has a population of approximately 350.000 people and a total surface of approximately 100 km², which makes it the fourth largest city of The Netherlands. | |
| The strong national and regional role of Utrecht has attracted several headquarters of large organisations, particularly those within the financial and business services sector. These sectors were also the main forces that caused a high increase in employment numbers within the city of Utrecht in recent years, relative to both national as well as historical local employment figures. Some well-known organisations in Utrecht are Fortis, NS (The Dutch Railway Association), Rabobank, Cap Gemini, Ernst & Young and AXA. |
| ON BEHALF OF: | MORGAN STANLEY |
| PROJECT NAME: | MSTAR |
| Distances from Utrecht to other major cities are: 40 Kilometres to Amsterdam, 60 kilometres to The Hague and 65 kilometres Rotterdam. | |
| The most important highways around Utrecht are the A2 (Amsterdam-Utrecht- Maastricht), the A12 (Den Haag-Utrecht-Maastricht)) and the A27 (Almere- Utrecht-Breda). The A28 connects Utrecht with the northern cities of the country, such as Amersfoort, Zwolle and Groningen. | |
| Accessibility by public transport is also good. The central station of Utrecht is the most important railway junction of the Netherland and therefore the largest in terms of square metres and the number of travellers per day. | |
| The property is situated adjacent to the Amsterdam-Rijnkanaal (canal) within the industrial area ‘Industrieterrein Zuilen’. The property is approximately 1,5 km northeast of the A2 motorway and 3 km northwest of Utrecht city centre. |
PROPERTY DESCRIPTION
| DESCRIPTION | The subject property is located at Havenweg 2-8, Demkaweg 23-29, 40 and Martin Ovenweg 1-16 in Utrecht and is a logistic complex located in the “Zuilen” Business Park, along the Amsterdam-Rijn Canal in Utrecht. The subject property comprises in total 9,421 sq m which is divided into 2,135 sq m of office space and 7,286 sq m of logistic space. The provided tenancy schedule shows 1,600 sq m defined as External. The property consists of 3 separate blocks, with a total 22 units and is fully let. Some of these units have been combined to create larger units. | |
| The buildings were built between 1990 and 1992 and 2000 and are constructed around a steel frame with masonry and steel facades, flat roofs and aluminium window frames. The warehouses are gas-heated. | ||
| Summary of known specification: |
| Characteristic | Result | ||
| Built / Renovation | 1990 - 1992 | ||
| Eaves Height | 7 metres | ||
| No. of loading Doors | Approx. 1 per unit | ||
| Warehouse (% of GLA) | 77.3% | ||
| Site Coverage Ratio | 60% | ||
| ACCOMMODATION | We have not measured the property, but as instructed, we have relied upon floor areas made available to us, detailed below and elsewhere within this report. | ||
| ON BEHALF OF: | MORGAN STANLEY |
| PROJECT NAME: | MSTAR |
| Floor Areas | ||
| FLOOR / UNIT | USE | SQ M |
| Unit 1 | Office and Warehouse | 481 |
| Unit 2 | Office and Warehouse | 210 |
| Unit 3 | Office and Warehouse | 304 |
| Unit 4 | Office and Warehouse | 569 |
| Unit 5 | Office and Warehouse | 305 |
| Unit 6 | Office and Warehouse | 573 |
| Unit 7 | Office and Warehouse | 301 |
| Unit 8 | Office and Warehouse | 424 |
| Unit 9 | Office and Warehouse | 301 |
| Unit 11A | Office and Warehouse | 405 |
| Unit 11B | Office and Warehouse | 561 |
| Unit 12 | Office and Warehouse | 401 |
| Unit 13 | Office and Warehouse | 395 |
| Unit 14 | Office and Warehouse | 401 |
| Unit 23 | Office and Warehouse | 534 |
| Unit 25 | Office and Warehouse | 130 |
| Unit 25W | Office | 612 |
| Unit 27 | Office and Warehouse | 605 |
| Unit 29 | Office and Warehouse | 611 |
| Unit 40 | Office and Warehouse | 429 |
| Unit B15 | Office and Warehouse | 433 |
| Unit M16 | Office and Warehouse | 436 |
| TOTAL | - | 9,421 |
DUE DILIGENCE
| STATE OF REPAIR | CBRE have not undertaken a structural survey, nor tested the services. The property was subject to an inspection for valuation purposes in early 2020. As you are aware, the property has not been re-inspected for the purposes of this report, nor have we been provided with updated TDD. We have therefore relied on the information provided by the Borrower, including a Capex schedule dated 12 June 2019 and schedule with revised budget of capex dated 19 January 2021. Based on the latter which indicates TDD assessment less completed spend in 2020, we have included the immediate and 2-5 years capex of €128,000 within our valuation. |
| According to our own limited inspection for valuation purposes, our opinion regarding the state of repair would substantiate the assessment by Arcadis. Based on our impression gained during the inspection, we are of the opinion that the buildings are in a fair condition, in line with the year of construction. | |
| ENVIRONMENTAL CONSIDERATIONS |
We have been instructed not to make any investigations in relation to the presence or potential presence of contamination in land or buildings or the potential presence of other environmental risk factors and to assume that if |
| ON BEHALF OF: | MORGAN STANLEY |
| PROJECT NAME: | MSTAR |
| investigations were made to an appropriate extent then nothing would be discovered sufficient to affect value. | |||
| We have summarised the findings from a schedule provided in relation to ‘Priority sites’ within the front section of this report. | |||
| We have relied on the information provided by the Borrower, including Draft Phase 1 Environmental Review prepared by Ambiente Ltd and dated December 2019. The report summarises that the following: | |||
| “The environmental risk assessment identified a very low potential environmental risk to site users, a moderate risk to groundwater and a low risk to surface water from known contaminants in soil and groundwater at the site. | |||
| The potential environmental risks from leaks and spills from current storage and handling of chemicals are assessed as very low to site users and surface water and low to groundwater. | |||
| The potential environmental risk from off-site land uses is assessed as low to site users and maintenance workers.’’ | |||
| We have not carried out investigation into past uses, either of the properties or of any adjacent lands, to establish whether there is any potential for contamination from such uses or sites, or other environmental risk factors and have therefore assumed that none exists. | |||
| TENURE | According to the information available from the Land Registry Office (Kadaster) the parcels are held freehold by MLET Netherlands 2 Holding B.V. and registered as follows: | ||
| Municipality: | Zuilen | ||
| Section: | C | ||
| Numbers: | 4920 & 4922 & 4925 | ||
| Total Area: | 4,425 & 6,320 & 5,710 sq m (total 16,455 sq m) | ||
| Comments | |||
| ■ We have encountered several (regular) perpetual clauses and/or easements on the parcels. We expect that these clauses and/or easements will have no effect on the value of the property. We however are no legal advisors and can give no warranties regarding the absence of value influencing clauses and/or easements. | |||
| We have also had sight of the Draft Red Flag Legal Report prepared by Loyens Loeff, dated 12 February 2021. Based on the information provided, we understand the property is held freehold. | |||
| We have assumed that there are no onerous legal conditions affecting the property which have a material impact on our opinion of value. | |||
| ON BEHALF OF: | MORGAN STANLEY |
| PROJECT NAME: | MSTAR |
| INCOME PROFILE | The subject property is fully let to 21 tenants on a WALL of 2 years and 6 months. The current rental income is € 660,454 per annum. The ERV is estimated at € 676,415 per annum, we are therefore of the opinion the property is slightly under-rented. |
VALUATION CONSIDERATIONS
| COSTS AND ADJUSTMENTS |
Based on the information provided or our knowledge of the market, in approaching our valuation, we made allowances for the following capital and non-recoverable costs. In all cases, we have cited whether they are deducted as at the date of valuation or whether they take effect at a later date. |
| Capital Expenditure: | |||||
| Type & Calculation | Source | Effective | Amount | ||
| Capital Expenditure: Fixed Amount |
Technical Due Diligence |
On Valuation No Repeat |
€128,000 | ||
| Letting Fees: 15% of Rental Value of the vacant space |
CBRE Estimate | On lease start / renewal No Repeat |
€22,112 | ||
| Rent Fee: Fixed Amounts |
Rent Roll | On Valuation No Repeat |
€72,605 | ||
| TOTAL ON VALUATION |
€222,717 | ||||
| Revenue Deductions: | |||||
| Type & Calculation | Source | Effective | Annual Amount | ||
| Management costs on Voids: 2% of market rent |
Borrower Estimate |
On all Voids | €2,948 | ||
| Management: 2% of rental revenue |
Borrower Estimate |
On Valuation | €13,985 | ||
| Property Tax: 2% of market rent |
Borrower Estimate |
On Valuation | €13,528 | ||
| Water Tax: 0.25% of market rent |
Borrower Estimate |
On Valuation | €1,691 | ||
| ON BEHALF OF: | MORGAN STANLEY |
| PROJECT NAME: | MSTAR |
| Insurance: 1.25 % of market rent |
Borrower Estimate |
On Valuation | €8,455 | ||
| Sewage Charge: 0.25 % of market rent |
Borrower Estimate |
On Valuation | €1,691 | ||
| Maintenance: € 4.00 per sq m |
Borrower Estimate |
5 Year Delay In perpetuity |
€44,084 | ||
| TOTAL: ON VALUATION |
€42,298 |
| Void and Rent-Free Allowances: | ||
| For the vacant unit, we have taken into account a void, inclusive of incentives, of 12 months. | ||
| For the adopted Rent-Free allowances, we refer to the calculation print out attached to the report. | ||
| VALUATION METHODOLOGY – MARKET VALUE |
We have made the following rental assumptions having regard to the lettings agreed within the subject property, whilst also considering rental rates in the surrounding area: | |
| Unit | ERV (€) per S qm (annum) |
|||
| Office | 95 | |||
| Warehouse | 65 | |||
| External. | 0 |
| The aforementioned rental values result in an annual ERV of € 676,415. | ||
| ■ The provided tenancy schedule shows 1,600 sq m defined as External. We have assumed this to be land have assigned no rental value to it. | ||
| Opinion of Market Rent | ||
| Based on the below-mentioned comparable transactions, the current market trends and our general market knowledge, we have estimated the above-mentioned rental values for the areas in the subject property. The below appended comparables indicate a (blended) range from € 55 per sq m per annum to € 61 per sq m per annum. The best evidence comes from within the property, including a letting from early 2020 to Autoverhuurbedrijf at a rent equating to €70 per sq m. Our blended rate largely aligns with this figure and is justified particularly given continued upward pressure on rents. | ||
| Within the evidence table appended, we would highlight the property ‘St-Laurensdreef 11’ as best comparable and therefore of greatest relevance in terms of similar appearance, state of repair, eaves height etc. However, we are of the opinion that the location of this property is inferior compared to |
| ON BEHALF OF: | MORGAN STANLEY |
| PROJECT NAME: | MSTAR |
| the subject property. Therefore, we have determined a higher ERV for the subject property. | ||
| The aforementioned rental values produce a total gross rental value of € 676,415 per annum or an average of circa € 72 per sq m. The agreed rental income amount to € 660,454 per annum or an average of circa € 70 per sq m. We are of the opinion that the subject property is slightly under-rented. | ||
| Opinion of Valuation Yields | ||
| Currently, we witness downward pressure on net initial yields for prime logistics properties due to the high scarcity of good, long leased logistics properties. | ||
| Indicative net initial yields for prime logistics property are currently quoting 3.7%. Due to favourable dynamics in the occupier market in the Netherlands, with prospects for production and export growth in mind and taking into account the capital available for (real estate) investments, investor appetite is expected to increase further. This is also expected to put further downward pressure on yields. | ||
|
Within the evidence table appended, we would highlight the following. The lower end of the yield range is indicated by the property located in Amsterdam. As this property is located at a superior location, we have allowed for a higher yield profile for the subject property. |
||
| The top of the range is indicated by the property in Tiel, which is has an inferior location. The middle of the range is highlighted by the properties located in Utrecht and Breda. For the subject property we have determined a yield profile that is best comparable with the property in Breda | ||
| We have arrived at our opinion of Market Value adopting the Traditional investment capitalisation method of valuation. Within this approach, we apply an income weighted average equivalent yield to our opinion of net income, reflecting the comparable evidence within the market for guidance on capital rates and values per sq m. The NIY’s of the comparable investments range from 5.16% to 6.86% and also taking into account the current market conditions and the WAULT to expiry by current income of 2.5 years. We have applied an equivalent yield of 5.8%. | ||
| The approach results in a net initial yield of circa 6.12% which reflects a capital rate per sq m of € 845, after allowing for purchaser’s costs equating to 9%. | ||
| On the assumption that there are no unusual factors of which we are unaware and on the basis of the comments and assumptions specified in this report, CBRE is of the opinion that the Market Value (rounded) of the subject property, is: | ||
| € 9,310,000 |
| ON BEHALF OF: | MORGAN STANLEY |
| PROJECT NAME: | MSTAR |
| (Nine million three hundred and ten thousand Euros) | ||
| The unrounded net capital value is € 9,313,017. The gross unrounded capital value is € 10,373,904 including € 838,171 purchaser's costs (9.00%). | ||
| VALUATION METHODOLOGY – VACANT POSSESSION VALUE |
The constituent inputs in terms of rental value and non-recoverable costs largely align with the Market Value approach. The key exception being that we have adopted a special assumption that the property is 100% vacant/non-income producing as at the valuation date. This value is predominantly derived using the traditional investment method of valuation but critically benchmarking the resultant capital rate per sq m against the prevailing evidence. | |
| In approaching our valuation under the Special Assumption that the property is entirely vacant (Vacant Possession Value), we have adopted a total void period of 12 months inclusive of rent free or tenant incentives and targeted an equivalent yield of 6.75%. | ||
| This results in a net rounded value of €7,370,000, equating to €669 per sq m. | ||
| ESTIMATED REINSTATEMENT ASSESSMENT |
The property has not been inspected by a suitably qualified building surveyor from CBRE, nor have we carried out a full Reinstatement Cost Assessment. For indicative purposes only we estimate that the reinstatement cost of insurance purposes would be in the region of €17,095,000 (rounded, excl. VAT) on a day one basis, including fees but excluding VAT and inflation. | |
| This figure should be compared with the current sum insured and if a material discrepancy exists we suggest that a full Reinstatement Cost Assessment is carried out. | ||
| ON BEHALF OF: | MORGAN STANLEY |
| PROJECT NAME: | MSTAR |
RENTAL EVIDENCE
| PROPERTY ADDRESS |
PROPERTY USE |
DATE | TOTAL AREA |
TENANT | LEASE LENGTH (YEARS) |
BREAK OPTION |
RENT (P.A) |
RENTAL
|
RELATIVE QUALITY |
| St- Laurensdreef 11, Utrecht | Industrial | 2020, June | 750 | Unknown | not available |
not available |
45,000 | 60 | Comparable quality, inferior location |
| Stuartweg 23, Vianen Utrecht | Industrial | 2019, August | 688 | Johnson Health Tech | not available |
not available |
37,500 | 55 | Comparable quality, inferior location |
| Tennesseedreef 12, Utrecht | Industrial | 2019, July | 825 | Hazyoun | not available |
not available |
50,000 | 61 | Comparable quality, inferior location |
| St- Laurensdreef 11, Utrecht | Industrial | 2020, June | 750 | Unknown | not available |
not available |
45,000 | 60 | Comparable quality, inferior location |
| Techniekweg 34, Utrecht | Industrial | 2020, January | 815 | Unknown | not available |
not available |
45.640 | 56 | Comparable quality, inferior location |
| ON BEHALF OF: | MORGAN STANLEY |
| PROJECT NAME: | MSTAR |
SALES EVIDENCE
| PROPERTY ADDRESS |
PROPERTY USE | DATE | TOTAL AREA |
WAULT (YEARS) |
PASSING RENT PER ANNUM |
PURCHASE PRICE |
NET
|
CAPITAL RATE PER SQ M |
RELATIVE QUALITY |
| Hudsondreef 32, Utrecht |
Industrial/ Logistics |
31/12/2020 | 2,142 | 0.12 | 123,411 | 1,700,000 | 5.60% | 794 | Superior quality, inferior location |
| Oudewei 4, Tiel |
Industrial/ Logistics |
26/7/2019 | 9,821 | 4.9 | 464,268 | 6,325,000 | 6.86% | 644 | Inferior location, higher quality |
| Plimsollweg 4, Amsterdam |
Industrial/ Logistics |
04/05/2020 | 9.999 | 5.8 | 457,500 | 7,455,614 | 5.16% | 746 | Inferior quality, superior location |
| Hazeldonk 6465-6467, Breda |
Industrial/ Logistics |
19/02/2020 | 3,751 | 3.0 | 236,344 | 3,300,000 | 5.89% | 880 | Comparable quality and location |
| PROPERTY ID: | nljarm - Jarmuiden 22-58 | |
| ON BEHALF OF: | MORGAN STANLEY | |
| VALUATION DATE: | 01-Feb-2021 | FINAL |
Jarmuiden 22-58 - Jarmuiden 22-58, Amsterdam, 1046 AD, Netherlands
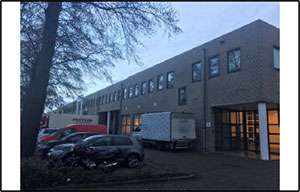 |
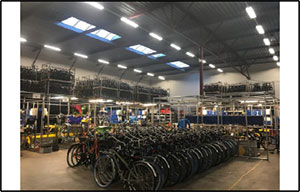 |
|
 |
 |
| VALUATION METRICS | (currency - EUR) |
| Metric | Value |
| Market Value | 16,150,000 |
| Market Value (per sq m) | 1,100 |
| Net Initial Yield | 4.80% |
| Reversionary Yield | 6.54% |
| Equivalent Yield | 5.54% |
| Gross Income (p.a.) | 911,872 |
| Gross Income (p.a.) (per sq m) | 62 |
| *Adj. Gross Income | 911,872 |
| Adj. Gross Income (per sq m) | 62 |
| Net Income (p.a.) | 844,301 |
| Net Income (p.a.) (per sq m) | 57 |
| Gross Rental Value | 1,284,475 |
| Gross Rental Value (per sq m) | 87 |
| Capital Expenditure | -2,691,705 |
| Transaction Costs | 9.00% |
| Over / Under Rented | -25.63% |
| KEY FACTS |
| Metric | Value | |
| Total Area (sq m) | 14,685 | |
| WAULT to Break by Rent | 2.80 | |
| WAULT to Break by ERV | 2.73 | |
| WAULT to Expiry by Rent | 2.80 | |
| WAULT to Expiry by ERV | 2.73 | |
| Percentage of Vacancy (Area) | 3.61% | |
| Percentage of Vacancy (ERV) | 4.54% | |
| ** | Number of Tenants | 21 |
| Current Voids (months) | 12 | |
| * Adjusted Gross Income equates to the Gross Income excluding any rent free periods | |
| LEASES RANKED BY RENT | ** Total tenant lines within our valuation. May differ to number of individual tenants |
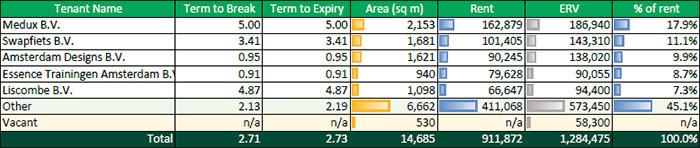
| Printed 09/03/2021 19:47 | |
| PROPERTY ID: | nljarm - Jarmuiden 22-58 | |
| ON BEHALF OF: | MORGAN STANLEY | |
| VALUATION DATE: | 01-Feb-2021 | FINAL |
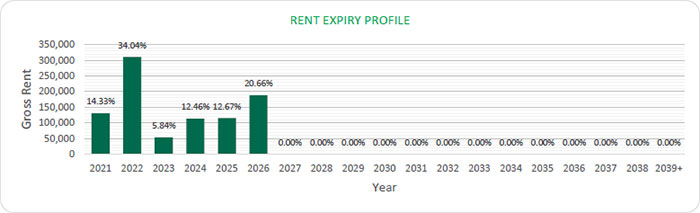
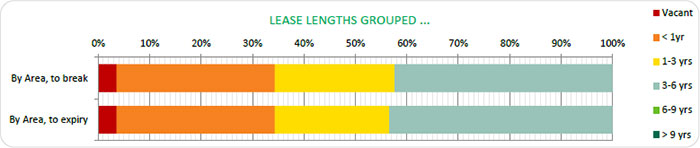
| Printed 09/03/2021 19:47 | |
| ON BEHALF OF: | MORGAN STANLEY |
| PROJECT NAME: | MSTAR |
PROPERTY REPORT
JARMUIDEN 22-58, AMSTERDAM, NETHERLANDS
| INSPECTED BY: | INSPECTION DATE: | VALUATION DATE: | PROPERTY TYPE |
| DEVIN UMMELS | 14 JANUARY 2019 | 1 FEBRUARY 2021 | INDUSTRIAL WAREHOUSE |
KEY VALUATION FACTORS
| STRENGTHS | WEAKNESSES | |
|
■ Nearly fully let
■ Multi-tenant
■ Location
|
■ Large amount of overdue maintenance | |
| OPPORTUNITIES | THREATS | |
|
■ Increasing investor appetite
■ Extend lease term with current tenants
■ Lease up vacancy
|
■ Macro-economic uncertainty (i.e. Trade Wars; Brexit)
■ Relative short WALL may result in future vacancy
|
LOCATION & SITUATION
| LOCATION | The subject property is located in Amsterdam. Amsterdam has a population of approximately 850,000 within the city, 1,343,000 in the urban area, and 2,431,000 in the Amsterdam metropolitan area. The city is currently the cultural capital of the Netherlands and is one of the most popular tourist destinations in Europe. Amsterdam is also the financial and business capital of The Netherlands and one of the most important cities in Europe in which to do business. Many large Dutch corporations and banks have their headquarters in Amsterdam, including ABN Amro, Heineken, ING Group, Ahold, Delta Lloyd Group and Philips. Amsterdam is the second largest harbour of the Netherlands. Amsterdam can be reached by A1(Amsterdam - German border), A2 (Amsterdam - Maastricht), A4(Amsterdam - Rotterdam) and A8(Amsterdam - Zaandijk). Amsterdam benefits from ten train stations with international train lines as well. There is a good connection to Schiphol international airport. Additionally, there are regional and local bus lines, metro lines and tram lines offering services in and around the municipality of |
| ON BEHALF OF: | MORGAN STANLEY |
| PROJECT NAME: | MSTAR |
| Amsterdam. Amsterdam's population is growing more rapidly than expected. Amsterdam is an international city and a lot of foreigners live in in the city. |
PROPERTY DESCRIPTION
| DESCRIPTION |
The subject property is located at Jarmuiden 22 in Amsterdam and is an industrial complex located in Amsterdam in the vicinity. The subject property comprises in total circa 14,685 sq m of lettable floor area divided over 24 units in two separate buildings, situated on an L-shaped building. Each unit has a small office component and at minimum one overhead door. The construction is of steel columns with façade comprising insulated panels and a flat roof presumed to be covered with bitumen.
The building was constructed in 1991 and the clear height is circa 7.2 metres. There is ample parking and manoeuvring space available on site. The site is bordered by greenery and is accessible via two access points.
|
||
| Summary of known specification: | |||
| Characteristic | Result | ||
| Built / Renovation | 1991 | ||
| Eaves Height | 7.2 metres | ||
| Warehouse (% of LFA) | 67% | ||
| Site Coverage Ratio | 71% | ||
|
Source: Inspection/BAG Viewer/Kadaster
|
|||
| ACCOMMODATION | We have not measured the property, but as instructed, we have relied upon floor areas made available to us, detailed below and elsewhere within this report. |
Floor Areas
| TENANT | UNIT | USE | SQ M |
| Alba Cura B.V. | Jarmuiden, Unit 30E | Office | 195 |
| Almalika Bakkerij B.V. | Jarmuiden, Unit 22A | Warehouse | 257 |
| Almalika Bakkerij B.V. | Jarmuiden, Unit 22B | Warehouse | 638 |
| Amsterdam Designs B.V. | Jarmuiden, Unit 24 | Office and Warehouse | 1,621 |
| DEHA B.V. | Jarmuiden, Unit 30B | Office and Warehouse | 902 |
| Essence Trainingen | Jarmuiden, Unit 26C, | Office | 940 |
| Amsterdam B.V. | 26D, 30D, 30F | ||
| Fouradvice V.O.F. | Jarmuiden, Unit 30C | Office and Warehouse | 195 |
| H. & A. Financial Consultancy V.O.F. | Jarmuiden, Unit 54D | Office and Warehouse | 156 |
| Huurverhuislift.nl B.V. | Jarmuiden, Unit 54A | Office and Warehouse | 919 |
| Liscombe B.V. | Jarmuiden, Unit 56A | Office and Warehouse | 1,098 |
| Media Shelf U.S. B.V. | Jarmuiden, Unit 28B | Office and Warehouse | 375 |
| Medux B.V. | Jarmuiden, Unit 58 | Office and Warehouse | 2,153 |
| ON BEHALF OF: | MORGAN STANLEY |
| PROJECT NAME: | MSTAR |
| Multimedia Trading B.V. | Jarmuiden, Unit 26B | Office and Warehouse | 170 |
|
Stichting Amsterdam Esnaflar Birligi |
Unit 22A1 | Office | 150 |
| Swapfiets B.V. | Jarmuiden, Unit 52 | Office and Warehouse | 1,681 |
| Terapy B.V. | Jarmuiden, Unit 26A | Office | 405 |
| Vacant | Jarmuiden, Unit 52_1 | Office and Warehouse | 530 |
| Vision Arena | Unit 22, Office | Office and Warehouse | 98 |
| Woninginterieur | |||
| Vision Arena Woninginterieur |
Unit 22, Warehouse | Warehouse | 296 |
| Welzorg Nederland B.V. | Jarmuiden, Unit 56 | Office and Warehouse | 1,034 |
| Yilka B.V. | Jarmuiden, Unit 30A | Office and Warehouse | 716 |
| Ҫiçek Administraties & | Jarmuiden, Unit 54C | Office and Warehouse | 156 |
| Advies V.O.F. | |||
| TOTAL | - | 14,685 |
DUE DILIGENCE
| STATE OF REPAIR |
RE have not undertaken a structural survey, nor tested the services. The property was subject to an inspection for valuation purposes in early 2020. As you are aware, the property has not been re-inspected for the purposes of this report, nor have we been provided with updated TDD. We have therefore relied on the information provided by the Borrower, including a Capex schedule dated 12 June 2019 and schedule with revised budget of capex dated 19 January 2021. Whilst the latter indicates TDD assessment in the coming 5 years, less completed spend in 2020, of €87,000, we have been advised that the intended spend could be in the region of €1,500,000. As such we have allowed this amount within our valuation.
According to our own limited inspection for valuation purposes, our opinion regarding the state of repair would substantiate the assessment by Arcadis. Based on our impression gained during the inspection, we are of the opinion that the buildings are in a fair condition, in line with the year of construction.
|
| ENVIRONMENTAL CONSIDERATIONS |
We have been instructed not to make any investigations in relation to the presence or potential presence of contamination in land or buildings, or the
potential presence of other environmental risk factors and to assume that if investigations were made to an appropriate extent, then nothing would be discovered sufficient to affect value.
We have summarised the findings from a schedule provided in relation to ‘Priority sites’ within the front section of this report.
We have relied on the information provided by the Borrower, including Draft Phase 1 Environmental Review prepared by Ambiente Ltd and dated December 2019. The report summarises that the potential environmental risks from known contaminants in groundwater at the site are assessed to be very low risk to site users and low risks to groundwater and local ecosystems. |
| ON BEHALF OF: | MORGAN STANLEY |
| PROJECT NAME: | MSTAR |
|
Potential environmental risks from potential contamination from the multi-let light industrial use since 1990 are assessed as very low risk to site users and low to groundwater and local ecosystems.
The potential environmental risk from off-site land uses is assessed as low to site users and maintenance workers.
We have not carried out investigation into past uses, either of the properties or of any adjacent lands, to establish whether there is any potential for contamination from such uses or sites, or other environmental risk factors and have therefore assumed that none exists.
|
||||
| TENURE |
We have assumed that there are no onerous legal conditions affecting the property which have a material impact on our opinion of value.
According to the information available from the Land Registry Office (Kadaster), the parcels are held leasehold from the municipality of Amsterdam by MLET Netherlands 2 Holding B.V. and registered as follows: |
|||
| Municipality: | Sloten (Noord-Holland) | |||
| Section: | A | |||
| Numbers: | 1351 | |||
| Total Area: | 17,032 sq m | |||
| Comments | ||||
|
■ The property is held on a perpetual leasehold;
■ The ground rent has been bought off for the first period until 15 February 2040.
■ At the end of the current term we have allowed for a correction to buy off the next 50-year term. For this we have allowed for a correction of € 285 per sq m LFA. The total amount in 2040 equates to € 4,185,225. This equates to a total correction per valuation date at € 1,154,250, discounted at 7%.
Based on the information provided, we understand the property is held leasehold.
|
||||
| INCOME PROFILE |
The subject property is partially let to 20 tenants on a WALL of 2.75 years. The vacancy equates to 530 sq m which equals 3.6% of the total lettable floor area. The ERV for the vacancy equates to € 58,300 per annum. The current rental income is € 911,872 per annum. The ERV for the leased part is estimated at € 1,226,175 per annum, we are therefore of the opinion the property is under rented. The ERV for the entire property equates to € 1,284,475 per annum.
There are no specific tenants which account for a significant portion of the total rental income. Overall, we are of the opinion the income profile is good.
|
| ON BEHALF OF: | MORGAN STANLEY |
| PROJECT NAME: | MSTAR |
VALUATION CONSIDERATIONS
|
COSTS AND
|
Based on the information provided or our knowledge of the market, in approaching our valuation, we made allowances for the following capital and non-recoverable costs. In all cases, we have cited whether they are deducted as at the date of valuation or whether they take effect at a later date.
|
| Capital Expenditure: | |||||
| Type & Calculation | Source | Effective | Amount | ||
| Capital Expenditure: Fixed Amount | Technical Due Diligence |
On Valuation
No Repeat |
€1,500,000 | ||
| Capital Expenditure: Ground rent buy- off Discounted at 7% | CBRE Estimate |
As per 15 February 2040
No repeat |
€ 1,154,250 | ||
| Letting Fees: 15% of Rental Value of the vacant space | CBRE Estimate |
On lease start / renewal
No Repeat |
€ 8,745 | ||
| Rent Fee: Fixed Amount | Rent Roll |
On Valuation
No Repeat |
€28,710 | ||
| TOTAL ON VALUATION | € 1,528,710 | ||||
| Revenue Deductions: | |||||
| Type & Calculation | Source | Effective | Annual Amount | ||
| Management: 2% of ERV | CBRE estimate |
On Valuation
In perpetuity |
€ 19,403 | ||
| Property tax: 2% of ERV | CBRE estimate |
On Valuation
In perpetuity |
€ 25,690 | ||
| Water tax: 0.25% of ERV | CBRE estimate |
On Valuation
In perpetuity |
€ 3,211 | ||
| Insurance: 1.25% of ERV | CBRE estimate |
On Valuation
In perpetuity |
€ 16,056 | ||
| Sewage charge: 0.25% of ERV | CBRE estimate |
On Valuation
In perpetuity |
€ 3,211 | ||
| Maintenance: € 4.00 per sq m | Borrower Estimate | 5 Year Delay | € 58,740 | ||
| ON BEHALF OF: | MORGAN STANLEY |
| PROJECT NAME: | MSTAR |
| In perpetuity | |||||
| Void Costs: 2% of ERV | Borrower Estimate |
On Valuation
On All Voids |
€ 1,166 | ||
|
TOTAL: ON VALUATION |
€ 68,737 |
|
Void and Rent-Free Allowances:
Regarding the vacant unit, we have allowed for a current void period of 12 months.
|
|
VALUATION METHODOLOGY
|
We have made the following rental assumptions having regard to the lettings agreed within the subject property, whilst also considering rental rates in the surrounding area: |
| Unit | Area (s qm) | ERV (€) per S qm (annum) |
Rent pa (€) | ||
| Office | 4,457 | 110 | 490,270 | ||
| Warehouse | 9,790 | 80 | 783,200 | ||
|
Other
|
438 | 25 | 10,950 | ||
| Total | 14,685 | 87 | 1,284,475 |
|
Opinion of Market Rent
Based on the below-mentioned comparable transactions, the current market trends and our general market knowledge, we have estimated the above-mentioned rental values for the areas in the subject property. The below appended comparables indicate a (blended) range from € 59 per sq m per annum to € 109 per sq m per annum.
Within the evidence table appended, we would highlight the property at the Computerweg 21, Amsterdam as the best comparable and therefore of greatest relevance in terms of similar appearance, state of repair, eaves height and location.
The aforementioned rental values produce a total gross rental value of € 1,284,475 per annum or an average of circa € 87 per sq m. The agreed rental income amount to € 911,872 per annum or an average of circa € 62 per sq m. We are of the opinion that the subject property is under-rented.
Opinion of Valuation Yields
Currently, we witness downward pressure on net initial yields for prime logistics properties due to the high scarcity of good, long leased logistics properties.
Indicative net initial yields for prime logistics property are currently quoting 3.5% and 5.5% for prime industrial estates. Due to favourable dynamics in the occupier market in the Netherlands, with prospects for production and export growth in mind and taking into account the capital available for (real
|
| ON BEHALF OF: | MORGAN STANLEY |
| PROJECT NAME: | MSTAR |
|
estate) investments, investor appetite is expected to increase further. This is also expected to put further downward pressure on yields.
Within the evidence table appended, we would highlight the following. The lower end of the yield range is indicated by the property located at Melbournestraat 50-68 in Rotterdam. Quality and characteristics of this asset are superior compared to the subject property as reflected by the underlying equivalent yield and capital rate per sq m.
The middle of the range is highlighted by the property located in Berchvliet, Amsterdam. The subject property has a more favourable location but the office/warehouse ratio results in inferior leasing conditions. Overall a similar let equivalent yield is applicable in our opinion.
We have arrived at our opinion of Market Value through adopting the traditional investment capitalisation method of valuation. Within this approach, we apply an income weighted average equivalent yield to our opinion of net income, reflecting the comparable evidence within the market for guidance on capital rates and values per sq m. The NIY’s of the comparable investments range from 5.14% to 6.16% and also taking into account the current market conditions and the WAULT to expiry by current income of 2.75 years, we have adopted a split yield approach, targeting the following rates:
- Vacant = 6.50%
- Let = 5.50%
The approach results in a blended equivalent yield of 5.54% and NIY of circa 4.80% which reflects a capital rate per sq m of € 1,100, after allowing for purchaser’s costs equating to 9%.
On the assumption that there are no unusual factors of which we are unaware and on the basis of the comments and assumptions specified in this report, CBRE is of the opinion that the Market Value (rounded) of the subject property, is:
€ 16,150,000
(Sixteen million one hundred fifty thousand Euros)
The unrounded net capital value is € 16,151,635. The gross unrounded capital value is € 20,296,987 including € 1,453,647 purchaser's costs (9.00%).
|
| VALUATION METHODOLOGY – VACANT POSSESSION VALUE |
The constituent inputs in terms of rental value and non-recoverable costs largely align with the Market Value approach. The key exception being that we have adopted a special assumption that the property is 100% vacant/non-income producing as at the valuation date. This value is predominantly derived using the traditional investment method of valuation but critically benchmarking the resultant capital rate per sq m against the prevailing evidence.
In approaching our valuation under the Special Assumption that the property is entirely vacant (Vacant Possession Value), we have adopted a total void
|
| ON BEHALF OF: | MORGAN STANLEY |
| PROJECT NAME: | MSTAR |
|
period of 12 months inclusive of rent free or tenant incentives and targeted an equivalent yield of 6.50%.
This results in a net rounded value of €12,725,000, equating to €867 per sq m.
|
||
| ESTIMATED REINSTATEMENT ASSESSMENT |
The property has not been inspected by a suitably qualified building surveyor from CBRE, nor have we carried out a full Reinstatement Cost Assessment. For indicative purposes only we estimate that the reinstatement cost of insurance purposes would be in the region of €22,310,000 (rounded, excl. VAT) on a day one basis, including fees but excluding VAT and inflation.
This figure should be compared with the current sum insured and if a material discrepancy exists we suggest that a full Reinstatement Cost Assessment is carried out.
|
| ON BEHALF OF: | MORGAN STANLEY |
| PROJECT NAME: | MSTAR |
| RENTAL EVIDENCE | |||||||||
| PROPERTY ADDRESS | PROPERTY USE | DATE | TOTAL AREA | TENANT | LEASE LENGTH (YEARS) | BREAK OPTION | RENT (P.A) | RENTAL RATE PER SQ M | RELATIVE QUALITY |
| Computerweg 9, Amsterdam | Industrial | 2019, June | 3,000 | floris bouwcenter | not available | not available | 225,000 | 75.00 | Slightly higher quality asset but less established location. A lower ERV is appropriate in our opinion. |
| Computerweg 21, Amsterdam | Industrial | 2019, August | 270 | cortina | not available | not available | 23,200 | 85.93 | Less established location and therefore slightly higher ERV appropriate for the subject property. |
| Bellsingel 51, Schiphol-Rijk | Industrial | 2020, June | 6,304 | TNT |
not available | not available | 684,000 | 108.50 | Similar quality but superior property specifications. |
| Chemieweg 103, Uithoorn | Industrial | 2020, March | 135 | onderneming | not available | not available | 13,140 | 97 | Similar quality and characteristics. Slightly smaller units and lesser location. |
| ON BEHALF OF: | MORGAN STANLEY |
| PROJECT NAME: | MSTAR |
| SALES EVIDENCE | |||||||||
| PROPERTY ADDRESS | PROPERTY USE | DATE | TOTAL AREA | WAULT (YEARS) | PASSING RENT PER ANNUM | PURCHASE PRICE | NET INITIAL YIELD (%) | CAPITAL RATE PER SQ M | RELATIVE QUALITY |
| Melbournestraat 50-68, Sydneystraat 32-56, Rotterdam | Industrial/Logistics | 17-03-2020 | 5,354 | 2.5 | 401,144 | 6,587,000 | 5.14% | 1,230 | During the transaction, the property was fully let to eleven tenants on a WALL of 2.5 years. The property is slightly under rented, the equivalent yield equates to 5.08. We are of the opinion the equivalent yield over the subject property would be higher. |
| Berchvliet 3-13, Sierenborch 1, Amsterdam | Industrial/Logistics | 20-02-2020 | 6,108 | 3.7 | 549,164 | 8,075,000 | 5.80% | 1,322 | During the transaction, the property was fully let on a WALL of 3.7 years. The equivalent yield amounts to 5.80%. Due to the superior quality, we are of the opinion a sharper yield is appropriate. |
| Jan Van Krimpenweg 1 + 21-26, Haarlem | Industrial/Logistics | 19-10-2020 | 10,503 | 1.0 | 621,655 | 8,400,000 | 6.16% | 800 | This transaction was part of the Vinvest portfolio. During the transaction, the property was fully let to multiple tenants on a weighted average WALL of 7.25 years. The property is in our opinion, slightly under rented (11.56%). The gross initial yield equates to 7.40%. The location and quality of the reference are less. A sharper yield is in our |
| ON BEHALF OF: | MORGAN STANLEY |
| PROJECT NAME: | MSTAR |
| opinion appropriate for the subject property. | |||||||||
| Spectrumlaan 5, Bleiswijk | Industrial/Logistics | 15-04-2020 | 8,641 | 2.2 | 557,770 | 8,000,000 | 6.00 | 926 | The reference property is let to Cemex Trescon B.V. with a remaining lease term of 2.2 years. We are of the opinion that, the property is slightly over-rented (approximately 3%). The equivalent yield equates to 5.8%. In our opinion a sharper yield profile is appropriate for the subject property considering location and occupancy. |
| PROPERTY ID: | nlkame - Kamerlingh Onnesweg 2 | |
| ON BEHALF OF: | MORGAN STANLEY | |
| VALUATION DATE: | 01-Feb-2021 | FINAL |
Kamerlingh Onnesweg 2 - Kamerlingh Onnesweg 2, Vianen, 4131 PK, Netherlands
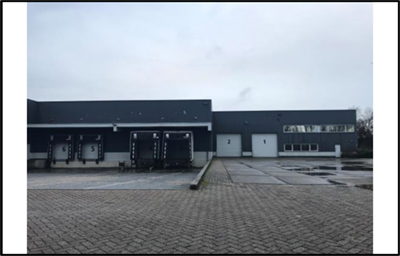
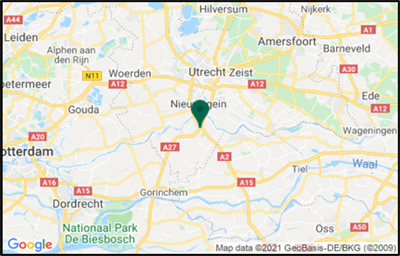
| VALUATION METRICS | (currency - EUR) |
| Metric | Value |
| Market Value | 6,560,000 |
| Market Value (per sq m) | 513 |
| Net Initial Yield | 0.18% |
| Reversionary Yield | 7.57% |
| Equivalent Yield | 7.00% |
| Gross Income (p.a.) | 48,000 |
| Gross Income (p.a.) (per sq m) | 4 |
| *Adj. Gross Income | 48,000 |
| Adj. Gross Income (per sq m) | 4 |
| Net Income (p.a.) | 13,155 |
| Net Income (p.a.) (per sq m) | 1 |
| Gross Rental Value | 628,440 |
| Gross Rental Value (per sq m) | 49 |
| Capital Expenditure | -307,391 |
| Transaction Costs | 8.99% |
| Over / Under Rented | -57.33% |
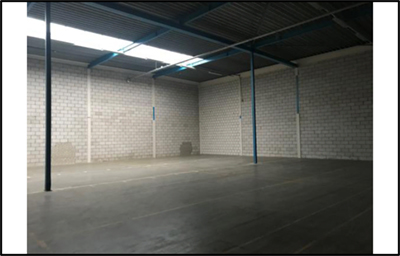
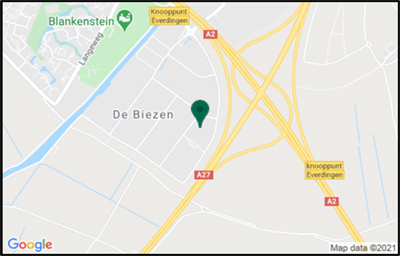
| KEY FACTS | ||
| Metric | Value | |
| Total Area (sq m) | 12,800 | |
| WAULT to Break by Rent | 0.08 | |
| WAULT to Break by ERV | 0.08 | |
| WAULT to Expiry by Rent | 0.08 | |
| WAULT to Expiry by ERV | 0.08 | |
| Percentage of Vacancy (Area) | 80.47% | |
| Percentage of Vacancy (ERV) | 82.10% | |
| ** | Number of Tenants | 1 |
| Current Voids (months) | 12 | |
* Adjusted Gross Income equates to the Gross Income excluding any rent free periods
| LEASES RANKED BY RENT** | ** Total tenant lines within our valuation. May differ to number of individual tenants |
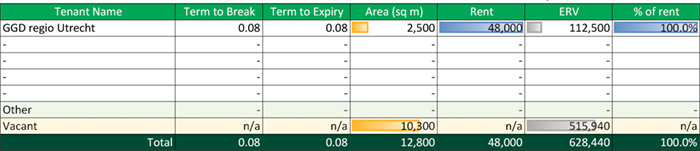
| Printed 09/03/2021 19:47 | |
| PROPERTY ID: | nlkame - Kamerlingh Onnesweg 2 | |
| ON BEHALF OF: | MORGAN STANLEY | |
| VALUATION DATE: | 01-Feb-2021 | FINAL |
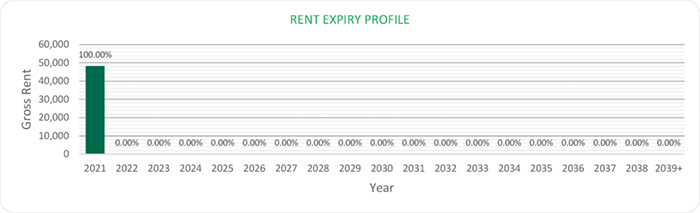
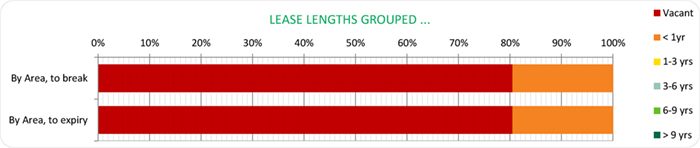
| Printed 09/03/2021 19:47 | |
| ON BEHALF OF: | MORGAN STANLEY |
| PROJECT NAME: | MSTAR |
| PROPERTY REPORT |
| KAMERLINGH ONNESWEG 2, VIANEN |
| INSPECTED BY: | INSPECTION DATE: | VALUATION DATE: | PROPERTY TYPE |
| MAURITS VAN HAARE HEIJMEIJER | 14 JANUARY 2020 | 1 FEBRUARY 2021 | INDUSTRIAL WAREHOUSE |
| KEY VALUATION FACTORS |
| STRENGTHS | WEAKNESSES |
|
■ Favourable layout
■ Good accessibility
■ Office/Warehouse ratio
|
■ Property is mostly vacant
■ Dated appearance
■ Office areas are in moderate condition
|
| OPPORTUNITIES | THREATS |
|
■ Increasing investor appetite
■ Lease the vacant space
|
■ Economic uncertainty due to Covid-19 outbreak
■ Continued vacancy
|
| LOCATION & SITUATION |
| LOCATION |
Vianen is a town part of the municipality Vianen, which is located in the centre of the Netherlands, in the province of Utrecht. Vianen is located at circa 10 kilometers from Utrecht which is the capital of the province of Utrecht. Vianen is located at circa 40 kilometers from Amsterdam. The town of Vianen has an estimated population of 20,000 inhabitants.
The average disposable income in Vianen is approximately equal to the national average. Vianen is linked is situated at the crossroads of motorways A2 (Amsterdam- Maastricht) and A27 (Almere – Breda) and is therefore very well accessible.
|
| ON BEHALF OF: | MORGAN STANLEY |
| PROJECT NAME: | MSTAR |
| PROPERTY DESCRIPTION |
| DESCRIPTION |
The subject property is located at the Kamerlingh Onnesweg in Vianen and is a logistic complex located in the ‘’De Biezen” Business Park, located at the crossroads of the A2 and A27 Motorways in the region of Utrecht. The subject property comprises in total 12,800 sq m LFA which is divided into 1,311 sq m LFA of office space on ground- and first floor and 11,468 sq m LFA of ground floor logistic space. The clear height of the warehouse is ca 6 metres. The property is built around a steel frame, with a steel façade and a flat room. The office areas have aluminium window frames and suspended ceilings. The logistics area is gas-heated.
At the back of the property, along the Laanakkerweg, a total of 12 loading docks and 6 overhead doors are located. At the side of the building, along the Marconiweg, an entrance is situated. At the front of the property, along the Kamerlingh Onnesweg, an entrance and 4 overhead doors are situated.
|
||
|
Summary of known specification:
|
|||
| Characteristic | Result | ||
| Built / Renovation | 1986 | ||
| Eaves Height | ca. 6 metres | ||
| No. of loading Doors | 19 (12 loading docks / 7 overhead doors) | ||
| Warehouse (% of GLA) | 90% | ||
| Site Coverage Ratio | 61% | ||
| Source: BAG viewer/Land Registry/Inspection | |||
| ACCOMMODATION | We have not measured the property, but as instructed, we have relied upon floor areas made available to us, detailed below and elsewhere within this report. | ||
| Floor Areas |
| FLOOR / UNIT | USE | SQ M |
| GGD (temp. lease) | Warehouse | 2,500 |
| Vacant | Office | 1,311 |
| Vacant | Warehouse | 5,040 |
| Vacant | Warehouse | 3,949 |
| TOTAL | - | 12,800 |
| ON BEHALF OF: | MORGAN STANLEY |
| PROJECT NAME: | MSTAR |
| DUE DILIGENCE |
|
STATE OF REPAIR
|
CBRE have not undertaken a structural survey, nor tested the services. The property was subject to an inspection for valuation purposes in early 2020. As you are aware, the property has not been re-inspected for the purposes of this report, nor have we been provided with updated TDD. We have therefore relied on the information provided by the Borrower, including a Capex schedule dated 12 June 2019 and schedule with revised budget of capex dated 19 January 2021. Based on the latter which indicates TDD assessment less completed spend in 2020, we have included the immediate and 2-5 years capex of €230,000 within our valuation.
According to our own limited inspection for valuation purposes, our opinion regarding the state of repair would substantiate the assessment by Arcadis. Based on our impression gained during the inspection, we are of the opinion that the buildings are in a fair condition, in line with the year of construction.
|
|||
| ENVIRONMENTAL CONSIDERATIONS |
We have been instructed not to make any investigations in relation to the presence or potential presence of contamination in land or buildings or the potential presence of other environmental risk factors and to assume that if investigations were made to an appropriate extent then nothing would be discovered sufficient to affect value.
We have summarised the findings from a schedule provided in relation to ‘Priority sites’ within the front section of this report.
We have relied on the information provided by the Borrower, including Draft Phase 1 Environmental Review prepared by Ambiente Ltd and dated December 2019. The report summarises that the soil appeared in good condition.
We have not carried out investigation into past uses, either of the properties or of any adjacent lands, to establish whether there is any potential for contamination from such uses or sites, or other environmental risk factors and have therefore assumed that none exists. |
|||
| TENURE |
According to the information available from the Land Registry Office (Kadaster) the parcel is held freehold by MLET Netherlands 2 Holding B.V. and registered as follows: |
|||
| Municipality: | Hagestein | |||
| Section: | D | |||
| Numbers: | 21 | |||
| Total Area: | 19,725 sq m | |||
|
We have also had sight of the Draft Red Flag Legal Report prepared by Loyens Loeff, dated 12 February 2021. Based on the information provided, we understand the property is held freehold.
We have assumed that there are no onerous legal conditions affecting the property which have a material impact on our opinion of value.
|
||||
| ON BEHALF OF: | MORGAN STANLEY |
| PROJECT NAME: | MSTAR |
| INCOME PROFILE | The subject property is fully vacant at valuation date with the exception of a temporary lease. The ERV for the entire property equates to € 628,440 per annum. We have taken into account a void period of 12 months, this includes marketing and incentives. |
| VALUATION CONSIDERATIONS |
| COSTS AND ADJUSTMENTS | Based on the information provided or our knowledge of the market, in approaching our valuation, we made allowances for the following capital and non-recoverable costs. In all cases, we have cited whether they are deducted as at the date of valuation or whether they take effect at a later date. | |||||||
| Capital Expenditure: | ||||||||
| Type & Calculation | Source | Effective | Amount | |||||
| Capital Expenditure: Fixed Amount | Technical Due Diligence | On Valuation No Repeat | € 230,000 | |||||
| Letting Fees: 15% of Rental Value of the vacant space | CBRE Estimate | On lease start / renewal | €77,391 | |||||
| TOTAL ON VALUATION | No Repeat | € 307,391 | ||||||
|
Revenue Deductions:
|
||||||||
| Type & Calculation | Source | Effective | Annual Amount | |||||
| Management costs on Voids: 2% of market rent | Borrower Estimate | On all Voids | €10,319 | |||||
| Management: 2% of rental revenue | Borrower Estimate | On Valuation | €11,279 | |||||
| Property Tax: 2% of market rent | Borrower Estimate | On Valuation | €12,569 | |||||
| Water Tax: 0.25% of market rent | Borrower Estimate | On Valuation | €1,571 | |||||
| Insurance: 1.25 % of market rent | Borrower Estimate | On Valuation | €7,856 | |||||
| ON BEHALF OF: | MORGAN STANLEY |
| PROJECT NAME: | MSTAR |
|
VALUATION METHODOLOGY – MARKET VALUE
|
Sewage Charge:0.25 % of market rent | Borrower Estimate | On Valuation | €1,571 | ||
| Maintenance: € 4.00 per sq m | Borrower Estimate | 5 Year Dela In perpetuity | €51,200 | |||
| TOTAL: ON VALUATION | €45,165 | |||||
| Void and Rent-Free Allowances: | ||||||
| We have allowed for a current void period of 12 months. | ||||||
|
We have made the following rental assumptions having regard to the lettings agreed within the subject property, whilst also considering rental rates in the surrounding area:
|
||||||
| Unit | Area (s qm) | ERV (€) per S qm (annum) |
Rent pa (€) | |||
| Office | 1,311 | 85 | 111,435 | |||
| Warehouse | 11,489 | 45 | 517,005 | |||
| Total | 12,800 | 49 | 628,440 | |||
| Opinion of Market Rent | ||||||
| Based on the below-mentioned comparable transactions, the current market trends and our general market knowledge, we have estimated the above- mentioned rental values for the areas in the subject property. The below appended comparables indicate a range from € 45 per sq m per annum to € 49 per sq m per annum. The rents of the comparables in Zwolle and Overbetuwe concern only warehouse rents. We would also flag the Etten Leur letting which achieved a blended rent of approximately €49 per sq m, whilst a better building, the location is inferior. On balance a similar rate is therefore justified. | ||||||
| We are of the opinion that all the mentioned comparables are of better quality that the subject property. The subject property however is located central in the Netherlands and we are of the opinion that it’s location is superior compared to the comparables. Considering the location, quality and current market conditions, we have adopted the above mentioned rental values for the subject property. | ||||||
| The aforementioned rental values produce a total gross rental value of € 628,440 per annum or an average of circa € 49 per sq m. | ||||||
| Opinion of Valuation Yields | ||||||
| ON BEHALF OF: | MORGAN STANLEY |
| PROJECT NAME: | MSTAR |
|
Currently, we witness downward pressure on net initial yields for prime logistics properties due to the high scarcity of good, long leased logistics properties.
Indicative net initial yields for prime logistics property are currently quoting 3.7%. Due to favourable dynamics in the occupier market in the Netherlands, with prospects for production and export growth in mind and taking into account the capital available for (real estate) investments, investor appetite is expected to increase further. This is also expected to put further downward pressure on yields.
Sale evidence for vacant large industrial/logistic properties are scarce. In the Sales evidence scheme overview below, we have included four transactions of vacant industrial/logistic properties. Due to the scarcity of these transactions, the bandwidth of capital value per sq m deviates more than 15% compared to the determined capital value for the subject property.
Within the evidence table appended, we would highlight the following. The lower end of the capital value bandwidth is indicated by the property located in Heijen. We are of the opinion that the quality of this property is comparable to the subject property. However the location of the comparable is inferior compared to the subject property.
The top end of the bandwidth is indicated by the property located in Amsterdam. We are of the opinion that this property is of higher quality compared to the subject property. We are of the opinion that the comparable located at the Koningsbeltweg in Almere is best comparable to the subject property. The inferior location equals out the superior quality, which leads to a comparable capital value per sq m compared to the subject property.
We have arrived at our opinion of Market Value adopting the Traditional investment capitalisation method of valuation. Within this approach, we apply an income weighted average equivalent yield to our opinion of net income, reflecting the comparable evidence within the market for guidance on capital rates and values per sq m.
We have adopted the following equivalent yield:
- Let (GGD) = 7.00 %
- Vacant = 7.00 %
The approach results in a capital rate per sq m of € 513, after allowing for purchaser’s costs equating to 9.00%.
On the assumption that there are no unusual factors of which we are unaware and on the basis of the comments and assumptions specified in this report, CBRE is of the opinion that the Market Value (rounded) of the subject property, is:
€ 6,560,000
(Six million five hundred sixty thousand Euros)
The unrounded net capital value is € 6,555,207. The gross unrounded capital value is € 7,452,567, including € 589,969, purchaser's costs (9.00%).
|
| ON BEHALF OF: | MORGAN STANLEY |
| PROJECT NAME: | MSTAR |
| VALUATION METHODOLOGY – VACANT POSSESSION VALUE |
The constituent inputs in terms of rental value and non-recoverable costs largely align with the Market Value approach. The key exception being that we have adopted a special assumption that the property is 100% vacant/non-income producing as at the valuation date. This value is predominantly derived using the traditional investment method of valuation but critically benchmarking the resultant capital rate per sq m against the prevailing evidence.
In approaching our valuation under the Special Assumption that the property is entirely vacant (Vacant Possession Value), we have adopted a total void period of 12 months inclusive of rent free or tenant incentives and targeted an equivalent yield of 7.00%.
This results in a net rounded value of €6,450,000, equating to €504 per sq m.
|
| ESTIMATED REINSTATEMENT ASSESSMENT |
The property has not been inspected by a suitably qualified building surveyor from CBRE, nor have we carried out a full Reinstatement Cost Assessment. For indicative purposes only we estimate that the reinstatement cost of insurance purposes would be in the region of €14,700,000 (rounded, excl. VAT) on a day one basis, including fees but excluding VAT and inflation.
This figure should be compared with the current sum insured and if a material discrepancy exists we suggest that a full Reinstatement Cost Assessment is carried out.
|
| ON BEHALF OF: | MORGAN STANLEY |
| PROJECT NAME: | MSTAR |
RENTAL EVIDENCE
| PROPERTY ADDRESS |
PROPERTY USE |
DATE | TOTAL AREA | TENANT | LEASE LENGTH (YEARS) |
BREAK OPTION |
RENT (P.A) |
RENTAL
|
RELATIVE QUALITY |
| Mindenstraat 3, Zwolle | Industrial | 2020, March | 11,545 (Warehouse) | Dynalogic Benelux | - | - | 520,000 | 45.00 | Better quality, inferior location |
| Nijverheidsweg 148, Etten Leur | Industrial | 2019, July | 8,880 | Red river-v Eck Eetbare Zadenspecialist | - | - | 435,000 | 48.99 | Better quality, inferior location |
| Linie 11-13, Overbetuwe | Industrial | 2020, November | 8,750 (Warehouse) | Nippon Express | - | - | 420,000 | 48.00 | Better quality, inferior location |
| Denemarkenlaan 11, Hazerswoude Dorp | Industrial | 2019, June | 8,500 | Centralen | - | - | 435,000 | 47,33 | Better quality, inferior location |
| ON BEHALF OF: | MORGAN STANLEY |
| PROJECT NAME: | MSTAR |
SALES EVIDENCE
| PROPERTY ADDRESS |
PROPERTY USE |
DATE | TOTAL AREA |
WAUL T (YEAR S) |
PASSING RENT PER ANNUM |
PURCHASE PRICE |
NET
|
CAPITAL RATE PER SQ M |
RELATIVE QUALITY |
| Koningsbeltweg 52, Almere | Warehouse - office | 26/2/2019 | 6,229 | 0 | € 0 | €3,500,000 | 0% | € 562 | Superior quality, inferior location, smaller scale. Property vacant during transaction. |
| Herwijk 12, Amsterdam | Warehouse - office | 30/11/2020 | 9,592 | 0 | € 0 | 6,175,000 | 0% | € 644 | Superior quality, superior location. Property vacant during transaction |
| Zilverstraat 100, The Hague | Warehouse – office | 30/11/2020 | 2,425 | 0 | € 0 | 1,600,000 | 0% | € 660 | Superior quality, inferior location, smaller scale. Property vacant during transaction. Higher Office/warehouse ratio. |
| De Grens 45, Heijen | Warehouse – Office | 14/10/2019 | 5,690 | 0 | € 0 | €2,300,000 | 0% | € 404 | Similar quality, inferior location. Property was vacant during transaction |
| PROPERTY ID: | nllake - Lakenblekerstraat 30-62 | |
| ON BEHALF OF: | MORGAN STANLEY | |
| VALUATION DATE: | 01-Feb-2021 | FINAL |
Lakenblekerstraat 30-62 - Lakenblekerstraat 30-62, Aalsmeer, 1431 GG, Netherlands
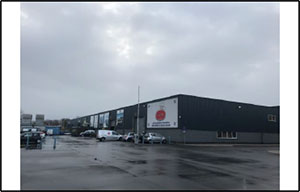 |
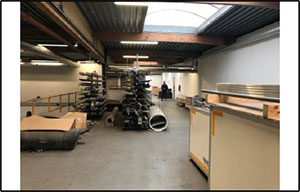 |
|
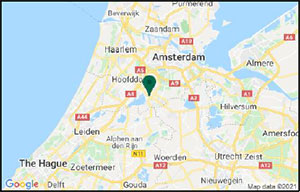 |
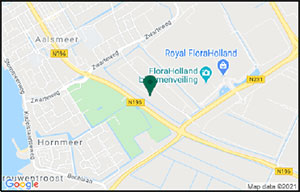 |
| VALUATION METRICS | (currency - EUR) |
| Metric | Value |
| Market Value | 13,225,000 |
| Market Value (per sq m) | 741 |
| Net Initial Yield | 5.10% |
| Reversionary Yield | 6.29% |
| Equivalent Yield | 6.02% |
| Gross Income (p.a.) | 791,092 |
| Gross Income (p.a.) (per sq m) | 44 |
| *Adj. Gross Income | 791,092 |
| Adj. Gross Income (per sq m) | 44 |
| Net Income (p.a.) | 735,767 |
| Net Income (p.a.) (per sq m) | 41 |
| Gross Rental Value | 1,038,325 |
| Gross Rental Value (per sq m) | 58 |
| Capital Expenditure | -187,308 |
| Transaction Costs | 9.00% |
| Over / Under Rented | -21.68% |
| KEY FACTS |
| Metric | Value | |
| Total Area (sq m) | 17,839 | |
| WAULT to Break by Rent | 3.95 | |
| WAULT to Break by ERV | 3.95 | |
| WAULT to Expiry by Rent | 3.95 | |
| WAULT to Expiry by ERV | 3.95 | |
| Percentage of Vacancy (Area) | 1.87% | |
| Percentage of Vacancy (ERV) | 2.73% | |
| ** | Number of Tenants | 15 |
| Current Voids (months) | 12 | |
| * Adjusted Gross Income equates to the Gross Income excluding any rent free periods | |
| LEASES RANKED BY RENT | ** Total tenant lines within our valuation. May differ to number of individual tenants |
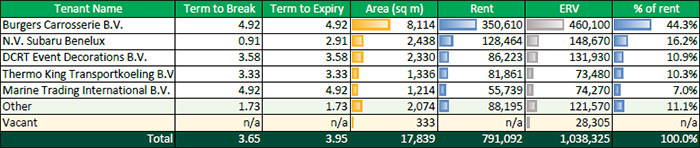
| Printed 09/03/2021 19:47 | |
| PROPERTY ID: | nllake - Lakenblekerstraat 30-62 | |
| ON BEHALF OF: | MORGAN STANLEY | |
| VALUATION DATE: | 01-Feb-2021 | FINAL |
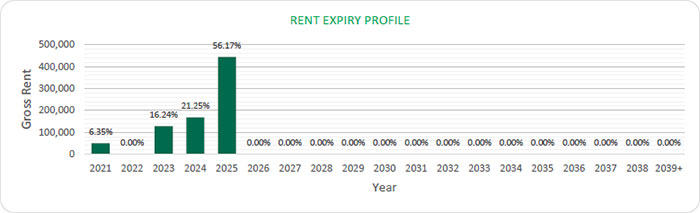
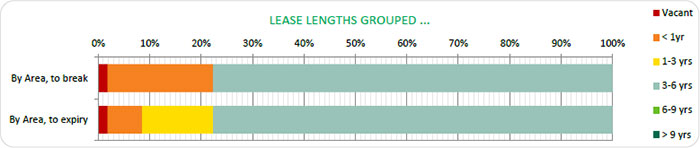
| Printed 09/03/2021 19:47 | |
| ON BEHALF OF: | MORGAN STANLEY |
| PROJECT NAME: | MSTAR |
PROPERTY REPORT
LAKENBLEKERSTRAAT 30-62, AALSMEER, NETHERLANDS
| INSPECTED BY: | INSPECTION DATE: | VALUATION DATE: | PROPERTY TYPE |
| DEVIN UMMELS | 14 JANUARY 2020 | 1 FEBRUARY 2021 | INDUSTRIAL WAREHOUSE |
KEY VALUATION FACTORS
| STRENGTHS | WEAKNESSES | |
|
■ Quality
■ Multi-tenanted
■ Accessibility
■ Office/Warehouse ratio
|
■ Unit 54B is vacant | |
| OPPORTUNITIES | THREATS | |
|
■ Increasing investor appetite
■ Lease the vacant space
■ Extend lease term with current tenants
■ Re-gear to market rent
|
■ Deterioration of quality
■ Macro-economic uncertainty (i.e. Trade Wars; Brexit)
|
LOCATION & SITUATION
| LOCATION |
Aalsmeer is located in the province of North Holland. The town is located 13km southwest of Amsterdam and its population consists of approximately 31,000 inhabitants. The town is located close to the airport Schiphol (8 km). The largest flower auction in the world is based in Aalsmeer.
Aalsmeer can be reached by private transportation by the national road A9 and the regional road the N201, which gives you access to other national roads (A4 and A2). Although Aalsmeer does not have a train station, transportation by bus is very well organised.
Distances from Aalsmeer to other major cities are: 30 kilometres to Amsterdam, 60 kilometres to Rotterdam, 45 kilometres to The Hague and 50 kilometres to Utrecht.
|
| ON BEHALF OF: | MORGAN STANLEY |
| PROJECT NAME: | MSTAR |
PROPERTY DESCRIPTION
| DESCRIPTION |
The subject property is located at Lakenblekerstraat 30-62 in Aalsmeer and is an industrial complex located alongside the N196 regional road connecting several towns in the greater Amsterdam area. The subject property comprises in total 17,839 sq m of lettable floor area, divided over 20 units in two separate buildings. Each unit has a small office component and at minimum one overhead door. The construction is of steel columns with the façade comprising insulated panels and a flat roof presumed to be covered with bitumen.
The building was constructed in 1974 and the clear height is circa 7.2 metres.
There is ample parking and manoeuvring space available on site.
|
||
| Summary of known specification: | |||
| Characteristic | Result | ||
| Built / Renovation | 1974 | ||
| Eaves Height | 7.2 metres | ||
| Warehouse (% of LFA) | 89% | ||
| Site Coverage Ratio | 58% | ||
|
Source: Schedule provided by client.
|
|||
| ACCOMMODATION | We have not measured the property, but as instructed, we have relied upon floor areas made available to us, detailed below and elsewhere within this report. |
Floor Areas
| FLOOR / UNIT | USE | SQ M | |
| Van Beekum Rijopleidingen B.V. | Car Parking | Car Parking | - |
| Vacant | Unit 54B | Office | 333 |
| Thermo King Transportkoeling B.V. | Unit 40 | Warehouse | 1,336 |
| Oma Bobs Snacks B.V. | Unit 54A | Warehouse | 860 |
| N.V. Subaru Benelux | Unit 60 & 62 | Office and Warehouse | 2,438 |
| MvO Energy Services B.V. | Unit 58 | Office and Warehouse | 1,214 |
| Marine Trading International B.V. | Unit 56 | Office and Warehouse | 1,214 |
| F.J. Hartsuiker | Plot 36-62 | Yard | - |
| DCRT Event Decorations B.V. | Unit 50 | Office and Warehouse | 1,257 |
| DCRT Event Decorations B.V. | Unit 52 | Office and Warehouse | 1,073 |
| Burgers Carrosserie B.V. | Unit 30 & 42 | Warehouse | 1,427 |
| Burgers Carrosserie B.V. | Unit 32 & 38 | Office and Warehouse | 1,200 |
| Burgers Carrosserie B.V. | Unit 34 & 36 | Office and Warehouse | 1,263 |
| Burgers Carrosserie B.V. | Unit 44 | Office and Warehouse | 1,627 |
| Burgers Carrosserie B.V. | Unit 46 | Office and Warehouse | 1,218 |
| Burgers Carrosserie B.V. | Unit 48 | Office and Warehouse | 1,379 |
| TOTAL | - | 17,839 |
| ON BEHALF OF: | MORGAN STANLEY |
| PROJECT NAME: | MSTAR |
DUE DILIGENCE
| STATE OF REPAIR |
CBRE have not undertaken a structural survey, nor tested the services. The property was subject to an inspection for valuation purposes in early 2020. As you are aware, the property has not been re-inspected for the purposes of this report, nor have we been provided with updated TDD. We have therefore relied on the information provided by the Borrower, including a Capex schedule dated 12 June 2019 and schedule with revised budget of capex dated 19 January 2021. Based on the latter which indicates TDD assessment less completed spend in 2020, we have included the immediate and 2-5 years capex of €166,875 within our valuation.
According to our own limited inspection for valuation purposes, our opinion regarding the state of repair would substantiate the assessment by Arcadis. Based on our impression gained during the inspection, we are of the opinion that the buildings are in a fair condition, in line with the year of construction.
|
| ENVIRONMENTAL CONSIDERATIONS |
We have been instructed not to make any investigations in relation to the presence or potential presence of contamination in land or buildings, or the potential presence of other environmental risk factors and to assume that if investigations were made to an appropriate extent, then nothing would be discovered sufficient to affect value.
We have summarised the findings from a schedule provided in relation to ‘Priority sites’ within the front section of this report.
We have relied on the information provided by the Borrower, including Draft Phase 1 Environmental Review prepared by Ambiente Ltd and dated December 2019. The report summarises that the environmental risk assessment identified a very low risk to site users and low risk to groundwater and surface water from current and historical activities at the site.
The potential environmental risk associated with materials containing asbestos is assessed to be moderate to site users / maintenance workers. The level of risk reflects the potential severity of the consequence of exposure and can
We have not carried out investigation into past uses, either of the properties or of any adjacent lands, to establish whether there is any potential for contamination from such uses or sites, or other environmental risk factors and have therefore assumed that none exists.
|
| ON BEHALF OF: | MORGAN STANLEY |
| PROJECT NAME: | MSTAR |
| TENURE | According to the information available from the Land Registry Office (Kadaster) the parcels are held freehold by Multi-Let Industrial Property 20 B.V. and registered as follows: | |||
| Municipality: | Aalsmeer | |||
| Section: | C | |||
| Numbers: | 4328 & 4330 | |||
| Total Area: | 32,908 sq m | |||
|
We have also had sight of the Draft Red Flag Legal Report prepared by Loyens Loeff, dated 12 February 2021. Based on the information provided, we understand the property is held freehold.
We understand that prior written permission from the municipality Aalsmeer is required for transfer and encumbrance of the Property in case the obligation to build the structures according the approved plans of the municipality of Aalsmeer have not been finished before 16 October 1978. This provision was included in a deed dated 30 December 1976. Once the building obligation has been fulfilled, permission for transfer is no longer required. We therefore assume this requirement no longer exists.
We have assumed that there are no onerous legal conditions affecting the property which have a material impact on our opinion of value.
|
||||
| INCOME PROFILE |
The subject property is partially let to 9 tenants on a WALL of 3.9 years. The vacancy equates to 333 metres office area, which equals 1.8% of the total lettable floor area. The ERV for the vacancy equates to € 28,305 per annum. The current rental income is € 791,092 per annum. The ERV for the leased part is estimated at € 1,010,200 per annum. We are therefore of the opinion the property is under-rented. The ERV for the entire property equates to € 1,038,325 per annum.
Tenant Burgers Carrosserie B.V. leases the majority of the property, 8,114 sq m and accounts for € 350,610 rent per annum, or 44% of the total rental income.
Burgers Carrosserie B.V. is specialised in fabrication of closed trailers for transport. The company has three locations in the Netherlands and coordinates subsidiaries in France, Germany, Germany, Belgium and Italy. We are of the opinion Burgers Carrosserie B.V. is an established international business. We are not aware of any insolvency of the tenant.
|
VALUATION CONSIDERATIONS
|
COSTS AND
|
Based on the information provided or our knowledge of the market, in approaching our valuation, we made allowances for the following capital and non-recoverable costs. In all cases, we have cited whether they are deducted as at the date of valuation or whether they take effect at a later date.
|
| ON BEHALF OF: | MORGAN STANLEY |
| PROJECT NAME: | MSTAR |
|
deducted as at the date of valuation or whether they take effect at a later date.
|
|||||
| Capital Expenditure: | |||||
| Type & Calculation | Source | Effective | Amount | ||
| Capital Expenditure: Fixed Amount | Technical Due Diligence |
On Valuation
No Repeat |
€ 166,875 | ||
| Letting Fees: 15% of Rental Value of the vacant space | CBRE Estimate |
On lease start / renewal No Repeat |
€ 4,246 | ||
| Rent Free - Burgers Carrosserie B.V. | Borrower Estimate | Borrower Estimate | € 14,187 | ||
| Rent Free - Marine Trading International B.V. | Borrower Estimate | Borrower Estimate | € 2,000 | ||
| TOTAL ON VALUATION | €187,308 | ||||
| Revenue Deductions: | |||||
| Type & Calculation | Source | Effective | Annual Amount | ||
| Management: 2% of ERV | CBRE estimate |
On Valuation In perpetuity |
€ 16,388 | ||
| Property tax: 2% of ERV | CBRE estimate |
On Valuation In perpetuity |
€ 20,767 | ||
| Water tax: 0.25% of ERV | CBRE estimate |
On Valuation In perpetuity |
€ 2,596 | ||
| Insurance: 1.25% of ERV | CBRE estimate |
On Valuation In perpetuity |
€ 12,979 | ||
| Sewage charge: 0.25% of ERV | CBRE estimate |
On Valuation In perpetuity |
€ 2,596 | ||
| Maintenance: € 4.00 per sq m | Borrower Estimate |
5 Year Delay In perpetuity |
€ 71,356 | ||
| Void Costs: 2% of ERV | Borrower Estimate |
On Valuation On All Voids |
€ 566 | ||
|
TOTAL: ON VALUATION |
€ 55,892 | ||||
| ON BEHALF OF: | MORGAN STANLEY |
| PROJECT NAME: | MSTAR |
|
Void and Rent-Free Allowances:
Regarding the vacant unit, we have allowed for a current void period of 12 months.
Regarding the let units, we have not allowed for an expiry void. We have not received information regarding the termination of prolongation of these leases, however given the characteristics of the property and location together with market conditions, we consider this expiry void allowance not to be appropriate.
|
|
VALUATION METHODOLOGY
|
We have made the following rental assumptions having regard to the lettings agreed within the subject property, whilst also considering rental rates in the surrounding area: |
| Unit | Area (s qm) | ERV (€) per S qm (annum) |
Rent pa (€) | ||
| Office | 1,906 | 85 | 162,010 | ||
| Warehouse | 15,933 | 55 | 876,315 | ||
| Total | 17,839 | 58 | 1,038,325 |
|
Opinion of Market Rent
Based on the below-mentioned comparable transactions, the current market trends and our general market knowledge, we have estimated the above-mentioned rental values for the areas in the subject property. The below appended comparables indicate a (blended) range from € 55 per sq m per annum to € 97 per sq m per annum.
Within the evidence table appended, we would highlight the property at the Pesetaweg 77, Nieuw Vennep as the best comparable and therefore of greatest relevance in terms of location, albeit the quality of the reference is superior.
The aforementioned rental values produce a total gross rental value of € 1,038,325 per annum or an average of circa € 58 per sq m. The agreed rental income amounts to € 791,092 per annum or an average of circa € 44 per sq m. We are of the opinion that the subject property is under-rented.
Opinion of Valuation Yields
Currently, we witness downward pressure on net initial yields for prime logistics properties due to the high scarcity of good, long leased logistics properties.
Indicative net initial yields for prime logistics property are currently quoting 3.5% and 5.5% for prime industrial estates. Due to favourable dynamics in the occupier market in the Netherlands, with prospects for production and export growth in mind and taking into account the capital available for (real
|
| ON BEHALF OF: | MORGAN STANLEY |
| PROJECT NAME: | MSTAR |
| estate) investments, investor appetite is expected to increase further. This is also expected to put further downward pressure on yields. | ||
| Within the evidence table appended, we would highlight the following. The lower end of the yield range is indicated by the property located at Melbournestraat 50-68 in Rotterdam. Quality and characteristics of this asset are superior compared to the subject property. | ||
| The middle of the range is highlighted by the property located in Berchvliet, Amsterdam. The subject property has a more favourable location but the office/warehouse ratio results in inferior leasing conditions. Overall a similar yield profile is applicable in our opinion. | ||
| We have arrived at our opinion of Market Value through adopting the traditional investment capitalisation method of valuation. Within this approach, we apply an income weighted average equivalent yield to our opinion of net income, reflecting the comparable evidence within the market for guidance on capital rates and values per sq m. The NIY’s of the comparable investments range from 5.14% to 6.16% and also taking into account the current market conditions and the WAULT to expiry by current income of 3.9 years, we have adopted a split yield approach, targeting the following rates: | ||
| - Vacant = 7.00% | ||
| - Let = 6.00% | ||
| The approach results in a blended equivalent yield of 6.02% and NIY of circa 5.10% which reflects a capital rate per sq m of € 741, after allowing for purchaser’s costs equating to 9%. | ||
| On the assumption that there are no unusual factors of which we are unaware and on the basis of the comments and assumptions specified in this report, CBRE is of the opinion that the Market Value (rounded) of the subject property, is: | ||
| € 13,225,000 | ||
| (Thirteen million two hundred twenty five thousand Euro) | ||
| The unrounded net capital value is € 13,236,056. The gross unrounded capital value is € 14,610,363 including € 1,191,244 purchaser's costs(9.00%). | ||
|
VALUATION ETHODOLOGY – VACANT POSSESSION VALUE |
The constituent inputs in terms of rental value and non-recoverable costs largely align with the Market Value approach. The key exception being that we have adopted a special assumption that the property is 100% vacant/non-income producing as at the valuation date. This value is predominantly derived using the traditional investment method of valuation but critically benchmarking the resultant capital rate per sq m against the prevailing evidence. | |
| In approaching our valuation under the Special Assumption that the property is entirely vacant (Vacant Possession Value), we have adopted a total void |
| ON BEHALF OF: | MORGAN STANLEY |
| PROJECT NAME: | MSTAR |
| period of 12 months inclusive of rent free or tenant incentives and targeted an equivalent yield of 7%. | ||
| This results in a net rounded value of €11,100,000, equating to €622 per sq m. | ||
|
ESTIMATED REINSTATEMENT ASSESSMENT |
The property has not been inspected by a suitably qualified building surveyor from CBRE, nor have we carried out a full Reinstatement Cost Assessment. For indicative purposes only we estimate that the reinstatement cost of insurance purposes would be in the region of €21,290,000 (rounded, excl. VAT) on a day one basis, including fees but excluding VAT and inflation. | |
| This figure should be compared with the current sum insured and if a material discrepancy exists we suggest that a full Reinstatement Cost Assessment is carried out. |
| ON BEHALF OF: | MORGAN STANLEY |
| PROJECT NAME: | MSTAR |
| RENTAL EVIDENCE | |||||||||
| PROPERTY ADDRESS | PROPERTY USE | DATE | TOTAL AREA | TENANT | LEASE LENGTH (YEARS) | BREAK OPTION | RENT (P.A) | RENTAL RATE PER SQ M | RELATIVE QUALITY |
| Pesetaweg 77, Nieuw Vennep | Industrial | 2020, August | 726 | Golicia Transpo | not available | not available | 50,000 | 69 | Superior quality, similar location. |
| Rietschans 3, Leiderdorp | Industrial | 2019, July | 2,000 | zeeuw & zeeuw autodealer | not available | not available | 110,000 | 55.00 | Better quality asset, inferior location. |
| Hoofddorp, Daalmeerstraat 15 | Industrial | 2019, December | 755 | backbone | not available | not available | 51,060 | 68 | Superior quality, similar location. |
| Lireweg 15, Nieuw- Vennep | 2020, December | 2,776 | Stichting Probiblio | not available | not available | 158,620 | 57 | Similar quality and location. | |
ON BEHALF OF: |
MORGAN STANLEY |
| PROJECT NAME: | MSTAR |
| SALES EVIDENCE | |||||||||
| PROPERTY ADDRESS | PROPERTY USE | DATE | TOTAL AREA | WAULT (YEARS) | PASSING RENT PER ANNUM | PURCHASE PRICE | NET INITIAL YIELD (%) | CAPITAL RATE PER SQ M | RELATIVE QUALITY |
|
Melbournestraat 50-68, Sydneystraat 32-56, Rotterdam |
Industrial/Logistics | 17-03-2020 | 5,354 | 2.5 | 401,144 | 6,587,000 | 5.14% | 1,230 | During the transaction, the property was fully let to eleven tenants on a WALL of 2.5 years. The property is slightly under rented, the equivalent yield equates to 5.08. Due to the leasehold situation of the reference property a softer yield for the subject property is appropriate. |
| Berchvliet 3-13, Sierenborch 1, Amsterdam | Industrial/Logistics | 20-02-2020 | 6,108 | 3.7 | 549,164 | 8,075,000 | 5.80% | 1,322 | During the transaction, the property was fully let on a WALL of 3.7 years. The equivalent yield amounts to 5.80%. Better location but worse office to warehouse ratio. On balance, slightly higher yield to reflect location. |
| Jan Van Krimpenweg 1 + 21-26, Haarlem | Industrial/Logistics | 19-10-2020 | 10,503 | 1.0 | 621,655 | 8,400,000 | 6.16% | 800 | This transaction was part of the Vinvest portfolio. During the transaction, the property was fully let to multiple tenants on a weighted average WALL of 7.25 years. The property is in our opinion, slightly under rented (11.56%). The gross initial yield |
| ON BEHALF OF: | MORGAN STANLEY |
| PROJECT NAME: | MSTAR |
| equates to 7.40%. The location and quality of the reference are less. A sharper yield is in our opinion appropriate for the subject property. | |||||||||
| Spectrumlaan 5, Bleiswijk | Industrial/Logistics | 15-04-2020 | 8,641 | 2.2 | 557,770 | 8,000,000 | 6.00 | 926 | The reference property is let to Cemex Trescon B.V. with a remaining lease term of 2.2 years. We are of the opinion that, the property is slightly over-rented (approximately 3%). The equivalent yield equates to 5.8%. In our opinion a similar yield profile is appropriate for the subject property considering location and occupancy. |
| PROPERTY ID: | nlmonp - Mon Plaisir 102-104 | |
| ON BEHALF OF: | MORGAN STANLEY | |
| VALUATION DATE: | 01-Feb-2021 | FINAL |
Mon Plaisir 102-104 - Mon Plaisir 102-104, Etten-Leu, 4879 AT, Netherlands
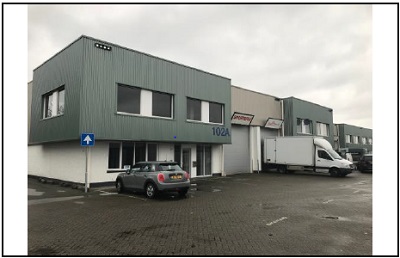 |
 |
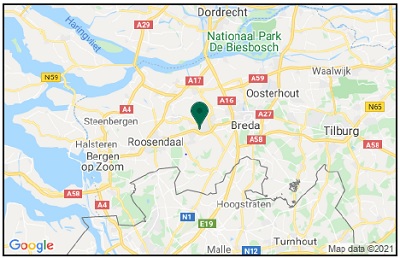 |
 |
| VALUATION METRICS | (currency - EUR) |
|
Metric |
Value |
| Market Value | 3,130,000 |
| Market Value (per sq m) | 547 |
| Net Initial Yield | 5.46% |
| Reversionary Yield | 6.86% |
| Equivalent Yield | 6.92% |
| Gross Income (p.a.) | 202,036 |
| Gross Income (p.a.) (per sq m) | 35 |
| *Adj. Gross Income | 202,036 |
| Adj. Gross Income (per sq m) | 35 |
| Net Income (p.a.) | 186,164 |
| Net Income (p.a.) (per sq m) | 33 |
| Gross Rental Value | 272,585 |
| Gross Rental Value (per sq m) | 48 |
| Capital Expenditure | -14,762 |
| Transaction Costs | 9.00% |
| Over / Under Rented | 5.15% |
| KEY FACTS | ||
| Metric | Value | |
| Total Area (sq m) | 5,723 | |
| WAULT to Break by Rent | 1.54 | |
| WAULT to Break by ERV | 1.49 | |
| WAULT to Expiry by Rent | 1.54 | |
| WAULT to Expiry by ERV | 1.49 | |
| Percentage of Vacancy (Area) | 29.20% | |
| Percentage of Vacancy (ERV) | 29.51% | |
| ** | Number of Tenants | 12 |
| Current Voids (months) | 12 | |
| * Adjusted Gross Income equates to the Gross Income excluding any rent free periods | |
| LEASES RANKED BY RENT | ** Total tenant lines within our valuation. May differ to number of individual tenants |
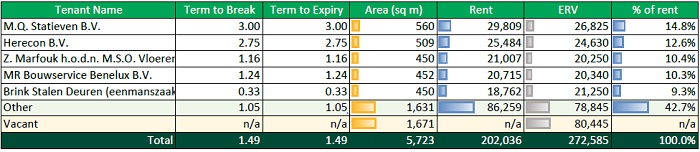
|
Printed 09/03/2021 19:48 |
|
| ROPERTY ID: | nlmonp - Mon Plaisir 102-104 | |
| ON BEHALF OF: | MORGAN STANLEY | |
| VALUATION DATE: | 01-Feb-2021 | FINAL |

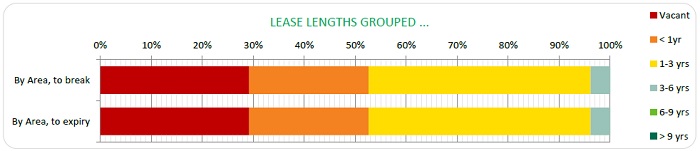
|
Printed 09/03/2021 19:48 |
|
ON BEHALF OF: |
MORGAN STANLEY |
| PROJECT NAME: | MSTAR |
PROPERTY REPORT
MON PLAISIR 102-104, ETTEN-LEUR, NETHERLANDS
| INSPECTED BY: | INSPECTION DATE: | VALUATION DATE: | PROPERTY TYPE |
| J. BAKKER | 14-01-2020 | 1 FEBRUARY 2021 | INDUSTRIAL WAREHOUSE |
KEY VALUATION FACTORS
| STRENGTHS | WEAKNESSES | ||
| ■ | Multi-tenanted | ■ | Not located in a G-4 city |
| ■ | Accessibility | ||
| ■ | Quality | ||
| OPPORTUNITIES | THREATS | ||
| ■ | Increasing investor appetite | ■ | Macro-economic uncertainty(i.e. COVID-19; Trade Wars; Brexit) |
| ■ | Extend lease term with current tenants | ||
| ■ | Leasing out vacant space |
| LOCATION & SITUATION | ||
| LOCATION | Etten-Leur is a middle-sized town of around 41,000 inhabitants with an area of approximately 55 square kilometres, located in the South of the Netherlands in the province of North Brabant. It can be seen as an established location in the Netherlands for distribution companies, particularly for those serving the France/Belgium/Germany markets and wish to be close to Rotterdam. The city is surrounded by a network of motorways and consequently is good accessible by car. Going West, the A58 (Etten-Leur-Roosendaal) links Etten- Leur with the A17 (Roosendaal-Moerdijk) and to the east side the A58 links Etten-Leur with the A16 (Rotterdam-Breda-Antwerp), the A2 (Amsterdam- Eindhoven-Maastricht) and the A67 (Antwerp-Eindhoven-Venlo) to Belgium/France and Germany respectively. | |
| The distance from Etten-Leur to other major cities are: Amsterdam: 120 kilometres, Rotterdam: 55 kilometres and Antwerp: 60 kilometres. | ||
ON BEHALF OF: |
MORGAN STANLEY |
| PROJECT NAME: | MSTAR |
| PROPERTY DESCRIPTION | |||
| DESCRIPTION | The subject property is located at Mon Plaisir 102-104 in Etten-Leur and is a light industrial complex located in the “Vosdonk-Zuid” Business Park, near to the A58 motorway from Bergen op Zoom to Breda. The subject property comprises a total of 5,685 sq m. The property consists of 15 separate units, each between 218 and 888 sq m, divided into a warehouse and office space. Three units are vacant at the time of valuation. | ||
| The building was constructed in 1979. The warehouse is located on the ground floor, each unit benefit from an overhead door and has office space at the front side of the unit. The clear eaves of the warehouse is circa 6 metres. | |||
| Summary of known specification: | |||
| Characteristic | Result | ||
| Built / Renovation | 1979 | ||
| Eaves Height | 6 metres | ||
| No. of loading Doors | 1 per unit | ||
| Warehouse (% of GLA) | 93% | ||
| Source: Schedule provided by client. | |||
| ACCOMMODATION | We have not measured the property, but as instructed, we have relied upon floor areas made available to us, detailed below and elsewhere within this report. | ||
| Floor Areas | ||
| FLOOR / UNIT | USE | SQ M |
| Unit 102 A | Warehouse and office | 295 |
| Unit 102 B | Warehouse and office | 334 |
| Unit 102 C | Warehouse and office | 450 |
| Unit 102 D | Warehouse and office | 225 |
| Unit 102 E | Warehouse and office | 509 |
| Unit 102 F | Warehouse and office | 224 |
| Unit 102 G | Warehouse and office | 220 |
| Unit 102 H | Warehouse and office | 340 |
| Unit 104 | Warehouse and office | 450 |
| Unit 104 A | Warehouse and office | 450 |
| Unit 104 B | Warehouse and office | 219 |
| Unit 104 C | Warehouse and office | 218 |
| Unit 104 D | Warehouse and office | 888 |
| Unit 104 F | Warehouse and office | 452 |
| Unit 104/2B | Warehouse and office | 450 |
| TOTAL | - | 5,723 |
| ON BEHALF OF: | MORGAN STANLEY |
| PROJECT NAME: | MSTAR |
| DUE DILIGENCE | ||
| STATE OF REPAIR | CBRE have not undertaken a structural survey, nor tested the services. The property was subject to a limited inspection for the initial valuation purpose. | |
| At the time of our inspection, the property appeared to be in reasonable condition commensurate with its age, use and construction. | ||
| As you are aware, the property has not been re-inspected for the purposes of this report, nor have we been provided with updated TDD. We have therefore relied on the information provided by the Borrower, including a Capex schedule dated 12 June 2019 and schedule with revised budget of capex dated 19 January 2021. Based on the latter which indicates TDD assessment less completed spend in 2020, we have not included any associated capex within the coming 5 year period. | ||
| ENVIRONMENTAL CONSIDERATIONS | We have been instructed not to make any investigations in relation to the presence or potential presence of contamination in land or buildings, or the potential presence of other environmental risk factors and to assume that if investigations were made to an appropriate extent, then nothing would be discovered sufficient to affect value. | |
| We have summarised the findings from a schedule provided in relation to ‘Priority sites’ within the front section of this report. | ||
| We have relied on the information provided by the Borrower, including Draft Phase 1 Environmental Review prepared by Ambiente Ltd and dated December 2019. The report summarises that the soil appeared in good condition. | ||
| We have not carried out investigation into past uses, either of the properties or of any adjacent lands, to establish whether there is any potential for contamination from such uses or sites, or other environmental risk factors and have therefore assumed that none exists. | ||
| ON BEHALF OF: | MORGAN STANLEY |
| PROJECT NAME: | MSTAR |
| TENURE | According to the information available from the Land Registry Office (Kadaster) the parcels are held freehold by MLET Netherlands 2 Holding B.V. and registered as follows: | |
| Municipality: Etten-Leur | ||
| Section: H | ||
| Numbers: 4097 | ||
| Total Area: 10,808 sq m | ||
| We have also had sight of the Draft Red Flag Legal Report prepared by Loyens Loeff, dated 12 February 2021. Based on the information provided, we understand the property is held freehold. | ||
| We have assumed that there are no onerous legal conditions affecting the property which have a material impact on our opinion of value. | ||
| INCOME PROFILE | The subject property is partially let to 14 tenants on a WALL of 1.8 years. There are three units vacant with a total area of 1,671 sq m. The current rental income is € 202,036 per annum. The ERV for the leased part is estimated at € 192,140 per annum, we are therefore of the opinion the property is let at market rent. The ERV for the entire property equates to € 272,585 per annum. |
| VALUATION CONSIDERATIONS | ||||||
| COSTS AND ADJUSTMENTS | Based on the information provided or our knowledge of the market, in approaching our valuation, we made allowances for the following capital and non-recoverable costs. In all cases, we have cited whether they are deducted as at the date of valuation or whether they take effect at a later date. | |||||
| Capital Expenditure: | ||||||
| Type & Calculation | Source | Effective | Amount | ||
| Capital Expenditure: Fixed Amount |
Technical Due Diligence |
On Valuation No Repeat |
€ 0 | ||
| Letting Fees: 15% of Rental Value of the vacant space |
CBRE Estimate | On lease start / renewal No Repeat |
€ 12,067 | ||
| Rent Free: Fixed Amount |
Rent Roll | On Valuation No Repeat |
€ 2,695 |
| ON BEHALF OF: | MORGAN STANLEY |
| PROJECT NAME: | MSTAR |
| TOTAL ON VALUATION |
€ 14,762 | |||||
| Revenue Deductions: | ||||||
| Type & Calculation | Source | Effective | Annual Amount | |||
| Management: 2% of ERV |
CBRE estimate | On Valuation In perpetuity |
€ 5,650 | |||
| Property tax: 2% of ERV |
CBRE estimate |
On Valuation In perpetuity
|
€ 5,452 | |||
| Water tax: 0.25% of ERV |
CBRE estimate | On Valuation In perpetuity |
€ 681 | |||
| Insurance: 1.25% of ERV |
CBRE estimate | On Valuation In perpetuity |
€ 3,407 | |||
| Sewage charge: 0.25% of ERV |
CBRE estimate | On Valuation In perpetuity |
€ 681 | |||
| Maintenance: € 4.00 per sq m |
Borrower Estimate |
5 Year Delay In perpetuity |
€ 22,892 | |||
| Void Costs: 2% of ERV |
Borrower Estimate |
On Valuation On All Voids |
€ 1,609 | |||
| TOTAL: ON VALUATION |
€17,480 | |||||
| Void and Rent-Free Allowances: | ||||||
| Currently there are three vacant units and we have allowed for 6 months of current void. We are of the opinion re-lettability is good and have therefore not allowed for a future void period for the running leases. | ||||||
| VALUATION METHODOLOGY – MARKET VALUE |
We have made the following rental assumptions having regard to the lettings agreed within the subject property, whilst also considering rental rates in the surrounding area: | |||||
| Unit | Area (s qm) | ERV (€) per S qm (annum) |
Rent pa (€) | ||
| Office | 532 | 70 | 37,240 | ||
| Warehouse | 5,153 | 45 | 231,885 | ||
| Total | 5,685 | 48 | 272,585 | ||
| Opinion of Market Rent | |||||
| ON BEHALF OF: | MORGAN STANLEY |
| PROJECT NAME: | MSTAR |
| Based on the below-mentioned comparable transactions, the current market trends and our general market knowledge, we have estimated the above- mentioned rental values for the areas in the subject property. The below appended comparables indicate a (blended) range from € 44 per sq m per annum to € 49 per sq m per annum. | ||
| Within the evidence table appended, we would highlight the property in Breda as best comparable and therefore of greatest relevance in terms of similar appearance, state of repair, eaves height and location close to the border. | ||
| The aforementioned rental values produce a total gross rental value of € 272,585 per annum or an average of circa € 48 per sq m. The agreed rental income amounts to € 202,036 per annum or an average of circa € 35 per sq m per annum. Taken into account the ERV of the vacant space we are of the opinion that the subject property is more or less at market rent. | ||
| Opinion of Valuation Yields | ||
| Currently, we witness downward pressure on net initial yields for prime logistics properties due to the high scarcity of good, long leased logistics properties. | ||
| Indicative net initial yields for prime logistics property are currently quoting 4.0%. Due to favourable dynamics in the occupier market in the Netherlands, with prospects for production and export growth in mind, and taking into account the capital available for (real estate) investments, investor appetite is expected to increase further. This is also expected to put further downward pressure on yields. | ||
| Within the evidence table appended, we would highlight the following. The lower end of the yield range is indicated by the property located in Tiel. As this property is located at a better location and has a long WAULT, we have allowed for a higher yield profile for the subject property. | ||
| The middle of the range is highlighted by the property located in Rotterdam. Since the subject property has a similar WAULT and building quality we allowed for a comparable yield profile despite the favourable location of the reference property. | ||
| We have arrived at our opinion of Market Value through adopting the traditional investment capitalisation method of valuation. Within this approach, we apply an income weighted average equivalent yield to our opinion of net income, reflecting the comparable evidence within the market for guidance on capital rates and values per sq m. The NIY’s of the comparable investments range from 6.90% to 8.20% and also taking into account the current market conditions and the WAULT to expiry by current income of 1.8 years, we have adopted a split yield approach, targeting the following rates: | ||
| - Let = 6.75% | ||
| - Vacant = 7.25% | ||
| ON BEHALF OF: | MORGAN STANLEY |
| PROJECT NAME: | MSTAR |
| The approach results in an equivalent yield of 6.92% and NIY of 5.46% which reflects a capital rate per sq m of € 547, after allowing for purchaser’s costs equating to 9%. | ||
| On the assumption that there are no unusual factors of which we are unaware and on the basis of the comments and assumptions specified in this report, CBRE is of the opinion that the Market Value (rounded) of the subject property, is: | ||
| € 3,130,000 | ||
| (Three million one hundred thirty thousand Euros) | ||
| The unrounded net capital value is € 3,128,408. The gross unrounded capital value is € 3,424,727 including € 281,557, purchaser's costs (9.00%). | ||
| VALUATION METHODOLOGY – VACANT POSSESSION VALUE |
The constituent inputs in terms of rental value and non-recoverable costs largely align with the Market Value approach. The key exception being that we have adopted a special assumption that the property is 100% vacant/non-income producing as at the valuation date. This value is predominantly derived using the traditional investment method of valuation but critically benchmarking the resultant capital rate per sq m against the prevailing evidence. | |
| In approaching our valuation under the Special Assumption that the property is entirely vacant (Vacant Possession Value), we have adopted a total void period of 12 months inclusive of rent free or tenant incentives and targeted an equivalent yield of 7.25%. | ||
| This results in a net rounded value of €2,770,000, equating to €484 per sq m. | ||
| ESTIMATED REINSTATEMENT ASSESSMENT |
The property has not been inspected by a suitably qualified building surveyor from CBRE, nor have we carried out a full Reinstatement Cost Assessment. For indicative purposes only we estimate that the reinstatement cost of insurance purposes would be in the region of €8,815,000 (rounded, excl. VAT) on a day one basis, including fees but excluding VAT and inflation. | |
| This figure should be compared with the current sum insured and if a material discrepancy exists we suggest that a full Reinstatement Cost Assessment is carried out. |
| ON BEHALF OF: | MORGAN STANLEY |
| PROJECT NAME: | MSTAR |
RENTAL EVIDENCE
| PROPERTY ADDRESS | PROPERTY USE | DATE | TOTAL AREA | TENANT | LEASE LENGTH (YEARS) | BREAK OPTION | RENT (P.A) | RENTAL RATE PER SQ M | RELATIVE QUALITY |
| Oude Baan 14, Breda | Industrial | 2020, April | 385 | Party express | not available | not available | 18,000 | 47 | Better location, building quality less. Similar rental value. |
| Mineverum 7485, Breda | Industrial | 2020, February | 975 | Lu-ve groothandel | not available | not available | 51,000 | 52 | Better location, similar building quality. Higher rental value. |
| Nijverheidsweg 148, Etten Leur | Industrial | 2019, July | 8.880 | red river-v eck eetbare zadenspecialist | not available | not available | 435.000 | 48,99 | Better quality but a larger scale unit which will results in a similar rental value. |
| Minervum 7226, Breda | Industrial | 2019, March | 1.077 | jr sportpromotions | not available | not available | 48.000 | 44,57 | Better location but a larger scale unit which will overall results in a similar rental value. |
| ON BEHALF OF: | MORGAN STANLEY |
| PROJECT NAME: | MSTAR |
SALES EVIDENCE
| PROPERTY ADDRESS | PROPERTY USE | DATE | TOTAL AREA | WAULT (YEARS) | PASSING RENT PER ANNUM | PURCHASE PRICE | NET INITIAL YIELD (%) | CAPITAL RATE PER SQ M | RELATIVE QUALITY |
| Graafstroomstraat 51, Rotterdam | Industrial/Logistics | 5-6- 2019 | 1.820 | 1,3 | 149.091 | 1.775.000 | 7,85% | 975 | During transaction the property was fully let to 14 tenants on a WALL of circa 1.3 years. In our opinion the ERV equates to € 182,000 per annum. The property is therefore in our opinion under rented. The location is better as indicated by the capital rate per sq m. |
| Visserijweg 2, Oosterhout | Industrial/Logistics | 19-10- 2020 | 2,925 | 5.3 | 132,776 | 1,800,000 | 7.38% | 615 | During transaction the property was fully let on a WALL of circa 5.3 years. In our opinion the property is slightly under rented. Due to the difference in building quality we expect a sharper yield |
| ON BEHALF OF: | MORGAN STANLEY |
| PROJECT NAME: | MSTAR |
| at the subject property. | |||||||||
| Oudewei 4, Tiel | Industrial/Logistics | 26-7- 2019 | 9.821 | 4,9 | 464.268 | 6.325.000 | 6,86% | 644 | During transaction the property was fully let to one tenant with a remaining lease period of 4.9 years. The property is considered to be over rented by circa 6.8%. The location is considered better, the building quality is better as well but the market has improved since this transaction. We expect a slightly higher capital rate per sqm for this asset. |
| Delta-Industrieweg 38, 40, 42, Stellendam | Industrial/Logistics | 19-6- 2019 | 9.407 | 1,4 | 305.967 | 3.500.000 | 8,17% | 372 | The property is currently fully let, although one of the larger tenants (Horeca Handelsonderneming Delta) has served notice to vacate. This tenant occupies |
| ON BEHALF OF: | MORGAN STANLEY |
| PROJECT NAME: | MSTAR |
| 3,000 sq m and is paying less than €30 psm. Our opinion of the ERV equates to € 40 per sq m and therefore this offers reversionary potential for this asset. The NIY equates to 8.17% and the WALL is 1.4 remaining years. Due to the difference in WAULT and location we expect a lower yield at the subject property. |
| PROPERTY ID: | nlnieu - Nieuwe Hemweg 20-62 | |
| ON BEHALF OF: | MORGAN STANLEY | |
| VALUATION DATE: | 01-Feb-2021 | FINAL |
| Nieuwe Hemweg 20-62 - Nieuwe Hemweg 20-62, Amsterdam, 1013 CX, Netherlands |
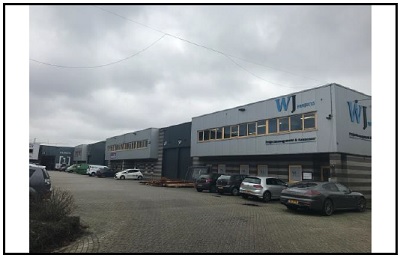 |
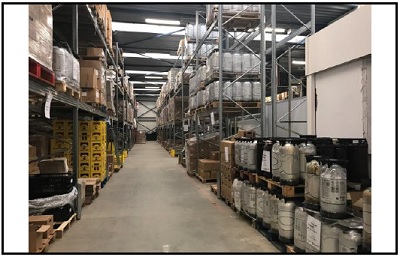 |
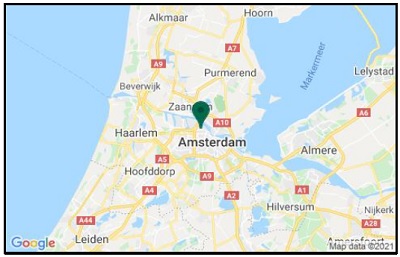 |
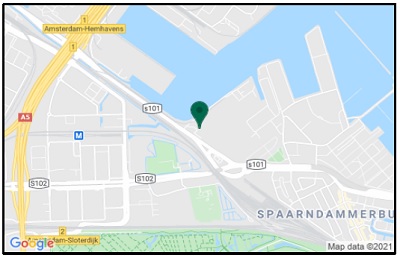 |
| VALUATION METRICS | (currency - EUR) |
| Metric | Value |
| Market Value | 14,425,000 |
| Market Value (per sq m) | 1,213 |
| Net Initial Yield | 4.30% |
| Reversionary Yield | 5.50% |
| Equivalent Yield | 5.25% |
| Gross Income (p.a.) | 1,010,891 |
| Gross Income (p.a.) (per sq m) | 85 |
| *Adj. Gross Income | 1,010,891 |
| Adj. Gross Income (per sq m) | 85 |
| Net Income (p.a.) | 676,411 |
| Net Income (p.a.) (per sq m) | 57 |
| Gross Rental Value | 1,250,860 |
| Gross Rental Value (per sq m) | 105 |
| Capital Expenditure | -330,084 |
| Transaction Costs | 9.00% |
| Over / Under Rented | -19.18% |
| KEY FACTS | ||
| Metric | Value | |
| Total Area (sq m) | 11,893 | |
| WAULT to Break by Rent | 3.36 | |
| WAULT to Break by ERV | 3.30 | |
| WAULT to Expiry by Rent | 3.36 | |
| WAULT to Expiry by ERV | 3.30 | |
| Percentage of Vacancy (Area) | 0.00% | |
| Percentage of Vacancy (ERV) | 0.00% | |
| ** | Number of Tenants | 22 |
| Current Voids (months) | - |
* Adjusted Gross Income equates to the Gross Income excluding any rent free periods
** Total tenant lines within our valuation. May differ to number of individual tenants
LEASES RANKED BY RENT
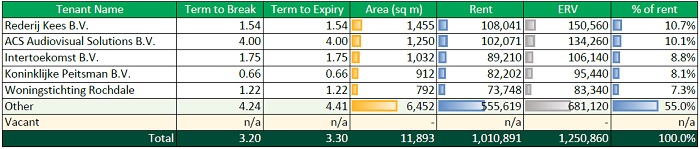 |
| Printed 09/03/2021 19:48 | |
| PROPERTY ID: | nlnieu - Nieuwe Hemweg 20-62 | |
| ON BEHALF OF: | MORGAN STANLEY | |
| VALUATION DATE: | 01-Feb-2021 | FINAL |
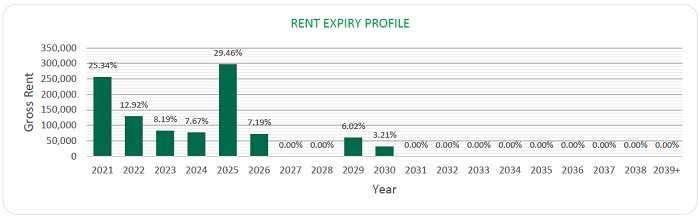 |
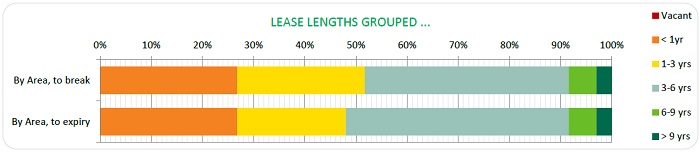 |
| Printed 09/03/2021 19:48 | |
| ON BEHALF OF: | MORGAN STANLEY |
| PROJECT NAME: | MSTAR |
PROPERTY REPORT
NIEUWE HEMWEG 20-62, AMSTERDAM, NETHERLANDS
| INSPECTED BY: | INSPECTION DATE: | VALUATION DATE: | PROPERTY TYPE |
| DEVIN UMMELS | 14 JANUARY 2019 | 1 FEBRUARY 2021 | INDUSTRIAL WAREHOUSE |
KEY VALUATION FACTORS
| STRENGTHS | WEAKNESSES | |
|
■ Location
■ Fully let
■ Multi-tenanted
|
■ Slightly dated
|
|
| OPPORTUNITIES | THREATS | |
|
■ Increasing investor appetite
■ Extend .lease .term .with current tenants
|
■ Macro-economic .uncertainty .(i.e. .Trade .Wars; Brexit)
■ Relatively short WALL may result in future vacancy
|
LOCATION & SITUATION
| LOCATION |
The subject property is located in Amsterdam. Amsterdam has a population of approximately 850,000 within the city, 1,343,000 in the urban area, and 2,431,000 in the Amsterdam metropolitan area. The city is currently the cultural capital of the Netherlands and is one of the most popular tourist destinations in Europe. Amsterdam is also the financial and business capital of The Netherlands and one of the most important cities in Europe in which to do business. Many large Dutch corporations and banks have their headquarters in Amsterdam, including ABN Amro, Heineken, ING Group, Ahold, Delta Lloyd Group and Philips. Amsterdam is the second largest harbour of the Netherlands. Amsterdam can be reached by A1(Amsterdam - German border), A2 (Amsterdam - Maastricht), A4(Amsterdam - Rotterdam) and A8(Amsterdam - Zaandijk). Amsterdam benefits from ten train stations with international train lines as well. There is a good connection to Schiphol international airport. Additionally, there are regional and local bus lines, metro lines and tram lines offering services in and around the municipality of
|
| ON BEHALF OF: | MORGAN STANLEY |
| PROJECT NAME: | MSTAR |
|
Amsterdam. Amsterdam's population is growing more rapidly than expected. Amsterdam is an international city and a lot of foreigners live in in the city.
|
PROPERTY DESCRIPTION
| DESCRIPTION |
The subject property comprises a multi-let estate located close to the motorways A13 and A20, near the zoo Diergaarde Blijdorp. The property comprises 18,143 sq m which is divided into 3,840 sq m office space and 14,303 sq m of warehouse space. The property consists of 3 separate buildings, of which some units have been combined. Furthermore, there is a large advertising pole located on the plot.
The building was constructed in 1983, the office is divided over a ground and first floor. The warehouse is located on the ground floor, the clear height of the warehouse is circa 6 metres.
|
||
| Summary of known specification: | |||
| Characteristic | Result | ||
| Eaves Height | 7.2 metres | ||
| Warehouse (% of LFA) | 74% | ||
| Site Coverage Ratio | 71% | ||
|
Source: Inspection/BAG Viewer/Kadaster
|
|||
| ACCOMMODATION | We have not measured the property, but as instructed, we have relied upon floor areas made available to us, detailed below and elsewhere within this report. |
Floor Areas
| TENANT | UNIT | USE | SQ M |
| Yagmur Organisatie B.V. | Unit 34 | Office and Warehouse | 421 |
| Woningstichting Rochdale | Unit 48 | Office and Warehouse | 347 |
| Woningstichting Rochdale | Unit 46 | Office and Warehouse | 445 |
| WJ Projects B.V. | Unit 50 | Office and Warehouse | 567 |
| v.o.f. Rerags | Unit 44 | Office and Warehouse | 453 |
| USS Handelsmaatschappij B.V. | Unit 28 | Office and Warehouse | 445 |
| Rexel Nederland B.V. | Unit 38 | Office and Warehouse | 424 |
| Rederij Kees B.V. | Unit 42 | Office and Warehouse | 1,033 |
| Rederij Kees B.V. | Unit 40 | Office and Warehouse | 422 |
| Mooij Verf B.V. | Unit 62 | Office and Warehouse | 695 |
| Koninklijke Peitsman B.V. | Unit 56 & 58 | Office and Warehouse | 912 |
| Intertoekomst B.V. | Unit 20 | Office and Warehouse | 1,032 |
| Inbouw Centrum Randstad (ICR) V.O.F | Unit 30 | Office and Warehouse | 445 |
| ON BEHALF OF: | MORGAN STANLEY |
| PROJECT NAME: | MSTAR |
| IJzer Parket B.V. | Unit 54 | Office and Warehouse | 347 |
| HGI.Glas Bewerking B.V. | Unit 32 | Office and Warehouse | 885 |
| Gapph B.V. (Nieuwe Hemweg) | Vacancy management | Office and Warehouse | 0 |
| FormX v.o.f. | Unit 60 | Office and Warehouse | 347 |
| Destil B.V. | Unit 52 | Office and Warehouse | 646 |
| D.L. .Sedgwick .en .L. .Wenneker .h.o.d.n. Friedhats Coffee V.O.F. | Unit 36 | Office and Warehouse | 421 |
| Carrier 2 (Holding) B.V. | Unit 26 | Office and Warehouse | 356 |
| ACS Audiovisual Solutions B.V. | Unit 24 | Office and Warehouse | 512 |
| ACS Audiovisual Solutions B.V. | Unit 22 | Office and Warehouse | 738 |
| TOTAL | - | 11,893 |
DUE DILIGENCE
| STATE OF REPAIR |
CBRE have not undertaken a structural survey, nor tested the services. The property was subject to an inspection for valuation purposes in early 2020. As you are aware, the property has not been re-inspected for the purposes of this report, nor have we been provided with updated TDD. We have therefore relied on the information provided by the Borrower, including a Capex schedule dated 12 June 2019 and schedule with revised budget of capex dated 19 January 2021. Based on the latter which indicates TDD assessment less completed spend in 2020, we have included the immediate and 2-5 years capex of €176,000 within our valuation.
According to our own limited inspection for valuation purposes, our opinion regarding the state of repair would substantiate the assessment by Arcadis. Based on our impression gained during the inspection, we are of the opinion that the buildings are in a fair condition, in line with the year of construction.
|
| ENVIRONMENTAL CONSIDERATIONS |
We have been instructed not to make any investigations in relation to the presence or potential presence of contamination in land or buildings, or the potential presence of other environmental risk factors and to assume that if investigations were made to an appropriate extent, then nothing would be discovered sufficient to affect value.
We have summarised the findings from a schedule provided in relation to ‘Priority sites’ within the front section of this report.
We have relied on the information provided by the Borrower, including Draft Phase 1 Environmental Review prepared by Ambiente Ltd and dated December 2019. The report summarises that the environmental risk assessment identified a very low risk to site users and low risk to groundwater and surface water from historical and current activities at the site. The risk from off-site neighbouring light industrial uses is assessed as very low.
We have not carried out investigation into past uses, either of the properties or of any adjacent lands, to establish whether there is any potential for contamination from such uses or sites, or other environmental risk factors and have therefore assumed that none exists.
|
| ON BEHALF OF: | MORGAN STANLEY |
| PROJECT NAME: | MSTAR |
| TENURE |
We have assumed that there are no onerous legal conditions affecting the property which have a material impact on our opinion of value.
According to the information available from the Land Registry Office (Kadaster)the parcels are held leasehold from the Municipality of Amsterdam by Multi-Let Industrial Property 7 B.V. and registered as follows:
|
|||
| Municipality: | Amsterdam | |||
| Section: | AI | |||
| Numbers: | 346 & 500 | |||
| Total Area: | 17,891 sq m | |||
| Comments | ||||
|
■ The leasehold concerns a perpetual right.
■ The current terms started at 27 November 1990.
■ The current ground lease equates to € 188,705 per annum.
■ General terms Municipality of Amsterdam dated 18 August 1966 apply.
Based on the information provided, we understand the property is held leasehold.
|
||||
| INCOME PROFILE |
The subject property is fully let to 1 tenant on a WALL of 3.25 years. The current rental income is € 1,010,891 per annum. The ERV is estimated at € 1,250,860 per annum. We are therefore of the opinion the property is let market conform.
There are no specific tenants which account for a significant portion of the total rental income. Overall, we are of the opinion the income profile is good.
|
|||
VALUATION CONSIDERATIONS
|
COSTS AND
|
Based on the information provided or our knowledge of the market, in approaching our valuation, we made allowances for the following capital and non-recoverable costs. In all cases, we have cited whether they are deducted as at the date of valuation or whether they take effect at a later date. | ||||
| Capital Expenditure: | |||||
| Type & Calculation | Source | Effective | Amount | ||
| Capital Expenditure: Fixed Amount | Technical Due Diligence | On Valuation No Repeat | € 176,000 | ||
| Letting Fees: 15% of Rental Value of the vacant space | CBRE Estimate | On lease start/ renewal | - | ||
| ON BEHALF OF: | MORGAN STANLEY |
| PROJECT NAME: | MSTAR |
| No Repeat | |||||
| Rent Free: Fixed Amount | Rent Roll |
On Valuation No Repeat
|
€154,084 | ||
|
TOTAL ON VALUATION |
€ 330,084 | ||||
| Revenue Deductions: | |||||
| Type & Calculation | Source | Effective | Annual Amount | ||
| Management: 2% of ERV | CBRE estimate | On Valuation In perpetuity | € 20,218 | ||
| Property tax: 2% of ERV | CBRE estimate | On Valuation In perpetuity | € 25,017 | ||
| Water tax: 0.25% of ERV | CBRE estimate | On Valuation In perpetuity | € 3,127 | ||
| Insurance: 1.25% of ERV | CBRE estimate | On Valuation In perpetuity | € 15,636 | ||
| Sewage charge: 0.25% of ERV | CBRE estimate | On Valuation In perpetuity | € 3,127 | ||
| Maintenance: € 4.00 per sq m | Borrower Estimate | 5 Year Delay In perpetuity | € 47,572 | ||
| Void Costs: 2% of ERV | Borrower Estimate | On Valuation On All Voids | € 0 | ||
| Ground Rent: € 15.87 per sq m | Borrower Estimate | Post Valuation End of Event | € 267,355 | ||
|
TOTAL: ON VALUATION |
€ 330,084 |
|
Void and Rent-Free Allowances:
Currently there is no vacancy. We are of the opinion relatability is very good and have therefore not allowed for a future void period for the running leases.
|
|
VALUATION METHODOLOGY
|
We have made the following rental assumptions having regard to the lettings agreed within the subject property, whilst also considering rental rates in the surrounding area: |
| ON BEHALF OF: | MORGAN STANLEY |
| PROJECT NAME: | MSTAR |
| Unit | Area (s qm) |
ERV (€) per S qm (annum) |
Rent pa (€) | ||
| Office | 3,079 | 120 | 369,460 | ||
| Warehouse | 8,814 | 100 | 881,400 | ||
| Total | 11,893 | 105 | 1,250,860 |
|
Opinion of Market Rent
Based on the below-mentioned comparable transactions, the current market trends and our general market knowledge, we have estimated the above-mentioned rental values for the areas in the subject property. The below appended comparables indicate a (blended) range from € 75 per sq m per annum to € 112 per sq m per annum.
Within the evidence table appended, we would highlight the property in Lemelerbergweg Amsterdam as the best comparable and therefore of greatest relevance in terms of similar appearance, state of repair, eaves height and location layout. We do note that since this transaction, which is relatively dated, there has been upward pressure on market rents, signalled by the transactions at the Beiraweg and Bellsingel.
The aforementioned rental values produce a total gross rental value of € 1,250,860 per annum or an average of circa € 105 per sq m. The agreed rental income amount to € 1,010,891 per annum or an average of circa € 85 per sq m. We are of the opinion that the subject property is under rented.
Opinion of Valuation Yields
Currently, we witness downward pressure on net initial yields for prime logistics properties due to the high scarcity of good, long leased logistics properties.
Indicative net initial yields for prime logistics property are currently quoting 3.5% and 5.5% for prime industrial estates. Due to favourable dynamics in the occupier market in the Netherlands, with prospects for production and export growth in mind and taking into account the capital available for (real estate) investments, investor appetite is expected to increase further. This is also expected to put further downward pressure on yields.
Within the evidence table appended, we would highlight the following. The lower end of the yield range is indicated by the property located at Melbournestraat 50-68 in Rotterdam. Quality and characteristics of this asset are superior compared to the subject property. Therefore we anticipate the adopted equivalent yield and resultant capital rate per sq m to be within a range of being similar.
The middle of the range is highlighted by the property located in Berchvliet, Amsterdam. The subject property has a more favourable location but the office/warehouse ratio results in lesser leasing conditions. Overall a similar yield profile is applicable in our opinion.
|
| ON BEHALF OF: | MORGAN STANLEY |
| PROJECT NAME: | MSTAR |
| We have arrived at our opinion of Market Value through adopting the traditional investment capitalisation method of valuation. Within this approach, we apply an income weighted average equivalent yield to our opinion of net income, reflecting the comparable evidence within the market for guidance on capital rates and values per sq m. The NIY’s of the comparable investments range from 5.14% to 6.16% and also taking into account the current market conditions and the WAULT to expiry by current income of ca. 3.25 years, we have applied an equivalent yield of 5.25%. | ||
| The approach results in net initial yield of circa 4.30% which reflects a capital rate per sq m of € 1,213, after allowing for purchaser’s costs equating to 9%. | ||
|
On the assumption that there are no unusual factors of which we are unaware and on the basis of the comments and assumptions specified in this report, CBRE is of the opinion that the Market Value (rounded) of the subject property, is:
|
||
| € 14,425,000 | ||
| (Fourteen million four hundred twenty-five thousand Euros) | ||
| The unrounded net capital value is € 14,417,561. The gross unrounded capital value is € 16,045,226 including € 1,297,580 purchaser's costs (9.00%). | ||
| VALUATION METHODOLOGY – VACANT POSSESSION VALUE | The constituent inputs in terms of rental value and non-recoverable costs largely align with the Market Value approach. The key exception being that we have adopted a special assumption that the property is 100% vacant/non-income producing as at the valuation date. This value is predominantly derived using the traditional investment method of valuation but critically benchmarking the resultant capital rate per sq m against the prevailing evidence. | |
| In approaching our valuation under the Special Assumption that the property is entirely vacant (Vacant Possession Value), we have adopted a total void period of 12 months inclusive of rent free or tenant incentives and targeted an equivalent yield of 5.75%. | ||
| This results in a net rounded value of €13,675,000, equating to €1,150 per sq m. | ||
| ESTIMATED REINSTATEMENT ASSESSMENT |
The property has not been inspected by a suitably qualified building surveyor from CBRE, nor have we carried out a full Reinstatement Cost Assessment. For indicative purposes only we estimate that the reinstatement cost of insurance purposes would be in the region of €18,065,000 (rounded, excl. VAT) on a day one basis, including fees but excluding VAT and inflation.
This figure should be compared with the current sum insured and if a material discrepancy exists we suggest that a full Reinstatement Cost Assessment is carried out.
|
| ON BEHALF OF: | MORGAN STANLEY |
| PROJECT NAME: | MSTAR |
RENTAL EVIDENCE
| PROPERTY ADDRESS | PROPERTY USE | DATE | TOTAL AREA | TENANT | LEASE LENGTH (YEARS) | BREAK OPTION | RENT(P.A) | RENTAL RATE PER SQ M | RELATIVE QUALITY |
| Computerweg 9, Amsterdam | Industrial | 2019, June | 3,000 | floris bouwcenter | not available | not available | 225,000 | 75.00 | Similar quality, this unit does not comprise office and due to the larger size a higher ERV is in our opinion appropriate. |
| Lemelerbergweg 22, Amsterdam | Industrial | 2019, November | 1,074 | ing bank | not available | not available | 100,800 | 93.85 | Similar quality but South- East shows somewhat higher ERV levels compared to the subject location. |
| Bellsingel 51, Schiphol-Rijk | Industrial | 2020, June | 6,304 | TNT | not available | not available | 684,000 | 108.50 | Similar quality but superior property specifications. |
| Beiraweg 5, Amsterdam | Industrial | 2020, September | 5,351 | VDSV | not available | not available | 600,000 | 112.13 | Superior quality, lesser location. |
| ON BEHALF OF: | MORGAN STANLEY |
| PROJECT NAME: | MSTAR |
SALES EVIDENCE
| PROPERTY ADDRESS | PROPERTY USE | DATE | TOTAL AREA | WAULT (YEARS) |
PASSING RENT PER ANNUM | PURCHASE PRICE | NET INITIAL YIELD (%) | CAPITAL RATE PER SQ M | RELATIVE QUALITY |
| Melbournestraat 50-68, Sydneystraat 32-56, Rotterdam |
Industrial/ Logistics |
17-03-2020 | 5,354 | 2.5 | 401,144 | 6,587,000 | 5.14% | 1,230 | During the transaction, the property was fully let to eleven tenants on a WALL of 2.5 years. The property is slightly under rented, the equivalent yield equates to 5.08%. We are of the opinion the equivalent yield over the subject property would be relatively similar. |
| Berchvliet 3-13, Sierenborch 1, Amsterdam |
Industrial/ Logistics |
20-02-2020 | 6,108 | 3.7 | 549,164 | 8,075,000 | 5.80% | 1,322 | During the transaction, the property was fully let on a WALL of 3.7 years. The equivalent yield amounts to 5.80%. Due to the superior quality of the subject property we are of the opinion a sharper yield is appropriate. |
| Jan Van Krimpenweg 1+ 21-26, Haarlem |
Industrial/ Logistics |
19-10-2020 | 10,503 | 1.0 | 621,655 | 8,400,000 | 6.16% | 800 | This transaction was part of the Vinvest portfolio. During the transaction, the property was fully let to multiple tenants on a weighted average WALL of 7.25 years. The property is in our opinion, slightly under rented (11.56%). The gross initial yield equates to 7.40%. The location |
| ON BEHALF OF: | MORGAN STANLEY |
| PROJECT NAME: | MSTAR |
| and quality of the reference are less. A sharper yield is in our opinion appropriate for the subject property. | |||||||||
| Spectrumlaan 5, Bleiswijk |
Industrial/ Logistics |
15-04-2020 | 8,641 | 2.2 | 557,770 | 8,000,000 | 6.00 | 926 | The reference property is let to Cemex Trescon B.V. with a remaining lease term of 2.2 years. We are of the opinion that, the property is slightly over-rented (approximately 3%). The equivalent yield equates to 5.8%. In our opinion a sharper yield profile is appropriate for the subject property considering location. |
| PROPERTY ID: | nloslo - Osloweg 1-107 | |
| ON BEHALF OF: | MORGAN STANLEY | |
| VALUATION DATE: | 01-Feb-2021 | FINAL |
Osloweg 1-107 - Osloweg 1-107, Groningen, 9723 BE, Netherlands
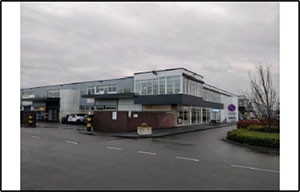 |
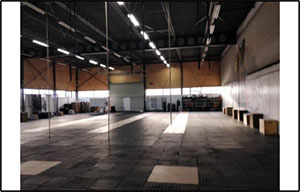 |
|
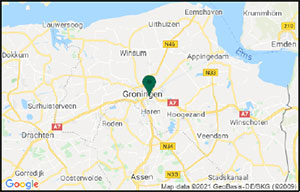 |
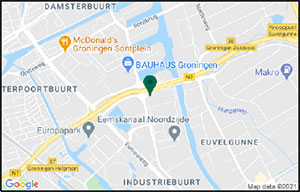 |
| VALUATION METRICS | (currency - EUR) |
| Metric | Value |
| Market Value | 31,000,000 |
| Market Value (per sq m) | 677 |
| Net Initial Yield | 5.39% |
| Reversionary Yield | 5.52% |
| Equivalent Yield | 5.56% |
| Gross Income (p.a.) | 1,966,530 |
| Gross Income (p.a.) (per sq m) | 43 |
| *Adj. Gross Income | 1,981,050 |
| Adj. Gross Income (per sq m) | 43 |
| Net Income (p.a.) | 1,821,652 |
| Net Income (p.a.) (per sq m) | 40 |
| Gross Rental Value | 2,196,245 |
| Gross Rental Value (per sq m) | 48 |
| Capital Expenditure | -586,114 |
| Transaction Costs | 9.00% |
| Over / Under Rented | -4.70% |
| KEY FACTS | ||
| Metric | Value | |
| Total Area (sq m) | 45,782 | |
| WAULT to Break by Rent | 4.11 | |
| WAULT to Break by ERV | 3.75 | |
| WAULT to Expiry by Rent | 4.11 | |
| WAULT to Expiry by ERV | 3.75 | |
| Percentage of Vacancy (Area) | 4.35% | |
| Percentage of Vacancy (ERV) | 5.35% | |
| ** | Number of Tenants | 52 |
| Current Voids (months) | 12 | |
| * Adjusted Gross Income equates to the Gross Income excluding any rent free periods | |
| LEASES RANKED BY RENT | ** Total tenant lines within our valuation. May differ to number of individual tenants |
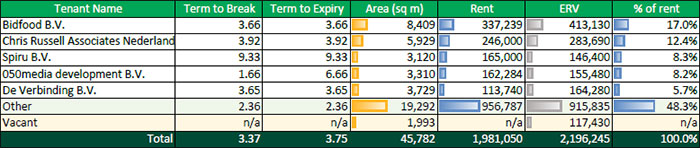
| Printed 09/03/2021 19:48 | |
| PROPERTY ID: |
nloslo - Osloweg 1-107
|
|
| ON BEHALF OF: | MORGAN STANLEY | |
| VALUATION DATE: | 01-Feb-2021 | FINAL |
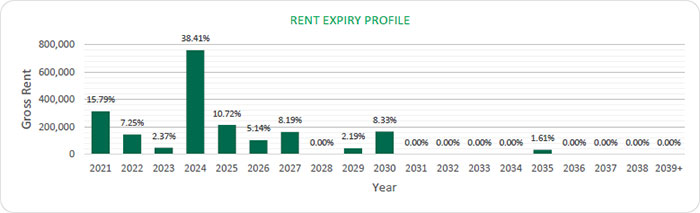
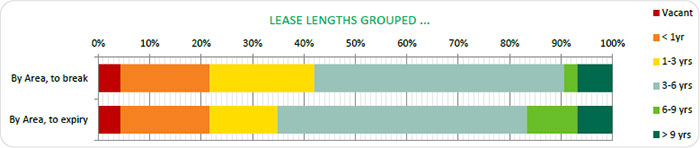
| Printed 09/03/2021 19:48 | |
| ON BEHALF OF: | MORGAN STANLEY |
| PROJECT NAME: | MSTAR |
PROPERTY REPORT
OSLOWEG 1-107, GRONINGEN, NETHERLANDS
| INSPECTED BY: | INSPECTION DATE: | VALUATION DATE: | PROPERTY TYPE |
| J. BAKKER | 14-01-2020 | 1 FEBRUARY 2021 | INDUSTRIAL WAREHOUSE |
KEY VALUATION FACTORS
| STRENGTHS | WEAKNESSES |
|
■ Multi-tenanted
■ Accessibility
■ Quality |
■ Not located in a G-4 city
■ Vacancy
|
| OPPORTUNITIES | THREATS |
|
■ Increasing investor appetite
■ Extend lease term with current tenants
■ Leasing out vacant space |
■ Macro-economic uncertainty (i.e. COVID-19; Trade Wars; Brexit) |
LOCATION & SITUATION
| LOCATION | The city of Groningen (approximately 193,000 inhabitants) is the capital of the province of Groningen and is the economic heart of the province. Groningen is situated in the north of The Netherlands at approximately 65 kilometres east of Leeuwarden and 30 kilometres north of Assen. | |
| The distance from Amsterdam is 180 km and Hamburg in Germany are at 300 km. Some (inter)national companies such as Nederlandse Gasunie, KPN, ABN AMRO Bank, ABP and EY have settled in Groningen as well as governmental organisations like the Province of Groningen and the Dienst Uitvoering Onderwijs (Student Grant Organisation). The city is also an important educational centre, mainly due to the presence of the University of Groningen and the Hanzehogeschool polytechnics. | ||
| The A28 motorway connects the city of Groningen to Utrecht (via Zwolle and Amersfoort). The A7 motorway connects Groningen to Friesland and Amsterdam (South-West) and Winschoten and the direction of Bremen in the East. |
| ON BEHALF OF: | MORGAN STANLEY |
| PROJECT NAME: | MSTAR |
PROPERTY DESCRIPTION
| DESCRIPTION | The subject property is located at the Osloweg 1-107 in Groningen and is a light industrial complex located in the “Industirebuurt” Business Park, direct next to the A7. The subject property comprises in total 46,097 sq m. The property consists of 54 connected units, each between 103 and 8,409 sq m divided into warehouse and office space. Nine units are vacant at the time of valuation. | |
| The building was constructed in 1971. The warehouse is located on the ground floor, each unit benefit from (multiple) overhead doors with additional office space at the front side of the building divided on the ground and first floor. The eaves height of the warehouse is circa 9 metres. | ||
| Summary of known specification: |
| Characteristic | Result | ||
| Built / Renovation | 1971 | ||
| Eaves Height | 9 metres | ||
| No. of loading Doors | 1 per unit | ||
| Warehouse (% of GLA) | 93% |
| Source: Schedule provided by client. | ||
| ACCOMMODATION | We have not measured the property, but as instructed, we have relied upon floor areas made available to us, detailed below and elsewhere within this report. |
Floor Areas
| FLOOR / UNIT | USE | SQ M |
| Unit 1 | Warehouse and office | 355 |
| Unit 101 | Warehouse and office | 1,050 |
| Unit 103 | Warehouse and office | 525 |
| Unit 103A | Warehouse and office | 525 |
| Unit 105 | Warehouse and office | 1,210 |
| Unit 107 | Warehouse and office | 359 |
| Unit 11-25 | Warehouse and office | 8,409 |
| Unit 23 | Warehouse and office | 150 |
| Unit 25B | Warehouse and office | 211 |
| Unit 27 | Warehouse and office | 1,022 |
| Unit 29 | Warehouse and office | 1,000 |
| Unit 3 | Warehouse and office | 103 |
| Unit 31-35 | Warehouse and office | 2,689 |
| Unit 31A | Warehouse and office | 140 |
| Unit 33A | Warehouse and office | 140 |
| Unit 35A | Warehouse and office | 140 |
| Unit 39-1 | Warehouse and office | 1,179 |
| ON BEHALF OF: | MORGAN STANLEY |
| PROJECT NAME: | MSTAR |
| Unit 39-2 | Warehouse and office | 336 |
| Unit 39AB | Warehouse and office | 275 |
| Unit 41 | Warehouse and office | 1,050 |
| Unit 43 | Warehouse and office | 1,040 |
| Unit 45 | Warehouse and office | 1,040 |
| Unit 47 | Warehouse and office | 677 |
| Unit 47B | Warehouse and office | 363 |
| Unit 49 | Warehouse and office | 1,806 |
| Unit 5 | Warehouse and office | 103 |
| Unit 53A | Warehouse and office | 160 |
| Unit 53B | Warehouse and office | 143 |
| Unit 53C | Warehouse and office | 128 |
| Unit 53D | Warehouse and office | 271 |
| Unit 53E | Warehouse and office | 135 |
| Unit 53F | Warehouse and office | 360 |
| Unit 53G | Warehouse and office | 183 |
| Unit 53H | Warehouse and office | 279 |
| Unit 53J | Warehouse and office | 217 |
| Unit 53K | Warehouse and office | 126 |
| Unit 55 | Warehouse and office | 1,350 |
| Unit 57 | Warehouse and office | 1,040 |
| Unit 59-75 | Warehouse and office | 3,172 |
| Unit 7 | Warehouse and office | 117 |
| Unit 79-83 | Warehouse and office | 3,120 |
| Unit 85-87 | Warehouse and office | 2,317 |
| Unit 89 | Warehouse and office | 1,040 |
| Unit 91 | Warehouse and office | 593 |
| Unit 91A | Warehouse and office | 585 |
| Unit 93 | Warehouse and office | 720 |
| Unit 93A | Warehouse and office | 560 |
| Unit 95 | Warehouse and office | 545 |
| Unit 95A | Warehouse and office | 508 |
| Unit 97 | Warehouse and office | 520 |
| Unit 97A | Warehouse and office | 520 |
| Unit 99 | Warehouse and office | 588 |
| Unit 99A | Warehouse and office | 588 |
| TOTAL | 45,782 |
| ON BEHALF OF: | MORGAN STANLEY |
| PROJECT NAME: | MSTAR |
DUE DILIGENCE
| STATE OF REPAIR | CBRE have not undertaken a structural survey, nor tested the services. The property was subject to an inspection for valuation purposes in early 2020. As you are aware, the property has not been re-inspected for the purposes of this report, nor have we been provided with updated TDD. We have therefore relied on the information provided by the Borrower, including a Capex schedule dated 12 June 2019 and schedule with revised budget of capex dated 19 January 2021. Based on the latter which indicates TDD assessment less completed spend in 2020, we have included the immediate and 2-5 years capex of €358,500 within our valuation. | |
| According to our own limited inspection for valuation purposes, our opinion regarding the state of repair would substantiate the assessment by Arcadis. Based on our impression gained during the inspection, we are of the opinion that the buildings are in a fair condition, in line with the year of construction | ||
| ENVIRONMENTAL CONSIDERATIONS |
We have been instructed not to make any investigations in relation to the presence or potential presence of contamination in land or buildings, or the potential presence of other environmental risk factors and to assume that if investigations were made to an appropriate extent, then nothing would be discovered sufficient to affect value. | |
| We have summarised the findings from a schedule provided in relation to ‘Priority sites’ within the front section of this report. | ||
| We have relied on the information provided by the Borrower, including Draft Phase 1 Environmental Review prepared by Ambiente Ltd and dated December 2019. The report summarises that the soil appeared in good condition. | ||
| We have not carried out investigation into past uses, either of the properties or of any adjacent lands, to establish whether there is any potential for contamination from such uses or sites, or other environmental risk factors and have therefore assumed that none exists. |
| ON BEHALF OF: | MORGAN STANLEY |
| PROJECT NAME: | MSTAR |
| TENURE | According to the information available from the Land Registry Office (Kadaster) the parcels are held freehold by MLET Netherlands 2 Holding B.V. and registered as follows: |
| Municipality: | Groningen | ||
| Section: | P | ||
| Numbers: | 2248, 2250 | ||
| Total Area: | 16,180 sq m | ||
| We have also had sight of the Draft Red Flag Legal Report prepared by Loyens Loeff, dated 12 February 2021. Based on the information provided, we understand the property is held freehold. | ||
| We understand that prior written permission of the municipality is required for transfer in case the construction of the manufacturing buildings has not been completed in accordance with the designated use. This provision was included in a deed dated 23 March 1965. Once the building obligation has been fulfilled, permission for transfer is no longer required. We have therefore assumed this requirement no longer exists. | ||
| We have assumed that there are no onerous legal conditions affecting the property which have a material impact on our opinion of value. | ||
| INCOME PROFILE | The subject property is partially let to 45 tenants on a WALL of 4.12 years. The vacancy equates to 1,993 metres which equals 4% of the total lettable floor area. The ERV for the vacancy equates to € 117,430 per annum. The current rental income is € 1,966,530 per annum. The ERV for the leased part is estimated at € 2,078,815 per annum, we are therefore of the opinion the property is slightly under-rented. The ERV for the entire property equates to € 2,196,245 per annum. |
VALUATION CONSIDERATIONS
| COSTS AND ADJUSTMENTS | Based on the information provided or our knowledge of the market, in approaching our valuation, we made allowances for the following capital and non-recoverable costs. In all cases, we have cited whether they are deducted as at the date of valuation or whether they take effect at a later date. | |
| Capital Expenditure: |
| Type & Calculation | Source | Effective | Amount | ||
| Capital Expenditure: Fixed Amount |
Technical Due Diligence |
On Valuation No Repeat |
€358,500 |
| ON BEHALF OF: | MORGAN STANLEY |
| PROJECT NAME: | MSTAR |
| Letting Fees: 15% of Rental Value of the vacant space | CBRE Estimate | On lease start/ renewal No Repeat | € 17,615 | ||
| Rent free period | Borrower Estimate | On Valuation No Repeat | € 210,000 | ||
| TOTAL ON VALUATION | €586,115 |
| Revenue Deductions: | |||||
| Type & Calculation | Source | Effective | Annual Amount | ||
| Management: 2% of ERV | CBRE estimate | On Valuation In perpetuity | € 63,039 | ||
| Property tax: 2% of ERV | CBRE estimate | On Valuation In perpetuity | € 43,925 | ||
| Water tax: 0.25% of ERV | CBRE estimate | On Valuation In perpetuity | € 5,491 | ||
| Insurance: 1.25% of ERV | CBRE estimate | On Valuation In perpetuity | € 27,453 | ||
| Sewage charge: 0.25% of ERV | CBRE estimate | On Valuation In perpetuity | € 5,491 | ||
| Maintenance: € 4.00 per sq m | Borrower Estimate |
5 Year Delay In perpetuity | € 183,128 | ||
| Void Costs: 2% of ERV | Borrower Estimate | On Valuation On All Voids | € 3,523 | ||
| TOTAL: ON VALUATION | € 148,922 | ||||
| Void and Rent-Free Allowances: | ||
| Currently there are eight unit vacant we have allowed for 6 months of current void. We are of the opinion relatability is good and have therefore not allowed for a future void period for the running leases. | ||
| VALUATION METHODOLOGY –MARKET VALUE | We have made the following rental assumptions having regard to the lettings agreed within the subject property, whilst also considering rental rates in the surrounding area: |
| Unit | Area (s qm) | ERV (€) per S qm (annum) | Rent pa (€) | ||
| Office | 12,648 | 70 | 885,360 | ||
| Warehouse | 32,891 | 40 | 1,315,640 |
| ON BEHALF OF: | MORGAN STANLEY |
| PROJECT NAME: | MSTAR |
| Other | 579 | 15 | 8,685 | ||
| Total | 46,097 | 48 | 2,196,245 |
| Opinion of Market Rent | ||
| Based on the below-mentioned comparable transactions, the current market trends and our general market knowledge, we have estimated the above-mentioned rental values for the areas in the subject property. The below appended comparables indicate a (blended) range from € 38 per sq m per annum to € 47 per sq m per annum. | ||
| Within the evidence table appended, we would highlight the property in Rijssen as the best comparable and therefore of greatest relevance in terms of similar appearance, state of repair, eaves height and location close to the border. | ||
| The aforementioned rental values produce a total gross rental value of € 2,196,245 per annum or an average of circa € 48 per sq m. The agreed rental income amount to € 1,966,530 per annum or an average of circa € 42 per sq m. We are of the opinion that the subject property is slightly under-rented. | ||
| Opinion of Valuation Yields | ||
| Currently, we witness downward pressure on net initial yields for prime logistics properties due to the high scarcity of good quality, long let logistics properties. | ||
| Indicative net initial yields for prime logistics property are currently quoting 4.0%. Due to favourable dynamics in the occupier market in the Netherlands, with prospects for production and export growth in mind and taking into account the capital available for (real estate) investments, investor appetite is expected to increase further. This is also expected to put further downward pressure on yields. There is limited directly comparable business park type evidence of a similar lot size, though the sales highlighted are of relevance given the multi-let and divisible characteristics of this property across a significant number of individual units which make it whole. | ||
|
We have arrived at our opinion of Market Value through adopting the traditional investment capitalisation method of valuation. Within this approach, we apply an income weighted average equivalent yield to our opinion of net income, reflecting the comparable evidence within the market for guidance on capital rates and values per sq m. The NIY’s of the relevant comparable investments range from 5.8% to 10.6% and also taking into account the current market conditions and the WAULT to expiry by current income of 4.12 years, we have adopted a split yield approach, targeting the following rate:
- Let = 5.50%
|
| ON BEHALF OF: | MORGAN STANLEY |
| PROJECT NAME: | MSTAR |
|
- Vacant = 7.00% |
||
| Next to the NIY we have checked capital values of comparable transactions. Those shows a range of € 286 to € 682 per sq m. The higher end of this range is applicable for the subject property. | ||
| The approach results in a blended equivalent yield of 5.56% and a net initial yield of circa 5.39% which reflects a capital rate per sq m of € 677, after allowing for purchaser’s costs equating to 9%. | ||
| On the assumption that there are no unusual factors of which we are unaware and on the basis of the comments and assumptions specified in this report, CBRE is of the opinion that the Market Value (rounded) of the subject property, is: | ||
|
€ 31,000,000
(Thirty one million Euros) |
||
| The unrounded net capital value is € 30,984,315. The gross unrounded capital value is € 34,359,017 including € 2,788,589 purchaser's costs (9.00%). | ||
| VALUATION METHODOLOGY – VACANT POSSESSION VALUE | The constituent inputs in terms of rental value and non-recoverable costs largely align with the Market Value approach. The key exception being that we have adopted a special assumption that the property is 100% vacant/non-income producing as at the valuation date. This value is predominantly derived using the traditional investment method of valuation but critically benchmarking the resultant capital rate per sq m against the prevailing evidence. | |
| In approaching our valuation under the Special Assumption that the property is entirely vacant (Vacant Possession Value), we have adopted a total void period of 12 months inclusive of rent free or tenant incentives and targeted an equivalent yield of 7%. | ||
| This results in a net rounded value of €22,425,000, equating to €490 per sq m. | ||
| ESTIMATED REINSTATEMENT ASSESSMENT | The property has not been inspected by a suitably qualified building surveyor from CBRE, nor have we carried out a full Reinstatement Cost Assessment. For indicative purposes only we estimate that the reinstatement cost of insurance purposes would be in the region of €67,240,000 (rounded, excl. VAT) on a day one basis, including fees but excluding VAT and inflation. | |
| This figure should be compared with the current sum insured and if a material discrepancy exists we suggest that a full Reinstatement Cost Assessment is carried out. |
| ON BEHALF OF: | MORGAN STANLEY |
| PROJECT NAME: | MSTAR |
RENTAL EVIDENCE
| PROPERTY ADDRESS |
PROPERTY USE |
DATE | TOTAL AREA |
TENANT | LEASE LENGTH (YEARS) |
BREAK OPTION |
RENT (P.A) |
RENTAL RATE PER SQ M |
RELATIVE QUALITY |
| Noordermorssingel 7, Rijssen | Industrial | 2019, January | 1.950 | leverink transportbedrijf | not available | not available | 75.000 | 38,46 | Equal quality and a less location which results in a lower rental value. |
| Edisonstraat 24, Nijverdal | Industrial | 2019, November | 134 | dln dak- en montagewerken | not available | not available | 6.000 | 44,78 | The location is less and the quality better which will overall results in a lower rental value. |
| Kalanderstraat 20, Rijssen | Industrial | 2019, July | 510 | europanel | not available | not available | 22.000 | 43,14 | Equal quality and a similar location but dated which results in a lower rental value. |
| Ceresweg 48, Leeuwarden | Industrial | 2020, April | 760 | Weed free service | not available | not available | 36,000 | 47 | Less established location and better quality which will overall results in a similar rental value. |
| ON BEHALF OF: | MORGAN STANLEY |
| PROJECT NAME: | MSTAR |
SALES EVIDENCE
| PROPERTY ADDRESS |
PROPERTY USE |
DATE | TOTAL AREA |
WAULT (YEARS) |
PASSING RENT PER ANNUM |
PURCHASE PRICE | NET INITIAL YIELD (%) |
CAPITAL RATE PER SQ M |
RELATIVE QUALITY |
| Hermesweg 7- 9, Barneveld | Industrial/Logistics | 29-3- 2019 | 23.110 | 6,5 | 815.018 | 11.436.925 | 6,66% | 495 | During transaction the property was fully let to one tenant on a remaining lease term of 6.5 years. The property is more or less rack rented. The location is less established and whilst the WAULT is better compared to the subject property, we expect a lower yield at the subject property. |
| Van der Hoopstraat 4, Groningen | Industrial/Logistics | 15-3- 2019 | 4.200 | - | - | 1.200.000 | 10,6% | 286 | During the transaction the property was vacant and is bought by an owner-occupier. The NIY is out of the range of 15% but shows the market for vacant properties in Groningen. The quality is less compared to the subject property and the locations is less visible. We expect a higher capital value at the subject property. |
| ON BEHALF OF: | MORGAN STANLEY |
| PROJECT NAME: | MSTAR |
| Energieweg 11 a,b, Groningen | Industiral/Retail | 4-4- 2019 | 3.981 | Unknown | 279.157 | 2.540.000 | 9,67% | 638 | During the transaction the property is fully let to two tenants. The tenants are wholesale retailers. This zoning is also applicable to the Osloweg. Due to the multi- tenant character and the better location of the subject property we expect a lower NIY. |
| Galvaniweg 1, Zwolle | Industrial/Logistics | 12-6- 2019 | 52.086 | 15,0 | 2.206.929 | 35.500.000 | 5,81% | 682 | The property is fully let to Ahold for a remaining lease term of 15 years. The rental income comprises € 2,385,125 per annum and we consider the property to be let at market levels. The property sold is of better quality and the WAULT is longer, though the market has improved. We expect a similar relative price through a combination of yield and rate psm. |
| Utrecht, Rutherfordwe g 91-95 | Industrial/Logistics | 28-7- 2020 | 7,453 | 1,6 | 320,556 | 3,900,000 | 6,75% | 523 | The property is fully let one tenant. The property is slightly under rented (10%). The NIY on rental value equates to 7.57%. We expect a sharper yield profile due to the multi tenant situation at the subject property and the difference in built quality. |
| PROPERTY ID: | nlpamp - Pampuslaan 96 | |
| ON BEHALF OF: | MORGAN STANLEY | |
| VALUATION DATE: | 01-Feb-2021 | FINAL |
Pampuslaan 96 - Pampuslaan 96, Weesp, 1382 JR, Netherlands
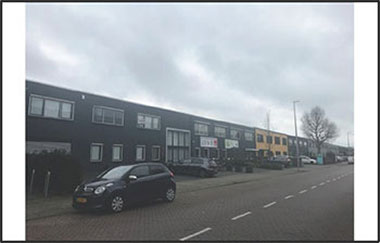 |
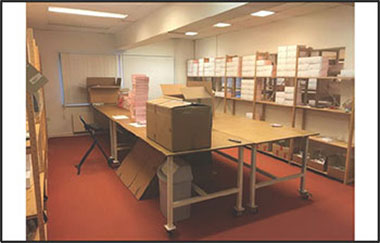 |
|
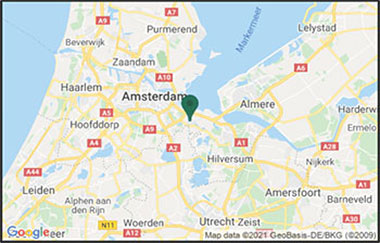 |
 |
| VALUATION METRICS | (currency - EUR) | KEY FACTS | ||
| Metric | Value | Metric | Value | |
| Market Value | 6,280,000 | Total Area (sq m) | 8,250 | |
| Market Value (per sq m) | 761 | WAULT to Break by Rent | 2.97 | |
| Net Initial Yield | 6.06% | WAULT to Break by ERV | 2.82 | |
| Reversionary Yield | 6.29% | WAULT to Expiry by Rent | 2.97 | |
| Equivalent Yield | 6.25% | WAULT to Expiry by ERV | 2.82 | |
| Gross Income (p.a.) | 441,896 | Percentage of Vacancy (Area) | 0.00% | |
| Gross Income (p.a.) (per sq m) | 54 | Percentage of Vacancy (ERV) | 0.00% | |
| *Adj. Gross Income | 441,896 | ** | Number of Tenants | 6 |
| Adj. Gross Income (per sq m) | 54 | Current Voids (months) | - | |
| Net Income (p.a.) | 414,616 | |||
| Net Income (p.a.) (per sq m) | 50 | |||
| Gross Rental Value | 491,790 | |||
| Gross Rental Value (per sq m) | 60 | |||
| Capital Expenditure | -117,067 | |||
| Transaction Costs | 9.00% | |||
| Over / Under Rented | -10.15% | |||
|
* Adjusted Gross Income equates to the Gross Income excluding any rent free periods ** Total tenant lines within our valuation. May differ to number of individual tenants |
||||
LEASES RANKED BY RENT
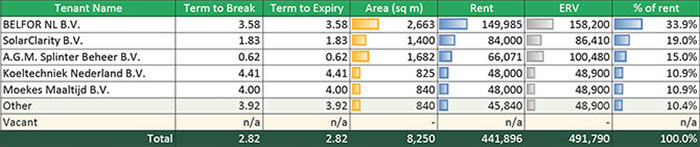
| Printed 09/03/2021 19:48 | |
| PROPERTY ID: | nlpamp - Pampuslaan 96 | |
| ON BEHALF OF: | MORGAN STANLEY | |
| VALUATION DATE: | 01-Feb-2021 | FINAL |
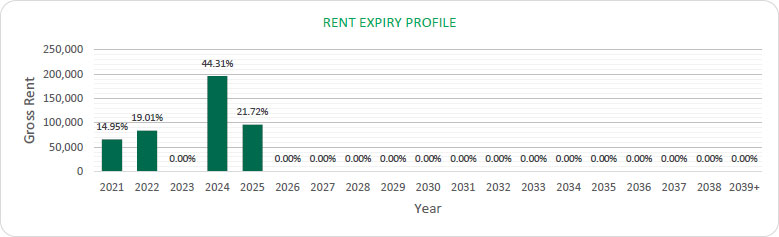
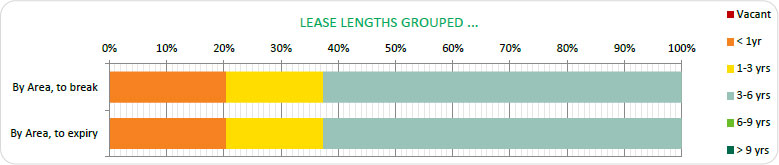
| Printed 09/03/2021 19:48 | |