EXHIBIT 99.C
BHINNEKA TUNGGAL IKA REPUBLIK INDONESIA UNDANG-UNDANG BUKU I NOMOR 62 TAHUN 2024 TENTANG ANGGARAN PENDAPATAN DAN BELANJA NEGARA TAHUN ANGGARAN 2025
UNITED STATES
SECURITIES AND EXCHANGE COMMISSION
Washington, D.C. 20549
FORM 18-K
For Foreign Governments and Political Subdivisions Thereof
ANNUAL REPORT
OF
REPUBLIC OF INDONESIA
(Name of Registrant)
Date of end of last fiscal year: December 31, 2024
SECURITIES REGISTERED*
(As of the close of the fiscal year)
|
| ||||
| Title of Issue | Amount as to Which Registration is Effective |
Names of Exchanges on Which Registered | ||
| N/A |
N/A | N/A | ||
|
| ||||
|
| ||||
Name and address of person authorized to receive notices
and communications from the Securities and Exchange Commission:
Chief Representative of Bank Indonesia New York
Bank Indonesia New York
25/F, 200 Vesey Street, New York, New York, 10285
It is requested that copies of notices and communications from the Securities and Exchange Commission be sent to:
Felipe Duque, Esq.
Allen Overy Shearman Sterling (Asia) Pte. Ltd.
c/o 50 Collyer Quay
#09-01 OUE Bayfront
Singapore 049321
| * | The Registrant is filing this annual report on a voluntary basis. |
The information set forth below is to be furnished:
| 1. | In respect of each issue of securities of the registrant registered, a brief statement as to: |
| (a) | The general effect of any material modifications, not previously reported, of the rights of the holders of such securities. |
There have been no such modifications.
| (b) | The title and the material provisions of any law, decree or administrative action, not previously reported, by reason of which the security is not being serviced in accordance with the terms thereof. |
There has been no such law, decree or administrative action.
| (c) | The circumstances of any other failure, not previously reported, to pay principal, interest, or any sinking fund or amortization installment. |
There has been no such failure.
| 2. | A statement as of the close of the last fiscal year of the registrant giving the total outstanding of: |
| (a) | Internal funded debt of the registrant. (Total to be stated in the currency of the registrant. If any internal funded debt is payable in foreign currency it should not be included under this paragraph (a), but under paragraph (b) of this item.) |
See “Domestic Public Debt of the Central Government,” on page D-101 of Exhibit 99.D, which is hereby incorporated by reference herein.
| (b) | External funded debt of the registrant. (Totals to be stated in the respective currencies in which payable. No statement need be furnished as to intergovernmental debt.) |
See “Outstanding External Public Debt of the Republic by Major Currency,” on page D-98 of Exhibit 99.D, which is hereby incorporated by reference herein.
| 3. | A statement giving the title, date of issue, date of maturity, interest rate and amount outstanding, together with the currency or currencies in which payable, of each issue of funded debt of the registrant outstanding as of the close of the last fiscal year of the registrant. |
See “Debt Tables of the Republic of Indonesia,” on pages D-108 to D-141 of Exhibit 99.D, which is hereby incorporated by reference herein.
| 4. (a) | As to each issue of securities of the registrant which is registered, there should be furnished a break-down of the total amount outstanding, as shown in Item 3, into the following: |
| (1) | Total amount held by or for the account of the registrant. |
Not applicable.
| (2) | Total estimated amount held by nationals of the registrant (or if registrant is other than a national government by the nationals of its national government); this estimate need be furnished only if it is practicable to do so. |
Not practicable.
| (3) | Total amount otherwise outstanding. |
Not applicable.
| (b) | If a substantial amount is set forth in answer to paragraph (a)(1) above, describe briefly the method employed by the registrant to reacquire such securities. |
Not applicable.
| 5. | A statement as of the close of the last fiscal year of the registrant giving the estimated total of: |
| (a) | Internal floating indebtedness of the registrant. (Total to be stated in the currency of the registrant.) |
See “Debt Tables of the Republic of Indonesia,” on pages D-108 to D-141 of Exhibit 99.D, which is hereby incorporated by reference herein.
| (b) | External floating indebtedness of the registrant. (Total to be stated in the respective currencies in which payable.) |
See “Debt Tables of the Republic of Indonesia,” on pages D-108 to D-141 of Exhibit 99.D, which is hereby incorporated by reference herein.
2
| 6. | Statements of the receipts, classified by source, and of the expenditures, classified by purpose, of the registrant for each fiscal year of the registrant ended since the close of the latest fiscal year for which such information was previously reported. These statements should be so itemized as to be reasonably informative and should cover both ordinary and extraordinary receipts and expenditures; there should be indicated separately, if practicable, the amount of receipts pledged or otherwise specifically allocated to any issue registered, indicating the issue. |
See “Government Budget—Government Finances,” on pages D-85 to D-96 of Exhibit 99.D, which is hereby incorporated by reference herein.
| 7. (a) | If any foreign exchange control, not previously reported, has been established by the registrant (or if the registrant is other than a national government, by its national government), briefly describe the effect of any such action, not previously reported. |
Not applicable.
| (b) | If any foreign exchange control previously reported has been discontinued or materially modified, briefly describe the effect of any such action, not previously reported. |
Not applicable.
| 8. | Brief statements as of a date reasonably close to the date of the filing of this report (indicating such date), in respect of the note issue and gold reserves of the central bank of issue of the registrant, and of any further gold stocks held by the registrant. |
See “Foreign Exchange and Reserves—International Reserves,” on page D-104 of Exhibit 99.D, which is hereby incorporated by reference herein.
| 9. | Statements of imports and exports of merchandise for each year ended since the close of the latest year for which such information was previously reported. The statements should be reasonably itemized so far as practicable as to commodities and as to countries. They should be set forth in items of value and of weight or quantity; if statistics have been established in terms of value, such will suffice. |
See “Foreign Trade and Balance of Payments,” on pages D-52 to D-65 of Exhibit 99.D, which is hereby incorporated by reference herein.
| 10. | The balances of international payments of the registrant for each year ended since the close of the latest year for which such information was previously reported. The statements of such balances should conform, if possible, to the nomenclature and form used in the “Statistical Handbook of the League of Nations.” (These statements need to be furnished only if the registrant has published balances of international payments.) |
See “Foreign Trade and Balance of Payments,” on pages D-52 to D-65 of Exhibit 99.D, which is hereby incorporated by reference herein.
This annual report comprises:
| (a) | Pages numbered 1 to 6 consecutively. |
| (b) | The following exhibits: |
Exhibit A — None.
Exhibit B — None.
Exhibit 99.C — The Law Number 62 of 2024 Regarding the State Budget for Fiscal Year 2025
Exhibit 99.D — Description of the Republic of Indonesia dated July 25, 2025
This annual report is filed subject to the Instructions for Form 18-K for Foreign Governments and Political Subdivisions Thereof.
3
Pursuant to the requirements of the Securities Exchange Act of 1934, the Republic of Indonesia has duly caused this Annual Report to be signed on its behalf by the undersigned, thereunto duly authorized, in the City of Jakarta, Indonesia on the 25th day of July 2025.
| REPUBLIC OF INDONESIA | ||
| acting for and on behalf of the Minister of Finance | ||
| By | /s/ Suminto | |
| Suminto | ||
| Director General of Budget Financing and Risk Management of the Ministry of Finance of the Republic of Indonesia | ||
5
| Exhibit | Description | |
| 99.C: | The Law Number 62 of 2024 Regarding the State Budget for Fiscal Year 2025 | |
| 99.D: | Description of the Republic of Indonesia dated July 25, 2025 | |
6
EXHIBIT 99.C
BHINNEKA TUNGGAL IKA REPUBLIK INDONESIA UNDANG-UNDANG BUKU I NOMOR 62 TAHUN 2024 TENTANG ANGGARAN PENDAPATAN DAN BELANJA NEGARA TAHUN ANGGARAN 2025
UNDANG-UNDANG BUKU I NOMOR 62 TAHUN 2024 TENTANG ANGGARAN PENDAPATAN DAN BELANJA NEGARA TAHUN ANGGARAN 2025
SALINAN PRESIDEN REPUEUK INDONESIA UNDANG-UNDANG REPUBLIK INDONESI.A NOMOR 62TAI[UN 2024 TENTANG ANGGARAN PENDAPATAN DAN BEI,ANJA NEGARA TAHUN ANGGARAN 2025 DENGAN RAHMATTUHAN YANG MAHA ESA PRESIDEN REPUBLIK INDONESIA, Menimbang a bahwa Anggaran Pendapatan dan Belanja Negara merupakan wujud dari pengelolaan keuangan negara yang dilaksanakan secara terbuka dan bertanggung jawab untuk sebesar-besamya kemakmuran rakyat; b bahwa Anggaran Pendapatan dan Belanja Negara Tahun Anggaran 2025 termuat dalam Undang- Undang tentang Anggaran Pendapatan dan Belanja Negara Tahun Anggaran 2025 yang disusun sesuai dengan kebutuhan penyelenggaraan pemerintahan negara dan kemampuan dalam menghimpun pendapatan negara dalam rangka mendukung terwujudnya perekonomian nasional berdasarkan demokrasi ekonomi dengan prinsip kebersamaan, efisiensi, berkeadilan, berkelanjutan, berwawasan lingkungan, kemandirian, serta dengan menjaga keseimbangan kemajuan dan kesatuan ekonomi nasional; c bahwa berdasarkan pertimbangan sebagaimana dimaksud dalam huruf a dan huruf b, serta melaksanakan ketentuan Pasal 23 ayat (l) Undang- Undang Dasar Negara Republik Indonesia Tahun 1945, perlu membentuk Undang-Undang tentang Anggaran Pendapatan dan Belanja Negara Tahun Anggaran 2025; Mengingat: . . . SK No236224A
PRESIDEN REPUBLIK INDONESIA -2- Mengingat 1 Pasal 5 ayat (1), Pasal 2O, Pasal 23 ayat (l) dan ayat (2), Pasal 31 ayat (4), dan Pasal 33 ayat (1), ayat (2), ayat (3), dan ayat (4) Undang-Undang Dasar Negara Republik Indonesia Tahun 1945; 2 Undang-Undang Nomor 17 Tahun 2OO3 tentang Keuangan Negara (Lembaran Negara Republik Indonesia Tahun 2OO3 Nomor 47, Tambahan Lembaran Negara Republik Indonesia Nomor 4286); 3 Undang-Undang Nomor 25 Tahun 2004 tentang Sistem Perencanaan Pembangunan Nasional (Lembaran Negara Republik Indonesia Tahun 2OO4 Nomor 104, Tambahan kmbaran Negara Republik Indonesia Nomor 4421); 4 Undang-Undang Nomor 17 Tahun 2014 tentang Majelis Permusyawaratan Ralryat, Dewan Perwakilan Rakyat, Dewan Perwakilan Daerah, dan Dewan Perwakilan Ralryat Daerah (kmbaran Negara Republik Indonesia Tahun 2OL4 Nomor La2, Tambahan lembaran Negara Republik Indonesia Nomor 5568) sebagaimana telah beberapa kali diubah terakhir dengan Undang-Undang Nomor 13 Tahun 2O19 tentang Perubahan Ketiga 2Ol4 atas Undang-Undang Nomor 17 Tahun tentang Majelis Permusyawaratan Ralryat, Dewan Perwakilan Rakyat, Dewan Perwakilan Daerah, dan Dewan Perwakilan Rakyat Daerah (Iembaran Negara Republik Indonesia Tahun 2019 Nomor 181, Tambahan Lembaran Negara Republik Indonesia Nomor 6396); 5 Undang-Undang Nomor I Tahun 2022 tentang Hubungan Keuangan antara Pemerintah Pusat dan Pemerintahan Daerah (kmbaran Negara Republik Indonesia Tahun 2022 Nomor 4, Tambahan Lembaran Negara Republik Indonesia Nomor 6757); Dengan Persetujuan Bersama DEWAN PERWAKII.AN RAKYAT REPUBLIK INDONESIA dan PRESIDEN REPUBLIK INDONESIA MEMUTUSKAN SK No210956A
PRESIDEN REPUBLIK INDONESIA -3- MEMUTUSKAN UNDANG-UNDANG TENTANG ANGGARAN PENDAPATAN DAN BELANJA NEGARA TAHUN ANGGARAN 2025. Menetapkan Pasa1 1 Dalam Undang-Undang ini yang dimaksud dengan: 1. Anggaran Pendapatan dan Belanja Negara yang selanjutnya disingkat APBN adalah rencana keuangan tahunan pemerintahan negara yang disetujui oleh Dewan Perwakilan Ralryat. 2. Pendapatan Negara adalah hak Pemerintah Pusat yang diakui sebagai penambah kekayaan bersih yang terdiri atas Penerimaan Perpajakan, Penerimaan Negara Bukan Pajak, dan Penerimaan Hibah. 3. Penerimaan Perpajakan adalah semua negara yang terdiri atas pendapatan pajak dalam negeri dan internasional. pajak perdagangan 4. Pendapatan Pajak Dalam Negeri adalah semua penerimaan negara yang berasal dari pajak penghasilan, pendapatan pajak nilai barang dan jasa dan pajak penjualan atas barang mewah, pendapatan pqiak bumi dan bangunan, pendapatan cukai, dan pendapatan pajak lainnya. Pendapatan Pajak Perdagangan Intemasional adalah semua penerimaan negara yang berasal dari pendapatan bea masuk dan pendapatan bea keluar. Penerimaan Negara Bukan Pajak yang selanjutnya disingkat PNBP adalah pungutan yang dibayar oleh orang pribadi atau badan dengan memperoleh manfaat langsung maupun tidak langsung atas layanan atau pemanfaatan sumber daya dan hak yang diperoleh Negara, berdasarkan peraturan perundang-undangan yang menjadi penerimaan Pemerintah Pusat di luar penerimaan perpajakan dan hibah dan dikelola dalam mekanisme anggaran pendapatan dan belanja negara. 7. Penerimaan . , . 5 6 SK No 210955 A
PRESIDEN REPUBLIK INDONESIA -4- 7. Penerimaan Hibah adalah semua penerimaan negara baik dalam bentuk devisa dan/atau devisa yang dirupiahkan, rupiah, jasa, dan/ atau surat berharga yang diperoleh dari pemberi hibah yang tidak perlu dibayar kembali dan yang tidak mengikat, baik yang berasal dari dalam negeri maupun dari luar negeri. 8. Belanja Negara adalah kewajiban Pemerintah Pusat yang diakui sebagai pengurang nilai kekayaan bersih yang terdiri atas belanja Pemerintah Pusat dan Transfer ke Daerah. 9. Belanja Pemerintah Pusat Menurut Rrngsi adalah belanja Pemerintah Pusat yang digunakan untuk fungsi kepemerintahan yang dilaksanakan untuk mencapai tujuan pembangunan nasional sesuai dengan ketentuan peraturan perundang-undangan di bidang keuangan negara. 10. Belanja Pemerintah Pusat Menurut Organisasi adalah belanja Pemerintah Pusat yang dialokasikan kepada kementerian/ lembaga dan Bendahara Umum Negara. 11. Betanja Pemerintah Pusat Menurut Program adalah belanja Pemerintah Pusat yang dialokasikan untuk mencapai hasil (outome) tertentu pada Bagian Anggaran kementerian/lembaga dan Bagian Anggaran Bendahara Umum Negara. 12. Program Pengelolaan Subsidi adalah pemberian dukungan dalam bentuk pengalokasian anggaran kepada perusahaan negara, lembaga pemerintah, atau pihak ketiga berdasarkan peraturan perundangundangan yang berlaku untuk menyediakan barang atau jasa yang bersifat strategis atau menguasai hajat hidup orang banyak, dan/ atau disalurkan langsung kepada penerima manfaat, sesuai kemampuan keuangan negara. 13. Daerah Otonom yang selanjutnya disebut Daerah adalah kesatuan masyarakat hukum yang mempunyai batas-batas wilayah yang berwenang mengatur dan mengurus urusan pemerintahan dan kepentingan masyarakat setempat menurut prakarsa sendiri berdasarkan aspirasi masyarakat dalam sistem Negara Kesatuan Republik Indonesia. 14.Urusan... SK No 210954A
PRESIDEN REPUBLIK INDONESIA -5- 14. Urusan Pemerintahan adalah kekuasaan pemerintahan yang menjadi kewenangan Presiden yang dan dilakukan oleh kementerian Pemerintahan Daerah untuk melindungi, melayani, membetdayakan, dan menyejahterakan masyarakat. 15. Transfer ke Daerah yang selanjutnya disingkat TKD adalah dana yang bersumber dari APBN dan merupakan bagian dari Belanja Negara yang dialokasikan dan disalurkan kepada Daerah untuk dikelola oleh Daerah dalam rangka mendanai penyelenggaraan Urusan Pemerintahan yang menjadi kewenangan Daerah. 16. Dana Bagi Hasil yang selanjutnya disingkat DBH adalah bagian dari TKD yang dialokasikan berdasarkan persentase atas pendapatan tertentu dalam APBN dan kinerja tertentu, yang dibagikan kepada Daerah penghasil dengan tujuan untuk mengurangi ketimpangan fiskal antara Pemerintah dan Daerah, serta kepada Daerah lain non-penghasil dalam rangka menanggulangi eksternalitas negatif dan/ atau meningkatkan pemerataan dalam satu wilayah. 17. Dana Alokasi Umum yang selanjutnya disingkat DAU adalah bagran dari TKD yang dialokasikan dengan tqjuan mengurangi ketimpangan kemampuan keuangan dan layanan publik antardaerah. 18. Dana Alokasi Khusus yang selanjutnya disingkat DAK adalah bagian dari TKD yang dialokasikan dengan tujuan untuk mendanai program, kegiatan, dan/ atau kebijakan tertentu yang menjadi prioritas nasional dan membantu operasionalisasi layanan publik, yang penggunaannya tetah ditentukan oleh Pemerintah’ 19. Dana Otonomi Khusus adalah bagian dari TKD yang dialokasikan kepada Daerah tertentu untuk mendanai pelaksanaan otonomi khusus sebagaimana ditetapkan dalam Undang-Undang mengenai otonomi khusus. 2O. Dana. . . SK No 210953 A
PRESIDEN REPUBLIK INDONESIA -6- 2O. Dana Tambahan Infrastruktur Dalam Rangka Otonomi Khusus bagi provinsi-provinsi di wilayah Papua yang selanjutnya disingkat DTI adalah dana tambahan dalam rangka pelalsanaan Otonomi Khusus yang besarannya ditetapkan antara Pemerintah dan Dewan Perwakilan Rakyat yang diberikan berdasarkan usulan Provinsi pada setiap tahun anggaran yang ditujukan untuk pendanaan pembangunan infrastruktur perhubungan, energi listrik, air bersih, telekomunikasi, dan sanitasi lingkungan. 2L. Dana Keistimewaan Daerah Istimewa Yoglakarta yang selanjutnya disebut Dana Keistimewaan adalah bagian dari TKD yang dialokasikan untuk mendukung urusan keistimewaan Daerah Istimewa Yoryakarta, sebagaimana ditetapkan dalam Undang-Undang mengenai keistimewaan Yoryakarta. 22. Dana Desa adalah bagran dari TKD tujuan yang diperuntukkan untuk mendukung pemerintahan, bagr desa dengan pendanaan pelaksanaan pemberdayaan masyarakat, dan kemasyarakatan. 23. Dana Insentif Fiskal adalah dana yang bersumber dari APBN yang diberikan kepada Daerah atas pencapaian kinerja berdasarkan kriteria tertentu berupa perbaikan dan/ atau pencapaian kinerja pemerintah daerah dapat berupa pengelolaan keuangan Daerah, pelayanan umum pemerintahan, dan pelayanan dasar yang mendukung kebiiakan strategis nasional dan/ atau pelaksanaan kebijakan fiskal nasional. 24. Pembiayaan Anggaran adalah setiap penerimaan yang perlu dibayar kembali, penerimaan kembali atas pengeluaran pembiayaan tahun-tahun anggaran sebelumnya, pengeluaran kembali atas penerimaan pembiayaan tahun-tahun anggaran sebelumnya, penggunaan saldo anggaran lebih, dan/atau pengeluaran yang akan diterima kembali, baik pada tahun anggaran yang bersangkutan maupun tahuntahun anggaran berikutnya. 25.Sisa... SK No2l0952A
PRESIDEN REPUBLIK INDONESIA -7 - 25. Sisa kbih Pembiayaan Anggaran yang selanjutnya disebut SiLPA adalah selisih lebih antara realisasi pendapatan dan belanja, serta penerimaan dan pengeluaran pembiayaan dalam APBN selama satu periode pelaporan. 26. Saldo Anggaran Lebih yang selanjutnya disingkat SAL adalah akumulasi neto dari SiLPA dan Sisa Kurang Pembiayaan Anggaran tahun-tahun anggaran yang lalu dan tahun anggaran yang bersangkutan setelah ditutup, ditambah/dikurangi dengan koreksi pembukuan. 27. Surat Berharga Negara yang selanjutnya disingkat SBN meliputi surat utang negara dan surat berharga syariah negara. 28. Surat Utang Negara yang selanjutnya disingkat SUN adalah surat berharga berupa surat pengakuan utang dalam mata uang rupiah maupun valuta asing yang dijamin pembayaran bunga dan pokoknya oleh Negara Republik Indonesia sesuai dengan masa berlakunya. 29. Surat Berharga Syariah Negara yang selanjutnya disingkat SBSN atau dapat disebut sukuk negara adalah SBN yang diterbitkan berdasarkan prinsip syariah, sebagai bukti atas bagan penyertaan terhadap aset SBSN, baik dalam mata uang rupiah maupun valuta asing. 3O. Barang Milik Negara yang selanjutnya disingkat BMN adalah semua barang yang dibeli atau diperoleh atas beban APBN atau berasal dari perolehan lainnya yang sah. 31. Penyertaan Modal Negara yang selanjutnya disingkat PMN adalah pemisahan kekayaan negara dari APBN untuk dijadikan sebagai modal Perusahaan Negara dan/atau Perseroan Terbatas lainnya serta Lembaga/Badan Lainnya, yang dil,akukan secara korporasi. 32. Investasi Pemerintah adalah penempatan sejumlah dana dan/atau aset keuangan dalam jangka panjang untuk investasi dalam bentuk saham, surat utang, dan/ atau investasi langsung guna memperoleh manfaat ekonomi, dan/atau sosial, dan/atau manfaat lainnya bagi sebesar-besarnya kemakmuran rakyat. 33. Dana. . . SK No 210951 A
PRESIDEN REPUBLIK INDONESIA -8- 33. Dana Bergulir adalah dana yang dikelola oleh Badan layanan Umum tertentu untuk dipinjamkan dan digulirkan kepada masyarakat/lembaga dengan tqiuan untuk meningkatkan ekonomi ralryat dan tujuan lainnya. 34. Pinjaman Dalam Negeri adalah setiap pinjaman oleh Pemerintah yang diperoleh dari pemberi pinjaman dalam negeri yang harus dibayar kembali dengan persyarat€rn tertentu, sesuai dengan masa berlakunya. 35. Kewajiban Penjaminan adalah kewajiban yang menjadi beban Pemerintah akibat pemberian jaminan kepada kementerian/lembaga, pemerintah daerah, Badan Usaha Milik Negara, Badan Usaha Milik Daerah, dan pelaku usaha dalam program pemulihan ekonomi nasional, dalam hal kementerian / lembaga, pemerintah daerah, Badan Usaha Milik Negara, Badan Usaha Milik Daerah, dan pelaku usaha dalam program pemulihan ekonomi nasional, dimaksud tidak dapat memenuhi kewajibannya kepada kreditur dan/atau badan usaha sesuai perjanjian pinjaman atau perjanjian kerja sama. 36. Pinjaman Luar Negeri Neto adalah semua pembiayaan yang berasal dari penarikan pinjaman luar negeri yang terdiri atas pinjaman tunai dan pinjaman kegiatan dikurangi dengan pembayaran cicilan pokok pinjaman luar negeri. 37. Pinjaman Tunai adalah pinjaman luar negeri dalam bentuk devisa dan/ atau rupiah yang digunakan untuk pembiayaan defisit APBN dan pengelolaan portofolio utang. 38. Pinjaman Kegiatan adalah pinjaman luar negeri yang digunalan untuk pembiayaan kegiatan tertentu kementerian/lembaga, pinjaman yang diteruspinjamkan kepada pemerintah daerah dan/ atau Badan Usaha Milik Negara, dan pinjaman yang diterushibahkan kepada pemerintah daerah. 39. Pemberian Pinjaman adalah pinjaman Pemerintah Pusat kepada pemerintah daerah, Badan Usaha Milik Negara, lembaga, dan/ atau badan lainnya yang harus dibayar kembali dengan ketentuan dan persyaratan tertentu. 40. Anggaran. . . SK No2l0950A
PRESIDEN REPUBLIK INDONESIA -9- 40. Anggaran Pendidikan adalah alokasi angg.rran pendidikan termasuk sumber daya keuangan yang disediakan melalui kementerian/lembaga, nonkementerian/lembaga, TKD, dan pengeluaran pembiayaan, untuk menyelenggarakan dan mengelola pendidikan dan pelatihan yang menjadi tanggung jawab pemerintah, termasuk gaji pendidik. 41. Persentase Anggaran Pendidikan adalah perbandingan alokasi anggaran pendidikan terhadap total anggaran belanja negara pada saat Undang- Undang mengenai APBN ditetapkan. 42. Tahun Anggaran 2025 adaiah masa 1 (satu) tahun terhitung mulai dari tanggal 1 Januari 2025 sampai dengan tanggal 31 Desember 2O25. Pasal 2 APBN terdiri atas anggaran Pendapatan Negara, €rnggaran Belanja Negara, dan Pembiayaan Anggaran. Pasal 3 Anggaran Pendapatan Negara Tahun Anggaran 2025 direncanakan sebesar RpS.OOS. 127.683.257.000,00 (tiga kuadriliun lima triliun seratus dua puluh tujuh miliar enam ratus delapan puluh tiga juta dua ratus lima puluh tqluh ribu rupiah), yang diperoleh dari sumber: a. PenerimaanPerpajakan; b. PNBP; dan c. Penerimaan Hibah. Pasal 4 (1) Penerimaan Perpajakan sebagaimana dimaksud dalam Pasal 3 huruf a direncanakan sebesar Rp2.490.911.571.145.000,00 (dua kuadriliun empat ratus sembilan puluh triliun sembilan ratus sebelas miliar lima ratus tujuh puluh satu juta seratus empat puluh lima ribu rupiah), terdiri atas: a. Pendapatan . . . SK No210949A
PRESIDEN REPIJBLIK INDONESIA -10- Pendapatan Pajak Dalam Negeri; dan Pendapatan Pajak Perdagangaa Intemasional, 12) Pendapatan Pajak Dalam Negeri sebagaimana dimaksud pada ayat (1) huruf a direncanakan sebesar Rp2.433.505.588.870.000,O0 (dua kuadriliun empat ratus tiga puluh tiga triliun lima ratus lima miliar lima ratus delapan puluh delapan juta delapan ratus tujuh puluh ribu rupiah), terdiri atas: a. pendapatan pajak penghasilan; b. pendapatan pajak pertambahan nilai barang dan jasa dan pajak penjualan atas barang mewah; c. pendapatan pajak bumi dan bangunan; d. pendapatan cukai; dan e. pendapatan pajak lainnya. (3) pajak penghasilan sebagaimana dimaksud pada ayat (2) huruf a direncanakan sebesar Rp|.2O9.278.861.976.000,00 (satu kuadriliun dua ratus sembilan triliun dua ratus tqjuh puluh delapan miliar delapan ratus enam puluh satu juta sembilan ratus tujuh puluh enam ribu rupiah) yang di dalamnya termasuk pajak penghasilan ditanggung Pemerintah atas: a, komoditas panas bumi sebesar Rp2.91l.630.730.000,00 (dua triliun sembilan ratus sebelas miliar enam ratus tiga puluh juta tujuh ratus tiga puluh ribu rupiah) yang diatur dengan Peraturan Menteri Keuangan; dan bunga, imbal hasil, dan penghasilan pihak ketiga atas jasa yang diberikan kepada Pemerintah atau pihak lain yang mendapat penugasan sesuai dengan ketentuan peraturan perundangundangan dalam rangka penerbitan dan/ atau pembelian kembali SBN di pasar intemasional, tetapi tidak termasuk jasa konsultan hukum lokal, sebesar Rp5.254.139.310.000,00 (tima triliun dua ratus lima puluh empat miliar seratus tiga puluh sembilan juta tiga ratus sepuluh ribu rupiah) yang diatur dengan a. b. b SK No 210963 A Peraturan Menteri Keuangan. (4) Pendapatan . . .
PRESIDEN REPUELIK INDONESIA - 11- (4) Pendapatan pajak pertambahan nilai barang dan jasa dan pajak penjualan atas barang mewah sebagaimana dimaksud pada ayat (2) huruf b direncanakan sebesar Rp945.120.626.363.000,00 (sembilan ratus empat puluh lima triliun seratus dua puluh miliar enam ratus dua puluh enam juta tiga ratus enam puluh tiga ribu rupiah). (5) Pendapatan pajak bumi dan bangunan sebagaimana dimaksud pada ayat (2) huruf c direncanakan sebesar Rp27.111.788.827.000,00 (dua puluh tqiuh triliun seratus sebelas miliar tujuh ratus delapan puluh delapan juta delapan ratus dua puluh tqiuh ribu rupiah). (6) Pendapatan cukai sebagaimana dimaksud pada ayat (2) huruf d berasal dari pengenaan atas barang kena cukai yang meliputi: a. hasil tembakau; b. minuman yang mengandung etil alkohol; c. etil alkohol atau etanol; dan d. minuman berpemanis dalam kemasan, yang jumlah besarannya direncanakan sebesar Rp244.198.429.O82.000,00 (dua ratus empat puluh empat triliun seratus sembilan puluh delapan miliar empat ratus dua puluh sembilan juta delapan puluh dua ribu rupiah). {71 Pendapatan pajak lainnya sslagaimana dimaksud pada ayat (21 huruf e direncanakan sebesar Rp7.795.882.622.OOO,O0 (tujuh triliun tujuh ratus sembilan puluh lima miliar delapan ratus delapan puluh dua juta enam ratus dua puluh dua ribu rupiah). (8) Pendapatan Pajak Perdagangan Internasional sebasaimana dimaksud pada ayat (U huruf b direncanakan sebesar Rp57.405.982.275.OO0,00 (lima puluh tujuh triliun empat ratus lima miliar sembilan ratus delapan puluh dua juta dua ratus tujuh puluh lima ribu rupiah), terdiri atas: a. pendapatan . . . SK No2l0962A
PRESIDEN REPUBLIK INDONESIA -12- a. pendapatan bea masuk; dan b. pendapatan bea keluar. (9) Pendapatan bea masuk sebagaimana dimaksud pada ayat (8) huruf a direncanakan sebesar Rp52.935.411.021.O00,0O (lima puluh dua triliun sembilan ratus tiga puluh lima miliar empat ratus sebelas juta dua puluh satu ribu rupiah), (10) Pendapatan bea keluar sebagaimana dimaksud pada ayat (8) huruf b direncanakan sebesar Rp4.47O.57 L.2S4.OOO,OO (empat triliun empat ratus tujuh puluh miliar lima ratus tujuh puluh satu juta dua ratus lima puluh empat ribu rupiah). (11) Ketentuan lebih lanjut mengenai rincian Penerimaan Perpajakan Tahun Anggaran 2025 sebagaimana dimaksud pada ayat (2) dan ayat (8) diatur dalam Peraturan Presiden. Pasal 5 (1) PNBP sebagaimana dimaksud dalam Pasal 3 huruf b direncanakan sebesar RpS13.635.052.112.O0O,00 (lima ratus tiga belas triliun enam ratus tiga puluh lima miliar lima puluh dua juta seratus dua belas ribu rupiah), terdiri atas: a, pendapatan sumber daya alam; b. pendapatan dari Kekayaan Negara Dipisahkan; c. pendapatan PNBP lainnya; dan d. pendapatan Badan Layanan Umum. (21 Pendapatan sumber daya alam sebagaimana dimaksud pada ayat (1) huruf a direncanakan sebesar Rp217.96a.185.573.000,00 (dua ratus tujuh belas triliun sembilan ratus enam puluh empat miliar seratus delapan puluh lima juta lima ratus tujuh puluh tiga ribu rupiah), terdiri atas: a. pendapatan sumber daya alam minyak bumi dan gas bumi; dan b. pendapatan. . . SK No 210945 A

PRESIDEN REPUBLIK INDONESIA -13- b. pendapatan sumber daya alam non-minyak bumi dan gas bumi. (3) Pendapatan dari Kekayaan Negara Dipisahkan sebagaimana dimaksud pada ayat (1) huruf b direncanakan sebesar Rp9O.O0O.OOO.0OO.OO0,O0 (sembilan puluh triliun rupiah). (4) Pendapatan PNBP lainnya sebagaimana dimaksud pada ayat (1) huruf c direncanakan sebesar RpL27 .7 4L.396.429.O0O,00 (seratus dua puluh tujuh triliun tqluh ratus empat puluh satu miliar tiga ratus sembilan puluh enam juta empat ratus dua puluh sembilan ribu rupiah). (5) Pendapatan Badan Layanan Umum sebagaimana dimaksud pada ayat (1) huruf d direncanakan sebesar Rp77.929.47O. I 10.OOO,OO (tqjuh puluh tqiuh triliun sembilan ratus dua puluh sembilan miliar empat ratus tujuh puluh juta seratus sepuluh ribu rupiah). (6) Ketentuan lebih lanjut mengenai rincian PNBP Tahun Anggaran 2O25 sebagaimana dimaksud pada ayat (21, ayat (3), ayat (4), dan ayat (5) diatur dalam Peraturan Presiden. Pasal 6 Penerimaan Hibah sebagaimana dimaksud dalam Pasal 3 huruf c direncanakan sebesar Rp581.O60.OOO.OOO,OO (lima ratus delapan puluh satu miliar enam puluh juta rupiah). Pasal 7 Anggaran Belanja Negara Tahun Anggaran 2025 direncanakan sebesar Rp3.62 1.3 13.743.50O.O0O,O0 (tiga kuadriliun enam ratus dua puluh satu triliun tiga ratus ‘‘ga belas miliar tujuh ratus empat puluh tiga juta lima ratus ribu rupiah), terdiri atas: a. anggaran belanja Pemerintah Pusat; dan b. anggaranTKD. Pasal 8... SK No210944A
PRESIDEN REPUBLIK INDONESIA -14- Pasal 8 (1) Anggaran belanja Pemerintah Pusat sebagaimana dimaksud dalam Pasal 7 huruf a direncanakan sebesar Rp2.7 O1.44 1.624.9 17 .OOO,0O (dua kuadriliun tujuh ratus satu triliun empat ratus empat puluh satu miliar enam ratus dua puluh delapan juta sembilan ratus tujuh belas ribu rupiah). (21 Anggaran belanja Pemerintah Pusat sebagaimana dimaksud pada ayat (1) dikelompokkan atas: a. Belanja Pemerintah Pusat Menurut Fungsi; b. Belanja Pemerintah Pusat Menurut Organisasi; dan c. Belanja Pemerintah Pusat Menurut Program. (3) Pelaksanaan belanja Pemerintah Pusat sebagaimana dimaksud pada ayat (1) dan ayat{21 berorientasi pada keluaran (output) dan hasil (outume), untuk meningkatkan kesejahteraan ralfyat. (4) Pelaksanaan belanja Pemerintah Pusat sebagaimana dimaksud pada ayat (1) dan ayat l2l memprioritaskan dan memperkuat penggunaan barang produksi dalam negeri dan mengandung tingkat komponen dalam negeri yang tinggi. (5) Rincian anggaran Belanja Pemerintah Pusat Menurut Organisasi, Fungsi, dan Program sebagaimana dimaksud pada ayat (2) tercantum dalam La,mpiran I yang merupakan bagian tidak terpisahkan dari Undang-Undang ini sesuai dengan Nota Keuangan dan apabila ada perubahan diatur dengan Peraturan Presiden. Pasal 9 (1) Anggaran TKD sebagaimana dimaksud dalam Pasal 7 huruf b direncanakan sebesar Rp9 1 9,872. 1 1 4.583.000,00 (sembilan ratus sembilan belas triliun delapan ratus tujuh puluh dua miliar seratus empat belas juta lima ratus delapan puluh tiga ribu rupiah). (2)TKD . . . SK No 210943 A
PRESIDEN REPUBLIK INDONESIA -15- l2l TKD sebagaimana dimaksud pada ayat (1) terdiri atas: a. DBH; b. DAU; c. DAK; d. Dana Otonomi Khusus; e. Dana Keistimewaan; dan f. Dana Desa. (3) Anggaran TKD sebagaimana dimaksud pada ayat (l) termasuk alokasi untuk Dana Insentif Fiskal. (4) Ketentuan mengenai rincian anggaran TKD sebagaimana dimaksud pada ayat (1) diatur dalam Peraturan Presiden. Pasal L0 (1) DBH sebagaimana dimaksud dalam Pasal 9 ayat l2l huruf a direncanakan sebesar Rpl92.2al.743.134.OOO,OO (seratus sembilan puluh dua triliun dua ratus delapan puluh satu miliar tqiuh ratus empat puluh tiga juta seratus :ga puluh empat ribu rupiah), yang terdiri atas: a. DBH pajak; b. DBH sumber daya alam; c. DBH lainnya berupa DBH perkebunan sawit; dan d. kurangbayarDBH. (21 DBH pajak sebagaimana dimaksud pada ayat (l) huruf a terdiri atas: a. pajak penghasilan; b. pajak bumi dan bangunan; dan c. cukai hasil tembakau. (3) DBH sumber daya alam sebagaimana dimaksud pada ayat (l) huruf b terdiri atas: a. kehutanan; b. mineral dan batubara; c. minyak bumi dan gas bumi; d. panas . . . SK No210942A
PRESIDEN REPUBLIK INDONESIA _ 16_ d. panas bumi; dan e. perikanan, (4) DBH pajak bumi dan bangunan sebagaimana dimaksud pada ayat (21 huruf b dapat memperhitungkan biaya operasional yang diatur dengan Peraturan Menteri Keuangan. (5) Alokasi DBH ditetapkan berdasarkan realisasi penerimaan negara sampai dengan alhir Tahun Anggaran 2024 dan sesuai dengan ketentuan peraturan pemndang-undangan dengan memperhatikan kemampuan keuangan negara. (6) Alokasi DBH sebagaimana dimaksud pada ayat (5) terdiri atas alokasi formula dan alokasi kinerja. (71 Dalam rangka mempercepat penyelesaian kurang bayar DBH sampai dengan Tahun Angaran 2024, Menteri Keuangan dapat menetapkan alokasi sementara kurang bayar DBH sampai dengan Tahun Anggaran 2O24 danlatano dapat menggunakan alokasi DBH tahun anggaran berjalan. (8) DBH sumber daya alam kehutanan sebagaimana dimaksud pada ayat (3) huruf a, khusus dana reboisasi digunakan untuk membiayai kegiatan, terdiri atas: a. rehabilitasi di luar kawasan sesuai kewenangan provinsi; b. rehabilitasi hutan dan lahan sesuai kewenangan provinsi; c. pembangunan dan pengelolaan hasil hutan kayu, hasil hutan bukan kayu dan/atau jasa lingkungan dalam kawasan; d. pemberdayaan masyarakat dan perhutanan sosial; e. operasionalisasiKesatuanPengelolaanHutan; f. pengendalian kebakaran hutan dan lahan; g. perlindungan dan pengamanan hutan; h. pengembangan perbenihan tanaman hutan; i. penyuluhan kehutanan; dan/atau j. strategis. . . SK No2l094l A
PRESIDEN REPUBLIK INDONESIA - 17- j. strategis lainnya yang ditetapkan oleh Pemerintah. (9) Penggunaan DBH cukai hasil tembakau sebagaimana dimaksud pada ayat (2) huruf c, DBH sumber daya alam minyak bumi dan gas bumi sebagaimana dimaksud pada ayat (3) huruf c dan DBH sumber daya alam kehutanan sebagaimana dimaksud pada ayat (3) huruf a, diatur sebagai berikut: a. Penerimaan DBH cukai hasil tembakau, baik bagian provinsi maupun bagian kabupaten / kota dialokasikan untuk mendanai progrerm sebagaimana diatur dalam ketentuan peraturan perundang-undangan mengenai cukai, dengan prioritas pada bidang kesehatan untuk mendukung program jaminan kesehatan nasional terutama peningkatan kuantitas dan kualitas layanan kesehatan; b. Penerimaan DBH sumber daya alam minyak bumi dan gas bumi, baik bagian provinsi maupun bagian kabupaten/kota digunakan sesuai kebutuhan dan prioritas Daerah, kecuali tambahan DBH minyak bumi dan gas bumi untuk Provinsi Papua Barat, Provinsi Papua Barat Daya, dan Provinsi Aceh digunakan sesuai dengan ketentuan peraturan undangan; dan c Sisa DBH sumber daya alam kehutanan dari dana reboisasi kabupaten /kota, yang disalurkan sebelum tahun 2017 yang masih terdapat di kas Daerah dapat digunakan oleh organisasi perangkat daerah yang ditunjuk oleh bupati/wali kota untuk: dan pengelolaan taman hutan raya; pencegahan dan penanggulangan kebakaran hutan dan lahan; penangurnan pasca kebakaran hutan dan lahan di taman hutan raya; penuuraman daerah aliran sungai kritis, penanaman pada kawasan perlindungan setempat, dan pembuatan bangunan konservasi tanah dan air; 5. pembangunan . . . 1. 2. 3. 4. SK No210919A
PRESIDEN REPUBLIK INDONESIA -18- 5. pembangunan dan pengelolaan Ruang Terbuka Hijau; 6. penyuluhan lingkungan hidup; 7. konservasi sumber daya alam hayati dan ekosistemnya; pengelolaan dan/atau hayati; 9. kegiatan strategis lainnya yang ditetapkan oleh Pemerintah. Dalam hal realisasi penerimaan negara yang dibagihasilkan melebihi pagu penerimaan yang dianggarkan dalam tahun 2025, Pemerintah dapat menyalurkan DBH berdasarkan realisasi penerimaan tahun berjalan dan/ atau menyelesaikan kurang bayar DBH tahun-tahun sebelumnya sesuai dengan kemampuan keuangan negara. Tata cara percepatan penyelesaian kurang bayar DBH sebagaimana dimalsud pada ayat (7) dilaksanakan sesuai dengan ketentuan peraturan perundangundangan. Ketentuan lebih lanjut mengenai DBH sumber daya alam kehutanan dana reboisasi dan sisa DBH sumber daya alam kehutanan dana reboisasi diatur dengan Peraturan Menteri Keuangan. Ketentuan lebih lanjut mengenai DBH cukai hasil tembakau diatur dengan Peraturan Menteri Keuangan. 8 (10) (1 1) (r2l (13) Pasal 11 (l) DAU sebaqaimana dimaksud dalam Pasal 9 ayat (21 huruf b, direncanakan sebesar Rp446.633.8 14. 10 1.0OO,OO (empat ratus empat puluh enam triliun enam ratus tiga puluh tiga miliar delapan ratus empat belas juta seratus satu ribu rupiah). (21 Dalam hal terdapat kebijakan pemerintah yang pada perhitungan DAU, DAU sebagaimana dimaksud pada ayat (1) dapat dilakukan penyesuaian. SK No2l0918A (3) Penyesuaian
PRESIDEN REPUELIK INDONESIA -19- (3) Penyesuaian DAU sebagaimana dimaksud pada ayat l2l tidak mengubah pagu TKD lainnya dan/atau kewajiban yang timbul bagi Daerah. (4) Proporsi DAU antara provinsi dan kabupaten/kota ditetapkan dengan imbangan 14,1% (empat belas koma satu persen) dan 85,9%o (delapan puluh lima koma sembilan persen) dengan mempertimbangkan kebutuhan pendanaan dalam rangka pelaksanaan Urusan Pemerintahan yang menjadi kewenangan Daerah provinsi dan kabupaten/ kota, (5) DAU untuk tiap-tiap Daerah dialokasikan berdasarkan celah fiskal. (6) Alokasi DAU per Daerah dilakukan penyesuaian secara proporsional dengan memperhatikan alokasi DAU per Daerah tahun sebelumnya. (71 Alokasi DAU untuk setiap Daerah terdiri atas bagian DAU yang tidak ditentukan penggunaannya dan bagian DAU yang ditentukan penggunaannya. (8) Penyesuaian DAU sebaqaimana dimaksud pada ayat (21 dilaksanakan sesuai dengan ketentuan peraturan perundang-undangan. (9) Sebagian alokasi DAU provinsi di wilayah Papua untuk bidang pendidikan dialihkan kepada kabupaten/kota diwilayahnya masing-masing sebagai tindak lanjut dari pengalihan kewenangan pengelolaan pendidikan menengah dari provinsi kepada kabupaten / kota sesuai dengan ketentuan peraturan perundang-undangan yang mengatur mengenai kewenangan dan kelembagaan pelaksanaan kebijakan otonomi khusus Provinsi Papua. Pasal 12 (1) DAK sebagaimana dimaksud dalam Pasal 9 ayat (21 huruf c direncanakan sebesar Rp185.240.958.39O.000,0O (seratus delapan puluh lima triliun dua ratus empat puluh miliar sembilan ratus lima puluh delapan juta tiga ratus sembilan puluh ribu rupiah), terdiri atas: a. DAK fisik; b. DAK non-fisik; dan c. Hibah kepada daerah. SK No2l09l7A (2) Pengalokasian
PRESIDEN REPUELIK INDONESIA 20- l2l Pengalokasian DAK frsik sebagaimaaa dimaksud pada ayat (1) huruf a ditetapkan berdasarkan usulan pemerintah daerah dan/ atau aspirasi anggota Dewan Perwakilan Rakyat dalam memperjuangkan program pembangunan daerah dengan memperhatikan prioritas nasional, keuangan negara, (3) kapasitas fiskal Daerah dan kinerja Daerah, serta tata kelola keuangan negara yang baik. Pengelolaan DAK Fisik sebagaimana dimaksud pada ayat (1) huruf a dilaksanakan dengan mengimplementasikan kebijakan afirmatif. DAK frsik sebagaimana dimaksud pada ayat (1) huruf a direncanakan sebesar Rp36.953.988.957.000,00 (tiga puluh enam triliun sembilan ratus lima puluh tiga miliar sembilan ratus delapan puluh delapan juta sembilan ratus lima puluh tujuh ribu rupiah), terdiri atas: a. bidang pendidikan sebesar Rp2. 482.O2O.827.000,00 (dua triliun empat ratus delapan puluh dua miliar dua puluh juta delapan ratus dua puluh tujuh ribu rupiah); b. bidang kesehatan sebesar Rpl1.809.651.294.000,00 (sebelas triliun delapan ratus sembilan miliar enam ratus lima puluh satu juta dua ratus sembilan puluh empat ribu rupiah); (4) c. bidang perempuan dan anak d. sebesar Rp96.961.O9O.OOO,OO (sembilan puluh enam miliar sembilan ratus enam puluh satu juta sembilan puluh ribu rupiah); bidang air minum sebesar Rp2.2L9.373.292.O00,0O (dua triliun dua ratus sembilan belas miliar tiga ratus tujuh puluh tiga juta dua ratus sembilan puluh dua ribu rupiah); bidang sanitasi sebesar Rp l.609.a32.OOO.OOO,OO (satu triliun enam ratus sembilan miliar empat ratus tiga puluh dua juta rupiah); bidang irigasi sebesar Rpl.724.72 1. 102.000,00 (satu triliun tujuh ratus dua puluh empat miliar tujuh ratus dua puluh satu juta seratus dua ribu rupiah); g. bidang. . . e f. SK No2109l6A
PRESIDEN REPUBLIK INDONESIA -21 - g. bidang perumahan dan permukiman sebesar Rp256.155.859.00O,0O (dua ratus lima puluh enam miliar seratus lima puluh lima juta delapan ratus lima puluh sembilan ribu rupiah); h. bidang konektivitas sebesar Rp14.596.245.094.000,00 (empat belas triliun lima ratus sembilan puluh enam miliar dua ratus empat puluh lima juta sembilan puluh empat ribu rupiah), terdiri dari: 1. subbidang jalan sebesar Rp14.258.651.440.000,00 (empat belas triliun dua ratus lima puluh delapan miliar enam ratus lima puluh satu juta empat ratus empat puluh ribu rupiah); dan 2. subbidang perairan sebesar Rp337.593.654.000,00 (tiga ratus tiga puluh tujuh miliar lima ratus sembilan puluh tiga juta enam ratus lima puluh empat ribu rupiah); i. bidang pangan pertanian sebesar Rp675.329.519.000,00 (enam ratus tqjuh puluh lima miliar tiga ratus dua puluh sembilan juta lima ratus sembilan belas ribu rupiah), terdiri dari: 1. subbidang pertanian sebesar Rp60O.311.212.000,00 (enam ratus miliar tiga ratus sebelas juta dua ratus dua belas ribu rupiah); dan 2. subbidang pangan sebesar Rp75.018.307.000,00 (tujuh puluh lima miliar delapan belas juta tiga ratus tqiuh ribu rupiah); j. bidang pangan akuatik sebesar Rpl.3O9.9O0.OOO.OOO,OO (satu triliun tiga ratus sembilan miliar sembilan ratus juta rupiah); k. bidang industri kecil dan menengah sebesar Rp50.OOO.O0O.OOO,OO (lima puluh miliar rupiah); dan l. bidang perdagangan sebesar Rp 1 24. 198.88O.OOO,OO (seratus dua puluh empat miliar seratus sembilan puluh delapan juta delapan ratus delapan puluh ribu rupiah). (s) DAK. . . SK No2109l5A
PRESIDEN REPUBLIK INDONESIA -22- (5) DAK lisik digunakan pengadaan terdiri dari: bersifat untuk sarana tematik dan dan prasarana lintas bidang pembangunan/ layanan dasar a. DAK fisik untuk layanan dasar; dan b. DAK fisik dengan tema tertentu, yaitu: 1. tematik pengentasan permukiman kumuh terpadu; 2. tematik kawasan produksi pangan nasional; dan 3. tematik pengembangan ekosistem dan rantai pasok kawasan industri. (6) DAK non-fisik sebagaimana dimaksud pada ayat (1) huruf b direncanakan sebesar Rp146.677.929.010.000,00 (seratus empat puluh enam triliun enam ratus tujuh puluh tqiuh miliar sembilan ratus dua puluh sembilan juta sepuluh ribu rupiah), terdiri atas: a. dana bantuan operasional satuan pendidikan sebesar Rp59.271.610.326.000,00 (lima puluh sembilan triliun dua ratus tujuh puluh satu miliar enam ratus sepuluh juta tiga ratus dua puluh enam ribu rupiah); b. dana tunjangan guru aparatur sipil negara daerah sebesar Rp70.064.302.522.000,00 (tqiuh puluh triliun enam puluh empat miliar tiga ratus dua juta lima ratus dua puluh dua ribu rupiah); c. dana bantuan operasional kesehatan sebesar Rp12.878.672.152.000,00 (dua belas triliun delapan ratus tujuh puluh delapan miliar enam ratus tujuh puluh dua juta seratus lima puluh dua ribu rupiah); d. dana bantuan operasional keluarga berencana sebesar Rp3.239.300. OOO. OOO, 0O (tiga triliun dua ratus tiga puluh sembilan miliar tiga ratus juta rupiah); e. dana . . . SK No2l09l4A
PRESIDEN REPUBLIK INDONESIA -23- dana peningkatan kapasitas koperasi, usaha mikro dan kecil, sebesar Rp163.7OO.OOO.OOO,0O (seratus enam puluh tiga miliar tujuh ratus juta rupiah); dana bantuan operasional penyelenggaraan museum dan taman budaya sebesar Rp169.975.0O0.O00,0O (seratus enam puluh sembilan miliar sembilan ratus tujuh puluh lima juta rupiah); g. dana bantuan pengembangan program sebesar puluh daerah Rpl5O.OO0.O00.OOO,OO (seratus lima miliar rupiah); h. dana pelayanan perempuan dan anak sebesar Rp132.O00.OOO.O0O,OO (seratus tiga puluh dua miliar rupiah); i. dana ketahanan pEurgan dan pertanian sebesar Rp516.379.010.0OO,0O (lima ratus enam belas miliar tiga ratus tqjuh puluh sembilan juta sepuluh ribu rupiah); dan j. dana penguatan kapasitas kelembagaan sentra industri kecil dan menengah sebesar Rp91.99O.O0O.0OO,OO (sembilan puluh satu miliar sembilan ratus sembilan puluh juta rupiah). (71 Hibah kepada Daerah sebagaimana dimaksud pada ayat (1) huruf c direncanakan sebesar Rp1.609.0a0.423.000,00 (satu triliun enam ratus sembilan miliar empat puluh juta empat ratus dua puluh tiga ribu rupiah). Pasal 13 (U Dana Otonomi Khusus sslagaimana dimaksud dalam Pasal 9 ayat (21 huruf d direncanakan sebesar Rp17.515.598.958.000,00 (tujuh belas triliun lima ratus lima belas miliar lima ratus sembilan puluh delapan juta sembilan ratus lima puluh delapan ribu rupiah), terdiri atas: a. Alokasi . . . e f. SK No236082A
PRESIDEN REPUBLIK INDONESIA -24- a. Alokasi Dana Otonomi Khusus untuk Provinsi Papua, Provinsi Papua Barat, Provinsi Papua Pegunungan, Provinsi Papua Tengah, Provinsi Papua Selatan, dan Provinsi Papua Barat Daya sebesar Rp1O.049.26O.817.00O,O0 (sepuluh triliun empat puluh sembilan miliar dua ratus enam puluh juta delapan ratus tujuh belas ribu rupiah); b. Alokasi Dana Otonomi Khusus Provinsi Aceh sebesar Rp4.466.338. 141.000,00 (empat triliun empat ratus enam puluh enam miliar tiga ratus tiga puluh delapan juta seratus empat puluh satu ribu rupiah); dan c. DTI untuk Provinsi Papua, Proyinsi Papua Barat, Provinsi Papua Pegunungan, Provinsi Papua Tengah, Provinsi Papua Selatan, dan Provinsi Papua Barat Daya sebesar Rp3.OOO.OOO.O00.0OO,O0 (tiga triliun rupiah). l2l Dalam hal pembagian alokasi Dana Otonomi Khusus sebagaimana dimaksud pada ayat (1) huruf a dan DTI sebagaimana dimaksud pada ayat (1) huruf c tidak dapat dilakukan sesuai dengan Undang-Undang mengenai Otonomi Khusus bagi Provinsi Papua dan peraturan pelaksanaannya sebagai akibat ketidaktersediaan data, pembagisn Dana Otonomi Khusus dan DTI tersebut dilakukan berdasarkan perhitungan rata-rata atas data yang digunakan untuk kabupaten/kota di lingkup wilayah provinsi di wilayah Papua. (3) Pembagian alokasi Dana Otonomi Khusus antara provinsi dengan kabupaten/kota untuk Daerah baru di wilayah Papua ditetapkan dengan proporsi 30o/o (tiga puluh persen) untuk bagian provinsi dan TOVo (tujuh puluh persen) untuk bagian kabupaten/kota. (4) DTI sebagaimana dimaksud pada ayat (1) huruf c untuk provinsi Daerah baru diprioritaskan penggunaannya untuk pembangunan infrastruktur penunjang gedung perkantoran, meliputi infrastruktur jalan dan jembatan menuju lokasi perkantoran, infrastruktur instalasi listrik, infrastruktur jaringan air bersih, jaringan telekomunikasi, dan infrastruktur sanitasi lingkungan. (5) Dana . . . SK No236081A
PRESIOEN REPUBLIK INDONESIA _25_ (5) Dana Keistimewaan sebagaimana dimaksud dalam Pasal 9 ayat (2) huruf e direncanakan sebesar Rpl.2O0.O00.OOO.OO0,OO (satu triliun dua ratus miliar rupiah) yang digunakan untuk mendanai kewenangan keistimewaan Daerah Istimewa Yograkarta serta dapat mendanai kegiatan prioritas nasional sesuai dengan ketentuan peraturan perundang-undangan. (6) Ketentuan lebih lanjut mengenai pengelolaan Dana Otonomi Khusus sebagaimana dimaksud pada ayat (1) dan Dana Keistimewaan sebagaimana dimaksud pada ayat (5) diatur dalam Peraturan Menteri Keuangan. Pasal 14 (1) Dana Desa sebagaimana dimaksud dalam Pasal 9 ayat l2l huruf f direncanakan sebesar Rp7I.O0O.OOO.O00.O0O,0O (tujuh puluh satu triliun rupiah), yang terdiri atas: a. sebesar Rp69.OOO.0OO.0OO.OO0,O0 (enam puluh sembilan triliun rupiah) dihitung pada tahun angg€rr€m sebelum tahun anggaran berjalan berdasarkan formula; dan sebesar Rp2.0OO.OOO.0OO.OO0,0O (dua triliun rupiah) dihitung pada tahun anggaran berjalan sebagai insentif desa dan/atau melaksanakan kebijakan Pemerintah Pusat. (21 Dana Desa sebagaimana dimaksud pada ayat (1) huruf a dialokasikan kepada setiap desa dengan ketentuan: a. Alokasi Dasar sebesar 65% (enam puluh lima persen) dibagi secara proporsional kepada setiap desa; b. Alokasi Afirmasi sebesar 17o (satu persen) dibagr secara proporsional kepada desa tertinggal dan desa sangat tertinggal dan dapat mempertimbangkan jumlah penduduk miskin di desa tertinggal dan desa sangat tertinggal; c. Alokasi Kinerja sebesar 4o/o lempat persen) dibagi kepada desa dengan kinerja terbaik; dan b SK No236080A d. Alokasi . . .
PRESIDEN REPUBLIK INDONESIA -26- d. Alokasi Formula sebesar 3oo/o (tiga puluh persen) dihitung dengan memperhatikan jumlah penduduk, angka kemiskinan, luas wilayah, dan tingkat kesulitan geografis. (3) Insentif Desa sebagaimana dimaksud pada ayat (1) huruf b dialokasikan berdasarkan kriteria tertentu. (4) Berdasarkan hasil penghitungan alokasi Dana Desa setiap desa sebagaimana dimaksud pada ayat (2), Pemerintah menetapkan alokasi Dana Desa per kabupaten/kota. (5) Dana Desa diutamakan penggunaannya untuk mendukung: a. penanganarn kemiskinan ekstrem dengan penggunaan Dana Desa paling tinggi 15% (lima belas persen) untuk bantuan langsung tunai desa dengan target keluarga penerima manfaat dapat menggunakan data pemerintah sebagai acuan; b. penguatan desa yang adaptif terhadap perubahan iklim; c. peningkatan promosi dan penyediaan layanan dasar kesehatan skala desa termasuk stuntirq; d. dukungan program ketahanan pangan; e. pengembangan potensi dan keunggulan desa; f. pemanfaatan teknologi dan informasi untuk percepatan implementasi desa digital; g. pembangunan berbasis padat karya tunai dan penggunaan bahan baku lokal; dan/atau h. program sektor prioritas lainnya di desa. (6) Dana Desa dapat digunakan untuk dana operasional pemerintah desa paling banyak 3% (tiga persen) dari pagu Dana Desa setiap desa. (71 Ketentuan mengenai pengelolaan Dana Desa dan penetapan rincian Dana Desa setiap desa berdasarkan hasil perhitungan sebagaimana dimaksud pada ayat (2) dan ayat (3) diatur dengan Peraturan Menteri Keuangan. Pasal 15. . . SK No236079A
PRESIDEN REPUBLIK INDONESIA -27 - Pasal 15 (1) Dana Insentif Fiskal sebagaimana dimaksud dalam Pasal 9 ayat (3) direncanakan sebesar Rp6.OOO.O0O.OOO.0OO,OO (enam triliun rupiah). (21 Dana Insentif Fiskal sebagaimana dimaksud pada ayat (l) dialokasikan untuk penghargaan kinerja tahun sebelumnya dan penghargaan kinerja tahun berjalan berdasarkan penilaian kinerja daerah. (3) Dana Insentif Fiskal untuk penghargaan kinerja tahun be{alan sebagaimana dima}sud pada ayat (2) pengalokasian per daerahnya dilakukan pada Tahun Anggaran 2025. (4) Ketentuan lebih lanjut mengenai pengelolaan Dana Insentif Fiskal diatur dalam Peraturan Menteri Keuangan. Pasal 16 (1) Ketentuan mengenai penyaluran anggaran TKD diatur sebagai berikut: a. dapat dilakukan dalam bentuk tunai dan nontunai; b. bagi daerah yang memiliki uang kas dan/atau simpanan di bank dalam jumlah tidak wajar, dapat dilakukan konversi penyaluran DBH dan/ atau DAU dalam bentuk non-tunai; c. dilakukan berdasarkan kinerja pelaksanaan; dan d. dapat dilakukan penundaan, pemotongan, dan/atau penghentian, dalam hal daerah tidak memenuhi anggaran yang diwajibkan dalam peraturan perundang-undangan atau menunggak membayar iuran yang diwajibkan dalam peraturan perundang-undangan. l2l Ketentuan lebih lanjut mengenai pengelolaan TKD sebasaimana dimaksud pada ayat (1) diatur dengan Peraturan Menteri Keuangan. Pasal 17. . . SK No21096l A
PRESIDEN REPUBLIK INDONESIA -28 Pasal 17 (1) Program Pengelolaan Subsidi dalam Tahun Anggaran 2025 direncanakan sebesar Rp3O7.931.929.O1O.OOO,OO (tiga ratus tujuh triliun sembilan ratus tiga puluh satu miliar sembilan ratus dua puluh sembilan juta sepuluh ribu rupiah). (2) Anggaran untuk Program Pengelolaan Subsidi sebagaimana dimaksud pada ayat (1) dilaksanakan sesuai dengan ketentuan peraturan perundangundangan. (3) Anggaran untuk Program Pengelolaan Subsidi sebagaimana dimaksud pada ayat (1) dapat disesuaikan dengan kebutuhan realisasi pada tahun anggaran berjalan berdasarkan asumsi dasar ekonomi malro, perubahan parameter, perubahan kebijakan, dan/atau pembayaran kekurangan subsidi tahun-tahun sebelumnya. (4) Ketentuan lebih lanjut mengenai rincian Program Pengelolaan Subsidi dalam Tahun Anggaran 2O25 sebagaimana dimaksud pada ayat (1) diatur dalam Peraturan Presiden. Pasal 18 (1) Dalam ha1 perkiraan realisasi PNBP sumber daya alam yang melampaui target penerimaan dalam APBN yang diikuti dengan kebijakan peningkatan belanja subsidi energi dan/atau kompensasi, Pemerintah dapat memperhitungkan persentase tertentu atas peningkatan belanja subsidi energl dan/ atau kompensasi terhadap kenaikan PNBP sumber daya alam yang dibagihasilkan. l2l Ketentuan mengenai tata cara perhitungan persentase tertentu atas peningkatan belanja subsidi energi dan/ atau kompensasi terhadap kenaikan PNBP sumber daya alam yang dibagihasilkan sebagaimana dimaksud pada ayat (1) diatur dengan Peraturan Menteri Keuangan. Pasal 19. . . SK No235075A
PRESIDEN REPUBLIK INDONESIA -29- Pasal 19 Dalam rangka elisiensi dan efektivitas anggaran kementerian/lembaga, Pemerintah dapat memberikan penghargaan dan/ atau pengenaan sanksi berdasarkan: a. indikator kinerja anggaran; dan b. pengelolaananggaran, yang dilaksanakan sesuai dengan ketentuan peraturan perundang-undangan. Pasal 2O (1) Perubahan anggaran Belanja Negara berupa: a. perubahan anggaran belanja yang bersumber dari PNBP termasuk penggunaan saldo kas Badan layanan Umum; b. perubahan anggaran belanja yang bersumber dari perhitungan PNBP tahun anggaran sebelumnya yang belum digunakan pada Otorita Ibu Kota Nusantara dan/atau perhitungan sisa klaim asuransi BMN tahun anggaran sebelumnya; c. perubahan anggaran belanja yang bersumber dari pinjaman termasuk pinjaman baru; d, pergeseran anggaran antarprogram dalam 1 (satu) Bagian Anggaran untuk bencana; e. perubahan anggaran belanja yang bersumber dari hibah termasuk hibah yang diterushibahkan; f. perubahan anggaran belanja dalam rangka penanggulangan bencana; g. perubahan anggaran cadangan kompensasi dalam Program Pengelolaan Belanja Lainnya; h. pergeseran dari Bagian Anggaran 999.08 (BUN Pengelolaan Belanja Lainnya) ke Bagran Anggaran kementerian/lembaga atau sebaliknya atau pergeseran antarsubbagian anggaran dalam Bagran Anggaran 999 (BA BUN); i. pergeseran . . . SK No236075A
PRESIDEN REPUBLIK INDONESIA -30- i. pergeseran anggaran belanja yang dibiayai dari PNBP antarsatuan kerja dalam I (satu) program yang sama atau antarprogram dalam satu Bagian Anggaran; j. perubahan anggaran belanja yang bersumber dari SBSN untuk pembiayaan kegiatan/proyek kementerian/lembaga; k. pergeseran anggaran antarprogram dalam 1 (satu) Bagian Anggaran yang bersumber dari rupiah murni untuk memenuhi kebutuhan belanja operasional; L pergeseran anggaran antarprogram dalam I (satu) Bagran Anggaran untuk memenuhi kebutuhan pengeluaran yang tidak diperkenankan lineligible expendihrel atas kegiatan yang dibiayai dari pinjaman dan/atau hibah luar negeri; m. pergeseran anggaran antarprogram dalam rangka penyelesaian restrukturisasi kementerian/lembaga; n. pergeseran anggaran antarprogram dalam unit eselon I yang sama; dan o. perubahan anggarErn belanja dalam rangka pembayaran tunggakan tahun sebelumnya/kewajiban Pemerintah, ditetapkan oleh Pemerintah. Pemerintah dapat melakukan pinjaman baru sebagaimana dimaksud pada ayat (1) huruf c untuk penanggulangan bencana. Perubahan lebih lanjut Pembiayaan Anggaran berupa perubahan pagu Pemberian Pinjaman akibat dari lanjutan, percepatan penarikan Pemberian Pinjaman, dan pengesahan atas Pemberian Pinjaman yang telah closirq date, ditetapkan oleh Pemerintah. Perubahan anggaran Belanja Negara berupa perubahan pagu untuk pengesahan belanja dan penerimaan pembiayaan dan I atan pendapatan hibah yang bersumber dari pinjaman/hibah termasuk pinjaman/hibah yang diterushibahkan yang telah dosing date, ditetapkan oleh Pemerintah. (5) Perubahan... SK No236074A (41
PRESIDEN REPUBLIK INDONESIA -31 - (5) Perubahan anggaran Belanja Negara berupa penambahan pagu karena luncuran Rupiah Murni Pendamping dalam Daftar Isian Pelaksanaan Anggaran Tahun 2024 yang tidak terserap untuk pembayaran uang muka kontrak kegiatan yang dibiayai pinjaman luar negeri, ditetapkan oleh Pemerintah. (6) Pencairan Rupiah Murni Pendamping sebagaimana dimaksud pada ayat (5) dilaksanakan paling lambat tanggal 31 Maret 2025. 171 Pelaksanaan perubahan anggaran sebagaimana dimaksud pada ayat (1) huruf h dilaporkan oleh Pemerintah kepada Dewan Perwakilan Ralryat melalui pimpinan alat kelengkapan yang khusus menangani urusan di bidang ansgaran dan/atau pimpinan alat kelengkapan yang khusus menangani urusan kementerian / lembaga dimaksud. (8) Perubahan sebagaimana dimaksud pada ayat (l), ayat {21, ayat (3), ayat (4), dan ayat (5), dilaporkan Pemerintah dalam APBN Perubahan Tahun Anggaran 2025 danlatau Laporan Keuangan Pemerintah Pusat Tahun 2025. Pasal 21 (1) Pemerintah dapat memberikan hibah kepada pemerintah asing/lembaga asing dan menetapkan pemerintah asing/lembaga asing penerima untuk pencapaian kepentingan nasional Indonesia. (21 Pencapaian kepentingan nasional Indonesia sebagaimana dimaksud pada ayat (1) dilaksanakan dengan pemanfaatan barang/jasa dan/atau penyedia barang/jasa dalam negeri Indonesia. (3) Anggaran pemberian hibah sebagaimana dimaksud pada ayat {1) dapat bersumber dari PNBP kmbaga Dana Kerja Sama Pembangu.nan Intemasional. (4) Pemerintah dapat memberikan hibah kepada pemerintah daerah yang pelaksanasnnya dilaporkan Pemerintah dalam APBN Perubahan Tahun Anggaran 2025 danlatau Laporan Keuangan Pemerintah Pusat Tahun 2O25. Pasal22. . . SK No 236073 A
PRESIDEN REPUBLIK INDONESIA _32_ Pasal22 (1) Anggaran Pendidikan direncanakan sebesar Rp724.262.748.700.000,00 (tujuh ratus dua puluh empat triliun dua ratus enam puluh dua miliar tqiuh ratus empat puluh delapan juta tujuh ratus ribu rupiah). (21 Anggaran Pendidikan sebagaimana dimaksud pada ayat (1) sebesar 2O,Oo/o (dua puluh koma nol persen) dari total anggaran Belanja Negara sebesar Rp3.62 1.3 I 3.743.5OO.OOO,OO (tiga kuadriliun enam ratus dua puluh satu triliun tiga ratus tiga belas miliar tujuh ratus empat puluh tiga juta lima ratus ribu rupiah). (3) Anggaran Pendidikan sebagaimana dimaksud pada ayat (1) termasuk untuk pendanaan operasional penyelenggaraan pendidikan. (41 Anggaran Pendidikan sslagaimana dimaksud pada ayat (1) termasuk Investasi Pemerintah pada pos pembiayaan untuk dana abadi di bidang pendidikan. (5) Hasil kelolaan dari dana abadi sebagaimana dimaksud pada ayat (4) digunakan oleh kementerian/lembaga terkait sesuai peruntukannya. (6) Ketentuan lebih lanjut mengenai rincian Anggaran Pendidikan dan penggunaan hasil kelolaan dana abadi diatur dalam Peraturan Fresiden. Pasal 23 (1) Jumlah anggaran Pendapatan Negara Tahun Anggaran 2025 sebagaimana dimaksud dalam Pasal 3, lebih kecil dari pada jumlah anggaran Belanja Negara sebagaimana dimaksud dalam Pasal 7 sehingga dalam Tahun Anggaran 2025 terdapat delisit anggaran sebesar Rp616. 186.060.243.O00,0O (enam ratus enam belas triliun seratus delapan puluh enam miliar enam puluh juta dua ratus empat puluh tiga ribu rupiah) yang akan dibiayai dari Pembiayaan Anggaran. (21 Pembiayaan Anggaran sebagaimana dimaksud pada ayat (1) sebesar Rp616.186.060.243.000,00 (enam ratus enam belas triliun seratus delapan puluh enam miliar enam puluh juta dua ratus empat puluh tiga ribu rupiah), terdiri atas: SK No236072A a.
PRESIDEN REPUBLIK INDONESIA -33- a. pembiayaan utang sebesar Rp775.867.469.094.000,00 (tqiuh ratus tujuh puluh lima triliun delapan ratus enam puluh tu-iuh miliar empat ratus enam puluh sembilan juta sembilan puluh empat ribu rupiah); b. pembiayaan investasi sebesar negatif Rp154.501.300.000.000,00 (seratus lima puluh empat triliun lima ratus satu miliar tiga ratus juta rupiah); c. pemberian pinjaman sebesar negatif Rp5.442.108.851.0O0,O0 (lima triliun empat ratus empat puluh dua miliar seratus delapan juta delapan ratus lima puluh satu ribu rupiah); dan d, pembiayaan lainnya sebesar Rp262.OOO.0OO.O0O,00 (dua ratus enam puluh dua miliar rupiah). (3) Ketentuan mengenai alokasi Pembiayaan Anggaran sebagaimana dimaksud pada ayat (1) tercantum dalam Lampiran I yang merupakan bagian tidak terpisahkan dari Undang-Undang ini. (4) Ketentuan lebih lanjut mengenai rincian alokasi Pembiayaan Anggaran tercantum dalam Lampiran I yang merupakan bagran tidak terpisahkan dari Undang-Undang ini diatur dalam Peraturan Presiden. Pasal 24 (1) Dalam hal anggaran diperkirakan defisit melampaui target yang ditetapkan dalam APBN, Pemerintah dapat menggunakan dana SAL, penarikan Pinjaman T\rnai, penerbitan SBN, dan/atau pemanfaatan saldo kas Badan Layanan Umum sebagai tambahan pembiayaan. (21 Kewajiban yang timbul dari penggunaan dana SAL, penarikan Pinjaman Tunai, penerbitan SBN, dan/ atau pemanfaatan saldo kas Badan Layanan Umum sebagai tambahan pembiayaan sebagaimana dimaksud pada ayat (1) dibebankan pada anggaran negara. (3) Penggunaan... SK No236071A
PRESIDEN REPUBLIK INDONESIA -34- (3) Penggunaan dana SAL, penarikan Pinjaman Tunai, penerbitan SBN, dan/ atau pemanfaatan saldo kas Badan Layanan Umum sebagai tambahan pembiayaan sslagaimana dimaksud pada ayat (1) dilaporkan Pemerintah dalam l-aporan Keuangan Pemerintah Pusat Tahun 2025. (4) Ketentuan lebih lanjut mengenai perkiraan defisit melampaui tsrget serta penggunaan dana SAL, penarikan Pinjaman T\rnai, SBN, dan/atau saldo kas Badan Layanan Umum sebagai tambahan pembiayaan sebagaimana dimaksud pada ayat (1) diatur dengan Peraturan Menteri Keuangan. Pasal 25 (1) Pemerintah dapat menggunakan program kementerian / lembaga yang bersumber dari Rupiah Murni dan/ atau PNBP dalam alokasi anggaran belanja Pemerintah Pusat dan/atau BMN untuk digunakan sebagai dasar penerbitan SBSN. (2) Rincian atas program kementerian/lembaga yang bersumber dari Rupiah Murni dan/atau PNBP yang digunakan sebagai dasar penerbitan SBSN sebasaimana dimaksud pada ayat (1) ditetapkan oleh Menteri Keuangan setelah pengesahan Undang- Undang mengenai APBN Tahun Anggaran 2025 dan penetapan Peraturan Presiden mengenai Rincian APBN Tahun Anggaran 2O25. (3) Ketentuan lebih lanjut mengenai penggunaan program kementerian/lembaga dan/atau BMN sebagai dasar penerbitan SBSN sebagaimana dimaksud pada ayat (1) diatur dengan Peraturan Menteri Keuangan. Pasal 26 (U Pemerintah dapat menggunakan sisa dana penerbitan SBSN untuk pembiayaan kegiatan/proyek kementerian/lembaga yang tidak terserap pada Tahun Anggaran 2024 untuk membiayai pelaksanaan lanjutan kegiatan/proyek tersebut pada Tahun Anggaran 2025. (2) Penggunaan . . . SK No2360704
PRESIDEN REPUBLIK INDONESIA -35- (2) Penggunaan sisa dana penerbitan SBSN untuk kegiatan/proyek kementerian/lembaga sebagaimana dimaksud pada ayat (1) dilaporkan Pemerintah dalam APBN Perubahan Tahun Anggaran 2025 d,an/atau Laporan Keuangan Pemerintah Pusat Tahun 2O25. (3) Ketentuan lebih lanjut mengenai penggunaan sisa dana penerbitan SBSN untuk pembiayaan kegiatan/proyek kementerian/lembaga sebagaimana dimaksud pada ayat (1) diatur dengan Peraturan Menteri Keuangan. Pasal 27 (1) Dalam hal terjadi krisis pasar SBN domestik, Pemerintah dengan persetujuan Dewan Perwakilan Rakyat diberikan kewenangan menggunakan SAL untuk melakukan stabilisasi pasar SBN domestik setelah memperhitungkan kebutuhan anggaran sampai dengan akhir tahun anggaran berjalan dan awal tahun anggaran berikutnya. l2l Persetujuan Dewan Perwakilan Rakyat sebagaimana dimaksud pada ayat (1) merupakan keputusan yang tertuang di dalam kesimpulan Rapat Kerja Badan Anggaran Dewan Perwakilan Ralqpat dengan Pemerintah, yang diberikan dalam waktu tidak lebih dari Lx24 (satu kali dua puluh empat) jam setelah usulan disampaikan Pemerintah kepada Dewan Perwakilan Ralryat. (3) Jumlah penggunEran SAL dalam rangka stabilisasi pasar SBN sslagaimana dimaksud pada ayat (1) dilaporkan Pemerintah dalam APBN Perubahan Tahun Anggaran 2025 danlatau Laporan Keuangan Pemerintah Pusat Tahun 2O25. (4) Ketentuan lebih lanjut mengenai penggunaan SAL dalam rangka stabilisasi pasar SBN domestik sebagaimana dimaksud pada ayat (1) diatur dengan Peraturan Menteri Keuangan. SK No236069A Pasal 28. . .
PRESIDEN REPUBLIK INDONESIA -36- Pasal 28 (1) Dalam hal perkiraan realisasi penerimaan negara tidak sesuai dengan target, adanya perkiraan yang belum tersedia anggarannya, pengeluaran melebihi pagu yang ditetapkan dalam APBN Tahun Anggaran 2025, kinerja anggaran telah tercapai, dan/atau unhrk meqjaga keberlanjutan fiskal, Pemerintah dapat melakukan: a. penggunaan dana SAL; b. penarikan Pinjaman T\.rnai; c. penambahan penerbitan SBN; d. pemanfaatan saldo kas Badan Layanan Umum; dan/atau e. penyesuaian Belanja Negara. (21 Penambahan penerbitan SBN sebagaimana dimaksud pada ayat (1) huruf c dilaksanakan setelah mendapatkan persetqjuan Dewan Perwakilan Rakyat. (3) Pemerintah dapat melakukan pembelian kembali SBN untuk pengelolaan kas dengan tetap memerhatikan jumlah kebutuhan penerbitan SBN neto untuk memenuhi kebutuhan pembiayaan yang ditetapkan. (4) Dalam hal terdapat instrumen pembiayaan dari utang yang lebih menguntungkan dan/atau ketidaktersediaan salah satu instrumen pembiayaan dari utang, Pemerintah dapat melakukan perubahan komposisi instrumen pembiayaan utang dalam rangka menjaga ketahanan ekonomi dan liskal. (5) Dalam hal diperlukan realokasi anggaran bunga utang sebagai dampak perubahan komposisi instrrrmen pembiayaan utang sebagaimana dimaksud pada ayat (4), Pemerintah dapat melalrukan realokasi dari pembayaran bunga utang luar negeri ke pembayaran bunga utang dalam negeri atau sebaliknya. (6) Untuk menurunkan biaya penerbitan SBN dan/atau memastikan ketersediaan pembiayaan melalui utang, Pemerintah dapat menerima jaminan penerbitan utang dari lembaga yang dapat menjalankan fungsi penjaminan, dan/atau menerima fasilitas dalam bentuk dukungan pembiayaan. (7) Pelaksanaan . . . SK No236024A
PRESIDEN REPUBLIK INDONESIA -37 - (71 Pelaksanaan ketentuan sebagaimana dimaksud pada ayat (1) sampai dengan ayat (6) dilaporkan dalam Laporan Keuangan Pemerintah Pusat Tahun 2025. Pasal 29 (1) Pemerintah dapat menempuh langkah kebijakan yang berkaitan dengan Pendapatan Negara, Belanja Negara, dan/atau Pembiayaan Anggaran untuk menghadapi ancaman yang membahayakan perekonomian nasional dan/ atau stabilitas sistem keuangan. (21 Langkah kebijakan Pemerintah sebagaimana dimaksud pada ayat (1) dilaporkan dalam Laporan Keuangan Pemerintah Pusat Tahun 2025. Pasal 3O (1) Dalam rangka memenuhi pembiayaan APBN Tahun Anggaran 2025, Pemerintah dapat melakukan penerbitan SBN pada triwulan keempat Tahun 2024. (21 Penerbitan SBN sebagaimana dimaksud pada ayat (1) dilaporkan Pemerintah dalam APBN Perubahan Tahun Anggaran 2025 dan/atau Laporan Keuangan Pemerintah Pusat Tahun 2025. Pasal 31 (1) Dalam rangka pembayaran gaji, tunjangan, DAU, dan kewajiban pemerintah lainnya bulan Januari 2025 yang dananya harus disediakan pada akhir Tahun Anggaran 2a24, Pemerintah dapat melakukan pinjaman SAL dan/ atau menggunakan dana dari hasil penerbitan SBN sebagaimana dimaksud dalam Pasal 30 ayat (1) pada a.khir Tahun 2O24. (21 Dal,am rangka mendukung kebijakan Pemerintah dan menjaga keberlanjutan fiskal, Bendahara Umum Negara dapat mengelola dana SAL melalui penempatan dana SAL selain di Bank Indonesia. (3) Pengelolaan . . . SK No 235023 A
PRESIDEN REPUBLIK INDONESIA -38- (3) Pengelolaan dana SAL sebagaimana dimaksud pada ayat (21 dapat dilakukan dalam bentuk pinjaman dana SAL yang diberikan kepada Badan Usaha Milik Negara/Badan Usaha Milik Daerah/pemerintah daerah atau badan hukum lainnya yang mendapatkan penugasan Pemerintah dalam rangka melaksanakan kebijakan nasional. (41 Ketentuan lebih laqiut mengenai penggunaan pinjaman SAL sebagaimana dimaksud pada ayat (1), ayat (2), dan ayat (3) diatur dalam Peraturan Menteri Keuangan. Pasal 32 (l) Investasi pada organisasi/lemb“ga keuangan internasional/ badan usaha internasional yang akan dilakukan dan/ atau telah tercatat pada Laporan Keuangan Pemerintah Pusat sebagai investasi peflnanen, ditetapkan untuk dijadikan investasi pada organisasi/lembaga keuangan internasional/badan usaha internasional tersebut. l2l Pemerintah dapat melakukan pembayaran investasi pada organisasi/lembaga keuangan intemasional/ badan usaha intemasional melebihi pagu yang ditetapkan dalam Tahun Anggaran 2025 yang diakibatkan oleh selisih kurs, yang selanjutnya dilaporkan dalam APBN Perubahan Tahun Anggaran 2025 dartlatau Laporan Keuangan Pemerintah Pusat Tahun 2025. (3) Pelaksanaan investasi pada organisasi/ lembaga keuangan internasional/badan usaha intemasional sebagaimana dimaksud pada ayat (1) ditetapkan dengan Peraturan Menteri Keuangan. Pasal 33 (1) Saldo kas pada Badan Layanan Umum dan dana yang ditampung dalam rekening investasi Bendahara Umum Negara dapat menjadi tambahan investasi pada Bagian Anggaran Bendahara Umum Negara Pengelolaan Investasi Pemerintah. (2) Ketentuan . . . SK No236022A
PRESIDEN REPUBLIK TNDONESIA -39- (21 Ketentuan mengenai investasi sebagaimana dimaksud pada ayat (l) diatur dengan Peraturan Menteri Keuangan. Pasal 34 (l) Pemerintah mengalokasikan pembiayaan investasi kepada: a. Badan layanan Umum Lembaga Manajemen Aset Negara dengan tujuan pembentukan dana jangka panjang dan/atau dana cadangan dalam rangka pengadaan tanah untuk kepentingan proyek strategis nasional dan pengelolaan aset Pemerintah lainnya; dan b. Badan Layanan Umum Badan Pengelola Dana Lingkungan Hidup dengan tqjuan pembentukan dana abadi, dana jangka par{ang, dan/atau dana cadangan dalam rangka percepatan kegiatan rehabilitasi mangrove dan pengembangan kegiatan sektor pariwisata serta ekonomi kreatif. {21 Tanah untuk kepentingan proyek strategis nasional sebagaimana dimaksud pada ayat (1) huruf a dapat ditetapkan status penggunaannya pada kementerian/lembaga dengan mekanisme pengesahan belanja modal. (3) Kegiatan rehabilitasi mangrove dan kegiatan pariwisata sebagaimana dimaksud pada ayat (1) huruf b ditetapkan dan dicatat sebagai kegiatan kementerian/lembaga dengan mekanisme pengesahan belanja atau mekanisme pembiayaan. (4) Dalam hal anggaran pengesahan belanja yang dilaksanakan oleh kementerian/lembaga sebagaimana dimaksud pada ayat (2) dan ayat (3) belum tersedia, dapat dilakukan penyesuaian Belanja Negara. (5) Pelaksanaan pengesahan belanja sebagaimana dimaksud pada ayat (21 dan ayat (3), serta penyesuaian Belanja Negara sebagaimana dimaksud pada ayat (4) dilaporkan Pemerintah dalam l,aporan Keuanga.n Pemerintah Pusat tahun berkenaan. (6) Penerimaan . . . SK No236021A
PRESIDEN REPUBLIK INDONESIA -40_ (6) Penerimaan kembali dari Pinjaman Pemerintah Daerah dalam rangka ekonomi nasional digunakan sebagai dana Investasi Pemerintah untuk pemberian pinjaman kepada Badaa Layalan Umum, badan usaha, dan/ atau pemerintah daerah sesuai dengan ketentuan peraturan perundang-undangan. Pasal 35 (1) BMN yang dari awal pengadaannya direncanakan untuk disertakan menjadi tambahan modal Badan Usaha Milik Negara atau Perseroan Terbatas/ Badan terdapat negara, ditetapkan menjadi PMN pada Badan Usaha Milik Negara atau Perseroan Terbatas/ Badan Hukum Lainnya yang didalamnya terdapat kepemilikan negara tersebut. l2l Ketentuan mengenai tata cara penetapan PMN untuk BMN yang dari awal pengadaannya direncana,kan untuk disertakan menjadi tambahan modal Badan Usaha Milik Negara atau Perseroan Terbatas/Badan Hukum Lainnya yang didalamnya terdapat kepemilikan negara sebagaimana dimaksud pada ayat (1) dilaksanakan sesuai dengan ketentuan peraturan perundang-undangan di bidang pengelolaan BMN, (3) Pemerintah melakukan penambahan PMN yang berasal dari piutang Negara dan dana tunai sebagai pembiayaan investasi pada Badan Usaha Milik Negara/Lembaga/Badan Hukum Lainnya sebagaimana tercantum dalam lampiran I yang merupa}an bagian tidak terpisahkan dari Undang- Undang ini. (4) Dalam rangka meningkatkan kapasitas usaha Badan Bank Tanah, Pemerintah melakukan penambahan PMN yang berasal dari BMN melalui mekanisme pemindahtanganan BMN sesuai dengan ketentuan peraturan perundang-undangan. (5) Untuk menjaga kecukupan modal, kepada PT Asabri (Persero) diberikan PMN paling banyak sebesar sisa penerimaan hasil sitaan atau rampasan Kejaksaan Agung terkait tindak pidana korupsi PT Asabri (Persero) yang telah mendapat putusan pengadilan yang berkekuatan hukum tetap dan telah disetorkan ke kas negara. (6) Penambahan . . . Hukum Lainnya yang SK No236020A
PRESIDEN REPUBLIK INDONESIA -41 - (6) Penambahan PMN sebagaimana dimaksud pada ayat (1), ayat (3), dan ayat (4), serta pemberian PMN sebagaimana dimaksud pada ayat (5), ditetapkan dengan Peraturan Pemerintah. Pasal 36 (U Pemerintah dalam mengurus kekayaan negara yang dipisahkan dan dikelola oleh Badan Usaha Milik Negara atau badafl lainnya, akan dan manfaat ekonomi, sosial, rantai produksi dalam negeri, meningkatkan daya saing, serta memperkuat penguasaan pasar dalam negeri. (21 Pemerintah dalam menangani kekayaan negara yang dipisahkan dan dikelola oleh Badan Usaha Milik Negara, atau badan lainnya, agar menjaga aset yang bersumber dari cabang-cabang produksi yang penting dan menguasai hajat hidup orang banyak serta aset bumi, air, dan kekayaan didalamnya, tetap dikuasai oleh negara sesuai dengan ketentuan peraturan perundang-undangan. (3) Untuk pendapatan dari kekayaan negara yang dipisahkan, penyelesaian piutang pada Badan Usaha Milik Negara dilakukan: a. sesuai dengan ketentuan peraturan perundangundangan di bidang perseroan terbatas, badan usaha milik negara, dan perbankan; b. memperhatikan prinsip tata kelola pemerintahan yang baik; dan c. Pemerintah melakukan pengawasan penyelesaian piutang pada Badan Usaha Milik Negara tersebut, Pasal 37 (l) Pemerintah dapat memberikan pinjaman kepada pemerintah asing dan menetapkan pemerintah asing penerima pinjaman untuk pencapaian kepentingan nasional Indonesia. (21 Anggaran pemberian pinjaman sebagaimana dimaksud pada ayat (1) dapat bersumber dari penerimaan negara bukan pajak Lembaga Dana Kerja Sama Pembangunan Internasional. Pasal 38... SK No236019A
PRESIDEN REPUBLIK INDONESIA -42- Pasal 38 (l) Menteri Keuangan diberikan mengelola €rnggaran Kewajiban Pemerintah untuk: untuk ekonomi a, dukungan penjaminan dalam rangka Penyediaan Infrastruktur Nasional; b. dukungan penjaminan pada program ekonomi nasional; c. penugasan penyediaan pembiayaan infrastruktur daerah kepada Badan Usaha Milik Negara; dan/atau d. pemberian jaminan Pemerintah dalam rangka penyelenggaraan cadangan pangan Pemerintah. (21 Dukungan penjaminan dalam rangka Penyediaan Infrastruktur Nasional sebagaimana dimaksud pada ayat (1) huruf a terdiri atas: a. pemberian jaminan Pemerintah Pusat untuk percepatan pelaksanaan proyek strategis nasional; b. pemberian jaminan Pemerintah untuk pelaksanaan pembangunan infrastruktur dalam proyek kerja sama Pemerintah dengan badan usaha; c. pemberian dan pelaksanaan jaminan Pemerintah atas pembiayaan infrastruktur melalui pinjaman langsung dari lembaga keuangan internasional kepada Badan Usaha Milik Negara; dan/atau d. pemberian jaminan Pemerintah untuk percepatan pembangunan infrastruktur infrastruktur jalan tol, infrastruktur transportasi penyediaan air minum. perkeretaapian, serta (3) Dukungan penjaminan pada program pemulihan ekonomi nasional sebagaimana dimaksud pada ayat (1) huruf b terdiri atas: Pemerintah yang dilakukan secara langsung oleh pemerintah dalam rangka pelaksanaan pftrgram nasional; dan/ atau b. penjaminan . . . SK No236018A a.
PRESIDEN REPUBLIK INDONESIA _43_ b. penjaminan Pemerintah melalui badan usaha penjaminan yang ditunjuk dalam rangka pelaksanaan program pemulihan ekonomi nasional. (4) Anggaran Kewajiban Penjaminan Pemerintah sebagaimana dimaksud pada ayat (l) huruf a, huruf b, dan huruf d, diakumulasikan ke dalam rekening dana cadangan penjaminan Pemerintah dan Anggaran Kewajiban Penjaminan Pemerintah sebagaimana dimaksud pada ayat (1) huruf c diakumulasikan ke dalam rekening dana jaminan penugasan pembiayaan infrastruktur daerah yang dibuka di Bank Indonesia. (5) Dana yang telah diakumulasikan dalam rekening sebagaimana dimaksud pada ayat (a) digunakan untuk pembayaran kewajiban penjaminan Pemerintah sebagaimana dimaksud pada ayat (1) pada tahun anggaran berjalan dan/ atau tahun anggaran berikutnya. (6) Dana dalam rekening dana cadangan Pemerintah sebagaimana dimaksud pada ayat (41 digunakan untuk pembayaran kewajiban penjaminan Pemerintah antarprogram pemberian penjaminan sebagaimana dimaksud pada ayat (1) huruf d, ayat (2), dan ayat (3). (71 Dalam hal terjadi tagihan pembayaran kewajiban penjaminan dan/ atau penggantian biaya yang timbul dari pelaksanaan kewajiban penjaminan untuk dukungan penjaminan progrErm pemulihan ekonomi nasional yang bersumber dari dana cadangan penjaminan Pemerintah sebagaimana dimaksud pada ayat (6), Pemerintah melakukan pembayaran melalui Bagian Anggaran 999.99 (Bendahara Umum Negara Pengelolaan Belanja Ttansaksi Khusus). (8) Pembayaran melalui Bagian Anggaran 999.99 (Bendahara Umum Negara Pengelolaan Belanja Transaksi Khusus) sebagaimana dimaksud pada ayat (71, merupakan pengeluaran belanja transaksi khusus yang belum dialokasikan dan/ atau melebihi alokasi yang telah ditetapkan dalam APBN dan/atau APBN Perubahan pada tahun anggaran be{alan. (9) Dana . . . SK No210972A
PRESIDEN REPUBLIK INDONESIA -44- ESIA (e) Dana dalam rekening dana jaminan penugas€rn pembiayaan infrastruktur daerah sebagaimana dimaksud pada ayat (41 digunakan untuk pembayaran atas penugasan penjaminan sebagaimana dimaksud pada ayat (1) huruf c. Dana yang telah diakumulasikan ke dalam rekening sebagaimana dimaksud pada ayat (4), dapat ditempatkan ke dalam instrumen Investasi Pemerintah. Penggunaan anggaran Kewajiban Penjaminan dan penggunaan dana cadangan penjaminan Pemerintah atau dana jaminan penugasan pembiayaan infrastruktur daerah sebagaimana dimaksud pada ayat l2l sampai dengan ayat (10) dilaksanakan berdasarkan ketentuan peraturan perundangundangan. (10) (1 1) Pasal 39 (1) Pembayaran bunga utang dan pengeluaran cicilan pokok utang dapat disesuaikan dengan kebutuhan realisasi pada tahun Eurggaran berjdan, yang selanjutnya dilaporkan Pemerintah dalam APBN Perubahan Tahun Anggaran 2025 dan/atau Laporan Keuangan Pemerintah Pusat Tahun 2025. (21 Pemerintah dapat melakukan transaksi lindung nilai dalam rangka mengendalikan risiko fluktuasi beban pembayaran kewajiban utang, dan/ atau melindungi posisi nilai utang, dari risiko yang timbul maupun yang diperkirakan akan timbul akibat adanya volatilitas faktor-faktor pasar keuangan. (3) Pemenuhan kewajiban yang timbul dari transaksi lindung nilai sebagaimana dimaksud pada ayat (21 dibebankan pada anggaran pembayaran bunga utang dan/ atau pengeluaran cicilan pokok utang. (4) Kewajiban yang timbul sebagaimana dimaksud pada ayat (3) bukan merupakan kerugian keuangan negara, (5) Ketentuan lebih lanjut mengenai pelaksanaan transaksi lindung nilai sebagaimana dimaksud pada ayat (21diatur dengan Peraturan Menteri Keuangan. Pasal 40... SK No2l097l A
PRESIDEN REPUBLIK INDONESIA -45- Pasal 4O Pemerintah menyusun laporan: a. pelaksanaan APBN Semester Pertama Tahun Anggaran 2025; d,an b, pertanggungiawaban atas pelaksanaan APBN Tahun Anggaran 2025, sesuai dengan ketentuan peraturan perundang-undangan. Pasal 41 (1) Dalam keadaan darurat, Pemerintah dapat melakukan langkah antisipasi dengan persetujuan Dewan Perwakilan Ralryat. (21 Persetujuan Dewan Perwakilan Rakyat sebagaimana dimaksud pada ayat (1) merupakan keputusan yang tertuang di dalam kesimpulan Rapat Kerja Badan Anggaran Dewan Perwakilan Ralryat dengan Pemerintah, yang diberikan dalam waktu tidak lebih dari 2x24 (dua kali dua puluh empat) jam setelah usulan disampaikan Pemerintah kepada Dewan Perwakilan Rakyat. (3) Dalam hal persetqjuan Dewan Perwakilan Ralyat sebagaimana dimaksud pada ayat (1) karena suatu dan lain hal belum dapat ditetapkan, Pemerintah dapat mengambil langkah antisipasi sebagaimana dimaksud pada ayat (l) sesuai dengan ketentuan peraturan perundang-undangan. (4) Pemerintah melaporkan langkah kebijakan sebagaimana dimaksud pada ayat (1) dafam Laporan Keuangan Pemerintah Pusat Tahun 2O25. Pasal 42 (1) Pemerintah dapat melakukan penyesuaian APBN Tahun Anggaran 2025 dengan perkembangan dan/ atau perubahan keadaan, untuk dibahas bersama Dewan Perwakilan Ralryat dengan Pemerintah dalam rangka penJrusunan perkiraan perubahan atas APBN Tahun Anggaran 2O25, jika terjadi: a. perkembangan . . . SK No210970A
PRESIDEN REPUBLIK INDONESIA - 46- a. perkembangan indikator ekonomi makro yang tidak sesuai dengan asumsi yang digunakan sebagai acuan dalam APBN Tahun Anggaran 2025; b. perubahan pokok-pokok kebijakan fiskal; c. keadaan yang menyebabkan harus dilakukan pergeseran anggaran antarunit organisasi dan/atau antarprogram; dan/ atau d. keadaan yang menyebabkan SAL tahun sebelumnya harus digunakan untuk pembiayaan anggaran tahun berjalan. l2l Perkembangan indikator ekonomi makro sebagaimana dimaksud pada ayat (1) huruf a dan perubahan pokok-pokok kebijakan fiskal sebagaimana dimaksud pada ayat (1) huruf b berupa; a. penurunan pertumbuhan ekonomi paling sedikit 1O% (sepuluh persen) di bawah asumsi yang telah ditetapkan; b. deviasi asumsi ekonomi makro lainnya paling sedikit 1O% (sepuluh persen) dari asumsi yang telah ditetapkan; dan/ atau c. penurunan penerimaan perpajakan paling sedikit l0% (sepuluh persen) dari pagu yang telah ditetapkan. (3) SAL sebagaimana dimaksud pada ayat (1) huruf d merupakan SAL yang ada di rekening Bank Indonesia yang penggunaannya ditetapkan oleh Menteri Keuangan sesuai dengan ketentuan peraturan perundang-undangan dan dilaporkan dalam laporan pertanggungjawaban pelaksanaan atas APBN. (4) Dalam hal dilakukan penyesuaian APBN Tahun Anggaran 2025 sebagaimana dimaksud pada ayat (1), Pemerintah mengajukan Rancangan Undang-Undang mengenai Perubahan atas Undang-Undang APBN Tahun Anggaran 2025 untuk mendapatkan persetujuan Dewan Perwakilan Rakyat sebelum Tahun Anggaran 2025 berakhir. Pasal 43 (U Dalam hal kmbaga Penjamin Simpanan mengalami kesulitan likuiditas, Pemerintah dapat memberikan pinjaman kepada lembaga Penjamin Simpanan. (2) Sumber. . . SK No210969A
PRESIDEN REPUBLIK INDONESIA -47- (21 Sumber dana untuk pemberian pinjaman sebagaimana dimaksud pada ayat (1) sebagai berikut: a. penggunaan SAL untuk menutup kekurangan pembiayaan APBN, dengan terlebih dahulu memperhitungkan ketersediaan SAL untuk kebutuhan anggaran sampai dengan akhir tahun anggaran bedalan dan awal tahun anggaran dan/atau b. penambahan utang. (3) Dalam hal terjadi pemberian pinjaman kepada lembaga Penjamin Simpanan sebagaimana dimaksud pada ayat (l), Pemerintah melaporkan dalam Laporan Keuangan Pemerintah Pusat Tahun 2025 termasuk sumber dana untuk pemberian pinjaman sebagaimana dimaksud pada ayat (2). Pasal 44 (1) Pelaksanaan kegiatan persiapan, dan/ atau pemindahan Ibu Kota Negara dilakukan oleh Otorita Ibu Kota Nusantara dan dapat dilakukan oleh kementerian/ lembaga sesuai tugas dan fungsinya dengan anggaran yang bersumber dari APBN. l2l Pengawasan terhadap pelaksanaan anggaran untuk kegiatan sebagaimana dimaksud pada ayat (1) dilakukan oleh Dewan Perwakilan Ralryat. Pasal 45 (1) Dalam rangka mendukung kelancaran pelaksanaan persiapan, pembangunan dan pemindahan Ibu Kota Negara, serta untuk menjaga keberlangsungan penyelenggaraan layanan kepada masyarakat, sampai dengan akhir tahun 2025 Pemerintah Provinsi Kalimantan Timur, Pemerintah Daerah Kabupaten Kutai Kartanegara, dan Pemerintah Daerah Kabupaten Penajam Paser Utara, masih dapat urusan pemerintahan daerah di SK No210968A wilayah Ibu Kota Nusantara. (2) Alokasi...
PRESIDEN REPUBLIK INDONESIA -48- (2) Alokasi TKD untuk Pemerintah Daerah Provinsi Kalimantan Timur, Pemerintah Daerah Kabupaten Kutai Kartanegara, dan Pemerintah Daerah Kabupaten Penajam Paser Utara sebagaimana dimaksud pada ayat (l), dihitung sesuai kondisi awal sebelum 5slqgian wilayahnya menjadi bagian dari wilayah Ibu Kota Nusantara. (3) Daiam rangka penyelenggaraan pemerintahan daerah sebagaimana dimaksud pada ayat (1), Pemerintah Daerah Provinsi Kalimantan fimur, Pemerintah Daerah Kabupaten Kutai Kartanegara, dan Pemerintah Daerah Kabupaten Penajam Paser Utara, tetap dapat memungut pajak daerah dan retribusi daerah sesuai dengan ketentuan peraturan perundang-undangan. Pasal 46 Postur APBN Tahun Anggaran 2025 yang memuat rincian besaran Pendapatan Negara, Belanja Negara, surplus/defisit anggaran, dan Pembiayaan Anggaran tercantum dalam l,ampiran II yang merupakan bagian tidak terpisahkan dari Undang-Undang ini. Pasal 47 (1) Peraturan Presiden mengenai Rincian APBN Tahun Anggaran 2025 yang merupakan dari Undang-Undang ini ditetapkan paling lambat tansgal 3O November 2024. 121 Rincian APBN, sebagaimana dimaksud pada ayat (1), antara lain berisikan rincian program, kegiatan, klasilikasi rincian keluaran (outryti, keluaran (outptttl, rincian jenis belanja, serta Kerangka Pengeluaran Jangka Menengah (KPJM) untuk Belanja Pemerintah Pusat, dan/ atau pengaturan earmarking belanja dalam rangka menghadapi ancaman terhadap perekonomian dan/ atau instabilitas sistem keuangan. SK No210967A (3) Menteri . . .
PRESIDEN REPUBLIK INDONESIA -49- (3) Menteri Keuangan standardisasi keluaran (attput) dan hasil (outame) dari belanja negara serta kriteria yang jelas terkait outtrrut/ out@me, untuk mewujudkan kinerja anggaran yang lebih tepat guna dan tepat sasaran dan kesejahteraan ral<yat, serta menciptakan kemudahan akses atas pelayanan kesehatan, pendidikan, perumahan, pekerjaan, dan/ atau bantuan dari Pemerintah. Pasal 48 (1) Dalam rangka penanggulangan bencana, Pemerintah melalui Kementerian Keuangan mengelola dana bersama penanggulangan bencana. l2l Dana bersama penanggul,angan bencana sebagaimana dimaksud pada ayat (l) dikelola secara khusus. (3) Dalam hal sumber dana bersama penanggulangan bencana sebagaimana dimaksud pada ayat (1) yang berasal dari pinjaman luar negeri, Pemerintah dapat mengadakan pinjaman siaga. (41 Da.lam rangka pengelolaan secara khusus dana bersama bencana sebagaimana dimaksud pada ayat (2), dalam hal terdapat sisa dana cadangan bencana dapat diakumulasikan ke dalam dana bersama penanggulangan bencana pada tahuntahun berikutnya. Pasal 49 Pemerintah dalam melaksanakan APBN Tahun Anggaran 2025 mengupayakan pemenuhan sasaran pembangunan yang berkualitas, dalam bentuk: a. penurunan kemiskinan menjadi 7,Oo/o - 8,0% (tujuh koma nol persen sampai dengan delapan koma nol persen); b. tingkat kemiskinan ekstrem menjadi Oolo (nol persen); c. tingkat pengangguran terbuka menjadi 4,5o/o ‘ 5,Oo/o (empat koma lima persen sampai dengan lima koma nol persen); d. penurunan Gini Ratio menjadi 0,379 - 0,382 (nol koma tiga tujuh sembilan sampai dengan nol koma tiga delapan dua); e.peningkatan... SK No210966A
PRESIDEN REPUBLIK INDONESIA -50- e. peningkatan Indeks Modal Manusia menjadi 0,56 (nol koma lima enam); dan f. potensi penurunan emisi gas rumah kaca sebesar 38,60/o (ttga puluh delapan koma enam persen); dan g. peningkatan Nilai Tukar Petani menjadi 115 - 120 (seratus lima belas sampai dengan seratus dua puluh) dan Nilai T\rkar Nelayan menjadi 105 - 108 (seratus lima sampai dengan seratus delapan). Pasal 5O Segala kebijakan yang telah dilalukan di bidang keuangan negara oleh Pemerintah Pusat dan/atau pemerintah daerah untuk penanganan pandemi Corcna Virus Disease 2Ol9 dan pemulihan ekonomi nasional beserta hak dan kewajiban yang ditimbulkan sebelum berlakunya ketentuan mengenai penetapan berakhirnya status pandemi Corona Virus Disease 2OLg di Indonesia, dinyatakan masih tetap berlaku sampai dengan terpenuhinya hak dan kewajiban tersebut sesuai dengan ketentuan peraturan perundang-undangan. Pasal 51 Pada saat Undang-Undang ini mulai berlaku, kementerian/lembaga yang mensalami pemisahan dan/ atau kementerian/lembaga yang barrr dibentuk, pengalokasian anggarannya harus mendapatkan persetqiuan dari Dewan Perwakilan Rakyat melalui pimpinan alat kelengkapan yang khusus menangani urusan kementerian/lembaga dimaksud. Pasal 52 Ketentuan sebagaimana dimaksud dalam Pasal 3O dan Pasal 31 mulai berlaku pada tanggal Undang-Undang ini diundangkan. Pasal 53 Undang-Undang ini mulai berlaku pada tanggal I Januari 2025. SK No 210965 A Agar
PRESIDEN REPI.JELIK INDONESIA _51 _ Agar setiap orang mengetahuinya, memerintahkan pengundangan Undang-Undang ini dengan penempatannya dalam Lembaran Negara Republik Indonesia. Disahkan di Jakarta pada tanggal 17 Oktober 2024 PRESIDEN REPUBLIK INDONESIA, JOKO WIDODO Diundangkan di Jakarta pada tanggal 17 Oktober 2024 MENTERI SEKRETARIS NEGARA REPUBLIK INDONESIA, PRATIKNO LEMBARAN NEGARA REPUBLIK INDONESIA TAHUN 2024 NOMOR 226 Salinan sesuai dengan aslinya KEMENTERIAN SEKRETARIAT NEGARA LIK INDONESIA -undangan dan trasi Hgkum, ttd ttd SK No 236223 A vanna Djaman
PRESIDEN REPUBLIK INDONESIA PENJELASAN ATAS UNDANG-UNDANG REPUBLIK INDONESIA NOMOR 62 TAHUN 2024 TENTANG ANGGARAN PENDAPATAN DAN BELANJA NEGARA TAHUN ANGGARAN 2025 I. UMUM APBN Tahun 2025 disusun dengan mempertimbangkan faktor global dan dilandaskan pada bauran kebijakan jangka pendek, menengah, dan panjang untuk Visi Indonesia Emas 2045, serta memberikan ruang untuk pelaks.uraan program pemerintahan selanjutnya. HaI tersebut diperlukan agar peralihan pemerintahan dapat dilakukan secErra lancar pada masa transisi. Kebijakan liska1 yang disusun diharapkan dapat menjawab tantangan, baik struktural maupun siklikal, yang berasal dari global dan domestik. Perekonomian global yang masih dinamis diperkirakan akan menjadi tantangan terhadap kinerja ekonomi ke depan dengan pertumbuhan ekonomi global diperkirakan masih stagnan di level rendah (di bawah level prapandemi). Selain itu, penurunan inflasi global yang masih terbatas menyebabkan tertundanya normalisasi kebdakan moneter bank sentral negara-negara maju. Di sisi lain, suku bunga global yang masih tinggi berdampak terhadap pengetatan likuiditas dan terbatasnya arus modal masuk ke negara-negara berkembang. Hal tersebut akan memberikan tekanan pada nilai tukar mata uang negara-negara berkembang termasuk Indonesia. Sementara itu, fragmentasi dan akibat tensi geopolitik yang masih eskalatif, perang Rusia-Ukraina dan konflik di Timur Tengah yang belum mereda, serta risiko persaingan hegemoni AS-Tiongkok masih berlanjut. Di tengah berbagai gejolak global, ekonomi Indonesia tetap terjaga dengan baik. Stabilitas ekonomi domestik mampu menjaga pertumbuhan ekonomi yang tetap solid dan kesejahteraan masyarakat yang lebih baik. Laju inflasi tetap terjaga pada tingkat yang rendah, terutama bila dibandingkan dengan negara-negara mitra dagang Indonesia seperti Jepang. . . SK No236222A
PRESIDEN REPUBLIK INDONESIA -2- Jepang, Amerika Serikat, dan India. Kinerja neraca perdagangan masih mencatatkan surplus di tengah perekonomian dunia yang relatif stagnan. Namun, surplus neraca perdagangan memperlihatkan tren penurunan. Ini menunjukkan risiko perlambatan ekonomi global yang masih perlu diwaspadai. Selain itu, tekanan perekonomian global terhadap perekonomian domestik juga mulai berdampak pada depresiasi nilai tukar rupiah terhadap dolar Amerika Serikat dan tren peningkatan yield SBN, sehingga perlu untuk tenrs diwaspadai. Bauran kebijakan fiskal, dan moneter, serta sektor keuangan dirancang untuk dapat mendorong pertumbuhan ekonomi domestik yang kuat dan berkelanjutan pada tahun 2025. Konsumsi domestik diperkirakan masih kuat dengan terkendalinya inflasi dan penciptaan lapangan kerja. Akselerasi transformasi ekonomi terus ditingkatkan melalui revitalisasi industri termasuk hilirisasi dan ekosistem electric uehicles (EV) industrg, penguatan sektor jasa termasuk ekonomi kreatif dan digitalisasi, serta penguatan reformasi strulrtural untuk meningkatkan ease of doirq btsiness, dan memperkuat daya saing produk ekspor dan investasi. Selanjutnya, guna mencapai Visi Indonesia Emas 2045, yaifi menjadi negara maju dan keluar dari jebakan middle iname frap diperlukan akselerasi pertumbuhan ekonomi. Di sisi lain, APBN harus didorong untuk semakin sehat agar dapat mewujudkan pertumbuhan ekonomi yang inklusif dan berkelanjutan. Oleh karena itu, kebijakan makro fiskal tahun 2025 diarahkan untuk menjaga keberlanjutan sekaligus penguatan program prioritas dalam mewujudkan Visi Indonesia Emas 2045. Dengan demikian, APBN 2025 disusun sebagai jangkar untuk mendukung percepatan pertumbuhan ekonomi yang inklusif dan berkelanjutan dengan kebdakan a untercycliml yang terukur dan terkendali. Dengan berpijak pada kebiiakan reformasi struktural dan transformasi ekonomi, serta memperhitungkan berbagai risiko ekonomi global dan potensi pertumbuhan ekonomi nasional di tahun depan, maka asumsi indikator ekonomi makro di tahun 2025 ditargetkan sebagai berikut. . Pertumbuhan ekonomi tahun 2025 ditargetkan mencapai 5,2o/o (lima koma dua persen). ekonomi tahun depan akan didukung oleh permintaan domestik yang kuat dan kebijakan fiskal yang efektif dalam menjaga stabilitas ekonomi serta mendorong transformasi ekonomi nasional. Faktor-faktor seperti konsumsi domestik yang kuat, keberlanjutan pembangunan infrastruktur nasional, dan langkah reformasi struktural untuk meningkatkan iklim usaha, investasi, serta daya saing, akan menjadi kunci mendorong kinerja investasi di tahun 2025, Di tengah prospek ekonomi dunia yang diperkirakan masih stagnan, berbagai upaya Pemerintah untuk mendorong diversifikasi pasar dan produk ekspor, termasuk pengembangan produk hilirisasi lanjutan, ekspor jasa termasuk eksPor . . . SK No 210959A
PRESIDEN REPUBLIK INDONESIA -3 ekspor jasa melalui internet (digitallg deliuered serui@s expor$ seperti animasi, desain, audio dan video, musik dan film, gdmes, jasa konsultansi bisnis, periklanan, dan lainnya, diharapkan dapat meningkatkan kinerja ekspor nasional. Inflasi akan tetap terjaga pada tingkat 2,5o/o ldua koma lima persen), didukung oleh terjaganya daya beli masyarakat, pengendalian inflasi pada periode hari besar keagamaan nasional, serta penerapan kebijakan administered prie yarry hati-hati. Rupiah diperkirakan masih akan menghadapi risiko ketidakpastian global pada tahun 2025, terutama yang bersumber dari perubahan kebdakan moneter The Fed sehingga diperkirakan akan mencapai Rp16.000,00 (enam belas ribu rupiah) per dollar Amerika Serikat. Suku bunga Surat Berharga Negara 10 tahun ditargetkan sebesar 7,0% (tujuh koma nol persen), didukung kehati-hatian pengelolaan anggaran sehingga dapat pasar yang pada akhirnya akan penurunan yrbld SBN. Namun, risiko tekanan frskal AS juga perlu diwaspadai karena kebutuhan pembiayaan fiskal AS yang tinggi akan membutuhkan penerbitar: United. States Tleastljr lebih banyak, sehingga dapat mendorong kenaikan yield United. States Tleasury yang pada gilirannya dapat memengaruhi yield SBN. Harga minyak mentah Indonesia diperkirakan akan mencapai 82 (delapan puluh dua) dollar Amerika Serikat per barel. Lifiing minyak dan gas bumi diperkirakan masing-masing mencapai 605.000 (enam ratus lima ribu) barel per hari dan 1.005.000 (satu juta lima ribu) barel setara minyak per hari. Di tengah berbagai tantangan yang dihadapi, lifitng minyak dan gas pada tahun 2025 terus diupayakan untuk mempertahankan produksinya. Tema kebijakan fiskal tahun 2025 adalah “Akselerasi Pertumbuhan Ekonomi yang Inklusif dan Berkelanjutan”. Untuk mendukung tema tersebut, ditempuh melalui 2 (dua) strategi utama yaitu strategi jangka menengah-panjang dan strategi jangka pendek. Strategi jangka menengahpanjang difokuskan pada (i) peningkatan kualitas sumber daya manusia yang unggul; (ii) hilirisasi dan transformasi ekonomi hijau; (iii) inklusivitas; (iv) infrastruktur; (v) birokrasi dan regulasi; (vi) ekonomi kreatif dan kewirausahaan; (vii) pertahanan, keamanan, kemandirian pangan dan energi; serta (viii) nasionalisme, demokrasi, dan hak asasi manusia. Sementara itu strategi jangka pendek difokuskan pada: 1) pendidikan bermutu, melalui program (i) peningkatan gizi anak sekolah, serta (ii) p€nguatan mutu sekolah untuk link and matclt;2) kesehatan berkualitas, melalui (i) efektivitas program jaminan kesehatan nasional untuk akses, kualitas, dan financial protection, serta (ii) akselerasi penurunan sfunting dan kasus penyakit menular; 3) pengentasan kemiskinan dan pemerataan, melalui (i) perlindungan sosial pemberdayaan untuk percepatan graduasi, (ii) rumah layak huni dan terjangkau, (iii) Program Desa Mandiri, ketahanan pangan, petani makmur, nelayan sejahtera, dan pembangunan Ibu Kota Nusantara; dan 4) pertumbuhan ekonomi . . . SK No 210958 A
PRESIDEN REPUBLIK INDONESIA -4- ekonomi tinggi, melalui (i) hilirisasi, (ii) akselerasi investasi berorientasi ekspor, (iii) transformasi ekonomi hijau melalui percepatan transisi energi dan penguatan energi banr dan terbarukan. Untuk mendukung percepatan pertumbuhan ekonomi tersebut juga disertai penguatan fiskal yang holistik untuk mewujudkan APBN sehat melalui Collecting More, Spending Better, Prudent dan Innouatiue Finarrcing, Optimalisasi pendapatan lalteding more) dengan tetap menjaga iklim investasi, penguatan spendmg better melahti efisiensi belanja kebutuhan dasar, fokus pada program prioritas dan berorientasi pada hasil (result based budget exeantion), mendorong pembiayaan yang prudent dart innouatiue financing dengan memberdayakan peran badan usaha milik negara, badan layanan umum, souereign uealth fund, dan spcial mission uehicl.e serta mendorong pengembangan skema kerja sama antara Pemerintah dan badan usaha untuk mengakselerasi pencapaian target pembangu.nan, serta mendorong penguatan ketahanan fiskal melalui penguatan fiscal buffer yang handal dan elisien, serta meningkatkan fleksibilitas dan kolaborasi yang lebih solid antara kebljakan fiskal, moneter, sektor keuangan, dan Pemerintah Daerah. Tema Kebijakan Fiskal Tahun 2025 di atas diselaraskan dengan tema Rencana Kerja Pemerintah Tahun 2025 yaitu Akselerasi Pertumbuhan Ekonomi Yang Inklusif dan Berkelanjutan. Rencana Kerja Pemerintah Tahun 2025 disusun dalam rangka menjaga pembangunan menjelang peralihan pemerintahan yang baru sebagaimana diamanatkan dalam Undang-Undang Nomor 17 Tahun 2OO7 tentang Rencana Pembangunan Jangka Panjang Nasional Tahun 2OO5-2O25. Dalam Rencana Kerja Pemerintah Tahun 2025 memuat pengelompokan prioritas pembangunan yang telah dipadupadankan dengan visi-misi Presiden terpilih untuk memberikan dasar bergerak yang lebih leluasa dalam kabinet yang baru, dan disusun dengan mempedomani pula Rencana Pembangunan Jangka Panjang Nasional 2025-2045 dan Rencana Pembangunan Jangka Menengah Nasional Teknokratik 2025-2029. Rencana Pembangunan Jangka Menengah Nasional Tahun 2025-2029 akan ditetapkan selambatJambatnya tiga bulan setelah Presiden terpilih dilantik. Rencana Kerja Pemerintah Tahun 2025 adalah tahun pertama pelaksanaan RPJMN Tahun 2025-2029, oleh karena itu Arah Kebijakan dan Agenda Pembangunan Rencana Kerja Pemerintah Tahun 2025 mengacu kepada Undang-Undang Nomor 17 Tahun 2OO7 tentang Rencana Pembangunan Jangka Panjang Nasional Tahun 2005-2025. Sasaran pembangunan dalam Rencana Kerja Pemerintah Tahun 2025 diarahkan untuk meningkatkan pertumbuhan ekonomi, indeks modal manusia, nilai tukar petani, nilai tukar nelayan, dan menurunkan tingkat pengangguran terbuka, rasio gini, tingkat kemiskinan, dan tingkat kemiskinan ekstrem serta intensitas emisi gas rumah kaca, Selanjutnya, SK No211000A sasaran
FRESIDEN REPUBLIK INOONESIA -5- sasaran pembangunan dan arah kebijakan tersebut disajikan dalam masing-masing prioritas nasional sebagai berikut: 1. Memperkokoh ideologi Pancasila, demokrasi, dan hak asasi manusia; 2. Memantapkan sistem pertahanan keamanan negara dan mendorong kemandirian bangsa melalui swasembada pangan, energi, air, ekonomi syariah, ekonomi digital, ekonomi hijau, dan ekonomi biru; 3. Melanjutkan pengembangan infrastruktur dan meningkatkan lapangan kerja yang berkualitas, mendorong kewirausahaan, mengembangkan industri kreatif, serta mengembangkan agromaritim industri di sentra produksi melalui peran aktif koperasi; 4, Memperkuat pembangunan sumber daya manusia, sains, telorologi, pendidikan, kesehatan, prestasi olahraga, kesetaraan gender, serta penguatan peran perempuan, pemuda (generasi milenial dan generasi Z) dan penyandang disabilitas; 5. Melanjutkan hilirisasi dan mengembangkan industri berbasis sumber daya alam untuk meningkatkan nilai tambah di dalam negeri; 6. Membangun dari desa dan dari bawah untuk pertumbuhan ekonomi, pemerataan ekonomi, dan pemberantasan kemiskinan; 7. Memperkuat reformasi politik, hukum, dan birokrasi, serta memperkuat pencegahan dan pemberantasan korupsi, narkoba, judi, dan penyelundupan; serta 8. Memperkuat kehidupan yang harmonis dengan lingkungan, alam, dan budaya, serta peningkatan toleransi antarumat beragama untuk mencapai masyarakat yang adil dan makrnur. Agar prioritas sasaran pembangunan nasional dan prioritas nasional lainnya tersebut dapat tercapai, Pemerintah perlu tetap menjaga keberlanjutan reformasi baik dari sisi pendapatan dan belanja, serta melakukan berbagai inovasi untuk pembiayaan defrsit APBN Tahun Anggaran 2025. Oleh sebab itu, konsolidasi dan reformasi frskal harus terus dilakukan secara menyeluruh, bertahap, dan terukur. Dimulai dari penguatan sisi penerimaan negara, perbaikan sisi belanja dan pengelolaan pembiayaan yang prudent dan hati-hati, untuk mewujudkan pengelolaan fiskal yang lebih sehat, berdaya tahan, dan mampu menjaga stabilitas perekonomian ke depan. Reformasi fiskal di sisi penerimaan dijalankan melalui optimalisasi pendapatan yang ditempuh melalui penggalian potensi, perluasan basis perpajakan, peningkatan kepatuhan wajib pajak, dan optimalisasi pengelolaan aset serta inovasi layanan. Dengan demikian, rasio perpajakan dapat meningkat untuk penguatan ruang liskal, dengan tetap menjaga iklim investasi dan keberlanjutan dunia usaha serta masyarakat. daya beli Di... SK No210999A
PRESIDEN REPUBLIK INDONESIA -6- Di sisi belanja, reformasi dijalankan melalui penguatan belanja agar lebih berkualitas dengan penguatan spending better. Upaya yang ditempuh melalui belanja agar lebih efisien, Iebih produktif, dan menghasilkan multiplier effed yang kuat terhadap perekonomian serta efektif untuk mendukung program-program pembangunan prioritas dan peningkatan kesejahteraan masyarakat. Inovasi di sisi pembiayaan difokuskan untuk mendorong pembiayaan yang kreatif dalam infrastruktur dengan melibatkan partisipasi swasta melalui Kerja Sama Pemerintah dengan Badan Usaha, penguatan peran Lembaga Pengelola Investasi, serta pasar obligasi negara yang mengedepankan prinsip kehati-hatian. Pembahasan Rancangan Undang-Undang tentang APBN Tahun Anggaran 2025 dilakukan Dewan Perwakilan Rakyat bersama Pemerintah dengan memperhatikan pertimbangan Dewan Perwakilan Daerah sebagaimana tercantum dalam Surat Keputusan Dewan Perwakilan Daerah Nomor 65/DPD RllV /2023-2024 tanggal 4 September 2024. Pembahasan Undang-Undang ini dilaksanakan oleh Pemerintah dan Dewan Perwakilan Ralryat dengan memperhatikan Putusan Mahkamah Konstitusi Nomor 35/PUV-XI/2O13 tanggal 22 Mei2Ol4. II. PASAL DEMI PASAI Pasal 1 Cukup jelas. Pasal 2 Cukup jelas. Pasal 3 Cukup jelas. Pasal 4 Ayat (1) Cukup je1as. Ayar (21 Cukup jelas. Ayat (3) Huruf a Cukup jelas. SK No 210998 A Hurufb. ..
PRESIDEN REPUBLIK INDONESIA -7 - Hurufb Pihak ketiga yang pajak ditanggung Pemerintah adalah pihak ketiga yang memberikan jasa kepada Pemerintah atau pihak lain yang mendapat penugasan sesuai dengan ketentuan peraturan perundang-undangan dalam rangka penerbitan dan/ atau pembelian kembali SBN di pasar internasional, yang antara lain agen penjual, agen pembeli/penukar, bursa efek di luar negeri, wali amanat, agen penata usaha, agen pembayar, lembaga rating, dan konsultan hukum intemasional, tidak termasuk konsultan hukum lokal. Ayat (4) Cukup jelas. Ayat (5) Cukup jelas. Ayat (6) Cukup jelas. Ayat (7) Cukup jelas. Ayat (8) Cukup jelas. Ayat (9) Cukup jelas. Ayat (10) Cukup jelas. Ayat (11) Cukup je1as. Pasal 5 Ayat (1) Cukup jelas. Ayat (2) Huruf a Cukup jelas. Huruf b Pendapatan sumber daya alam non-minyak bumi dan gas bumi bersumber dari pendapatan mineral dan batubara, kehutanan, panas bumi, serta kelautan dan perikanan tidak hanya ditujukan sebagai target penerimaan negara melainkan juga ditujukan untuk pengamanErn kelestarian lingkungan. Ayat(3)... SK No210997A
PRESIDEN REPUBLIK INDONESIA -8- Ayat (3) Cukup jelas. Ayat (4) Cukup jelas. Ayat (5) Cukup jelas. Ayat (6) Cukup jelas. Pasal 6 Cukup jelas. Pasal 7 Cukup jelas. Pasal 8 Ayat (1) Belanja Pemerintah Pusat termasuk belanja pegawai untuk pembayaran hak keuangan dan/ atau fasilitas untuk penyelenggara negaralpejabat negara yang dilakukan sesuai tata kelola penganggaran dengan memperhatikan kesinambungan Iiskal. Ayat (2) Huruf a Yang dimaksud dengan oBelanja Pemerintah Pusat Menurut Fungsi” antara lain terdiri atas: 1. fungsi pelayanan umum yang merupakan Belanja Pemerintah Pusat yang berdaya guna dalam kegiatan legislatif, yudikatif, dan eksekutif, termasuk pelayanan umum, pelayanan administratif, pelayanan barang, pelayanan jasa, pelayanan regulasi, dan pelayanan lainnya, dengan kualitas layanan yang baik; 2. fungsi pertahanan yang merupakan Belanja Pemerintah Pusat yang berdaya guna dalam menegakkan kedaulatan negara, mempertahankan keutuhan wilayah Negara Kesatuan Republik Indonesia serta ikut menjaga ketertiban dunia; 3. fungsi. . . SK No210996A
PRESIDEN REPUBLIK INDONESIA -9- 3. fungsi ketertiban dan keamanan yang merupakan Belanja Pemerintah Pusat yang berdaya guna dalam keamanan, ketertiban, tegaknya hukum, ketenteraman, meningkatnya dan potensi masyarakat dalam menangkal, mencegah, dan menanggulangi segala bentuk pelanggaran hukum dan bentuk-bentuk gangguan lainnya yang dapat meresahkan masyarakat serta penanggulangan bencana; 4. fungsi ekonomi yang merupakan Belanja Pemerintah Pusat yang berdaya guna dalam mendorong pertumbuhan ekonomi dan menjaga daya beli masyarakat di bidang perdagangan termasuk pengembangan usaha koperasi dan usaha mikro, kecil, dan menengah, ketenagakerjaan, pertanian, kehutanan, kelautan dan perikanan, bahan bakar dan energi, pertambangan, industri dan konstruksi, transportasi, serta telekomunikasi dan informatika; 5. fungsi perlindungan lingkungan hidup yang merupakan Belanja Pemerintah Pusat yang berdaya guna dalam rangka peningkatan kualitas lingkungan hidup, menjaga pelestarian sumber daya alam dan ekosistem, tata ruang dan pertanahan, serta perlindungan lingkungan hidup lainnya; 6. fungsi perumahan dan fasilitas umum yang merupakan Belanja Pemerintah Pusat yang berdaya guna dalam akses dan kawasan permukiman layak, aman, dan terjangkau, fasilitasi peningkatan kualitas rumah, penyediaan sarana, prasarana, utilitas perumahan dan kawasan permukiman, serta perumahan dan fasilitas umum lainnya; 7. fungsi kesehatan yang merupakan Belanja Pemerintah Pusat yang berdaya gtrna dalam menjaga dan meningkatkan derajat kesehatan masyarakat; 8. fungsi pariwisata yang merupakan Belanja Pemerintah Pusat yang berdaya guna dalam menyediakan fasilitas, kegiatan, dan promosi, termasuk standardisasi, penyebaran informasi, dan penyusunan data statistik pariwisata; SK No210995A 9.fungsi...
PRESIDEN REPUBLIK INDONESIA —10- 9. fungsi agama yang merupakan Belanja Pemerintah Pusat yang berdaya guna dalam kualitas kehidupan dan kerukunan hidup beragama, termasuk namun tidak terbatas pada urusan ibadah haji, serta pematraman dan pengamalan ajaran agama; lO. fungsi pendidikan yang merupakan Belanja Pemerintah Pusat yang berdaya guna dalam meningkatkan kualitas Sumber Daya Manusia di berbagai aspek yang berakhlak mulia, ddam rangka mencerdaskan kehidupan bangsa; dan 1l. fungsi perlindungan sosial yang merupakan Belanja Pemerintah Pusat yang berdaya guna dalam memberikan pelayanan sosial, jaminan sosial, pemberdayaan sosial, penyuluhan sosial, dan bantuan sosial, serta perlindungan sosial lainnya, untuk melindungi masyarakat dari kemungkinan terjadinya risiko sosial. Huruf b Cukup jelas. Huruf c Cukup jelas. Ayat (3) Cukup jelas, Ayat (4) Cukup jelas. Ayat (5) Cukup jelas. Pasal 9 Cukup jelas. Pasal 1O Ayat (1) DBH tahun anggaran berjalan yang dialokasikan per daerah telah memperhitungkan penyesuaian DBH sebesar Rp10.324.514.173.000,00 (sepuluh triliun tiga ratus dua puluh empat miliar lima ratus empat belas juta seratus tqjuh puluh tiga ribu rupiah) yang dihitung secara proporsional terhadap pagu alokasi per jenis DBH Pajak dan DBH sumber daya alam, sehingga nilai yang dialokasikan sebesar Rp164.473.790.702.O0O,00 (seratus enam puluh empat triliun empat ratus tujuh puluh tiga miliar tqiuh ratus sembilan puluh juta tqjuh ratus dua ribu rupiah). Ayat(2)... SK No210994A
PRESIDEN REPUBLIK INDONESIA —11- Ayat (2) Hurufa DBH ini terdiri atas DBH Pajak Penghasilan Pasal 21, Pasal 25, dan Pasal 29 Wajib Pajak Orang Pribadi Dalam Negeri, termasuk DBH dari Pajak Penghasilan Pasal 25 dan Pasal 29 Wajib Pajak Orang Pribadi Dalam Negeri yang pemungutannya bersifat final berdasarkan Peraturan Pemerintah mengenai Penyesuaian Pengaturan di Bidang Pajak Penghasilan dan tidak termasuk Pajak Penghasilan ditanggung Pemerintah. Huruf b Cukup jelas. Huruf c Cukup jelas. Ayat (3) Cukup jelas. Ayat (4) Cukup jelas. Ayat (5) Dalam hal realisasi negara sampai dengan akhir Tahun Anggaran 2024 belum tersedia, dapat digunakan perkiraan realisasi penerimaan negara. Yang dimaksud dengan “ketentuan peraturan perundangundangan” adalah ketentuan peraturan perundang-undangan yang mengatur mengenai tata cara pengalokasian DBH. Ayat (6) Alokasi kinerja diberikan kepada daerah yang mencapai tingkat kinerja tertentu. Ayat (7) Cukup jelas. Ayat (8) Dana reboisasi dilaksanakan sesuai dengan ketentuan peraturan perundang-undangan serta dapat mempertimbangkan kinerja atas pengelolaan hutan. Ayat (9) Huruf a Cukup jelas. Hurufb. . . SK No 210993 A
PRESIDEN REPUBLIK INDONESIA -12- Hurufb Dengan ketentuan ini Daerah tidak lagi diwajibkan untuk mengalokasikan DBH minyak bumi dan gas bumi sebesar O,5% (nol koma lima persen) untuk tambahan anggaran pendidikan dasar. Kebijakan penggunaan DBH minyak bumi dan gas bumi untuk Provinsi Papua Barat, Provinsi Papua Barat Daya, dan Provinsi Aceh dilaksanakan sesuai dengan ketentuan Undang-Undang Nomor 21 Tahun 20O1 tentang Otonomi Khusus Bagi Provinsi Papua sebagaimana telah beberapa kali diubah terakhir dengan Undang-Undang Nomor 2 Tahun 2O2L tentang Perubahan Kedua atas Undang-Undang Nomor 21 Tahun 20O1 tentang Otonomi Khusus Bagi Provinsi Papua, dan Undang-Undang Nomor 11 Tahun 2006 tentang Pemerintahan Aceh beserta peraturan turunannya. Hurufc Kebijakan ini merupakan konsekuensi dari perubahan kebdakan berupa pengdihan kewenangan di bidang kehutanan dari kabupaten/ kota menjadi kewenangan provinsi sebagaimana diatur dalam Undang-Undang Nomor 23 Tahun 2014 tentang Pemerintahan Daerah sebagaimana telah beberapa kali diubah terakhir dengan Undang-Undang Nomor 9 Tahun 2015 tentang Perubahan Kedua atas Undang-Undang Nomor 23 Tahun 2Ol4 tentang Pemerintahan Daerah. Ayat (1o) Cukup jelas. Ayat (11) Cukup jelas. Ayat (12) Cukup jelas. Ayat (13) Cukup jelas. Pasal 11 Ayat (1) Cukup jelas. Ayat (2) Cukup jelas. Ayat (3) Yang dimaksud dengan “tidak mengubah pagu TKD lainnya” adalah tidak mengubah pagu Dana Otonomi Khusus. Yang. . . SK No210992A
PRESIDEN REPUBLIK INDONESIA -13- Yang dimaksud dengan “kewajiban yang timbul bagi Daerah” adalah kewajiban pengalokasian alokasi dana desa oleh kabupaten/kota. Ayat (4) Proporsi pagu DAU daerah provinsi dan daerah kabupaten/ kota dibagi menjadi beberapa kelompok berdasarkan karakteristik tertentu. Ayat (5) Celah fiskal dihitung sebagai selisih antara kebutuhan fiskal Daerah dan potensi pendapatan Daerah. Ayat (6) Penyesuaian dilakukan agar tidak terdapat Daerah yang mengalami penurunan alokasi DAU dibandingkan alokasi DAU tahun sebelumnya. Ayat (7) Bagran DAU yang ditentukan penggunaannya untuk urusan layanan umum pada daerah provinsi/ kabupaten / kota dipergunakan untuk mendukung penggajian Pegawai Pemerintah dengan Perjanjian Kerja Daerah sebesar Rp 1 5.355. 1 4O.OOO.OO0,OO (lima belas triliun tiga ratus lima puluh lima miliar seratus empat puluh juta rupiah), dan pada Daerah kabupaten/kota dipergunakan untuk pembangunan sarana dan prasarana, pemberdayaan masyarakat di kelurahan, serta kegiatan prioritas lainnya sebesar Rp1.699.6OO.OOO.OO0,OO (satu triliun enam ratus sembilan puluh sembilan miliar enam ratus juta rupiah). Ayat (8) Cukup jelas. Ayat (9) Jumlah alokasi DAU provinsi di wilayah Papua yang dialihkan kepada kabupaten / kota di wilayah masing-masing sebesar 9oolo (sembilan puluh persen) dari alokasi DAU bidang Pendidikan. Pembagian alokasi DAU dari pengalihan alokasi DAU bidang Pendidikan provinsi di wilayah Papua untuk setiap kabupaten/ kota dihitung secara proporsional berdasarkan jumlah siswa Sekolah Menengah Atas dan Sekolah Menengah Kejuruan pada masing-masing kabupaten / kota. Pasal 12 Ayat (1) Cukup jelas. SK No2l099l A Ayat(2)...
PRESIDEN REPUBLIK INDONESIA -14- Ayat (2) Cukup jelas. Ayat (3) Yang dimaksud dengan “kebijakan afirmatil” adalah keb[jakan yang diarahkan untuk mempercepat dan memperkuat pembangunan dan perekonomian Daerah. Ayat (4) Cukup jelas. Ayat (5) Huruf a DAK fisik untuk layanan dasar, mencakup bidang: (i) air minum, (ii) sanitasi, (iii) irigasi, (iv) konektivitas (subbidang jalan), (v) pendidikan (termasuk subbidang perpustakaan daerah), (vi) kesehatan (termasuk subbidang keluarga berencana), dan (vii) perlindungan perempuan dan anak. Huruf b DAK lisik dengan tema tertentu, yaitu: l. tematik pengentasan kumuh terpadu, mencakup bidang: (i) air minum, (ii) sanitasi, (iii) perumahan dan 2. tematik kawasan produksi pangan nasional, mencakup bidang: (i) pangan pertanian, (ii) konektivitas (subbidang jalan dan subbidang transportasi perairan), (iii) irigasi, dan (iv) pangan akuatik; 3. tematik pengembangan ekosistem dan rantai pasok kawasan industri, mencakup bidang: (i) industri kecil dan menengah, (ii) perdagangan, (iii) konektivitas (subbidang jalan), (iv) air minum, dan (v) sanitasi. Ayat (6) Dana bantuan operasional satuan pendidikan terdiri atas dana bantuan operasional sekolah, dana bantuan operasional pendidikan anak usia dini, dan dana bantuan operasional penyelenggaraan pendidikan kesetaraan. Dana tunjangan guru aparatur sipil negara Daerah terdiri atas dana tunjangan profesi guru aparatur sipil negara Daerah, dana tambahan penghasilan guru aparatur sipil negara Daerah, dan dana tunjangan khusus guru aparatur sipil negara Daerah di daerah khusus. Dana bantuan operasional kesehatan terdiri atas dana bantuan operasional kesehatan dinas dan dana bantuan operasional kesehatan puskesmas. Ayat(7)... SK No210990A
PRESIDEN REPUBLIK INDONESIA —15- Ayat (71 Cukup jelas. Pasal 13 Ayat (1) Hurrf a Pembagian Dana Otonomi Khusus untuk provinsi-provinsi di wilayah Papua dilaksanakan sesuai dengan ketentuan peraturan perundang-undangan. Hurufb Cukup jelas. Huruf c Pembagian DTI untuk provinsi-provinsi di wilayah Papua dilaksanakan sesuai dengan ketentuan peraturan perundang-undangan. Ayat (2) Yang dimaksud dengan “data” adalah data yang disediakan oleh instansi yang berwenang antara lain berupa data Indeks Pembangunan Manusia, Indeks Kemahalan Konstruksi, Indeks Kesulitan Geografis, dan Indeks Desa Membangun pada level provinsi dan kabupaten/kota, terutama data untuk provinsi daerah otonom baru. Ayat (3) Yang dimaksud dengan “Daerah baru di wilayah Papua” mencakup Provinsi Papua Selatan, Provinsi Papua Tengah, Provinsi Papua Pegunungan, dan Provinsi Papua Barat Daya. Ayat (4) Yang dimaksud dengan “DTI untuk Daerah baru’ adalah DTI untuk Provinsi Papua Selatan, Provinsi Papua Tengah, Provinsi Papua Pegunungan, dan Provinsi Papua Barat Daya. Ayat (5) Cukup jelas. Ayat (6) Cukup jelas. Pasal 14 Ayat (1) Huruf a Cukup jelas. Huruf b Kebijakan Pemerintah Pusat antara lain berupa burden slwrirq pendanaan. Ayat(2)... SK No210989A
PRESIDEN REPUBLIK INDONESIA —16- Ayat (2) Hurufa Cukup jelas. Huruf b Cukup jelas. Huruf c Yang dimaksud dengan “desa dengan kinerja terbailf adalah desa yang memiliki hasil penilaian kinerja terbaik di masingmasing kabupaten/ kota, Penilaian kinerja berdasarkan kriteria utama dan kriteria kinerja antara lain: pengelolaan keuangan desa; pengelolaan Dana Desa; capaian keluaran (outputl Dana Desa; dan capaian hasil (outcome) pembangunan desa. Hurufd Data jumlah desa, jumlah penduduk, angka kemiskinan, luas wilayah, dan tingkat kesulitan geografis bersumber dari kementerian terkait dan/ atau lembaga yang menyelenggarakan urusan pemerintahan di bidang statistik. Dalam hal data tidak tersedia, terdapat anomali data, atau data tidak memadai, penghitungan Dana Desa dilakukan berdasarkan: a. data yang digunakan dalam penghitungan Dana Desa tahun anggaran sebelumnya; b. data yang dibagi secara proporsional antara desa pemekaran dan desa induk dan/atau menggunakan data desa induk; c. rata-rata data desa dalam satu kecamatan dimana desa tersebut berada; d. data hasil pembahasan dengan kementerian/lembaga penyedia data; dan/ atau e. data hasil penyesuaian atas data dengan menggunakan data yang digunakan pada penghitungan Dana Desa tahun anggaran sebelumnya dan/atau data yang dirilis pada laman kementerian/ lembaga penyedia data terkait. Ayat (3) Kriteria tertentu antara lain desa yang memiliki tata kelola keuangan yang efektif, efisien, dan bebas dari korupsi. 1 2 3 4 Ayat(4) ... SK No210988A
PRESIDEN REPUBLIK INDONESIA -17- Ayat (4) Cukup jelas. Ayat (5) Huruf a Cukup jelas. Huruf b Cukup jelas. Huruf c Cukup jelas. Hurrf d Cukup jelas. Huruf e Pengembangan potensi dan keunggulan desa antara lain pengembangan desa wisata, desa devisa, dan desa argoekonomi sesuai karakteristik desa. Huruf f Cukup jelas. Huruf g Yang dimaksud dengan opembangunan berbasis padat karya tunai” adalah kegiatan pembangunan desa yang dilakukan oleh penduduk desa dalam rangka kesejahteraan, antara lain pembangunan rumah murah dengan sanitasi baik untuk masyarakat yang membutuhkan. Huruf h Yang dimaksud dengan “program sektor prioritas lainnya di desa” antara lain bantuan permodalan kepada badan usaha milik desa. Ayat (6) Cukup jelas. Ayat (7) Peraturan Menteri Keuangan memuat antara lain penetapan rincian Dana Desa setiap desa, pengalokasian Dana Desa, penggunaan dan penyaluran Dana Desa. Penetapan rincian Dana Desa setiap desa dimaksud merupakan dasar penetapan alokasi Dana Desa per kabupaten / kota yang ditetapkan dalam Peraturan Presiden mengenai rincian APBN. SK No210987A Pasal 15. . .
PRESIDEN REPUBLIK INDONESIA -18- ESIA Pasal 15 Cukup jelas. Pasal 16 Ayat (1) Hurufa Cukup jelas. Huruf b Cukup jelas. Huruf c Cukup jelas. Huruf d Yang dimaksud dengan “anggaran yang diwajibkan dalam peraturan perundang-undangan’ antara lain kewajiban anggaran pendidikan, alokasi Dana Desa, dan iuran jaminan kesehatan. Ayat (2) Cukup jelas. Pasal 17 Ayat (l) Cukup jelas. Ayat (21 Program Pengelolaan Subsidi dilaksanakan secara efektif, efisien, dan tepat sasaran guna memberikan manfaat yang optimal bagi pengentasafl kemiskinan dan ketimpangan masyarakat. Ayat (3) Yang dimaksud dengan “asumsi dasar ekonomi makro” adalah harga minyak mentah dan nilai tukar rupiah. Yang dimaksud dengan “parametef adalah semua variabel yang memengaruhi perhitungan subsidi, antara lain: besaran subsidi harga, volume konsumsi bahan bakar minyak dan gas bersubsidi, harga indeks minyak dan gas bersubsidi, volume penjualan listrik bersubsidi, dan volume pupuk bersubsidi. Dalam rangka melaksanakan program pengelolaan subsidi fienis bahan bakar tertentu, listrik, LPG tabung 3 kg, pupuk, dan lain sebagainya) yang lebih tepat sasaran, mulai tahun 2025, Pemerintah akan melaksanakan penguatan basis data dan pengawasan implementasinya. Pelaksanaan penyaluran subsidi dengan berbasis data pengguna akan dilakukan secara bertahap dengan kesiapan teknis, kondisi ekonomi, SK No210986A dan/ atau daya beli masyarakat. Ayat(4)...
PRESIDEN REPUBLIK INDONESIA -19- Ayat (4) Cukup jelas. Pasal 18 Ayat (1) Kenaikan PNBP sumber daya alam yang dibagihasilkan dan diperhitungkan dengan persentase tertentu atas peningkatan belanja subsidi energi dan/atau kompensasi, tidak dibagihasilkan ke daerah dan tidak diperhitungkan sebagai kurang bayar DBH. Ayat (2) Cukup jelas. Pasal 19 Cukup jelas. Pasal 2O Ayat (1) Huruf a Perubahan anggaran belanja yang bersumber dari PNBP yang merupakan pengguna€rn PNBP melebihi target yang telah ditetapkan, dilakukan analisis kebutuhan riil kementerian / lembaga oleh Kementerian Keuangan dengan memperhatikan fleksibilitas instansi pemerintah yang menerapkan Pola Pengelolaan Keuangan Badan Layanan Umum. Dalam hal realisasi PNBP yang melampaui target penerimaan dalam APBN, dapat digunakan untuk belanja dengan ketentuan sebagai berikut: 1. digunakan untuk belanja kementerian / lembaga tertentu paling tinggi sebesar 7,5% (tujuh koma lima persen) dari tambahan realisasi penerimaan PNBP dalam APBN; atau 2. digunakan untuk belanja kementerian/ lembaga tertentu lebih dari 7,5% (tqjuh koma lima persen) dari tambahan realisasi penerimaan PNBP dalam APBN, setelah berkonsultasi dengan Dewan Perwakilan Ralqfat dalam hal ini Badan Anggaran Dewan Perwakilan Ralyat. Ketentuan tersebut di atas dikecualikan untuk PNBP yang diperoleh dari: a. layanan yang membutuhkan biaya untuk pelaksanaan layanan berkenaan, sehingga dapat diberikan sesuai kebutuhan, antara lain: untuk penyelenggaraan pendidikan, kesehatan, penelitian, pengujian laboratorium, pengujian dalam rangka sertifikasi, advis teknis, penilaian, pelatihan, dan diklat kepemimpinan; b. penggunaan . . . SK No 210985 A
PRESIDEN REPUBLIK INDONESIA 20- b. penggunaan dan pemanfaatan BMN; c. pengelolaan dana; d. satker dengan pengelolaan keuangan Badan layanan Umum; dan e. putusan pro justitia yang telah berkekuatan hukum tetap. Realisasi penggunaan PNBP dilaporkan kepada Badan Anggaran secara triwulanan. Huruf b Cukup je1as. Huruf c Perubahan anggaran belanja yang bersumber dari pinjaman karena: a. perubahan kurs; b. sebab lain sepanjang perubahan tersebut tidak mengakibatkan pelampauan pagu belanja kementerian/lembaga; c. untuk penanggulangan bencana, merupakan kewenangan Pemerintah. Perubahan anggaran belanja yang bersumber dari pinjaman yang mengakibatkan pelampauan pagu belanja kementerian/lembaga selain huruf a dan huruf c di atas, dilakukan dengan mempertimbangkan kemampuan keuangan negara dan harus mendapat persetqiuan dari alat kelengkapan Dewan Perwakilan Rakyat yang khusus menangani urusan kementerian/lembaga dimaksud. Persetujuan tersebut diberikan dalam jangka waktu paling lama 30 (tiga puluh) hari kalender terhitung sejak permohonan diterima oleh alat kelengkapan Dewan Perwakilan Rakyat yang khusus menangani urusan kementerian/ lembaga dimaksud. Apabila karena satu dan lain hal persetujuan belum dapat diberikan dalam jangka waktu dimaksud, Pemerintah melaksanakan perubahan anggaran belanja yang bersumber dari pinjaman yang mengakibatkan pelampauan pagu belanja kementerian / lembaga tersebut serta melaporkannya dalam Laporan Keuangan Pemerintah Pusat. Hurufd. . . SK No210984A
PRESIDEN REPUBLIK INDONESIA -21— Huruf d Cukup jelas. Huruf e Cukup jelas. Huruf f Perubahan anggaran dimaksud dapat bersumber dari: 1. rupiah murni; 2. pinjaman; 3. hibah; 4. sisa klaim asuransi BMN; 5. dana bersama penanggulangan bencana dan/ atau hasil pengembangannya; dan/ atau 6. penerimaan lain yang sah. Huruf g Perubahan anggaran cadangan kompensasi dalam program belanja dilakukan berdasarkan perubahan asumsi dasar ekonomi makro, perubahan parameter, perubahan kebijakan, dan/atau pembayaran kewajiban kompensasi tahun-tahun sebelumnya. Huruf h Pemanfaatan belanja BUN Pengelolaan Belanja Lainnya diprioritaskan untuk pendanaan program prioritas Pemerintah yang berkaitan dengan perlindungan sosial, penanggulangan bencana, penguatan program penuntasan kemiskinan ekstrem, ketersediaan dan keterjangkauan harga pangEm, keperluan mendesak untuk ketertiban dan keamanan nasional, dan/ atau pemenuhan kewajiban Pemerintah (subsidi dan/ atau kompensasi). Hurufi Cukup jelas. Hurufj Cukup jelas. Hurufk Cukup jelas. Hurufl. . . SK No 210983 A
PRESIDEN REPUBLIK INDONESIA -22- Huruf I Yang dimaksud dengan “ineligible expenditure’ adalah pengeluaran-pengeluaran yang tidak diperkenankan dibiayai dari dana pinjaman/hibah luar negeri karena tidak sesuai dengan kesepakatan dalam Perjanjian Pinjaman dan/atau Hibah Luar Negeri. Hurufm Cukup jelas. Hurufn Cukup jelas. Hurrf o Cukup jelas. Ayat (2) Pinjaman baru merupakan pinjaman yang dilakukan Pemerintah setelah Undang-Undang tentang APBN Tahun Anggaran 2025 diundangkan. Pinjaman baru setelah penetapan Undang-Undang tentang APBN Tahun Anggaran 2025 dapat berupa pinjaman luar negeri kegiatan dan pinjaman dalam negeri termasuk pinjaman yang diteruspinjamkan dan/ atau diterushibahkan. Ayat (3) Yang dimaksud dengan “perubahan pagu Pemberian Pinjaman” adalah peningkatan pagu Pemberian Pinjaman akibat adanya lanjutan Pemberian Pinjaman yang bersifat tahun jamak, percepatan penarikan Pemberian Pinjaman yang sudah disetqjui dalam rangka mengoptimalkan pemanfaatan Pemberian Pinjaman dan/ atau penambahan pagu Pemberian Pinjaman untuk penerbitan Surat Perintah Pembukuan/Pengesahan atas transaksi dokumen bukti penarikan pinjaman dan/ atau hibah yang dikeluarkan oleh pemberi pinjaman dan/atau hibah (ffotice of Disbursement-NoD). Perubahan pagu Pemberian Pinjaman tersebut tidak termasuk Pemberian Pinjaman baru yang belum dialokasikan dalam APBN Tahun Anggaran 2025. Yang dimaksud dengan “closing date” adalah tanggal batas akhir penarikan dana pinjaman / hibah luar negeri melalui penerbitan Surat Perintah Pencairan Dana oleh Kantor Pelayanan Perbendaharaan Negara. Ayat(4)... SK No 210982A
PRESIDEN REPUBLIK INDONESIA -23- Ayat (4) Perubahan pagu ini dipergunakan untuk penerbitan Surat Perintah Pembukuan / Pengesahan atas transaksi dokumen bukti penarikan Pinjaman dan/ atau Hibah yang dikeluarkan oleh pemberi Pinjaman dan/atau Hibah fiVotioe of Disbursement-NOD). Ayat (5) Yang dimaksud dengan “uang muka kontrak kegiatan yang dibiayai pinjaman luar negeri” adalah Alokasi Rupiah Murni yang wajib disediakan pemerintah dalam Daftar Isian Pelaksanaan Anggaran Kementerian/ Lembaga Pengguna Pinjaman Luar Negeri, untuk membayar sejumlah tertentu kepada penyedia barang danlatau jasa sebagai salah satu persyaratan pengefektifan kontrak. Tanpa pembayaxan uang muka, pinjaman luar negeri yang perjanjian pinjamannya telah ditandatangani tidak dapat dicairkan. Ayat (6) Cukup jelas. Ayat (7) Yang dimaksud dengan “dilaporkan” adalah laporan yang disampaikan dalam rapat kerja. Ayat (8) Cukup jelas. Pasal 21 Ayat (1) Pemberian hibah kepada pemerintah asing/lembaga asing dilakukan dalam bentuk uang tunai dan/atau uang untuk membiayai kegiatan. Ayat (2) Cukup jelas. Ayat (3) Cukup jelas. Ayat (4) Pemerintah dapat memberikan hibah kepada pemerintah daerah antara lain dalam rangka penanggulangan bencana. Anggaran pemberian hibah dapat bersumber dari realokasi anggaran kegiatan kementerian / lembaga yang sudah menjadi kewenangan pemerintah daerah. Pasal 22... SK No 210981 A
PRESIDEN REPUBLIK INDONESIA -24- PasaL22 Ayat (1) Cukup jelas. Ayat (2) Cukup jelas. Ayat (3) Pendanaan operasional penyelenggaraan pendidikan termasuk program makan bergpzi pada lembaga yang berkaitan dengan penyelenggaraan pendidikan baik umum maupun keagamaan. Ayat (4) Pos pembiayaan untuk dana abadi di bidang pendidikan antara lain untuk: a. dana abadi pendidikan yang di dalamnya termasuk dana abadi pesantren; b. dana abadi penelitian; c, dana abadi kebudayaan; dan d. dana abadi perguruan tinggi. Dana abadi pendidikan, dana abadi penelitian, dan dana abadi perguruan tinggi dikelola oleh lcmbaga Pengelola Dana Pendidikan sebagai endoument fund. Dana abadi pendidikan yang di dalamnya termasuk dana abadi pesantren merupakan dana yang diakumulasikan dalam bentuk dana abadi yang berasal dari alokasi anggaran pendidikan tahuntahun sebelumnya sebagai dana abadi pendidikan. Hasil pengelolaan dana abadi pendidikan dimaksud digunakan untuk menjamin keberlangsungan program pendidikan bagi generasi berikutnya termasuk pesantren dan pendidikan keagamaan sebagai bentuk antargenerasi. Bentuk, skema, dan cakupan bidang pendidikan yang di dalamnya termasuk dana abadi pesantren dilaksanakan sesuai dengan ketentuan peraturan perundang-undangan. Dana abadi penelitian merupakan dana yang diakumulasikan dalam bentuk dana abadi yang hasil kelolaannya digunakan dalam rangka penelitian, pengembangan, pengkajian, dan penerapan untuk menghasilkan invensi dan inovasi. Bentuk , . . SK No210980A
PRESIDEN REPUBLIK INDONESIA -25- Bentuk, skema, dan cakupan bidang penelitian, pengembangan, pengkajian, dan penerapan untuk menghasilkan invensi dan inovasi dilaksanakan sesuai dengan ketentuan peraturan perundang-undangan. Dana abadi kebudayaan merupakan dana yang diakumulasikan dalam bentuk dana abadi yang hasil kelolaannya digunakan untuk mendukung kegiatan terkait pemajuan kebudayaan. Bentuk, skema, dan cakupan bidang kebudayaan dilaksanakan sesuai dengan ketentuan peraturan perundang-undangan. Dana abadi perguruan tinggr merupakan dana yang diakumulasikan dalam bentuk dana abadi yang hasil kelolaannya digunakan untuk mendukung pengembangan perguruan tinggi kelas dunia di perguruan tinggi terpilih. Bentuk, skema, dan cakupan bidang pengembangan perguruan tingg dilaksanakan sesuai dengan ketentuan peraturan perundang-undangan. Ayat (5) Cukup jelas. Ayat (6) Rincian yang terkait dengan Anggaran Pendidikan juga mencakup kementerian/Iembaga yang menjalankan program, nonkementerian/ lembaga, dan investasi Pemerintah. Pasal 23 Ayat (1) Cukup jelas. Ayat (21 Huruf a Cukup jelas. Hurufb Da1am pelaksanaan PMN, Komisi yang membidangi urusan keuangan negara pada Dewan Perwakilan Rat<yat melakukan dan menuntaskan pendalaman dalam waktu paling lama 45 (empat puluh lima) hari keda sejak diajukan penjadwalan rapat kerja pendalaman oleh Pemerintah. Dalam hal pendalaman sebagaimana dimaksud di atas, karena satu dan lain hal belum dapat dituntaskan, Pemerintah dapat mengambil langkah-langkah PMN sesuai dengan ketentuan peraturan perundang-undangan, serta melaporkan langkah-langkah tersebut dalam Laporan Keuangan Pemerintah Pusat Tahun 2025. Hurufc . . . SK No210979A
PRESIDEN REPUBLIK INDONESIA -26- Huruf c Cukup jelas. Hurufd Cukup jelas. Ayat (3) Cukup jelas. Ayat (4) Cukup jelas. Pasal 24 Ayat (1) Yang dimaksud dengan “defisit” adalah defisit sebagaimana ditetapkan dalam Undang-Undang Nomor 17 Tahun 2O03 tentang Keuangan Negara. Ayat (2I Cukup jelas. Ayat (3) Cukup jelas. Ayat (4) Cukup jelas. Pasal 25 Cukup jelas. Pasal 26 Cukup jelas. Pasal 27 Ayat (1) Yang dimaksud dengan “krisis pasar SBN domestil* adalah kondisi krisis pasar SBN berdasarkan indikator Protokol Manajemen Krisis (C’isis Management Proto@If pasar SBN yang ditetapkan oleh Menteri Keuangan. Penggunaan dana SAL untuk melakukan stabilisasi pasar SBN dapat dilakukan apabila kondisi pasar SBN telah ditetapkan oleh Menteri Keuangan pada level krisis. Krisis di pasar SBN tersebut dapat memicu krisis di pasar keuangan secara keseluruhan, mengingat sebagian besar lembaga keuangan memiliki SBN. Situasi tersebut juga dapat memicu krisis fiskal, apabila Pemerintah harus melakukan upaya penyelamatan lembaga keuangan nasional. Stabilisasi . . . SK No 210978 A
PRESIDEN REPUBLIK INDONESIA -27- Stabilisasi pasar SBN domestik dilakukan melalui pembelian SBN di pasar sekunder oleh Menteri Keuangan. Ayat (2) Cukup jelas. Ayat (3) Cukup jelas. Ayat (4) Cukup jelas. Pasal 28 Ayat (1) Huruf a Penggunaan tambahan anggaran yang berasal dari dana SAL termasuk untuk memenuhi kebutuhan mendesak dan/atau prioritas yang timbul pada tahun anggaran bedalan antara lain untuk menurunkan pembiayaan utang, cadangan belanja Ibu Kota Nusantara/ sentra pertumbuhan ekonomi baru, cadangan kompensasi, cadangan kurang bayar DBH, dan/ atau cadangan kurang bayar subsidi. Huruf b Cukup jelas. Huruf c Cukup jelas. Huruf d Khusus untuk pemanfaatan saldo kas Badan Layanan Umum ditakukan dengan mempertimbangkan operasional dan manajemen kas Badan Layanan Umum. Huruf e Yang dimaksud dengan “penyesuaian Belar{a Negara” termasuk melakukan pengutamaan penggunaan anggaran, pemotongan anggarzrn Belanja Negara, dan/ atau penyesuaian pagu. Ayat (2) Yang dimaksud dengan “Persetujuan Dewan Perwakilan Rakyaf adalah kesepakatan Pemerintah dengan Badan Anggaran Dewan Perwakilan Rakyat. Persetujuan Dewan Perwakilan Rakyat diberikan dalam jangka waktu 3x24 (tiga kali dua puluh empat) jam setelah pemberitahuan disampaikan Pemerintah. Dalam . , . SK No210977A
PRESIDEN REPUBLIK INDONESIA -28- Dalam hal jangka waktu persetqluan tersebut di atas terlampaui dan Dewan Perwalilan Rakyat belum memberikan persetujuan, Pemerintah dapat melaksanakan penerbitan SBN dimaksud. Ayat (3) Cukup jelas. Ayat (4) Perubahan komposisi instrumen pembiayaan utang meliputi perubahan SBN neto, penarikan Pinjaman Dalam Negeri, dan/atau penarikan Pinjaman Luar Negeri. Penarikan Pinjaman Luar Negeri meliputi penarikan Pinjaman T\rnai dan Pinjaman Kegiatan. Dalam hal Pinjaman Luar Negeri dan/atau Pinjaman Dalam Negeri tidak tersedia dapat digantikan dengan penerbitan SBN atau sebaliknya dalam rangka menjaga ketahanan ekonomi dan liskal. Ayat (5) Cukup jelas. Ayat (6) Cukup jelas. Ayat (7) Cukup jelas. Pasal 29 Ayat (1) Ancaman yang membahayakan perekonomian nasional dan/atau stabilitas sistem keuangan termasuk kondisi geopolitik yang berdampak terhadap perekonomian global dan domestik. Termasuk langkah kebijakan yang dapat ditempuh untuk ancaman perekonomian dan/ atau stabilitas sistem keuangan tersebut antara lain melakukan penyesuaian besaran Pendapatan Negara, Belanja Negara dan/ atau Pembiayaan Anggaran. Ayat (2) Cukup jelas. Pasal 30 Ayat (1) Pemenuhan pembiayaan APBN Tahun Anggaran 2025 dapatjuga berasal dari hasil penerbitan SBN dalam triwulan keempat Tahun 2024, dalam hal perkiraan realisasi penerimaan negara dan/atau perkiraan realisasi pengeluaran negara tidak sesuai dengan target Tahun2024. Ayat(21... SK No210976A
PRESIDEN REPUBLIK INDONESIA -29- Ayat (2) Cukup jelas. Pasal 31 Cukup jelas. Pasal 32 Cukup jelas. Pasal 33 Ayat (1) Saldo kas pada Badan layanan Umum dan dana yang ditampung dalam rekening investasi Bendahara Umum Negara dialokasikan sebagai penerimaan pembiayaan lainnya untuk dapat menjadi anggarErn dan/ atau tambahan anggaran pengeluaran pembiayaan investasi pada Bagian Anggaran Bendahara Umum Negara Pengelolaan Investasi Pemerintah. Ayat (2) Cukup jelas. Pasal 34 Ayat (1) Cukup jelas. Ayat (2) Mekanisme pengesahan belanja modal pertanggungiawaban penggunaan dana jangka panjang dan/ atau dana cadangan pada Badan Layanan Umum Lembaga Manajemen Aset Negara. Ayat (3) Mekanisme pengesahan belanja merupakan penggunaan dana abadi, dana jangka panjang, dan/ atau dana cadangan pada Badan Layanan Umum Badan Pengelola Dana Lingkungan Hidup. Ayat (4) Cukup jelas. Ayat (5) Cukup jelas. Ayat (6) Yang dimaksud dengan “ketentuan peraturan perundangundangan’ antara lain peraturan perundang-undangan di bidang Investasi Pemerintah. Pengelolaan . . . SK No 210975 A
PRESIDEN REPUBLIK INDONESIA -30- Pengelolaan selanjutrrya dilakukan oleh PT. Sarana Multi Infrastruktur (Persero). Pasal 35 Ayat (1) Cukup jelas. Ayat {21 Cukup jelas. Ayat (3) Cukup jelas. Ayat (4) Cukup jelas. Ayat (5) Yang dimaksud dengan “hasil sitaan atau rampasan’ adalah hasil yang diperoleh pada tahun 2021,2022, 2023,2024, dan 2025. Ayat (6) Terhadap penambahan PMN sebagaimana dimaksud pada ayat (1) dan ayat (4), serta pemberian PMN sebagaimana dimaksud pada ayat (5), Komisi yang membidangi urusan keuangan negara pada Dewan Perwakilan Rakyat melakukan pendalaman dalam waktu paling lama 45 (empat puluh lima) hari kerja sejak diajukan permohonan penjadwalan rapat kerja oleh Pemerintah. Kegiatan pendalaman PMN dimulai pada triwulan I Tahun 2025. Dalam hal pendalaman sebagaimana dimaksud di atas, karena satu dan lain hal belum dapat dituntaskan, Pemerintah dapat mengambil langkah PMN sesuai dengan ketentuan peraturan perundang-undangan, serta melaporkan langkah-langkah tersebut dalam Laporan Keuangan Pemerintah Pusat Tahun 2025. Pasal 36 Cukup jelas. Pasal 37 Ayat (1) Pencapaian kepentingan nasional Indonesia dilaksanakan dalam rangka pelaksanaan diplomasi ekonomi Indonesia. Ayat (2) Cukup jelas. Pasal 38... SK No210974A
PRESIDEN REPUBLIK INDONESIA -31—Pasal 38 Ayat (1) Penjaminan Pemerintah untuk masing-masing dilaksanakan sesuai dengan ketentuan peraturan undangan. Ayat l2l Hurufa Pemberian jaminan Pemerintah Pusat untuk percepatan pelaksanaan proyek strategis nasional dibatasi hanya pada proyek strategis nasional yang telah memperoleh surat jaminan oleh Pemerintah sebagaimana diatur dengan Peraturan Menteri Keuangan mengenai tata cara pemberian jaminan Pemerintah Pusat untuk percepatan pelaksanaan proyek strategis nasional. Hurufb Pelaksanaan penjaminan infrastruktur dalam proyek kerja sama Pemerintah dengan badan usaha yang dibatasi pada proyek kerja sama Pemerintah dengan badan usaha dengan penanggung jawab proyek kerja sama adalah pemerintah daerah, Badan Usaha Milik Negara, dan Badan Usaha Milik Daerah. Huruf c Cukup jelas. Huruf d Pemberian jaminan Pemerintah untuk percepatan infrastruktur dibatasi hanya pada proyek yang telah memperoleh jaminan pinjaman oleh Pemerintah kepada kreditur sehubungan dengan pembayaran kembali pinjaman PT Perusahaan Listrik Negara (Persero) selaku pelaksana penugasan pembangunan infrastruktur kelistrikan. Ayat (3) Cukup jelas. Ayat (4) Pembentukan rekening dana cadangan penjaminan Pemerintah ditqiukan terutama untuk menghindari pengalokasian anggaran kewajiban penjaminan Pemerintah daLam jumlah besar dalam satu tahun anggaran di masa yang akan datang, menjamin ketersediaan dana yang jumlahnya sesuai kebutuhan, menjamin pembayaran klaim secara tepat waktu dan memberikan kepastian kepada pemangku kepentingan (termasuk kreditur/investor). Ayat(S)... program SK No 210973 A
PRESIDEN REPUBLIK INDONESIA _32_ Ayat (5) Cukup jelas. Ayat (6) Cukup jelas. Ayat (7) Mekanisme pembayaran pengeluaran belanja transaksi khusus atas klaim kewajiban dan/ atau penggantian biaya yang timbul dari pelaksanaan kewajiban penjaminan untuk program penjaminan pemulihan ekonomi nasional dilaksanakan melalui pemindahbukuan dana cadangan penjaminan ke rekening kas umum negara dan diperlakukan sebagai penerimaan pembiayaan. dana cadangan penjaminan dijadikan sebagai dasar pagu belanja transaksi khusus dalam penyusunan daftar isian pelaksanaan anggaran. Ayat (8) Cukup jelas. Ayat (9) Cukup jelas. Ayat (10) Penempatan dana cadangan ke dalam instrumen investasi Pemerintah dimaksudkan dalam rangka optimalisasi dana cadangan. Ayat (11) Cukup jelas. Pasal 39 Ayat (l) Penyesuaian pembayaran bunga utang dan pengeluaran cicilan pokok utang dengan kebutuhan realisasi pada tahun anggaran berjalan, antara lain dapat disebabkan oleh: 1. Kondisi ekonomi makro yang tidak sesuai dengan kondisi yang diperktakan pada saat penyusunan APBN Perubahan dan/ atau laporan realisasi pelaksanaan APBN Semester Pertama Tahun Anggaran 2025; 2. Dampak dari restrukturisasi utang dalam rangka pengelolaan portofolio utang; 3. Dampak dari percepatan penarikan pinjaman; 4. Dampak dari transaksi Lindung Nilai atas pembayaran bunga utang dan pengeluaran cicilan pokok utang; dan/ atau SK No236078A 5. Dampak. . .
PRESIDEN REPUBLIK INDONESIA -33- 5. Dampak dari perubahan komposisi instrumen pembiayaan utang. Ayat (2) Pelaksanaan transaksi Lindung Nilai dilaporkan Pemerintah dalam laporan Keuangan Pemerintah Pusat Tahun 2025. Ayat (3) Cukup jelas. Ayat (4) Kewajiban yang timbul dari transaksi Lindung Nilai bukan merupakan kerugian keuangan negara karena ditujukan untuk melindungi pembayaran bunga utang dan pengeluaran cicilan pokok utang dari risiko fluktuasi mata uang dan tingkat bunga. Selain itu, transaksi Lindung Nilai tidak ditujukan untuk spekulasi mendapatkan keuntungan. Ayat (5) Cukup jelas. Pasal 4O Laporan paling sedikit memuat capaian sasaran program prioritas nasional yang mengaitkan indikator kementerian /lembaga, program, dan anggarannya. Pasal 4l Ayat (1) Yang dimaksud dengan “keadaan darurat” adalah memburuknya kondisi ekonomi makro dan keuangan yang menyebabkan fungsi dan peran APBN tidak dapat bedalan secara efektjf dan efisien, antara lain: a. proyeksi pertumbuhan ekonomi di bawah asumsi dan deviasi asumsi dasar ekonomi malro lainnya secara signifikan; b. proyeksi penurunan pendapatan negara dan/ atau meningkatnya belanja negara secara signilikan; dan/ atau c. kenaikan biaya utang, khususnya imbal hasil SBN secara signifikan. Ayat (2) Cukup jelas. SK No 210948 A Ayat(3)...
PRESIDEN REPUBLIK INDONESIA -34- Ayat (3) Yang dimaksud dengan “karena suatu dan lain hal belum dapat ditetapkan” adalah apabila Badan Anggaran belum dapat melakukan rapat kerja dan/ atau mengambil kesimpulan di dalam rapat kerja, dalam waktu 2x24 (dua kali dua puluh empat) jam setelah usulan disampaikan Pemerintah kepada Dewan Perwakilan Rakyat. Yang dimaksud dengan “langkah antisipasi’ adalah langkah yang diambil oleh Pemerintah dalam rangka penanganan kondisi darurat. Ayat (4) Cukup jelas. Pasal 42 Cukup jelas. Pasal 43 Ayat (1) Yang dimaksud dengan “Lembaga Penjamin Simpanan mengalami kesulitan likuiditas” adalah dalam hal perkiraan kas yang dapat diperoleh dari sumber daya keuangan Lembaga Penjamin Simpanan tidak mencukupi pada saat kebutuhan dana harus dipenuhi oleh Lembaga Penjamin Simpanan. Ayat (21 Penambahan utang antara lain bersumber dari penerbitan SBN. Ayat (3) Cukup jelas. Pasal 44 Ayat (1) Otorita Ibu Kota Nusantara dan melakukan persiapan, pembangunan, dan/ atau pemindahan Ibu Kota Negara, serta penyelenggaraan Pemerintahan Daerah Khusus lbu Kota Nusantara. Pelaksanaan persiapan, pelaksanaan pembangunan Ibu Kota Nusantara, dan/ atau pemindahan Ibu Kota Negara tersebut juga dapat dilakukan oleh kementerian / lembaga sesuai dengan tugas dan fungsinya dengan angg€rran yang bersumber dari APBN. Dalam rangka menjaga kesinambungan pembangunan Ibu Kota Nusantara, Pemerintah memberikan dukungan pendanaan melalui APBN sesuai dengan peraturan perundang-undangan mengenai Ibu Kota Negara dan dengan mempertimbangkan kemampuan keuangan negara. Ayat (21 . . , SK No236t05A
PRESIDEN REPUBLIK INDONESIA -35- Ayat (2) Yang dimaksud dengan “anggaran’ adalah anggaran yang bersumber dari APBN atau anggaran yang bersumber dari APBN dan sumber lain yang sah sesuai dengan ketentuan peraturan perundang-undangan. Yang dimaksud dengan “Dewan Perwakilan Rakyat’ adalah komisi yang membidangi keuangan negara dan pembangunan nasional. Pasal 45 Pengaturan ini dimaksudkan agar pemberian layanan dasar kepada masyarakat tidak terganggu dengan adanya pemindahan Ibukota Negara, sementara Otorita lbu Kota Nusantara belum sepenuhnya dapat melaksanakan tuga.s dan fungsinya sebagai penyelenggara pemerintah daerah khusus Ibu Kota Nusantara khususnya dalam melakukan pengambilalihan tanggung jawab pemerintahan daerah. Yang dimaksud dengan “penyelenggaraan urusan pemerintahan daerah” adalah pemberian layanan dasar kepada penduduk Ibu Kota Nusantara antara lain pemberian layanan di bidang kependudukan, bidang pendidikan, bidang kesehatan dan/atau bidang lainnya di luar kewenangan khusus dari Otorita Ibu Kota Nusantara. Sebagai konsekuensinya, pemungutan pajak daerah dan retribusi daerah sampai dengan akhir tahun 2O25 masih menjadi kewenangan dari Pemerintah Daerah Provinsi Kalimantan Timur, Pemerintah Daerah Kabupaten Kutai Kartanegara, dan Pemerintah Daerah Kabupaten Penajam Paser Utara sesuai ketentuan peraturan perundang-undangan termasuk peraturan perundang-undangan di bidang hubungan keuangan pusat dan daerah dan pemerintahan daerah. Pasal 46 Cukup jelas. PasaT 47 Ayat (1) Cukup jelas. Ayat (2) Pemerintah menyampaikan Peraturan Presiden mengenai Rincian APBN kepada Badan Anggaran Dewan Perwakilan Rakyat. Selain penyampaian Peraturan Presiden mengenai Rincian APBN, Pemerintah juga menyampaikan dokumen yang berisi kelompok penerima manfaat dari program dan kegiatan, Selain . . . urusan SK No236104A
PRESIDEN REPUBLIK INDONESIA -36- Selain itu juga disampaikan dokumen yang menjelaskan mengenai sasaran prioritas nasional dalam Rencana Kerja Pemerintah yang disertai dengan sasaran indikator (baselinel tahun 2020, capaian tahun 2023, target tahun 2025, program-program kementerian / lembaga, dan alokasi anggarannya. Dokumen tersebut disampaikan pada bulan Desember tahun 2024, Ayat (3) Pelaksanaan dilakukan secara bertahap. Pasal 48 Ayat (1) Cukup jelas. Ayat (2) Yang dimaksud dengan “dikelola secara khusus” adalah Dana Bersama Bencana dapat dikelola oleh unit pengelola Dana Bersama Penanggulangan Bencana dan sebagai pendapatan/penerimaan unit pengelola Dana Bersama Ayat (3) Cukup jelas. Ayat (4) Cukup jelas. Bencana. Pasal 49 Hurufa Penetapan tingkat kemiskinan sesuai dengan metodologi penghitungan Garis Kemiskinan Nasional yang dilakukan oleh Badan Pusat Statistik. Huruf b Cukup jelas. Huruf c Cukup jelas. Huruf d Cukup jelas. Huruf e Cukup jelas. Huruf f Cukup jelas. Huruf g Cukup jelas. SK No 236103 A Pasal 5O...
PRESIDEN REPUBLIK INDONESIA -37- Pasal 50 Cukup jelas. Pasal 51 Yang dimaksud dengan adalah keputusan pemberian persetqjuan yang diambil melalui forum rapat kerja. Yang dimaksud dengan “pengalokasian” termasuk di dalamnya pembagian menurut fungsi, organisasi, dan program, Pasal 52 Cukup jelas. Pasal 53 Cukup jelas. TAMBAHAN LEMBARAN NEGARA REPUBLIK INDONESIA NOMOR 6995 SK No236220A
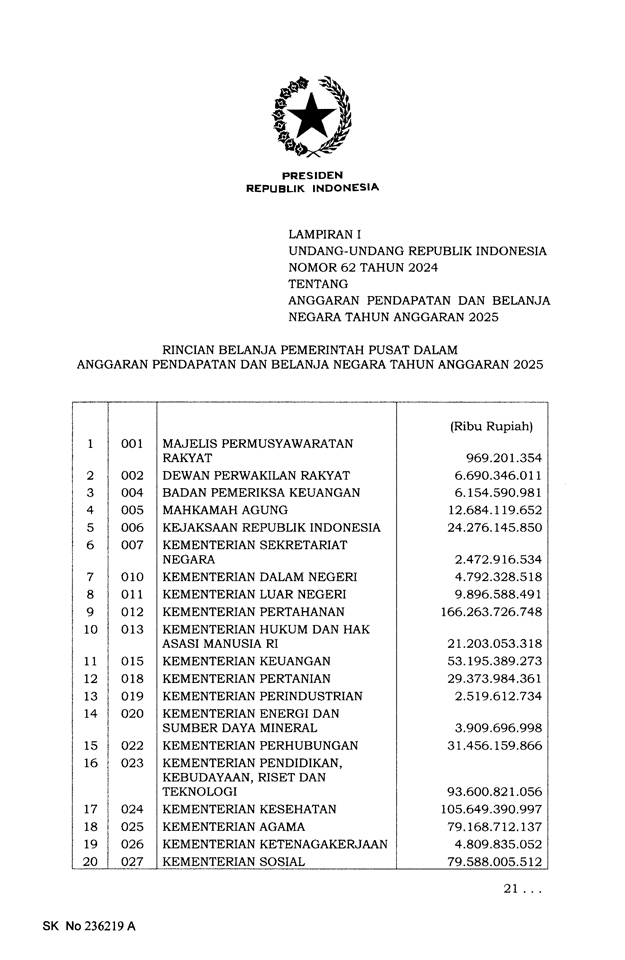
PRESIDEN REPUBLIK INDONESIA LAMPIRAN I UNDANG-UNDANG REPUBLIK INDONESI,A NOMOR 62TAIIVN 2024 TENTANG ANGGARAN PENDAPATAN DAN BELANJA NEGARA TAHUN ANGGARAN 2025 RINCI,AN BELANJA PEMERINTAH PUSAT DALAM ANGGARAN PENDAPATAN DAN BELANJA NEGARA TAHUN ANGGARAN 2025 1 2 3 4 5 6 7 8 9 10 1l L2 13 L4 15 16 t7 18 19 20 ool 015 018 019 o20 o22 023 o24 o25 026 o27 oo2 004 005 oo6 oo7 oro orl ot2 013 MAJELIS PERMUSYAWARATAN RAKYAT DEWAN PERWAKII,AN RAKYAT BADAN PEMERIKSA KEUANGAN MAHKAMAH AGUNG KE.JAKSAAN REPUBLIK INDONESIA KEMENTERIAN SEKRETARIAT NEGARA KEMENTERIAN DALAM NEGEzu KEMENTERIAN LUAR NEGERI KEMENTERIAN PERTAHANAN KEMENTERIAN HUKUM DAN HAK ASASI MANUSIA RI KEMENTERIAN KEUANGAN KEMENTERIAN PERTANIAN KEMENTERIAN PEzuNDUSTRIAN KEMENTERIAN ENERGI DAN SUMBER DAYA MINERAL KEMENTERIAN PERHUBUNGAN KEMENTERIAN PENDIDIKAN, KEBUDAYAAN, RISET DAN TEKNOLOGI KEMENTERIAN KESEHATAN KEMENTERIAN AGAMA KEMENTERIAN KETENAGAKER.IAAN KEMENTERIAN SOSIAL (Ribu Rupiah) 969.20r.354 6.690.346.O11 6.154.590.981 12.684.1t9.652 24.276.r45.850 2.472.9t6.534 4.792.328.514 9.896.s88.491 t66.263.726.744 21.203.053.318 53.195.389.273 29.373.984.36r 2.519.6L2.734 3.909.696.998 31.456.159.866 93.600.821.056 105.649.390.997 79.168.712.137 4.809.835.O52 79.588.OO5.512 21 ... SK No236219A
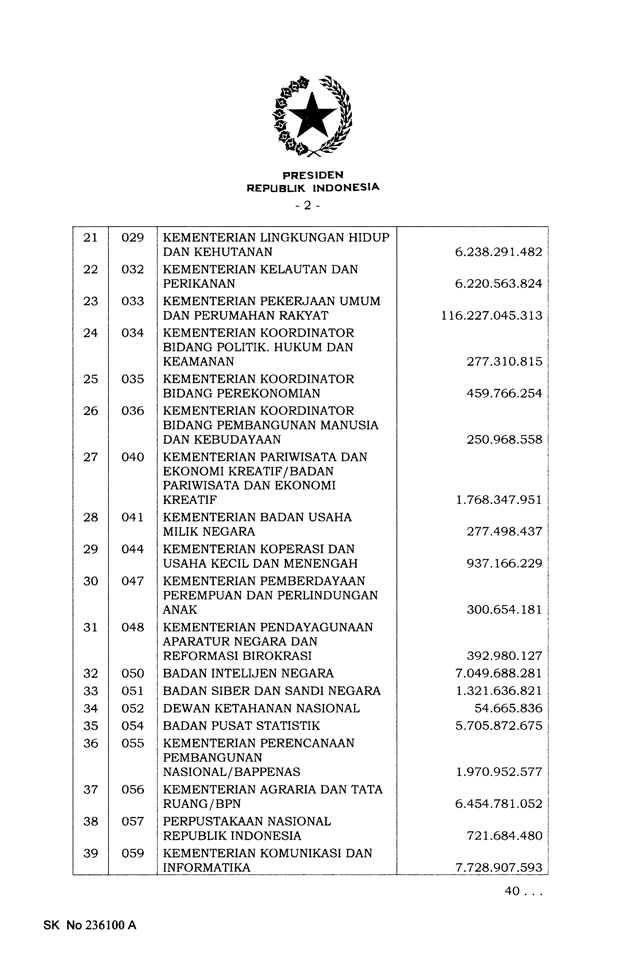
PRESIDEN REPUBLIK INDONESIA -2- 2L 22 23 24 25 26 27 28 29 30 31 32 33 34 35 36 37 38 39 o29 o32 033 034 035 036 040 041 044 o47 048 050 05t 052 054 o55 o56 057 059 KEMENTERIAN LINGKUNGAN HIDUP DAN KEHUTANAN KEMENTEzuAN KELAUTAN DAN PERIKANAN KEMENTERIAN PEKERJAAN UMUM DAN PERUMAHAN RAKYAT KEMENTERIAN KOORDINATOR BIDANG POLITIK. HUKUM DAN KEAMANAN KEMENTERIAN KOORDINATOR BIDANG PEREKONOM1AN KEMENTERI.AN KOORDINATOR BIDANG PEMBANGUNAN MANUSIA DAN KEBUDAYAAN KEMENTERTAN PARIWISATA DAN EKONOMI KREATIF/BADAN PARIWISATA DAN EKONOMI KREATIF KEMENTERIAN BADAN USAHA MILIK NEGARA KEMENTERIAN KOPERASI DAN USAHA KECIL DAN MENENGAH KEMENTERIAN PEMBERDAYAAN PEREMPUAN DAN PERLINDUNGAN ANAK KEMENTERI.AN PENDAYAGUNAAN APARATUR NEGARA DAN REFORMASI BIROKRASI BADAN INTELIJEN NEGARA BADAN SIBER DAN SANDI NEGARA DEWAN KETAHANAN NASIONAL BADAN PUSAT STATISTIK KEMENTERIAN PERENCANAAN PEMBANGUNAN NASIONAL/BAPPENAS KEMENTERIAN AGRARIA DAN TATA RUANG/BPN PERPUSTAKAAN NASIONAL REPUBLIK INDONESIA KEMENTERIAN KOMUNIKASI DAN INFORMATIKA 6.238.29t.442 6.220.563.824 1L6.227.O45.3L3 277.3tO.8t5 459.766.254 250.968.558 t.768.347.95r 277.494.437 937.t66.229 300.654.181 392.9AO.L27 7.O49.648.241 t.32r.636.82r 54.665.836 5.705.472.675 r.970.952.577 6.454.781.O52 721.684.480 7.72A.907.593 SK No236100A 40
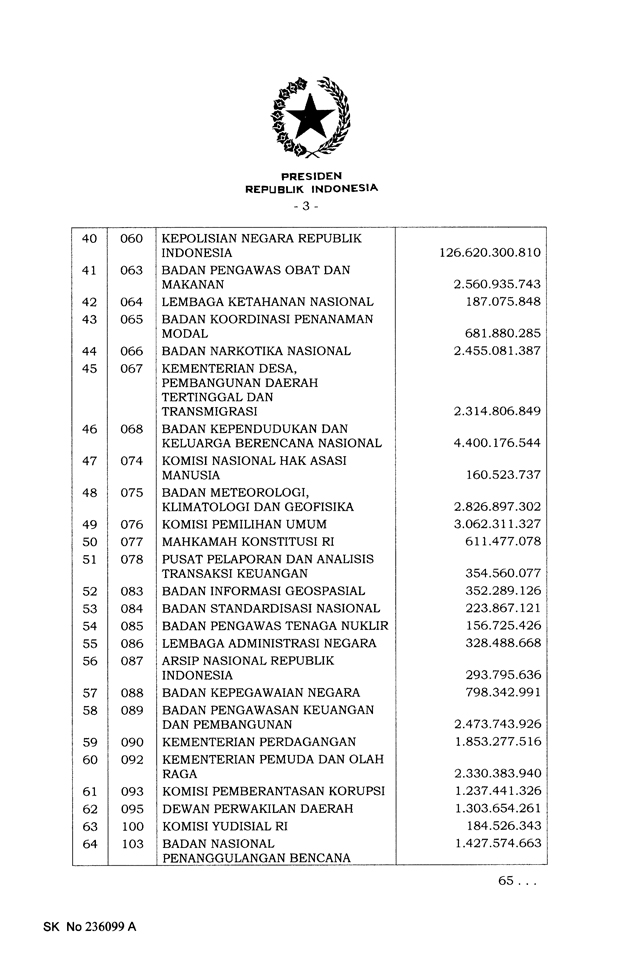
PRESIDEN REPUBLIK INDONESIA -3- 40 4L 42 43 44 45 46 48 47 49 50 5l 52 53 54 55 56 57 58 59 60 61 62 63 64 o60 063 0,64 065 066 o67 068 075 074 076 077 078 088 o89 090 092 093 095 100 103 o83 084 085 086 o87 KEPOLISIAN NEGARA REPUBLIK INDONESIA BADAN PENGAWAS OBAT DAN MAKANAN LEMBAGA KEIAHANAN NASIONAL BADAN KOORDINASI PENANAMAN MODAL BADAN NARKOTIKA NASIONAL KEMENTERIAN DESA, PEMBANGUNAN DAERAH TERTINGGAL DAN TRANSMIGRASI BADAN KEPENDUDUKAN DAN KELUARGA BERENCANA NASIONAL KOMISI NASIONAL HAK ASASI MANUSlA BADAN METEOROI.OGI, KLIMATOLOGI DAN GEOFISIKA KOMISI PEMILIHAN UMUM MAHKAMAH KONSTITUSI RI PUSAT PELAPORAN DAN ANALISIS TRANSAKSI KEUANGAN BADAN INFORMASI GEOSPASIAL BADAN STANDARDISASI NASIONAL BADAN PENGAWAS TENAGA NUKLIR LEMBAGA ADMINISTRASI NEGARA ARSIP NASIONAL REPUBLIK INDONESIA BADAN KEPEGAWAIAN NEGARA BADAN PENGAWASAN KEUANGAN DAN PEMBANGUNAN KEMENTERIAN PERDAGANGAN KEMENTERIAN PEMUDA DAN OL,AH RAGA KOMISI PEMBERANTASAN KORUPSI DEWAN PERWAKII,AN DAERAH KOMISI YUDISIAL RI BADAN NASIONAL PENANGGULANGAN BENCANA 126.620.300.810 2.560.935.743 ra7.o75.a4a 681.880.285 2.455.081.387 2.314.806.849 4.400.176.544 t60.523.737 2.826.897.302 3.062.3tt.327 6t1.477.O78 354.560.O77 352.289.126 223.867.r2r 156.725.426 328.488.668 293.795.636 79A342.99L 2.473.743.926 1.853.277.5t6 2.330.383.940 L.237.441.326 1.303.654.261 184.526.343 7.427.574.663 SK No236099A 65
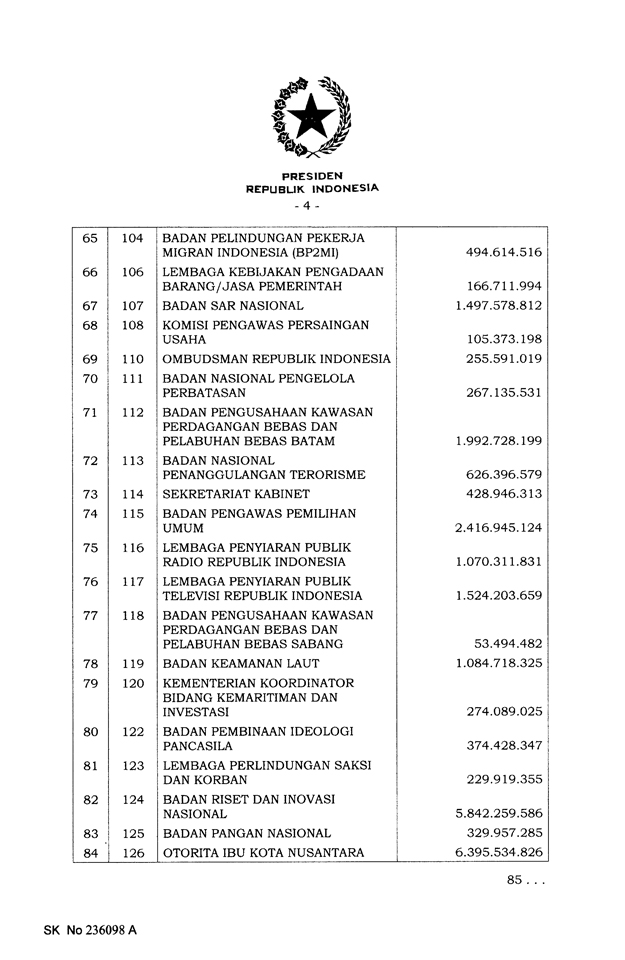
PRESIDEN REPUBLIK INDONESIA -4- 65 66 7L 67 68 69 70 72 73 74 75 76 77 7A 79 80 81 a2 83 a4 104 Lt2 106 t07 108 113 114 115 110 111 116 tt7 118 ll9 120 122 123 124 125 126 BADAN PELINDUNGAN PEKERJA MIGRAN INDONESIA (BP2MD LEMBAGA KEBIJAKAN PENGADAAN BARANG/ JASA PEMERINTAH BADAN SAR NASIONAL KOMISI PENGAWAS PERSAINGAN USAHA OMBUDSMAN REPUBLIK INDONESIA BADAN NASIONAL PENGELOI,A PERBATASAN BADAN PENGUSAHAAN KAWASAN PERDAGANGAN BEBAS DAN PELABUHAN BEBAS BATAM BADAN NASIONAL PENANGGULC,NGAN TERORISME SEKRETARIAT KABINET BADAN PENGAWAS PEMILIHAN UMUM LEMBAGA PET{YIARAN PUBLIK RADIO REPUBLIK INDONESIA LEMBAGA PEI{YIARAN PUBLIK TELEVISI REPUBLIK INDONESIA BADAN PENGUSAHAAN KAWASAN PERDAGANGAN BEBAS DAN PELABUHAN BEBAS SABANG BADAN KEAMANAN I,AUT KEMENTERIAN KOORDINATOR BIDANG KEMARITIMAN DAN II{VESTASI BADAN PEMBINAAN IDEOLOGI PANCASILA LEMBAGA PERLINDUNGAN SAKSI DAN KORBAN BADAN RISET DAN INOVASI NASIONAL BADAN PANGAN NASIONAL OTOzuTA IBU KOTA NUSANTARA 494.6t4.5t6 t66.711.994 1.497.574.4t2 105.373.198 255.591.019 267.135.531 t.992.72A.L99 626.396.579 428.946.313 2.416.945.L24 1.O70.311.831 1.524.203.659 53.494.482 l.O84.718.325 274.OA9.O25 374.424347 229.9t9.355 5.842.259.586 329.957.285 6.395.534.826 85... SK No236098A
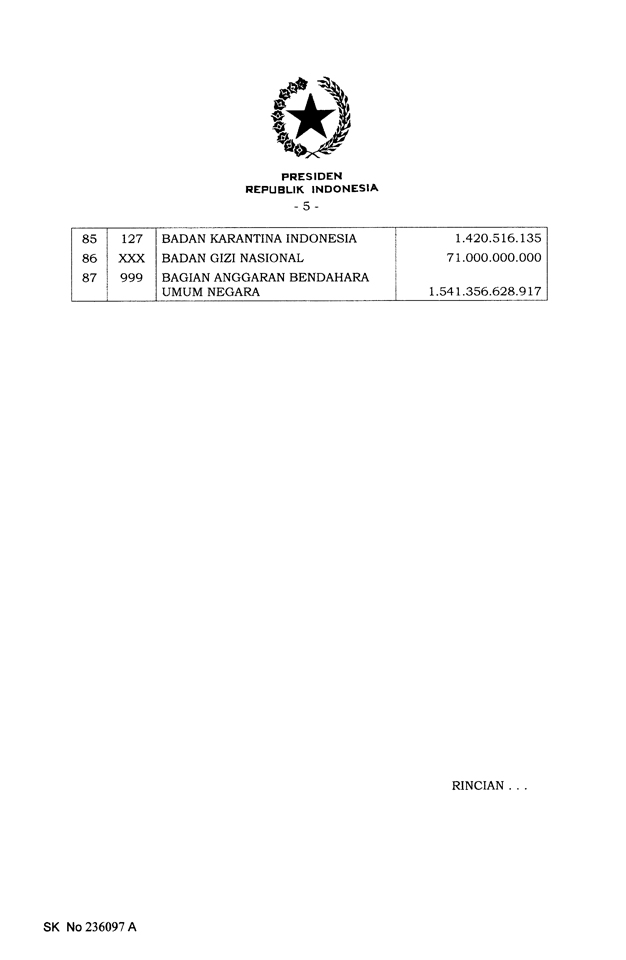
PRESIDEN REPUBLIK INDONESIA -5- 85 86 87 t27 xxx 999 BADAN KARANTINA INDONESIA BADAN GIZI NASIONAL BAGIAN ANGGARAN BENDAHARA UMUM NEGARA 1.420.516.135 71.O00.000.000 1.541.356.628.917 SK No236097A RINCIAN. . .
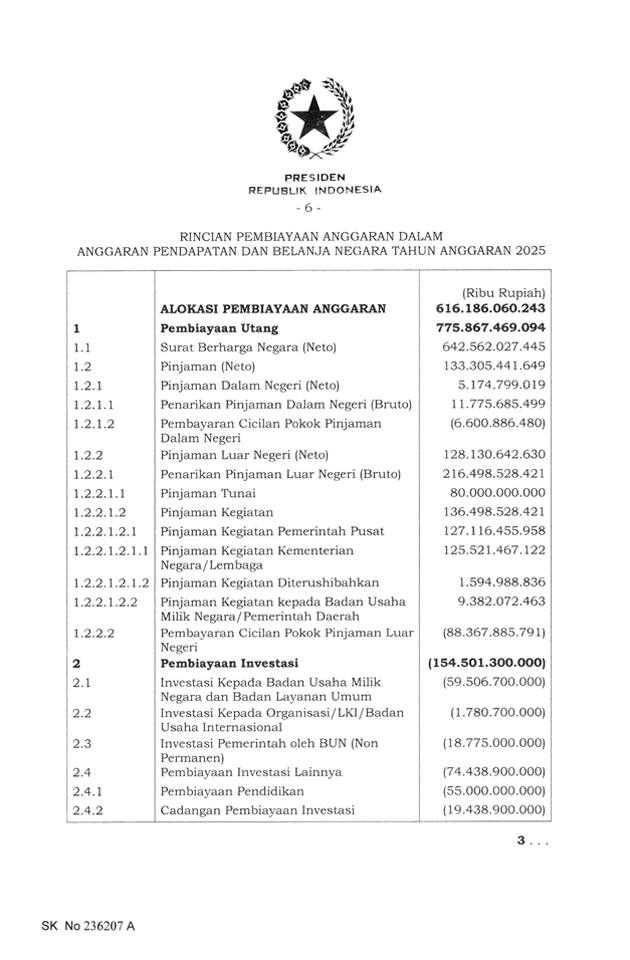
PRESIDEN REPUBLIK INDONESIA -6- RINCIAN PEMBIAYAAN ANGGARAN DALAM ANGGARAN PENDAPATAN DAN BELANJA NEGARA TAHUN ANGGARAN 2A25 3 1 1.1 1.2 L.2 1.2 1,2 1 1 1 1 2 1.2.2 L .2.2.t L.2.2. 1.1 L.2.2.L.2 1.2.2.t.2. L.2.2.1.2. L .2.2.1 .2.1 .2 | .2.2.L .2.2 t.2.2.2 2.2 2.3 2,4 2,4.1 2.4.2 1 1.1 1 2 2 ALOI(ASI PEMBIAYAAN ANGGARAN Pembiayaan Utang Surat Berharga Negara (Neto) Pinjaman (Neto) Pinjaman Dalam Negeri (Neto) Penarikan Pinjaman Dalam Negeri (Bruto) Pembayaran Cicilan Pokok Pinjaman Dalam Negeri Pinjaman Luar Negeri (Neto) Penarikan Pinjaman Luar Negeri (Bruto) Pinjaman T\rnai Pinjaman Kegiatan Pinjaman Kegiatan Pemerintah Pusat Pinjaman Kegiatan Kementerian Negara/Lembaga Pinjaman Kegiatan Diterushibahkan Pinjaman Kegiatan kepada Badan Usaha Milik Negara/ Pemerintah Daerah Pembayaran Cicilan Pokok Pinjaman Luar Negeri Pembiayaan Investasl Investasi Kepada Badan Usaha Milik Negara dan Badan Layanan Umum Investasi Kepada Organisasi I LKI I Badan Usaha Internasional Investasi Pemerintah oleh BUN (Non Permanen) Pembiayaan Investasi Lainnya Pembiayaan Pendidikan Cadangan Pembiayaan Investasi (Ribu Rupiah) 516.186.050,249 775,867.469.0/94 642.562.A27.445 133.305.44 L .649 5.L74.799.019 1t.775.685.499 (6.600.886.480) L28. 130.642.630 2t6.498.528.421 80.000.000.o00 136.498.528.421 127.1 16.455.958 1,25.52L.467 .122 1.594.988.836 9.382.A72.463 (88.367.88s .7eLl ( 154.501.3OO.OOOI (se.s06.7o0.00o) (1.78O.700.000) (18.775.000.000) (74.438.e00.000) (ss.000.000.o00) (19.438.900.0O0) SK No 2362A7 A
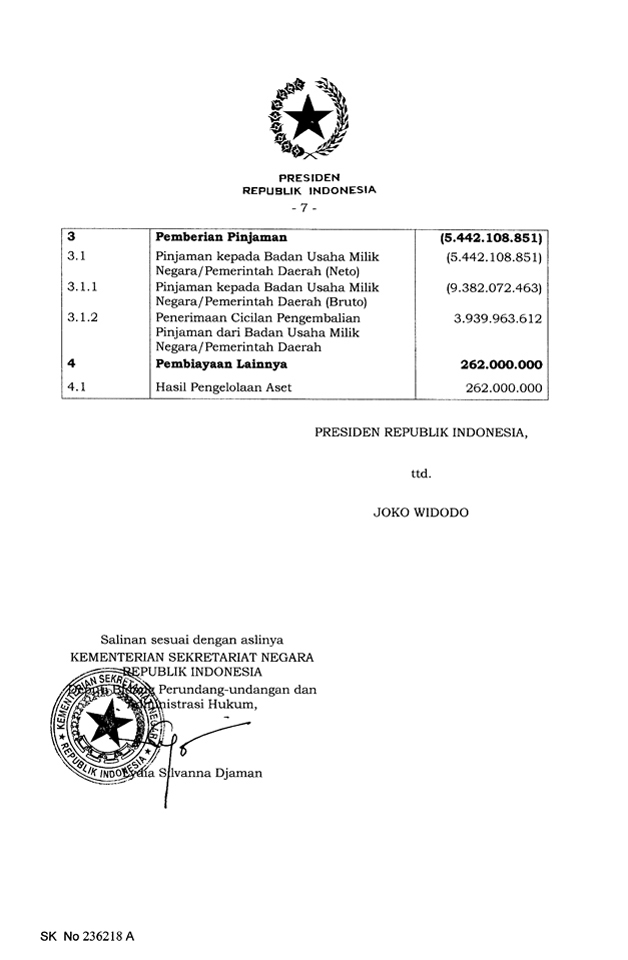
PRESIDEN REPUBLIK INDONESIA -7—1 3 3 3.1.1 3.1.2 4 4 1 Pinjaman kepada Badan Usaha Milik Negara/ Pemerintah Daerah (Neto) Pinjaman kepada Badan Usaha Milik Negara/ Pemerintah Daerah (Bruto) Penerimaan Cicilan Pengembalian Pinjaman dari Badan Usaha Milik Negara/ Pemerintah Daerah Hasil Pengelolaan Aset (5.442.108.85U (s.442.108.8s1) (9.382.O72.4631 3.939.963.612 262.O00.000 a n a PRESIDEN REPUBLIK INDONESIA, JOKO WIDODO ttd Salinan sesuai dengan aslinya KEMENTERIAN SEKRETARIAT NEGARA INDONESIA Perundang-undangan dan Hukum, SK No236218A Djaman
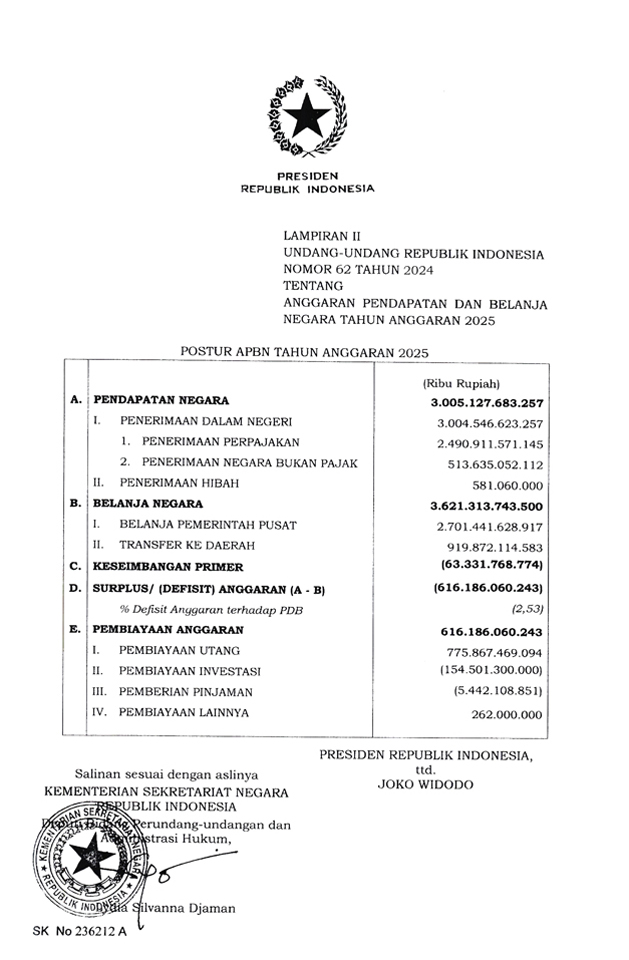
PRESIDEN REPUBLIK INDONESIA LAMPIRAN II UNDANG-UNDANG REPUBLIK INDONESIA NOMOR 62 TAHUN 2024 TENTANG ANGGARAN PENDAPATAN DAN BELANJA NEGARA TAHUN ANGGARAN 2C/25 POSTUR APBN TAHUN ANGGARAN 2025 PRESIDEN REPUBLIK INDONESIA, ttd. JOKO WIDODO Salinan sesuai dengan aslinya KEMENTERIAN SEKRETARIAT NEGARA BLIK INDONESIA rundang-undangan dan trasi Hukum, A B c. D. E. PENDAPATAN NEGARA I. PENERIMAAN DALAM NEGERI 1. PtrNERIMAAN PERPAJAKAN 2, PBNEzuMAAN NEGARA BUI(AN PAJAK II. PENERIMAAN HIBAH BTLANJA NEGARA I. BELANJA PEMBRINTAH PUSAT II. TRANSFER KE DAERAH I(ESEIMBANGAI{ PRIMER SURPLUS/ (DEHSTTI ANGGARATTI (A—Bl % Defi.sit Anggaran terhadap PDB PEMB IAYAAIT AIVGGARAIT I. PEMBIAYAAN UTANG II. PEMBIAYAAN INVESTASI III. PEMBERIAN PINJAMAN IV. PEMBIAYAAN LAINNYA (Ribu Rupiah) 3.OO5.127.68,3.267 3.004.546.623.257 2.490.91 1.571.145 513.635 .O52.112 581.060.000 3.621.313.743,500 2.70L.44r.628.9t7 919.872. 1 14.583 [63.331.768..7741 (616.196.060.2431 (2,53) 616.196.060.243 775.867.469.O94 (154.s01.3OO.OO0) (s.442. 108.8s 1) 262.AOO.OOO SK No 236212 A anna Djaman a
EXHIBIT 99.D
DESCRIPTION OF THE REPUBLIC OF INDONESIA DATED JULY 25, 2025
TABLE OF CONTENTS
| Page | ||||
| CERTAIN DEFINED TERMS AND CONVENTIONS |
D-2 | |||
| PRESENTATION OF INFORMATION |
D-3 | |||
| FORWARD-LOOKING STATEMENTS |
D-4 | |||
| DATA DISSEMINATION |
D-5 | |||
| REPUBLIC OF INDONESIA |
D-6 | |||
| Overview |
D-6 | |||
| Land and People |
D-7 | |||
| Government and Political Developments |
D-10 | |||
| Foreign Relations and International and Regional Organizations |
D-13 | |||
| Economy and Gross Domestic Product |
D-17 | |||
| Privatization and Management of State-Owned Enterprises |
D-32 | |||
| Labor and Employment |
D-35 | |||
| Infrastructure Development |
D-39 | |||
| Foreign Investment |
D-43 | |||
| Foreign Trade and Balance of Payments |
D-52 | |||
| Financial System |
D-65 | |||
| Monetary Policy |
D-73 | |||
| Government Budget |
D-81 | |||
| Public Debt |
D-96 | |||
| Foreign Exchange and Reserves |
D-103 | |||
| Debt-to-GDP Ratios |
D-106 | |||
| DEBT TABLES OF THE REPUBLIC OF INDONESIA |
D-107 | |||
D-1
CERTAIN DEFINED TERMS AND CONVENTIONS
Unless otherwise indicated, all references in this report to “Rupiah”, “IDR” or “Rp” are to the currency of Indonesia, those to “dollars”, “U.S. dollars” or “U.S.$” are to the currency of the United States of America, those to “Euro” or “€” are to the currency of the European Union, those to “SDR” are to Special Drawing Rights of the International Monetary Fund (“IMF”) and those to “ID” are to Islamic Dinars of the Islamic Development Bank. References to “Indonesia” or the “Republic” are to the Republic of Indonesia, references to the “Government” are to the Government of Indonesia and references to “BI” are to Bank Indonesia.
In addition, unless otherwise indicated, all references in this report to (i) “tons” are to metric tons, each of which is equal to 1,000 kilograms or approximately 2,204.6 pounds, (ii) “barrels” are to U.S. barrels, each of which is equal to 159.0 liters, (iii) “LNG” are to liquefied natural gas and (iv) “LPG” are to liquefied petroleum gas. Measures of distance referred to herein are stated in kilometers or “km” each of which is equal to 1,000 meters or approximately 0.62 miles. Measures of area referred to herein are stated in square kilometers, each of which is equal to approximately 0.39 square miles, or in hectares, each of which is equal to approximately 2.47 acres.
The Ministry of Energy and Mineral Resources publishes an average monthly and annual price for Indonesian crude oil which is commonly referred to as the Indonesian Crude Price (the “ICP”). According to the Minister of Energy and Mineral Resources Regulation No. 29 of 2021 on the Procedure for Determination of Methodology, Price Formula, and Indonesian Crude Price, the determination of ICP can be based on 3 methods, namely benchmarking method, indexation method, and auction method. The Government evaluates the methodology of the calculation of the ICP from time to time and, if appropriate, adjusts the formula to ensure that the ICP closely tracks world market prices for Indonesian crude oil. The Government uses the ICP for various accounting and other purposes. For instance, the Ministry of Finance uses the ICP as an assumption underlying the preparation of the Government budget. See “Republic of Indonesia — Government Budget.”
Statistical information included in this report is the latest official data publicly available at the date hereof. Financial data provided in this report may be subsequently revised in accordance with Indonesia’s ongoing maintenance of its economic data. The Republic has no obligation to distribute such revised data to any holder of debt securities.
In August 2014, the Republic revised its methodology in compiling balance of payments data, using the sixth edition of Balance of Payments and International Investment Position Manual (“BPM6”). This revised methodology was implemented to comply with international best practices. Indonesia’s balance of payments statistics generally follows the concepts and definitions outlined in BPM6 and, in particular, current accounts, and capital and financial accounts of the balance of payment statements are defined generally in accordance with BPM6.
In this report, gross domestic product (“GDP”) is shown in both current and constant market prices. GDP at current market prices value a country’s output using the actual prices for each year, while GDP at constant market prices (also referred to as “real” GDP) value output using the prices from a base year, thereby eliminating the distorting effects of inflation and deflation. In 2015, Statistics Indonesia (Badan Pusat Statistik (“BPS”)) adopted the calendar year 2010 as the base year (the “Base Year”) for the calculation of Indonesia’s GDP in constant market prices. Unless stated otherwise, all GDP growth rates in this report (in aggregate or by sector) are period-on-period comparisons based on constant market prices using the Base Year. Percentage shares of Indonesia’s GDP represented by various sectors (unless otherwise noted) use current market prices.
D-2
PRESENTATION OF INFORMATION
For ease of presentation, certain financial information relating to the Republic included herein is presented as translated into U.S. dollars. Unless otherwise specified herein, all translations of Rupiah into U.S. dollars or from U.S. dollars into Rupiah were made at the middle exchange rate, the mid- point between the buy and sell rates (the “BI middle exchange rate”), between the Rupiah and the U.S. dollar, as announced by Bank Indonesia, the Indonesian Central Bank, as of the respective dates to which such information relates. However, these translations should not be construed as a representation that the Rupiah amount actually represents such U.S. dollar amount or could be converted into U.S. dollars at the rate indicated or any other rate. In addition, unless otherwise specified herein, all translations of Rupiah into currencies other than U.S. dollars, or from such other currencies into Rupiah, were made at the BI middle exchange rate between the Rupiah and such other currencies as announced by Bank Indonesia as of the respective dates to which such information relates.
The following table sets forth information on exchange rates between the Rupiah and the U.S. dollar for and as of the end of the periods indicated.
Exchange Rates
| Rupiah per U.S. dollar |
||||||||
| End of period |
Period average |
|||||||
| 2020 |
14,050 | 14,525 | ||||||
| 2021 |
14,253 | 14,296 | ||||||
| 2022 |
15,568 | 14,873 | ||||||
| 2023 |
15,397 | 15,247 | ||||||
| 2024 |
16,095 | 15,841 | ||||||
| January 2025 |
16,300 | 16,256 | ||||||
| February 2025 |
16,580 | 16,342 | ||||||
| March 2025 |
16,560 | 16,444 | ||||||
| April 2025 |
16,600 | 16,813 | ||||||
| May 2025 |
16,290 | 16,409 | ||||||
| June 2025 |
16,235 | 16,297 | ||||||
| July 2025 (through July 23, 2025) |
16,290 | 16,248 | ||||||
Source: Bank Indonesia
Statistical Data
Unless otherwise indicated, all statistical data and figures for 2024 and 2025 or any part thereof are estimates based upon preliminary data and are subject to review and adjustment.
Certain budget figures appear as audited numbers in the relevant year’s Central Government Financial Report (Laporan Keuangan Pemerintah Pusat (“LKPP”)).
Certain statistical or financial information included in this report may differ from previously published information for a number of reasons, including basis of presentation and ongoing statistical revisions. Also, certain monetary amounts included in this report have been subject to rounding adjustments. Accordingly, figures shown as totals in certain tables may not be an exact arithmetic aggregation of the figures that precede them.
D-3
FORWARD-LOOKING STATEMENTS
Forward-looking statements are statements that are not about historical facts, including statements about Indonesia’s beliefs and expectations. These statements are based on current plans, estimates and projections, and therefore, you should not place undue reliance on them. Forward-looking statements speak only as of the date they are made. Some of the statements contained in this report under “Republic of Indonesia” are forward looking. They include statements concerning, among others:
| • | the Republic’s economic, business and political conditions and prospects; |
| • | the Republic’s financial stability; |
| • | the depreciation or appreciation of the Rupiah; |
| • | changes in interest rates and inflation; and |
| • | governmental, statutory, regulatory or administrative initiatives. |
The Republic undertakes no obligation to update publicly any of these statements in light of new information or future events, including changes in Indonesia’s economic policy or budgeted expenditures, or to reflect the occurrence of unanticipated events.
Forward-looking statements involve inherent risks and uncertainties. The Republic cautions you that a number of important factors could cause actual results to differ materially from those expressed in any forward-looking statement. These factors include, but are not limited to:
| • | adverse external factors, such as high international interest rates and recession or low growth in the Republic’s trading partners. High international interest rates could increase the Republic’s current account deficit and budgetary expenditures. Recession or low growth in, or trade policies of, the Republic’s trading partners could lead to fewer exports from the Republic and, indirectly, lower growth in the Republic; |
| • | instability or volatility in the international financial markets. This could lead to domestic volatility, making it more difficult for the Government to achieve its macroeconomic goals. This could also lead to declines in foreign direct and portfolio investment inflows; |
| • | adverse domestic factors, such as a decline in domestic savings and investment, increases in domestic inflation, high domestic interest rates and exchange rate volatility. Each of these factors could lead to lower growth or lower international reserves; and |
| • | other adverse factors, such as adverse commodity price movements, climatic or seismic events, international or domestic hostilities, infectious disease outbreaks or pandemics, political uncertainty and delays in implementing and realizing infrastructure projects and economic policies. |
D-4
DATA DISSEMINATION
The Republic subscribes to the IMF’s Special Data Dissemination Standard, which is designed to improve the timeliness and quality of information of subscribing member countries. This standard requires subscribing member countries to provide schedules, referred to as the “Advance Release Calendar”, indicating, in advance, the date on which data will be released. For Indonesia, precise dates or “no-later-than-dates” for the release of data are disseminated three months in advance through the Advance Release Calendar, which is published on the Internet under the IMF’s Dissemination Standards Bulletin Board. Summary methodologies of all metadata to enhance transparency of statistical compilation are also provided on the Internet under the IMF’s Dissemination Standards Bulletin Board. The internet website for Indonesia’s Advance Release Calendar and metadata is located at https://dsbb.imf.org/sdds/country/IDN/advance-release-calendar-base. Neither the Republic nor any agents or underwriters acting on behalf of the Republic in connection with any offer and sale of securities of the Republic accept any responsibility for information included on that website, and its contents are not intended to be incorporated by reference into this report.
D-5
REPUBLIC OF INDONESIA
Overview
Indonesia is the world’s fourth most populous country, with a population of approximately 281.6 million in 2024. It is a developing nation in Southeast Asia, spread across an archipelago of approximately 16,766 islands.
The following table sets forth certain of the Republic’s principal economic indicators as of and for the specified dates and periods.
Selected Key Economic Indicators
| Year Ended December 31, | Three Months Ended March 31, |
|||||||||||||||||||||||
| 2020L | 2021L | 2022L | 2023L | 2024P | 2025P | |||||||||||||||||||
| National account and prices: |
||||||||||||||||||||||||
| Real GDP growth (period-on-period) |
(2.1 | )% | 3.7 | % | 5.3 | % | 5.1 | % | 5.0 | % | 4.9 | % | ||||||||||||
| Per capita GDP (in millions of Rupiah) |
56.9 | 62.2 | 71.0 | 75.0 | 78.6 | N/A | ||||||||||||||||||
| Per capita GDP (in U.S. dollars)(1) |
3,912 | 4,350 | 4,784 | 4,856 | 4,960 | N/A | ||||||||||||||||||
| Inflation rate (year-on-year change in CPI) |
1.7 | % | 1.9 | % | 5.5 | % | 2.6 | % | 1.6 | % | 1.9 | %(2) | ||||||||||||
| External sector: |
||||||||||||||||||||||||
| Current account (% of GDP) |
(0.4 | )% | 0.3 | % | 1.0 | % | (0.1 | )% | 0.6 | % | (0.1 | )% | ||||||||||||
| Fiscal account: |
||||||||||||||||||||||||
| Budget (deficit) / surplus (% of GDP) |
(6.1 | )% | (4.6 | )% | (2.4 | )% | (1.6 | )% | (2.3 | )% | (0.4 | )% | ||||||||||||
| External debt of the central Government (in trillions of Rupiah) |
2,041.0 | 2,077.8 | 2,302.7 | 2,346.0 | 2,525.1 | 2,656.5 | ||||||||||||||||||
| Debt service ratio (% of Government revenue) |
47.3 | % | 45.0 | % | 34.5 | % | 38.5 | % | 42.9 | % | 53.9 | % | ||||||||||||
Sources: Statistics Indonesia (Badan Pusat Statistik (“BPS”)), BI and Ministry of Finance
| L | LKPP (Financial Report of Central Government/Audited). |
| P | Preliminary. |
| N/A | Not available. |
| (1) | Per capita GDP in U.S. dollars has been converted from Rupiah into U.S. dollars and the U.S. dollar amounts of external debt of the central Government have been converted into Rupiah at the following exchange rates per U.S. dollar: Rp14,556 per U.S. dollar for 2020, Rp14,309 per U.S. dollar for 2021, Rp14,848 per U.S. dollar for 2022, Rp15,439 per U.S. dollar for 2023 and Rp15,849 per U.S. dollar for 2024. These exchange rates are calculated by BPS with reference to the weighted average monthly exchange rates applicable to export and import transactions for each month in a given period. |
| (2) | As of June 2025. |
D-6
Land and People
Area
Situated between Malaysia, Singapore and the Philippines to the north and Australia to the south, the Republic of Indonesia covers a total land area of approximately 1,916,907 square km, comprising approximately 16,766 islands (the majority of which are uninhabited) and forming part of the world’s largest archipelago.
The main islands of Indonesia are Sumatera, Java, Bali, Kalimantan (also known as Borneo, the northern part of which belongs to Malaysia and Brunei), Sulawesi and Papua (the eastern part of which belongs to Papua New Guinea). Indonesia extends 5,120 km across the equator from Nanggroe Aceh Darussalam, or Aceh, in the west to Papua in the east. Jakarta, Indonesia’s capital and largest city, is located on the northern coast of the western part of Java.
Volcanic and Other Natural Disasters
Indonesia is located in one of the most volcanically and seismically active regions in the world. Because it is located in the convergence zone of three major lithospheric plates, it is subject to significant seismic activity that can lead to destructive volcanic eruptions, earthquakes and tsunamis, or tidal waves, including the 2004 earthquake and subsequent Indian Ocean tsunami that devastated the Province of Aceh and the 2018 earthquake and subsequent tsunami that caused substantial loss of life and extensive infrastructure and property damage in Central Sulawesi. In addition to these geological events, Indonesia has also been struck by other natural disasters such as heavy rains and flooding. The central Government’s realization of contingency fund for financing post-natural disaster relief efforts was Rp3.0 trillion in 2020, Rp4.5 trillion in 2021, Rp2.5 trillion in 2022, Rp4.3 trillion in 2023 and Rp5.3 trillion in 2024. All of these natural disasters have resulted in loss of life, displacement of people and destruction of property, and could have significant economic and developmental effects.
Environment
Environmental problems confronting Indonesia include:
| • | deforestation; |
| • | scarcity and quality of the water supply; |
| • | land subsidence; |
| • | soil erosion; |
| • | air pollution; |
| • | inadequate waste management in urban centers; and |
| • | land and forest fires. |
Indonesia is also vulnerable to the impact of global climate change such as prolonged droughts, increased frequency of extreme weather events and heavy rainfall resulting in floods, that will, in turn, impact the production and distribution of food, water, and energy in various provinces or regencies across Indonesia. Therefore, Indonesia considers climate change mitigation and adaptation efforts as an integrated concept that is essential for building resilience in safeguarding food, water and energy resources. Indonesia has adopted the National Action Plan on Climate Change Adaptation, which provides a national framework for adaptation initiatives that has been mainstreamed into the National Development Plan. The medium-term goal of Indonesia’s climate change adaptation strategy is to reduce risks on all development sectors (agriculture, water, energy security, forestry, maritime and fisheries, health, public service, infrastructure, and urban system) by 2030 through local capacity strengthening, improved knowledge management, convergent policy on climate change adaptation and disaster risks reduction, and application of adaptive technology.
In recent years, the Government has implemented various measures to address haze and other adverse effects caused by forest and field fires related to land clearance for agriculture in the islands of Sumatera and Kalimantan. The Government seeks to address these and other environmental concerns through greater supervision and regulation, and community and private sector awareness and involvement.
In 2009, then President Susilo Bambang Yudhoyono announced an emissions target that became the basis for Indonesia’s national climate change policy in 2015: a 26.0% reduction in greenhouse gas (“GHG”) emissions below business-as-usual by 2020 and up to 41.0% reduction by 2020 with international assistance. The Republic ratified the Paris Agreement on October 31, 2016, and published its nationally determined contribution (“NDC”) in November 2016, committing to a 29.0% reduction in GHG by 2030 and the same 41.0% conditional target by 2030. The Republic updated the NDC in September 2022, improving the targets to a 31.9% reduction in GHG and 43.2% conditional target with international support by 2030, in line with the Republic’s pledge made at the 26th United Nations Climate Change Conference to achieve net zero GHG emissions by 2060. The NDC, as updated, is consistent with Indonesia’s nationally determined contribution target as set out in Presidential Regulation No. 98 of 2021 on the Implementation of Carbon Economic Value to Achieve Nationally Determined Contribution Target and Control over Greenhouse Gas Emission Pertaining to National Development.
D-7
The Government is making efforts, including multilateral cooperation, to achieve these climate targets. At the G20 meeting in Bali in November 2022, Indonesia and a number of developed economies including Canada, Denmark, the European Union, France, Germany, Italy, Japan, Norway, the United Kingdom and the United States issued a joint statement to launch a Just Energy Transition Partnership (“JETP”), pursuant to which the developed economies committed to provide, mobilize and facilitate funding in the form of grants, low interest loans, and investment, with U.S.$10 billion expected to come from public sectors and U.S.$10 billion from private investment, to support Indonesia’s transition to clean energy. In November 2023, Indonesia released for public consultation a draft of the investment roadmap to mobilize the U.S.$20 billion committed under JETP and accelerate the country’s transition toward clean energy. Under the roadmap, known as the Comprehensive Investment and Policy Plan (“CIPP”), Indonesia is seeking to cut CO2 emissions from its on-grid power sector by 250 million tons by 2030 and to increase the portion of renewable energy in its power mix to 44% by 2030. CIPP outlines the need for U.S.$97.1 billion of further investment beyond the U.S.$20 billion committed under JETP, including U.S.$66.9 billion for 400 clean energy project proposals to be started by 2030 at the latest.
As part of its efforts to achieve the climate goals, the Government launched an emissions trading system for the power generation sector in February 2023. The trading system initially covered 99 coal-fired power plants, accounting for 81.4% of Indonesia’s national power generation capacity. These power plants are subject to Government-established emissions intensity targets, which determine the number of allowances allocated to each plant for every megawatt-hour (MWh) of electricity produced. In September 2023, the Government also launched a carbon exchange, the Indonesia Carbon Exchange, or the IDX Carbon, operated by the Indonesia Stock Exchange. The IDX Carbon is designed to facilitate emissions trading and serve as a platform for future environmental commodities. In addition, the Government is working on implementing carbon tax, with its legal basis established under Law No. 7 of 2021 on the Harmonization of Tax Regulations. Revenue generated from carbon tax will be allocated to finance climate mitigation and adaptation projects, support investment in clean technology and energy efficiency, and strengthen social safety nets for vulnerable communities. Entities will be able to use carbon units obtained through the emissions trading system or offset mechanisms to reduce their carbon tax liability. The carbon tax is expected to be imposed initially on coal-fired power plants, with a gradual expansion to other sectors in subsequent phases.
On March 17, 2025, the Coordinating Minister for Economic Affairs established an energy transition and green economy task force comprising 18 ministries to lead Indonesia’s cross-sectoral efforts to implement a just, inclusive, and measurable green transition, in line with the 2025–2029 National Medium-Term Development Plan and Indonesia’s commitments made during the G20 Leaders’ Summit. The Government has authorized the task force to develop roadmaps, evaluate existing regulations, and propose new policy instruments to accelerate renewable energy adoption, clean industrial technologies, and decarbonization pathways.
The Republic anticipates that its pursuit of these targets, in conjunction with the ongoing global transition towards sustainable energy and the climate commitments made by governments and the private sector, will, over time, lead to declines in demand for conventional sources of energy such as coal, oil, gas, and timber in the future. These anticipated declines are likely to result in lower export and domestic consumption, presenting challenges to the Republic’s sectors centered on these natural resources. The Government is proactively addressing these challenges by seeking to diversify the national economy and investing in sustainable energy sources through initiatives such as the following:
| • | Investment in emerging sectors. The Republic is channeling investments into renewable energy sectors such as solar, wind and geothermal energy. For example, following the Government mandate stipulated in Indonesia’s Law 3/2022 (as amended by Law No. 21 of 2023) (as defined herein) and Presidential Regulation 63/2022, Nusantara must be powered by 100% renewable electricity and achieve net zero by 2045. The cultivation of these renewable energy industries is anticipated to yield economic benefits and stimulate job creation. |
| • | Developing value-added industries. The Republic has implemented policies to develop downstream manufacturing and refining industries that add value to the raw materials before export. This approach increases export value, creates jobs and stimulates domestic industrial growth. See “Economy and Gross Domestic Product — Principal Sectors of the Economy — Manufacturing Industry” for further information. |
| • | Expanding market access. The Republic is pursuing trade agreements and strengthening trade partnerships to open new market opportunities for export, including export of products other than natural resources. The Republic is currently carrying out negotiations on several bilateral preferential or free trade agreements, such as the Indonesia-EU Comprehensive Economic Partnership Agreement. See “Foreign Trade and Balance of Payments — Membership in International and Regional Free Trade Agreements” for more information. |
| • | Infrastructure improvements. Infrastructure development aims to enhance connectivity between different geographies, elevate economic productivity, drive urbanization, facilitate the movement of labor, foster equitable regional development and boost foreign and domestic investment. These goals, if achieved, will lay a solid foundation for Indonesia’s economic diversification. |
These efforts are expected to help reduce the Republic’s reliance on a narrow spectrum of commodities and better grow its economy, while steadfastly advancing towards its climate objectives.
D-8
The Law on Job Creation (as defined in “— Labor and Employment — Law on Job Creation”) substantially revamped Indonesia’s environmental law that was enacted in 2009 by virtue of Law No. 32 of 2009 on Environmental Protection and Management (as so amended, the “Environmental Law”). The Environmental Law is based on the concepts of sustainable development, prevention, precaution and a “polluter pays” principle and introduced environmental documentation and licensing requirements. Under the Environmental Law, all business activities must have an environmental document, either in the form of an environmental impact planning document (Analisis Mengenai Dampak Lingkungan (“AMDAL”)), an environmental management/monitoring efforts report (Upaya Pengelolaan Lingkungan Hidup dan Upaya Pemantauan Lingkungan Hidup (“UKL-UPL”)), or a written statement on readiness to manage and monitor the environment (Surat Pernyataan Pengelolaan Lingkungan Hidup (“SPPL”)). An AMDAL is a comprehensive study of the potentially significant environmental impacts of a proposed business. A UKL-UPL covers the monitoring and management efforts undertaken by businesses that are unlikely to have a significant impact on the environment. An SPPL is typically required by services providers. These documents must be obtained before the business can apply for a business license. The Law on Job Creation simplified such environmental licensing policy by, among other things, integrating the environmental license into the business license (perizinan berusaha) which is now administered through the Online Single Submission (“OSS”) system. The OSS system is an electronic licensing platform managed by the OSS Body, which is part of the Indonesia Investment Coordinating Board (Badan Koordinasi Penanaman Modal).
The Ministry of Environment and Forestry received a budget for 2020 of Rp6,779.6 billion, or approximately U.S.$480.7 million, for 2021 of Rp7,957.1 billion, or approximately U.S.$509.4 million, for 2022 of Rp7,120.4 billion, or approximately U.S.$496.2 million, for 2023 of Rp7,516.0 billion, or approximately U.S.$507.8 million, for 2024 of Rp7,715.1 billion, or approximately U.S.$514.3 million. Under the new administration of President Prabowo Subianto, the Ministry of Environment and Forestry has been restructured into two distinct ministries: the Ministry of Environment and the Ministry of Forestry. Their allocated budgets for 2025 are Rp1,079.8 billion, or approximately U.S.$67.1 million, and Rp5,158.5 billion, or approximately U.S.$320.5 million, respectively.
The budgets are focused on improving water quality, air quality, forest and land rehabilitation, mangrove rehabilitation, hazardous material and hazardous waste management, conservation forest management, domestic waste management, and environmental law enforcement.
In recent years, Jakarta has been plagued by frequent floods amid peaks in the rainy season given inadequate infrastructure and water management, resulting in the temporary relocation of tens of thousands of residents. Jakarta is also experiencing land subsidence issues primarily due to deep groundwater extraction combined with demand pressure from high-rise buildings in Jakarta. To address this, the Ministry of Public Works and Housing introduced a National Capital Integrated Coastal Development master plan, under which a giant seawall is proposed to be constructed in the north of Jakarta Bay in an effort to protect Jakarta from floods, and large lagoons will be built within the seawall to accommodate the water flow from 13 rivers in Jakarta. The project is under construction and has a target completion date of 2030, which was extended from the initial target of 2025 due to unforeseen complexities such as the protracted land acquisition process.
In addition, the Ministry of Public Works and Housing is collaborating with the Ministry of Environment and Forestry on an environmental program to build regional domestic waste infrastructure and domestic wastewater treatment in order to improve environmental quality.
Energy Security
To enhance energy security, promote economic self-sufficiency, and support sustainable development, the Government is accelerating the development of biodiesel. Beginning in 2025, the Government started to implement its B40 biodiesel mandate, which requires a 40% blend of palm oil-based fuel with 60% diesel. The target is to increase this blend to 50% by 2027. To facilitate the implementation of biodiesel, the Government is providing financial support, including a projected annual biodiesel incentive of Rp35.8 trillion and projected annual biodiesel subsidy and compensation of Rp51.4 trillion from 2025 to 2029.
In addition, the Government is encouraging private sector participation in the development of the upstream electricity ecosystem, which encompasses electricity generation and transmission. This sector has traditionally been dominated by SOEs, but the Government believes that greater private sector involvement is key to satisfy the country’s electrification investment needs. The Government has set a target for renewable energy to account for 19% of Indonesia’s power generation by 2029 and 23% by 2034. To achieve these goals, the required investments are estimated at Rp1,410 trillion by 2029 and Rp2,820 trillion by 2034.
Population
Indonesia had a population of approximately 281.6 million in 2024 and is the fourth most populous country in the world, after India, China and the United States. The population is primarily concentrated in Java (estimated at approximately 156.9 million in 2023). In 2024, Jakarta, the capital, was estimated to have a population of approximately 11.4 million.
Indonesia’s population is young and growing. In 2024, the Government estimated that approximately 23.7% of the population was under 15 years of age, approximately 69.1% was 15 to 64 years of age, and approximately 7.3% was 65 years of age or above. The annual population growth rate during the period of 2020 to 2024 was 1.1% per annum.
D-9
Indonesia’s population is predominantly Muslim, with a significant Christian minority and the remaining consists of Hindus, Buddhists and followers of other religions. Indonesia’s population is primarily of Malay descent, but consists of more than 300 ethnic groups, including the Acehnese, Batak and Minangkabau in Sumatera; the Javanese and Sundanese in Java; the Madurese in Madura; the Balinese in Bali; the Sasak in Lombok; the Minahasan, Makassarese, Toraja and Bugis in Sulawesi; the Dayak in Kalimantan; and the Dani and Asmat in Papua. The country’s population also includes people of Chinese, Arab, Eurasian, Indian and Pakistani backgrounds.
The national language is Bahasa Indonesia, which is based on the Malay language. English is widely used and taught in most secondary schools.
In total, approximately 500 languages and dialects are spoken throughout Indonesia.
Government and Political Developments
Political History and Development of Political Parties
From 1605 until its independence in 1945, Indonesia was under almost continuous Dutch colonial rule. The period of Dutch administration was interrupted by a short period of British colonial rule in the 19th century and ended by the Japanese occupation for three years before Indonesia proclaimed its independence on August 17, 1945. In the same year, Indonesia adopted its Constitution. In 1967, the executive power was transferred from President Soekarno to General Soeharto who served as Indonesia’s President until 1998, when he resigned in the aftermath of social unrest that followed the 1997 Asian financial crisis.
The post-Soeharto era, which is known in Indonesia as the Reformasi, led to changes in various governmental institutions and structural reforms of the judiciary, legislature, and executive office. Between 1999 and 2002, the Constitution was amended to strengthen constitutional checks-and-balances and the separation of powers and provide for a more direct democracy.
While Indonesia has successfully conducted elections in the past, the country continues to face various socio- political issues and has, from time to time, experienced political instability and social and civil unrest. Since 2000, demonstrations have taken place in Jakarta and other Indonesian cities both for and against former President Megawati and subsequent administrations, as well as in response to specific issues, including the introduction of new bills, laws and/or policies by the Government, reductions in fuel or electricity subsidies, privatization of state assets, anticorruption measures, decentralization and provincial autonomy, actions of former Government officials and their family members, and geopolitical events. Despite a few demonstrations that turned disruptive, Indonesia has gone through several major elections that were generally peaceful and led to successful transition.
2024 Indonesian General Elections
The 2024 general election was held on February 14, 2024 to elect the president, the vice president, members of the House of Representatives (Dewan Perwakilan Rakyat (“DPR”)), members of the Regional Representatives’ Council (Dewan Perwakilan Daerah (“DPD”)), and members of local legislative bodies at the province and regency levels.
On March 20, 2024, the general election commission confirmed the election of Prabowo Subianto and Gibran Rakabuming Raka to serve as president and vice president, respectively, until 2029. Members of the DPR, DPD and local legislative bodies were sworn in on October 1, 2024, and the president and the vice president were sworn in on October 20, 2024.
Central Government
The Government is based on the Constitution, under which the Republic is structured as a unitary republic. The Constitution enshrines a set of fundamental principles known as Pancasila (the five principles), encompassing belief in one supreme God, humanity, the unity of Indonesia, democracy led by the wisdom of deliberations among representatives and social justice for all.
The Constitution vests the sovereignty in the country’s people and establishes the office of the President, the People’s Consultative Assembly (Majelis Permusyawaratan Rakyat, or the “MPR”), which consists of the DPR and the DPD, the Supreme Court (Mahkamah Agung), the Constitutional Court (Mahkamah Konstitusi) and the Judicial Commission (Komisi Yudisial).
The MPR has the authority to amend the Constitution and inaugurate and dismiss the President. The MPR has a bicameral structure, consisting of the DPR, which is the principal legislative body, and the DPD. The DPR has 580 members. Starting from 2024, the DPD has 152 members, consisting of four members from each province.
Members of the DPR are elected by a proportional representation system. The DPD members are elected in non-partisan elections based on a plurality of votes within the relevant electorate.
Each of the DPR and the President has the power to initiate legislation. All legislation, including the Republic’s budget, must be approved by both the DPR and the President. While the DPD is able to initiate legislation regarding regional matters, this is subject to approval from both the DPR and the President.
D-10
The President has the authority and responsibility for the conduct of the administration of the Republic. This includes the authority to declare war, make peace, conclude treaties with other states and propose statutes; these presidential actions must, however, be approved by the DPR before taking effect. Constitutional amendments in 1999 restrict the President and Vice President to a maximum of two five-year terms.
The President is assisted in the administration of his responsibilities by ministers who are appointed and dismissed by the President and who are responsible only to the President.
Formation of Cabinet under President Prabowo Subianto’s administration
On October 21, 2024, one day after his inauguration, President Prabowo Subianto issued Presidential Regulation Number 139 of 2024 on the Arrangement of Duties and Functions of State Ministries in the Red and White Cabinet for the 2024-2029 period. The 48 ministries include 22 new ministries and agencies, created through the establishment of new entities and the reorganization of existing ones. Seven of the 48 ministries are coordinating ministries which oversee and coordinate the ministries and agencies within their respective sectors, compared to four coordinating ministries under the prior administration. President Prabowo Subianto also dissolved the Cabinet Secretariat, a government agency that previously worked directly beneath and was answerable to the President, mandating that its duties and functions be integrated into the ministries responsible for managing the relevant government affairs.
Asta Cita
President Prabowo Subianto and Vice President Gibran Rakabuming Raka have adopted a comprehensive strategy to address Indonesia’s socio-economic challenges. The strategy, which is also referred to by the sanskit term “Asta Cita” (eight aspirations), comprises:
| 1. | strengthening the Constitutionally-enshrined ideology of Pancasila (the five principles), democracy, and human rights; |
| 2. | consolidating the national defense and security system and fostering national self-reliance through self- sufficiency in food, energy, water, Islamic economy, digital economy, green economy and blue economy; |
| 3. | continuing infrastructure development and improving quality employment opportunities, promoting entrepreneurship, expanding creative industries, and developing agro-maritime industries in production centers through active cooperative involvement; |
| 4. | strengthening the development of human resources, gender equality and the achievements in respect of science, technology, education, health and sports, and empowering the roles of women, youth (millennials and Generation Z), and persons with disabilities; |
| 5. | continuing downstream processing and developing natural resource-based industries to increase domestic value-add in the supply chain; |
| 6. | fostering economic growth, equity, and poverty eradication from the village and grassroot levels; |
| 7. | intensifying political, legal, and bureaucratic reform, and strengthening efforts to prevent and eradicate corruption, drugs, gambling, and smuggling; and |
| 8. | promoting harmonious lives in alignment with the environment, nature and culture, and increasing religious tolerance to achieve a just and prosperous society. |
Revision of Law No. 34/2004 on the Indonesian Military
On March 20, 2025, the House of Representatives, or DPR, amended Law No. 34/2004 on the Indonesian Military pursuant to Law No. 3 of 2025. The amendment introduces several changes, including provisions to raise the retirement ages of senior military officers and introduce two new duties for military operations other than war: resolving cyber defense threats and protecting and safeguarding citizens and national interests abroad. Additionally, pursuant to an amendment that has attracted criticism from observers as being at risk of undermining civilian supremacy, the amendment expanded the list of government agencies where military personnel can hold positions. Previously, military personnel could serve in ten primarily security-related government agencies, such as the Ministry of Defense and the State Intelligence Agency. The amended law now permits military personnel to assume positions in certain other agencies, including the National Border Management Agency, the National Counterterrorism Agency, the Maritime Security Agency, and the Attorney General’s Office, without requiring the military personnel to retire or resign from military service before taking those positions. Military personnel must still retire or resign from the military if they wish to assume positions in other agencies that are not covered by the amended law.
Judicial System
The Constitution states that the Indonesian judicial system must be independent and that judicial authority is to be exercised by the courts free from the influence of non-judicial power. The Republic’s judicial power is exercised by the Supreme Court, various lower courts and the Constitutional Court. The courts below the Supreme Court are organized by subject matter jurisdiction. These courts include the general, religious, military and administrative courts. The general courts have jurisdiction over all criminal and civil cases outside the limited jurisdiction of any of the special courts. The religious courts have jurisdiction over cases such as family law among Muslims. The military courts have jurisdiction over cases involving military personnel. The administrative courts have jurisdiction over actions involving certain Government decisions.
D-11
Furthermore, there are several special courts under the general courts and the administrative courts such as (i) commercial courts, which have jurisdiction over bankruptcy cases and intellectual property rights cases (except trade secrets); (ii) juvenile courts, which have jurisdiction over child cases; (iii) human rights courts, which have jurisdiction over gross violations of human rights cases; (iv) corruption courts, which have jurisdiction over corruption cases; (v) labor courts, which have jurisdiction over industrial relations cases; (vi) fishery courts, which have jurisdiction over criminal fishery cases; and (vii) tax courts which have jurisdiction over tax disputes. The Supreme Court also has the authority to issue opinions on legal matters to various Government authorities and officials, to order a court to adjudicate a particular matter or to set aside an unlawful decision. The Constitutional Court has exclusive jurisdiction with respect to questions of constitutional law.
Regional Governments and Regional Autonomy
Indonesia has 38 provinces, including the special capital region of Jakarta. Each province is headed by a governor and consists of several subdivisions. There are two types of subdivisions, namely kabupaten, or regencies, and kota, or municipalities. Political and governmental arrangements in regencies and municipalities are generally similar, but municipalities tend to be more urban. Regencies and municipalities are divided into kecamatan, or districts, which in turn are further divided into kelurahan, or villages, or sub-districts. Indonesia consists of 416 regencies and 98 municipalities in 38 provinces. The latest regional elections were held on November 27, 2024 across 37 provinces, 415 regencies and 93 municipalities.
Over the past two decades, the central Government has promoted and created significant regional autonomy through legislation. Under current law, government matters are divided into three areas:
| (i) | matters that are solely under the authority of the central Government, such as foreign affairs, defense, security, judicial, national fiscal and monetary matters, and religion; |
| (ii) | matters that are concurrently implemented by the central Government, provincial governments and regency/municipal governments. Based on the Law on Job Creation, the Government may determine the implementation of these concurrent matters based on, among others, certain norms, standards, procedures and criteria as determined by the central Government. These include: |
| (a) | mandatory matters to be implemented by regional governments, namely basic services, which consists of education, health, public works and special planning, housing, social order and social welfare, and non-basic services. Social welfare and non-basic services are further divided into other matters such as labor, women’s empowerment and child protection, food sustainability, land policy, living environment, population administration and civil registration, community and village empowerment, population control and family planning, transportation, communication and informatics, cooperatives, plantations, investment, youth and sports, statistics, encryption, culture, libraries and archives; and |
| (b) | optional matters to be implemented by regional governments, namely maritime and fisheries, tourism, agriculture, forestry, energy and mineral resources, trade, industry and transmigration; and |
| (iii) | matters that are solely under the authority of the President as head of Government, such as Army, Navy and Air Force affairs, the appointment and the replacement of ambassadors and consuls, the granting of pardon and rehabilitation, amnesty and abolition, award of titles, decorations and other marks of state honor. |
The provinces of Aceh, Jakarta, Yogyakarta, Papua, West Papua, South Papua, Central Papua, Highland Papua, and South West Papua enjoy special autonomy from the central Government. In Papua and West Papua, a portion of the population has shown support for the Free Papua Movement (generally known by its Indonesian initials, OPM). While there have been some violent incidents involving the armed wing of the OPM, including those targeting the Indonesian police, the National Armed Forces and police have taken measures to maintain security and order in these provinces, and the Government has continued its policy of promoting social welfare in Papua, West Papua, South Papua, Central Papua, Highland Papua, and South West Papua. The Government is addressing the concerns of certain groups seeking greater independence by expanding the powers of the local governments, investing in infrastructure, improving judicial access, instituting affirmative action programs, working to resolve differences among local ethnic groups, increasing welfare programs and infrastructure development and fostering business growth and investment in areas populated by these groups.
Terrorism
Several terrorism-linked bombing incidents have taken place in Indonesia over the years, including incidents linked to ISIS and Jemaah Islamiah, a Southeast Asian terrorist network linked to other terrorist organizations outside the region. In response to these incidents, security forces and the judiciary took action to bring the perpetrators to justice and have targeted terrorist networks. Since the emergence of ISIS, several terror attacks have been committed by ISIS or ISIS affiliated groups in Indonesia.
D-12
The deadliest terror attacks in Indonesia since 2002 Bali bombings were the Surabaya bombings on May 13, 2018, in which 15 civilians, one police officer and 13 suicide bombers were killed, and around 50 people were injured, and the Mako Brimob standoff on May 9, 2018, in which five police officers were killed. There have since been sporadic, less deadly suicide bombings and other instances of terrorism in Indonesia, though the threat remains and there could be additional outbursts of violence and destruction in the country.
Indonesia’s counter-terrorism efforts include laws in respect of counter-terrorism, anti-radicalization, money laundering, cyber security, and training efforts for police and security officers (including sending officers to Canada and the United States for training). Indonesia also participates in regional counter-terrorism efforts through the Association of South East Asian Nations (“ASEAN”), and global efforts through the United Nations. The Government also adopted de-radicalization/counter narrative measures as well as bolstered police anti-terror units with additional personnel, equipment and training. Over the course of the Widodo administration, several hundred terrorist suspects have been reformed through de-radicalization measures.
Foreign Relations and International and Regional Organizations
Indonesia maintains close diplomatic relationships with neighboring countries and its major economic partners and aims to continue to strengthen economic relations with all its partners.
The Republic is one of the five founding members of ASEAN, an organization that was established in 1967 to ensure regional stability and is now committed to reducing development gaps among its member states (Brunei Darussalam, Cambodia, Indonesia, Laos, Malaysia, Myanmar, Philippines, Singapore, Thailand and Vietnam), which have entered into various agreements on mutual assistance and cooperation in several areas.
Indonesia assumed ASEAN’s annual rotating chairmanship for 2023 in November 2022, adopting the theme “ASEAN Matters: Epicentrum of Growth” and focusing on four areas including finance and health cooperation, food security, local currency transactions and regional payment connectivity. As part of the Republic’s chairmanship, to foster ASEAN and ASEAN+3 cooperation, Indonesia organized a series of meetings including, among others, the 42nd ASEAN Summit in Labuan Bajo in May 2023, the 43rd ASEAN Summit in Jakarta in September 2023, the ASEAN+3 Finance Ministers’ and Central Bank Governors’ Meeting in Incheon, May 2023 and the 10th ASEAN Finance Ministers’ and Central Bank Governors’ Meeting in Jakarta in August 2023.
The Republic’s other principal memberships in international and regional organizations include:
| • | United Nations; |
| • | the IMF; |
| • | the World Bank and certain World Bank-related organizations; |
| • | the Asian Development Bank (“ADB”); |
| • | the Chiang Mai Initiative Multilateralization; |
| • | the Credit Guarantee and Investment Facility (“CGIF”); |
| • | the Group of Twenty (“G20”), in which it is the only ASEAN member state that concurrently enjoys membership; |
| • | the Islamic Development Bank; |
| • | World Trade Organization; |
| • | the Asia Pacific Economic Cooperation (“APEC”), where it was one of the 12 founding economies and continues to play an important role; |
| • | the Asian Infrastructure Investment Bank, an initiative by the government of China which has a mission to improve social and economic outcomes by investing in sustainable infrastructure and other productive sectors in Asia and beyond; |
| • | the ASEAN Infrastructure Fund, a collaborative initiative between ASEAN countries and the ADB to establish a joint funding institution for infrastructure development in the ASEAN region; and |
| • | the Indian Ocean Rim Association (“IORA”). |
Indonesia also seeks to lead other developing countries through its membership in the following organizations of developing countries: the Non-Aligned Movement, the Organization of the Islamic Conference, the Group of 77 and China, the Developing 8, the Group of 15, and as observer at the G-24 Forum.
D-13
Since 1962, the Republic has been a member of the Organisation of Petroleum Exporting Countries (“OPEC”). In view of the shift in its status from a net exporter to a net importer of oil, the Republic suspended its membership in OPEC effective from January 2009. The Republic reactivated its OPEC membership effective from January 2016, but due to policy considerations and its continuing status as a net importer of oil, the Republic decided to suspend its OPEC membership during the November 30, 2016 OPEC meeting. On May 24, 2017, the Republic sent OPEC a letter requesting reactivation of its membership on the condition that Indonesian crude oil production would not have to be cut. In December 2017, the Government decided not to continue the reactivation process.
In terms of bilateral cooperation with China, Indonesia has been pursuing opportunities to support Government’s infrastructure connectivity development program through the Belt and Road Initiative. This initiative led by the People’s Republic of China, comprises two segments: (i) the Silk Road Economic Belt, a land road route western mainland China that leads to Central Asia up to the Middle East; and (ii) the 21st Century Maritime Silk Road, a strategic and important sea-land encircling Southeast Asia, the Persian Gulf and reaching the Horn of Africa. This initiative promotes better connectivity among countries in Asia, Europe as well as Africa and South America, and also encourages trade balance, e-commerce, digital economy and financial inclusion. In 2017, Indonesia was actively involved in the formulation of the Guiding Principles on Financing the Development for the Belt and Road Initiative. The Republic is developing a new airport in Lembeh Island, North Sulawesi as part of its involvement in the Belt and Road Initiative.
Indonesia became a member of the IORA (an association that connects countries along the Indian Ocean region) in 1997. Since joining the IORA, Indonesia has been an active member and has directly engaged in a number of initiatives and Indonesia continues to promote economic and maritime diplomacy in the Indian Ocean region. Indonesia hosted the leader’s summit of IORA in Jakarta in March 2017, which concluded with the enactment of the IORA Concord (also referred to as the Jakarta Concord), which aims to lay the foundation and set the course for cooperation within the IORA in the coming years to overcome the increasingly complex problems in the Indian Ocean region.
On January 6, 2025, Indonesia joined BRICS, an intergovernmental organization comprising ten countries – Brazil, Russia, India, China, South Africa, Egypt, Ethiopia, Indonesia, Iran and the United Arab Emirates – as a full member.
Indonesia has been a key partner of the Organisation for Economic Co-operation and Development (“OECD”) since 2007 and became the first accession candidate country from Southeast Asia in February 2024. Indonesia submitted its initial memorandum for OECD accession on June 3, 2025.
The following table shows Indonesia’s capital participation in certain major international financial organizations as of December 31, 2024.
| As of December 31, 2024 Contributed capital |
||||||||||||
| Year of admission |
Subscribed | Paid in | ||||||||||
| (in millions of U.S. dollars) | ||||||||||||
| Asian Development Bank(1) |
1966 | 7,514.6 | 375.8 | |||||||||
| IMF(1) |
1966 | (2) | 6,062.1 | 6,062.1 | ||||||||
| World Bank Group |
||||||||||||
| International Bank for Reconstruction and Development |
1966 | (2) | 3,481.8 | 249.9 | ||||||||
| International Development Association |
1968 | 168.2 | 109.0 | |||||||||
| International Finance Corporation |
1968 | (3) | 309.3 | 309.3 | ||||||||
| Multilateral Investment and Guarantee Agency |
1986 | 20.0 | 3.8 | |||||||||
| Islamic Development Bank(4) |
1975 | 1,641.1 | 313.5 | |||||||||
| International Islamic Trade Finance Corporation |
1992 | 2.1 | 2.1 | |||||||||
| The Islamic Corporation for the Insurance of Investment and Export Credit(4) |
1992 | 0.6 | 0.3 | |||||||||
| Islamic Corporation for the Development of the Private Sector |
1992 | 22.2 | 22.2 | |||||||||
| International Fund for Agricultural Development |
1977 | 92.0 | 92.0 | |||||||||
| Common Fund for Commodities |
1980 | 1.0 | 1.0 | |||||||||
| Credit Guarantee and Investment Facility |
2012 | 30.6 | 30.6 | |||||||||
| ASEAN Infrastructure Investment Bank |
2015 | 3,360.7 | 672.1 | |||||||||
| ASEAN Infrastructure Fund |
2012 | 120.0 | 120.0 | |||||||||
| International Rubber Consortium Limited |
2002 | 4.0 | 4.0 | |||||||||
Source: Bank Indonesia and Ministry of Finance
| (1) | Denominated in Special Drawing Rights (“SDR”) of the IMF. For the Asian Development Bank numbers as of December 31, 2024, converted to U.S. dollars using the exchange rate on January 2, 2025 of U.S.$1.29988 to SDR 1. For the IMF numbers as of December 31, 2024, converted to U.S. dollars using the exchange rate on December 23, 2024 of U.S.$1.30413 to SDR 1. |
| (2) | Indonesia was readmitted as a member of the IMF and the International Bank for Reconstruction and Development in 1967. (It originally became a member of these organizations in 1954 and resigned its memberships in 1965.) |
| (3) | Indonesia rejoined the International Finance Corporation in 1968, it originally became a member in 1956 and resigned its membership in 1961. |
| (4) | Denominated in Islamic Dinars (ID 1 = SDR 1). |
D-14
Foreign Relations
Indonesia embraces an “independent and active” foreign policy while being committed to maintaining a world order based on freedom, perpetual peace and social justice. This policy is ingrained in Indonesia’s Constitution and is a testament to Indonesia’s alignment to the aspirations of the international community as enshrined in the Charter of the United Nations. In this respect, Indonesia pursues an active role in global affairs while striving to strengthen multilateralism and avoiding involvement in conflicts or polarizations among major powers. Indonesia assumes leadership roles in the international community not to advance the interests of any group of countries, but rather build bridges and facilitate discussion of all countries for the common benefit of all.
Indonesia held the G20 Presidency from December 1, 2021 until November 30, 2022, during which Indonesia carried the theme “Recover Together, Recover Stronger” at the G20 Presidency. The Indonesian Presidency focused on three strategic issues: inclusive health management, digital-based economic transformation and the transition to sustainable energy use. During the Indonesian Presidency, 437 G20 events were implemented in 24 cities throughout Indonesia and hundreds of bilateral meetings were held, and 226 multilateral projects, programs and initiatives and 140 bilateral mature projects with a total value of U.S.$71.5 billion were delivered. The G20 Summit was held in Bali, Indonesia from November 15 to 16, 2022, and was attended by more than 10,000 delegations. Moreover, Indonesia continues to voice out developing and Global South countries’ needs and interests in various issues such as climate financing, sustainable development and energy transition.
As part of its effort to tackle the common issues faced by archipelagic and island states, such as sea level rise and climate change, Indonesia convened the 1st High-Level Meeting of Archipelagic and Island States Forum in Bali on October 11, 2023. The meeting was attended by 32 countries and four international organizations, and is intended to become a platform of inclusive collaboration that produces strategic and concrete solutions to the needs of its members.
Maritime Boundaries Delimitation and the South China Sea
The Government has conducted border diplomacy with its 10 neighboring countries, namely, India, Thailand, Malaysia, Singapore, Vietnam, the Philippines, Palau, Papua New Guinea, Timor-Leste, and Australia.
Indonesia has agreed on the following maritime boundaries:
| • | several territorial sea boundaries with Malaysia (northern part of the Malacca Strait, southernmost part of the Malacca Strait, and the Sulawesi Sea) and Singapore (central, western and eastern part of the Singapore Strait), and completion of all Territorial Sea boundaries with Papua New Guinea; |
| • | Exclusive Economic Zone, or EEZ, with the Philippines, Australia, Papua New Guinea and Vietnam; and |
| • | continental shelf with India, Thailand, Malaysia (Malacca Strait and South China Sea), Vietnam, Australia and Papua New Guinea. |
Negotiations on the following maritime boundaries are ongoing:
| • | remaining segments of territorial sea boundaries with Malaysia, Singapore and Timor-Leste; |
| • | Exclusive Economic Zone with India, Thailand, Malaysia, Palau and Timor-Leste; and |
| • | continental shelf with Malaysia, the Philippines, Palau, and Timor-Leste. |
Indonesia aims to resolve these maritime boundaries through peaceful and diplomatic channels in accordance with international law.
South China Sea
Indonesia has been consistent in its position that it does not have overlapping territorial claims in the South China Sea with China. This position is based on the United Nations Conventions on the Law of the Sea (“UNCLOS”), and in line with the 2016 Award of the Permanent Court of Arbitration (“PCA”) on the South China Sea.
In the South China Sea, Indonesia only has maritime boundaries with Malaysia and Vietnam. In 2022, Indonesia and Vietnam concluded its EEZ boundary negotiation. This significant achievement further signified Indonesia’s commitment to promote peaceful boundary negotiation and contribution to international law, in accordance with UNCLOS. Indonesia is currently negotiating the territorial sea boundary and the EEZ boundary with Malaysia.
D-15
Indonesia is working to maintain stability and security in the South China Sea in accordance with international law. In this regard, Indonesia as the non-claimant State to the South China Sea remains supportive of the negotiation of the Code of Conduct (“COC”) along with China and other ASEAN Member States which should be actionable, implementable, and in accordance with UNCLOS. The negotiation of COC has been initiated since November 2017, which is aimed to implement the 2002 ASEAN-China Declaration on the Conduct of Parties in the South China Sea (frequently referred to as the DOC) based on a negotiating framework agreed in August 2017. Indonesia is an active participant in ASEAN-China Senior Officials on the Implementation of the DOC and the ASEAN-China Joint Working Group on the Implementation of the DOC, which meet on a regular basis all year round to review the implementation of the DOC and to negotiate the COC.
Indonesia utilized its ASEAN Chairmanship in 2023 to accelerate the negotiation process of the COC, as it will help maintain security, safety, and stability in the region. It is hoped that the COC can become a set of rules to govern the conduct of parties in the South China Sea. In this case, the COC shall be based on international law, including UNCLOS in order to achieve a stable, safe and peaceful South China Sea region. The main elements of COC that Indonesia always emphasizes are preventing incidents; managing incidents (if they occur); and continuing with confidence building measures.
Indonesia continues to exercise its rights to pursue economic development of its exclusive economic zone off the coast of the Natuna Islands in the North Natuna Sea, which is also referred to as a part of the South China Sea. The Government remains committed to overseeing and securing the exploration and exploitation activities, and refraining from any provocative actions in maintaining peace and stability in the region.
With regard to the presence of foreign-flagged vessels in the South China Sea, Indonesia acknowledges the freedom of navigation in the Indonesian EEZ in the North Natuna Sea/South China Sea in accordance with UNCLOS. Accordingly, Indonesia has taken action against foreign-flagged fishing vessels which violate Indonesia’s sovereign rights over its EEZ.
Sustainable Development Goals
The Republic published its Sustainable Government Securities Framework dated April 2025 for the issuance of sustainable bonds and sukuks to fund projects delivering environmental and social benefits. The Sustainable Government Securities Framework updates the Republic’s prior framework, the SDGs Government Securities Framework published in September 2021. Under the current framework, sustainable securities will be issued to fund eligible expenditures with a green and blue focus of 10 categories—namely, (i) renewable and clean energy, (ii) energy efficiency, (iii) climate change adaption, (iv) clean transport, (v) waste management, waste to energy and pollution prevention and control, (vi) sustainable management of nature resources on land, (vii) sustainable management of natural resources on ocean, (viii) green tourism, (ix) green buildings, and (x) sustainable water and wastewater management—and social focus of four categories, namely, (i) employment generation and socioeconomic advancement and empowerment, (ii) food security and sustainable food systems, (iii) access to essential services, and (iv) affordable basic infrastructure. The Sustainable Government Securities Framework expressly excludes certain activities from consideration for eligible expenditures thereunder, including projects causing or contributing to deforestation, child or forced labor, adult entertainment, weapons, alcohol, tobacco, fossil fuels, gambling, highly polluting or carbon-intensive infrastructure, unsustainable biomass or feedstock projects, and wholesale or brokerage of precious metals, precious minerals, artworks and antiques.
The Republic’s 2030 SDGs targets have been described in the Roadmap of SDGs Indonesia, which was published by the Ministry of National Development Planning (“Bappenas”) pursuant to Presidential Regulation No. 59/2017. The 2030 SDGs targets include 17 targets with respect to green, social and sustainable development such as, among others, eradication of poverty and hunger, improvement of education, health and well-being, reduced inequalities, affordable and clean energy, climate action, and sustainable cities and communities. The Republic believes that eligible expenditures under the Sustainable Government Securities Framework will deliver environmental and social benefits as part of the Republic’s efforts in achieving its 2030 SDGs targets.
The Republic has implemented an evaluation and selection process to seek to ensure that the proceeds from sustainable securities are used for eligible expenditures. The process involves a budget tagging process where various ministries select and tag projects that are reviewed primarily by the Ministry of Finance for expenditures with green and blue focus and by the Bappenas for expenditures with social focus. Tagged projects that fall into one or more of the eligibility criteria and that have a project development timeline consistent with the tenor of the relevant sustainable securities may be approved by the Bappenas and the Ministry of Finance, in coordination with other line ministries, to be funded by the proceeds of the relevant sustainable securities.
The Ministry of Finance manages and allocates the proceeds from each issue of sustainable securities and the ministries utilizing the proceeds track, monitor and report to the Ministry of Finance the environmental and social benefits of the eligible expenditures in their portfolio. A sustainable securities allocation register has been established to record the allocation of proceeds therefrom. For the sustainable securities issued, the Republic currently reports the fund allocation and the respective impacts annually. This reporting policy is not a contractual obligation of the Republic, and the Republic may decide to change its reporting policy or not comply with the policy at any time. If the Republic does provide such reports, they are published on a designated page of the Ministry of Finance’s website.
D-16
Although the projects are selected in accordance with the categories recognized under the Sustainable Government Securities Framework and are developed in accordance with relevant legislation and standards, the projects may fail to deliver the benefits as anticipated, and there can be no assurance that adverse environmental and/or social impacts will not occur during the design, construction, commissioning and operation of the projects.
A second party opinion on the Sustainable Government Securities Framework was published by an independent ratings and analytics firm on April 30, 2025. confirming the framework’s alignment with the International Capital Market Association’s Green Bond Principles (2021), Social Bond Principles (2023) and Sustainability Bond Guidelines (2021), as well as the ASEAN Capital Markets Forum’s ASEAN Green Standards 2018, ASEAN Social Bond Standards 2021 and ASEAN Sustainability Bond Standards 2018. The second party opinion is not, nor should be deemed to be, a recommendation to buy, sell or hold any securities.
Economy and Gross Domestic Product
Introduction
Indonesia has a balanced and diversified economy. The main challenges currently facing Indonesia’s economy include uncertainty in relation to the global economic recovery and commodity prices, which are crucial factors in determining the Republic’s export performance.
Domestically, factors that affect the economy are demographic growth and job creation, the country’s progress in implementing its infrastructure programs, maintaining relatively stable and low inflation and balancing domestic budgetary pressures against the burden of serving external debt.
Principal Sectors of the Economy
Indonesia’s principal economic sectors are manufacturing industry (including coal, oil and gas); agriculture, forestry and fishery; wholesale and retail trade, repair of motor vehicles and motorcycles; construction; and mining and quarrying.
D-17
The tables below show the composition of Indonesia’s GDP by sector at current prices and constant prices, respectively, for the periods indicated.
Gross Domestic Product by Industry
(at current prices)
| Year Ended December 31, | Three Months Ended March 31, |
|||||||||||||||||||||||||||||||||||||||||||||||||||||||
| 2020 | % | 2021 | % | 2022 | % | 2023P | % | 2024P | % | 2024P | % | 2025P | % | |||||||||||||||||||||||||||||||||||||||||||
| (in billions of Rupiah and percentage of GDP) | ||||||||||||||||||||||||||||||||||||||||||||||||||||||||
| Manufacturing Industry |
||||||||||||||||||||||||||||||||||||||||||||||||||||||||
| Coal Industry and Oil and Gas Refining |
307,606 | 2.0 | 320,009 | 1.9 | 363,620 | 1.9 | 400,447 | 1.9 | 403,578 | 1.8 | 95,932 | 1.8 | 98,749 | 1.7 | ||||||||||||||||||||||||||||||||||||||||||
| Non-Coal, Oil and Gas Manufacturing |
2,760,435 | 17.9 | 2,946,897 | 17.4 | 3,228,155 | 16.5 | 3,499,615 | 16.8 | 3,799,289 | 17.2 | 923,723 | 17.5 | 991,785 | 17.5 | ||||||||||||||||||||||||||||||||||||||||||
|
|
|
|
|
|
|
|
|
|
|
|
|
|
|
|
|
|
|
|
|
|
|
|
|
|
|
|
|
|||||||||||||||||||||||||||||
| Total Manufacturing Industry |
3,068,042 | 19.9 | 3,266,906 | 19.2 | 3,591,775 | 18.3 | 3,900,062 | 18.7 | 4,202,867 | 19.0 | 1,019,655 | 19.3 | 1,090,534 | 19.2 | ||||||||||||||||||||||||||||||||||||||||||
| Wholesale and Retail Trade, Repair of Motor Vehicles and Motorcycles |
1,993,989 | 12.9 | 2,199,935 | 13.0 | 2,516,779 | 12.8 | 2,702,642 | 12.9 | 2,892,695 | 13.1 | 695,438 | 13.1 | 749,025 | 13.2 | ||||||||||||||||||||||||||||||||||||||||||
| Agriculture, Forestry, and Fishery |
||||||||||||||||||||||||||||||||||||||||||||||||||||||||
| Agriculture, Livestock, Hunting & Agriculture Services |
1,575,280 | 10.2 | 1,672,938 | 9.9 | 1,805,454 | 9.2 | 1,932,533 | 9.2 | 2,107,181 | 9.5 | 459,817 | 8.7 | 558,072 | 9.8 | ||||||||||||||||||||||||||||||||||||||||||
| Forestry and Logging |
108,646 | 0.7 | 112,009 | 0.7 | 118,386 | 0.6 | 130,117 | 0.6 | 129,570 | 0.6 | 30,441 | 0.6 | 29,402 | 0.5 | ||||||||||||||||||||||||||||||||||||||||||
| Fishery |
431,469 | 2.8 | 469,594 | 2.8 | 505,061 | 2.6 | 555,041 | 2.7 | 554,677 | 2.5 | 123,513 | 2.3 | 129,807 | 2.3 | ||||||||||||||||||||||||||||||||||||||||||
|
|
|
|
|
|
|
|
|
|
|
|
|
|
|
|
|
|
|
|
|
|
|
|
|
|
|
|
|
|||||||||||||||||||||||||||||
| Total Agriculture, Forestry, and Fishery |
2,115,495 | 13.7 | 2,254,541 | 13.3 | 2,428,901 | 12.4 | 2,617,690 | 12.5 | 2,791,428 | 12.5 | 613,795 | 11.6 | 717,281 | 12.7 | ||||||||||||||||||||||||||||||||||||||||||
| Mining and Quarrying |
0.0 | |||||||||||||||||||||||||||||||||||||||||||||||||||||||
| Oil, Gas and Geothermal Mining |
332,560 | 2.2 | 461,703 | 2.7 | 587,597 | 3.0 | 521,070 | 2.5 | 526,156 | 2.4 | 129,275 | 2.4 | 132,951 | 2.3 | ||||||||||||||||||||||||||||||||||||||||||
| Coal and Lignite Mining |
283,195 | 1.8 | 603,138 | 3.6 | 1,296,912 | 6.6 | 1,116,571 | 5.3 | 850,454 | 3.8 | 211,041 | 4.0 | 213,512 | 3.8 | ||||||||||||||||||||||||||||||||||||||||||
| Metal Ore |
130,957 | 0.8 | 204,590 | 1.2 | 242,717 | 1.2 | 272,022 | 1.3 | 343,502 | 1.6 | 78,636 | 1.5 | 85,215 | 1.5 | ||||||||||||||||||||||||||||||||||||||||||
| Other Mining and Quarrying |
246,831 | 1.6 | 254,219 | 1.5 | 266,165 | 1.4 | 288,356 | 1.4 | 306,478 | 1.4 | 74,958 | 1.4 | 77,552 | 1.4 | ||||||||||||||||||||||||||||||||||||||||||
|
|
|
|
|
|
|
|
|
|
|
|
|
|
|
|
|
|
|
|
|
|
|
|
|
|
|
|
|
|||||||||||||||||||||||||||||
| Total Mining and Quarrying |
993,542 | 6.4 | 1,523,650 | 9.0 | 2,393,391 | 12.2 | 2,198,018 | 10.5 | 2,026,589 | 9.2 | 493,909 | 9.3 | 509,230 | 9.0 | ||||||||||||||||||||||||||||||||||||||||||
| Construction |
1,652,660 | 10.7 | 1,771,727 | 10.4 | 1,912,979 | 9.8 | 2,072,385 | 9.9 | 2,233,463 | 10.1 | 541,249 | 10.2 | 557,337 | 9.8 | ||||||||||||||||||||||||||||||||||||||||||
| Government Administration, Defence Compulsory Social Security |
585,960 | 3.8 | 586,757 | 3.5 | 605,341 | 3.1 | 616,445 | 3.0 | 673,718 | 3.0 | 177,749 | 3.4 | 190,404 | 3.4 | ||||||||||||||||||||||||||||||||||||||||||
| Information and Communication |
695,963 | 4.5 | 748,803 | 4.4 | 812,737 | 4.1 | 883,637 | 4.2 | 960,022 | 4.3 | 232,923 | 4.4 | 251,539 | 4.4 | ||||||||||||||||||||||||||||||||||||||||||
| Transportation and Warehousing |
689,552 | 4.5 | 719,610 | 4.2 | 983,520 | 5.0 | 1,231,242 | 5.9 | 1,358,117 | 6.1 | 313,445 | 5.9 | 344,827 | 6.1 | ||||||||||||||||||||||||||||||||||||||||||
| Financial and Insurance Service |
696,073 | 4.5 | 736,187 | 4.3 | 809,371 | 4.1 | 869,168 | 4.2 | 922,811 | 4.2 | 227,865 | 4.3 | 240,725 | 4.2 | ||||||||||||||||||||||||||||||||||||||||||
| Education Service |
551,227 | 3.6 | 557,667 | 3.3 | 566,378 | 2.9 | 583,384 | 2.8 | 621,417 | 2.8 | 147,252 | 2.8 | 158,183 | 2.8 | ||||||||||||||||||||||||||||||||||||||||||
| Other* |
1,837,207 | 11.9 | 1,923,038 | 11.3 | 2,109,284 | 10.8 | 2,303,521 | 11.0 | 2,503,657 | 11.3 | 600,583 | 11.4 | 634,906 | 11.2 | ||||||||||||||||||||||||||||||||||||||||||
|
|
|
|
|
|
|
|
|
|
|
|
|
|
|
|
|
|
|
|
|
|
|
|
|
|
|
|
|
|||||||||||||||||||||||||||||
| Gross Value Added at Basic Prices |
14,879,709 | 96.4 | 16,288,821 | 95.9 | 18,730,454 | 95.6 | 19,978,195 | 95.6 | 21,186,782 | 95.7 | 5,063,860 | 95.8 | 5,443,989 | 96.1 | ||||||||||||||||||||||||||||||||||||||||||
| Taxes less Subsidies on Products |
563,644 | 3.6 | 687,930 | 4.1 | 858,006 | 4.4 | 914,154 | 4.4 | 952,182 | 4.3 | 224,716 | 4.2 | 221,941 | 3.9 | ||||||||||||||||||||||||||||||||||||||||||
|
|
|
|
|
|
|
|
|
|
|
|
|
|
|
|
|
|
|
|
|
|
|
|
|
|
|
|
|
|||||||||||||||||||||||||||||
| Total GDP |
15,443,353 | 100.0 | 16,976,751 | 100.0 | 19,588,460 | 100.0 | 20,892,348 | 100.0 | 22,138,964 | 100.0 | 5,288,577 | 100.0 | 5,665,930 | 100.0 | ||||||||||||||||||||||||||||||||||||||||||
|
|
|
|
|
|
|
|
|
|
|
|
|
|
|
|
|
|
|
|
|
|
|
|
|
|
|
|
|
|||||||||||||||||||||||||||||
Source: BPS
| P | Preliminary. |
| * | Includes the Procurement of Electricity and Gas; Procurement of Water, Management of Trash, Waste and Recycle; Accommodation and Food Beverages Supply; Real Estate; Corporate Services; Health Service and Social Activity; and Other Services sectors. |
D-18
Gross Domestic Product by Industry
(at constant 2010 prices)
| Year Ended December 31, | Three Months Ended March 31, |
|||||||||||||||||||||||||||||||||||||||||||||||||||||||
| 2020 | % | 2021 | % | 2022 | % | 2023P | % | 2024P | % | 2024P | % | 2025P | % | |||||||||||||||||||||||||||||||||||||||||||
| (in billions of Rupiah and percentage of GDP) | ||||||||||||||||||||||||||||||||||||||||||||||||||||||||
| Manufacturing Industry |
||||||||||||||||||||||||||||||||||||||||||||||||||||||||
| Coal Industry and Oil and Gas Refining |
202,604 | 1.9 | 203,767 | 1.8 | 211,340 | 1.8 | 220,140 | 1.8 | 222,427 | 1.7 | 51,475 | 1.7 | 55,224 | 1.7 | ||||||||||||||||||||||||||||||||||||||||||
| Non-Coal, Oil and Gas Manufacturing Industries |
2,007,317 | 18.7 | 2,081,055 | 18.7 | 2,185,263 | 18.7 | 2,287,660 | 18.6 | 2,396,428 | 18.5 | 587,125 | 18.9 | 612,431 | 18.8 | ||||||||||||||||||||||||||||||||||||||||||
| Total Manufacturing Industry |
2,209,920 | 20.6 | 2,284,822 | 20.5 | 2,396,603 | 20.5 | 2,507,800 | 20.4 | 2,618,855 | 20.3 | 638,600 | 20.5 | 667,655 | 20.5 | ||||||||||||||||||||||||||||||||||||||||||
| Wholesale and Retail Trade; Repair of Motor Vehicles and Motorcycles |
1,385,651 | 12.9 | 1,449,831 | 13.0 | 1,530,004 | 13.1 | 1,604,234 | 13.0 | 1,682,254 | 13.0 | 407,505 | 13.1 | 427,990 | 13.1 | ||||||||||||||||||||||||||||||||||||||||||
| Agriculture, Forestry, and Fishery |
||||||||||||||||||||||||||||||||||||||||||||||||||||||||
| Agriculture, Livestock, Hunting & Agriculture Services |
1,061,087 | 9.9 | 1,072,978 | 9.6 | 1,097,952 | 9.4 | 1,099,951 | 8.9 | 1,109,014 | 8.6 | 246,795 | 7.9 | 280,370 | 8.6 | ||||||||||||||||||||||||||||||||||||||||||
| Forestry and Logging |
63,199 | 0.6 | 63,247 | 0.6 | 62,449 | 0.5 | 64,076 | 0.5 | 62,758 | 0.5 | 14,825 | 0.5 | 14,190 | 0.4 | ||||||||||||||||||||||||||||||||||||||||||
| Fishery |
254,112 | 2.4 | 267,967 | 2.4 |
|
275,452 |
|
|
2.4 |
|
|
290,575 |
|
|
2.4 |
|
292,559 | 2.3 | 65,468 | 2.1 | 66,943 | 2.1 | ||||||||||||||||||||||||||||||||||
|
|
|
|
|
|
|
|
|
|
|
|
|
|
|
|
|
|
|
|
|
|
|
|
|
|
|
|
|
|||||||||||||||||||||||||||||
| Total Agriculture, Forestry, and Fishery |
1,378,399 | 12.9 | 1,404,191 | 12.6 | 1,435,853 | 12.3 | 1,454,602 | 11.8 | 1,464,331 | 11.3 | 327,089 | 10.5 | 361,502 | 11.1 | ||||||||||||||||||||||||||||||||||||||||||
| Mining and Quarrying |
||||||||||||||||||||||||||||||||||||||||||||||||||||||||
| Oil, Gas and Geothermal Mining |
272,583 | 2.5 | 260,546 | 2.3 | 247,986 | 2.1 | 249,801 | 2.0 | 247,850 | 1.9 | 59,993 | 1.9 | 61,549 | 1.9 | ||||||||||||||||||||||||||||||||||||||||||
| Coal and Lignite Mining |
245,499 | 2.3 | 261,710 | 2.4 | 282,944 | 2.4 | 311,291 | 2.5 | 332,527 | 2.6 | 81,201 | 2.6 | 80,458 | 2.5 | ||||||||||||||||||||||||||||||||||||||||||
| Metal Ore |
105,829 | 1.0 | 130,000 | 1.2 | 153,413 | 1.3 | 166,453 | 1.4 | 180,275 | 1.4 | 46,002 | 1.5 | 40,558 | 1.2 | ||||||||||||||||||||||||||||||||||||||||||
| Other Mining and Quarrying |
166,564 | 1.6 | 169,844 | 1.5 | 173,804 | 1.5 | 183,134 | 1.5 | 194,609 | 1.5 | 47,035 | 1.5 | 48,775 | 1.5 | ||||||||||||||||||||||||||||||||||||||||||
|
|
|
|
|
|
|
|
|
|
|
|
|
|
|
|
|
|
|
|
|
|
|
|
|
|
|
|
|
|||||||||||||||||||||||||||||
| Total Mining and Quarrying |
790,475 | 7.4 | 822,100 | 7.4 | 858,147 | 7.3 | 910,679 | 7.4 | 955,260 | 7.4 | 234,231 | 7.5 | 231,340 | 7.1 | ||||||||||||||||||||||||||||||||||||||||||
| Construction |
1,072,335 | 10.0 | 1,102,518 | 9.9 | 1,124,725 | 9.6 | 1,179,989 | 9.6 | 1,262,793 | 9.8 | 307,150 | 9.9 | 313,849 | 9.6 | ||||||||||||||||||||||||||||||||||||||||||
| Government Administration, Defence Compulsory Social Security |
365,446 | 3.4 | 364,247 | 3.3 | 373,424 | 3.2 | 379,071 | 3.1 | 403,335 | 3.1 | 106,006 | 3.4 | 111,075 | 3.4 | ||||||||||||||||||||||||||||||||||||||||||
| Information and Communication |
652,063 | 6.1 | 696,506 | 6.3 | 750,319 | 6.4 | 807,305 | 6.6 | 868,447 | 6.7 | 211,047 | 6.8 | 227,340 | 7.0 | ||||||||||||||||||||||||||||||||||||||||||
| Transportation and Warehousing |
393,419 | 3.7 | 406,169 | 3.7 | 486,874 | 4.2 | 554,855 | 4.5 | 603,051 | 4.7 | 141,940 | 4.6 | 154,724 | 4.7 | ||||||||||||||||||||||||||||||||||||||||||
| Financial and Insurance Service |
457,487 | 4.3 | 464,638 | 4.2 | 473,624 | 4.0 | 496,237 | 4.0 | 519,736 | 4.0 | 129,247 | 4.2 | 134,393 | 4.1 | ||||||||||||||||||||||||||||||||||||||||||
| Education Service |
350,273 | 3.3 | 350,660 | 3.2 | 352,578 | 3.0 | 358,828 | 2.9 | 372,290 | 2.9 | 88,384 | 2.8 | 92,834 | 2.8 | ||||||||||||||||||||||||||||||||||||||||||
| Other* |
1,276,165 | 11.9 | 1,323,766 | 11.9 |
|
1,415,146 |
|
|
12.1 |
|
|
1,509,623 |
|
|
12.3 |
|
1,614,238 | 12.5 | 389,592 | 12.5 | 413,946 | 12.7 | ||||||||||||||||||||||||||||||||||
|
|
|
|
|
|
|
|
|
|
|
|
|
|
|
|
|
|
|
|
|
|
|
|
|
|
|
|
|
|||||||||||||||||||||||||||||
| Gross Value Added at Basic Prices |
10,331,632 | 96.4 | 10,669,447 | 95.9 | 11,197,297 | 95.6 | 11,763,224 | 95.6 | 12,364,589 | 95.7 | 2,980,791 | 95.8 | 3,136,650 | 96.1 | ||||||||||||||||||||||||||||||||||||||||||
| Taxes less Subsidies on Products |
391,367 | 3.6 | 450,613 | 4.1 |
|
512,927 |
|
|
4.4 |
|
|
538,252 |
|
|
4.4 |
|
555,693 | 4.3 | 132,249 | 4.2 | 127,874 | 3.9 | ||||||||||||||||||||||||||||||||||
|
|
|
|
|
|
|
|
|
|
|
|
|
|
|
|
|
|
|
|
|
|
|
|
|
|
|
|
|
|||||||||||||||||||||||||||||
| Total GDP |
10,722,999 | 100.0 | 11,120,060 | 100.0 | 11,710,223 | 100.0 | 12,301,475 | 100.0 | 12,920,282 | 100.0 | 3,113,040 | 100.0 | 3,264,524 | 100.0 | ||||||||||||||||||||||||||||||||||||||||||
|
|
|
|
|
|
|
|
|
|
|
|
|
|
|
|
|
|
|
|
|
|
|
|
|
|
|
|
|
|||||||||||||||||||||||||||||
Source: BPS
| P | Preliminary. |
| * | Includes the Procurement of Electricity and Gas; Procurement of Water, Management of Trash, Waste and Recycle; Accommodation and Food Beverages Supply; Real Estate; Corporate Services; Health Service and Social Activity; and Other Services sectors. |
D-19
Manufacturing Industry
Indonesia’s principal manufacturing industries include food products and beverages, coal and refined petroleum products, fabricated metal products, computer, electronic and optical products and electrical equipment. Other major manufacturing industries include transport equipment and chemicals, pharmaceuticals and botanical products. Manufacturing has been the largest contributor to economic growth since the 1980s. The manufacturing industry sector consists of the sub-sectors of (i) coal industry and oil and gas refining and (ii) non-coal, oil and gas manufacturing industries.
In 2020, Indonesia’s manufacturing industries contracted by 2.9%, compared to 2019, primarily due to a 6.8% contraction in the coal, oil and gas refinery industry. Non-coal, oil and gas manufacturing industries declined by 2.5%, primarily due to contractions in the transport equipment industry and the machinery equipment industry, which contracted by 19.9% and 10.2%, respectively.
In 2021, Indonesia’s manufacturing industry grew by 3.4%, compared to 2020. Non-coal, oil and gas manufacturing industries grew by 3.7%, mainly driven by growth in the transportation equipment industry, basic metal industry, and machinery and equipment industry sub-sector, which grew by 17.8%, 11.5% and 11.4% respectively.
In 2022, the manufacturing industry grew by 4.9%, compared to 2021. This was due to a growth of 5.0% in the non-coal, oil and gas manufacturing industries and a growth of 3.7% in the coal, oil and gas refining industry, each as compared to 2021. The 5.0% growth in the non-coal, oil and gas manufacturing industries was primarily driven by a growth of 14.8% in the basic metals industry due to increased production of iron and steel as well as increasing foreign demand of basic metals, a growth of 10.7% in transportation equipment industry as a result of increased car production and a growth of 4.9% in food and beverages industry primarily because the growing demand for downstream natural resource products boosted refined crude palm oil production.
In 2023, the manufacturing industry grew by 4.6%, compared to 2022 and was the main source of economic growth in 2023. This was due to a 4.7% growth in the non-coal, oil and gas manufacturing industries and a 4.2% growth in the coal, oil and gas refining industry, each as compared to 2022. This performance was primarily driven by relatively strong domestic and global demand for Indonesian export products, such as basic metal industry products, metal goods, and transportation equipment. The results of the downstreaming policy contributed to the growth of the basic metal industry, which grew by 14.2%, compared to 2022. The metal goods, computers, electronic goods, optics, and electrical equipment industry grew by 13.7%, compared to 2022 due to increased demand for metal goods because of increased construction activity. Similarly, the transportation equipment industry grew by 7.6%, primarily due to an increased demand for motorcycles.
In 2024, the manufacturing sector grew by 4.4%, compared to 2023, driven by both domestic and external demand. This was primarily attributable to a growth of 13.3% in base metal industry, supported by Indonesia’s downstreaming policy, a growth of 5.9% in chemical, pharmaceutical and traditional medicine industry, a growth of 5.9% in food and beverage industry and a growth of 6.2% in metal goods, computers, electronic goods, optics and electrical equipment industry, driven by strong global and domestic demand for electronic components.
In the first quarter of 2025, the manufacturing sector grew by 4.5%, compared to the first quarter of 2024, driven by both domestic and external demand, as well as downstreaming activities. In the first quarter of 2025, the food and beverage subsector, which accounted for 34.7% of the manufacturing sector, grew by 6.0%, supported by higher demand during Ramadan and increased rice milling activities. Growth in the manufacturing sector was also bolstered by a growth of 14.5% in base metal industry, supported by rising export demand, particularly for iron and steel products. Additionally, the footwear industry grew by 7.0%, in line with higher demand both domestically and internationally.
The growth in manufacturing sector is in line with the Government’s downstreaming policy and policy of increasing the use of domestic products. The downstreaming policy aims to develop more value-added manufacturing and refining industries that add value to the raw materials before export. For example, since 2020 the Republic has banned the export of raw nickel and instead sought to encourage, through measures including tax incentives and local content requirements, onshore investment in industries that produce nickel-based products such as batteries for electric vehicles.
The downstreaming policy originally focused on a few mining commodities—i.e., nickel, copper, tin, bauxite and coal—and the Government has gradually expanded the policy coverage to other products. Under the administration of President Prabowo Subianto, the Government has devised a downstreaming roadmap encompassing over two dozen commodities, including not only mining commodities, but also gas, petroleum, agricultural products, forestry and marine resources, with priority accorded to: nickel, tin, copper, bauxite, iron/steel, silica sand, gas, petroleum, oil palm, coconut, shrimp, tuna fish, seaweed, salt, and tilapia. The Government expects Indonesia’s downstreaming policy to attract investment of up to U.S.$618.1 billion and create up to three million jobs by 2040.
D-20
The Government has also implemented policies of increasing the use of domestic products, such as local content regulation aimed at bolstering domestic manufacturing and reducing reliance on imports. In November 2024, the Government temporarily banned the sale of products by a major international electronics manufacturer for failing to comply with a local content requirement that mandates that 35% of components in electronic devices be locally sourced. The Government expects to continue to emphasize its downstreaming and local content policies to support Indonesia’s push to become part of global value-added supply chains and its broader growth ambitions.
Wholesale and retail trade, repair of motor vehicles and motorcycles
The wholesale and retail trade, repair of motor vehicles and motorcycles sector includes wholesale and retail trade, as well as the repair of motor vehicles, including motorcycles. In recent years, this has generally been the third largest segment of the economy, behind manufacturing and agriculture, forestry and fishery.
In 2020, the wholesale and retail trade, repair of motor vehicles and motorcycles sector declined by 3.8%, compared to 2019, mainly driven by a 14.1% contraction in the wholesale, retail trade, and repairs of cars and motorcycles sub-sector. The wholesale and retail trade of non-cars and motorcycles sub-sector declined by 1.4%.
In 2021, the wholesale and retail trade, repair of motor vehicles and motorcycles sector increased by 4.7%, compared to 2020. This was mainly driven by the trade of cars, motorbikes and repair sub-sector, which grew by 12.1%, as a result of the implementation of sales tax incentives on luxurious goods which drove an increase in the number of car sales.
In 2022, the wholesale and retail trade, repair of motor vehicles and motorcycles sector grew by 5.5%, compared to 2021. This was driven by a growth of 5.9% in the trade of cars, motorbikes and repair subsector and a growth of 5.4% in the big trade and retail (not cars and motorcycles) subsector. These growths were driven by increased vehicle sales and the population’s increased visits to shopping areas, in line with the easing of mobility restrictions.
In 2023, the wholesale and retail trade, repair of motor vehicles and motorcycles sector grew by 4.8%, compared to 2022. This was driven by a growth of 4.9% in the wholesale and retail trade (excluding automobiles and motorcycles) subsector due to increased domestic trade activity and a 4.5% growth in the automobiles, motorcycles and their repairs subsector primarily due to increased sales of motorcycles (a 20.3% increase, as compared to 2022, which offset a 4.0% decrease in automobiles sales in 2023, as compared to 2022).
In 2024, the wholesale and retail trade, repair of motor vehicles and motorcycles sector grew by 4.9%, compared to 2023. This was driven by a growth of 5.9% in wholesale and retail trade of goods other than cars and motorcycles.
In the first quarter of 2025, the wholesale and retail trade, repair of motor vehicles and motorcycles sector grew by 5.0%, compared to the first quarter of 2024. This was driven by a growth of 6.2% in wholesale and retail trade of goods other than cars and motorcycles.
Agriculture, forestry and fishery
The agriculture, forestry and fishery sector consists of the sub-sectors of (i) agriculture, livestock, hunting and agriculture services, (ii) forestry and logging, and (iii) fishery.
In 2020, the agriculture, forestry, and fishery sector grew by 1.8%, compared to 2019. This growth was mainly driven by the agriculture, livestock, hunting and agriculture services sub-sector, which grew by 2.1%, compared to 2019. The fishery sub-sector grew by 0.7% and the forestry and logging sub-sector declined by 0.03%, in 2020.
In 2021, the agriculture, forestry and fishery sector grew by 1.8%, compared to 2020. This growth was mainly driven by the fishery sub-sector which grew by 5.5% due to an increased production of captured fish and seaweed cultivation. The agriculture, livestock, hunting, and agriculture services sub-sector grew by 1.1% and the forestry and logging sub-sector grew by 0.1%, as compared to 2020.
In 2022, the agriculture, forestry and fishery sector grew by 2.3%, compared to 2021. This growth was mainly driven by a growth of 2.8% in fishery subsector driven by increased production in captured and farmed fisheries, and a growth of 2.3% in agriculture, livestock, hunting, and agriculture services subsector partly due to the increases in rice, palm oil and cocoa production. The forestry and logging subsector declined by 1.3%, as compared to 2021, due to a significant decrease in log production in community forests.
D-21
In 2023, the agriculture, forestry and fishery sector grew by 1.3%, compared to 2022. This low growth was primarily due to the El Niño phenomenon, which caused a reduction in the production of food crops such as rice, corn, peanuts, and seasonal horticultural products such as vegetables. As such, the food crop and horticultural subsectors experienced contractions of 3.9% and 0.3%, respectively, compared to 2022. The fisheries subsector grew by 5.5% compared to 2022, primarily due to increased seaweed production. The livestock subsector grew by 3.7%, compared to 2022, due to the distribution of corn feed stocks to small-scale farmers to revive poultry farming businesses. The forestry and logging subsector grew by 2.6% compared to 2022 due to increased foreign demand for wood and non-timber forest products. The plantation subsector also grew by 1.7% compared to 2022, as a result of increased demand for palm oil products, both domestically and internationally.
In 2024, the agriculture, forestry and fishery sector grew by 0.7%, compared to 2023. This was primarily due to a growth of 2.8% in animal husbandry and a growth of 0.7% in plantation crops.
In the first quarter of 2025, the agriculture, forestry and fishery sector grew by 10.5%, compared to the first quarter of 2024. This was primarily due to a growth of 42.3% in food crops. The peak harvest season for rice and corn shifted back to the first quarter, following a delay to the second quarter in the previous year due to the impact of El Niño.
The following table sets forth production statistics for Indonesia’s most important agricultural products for the periods indicated.
Production of Principal Agricultural Products by Sub-sectors
| Year Ended December 31, | ||||||||||||||||||||
| 2020 | 2021 | 2022 | 2023 | 2024P | ||||||||||||||||
| (in thousands of tons, except as otherwise indicated) | ||||||||||||||||||||
| Food crops |
||||||||||||||||||||
| Rice |
54,649 | 54,415 | 54,749 | 53,981 | 53,143 | |||||||||||||||
| Cassava |
16,271 | 15,731 | 18,017 | 16,764 | 15,176 | |||||||||||||||
| Corn |
17,489 | 18,147 | 22,357 | 19,986 | 20,479 | |||||||||||||||
| Sweet Potato |
1,604 | 1,424 | 2,011 | 1,430 | 1,386 | |||||||||||||||
| Soybeans (shelled) |
291 | 213 | 243 | 349 | 218 | |||||||||||||||
| Peanuts (shelled) |
416 | 399 | 380 | 350 | 318 | |||||||||||||||
| Mung beans |
199 | 211 | 122 | 166 | 129 | |||||||||||||||
| Estate cash crops |
||||||||||||||||||||
| Dry Rubber |
3,037 | 3,045 | 2,717 | 2,241 | 2,262 | |||||||||||||||
| Coffee |
762 | 786 | 775 | 759 | 808 | |||||||||||||||
| Cocoa |
721 | 688 | 651 | 632 | 633 | |||||||||||||||
| Tea |
144 | 138 | 125 | 117 | 124 | |||||||||||||||
| Sugarcane |
2,131 | 2,351 | 2,406 | 2,271 | 2,466 | |||||||||||||||
| Tobacco |
261 | 245 | 222 | 287 | 353 | |||||||||||||||
| Palm Oil |
46,766 | 45,121 | 46,819 | 47,084 | 47,475 | |||||||||||||||
| Livestock |
||||||||||||||||||||
| Meat |
4,555 | 4,547 | 4,947 | 4,094 | 4,219 | |||||||||||||||
| Eggs |
5,874 | 5,893 | 6,339 | 6,585 | 6,876 | |||||||||||||||
| Milk |
947 | 903 | 824 | 787 | 808 | |||||||||||||||
| Fish products |
||||||||||||||||||||
| Captured Fish |
6,989 | 7,225 | 7,400 | 7,846 | 7,393 | |||||||||||||||
| Farmed Fish |
14,845 | 14,648 | 14,776 | 15,361 | 17,182 | |||||||||||||||
| Forestry(1) |
||||||||||||||||||||
| Logs |
51,916 | 54,939 | 56,665 | 59,751 | 57,473 | |||||||||||||||
| Sawn Timber |
2,581 | 2,660 | 2,297 | 2,118 | 2,102 | |||||||||||||||
| Plywood |
3,863 | 4,461 | 4,207 | 3,470 | 3,591 | |||||||||||||||
Sources: BPS, Ministry of Agriculture, Ministry of Marine Affairs and Fisheries, and Ministry of Environment and Forestry
| P | Preliminary. |
| (1) | All units are in thousands of cubic meters. |
D-22
Mining and Quarrying
Indonesia is a significant player in the global mining and quarrying industry with significant production of natural gas, coal, crude oil, tin, nickel, bauxite and copper.
In 2020, the mining and quarrying sector declined by 2.0%, compared to 2019, primarily due to contractions in the oil, gas, and geothermal mining sub-sector and the coal and lignite mining sub-sector, which respectively contracted by 6.0% and 5.4%. This contraction was offset by a growth in metal ore mining sub-sector, which grew by 20.3%.
In 2021, the mining and quarrying sector grew by 4.0%, compared to 2020. This was mainly driven by the metal ore mining sub-sector, which grew by 22.8% due to increase in copper and gold production. The oil, gas and geothermal mining sub-sector contracted by 4.4% due to a decrease in the amount of oil production.
In 2022, the mining and quarrying sector grew by 4.4%, compared to 2021. This was mainly driven by a growth of 18.0% in metal ore mining subsector driven by increased production of copper and gold in the mineral district of Grasberg, Papua, and increased demand from abroad, especially for gold and copper commodities. The coal and lignite mining subsector grew by 8.1% and the other mining and quarrying subsector saw a growth of 2.3%, due to the increased exports of mining commodities such as natural sand, precious stones, and natural asphalt. On the contrary, the oil, gas and geothermal mining subsector declined by 4.8%, as compared to 2021, due to unplanned shutdowns.
In 2023, the mining and quarrying sector grew by 6.1%, compared to 2022. This was mainly driven by a growth of 10.0% in the coal and lignite mining industry attributable to growth in coal exports, a growth of 8.5% in metal ore mining industry, driven by increased production of minerals such as gold, copper and nickel, and a growth of 5.4% in mining and other quarrying industry due to increased exports of mining commodities such as gemstones, gravel and sand. The oil and gas subsector grew by 0.7%, compared to 2022, in line with the optimization of oil exploitation and the exploitation of new gas sources after experiencing contractions in recent years.
In 2024, the mining and quarrying sector grew by 4.9%, compared to 2023. This was driven by a growth of 8.3% in metal ore mining, a growth of 6.8% in coal and lignite mining and a growth of 6.3% in mining and other excavations.
In the first quarter of 2025, the mining and quarrying sector declined by 1.2%, compared to the first quarter of 2024. This was due to a decline of 11.8% in metal ore mining and a decline of 0.9% in coal and lignite mining. Gold and copper production fell due to major scheduled maintenance at the copper and gold mines in Central Papua, and coal production declined in response to weakening demand in international markets. The declines were partially offset by a growth of 3.7% in mining and other excavations and a growth of 2.6% in oil, gas and geothermal mining.
As products in the mining and quarrying sector are internationally traded commodities with prices set by the world markets, the performance of this sub-sector is primarily affected by international market prices. See “— Foreign Trade and Balance of Payments — Exports and Imports.”
Oil and Natural Gas
The oil and gas market in Indonesia is characterized by the presence of large, diversified companies with highly vertically integrated operations throughout oil exploration, production, refining, transportation and marketing. Pertamina, a state-owned enterprise, or SOE, plays an important role in the production of oil and gas in Indonesia.
Oil and gas exports contributed 5.1%, 5.3%, 5.5%, 6.1%, 6.0% and 5.5% to total exports in 2020, 2021, 2022, 2023, 2024 and the first four months of 2025, respectively. In 2020, 2021, 2022, 2023 and 2024, oil and gas revenues comprised 6.2%, 7.4%, 8.6%, 6.7% and 6.3%, respectively, of the Government’s domestic revenue (inclusive of income tax revenue from the oil and gas sub-sector). The fluctuations in exports and contribution to domestic revenue are due to the natural decline in the reservoir performance and lack of discovery and production of replacement reserves, fluctuating commodities pricing during the period and also the growth of other sectors in the economy.
D-23
The following table sets forth crude oil production by source for the periods indicated.
Crude Oil Production by Source(1)
| Year Ended December 31, | ||||||||||||||||||||
| 2020 | 2021 | 2022 | 2023 | 2024P | ||||||||||||||||
| (in millions of barrels) | ||||||||||||||||||||
| Pertamina |
29 | 26 | 26 | 25 | 24 | |||||||||||||||
| Production sharing contracts(2) |
260 | 215 | 198 | 196 | 188 | |||||||||||||||
|
|
|
|
|
|
|
|
|
|
|
|||||||||||
| Total |
259 | 241 | 224 | 221 | 212 | |||||||||||||||
|
|
|
|
|
|
|
|
|
|
|
|||||||||||
Source: Ministry of Energy and Mineral Resources
| P | Preliminary. |
| (1) | Includes production of crude oil condensate. |
| (2) | Most of the production under production sharing contracts is provided to Pertamina. Production sharing contracts are a common type of joint cooperation contract used in Indonesia’s oil and gas upstream sector, under which the Government and the contractor agree to split the production measured in revenue based on agreed percentages. |
The table below sets forth Indonesia’s proven crude oil reserves for the periods indicated based on estimates prepared by (1) the Ministry of Energy and Mineral Resources’ Reserve Oil and Gas Evaluation Team, which is composed of representatives from the Oil and Gas Directorate of the Ministry of Energy and Mineral Resources, the Center of Research and Development of Oil and Gas Technology of the Ministry of Energy and Mineral Resources (the “TECP”) and (2) the Special Task Force for Upstream Oil and Gas Business Activities (“SKK Migas”, which is a government entity responsible for supervising upstream oil and gas activities) based on reports received by SKK Migas from various oil and gas contractors. Proven crude oil reserves include developed and undeveloped volumes that are economically recoverable at either current prices or forecasted future prices as calculated by each relevant contractor under the coordination of SKK Migas. Estimates of proven crude oil reserves are comparable to estimates prepared using international standards and include total volume without regard to the direct economic benefit of Indonesia. Estimates are prepared pursuant to the Petroleum Resources Management System sponsored by the Society of Petroleum Engineers.
Proven Crude Oil Reserves
| Year |
Proven Crude Oil Reserves | |||
| (in million stock tank barrels) | ||||
| 2020 |
2,442.1 | |||
| 2021 |
2,245.2 | |||
| 2022 |
2,271.6 | |||
| 2023 |
2,413.2 | |||
| 2024 |
2,287.8 | |||
Source: Ministry of Energy and Mineral Resources
The following table sets forth Indonesia’s crude oil exports by source for the periods indicated.
Crude Oil Exports(1)
| Year Ended December 31, | ||||||||||||||||||||
| 2020 | 2021 | 2022 | 2023 | 2024 | ||||||||||||||||
| (in millions of barrels) | ||||||||||||||||||||
| Production sharing contracts(2) |
28 | 44 | 15 | 21 | 27 | |||||||||||||||
| Government and government-designated(3) |
4 | 0 | 0 | 0 | 0 | |||||||||||||||
|
|
|
|
|
|
|
|
|
|
|
|||||||||||
| Total |
32 | 44 | 15 | 21 | 27 | |||||||||||||||
|
|
|
|
|
|
|
|
|
|
|
|||||||||||
Source: Ministry of Energy and Mineral Resources
| (1) | Includes exports of crude oil condensate. |
| (2) | Most of the production under production sharing contracts is provided to Pertamina. Production sharing contracts are a common type of joint cooperation contract used in Indonesia’s oil and gas upstream sector, under which the Government and the contractor agree to split the production measured in revenue based on agreed percentages. |
| (3) | Exports by Pertamina and entities designated by SKK Migas are reported together. |
D-24
The following table sets forth the average price of Indonesian crude oil, measured by the ICP, for the periods indicated.
Average Price of Crude Oil
| As of December 31, | As of April 30, |
|||||||||||||||||||||||||||
| 2020 | 2021 | 2022 | 2023 | 2024P | 2024P | 2025P | ||||||||||||||||||||||
| (in U.S. dollars per barrel) | ||||||||||||||||||||||||||||
| ICP(1) |
40.4 | 68.5 | 97.0 | 75.5 | 71.2 | 87.6 | 65.9 | |||||||||||||||||||||
Sources: Directorate General of Oil and Gas, Ministry of Energy and Mineral Resources
| P | Preliminary. |
| (1) | For a description of the ICP, see “Certain Defined Terms and Conventions.” |
The following table sets forth natural gas production by source for the periods indicated.
Natural Gas Production by Source(1)
| Year Ended December 31, | ||||||||||||||||||||
| 2020 | 2021 | 2022 | 2023 | 2024 | ||||||||||||||||
| (in millions of cubic feet) | ||||||||||||||||||||
| Pertamina |
314 | 324 | 311 | 305 | 296 | |||||||||||||||
| Production sharing contracts(2) |
2,129 | 2,109 | 2,058 | 2,115 | 2,193 | |||||||||||||||
|
|
|
|
|
|
|
|
|
|
|
|||||||||||
| Total |
2,443 | 2,433 | 2,369 | 2,420 | 2,489 | |||||||||||||||
|
|
|
|
|
|
|
|
|
|
|
|||||||||||
Source: Ministry of Energy and Mineral Resources
| (1) | Includes LPG. |
| (2) | Most of the production under production sharing contracts is provided to Pertamina. Production sharing contracts are a common type of joint cooperation contract used in Indonesia’s oil and gas upstream sector, under which the Government and the contractor agree to split the production measured in revenue based on agreed percentages. |
The table below sets forth Indonesia’s proven natural gas reserves for the periods indicated based on estimates prepared by the TECP and SKK Migas based on reports from various oil and gas contractors. Proven natural gas reserves represent marketable volumes that generate sales revenue. Estimates of proven natural gas reserves are comparable to estimates prepared using international standards and include total volume without regard to the direct economic benefit of Indonesia. Estimates are prepared pursuant to the Petroleum Resources Management System sponsored by the Society of Petroleum Engineers.
Proven Natural Gas Reserves
| Year |
Proven Natural Gas Reserves | |||
| (in trillions of standard cubic feet of gas) | ||||
| 2020 | 43.6 | |||
| 2021 | 41.6 | |||
| 2022 | 36.3 | |||
| 2023 | 35.3 | |||
| 2024P | 33.8 | |||
Source: Ministry of Energy and Mineral Resources
| P | Preliminary. |
D-25
Minerals
The Republic’s major mineral products are coal, nickel, copper and bauxite, and it has substantial resources of each of these minerals. In recent years, the Government has pursued policies designed to increase the production and export of value-added products using these mineral resources.
Under Law No. 4 of 2009 on Mineral and Coal Mining enacted by the Government in January 2009 (which was subsequently amended by Law No. 3 of 2020 enacted in June 2020 and further amended by Article 39 of the Law on Job Creation, as so amended, the “Mining Law”), two new types of licenses were created: ijin usaha pertambangan (“IUP”) and ijin usaha pertambangan khusus (“IUPK”). Subsequent to the enactment of the Mining Law, the Government issued various regulations thereunder, including (i) regulations mandating the domestic processing and refining of minerals, (ii) regulations requiring the reclamation of areas affected by mining activities, (iii) regulations related to local community development and empowerment, optimization and conservation of mineral resources, and job opportunities for local mining service providers and local communities surrounding a mining area and (iv) regulations relating to procedures for the granting of a production operation special mining permit, which provide guidelines for the granting of an operation production IUPK in order to continue the operation of a contract of work.
Grasberg Copper Mine
On September 27, 2018, the Indonesian state-owned enterprise PT Indonesia Asahan Aluminium (Persero) or Inalum, entered into various agreements with Freeport McMoRan Inc, the parent company of Freeport Indonesia, the operator of the Grasberg copper mine in the province of Papua, Rio Tinto and other relevant parties in connection with Inalum’s acquisition of a 51.2% share ownership in Freeport Indonesia and other interests related to the Grasberg copper mine for a cash consideration of U.S.$3.85 billion, following a dispute between the Government and Freeport relating to the failure to convert the mine’s contract of work into an IUPK..
The transaction was completed in December 2018, pursuant to which Inalum owns, directly and indirectly, 51.2% beneficial equity interest in Freeport Indonesia (subject to a dividend assignment mechanism to replicate the joint venture economics), and FCX’s ownership is 48.8%. FCX continues to manage the operations of Freeport Indonesia. The Government and FCX are currently in discussions around potentially extending Freeport Indonesia’s mining rights beyond 2041.
Construction
Over the last five years, besides the development of a basic public services infrastructure, the main drivers of the construction sector were improvement works in the areas of communications and logistics infrastructure, transportation and electrification.
In 2020, the construction sector contracted by 3.3%, compared to 2019. This contraction was primarily due to reduced construction activity as a result of Covid-19, which led to delayed completion of infrastructure projects.
In 2021, the construction sector grew by 2.8%, compared to 2020. This was in line with the increase in infrastructure activities and the increase in imports of raw materials for construction activities.
In 2022, the construction sector grew by 2.0%, compared to 2021. This growth was in line with the increase in infrastructure activities and the increase in imports of raw materials for construction activities, as the Covid-19 related social restrictions eased and the economy was recovering.
In 2023, the construction sector grew by 4.9%, compared to 2022. This growth was primarily due to the Government’s capital expenditure activities to support national strategic projects and the development of basic infrastructure in the new capital city, Nusantara. Key construction indicators, such as domestic cement sales, saw a 4.1% increase in 2023, compared to 2022.
In 2024, the construction sector grew by 7.0%, compared to 2023, as a result of the continued development of Nusantara and national strategic projects, as discussed in “Infrastructure Development” below.
In the first quarter of 2025, the construction sector grew by 2.2%, compared to the first quarter of 2024. This growth was supported by an increase in imports of raw materials for construction, including glass, iron and steel products, and other related goods. However, the construction sector’s overall performance was constrained by lower government capital spending resulting from budget cuts and delayed infrastructure projects, as well as a decline in cement production due to adverse weather conditions and reduced activities during Ramadan and the Eid holidays.
D-26
Transportation and Warehousing
The transportation and warehousing sector comprises the sub-sectors of (i) railway transport, (ii) land transport, (iii) sea transport, (iv) river, lake and ferry transport, (v) air transport and (vi) warehousing and support activities for transportation; postal and courier.
In 2020, the transportation and warehousing sector contracted by 15.1%, compared to 2019. The sub-sector contributing the highest contractions was air transport at 53.1%, followed by railways transport at 42.3%. This contraction was primarily due to mobility restriction during the Covid-19 pandemic.
In 2021, the transportation and warehousing sector grew by 3.2%, compared to 2020. This was partly due to increased mobility in public transportation and recreational areas.
In 2022, the transportation and warehousing sector grew by 19.9%, compared to 2021. This was primarily due to a growth of 40.5% in warehousing and transportation support services, and post and courier, a growth of 66.9% in air freight and a growth of 8.7% in land transport.
In 2023, the transportation and warehousing sector grew by 14.0%, compared to 2022, due to increased societal mobility. In particular, air transport grew by 29.0% due to increased number of domestic and international passenger, while rail transport grew by 23.7% due to increased number of passengers, additional schedules for long-distance trains and the opening of new routes including the Jakarta-Bandung High Speed Rail and the Jabodebek Integrated Corridor Light Rail Transit. The warehousing and transportation support services, and post and courier subsector also grew by 17.9% and the sea freight subsector grew by 15.5%.
In 2024, the transportation and warehousing sector grew by 8.7%, compared to 2023, driven by increases in passenger and cargo volumes, supported by higher mobility and increased economic activities. This was partly attributable to the hosting of national and international events that boosted the flow of domestic and international tourists in Indonesia. All the transportation and warehousing subsectors experienced growths. In particular, rail transportation grew by 18.6%, land transportation grew by 9.9%, air freight grew by 6.7% and warehousing and transportation support services and post and courier increased by 9.4%.
In the first quarter of 2025, the transportation and warehousing sector grew by 9.0%, compared to the first quarter of 2024, primarily driven by an increase in public transportation passenger volume due to the New Year holidays and the shift of part of the 2025 Eid homecoming travel flow to the first quarter, whereas in 2024 it took place in the second quarter. In particular, rail transportation grew by 17.6%, land transportation grew by 9.9%, warehousing and transportation support services and post and courier increased by 9.5% and sea transportation grew by 6.9%.
Information and Communication
In 2020, the information and communication grew by 10.6% compared to 2019. This growth was primarily due to an increase in data traffic in telecommunications industry as a result of the working from home and school from home arrangements.
In 2021, the information and communication sector grew by 6.8% compared to 2020. The slower growth was partly due to decline in the information industry, which includes the printing and paper goods industry.
In 2022, the information and communication sector grew by 7.7%, compared to 2021. This growth was in line with the increased data traffic among various telecommunication service providers as well as a growth in digital banking transactions and electronic money transactions.
In 2023, the information and communication sector grew by 7.6%, compared to 2022, driven largely by digital transformation, as evidenced by increased data traffic from several telecommunications providers (from access to social media, communication services, video streaming, mobile gaming, and browsing access) as well as an increase in digital banking transactions and electronic money transactions.
In 2024, the information and communication sector grew by 7.6%, compared to 2023. This was driven by increased telecommunication data traffic during events and festivals, the rising popularity of Indonesian movies and the expansion of Indonesia’s data center industry.
D-27
In the first quarter of 2025, the information and communication sector grew by 7.7%, compared to the first quarter of 2024. This growth was fueled by higher revenues from both wired and wireless telecommunications, an increase in the number of start-ups in Indonesia, increased production of Indonesian films, and the opening of new cinemas in several regions, including West Java and Banten.
Financial and Insurance Service
In 2020, the financial and insurance service sector grew by 3.2%, compared to 2019. This growth was primarily due to a growth of 4.0% in financial intermediary services and a growth of 4.0% in insurance and pension fund, partially offset by a decline of 0.6% in other financial services.
In 2021, the financial and insurance service sector grew by 1.6%, compared to 2020. This growth was primarily due to a growth of 2.7% in financial intermediary services, partially offset by a decline of 2.4% in other financial services.
In 2022, the financial and insurance service sector grew by 1.9%, compared to 2021. This growth was primarily due to a growth of 2.4% in financial intermediary services and a growth of 4.5% in other financial services.
In 2023, the financial and insurance service sector grew by 4.8%, compared to 2022. This growth was primarily due to a growth of 7.0% in financial intermediary services and a growth of 4.0% in other financial services. These were primarily due to an increase in revenue generated from financial intermediary services (due to the widening spread between reference interest rates and deposit interest rates along with a rise in commission income for commercial banks) and enhanced revenue streams from various financing entities, including financing institutions, pawnshops, venture capital firms, infrastructure financing and guarantee institutions.
In 2024, the financial and insurance service sector grew by 4.7%, compared to 2023. This growth was primarily due to a growth of 6.8% in financial intermediary services and a growth of 4.6% in other financial services.
In the first quarter of 2025, the financial and insurance service sector grew by 4.0%, compared to the first quarter of 2024. This growth was primarily due to a growth of 5.2% in financial intermediary services and a growth of 7.7% in other financial services.
Other sectors
None of the other sectors shown in the tables above comprised more than 5.0% of GDP, at either current prices or constant prices, for the periods indicated.
D-28
Gross Domestic Product by Expenditure
In this report, GDP is shown in both current and constant prices. GDP at current prices value a country’s output using the actual prices for each year, while GDP at constant prices (also referred to as “real” GDP) value output using the prices from a base year, thereby eliminating the distorting effects of inflation and deflation.
The following tables show the distribution of GDP in the Indonesian economy by expenditure at current prices and constant prices, respectively, for the periods indicated (at current prices).
Gross Domestic Product by Expenditure
(at current prices)
| Year Ended December 31, | Three Months Ended March 31, | |||||||||||||||||||||||||||||||||||||||||||||||||||||||
| 2020 | % | 2021 | % | 2022 | % | 2023P | % | 2024P | % | 2024P | % | 2025P | % | |||||||||||||||||||||||||||||||||||||||||||
|
|
|
|
|
|
|
|
|
|
|
|
|
|
|
|
|
|
|
|
|
|
|
|
|
|
|
|
|
|||||||||||||||||||||||||||||
| (in billions of Rupiah and percentage of GDP) | ||||||||||||||||||||||||||||||||||||||||||||||||||||||||
| GDP |
15,443,353 | 100.0 | 16,976,751 | 100.0 | 19,588,460 | 100.0 | 20,892,349 | 100.0 | 22,138,964 | 100.0 | 288,577 | 100.0 | 5,665,930 | 100.0 | ||||||||||||||||||||||||||||||||||||||||||
| Add: Imports of goods and services |
2,415,496 | 18.9 | 3,189,626 | 18.8 | 4,106,086 | 21.0 | 4,091,232 | 19.6 | 4,513,987 | 20.4 | 1,042,630 | 19.7 | 1,118,541 | 19.7 | ||||||||||||||||||||||||||||||||||||||||||
|
|
|
|
|
|
|
|
|
|
|
|
|
|
|
|
|
|
|
|
|
|
|
|
|
|
|
|
|
|||||||||||||||||||||||||||||
| Total supply of goods and services |
17,858,849 | 118.9 | 20,166,378 | 118.8 | 23,694,546 | 121.0 | 24,983,580 | 119.6 | 26,652,951 | 120.4 | 6,331,207 | 119.7 | 6,784,471 | 119.7 | ||||||||||||||||||||||||||||||||||||||||||
|
|
|
|
|
|
|
|
|
|
|
|
|
|
|
|
|
|
|
|
|
|
|
|
|
|
|
|
|
|||||||||||||||||||||||||||||
| Less: Exports of goods and services |
2,676,514 | 21.6 | 3,635,835 | 21.4 | 4,799,743 | 24.5 | 4,544,890 | 21.8 | 4,911,156 | 22.2 | 1,135,852 | 21.5 | 1,263,347 | 22.3 | ||||||||||||||||||||||||||||||||||||||||||
|
|
|
|
|
|
|
|
|
|
|
|
|
|
|
|
|
|
|
|
|
|
|
|
|
|
|
|
|
|||||||||||||||||||||||||||||
| Total domestic expenditure |
15,182,336 | 97.3 | 16,530,542 | 97.4 | 18,894,803 | 96.5 | 20,438,690 | 97.8 | 21,741,796 | 98.2 | 195,355 | 98.2 | 521,123 | 97.4 | ||||||||||||||||||||||||||||||||||||||||||
|
|
|
|
|
|
|
|
|
|
|
|
|
|
|
|
|
|
|
|
|
|
|
|
|
|
|
|
|
|||||||||||||||||||||||||||||
| Allocation of total domestic expenditure: |
||||||||||||||||||||||||||||||||||||||||||||||||||||||||
| Household consumption expenditure |
8,899,918 | 54.4 | 9,236,049 | 54.4 | 10,161,713 | 51.9 | 11,109,566 | 53.2 | 11,964,947 | 54.0 | 2,905,130 | 54.9 | 3,089,482 | 54.5 | ||||||||||||||||||||||||||||||||||||||||||
| NPISHs consumption expenditure |
201,452 | 1.2 | 207,916 | 1.2 | 228,999 | 1.2 | 261,210 | 1.3 | 300,080 | 1.4 | 75,820 | 1.4 | 78,589 | 1.4 | ||||||||||||||||||||||||||||||||||||||||||
| Government consumption expenditure |
1,491,172 | 9.1 | 1,569,830 | 9.2 | 1,506,285 | 7.7 | 1,557,496 | 7.5 | 1,711,551 | 7.7 | 331,985 | 6.3 | 333,287 | 5.9 | ||||||||||||||||||||||||||||||||||||||||||
|
|
|
|
|
|
|
|
|
|
|
|
|
|
|
|
|
|
|
|
|
|
|
|
|
|
|
|
|
|||||||||||||||||||||||||||||
| Total consumption |
10,592,541 | 64.8 | 11,013,796 | 64.9 | 11,896,997 | 60.7 | 12,928,272 | 61.9 | 13,976,578 | 63.1 | 3,312,935 | 62.6 | 3,501,357 | 61.8 | ||||||||||||||||||||||||||||||||||||||||||
|
|
|
|
|
|
|
|
|
|
|
|
|
|
|
|
|
|
|
|
|
|
|
|
|
|
|
|
|
|||||||||||||||||||||||||||||
| Gross domestic fixed capital formation |
4,491,937 | 30.8 | 5,227,854 | 30.8 | 5,697,279 | 29.1 | 6,090,677 | 29.2 | 6,452,531 | 29.1 | 1,541,269 | 29.1 | 1,588,267 | 28.0 | ||||||||||||||||||||||||||||||||||||||||||
| Change in inventories (residual)(1) |
97,858 | 1.7 | 288,893 | 1.7 | 1,300,526 | 6.6 | 1,419,742 | 6.8 | 1,312,687 | 5.9 | 341,152 | 6.5 | 431,499 | 7.6 | ||||||||||||||||||||||||||||||||||||||||||
|
|
|
|
|
|
|
|
|
|
|
|
|
|
|
|
|
|
|
|
|
|
|
|
|
|
|
|
|
|||||||||||||||||||||||||||||
| Total domestic expenditure |
15,182,336 | 97.3 | 16,530,542 | 97.4 | 18,894,803 | 96.5 | 20,438,690 | 97.8 | 21,741,796 | 98.2 | 5,195,355 | 98.2 | 5,521,123 | 97.4 | ||||||||||||||||||||||||||||||||||||||||||
|
|
|
|
|
|
|
|
|
|
|
|
|
|
|
|
|
|
|
|
|
|
|
|
|
|
|
|
|
|||||||||||||||||||||||||||||
Source: BPS
| P | Preliminary. |
| (1) | Includes statistical discrepancies. |
D-29
Gross Domestic Product by Expenditure
(at constant 2010 prices)(1)
| Year Ended December 31, | Three Months Ended March 31, | |||||||||||||||||||||||||||||||||||||||||||||||||||||||
| 2020 | % | 2021 | % | 2022 | % | 2023P | % | 2024P | % | 2024P | % | 2025P | % | |||||||||||||||||||||||||||||||||||||||||||
| (in billions of Rupiah and percentage of GDP) | ||||||||||||||||||||||||||||||||||||||||||||||||||||||||
| GDP |
10,722,999 | 100.0 | 11,120,060 | 100.0 | 11,710,223 | 100.0 | 12,301,475 | 100.0 | 12,920,282 | 100.0 | 3,113,040 | 100.0 | 3,264,524 | 100.0 | ||||||||||||||||||||||||||||||||||||||||||
| Add: Imports of goods and services |
1,686,004 | 15.7 | 2,105,117 | 18.9 | 2,420,794 | 20.7 | 2,382,010 | 19.4 | 2,571,356 | 19.9 | 597,374 | 19.2 | 621,004 | 19.0 | ||||||||||||||||||||||||||||||||||||||||||
|
|
|
|
|
|
|
|
|
|
|
|
|
|
|
|
|
|
|
|
|
|
|
|
|
|
|
|
|
|||||||||||||||||||||||||||||
| Total supply of goods and services |
12,409,003 | 115.7 | 13,225,177 | 118.9 | 14,131,017 | 120.7 | 14,683,485 | 119.4 | 15,491,637 | 119.9 | 3,710,414 | 119.2 | 3,885,527 | 119.0 | ||||||||||||||||||||||||||||||||||||||||||
|
|
|
|
|
|
|
|
|
|
|
|
|
|
|
|
|
|
|
|
|
|
|
|
|
|
|
|
|
|||||||||||||||||||||||||||||
| Less: Exports of goods and services |
2,083,942 | 19.4 | 2,458,849 | 22.1 | 2,857,958 | 24.4 | 2,896,372 | 23.5 | 3,085,059 | 23.9 | 728,807 | 23.4 | 778,222 | 23.8 | ||||||||||||||||||||||||||||||||||||||||||
|
|
|
|
|
|
|
|
|
|
|
|
|
|
|
|
|
|
|
|
|
|
|
|
|
|
|
|
|
|||||||||||||||||||||||||||||
| Total domestic expenditure |
10,325,061 | 96.3 | 10,766,328 | 96.8 | 11,273,059 | 96.3 | 11,787,113 | 95.8 | 12,406,578 | 96.0 | 2,981,607 | 95.8 | 3,107,305 | 95.2 | ||||||||||||||||||||||||||||||||||||||||||
|
|
|
|
|
|
|
|
|
|
|
|
|
|
|
|
|
|
|
|
|
|
|
|
|
|
|
|
|
|||||||||||||||||||||||||||||
| Allocation of total domestic expenditure: |
||||||||||||||||||||||||||||||||||||||||||||||||||||||||
| Household consumption expenditure |
5,780,223 | 53.9 | 5,896,662 | 53.0 | 6,187,944 | 52.8 | 6,486,254 | 52.7 | 6,806,404 | 52.7 | 1,659,855 | 53.3 | 1,741,028 | 53.3 | ||||||||||||||||||||||||||||||||||||||||||
| NPISHs consumption expenditure |
130,306 | 1.2 | 132,412 | 1.2 | 139,904 | 1.2 | 153,938 | 1.3 | 173,143 | 1.3 | 43,939 | 1.4 | 45,288 | 1.4 | ||||||||||||||||||||||||||||||||||||||||||
| Government consumption expenditure |
874,146 | 8.2 | 911,320 | 8.2 | 871,026 | 7.4 | 897,299 | 7.3 | 956,623 | 7.4 | 190,467 | 6.1 | 187,837 | 5.8 | ||||||||||||||||||||||||||||||||||||||||||
|
|
|
|
|
|
|
|
|
|
|
|
|
|
|
|
|
|
|
|
|
|
|
|
|
|
|
|
|
|||||||||||||||||||||||||||||
| Total consumption |
6,784,675 | 63.3 | 6,940,393 | 62.4 | 7,198,874 | 61.5 | 7,537,491 | 61.3 | 7,936,170 | 61.4 | 1,894,261 | 60.8 | 1,974,154 | 60.5 | ||||||||||||||||||||||||||||||||||||||||||
|
|
|
|
|
|
|
|
|
|
|
|
|
|
|
|
|
|
|
|
|
|
|
|
|
|
|
|
|
|||||||||||||||||||||||||||||
| Gross domestic fixed capital formation |
3,489,052 | 32.5 | 3,549,219 | 31.9 | 3,686,574 | 31.5 | 3,825,222 | 31.1 | 4,001,693 | 31.0 | 959,007 | 30.8 | 979,303 | 30.0 | ||||||||||||||||||||||||||||||||||||||||||
| Change in inventories (residual)(2) |
51,334 | 0.5 | 276,715 | 2.5 | 387,611 | 3.3 | 424,399 | 3.4 | 468,715 | 3.6 | 128,338 | 4.1 | 153,848 | 4.7 | ||||||||||||||||||||||||||||||||||||||||||
|
|
|
|
|
|
|
|
|
|
|
|
|
|
|
|
|
|
|
|
|
|
|
|
|
|
|
|
|
|||||||||||||||||||||||||||||
| Total domestic expenditure |
10,325,061 | 96.3 | 10,766,328 | 96.8 | 11,273,059 | 96.3 | 11,787,113 | 95.8 | 12,406,578 | 96.0 | 2,981,607 | 95.8 | 3,107,305 | 95.2 | ||||||||||||||||||||||||||||||||||||||||||
|
|
|
|
|
|
|
|
|
|
|
|
|
|
|
|
|
|
|
|
|
|
|
|
|
|
|
|
|
|||||||||||||||||||||||||||||
Source: BPS
| P | Preliminary. |
| (1) | Calculated with calendar year 2010 as the Base Year. |
| (2) | Includes statistical discrepancies. |
D-30
Inflation
The Government sets inflation targets periodically and targeted an inflation rate of 3.5% (±1.0%) for 2019 and 3.0% (±1.0%) for 2020 to 2023. The inflation target for 2024 is 2.5% (±1.0%). The inflation target for 2025 is 2.5% (±1.0%). Bank Indonesia enacts and implements policies to achieve the inflation target in coordination with the Government.
In addition, the Inflation Control Team (Tim Pengendalian Inflasi (“TPI”)) is responsible for identifying and analyzing the sources of inflation and making policy recommendations to maintain low and stable inflation levels in the medium-to-long term. The TPI at the national level consists of a number of governmental authorities, including Bank Indonesia, the Ministry of Finance, the Ministry of Transportation, the Ministry of Trade, the Ministry of Agriculture, the Ministry of Energy and Mineral Resources, and the Coordinating Ministry of Economic Affairs. The TPI also operates in Indonesia’s various regions to strengthen policy coordination, particularly in monitoring and controlling regional inflation.
The following table shows the Consumer Price Index (“CPI”) as of the end of the periods indicated and the percentage change against the previous period.
Changes in Consumer Price Index
| As of December 31, | As of June 30, | |||||||||||||||||||||||
| 2020(1) | 2021(1) | 2022(1) | 2023(1) | 2024(2) | 2025(2) | |||||||||||||||||||
| CPI |
105.7 | 107.7 | 113.6 | 116.6 | 106.8 | 108.3 | ||||||||||||||||||
| Annual percentage year-on-year |
1.7 | % | 1.9 | % | 5.5 | % | 2.6 | % | 1.6 | % | 1.9 | % | ||||||||||||
Source: BPS
| (1) | Calculated on the basis of 2018 CPI = 100. From January 2020, BPS calculated CPI based on a consumption pattern obtained from a cost of living survey conducted in 2018 in 90 cities in Indonesia. |
| (2) | Calculated on the basis of 2022 CPI = 100. From January 2024, BPS calculated CPI based on consumption pattern obtained from 2022 Cost of Living Survey in 150 cities in Indonesia. |
The following table shows percentage changes year-on-year in the CPI for certain commodities for the periods indicated.
Inflation by Commodity(1)
| As of December 31, | As of June 30, | |||||||||||||||||||||||
| 2020 | 2021 | 2022 | 2023 | 2024 | 2025 | |||||||||||||||||||
| Food, drinks, and tobacco |
3.6 | 3.1 | 5.8 | 6.2 | 1.9 | 2.0 | ||||||||||||||||||
| Clothing and Footwear |
1.0 | 1.5 | 1.4 | 0.8 | 1.2 | 1.0 | ||||||||||||||||||
| Housing, water, electricity, and household fuel |
0.4 | 0.8 | 3.8 | 0.5 | 0.6 | 1.6 | ||||||||||||||||||
| Household equipment, tools, and routine maintenance |
1.0 | 2.7 | 4.9 | 1.6 | 1.0 | 0.6 | ||||||||||||||||||
| Health |
2.8 | 1.7 | 2.9 | 1.9 | 1.9 | 1.9 | ||||||||||||||||||
| Transportation |
(0.9 | ) | 1.6 | 15.3 | 1.3 | (0.3 | ) | 0.2 | ||||||||||||||||
| Information, communication, and financial services |
(0.4 | ) | (0.1 | ) | (0.4 | ) | 0.2 | (0.3 | ) | (0.3 | ) | |||||||||||||
| Recreation, sports, and culture |
0.7 | 1.1 | 3.0 | 1.7 | 1.2 | 1.2 | ||||||||||||||||||
| Education |
1.4 | 1.6 | 2.8 | 2.0 | 1.9 | 1.8 | ||||||||||||||||||
| Food and beverage providers/restaurant |
2.3 | 2.7 | 4.5 | 2.1 | 2.5 | 2.0 | ||||||||||||||||||
| Personal care and other services |
5.8 | 1.7 | 5.9 | 3.6 | 7.0 | 9.3 | ||||||||||||||||||
Source: BPS
| (1) | Annual percentage year-on-year. |
Indonesia measures annual inflation by year-on-year changes in the CPI.
D-31
In 2020, annual inflation was 1.7%, which was lower than the 2.7% annual inflation in 2019. This was primarily due to deflation in the prices for: transportation; and information, communication, and financial services, which decreased by 0.9% and 0.4%, respectively. From January 2020, BPS has calculated CPI based on a consumption pattern obtained from a cost of living survey conducted in 2018 in 90 cities in Indonesia. Prior to January 2020, CPI was based on a consumption pattern obtained from a cost of living survey conducted in 2012 in 82 provincial capital cities in Indonesia.
In 2021, annual inflation was 1.9%, which was higher than the 1.7% annual inflation in 2020. This was primarily due to increases in the prices for: food, drinks and tobacco; food and beverage providers/restaurant; household equipment, tools, and routine maintenance; and personal care and other services, which increased by 3.1%, 2.7%, 2.7% and 1.7%, respectively.
In 2022, annual inflation was 5.5%, which was higher than the 1.9% annual inflation in 2021. This was primarily due to larger increases in the prices for most of the sectors. In particular, annual inflation for food, drinks and tobacco; housing, water, electricity and household fuels; health; transport; recreation, sport and culture; and personal care and other services was 5.8%, 3.8%, 4.9%, 15.3%, 3.0% and 5.9% in 2022, respectively, compared to 3.1%, 0.8%, 2.7%, 1.6%, 1.1% and 1.7% in 2021, respectively.
In 2023, annual inflation was 2.6%, which was lower than the 5.5% annual inflation in 2022. This was primarily due to smaller increases in the prices for all the sectors except food, drinks and tobacco and information, communication and financial services. Annual inflation decreased the most for transport; housing, water, electricity, and household fuel; and household equipment, tools and routine maintenance. Annual inflation for these three sectors was 1.3%, 0.5% and 1.6% in 2023, respectively, compared to 15.3%, 3.8% and 4.9% in 2022, respectively.
In 2024, annual inflation was 1.6%, which was lower than the 2.6% annual inflation in 2023. This was primarily due to smaller increases in the prices for majority of the sectors. In particular, annual inflation for food, drinks and tobacco; household equipment, tools, and routine maintenance; transportation; information, communication, and financial services; and recreation, sports, and culture was 1.9%, 1.0%, (0.3)%, (0.3)% and 1.2% in 2024, respectively, compared to 6.2%, 1.6%, 1.3%, 0.2% and 1.7% in 2023, respectively. These inflationary changes were partially offset by higher price increases in clothing and footwear; education; and personal care and other services: annual inflation for these sectors was 1.2%, 2.5% and 7.0% in 2024, respectively, compared to 0.8%, 2.1% and 3.6% in 2023, respectively.
In June 2025, annual inflation was 1.9%, which was higher than the annual inflation of 1.6% in May 2025. This increase was primarily due to higher inflation in the food, drinks, and tobacco sector, for which annual inflation was 2.0% in June 2025, compared to 1.0% in May 2025. Inflation also increased in housing, water, electricity, and household fuel; health; and personal care and other services: annual inflation for these sectors were 1.6%, 1.9% and 9.3% in June 2025, respectively, compared to 1.5%, 1.8% and 9.2% in May 2025, respectively. These inflationary changes were partially offset by lower price increases in household equipment, tools and routine maintenance; and education: annual inflation was 0.6% and 1.8% in June 2025, respectively, compared to 0.8% and 1.9% in May 2025, respectively.
Privatization and Management of State-Owned Enterprises
The sale by the Government of shares in state-owned enterprises (“SOEs”), which under Indonesian law are business entities whose capital is at least 51% directly owned by the state, to private investors has been an important means for the Government to promote private investment and to improve the efficiency, transparency, public accountability and corporate governance of the SOEs.
As of December 31, 2024, there were 64 SOEs, of which 13 were listed SOEs and 51 non-listed SOEs. The Ministry of SOEs formed clusters based on supply-chain linkages and industry similarities to increase synergies that divided into 12 clusters and 1 SOE investment holding company. The classification was based on the alignment of business models and supply chains, simplification of complexity and span of control, as well as the harmonizing of the number of SOEs.
As of December 2024, these clusters comprise: SOEs in the form of Perum and Holding Investment SOE Danareksa (22 SOEs), Infrastructure cluster (9 SOEs), Logistic and Transportation cluster (7 SOEs), Insurance cluster (5 SOEs), Banking cluster (4 SOEs), Manufacture cluster (3 SOEs), Tourism cluster (3 SOEs), Food and Agriculture cluster (3 SOEs), Energy cluster (2 SOEs), Plantations cluster (2 SOEs), Telco cluster (2 SOEs), Health Care cluster (1 SOE) and Mining cluster (1 SOE).
The Government has been restructuring SOEs and/or their subsidiaries in an effort to optimize their agility and value creation of SOEs. The Government has also been pursuing the amalgamation of SOEs that operate in the same or related industries or sectors.
D-32
The following table sets forth significant full and partial privatizations, and in some cases re-capitalization, since 2011 (including prior periods where relevant):
State-Owned Enterprises Privatizations
| SOE |
Year of offering |
Government equity interest after offering |
Proceeds to the Government |
Proceeds to SOE |
||||||||||||
|
|
|
|
|
|
|
|
|
|||||||||
| (percentages) | (in billions of Rupiah) | |||||||||||||||
| PT Bank Tabungan Negara (Persero) Tbk |
2009 | 72.9 | — | 1,819 | ||||||||||||
| 2012 | (1) | 60.0 | 135.9 | 1,870 | ||||||||||||
| 2022 | (8) | 60.0 | — | 4,130 | ||||||||||||
| PT Garuda Indonesia (Persero) Tbk |
2011 | 69.1 | — | 3,187 | ||||||||||||
| 2014 | (1) | 60.5 | 11.2 | 1,449 | ||||||||||||
| 2022 | (8) | 64.5 | — | 12,860 | ||||||||||||
| PT Kertas Basuki Rachmat Tbk |
2011 | — | 2.6 | — | ||||||||||||
| PT Atmindo Tbk |
2011 | — | 9.0 | — | ||||||||||||
| PT Jakarta International Hotel Development, Tbk |
2011 | — | 18.5 | — | ||||||||||||
| PT Waskita Karya (Persero) Tbk |
2012 | 68.0 | — | 1,171 | ||||||||||||
| 2015 | (4) | 68.0 | — | 5,289 | ||||||||||||
| 2021 | (6) | 75.4 | — | 9,444 | ||||||||||||
| PT Semen Baturaja (Persero) Tbk |
2013 | 76.2 | — | 1,309 | ||||||||||||
| PT Sarana Karya (Persero)(2) |
2013 | — | 48.2 | — | ||||||||||||
| PT Kertas Padalarang (Persero)(3) |
2013 | — | 12.1 | — | ||||||||||||
| PT Aneka Tambang (Persero) Tbk(4) |
2015 | 65.0 | — | 5,381 | ||||||||||||
| PT Adhi Karya (Persero) Tbk |
2015 | (4) | 51.0 | — | 2,727 | |||||||||||
| 2022 | (8) | 64.3 | — | 2,670 | ||||||||||||
| PT Wijaya Karya (Persero) Tbk(4) |
2016 | 65.0 | — | 6,149 | ||||||||||||
| 2024 | (9) | 91.0 | — | 6,080 | ||||||||||||
| PT Krakatau Steel (Persero) Tbk(4) |
2016 | 51.0 | — | 4,412 | ||||||||||||
| PT Pembangunan Perumahan (Persero) Tbk(4) |
2016 | 75.4 | — | 9,444 | ||||||||||||
| PT Jasa Marga (Persero) Tbk(4) |
2016 | 70.0 | — | 1,786 | ||||||||||||
| PT Bank Rakyat Indonesia (Persero) Tbk(5) |
2021 | 56.8 | — | 95,900 | ||||||||||||
| PT Semen Indonesia (Persero) Tbk(7) |
2022 | 51.2 | — | 5,410 | ||||||||||||
Source: Ministry of State-Owned Enterprises.
| (1) | Rights issue through the issuance of new shares. |
| (2) | Pursuant to Government Regulation No. 91 of 2013, the Republic sold its shares in PT Sarana Karya (Persero) to PT Wijaya Karya (Persero) Tbk with total gross proceeds of Rp50 billion on December 31, 2013. |
| (3) | Pursuant to Government Regulation No. 35 and 36 of 2013, sales of shares held by the Republic in PT Kertas Padalarang (Persero) have been made using strategic sales method to Perum Peruri with total gross proceeds of Rp13 billion on 18 December 2013. |
| (4) | Rights issues carried out through the execution of pre-emptive rights using the addition of State Capital Investment Fund, from the Government. |
| (5) | Rights issue due the consolidation of SOEs for the establishment of ultra-micro holdings with PT Bank Rakyat Indonesia (Persero) Tbk as the parent company and PT Permodalan Nasional Madani and PT Pegadaian as subsidiaries. |
| (6) | Rights issue of PT Waskita Karya (Persero) Tbk for business restructuring and the capital injection from the Government. |
| (7) | Rights issue of PT Semen Indonesia (Persero) Tbk as the result of non-cash capital injection in framework of cement holding. |
| (8) | Rights issue of Adhi Karya (Persero) Tbk, PT Bank Tabungan Negara (Persero) Tbk and PT Garuda Indonesia (Persero) Tbk as a result of cash capital injection from the Government. |
| (9) | Rights issue of PT Wijaya Karya (Persero) Tbk as a result of cash capital injection from the Government. |
D-33
Indonesia Investment Authority
The Indonesia Investment Authority (“INA”), also known as the “Nusantara Investment Authority”, is the Republic’s first sovereign wealth fund and it was established in 2021 under the Law on Job Creation, with the purpose of attracting foreign capital to invest in strategic sectors of the Indonesian economy and supporting sustainable development and boost economic growth.
The initial capital of INA amounted to U.S.$5.0 billion. Since its establishment, the INA has deployed over U.S.$3.0 billion in capital together with, and secured commitments of up to U.S.$25.0 billion from investors, including foreign funds and financial institutions. INA primarily focuses on sectors targeted for sustainable development while also aiming to offer attractive risk-adjusted returns. The priority sectors for INA’s investments include transport and logistics, digitalization and digital infrastructure, green energy and transformation, and health; additionally, INA seeks investment opportunities in property and tourism, financial services, mining, oil and gas, engineering and construction, electronics, consumer goods, and food and agriculture.
Danantara
Badan Pengelola Investasi Daya Anagata Nusantara (“BPI Danantara”) is an independent legal entity that was established on February 24, 2025 through Law No. 1/2025, which is an amendment to Law No. 19/2003 on State-Owned Enterprises.
Pursuant to the amended law, the President of the Republic holds the authority to manage SOEs as part of the executive branch’s power in managing state finances, including ownership of state assets that are separated and placed in SOEs. Through Law No. 1/2025, the President’s authority is delegated to the Minister of State-Owned Enterprises as the holder of the Series A Dwiwarna shares(1) and to BPI Danantara as the holder of the Series B shares in SOEs.
The Ministry of State-Owned Enterprises acts as regulator and supervisor of SOEs, whereas BPI Danantara acts as the operator and also has the authority to manage dividends from SOEs.
BPI Danantara reports directly to the President, with a supervisory board chaired by the Minister of State-Owned Enterprises and an executive board appointed by the President. In carrying out its role, BPI Danantara has established two subsidiaries:
1. Danantara Asset Management (“DAM”), which is the entity that holds the Series B shares of SOEs that were previously held by the Government. DAM is responsible for managing the operational activities of these SOEs, with the objective to optimize the value of the SOEs under its portfolio.
2. Danantara Investment Management (“DIM”), which is the entity that holds and manages the investment and optimization of dividends. DIM aims to invest in areas of strategic importance, generate sustainable returns, and expand investment capacity including through partnerships with leading institutions.
The Series B shares of 52 SOEs in 13 sub-sectors (including special purpose entities) have been transferred to BPI Danantara through DAM. SOEs generate profits and distribute dividends to their direct owner, DAM. For 2025, the SOEs under DAM are projected to generate dividends of Rp150 trillion (based on FY2024 results), with Rp139 trillion expected to be received and managed by BPI Danantara through DAM.
DAM may reinvest the cash back into the SOEs or transfer the cash to BPI Danantara (through dividend upstreaming, as BPI Danantara owns 99% of DAM). BPI Danantara may inject the cash to DIM for investment purposes outside the SOEs.
BPI Danantara aims to help Indonesia escape the “middle income trap” by implementing a set of strategic initiatives that are anchored by the Asta Cita principles of President Prabowo Subianto’s administration (see “—Government and Political Developments—Asta Cita” for more details). These initiatives include the policies of downstreaming and industrialization, strengthening national self-reliance through food, energy, and water security, investing in low-carbon energy, resilient infrastructure as the backbone for growth, and human capital development, to name a few. Despite having different mandates, DIM and DAM share a rigorous and comprehensive risk management framework and governance under the supervision of BPI Danantara . Since its launch, BPI Danantara has sought to allay concerns about transparency, governance, and potential political interference, and has focused on establishing the credibility and intended benefits of its mandate.
| (1) | Series A Dwiwarna shares refer to a special class of shares issued to the Republic or its representative. These shares, a type of golden share, grant the holder unique rights to maintain control over strategic decisions in the relevant entity, even when holding a single Series A share. The term “Dwiwarna” (meaning “two colors” in Indonesian, refers to the red and white of the national flag) symbolizes the state’s authority and national interest in SOEs. |
D-34
Labor and Employment
Labor
The following table sets forth the proportion of the employed labor force in each sector of the economy as of the period indicated.
| As of February |
As of August |
As of February |
As of August |
As of February |
As of August |
As of February |
As of August |
As of February |
As of August |
As of February |
||||||||||||||||||||||||||||||||||||||||||||||||||||||||||||||||||||||||||||||
| Sector |
2020(1) | 2020(1) | 2021(1) | 2021(1) | 2022(1) | 2022(1) | 2023(1) | 2023(1) | 2024(1) | 2024(1) | 2025(1) | |||||||||||||||||||||||||||||||||||||||||||||||||||||||||||||||||||||||||||||
| (in millions) |
% | (in millions) |
% | (in millions) |
% | (in millions) |
% | (in millions) |
(in millions) |
% | (in millions) |
% | % | (in millions) |
% | (in millions) |
% | (in millions) |
% | (in millions) |
% | |||||||||||||||||||||||||||||||||||||||||||||||||||||||||||||||||||
| Agriculture, forestry and fishing |
39.0 | 29.2 | 38.2 | 29.8 | 38.8 | 29.6 | 37.1 | 28.3 | 40.6 | 40.8 | 28.2 | 40.8 | 28.2 | 29.4 | 39.5 | 28.2 | 40.7 | 28.6 | 40.8 | 28.2 | 41.6 | 28.5 | ||||||||||||||||||||||||||||||||||||||||||||||||||||||||||||||||||
| Mining and quarrying |
1.3 | 1.0 | 1.4 | 1.1 | 1.4 | 1.0 | 1.4 | 1.1 | 1.6 | 1.7 | 1.2 | 1.7 | 1.2 | 1.2 | 1.7 | 1.2 | 1.7 | 1.2 | 1.7 | 1.2 | 1.6 | 1.1 | ||||||||||||||||||||||||||||||||||||||||||||||||||||||||||||||||||
| Manufacturing |
18.7 | 14.0 | 17.5 | 13.6 | 17.8 | 13.6 | 18.7 | 14.3 | 18.7 | 20.0 | 13.8 | 20.0 | 13.8 | 13.4 | 19.4 | 13.8 | 18.9 | 13.3 | 20.0 | 13.8 | 19.6 | 13.5 | ||||||||||||||||||||||||||||||||||||||||||||||||||||||||||||||||||
| Electricity, gas, steam and air conditioning supply |
0.3 | 0.3 | 0.3 | 0.2 | 0.3 | 0.2 | 0.3 | 0.2 | 0.3 | 0.4 | 0.2 | 0.4 | 0.2 | 0.3 | 0.3 | 0.2 | 0.4 | 0.3 | 0.4 | 0.2 | 0.4 | 0.3 | ||||||||||||||||||||||||||||||||||||||||||||||||||||||||||||||||||
| Water supply, sewerage, waste management and remediation activities |
0.5 | 0.3 | 0.5 | 0.4 | 0.5 | 0.4 | 0.6 | 0.4 | 0.5 | 0.6 | 0.4 | 0.6 | 0.4 | 0.4 | 0.5 | 0.4 | 0.6 | 0.4 | 0.6 | 0.4 | 0.6 | 0.4 | ||||||||||||||||||||||||||||||||||||||||||||||||||||||||||||||||||
| Construction |
8.1 | 6.1 | 8.1 | 6.3 | 7.9 | 6.1 | 8.3 | 6.3 | 8.2 | 9.5 | 6.5 | 9.5 | 6.5 | 6.2 | 9.3 | 6.6 | 8.6 | 6.1 | 9.5 | 6.5 | 8.7 | 6.0 | ||||||||||||||||||||||||||||||||||||||||||||||||||||||||||||||||||
| Wholesale and retail trade, repair of motor vehicles and motorcycles |
24.8 | 18.6 | 24.7 | 19.2 | 25.2 | 19.2 | 25.7 | 19.6 | 25.8 | 27.3 | 18.9 | 27.3 | 18.9 | 18.9 | 26.6 | 19 | 27.1 | 19.1 | 27.3 | 18.9 | 28.1 | 19.3 | ||||||||||||||||||||||||||||||||||||||||||||||||||||||||||||||||||
| Transportation and storage |
5.5 | 4.1 | 5.6 | 4.4 | 5.3 | 4.1 | 5.4 | 4.2 | 5.7 | 6.2 | 4.3 | 6.2 | 4.3 | 4.2 | 6.2 | 4.4 | 5.9 | 4.1 | 6.2 | 4.3 | 6.2 | 4.2 | ||||||||||||||||||||||||||||||||||||||||||||||||||||||||||||||||||
| Accommodation and food service activities |
9.1 | 6.8 | 8.5 | 6.7 | 9.2 | 7.0 | 9.2 | 7.0 | 9.6 | 11.3 | 7.8 | 11.3 | 7.8 | 7.3 | 10.8 | 7.7 | 11.1 | 7.8 | 11.3 | 7.8 | 11.5 | 7.9 | ||||||||||||||||||||||||||||||||||||||||||||||||||||||||||||||||||
| Information and communication |
1.0 | 0.7 | 0.9 | 0.7 | 1.1 | 0.8 | 1.0 | 0.8 | 1.1 | 1.0 | 0.7 | 1.0 | 0.7 | 0.9 | 1 | 0.7 | 1.2 | 0.9 | 1.0 | 0.7 | 1.3 | 0.9 | ||||||||||||||||||||||||||||||||||||||||||||||||||||||||||||||||||
| Financial and insurance activities |
1.8 | 1.4 | 1.6 | 1.2 | 1.5 | 1.2 | 1.6 | 1.2 | 1.5 | 1.7 | 1.2 | 1.7 | 1.2 | 1.2 | 1.6 | 1.2 | 1.6 | 1.2 | 1.7 | 1.2 | 1.7 | 1.1 | ||||||||||||||||||||||||||||||||||||||||||||||||||||||||||||||||||
| Real estate activities |
0.4 | 0.3 | 0.4 | 0.3 | 0.5 | 0.4 | 0.4 | 0.3 | 0.5 | 0.6 | 0.4 | 0.6 | 0.4 | 0.3 | 0.5 | 0.3 | 0.5 | 0.3 | 0.6 | 0.4 | 0.5 | 0.3 | ||||||||||||||||||||||||||||||||||||||||||||||||||||||||||||||||||
| Professional, scientific and technical activities, Administrative and support service activities |
1.8 | 1.4 | 1.8 | 1.4 | 1.9 | 1.4 | 2.0 | 1.5 | 1.9 | 2.5 | 1.7 | 2.5 | 1.7 | 1.5 | 2.3 | 1.7 | 2.2 | 1.6 | 2.5 | 1.7 | 2.5 | 1.7 | ||||||||||||||||||||||||||||||||||||||||||||||||||||||||||||||||||
| Public administration and defense, compulsory social security |
5.4 | 4.1 | 4.6 | 3.6 | 4.7 | 3.6 | 4.9 | 3.7 | 4.6 | 5.1 | 3.5 | 5.1 | 3.5 | 3.4 | 4.9 | 3.5 | 5.5 | 3.8 | 5.1 | 3.5 | 5.3 | 3.7 | ||||||||||||||||||||||||||||||||||||||||||||||||||||||||||||||||||
| Education |
7.1 | 5.3 | 6.0 | 4.7 | 6.5 | 5.0 | 6.5 | 5.0 | 6.6 | 7.2 | 5.0 | 7.2 | 5.0 | 4.7 | 6.9 | 4.9 | 7.3 | 5.1 | 7.2 | 5.0 | 7.3 | 5.0 | ||||||||||||||||||||||||||||||||||||||||||||||||||||||||||||||||||
| Human health and social work activities |
2.2 | 1.7 | 2.0 | 1.6 | 2.3 | 1.8 | 2.2 | 1.7 | 2.4 | 2.4 | 1.6 | 2.4 | 1.6 | 1.8 | 2.2 | 1.6 | 2.5 | 1.8 | 2.4 | 1.6 | 2.5 | 1.7 | ||||||||||||||||||||||||||||||||||||||||||||||||||||||||||||||||||
| Other service |
6.2 | 4.7 | 6.4 | 5.0 | 6.4 | 4.9 | 5.8 | 4.4 | 5.9 | 6.6 | 4.6 | 6.6 | 4.6 | 4.6 | 6.4 | 4.6 | 6.4 | 4.5 | 6.6 | 4.6 | 6.4 | 4.4 | ||||||||||||||||||||||||||||||||||||||||||||||||||||||||||||||||||
|
|
|
|
|
|
|
|
|
|
|
|
|
|
|
|
|
|
|
|
|
|
|
|
|
|
|
|
|
|
|
|
|
|
|
|
|
|
|
|
|
|
|
|
|
|||||||||||||||||||||||||||||||||||||||||||||
| Total |
133.3 | 100.0 | 128.5 | 100.0 | 131.1 | 100.0 | 131.1 | 100.0 | 135.6 | 144.6 | 100.0 | 144.6 | 100.0 | 100.0 | 139.9 | 100.0 | 142.2 | 100.0 | 144.6 | 100.0 | 145.8 | 100.0 | ||||||||||||||||||||||||||||||||||||||||||||||||||||||||||||||||||
|
|
|
|
|
|
|
|
|
|
|
|
|
|
|
|
|
|
|
|
|
|
|
|
|
|
|
|
|
|
|
|
|
|
|
|
|
|
|
|
|
|
|
|
|
|||||||||||||||||||||||||||||||||||||||||||||
Source: BPS
| (1) | Estimation using population projections weighing results. |
D-35
Employed Labor Force of Indonesia by Gender
The following table sets forth Indonesia’s employed labor force by gender as of the period indicated.
| As of February |
As of August |
As of February |
As of August |
As of February |
As of August |
As of February |
As of August |
As of February |
As of August |
As of February |
||||||||||||||||||||||||||||||||||||||||||||||||||||||||||||||||||||||||||||||
| 2020 | 2020 | 2021 | 2021 | 2022 | 2022 | 2023 | 2023 | 2024 | 2024 | 2025 | ||||||||||||||||||||||||||||||||||||||||||||||||||||||||||||||||||||||||||||||
| (in millions) |
%(1) | (in millions) |
%(1) | (in millions) |
%(1) | (in millions) |
%(1) | (in millions) |
%(1) | (in millions) |
%(1) | (in millions) |
%(1) | (in millions) |
%(1) | (in millions) |
%(1) | (in millions) |
%(1) | (in millions) |
%(1) | |||||||||||||||||||||||||||||||||||||||||||||||||||||||||||||||||||
| Male |
80.7 | 60.5 | 77.8 | 60.5 | 78.6 | 59.9 | 79.3 | 60.5 | 82.3 | 60.7 | 82.6 | 61.0 | 84.2 | 60.7 | 85.2 | 60.9 | 86.0 | 60.5 | 87.2 | 60.3 | 88.3 | 60.6 | ||||||||||||||||||||||||||||||||||||||||||||||||||||||||||||||||||
| Female |
52.6 | 39.5 | 50.7 | 39.5 | 52.5 | 40.1 | 51.8 | 39.5 | 53.3 | 39.3 | 52.7 | 39.0 | 54.4 | 39.3 | 54.6 | 39.1 | 56.2 | 39.5 | 57.4 | 39.7 | 57.5 | 39.4 | ||||||||||||||||||||||||||||||||||||||||||||||||||||||||||||||||||
|
|
|
|
|
|
|
|
|
|
|
|
|
|
|
|
|
|
|
|
|
|
|
|
|
|
|
|
|
|
|
|
|
|
|
|
|
|
|
|
|
|
|
|
|
|||||||||||||||||||||||||||||||||||||||||||||
| Total |
133.3 | 100.0 | 128.5 | 100.0 | 131.1 | 100.0 | 131.1 | 100.0 | 135.6 | 100.0 | 135.3 | 100.0 | 138.6 | 100.0 | 139.9 | 100.0 | 138.6 | 100.0 | 144.6 | 100.0 | 145.8 | 100.8 | ||||||||||||||||||||||||||||||||||||||||||||||||||||||||||||||||||
|
|
|
|
|
|
|
|
|
|
|
|
|
|
|
|
|
|
|
|
|
|
|
|
|
|
|
|
|
|
|
|
|
|
|
|
|
|
|
|
|
|
|
|
|
|||||||||||||||||||||||||||||||||||||||||||||
Source: BPS
| (1) | Percentages are calculated as percentages of the employed labor force. |
Employment and Unemployment in Indonesia
The following table sets forth Indonesia’s employment and unemployment rate as a percentage of Indonesia’s working age population as of the period indicated.(1)
| As of February |
As of August |
As of February |
As of August |
As of February |
As of August |
As of February |
As of August |
As of February |
As of August |
As of February |
||||||||||||||||||||||||||||||||||||||||||||||||||||||||||||||||||||||||||||||
| 2020 | 2020 | 2021 | 2021 | 2022 | 2022 | 2023 | 2023 | 2024 | 2024 | 2025 | ||||||||||||||||||||||||||||||||||||||||||||||||||||||||||||||||||||||||||||||
| (in millions) |
% | (in millions) |
% | (in millions) |
% | (in millions) |
% | (in millions) |
% | (in millions) |
% | (in millions) |
% | (in millions) |
% | (in millions) |
% | (in millions) |
% | (in millions) |
% | |||||||||||||||||||||||||||||||||||||||||||||||||||||||||||||||||||
| Employed |
133.3 | 95.1 | 128.5 | 92.9 | 131.1 | 93.7 | 131.1 | 93.5 | 135.6 | 94.2 | 135.3 | 94.1 | 138.6 | 94.5 | 139.9 | 94.7 | 142.2 | 95.2 | 144.6 | 95.1 | 145.8 | 95.2 | ||||||||||||||||||||||||||||||||||||||||||||||||||||||||||||||||||
| Unemployed(2) |
6.9 | 4.9 | 9.8 | 7.1 | 8.8 | 6.3 | 9.1 | 6.5 | 8.4 | 5.8 | 8.4 | 5.9 | 8.0 | 5.5 | 7.9 | 5.3 | 7.2 | 4.8 | 7.5 | 4.9 | 7.3 | 4.8 | ||||||||||||||||||||||||||||||||||||||||||||||||||||||||||||||||||
|
|
|
|
|
|
|
|
|
|
|
|
|
|
|
|
|
|
|
|
|
|
|
|
|
|
|
|
|
|
|
|
|
|
|
|
|
|
|
|
|
|
|
|
|
|||||||||||||||||||||||||||||||||||||||||||||
| Total |
140.2 | 100.0 | 138.2 | 100.0 | 139.8 | 100.0 | 140.2 | 100.0 | 144.0 | 100.0 | 143.7 | 100.0 | 146.6 | 100 | 147.7 | 100.0 | 149.4 | 100.0 | 152.1 | 100.0 | 153.1 | 100.0 | ||||||||||||||||||||||||||||||||||||||||||||||||||||||||||||||||||
|
|
|
|
|
|
|
|
|
|
|
|
|
|
|
|
|
|
|
|
|
|
|
|
|
|
|
|
|
|
|
|
|
|
|
|
|
|
|
|
|
|
|
|
|
|||||||||||||||||||||||||||||||||||||||||||||
Source: BPS
| (1) | Working age population refers to all persons in Indonesia 15 years old or older and includes certain non-workforce categories such as students and home makers. |
| (2) | The Government defines unemployment to include all persons 15 years old and older without work who (i) are looking for work, (ii) have established a new business, (iii) are not looking for work because they do not expect to find work, and (iv) have made arrangements to start work on a date subsequent to the unemployment measurement date. |
.
D-36
Despite improvements in recent years, unemployment is expected to remain a problem in Indonesia if economic growth and job creation fail to keep pace with population growth. Youth unemployment (between the ages of 15 to 24) remains a particular problem, but has improved in recent years. The Government has sought to address employment issues through a number of policies and regulations, including efforts to create new areas of work and to develop existing areas of work through employee-employer relationships and entrepreneurial programs. The Government provides various forms of assistance (including tax relief and infrastructure support) to encourage employers to create jobs for employees while also creating and developing productive and sustainable working opportunities through entrepreneurial programs, the use of technology and encouraging voluntary work. As of February 2020, immediately prior to the severity of the Covid-19 outbreak in the country, Indonesia had its lowest unemployment rate in ten years. This improvement was due in part to a narrowing of the gap between workforce skills and the skills required in available jobs. Indonesia’s unemployment rate rose after the Covid-19 outbreak, but declined since February 2022, as a result of the easement of social restrictions and the post-Covid economic recovery.
Regional governments have the power to establish minimum wage requirements through tripartite wage boards and do so from the beginning of each calendar year. The table below sets out the national average monthly minimum wage for each year and the average increase across the country for each year. Due to the Covid-19 pandemic, most provinces have not increased the minimum wage for 2021.
The Government increased the average minimum wage of each province by 1.1% for 2022. The figure was obtained through the new guidelines on the minimum wage under Government Regulation No. 36 of 2021 on Wages (“GR 36/2021”).
The Government increased the national average minimum wage by 7.3% for 2023 and 6.5% for 2024. The figures were obtained through the new guidelines on the minimum wage under GR 36/2021 as amended by Government Regulation No. 51 of 2023 on the Amendment to GR 36/2021.
The Government increased the national average minimum wage by 6.5% for 2025.
| Year |
National average minimum wage |
Increase in average minimum wage |
||||||
| 2020 |
Rp2,672,370.8 | 8.9 | % | |||||
| 2021 |
Rp2,687,723.7 | 0.0 | % | |||||
| 2022 |
Rp2,725,505.0 | 1.4 | % | |||||
| 2023 |
Rp2,923,309.4 | 7.3 | % | |||||
| 2024 |
Rp3,113,359.9 | 6.5 | % | |||||
| 2025 |
Rp3,315,761.7 | 6.5 | % | |||||
Source: Ministry of Manpower
Pension and Health Funds
The pension system in Indonesia consists of compulsory and voluntary pension funds. The compulsory system includes health insurance for Government employees (not including employees of SOEs) administered initially by PT Askes (Persero) and currently by BPJS Kesehatan (as defined below), pension plans for Government employees (not including employees of SOEs) administered by PT Taspen (Persero), old age savings for the police and armed forces administered by PT Asabri and old age security for private sector and SOEs employees (in companies that meet minimum requirements stipulated in the relevant law) administered initially by PT Jamsostek (Persero) and currently by BPJS Ketenagakerjaan (as defined below).
The establishment of pension funds for non-government employees is regulated by Law No. 4/2023 (as defined below) that provides for the establishment of two types of pension funds: employer pension funds, which are provided by a private employer to its employees, and financial institution pension funds, which are formed by a bank or insurance company that aims to manage pension funds for employees and self-employed who want to have a pension fund. In addition, the law and several government regulations and decrees specify the types of assets that these pension funds may acquire, as well as the permissible allocation of investments among assets and asset classes.
In November 2011, the Government enacted a law creating the Social Security Administering Agencies (Badan Penyelenggara Jaminan Sosial (“BPJS”)), i.e., Law No. 24 of 2011 on Social Security Administering Agencies (“Law No. 24 of 2011”). The BPJS consists of the (i) BPJS for Health Coverage (“ BPJS Kesehatan”), which provides healthcare services for all citizens and (ii) BPJS for Social Security Benefit for Workers (“BPJS Ketenagakerjaan”), which provides social security benefits for private sector and informal workers. BPJS Kesehatan and BPJS Ketenagakerjaan took over the functions of the Government’s other social security administering agencies, namely PT Askes (Persero) and PT Jamsostek (Persero), on January 1, 2014. In December 2022, Law No. 24 of 2011 was amended by the Law on Job Creation.
D-37
In order to implement the BPJS, PT Asabri (Persero) and PT Taspen (Persero) will assign: (i) the provision of healthcare benefits and pensions for police and armed forces to be administered by PT Asabri (Persero) and (ii) the provision of pensions and retirement benefits to be administered by PT Taspen (Persero) and BPJS Ketenagakerjaan. The assignments are expected to be completed by no later than 2029.
The Law on Job Creation and Law No. 24 of 2011 together amended Law No. 40 of 2004 on the National Social Security System by adding the Unemployment Benefits Program (Jaminan Kehilangan Pekerjaan (“JKP”)). Prior to the effectiveness of the Law on Job Creation, unemployment benefit was not a part of Indonesia’s social security program. Under Law of Job Creation and its implementing regulation, employers are mandated to register their employees in JKP program. The benefits include hard cash, access to job market information and job training, all of which are accessible in the event of employment termination.
Income Distribution
As of September 2024, Indonesia had a Gini Index of 0.381. The Gini Index is a measure of income distribution that ranges between 0.0 and 1.0, with higher numbers indicating greater inequality.
The percentage of people living below the poverty line in Indonesia has exhibited a decreasing trend since the Asian financial crisis in 1998. BPS measures poverty using a basic needs approach and defines poverty as an economic inability to fulfil food and non-food basic needs, measured by consumption and expenditure. Based on this methodology, approximately 49.5 million people, or 24.2% of the population, were living below the poverty line in 1998, and this decreased to approximately 24.1 million, or 8.6% of the population, as of September 2024.
Policy Package for Purchasing Power Protection and Economic Stabilization
The Government has been making efforts to alleviate poverty.
Amid high inflation, high interest rates, commodity price volatility and other economic uncertainties, the Government introduced in 2023 a policy package to protect the purchasing power of the poor and vulnerable population, support micro, small and medium enterprises (“MSMEs”) and strengthen the housing sector. The support measures include:
| • | additional rice assistance of 10 kilograms per family for 21.3 million recipients in December 2023, and of 10 kilogram per family for 22.0 million recipients monthly from January to June 2024; |
| • | El Niño direct cash assistance of Rp200,000 per month for 18.8 million recipients for their basic necessities during November and December 2023; |
| • | accelerating the People’s Business Credit Program (Kredit Usaha Rakyat) to provide government-subsidized financing with low interest rates for MSMEs, for which the realization amount was Rp177.5 trillion by September 2023, with a target realization of Rp297 trillion by the end of 2023; and |
| • | fiscal stimulus for the housing sector in the form of VAT exemption/reduction for the first Rp2.0 billion for the purchase of houses priced below Rp5.0 billion from November 2023 to December 2024, administrative fee assistance of up to Rp4.0 million per house for low-income community houses from November 2023 to December 2024; and poor community house support of Rp20.0 million per house for 1,800 houses from November to December 2023. |
Regional Growth
As the island with the highest population density, high consumption and an industrial base, Java has historically been the main contributor to Indonesia’s economic growth. In 2024, Java contributed 57.0% of Indonesia’s GDP, Sumatera contributed 22.1%, Kalimantan contributed 8.2%, Sulawesi contributed 7.1%, Bali and Nusa Tenggara contributed 2.8%, and Maluku and Papua contributed 2.7%. In the first quarter of 2025, Java contributed 57.4% of Indonesia’s GDP, Sumatera contributed 22.1%, Kalimantan contributed 8.1%, Sulawesi contributed 7.0%, Bali and Nusa Tenggara contributed 2.7%, and Maluku and Papua contributed 2.6%.
The Government allocates a portion of the state budget for transfers to regions and village funds each year. Transfers to regions and village funds has become one of the funding instruments for accelerated development programs and is an instrument to achieve national priority goals carried out by the regional government. This allocation plays a strategic role to support the performance of all regions in improving the quality of and equalizing basic public services, creating employment, alleviating poverty and improving equity in capacity inter-regional finance.
D-38
Through the implementation of Law No. 1 of 2022 on the Financial Relations between the Central Government and the Regional government, with respect to, among other things, budget allocation and deficit provisions), the Government allocates a portion of the state budget for transfers to regions and village funds each year. Transfers to regions and village funds have become one of the funding instruments for accelerated development programs and is an instrument to achieve national priority goals carried out by the regional government. This allocation plays a strategic role to support the performance of all regions in improving the quality of and equalizing basic public services, creating employment, alleviating poverty and improving equity in capacity inter-regional finance.
From 2020 to 2024, transfers to regions and village funds on average increased by 3.2% per year. The increase in transfers to the regions in recent years has been instrumental in improving delivery of basic public services in the area. For more information, see “ — Government Revenues and Expenditure.”
The Law on Job Creation
The “Law on Job Creation” refers to Government Regulation in Lieu of Law No. 2 of 2022 on Job Creation (“GR 2/2022”) together with Law No. 6 of 2023 on the Enactment of GR 2/2022 as Law (“Law 6/2023”).
On November 2, 2020, the President signed Law No. 11 of 2020 on Job Creation (“Law 11/2020”), an omnibus law that amended or revoked more than 70 existing laws and regulations. Law 11/2020 aims to increase investment in the country by (i) reducing and streamlining licensing requirements, (ii) reducing restrictions on foreign investments, (iii) creating a framework for incentivizing investments, (iv) amending employment laws and regulations, including changes to existing rules on employee termination, fixed-term employment and outsourcing, and (v) amending land and spatial planning laws. The Law on Job Creation provides for the establishment of an Indonesian sovereign wealth fund, the Nusantara Investment Authority, to attract foreign capital to invest in strategic sectors of the Indonesian economy, support sustainable development and boost economic growth. The Nusantara Investment Authority will have a two-tiered board, comprising a five-member supervisory board co-chaired by the Minister of Finance and the Minister of State-Owned Enterprises and a five-member independent board of directors.
Law 11/2020 mandates the issuance of implementing government regulations and presidential regulations that will significantly influence how the law is substantively implemented. The Government has since then issued a number of implementing regulations for the Law on Job Creation. The implementation of Law 11/2020 is carried out through the enactment of Government Regulation No. 5 of 2021 on the Implementation of Risk-Based Business Licensing (as partially revoked) (“GR 5/2021”), which regulates the business permit based on risk-based business licensing, the purpose of which is to improve the investment ecosystem and business activities to make it more effective and simpler as well as to oversee transparent, structured, and accountable business activities. Furthermore, for the purpose of the implementation of the GR 5/2021, the Government issued the Central Statistics Agency Regulation No. 2 of 2020, which regulates the new Standard Classification of Indonesian Business Fields (“KBLI”) 2020 and replaces the KBLI 2017. The business permit has to comply with the KBLI 2020, which is a standard reference, coordination, integration and synchronization of statistical operations.
The Government issued GR 2/2022 on December 30, 2022, effective the same day. This followed and was part of the responses to the Constitutional Court Decision No. 91/PUU-XVIII/2020 made in November 2021, which rendered Law 11/ 2020 conditionally unconstitutional and gave the Government two years, until November 2023, to amend the law. GR 2/2022 was enacted as law, effective March 31, 2023, by Law 6/2023. The Law on Job Creation replaces Law 11/2020. All implementing regulations of Law 11/2020 remain valid provided that they are not in contradictory to the Law on Job Creation.
In 2024, the Constitutional Court issued a ruling in response to a challenge of certain labor provisions in the Law on Job Creation, whereby the Constitutional Court ordered the Indonesian legislature to promptly draft and enact a new labor law, separating labor provisions from the Law on Job Creation. This new statute should specifically address labor issues, harmonize existing labor regulations, and resolve any contradictions with other laws.
GR 5/2021 was revoked and replaced by Government Regulation No. 28 of 2025 on the Implementation of Risk-Based Business Licensing (“GR 28/2025”), which became effective from June 5, 2025. GR 28/2025 maintains the same core objective as GR 5/2021, streamlining business licensing through a risk-based approach. It introduces clearer classifications of business risks, strengthens oversight by technical ministries and local governments, and enhances integration within the OSS system. Under GR 28/2025, the OSS system must be adjusted to align with the new provisions, and implementing regulations are mandated to be issued within four months from its effective date of June 5, 2025. These adjustments include expanded sectoral coverage, refined licensing stages, and more detailed prerequisites such as environmental and spatial approvals.
Infrastructure Development
A key priority of the Government is to encourage infrastructure development as a means to accelerate economic growth particularly in rural areas, support further industrial development and tourism, enhance urban transportation and improve the lives and economic welfare of Indonesians by reducing unemployment and poverty. National strategic projects (Proyek Strategis Nasional (“PSNs”)) are projects of strategic importance to promote economic growth, equitable development, job creation and advancement of national development plans. Substantially all the PSNs are infrastructure projects, with only a few exceptions, such as the Free Nutritious Meal Program, as described in “Government Budget — Free Nutritious Meal Program”. A project that is designated as a national strategic project will receive more attention from the Government through the grant of additional resources and completion on an expedited timeline.
National strategic projects are regulated through presidential regulations and implemented by the central and regional governments in coordination with BPI Danantara, SOEs and the private sector, prioritizing the use of domestic components. PSNs were first introduced in 2016. From 2016 to December 2024, a total of 229 PSNs had been completed, with total investment value of Rp1,993 trillion.
D-39
The PSN program currently comprises two groups of ongoing projects:
The first group comprises PSNs designated as such by the Coordinating Minister of Economic Affairs in 2024, under the administration of President Joko Widodo. These initially included 228 projects and 16 programs, divided into five main categories by function and purpose:
| (i) | basic infrastructure, such as dams and irrigation facilities, drinking water supply systems, airports, railways, and toll roads; |
| (ii) | regional development projects, such as tourism areas and eco-city areas; |
| (iii) | energy resilience projects, such as power plants, waste-to-energy plants, and transmission networks; |
| (iv) | industry downstreaming and investment projects, such as special economic zones, industrial zones, smelters, and agricultural and plantation projects; and |
| (v) | projects for strategic policies, such as food estates, merger of SOEs, agrarian reform, drone research, and multifunctional satellites. |
As of December 2024, 114 of the projects in this first group had been completed.
The second group comprises PSNs under the 2025-2029 National Medium-Term Development Plan (“RPJMN 2025-2029”), which was enacted and published in February 2025. Under the RPJMN 2025-2029, 77 PSNs have been identified, including 47 projects carried over from the first group. The remaining 30 projects are new projects. The 77 PSNs in this second group comprise eight categories:
| (i) | the Free Nutritious Meal Program (1 PSN); |
| (ii) | human development and culture, such as development of schools and construction of hospitals (5 PSNs); |
| (iii) | food self-sufficiency, such as construction and development food estate, irrigation services, fishing port and aquaculture (6 PSNs); |
| (iv) | water self-sufficiency, such as the giant sea wall on the north coast of Java and river dams (7 PSNs); |
| (v) | energy self-sufficiency, such as a hydropower plant, sugarcane-based bioethanol projects, biorefinery projects, oil refineries and urban gas networks (11 PSNs); |
| (vi) | downstreaming, industrialization and digital transformation, such as development of special economic zones, industrial estates, and downstream industries (35 PSNs); |
| (vii) | connectivity and regions, such as development of Nusantara, ports, and toll roads (9 PSNs); and |
| (viii) | housing and settlements, such as construction of national houses, and development of waste processing plants and Jakarta’s sewerage system (3 PSNs). |
The ongoing PSNs represent long-term initiatives developed over the past decade and also include innovative programs and projects introduced under President Prabowo Subianto’s “Asta Cita” vision, which places a strong emphasis on human development. These ongoing PSNs have been fully integrated into national development planning documents and reflected in the 2026 Government Work Plan (Rencana Kerja Pemerintah).
The Government estimates that achieving its ambitious 8% economic growth rate by 2029 will require infrastructure investments totaling more than Rp10,000 trillion. This amount significantly exceeds the funding capacity of the public sector alone. As a result, the Government currently expects to pay for 40% of this cost using public sector funding (state budgets, SOEs and regional SOEs), with the balance coming private sector investment. The public sector funds would primarily be used to support basic infrastructure projects, food security (e.g., irrigation, dams) and transportation, logistics and connectivity projects as well as urban transportation.
The Government expects to finance the remaining cost of the priority infrastructure projects through greater private sector participation, specifically: partnerships between the Government and the private sector (i.e., private public partnerships (“PPPs”)), and increased borrowing by the Government and SOEs.
The Government recognizes the important role of PPPs in the development of infrastructure projects and has adopted regulations that provide the legal and regulatory framework for PPPs—from procurement of the PPP concessionaire to the provision of Government support and guarantees. For a discussion of these guarantees, see “—Public Debt—Contingent Liabilities from Government Guarantees” below.
D-40
Transportation-related projects
The transportation network on the Indonesian archipelago relies heavily on sea and air transportation compared to most other countries of comparable size. Most road networks in and around major cities are heavily congested, while many inter-urban and rural road networks are in poor condition and are in need of repair. Public funds for road maintenance and construction are insufficient, and the Government is encouraging private participation and investment in building toll roads, mostly in Java, Sumatera and Sulawesi.
In the railways sector, by 2030 the railway network is expected to cover 12,100 km and achieve passenger share of approximately 11.0%-13.0%, and freight transport share of approximately 15.0%-17.0%. In addition, the plan provides strategies for the Government to achieve its goals by 2030, such as strategies regarding railway network development, increasing security and safety, technology transfer and industrial development, human resources development, institutional development, investment and financing.
In addition, railway projects are expected to be developed in the provinces of Aceh, North Sumatera, West Sumatera, South Sumatera and South Sulawesi, as well as in Java and several urban railways in Jakarta, Bandung, Yogyakarta, Surabaya and Medan. The Government is also studying the feasibility of railway projects in Kalimantan and Papua and an elevated train and subway system in Jakarta.
Construction of the first phase of the Jakarta Mass Rapid Transit (“MRT”), connecting Lebak Bulus to Bundaran Hotel Indonesia, commenced in 2013. Phase One constitutes approximately 15.7 km out of a total of approximately 23.8 km and was completed and operational in March 2019. Construction for the second phase of the Jakarta MRT, connecting Bundaran Hotel Indonesia to Kota Station and West Ancol has commenced.
Construction of the Light Rail Transit in South Sumatera and the Jakarta, Bogor, Depok and Bekasi region commenced in 2015. Construction in South Sumatera was completed in 2018. Construction in Jakarta, Bogor, Depok, Bekasi and Cibubur was completed and commenced commercial operation in 2023.
Indonesia’s first high-speed railway, which connects Jakarta and Bandung, was constructed from 2016 to 2023 and commenced commercial operation in October 2023. In addition, two additional bus-way corridors have been developed and the construction of the remaining sections of the tolled ring road circling the outer city of Jakarta, the Jakarta Outer Ring Road, has been completed.
The RPJMN 2025-2029 maintains a strong emphasis on infrastructure, identifying 7 transportation PSNs for the period. Notable projects include the Jakarta Metropolitan MRT East-West Corridor, the Serang-Panimbang Toll Road, and the Probolinggo-Banyuwangi Toll Road. In addition, the Government has selected 20 cities for the development and enhancement of urban mass transit systems, incorporating both road-based and rail-based solutions. Sustainability remains a key emphasis, with recommendations to integrate a national roadmap for the electrification of urban public transportation into the RPJMN 2025-2029 to secure funding and guide implementation toward the national goal of electrifying 90% of urban public transport by 2030.
Energy-related projects
The RPJMN 2025-2029 aims to guide Indonesia toward a sustainable, green economy, aligning with the long-term goal of achieving net zero emissions. Recognizing the shortfall in the previous renewable energy target — where the share of renewables in the national energy mix reached only 14% instead of the intended 23% by 2025 — the new plan places a heightened emphasis on accelerating the adoption of renewable energy sources. This energy transition is not only viewed as an environmental imperative but also as a strategic economic opportunity to stimulate industrial growth, foster innovation, and enhance Indonesia’s global competitiveness.
Eleven energy-related PSNs have been included in the RPJMN 2025-2029. Key projects encompass the Tuban Oil Refinery, the development of biofuels from methanol and ethanol in Bojonegoro, the North Hub Development Project in the Makassar Strait, the establishment of a biorefinery in Cilacap, and the expansion of the urban gas distribution networks. These projects are intended to enhance Indonesia’s energy self-sufficiency, diversify the country’s energy portfolio, and support the broader transition to cleaner energy.
Securing adequate financing for these undertakings will be challenging. The Government is prioritizing regulatory reforms and the creation of risk-sharing mechanisms to attract greater private sector and foreign investment.
For further information on Indonesia’s energy security and environmental policies, see “Land and People — Energy Security” and “Land and People — Environment.”
D-41
Telecommunications
The Government aims to reduce the digital divide between rural and urban areas. One Government initiative to achieve this reduction is to implement the Universal Service Obligation (“USO”), which aims at providing broadband access to villages in non-commercial areas using facilities placed in schools, community health centers, or rural government offices.
Due to the importance of broadband network access to the improvement of economic growth, the Government introduced the Indonesia Broadband Plan (“IBP”), which consists of a policy document and an implementation plan. The policy document outlines Indonesia’s current broadband ecosystem, the use of broadband as a strategy to improve Indonesia’s competitiveness, and the policies and strategies for developing Indonesia’s broadband. The implementation plan includes a detailed action plan for the broadband infrastructure project and its development.
One of the Government’s major projects in telecommunication is the Palapa Ring Broadband project. This Rp21 trillion (U.S.$1.55 billion) project comprises three sections, west, central and east, and will span 13,000 kilometers. It aims to construct a broadband network across Indonesia’s 57 cities, as well as in frontier, outermost and remote regions. In July 2017, telecommunication developer PT Palapa Timur Telematika commenced the construction of a broadband network in eastern Indonesia under the Palapa Ring Broadband project, which was completed in October 2019.
Under the RPJMN 2020-2024, one of the Strategic Priority Projects is information, communication and technology infrastructure to support digital transformation, to reduce the digital gap and provide fast internet services to support the digitization of the economic, social and government sectors. The RPJMN 2020-2024 also laid out the policies and target for the development and utilization of information, communication and technology infrastructure, including improving fixed and mobile broadband network coverage, increasing population served by digital broadcasting and facilitating new start-up unicorns.
Under the RPJMN 2025-2029, Indonesia’s telecommunications strategy will transition from providing basic telecommunication access to delivering “meaningful connectivity” with a focus on quality, equity, and utilization to drive economic growth. The plan targets an increase in average mobile broadband speeds to 100 Mbps by 2029 through new spectrum allocation and efficient infrastructure sharing models. Beyond infrastructure development, the Government committed to developing a more robust digital ecosystem by prioritizing the cultivation of a skilled digital workforce, enhancing data governance via national data centers, and integrating digital technology with traditional economic sectors. The Government expects the new capital, Nusantara, to serve as a national model for advanced digital services, setting a benchmark for future smart cities in Indonesia.
Progress on the Development of Nusantara
In August 2019, President Widodo announced plans to move Indonesia’s capital from Jakarta to an area in East Kalimantan province on the island on the island of Kalimantan, named Nusantara. The proposed move has been authorized under Law No. 3 of 2022 on Capital City (as amended by Law No. 21 of 2023 on the Amendment of Law No. 3 of 2022 on Capital City) (“Law 3/2022”).
The development of Nusantara is planned in five phases starting in 2022 and ending in 2045, as outlined in the Government’s master plan for the development of the new capital included in Presidential Regulation No. 63 of 2022 (the “Master Plan”). According to the Master Plan, Phase I is the construction of basic infrastructure such as main roads and core public transportation infrastructure, IT, electricity, and water supply; Phase II focuses on the development of mixed-use areas to accommodate business and industrial districts, educational and tourism facilities, as well as advanced IT infrastructure and additional facilities to support the target population; Phase III focuses on the development of mass transportation infrastructure, expansion of waste and water infrastructure and businesses and industries; Phase IV focuses on the development of infrastructure and ecosystems for three cities (i.e., Nusantara, Balikpapan and Samarinda), to accelerate Kalimantan’s overall development; and Phase V, the final phase, which is targeted to be completed within the 2040-2045 period, focuses on developing mass public transport and integrated infrastructure and utilities, promoting zero carbon emissions and 100% renewable energy, fostering sustainable industrial development, and turning Nusantara into an internationally competitive city.
As of July 2025, the physical work for the basic infrastructure for the core area of Nusantara had reached approximately 95% completion. In particular, construction has been completed for a number of key facilities, including the Presidential Palace and ceremonial grounds, office buildings for various ministries and the Nusantara Capital Authority, Taman Kusuma Bangsa (a public park), certain hospitals, 36 housing units designated for ministerial positions, a piped water supply and distribution system, the Sepaku Semoi Dam, and 27 apartment towers for civil servants and security personnel.
By the end of 2024, Nusantara had attracted a total of Rp65 trillion in investment by private sector and state-owned enterprises. Additionally, from 2022 to 2024, the infrastructure development in Nusantara was supported by state budget of Rp89 trillion.
President Prabowo Subianto has directed that Nusantara be prepared to serve as the political capital from 2028, with supporting infrastructure — including buildings for the executive, legislative, and judiciary branches — completed by that time. To support this plan, the Government estimates that the total funding required for Nusantara’s development from 2025 to 2029 will amount to Rp407.6 trillion. Of this amount, a state budget of Rp48.8 trillion has been allocated for the construction of office buildings, residential facilities for the judiciary and legislative bodies, development of supporting ecosystems, and the construction of specific roads; meanwhile, the Nusantara Capital Authority is seeking additional state funding. The remaining funding needs are expected to be met through public-private partnerships, private investment, and multilateral funding sources.
D-42
The development of Nusantara is designated as a PSN under the RPJMN 2025-2029, aligning with Phase II of the Master Plan. The Government will continue the relocation of civil servants to Nusantara, and advancement of 12 fundamental sectors, including renewable energy, telecommunication networks, transportation, housing, water treatment, waste management, technological infrastructure, commercial infrastructure, health facilities, social and public facilities, educational facilities, and green industrial estates. With investments in renewable energy (e.g., a 50 MW solar power plant), green transportation (e.g., electric bus rapid transit), and digital infrastructure, the Government hopes that Nusantara will ultimately serve as a model for sustainable urban development.
Affordable Housing Program
The Government has launched an affordable housing program for the construction or renovation of residential units in urban, rural, and coastal areas. The program is designated as a PSN under the RPJMN 2025-2029. The primary focus is to address the significant housing backlog and to provide decent, affordable housing for the country’s low-income population.
The program is structured to meet the diverse needs of Indonesia’s rapidly urbanizing society, as well as to support rural and coastal communities where housing deficits and substandard living conditions are acute. In urban areas, the initiative emphasizes the development of vertical housing, to maximize land use and improve access to employment and public services. In rural and coastal regions, the program leverages local contractors, MSMEs, cooperatives, and village-owned enterprises to construct homes that are adapted to local conditions and cultural wisdom, thereby fostering community participation and job creation.
To ensure affordability, the Government is implementing a range of financing schemes, including (i) the Low Income Subsidized Mortgage Program (Fasilitas Likuiditas Pembiayaan Perumahan), which provides interest subsidies and financial support and (ii) the Public Housing Savings (Tabungan Perumahan Rakyat) program, a mandatory housing savings program for the country’s private sector and SOE employees and armed forces and police personnel.
Foreign Investment
Foreign investment in Indonesia is primarily governed under Law No.25 of 2007 on Capital Investment (as partially amended by Law on Job Creation) (the “2007 Investment Law”). Pursuant to 2007 Investment Law, the Government has enacted a list of among others (i) sectors that are restricted for any investment and (ii) sectors that are open for investment with certain requirements (e.g. maximum foreign ownership or limited to certain locations) by issuing a presidential regulation. Any sector that is not included in the list is open for foreign investment without restriction.
As part of the implementing regulations to the Law on Job Creation, in 2021, the government enacted a new investment list. The new investment list notably reduces a considerable number of sectors that are open for investment with certain requirements, from previously 350 sectors to 46 sectors. Sectors that are not listed are generally fully open for any investment (domestic or foreign investment) without any ownership restriction/limitation.
With the issuance of GR 28/2025, as part of the Government’s ease of doing business initiative, the Government, among other things, launched the OSS system and changed the applicable licensing policy from a “pre-approval” regime to a “post evaluation” regime. These initiatives are also applicable to foreign investments.
The 2007 Investment Law provides certain tax incentives such as income tax deductions and certain deductions or exemptions with respect to import duties and value added tax on purchases of capital goods and raw materials. These tax incentives are granted in accordance with prevailing tax laws and regulations. Examples of tax incentives to attract foreign investment include import duty exemption on machinery, equipment, raw materials, and strategic goods, and VAT exemption on domestic purchases of production machinery. Additionally, tax holidays or reductions are available to businesses operating in peer industries (i.e., an industry with wide-ranging links that give added value, promotes new technology, and possesses strategic values for the national economy), or located in special economic zones or the new national capital of Nusantara, provided that the criteria under the specific tax schemes are satisfied. To date, tax holidays have been granted to 275 investments, of which 222 are foreign direct investments, and tax allowance has been granted to 152 investments, of which 78 are foreign direct investments. Moreover, the Government also provides super tax deduction for research and development activities and vocational training activities. See “Government Budget — Government Finances — Tax Incentive Policies” for more information on tax incentives.
The Government has also taken other measures to attract more foreign investment, including acceleration of licensing process, provision of financing facilities by Indonesia Eximbank to exporters, establishment of special economic zones and bonded areas, and signing of tax treaties and trade agreements. See “Foreign Trade and Balance of Payments — Membership in International and Regional Free Trade Agreements” for more information on Indonesia’s trade agreements.
Foreign Investment in Indonesia
Foreign investment in Indonesia is divided into direct investments, portfolio investments and other investments, and information about these types of investments is included in the Republic’s reports on its balance of payments published by the Bank Indonesia. Due to the different concept and method of compiling investment statistics, foreign direct investment statistical data published by Bank Indonesia are not comparable to the “administrative” foreign direct investment statistical data published by the Indonesia Investment Coordinating Board (Badan Koordinasi Penanaman Modal (“BKPM”)) under “Direct Investments Realizations.”
D-43
The following table sets out the amounts of foreign investments in Indonesia by non-residents.
Foreign Investment in Indonesia
| Year Ended December 31, | Three Months Ended March 31, |
|||||||||||||||||||||||||||
| 2020 | 2021 | 2022 | 2023 | 2024P | 2024P | 2025P | ||||||||||||||||||||||
| (in millions of U.S. dollars) | ||||||||||||||||||||||||||||
| Direct Investments |
||||||||||||||||||||||||||||
| Equity Capital |
19,348 | 20,566 | 22,873 | 20,090 | 22,597 | 6,522 | 4,107 | |||||||||||||||||||||
| Debt instrument |
(173 | ) | 647 | 1,829 | 1,453 | 1,533 | (4 | ) | 93 | |||||||||||||||||||
|
|
|
|
|
|
|
|
|
|
|
|
|
|
|
|||||||||||||||
| Total direct investments |
19,175 | 21,213 | 24,702 | 21,543 | 24,130 | 6,518 | 4,199 | |||||||||||||||||||||
| Portfolio investments: |
||||||||||||||||||||||||||||
| Equity securities |
(4,362 | ) | 3,131 | 671 | 265 | (1,032 | ) | 1,109 | (1,873 | ) | ||||||||||||||||||
| Debt securities |
8,929 | 3,732 | (7,256 | ) | 4,840 | 13,267 | (1,898 | ) | 3,346 | |||||||||||||||||||
|
|
|
|
|
|
|
|
|
|
|
|
|
|
|
|||||||||||||||
| Total portfolio investments |
4,567 | 6,863 | (6,585 | ) | 5,104 | 12,235 | (789 | ) | 1,473 | |||||||||||||||||||
| Financial derivatives |
(1,291 | ) | (1,143 | ) | (1,286 | ) | (856 | ) | (965 | ) | (696 | ) | (307 | ) | ||||||||||||||
| Other investments |
2,264 | (726 | ) | 242 | 4,370 | 10,112 | 1,859 | 487 | ||||||||||||||||||||
|
|
|
|
|
|
|
|
|
|
|
|
|
|
|
|||||||||||||||
| Total foreign investment |
24,715 | 26,207 | 17,073 | 30,161 | 45,512 | 6,892 | 5,852 | |||||||||||||||||||||
|
|
|
|
|
|
|
|
|
|
|
|
|
|
|
|||||||||||||||
Source: Bank Indonesia
| P | Preliminary. |
Foreign Direct Investment in Indonesia by Country of Origin(1)
| Year Ended December 31, | Three Months Ended March 31, |
|||||||||||||||||||||||||||
| 2020 | 2021 | 2022 | 2023 | 2024P | 2024P | 2025P | ||||||||||||||||||||||
| (in millions of U.S. dollars) | ||||||||||||||||||||||||||||
| North America |
786 | 1,751 | 2,062 | 830 | 629 | 192 | 100 | |||||||||||||||||||||
| USA |
613 | 1,691 | 2,060 | 747 | 582 | 176 | 84 | |||||||||||||||||||||
| Canada |
17 | 38 | 2 | 81 | 44 | 14 | 15 | |||||||||||||||||||||
| Other North America(2) |
156 | 22 | 1 | 2 | 2 | 2 | 1 | |||||||||||||||||||||
| Central and South America |
1,580 | (70 | ) | (606 | ) | 2,075 | 400 | 62 | 51 | |||||||||||||||||||
| Argentina |
0 | 0 | 0 | 0 | 0 | 0 | 0 | |||||||||||||||||||||
| Brazil |
3 | 18 | (22 | ) | 0 | 0 | 1 | (1 | ) | |||||||||||||||||||
| Mexico |
0 | 1 | 2 | (3 | ) | 3 | 0 | (2 | ) | |||||||||||||||||||
| Cayman Islands |
101 | (7 | ) | (380 | ) | (48 | ) | (359 | ) | 5 | 21 | |||||||||||||||||
| Other Central and South America |
1,476 | (81 | ) | (206 | ) | 2,127 | 756 | 56 | 33 | |||||||||||||||||||
| Europe |
(1,055 | ) | 1,037 | 1,773 | 1,923 | 2,167 | 437 | 598 | ||||||||||||||||||||
| European Union and United Kingdom |
(1,039 | ) | 999 | 1,642 | 2,616 | 741 | 70 | 280 | ||||||||||||||||||||
| Austria |
58 | (40 | ) | 135 | 101 | 378 | 33 | 201 | ||||||||||||||||||||
| Belgium |
(17 | ) | 96 | 3 | 56 | 301 | 13 | (24 | ) | |||||||||||||||||||
| Denmark |
5 | (15 | ) | 2 | (6 | ) | 0 | (2 | ) | 0 | ||||||||||||||||||
| Finland |
15 | 1 | 86 | (26 | ) | (38 | ) | (38 | ) | 0 | ||||||||||||||||||
| France |
(46 | ) | 38 | 224 | 45 | 16 | (6 | ) | 15 | |||||||||||||||||||
| Germany |
(48 | ) | 9 | 18 | 2,144 | 75 | 15 | 16 | ||||||||||||||||||||
| Greece |
0 | 0 | 0 | 0 | 0 | 0 | 0 | |||||||||||||||||||||
| Ireland |
41 | 38 | 16 | 35 | (29 | ) | (13 | ) | 15 | |||||||||||||||||||
| Italy |
(403 | ) | (406 | ) | (351 | ) | (339 | ) | (56 | ) | (73 | ) | (40 | ) | ||||||||||||||
| Luxembourg |
(1 | ) | (1 | ) | 24 | 380 | 113 | 3 | 8 | |||||||||||||||||||
| Netherlands |
(115 | ) | 397 | 272 | 194 | (27 | ) | 139 | 77 | |||||||||||||||||||
| Portugal |
0 | 0 | 0 | 0 | 0 | 0 | 0 | |||||||||||||||||||||
| Spain |
12 | 20 | (7 | ) | 2 | 6 | 2 | 4 | ||||||||||||||||||||
| Sweden |
(8 | ) | 142 | 9 | 25 | (3 | ) | (3 | ) | 2 | ||||||||||||||||||
| United Kingdom |
(532 | ) | 719 | 1,209 | (798 | ) | 1,151 | 362 | 195 | |||||||||||||||||||
| Other European Union |
(0 | ) | 0 | 2 | 5 | 5 | 1 | 6 | ||||||||||||||||||||
| Russia |
23 | 0 | 1 | 1 | 2 | 1 | — | |||||||||||||||||||||
| Turkey |
4 | 4 | 3 | 25 | 7 | 4 | 2 | |||||||||||||||||||||
| Other Europe |
(43 | ) | 34 | 126 | 78 | 266 | 1 | 121 | ||||||||||||||||||||
D-44
| Year Ended December 31, | Three Months Ended March 31, |
|||||||||||||||||||||||||||
| 2020 | 2021 | 2022 | 2023 | 2024P | 2024P | 2025P | ||||||||||||||||||||||
| (in millions of U.S. dollars) | ||||||||||||||||||||||||||||
| Asia |
17,202 | 18,668 | 21,733 | 15,444 | 21,161 | 5,603 | 2,551 | |||||||||||||||||||||
| Japan |
2,089 | 1,961 | 1,795 | 1,011 | 1,699 | 743 | 93 | |||||||||||||||||||||
| People’s Republic of China |
904 | 5,076 | 3,511 | 1,530 | 2,573 | 441 | 712 | |||||||||||||||||||||
| South Korea |
1,557 | 770 | 1,829 | 1,966 | 1,287 | 282 | 300 | |||||||||||||||||||||
| India |
302 | 227 | 521 | 85 | (6 | ) | (14 | ) | (17 | ) | ||||||||||||||||||
| Hong Kong SAR |
2,850 | 3,118 | 2,395 | 3,471 | 3,271 | 1,141 | 885 | |||||||||||||||||||||
| Taiwan |
944 | 109 | 796 | 5 | 106 | 23 | 57 | |||||||||||||||||||||
| Saudi Arabia |
40 | 2 | (0 | ) | 2 | 1 | 1 | 0 | ||||||||||||||||||||
| ASEAN |
7,928 | 7,404 | 10,747 | 6,592 | 11,981 | 2,921 | 530 | |||||||||||||||||||||
| Brunei Darussalam |
(0 | ) | 0 | 1 | 0 | 0 | 0 | 0 | ||||||||||||||||||||
| Cambodia |
2 | 1 | 3 | 1 | 2 | 0 | 0 | |||||||||||||||||||||
| Lao PDR |
— | — | — | 0 | 0 | 0 | 0 | |||||||||||||||||||||
| Malaysia |
415 | (26 | ) | 995 | 551 | (191 | ) | 91 | (78 | ) | ||||||||||||||||||
| Myanmar |
1 | 0 | (1 | ) | 0 | 0 | 0 | 0 | ||||||||||||||||||||
| Philippines |
0 | 5 | 104 | 13 | 87 | 53 | 0 | |||||||||||||||||||||
| Singapore |
4,177 | 5,343 | 9,769 | 5,412 | 11,572 | 2,637 | 531 | |||||||||||||||||||||
| Thailand |
3,208 | 2,077 | (127 | ) | 611 | 482 | 140 | (22 | ) | |||||||||||||||||||
| Vietnam |
126 | 3 | 2 | 3 | 28 | (1 | ) | 99 | ||||||||||||||||||||
| Other Asia |
588 | 3 | 139 | 782 | 248 | 65 | (10 | ) | ||||||||||||||||||||
| Australia and Oceania |
189 | 119 | 356 | 572 | 92 | 6 | 359 | |||||||||||||||||||||
| Australia |
184 | 118 | 353 | 572 | 90 | 5 | 248 | |||||||||||||||||||||
| New Zealand |
4 | 2 | 2 | (6 | ) | 1 | 2 | 0 | ||||||||||||||||||||
| Other Australia and Oceania |
1 | (2 | ) | 0 | 7 | 1 | 0 | 110 | ||||||||||||||||||||
| Africa |
(29 | ) | (24 | ) | (7 | ) | 606 | 12 | (1 | ) | 1 | |||||||||||||||||
| South Africa |
25 | 0 | 1 | (1 | ) | 1 | 0 | 0 | ||||||||||||||||||||
| Other Africa |
(55 | ) | (23 | ) | (8 | ) | 607 | 12 | 0 | 0 | ||||||||||||||||||
| Others |
(83 | ) | (351 | ) | 79 | 47 | 212 | 29 | 85 | |||||||||||||||||||
|
|
|
|
|
|
|
|
|
|
|
|
|
|
|
|||||||||||||||
| Total |
18,591 | 21,131 | 25,390 | 21,497 | 24,674 | 6,329 | 3,744 | |||||||||||||||||||||
|
|
|
|
|
|
|
|
|
|
|
|
|
|
|
|||||||||||||||
Source: Bank Indonesia
| P | Preliminary. |
| (1) | Presents foreign direct investment in accordance with the directional principle prescribed by BPM5. |
| (2) | Includes Bermuda, Greenland and Saint Pierre & Miquelon. |
Foreign Direct Investment
The following table sets out the amounts of foreign direct investments in Indonesia by non-residents.
Foreign Direct Investment
| Year Ended December 31, | Three Months Ended March 31, |
|||||||||||||||||||||||||||
| 2020 | 2021 | 2022 | 2023 | 2024P | 2024P | 2025P | ||||||||||||||||||||||
|
|
|
|
|
|
|
|
|
|
|
|
|
|
|
|||||||||||||||
| (in millions of U.S. dollars) | ||||||||||||||||||||||||||||
| Equity capital(1) |
19,348 | 20,566 | 22,873 | 20,090 | 22,597 | 6,522 | 4,107 | |||||||||||||||||||||
| Debt instruments: |
||||||||||||||||||||||||||||
| Inflow |
41,710 | 42,607 | 47,064 | 44,407 | 47,144 | 9,843 | 10,458 | |||||||||||||||||||||
| Outflow |
(41,882 | ) | (41,960 | ) | (45,236 | ) | (42,954 | ) | (45,611 | ) | (9,847 | ) | (10,366 | ) | ||||||||||||||
| Total debt instruments |
(173 | ) | 647 | 1,829 | 1,453 | 1,533 | (4 | ) | 93 | |||||||||||||||||||
|
|
|
|
|
|
|
|
|
|
|
|
|
|
|
|||||||||||||||
| Total direct investments |
19,175 | 21,213 | 24,702 | 21,543 | 24,130 | 6,518 | 4,199 | |||||||||||||||||||||
|
|
|
|
|
|
|
|
|
|
|
|
|
|
|
|||||||||||||||
| Memorandum |
||||||||||||||||||||||||||||
| Direct investment in Indonesia(2) |
18,591 | 21,131 | 25,390 | 21,497 | 24,674 | 6,329 | 3,744 | |||||||||||||||||||||
Source: Bank Indonesia
| P | Preliminary. |
| (1) | Includes privatization and banking restructuring. |
| (2) | Presents foreign direct investment in accordance with the directional principle prescribed by BPM5. |
D-45
In 2020, despite the exceptional global financial market uncertainty caused by the Covid-19 pandemic, net foreign direct investment was maintained at U.S.$19.2 billion, down from U.S.$25.0 billion in 2019. Foreign direct investment inflows in 2020 were primarily attributable to a net inflow of equity capital relating to the acquisition of a domestic bank by a company from Thailand and in the form of debt instruments relating to global bond issuances by mining companies through foreign affiliates. The financial intermediaries and manufacturing sectors were still the main contributors to net foreign direct investment inflows in 2020. ASEAN countries were the main contributors to foreign direct investment inflows, followed by China and other Asian emerging markets.
In the middle of rapid transmission of the highly virulent Delta variant, net foreign direct investment amassed a higher U.S.$21.2 billion surpluses in 2021 compared to U.S.$19.2 billion in 2020, primarily stemming from a higher net inflow of equity capital. Debt instruments also recorded a net inflow, reversing deficit in the previous year. A higher net inflow on equity capital was primarily driven by foreign capital investment in domestic courier companies, mining, manufacturing and financial intermediaries. The manufacturing sector dominated foreign direct investment inflows in 2021, followed by transportation, storage and communication, and mining and quarrying sectors. Meanwhile, emerging Asia (including China) and ASEAN were the major contributors to the foreign direct investment inflows in 2021.
Foreign direct investment maintained a surplus totaling U.S.$24.7 billion in 2022, primarily in the form of equity capital, representing an increase of 16.4% from a U.S.$21.2 billion in 2021. The increase was primarily due to increases of investment in manufacturing, transportation, storage, and communication, as well as construction, which are in line with the Government’s reform measures to develop downstream processing industries and to upgrade industrial capabilities to increase the added value of exports. With respect to country of origin, the increase was primarily due to increases of investment from Singapore, Malaysia and South Korea. The manufacturing, transportation, storage, and communication, financial intermediaries and trade sectors were the main contributors to net foreign direct investment inflows in 2022. With respect to country of origin, investors from Asian emerging markets (including the People’s Republic of China) were the main contributors to net foreign direct investment inflows, followed by ASEAN countries.
Foreign direct investment maintained a surplus totaling U.S.$21.9 billion in 2023, primarily in the form of equity capital, representing a decrease of 11.4% from a U.S.$24.7 billion surplus in 2022. The decrease was primarily due to decreases of investment in transportation, storage and communication as well as financial intermediaries, partially offset by increases of investment in manufacturing. With respect to country of origin, the decrease was primarily due to decreases of investment from Singapore, the United Kingdom and the People’s Republic of China, partially offset by increases of investment from Germany, Hong Kong SAR and Thailand.
The manufacturing, transportation, storage, and communication, as well as trade sectors were the main contributors to net foreign direct investment inflows in 2023. With respect to country of origin, investors from Asian emerging markets (including the People’s Republic of China) were the main contributors to net foreign direct investment inflows, followed by ASEAN countries.
Foreign direct investment recorded a surplus totalling U.S.$24.1 billion in 2024, primarily in the form of equity capital, representing a 12.0% increase from a U.S.$21.5 billion surplus in 2023. The increase was primarily due to higher investment in health and social work, trade, and mining and quarrying, partially offset by lower investment in real estate and manufacturing. With respect to the country of origin, increased investment from Singapore and the United Kingdom was the main driver of the higher foreign direct investment in 2024.
The manufacturing, trade as well as health and social work sectors were the main contributors to net foreign direct investment inflows in 2024. With respect to country of origin, investors from Singapore were the main contributors to net foreign direct investment inflows, followed by those from Hong Kong SAR, the People’s Republic of China, South Korea and Japan.
Foreign direct investment recorded a surplus of U.S.$4.2 billion in the first quarter of 2025, primarily in the form of equity capital. This amount represents a 35.6% decrease from the U.S.$6.5 billion surplus recorded in the first quarter of 2024. The decline was primarily attributable to lower investment in the trade, financial intermediaries, and electricity, gas and water supply sectors. By country of origin, decrease in foreign director investment was largely driven by lower investment from Singapore and Japan.
The manufacturing, transportation, storage, and communication, and real estate sectors were the main contributors to net foreign direct investment inflows in the first quarter of 2025. With respect to country of origin, investment from Hong Kong was the largest contributor to the net foreign direct investment inflows, followed by the investments from People’s Republic of China and South Korea.
D-46
Foreign Portfolio Investment
The following table sets out the amounts of foreign portfolio investments in Indonesia by non-residents.
Foreign Portfolio Investments
| Year Ended December 31, | Three Months Ended March 31, |
|||||||||||||||||||||||||||
| 2020 | 2021 | 2022 | 2023 | 2024P | 2024P | 2025P | ||||||||||||||||||||||
|
|
|
|
|
|
|
|
|
|
|
|
|
|
|
|||||||||||||||
| (in millions of U.S. dollars) | ||||||||||||||||||||||||||||
| Equity securities: |
||||||||||||||||||||||||||||
| Inflow |
44,300 | 59,114 | 76,604 | 60,362 | 77,752 | 17,153 | 16,763 | |||||||||||||||||||||
| Outflow |
(48,662 | ) | (55,983 | ) | (75,933 | ) | (60,097 | ) | (78,784 | ) | (16,043 | ) | (18,636 | ) | ||||||||||||||
| Net equity securities |
(4,362 | ) | 3,131 | 671 | 265 | (1,032 | ) | 1,109 | (1,873 | ) | ||||||||||||||||||
| Debt securities (net) |
8,929 | 3,732 | (7,256 | ) | 4,840 | 13,267 | (1,898 | ) | 3,346 | |||||||||||||||||||
|
|
|
|
|
|
|
|
|
|
|
|
|
|
|
|||||||||||||||
| Total portfolio investments |
4,567 | 6,863 | (6,585 | ) | 5,104 | 12,235 | (789 | ) | 1,473 | |||||||||||||||||||
|
|
|
|
|
|
|
|
|
|
|
|
|
|
|
|||||||||||||||
Source: Bank Indonesia
| P | Preliminary. |
In 2020, foreign capital inflows in the form of portfolio investments were U.S.$4.6 billion, lower than the U.S.$21.6 billion recorded in 2019. Elevated financial market uncertainty caused by global and domestic factors, especially in the first quarter of 2020 has contributed to limited foreign fund placements in the government bond market and higher net outflows in the stock market, resulting in lower net foreign capital inflows to Indonesia.
After recording a surplus of U.S.$4.6 billion in 2020, portfolio investment achieved a higher surplus of U.S.$6.9 billion in 2021, predominantly driven by a larger net inflow in the first half of 2021. For the year, the stronger performance of the stock market bolstered portfolio investment inflow in line with the accelerated domestic economic growth achieved in 2021, thus maintaining non-resident investor confidence in the Indonesian economic outlook.
In 2022, foreign capital flows in the form of portfolio investments in Indonesia recorded a net outflow of U.S.$6.6 billion, compared to a net inflow of U.S.$6.9 billion in 2021. The increasing global financial market uncertainty triggered the rebalancing of domestic government securities (Surat Berharga Negara (“SBN”)) to other instruments, thus reducing the portion of non-resident holdings of domestic SBN. Capital inflows to the stock market remained positive, though lower than the previous year.
In 2023, foreign capital flows in the form of portfolio investments in Indonesia recorded a net inflow of U.S.$5.1 billion, compared to the net outflow of U.S.$6.6 billion in 2022. The net inflow comprise predominantly long-term instruments such as SBN denominated in Rupiah, as well as the newly introduced instrument Bank Indonesia Rupiah Securities (Sekuritas Rupiah Bank Indonesia (“SRBI”)).
In 2024, foreign capital flows in the form of portfolio investments in Indonesia recorded a net inflow of U.S.$12.2 billion, compared to the net inflow of U.S.$5.1 billion in 2023. The net inflow was mainly driven by foreign capital inflow in the form of SRBI and Government securities issued in international markets.
In the first quarter of 2025, foreign capital flows in the form of portfolio investments in Indonesia recorded a net inflow of U.S.$1.5 billion, compared to the net outflow of U.S.$0.8 billion in the first quarter of 2024. The net inflow was mainly driven by foreign capital inflow in the form of SRBI and Government securities issued in both domestic and international markets.
D-47
Other Foreign Investment
The following table sets out the amounts of other investments (other than portfolio or foreign direct investments) in Indonesia by non-residents, mainly consisting of loans received and paid.
Other Foreign Investments
| Year Ended December 31, | Three Months Ended March 31, |
|||||||||||||||||||||||||||
| 2020 | 2021 | 2022 | 2023 | 2024P | 2024P | 2025P | ||||||||||||||||||||||
|
|
|
|
|
|
|
|
|
|
|
|
|
|
|
|||||||||||||||
| (in millions of U.S. dollars) | ||||||||||||||||||||||||||||
| Loans |
||||||||||||||||||||||||||||
| Bank sector: |
||||||||||||||||||||||||||||
| Disbursements |
3,902 | 1,409 | 3,704 | 1,526 | 6,154 | 958 | 224 | |||||||||||||||||||||
| Debt repayments |
(5,502 | ) | (4,489 | ) | (2,844 | ) | (5,145 | ) | (3,652 | ) | (659 | ) | (1,096 | ) | ||||||||||||||
|
|
|
|
|
|
|
|
|
|
|
|
|
|
|
|||||||||||||||
| Total bank sector |
(1,600 | ) | (3,080 | ) | 860 | (3,619 | ) | 2,502 | 298 | (872 | ) | |||||||||||||||||
| Corporate sector: |
||||||||||||||||||||||||||||
| Disbursements |
20,975 | 15,141 | 19,972 | 18,435 | 15,034 | 3,583 | 3,620 | |||||||||||||||||||||
| Debt repayments |
(17,887 | ) | (20,307 | ) | (22,628 | ) | (17,088 | ) | (15,938 | ) | (3,016 | ) | (2,797 | ) | ||||||||||||||
|
|
|
|
|
|
|
|
|
|
|
|
|
|
|
|||||||||||||||
| Total corporate sector |
3,088 | (5,167 | ) | (2,656 | ) | 1,347 | (905 | ) | 568 | 822 | ||||||||||||||||||
| Other (net)(1) |
776 | 7,521 | 2,039 | 6,642 | 8,514 | 992 | 537 | |||||||||||||||||||||
|
|
|
|
|
|
|
|
|
|
|
|
|
|
|
|||||||||||||||
| Total other investments |
2,264 | (726 | ) | 242 | 4,370 | 10,112 | 1,859 | 487 | ||||||||||||||||||||
|
|
|
|
|
|
|
|
|
|
|
|
|
|
|
|||||||||||||||
Source: Bank Indonesia
| P | Preliminary. |
| (1) | Consists of loans of public sector and trade credit, currency and deposits, SDR allocations, and other liabilities of private sector and public sector. |
D-48
In 2020, other foreign investments decreased from a surplus of U.S.$6.1 billion in 2019 to a surplus of U.S.$2.3 billion. The decreased surplus was primarily due to lower loan withdrawal and a net payment on trade credit of private sector.
In 2021, other foreign investments fell from a surplus of U.S.$2.3 billion in 2020 to a deficit of U.S.$0.7 billion. The deficit was primarily due to net payments of foreign loans by both the public and private sectors (banking and corporate sector).
In 2022, other foreign investments increased from a deficit of U.S.$0.7 billion in 2021 to a surplus of U.S.$0.2 billion. The surplus in 2022 is primarily due to net drawings of foreign loans by the government and banking sector.
In 2023, other foreign investments increased from a surplus of U.S.$0.2 billion in 2022 to a surplus of U.S.$2.9 billion. The increase is primarily attributable to net drawings of foreign loans by the government and corporate sector.
In 2024, other foreign investments increased from a surplus of U.S.$4.4 billion in 2023 to a surplus of U.S.$10.1 billion. The surplus is primarily due to net drawings of foreign loans by the Government and the banking sector.
In the first quarter of 2025, other foreign investments decreased from a surplus of U.S.$1.9 billion in the first quarter of 2024 to a surplus of U.S.$0.5 billion. The surplus is primarily attributable to net drawings of foreign loans by the corporate and the Government sector.
Direct Investment Realizations
Foreign Direct Investment
In 1973, the Republic established BKPM, an investment services agency of the Government, to accelerate economic growth by attracting foreign capital investment. BKPM’s main function is to implement the Government’s objectives for investment in the country.
Under Indonesian law, most direct equity investments by foreign persons are subject to approval by the BKPM, regardless of the size of the investment. The BKPM reviews applications for approval based on the list of sectors that are open for investment under the Law on Job Creation, which lists those business sectors that are closed to foreign investment and those that are open to foreign investment subject to certain conditions, including limits on the percentage of foreign capital ownership; and also based on criteria established by the particular ministry that regulates the sector in which the foreign investor seeks to invest. Upon receiving approval, a foreign investor may complete the investment, but is not obligated to do so.
Due to the different concept and method of compiling investment statistics, “administrative” foreign direct investment statistical data published by the BKPM and “Balance of Payment” foreign direct investment statistical data published by Bank Indonesia are not comparable. BKPM calculates foreign direct investment based on realized investments in Indonesian companies owned by foreign investors within a certain reporting period. BKPM’s realization data covers the total value of investments funded by foreign investors, other foreign creditors, as well as domestic investors and creditors. In comparison, Bank Indonesia’s calculation method covers the entire flow of investments stemming from foreign investors over a certain reporting period. In addition, Bank Indonesia excludes from its calculations foreign investments made by investors with a non-resident ownership of less than 10% per individual investors while BKPM has no such minimum ownership requirement. In terms of sector coverage, BKPM excludes certain sectors from its calculation, including investments in oil and gas, banking, non-bank financial institutions, insurance, leasing, investment sectors licensed by technical/sectoral agencies, investments through the stock market and household investments. Bank Indonesia covers all economic sectors. As a result the data regarding realized foreign direct investments is not comparable to those under “Foreign Investment in Indonesia” in the table above.
D-49
The following table sets forth the amount of realized foreign direct investment by sector of the economy for the periods indicated.
Realized Foreign Direct Investment by Sector(1)
| Year Ended December 31, | Three Months Ended March 31, |
|||||||||||||||||||||||||||
| 2020 | 2021 | 2022 | 2023P | 2024P | 2024P | 2025P | ||||||||||||||||||||||
|
|
|
|
|
|
|
|
|
|
|
|
|
|
|
|||||||||||||||
| (in millions of U.S. dollars) | ||||||||||||||||||||||||||||
| Primary Sector |
||||||||||||||||||||||||||||
| Food Crops, Plantation & Livestock |
1,184 | 951 | 1,789 | 1,946 | 1,827 | 306 | 285 | |||||||||||||||||||||
| Forestry |
43 | 41 | 99 | 96 | 86 | 51 | 35 | |||||||||||||||||||||
| Fishery |
48 | 17 | 32 | 26 | 218 | 49 | 5 | |||||||||||||||||||||
| Mining |
2,005 | 3,817 | 5,145 | 4,715 | 5,188 | 1,405 | 1,192 | |||||||||||||||||||||
|
|
|
|
|
|
|
|
|
|
|
|
|
|
|
|||||||||||||||
| Total Primary Sector |
3,280 | 4,826 | 7,065 | 6,782 | 7,319 | 1,811 | 1,516 | |||||||||||||||||||||
|
|
|
|
|
|
|
|
|
|
|
|
|
|
|
|||||||||||||||
| Secondary sector: |
||||||||||||||||||||||||||||
| Food Industry |
1,592 | 2,337 | 2,425 | 2,263 | 3,463 | 680 | 611 | |||||||||||||||||||||
| Textile Industry |
280 | 312 | 658 | 458 | 948 | 194 | 225 | |||||||||||||||||||||
| Leather Goods & Footwear Industry |
214 | 486 | 630 | 782 | 904 | 144 | 416 | |||||||||||||||||||||
| Wood Industry |
85 | 68 | 243 | 158 | 144 | 24 | 41 | |||||||||||||||||||||
| Paper and Printing Industry |
943 | 953 | 1,630 | 3,431 | 4,777 | 984 | 669 | |||||||||||||||||||||
| Chemical and Pharmaceutical Industry |
1,743 | 1,657 | 4,506 | 4,805 | 4,126 | 1,076 | 914 | |||||||||||||||||||||
| Rubber and Plastic Industry |
291 | 262 | 363 | 576 | 927 | 183 | 322 | |||||||||||||||||||||
| Non Metallic Mineral Industry |
248 | 327 | 537 | 523 | 1,142 | 152 | 182 | |||||||||||||||||||||
| Metal, Industry not Machinery & Electronic Industry |
5,969 | 6,974 | 10,961 | 11,787 | 13,557 | 2,751 | 3,643 | |||||||||||||||||||||
| Medical Precision & Optical Instruments, Watches & Clock, Machinery and Electronic Industry |
601 | 679 | 789 | 1,478 | 2,089 | 523 | 595 | |||||||||||||||||||||
| Motor Vehicles & Other Transport Equipment |
942 | 1,502 | 1,522 | 2,046 | 2,503 | 671 | 666 | |||||||||||||||||||||
| Other Industry |
294 | 246 | 415 | 382 | 552 | 123 | 115 | |||||||||||||||||||||
|
|
|
|
|
|
|
|
|
|
|
|
|
|
|
|||||||||||||||
| Total Secondary Sector |
13,202 | 15,804 | 24,679 | 28,690 | 35,131 | 7,504 | 8,401 | |||||||||||||||||||||
|
|
|
|
|
|
|
|
|
|
|
|
|
|
|
|||||||||||||||
| Tertiary sector: |
||||||||||||||||||||||||||||
| Electricity, Gas & Water Supply |
4,614 | 2,939 | 3,763 | 2,742 | 2,469 | 525 | 523 | |||||||||||||||||||||
| Construction |
190 | 93 | 165 | 282 | 767 | 182 | 124 | |||||||||||||||||||||
| Trade & Repair |
434 | 464 | 737 | 944 | 2,007 | 335 | 652 | |||||||||||||||||||||
| Hotel & Restaurant |
441 | 432 | 498 | 811 | 944 | 368 | 205 | |||||||||||||||||||||
| Transportation, Storage & Communication |
3,580 | 3,159 | 4,125 | 5,615 | 4,654 | 1,182 | 1,134 | |||||||||||||||||||||
| Housing, Ind. Estate & Office Building |
2,191 | 2,186 | 3,015 | 2,575 | 3,090 | 946 | 763 | |||||||||||||||||||||
| Other Services |
733 | 1,190 | 1,558 | 1,827 | 3,632 | 776 | 1,081 | |||||||||||||||||||||
|
|
|
|
|
|
|
|
|
|
|
|
|
|
|
|||||||||||||||
| Total Tertiary Sector |
12,184 | 10,463 | 13,861 | 14,795 | 17,564 | 4,314 | 4,482 | |||||||||||||||||||||
|
|
|
|
|
|
|
|
|
|
|
|
|
|
|
|||||||||||||||
| Total |
28,666 | 31,093 | 45,605 | 50,268 | 60,014 | 13,629 | 14,399 | |||||||||||||||||||||
|
|
|
|
|
|
|
|
|
|
|
|
|
|
|
|||||||||||||||
Source: BKPM
| P | Preliminary. |
| (1) | Excludes foreign investment in oil and natural gas projects, banking, non-bank financial institutions, insurance, leasing, mining in terms of contracts of work, coal mining in terms of agreement of work, investment in which licenses were issued by a technical/sectoral agency, portfolio as well as household investment. |
D-50
Domestic Direct Investment
In addition to direct equity investments by foreign persons, BKPM also approves certain types of domestic direct investments. The following table sets forth the amount of realized domestic direct investment by sector of the economy for the periods indicated.
Realized Domestic Direct Investment by Sector(1)
| Year Ended December 31, | Three Months Ended March 31, |
|||||||||||||||||||||||||||
| 2020 | 2021 | 2022 | 2023P | 2024P | 2024P | 2025P | ||||||||||||||||||||||
|
|
|
|
|
|
|
|
|
|
|
|
|
|
|
|||||||||||||||
| (in billions of Rupiah) | ||||||||||||||||||||||||||||
| Primary sector: |
||||||||||||||||||||||||||||
| Food Crops, Plantation & Livestock |
32,096 | 29,375 | 38,879 | 42,912 | 45,502 | 11,055 | 11,318 | |||||||||||||||||||||
| Forestry |
1,164 | 6,863 | 8,603 | 23,032 | 33,464 | 11,244 | 2,464 | |||||||||||||||||||||
| Fishery |
565 | 1,012 | 1,214 | 2,507 | 1,816 | 496 | 935 | |||||||||||||||||||||
| Mining |
13,755 | 25,517 | 62,522 | 86,689 | 106,859 | 21,227 | 29,531 | |||||||||||||||||||||
|
|
|
|
|
|
|
|
|
|
|
|
|
|
|
|||||||||||||||
| Total Primary Sector |
47,580 | 62,767 | 111,217 | 155,140 | 187,640 | 44,022 | 44,248 | |||||||||||||||||||||
|
|
|
|
|
|
|
|
|
|
|
|
|
|
|
|||||||||||||||
| Secondary sector: |
||||||||||||||||||||||||||||
| Food Industry |
27,873 | 26,518 | 54,937 | 54,828 | 65,941 | 18,836 | 14,056 | |||||||||||||||||||||
| Textile Industry |
2,103 | 1,972 | 5,615 | 7,950 | 7,218 | 1,714 | 1,794 | |||||||||||||||||||||
| Leather Goods & Footwear Industry |
395 | 700 | 484 | 1,641 | 1,644 | 140 | 371 | |||||||||||||||||||||
| Wood Industry |
1,263 | 1,144 | 3,588 | 4,611 | 4,713 | 2,263 | 527 | |||||||||||||||||||||
| Paper and Printing Industry |
3,746 | 7,833 | 9,508 | 9,295 | 9,003 | 3,859 | 2,195 | |||||||||||||||||||||
| Chemical and Pharmaceutical Industry |
22,526 | 23,364 | 28,905 | 33,870 | 35,916 | 7,505 | 7,131 | |||||||||||||||||||||
| Rubber and Plastic Industry |
4,429 | 7,803 | 7,370 | 9,256 | 8,693 | 2,340 | 2,002 | |||||||||||||||||||||
| Non Metallic Mineral Industry |
5,862 | 6,522 | 6,368 | 7,770 | 8,045 | 2,055 | 1,915 | |||||||||||||||||||||
| Metal Industry not Machinery & Electronic Industry |
8,858 | 15,656 | 13,950 | 25,886 | 35,088 | 6,862 | 8,984 | |||||||||||||||||||||
| Medical Precision & Optical Instruments, Watches & Clock, Machinery, and Electronic Industry |
1,156 | 535 | 3,693 | 4,263 | 4,934 | 1,005 | 1,501 | |||||||||||||||||||||
| Motor Vehicles & Other Transport Equipment Industry |
2,556 | 1,459 | 2,425 | 6,173 | 8,190 | 572 | 3,488 | |||||||||||||||||||||
| Other Industry |
2,051 | 1,192 | 6,721 | 6,114 | 4,910 | 1,453 | 1,327 | |||||||||||||||||||||
|
|
|
|
|
|
|
|
|
|
|
|
|
|
|
|||||||||||||||
| Total Secondary Sector |
82,818 | 94,699 | 143,564 | 171,657 | 194,293 | 48,605 | 45,291 | |||||||||||||||||||||
|
|
|
|
|
|
|
|
|
|
|
|
|
|
|
|||||||||||||||
| Tertiary sector: |
||||||||||||||||||||||||||||
| Electricity, Gas & Water Supply |
35,519 | 38,728 | 32,107 | 37,585 | 46,312 | 13,871 | 13,407 | |||||||||||||||||||||
| Construction |
68,289 | 39,569 | 33,847 | 32,813 | 33,399 | 5,297 | 8,085 | |||||||||||||||||||||
| Trade & Repair |
16,748 | 22,432 | 31,051 | 48,558 | 65,300 | 16,474 | 18,911 | |||||||||||||||||||||
| Hotel & Restaurant |
10,203 | 17,819 | 21,579 | 23,363 | 24,138 | 6,172 | 7,577 | |||||||||||||||||||||
| Transportation, Storage & Communication |
93,283 | 61,242 | 75,138 | 76,659 | 120,083 | 30,218 | 48,360 | |||||||||||||||||||||
| Housing, Ind. Estate & Office Building |
44,853 | 85,498 | 66,168 | 77,099 | 76,517 | 15,193 | 25,294 | |||||||||||||||||||||
| Other Services |
14,243 | 24,310 | 38,097 | 52,048 | 66,337 | 17,257 | 23,659 | |||||||||||||||||||||
|
|
|
|
|
|
|
|
|
|
|
|
|
|
|
|||||||||||||||
| Total Tertiary Sector |
283,138 | 289,598 | 297,987 | 348,126 | 432,085 | 104,483 | 145,292 | |||||||||||||||||||||
|
|
|
|
|
|
|
|
|
|
|
|
|
|
|
|||||||||||||||
| Total |
413,536 | 447,064 | 552,769 | 674,923 | 814,018 | 197,109 | 234,831 | |||||||||||||||||||||
|
|
|
|
|
|
|
|
|
|
|
|
|
|
|
|||||||||||||||
Source: BKPM
| P | Preliminary. |
| (1) | Excludes foreign investment in oil and natural gas projects, banking, non-bank financial institutions, insurance, leasing, mining in terms of contracts of work, coal mining in terms of agreement of work, investment in which licenses were issued by a technical/sectoral agency, portfolio as well as household investment. |
D-51
Foreign Trade and Balance of Payments
Membership in International and Regional Free Trade Agreements
The Government supports the liberalization of international trade and investment through its membership in several international and regional trade organizations. Indonesia is a signatory to the GATT 1947 and a founding member of the World Trade Organization through the ratification of Law No. 7 of 1994 on Agreement Establishing the World Trade Organization. In 2017, the Government ratified the WTO Trade Facilitation Agreement through Law No. 17 of 2017 on Ratification of Protocol Amending the Marrakesh Agreement Establishing the World Trade Organization.
ASEAN has served as the forum for the negotiation of a number of regional agreements, and in 2015, ASEAN leaders adopted the ASEAN Economic Community Blueprint 2025, which is a roadmap for strategic integration of the economies of the ASEAN Member States. In 2009, the ASEAN Member States also entered into the ASEAN Comprehensive Investment Agreement which aims to create a free and open regime in ASEAN to achieve economic integration. ASEAN Member States have entered into eight free trade agreements, namely: the ASEAN Trade in Goods Agreement, the ASEAN-China Free Trade Agreement, the ASEAN-Korea Free Trade Agreement, the ASEAN-Japan Comprehensive Economic Partnership, the ASEAN-India Free Trade Agreement, the ASEAN-Australia and New Zealand Free Trade Agreement, the ASEAN-Hong Kong, China Free Trade Agreement, and the Regional Comprehensive Economic Partnership. In addition, Indonesia has entered into and implemented nine bilateral trade agreements and two multilateral trade agreements: the Indonesia-Japan Economic Partnership Agreement, the Indonesia-Pakistan Preferential Trade Agreement, the Indonesia-Chile Comprehensive Economic Partnership, the Indonesia-Australia Comprehensive Economic Partnership Agreement, the Indonesia-Korea Comprehensive Economic Partnership Agreement, the Indonesia-United Arab Emirates Comprehensive Economic Partnership Agreement, the Indonesia-Mozambique Preferential Trade Agreement, the Indonesia-Palestina MOU on Trade Facilitation for Certain Products, the Indonesia-Iran Preferential Trade Agreement, the Indonesia-EFTA Comprehensive Economic Partnership Agreement, and the Preferential Trade Agreement Among Developing Eight. These free trade agreements cover three core areas, namely: trade in goods, trade in services and investments.
In addition, the Indonesia-European Free Trade Association Comprehensive Economic Partnership was signed in 2018 and entered into force in November 2021. It covers trade in goods and services, investments, intellectual property rights, government procurement, cooperation, capacity building, and sustainable development.
Various regional and bilateral free trade agreements of which Indonesia is a party are currently in different stages of negotiations, namely, the Indonesia-European Union Comprehensive Economic Partnership Agreement, the Indonesia-Canada Comprehensive Economic Partnership Agreement, the Indonesia-Bangladesh Preferential Trade Agreement, the Indonesia-Peru Comprehensive Economic Partnership Agreement, the Indonesia-Eurasian Economic Union Free Trade Agreement, the Indonesia-Tunisia Preferential Trade Agreement, the Indonesia-Gulf Cooperation Council Free Trade Agreement, the Indonesia-Türkiye Comprehensive Economic Partnership Agreement and the Indonesia-Sri Lanka Preferential Trade Agreement.
The Minister of Finance is authorized to set rates for import duties. The Republic maintains a policy of using tariff rates to promote the competitiveness of Indonesian products in international markets and to reduce price distortions in order to support the establishment of free trade. The Republic has implemented preferential tariff commitments under its various international and regional free trade agreements.
United States Tariffs
On April 2, 2025, President Donald Trump announced that the U.S. Government would impose a 10% tariff on all countries, effective April 5, 2025. Additionally, the U.S. Government announced the imposition of individualized reciprocal higher tariffs on specific countries, including a 32% tariff on goods imported from Indonesia, initially set to take effect on April 9, 2025, but later delayed. On April 9, 2025, President Donald Trump announced a 90-day pause on the individualized reciprocal higher tariff on almost all countries, including Indonesia. This pause was further extended, the 32% tariff has been postponed beyond its originally planned implementation date of August 1, 2025, following high-level talks between Indonesian and US officials on July 9, 2025.
The Republic has refrained from retaliatory trade measures and has actively pursued negotiations with the U.S. government. During the IMF-World Bank Spring Meeting held in Washington D.C. in April 2025, the Indonesian delegation, led by the Coordinating Minister of Economic Affairs, held bilateral meetings with the U.S. Secretary of the Treasury and also engaged with other key US authorities. In addition, on July 7, 2025, Indonesian businesses signed a U.S.$34 billion trade and investment pact with their U.S. counterparts to increase imports and investments from the U.S. into Indonesia, aiming to secure a better tariff deal for the Republic. On July 15, 2025, the US and Indonesia announced a new trade agreement, reducing the proposed tariff on Indonesian imports to 19%. The new tariff rate is expected to take effect on August 1, 2025, replacing the previously proposed 32% tariff.
D-52
The higher tariffs could have a negative effect on certain of the Republic’s key export sectors and lead to lower economic growth.
Negotiation on Free Trade Agreement between Indonesia and the European Union
On July 13, 2025, the Republic and the European Union reached a political agreement to advance a free trade agreement known as the Comprehensive Economic Partnership Agreement (“CEPA”), marking a milestone after nine years of negotiation since the official launch in 2016. The CEPA is designed to promote trade and investment, foster inclusive and sustainable growth and enhance the resilience of supply chain.
Exports and Imports
The following table shows Indonesia’s exports and imports for the periods indicated as published by Bank Indonesia.
Exports and Imports
| Year Ended December 31, | Five Months Ended May 31, |
|||||||||||||||||||||||||||
| 2020 | 2021 | 2022 | 2023 | 2024P | 2024P | 2025P | ||||||||||||||||||||||
|
|
|
|
|
|
|
|
|
|
|
|
|
|
|
|||||||||||||||
| (in millions of U.S. dollars) | ||||||||||||||||||||||||||||
| Exports: |
||||||||||||||||||||||||||||
| Oil and gas exports (f.o.b.) |
8,480 | 13,201 | 17,039 | 14,840 | 15,029 | 6,170 | 5,081 | |||||||||||||||||||||
| Non-oil and gas exports (f.o.b.) |
154,921 | 219,635 | 275,499 | 242,841 | 246,810 | 97,098 | 105,004 | |||||||||||||||||||||
|
|
|
|
|
|
|
|
|
|
|
|
|
|
|
|||||||||||||||
| Total exports (f.o.b.) |
163,402 | 232,835 | 292,538 | 257,681 | 261,839 | 103,268 | 110,085 | |||||||||||||||||||||
| Total imports (c.i.f.) |
(142,104 | ) | (198,800 | ) | (241,716 | ) | (222,292 | ) | (233,782 | ) | (91,666 | ) | (95,933 | ) | ||||||||||||||
| Balance of trade |
21,298 | 34,035 | 50,822 | 35,389 | 28,056 | 11,603 | 14,152 | |||||||||||||||||||||
|
|
|
|
|
|
|
|
|
|
|
|
|
|
|
|||||||||||||||
Source: Bank Indonesia
| P | Preliminary. |
In 2020, Indonesia recorded a trade surplus of U.S.$21.3 billion, reversed from the U.S.$5.0 billion deficit in 2019. The trade surplus was caused by an 18.1% decrease in imports, which was greater than the 3.0% decrease in exports. A greater import contraction affected all commodity groups in response to severely impaired domestic economic activity, curbed by mobility restrictions during the Covid-19 pandemic, as well as an export contraction recorded in 2020.
In 2021, Indonesia recorded a trade surplus of U.S.$34.0 billion, which increased from the U.S.$21.3 billion surplus recorded in 2020. The higher trade surplus was caused by a 42.5% increase in exports, which was higher than the 39.9% increase in imports, each compared to the previous year. Exports expanded at a higher rate compared to 2020, given stronger demand and higher export prices in 2021, which is in line with the global economic recovery. Increasing prices of Indonesia’s major commodities such as coal and palm oil has boosted exports throughout 2021.
In 2022, Indonesia recorded a trade surplus of U.S.$50.8 billion, which increased by 49.3% from the U.S.$34.0 billion surplus in 2021. The higher trade surplus was caused by a 25.6% year-on-year increase in exports, which was higher than the 21.6% year-on-year increase in imports (c.i.f). The improvement of export performance was mainly due to persistently high international commodity prices and robust demand for Indonesian major commodities. Consistent with stronger exports, imports also experienced an uptick compared to 2021 as the domestic economy continues to recover.
In 2023, Indonesia recorded a trade surplus of U.S.$35.5 billion, which decreased by 30.2% from the U.S.$50.8 billion surplus in 2022. The lower trade surplus was mainly due to a 11.3% decrease in exports primarily due to softening demand from Indonesia’s major trading partners for its main non-oil and gas export commodities as well as decreasing commodity prices. In addition, imports (c.i.f) decreased by 7.3%, in line with export performance.
In 2024, Indonesia recorded a trade surplus of U.S.$28.1 billion, which decreased by 20.7% from the U.S.$35.4 billion surplus in 2023. The lower trade surplus was primarily driven by a 5.2% year-on-year increase in imports in line with solid domestic demand. Meanwhile, exports grew by 1.6% year-on-year, supported by higher international commodity prices.
In the five months of 2025, Indonesia recorded a trade surplus of U.S.$14.2 billion, which increased by 22.0% from the U.S.$11.6 billion surplus in the same period of 2024. The higher surplus was driven by a 6.6% year-on-year increase in exports, supported by rising international commodity prices. This increase was partially offset by a 4.7% year-on-year increase in imports.
D-53
Export-Import Data from the Central Statistics Agency
In addition to the exports and imports related data published by Bank Indonesia, the Central Statistics Agency or BPS also publishes data relating to imports and exports compiled based on the International Merchandise Trade Statistics Manual issued by the United Nations. Due to the different methods and timing of compiling export-import statistics, the export-import data published by BPS is different to the export-import data published by Bank Indonesia.
The tables below show Indonesia’s exports and imports for the periods indicated as published by the BPS.
| Year Ended December 31, | Four Months Ended April 30, |
|||||||||||||||||||||||||||
| 2020 | 2021 | 2022R | 2023R | 2024P | 2024P | 2025P | ||||||||||||||||||||||
|
|
|
|
|
|
|
|
|
|
|
|
|
|
|
|||||||||||||||
| (in millions of U.S. dollars) | ||||||||||||||||||||||||||||
| Exports: |
||||||||||||||||||||||||||||
| Non-oil and gas exports |
154,941 | 219,362 | 275,906 | 242,853 | 248,823 | 76,669 | 82,557 | |||||||||||||||||||||
| Oil and gas exports |
8,251 | 12,248 | 15,998 | 15,922 | 15,877 | 5,250 | 4,807 | |||||||||||||||||||||
|
|
|
|
|
|
|
|
|
|
|
|
|
|
|
|||||||||||||||
| Total exports |
163,192 | 231,610 | 291,904 | 258,774 | 264,703 | 81,919 | 87,364 | |||||||||||||||||||||
|
|
|
|
|
|
|
|
|
|
|
|
|
|
|
|||||||||||||||
| Imports: |
||||||||||||||||||||||||||||
| Non-oil and gas imports |
127,312 | 170,661 | 197,031 | 186,056 | 197,384 | 59,803 | 65,293 | |||||||||||||||||||||
| Oil and gas imports |
14,257 | 25,529 | 40,416 | 35,830 | 36,275 | 11,989 | 10,997 | |||||||||||||||||||||
|
|
|
|
|
|
|
|
|
|
|
|
|
|
|
|||||||||||||||
| Total imports |
141,569 | 196,190 | 237,447 | 221,886 | 233,659 | 71,791 | 76,290 | |||||||||||||||||||||
|
|
|
|
|
|
|
|
|
|
|
|
|
|
|
|||||||||||||||
Source: BPS.
| P | Preliminary. |
| R | Revised. |
Government Regulation of Export Proceeds
The Government Regulation Number 36 Year 2023 on Foreign Exchange Export Earnings from the Business, Management and/or Processing of Natural Resources (as amended, “GR 36/2023”), effective August 1, 2023, was recently amended by Government Regulation Number 8 Year 2025. Under GR 36/2023, all export proceeds from certain mining, plantation, forestry, and fisheries products must be deposited in special accounts at the Indonesian Export Finance Agency (currently Indonesia Eximbank) or a licensed foreign-exchange bank and retained in the Indonesian banking system for at least 12 months from the date of deposit.
Export proceeds from oil and gas products are subject to a different rule mandating that at least 30% of such proceeds must remain in the Indonesian banking system for a minimum of three months following their deposit into special accounts at Indonesia Eximbank or a licensed foreign-exchange bank.
Exporters are permitted to utilize the export proceed held in these special accounts as collateral for Rupiah-denominated bank loans or credit facilities from Indonesia Eximbank or a licensed foreign-exchange bank, or for such other purpose as may be approved by Bank Indonesia.
Ban on Raw Material Exports
The Government has banned exports of bauxite ore since June 2023. It has also banned exports of copper concentrate since the same month, with an exemption for Freeport Indonesia and Amman Mineral Nusa Tenggara to continue such exports until May 2024. These bans, together with the Government’s ban on exports of nickel ore since January 2020, are part of the Republic’s efforts to encourage the domestic processing of raw materials and reduce its reliance on imports of processed materials.
Temporary Ban on Palm Oil and Other Products
On April 28, 2022, the Government implemented a temporary ban on export of Indonesian (i) crude palm oil, (ii) bleached and deodorized palm oil, (iii) refined, bleached, and deodorized palm olein, and (iv) used cooking oil, to the global market. The policy was aimed at maintaining the domestic stock and reducing the scarcity of palm-based cooking oil in the domestic Indonesian market. As a result, the Government has stabilized the stock and lower the palm-based cooking oil price in the domestic market. In May 2022, the Government revoked the ban and permitted the export of (i) crude palm oil, (ii) bleached and deodorized palm oil, (iii) refined, bleached, and deodorized palm olein, and (iv) used cooking oil.
D-54
Exports
The following table sets forth Indonesia’s exports by major commodity groups for the periods indicated.
Exports by Sector
| Year Ended December 31, |
Five Months Ended May 31, |
|||||||||||||||||||||||||||
| 2020 | 2021 | 2022 | 2023 | 2024P | 2024P | 2025P | ||||||||||||||||||||||
| (in thousands of U.S. dollars) | ||||||||||||||||||||||||||||
| General merchandise |
157,859,928 | 231,316,430 | 291,510,626 | 256,832,315 | 260,776,391 | 102,879,323 | 109,201,143 | |||||||||||||||||||||
| Agricultural products |
||||||||||||||||||||||||||||
| Coffee bean |
808,635 | 848,285 | 1,137,939 | 915,636 | 1,623,533 | 367,709 | 914,475 | |||||||||||||||||||||
| Medicinal herb, aromatic and spice plant |
611,521 | 759,231 | 608,628 | 467,475 | 427,439 | 159,556 | 252,767 | |||||||||||||||||||||
| Bird nest |
540,566 | 504,261 | 590,240 | 633,094 | 551,871 | 238,907 | 204,003 | |||||||||||||||||||||
| Seasonal fruit |
449,724 | 403,175 | 307,306 | 334,262 | 582,811 | 233,074 | 366,570 | |||||||||||||||||||||
| Other non-timber forest product |
309,009 | 417,705 | 486,813 | 620,760 | 546,823 | 227,116 | 238,438 | |||||||||||||||||||||
| Seaweed and other algae |
181,620 | 233,454 | 402,636 | 279,744 | 188,480 | 77,485 | 68,198 | |||||||||||||||||||||
| Fresh / chilled fish |
140,583 | 132,366 | 127,674 | 120,682 | 143,797 | 58,878 | 68,611 | |||||||||||||||||||||
| Clove |
173,270 | 94,308 | 54,624 | 95,171 | 319,431 | 95,910 | 116,869 | |||||||||||||||||||||
| Vegetables |
116,125 | 85,664 | 98,713 | 134,958 | 218,184 | 34,218 | 99,761 | |||||||||||||||||||||
| White pepper |
75,219 | 96,736 | 80,549 | 63,953 | 123,096 | 37,114 | 65,541 | |||||||||||||||||||||
| Tobacco |
63,743 | 73,901 | 106,321 | 86,675 | 104,337 | 34,841 | 22,027 | |||||||||||||||||||||
| Cocoa bean |
75,256 | 55,362 | 62,865 | 46,595 | 80,605 | 25,592 | 35,823 | |||||||||||||||||||||
| Shrimp and prawn |
101,655 | 72,453 | 43,451 | 43,236 | 104,673 | 37,987 | 68,459 | |||||||||||||||||||||
| Rubber latex |
46,111 | 68,490 | 68,003 | 54,726 | 56,924 | 21,655 | 22,082 | |||||||||||||||||||||
| Crab |
38,097 | 62,540 | 58,564 | 62,662 | 98,760 | 48,397 | 58,006 | |||||||||||||||||||||
| Other agricultural products |
402,653 | 1,058,791 | 1,130,610 | 1,142,271 | 1,251,196 | 445,420 | 508,379 | |||||||||||||||||||||
|
|
|
|
|
|
|
|
|
|
|
|
|
|
|
|||||||||||||||
| Total Agricultural products |
4,133,788 | 4,966,721 | 5,364,936 | 5,101,900 | 6,421,959 | 2,143,859 | 3,110,010 | |||||||||||||||||||||
|
|
|
|
|
|
|
|
|
|
|
|
|
|
|
|||||||||||||||
| Manufacturing products |
||||||||||||||||||||||||||||
| Palm oils |
18,390,249 | 28,474,899 | 29,628,992 | 23,965,276 | 21,528,367 | 7,469,984 | 9,848,605 | |||||||||||||||||||||
| Iron/steel |
11,262,371 | 21,471,317 | 28,465,009 | 27,599,169 | 27,147,960 | 11,091,025 | 11,939,621 | |||||||||||||||||||||
| Clothing and apparel of textile fabrics |
5,766,674 | 7,029,237 | 8,074,099 | 6,801,682 | 7,069,206 | 2,774,824 | 2,877,366 | |||||||||||||||||||||
| Electrical equipment |
5,110,653 | 6,439,195 | 8,329,344 | 7,706,789 | 8,574,706 | 3,114,449 | 4,335,988 | |||||||||||||||||||||
| Organic chemicals derived from agricultural products |
3,948,956 | 7,023,263 | 8,414,275 | 6,233,256 | 6,787,146 | 2,506,566 | 3,811,854 | |||||||||||||||||||||
| Motor vehicle, four-wheel drive and more |
3,048,391 | 3,806,332 | 6,183,459 | 6,843,321 | 6,690,045 | 2,558,411 | 2,655,953 | |||||||||||||||||||||
| Sport shoes |
3,115,785 | 4,233,622 | 5,062,107 | 3,858,898 | 4,081,767 | 1,639,288 | 1,695,062 | |||||||||||||||||||||
| Crumb rubber |
2,901,447 | 3,844,833 | 3,452,591 | 2,416,047 | 2,816,113 | 1,009,864 | 1,406,542 | |||||||||||||||||||||
| Pulp |
2,533,513 | 3,283,505 | 3,698,451 | 3,486,523 | 3,566,604 | 1,298,418 | 1,463,091 | |||||||||||||||||||||
| Jewellery and precious articles |
1,469,369 | 2,585,091 | 3,819,429 | 5,606,891 | 5,530,474 | 2,876,246 | 3,207,521 | |||||||||||||||||||||
| Nickel |
794,434 | 1,271,688 | 5,968,877 | 6,806,140 | 7,983,095 | 2,903,618 | 3,361,603 | |||||||||||||||||||||
| Copper |
1,894,934 | 3,049,936 | 2,787,315 | 2,285,775 | 3,456,253 | 1,404,909 | 1,509,926 | |||||||||||||||||||||
| Other papers |
1,882,830 | 2,081,467 | 2,480,548 | 2,409,737 | 2,190,766 | 924,675 | 882,489 | |||||||||||||||||||||
| Spare parts for four or more wheeled vehicles |
1,723,592 | 2,206,414 | 2,281,060 | 2,317,038 | 2,384,534 | 970,646 | 958,435 | |||||||||||||||||||||
D-55
| Year Ended December 31, |
Five Months Ended May 31, |
|||||||||||||||||||||||||||
| 2020 | 2021 | 2022 | 2023 | 2024P | 2024P | 2025P | ||||||||||||||||||||||
| (in thousands of U.S. dollars) | ||||||||||||||||||||||||||||
| Machines for general purposes |
1,675,770 | 1,999,141 | 2,183,884 | 1,887,282 | 2,148,468 | 854,827 | 969,205 | |||||||||||||||||||||
| Tin |
1,130,022 | 2,448,056 | 2,387,742 | 1,783,633 | 1,432,440 | 308,174 | 685,159 | |||||||||||||||||||||
| Soap and household cleaning agents |
1,475,504 | 1,958,853 | 2,216,268 | 1,925,666 | 1,988,552 | 800,088 | 899,742 | |||||||||||||||||||||
| Other telecommunications equipment |
1,614,912 | 1,635,724 | 2,299,968 | 3,020,326 | 2,488,947 | 1,067,272 | 916,401 | |||||||||||||||||||||
| Outer and inner tires |
1,500,345 | 1,753,688 | 1,873,655 | 1,814,950 | 1,632,083 | 695,205 | 677,890 | |||||||||||||||||||||
| Wooden furniture |
1,500,456 | 1,994,280 | 1,933,083 | 1,455,492 | 1,494,227 | 600,151 | 615,143 | |||||||||||||||||||||
| Fertilizers |
1,088,573 | 1,761,467 | 2,843,723 | 1,426,122 | 1,147,470 | 495,317 | 453,327 | |||||||||||||||||||||
| Computer equipment |
1,548,056 | 1,705,354 | 1,831,430 | 1,576,249 | 1,591,486 | 581,428 | 674,305 | |||||||||||||||||||||
| Organic chemicals derived from oil |
1,301,200 | 2,358,458 | 1,159,584 | 762,107 | 886,262 | 285,313 | 329,556 | |||||||||||||||||||||
| Plywood |
1,317,718 | 1,927,685 | 1,813,088 | 1,291,706 | 1,342,836 | 525,967 | 555,690 | |||||||||||||||||||||
| Spun yarn |
1,274,690 | 1,796,310 | 1,405,893 | 1,068,095 | 922,241 | 396,823 | 348,047 | |||||||||||||||||||||
| Tanks and other armoured fighting vehicles and parts of such vehicles |
1,366,690 | 1,608,379 | 1,599,826 | 1,286,171 | 1,223,092 | 451,636 | 656,078 | |||||||||||||||||||||
| Televisions and television equipment |
1,039,513 | 1,920,584 | 1,891,876 | 1,362,151 | 1,440,426 | 603,894 | 601,627 | |||||||||||||||||||||
| Frozen shrimp and prawn |
1,421,284 | 1,535,044 | 1,459,273 | 1,115,072 | 1,085,577 | 399,692 | 505,849 | |||||||||||||||||||||
| Semiconductors and other electronic components |
1,097,944 | 1,425,378 | 1,735,144 | 1,870,186 | 2,224,548 | 920,759 | 1,608,878 | |||||||||||||||||||||
| Margarine |
861,734 | 1,635,103 | 1,968,603 | 1,773,741 | 1,949,832 | 694,334 | 1,010,525 | |||||||||||||||||||||
| Oil-cake and solid residues |
748,224 | 1,328,493 | 2,239,044 | 2,259,348 | 1,724,298 | 787,160 | 277,504 | |||||||||||||||||||||
| Machines for special purposes |
948,553 | 1,347,494 | 1,591,423 | 1,419,386 | 1,376,228 | 498,202 | 517,268 | |||||||||||||||||||||
| Artificial resin (synthetic resin) and raw materials |
1,201,176 | 1,323,366 | 1,274,782 | 1,294,712 | 1,260,681 | 532,459 | 511,653 | |||||||||||||||||||||
| Other organic chemicals |
814,807 | 1,238,675 | 1,659,338 | 1,233,910 | 1,239,540 | 501,783 | 600,649 | |||||||||||||||||||||
| Oil products(1) |
1,312,539 | 1,899,971 | 4,303,720 | 3,487,770 | 3,483,682 | 1,526,278 | 1,129,315 | |||||||||||||||||||||
| Liquefied Petroleum Gas(1) |
416 | 4,185 | 26,092 | 143,213 | 399 | 149 | 199 | |||||||||||||||||||||
| Other manufacture products |
36,401,025 | 42,118,094 | 46,454,344 | 43,669,758 | 50,996,684 | 19,338,593 | 22,331,106 | |||||||||||||||||||||
|
|
|
|
|
|
|
|
|
|
|
|
|
|
|
|||||||||||||||
| Total Manufacturing products |
126,484,347 | 175,524,581 | 206,797,341 | 187,263,589 | 194,887,034 | 75,408,426 | 86,829,173 | |||||||||||||||||||||
|
|
|
|
|
|
|
|
|
|
|
|
|
|
|
|||||||||||||||
D-56
| Year Ended December 31, |
Five Months Ended May 31, |
|||||||||||||||||||||||||||
| 2020 | 2021 | 2022 | 2023 | 2024P | 2024P | 2025P | ||||||||||||||||||||||
| (in thousands of U.S. dollars) | ||||||||||||||||||||||||||||
| Mining products |
||||||||||||||||||||||||||||
| Coal |
14,525,404 | 26,538,367 | 46,671,824 | 34,590,782 | 30,478,761 | 12,667,774 | 10,257,699 | |||||||||||||||||||||
| Copper ore |
2,412,204 | 5,386,226 | 9,243,991 | 8,326,477 | 7,969,176 | 4,185,454 | 1,938,451 | |||||||||||||||||||||
| Lignite |
1,914,067 | 4,966,852 | 7,846,348 | 8,103,053 | 7,345,259 | 2,948,145 | 2,160,484 | |||||||||||||||||||||
| Other metal ore |
556,855 | 629,184 | 623,005 | 68,121 | 18 | 15 | — | |||||||||||||||||||||
| Crude Oil(1) |
1,426,591 | 2,956,045 | 1,590,215 | 1,716,572 | 2,153,385 | 918,600 | 641,019 | |||||||||||||||||||||
| Natural Gas(1) |
5,111,340 | 7,178,270 | 9,381,892 | 8,037,106 | 7,989,263 | 3,145,720 | 2,879,717 | |||||||||||||||||||||
| o/w Liquefied Natural Gas |
3,359,689 | 4,294,339 | 6,361,156 | 6,225,383 | 6,245,259 | 2,454,086 | 2,185,277 | |||||||||||||||||||||
| Other mining products |
306,840 | 559,675 | 659,777 | 884,314 | 1,169,818 | 460,100 | 647,466 | |||||||||||||||||||||
|
|
|
|
|
|
|
|
|
|
|
|
|
|
|
|||||||||||||||
| Total Mining products |
26,253,299 | 48,214,620 | 76,017,051 | 61,726,425 | 57,105,679 | 24,325,808 | 18,524,836 | |||||||||||||||||||||
|
|
|
|
|
|
|
|
|
|
|
|
|
|
|
|||||||||||||||
| Other merchandise(2) |
988,493 | 2,610,508 | 3,331,299 | 2,740,401 | 2,361,719 | 1,001,230 | 737,124 | |||||||||||||||||||||
| Other goods(3) |
5,541,878 | 1,518,852 | 1,027,514 | 848,317 | 1,062,178 | 389,041 | 884,162 | |||||||||||||||||||||
|
|
|
|
|
|
|
|
|
|
|
|
|
|
|
|||||||||||||||
| Total Exports |
163,401,806 | 232,835,282 | 292,538,140 | 257,680,632 | 261,838,569 | 103,268,364 | 110,085,305 | |||||||||||||||||||||
|
|
|
|
|
|
|
|
|
|
|
|
|
|
|
|||||||||||||||
| Memorandum(4) |
||||||||||||||||||||||||||||
| Non-oil & gas exports |
154,921,425 | 219,634,699 | 275,498,694 | 242,840,602 | 246,809,591 | 97,098,148 | 105,004,140 | |||||||||||||||||||||
| Oil & gas exports |
8,480,381 | 13,200,583 | 17,039,446 | 14,840,030 | 15,028,978 | 6,170,216 | 5,081,165 | |||||||||||||||||||||
Source: Bank Indonesia
| P | Preliminary. |
| (1) | As a component of oil and gas exports. |
| (2) | Consists of art goods, goods not elsewhere specified, and goods procured in ports by carriers. |
| (3) | Consists of non-monetary gold and merchanting goods. |
| (4) | Presents the classification of exports based on two main groups of commodities: (i) oil and gas and (ii) non-oil and gas. |
D-57
The table below sets forth Indonesia’s exports by destination for the periods indicated.
Exports by Destination
| Year Ended December 31, |
Five Months Ended May 31, |
|||||||||||||||||||||||||||
| 2020 | 2021 | 2022 | 2023 | 2024P | 2024P | 2025P | ||||||||||||||||||||||
|
|
|
|
|
|
|
|
|
|
|
|
|
|
|
|||||||||||||||
| (in thousands of U.S. dollars) | ||||||||||||||||||||||||||||
| America |
||||||||||||||||||||||||||||
| North America |
||||||||||||||||||||||||||||
| United States of America |
18,594,853 | 25,765,002 | 28,310,297 | 23,163,130 | 26,166,075 | 10,121,989 | 11,945,188 | |||||||||||||||||||||
| Canada |
782,733 | 1,064,214 | 1,284,783 | 1,292,084 | 1,402,807 | 569,306 | 740,895 | |||||||||||||||||||||
| Other North America |
1,021 | 1,620 | 1,717 | 2,869 | 4,116 | 1,501 | 1,838 | |||||||||||||||||||||
|
|
|
|
|
|
|
|
|
|
|
|
|
|
|
|||||||||||||||
| Total North America |
19,378,608 | 26,830,836 | 29,596,798 | 24,458,083 | 27,572,998 | 10,692,796 | 12,687,922 | |||||||||||||||||||||
|
|
|
|
|
|
|
|
|
|
|
|
|
|
|
|||||||||||||||
| Central and South America |
||||||||||||||||||||||||||||
| Argentina |
157,271 | 281,227 | 311,017 | 200,319 | 217,070 | 66,660 | 134,294 | |||||||||||||||||||||
| Brazil |
1,017,307 | 1,504,539 | 1,483,496 | 1,278,005 | 1,715,161 | 619,863 | 933,568 | |||||||||||||||||||||
| Mexico |
883,204 | 1,298,970 | 1,688,739 | 2,129,927 | 2,232,080 | 893,376 | 936,841 | |||||||||||||||||||||
| Other Central and South America |
1,112,753 | 1,910,190 | 2,333,449 | 2,387,097 | 2,397,566 | 1,013,653 | 1,126,846 | |||||||||||||||||||||
| Total Central and South America |
3,170,535 | 4,994,925 | 5,816,701 | 5,995,347 | 6,561,877 | 2,593,552 | 3,131,548 | |||||||||||||||||||||
|
|
|
|
|
|
|
|
|
|
|
|
|
|
|
|||||||||||||||
| Total America |
22,549,143 | 31,825,761 | 35,413,499 | 30,453,431 | 34,134,875 | 13,286,348 | 15,819,470 | |||||||||||||||||||||
|
|
|
|
|
|
|
|
|
|
|
|
|
|
|
|||||||||||||||
| Europe |
||||||||||||||||||||||||||||
| European Union |
||||||||||||||||||||||||||||
| Netherlands |
3,106,339 | 4,624,534 | 5,378,926 | 3,868,396 | 4,726,867 | 1,855,302 | 2,183,791 | |||||||||||||||||||||
| Belgium |
1,175,519 | 1,635,031 | 2,139,872 | 1,586,600 | 1,538,392 | 578,828 | 773,330 | |||||||||||||||||||||
| Italy |
1,740,505 | 2,804,545 | 3,131,432 | 2,097,717 | 2,246,484 | 963,881 | 1,173,164 | |||||||||||||||||||||
| Germany |
2,407,245 | 2,912,856 | 3,233,288 | 2,518,779 | 2,381,493 | 939,777 | 1,068,298 | |||||||||||||||||||||
| France |
913,922 | 996,178 | 1,044,079 | 903,474 | 902,500 | 367,404 | 451,968 | |||||||||||||||||||||
| Spain |
1,509,349 | 2,347,650 | 2,293,582 | 2,194,164 | 2,102,569 | 926,362 | 640,628 | |||||||||||||||||||||
| Other European Union |
2,106,142 | 2,657,501 | 3,780,308 | 3,262,361 | 3,351,056 | 1,505,373 | 1,502,778 | |||||||||||||||||||||
|
|
|
|
|
|
|
|
|
|
|
|
|
|
|
|||||||||||||||
| Total European Union |
12,959,020 | 17,978,294 | 21,001,487 | 16,431,491 | 17,249,360 | 7,136,927 | 7,793,957 | |||||||||||||||||||||
|
|
|
|
|
|
|
|
|
|
|
|
|
|
|
|||||||||||||||
| United Kingdom |
1,264,374 | 1,474,290 | 1,578,289 | 1,456,782 | 1,563,049 | 659,590 | 640,969 | |||||||||||||||||||||
| Russia |
971,609 | 1,492,891 | 1,386,014 | 912,270 | 1,314,930 | 417,483 | 678,890 | |||||||||||||||||||||
| Turkey |
1,046,747 | 1,599,382 | 2,071,280 | 1,531,222 | 1,848,999 | 739,308 | 826,683 | |||||||||||||||||||||
| Other Europe |
2,796,242 | 2,162,096 | 2,411,475 | 3,107,016 | 1,970,748 | 945,084 | 1,645,806 | |||||||||||||||||||||
|
|
|
|
|
|
|
|
|
|
|
|
|
|
|
|||||||||||||||
| Total Europe |
19,037,992 | 24,706,953 | 28,448,545 | 23,438,781 | 23,947,087 | 9,898,392 | 11,586,306 | |||||||||||||||||||||
|
|
|
|
|
|
|
|
|
|
|
|
|
|
|
|||||||||||||||
| Asia and Middle East |
||||||||||||||||||||||||||||
| ASEAN |
||||||||||||||||||||||||||||
| Brunei Darussalam |
128,789 | 211,268 | 240,628 | 196,352 | 226,415 | 115,431 | 78,776 | |||||||||||||||||||||
| Philippines |
5,892,160 | 8,590,823 | 12,895,188 | 11,028,339 | 10,609,780 | 4,016,476 | 4,242,863 | |||||||||||||||||||||
| Cambodia |
540,472 | 530,909 | 720,673 | 828,316 | 831,466 | 366,996 | 380,311 | |||||||||||||||||||||
| PDR Laos |
5,038 | 7,578 | 26,620 | 16,650 | 15,025 | 8,439 | 6,764 | |||||||||||||||||||||
| Malaysia |
7,985,113 | 11,954,531 | 15,148,054 | 11,815,815 | 11,656,811 | 4,755,128 | 5,191,334 | |||||||||||||||||||||
| Myanmar |
1,030,922 | 1,117,043 | 905,561 | 728,215 | 601,229 | 211,700 | 304,615 | |||||||||||||||||||||
| Singapore |
10,817,047 | 12,167,500 | 14,972,580 | 11,668,197 | 11,011,273 | 4,239,042 | 4,831,259 | |||||||||||||||||||||
| Thailand |
5,086,236 | 7,110,300 | 8,154,975 | 7,151,731 | 7,598,312 | 3,004,106 | 3,986,979 | |||||||||||||||||||||
| Vietnam |
4,937,619 | 6,842,952 | 8,276,540 | 7,524,281 | 9,454,047 | 3,492,927 | 4,372,596 | |||||||||||||||||||||
|
|
|
|
|
|
|
|
|
|
|
|
|
|
|
|||||||||||||||
| Total ASEAN |
36,423,395 | 48,532,903 | 61,340,817 | 50,957,897 | 52,004,359 | 20,210,246 | 23,395,498 | |||||||||||||||||||||
|
|
|
|
|
|
|
|
|
|
|
|
|
|
|
|||||||||||||||
| Hong Kong SAR |
2,003,349 | 2,001,026 | 2,812,535 | 2,636,040 | 2,610,551 | 1,144,173 | 891,808 | |||||||||||||||||||||
| India |
10,350,802 | 13,308,709 | 23,362,674 | 20,269,352 | 20,286,724 | 8,842,567 | 7,201,324 | |||||||||||||||||||||
| Iraq |
185,901 | 218,389 | 348,391 | 235,746 | 349,588 | 144,639 | 134,669 | |||||||||||||||||||||
| Japan |
13,472,208 | 17,595,122 | 24,356,469 | 20,654,400 | 20,520,716 | 8,654,120 | 6,618,097 | |||||||||||||||||||||
| South Korea |
6,334,796 | 9,161,223 | 12,339,146 | 10,123,823 | 10,575,481 | 4,439,625 | 4,077,479 | |||||||||||||||||||||
| Pakistan |
2,374,442 | 3,823,688 | 4,251,636 | 3,020,780 | 3,478,649 | 1,199,219 | 1,435,683 | |||||||||||||||||||||
| People’s Republic of China |
31,557,495 | 53,278,076 | 65,814,936 | 64,769,663 | 62,160,532 | 23,105,619 | 25,055,327 | |||||||||||||||||||||
| Saudi Arabia |
1,337,231 | 1,580,531 | 2,019,038 | 2,076,180 | 2,411,677 | 912,606 | 1,468,617 | |||||||||||||||||||||
| Taiwan |
4,232,878 | 6,726,353 | 8,385,255 | 6,663,678 | 6,651,322 | 2,593,465 | 2,282,353 | |||||||||||||||||||||
| Other Asia and Middle East |
5,714,233 | 8,676,922 | 10,458,131 | 10,381,481 | 10,521,011 | 3,945,863 | 4,990,536 | |||||||||||||||||||||
|
|
|
|
|
|
|
|
|
|
|
|
|
|
|
|||||||||||||||
| Total Asia and Middle East |
113,986,732 | 164,902,943 | 215,489,028 | 191,789,041 | 191,570,610 | 75,192,141 | 77,551,391 | |||||||||||||||||||||
|
|
|
|
|
|
|
|
|
|
|
|
|
|
|
|||||||||||||||
D-58
| Year Ended December 31, |
Five Months Ended May 31, |
|||||||||||||||||||||||||||
| 2020 | 2021 | 2022 | 2023 | 2024P | 2024P | 2025P | ||||||||||||||||||||||
|
|
|
|
|
|
|
|
|
|
|
|
|
|
|
|||||||||||||||
| (in thousands of U.S. dollars) | ||||||||||||||||||||||||||||
| Australia and Oceania |
||||||||||||||||||||||||||||
| Australia |
2,506,086 | 3,236,357 | 3,454,173 | 3,001,010 | 4,261,674 | 1,862,839 | 1,485,700 | |||||||||||||||||||||
| New Zealand |
479,782 | 717,463 | 730,422 | 591,665 | 681,651 | 229,636 | 316,029 | |||||||||||||||||||||
| Other Australia and Oceania |
373,653 | 403,551 | 486,923 | 520,265 | 573,420 | 208,350 | 230,372 | |||||||||||||||||||||
|
|
|
|
|
|
|
|
|
|
|
|
|
|
|
|||||||||||||||
| Total Australia and Oceania |
3,359,521 | 4,357,371 | 4,671,518 | 4,112,940 | 5,516,744 | 2,300,825 | 2,032,101 | |||||||||||||||||||||
|
|
|
|
|
|
|
|
|
|
|
|
|
|
|
|||||||||||||||
| Africa |
||||||||||||||||||||||||||||
| South Africa |
572,239 | 965,270 | 1,092,889 | 842,579 | 787,372 | 264,032 | 396,913 | |||||||||||||||||||||
| Other Africa |
2,912,644 | 4,388,304 | 4,588,941 | 4,646,656 | 3,950,306 | 1,487,328 | 2,154,727 | |||||||||||||||||||||
|
|
|
|
|
|
|
|
|
|
|
|
|
|
|
|||||||||||||||
| Total Africa |
3,484,883 | 5,353,573 | 5,681,831 | 5,489,235 | 4,737,678 | 1,751,360 | 2,551,640 | |||||||||||||||||||||
|
|
|
|
|
|
|
|
|
|
|
|
|
|
|
|||||||||||||||
| Unclassified exports(1) |
983,534 | 1,688,680 | 2,833,719 | 2,397,205 | 1,931,574 | 839,298 | 544,398 | |||||||||||||||||||||
|
|
|
|
|
|
|
|
|
|
|
|
|
|
|
|||||||||||||||
| Total (f.o.b.) |
163,401,806 | 232,835,282 | 292,538,140 | 257,680,632 | 261,838,569 | 103,268,364 | 110,085,305 | |||||||||||||||||||||
|
|
|
|
|
|
|
|
|
|
|
|
|
|
|
|||||||||||||||
Source: Bank Indonesia
| P | Preliminary. |
| (1) | Consists of goods procured in ports by carriers and merchanting goods. |
D-59
Imports
The following table sets forth Indonesia’s imports by major commodity groups for the periods indicated.
Imports by Sector(1)
| Year Ended December 31, |
Five Months Ended May 31, |
|||||||||||||||||||||||||||
| 2020 | 2021 | 2022 | 2023 | 2024P | 2024P | 2025P | ||||||||||||||||||||||
|
|
|
|
|
|
|
|
|
|
|
|
|
|
|
|||||||||||||||
| (in thousands of U.S. dollars) | ||||||||||||||||||||||||||||
| General Merchandise |
140,202,566 | 196,118,688 | 238,196,580 | 219,691,365 | 229,199,415 | 90,601,019 | 92,841,622 | |||||||||||||||||||||
| Consumption Goods |
||||||||||||||||||||||||||||
| Food and beverages, primary, mainly for household |
2,311,232 | 2,778,536 | 2,900,624 | 2,883,081 | 3,011,269 | 1,098,849 | 1,179,320 | |||||||||||||||||||||
| Food and beverages, processed, mainly for household |
3,123,868 | 3,930,449 | 4,948,999 | 6,043,813 | 6,855,484 | 2,887,496 | 1,808,758 | |||||||||||||||||||||
| Passenger motor cars |
305,712 | 368,733 | 620,196 | 1,044,254 | 1,315,359 | 453,115 | 650,428 | |||||||||||||||||||||
| Transport equipment, nonindustrial |
202,426 | 216,419 | 288,582 | 293,186 | 236,457 | 100,101 | 82,915 | |||||||||||||||||||||
| Durable consumer goods |
1,777,178 | 2,258,482 | 2,299,231 | 2,291,875 | 2,405,081 | 942,468 | 934,411 | |||||||||||||||||||||
| Semi-durable consumer goods |
3,198,553 | 3,589,078 | 4,117,226 | 4,113,141 | 4,250,159 | 1,508,521 | 1,768,587 | |||||||||||||||||||||
| Non-durable consumer goods |
2,608,670 | 6,225,145 | 3,506,568 | 3,351,800 | 3,423,238 | 1,217,986 | 1,479,277 | |||||||||||||||||||||
| Fuels and lubricants, processed, oil products(2) |
3,666,469 | 7,567,201 | 13,637,777 | 10,785,334 | 12,116,558 | 5,235,633 | 4,119,165 | |||||||||||||||||||||
| Goods not elsewhere |
781,049 | 359,105 | 298,341 | 621,571 | 350,833 | 90,824 | 87,805 | |||||||||||||||||||||
|
|
|
|
|
|
|
|
|
|
|
|
|
|
|
|||||||||||||||
| Total Consumption Goods |
17,975,158 | 27,293,149 | 32,617,546 | 31,428,054 | 33,964,438 | 13,534,993 | 12,110,665 | |||||||||||||||||||||
|
|
|
|
|
|
|
|
|
|
|
|
|
|
|
|||||||||||||||
| Raw materials and auxiliary goods |
||||||||||||||||||||||||||||
| Food and beverages, primary, mainly for industry |
5,006,804 | 6,651,027 | 7,062,365 | 6,883,310 | 7,315,156 | 3,246,966 | 3,147,693 | |||||||||||||||||||||
| Food and beverages, processed, mainly for industry |
3,763,531 | 4,533,242 | 5,690,242 | 5,227,898 | 5,473,603 | 2,381,412 | 1,924,020 | |||||||||||||||||||||
| Industrial supplies, primary |
4,545,622 | 7,419,509 | 7,828,362 | 6,756,735 | 8,338,706 | 3,114,901 | 3,428,338 | |||||||||||||||||||||
| Industrial supplies, processed |
48,763,004 | 68,862,733 | 78,419,327 | 66,750,868 | 70,244,153 | 27,386,858 | 28,967,022 | |||||||||||||||||||||
| Parts and accessories for capital goods |
17,749,286 | 20,862,729 | 24,094,319 | 22,607,624 | 23,506,149 | 9,681,203 | 9,530,421 | |||||||||||||||||||||
| Parts and accessories for transport equipment |
5,800,391 | 8,032,124 | 9,596,459 | 9,522,749 | 9,082,157 | 3,184,011 | 3,543,900 | |||||||||||||||||||||
| Fuels and lubricants, primary |
4,459,708 | 10,167,716 | 17,271,332 | 15,633,539 | 14,359,260 | 6,310,485 | 5,434,610 | |||||||||||||||||||||
| o/w Crude oil(2) |
3,557,106 | 7,886,555 | 13,648,439 | 12,221,871 | 10,734,952 | 4,792,504 | 4,085,965 | |||||||||||||||||||||
| Fuels and lubricants, |
7,772,769 | 12,679,881 | 17,504,885 | 14,365,208 | 14,308,964 | 5,532,688 | 5,428,056 | |||||||||||||||||||||
| o/w Oil products(2) |
4,533,505 | 7,367,209 | 11,095,200 | 9,128,025 | 9,109,120 | 3,706,530 | 3,461,561 | |||||||||||||||||||||
| o/w Liquefied Petroleum Gas(2) |
2,809,927 | 4,713,059 | 5,563,184 | 4,386,640 | 4,459,849 | 1,534,224 | 1,672,659 | |||||||||||||||||||||
|
|
|
|
|
|
|
|
|
|
|
|
|
|
|
|||||||||||||||
| Total Raw materials and auxiliary goods |
97,861,115 | 139,208,961 | 167,467,292 | 147,747,930 | 152,628,149 | 60,838,523 | 61,404,059 | |||||||||||||||||||||
|
|
|
|
|
|
|
|
|
|
|
|
|
|
|
|||||||||||||||
| Capital Goods |
||||||||||||||||||||||||||||
| Capital goods (except transport equipment) |
21,970,509 | 25,734,355 | 31,825,253 | 32,915,410 | 35,832,399 | 13,761,687 | 15,932,269 | |||||||||||||||||||||
| Passenger motor cars |
305,712 | 368,733 | 620,196 | 1,044,254 | 1,315,359 | 453,115 | 650,428 | |||||||||||||||||||||
| Other transport equipment, industrial |
1,714,339 | 2,929,100 | 4,912,986 | 5,837,492 | 4,626,368 | 1,661,634 | 2,404,894 | |||||||||||||||||||||
|
|
|
|
|
|
|
|
|
|
|
|
|
|
|
|||||||||||||||
| Total Capital Goods |
23,990,560 | 29,032,188 | 37,358,435 | 39,797,156 | 41,774,125 | 15,876,436 | 18,987,591 | |||||||||||||||||||||
|
|
|
|
|
|
|
|
|
|
|
|
|
|
|
|||||||||||||||
| Other merchandise(3) |
375,733 | 584,389 | 753,308 | 718,226 | 832,703 | 351,066 | 339,307 | |||||||||||||||||||||
| Other goods(4) |
1,901,635 | 2,681,663 | 3,519,420 | 2,600,542 | 4,582,911 | 1,064,643 | 3,091,189 | |||||||||||||||||||||
|
|
|
|
|
|
|
|
|
|
|
|
|
|
|
|||||||||||||||
| Total |
142,104,201 | 198,800,351 | 241,716,000 | 222,291,907 | 233,782,326 | 91,665,662 | 95,932,811 | |||||||||||||||||||||
|
|
|
|
|
|
|
|
|
|
|
|
|
|
|
|||||||||||||||
Source: Bank Indonesia
| P | Preliminary. |
| (1) | Data collected on a cost, insurance and freight basis. |
| (2) | As a component of oil and gas imports. |
| (3) | Consists of goods procured in ports by carriers. |
| (4) | Consists of nonmonetary gold. |
D-60
The following table sets forth Indonesia’s imports by country of origin for the periods indicated.
Imports by Place of Origin(1)
| Year Ended December 31, |
Five Months Ended May 31, |
|||||||||||||||||||||||||||
| 2020 | 2021 | 2022 | 2023 | 2024P | 2024P | 2025P | ||||||||||||||||||||||
| America |
||||||||||||||||||||||||||||
| North America |
||||||||||||||||||||||||||||
| United States of America |
8,417,952 | 11,607,175 | 11,715,415 | 11,483,028 | 12,298,394 | 4,769,501 | 4,978,920 | |||||||||||||||||||||
| Canada |
1,623,021 | 2,039,320 | 2,999,835 | 2,149,299 | 2,124,004 | 877,319 | 1,054,478 | |||||||||||||||||||||
| Other North America |
1 | 0 | 0 | 374 | 80 | 78 | 1 | |||||||||||||||||||||
|
|
|
|
|
|
|
|
|
|
|
|
|
|
|
|||||||||||||||
| Total North America |
10,040,973 | 13,646,496 | 14,715,250 | 13,632,700 | 14,422,479 | 5,646,898 | 6,033,399 | |||||||||||||||||||||
|
|
|
|
|
|
|
|
|
|
|
|
|
|
|
|||||||||||||||
| Central and South America |
||||||||||||||||||||||||||||
| Argentina |
1,740,897 | 2,028,162 | 2,400,666 | 1,374,093 | 1,378,270 | 635,164 | 526,895 | |||||||||||||||||||||
| Brazil |
2,275,776 | 2,357,034 | 3,679,381 | 4,796,243 | 5,408,008 | 2,240,390 | 1,697,522 | |||||||||||||||||||||
| Mexico |
238,295 | 251,035 | 320,300 | 359,514 | 334,661 | 134,927 | 133,188 | |||||||||||||||||||||
| Other Central and South America |
500,835 | 600,554 | 690,476 | 663,101 | 765,663 | 291,487 | 496,875 | |||||||||||||||||||||
|
|
|
|
|
|
|
|
|
|
|
|
|
|
|
|||||||||||||||
| Total Central and South America |
4,755,804 | 5,236,784 | 7,090,823 | 7,192,951 | 7,886,602 | 3,301,968 | 2,854,479 | |||||||||||||||||||||
|
|
|
|
|
|
|
|
|
|
|
|
|
|
|
|||||||||||||||
| Total America |
14,796,777 | 18,883,280 | 21,806,073 | 20,825,651 | 22,309,081 | 8,948,866 | 8,887,878 | |||||||||||||||||||||
|
|
|
|
|
|
|
|
|
|
|
|
|
|
|
|||||||||||||||
| Europe |
||||||||||||||||||||||||||||
| European Union |
||||||||||||||||||||||||||||
| Netherlands |
820,167 | 877,900 | 923,007 | 944,430 | 975,609 | 340,194 | 350,974 | |||||||||||||||||||||
| Belgium |
513,385 | 763,083 | 640,671 | 686,363 | 496,927 | 183,278 | 196,797 | |||||||||||||||||||||
| Italy |
1,521,690 | 1,674,996 | 1,448,006 | 1,728,666 | 1,594,656 | 655,349 | 663,074 | |||||||||||||||||||||
| Germany |
2,939,619 | 3,057,219 | 3,718,454 | 4,550,687 | 3,683,748 | 1,411,441 | 1,363,433 | |||||||||||||||||||||
| France |
1,420,698 | 1,316,552 | 1,384,362 | 1,681,505 | 1,484,728 | 494,845 | 566,437 | |||||||||||||||||||||
| Spain |
440,412 | 676,814 | 564,556 | 579,930 | 579,921 | 214,097 | 233,814 | |||||||||||||||||||||
| Other European Union |
2,412,368 | 2,413,677 | 2,952,115 | 3,557,437 | 3,807,592 | 1,587,400 | 1,086,211 | |||||||||||||||||||||
|
|
|
|
|
|
|
|
|
|
|
|
|
|
|
|||||||||||||||
| Total European Union |
10,068,337 | 10,780,240 | 11,631,169 | 13,729,018 | 12,623,181 | 4,886,603 | 4,460,740 | |||||||||||||||||||||
|
|
|
|
|
|
|
|
|
|
|
|
|
|
|
|||||||||||||||
| United Kingdom |
984,941 | 1,116,936 | 1,038,364 | 1,103,335 | 946,976 | 384,510 | 419,083 | |||||||||||||||||||||
| Russia |
843,722 | 1,033,735 | 1,890,871 | 2,243,473 | 2,050,534 | 899,847 | 842,891 | |||||||||||||||||||||
| Turkey |
273,981 | 353,531 | 530,585 | 648,868 | 462,891 | 158,744 | 212,568 | |||||||||||||||||||||
| Other Europe |
2,317,252 | 2,732,492 | 2,324,377 | 1,939,516 | 2,467,901 | 1,028,223 | 737,198 | |||||||||||||||||||||
|
|
|
|
|
|
|
|
|
|
|
|
|
|
|
|||||||||||||||
| Total Europe |
14,488,232 | 16,016,934 | 17,415,366 | 19,664,209 | 18,551,482 | 7,357,928 | 6,672,479 | |||||||||||||||||||||
|
|
|
|
|
|
|
|
|
|
|
|
|
|
|
|||||||||||||||
| Asia and Middle East |
||||||||||||||||||||||||||||
| ASEAN |
||||||||||||||||||||||||||||
| Brunei Darussalam |
71,940 | 156,977 | 646,007 | 300,890 | 507,895 | 204,932 | 193,840 | |||||||||||||||||||||
| Philippines |
556,337 | 1,169,335 | 1,423,661 | 1,373,756 | 1,786,468 | 570,059 | 546,612 | |||||||||||||||||||||
| Cambodia |
44,258 | 50,094 | 61,077 | 103,380 | 142,848 | 70,130 | 54,268 | |||||||||||||||||||||
| PDR Laos |
42,290 | 38,976 | 170,430 | 83,239 | 64,837 | 29,493 | 37,403 | |||||||||||||||||||||
| Malaysia |
6,992,397 | 9,634,006 | 12,686,248 | 10,347,081 | 10,684,816 | 4,025,996 | 4,384,752 | |||||||||||||||||||||
| Myanmar |
187,175 | 164,217 | 107,536 | 149,800 | 572,907 | 196,252 | 58,386 | |||||||||||||||||||||
| Singapore |
13,895,105 | 18,470,973 | 22,552,422 | 20,479,833 | 21,747,115 | 9,039,068 | 8,284,838 | |||||||||||||||||||||
| Thailand |
6,289,009 | 8,920,455 | 10,677,210 | 9,970,092 | 9,637,949 | 4,065,295 | 3,951,599 | |||||||||||||||||||||
| Vietnam |
2,983,247 | 3,972,949 | 4,573,019 | 5,117,178 | 6,401,754 | 2,519,313 | 2,484,137 | |||||||||||||||||||||
|
|
|
|
|
|
|
|
|
|
|
|
|
|
|
|||||||||||||||
| Total ASEAN |
31,061,759 | 42,577,980 | 52,897,611 | 47,925,250 | 51,546,589 | 20,720,538 | 19,995,835 | |||||||||||||||||||||
|
|
|
|
|
|
|
|
|
|
|
|
|
|
|
|||||||||||||||
| Hong Kong SAR |
4,015,843 | 5,557,561 | 4,597,011 | 3,807,494 | 3,282,837 | 1,292,342 | 1,412,921 | |||||||||||||||||||||
| India |
3,595,103 | 7,057,958 | 9,025,789 | 6,407,195 | 5,643,277 | 2,255,705 | 1,985,225 | |||||||||||||||||||||
| Iraq |
301 | 110 | 704 | 209 | 972 | 479 | 12 | |||||||||||||||||||||
| Japan |
11,001,764 | 15,533,193 | 17,400,251 | 16,493,891 | 14,934,408 | 5,403,905 | 6,334,727 | |||||||||||||||||||||
| South Korea |
7,063,543 | 9,773,262 | 12,240,239 | 10,744,900 | 9,331,561 | 3,794,085 | 3,534,728 | |||||||||||||||||||||
| Pakistan |
196,596 | 192,770 | 189,871 | 308,149 | 619,031 | 332,802 | 59,417 | |||||||||||||||||||||
| People’s Republic of China |
38,202,228 | 53,649,120 | 65,212,072 | 60,075,752 | 72,028,499 | 26,935,378 | 32,816,939 | |||||||||||||||||||||
| Saudi Arabia |
2,559,806 | 4,359,067 | 5,825,001 | 4,016,022 | 4,083,557 | 1,889,179 | 1,312,693 | |||||||||||||||||||||
| Taiwan |
3,610,972 | 4,293,046 | 4,292,654 | 3,855,454 | 3,881,613 | 1,575,548 | 1,819,596 | |||||||||||||||||||||
| Other Asia and Middle East |
3,791,845 | 5,166,872 | 7,642,381 | 6,845,160 | 5,337,580 | 2,128,711 | 2,259,047 | |||||||||||||||||||||
|
|
|
|
|
|
|
|
|
|
|
|
|
|
|
|||||||||||||||
| Total Asia and Middle East |
105,099,760 | 148,160,938 | 179,323,583 | 160,479,475 | 170,689,924 | 66,328,672 | 71,531,140 | |||||||||||||||||||||
|
|
|
|
|
|
|
|
|
|
|
|
|
|
|
|||||||||||||||
D-61
| Year Ended December 31, |
Five Months Ended May 31, |
|||||||||||||||||||||||||||
| 2020 | 2021 | 2022 | 2023 | 2024P | 2024P | 2025P | ||||||||||||||||||||||
| Australia and Oceania |
||||||||||||||||||||||||||||
| Australia |
4,499,423 | 9,404,535 | 9,684,791 | 9,284,037 | 10,488,340 | 4,039,852 | 3,620,097 | |||||||||||||||||||||
| New Zealand |
750,076 | 954,512 | 1,381,182 | 1,134,475 | 1,234,993 | 408,018 | 492,353 | |||||||||||||||||||||
| Other Australia and Oceania |
167,923 | 39,107 | 113,399 | 96,187 | 80,046 | 24,558 | 18,969 | |||||||||||||||||||||
|
|
|
|
|
|
|
|
|
|
|
|
|
|
|
|||||||||||||||
| Total Australia and Oceania |
5,417,421 | 10,398,154 | 11,179,372 | 10,514,699 | 11,803,378 | 4,472,428 | 4,131,419 | |||||||||||||||||||||
|
|
|
|
|
|
|
|
|
|
|
|
|
|
|
|||||||||||||||
| Africa |
||||||||||||||||||||||||||||
| South Africa |
258,480 | 634,585 | 2,048,231 | 1,250,184 | 1,621,606 | 680,129 | 381,870 | |||||||||||||||||||||
| Other Africa |
1,667,797 | 4,122,070 | 9,190,067 | 8,839,464 | 7,974,151 | 3,526,573 | 3,988,718 | |||||||||||||||||||||
|
|
|
|
|
|
|
|
|
|
|
|
|
|
|
|||||||||||||||
| Total Africa |
1,926,277 | 4,756,656 | 11,238,298 | 10,089,648 | 9,595,756 | 4,206,702 | 4,370,588 | |||||||||||||||||||||
|
|
|
|
|
|
|
|
|
|
|
|
|
|
|
|||||||||||||||
| Unclassified imports(2) |
375,733 | 584,389 | 753,308 | 718,226 | 832,703 | 351,066 | 339,307 | |||||||||||||||||||||
|
|
|
|
|
|
|
|
|
|
|
|
|
|
|
|||||||||||||||
| Total |
142,104,201 | 198,800,351 | 241,716,000 | 222,291,907 | 233,782,326 | 91,665,662 | 95,932,811 | |||||||||||||||||||||
|
|
|
|
|
|
|
|
|
|
|
|
|
|
|
|||||||||||||||
Source: Bank Indonesia
| P | Preliminary. |
| (1) | Data collected on a cost, insurance and freight basis. |
| (2) | Consists of goods procured in ports by carriers. |
D-62
Balance of Payments
Balance of payments figures measure the relative flow of goods, services and capital into and out of a country as represented in the current account and the capital and financial account. The current account tracks a country’s trade in goods and services, as well as income and current transfer transactions. The capital and financial account covers all transactions involving capital transfers, acquisition or disposal of non-produced, non-financial assets, and financial assets and liabilities. A balance of payments surplus indicates a net inflow of foreign currencies, while a balance of payments deficit indicates a net outflow of foreign currencies.
The following table sets forth the Republic’s balance of payments for the periods indicated.
Balance of Payments(1)
| Year Ended December 31, | Three Months Ended March 31, |
|||||||||||||||||||||||||||
| 2020 | 2021 | 2022 | 2023 | 2024P | 2024P | 2025P | ||||||||||||||||||||||
| Current account |
(4,433 | ) | 3,511 | 13,215 | (2,042 | ) | (8,470 | ) | (2,438 | ) | (177 | ) | ||||||||||||||||
| Goods(2) |
28,301 | 43,806 | 62,672 | 46,269 | 39,932 | 9,293 | 13,058 | |||||||||||||||||||||
| Total exports (f.o.b.) |
163,402 | 232,835 | 292,538 | 257,681 | 261,839 | 61,698 | 65,378 | |||||||||||||||||||||
| Non-oil and gas exports |
154,921 | 219,635 | 275,499 | 242,841 | 246,810 | 58,217 | 62,229 | |||||||||||||||||||||
| Oil and gas exports |
8,480 | 13,201 | 17,039 | 14,840 | 15,029 | 3,481 | 3,148 | |||||||||||||||||||||
| Total imports (f.o.b.) |
(135,101 | ) | (189,029 | ) | (229,866 | ) | (211,411 | ) | (221,907 | ) | (52,405 | ) | (52,319 | ) | ||||||||||||||
| Non-oil and gas imports |
(121,234 | ) | (162,864 | ) | (188,049 | ) | (176,654 | ) | (187,232 | ) | (43,416 | ) | (44,403 | ) | ||||||||||||||
| Oil and gas imports |
(13,867 | ) | (26,166 | ) | (41,817 | ) | (34,757 | ) | (34,675 | ) | (8,990 | ) | (7,916 | ) | ||||||||||||||
| Services |
(9,755 | ) | (14,599 | ) | (19,957 | ) | (17,676 | ) | (18,482 | ) | (4,193 | ) | (5,437 | ) | ||||||||||||||
| Primary income |
(28,911 | ) | (31,961 | ) | (35,303 | ) | (36,015 | ) | (35,897 | ) | (8,842 | ) | (9,365 | ) | ||||||||||||||
| Secondary income |
5,932 | 6,264 | 5,803 | 5,380 | 5,977 | 1,304 | 1,567 | |||||||||||||||||||||
| Capital account |
37 | 80 | 476 | 28 | 40 | 5 | 4 | |||||||||||||||||||||
| Financial account |
7,884 | 12,492 | (9,157 | ) | 9,846 | 17,476 | (2,395 | ) | (331 | ) | ||||||||||||||||||
| (i) Public sector |
3,413 | 4,317 | (4,618 | ) | 12,915 | 24,713 | (351 | ) | 2,013 | |||||||||||||||||||
| Portfolio investment |
1,424 | (616 | ) | (6,889 | ) | 8,916 | 16,639 | (1,007 | ) | 3,217 | ||||||||||||||||||
| Assets |
— | — | — | — | — | — | — | |||||||||||||||||||||
| Liabilities |
1,424 | (616 | ) | (6,889 | ) | 8,916 | 16,639 | (1,007 | ) | 3,217 | ||||||||||||||||||
| Other investment |
1,989 | 4,933 | 2,271 | 3,999 | 8,075 | 655 | (1,204 | ) | ||||||||||||||||||||
| Assets |
— | — | (133 | ) | (1,079 | ) | (1,852 | ) | (416 | ) | (1,621 | ) | ||||||||||||||||
| Liabilities |
1,989 | 4,933 | 2,405 | 5,078 | 9,927 | 1,071 | 417 | |||||||||||||||||||||
| Loans |
1,989 | (1,377 | ) | 1,789 | 4,902 | 5,457 | 928 | 448 | ||||||||||||||||||||
| Drawings |
8,166 | 4,355 | 7,130 | 10,242 | 11,000 | 2,075 | 2,346 | |||||||||||||||||||||
| Repayments |
(6,177 | ) | (5,732 | ) | (5,341 | ) | (5,341 | ) | (5,543 | ) | (1,147 | ) | (1,898 | ) | ||||||||||||||
| Other liabilities |
— | 6,310 | 616 | 176 | 4,469 | 143 | (31 | ) | ||||||||||||||||||||
| (ii) Private sector |
4,471 | 8,175 | (4,539 | ) | (3,069 | ) | (7,237 | ) | (2,043 | ) | (2,344 | ) | ||||||||||||||||
| Direct investment |
14,142 | 17,286 | 18,067 | 14,417 | 14,852 | 4,714 | 2,633 | |||||||||||||||||||||
| Assets |
(5,033 | ) | (3,927 | ) | (6,635 | ) | (7,126 | ) | (9,278 | ) | (1,803 | ) | (1,566 | ) | ||||||||||||||
| Liabilities |
19,175 | 21,213 | 24,702 | 21,543 | 24,130 | 6,518 | 4,199 | |||||||||||||||||||||
| Portfolio investment |
1,945 | 5,701 | (4,741 | ) | (6,709 | ) | (8,393 | ) | (1,082 | ) | (2,188 | ) | ||||||||||||||||
| Assets |
(1,199 | ) | (1,778 | ) | (5,045 | ) | (2,897 | ) | (3,990 | ) | (1,300 | ) | (444 | ) | ||||||||||||||
| Liabilities |
3,144 | 7,479 | 304 | (3,812 | ) | (4,403 | ) | 218 | (1,744 | ) | ||||||||||||||||||
| Financial derivatives |
18 | 333 | 48 | 167 | 291 | (421 | ) | 190 | ||||||||||||||||||||
| Other investment |
(11,634 | ) | (15,145 | ) | (17,913 | ) | (10,945 | ) | (13,987 | ) | (5,255 | ) | (2,978 | ) | ||||||||||||||
| Assets |
(11,909 | ) | (9,486 | ) | (15,751 | ) | (10,237 | ) | (14,172 | ) | (6,043 | ) | (3,049 | ) | ||||||||||||||
| Liabilities |
274 | (5,659 | ) | (2,162 | ) | (708 | ) | 185 | 788 | 71 | ||||||||||||||||||
| Errors and omissions |
(891 | ) | (2,622 | ) | (535 | ) | (1,531 | ) | (1,836 | ) | (1,142 | ) | (283 | ) | ||||||||||||||
|
|
|
|
|
|
|
|
|
|
|
|
|
|
|
|||||||||||||||
| Overall balance |
2,597 | 13,461 | 3,999 | 6,301 | 7,210 | (5,970 | ) | (787 | ) | |||||||||||||||||||
|
|
|
|
|
|
|
|
|
|
|
|
|
|
|
|||||||||||||||
| Reserves and related items Memorandum |
(2,597 | ) | (13,461 | ) | (3,999 | ) | (6,301 | ) | (7,210 | ) | 5,970 | 787 | ||||||||||||||||
|
|
|
|
|
|
|
|
|
|
|
|
|
|
|
|||||||||||||||
| Reserve asset position(3) |
135,897 | 144,905 | 137,233 | 146,384 | 155,719 | 140,390 | 157,090 | |||||||||||||||||||||
|
|
|
|
|
|
|
|
|
|
|
|
|
|
|
|||||||||||||||
Source: Bank Indonesia
| P | Preliminary. |
| (1) | Bank Indonesia uses (+) and (-) signs in its published data to follow BPM5 whereby (+) means inflow and (-) means outflow. In financial account, (+) denotes increase in liabilities or decrease in assets, while (-) represents increase in assets or decrease in liabilities. The table above has been adjusted to align with the formatting hereof. |
| (2) | The calculation of export and import figures included in the balance of payments data compiled by Bank Indonesia differs in coverage and timing from the data on export/import trade compiled by BPS. |
| (3) | Presents the position of reserve assets at the end of period. A change in the overall balance of payments during a reporting period will affect the outstanding amount of reserve assets at the end of that period. |
D-63
In 2020, the current account deficit decreased considerably to U.S.$4.4 billion compared to a U.S.$30.3 billion deficit in 2019. The lower current account deficit was primarily due to higher goods trade surplus and lower primary income deficit. The higher goods trade surplus in 2020 was driven by rapid growth of the non-oil and gas trade surplus coupled with a narrower oil and gas trade deficit. In addition, lower primary income deficit in line with the ongoing Covid-19 pandemic coupled with exceptional global financial market uncertainty, which fed through to deteriorating corporate performance and lower foreign capital inflows in the form of direct investment, portfolio investment and other investment. On the other hand, the services trade deficit recorded a wider deficit which was primarily caused by reduction in the travel services trade surplus due to a precipitous decline of international and domestic travelers caused by closed borders and mobility restrictions to prevent Covid-19 transmission.
The capital and financial account surplus decreased to U.S.$7.9 billion in 2020 compared to a U.S.$36.6 billion surplus in 2019, primarily due to a net outflow of portfolio investment at the beginning of the year in response to global financial market panic stoked by rapid Covid-19 transmission around the world. Hence, Indonesia’s overall balance of payments in 2020 recorded a surplus of U.S.$2.6 billion. The position of international reserves assets at the end of 2020 were U.S.$135.9 billion, increased from U.S.$129.2 billion at the end of 2019.
In 2021, the current account reversed to a surplus of U.S.$3.5 billion compared to a U.S.$4.4 billion deficit in 2020. The current account improvements were primarily supported by a significantly larger goods trade surplus compared with conditions one year earlier due to non-oil and gas export performance. Exports of all major commodities improved in 2021, boosted by stronger export demand and higher prices. In addition, the secondary income account surplus also increased as compared to the previous year, which contributed to the current account surplus in 2021.
Notwithstanding the uncertainties in the global financial markets due to the Covid-19 pandemic, the capital and financial account increased to a surplus of U.S.$12.6 billion in 2021, mainly due to long-term capital inflows from foreign direct investments and portfolio investments of the private sector. Hence, Indonesia’s overall balance of payments in 2021 recorded a surplus of U.S.$13.5 billion. The position of international reserves assets at the end of 2021 were U.S.$144.9 billion, increased from U.S.$135.9 billion at the end of 2020.
The current account recorded a U.S.$13.2 billion surplus in 2022, higher than the U.S.$3.5 billion surplus recorded in 2021. This was primarily supported by higher exports in line with the increased international commodity prices and robust demand for several Indonesian commodities such as coal, iron and steel, and metalliferous ores, with imports also rising to fuel the domestic economic improvements. On the other hand, the services trade balance deficit widened as public mobility increased and domestic economic recovery accelerated. The primary income deficit also increased in response to the higher investment income payments on direct investment, which was in line with corporate performance improvements.
The capital and financial account recorded a U.S.$8.7 billion deficit in 2022, reversing a U.S.$12.6 billion surplus in 2021, amidst the higher global financial market uncertainty. Direct investment surplus increased in 2022, reflecting investor views in the domestic economic outlook and domestic investment climate of Indonesia. Meanwhile, portfolio investment recorded a deficit, mainly due to outflow in the domestic SBN market in line with the increasing global financial market uncertainty amid ongoing measures in various economies to tighten monetary policy more aggressively. Other investments also recorded a deficit due to private investments in several financial instruments abroad and net payments of private sector external debt.
As a result of the foregoing, Indonesia’s balance of payments in 2022 booked a U.S.$4.0 billion surplus, compared to the U.S.$13.5 billion surplus in 2021. The official reserve assets was U.S.$137.2 billion as at December 31, 2022, compared to U.S.$144.9 billion as at December 31, 2021.
In 2023, the current account recorded a deficit of U.S.$1.9 billion, after registering a U.S.$13.2 billion surplus in 2022. These developments were mainly influenced by a lower goods trade surplus in line with global economic moderation and lower commodity prices, coupled with steady domestic demand. On the other hand, the services trade deficit narrowed in line with a surge of inbound international travelers as the tourism sector continued to recover.
The capital and financial account in 2023 improved, registering a U.S.$10.0 billion surplus compared to the U.S.$8.7 billion deficit in 2022, supported by surpluses in both direct investment and portfolio investment despite global financial market uncertainty. A conducive investment climate and investors’ view with respect to domestic economic outlook maintained direct investment inflows to Indonesia. In addition, portfolio inflows recorded a surplus despite global financial market uncertainty. Relatively high yields on domestic financial assets for investment and the introduction of new financial instruments issued by Bank Indonesia further bolstered portfolio investment surplus.
As a result of the foregoing, Indonesia’s balance of payments in 2023 booked a U.S.$6.3 billion surplus, an increase from the U.S.$4.0 billion surplus in 2022. The official reserve assets as at December 31, 2023 increased to U.S.$146.4 billion from U.S.$137.2 billion as at December 31, 2022.
D-64
In 2024, the current account recorded a deficit of U.S.$8.5 billion, an increase from the U.S.$2.0 billion deficit recorded in 2023. This was primarily due to a decrease in the non-oil and gas trade balance surplus as demand from Indonesia’s main trading partners weakened, while Indonesia’s domestic demand remained strong.
In 2024, the capital and financial account recorded a U.S.$17.5 billion surplus, an increase from the U.S.$9.9 billion surplus in 2023. The higher surplus was supported by foreign capital inflows in the form of direct investment and portfolio investment, despite ongoing uncertainty in global financial markets. Direct investment continued to book a surplus, reflecting positive investor sentiment towards Indonesia’s economic outlook. Additionally, public sector portfolio investment inflow increased, driven by foreign investment in SRBI and the Government’s issuance of bonds and sukuk in international markets.
As a result of the foregoing, Indonesia’s balance of payments in 2024 booked a U.S.$7.2 billion surplus, larger than the U.S.$6.3 billion surplus in 2023. The official reserve assets as at December 31, 2024 were U.S.$155.7 billion, increased from U.S.$146.4 billion as at December 31, 2023.
In the first quarter of 2025, the current account recorded a deficit of U.S.$0.2 billion, a decrease from the U.S.$2.4 billion deficit in the first quarter of 2024. This improvement was primarily due to a higher non-oil and gas trade surplus, supported by the higher global commodity prices, coupled with a lower oil and gas trade deficit resulting from subdued domestic demand.
The capital and financial account recorded a deficit of U.S.$0.3 billion in the first quarter of 2025, a decrease from the U.S.$2.4 billion deficit in the first quarter of 2024. This improvement was attributable to foreign capital inflows, mainly in the form of direct and portfolio investments, reflecting positive investor perception towards domestic economic outlook and the attractiveness of financial asset yields.
As a result of the foregoing, Indonesia’s balance of payments booked a deficit of U.S.$0.8 billion in the first quarter of 2025, which was narrower than the U.S.$6.0 billion deficit in the first quarter of 2024. As of March 31, 2025, official reserve assets stood at U.S.$157.1 billion, up from U.S.$140.4 billion as of March 31, 2024.
Financial System
Indonesia Financial Safety Net and Crisis Management
In April 2016, Law No. 9 of 2016 on the Prevention and Resolution of Financial System Crisis (as amended by Law No. 4/2023, “Law No. 9/2016”) was passed. Law No. 9/2016 revamped the coordination framework for crisis management and resolution among Indonesia Financial Safety Net (“KSSK”) participants and also refined the emphasis on strengthened supervisory capacity, improved banking liquidity and prevention measures. These coordinated policy responses allow an institutionalized early warning system and crisis management protocol which enable KSSK to identify potential disruptions, and determine effective policy responses and resolution steps.
As a participant of the KSSK, the Ministry of Finance also contributes to safeguard financial system stability. In the event of a disruption, such as sudden reversals in capital flows, the Crisis Management Protocol will be activated to determine the policy response required to maintain market confidence and stability. Policy responses include, amongst others, the Bond Stabilization Framework which provides the mechanism to execute buybacks with several SOEs for the purpose of maintaining stability of the sovereign bond market, placement of funds in instruments with a longer maturity period by issuing longer term securities, debt switching to lengthen debt maturities and reduce the risks associated with refinancing.
Indonesia Deposit Insurance Corporation and Liquidity Support
Since September 2005, the Indonesia Deposit Insurance Corporation (“IDIC”), has insured customers’ deposits and actively participated in maintaining the stability of the financial system. The IDIC membership is compulsory for every bank conducting business in Indonesia. The prevailing IDIC coverage is up to Rp2 billion for each depositor in any one bank. The IDIC will pay, in accordance with its procedures, deposit insurance claims when a member bank has its license revoked by the OJK. The maximum amount of deposit insured can be adjusted, among others, in the event of a crisis that can potentially decrease public trust in the banking system or affect the stability of the financial system.
The Government’s policy on addressing sudden reversals in capital flows involves, among others, the implementation of a Crisis Management Protocol, which involves cooperation between the Ministry of Finance, Bank Indonesia, OJK and IDIC. In the event of a financial crisis, policy steps could include executing buybacks for stabilization in the event of a disruption; taking steps to enhance cooperation among Government institutions, Bank Indonesia, SOEs, regulators and other market participants to maintain stability of the sovereign bond market; and encouraging the placement of funds in instruments with a longer maturity by issuing longer term securities and debt switching to lengthen debt maturities and reduce risks associated with refinancing.
D-65
Law No. 9/2016 provides a clear division of responsibilities between the Ministry of Finance, Bank Indonesia, OJK and IDIC in preventing and resolving crises in the financial system through the establishment of a Financial System Stability Committee with representatives from each of the Ministry of Finance, Bank Indonesia, OJK and IDIC. The Financial System Stability Committee aims to provide a coordinated policy response on the basis of regular monitoring of key areas of the financial system. In March 2020, certain provisions with respect to short term liquidity loans were revoked in order to enable the implementation of Covid-19 related financial policies.
Financial Sector Omnibus Law (Law No. 4/2023 )
Law No. 4/2023, which was enacted and became effective on January 12, 2023, represented a milestone for Indonesia’s financial sector reform and aims to develop an inclusive, deep and stable financial sector for accelerating the development of Indonesia’s national economy. Law No. 4/2023 is an omnibus law to amend 16 existing laws on financial sectors, such as banking, capital markets, insurance, guarantees, financing companies, financial system stability and export credits. Law No. 4/2023 also revoked the pension fund law and issued the new one.
Law No. 4/2023 focuses on, among others, strengthening the institutional setting of the authorities; strengthening governance of financial institutions; improving public’s trust in financial industry; promoting long- term fund accumulation in the financial sector for welfare and supporting sustainable development funding; strengthening of customers protection for financial products; and strengthening of financial sectors literacy, inclusion and innovation in the financial sector.
Among other provisions, Law No. 4/2023 grants supervisory authority over digital financial assets (including cryptocurrencies) and securities-related financial derivatives to OJK and over financial derivatives related to the money markets and FX to Bank Indonesia, rather than the commodities regulatory authority, Badan Pengawas Perdagangan Berjangka Komoditi. Law No. 4/2023 also mandates Bank Indonesia to be the sole authorized institution empowered to manage digital Rupiah.
The law also permits Bank Indonesia to purchase domestic government bonds (SBN) in the primary market during in the event of a crisis (as declared by the President). The acquisition of long-term government securities in the primary market shall be carried out pursuant to the decisions of the Financial System Stability Committee. The purchase scheme and mechanism of any such initiative under Law No 4/2023 is required to be stipulated in a joint decision by the Minister of Finance and the Governor of Bank Indonesia.
The Banking System
The Government’s policies for the banking sector emphasize the strengthening of the banking system.
The law governing Bank Indonesia (the “Central Bank Law”), Indonesia’s central bank, provides that Bank Indonesia will conduct monetary policy to achieve an inflation target as determined by the Government in consultation with Bank Indonesia. It also provides for the creation of the Bank Indonesia Supervisory Board (the “Supervisory Board”), to assist the DPR in conducting oversight of Bank Indonesia’s internal financial management. The Supervisory Board comprises five members chosen by the DPR and appointed by the President for three-year tenures. The January 2004 amendment also stipulates that Bank Indonesia is the lender of last resort to ensure the stability of the financial system. Bank Indonesia’s banking supervision function was transferred to the OJK on December 31, 2013. The latest amendment to the Central Bank Law was in 2023 through the enactment of Law No. 4/2023.
The authorities implement risk mitigation by strengthening micro and macro-prudential surveillance. Micro-prudential surveillance is performed on an individual bank or financial institution in order to ensure the fulfillment of prudential regulations through on-site and off-site supervision. Additionally, macro-prudential surveillance also aims to ensure that prudential regulations are adhered to at the industry level as an aggregate.
Under a framework of strengthening micro-prudential surveillance, a number of measures have been introduced by Bank Indonesia and the OJK to bolster and improve surveillance in order to better anticipate the symptoms of troubled banks on a risk basis, as well as enhance the quality of human resources through training, attachments and certification programs.
In addition, improvements to the tools and methodologies used in surveillance are ongoing in order to reinforce macro-prudential aspects, among others, stress testing, probability of default analysis, transition matrices and other early warning mechanisms. The creation of the financial system safety net also assists authorities to mitigate potential systemic risks that might arise.
OJK has issued banking regulations that are in line with the international standards, such as the Basel framework. In terms of the capital reforms, the Basel III capital framework has been transposed into domestic regulations and in force since December 2013, and was lastly amended in December 2022. These regulations cover (i) raising the quality of regulatory capital, (ii) setting a minimum Tier 1 and CET 1 ratio of 6% and 4.5%, respectively, as well as a minimum capital requirement based on risk profile between 8% to 14%, and (iii) building-up of adequate buffers above the minimum capital requirement based on risk profile (including a capital conservation buffer, countercyclical buffer and capital surcharge for D-SIBs). The December 2022 amendments also cover the capital requirements for bank’s exposure to central counterparties and margin requirements for non-centrally cleared derivatives.
D-66
As part of its Basel III implementation policies, OJK issued regulations for the Basel III Liquidity framework, Liquidity Coverage Ratio (“LCR”), Net Stable Funding Ratio (“NSFR”), and the risk weighted assets (“RWA”), calculation relating to derivative transactions. The LCR regulation was issued in December 2015 and requires banks to maintain short-term liquidity through high quality liquid assets that meet their liquidity needs for thirty days. The NSFR regulation was issued in July 2017 and uses NSFR as an indicator to evaluate a bank’s long-term liquidity risk by comparing the amount of stable funding available to the bank with the amount of stable funding required by the bank. It aims to reduce long-term liquidity risk by requiring banks to fund activities from stable and adequate sources of funds. Regulations relating to the RWA calculation for derivative transactions were issued in September 2017, providing guidelines for calculating the risk exposure to derivative transactions due to counterparty credit risk.
Under the Prevention and Resolution of Financial System Crisis law, OJK has issued a regulation concerning a systemic bank recovery plan in April 2017. This regulation was later consolidated under OJK Regulation No. 5 of Year 2024 concerning the Determination of Status of Supervision and Problem Handling and Commercial Banks. This regulation establishes the requirements for systemic banks to prepare and submit recovery plans. Systemic banks are also required to have guidelines in relation to the recovery plan in place, which are prepared by taking into account the governance principles supporting the implementation of the recovery plan. Moreover, systemic banks are also obliged to evaluate and perform stress testing in order to assess the adequacy of their recovery plans at least once a year.
As of December 31, 2022, total banking assets were Rp11,315.8 trillion, consisting of commercial bank assets of Rp11,113.3 trillion and rural bank assets (including assets of Sharia rural banks) of Rp202.5 trillion.
As of December 31, 2023, total banking assets were Rp11,984.0 trillion, consisting of commercial bank assets of Rp11,765.8 trillion and rural bank assets (including assets of Sharia rural banks) of Rp218.2 trillion.
As of December 31, 2024, total banking assets were Rp12,690.7 trillion, consisting of commercial bank assets of Rp12,461.0 trillion and rural bank assets (including assets of Sharia rural banks) of Rp229.7 trillion.
As of March 31, 2025, total banking assets were Rp12,955.2 trillion, consisting of commercial bank assets of Rp12,726.9 trillion and rural bank assets (including assets of Sharia rural banks) of Rp228.3 trillion.
Islamic Financial System
The Government believes that the Islamic finance banking industry has an opportunity to grow rapidly in Indonesia, which has the largest Muslim population in the world. The industry provides the Muslim community with alternative financial products and services that conform to Sharia principles. These Sharia principles as applied to the Islamic finance banking industry includes Sharia concepts related to mudarabah (profit and loss sharing), wadiah (safekeeping), musharaka (joint venture), murabahah (cost plus), and ijara (leasing). Sharia prohibits riba, or usury, defined as interest paid on all loans of money. Furthermore, investments in some businesses that provide goods or services considered contrary to Islamic principles (such as pork or alcohol) are also considered haraam (sinful and prohibited) under Sharia principles. To assist with the development and growth of Islamic financial services in Indonesia, these alternative financial products are considered an integral part of the banking industry and contribute to enhancing the stability of the Indonesian financial system by supporting national economic development in Indonesia.
Law No. 21 of 2008 on Sharia Banking (as lastly amended by Law No. 4/2023, the “Sharia Banking Law”) was enacted to facilitate the expansion of the Indonesian Islamic banking industry. The Sharia Banking Law applies Sharia principles to banking for Sharia banks and Sharia divisions of conventional banks, prohibiting the payment and receipt of interest and providing that returns on funds that are distributed or lent out must be based on the actual profits generated. The Sharia Banking Law also prohibits Islamic banking business and transactions that would support practices or products forbidden or discouraged by Sharia principles. The Government believes that this legislation will better position Indonesia as a venue for Islamic banking and finance.
One of the main challenges for Indonesia’s Sharia capital markets is the small number of companies that issue Sharia-compliant products such as Islamic bonds (“Sukuk”).
The Indonesian Islamic financial industry has been developing under the regulatory authority of OJK (since December 31, 2013) and previously Bank Indonesia, which formulates and publishes a strategic plan for the development of the industry. OJK has established a new strategic plan for the development of Indonesia’s Islamic banking industry for 2020-2025. This new strategic plan is expected to provide guidelines that include detailed initiatives as well as specific objectives for the Sharia banking industry to achieve. This strategic plan for the development of the national Sharia banking industry is recognized as the “Roadmap of Indonesian Islamic Banking 2020-2025” with a view to “establish a Sharia banking industry that contributes to facilitating the development of the halal industry and a competitive and efficient Sharia banking industry by increase of business scale and application of technology.” The roadmap includes, among others, the following measures: (i) establishment of Shariah banker code of conduct and basic competence, (ii) strengthening the implementation of compliance and internal audit functions on compliance with Sharia principles, (iii) issuance of regulations to develop Sharia banking products to be offered to the customers and to aid national priority programs, (iv) strengthening the capital of Sharia banking entities and issuing regulations on banking synergy and settlement of Shariah People’s Financing Bank (Bank Pembiayaan Rakyat Syariah), and (v) encouraging digitalization of Sharia banking.
D-67
OJK and Bank Indonesia have issued various regulations in order to support the growth and development of the Sharia banking industry taking into account precautionary principles and Sharia principles.
The Sharia Non-Bank Financial Industry (Industri keuangan Non Bank Syariah or IKNB Sharia) is also supervised by OJK and consists of the Sharia Insurance Company, the Sharia Pension Fund, the Sharia Financial Institution and other Sharia Financial Service Institutions. OJK issued OJK Regulation No. 35 of 2024 to govern the Sharia pension funds which came into force in March 2025. Under the regulation, management of Sharia pension funds may be conducted by way of: (i) establishment of Sharia pension fund, (ii) conversion of pension fund into Sharia pension fund, (iii) formation of Sharia unit in Employee Pension Fund, or (iv) sale of Sharia investment package in financial institution pension fund.
As of December 31, 2022, of the 87 underwriters licensed by OJK, only 33 were involved in issuances of Sukuk, and of the 96 investment managers licensed by OJK, there are 61 investment managers having Sharia investment management unit and one Sharia investment manager.
As of December 31, 2023, of the 88 underwriters licensed by OJK, only 34 were involved in issuances of Sukuk, and of the 94 investment managers licensed by OJK, there are 60 investment managers having Sharia investment management unit and one Sharia investment manager.
As of December 31, 2024, out of the 89 underwriters licensed by OJK, 36 were involved in issuances of Sukuk; and out of the 91 investment managers licensed by OJK, there were 59 investment managers with Sharia investment management units.
As of March 31, 2025, out of the 89 underwriters licensed by OJK, 36 were involved in issuances of Sukuk; and out of the 90 investment managers licensed by OJK, there were 59 investment managers with Sharia investment management units.
As of December 31, 2022, assets of Sharia banks were Rp782.1 trillion, or 7.0% of Indonesia’s total banking assets.
As of December 31, 2023, assets of Sharia banks were Rp869.0 trillion, or 6.8% of Indonesia’s total banking assets.
As of December 31, 2024, assets of Sharia banks were Rp955.3 trillion, or 7.5% of Indonesia’s total banking assets.
As of March 31, 2025, assets of Sharia banks were Rp960.8 trillion, or 7.5% of Indonesia’s total banking assets.
Anti-Money Laundering Regime
Various financial regulatory agencies in the Republic were formed to combat money laundering activities within Indonesia. In 2002, the Government enacted an anti-money laundering law (“2002 AML Law”), and established a financial intelligence unit, the Indonesian Financial Transaction Reports and Analysis Centre (Pusat Pelaporan Analisis Transaksi Keuangan (“PPATK”)). The PPATK’s duties were later expanded to include matters relating to countering terrorism financing, and consequently, the PPATK was appointed to be the focal point of countering money- laundering and financing of terrorism in Indonesia.
Some of the significant progress made in implementing the Government’s anti-money laundering laws and countering financing of terrorism, national strategies in the last few years includes: promulgating a new Anti-Money Laundering Law, namely, Law No. 8 of 2010 on the Prevention and Eradication of Money Laundering Crimes (the “2010 AML Law”), and the ratification of the UN Convention against Transnational Organized Crime. The 2010 AML Law came into force on October 22, 2010 replacing the 2002 AML Law, as amended, to be in line with current international standards and best practices.
As part of the implementation of the Government’s policy to prevent and eradicate the crime of money laundering, the PPATK has issued and continues to issue various regulations as further implementation of the 2010 AML Law.
On March 13, 2013, the DPR adopted Law No. 9 of 2013 on the Prevention and Eradication of the Financing of Terrorism (“Law No. 9”). Law No. 9 comprehensively regulates: (i) the criminalization of terrorist financing offenses and other offenses related to terrorism financing offenses; (ii) the application of the principle of recognizing users of financial services; reporting and compliance monitoring; (iii) surveillance activities through a remittance transfer system or through other systems by financial service providers; (iv) control disposition of cash and/or other payment instruments into or outside the Indonesian customs area; (v) blocking mechanisms relating to the movement of cash and/or other payment instruments; (vi) the inclusion in the list of suspected terrorists and terrorist organizations; and (vii) arrangements regarding the setting of the investigation, prosecution, and examination at trial.
Terrorism financing within the scope of Law No. 9 includes acts committed, directly or indirectly, in order to provide, gather, give, or lend funds to those who are known to intend to commit an act of terrorism. In addition to individuals, Law No. 9 regulates the criminalization of terrorist financing to terrorist organizations. Terrorist organizations within Law No. 9 can include a collection of people who have a common goal and that, based on a court decision, have committed an act of terrorism. Parties that are named in lists of terrorist organizations also fall within the scope of Law No. 9.
D-68
Since 2017, OJK has required any financial service provider to identify, assess and understand the risk of money laundering and/or terrorism financing crimes related to customers, countries, geographic areas, products, services, transaction or delivery channels. To perform these types of activities, the financial service provider must establish policies, supervision and maintenance procedures and mitigation of money laundering and terrorism financing risks and establish a special task force and/or appoint an officer to act as a person-in-charge for the implementation of anti-money laundering and anti-terrorism financing programs. The financial service provider is required to submit suspicious financial transaction reports, cash transaction reports and other reports to the PPATK. In September 2019, OJK began to require certain additional measures to prevent the funding and proliferation of weapons of mass destructions, namely the requirements for OJK to conduct data maintenance, identity and background checking of transaction parties and immediate blocking of suspected transactions.
Bank Indonesia
Bank Indonesia’s statutory mandate states that “the goal of Bank Indonesia as the central bank of the Republic of Indonesia is to achieve Rupiah stability, maintain payment system stability and contribute in maintaining financial system stability to support sustainable economic growth.” Rupiah stability is measured by the stability of prices of goods and services as well as the Rupiah exchange rate. The stability of prices of goods and services is reflected by a low and stable inflation. Stability of exchange rate is reflected by a stable Rupiah exchange rate against other currencies. A stable exchange rate is inherent in supporting a low and stable inflation, and both are crucial in achieving sustainable economic growth. Market conditions determine the Rupiah exchange rate, consistent with the floating exchange rate system adopted by Bank Indonesia in August 1997. See “Foreign Exchange and Reserves — Exchange Rates.” Bank Indonesia may, however, continue to use its policy instruments to minimize exchange rate fluctuations.
Bank Indonesia, as a separate legal entity from the Government, has its own assets and its own liabilities. The foreign exchange reserves held by Bank Indonesia are recorded on the assets side of the Bank Indonesia balance sheet, while certain items of foreign debt (such as loans from the IMF) are liabilities of Bank Indonesia.
The following table sets forth the balance sheet of Bank Indonesia and was prepared in accordance with the Monetary and Financial Statistics Manual published by the IMF, as of the dates indicated.
Analytical Balance Sheet of Bank Indonesia
| As of December 31, | As of June 30, | |||||||||||||||||||||||
| 2020 | 2021 | 2022 | 2023 | 2024 | 2025P | |||||||||||||||||||
|
|
|
|
|
|
|
|
|
|
|
|
|
|||||||||||||
| Base Money (M0) |
1,147,200 | 1,351,172 | 1,715,619 | 1,690,270 | 1,774,691 | 1,583,403 | ||||||||||||||||||
| Currency in Circulation(1) |
898,870 | 959,812 | 1,026,483 | 1,101,748 | 1,204,536 | 1,153,040 | ||||||||||||||||||
| Commercial Banks Demand Deposits at Bank Indonesia |
246,807 | 389,178 | 687,245 | 585,270 | 472,592 | 382,590 | ||||||||||||||||||
| Private sector Demand Deposits |
1,523 | 2,183 | 1,890 | 3,253 | 7,022 | 3,780 | ||||||||||||||||||
| Bank Indonesia Certificates (“SBI”)(2) |
— | — | — | — | — | — | ||||||||||||||||||
| Factors Affecting Base Money (M0) |
1,147,200 | 1,351,172 | 1,715,619 | 1,690,270 | 1,774,691 | 1,583,403 | ||||||||||||||||||
| Net Foreign Assets |
1,877,480 | 1,942,909 | 1,999,397 | 2,058,128 | 2,077,811 | 2,029,014 | ||||||||||||||||||
| Claims on Non-Residents |
1,997,927 | 2,151,872 | 2,227,898 | 2,354,811 | 2,687,251 | 2,692,631 | ||||||||||||||||||
| Liabilities to Non-Resident |
(120,447 | ) | (208,964 | ) | (228,501 | ) | (296,683 | ) | 609,440 | 663,618 | ||||||||||||||
| Claims on Other Depository Corporations |
56 | 56 | 56 | 56 | 56 | 56 | ||||||||||||||||||
| Liquidity Credits |
56 | 56 | 56 | 56 | 56 | 56 | ||||||||||||||||||
| Other Claims |
— | — | — | — | — | — | ||||||||||||||||||
| Net claims on central Government |
(191,278 | ) | (167,718 | ) | (335,849 | ) | (378,193 | ) | (417,471 | ) | (356,425 | ) | ||||||||||||
| Claims on central Government |
124,326 | 113,358 | 101,611 | 87,814 | 77,638 | 71,627 | ||||||||||||||||||
| Liabilities to central Government |
(315,605 | ) | (281,076 | ) | (437,460 | ) | (466,008 | ) | 495,109 | 428,051 | ||||||||||||||
| Claims on Other Sectors |
9,805 | 9,782 | 9,814 | 9,767 | 9,858 | 9,920 | ||||||||||||||||||
| Claims on Other Financial Institutions |
— | — | — | — | 40 | 40 | ||||||||||||||||||
| Claims on Private Sectors |
9,805 | 9,782 | 9,814 | 9,767 | 9,818 | 10,122 | ||||||||||||||||||
| Open Market Operations(3) |
(15,312 | ) | 126,293 | 465,960 | 460,247 | 664,662 | 530,120 | |||||||||||||||||
| Other Liabilities to Commercial & Rural Banks |
(58,222 | ) | (87,160 | ) | (66,386 | ) | (65,007 | ) | (73,286 | ) | (76,081 | ) | ||||||||||||
| Deposits included in Broad Money (M2) |
— | — | — | — | — | — | ||||||||||||||||||
| Deposits excluded from Broad Money (M2) |
— | — | — | — | — | — | ||||||||||||||||||
| Shares and Other Equity |
(447,681 | ) | (412,022 | ) | (354,640 | ) | (398,168 | ) | (494,934 | ) | (565,116 | ) | ||||||||||||
| Net Other Items |
(27,649 | ) | (60,967 | ) | (2,734 | ) | 3,441 | 7,996 | 11,915 | |||||||||||||||
Source: Bank Indonesia
| (1) | Currency outside banks plus cash in vault. |
D-69
| (2) | SBI which is used to fulfill the secondary statutory reserve requirement of banks and accounted for as primary money supply components. Included in base money from October 2009 to June 2018. Starting from July 2018 SBI is not accounted as component of primary money supply, due to changes in the reserve requirement regulation. |
| (3) | Consists of total SBI after it is reduced by the SBI used to fulfill the secondary statutory reserve requirement of banks, and is accounted for as a primary money supply component (see footnote 2). Such SBI types include: Syariah SBI, Third Party Syariah SBI, Bank Indonesia Facility, Fine Tune Operation, Government Bonds, State Syariah Negotiable Paper, and Reserve Reverse Repo Government Bonds. |
Banks and Other Financial Institutions
The Indonesian financial system consists of banks and non-bank financial institutions. Non-bank financial institutions consist of, among others, insurance companies, pension funds, finance companies, venture capital companies, securities companies, mutual funds, credit guarantee companies and pawn shops.
The following table sets forth the total number of financial institutions in operation and their share of total assets of the financial system as of the date indicated.
Indonesian Financial Institutions as of December 31, 2024
| Number of institutions |
Assets* | Percentage of total assets |
||||||||||
| (in trillions of Rupiah) |
(%) | |||||||||||
| Banking: |
||||||||||||
| Commercial banks |
105 | 12,461,0 | 98.2 | |||||||||
| Rural credit banks(1) |
1,530 | 229.7 | 1.8 | |||||||||
|
|
|
|
|
|
|
|||||||
| Total banking |
1,635 | 12,690.7 | 100.0 | |||||||||
|
|
|
|
|
|
|
|||||||
| Insurance: |
||||||||||||
| Life insurance |
49 | 585.0 | 33.0 | |||||||||
| General insurance & Reinsurance |
80 | 281.7 | 15.9 | |||||||||
| Social insurance(2) |
2 | 905.8 | 51.1 | |||||||||
|
|
|
|
|
|
|
|||||||
| Total insurance |
131 | 1,772.5 | 100.0 | |||||||||
|
|
|
|
|
|
|
|||||||
| Pension funds: |
||||||||||||
| Financial institution pension funds |
26 | 146.1 | 38.2 | |||||||||
| Employer pension funds |
165 | 236.4 | 61.8 | |||||||||
|
|
|
|
|
|
|
|||||||
| Total pension funds |
191 | 382.5 | 100.0 | |||||||||
|
|
|
|
|
|
|
|||||||
| Finance companies(3) |
146 | 588.9 | 42.9 | |||||||||
| Venture capital companies |
53 | 26.6 | 1.9 | |||||||||
| Securities companies(4) |
119 | 72.5 | 5.3 | |||||||||
| Mutual funds (collective investment schemes. not institutions) |
1,505 | 499.3 | 36.4 | |||||||||
| Credit guarantee companies |
23 | 46.4 | 3.4 | |||||||||
| Pawn shops |
184 | 106.0 | 7.7 | |||||||||
| Fintech peer to peer lending(5) |
97 | 8.6 | 0.6 | |||||||||
| Micro financial institutions(6) |
250 | 1.7 | 0.1 | |||||||||
| Insurance and reinsurance brokers |
191 | 21.3 | 1.6 | |||||||||
|
|
|
|
|
|
|
|||||||
| Total |
2,568 | 1,371.3 | 100.0 | |||||||||
|
|
|
|
|
|
|
|||||||
Source: OJK
| * | Unaudited. |
| (1) | Including Sharia rural banks. |
| (2) | Social insurance encompasses traffic and public transportation. health social security programs. worker social security programs and insurance for civil servants and the armed forces. |
| (3) | Finance companies provide investment financing, working capital financing, multipurpose financing, Sharia financing and other financing based on OJK approval. |
| (4) | These include 27 securities companies that are not members of a securities exchange but acting as broker- dealers and/or underwriters. |
| (5) | Fintech peer to peer lending includes Sharia. |
| (6) | Micro financial institutions include Sharia micro financial institutions. |
D-70
Indonesian banks are divided into two categories: commercial banks and rural banks. Both commercial and rural banks may operate under either conventional banking principles or under Sharia principles.
The OJK is responsible for the regulation and supervision of the insurance industry. Development of this sub-sector has required the implementation of more robust regulatory requirements and, in particular, improved capital requirements, including requirements to continuously maintain a specified ratio of risk-weighted assets to risk-weighted liabilities.
Pension funds are divided into two categories: employer pension funds and financial institution pension funds. Employer pension funds may be run either as defined benefit plans or as defined contribution plans, while financial institution pension funds may only be run as defined contribution plans.
Indonesia’s other non-bank financial institutions include finance companies, guarantee companies, venture capital companies, Indonesia export credit agencies, infrastructure financing companies and secondary mortgage facilities companies.
Bank Assets and Liabilities
The following table sets forth the consolidated balance sheets of the commercial banks as of the dates indicated.
Consolidated Balance Sheet of Commercial Banks
| As of December 31, | As of March 31, |
|||||||||||||||||||||||
| 2020 | 2021 | 2022 | 2023 | 2024P | 2025P | |||||||||||||||||||
|
|
|
|
|
|
|
|
|
|
|
|
|
|||||||||||||
| Assets |
||||||||||||||||||||||||
| Loans |
5,547.6 | 5,820.6 | 6,497.6 | 7,186.9 | 7,942.9 | 8,020.0 | ||||||||||||||||||
| Interbank Assets |
252.8 | 223.1 | 245.4 | 258.4 | 275.1 | 288.1 | ||||||||||||||||||
| Placements at Bank Indonesia |
775.4 | 1,146.4 | 1,293.6 | 1,047.8 | 858.9 | 878.5 | ||||||||||||||||||
| Securities (including Government Bonds) |
1,466.9 | 1,831.0 | 1,863.5 | 1,987.8 | 2,222.6 | 2,256.6 | ||||||||||||||||||
| Equity Participation |
55.0 | 96.5 | 111.1 | 116.7 | 126.1 | 126.6 | ||||||||||||||||||
| Other Claims |
656.5 | 623.6 | 667.6 | 661.6 | 478.6 | 531.7 | ||||||||||||||||||
| Others |
423.6 | 371.1 | 434.5 | 506.7 | 556.8 | 625.3 | ||||||||||||||||||
|
|
|
|
|
|
|
|
|
|
|
|
|
|||||||||||||
| Total Assets |
9,177.8 | 10,112.3 | 11,113.3 | 11,765.8 | 12,461.0 | 12,726.9 | ||||||||||||||||||
|
|
|
|
|
|
|
|
|
|
|
|
|
|||||||||||||
| Liabilities |
||||||||||||||||||||||||
| Third Party Funds |
6,665.4 | 7,479.5 | 8,153.6 | 8,457.9 | 8,837.2 | 9,010.2 | ||||||||||||||||||
| Liabilities owed to Bank Indonesia |
6.0 | 1.7 | 2.1 | 17.6 | 23.6 | 25.3 | ||||||||||||||||||
| Interbank Liabilities |
176.7 | 160.6 | 173.4 | 198.4 | 192.6 | 187.0 | ||||||||||||||||||
| Securities |
125.1 | 117.7 | 115.1 | 99.0 | 99.3 | 114.6 | ||||||||||||||||||
| Borrowing |
270.0 | 227.6 | 293.3 | 308.3 | 395.4 | 393.5 | ||||||||||||||||||
| Other Liabilities |
135.0 | 125.8 | 156.1 | 239.4 | 355.3 | 374.8 | ||||||||||||||||||
| Guarantee Deposits |
4.4 | 4.6 | 4.3 | 4.9 | 5.2 | 5.1 | ||||||||||||||||||
| Others |
526.2 | 523.5 | 606.0 | 680.7 | 699.8 | 818.0 | ||||||||||||||||||
| Capital: |
||||||||||||||||||||||||
| Paid in Capital |
229.6 | 261.7 | 282.9 | 312.8 | 313.8 | 315.3 | ||||||||||||||||||
| Reserves |
73.7 | 81.2 | 88.9 | 97.7 | 104.9 | 107.5 | ||||||||||||||||||
| Current Earnings/Loss |
104.7 | 140.2 | 201.8 | 243.3 | 255.2 | 65.5 | ||||||||||||||||||
| Retained Earnings/Loss |
612.6 | 648.3 | 675.7 | 738.6 | 810.4 | 944.9 | ||||||||||||||||||
| Estimates of Additional Paid in Capital |
192.2 | 274.0 | 282.0 | 288.2 | 300.4 | 303.7 | ||||||||||||||||||
| Others |
56.2 | 65.9 | 78.1 | 78.9 | 67.8 | 61.5 | ||||||||||||||||||
|
|
|
|
|
|
|
|
|
|
|
|
|
|||||||||||||
| Total Liabilities |
9,177.8 | 10,112.3 | 11,113.3 | 11,765.8 | 12,461.0 | 12,726.9 | ||||||||||||||||||
|
|
|
|
|
|
|
|
|
|
|
|
|
|||||||||||||
Source: OJK
D-71
The following table shows the average capital adequacy ratio of the banking system as of the dates indicated:
Average Capital Adequacy Ratios
| As of December 31, | As of March 31, |
|||||||||||||||||||||||
| 2020 | 2021 | 2022 | 2023 | 2024P | 2025P | |||||||||||||||||||
|
|
|
|
|
|
|
|
|
|
|
|
|
|||||||||||||
| (percentages) | ||||||||||||||||||||||||
| CAR |
23.8 | 25.7 | 25.7 | 27.8 | 27.8 | 25.4 | ||||||||||||||||||
Source: OJK.
Non-Performing Loans
Since the beginning of 2005, Indonesian banks have been required to calculate their non-performing loans (“NPLs”), using international best practices-based standards that require banks to classify as “non-performing” all loans to any borrower if any of that borrower’s loans are non- performing. Banks nationwide are required to apply the same uniform loan classification system to all loans meeting one of three criteria: (i) loans greater than Rp10 billion that are made to one borrower or one similar project; (ii) loans between Rp1 billion and Rp10 billion that are made to one of the 50 largest debtors of the lending bank; and (iii) loans based on joint financing to one borrower or one project.
The following table shows the gross NPL ratios as of the dates indicated.
Non-Performing Loans Ratios
| As of December 31, | As of March 31, |
|||||||||||||||||||||||
| 2020 | 2021 | 2022 | 2023 | 2024P | 2025P | |||||||||||||||||||
|
|
|
|
|
|
|
|
|
|
|
|
|
|||||||||||||
| (percentages) | ||||||||||||||||||||||||
| Gross NPL ratio* |
3.1 | 3.0 | 2.4 | 2.2 | 2.1 | 2.2 | ||||||||||||||||||
Source: OJK.
| * | Interbank loans excluded. |
| P | Preliminary. |
Capital Markets and Capital Markets Regulation
The Indonesian capital markets are regulated by the OJK, which superseded the Capital Markets and Financial Institutions Supervisory Agency (Badan Pengawas Pasar Modal dan Lembaga Keuangan (“Bapepam-LK”)) and assumed its duties and functions when Bapepam-LK and the Ministry of Finance’s Directorate General of Financial Institution, were merged into a single unit on December 31, 2012.
The regulatory framework for the Indonesian capital markets is provided by the Capital Markets Law No. 8 of 1995 on Capital Markets (as amended by Law No. 4/2023, the “Capital Markets Law”). The Capital Markets Law granted the original regulatory authority (and its successors, including OJK) authority in the fields of regulation, development, supervision and law enforcement. The law also provides the authority and responsibilities of self-regulatory organizations, capital market institutions, professionals and firms conducting business in the capital markets. According to the Capital Markets Law, OJK is responsible for the guidance, regulation and day-to-day supervision necessary to implement orderly, fair and efficient capital markets and to protect the interests of investors and the public.
Over the past few years, OJK has introduced rules to strengthen its supervisory and enforcement capacity over Indonesia’s capital markets and to promote sound and transparent capital markets. It has exercised its authority over publicly listed companies by issuing new corporate governance regulations to make corporate management and audit committees more directly responsible for financial reports. OJK has also issued revised regulations on the content of listed companies’ annual reports, general meeting of shareholders, board of directors and board of commissioners, remuneration and nomination committees, and corporate secretary.
The following table sets forth key indicators regarding the IDX and any securities traded on the IDX as of and for the four months ended April 30, 2025.
D-72
Indonesian Stock Exchange
| IDX | ||||
| Market capitalization (in trillions of Rupiah) |
11,704.9 | |||
| Listed shares (in billions of shares) |
11,598.4 | |||
| Average daily transaction value (in billions of Rupiah)(1) |
12,472.0 | |||
| Average daily transaction volume (in millions of shares)(1) |
19,032.0 | |||
Source: IDX
As the largest Muslim country in the world, Indonesia has been engaged in an initiative to establish a legal framework for the development of an investor market in Indonesia for Sharia-compliant securities, which are securities that comply with the tenets of Islamic legal principles. The OJK and Bapepam-LK issued various regulations on the form and issuance of Sharia-compliant commercial paper and mutual funds to enhance the growth of the Sharia-compliant securities industry and to provide alternative mutual fund products to investors within Indonesia as well as to attract Muslim investors outside Indonesia.
The IDX, a self-regulatory body, has two indices based on Sharia stock, the Jakarta Islamic Index (“JII”), and the Indonesia Sharia Stock Index (“ISSI”).
The JII is a stock market index established on the Indonesian Stock Exchange. The JII was launched in 2000 and consists of the 30 largest Sharia-compliant listings by market capitalization and average liquidity in the regular market. As of December 31, 2024 and April 30, 2025, the market capitalization of the JII was Rp3,340.6 trillion and Rp3,794.7 trillion, respectively.
The IDX launched the Indonesia Sharia Stock Index, or ISSI on May 12, 2011. As of December 31, 2024, the ISSI comprised of 616 Sharia stocks listed on the IDX and its market capitalization was Rp6,825.3 trillion. As of April 30, 2025, the ISSI comprised of 626 Sharia stocks listed on the IDX and its market capitalization was Rp6,863.1 trillion.
Monetary Policy
In order to ensure financial and macroeconomic stability, Bank Indonesia also deploys a variety of policy instruments (policy mix approach) which consist of (i) policy rate to anchor inflation expectation complemented by (ii) exchange rate flexibility to lessen pressure on current account, (iii) capital flow management to dampen short-term excessive volatility of exchange rate, (iv) appropriate macroprudential measures, and (v) ensure good communication to the public. Bank Indonesia also pursues financial market deepening to support the stability of the Rupiah exchange rate and enhance the effectiveness of transmission of monetary policy.
During 2020, Bank Indonesia strengthened its policy mix oriented towards safeguarding economic stability and stimulating economic recovery from the distress caused by the Covid-19 pandemic. The policy response was instituted through an accommodative monetary policy mix, including reductions in the Bank Indonesia 7-Day Reverse Repo Rate (“BI Rate”), liquidity injections, strengthening the monetary operations strategy and guiding the exchange rate towards the currency’s fundamental value. Accommodative macroprudential policy was maintained along with efforts to strengthen payment system policy in order to accelerate the digital economy and finance, buttressed by other supporting policies. Bank Indonesia also continued to strengthen synergy with the Government and other relevant authorities in order to follow up on all responsibilities in accordance with Law No. 2 of 2020 as part of the national policy response under the extraordinary conditions caused by the Covid-19 pandemic.
Bank Indonesia lowered the BI Rate five times in 2020. BI Rate reductions in 2020 totaled 125 basis points, bringing the BI Rate to 3.75% by the end of 2020. Reductions of 25 basis points (“bps”) were announced at each Board of Governors Meeting in February, March, June, July and November 2020. The measured decision to reduce gradually the BI Rate was based on low inflation and the need to maintain the attractiveness and competitiveness of domestic financial assets for investment for the sake of external stability.
To stimulate national economic recovery and maintain financial system stability, Bank Indonesia also introduced monetary stimuli in the form of quantitative easing. As of the end of 2020, Bank Indonesia had injected Rupiah liquidity totaling approximately Rp726.57 trillion, equivalent to 4.7% of GDP, primarily in the form of lower reserve requirements totaling around Rp155 trillion and monetary expansion totaling approximately Rp555.77 trillion. Bank Indonesia lowered reserve requirements by 300 bps, including the 50 bps incentive, in 2020. In addition, Bank Indonesia lowered the foreign currency reserve requirements by 400 bps, effective March 16, 2020 in order to boost foreign exchange liquidity in the banking industry and alleviate pressures in the foreign exchange market. Bank Indonesia also waived the additional macroprudential intermediation ratio (“MIR”) Giro, the balance of Rupiah demand deposits held at Bank Indonesia to meet MIR. This policy provided approximately Rp15.8 trillion of additional liquidity to the banking industry. In the latter half of the year, Bank Indonesia provided Giro services to banks meeting the daily and average Rupiah reserve requirements of 1.5% per year, with a portion calculated to obtain a Giro service of 3% of deposit, effective August 1, 2020.
D-73
Bank Indonesia also maintained a Rupiah exchange rate stabilization policy in line with the currency’s fundamental value and market mechanisms amid persistent global financial market uncertainty. Bank Indonesia stabilized and strengthened the Rupiah by increasing the intensity of triple-intervention policy in the spot market, Domestic Non-Deliverable Forwards (“DNDF”), transactions and purchases of Government securities in the secondary market. In addition, in March 2020, Bank Indonesia lowered the foreign currency reserve requirement by 400 bps to boost foreign exchange liquidity in the banking sector and simultaneously alleviate pressure on the foreign exchange market, as well as expanding the types of underlying transactions for foreign investors to provide an alternative hedging instrument against Rupiah holdings. Furthermore, exchange rate stabilization policy is supported by efforts to reinforce external resilience. To that end, Bank Indonesia secured a bilateral repo line agreement with the US Federal Reserve and extended bilateral swap and repo line agreements with the Monetary Authority of Singapore.
Furthermore, Bank Indonesia expanded money market and foreign exchange market instruments and transactions in order to provide more hedging instruments against currency risk through DNDF transactions, foreign exchange swaps and term repo agreements with the banking industry, while strengthening monetary operations and Islamic financial market deepening through the Sharia Compliant Liquidity Facility, Sharia-Compliant Liquidity Management and Sharia-Compliant Interbank Fund Management Certificates. In addition, Bank Indonesia also strengthened foreign currency term deposit instruments in order to enhance foreign currency liquidity management in the domestic markets, while encouraging banks to utilize lower foreign currency reserve requirements for domestic purposes. Furthermore, to strengthen money market and foreign exchange market deepening, Bank Indonesia was also encouraging infrastructure development in terms of electronic trading platforms and a central counterparty. Striving to enhance transmission of its accommodative monetary policy stance, Bank Indonesia continued to strengthen its monetary operations strategy, while developing money market instruments to support corporate and small and medium enterprise (“SME”) financing in line with the national economic recovery program.
Bank Indonesia implemented an accommodative macro-prudential policy in line with the existing policy mix and national policy mix, including various efforts to mitigate risk in the financial sector caused by the outbreak of Covid-19. Therefore, Bank Indonesia relaxed the MIR by extending the incentive period of 50 bps lower Rupiah reserve requirements for banks allocating SME loans, loans for export-import activity as well as non-SME loans to priority sectors as stipulated in the national economic recovery program from previously December 31, 2020 to June 30, 2021, while also injecting liquidity into the banking industry to support loan restructuring for SMEs as well as ultra-micro enterprises with loans from financial institutions and strengthening macro-prudential policies to encourage inclusive financing, particularly for SMEs. Furthermore, Bank Indonesia maintained a Countercyclical Buffer ratio of 0%, MIR in the range of 84-94% with a disincentive parameter of 0%, a Macroprudential Liquidity Buffer ratio of 6% with repo flexibility of 6%, and a Loan to Value / Financing to ratio Value for property credit / financing is in accordance with current regulations. Bank Indonesia also lowered the minimum down payment on automotive loans/financing from 5-10% to 0% for the purchase of green vehicles, while maintaining prudential principles.
Bank Indonesia maintained cash and non-cash payment system convenience and availability in order to facilitate economic and financial transactions. This was achieved through, amid the Covid-19 pandemic, the circulation of sanitized currency notes and the promotion of cashless transactions through e-money, internet banking and the launch of an Indonesian standard for quick response codes, as well as accelerating the implementation of the digital economy and finance as part of the economic recovery efforts. Bank Indonesia also implemented measures among the banking industry, financial technology companies, the Government and other relevant authorities to promote digitalization and support the economic recovery.
Bank Indonesia has also accelerated the implementation of the Indonesia payment systems blueprint for 2025 to support digital economy and finance activities during the Covid-19 pandemic, stimulate a momentum for national economic recovery as well as expedite economic and financial inclusion. Bank Indonesia also continued to strengthen synergies with the Government and other relevant authorities to support cashless social aid program disbursements through expediting the electronification of the social aid program disbursements, including the Family Hope Program, Noncash Food Assistance Program, Pre-Employment Card and Indonesia Smart Card to help alleviate the impact of Covid-19.
In 2021, Bank Indonesia oriented all monetary, macroprudential and payment system policy instruments towards supporting the national economic recovery in close coordination with the Government and Financial System Stability Committee as follows:
| (i) | In the monetary sector, a historically low policy rate was maintained along with the maintenance of Rupiah exchange rate stability and liquidity injections through quantitative easing. The low policy rate would be maintained until there are indications of rising inflation. Since 2020, Bank Indonesia lowered the BI Rate six times to 3.50%, the lowest in history. The Rupiah exchange rate stabilization policy was implemented through triple intervention targeting the spot market, DNDF and purchases of government securities in the secondary market, amid persistent global financial market uncertainty. Likewise, Bank Indonesia continued to inject liquidity via quantitative easing to strengthen the banking industry’s ability to extend credit/financing to the corporate sector. In 2020 and 2021, the quantitative easing policy resulted in liquidity injections of Rp874.4 trillion into the banking industry to support the national economic recovery program; |
D-74
| (ii) | Accommodative macroprudential policies continued to revive bank financing disbursed to the corporate sector, in synergy with Financial elevated uncertainty System Stability Committee policy. This included loosening the down payment requirements on automotive loans; the Loan/Financing-to-Value (LTV/FTV) Ratio on Property Loans and the (Sharia) MIR; encouraging the banks to lower prime lending rates; as well as other accommodative macroprudential policies. Bank Indonesia also refined and modernized the MSME Credit Ratio policy into the Macroprudential Inclusive Financing Ratio (Rasio Pembiayaan Inklusif Makroprudensial (“RPIM”)); |
| (iii) | Bank Indonesia continued to accelerate payment system digitalization for integration of the national digital economy and finance. This included expansion of Quick Response Code Indonesian Standard (“QRIS”) acceptance to 12 million merchants by the end of 2021, including cross-border QRIS, implementation of the National Open API Payment Standard; as well as electronification of social aid program (bansos) disbursements, transportation modes and government financial operations. Various agendas in the Indonesia Payment System Blueprint (Blueprint Sistem Pembayaran Indonesia (“BSPI”)) 2025 had also been accelerated, including development of Bank Indonesia-Fast Payment (“BI-FAST”) as a real-time retail payment system available 24/7, along with interlinkages between digital banking and FinTech, as well as payment system regulatory reform; |
| (iv) | In addition to the three main policy initiatives above, Bank Indonesia also directed four supporting policies (MSMEs, Islamic economy and finance, financial market deepening, and international policy) towards national economic recovery. Bank Indonesia enhanced the policy synergy with the Government, banks, and other institutions to develop MSMEs as well as the Islamic economy and finance as a new source of national economic growth in Indonesia. Financial market deepening also accelerated, particularly the Rupiah and foreign exchange money markets, to strengthen monetary policy transmission, support financial system stability, and finance development, including infrastructure. International policy was directed towards not only strengthening Bank Indonesia’s policy diplomacy, but also to support the Government in facilitating and promoting trade and investment in various countries; and |
| (v) | Bank Indonesia also adjusted its operational activities and public services to support Government restrictions on public mobility during the Covid-19 pandemic. This included cash services, payment systems, monetary operations and central banking services to the Government. In addition, Bank Indonesia temporarily increased the maximum limit on cash withdrawals through ATM machines using chip technology until 30 September 2021. |
During 2022, Bank Indonesia raised the BI Rate by 200 bps to 5.50% since August 2022. The decision to increase the interest rate is a front-loaded, pre-emptive, and forward-looking measure to cause the inflation expectations and inflation to decline, so that the core inflation is maintained within the range of 3.0±1%. This is in line with the increase in inflation expectations after the increase in subsidized fuel prices which had reached 6.5% and needed to be controlled to avoid pressure on core inflation. With the increase in the BI Rate, inflation expectations gradually decreased to 5.5% and therefore supported lower core inflation realization of 3.36% (year-on-year) at the end of 2022 compared to the initial forecast of 4.16% (year-on-year). In line with this, Bank Indonesia also strengthened monetary operations by increasing the structure of interest rates on the money market in accordance with the increase in the BI Rate.
The direction of the BI policy mix in 2022 continues to be synergized as part of the national policy direction to accelerate economic recovery while maintaining stability. In this regard, in line with the risk of increasing uncertainty in the global financial markets due to the tightening monetary policies in advanced economies, especially the United States, amid the early stages of Indonesia’s economic recovery, Bank Indonesia adopted a policy mix consisting of “one policy to maintain stability and four policies to support economic growth” as it has alluded to before. Monetary policy is directed at maintaining stability (pro-stability), while the other four instruments, namely macroprudential policies, digitalization of the payment system, deepening of the money market, as well as inclusive and green economy-finance are aimed to accelerate national economic recovery (pro-growth).
The key points of Bank Indonesia’s policy mix implemented in 2022 are as follows:
| 1. | Monetary policy was aimed at ensuring macroeconomic stability, through increase of policy rate (BI Rate), Rupiah exchange rate stabilization, and liquidity normalization. In this context, in line with the low core inflation pressures, especially in the first semester of 2022, the monetary policy response was taken by normalizing liquidity through a gradual increase in the reserves requirement ratio to 9% for conventional commercial banks and 7.5% for Sharia commercial banks and Sharia business units. Bank Indonesia adopted this policy to proactively address the impact of global financial market uncertainty on macroeconomic stability. Meanwhile, the BI Rate was raised by 200 bps since August 2022 to 5.50% at the end of 2022 in response to the increasing inflation expectations and to make sure that core inflation remained within 3±1% range. This policy was supported by Rupiah exchange rate stabilization policy as part of the measures to control inflation, primarily imported inflation, through foreign exchange intervention, including spot and DNDF transactions, as well as buying/selling SBN in the secondary market (twist operation). |
D-75
| 2. | Macroprudential policies continued to be accommodative in synergy with the integrated policy package of the Financial System Stability Committee to support the national economic recovery. Bank Indonesia continued to maintain accommodative macroprudential policies by holding the Countercyclical Capital Buffer (CcyB) ratio at 0%, the MIR at the range of 84-94%, and the Macroprudential Liquidity Buffer (“MPLB”) ratio at 6% with repo flexibility of 6%, and the Sharia MPLB ratio at 4.5% with repo flexibility of 4.5%. Bank Indonesia also continued to relax the Loan to Value/Financing to Value (LTV/FTV) ratio for property loans/financing to a maximum of 100% and relaxed the down payment requirements for automotive loans to 0% for all types of new vehicles. Bank Indonesia also strengthened the prime lending rate transparency policy to support the effectiveness of the transmission of the policy rate and macroprudential policy. In addition, Bank Indonesia increased incentives for banks to disburse loans to priority sectors and MSME and/or meet the Macroprudential Inclusive Financing Ratio (RPIM) target in the form of easing Rupiah reserve requirements and expanding the coverage of priority sectors. |
| 3. | Bank Indonesia continued to strengthen payment system policies to support economic recovery and accelerate inclusive digitalization. These policies included: (i) expanding the use of QRIS; (ii) intensification of the electronification program through digitizing government social assistance programs, electronification of regional government services, and also the integration of modes of transportation; (iii) strengthening the implementation of the National Open API Payment Standard by encouraging the acceleration of its adoption for banks and non-bank institutions; (iv) accelerating the implementation of BI-FAST by increasing membership, expanding services, and accepting the use of BI-FAST; and (v) payment system pricing policies to support national economic recovery. |
These three major policies were supported by the synergy among the efforts of Bank Indonesia and the Government, banks, and other institutions to continue support for MSMEs as well as the Sharia economy and finance. Bank Indonesia also pursued deepening of foreign exchange market to support Rupiah stability and to expand hedging instruments and continued to accelerate the promotion of trade and investment between countries, including through the expansion of local currency transactions. In addition, Bank Indonesia continued to strengthen its international policy and practice by expanding international cooperation with other central banks and monetary authorities, promoting trade and investment in priority sectors in synergy with other relevant institutions.
In 2023, Bank Indonesia’s policy mix continued to be directed towards strengthening resilience, recovery, and revival of the Indonesia economy in a close synergy with national economic policy. Meanwhile, the policy mix intended to counteract the spillover effects of global turmoil, including the risks of economic recession and high inflation, policy rate hikes by the United States Federal Reserves and other central banks, depreciatory pressures on the Rupiah exchange rate due to a very strong U.S. dollar, as well as high global financial market uncertainty. To that end, the objective of monetary policy is to manage inflation back towards the target corridor set by the Government, namely 3.0%±1% in 2023 and 2.5%±1% in 2024, to maintain Rupiah stability against the impact of global turmoil to control imported inflation, as well as to support macroeconomic and financial system stability. Meanwhile, to support national economic growth, accommodative macroprudential policies continue to be oriented towards encouraging lending/financing to the businesses, particularly priority sectors. Similarly, Bank Indonesia continued accelerating payment system digitalization to expand digital economic and financial inclusion, specifically in the real sector and MSMEs as drivers of private consumption. The mix of three main Bank Indonesia policies, namely monetary policy, macroprudential policy and payment system policy, were also supported by strengthening money market and foreign exchange market deepening policy, MSMEs empowerment and Sharia economy and finance development programs as well as international policy.
In December 2023, Bank Indonesia maintained the BI Rate at 6.00%, the deposit facility rate at 5.25% and the lending facility rate at 6.75%.
The decision remains consistent with the pro-stability focus of monetary policy, namely, to strengthen Rupiah stabilization policy, and as a pre-emptive and forward-looking measure to maintain inflation within the 2.5%±1% target corridor in 2024. Meanwhile, Bank Indonesia will maintain pro-growth macroprudential and payment system policies to foster sustainable economic growth. Bank Indonesia will also hold an accommodative macroprudential policy stance to revive bank lending/financing to businesses and households. Payment system digitalization will be accelerated to increase transaction volume and expand digital economic and financial inclusion, which includes the electronification of (central and regional) government transactions. Bank Indonesia has, therefore, strengthened its mix of monetary, macroprudential and payment system policies to maintain stability and nurture sustainable economic growth through the following measures:
| 1. | Rupiah stabilization through foreign exchange market intervention with a focus on spot and domestic non-deliverable forward transactions, as well as government securities in the secondary market. |
| 2. | Strengthening the pro-market monetary operations strategy for effective monetary policy, which includes optimizing SRBI, Bank Indonesia Forex Securities and Bank Indonesia Forex Sukuk. |
| 3. | Deepening prime lending rate transparency policy with a focus on interest rates by economic sector. |
D-76
| 4. | Accelerating payment system digitalization towards greater transaction efficiency and expanding the digital economy and finance ecosystem as follows: (a) Expanding QRIS implementation by: (i) setting a target of 55 million QRIS users in 2024, (ii) setting a target of 2.5 billion QRIS transactions in 2024, and (iii) strengthening the cross-border QRIS implementation strategy to accelerate uptake, (b) Strengthening implementation of Indonesian Credit Card (Kartu Kredit Indonesia) (i.e., credit cards that use an Indonesian payment network, rather than foreign payment networks such as Visa or Mastercard) for the government segment by developing online payment features, while expanding more intensive socialization, coordination and monitoring activities. |
| 5. | Expanding international cooperation with other central banks and authorities in partner countries, particularly through cross-border QRIS linkages and local currency transactions, as well as facilitating investment, trade and tourism promotion in priority sectors in conjunction with relevant institutions. |
Policy coordination between Bank Indonesia and the government of the Republic is also constantly improved to maintain macroeconomic stability and bolster economic growth. Bank Indonesia strengthens policy coordination with the central and regional government and strategic partners, including the National Movement for Food Inflation Control in various regions within the Central and Regional Inflation Control Teams, as well as Region Digitalization Acceleration and Expansion (P2DD) Teams to Accelerate and Expand the Electronification of Central and Regional Government Transactions. Furthermore, policy synergy between Bank Indonesia and the KSSK is also strengthened to maintain financial system stability and revive lending/financing to businesses, particularly those in priority sectors.
In 2024, Bank Indonesia’s policy mix is directed at strengthening economic stability and supporting sustainable growth, in close synergy with the national economic policy mix. Monetary policy in 2024 is focused primarily on maintaining stability (pro-stability), while macroprudential and payment system policies remain directed at supporting economic growth (pro-growth). This policy direction aims to balance between maintaining stability amid high global uncertainties and supporting sustainable economic growth. The 2024 monetary policy targets are focused on controlling inflation within the 2.5±1% target range and stabilizing the Rupiah exchange rate against global shocks, consistent with inflation control and support for macroeconomic and financial system stability. Meanwhile, to support economic growth, accommodative macroprudential policies continue to be directed at encouraging bank credit/financing to priority sectors, while maintaining financial system stability. Likewise, the digitalization of payment systems continues to be accelerated to support inclusive economic growth through the expansion of digital economy and finance. The mix of monetary, macroprudential and payment system policies is supported by strengthening policies on money and foreign exchange market deepening, developing MSMEs, Islamic economy and finance, and international policies. Monetary policies aimed at controlling inflation and stabilizing the Rupiah exchange rate are implemented through consistent and prudent interest rate policies, supported by foreign exchange market intervention, pro-market monetary operation strategies and adequate foreign exchange reserves.
Consistent with this policy direction, Bank Indonesia in April 2024 raised the BI-Rate by 25 bps to 6.25% amid increasing global uncertainty and rising inflation pressures. Subsequently, as the trajectory of the federal funds rate (“FFR”) becomes more evident, followed by an FFR cut that eased global turmoil, Bank Indonesia lowered the BI-Rate by 25 bps to 6.0% on September 17, 2024, one day before the Federal Reserve’s FFR reduction in September 2024. This BI-Rate cut is consistent with pre-emptive and forward-looking measures to keep inflation in 2024 and 2025 within the 2.5±1% target. Bank Indonesia also anticipates still room for further BI-Rate cuts given low inflation projection and the need to support sustainable economic growth. Further decisions regarding the BI-Rate will be made from time to time in the Board of Governors Meetings based on global and domestic economic dynamics (data dependent).
Based on Bank Indonesia’s policy mix stance, the following policy instruments were implemented in 2024.
| 1. | Monetary policy. Inflation control and Rupiah stability were achieved through a consistent and well-calibrated policy rate, underpinned by foreign exchange market intervention, a pro-market monetary operations strategy, and adequate reserve assets. To that end, Bank Indonesia has been directing BI-Rate policy toward achieving the inflation targets in 2024 and 2025. Meanwhile, Rupiah stabilization efforts aim to mitigate short-term volatility and control the impact of imported inflation through triple intervention in the spot, domestic non-deliverable forward and SBN markets as needed. The effectiveness of monetary policy transmission was strengthened by a pro-market monetary operations strategy through optimization of Bank Indonesia Rupiah Securities (Sekuritas Rupiah Bank Indonesia, “SRBI”), Bank Indonesia Foreign Exchange Securities and Bank Indonesia Foreign Exchange Sukuk to attract portfolio inflows and maintain Rupiah stability, while deepening the money market and foreign exchange markets. Inflation control, particularly for food, was supported by close coordination with the Government through the Central and Regional Government Inflation Control Teams and the National Movement for Food Inflation Control nationwide. |
| 2. | Macroprudential policy. Bank Indonesia increased liquidity incentives and loosened macroprudential instruments to stimulate bank lending/financing and maintain financial system stability. Additional liquidity incentives were provided to banks through implementation of the macroprudential liquidity incentive policy to promote bank lending/financing to priority sectors, including downstream sectors (mineral and coal mining, agriculture, plantation crops and fishing), housing (including public housing), tourism, the creative economy, and green economy and finance, and to enhance financial inclusion of MSMEs, people’s business credit program, and ultra-micro enterprises. The flexibility of liquidity management in the banking industry was also enhanced by loosening the macroprudential liquidity buffer. Likewise, all other macroprudential policy instruments remained loose, including the countercyclical capital buffer, macroprudential intermediation ratio, loan/financing-to-value ratio for property loans/financing, down payment requirements on automotive loans/ financing, and bank foreign funding ratio. Macroprudential and money market surveillance of the banking system was strengthened to help maintain financial system stability in close coordination with the Financial System Stability Committee. |
| 3. | Payment system policy. Bank Indonesia continued accelerating payment system digitalization and ensuring adequate currency in circulation for seamless, efficient and productive economic and financial transactions. Digitalization was implemented through innovation in various instruments and expansion of digital payment services, while strengthening the industry structure and the stability of payment system infrastructure, including integrating the national digital economy and finance ecosystem. To increase transaction value and the velocity of digital payments, Bank Indonesia in 2024 enhanced QRIS by expanding the user base and participating merchants, while extending the 0% merchant discount rate for micro merchants. The payment system structure was strengthened by expanding standard national open API payment (Bank Indonesia’s initiative to standardize and interconnect payment services through an open API framework) for greater interconnection of payment services and enhancing the surveillance of payment system providers, including monitoring for illegal transactions and strengthening cybersecurity. BI-FAST acceptance and stability were improved as retail payment system infrastructure that has become increasingly popular with the public. Similarly, the digitalization of social aid program (Bantuan Sosial – Bansos) disbursements and government financial transactions was expanded, particularly to accelerate and enhance local regional digitalization and increase acceptance of the Indonesia Credit Card for the government segment. Furthermore, Bank Indonesia also expanded cross-border payment cooperation through implementation of the Regional Payment Connectivity initiative in the ASEAN along with several other important economic partners of Indonesia. |
D-77
From January 2025 to July 2025, Bank Indonesia reduced the BI Rate three times each by 25 bps. In January 2025, Bank Indonesia reduced the BI rate to 5.75%, while reducing the deposit facility rate and lending facility rate to 5.00% and 6.50%, respectively. In May 2025, Bank Indonesia reduced the BI rate to 5.50%, while reducing the deposit facility rate and lending facility rate to 4.75% and 6.25%, respectively. Bank Indonesia maintained the BI rate, the deposit facility rate and lending facility rate unchanged in February, March, April and June 2025.
In July 2025, Bank Indonesia reduced the BI rate to 5.25%, while reducing the deposit facility rate and lending facility rate to 4.50% and 6.00%, respectively.
The decision is consistent with the lower inflation projections for 2025 and 2026, which remain within the 2.5±1% target corridor, Rupiah exchange rate stability in line with economic fundamentals, and the need to support economic growth. Moving forward, Bank Indonesia will continue considering further room for interest rate reduction to nurture economic growth, while maintaining Rupiah exchange rate stability and orienting monetary policy towards managing inflation within the target corridor based on global and domestic economic dynamics. Meanwhile, Bank Indonesia continues optimizing accommodative macroprudential policy through strategies to increase credit and financing, lower interest rates and enhance liquidity management flexibility in the banking industry to support sustainable economic growth. Payment system policies are also oriented towards supporting economic growth by expanding digital payment acceptance, strengthening the infrastructure and consolidating the structure of the payment system industry.
Bank Indonesia has, therefore, strengthened its monetary, macroprudential and payment system policy mix to maintain stability in order to strengthen sustainable economic growth through the following policy measures:
| 1. | strengthening the Rupiah stabilization strategy in line with economic fundamentals, primarily through domestic foreign exchange market intervention with a focus on spot and domestic non-deliverable forward transactions as well as intervention in offshore non-deliverable forward transactions, while also purchasing SBN in the secondary market to maintain financial market stability; |
| 2. | strengthening the pro-market monetary operations strategy to enhance monetary policy transmission effectiveness, maintain adequate liquidity, accelerate money market and foreign exchange market deepening and attract foreign capital inflows by: |
| a. | strengthening the effective transmission of lower interest rates by managing the interest rate structure of monetary instruments and forex swaps by attracting portfolio inflows to domestic financial assets, |
| b. | maintaining adequate liquidity in the money market and banking industry through SRBI auctions and purchasing SBN in the secondary market, and |
| c. | strengthening the function of primary dealers to increase SRBI transactions in the secondary market and repurchase agreement (“repo”) transactions between market players; |
| 3. | strengthening prime lending rate publication transparency with a focus on interest rates based on priority sectors in accordance with the scope of macroprudential liquidity incentive policy (Kebijakan Insentif Likuiditas Makroprudensial); |
| 4. | expanding digital acceptance by: (i) launching QRIS Cross-Border cooperation with Japan on and initiating the QRIS Cross-Border sandbox with China on August 17, 2025, and (ii) enhancing education and outreach of QRIS Tap, targeting users and merchants. QRIS Cross-Border is an initiative to enable QRIS payments for transactions between Indonesia and other countries. QRIS Tap is an initiative to apply QRIS in contactless payments; and |
| 5. | strengthening and expanding international cooperation among central banks, including efforts to enhance payment system connectivity and facilitate local currency transactions, while promoting trade and investment in priority sectors in coordination with relevant institutions. |
Bank Indonesia is also strengthening policy synergy with the Government to maintain stability and nurture economic growth in line with the Government’s Asta Cita program. In addition, Bank Indonesia will continue strengthening policy synergy with the Financial System Stability Committee (Komite Stabilitas Sistem Keuangan) to maintain the stability of the financial system.
Policy Synergy between Bank Indonesia and Ministry of Finance
In connection with the Republic’s legislative and regulatory response to the Covid-19 pandemic, the Ministry of Finance and Bank Indonesia issued two joint decrees: (i) the first (“SKB I”), on April 16, 2020, provided for Bank Indonesia to act as backstop buyer in primary market auctions of Government securities from 2020 to 2022, pursuant to which Bank Indonesia purchased Rp75.9 trillion of Government securities in 2020, Rp143.3 trillion in 2021 and Rp49.1 trillion in 2022; and (ii) the second (“SKB II”), on July 7, 2020, related to the “burden sharing” between Bank Indonesia and the Ministry of Finance whereby, to help fund the Government’s Covid-19 relief and recovery efforts:
| • | Rp397.5 trillion of Government expenditure in the public goods sector which includes health sector, social protection and labor-intensive programs, support sectoral and local government support is to be financed via Government securities privately placed to Bank Indonesia with a reference interest rate equal to the 3-month BI Reverse Repo Rate, to be borne entirely by Bank Indonesia; and |
| • | a substantial portion, or Rp177.0 trillion, of the total Rp505.9 trillion of Government expenditure in the non-public goods sector, which includes support to MSME and non-MSME corporates, is to be financed via Government securities issued via market mechanisms. The Government will bear the interest expense at a rate equal to the 3-month BI Reverse Repo Rate minus 1% and Bank Indonesia will bear the remaining interest expense necessary to match the market rate. |
These initial burden sharing schemes were valid for 2020 and 2021 only. As part of their commitment to transparency to the public, the Ministry of Finance and Bank Indonesia reported the realization of financing support under the joint decrees in their respective monthly press releases.
On August 23, 2021, the Ministry of Finance and Bank Indonesia issued the third joint decree (“SKB III”) to cooperate on financing health and humanitarian care. Pursuant to the SKB III, the Government privately placed Government securities to Bank Indonesia, and the Government and Bank Indonesia coordinated to provide healthcare and humanitarian support in response to the Covid 19 pandemic. Specifically, Bank Indonesia contributed interest paid on the Government securities of Rp58 trillion in 2021 and Rp40 trillion in 2022 toward vaccination programs and other healthcare expenses and the Government contributed the remaining interest costs (at a variable interest rate equal to the three-month BI Reference Rate) of Rp157 trillion in 2021 and Rp184 trillion in 2022 toward healthcare expenses and humanitarian initiatives such protection programs for affected communities and small businesses.
SKB III concluded in December 2022 and no further joint initiatives have been pursued since, although the omnibus financial sector law passed in 2023 provides for additional coordination of fiscal policy of the Government and monetary policy of Bank Indonesia in the case of a future crisis declared by the President. See “—Financial System Financial Sector Omnibus Law (Law No. 4/2023)”.
D-78
Money Supply
Bank Indonesia tracks several different measures of money supply. Base money includes currency (bank notes and coins in circulation) and demand deposits of commercial banks and private sector at Bank Indonesia. Narrow money consists of currency outside the bank system plus Rupiah denominated demand deposits in commercial banks. Broad money consists of narrow money, securities other than shares, plus quasi-money, which includes time deposits and savings deposits in Rupiah and demand deposits in foreign currencies.
The following table sets forth the money supply as of the periods indicated.
Money Supply
| Money | ||||||||||||||||||||||||||||||||
| End of period |
Base money |
Currency | Demand deposits |
Rupiah saving deposits(1) |
TotalM1 (1) | Quasi- money |
Securities other than shares |
TotalM2 | ||||||||||||||||||||||||
| (in billions of Rupiah) | ||||||||||||||||||||||||||||||||
| 2020 | 1,147,200 | 760,112 | 1,095,580 | 1,887,268 | 3,742,960 | 3,139,759 | 23,220 | 6,905,939 | ||||||||||||||||||||||||
| 2021 | 1,351,172 | 831,234 | 1,450,967 | 2,131,756 | 4,413,956 | 3,433,822 | 22,675 | 7,870,453 | ||||||||||||||||||||||||
| 2022 | 1,715,619 | 897,799 | 1,710,998 | 2,225,849 | 4,834,646 | 3,668,813 | 24,563 | 8,528,022 | ||||||||||||||||||||||||
| 2023 | 1,690,270 | 975,928 | 1,699,406 | 2,260,192 | 4,935,525 | 3,862,393 | 28,613 | 8,826,531 | ||||||||||||||||||||||||
| 2024 | 1,774,691 | 1,062,795 | 1,776,745 | 2,384,441 | 5,223,981 | 3,908,462 | 114,187 | 9,246,630 | ||||||||||||||||||||||||
| May 2024 |
1,522,728 | 934,144 | 1,691,128 | 2,290,551 | 4,915,822 | 4,016,381 | 36,618 | 8,968,821 | ||||||||||||||||||||||||
| May 2025(2) |
1,563,818 | 1,033,639 | 1,803,738 | 2,388,919 | 5,226,296 | 4,077,256 | 103,036 | 9,406,588 | ||||||||||||||||||||||||
Source: Bank Indonesia.
| M1 | Narrow money. |
| M2 | Broad money. |
| (1) | Since September 2021, Rupiah saving deposits that can be withdrawn at any time is reclassified from quasi-money to narrow money, due to their high liquidity. |
| (2) | Money supply data are ordinarily released approximately one month after the analytical balance sheet of Bank Indonesia. |
| Factors affecting money supply | ||||||||||||||||
| End of period |
Foreign assets (net) |
Claims on central Government (net) (1) |
Claims on business sectors |
Other items (net)(2) |
||||||||||||
| (in billions of Rupiah) | ||||||||||||||||
| 2020 |
1,711,187 | 818,392 | 5,129,116 | 713,554 | ||||||||||||
| 2021 |
1,809,680 | 1,127,267 | 5,444,160 | 1,007,279 | ||||||||||||
| 2022 |
1,898,133 | 970,957 | 5,996,010 | 1,257,016 | ||||||||||||
| 2023 |
1,967,180 | 907,964 | 6,545,841 | 1,222,684 | ||||||||||||
| 2024 |
1,982,701 | 748,934 | 7,046,941 | 1,414,908 | ||||||||||||
| May 2024 |
1,882,646 | 782,059 | 6,690,548 | 1,348,789 | ||||||||||||
| May 2025(3) |
1,956,309 | 580,820 | 7,186,675 | 1,574,235 | ||||||||||||
Source: Bank Indonesia.
| (1) | Claims on the Government include net of the Government’s deposits with the banking system. |
| (2) | Includes capital accounts, tradeable government bonds held by central bank and inter-system accounts. |
| (3) | Money supply data are ordinarily released approximately one month after the analytical balance sheet of Bank Indonesia. |
As of December 31, 2020, broad money experienced faster growth on the back of narrow money (M1) and quasi-money. Totaling Rp6,905.9 trillion, broad money accelerated to 12.5% (year on year) compared to 6.5% (year on year) growth as of the end of the previous year. Narrow money growth increased to 14.9% (year on year) compared to 7.0% (year on year) as of the end of the previous year, in line with increases recorded in terms of currency outside banks and Rupiah demand deposits, as well as Rupiah saving deposits that can be withdrawn at any time. Further, quasi-money growth increased to 10.0% (year on year) compared to 5.8% (year on year) as of the end of the previous year, due to increases in all components, namely time deposits, other saving deposits and foreign currency demand deposits.
As of December 31, 2021, broad money grew by 14.0% (year-on-year) compared to 12.5% (year-on-year) as of the same date in the previous year, resulting from higher growth in narrow money. Narrow money growth increased to 17.9% (year-on-year) as of December 31, 2021 compared to 14.9% (year-on-year) as of the same date in the previous year, due to higher growth in Rupiah demand deposits and Rupiah saving deposits that can be withdrawn at any time. Quasi-money growth decreased to 9.4% (year-on-year) compared to 10.0% (year-on-year) as of the same date in the previous year, due to slower growth in time deposits and other saving deposits.
As of December 31, 2022, broad money grew by 8.4% (year-on-year) compared to 14.0% (year-on-year) as of December 31, 2021, due to a much slower growth of narrow money and quasi money. Narrow money grew slower by 9.5% (year-on-year) as of December 31, 2022, compared to 17.9% (year-on-year) as of December 31, 2021, due to slower growths of Rupiah demand deposits and Rupiah saving deposits. Quasi-money growth decreased to 6.8% (year-on-year) compared to 9.4% (year-on-year) as of December 31, 2021, due to a slower growth in Rupiah time deposits.
D-79
As of December 31, 2023, broad money grew by 3.5% (year-on-year), compared to a growth of 8.4% (year-on-year) as of December 31, 2022, due to slower growth of narrow money and quasi money. The much slower pace of broad money was primarily due to a growth of narrow money by 2.1% (year-on-year), compared to 9.5% (year-on-year) of robust growth as of December 31, 2022, due to decreasing Rupiah demand deposit. Quasi-money recorded a 5.3% growth (year-on-year) in December 2023, compared to a 6.8% increase (year-on-year) in December 2022. The slower growth of quasi money was primarily driven by slower growth pace of foreign currency demand deposits.
As of December 31, 2024, broad money grew by 4.8% (year-on-year) compared to 3.5% (year-on-year) as of December 31, 2023, due to a higher increase in narrow money. Narrow money grew by 5.8% (year-on-year) as of December 31, 2024 compared to 2.1% (year-on-year) as of December 31, 2023, due to higher growth of Rupiah demand deposits and Rupiah saving deposits. Quasi money grew slower by 1.2% (year-on-year) as of December 31, 2024 compared to 5.3% (year-on-year) as of December 31, 2023, due to a decrease in time deposits.
As of May 31, 2025, broad money grew by 4.9% (year-on-year) compared to 7.6% (year-on-year) as of May 31, 2024, due to a lower increase in quasi-money. Quasi-money grew by 1.5% (year-on-year) as of May 31, 2025 compared to 8.8% (year-on-year) as of May 31, 2024. Meanwhile, narrow money grew by the same rate at 6.3% as of May 31, 2025 and May 31, 2024.
D-80
Government Budget
Fiscal Policy
Since 2001, the focus of the Government’s fiscal policy has been to promote fiscal consolidation and reduce Government debt gradually in order to achieve fiscal sustainability. As a result of the overall macroeconomic situation and current policy challenges, since 2006, the Government has also focused fiscal policy on providing a modest degree of stimulus to the overall economy, within the constraints of the Government’s overall fiscal situation.
The following table sets forth Government revenues and expenditures for the periods indicated.
Government Revenues and Expenditures
| Year Ended December 31, | Six Months Ended June 30, |
|||||||||||||||||||||||||||||||
| 2020L | 2021L | 2022L | 2023L | 2024B | 2024P | 2025B | 2025P | |||||||||||||||||||||||||
| (in trillions of Rupiah) | ||||||||||||||||||||||||||||||||
| Revenues and grants: |
||||||||||||||||||||||||||||||||
| Domestic revenues |
||||||||||||||||||||||||||||||||
| Tax revenues |
1,285.1 | 1,547.8 | 2,034.6 | 2,154.2 | 2,309.9 | 2,232.7 | 2,490.9 | 978.3 | ||||||||||||||||||||||||
| Non-tax revenue |
343.8 | 458.5 | 595.6 | 612.5 | 492.0 | 579.5 | 513.6 | 222.9 | ||||||||||||||||||||||||
| Total domestic revenues |
1,629.0 | 2,006.3 | 2,630.1 | 2,766.7 | 2,801.9 | 2,812.2 | 3,004.5 | 1,201.2 | ||||||||||||||||||||||||
| Grants |
18.8 | 5.0 | 5.7 | 17.2 | 0.4 | 30.3 | 0.6 | 0.6 | ||||||||||||||||||||||||
|
|
|
|
|
|
|
|
|
|
|
|
|
|
|
|
|
|||||||||||||||||
| Total revenues and grants |
1,647.8 | 2,011.3 | 2,635.8 | 2,783.9 | 2,802.3 | 2,842.5 | 3,005.1 | 1,201.8 | ||||||||||||||||||||||||
|
|
|
|
|
|
|
|
|
|
|
|
|
|
|
|
|
|||||||||||||||||
| Expenditures: |
||||||||||||||||||||||||||||||||
| Central government expenditures |
1,833.0 | 2,000.7 | 2,280.0 | 2,239.8 | 2,467.5 | 2,486.7 | 2,701.4 | 1,003.6 | ||||||||||||||||||||||||
| Transfer to regions and rural fund |
762.5 | 785.7 | 816.2 | 881.4 | 857.6 | 863.5 | 919.9 | 402.5 | ||||||||||||||||||||||||
|
|
|
|
|
|
|
|
|
|
|
|
|
|
|
|
|
|||||||||||||||||
| Total expenditures |
2,595.5 | 2,786.4 | 3,096.3 | 3,121.2 | 3,325.1 | 3,350.3 | 3,621.3 | 1,406.0 | ||||||||||||||||||||||||
|
|
|
|
|
|
|
|
|
|
|
|
|
|
|
|
|
|||||||||||||||||
| Primary balance(1) |
(633.6 | ) | (431.6 | ) | (74.1 | ) | 102.6 | (25.5 | ) | (19.4 | ) | (63.3 | ) | 52.8 | ||||||||||||||||||
| Surplus/(deficit) |
(947.7 | ) | (775.1 | ) | (460.4 | ) | (337.3 | ) | (522.8 | ) | (507.8 | ) | (616.2 | ) | (204.2 | ) | ||||||||||||||||
| Financing: |
||||||||||||||||||||||||||||||||
| Debt Financing |
1,229.6 | 870.5 | 696.0 | 404.0 | 648.1 | 556.6 | 775.9 | 315.4 | ||||||||||||||||||||||||
| Investment Financing |
(104.7 | ) | (142.5 | ) | (106.7 | ) | (89.9 | ) | (176.2 | ) | (60.0 | ) | (154.5 | ) | (33.5 | ) | ||||||||||||||||
| On-Lending |
1.0 | 1.9 | 2.2 | 4.5 | (0.3 | ) | (0.4 | ) | (5.4 | ) | 1.3 | |||||||||||||||||||||
| Government Guarantee |
(3.6 | ) | (2.7 | ) | (1.1 | ) | (0.3 | ) | (0.8 | ) | (0.8 | ) | 0.0 | 0.0 | ||||||||||||||||||
| Other Financing |
70.9 | 144.4 | 0.7 | 38.5 | 52.0 | 57.8 | 0.3 | 0.4 | ||||||||||||||||||||||||
|
|
|
|
|
|
|
|
|
|
|
|
|
|
|
|
|
|||||||||||||||||
| Total Financing |
1,193.3 | 871.7 | 591.0 | 356.7 | 522.8 | 553.2 | 616.2 | 283.6 | ||||||||||||||||||||||||
|
|
|
|
|
|
|
|
|
|
|
|
|
|
|
|
|
|||||||||||||||||
Source: Ministry of Finance
| L | LKPP (Financial Report of Central Government/Audited). |
| B | Budget. |
| P | Preliminary. |
| (1) | Primary balance represents revenues minus expenditures excluding interest expenditures. |
2024 Budget
On October 16, 2023, the Government promulgated Law No. 19 of 2023 on the State Budget for 2024. The state budget is directed at “Accelerating Inclusive and Sustainable Economic Transformation.” The state budget is aligned with the Government’s work plan for 2024, which has seven national priorities: (1) strengthening economic resilience for quality and equitable growth; (2) developing areas to reduce inequality and ensure equity; (3) increasing quality and competitiveness of human resources; (4) mental revolution and cultural development; (5) strengthening infrastructure to support economic development and basic services; (6) building the environment and improving disaster and climate change resilience; and (7) strengthening stability of politics, law, defense and security and transforming public service.
The key macroeconomic assumptions for 2024 underlying the 2024 Budget contained in the bill are as follows:
| • | an economic growth rate of 5.2%; |
| • | an inflation rate of 2.8%; |
D-81
| • | an exchange rate of Rp15,000 to U.S.$1.00; |
| • | an average Government 10-year bond rate of 6.70%; |
| • | an ICP of U.S.$82 per barrel; |
| • | an oil production by the Republic of 635 thousand barrels of oil per day; and |
| • | gas production by the Republic of 1,033 million barrels of oil equivalent of gas per day. |
Total revenue in the 2024 Budget is expected to be Rp2,802.3 trillion, or an increase of 13.8% from the 2023 Budget of Rp2,463.0 trillion. Total revenue comprises Rp2,309.9 trillion in tax revenues, Rp492.0 trillion in non-tax revenues and Rp0.4 trillion in grants.
Total expenditures under the 2024 Budget are estimated at Rp3,325.1 trillion, or 8.6% increase from the 2023 Budget of Rp3,061.2 trillion, comprising Rp2,467.5 trillion in central Government expenditures and Rp857.6 trillion in transfer to regions.
For 2024, the Government will continue to be committed to taking steps toward fiscal consolidation by maintaining a budget deficit below 3% of GDP. The primary deficit in the 2024 Budget is projected to be Rp522.8 trillion, or 2.29% of the projected 2024 GDP. The Government expects to fund the deficit through debt financing.
The 2024 Budget prioritizes inclusive and sustainable economic transformation by investing in human resources, social welfare, and infrastructure to boost productivity and competitiveness, reduce poverty, enhance social well-being, and promote equality. The 2024 Budget is based on and aligned with: (i) the Government’s 2024 tax policies that focus on the implementation of its new core tax administration system, technology-driven compliance and collaborative programs for effectiveness; (ii) the Government’s non-tax state revenue policies that aim to refine natural resource policies, optimize state-owned enterprise dividends, foster innovation and service quality in government agencies, improve synergy, expand information technology application, and strengthen oversight and compliance with international standards; and (iii) the Government’s financing policies that seek to achieve a positive primary balance, lower the negative balance caused by the COVID-19 pandemic, manage the budget deficit and debt financing and invest efficiently for economic transformation, and optimize the budget to mitigate global uncertainties.
The 2024 Budget aims to improve productivity and diversify the economy and achieve a clean and green environment. The Government’s fiscal policies target both short-term economic improvements and long-term structural reforms.
Preliminary Full-Year Realization Results for 2024 Budget
On January 6, 2025, the Ministry of Finance announced updated preliminary realization figures for the 2024 budget. Based on the announcement, the realized Government revenues for 2024 are expected to reach Rp2,842.5 trillion, representing an increase of 2.1% from Rp2,783.9 trillion for 2023. The realized revenues for 2024 comprise total tax revenues that are expected to be Rp2,232.7 trillion, representing an increase of 3.6% from Rp2,154.20 trillion for 2023, and total non-tax revenues that are expected to be Rp579.5 trillion, representing a decrease of 5.4% from Rp612.5 trillion for 2023.
Based on the announcement, the realized Government expenditures for 2024 are expected to be Rp3,350.3 trillion, representing an increase of 7.3% from Rp3,121.2 trillion for 2023. Out of the realized Government expenditures, total central Government expenditures are expected to be Rp2,486.7 trillion, representing an increase of 11.0% from Rp2,239.8 trillion for 2023, and total transfers to regions and rural fund are expected to be Rp863.5 trillion, representing a decrease of 2.0% from Rp881.4 trillion for 2023.
As a result, the Government expects to realize a primary balance of a deficit of Rp19.4 trillion in 2024, compared to a surplus of Rp102.6 trillion in 2023. The total deficit is expected to be Rp507.8 trillion for 2024, representing 2.29% of the GDP.
2025 Budget
On October 17, 2024, the Government promulgated Law No. 62 of 2024 on the State Budget for 2025 (the “2025 Budget”). The 2025 Budget was designed to accelerate inclusive and sustainable economic growth with measurable and controlled countercyclical policies, amid global economic uncertainties. The 2025 Budget was formulated based on a mix of short, medium and long-term policy considerations aimed at advancing the Golden Indonesia Vision 2045, which was the goal announced in 2019 by former President Joko Widodo for Indonesia to become the fifth largest economy in the world by 2045. See “Government and Political Developments—2019 Indonesian General Elections” in the Exhibit 99.D. to the Republic’s Annual Report on Form 18-K for the fiscal year ended on December 31, 2023 for further details.
The key macroeconomic assumptions underlying the 2025 Budget are as follows:
| • | an economic growth rate of 5.2%; |
D-82
| • | an inflation rate of 2.5%; |
| • | an exchange rate of Rp16,000 to U.S.$1.00; |
| • | an average Government 10-year bond rate of 7.0%; |
| • | an ICP of U.S.$82 per barrel; |
| • | oil production by the Republic of 605 thousand barrels of oil per day; and |
| • | gas production by the Republic of 1,005 thousand barrels of oil equivalent of gas per day. |
Total revenue in the 2025 Budget is expected to be Rp3,005.1 trillion, or an increase of 7.2% from the 2024 Budget of Rp2,802.3 trillion. Total revenue comprises Rp2,490.9 trillion in tax revenues, Rp513.6 trillion in non-tax revenues and Rp0.6 trillion in grants.
Total expenditures under the 2025 Budget are estimated to be Rp3,621.3 trillion, or 9.5% increase from the 2024 Budget of Rp3,325.1 trillion, comprising Rp2,701.4 trillion in central Government expenditures and Rp919.9 trillion in transfer to regional and rural funds.
For 2025, the Government will continue its commitment toward fiscal consolidation by maintaining a budget deficit below 3% of GDP. The primary deficit in the 2025 Budget is projected to be Rp616.2 trillion, or 2.53% of the projected 2025 GDP. The Government expects to fund the deficit through debt financing.
The 2025 Budget included the following allocations:
| • | Education: Rp724.3 trillion, or 20.0% of the total budget expenditures. This allocation is directed towards improving access to and the quality of education, providing nutritious food for school children, renovating schools, building model schools, and improving the connection between education and the needs of the job market. |
| • | Social protection: Rp503.2 trillion, or 13.9% of the total budget expenditures. This allocation is directed towards social assistance distribution, integrating and strengthening social protection programs, strengthening lifelong social protection, and facilitating poverty alleviation through empowerment-based social protection. |
| • | Infrastructure: Rp399.3 trillion, or 11.0% of the total budget expenditures. This allocation is directed towards developing agricultural infrastructure such as irrigation networks and dams and building infrastructure to support economic transformation with respect to, among others, downstreaming policy, connectivity improvement and energy transition. |
| • | Law and defense: Rp376.4 trillion, or 10.4% of the total budget expenditures. This allocation is directed towards modernizing defense equipment, strengthening information and communication technologies against cyber threats, supporting strategic industrial capabilities, and implementing legal and security operational activities. |
| • | Health: Rp218.5 trillion, or 6.0% of the total budget expenditures. This allocation is directed towards promotive and preventive efforts, accelerating the reduction of stunting and tuberculosis cases, constructing high-quality hospitals, providing free health checks, enhancing the universal healthcare program, improving technology and pharmaceutical independence, and building a reliable healthcare system. |
| • | Food security: Rp139.4 trillion, or 3.8% of the total budget expenditures. This allocation is directed towards intensification and extensification of agricultural land, strengthening agricultural facilities and infrastructure, increasing farmers’ access to financing, and bolstering national food reserves. |
The 2025 Budget was formulated prior to President Prabowo Subianto assuming power, by the then-incumbent administration of former President Joko Widodo working with the then President-elect Prabowo Subianto’s transition team to reflect both leaders’ policy proposals and priorities and to provide space for implementation of the incoming administration’s programs.
Review of the 2025 Budget
Presidential Instruction (Inpres) No. 1 of 2025, issued on January 22, 2025, directed members of the cabinet and other designated senior government officials to review the 2025 Budget in accordance with their respective duties, functions, and authorities to achieve budget efficiency. The presidential instruction highlighted a potential reduction of Rp306.7 trillion in government expenditure, including possible cuts of Rp256.1 trillion in the expenditures of central ministries and institutions, and Rp50.6 trillion in transfer to regions. The Government is reviewing the 2025 Budget following the presidential instruction and may revise the 2025 Budget.
On February 15, 2025, President Prabowo Subianto announced that the planned budget cuts would occur in three stages, extending beyond 2025 and aiming for total savings of Rp750 trillion.
D-83
In accordance with the presidential instruction, the Government is taking steps to (i) maximize revenue by implementing key strategies including enhancing tax compliance, expanding the tax base, leveraging data analytics for more accurate revenue forecasting, and implementing a technology-drive and effective revenue system; and (ii) refocus expenditure to accelerate priority programs by adopting measures including increasing efficiency in travel, seminars, office supplies and workshops, as well as prioritizing investments in human capital, job creation, productivity growth, food and energy security, and technological innovation.
As of June 24, 2025, a total of Rp134.9 trillion had been achieved in the release of budget blocks and reserves and the reallocation of expenditure efficiency gains, in accordance with President Prabowo Subianto’s directives to support national development priorities.
Changes to VAT; Stimulus Package
On December 31, 2024, President Prabowo Subianto announced that the previously-scheduled increase in VAT rates from 11% to 12% from January 1, 2025 applies only to goods and services already subject to luxury goods sales taxes (Pajak Penjualan Barang Mewah). Goods and services not classified as luxury items would remain subject to the VAT rate of 11% established in 2022. The 0% VAT exemption for essential goods and services remains in effect, covering basic necessities such as rice, meat, fish, eggs, vegetables, fresh milk, educational services, healthcare services, public transportation services, affordable housing, and drinking water.
In December 2024, the Government introduced a stimulus package for 2025 with the budget amount of Rp38.6 trillion that includes, among other incentives:
| • | rice assistance of 10 kg per month for 16 million food aid recipients; |
| • | a 50% discount on electricity bills for customers with a maximum capacity of 2,200 VA; |
| • | incentives for electric and hybrid vehicles; |
| • | financing for labor-intensive industries; and |
| • | certain income tax incentives for employees earning up to Rp10 million per month. |
The Government had completed the stimulus package disbursement in February 2025 and the actual amount disbursed was Rp33.0 trillion.
Free Nutritious Meal Program
On January 6, 2025, the Government launched the Free Nutritious Meal Program to provide free meals to pregnant women, breastfeeding mothers, toddlers, and students to fight malnutrition and stunting. The Government believes that the program will contribute meaningfully to GDP growth, employment generation and poverty reduction. According to the Head of the National Nutrition Agency, the program was initially allocated a budget of Rp71 trillion (approximately U.S.$4.3 billion) to serve an estimated 17.9 million beneficiaries throughout 2025. Following President Prabowo Subianto’s directive to accelerate the program’s scale-up, the Government now aims to reach 82.9 million beneficiaries by the end of 2025 through 32,000 active nutrition units (satuan pelayanan pemenuhan gizi, “SPPG”). To support this expansion, an additional budget of Rp100 trillion (approximately U.S.$6.2 billion) has been allocated, increasing the total 2025 budget for the program to Rp171 trillion (approximately U.S.$10.5 billion). As of June 30, 2025, there were approximately 5.59 million beneficiaries under the program, served by approximately 1,863 SPPG.
Red and White Village Cooperative
Presidential Instruction (Inpres) No. 9 of 2025, issued on April 21, 2025, mandates the Government to take comprehensive, coordinated and integrated steps to optimize and accelerate the establishment, development and revitalization of around 80,000 red and white village/sub-district cooperatives (the “Cooperatives”). This includes establishing new Cooperatives in villages that currently lack them, enhancing the potential of existing Cooperatives, and ensuring that Cooperatives are better equipped to address the specific needs of each village. The instruction requires that budget allocation be prioritized and that acceleration strategies be incorporated into the work plans of ministries, institutions, and regional governments to achieve this goal. The Cooperatives are expected to provide a range of services such as basic goods procurement, savings and loans, clinics, pharmacies, and logistics, tailored to the unique needs and potential of each village or sub-district.
Economic Stimulus Packages to Maintain Economic Growth
On June 2, 2025, the Government officially launched an economic stimulus package worth Rp24.44 trillion (approximately U.S.$1.5 billion) for June and July 2025, aimed at maintaining and strengthening national economic growth and stability.
The stimulus package includes, among other things, (i) Rp11.93 trillion allocated for social assistance to 18.3 million beneficiaries, which includes monthly support of Rp200,000 per person under the Basic Food Card program and the provision of 10 kilograms of free rice per month for each beneficiary, (ii) Rp10.72 trillion allocated for wage subsidy, providing Rp300,000 per person per month to 17.3 million low-income workers and 565,000 non-tenured teachers, and (iii) Rp0.94 trillion allocated to subsidize mass transportation tickets, toll road tariff, and work accident insurance contribution.
D-84
Out of the total Rp24.44 trillion budget, Rp23.59 trillion will be sourced from the state budget and the remaining Rp0.85 trillion will come from other sources.
Government Finances
The following table sets forth information regarding the revenues and expenditures of the Government for the periods indicated.
Government Revenues
The following table sets forth Government revenues by category for the periods indicated.
Government Revenues
| Year Ended December 31, | Six Months Ended June 30, |
|||||||||||||||||||||||||||||||
| 2020L | 2021L | 2022L | 2023L | 2024B | 2024P | 2025B | 2025P | |||||||||||||||||||||||||
|
|
|
|
|
|
|
|
|
|
|
|
|
|
|
|
|
|||||||||||||||||
| (in trillions of Rupiah) | ||||||||||||||||||||||||||||||||
| Domestic revenues: |
||||||||||||||||||||||||||||||||
| Tax revenues |
||||||||||||||||||||||||||||||||
| Domestic tax |
||||||||||||||||||||||||||||||||
| Income tax: |
||||||||||||||||||||||||||||||||
| Oil and gas |
33.0 | 52.8 | 77.8 | 68.8 | 76.4 | 65.1 | 62.8 | 20.3 | ||||||||||||||||||||||||
| Non-oil and gas |
561.0 | 643.8 | 920.4 | 992.5 | 1,063.4 | 997.6 | 1,146.4 | 470.9 | ||||||||||||||||||||||||
|
|
|
|
|
|
|
|
|
|
|
|
|
|
|
|
|
|||||||||||||||||
| Total income tax |
594.0 | 696.7 | 998.2 | 1,061.2 | 1,139.8 | 1,062.7 | 1,209.3 | 491.1 | ||||||||||||||||||||||||
| Value added tax (VAT) |
450.3 | 551.9 | 687.6 | 763.6 | 811.4 | 828.5 | 945.1 | 267.3 | ||||||||||||||||||||||||
| Land and building tax |
21.0 | 18.9 | 23.3 | 33.3 | 27.2 | 32.5 | 27.1 | 11.5 | ||||||||||||||||||||||||
| Excises |
176.3 | 195.5 | 226.9 | 221.9 | 246.1 | 226.4 | 244.2 | 108.8 | ||||||||||||||||||||||||
| Other taxes |
6.8 | 11.1 | 7.7 | 9.7 | 10.5 | 8.7 | 7.8 | 61.3 | ||||||||||||||||||||||||
|
|
|
|
|
|
|
|
|
|
|
|
|
|
|
|
|
|||||||||||||||||
| Total domestic taxes |
1,248.4 | 1,474.1 | 1,943.7 | 2,089.7 | 2,235.0 | 2,158.8 | 2,433.5 | 940.0 | ||||||||||||||||||||||||
|
|
|
|
|
|
|
|
|
|
|
|
|
|
|
|
|
|||||||||||||||||
| International trade taxes: |
||||||||||||||||||||||||||||||||
| Import duties |
32.4 | 39.1 | 51.1 | 50.9 | 57.4 | 53.0 | 52.9 | 23.6 | ||||||||||||||||||||||||
| Export tax |
4.3 | 34.6 | 39.8 | 13.6 | 17.5 | 20.9 | 4.5 | 14.6 | ||||||||||||||||||||||||
|
|
|
|
|
|
|
|
|
|
|
|
|
|
|
|
|
|||||||||||||||||
| Total international trade taxes |
36.7 | 73.7 | 90.9 | 64.5 | 74.9 | 73.9 | 57.4 | 38.3 | ||||||||||||||||||||||||
|
|
|
|
|
|
|
|
|
|
|
|
|
|
|
|
|
|||||||||||||||||
| Total tax revenues |
1,285.1 | 1,547.8 | 2,034.6 | 2,154.2 | 2,309.9 | 2,232.7 | 2,490.9 | 978.3 | ||||||||||||||||||||||||
|
|
|
|
|
|
|
|
|
|
|
|
|
|
|
|
|
|||||||||||||||||
| Non-tax revenues: |
||||||||||||||||||||||||||||||||
| Natural resources: |
||||||||||||||||||||||||||||||||
| Oil |
44.9 | 65.0 | 112.0 | 87.4 | 80.5 | 85.9 | 89.0 | 40.3 | ||||||||||||||||||||||||
| Gas |
24.2 | 31.6 | 36.7 | 28.8 | 29.6 | 25.0 | 32.0 | 6.9 | ||||||||||||||||||||||||
|
|
|
|
|
|
|
|
|
|
|
|
|
|
|
|
|
|||||||||||||||||
| Total oil and gas |
69.1 | 96.6 | 148.7 | 116.2 | 110.2 | 110.9 | 121.0 | 47.2 | ||||||||||||||||||||||||
| General mining |
21.2 | 44.8 | 110.8 | 129.1 | 85.8 | 107.8 | 87.5 | 51.5 | ||||||||||||||||||||||||
| Forestry |
4.4 | 5.4 | 5.8 | 5.4 | 6.0 | 6.7 | 5.7 | 2.5 | ||||||||||||||||||||||||
| Fishery |
0.6 | 0.7 | 1.2 | 0.6 | 3.5 | 1 | 1.6 | 0.4 | ||||||||||||||||||||||||
| Geothermal |
2.0 | 1.9 | 2.3 | 2.8 | 2.2 | 2.8 | 2.2 | 1.1 | ||||||||||||||||||||||||
|
|
|
|
|
|
|
|
|
|
|
|
|
|
|
|
|
|||||||||||||||||
| Total non-oil and gas |
28.1 | 52.9 | 120.1 | 138.0 | 97.5 | 118.3 | 97.0 | 55.5 | ||||||||||||||||||||||||
|
|
|
|
|
|
|
|
|
|
|
|
|
|
|
|
|
|||||||||||||||||
| Total natural resources |
97.2 | 149.5 | 268.8 | 254.2 | 207.7 | 229.2 | 218.0 | 102.7 | ||||||||||||||||||||||||
|
|
|
|
|
|
|
|
|
|
|
|
|
|
|
|
|
|||||||||||||||||
| Profit transfer from SOEs |
66.1 | 30.5 | 40.6 | 82.1 | 85.8 | 86.4 | 90.0 | 11.8 | (1) | |||||||||||||||||||||||
| Other non-tax revenues |
111.2 | 152.5 | 196.3 | 180.4 | 115.1 | 163.6 | 127.7 | 68.1 | ||||||||||||||||||||||||
| Public Service Agency (BLU) Income |
69.3 | 126.0 | 89.9 | 95.9 | 83.4 | 100.3 | 77.9 | 40.3 | ||||||||||||||||||||||||
|
|
|
|
|
|
|
|
|
|
|
|
|
|
|
|
|
|||||||||||||||||
| Total non-tax revenues |
343.8 | 458.5 | 595.6 | 612.5 | 492.0 | 579.5 | 513.6 | 222.9 | ||||||||||||||||||||||||
|
|
|
|
|
|
|
|
|
|
|
|
|
|
|
|
|
|||||||||||||||||
| Total domestic revenues |
1,629.0 | 2,006.3 | 2,630.1 | 2,766.7 | 2,801.9 | 2,812.2 | 3,004.5 | 1,201.2 | ||||||||||||||||||||||||
|
|
|
|
|
|
|
|
|
|
|
|
|
|
|
|
|
|||||||||||||||||
| Grants |
18.8 | 5.0 | 5.7 | 17.2 | 0.4 | 30.3 | 0.6 | 0.6 | ||||||||||||||||||||||||
|
|
|
|
|
|
|
|
|
|
|
|
|
|
|
|
|
|||||||||||||||||
| Total revenues and grants |
1,647.8 | 2,011.3 | 2,635.8 | 2,783.9 | 2,802.3 | 2,842.5 | 3,005.1 | 1,201.8 | ||||||||||||||||||||||||
|
|
|
|
|
|
|
|
|
|
|
|
|
|
|
|
|
|||||||||||||||||
Source: Ministry of Finance.
| L | LKPP (Financial Report of Central Government/Audited). |
| B | Budget. |
| P | Preliminary. |
| (1) | Profits of the SOEs held by BPI Danantara are being transferred to BPI Danantara rather than the Government. See “Privatization and Management of State-Owned Enterprises -- BPI Danantara.” |
D-85
Sources of Government Revenues.
The Government derives its revenues from both tax and non-tax sources. The main sources of tax revenues include income tax, value-added tax (“VAT”), customs duties and excises. The main sources of non-tax revenues are revenues generated from the sale of natural resources, profit transfers from SOEs and other non-tax revenues. Although oil and gas have historically been the single largest source of income tax and non-tax revenues for the Government, this has changed in recent years. In 2014, income tax from oil and gas as well as revenues generated from the sale of oil and gas constituted 16.0% and 54.4% of total income tax revenue and total non-tax revenues, respectively. In 2020, these ratios decreased to 5.6% and 20.6% respectively, primarily driven by a decrease in the average price of Indonesian crude oil and a decrease in oil and gas lifting.
Indonesian income tax comprises both corporate income tax and personal income tax. Starting from the fiscal year of 2020, the general corporate income tax rate is 22% applied to taxable profits. Listed companies that meet certain criteria are entitled to a reduction from the general rate (i.e., 3% lower); therefore the effective corporate income tax rate for listed companies is 19%. Small enterprises, being, corporate taxpayers with an annual gross turnover of up to Rp50 billion, are entitled to a 50% discount of the general income tax rate so that their effective tax rate will be 11%, to be imposed proportionally on taxable income of the part of gross turnover up to Rp4.8 billion. Certain enterprises with gross turnover of up to Rp4.8 billion are subject to a final income tax at 0.5% of revenue.
Personal income tax rates are set at progressive rates: (i) the maximum rate of 35% for annual taxable income above Rp5 billion, (ii) 30% for annual taxable income above Rp500 million and up to Rp5 billion, (iii) 25% for annual taxable income above Rp250 million and up to Rp500 million, (iv) 15% for annual taxable income above Rp60 million and up to Rp250 million, and (v) 5% for annual taxable income from Rp0 up to Rp60 million.
VAT is typically levied at a 11% rate on events involving the delivery of VAT-able goods or the provision of VAT-able services in the Indonesian customs area. The VAT rate was increased on January 1, 2025 to 12% only for goods and services already subject to luxury goods sales taxes (Pajak Penjualan Barang Mewah). Exports of VAT-able goods and certain VAT-able services are subject to a VAT rate of 0%. See “— Changes to VAT; Stimulus Package” for further information.
Customs duties consist of import duty and export duty. Import duty is applied on importation of goods and is payable at rates from 0% and 150% on cost, insurance and freight (“CIF”) level. Export of certain goods are subject to export duty on certain tariff based on the type of the products and calculated based on either certain percentage of customs value (ad valorem) or specifically based on duty rate/quantity in certain currency. Excises are generally imposed on certain goods, the distribution and consumption of which are required to be controlled due to their potential negative effects on society or the environment (such as ethyl alcohol and its concentrate, alcoholic drinks and tobacco products).
Other than the taxes described above, deliveries or imports of certain manufactured taxable goods may be subject to a sales tax on luxury goods, the rates of which by law may be increased up to 200%. These rates currently range between 10%—125%. Further, a property tax, called Land and Building Tax (Pajak Bumi dan Bangunan (“PBB”)), is chargeable on all land and/or buildings unless exempted. Previously, certain documents were subject to nominal stamp duty payable as a fixed amount of either Rp6,000 or Rp3,000. Since January 2021, the nominal stamp duty increased to a single fixed amount of Rp10,000. The Rp6,000 and Rp3,000 stamp duties apply until January 1, 2022 provided that at least Rp9,000 had been paid.
Government revenues realization decreased by 16.0% from Rp1,960.6 trillion in 2019 to Rp1,647.8 trillion in 2020, caused by reduced economic activities due to the Covid-19 pandemic and provision of tax incentives. By the end of 2020, total tax revenues decreased by 16.9% from Rp1,546.1 trillion in 2019 to Rp1,285.1 trillion in 2020, mainly driven by decreases in almost all tax revenues. Total non-tax revenues decreased by 15.9% from Rp409.0 trillion in 2019 to Rp343.8 trillion in 2020. This was mainly due to a decrease in the average price of Indonesian crude oil, measured by the ICP, and a decrease in oil and gas lifting, compared to the same period in 2019.
Government revenues realization increased by 22.1% from Rp1,647.8 trillion in 2020 to Rp2,011.3 trillion in 2021, driven by increases in domestic revenues. By the end of 2021, total tax revenues increased by 20.4% from Rp1,285.1 trillion in 2020 to Rp1,547.8 trillion in 2021, in line with improving economic activity and international trade. Total non-tax revenues increased by 33.4% from Rp343.8 trillion in 2020 to Rp458.5 trillion in 2021, in line with the upward trend in commodity prices, especially oil, minerals, coal, and crude palm oil.
Government revenues realization improved by a positive 31.0%, from Rp2,011.3 trillion in 2021, to Rp2,635.8 trillion in 2022, supported by rising commodity prices and maintained economic recovery. Total tax revenues increased by 31.5% from Rp1,547.8 trillion to Rp2,034.6 trillion, due to the increasing commodity prices, the expansive economic growth, and the implementation of Law No. 7 of 2021 on Harmonization on Tax Regulation. Total non-tax revenues increased by 29.9% from Rp458.5 trillion to Rp595.6 trillion, driven by significant increases in commodity prices and increases in the dividends of banking SOEs.
D-86
Government revenues realization improved by a positive 5.6%, from Rp2,635.8 trillion in 2022, to Rp2,783.9 trillion in 2023, representing 105.6% of the 2023 revised budget Government revenues. Tax revenues realization was Rp2,154.2 trillion and non-tax revenues realization was Rp612.5 trillion, representing 101.7% and 118.8% of the 2023 revised budget figures, respectively.
Government revenues realization improved by 2.1% from Rp2,783.9 trillion in 2023 to Rp2,842.5 trillion in 2024, representing 101.4% of the 2024 budget Government revenues. In 2024, tax revenues realization was Rp2,232.7 trillion or an increase of 3.6% from Rp2,154.2 trillion in 2023, and non-tax revenues realization was Rp579.5 trillion or a decrease of 5.4% from Rp612.5 trillion in 2023, representing 96.7% and 117.8% of the 2024 budget figures, respectively.
Government revenues realization decreased by 9.0% from Rp1,320.7 trillion in the first half of 2024 to Rp1,201.8 trillion in the first half of 2025, representing 40.0% of the 2025 budget Government revenues target. In the first half of 2025, tax revenues realization was Rp978.3 trillion or a decrease of 4.8% from Rp1,028.0 trillion in the first half of 2024, and non-tax revenues realization was Rp222.9 trillion or a decrease of 22.7% from Rp288.4 trillion in the first half of 2024, representing 39.3% and 43.4% of the 2025 budget figures, respectively. The decrease in non-tax revenues was driven by lower ICP, fluctuations in oil and gas lifting, and a drop in coal production relative to the prior period. Additionally, following the creation of BPI Danantara, profit from SOEs is now being transferred to BPI Danantara rather than the Government.
The tax-to-GDP ratio was in a relatively moderate range from 2017 to 2019, being 9.9% in 2017, 10.2% in 2018 and 9.8% in 2019. The tax-to-GDP ratio declined in 2020 to 8.3% due to the reduction of economic activity as a result of the Covid-19 pandemic. The tax-to-GDP ratio increased to 9.1% in 2021, 10.4% in 2022 and 10.3% in 2023 as a result of the recovery of economic activity. The tax-to-GDP ratio in 2024 was 10.1%.
Tax Amnesty
In July 2016, the Government passed Law No. 11 of 2016 on Tax Amnesty, which grants a certain tax amnesty to any individual or corporate taxpayer who met the requirements and submitted their application before March 31, 2017. 973,462 taxpayers participated in the program, which has concluded as of March 31, 2017.
As of March 31, 2017, Rp4,884.3 trillion in assets had been declared and the Government had collected Rp135.7 trillion as penalties under the scheme. Of the assets declared under the program, 75.8% are onshore, 21.2% are offshore and 3.0% have been repatriated (predominantly from Singapore). Most of the penalties collected, or Rp114.5 trillion of the total, as of March 31, 2017, represent “redemption” money, or the fee payable to the Government in exchange for the amnesty.
The Government hopes that the success of the tax amnesty program will continue to improve tax compliance in Indonesia. The submissions of annual tax reports by taxpayers who are required to submit one has generally risen, despite some fluctuation, in tandem with the general increase in the number of registered taxpayers in the past few years. The compliance rate for annual tax rate submissions was 77.6% in 2020, 84.0% in 2021, 83.2% in 2022, 88.0% in 2023 and 85.7% in 2024.
The Government has also been working to increase the number of registered taxpayers by unifying the identification number (Nomor Induk Kependudukan (“NIK”)) with the taxpayer identification number (Nomor Pokok Wajib Pajak (“NPWP”)). Previously, Indonesian individuals were required to register with the KPP to obtain an NPWP, which was a separate identification number from the NIK. However, starting from June 30, 2024, an individual’s NIK serves as his/her NPWP. This change is expected to enhance the efficiency and effectiveness of the Government’s taxation system.
Tax Incentive Policies
To drive investment, the Government’s tax incentives policy includes:
| • | Tax holiday for certain “pioneer” industries, where eligible companies may be entitled to a 50% or 100% corporate income tax discount for a period of five to 20 years depending on the investment value, subsequent to which the eligible company may be entitled to a 25% or 50% income tax discount for an additional two years depending on the investment value; |
| • | Tax allowances to support investment in priority sectors, where the Government grants investment allowances of 30% from investment value (5% per year for six years) in addition to accelerated depreciation and amortization, dividend tariffs for foreign taxpayers of up to 10% or an amount according to the applicable tax treaty, and extended loss compensation beyond five years for a maximum period of 10 years; |
| • | Investment allowance for new investment in labor intensive sectors, where the Government grants investment allowance of 60% from investment value, spread throughout a certain period; |
| • | Super deduction for vocational activities conducted by industry, where government allows deduction to maximum 200% from all cost incurred; |
| • | Super deduction for research and development activities conducted in Indonesia, where government allows deduction to maximum 300% from all costs incurred for specific research and development; |
D-87
| • | VAT exemption on the supply of goods and services within free trade and free port zones, special economic zones and bonded warehouse areas (kawasan berikat); and |
| • | Income tax incentives in the capital city of Nusantara, including (1) tax holiday on investment in the capital city of Nusantara and partner areas; (2) tax holiday for the financial center of the capital city of Nusantara and withholding tax exemption for the foreign investors on the income arising from their investment in the financial center of the capital city of Nusantara; (3) tax holiday for the establishment and/or relocation of head office or regional office; (4) Article 21 income tax to be borne by the Government; (5) super tax deduction for research and development activities up to 350% of the costs incurred; (6) super tax deduction for vocational activities conducted by industry up to 250% of the costs incurred; (7) super tax deduction for donations and/or the cost of constructing public facilities, social facilities, and/or other non-profit facilities up to 200% of the costs incurred; (8) zero percent final income tax for MSME; and (9) exemption of income tax payable on the transfer of land and/or building rights. |
Reform and Deregulation of Customs Taxation
The Government has been conducting reform and deregulation of customs taxation to support external trade. Key measures include, among other things:
| • | Implementation of the Core Tax Administration System (“CORETAX”) starting from January 1, 2025, a unified platform that has integrated all the existing applications for tax filing, payment and administration; |
| • | Simplification of the tax refund process. Individual taxpayers with income tax overpayments of less than Rp100 million are now eligible to receive refunds without undergoing an audit; |
| • | Acceleration of tax audits. Effective February 14, 2025, the maximum audit period has been reduced from 12 months to six months. For group taxpayers and transfer pricing cases, the maximum audit period has been shortened from 24 months to ten months; |
| • | Customs valuation policy. The Government is using a price range system to improve the accuracy and speed of import document verification. |
| • | Import facilitation. The Government is reviewing and simplifying quota requirements and technical licensing for imports, and also improving licensing process through data-driven adjustments, making it easier for businesses to import goods and materials; |
| • | Simplification of import licensing and commercial processes. The Government is improving licensing processes through data-driven adjustments that align with supply and demand. Additionally, there is a shift in monitoring from border control to post-border oversight, with border inspections now limited to goods and materials that impact health, safety, security and the environment. |
| • | Implementation of AI-based HICO X-ray system. The Government is enhancing non-intrusive customs supervision at seaports and airports with the artificial intelligence-based system, which also improves the analysis of scanning results; |
| • | Building the National Logistic Ecosystem. This digitally integrated ecosystem across ministries has reduced logistics costs by streamlining, speeding up, and ensuring transparent processes. It currently covers 53 seaports and 7 airports; and |
| • | Other policies, including (i) harmonization of customs policies and administrative procedures for import and export activities to ensure alignment between upstream and downstream policies, while minimizing restitution; and (ii) improving processes related to trade protection policies to better support the competitiveness of businesses through trade remedies. |
These measures collectively aim to create a more efficient, transparent, and business-friendly environment for external trade, supporting Indonesia’s competitiveness in the global market.
Government Expenditures
The following table sets forth the expenditures of the Government for the periods indicated.
D-88
Government Expenditures
| Year ended December 31 | Six Months Ended June 30, |
|||||||||||||||||||||||||||||||
| 2020L | 2021L | 2022L | 2023L | 2024B | 2024P | 2025B | 2025P | |||||||||||||||||||||||||
|
|
|
|
|
|
|
|
|
|
|
|
|
|
|
|
|
|||||||||||||||||
| (in trillions of Rupiah) | ||||||||||||||||||||||||||||||||
| Central Government expenditures: |
||||||||||||||||||||||||||||||||
| Personnel expenditures |
380.5 | 387.8 | 402.1 | 412.7 | 484.4 | 464.5 | 521.5 | 276.2 | ||||||||||||||||||||||||
| Good and services expenditures |
422.3 | 530.1 | 426.1 | 432.7 | 407.0 | 517.6 | 486.9 | 133.5 | ||||||||||||||||||||||||
| Capital expenditures |
190.9 | 239.6 | 240.6 | 303.0 | 247.5 | 352.6 | 234.1 | 96.0 | ||||||||||||||||||||||||
| Interest payments: |
||||||||||||||||||||||||||||||||
| Domestic debt |
297.2 | 332.9 | 373.6 | 409.3 | 456.8 | 445.9 | 497.6 | 235.2 | ||||||||||||||||||||||||
| Foreign debt |
16.9 | 10.6 | 12.7 | 30.6 | 40.5 | 42.5 | 55.2 | 21.9 | ||||||||||||||||||||||||
| Total interest payments |
314.1 | 343.5 | 386.3 | 439.9 | 497.3 | 488.4 | 552.9 | 257.1 | ||||||||||||||||||||||||
| Subsidies: |
||||||||||||||||||||||||||||||||
| Energy subsidies |
108.8 | 140.4 | 171.9 | 164.3 | 189.1 | 177.6 | 203.4 | 66.9 | ||||||||||||||||||||||||
| Non-energy subsidies |
87.4 | 101.7 | 81.0 | 105.3 | 96.9 | 114.9 | 104.5 | 25.9 | ||||||||||||||||||||||||
| Total subsidies |
196.2 | 242.1 | 252.8 | 269.6 | 286.0 | 292.5 | 307.9 | 92.8 | ||||||||||||||||||||||||
| Grant expenditures |
6.3 | 4.3 | 5.8 | 0.2 | 0.0 | 0.3 | 0.2 | 0.2 | ||||||||||||||||||||||||
| Social assistance(1) |
202.5 | 173.7 | 161.5 | 156.9 | 157.3 | 155.0 | 140.1 | 78.0 | ||||||||||||||||||||||||
| Other expenditures |
120.0 | 79.7 | 404.4 | 225.0 | 388.0 | 215.8 | 458.0 | 69.8 | ||||||||||||||||||||||||
|
|
|
|
|
|
|
|
|
|
|
|
|
|
|
|
|
|||||||||||||||||
| Total central Government expenditures |
1,833.0 | 2,000.7 | 2,280.0 | 2,239.8 | 2,467.5 | 2,486.7 | 2,701.4 | 1,003.6 | ||||||||||||||||||||||||
|
|
|
|
|
|
|
|
|
|
|
|
|
|
|
|
|
|||||||||||||||||
| Transfers to Regions and Rural Fund |
||||||||||||||||||||||||||||||||
| Transfer to Regions |
||||||||||||||||||||||||||||||||
| Balanced funds: |
||||||||||||||||||||||||||||||||
| General transfer funds: |
||||||||||||||||||||||||||||||||
| Revenue sharing funds |
93.9 | 117.2 | 168.4 | 205.7 | 143.1 | 153.2 | 192.3 | 60.2 | ||||||||||||||||||||||||
| General allocation funds |
381.6 | 377.8 | 378.0 | 398.0 | 427.7 | 429.2 | 446.6 | 227.1 | ||||||||||||||||||||||||
| Total general transfer funds |
475.5 | 494.9 | 546.4 | 603.7 | 570.8 | 582.4 | 638.9 | 287.3 | ||||||||||||||||||||||||
| Specific allocation funds: |
||||||||||||||||||||||||||||||||
| Physical special allocation fund |
50.2 | 57.1 | 54.8 | 50.3 | 53.8 | 50.9 | 37.0 | 1.1 | ||||||||||||||||||||||||
| Non-physical special allocation fund |
126.4 | 127.6 | 118.4 | 128.1 | 133.8 | 130.4 | 146.7 | 69.7 | ||||||||||||||||||||||||
| Grants to Regions(2) |
— | — | — | 2.9 | 0.5 | 2.2 | 1.6 | — | ||||||||||||||||||||||||
| Total specific allocation funds |
176.6 | 184.6 | 173.2 | 181.4 | 188.1 | 183.5 | 185.2 | 70.8 | ||||||||||||||||||||||||
| Total balanced funds |
652.1 | 679.6 | 719.6 | 785.0 | 758.9 | 765.9 | 824.2 | 358.1 | ||||||||||||||||||||||||
| Regional incentive fund |
18.5 | 13.5 | 7.0 | — | — | — | — | — | ||||||||||||||||||||||||
| Specific autonomy funds(3) |
19.6 | 19.5 | 20.4 | 17.2 | 18.3 | 18.3 | 17.5 | 3.4 | ||||||||||||||||||||||||
| Specific Fund for Special Region of Yogyakarta |
1.3 | 1.3 | 1.3 | 1.4 | 1.4 | 1.4 | 1.2 | 0.8 | ||||||||||||||||||||||||
| Fiscal Incentives(4) |
— | — | — | 7.9 | 8.0 | 7.0 | 71.0 | 2.0 | ||||||||||||||||||||||||
| Total Transfer to Regions |
691.4 | 713.9 | 748.3 | 811.5 | 786.6 | 792.6 | 913.9 | 364.4 | ||||||||||||||||||||||||
| Rural Fund |
71.1 | 71.9 | 67.9 | 69.9 | 71.0 | 70.9 | 6.0 | 38.1 | ||||||||||||||||||||||||
|
|
|
|
|
|
|
|
|
|
|
|
|
|
|
|
|
|||||||||||||||||
| Total transfers to regions and Rural Fund |
762.5 | 785.7 | 816.2 | 881.4 | 857.6 | 863.5 | 919.9 | 402.5 | ||||||||||||||||||||||||
|
|
|
|
|
|
|
|
|
|
|
|
|
|
|
|
|
|||||||||||||||||
|
|
|
|
|
|
|
|
|
|
|
|
|
|
|
|
|
|||||||||||||||||
| Total Government expenditures |
2,595.5 | 2,786.4 | 3,096.3 | 3,121.2 | 3,325.1 | 3,350.3 | 3,621.3 | 1,406.0 | ||||||||||||||||||||||||
|
|
|
|
|
|
|
|
|
|
|
|
|
|
|
|
|
|||||||||||||||||
Source: Ministry of Finance.
| L | LKPP (Financial Report of Central Government/Audited). |
| B | Budget. |
| P | Preliminary. |
| (1) | Consists of social assistance from ministries/agencies spending and social assistance for disaster relief. |
| (2) | Starting in 2023, became part of the Transfer to the Regions. |
| (3) | Consists of specific autonomy fund for Aceh and Papua Provinces and additional infrastructure fund for Papua Provinces. |
| (4) | It is the Regional Incentive Fund before 2023. |
D-89
Fuel Prices and Subsidies
The basic price and retail price of certain types of fuel are set by the Government through the Minister of Energy and Mineral Resources taking into consideration fuel purchasing cost, distribution cost, storage cost, and margin. Although the Government subsidy for fuel was eliminated in 2015, kerosene and gasoil continue to be subsidized by the Government. Historically, spending on subsidies has consumed a large portion of the Indonesian state budget. However, the Government in recent years has been implementing measures to raise subsidized fuel prices and reduce energy subsides by controlling the consumption of subsidized fuel through regulations, increased supervision and distribution management. In the past, fuel hike announcements have resulted in protests in major cities across Indonesia.
With recent global and domestic economic challenges, greater emphasis has been placed on improving national competitiveness. The Government is pursuing a more focused subsidy regime to provide direct subsidies to low-income households and to allocate a large part of the budget for infrastructure development. Following the adjustment of fuel subsidies, the Government has implemented a conditional cash transfer program for low- income households. “Smart cards” have been introduced to provide improved health care services, better facilities, education assistance and other kinds of social assistance.
The savings from reductions in fuel subsidies have been allocated to more productive Government spending. For example, energy subsidy spending was Rp108.8 trillion for 2020, Rp140.4 trillion for 2021, Rp171.9 trillion for 2022, Rp164.3 trillion for 2023 and Rp177.6 trillion for 2024. Budget energy subsidy for 2025 is Rp203.4 trillion. Spending for infrastructure was Rp286.5 trillion for 2020, Rp403.3 trillion for 2021, Rp372.8 trillion for 2022, Rp389.3 trillion for 2023 and Rp389.8 trillion for 2024. Budget infrastructure spending for 2025 is Rp399.3 trillion.
The table below sets forth the amounts of subsidies for the periods indicated.
| Year ended December 31 | Six Months Ended June 30, |
|||||||||||||||||||||||||||||||
| 2020L | 2021L | 2022L | 2023L | 2024B | 2024P | 2025B | 2025P | |||||||||||||||||||||||||
|
|
|
|
|
|
|
|
|
|
|
|
|
|
|
|
|
|||||||||||||||||
| (in trillions of Rupiah) | ||||||||||||||||||||||||||||||||
| Subsidies: |
||||||||||||||||||||||||||||||||
| Energy subsidies |
108.8 | 140.4 | 171.9 | 164.3 | 189.1 | 177.6 | 203.4 | 66.9 | ||||||||||||||||||||||||
| Non-energy subsidies |
87.4 | 101.7 | 80.9 | 105.3 | 96.9 | 114.9 | 104.5 | 25.9 | ||||||||||||||||||||||||
|
|
|
|
|
|
|
|
|
|
|
|
|
|
|
|
|
|||||||||||||||||
| Total subsidies |
196.2 | 242.1 | 252.8 | 269.6 | 286.0 | 292.5 | 307.9 | 92.8 | ||||||||||||||||||||||||
|
|
|
|
|
|
|
|
|
|
|
|
|
|
|
|
|
|||||||||||||||||
Source: Ministry of Finance.
| L | LKPP (Financial Report of Central Government/Audited). |
| B | Budget. |
| P | Preliminary. |
Government Expenditure Allocation
The following table sets forth, by percentage, the allocation of central Government expenditures by function for the periods indicated.
D-90
Allocation of Central Government Expenditures by Function
| Year ended December 31 | Six Months Ended June 30, |
|||||||||||||||||||||||||||||||
| 2020L | 2021L | 2022L | 2023L | 2024B | 2024P | 2025B | 2025P | |||||||||||||||||||||||||
|
|
|
|
|
|
|
|
|
|
|
|
|
|
|
|
|
|||||||||||||||||
| (Percentages) | ||||||||||||||||||||||||||||||||
| General public services |
29.3 | 27.5 | 39.9 | 36.2 | 34.8 | 27.5 | 31.2 | 31.9 | ||||||||||||||||||||||||
| Defense |
7.5 | 6.3 | 6.6 | 7.7 | 5.5 | 7.6 | 6.1 | 6.5 | ||||||||||||||||||||||||
| Public order and safety |
8.4 | 7.9 | 7.5 | 8.6 | 7.7 | 9.2 | 7.7 | 9.5 | ||||||||||||||||||||||||
| Economic affairs |
21.8 | 23.1 | 19.5 | 21.7 | 26.0 | 30.3 | 29.5 | 22.1 | ||||||||||||||||||||||||
| Environmental protection |
0.7 | 0.7 | 0.6 | 0.6 | 0.6 | 0.6 | 0.4 | 0.5 | ||||||||||||||||||||||||
| Housing and community amenities |
1.2 | 1.5 | 1.1 | 1.7 | 1.5 | 1.9 | 0.6 | 1.2 | ||||||||||||||||||||||||
| Health |
5.7 | 10.6 | 5.5 | 4.4 | 4.0 | 4.0 | 3.8 | 4.2 | ||||||||||||||||||||||||
| Tourism and culture |
0.2 | 0.2 | 0.2 | 0.2 | 0.1 | 0.2 | 0.1 | 0.1 | ||||||||||||||||||||||||
| Religion |
0.5 | 0.5 | 0.5 | 0.5 | 0.5 | 0.5 | 0.5 | 0.6 | ||||||||||||||||||||||||
| Education |
8.5 | 8.1 | 7.0 | 7.7 | 9.0 | 7.9 | 10.1 | 8.5 | ||||||||||||||||||||||||
| Social protection |
16.1 | 13.6 | 11.7 | 10.8 | 10.3 | 10.4 | 10.0 | 14.9 | ||||||||||||||||||||||||
|
|
|
|
|
|
|
|
|
|
|
|
|
|
|
|
|
|||||||||||||||||
| Total |
100.0 | 100.0 | 100.0 | 100.0 | 100.0 | 100.0 | 100.0 | 100.0 | ||||||||||||||||||||||||
|
|
|
|
|
|
|
|
|
|
|
|
|
|
|
|
|
|||||||||||||||||
Source: Ministry of Finance.
| L | LKPP (Financial Report of Central Government/Audited). |
| B | Budget. |
| P | Preliminary. |
The table below sets forth certain government budget expenditures for priority sectors for the periods indicated.
| Year ended December 31 | Six Months Ended June 30, |
|||||||||||||||||||||||||||||||
| 2020L | 2021L | 2022L | 2023L | 2024B | 2024P | 2025B | 2025P | |||||||||||||||||||||||||
|
|
|
|
|
|
|
|
|
|
|
|
|
|
|
|
|
|||||||||||||||||
| (in trillions of Rupiah) | ||||||||||||||||||||||||||||||||
| Education |
473.7 | 479.5 | 480.3 | 503.8 | 665.0 | 550.4 | 724.3 | 259.3 | ||||||||||||||||||||||||
| Infrastructure |
286.5 | 403.3 | 372.8 | 389.3 | 423.4 | 389.8 | 399.3 | 135.1 | ||||||||||||||||||||||||
| Energy Subsidy |
108.8 | 140.4 | 171.9 | 164.3 | 189.1 | 177.6 | 203.4 | 66.9 | ||||||||||||||||||||||||
| Health |
172.3 | 312.4 | 188.1 | 183.2 | 187.5 | 194.4 | 218.5 | 78.6 | ||||||||||||||||||||||||
Source: Ministry of Finance.
| L | LKPP (Financial Report of Central Government/Audited). |
| B | Budget. |
| P | Preliminary. |
D-91
Deficit Financing
The following table sets forth, by amount, information on deficit financing for the periods indicated.
Deficit Financing
| Year ended December 31 | Six Months Ended June 30, |
|||||||||||||||||||||||||||||||
| 2020L | 2021L | 2022L | 2023L | 2024B | 2024P | 2025B | 2025P | |||||||||||||||||||||||||
|
|
|
|
|
|
|
|
|
|
|
|
|
|
|
|
|
|||||||||||||||||
| (in trillions of Rupiah) | ||||||||||||||||||||||||||||||||
| Debt financing |
||||||||||||||||||||||||||||||||
| Government securities (net) |
1,177.2 | 877.5 | 658.8 | 308.2 | 666.4 | 450.7 | 642.6 | 308.6 | ||||||||||||||||||||||||
| Loans |
||||||||||||||||||||||||||||||||
| Domestic loans (net) |
2.4 | 0.9 | 8.2 | 14.6 | (0.6 | ) | 15.0 | 5.17 | (2.3 | ) | ||||||||||||||||||||||
| Foreign loans: |
||||||||||||||||||||||||||||||||
| Gross drawings: |
||||||||||||||||||||||||||||||||
| Program loan |
102.3 | 41.6 | 65.6 | 83.0 | 30.0 | 60.0 | 80.0 | 7.9 | ||||||||||||||||||||||||
| Project loan |
38.9 | 32.6 | 42.7 | 79.7 | 37.8 | 118.3 | 136.5 | 50.0 | ||||||||||||||||||||||||
| Total gross drawing |
141.1 | 74.2 | 108.3 | 162.7 | 67.8 | 178.3 | 216.5 | 57.9 | ||||||||||||||||||||||||
| Amortization |
(91.0 | ) | (82.1 | ) | (79.3 | ) | (81.5 | ) | (85.5 | ) | (87.5 | ) | (88.4 | ) | (48.7 | ) | ||||||||||||||||
| Total foreign loan (net) |
50.1 | (7.9 | ) | 29.0 | 81.2 | (17.7 | ) | 90.8 | 128.1 | 9.2 | ||||||||||||||||||||||
| Total loans (net) |
52.5 | (7.0 | ) | 37.2 | 95.8 | (18.4 | ) | 105.8 | 133.3 | 6.9 | ||||||||||||||||||||||
|
|
|
|
|
|
|
|
|
|
|
|
|
|
|
|
|
|||||||||||||||||
| Total debt financing |
1,229.6 | 870.5 | 696.0 | 404.0 | 648.1 | 556.6 | 775.9 | 315.4 | ||||||||||||||||||||||||
|
|
|
|
|
|
|
|
|
|
|
|
|
|
|
|
|
|||||||||||||||||
| Investment financing |
||||||||||||||||||||||||||||||||
| Investment to SOEs |
(31.3 | ) | (71.2 | ) | (59.2 | ) | (42.1 | ) | (30.7 | ) | (30.7 | ) | (22.7 | ) | — | |||||||||||||||||
| Investment to other institutions |
(25.0 | ) | (21.0 | ) | (0.5 | ) | — | (10.0 | ) | (5.0 | ) | — | — | |||||||||||||||||||
| Investment to public service agencies |
(31.3 | ) | (39.4 | ) | (52.8 | ) | (52.5 | ) | (41.2 | ) | (23.1 | ) | (36.8 | ) | — | |||||||||||||||||
| Investment in financial organizations/institutions |
(0.7 | ) | (0.9 | ) | (1.0 | ) | (1.6 | ) | (1.9 | ) | (2.0 | ) | (1.8 | ) | — | |||||||||||||||||
| Revenue of investment |
22.0 | — | 27.1 | 26.8 | — | 22.9 | — | 1.8 | ||||||||||||||||||||||||
| Government’s Investments |
(38.4 | ) | (10.0 | ) | (20.3 | ) | (20.5 | ) | (13.7 | ) | (13.7 | ) | (18.8 | ) | (35.4 | ) | ||||||||||||||||
| Others investment financing |
— | 0.0 | — | — | (65.7 | ) | 0.0 | (55.0 | ) | — | ||||||||||||||||||||||
| Investment financing reserves |
— | (142.5 | ) | — | — | (13.0 | ) | (8.4 | ) | (19.4 | ) | — | ||||||||||||||||||||
|
|
|
|
|
|
|
|
|
|
|
|
|
|
|
|
|
|||||||||||||||||
| Total investment financing |
(104.7 | ) | (71.2 | ) | (106.7 | ) | (89.9 | ) | (176.2 | ) | (60.0 | ) | (154.5 | ) | (33.5 | ) | ||||||||||||||||
|
|
|
|
|
|
|
|
|
|
|
|
|
|
|
|
|
|||||||||||||||||
| Lending |
1.0 | 1.9 | 2.1 | 4.5 | (0.3 | ) | (0.4 | ) | (5.4 | ) | 1.3 | |||||||||||||||||||||
| Government guarantee |
(3.6 | ) | (2.7 | ) | (1.1 | ) | (0.3 | ) | (0.8 | ) | (0.8 | ) | 0.0 | 0.0 | ||||||||||||||||||
| Other financing |
70.9 | 144.4 | 0.7 | 38.5 | 52.0 | 57.8 | 0.3 | 0.4 | ||||||||||||||||||||||||
|
|
|
|
|
|
|
|
|
|
|
|
|
|
|
|
|
|||||||||||||||||
| Total financing (net) |
1,193.3 | 871.7 | 591.0 | 356.7 | 522.8 | 553.2 | 616.2 | 283.6 | ||||||||||||||||||||||||
|
|
|
|
|
|
|
|
|
|
|
|
|
|
|
|
|
|||||||||||||||||
Source: Ministry of Finance.
| L | LKPP (Financial Report of Central Government/Audited). |
| B | Budget. |
| P | Preliminary. |
Government Expenditures
Total Government expenditures consist primarily of two components: (i) central Government expenditures and (ii) transfers to regions and rural fund. Central Government expenditures consist primarily of personnel, goods and services, capital, interest and social expenditures, as well as energy subsidies. Regional transfers consist primarily of expenditures for general and specific funds on the regional and rural level.
Total Government expenditure in 2020 reached Rp2,595.5 trillion or an increase of 12.4% from Rp2,309.3 trillion in 2019, in line with the countercyclical State Budget policy strategy adopted by the Government to withstand the impact of Covid-19 pandemic. Total central Government expenditure increased by 22.5% from Rp1,496.3 trillion in 2019 to Rp1,833.0 trillion in 2020. Total transfers to regions and rural fund decreased by 6.2% from Rp813.0 trillion in 2019 to Rp762.5 trillion in 2020 primarily due to lower general allocation funds realization, which also has lower budget allocation in the Revised 2020 Budget No. 2 compared to 2019.
D-92
Total Government expenditures in 2021 reached Rp2,786.4 trillion or an increase of 7.4% from Rp2,595.5 trillion in 2020. This is mainly driven by the realization of central Government expenditures, which, among other things, support the handling of the impact of the Covid-19 pandemic, especially in health sector and social protection. Total central Government expenditures increased by 9.1% from Rp1,833.0 trillion in 2020 to Rp2,000.7 trillion in 2021, primarily due to high expenditures from line ministries, which was mainly driven by the realization for infrastructure, connectivity projects, vaccination, medical treatment claims, productive relief programs, as well as disbursement of various protection programs. Total transfers to regions and rural fund increased by 3.0% from Rp762.5 trillion in 2020 to Rp785.7 trillion in 2021.
Total Government expenditures in 2022 reached Rp3,096.3 trillion or an increase of 11.1% from Rp2,786.4 trillion in 2021. This is primarily driven by the realization of central Government expenditures which increased by 14.0% from Rp2,000.7 trillion to Rp2,280.0 trillion. The increase was driven by line ministries and non-line ministries’ expenditures realization, which, among other things, supported the handling of the impact of the Covid-19 pandemic and economic growth and protected the populace. Total transfers to regions and rural fund increased by 3.9% from Rp785.7 trillion to Rp816.2 trillion.
Total Government expenditures in 2023 reached Rp3,121.2 billion or an increase of 0.8% from Rp3,096.3 trillion in 2022. This is primarily driven by the realization of transfer to regions and rural fund which increased by 8.0% from Rp816.2 trillion to Rp881.4 trillion, partially offset by the decrease of 1.8% in central Government expenditures from Rp2,280.0 trillion to Rp2,239.8 trillion.
Total Government expenditures in 2024 reached Rp3,350.3 trillion or an increase of 7.3% from Rp3,121.2 trillion in 2023, representing 100.8% of the 2024 budget Government expenditures. This was primarily driven by the realization of central government expenditures which increased by 11.0% from Rp2,239.8 trillion to Rp2,486.7 trillion, representing 100.8% of the 2024 budget figure, partially offset by the decrease of 2.0% in transfer to regions and rural fund from Rp881.4 trillion to Rp863.5 trillion, representing 100.7% of the 2024 budget figure.
Total Government expenditures in the first half of 2025 reached Rp1,406.0 trillion or an increase of 0.6% from Rp1,398.0 trillion in the first half of 2024, representing 38.8% of the 2025 budget Government expenditures. In the first half of 2025, central Government expenditures were Rp1,003.6 trillion or an increase of 0.6% from Rp997.9 trillion in the first half of 2024, representing 37.2% of the 2025 budget figure. In the first half of 2025, transfer to regions and rural funds reached Rp402.5 trillion or an increase of 0.6% from Rp400.1 trillion in the first half of 2024, representing 43.8% of the 2025 budget figure.
Government Revenues
The following table sets forth the revenues of the Government as (i) audited 2023 revenue as a percentage of the preliminary 2023 GDP at current prices and (ii) preliminary 2024 revenue figures as a percentage of the preliminary 2024 GDP at current prices, respectively.
D-93
Government Revenues
| 2023 LKPP Audited |
2024 Preliminary |
|||||||
| (percentage of 2023 GDP) |
(percentage of 2024 GDP) |
|||||||
| Total revenues and grants (in trillions of Rupiah) |
2,783.9 | 2,842.5 | ||||||
| Domestic revenue: |
||||||||
| Tax revenues: |
||||||||
| Domestic tax |
||||||||
| Income tax: |
||||||||
| Oil and gas |
0.33 | 0.29 | ||||||
| Non-oil and gas |
4.75 | 4.51 | ||||||
|
|
|
|
|
|||||
| Total income tax |
5.08 | 4.80 | ||||||
| Value added tax (VAT) |
3.65 | 3.74 | ||||||
| Land and building tax |
0.16 | 0.15 | ||||||
| Excises |
1.06 | 1.02 | ||||||
| Other taxes |
0.05 | 0.04 | ||||||
|
|
|
|
|
|||||
| Total domestic taxes |
10.00 | 9.75 | ||||||
| International trade taxes: |
||||||||
| Import duties |
0.24 | 0.24 | ||||||
| Export tax |
0.07 | 0.09 | ||||||
|
|
|
|
|
|||||
| Total international trade taxes |
0.31 | 0.33 | ||||||
|
|
|
|
|
|||||
| Total tax revenue |
10.31 | 10.08 | ||||||
|
|
|
|
|
|||||
| Non-tax revenues: |
||||||||
| Natural resources: |
||||||||
| Oil |
0.42 | 0.39 | ||||||
| Gas |
0.14 | 0.11 | ||||||
|
|
|
|
|
|||||
| Total oil and gas |
0.56 | 0.50 | ||||||
| General Mining |
0.62 | 0.49 | ||||||
| Forestry |
0.03 | 0.03 | ||||||
| Fishery |
0.00 | 0.00 | ||||||
| Geothermal |
0.01 | 0.01 | ||||||
|
|
|
|
|
|||||
| Total non-oil and gas |
0.66 | 0.53 | ||||||
|
|
|
|
|
|||||
| Total natural resources |
1.22 | 1.04 | ||||||
|
|
|
|
|
|||||
| Profit transfer from SOEs |
0.39 | 0.39 | ||||||
| Other non-tax revenues |
0.86 | 0.74 | ||||||
| Public Service Agency (BLU) Income |
0.46 | 0.45 | ||||||
|
|
|
|
|
|||||
| Total non-tax revenues |
2.93 | 2.62 | ||||||
|
|
|
|
|
|||||
| Total domestic revenues |
13.24 | 12.70 | ||||||
| Grants |
0.08 | 0.14 | ||||||
|
|
|
|
|
|||||
| Total Revenues and Grants |
13.32 | 12.84 | ||||||
|
|
|
|
|
|||||
Source: Ministry of Finance
Government Expenditures
The following table sets forth the expenditures of the Government as (i) audited 2023 expenditures as a percentage of the 2023 GDP at current prices and (ii) preliminary expenditure figures for 2024 as a percentage of the preliminary 2024 GDP at current prices, respectively.
D-94
Government Expenditure
| 2023 LKPP Audited |
2024 Preliminary |
|||||||
| (percentages of 2023 GDP) |
(percentages of 2024 GDP) |
|||||||
| Total expenditures (in trillions of Rupiah) |
3,121.2 | 3,350.3 | ||||||
| Central Government expenditures: |
||||||||
| Personnel expenditures |
1.98 | 2.10 | ||||||
| Good and services expenditures |
2.07 | 2.34 | ||||||
| Capital expenditures |
1.45 | 1.59 | ||||||
| Interest payments: |
||||||||
| Domestic debt |
1.96 | 2.01 | ||||||
| Foreign debt |
0.15 | 0.19 | ||||||
| Total interest payments |
2.11 | 2.21 | ||||||
| Subsidies: |
||||||||
| Energy subsidies |
0.79 | 0.80 | ||||||
| Non-energy subsidies |
0.50 | 0.52 | ||||||
| Total subsidies |
1.29 | 1.32 | ||||||
| Grant expenditures |
0.00 | 0.00 | ||||||
| Social assistance(1) |
0.75 | 0.70 | ||||||
| Other expenditures |
1.08 | 0.97 | ||||||
|
|
|
|
|
|||||
| Total central Government expenditures |
10.72 | 11.23 | ||||||
|
|
|
|
|
|||||
| Transfers to Regions and Rural Fund: |
||||||||
| Transfer to Regions |
||||||||
| Balance funds: |
||||||||
| General transfer funds: |
||||||||
| Revenue sharing funds |
0.98 | 0.69 | ||||||
| General allocation funds |
1.91 | 1.94 | ||||||
|
|
|
|
|
|||||
| Total general transfer funds |
2.89 | 2.63 | ||||||
| Specific allocation funds: |
||||||||
| Physical special allocation fund |
0.24 | 0.23 | ||||||
| Non-physical special allocation fund |
0.61 | 0.59 | ||||||
| Grants to region |
0.01 | 0.01 | ||||||
|
|
|
|
|
|||||
| Total specific allocation funds |
0.87 | 0.83 | ||||||
|
|
|
|
|
|||||
| Total balanced funds |
3.76 | 3.46 | ||||||
| Incentive fund |
— | — | ||||||
| Specific autonomy funds(2) |
0.08 | 0.08 | ||||||
| Specific Fund for Special Region of Yogyakarta |
0.01 | 0.01 | ||||||
|
|
|
|
|
|||||
| Total transfer to Regions |
3.88 | 3.90 | ||||||
| Rural Fund |
0.33 | 0.32 | ||||||
|
|
|
|
|
|||||
| Total transfer to regions and rural fund |
4.22 | 3.90 | ||||||
|
|
|
|
|
|||||
| Total Government expenditures |
14.94 | 15.13 | ||||||
|
|
|
|
|
|||||
Source: Ministry of Finance
| (1) | Consists of Social Assistance from Ministries/Agencies Spending and Social Assistance for Disaster Relief. |
| (2) | Consists of specific autonomy fund and additional specific infrastructure autonomy fund for Papua and West Papua Provinces. |
Government Deficit Financing
The following table sets forth the deficit financing of the Government, by amount and (i) audited 2023 deficit financing as a percentage of the 2023 GDP at current prices and (ii) preliminary 2024 deficit financing figures as a percentage of the preliminary 2024 GDP at current prices, respectively.
D-95
Government Deficit Financing
| 2023 LKPP Audited |
2024 Preliminary |
|||||||
| (percentages of 2023 GDP) |
(percentages of 2024 GDP) |
|||||||
| Total financing (net) (in trillions of Rupiah) |
356.7 | 553.2 | ||||||
| Debt financing |
||||||||
| Government securities (net) |
1.48 | 2.04 | ||||||
| Loans |
||||||||
| Domestic loans (net) |
0.07 | 0.07 | ||||||
| Foreign loans: |
||||||||
| Gross drawings: |
||||||||
| Program loan |
0.40 | 0.27 | ||||||
| Project loan |
0.38 | 0.53 | ||||||
|
|
|
|
|
|||||
| Total gross drawing |
0.78 | 0.81 | ||||||
| Amortization |
(0.39 | ) | (0.40 | ) | ||||
|
|
|
|
|
|||||
| Total foreign loan (net) |
0.39 | 0.41 | ||||||
| Total loans (net) |
0.46 | 0.48 | ||||||
|
|
|
|
|
|||||
| Total debt financing |
1.93 | 2.51 | ||||||
|
|
|
|
|
|||||
| Investment financing |
||||||||
| Investment to SOEs |
(0.20 | ) | (0.14 | ) | ||||
| Investment to other institutions |
(0.00 | ) | (0.02 | ) | ||||
| Investment to public service agencies |
(0.25 | ) | (0.10 | ) | ||||
| Investment in financial organizations/institutions |
(0.01 | ) | (0.01 | ) | ||||
| Revenue of investment |
0.13 | 0.10 | ||||||
| Government’s investments |
(0.10 | ) | (0.06 | ) | ||||
| Others investment financing |
— | — | ||||||
| Investment financing reserves |
— | (0.04 | ) | |||||
|
|
|
|
|
|||||
| Total investment financing |
(0.43 | ) | (0.27 | ) | ||||
|
|
|
|
|
|||||
| Lending |
0.02 | (0.00 | ) | |||||
| Government guarantee |
(0.00 | ) | (0.00 | ) | ||||
| Other financing |
0.18 | 0.26 | ||||||
|
|
|
|
|
|||||
| Total financing (net) |
1.71 | 2.50 | ||||||
Source: Ministry of Finance
Public Debt
The reduction of public debt in percentage-of-GDP terms has been a consistent key fiscal policy objective of the Government. To achieve this objective, the Government’s policy has emphasized the strengthening of public debt management, the lengthening and balancing of the maturities of public debt and the growth of public debt at sustainable levels.
As of December 31, 2023, the central Government’s foreign debt-to-GDP ratio was 11.2%, with foreign debt to total debt ratio of 28.3%.
As of December 31, 2024, the central Government’s foreign debt-to-GDP ratio was 11.4%, with foreign debt to total debt ratio of 28.7%.
As of March 31, 2025, the central Government’s foreign debt-to-GDP ratio was 10.7%, with foreign debt to total debt ratio of 29.2%.
External Public Debt of the Republic
External public debt of the Republic consists of central Government debt (other than public domestic debt) and debt of Bank Indonesia owed to creditors outside Indonesia. The discussion below treats the external debt of Bank Indonesia as part of the Republic’s external debt. However, SBI and SRBI, which are issued by Bank Indonesia in its role as formulator and implementer of the Republic’s monetary policy, are not considered liabilities of the Republic. Accordingly, SBI and SRBI are not reflected in the Government debt discussions herein. See “— Financial System — Bank Indonesia.” The discussion of debt of the Republic in this section differs from the discussion of “Government debt” elsewhere in this report, in which Bank Indonesia debt is excluded and only central Government debt, which depends on Government revenue for its repayment, is included. See “— Government Budget — Government Finances.”
D-96
The following table sets forth information on the outstanding external public debt of the Republic in terms of creditor type as of the dates indicated.
Outstanding External Public Debt of the Republic by Source(1)
| As of December 31, | As of March 31, |
|||||||||||||||||||||||
| 2020 | 2021 | 2022 | 2023 | 2024P | 2025P | |||||||||||||||||||
|
|
|
|
|
|
|
|
|
|
|
|
|
|||||||||||||
| (in billions of U.S. dollars) | ||||||||||||||||||||||||
| Concessional Loans: |
||||||||||||||||||||||||
| Multilateral creditors |
33.0 | 32.8 | 34.0 | 36.8 | 37.0 | 37.1 | ||||||||||||||||||
| Bilateral creditors |
23.7 | 20.8 | 20.7 | 20.3 | 16.6 | 16.7 | ||||||||||||||||||
| Commercial(2) |
88.0 | 92.0 | 93.0 | 94.8 | 102.7 | 106.5 | ||||||||||||||||||
|
|
|
|
|
|
|
|
|
|
|
|
|
|||||||||||||
| Total |
144.7 | 145.5 | 147.7 | 152.0 | 156.3 | 160.4 | ||||||||||||||||||
|
|
|
|
|
|
|
|
|
|
|
|
|
|||||||||||||
| Total external public debt of the Republic, as a percentage of GDP for the period indicated(3) |
12.7 | % | 12.2 | % | 11.2 | % | 11.2 | % | 11.4 | % | 11.8 | % | ||||||||||||
Source: Ministry of Finance.
| P | Preliminary. |
| (1) | Foreign currency values of outstanding external debt have been converted into U.S. dollars at the applicable BI middle exchange rates as of the respective dates indicated. |
| (2) | Includes securities (bonds and Sukuk) issued in international capital markets and commercial bank borrowings. |
| (3) | In calculating as a percentage of GDP, GDP in U.S. dollars has been converted from Rupiah into U.S. dollars at the applicable BI middle exchange rates as of the respective dates indicated. |
As of December 31, 2023, 62.4% and 37.6% of the outstanding external public debt of the Republic are from commercial and concessional loans, respectively. The total outstanding external public debt of the Republic as of December 31, 2023 was U.S.$152.0 billion.
As of December 31, 2024, 65.7% and 34.3% of the outstanding external public debt of the Republic were from commercial and concessional loans, respectively. The total outstanding external public debt of the Republic as of December 31, 2024 was U.S.$156.3 billion.
As if March 31, 2025, 66.4% and 33.6% of the outstanding external public debt of the Republic were from commercial and concessional loans, respectively. The total outstanding external public debt of the Republic as of March 31, 2025 was U.S.$160.4 billion.
Sources of External Public Borrowing
The sources of the Republic’s external public borrowings are, among others, foreign loans extended by multilateral creditors, bilateral creditors, export credit agency, and commercial creditors, including international bondholders.
Since 2012, the Government has expanded its sources of external financing by accessing the international capital markets (including the Islamic financial markets).
The World Bank and the ADB have been important sources of funds for the Republic, and the Republic has also secured substantial commitments from the Kreditanstalt für Wiederaufbau (“KfW”), The Agence Française de Développement (“AFD”), and Japan International Cooperation Agency (“JICA”) in recent years.
In 2019, the Republic drew down program loans of U.S.$1.1 billion from the World Bank and U.S$1.5 billion from ADB.
Due to the Covid-19 pandemic, in 2020, the Republic increased the financing of program loans from equivalent of U.S.$1.5 billion in its initial budget to equivalent of U.S.$6.9 billion in budget realization. These program loans were sourced from World Bank in the amount of U.S.$875.10 million and JPY31,975.60 million, ADB in the amount of €1,388.76 million, AFD in the amount of €200 million, KfW in the amount of €1,050 million, Japan International Cooperation Agency in the amount of JPY81,800 million, Asian Infrastructure Development Bank in the amount of U.S.$962.5 million, and Australian Government in the amount of AUD1,500 million. A total of 71% from these program loans have been utilized for the Republic’s Covid-19 pandemic responses.
In 2021, the Republic drew down program loans of U.S.$1,052.8 million from the World Bank, U.S.$1,000 million from the ADB, U.S.$37.5 million from the Asian Infrastructure Development Bank, €200 million from KfW, €100 million from AFD, and JPY50,000 million from JICA.
D-97
In 2022, the Republic drew program loans of U.S.$1,099.3 million and €1,041.2 million from the World Bank, U.S.$1,000 million from the ADB, U.S.$500 million from the Asian Infrastructure Development Bank, €595.2 million from KfW, €50 million from AFD and U.S.$40 million from Korea Economic Development Co-operation Fund.
In 2023, the Republic drew down program loans of U.S.$1,336.2 million and €937.7 million from the World Bank, U.S.$1,500 million and JPY71,865 million from ADB, U.S.$15 million from the ASEAN Infrastructure Fund, €304.8 million from KfW, €150 million from AFD, JPY60,000 million from JICA and U.S.$119.9 million from Korea Economic Development Co-operation Fund.
In 2024, the Republic drew down program loans of U.S.$200.5 million, €107.9 million, and JPY20,411.3 million from the World Bank, U.S.$ 36.5 million, €1,040.1 million, and JPY74,930 million from the ADB, €939.8 million from the AIIB, U.S.$7.3 million from AIF, €400 million from KfW, and €200 million from AFD.
The following table sets forth the outstanding amounts of international development assistance received by the Republic as of the dates indicated.
International Development Assistance(1)(2)
| As of December 31, | As of March 31, |
|||||||||||||||||||||||
| 2020 | 2021 | 2022 | 2023P | 2024P | 2025P | |||||||||||||||||||
|
|
|
|
|
|
|
|
|
|
|
|
|
|||||||||||||
| (in billions of U.S. dollars) | ||||||||||||||||||||||||
| Bilateral loans |
23,739.3 | 20,781.8 | 20,686.5 | 20,310.4 | 16,627 | 16,738 | ||||||||||||||||||
| Multilateral loans: |
||||||||||||||||||||||||
| International Monetary Fund |
— | — | — | — | — | — | ||||||||||||||||||
| World Bank Group |
19,285.6 | 19,091.2 | 20,276.5 | 21,893.7 | 21,247 | 20,870 | ||||||||||||||||||
| Asian Development Bank |
10,999.8 | 10,818.4 | 10,194.2 | 11,272.9 | 11,183 | 11,680 | ||||||||||||||||||
| Islamic Development Bank |
1,325.6 | 1,345.4 | 1,364.8 | 1,339.7 | 1,361 | 1,336 | ||||||||||||||||||
| Nordic Investment Bank |
9.4 | 8.1 | 6.7 | 6.3 | 5 | 5 | ||||||||||||||||||
| European Investment Bank |
— | — | — | — | — | — | ||||||||||||||||||
| International Fund for Agricultural Development |
195.7 | 202.1 | 252.1 | 282.7 | 289 | 286 | ||||||||||||||||||
| Asian Infrastructure Investment Bank |
1,187.4 | 1,306.7 | 1,935.1 | 2,013.4 | 2,918 | 2,946 | ||||||||||||||||||
| Multilateral Investment Guarantee Agency |
— | — | — | — | — | — | ||||||||||||||||||
|
|
|
|
|
|
|
|
|
|
|
|
|
|||||||||||||
| Total multilateral loans |
33,003.5 | 32,771.8 | 34,029.5 | 36,808.7 | 37,003 | 37,122 | ||||||||||||||||||
|
|
|
|
|
|
|
|
|
|
|
|
|
|||||||||||||
| Total loans |
56,742.8 | 53,553.6 | 54,716.0 | 57,119.1 | 53,630 | 53,861 | ||||||||||||||||||
|
|
|
|
|
|
|
|
|
|
|
|
|
|||||||||||||
Source: Ministry of Finance.
| P | Preliminary. |
| (1) | The term international development assistance includes any concessionary loans provided by international financial institutions or foreign governments, excluding grants. |
| (2) | Foreign currency values of international development assistance have been converted into U.S. dollars at the applicable BI middle exchange rates as of the respective dates indicated. |
The following table sets forth the external public debt of the Republic by currency as of the dates indicated.
Outstanding External Public Debt of the Republic by Major Currency
| As of December 31, | As of March 31, | |||||||||||||||||||||||||||||||||||||||||||||||
| 2020 | 2021 | 2022 | 2023 | 2024P | 2025P | |||||||||||||||||||||||||||||||||||||||||||
| (in millions of original currency) |
(in millions of U.S. dollars(1)) |
(in millions of original currency) |
(in millions of U.S. dollars(1)) |
(in millions of original currency) |
(in millions of U.S. dollars(1)) |
(in millions of original currency) |
(in millions of U.S. dollars(1)) |
(in millions of original currency) |
(in millions of U.S. dollars)(1) |
(in millions of original currency) |
(in millions of U.S. dollars)(1) |
|||||||||||||||||||||||||||||||||||||
| U.S. dollars |
95,823 | 95,823 | 99,263 | 99,263 | 103,948 | 103,948 | 107,885 | 107,885 | 111,511 | 111,511 | 110,891 | 110,891 | ||||||||||||||||||||||||||||||||||||
| Japanese yen |
2,391,841 | 23,142 | 2,392,620 | 20,786 | 2,451,372 | 18,545 | 2,531,210 | 17,904 | 2,605,730 | 17,133 | 2,582,398 | 16,995 | ||||||||||||||||||||||||||||||||||||
| Euros |
18,036 | 22,160 | 19,843 | 22,453 | 21,358 | 22,751 | 21,746 | 24,067 | 22,052 | 26,026 | 26,537 | 30,130 | ||||||||||||||||||||||||||||||||||||
| SDR |
861 | 1,239 | 701 | 981 | 516 | 687 | 342 | 458 | 314 | 241 | 168 | 186 | ||||||||||||||||||||||||||||||||||||
| British pounds |
17 | 22 | 1 | 1 | — | — | — | — | — | — | — | — | ||||||||||||||||||||||||||||||||||||
| Others |
|
Multiple currencies |
|
2,315 | |
Multiple currencies |
|
2,036 | |
Multiple currencies |
|
1,754 | |
Multiple currencies |
|
1,640 | |
Multiple Currencies |
|
1,374 | |
Multiple Currencies |
|
2,156 | ||||||||||||||||||||||||
|
|
|
|
|
|
|
|
|
|
|
|
|
|
|
|
|
|
|
|
|
|
|
|
|
|||||||||||||||||||||||||
| Total |
N/A | 144,702 | N/A | 145,521 | N/A | 147,685 | N/A | 151,953 | N/A | 156,285 | N/A | 160,358 | ||||||||||||||||||||||||||||||||||||
|
|
|
|
|
|
|
|
|
|
|
|
|
|
|
|
|
|
|
|
|
|
|
|
|
|||||||||||||||||||||||||
Source: Ministry of Finance.
| P | Preliminary. |
| (1) | Calculated based on the applicable BI middle exchange rates as of the date indicated for each column. |
D-98
As of December 31, 2023, 71.0%, 11.8%, 15.8% and 1.4% of the external public debt of the Republic was denominated in U.S. dollars, Japanese Yen, Euros and other currencies (including SDR) respectively.
As of December 31, 2024, 71.4%, 11.0%, 16.7% and 1.1% of the external public debt of the Republic was denominated in U.S. dollars, Japanese Yen, Euros and other currencies (including SDR), respectively.
As of March 31, 2025, 69.2%, 10.6%, 18.8% and 1.4% of the external public debt of the Republic was denominated in U.S. dollars, Japanese Yen, Euros and other currencies (including SDR), respectively.
The following table sets forth the external debt service requirements of the central Government for the years indicated.
External Debt Service Requirements of the Central Government
| Period |
Principal repayment |
Interest repayment |
Total | |||||||||
|
|
|
|
|
|
|
|||||||
| (in billions of U.S. dollars) | ||||||||||||
| 2023R |
11.8 | 5.6 | 17.5 | |||||||||
| 2024R |
11.8 | 6.4 | 18.2 | |||||||||
| 2025* |
14.2 | 6.6 | 20.8 | |||||||||
| 2026** |
13.0 | 6.4 | 19.4 | |||||||||
| 2027** |
15.4 | 6.0 | 21.4 | |||||||||
Source: Ministry of Finance
| R | Realization. |
| * | Calculated based on (i) actual principal and interest payments made from January 1, 2025 to March 31, 2025 and (ii) projected principal and interest payments to be made from April 1, 2025 to December 31, 2025 based on external debt outstanding as of March 31, 2025. |
| ** | Projected based on external debt outstanding as of March 31, 2025. |
Payment History of External Debt
Indonesia maintains a policy of external debt management and has a history of servicing its external debt obligations in accordance with its terms.
In the wake of the Asian financial crisis in 1997, the Paris Club, an informal voluntary group of 18 creditor countries that seeks to coordinate solutions for payment difficulties experienced by debtor nations by extending or guaranteeing bilateral credits, played an important role in easing Indonesia’s foreign exchange burden. Between 1998 and 2000, Indonesia twice rescheduled certain payments of its Paris Club foreign debt. Pursuant to an April 2002 agreement, Paris Club debt payments of principal and interest of approximately U.S.$5.4 billion that were due to certain of Indonesia’s creditors between April 2002 and December 2003 were rescheduled.
In addition, on March 10, 2005, the Paris Club offered to permit Indonesia, as well as other countries affected by the December 2004 tsunami, to defer debt services payments through the end of 2005 to allow these countries to commit additional government resources to the tsunami-related humanitarian and relief efforts. On May 10, 2005, 18 individual Paris Club members and Indonesia signed a memorandum of understanding to reschedule some payments of principal and interest due under official development assistance and non-official development assistance.
While there have been a number of reschedulings of Indonesia’s external debt to its bilateral creditors as described above, Indonesia has not defaulted on, and has not attempted to restructure, the payment of principal or interest on any of its external securities in the last 20 years.
External Debt of Bank Indonesia
Under Indonesian law, Bank Indonesia has the ability to incur external debt primarily to meet balance of payments needs and maintain adequate foreign exchange reserves.
The following table sets forth the outstanding multilateral and commercial external debt of Bank Indonesia by type of credit as of the dates indicated.
D-99
Outstanding Multilateral and Commercial External Debt of Bank Indonesia(1)
| As of December 31, | As of May 31, |
|||||||||||||||||||||||
| 2020 | 2021 | 2022 | 2023 | 2024P | 2025P | |||||||||||||||||||
| Multilateral |
2,852 | 9,007 | 8,565 | 8,635 | 8,393 | 8,738 | ||||||||||||||||||
| Commercial(2) |
0 | 0 | 0 | 0 | 0 | 0 | ||||||||||||||||||
| Total |
2,852 | 9,007 | 8,565 | 8,635 | 8,393 | 8,738 | ||||||||||||||||||
Source: Bank Indonesia
| P | Preliminary. |
| (1) | Foreign currency values of outstanding external debt have been converted into U.S. dollars at the applicable BI middle exchange rates as of the respective dates indicated. |
| (2) | Includes bonds issued in international capital markets and commercial bank borrowings but excludes SBI and SRBI owned by non-residents, currencies and deposits and other liabilities. |
As of December 31, 2021, December 31, 2022 and December 31, 2023, the external debt of Bank Indonesia amounted to U.S.$9,007 million, U.S.$8,565 million and U.S.$8,635 million, respectively. As of each of the three dates, the external debt of Bank Indonesia comprised entirely of SDR allocation, while commercial debt was nil. As of December 31, 2024, the external debt of Bank Indonesia amounted to U.S.$8,393 million, comprised entirely of SDR allocation (and excluding currency, deposits and SRBI), while commercial debt was nil. As of May 31, 2025, the external debt of Bank Indonesia amounted to U.S.$8,738 million, comprised entirely of SDR allocation (and excluding currency, deposits and SRBI), while commercial debt was nil. For calculation purposes, foreign currency values of outstanding external debt were converted into U.S. dollars at the applicable BI middle exchange rates as of the respective dates indicated.
The following table sets forth the external debt service requirements of Bank Indonesia for the years indicated.
External Debt Service Requirements of Bank Indonesia(1)(2)
| Period |
Principal repayment |
Interest repayment |
Total | |||||||||
| (in millions of U.S. dollars) | ||||||||||||
| 2020 |
0.0 | 19 | 19 | |||||||||
| 2021 |
0.0 | 3 | 3 | |||||||||
| 2022 |
0.0 | 41 | 42 | |||||||||
| 2023P |
0.0 | 174 | 174 | |||||||||
| 2024P |
0.0 | 196 | 196 | |||||||||
| 2025* |
0.0 | 275 | 275 | |||||||||
Source: Bank Indonesia.
| P | Preliminary |
| * | Projected based on external debt outstanding as of May 31, 2025. |
| (1) | Excludes SBI and SRBI owned by non-residents, currencies and deposits and other liabilities. |
| (2) | Foreign currency values of outstanding external debt have been converted into U.S. dollars at the applicable BI middle exchange rates as of the end of each year and, for 2025, as of May 31, 2025. |
In order to strengthen its international reserves and support its balance of payments, the Republic has entered into a swap arrangement with ASEAN as well as bilateral swap arrangements with other countries. See “— Foreign Exchange and Reserves — Regional Swap Arrangements of the Republic.”
External Debt of State-Owned Enterprises
The following table sets forth the outstanding direct external debt of SOEs as of the dates indicated.
D-100
Outstanding Direct External Debt of State-Owned Enterprises(1)
| As of December 31, | As of May 31, |
|||||||||||||||||||||||
| 2020 | 2021 | 2022 | 2023 | 2024P | 2025P | |||||||||||||||||||
| (in millions of U.S. dollars) | ||||||||||||||||||||||||
| Financial institutions: |
||||||||||||||||||||||||
| Bank |
8,807 | 9,280 | 8,231 | 6,847 | 7,326 | 7,146 | ||||||||||||||||||
| Non-bank |
2,615 | 2,895 | 2,297 | 1,881 | 1,271 | 1,270 | ||||||||||||||||||
|
|
|
|
|
|
|
|
|
|
|
|
|
|||||||||||||
| Total financial institutions |
11,422 | 12,175 | 10,528 | 8,728 | 8,596 | 8,416 | ||||||||||||||||||
| Non-financial institutions |
45,677 | 43,743 | 41,062 | 36,501 | 35,789 | 34,700 | ||||||||||||||||||
|
|
|
|
|
|
|
|
|
|
|
|
|
|||||||||||||
| Total |
57,100 | 55,917 | 51,590 | 45,228 | 44,386 | 43,116 | ||||||||||||||||||
|
|
|
|
|
|
|
|
|
|
|
|
|
|||||||||||||
Source: Bank Indonesia.
| P | Preliminary. |
| (1) | Foreign currency values of outstanding direct external debt have been converted into U.S. dollars at the applicable BI middle exchange rates as of the respective dates indicated. |
For a discussion of the Republic’s guarantee of certain external debt in connection with infrastructure projects in the country, see “— Public Debt — Contingent Liabilities from Government Guarantees.”
Domestic Public Debt of the Central Government
The following table sets forth the outstanding domestic public debt of the central Government as of the dates indicated.
Domestic Public Debt of the Central Government
| As of December 31, | As of March 31, |
|||||||||||||||||||||||
| 2020 | 2021 | 2022 | 2023 | 2024P | 2025P | |||||||||||||||||||
| (in trillions of Rupiah) | ||||||||||||||||||||||||
| Total domestic public debt(1) |
4,038.2 | 4,836.2 | 5,474.0 | 5,844.4 | 6,276.0 | 6,451.2 | ||||||||||||||||||
Source: Ministry of Finance.
| P | Preliminary. |
| (1) | Excludes SBI, which are obligations of Bank Indonesia and not of the Government. See “— Financial System — Bank Indonesia.” |
Domestic Debt Service Requirements of the Central Government
The following table sets forth the debt service requirements for the central Government for the years indicated.
| Period |
Principal repayment and redemption |
Interest repayment |
Total | |||||||||
| (in trillions of Rupiah) | ||||||||||||
| 2023R |
444.5 | 354.5 | 799.0 | |||||||||
| 2024R |
531.6 | 387.7 | 919.3 | |||||||||
| 2025* |
652.9 | 392.3 | 1,045.2 | |||||||||
| 2026* |
688.5 | 375.7 | 1,064.2 | |||||||||
| 2027** |
627.8 | 335.0 | 962.8 | |||||||||
Source: Ministry of Finance
| R | Realization. |
| * | Calculated based on (i) actual principal and interest payments made from January 1, 2025 to March 31, 2025 and (ii) projected principal and interest payments to be made from April 1, 2025 to December 31, 2025 based on external debt outstanding as of March 31, 2025. |
| ** | Projected based on external debt outstanding as of March 31, 2025. |
D-101
Contingent Liabilities from Government Guarantees
As part of the Government’s policy to accelerate infrastructure development, the Government has provided support to encourage investments in infrastructure projects in the form of credit and investment guarantees. External debts of SOEs (or of BPI Danantara) are not direct obligations of the Republic, unless such debts are explicitly guaranteed by the Republic.
Beginning in 2008 the Government has allocated a contingent budget with respect to these guarantees. The allocated budget is then transferred to a guarantee reserve fund. This fund stands ready as reserves for any claims that may arise from the guarantees. Additional budget allocation can also be made available for direct payment of claims if necessary.
Total infrastructure guarantees provided by the Government between 2008 and 2024 have accumulated to Rp758.3 trillion, of which Rp390.7 trillion have expired, leaving active guarantees of Rp372.2 trillion as of December 31, 2024. No guarantee claim has materialized since the introduction of the Government’s guarantee programs. The Government has set a maximum guarantee limit of 1.5% of GDP per year for 2023-2026. However, the Ministry of Finance may re-evaluate the limit if it considers necessary.
As of December 31, 2024, the Government had provided infrastructure guarantees of Rp372.2 trillion, an increase from active guarantees of Rp345.0 trillion as of December 31, 2023.
As of December 31, 2024, the Government had accumulated Rp6.8 trillion in the guarantee reserve fund account.
The guarantee that the Government provided to infrastructure projects included:
| • | full default risk guarantees relating to the PT PLN loans for the construction of coal power plants with aggregate capacity of 10,000 MW and the associated transmission lines (‘Fast Track I’ program). Outstanding guarantees for this program amounted to Rp0.6 trillion; |
| • | business viability guarantees to independent power producers on the ability of PT PLN to fulfill its financial obligations based on power purchase agreements related to the ‘Fast Track II’ program. The guarantee exposure for this program amounted to Rp64.4 trillion; |
| • | full default risk guarantees relating to the PT PLN loans for the construction of electricity infrastructure and business viability guarantees under 35 GW program. Outstanding guarantees for this program amounted to Rp91.3 trillion; |
| • | full default risk guarantees relating to direct lending from international financial institutions (multilateral and bilateral agencies) to SOEs for the construction of infrastructure projects. Outstanding guarantees for this program amounted to Rp49.7 trillion; |
| • | partial default risk guarantees for local government-owned water companies’ loans in connection with the Millennium Development Goals in water provision. Outstanding guarantees for this program amounted to Rp0.2 trillion; |
| • | co-guarantee scheme between the Government and the Indonesia Infrastructure Guarantee Fund to guarantee private-public partnership projects such as power plant projects (e.g., the Central Java steam power plant) and several sections of toll road projects (e.g., Jakarta Cikampek II Elevated, Cileunyi — Sumedang — Dawunan, Krian — Legundi — Bunder — Manyar, Serang — Panimbang, Probolinggo — Banyuwangi, and Jakarta Cikampek II Selatan). The guarantee exposure for this program amounted to Rp108.8 trillion; |
| • | full default risk guarantees relating to PT Hutama Karya loans and bonds for the construction of Sumatera Toll Roads. Outstanding guarantees for this program amounted to Rp22.3 trillion; |
| • | full default risk guarantees relating to PT Kereta Api Indonesia loans for the construction of rail transport projects. Outstanding guarantees for this program amounted to Rp22.3 trillion; and |
| • | guarantee for local infrastructure financing through PT SMI. Outstanding guarantees for this program amounted to Rp1.4 trillion. |
As of March 31, 2025, the Government had provided infrastructure guarantees of Rp376.1 trillion, an increase from active guarantees of Rp372.2 trillion as of December 31, 2024.
As of March 31, 2025, the Government had accumulated Rp6.8 trillion in the guarantee reserve fund account.
The guarantee that the Government provided to infrastructure projects included:
| • | full default risk guarantees relating to the PT PLN loans for the construction of coal power plants with aggregate capacity of 10,000 MW and the associated transmission lines (‘Fast Track I’ program). Outstanding guarantees for this program amounted to Rp0.6 trillion; |
D-102
| • | business viability guarantees to independent power producers on the ability of PT PLN to fulfill its financial obligations based on power purchase agreements related to the ‘Fast Track II’ program. The guarantee exposure for this program amounted to Rp66.1 trillion; |
| • | full default risk guarantees relating to the PT PLN loans for the construction of electricity infrastructure and business viability guarantees under 35 GW program. Outstanding guarantees for this program amounted to Rp92.7 trillion; |
| • | full default risk guarantees relating to direct lending from international financial institutions (multilateral and bilateral agencies) to SOEs for the construction of infrastructure projects. Outstanding guarantees for this program amounted to Rp51.9 trillion; |
| • | partial default risk guarantees for local government-owned water companies’ loans in connection with the Millennium Development Goals in water provision. Outstanding guarantees for this program amounted to Rp0.2 trillion; |
| • | co-guarantee scheme between the Government and the Indonesia Infrastructure Guarantee Fund to guarantee private-public partnership projects such as power plant projects (e.g., the Central Java steam power plant) and several sections of toll road projects (e.g., Jakarta Cikampek II Elevated, Cileunyi — Sumedang — Dawunan, Krian — Legundi — Bunder — Manyar, Serang — Panimbang, Probolinggo — Banyuwangi, and Jakarta Cikampek II Selatan). The guarantee exposure for this program amounted to Rp110.6 trillion; |
| • | full default risk guarantees relating to PT Hutama Karya loans and bonds for the construction of Sumatera Toll Roads. Outstanding guarantees for this program amounted to Rp26.5 trillion; |
| • | full default risk guarantees relating to PT Kereta Api Indonesia loans for the construction of rail transport projects. Outstanding guarantees for this program amounted to Rp22.0 trillion; and |
| • | guarantee for local infrastructure financing through PT SMI. Outstanding guarantees for this program amounted to Rp0.5 trillion. |
Foreign Exchange and Reserves
Exchange Rates
From 1978 to 1997, Indonesia maintained a managed floating exchange rate system under which the Rupiah was linked to a basket of currencies, the composition of which was based on Indonesia’s main trading partners. Indonesia has adopted a free-floating exchange rate system since August 1997, under which market forces determine the exchange rate for the Rupiah. See “— Monetary Policy.”
For the information on historical exchange rates between the Rupiah and the U.S. dollar, see “Presentation of Information—Exchange Rates.”
Prudential Policies on Foreign Exchange and Rupiah
Under Law No. 24 of 1999 on Foreign Exchange Activities and Exchange Rate System, every resident may freely own and use foreign currency. Foreign currency is also generally freely transferable within or from Indonesia although by regulation most domestic transactions are prohibited from using foreign currency. Bank Indonesia has the authority to request information and data regarding foreign exchange activities and implement provisions regarding foreign exchange activities based on prudential principles.
To maintain the stability of the Rupiah, and to prevent the utilization of the Rupiah for speculative purposes by foreign parties, the Rupiah is non- internationalized. Regulations prohibit banks from conducting, among others, the following transactions: (i) extensions of loans or of overdrafts in Rupiah or foreign currencies to foreign parties, (ii) transfers of Rupiah to foreign parties or offshore banks in excess of U.S.$1 million without underlying transactions, and (iii) purchases of Rupiah-denominated securities issued by foreign parties.
Bank Indonesia has issued several regulations concerning foreign currency transactions relating to the Rupiah in order to deepen financial markets. A deep foreign exchange market is distinguished by adequate liquidity, convenient transactions, fair prices and minimal risk in order to maintain economic stability. Bank Indonesia strives towards the creation of a liquid, efficient and secure domestic foreign exchange market through amendments to regulations concerning foreign exchange transactions.
On January 1, 2015, Bank Indonesia regulations came into effect to mitigate risks relating to external borrowing by non-bank corporations. Under these regulations, corporate issuers of debt must, subject to certain limited exceptions:
D-103
| • | hedge at least 25% of their open foreign exchange positions (i.e., the excess of foreign currency liabilities that fall due within the following three to six months over foreign currency assets); |
| • | maintain a 70% minimum liquidity ratio of foreign currency assets to foreign currency liabilities maturing within three months after the end of a quarter; and |
| • | maintain a minimum credit rating (issuer and/or issue) of BB- by a rating agency acknowledged by Bank Indonesia. |
As of December 31, 2024, based on Bank Indonesia’s assessment of corporate issuers’ compliance with the regulations above:
| • | 89.0% of corporate issuers are compliant with the hedging ratio requirement for liabilities due under three months; |
| • | 94.5% of corporate issuers are compliant with the hedging ratio requirement for liabilities due between three to six months; and |
| • | 86.8% of corporate issuers are compliant with the liquidity ratio requirement for liabilities due under three months.] |
International Reserves
The following table sets forth the Republic’s total official international reserves, expressed in (i) U.S. dollar equivalents and (ii) the number of months of imports and Government external debt repayments, in each case at the end of the periods indicated. These reserves consist of foreign exchange, gold, SDRs and a reserve position with the IMF. Indonesia complies with the IMF’s Special Data Dissemination Standard requirement on international reserves and foreign exchange currency liquidity.
Official International Reserves of the Republic(1)
| As of December 31, | As of June 30, |
|||||||||||||||||||||||
| 2020 | 2021 | 2022 | 2023 | 2024 | 2025 | |||||||||||||||||||
| (in millions of U.S. dollars, except for months) | ||||||||||||||||||||||||
| Gold |
4,758 | 4,595 | 4,589 | 5,234 | 6,602 | 8,320 | ||||||||||||||||||
| SDRs |
1,605 | 7,795 | 7,411 | 7,464 | 7,236 | 7,617 | ||||||||||||||||||
| Reserve position with the IMF |
1,135 | 1,110 | 1,055 | 1,064 | 1,034 | 1,089 | ||||||||||||||||||
| Foreign exchange and others |
128,398 | 131,405 | 124,178 | 132,621 | 140,848 | 135,541 | ||||||||||||||||||
|
|
|
|
|
|
|
|
|
|
|
|
|
|||||||||||||
| Total |
135,897 | 144,905 | 137,233 | 146,384 | 155,719 | 152,567 | ||||||||||||||||||
|
|
|
|
|
|
|
|
|
|
|
|
|
|||||||||||||
| Total as number of months of imports and Government external debt repayments |
9.8 | 7.8 | 5.9 | 6.5 | 6.5 | P | 6.2 | P | ||||||||||||||||
|
|
|
|
|
|
|
|
|
|
|
|
|
|||||||||||||
Source: Bank Indonesia.
| P | Preliminary. |
| (1) | Converted into U.S. dollars at the applicable BI middle exchange rates as of the respective dates indicated. |
Foreign reserves totaled U.S.$135.9 billion, U.S.$144.9 billion, U.S.$137.2 billion and U.S.$146.4 billion as of December 31, 2020, 2021, 2022 and 2023, respectively.
As of December 31, 2024 and June 30, 2025, official international reserves position was U.S.$155.7 billion and U.S.$152.6 billion, respectively, equivalent to 6.5 and 6.2 months of imports and servicing government’s external debt, respectively. These are well above the international adequacy standard of around three months of imports.
Regional Swap Arrangements of the Republic
Following the experience of the Asian crisis in 1997 to 1998, ASEAN recognized a need to strengthen regional self-help and support mechanisms in East Asia and endeavored to prevent future financial crises. In 2000, ASEAN+3 members agreed to strengthen the existing cooperative frameworks among monetary authorities through the Chiang Mai Initiative (“CMI”). The CMI involves a network of BSAs among ASEAN+3 countries. The objectives of these bilateral swap arrangements are to address short-term liquidity difficulties in the region and to supplement existing international financial arrangements.
D-104
Since CMI’s inception in 2000, ASEAN+3 member countries undertook a review to explore ways of enhancing its effectiveness. On 2010, ASEAN+3 member countries entered into a multilateral currency swap contract which covers all ASEAN+3 member countries with a total size of U.S.$120 billion (the CMI Multilateralization or CMIM). CMIM was developed from the CMI-BSA network to facilitate prompt and simultaneous currency swap transactions through establishing a common decision making mechanism under a single contract. The CMIM objectives are the same as the BSAs. In May 2012 and in response to the global and regional economic developments, the ASEAN+3 Finance Ministers and Central Bank Governors agreed to strengthen the CMIM as a regional financial safety net by doubling the total size to U.S.$240 billion and launching a crisis prevention program called the CMIM Precautionary Line (“CMIM-PL”). This arrangement became effective on July 17, 2014. On May 4, 2025, the ASEAN+3 Finance Ministers and Central Bank Governors agreed to amend the CMIM Agreement to introduce the Rapid Financing Facility (RFF) with the incorporation of eligible freely usable currencies as its currencies of choice under the CMIM. The amendment will take effect upon the completion of all necessary domestic procedures and the signing of the agreement by all participating authorities. In addition to the role of providing liquidity support for ASEAN+3 member countries, CMIM has contributed to the development of the regional surveillance capacity by establishing the ASEAN+3 Macroeconomic Research Office (“AMRO”), as an ASEAN+3 independent surveillance unit since early 2011.
Under the BSA, and CMIM, a total of U.S.$46.1 billion of foreign currency swap is currently available to the Republic. Up to 30.0% of the amount available under the BSAs and CMIM may be activated without participating in any IMF program, but greater amounts requires participation in an IMF program. The Republic also has a U.S.$22.8 billion bilateral swap line in place with Japan. These swap arrangements will contribute to greater financial stability and sustainable economic growth in the region.
On November 5, 2018, Bank Indonesia established a one-year bilateral financial arrangement with the Monetary Authority of Singapore with a size of up to U.S.$10.0 billion or equivalent (bilateral swap agreement and bilateral repo agreement). This bilateral financial arrangement enables the two central banks to access foreign currency liquidity from each other, if needed, to preserve monetary and financial stability. In November 2023, Bank Indonesia and the Monetary Authority of Singapore extended the bilateral financial arrangement by one year. This arrangement continues to reinforce the ongoing financial cooperation in preserving monetary and financial stability in both countries amid global macroeconomic uncertainties. The arrangement comprises two agreements: (1) A local currency bilateral swap agreement that allows for the exchange of local currencies between the two central banks of up to SGD9.5 billion or Rp100 trillion; (2) A bilateral repo agreement of U.S.$3 billion that allows for repurchase transactions between the two central banks to obtain USD cash using G3 government bonds as collateral.
On September 27, 2019, Bank Indonesia and Bank Negara Malaysia established a three-year local currency bilateral swap agreement with a size up to RM8 billion / Rp28 trillion, which will enable both central banks to access foreign currency liquidity from each other if needed. This arrangement was renewed on September 23, 2022 for three more years. Bank Indonesia and Bank Negara Malaysia have drawn on this local currency bilateral swap arrangement as part of their efforts to strengthen the cooperation in liquidity management between the two institutions, which is still continuing. Up to December 2024, there is no actual usage from these drawings.
In October 2021, Bank Indonesia renewed a bilateral swap agreement with Bank of Japan. The agreement enables Indonesia to swap IDR against the Japanese Yen or the U.S. dollar in an amount of up to U.S.$22.8 billion or equivalent.
In January 2022, Bank Indonesia renewed a three-year Bilateral Currency Swap Agreement (“BCSA”) with People’s Bank of China. The agreement allows exchanges of local currencies between the two central banks of up to CNY250 billion or Rp550 trillion (about U.S.$38.8 billion equivalent).
In February 2022, Bank Indonesia renewed a BCSA with the Reserve Bank of Australia. The agreement will span a period of three years and allow for the exchange of local currencies between the two central banks of up to A.U.$10 billion or Rp100.0 trillion.
In March 2023, Bank Indonesia has renewed a three-year BCSA, with the Republic of Korea amounting to KRW 10.7 trillion or Rp115 trillion.
In September 2024, Bank Indonesia and Bank Negara Malaysia renewed a local currency bilateral swap agreement, which was initially signed in September 2019 and first renewed in September 2022. This renewed agreement allows exchange of local currencies between the two central banks of up to RM24 billion or Rp82 trillion, for a period of five years.
In October 2024, Bank Indonesia and Bank of Japan renewed a bilateral swap arrangement, which enables Indonesia to swap Indonesian Rupiahs against the Japanese Yen or U.S. dollar in an amount up to U.S.$22.8 billion or equivalent.
In November 2024, Bank Indonesia and the Monetary Authority of Singapore renewed a bilateral financial arrangement to November 2027. The bilateral financial arrangement comprises a local currency bilateral swap agreement that allows exchange of local currencies between the two central banks of up to SGD9.5 billion or Rp100 trillion and a bilateral repo agreement of U.S.$3 billion that allows repurchase transactions between the two central banks to obtain USD cash using as collateral government bonds of the U.S., Japan and Germany.
D-105
In January 2025, Bank Indonesia and the People’s Bank of China renewed and strengthened their bilateral currency swap arrangement for a period of five years, which was initially signed in March 2009. This arrangement allows the two central banks to exchange their local currencies up to a value of CNY400 billion or the equivalent amount in Indonesian Rupiah, to further promote the bilateral trade and direct investment in local currencies and strengthen financial market stability.
In March 2025, Bank Indonesia and Reserve Bank of Australia renewed and strengthened their bilateral currency swap arrangement for a period of five years, to support trade and investment for the economic development of Australia and Indonesia and contribute to the financial stability of both countries. The arrangement enables the two central banks to exchange their local currencies up to a value of AUD10 billion or the equivalent amount in Indonesian Rupiah.
Debt-to-GDP Ratios
The following table sets forth the central Government’s debt-to-GDP ratio and debt service to GDP ratio as of the dates indicated. Under the State Finances Law No. 17 of 2003, the Republic’s debt-to-GDP ratio must remain below 60%.
Debt-to-GDP Ratios
| As of December 31, | As of March 31, | |||||||||||||||||||||||
| 2020L | 2021L | 2022L | 2023L | 2024P | 2025P | |||||||||||||||||||
|
|
|
|
|
|
|
|
|
|
|
|
|
|||||||||||||
| (percentages, unless indicated otherwise) | ||||||||||||||||||||||||
| Debt-to-GDP ratio |
39.4 | 40.7 | 39.7 | 39.2 | 39.8 | 40.4 | ||||||||||||||||||
| Debt service to GDP ratio |
5.0 | 5.3 | 4.5 | 5.1 | 5.5 | 6.2 | ||||||||||||||||||
| Total public debt of the central Government (in billions of U.S.$) (1) |
431.0 | 484.1 | 498.8 | 530.5 | 544.7 | 549.8 | ||||||||||||||||||
| —% in Loans |
14.1 | 11.9 | 12.0 | 12.3 | 12.2 | 12.5 | ||||||||||||||||||
| —% in Bonds |
85.9 | 88.1 | 88.0 | 87.7 | 87.8 | 87.5 | ||||||||||||||||||
Source: Ministry of Finance, Bank Indonesia.
| L | LKPP (Financial Report of Central Government/Audited). |
| P | Preliminary. |
| (1) | Outstanding foreign currency debt was converted to U.S. dollars using the BI middle exchange rate as of each period indicated in the table. |
As of December 31, 2023, the central Government’s debt-to-GDP ratio was 39.2%, with U.S.$530.5 billion of total public debt of the central Government, 12.3% of which was in loans and 87.7% was in bonds.
As of December 31, 2024, the central Government’s debt-to-GDP ratio was 39.8%, with U.S.$544.7 billion of total public debt of the central Government, of which 12.2% was in loans and 87.8% was in bonds.
As of March 31, 2025, the central Government’s debt-to-GDP ratio was 40.4%, with U.S.$549.8 billion of total public debt of the central Government, of which 12.5% was in loans and 87.5% was in bonds.
D-106
DEBT TABLES OF THE REPUBLIC OF INDONESIA
| External Loans of the Republic of Indonesia as of December 31, 2024 |
D-108 | |||
| Domestic Loans of the Republic of Indonesia as of December 31, 2024 |
D-125 | |||
| Guaranteed External Loans of the Republic of Indonesia as of December 31, 2024 |
D-132 | |||
| Guaranteed Domestic Loans of the Republic of Indonesia as of December 31, 2024 |
D-133 | |||
| Foreign Currency-Denominated Bonds of the Republic of Indonesia as of December 31, 2024 |
D-134 | |||
| Domestic Currency-Denominated Bonds of the Republic of Indonesia as of December 31, 2024 |
D-137 | |||
D-107
EXTERNAL LOANS OF THE REPUBLIC OF INDONESIA
AS OF DECEMBER 31, 2024
| CURRENCY |
INTEREST RATE BASIS |
INTEREST RATE |
COMMITMENT CHARGE |
YEAR OF CONTRACT |
YEAR OF MATURITY |
ORIGINAL AMOUNT | OUTSTANDING BALANCE | |||||||||||||||||||||||||||
| (In Original Currency) |
(In US Dollar) | (In Original Currency) |
(In US Dollar) | |||||||||||||||||||||||||||||||
| BILATERAL |
| |||||||||||||||||||||||||||||||||
| AUD |
AUSTRALIA PRIME RATE | 1.49 | % | 0.00 | % | 2020 | 2035 | 1,500,000,000 | 933,300,427 | 1,100,000,000 | 684,420,313 | |||||||||||||||||||||||
| AUD |
NO INTEREST RATE | 0.00 | % | 0.00 | % | 2006 | 2046 | 197,505,719 | 122,888,114 | 163,929,747 | 101,997,135 | |||||||||||||||||||||||
| AUD |
NO INTEREST RATE | 0.00 | % | 0.00 | % | 2007 | 2047 | 290,024,929 | 180,453,593 | 246,521,190 | 153,385,554 | |||||||||||||||||||||||
| CAD |
NO INTEREST RATE | 0.00 | % | 0.00 | % | 1973 | 2025 | 11,114,464 | 7,735,837 | 124,316 | 86,526 | |||||||||||||||||||||||
| CAD |
NO INTEREST RATE | 0.00 | % | 0.00 | % | 1976 | 2026 | 9,951,252 | 6,926,224 | 372,957 | 259,584 | |||||||||||||||||||||||
| CAD |
NO INTEREST RATE | 0.00 | % | 0.00 | % | 1977 | 2027 | 3,797,864 | 2,643,371 | 282,864 | 196,878 | |||||||||||||||||||||||
| CAD |
NO INTEREST RATE | 0.00 | % | 0.00 | % | 1978 | 2027 | 18,482,976 | 12,864,435 | 1,354,760 | 942,934 | |||||||||||||||||||||||
| CAD |
NO INTEREST RATE | 0.00 | % | 0.00 | % | 1978 | 2027 | 19,479,946 | 13,558,342 | 1,229,946 | 856,062 | |||||||||||||||||||||||
| CAD |
NO INTEREST RATE | 0.00 | % | 0.00 | % | 1979 | 2029 | 12,847,054 | 8,941,747 | 1,605,882 | 1,117,719 | |||||||||||||||||||||||
| CAD |
NO INTEREST RATE | 0.00 | % | 0.00 | % | 1981 | 2030 | 21,059,866 | 14,657,990 | 3,158,980 | 2,198,699 | |||||||||||||||||||||||
| CAD |
NO INTEREST RATE | 0.00 | % | 0.00 | % | 1982 | 2030 | 31,544,124 | 21,955,195 | 4,731,619 | 3,293,279 | |||||||||||||||||||||||
| CAD |
NO INTEREST RATE | 0.00 | % | 0.00 | % | 1983 | 2033 | 14,999,732 | 10,440,044 | 3,152,557 | 2,194,228 | |||||||||||||||||||||||
| CAD |
NO INTEREST RATE | 0.00 | % | 0.00 | % | 1984 | 2034 | 855,778 | 595,635 | 203,248 | 141,464 | |||||||||||||||||||||||
| CAD |
NO INTEREST RATE | 0.00 | % | 0.00 | % | 1984 | 2034 | 49,977,499 | 34,785,106 | 12,977,499 | 9,032,539 | |||||||||||||||||||||||
| CNY |
FIXED | 2.50 | % | 0.35 | % | 2008 | 2025 | 1,550,083,480 | 212,358,654 | 77,504,174 | 10,617,933 | |||||||||||||||||||||||
| EUR |
FIXED | 2.00 | % | 0.00 | % | 1982 | 2016 | 4,729,450 | 4,924,304 | 147,252 | 153,319 | |||||||||||||||||||||||
| EUR |
FIXED | 2.00 | % | 0.00 | % | 1984 | 2014 | 27,251,857 | 28,374,636 | 634,002 | 660,123 | |||||||||||||||||||||||
| EUR |
FIXED | 0.75 | % | 0.00 | % | 1984 | 2034 | 26,570,305 | 27,665,004 | 634,002 | 660,123 | |||||||||||||||||||||||
| EUR |
FIXED | 0.75 | % | 0.00 | % | 1991 | 2031 | 79,311,597 | 82,579,242 | 19,096,241 | 19,883,008 | |||||||||||||||||||||||
| EUR |
FIXED | 0.75 | % | 0.00 | % | 1989 | 2029 | 20,451,675 | 21,294,286 | 3,354,075 | 3,492,263 | |||||||||||||||||||||||
| EUR |
FIXED | 2.00 | % | 0.00 | % | 1991 | 2021 | 17,383,924 | 18,100,143 | 777,675 | 809,715 | |||||||||||||||||||||||
| EUR |
FIXED | 0.75 | % | 0.00 | % | 1991 | 2033 | 58,747,437 | 61,167,837 | 16,427,808 | 17,104,635 | |||||||||||||||||||||||
| EUR |
FIXED | 0.75 | % | 0.00 | % | 1992 | 2032 | 20,093,771 | 20,921,636 | 3,965,069 | 4,128,430 | |||||||||||||||||||||||
| EUR |
FIXED | 2.00 | % | 0.00 | % | 1992 | 2022 | 9,816,804 | 10,221,257 | 2,300,814 | 2,395,607 | |||||||||||||||||||||||
| EUR |
FIXED | 0.75 | % | 0.00 | % | 1993 | 2033 | 10,839,388 | 11,285,972 | 3,257,952 | 3,392,180 | |||||||||||||||||||||||
| EUR |
FIXED | 2.00 | % | 0.00 | % | 1993 | 2023 | 36,659,628 | 38,170,008 | 710,185 | 739,444 | |||||||||||||||||||||||
| EUR |
FIXED | 2.00 | % | 0.00 | % | 1993 | 2023 | 23,723,943 | 24,701,372 | 589,008 | 613,275 | |||||||||||||||||||||||
| EUR |
FIXED | 0.75 | % | 0.25 | % | 1994 | 2034 | 9,246,474 | 9,627,430 | 1,560,847 | 1,625,154 | |||||||||||||||||||||||
| EUR |
FIXED | 2.00 | % | 0.25 | % | 1995 | 2025 | 10,276,967 | 10,700,379 | 1,353,901 | 1,409,682 | |||||||||||||||||||||||
| EUR |
FIXED | 0.75 | % | 0.25 | % | 1995 | 2035 | 8,513,009 | 8,863,746 | 2,982,010 | 3,104,869 | |||||||||||||||||||||||
| EUR |
FIXED | 0.75 | % | 0.25 | % | 1995 | 2035 | 14,902,735 | 15,516,729 | 5,478,735 | 5,704,460 | |||||||||||||||||||||||
| EUR |
FIXED | 0.75 | % | 0.00 | % | 1995 | 2035 | 11,654,155 | 12,134,307 | 4,276,932 | 4,453,142 | |||||||||||||||||||||||
| EUR |
FIXED | 0.75 | % | 0.25 | % | 1995 | 2035 | 21,609,069 | 22,499,364 | 7,658,069 | 7,973,582 | |||||||||||||||||||||||
| EUR |
FIXED | 0.75 | % | 0.25 | % | 1999 | 2039 | 76,609,992 | 79,766,331 | 36,421,128 | 37,921,682 | |||||||||||||||||||||||
| EUR |
FIXED | 0.75 | % | 0.24 | % | 1998 | 2038 | 12,271,005 | 12,776,572 | 5,726,469 | 5,962,400 | |||||||||||||||||||||||
| EUR |
FIXED | 0.75 | % | 0.25 | % | 1998 | 2038 | 10,946,906 | 11,397,919 | 5,056,823 | 5,265,165 | |||||||||||||||||||||||
| EUR |
FIXED | 2.00 | % | 0.40 | % | 2014 | 2029 | 15,312,037 | 15,942,895 | 6,811,968 | 7,092,622 | |||||||||||||||||||||||
| EUR |
FIXED | 0.75 | % | 0.25 | % | 2000 | 2040 | 14,622,948 | 15,225,415 | 7,560,473 | 7,871,965 | |||||||||||||||||||||||
| EUR |
FIXED | 0.75 | % | 0.25 | % | 2000 | 2040 | 8,087,557 | 8,420,765 | 4,185,557 | 4,358,003 | |||||||||||||||||||||||
| EUR |
FIXED | 0.75 | % | 0.25 | % | 1999 | 2039 | 11,759,713 | 12,244,215 | 5,784,245 | 6,022,556 | |||||||||||||||||||||||
| EUR |
FIXED | 0.75 | % | 0.25 | % | 2001 | 2041 | 19,186,859 | 19,977,359 | 10,379,828 | 10,807,477 | |||||||||||||||||||||||
| EUR |
FIXED | 2.00 | % | 0.25 | % | 2001 | 2031 | 9,428,222 | 9,816,666 | 2,991,057 | 3,114,289 | |||||||||||||||||||||||
| EUR |
FIXED | 0.75 | % | 0.25 | % | 2001 | 2041 | 20,221,795 | 21,054,935 | 11,458,890 | 11,930,997 | |||||||||||||||||||||||
| EUR |
FIXED | 0.75 | % | 0.25 | % | 2002 | 2042 | 74,649,000 | 77,724,546 | 21,437,000 | 22,320,207 | |||||||||||||||||||||||
| EUR |
FIXED | 0.75 | % | 0.25 | % | 2001 | 2035 | 2,652,707 | 2,761,999 | 1,168,707 | 1,216,858 | |||||||||||||||||||||||
| EUR |
FIXED | 0.75 | % | 0.25 | % | 2002 | 2042 | 14,762,878 | 15,371,110 | 4,500,000 | 4,685,400 | |||||||||||||||||||||||
| EUR |
FIXED | 0.75 | % | 0.25 | % | 2003 | 2043 | 10,500,383 | 10,933,000 | 6,422,541 | 6,687,151 | |||||||||||||||||||||||
| EUR |
FIXED | 0.75 | % | 0.25 | % | 2004 | 2044 | 9,000,000 | 9,370,801 | 5,766,000 | 6,003,560 | |||||||||||||||||||||||
| EUR |
FIXED | 0.75 | % | 0.00 | % | 2004 | 2044 | 74,927,500 | 78,014,520 | 27,372,000 | 28,499,729 | |||||||||||||||||||||||
| EUR |
FIXED | 0.75 | % | 0.25 | % | 2006 | 2045 | 6,000,000 | 6,247,201 | 4,200,000 | 4,373,040 | |||||||||||||||||||||||
| EUR |
FIXED | 0.75 | % | 0.25 | % | 2006 | 2046 | 8,821,144 | 9,184,576 | 6,469,144 | 6,735,673 | |||||||||||||||||||||||
| EUR |
FIXED | 0.75 | % | 0.25 | % | 2009 | 2049 | 30,887,392 | 32,159,956 | 14,907,392 | 15,521,578 | |||||||||||||||||||||||
| EUR |
FIXED | 0.75 | % | 0.25 | % | 2011 | 2051 | 19,000,000 | 19,782,802 | 16,939,731 | 17,637,649 | |||||||||||||||||||||||
| EUR |
FIXED | 2.30 | % | 0.25 | % | 2013 | 2028 | 71,585,136 | 74,534,451 | 22,835,136 | 23,775,946 | |||||||||||||||||||||||
| EUR |
FIXED | 1.30 | % | 0.25 | % | 2017 | 2028 | 200,000,000 | 208,240,020 | 94,120,000 | 97,997,753 | |||||||||||||||||||||||
D-108
| CURRENCY |
INTEREST RATE BASIS |
INTEREST RATE |
COMMITMENT CHARGE |
YEAR OF CONTRACT |
YEAR OF MATURITY |
ORIGINAL AMOUNT | OUTSTANDING BALANCE | |||||||||||||||||||||||||||
| (In Original Currency) |
(In US Dollar) | (In Original Currency) |
(In US Dollar) | |||||||||||||||||||||||||||||||
| EUR |
EURIBOR 6 MTH | 3.55 | % | 0.25 | % | 2021 | 2036 | 85,700,000 | 89,230,848 | 72,263,772 | 75,241,047 | |||||||||||||||||||||||
| EUR |
FIXED | 1.50 | % | 0.00 | % | 1987 | 2021 | 34,256,162 | 35,667,519 | 94,307 | 98,193 | |||||||||||||||||||||||
| EUR |
FIXED | 1.50 | % | 0.00 | % | 1985 | 2018 | 26,359,240 | 27,445,244 | 49,570 | 51,612 | |||||||||||||||||||||||
| EUR |
FIXED | 2.00 | % | 0.00 | % | 1988 | 2022 | 5,158,481 | 5,371,011 | 53,730 | 55,944 | |||||||||||||||||||||||
| EUR |
FIXED | 2.00 | % | 0.00 | % | 1989 | 2023 | 33,043,770 | 34,405,176 | 731,365 | 761,497 | |||||||||||||||||||||||
| EUR |
FIXED | 1.50 | % | 0.00 | % | 1983 | 2017 | 11,820,946 | 12,307,970 | 1,404 | 1,462 | |||||||||||||||||||||||
| EUR |
FIXED | 2.00 | % | 0.00 | % | 1991 | 2022 | 19,223,588 | 20,015,602 | 96,008 | 99,964 | |||||||||||||||||||||||
| EUR |
FIXED | 2.00 | % | 0.00 | % | 1989 | 2022 | 28,503,046 | 29,677,374 | 236,780 | 246,535 | |||||||||||||||||||||||
| EUR |
FIXED | 1.50 | % | 0.00 | % | 1988 | 2022 | 6,342,039 | 6,603,332 | 57,319 | 59,681 | |||||||||||||||||||||||
| EUR |
FIXED | 2.00 | % | 0.00 | % | 1991 | 2025 | 8,402,989 | 8,749,193 | 378,413 | 394,004 | |||||||||||||||||||||||
| EUR |
FIXED | 2.00 | % | 0.00 | % | 1989 | 2024 | 33,122,379 | 34,487,025 | 2,331,308 | 2,427,358 | |||||||||||||||||||||||
| EUR |
FIXED | 2.00 | % | 0.00 | % | 1990 | 2025 | 37,767,403 | 39,323,423 | 2,938,253 | 3,059,309 | |||||||||||||||||||||||
| EUR |
FIXED | 0.50 | % | 0.00 | % | 1993 | 2033 | 63,683,736 | 66,307,512 | 23,039,620 | 23,988,855 | |||||||||||||||||||||||
| EUR |
FIXED | 0.50 | % | 0.00 | % | 1993 | 2034 | 47,838,742 | 49,809,703 | 19,786,663 | 20,601,876 | |||||||||||||||||||||||
| EUR |
FIXED | 0.50 | % | 0.00 | % | 1993 | 2034 | 13,102,993 | 13,642,838 | 4,555,275 | 4,742,953 | |||||||||||||||||||||||
| EUR |
FIXED | 0.25 | % | 0.00 | % | 1995 | 2035 | 40,998,276 | 42,687,409 | 10,317,813 | 10,742,907 | |||||||||||||||||||||||
| EUR |
FIXED | 0.25 | % | 0.00 | % | 1996 | 2025 | 45,463,607 | 47,336,712 | 8,798,804 | 9,161,316 | |||||||||||||||||||||||
| EUR |
FIXED | 0.25 | % | 0.00 | % | 1997 | 2028 | 15,683,500 | 16,329,661 | 4,840,935 | 5,040,382 | |||||||||||||||||||||||
| EUR |
FIXED | 0.25 | % | 0.00 | % | 1997 | 2029 | 12,337,977 | 12,846,303 | 4,172,775 | 4,344,694 | |||||||||||||||||||||||
| EUR |
FIXED | 0.63 | % | 0.00 | % | 1998 | 2030 | 2,285,816 | 2,379,992 | 706,453 | 735,559 | |||||||||||||||||||||||
| EUR |
FIXED | 2.20 | % | 0.00 | % | 1999 | 2025 | 15,882,219 | 16,536,568 | 1,528,285 | 1,591,250 | |||||||||||||||||||||||
| EUR |
FIXED | 2.35 | % | 0.00 | % | 2002 | 2023 | 9,365,347 | 9,751,200 | 110,976 | 115,548 | |||||||||||||||||||||||
| EUR |
FIXED | 2.35 | % | 0.00 | % | 2004 | 2025 | 2,456,933 | 2,558,159 | 240,238 | 250,136 | |||||||||||||||||||||||
| EUR |
FIXED | 1.00 | % | 0.00 | % | 2008 | 2028 | 36,312,283 | 37,808,352 | 12,709,299 | 13,232,923 | |||||||||||||||||||||||
| EUR |
FIXED | 1.00 | % | 0.00 | % | 2011 | 2031 | 30,299,373 | 31,547,710 | 17,142,733 | 17,849,015 | |||||||||||||||||||||||
| EUR |
FIXED | 2.06 | % | 0.00 | % | 2015 | 2033 | 140,000,000 | 145,768,014 | 96,923,077 | 100,916,317 | |||||||||||||||||||||||
| EUR |
FIXED | 2.08 | % | 0.00 | % | 2016 | 2034 | 100,000,000 | 104,120,010 | 76,923,077 | 80,092,315 | |||||||||||||||||||||||
| EUR |
FIXED | 1.41 | % | 0.50 | % | 2017 | 2032 | 150,000,000 | 156,180,015 | 112,500,000 | 117,135,011 | |||||||||||||||||||||||
| EUR |
FIXED | 1.90 | % | 0.00 | % | 2017 | 2032 | 100,000,000 | 104,120,010 | 80,000,000 | 83,296,008 | |||||||||||||||||||||||
| EUR |
FIXED | 0.00 | % | 0.00 | % | 2018 | 2055 | 42,782,878 | 44,545,537 | 42,782,877 | 44,545,536 | |||||||||||||||||||||||
| EUR |
FIXED | 1.62 | % | 0.00 | % | 2018 | 2028 | 150,000,000 | 156,180,015 | 85,714,286 | 89,245,723 | |||||||||||||||||||||||
| EUR |
FIXED | 1.62 | % | 0.00 | % | 2018 | 2028 | 150,000,000 | 156,180,015 | 85,714,286 | 89,245,723 | |||||||||||||||||||||||
| EUR |
FIXED | 0.33 | % | 0.50 | % | 2019 | 2031 | 20,779,100 | 21,635,201 | 16,883,019 | 17,578,601 | |||||||||||||||||||||||
| EUR |
EURIBOR 6 MTH | 1.48 | % | 0.40 | % | 2019 | 2034 | 63,718,241 | 66,343,439 | 9,536,099 | 9,928,987 | |||||||||||||||||||||||
| EUR |
FIXED | 1.23 | % | 0.00 | % | 2020 | 2030 | 100,000,000 | 104,120,010 | 68,750,000 | 71,582,507 | |||||||||||||||||||||||
| EUR |
FIXED | 0.99 | % | 0.00 | % | 2020 | 2030 | 100,000,000 | 104,120,010 | 100,000,000 | 104,120,010 | |||||||||||||||||||||||
| EUR |
EURIBOR 6 MTH | 3.86 | % | 0.20 | % | 2021 | 2039 | 89,008,005 | 92,675,144 | 1,074,969 | 1,119,258 | |||||||||||||||||||||||
| EUR |
FIXED | 1.36 | % | 0.00 | % | 2021 | 2031 | 100,000,000 | 104,120,010 | 100,000,000 | 104,120,010 | |||||||||||||||||||||||
| EUR |
FIXED | 0.78 | % | 0.50 | % | 2021 | 2034 | 80,000,000 | 83,296,008 | 70,645,136 | 73,555,723 | |||||||||||||||||||||||
| EUR |
EURIBOR 6 MTH | 3.34 | % | 0.00 | % | 2022 | 2034 | 50,000,000 | 52,060,005 | 50,000,000 | 52,060,005 | |||||||||||||||||||||||
| EUR |
EURIBOR 6 MTH | 3.42 | % | 0.00 | % | 2023 | 2034 | 150,000,000 | 156,180,015 | 150,000,000 | 156,180,015 | |||||||||||||||||||||||
| EUR |
EURIBOR 6 MTH | 3.89 | % | 0.00 | % | 2024 | 2036 | 200,000,000 | 208,240,020 | 200,000,000 | 208,240,020 | |||||||||||||||||||||||
| EUR |
EURIBOR 6 MTH | 3.93 | % | 0.20 | % | 2022 | 2040 | 98,674,936 | 102,740,353 | 967,143 | 1,006,989 | |||||||||||||||||||||||
| EUR |
FIXED | 3.09 | % | 0.00 | % | 2013 | 2031 | 74,700,000 | 77,777,647 | 37,350,000 | 38,888,824 | |||||||||||||||||||||||
| EUR |
FIXED | 0.22 | % | 0.00 | % | 2014 | 2035 | 47,677,098 | 49,641,399 | 45,288,777 | 47,154,679 | |||||||||||||||||||||||
| EUR |
NO INTEREST RATE | 0.00 | % | 0.00 | % | 1996 | 2033 | 1,801,799 | 1,876,033 | 810,810 | 844,215 | |||||||||||||||||||||||
| EUR |
FIXED | 0.75 | % | 0.25 | % | 2005 | 2044 | 48,496,003 | 50,494,043 | 17,664,821 | 18,392,613 | |||||||||||||||||||||||
| EUR |
FIXED | 1.25 | % | 0.00 | % | 2017 | 2028 | 200,000,000 | 208,240,020 | 94,120,000 | 97,997,753 | |||||||||||||||||||||||
| EUR |
FIXED | 2.55 | % | 0.25 | % | 2017 | 2032 | 29,367,573 | 30,577,520 | 22,224,716 | 23,140,377 | |||||||||||||||||||||||
D-109
| CURRENCY |
INTEREST RATE BASIS |
INTEREST RATE |
COMMITMENT CHARGE |
YEAR OF CONTRACT |
YEAR OF MATURITY |
ORIGINAL AMOUNT | OUTSTANDING BALANCE | |||||||||||||||||||||||||||
| (In Original Currency) |
(In US Dollar) | (In Original Currency) |
(In US Dollar) | |||||||||||||||||||||||||||||||
| EUR |
EURIBOR 6 MTH | 3.86 | % | 0.25 | % | 2018 | 2029 | 200,000,000 | 208,240,020 | 117,650,000 | 122,497,192 | |||||||||||||||||||||||
| EUR |
EURIBOR 6 MTH | 3.86 | % | 0.25 | % | 2018 | 2029 | 200,000,000 | 208,240,020 | 117,650,000 | 122,497,192 | |||||||||||||||||||||||
| EUR |
EURIBOR 6 MTH | 3.81 | % | 0.25 | % | 2018 | 2029 | 300,000,000 | 312,360,030 | 176,471,000 | 183,741,623 | |||||||||||||||||||||||
| EUR |
EURIBOR 6 MTH | 3.76 | % | 0.25 | % | 2019 | 2031 | 500,000,000 | 520,600,050 | 382,356,000 | 398,109,105 | |||||||||||||||||||||||
| EUR |
EURIBOR 6 MTH | 3.77 | % | 0.25 | % | 2020 | 2032 | 250,000,000 | 260,300,025 | 220,590,000 | 229,678,330 | |||||||||||||||||||||||
| EUR |
EURIBOR 6 MTH | 3.75 | % | 0.25 | % | 2020 | 2032 | 300,000,000 | 312,360,030 | 264,706,000 | 275,611,913 | |||||||||||||||||||||||
| EUR |
EURIBOR 6 MTH | 3.75 | % | 0.25 | % | 2021 | 2032 | 200,000,000 | 208,240,020 | 176,472,000 | 183,742,664 | |||||||||||||||||||||||
| EUR |
EURIBOR 6 MTH | 3.32 | % | 0.25 | % | 2021 | 2036 | 200,000,000 | 208,240,020 | 200,000,000 | 208,240,020 | |||||||||||||||||||||||
| EUR |
EURIBOR 6 MTH | 3.70 | % | 0.25 | % | 2021 | 2033 | 400,000,000 | 416,480,040 | 400,000,000 | 416,480,040 | |||||||||||||||||||||||
| EUR |
EURIBOR 6 MTH | 3.50 | % | 0.25 | % | 2022 | 2034 | 300,000,000 | 312,360,030 | 300,000,000 | 312,360,030 | |||||||||||||||||||||||
| EUR |
EURIBOR 6 MTH | 4.03 | % | 0.25 | % | 2021 | 2037 | 37,000,000 | 38,524,404 | 197,000 | 205,116 | |||||||||||||||||||||||
| EUR |
EURIBOR 6 MTH | 3.76 | % | 0.25 | % | 2024 | 2035 | 400,000,000 | 416,480,040 | 400,000,000 | 416,480,040 | |||||||||||||||||||||||
| EUR |
FIXED | 0.20 | % | 0.00 | % | 2003 | 2038 | 10,840,484 | 11,287,113 | 5,973,328 | 6,219,430 | |||||||||||||||||||||||
| EUR |
FIXED | 0.15 | % | 0.00 | % | 2007 | 2037 | 13,594,264 | 14,154,349 | 11,781,695 | 12,267,103 | |||||||||||||||||||||||
| EUR |
FIXED | 0.15 | % | 0.00 | % | 2008 | 2038 | 10,198,683 | 10,618,870 | 9,178,815 | 9,556,983 | |||||||||||||||||||||||
| EUR |
FIXED | 0.15 | % | 0.00 | % | 2008 | 2038 | 8,554,233 | 8,906,668 | 7,698,810 | 8,016,001 | |||||||||||||||||||||||
| EUR |
FIXED | 0.15 | % | 0.00 | % | 2008 | 2039 | 6,888,832 | 7,172,652 | 6,659,204 | 6,933,564 | |||||||||||||||||||||||
| EUR |
FIXED | 0.15 | % | 0.00 | % | 2010 | 2040 | 3,695,046 | 3,847,282 | 3,695,046 | 3,847,282 | |||||||||||||||||||||||
| EUR |
FIXED | 0.15 | % | 0.00 | % | 2011 | 2046 | 7,349,159 | 7,651,945 | 7,349,159 | 7,651,945 | |||||||||||||||||||||||
| EUR |
FIXED | 0.15 | % | 0.00 | % | 2013 | 2051 | 12,430,001 | 12,942,118 | 12,430,001 | 12,942,118 | |||||||||||||||||||||||
| EUR |
FIXED | 0.15 | % | 0.00 | % | 2016 | 2054 | 6,979,739 | 7,267,305 | 6,979,739 | 7,267,305 | |||||||||||||||||||||||
| EUR |
EURIBOR 6 MTH | 4.08 | % | 0.50 | % | 2023 | 2029 | 26,956,350 | 28,066,954 | 18,213,750 | 18,964,158 | |||||||||||||||||||||||
| EUR |
NO INTEREST RATE | 0.00 | % | 0.00 | % | 2024 | 2027 | 68,523,387 | 71,346,558 | 57,379,993 | 59,744,054 | |||||||||||||||||||||||
| JPY |
FIXED | 2.30 | % | 0.00 | % | 1995 | 2025 | 934,666,009 | 5,983,205 | 45,592,000 | 291,854 | |||||||||||||||||||||||
| JPY |
FIXED | 2.50 | % | 0.00 | % | 1995 | 2025 | 16,269,800,349 | 104,150,084 | 791,836,000 | 5,068,887 | |||||||||||||||||||||||
| JPY |
FIXED | 2.50 | % | 0.00 | % | 1995 | 2025 | 2,699,554,273 | 17,281,024 | 131,680,000 | 842,941 | |||||||||||||||||||||||
| JPY |
FIXED | 2.50 | % | 0.00 | % | 1995 | 2025 | 11,416,106,238 | 73,079,472 | 556,880,000 | 3,564,832 | |||||||||||||||||||||||
| JPY |
FIXED | 2.50 | % | 0.00 | % | 1995 | 2025 | 5,854,899,193 | 37,479,762 | 285,602,000 | 1,828,263 | |||||||||||||||||||||||
| JPY |
FIXED | 2.50 | % | 0.00 | % | 1995 | 2025 | 2,788,907,810 | 17,853,015 | 136,040,000 | 870,851 | |||||||||||||||||||||||
| JPY |
FIXED | 2.30 | % | 0.00 | % | 1995 | 2025 | 3,221,493,655 | 20,622,185 | 151,440,000 | 969,433 | |||||||||||||||||||||||
| JPY |
FIXED | 2.50 | % | 0.00 | % | 1995 | 2025 | 2,833,282,030 | 18,137,073 | 131,740,000 | 843,325 | |||||||||||||||||||||||
| JPY |
FIXED | 2.50 | % | 0.00 | % | 1995 | 2025 | 5,313,543,703 | 34,014,309 | 259,194,000 | 1,659,214 | |||||||||||||||||||||||
| JPY |
FIXED | 2.30 | % | 0.00 | % | 1995 | 2025 | 10,780,551,260 | 69,011,008 | 525,876,000 | 3,366,362 | |||||||||||||||||||||||
| JPY |
FIXED | 2.30 | % | 0.00 | % | 1995 | 2025 | 4,810,783,364 | 30,795,921 | 234,668,000 | 1,502,212 | |||||||||||||||||||||||
| JPY |
FIXED | 2.30 | % | 0.00 | % | 1995 | 2025 | 4,399,191,845 | 28,161,145 | 214,590,000 | 1,373,684 | |||||||||||||||||||||||
| JPY |
FIXED | 2.50 | % | 0.00 | % | 1995 | 2025 | 6,043,377,777 | 38,686,296 | 294,794,000 | 1,887,105 | |||||||||||||||||||||||
| JPY |
FIXED | 2.50 | % | 0.00 | % | 1995 | 2025 | 4,063,855,000 | 26,014,507 | 184,094,000 | 1,178,466 | |||||||||||||||||||||||
| JPY |
FIXED | 2.30 | % | 0.00 | % | 1995 | 2025 | 3,845,709,495 | 24,618,063 | 186,166,000 | 1,191,730 | |||||||||||||||||||||||
| JPY |
FIXED | 2.30 | % | 0.00 | % | 1995 | 2025 | 11,723,113,208 | 75,044,758 | 485,058,000 | 3,105,068 | |||||||||||||||||||||||
| JPY |
FIXED | 2.50 | % | 0.00 | % | 1995 | 2025 | 12,070,722,652 | 77,269,957 | 581,996,000 | 3,725,610 | |||||||||||||||||||||||
| JPY |
FIXED | 2.50 | % | 0.00 | % | 1995 | 2025 | 6,767,086,104 | 43,319,068 | 330,100,000 | 2,113,114 | |||||||||||||||||||||||
| JPY |
FIXED | 2.50 | % | 0.00 | % | 1995 | 2025 | 2,796,236,510 | 17,899,929 | 136,398,000 | 873,143 | |||||||||||||||||||||||
| JPY |
FIXED | 2.30 | % | 0.00 | % | 1995 | 2025 | 351,467,896 | 2,249,899 | 17,142,000 | 109,733 | |||||||||||||||||||||||
| JPY |
FIXED | 2.30 | % | 0.00 | % | 1995 | 2025 | 194,000,000 | 1,241,879 | 9,462,000 | 60,570 | |||||||||||||||||||||||
| JPY |
FIXED | 2.70 | % | 0.00 | % | 1996 | 2026 | 1,638,883,994 | 10,491,211 | 159,880,000 | 1,023,462 | |||||||||||||||||||||||
| JPY |
FIXED | 2.70 | % | 0.00 | % | 1996 | 2026 | 6,760,714,022 | 43,278,278 | 659,580,000 | 4,222,259 | |||||||||||||||||||||||
D-110
| CURRENCY |
INTEREST RATE BASIS |
INTEREST RATE |
COMMITMENT CHARGE |
YEAR OF CONTRACT |
YEAR OF MATURITY |
ORIGINAL AMOUNT | OUTSTANDING BALANCE | |||||||||||||||||||||||||||
| (In Original Currency) |
(In US Dollar) | (In Original Currency) |
(In US Dollar) | |||||||||||||||||||||||||||||||
| JPY |
FIXED | 2.70 | % | 0.00 | % | 1996 | 2026 | 4,044,399,437 | 25,889,964 | 389,088,000 | 2,490,722 | |||||||||||||||||||||||
| JPY |
FIXED | 2.70 | % | 0.00 | % | 1996 | 2026 | 4,897,893,000 | 31,353,548 | 414,868,000 | 2,655,751 | |||||||||||||||||||||||
| JPY |
FIXED | 2.70 | % | 0.00 | % | 1996 | 2026 | 10,179,763,353 | 65,165,103 | 992,992,000 | 6,356,575 | |||||||||||||||||||||||
| JPY |
FIXED | 2.70 | % | 0.00 | % | 1996 | 2026 | 5,638,684,098 | 36,095,675 | 550,108,000 | 3,521,481 | |||||||||||||||||||||||
| JPY |
FIXED | 2.70 | % | 0.00 | % | 1996 | 2026 | 13,737,371,078 | 87,938,901 | 1,142,028,000 | 7,310,619 | |||||||||||||||||||||||
| JPY |
FIXED | 2.70 | % | 0.00 | % | 1996 | 2026 | 5,988,924,586 | 38,337,717 | 584,276,000 | 3,740,205 | |||||||||||||||||||||||
| JPY |
FIXED | 2.70 | % | 0.00 | % | 1996 | 2026 | 971,466,270 | 6,218,779 | 94,772,000 | 606,677 | |||||||||||||||||||||||
| JPY |
FIXED | 2.70 | % | 0.00 | % | 1996 | 2026 | 4,997,313,008 | 31,989,979 | 487,536,000 | 3,120,930 | |||||||||||||||||||||||
| JPY |
FIXED | 2.70 | % | 0.00 | % | 1996 | 2026 | 12,866,917,324 | 82,366,747 | 1,255,296,000 | 8,035,697 | |||||||||||||||||||||||
| JPY |
FIXED | 2.70 | % | 0.00 | % | 1996 | 2026 | 10,327,876,843 | 66,113,242 | 993,740,000 | 6,361,363 | |||||||||||||||||||||||
| JPY |
FIXED | 2.50 | % | 0.00 | % | 1996 | 2026 | 2,810,949,132 | 17,994,111 | 274,232,000 | 1,755,479 | |||||||||||||||||||||||
| JPY |
FIXED | 2.50 | % | 0.00 | % | 1996 | 2026 | 8,769,146,199 | 56,135,127 | 845,532,000 | 5,412,619 | |||||||||||||||||||||||
| JPY |
FIXED | 2.70 | % | 0.00 | % | 1996 | 2026 | 9,933,865,838 | 63,591,006 | 937,248,000 | 5,999,733 | |||||||||||||||||||||||
| JPY |
FIXED | 2.70 | % | 0.00 | % | 1996 | 2026 | 4,612,342,063 | 29,525,612 | 425,236,000 | 2,722,121 | |||||||||||||||||||||||
| JPY |
FIXED | 2.70 | % | 0.00 | % | 1996 | 2026 | 6,023,804,059 | 38,560,996 | 587,680,000 | 3,761,996 | |||||||||||||||||||||||
| JPY |
FIXED | 2.70 | % | 0.00 | % | 1996 | 2026 | 5,403,909,048 | 34,592,777 | 527,200,000 | 3,374,837 | |||||||||||||||||||||||
| JPY |
FIXED | 2.70 | % | 0.00 | % | 1996 | 2026 | 436,583,101 | 2,794,759 | 42,084,000 | 269,398 | |||||||||||||||||||||||
| JPY |
FIXED | 2.70 | % | 0.00 | % | 1996 | 2026 | 1,271,465,139 | 8,139,203 | 124,040,000 | 794,034 | |||||||||||||||||||||||
| JPY |
FIXED | 2.70 | % | 0.00 | % | 1996 | 2026 | 4,618,666,272 | 29,566,096 | 450,592,000 | 2,884,436 | |||||||||||||||||||||||
| JPY |
FIXED | 2.70 | % | 0.00 | % | 1998 | 2028 | 2,665,501,317 | 17,063,036 | 455,070,000 | 2,913,101 | |||||||||||||||||||||||
| JPY |
FIXED | 2.70 | % | 0.00 | % | 1998 | 2028 | 26,783,193,096 | 171,450,894 | 4,509,337,000 | 28,866,232 | |||||||||||||||||||||||
| JPY |
FIXED | 2.70 | % | 0.00 | % | 1998 | 2028 | 4,762,885,004 | 30,489,303 | 813,162,000 | 5,205,404 | |||||||||||||||||||||||
| JPY |
FIXED | 2.70 | % | 0.00 | % | 1998 | 2028 | 7,906,192,340 | 50,610,984 | 1,329,965,000 | 8,513,686 | |||||||||||||||||||||||
| JPY |
FIXED | 2.70 | % | 0.00 | % | 1998 | 2028 | 8,742,020,786 | 55,961,486 | 1,492,197,000 | 9,552,203 | |||||||||||||||||||||||
| JPY |
FIXED | 2.70 | % | 0.00 | % | 1998 | 2028 | 7,454,120,226 | 47,717,073 | 1,187,697,000 | 7,602,966 | |||||||||||||||||||||||
| JPY |
FIXED | 2.70 | % | 0.00 | % | 1998 | 2028 | 8,093,719,955 | 51,811,430 | 1,381,842,000 | 8,845,773 | |||||||||||||||||||||||
| JPY |
FIXED | 2.70 | % | 0.00 | % | 1998 | 2028 | 2,509,432,920 | 16,063,974 | 428,428,000 | 2,742,554 | |||||||||||||||||||||||
| JPY |
FIXED | 2.70 | % | 0.00 | % | 1998 | 2028 | 2,894,769,534 | 18,530,682 | 486,129,000 | 3,111,924 | |||||||||||||||||||||||
| JPY |
FIXED | 2.70 | % | 0.00 | % | 1998 | 2028 | 6,479,673,714 | 41,479,216 | 1,092,525,000 | 6,993,729 | |||||||||||||||||||||||
| JPY |
FIXED | 2.50 | % | 0.00 | % | 1998 | 2028 | 9,323,394,424 | 59,683,112 | 1,586,739,000 | 10,157,408 | |||||||||||||||||||||||
| JPY |
FIXED | 2.10 | % | 0.00 | % | 1998 | 2028 | 411,741,033 | 2,635,734 | 70,294,000 | 449,983 | |||||||||||||||||||||||
| JPY |
FIXED | 2.50 | % | 0.00 | % | 1998 | 2028 | 4,567,508,445 | 29,238,613 | 779,135,000 | 4,987,583 | |||||||||||||||||||||||
| JPY |
FIXED | 2.70 | % | 0.00 | % | 1998 | 2028 | 9,148,152,658 | 58,561,313 | 1,561,861,000 | 9,998,153 | |||||||||||||||||||||||
| JPY |
FIXED | 2.70 | % | 0.00 | % | 1998 | 2028 | 16,008,569,778 | 102,477,833 | 2,733,150,000 | 17,496,085 | |||||||||||||||||||||||
| JPY |
FIXED | 2.70 | % | 0.00 | % | 1998 | 2028 | 29,283,319,347 | 187,455,292 | 4,298,952,000 | 27,519,466 | |||||||||||||||||||||||
| JPY |
FIXED | 2.30 | % | 0.00 | % | 1998 | 2028 | 902,092,741 | 5,774,689 | 154,007,000 | 985,866 | |||||||||||||||||||||||
| JPY |
FIXED | 2.30 | % | 0.00 | % | 1998 | 2028 | 428,467,622 | 2,742,808 | 73,143,000 | 468,220 | |||||||||||||||||||||||
| JPY |
FIXED | 2.50 | % | 0.00 | % | 1995 | 2025 | 17,312,000,000 | 110,821,658 | 844,486,000 | 5,405,923 | |||||||||||||||||||||||
| JPY |
FIXED | 2.70 | % | 0.00 | % | 1996 | 2026 | 16,005,000,000 | 102,454,982 | 1,561,460,000 | 9,995,586 | |||||||||||||||||||||||
| JPY |
FIXED | 2.20 | % | 0.00 | % | 1998 | 2028 | 20,000,000,000 | 128,028,718 | 3,414,628,000 | 21,858,522 | |||||||||||||||||||||||
| JPY |
FIXED | 1.00 | % | 0.00 | % | 1998 | 2028 | 48,500,000,000 | 310,469,642 | 9,463,408,000 | 60,579,400 | |||||||||||||||||||||||
| JPY |
FIXED | 1.00 | % | 0.00 | % | 1998 | 2028 | 98,524,758,827 | 630,699,929 | 19,224,336,000 | 123,063,355 | |||||||||||||||||||||||
| JPY |
FIXED | 1.30 | % | 0.00 | % | 2005 | 2035 | 10,794,000,000 | 69,097,099 | 5,528,628,000 | 35,391,158 | |||||||||||||||||||||||
| JPY |
FIXED | 1.50 | % | 0.00 | % | 2006 | 2036 | 11,729,000,000 | 75,082,442 | 6,579,679,000 | 42,119,393 | |||||||||||||||||||||||
| JPY |
FIXED | 1.50 | % | 0.00 | % | 2007 | 2037 | 11,777,000,000 | 75,389,711 | 7,181,075,000 | 45,969,191 | |||||||||||||||||||||||
| JPY |
FIXED | 1.50 | % | 0.00 | % | 2007 | 2037 | 11,777,000,000 | 75,389,711 | 7,181,075,000 | 45,969,191 | |||||||||||||||||||||||
| JPY |
FIXED | 0.70 | % | 0.10 | % | 2010 | 2025 | 8,997,000,000 | 57,593,719 | 428,428,000 | 2,742,554 | |||||||||||||||||||||||
| JPY |
FIXED | 0.15 | % | 0.10 | % | 2010 | 2025 | 27,195,000,000 | 174,087,050 | 1,295,000,000 | 8,289,860 | |||||||||||||||||||||||
| JPY |
FIXED | 0.80 | % | 0.10 | % | 2010 | 2025 | 8,391,000,000 | 53,714,449 | 799,142,000 | 5,115,656 | |||||||||||||||||||||||
| JPY |
FIXED | 0.80 | % | 0.10 | % | 2011 | 2026 | 8,291,000,000 | 53,074,305 | 1,184,427,000 | 7,582,034 | |||||||||||||||||||||||
| JPY |
FIXED | 0.80 | % | 0.10 | % | 2013 | 2028 | 15,490,000,000 | 99,158,242 | 5,163,333,000 | 33,052,745 | |||||||||||||||||||||||
| JPY |
FIXED | 0.80 | % | 0.00 | % | 2013 | 2028 | 19,848,000,000 | 127,055,700 | 7,561,136,000 | 48,402,128 | |||||||||||||||||||||||
| JPY |
FIXED | 0.40 | % | 0.00 | % | 2020 | 2035 | 31,800,000,000 | 203,565,662 | 31,800,000,000 | 203,565,662 | |||||||||||||||||||||||
| JPY |
FIXED | 0.30 | % | 0.00 | % | 1998 | 2028 | 15,171,500,000 | 97,119,385 | 1,769,075,000 | 11,324,620 | |||||||||||||||||||||||
| JPY |
FIXED | 3.00 | % | 0.00 | % | 1998 | 2028 | 6,068,600,000 | 38,847,754 | 707,630,000 | 4,529,848 | |||||||||||||||||||||||
| JPY |
FIXED | 0.01 | % | 0.00 | % | 2020 | 2035 | 50,000,000,000 | 320,071,796 | 47,826,086,000 | 306,155,624 | |||||||||||||||||||||||
| JPY |
FIXED | 0.45 | % | 0.00 | % | 2021 | 2036 | 50,000,000,000 | 320,071,796 | 50,000,000,000 | 320,071,796 | |||||||||||||||||||||||
| JPY |
FIXED | 0.01 | % | 0.00 | % | 2023 | 2038 | 30,000,000,000 | 192,043,077 | 30,000,000,000 | 192,043,077 | |||||||||||||||||||||||
| JPY |
FIXED | 0.50 | % | 0.00 | % | 2023 | 2038 | 30,000,000,000 | 192,043,077 | 30,000,000,000 | 192,043,077 | |||||||||||||||||||||||
D-111
| CURRENCY |
INTEREST RATE BASIS |
INTEREST RATE |
COMMITMENT CHARGE |
YEAR OF CONTRACT |
YEAR OF MATURITY |
ORIGINAL AMOUNT | OUTSTANDING BALANCE | |||||||||||||||||||||||||||
| (In Original Currency) |
(In US Dollar) | (In Original Currency) |
(In US Dollar) | |||||||||||||||||||||||||||||||
| JPY |
FIXED | 1.00 | % | 0.00 | % | 1999 | 2029 | 45,200,000,000 | 289,344,903 | 9,921,951,000 | 63,514,733 | |||||||||||||||||||||||
| JPY |
FIXED | 1.00 | % | 0.00 | % | 1999 | 2029 | 35,280,000,000 | 225,842,659 | 7,744,383,000 | 49,575,171 | |||||||||||||||||||||||
| JPY |
FIXED | 1.00 | % | 0.00 | % | 2000 | 2030 | 35,964,000,000 | 230,221,241 | 9,648,870,000 | 61,766,623 | |||||||||||||||||||||||
| JPY |
FIXED | 1.80 | % | 0.00 | % | 2001 | 2031 | 6,350,883,729 | 40,654,775 | 2,453,190,000 | 15,703,939 | |||||||||||||||||||||||
| JPY |
FIXED | 1.80 | % | 0.00 | % | 2001 | 2031 | 18,473,896,575 | 118,259,465 | 6,951,410,000 | 44,499,006 | |||||||||||||||||||||||
| JPY |
FIXED | 1.80 | % | 0.00 | % | 2001 | 2031 | 19,906,758,134 | 127,431,836 | 7,065,630,000 | 45,230,178 | |||||||||||||||||||||||
| JPY |
FIXED | 0.75 | % | 0.00 | % | 2001 | 2041 | 5,705,511,965 | 36,523,469 | 3,180,088,000 | 20,357,130 | |||||||||||||||||||||||
| JPY |
FIXED | 0.95 | % | 0.00 | % | 2001 | 2041 | 21,556,651,657 | 137,993,524 | 12,158,944,000 | 77,834,701 | |||||||||||||||||||||||
| JPY |
FIXED | 1.80 | % | 0.00 | % | 2002 | 2032 | 25,541,797,385 | 163,504,179 | 11,034,388,000 | 70,635,928 | |||||||||||||||||||||||
| JPY |
FIXED | 1.80 | % | 0.00 | % | 2002 | 2032 | 13,784,512,741 | 88,240,675 | 5,938,880,000 | 38,017,360 | |||||||||||||||||||||||
| JPY |
FIXED | 0.95 | % | 0.00 | % | 2003 | 2043 | 48,538,362,136 | 310,715,214 | 29,435,683,000 | 188,430,638 | |||||||||||||||||||||||
| JPY |
FIXED | 1.80 | % | 0.00 | % | 2003 | 2033 | 54,150,511,998 | 346,641,032 | 23,773,392,000 | 152,183,845 | |||||||||||||||||||||||
| JPY |
FIXED | 1.80 | % | 0.00 | % | 2003 | 2033 | 16,526,621,188 | 105,794,106 | 7,255,566,000 | 46,446,041 | |||||||||||||||||||||||
| JPY |
FIXED | 1.80 | % | 0.00 | % | 2004 | 2034 | 14,542,600,396 | 93,093,524 | 6,739,243,000 | 43,140,832 | |||||||||||||||||||||||
| JPY |
FIXED | 1.30 | % | 0.00 | % | 2004 | 2034 | 56,647,456,984 | 362,625,065 | 26,227,714,000 | 167,895,030 | |||||||||||||||||||||||
| JPY |
FIXED | 0.75 | % | 0.00 | % | 2004 | 2044 | 558,369,285 | 3,574,365 | 356,967,000 | 2,285,101 | |||||||||||||||||||||||
| JPY |
FIXED | 0.75 | % | 0.00 | % | 2004 | 2044 | 4,517,356,107 | 28,917,566 | 3,090,789,000 | 19,785,488 | |||||||||||||||||||||||
| JPY |
FIXED | 1.30 | % | 0.00 | % | 2004 | 2034 | 9,093,144,720 | 58,209,183 | 4,213,877,000 | 26,974,864 | |||||||||||||||||||||||
| JPY |
FIXED | 1.30 | % | 0.00 | % | 2004 | 2034 | 3,382,052,096 | 21,649,990 | 1,567,272,000 | 10,032,791 | |||||||||||||||||||||||
| JPY |
FIXED | 1.30 | % | 0.00 | % | 2004 | 2034 | 5,382,263,817 | 34,454,217 | 2,494,206,000 | 15,966,500 | |||||||||||||||||||||||
| JPY |
FIXED | 1.30 | % | 0.00 | % | 2004 | 2034 | 10,551,284,688 | 67,543,373 | 4,793,016,000 | 30,682,185 | |||||||||||||||||||||||
| JPY |
FIXED | 1.30 | % | 0.00 | % | 2005 | 2035 | 8,515,235,486 | 54,509,734 | 4,288,578,000 | 27,453,057 | |||||||||||||||||||||||
| JPY |
FIXED | 1.30 | % | 0.00 | % | 2005 | 2035 | 13,690,981,879 | 87,641,943 | 7,009,842,000 | 44,873,054 | |||||||||||||||||||||||
| JPY |
FIXED | 1.30 | % | 0.00 | % | 2005 | 2035 | 16,401,023,543 | 104,990,101 | 8,400,504,000 | 53,775,288 | |||||||||||||||||||||||
| JPY |
FIXED | 0.75 | % | 0.00 | % | 2005 | 2045 | 16,068,683,783 | 102,862,649 | 10,800,220,000 | 69,136,916 | |||||||||||||||||||||||
| JPY |
FIXED | 0.75 | % | 0.00 | % | 2005 | 2045 | 677,399,208 | 4,336,328 | 455,223,000 | 2,914,081 | |||||||||||||||||||||||
| JPY |
FIXED | 1.30 | % | 0.00 | % | 2005 | 2035 | 9,677,262,639 | 61,948,377 | 4,955,076,000 | 31,719,601 | |||||||||||||||||||||||
| JPY |
FIXED | 0.40 | % | 0.00 | % | 2005 | 2045 | 2,880,815,148 | 18,441,354 | 1,936,225,000 | 12,394,620 | |||||||||||||||||||||||
| JPY |
FIXED | 0.40 | % | 0.00 | % | 2005 | 2045 | 17,911,070,347 | 114,656,569 | 11,422,969,000 | 73,123,404 | |||||||||||||||||||||||
| JPY |
FIXED | 1.30 | % | 0.00 | % | 2005 | 2035 | 2,596,360,512 | 16,620,435 | 1,409,098,000 | 9,020,251 | |||||||||||||||||||||||
| JPY |
FIXED | 0.40 | % | 0.00 | % | 2006 | 2046 | 23,125,703,144 | 148,037,707 | 16,218,181,000 | 103,819,646 | |||||||||||||||||||||||
| JPY |
FIXED | 0.75 | % | 0.00 | % | 2006 | 2046 | 27,598,117,698 | 176,667,582 | 24,260,557,000 | 155,302,401 | |||||||||||||||||||||||
| JPY |
FIXED | 1.50 | % | 0.00 | % | 2006 | 2036 | 15,671,499,292 | 100,320,098 | 8,782,458,000 | 56,220,342 | |||||||||||||||||||||||
| JPY |
FIXED | 0.75 | % | 0.00 | % | 2006 | 2046 | 8,040,654,742 | 51,471,736 | 5,667,959,000 | 36,283,076 | |||||||||||||||||||||||
| JPY |
FIXED | 0.40 | % | 0.00 | % | 2006 | 2046 | 1,550,354,185 | 9,924,493 | 1,118,260,000 | 7,158,470 | |||||||||||||||||||||||
| JPY |
FIXED | 1.50 | % | 0.00 | % | 2007 | 2037 | 284,232,810 | 1,819,498 | 41,525,000 | 265,820 | |||||||||||||||||||||||
| JPY |
FIXED | 0.75 | % | 0.00 | % | 2007 | 2047 | 25,927,805,569 | 165,975,186 | 19,117,170,000 | 122,377,339 | |||||||||||||||||||||||
| JPY |
FIXED | 1.50 | % | 0.00 | % | 2007 | 2037 | 10,046,900,990 | 64,314,593 | 6,126,150,000 | 39,216,157 | |||||||||||||||||||||||
| JPY |
FIXED | 1.50 | % | 0.00 | % | 2007 | 2037 | 833,233,056 | 5,333,888 | 508,025,000 | 3,252,089 | |||||||||||||||||||||||
| JPY |
FIXED | 1.50 | % | 0.00 | % | 2007 | 2037 | 7,752,931,689 | 49,629,895 | 4,792,760,000 | 30,680,546 | |||||||||||||||||||||||
| JPY |
FIXED | 1.50 | % | 0.00 | % | 2007 | 2037 | 1,520,108,426 | 9,730,877 | 926,875,000 | 5,933,331 | |||||||||||||||||||||||
| JPY |
FIXED | 1.50 | % | 0.00 | % | 2007 | 2037 | 23,183,574,406 | 148,408,166 | 14,136,300,000 | 90,492,618 | |||||||||||||||||||||||
| JPY |
FIXED | 0.40 | % | 0.00 | % | 2007 | 2047 | 6,210,886,208 | 39,758,590 | 4,579,785,000 | 29,317,200 | |||||||||||||||||||||||
| JPY |
FIXED | 0.75 | % | 0.00 | % | 2007 | 2047 | 8,619,294,974 | 55,175,864 | 6,321,915,000 | 40,469,334 | |||||||||||||||||||||||
| JPY |
FIXED | 1.40 | % | 0.10 | % | 2008 | 2038 | 12,260,163,334 | 78,482,650 | 8,073,702,000 | 51,683,286 | |||||||||||||||||||||||
| JPY |
FIXED | 1.40 | % | 0.10 | % | 2008 | 2038 | 8,591,830,235 | 55,000,051 | 5,657,985,000 | 36,219,228 | |||||||||||||||||||||||
| JPY |
FIXED | 0.01 | % | 0.10 | % | 2008 | 2038 | 646,301,237 | 4,137,256 | 425,601,000 | 2,724,458 | |||||||||||||||||||||||
| JPY |
FIXED | 1.40 | % | 0.10 | % | 2008 | 2038 | 14,179,821,482 | 90,771,218 | 9,322,317,000 | 59,676,215 | |||||||||||||||||||||||
| JPY |
FIXED | 0.65 | % | 0.10 | % | 2008 | 2048 | 5,846,601,826 | 37,426,647 | 4,504,668,000 | 28,836,343 | |||||||||||||||||||||||
| JPY |
FIXED | 1.40 | % | 0.10 | % | 2009 | 2039 | 6,407,959,986 | 41,020,145 | 4,532,410,000 | 29,013,932 | |||||||||||||||||||||||
| JPY |
FIXED | 1.40 | % | 0.10 | % | 2009 | 2039 | 5,414,467,136 | 34,660,364 | 3,829,682,000 | 24,515,464 | |||||||||||||||||||||||
| JPY |
FIXED | 1.40 | % | 0.10 | % | 2009 | 2039 | 4,812,991,753 | 30,810,058 | 3,404,252,000 | 21,792,101 | |||||||||||||||||||||||
| JPY |
FIXED | 0.20 | % | 0.10 | % | 2009 | 2049 | 48,131,267,599 | 308,109,225 | 38,662,470,000 | 247,495,324 | |||||||||||||||||||||||
| JPY |
FIXED | 0.01 | % | 0.10 | % | 2009 | 2039 | 1,572,911,089 | 10,068,890 | 1,028,630,000 | 6,584,709 | |||||||||||||||||||||||
| JPY |
FIXED | 0.30 | % | 0.10 | % | 2011 | 2050 | 26,966,000,000 | 172,621,121 | 18,380,903,724 | 117,664,177 | |||||||||||||||||||||||
D-112
| CURRENCY |
INTEREST RATE BASIS |
INTEREST RATE |
COMMITMENT CHARGE |
YEAR OF CONTRACT |
YEAR OF MATURITY |
ORIGINAL AMOUNT | OUTSTANDING BALANCE | |||||||||||||||||||||||||||
| (In Original Currency) |
(In US Dollar) | (In Original Currency) |
(In US Dollar) | |||||||||||||||||||||||||||||||
| JPY |
FIXED | 1.40 | % | 0.10 | % | 2013 | 2038 | 3,077,927,607 | 19,703,156 | 2,231,010,000 | 14,281,668 | |||||||||||||||||||||||
| JPY |
FIXED | 0.30 | % | 0.10 | % | 2013 | 2053 | 3,663,148,274 | 23,449,409 | 3,422,850,000 | 21,911,155 | |||||||||||||||||||||||
| JPY |
FIXED | 0.01 | % | 0.10 | % | 2013 | 2053 | 721,915,649 | 4,621,297 | 584,649,000 | 3,742,593 | |||||||||||||||||||||||
| JPY |
FIXED | 1.40 | % | 0.00 | % | 2014 | 2044 | 16,322,000,000 | 104,484,237 | 241,482,713 | 1,545,836 | |||||||||||||||||||||||
| JPY |
FIXED | 1.40 | % | 0.00 | % | 2014 | 2039 | 9,554,358,849 | 61,161,616 | 7,480,637,000 | 47,886,818 | |||||||||||||||||||||||
| JPY |
FIXED | 0.01 | % | 0.00 | % | 2014 | 2054 | 1,411,006,769 | 9,032,469 | 1,364,670,000 | 8,735,848 | |||||||||||||||||||||||
| JPY |
FIXED | 0.01 | % | 0.00 | % | 2014 | 2054 | 5,000,975,715 | 32,013,426 | 4,831,982,000 | 30,931,623 | |||||||||||||||||||||||
| JPY |
FIXED | 1.40 | % | 0.00 | % | 2014 | 2037 | 4,954,000,000 | 31,712,713 | 3,334,060,101 | 21,342,772 | |||||||||||||||||||||||
| JPY |
FIXED | 0.30 | % | 0.00 | % | 2014 | 2054 | 7,075,000,000 | 45,290,159 | 6,777,889,482 | 43,388,225 | |||||||||||||||||||||||
| JPY |
FIXED | 0.01 | % | 0.00 | % | 2015 | 2040 | 1,911,026,019 | 12,233,311 | 1,651,674,019 | 10,573,085 | |||||||||||||||||||||||
| JPY |
FIXED | 0.10 | % | 0.00 | % | 2015 | 2055 | 68,305,676,917 | 437,254,413 | 68,230,458,917 | 436,772,910 | |||||||||||||||||||||||
| JPY |
FIXED | 0.01 | % | 0.10 | % | 2015 | 2055 | 657,000,000 | 4,205,743 | 414,936,752 | 2,656,191 | |||||||||||||||||||||||
| JPY |
TORF 6 MONTHS | 0.76 | % | 0.00 | % | 2017 | 2047 | 48,237,000,000 | 308,786,064 | 37,194,993,689 | 238,101,368 | |||||||||||||||||||||||
| JPY |
TORF 6 MONTHS | 0.76 | % | 0.00 | % | 2017 | 2047 | 15,896,000,000 | 101,757,225 | 3,656,325,214 | 23,405,732 | |||||||||||||||||||||||
| JPY |
TORF 6 MONTHS | 0.76 | % | 0.00 | % | 2017 | 2047 | 9,855,000,000 | 63,086,151 | 1,942,443,893 | 12,434,430 | |||||||||||||||||||||||
| JPY |
TORF 6 MONTHS | 0.61 | % | 0.00 | % | 2017 | 2042 | 8,042,507,966 | 51,483,599 | 7,809,574,966 | 49,992,494 | |||||||||||||||||||||||
| JPY |
FIXED | 0.10 | % | 0.00 | % | 2017 | 2057 | 118,906,000,000 | 761,169,138 | 93,823,268,203 | 600,603,638 | |||||||||||||||||||||||
| JPY |
FIXED | 0.10 | % | 0.00 | % | 2018 | 2058 | 70,021,000,000 | 448,234,944 | 69,689,691,125 | 446,114,091 | |||||||||||||||||||||||
| JPY |
FIXED | 1.30 | % | 0.00 | % | 2019 | 2044 | 30,980,000,000 | 198,316,484 | 1,559,470,774 | 9,982,852 | |||||||||||||||||||||||
| JPY |
FIXED | 0.01 | % | 0.00 | % | 2020 | 2060 | 27,970,000,000 | 179,048,162 | 24,127,411,773 | 154,450,080 | |||||||||||||||||||||||
| JPY |
FIXED | 1.20 | % | 0.00 | % | 2020 | 2045 | 57,061,000,000 | 365,272,334 | 19,006,732,066 | 121,670,377 | |||||||||||||||||||||||
| JPY |
FIXED | 0.80 | % | 0.00 | % | 2020 | 2040 | 7,299,000,000 | 46,724,081 | 3,012,426,586 | 19,283,856 | |||||||||||||||||||||||
| JPY |
FIXED | 0.10 | % | 0.00 | % | 2022 | 2062 | 70,195,000,000 | 449,348,794 | 37,825,032,463 | 242,134,521 | |||||||||||||||||||||||
| JPY |
FIXED | 0.10 | % | 0.00 | % | 2023 | 2063 | 87,918,000,000 | 562,801,442 | 36,306,050,672 | 232,410,857 | |||||||||||||||||||||||
| JPY |
FIXED | 1.05 | % | 0.00 | % | 2023 | 2038 | 42,120,000,000 | 269,628,481 | 12,830,295,787 | 82,132,316 | |||||||||||||||||||||||
| JPY |
COMMERCIAL INTEREST REFERENCE RATE | 2.20 | % | 0.20 | % | 2012 | 2025 | 1,412,670,247 | 9,043,118 | 53,063,635 | 339,683 | |||||||||||||||||||||||
| KRW |
FIXED | 2.50 | % | 0.00 | % | 1998 | 2027 | 27,366,962,730 | 18,564,208 | 4,105,044,000 | 2,784,631 | |||||||||||||||||||||||
| KRW |
FIXED | 2.50 | % | 0.00 | % | 2000 | 2030 | 44,912,981,250 | 30,466,440 | 13,473,888,000 | 9,139,928 | |||||||||||||||||||||||
| KRW |
FIXED | 2.00 | % | 0.00 | % | 2000 | 2030 | 32,899,947,110 | 22,317,474 | 9,869,976,000 | 6,695,237 | |||||||||||||||||||||||
| KRW |
FIXED | 3.00 | % | 0.00 | % | 2001 | 2025 | 13,203,435,770 | 8,956,468 | 733,524,000 | 497,581 | |||||||||||||||||||||||
| KRW |
FIXED | 2.00 | % | 0.00 | % | 2005 | 2035 | 19,312,358,510 | 13,100,418 | 10,621,776,000 | 7,205,215 | |||||||||||||||||||||||
| KRW |
FIXED | 1.50 | % | 0.00 | % | 2007 | 2037 | 14,124,233,500 | 9,581,086 | 9,180,730,000 | 6,227,691 | |||||||||||||||||||||||
| KRW |
FIXED | 1.50 | % | 0.00 | % | 2007 | 2037 | 19,102,895,130 | 12,958,330 | 12,416,872,000 | 8,422,908 | |||||||||||||||||||||||
| KRW |
FIXED | 1.50 | % | 0.00 | % | 2007 | 2037 | 23,717,066,770 | 16,088,324 | 15,416,076,000 | 10,457,399 | |||||||||||||||||||||||
| KRW |
FIXED | 1.50 | % | 0.00 | % | 2009 | 2039 | 32,354,707,860 | 21,947,614 | 23,457,143,000 | 15,912,006 | |||||||||||||||||||||||
| KRW |
FIXED | 0.20 | % | 0.00 | % | 2011 | 2041 | 39,845,706,280 | 27,029,086 | 32,872,686,000 | 22,298,981 | |||||||||||||||||||||||
| KRW |
FIXED | 0.15 | % | 0.00 | % | 2011 | 2051 | 109,426,000,000 | 74,228,443 | 97,825,212,000 | 66,359,121 | |||||||||||||||||||||||
| KRW |
FIXED | 0.15 | % | 0.00 | % | 2014 | 2054 | 57,397,000,000 | 38,934,896 | 51,111,495,070 | 34,671,163 | |||||||||||||||||||||||
| KRW |
FIXED | 0.15 | % | 0.00 | % | 2014 | 2054 | 40,720,146,500 | 27,622,257 | 40,041,412,000 | 27,161,842 | |||||||||||||||||||||||
| KRW |
NO INTEREST RATE | 0.00 | % | 0.00 | % | 2019 | 2059 | 98,000,000 | 66,478 | 8,189,999,100 | 5,555,635 | |||||||||||||||||||||||
| KRW |
NO INTEREST RATE | 0.00 | % | 0.00 | % | 2021 | 2061 | 67,255,000 | 45,622 | 4,901,626,240 | 3,324,988 | |||||||||||||||||||||||
| KRW |
FIXED | 0.15 | % | 0.00 | % | 2023 | 2062 | 48,010,000,000 | 32,567,284 | 29,477,648,750 | 19,995,979 | |||||||||||||||||||||||
| SAR |
FIXED | 2.00 | % | 0.00 | % | 2010 | 2035 | 107,294,934 | 28,558,701 | 52,094,669 | 13,866,042 | |||||||||||||||||||||||
| SAR |
FIXED | 2.00 | % | 0.00 | % | 2014 | 2038 | 111,198,680 | 29,597,762 | 73,136,000 | 19,466,615 | |||||||||||||||||||||||
| SAR |
FIXED | 2.00 | % | 0.00 | % | 2019 | 2038 | 208,500,000 | 55,496,462 | 95,902,628 | 25,526,410 | |||||||||||||||||||||||
| SAR |
FIXED | 2.00 | % | 0.00 | % | 2019 | 2038 | 122,625,000 | 32,639,106 | 87,316,291 | 23,240,984 | |||||||||||||||||||||||
| SAR |
FIXED | 2.00 | % | 0.00 | % | 2019 | 2039 | 83,625,000 | 22,258,473 | 14,845,482 | 3,951,423 | |||||||||||||||||||||||
| USD |
FIXED | 3.90 | % | 0.25 | % | 2014 | 2025 | 200,000,000 | 200,000,000 | 23,530,000 | 23,530,000 | |||||||||||||||||||||||
| USD |
FIXED | 3.40 | % | 0.25 | % | 2015 | 2026 | 45,000,000 | 45,000,000 | 7,941,177 | 7,941,177 | |||||||||||||||||||||||
| USD |
FIXED | 3.40 | % | 0.25 | % | 2015 | 2026 | 200,000,000 | 200,000,000 | 47,060,000 | 47,060,000 | |||||||||||||||||||||||
| USD |
FIXED | 2.85 | % | 0.25 | % | 2016 | 2027 | 220,000,000 | 220,000,000 | 77,649,000 | 77,649,000 | |||||||||||||||||||||||
| USD |
FIXED | 3.47 | % | 0.25 | % | 2016 | 2028 | 220,000,000 | 220,000,000 | 90,590,000 | 90,590,000 | |||||||||||||||||||||||
D-113
| CURRENCY |
INTEREST RATE BASIS |
INTEREST RATE |
COMMITMENT CHARGE |
YEAR OF CONTRACT |
YEAR OF MATURITY |
ORIGINAL AMOUNT | OUTSTANDING BALANCE | |||||||||||||||||||||||||||
| (In Original Currency) |
(In US Dollar) | (In Original Currency) |
(In US Dollar) | |||||||||||||||||||||||||||||||
| USD |
FIXED | 3.71 | % | 0.00 | % | 2010 | 2025 | 300,000,000 | 300,000,000 | 15,000,000 | 15,000,000 | |||||||||||||||||||||||
| USD |
FIXED | 2.43 | % | 0.00 | % | 2010 | 2025 | 31,621,675 | 31,621,675 | 1,581,084 | 1,581,084 | |||||||||||||||||||||||
| USD |
FIXED | 3.24 | % | 0.00 | % | 2012 | 2032 | 29,999,128 | 29,999,128 | 14,999,564 | 14,999,564 | |||||||||||||||||||||||
| USD |
SOFR 6 MONTHS | 6.11 | % | 0.25 | % | 2023 | 2040 | 39,999,391 | 39,999,391 | 646,000 | 646,000 | |||||||||||||||||||||||
| USD |
FIXED | 3.85 | % | 0.00 | % | 2013 | 2028 | 38,758,055 | 38,758,055 | 13,565,319 | 13,565,319 | |||||||||||||||||||||||
| USD |
FIXED | 5.00 | % | 0.30 | % | 2014 | 2028 | 9,481,270 | 9,481,270 | 3,318,444 | 3,318,444 | |||||||||||||||||||||||
| USD |
NO INTEREST RATE | 0.00 | % | 0.00 | % | 2018 | 2058 | 31,705,000 | 31,705,000 | 13,157,363 | 13,157,363 | |||||||||||||||||||||||
| USD |
FIXED | 1.00 | % | 0.00 | % | 2022 | 2033 | 100,000,000 | 100,000,000 | 100,000,000 | 100,000,000 | |||||||||||||||||||||||
| USD |
FIXED | 1.30 | % | 0.00 | % | 2023 | 2039 | 207,725,000 | 207,725,000 | 2,522,612 | 2,522,612 | |||||||||||||||||||||||
| USD |
FIXED | 1.00 | % | 0.00 | % | 2023 | 2043 | 60,000,000 | 60,000,000 | 60,000,000 | 60,000,000 | |||||||||||||||||||||||
| USD |
FIXED | 2.60 | % | 0.00 | % | 2017 | 2030 | 101,660,000 | 101,660,000 | 60,996,000 | 60,996,000 | |||||||||||||||||||||||
| USD |
FIXED | 5.30 | % | 0.00 | % | 2009 | 2024 | 42,500,000 | 42,500,000 | 8,500,000 | 8,500,000 | |||||||||||||||||||||||
| USD |
FIXED | 5.30 | % | 0.00 | % | 2009 | 2024 | 47,685,000 | 47,685,000 | 11,921,250 | 11,921,250 | |||||||||||||||||||||||
| USD |
FIXED | 5.30 | % | 0.00 | % | 2010 | 2025 | 47,600,000 | 47,600,000 | 14,280,000 | 14,280,000 | |||||||||||||||||||||||
| USD |
FIXED | 5.30 | % | 0.00 | % | 2010 | 2025 | 2,550,000 | 2,550,000 | 765,000 | 765,000 | |||||||||||||||||||||||
| USD |
FIXED | 5.30 | % | 0.00 | % | 2011 | 2026 | 45,900,000 | 45,900,000 | 18,360,000 | 18,360,000 | |||||||||||||||||||||||
| USD |
FIXED | 5.30 | % | 0.00 | % | 2011 | 2026 | 4,242,605 | 4,242,605 | 1,697,042 | 1,697,042 | |||||||||||||||||||||||
| USD |
FIXED | 5.30 | % | 0.00 | % | 2012 | 2027 | 96,900,000 | 96,900,000 | 53,295,000 | 53,295,000 | |||||||||||||||||||||||
| USD |
FIXED | 3.47 | % | 0.00 | % | 2002 | 2028 | 49,578,504 | 49,578,504 | 9,640,265 | 9,640,265 | |||||||||||||||||||||||
| USD |
FIXED | 3.47 | % | 0.00 | % | 2002 | 2032 | 3,693,809 | 3,693,809 | 1,539,087 | 1,539,087 | |||||||||||||||||||||||
| USD |
FIXED | 3.00 | % | 0.00 | % | 1987 | 2029 | 602,843 | 602,843 | 126,687 | 126,687 | |||||||||||||||||||||||
| USD |
FIXED | 3.00 | % | 0.00 | % | 1979 | 2025 | 5,078,561 | 5,078,561 | 95,214 | 95,214 | |||||||||||||||||||||||
| USD |
FIXED | 3.00 | % | 0.00 | % | 1982 | 2026 | 1,175,983 | 1,175,983 | 113,934 | 113,934 | |||||||||||||||||||||||
| USD |
FIXED | 3.00 | % | 0.00 | % | 1983 | 2026 | 194,518 | 194,518 | 18,846 | 18,846 | |||||||||||||||||||||||
| USD |
FIXED | 3.00 | % | 0.00 | % | 1981 | 2028 | 286,568 | 286,568 | 47,528 | 47,528 | |||||||||||||||||||||||
| USD |
FIXED | 3.00 | % | 0.00 | % | 1982 | 2027 | 1,477,874 | 1,477,874 | 211,638 | 211,638 | |||||||||||||||||||||||
| USD |
FIXED | 3.00 | % | 0.00 | % | 1985 | 2027 | 2,368,361 | 2,368,361 | 339,161 | 339,161 | |||||||||||||||||||||||
| USD |
FIXED | 3.00 | % | 0.00 | % | 1985 | 2027 | 4,075,000 | 4,075,000 | 489,883 | 489,883 | |||||||||||||||||||||||
| USD |
FIXED | 3.00 | % | 0.00 | % | 1985 | 2027 | 31,812 | 31,812 | 4,555 | 4,555 | |||||||||||||||||||||||
| USD |
FIXED | 3.00 | % | 0.00 | % | 1987 | 2028 | 51,760 | 51,760 | 9,740 | 9,740 | |||||||||||||||||||||||
| USD |
FIXED | 3.00 | % | 0.00 | % | 1987 | 2029 | 585,449 | 585,449 | 123,032 | 123,032 | |||||||||||||||||||||||
| USD |
FIXED | 3.00 | % | 0.00 | % | 1987 | 2031 | 1,215,947 | 1,215,947 | 358,563 | 358,563 | |||||||||||||||||||||||
| USD |
FIXED | 3.00 | % | 0.00 | % | 1981 | 2025 | 25,960 | 25,960 | 643 | 643 | |||||||||||||||||||||||
| USD |
FIXED | 3.00 | % | 0.00 | % | 1982 | 2025 | 1,500,000 | 1,500,000 | 73,745 | 73,745 | |||||||||||||||||||||||
| USD |
FIXED | 3.00 | % | 0.00 | % | 1986 | 2028 | 100,000 | 100,000 | 16,586 | 16,586 | |||||||||||||||||||||||
| USD |
FIXED | 3.00 | % | 0.00 | % | 1987 | 2027 | 1,775,032 | 1,775,032 | 213,390 | 213,390 | |||||||||||||||||||||||
| USD |
FIXED | 3.00 | % | 0.00 | % | 1986 | 2026 | 980,434 | 980,434 | 94,989 | 94,989 | |||||||||||||||||||||||
| USD |
FIXED | 3.00 | % | 0.00 | % | 1983 | 2025 | 3,494,360 | 3,494,360 | 171,794 | 171,794 | |||||||||||||||||||||||
| USD |
FIXED | 3.00 | % | 0.00 | % | 1983 | 2026 | 2,254,775 | 2,254,775 | 218,451 | 218,451 | |||||||||||||||||||||||
| USD |
FIXED | 3.00 | % | 0.00 | % | 1983 | 2025 | 3,888,753 | 3,888,753 | 96,304 | 96,304 | |||||||||||||||||||||||
| USD |
FIXED | 3.00 | % | 0.00 | % | 1987 | 2028 | 1,229,291 | 1,229,291 | 202,878 | 202,878 | |||||||||||||||||||||||
| USD |
FIXED | 3.00 | % | 0.00 | % | 1984 | 2026 | 2,100,000 | 2,100,000 | 153,723 | 153,723 | |||||||||||||||||||||||
| USD |
FIXED | 3.00 | % | 0.00 | % | 1984 | 2028 | 1,170,000 | 1,170,000 | 194,048 | 194,048 | |||||||||||||||||||||||
| USD |
FIXED | 3.00 | % | 0.00 | % | 1984 | 2027 | 1,000,000 | 1,000,000 | 143,205 | 143,205 | |||||||||||||||||||||||
| USD |
FIXED | 3.00 | % | 0.00 | % | 1985 | 2028 | 1,959,000 | 1,959,000 | 368,618 | 368,618 | |||||||||||||||||||||||
| USD |
FIXED | 3.00 | % | 0.00 | % | 1985 | 2029 | 41,000 | 41,000 | 8,616 | 8,616 | |||||||||||||||||||||||
| USD |
FIXED | 3.00 | % | 0.00 | % | 1984 | 2026 | 1,200,000 | 1,200,000 | 116,261 | 116,261 | |||||||||||||||||||||||
| USD |
FIXED | 3.00 | % | 0.00 | % | 1986 | 2028 | 2,125,851 | 2,125,851 | 352,579 | 352,579 | |||||||||||||||||||||||
| USD |
FIXED | 3.00 | % | 0.00 | % | 1986 | 2028 | 696,000 | 696,000 | 130,964 | 130,964 | |||||||||||||||||||||||
| USD |
FIXED | 3.00 | % | 0.00 | % | 1986 | 2026 | 1,751,928 | 1,751,928 | 169,734 | 169,734 | |||||||||||||||||||||||
| USD |
FIXED | 3.00 | % | 0.00 | % | 1984 | 2025 | 3,936,113 | 3,936,113 | 97,476 | 97,476 | |||||||||||||||||||||||
| USD |
FIXED | 3.00 | % | 0.00 | % | 1984 | 2026 | 70,000 | 70,000 | 6,782 | 6,782 | |||||||||||||||||||||||
| USD |
FIXED | 3.00 | % | 0.00 | % | 1984 | 2025 | 5,382,648 | 5,382,648 | 264,628 | 264,628 | |||||||||||||||||||||||
| USD |
FIXED | 3.00 | % | 0.00 | % | 1984 | 2027 | 1,832,922 | 1,832,922 | 220,348 | 220,348 | |||||||||||||||||||||||
| USD |
FIXED | 3.00 | % | 0.00 | % | 1984 | 2025 | 14,211,987 | 14,211,987 | 698,707 | 698,707 | |||||||||||||||||||||||
| USD |
FIXED | 3.00 | % | 0.00 | % | 1986 | 2030 | 530,451 | 530,451 | 134,283 | 134,283 | |||||||||||||||||||||||
| USD |
FIXED | 3.00 | % | 0.00 | % | 1984 | 2025 | 4,244,083 | 4,244,083 | 105,103 | 105,103 | |||||||||||||||||||||||
D-114
| CURRENCY |
INTEREST RATE BASIS |
INTEREST RATE |
COMMITMENT CHARGE |
YEAR OF CONTRACT |
YEAR OF MATURITY |
ORIGINAL AMOUNT | OUTSTANDING BALANCE | |||||||||||||||||||||||||||
| (In Original Currency) |
(In US Dollar) | (In Original Currency) |
(In US Dollar) | |||||||||||||||||||||||||||||||
| USD |
FIXED | 3.00 | % | 0.00 | % | 1984 | 2025 | 4,371,309 | 4,371,309 | 108,254 | 108,254 | |||||||||||||||||||||||
| USD |
FIXED | 3.00 | % | 0.00 | % | 1984 | 2025 | 190,000 | 190,000 | 4,705 | 4,705 | |||||||||||||||||||||||
| USD |
FIXED | 3.00 | % | 0.00 | % | 1986 | 2027 | 196,750 | 196,750 | 28,176 | 28,176 | |||||||||||||||||||||||
| USD |
FIXED | 3.00 | % | 0.00 | % | 1985 | 2026 | 236,726 | 236,726 | 17,329 | 17,329 | |||||||||||||||||||||||
| USD |
FIXED | 3.00 | % | 0.00 | % | 1985 | 2026 | 4,171,492 | 4,171,492 | 305,358 | 305,358 | |||||||||||||||||||||||
| USD |
FIXED | 3.00 | % | 0.00 | % | 1985 | 2026 | 3,364,174 | 3,364,174 | 325,934 | 325,934 | |||||||||||||||||||||||
| USD |
FIXED | 3.00 | % | 0.00 | % | 1986 | 2027 | 3,322,901 | 3,322,901 | 399,468 | 399,468 | |||||||||||||||||||||||
| USD |
FIXED | 3.00 | % | 0.00 | % | 1986 | 2030 | 1,717,012 | 1,717,012 | 470,756 | 470,756 | |||||||||||||||||||||||
| USD |
FIXED | 3.00 | % | 0.00 | % | 1987 | 2028 | 7,967,454 | 7,967,454 | 1,499,208 | 1,499,208 | |||||||||||||||||||||||
| USD |
FIXED | 3.00 | % | 0.00 | % | 1987 | 2030 | 1,772,056 | 1,772,056 | 485,847 | 485,847 | |||||||||||||||||||||||
| USD |
FIXED | 7.31 | % | 0.00 | % | 1995 | 2025 | 20,000,000 | 20,000,000 | 1,818,103 | 1,818,103 | |||||||||||||||||||||||
| USD |
FIXED | 7.31 | % | 0.00 | % | 1995 | 2025 | 5,000,000 | 5,000,000 | 454,526 | 454,526 | |||||||||||||||||||||||
| USD |
FIXED | 7.44 | % | 0.00 | % | 1994 | 2026 | 15,000,000 | 15,000,000 | 2,654,864 | 2,654,864 | |||||||||||||||||||||||
| USD |
FIXED | 7.44 | % | 0.00 | % | 1994 | 2026 | 10,000,000 | 10,000,000 | 1,769,909 | 1,769,909 | |||||||||||||||||||||||
| USD |
FIXED | 3.00 | % | 0.00 | % | 1998 | 2028 | 23,144,880 | 23,144,880 | 3,560,751 | 3,560,751 | |||||||||||||||||||||||
| USD |
FIXED | 6.65 | % | 0.00 | % | 1999 | 2029 | 11,000,000 | 11,000,000 | 4,205,348 | 4,205,348 | |||||||||||||||||||||||
| USD |
FIXED | 6.65 | % | 0.00 | % | 1999 | 2029 | 14,000,000 | 14,000,000 | 5,352,261 | 5,352,261 | |||||||||||||||||||||||
| USD |
FIXED | 1.00 | % | 0.00 | % | 1999 | 2029 | 40,476,113 | 40,476,113 | 7,783,868 | 7,783,868 | |||||||||||||||||||||||
| USD |
FIXED | 1.00 | % | 0.00 | % | 2002 | 2032 | 18,995,245 | 18,995,245 | 6,021,366 | 6,021,366 | |||||||||||||||||||||||
| USD |
FIXED | 1.25 | % | 0.00 | % | 1994 | 2025 | 100,000,000 | 100,000,000 | 2,439,024 | 2,439,024 | |||||||||||||||||||||||
| USD |
FIXED | 1.25 | % | 0.00 | % | 1995 | 2025 | 10,803,941 | 10,803,941 | 263,511 | 263,511 | |||||||||||||||||||||||
| USD |
FIXED | 0.30 | % | 0.00 | % | 1995 | 2026 | 7,138,645 | 7,138,645 | 522,340 | 522,340 | |||||||||||||||||||||||
| USD |
FIXED | 1.25 | % | 0.00 | % | 1996 | 2027 | 8,000,000 | 8,000,000 | 975,610 | 975,610 | |||||||||||||||||||||||
| USD |
FIXED | 3.50 | % | 0.00 | % | 2000 | 2025 | 18,000,000 | 18,000,000 | 972,973 | 972,973 | |||||||||||||||||||||||
| USD |
FIXED | 3.50 | % | 0.00 | % | 2000 | 2025 | 25,801,357 | 25,801,357 | 1,394,668 | 1,394,668 | |||||||||||||||||||||||
| USD |
FIXED | 3.50 | % | 0.00 | % | 2003 | 2028 | 10,199,208 | 10,199,208 | 2,205,234 | 2,205,234 | |||||||||||||||||||||||
| USD |
FIXED | 0.70 | % | 0.00 | % | 2003 | 2034 | 9,189,325 | 9,189,325 | 4,258,468 | 4,258,468 | |||||||||||||||||||||||
| USD |
FIXED | 0.70 | % | 0.00 | % | 2004 | 2034 | 9,996,353 | 9,996,353 | 4,876,270 | 4,876,270 | |||||||||||||||||||||||
| USD |
FIXED | 3.00 | % | 0.00 | % | 2011 | 2027 | 68,724,795 | 68,724,795 | 13,216,314 | 13,216,314 | |||||||||||||||||||||||
| USD |
FIXED | 3.00 | % | 0.00 | % | 2012 | 2027 | 56,251,832 | 56,251,832 | 16,406,784 | 16,406,784 | |||||||||||||||||||||||
| USD |
FIXED | 3.00 | % | 0.20 | % | 2014 | 2030 | 230,300,260 | 230,300,260 | 126,665,143 | 126,665,143 | |||||||||||||||||||||||
| USD |
FIXED | 3.00 | % | 0.20 | % | 2012 | 2028 | 101,793,291 | 101,793,291 | 35,627,652 | 35,627,652 | |||||||||||||||||||||||
| USD |
FIXED | 3.00 | % | 0.00 | % | 2012 | 2028 | 99,531,602 | 99,531,602 | 34,836,061 | 34,836,061 | |||||||||||||||||||||||
| USD |
FIXED | 3.00 | % | 0.00 | % | 2012 | 2028 | 92,761,947 | 92,761,947 | 30,920,649 | 30,920,649 | |||||||||||||||||||||||
| USD |
FIXED | 3.00 | % | 0.20 | % | 2014 | 2030 | 316,153,519 | 316,153,519 | 173,884,435 | 173,884,435 | |||||||||||||||||||||||
| USD |
FIXED | 3.00 | % | 0.20 | % | 2013 | 2026 | 116,999,053 | 116,999,053 | 23,399,811 | 23,399,811 | |||||||||||||||||||||||
| USD |
FIXED | 3.00 | % | 0.20 | % | 2015 | 2031 | 195,111,421 | 195,111,421 | 136,577,995 | 136,577,995 | |||||||||||||||||||||||
| USD |
FIXED | 3.00 | % | 0.20 | % | 2015 | 2031 | 52,453,797 | 52,453,797 | 36,717,658 | 36,717,658 | |||||||||||||||||||||||
| USD |
FIXED | 3.00 | % | 0.20 | % | 2016 | 2031 | 206,765,453 | 206,765,453 | 144,735,817 | 144,735,817 | |||||||||||||||||||||||
| USD |
FIXED | 3.00 | % | 0.20 | % | 2016 | 2031 | 77,050,253 | 77,050,253 | 53,935,177 | 53,935,177 | |||||||||||||||||||||||
| USD |
FIXED | 3.00 | % | 0.25 | % | 2016 | 2032 | 175,056,018 | 175,056,018 | 109,410,011 | 109,410,011 | |||||||||||||||||||||||
| USD |
FIXED | 3.00 | % | 0.00 | % | 2018 | 2033 | 130,285,575 | 130,285,575 | 117,257,017 | 117,257,017 | |||||||||||||||||||||||
| USD |
SOFR 6 MONTHS | 5.61 | % | 0.50 | % | 2021 | 2027 | 8,492,109 | 8,492,109 | 5,307,568 | 5,307,568 | |||||||||||||||||||||||
| USD |
FIXED | 2.80 | % | 0.25 | % | 2022 | 2032 | 251,275,159 | 251,275,159 | 188,138,507 | 188,138,507 | |||||||||||||||||||||||
| USD |
FIXED | 2.80 | % | 0.25 | % | 2022 | 2037 | 108,129,795 | 108,129,795 | 44,109,119 | 44,109,119 | |||||||||||||||||||||||
| USD |
FIXED | 2.80 | % | 0.25 | % | 2022 | 2037 | 112,733,944 | 112,733,944 | 23,820,242 | 23,820,242 | |||||||||||||||||||||||
| USD |
FIXED | 2.80 | % | 0.25 | % | 2022 | 2037 | 365,150,734 | 365,150,734 | 92,338,328 | 92,338,328 | |||||||||||||||||||||||
| USD |
FIXED | 3.00 | % | 0.25 | % | 2023 | 2040 | 237,862,427 | 237,862,427 | 34,163,393 | 34,163,393 | |||||||||||||||||||||||
| USD |
FIXED | 3.98 | % | 0.50 | % | 2012 | 2023 | 917,999,150 | 917,999,150 | 253,535,405 | 253,535,405 | |||||||||||||||||||||||
| USD |
SOFR 6 MONTHS | 5.46 | % | 0.50 | % | 2019 | 2029 | 20,400,000 | 20,400,000 | 13,114,286 | 13,114,286 | |||||||||||||||||||||||
| USD |
SOFR 6 MONTHS | 5.63 | % | 0.50 | % | 2019 | 2029 | 53,125,000 | 53,125,000 | 34,151,786 | 34,151,786 | |||||||||||||||||||||||
| COMMERCIAL CREDIT |
|
|||||||||||||||||||||||||||||||||
| CHF |
SARON COMPOUNDED | 0.85 | % | 0.25 | % | 2019 | 2028 | 25,390,381 | 28,103,806 | 12,780,549 | 14,146,383 | |||||||||||||||||||||||
| CHF |
SARON COMPOUNDED | 0.85 | % | 0.35 | % | 2017 | 2025 | 101,946,785 | 112,841,657 | 13,193,113 | 14,603,038 | |||||||||||||||||||||||
| EUR |
EURIBOR 6 MTH | 3.17 | % | 0.40 | % | 2019 | 2033 | 152,721,115 | 159,013,240 | 129,812,948 | 135,161,254 | |||||||||||||||||||||||
| EUR |
EURIBOR 6 MTH | 3.47 | % | 0.00 | % | 2022 | 2036 | 108,728,081 | 113,207,689 | 70,353,464 | 73,252,034 | |||||||||||||||||||||||
| EUR |
EURIBOR 6 MTH | 5.41 | % | 0.35 | % | 2022 | 2027 | 9,593,654 | 9,988,914 | 5,756,193 | 5,993,348 | |||||||||||||||||||||||
| EUR |
EURIBOR 6 MTH | 4.64 | % | 0.00 | % | 2023 | 2031 | 20,983,699 | 21,848,229 | 5,104,143 | 5,314,434 | |||||||||||||||||||||||
D-115
| CURRENCY |
INTEREST RATE BASIS |
INTEREST RATE |
COMMITMENT CHARGE |
YEAR OF CONTRACT |
YEAR OF MATURITY |
ORIGINAL AMOUNT | OUTSTANDING BALANCE | |||||||||||||||||||||||||||
| (In Original Currency) |
(In US Dollar) | (In Original Currency) |
(In US Dollar) | |||||||||||||||||||||||||||||||
| EUR |
FIXED | 3.50 | % | 0.00 | % | 1998 | 2026 | 20,481,742 | 21,325,592 | 2,275,749 | 2,369,510 | |||||||||||||||||||||||
| EUR |
FIXED | 3.50 | % | 0.00 | % | 1998 | 2026 | 15,647,789 | 16,292,479 | 1,303,982 | 1,357,706 | |||||||||||||||||||||||
| EUR |
FIXED | 3.50 | % | 0.00 | % | 1998 | 2026 | 34,193,032 | 35,601,788 | 3,799,226 | 3,955,754 | |||||||||||||||||||||||
| EUR |
FIXED | 3.50 | % | 0.00 | % | 1999 | 2027 | 68,632,225 | 71,459,879 | 9,532,253 | 9,924,983 | |||||||||||||||||||||||
| EUR |
FIXED | 3.50 | % | 0.00 | % | 1999 | 2026 | 21,667,405 | 22,560,105 | 2,407,490 | 2,506,678 | |||||||||||||||||||||||
| EUR |
FIXED | 3.50 | % | 0.00 | % | 1998 | 2029 | 24,898,896 | 25,924,733 | 6,224,724 | 6,481,183 | |||||||||||||||||||||||
| EUR |
FIXED | 0.88 | % | 0.26 | % | 2022 | 2034 | 59,977,728 | 62,448,816 | 52,964,310 | 55,146,445 | |||||||||||||||||||||||
| EUR |
EURIBOR 6 MTH | 5.92 | % | 1.00 | % | 2012 | 2025 | 148,802,419 | 154,933,093 | 9,300,151 | 9,683,318 | |||||||||||||||||||||||
| EUR |
EURIBOR 6 MTH | 5.16 | % | 1.00 | % | 2013 | 2025 | 147,441,457 | 153,516,060 | 18,430,182 | 19,189,508 | |||||||||||||||||||||||
| EUR |
EURIBOR 6 MTH | 4.14 | % | 0.27 | % | 2016 | 2028 | 166,961,250 | 173,840,070 | 73,045,547 | 76,055,031 | |||||||||||||||||||||||
| EUR |
EURIBOR 6 MTH | 3.72 | % | 0.00 | % | 2023 | 2025 | 297,368,504 | 309,620,116 | 107,695,621 | 112,132,691 | |||||||||||||||||||||||
| EUR |
FIXED | 1.28 | % | 0.30 | % | 2018 | 2027 | 35,214,565 | 36,665,409 | 19,678,728 | 20,489,493 | |||||||||||||||||||||||
| EUR |
FIXED | 0.49 | % | 0.25 | % | 2019 | 2027 | 26,264,490 | 27,346,590 | 19,698,368 | 20,509,942 | |||||||||||||||||||||||
| EUR |
EURIBOR 6 MTH | 3.99 | % | 0.65 | % | 2019 | 2028 | 243,908,151 | 253,957,191 | 213,419,632 | 222,212,542 | |||||||||||||||||||||||
| EUR |
EURIBOR 6 MTH | 3.08 | % | 0.37 | % | 2020 | 2027 | 32,895,000 | 34,250,277 | 18,814,250 | 19,589,399 | |||||||||||||||||||||||
| EUR |
EURIBOR 6 MTH | 3.16 | % | 0.00 | % | 2022 | 2036 | 411,400,000 | 428,349,721 | 237,160,000 | 246,931,015 | |||||||||||||||||||||||
| EUR |
EURIBOR 6 MTH | 3.25 | % | 0.00 | % | 2022 | 2036 | 793,333,050 | 826,018,450 | 473,995,845 | 493,524,521 | |||||||||||||||||||||||
| EUR |
EURIBOR 6 MTH | 4.61 | % | 0.00 | % | 2022 | 2029 | 69,999,975 | 72,883,981 | 69,999,975 | 72,883,981 | |||||||||||||||||||||||
| EUR |
FIXED | 3.25 | % | 0.38 | % | 2022 | 2032 | 166,600,000 | 173,463,936 | 66,640,000 | 69,385,575 | |||||||||||||||||||||||
| EUR |
EURIBOR 6 MTH | 3.71 | % | 0.00 | % | 2023 | 2036 | 2,264,005,558 | 2,357,282,811 | 1,198,591,178 | 1,247,973,253 | |||||||||||||||||||||||
| EUR |
EURIBOR 6 MTH | 5.36 | % | 0.00 | % | 2023 | 2030 | 199,765,196 | 207,995,542 | 199,765,196 | 207,995,542 | |||||||||||||||||||||||
| EUR |
EURIBOR 6 MTH | 3.50 | % | 0.35 | % | 2023 | 2039 | 3,007,554,218 | 3,131,465,750 | 530,744,862 | 552,611,603 | |||||||||||||||||||||||
| EUR |
EURIBOR 6 MTH | 5.57 | % | 0.00 | % | 2023 | 2030 | 265,372,431 | 276,305,801 | 265,372,431 | 276,305,801 | |||||||||||||||||||||||
| EUR |
EURIBOR 6 MTH | 3.62 | % | 0.35 | % | 2024 | 2033 | 87,548,456 | 91,155,461 | 30,899,455 | 32,172,516 | |||||||||||||||||||||||
| EUR |
EURIBOR 6 MTH | 4.74 | % | 0.35 | % | 2024 | 2029 | 7,724,864 | 8,043,129 | 7,724,864 | 8,043,129 | |||||||||||||||||||||||
| EUR |
EURIBOR 6 MTH | 4.15 | % | 0.50 | % | 2017 | 2027 | 21,335,000 | 22,214,004 | 7,530,000 | 7,840,237 | |||||||||||||||||||||||
| EUR |
FIXED | 3.50 | % | 0.00 | % | 1997 | 2026 | 29,601,112 | 30,820,681 | 3,289,012 | 3,424,520 | |||||||||||||||||||||||
| EUR |
FIXED | 3.50 | % | 0.00 | % | 1995 | 2020 | 46,699,077 | 48,623,084 | 759,143 | 790,420 | |||||||||||||||||||||||
| EUR |
FIXED | 3.50 | % | 0.00 | % | 1998 | 2027 | 11,118,944 | 11,577,045 | 1,853,157 | 1,929,507 | |||||||||||||||||||||||
| EUR |
EURIBOR 6 MTH | 6.70 | % | 0.00 | % | 2016 | 2027 | 6,979,739 | 7,267,305 | 2,107,533 | 2,194,363 | |||||||||||||||||||||||
| EUR |
EURIBOR 6 MTH | 1.27 | % | 0.50 | % | 2011 | 2019 | 7,349,159 | 7,651,945 | 183,471 | 191,030 | |||||||||||||||||||||||
| EUR |
EURIBOR 6 MTH | 2.30 | % | 0.92 | % | 2024 | 2034 | 224,642,845 | 233,898,153 | 18,214,285 | 18,964,715 | |||||||||||||||||||||||
| EUR |
NO INTEREST RATE | 0.00 | % | 0.25 | % | 2012 | 2027 | 8,000,000 | 8,329,601 | 2,400,000 | 2,498,880 | |||||||||||||||||||||||
| EUR |
NO INTEREST RATE | 0.00 | % | 0.25 | % | 2012 | 2027 | 8,000,000 | 8,329,601 | 2,400,000 | 2,498,880 | |||||||||||||||||||||||
| EUR |
FIXED | 0.40 | % | 0.40 | % | 2014 | 2034 | 11,523,700 | 11,998,478 | 8,758,012 | 9,118,843 | |||||||||||||||||||||||
| EUR |
FIXED | 0.40 | % | 0.40 | % | 2015 | 2034 | 7,730,000 | 8,048,477 | 5,874,800 | 6,116,842 | |||||||||||||||||||||||
| EUR |
NO INTEREST RATE | 0.00 | % | 0.40 | % | 2018 | 2043 | 12,500,000 | 13,015,001 | 12,500,000 | 13,015,001 | |||||||||||||||||||||||
| EUR |
NO INTEREST RATE | 0.00 | % | 0.40 | % | 2018 | 2043 | 12,000,000 | 12,494,401 | 12,000,000 | 12,494,401 | |||||||||||||||||||||||
| EUR |
FIXED | 0.40 | % | 0.40 | % | 2019 | 2033 | 114,750,000 | 119,477,711 | 102,349,412 | 106,566,218 | |||||||||||||||||||||||
| EUR |
NO INTEREST RATE | 0.00 | % | 0.40 | % | 2019 | 2047 | 12,400,000 | 12,910,881 | 12,400,000 | 12,910,881 | |||||||||||||||||||||||
| EUR |
NO INTEREST RATE | 0.00 | % | 0.40 | % | 2020 | 2046 | 8,000,000 | 8,329,601 | 8,000,000 | 8,329,601 | |||||||||||||||||||||||
| EUR |
NO INTEREST RATE | 0.00 | % | 0.40 | % | 2020 | 2048 | 14,883,000 | 15,496,181 | 14,883,000 | 15,496,181 | |||||||||||||||||||||||
| EUR |
NO INTEREST RATE | 0.00 | % | 0.40 | % | 2020 | 2047 | 12,000,000 | 12,494,401 | 12,000,000 | 12,494,401 | |||||||||||||||||||||||
| EUR |
NO INTEREST RATE | 0.00 | % | 0.40 | % | 2020 | 2048 | 10,000,000 | 10,412,001 | 10,000,000 | 10,412,001 | |||||||||||||||||||||||
| EUR |
NO INTEREST RATE | 0.00 | % | 0.45 | % | 2021 | 2049 | 12,599,493 | 13,118,593 | 12,599,493 | 13,118,593 | |||||||||||||||||||||||
| EUR |
NO INTEREST RATE | 0.00 | % | 0.40 | % | 2022 | 2048 | 8,000,000 | 8,329,601 | 8,000,000 | 8,329,601 | |||||||||||||||||||||||
| EUR |
NO INTEREST RATE | 0.00 | % | 0.40 | % | 2022 | 2049 | 10,000,000 | 10,412,001 | 6,086,204 | 6,336,956 | |||||||||||||||||||||||
D-116
| CURRENCY |
INTEREST RATE BASIS |
INTEREST RATE |
COMMITMENT CHARGE |
YEAR OF CONTRACT |
YEAR OF MATURITY |
ORIGINAL AMOUNT | OUTSTANDING BALANCE | |||||||||||||||||||||||||||
| (In Original Currency) |
(In US Dollar) | (In Original Currency) |
(In US Dollar) | |||||||||||||||||||||||||||||||
| EUR |
NO INTEREST RATE | 0.00 | % | 0.40 | % | 2022 | 2048 | 9,950,000 | 10,359,941 | 9,950,000 | 10,359,941 | |||||||||||||||||||||||
| EUR |
FIXED | 0.15 | % | 0.40 | % | 2023 | 2038 | 53,460,000 | 55,662,557 | 15,751,760 | 16,400,734 | |||||||||||||||||||||||
| EUR |
NO INTEREST RATE | 0.00 | % | 0.40 | % | 2023 | 2055 | 10,800,000 | 11,244,961 | 9,524,098 | 9,916,492 | |||||||||||||||||||||||
| EUR |
EURIBOR 6 MTH | 4.27 | % | 0.00 | % | 2020 | 2027 | 12,526,875 | 13,042,983 | 9,833,875 | 10,239,032 | |||||||||||||||||||||||
| EUR |
EURIBOR 6 MTH | 4.38 | % | 0.00 | % | 2020 | 2028 | 17,791,988 | 18,525,019 | 13,605,638 | 14,166,191 | |||||||||||||||||||||||
| EUR |
EURIBOR 6 MTH | 4.28 | % | 0.00 | % | 2020 | 2028 | 10,639,960 | 11,078,327 | 6,524,930 | 6,793,757 | |||||||||||||||||||||||
| EUR |
EURIBOR 6 MTH | 4.22 | % | 0.00 | % | 2022 | 2029 | 36,300,000 | 37,795,564 | 27,225,000 | 28,346,673 | |||||||||||||||||||||||
| EUR |
EURIBOR 6 MTH | 5.91 | % | 0.00 | % | 2022 | 2035 | 160,960,160 | 167,591,735 | 59,072,278 | 61,506,062 | |||||||||||||||||||||||
| EUR |
EURIBOR 6 MTH | 5.38 | % | 0.00 | % | 2022 | 2030 | 148,181,235 | 154,286,317 | 84,102,863 | 87,567,910 | |||||||||||||||||||||||
| EUR |
EURIBOR 6 MTH | 4.57 | % | 0.00 | % | 2023 | 2025 | 361,757,852 | 376,662,311 | 73,329,294 | 76,350,469 | |||||||||||||||||||||||
| EUR |
EURIBOR 6 MTH | 3.67 | % | 0.15 | % | 2021 | 2030 | 80,403,817 | 83,716,462 | 65,856,938 | 68,570,250 | |||||||||||||||||||||||
| EUR |
EURIBOR 6 MTH | 3.97 | % | 0.00 | % | 2022 | 2028 | 10,059,338 | 10,473,784 | 10,059,338 | 10,473,784 | |||||||||||||||||||||||
| USD |
SOFR 6 MONTHS | 5.50 | % | 0.31 | % | 2022 | 2031 | 32,375,000 | 32,375,000 | 18,956,887 | 18,956,887 | |||||||||||||||||||||||
| USD |
SOFR 6 MONTHS | 5.41 | % | 0.00 | % | 2022 | 2031 | 32,375,000 | 32,375,000 | 18,956,887 | 18,956,887 | |||||||||||||||||||||||
| USD |
SOFR 6 MONTHS | 6.07 | % | 0.00 | % | 2023 | 2029 | 64,543,725 | 64,543,725 | 5,233,275 | 5,233,275 | |||||||||||||||||||||||
| USD |
SOFR 6 MONTHS | 5.83 | % | 0.00 | % | 2023 | 2029 | 110,676,250 | 110,676,250 | 110,676,250 | 110,676,250 | |||||||||||||||||||||||
| USD |
SOFR 6 MONTHS | 6.37 | % | 0.00 | % | 2023 | 2030 | 32,046,329 | 32,046,329 | 2,598,351 | 2,598,351 | |||||||||||||||||||||||
| USD |
SOFR 6 MONTHS | 6.13 | % | 0.00 | % | 2023 | 2030 | 56,994,486 | 56,994,486 | 47,069,368 | 47,069,368 | |||||||||||||||||||||||
| USD |
SOFR 6 MONTHS | 6.09 | % | 0.00 | % | 2023 | 2030 | 138,696,655 | 138,696,655 | 101,515,059 | 101,515,059 | |||||||||||||||||||||||
| USD |
SOFR 6 MONTHS | 5.91 | % | 0.00 | % | 2023 | 2030 | 147,917,028 | 147,917,028 | 88,116,223 | 88,116,223 | |||||||||||||||||||||||
| USD |
SOFR 3 MONTHS | 6.49 | % | 0.50 | % | 2017 | 2030 | 130,474,830 | 130,474,830 | 78,284,898 | 78,284,898 | |||||||||||||||||||||||
| USD |
FIXED | 0.05 | % | 0.00 | % | 2016 | 2040 | 36,440,994 | 36,440,994 | 32,276,309 | 32,276,309 | |||||||||||||||||||||||
| USD |
SOFR 6 MONTHS | 0.43 | % | 0.35 | % | 2017 | 2026 | 170,000,000 | 170,000,000 | 42,500,000 | 42,500,000 | |||||||||||||||||||||||
| USD |
SOFR 6 MONTHS | 0.43 | % | 0.25 | % | 2020 | 2028 | 94,267,785 | 94,267,785 | 76,806,237 | 76,806,237 | |||||||||||||||||||||||
| USD |
SOFR 6 MONTHS | 0.43 | % | 0.25 | % | 2020 | 2029 | 36,975,000 | 36,975,000 | 27,731,250 | 27,731,250 | |||||||||||||||||||||||
| USD |
SOFR 6 MONTHS | 5.70 | % | 0.00 | % | 2019 | 2025 | 34,849,150 | 34,849,150 | 8,712,288 | 8,712,288 | |||||||||||||||||||||||
| USD |
SOFR 6 MONTHS | 5.85 | % | 0.00 | % | 2020 | 2028 | 114,747,564 | 114,747,564 | 114,747,564 | 114,747,564 | |||||||||||||||||||||||
| USD |
SOFR 6 MONTHS | 5.98 | % | 0.00 | % | 2020 | 2028 | 330,732,215 | 330,732,215 | 310,811,070 | 310,811,070 | |||||||||||||||||||||||
| USD |
SOFR 6 MONTHS | 6.11 | % | 0.00 | % | 2020 | 2029 | 68,000,000 | 68,000,000 | 37,327,153 | 37,327,153 | |||||||||||||||||||||||
| USD |
SOFR 6 MONTHS | 6.58 | % | 0.00 | % | 2020 | 2031 | 612,000,000 | 612,000,000 | 177,840,000 | 177,840,000 | |||||||||||||||||||||||
| USD |
SOFR 6 MONTHS | 5.68 | % | 0.00 | % | 2021 | 2028 | 33,947,129 | 33,947,129 | 33,947,129 | 33,947,129 | |||||||||||||||||||||||
| USD |
SOFR 6 MONTHS | 6.48 | % | 0.00 | % | 2021 | 2028 | 110,500,000 | 110,500,000 | 110,500,000 | 110,500,000 | |||||||||||||||||||||||
| USD |
SOFR 6 MONTHS | 6.19 | % | 0.00 | % | 2021 | 2027 | 12,730,051 | 12,730,051 | 7,956,282 | 7,956,282 | |||||||||||||||||||||||
| USD |
SOFR 6 MONTHS | 6.67 | % | 0.00 | % | 2021 | 2027 | 9,350,000 | 9,350,000 | 5,843,750 | 5,843,750 | |||||||||||||||||||||||
| USD |
SOFR 6 MONTHS | 6.24 | % | 0.00 | % | 2021 | 2026 | 8,493,650 | 8,493,650 | 6,066,893 | 6,066,893 | |||||||||||||||||||||||
| USD |
SOFR 6 MONTHS | 5.63 | % | 0.00 | % | 2021 | 2028 | 11,050,000 | 11,050,000 | 9,668,750 | 9,668,750 | |||||||||||||||||||||||
| USD |
SOFR 6 MONTHS | 5.63 | % | 0.00 | % | 2021 | 2027 | 8,489,970 | 8,489,970 | 6,367,478 | 6,367,478 | |||||||||||||||||||||||
| USD |
SOFR 6 MONTHS | 5.63 | % | 0.00 | % | 2021 | 2027 | 12,748,895 | 12,748,895 | 9,561,671 | 9,561,671 | |||||||||||||||||||||||
| USD |
SOFR 6 MONTHS | 5.63 | % | 0.00 | % | 2021 | 2027 | 25,491,500 | 25,491,500 | 19,118,625 | 19,118,625 | |||||||||||||||||||||||
| USD |
SOFR 6 MONTHS | 5.41 | % | 0.00 | % | 2022 | 2028 | 36,996,457 | 36,996,457 | 36,996,457 | 36,996,457 | |||||||||||||||||||||||
| USD |
SOFR 6 MONTHS | 5.41 | % | 0.00 | % | 2022 | 2028 | 12,733,323 | 12,733,323 | 11,141,658 | 11,141,658 | |||||||||||||||||||||||
| USD |
SOFR 6 MONTHS | 5.09 | % | 0.35 | % | 2022 | 2028 | 46,240,245 | 46,240,245 | 40,460,214 | 40,460,214 | |||||||||||||||||||||||
| USD |
SOFR 6 MONTHS | 4.91 | % | 0.35 | % | 2022 | 2028 | 46,210,001 | 46,210,001 | 46,210,001 | 46,210,001 | |||||||||||||||||||||||
| USD |
SOFR 6 MONTHS | 4.96 | % | 0.35 | % | 2022 | 2028 | 55,470,400 | 55,470,400 | 48,536,600 | 48,536,600 | |||||||||||||||||||||||
| USD |
SOFR 6 MONTHS | 5.64 | % | 0.00 | % | 2022 | 2028 | 18,496,961 | 18,496,961 | 16,184,841 | 16,184,841 | |||||||||||||||||||||||
| USD |
SOFR 6 MONTHS | 6.26 | % | 0.00 | % | 2022 | 2029 | 184,970,400 | 184,970,400 | 105,466,271 | 105,466,271 | |||||||||||||||||||||||
| USD |
SOFR 6 MONTHS | 6.28 | % | 0.00 | % | 2022 | 2030 | 259,000,000 | 259,000,000 | 130,816,000 | 130,816,000 | |||||||||||||||||||||||
| USD |
SOFR 6 MONTHS | 6.23 | % | 0.00 | % | 2022 | 2030 | 27,750,000 | 27,750,000 | 2,250,000 | 2,250,000 | |||||||||||||||||||||||
| USD |
SOFR 6 MONTHS | 6.34 | % | 0.00 | % | 2022 | 2029 | 184,977,597 | 184,977,597 | 184,977,597 | 184,977,597 | |||||||||||||||||||||||
| USD |
SOFR 6 MONTHS | 5.33 | % | 0.00 | % | 2022 | 2029 | 18,490,334 | 18,490,334 | 17,034,699 | 17,034,699 | |||||||||||||||||||||||
| USD |
SOFR 6 MONTHS | 6.18 | % | 0.00 | % | 2022 | 2029 | 92,488,501 | 92,488,501 | 92,488,501 | 92,488,501 | |||||||||||||||||||||||
| USD |
SOFR 6 MONTHS | 5.79 | % | 0.00 | % | 2022 | 2029 | 55,460,154 | 55,460,154 | 47,846,796 | 47,846,796 | |||||||||||||||||||||||
| USD |
SOFR 6 MONTHS | 6.81 | % | 0.00 | % | 2022 | 2029 | 161,875,000 | 161,875,000 | 81,157,202 | 81,157,202 | |||||||||||||||||||||||
| USD |
SOFR 6 MONTHS | 5.60 | % | 0.00 | % | 2022 | 2028 | 25,890,750 | 25,890,750 | 25,890,750 | 25,890,750 | |||||||||||||||||||||||
| USD |
SOFR 6 MONTHS | 6.20 | % | 0.00 | % | 2022 | 2028 | 97,125,000 | 97,125,000 | 44,527,560 | 44,527,560 | |||||||||||||||||||||||
| USD |
SOFR 6 MONTHS | 6.36 | % | 0.00 | % | 2022 | 2029 | 58,737,500 | 58,737,500 | 25,748,231 | 25,748,231 | |||||||||||||||||||||||
| USD |
SOFR 6 MONTHS | 5.88 | % | 0.00 | % | 2023 | 2028 | 84,922,650 | 84,922,650 | 84,922,650 | 84,922,650 | |||||||||||||||||||||||
D-117
| CURRENCY |
INTEREST RATE BASIS |
INTEREST RATE |
COMMITMENT CHARGE |
YEAR OF CONTRACT |
YEAR OF MATURITY |
ORIGINAL AMOUNT | OUTSTANDING BALANCE | |||||||||||||||||||||||||||
| (In Original Currency) |
(In US Dollar) | (In Original Currency) |
(In US Dollar) | |||||||||||||||||||||||||||||||
| USD |
SOFR 6 MONTHS | 5.70 | % | 0.00 | % | 2023 | 2028 | 147,937,100 | 147,937,100 | 138,900,340 | 138,900,340 | |||||||||||||||||||||||
| USD |
SOFR 6 MONTHS | 5.72 | % | 0.35 | % | 2023 | 2028 | 21,054,850 | 21,054,850 | 18,713,616 | 18,713,616 | |||||||||||||||||||||||
| USD |
SOFR 6 MONTHS | 5.75 | % | 0.35 | % | 2023 | 2029 | 36,981,500 | 36,981,500 | 30,907,526 | 30,907,526 | |||||||||||||||||||||||
| USD |
SOFR 6 MONTHS | 6.70 | % | 0.00 | % | 2023 | 2029 | 78,732,901 | 78,732,901 | 6,383,749 | 6,383,749 | |||||||||||||||||||||||
| USD |
SOFR 6 MONTHS | 6.24 | % | 0.00 | % | 2023 | 2029 | 36,982,425 | 36,982,425 | 30,773,979 | 30,773,979 | |||||||||||||||||||||||
| USD |
SOFR 6 MONTHS | 6.83 | % | 0.90 | % | 2017 | 2026 | 5,939,237 | 5,939,237 | 2,969,619 | 2,969,619 | |||||||||||||||||||||||
| USD |
SOFR 6 MONTHS | 5.56 | % | 0.00 | % | 2018 | 2025 | 59,498,368 | 59,498,368 | 14,874,592 | 14,874,592 | |||||||||||||||||||||||
| USD |
SOFR 6 MONTHS | 5.41 | % | 0.00 | % | 2022 | 2028 | 36,998,890 | 36,998,890 | 36,998,890 | 36,998,890 | |||||||||||||||||||||||
| USD |
SOFR 6 MONTHS | 5.41 | % | 0.00 | % | 2022 | 2027 | 41,625,000 | 41,625,000 | 35,678,571 | 35,678,571 | |||||||||||||||||||||||
| USD |
SOFR 6 MONTHS | 5.41 | % | 0.00 | % | 2022 | 2028 | 22,157,087 | 22,157,087 | 19,387,451 | 19,387,451 | |||||||||||||||||||||||
| USD |
SOFR 6 MONTHS | 6.16 | % | 0.00 | % | 2022 | 2029 | 481,924,170 | 481,924,170 | 382,945,797 | 382,945,797 | |||||||||||||||||||||||
| USD |
SOFR 6 MONTHS | 5.57 | % | 0.00 | % | 2022 | 2029 | 78,616,459 | 78,616,459 | 29,045,656 | 29,045,656 | |||||||||||||||||||||||
| USD |
SOFR 6 MONTHS | 5.67 | % | 0.00 | % | 2022 | 2028 | 127,461,750 | 127,461,750 | 111,529,031 | 111,529,031 | |||||||||||||||||||||||
| USD |
SOFR 6 MONTHS | 6.11 | % | 0.00 | % | 2023 | 2030 | 123,088,906 | 123,088,906 | 9,980,182 | 9,980,182 | |||||||||||||||||||||||
| USD |
SOFR 6 MONTHS | 6.25 | % | 0.00 | % | 2023 | 2030 | 184,980,665 | 184,980,665 | 116,295,490 | 116,295,490 | |||||||||||||||||||||||
| USD |
SOFR 6 MONTHS | 6.25 | % | 0.00 | % | 2023 | 2030 | 92,482,529 | 92,482,529 | 65,771,407 | 65,771,407 | |||||||||||||||||||||||
| USD |
SOFR 6 MONTHS | 6.25 | % | 0.00 | % | 2023 | 2030 | 116,509,521 | 116,509,521 | 90,344,547 | 90,344,547 | |||||||||||||||||||||||
| USD |
SOFR 6 MONTHS | 5.42 | % | 0.00 | % | 2023 | 2029 | 27,746,763 | 27,746,763 | 26,217,706 | 26,217,706 | |||||||||||||||||||||||
| USD |
SOFR 6 MONTHS | 5.41 | % | 0.00 | % | 2023 | 2030 | 46,229,743 | 46,229,743 | 9,238,143 | 9,238,143 | |||||||||||||||||||||||
| USD |
SOFR 6 MONTHS | 5.42 | % | 0.00 | % | 2023 | 2030 | 18,491,467 | 18,491,467 | 15,833,763 | 15,833,763 | |||||||||||||||||||||||
| USD |
SOFR 6 MONTHS | 5.77 | % | 0.00 | % | 2023 | 2028 | 36,963,000 | 36,963,000 | 36,963,000 | 36,963,000 | |||||||||||||||||||||||
| USD |
SOFR 6 MONTHS | 5.54 | % | 0.00 | % | 2018 | 2025 | 22,082,702 | 22,082,702 | 2,760,338 | 2,760,338 | |||||||||||||||||||||||
| USD |
SOFR 6 MONTHS | 5.94 | % | 0.00 | % | 2019 | 2025 | 93,499,997 | 93,499,997 | 13,357,143 | 13,357,143 | |||||||||||||||||||||||
| USD |
SOFR 6 MONTHS | 5.79 | % | 0.00 | % | 2019 | 2026 | 156,398,376 | 156,398,376 | 58,649,391 | 58,649,391 | |||||||||||||||||||||||
| USD |
SOFR 6 MONTHS | 6.89 | % | 0.15 | % | 2020 | 2027 | 25,498,916 | 25,498,916 | 15,936,823 | 15,936,823 | |||||||||||||||||||||||
| USD |
SOFR 6 MONTHS | 6.45 | % | 0.15 | % | 2020 | 2028 | 41,565,000 | 41,565,000 | 36,369,375 | 36,369,375 | |||||||||||||||||||||||
| USD |
SOFR 6 MONTHS | 6.39 | % | 0.39 | % | 2021 | 2027 | 26,349,657 | 26,349,657 | 16,468,536 | 16,468,536 | |||||||||||||||||||||||
| USD |
SOFR 6 MONTHS | 5.48 | % | 0.15 | % | 2021 | 2027 | 8,500,000 | 8,500,000 | 4,250,000 | 4,250,000 | |||||||||||||||||||||||
| USD |
SOFR 6 MONTHS | 5.12 | % | 0.00 | % | 2021 | 2027 | 16,998,725 | 16,998,725 | 12,749,044 | 12,749,044 | |||||||||||||||||||||||
| USD |
SOFR 6 MONTHS | 5.57 | % | 0.00 | % | 2019 | 2025 | 13,574,208 | 13,574,208 | 4,524,736 | 4,524,736 | |||||||||||||||||||||||
| USD |
SOFR 6 MONTHS | 6.52 | % | 0.00 | % | 2019 | 2026 | 169,995,989 | 169,995,989 | 84,997,994 | 84,997,994 | |||||||||||||||||||||||
| USD |
SOFR 6 MONTHS | 5.78 | % | 0.00 | % | 2020 | 2027 | 69,699,840 | 69,699,840 | 58,083,200 | 58,083,200 | |||||||||||||||||||||||
| USD |
SOFR 6 MONTHS | 6.08 | % | 0.00 | % | 2020 | 2026 | 12,737,684 | 12,737,684 | 5,456,824 | 5,456,824 | |||||||||||||||||||||||
| USD |
SOFR 6 MONTHS | 6.47 | % | 0.00 | % | 2020 | 2026 | 8,490,650 | 8,490,650 | 3,183,994 | 3,183,994 | |||||||||||||||||||||||
| USD |
SOFR 6 MONTHS | 6.39 | % | 0.00 | % | 2020 | 2026 | 12,728,750 | 12,728,750 | 6,364,375 | 6,364,375 | |||||||||||||||||||||||
| USD |
SOFR 6 MONTHS | 5.23 | % | 0.00 | % | 2022 | 2029 | 222,000,000 | 222,000,000 | 186,000,000 | 186,000,000 | |||||||||||||||||||||||
| USD |
SOFR 6 MONTHS | 5.52 | % | 0.50 | % | 2022 | 2030 | 56,425,000 | 56,425,000 | 50,324,998 | 50,324,998 | |||||||||||||||||||||||
| USD |
SOFR 6 MONTHS | 5.13 | % | 0.50 | % | 2022 | 2028 | 70,254,953 | 70,254,953 | 45,926,235 | 45,926,235 | |||||||||||||||||||||||
| USD |
SOFR 6 MONTHS | 5.91 | % | 0.00 | % | 2022 | 2027 | 42,487,250 | 42,487,250 | 31,865,438 | 31,865,438 | |||||||||||||||||||||||
| USD |
SOFR 6 MONTHS | 6.93 | % | 0.00 | % | 2022 | 2029 | 97,125,000 | 97,125,000 | 42,339,000 | 42,339,000 | |||||||||||||||||||||||
| USD |
SOFR 6 MONTHS | 6.91 | % | 0.50 | % | 2023 | 2031 | 185,000,000 | 185,000,000 | 45,000,000 | 45,000,000 | |||||||||||||||||||||||
| USD |
SOFR 6 MONTHS | 6.26 | % | 0.50 | % | 2023 | 2029 | 60,125,000 | 60,125,000 | 56,875,000 | 56,875,000 | |||||||||||||||||||||||
| USD |
SOFR 6 MONTHS | 6.31 | % | 0.50 | % | 2023 | 2029 | 246,558,750 | 246,558,750 | 246,558,750 | 246,558,750 | |||||||||||||||||||||||
| USD |
SOFR 6 MONTHS | 6.21 | % | 0.50 | % | 2023 | 2030 | 77,182,336 | 77,182,336 | 75,542,384 | 75,542,384 | |||||||||||||||||||||||
| USD |
SOFR 6 MONTHS | 6.31 | % | 0.50 | % | 2023 | 2029 | 96,274,000 | 96,274,000 | 96,274,000 | 96,274,000 | |||||||||||||||||||||||
| USD |
SOFR 6 MONTHS | 6.31 | % | 0.50 | % | 2023 | 2030 | 165,745,246 | 165,745,246 | 145,993,686 | 145,993,686 | |||||||||||||||||||||||
| USD |
SOFR 6 MONTHS | 6.31 | % | 0.50 | % | 2023 | 2030 | 63,816,943 | 63,816,943 | 51,144,319 | 51,144,319 | |||||||||||||||||||||||
| USD |
SOFR 6 MONTHS | 6.07 | % | 0.00 | % | 2023 | 2031 | 51,098,956 | 51,098,956 | 45,955,915 | 45,955,915 | |||||||||||||||||||||||
| USD |
SOFR 6 MONTHS | 6.62 | % | 0.00 | % | 2023 | 2033 | 138,745,863 | 138,745,863 | 30,827,256 | 30,827,256 | |||||||||||||||||||||||
| USD |
SOFR 6 MONTHS | 6.06 | % | 0.00 | % | 2024 | 2030 | 284,900,000 | 284,900,000 | 130,900,000 | 130,900,000 | |||||||||||||||||||||||
| USD |
SOFR 6 MONTHS | 5.24 | % | 0.10 | % | 2019 | 2026 | 25,499,717 | 25,499,717 | 9,562,394 | 9,562,394 | |||||||||||||||||||||||
| MULTILATERAL |
||||||||||||||||||||||||||||||||||
| ACU |
NO INTEREST RATE | 0.00 | % | 0.00 | % | 2000 | 2025 | 6,090,241 | 7,942,466 | 169,173 | 220,624 | |||||||||||||||||||||||
| ACU |
NO INTEREST RATE | 0.00 | % | 0.00 | % | 2003 | 2027 | 3,880,448 | 5,060,609 | 845,887 | 1,103,147 | |||||||||||||||||||||||
| ACU |
NO INTEREST RATE | 0.00 | % | 0.00 | % | 2006 | 2026 | 25,196,731 | 32,859,815 | 1,511,706 | 1,971,461 | |||||||||||||||||||||||
| ACU |
NO INTEREST RATE | 0.00 | % | 0.00 | % | 2006 | 2027 | 6,533,167 | 8,520,100 | 703,116 | 916,954 | |||||||||||||||||||||||
| ACU |
NO INTEREST RATE | 0.00 | % | 0.00 | % | 2006 | 2013 | 27,520,000 | 35,889,660 | 4,002,815 | 5,220,192 | |||||||||||||||||||||||
D-118
| CURRENCY |
INTEREST RATE BASIS |
INTEREST RATE |
COMMITMENT CHARGE |
YEAR OF CONTRACT |
YEAR OF MATURITY |
ORIGINAL AMOUNT | OUTSTANDING BALANCE | |||||||||||||||||||||||||||
| (In Original Currency) |
(In US Dollar) | (In Original Currency) |
(In US Dollar) | |||||||||||||||||||||||||||||||
| ACU |
NO INTEREST RATE | 0.00 | % | 0.00 | % | 2006 | 2033 | 2,468,697 | 3,219,502 | 1,398,928 | 1,824,385 | |||||||||||||||||||||||
| ACU |
NO INTEREST RATE | 0.00 | % | 0.00 | % | 2006 | 2027 | 21,443,443 | 27,965,040 | 2,257,695 | 2,944,329 | |||||||||||||||||||||||
| ACU |
NO INTEREST RATE | 0.00 | % | 0.00 | % | 2006 | 2016 | 11,017,000 | 14,367,601 | 2,003,138 | 2,612,353 | |||||||||||||||||||||||
| ACU |
NO INTEREST RATE | 0.00 | % | 0.00 | % | 2007 | 2032 | 8,864,502 | 11,560,464 | 3,447,306 | 4,495,736 | |||||||||||||||||||||||
| ACU |
NO INTEREST RATE | 0.00 | % | 0.00 | % | 2008 | 2032 | 10,274,000 | 13,398,633 | 2,811,441 | 3,666,485 | |||||||||||||||||||||||
| ACU |
NO INTEREST RATE | 0.00 | % | 0.00 | % | 2008 | 2029 | 3,750,773 | 4,891,496 | 1,310,436 | 1,708,979 | |||||||||||||||||||||||
| ACU |
NO INTEREST RATE | 0.00 | % | 0.00 | % | 2009 | 2025 | 10,033,378 | 13,084,830 | 416,931 | 543,732 | |||||||||||||||||||||||
| ACU |
NO INTEREST RATE | 0.00 | % | 0.00 | % | 2009 | 2033 | 912,816 | 1,190,431 | 456,408 | 595,216 | |||||||||||||||||||||||
| ACU |
NO INTEREST RATE | 0.00 | % | 0.00 | % | 2009 | 2027 | 40,329,934 | 52,595,481 | 6,721,656 | 8,765,914 | |||||||||||||||||||||||
| ACU |
NO INTEREST RATE | 0.00 | % | 0.00 | % | 2009 | 2033 | 9,172,817 | 11,962,547 | 4,586,408 | 5,981,273 | |||||||||||||||||||||||
| ACU |
NO INTEREST RATE | 0.00 | % | 0.00 | % | 2011 | 2030 | 4,000,000 | 5,216,520 | 711,937 | 928,459 | |||||||||||||||||||||||
| ACU |
NO INTEREST RATE | 0.00 | % | 0.00 | % | 2011 | 2031 | 1,746,424 | 2,277,564 | 756,784 | 986,944 | |||||||||||||||||||||||
| ACU |
NO INTEREST RATE | 0.00 | % | 0.00 | % | 2011 | 2031 | 3,140,000 | 4,094,968 | 1,465,317 | 1,910,965 | |||||||||||||||||||||||
| ACU |
NO INTEREST RATE | 0.00 | % | 0.00 | % | 2013 | 2033 | 1,459,473 | 1,903,342 | 827,035 | 1,078,561 | |||||||||||||||||||||||
| ACU |
NO INTEREST RATE | 0.00 | % | 0.00 | % | 2013 | 2033 | 3,625,695 | 4,728,378 | 2,054,561 | 2,679,414 | |||||||||||||||||||||||
| EUR |
EURIBOR 6 MTH | 3.29 | % | 0.25 | % | 2022 | 2032 | 709,900,000 | 739,147,950 | 709,900,000 | 739,147,950 | |||||||||||||||||||||||
| EUR |
EURIBOR 6 MTH | 3.29 | % | 0.25 | % | 2022 | 2032 | 331,300,000 | 344,949,593 | 331,300,000 | 344,949,593 | |||||||||||||||||||||||
| EUR |
EURIBOR 6 MTH | 3.27 | % | 0.25 | % | 2023 | 2036 | 367,900,000 | 383,057,516 | 107,849,885 | 112,293,311 | |||||||||||||||||||||||
| EUR |
EURIBOR 6 MTH | 3.48 | % | 0.25 | % | 2023 | 2038 | 937,700,000 | 976,333,333 | 937,700,000 | 976,333,333 | |||||||||||||||||||||||
| EUR |
EURIBOR 6 MTH | 3.63 | % | 0.25 | % | 2023 | 2040 | 1,391,600,000 | 1,448,934,058 | 7,023,000 | 7,312,348 | |||||||||||||||||||||||
| EUR |
EURIBOR 6 MTH | 3.27 | % | 0.25 | % | 2024 | 2038 | 132,200,000 | 137,646,653 | 651,735 | 678,587 | |||||||||||||||||||||||
| EUR |
EURIBOR 6 MTH | 4.28 | % | 0.25 | % | 2024 | 2037 | 471,000,000 | 490,405,247 | 471,000,000 | 490,405,247 | |||||||||||||||||||||||
| EUR |
EURIBOR MTH | 4.04 | % | 0.25 | % | 2024 | 2040 | 468,800,000 | 488,114,606 | 468,800,000 | 488,114,606 | |||||||||||||||||||||||
| EUR |
FIXED | 3.97 | % | 0.00 | % | 2012 | 2030 | 5,695,647 | 5,930,308 | 2,528,028 | 2,632,183 | |||||||||||||||||||||||
| EUR |
FIXED | 3.97 | % | 0.00 | % | 2017 | 2035 | 39,711,400 | 41,347,514 | 28,514,400 | 29,689,196 | |||||||||||||||||||||||
| EUR |
FIXED | 3.57 | % | 0.00 | % | 2019 | 2033 | 44,850,000 | 46,697,824 | 35,522,000 | 36,985,510 | |||||||||||||||||||||||
| EUR |
COMMERCIAL INTEREST REFERENCE RATE | 3.57 | % | 0.00 | % | 2019 | 2032 | 55,000,000 | 57,266,005 | 28,959,785 | 30,152,931 | |||||||||||||||||||||||
| EUR |
COMMERCIAL INTEREST REFERENCE RATE | 3.77 | % | 0.00 | % | 2023 | 2036 | 36,934,440 | 38,456,143 | 93,952 | 97,822 | |||||||||||||||||||||||
| EUR |
EURIBOR 6 MTH | 4.07 | % | 0.00 | % | 2023 | 2043 | 205,002,000 | 213,448,103 | 38,449,385 | 40,033,504 | |||||||||||||||||||||||
| EUR |
EURIBOR 6 MTH | 4.09 | % | 0.00 | % | 2023 | 2043 | 100,000,000 | 104,120,010 | 832,148 | 866,432 | |||||||||||||||||||||||
| EUR |
NO INTEREST RATE | 0.00 | % | 0.00 | % | 2024 | 2043 | 803,300,000 | 836,396,040 | 369,331 | 384,548 | |||||||||||||||||||||||
| EUR |
EURIBOR 6 MTH | 3.65 | % | 0.15 | % | 2020 | 2030 | 462,920,000 | 481,992,350 | 363,722,857 | 378,708,275 | |||||||||||||||||||||||
| EUR |
EURIBOR 6 MTH | 3.65 | % | 0.15 | % | 2020 | 2025 | 925,840,000 | 963,984,700 | 231,460,000 | 240,996,175 | |||||||||||||||||||||||
| EUR |
EURIBOR 6 MTH | 4.26 | % | 0.15 | % | 2023 | 2042 | 78,486,000 | 81,719,631 | 199,648 | 207,873 | |||||||||||||||||||||||
| EUR |
EURIBOR 6 MTH | 3.36 | % | 0.15 | % | 2023 | 2042 | 331,251,000 | 344,898,574 | 119,250,000 | 124,163,112 | |||||||||||||||||||||||
| EUR |
EURIBOR 6 MTH | 3.45 | % | 0.15 | % | 2024 | 2039 | 459,475,000 | 478,405,416 | 459,475,000 | 478,405,416 | |||||||||||||||||||||||
| EUR |
EURIBOR 6 MTH | 0.50 | % | 0.15 | % | 2024 | 2039 | 461,383,000 | 480,392,025 | 461,383,000 | 480,392,025 | |||||||||||||||||||||||
| EUR |
FIXED | 0.83 | % | 0.00 | % | 2013 | 2033 | 337,952,011 | 351,875,667 | 289,354,512 | 301,275,946 | |||||||||||||||||||||||
| EUR |
FIXED | 0.82 | % | 0.00 | % | 2013 | 2033 | 253,356,980 | 263,795,313 | 216,924,246 | 225,861,547 | |||||||||||||||||||||||
| EUR |
NO INTEREST RATE | 0.00 | % | 0.00 | % | 2011 | 2026 | 102,989,447 | 107,232,622 | 43,965,481 | 45,776,863 | |||||||||||||||||||||||
| EUR |
NO INTEREST RATE | 0.00 | % | 0.00 | % | 2012 | 2027 | 139,007,699 | 144,734,830 | 53,464,500 | 55,667,242 | |||||||||||||||||||||||
| EUR |
NO INTEREST RATE | 0.00 | % | 0.00 | % | 2012 | 2027 | 149,700,599 | 155,868,279 | 64,157,400 | 66,800,691 | |||||||||||||||||||||||
| EUR |
NO INTEREST RATE | 0.00 | % | 0.00 | % | 2013 | 2028 | 228,115,198 | 237,513,567 | 114,057,599 | 118,756,783 | |||||||||||||||||||||||
| EUR |
NO INTEREST RATE | 0.00 | % | 0.00 | % | 2014 | 2029 | 242,372,398 | 252,358,165 | 142,571,999 | 148,445,979 | |||||||||||||||||||||||
| EUR |
NO INTEREST RATE | 0.00 | % | 0.00 | % | 2018 | 2033 | 452,867,785 | 471,525,983 | 320,781,348 | 333,997,571 | |||||||||||||||||||||||
| EUR |
NO INTEREST RATE | 0.00 | % | 0.00 | % | 2018 | 2033 | 452,867,785 | 471,525,983 | 320,781,348 | 333,997,571 | |||||||||||||||||||||||
| EUR |
FIXED | 0.75 | % | 0.00 | % | 1990 | 2029 | 2,584,961 | 2,691,461 | 994,216 | 1,035,177 | |||||||||||||||||||||||
| EUR |
FIXED | 0.75 | % | 0.00 | % | 1993 | 2031 | 2,900,308 | 3,019,801 | 1,353,477 | 1,409,240 | |||||||||||||||||||||||
| EUR |
FIXED | 0.75 | % | 0.00 | % | 1995 | 2035 | 4,731,712 | 4,926,659 | 2,685,566 | 2,796,212 | |||||||||||||||||||||||
| IDR |
FIXED | -0.77 | % | 0.00 | % | 2012 | 2030 | 595,427,194,366 | 36,852,584 | 595,427,194,366 | 36,852,584 | |||||||||||||||||||||||
| IDR |
FIXED | -0.77 | % | 0.00 | % | 2012 | 2030 | 497,265,716,756 | 30,777,107 | 497,265,716,756 | 30,777,107 | |||||||||||||||||||||||
| IDR |
FIXED | -0.35 | % | 0.00 | % | 2013 | 2031 | 118,343,362,049 | 7,324,588 | 118,343,362,049 | 7,324,588 | |||||||||||||||||||||||
| IDR |
FIXED | -0.45 | % | 0.00 | % | 2016 | 2031 | 4,497,791,667,181 | 278,380,372 | 4,497,791,667,181 | 278,380,372 | |||||||||||||||||||||||
| IDR |
FIXED | -0.45 | % | 0.00 | % | 2018 | 2038 | 7,244,066,666,563 | 448,354,686 | 7,244,066,666,563 | 448,354,686 | |||||||||||||||||||||||
| JPY |
TONAR/TONA 6 MONTHS | 0.64 | % | 0.00 | % | 2019 | 2033 | 110,795,000,000 | 709,247,092 | 104,634,798,000 | 669,812,953 | |||||||||||||||||||||||
| JPY |
TONA COMPOUNDED | 0.63 | % | 0.25 | % | 2020 | 2034 | 31,975,600,000 | 204,689,754 | 31,975,600,000 | 204,689,754 | |||||||||||||||||||||||
D-119
| CURRENCY |
INTEREST RATE BASIS |
INTEREST RATE |
COMMITMENT CHARGE |
YEAR OF CONTRACT |
YEAR OF MATURITY |
ORIGINAL AMOUNT | OUTSTANDING BALANCE | |||||||||||||||||||||||||||
| (In Original Currency) |
(In US Dollar) | (In Original Currency) |
(In US Dollar) | |||||||||||||||||||||||||||||||
| JPY |
TONA COMPOUNDED | 0.77 | % | 0.25 | % | 2023 | 2035 | 81,645,000,000 | 522,645,235 | 20,411,250,000 | 130,661,309 | |||||||||||||||||||||||
| JPY |
TONA COMPOUNDED | 0.73 | % | 0.15 | % | 2022 | 2040 | 13,940,700,000 | 89,240,498 | 1,173,873,688 | 7,514,477 | |||||||||||||||||||||||
| JPY |
TONA COMPOUNDED | 0.48 | % | 0.15 | % | 2022 | 2041 | 20,487,108,000 | 131,146,909 | 1,713,203,421 | 10,966,962 | |||||||||||||||||||||||
| JPY |
TONA COMPOUNDED | 0.48 | % | 0.15 | % | 2023 | 2038 | 71,865,000,000 | 460,039,192 | 71,865,000,000 | 460,039,192 | |||||||||||||||||||||||
| JPY |
TONA COMPOUNDED | 0.48 | % | 0.15 | % | 2023 | 2038 | 74,930,000,000 | 479,659,593 | 74,930,000,000 | 479,659,593 | |||||||||||||||||||||||
| JPY |
TONA COMPOUNDED | 0.48 | % | 0.15 | % | 2023 | 2042 | 36,055,200,000 | 230,805,052 | 1,807,452,462 | 11,570,291 | |||||||||||||||||||||||
| JPY |
NO INTEREST RATE | 0.00 | % | 0.00 | % | 2011 | 2036 | 9,039,216,675 | 57,863,966 | 7,931,470,582 | 50,772,801 | |||||||||||||||||||||||
| JPY |
NO INTEREST RATE | 0.00 | % | 0.00 | % | 2012 | 2036 | 15,376,956,872 | 98,434,604 | 13,492,527,666 | 86,371,551 | |||||||||||||||||||||||
| JPY |
ADB FLOATING RATE | 0.03 | % | 0.00 | % | 2015 | 2025 | 33,454,249,998 | 214,155,237 | 21,128,999,998 | 135,255,939 | |||||||||||||||||||||||
| JPY |
NO INTEREST RATE | 0.00 | % | 0.00 | % | 2015 | 2025 | 34,946,666,665 | 223,708,847 | 20,968,000,001 | 134,225,308 | |||||||||||||||||||||||
| JPY |
ADB FLOATING RATE | 0.07 | % | 0.00 | % | 2016 | 2031 | 46,191,250,001 | 295,690,326 | 28,594,583,337 | 183,046,393 | |||||||||||||||||||||||
| JPY |
NO INTEREST RATE | 0.00 | % | 0.00 | % | 2017 | 2032 | 42,728,000,000 | 273,520,554 | 26,705,000,003 | 170,950,346 | |||||||||||||||||||||||
| JPY |
NO INTEREST RATE | 0.00 | % | 0.00 | % | 2017 | 2025 | 40,964,000,000 | 262,228,421 | 27,309,333,336 | 174,818,947 | |||||||||||||||||||||||
| JPY |
NO INTEREST RATE | 0.00 | % | 0.00 | % | 2019 | 2034 | 52,595,000,000 | 336,683,522 | 41,637,708,335 | 266,541,121 | |||||||||||||||||||||||
| JPY |
NO INTEREST RATE | 0.00 | % | 0.00 | % | 2019 | 2034 | 51,840,000,000 | 331,850,438 | 43,200,000,000 | 276,542,031 | |||||||||||||||||||||||
| JPY |
ADB FLOATING RATE | 0.53 | % | 0.00 | % | 2020 | 2036 | 63,750,000,000 | 408,091,539 | 63,750,000,000 | 408,091,539 | |||||||||||||||||||||||
| JPY |
ADB FLOATING RATE | 0.41 | % | 0.00 | % | 2020 | 2035 | 63,560,000,000 | 406,875,266 | 58,263,333,334 | 372,968,994 | |||||||||||||||||||||||
| JPY |
ADB FLOATING RATE | 0.42 | % | 0.00 | % | 2021 | 2036 | 63,530,000,000 | 406,683,223 | 63,530,000,000 | 406,683,223 | |||||||||||||||||||||||
| JPY |
ADB FLOATING RATE | 0.54 | % | 0.00 | % | 2021 | 2036 | 64,685,000,000 | 414,076,882 | 64,685,000,000 | 414,076,882 | |||||||||||||||||||||||
| JPY |
NO INTEREST RATE | 0.00 | % | 0.00 | % | 2009 | 2033 | 1,570,573,575 | 10,053,926 | 1,277,156,202 | 8,175,634 | |||||||||||||||||||||||
| JPY |
NO INTEREST RATE | 0.00 | % | 0.00 | % | 2009 | 2034 | 7,494,931,344 | 47,978,323 | 6,378,692,764 | 40,832,793 | |||||||||||||||||||||||
| SDR |
FIXED | 0.75 | % | 0.00 | % | 1999 | 2024 | 11,685,983 | 15,240,042 | 11,298 | 14,734 | |||||||||||||||||||||||
| SDR |
FIXED | 0.75 | % | 0.00 | % | 1999 | 2024 | 71,023,332 | 92,623,665 | 68,663 | 89,546 | |||||||||||||||||||||||
| SDR |
FIXED | 0.75 | % | 0.35 | % | 2000 | 2025 | 21,799,223 | 28,429,022 | 1,085,192 | 1,415,231 | |||||||||||||||||||||||
| SDR |
FIXED | 0.75 | % | 0.20 | % | 2000 | 2025 | 54,139,161 | 70,604,510 | 2,692,460 | 3,511,318 | |||||||||||||||||||||||
| SDR |
FIXED | 0.75 | % | 0.00 | % | 2001 | 2026 | 4,586,621 | 5,981,550 | 221,408 | 288,745 | |||||||||||||||||||||||
| SDR |
FIXED | 0.75 | % | 0.30 | % | 2001 | 2025 | 2,776,666 | 3,621,134 | 138,772 | 180,977 | |||||||||||||||||||||||
| SDR |
FIXED | 0.75 | % | 0.50 | % | 2001 | 2026 | 87,499,973 | 114,111,349 | 3,118,404 | 4,066,804 | |||||||||||||||||||||||
| SDR |
FIXED | 0.75 | % | 0.10 | % | 2001 | 2026 | 30,282,981 | 39,492,947 | 1,461,847 | 1,906,439 | |||||||||||||||||||||||
| SDR |
FIXED | 0.75 | % | 0.10 | % | 2002 | 2025 | 55,551,518 | 72,446,407 | 2,794,843 | 3,644,839 | |||||||||||||||||||||||
| SDR |
FIXED | 0.75 | % | 0.10 | % | 2007 | 2027 | 89,508,359 | 116,730,545 | 4,446,926 | 5,799,370 | |||||||||||||||||||||||
| SDR |
FIXED | 0.75 | % | 0.50 | % | 2003 | 2026 | 36,831,596 | 48,033,193 | 1,777,968 | 2,318,701 | |||||||||||||||||||||||
| SDR |
FIXED | 0.75 | % | 0.30 | % | 2004 | 2026 | 21,585,432 | 28,150,212 | 1,086,059 | 1,416,362 | |||||||||||||||||||||||
| SDR |
FIXED | 0.75 | % | 0.30 | % | 2004 | 2026 | 15,645,948 | 20,404,352 | 787,162 | 1,026,562 | |||||||||||||||||||||||
| SDR |
FIXED | 0.75 | % | 0.30 | % | 2004 | 2025 | 31,597,889 | 41,207,758 | 1,586,770 | 2,069,355 | |||||||||||||||||||||||
| SDR |
FIXED | 0.75 | % | 0.20 | % | 2004 | 2025 | 3,409,938 | 4,447,003 | 169,514 | 221,069 | |||||||||||||||||||||||
| SDR |
FIXED | 0.75 | % | 0.30 | % | 2005 | 2025 | 17,899,858 | 23,343,744 | 900,624 | 1,174,530 | |||||||||||||||||||||||
| SDR |
FIXED | 0.75 | % | 0.30 | % | 2005 | 2025 | 51,647,003 | 67,354,412 | 50,067 | 65,294 | |||||||||||||||||||||||
| SDR |
FIXED | 0.75 | % | 0.30 | % | 2005 | 2026 | 19,832,774 | 25,864,517 | 955,359 | 1,245,913 | |||||||||||||||||||||||
| SDR |
FIXED | 0.75 | % | 0.30 | % | 2005 | 2026 | 22,683,185 | 29,581,824 | 1,090,207 | 1,421,771 | |||||||||||||||||||||||
| SDR |
FIXED | 0.75 | % | 0.30 | % | 2005 | 2026 | 9,920,000 | 12,936,971 | 477,903 | 623,247 | |||||||||||||||||||||||
| SDR |
FIXED | 0.75 | % | 0.30 | % | 2005 | 2026 | 47,003,494 | 61,298,671 | 2,349,666 | 3,064,271 | |||||||||||||||||||||||
| SDR |
FIXED | 0.75 | % | 0.20 | % | 2006 | 2026 | 45,655,179 | 59,540,293 | 2,245,860 | 2,928,894 | |||||||||||||||||||||||
| SDR |
FIXED | 0.75 | % | 0.00 | % | 2006 | 2026 | 47,370,000 | 61,776,643 | 2,338,108 | 3,049,197 | |||||||||||||||||||||||
| SDR |
FIXED | 0.75 | % | 0.10 | % | 2007 | 2027 | 81,950,000 | 106,873,462 | 4,079,571 | 5,320,291 | |||||||||||||||||||||||
| SDR |
FIXED | 0.75 | % | 0.20 | % | 2007 | 2026 | 39,654,356 | 51,714,440 | 15,963 | 20,818 | |||||||||||||||||||||||
| SDR |
FIXED | 0.75 | % | 0.10 | % | 2007 | 2027 | 38,320,881 | 49,975,414 | 1,913,173 | 2,495,026 | |||||||||||||||||||||||
| SDR |
FIXED | 0.75 | % | 0.10 | % | 2007 | 2025 | 90,838,458 | 118,465,167 | 4,437,174 | 5,786,652 | |||||||||||||||||||||||
| SDR |
FIXED | 0.75 | % | 0.50 | % | 2008 | 2027 | 78,598,745 | 102,502,989 | 3,879,899 | 5,059,894 | |||||||||||||||||||||||
| SDR |
FIXED | 0.75 | % | 0.50 | % | 2008 | 2027 | 119,359,232 | 155,659,967 | 5,891,974 | 7,683,901 | |||||||||||||||||||||||
| SDR |
FIXED | 0.75 | % | 0.00 | % | 1999 | 2024 | 14,782,027 | 19,277,686 | 14,291 | 18,637 | |||||||||||||||||||||||
| SDR |
FIXED | 1.00 | % | 0.00 | % | 1982 | 2031 | 23,677,607 | 30,878,679 | 4,143,587 | 5,403,776 | |||||||||||||||||||||||
| SDR |
FIXED | 0.75 | % | 0.00 | % | 1995 | 2035 | 5,443,537 | 7,099,080 | 1,995,949 | 2,602,977 | |||||||||||||||||||||||
| SDR |
FIXED | 0.75 | % | 0.00 | % | 1998 | 2037 | 15,352,987 | 20,022,293 | 5,290,839 | 6,899,942 | |||||||||||||||||||||||
| SDR |
FIXED | 0.75 | % | 0.00 | % | 2000 | 2040 | 17,500,000 | 22,822,277 | 9,040,100 | 11,789,467 | |||||||||||||||||||||||
| SDR |
FIXED | 0.75 | % | 0.00 | % | 2006 | 2044 | 13,638,602 | 17,786,512 | 9,077,195 | 11,837,844 | |||||||||||||||||||||||
| SDR |
FIXED | 0.75 | % | 0.00 | % | 2008 | 2048 | 41,696,408 | 54,377,540 | 33,342,458 | 43,482,903 | |||||||||||||||||||||||
D-120
| CURRENCY |
INTEREST RATE BASIS |
INTEREST RATE |
COMMITMENT CHARGE |
YEAR OF CONTRACT |
YEAR OF MATURITY |
ORIGINAL AMOUNT | OUTSTANDING BALANCE | |||||||||||||||||||||||||||
| (In Original Currency) |
(In US Dollar) | (In Original Currency) |
(In US Dollar) | |||||||||||||||||||||||||||||||
| SDR |
FIXED | 2.46 | % | 0.00 | % | 2011 | 2032 | 29,022,733 | 37,849,419 | 14,351,704 | 18,716,489 | |||||||||||||||||||||||
| SDR |
FIXED | 4.91 | % | 0.00 | % | 2012 | 2030 | 11,727,046 | 15,293,594 | 4,708,006 | 6,139,853 | |||||||||||||||||||||||
| SDR |
FIXED | 1.50 | % | 0.00 | % | 2005 | 2025 | 11,109,377 | 14,488,072 | 456,127 | 594,848 | |||||||||||||||||||||||
| SDR |
FIXED | 1.00 | % | 0.00 | % | 1998 | 2024 | 10,500,493 | 13,694,009 | 8,079 | 10,536 | |||||||||||||||||||||||
| SDR |
FIXED | 1.50 | % | 0.00 | % | 2005 | 2025 | 2,945,950 | 3,841,902 | 245,494 | 320,156 | |||||||||||||||||||||||
| SDR |
FIXED | 1.50 | % | 0.00 | % | 2006 | 2025 | 34,207,410 | 44,610,913 | 2,850,634 | 3,717,598 | |||||||||||||||||||||||
| SDR |
FIXED | 1.50 | % | 0.00 | % | 2006 | 2026 | 14,588,899 | 19,025,822 | 2,349,667 | 3,064,272 | |||||||||||||||||||||||
| SDR |
FIXED | 1.50 | % | 0.00 | % | 2007 | 2026 | 20,457,033 | 26,678,633 | 3,409,513 | 4,446,449 | |||||||||||||||||||||||
| SDR |
FIXED | 1.50 | % | 0.00 | % | 2007 | 2026 | 32,326,766 | 42,158,309 | 5,387,766 | 7,026,348 | |||||||||||||||||||||||
| SDR |
FIXED | 1.50 | % | 0.00 | % | 2007 | 2027 | 31,155,525 | 40,630,858 | 7,788,879 | 10,157,712 | |||||||||||||||||||||||
| SDR |
FIXED | 1.50 | % | 0.00 | % | 2008 | 2027 | 49,323,506 | 64,324,268 | 12,330,878 | 16,081,069 | |||||||||||||||||||||||
| SDR |
FIXED | 1.50 | % | 0.00 | % | 2008 | 2028 | 31,335,613 | 40,865,716 | 10,445,213 | 13,621,916 | |||||||||||||||||||||||
| SDR |
FIXED | 1.50 | % | 0.00 | % | 2009 | 2028 | 16,502,377 | 21,521,246 | 5,431,216 | 7,083,013 | |||||||||||||||||||||||
| USD |
FIXED | 0.75 | % | 0.00 | % | 1978 | 2028 | 40,000,000 | 40,000,000 | 600,000 | 600,000 | |||||||||||||||||||||||
| USD |
FIXED | 0.75 | % | 0.00 | % | 1978 | 2028 | 28,673,287 | 28,673,287 | 430,099 | 430,099 | |||||||||||||||||||||||
| USD |
FIXED | 0.75 | % | 0.00 | % | 1978 | 2028 | 49,000,000 | 49,000,000 | 735,000 | 735,000 | |||||||||||||||||||||||
| USD |
FIXED | 0.75 | % | 0.00 | % | 1979 | 2026 | 9,546,069 | 9,546,069 | 143,191 | 143,191 | |||||||||||||||||||||||
| USD |
FIXED | 0.75 | % | 0.00 | % | 1979 | 2029 | 5,500,000 | 5,500,000 | 1,008,480 | 1,008,480 | |||||||||||||||||||||||
| USD |
FIXED | 0.75 | % | 0.00 | % | 1979 | 2029 | 11,147,916 | 11,147,916 | 167,151 | 167,151 | |||||||||||||||||||||||
| USD |
FIXED | 0.75 | % | 0.00 | % | 1980 | 2026 | 26,163,597 | 26,163,597 | 392,453 | 392,453 | |||||||||||||||||||||||
| USD |
FIXED | 0.75 | % | 0.00 | % | 1980 | 2025 | 35,058,627 | 35,058,627 | 525,879 | 525,879 | |||||||||||||||||||||||
| USD |
FIXED | 0.75 | % | 0.00 | % | 1980 | 2030 | 36,526,867 | 36,526,867 | 547,902 | 547,902 | |||||||||||||||||||||||
| USD |
FIXED | 0.75 | % | 0.00 | % | 1980 | 2030 | 30,000,000 | 30,000,000 | 450,000 | 450,000 | |||||||||||||||||||||||
| USD |
FIXED | 4.58 | % | 0.00 | % | 2005 | 2025 | 400,000,000 | 400,000,000 | 42,680,000 | 42,680,000 | |||||||||||||||||||||||
| USD |
SOFR COMPOUNDED | 6.05 | % | 0.25 | % | 2005 | 2025 | 66,612,197 | 66,612,197 | 2,793,991 | 2,793,991 | |||||||||||||||||||||||
| USD |
SOFR COMPOUNDED | 5.99 | % | 0.25 | % | 2005 | 2025 | 80,000,000 | 80,000,000 | 3,242,489 | 3,242,489 | |||||||||||||||||||||||
| USD |
SOFR COMPOUNDED | 5.63 | % | 0.25 | % | 2005 | 2025 | 39,549,612 | 39,549,612 | 1,584,872 | 1,584,872 | |||||||||||||||||||||||
| USD |
SOFR COMPOUNDED | 6.05 | % | 0.25 | % | 2005 | 2025 | 36,374,144 | 36,374,144 | 1,603,561 | 1,603,561 | |||||||||||||||||||||||
| USD |
SOFR COMPOUNDED | 5.63 | % | 0.25 | % | 2005 | 2025 | 14,500,000 | 14,500,000 | 615,000 | 615,000 | |||||||||||||||||||||||
| USD |
SOFR COMPOUNDED | 5.91 | % | 0.25 | % | 2007 | 2026 | 25,729,880 | 25,729,880 | 5,224,935 | 5,224,935 | |||||||||||||||||||||||
| USD |
LIBOR 6 MONTHS DEPOSIT | 3.02 | % | 0.00 | % | 2007 | 2026 | 174,107,152 | 174,107,152 | 25,106,926 | 25,106,926 | |||||||||||||||||||||||
| USD |
SOFR COMPOUNDED | 5.46 | % | 0.00 | % | 2007 | 2027 | 18,060,078 | 18,060,078 | 4,525,876 | 4,525,876 | |||||||||||||||||||||||
| USD |
FIXED | 4.22 | % | 0.00 | % | 2007 | 2027 | 600,000,000 | 600,000,000 | 175,500,000 | 175,500,000 | |||||||||||||||||||||||
| USD |
FIXED | 4.25 | % | 0.00 | % | 2008 | 2027 | 200,000,000 | 200,000,000 | 58,500,000 | 58,500,000 | |||||||||||||||||||||||
| USD |
SOFR COMPOUNDED | 5.09 | % | 0.00 | % | 2008 | 2030 | 51,965,240 | 51,965,240 | 30,545,168 | 30,545,168 | |||||||||||||||||||||||
| USD |
SOFR COMPOUNDED | 5.09 | % | 0.00 | % | 2008 | 2030 | 41,190,000 | 41,190,000 | 24,211,482 | 24,211,482 | |||||||||||||||||||||||
| USD |
FIXED | 4.41 | % | 0.00 | % | 2008 | 2033 | 600,000,000 | 600,000,000 | 378,960,000 | 378,960,000 | |||||||||||||||||||||||
| USD |
FIXED | 4.69 | % | 0.00 | % | 2008 | 2033 | 200,000,000 | 200,000,000 | 128,280,000 | 128,280,000 | |||||||||||||||||||||||
| USD |
FIXED | 4.69 | % | 0.00 | % | 2008 | 2033 | 750,000,000 | 750,000,000 | 481,050,000 | 481,050,000 | |||||||||||||||||||||||
| USD |
SOFR COMPOUNDED | 5.79 | % | 0.00 | % | 2009 | 2033 | 275,000 | 275,000 | 176,385 | 176,385 | |||||||||||||||||||||||
| USD |
SOFR COMPOUNDED | 7.16 | % | 0.00 | % | 2009 | 2034 | 5,000,000 | 5,000,000 | 3,275,000 | 3,275,000 | |||||||||||||||||||||||
| USD |
SOFR COMPOUNDED | 6.52 | % | 0.00 | % | 2009 | 2033 | 47,365,385 | 47,365,385 | 31,685,805 | 31,685,805 | |||||||||||||||||||||||
| USD |
SOFR COMPOUNDED | 6.44 | % | 0.00 | % | 2009 | 2033 | 114,946,690 | 114,946,690 | 73,726,807 | 73,726,807 | |||||||||||||||||||||||
| USD |
SOFR COMPOUNDED | 6.44 | % | 0.00 | % | 2009 | 2033 | 296,075,411 | 296,075,411 | 189,902,768 | 189,902,768 | |||||||||||||||||||||||
| USD |
SOFR COMPOUNDED | 5.23 | % | 0.00 | % | 2009 | 2033 | 20,487,156 | 20,487,156 | 13,753,028 | 13,753,028 | |||||||||||||||||||||||
| USD |
SOFR COMPOUNDED | 6.09 | % | 0.00 | % | 2009 | 2034 | 66,954,247 | 66,954,247 | 46,864,461 | 46,864,461 | |||||||||||||||||||||||
| USD |
SOFR COMPOUNDED | 6.27 | % | 0.00 | % | 2009 | 2034 | 750,000,000 | 750,000,000 | 525,375,000 | 525,375,000 | |||||||||||||||||||||||
| USD |
SOFR COMPOUNDED | 6.27 | % | 0.00 | % | 2009 | 2034 | 250,000,000 | 250,000,000 | 175,125,000 | 175,125,000 | |||||||||||||||||||||||
| USD |
SOFR COMPOUNDED | 5.23 | % | 0.00 | % | 2010 | 2033 | 99,880,000 | 99,880,000 | 67,049,444 | 67,049,444 | |||||||||||||||||||||||
| USD |
SOFR COMPOUNDED | 5.56 | % | 0.00 | % | 2010 | 2034 | 149,826,594 | 149,826,594 | 104,953,529 | 104,953,529 | |||||||||||||||||||||||
| USD |
SOFR COMPOUNDED | 5.56 | % | 0.00 | % | 2010 | 2034 | 779,674,925 | 779,674,925 | 546,162,285 | 546,162,285 | |||||||||||||||||||||||
| USD |
SOFR COMPOUNDED | 5.56 | % | 0.00 | % | 2010 | 2034 | 200,000,000 | 200,000,000 | 145,800,000 | 145,800,000 | |||||||||||||||||||||||
| USD |
SOFR COMPOUNDED | 5.56 | % | 0.00 | % | 2010 | 2034 | 500,000,000 | 500,000,000 | 364,500,000 | 364,500,000 | |||||||||||||||||||||||
| USD |
SOFR COMPOUNDED | 5.56 | % | 0.00 | % | 2010 | 2034 | 219,770,855 | 219,770,855 | 160,212,953 | 160,212,953 | |||||||||||||||||||||||
| USD |
SOFR COMPOUNDED | 6.28 | % | 0.00 | % | 2010 | 2034 | 18,718,505 | 18,718,505 | 13,645,790 | 13,645,790 | |||||||||||||||||||||||
| USD |
SOFR COMPOUNDED | 6.09 | % | 0.00 | % | 2010 | 2034 | 182,064,708 | 182,064,708 | 132,928,858 | 132,928,858 | |||||||||||||||||||||||
| USD |
SOFR COMPOUNDED | 5.76 | % | 0.00 | % | 2010 | 2035 | 200,000,000 | 200,000,000 | 151,360,000 | 151,360,000 | |||||||||||||||||||||||
| USD |
SOFR COMPOUNDED | 5.76 | % | 0.00 | % | 2010 | 2035 | 600,000,000 | 600,000,000 | 454,080,000 | 454,080,000 | |||||||||||||||||||||||
| USD |
SOFR COMPOUNDED | 5.76 | % | 0.00 | % | 2011 | 2035 | 110,618,216 | 110,618,216 | 83,715,866 | 83,715,866 | |||||||||||||||||||||||
D-121
| CURRENCY |
INTEREST RATE BASIS |
INTEREST RATE |
COMMITMENT CHARGE |
YEAR OF CONTRACT |
YEAR OF MATURITY |
ORIGINAL AMOUNT | OUTSTANDING BALANCE | |||||||||||||||||||||||||||
| (In Original Currency) |
(In US Dollar) | (In Original Currency) |
(In US Dollar) | |||||||||||||||||||||||||||||||
| USD |
SOFR COMPOUNDED | 6.29 | % | 0.00 | % | 2011 | 2035 | 8,455,448 | 8,455,448 | 6,628,226 | 6,628,226 | |||||||||||||||||||||||
| USD |
SOFR COMPOUNDED | 6.49 | % | 0.00 | % | 2011 | 2035 | 525,373,016 | 525,373,016 | 411,839,907 | 411,839,907 | |||||||||||||||||||||||
| USD |
SOFR COMPOUNDED | 5.59 | % | 0.00 | % | 2011 | 2035 | 119,319,612 | 119,319,612 | 90,243,101 | 90,243,101 | |||||||||||||||||||||||
| USD |
SOFR COMPOUNDED | 5.76 | % | 0.00 | % | 2011 | 2036 | 400,000,000 | 400,000,000 | 324,120,000 | 324,120,000 | |||||||||||||||||||||||
| USD |
SOFR 6 MONTHS | 6.12 | % | 0.00 | % | 2011 | 2035 | 36,091,438 | 36,091,438 | 28,306,659 | 28,306,659 | |||||||||||||||||||||||
| USD |
SOFR COMPOUNDED | 5.70 | % | 0.00 | % | 2011 | 2035 | 129,044,476 | 129,044,476 | 101,157,965 | 101,157,965 | |||||||||||||||||||||||
| USD |
FIXED | 0.25 | % | 0.25 | % | 2011 | 2051 | 124,311,085 | 124,311,085 | 115,609,309 | 115,609,309 | |||||||||||||||||||||||
| USD |
SOFR 6 MONTHS | 6.12 | % | 0.00 | % | 2011 | 2035 | 223,752,199 | 223,752,199 | 175,683,223 | 175,683,223 | |||||||||||||||||||||||
| USD |
SOFR COMPOUNDED | 6.29 | % | 0.00 | % | 2012 | 2036 | 91,089,216 | 91,089,216 | 73,785,928 | 73,785,928 | |||||||||||||||||||||||
| USD |
SOFR COMPOUNDED | 6.29 | % | 0.00 | % | 2012 | 2036 | 77,093,168 | 77,093,168 | 64,457,597 | 64,457,597 | |||||||||||||||||||||||
| USD |
SOFR COMPOUNDED | 6.12 | % | 0.00 | % | 2012 | 2034 | 4,114,072 | 4,114,072 | 4,073,686 | 4,073,686 | |||||||||||||||||||||||
| USD |
SOFR COMPOUNDED | 6.48 | % | 0.00 | % | 2012 | 2037 | 300,000,000 | 300,000,000 | 258,390,000 | 258,390,000 | |||||||||||||||||||||||
| USD |
SOFR COMPOUNDED | 6.48 | % | 0.00 | % | 2012 | 2037 | 100,000,000 | 100,000,000 | 86,130,000 | 86,130,000 | |||||||||||||||||||||||
| USD |
SOFR 6 MONTHS | 6.48 | % | 0.00 | % | 2012 | 2037 | 100,000,000 | 100,000,000 | 86,130,000 | 86,130,000 | |||||||||||||||||||||||
| USD |
SOFR COMPOUNDED | 5.70 | % | 0.00 | % | 2012 | 2037 | 260,609,548 | 260,609,548 | 224,463,004 | 224,463,004 | |||||||||||||||||||||||
| USD |
SOFR COMPOUNDED | 5.55 | % | 0.00 | % | 2013 | 2037 | 632,570,760 | 632,570,760 | 544,804,802 | 544,804,802 | |||||||||||||||||||||||
| USD |
SOFR COMPOUNDED | 5.76 | % | 0.00 | % | 2013 | 2037 | 70,076,683 | 70,076,683 | 59,896,955 | 59,896,955 | |||||||||||||||||||||||
| USD |
SOFR COMPOUNDED | 6.29 | % | 0.00 | % | 2013 | 2029 | 95,419,264 | 95,419,264 | 52,967,234 | 52,967,234 | |||||||||||||||||||||||
| USD |
SOFR 6 MONTHS | 6.02 | % | 0.00 | % | 2013 | 2034 | 105,364,546 | 105,364,546 | 81,067,482 | 81,067,482 | |||||||||||||||||||||||
| USD |
SOFR COMPOUNDED | 5.45 | % | 0.00 | % | 2014 | 2033 | 44,793,480 | 44,793,480 | 37,906,631 | 37,906,631 | |||||||||||||||||||||||
| USD |
SOFR COMPOUNDED | 6.29 | % | 0.00 | % | 2014 | 2030 | 500,000,000 | 500,000,000 | 329,200,000 | 329,200,000 | |||||||||||||||||||||||
| USD |
SOFR COMPOUNDED | 5.35 | % | 0.00 | % | 2014 | 2030 | 500,000,000 | 500,000,000 | 347,000,000 | 347,000,000 | |||||||||||||||||||||||
| USD |
SOFR COMPOUNDED | 5.65 | % | 0.25 | % | 2015 | 2035 | 500,000,000 | 500,000,000 | 400,350,000 | 400,350,000 | |||||||||||||||||||||||
| USD |
SOFR COMPOUNDED | 5.65 | % | 0.25 | % | 2016 | 2037 | 400,000,000 | 400,000,000 | 346,840,000 | 346,840,000 | |||||||||||||||||||||||
| USD |
SOFR COMPOUNDED | 6.59 | % | 0.25 | % | 2016 | 2036 | 297,979,759 | 297,979,759 | 272,502,368 | 272,502,368 | |||||||||||||||||||||||
| USD |
SOFR COMPOUNDED | 6.98 | % | 0.25 | % | 2016 | 2032 | 206,161,574 | 206,161,574 | 179,704,428 | 179,704,428 | |||||||||||||||||||||||
| USD |
SOFR COMPOUNDED | 5.73 | % | 0.25 | % | 2016 | 2036 | 400,000,000 | 400,000,000 | 400,000,000 | 400,000,000 | |||||||||||||||||||||||
| USD |
SOFR COMPOUNDED | 6.51 | % | 0.25 | % | 2017 | 2032 | 124,879,619 | 124,879,619 | 124,548,530 | 124,548,530 | |||||||||||||||||||||||
| USD |
SOFR COMPOUNDED | 6.16 | % | 0.25 | % | 2017 | 2026 | 43,347,009 | 43,347,009 | 17,836,535 | 17,836,535 | |||||||||||||||||||||||
| USD |
SOFR COMPOUNDED | 6.34 | % | 0.25 | % | 2017 | 2036 | 198,600,179 | 198,600,179 | 198,600,179 | 198,600,179 | |||||||||||||||||||||||
| USD |
SOFR COMPOUNDED | 5.92 | % | 0.25 | % | 2017 | 2030 | 186,600,000 | 186,600,000 | 151,873,740 | 151,873,740 | |||||||||||||||||||||||
| USD |
SOFR COMPOUNDED | 6.61 | % | 0.25 | % | 2017 | 2037 | 300,000,000 | 300,000,000 | 260,040,000 | 260,040,000 | |||||||||||||||||||||||
| USD |
SOFR COMPOUNDED | 6.31 | % | 0.25 | % | 2017 | 2031 | 400,259,836 | 400,259,836 | 296,112,064 | 296,112,064 | |||||||||||||||||||||||
| USD |
SOFR COMPOUNDED | 6.98 | % | 0.25 | % | 2018 | 2038 | 300,000,000 | 300,000,000 | 270,030,000 | 270,030,000 | |||||||||||||||||||||||
| USD |
SOFR COMPOUNDED | 6.39 | % | 0.25 | % | 2018 | 2031 | 150,000,000 | 150,000,000 | 150,000,000 | 150,000,000 | |||||||||||||||||||||||
| USD |
SOFR COMPOUNDED | 6.47 | % | 0.25 | % | 2018 | 2034 | 250,000,000 | 250,000,000 | 239,463,873 | 239,463,873 | |||||||||||||||||||||||
| USD |
SOFR COMPOUNDED | 6.39 | % | 0.25 | % | 2018 | 2032 | 400,000,000 | 400,000,000 | 377,680,000 | 377,680,000 | |||||||||||||||||||||||
| USD |
SOFR COMPOUNDED | 6.40 | % | 0.25 | % | 2018 | 2031 | 95,497,719 | 95,497,719 | 95,750,000 | 95,750,000 | |||||||||||||||||||||||
| USD |
SOFR COMPOUNDED | 5.88 | % | 0.25 | % | 2018 | 2031 | 272,515,000 | 272,515,000 | 270,187,140 | 270,187,140 | |||||||||||||||||||||||
| USD |
SOFR COMPOUNDED | 6.37 | % | 0.25 | % | 2018 | 2031 | 200,000,000 | 200,000,000 | 197,191,569 | 197,191,569 | |||||||||||||||||||||||
| USD |
SOFR COMPOUNDED | 6.30 | % | 0.25 | % | 2019 | 2032 | 49,600,000 | 49,600,000 | 16,920,700 | 16,920,700 | |||||||||||||||||||||||
| USD |
SOFR COMPOUNDED | 6.26 | % | 0.25 | % | 2019 | 2032 | 227,500,000 | 227,500,000 | 227,500,000 | 227,500,000 | |||||||||||||||||||||||
| USD |
SOFR COMPOUNDED | 6.60 | % | 0.25 | % | 2020 | 2032 | 100,000,000 | 100,000,000 | 59,083,095 | 59,083,095 | |||||||||||||||||||||||
| USD |
SOFR COMPOUNDED | 5.69 | % | 0.25 | % | 2020 | 2032 | 250,020,000 | 250,020,000 | 211,480,000 | 211,480,000 | |||||||||||||||||||||||
| USD |
SOFR COMPOUNDED | 6.38 | % | 0.25 | % | 2020 | 2034 | 300,000,000 | 300,000,000 | 300,000,000 | 300,000,000 | |||||||||||||||||||||||
| USD |
SOFR COMPOUNDED | 5.86 | % | 0.25 | % | 2020 | 2032 | 150,000,000 | 150,000,000 | 146,350,000 | 146,350,000 | |||||||||||||||||||||||
| USD |
SOFR 6 MONTHS | 6.02 | % | 0.25 | % | 2020 | 2033 | 250,000,000 | 250,000,000 | 250,000,000 | 250,000,000 | |||||||||||||||||||||||
| USD |
SOFR 6 MONTHS | 6.02 | % | 0.25 | % | 2020 | 2034 | 121,000,000 | 121,000,000 | 121,000,000 | 121,000,000 | |||||||||||||||||||||||
| USD |
SOFR COMPOUNDED | 6.70 | % | 0.25 | % | 2020 | 2033 | 160,000,000 | 160,000,000 | 108,267,000 | 108,267,000 | |||||||||||||||||||||||
| USD |
SOFR COMPOUNDED | 5.69 | % | 0.25 | % | 2021 | 2031 | 500,000,000 | 500,000,000 | 315,000,000 | 315,000,000 | |||||||||||||||||||||||
| USD |
SOFR COMPOUNDED | 6.38 | % | 0.25 | % | 2021 | 2034 | 500,000,000 | 500,000,000 | 500,000,000 | 500,000,000 | |||||||||||||||||||||||
| USD |
SOFR COMPOUNDED | 6.38 | % | 0.25 | % | 2021 | 2033 | 800,000,000 | 800,000,000 | 800,000,000 | 800,000,000 | |||||||||||||||||||||||
| USD |
SOFR COMPOUNDED | 6.36 | % | 0.25 | % | 2021 | 2034 | 400,000,000 | 400,000,000 | 400,000,000 | 400,000,000 | |||||||||||||||||||||||
| USD |
SOFR COMPOUNDED | 6.81 | % | 0.25 | % | 2021 | 2046 | 380,000,000 | 380,000,000 | 1,933,762 | 1,933,762 | |||||||||||||||||||||||
| USD |
SOFR COMPOUNDED | 6.36 | % | 0.25 | % | 2022 | 2033 | 400,000,000 | 400,000,000 | 233,640,000 | 233,640,000 | |||||||||||||||||||||||
| USD |
SOFR COMPOUNDED | 6.44 | % | 0.25 | % | 2022 | 2035 | 223,996,591 | 223,996,591 | 6,382,000 | 6,382,000 | |||||||||||||||||||||||
| USD |
SOFR COMPOUNDED | 6.39 | % | 0.25 | % | 2022 | 2035 | 100,000,000 | 100,000,000 | 2,546,195 | 2,546,195 | |||||||||||||||||||||||
| USD |
SOFR COMPOUNDED | 6.19 | % | 0.25 | % | 2022 | 2036 | 400,000,000 | 400,000,000 | 43,880,000 | 43,880,000 | |||||||||||||||||||||||
D-122
| CURRENCY |
INTEREST RATE BASIS |
INTEREST RATE |
COMMITMENT CHARGE |
YEAR OF CONTRACT |
YEAR OF MATURITY |
ORIGINAL AMOUNT | OUTSTANDING BALANCE | |||||||||||||||||||||||||||
| (In Original Currency) |
(In US Dollar) | (In Original Currency) |
(In US Dollar) | |||||||||||||||||||||||||||||||
| USD |
SOFR COMPOUNDED | 5.81 | % | 0.25 | % | 2023 | 2033 | 300,000,000 | 300,000,000 | 166,815,190 | 166,815,190 | |||||||||||||||||||||||
| USD |
SOFR COMPOUNDED | 5.88 | % | 0.25 | % | 2023 | 2036 | 400,000,000 | 400,000,000 | 12,337,000 | 12,337,000 | |||||||||||||||||||||||
| USD |
SOFR COMPOUNDED | 5.49 | % | 0.25 | % | 2023 | 2036 | 200,000,000 | 200,000,000 | 1,620,000 | 1,620,000 | |||||||||||||||||||||||
| USD |
SOFR COMPOUNDED | 6.47 | % | 0.25 | % | 2023 | 2035 | 250,000,000 | 250,000,000 | 16,083,930 | 16,083,930 | |||||||||||||||||||||||
| USD |
SOFR COMPOUNDED | 5.39 | % | 0.25 | % | 2023 | 2033 | 1,000,000,000 | 1,000,000,000 | 1,000,000,000 | 1,000,000,000 | |||||||||||||||||||||||
| USD |
SOFR COMPOUNDED | 6.05 | % | 0.25 | % | 2005 | 2025 | 68,139,965 | 68,139,965 | 2,977,348 | 2,977,348 | |||||||||||||||||||||||
| USD |
SOFR COMPOUNDED | 7.19 | % | 0.25 | % | 2006 | 2026 | 61,765,082 | 61,765,082 | 8,173,441 | 8,173,441 | |||||||||||||||||||||||
| USD |
SOFR COMPOUNDED | 6.22 | % | 0.25 | % | 2016 | 2032 | 206,188,974 | 206,188,974 | 179,730,514 | 179,730,514 | |||||||||||||||||||||||
| USD |
SOFR COMPOUNDED | 5.83 | % | 0.25 | % | 2017 | 2032 | 124,548,590 | 124,548,590 | 124,548,590 | 124,548,590 | |||||||||||||||||||||||
| USD |
SOFR COMPOUNDED | 5.57 | % | 0.25 | % | 2017 | 2027 | 43,031,795 | 43,031,795 | 22,249,530 | 22,249,530 | |||||||||||||||||||||||
| USD |
SOFR COMPOUNDED | 6.22 | % | 0.25 | % | 2018 | 2034 | 250,000,000 | 250,000,000 | 239,463,873 | 239,463,873 | |||||||||||||||||||||||
| USD |
SOFR COMPOUNDED | 5.40 | % | 0.25 | % | 2020 | 2033 | 250,000,000 | 250,000,000 | 250,000,000 | 250,000,000 | |||||||||||||||||||||||
| USD |
SOFR COMPOUNDED | 5.26 | % | 0.25 | % | 2020 | 2032 | 750,000,000 | 750,000,000 | 631,650,000 | 631,650,000 | |||||||||||||||||||||||
| USD |
SOFR COMPOUNDED | 5.61 | % | 0.25 | % | 2021 | 2036 | 500,000,000 | 500,000,000 | 500,000,000 | 500,000,000 | |||||||||||||||||||||||
| USD |
FIXED | 1.74 | % | 0.00 | % | 2018 | 2036 | 39,885,000 | 39,885,000 | 35,195,100 | 35,195,100 | |||||||||||||||||||||||
| USD |
FIXED | 1.74 | % | 0.00 | % | 2019 | 2037 | 55,300,000 | 55,300,000 | 47,400,000 | 47,400,000 | |||||||||||||||||||||||
| USD |
NO INTEREST RATE | 0.00 | % | 0.00 | % | 2008 | 2026 | 13,585,521 | 13,585,521 | 1,866,179 | 1,866,179 | |||||||||||||||||||||||
| USD |
NO INTEREST RATE | 0.00 | % | 0.00 | % | 2008 | 2027 | 4,584,236 | 4,584,236 | 1,040,559 | 1,040,559 | |||||||||||||||||||||||
| USD |
NO INTEREST RATE | 0.00 | % | 0.00 | % | 2009 | 2030 | 51,484,813 | 51,484,813 | 25,742,407 | 25,742,407 | |||||||||||||||||||||||
| USD |
NO INTEREST RATE | 0.00 | % | 0.00 | % | 2011 | 2028 | 19,632,981 | 19,632,981 | 6,246,870 | 6,246,870 | |||||||||||||||||||||||
| USD |
NO INTEREST RATE | 0.00 | % | 0.00 | % | 2011 | 2028 | 28,794,548 | 28,794,548 | 12,328,183 | 12,328,183 | |||||||||||||||||||||||
| USD |
NO INTEREST RATE | 0.00 | % | 0.00 | % | 2011 | 2030 | 23,569,859 | 23,569,859 | 11,784,929 | 11,784,929 | |||||||||||||||||||||||
| USD |
NO INTEREST RATE | 0.00 | % | 0.00 | % | 2011 | 2027 | 7,304,212 | 7,304,212 | 1,992,058 | 1,992,058 | |||||||||||||||||||||||
| USD |
NO INTEREST RATE | 0.00 | % | 0.00 | % | 2011 | 2026 | 133,605,200 | 133,605,200 | 23,860,693 | 23,860,693 | |||||||||||||||||||||||
| USD |
NO INTEREST RATE | 0.00 | % | 0.00 | % | 2011 | 2030 | 9,000,832 | 9,000,832 | 3,531,373 | 3,531,373 | |||||||||||||||||||||||
| USD |
NO INTEREST RATE | 0.00 | % | 0.00 | % | 2011 | 2030 | 6,071,773 | 6,071,773 | 2,522,364 | 2,522,364 | |||||||||||||||||||||||
| USD |
NO INTEREST RATE | 0.00 | % | 0.00 | % | 2011 | 2028 | 21,198,322 | 21,198,322 | 6,720,039 | 6,720,039 | |||||||||||||||||||||||
| USD |
NO INTEREST RATE | 0.00 | % | 0.00 | % | 2011 | 2027 | 5,619,569 | 5,619,569 | 1,531,375 | 1,531,375 | |||||||||||||||||||||||
| USD |
NO INTEREST RATE | 0.00 | % | 0.00 | % | 2011 | 2032 | 20,359,477 | 20,359,477 | 10,858,388 | 10,858,388 | |||||||||||||||||||||||
| USD |
NO INTEREST RATE | 0.00 | % | 0.00 | % | 2011 | 2027 | 22,918,836 | 22,918,836 | 5,208,348 | 5,208,348 | |||||||||||||||||||||||
| USD |
NO INTEREST RATE | 0.00 | % | 0.00 | % | 2011 | 2027 | 3,997,338 | 3,997,338 | 1,090,183 | 1,090,183 | |||||||||||||||||||||||
| USD |
NO INTEREST RATE | 0.00 | % | 0.00 | % | 2012 | 2035 | 65,000,000 | 65,000,000 | 23,932,187 | 23,932,187 | |||||||||||||||||||||||
| USD |
NO INTEREST RATE | 0.00 | % | 0.00 | % | 2013 | 2030 | 102,735,040 | 102,735,040 | 61,641,024 | 61,641,024 | |||||||||||||||||||||||
| USD |
NO INTEREST RATE | 0.00 | % | 0.00 | % | 2013 | 2029 | 26,323,881 | 26,323,881 | 10,768,861 | 10,768,861 | |||||||||||||||||||||||
| USD |
NO INTEREST RATE | 0.00 | % | 0.00 | % | 2013 | 2028 | 161,565,869 | 161,565,869 | 64,626,348 | 64,626,348 | |||||||||||||||||||||||
| USD |
NO INTEREST RATE | 0.00 | % | 0.00 | % | 2013 | 2033 | 8,302,857 | 8,302,857 | 4,704,952 | 4,704,952 | |||||||||||||||||||||||
| USD |
NO INTEREST RATE | 0.00 | % | 0.00 | % | 2014 | 2031 | 160,956,898 | 160,956,898 | 104,621,984 | 104,621,984 | |||||||||||||||||||||||
| USD |
NO INTEREST RATE | 0.00 | % | 0.00 | % | 2014 | 2029 | 69,924,759 | 69,924,759 | 35,355,483 | 35,355,483 | |||||||||||||||||||||||
| USD |
NO INTEREST RATE | 0.00 | % | 0.00 | % | 2016 | 2033 | 7,412,194 | 7,412,194 | 6,236,723 | 6,236,723 | |||||||||||||||||||||||
| USD |
NO INTEREST RATE | 0.00 | % | 0.00 | % | 2016 | 2033 | 293,511,116 | 293,511,116 | 249,017,285 | 249,017,285 | |||||||||||||||||||||||
| USD |
NO INTEREST RATE | 0.00 | % | 0.00 | % | 2016 | 2035 | 9,817,404 | 9,817,404 | 7,202,263 | 7,202,263 | |||||||||||||||||||||||
| USD |
NO INTEREST RATE | 0.00 | % | 0.00 | % | 2016 | 2032 | 13,870,000 | 13,870,000 | 8,682,567 | 8,682,567 | |||||||||||||||||||||||
| USD |
NO INTEREST RATE | 0.00 | % | 0.00 | % | 2016 | 2032 | 122,468,065 | 122,468,065 | 97,974,452 | 97,974,452 | |||||||||||||||||||||||
| USD |
NO INTEREST RATE | 0.00 | % | 0.00 | % | 2017 | 2034 | 15,000,000 | 15,000,000 | 10,280,567 | 10,280,567 | |||||||||||||||||||||||
| USD |
NO INTEREST RATE | 0.00 | % | 0.00 | % | 2017 | 2034 | 235,000,000 | 235,000,000 | 188,409,367 | 188,409,367 | |||||||||||||||||||||||
| USD |
NO INTEREST RATE | 0.00 | % | 0.00 | % | 2020 | 2035 | 4,000,000 | 4,000,000 | 846,837 | 846,837 | |||||||||||||||||||||||
| USD |
NO INTEREST RATE | 0.00 | % | 0.00 | % | 2020 | 2040 | 66,000,000 | 66,000,000 | 33,536,303 | 33,536,303 | |||||||||||||||||||||||
| USD |
NO INTEREST RATE | 0.00 | % | 0.00 | % | 2020 | 2035 | 12,153,000 | 12,153,000 | 3,064,877 | 3,064,877 | |||||||||||||||||||||||
| USD |
NO INTEREST RATE | 0.00 | % | 0.00 | % | 2020 | 2036 | 154,239,000 | 154,239,000 | 151,566,276 | 151,566,276 | |||||||||||||||||||||||
| USD |
NO INTEREST RATE | 0.00 | % | 0.00 | % | 2020 | 2041 | 95,326,000 | 95,326,000 | 47,665,274 | 47,665,274 | |||||||||||||||||||||||
| USD |
NO INTEREST RATE | 0.00 | % | 0.00 | % | 2022 | 2043 | 150,000,000 | 150,000,000 | 47,658,774 | 47,658,774 | |||||||||||||||||||||||
| USD |
SOFR COMPOUNDED | 5.31 | % | 0.75 | % | 2002 | 2025 | 29,581,192 | 29,581,192 | 3,272,049 | 3,272,049 | |||||||||||||||||||||||
| USD |
SOFR COMPOUNDED | 5.31 | % | 0.75 | % | 2002 | 2025 | 129,187,219 | 129,187,219 | 14,295,010 | 14,295,010 | |||||||||||||||||||||||
| USD |
SOFR COMPOUNDED | 5.29 | % | 0.75 | % | 2003 | 2027 | 152,506,250 | 152,506,250 | 47,768,151 | 47,768,151 | |||||||||||||||||||||||
| USD |
SOFR COMPOUNDED | 5.29 | % | 0.75 | % | 2003 | 2027 | 101,942,064 | 101,942,064 | 32,419,522 | 32,419,522 | |||||||||||||||||||||||
| USD |
SOFR COMPOUNDED | 5.30 | % | 0.75 | % | 2004 | 2028 | 51,938,068 | 51,938,068 | 19,952,060 | 19,952,060 | |||||||||||||||||||||||
| USD |
SOFR COMPOUNDED | 5.30 | % | 0.64 | % | 2004 | 2028 | 46,372,874 | 46,372,874 | 17,991,862 | 17,991,862 | |||||||||||||||||||||||
D-123
| CURRENCY |
INTEREST RATE BASIS |
INTEREST RATE |
COMMITMENT CHARGE |
YEAR OF CONTRACT |
YEAR OF MATURITY |
ORIGINAL AMOUNT | OUTSTANDING BALANCE | |||||||||||||||||||||||||||
| (In Original Currency) |
(In US Dollar) | (In Original Currency) |
(In US Dollar) | |||||||||||||||||||||||||||||||
| USD |
SOFR COMPOUNDED | 5.30 | % | 0.75 | % | 2005 | 2025 | 53,986,553 | 53,986,553 | 6,595,267 | 6,595,267 | |||||||||||||||||||||||
| USD |
SOFR COMPOUNDED | 5.60 | % | 0.75 | % | 2005 | 2030 | 17,547,670 | 17,547,670 | 8,708,903 | 8,708,903 | |||||||||||||||||||||||
| USD |
SOFR COMPOUNDED | 5.37 | % | 0.75 | % | 2006 | 2030 | 143,052,258 | 143,052,258 | 69,425,001 | 69,425,001 | |||||||||||||||||||||||
| USD |
SOFR COMPOUNDED | 5.10 | % | 0.15 | % | 2010 | 2034 | 99,481,861 | 99,481,861 | 70,094,773 | 70,094,773 | |||||||||||||||||||||||
| USD |
SOFR COMPOUNDED | 5.20 | % | 0.15 | % | 2010 | 2035 | 31,425,843 | 31,425,843 | 24,247,400 | 24,247,400 | |||||||||||||||||||||||
| USD |
SOFR COMPOUNDED | 5.02 | % | 0.15 | % | 2010 | 2025 | 200,000,000 | 200,000,000 | 26,950,630 | 26,950,630 | |||||||||||||||||||||||
| USD |
SOFR COMPOUNDED | 5.20 | % | 0.00 | % | 2011 | 2025 | 200,000,000 | 200,000,000 | 26,950,630 | 26,950,630 | |||||||||||||||||||||||
| USD |
SOFR COMPOUNDED | 5.12 | % | 0.15 | % | 2013 | 2033 | 48,757,919 | 48,757,919 | 30,944,175 | 30,944,175 | |||||||||||||||||||||||
| USD |
SOFR COMPOUNDED | 5.27 | % | 0.15 | % | 2013 | 2033 | 17,344,813 | 17,344,813 | 11,962,928 | 11,962,928 | |||||||||||||||||||||||
| USD |
SOFR COMPOUNDED | 6.20 | % | 0.00 | % | 2013 | 2033 | 1,920,255 | 1,920,255 | 1,324,420 | 1,324,420 | |||||||||||||||||||||||
| USD |
SOFR COMPOUNDED | 5.40 | % | 0.15 | % | 2014 | 2032 | 71,221,904 | 71,221,904 | 49,305,339 | 49,305,339 | |||||||||||||||||||||||
| USD |
SOFR COMPOUNDED | 5.50 | % | 0.15 | % | 2014 | 2031 | 77,885,822 | 77,885,822 | 62,982,180 | 62,982,180 | |||||||||||||||||||||||
| USD |
SOFR COMPOUNDED | 6.33 | % | 0.15 | % | 2014 | 2031 | 33,467,310 | 33,467,310 | 27,851,050 | 27,851,050 | |||||||||||||||||||||||
| USD |
SOFR COMPOUNDED | 6.10 | % | 0.15 | % | 2015 | 2030 | 100,000,000 | 100,000,000 | 50,000,000 | 50,000,000 | |||||||||||||||||||||||
| USD |
SOFR COMPOUNDED | 5.50 | % | 0.15 | % | 2016 | 2033 | 106,200,000 | 106,200,000 | 106,467,274 | 106,467,274 | |||||||||||||||||||||||
| USD |
SOFR COMPOUNDED | 5.22 | % | 0.00 | % | 2016 | 2031 | 143,000,000 | 143,000,000 | 93,989,046 | 93,989,046 | |||||||||||||||||||||||
| USD |
SOFR COMPOUNDED | 5.20 | % | 0.15 | % | 2017 | 2034 | 459,487,908 | 459,487,908 | 459,487,908 | 459,487,908 | |||||||||||||||||||||||
| USD |
SOFR COMPOUNDED | 6.03 | % | 0.15 | % | 2017 | 2034 | 92,110,284 | 92,110,284 | 92,110,284 | 92,110,284 | |||||||||||||||||||||||
| USD |
SOFR COMPOUNDED | 6.30 | % | 0.15 | % | 2017 | 2032 | 100,000,000 | 100,000,000 | 66,666,667 | 66,666,667 | |||||||||||||||||||||||
| USD |
SOFR COMPOUNDED | 5.22 | % | 0.15 | % | 2018 | 2037 | 192,500,000 | 192,500,000 | 192,331,210 | 192,331,210 | |||||||||||||||||||||||
| USD |
SOFR COMPOUNDED | 5.22 | % | 0.15 | % | 2019 | 2039 | 181,311,946 | 181,311,946 | 175,558,576 | 175,558,576 | |||||||||||||||||||||||
| USD |
SOFR COMPOUNDED | 5.22 | % | 0.15 | % | 2019 | 2039 | 109,750,000 | 109,750,000 | 82,298,580 | 82,298,580 | |||||||||||||||||||||||
| USD |
SOFR COMPOUNDED | 5.20 | % | 0.15 | % | 2019 | 2037 | 90,000,000 | 90,000,000 | 59,379,084 | 59,379,084 | |||||||||||||||||||||||
| USD |
SOFR COMPOUNDED | 5.40 | % | 0.15 | % | 2019 | 2039 | 50,000,000 | 50,000,000 | 33,257,929 | 33,257,929 | |||||||||||||||||||||||
| USD |
SOFR COMPOUNDED | 5.40 | % | 0.15 | % | 2021 | 2039 | 79,475,000 | 79,475,000 | 17,301,469 | 17,301,469 | |||||||||||||||||||||||
| USD |
SOFR COMPOUNDED | 5.22 | % | 0.15 | % | 2022 | 2041 | 150,000,000 | 150,000,000 | 71,824,383 | 71,824,383 | |||||||||||||||||||||||
| USD |
SOFR COMPOUNDED | 5.47 | % | 0.15 | % | 2022 | 2037 | 500,000,000 | 500,000,000 | 500,000,000 | 500,000,000 | |||||||||||||||||||||||
| USD |
SOFR COMPOUNDED | 5.47 | % | 0.15 | % | 2022 | 2037 | 500,000,000 | 500,000,000 | 500,000,000 | 500,000,000 | |||||||||||||||||||||||
| USD |
SOFR COMPOUNDED | 5.47 | % | 0.15 | % | 2022 | 2037 | 500,000,000 | 500,000,000 | 500,000,000 | 500,000,000 | |||||||||||||||||||||||
| USD |
SOFR COMPOUNDED | 1.70 | % | 0.15 | % | 2022 | 2037 | 15,000,000 | 15,000,000 | 15,000,000 | 15,000,000 | |||||||||||||||||||||||
| USD |
NO INTEREST RATE | 0.00 | % | 0.00 | % | 2023 | 2038 | 10,000,000 | 10,000,000 | 2,320,925 | 2,320,925 | |||||||||||||||||||||||
| USD |
SOFR COMPOUNDED | 5.20 | % | 0.15 | % | 2010 | 2035 | 39,126,660 | 39,126,660 | 29,360,661 | 29,360,661 | |||||||||||||||||||||||
| USD |
FIXED | 4.73 | % | 0.00 | % | 2006 | 2026 | 530,000,000 | 530,000,000 | 107,484,000 | 107,484,000 | |||||||||||||||||||||||
| USD |
SOFR COMPOUNDED | 5.94 | % | 0.00 | % | 2017 | 2034 | 36,507,543 | 36,507,543 | 36,507,543 | 36,507,543 | |||||||||||||||||||||||
| USD |
SOFR COMPOUNDED | 6.84 | % | 0.00 | % | 2017 | 2034 | 7,314,980 | 7,314,980 | 7,314,980 | 7,314,980 | |||||||||||||||||||||||
|
|
|
|
|
|||||||||||||||||||||||||||||||
| TOTAL BILATERAL |
|
USD | 32,567,733,376 | USD | 16,755,846,418 | |||||||||||||||||||||||||||||
|
|
|
|
|
|||||||||||||||||||||||||||||||
| TOTAL COMMERCIAL CREDIT |
|
USD | 19,331,909,341 | USD | 10,109,504,852 | |||||||||||||||||||||||||||||
|
|
|
|
|
|||||||||||||||||||||||||||||||
| TOTAL MULTILATERAL |
|
USD | 56,326,552,994 | USD | 37,250,143,904 | |||||||||||||||||||||||||||||
|
|
|
|
|
|||||||||||||||||||||||||||||||
Assumed exchange rates for conversion
| ACU/IDR |
21,070.83 | |||
| AUD/IDR |
10,052.89 | |||
| CAD/IDR |
11,245.52 | |||
| CHF/IDR |
17,883.67 | |||
| CNY/IDR |
2,213.48 | |||
| EUR/IDR |
16,822.67 | |||
| JPY/IDR |
103.4280 | |||
| KRW/IDR |
10.9600 | |||
| SAR/IDR |
4,300.51 | |||
| SDR/IDR |
21,070.83 | |||
| USD/IDR |
16,157.00 |
D-124
DOMESTIC LOANS OF THE REPUBLIC OF INDONESIA
AS OF DECEMBER 31, 2024
| CURRENCY BASE |
INTEREST RATE BASIS |
INTEREST RATE |
YEAR OF CONTRACT |
YEAR OF MATURITY |
ORIGINAL AMOUNT | OUTSTANDING BALANCE | ||||||||||||||||||||||||
| (In Original Currency) | (In US Dollar) | (In Original Currency) | (In US Dollar) | |||||||||||||||||||||||||||
| COMMERCIAL CREDIT |
| |||||||||||||||||||||||||||||
| IDR |
JIBOR 6 MONTHS |
7.22 | % | 2017 | 2025 | 29,921,000,000 | 1,851,891 | 8,976,300,000 | 555,567 | |||||||||||||||||||||
| IDR |
JIBOR 6 MONTHS |
7.22 | % | 2017 | 2025 | 59,857,402,000 | 3,704,735 | 17,957,220,600 | 1,111,420 | |||||||||||||||||||||
| IDR |
JIBOR 6 MONTHS |
7.22 | % | 2017 | 2025 | 35,000,000,000 | 2,166,244 | 10,500,000,000 | 649,873 | |||||||||||||||||||||
| IDR |
JIBOR 6 MONTHS |
7.22 | % | 2017 | 2025 | 79,880,000,000 | 4,943,987 | 23,964,000,000 | 1,483,196 | |||||||||||||||||||||
| IDR |
JIBOR 6 MONTHS |
7.22 | % | 2017 | 2025 | 29,841,273,000 | 1,846,956 | 8,952,381,900 | 554,087 | |||||||||||||||||||||
| IDR |
JIBOR 6 MONTHS |
7.22 | % | 2017 | 2025 | 39,853,350,000 | 2,466,631 | 11,956,005,000 | 739,989 | |||||||||||||||||||||
| IDR |
JIBOR 6 MONTHS |
7.19 | % | 2017 | 2025 | 60,000,000,000 | 3,713,561 | 18,000,000,000 | 1,114,068 | |||||||||||||||||||||
| IDR |
JIBOR 6 MONTHS |
7.19 | % | 2017 | 2025 | 20,000,000,000 | 1,237,854 | 6,000,000,000 | 371,356 | |||||||||||||||||||||
| IDR |
JIBOR 6 MONTHS |
7.19 | % | 2017 | 2025 | 49,106,000,000 | 3,039,302 | 14,731,800,000 | 911,791 | |||||||||||||||||||||
| IDR |
JIBOR 6 MONTHS |
7.19 | % | 2017 | 2025 | 105,894,000,000 | 6,554,063 | 31,768,200,000 | 1,966,219 | |||||||||||||||||||||
| IDR |
JIBOR 6 MONTHS |
7.19 | % | 2017 | 2025 | 42,000,000,000 | 2,599,492 | 12,600,000,000 | 779,848 | |||||||||||||||||||||
| IDR |
JIBOR 6 MONTHS |
7.19 | % | 2017 | 2025 | 22,500,000,000 | 1,392,585 | 6,750,000,000 | 417,776 | |||||||||||||||||||||
| IDR |
JIBOR 6 MONTHS |
7.19 | % | 2017 | 2025 | 383,000,000,000 | 23,704,896 | 114,900,000,000 | 7,111,469 | |||||||||||||||||||||
| IDR |
JIBOR 6 MONTHS |
7.19 | % | 2017 | 2025 | 110,000,000,000 | 6,808,195 | 33,000,000,000 | 2,042,458 | |||||||||||||||||||||
| IDR |
JIBOR 6 MONTHS |
7.19 | % | 2017 | 2025 | 69,998,560,000 | 4,332,398 | 20,999,568,000 | 1,299,720 | |||||||||||||||||||||
| IDR |
JIBOR 6 MONTHS |
7.19 | % | 2017 | 2025 | 147,000,000,000 | 9,098,224 | 44,100,000,000 | 2,729,467 | |||||||||||||||||||||
| IDR |
JIBOR 6 MONTHS |
7.19 | % | 2017 | 2025 | 19,998,090,000 | 1,237,735 | 5,999,427,000 | 371,321 | |||||||||||||||||||||
| IDR |
JIBOR 6 MONTHS |
7.19 | % | 2017 | 2025 | 19,903,690,000 | 1,231,893 | 5,971,107,000 | 369,568 | |||||||||||||||||||||
| IDR |
JIBOR 6 MONTHS |
7.19 | % | 2017 | 2025 | 27,800,000,000 | 1,720,616 | 8,340,000,000 | 516,185 | |||||||||||||||||||||
| IDR |
JIBOR 6 MONTHS |
7.19 | % | 2017 | 2025 | 44,978,780,000 | 2,783,857 | 13,493,634,000 | 835,157 | |||||||||||||||||||||
| IDR |
JIBOR 6 MONTHS |
7.22 | % | 2017 | 2025 | 34,867,909,600 | 2,158,068 | 10,460,372,880 | 647,420 | |||||||||||||||||||||
| IDR |
JIBOR 6 MONTHS |
7.22 | % | 2018 | 2025 | 249,975,000,000 | 15,471,622 | 74,992,500,000 | 4,641,487 | |||||||||||||||||||||
| IDR |
JIBOR 6 MONTHS |
7.22 | % | 2018 | 2025 | 199,975,000,000 | 12,376,988 | 59,992,500,000 | 3,713,096 | |||||||||||||||||||||
| IDR |
JIBOR 6 MONTHS |
7.22 | % | 2018 | 2025 | 29,895,817,500 | 1,850,332 | 8,968,745,250 | 555,100 | |||||||||||||||||||||
| IDR |
JIBOR 6 MONTHS |
7.22 | % | 2018 | 2025 | 24,891,350,000 | 1,540,592 | 7,467,405,000 | 462,178 | |||||||||||||||||||||
| IDR |
JIBOR 6 MONTHS |
7.19 | % | 2018 | 2025 | 271,093,250,000 | 16,778,687 | 81,327,975,000 | 5,033,606 | |||||||||||||||||||||
| IDR |
JIBOR 6 MONTHS |
7.19 | % | 2018 | 2025 | 20,000,000,000 | 1,237,854 | 6,000,000,000 | 371,356 | |||||||||||||||||||||
| IDR |
JIBOR 6 MONTHS |
7.22 | % | 2018 | 2025 | 64,854,466,000 | 4,014,017 | 19,456,339,800 | 1,204,205 | |||||||||||||||||||||
| IDR |
JIBOR 6 MONTHS |
7.22 | % | 2018 | 2025 | 19,826,481,400 | 1,227,114 | 5,947,944,420 | 368,134 | |||||||||||||||||||||
| IDR |
JIBOR 6 MONTHS |
7.22 | % | 2018 | 2025 | 49,832,733,100 | 3,084,281 | 14,949,819,930 | 925,284 | |||||||||||||||||||||
| IDR |
JIBOR 6 MONTHS |
7.22 | % | 2018 | 2025 | 59,978,492,000 | 3,712,229 | 17,993,547,600 | 1,113,669 | |||||||||||||||||||||
| IDR |
JIBOR 6 MONTHS |
7.19 | % | 2018 | 2025 | 40,000,000,000 | 2,475,707 | 12,000,000,000 | 742,712 | |||||||||||||||||||||
| IDR |
JIBOR 6 MONTHS |
7.30 | % | 2018 | 2025 | 185,500,000,000 | 11,481,092 | 37,100,000,000 | 2,296,218 | |||||||||||||||||||||
| IDR |
JIBOR 6 MONTHS |
7.00 | % | 2018 | 2026 | 249,950,000,000 | 15,470,075 | 156,218,750,000 | 9,668,797 | |||||||||||||||||||||
| IDR |
JIBOR 6 MONTHS |
7.00 | % | 2018 | 2026 | 29,828,780,000 | 1,846,183 | 18,643,017,500 | 1,153,866 | |||||||||||||||||||||
| IDR |
JIBOR 6 MONTHS |
7.00 | % | 2018 | 2026 | 50,000,000,000 | 3,094,634 | 31,250,000,000 | 1,934,146 | |||||||||||||||||||||
| IDR |
JIBOR 6 MONTHS |
7.00 | % | 2018 | 2026 | 19,896,283,000 | 1,231,434 | 12,435,176,875 | 769,646 | |||||||||||||||||||||
| IDR |
JIBOR 6 MONTHS |
7.00 | % | 2018 | 2026 | 99,803,391,600 | 6,177,099 | 62,377,119,750 | 3,860,687 | |||||||||||||||||||||
| IDR |
JIBOR 6 MONTHS |
7.00 | % | 2018 | 2026 | 19,906,920,000 | 1,232,093 | 12,441,825,000 | 770,058 | |||||||||||||||||||||
| IDR |
JIBOR 6 MONTHS |
7.00 | % | 2019 | 2026 | 536,084,300 | 33,180 | 335,052,686 | 20,737 | |||||||||||||||||||||
| IDR |
JIBOR 6 MONTHS |
7.00 | % | 2019 | 2026 | 131,155,000,000 | 8,117,534 | 81,971,875,000 | 5,073,459 | |||||||||||||||||||||
| IDR |
JIBOR 6 MONTHS |
7.00 | % | 2019 | 2026 | 23,808,895,000 | 1,473,596 | 14,880,559,375 | 920,998 | |||||||||||||||||||||
| IDR |
JIBOR 6 MONTHS |
7.00 | % | 2019 | 2026 | 147,500,000,000 | 9,129,170 | 92,187,500,000 | 5,705,731 | |||||||||||||||||||||
| IDR |
JIBOR 6 MONTHS |
7.00 | % | 2019 | 2026 | 158,460,004,000 | 9,807,514 | 99,037,502,500 | 6,129,696 | |||||||||||||||||||||
| IDR |
JIBOR 6 MONTHS |
7.00 | % | 2019 | 2026 | 115,000,000,000 | 7,117,658 | 71,875,000,000 | 4,448,536 | |||||||||||||||||||||
| IDR |
JIBOR 6 MONTHS |
7.00 | % | 2019 | 2026 | 383,499,973,000 | 23,735,840 | 239,687,473,000 | 14,834,900 | |||||||||||||||||||||
| IDR |
JIBOR 6 MONTHS |
7.00 | % | 2019 | 2026 | 40,768,100,000 | 2,523,247 | 25,480,062,500 | 1,577,029 | |||||||||||||||||||||
| IDR |
JIBOR 6 MONTHS |
7.00 | % | 2019 | 2026 | 1,662,500,000,000 | 102,896,577 | 1,039,062,500,000 | 64,310,361 | |||||||||||||||||||||
| IDR |
JIBOR 6 MONTHS |
7.00 | % | 2019 | 2026 | 24,984,320,000 | 1,546,346 | 15,615,200,000 | 966,467 | |||||||||||||||||||||
| IDR |
JIBOR 6 MONTHS |
7.00 | % | 2019 | 2026 | 59,962,260,000 | 3,711,225 | 37,476,412,500 | 2,319,516 | |||||||||||||||||||||
| IDR |
JIBOR 6 MONTHS |
7.00 | % | 2019 | 2026 | 19,996,367,000 | 1,237,629 | 12,497,729,375 | 773,518 | |||||||||||||||||||||
| IDR |
JIBOR 6 MONTHS |
7.00 | % | 2019 | 2026 | 19,000,440,000 | 1,175,988 | 11,875,275,000 | 734,993 | |||||||||||||||||||||
| IDR |
JIBOR 6 MONTHS |
7.00 | % | 2019 | 2026 | 60,000,000,000 | 3,713,561 | 37,500,000,000 | 2,320,975 | |||||||||||||||||||||
| IDR |
JIBOR 6 MONTHS |
7.00 | % | 2019 | 2026 | 20,000,000,000 | 1,237,854 | 12,500,000,000 | 773,658 | |||||||||||||||||||||
D-125
| CURRENCY BASE |
INTEREST RATE BASIS |
INTEREST RATE |
YEAR OF CONTRACT |
YEAR OF MATURITY |
ORIGINAL AMOUNT | OUTSTANDING BALANCE | ||||||||||||||||||||||||
| (In Original Currency) | (In US Dollar) | (In Original Currency) | (In US Dollar) | |||||||||||||||||||||||||||
| IDR |
JIBOR 6 MONTHS |
7.00 | % | 2019 | 2026 | 49,998,833,220 | 3,094,562 | 31,249,270,761 | 1,934,101 | |||||||||||||||||||||
| IDR |
JIBOR 6 MONTHS |
7.00 | % | 2019 | 2026 | 30,000,000,000 | 1,856,780 | 18,750,000,000 | 1,160,488 | |||||||||||||||||||||
| IDR |
JIBOR 6 MONTHS |
7.00 | % | 2019 | 2026 | 29,989,014,000 | 1,856,100 | 18,743,133,750 | 1,160,063 | |||||||||||||||||||||
| IDR |
JIBOR 6 MONTHS |
7.00 | % | 2019 | 2026 | 55,000,000,000 | 3,404,097 | 34,375,000,000 | 2,127,561 | |||||||||||||||||||||
| IDR |
JIBOR 6 MONTHS |
7.19 | % | 2019 | 2025 | 180,000,000,000 | 11,140,682 | 54,000,000,000 | 3,342,205 | |||||||||||||||||||||
| IDR |
JIBOR 6 MONTHS |
7.00 | % | 2019 | 2026 | 17,998,251,200 | 1,113,960 | 11,248,907,000 | 696,225 | |||||||||||||||||||||
| IDR |
JIBOR 6 MONTHS |
7.00 | % | 2019 | 2026 | 49,999,985,750 | 3,094,633 | 31,249,991,093 | 1,934,146 | |||||||||||||||||||||
| IDR |
JIBOR 6 MONTHS |
7.00 | % | 2019 | 2026 | 170,000,000,000 | 10,521,755 | 106,250,000,000 | 6,576,097 | |||||||||||||||||||||
| IDR |
JIBOR 6 MONTHS |
7.00 | % | 2019 | 2026 | 185,000,000,000 | 11,450,145 | 115,625,000,000 | 7,156,341 | |||||||||||||||||||||
| IDR |
JIBOR 6 MONTHS |
7.00 | % | 2019 | 2026 | 35,000,000,000 | 2,166,244 | 21,875,000,000 | 1,353,902 | |||||||||||||||||||||
| IDR |
JIBOR 6 MONTHS |
7.00 | % | 2019 | 2026 | 175,000,000,000 | 10,831,219 | 109,375,000,000 | 6,769,512 | |||||||||||||||||||||
| IDR |
JIBOR 6 MONTHS |
7.00 | % | 2019 | 2026 | 39,987,475,000 | 2,474,932 | 24,992,171,875 | 1,546,832 | |||||||||||||||||||||
| IDR |
JIBOR 6 MONTHS |
6.55 | % | 2019 | 2025 | 61,512,638,850 | 3,807,182 | 6,151,263,885 | 380,718 | |||||||||||||||||||||
| IDR |
JIBOR 6 MONTHS |
6.55 | % | 2019 | 2027 | 54,100,000,000 | 3,348,394 | 27,050,000,000 | 1,674,197 | |||||||||||||||||||||
| IDR |
JIBOR 6 MONTHS |
6.55 | % | 2019 | 2026 | 339,999,200,000 | 21,043,461 | 135,999,680,000 | 8,417,384 | |||||||||||||||||||||
| IDR |
JIBOR 6 MONTHS |
6.55 | % | 2019 | 2028 | 170,000,000,000 | 10,521,755 | 119,000,000,000 | 7,365,229 | |||||||||||||||||||||
| IDR |
JIBOR 6 MONTHS |
6.55 | % | 2019 | 2026 | 236,987,660,000 | 14,667,801 | 94,795,064,000 | 5,867,120 | |||||||||||||||||||||
| IDR |
JIBOR 6 MONTHS |
6.55 | % | 2019 | 2026 | 38,999,348,873 | 2,413,774 | 15,599,739,551 | 965,510 | |||||||||||||||||||||
| IDR |
JIBOR 6 MONTHS |
6.55 | % | 2019 | 2026 | 147,500,000,000 | 9,129,170 | 59,000,000,000 | 3,651,668 | |||||||||||||||||||||
| IDR |
JIBOR 6 MONTHS |
6.55 | % | 2019 | 2025 | 35,000,000,000 | 2,166,244 | 3,500,000,000 | 216,624 | |||||||||||||||||||||
| IDR |
JIBOR 6 MONTHS |
6.55 | % | 2019 | 2025 | 34,994,895,000 | 2,165,928 | 6,998,979,000 | 433,186 | |||||||||||||||||||||
| IDR |
JIBOR 6 MONTHS |
6.55 | % | 2019 | 2025 | 29,968,673,600 | 1,854,841 | 5,993,734,720 | 370,968 | |||||||||||||||||||||
| IDR |
JIBOR 6 MONTHS |
6.55 | % | 2019 | 2025 | 13,749,835,000 | 851,014 | 1,374,983,500 | 85,101 | |||||||||||||||||||||
| IDR |
JIBOR 6 MONTHS |
6.55 | % | 2019 | 2026 | 27,600,000,000 | 1,708,238 | 8,280,000,000 | 512,471 | |||||||||||||||||||||
| IDR |
JIBOR 6 MONTHS |
6.55 | % | 2019 | 2026 | 9,999,998,800 | 618,927 | 2,999,999,640 | 185,678 | |||||||||||||||||||||
| IDR |
JIBOR 6 MONTHS |
6.55 | % | 2019 | 2026 | 20,000,000,000 | 1,237,854 | 6,000,000,000 | 371,356 | |||||||||||||||||||||
| IDR |
JIBOR 6 MONTHS |
6.55 | % | 2019 | 2026 | 8,595,966,810 | 532,027 | 2,578,790,050 | 159,608 | |||||||||||||||||||||
| IDR |
JIBOR 6 MONTHS |
6.55 | % | 2019 | 2025 | 104,727,986,160 | 6,481,896 | 20,945,597,232 | 1,296,379 | |||||||||||||||||||||
| IDR |
JIBOR 6 MONTHS |
6.55 | % | 2019 | 2026 | 49,998,866,500 | 3,094,564 | 14,999,659,950 | 928,369 | |||||||||||||||||||||
| IDR |
JIBOR 6 MONTHS |
6.55 | % | 2019 | 2025 | 13,717,000,000 | 848,982 | 1,371,700,000 | 84,898 | |||||||||||||||||||||
| IDR |
JIBOR 6 MONTHS |
6.55 | % | 2019 | 2028 | 1,222,500,000,000 | 75,663,799 | 855,750,000,000 | 52,964,659 | |||||||||||||||||||||
| IDR |
JIBOR 6 MONTHS |
6.55 | % | 2019 | 2028 | 99,795,000,000 | 6,176,580 | 69,856,500,000 | 4,323,606 | |||||||||||||||||||||
| IDR |
JIBOR 6 MONTHS |
6.55 | % | 2019 | 2025 | 28,786,100,000 | 1,781,649 | 5,757,220,000 | 356,330 | |||||||||||||||||||||
| IDR |
JIBOR 6 MONTHS |
6.55 | % | 2019 | 2028 | 174,956,278,000 | 10,828,513 | 122,469,394,600 | 7,579,959 | |||||||||||||||||||||
| IDR |
JIBOR 6 MONTHS |
6.55 | % | 2019 | 2026 | 77,998,697,749 | 4,827,548 | 31,199,479,102 | 1,931,019 | |||||||||||||||||||||
| IDR |
JIBOR 6 MONTHS |
6.55 | % | 2019 | 2027 | 180,000,000,000 | 11,140,682 | 90,000,000,000 | 5,570,341 | |||||||||||||||||||||
| IDR |
JIBOR 6 MONTHS |
6.55 | % | 2019 | 2026 | 17,000,000,000 | 1,052,176 | 5,100,000,000 | 315,653 | |||||||||||||||||||||
| IDR |
JIBOR 6 MONTHS |
6.55 | % | 2019 | 2026 | 115,000,000,000 | 7,117,658 | 34,500,000,000 | 2,135,297 | |||||||||||||||||||||
| IDR |
JIBOR 6 MONTHS |
6.55 | % | 2019 | 2027 | 185,000,000,000 | 11,450,145 | 92,500,000,000 | 5,725,073 | |||||||||||||||||||||
| IDR |
JIBOR 6 MONTHS |
6.55 | % | 2019 | 2025 | 294,000,000,000 | 18,196,447 | 29,400,000,000 | 1,819,645 | |||||||||||||||||||||
| IDR |
JIBOR 6 MONTHS |
6.55 | % | 2019 | 2025 | 59,994,270,000 | 3,713,206 | 11,998,854,000 | 742,641 | |||||||||||||||||||||
| IDR |
JIBOR 6 MONTHS |
6.55 | % | 2019 | 2025 | 30,000,000,000 | 1,856,780 | 6,000,000,000 | 371,356 | |||||||||||||||||||||
| IDR |
JIBOR 6 MONTHS |
6.55 | % | 2019 | 2025 | 30,000,000,000 | 1,856,780 | 6,000,000,000 | 371,356 | |||||||||||||||||||||
| IDR |
JIBOR 6 MONTHS |
6.55 | % | 2019 | 2025 | 30,000,000,000 | 1,856,780 | 6,000,000,000 | 371,356 | |||||||||||||||||||||
| IDR |
JIBOR 6 MONTHS |
6.55 | % | 2019 | 2026 | 39,883,379,000 | 2,468,489 | 11,965,013,700 | 740,547 | |||||||||||||||||||||
| IDR |
JIBOR 6 MONTHS |
6.55 | % | 2019 | 2025 | 59,936,800,000 | 3,709,649 | 5,993,680,000 | 370,965 | |||||||||||||||||||||
| IDR |
JIBOR 6 MONTHS |
6.55 | % | 2019 | 2026 | 24,969,500,000 | 1,545,429 | 7,490,850,000 | 463,629 | |||||||||||||||||||||
| IDR |
JIBOR 6 MONTHS |
6.55 | % | 2019 | 2025 | 39,917,980,000 | 2,470,631 | 7,983,596,000 | 494,126 | |||||||||||||||||||||
| IDR |
JIBOR 6 MONTHS |
6.55 | % | 2019 | 2026 | 40,768,100,000 | 2,523,247 | 12,230,430,000 | 756,974 | |||||||||||||||||||||
| IDR |
JIBOR 6 MONTHS |
6.55 | % | 2019 | 2026 | 185,499,994,438 | 11,481,091 | 74,199,997,780 | 4,592,437 | |||||||||||||||||||||
| IDR |
JIBOR 6 MONTHS |
6.55 | % | 2019 | 2028 | 374,999,960,000 | 23,209,752 | 262,499,972,000 | 16,246,826 | |||||||||||||||||||||
| IDR |
JIBOR 6 MONTHS |
6.55 | % | 2019 | 2025 | 29,922,220,800 | 1,851,966 | 5,984,444,160 | 370,393 | |||||||||||||||||||||
| IDR |
JIBOR 6 MONTHS |
6.55 | % | 2019 | 2028 | 131,000,000,000 | 8,107,941 | 91,700,000,000 | 5,675,559 | |||||||||||||||||||||
| IDR |
JIBOR 6 MONTHS |
6.55 | % | 2019 | 2026 | 41,400,000,000 | 2,562,357 | 16,560,000,000 | 1,024,943 | |||||||||||||||||||||
| IDR |
JIBOR 6 MONTHS |
7.00 | % | 2019 | 2026 | 84,442,466,900 | 5,226,370 | 52,776,541,811 | 3,266,482 | |||||||||||||||||||||
| IDR |
JIBOR 6 MONTHS |
6.55 | % | 2019 | 2026 | 19,581,000,000 | 1,211,921 | 7,832,400,000 | 484,768 | |||||||||||||||||||||
| IDR |
JIBOR 6 MONTHS |
6.55 | % | 2020 | 2027 | 383,500,000,000 | 23,735,842 | 191,750,000,000 | 11,867,921 | |||||||||||||||||||||
| IDR |
JIBOR 6 MONTHS |
7.30 | % | 2020 | 2026 | 750,000,000,000 | 46,419,509 | 625,000,000,000 | 38,682,924 | |||||||||||||||||||||
| IDR |
JIBOR 6 MONTHS |
6.55 | % | 2020 | 2028 | 880,000,000,000 | 54,465,557 | 601,370,000,000 | 37,220,400 | |||||||||||||||||||||
D-126
| CURRENCY BASE |
INTEREST RATE BASIS |
INTEREST RATE |
YEAR OF CONTRACT |
YEAR OF MATURITY |
ORIGINAL AMOUNT | OUTSTANDING BALANCE | ||||||||||||||||||||||||
| (In Original Currency) | (In US Dollar) | (In Original Currency) | (In US Dollar) | |||||||||||||||||||||||||||
| IDR |
JIBOR 6 MONTHS |
6.31 | % | 2021 | 2029 | 262,800,000,000 | 16,265,396 | 262,800,000,000 | 16,265,396 | |||||||||||||||||||||
| IDR |
JIBOR 6 MONTHS |
6.46 | % | 2021 | 2030 | 335,000,000,000 | 20,734,047 | 237,350,000,000 | 14,690,227 | |||||||||||||||||||||
| IDR |
JIBOR 6 MONTHS |
6.47 | % | 2021 | 2030 | 220,000,000,000 | 13,616,389 | 120,955,714,000 | 7,486,273 | |||||||||||||||||||||
| IDR |
JIBOR 6 MONTHS |
6.31 | % | 2021 | 2029 | 138,230,000,000 | 8,555,425 | 138,230,000,000 | 8,555,425 | |||||||||||||||||||||
| IDR |
JIBOR 6 MONTHS |
6.31 | % | 2021 | 2029 | 140,783,000,000 | 8,713,437 | 140,783,000,000 | 8,713,437 | |||||||||||||||||||||
| IDR |
JIBOR 6 MONTHS |
6.31 | % | 2021 | 2029 | 116,564,700,000 | 7,214,501 | 116,564,700,000 | 7,214,501 | |||||||||||||||||||||
| IDR |
JIBOR 6 MONTHS |
6.30 | % | 2021 | 2029 | 129,600,000,000 | 8,021,291 | 129,600,000,000 | 8,021,291 | |||||||||||||||||||||
| IDR |
JIBOR 6 MONTHS |
6.31 | % | 2021 | 2029 | 23,619,474,000 | 1,461,873 | 23,619,474,000 | 1,461,873 | |||||||||||||||||||||
| IDR |
JIBOR 6 MONTHS |
6.31 | % | 2021 | 2029 | 144,397,845,708 | 8,937,169 | 144,397,845,708 | 8,937,169 | |||||||||||||||||||||
| IDR |
JIBOR 6 MONTHS |
6.31 | % | 2021 | 2029 | 215,999,994,000 | 13,368,818 | 215,999,994,000 | 13,368,818 | |||||||||||||||||||||
| IDR |
JIBOR 6 MONTHS |
6.31 | % | 2021 | 2029 | 194,499,650,000 | 12,038,104 | 194,499,650,000 | 12,038,104 | |||||||||||||||||||||
| IDR |
JIBOR 6 MONTHS |
6.31 | % | 2021 | 2029 | 91,857,096,285 | 5,685,282 | 91,857,096,285 | 5,685,282 | |||||||||||||||||||||
| IDR |
JIBOR 6 MONTHS |
6.31 | % | 2021 | 2029 | 36,000,000,000 | 2,228,136 | 36,000,000,000 | 2,228,136 | |||||||||||||||||||||
| IDR |
JIBOR 6 MONTHS |
6.31 | % | 2021 | 2029 | 54,150,000,000 | 3,351,489 | 54,150,000,000 | 3,351,489 | |||||||||||||||||||||
| IDR |
JIBOR 6 MONTHS |
6.31 | % | 2021 | 2029 | 120,000,000,000 | 7,427,121 | 120,000,000,000 | 7,427,121 | |||||||||||||||||||||
| IDR |
JIBOR 6 MONTHS |
6.31 | % | 2021 | 2029 | 75,100,000,000 | 4,648,140 | 75,100,000,000 | 4,648,140 | |||||||||||||||||||||
| IDR |
JIBOR 6 MONTHS |
6.30 | % | 2021 | 2029 | 200,000,000,000 | 12,378,536 | 170,000,000,000 | 10,521,755 | |||||||||||||||||||||
| IDR |
JIBOR 6 MONTHS |
6.31 | % | 2021 | 2029 | 32,500,000,000 | 2,011,512 | 32,500,000,000 | 2,011,512 | |||||||||||||||||||||
| IDR |
JIBOR 6 MONTHS |
6.31 | % | 2021 | 2029 | 79,146,000,000 | 4,898,558 | 79,146,000,000 | 4,898,558 | |||||||||||||||||||||
| IDR |
JIBOR 6 MONTHS |
6.31 | % | 2021 | 2029 | 175,011,000,000 | 10,831,899 | 175,011,000,000 | 10,831,899 | |||||||||||||||||||||
| IDR |
JIBOR 6 MONTHS |
6.31 | % | 2021 | 2029 | 1,054,125,000,000 | 65,242,619 | 785,552,979,975 | 48,619,978 | |||||||||||||||||||||
| IDR |
JIBOR 6 MONTHS |
6.31 | % | 2021 | 2029 | 25,978,000,000 | 1,607,848 | 25,978,000,000 | 1,607,848 | |||||||||||||||||||||
| IDR |
JIBOR 6 MONTHS |
6.31 | % | 2021 | 2029 | 87,310,000,000 | 5,403,850 | 87,310,000,000 | 5,403,850 | |||||||||||||||||||||
| IDR |
JIBOR 6 MONTHS |
6.31 | % | 2021 | 2029 | 59,837,908,200 | 3,703,528 | 59,837,908,200 | 3,703,528 | |||||||||||||||||||||
| IDR |
JIBOR 6 MONTHS |
6.31 | % | 2021 | 2029 | 67,589,863,334 | 4,183,318 | 67,589,863,334 | 4,183,318 | |||||||||||||||||||||
| IDR |
JIBOR 6 MONTHS |
6.31 | % | 2021 | 2029 | 76,343,863,175 | 4,725,126 | 76,343,863,175 | 4,725,126 | |||||||||||||||||||||
| IDR |
JIBOR 6 MONTHS |
6.31 | % | 2021 | 2029 | 9,135,972,600 | 565,450 | 9,135,972,600 | 565,450 | |||||||||||||||||||||
| IDR |
JIBOR 6 MONTHS |
6.31 | % | 2021 | 2029 | 84,000,000,000 | 5,198,985 | 84,000,000,000 | 5,198,985 | |||||||||||||||||||||
| IDR |
JIBOR 6 MONTHS |
6.31 | % | 2021 | 2029 | 66,000,000,000 | 4,084,917 | 66,000,000,000 | 4,084,917 | |||||||||||||||||||||
| IDR |
JIBOR 6 MONTHS |
6.31 | % | 2021 | 2029 | 12,236,000,000 | 757,319 | 12,236,000,000 | 757,319 | |||||||||||||||||||||
| IDR |
JIBOR 6 MONTHS |
6.31 | % | 2021 | 2029 | 45,664,000,000 | 2,826,267 | 45,664,000,000 | 2,826,267 | |||||||||||||||||||||
| IDR |
JIBOR 6 MONTHS |
6.31 | % | 2021 | 2029 | 380,557,975,892 | 23,553,752 | 380,557,975,892 | 23,553,752 | |||||||||||||||||||||
| IDR |
JIBOR 6 MONTHS |
6.31 | % | 2021 | 2029 | 29,829,000,000 | 1,846,197 | 29,829,000,000 | 1,846,197 | |||||||||||||||||||||
| IDR |
JIBOR 6 MONTHS |
5.78 | % | 2022 | 2028 | 80,000,000,000 | 4,951,414 | 56,000,000,000 | 3,465,990 | |||||||||||||||||||||
| IDR |
JIBOR 6 MONTHS |
5.78 | % | 2022 | 2029 | 84,000,000,000 | 5,198,985 | 84,000,000,000 | 5,198,985 | |||||||||||||||||||||
| IDR |
JIBOR 6 MONTHS |
5.78 | % | 2022 | 2029 | 37,500,000,000 | 2,320,975 | 37,500,000,000 | 2,320,975 | |||||||||||||||||||||
| IDR |
JIBOR 6 MONTHS |
5.78 | % | 2022 | 2029 | 15,375,000,000 | 951,600 | 15,375,000,000 | 951,600 | |||||||||||||||||||||
| IDR |
JIBOR 6 MONTHS |
5.78 | % | 2022 | 2029 | 98,129,000,000 | 6,073,467 | 98,129,000,000 | 6,073,467 | |||||||||||||||||||||
| IDR |
JIBOR 6 MONTHS |
5.78 | % | 2022 | 2029 | 200,000,000,000 | 12,378,536 | 180,000,000,000 | 11,140,682 | |||||||||||||||||||||
| IDR |
JIBOR 6 MONTHS |
5.78 | % | 2022 | 2029 | 582,998,000,000 | 36,083,308 | 524,698,200,000 | 32,474,977 | |||||||||||||||||||||
| IDR |
JIBOR 6 MONTHS |
5.78 | % | 2022 | 2029 | 900,517,971,720 | 55,735,469 | 900,517,971,720 | 55,735,469 | |||||||||||||||||||||
| IDR |
JIBOR 6 MONTHS |
5.78 | % | 2022 | 2028 | 42,770,000,000 | 2,647,150 | 34,216,000,000 | 2,117,720 | |||||||||||||||||||||
| IDR |
JIBOR 6 MONTHS |
5.78 | % | 2022 | 2029 | 42,770,000,000 | 2,647,150 | 38,493,000,000 | 2,382,435 | |||||||||||||||||||||
| IDR |
JIBOR 6 MONTHS |
5.78 | % | 2022 | 2028 | 43,579,000,000 | 2,697,221 | 34,863,200,000 | 2,157,777 | |||||||||||||||||||||
| IDR |
JIBOR 6 MONTHS |
5.78 | % | 2022 | 2028 | 68,445,000,000 | 4,236,244 | 47,911,500,000 | 2,965,371 | |||||||||||||||||||||
| IDR |
JIBOR 6 MONTHS |
5.78 | % | 2022 | 2027 | 162,000,000,000 | 10,026,614 | 97,200,000,000 | 6,015,968 | |||||||||||||||||||||
| IDR |
JIBOR 6 MONTHS |
5.78 | % | 2022 | 2028 | 37,500,000,000 | 2,320,975 | 30,000,000,000 | 1,856,780 | |||||||||||||||||||||
| IDR |
JIBOR 6 MONTHS |
5.78 | % | 2022 | 2029 | 135,000,000,000 | 8,355,512 | 87,750,000,000 | 5,431,083 | |||||||||||||||||||||
| IDR |
JIBOR 6 MONTHS |
5.78 | % | 2022 | 2029 | 350,000,000,000 | 21,662,437 | 227,500,000,000 | 14,080,584 | |||||||||||||||||||||
| IDR |
JIBOR 6 MONTHS |
5.78 | % | 2022 | 2028 | 102,000,000,000 | 6,313,053 | 71,400,000,000 | 4,419,137 | |||||||||||||||||||||
| IDR |
JIBOR 6 MONTHS |
5.78 | % | 2022 | 2028 | 38,364,000,000 | 2,374,451 | 26,854,800,000 | 1,662,115 | |||||||||||||||||||||
| IDR |
JIBOR 6 MONTHS |
5.78 | % | 2022 | 2029 | 4,162,655,477 | 257,638 | 4,162,655,477 | 257,638 | |||||||||||||||||||||
| IDR |
JIBOR 6 MONTHS |
5.78 | % | 2022 | 2029 | 2,814,000,749 | 174,166 | 2,532,600,674 | 156,749 | |||||||||||||||||||||
| IDR |
JIBOR 6 MONTHS |
5.78 | % | 2022 | 2029 | 17,086,352,907 | 1,057,520 | 17,086,352,907 | 1,057,520 | |||||||||||||||||||||
| IDR |
JIBOR 6 MONTHS |
5.78 | % | 2022 | 2029 | 4,045,506,388 | 250,387 | 3,640,955,749 | 225,349 | |||||||||||||||||||||
| IDR |
JIBOR 6 MONTHS |
5.78 | % | 2022 | 2029 | 10,737,032,678 | 664,544 | 10,737,032,678 | 664,544 | |||||||||||||||||||||
| IDR |
JIBOR 6 MONTHS |
5.78 | % | 2022 | 2029 | 35,017,898,474 | 2,167,352 | 31,516,108,627 | 1,950,616 | |||||||||||||||||||||
| IDR |
JIBOR 6 MONTHS |
5.78 | % | 2022 | 2029 | 27,218,703,224 | 1,684,638 | 27,218,703,224 | 1,684,638 | |||||||||||||||||||||
| IDR |
JIBOR 6 MONTHS |
5.78 | % | 2022 | 2029 | 123,782,915,805 | 7,661,256 | 111,404,624,224 | 6,895,131 | |||||||||||||||||||||
D-127
| CURRENCY BASE |
INTEREST RATE BASIS |
INTEREST RATE |
YEAR OF CONTRACT |
YEAR OF MATURITY |
ORIGINAL AMOUNT | OUTSTANDING BALANCE | ||||||||||||||||||||||||
| (In Original Currency) | (In US Dollar) | (In Original Currency) | (In US Dollar) | |||||||||||||||||||||||||||
| IDR |
JIBOR 6 MONTHS |
5.78 | % | 2022 | 2029 | 127,953,000,000 | 7,919,354 | 115,157,700,000 | 7,127,418 | |||||||||||||||||||||
| IDR |
JIBOR 6 MONTHS |
5.78 | % | 2022 | 2029 | 196,226,000,000 | 12,144,953 | 176,603,400,000 | 10,930,457 | |||||||||||||||||||||
| IDR |
JIBOR 6 MONTHS |
5.78 | % | 2022 | 2029 | 86,225,715,000 | 5,336,740 | 77,603,143,500 | 4,803,066 | |||||||||||||||||||||
| IDR |
JIBOR 6 MONTHS |
5.78 | % | 2022 | 2029 | 256,246,700,000 | 15,859,795 | 256,246,700,000 | 15,859,795 | |||||||||||||||||||||
| IDR |
JIBOR 6 MONTHS |
5.78 | % | 2022 | 2029 | 124,965,300,000 | 7,734,437 | 124,965,300,000 | 7,734,437 | |||||||||||||||||||||
| IDR |
JIBOR 6 MONTHS |
5.78 | % | 2022 | 2028 | 28,336,007,850 | 1,753,791 | 19,835,205,495 | 1,227,654 | |||||||||||||||||||||
| IDR |
JIBOR 6 MONTHS |
5.78 | % | 2022 | 2028 | 1,856,600,000 | 114,910 | 1,299,620,000 | 80,437 | |||||||||||||||||||||
| IDR |
JIBOR 6 MONTHS |
5.78 | % | 2022 | 2029 | 51,999,051,300 | 3,218,361 | 34,666,034,200 | 2,145,574 | |||||||||||||||||||||
| IDR |
JIBOR 6 MONTHS |
5.78 | % | 2022 | 2029 | 35,655,450,000 | 2,206,811 | 35,655,450,000 | 2,206,811 | |||||||||||||||||||||
| IDR |
JIBOR 6 MONTHS |
5.78 | % | 2022 | 2028 | 71,306,739,000 | 4,413,365 | 57,045,391,200 | 3,530,692 | |||||||||||||||||||||
| IDR |
JIBOR 6 MONTHS |
5.78 | % | 2022 | 2028 | 75,300,067,200 | 4,660,523 | 52,710,047,040 | 3,262,366 | |||||||||||||||||||||
| IDR |
JIBOR 6 MONTHS |
5.78 | % | 2022 | 2027 | 77,840,000,000 | 4,817,726 | 46,704,000,000 | 2,890,636 | |||||||||||||||||||||
| IDR |
JIBOR 6 MONTHS |
5.78 | % | 2022 | 2029 | 409,000,000,000 | 25,314,105 | 327,200,000,000 | 20,251,284 | |||||||||||||||||||||
| IDR |
JIBOR 6 MONTHS |
5.78 | % | 2022 | 2028 | 74,987,442,600 | 4,641,174 | 52,491,209,820 | 3,248,822 | |||||||||||||||||||||
| IDR |
JIBOR 6 MONTHS |
5.78 | % | 2022 | 2029 | 80,212,900,000 | 4,964,591 | 80,212,900,000 | 4,964,591 | |||||||||||||||||||||
| IDR |
JIBOR 6 MONTHS |
5.78 | % | 2022 | 2028 | 202,395,509,662 | 12,526,800 | 141,676,856,763 | 8,768,760 | |||||||||||||||||||||
| IDR |
JIBOR 6 MONTHS |
5.78 | % | 2022 | 2028 | 23,966,700,000 | 1,483,363 | 16,776,690,000 | 1,038,354 | |||||||||||||||||||||
| IDR |
JIBOR 6 MONTHS |
5.78 | % | 2022 | 2027 | 20,983,412,000 | 1,298,720 | 12,590,047,200 | 779,232 | |||||||||||||||||||||
| IDR |
JIBOR 6 MONTHS |
5.78 | % | 2022 | 2028 | 40,499,407,300 | 2,506,617 | 28,349,585,110 | 1,754,632 | |||||||||||||||||||||
| IDR |
JIBOR 6 MONTHS |
5.78 | % | 2022 | 2028 | 179,807,539,000 | 11,128,770 | 125,865,277,300 | 7,790,139 | |||||||||||||||||||||
| IDR |
JIBOR 6 MONTHS |
5.78 | % | 2022 | 2028 | 74,054,875,000 | 4,583,455 | 51,838,412,500 | 3,208,418 | |||||||||||||||||||||
| IDR |
JIBOR 6 MONTHS |
5.78 | % | 2022 | 2028 | 54,739,949,200 | 3,388,002 | 38,317,964,440 | 2,371,601 | |||||||||||||||||||||
| IDR |
JIBOR 6 MONTHS |
5.78 | % | 2022 | 2028 | 26,993,276,000 | 1,670,686 | 18,895,293,200 | 1,169,480 | |||||||||||||||||||||
| IDR |
JIBOR 6 MONTHS |
5.78 | % | 2022 | 2028 | 59,999,993,546 | 3,713,560 | 41,999,995,483 | 2,599,492 | |||||||||||||||||||||
| IDR |
JIBOR 6 MONTHS |
5.78 | % | 2022 | 2028 | 98,934,088,000 | 6,123,296 | 69,253,861,600 | 4,286,307 | |||||||||||||||||||||
| IDR |
JIBOR 6 MONTHS |
5.78 | % | 2022 | 2028 | 154,916,550,000 | 9,588,200 | 123,933,240,000 | 7,670,560 | |||||||||||||||||||||
| IDR |
JIBOR 6 MONTHS |
5.78 | % | 2022 | 2028 | 186,035,878,000 | 11,514,259 | 148,828,702,400 | 9,211,407 | |||||||||||||||||||||
| IDR |
JIBOR 6 MONTHS |
5.78 | % | 2022 | 2028 | 62,937,660,000 | 3,895,380 | 50,350,128,000 | 3,116,304 | |||||||||||||||||||||
| IDR |
JIBOR 6 MONTHS |
5.78 | % | 2022 | 2028 | 25,495,793,178 | 1,578,003 | 17,847,055,224 | 1,104,602 | |||||||||||||||||||||
| IDR |
JIBOR 6 MONTHS |
5.78 | % | 2022 | 2028 | 149,960,098,381 | 9,281,432 | 104,972,068,867 | 6,497,002 | |||||||||||||||||||||
| IDR |
JIBOR 6 MONTHS |
5.78 | % | 2022 | 2028 | 38,996,110,397 | 2,413,574 | 27,297,277,277 | 1,689,502 | |||||||||||||||||||||
| IDR |
JIBOR 6 MONTHS |
5.78 | % | 2022 | 2028 | 599,446,869,000 | 37,101,372 | 479,557,495,200 | 29,681,098 | |||||||||||||||||||||
| IDR |
JIBOR 6 MONTHS |
5.78 | % | 2022 | 2028 | 107,887,248,000 | 6,677,431 | 86,309,798,400 | 5,341,945 | |||||||||||||||||||||
| IDR |
JIBOR 6 MONTHS |
5.78 | % | 2022 | 2028 | 59,873,209,000 | 3,705,713 | 47,898,567,200 | 2,964,571 | |||||||||||||||||||||
| IDR |
JIBOR 6 MONTHS |
6.31 | % | 2022 | 2029 | 264,625,000,000 | 16,378,350 | 264,625,000,000 | 16,378,350 | |||||||||||||||||||||
| IDR |
JIBOR 6 MONTHS |
5.71 | % | 2022 | 2030 | 67,228,704,850 | 4,160,965 | 57,094,397,183 | 3,533,725 | |||||||||||||||||||||
| IDR |
JIBOR 6 MONTHS |
5.69 | % | 2022 | 2030 | 350,000,000,000 | 21,662,437 | 315,000,000,000 | 19,496,194 | |||||||||||||||||||||
| IDR |
JIBOR 6 MONTHS |
5.94 | % | 2022 | 2029 | 6,113,083,548 | 378,355 | 6,113,083,548 | 378,355 | |||||||||||||||||||||
| IDR |
JIBOR 6 MONTHS |
5.71 | % | 2022 | 2030 | 53,859,495,368 | 3,333,508 | 53,859,495,368 | 3,333,508 | |||||||||||||||||||||
| IDR |
JIBOR 6 MONTHS |
5.70 | % | 2022 | 2030 | 44,121,000,000 | 2,730,767 | 44,121,000,000 | 2,730,767 | |||||||||||||||||||||
| IDR |
JIBOR 6 MONTHS |
5.70 | % | 2022 | 2030 | 112,500,000,000 | 6,962,926 | 112,500,000,000 | 6,962,926 | |||||||||||||||||||||
| IDR |
JIBOR 6 MONTHS |
5.94 | % | 2022 | 2029 | 298,447,000,000 | 18,471,684 | 298,447,000,000 | 18,471,684 | |||||||||||||||||||||
| IDR |
JIBOR 6 MONTHS |
5.94 | % | 2022 | 2029 | 1,305,000,000,000 | 80,769,945 | 1,305,000,000,000 | 80,769,945 | |||||||||||||||||||||
| IDR |
JIBOR 6 MONTHS |
5.71 | % | 2022 | 2030 | 205,500,000,000 | 12,718,945 | 205,500,000,000 | 12,718,945 | |||||||||||||||||||||
| IDR |
JIBOR 6 MONTHS |
5.94 | % | 2022 | 2030 | 68,700,000,000 | 4,252,027 | 68,700,000,000 | 4,252,027 | |||||||||||||||||||||
| IDR |
JIBOR 6 MONTHS |
5.94 | % | 2022 | 2028 | 68,695,300,000 | 4,251,736 | 48,086,710,000 | 2,976,215 | |||||||||||||||||||||
| IDR |
JIBOR 6 MONTHS |
5.94 | % | 2022 | 2030 | 30,000,000,000 | 1,856,780 | 12,000,000,000 | 742,712 | |||||||||||||||||||||
| IDR |
JIBOR 6 MONTHS |
5.94 | % | 2022 | 2029 | 52,500,000,000 | 3,249,366 | 47,250,000,000 | 2,924,429 | |||||||||||||||||||||
| IDR |
JIBOR 6 MONTHS |
5.94 | % | 2022 | 2030 | 411,917,000,000 | 25,494,646 | 411,917,000,000 | 25,494,646 | |||||||||||||||||||||
| IDR |
JIBOR 6 MONTHS |
5.94 | % | 2022 | 2030 | 709,225,000,000 | 43,895,835 | 709,225,000,000 | 43,895,835 | |||||||||||||||||||||
| IDR |
JIBOR 6 MONTHS |
5.94 | % | 2022 | 2029 | 35,975,800,000 | 2,226,639 | 32,378,220,000 | 2,003,975 | |||||||||||||||||||||
| IDR |
JIBOR 6 MONTHS |
5.94 | % | 2022 | 2029 | 29,916,000,000 | 1,851,581 | 26,924,400,000 | 1,666,423 | |||||||||||||||||||||
| IDR |
JIBOR 6 MONTHS |
5.94 | % | 2022 | 2029 | 55,931,281,660 | 3,461,737 | 55,931,281,660 | 3,461,737 | |||||||||||||||||||||
| IDR |
JIBOR 6 MONTHS |
5.94 | % | 2022 | 2028 | 22,470,000,000 | 1,390,728 | 15,729,000,000 | 973,510 | |||||||||||||||||||||
| IDR |
JIBOR 6 MONTHS |
5.69 | % | 2022 | 2030 | 76,000,000,000 | 4,703,844 | 76,000,000,000 | 4,703,844 | |||||||||||||||||||||
| IDR |
JIBOR 6 MONTHS |
5.94 | % | 2022 | 2029 | 28,440,000,000 | 1,760,228 | 25,596,000,000 | 1,584,205 | |||||||||||||||||||||
| IDR |
JIBOR 6 MONTHS |
5.94 | % | 2022 | 2029 | 114,999,962,000 | 7,117,656 | 114,999,962,000 | 7,117,656 | |||||||||||||||||||||
| IDR |
JIBOR 6 MONTHS |
5.69 | % | 2022 | 2030 | 144,985,000,000 | 8,973,510 | 50,744,750,000 | 3,140,728 | |||||||||||||||||||||
| IDR |
JIBOR 6 MONTHS |
5.69 | % | 2022 | 2030 | 161,938,583,430 | 10,022,813 | 97,163,150,058 | 6,013,688 | |||||||||||||||||||||
D-128
| CURRENCY BASE |
INTEREST RATE BASIS |
INTEREST RATE |
YEAR OF CONTRACT |
YEAR OF MATURITY |
ORIGINAL AMOUNT | OUTSTANDING BALANCE | ||||||||||||||||||||||||
| (In Original Currency) | (In US Dollar) | (In Original Currency) | (In US Dollar) | |||||||||||||||||||||||||||
| IDR |
JIBOR 6 MONTHS |
5.94 | % | 2022 | 2028 | 45,063,674,700 | 2,789,112 | 31,544,572,290 | 1,952,378 | |||||||||||||||||||||
| IDR |
JIBOR 6 MONTHS |
5.94 | % | 2022 | 2028 | 48,123,472,680 | 2,978,491 | 33,686,430,876 | 2,084,943 | |||||||||||||||||||||
| IDR |
JIBOR 6 MONTHS |
5.94 | % | 2022 | 2030 | 318,397,000,000 | 19,706,443 | 318,388,000,000 | 19,705,886 | |||||||||||||||||||||
| IDR |
JIBOR 6 MONTHS |
5.94 | % | 2022 | 2029 | 225,915,000,000 | 13,982,484 | 203,323,500,000 | 12,584,236 | |||||||||||||||||||||
| IDR |
JIBOR 6 MONTHS |
5.94 | % | 2022 | 2028 | 79,500,000,000 | 4,920,468 | 63,600,000,000 | 3,936,374 | |||||||||||||||||||||
| IDR |
JIBOR 6 MONTHS |
5.94 | % | 2022 | 2028 | 197,760,000,000 | 12,239,896 | 158,208,000,000 | 9,791,917 | |||||||||||||||||||||
| IDR |
JIBOR 6 MONTHS |
5.94 | % | 2022 | 2030 | 273,926,000,000 | 16,954,014 | 273,926,000,000 | 16,954,014 | |||||||||||||||||||||
| IDR |
JIBOR 6 MONTHS |
5.94 | % | 2022 | 2028 | 87,709,000,000 | 5,428,545 | 70,167,200,000 | 4,342,836 | |||||||||||||||||||||
| IDR |
JIBOR 6 MONTHS |
5.94 | % | 2022 | 2029 | 135,000,000,000 | 8,355,512 | 121,500,000,000 | 7,519,960 | |||||||||||||||||||||
| IDR |
JIBOR 6 MONTHS |
6.68 | % | 2023 | 2031 | 87,707,787,200 | 5,428,470 | 87,707,787,200 | 5,428,470 | |||||||||||||||||||||
| IDR |
JIBOR 6 MONTHS |
6.68 | % | 2023 | 2031 | 110,260,500,000 | 6,824,318 | 110,260,500,000 | 6,824,318 | |||||||||||||||||||||
| IDR |
JIBOR 6 MONTHS |
6.70 | % | 2023 | 2031 | 135,000,000,000 | 8,355,512 | 67,495,447,500 | 4,177,474 | |||||||||||||||||||||
| IDR |
JIBOR 6 MONTHS |
6.68 | % | 2023 | 2031 | 105,148,574,300 | 6,507,927 | 105,148,574,300 | 6,507,927 | |||||||||||||||||||||
| IDR |
JIBOR 6 MONTHS |
6.68 | % | 2023 | 2031 | 112,288,102,921 | 6,949,811 | 112,288,102,921 | 6,949,811 | |||||||||||||||||||||
| IDR |
JIBOR 6 MONTHS |
6.68 | % | 2023 | 2031 | 174,970,699,400 | 10,829,405 | 112,481,163,900 | 6,961,760 | |||||||||||||||||||||
| IDR |
JIBOR 6 MONTHS |
6.70 | % | 2023 | 2031 | 363,000,000,000 | 22,467,042 | 363,000,000,000 | 22,467,042 | |||||||||||||||||||||
| IDR |
JIBOR 6 MONTHS |
6.68 | % | 2023 | 2031 | 175,700,156,800 | 10,874,553 | 175,700,156,800 | 10,874,553 | |||||||||||||||||||||
| IDR |
JIBOR 6 MONTHS |
7.95 | % | 2023 | 2029 | 26,989,920,000 | 1,670,478 | 26,989,920,000 | 1,670,478 | |||||||||||||||||||||
| IDR |
JIBOR 6 MONTHS |
7.95 | % | 2023 | 2029 | 48,893,880,000 | 3,026,173 | 44,004,492,000 | 2,723,556 | |||||||||||||||||||||
| IDR |
JIBOR 6 MONTHS |
7.95 | % | 2023 | 2029 | 202,239,996,000 | 12,517,175 | 182,015,996,400 | 11,265,457 | |||||||||||||||||||||
| IDR |
JIBOR 6 MONTHS |
7.95 | % | 2023 | 2029 | 74,200,090,000 | 4,592,442 | 66,780,081,000 | 4,133,198 | |||||||||||||||||||||
| IDR |
JIBOR 6 MONTHS |
6.85 | % | 2023 | 2030 | 202,484,510,000 | 12,532,309 | 161,987,608,000 | 10,025,847 | |||||||||||||||||||||
| IDR |
JIBOR 6 MONTHS |
6.85 | % | 2023 | 2029 | 209,886,367,000 | 12,990,429 | 188,886,367,000 | 11,690,683 | |||||||||||||||||||||
| IDR |
JIBOR 6 MONTHS |
6.85 | % | 2023 | 2029 | 90,998,922,000 | 5,632,167 | 81,898,922,000 | 5,068,944 | |||||||||||||||||||||
| IDR |
JIBOR 6 MONTHS |
6.85 | % | 2023 | 2029 | 47,248,790,469 | 2,924,354 | 42,448,790,469 | 2,627,269 | |||||||||||||||||||||
| IDR |
JIBOR 6 MONTHS |
6.85 | % | 2023 | 2029 | 59,495,762,500 | 3,682,352 | 53,495,762,500 | 3,310,996 | |||||||||||||||||||||
| IDR |
JIBOR 6 MONTHS |
6.85 | % | 2023 | 2029 | 55,992,500,000 | 3,465,526 | 50,392,500,000 | 3,118,927 | |||||||||||||||||||||
| IDR |
JIBOR 6 MONTHS |
7.75 | % | 2023 | 2029 | 1,807,735,267,000 | 111,885,577 | 1,626,961,740,300 | 100,697,019 | |||||||||||||||||||||
| IDR |
JIBOR 6 MONTHS |
7.75 | % | 2023 | 2029 | 692,508,634,000 | 42,861,214 | 623,257,770,600 | 38,575,093 | |||||||||||||||||||||
| IDR |
JIBOR 6 MONTHS |
7.75 | % | 2023 | 2029 | 1,144,276,443,800 | 70,822,334 | 1,144,276,443,800 | 70,822,334 | |||||||||||||||||||||
| IDR |
JIBOR 6 MONTHS |
7.56 | % | 2023 | 2031 | 576,000,000,000 | 35,650,183 | 345,600,000,000 | 21,390,110 | |||||||||||||||||||||
| IDR |
JIBOR 6 MONTHS |
7.55 | % | 2023 | 2031 | 379,248,750,000 | 23,472,721 | 303,399,000,000 | 18,778,177 | |||||||||||||||||||||
| IDR |
JIBOR 6 MONTHS |
7.56 | % | 2023 | 2031 | 94,131,250,000 | 5,826,035 | 94,131,250,000 | 5,826,035 | |||||||||||||||||||||
| IDR |
JIBOR 6 MONTHS |
7.56 | % | 2023 | 2031 | 195,226,600,000 | 12,083,097 | 195,226,600,000 | 12,083,097 | |||||||||||||||||||||
| IDR |
JIBOR 6 MONTHS |
7.56 | % | 2023 | 2031 | 82,400,000,000 | 5,099,957 | 82,400,000,000 | 5,099,957 | |||||||||||||||||||||
| IDR |
JIBOR 6 MONTHS |
7.55 | % | 2023 | 2031 | 122,500,000,000 | 7,581,853 | 78,750,000,000 | 4,874,048 | |||||||||||||||||||||
| IDR |
JIBOR 6 MONTHS |
7.56 | % | 2023 | 2031 | 33,125,000,000 | 2,050,195 | 33,125,000,000 | 2,050,195 | |||||||||||||||||||||
| IDR |
JIBOR 6 MONTHS |
7.56 | % | 2023 | 2031 | 162,000,000,000 | 10,026,614 | 162,000,000,000 | 10,026,614 | |||||||||||||||||||||
| IDR |
JIBOR 6 MONTHS |
7.67 | % | 2023 | 2030 | 281,000,000,000 | 17,391,843 | 281,000,000,000 | 17,391,843 | |||||||||||||||||||||
| IDR |
JIBOR 6 MONTHS |
7.67 | % | 2023 | 2030 | 65,000,000,000 | 4,023,024 | 65,000,000,000 | 4,023,024 | |||||||||||||||||||||
| IDR |
JIBOR 6 MONTHS |
7.67 | % | 2023 | 2030 | 162,868,045,000 | 10,080,339 | 162,868,045,000 | 10,080,339 | |||||||||||||||||||||
| IDR |
JIBOR 6 MONTHS |
7.67 | % | 2023 | 2030 | 60,000,000,000 | 3,713,561 | 60,000,000,000 | 3,713,561 | |||||||||||||||||||||
| IDR |
JIBOR 6 MONTHS |
7.67 | % | 2023 | 2030 | 60,000,000,000 | 3,713,561 | 60,000,000,000 | 3,713,561 | |||||||||||||||||||||
| IDR |
JIBOR 6 MONTHS |
7.67 | % | 2023 | 2030 | 74,970,417,000 | 4,640,120 | 74,970,417,000 | 4,640,120 | |||||||||||||||||||||
| IDR |
JIBOR 6 MONTHS |
7.67 | % | 2023 | 2030 | 53,116,133,000 | 3,287,500 | 53,116,133,000 | 3,287,500 | |||||||||||||||||||||
| IDR |
JIBOR 6 MONTHS |
7.67 | % | 2023 | 2030 | 50,572,916,000 | 3,130,093 | 50,572,916,000 | 3,130,093 | |||||||||||||||||||||
| IDR |
JIBOR 6 MONTHS |
7.67 | % | 2023 | 2030 | 157,365,000,000 | 9,739,741 | 157,365,000,000 | 9,739,741 | |||||||||||||||||||||
| IDR |
JIBOR 6 MONTHS |
7.67 | % | 2023 | 2030 | 35,000,000,000 | 2,166,244 | 35,000,000,000 | 2,166,244 | |||||||||||||||||||||
| IDR |
JIBOR 6 MONTHS |
7.67 | % | 2023 | 2030 | 38,000,000,000 | 2,351,922 | 38,000,000,000 | 2,351,922 | |||||||||||||||||||||
| IDR |
JIBOR 6 MONTHS |
7.67 | % | 2023 | 2030 | 35,000,000,000 | 2,166,244 | 35,000,000,000 | 2,166,244 | |||||||||||||||||||||
| IDR |
JIBOR 6 MONTHS |
7.67 | % | 2023 | 2030 | 40,000,000,000 | 2,475,707 | 40,000,000,000 | 2,475,707 | |||||||||||||||||||||
| IDR |
JIBOR 6 MONTHS |
7.67 | % | 2023 | 2030 | 52,000,000,000 | 3,218,419 | 52,000,000,000 | 3,218,419 | |||||||||||||||||||||
| IDR |
JIBOR 6 MONTHS |
7.67 | % | 2023 | 2030 | 40,000,000,000 | 2,475,707 | 40,000,000,000 | 2,475,707 | |||||||||||||||||||||
| IDR |
JIBOR 6 MONTHS |
7.67 | % | 2023 | 2030 | 39,500,000,000 | 2,444,761 | 39,500,000,000 | 2,444,761 | |||||||||||||||||||||
| IDR |
JIBOR 6 MONTHS |
7.67 | % | 2023 | 2030 | 50,000,000,000 | 3,094,634 | 50,000,000,000 | 3,094,634 | |||||||||||||||||||||
D-129
| CURRENCY BASE |
INTEREST RATE BASIS |
INTEREST RATE |
YEAR OF CONTRACT |
YEAR OF MATURITY |
ORIGINAL AMOUNT | OUTSTANDING BALANCE | ||||||||||||||||||||||||
| (In Original Currency) | (In US Dollar) | (In Original Currency) | (In US Dollar) | |||||||||||||||||||||||||||
| IDR |
JIBOR 6 MONTHS |
7.67 | % | 2023 | 2030 | 30,000,000,000 | 1,856,780 | 30,000,000,000 | 1,856,780 | |||||||||||||||||||||
| IDR |
JIBOR 6 MONTHS |
7.67 | % | 2023 | 2030 | 47,656,524,000 | 2,949,590 | 47,656,524,000 | 2,949,590 | |||||||||||||||||||||
| IDR |
JIBOR 6 MONTHS |
7.67 | % | 2023 | 2030 | 44,178,000,000 | 2,734,295 | 44,178,000,000 | 2,734,295 | |||||||||||||||||||||
| IDR |
JIBOR 6 MONTHS |
7.67 | % | 2023 | 2030 | 22,300,000,000 | 1,380,207 | 22,300,000,000 | 1,380,207 | |||||||||||||||||||||
| IDR |
JIBOR 6 MONTHS |
7.67 | % | 2023 | 2030 | 26,934,084,000 | 1,667,023 | 26,934,084,000 | 1,667,023 | |||||||||||||||||||||
| IDR |
JIBOR 6 MONTHS |
7.67 | % | 2023 | 2030 | 128,686,869,000 | 7,964,775 | 128,686,869,000 | 7,964,775 | |||||||||||||||||||||
| IDR |
JIBOR 6 MONTHS |
7.67 | % | 2023 | 2030 | 151,377,360,000 | 9,369,150 | 151,377,360,000 | 9,369,150 | |||||||||||||||||||||
| IDR |
JIBOR 6 MONTHS |
7.67 | % | 2023 | 2030 | 349,105,000,000 | 21,607,043 | 349,105,000,000 | 21,607,043 | |||||||||||||||||||||
| IDR |
JIBOR 6 MONTHS |
7.67 | % | 2023 | 2030 | 50,000,000,000 | 3,094,634 | 50,000,000,000 | 3,094,634 | |||||||||||||||||||||
| IDR |
JIBOR 6 MONTHS |
7.52 | % | 2023 | 2030 | 2,646,128,000,000 | 163,775,949 | 1,323,064,000,000 | 81,887,974 | |||||||||||||||||||||
| IDR |
JIBOR 6 MONTHS |
7.52 | % | 2023 | 2028 | 1,191,872,000,000 | 73,768,150 | 953,497,600,000 | 59,014,520 | |||||||||||||||||||||
| IDR |
JIBOR 6 MONTHS |
7.52 | % | 2023 | 2029 | 180,000,000,000 | 11,140,682 | 180,000,000,000 | 11,140,682 | |||||||||||||||||||||
| IDR |
JIBOR 6 MONTHS |
7.08 | % | 2023 | 2031 | 76,344,248,427 | 4,725,150 | 34,354,911,792 | 2,126,317 | |||||||||||||||||||||
| IDR |
JIBOR 6 MONTHS |
7.10 | % | 2023 | 2031 | 1,288,147,705,000 | 79,726,911 | 783,193,804,640 | 48,473,962 | |||||||||||||||||||||
| IDR |
JIBOR 6 MONTHS |
7.08 | % | 2023 | 2031 | 67,452,302,100 | 4,174,804 | 53,961,841,680 | 3,339,843 | |||||||||||||||||||||
| IDR |
JIBOR 6 MONTHS |
7.10 | % | 2023 | 2031 | 158,398,482,648 | 9,803,706 | 79,199,241,324 | 4,901,853 | |||||||||||||||||||||
| IDR |
JIBOR 6 MONTHS |
7.08 | % | 2023 | 2029 | 107,879,589,000 | 6,676,957 | 107,879,589,000 | 6,676,957 | |||||||||||||||||||||
| IDR |
JIBOR 6 MONTHS |
7.08 | % | 2023 | 2029 | 599,784,938,000 | 37,122,296 | 599,784,938,000 | 37,122,296 | |||||||||||||||||||||
| IDR |
JIBOR 6 MONTHS |
7.08 | % | 2023 | 2029 | 222,510,000,000 | 13,771,740 | 222,510,000,000 | 13,771,740 | |||||||||||||||||||||
| IDR |
JIBOR 6 MONTHS |
7.08 | % | 2023 | 2029 | 98,950,200,000 | 6,124,293 | 89,055,180,000 | 5,511,864 | |||||||||||||||||||||
| IDR |
JIBOR 6 MONTHS |
7.08 | % | 2023 | 2029 | 68,700,000,000 | 4,252,027 | 61,830,000,000 | 3,826,824 | |||||||||||||||||||||
| IDR |
JIBOR 6 MONTHS |
7.08 | % | 2023 | 2031 | 58,659,380,000 | 3,630,586 | 58,659,380,000 | 3,630,586 | |||||||||||||||||||||
| IDR |
JIBOR 6 MONTHS |
7.08 | % | 2023 | 2031 | 242,915,630,000 | 15,034,699 | 109,312,033,500 | 6,765,615 | |||||||||||||||||||||
| IDR |
JIBOR 6 MONTHS |
7.09 | % | 2023 | 2031 | 85,601,980,000 | 5,298,136 | 47,081,089,000 | 2,913,975 | |||||||||||||||||||||
| IDR |
JIBOR 6 MONTHS |
7.10 | % | 2023 | 2031 | 53,942,900,000 | 3,338,671 | 43,154,320,000 | 2,670,936 | |||||||||||||||||||||
| IDR |
JIBOR 6 MONTHS |
7.10 | % | 2023 | 2031 | 17,466,910,000 | 1,081,074 | 13,973,528,000 | 864,859 | |||||||||||||||||||||
| IDR |
JIBOR 6 MONTHS |
7.08 | % | 2023 | 2029 | 132,500,000,000 | 8,200,780 | 132,500,000,000 | 8,200,780 | |||||||||||||||||||||
| IDR |
JIBOR 6 MONTHS |
7.08 | % | 2023 | 2030 | 89,999,998,984 | 5,570,341 | 35,999,999,592 | 2,228,136 | |||||||||||||||||||||
| IDR |
JIBOR 6 MONTHS |
7.67 | % | 2023 | 2030 | 143,500,000,000 | 8,881,599 | 143,500,000,000 | 8,881,599 | |||||||||||||||||||||
| IDR |
JIBOR 6 MONTHS |
6.95 | % | 2023 | 2030 | 1,725,991,880,000 | 106,826,260 | 1,208,194,316,000 | 74,778,382 | |||||||||||||||||||||
| IDR |
JIBOR 6 MONTHS |
7.10 | % | 2023 | 2030 | 104,004,980,000 | 6,437,147 | 20,800,996,000 | 1,287,429 | |||||||||||||||||||||
| IDR |
JIBOR 6 MONTHS |
7.10 | % | 2023 | 2030 | 129,600,000,000 | 8,021,291 | 25,920,000,000 | 1,604,258 | |||||||||||||||||||||
| IDR |
JIBOR 6 MONTHS |
6.85 | % | 2023 | 2030 | 375,215,630,000 | 23,223,100 | 168,847,033,500 | 10,450,395 | |||||||||||||||||||||
| IDR |
JIBOR 6 MONTHS |
7.10 | % | 2023 | 2029 | 68,700,000,000 | 4,252,027 | 68,700,000,000 | 4,252,027 | |||||||||||||||||||||
| IDR |
JIBOR 6 MONTHS |
6.85 | % | 2023 | 2030 | 56,708,910,000 | 3,509,866 | 25,519,009,500 | 1,579,440 | |||||||||||||||||||||
| IDR |
JIBOR 6 MONTHS |
7.10 | % | 2023 | 2030 | 195,991,430,000 | 12,130,434 | 39,198,286,000 | 2,426,087 | |||||||||||||||||||||
| IDR |
JIBOR 6 MONTHS |
7.10 | % | 2023 | 2030 | 181,016,690,000 | 11,203,608 | 36,203,338,000 | 2,240,722 | |||||||||||||||||||||
| IDR |
JIBOR 6 MONTHS |
6.85 | % | 2023 | 2030 | 140,712,620,000 | 8,709,081 | 63,320,679,000 | 3,919,086 | |||||||||||||||||||||
| IDR |
JIBOR 6 MONTHS |
6.85 | % | 2023 | 2030 | 271,989,380,000 | 16,834,151 | 203,992,035,000 | 12,625,613 | |||||||||||||||||||||
| IDR |
JIBOR 6 MONTHS |
6.85 | % | 2023 | 2030 | 104,000,000,000 | 6,436,839 | 62,400,000,000 | 3,862,103 | |||||||||||||||||||||
| IDR |
JIBOR 6 MONTHS |
7.10 | % | 2023 | 2030 | 52,886,580,000 | 3,273,292 | 10,577,316,000 | 654,658 | |||||||||||||||||||||
| IDR |
JIBOR 6 MONTHS |
7.10 | % | 2023 | 2030 | 256,550,630,000 | 15,878,606 | 51,310,126,000 | 3,175,721 | |||||||||||||||||||||
| IDR |
JIBOR 6 MONTHS |
6.86 | % | 2023 | 2030 | 318,370,950,000 | 19,704,831 | 318,370,950,000 | 19,704,831 | |||||||||||||||||||||
| IDR |
JIBOR 6 MONTHS |
6.86 | % | 2023 | 2030 | 296,992,100,000 | 18,381,636 | 215,926,530,000 | 13,364,271 | |||||||||||||||||||||
| IDR |
JIBOR 6 MONTHS |
6.85 | % | 2023 | 2030 | 222,149,750,000 | 13,749,443 | 162,658,800,000 | 10,067,389 | |||||||||||||||||||||
| IDR |
JIBOR 6 MONTHS |
7.10 | % | 2023 | 2029 | 216,000,000,000 | 13,368,818 | 216,000,000,000 | 13,368,818 | |||||||||||||||||||||
| IDR |
JIBOR 6 MONTHS |
6.87 | % | 2023 | 2030 | 152,375,000,000 | 9,430,897 | 72,875,000,000 | 4,510,429 | |||||||||||||||||||||
| IDR |
JIBOR 6 MONTHS |
7.25 | % | 2023 | 2030 | 156,896,441,104 | 9,710,741 | 31,379,288,221 | 1,942,148 | |||||||||||||||||||||
| IDR |
JIBOR 6 MONTHS |
7.01 | % | 2023 | 2030 | 55,000,000,000 | 3,404,097 | 55,000,000,000 | 3,404,097 | |||||||||||||||||||||
| IDR |
JIBOR 6 MONTHS |
7.25 | % | 2023 | 2030 | 46,875,000,000 | 2,901,219 | 23,437,500,000 | 1,450,610 | |||||||||||||||||||||
| IDR |
JIBOR 6 MONTHS |
7.25 | % | 2023 | 2030 | 59,689,400,000 | 3,694,337 | 50,735,990,000 | 3,140,186 | |||||||||||||||||||||
| IDR |
JIBOR 6 MONTHS |
7.00 | % | 2023 | 2030 | 269,833,130,000 | 16,700,695 | 121,424,908,500 | 7,515,313 | |||||||||||||||||||||
| IDR |
JIBOR 6 MONTHS |
7.25 | % | 2023 | 2030 | 202,421,280,000 | 12,528,395 | 40,484,256,000 | 2,505,679 | |||||||||||||||||||||
| IDR |
JIBOR 6 MONTHS |
7.20 | % | 2023 | 2031 | 13,176,161,900 | 815,508 | 11,199,737,615 | 693,182 | |||||||||||||||||||||
| IDR |
JIBOR 6 MONTHS |
6.95 | % | 2023 | 2031 | 7,640,204,100 | 472,873 | 6,494,173,485 | 401,942 | |||||||||||||||||||||
| IDR |
JIBOR 6 MONTHS |
6.95 | % | 2023 | 2031 | 748,590,870,000 | 46,332,294 | 262,006,804,500 | 16,216,303 | |||||||||||||||||||||
| IDR |
JIBOR 6 MONTHS |
7.20 | % | 2023 | 2031 | 729,201,193,000 | 45,132,215 | 145,840,238,600 | 9,026,443 | |||||||||||||||||||||
| IDR |
JIBOR 6 MONTHS |
7.20 | % | 2023 | 2031 | 89,970,188,941 | 5,568,496 | 17,994,037,788 | 1,113,699 | |||||||||||||||||||||
| IDR |
JIBOR 6 MONTHS |
7.20 | % | 2023 | 2031 | 101,624,973,120 | 6,289,842 | 20,324,994,624 | 1,257,968 | |||||||||||||||||||||
D-130
| CURRENCY BASE |
INTEREST RATE BASIS |
INTEREST RATE |
YEAR OF CONTRACT |
YEAR OF MATURITY |
ORIGINAL AMOUNT | OUTSTANDING BALANCE | ||||||||||||||||||||||||
| (In Original Currency) | (In US Dollar) | (In Original Currency) | (In US Dollar) | |||||||||||||||||||||||||||
| IDR |
JIBOR 6 MONTHS |
6.95 | % | 2023 | 2031 | 98,500,000,000 | 6,096,429 | 78,800,000,000 | 4,877,143 | |||||||||||||||||||||
| IDR |
JIBOR 6 MONTHS |
6.96 | % | 2023 | 2030 | 100,000,000,000 | 6,189,268 | 100,000,000,000 | 6,189,268 | |||||||||||||||||||||
| IDR |
JIBOR 6 MONTHS |
6.95 | % | 2023 | 2031 | 75,120,000,000 | 4,649,378 | 75,120,000,000 | 4,649,378 | |||||||||||||||||||||
| IDR |
JIBOR 6 MONTHS |
6.96 | % | 2023 | 2030 | 180,000,000,000 | 11,140,682 | 180,000,000,000 | 11,140,682 | |||||||||||||||||||||
| IDR |
JIBOR 6 MONTHS |
6.95 | % | 2023 | 2031 | 135,000,000,000 | 8,355,512 | 81,000,000,000 | 5,013,307 | |||||||||||||||||||||
| IDR |
JIBOR 6 MONTHS |
6.95 | % | 2023 | 2031 | 87,600,000,000 | 5,421,799 | 61,320,000,000 | 3,795,259 | |||||||||||||||||||||
| IDR |
JIBOR 6 MONTHS |
7.20 | % | 2023 | 2031 | 16,575,000,000 | 1,025,871 | 3,315,000,000 | 205,174 | |||||||||||||||||||||
| IDR |
JIBOR 6 MONTHS |
7.20 | % | 2023 | 2031 | 146,250,000,000 | 9,051,804 | 29,250,000,000 | 1,810,361 | |||||||||||||||||||||
| IDR |
JIBOR 6 MONTHS |
7.20 | % | 2023 | 2031 | 32,500,000,000 | 2,011,512 | 6,500,000,000 | 402,302 | |||||||||||||||||||||
| IDR |
JIBOR 6 MONTHS |
6.95 | % | 2023 | 2031 | 75,453,170,000 | 4,669,999 | 37,726,585,000 | 2,334,999 | |||||||||||||||||||||
| IDR |
JIBOR 6 MONTHS |
6.95 | % | 2023 | 2030 | 253,599,150,000 | 15,695,931 | 253,599,150,000 | 15,695,931 | |||||||||||||||||||||
| IDR |
JIBOR 6 MONTHS |
6.97 | % | 2023 | 2031 | 249,310,224,200 | 15,430,477 | 22,646,796,688 | 1,401,671 | |||||||||||||||||||||
| IDR |
JIBOR 6 MONTHS |
7.20 | % | 2023 | 2031 | 116,944,524,800 | 7,238,010 | 116,944,524,800 | 7,238,010 | |||||||||||||||||||||
| IDR |
JIBOR 6 MONTHS |
7.01 | % | 2023 | 2030 | 98,860,380,000 | 6,118,734 | 88,974,342,000 | 5,506,860 | |||||||||||||||||||||
| IDR |
JIBOR 6 MONTHS |
7.25 | % | 2023 | 2030 | 35,995,800,000 | 2,227,876 | 19,530,890,000 | 1,208,819 | |||||||||||||||||||||
| IDR |
JIBOR 6 MONTHS |
7.00 | % | 2023 | 2030 | 209,887,574,000 | 12,990,504 | 83,955,029,600 | 5,196,202 | |||||||||||||||||||||
| IDR |
JIBOR 6 MONTHS |
7.00 | % | 2023 | 2030 | 47,247,280,000 | 2,924,261 | 47,247,280,000 | 2,924,261 | |||||||||||||||||||||
| IDR |
JIBOR 6 MONTHS |
7.00 | % | 2023 | 2030 | 301,201,000,000 | 18,642,137 | 180,720,600,000 | 11,185,282 | |||||||||||||||||||||
| IDR |
JIBOR 6 MONTHS |
7.25 | % | 2023 | 2030 | 131,909,400,000 | 8,164,226 | 131,909,400,000 | 8,164,226 | |||||||||||||||||||||
| IDR |
JIBOR 6 MONTHS |
7.25 | % | 2023 | 2030 | 134,980,836,000 | 8,354,325 | 126,541,629,400 | 7,832,000 | |||||||||||||||||||||
| IDR |
JIBOR 6 MONTHS |
6.80 | % | 2023 | 2030 | 1,548,607,980,000 | 95,847,495 | 1,548,607,980,000 | 95,847,495 | |||||||||||||||||||||
| IDR |
JIBOR 6 MONTHS |
6.80 | % | 2023 | 2030 | 2,446,741,429,000 | 151,435,380 | 2,446,741,429,000 | 151,435,380 | |||||||||||||||||||||
| IDR |
JIBOR 6 MONTHS |
7.10 | % | 2023 | 2030 | 76,658,310,000 | 4,744,588 | 34,496,239,500 | 2,135,065 | |||||||||||||||||||||
| IDR |
JIBOR 6 MONTHS |
6.82 | % | 2024 | 2031 | 1,499,619,768,000 | 92,815,484 | 299,923,953,600 | 18,563,097 | |||||||||||||||||||||
| IDR |
JIBOR 6 MONTHS |
6.82 | % | 2024 | 2031 | 999,743,704,000 | 61,876,815 | 399,897,481,600 | 24,750,726 | |||||||||||||||||||||
| IDR |
JIBOR 6 MONTHS |
6.82 | % | 2024 | 2031 | 2,499,347,891,000 | 154,691,334 | 949,752,198,580 | 58,782,707 | |||||||||||||||||||||
| IDR |
JIBOR 6 MONTHS |
6.82 | % | 2024 | 2031 | 2,271,905,909,000 | 140,614,341 | 2,044,715,318,100 | 126,552,907 | |||||||||||||||||||||
| IDR |
JIBOR 6 MONTHS |
6.92 | % | 2024 | 2032 | 143,852,562,000 | 8,903,420 | 21,577,884,300 | 1,335,513 | |||||||||||||||||||||
| IDR |
JIBOR 6 MONTHS |
6.92 | % | 2024 | 2032 | 399,856,276,000 | 24,748,176 | 59,978,441,400 | 3,712,226 | |||||||||||||||||||||
| IDR |
JIBOR 6 MONTHS |
6.82 | % | 2024 | 2031 | 1,683,581,014,000 | 104,201,338 | 366,683,946,000 | 22,695,051 | |||||||||||||||||||||
| IDR |
JIBOR 6 MONTHS |
6.82 | % | 2024 | 2031 | 2,125,858,440,000 | 131,575,072 | 437,501,668,000 | 27,078,150 | |||||||||||||||||||||
|
|
|
|
|
|||||||||||||||||||||||||||
| TOTAL COMMERCIAL CREDIT |
|
USD | 4,634,287,295 | USD | 3,172,252,465 | |||||||||||||||||||||||||
|
|
|
|
|
|||||||||||||||||||||||||||
Assumed exchange rates for conversion
| USD/IDR |
16,157.00 |
D-131
GUARANTEED EXTERNAL LOANS OF THE REPUBLIC OF INDONESIA
AS OF DECEMBER 31, 2024
| CURRENCY |
INTEREST RATE |
INTEREST MARGIN (%) |
YEAR OF CONTRACT |
YEAR OF MATURITY |
ORIGINAL AMOUNT | OUTSTANDING BALANCE | ||||||||||||||||||||||
| (In Original Currency) | (In US Dollar) | (In Original Currency) | (In US Dollar) | |||||||||||||||||||||||||
| EXTERNAL CREDIT |
| |||||||||||||||||||||||||||
| USD |
LIBOR 6 MONTHS |
0.840% | 2008 | 2023 | 284,288,744 | 284,288,744 | — | |||||||||||||||||||||
| USD |
LIBOR 6 MONTHS |
0.840% | 2008 | 2023 | 330,825,515 | 330,825,515 | — | |||||||||||||||||||||
| USD |
LIBOR 6 MONTHS |
3.850% | 2009 | 2024 | 625,256,803 | 625,256,803 | — | |||||||||||||||||||||
| USD |
Fixed 3.75% |
0.000% | 2020 | 2030 | 600,000,000 | 600,000,000 | 600,000,000 | 600,000,000 | ||||||||||||||||||||
| EUR |
EURIBOR 6 MONTHS |
0.000% | 2019 | 2034 | 294,700,000 | 306,841,669 | — | — | ||||||||||||||||||||
| EUR |
EURIBOR 6 MONTHS |
4.700% | 2020 | 2035 | 255,165,034 | 265,677,859 | 250,820,061 | 261,153,872 | ||||||||||||||||||||
| EUR |
LIBOR 6 MONTHS |
0.500% | 2015 | 2035 | 36,277,710 | 37,772,355 | 18,961,735 | 19,742,960 | ||||||||||||||||||||
| EUR |
LIBOR 6 MONTHS |
0.500% | 2015 | 2035 | 489,881,140 | 510,064,291 | 359,246,169 | 374,047,147 | ||||||||||||||||||||
| USD |
LIBOR 6 MONTHS |
0.500% | 2015 | 2035 | 25,000,000 | 25,000,000 | 18,097,130 | 18,097,130 | ||||||||||||||||||||
| EUR |
Reference Rate for Loan Curr. + Var. Spread |
2016 | 2036 | 500,000,000 | 520,600,050 | 229,587,286 | 239,046,305 | |||||||||||||||||||||
| JPY |
LIBOR 6 MONTHS |
0.500% | 2017 | 2037 | 600,000,000 | 3,840,862 | 72,859,658,327 | 466,406,433 | ||||||||||||||||||||
| USD |
LIBOR + 0.5% |
2020 | 2040 | 300,000,000 | 300,000,000 | 168,486,994 | 168,486,994 | |||||||||||||||||||||
| USD |
fixed 0.75% |
2020 | 2040 | 35,000,000 | 35,000,000 | 2,560,276 | 2,560,276 | |||||||||||||||||||||
| USD |
LIBOR 6 MONTHS |
0.500% | 2020 | 2040 | 600,000,000 | 600,000,000 | 18,059,392 | 18,059,392 | ||||||||||||||||||||
| JPY |
70,495,150,260 | 451,270,186 | ||||||||||||||||||||||||||
| USD |
LIBOR 6 MONTHS |
1.400% | 2018 | 2053 | 248,400,000 | 248,400,000 | 111,820,000 | 111,820,000 | ||||||||||||||||||||
| USD |
SWAP Rate (LIBOR-6mo) |
1.300% | 2017 | Tentative | 330,000,000 | 330,000,000 | 229,587,286 | 229,587,286 | ||||||||||||||||||||
| USD |
LIBOR 6 MONTHS |
0.800% | 2021 | 2041 | 310,000,000 | 310,000,000 | 186,016,621 | 186,016,621 | ||||||||||||||||||||
|
|
|
|
|
|
|
|
|
|||||||||||||||||||||
| Total |
|
5,864,794,946 | 5,333,568,148 | 145,548,051,538 | 3,146,294,604 | |||||||||||||||||||||||
|
|
|
|
|
|
|
|
|
|||||||||||||||||||||
Assumed exchange rates for conversion
| EUR/IDR |
16,822.67 | |||
| JPY/IDR |
103.4280 | |||
| USD/IDR |
16,157.00 |
D-132
GUARANTEED DOMESTIC LOANS OF THE REPUBLIC OF INDONESIA
AS OF DECEMBER 31, 2024
| CURRENCY |
INTEREST RATE BASIS |
INTEREST MARGIN (%) |
YEAR OF CONTRACT |
YEAR OF MATURITY |
ORIGINAL AMOUNT | OUTSTANDING BALANCE | ||||||||||||||||||||||
| (In Original Currency) | (In US Dollar) | (In Original Currency) | (In US Dollar) | |||||||||||||||||||||||||
| DOMESTIC CREDIT |
| |||||||||||||||||||||||||||
| IDR |
SBI 12 Bulan |
4.500% | 2014 | 2024 | 7,984,000,000 | 494,151 | 1,958,128,957 | 121,194 | ||||||||||||||||||||
| IDR |
JIBOR 3 MONTHS |
1.200% | 2015 | 2025 | 2,449,962,746,818 | 151,634,756 | 349,994,666,818 | 21,662,107 | ||||||||||||||||||||
| IDR |
JIBOR 3 MONTHS |
1.500% | 2015 | 2025 | 2,225,000,000,000 | 137,711,209 | 238,392,857,126 | 14,754,772 | ||||||||||||||||||||
| IDR |
BI Rate |
2.000% | 2016 | 2041 | 481,000,000,000 | 29,770,378 | — | — | ||||||||||||||||||||
| IDR |
BI Rate |
1.500 -4.000% | 2016 | 2041 | 1,240,335,000,000 | 76,767,655 | 726,325,731,375 | 44,954,245 | ||||||||||||||||||||
| IDR |
Average Time Deposit |
2.77 (CDS 2.77% + 2%) |
2017 | 2032 | 15,592,413,000,000 | 965,056,199 | — | — | ||||||||||||||||||||
| IDR |
Fixed 8.4 |
0.000% | 2017 | 2022 | 3,532,000,000,000 | 218,604,939 | 2,367,000,000,000 | 146,499,969 | ||||||||||||||||||||
| IDR |
Fixed 8.55 |
0.000% | 2016 | 2026 | 1,000,000,000,000 | 61,892,678 | 1,000,000,000,000 | 61,892,678 | ||||||||||||||||||||
| IDR |
Fixed 8.01 |
0.000% | 2017 | 2027 | 1,968,000,000,000 | 121,804,790 | 1,968,000,000,000 | 121,804,790 | ||||||||||||||||||||
| IDR |
JIBOR 3 bln |
1.875% | 2018 | 2028 | 4,500,000,000,000 | 278,517,051 | 2,000,000,000,000 | 123,785,356 | ||||||||||||||||||||
| IDR |
SUN Y15 / SUN Y20 |
1.000% / 2.000% |
2018 | 2033 | 12,264,000,000,000 | 759,051,804 | 1,500,000,000,000 | 92,839,017 | ||||||||||||||||||||
| IDR |
ATD 3 Bln |
3.690% | 2018 | 2033 | 14,366,000,000,000 | 889,150,214 | 7,687,974,175,242 | 475,829,311 | ||||||||||||||||||||
| IDR |
JIBOR 6 Months |
1.250% | 2019 | 2029 | 4,506,787,490,000 | 278,937,147 | 2,650,035,661,215 | 164,017,804 | ||||||||||||||||||||
| IDR |
JIBOR 6 Months |
1.250% | 2020 | 2030 | 5,071,000,000,000 | 313,857,771 | 3,150,749,514,375 | 195,008,325 | ||||||||||||||||||||
| IDR |
JIBOR 6 Months |
1.250% | 2020 | 2030 | 2,846,000,000,000 | 176,146,562 | 1,526,494,348,463 | 94,478,823 | ||||||||||||||||||||
| IDR |
JIBOR 6 Months |
1.250% | 2022 | 2032 | 2,750,000,000,000 | 170,204,865 | 2,481,853,911,346 | 153,608,585 | ||||||||||||||||||||
| IDR |
JIBOR 3 Bulan |
2.500% | 2017 | 2032 | 23,419,128,801,423 | 1,449,472,600 | 22,330,000,000,000 | 1,382,063,502 | ||||||||||||||||||||
|
|
|
|
|
|
|
|
|
|||||||||||||||||||||
| TOTAL |
|
98,219,611,038,241 | 6,079,074,769 | 49,976,820,865,960 | 3,093,320,480 | |||||||||||||||||||||||
|
|
|
|
|
|
|
|
|
|||||||||||||||||||||
Assumed exchange rates for conversion
| USD/IDR |
16,157.00 |
D-133
FOREIGN CURRENCY-DENOMINATED BONDS OF THE REPUBLIC OF INDONESIA
As of December 31, 2024
| Currency and Series |
Interest Rate Basis |
Interest Rate |
First Issue Date |
Maturity Date |
Outstanding Balance | |||||||||||||||||||
| (in Original Currency) | (in US Dollar) | |||||||||||||||||||||||
| A. GOVERNMENT DEBT SECURITIES |
| |||||||||||||||||||||||
| US DOLLAR |
| |||||||||||||||||||||||
| RI0035 |
FIXED | 8.500 | % | 12-Oct-2035 | 12-Apr-2025 | 1,562,661,000 | 1,562,661,000 | |||||||||||||||||
| RI0037 |
FIXED | 6.625 | % | 17-Feb-2037 | 17-Feb-2025 | 1,427,762,000 | 1,427,762,000 | |||||||||||||||||
| RI0038 |
FIXED | 7.750 | % | 17-Jan-2038 | 17-Jan-2025 | 1,945,398,000 | 1,945,398,000 | |||||||||||||||||
| RI0125 |
FIXED | 4.125 | % | 15-Jan-2025 | 15-Jan-2025 | 2,000,000,000 | 2,000,000,000 | |||||||||||||||||
| RI0126 |
FIXED | 4.750 | % | 08-Jan-2026 | 08-Jan-2025 | 2,070,963,000 | 2,070,963,000 | |||||||||||||||||
| RI0127 |
FIXED | 4.350 | % | 08-Jan-2027 | 08-Jan-2025 | 1,250,000,000 | 1,250,000,000 | |||||||||||||||||
| RI0128 |
FIXED | 3.500 | % | 11-Jan-2028 | 11-Jan-2025 | 1,250,000,000 | 1,250,000,000 | |||||||||||||||||
| RI0128A |
FIXED | 4.550 | % | 11-Jan-2028 | 11-Jan-2025 | 1,000,000,000 | 1,000,000,000 | |||||||||||||||||
| RI0133 |
FIXED | 4.850 | % | 11-Jan-2033 | 11-Jan-2025 | 1,250,000,000 | 1,250,000,000 | |||||||||||||||||
| RI0142 |
FIXED | 5.250 | % | 17-Jan-2042 | 17-Jan-2025 | 2,250,000,000 | 2,250,000,000 | |||||||||||||||||
| RI0144 |
FIXED | 6.750 | % | 15-Jan-2044 | 15-Jan-2025 | 2,000,000,000 | 2,000,000,000 | |||||||||||||||||
| RI0145 |
FIXED | 5.125 | % | 15-Jan-2045 | 15-Jan-2025 | 2,000,000,000 | 2,000,000,000 | |||||||||||||||||
| RI0146 |
FIXED | 5.950 | % | 08-Jan-2046 | 08-Jan-2025 | 1,250,000,000 | 1,250,000,000 | |||||||||||||||||
| RI0147 |
FIXED | 5.250 | % | 08-Jan-2047 | 08-Jan-2025 | 1,500,000,000 | 1,500,000,000 | |||||||||||||||||
| RI0148 |
FIXED | 4.350 | % | 11-Jan-2048 | 11-Jan-2025 | 1,750,000,000 | 1,750,000,000 | |||||||||||||||||
| RI0153 |
FIXED | 5.650 | % | 11-Jan-2053 | 11-Jan-2025 | 750,000,000 | 750,000,000 | |||||||||||||||||
| RI0229 |
FIXED | 4.750 | % | 11-Feb-2029 | 11-Feb-2025 | 1,250,000,000 | 1,250,000,000 | |||||||||||||||||
| RI0230 |
FIXED | 2.850 | % | 14-Feb-2030 | 14-Feb-2025 | 1,200,000,000 | 1,200,000,000 | |||||||||||||||||
| RI0234 |
FIXED | 4.700 | % | 10-Feb-2034 | 10-Feb-2025 | 650,000,000 | 650,000,000 | |||||||||||||||||
| RI0249 |
FIXED | 5.350 | % | 11-Feb-2049 | 11-Feb-2025 | 1,000,000,000 | 1,000,000,000 | |||||||||||||||||
| RI0250 |
FIXED | 3.500 | % | 14-Feb-2050 | 14-Feb-2025 | 800,000,000 | 800,000,000 | |||||||||||||||||
| RI0254 |
FIXED | 5.100 | % | 10-Feb-2054 | 10-Feb-2025 | 900,000,000 | 900,000,000 | |||||||||||||||||
| RI0329 |
FIXED | 4.400 | % | 10-Mar-2029 | 10-Mar-2025 | 500,000,000 | 500,000,000 | |||||||||||||||||
| RI0331 |
FIXED | 1.850 | % | 12-Mar-2031 | 12-Mar-2025 | 1,250,000,000 | 1,250,000,000 | |||||||||||||||||
| RI0332 |
FIXED | 3.550 | % | 31-Mar-2032 | 31-Mar-2025 | 1,000,000,000 | 1,000,000,000 | |||||||||||||||||
| RI0351 |
FIXED | 3.050 | % | 12-Mar-2051 | 12-Mar-2025 | 2,000,000,000 | 2,000,000,000 | |||||||||||||||||
| RI0352 |
FIXED | 4.300 | % | 31-Mar-2052 | 31-Mar-2025 | 750,000,000 | 750,000,000 | |||||||||||||||||
| RI0371 |
FIXED | 3.350 | % | 12-Mar-2071 | 12-Mar-2025 | 800,000,000 | 800,000,000 | |||||||||||||||||
| RI0428 |
FIXED | 4.100 | % | 24-Apr-2028 | 24-Apr-2025 | 1,000,000,000 | 1,000,000,000 | |||||||||||||||||
| RI0443 |
FIXED | 4.625 | % | 15-Apr-2043 | 15-Apr-2025 | 1,500,000,000 | 1,500,000,000 | |||||||||||||||||
| RI0470 |
FIXED | 4.450 | % | 15-Apr-2070 | 15-Apr-2025 | 1,000,000,000 | 1,000,000,000 | |||||||||||||||||
| RI0727 |
FIXED | 3.850 | % | 18-Jul-2027 | 18-Jan-2025 | 1,000,000,000 | 1,000,000,000 | |||||||||||||||||
| RI0731 |
FIXED | 2.150 | % | 28-Jul-2031 | 28-Jan-2025 | 1,200,000,000 | 1,200,000,000 | |||||||||||||||||
| RI0747 |
FIXED | 4.750 | % | 18-Jul-2047 | 18-Jan-2025 | 1,000,000,000 | 1,000,000,000 | |||||||||||||||||
| RI0927 |
FIXED | 4.150 | % | 20-Sep-2027 | 20-Mar-2025 | 750,000,000 | 750,000,000 | |||||||||||||||||
| RI0929 |
FIXED | 3.400 | % | 18-Sep-2029 | 18-Mar-2025 | 750,000,000 | 750,000,000 | |||||||||||||||||
| RI0932 |
FIXED | 4.650 | % | 20-Sep-2032 | 20-Mar-2025 | 1,400,000,000 | 1,400,000,000 | |||||||||||||||||
| RI0934 |
FIXED | 4.750 | % | 10-Sep-2034 | 10-Mar-2025 | 1,150,000,000 | 1,150,000,000 | |||||||||||||||||
| RI0952 |
FIXED | 5.450 | % | 20-Sep-2052 | 20-Mar-2025 | 500,000,000 | 500,000,000 | |||||||||||||||||
| RI0954 |
FIXED | 5.150 | % | 10-Sep-2054 | 10-Mar-2025 | 650,000,000 | 650,000,000 | |||||||||||||||||
| RI0961 |
FIXED | 3.200 | % | 23-Sep-2061 | 23-Mar-2025 | 650,000,000 | 650,000,000 | |||||||||||||||||
| RI1030 |
FIXED | 3.850 | % | 15-Oct-2030 | 15-Apr-2025 | 1,650,000,000 | 1,650,000,000 | |||||||||||||||||
| RI1049 |
FIXED | 3.700 | % | 30-Oct-2049 | 30-Apr-2025 | 1,000,000,000 | 1,000,000,000 | |||||||||||||||||
| RI1050 |
FIXED | 4.200 | % | 15-Oct-2050 | 15-Apr-2025 | 1,650,000,000 | 1,650,000,000 | |||||||||||||||||
| USDFR0002 |
FIXED | 4.050 | % | 24-Jun-2026 | 24-Jun-2025 | 200,000,000 | 200,000,000 | |||||||||||||||||
| USDFR0003 |
FIXED | 3.000 | % | 15-Jan-2032 | 15-Jan-2025 | 127,099,000 | 127,099,000 | |||||||||||||||||
|
|
|
|
|
|||||||||||||||||||||
| TOTAL US DOLLAR DENOMINATED |
|
54,533,883,000 | 54,533,883,000 | |||||||||||||||||||||
|
|
|
|
|
|||||||||||||||||||||
D-134
| Currency and Series |
Interest Rate Basis |
Interest Rate |
First Issue Date | Maturity Date |
Outstanding Balance | |||||||||||||||||||
| (in Original Currency) | (in US Dollar) | |||||||||||||||||||||||
| JAPANESE YEN |
||||||||||||||||||||||||
| RIJPY0525 |
FIXED | 1.070 | % | 31-May-2018 | 30-May-2025 | 3,500,000,000 | 22,405,026 | |||||||||||||||||
| RIJPY0526 |
FIXED | 0.960 | % | 22-May-2019 | 22-May-2026 | 4,500,000,000 | 28,806,462 | |||||||||||||||||
| RIJPY0526A |
FIXED | 0.570 | % | 27-May-2021 | 27-May-2026 | 46,800,000,000 | 299,587,201 | |||||||||||||||||
| RIJPY0526B |
FIXED | 0.740 | % | 26-May-2023 | 26-May-2026 | 46,900,000,000 | 300,227,344 | |||||||||||||||||
| RIJPY0527 |
FIXED | 0.990 | % | 27-May-2024 | 27-May-2027 | 50,000,000,000 | 320,071,796 | |||||||||||||||||
| RIJPY0528 |
FIXED | 1.270 | % | 31-May-2018 | 31-May-2028 | 8,500,000,000 | 54,412,205 | |||||||||||||||||
| RIJPY0528A |
FIXED | 0.700 | % | 27-May-2021 | 26-May-2028 | 1,200,000,000 | 7,681,723 | |||||||||||||||||
| RIJPY0528B |
FIXED | 0.980 | % | 26-May-2023 | 26-May-2028 | 37,200,000,000 | 238,133,416 | |||||||||||||||||
| RIJPY0529 |
FIXED | 1.170 | % | 22-May-2019 | 22-May-2029 | 7,600,000,000 | 48,650,913 | |||||||||||||||||
| RIJPY0529A |
FIXED | 1.330 | % | 27-May-2024 | 25-May-2029 | 88,000,000,000 | 563,326,360 | |||||||||||||||||
| RIJPY0530 |
FIXED | 1.200 | % | 26-May-2023 | 24-May-2030 | 14,700,000,000 | 94,101,108 | |||||||||||||||||
| RIJPY0531 |
FIXED | 0.890 | % | 27-May-2021 | 27-May-2031 | 18,200,000,000 | 116,506,134 | |||||||||||||||||
| RIJPY0531A |
FIXED | 1.570 | % | 27-May-2024 | 27-May-2031 | 17,700,000,000 | 113,305,416 | |||||||||||||||||
| RIJPY0531B |
FIXED | 1.570 | % | 27-May-2024 | 27-May-2031 | 2,000,000,000 | 12,802,872 | |||||||||||||||||
| RIJPY0533 |
FIXED | 1.430 | % | 26-May-2023 | 26-May-2033 | 6,000,000,000 | 38,408,615 | |||||||||||||||||
| RIJPY0534 |
FIXED | 1.550 | % | 22-May-2019 | 22-May-2034 | 4,000,000,000 | 25,605,744 | |||||||||||||||||
| RIJPY0534A |
FIXED | 1.910 | % | 27-May-2024 | 26-May-2034 | 19,300,000,000 | 123,547,713 | |||||||||||||||||
| RIJPY0534B |
FIXED | 1.910 | % | 27-May-2024 | 26-May-2034 | 6,800,000,000 | 43,529,764 | |||||||||||||||||
| RIJPY0536 |
FIXED | 1.170 | % | 27-May-2021 | 27-May-2036 | 2,500,000,000 | 16,003,590 | |||||||||||||||||
| RIJPY0539 |
FIXED | 1.790 | % | 22-May-2019 | 20-May-2039 | 5,000,000,000 | 32,007,180 | |||||||||||||||||
| RIJPY0541 |
FIXED | 1.440 | % | 27-May-2021 | 27-May-2041 | 2,300,000,000 | 14,723,303 | |||||||||||||||||
| RIJPY0544 |
FIXED | 2.550 | % | 27-May-2024 | 27-May-2044 | 16,200,000,000 | 103,703,262 | |||||||||||||||||
| RIJPY0625 |
FIXED | 0.960 | % | 09-Jun-2022 | 09-Jun-2025 | 68,200,000,000 | 436,577,929 | |||||||||||||||||
| RIJPY0627 |
FIXED | 1.130 | % | 09-Jun-2022 | 09-Jun-2027 | 5,100,000,000 | 32,647,323 | |||||||||||||||||
| RIJPY0629 |
FIXED | 1.270 | % | 09-Jun-2022 | 08-Jun-2029 | 1,700,000,000 | 10,882,441 | |||||||||||||||||
| RIJPY0632 |
FIXED | 1.450 | % | 09-Jun-2022 | 09-Jun-2032 | 6,000,000,000 | 38,408,615 | |||||||||||||||||
| RIJPY0725 |
FIXED | 1.350 | % | 08-Jul-2020 | 08-Jul-2025 | 24,300,000,000 | 155,554,893 | |||||||||||||||||
| RIJPY0727 |
FIXED | 1.480 | % | 08-Jul-2020 | 08-Jul-2027 | 10,100,000,000 | 64,654,503 | |||||||||||||||||
| RIJPY0730 |
FIXED | 1.590 | % | 08-Jul-2020 | 08-Jul-2030 | 13,400,000,000 | 85,779,241 | |||||||||||||||||
| RIJPY0740 |
FIXED | 1.800 | % | 08-Jul-2020 | 06-Jul-2040 | 1,500,000,000 | 9,602,154 | |||||||||||||||||
| RIJPY0825 |
FIXED | 0.910 | % | 13-Aug-2015 | 13-Aug-2025 | 55,000,000,000 | 352,078,975 | |||||||||||||||||
|
|
|
|
|
|||||||||||||||||||||
| TOTAL JAPANESE YEN DENOMINATED |
|
594,200,000,000 | 3,803,733,218 | |||||||||||||||||||||
|
|
|
|
|
|||||||||||||||||||||
| EURO DENOMINATED |
||||||||||||||||||||||||
| RIEUR0227 |
FIXED | 0.900 | % | 14-Jan-2020 | 14-Feb-2027 | 1,000,000,000 | 1,041,200,099 | |||||||||||||||||
| RIEUR0333 |
FIXED | 1.100 | % | 12-Jan-2021 | 12-Mar-2033 | 1,000,000,000 | 1,041,200,099 | |||||||||||||||||
| RIEUR0334 |
FIXED | 1.300 | % | 23-Sep-2021 | 23-Mar-2034 | 500,000,000 | 520,600,050 | |||||||||||||||||
| RIEUR0425 |
FIXED | 1.750 | % | 24-Apr-2018 | 24-Apr-2025 | 1,000,000,000 | 1,041,200,099 | |||||||||||||||||
| RIEUR0628 |
FIXED | 3.750 | % | 14-Jun-2016 | 14-Jun-2028 | 1,500,000,000 | 1,561,800,149 | |||||||||||||||||
| RIEUR0725 |
FIXED | 3.375 | % | 30-Jul-2015 | 30-Jul-2025 | 1,250,000,000 | 1,301,500,124 | |||||||||||||||||
| RIEUR0729 |
FIXED | 1.000 | % | 28-Jul-2021 | 28-Jul-2029 | 500,000,000 | 520,600,050 | |||||||||||||||||
| RIEUR0926 |
FIXED | 1.450 | % | 18-Jun-2019 | 18-Sep-2026 | 750,000,000 | 780,900,074 | |||||||||||||||||
| RIEUR0932 |
FIXED | 3.650 | % | 10-Sep-2024 | 10-Sep-2032 | 750,000,000 | 780,900,074 | |||||||||||||||||
| RIEUR1031 |
FIXED | 1.400 | % | 30-Oct-2019 | 30-Oct-2031 | 1,000,000,000 | 1,041,200,099 | |||||||||||||||||
|
|
|
|
|
|||||||||||||||||||||
| TOTAL EURO DENOMINATED |
|
9,250,000,000 | 9,631,100,916 | |||||||||||||||||||||
|
|
|
|
|
|||||||||||||||||||||
| B. GOVERNMENT ISLAMIC DEBT SECURITIES |
|
|||||||||||||||||||||||
| US DOLLAR |
||||||||||||||||||||||||
| SNI0229 |
FIXED | 4.450 | % | 20-Feb-2019 | 20-Feb-2029 | 1,250,000,000 | 1,250,000,000 | |||||||||||||||||
| SNI0327 |
FIXED | 4.150 | % | 29-Mar-2017 | 29-Mar-2027 | 2,000,000,000 | 2,000,000,000 | |||||||||||||||||
| SNI0328 |
FIXED | 4.400 | % | 01-Mar-2018 | 01-Mar-2028 | 1,750,000,000 | 1,750,000,000 | |||||||||||||||||
| SNI0625 |
FIXED | 5.000 | % | 25-Nov-2024 | 25-May-2030 | 1,100,000,000 | 1,100,000,000 | |||||||||||||||||
| SNI0626 |
FIXED | 2.300 | % | 23-Jun-2020 | 23-Jun-2025 | 750,000,000 | 750,000,000 | |||||||||||||||||
| SNI0627 |
FIXED | 1.500 | % | 09-Jun-2021 | 09-Jun-2026 | 1,250,000,000 | 1,250,000,000 | |||||||||||||||||
| SNI0630 |
FIXED | 4.400 | % | 06-Jun-2022 | 06-Jun-2027 | 1,750,000,000 | 1,750,000,000 | |||||||||||||||||
| SNI0631 |
FIXED | 2.800 | % | 23-Jun-2020 | 23-Jun-2030 | 1,000,000,000 | 1,000,000,000 | |||||||||||||||||
| SNI0632 |
FIXED | 2.550 | % | 09-Jun-2021 | 09-Jun-2031 | 1,000,000,000 | 1,000,000,000 | |||||||||||||||||
| SNI0650 |
FIXED | 4.700 | % | 06-Jun-2022 | 06-Jun-2032 | 1,500,000,000 | 1,500,000,000 | |||||||||||||||||
D-135
| Currency and Series |
Interest Rate Basis |
Interest Rate |
First Issue Date | Maturity Date |
Outstanding Balance | |||||||||||||||||||
| (in Original Currency) | (in US Dollar) | |||||||||||||||||||||||
| SNI0651 |
FIXED | 3.800 | % | 23-Jun-2020 | 23-Jun-2050 | 750,000,000 | 750,000,000 | |||||||||||||||||
| SNI0824 |
FIXED | 3.550 | % | 09-Jun-2021 | 09-Jun-2051 | 750,000,000 | 750,000,000 | |||||||||||||||||
| SNI1128 |
FIXED | 5.100 | % | 02-Jul-2024 | 02-Jul-2029 | 750,000,000 | 750,000,000 | |||||||||||||||||
| SNI1133 |
FIXED | 5.200 | % | 02-Jul-2024 | 02-Jul-2034 | 1,000,000,000 | 1,000,000,000 | |||||||||||||||||
| SNI24 |
FIXED | 5.500 | % | 02-Jul-2024 | 02-Jul-2054 | 600,000,000 | 600,000,000 | |||||||||||||||||
| SNI25 |
FIXED | 5.400 | % | 15-Nov-2023 | 15-Nov-2028 | 1,000,000,000 | 1,000,000,000 | |||||||||||||||||
| SNI26 |
FIXED | 5.600 | % | 15-Nov-2023 | 15-Nov-2033 | 1,000,000,000 | 1,000,000,000 | |||||||||||||||||
| SNI1133 |
FIXED | 5.250 | % | 25-Nov-2024 | 25-Nov-2034 | 900,000,000 | 900,000,000 | |||||||||||||||||
| SNI24 |
FIXED | 5.650 | % | 25-Nov-2024 | 25-Nov-2054 | 750,000,000 | 750,000,000 | |||||||||||||||||
| SNI25 |
FIXED | 4.325 | % | 28-May-2015 | 28-May-2025 | 2,000,000,000 | 2,000,000,000 | |||||||||||||||||
| SNI26 |
FIXED | 4.550 | % | 29-Mar-2016 | 29-Mar-2026 | 1,750,000,000 | 1,750,000,000 | |||||||||||||||||
| USDPBS003 |
FIXED | 3.700 | % | 02-Sep-2022 | 02-Sep-2025 | 150,000,000 | 150,000,000 | |||||||||||||||||
| USDPBS004 |
FIXED | 3.900 | % | 02-Sep-2022 | 02-Sep-2027 | 25,000,000 | 25,000,000 | |||||||||||||||||
|
|
|
|
|
|||||||||||||||||||||
| TOTAL US DOLLAR DENOMINATED |
|
24,775,000,000 | 24,775,000,000 | |||||||||||||||||||||
|
|
|
|
|
|||||||||||||||||||||
Assumed exchange rates for conversion
| EUR/IDR |
16,822.67 | |||
| JPY/IDR |
103.4280 | |||
| USD/IDR |
16,157.00 |
D-136
DOMESTIC CURRENCY-DENOMINATED BONDS OF THE REPUBLIC OF INDONESIA
As of December 31, 2024
| Series |
Interest Rate Basis |
Interest Rate |
First Issue Date |
Maturity Date |
Outstanding Balance | |||||||||||||||||
|
|
(in Original Currency (IDR)) | (in US Dollar) | ||||||||||||||||||||
| I. TRADABLE SECURITIES |
||||||||||||||||||||||
| A. GOVERNMENT DEBT SECURITIES |
||||||||||||||||||||||
| 1. TREASURY BILLS |
||||||||||||||||||||||
| SPN03240214 | Zero Coupon | 18-Jan-2024 | 16-Jan-2025 | 1,100,000,000,000 | 68,081,946 | |||||||||||||||||
| SPN03240313 | Zero Coupon | 15-Feb-2024 | 13-Feb-2025 | 3,250,000,000,000 | 201,151,204 | |||||||||||||||||
| SPN12240104 | Zero Coupon | 15-Mar-2024 | 14-Mar-2025 | 3,400,000,000,000 | 210,435,106 | |||||||||||||||||
| SPN12240201 | Zero Coupon | 03-May-2024 | 02-May-2025 | 2,600,000,000,000 | 160,920,963 | |||||||||||||||||
| SPN12240229 | Zero Coupon | 30-May-2024 | 29-May-2025 | 400,000,000,000 | 24,757,071 | |||||||||||||||||
| SPN12240328 | Zero Coupon | 13-Jun-2024 | 12-Jun-2025 | 1,000,000,000,000 | 61,892,678 | |||||||||||||||||
| SPN12240411 | Zero Coupon | 11-Jul-2024 | 10-Jul-2025 | 1,000,000,000,000 | 61,892,678 | |||||||||||||||||
| SPN12240529 | Zero Coupon | 08-Aug-2024 | 07-Aug-2025 | 3,200,000,000,000 | 198,056,570 | |||||||||||||||||
| SPN12240628 | Zero Coupon | 03-Oct-2024 | 02-Oct-2025 | 4,000,000,000,000 | 247,570,712 | |||||||||||||||||
| SPN12240725 | Zero Coupon | 31-Oct-2024 | 30-Oct-2025 | 3,300,000,000,000 | 204,245,838 | |||||||||||||||||
| SPN12240822 | Zero Coupon | 29-Nov-2024 | 27-Nov-2025 | 3,150,000,000,000 | 194,961,936 | |||||||||||||||||
|
|
|
|
|
|||||||||||||||||||
| TOTAL TREASURY BILLS |
26,400,000,000,000 | 1,633,966,702 | ||||||||||||||||||||
|
|
|
|
|
|||||||||||||||||||
| 2. TREASURY NOTES |
||||||||||||||||||||||
| FR0037 | Fixed | 12.00000 | % | 18-May-2006 | 15-Sep-2026 | 2,417,000,000,000 | 149,594,603 | |||||||||||||||
| FR0040 | Fixed | 11.00000 | % | 21-Sep-2006 | 15-Sep-2025 | 22,137,590,000,000 | 1,370,154,732 | |||||||||||||||
| FR0042 | Fixed | 10.25000 | % | 25-Jan-2007 | 15-Jul-2027 | 14,252,100,000,000 | 882,100,637 | |||||||||||||||
| FR0045 | Fixed | 9.75000 | % | 24-May-2007 | 15-May-2037 | 9,624,304,000,000 | 595,673,949 | |||||||||||||||
| FR0047 | Fixed | 10.00000 | % | 30-Aug-2007 | 15-Feb-2028 | 20,021,000,000,000 | 1,239,153,308 | |||||||||||||||
| FR0050 | Fixed | 10.50000 | % | 24-Jan-2008 | 15-Jul-2038 | 15,661,000,000,000 | 969,301,232 | |||||||||||||||
| FR0052 | Fixed | 10.50000 | % | 20-Aug-2009 | 15-Aug-2030 | 23,500,000,000,000 | 1,454,477,935 | |||||||||||||||
| FR0054 | Fixed | 9.50000 | % | 22-Jul-2010 | 15-Jul-2031 | 27,096,000,000,000 | 1,677,044,006 | |||||||||||||||
| FR0056 | Fixed | 8.37500 | % | 23-Sep-2010 | 15-Sep-2026 | 119,707,000,000,000 | 7,408,986,817 | |||||||||||||||
| FR0057 | Fixed | 9.50000 | % | 21-Apr-2011 | 15-May-2041 | 17,236,573,000,000 | 1,066,817,664 | |||||||||||||||
| FR0058 | Fixed | 8.25000 | % | 21-Jul-2011 | 15-Jun-2032 | 42,798,000,000,000 | 2,648,882,837 | |||||||||||||||
| FR0059 | Fixed | 7.00000 | % | 15-Sep-2011 | 15-May-2027 | 115,764,000,000,000 | 7,164,943,987 | |||||||||||||||
| FR0062 | Fixed | 6.37500 | % | 09-Feb-2012 | 15-Apr-2042 | 14,692,000,000,000 | 909,327,227 | |||||||||||||||
| FR0064 | Fixed | 6.12500 | % | 13-Aug-2012 | 15-May-2028 | 113,004,000,000,000 | 6,994,120,196 | |||||||||||||||
| FR0065 | Fixed | 6.62500 | % | 30-Aug-2012 | 15-May-2033 | 101,392,304,000,000 | 6,275,441,233 | |||||||||||||||
| FR0067 | Fixed | 8.75000 | % | 18-Jul-2013 | 15-Feb-2044 | 28,488,284,000,000 | 1,763,216,191 | |||||||||||||||
| FR0068 | Fixed | 8.37500 | % | 01-Aug-2013 | 15-Mar-2034 | 137,758,000,000,000 | 8,526,211,549 | |||||||||||||||
| FR0071 | Fixed | 9.00000 | % | 12-Sep-2013 | 15-Mar-2029 | 93,390,682,000,000 | 5,780,199,418 | |||||||||||||||
| FR0072 | Fixed | 8.25000 | % | 09-Jul-2015 | 15-May-2036 | 90,910,000,000,000 | 5,626,663,366 | |||||||||||||||
| FR0073 | Fixed | 8.75000 | % | 06-Aug-2015 | 15-May-2031 | 66,717,000,000,000 | 4,129,293,805 | |||||||||||||||
| FR0074 | Fixed | 7.50000 | % | 10-Nov-2016 | 15-Aug-2032 | 50,831,140,000,000 | 3,146,075,385 | |||||||||||||||
| FR0075 | Fixed | 7.50000 | % | 10-Aug-2017 | 15-May-2038 | 68,420,860,000,000 | 4,234,750,263 | |||||||||||||||
| FR0076 | Fixed | 7.37500 | % | 22-Sep-2017 | 15-May-2048 | 71,589,000,000,000 | 4,430,834,932 | |||||||||||||||
| FR0078 | Fixed | 8.25000 | % | 27-Sep-2018 | 15-May-2029 | 108,775,000,000,000 | 6,732,376,060 | |||||||||||||||
| FR0079 | Fixed | 8.37500 | % | 07-Jan-2019 | 15-Apr-2039 | 57,180,000,000,000 | 3,539,023,334 | |||||||||||||||
| FR0080 | Fixed | 7.50000 | % | 04-Jul-2019 | 15-Jun-2035 | 111,628,300,000,000 | 6,908,974,438 | |||||||||||||||
| FR0081 | Fixed | 6.50000 | % | 01-Aug-2019 | 15-Jun-2025 | 142,281,400,000,000 | 8,806,176,889 | |||||||||||||||
| FR0082 | Fixed | 7.00000 | % | 01-Aug-2019 | 15-Sep-2030 | 169,288,800,000,000 | 10,477,737,204 | |||||||||||||||
| FR0083 | Fixed | 7.50000 | % | 07-Nov-2019 | 15-Apr-2040 | 128,999,500,000,000 | 7,984,124,528 | |||||||||||||||
| FR0084 | Fixed | 7.25000 | % | 04-May-2020 | 15-Feb-2026 | 37,452,372,000,000 | 2,318,027,604 | |||||||||||||||
| FR0085 | Fixed | 7.75000 | % | 04-May-2020 | 15-Apr-2031 | 21,177,940,000,000 | 1,310,759,423 | |||||||||||||||
| FR0086 | Fixed | 5.50000 | % | 13-Aug-2020 | 15-Apr-2026 | 134,548,000,000,000 | 8,327,536,052 | |||||||||||||||
| FR0087 | Fixed | 6.50000 | % | 13-Aug-2020 | 15-Feb-2031 | 182,911,300,000,000 | 11,320,870,211 | |||||||||||||||
| FR0088 | Fixed | 6.25000 | % | 07-Jan-2021 | 15-Jun-2036 | 54,994,500,000,000 | 3,403,756,886 | |||||||||||||||
| FR0089 | Fixed | 6.87500 | % | 07-Jan-2021 | 15-Aug-2051 | 73,674,385,000,000 | 4,559,904,995 | |||||||||||||||
| FR0090 | Fixed | 5.12500 | % | 08-Jul-2021 | 15-Apr-2027 | 113,128,000,000,000 | 7,001,794,888 | |||||||||||||||
| FR0091 | Fixed | 6.37500 | % | 08-Jul-2021 | 15-Apr-2032 | 179,978,300,000,000 | 11,139,338,986 | |||||||||||||||
| FR0092 | Fixed | 7.12500 | % | 08-Jul-2021 | 15-Jun-2042 | 108,828,400,000,000 | 6,735,681,129 | |||||||||||||||
D-137
| Series |
Interest Rate Basis |
Interest Rate |
First Issue Date |
Maturity Date |
Outstanding Balance | |||||||||||||||||
|
|
(in Original Currency (IDR)) | (in US Dollar) | ||||||||||||||||||||
| FR0093 | Fixed | 6.37500 | % | 06-Jan-2022 | 15-Jul-2037 | 19,193,000,000,000 | 1,187,906,171 | |||||||||||||||
| FR0094 | Fixed | 5.60000 | % | 04-Mar-2022 | 15-Jan-2028 | 3,990,927,000,000 | 247,009,160 | |||||||||||||||
| FR0095 | Fixed | 6.37500 | % | 19-Aug-2022 | 15-Aug-2028 | 98,673,000,000,000 | 6,107,136,226 | |||||||||||||||
| FR0096 | Fixed | 7.00000 | % | 19-Aug-2022 | 15-Feb-2033 | 152,564,000,000,000 | 9,442,594,541 | |||||||||||||||
| FR0097 | Fixed | 7.12500 | % | 19-Aug-2022 | 15-Jun-2043 | 107,004,300,000,000 | 6,622,782,695 | |||||||||||||||
| FR0098 | Fixed | 7.12500 | % | 15-Sep-2022 | 15-Jun-2038 | 119,799,000,000,000 | 7,414,680,943 | |||||||||||||||
| FR0099 | Fixed | 6.40000 | % | 27-Jan-2023 | 15-Jan-2029 | 2,871,531,000,000 | 177,726,744 | |||||||||||||||
| FR0100 | Fixed | 6.62500 | % | 24-Aug-2023 | 15-Feb-2034 | 158,676,489,000,000 | 9,820,912,855 | |||||||||||||||
| FR0101 | Fixed | 6.87500 | % | 02-Nov-2023 | 15-Apr-2029 | 155,368,877,000,000 | 9,616,195,890 | |||||||||||||||
| FR0102 | Fixed | 6.87500 | % | 05-Jan-2024 | 15-Jul-2054 | 45,441,000,000,000 | 2,812,465,185 | |||||||||||||||
| FR0103 | Fixed | 6.75000 | % | 08-Aug-2024 | 15-Jul-2035 | 89,091,000,000,000 | 5,514,080,584 | |||||||||||||||
| FR0104 | Fixed | 6.50000 | % | 22-Aug-2024 | 15-Jul-2030 | 58,768,000,000,000 | 3,637,308,906 | |||||||||||||||
| FR0105 | Fixed | 6.87500 | % | 27-Aug-2024 | 15-Jul-2064 | 7,850,000,000,000 | 485,857,523 | |||||||||||||||
| FRSDG001 | Fixed | 7.37500 | % | 27-Oct-2022 | 15-Oct-2030 | 13,810,000,000,000 | 854,737,885 | |||||||||||||||
| VR0033 | 3 month-Reserve Repo BI | 6.04000 | % | 04-May-2020 | 25-Apr-2025 | 3,568,686,000,000 | 220,875,534 | |||||||||||||||
| VR0034 | 3 month-Reserve Repo BI | 6.56618 | % | 10-Aug-2020 | 10-Aug-2025 | 20,525,000,000,000 | 1,270,347,218 | |||||||||||||||
| VR0035 | 3 month-Reserve Repo BI | 6.56618 | % | 10-Aug-2020 | 10-Aug-2026 | 20,525,000,000,000 | 1,270,347,218 | |||||||||||||||
| VR0036 | 3 month-Reserve Repo BI | 6.56618 | % | 10-Aug-2020 | 10-Aug-2027 | 20,525,000,000,000 | 1,270,347,218 | |||||||||||||||
| VR0037 | 3 month-Reserve Repo BI | 6.56618 | % | 10-Aug-2020 | 10-Aug-2028 | 20,525,000,000,000 | 1,270,347,218 | |||||||||||||||
| VR0038 | 3 month-Reserve Repo BI | 6.56618 | % | 28-Aug-2020 | 28-Aug-2025 | 4,245,000,000,000 | 262,734,419 | |||||||||||||||
| VR0039 | 3 month-Reserve Repo BI | 6.56618 | % | 28-Aug-2020 | 28-Aug-2026 | 4,245,000,000,000 | 262,734,419 | |||||||||||||||
| VR0040 | 3 month-Reserve Repo BI | 6.56618 | % | 28-Aug-2020 | 28-Aug-2027 | 4,245,000,000,000 | 262,734,419 | |||||||||||||||
| VR0041 | 3 month-Reserve Repo BI | 6.56618 | % | 28-Aug-2020 | 28-Aug-2028 | 4,245,000,000,000 | 262,734,419 | |||||||||||||||
| VR0042 | 3 month-Reserve Repo BI | 6.70287 | % | 28-Sep-2020 | 28-Sep-2025 | 21,100,000,000,000 | 1,305,935,508 | |||||||||||||||
| VR0043 | 3 month-Reserve Repo BI | 6.70287 | % | 28-Sep-2020 | 28-Sep-2026 | 21,100,000,000,000 | 1,305,935,508 | |||||||||||||||
| VR0044 | 3 month-Reserve Repo BI | 6.70287 | % | 28-Sep-2020 | 28-Sep-2027 | 21,100,000,000,000 | 1,305,935,508 | |||||||||||||||
| VR0045 | 3 month-Reserve Repo BI | 6.70287 | % | 28-Sep-2020 | 28-Sep-2028 | 21,100,000,000,000 | 1,305,935,508 | |||||||||||||||
| VR0046 | 3 month-Reserve Repo BI | 6.55895 | % | 12-Oct-2020 | 12-Oct-2025 | 11,550,000,000,000 | 714,860,432 | |||||||||||||||
| VR0047 | 3 month-Reserve Repo BI | 6.55895 | % | 12-Oct-2020 | 12-Oct-2026 | 11,550,000,000,000 | 714,860,432 | |||||||||||||||
| VR0048 | 3 month-Reserve Repo BI | 6.55895 | % | 12-Oct-2020 | 12-Oct-2027 | 11,550,000,000,000 | 714,860,432 | |||||||||||||||
| VR0049 | 3 month-Reserve Repo BI | 6.55895 | % | 12-Oct-2020 | 12-Oct-2028 | 11,550,000,000,000 | 714,860,432 | |||||||||||||||
| VR0050 | 3 month-Reserve Repo BI | 6.56618 | % | 26-Oct-2020 | 26-Oct-2025 | 5,717,500,000,000 | 353,871,387 | |||||||||||||||
| VR0051 | 3 month-Reserve Repo BI | 6.56618 | % | 26-Oct-2020 | 26-Oct-2026 | 5,717,500,000,000 | 353,871,387 | |||||||||||||||
| VR0052 | 3 month-Reserve Repo BI | 6.56618 | % | 26-Oct-2020 | 26-Oct-2027 | 5,717,500,000,000 | 353,871,387 | |||||||||||||||
| VR0053 | 3 month-Reserve Repo BI | 6.56618 | % | 26-Oct-2020 | 26-Oct-2028 | 5,717,500,000,000 | 353,871,387 | |||||||||||||||
| VR0054 | 3 month-Reserve Repo BI | 6.56618 | % | 16-Nov-2020 | 16-Nov-2025 | 4,370,000,000,000 | 270,471,003 | |||||||||||||||
| VR0055 | 3 month-Reserve Repo BI | 6.56618 | % | 16-Nov-2020 | 16-Nov-2026 | 4,370,000,000,000 | 270,471,003 | |||||||||||||||
| VR0056 | 3 month-Reserve Repo BI | 6.56618 | % | 16-Nov-2020 | 16-Nov-2027 | 4,370,000,000,000 | 270,471,003 | |||||||||||||||
| VR0057 | 3 month-Reserve Repo BI | 6.56618 | % | 16-Nov-2020 | 16-Nov-2028 | 4,370,000,000,000 | 270,471,003 | |||||||||||||||
| VR0058 | 3 month-Reserve Repo BI | 6.56618 | % | 23-Nov-2020 | 23-Nov-2025 | 6,750,000,000,000 | 417,775,577 | |||||||||||||||
| VR0059 | 3 month-Reserve Repo BI | 6.56618 | % | 23-Nov-2020 | 23-Nov-2026 | 6,750,000,000,000 | 417,775,577 | |||||||||||||||
| VR0060 | 3 month-Reserve Repo BI | 6.56618 | % | 23-Nov-2020 | 23-Nov-2027 | 6,750,000,000,000 | 417,775,577 | |||||||||||||||
| VR0061 | 3 month-Reserve Repo BI | 6.56618 | % | 23-Nov-2020 | 23-Nov-2028 | 6,750,000,000,000 | 417,775,577 | |||||||||||||||
| VR0062 | 3 month-Reserve Repo BI | 6.70287 | % | 14-Dec-2020 | 14-Dec-2025 | 25,742,500,000,000 | 1,593,272,266 | |||||||||||||||
| VR0063 | 3 month-Reserve Repo BI | 6.70287 | % | 14-Dec-2020 | 14-Dec-2026 | 25,742,500,000,000 | 1,593,272,266 | |||||||||||||||
| VR0064 | 3 month-Reserve Repo BI | 6.70287 | % | 14-Dec-2020 | 14-Dec-2027 | 25,742,500,000,000 | 1,593,272,266 | |||||||||||||||
| VR0065 | 3 month-Reserve Repo BI | 6.70287 | % | 14-Dec-2020 | 14-Dec-2028 | 23,302,500,000,000 | 1,442,254,131 | |||||||||||||||
| VR0066 | 3 month-Reserve Repo BI | 6.70287 | % | 02-Dec-2021 | 02-Dec-2026 | 14,500,000,000,000 | 897,443,832 | |||||||||||||||
| VR0067 | 3 month-Reserve Repo BI | 6.70287 | % | 02-Dec-2021 | 02-Dec-2027 | 14,500,000,000,000 | 897,443,832 | |||||||||||||||
| VR0068 | 3 month-Reserve Repo BI | 6.70287 | % | 02-Dec-2021 | 02-Dec-2028 | 14,500,000,000,000 | 897,443,832 | |||||||||||||||
| VR0069 | 3 month-Reserve Repo BI | 6.70287 | % | 02-Dec-2021 | 02-Dec-2029 | 14,500,000,000,000 | 897,443,832 | |||||||||||||||
| VR0070 | 3 month-Reserve Repo BI | 6.72259 | % | 30-Dec-2021 | 30-Dec-2026 | 40,000,000,000,000 | 2,475,707,124 | |||||||||||||||
| VR0071 | 3 month-Reserve Repo BI | 6.72259 | % | 30-Dec-2021 | 30-Dec-2027 | 40,000,000,000,000 | 2,475,707,124 | |||||||||||||||
| VR0072 | 3 month-Reserve Repo BI | 6.72259 | % | 30-Dec-2021 | 30-Dec-2028 | 40,000,000,000,000 | 2,475,707,124 | |||||||||||||||
| VR0073 | 3 month-Reserve Repo BI | 6.72259 | % | 30-Dec-2021 | 30-Dec-2029 | 37,000,000,000,000 | 2,290,029,090 | |||||||||||||||
| VR0074 | 3 month-Reserve Repo BI | 6.55895 | % | 01-Jul-2022 | 01-Jul-2027 | 5,467,230,000,000 | 338,381,506 | |||||||||||||||
| VR0075 | 3 month-Reserve Repo BI | 6.55895 | % | 01-Jul-2022 | 01-Jul-2028 | 5,467,240,000,000 | 338,382,125 | |||||||||||||||
| VR0076 | 3 month-Reserve Repo BI | 6.55895 | % | 01-Jul-2022 | 01-Jul-2029 | 5,467,240,000,000 | 338,382,125 | |||||||||||||||
| VR0077 | 3 month-Reserve Repo BI | 6.55895 | % | 01-Jul-2022 | 01-Jul-2030 | 5,467,240,000,000 | 338,382,125 | |||||||||||||||
D-138
| Series |
Interest Rate Basis |
Interest Rate |
First Issue Date |
Maturity Date |
Outstanding Balance | |||||||||||||||||
|
|
(in Original Currency (IDR)) | (in US Dollar) | ||||||||||||||||||||
| VR0078 | 3 month-Reserve Repo BI | 6.56618 | % | 26-Aug-2022 | 26-Aug-2027 | 2,198,565,000,000 | 136,075,076 | |||||||||||||||
| VR0079 | 3 month-Reserve Repo BI | 6.56618 | % | 26-Aug-2022 | 26-Aug-2028 | 2,198,565,000,000 | 136,075,076 | |||||||||||||||
| VR0080 | 3 month-Reserve Repo BI | 6.56618 | % | 26-Aug-2022 | 26-Aug-2029 | 2,198,565,000,000 | 136,075,076 | |||||||||||||||
| VR0081 | 3 month-Reserve Repo BI | 6.56618 | % | 26-Aug-2022 | 26-Aug-2030 | 2,198,565,000,000 | 136,075,076 | |||||||||||||||
| VR0082 | 3 month-Reserve Repo BI | 6.56618 | % | 26-Aug-2022 | 26-Aug-2027 | 7,901,435,000,000 | 489,040,973 | |||||||||||||||
| VR0083 | 3 month-Reserve Repo BI | 6.56618 | % | 26-Aug-2022 | 26-Aug-2028 | 7,901,435,000,000 | 489,040,973 | |||||||||||||||
| VR0084 | 3 month-Reserve Repo BI | 6.56618 | % | 26-Aug-2022 | 26-Aug-2029 | 7,901,435,000,000 | 489,040,973 | |||||||||||||||
| VR0085 | 3 month-Reserve Repo BI | 6.56618 | % | 26-Aug-2022 | 26-Aug-2030 | 7,901,435,000,000 | 489,040,973 | |||||||||||||||
| VR0086 | 3 month-Reserve Repo BI | 6.70287 | % | 27-Sep-2022 | 27-Sep-2028 | 8,288,330,000,000 | 512,986,941 | |||||||||||||||
| VR0087 | 3 month-Reserve Repo BI | 6.70287 | % | 27-Sep-2022 | 27-Sep-2030 | 8,288,330,000,000 | 512,986,941 | |||||||||||||||
| VR0088 | 3 month-Reserve Repo BI | 6.70287 | % | 29-Dec-2022 | 29-Dec-2027 | 2,334,205,000,000 | 144,470,199 | |||||||||||||||
| VR0089 | 3 month-Reserve Repo BI | 6.70287 | % | 29-Dec-2022 | 29-Dec-2028 | 2,334,195,000,000 | 144,469,580 | |||||||||||||||
| VR0090 | 3 month-Reserve Repo BI | 6.70287 | % | 29-Dec-2022 | 29-Dec-2029 | 2,334,195,000,000 | 144,469,580 | |||||||||||||||
| VR0091 | 3 month-Reserve Repo BI | 6.70287 | % | 29-Dec-2022 | 29-Dec-2030 | 2,334,195,000,000 | 144,469,580 | |||||||||||||||
| VR0092 | 3 month-Reserve Repo BI | 6.70287 | % | 29-Dec-2022 | 29-Dec-2027 | 29,810,245,000,000 | 1,845,035,898 | |||||||||||||||
| VR0093 | 3 month-Reserve Repo BI | 6.70287 | % | 29-Dec-2022 | 29-Dec-2028 | 29,810,235,000,000 | 1,845,035,279 | |||||||||||||||
| VR0094 | 3 month-Reserve Repo BI | 6.70287 | % | 29-Dec-2022 | 29-Dec-2029 | 29,810,235,000,000 | 1,845,035,279 | |||||||||||||||
| VR0095 | 3 month-Reserve Repo BI | 6.70287 | % | 29-Dec-2022 | 29-Dec-2030 | 29,810,235,000,000 | 1,845,035,279 | |||||||||||||||
|
|
|
|
|
|||||||||||||||||||
| TOTAL TREASURY NOTES |
4,748,907,194,000,000 | 293,922,584,267 | ||||||||||||||||||||
|
|
|
|
|
|||||||||||||||||||
| 3. RETAIL BONDS |
||||||||||||||||||||||
| ORI021 | Fixed | 4.90000 | % | 23-Feb-2022 | 15-Feb-2025 | 25,065,802,000,000 | 1,551,389,614 | |||||||||||||||
| ORI022 | Fixed | 5.95000 | % | 26-Oct-2022 | 15-Oct-2025 | 13,017,714,000,000 | 805,701,182 | |||||||||||||||
| ORI023T3 | Fixed | 5.90000 | % | 26-Jul-2023 | 15-Jul-2026 | 20,000,000,000,000 | 1,237,853,562 | |||||||||||||||
| ORI023T6 | Fixed | 6.10000 | % | 26-Jul-2023 | 15-Jul-2029 | 8,900,050,000,000 | 550,847,930 | |||||||||||||||
| ORI024T3 | Fixed | 6.10000 | % | 08-Nov-2023 | 15-Oct-2026 | 11,862,803,000,000 | 734,220,647 | |||||||||||||||
| ORI024T6 | Fixed | 6.35000 | % | 08-Nov-2023 | 15-Oct-2029 | 2,644,853,000,000 | 163,697,035 | |||||||||||||||
| ORI025T3 | Fixed | 6.25000 | % | 28-Feb-2024 | 15-Feb-2027 | 19,381,360,000,000 | 1,199,564,276 | |||||||||||||||
| ORI025T6 | Fixed | 6.40000 | % | 28-Feb-2024 | 15-Feb-2030 | 4,539,342,000,000 | 280,952,033 | |||||||||||||||
| ORI026T3 | Fixed | 6.30000 | % | 30-Oct-2024 | 15-Oct-2027 | 16,313,510,000,000 | 1,009,686,823 | |||||||||||||||
| ORI026T6 | Fixed | 6.40000 | % | 30-Oct-2024 | 15-Oct-2030 | 3,042,834,000,000 | 188,329,145 | |||||||||||||||
|
|
|
|
|
|||||||||||||||||||
| TOTAL RETAIL BONDS |
124,768,268,000,000 | 7,722,242,248 | ||||||||||||||||||||
|
|
|
|
|
|||||||||||||||||||
| TOTAL TRADABLE GOVERNMENT DEBT SECURITIES |
4,900,075,462,000,000 | 317,856,477,815 | ||||||||||||||||||||
|
|
|
|
|
|||||||||||||||||||
| B. GOVERNMENT ISLAMIC DEBT SECURITIES |
||||||||||||||||||||||
| 1. ISLAMIC TREASURY BILLS |
||||||||||||||||||||||
| SPNS01042025 | Zero Coupon | 04-Jul-2024 | 01-Apr-2025 | 4,834,000,000,000 | 299,189,206 | |||||||||||||||||
| SPNS01092025 | Zero Coupon | 05-Dec-2024 | 01-Sep-2025 | 6,200,000,000,000 | 383,734,604 | |||||||||||||||||
| SPNS02022025 | Zero Coupon | 08-May-2024 | 02-Feb-2025 | 4,075,600,000,000 | 252,249,799 | |||||||||||||||||
| SPNS03032025 | Zero Coupon | 06-Jun-2024 | 03-Mar-2025 | 3,450,000,000,000 | 213,529,739 | |||||||||||||||||
| SPNS04082025 | Zero Coupon | 07-Nov-2024 | 04-Aug-2025 | 6,750,000,000,000 | 417,775,577 | |||||||||||||||||
| SPNS07072025 | Zero Coupon | 10-Oct-2024 | 07-Jul-2025 | 5,850,000,000,000 | 362,072,167 | |||||||||||||||||
| SPNS09062025 | Zero Coupon | 12-Sep-2024 | 09-Jun-2025 | 3,600,000,000,000 | 222,813,641 | |||||||||||||||||
| SPNS20012025 | Zero Coupon | 25-Apr-2024 | 20-Jan-2025 | 3,708,700,000,000 | 229,541,375 | |||||||||||||||||
| SPNS29052025 | Zero Coupon | 01-Aug-2024 | 29-May-2025 | 5,750,000,000,000 | 355,882,899 | |||||||||||||||||
|
|
|
|
|
|||||||||||||||||||
| TOTAL ISLAMIC TREASURY BILLS |
44,218,300,000,000 | 2,736,789,008 | ||||||||||||||||||||
|
|
|
|
|
|||||||||||||||||||
| 2. ISLAMIC TREASURY NOTES |
||||||||||||||||||||||
| IFR0006 | Fixed | 10.25000 | % | 01-Apr-2010 | 15-Mar-2030 | 2,175,000,000,000 | 134,616,575 | |||||||||||||||
| IFR0007 | Fixed | 10.25000 | % | 21-Jan-2010 | 15-Jan-2025 | 1,547,000,000,000 | 95,747,973 | |||||||||||||||
| IFR0010 | Fixed | 10.00000 | % | 03-Mar-2011 | 15-Feb-2036 | 4,110,000,000,000 | 254,378,907 | |||||||||||||||
| PBS003 | Fixed | 6.00000 | % | 02-Feb-2012 | 15-Jan-2027 | 57,139,700,000,000 | 3,536,529,059 | |||||||||||||||
| PBS004 | Fixed | 6.10000 | % | 16-Feb-2012 | 15-Feb-2037 | 50,785,077,000,000 | 3,143,224,423 | |||||||||||||||
| PBS005 | Fixed | 6.75000 | % | 02-May-2013 | 15-Apr-2043 | 34,324,000,000,000 | 2,124,404,283 | |||||||||||||||
| PBS007 | Fixed | 9.00000 | % | 29-Sep-2014 | 15-Sep-2040 | 10,375,000,000,000 | 642,136,535 | |||||||||||||||
| PBS012 | Fixed | 8.87500 | % | 28-Jan-2016 | 15-Nov-2031 | 47,680,694,000,000 | 2,951,085,845 | |||||||||||||||
| PBS015 | Fixed | 8.00000 | % | 21-Jul-2017 | 15-Jul-2047 | 23,043,000,000,000 | 1,426,192,981 | |||||||||||||||
| PBS017 | Fixed | 6.12500 | % | 11-Jan-2018 | 15-Oct-2025 | 63,086,476,000,000 | 3,904,590,951 | |||||||||||||||
| PBS018 | Fixed | 7.62500 | % | 04-Jun-2018 | 15-May-2028 | 7,500,000,000,000 | 464,195,086 | |||||||||||||||
| PBS020 | Fixed | 9.00000 | % | 22-Oct-2018 | 15-Oct-2027 | 2,250,000,000,000 | 139,258,526 | |||||||||||||||
D-139
| Series |
Interest Rate Basis |
Interest Rate |
First Issue Date |
Maturity Date |
Outstanding Balance | |||||||||||||||||
|
|
(in Original Currency (IDR)) | (in US Dollar) | ||||||||||||||||||||
| PBS021 | Fixed | 8.50000 | % | 05-Dec-2018 | 15-Nov-2026 | 13,185,000,000,000 | 816,054,961 | |||||||||||||||
| PBS022 | Fixed | 8.62500 | % | 24-Jan-2019 | 15-Apr-2034 | 16,330,000,000,000 | 1,010,707,433 | |||||||||||||||
| PBS023 | Fixed | 8.12500 | % | 15-May-2019 | 15-May-2030 | 10,875,000,000,000 | 673,082,874 | |||||||||||||||
| PBS024 | Fixed | 8.37500 | % | 28-May-2019 | 15-May-2032 | 3,000,000,000,000 | 185,678,034 | |||||||||||||||
| PBS025 | Fixed | 8.37500 | % | 29-May-2019 | 15-May-2033 | 24,735,000,000,000 | 1,530,915,393 | |||||||||||||||
| PBS028 | Fixed | 7.75000 | % | 23-Jul-2020 | 15-Oct-2046 | 75,503,418,000,000 | 4,673,108,745 | |||||||||||||||
| PBS029 | Fixed | 6.37500 | % | 14-Jan-2021 | 15-Mar-2034 | 80,266,794,000,000 | 4,967,926,843 | |||||||||||||||
| PBS030 | Fixed | 5.87500 | % | 04-Jun-2021 | 15-Jul-2028 | 43,615,000,000,000 | 2,699,449,155 | |||||||||||||||
| PBS032 | Fixed | 4.87500 | % | 29-Jul-2021 | 15-Jul-2026 | 90,307,000,000,000 | 5,589,342,081 | |||||||||||||||
| PBS033 | Fixed | 6.75000 | % | 13-Jan-2022 | 15-Jun-2047 | 52,427,000,000,000 | 3,244,847,435 | |||||||||||||||
| PBS034 | Fixed | 6.50000 | % | 13-Jan-2022 | 15-Jun-2039 | 19,395,000,000,000 | 1,200,408,492 | |||||||||||||||
| PBS035 | Fixed | 6.75000 | % | 30-Mar-2022 | 15-Mar-2042 | 1,908,862,000,000 | 118,144,581 | |||||||||||||||
| PBS036 | Fixed | 5.37500 | % | 25-Aug-2022 | 15-Aug-2025 | 78,797,600,000,000 | 4,876,994,492 | |||||||||||||||
| PBS037 | Fixed | 6.87500 | % | 12-Jan-2023 | 15-Mar-2036 | 33,350,000,000,000 | 2,064,120,815 | |||||||||||||||
| PBS038 | Fixed | 6.87500 | % | 07-Dec-2023 | 15-Dec-2049 | 53,658,000,000,000 | 3,321,037,321 | |||||||||||||||
| PBS039 | Fixed | 6.62500 | % | 11-Jan-2024 | 15-Jul-2041 | 8,315,500,000,000 | 514,668,565 | |||||||||||||||
| PBSG001 | Fixed | 6.62500 | % | 22-Sep-2022 | 15-Sep-2029 | 31,170,000,000,000 | 1,929,194,776 | |||||||||||||||
| FRS001 | 3 month-Reserve Repo BI | 6.70287 | % | 27-Sep-2022 | 27-Sep-2027 | 8,288,320,000,000 | 512,986,322 | |||||||||||||||
| FRS002 | 3 month-Reserve Repo BI | 6.70287 | % | 27-Sep-2022 | 27-Sep-2029 | 8,288,330,000,000 | 512,986,941 | |||||||||||||||
|
|
|
|
|
|||||||||||||||||||
| TOTAL ISLAMIC TREASURY NOTES |
957,431,771,000,000 | 59,258,016,402 | ||||||||||||||||||||
|
|
|
|
|
|||||||||||||||||||
| 3. RETAIL ISLAMIC DEBT SECURITIES |
||||||||||||||||||||||
| SR-016 | Fixed | 4.95000 | % | 23-Mar-2022 | 10-Mar-2025 | 18,409,546,000,000 | 1,139,416,104 | |||||||||||||||
| SR-017 | Fixed | 5.90000 | % | 21-Sep-2022 | 10-Sep-2025 | 26,974,976,000,000 | 1,669,553,506 | |||||||||||||||
| SR-018T3 | Fixed | 6.25000 | % | 05-Apr-2023 | 10-Mar-2026 | 16,949,759,000,000 | 1,049,065,978 | |||||||||||||||
| SR-018T5 | Fixed | 6.40000 | % | 05-Apr-2023 | 10-Mar-2028 | 4,544,818,000,000 | 281,290,957 | |||||||||||||||
| SR-019T3 | Fixed | 5.95000 | % | 27-Sep-2023 | 10-Sep-2026 | 17,543,813,000,000 | 1,085,833,571 | |||||||||||||||
| SR-019T5 | Fixed | 6.10000 | % | 27-Sep-2023 | 10-Sep-2028 | 7,790,600,000,000 | 482,181,098 | |||||||||||||||
| SR-020T3 | Fixed | 6.30000 | % | 03-Apr-2024 | 10-Mar-2027 | 17,784,237,000,000 | 1,100,714,056 | |||||||||||||||
| SR-020T5 | Fixed | 6.40000 | % | 03-Apr-2024 | 10-Mar-2029 | 3,575,013,000,000 | 221,267,129 | |||||||||||||||
| SR-021T3 | Fixed | 6.35000 | % | 25-Sep-2024 | 10-Sep-2027 | 19,276,188,000,000 | 1,193,054,899 | |||||||||||||||
| SR-021T5 | Fixed | 6.45000 | % | 25-Sep-2024 | 10-Sep-2029 | 4,948,222,000,000 | 306,258,711 | |||||||||||||||
|
|
|
|
|
|||||||||||||||||||
| TOTAL RETAIL ISLAMIC DEBT SECURITIES |
137,797,172,000,000 | 8,528,636,009 | ||||||||||||||||||||
|
|
|
|
|
|||||||||||||||||||
| TOTAL GOVERNMENT ISLAMIC DEBT SECURITIES |
1,139,447,243,000,000 | 70,523,441,419 | ||||||||||||||||||||
|
|
|
|
|
|||||||||||||||||||
| TOTAL TRADABLE SECURITIES |
6,039,522,705,000,000 | 373,802,234,635 | ||||||||||||||||||||
|
|
|
|
|
|||||||||||||||||||
| II. NON TRADABLE SECURITIES |
||||||||||||||||||||||
| A. GOVERNMENT DEBT SECURITIES |
||||||||||||||||||||||
| 1. HELD BY BANK INDONESIA |
||||||||||||||||||||||
| SRBI01 (4) | Fixed | 0.10000 | % | 07-Aug-2003 | 01-Aug-2043 | 46,266,009,479,819 | 2,863,527,232 | |||||||||||||||
| SU002 (3) | Fixed | 0.10000 | % | 23-Oct-1998 | 01-Apr-2025 | 1,221,564,197,515 | 75,605,880 | |||||||||||||||
| SU004 (3) | Fixed | 0.10000 | % | 28-May-1999 | 01-Dec-2025 | 6,327,925,664,988 | 391,652,266 | |||||||||||||||
| SU007 (3) | Fixed | 0.10000 | % | 01-Jan-2006 | 01-Aug-2025 | 6,047,658,490,845 | 374,305,780 | |||||||||||||||
|
|
|
|
|
|||||||||||||||||||
| TOTAL GOVERNMENT DEBT SECURITIES HELD BY BANK INDONESIA |
59,863,157,833,167 | 3,705,091,158 | ||||||||||||||||||||
|
|
|
|
|
|||||||||||||||||||
| 2. RETAIL NON TRADABLE BONDS |
||||||||||||||||||||||
| SBR012T2 | BI 7-Day Reverse Repo Rate | 6.65000 | % | 15-Feb-2023 | 10-Feb-2025 | 16,554,919,000,000 | 1,024,628,273 | |||||||||||||||
| SBR012T4 | BI 7-Day Reverse Repo Rate | 6.85000 | % | 15-Feb-2023 | 10-Feb-2027 | 5,452,395,000,000 | 337,463,329 | |||||||||||||||
| SBR013T2 | BI 7-Day Reverse Repo Rate | 6.45000 | % | 10-Jul-2024 | 10-Jul-2026 | 14,493,384,000,000 | 897,034,350 | |||||||||||||||
| SBR013T4 | BI 7-Day Reverse Repo Rate | 6.60000 | % | 10-Jul-2024 | 10-Jul-2028 | 4,961,110,000,000 | 307,056,384 | |||||||||||||||
|
|
|
|
|
|||||||||||||||||||
| TOTAL GOVERNMENT DEBT SECURITIES RETAIL NON-TRADABLE BONDS |
41,461,808,000,000 | 2,566,182,336 | ||||||||||||||||||||
|
|
|
|
|
|||||||||||||||||||
| B. GOVERNMENT ISLAMIC DEBT SECURITIES |
||||||||||||||||||||||
| 1. HELD BY MINISTRY OF RELIGIOUS AFFAIR |
||||||||||||||||||||||
| PBSNT002 | Fixed | 6.51000 | % | 23-Jun-2021 | 23-Jun-2036 | 2,000,000,000,000 | 123,785,356 | |||||||||||||||
| PBSNTQ01 | Fixed | 6.37000 | % | 27-Aug-2020 | 27-Aug-2030 | 3,000,000,000,000 | 185,678,034 | |||||||||||||||
| SDHI-2029A | Fixed | 8.43000 | % | 25-Mar-2014 | 25-Mar-2029 | 1,000,000,000,000 | 61,892,678 | |||||||||||||||
| SDHI-2029B | Fixed | 8.62000 | % | 13-Aug-2014 | 13-Aug-2029 | 2,855,000,000,000 | 176,703,596 | |||||||||||||||
D-140
| Series |
Interest Rate Basis |
Interest Rate |
First Issue Date |
Maturity Date |
Outstanding Balance | |||||||||||||||||
|
|
(in Original Currency (IDR)) | (in US Dollar) | ||||||||||||||||||||
| SDHI2025A | Fixed | 8.30000 | % | 08-Jul-2015 | 08-Jul-2025 | 2,000,000,000,000 | 123,785,356 | |||||||||||||||
| SW001 | Fixed | 5.00000 | % | 10-Mar-2020 | 10-Mar-2025 | 50,849,000,000 | 3,147,181 | |||||||||||||||
| SW002 | Fixed | 5.50000 | % | 30-Jun-2022 | 30-Jun-2027 | 50,000,000,000 | 3,094,634 | |||||||||||||||
| SW004 | Fixed | 6.65000 | % | 06-Oct-2022 | 06-Oct-2027 | 100,000,000,000 | 6,189,268 | |||||||||||||||
| SW005 | Fixed | 6.25000 | % | 13-Jan-2023 | 13-Jan-2025 | 300,000,000,000 | 18,567,803 | |||||||||||||||
| SW006 | Fixed | 5.50000 | % | 03-Jul-2023 | 03-Jul-2028 | 50,000,000,000 | 3,094,634 | |||||||||||||||
| SW007 | Fixed | 6.65000 | % | 25-Apr-2024 | 25-Apr-2029 | 150,000,000,000 | 9,283,902 | |||||||||||||||
| SW008 | Fixed | 6.70000 | % | 02-May-2024 | 02-May-2029 | 21,200,000,000 | 1,312,125 | |||||||||||||||
|
|
|
|
|
|||||||||||||||||||
| TOTAL GOVERNMENT ISLAMIC DEBT SECURITIES HELD BY MINISTRY OF RELIGIOUS AFFAIR |
11,577,049,000,000 | 716,534,567 | ||||||||||||||||||||
|
|
|
|
|
|||||||||||||||||||
| 2. RETAIL NON TRADABLE ISLAMIC DEBT SECURITIES |
||||||||||||||||||||||
| ST010T2 | BI 7-Day Reverse Repo Rate | 6.50000 | % | 14-Jun-2023 | 10-Jun-2025 | 11,593,770,000,000 | 717,569,475 | |||||||||||||||
| ST010T4 | BI 7-Day Reverse Repo Rate | 6.65000 | % | 14-Jun-2023 | 10-Jun-2027 | 3,300,000,000,000 | 204,245,838 | |||||||||||||||
| ST011T2 | BI 7-Day Reverse Repo Rate | 6.30000 | % | 13-Dec-2023 | 10-Nov-2025 | 14,402,626,000,000 | 891,417,095 | |||||||||||||||
| ST011T4 | BI 7-Day Reverse Repo Rate | 6.50000 | % | 13-Dec-2023 | 10-Nov-2027 | 5,501,500,000,000 | 340,502,569 | |||||||||||||||
| ST012T2 | BI 7-Day Reverse Repo Rate | 6.40000 | % | 05-Jun-2024 | 10-May-2026 | 14,569,758,000,000 | 901,761,342 | |||||||||||||||
| ST012T4 | Fixed | 6.55000 | % | 05-Jun-2024 | 10-May-2028 | 5,076,671,000,000 | 314,208,764 | |||||||||||||||
| ST013T2 | BI 7-Day Reverse Repo Rate | 6.40000 | % | 11-Dec-2024 | 10-Nov-2026 | 15,561,028,000,000 | 963,113,697 | |||||||||||||||
| ST013T4 | BI 7-Day Reverse Repo Rate | 6.50000 | % | 11-Dec-2024 | 10-Nov-2028 | 4,840,968,000,000 | 299,620,474 | |||||||||||||||
| SWR004 | Fixed | 6.35000 | % | 06-Sep-2023 | 10-Sep-2025 | 112,563,000,000 | 6,966,826 | |||||||||||||||
| SWR005 | BI 7-Day Reverse Repo Rate | 12.75000 | % | 16-Oct-2024 | 10-Oct-2026 | 147,373,000,000 | 9,121,310 | |||||||||||||||
|
|
|
|
|
|||||||||||||||||||
| TOTAL RETAIL NON TRADABLE ISLAMIC DEBT SECURITIES |
75,106,257,000,000 | 4,648,527,388 | ||||||||||||||||||||
|
|
|
|
|
|||||||||||||||||||
| TOTAL NON-TRADABLE SECURITIES |
188,008,271,833,167 | 11,636,335,448 | ||||||||||||||||||||
|
|
|
|
|
|||||||||||||||||||
| TOTAL DOMESTIC CURRENCY DENOMINATED BONDS |
6,227,530,976,833,170 | 385,438,570,083 | ||||||||||||||||||||
|
|
|
|
|
|||||||||||||||||||
Assumed exchange rates for conversion
| USD/IDR |
16,157.00 |
D-141