UNITED STATES

SECURITIES AND EXCHANGE COMMISSION

Washington, D.C.  20549


FORM 18-K

For Foreign Governments and Political Subdivisions Thereof


ANNUAL REPORT

of

EUROPEAN INVESTMENT BANK

(Name of registrant)


Date of end of last fiscal year:  December 31, 2017


Name and address of person authorized to receive notices
and communications from the Securities and Exchange Commission:


Philip J. Boeckman, Esq.

Cravath, Swaine & Moore LLP

CityPoint

One Ropemaker Street

London EC2Y 9HR

United Kingdom


Note on Incorporation by Reference


Throughout this annual report, various information and data are incorporated by reference to specific portions of the European Investment Bank’s (the “EIB’s”) 2017 annual report (which is hereinafter referred to as “Exhibit I”).  Any reference in this annual report to disclosures in Exhibit I shall constitute incorporation by reference of the specified portion into this Form 18-K.  The information on the registrant’s website is not part of this annual report.


Explanatory Note


Exhibit I of this annual report includes the consolidated financial statements of the EIB Group presented in accordance with International Financial Reporting Standards as adopted by the European Union (“IFRS”) and the financial statements of the EIB presented in accordance with the general principles of Directive 86/635/EEC of the Council of the European Communities of December 8, 1986 on the annual accounts and consolidated accounts of banks and other financial institutions, as amended by Directive 2001/65/EC of September 27, 2001, Directive 2003/51/EC of June 18, 2003 and Directive 2006/46/EC of June 14, 2006 (together, “EUGAAP”).


In order to provide a more coherent approach to the financial statements of the EIB, which are drawn up in application of the EUGAAP, Exhibit I of this annual report also contains the financial statements of the EIB Group presented in accordance with EUGAAP.


2


The information set forth below is to be furnished:


1.                                      In respect of each issue of securities of the registrant registered, a brief statement as to:


(a)                                 The general effect of any material modifications, not previously reported, of the rights of the holders of such securities.

….. None.


(b)                                 The title and the material provisions of any law, decree or administrative action, not previously reported, by reason of which the security is not being serviced in accordance with the terms thereof.

….. None.


(c)                                  The circumstances of any other failure, not previously reported, to pay principal, interest, or any sinking fund or amortization installment.

….. None.


2.                                      A statement as of the close of the last fiscal year of the registrant giving the total outstanding of:


(a)                                 Internal funded debt of the registrant.  (Total to be stated in the currency of the registrant.  If any internal funded debt is payable in foreign currency it should not be included under this paragraph (a), but under paragraph (b) of this item.)

….. Not applicable.


(b)                                 External funded debt of the registrant.  (Totals to be stated in the respective currencies in which payable.  No statement need be furnished as to intergovernmental debt.)

….. The information called for by this item is incorporated herein by reference to the material on pages 46, 110 and 180 of Exhibit I, and to Exhibit II.


3.                                      A statement giving the title, date of issue, date of maturity, interest rate and amount outstanding, together with the currency or currencies in which payable, of each issue of funded debt of the registrant outstanding as of the close of the last fiscal year of the registrant.

….. See Exhibit II.


4.                                      (a)                                 As to each issue of securities of the registrant which is registered, there should be furnished a break-down of the total amount outstanding, as shown in Item 3, into the following:


(1)                                 Total amount held by or for the account of registrant.

...... As of December 31, 2017, USD 92,586,000 was held by or for the account of the registrant.
...... See Exhibit III.


(2)                                 Total estimated amount held by nationals of the registrant (or if registrant is other than a national government by the nationals of its national government); this estimate need be furnished only if it is practicable to do so.

...... Figures not available.


3


(3)                                 Total amount otherwise outstanding.

...... See Item 3.


(b)                                 If a substantial amount is set forth in answer to paragraph (a)(1) above, describe briefly the method employed by the registrant to reacquire such securities.

...... Not applicable.


5.                                      A statement as of the close of the last fiscal year of the registrant giving the estimated total of:


(a)                                 Internal floating indebtedness of the registrant.  (Total to be stated in the currency of the registrant.)

...... Not applicable.


(b)                                 External floating indebtedness of the registrant.  (Total to be stated in the respective currencies in which payable.)

….. The information called for by this item is incorporated herein by reference to the material on pages 46, 110 and 180 of Exhibit I, and to Exhibit II.


6.                                      Statements of the receipts, classified by source, and of the expenditures, classified by purpose, of the registrant for each fiscal year of the registrant ended since the close of the latest fiscal year for which such information was previously reported.  These statements should be so itemized as to be reasonably informative and should cover both ordinary and extraordinary receipts and expenditures; there should be indicated separately, if practicable, the amount of receipts pledged or otherwise specifically allocated to any issue registered, indicating the issue.

...... The information called for by this item is incorporated by reference to the material on pages 1-14 and 21-246 of Exhibit I, and Exhibit II.


7.                                      (a)                                 If any foreign exchange control, not previously reported, has been established by the registrant (or if the registrant is other than a national government, by its national government), briefly describe the effect of any such action, not previously reported.

...... None.


(b)                                 If any foreign exchange control previously reported has been discontinued or materially modified, briefly describe the effect of any such action, not previously reported.

...... None.


4


IF THE REGISTRANT IS A GOVERNMENTAL UNIT OTHER THAN A NATIONAL GOVERNMENT, IT NEED NOT ANSWER ITEMS 8, 9 AND 10.


8.                                      Brief statements as of a date reasonably close to the date of the filing of this report (indicating such date) in respect of the note issue and gold reserves of the central bank of issue of the registrant, and of any further gold stocks held by the registrant.

...... Inasmuch as the registrant is not a national government, Item 8 is not applicable.


9.                                      Statements of imports and exports of merchandise for each year ended since the close of the latest year for which such information was previously reported.  The statements should be reasonably itemized so far as practicable as to commodities and as to countries.  They should be set forth in terms of value and of weight or quantity; if statistics have been established in terms of value, such will suffice.

...... Inasmuch as the registrant is not a national government, Item 9 is not applicable.


10.                               The balances of international payments of the registrant for each year ended since the close of the latest year for which such information was previously reported.  The statements of such balances should conform, if possible, to the nomenclature and form used in the “Statistical Handbook of the League of Nations.”  (These statements need to be furnished only if the registrant has published balances of international payments.)

...... Inasmuch as the registrant is not a national government, Item 10 is not applicable.


11.                               In addition to the foregoing, we also incorporate by reference the materials on pages 15-20 of Exhibit I.


5


EXHIBITS


The following exhibits should be filed as part of the annual report:


(a)                                 Copies of any amendments or modifications, other than such as have been previously filed, to all exhibits previously filed other than annual budgets.  If such amendments or modifications are not in the English language, there should be furnished in addition a translation into English if the original exhibit was translated into English.

...... Not applicable.


(b)                                 A copy of any law, decree or administrative document outlined in answer to Item 1(b).  If such law, decree or document is not in the English language, there should be furnished in addition thereto a translation thereof into English.

...... Not applicable.


(c)                                  A copy of the latest annual budget of the registrant, if not previously filed, as presented to its legislative body.  This document need not be translated into English.

...... Not applicable.


The registrant may file such other exhibits as it may desire, marking them so as to indicate clearly the items to which they refer.


This annual report comprises:


(a)                                 Pages numbered 1 to 8 consecutively, and insert pages numbered (none).


(b)                                 The following exhibits:


...... Financial report for 2017 of registrant (Exhibit I).


...... Schedule of outstanding borrowings as of December 31, 2017 (Exhibit II).


...... Breakdown of registered securities held by or for the account of the registrant (Exhibit III).


...... Consent of KPMG Luxembourg, Société coopérative, independent auditors (Exhibit IV).


...... Reconciliation of the consolidated balance sheet as at December 31, 2017 and the consolidated income statement for the year ending December 31, 2017 of the EIB Group prepared in accordance with IFRS and EUGAAP (Exhibit V).


This annual report is filed subject to the Instructions for Form 18-K for Foreign Governments and Political Subdivisions Thereof, and the amendments to such Instructions.


6


SIGNATURE


Pursuant to the requirements of the Securities Exchange Act of 1934, the registrant has duly caused this annual report to be signed on its behalf by the undersigned, thereunto duly authorized at Luxembourg, Grand Duchy of Luxembourg, on the 3rd day of May, 2018.


EUROPEAN INVESTMENT BANK


 (Name of registrant)


by


/s/ BERTRAND DE MAZIÈRES


Bertrand de Mazières


Director General


Finance Directorate


by


/s/ SANDEEP DHAWAN


Sandeep Dhawan


Head of Funding


Americas, Asia, Pacific Capital Markets


7


EXHIBIT INDEX


Exhibit


Document


I


Financial report for 2017 of the European Investment Bank (only those specific portions of the annual report incorporated by reference in this report are deemed “filed”).


II


Schedule of outstanding borrowings as of December 31, 2017.


III


Breakdown of registered securities held by or for the account of the registrant.


IV


Consent of KPMG Luxembourg, Société coopérative, independent auditors.


V


Reconciliation of the consolidated balance sheet as at December 31, 2017 and the consolidated income statement for the year ending December 31, 2017 of the EIB Group prepared in accordance with IFRS and EUGAAP.


8


EXHIBIT I

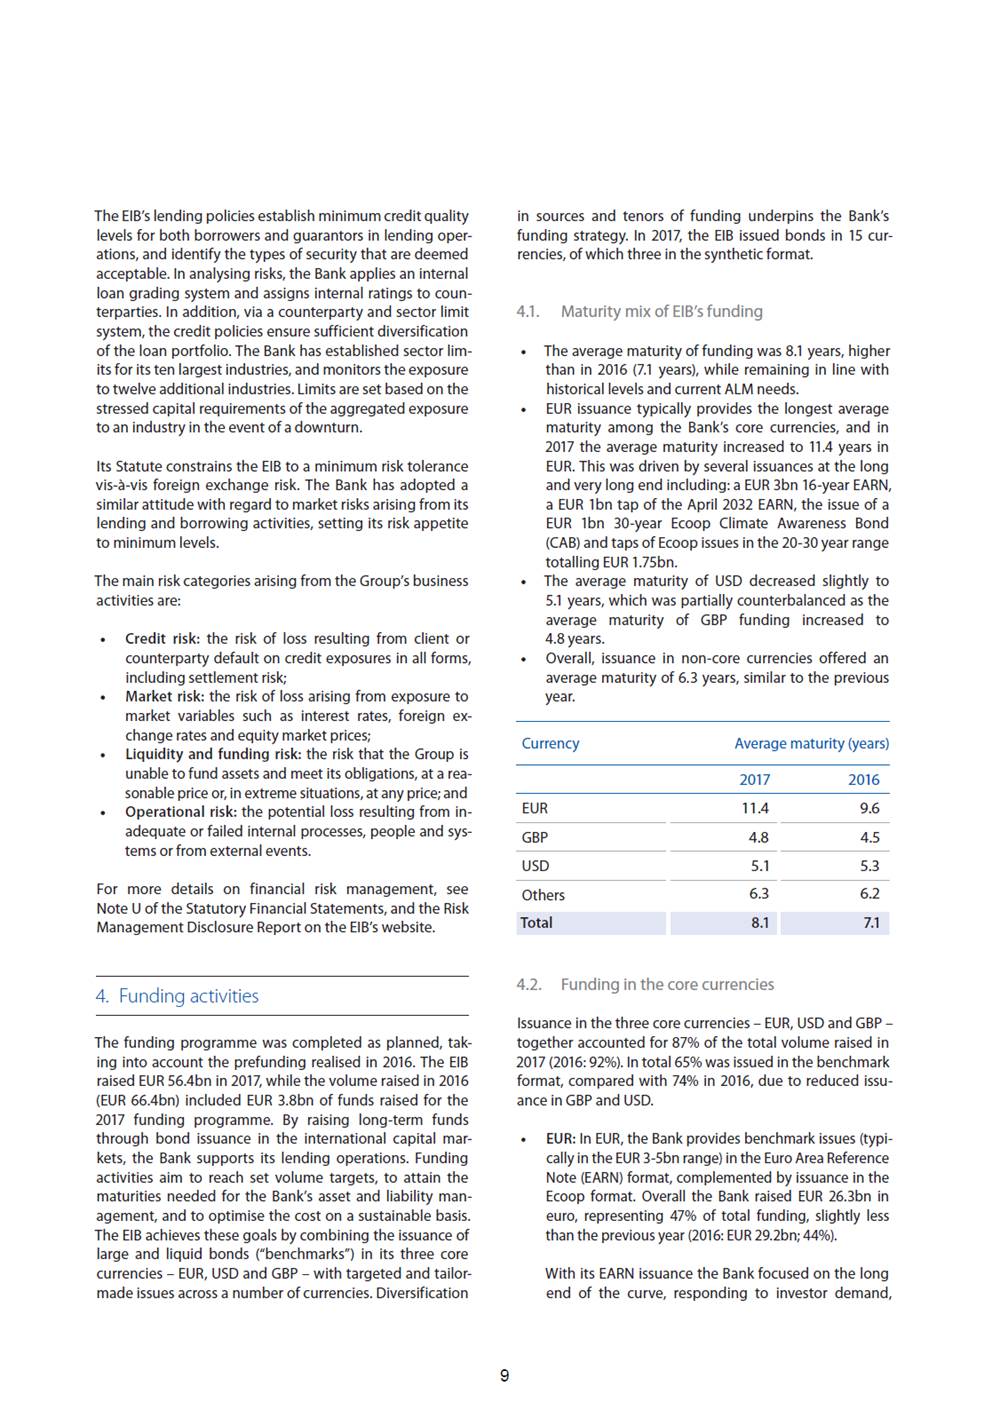
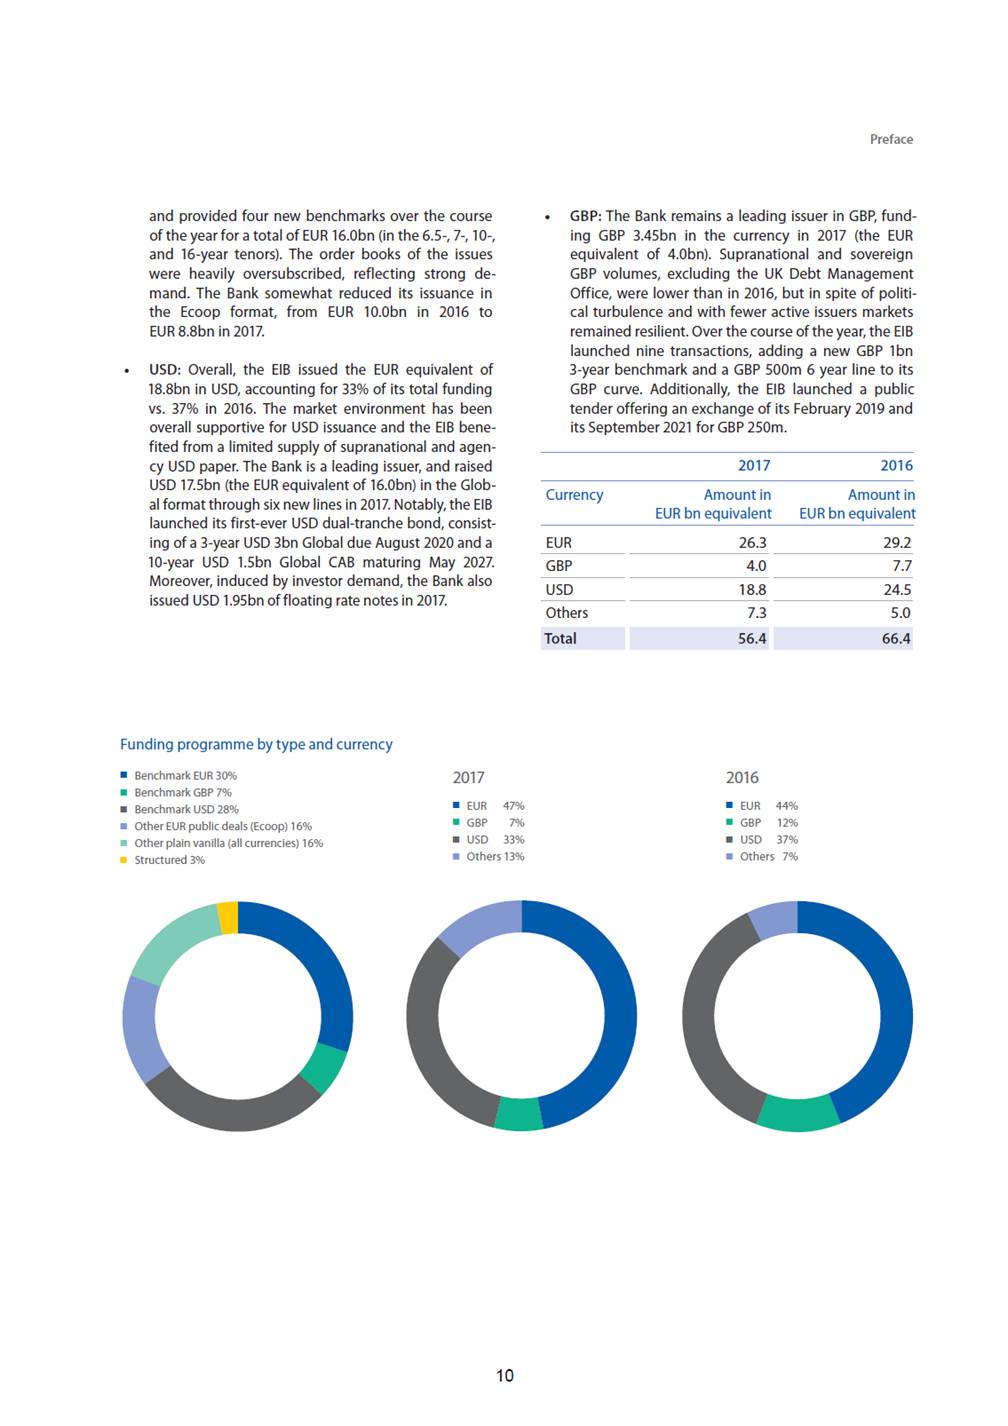
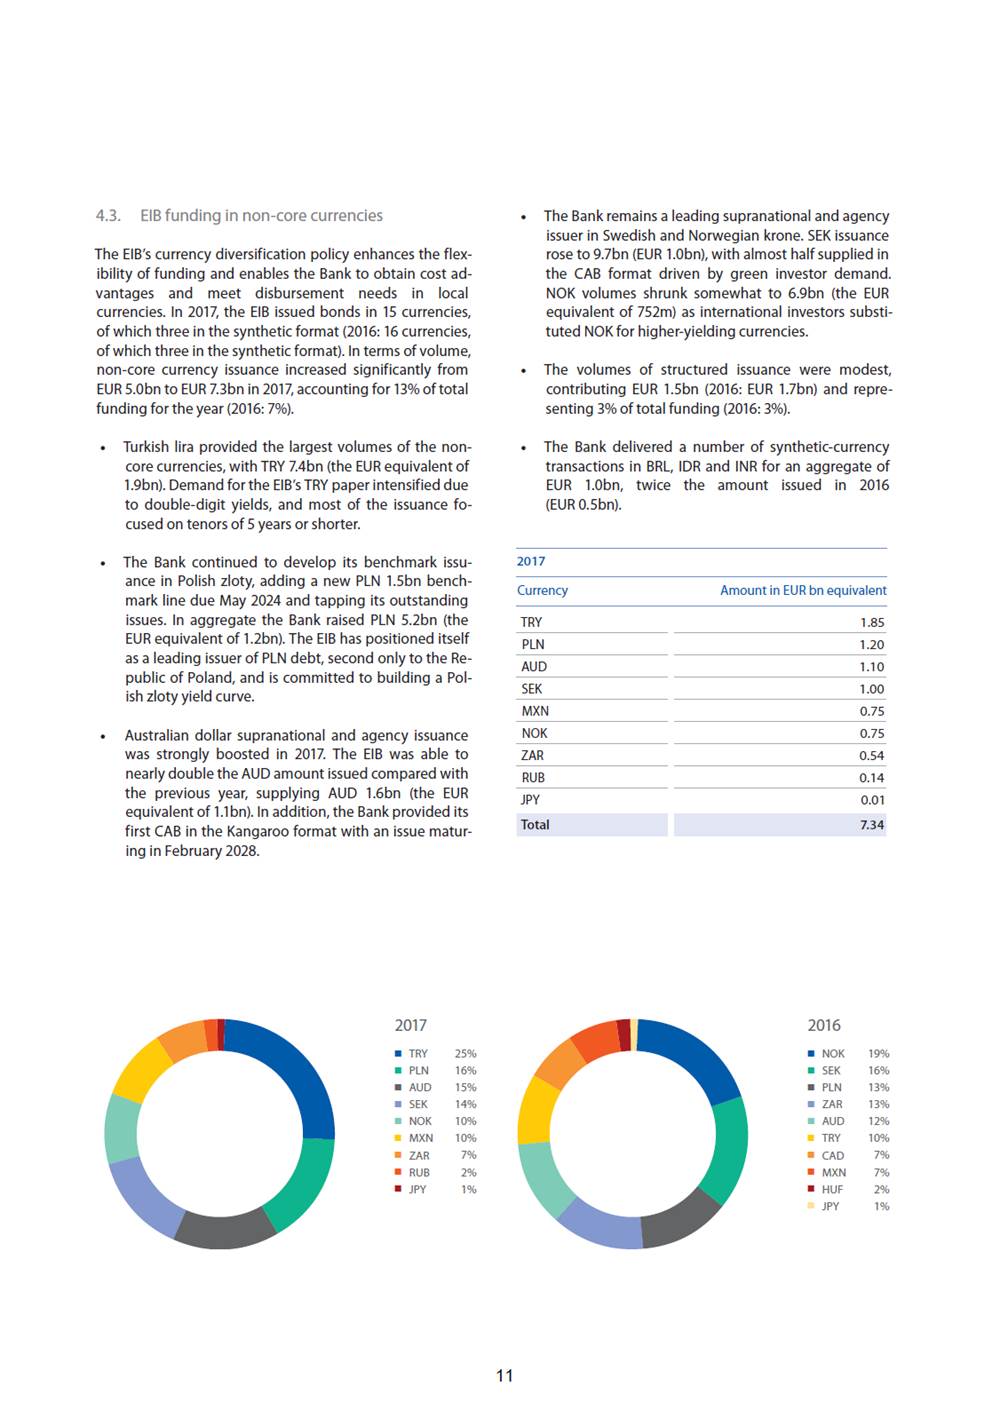
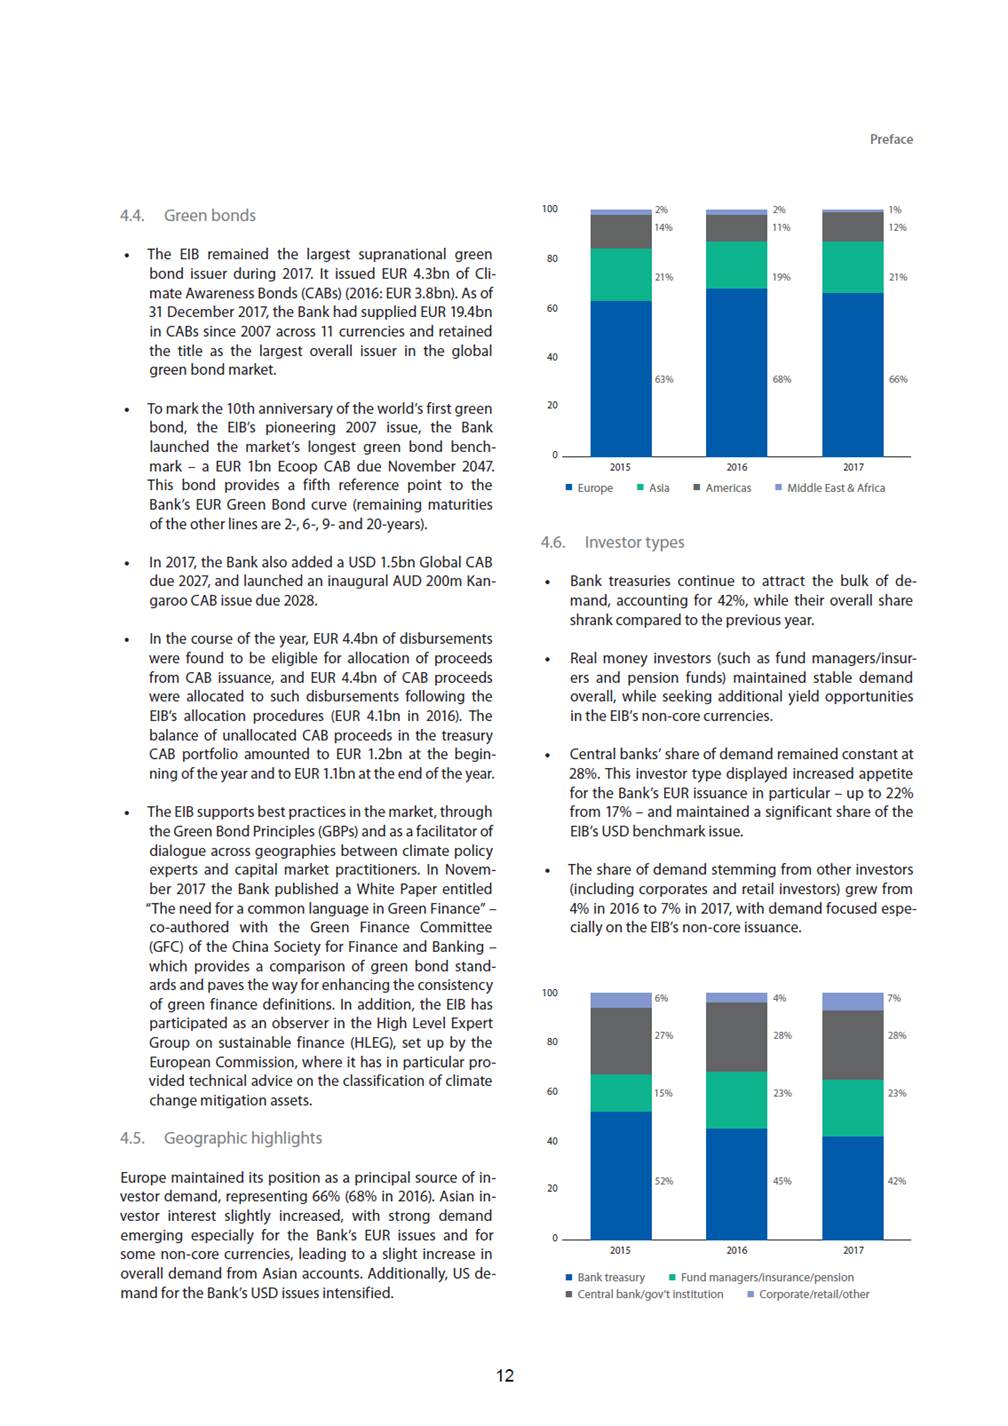
EXHIBIT I Preface Highlights of developments in 20171 The EIB generated healthy financial results in 2017, record-ing an annual net surplus of EUR 2.81bn, roughly in line with the previous year (EUR 2.86bn in 2016). The net result is fully retained, contributing to the Bank’s own funds in support of its long-term financing capacity. This increase in own funds more than offsets a slight increase in RWA, re-sulting in an overall increase in the CET1 ratio to 28.5% from 26.4% the previous year. The leverage ratio7 similarly displayed an improving trend, reducing to 667% in 2017 (742% in 2016) due primarily to the increase of own funds and the appreciation of the euro. Overview In 2017 the EIB successfully achieved its objectives, imple-menting EU policy in line with its mission2 and as detailed in its Operational Plan3. The Bank’s lending signatures for the year amounted to EUR 69.9bn4 (out of which EUR 69.0bn under the Bank’s own resources) and total dis-bursements reached EUR 58.4bn5 (out of which EUR 57.9bn under the Bank’s own resources). While the overall vol-umes are slightly lower than in 2016 (EUR 76.4bn signed out of which EUR 76.0bn under the Bank’s own resources; EUR 60.4bn disbursed out of which EUR 59.5bn under the Bank’s own resources), they are within the 10% flexibility margin foreseen in the Operational Plan. The 2017 funding programme was completed as planned, taking into account the prefunding of end-2016. In 2017 the EIB raised EUR 56.4bn in the international capital mar-kets to finance lending activities and other cashflow needs. The total of borrowings and commercial paper amounted to EUR 449.6bn at end-2017, compared to EUR 470.9bn at end-2016, representing a decrease of EUR 21.3bn or 4.5%. The quality of the Bank’s loan portfolio remains remarkably high, despite increased lending in higher risk projects due to the EIB’s role in the European Fund for Strategic Invest-ments (EFSI). The overall loan portfolio6 remained stable, with only 0.3% impaired at end-2017 (0.3% end-2016). The portion of payments overdue by more than 90 days re-mains very low, totalling EUR 180.0m at end-2017 (EUR 89.6m end-2016) and representing only 0.04% of the risk portfolio. Specific provisions on loans decreased to EUR 463.3m from EUR 538.7m at end-2016. Rigorous risk management policies and thorough project due diligence underpin the Bank’s credit standing. The Bank has a prudent approach to liquidity management, focusing on liquid and very high quality investments. Treas-ury assets amounted to EUR 72.1bn at the end of 2017 (EUR 83.5bn in 2016). The Bank’s liquidity ratios remain well within limits, covering 74% of 2018 projected net cash out-flows (compared to 75% in 2016). Importantly, the EIB’s access to the Eurosystem’s refinancing facility provides additional protection in circumstances of extreme liquidity distress. 1


Preface • General administrative expenses increased by EUR 114.9m year on year. This evolution was primarily driven by the increase in staff-related costs (associat-ed with the increase in the staff count over the period under review). For more details, see Note R of the Statutory Financial Statements. 1. EIB delivers healthy financial performance The EIB generates surpluses by financing large volumes of loans at low margins, and has recorded annual surpluses in its statutory8 accounts every year since its foundation. The surplus for the financial year 2017 amounted to EUR 2,805.7m, which is comparable with the 2016 surplus (EUR 2,856.6m). The main factors that influenced the finan-cial results were the following: • Income from shares and other variable-yield securi-ties increased year on year by EUR 89.4m due to addi-tional dividends recognised in 2017 (EUR 307.7m) as compared to 2016 (EUR 218.3m). • The net interest income realised9 by the Bank in 2017 amounted to EUR 3,259.8m as compared to EUR 3,312.8m in 2016. Additional details on the inter-est income and expenses are provided under Note N of the Statutory Financial Statements. The EIB’s balance sheet totalled EUR 549.5bn at the end of 2017 as compared to EUR 573.2bn at the end of 2016 (de-crease of EUR 23.7bn). Evolution of the net result and total assets (EUR million) 2 857 2 806 3 000 700 000 2 757 2 626 2 515 600 000 2 500 500 000 2 000 400 000 1 500 300 000 1 000 200 000 500 100 000 0 0 2013 2014 2015 2016 2017 1 This section covers activities and financial information of the European Invest-ment Bank; figures presented have to be regarded together with the Statutory Fi-nancial Statements of the Bank prepared in accordance with the EU Accounting Directives (unless otherwise stated). 2 The Bank’s Corporate Governance Report is available via the EIB’s website. 3 The annual Operational Plan includes orientations of performance and elaborates on major priorities and activities of the Group for the coming three years. 4 Includes all resources, loans, equities and guarantees. 5 Includes all resources, loans, equities and guarantees. 6 Data on the loan portfolio provided in the Preface apply (unless otherwise stated) to the own resources loan portfolio, which includes the ‘’risk portfolio’’ and the portion of the portfolio outside the EU that benefits from a global guarantee from the EU or Member States (refer to Note U of the Statutory Financial State-ments for more details). 7 The leverage ratio is computed as gross debt (long and short-term) divided by ad-justed shareholders’ equity (own funds less the EIB’s participation in the EIF’s and EUMPF’s capital). 8 Prepared in accordance with the EU Accounting Directives. 9 Interest receivable and similar income less interest payable and similar charges. 2 570 617 573 231 549 544 542 372 512 203 Net result Total assets


1.1. Strong capitalisation The Bank’s consistent profitability led to the build-up of considerable reserves over the years, as profits are re-tained to support the Bank’s operations. Own funds in-creased from EUR 66.2bn at end-2016 to EUR 69.0bn at end-2017 following the appropriation of the annual net surplus. Own funds composition as at 31 December 2017 It was proposed that the surplus for the year be appropri-ated as follows: 1.3. Outlook for the future i) reserve fund ii) additional reserves iii) special activities reserve iv) general loan reserve nil EUR 647.6m EUR 2,122.6m The Operational Plan for the coming year was approved by the EIB’s Board of Directors on 12 December 2017, and was published on 22 January 2018. Under the new plan, the EIB maintains its commitment to productive investments and will continue to target activities to address market gaps and to ensure the highest level of impact possible. Importantly, the Bank reviews its operational targets during the year so as to ensure optimal alignment of resources, whilst remaining at-tentive to the maintenance of its financial and credit strength. EUR 35.5m 1.2. EIB’s callable capital provides a substantial cushion The EIB is owned by the 28 EU Member States. On 31 Decem-ber 2012, the EIB’s shareholders unanimously approved a EUR 10bn increase in paid-in capital. Following the cash pay-ment of the capital increase, this brought the Bank’s paid-in capital to EUR 21.7bn. In addition, the EIB has subscribed un-paid capital, or callable capital, amounting to EUR 221.6bn. The EIB’s Member States have a legal obligation to pay their share of the callable capital, if necessary for the Bank to meet its obligations, at the request of the EIB’s Board of Directors (as set out in the EIB’s Statute10). This legal obligation derives from an EU Treaty, which supersedes national law, and is a special feature of the EIB. The callable capital, which is not considered in own funds or for CRR/CRD IV capital adequacy purposes, represents a buffer equivalent to roughly half of the Bank’s borrowings. The Bank targets lending signatures of EUR 67bn in 2018, with a flexibility allowance of +10% and -20%. The lending remains focused on the EIB’s public policy goals, namely innovation, SMEs and mid-cap financing, infrastructure and environment in addition to its two overarching policy goals related to EU social and economic cohesion and climate action. In line with these goals, the EIB makes long-term finance available to public and private investors for projects that contribute to supporting Europe in terms of global compet-itiveness and job creation, tackling security and migration challenges, and ultimately promoting European values both inside and outside the EU. In addition to the Group’s 10 EIB Statute, Article 5(3): “The Board of Directors may require payment of the balance of the subscribed capital, to such extent as may be required for the Bank to meet its obligations.’’ 3 Own funds in EUR ‘000 31/12/2017 31/12/2016 Capital – Subscribed – Uncalled Reserves a) reserve fund b) additional reserves c) special activities reserve d) general loan reserve Profit for the financial year 243 284 155 -221 585 020 243 284 155 -221 585 020 21 699 135 21 699 135 24 328 415 9 947 736 7 504 091 2 700 556 24 328 415 7 214 264 6 776 060 3 305 458 44 480 798 2 805 711 41 624 197 2 856 601 Total own funds 68 985 644 66 179 933


Preface core activities of lending, blending and advising, the EIB also remains committed to its third party mandates. In pursuit of its business strategy, the EIB only accepts to take credit, market and liquidity risk in line with its risk ap-petite and public mission. The Bank aims to retain its high credit standing, which is the core of the business model. At the same time, it aims for stability of earnings and preserva-tion of the economic value of own funds, enabling it to self-finance its growth in the long term. The funding programme forecast in the Operational Plan re-flects the borrowings required to support the operational tar-gets. The Board of Directors has approved a global borrowing authorisation of up to EUR 65bn for 2018; the Bank has an-nounced an expected funding programme of EUR 60bn. UK paid-in capital: “The UK share of the paid-in capital” market regarding the implications for the EIB. According to twelve annual instalments starting at the end of 2019. The UK the EU and the withdrawing Member State. Council decided on 15 December 2017 that the progress by the Member States provided that it is used for covering to move to the second phase related to the transition and the as ALM (Asset-Liability management) risks or operational risks) the UK. drawal. For other such risks not associated with specific loans does not prejudge any adaptations that might be appropriate ileges and immunities under Protocols 5 and 7 annexed to ond phase of the negotiations, and is without prejudice to dis-drawal, UK projects will not be eligible for new operations be explored in the second phase of negotiations. an amount equal to its callable capital on the day of with-4 EIB’s relationship with the United Kingdom (UK) The notification of the UK to the European Council to with-in capital on the date of withdrawal, both as defined in the draw from the EU pursuant to Article 50 of the Treaty on Euro-EIB Statute”. pean Union (TEU) of 29 March 2017, led to questions from the the TEU, the terms of a withdrawal are negotiated between(currently amounting to EUR 3.5bn) “will be reimbursed in remains liable for the reimbursed amount of paid-in capital On 8 December 2017, the negotiators of the EU and the UK until the outstanding stock of EIB operations equals the total Government published a “Joint report from the negotiators paid-in capital on the date of withdrawal, at which point the of the European Union and the United Kingdom Government liability will start to be amortised in line with the remaining on progress during phase 1 of negotiations under Article 50 non-amortised operations. Apart from these reimbursements, TEU on the United Kingdom's orderly withdrawal from thethe EIB will not make any other payment, return or remunera-European Union” (the Joint Report). tion on account of the withdrawal of the UK from the EIB or Based on the Joint Report and the recommendation made on account of the provision by the UK of a guarantee”. by the European Commission on the state of progress of the Call: “Any call to the callable guarantee or the paid-in (cash or negotiations with the UK of 8 December 2017, the European guarantee) will be “pari-passu” with calls on or payments made achieved in the first phase of the negotiations was sufficient operations at the withdrawal date or for covering risks (such framework for the future relationship between the EU and attributable to the stock of operations at the date of with-The Joint Report was put forward with a view to the meeting and not attributable to the stock of operations built after the of the European Council (Article 50) of 14-15 December 2017. date of withdrawal, the UK responsibility will be proportional “Under the caveat that nothing is agreed until everything is to the ratio between the stock of outstanding operations and agreed, the joint commitments set out in this Joint Report shall the total amount of operations at the date of the event”. be reflected in the Withdrawal Agreement in full detail. This Financing in the UK: “The UK will maintain the EIB's priv-in case transitional arrangements were to be agreed in the sec-the Treaties throughout the amortisation of the EIB's stock of cussions on the framework of the future relationship”. operations at the date of withdrawal. After the date of with-The following key principles have been agreed regarding the from the EIB reserved for Member States, including those EIB in the Joint Report: under Union mandates”. The UK has expressed an interest in a UK callable capital: “The UK will provide a guarantee for continued relationship with the EIB, and such possibilities will drawal” (callable capital currently amounts to EUR 35.7bn). On 15 December 2017, the President of the European Coun-“This guarantee will decrease in line with the amortisation of cil, Donald Tusk, expressed his trust in the continuation of the stock of EIB operations at the date of withdrawal, starting the unity on the European side, stating as an example that on the date on which the outstanding stock represents an “the EU is committed to preserving the financing activity of amount equal to the total subscribed capital on the date of the EIB Group and its business model throughout and after withdrawal and ending on the date it equals the total paid-Brexit”.


ble at an aggregate of EUR 567.9bn12 (EUR 568.7bn end-2016), of which 88.9% was for projects within the EU (2016: 88.6%). 2. Lending activities – stable volumes, thorough project appraisal 2.1. New signatures As the EU bank, the EIB’s mission is to invest in viable pro-jects that deliver on the EU’s policy objectives, as stipulat-ed in Article 309 of the Treaty on the Functioning of the European Union. Projects financed need to satisfy strict economic, technical, environmental and social standards and are subject to careful due diligence and sound risk management practices. At 31 December 2017, the EIB’s disbursed loan portfolio amounted to EUR 455.0bn11 compared with EUR 455.4bn at end-2016. The outstanding volume of signed loans was sta-In 2017, the flow of new signatures amounted to EUR 69.9bn13, of which EUR 69.0bn under the Bank’s own resources (2016: EUR 76.4bn, of which EUR 76.0bn under the Bank’s own resources). Out of the new signatures, 90% provide financing to projects in EU Member States (see the detailed geographic distribution below). 11 Includes own resources loans and loan substitutes. 12 Includes own resources loans and loan substitutes. 13 Includes all resources, loans, equities and guarantees. Austria Czech Republic France Germany Greece Hungary Italy Poland Portugal Spain United Kingdom EU Benelux* EU Scandinavia* EU other* Non-EU Geographical distribution of the stock of loans at end of 2017 (%) 2.8 1.5 9.4 8.1 3.5 1.8 12.1 7.2 3.8 18.6 8.3 4.8 3.5 5.7 8.9 Transport Global loans Energy Health, education Water, sewerage Industry Miscellaneous infrastructure Services Telecommunications Agriculture, fisheries, forestry 28.7 23.6 14.8 7.4 6.4 6.3 6.1 3.5 2.4 0.8 Distribution by sector of the stock of loans at end of 2017 (%) * EU Benelux: Belgium 2.1%, Luxembourg 0.1%, Netherlands 2.6%, EU Scandinavia: Denmark 0.4%, Finland 1.6%, Sweden 1.5%, EU other: Bulgaria 0.4%, Croatia 0.8%, Cyprus 0.4%, Estonia 0.2%, Ireland 1.0%, Latvia 0.2%, Lithuania 0.3%, Malta 0.1%, Romania 0.9%, Slovakia 0.7%, Slovenia 0.7%. 5 Signatures per country or region (in EUR million) 2017 % of total EFSI 2017 2016 % of total Italy Spain France Germany Poland Sweden Netherlands Greece United Kingdom Portugal Belgium Romania Finland Austria Other EU Member States EFTA Candidate and potential candidate countries Rest of world EFSI signatures 11 010 10 197 7 403 6 606 5 061 2 355 2 175 2 110 1 843 1 514 1 502 1 327 1 311 1 252 6 973 351 837 6 114 16% 15% 11% 9% 7% 3% 3% 3% 3% 2% 2% 2% 2% 2% 10% 0% 1% 9% 20% 1 8089 87013% 2 32210 04313% 2 2748 00111% 1 1757 52410% 1 1224 4446% 1 0111 6882% 2182 5653% 8041 5162% 06 9639% 3591 4862% 392 2883% 1781 0552% 3232 2203% 3191 4472% 1 8297 3129% 03310% 02 6554% 04 9506% 76 358 13 00817% 69 941 13 781


Preface 2.2. EFSI progress At end-2017, the EIB Group had approved 717 projects for an aggregate of EUR 51.3bn of financing, expected to mo-bilise investments of EUR 256.9bn (the figures refer to ac-tive operations, excluding global authorisations or fully cancelled operations). This represents 82% of the three-year target. Infrastructure and Innovation Windows (IIW) Total 2017 FY As at 31 December 2017, 362 projects had been approved under the IIW, providing total financing of EUR 39.3bn, of which EUR 27.4bn had been signed. The Bank’s disbursed operations amounted to EUR 10.2bn for operations signed under the IIW, of which EUR 9.8bn are Debt Type Opera-tions and EUR 441m are Equity Type Operations. Under the SME Window, 224 financial guarantee transac-tions had been approved for an amount of EUR 7.14bn, out of which EUR 2.92bn were approved in 2017. At end-2017, guarantee transactions signed benefiting from EFSI sup-port equalled EUR 6.07bn. Through the SMEW Equity and Risk Capital Resources mandate, the EIF had also approved 131 transactions in investment funds adding up to EUR 4.81bn (of which EUR 1.25bn was approved in 2017), with a signed amount of EUR 4.14bn as at 31 December 2017. SME Window (SMEW) Total 2017 FY Infrastructure and Innovation Windows (IIW) Total 2017 FY 6 # projects approved 362194 Operations approved as of 31.12.2017 (EUR m) 39 31018 417 of which Equity Type Operations 3 9752 453 of which Debt Type Operations 35 33515 964 # projects approved 355134 Operations approved as of 31.12.2017 (EUR m) 11 9504 168 # projects signed 323124 Operations signed as of 31.12.2017 (EUR m) 10 2133 246 Operations disbursed as of 31.12.2017 (EUR m) 5 8573 038 # projects signed 278161 Operations signed as of 31.12.2017 (EUR m) 27 41213 781 of which Equity Type Operations 3 2792 200 of which Debt Type Operations 24 13311 581 Operations disbursed as of 31.12.2017 (EUR m) 10 2446 042 of which Equity Type Operations 441353 of which Debt Type Operations 9 8035 689 EFSI Building on the EIB’s traditional lending activities, the European Commission (EC) and the Bank agreed in November 2014 to set up the European Fund for Strategic Investments (EFSI). Spanning a three-year period, EFSI was designed to mobilise EUR 315bn of additional investments to enhance Europe’s economic growth and competitiveness, and to generate jobs, supported by EUR 21bn of risk capital contributions from the European Commission (EC) and the EIB. EFSI is deployed by both the EIB and the EIF through the Infrastructure and Innovation Windows (IIW) and the SME Window (SMEW), respectively. To address continued low investment levels in the EU, the EC proposed to extend EFSI (creating EFSI 2.0), raising the investment target to EUR 500bn by 2020 and at the same time increasing the contributions from the EC and the EIB. Following the conclu-sion of the legislative process, the Regulation enacting EFSI 2.0 was published in the Official Journal of the European Union on 27 December 2017 and came into force on 30 December 2017. The corresponding amendment to the Implementation Agree-ment is expected to be signed during Q1 2018.


2.3. Rigorous due diligence and strict selection criteria Project appraisal • Financial • Economic • Social • Environmental • Technical Manage-ment Committee review/ approval Board of Directors’ approval Identification of a project opportunity L o ed Physical & financial monitoring Contract signed Disbursement Negotiation Repayment The EIB’s due diligence process (applicable to all opera-tions, including those under EFSI) ensures high loan quali-ty, applying strict eligibility criteria to all projects. The appraisal process involves assessments from loan officers, economists, engineers and other sector specialists, risk managers and lawyers. The viability of a project is consid-ered from four angles: economic, technical, environmen-tal/social and financial. • The vast majority of the Bank’s loan portfolio benefits from credit enhancements or recourse to EC or EU Member State guarantees (in which case, the Bank benefits from the preferred creditor status (PCS) and the protection granted by the EIB’s Statute). Credit en-hancements are largely in the form of guarantees from EU sovereigns, the European Community budg-et, investment grade banks and corporates, as well as high quality financial collateral and assignments of rights or pledges. Unsecured loans to banks and cor-porates had a combined value of EUR 129.1bn14, repre-senting 22.7% of the overall loan portfolio, at 31 December 2017 (2016: 21.3%). Risk guidelines are applied at project selection and throughout the lifetime of the loan. Post signature moni-toring is performed in order to enable early interventions, tracking closely whether initial conditions have deteriorat-ed or contractual clauses have been breached. Firm adher-ence to project screening and ex ante evaluations, coupled with regular ex post reviews, underpins the quali-ty of the EIB’s loan portfolio. • Expected losses associated with lending exposures are allocated to a dedicated General Loan Reserve (GLR). Climate aspects are taken into consideration throughout the assessment and monitoring of all projects. The Bank calculates and reports the carbon footprint, in absolute and relative terms, for all directly financed projects that have material emissions. In addition, an economic price of carbon is incorporated into the accounting for environ-mental externalities. • Due to the EIB’s exceptional asset quality, the share of the risk portfolio with a borrower or guarantor inter-nal rating of investment-grade level15 stood at 77.4% at end-2017 (2016: 73.6%). • At end-2017 the disbursed sovereign exposure of the Bank amounted to EUR 45.4bn (2016: EUR 44.6bn) and the sovereign-guaranteed signed exposure to EUR 85.6bn (2016: EUR 88.1bn). The Bank has not re-corded any impairment in respect of its holding of EU sovereign and EU sovereign-guaranteed exposures. The Bank’s preferred creditor status and the protec-tion given by the Bank’s Statute are deemed to guar-antee full recovery of its sovereign assets. 2.4. A highly secured and high-quality loan portfolio The conservative lending policies that the EIB applies, cou-pled with the nature of the projects financed and strong collateralisation, enable a high-quality loan portfolio to be maintained despite the Bank’s recent move into higher risk lending. The credit quality of the loan portfolio is re-flected in the EIB’s low rate of impairments and the histori-cally low level of defaults. 14 Includes own resources loans and loan substitutes. 15 Above Baa3 rating. 7


Preface • At end-2017, there were 24 impaired loan contracts (2016: 26 impaired loan contracts) for a total dis-bursed exposure of EUR 1.3bn (2016: EUR 1.5bn). These operations represent 0.3% of the total loan portfolio (2016: 0.3%), for which the Bank has specific provisions for the gross exposure (disbursed expo-sures, accrued interest and exposures in arrears) of EUR 463.3m (2016: 538.7m). 2.5. Operation outside the EU By offering loans outside the EU, the Bank actively pro-motes the EU’s external policy objectives. The majority of non-EU activities are covered by guarantees from the EU (External Lending Mandate) or the EIB’s Member States (Cotonou Agreement), in the form of either a comprehen-sive guarantee or a political risk guarantee. Arrears of over 90 days on non-EU loans amounted to EUR 2.2m as at 31 December 2017 (2016: EUR 4.0m). Overall, cumulative amounts called and not refunded for loans guaranteed by the European Union budget or by the Member States amounted to EUR 502.3m (2016: EUR 489.2m). • For loans not secured by the European Union budget or Member State guarantees (known as the Bank’s risk portfolio, although it still typically benefits from vari-ous credit enhancements), arrears over 90 days amounted to EUR 180.0m as at 31 December 2017 (2016: EUR 89.6m). Operations that carry higher risk than the EIB’s usual activities are termed “special ac-tivities”. The volume of new special activities16 signed in 2017 was EUR 18.0bn (2016: EUR 13.1bn), of which EUR 2.7bn was at the EIB’s own risk (2016: EUR 1.1bn) and the remaining EUR 15.3bn was covered by portfo-lio credit risk mitigation (2016: EUR 12.0bn). The stock of own resources special activities17 increased to EUR 18.0bn (2016: EUR 17.2bn), mainly due to the pace of new signatures in 2017, which was only partially offset by redemptions and improvements in the cred-it quality of outstanding loans. Own resources special activities now represent approximately 3.3% of the total loan portfolio not covered by the EU’s or Mem-ber States’ comprehensive guarantee (2016: 3.2%). The unexpected losses associated with special activi-ties at the EIB’s own risk are allocated to a dedicated special activities reserve (SAR) whose level stood at EUR 4.8bn at the end of 2017 (2016: EUR 3.0bn). In ad-dition, EUR 4.8bn of the SAR is allocated to the equity fund activities managed by the EIF on behalf of the Bank (2016: EUR 4.5bn). After inclusion of the pro-posed appropriation of the 2017 result, the SAR would amount to EUR 9.6bn (See section “Strong capitalisa-tion” above). Russia The EIB continues to apply the sanctions on Russia adopt-ed by the European Council in 2014. The Bank’s total dis-bursed exposure to borrowers in the Russian Federation amounted to EUR 137.7m as of end-2017 (2016: EUR 160.8m) with EUR 110.4m (2016: EUR 123.6m) at the EIB’s own risk. The remaining part consists of operations covered by the EU External Lending Mandate guarantee. Additionally, the EIB has exposure to foreign subsidiaries of Russian groups outside Russia amounting to EUR 294.5m (2016: EUR 692.6m), of which a volume of EUR 119.5m is se-cured by a pledge of bonds or financial collateral. Ukraine Total disbursed exposure in the Ukraine amounted to EUR 1,010.6m at end 2017 (2016: EUR 920.7m). Of this amount, EUR 910.2m (2016: EUR 893.1m) is covered by the EU External Lending Mandate guarantee while the remain-der is at the EIB’s own risk. A further EUR 3.4bn has been committed in signed operations not yet disbursed, of which EUR 412.9m is expected to be at the EIB’s own risk. 3. Conservative risk management aligned with best banking practice • The Watch List comprises lending operations deemed to require heightened monitoring, though they gen-erally continue to perform. Lending operations are placed on the Watch List subject to an internal loan grading threshold or an occurrence of a significant credit event. The amount of operations on the Watch List followed a downward trend, decreasing to EUR 4.9bn (2016: EUR 6.5bn). This represents 0.9% of the risk portfolio (2016: 1.2%). The trend is mainly driv-en by upgrades of the internal loan grades, caused by higher counterparty ratings, and repayments of watch-listed operations. The Bank aims to align its risk management with best banking practice, and adherence to that practice is moni-tored by the independent Audit Committee, which re-ports directly to the Board of Governors. The approach in determining annual operational targets and orientations takes into account the Bank’s objective of maintaining a robust credit standing, the long-term nature of its lend-ing business and the granularity of its portfolio. The Bank has defined a set of indicators to monitor the credit, li-quidity, market and operational risks inherent to its activi-ties including, among others, minimum capital requirements, the credit quality distribution of the Bank’s loan portfolio, risk concentration measures, and liquidity measures. 16 Includes loans, equities and guarantees, excludes EIB’s mandates to EIF. 17 Includes loans, equities and guarantees, excludes EIB’s mandates to EIF. 8


The EIB’s lending policies establish minimum credit quality levels for both borrowers and guarantors in lending oper-ations, and identify the types of security that are deemed acceptable. In analysing risks, the Bank applies an internal loan grading system and assigns internal ratings to coun-terparties. In addition, via a counterparty and sector limit system, the credit policies ensure sufficient diversification of the loan portfolio. The Bank has established sector lim-its for its ten largest industries, and monitors the exposure to twelve additional industries. Limits are set based on the stressed capital requirements of the aggregated exposure to an industry in the event of a downturn. in sources and tenors of funding underpins the Bank’s funding strategy. In 2017, the EIB issued bonds in 15 cur-rencies, of which three in the synthetic format. 4.1. Maturity mix of EIB’s funding • The average maturity of funding was 8.1 years, higher than in 2016 (7.1 years), while remaining in line with historical levels and current ALM needs. EUR issuance typically provides the longest average maturity among the Bank’s core currencies, and in 2017 the average maturity increased to 11.4 years in EUR. This was driven by several issuances at the long and very long end including: a EUR 3bn 16-year EARN, a EUR 1bn tap of the April 2032 EARN, the issue of a EUR 1bn 30-year Ecoop Climate Awareness Bond (CAB) and taps of Ecoop issues in the 20-30 year range totalling EUR 1.75bn. The average maturity of USD decreased slightly to 5.1 years, which was partially counterbalanced as the average maturity of GBP funding increased to 4.8 years. Overall, issuance in non-core currencies offered an average maturity of 6.3 years, similar to the previous year. • Its Statute constrains the EIB to a minimum risk tolerance vis-à-vis foreign exchange risk. The Bank has adopted a similar attitude with regard to market risks arising from its lending and borrowing activities, setting its risk appetite to minimum levels. The main risk categories arising from the Group’s business activities are: • • Credit risk: the risk of loss resulting from client or counterparty default on credit exposures in all forms, including settlement risk; Market risk: the risk of loss arising from exposure to market variables such as interest rates, foreign ex-change rates and equity market prices; Liquidity and funding risk: the risk that the Group is unable to fund assets and meet its obligations, at a rea-sonable price or, in extreme situations, at any price; and Operational risk: the potential loss resulting from in-adequate or failed internal processes, people and sys-tems or from external events. • • Currency Average maturity (years) • 2017 2016 EUR 11.4 9.6 • For more details on financial risk management, see Note U of the Statutory Financial Statements, and the Risk Management Disclosure Report on the EIB’s website. 4.2. Funding in the core currencies 4. Funding activities Issuance in the three core currencies – EUR, USD and GBP – together accounted for 87% of the total volume raised in 2017 (2016: 92%). In total 65% was issued in the benchmark format, compared with 74% in 2016, due to reduced issu-ance in GBP and USD. The funding programme was completed as planned, tak-ing into account the prefunding realised in 2016. The EIB raised EUR 56.4bn in 2017, while the volume raised in 2016 (EUR 66.4bn) included EUR 3.8bn of funds raised for the 2017 funding programme. By raising long-term funds through bond issuance in the international capital mar-kets, the Bank supports its lending operations. Funding activities aim to reach set volume targets, to attain the maturities needed for the Bank’s asset and liability man-agement, and to optimise the cost on a sustainable basis. The EIB achieves these goals by combining the issuance of large and liquid bonds (“benchmarks”) in its three core currencies – EUR, USD and GBP – with targeted and tailor-made issues across a number of currencies. Diversification • EUR: In EUR, the Bank provides benchmark issues (typi-cally in the EUR 3-5bn range) in the Euro Area Reference Note (EARN) format, complemented by issuance in the Ecoop format. Overall the Bank raised EUR 26.3bn in euro, representing 47% of total funding, slightly less than the previous year (2016: EUR 29.2bn; 44%). With its EARN issuance the Bank focused on the long end of the curve, responding to investor demand, 9 GBP 4.8 4.5 USD 5.1 5.3 Others 6.3 6.2 Total 8.1 7.1


Preface and provided four new benchmarks over the course of the year for a total of EUR 16.0bn (in the 6.5-, 7-, 10-, and 16-year tenors). The order books of the issues were heavily oversubscribed, reflecting strong de-mand. The Bank somewhat reduced its issuance in the Ecoop format, from EUR 10.0bn in 2016 to EUR 8.8bn in 2017. • GBP: The Bank remains a leading issuer in GBP, fund-ing GBP 3.45bn in the currency in 2017 (the EUR equivalent of 4.0bn). Supranational and sovereign GBP volumes, excluding the UK Debt Management Office, were lower than in 2016, but in spite of politi-cal turbulence and with fewer active issuers markets remained resilient. Over the course of the year, the EIB launched nine transactions, adding a new GBP 1bn 3-year benchmark and a GBP 500m 6 year line to its GBP curve. Additionally, the EIB launched a public tender offering an exchange of its February 2019 and its September 2021 for GBP 250m. • USD: Overall, the EIB issued the EUR equivalent of 18.8bn in USD, accounting for 33% of its total funding vs. 37% in 2016. The market environment has been overall supportive for USD issuance and the EIB bene-fited from a limited supply of supranational and agen-cy USD paper. The Bank is a leading issuer, and raised USD 17.5bn (the EUR equivalent of 16.0bn) in the Glob-al format through six new lines in 2017. Notably, the EIB launched its first-ever USD dual-tranche bond, consist-ing of a 3-year USD 3bn Global due August 2020 and a 10-year USD 1.5bn Global CAB maturing May 2027. Moreover, induced by investor demand, the Bank also issued USD 1.95bn of floating rate notes in 2017. 2017 2016 Currency Amount in EUR bn equivalent Amount in EUR bn equivalent EUR 26.3 29.2 Funding programme by type and currency Benchmark EUR 30% Benchmark GBP 7% Benchmark USD 28% Other EUR public deals (Ecoop) 16% Other plain vanilla (all currencies) 16% Structured 3% 2017 EUR GBP USD 2016 EUR GBP USD 47% 7% 33% 44% 12% 37% Others 13% Others 7% 10 GBP 4.0 7.7 USD 18.8 24.5 Others 7.3 5.0 Total 56.4 66.4


4.3. EIB funding in non-core currencies • The Bank remains a leading supranational and agency issuer in Swedish and Norwegian krone. SEK issuance rose to 9.7bn (EUR 1.0bn), with almost half supplied in the CAB format driven by green investor demand. NOK volumes shrunk somewhat to 6.9bn (the EUR equivalent of 752m) as international investors substi-tuted NOK for higher-yielding currencies. The EIB’s currency diversification policy enhances the flex-ibility of funding and enables the Bank to obtain cost ad-vantages and meet disbursement needs in local currencies. In 2017, the EIB issued bonds in 15 currencies, of which three in the synthetic format (2016: 16 currencies, of which three in the synthetic format). In terms of volume, non-core currency issuance increased significantly from EUR 5.0bn to EUR 7.3bn in 2017, accounting for 13% of total funding for the year (2016: 7%). • The volumes of structured issuance were modest, contributing EUR 1.5bn (2016: EUR 1.7bn) and repre-senting 3% of total funding (2016: 3%). • Turkish lira provided the largest volumes of the non-core currencies, with TRY 7.4bn (the EUR equivalent of 1.9bn). Demand for the EIB’s TRY paper intensified due to double-digit yields, and most of the issuance fo-cused on tenors of 5 years or shorter. • The Bank delivered a number of synthetic-currency transactions in BRL, IDR and INR for an aggregate of EUR 1.0bn, twice the amount issued in 2016 (EUR 0.5bn). 2017 • The Bank continued to develop its benchmark issu-ance in Polish zloty, adding a new PLN 1.5bn bench-mark line due May 2024 and tapping its outstanding issues. In aggregate the Bank raised PLN 5.2bn (the EUR equivalent of 1.2bn). The EIB has positioned itself as a leading issuer of PLN debt, second only to the Re-public of Poland, and is committed to building a Pol-ish zloty yield curve. Currency Amount in EUR bn equivalent TRY 1.85 PLN 1.20 AUD 1.10 SEK 1.00 MXN 0.75 NOK 0.75 • Australian dollar supranational and agency issuance was strongly boosted in 2017. The EIB was able to nearly double the AUD amount issued compared with the previous year, supplying AUD 1.6bn (the EUR equivalent of 1.1bn). In addition, the Bank provided its first CAB in the Kangaroo format with an issue matur-ing in February 2028. ZAR 0.54 RUB 0.14 2017 TRY PLN AUD SEK NOK MXN ZAR RUB JPY 2016 NOK SEK PLN ZAR AUD TRY CAD MXN HUF JPY 25% 16% 15% 14% 10% 10% 7% 2% 1% 19% 16% 13% 13% 12% 10% 7% 7% 2% 1% 11 JPY 0.01 Total 7.34


Preface 100 2% 2% 1% 4.4.Green bonds • The EIB remained the largest supranational green bond issuer during 2017. It issued EUR 4.3bn of Cli-mate Awareness Bonds (CABs) (2016: EUR 3.8bn). As of 31 December 2017, the Bank had supplied EUR 19.4bn in CABs since 2007 across 11 currencies and retained the title as the largest overall issuer in the global green bond market. 80 60 40 20 • To mark the 10th anniversary of the world’s first green bond, the EIB’s pioneering 2007 issue, the Bank launched the market’s longest green bond bench-mark – a EUR 1bn Ecoop CAB due November 2047. This bond provides a fifth reference point to the Bank’s EUR Green Bond curve (remaining maturities of the other lines are 2-, 6-, 9-and 20-years). 0 2015 Europe 2016 Americas 2017 Middle East & Africa Asia 4.6. Investor types • In 2017, the Bank also added a USD 1.5bn Global CAB due 2027, and launched an inaugural AUD 200m Kan-garoo CAB issue due 2028. • Bank treasuries continue to attract the bulk of de-mand, accounting for 42%, while their overall share shrank compared to the previous year. • In the course of the year, EUR 4.4bn of disbursements were found to be eligible for allocation of proceeds from CAB issuance, and EUR 4.4bn of CAB proceeds were allocated to such disbursements following the EIB’s allocation procedures (EUR 4.1bn in 2016). The balance of unallocated CAB proceeds in the treasury CAB portfolio amounted to EUR 1.2bn at the begin-ning of the year and to EUR 1.1bn at the end of the year. • Real money investors (such as fund managers/insur-ers and pension funds) maintained stable demand overall, while seeking additional yield opportunities in the EIB’s non-core currencies. • Central banks’ share of demand remained constant at 28%. This investor type displayed increased appetite for the Bank’s EUR issuance in particular – up to 22% from 17% – and maintained a significant share of the EIB’s USD benchmark issue. • The EIB supports best practices in the market, through the Green Bond Principles (GBPs) and as a facilitator of dialogue across geographies between climate policy experts and capital market practitioners. In Novem-ber 2017 the Bank published a White Paper entitled “The need for a common language in Green Finance” – co-authored with the Green Finance Committee (GFC) of the China Society for Finance and Banking – which provides a comparison of green bond stand-ards and paves the way for enhancing the consistency of green finance definitions. In addition, the EIB has participated as an observer in the High Level Expert Group on sustainable finance (HLEG), set up by the European Commission, where it has in particular pro-vided technical advice on the classification of climate change mitigation assets. • The share of demand stemming from other investors (including corporates and retail investors) grew from 4% in 2016 to 7% in 2017, with demand focused espe-cially on the EIB’s non-core issuance. 100 80 60 4.5.Geographic highlights 40 Europe maintained its position as a principal source of in-vestor demand, representing 66% (68% in 2016). Asian in-vestor interest slightly increased, with strong demand emerging especially for the Bank’s EUR issues and for some non-core currencies, leading to a slight increase in overall demand from Asian accounts. Additionally, US de-mand for the Bank’s USD issues intensified. 20 0 2015 2016 2017 Bank treasury Fund managers/insurance/pension Central bank/gov’t institution Corporate/retail/other 12 6%4% 7% 28% 23% 42% 27% 15% 52% 28% 23% 45% 14% 21% 63% 11% 19% 68% 12% 21% 66%


monetary policy operations of the European Central Bank. This access has been activated, albeit at low levels, in a continuous manner to ensure its permanent operational maintenance. These operations are conducted via the Central Bank of Luxembourg, where the EIB maintains a deposit to cover minimum reserve requirements. The abil-ity to repo ECB-eligible collateral adds substantially to the EIB’s liquidity buffer. 5. Treasury activities 5.1. High-quality assets Treasury management has the dual role of ensuring that the Bank has the capacity to continually meet its financial commitments and of implementing the Bank’s asset and liability policy. Funds are invested in designated portfolios with defined criteria based on a low-risk strategy of diver-sification. The Bank’s portfolio management must at all times comply with the guidelines, prudential limits and in-dicators laid down by the EIB’s governing bodies. The Bank’s treasury exposure to EU sovereigns, excluding loan substitutes, was EUR 17.8bn at end-2017, representing 25% of total treasury assets (2016: EUR 25.2bn and 30% re-spectively). The vast majority of this exposure was held in short-term instruments of less than twelve months (89% at end-2017 compared with 91% at end-2016). At end-2017, the operational treasury included the follow-ing portfolios: 5.3.Treasury financial result in 2017 • Treasury Monetary Portfolio (TMP), designed for daily liquidity management; The market environment continued to be impacted by negative euro interest rates for short and medium tenors, which meant that investment opportunities meeting re-quirements in terms of tenors, credit quality and liquidity remained challenging to identify. The financial income from treasury portfolios for the year was EUR 259m (2016: EUR 201m), with an average rate of return on the Bank’s treasury of 0.5% (2016: 0.4%). • Securities Liquidity Portfolio (SLP), which invests in the currencies EUR, GBP and USD and aims to provide diversification while enhancing the return on treasury assets. Operating under the constraint of holding 75% in ECB-eligible assets, the SLP also serves as an addi-tional line of liquidity; and • Long-Term Hedge Portfolio (LTHP), which serves as an asset and liability management (ALM) tool, targeting high-quality EUR-denominated assets. 5.4. Asset and liability management The interest rate, foreign exchange rate and basis risk posi-tion of the Bank’s assets and liabilities are managed within prescribed limits. This involves rebalancing the various risk profiles through the use of standard derivative instru-ments to achieve a target exposure of the managed risk factors. The ALM policy aims at ensuring self-sustainability of the Bank’s business and growth of own funds. At year-end, the bulk of these assets (89%) were held in the Treasury Monetary Portfolio invested in short-term in-struments with a maturity of up to one year. For a break-down of the credit exposure of the treasury portfolio, please refer to the notes of the Statutory Financial State-ments of the Bank. 5.2. Prudent liquidity management 6. Corporate responsibility and sustainability Treasury activities are conducted with the primary objec-tive of protecting the capital invested and ensuring that the Bank can meet its payment obligations on time and in full. Liquidity is consistently maintained within the set pru-dential limits in order to cater to the EIB’s operating envi-ronment. The EIB appraises and selects the investment projects it fi-nances based on certain criteria, including sustainability credentials such as their environmental, social and gov-ernance aspects. Certain activities are completely exclud-ed from EIB financing, and investment projects need to observe EIB environmental and social principles and standards. Furthermore, the Bank makes an economic ap-praisal of the investment projects to assess the costs and benefits to society as a whole. At year-end 2017 total treasury assets amounted to EUR 72.1bn (2016: EUR 83.5bn) and the Bank’s total liquidity ra-tio stood at 74% (2016: 75%), in excess of the minimum li-quidity requirement of 25%18. The Liquidity Coverage Ratio stood at 201% at the end of the year (2016: 199%). As an eligible counterparty in the Eurosystem’s monetary policy operations, the EIB also benefits from access to the 18 The minimum liquidity ratio is 25% of the forecast net cash outflows for the fol-lowing 12 months. 13


Preface To provide an overview of the EIB’s operations and im-pacts as they relate to the Bank’s objective of supporting smart, sustainable and inclusive growth, the Bank issues annually a sustainability report. The report is prepared in accordance with the Global Reporting Initiative (GRI) Standards’ “comprehensive” option and is subjected to a limited assurance review by its external auditors. It should be read in conjunction with the annually published Sus-tainability Reporting Disclosures. Both documents are available on the Bank’s website. EUR 3,595.0m period on period). The volatility of the consolidated result under IFRS is primarily explained by the application of the Fair Value Option (“FVO”). Additional information on the FVO is provided under Notes A and M of the EIB Group Consolidated Finan-cial Statements under IFRS. 7.3. Implementation of IFRS 9 The Bank is in the process of implementing IFRS 9 “Fi-nancial Instruments”. This Standard has mandatory application by 1 January 2018. The following two fea-tures introduced by the Standard have been identi-fied as particularly impacting the EIB Group Consolidated Financial Statements under IFRS: 7. EIB Group financial performance19 The EIB Group consists of the European Investment Bank, the European Investment Fund (“EIF”) and the EU Microfi-nance Platform FCP FIS (“EUMPF”). • The first concerns the application of hedge ac-counting. With the implementation of IFRS 9 the Bank plans to designate a significant part of its borrowings and loans, hedged by swaps on a mi-cro level, from FVO to hedge accounting, apply-ing the less complex requirements introduced by IFRS 9. It is expected that the application of hedge accounting could reduce to a certain ex-tent the volatility connected with the current use of the FVO. 7.1. EIB consolidated financial statements under EU Accounting Directives The EUR 2017EU-AD consolidated 2,858.6m as compared to resultstandsat a net surplus of EUR 2,926.4m for 2016 (negative variance of EUR 67.8m or -2.3% year on year). It is closely aligned to the statutory surplus as the consolidated EU-AD result is almost wholly driven by the EIB unconsolidated result. • The second main impact relates to the introduc-tion of a new impairment concept, which requires the development of a forward-looking expected loss model for all of the EIB’s financial instruments not measured at fair value under IFRS 9. Depend-ing on the increase in its credit risk since origina-tion, a transaction has to be accounted for at either one-year or lifetime expected loss calculat-ed on a point-in time basis. As at 31 December 2017, the total Group Balance Sheet stood at EUR 551.0bn, showing a decrease of EUR 23.5bn as compared to 31 December 2016. 7.2. EIB consolidated financial statements under IFRS For further details of the impact of the IFRS 9 imple-mentation and quantitative analysis, please refer to Note A of the EIB Group Consolidated Financial State-ments under IFRS. The 2017 IFRS consolidated positive result stands at EUR 3,318.0m as compared to a negative result of EUR 277.0m observed in 2016 (i.e. a positive variance of 19 This covers the Consolidated Financial Statements of the EIB Group prepared in accordance with the EU Accounting Directives and with the International Finan-cial Reporting Standards. 14


EIB Statutory Bodies Situation at 25 April 2018 The composition of the Bank's statutory bodies, the curricula vitae of their members and additional information on the remuneration arrangements are regularly updated and posted on the EIB's website: www.eib.org. Board of Governors Chairman Belgium Bulgaria Czech Republic Denmark Germany Estonia Ireland Greece Spain Mário CENTENO Johan Van OVERTVELDT Vladislav GORANOV Alena SCHILLEROVÁ Brian MIKKELSEN Olaf SCHOLZ Toomas TÕNISTE Paschal DONOHOE, T.D. Euclid TSAKALOTOS Román ESCOLANO (Portugal) Minister of Finance Minister for Finance Minister of Finance Minister for Industry, Business and Financial Affairs Federal Minister of Finance Minister for Finance Minister for Finance Minister for Finance Minister for Economic Affairs, Industry and Competitiveness Minister of Economy and Finance Minister of Finance Minister of Economy and Finance Minister of Finance Minister of Finance Minister of Finance Minister of Finance Minister for National Economy Minister for Finance Minister of Finance Federal Minister of Finance Minister of Finance Minister of Finance Minister of Public Finance Minister of Finance Minister of Finance Minister of Finance Minister for Finance Chancellor of the Exchequer France Croatia Italy Cyprus Latvia Lithuania Luxembourg Hungary Malta Netherlands Austria Poland Portugal Romania Slovenia Slovakia Finland Sweden United Kingdom Bruno LE MAIRE Zdravko MARIC Pier Carlo PADOAN Harris GEORGIADES Dana REIZNIECE-OZOLA Vilius ŠAPOKA Pierre GRAMEGNA Mihály VARGA Edward SCICLUNA Wopke HOEKSTRA Hartwig LÖGER Teresa CERWINSKA Mário CENTENO Eugen Orlando TEODOROVICI Mateja Vranicar ERMAN Peter KAŽIMIR Petteri ORPO Magdalena ANDERSSON Philip HAMMOND Audit Committee Chairman Members Pierre KRIER Duarte PITTA FERRAZ Former PwC Audit Partner, Luxembourg Professor, Nova School of Business and Economics, Lisbon Senior Adviser, Financial Conduct Authority, London General Counselor, Ministry of Finance, Warsaw John SUTHERLAND Jacek DOMINIK Mindaugas MACIJAUSKAS Director of Audit Development Department, National Audit Office of Lithuania, Vilnius Vasile IUGA Uldis CERPS Former PwC Audit Partner, Bucharest Advisor of Banking Supervision to the Governor Central Bank of the United Arab Emirates, Abu-Dhabi Deputy Director, Life-Assurance Division, Danish Financial Supervisory Authorities (DFSA), Copenhagen Observer Jens Henrik Myllerup LAURSEN Management Committee President Werner HOYER Vice-PresidentsDario SCANNAPIECO Jonathan TAYLOR Ambroise FAYOLLE Andrew McDOWELL Vazil HUDÁK Alexander STUBB 15


Board of Directors The Board of Directors consists of 29 Directors, with one Director nominated by each Member State and one by the European Commission. There are 19 Alternates, meaning that some of these positions will be shared by groupings of states. Furthermore, in order to broaden the Board of Directors’ professional expertise in certain fields, the Board is able to co-opt a maximum of six experts (three Directors and three Alternates), who participate in the Board meetings in an advisory capacity, without voting rights. Directors Marc DESCHEEMAECKER Marinela PETROVA Petr PAVELEK Julie SONNE Thomas WESTPHAL Andres KUNINGAS John A. MORAN Konstantin J. ANDREOPOULOS Carlos SAN BASILIO PARDO Emmanuel MASSÉ Chairman of the Board, De Lijn, Mechelen Deputy Minister of Finance, Ministry of Finance, Sofia Deputy Minister of Finance, Ministry of Finance, Prague Head of Division, Ministry of Industry, Business and Financial Affairs, Copenhagen Director General – European Policy, Federal Ministry of Finance, Berlin Head of EU and International Affairs Department, Ministry of Finance, Tallinn Member of the Board of Directors of the EIB, Dublin Member of the Board of Directors of the EIB, Athens Director General, Treasury, Ministry of Economy, Industry and Competitiveness, Madrid Assistant Secretary, Macroeconomic Policies and European Affairs Department, Directorate-General of the Treasury, Paris Head of Sector for European Union Relations, Ministry of Finance, Zagreb Director General for International Financial Relations, Department of the Treasury, Ministry of Economy and Finance, Rome Senior Economic Officer, Ministry of Finance, Nicosia Deputy State Secretary, Ministry of Finance, Riga Vice-Minister, Ministry of Finance, Vilnius Head of International Financial Institutions Department, Ministry of Finance, Luxembourg Member of the Board of Directors of the EIB, Budapest Advisor to the Minister for Finance, Malta Investments Management Co Ltd, Sliema Head of the International Economics and Financial Institutions Division Ministry of Finance, The Hague European Affairs, Federal Ministry of Finance, Vienna Undersecretary of State, Ministry of Finance, Warsaw Member of the Board of Directors of the EIB, Lisbon Secretary of State, Ministry of Public Finance, Bucharest Head of International Finance Department, Ministry of Finance, Ljubljana CEO, Chief Executive Officer, SZRB Asset Management a.s. (SZRB AM), Bratislava Financial Counsellor, Director of Unit for International Affairs, Financial Markets Department, Ministry of Finance, Helsinki Senior Advisor, Swedish Central Bank, Stockholm Director Europe, Cabinet Office, London Deputy Director-General, Directorate-General for Economic and Financial Affairs (ECFIN), European Commission, Brussels Vladimira IVANDIC Gelsomina VIGLIOTTI Kyriacos KAKOURIS Armands EBERHARDS Migle TUSKIENE Arsène JACOBY László BARANYAY Stanley MIFSUD Mickie SCHOCH Karin RYSAVY Piotr NOWAK Filipe CARTAXO Attila GYÖRGY Andrej KAVCIC Ivan LESAY Kristina SARJO Mattias HECTOR Jonathan BLACK Kerstin JORNA Experts Timothy STONE Independent non-executive director, former Senior Advisor to the Secretary of State for Energy and Climate Change, former Chairman of KPMG, Global Infrastructure & Projects, Essex Member of the Executive Board, KfW Bankengruppe, Frankfurt Advisor “Hors Classe” for Economic Diplomacy, European External Action Service, Brussels Ingrid HENGSTER Angelos PANGRATIS 16


Alternates Rasmus RØNNE-AHM Martin HEIPERTZ Rudolf LEPERS Aija ZITCERE Achilleas TZIMAS Shanti BOBIN Head of Section, Financial Affairs, Copenhagen Head of Division “European Policy”, Federal Ministry of Finance, Berlin Head of Division, Federal Ministry of Economic Affairs and Technology, Berlin Director, Financial Markets Policy Department, Ministry of Finance, Riga Economist – Financial Expert, Directorate General for Economic Policy, Ministry of Finance, Athens Head of Unit, European bilateral relations and financial instruments, Directorate-General of the Treasury, Ministry for the Economy and Finance, Paris General Director, Agence Française de Développement, Paris Head of Sector for international financial relations, Ministry of Finance, Zagreb Director, International Financial Relations Directorate, Department of the Treasury, Ministry of Economic Affairs and Finance, Rome Counsellor to the Minister of Economy and Finance, Ministry of Economic Affairs and Finance, Rome Head of Department for International Finance, Ministry for National Economy, Hungary Director General, Strategy and Operations Support, Ministry for Finance, Valletta Senior Policy Advisor, Foreign Financial Affairs Directorate, Ministry of Finance, Den Haag Deputy Director General, Economic Policy and International Affairs, Ministry of Finance, Lisbon Senior Advisor, International Finance Department, Ministry of Finance, Ljubljana Ministerial Adviser, Financial Markets Department, Ministry of Finance, Helsinki Deputy Director of the European Engagement Team, H.M. Treasury, London Head of Europe Department, Department for International Development, London Director, Directorate-General for Economic and Financial Affairs (ECFIN), European Commission, Luxembourg Rémy RIOUX Silvija BELAJEC Francesca MERCUSA Stefano SCALERA Péter TÁRNOKI-ZÁCH Claude CUSCHIERI Otto de SMETH Rosa CAETANO Mateja DOLINAR Joanna TIKKANEN Jennifer YOUNG Sarah Jane SANYAHUMBI Benjamin ANGEL Alternate experts Philippe MILLS Franco PASSACANTANDO José María MÉNDEZ ÁLVAREZ-CEDRÓN Chief Executive Officer, Société de Financement Local, Paris Member of the Board of Directors of the EIB, Rome General Manager, Confederación Española de Cajas de Ahorros (CECA) & Cecabank S.A., Madrid 17


Audit and control Audit Committee – The Audit Committee is an independ-ent statutory body, appointed by and reporting directly to the Board of Governors, in compliance with the formalities and procedures defined in the Bank’s Statute and Rules of Procedure. The role of the Audit Committee is to verify that the Bank’s operations have been conducted and its books kept in a proper manner and that the activities of the Bank conform to best banking practice. The Audit Committee is responsible for the auditing of the Bank’s ac-counts. The Audit Committee is composed of six members, who are appointed by the Board of Governors for a non-renew-able term of six years. Members are chosen from among persons having independence, competence and integrity and who possess financial, auditing or banking superviso-ry expertise in the private or public sector. In addition, the Board of Governors, on a joint proposal from the President of the Bank and the Chairman of the Audit Committee, may appoint a maximum of three observers for a non-re-newable six-year term, on the basis of their particular qualifications, especially with regard to banking supervi-sion. The Audit Committee provides Statements each year on whether the financial statements, as well as any other fi-nancial information contained in the annual accounts drawn up by the Board of Directors, give a true and fair view of the financial position of the Bank in respect of its assets and liabilities, and of the results of the operations and cash flows for the year then ended of the Bank, the EIB Group, and certain Trust Funds administered by the Bank, namely the Investment Facility, EU-Africa Invest-ment Trust Fund and Neighbourhood Investment Facility (NIF) Trust Fund. The Audit Committee is required to ad-18


Audit and Control dress to the Board of Governors a detailed report on the results of its work during the preceding financial year, in-cluding verification that the activities of the Bank conform to best banking practice applicable to it. catalyst for improving procedures and strengthening con-trols. In support of the Audit Committee’s mandate on best banking practice, Internal Audit includes such assess-ments in all elements of its work. Internal Audit therefore reviews and tests controls in critical banking, information technology and administrative areas on a rotational basis using a risk-based approach. In fulfilling its role, the Audit Committee meets with repre-sentatives of the other statutory bodies, oversees the veri-fication procedures and practical modalities for implementing and maintaining the framework of best banking practices applicable to the Bank’s services, takes note of the work performed by the internal auditors, mon-itors the work of the external auditors in relation to the fi-nancial statements, safeguards the independence of the external audit function and coordinates audit work in gen-eral. Regular meetings with Bank staff and reviews of in-ternal and external reports enable the Audit Committee to understand and monitor how Management is providing for adequate and effective internal control systems, risk management and internal administration. The Inspector General, the Head of Internal Audit, the Director General of Risk Management, the Chief Compliance Officer and the Financial Controller have direct access to the Audit Committee and may request private meetings if necessary. Inspectorate General – The Inspectorate General (IG) comprises, under the authority of the Inspector General, three independent control and accountability functions: Operations Evaluation. Operations Evaluation (EV)’s man-date is to assess the EIB Group’s activities in order to identi-fy aspects that could improve operational performance, accountability and transparency. EV focuses on the quality and the results of the EIB Group’s activities within the framework of relevant EU policies and the decisions of the EIB’s Governing Bodies. To do so, EV independently and systematically carries out ex-post and mid-term evalua-tions of individual projects, sector-wide policies, pro-grammes, partnerships and financing instruments of the EIB Group. Evaluations are conducted using internationally accepted evaluation criteria (relevance, effectiveness, effi-ciency and sustainability) and also assess the EIB Group’s financial and non-financial contributions. External auditors – The EIB’s external auditors, KPMG, re-port directly to the Audit Committee, which is empow-ered to delegate the day-to-day work of auditing the fi-nancial statements to them. The external auditors are not allowed to carry out any work of an advisory nature or act in any other capacity that might compromise their inde-pendence when performing their audit tasks. A summary of services provided by the external auditors and the as-sociated fees is published each year by the Bank on its website. Investigation. Under the EIB’s Anti-Fraud Policy approved by the Board, the Inspectorate General, through the Fraud Investigations Division (IG/IN), is the sole office mandated to conduct independent investigations into allegations of possible fraud, corruption, collusion, coercion, obstruction, money laundering or terrorism financing involving EIB op-erations or activities. IG/IN may also call upon external as-sistance or experts in accordance with the requirements of the investigation, and works closely with the services of the European Anti-Fraud Office (OLAF). The scope of activi-ties also encompasses a proactive anti-fraud approach – the Proactive Integrity Reviews (PIRs). Through PIRs the Inspectorate General supports the Bank’s efforts to moni-tor projects, identify red flags and search for possible indi-cators of fraud and/or corruption. Projects are selected for PIRs independently by IG/IN on the basis of a risk assess-ment process. Moreover, IG/IN is working to implement Ex-clusion Procedures to exclude entities found to have engaged in fraud or corruption. Additionally, IG/IN coordi-nates with Personnel on the delivery of fraud awareness training for Bank staff and provides input into the develop-ment/review of policies and contractual clauses, drawing on lessons learned from investigations. Financial Control – Financial Control (FC) is an independ-ent Directorate and reports directly to the Bank’s Manage-ment Committee. FC’s main responsibilities relate to the Bank’s books and records and its various financial state-ments. Furthermore, Financial Control’s role in relation to the Bank’s Internal Control Framework (ICF) has recently been strengthened, incorporating additional capabilities and resources. Together with the Secretary General, the Financial Controller manages the relationship with the ex-ternal auditors, the Audit Committee and the European Court of Auditors. Internal Audit – As an independent function Internal Au-dit reports directly to the President. It caters for audit needs at all levels of management of the EIB Group and acts with the guarantees of independence and profession-al standards conferred upon it by its Charter. Internal Au-dit examines and evaluates the relevance and effectiveness of the internal control systems and the pro-cedures involved in managing risk within the Group. Ac-tion Plans agreed with the Bank’s departments are a Complaints Mechanism. The EIB Complaints Mechanism, as defined by its published Principles, Terms of Reference and Rules of Procedure, is a tool of horizontal accountabil-ity of the EIB Group vis-à-vis its stakeholders as regards the handling of complaints concerning its activities. It en-19


sures that stakeholders have appropriate means available to voice their concerns and aims to provide the public with procedures to enable the pre-emptive settlement of disputes between the public and the EIB Group. Any member of the public has access to a two-tier sequential mechanism: an internal part – under the responsibility of the Complaints Mechanism Division (EIB-CM) – and, if a complainant is not satisfied with the outcome of the inter-nal mechanism, an external one – the European Ombuds-man. To that end, the EIB and the European Ombudsman have signed a Memorandum of Understanding. OCCO activities are currently focused on the following main areas: 1. the assessment of money laundering, financing of ter-rorism and related integrity risks in EIB lending, bor-rowing and treasury activities; 2. the establishment and updating of policies and guide-lines, with particular reference to (i) anti-money laun-dering/combating the financing of terrorism (AML-CFT); (ii) specific transparency/integrity risks (e.g. for operations linked to non-compliant jurisdictions); and (iii) primary ethics and regulatory issues (e.g. in-sider dealing, conflicts of interest, etc.); Office of the Group Chief Compliance Officer (OCCO) – In accordance with the principles set out by the Basel Committee, OCCO’s remit is: “to identify, assess, advise on, monitor and report on the compliance risk of the EIB Group, that is, the risk of legal or regulatory sanctions, financial loss, or loss to reputation a member of the EIB Group may suffer as a result of its failure to comply with all applicable laws, regu-lations, staff codes of conduct and standards of good prac-tice.” In particular, OCCO “acts as a first line detector of potential incidents of non-observance or breaches by the staff of the rules on ethics and integrity, monitors compliance therewith by the staff of the EIB Group and recommends the adoption of such protective or redressing measures as are ap-propriate.” 3. ongoing AML-CFT monitoring of counterparties and operations, including counterparty screening and, where appropriate, assessment of specific patterns of transactions; 4. administration of (i) the Staff Code of Conduct and (ii) the Management Committee Code of Conduct, except for matters within the remit of the Ethics and Compli-ance Committee (where the GCCO delivers opinions and participates without voting rights); and 5. controls on procedures related to procurement for the Bank’s own account. OCCO is a group function headed by the Group Chief Compliance Officer (GCCO), supported by a dedicated compliance unit at the EIF. As set out in the EIB Integrity Policy and Compliance Charter, in line with best banking practice and the Basel Committee, OCCO is an independ-ent function “reporting directly to the President of the EIB un-der the functional authority of a Vice-President”. The above activities are complemented by regular training and awareness-building initiatives (AML-CFT training; presentations of OCCO activities to newcomers and mem-bers of the EIB’s Governing Bodies; presentations and workshops on main OCCO policies and general compli-ance issues), in order to ensure staff awareness and, when-ever possible, involvement in OCCO control activities for the timely detection and management of compliance risks within the EIB Group. OCCO is entrusted with a control mission and acts in close cooperation with EIB operational services, the Legal Direc-torate and other control services such as IG/Investigations. Regular contacts are held by the GCCO with peer interna-tional financial institutions (such as the World Bank, the EBRD and the IFC), EU bodies, standard-setting interna-tional organisations (e.g. FATF) as well as civil society or-ganisations (such as NGOs) in order to enable ongoing alignment of OCCO activities with relevant international standards and best banking practice. Management control – Within the Secretariat General, the Planning, Budget and Analytics Division brings to-gether key functions responsible for management control – namely, operational planning, budget/cost accounting and associated analyses. This structure ensures that the overall planning and management reporting processes are coordinated and support the achievement of the Bank-wide objectives and ultimately that the results achieved are monitored. Key tools include the Operational Plan, the budget and independent opinions and analysis on proposals affecting them, plus the associated manage-ment accounting and control systems. A suite of integrat-ed reports facilitates ongoing evaluation of the situation in relation to the operational strategy (including financial objectives). 20


EIB Statutory Financial Statements 21 EIB Statutory Financial Statements as at 31 December 2017


Balance sheet as at 31 December 2017 (in EUR ’000) Assets 31.12.2017 31.12.2016 Total assets 549,543,731 573,230,935 The accompanying notes form an integral part of these financial statements. 22 1.Cash in hand, balances with central banks and post office banks (Note B.1) 2.Treasury bills and other bills eligible for refinancing with central banks (Note B.2) 3.Loans and advances to credit institutions a) repayable on demand b) other loans and advances (Note C) c) loans (Note D.1) 4.Loans and advances to customers a) other loans and advances (Note C) b) loans (Note D.1) c) value adjustments (Note D.2) 5.Debt securities including fixed-income securities (Note B.2) a) issued by public bodies b) issued by other borrowers 6.Shares and other variable-yield securities (Note E.1) 7.Participating interests (Note E.1) 8.Shares in affiliated undertakings (Note E.2) 9.Intangible assets (Note F) 10. Tangible assets (Note F) 11. Other assets (Note G) Subscribed capital and reserves, called but not paid (Note 12. H.3) 13. Prepayments and accrued income (Note I) 162,483 40,391,561 764,073 33,753,676 121,511,896 316,769 50,456,265 661,809 35,180,699 124,213,824 160,056,332 2,219,989 310,256,151 -533,147 311,942,993 8,651,141 6,940,211 15,591,352 3,892,546 168,637 875,209 16,219 272,378 54,230 77,950 29,510,055 156,029,645 1,741,983 313,582,772 -457,603 314,867,152 7,024,316 8,328,847 15,353,163 4,715,722 238,486 836,653 21,264 264,900 52,568 25,983 16,584,151


EIB Statutory Financial Statements Balance sheet (continued) as at 31 December 2017 (in EUR ’000) Total liabilities 549,543,731 573,230,935 The accompanying notes form an integral part of these financial statements. 23 Liabilities 1.Amounts owed to credit institutions (Note J) a) repayable on demand b) with agreed maturity or periods of notice 2.Amounts owed to customers (Note J) a) repayable on demand b) with agreed maturity or periods of notice 3.Debts evidenced by certificates (Note K) a) debt securities in issue b) others 4.Other liabilities (Note G) 5.Accruals and deferred income (Note I) 6.Provisions a) pension plans and health insurance scheme (Note L) b) provision for guarantees issued in respect of loans granted by third parties 7.Subscribed capital (Note H) a) subscribed b) uncalled 8.Reserves (Note H) a) reserve fund b) additional reserves c) special activities reserve d) general loan reserve 9.Profit for the financial year 31.12.2017 31.12.2016 4,953,852 57,475 12,425,692 694,221 13,119,913 1,927,330 25,030 1,952,360 455,660,830 15,261,807 470,922,637 1,204,290 17,456,674 2,381,458 13,670 2,395,128 243,284,155 -221,585,020 21,699,135 24,328,415 7,214,264 6,776,060 3,305,458 41,624,197 2,856,601 5,011,327 1,922,589 8,349 1,930,938 435,730,418 13,854,945 449,585,363 919,412 20,482,791 2,620,147 8,109 2,628,256 243,284,155 -221,585,020 21,699,135 24,328,415 9,947,736 7,504,091 2,700,556 44,480,798 2,805,711


Off balance sheet as at 31 December 2017 (in EUR ’000) The accompanying notes form an integral part of these financial statements. 24 31.12.2017 31.12.2016 Commitments: - EIF capital uncalled (Notes E.2, X) - Undisbursed loans (Note D.1) - credit institutions - customers - Undisbursed shares and other variable-yield securities - Undisbursed venture capital operations (Note E.1) - Undisbursed investment funds (Note E.1) - EBRD capital uncalled (Note E.1) - Undisbursed participating interests - Undisbursed venture capital operations (Note E.1) - Securities receivable - Borrowings launched but not yet settled Contingent liabilities and guarantees: - In respect of loans granted by third parties Assets held on behalf of third parties (Note Z): - Investment Facility - Cotonou - Guarantee Fund - NER300 - EIF - JESSICA (Holding Funds) - InnovFin - RSFF (incl. RSI) - EU-Africa Infrastructure Trust Fund - CEF (incl. former PBI and LGTT) - Funds of Funds (JESSICA II) - GF Greece - Special Section - ENPI - AECID - DCFTA - FEMIP Trust Fund - NIF Trust Fund - HIPC - Private Finance for Energy Efficiency Instrument - EPTA Trust Fund - NIF Risk Capital Facility - IPA II - EFSI-EIAH - Natural Capital Financing Facility - RDI Advisory - JASPERS - Fi-compass Other items: - Nominal value of interest-rate swaps incl. commitment (Note V.1.2) - Nominal value of currency swap contracts payable - Nominal value of currency swap contracts receivable (Note V.1.1) - Nominal value of short-term currency swap contracts receivable (Note V.2) - Nominal value of short-term treasury currency swap contracts payable - Put option granted to EIF minority shareholders (Note E.2) - Currency forwards (Note V.2) - Currency swaps launched but not yet settled payable - Currency swaps launched but not yet settled receivable (Note V.1.1) - Special deposits for servicing borrowings (Note S) 2,104,800 28,886,186 84,035,696 2,099,200 29,905,563 83,395,374 113,300,937 4,784,377 1,113,939 712,630 6,610,946 556,472 556,472 109,100 223,950 6,779,075 2,870,139 2,506,053 2,106,441 1,285,949 1,396,000 697,996 839,290 647,629 492,898 203,350 305,234 362,234 142,089 76,958 0 48,811 48,691 35,438 17,988 22,205 19,816 17,778 8,868 11,150 5,762 2,237 2,555 14,173,559 523,352,665 198,881,468 212,232,364 46,311,642 45,328,388 753,544 666,973 0 0 3,001 112,921,882 4,836,072 2,649,089 712,630 8,197,791 558,349 558,349 419,864 279,008 9,121,399 3,024,653 2,560,762 2,086,410 1,259,389 975,912 941,251 762,989 594,869 523,636 419,539 307,794 301,039 124,540 71,766 53,074 49,128 46,485 35,408 31,235 22,754 19,546 18,435 13,973 11,757 1,156 814 0 14,258,314 510,007,074 205,439,795 203,935,206 43,942,480 43,909,464 813,042 584,605 144,078 142,263 34,411


EIB Statutory Financial Statements Profit and loss account for the year ended 31 December 2017 (in EUR ‘000) 12. Profit for the financial year 2,805,711 2,856,601 The accompanying notes form an integral part of these financial statements. 25 2017 2016 1.Interest receivable and similar income (Note N) 2.Interest payable and similar charges (Note N) 3.Income from securities a) income from shares and other variable-yield securities b) income from shares in affiliated undertakings 4.Commissions receivable (Note O) 5.Commissions payable (Note O) 6.Net result on financial operations (Note P) 7.Other operating income (Note Q) 8.General administrative expenses (Note R) a) staff costs (Note L) b) other administrative expenses 9.Value adjustments in respect of tangible and intangible assets (Note F) a) tangible assets b) intangible assets 10. Value (re-)adjustments in respect of transferable securities held as financial fixed assets, participating interests and shares in affiliated undertakings 11. Value (re-)adjustments in respect of loans and advances and provisions for contingent liabilities 23,386,075 -20,126,260 307,741 16,120 22,158,844 -18,846,048 218,292 16,659 234,951 180,451 -101,840 -36,869 14,202 -547,434 -243,627 -791,061 -28,164 -6,651 -34,815 -8,174 86,960 323,861 208,564 -153,929 19,786 22,311 -666,839 -239,104 -905,943 -31,726 -7,388 -39,114 -1,923 72,283


Cash flow statement for the year ended 31 December 2017 (in EUR ‘000) 2017 2016 A. Cash flows from operating activities: B. Cash flows from investing activities: C. Cash flows from financing activities: Summary statement of cash flows: Net cash from: Cash and cash equivalents are composed of: The accompanying notes form an integral part of these financial statements. 26 Cash in hand, balances with central banks and post office banks, excluding deposits with Central Bank of Luxembourg to cover minimum reserve requirement (Note B.1) Money market securities maturing within three months of issue Loans and advances to credit institutions and customers: Repayable on demand Other loans and advances (Note C) 35 18,863,479 764,073 31,822,614 35 23,483,405 661,809 30,440,939 51,450,201 54,586,188 Operating activities Investing activities Financing activities Effect of exchange rate changes on cash held -2,487,993 -337 639,742 -1,287,399 695,865 -1,533,016 5,041,228 345,537 Cash and cash equivalents at end of financial year 51,450,201 54,586,188 Cash and cash equivalents at beginning of financial year 54,586,188 50,036,574 Issuance of debts evidenced by certificates Redemption of debts evidenced by certificates Member States’ contribution 123,643,914 -123,056,139 51,967 165,543,970 -160,554,709 51,967 Net cash used from/(used in) financing activities 639,742 5,041,228 Purchase of EIF shares Sale of EIF shares Reflows on EUMPF Securities in Long Term Hedge Portfolio purchased during the year Securities from Long Term Hedge Portfolio matured during the year Purchase of loan substitutes included in the debt securities portfolios Redemption of loan substitutes included in the debt securities portfolios Additions on shares and other variable-yield securities Reflows on shares and other variable-yield securities Additions on participating interests Reflows on participating interests Purchase and disposals of tangible and intangible assets -5,499 2,550 42,227 0 13,500 -4,157,147 4,973,366 -1,469,381 708,500 -76,663 4,891 -36,681 0 3,198 22,514 -105,529 1,593,000 -5,315,458 3,045,166 -1,073,707 524,141 -184,211 0 -42,130 Net cash used from/(used in) investing activities -337 -1,533,016 Profit for the financial year Adjustments for: Value (re-)adjustments in respect of loans and advances and provisions for contingent liabilities Value adjustments in respect of tangible and intangible assets Value (re-)adjustments in respect of shares, other variable-yield securities and participating interests Net interest income Effect of exchange rate changes 2,805,711 -72,283 39,114 -60,372 -3,259,815 28,213 2,856,601 -86,960 34,815 49,606 -3,312,796 228,786 Profit on operating activities -519,432 -229,948 Disbursements of loans and advances to credit institutions and customers Repayments of loans and advances to credit institutions and customers Change in deposits with central banks Change in treasury securities liquidity portfolios Change in amounts owed to credit institutions and customers Change in provisions on pension plans and health insurance scheme Change in provisions for commitment on investment funds and guarantees issued Change in short term treasury derivative valuations Change in other assets and other liabilities Interest received Interest paid -48,647,645 47,348,351 154,286 4,295,037 -8,130,008 238,689 -5,561 -25,469 -257,747 21,611,051 -18,549,545 -54,296,197 52,245,406 -110,672 -872,662 -2,448,271 183,541 909 -34,206 469,652 22,395,282 -16,606,969 Net cash used from/(used in) operating activities -2,487,993 695,865


EIB Statutory Financial Statements European Investment Bank Notes to the financial statements as at 31 December 2017 The European Investment Bank (the ‘Bank’ or ‘EIB’) was created by the Treaty of Rome in 1958 as the long-term lending bank of the European Union (‘EU’). The task of the Bank is to contribute towards the integration, balanced development and economic and social cohesion of the EU Member States. The EIB raises substantial volumes of funds on the capital markets and lends these funds on favourable terms to projects furthering EU policy objectives. The EIB continuously adapts its activities to developments in EU policies. The Bank has its registered office at 98-100, boulevard Konrad Adenauer, Luxembourg. Note A – Significant accounting policies A.1. Basis of preparation A.1.1. Accounting standards The unconsolidated financial statements (the ‘Financial Statements’) of the European Investment Bank have been prepared in accordance with the general principles of Directive 86/635/EEC of the Council of the European Communities of 8 December 1986 on the annual accounts and consolidated accounts of banks and other financial institutions, as amended by Directive 2001/65/EC of 27 September 2001, by Directive 2003/51/EC of 18 June 2003 and by Directive 2006/46/EC of 14 June 2006 on the annual and consolidated accounts of certain types of companies, banks and other financial institutions (the ‘Directives’). On a proposal from the Management Committee, the Board of Directors adopted the Financial Statements on 15 March 2018 and authorised their submission to the Board of Governors for approval by 27 April 2018. The Bank also publishes consolidated financial statements as at the same date as the annual Financial Statements. A.1.2. Significant accounting judgments and estimates In preparing the Financial Statements, the Management Committee is required to make estimates and assumptions that affect reported income, expenses, assets, liabilities and disclosure of contingent assets and liabilities. Use of available information and application of judgement are inherent in the formation of estimates. Actual results in the future could differ from such estimates and the resulting differences may be material to the Financial Statements. The most significant use of judgments and estimates is as follows: Value adjustments on loans and advances The Bank reviews its loans and advances at each reporting date to assess whether an allowance for value adjustments should be recorded. In particular, judgment by management is required in the estimation of the amount and timing of future cash flows when determining the level of allowance required. Such estimates are based on assumptions about a number of factors and actual results may differ, resulting in future changes to the allowance. In addition to a specific allowance against individually significant loans and advances, the Bank also makes a collective provisioning test on exposures which, although not specifically identified as requiring a specific allowance, have a greater risk of default than when the loans and advances were originally granted. Provisions on financial guarantees The Bank recognises a liability at the fair value of the obligation at the inception of a financial guarantee contract. The guarantee is subsequently measured at the higher of the best estimate of the obligation or the amount initially recognised less amortisation of the premium. Financial guarantee provisions correspond to the cost of settling the obligation, which is the expected loss, estimated on the basis of all relevant factors and information existing at the balance sheet date. Pension and other post-employment benefits The cost of defined-benefit pension plans and other post-employment medical benefits is determined using actuarial valuations. The actuarial valuation involves making assumptions about discount rates, mortality rates and future salary and pension increases. Due to the long term nature of these plans, such estimates are subject to significant uncertainty. Bank’s exposure to the United Kingdom On March 29, 2017 the U.K. government triggered Article 50 of the Treaty on European Union (“TEU”), which officially commenced the process of the U.K.’s withdrawal from E.U. membership. On 8 December 2017, the negotiators of the EU and the UK Government published a “Joint report from the negotiators of the European Union and the United Kingdom Government on progress during phase 1 of negotiations under Article 50 TEU on the United Kingdom's orderly withdrawal from the European Union” (the Joint Report). The Joint Report was put forward with a view to the meeting of the European Council (Article 50) of 14-15 December 2017. “Under the caveat that nothing is agreed until everything is agreed, the joint 27


commitments set out in this Joint Report shall be reflected in the Withdrawal Agreement in full detail. This does not prejudge any adaptations that might be appropriate in case transitional arrangements were to be agreed in the second phase of the negotiations, and is without prejudice to discussions on the framework of the future relationship”. The following principles with respect to the callable - and the paid-in capital are included in the Joint Report: “The UK will provide a guarantee for an amount equal to its callable capital on the day of withdrawal” (callable capital currently amounts to EUR 35.7bn). “This guarantee will decrease in line with the amortisation of the stock of EIB operations at the date of withdrawal, starting on the date on which the outstanding stock represents an amount equal to the total subscribed capital on the date of withdrawal and ending on the date it equals the total paid-in capital on the date of withdrawal, both as defined in the EIB Statute”. “The UK share of the paid-in capital” (amounting to EUR 3.5bn) “will be reimbursed in twelve annual instalments starting at the end of 2019. The UK remains liable for the reimbursed amount of paid-in capital until the outstanding stock of EIB operations equals the total paid-in capital on the date of withdrawal, at which point the liability will start to be amortised in line with the remaining non-amortised operations. Apart from these reimbursements, the EIB will not make any other payment, return or remuneration on account of the withdrawal of the UK from the EIB or on account of the provision by the UK of a guarantee”. A.2. Summary of significant accounting policies A.2.1. Foreign currency translation The EIB uses the euro (EUR) as the unit of measurement for the capital accounts of Member States and for presenting its Financial Statements. The Bank conducts its operations in the currencies of the EU Member States, in euro and in non-EU currencies. Its resources are derived from its capital, borrowings and accumulated earnings in various currencies. Foreign currency transactions are translated at the exchange rate prevailing on the date of the transaction. The Bank's monetary assets and liabilities denominated in currencies other than euro are translated into euro at the closing exchange rates prevailing at the balance sheet date. The gain or loss arising from such translation is recorded in the profit and loss account. A.2.2. Derivatives The Bank uses derivative instruments, mainly currency and interest rate swaps, as part of its asset and liability management (“ALM”) activities to manage exposures to interest rate and foreign currency risks. All derivatives transactions are booked at nominal as off-balance sheet items at the date of the transaction. The majority of the Bank’s swaps are concluded with a view to hedging bond issues. The Bank enters into interest rate and currency swaps, whereby the proceeds of a borrowing are initially converted into a different currency and on maturity the Bank will obtain the amounts needed to service the borrowing in the original currency. The Bank also enters into currency, interest rate and overnight index swaps as part of its hedging operations on loans or for the global ALM position. The corresponding interest is accounted for on a pro rata temporis basis. The Bank also uses short-term derivative instruments, primarily FX swaps, as part of its treasury operations, as well as derivatives hedging the trading portfolio (Securities liquidity portfolios). A.2.2.1. Trading portfolio derivatives As part of the Securities liquidity portfolios, trading derivatives are entered in and recorded at market value in the balance sheet as Other assets when their market value is positive or Other liabilities when their market value is negative. Changes in the market value are included in Net result on financial operations. Market values are obtained from quoted market prices, discounted cash flow models and option pricing models, which consider current market and contractual prices for the underlying instrument, as well as the time value of money, yield curve and volatility of the underlying. Interest on derivative instruments is accrued pro rata temporis under Prepayments and accrued income or Accruals and deferred income. Currency swaps Currency swap contracts are entered into in order to adjust currency positions. The revaluation of the spot leg of a currency swap is neutralised in Accruals and deferred income or Prepayments and accrued income. The interest received and paid under interest rate swaps is accrued pro rata temporis and reported in the profit and loss account under Interest receivable and similar income or Interest payable and similar charges. The market value is recorded under Other assets when their market value is positive or Other liabilities when their market value is negative. Changes in the market value are included in Net result on financial operations. Interest rate swaps The interest received and paid under interest rate swaps is accrued pro rata temporis and reported in the profit and loss account under Interest receivable and similar income or Interest payable and similar charges. The market value is recorded under Other assets when their market value is positive or Other liabilities when their market value is negative. Changes in the market value are included in Net result on financial operations. 28


EIB Statutory Financial Statements A.2.2.2. All other derivatives Currency swaps Currency swap contracts are entered into in order to adjust currency positions. The revaluation of the spot leg of a currency swap is neutralised in Accruals and deferred income or Prepayments and accrued income. The forward leg of the currency swap is recorded off-balance sheet at settlement amount and is not revalued. The premium/discount between the spot and forward settlement amounts is amortised pro rata temporis through the profit and loss account in Interest receivable and similar income or Interest payable and similar charges. Interest rate swaps The hedging interest rate swaps are not revalued. The interest received and paid under interest rate swaps is accrued pro rata temporis and reported in the profit and loss account under Interest receivable and similar income or Interest payable and similar charges. Forward rate agreements Forward rate agreements are concluded for hedging purposes and are recorded off balance sheet on the trade date. The difference between the contractual forward rates and the year-end rates are reported in the profit and loss account under Interest receivable and similar income or Interest payable and similar charges. Currency forwards Currency forwards are entered into in order to adjust future currency positions. The forward leg is recorded off-balance sheet at the settlement amount and is not revalued. The difference between the spot amounts and the forward settlement amounts is amortised pro rata temporis through the profit and loss account in Interest receivable and similar income or Interest payable and similar charges. Interest on derivative instruments is accrued pro rata temporis under Prepayments and accrued income or Accruals and deferred income. A.2.3. Financial assets Financial assets are accounted for using the settlement date basis. A.2.4. Cash and cash equivalents The Bank defines cash and cash equivalents as short-term, highly liquid securities and interest-earning deposits with maturities of 90 days or less. A.2.5.Treasury bills and other bills eligible for refinancing with central banks and debt securities including fixed-income securities A.2.5.1. Long-term hedge portfolio The long-term hedge portfolio consists of securities purchased with the intention of holding them to maturity. These securities are issued or guaranteed by: • Governments of the European Union Member States, G10 countries and their agencies; • Supranational public institutions, including multinational development banks. These securities are initially recorded at the purchase price. Value adjustments are accounted for, if these are other than temporary. The difference between the entry price and redemption value is accounted for pro rata temporis over the life of the securities. All the securities remaining in the former Investment portfolio were transferred into the newly created long-term hedge portfolio, where they will continue to be held until final maturity. A.2.5.2. Operational portfolios Treasury Monetary Portfolio “TMP” In order to maintain an adequate level of liquidity, the Bank purchases money market products with a maximum maturity of 12 months, in particular Treasury bills and negotiable debt securities issued by public bodies and credit institutions. The securities in the Treasury Monetary Portfolio are held until their final maturity, initially recorded at purchase price and presented in the Financial Statements at amortised cost. The difference between purchase price and redemption value is accounted for pro rata temporis over the life of the securities as Interest receivable and similar income. Value adjustments are accounted for, if these are other than temporary. Securities liquidity portfolios P1 and P2 The P1 ‘fixed rate’ and P2 ‘floating rate’ are trading portfolios which comprise bonds issued or guaranteed by national governments, supranational institutions, financial institutions and corporations. Securities in these portfolios are initially recorded at the acquisition cost and presented in the Financial Statements at market value. Changes in market value are recorded under Net result on financial operations in the profit and loss account. The market value of treasury portfolios is based on published price quotations in an active market as the first source. For instruments without available published price quotations, the market values are determined by obtaining quotes from market participants and/or by using valuation techniques or models, based whenever possible on observable market data prevailing at the balance sheet date. 29


A.2.5.3. Loan substitutes This portfolio mainly consists of obligations in the form of bonds, notes or certificates issued by Special Purpose Vehicles (“SPVs”), trust vehicles or financial institutions. These securities are classified as held to maturity and initially recorded at purchase price and valued at amortised cost. The difference between purchase price and redemption value is accounted for pro rata temporis over the life of the securities as Interest receivable and similar income. Value adjustments are accounted for, if these are other than temporary. A.2.6.Loans and advances to credit institutions and customers A.2.6.1. Loans and advances Loans and advances are included in the assets of the Bank at their net disbursed amounts. Value adjustments have been made for loans and advances outstanding at the end of the financial year and presenting risks of non-recovery of all or part of their amounts. Such value adjustments are held in the same currency as the assets to which they relate. Value adjustments are accounted for in the profit and loss account as Value (re-)adjustments in respect of loans and advances and provisions for contingent liabilities and are deducted from the appropriate asset items on the balance sheet. A.2.6.2. Interests on loans Interests on loans are recorded in the profit and loss account on an accruals basis, i.e. over the life of the loans. On the balance sheet, accrued interest is included in ‘Prepayments and accrued income’ under assets. Value adjustments to interest amounts on these loans are determined on a case-by-case basis by the Bank’s Management and deducted from the appropriate asset item on the balance sheet. For non-performing loans, upon impairment the accrual of interest income based on the original terms of the claim may be discontinued. A.2.6.3. Reverse repurchase operations (reverse repos) Under a tripartite reverse repo, a custodian/clearing agency arranges for custody, clearing and settlement of the transactions between the Bank and a third party. The custodians/clearing agencies operate under standardised global master purchase agreements and provide for delivery against payment systems, substitution of securities, automatic marking to market, reporting and daily transaction administration. Reverse repos are carried at the amounts of cash advanced and are entered on the balance sheet under Loans and advances to credit institutions – b) other loans and advances. Interest on reverse repos is accrued pro rata temporis. A.2.6.4. Interest subsidies Interest subsidies received in advance (see Note I) are deferred and recognised in the profit and loss account over the period from disbursement to repayment of the subsidised loan. A.2.7.Shares, other variable-yield securities, participating interests and shares in affiliated undertakings A.2.7.1. Shares, other variable-yield securities and participating interests The Bank acquires shares, other variable-yield securities and participating interests when it enters into venture capital operations, infrastructure funds or investment funds. Shares, other variable-yield securities and participating interests are initially recorded at acquisition cost. Their carrying value is adjusted to the lower of cost or market value at subsequent measurement at the balance sheet date. Investments in venture capital enterprises, infrastructure funds and investment funds represent shares, other variable-yield securities and participating interests acquired for the longer term in the normal course of the Bank’s activities. They are initially recorded at their original purchase cost. Based on the reports received from fund managers, the portfolios of investments are valued on a line-by-line basis at the lower of cost or attributable net asset value (‘NAV’), thus excluding any attributable unrealised gain that may be prevailing in the portfolio. The attributable NAV is determined through applying either the Bank’s percentage ownership in the underlying vehicle to the NAV reflected in the latest available before year-end report or, to the extent available, the value per share at the same date, submitted by the respective Fund Manager. The attributable NAV is adjusted for events occurring between the date of the latest available NAV and the balance sheet date to the extent that such adjustment is considered to be material. Unrealised losses due solely to administrative expenses and management fees of venture capital, infrastructure funds and investment funds in existence for less than two years at the balance sheet date are not taken into consideration in determining the attributable NAV. A.2.7.2. Shares in affiliated undertakings Shares in affiliated undertakings represent medium and long-term investments and are accounted for at cost. Value adjustments are accounted for, if these are other than temporary. A.2.8. Tangible assets Tangible assets include land, Bank-occupied properties, other machines and equipment. 30


EIB Statutory Financial Statements Land is stated at acquisition cost and buildings are stated at acquisition cost less accumulated depreciation. The costs of the Bank's headquarter buildings in Luxembourg-Kirchberg and its building in Luxembourg-Weimershof are depreciated on a straight-line basis as set out below. Permanent equipment, fixtures and fittings, furniture, office equipment and vehicles have been recorded in the balance sheet at their acquisition cost, less accumulated depreciation. Depreciation is calculated on a straight-line basis over the estimated life of each item purchased, as set out below: • • • • Buildings in Kirchberg and Weimershof: 30 years Permanent equipment, fixtures and fittings: 10 years Furniture: 5 years Office equipment and vehicles: 3 years A.2.9. Intangible assets Intangible assets comprise of computer software. Software development costs are capitalised if they meet certain criteria relating to identifiability, the probability that future economic benefits will flow to the enterprise and to the reliability of cost measurement. Internally developed software meeting these criteria is carried at cost less accumulated amortisation calculated on a straight-line basis over three years from completion. A.2.10.Pension plans and health insurance scheme A.2.10.1. Pension plan for staff The Bank operates defined-benefit pension plans to provide retirement benefits to substantially its entire staff. The Bank's main pension scheme is a defined-benefit pension scheme funded by contributions from staff and from the Bank which covers all employees. All contributions of the Bank and its staff are invested in the assets of the Bank. Commitments for retirement benefits are valued at least every year using the projected unit credit method, in order to ensure that the provision entered in the accounts is adequate. The latest valuation was carried out as at 30 September 2017 and was updated as at 31 December 2017 with an extrapolation (roll forward method) for the last three months of 2017. The main assumptions used by the actuary are set out in Note L. Cumulative prior year actuarial deficits and surpluses in excess of 10% of the commitments for retirement benefits are recognised over the expected average remaining service lives of the plan’s participants on a straight-line basis. A.2.10.2. Health insurance scheme The Bank has set up its own health insurance scheme for the benefit of staff, financed by contributions from the Bank and its employees. The health insurance scheme is managed and accounted for under the same principles as the pension plan for staff described in Note A.2.10.1. The latest valuation was carried out as at 30 September 2017 and was updated as at 31 December 2017 with an extrapolation (roll forward method) for the last three months of 2017. A.2.10.3. The Management Committee pension plan The Management Committee pension plan is a defined-benefit pension scheme funded by contributions from the Bank only which covers all Management Committee members. All contributions of the Bank are invested in the assets of the Bank. The Management Committee pension plan is managed and accounted for under the same principles as the pension plan for staff described in Note A.2.10.1. A.2.10.4. Optional Supplementary Provident Scheme The Optional Supplementary Provident Scheme is a defined-contribution pension scheme, funded by voluntary staff contributions and employer contributions. The corresponding liability is recorded in Other liabilities. A.2.11.Amounts owed to credit institutions and customers Amounts owed to credit institutions and customers are presented in the financial statements at their redemption amounts. Interest on amounts owed to credit institutions and customers is recorded in the profit and loss account on an accruals basis as Interest payable and similar charges. Accrued interest is included in Accruals and deferred income under liabilities. A.2.12.Debts evidenced by certificates Debts evidenced by certificates are presented at their redemption amounts, except for zero-coupon bonds which are presented at their amortised cost. Transaction costs and premiums/ discounts are amortised in the profit and loss account on a straight-line basis over the life of the debt through 31


Accruals and deferred income or Prepayments and accrued income. Interest expense on debt instruments is included in Interest payable and similar charges in the profit and loss account. A.2.13.Financial guarantees Financial guarantee contracts require the issuer to make specified payments to reimburse the holder for a loss it incurs, if a specified debtor fails to make payment when due under the original or modified terms of a debt instrument. Signed financial guarantees are generally accounted for and disclosed as off-balance sheet items. In regards to the accounting treatment of the financial guarantees on balance sheet, all financial guarantees are measured initially at fair value (the net present value of premium receivable which is equal to the initial expected loss), and subsequently, at the higher of the amount determined as contingent liability, or the original fair value less amortisation of the premium. Financial guarantees measured at fair value on balance sheet are recorded under Other liabilities. Any fair value changes are recorded in the income statement as Net results on financial operations. When a financial guarantee operation measured on balance sheet at fair value is considered as impaired and therefore provisioned, its value previously recorded under Other liabilities is transferred to Provisions for guarantees issued in respect of loans granted by third parties on the balance sheet. This provision is intended to cover risks inherent in the Bank’s activity of issuing guarantees in favour of financial intermediaries or issued in respect of loans granted by third parties. A provision for guarantees issued is established if there is objective evidence that the Bank will have to incur a loss in respect of a given guarantee granted. The provision for financial guarantees is recognised in the income statement as Value (re-)adjustments in respect of loans and advances and provisions for contingent liabilities. A.2.14.Provision for commitment on investment funds This provision is intended to cover risks inherent in the Bank’s commitment on investment funds signed but not yet disbursed. A.2.15.Reserves A.2.15.1. Reserve fund As provided for under Article 22(-1) of the Statute, “a reserve fund of up to 10% of the subscribed capital shall be built up progressively” from the retained profit of the Bank. A.2.15.2. Additional reserves Additional reserves contain the remaining retained earnings of the Bank. A.2.15.3. Special activities reserve As provided for under Article 16(-5) of the Statute, “the special activities of the Bank […] will have a specific allocation of reserve”. The special activities reserve is a dedicated reserve for the capital allocation covering the unexpected loss of those activities, which have a risk profile higher than what is generally accepted by the Bank, including venture capital activities. The reserve is based on the capital allocation of each operation and is calculated monthly according to the evolution of the underlying assets. A.2.15.4. General loan reserve In 2009, a “general loan reserve” was introduced for the expected loss of the Bank’s loan and guarantee portfolio, modelled upon the Bank’s policy guidelines. It is calculated monthly according to the evolution of the underlying assets. A.2.16.Prepayments and accrued income Expenditure incurred during the financial year but relating to a subsequent financial year, together with any income for which payment is not due until the expiry of the underlying instrument. A.2.17.Accruals and deferred income Income received before the balance sheet date but relating to a subsequent financial year, together with any charges which, though relating to the financial year in question, will be paid only in the course of a subsequent financial year. 32


EIB Statutory Financial Statements A.2.18.Interest receivable and similar income Revenues on loans are mainly composed of interest revenue, commitment fees, front-end fees and prepayment indemnities. Prepayment indemnities are recognised in the profit and loss account when received, as the revenue is earned. A.2.19.Interest payable and similar charges Interest payable and similar charges includes interest on amounts owed to credit institutions and customers, interest expense on debt instruments and derivatives. A.2.20.Dividend income Dividends are recognised in the profit and loss account when the entity’s right to receive payment is established. A.2.21.Taxation The Protocol on the Privileges and Immunities of the European Union appended to the Treaty on European Union and the Treaty on the Functioning of the European Union, stipulates that the assets, revenues, and other property of the institutions of the Union are exempt from all direct taxes. A.2.22.Reclassification of prior year figures Certain prior year figures have been reclassified to conform with the current year’s presentation. This relates to reclassification of participating interests as follows: • • From Shares and other variable-yield securities EUR’000 - 168,637 To Participating interests EUR’000 168,637 • • From Net result on financial operations EUR’000 8,174 To Value (re-)adjustments in respect of transferable securities held as financial fixed assets, participating interests and shares in affiliated undertakings EUR’000 -8,174 33


Note B – Cash in hand, balances with central banks and post office banks and debt securities portfolio (in EUR ‘000) B.1. Cash in hand, balances with central banks and post office banks The cash in hand and balances with central banks and post office banks equals to EUR ’000 162,483 at 31 December 2017 (2016: EUR ‘000 316,769). The EIB is an eligible counterparty in the Eurosystem’s monetary policy operations, and has therefore been given access to the monetary policy operations of the European Central Bank. The Bank conducts the operations via the Central Bank of Luxembourg, where it maintains a deposit to cover the minimum reserve requirement. The balance of this deposit amounts to EUR ‘000 162,448 as at 31 December 2017 (2016: EUR ‘000 316,734). B.2. Debt securities portfolio The debt securities portfolio is composed of the long term hedge portfolio, the Treasury Monetary Portfolio “TMP”, the securities liquidity portfolios P1 and P2 and the loan substitutes portfolio. The details of the debt security portfolios as at 31 December 2017 and 2016 are as follows: 31.12.2017 31.12.2016 Treasury bills and other bills eligible for refinancing with central banks Debt securities including fixed-income securities 40,391,561 15,353,163 50,456,265 15,591,352 55,744,724 66,047,617 (*)of which EUR‘000 7,443,992 are unlisted as at 31 December 2017 (2016: EUR‘000 16,769,280). Premiums/ discounts to be amortised Value at final maturity At 31.12.2017 Purchase price Book value Market value Long term hedge portfolio 555,406 539,519 -6,219 533,300 656,034 Treasury Monetary Portfolios (TMP) - Money market securities Securities liquidity portfolios: - P1: Fixed rate portfolio - P2: Floating rate portfolio 27,893,290 27,776,497 -102,988 27,673,509 27,778,004 4,608,110 2,933,347 4,580,490 2,927,615 0 0 4,507,870 2,909,194 4,580,490 2,927,615 Loan substitutes (Note D) 19,950,153 19,920,603 -26,043 19,894,560 20,187,353 (*)of which cash and cash equivalents EUR'000 18,863,479 Premiums/ discounts to be amortised Value at final maturity At 31.12.2016 Purchase price Book value Market value Long term hedge portfolio 570,296 555,209 -8,409 546,800 694,244 Treasury Monetary Portfolios (TMP) - Money market securities Securities liquidity portfolios: - P1: Fixed rate portfolio - P2: Floating rate portfolio 37,497,614 37,445,855 -91,942 37,353,913 37,439,129 3,018,597 4,203,006 2,961,469 4,180,075 571 0 2,900,157 4,145,601 2,961,469 4,180,075 Loan substitutes (Note D) 25,284,564 20,905,009 -29,331 20,875,678 21,243,750 (*)of which cash and cash equivalents EUR'000 23,483,405 Loan substitutes, which represent acquisitions of interests in pools of loans or receivables in connection with securitisation transactions, are considered to be part of the aggregate loans (Note D). Some of these transactions have been structured by adding credit or project related remedies, thus offering additional recourse. No value adjustment is required and has thus not been accounted for as at 31 December 2017 and 2016. 34 Total debt securities(*) 70,574,077 66,047,617 -129,111 65,822,149 66,518,667 Total debt securities(*) 55,940,306 55,744,724 -135,250 55,518,433 56,129,496 Total debt securities(*)


EIB Statutory Financial Statements EU sovereign exposure in bond holdings The Bank did not record value adjustments in 2016 and 2017 in respect of its held to maturity EU sovereign and EU sovereign guaranteed exposure as at year-end, in view of the Bank’s preferred creditor status and the protection given by the Bank’s Statute as well as a detailed review of any value adjustments requirements. The following tables show the exposure to debt issued or guaranteed by EU sovereigns in the Bank’s debt securities portfolios (including loan substitutes) as at 31 December 2017 and 2016: Value at final maturity At 31.12.2017 Purchase price Book value Market value EU sovereigns Austria Belgium Czech Republic Denmark Finland France Germany Greece Hungary Ireland Italy Netherlands Poland Romania Slovakia Slovenia Spain Sweden United Kingdom 64,515 1,158,802 823,130 551,718 327,436 4,696,715 1,679,993 6,134 35,221 111,931 3,604,658 130,925 137,730 105,601 24,171 19,890 2,463,692 373,471 2,041,012 64,384 1,157,722 783,290 551,407 327,374 4,678,535 1,677,487 5,156 36,323 110,547 3,591,312 128,432 134,161 103,060 23,753 19,846 2,430,364 373,149 2,040,910 63,706 1,156,752 755,265 550,713 328,525 4,657,796 1,677,596 5,000 36,510 110,000 3,555,272 127,708 130,354 100,000 23,546 19,629 2,416,254 372,747 1,983,043 64,377 1,157,704 861,044 551,426 327,509 4,687,866 1,740,815 5,350 38,189 110,574 3,619,722 140,556 136,373 103,102 24,506 19,809 2,430,807 373,018 2,040,864 18,356,745 37,583,561 18,237,212 37,507,512 18,070,416 37,448,017 18,433,611 37,695,885 Non EU-sovereign and other bonds Value at final maturity At 31.12.2016 Purchase price Book value Market value EU sovereigns Austria Belgium Bulgaria Czech Republic Denmark Finland France Germany Greece Hungary Ireland Italy Lithuania Netherlands Poland Portugal Slovakia Slovenia Spain Sweden United Kingdom 1,211,425 911,414 6,159 727,551 107,820 50,773 6,342,449 4,019,175 13,294 17,472 11,505 6,843,460 11,300 1,305,471 109,273 821,105 79,647 6,212 2,870,200 472,044 23,986 1,203,631 908,687 6,129 693,483 107,736 49,230 6,323,614 4,008,526 13,096 18,647 10,909 6,827,284 10,542 1,299,133 104,503 821,069 73,749 6,170 2,860,943 471,382 23,774 1,193,421 907,500 6,000 659,849 107,608 49,870 6,299,800 4,006,049 15,000 19,000 10,000 6,795,200 10,000 1,296,700 97,000 821,000 73,100 6,118 2,839,370 471,081 23,717 1,203,034 909,233 6,132 812,914 107,745 49,230 6,333,518 4,081,020 12,635 21,184 10,909 6,856,829 10,542 1,313,057 107,541 821,121 74,670 6,156 2,861,707 471,308 23,774 25,961,735 44,612,342 25,842,237 40,205,380 25,707,383 40,114,766 26,094,259 40,424,408 Non EU-sovereign and other bonds 35 Total 70,574,077 66,047,617 65,822,149 66,518,667 Total 55,940,306 55,744,724 55,518,433 56,129,496


Note C – Loans and advances to credit institutions and to customers – other loans and advances (in EUR ‘000) 31.12.2017 31.12.2016 Term deposits Overnight deposits Tripartite reverse repos Total other loans and advances to credit institutions Total other loans and advances to customers 25,602,346 200,000 7,951,330 33,753,676 1,741,983 24,590,683 174,000 10,416,016 35,180,699 2,219,989 of which cash and cash equivalents 31,822,614 30,440,939 Note D – Summary statement of loans D.1. Aggregate loans granted (in EUR ‘000) Aggregate loans granted comprise both the disbursed and undisbursed portions of loans. The analysis is as follows: To intermediary credit institutions Directly to final beneficiaries 31.12.2017 31.12.2016 Disbursed portion Undisbursed loans 121,492,994 28,886,186 313,374,353 84,035,696 434,867,347 112,921,882 434,352,989 113,300,937 Loan instalments receivable Loan substitutes portfolio (Note B.2) 18,902 208,419 227,321 19,920,603 116,986 20,905,009 D.2. Value adjustments for loans (in EUR ‘000) Movements in the value adjustments are detailed below: 2017 2016 At 1 January Release during the year Use during the year Allowance during the year Foreign exchange adjustment 533,147 -184,333 -2,616 116,430 -5,025 625,547 -125,635 0 38,205 -4,970 (1)The value adjustment of EUR '000 457,603 (2016: EUR ‘000 533,147) relates only to disbursed loans including arrears. The Bank has additionally recorded value adjustments in regards to accrued interest of a total amount of EUR '000 5,691 (2016 EUR '000 5,539), which is recorded under the caption of Prepayments and accrued income. 36 At 31 December 457,603(1) 533,147 Aggregate loans including loan substitutes portfolio (Note D.3) 567,937,153 568,675,921 Aggregate loans granted 150,379,180 397,410,049 547,789,229 547,653,926 Total other loans and advances 35,495,659 37,400,688


EIB Statutory Financial Statements D.3. Geographical breakdown of lending by country in which projects are located (in EUR ‘000) D.3.1. Loans for projects within the European Union Countries and territories in which projects are located Number of loans Aggregate loans granted Disbursed portion Undisbursed portion % of total 2017 % of total 2016 Spain Italy France Germany Poland United Kingdom Portugal Greece Austria Netherlands Belgium Sweden Hungary Finland Czech Republic Romania Ireland Slovakia Croatia Slovenia Denmark Cyprus Bulgaria Lithuania Estonia Latvia Luxembourg Malta 797 750 564 405 369 321 264 162 187 137 146 102 89 156 117 104 68 72 62 54 44 52 43 23 28 17 14 12 92,317,443 67,221,553 56,385,268 45,732,062 43,964,893 43,369,341 18,909,050 17,874,033 14,733,586 14,423,170 12,994,636 10,739,354 9,848,093 9,640,731 7,594,867 7,028,047 6,098,165 4,705,862 4,298,521 3,590,990 3,034,387 2,687,981 2,320,287 1,893,413 1,359,224 1,006,064 641,615 435,528 84,741,122 54,954,650 42,800,040 37,081,387 32,845,066 37,648,585 17,163,150 16,068,919 12,600,101 11,753,738 9,664,515 6,895,633 7,994,232 7,144,067 6,921,230 4,309,304 4,678,565 3,264,496 3,411,448 3,034,701 1,956,368 1,988,034 1,599,640 1,574,593 1,026,979 697,571 360,014 328,021 7,576,321 12,266,903 13,585,228 8,650,675 11,119,827 5,720,756 1,745,900 1,805,114 2,133,485 2,669,432 3,330,121 3,843,721 1,853,861 2,496,664 673,637 2,718,743 1,419,600 1,441,366 887,073 556,289 1,078,019 699,947 720,647 318,820 332,245 308,493 281,601 107,507 16.28% 11.84% 9.93% 8.06% 7.74% 7.64% 3.33% 3.15% 2.60% 2.54% 2.29% 1.89% 1.73% 1.70% 1.34% 1.24% 1.07% 0.83% 0.76% 0.63% 0.53% 0.47% 0.41% 0.33% 0.24% 0.18% 0.11% 0.08% 16.09% 11.90% 9.72% 8.24% 7.43% 8.16% 3.38% 3.08% 2.70% 2.31% 2.31% 1.63% 1.82% 1.66% 1.36% 1.18% 0.97% 0.84% 0.72% 0.68% 0.48% 0.46% 0.46% 0.35% 0.25% 0.17% 0.15% 0.07% 37 Sub-total 5,159 504,848,164 414,506,169 90,341,995 88.94% 88.57%


D.3.2. Loans for projects outside the European Union D.3.2.1. Candidate Countries Countries and territories in which projects are located Number of loans Aggregate loans granted Disbursed portion Undisbursed portion % of total 2017 % of total 2016 Turkey Serbia Montenegro FYROM Albania 182 71 42 13 13 18,023,851 3,253,631 447,603 351,624 232,152 15,958,710 2,387,057 322,013 285,284 197,652 2,065,141 866,574 125,590 66,340 34,500 D.3.2.2. ACP states Countries and territories in which projects are located Number of loans Aggregate loans granted Disbursed portion Undisbursed portion % of total 2017 % of total 2016 Kenya Madagascar Zambia Senegal Tanzania, United republic of Ivory Coast Uganda Guinea Dominican Republic Regional - West Africa Lesotho Burkina Faso Mozambique Benin Malawi Burundi Cameroon Fiji Islands New Guinea Liberia Mali Cape Verde Mauritius Rwanda Congo (Democratic Republic) Ghana Ethiopia Seychelles Namibia Niger Congo Mauritania Regional - Caribbean Sao Tome and Principe Swaziland Belize Dominica Jamaica Botswana Togo Saint Vincent and Grenadines 7 5 5 6 3 2 2 2 2 5 4 5 5 4 4 1 2 1 1 1 1 2 5 1 1 1 1 2 4 1 1 2 2 1 2 1 1 1 1 1 1 411,864 399,324 326,477 311,860 198,386 152,700 126,139 125,000 114,233 107,800 105,248 96,172 93,246 89,383 78,100 70,000 64,788 62,536 53,367 50,000 50,000 49,677 45,789 45,000 43,492 42,538 40,000 30,537 29,922 21,000 20,894 19,605 19,159 12,000 9,797 7,380 5,621 4,947 2,960 2,806 2,306 180,502 190,724 89,447 36,860 52,412 0 64,932 0 30,851 71,459 105,248 63,286 59,291 35,883 13,500 0 49,788 0 0 50,000 26,000 49,677 45,789 0 43,492 42,538 5,000 12,623 29,922 3,000 17,632 4,605 19,159 0 9,797 0 5,621 4,947 2,960 2,806 2,306 231,362 208,600 237,030 275,000 145,974 152,700 61,207 125,000 83,382 36,341 0 32,886 33,955 53,500 64,600 70,000 15,000 62,536 53,367 0 24,000 0 0 45,000 0 0 35,000 17,914 0 18,000 3,262 15,000 0 12,000 0 7,380 0 0 0 0 0 38 Sub-total 100 3,542,053 1,422,057 2,119,996 0.62% 0.53% Sub-total 321 22,308,861 19,150,716 3,158,145 3.93% 4.34%


EIB Statutory Financial Statements D.3.2.3. Asia Countries and territories in which projects are located Number of loans Aggregate loans granted Disbursed portion Undisbursed portion % of total 2017 % of total 2016 China India Kazakhstan Vietnam Bangladesh Sri Lanka Nepal Pakistan Kyrgyzstan Mongolia Tajikistan Lao People's Democratic Rep. Maldives Indonesia 7 13 7 6 3 5 3 3 3 4 2 2 2 2 1,911,293 1,744,160 420,000 401,982 317,000 212,480 180,759 156,254 112,000 89,196 78,456 58,202 54,186 14,345 847,486 891,969 0 156,982 32,000 162,480 2,764 6,254 0 16,035 8,456 41,526 9,186 14,345 1,063,807 852,191 420,000 245,000 285,000 50,000 177,995 150,000 112,000 73,161 70,000 16,676 45,000 0 D.3.2.4. Potential Candidate Countries Countries and territories in which projects are located Number of loans Aggregate loans granted Disbursed portion Undisbursed portion % of total 2017 % of total 2016 Bosnia and Herzegovina Kosovo 35 2 1,452,014 52,000 1,129,679 10,000 322,335 42,000 D.3.2.5. Latin America Countries and territories in which projects are located Number of loans Aggregate loans granted Disbursed portion Undisbursed portion % of total 2017 % of total 2016 Brazil Ecuador Panama Nicaragua Regional - Central America Paraguay Argentina Mexico Peru Bolivia Chile Honduras Costa Rica Colombia 7 7 5 5 3 3 4 4 3 2 2 1 1 2 679,986 574,023 531,102 399,263 305,440 193,257 168,761 151,620 131,729 125,136 85,942 74,377 55,277 28,311 618,588 188,566 447,720 67,738 182,940 55,928 109,922 151,620 90,038 48,985 85,942 20,631 30,954 28,311 61,398 385,457 83,382 331,525 122,500 137,329 58,839 0 41,691 76,151 0 53,746 24,323 0 D.3.2.6. European Free Trade Association (EFTA) Countries Countries and territories in which projects are located Number of loans Aggregate loans granted Disbursed portion Undisbursed portion % of total 2017 % of total 2016 Norway Iceland Switzerland 11 8 7 1,122,433 490,269 104,284 922,433 420,269 61,556 200,000 70,000 42,728 39 Sub-total 26 1,716,986 1,404,258 312,728 0.30% 0.28% Sub-total 49 3,504,224 2,127,883 1,376,341 0.62% 0.70% Sub-total 37 1,504,014 1,139,679 364,335 0.26% 0.28% Sub-total 62 5,750,313 2,189,483 3,560,830 1.01% 0.86%


D.3.2.7. Mediterranean Countries Countries and territories in which projects are located Number of loans Aggregate loans granted Disbursed portion Undisbursed portion % of total 2017 % of total 2016 Egypt Morocco Tunisia Israel Lebanon Jordan Algeria Syrian Arab Republic Gaza-West Bank 43 65 63 10 25 11 1 9 7 4,692,491 4,510,635 3,804,621 1,006,453 904,744 517,359 398,750 309,720 92,990 2,423,270 2,990,939 2,263,479 853,923 360,313 315,636 398,750 261,719 41,517 2,269,221 1,519,696 1,541,142 152,530 544,431 201,723 0 48,001 51,473 D.3.2.8. Overseas Countries and Territories (OCT) Countries and territories in which projects are located Number of loans Aggregate loans granted Disbursed portion Undisbursed portion % of total 2017 % of total 2016 French Polynesia New Caledonia 2 1 19,010 18,889 11,510 18,889 7,500 0 D.3.2.9. Eastern Europe, Southern Caucasus, Russia Countries and territories in which projects are located Number of loans Aggregate loans granted Disbursed portion Undisbursed portion % of total 2017 % of total 2016 Ukraine Georgia Moldova, Republic of Armenia Russian Federation Azerbaijan 29 23 18 14 4 2 4,415,496 1,459,552 742,721 310,559 208,867 39,770 1,010,604 411,922 206,088 197,724 208,867 19,770 3,404,892 1,047,630 536,633 112,835 0 20,000 D.3.2.10. South Africa Countries and territories in which projects are located Number of loans Aggregate loans granted Disbursed portion Undisbursed portion % of total 2017 % of total 2016 South Africa 22 1,082,590 852,785 229,805 (1)Including loan substitutes (Notes B.2 and D.1) and excluding loan instalments receivables (2017: EUR 227 million, 2016: EUR 117 million) 40 Total loans for projects outside the Union 944 62,861,668 40,281,781 22,579,887 11.06% 11.43% Total loans 2017(1) 6,103 567,709,832 454,787,950 112,921,882 100.00% Total loans 2016(1) 5,992 568,558,935 455,257,998 113,300,937 100.00% Sub-total 22 1,082,590 852,785 229,805 0.19% 0.22% Sub-total 90 7,176,965 2,054,975 5,121,990 1.26% 1.38% Sub-total 3 37,899 30,399 7,500 0.01% 0.01% Sub-total 234 16,237,763 9,909,546 6,328,217 2.86% 2.83%


EIB Statutory Financial Statements Note E – Shares and other variable-yield securities, participating interests and shares in affiliated undertakings (EUR ‘000) E.1.Shares, other variable-yield securities and participating interests Participating interests Shares and other variable-yield securities Venture Capital Operations(1) Venture Capital Operations(1) Investment funds(1) (2) (3) EBRD shares Total Cost: At 1 January 2017 Additions Reflows 184,211 76,663 -4,891 3,534,844 1,076,114 -451,985 157,500 0 0 705,719 321,549 -184,797 4,398,063 1,397,663 -636,782 Value adjustments: At 1 January 2017 Additions Releases -15,574 -4,358 2,435 -459,373 -58,659 114,650 0 0 0 -46,144 -5,186 11,490 -505,517 -63,845 126,140 Net book value: (1) The amounts signed but not yet disbursed disclosed off-balance sheet are respectively: In relation to Shares and other variable-yield securities: • for venture capital operations EUR ‘000 4,836,072 (2016: EUR ‘000 4,784,377) • for investment funds EUR ‘000 2,649,089 (2016: EUR ‘000 1,113,939) In relation to participating interests: • for venture capital operations EUR ‘000 558,349 (2016: EUR ‘000 556,472) (2) The amount of EUR ‘000 157,500 (2016: EUR ‘000 157,500) corresponds to the capital paid in by the Bank as at 31 December 2017 with respect to its subscription of EUR ‘000 900,440 to the capital of the EBRD (European Bank for Reconstruction and Development). As at 31 December 2017, the Bank holds 3.03% of the subscribed capital of the EBRD. Based on the audited 2016 EBRD financial statements prepared in accordance with International Financial Reporting Standards, the share of underlying net equity of the Bank in EBRD amounted to EUR 467.5 million (2015: EUR 442.6 million). (3) The total amount includes only shares and other variable-yield securities. In EUR million % held Total own funds Total net result Total assets EBRD (31.12.2015) 3.03 14,586 442 55,026 EBRD (31.12.2016) 3.03 15,431 804 56,150 E.2.Shares in affiliated undertakings E.2.1 The European Investment Fund A balance of EUR ‘000 802,731 (2016: EUR ‘000 799,059) corresponds to the amount paid in by the Bank in respect of its subscription of EUR ‘000 2,631,000 (2016: EUR ‘000 2,624,000) to the capital of the European Investment Fund (‘EIF’), with its registered office in Luxembourg. The Bank holds 58.47% (2016: 59.88%) of the subscribed capital of the EIF amounting to EUR 4.50bn (2016: EUR 4.38bn). With respect to the 1,869 EIF shares subscribed by other EIF investors, the EIB is offering to buy these shares at any time under a Replacement Share Purchase Undertaking at a price per share of EUR ‘000 423. This price corresponds to the part of each share in the called capital of the EIF, increased by the share premium account, the statutory reserves, the disclosed unrealised gains in venture capital operations, the profit brought forward and the profit for the year. As a result of the General Meeting’s approval of the EIF’s capital increase in May 2014, the EIF’s authorised capital has been increased from EUR 3.0bn to EUR 4.5bn. As a result, the subscribed capital of the EIF amounts EUR 4.50bn as at 31 December 2017. During 2017, the Bank sold 6 of its shares to other investors and purchased 13 EIF shares. As a result the Bank’s holding has increased from 2,624 shares as of 1 January 2017 to 2,631 shares as of 31 December 2017. 41 At 31 December 2017 238,486 3,755,591 157,500 802,631 4,715,722 At 31 December 2016 168,637 3,075,471 157,500 659,575 3,892,546 At 31 December 2017 -17,497 -403,382 0 -39,840 -443,222 At 31 December 2017 255,983 4,158,973 157,500 842,471 5,158,944


The nominal value of EUR ‘000 813,042 (2016: EUR ‘000 753,544) of the put option granted to EIF minority shareholders, shown off-balance sheet, has been calculated on the basis of the 2017 audited EIF statutory accounts prepared according to the International Financial Reporting Standards. In EUR ‘000 % held Total own funds Total net result Total assets EIF (31.12.2016) 59.88 1,878,348 122,577 2,303,155 EIF (31.12.2017) 58.47 1,957,564 112,172 2,491,369 E.2.2 EU Microfinance Platform FCP FIS The EU Microfinance Platform FCP-FIS (‘EUMPF’) is structured as a Luxembourg “fonds commun de placement – fonds d’investissement spécialisé” governed by the Law of 13 February 2007 relating to specialised investment funds (the “2007 Law”) and launched on 22 November 2010. It is established as an umbrella fund, which may have several sub-funds. It has been launched with an unlimited duration provided that the fund will however be automatically put into liquidation upon the termination of a sub-fund if no further sub-fund is active at that time. Currently, the only sub-fund of the EUMPF is the European Progress Microfinance Fund. The balance of EUR ‘000 33,922 (2016: EUR ‘000 76,150) corresponds to the current outstanding amount invested by the Bank in respect of its subscription of EUR ‘000 100,000 to the total committed units of the EUMPF, with its registered office in Luxembourg. The Bank holds 55.56% (2016: 55.56%) of the total committed units of the EUMPF amounting to EUR 180.0 million (2016: EUR 180.0 million). In EUR ‘000 % held Total own funds Total net result Total assets EUMPF (31.12.2016) 55.56 151,256 -1,906 152,400 EUMPF (31.12.2017) 55.56 101,996 -7,668 101,996 Note F – Intangible and tangible assets (in EUR ‘000) Luxembourg buildings Furniture and equipment Total tangible assets Total intangible assets Land Cost: At 1 January 2017 Additions Disposals 20,145 0 0 374,515 6,728 0 87,332 17,520 -19,230 481,992 24,248 -19,230 22,172 13,273 -6,503 Accumulated depreciation: At 1 January 2017 Depreciation Disposals 0 0 0 -167,174 -9,792 0 -42,440 -21,934 19,230 -209,614 -31,726 19,230 -5,953 -7,388 5,663 Net book value: The Luxembourg buildings category includes cost relating to the construction of a new building for an amount of EUR ’000 38,513 (2016: EUR ’000 31,785), which is expected to be completed in 2021. 42 At 31 December 2017 20,145 204,277 40,478 264,900 21,264 At 31 December 2016 20,145 207,341 44,892 272,378 16,219 At 31 December 2017 0 -176,966 -45,144 -222,110 -7,678 At 31 December 2017 20,145 381,243 85,622 487,010 28,942


EIB Statutory Financial Statements Note G – Other assets and other liabilities (in EUR ‘000) Other assets 31.12.2017 31.12.2016 Receivables on sale of Venture Capital Operations Staff housing loans and advances(*) Fair value of derivatives Commission receivable on guarantees Advances on salaries and allowances Other 16,255 2,485 7,680 430 703 25,015 16,437 3,278 2,759 470 622 30,664 (*)The balance relates to staff housing loans disbursed previously to the Bank's employees by the Bank. Since 1999 these housing loans have been replaced by an arrangement with an external financial institution, whereby permanently employed staff members of the Bank may be granted staff housing loans in accordance with the Bank’s Staff Regulations. The same interest rates, terms and conditions are applicable to all employees concerned. Other liabilities 31.12.2017 31.12.2016 Optional Supplementary Provident Scheme (Note L) EIF Pension Plan Fair value of derivatives Personnel costs payable Financial guarantees Accounts payable and sundry creditors Transitory account on loans Payable on HIPC initiative Western Balkans Infrastructure Fund Other First Loss Piece Contribution 486,142 140,089 10,941 90,305 68,317 53,349 12,777 13,596 393 35,339 8,164 438,662 117,777 31,489 69,510 69,576 49,588 222,445 13,596 886 89,682 101,079 Note H – Subscription to the capital of the Bank, own funds and appropriation of profit H.1. Statement of Subscriptions to the Capital of the Bank as at 31 December 2017 and 2016 (in EUR) Uncalled capital(*) Member States Subscribed capital Called up capital Germany France Italy United Kingdom Spain Netherlands Belgium Sweden Denmark Austria Poland Finland Greece Portugal Czech Republic Hungary Ireland Romania Croatia Slovakia Slovenia Bulgaria Lithuania Luxembourg Cyprus Latvia Estonia Malta 39,195,022,000 39,195,022,000 39,195,022,000 39,195,022,000 23,517,013,500 10,864,587,500 10,864,587,500 7,207,577,000 5,501,052,500 5,393,232,000 5,017,144,500 3,098,617,500 2,946,995,500 1,899,171,000 1,851,369,500 1,751,480,000 1,375,262,000 1,270,021,000 891,165,500 630,206,000 585,089,500 427,869,500 367,127,000 275,054,500 269,710,500 224,048,000 173,020,000 102,665,000 35,699,118,050 35,699,118,050 35,699,118,050 35,699,118,050 21,419,470,925 9,895,547,225 9,895,547,225 6,564,714,700 5,010,399,750 4,912,195,875 4,569,652,475 2,822,243,850 2,684,145,675 1,729,779,000 1,686,240,975 1,595,260,900 1,252,598,750 1,156,744,700 811,680,000 573,996,175 532,903,925 389,706,625 334,381,950 250,521,650 245,654,325 204,064,750 157,587,900 93,508,025 3,495,903,950 3,495,903,950 3,495,903,950 3,495,903,950 2,097,542,575 969,040,275 969,040,275 642,862,300 490,652,750 481,036,125 447,492,025 276,373,650 262,849,825 169,392,000 165,128,525 156,219,100 122,663,250 113,276,300 79,485,500 56,209,825 52,185,575 38,162,875 32,745,050 24,532,850 24,056,175 19,983,250 15,432,100 9,156,975 (*)Can be called by decision of the Board of Directors to such extent as may be required for the Bank to meet its obligations. 43 Total 243,284,154,500 221,585,019,550 21,699,134,950 Total 919,412 1,204,290 Total 52,568 54,230


H.2. Own funds and appropriation of profit Statement of movements in own funds (in EUR ‘000) 2017 2016 Share capital: - Subscribed capital - Uncalled capital - Called capital - Capital called but not paid - Paid-in capital Reserves and profit for the year: Reserve fund: - Balance at beginning of the year - Balance at end of the year - Reserves called but not yet paid - Paid-in balance at end of the year Additional reserves: - Balance at beginning of the year - Appropriation of prior year's profit(1) - Balance at end of the year Special activities reserve: - Balance at beginning of the year - Appropriation of prior year's profit(1) - Balance at end of the year General loan reserve: - Balance at beginning of the year - Appropriation of prior year's profit(1) - Balance at end of the year Profit for the financial year 243,284,155 243,284,155 -221,585,020 -221,585,020 21,699,135 21,699,135 -9,936 -29,807 21,689,199 21,669,328 24,328,415 24,328,415 24,328,415 24,328,415 -16,047 -48,143 24,312,368 24,280,272 7,214,264 5,286,377 2,733,472 1,927,887 9,947,736 7,214,264 6,776,060 5,933,881 728,031 842,179 7,504,091 6,776,060 3,305,458 3,318,610 -604,902 -13,152 2,700,556 2,805,711 3,305,458 2,856,601 (1) On 25 April 2017 the Board of Governors decided to appropriate the profit of the Bank for the year ended 31 December 2016, which amounted to EUR ‘000 2,856,601, to the Additional reserves, the Special activities reserve and the General loan reserve. The fact that amounts are being released from / added to the General loan reserve or the Special activities reserve is the consequence of the evolution of the risks of the underlying operations. H.3. Subscribed capital and reserves, called but not paid On 1 July 2013, the subscribed capital increased from EUR 242,392,989,000 to EUR 243,284,154,500 by virtue of the contributions of Croatia, a new Member State that joined on 1 July 2013. The contributions of the new Member State to the Paid-in capital and to the Reserves amount to EUR 79.5 million and EUR 128.4 million respectively. The total amount to be paid by the new Member State has been equally spread over 8 instalments due on 30 November 2013, 30 November 2014, 30 November 2015, 31 May 2016, 30 November 2016, 31 May 2017, 30 November 2017, and 31 May 2018. The instalments up to and including 30 November 2017 were settled in full. The amount of EUR ‘000 25,983 shown in the balance sheet under the caption Subscribed capital and reserves, called but not paid relates to net receivable from the new Member State, Croatia. Statement of movements in own funds (in EUR ‘000) 31.12.2017 31.12.2016 Subscribed capital called but not paid (Croatia) Reserves called but not paid (Croatia) 9,936 16,047 29,807 48,143 44 Total 25,983 77,950 Total own funds 68,959,661 66,101,983


EIB Statutory Financial Statements Note I – ‘Prepayments and accrued income’ and ‘Accruals and deferred income’ (in EUR ‘000) Prepayments and accrued income 31.12.2017 31.12.2016 Foreign exchange on currency swap contracts Interest and commission receivable Redemption premiums on swaps receivable(*) Deferred borrowing charges Investment Facility’s commission receivable Other 8,281,162 7,717,260 157,017 351,058 45,104 32,550 20,669,791 8,299,570 243,360 225,131 43,483 28,720 Accruals and deferred income 31.12.2017 31.12.2016 Interest and commission payable Foreign exchange on currency swap contracts Redemption premiums on swaps payable(*) Deferred borrowing proceeds Deferred income on loans Interest subsidies received in advance(**) Prepaid management fees Other 8,640,163 9,888,606 793,826 838,045 194,318 101,077 14,504 12,252 9,130,084 6,490,094 833,758 688,232 177,053 106,693 16,638 14,122 (*) Redemption premiums on swaps receivable and payable represent end payments of the underlying swap agreements for those agreements which include such features. (**) Part of the amounts received from the European Commission has been made available as a long-term advance and is entered on the liabilities side under item Accruals and deferred income and comprises: • amounts in respect of interest subsidies for loans granted for projects outside the European Union, under Conventions signed with the ACP States and Protocols concluded with the Mediterranean Countries; and • interest subsidies, concerning certain lending operations put in place within the EU from the Bank's own resources, made available in conjunction with the EMS under Council Regulation (EEC) No 1736/79 of 3 August 1979 and in conjunction with the financial mechanism established by the EFTA Countries under the EFTA Agreement signed on 2 May 1992. Note J – Amounts owed to credit institutions and customers with agreed maturity dates or periods of notice (in EUR ‘000) J.1. Amounts owed to credit institutions 31.12.2017 31.12.2016 Repayable on demand Short term deposits Repo with banks Cash deposited on swaps payable 4,953,852 57,475 0 0 12,425,692 213,202 315,000 166,019 J.2. Amounts owed to customers 31.12.2017 31.12.2016 Overnight deposits European Union and Member States' accounts: · For Special Section operations and related unsettled amounts · Deposit accounts Short-term deposits 4,160 12,971 372,158 1,546,271 8,349 375,451 1,538,908 25,030 45 Total 1,930,938 1,952,360 Total 5,011,327 13,119,913 Total 20,482,791 17,456,674 Total 16,584,151 29,510,055


Note K – Debts evidenced by certificates In its financing activity, one of the Bank’s objectives is to align its funding strategy with the funds required for the loans granted, notably in terms of currencies. The caption Debts evidenced by certificates includes Debt securities in issue (securities offered to the general investing public) and Others (private placements). The table below discloses the details per currency of debts outstanding at 31 December 2017 and 2016, together with the average rates and due dates. Debts evidenced by certificates (in EUR '000) Outstanding at 31.12.2017 Average rate 2017(*) Outstanding at 31.12.2016 Average rate 2016(*) Due dates Payable in EUR USD GBP AUD CHF SEK NOK TRY ZAR JPY CAD PLN MXN NZD CZK HUF RUB DKK RON HKD CNY 233,246,441 119,928,350 49,311,992 11,111,557 6,831,909 5,369,877 4,071,522 4,008,066 3,778,963 3,698,520 3,562,299 2,097,199 1,007,979 459,941 410,718 290,658 230,574 124,133 18,890 12,974 12,801 2.00 1.75 2.63 4.54 2.16 2.57 1.98 8.23 7.83 1.00 2.00 2.65 4.96 3.74 2.18 0.07 6.75 3.46 1.15 4.96 3.28 2018/2057 2018/2058 2018/2054 2018/2042 2018/2036 2018/2040 2018/2037 2018/2027 2018/2032 2018/2053 2018/2045 2021/2026 2020/2027 2018/2021 2018/2034 2020/2021 2018/2020 2024/2026 2019/2019 2019/2019 2018/2018 220,901,207 146,683,436 51,872,036 12,317,012 8,002,794 5,214,132 5,240,229 3,498,782 3,683,341 6,732,871 3,784,938 872,846 369,743 577,253 399,456 291,127 307,154 124,308 19,388 30,584 0 2.21 1.67 2.86 4.85 2.14 2.96 2.70 7.38 7.60 1.11 2.02 2.83 4.34 4.21 2.16 0.66 6.73 3.46 0 5.27 0 (*) Weighted average interest rates at the balance sheet date The principal and interest of certain structured borrowings are index linked to stock exchange indexes (historical value: EUR 500 million in 2017 EUR 500 million in 2016). All borrowings are fully hedged through structured swap operations. The table below provides the movements in 2017 and 2016 for debts evidenced by certificates (including short-term commercial papers): (In EUR million) 2017 2016 Balance at 1 January Issuance during the year Contractual redemptions Early redemptions and buy-backs Exchange adjustments 470,923 123,644 -122,247 -810 -21,925 469,255 165,544 -158,542 -2,013 -3,321 46 Balance at 31 December 449,585 470,923 Total 449,585,363 470,922,637


EIB Statutory Financial Statements Note L – Provisions – pension plans and health insurance scheme (in EUR ’000) The Bank's main pension scheme is a defined-benefit pension scheme funded by contributions from staff and from the Bank covering all employees. All contributions of the Bank and its staff are invested in the assets of the Bank. The pension plans and health insurance scheme provisions are as follows (in EUR ‘000): 2017 2016 Staff pension plan: Provision at 1 January Payments made during the year Recognition of actuarial losses Annual contributions and interest 2,102,829 -77,489 74,978 193,435 1,941,990 -72,014 27,026 205,827 Management Committee Pension Plan Management Committee Pension Plan Recognition of actuarial losses 36,489 1,485 35,559 148 Health insurance scheme: Provision at 1 January Payments made during the year Recognition of actuarial losses Annual contributions and interest 242,922 -16,027 26,765 34,760 219,839 -15,553 7,730 30,906 The above figures do not include the liability towards members of staff in respect of the Optional Supplementary Provident Scheme (a defined contribution pension scheme). The corresponding amount of EUR 486 million (2016: EUR 439 million) is classified under Other liabilities (Note G). The provision in respect of future retirement and health insurance benefits was valued as at 30 September 2017 by an independent actuary using the projected unit credit method. The actuarial valuation was updated as at 31 December 2017 with an extrapolation (‘roll forward’ method) for the last three months of 2017, using the prevailing market rates of 31 December 2017 and the following assumptions (for the staff pension and medical plans): • a discount rate of 2.09% (2016: 1.95%) for determining the actuarial present value of benefits accrued in the pension and health insurance schemes, corresponding to 22.88 year duration (2016: 19.90 year duration); • in the light of past experience, the Bank estimates that the overall expected remuneration of post-employment reserves is set at a rate of 1.5% (2016: 1.5%) above the discount rate mentioned above; • progressive retirement between the age of 55 and 65 (same as 2016); • a combined average impact of the increase in the cost of living and career progression of 3.5% (2016: 3.5%); • a variation in the probable resignation rate between 30% and 0%, decreasing with age (same as 2016); • a rate of adjustment of pensions of 1.75% per annum (same as 2016); • use of the ISCLT longevity table 2013 (same as 2016); • a medical cost inflation rate of 4.0% per annum (2016: 4%); and • a medical cost profile per age updated in 2017. The provisions for these schemes are adjusted when needed (Note A.2.10.1) according to the actuarial valuation, as per the tables above. Cumulative prior year actuarial deficits or surpluses in excess of 10% of the commitments for retirement benefits are recognised over the expected average remaining service lives of the participants on a straight-line basis. In 2016, the actuarial valuation of the pension plans and the healthcare scheme displayed an unrecognised loss of EUR ‘000 2,053,485. EUR ’000 1,609,991 was reported in excess of the 10% corridor, and recognised over the expected average remaining service lives of the participants on a straight-line basis from 1 January 2017. Thus, the net loss recognised in 2017 is EUR ’000 103,228. In 2017, the actuarial valuation on the pension plans and the healthcare scheme displayed an unrecognised loss of EUR ‘000 2,588,379. EUR ‘000 2,067,527 was reported in excess of the 10% corridor, and the net loss which will be recognised in 2018 will be EUR ‘000 135,625. Note M – Profit for the financial year The appropriation of the balance of the profit and loss account for the year ended 31 December 2017, amounting to EUR ‘000 2,805,711 will be submitted to the Board of Governors for approval by 27 April 2018. 47 Sub-total health insurance scheme 288,420 242,922 Total provisions at 31 December 2,620,147 2,381,458 Sub-total Management Committee Pension Plan 37,974 35,707 Sub-total staff pension plan 2,293,753 2,102,829


Note N – ‘Interest receivable and similar income’ and ‘Interest payable and similar charges’ N.1. Net interest income (in EUR ‘000) 2017 2016 Interest receivable and similar income: Cash in hand, balance with central banks and post office banks Treasury bills and other bills eligible for refinancing with central banks and debt securities including fixed income securities Loans and advances to credits institutions and customers Derivatives Negative interest on interest bearing liabilities 0 25 741,813 7,293,395 15,299,723 51,144 286,237 7,792,249 14,038,219 42,114 Interest payable and similar charges: Amounts owed to credit institutions and customers Debts evidenced by certificates Derivatives Negative interest on interest bearing assets Other -6,425 -10,648,831 -8,642,043 -707,633 -121,328 -5,271 -11,691,394 -6,773,763 -220,945 -154,675 N.2. Geographical analysis of ‘Interest receivable and similar income’ (in EUR ‘000) 2017 2016 EU countries Spain United Kingdom Poland Italy Greece France Germany Austria Portugal Netherlands Hungary Belgium Romania Sweden Ireland Finland Croatia Slovakia Slovenia Lithuania Bulgaria Czech Republic Latvia Cyprus Denmark Malta Luxembourg Estonia 1,027,541 931,332 629,635 578,299 515,589 451,155 334,985 263,401 257,288 174,261 172,092 152,630 99,957 95,272 75,996 70,219 67,745 66,304 52,155 47,236 45,315 32,904 15,061 12,693 12,531 11,033 5,011 4,677 1,117,784 964,832 636,870 638,065 530,992 445,650 505,739 268,674 284,022 161,291 201,204 162,852 111,873 91,836 115,130 68,806 68,238 67,320 53,866 49,342 47,790 63,122 15,489 13,885 29,137 11,150 5,166 11,680 Outside the European Union 1,002,149 1,007,719 Income not analysed per country(1) 16,181,609 14,409,320 (1)Income not analysed by country: · · · · · Revenue from Long Term Hedge portfolio and loan substitutes portfolio Revenue from Securities Liquidity portfolios Revenue from money-market securities Revenue from money-market operations Income from derivatives 178,994 100,637 462,182 140,073 15,299,723 171,040 112,324 2,873 84,864 14,038,219 48 16,181,609 14,409,320 Total interest receivable and similar income 23,386,075 22,158,844 Total 7,204,466 7,749,524 Total EU countries 6,202,317 6,741,805 Total -20,126,260 -18,846,048 Net interest income 3,259,815 3,312,796 Total 23,386,075 22,158,844


EIB Statutory Financial Statements Note O – Commission receivable and Commission payable (in EUR ‘000) 2017 2016 Commission receivable: Commission on Investment Facility - Cotonou Commission on Jaspers Commission on guarantees Commission on Jessica Commission income on loans Commission on InnovFin Commission on Yaoundé/Lomé Conventions Commission on other mandates 48,284 31,063 43,194 9,690 11,411 9,300 2,459 53,163 45,846 32,510 27,920 12,353 7,318 4,862 2,696 46,946 Note P – Net result on financial operations (in EUR ‘000) 2017 2016 Net result on shares and other variable yield securities Net result on translation of balance sheet positions Net result on repurchase of debts evidenced by certificates Net result on derivatives Net result on securities liquidity portfolios (securities only) Net result on financial guarantees 40,086 -2,916 -2,999 26,590 -42,950 1,975 -82,996 3,325 -1,284 112,257 -60,321 -7,850 Note Q – Other operating income (in EUR ‘000) 2017 2016 Rental income Reversal of previous year’s unutilised accruals Sale of EIF shares (Note E.2) Other 10,768 8,776 723 2,044 8,803 4,370 762 267 Note R – General administrative expenses (in EUR ‘000) 2017 2016 Salaries and allowances(*) Welfare contributions and other staff costs -378,851 -287,988 -310,394 -237,040 Other general administrative expenses -239,104 -243,627 (*)Of which the amount for members of the Management Committee is EUR ‘000 2,844 at 31 December 2017 and EUR ‘000 3,230 at 31 December 2016. The number of persons employed by the Bank was 3,203 at 31 December 2017 (2,872 at 31 December 2016). Note S – Off-balance sheet special deposits for servicing borrowings This item represents the amount of coupons and bonds due, paid by the Bank to the paying agents, but not yet presented for payment by the holders of bonds issued by the Bank. 49 Total general administrative expenses -905,943 -791,061 Staff costs -666,839 -547,434 Total 22,311 14,202 Total net result on financial operations 19,786 -36,869 Total commission receivable 208,564 180,451 Commission payable -153,929 -101,840


Note T – Fair value of financial instruments At the balance sheet date, the Bank records balance sheet financial instruments on the basis of their historical cost in foreign currency (apart from the SLP portfolio) representing the amount received in the event of a liability or the amount paid to acquire an asset. The fair value of the financial instruments (mainly loans, treasury, securities and borrowings) entered under assets or liabilities compared with their accounting value is shown in the table below: Accounting value At 31 December 2017 (in EUR million) Fair value Financial assets: Cash in hand, balances with central banks and post office banks Loans and advances to credit institutions and customers, excluding loan substitutes Treasury bills and debt securities portfolios including loan substitutes (Note B.2) Shares, other variable yield securities and participating interests (Note E) 162 470,897 55,745 4,954 162 501,980 56,129 6,780 Financial liabilities: Amounts owed to credit institutions and customers (Note J) Debts evidenced by certificates (Note K) 6,942 449,585 6,941 493,107 Accounting value At 31 December 2016 (in EUR million) Fair value Financial assets: Cash in hand, balances with central banks and post office banks Loans and advances to credit institutions and customers, excluding loan substitutes Treasury bills and debt securities portfolios including loan substitutes (Note B.2) Shares, other variable yield securities and participating interests (Note E) 317 472,000 66,048 4,061 317 504,226 66,519 5,642 Financial liabilities: Amounts owed to credit institutions and customers (Note J) Debts evidenced by certificates (Note K) 15,072 470,923 15,067 520,784 Note U – Risk management This note presents information about the Bank’s exposure to and its management and control of risks, in particular the primary risks associated with its use of financial instruments. These are: • • Credit risk - the risk of loss resulting from client or counterparty default and arising from credit exposure in all forms, including settlement risk; Interest rate risk - the risk that an investment's value will change due to a change in the absolute level of interest rates, in the shape of the yield curve or in any other interest rate relationship; Liquidity and funding risk - the risk that the Bank is unable to fund assets or meet obligations at a reasonable price or, in extreme situations, at any price; Foreign exchange rate risk - the risk of an investment's value changing due to changes in currency exchange rates and Operational risk - the potential loss resulting from inadequate or failed internal processes, people and systems or from external events. • • • Risk management organisation The Bank’s objective is to analyse and manage risks so as to obtain the strongest possible protection for its assets, its financial result, and consequently its capital. While the Bank is not subject to full regulation, it aims to comply with the relevant EU banking directives and the recommendations of the banking supervisors of the EU Member States, EU legislation and the competent supranational bodies, such as the Basel Committee on Banking Supervision (BCBS) and the European Banking Authority (EBA). The Risk Management Directorate (RM) independently identifies, assesses, monitors and reports credit, market, liquidity and funding and operational risks to which the Bank is exposed. In order to preserve segregation of duties, RM is independent of the Front Offices and provides second opinion on all proposals made which have risk implications. The Director General of RM reports to the Management Committee and meets regularly with the Audit Committee to discuss topics relating to credit, market, liquidity, funding and operational risks. He is also responsible for overseeing risk reporting to the Management Committee, the Risk Policy Committee and the Board of Directors. The management and monitoring of loans post signature is, for significant parts of the portfolio, the responsibility of Transaction Monitoring and Restructuring Directorate (TMR), a Directorate independent from RM. TMR focuses on monitoring higher risk counterparts and certain forms of security and it also manages transactions requiring particular attention. All of its proposals which have credit risk implications are subject to an independent second opinion by the RM. The following sections disclose the credit, market, liquidity and funding and operational risks to which the Bank is exposed on its activities performed at own risk. For additional details, please refer to the EIB Group Risk Management Disclosure Report. 50 Total financial liabilities 485,995 535,851 Total financial assets 542,426 576,704 Total financial liabilities 456,527 500,048 Total financial assets 531,758 565,051


EIB Statutory Financial Statements Risk measurement and reporting system The Bank aligns its risk management systems to changing economic conditions and evolving regulatory standards. It adapts them on an on-going basis as market practice develops. Systems are in place to control and report on the main risks inherent in the Bank’s operations, i.e. credit, market, liquidity and funding and operational risks. Risks are assessed and measured both under normal circumstances and under possible stressed conditions, with the purpose to quantify their impact on the Bank’s solvency, liquidity, earnings and operations. Risk measurements combine metrics of capitalisation, earnings, liquidity, exposure to market and operational risks. Detailed information on credit, ALM, liquidity, financial and operational risks is reported to the Management Committee and to the Board of Directors on a monthly basis. Such information is presented and explained to the Management Committee and to the Board of Directors’ Risk Policy Committee on a quarterly basis. The Bank’s risk tolerance The Bank has defined its risk tolerance level and set prudent boundaries for the risks arising from the pursuit of the Bank’s business strategy. In setting these boundaries, the Bank ensures that its risk profile is aligned with its business strategy and stakeholders’ expectations. As a public institution, the Bank does not aim to make profits from speculative exposures to risks. As a consequence, the Bank does not consider its treasury or funding activities as profit-maximising centres, even though performance objectives are attached to these activities. Investment activities are conducted within the primary objective of protection of the capital invested. With respect to exposures arising from the Bank’s lending and borrowing operations, the main principle of the Bank’s financial risk policy is therefore to ensure that all material financial risks are hedged. All new types of transactions introducing operational or financial risks must be authorised by the Management Committee, after the approval of the New Products Committee, and are managed within approved limits. Sustainability of revenue and self-financing capacity The Bank’s ALM policy forms an integral part of the Bank’s overall financial risk management. It reflects the expectations of the main stakeholders of the Bank in terms of stability of earnings, preservation of the economic value of own funds, and the self-financing of the Bank’s growth in the long term. To achieve these aims, the ALM policy employs a medium to long term indexation for the investment of own funds to promote stability of revenues and enhance overall returns. This indexation policy implies an exposure to medium to long term yields and is not influenced by any short term views on interest rates trends. This is accomplished by targeting a duration for the Bank’s own funds of between 4.5 and 5.5 years. The Asset/Liability Committee (ALCO) provides a high-level discussion forum for considering the Bank’s ALM Strategy, loan rate setting principles and the financial risks arising from the activities of the Bank. U.1. Credit risk Credit risk concerns mainly the Bank's lending activities and, to a lesser extent, its derivative transactions and treasury instruments, such as debt securities, certificates of deposit and interbank term deposits. No credit risk is attached to the Bank’s venture capital operations, which are performed entirely through equity participations and are therefore only exposed to market risk. The credit risk associated with the use of derivatives is analysed in Note V. Credit risk is managed pursuant to detailed internal guidelines approved by the governing bodies. The purpose of these guidelines is to ensure that credit risk is managed prudently. As operations inside and outside the EU may have different risk profiles, there are separate guidelines for EU and non-EU activities. Whether or not a given entity is acceptable to the Bank as a counterpart in a lending operation is determined on the basis of a careful analysis and evaluation of the entity using quantitative and qualitative metrics but also relying on experience and expert judgment. They set out minimum credit quality levels for both borrowers and guarantors in lending operations and identify the types of security that are deemed acceptable. They also detail the minimum requirements that loan contracts must meet in terms of key legal clauses and other contractual stipulations to ensure that the Bank's position is adequately safeguarded. In addition, via a counterparty and sector limit system, the guidelines ensure an acceptable degree of diversification in the Bank’s loan portfolio. In order to ensure that the additional risk involved in complex or structured lending transactions is adequately analysed, quantified and mitigated, specific detailed guidelines have been developed in respect of certain types of operations complementing the general guidelines. The guidelines also set out the minimum credit quality of counterparties of derivatives and treasury transactions as well as the contractual framework for each type of transaction. Credit guidelines undergo periodic adaptations to incorporate evolving operational circumstances and respond to new mandates that the Bank may receive. Management of credit risk is based on an assessment of the level of credit risk vis-à-vis counterparties and on the level of security provided to the Bank in case of the counterparty’s insolvency. The aggregate amount outstanding at any time of loans and guarantees granted by the Bank is limited by its Statutory Gearing Ratio (Article 16.5 of Statute). For the purpose of calculating this ratio the Bank uses data drawn from the EU Accounting Directives (AD) framework. At year-end 2017 EIB’s Statutory Gearing Ratio under EU Accounting Directive stand-alone accounts stood at 208% and under EU AD consolidated accounts stood at 211% (max. 250% under Article 16.5 of the Statute). 53


U.1.1. Loans In order to measure and manage credit risk on loans, the Bank has graded its lending operations according to generally accepted criteria, based on the quality of the borrower and, where appropriate, the security. The structure of borrowers and guarantors relating to the loan portfolio as at 31 December 2017 is analysed below, including undisbursed portions. Loans outside the European Union (apart from those under EIB Own-Risk Facilities (*)) are, as the last resort, secured by guarantees of the European Union budget or the Member States (loans in the ACP Countries and the OCT). These guarantees are either Comprehensive (covering all risks) or limited to defined Political Risks (non-transfer of currency, expropriation, war or civil disturbance, denial of justice upon breach of contract). (*) Own-Risk Facilities are geographical or thematic lending frameworks decided by the Board of Governors pursuant to Article 16 (previously Article 18) of the Bank’s Statute. Currently under implementation are the Pre Accession Facility, the Neighbourhood Finance Facility, the EFTA Facility, the Climate Action and Environment Facility, and the Strategic Projects Facility. Lending under these Facilities is from the Bank’s own resources and at the Bank’s full own risk. The table below shows (in EUR million) the loans for projects inside and outside the European Union granted under the Facilities and the risk-sharing operations: Guarantor Public institutions Not guaranteed (1) States Banks Corporates Total 2017 Total 2016 Borrower States Public institutions Banks Corporates 0 34,151 40,141 11,320 0 18,580 22,820 9,082 0 431 26,467 15,524 0 373 27,120 35,334 56,424 81,211 29,481 98,121 56,424 134,746 146,029 169,381 53,924 128,045 148,958 174,504 (1) These amounts include loans for which no formal guarantee independent of the borrower and the loan itself was required, the borrower’s level of solvency itself representing adequate security. In the event of certain occurrences, appropriate contractual clauses ensure the Bank’s right to access independent security. (2) The loans in risk-sharing operations amount to EUR 5,202 million as of 31 December 2017 (2016: EUR 6,518 million). (3) This amount does not include loan substitutes (2017: EUR 19,921 million; 2016: EUR 20,905 million). (4) These amounts exclude loans to current European Union Member States granted before their accession to the European Union and guaranteed by the European Union budget or the Member States. The Bank did not record value adjustments in 2016 and 2017 in respect of its EU sovereign and EU sovereign guaranteed exposure as at the year-end as the Bank’s preferred creditor status and the protection given by the Bank’s Statute are deemed to guarantee a full recovery of the Bank’s assets upon maturity. The disbursed exposure on borrowers located in the United Kingdom through the EIB’s lending activities, including guarantees and equity type investments, amounted to EUR 37.0 billion as at December 31, 2017 (2016: EUR 36.0 billion), while the exposure on foreign borrowers with a guarantor from the United Kingdom amounted to EUR 1.5 billion (2016: EUR 1.8 billion). The Bank had no direct exposure to the United Kingdom acting as borrower at the end of December 2017 whereas disbursed loans guaranteed by the United Kingdom amounted to EUR 2.0 billion as at the end of December 2017 (2016: EUR 1.3 billion). The table below discloses information regarding the sovereign credit risk on loans granted inside and outside the European Union granted under the Facilities and the risk-sharing operations: 52 Total 2017(2)(3)(4) 85,612 50,482 42,422 62,827 265,237 506,580 Total 2016(2)(3)(4) 88,118 52,662 49,224 62,669 252,758 505,431


EIB Statutory Financial Statements 2017 2016 (in EUR million) Acting as guarantor Acting as guarantor Acting as borrower Acting as borrower Country Disbursed Undisbursed Signed Disbursed Undisbursed Signed Austria Belgium Bulgaria Croatia Cyprus Czech Republic Denmark Estonia Finland France Germany Greece Hungary Ireland Italy Latvia Lithuania Luxembourg Malta Netherlands Poland Portugal Romania Slovakia Slovenia Spain Sweden United Kingdom Non EU–Countries 0 0 858 645 922 2,005 0 472 51 0 0 7,882 5,911 950 2,967 353 1,343 150 0 0 9,694 1,142 1,774 1,895 606 4,696 0 0 1,099 0 0 350 0 225 0 0 215 0 0 0 300 1,140 490 400 200 0 150 72 0 1,872 325 2,291 820 400 3 0 0 1,756 77 104 0 2,945 1,356 80 47 118 98 2,410 1,412 7,691 1,247 1,198 4,513 47 55 66 301 80 16,417 4,965 0 0 1,990 29,388 44 2,085 6,878 0 0 864 453 850 2,082 0 489 108 0 0 7,473 5,795 950 3,040 357 1,396 0 0 0 10,173 1,112 1,910 1,820 615 3,978 0 0 1,110 0 0 603 210 389 0 0 215 0 0 0 700 1,477 0 0 200 0 300 72 0 492 250 1,756 895 400 358 0 0 1,032 82 118 0 2,699 1,285 130 51 118 318 1,420 1,925 7,650 1,131 1,240 5,374 56 87 77 313 80 16,883 5,420 0 0 2,236 29,428 45 2,161 7,791 The table below shows (in EUR million) the loans for projects outside the European Union (apart from the Article 16 Facility and those falling under the Pre Accession Facility, the Neighbourhood Finance Facility, the EFTA Facility, the Climate Action and Environment Facility, and the Strategic Projects Facility): Secured by: 31.12.2017 31.12.2016 Member States European Union budget(1) 3,580 42,831 3,098 45,643 (1) Of which EUR 5,202 million in risk-sharing operations as explained above (2016: EUR 6,518 million). (2) Including loans to current European Union Member States granted before their accession to the European Union and guaranteed by the European Union budget or the Member States. (3) Financial guarantees that have been granted by the Bank for a total amount of EUR 433.6 million (2016: EUR 493.3 million), are secured by Member States or the EU budget. The aforementioned guarantees are not included in the analysis as provided in table above. 53 Total(2) (3) 46,411 48,741 Total 45,415 11,009 85,612 44,575 9,349 88,118


LOANS FOR PROJECTS OUTSIDE THE EUROPEAN UNION (in EUR million) (including loans in the new Member States before accession) BREAKDOWN OF LOANS OUTSTANDING BY GUARANTEE AGREEMENT 31.12.2017 31.12.2016 75% Member States global guarantee - ACP/OCT Group 4th Lomé Convention - ACP/OCT Group 4th Lomé Convention/2nd Financial Protocol 1 84 2 108 75% Member States guarantee - - - - Cotonou partnership agreement Cotonou partnership 2nd agreement Cotonou Protocol 3 - OR / ACP Cotonou Protocol 3 - OR / OCT 385 1,533 1,558 19 439 1,627 902 20 100% European Union budget guarantee - - - - ALA interim (100% guarantee) –153m CEEC –3bn - BG Decision 02.05.94 Russia – 100 m - 2001-2005 Russia – 500 m - 2004-2007 0 1 27 195 0 2 37 212 75% European Union budget guarantee - Mediterranean Protocols 47 70 70% European Union budget guarantee - - - - - - South Africa – 375m – Decision 29.01.97 ALA II – 900m Bosnia–Herzegovina – 100m 99/2001 Euromed (EIB) –2 310m – Decision 29.01.97 FYROM (Former Yugoslav Republic of Macedonia) – 150m – 1998/2000 CEEC–3,520m–Decision 29.01.97 25 10 38 83 25 307 31 22 45 129 34 425 - - - - - - - - - - - - - - - - - - - - 65% European Union budget guarantee South Africa – 825m – 7/2000-7/2007 South Africa – Decision 2/2007–12/2013 ALA III – 2,480m –-2/2000 – 7/2007 ALA Decision – 2/2007–12/2013 Euromed II – 6,520m – 2/2000 –-1/2007 South Eastern Neighbours – 9,185m – 2/2000 – 7/2007 Turkey special action – 450m – 2001-2006 Turkey TERRA – 600m – 11/1999 – 11/2002 PEV EE/CAS/RUS 1/2/2007 – 31/12/2013 PEV MED 1/2/2007 – 31/12/2013 Pre-Accession – 8,700m – 2007 – 2013 Climate Change Mandate 2011 - 2013 ELM Asia 2014-2020 ELM Central Asia 2014-2020 ELM East-Russia 2014-2020 ELM Latin America 2014-2020 ELM MED 2014-2020 ELM Pre-Accession 2014-2020 ELM RSA 2014-2020 161 543 242 2,353 2,406 3,945 122 317 2,472 7,474 7,448 1,616 624 182 4,252 1,156 4,661 1,902 197 188 687 350 3,029 2,866 4,799 128 333 3,621 8,329 8,214 1,728 529 160 3,664 1,044 3,077 1,740 150 (1)Financial guarantees that have been granted by the Bank for a total amount of EUR 433.6 million (2016: EUR 493.3 million), are secured by Member States or the EU budget. The aforementioned guarantees are not included in the analysis as provided in table above. 54 Total 65% European Union budget guarantee 42,073 44,636 Total European Union budget guarantee 42,831 45,643 Total(1) 46,411 48,741 Total 70% European Union budget guarantee 488686 Total 75% European Union budget guarantee 4770 Total 100% European Union budget guarantee 223 251 Total 75% Member States guarantee 3,495 2,988 Total Member States guarantee 3,580 3,098 Total 75% Member States global guarantee 85 110


EIB Statutory Financial Statements Collateral on loans (in EUR million) Among other credit mitigant instruments, the Bank uses pledges of financial securities. These pledges are formalised through a Pledge Agreement, enforceable in the relevant jurisdiction. The portfolio of collateral received in pledge contracts amounts to EUR 26,277 million (2016: EUR 32,361 million), with the following composition: As at 31 December 2017 Loan Financial Collateral (in EUR million) Bonds Secured Bonds (covered bonds) Moody's or equivalent rating Bank and Corporate Bonds Cash Total Supra-national Government Agency ABS Aaa Aa1 to Aa3 A1 Below A1 Non-Rated 40 239 1,421 14,005 30 27 7 0 0 0 6 18 0 1,644 0 268 561 3,730 43 0 112 395 623 1,447 761 391 0 0 0 0 0 0 0 0 509 844 1,220 5,774 17,139 1,300 As at 31 December 2016 Loan Financial Collateral (in EUR million) Bonds Secured Bonds (covered bonds) Moody's or equivalent rating Bank and Corporate Bonds Cash Total Supra-national Government Agency ABS Aaa Aa1 to Aa3 A1 Below A1 Non-Rated 210 506 1,582 21,272 0 76 0 0 0 0 0 4 0 0 0 1,023 608 647 2,114 0 0 403 502 2,337 0 578 0 0 0 0 0 0 0 0 499 1,887 1,521 2,731 25,723 499 A breakdown of disbursed loans outstanding (in EUR million) at 31 December according to the sectors in which borrowers are engaged is set out below: Maturity not more than 1 year more than 5 years Sector 1 year to 5 years Total 2017 Total 2016 Transports Global Loans(1) Energy Health, education Water, sewerage Industry Miscellaneous infrastructure Services Telecommunications Agriculture, fisheries, forestry 6,646 12,575 4,979 2,443 1,724 4,664 1,258 1,114 960 133 30,623 49,521 23,641 8,257 8,091 16,463 5,773 7,475 6,800 864 92,684 28,063 37,477 23,053 18,628 7,261 20,572 7,140 3,437 2,548 129,953 90,159 66,097 33,753 28,443 28,388 27,603 15,729 11,197 3,545 128,541 91,668 65,572 33,299 29,821 28,236 26,821 15,450 11,635 3,310 (1)A global loan is a line of credit to an intermediary financing institution or a bank, which subsequently lends the proceeds, at its own risk, to finance small and medium-sized projects being undertaken by private or public sector promoters. Arrears on loans Amounts in arrears are identified, monitored and reported according to the procedures defined into the Bank-wide “Financial Monitoring Guidelines and Procedures”. These procedures are adopted for all loans managed by the EIB. Loans not secured by global guarantees of the European Union budget or the Member States: As of 31 December 2017, arrears above 90 days on loans from own resources not secured by guarantees of the European Union budget or the Member States amount to EUR 180.0 million (2016: EUR 89.6 million). The outstanding principal related to those arrears amounts to EUR 479.5 million (2016: EUR 273.3 million) and value adjustments of EUR 188.8 million (2016: EUR 206.5 million) cover the outstanding exposure (incl. outstanding principal and amounts in arrears) as of 31 December 2017. 55 Total 2017 36,496 157,508 240,863 434,867 Total 2016 37,839 159,458 237,056 434,353 Total 23,570 76 4 4,392 3,242 578 499 32,361 Total 15,735 34 1,668 4,602 3,338 391 509 26,277


Loans secured by guarantees of the European Union budget or the Member States: Loans for projects that are located outside the European Union and carried out on the basis of mandates are guaranteed by the European Union, the Member States or on a risk-sharing basis. For such loans, if an amount is due, the primary guarantee is first called, where available, otherwise the guarantee of the Member States or of the European Union is officially invoked. As of 31 December 2017, these arrears above 90 days amount to EUR 2.2 million (2016: EUR 4.0 million). Loans called under guarantees of the European Union budget or the Member States: During 2017, EUR 89.6 million have been called under the European Union budget guarantee and nothing was called under the Member States guarantee. Corresponding amounts in 2016 were EUR 147.7 million and EUR 4.9 million respectively. The table below gives an overview of the arrears above 90 days on loans: (EUR'000) 31.12.2017 31.12.2016 Amount in arrears Related principal outstanding 180,038 479,514 89,560 273,316 Amount in arrears Related principal outstanding 2,163 0 3,964 0 Amount called (during the year) 89,577 152,613 Cumulative amount called and not refunded as at year-end 502,285 489,243 Loan renegotiation and forbearance The EIB considers loans to be forborne loans (i.e. loans, debt securities and loan commitments) in respect of which forbearance measures have been extended. Forbearance measures consist of “concessions” that the EIB decides to make towards an obligor who is considered unable to comply with the contractual debt service terms and conditions due to its financial difficulties, in order to enable the obligor, to service the debt or to refinance, totally or partially, the contract. Forbearance measures occur in situations in which the borrower is considered to be unable to meet the debt service terms and conditions of the contract due to financial difficulties. Based on these difficulties, the EIB decides to modify the debt service terms and conditions of the contract to allow the borrower sufficient ability to service the debt or refinance the contract, either totally or partially. Exposures shall be treated as forborne if a concession has been made, irrespective of whether (i) any amount is past-due, (ii) the exposure is classified as impaired or (iii) the exposure is classified as defaulted. Exposures shall not be treated as forborne when the obligor is not in financial difficulties. In the normal course of business, the Loan Grading (LG) of the loans in question would have deteriorated and the loans would have been included in the Watch List before renegotiation. Once renegotiated, the EIB will continue to closely monitor these loans. If the renegotiated payment terms will not recover the original carrying amount of the asset, the Bank will consider accounting for value adjustments in the profit and loss account. The corresponding value adjustment will be calculated based on the forecasted cash flows discounted at the original effective interest rate. The need for a value adjustment for all loans whose LG deteriorated to E-is assessed regularly; all loans with a LG of F require a value adjustment. Once the Loan Grading of a loan has improved sufficiently, the loan will be removed from the Watch List in line with the Bank’s procedures. Forbearance measures and practices undertaken by the Bank’s restructuring team during the reporting period includes, but not limited to, extension of maturities, deferral of capital only, deferral of capital and interest, breach of material covenants and capitalisation of arrears. Operations subject to forbearance measures are reported as such in the tables below. (in EUR million) 31.12.2017 31.12.2016 Number of contracts subject to forbearance practices Carrying values (incl. interest and amounts in arrears) of which being subject to value adjustments Value adjustments recognised Interest income in respect of forborne contracts Exposures written off (following the termination/sale of the operation) 48 2,816 935 420 83 3 30 1,714 1,025 339 39 0 56 Loans called under the EU or Member State guarantees Loans secured by EU or Member State guarantees (callable) Loans not secured by EU or Member State guarantees


EIB Statutory Financial Statements Forbearance measures Breach of material financial covenants Deferral of capital and interest Contractual repayment and termination(1) Extension of maturities (in EUR million) 31.12.2016 Other 31.12.2017 Public Bank Corporate 251 4 1,459 51 0 79 0 6 398 730 0 62 0 0 89 0 0 -313 1,032 10 1,774 (1)Decreases are explained by repayments of capital. interest and amounts in arrears as well as write-off which occurred during the year on operations already considered as forborne as of 31 December 2016 and by termination during the year. U.1.2. Treasury The credit risk associated with treasury (securities, commercial paper, term accounts, etc.) is managed by selecting sound counterparties and issuers. Limits governing the structure of the securities portfolio and outstanding treasury instruments have been laid down by the Management. These limits are reviewed regularly by the Risk Management Directorate. The Bank enters into collateralised reverse repurchase and repurchase agreement transactions that may result in credit exposure in the event that the counterparty to the transaction is unable to fulfil its contractual obligations. The Bank controls credit risk associated with these activities by monitoring counterparty credit exposure and collateral values on a daily basis and requiring additional collateral to be deposited with the Bank when deemed necessary. Tripartite reverse repo operations are carried out with a third-party custodian who undertakes, on the basis of a framework contract, to guarantee compliance with the contractual terms and conditions, notably with respect to: - - - delivery against payment; verification of collateral; the collateral margin required by the lender which must always be available and adequate, with the market value of the securities being verified daily by the said custodian; and organisation of substitute collateral provided that this meets all the contractual requirements. - The table below provides a percentage breakdown of the credit risk associated with the securities in the Treasury portfolios and the money markets products (deposits and reverse repos) in terms of the credit rating of counterparties and issuers: Securities portfolio % Money market products % Moody’s or equivalent rating 31.12.2017 31.12.2016 31.12.2017 31.12.2016 Aaa Aa1 to Aa3 A1 to A3 Below A3 15 41 26 18 17 41 19 23 32 30 34 4 2 52 43 3 Collateral on Treasury transactions Collateral received The Treasury transactions include EUR 7,951 million (2016: EUR 10,369 million) of tripartite reverse repurchase agreements and the tripartite repurchase agreements stood at nil at 31 December 2017 (2016: EUR 315 million). These transactions are governed by Tripartite Agreements, for which the exposure is fully collateralised, with daily margin calls. The market value of the collateral portfolio at 31 December 2017 is EUR 8,275 million (2016: EUR 10,512 million), with the following classification: Tripartite Agreements Collateral (in EUR million) At 31 December 2017 Bonds Secured Bonds (covered bonds) Bank and Corporate Bonds Moody's or equivalent rating Government Supra-national ABS Total Aaa Aa1 to Aa3 A1 Below A1 519 723 366 3,687 562 95 0 19 1,056 91 0 21 100 291 54 618 73 0 0 0 2,310 1,200 420 4,345 57 Total 5,295 676 1,168 1,063 73 8,275 Total 100 100 100 100 Total 1,714 130 404 792 89 -313 2,816


Tripartite Agreements Collateral (in EUR million) At 31 December 2016 Bonds Secured Bonds (covered bonds) Bank and Corporate Bonds Moody's or equivalent rating Government Supra-national ABS Total Aaa Aa1 to Aa3 A1 Below A1 537 491 30 4,722 66 62 0 0 1,992 246 230 0 36 474 183 1,161 282 0 0 0 2,913 1,273 443 5,883 Securities deposited In the context of the Eurosystem’s monetary policy operations, the EIB deposited securities with the Central Bank of Luxembourg with a market value of EUR 3.1 billion as at 31 December 2017 (2016: EUR 2.6 billion). U.1.3. Guarantees granted by the Bank in respect of loans granted by third parties Credit risk arising from the Bank’s guarantees and securitisations transactions funded by own resources is managed by risk management policies covered by the Statute and the Credit Risk Policy Guidelines. At year-end of 2017, the disbursed exposure of the loans guaranteed by the Bank amount to EUR 3.3 billion (2016: EUR 2.4 billion), and such provisions on guarantees amount to EUR 8.1 million (2016: EUR 13.7 million). The Credit Risk Policy Guidelines ensure that the Bank continues to develop a diversified guarantee portfolio in terms of product range, geographic coverage, counterparty exposure, obligor exposure, industry concentration and also set out the capital allocation rules based on the ratings of the exposures. Concentration risk is limited because of the granular nature of the Bank’s transactions; typically, the underlying portfolios are highly diversified in terms of single obligor concentration, sectors, and also with regard to regional diversification. To cover concentration risk, the Bank has strict limits (based on capital allocation) for individual transactions and on originator level (maximum aggregate exposures for originators and originator Banks). In the context of the Bank’s guarantee operations, the credit risk is tracked from the very beginning on a deal-by-deal basis whilst adopting a different model analysis approach depending on the granularity and homogeneity of the underlying portfolios. The industry sector exposures are analysed on a deal-by-deal basis through their impact on the ratings assigned by the Bank to each transaction or tranche. For instance, dependent on the financial model to analyse the transaction, industry exposures can be reflected in implicit correlation or can be indirectly captured through the assumption on default rate volatility, as a key model input variable. Furthermore, concentration exposures are analysed in the context of each deal using qualitative measures such as current status and forecast for sectors with high concentrations in the portfolio. Exceptionally, some deals have a concentrated exposure in the same (broad) sector. This is typically captured through increased credit enhancement (e.g. subordination) to the benefit of the Bank. Typically, deals with replenishing features have portfolio criteria, such as maximum single obligor, maximum top five obligors, and maximum industry concentration levels. Furthermore, the consideration of sector exposures is part of the Bank’s overall portfolio analysis. Counterparty risk is mitigated by the quality of the Bank’s counterparties, which are usually major market players. The Bank performs additional on-site monitoring visits to ensure compliance with procedures and processes during the transaction life. Stress-test scenarios for the portfolio of guarantees, including extreme case assumptions, are regularly carried out to determine the ability of the capital base to sustain adverse shocks. U.2. Interest rate risk Interest rate risk is the volatility in the economic value of, or in the income derived from, the Bank’s positions due to adverse movements in market yields or the term structure of interest rates. Exposure to interest rate risk occurs when there are differences in the repricing and maturity characteristics of the different asset, liability and hedge instruments. In measuring and managing interest rate risk, the Bank refers to the relevant key principles of the Basel Committee on Banking Supervision (BCBS) and the European Banking Authority (EBA). The main sources of interest rate risk are: repricing risk, yield curve risk, basis risk and spread risk. An interest rate risk that is particularly relevant for the Bank is spread risk. Spread risk is the volatility in the economic value of, or in the income derived from, the Bank’s positions due to movements in the Bank’s funding or lending spread. The Bank manages its global structural interest rate position on the basis of a notional reference portfolio. The majority of the financial risk indicators and controls in use by the Bank apply to this portfolio. U.2.1. Value-at-Risk for the own funds of the Bank The Bank’s ALM strategy aims at maintaining a balanced and sustainable revenue profile as well as limiting the volatility of the economic value of the Bank. A clear preference has been given to the revenue profile in light of the objective of self-financing of the Bank’s growth. This overall objective is achieved by investing the Bank’s own funds according to a medium to long term investment profile, implying an own funds duration target of 4.5 – 5.5 years. Apart from the duration target for own funds, the Bank’s balance sheet should be match-funded with respect to currency and interest rate characteristics. However, small deviations are authorised for operational reasons. The net residual positions that arise from outstanding operations are managed within pre-set limits to keep market risk to minimum levels. 56 Total 5,780 128 2,468 1,854 282 10,512


EIB Statutory Financial Statements The Risk Management Directorate quantifies the Value at Risk (VaR) of own funds for both interest rates and foreign exchange risk factors. This is a parametric VaR calculated on the basis of the Riskmetrics methodology, where volatility and correlation data are computed internally on the basis of historical market data. It is measured on the Bank’s positions using a 99% confidence level and a one-day time horizon. As at 31 December 2017, the VaR of the EIB own funds amounted to EUR 185 million (2016: EUR 257 million). The evolution of the VaR of own funds since 2016 reflects the effective decrease of the volatility of the risk factors and not a change in the risk profile of the Bank’s positions. More generally, the VaR does not purport to measure the worst loss that could be experienced. For this reason, it is complemented by regular stress testing using interest rate shocks. As of 31 December 2017, the impact of a 200 basis point upward parallel shift of the interest rate curves would reduce the economic value of own funds by EUR 7.81 billion (2016: EUR 7.58 billion). Among the financial instruments in the Bank’s portfolio, some deals (borrowings and associated swaps) present callability options and may be redeemed early, introducing uncertainty as to their final maturity. At cash flow level all such borrowings are fully hedged by swaps so that they can be considered as synthetic floating rate notes indexed to Libor/Euribor. Below is a summary of the features of the Bank’s callable portfolio as of 31 December 2017 and 31 December 2016, where the total nominal amount, the average natural maturity and the average expected maturity (both weighted by the nominal amount of the concerned transactions) are shown per funding currency and per main risk factor involved: By funding currency (after swaps): 31.12.2017 (in EUR million) EUR JPY USD Total EUR Pay Notional Average maturity date -2,679 17.11.2042 -21 09.02.2032 -2,810 17.04.2037 -5,510 27.12.2039 Average expected maturity 13.06.2028 11.02.2029 16.10.2025 04.02.2027 31.12.2016 (in EUR million) EUR JPY USD Total EUR Pay Notional Average maturity date -2,614 24.09.2042 -77 25.08.2022 -2,776 29.01.2036 -5,467 25.01.2039 Average expected maturity 07.10.2028 01.10.2020 24.05.2026 13.06.2027 By risk factor involved: 31.12.2017 Risk factor (in EUR million) FX level IR curve level IR curve shape Total EUR Pay Notional Average maturity date -712 27.09.2037 -4,659 10.08.2040 -139 16.09.2030 -5,510 27.12.2039 Average expected maturity 05.06.2026 22.05.2027 21.09.2020 04.02.2027 31.12.2016 Risk factor (in EUR million) FX level IR curve level IR curve shape Total EUR Pay Notional Average maturity date -1,004 22.12.2034 -4,324 15.04.2040 -139 16.09.2030 -5,467 25.01.2039 Average expected maturity 24.07.2024 23.04.2028 03.07.2021 13.06.2027 U.2.2. Interest rate risk management The sensitivity of earnings quantifies the amount of net interest income that would change during the forthcoming 12 months if all interest rate curves would rise by one percentage point or decrease by one percentage point. Such exposure stems from the mismatch between interest rate repricing periods, volumes and rates of assets and liabilities that the Bank accepts within the approved limits. With the positions in place as of 31 December 2017, the earnings would increase by EUR 117.1 million (2016: EUR 103.6 million) if interest rates were to increase by 100 basis points and decrease by EUR 110.6 million (2016: EUR 119.1 million) if interest rates were to decrease by 100 basis points. The Bank computes the sensitivity measure with a dedicated software that simulates earnings on a deal by deal basis. The sensitivity of earnings is measured on an accruals basis and is calculated under the ‘’ongoing’’ assumption that, over the time horizon analysed, the Bank realises the new loan business forecast in the Operational Plan, maintains exposures within approved limits and executes monetary trades to refinance funding shortages or invest cash excesses. Earnings are simulated on monthly timely basis, assuming that all the fixed rate items carry their contractual rate and that all floating rate items are subject to interest rate repricing according to the interest rate scenario applied in the simulation. The monetary trades to refinance funding shortages or invest cash excesses carry rates equal to the money market rates prevailing according to the interest rate scenario applied in the simulation. In line with the Bank’s current practice of the model uses the hypothesis that simulated earnings are not distributed to the shareholders, but are used to refinance the Bank’s business. The administrative costs are projected according to the forecasts of the Operational Plan. 59


U.3. Liquidity risk Liquidity risk refers to the ability of the Bank to fund increases in assets and meet obligations as they come due, without incurring unacceptable losses. It can be further split into funding liquidity risk and market liquidity risk. Funding liquidity risk is connected to the risk for the Bank of being unable to refinance the asset side of its balance sheet and meet payment obligations punctually and in full out of readily available liquid resources. Funding liquidity risk may have an impact on the volatility in the economic value of, or income derived from the Bank’s positions, due to potentially increasing immediate risks relating to meeting payment obligations and the consequent need to borrow at unattractive conditions. Market liquidity risk is the volatility in the economic value of, or income derived from, the Bank’s positions due to potential inability to execute a transaction to offset, eliminate or reduce outstanding positions at reasonable market prices. Such an inability may force the early liquidation of assets at unattractive prices when it would be better to avoid such liquidation. This risk is tied to the size of the position compared to the liquidity of the instrument being transacted, as well as to potential deterioration of market availability and efficiency. The liquidity risk of the Bank is managed in order to ensure the regular functioning of its core activities at reasonable cost. The main objective of liquidity policy is to ensure that the Bank can always meet its payment obligations punctually and in full. In contrast to commercial banks, the EIB does not have retail deposits but relies on its access to capital markets to raise the funds it on-lends to its clients. The Bank manages the calendar of its new issues so as to maintain a prudential liquidity buffer. Liquidity planning takes into account the Bank’s needs to service its debt, make disbursements on loans and cash inflows from the loan portfolio. It also takes into account the sizeable amount of signed but un-disbursed loans, whose disbursements typically take place at the borrowers’ request. The Bank further assures management of liquidity risk by maintaining a sufficient level of short term liquid assets and by spreading the maturity dates of its placements according to the forecasts of liquidity needs. Liquidity risk policy also incorporates a floor on treasury levels. The Bank's total liquidity ratio (liquidity as a percentage of the next 12 months projected net cash flows) must at all times exceed 25%. The Bank has in place a Contingency Liquidity Plan (‘CLP’), which specifies appropriate decision making procedures and corresponding responsibilities. The CLP has been benchmarked against the “Principles for Sound Liquidity Risk Management and Supervision” by the Basel Committee on Banking Supervision (September 2008). The CLP is subject to ad-hoc updates and is presented to the Management Committee annually for approval. Regular stress-testing analyses tailored to the specific business model of the EIB are executed as a part of the liquidity risk monitoring. On 8 July 2009, the Bank became an eligible counterparty in the Eurosystem’s monetary policy operations, and therefore has been given access to the monetary policy operations of the European Central Bank. The Bank conducts the operations via the Central Bank of Luxembourg, where the Bank maintains deposits to cover the minimum reserve requirement. The Bank implemented the Liquidity Coverage Ratio (‘LCR’) in line with the requirements of the “delegated act” (EU No 2015/61 of 10 October) by the European Commission. The Bank calculates LCR on a daily basis, both in its functional currency (EUR) as was as in the other significant currencies (GBP and USD). Consistency of the currency denomination of its liquid assets with its net liquidity outflows is ensured by the Bank on an ongoing basis, in order to prevent an excessive currency mismatch. As of end 2017 the LCR stood at 201.4% (end 2016 198.9%). The table hereafter analyses the assets and liabilities of the Bank by maturity on the basis of the period remaining between the balance sheet date and the contractual maturity date. Assets and liabilities for which there is no contractual maturity date are classified under "Maturity undefined". 60


EIB Statutory Financial Statements Liquidity risk (in EUR million) More than 3 months to 1 year More than 1 year to 5 years 3 months or less More than 5 years Maturity undefined Maturity at 31 December 2017 Total 2017 Assets: Cash in hand, balances with central banks and post office banks Treasury bills and other bills eligible for refinancing with central banks Other loans and advances: - Current accounts - Credit institutions - Customers 162 0 0 0 0 162 13,197 8,179 11,016 8,000 0 40,392 764 30,144 0 3,610 0 0 0 0 0 0 764 33,754 1,679 63 0 0 0 1,742 32,587 3,673 0 0 0 36,260 Loans: - Credit institutions - Customers 2,403 12,038 57,665 49,387 19 121,512 3,806 18,240 99,693 191,340 46 313,125 6,209 30,278 157,358 240,727 65 434,637 Debt securities including fixed-income securities Shares, other variable-yield securities and participating interests Shares in affiliated undertakings Other assets 6,145 2,860 3,626 2,722 0 15,353 0 0 0 0 0 26 0 0 125 0 0 67 4,954 837 16,731 4,954 837 16,949 Liabilities: Amounts owed to credit institutions Amounts owed to customers Debts evidenced by certificates Capital, reserves and profit Other liabilities 5,011 1,931 34,735 0 9 0 0 31,634 0 11 0 0 217,182 0 516 0 0 166,034 0 257 0 0 0 68,986 23,238 5,011 1,931 449,585 68,986 24,031 Some of the borrowings and associated swaps include early termination triggers or call options granted to the investors or the hedging swap counterparties and the Bank as well has the right to call the related bonds before maturity. If the Bank were to exercise all the call options on its bonds at their next contractual exercise date, cumulated early redemptions for the period 2018 - 2020 would amount to EUR 2.7 billion. 61 Off balance sheet currency swaps -321 475 2,826 -1,373 0 1,607 Total liabilities 41,686 31,645 217,698 166,291 92,224 549,544 Total assets 58,300 45,016 172,125 251,516 22,587 549,544


More than 3 months to 1 year More than 1 year to 5 years 3 months or less More than 5 years Maturity undefined Maturity at 31 December 2016 Total 2016 Assets: Cash in hand, balances with central banks and post office banks Treasury bills and other bills eligible for refinancing with central banks Other loans and advances: - Current accounts - Credit institutions - Customers 317 0 0 0 0 317 15,711 14,891 11,705 8,149 0 50,456 662 28,345 0 6,836 0 0 0 0 0 0 662 35,181 2,096 124 0 0 0 2,220 31,103 6,960 0 0 0 38,063 Loans: - Credit institutions - Customers 3,228 12,913 59,480 48,590 3 124,214 3,858 17,307 99,978 188,466 114 309,723 7,086 30,220 159,458 237,056 117 433,937 Debt securities including fixed-income securities Shares, other variable-yield securities and participating interests Shares in affiliated undertakings Other assets 8,408 2,050 2,353 2,780 0 15,591 0 0 57 0 0 74 0 0 145 0 0 71 4,061 875 29,584 4,061 875 29,931 Liabilities: Amounts owed to credit institutions Amounts owed to customers Debts evidenced by certificates Capital, reserves and profit Other liabilities 12,954 1,952 36,099 0 0 166 0 42,173 0 41 0 0 229,347 0 466 0 0 163,304 0 327 0 0 0 66,180 20,222 13,120 1,952 470,923 66,180 21,056 62 Off balance sheet currency swaps 1,330 3,211 7,345 2,294 0 14,180 Total liabilities 51,005 42,380 229,813 163,631 86,402 573,231 Total assets 62,682 54,195 173,661 248,056 34,637 573,231


EIB Statutory Financial Statements U.4. Foreign exchange rate risk The foreign exchange (FX) risk is the volatility in the economic value of, or in the income derived from, the Bank’s positions due to adverse movements of foreign exchange rates. The Bank is exposed to a foreign exchange risk whenever there is a currency mismatch between its assets and liabilities. In compliance with its Statute, the Bank does not engage in currency operations not directly required to carry out its lending operations or fulfil commitments arising from loans or guarantees granted by it. Mismatches of currencies in the asset-liability structure of the Bank are kept within tight limits. The foreign exchange risk implicit in interest margin accruing in currencies different from EUR is regularly hedged. The hedging programme addresses the interest rate loan margins expressed in USD and in GBP for the next 3 years on a rolling basis. Foreign exchange position (in EUR million) Pound Sterling Other currencies Sub-total except Euro Currency at 31 December 2017 Euro US Dollar Total 2017 Assets: Cash in hand, balances with central banks and post office banks Treasury bills and other bills eligible for refinancing with central banks Other loans and advances: - Current accounts - Credit institutions - Customers 162 0 0 0 0 162 35,825 1,362 3,205 0 4,567 40,392 678 25,762 33 257 5 1,116 48 6,619 86 7,992 764 33,754 614 0 0 1,128 1,128 1,742 27,054 290 1,121 7,795 9,206 36,260 Loans: - Credit institutions - Customers 101,590 2,023 11,494 6,405 19,922 121,512 249,846 34,700 9,959 18,620 63,279 313,125 351,436 36,723 21,453 25,025 83,201 434,637 Debt securities including fixed-income securities Shares, other variable-yield securities and participating interests Shares in affiliated undertakings Other assets 2,573 2,583 4,692 5,505 12,780 15,353 3,901 837 16,152 673 0 341 227 0 205 153 0 251 1,053 0 797 4,954 837 16,949 Liabilities: Amounts owed to credit institutions Amounts owed to customers Debts evidenced by certificates: - Debt securities in issue - Others 4,704 1,708 0 7 259 75 48 141 307 223 5,011 1,931 225,341 49,205 118,961 42,223 210,389 435,730 7,906 107 967 4,875 5,949 13,855 233,247 68,986 24,009 49,312 0 879 119,928 0 287 47,098 0 -1,144 216,338 0 22 449,585 68,986 24,031 Capital, reserves and profit Other liabilities 63 Total liabilities 332,654 50,198 120,549 46,143 216,890 549,544 Off balance sheet currency swaps -105,284 8,269 89,594 7,421 105,284 Net position 2 43 -52 7 -2 Total assets 437,940 41,972 30,903 38,729 111,604 549,544


 Foreign exchange position (in EUR million) Pound Sterling Other currencies Sub-total except Euro Currency at 31 December 2016 Euro US Dollar Total 2016 Assets: Cash in hand, balances with central banks and post office banks Treasury bills and other bills eligible for refinancing with central banks Other loans and advances: - Current accounts - Credit institutions - Customers 317 0 0 0 0 317 48,922 464 1,070 0 1,534 50,456 501 26,320 19 58 8 2,953 134 5,850 161 8,861 662 35,181 1,228 0 0 992 992 2,220 28,049 77 2,961 6,976 10,014 38,063 Loans: - Credit institutions - Customers 102,465 2,780 12,190 6,779 21,749 124,214 247,152 32,916 11,914 17,741 62,571 309,723 349,617 35,696 24,104 24,520 84,320 433,937 Debt securities including fixed-income securities Shares, other variable-yield securities and participating interests Shares in affiliated undertakings Other assets 7,983 375 2,465 4,768 7,608 15,591 3,175 875 26,205 602 0 1,290 147 0 1,103 137 0 1,333 886 0 3,726 4,061 875 29,931 Liabilities: Amounts owed to credit institutions Amounts owed to customers Debts evidenced by certificates: - Debt securities in issue - Others 12,230 1,715 25 31 784 86 81 120 890 237 13,120 1,952 212,909 51,676 145,501 45,575 242,752 455,661 7,993 196 1,182 5,891 7,269 15,262 220,902 66,180 16,371 51,872 0 1,920 146,683 0 1,215 51,466 0 1,550 250,021 0 4,685 470,923 66,180 21,056 Capital, reserves and profit Other liabilities U.5. Operational risk Operational Risk is a potential failure in process, people, systems or other external events resulting in direct financial exposures or near-misses on the EIB. The definition includes legal and reputational risk, but excludes strategic risk. Operational risk is inherent in the EIB’s activities and can manifest itself in various ways, including human factors, inappropriate employee behaviour, cyber and technology related events, inadequate or failed processes, business interruptions or security, failure of information systems, 3rd party outsourcing failures or fraudulent acts. The goal is to keep operational risk at minimum levels in light of the EIB’s financial strength, the characteristics of its businesses and the markets in which it operates. The Operational Risk Management is responsible for defining the operational risk framework and related policies while the responsibility for implementing the framework lies with the Bank’s departments. The key elements of the framework of best banking practices as recommended by Basel Committee on Banking Supervision (BCBS) are risk identification, assessment, monitoring as well as risk control and mitigation. The Bank employs an assessment methodology that takes into account all available information including internal loss history, scenario analysis and the business and control environment through a set of operational risk indicators organized in scorecards. Specifically, operational risk provides oversight of the significant operational risk events that have or could lead to actual operational risk losses and areas of emerging risk. The EIB uses the SAS system to monitor on an on-going basis operational risk exposures and loss events by major business processes. In addition, a statistical model and a Value at Risk calculation engine complete the operational risk environment. The management of operational risk is carried out at all levels within the organisation and is a responsibility of all the various departments of the Bank. In terms of reporting, all information concerning operational risk internal loss history, scenario analysis and operational risk indicators are regularly forwarded to the Vice President, Directors General and Audit Committee and the report on the activities of the New Products Committee to senior management in the Bank. 64 Total liabilities 317,398 53,848 148,768 53,217 255,833 573,231 Off balance sheet currency swaps -147,800 15,417 116,891 15,492 147,800 Net position -55 73 -27 9 55 Total assets 465,143 38,504 31,850 37,734 108,088 573,231


EIB Statutory Financial Statements Note V – Derivatives The Bank uses derivative instruments mainly as part of its asset and liability management activities to manage exposures to interest rate and foreign currency risks. Derivatives are contractual financial instruments, the value of which fluctuates according to price movements of the underlying assets, interest rates, exchange rates or indices. The majority of the Bank’s swaps are concluded with a view to hedging bond issues, as part of its resource-raising operations (funding activity). All swaps linked to the borrowing portfolio have maturities matching the corresponding borrowings and are therefore of a long-term nature. The Bank also enters into swaps as part of its hedging operations on loans, treasury, or for the global Assets and Liabilities Management (ALM) position (ALM hedging activity) (see note V.1.). The Bank also enters into short-term currency swap contracts in order to adjust currency positions in its operational treasury in relation to its benchmark currency, the euro, and to cater for demand for currencies in conjunction with loan disbursements (see Note V.2.). Future contracts (futures) can be used in the context of the treasury activities, to hedge the exposure deriving from some investments in government bonds. Futures are standardised derivatives, traded on regulated markets, and they do not fall within the general policy for counterparty risk measurement and control (see note V.2.). Forward rate agreements are used by the Bank to hedge the interest rate risk of its short-term treasury position (see Note V.2.). V.1. Funding and ALM derivatives The derivatives used in the context of funding and ALM hedging activities are: • • • Currency swaps; Interest rate swaps; and Structured swaps. V.1.1. Currency swaps Currency swaps are contracts under which it is agreed to convert funds raised in one currency into another currency and, simultaneously, a forward exchange contract is concluded to re-exchange the two currencies in the future in order to be able to repay the funds raised on the due dates. The Bank enters into currency swaps, in which, at inception, the proceeds of a borrowing are converted into a different currency, mainly as part of its resource-raising operations, and, thereafter, the Bank will obtain the amounts needed to service the borrowing in the original currency. The following table shows the maturities of currency swaps (excluding short-term currency swaps – see Note V.2.), sub-divided according to their notional amount and fair value. The notional amounts are disclosed off balance sheet. More than 1 year and up to 5 years More than 5 years and up to 10 years More than 10 years Currency swaps at 31 December 2017 (in EUR million) 1 year or less Total 2017 Notional amount (receivable) Fair value (i.e. net discounted value including CVA and 36,128 35 108,446 -1,717 40,132 1,995 19,371 1,423 204,077 1,736 DVA)(*) More than 1 year and up to 5 years More than 5 years and up to 10 years More than 10 years Currency swaps at 31 December 2016 (in EUR million) 1 year or less Total 2016 Notional amount (receivable) Fair value (i.e. net discounted value including CVA and 34,392 3,865 125,331 8,323 36,858 2,443 15,651 2,064 212,232 16,695 DVA)(*) (*)Including the fair value of macro-hedging currency swaps which stood at EUR 500 million as at 31 December 2017 (2016: EUR 1,994 million). 65


V.1.2. Interest rate swaps Interest rate swaps are contracts under which, generally, it is agreed to exchange floating-rate interest for fixed-rate interest or vice versa. Interest rate swaps enable the Bank to modify the interest rate structure of its borrowing portfolio and other portfolios in order to accommodate requests from its clients and also to reduce funding costs by exchanging its advantageous conditions of access to certain capital markets with its counterparties. The following table shows the maturities of interest rate swaps (including synthetic swaps, whereby interest computed in a foreign currency is synthetically converted to EUR), sub-divided according to their notional amount and fair value. The notional amounts are disclosed off balance sheet. More than More than More than 10 years Interest rate swaps at 31 December 2017 (in EUR million) 1 year or less 1 year and up 5 years and up Total 2017 to 5 years to 10 years Notional amount Fair value (i.e. net discounted value including CVA and DVA)(*) 44,391 -350 202,704 4,158 126,652 4,267 136,260 1,345 510,007 9,420 More than More than More than 10 years Interest rate swaps at 31 December 2016 (in EUR million) 1 year or less 1 year and up 5 years and up Total 2016 to 5 years to 10 years Notional amount Fair value (i.e. net discounted value including CVA and DVA)(*) 75,265 587 197,166 5,027 116,008 6,987 134,914 607 523,353 13,208 (*)Including the fair value of macro-hedging interest rate swaps which stood at EUR -333 million as at 31 December 2017 (2016: EUR 461 million). V.1.3. Structured swaps The Bank does not generally enter into any options contracts in conjunction with its risk hedging policy. However, as part of its strategy of raising funds on the financial markets at a lesser cost, the Bank enters into borrowing contracts and loans encompassing notably interest rate or stock exchange index options. Such structured borrowings and loans are entirely covered by swap contracts to hedge the corresponding market risk. The table below further details the number, value and notional amounts of structured swaps: Special structure coupon or similar Early termination embedded Stock exchange index 2017 2016 2017 2016 2017 2016 Number of transactions Notional amount (in EUR million) 136 5,490 138 5,465 1 500 1 500 306 19,437 300 33,084 Net discounted value (in EUR million) 444 512 -33 -19 -2,461 -2,207 The fair value of swap transactions is computed using the income approach, applying valuation techniques to convert future amounts to a single present amount (discounted). The estimate of fair value is based on the value indicated by marketplace expectations about those future amounts. Valuation techniques can range from simple discounted known cash flows to complex option models. The valuation models applied are consistent with accepted economic methodologies for pricing financial instruments, and incorporate the factors that market participants consider when setting a price. For a portion of derivative transactions, internal estimates and assumptions might be used in the valuation techniques when the market inputs are not directly available. All option contracts embedded in, or linked with, borrowings are negotiated over the counter. The structured deals include a variety of transactions dependent on interest rates, FX rates, inflation rates, stock indexes and IR volatilities. V.1.4. Derivatives credit risk mitigation policy The credit risk with respect to derivatives lies in the loss that the Bank would incur if the counterparty is unable to honour its contractual obligations. In view of the special nature and complexity of the derivatives transactions, a series of procedures has been put in place to safeguard the Bank against losses arising from the use of such instruments. • Contractual framework: All of the Bank’s derivative transactions are concluded in the contractual framework of ISDA Swap Agreements and where applicable Credit Support Annexes, which specify the conditions of exposure collateralisation. These are generally accepted and practised contract types. • Counterparty selection: The minimum rating at the outset is set at A3. The EIB has the right of early termination if the rating drops below a certain level. 66


EIB Statutory Financial Statements • Collateralisation: - Exposures (exceeding limited thresholds) are collateralised by cash and bonds. - Complex and illiquid transactions could require collateralisation over and above the current market value. - Both the derivatives portfolio with individual counterparties and the collateral received are regularly monitored and valued, with a subsequent call for additional collateral or release. The market value of collateral received for swaps amounts to EUR 16,279 million as at 31 December 2017 (2016: EUR 37,963 million), with the following composition, detailed based on the nature of the collateral and based on Moody’s equivalent rating: Swap collateral (in EUR million) Bonds Agency, supranational, covered bonds Total 2017 Moody's equivalent rating Cash Government Aaa Aa1 to Aa3 A1 to A3 Baa1 to Baa3 Below Baa3 Non-Rated 2,877 2,430 96 4,419 2 0 1,517 0 0 0 0 0 0 0 0 0 0 4,938 4,394 2,430 96 4,419 2 4,938 Swap collateral (in EUR million) Bonds Agency, supranational, covered bonds Moody's equivalent rating Cash Total 2016 Government 7,340 11,899 244 5,496 221 12,763 Aaa Aa1 to Aa3 A1 to A3 Baa1 to Baa3 Below Baa3 Non-Rated 3,470 11,899 134 5,496 221 0 3,870 0 110 0 0 0 0 0 0 0 0 12,763 • Credit risk measurement for derivatives: The credit risk associated with derivatives varies according to a number of factors (such as interest and exchange rates) and generally corresponds to only a small portion of their notional value. The Bank measures the credit risk exposure related to swaps and derivatives transactions using the Current Unsecured Exposure and the Potential Future Exposure for reporting and limit monitoring, and the Credit Risk Equivalent for capital allocation according to the recommendations of the Basel Committee on Banking Supervision (BCBS) sponsored by the BIS. The Bank computes the Current Unsecured Exposure, which is the larger of zero and the market value of the portfolio of transactions within the netting set with a counterparty, less the value of collateral received. It is the amount that would be lost upon the default of the counterparty, using the received collateral and assuming no recovery on the value of those transactions in bankruptcy as well as immediate replacement of the swap counterparty for all the transactions. As of 31 December 2017 the Current Unsecured Exposure stood at EUR 364 million (EUR 448 million as of 31 December 2016). In addition, the Bank computes the Potential Future Exposure, which takes into account the possible increase in the netting set’s exposure over the margin period of risk, which ranges between 10 and 20 days, depending on the portfolio of transactions. The EIB computes the Potential Future Exposure at 90% confidence level using stressed market parameters to arrive at conservative estimates. This is in line with the recommendations issued by regulators in order to take into consideration the conditions that will prevail in case of default of an important market participant. As of 31 December 2017 the Potential Future Exposure at origin stood at EUR 7,366 million (EUR 9,499 million as of 31 December 2016). 67 Total 2016 21,220 3,980 12,763 37,963 Total 2017 9,824 1,517 4,938 16,279


• Limits: The limit system for banks covers the Potential Future Exposure in 3 time buckets (under 1 year, between 1 and 5 years and over 5 years) and in 2 rating scenarios (current and downgrade below A3). The derivatives portfolio is valued and compared against limits on a daily basis. The following table provides a breakdown of counterparties by internal rating. Grouped ratings Percentage of nominal Current Unsecured Exposure (in EUR million) Potential Future Exposure (in EUR million) Moody’s equivalent rating 2017 2016 2017 2016 2017 2016 Aaa Aa1 to Aa3 A1 to A3 Below A3 0.32% 23.48% 65.33% 10.87% 0.35% 24.57% 65.68% 9.40% 119 224 0 21 91 224 124 9 140 1,904 5,094 228 169 2,785 6,365 180 V.2. As part of liquidity management The Bank also enters into short-term currency swap contracts in order to adjust currency positions in its operational treasury portfolios in relation to its benchmark currency, the euro, and to cater for demand for currencies in conjunction with loan disbursements. The notional amount of short-term currency swaps receivable stood at EUR 43,942 million at 31 December 2017 against EUR 46,312 million at 31 December 2016. The fair value of these contracts was EUR -23 million at 31 December 2017 (2016: EUR 847 million). The notional amount of short-term currency forwards was EUR 585 million at 31 December 2017 (2016: EUR 667 million). The fair value of these contracts was EUR 39 million at 31 December 2017 (2016: EUR 18 million). 68 Total 100.00% 100.00% 364 448 7,366 9,499


EIB Statutory Financial Statements Note W – Conversion rates The following conversion rates were used for drawing up the balance sheets at 31 December 2017 and 2016: 31.12.2017 31.12.2016 Bulgarian lev (BGN) Czech koruna (CZK) Danish krone (DKK) Pound sterling (GBP) Hungarian forint (HUF) Polish zloty (PLN) Romanian leu (RON) Swedish krona (SEK) 1.9558 25.5350 7.4449 0.8872 310.3300 4.1770 4.6585 9.8438 1.9558 27.0210 7.4344 0.8562 309.8300 4.4103 4.5390 9.5525 Australian dollar (AUD) Canadian dollar (CAD) Swiss franc (CHF) Chinese yuan-renminbi (CNY) Dominican peso (DOP) Egyptian pound (EGP) Hong Kong dollar (HKD) Iceland króna (ISK) Japanese yen (JPY) Kenyan shilling (KES) Moroccan dirham (MAD) Mexican peso (MXN) Norwegian krone (NOK) New Zealand dollar (NZD) Russian ruble (RUB) Serbia dinars (RSD) Tunisia dinars (TND) Turkish lira (TRY) Taiwan dollar (TWD) Ukraine hryvnia (UAH) United States dollar (USD) CFA Franc (XOF) 1.5346 1.5039 1.1702 7.8044 57.1465 21.2725 9.3720 124.7000 135.0100 123.7000 11.2144 23.6612 9.8403 1.6850 69.3920 118.2700 2.9821 4.5464 35.5849 33.7627 1.1993 655.9570 1.4596 1.4188 1.0739 7.3202 48.7476 19.0008 8.1751 214.9400 123.4000 108.0600 10.6711 21.7719 9.0863 1.5158 64.3000 123.4000 2.4255 3.7072 34.1539 28.5012 1.0541 655.9570 South African rand (ZAR) 14.8054 14.4570 69 Non-EU currencies Non-euro currencies of EU member states


Note X – Related party transactions X.1. Shares in affiliated undertakings and participating interest Related party transactions with the European Investment Fund (‘EIF’) are mainly associated with the management by the Bank of the EIF treasury, the IT, the pension fund and other services on behalf of the EIF. In addition, the EIF manages the venture capital activity of the Bank (including participating interests). Related party transactions with the EU Microfinance Platform FCP-FIS (‘EUMPF’) mainly concern the dividends received by the Bank throughout the year ended 31 December 2017. As per the Management Regulations, the EIF serves as Management Company to the EUMPF umbrella fund. In line with the Management Regulations, EUMPF pays management fees to EIF. It is reminded that EUMPF has been classified in Shares in affiliated undertakings for the first time as of 01 January 2015. The amounts included in the Financial Statements concerning the EIF and EUMPF related parties transactions with the Bank are disclosed as follows: (in EUR´ 000) 31.12.2017 31.12.2016 Assets: Shares in affiliated undertakings Participating interests Prepayments and accrued income Other assets 836,653 238,486 1,914 8,379 875,209 168,637 1,351 2,485 Liabilities: Other liabilities -168,216 -143,943 Profit and loss account: Income from shares in affiliated undertakings Result from participating interests Interest payable and similar charges Commission income Commission expenses Other operating income General administrative expenses 16,120 -1,923 -5,297 9,797 -41,696 10,569 0 16,658 -8,174 -6,699 6,753 -37,018 8,803 482 Off balance sheet: EIF capital – uncalled EUMPF capital – uncalled EIF treasury management Put option granted to EIF minority shareholders Participating interests-uncalled 2,104,800 0 1,259,389 813,042 558,349 2,099,200 0 1,285,949 753,544 556,472 70 Total off balance sheet 4,735,580 4,695,165 Total profit and loss account -12,430 -19,195 Total liabilities -168,216 -143,943 Total assets 1,085,432 1,047,682


EIB Statutory Financial Statements X.2. Key Management Personnel The Bank has identified members of the Board of Directors, the Audit Committee, the Management Committee and the Directors General heading the different EIB organisational directorates as key management personnel. Key management personnel compensation for the relevant reporting periods, included within General administrative expenses (Note R), is disclosed in the following table: 2017 2016 (in EUR ’000) Short-term benefits(1) Post-employment benefits(2) Termination benefits 9,569 864 2,344 9,821 910 9 (1)Short-term employee benefits comprise salaries and allowances, bonuses and social security contributions of the Management Committee, the Directors General and other Directors, and benefits paid to the members of the Board of Directors and the Audit Committee. (2)Post-employment benefits comprise pensions and expenses for post-employment health insurance paid to members of the Management Committee and Directors General and other Directors. Open balances with key management personnel as at 31 December 2017 comprise the compulsory and optional supplementary pension plan and health insurance scheme liabilities, and payments outstanding as at the year-end: 31.12.2017 31.12.2016 (in EUR ’000) Pension plans and health insurance (Note L) Other liabilities (Note G) -44,709 -16,796 -40,081 -15,573 Note Y – Post balance sheet events There have been no material events after the balance sheet date that would require adjustment of, or disclosure in, the Financial Statements as at 31 December 2017. 7 Total 12,777 10,740


Note Z – Management of third party funds Z.1. Investment Facility – Cotonou The Investment Facility, which is managed by the EIB, has been established under Cotonou Agreement on cooperation and development between the African, Caribbean and Pacific Group of States and the European Union and its Member States on 23 June 2000 and subsequently revised. The EIB prepares separate financial statements for the Investment Facility. Z.2. Guarantee Fund The Guarantee Fund for External Actions was set up in 1994 to cover defaults on loans and loan guarantees granted to non-Member States or for projects in non-Member States. The European Commission (‘EC’) entrusted the financial management of the Guarantee Fund to the EIB under an agreement signed between the two parties in November 1994 and the subsequent amendments to the Agreement. The EIB prepares separate financial statements for the Guarantee Fund. Z.3. NER300 The EIB supports the EC as an agent in the implementation of the NER 300 initiative - a funding programme for carbon capture and storage demonstration projects and innovative renewable energy technologies. The Facility covers two activities which are i) the monetisation of EU Allowance Units (‘EUAs’) and ii) the management and disbursement of cash received via the EUA monetisation activity. The EIB prepares separate financial statements for NER300. Z.4. EIF treasury The EIF treasury is managed by the Bank in accordance with the treasury management agreement signed between the two parties in December 2000. Z.5. JESSICA (Holding Funds) JESSICA (Joint European Support for Sustainable Investment in City Areas) is an initiative developed by the EC and the EIB, in collaboration with the Council of Europe Development Bank. JESSICA Holding Funds are used in the context of the JESSICA initiative. Under new procedures, Managing Authorities are being given the option of using some of their EU grant funding to make repayable investments in projects forming part of an integrated plan for sustainable urban development. As manager, EIB gathers the funding received from the Managing Authorities and invests it in Urban Development Funds, according to investment guidelines agreed with the donors. The EIB prepares separate financial statements for JESSICA. Z.6. InnovFin The InnovFin or “InnovFin-EU Finance for Innovators” is a joint initiative between the EIB, the EIF and the European Commission under the new EU research programme for 2014-2020 “Horizon 2020”. On 11 December 2013, Regulation (EU) N 1291/2013 of the European Parliament and the Council establishing Horizon 2020 – the Framework Programme for Research and Innovation (2014-2020) and repealing Decision N 1982/2006/EC (“Horizon 2020 Regulation”) was adopted. On 12 June 2014 the European Commission, the EIB and the EIF signed a Delegation Agreement establishing the financial instrument InnovFin. InnovFin consists of a series of integrated and complementary financing tools and advisory services offered by the EIB Group, covering the entire value chain of research and innovation (R&I) in order to support investments from the smallest to the largest enterprise. The EIB prepares separate financial statements for the InnovFin. Z.7. Risk-Sharing Finance Facility (‘RSFF’) The RSFF has been established under the Co-operation Agreement that entered into force on 5 June 2007 between the EC on behalf of the European Union and the EIB. The RSFF aims to foster investment in research, technological development and demonstration, and innovation. As part of the RSFF, the EIF set up the Risk Sharing Instrument for Innovative and Research oriented SMEs and small Mid-Caps (‘RSI’). The RSI provides guarantees to banks and leasing companies for loans and financial leases to research-based small and medium-sized enterprises (SMEs) and small Mid-Caps. The EIB prepares separate consolidated financial statements for the RSFF including RSI. Z.8. EU-Africa Infrastructure (‘EUAI’) Trust Fund The EUAI Trust Fund has been created under Trust Fund Agreement between the EC on behalf of the European Union as the Founding Donor and the EIB as Manager and is also open to Member States of the European Union that subsequently accede to that agreement as Donors. On 9 February 2006, the EC and the EIB signed a Memorandum of Understanding to promote jointly the EU-Africa Infrastructure Partnership and, in particular, to establish a supporting EU-Africa Infrastructure Trust Fund. The EIB prepares separate financial statements for the EUAI Trust Fund. 72


EIB Statutory Financial Statements Z.9. Connecting Europe Facility (‘CEF’) The Connecting Europe Facility (CEF) is a joint agreement between the EIB and the European Commission which aims to provide union financial assistance to trans-European networks in order to support projects of common interest in the sectors of transport, telecommunications and energy infrastructures. The Commission entrusted EIB with the implementation and management of the debt instrument under the CEF, which ensures continuity of the Loan Guarantee Instrument for TEN-T Projects (LGTT) and to the Pilot phase of Project Bond Initiative (PBI). The LGTT and PBI were merged together under the CEF on 1 January 2016. The CEF Delegation Agreement foresees an updated and common risk sharing arrangement. The EIB prepares separate financial statements for the CEF. Z.10. Fund of Funds The Fund of Funds (“FoF”) consists of Decentralised Financial Instruments (DFIs) financed by the European Structural and Investment Funds (the "ESIF") from the Member States Operational Programmes during 2014-2020. The FoF facilitates access to finance for final recipients through the implementation of loans, equity and guarantees, in cooperation with selected Financial Intermediaries. As a fund manager, EIB gathers the funding (contributions) from the Managing Authorities and invests it via Financial Intermediaries, according to investment strategies agreed with the donors. The EIB prepares separate financial statements for each Fund of Fund. Z.11. GF Greece The Fund is a joint initiative between the Hellenic Republic, the EC and the EIB and was set up to support the lending to SMEs in Greece. Established by using unabsorbed Structural Funds for Greece, the Fund will guarantee EIB loans to SMEs via partner banks in Greece. The EIB prepares separate financial statements for the GF Greece. Z.12. Special Section The Special Section was set up by the Board of Governors on 27 May 1963. Under a decision taken on 4 August 1977, its purpose was redefined as being that of recording financing operations carried out by the EIB for the account of and under mandate from third parties. It includes the FED, MED/FEMIP, IPA (Instrument for Pre-Accession), Turkey mandates and the guarantee component of the European Development Finance Institutions Private Sector Development Facility. Z.13. European Neighbourhood and Partnership Instrument (‘ENPI’) The Framework Agreement between the European Union and the EIB on the implementation of operations financed from the general budget of the European Union in the countries covered by the European Neighbourhood Policy is channelled through ENPI. The EIB prepares separate financial statements for ENPI. Z.14. AECID This partnership agreement signed between the Kingdom of Spain (the Spanish Agency for International Development Cooperation (AECID)) and the EIB was set up to invest in operations in the countries covered by the FEMIP together with Mauritania (the "Southern Mediterranean region"), targeting mainly risk capital activities involving micro and small/medium sized enterprises as well as engaging in the wider development of the private sector in the region. The EIB prepares separate financial statements for the AECID. Z.15. DCFTA Initiative East (‘DCFTA’) The European Investment Bank and the European Commission signed on 19 December 2016 the Delegation Agreement for the Deep and Comprehensive Free Trade Area (DCFTA). DCFTA Initiative East aims to strengthen economic development in the countries which have signed an association agreement with the EU - namely Georgia, Moldova and Ukraine - by providing targeted financial and technical support to small and medium-sized enterprises (SMEs) in these three countries. As part of the DCFTA, the EIF implements and manages the Guarantee Facility Window. The EIB prepares separate consolidated financial statements for the DCFTA including the Guarantee Facility Window. Z.16. FEMIP Trust Fund The FEMIP (Facility for Euro-Mediterranean Investment and Partnership) Trust Fund, which is also managed by the EIB, was set up to enhance the existing activities of the EIB in the Mediterranean Partner Countries, with the support of a number of donor countries and with a view of directing resources to operations in certain priority sectors through the provision of technical assistance and risk capital. The EIB prepares separate financial statements for the FEMIP Trust Fund. Z.17. Neighbourhood Investment Facility (‘NIF’) Trust Fund The NIF Trust Fund, which is managed by the EIB was set up to achieve the strategic objective of the European Neighbourhood Policy (ENP) through targeted funding with particular focus on establishing better and more sustainable energy and transport interconnections, improving energy efficiency and promoting the use of renewable energy sources, addressing climate change as well as threats to the environment more broadly and promoting smart, sustainable and inclusive growth through support to SMEs, to the social sector including human capital development, and to municipal infrastructure development. The EIB prepares separate financial statements for the NIF Trust Fund. 73


Z.18. Heavily Indebted Poor Countries (‘HIPC’) Initiative The HIPC Initiative (the ‘Initiative’) is an international debt relief mechanism that provides special assistance to the world's poorest countries. It was launched in 1996 following a proposal from the World Bank and the International Monetary Fund. The principal objective of the Initiative is to reduce the debt burden of poor countries to sustainable levels. The EIB prepares separate financial statements for the Initiative. Z.19. Private Finance for Energy Efficiency (‘PF4EE’) Instrument The Private Finance for Energy Efficiency (PF4EE) instrument is a joint agreement between the EIB and the European Commission that aims to address the limited access to adequate and affordable commercial financing for energy efficiency investments. The instrument targets projects which support the implementation of National Energy Efficiency Action Plans or other energy efficiency programmes of EU Member States. In December 2014 the European Commission and the EIB signed a Delegation Agreement establishing the financial Instrument PF4EE. The EIB prepares separate financial statements for the PF4EE. Z.20. EPTA Trust Fund The EPTA (The Eastern Partnership Technical Assistance) Trust Fund is focused on increasing the quality and development impact of EIB Eastern Partnership operations by offering a multi-purpose, multi-sector funding facility for technical assistance. It will be complementary to the Neighbourhood Investment Facility. The EIB prepares separate financial statements for the EPTA Trust Fund. Z.21. Neighbourhood Investment Facility (‘NIF’) Risk Capital Facility The Neighbourhood Investment Facility (‘NIF’) Risk Capital Facility is financed from the general budget of the European Union. Its main purpose is focused on providing access to equity and debt finance to SMEs in the Southern Neighbourhood region in order to support private sector development, inclusive growth and private sector job creation. The Facility comprises a Financial Instrument Window which consists of equity and debt finance instruments and Additional Tasks Window which consists of the technical assistance services. The EIB prepares separate financial statements for Financial Instrument Window. Z.22. Instrument for Pre-accession Assistance II (‘IPA II’) The Instrument for Pre-accession Assistance (IPA) is the means by which the EU supports reforms in the 'enlargement countries' with financial and technical help. The pre-accession funds also help the EU reach its own objectives regarding a sustainable economic recovery, energy supply, transport, the environment and climate change, etc. The successor of IPA I, IPA II, will build on the results already achieved by dedicating EUR 11.7 billion for the period 2014-2020. The most important novelty of IPA II is its strategic focus. The Framework Partnership Agreement, signed at the end of the year 2015, is implemented by the EIB, allocating resources from DG NEAR via the signature of various “Specific Grant Agreements”. The EIB prepares financial statements for the specific grant agreements under IPA II. Z.23. European Fund for Strategic Investments (‘EFSI’) On the basis of applicable EFSI Regulations the European Commission and the EIB concluded agreements on the management of the EFSI, on the granting of the EU guarantee (the EFSI Agreement) as well as for the implementation of the European Investment Advisory Hub (‘EIAH’) (the EIAH Agreement). Under the EFSI Agreement, the EC is providing an EU guarantee to EIB for projects supported by the EFSI. Assets covering the EU guarantee are directly managed by the European Commission. Projects supported by the EFSI are subject to the normal EIB project cycle and governance. In addition, EFSI has its own dedicated governance structure which has been set in place to ensure that investments made under EFSI remain focused on the specific objective of addressing the market failure in risk-taking which hinders investment in Europe. Further information on approved projects and EIB’s exposure is provided in Note D.1. The EIAH aims to enhance the non-financial support for projects and investments. The EIAH consists of three complementary components: a) a point of entry to a wide range of advisory and technical assistance programmes and initiatives for public and private beneficiaries, b) a cooperation platform to leverage, exchange and disseminate expertise among partner institutions and c) a reinforcement or extension of existing advisory services or creation of new ones to address unmet needs. The EIB prepares separate financial statements for the EIAH. Z.24. Natural Capital Finance Facility (‘NCFF’) The Natural Capital Finance Facility (‘NCFF’) is a joint agreement between the EIB and the European Commission which aims to address market gaps and barriers for revenue generating or cost saving projects that are aimed at preserving natural capital, including climate change adaptation projects and thereby to contribute to the achievement of EU and Member States' objectives for biodiversity and climate change adaptation. The EIB prepares separate financial statements for the NCFF. Z.25. Research and Innovation Advisory (‘RDI Advisory’) The RDI Advisory was set up in partnership with the European Commission under a 7 year framework agreement signed in June 2014, as part of the InnovFin programme under Horizon 2020. It has two main lines of activity: (i) upstream project related advisory and (ii) horizontal activities destined to improve the overall framework conditions for RDI investments as well as the financing tools under Horizon 2020. The EIB prepares separate financial statements for the RDI Advisory. 74


EIB Statutory Financial Statements Z.26. JASPERS JASPERS (Joint Assistance to Support Projects in European Regions) is a technical assistance facility between the EIB, the European Commission and the EBRD. It provides support to the majority of EU and Candidate Countries to help improve the quality of the major projects to be submitted for grant financing under the Structural and Investment Funds. JASPERS assistance may cover project preparation support, from identification to submission of the request for EU grant finance; independent quality review of projects; horizontal assignments; strategic support: capacity building, including a Competence Centre; and implementation support. JASPERS’ work is organised in seven divisions (Roads; Rail, Air and Maritime; Water and Waste; Energy and Solid Waste; Smart Development; Networking and Competence Centre; and Independent Quality Review). In its first ten years of operations (2005-2015), JASPERS has assisted over 1000 projects. The investment value of the projects assisted by JASPERS and approved by the European Commission for grant financing, is over EUR 72 billion. The EIB prepares separate financial statements for JASPERS. Z.27. Financial Instrument (‘FI’) compass advisory platform The fi-compass advisory platform provides EU Member States and their managing authorities as well as microcredit providers with advisory support and learning opportunities for developing financial instruments, within the scope of European Structural Investment Funds (ESIF) and the Programme for Employment and Social Innovation (EaSI). It is implemented by the EIB and funded by the EC under a Framework Contract for the period 2014-2020. The EIB prepares separate financial statements for Financial Instrument compass advisory platform. 75


Statement of Special Section(1) as at 31 December 2017 and 2016 (in EUR ‘000) ASSETS 31.12.2017 31.12.2016 Turkey From resources of Member States Disbursed loans outstanding 0 271 Instrument for Pre-Accession ('IPA') From resources of Member States Disbursed loans outstanding 0 0 Mediterranean Countries From resources of the European Union Disbursed loans outstanding Risk capital operations - amounts to be disbursed - amounts disbursed 36,934 49,130 29,260 39,288 39,738 53,090 68,998 92,378 African, Caribbean and Pacific State and Overseas Countries and Territories From resources of the European Union · Yaoundé Conventions Loans disbursed Contributions to the formation of risk capital - amounts disbursed 352 764 419 419 · Lomé Conventions Operations from risk capital resources - amounts to be disbursed - amounts disbursed 0 0 194,336 219,272 194,336 219,272 LIABILITIES 31.12.2017 31.12.2016 Funds under trust management Under mandate from the European Union - Financial Protocols with the Mediterranean Countries - Financial Protocols with the instrument for Pre-Accession ('IPA') - Yaoundé Conventions - Lomé Conventions - Other resources under the Lomé Conventions 76,672 0 771 194,336 0 102,220 0 1,183 219,272 0 271,779 0 322,675 271 Under mandate from Member States Total funds under trust management 271,779 322,946 Funds to be disbursed On loans and risk capital operations in the Mediterranean countries On operations from risk capital resources under the Lomé Conventions 29,260 0 39,288 0 Total funds to be disbursed 29,260 39,288 Total 301,039 362,234 For information: Total amounts disbursed and not yet repaid on loans on special conditions made available by the Commission in respect of which the Bank has accepted an EU mandate for recovering principal and interest: a) Under the First, Second and Third Lomé Conventions as at 31 December 2017 EUR ‘000 229,159 (2016: EUR ‘000 321,166) b) Under Financial Protocols signed with the Mediterranean Countries as at 31 December 2017 EUR ‘000 54,433 (2016: EUR ‘000 60,557) In the context of the European Union – European Development Finance Institutions Private Sector Development Facility, the implementation agreement for the Guarantee Component was signed on 20 August 2014. Total amount of the EU guarantee issued is EUR ‘000 4,280 as at 31 December 2017 (2016: EUR ‘000 4,280). Total amount of the EU guarantee to be issued is EUR ‘000 38,920 as at 31 December 2017 (2016: EUR ‘000 38,920). Note (1): The Special Section was set up by the Board of Governors on 27 May 1963. Under a decision taken on 4 August 1977, its purpose was redefined as being that of recording financing operations carried out by the European Investment Bank for the account of and under mandate from third parties. However, for the Investment Facility under the Cotonou Agreement, the EU-Africa Infrastructure Trust Fund, the Neighbourhood 76 Total(6) 194,336 219,272 Total 301,039 362,234 Total(5) 771 1,183 Total(4) 105,932 141,508 Total(3) 0 0 Total(2) 0 271


EIB Statutory Financial Statements Investment Facility (NIF) Trust Fund and the FEMIP Trust Fund, separate financial statements are presented. In addition, since 2005, the EIB also prepares financial statements of different types for other mandates. The Statement of Special Section reflects amounts disbursed or to be disbursed, less cancellations and repayments, under mandate from the European Union and the Member States. Amounts disbursed and to be disbursed and funds received and to be received are carried at nominal value. No account is taken in the Statement of Special Section of provisions or value adjustments, which may be required to cover risks associated with such operations except for definite write-offs. Amounts in foreign currency are translated at exchange rates prevailing on 31 December. Note (2): Initial amount of contracts signed for financing projects in Turkey under mandate, for the account and at the risk of Member States. Initial amount: add: less: 405,899 20,547 exchange adjustments cancellations repayments 215 426,231 -426,446 Note (3): Initial amount of contracts signed for financing projects under the Instrument for Pre-Accession, for the account and at the risk of the European Union. Initial amount: less: 29,640 exchange adjustments cancellations repayments 10,517 0 19,123 -29,640 Note (4): Initial amount of contracts signed for financing projects in the Maghreb and Mashreq countries, Malta, Cyprus, Turkey and Greece (EUR 10 million lent prior to accession to the EC on 1 January 1981) under mandate, for the account and at the risk of the European Union. Initial amount: less: 840,457 exchange adjustments cancellations repayments 58,999 164,335 511,191 -734,525 Note (5): Initial amount of contracts signed for financing projects in the Associated African States, Madagascar and Mauritius and the Overseas Countries, Territories and Departments (AASMM-OCTD) under mandate, for the account and at the risk of the European Union. Loans on special conditions Contributions to the formation of risk capital Initial amount: add: 139,483 2,503 141,986 capitalised interest exchange adjustments 1,178 9,823 11,001 less: cancellations repayments 3,310 148,906 -152,216 77 771 105,932 0 0


Note (6): Initial amount of contracts signed for financing projects in the African, Caribbean and Pacific States and the Overseas Countries and Territories (ACP-OCT) under mandate, for the account and at the risk of the European Union: Loans from risk capital resources: Conditional and subordinated loans Equity participations Initial amount: add: 3,116,097 121,002 3,237,099 9,548 capitalised interest less: cancellations repayments exchange adjustments 731,474 2,264,829 56,008 -3,052,311 194,336 Loans from other resources: Initial amount: add: less: 16,500 58 exchange adjustments cancellations repayments 8,414 8,144 -16,558 0 78 194,336


EIB Statutory Financial Statements Independent Auditor’s Report To the Chairman of the Audit Committee of EUROPEAN INVESTMENT BANK 98-100, Boulevard Konrad Adenauer L-2950 LUXEMBOURG REPORT OF THE REVISEUR D’ENTREPRISES AGREE Report on the financial statements Opinion We have audited the financial statements of EUROPEAN INVESTMENT BANK (“the Bank”), which comprise the bal-ance sheet as at 31 December 2017, and the profit and loss account and the cash flow statement for the year then ended, and notes to the financial statements, including a summary of significant accounting policies and other ex-planatory information. by the “Commission de Surveillance du Secteur Financier” (“CSSF”). Our responsibilities under those Regulation, Law and standards are further described in the “Responsibilities of Réviseur d’Entreprises agréé for the audit of the financial statements” section of our report. We are also independent of the EUROPEAN INVESTMENT BANK in accordance with the International Ethics Standards Board for Accountants’ Code of Ethics for Professional Accountants (“IESBA Code”) as adopted for Luxembourg by the CSSF together with the ethical requirements that are relevant to our audit of the fi-nancial statements, and have fulfilled our other ethical re-sponsibilities under those ethical requirements. We believe that the audit evidence we have obtained is sufficient and appropriate to provide a basis for our opinion. In our opinion, the accompanying financial statements give a true and fair view of the financial position of the EUROPEAN INVESTMENT BANK as at 31 December 2017, and of the results of its operations and its cash flows for the year then ended in accordance with the general principles of the Directive 86/635/EEC of the Council of the European Communities of 8 December 1986 on the annual accounts and consolidated accounts of banks and other financial in-stitutions, as amended by Directive 2001/65/EC of 27 Sep-tember 2001, by Directive 2003/51/EC of 18 June 2003 and by Directive 2006/46/EC of 14 June 2006 (the “Directives”). Key audit matters Key audit matters are those matters that, in our profes-sional judgment, were of most significance in our audit of the financial statements of the current period. These mat-ters were addressed in the context of the audit of the fi-nancial statements as a whole, and in forming our opinion thereon, and we do not provide a separate opinion on these matters. Basis for Opinion We conducted our audit in accordance with the EU Regula-tion N° 537/2014, the Law of 23 July 2016 on the audit pro-fession (“Law of 23 July 2016”) and with International Standards on Auditing (“ISAs”) as adopted for Luxembourg 79


1Value adjustments of loans and advances to custom-ers and financial institutions the estimated recoverability. Based on a retrospective review, further critically assessed whether the Bank re-vised its estimates and assumptions for specific allowanc-es established in prior years. Description As at 31 December 2017, the Bank reports loans and ad-vances accounted for at cost of EUR 434,867 million repre-senting 79% of total assets and recognized individually assessed value adjustments on loans amounting to EUR 457 million. We also tested a sample of individually significant expo-sures, which had not been identified as potentially im-paired by the Bank and assessed whether appropriate consideration was given to the collectability of future cash flows and the valuation of the underlying collaterals. Management follows its Specific Provisioning Guidelines embedded in the Financial Monitoring Guidelines to esti-mate the level of specific provisions on loans and advanc-es on an individual basis. Allowances for credit losses reflected the difference between the carrying loan amount and the present value of all the expected future cash-flows generated by the impaired asset. The Bank nei-ther applies general nor collective value adjustments. We assessed the disclosures in the financial statements in relation to impairment of loans and advances with refer-ence to the requirements of the prevailing accounting standards. 2 Valuation of venture capital investments Description These loans and advances are not traded in an active mar-ket, therefore significant judgments and estimates are re-quired to be applied by Management in its assessment of their recoverable amount. Inappropriate judgments made in relation to the methodology and inputs used or the as-sumptions taken may have a material impact on the allow-ances for credit losses. Venture capital investments, for which no quoted markets prices are available amount to EUR 3,994 million as at 31 December 2017. Those investments are initially record-ed at cost. Their carrying value is subsequently measured adjusted to the lower of cost or market value. Manage-ment has determined the fair value of these unlisted in-vestments applying the Bank’s percentage ownership in the underlying vehicle to the Net Asset Value (“NAV”) re-flected in the most recent report adjusted for cash flows. Unrealized losses due to administrative expenses and management fees for investments in existence for less than two years are not taken into consideration in deter-mining the attributable NAV. These critical judgements include matters such as the identification and assessment of potential indicators of impairment, as well as discounted cash flows forecast techniques, estimation of guarantees obtained, valua-tion of collaterals received and forbearance measures ap-plied. These investments are not traded in an active market, therefore significant judgments and estimates are re-quired to be applied by Management in its assessment of their fair value. Inappropriate judgments made in relation to the methodology and inputs used or the assumptions taken may have a material impact on the valuation of the investment portfolio. The key inputs and assumptions used by Management in its assessment of loan value adjustments are detailed in notes A.2.6.1 and U.1.1 to the financial statements as well as the specific value adjustments in note D.2. How our audit addressed the area of focus Our procedures included the assessment of Key controls over the approval, recording, monitoring and restructur-ing of loans and advances to customers, the loan grading process and the measurement of impairment allowances for individually assessed loans and advances. The key inputs and assumptions used by Management in its assessment of the fair value of unlisted investments are detailed in note A.2.7.1 as well further disclosures are pre-sented in note E.1 to the financial statements. How our audit addressed the area of focus For a sample of loans with specific allowances for credit losses, we evaluated the Bank's individual assessment of each loan and specifically challenged the Bank's assump-tions used, including the value of realisable collateral and Our procedures over the valuation of the private equity in-vestments included, but were not limited to: 80


EIB Statutory Financial Statements We obtained an understanding of management’s process-es and controls for determining the fair valuation of in-vestments in private equity investments. This included discussing with management the valuation governance structure and protocols around their oversight of the valu-ation process and corroborating our understanding by at-tending the Investment & Risk Committee meeting. materially inconsistent with the financial statements or our knowledge obtained in the audit or otherwise ap-pears to be materially misstated. If, based on the work we have performed, we conclude that there is a material mis-statement of this other information we are required to re-port this fact. We have nothing to report in this regard. Responsibilities of the Management and Those Charged with Governance for the financial statements We have identified key controls in the process, assessed the design adequacy and tested the operating effective-ness of some of these controls. In addition, we obtained the ISAE 3402 report on EIF’s internal controls, compared our understanding of identified key controls in the pro-cess and inspected the conclusions reached based on the testing of operating effectiveness of those controls and noted no observations or exceptions in the report, which allow us to rely on controls over value adjustments of ven-ture capital investments. The Management is responsible for the preparation and fair presentation of the financial statements in accordance with the general principles of the Directives, and for such internal control as the Management determines is neces-sary to enable the preparation of financial statements that are free from material misstatement, whether due to fraud or error. In preparing the financial statements, the Management is responsible for assessing the Bank’s ability to continue as a going concern, disclosing, as applicable, matters related to going concern and using the going concern basis of ac-counting unless the Management either intends to liqui-date the Bank or to cease operations, or has no realistic alternative but to do so. We sought explanations from management where there are judgments applied in their application of the valuation guidelines, discussed and assessed their appropriateness. This included assessing the annual back-testing exercise on the accuracy of estimated fair values of private equity funds valuation during the year and the prior year fair val-ue, to further assess the reasonableness of the current year valuation assumptions used by management in perform-ing the value adjustments assessment. Responsibilities of the Réviseur d’Entreprises agréé for the audit of the financial statements On a sample basis, we reconciled the latest available NAV statements provided by private equity fund managers to the value adjustment file prepared by EIF and we recalcu-lated the mathematical accuracy of the unrealized results on the revaluation of investments on a sample basis. The objectives of our audit are to obtain reasonable assur-ance about whether the financial statements as a whole are free from material misstatement, whether due to fraud or error, and to issue a report of “Réviseur d’Entreprises agréé” that includes our opinion. Reasonable assurance is a high level of assurance, but is not a guarantee that an au-dit conducted in accordance with the EU Regulation N° 537/2014, the Law of 23 July 2016 and with ISAs as adopted for Luxembourg by the CSSF will always detect a material misstatement when it exists. Misstatements can arise from fraud or error and are considered material if, in-dividually or in the aggregate, they could reasonably be expected to influence the economic decisions of users taken on the basis of these financial statements. Other information The Management is responsible for the other information. The other information comprises the information included in the sections called “Highlights, Preface, Borrowing ac-tivities, Treasury Activities, EIB Statutory Bodies and Audit and control” mainly based on statutory EU Directives in-formation; but does not include the financial statements and our report of “Réviseur d’Entreprises agréé” thereon. As part of an audit in accordance with the EU Regulation N° 537/2014, the Law of 23 July 2016 and with ISAs as adopted for Luxembourg by the CSSF, we exercise profes-sional judgment and maintain professional skepticism throughout the audit. We also: Our opinion on the financial statements does not cover the other information and we do not express any form of assurance conclusion thereon. In connection with our audit of the financial statements, our responsibility is to read the other information and, in doing so, consider whether the other information is • Identify and assess the risks of material misstatement of the financial statements, whether due to fraud or 81


error, design and perform audit procedures responsive to those risks, and obtain audit evidence that is suffi-cient and appropriate to provide a basis for our opin-ion. The risk of not detecting a material misstatement resulting from fraud is higher than for one resulting from error, as fraud may involve collusion, forgery, in-tentional omissions, misrepresentations, or the over-ride of internal control. up to the date of our report of “Réviseur d’Entreprises agréé”. However, future events or conditions may cause the Bank to cease to continue as a going concern. • Evaluate the overall presentation, structure and con-tent of the financial statements, including the disclo-sures, and whether the financial statements represent the underlying transactions and events in a manner that achieves fair presentation. • Obtain an understanding of internal control relevant to the audit in order to design audit procedures that are appropriate in the circumstances, but not for the pur-pose of expressing an opinion on the effectiveness of the Bank’s internal control. We communicate with those charged with governance re-garding, among other matters, the planned scope and timing of the audit and significant audit findings, includ-ing any significant deficiencies in internal control that we identify during our audit. • Evaluate the appropriateness of accounting policies used and the reasonableness of accounting estimates and related disclosures made by the Management. We also provide those charged with governance with a statement that we have complied with relevant ethical re-quirements regarding independence, and to communi-cate with them all relationships and other matters that may reasonably be thought to bear on our independence, and where applicable, related safeguards. • Conclude on the appropriateness of Management’s use of the going concern basis of accounting and, based on the audit evidence obtained, whether a material uncer-tainty exists related to events or conditions that may cast significant doubt on the Bank’s ability to continue as a going concern. If we conclude that a material un-certainty exists, we are required to draw attention in our report of “Réviseur d’Entreprises agréé” to the re-lated disclosures in the financial statements or, if such disclosures are inadequate, to modify our opinion. Our conclusions are based on the audit evidence obtained From the matters communicated with those charged with governance, we determine those matters that were of most significance in the audit of the financial state-ments of the current period and are therefore the key au-dit matters. We describe these matters in our report unless law or regulation precludes public disclosure about the matter. Luxembourg, 15 March 2018 KPMG Luxembourg, Société coopérative Cabinet de révision agréé 39, Avenue John F. Kennedy L-1855 Luxembourg Société coopérative de droit luxembourgeois R.C.S. Luxembourg B 149133 Capital EUR 12 503 S. CHAMBOURDON 82


EIB Statutory Financial Statements Statement by the Audit Committee The Audit Committee reports to the Board of Governors, the following statement being communicated to the Gov-ernors prior to their approval of the Annual Report and the financial statements for the past financial year. Statement by the Audit Committee on the Bank’s un-consolidated financial statements prepared in accord-ance with the general principles of the ‘Directives’ The Committee, instituted in pursuance of Article 12 of the Statute and Chapter V of the Rules of Procedure of the European Investment Bank for the purpose of verifying that the operations of the Bank are conducted and its books kept in a proper manner, having: studied the documents which it deemed necessary to examine in the discharge of its duties, received assurance from the Management Commit-tee concerning the effectiveness of the internal con-trol structure and internal administration, • and considering • the financial statements for the financial year ended 31 December 2017 adopted by the Board of Direc-tors at its meeting on 15 March 2018, that the foregoing provides a reasonable basis for its statement and, Articles 24, 25 & 26 of the Rules of Procedure, • • designated KPMG as external auditors, reviewed their audit planning process, examined and dis-cussed their reports, and in particular their inde-pendent Auditor’s Report, noted that the opinion of KPMG on the unconsoli-dated financial statements of the European Invest-ment Bank for the year ended 31 December 2017 prepared in accordance with the general principles of the Directive 86/635/EEC of the Council of the European Communities of 8 December 1986 on the annual accounts and consolidated accounts of banks and other financial institutions, as amended by Directive 2001/65/EC of 27 September 2001, by Directive 2003/51/EC of 18 June 2003 and by Direc-tive 2006/46/EC of 14 June 2006 (the ‘Directives’) is unqualified, convened on a regular basis with the Heads of Direc-torates and relevant services including, • the Financial Controller, • the Directors General of Risk Management, Transaction Monitoring and Restructuring and Compliance, met regularly the Head of Internal Audit and dis-• to the best of its knowledge and judgement: • confirms that the activities of the Bank are conduct-ed in a proper manner, in particular with regard to risk management and monitoring; has verified that the operations of the Bank have been conducted and its books kept in a proper man-ner and that, to this end, it has verified that the Bank's operations have been carried out in compli-ance with the formalities and procedures laid down by the Statute and Rules of Procedure; confirms that the financial statements of the Euro-pean Investment Bank, which comprise the balance sheet as at 31 December 2017, the profit and loss ac-count and the cash flow statement for the year then ended, and notes to the financial statements, includ-ing a summary of significant accounting policies and other explanatory information, give a true and fair view of the financial position of the European Invest-ment Bank as of 31 December 2017, and of the results of its operations and its cash flows for the year then ended in accordance with the general principles of the Directives. • • • • • cussed the relevant internal audit reports, and Luxembourg, 15 March 2018 Audit Committee P. KRIER D. PITTA FERRAZ J. SUTHERLAND J. DOMINIK M. MACIJAUSKAS V. IUGA 83


EIB Group Consolidated Financial Statements under EU Directives 84 EIB Group Consolidated Financial Statements under EU Directives as at 31 December 2017


Consolidated balance sheet as at 31 December 2017 (in EUR ’000) Assets 31.12.2017 31.12.2016 316,769 51,636,687 160,426,019 311,942,993 15,859,460 4,147,216 185,786 16,219 272,900 139,327 77,950 29,525,590 The accompanying notes form an integral part of these consolidated financial statements. 85 1.Cash in hand, balances with central banks and post office banks (Note B.1) 2.Treasury bills and other bills eligible for refinancing with central banks (Note B.2) 3.Loans and advances to credit institutions a) repayable on demand b) other loans and advances (Note C) c) loans (Note D.1) 4.Loans and advances to customers a) other loans and advances (Note C) b) loans (Note D.1) c) value adjustments (Note D.2) 5.Debt securities including fixed-income securities (Note B.2) a) issued by public bodies b) issued by other borrowers 6.Shares and other variable-yield securities (Note E.2) 7.Participating interests (Note E.2) 8.Intangible assets (Note F) 9.Tangible assets (Note F) 10. Other assets (Note G) 11. Subscribed capital and reserves, called but not paid (Note H.2) 12. Prepayments and accrued income (Note I) 162,483 41,508,248 937,805 33,898,199 121,560,358 865,097 35,232,081 124,328,841 156,396,362 1,741,983 313,620,389 -465,507 2,219,989 310,256,151 -533,147 8,651,141 7,208,319 314,896,865 7,024,316 8,647,411 15,671,727 5,035,790 263,453 21,264 265,338 162,310 25,983 16,596,171 Total assets 551,005,994 574,546,916


EIB Group Consolidated Financial Statements under EU directives Consolidated balance sheet (continued) as at 31 December 2017 (in EUR ’000) Liabilities 31.12.2017 31.12.2016 The accompanying notes form an integral part of these consolidated financial statements. 86 1.Amounts owed to credit institutions (Note J) a) repayable on demand b) with agreed maturity or periods of notice 2.Amounts owed to customers (Note J) a) repayable on demand b) with agreed maturity or periods of notice 3.Debts evidenced by certificates (Note K) a) debt securities in issue b) others 4.Other liabilities (Note G) 5.Accruals and deferred income (Note I) 6.Provisions a) pension plans and health insurance scheme (Note L) b) provision for guarantees issued (Note D.4) 7.Subscribed capital (Note H) a) subscribed b) uncalled 8.Reserves (Note H) a) reserve fund b) additional reserves c) special activities reserve d) general loan reserve 9.Profit for the financial year 10. Equity attributable to minority interest (Note H) 4,953,852 57,475 12,425,692 694,221 13,119,913 1,927,330 25,030 1,952,360 455,660,830 15,261,807 470,922,637 1,168,354 17,456,674 2,489,914 42,479 2,532,393 243,284,155 -221,585,020 21,699,135 24,328,415 7,525,684 6,776,060 3,305,458 41,935,617 2,926,400 833,433 5,011,327 1,922,566 8,349 1,930,915 435,730,418 13,854,945 449,585,363 854,828 20,531,793 2,766,138 23,460 2,789,598 243,284,155 -221,585,020 21,699,135 24,328,415 10,312,322 7,504,091 2,700,556 44,845,384 2,858,647 899,004 Total liabilities 551,005,994 574,546,916


Consolidated off-balance sheet as at 31 December 2017 (in EUR ’000) 31.12.2016 29,925,074 83,395,374 113,320,448 5,215,963 1,113,939 712,630 7,042,532 597,512 597,512 109,100 223,950 12,735,555 2,870,139 2,506,053 2,106,441 1,396,000 697,996 839,290 647,629 492,898 203,350 254,622 305,234 362,234 160,090 199,371 0 142,089 0 95,256 0 99,610 50,523 60,037 116,205 89,717 76,958 48,536 55,912 48,811 53,530 48,691 20,460 35,438 25,043 17,988 22,205 19,816 17,778 5,676 13,503 15,939 8,868 17,444 5,040 87 31.12.2017 Commitments: - Undisbursed loans (Note D.1) - credit institutions - customers - Undisbursed shares and other variable-yield securities - Undisbursed venture capital operations (Note E.2) - Undisbursed investment funds (Note E.2) - EBRD capital uncalled (Note E.2) - Undisbursed participating interests - Undisbursed venture capital operations (Note E.2) - Securities receivable - Borrowings launched but not yet settled Contingent liabilities and guarantees: - In respect of loans granted by third parties Assets held on behalf of third parties (Note Z): - Investment Facility - Cotonou - Guarantee Fund - NER300 - JESSICA (Holding Funds) - InnovFin - RSFF (incl. RSI) - EU-Africa Infrastructure Trust Fund - CEF (incl. former PBI and LGTT) - Funds of Funds (JESSICA II) - JEREMIE - GF Greece - Special Section - ESIF - COSME LGF & EFG - SME initiative Italy - ENPI - DCFTA - SME initiative Bulgaria - SME initiative Romania - SMEG 2007 - InnovFin SME Guarantee - MAP Equity - InnovFin Equity - GIF 2007 - AECID - EaSI - WB EDIF - FEMIP Trust Fund - GAGF - NIF Trust Fund - SME initiative Finland - HIPC - MAP guarantee - Private Finance for Energy Efficiency Instrument - EPTA Trust Fund - NIF Risk Capital Facility - IPA II - Cultural Creative Sectors Guarantee Facility - SME initiative Malta - Student Loan Guarantee Facility - EFSI-EIAH - SME Guarantee Facility - NPI Securitisation Initiative (ENSI) 28,890,536 84,037,546 112,928,082 5,323,061 2,649,089 712,630 8,684,780 600,531 600,531 419,864 279,008 15,810,651 3,024,653 2,560,762 2,086,410 975,912 941,251 762,989 594,869 523,636 419,539 335,889 307,794 301,039 270,451 243,949 180,442 124,540 103,070 94,635 91,396 90,098 86,811 83,512 83,438 82,575 71,766 55,790 50,715 49,128 47,359 46,485 37,238 35,408 32,425 31,235 22,754 19,546 18,435 17,377 14,692 14,466 13,973 12,186 11,976


EIB Group Consolidated Financial Statements under EU directives Consolidated off-balance sheet (continued) as at 31 December 2017 (in EUR ’000) 31.12.2016 14,346,964 Other items: 523,352,665 198,881,468 212,232,364 46,311,642 45,328,388 753,544 666,973 0 0 3,001 The accompanying notes form an integral part of these consolidated financial statements. 88 31.12.2017 - Natural Capital Financing Facility - NPI - Bundesministerium für Wirtschaft und Technologie - G43 Trust Fund - European Technology Facility - Alp GIP - EPPA - PGFF - BIF - RDI Advisory - GEEREF Technical Support Facility - JASPERS - LFA-EIF Facility - TTP - MDD - SME initiative Spain - GGF - GEEREF - TTA Turkey - Fi-compass - Nominal value of interest-rate swaps incl. commitment (Note V.1.2) - Nominal value of treasury currency swap contracts payable - Nominal value of currency swap contracts receivable (Note V.1.1) - Nominal value of short-term currency swap contracts receivable (Note V.2) - Nominal value of short-term currency swap contracts payable - Put option granted to EIF minority shareholders - Currency forwards (Note V.2) - Currency swaps launched but not yet settled payable - Currency swaps launched but not yet settled receivable (Note V.1.1) - Special deposits for servicing borrowings (Note S) 11,757 11,052 7,336 5,679 5,604 4,282 1,972 1,393 1,223 1,156 1,056 814 805 397 193 192 12 5 3 0 11,150 0 1,302 10,578 4,329 0 1,977 2,913 6,199 5,762 1,165 2,237 551 385 987 177 7,210 5 35,062 2,555 15,027,545 510,007,074 205,439,795 203,935,206 43,942,480 43,909,464 813,042 584,605 144,078 142,263 34,411


Consolidated profit and loss account for the year ended 31 December 2017 (in EUR ‘000) The accompanying notes form an integral part of these consolidated financial statements. 89 2017 2016 1.Interest receivable and similar income (Note N) 2.Interest payable and similar charges (Note N) 3.Income from securities 4.Commissions receivable (Note O) 5.Commissions payable 6.Net result on financial operations (Note P) 7.Other operating income (Note Q) 8.General administrative expenses (Note R) a) staff costs (Note L) b) other administrative expenses 9.Value adjustments in respect of tangible and intangible assets (Note F) a) tangible assets b) intangible assets 10. Value (re-)adjustments in respect of transferable securities held as financial fixed assets , participating interests and shares in affiliated undertakings 11. Value (re-)adjustments in respect of loans and advances and provisions for contingent liabilities 12. Profit for the financial year 13. Profit attributable to minority interest 23,412,219 -20,121,596 336,162 347,541 -112,257 -2,955 11,038 -771,360 -258,604 22,184,899 -18,839,881 241,540 297,321 -64,896 -46,673 8,334 -629,444 -251,583 -881,027 -28,369 -6,651 -35,020 -8,216 107,422 2,963,803 37,403 -1,029,964 -31,810 -7,388 -39,198 -1,923 81,071 2,880,138 21,491 14. Profit attributable to equity holders of the Bank 2,858,647 2,926,400


EIB Group Consolidated Financial Statements under EU directives Consolidated cash flow statement for the year ended 31 December 2017 (in EUR ‘000) 2017 2016 A. Cash flows from operating activities: B. Cash flows from investing activities: C. Cash flows from financing activities: Summary statement of cash flows: Net cash from: Cash and cash equivalents are composed of: The accompanying notes form an integral part of these consolidated financial statements. 90 Cash in hand, balances with central banks and post office banks, excluding deposits with Central Bank of Luxembourg to cover minimum reserve requirement (Note B.1) Money market securities maturing within three months of issue Loans and advances to credit institutions and customers: Repayable on demand Other loans and advances (Note C) 35 18,863,479 937,805 31,958,799 35 23,483,405 865,097 30,492,322 51,760,118 54,840,859 Operating activities Investing activities Financing activities Effects of exchange rate changes on cash held -2,390,178 -122,256 719,093 -1,287,400 780,633 -1,719,107 5,098,843 345,537 Cash and cash equivalents at end of financial year 51,760,118 54,840,859 Cash and cash equivalents at beginning of financial year 54,840,859 50,334,953 Issuance of debts evidenced by certificates Redemption of debts evidenced by certificates Member States’ contribution Sale of EIF shares Return on capital EUMPF Capital increase Dividend paid to minority interest 123,643,914 -123,056,139 51,967 2,550 42,227 44,416 -9,842 165,543,970 -160,554,709 51,967 3,198 22,514 40,988 -9,085 Net cash used from/(used in) financing activities 719,093 5,098,843 Securities in Long Term Hedge Portfolio purchased during the year Securities from Long Term Hedge Portfolio matured during the year Purchase of loan substitutes and ABS portfolio EIF included in the debt securities portfolios Redemption of loan substitutes included in the debt securities portfolios Additions on shares and other variable-yield securities Reflows on shares and other variable-yield securities Additions on participating interests Reflows on participating interests Purchase of tangible and intangible assets Disposal of tangible assets Proceeds from sale of tangible assets 0 13,500 -4,250,895 5,046,227 -1,485,318 669,583 -85,699 7,027 -37,521 840 0 -105,529 1,606,000 -5,443,890 3,045,166 -1,162,362 577,470 -202,278 0 -42,686 2,220 6,782 Net cash used from/(used in) investing activities -122,256 -1,719,107 Profit for the financial year Adjustments for: Value (re-)adjustments in respect of loans and advances and provisions for contingent liabilities Change in value adjustments in respect of transferable securities held as financial fixed assets and participating interests Value adjustments in respect of tangible and intangible assets, net result on sale of tangible assets Value (re-)adjustments in respect of shares and other variable-yield securities Net interest income Effect of exchange rate changes 2,880,138 -81,071 1,923 39,198 -73,757 -3,290,623 22,352 2,963,803 -107,422 8,216 32,173 54,371 -3,345,018 234,277 Profit on operating activities -501,840 -159,600 Disbursements of loans and advances to credit institutions and customers Repayments of loans and advances to credit institutions and customers Change in deposits with central banks Change in treasury securities liquidity portfolios Change in amounts owed to credit institutions and customers Change in provisions on pension plans and health insurance scheme Change in provisions for commitment on investment funds and guarantees issued Change in short term treasury derivative valuations Change in other assets and other liabilities Interest received Interest paid -48,759,528 47,480,834 154,286 4,329,176 -8,130,031 276,224 -19,019 -25,469 -311,040 21,665,775 -18,549,546 -54,320,048 52,252,742 -110,672 -775,941 -2,448,271 200,699 -61,904 -34,206 415,340 22,435,630 -16,613,136 Net cash used from/(used in) operating activities -2,390,178 780,633


European Investment Bank Group Notes to the consolidated financial statements as at 31 December 2017 The European Investment Bank (the ‘Bank’ or ‘EIB’) was created by the Treaty of Rome in 1958 as the long-term lending bank of the European Union (‘EU’). The task of the Bank is to contribute towards the integration, balanced development and economic and social cohesion of the EU Member States. The EIB raises substantial volumes of funds on the capital markets and lends these funds on favourable terms to projects furthering EU policy objectives. The EIB continuously adapts its activities to developments in EU policies. The Bank has its registered office at 98-100, boulevard Konrad Adenauer, Luxembourg. The Bank and its subsidiaries are defined as the ‘Group’. Subsidiaries held by the Bank are disclosed in note E.1. Note A – Significant accounting policies A.1. Basis of preparation A.1.1. Accounting standards The consolidated financial statements (the ‘Financial Statements’) of the European Investment Bank have been prepared in accordance with the general principles of Directive 86/635/EEC of the Council of the European Communities of 8 December 1986 on the annual accounts and consolidated accounts of banks and other financial institutions, as amended by Directive 2001/65/EC of 27 September 2001, by Directive 2003/51/EC of 18 June 2003 and by Directive 2006/46/EC of 14 June 2006 on the annual and consolidated accounts of certain types of companies, banks and other financial institutions (the ‘Directives’). On a proposal from the Management Committee, the Board of Directors adopted the Financial Statements on 15 March 2018 and authorised their submission to the Board of Governors for approval by 27 April 2018. The Group also publishes consolidated financial statements, which have been prepared in accordance with International Financial Reporting Standards (IFRS), as endorsed by the European Union. A.1.2. Significant accounting judgments and estimates In preparing the Financial Statements, the Management Committee is required to make estimates and assumptions that affect reported income, expenses, assets, liabilities and disclosure of contingent assets and liabilities. Use of available information and application of judgement are inherent in the formation of estimates. Actual results in the future could differ from such estimates and the resulting differences may be material to the Financial Statements. The most significant use of judgments and estimates is as follows: Value adjustments on loans and advances The Group reviews its loans and advances at each reporting date to assess whether an allowance for value adjustments should be recorded. In particular, judgment by management is required in the estimation of the amount and timing of future cash flows when determining the level of allowance required. Such estimates are based on assumptions about a number of factors and actual results may differ, resulting in future changes to the allowance. In addition to a specific allowance against individually significant loans and advances, the Group also makes a collective provisioning test on exposures which, although not specifically identified as requiring a specific allowance, have a greater risk of default than when the loans and advances were originally granted. Provisions on financial guarantees The Group recognises a liability at the fair value of the obligation at the inception of a financial guarantee contract. The guarantee is subsequently measured at the higher of the best estimate of the obligation or the amount initially recognised less amortisation of the premium. Financial guarantee provisions correspond to the cost of settling the obligation, which is the expected loss, estimated on the basis of all relevant factors and information existing at the consolidated balance sheet date. Pension and other post-employment benefits The cost of defined-benefit pension plans and other post-employment medical benefits is determined using actuarial valuations. The actuarial valuation involves making assumptions about discount rates, mortality rates and future salary and pension increases. Due to the long term nature of these plans, such estimates are subject to significant uncertainty. 91


EIB Group Consolidated Financial Statements under EU directives Group’s exposure to the United Kingdom On March 29, 2017 the U.K. government triggered Article 50 of the Treaty on European Union (“TEU”), which officially commenced the process of the U.K.’s withdrawal from E.U. membership. On 8 December 2017, the negotiators of the EU and the UK Government published a “Joint report from the negotiators of the European Union and the United Kingdom Government on progress during phase 1 of negotiations under Article 50 TEU on the United Kingdom's orderly withdrawal from the European Union” (the Joint Report). The Joint Report was put forward with a view to the meeting of the European Council (Article 50) of 14-15 December 2017. “Under the caveat that nothing is agreed until everything is agreed, the joint commitments set out in this Joint Report shall be reflected in the Withdrawal Agreement in full detail. This does not prejudge any adaptations that might be appropriate in case transitional arrangements were to be agreed in the second phase of the negotiations, and is without prejudice to discussions on the framework of the future relationship”. The following principles with respect to the callable - and the paid in capital are included in the Joint Report: “The UK will provide a guarantee for an amount equal to its callable capital on the day of withdrawal” (callable capital currently amounts to EUR 35.7bn). “This guarantee will decrease in line with the amortisation of the stock of EIB operations at the date of withdrawal, starting on the date on which the outstanding stock represents an amount equal to the total subscribed capital on the date of withdrawal and ending on the date it equals the total paid-in capital on the date of withdrawal, both as defined in the EIB Statute”. “The UK share of the paid-in capital” (amounting to EUR 3.5bn) “will be reimbursed in twelve annual instalments starting at the end of 2019. The UK remains liable for the reimbursed amount of paid-in capital until the outstanding stock of EIB operations equals the total paid-in capital on the date of withdrawal, at which point the liability will start to be amortised in line with the remaining non-amortised operations. Apart from these reimbursements, the EIB will not make any other payment, return or remuneration on account of the withdrawal of the UK from the EIB or on account of the provision by the UK of a guarantee”. A.2. Summary of significant accounting policies A.2.1. Foreign currency translation The Group uses the euro (EUR) as the unit of measurement for the capital accounts of Member States and for presenting its Financial Statements. The Group conducts its operations in the currencies of the EU Member States, in euro and in non-EU currencies. Its resources are derived from its capital, borrowings and accumulated earnings in various currencies. Foreign currency transactions are translated at the exchange rate prevailing on the date of the transaction. The Group's monetary assets and liabilities denominated in currencies other than euro are translated into euro at the closing exchange rates prevailing at the balance sheet date. The gain or loss arising from such translation is recorded in the profit and loss account. A.2.2. Basis of consolidation The Financial Statements comprise those of the European Investment Bank (the “Bank” or “EIB”) and those of its subsidiaries, the European Investment Fund (the “Fund” or “EIF”) and the EU Microfinance Platform FCP FIS (“EUMPF”). The financial statements of both subsidiaries are prepared for the same reporting year as the Bank, using consistent accounting policies. The Bank consolidates the financial statements of the EIF and EUMPF. EUMPF was consolidated for the first time as of 01 January 2015. After aggregation of the balance sheets and the profit and loss accounts, all intra-group balances, transactions, income and expenses resulting from intra-group transactions are eliminated. Minority interest represents the portion of profit or loss and net assets not owned, directly or indirectly, by the Bank. Assets held in an agency or fiduciary capacity are not assets of the Group and are reported in Note Z. A.2.3. Derivatives The Group uses derivative instruments, mainly currency and interest rate swaps, as part of its asset and liability management (‘ALM’) activities to manage exposures to interest rate and foreign currency risks. All derivatives transactions are booked at nominal as off-balance sheet items at the date of the transaction. The majority of the Group’s swaps are concluded with a view to hedging bond issues. The Group enters into interest rate and currency swaps, whereby the proceeds of a borrowing are initially converted into a different currency and on maturity the Group will obtain the amounts needed to service the borrowing in the original currency. The Group also enters into currency, interest rate and overnight index swaps as part of its hedging operations on loans or for the global ALM position. The corresponding interest is accounted for on a pro rata temporis basis. The Group also uses short-term derivative instruments, primarily FX swaps, as part of its treasury operations, as well as derivatives hedging the trading portfolio (Securities liquidity portfolios). 92


A.2.3.1. Trading portfolio derivatives As part of the Securities liquidity portfolios, trading derivatives are entered in and recorded at market value in the balance sheet as Other assets when their market value is positive or Other liabilities when their market value is negative. Changes in the market value are included in Net result on financial operations. Market values are obtained from quoted market prices, discounted cash flow models and option pricing models, which consider current market and contractual prices for the underlying instrument, as well as the time value of money, yield curve and volatility of the underlying. Interest on derivative instruments is accrued pro rata temporis under Prepayments and accrued income or Accruals and deferred income. Currency swaps Currency swap contracts are entered into in order to adjust currency positions. The revaluation of the spot leg of a currency swap is neutralised in Accruals and deferred income or Prepayments and accrued income. The interest received and paid under interest rate swaps is accrued pro rata temporis and reported in the profit and loss account under Interest receivable and similar income or Interest payable and similar charges. The market value is recorded under Other assets when their market value is positive or Other liabilities when their market value is negative. Changes in the market value are included in Net result on financial operations. Interest rate swaps The interest received and paid under interest rate swaps is accrued pro rata temporis and reported in the profit and loss account under Interest receivable and similar income or Interest payable and similar charges. The market value is recorded under Other assets when their market value is positive or Other liabilities when their market value is negative. Changes in the market value are included in Net result on financial operations. A.2.3.2. All other derivatives Currency swaps Currency swap contracts are entered into in order to adjust currency positions. The revaluation of the spot leg of a currency swap is neutralised in Accruals and deferred income or Prepayments and accrued income. The forward leg of the currency swap is recorded off-balance sheet at settlement amount and is not revalued. The premium/discount between the spot and forward settlement amounts is amortised pro rata temporis through the profit and loss account in Interest receivable and similar income or Interest payable and similar charges. Interest rate swaps The hedging interest rate swaps are not revalued. The interest received and paid under interest rate swaps is accrued pro rata temporis and reported in the profit and loss account under Interest receivable and similar income or Interest payable and similar charges. Forward rate agreements Forward rate agreements are concluded for hedging purposes and are recorded off balance sheet on the trade date. The difference between the contractual forward rates and the year-end rates are reported in the profit and loss account under Interest receivable and similar income or Interest payable and similar charges. Currency forwards Currency forwards are entered into in order to adjust future currency positions. The forward leg is recorded off-balance sheet at the settlement amount and is not revalued. The difference between the spot amounts and the forward settlement amounts is amortised pro rata temporis through the profit and loss account in Interest receivable and similar income or Interest payable and similar charges. Interest on derivative instruments is accrued pro rata temporis under Prepayments and accrued income or Accruals and deferred income. A.2.4. Financial assets Financial assets are accounted for using the settlement date basis. A.2.5. Cash and cash equivalents The Group defines cash and cash equivalents as short-term, highly liquid securities and interest-earning deposits with maturities of 90 days or less. A.2.6.Treasury bills and other bills eligible for refinancing with central banks and debt securities including fixed-income securities A.2.6.1. Group Long Term Hedge Portfolio The Group Long Term Hedge Portfolio contains securities of the Bank’s Long Term Hedge Portfolio and the EIF investment portfolio, and consists of securities purchased with the intention of holding them to maturity. These securities are issued or guaranteed by: • Governments of the European Union Member States, G10 countries and their agencies; • Supranational public institutions, including multinational development banks. These securities are initially recorded at the purchase price. Value adjustments are accounted for, if these are other than temporary. The difference between the entry price and redemption value is accounted for pro rata temporis over the life of the securities. 93


EIB Group Consolidated Financial Statements under EU directives A.2.6.2. Operational portfolios Treasury Monetary Portfolio “TMP” In order to maintain an adequate level of liquidity, the Bank purchases money market products with a maximum maturity of 12 months, in particular Treasury bills and negotiable debt securities issued by public bodies and credit institutions. The securities in the Treasury Monetary Portfolio are held until their final maturity, initially recorded at purchase price and presented in the Financial Statements at amortised cost. The difference between purchase price and redemption value is accounted for pro rata temporis over the life of the securities as interest receivable and similar income. Value adjustments are accounted for, if these are other than temporary. Securities liquidity portfolios P1 and P2, as well as Operational and ABS portfolios EIF The P1 ‘fixed rate’ and P2 ‘floating rate’ are trading portfolios which comprise bonds issued or guaranteed by national governments, supranational institutions, financial institutions and corporations. Securities in these portfolios are initially recorded at acquisition cost and presented in the Financial Statements at market value. Changes in market value are recorded under Net result on financial operations in the profit and loss account. The Operational portfolio EIF comprises listed securities with a maximum residual maturity of 10 years. These securities are classified in the available for sale category and are presented in the Financial Statements at market value. Changes in market value are recorded under Net result on financial operations in the profit and loss account. The ABS Portfolio EIF consists of obligations in the form of bonds, notes or certificates issued by Special Purpose Vehicles (SPV), trust vehicles or financial institutions. These securities are classified as loans and receivables and initially recorded at purchase price and valued at amortised cost. The difference between purchase price and redemption value is accounted for pro rata temporis over the life of the securities as interest receivable and similar income. Value adjustments are accounted for, if these are other than temporary. The market value of treasury portfolios is based on published price quotations in an active market as the first source. For instruments without available published price quotations, the market values are determined by obtaining quotes from market participants and/or by using valuation techniques or models, based whenever possible on observable market data prevailing at the balance sheet date. A.2.6.3. Loan substitutes This portfolio mainly consists of obligations in the form of bonds, notes or certificates issued by Special Purpose Vehicles (SPVs), trust vehicles or financial institutions. These securities are classified as held to maturity and initially recorded at purchase price and valued at amortised cost. The difference between purchase price and redemption value is accounted for pro rata temporis over the life of the securities as interest receivable and similar income. Value adjustments are accounted for, if these are other than temporary. A.2.7.Loans and advances to credit institutions and customers A.2.7.1. Loans and advances Loans and advances are included in the assets of the Group at their net disbursed amounts. Value adjustments have been made for loans and advances outstanding at the end of the financial year and presenting risks of non-recovery of all or part of their amounts. Such value adjustments are held in the same currency as the assets to which they relate. Value adjustments are accounted for in the profit and loss account as Value (re-)adjustments in respect of loans and advances and provisions for contingent liabilities and are deducted from the appropriate asset items on the balance sheet. A.2.7.2. Interests on loans Interests on loans are recorded in the profit and loss account on an accruals basis, i.e. over the life of the loans. On the balance sheet, accrued interest is included in Prepayments and accrued income under assets. Value adjustments to interest amounts on these loans are determined on a case-by-case basis by the Group’s Management and deducted from the appropriate asset item on the balance sheet. For non-performing loans, upon impairment the accrual of interest income based on the original terms of the claim may be discontinued. A.2.7.3. Reverse repurchase operations (reverse repos) Under a tripartite reverse repo, a custodian/clearing agency arranges for custody, clearing and settlement of the transactions between the Bank and a third party. The custodians/clearing agencies operate under standardised global master purchase agreements and provide for delivery against payment systems, substitution of securities, automatic marking to market, reporting and daily transaction administration. Reverse repos are carried at the amounts of cash advanced and are entered on the balance sheet under Loans and advances to credit institutions – b) other loans and advances. Interest on reverse repos is accrued pro rata temporis. A.2.7.4. Interest subsidies Interest subsidies received in advance (see Note I) are deferred and recognised in the profit and loss account over the period from disbursement to repayment of the subsidised loan. 94


A.2.8. Shares, other variable-yield securities and participating interests The Group acquires shares, other variable-yield securities and participating interests when it enters into venture capital operations, infrastructure funds or investment funds. Shares, other variable-yield securities and participating interests are initially recorded at acquisition cost. Their carrying value is adjusted to the lower of cost or market value at subsequent measurement at the balance sheet date. Investments in venture capital enterprises, infrastructure funds and investment funds represent shares, other variable-yield securities and participating interests acquired for the longer term in the normal course of the Group’s activities. They are initially recorded at their original acquisition cost. Based on the reports received from fund managers, the portfolios of investments are valued on a line-by-line basis at the lower of cost or attributable net asset value (‘NAV’), thus excluding any attributable unrealised gain that may be prevailing in the portfolio. The attributable NAV is determined through applying either the Group’s percentage ownership in the underlying vehicle to the NAV reflected in the latest available before year-end report or, to the extent available, the value per share at the same date, submitted by the respective Fund Manager. The attributable NAV is adjusted for events occurring between the date of the latest available NAV and the balance sheet date to the extent that such adjustment is considered to be material. Unrealised losses due solely to administrative expenses and management fees of venture capital, infrastructure funds and investment funds in existence for less than two years at the balance sheet date are not taken into consideration in determining the attributable NAV. Participating interests are accounted based on the equity accounting using methods consistent with EIB Group’s accounting policies. A.2.9. Tangible assets Tangible assets include land, Group-occupied properties, other machines and equipment. Land is stated at acquisition cost and buildings are stated at acquisition cost less accumulated depreciation. The costs of the Group's headquarters building in Luxembourg-Kirchberg and its building in Luxembourg-Weimershof are depreciated on a straight-line basis as set out below. Permanent equipment, fixtures and fittings, furniture, office equipment and vehicles have been recorded in the balance sheet at their acquisition cost, less accumulated depreciation. Depreciation is calculated on a straight-line basis over the estimated life of each item purchased, as set out below: • • • • Buildings in Kirchberg and Weimershof: 30 years Permanent equipment, fixtures and fittings: 10 years Furniture: 5 years Office equipment and vehicles: 3 years A.2.10.Intangible assets Intangible assets comprise computer software. Software development costs are capitalised if they meet certain criteria relating to identifiability, the probability that future economic benefits will flow the enterprise and to the reliability of cost measurement. Internally developed software meeting these criteria is carried at cost less accumulated amortisation calculated on a straight-line basis over three years from completion. A.2.11.Pension plans and health insurance scheme A.2.11.1. Pension plan for staff The Group operates defined-benefit pension plans to provide retirement benefits to substantially its entire staff. The Bank’s main pension scheme is a defined-benefit pension scheme funded by contributions from staff and from the Bank which covers all employees. All contributions of the Bank and its staff are invested in the assets of the Bank. Commitments for retirement benefits are valued at least every year using the projected unit credit method, in order to ensure that the provision entered in the accounts is adequate. The latest valuation was carried out as at 30 September 2017 and was updated as at 31 December 2017 with an extrapolation (roll forward method) for the last three months of 2017. The main assumptions used by the actuary are set out in Note L. The main pension scheme of the EIF is a defined-benefit scheme funded by contributions from staff and from the EIF which covers all employees. The scheme entered into force in March 2003, replacing the previous defined-contribution scheme. Cumulative prior year actuarial deficits and surpluses in excess of 10% of the commitments for retirement benefits are recognised over the expected average remaining service lives of the plan’s participants on a straight-line basis. A.2.11.2. Health insurance scheme The Group has set up its own health insurance scheme for the benefit of staff, financed by contributions from the Group and its employees. The health insurance scheme is managed and accounted for under the same principles as the pension plan for staff described in Note A.2.11.1. The latest valuation was carried out as at 30 September 2017 and was updated as at 31 December 2017 with an extrapolation (roll forward method) for the last three months of 2017. 95


EIB Group Consolidated Financial Statements under EU directives A.2.11.3. The Management Committee pension plan The Management Committee pension plan is a defined-benefit pension scheme funded by contributions from the Group only which covers all Management Committee members. All contributions of the Group are invested in the assets of the Group. The Management Committee pension plan is managed and accounted for under the same principles as the pension plan for staff described in Note A.2.11.1. A.2.11.4. Optional Supplementary provident scheme The optional supplementary provident scheme is a defined-contribution pension scheme, funded by voluntary staff and employer contributions. The corresponding liability is recorded in Other liabilities. A.2.12.Amounts owed to credit institutions and customers Amounts owed to credit institutions and customers are presented in the financial statements at their redemption amounts. Interest on amounts owed to credit institutions and customers is recorded in the profit and loss account on an accruals basis as Interest payable and similar charges. Accrued interest is included in Accruals and deferred income under liabilities. A.2.13.Debts evidenced by certificates Debts evidenced by certificates are presented at their redemption amounts, except for zero coupon bonds which are presented at their amortised cost. Transaction costs and premiums/ discounts are amortised in the profit and loss account on a straight-line basis over the life of the debt through Accruals and deferred income or Prepayments and accrued income. Interest expense on debt instruments is included in Interest payable and similar charges in the consolidated profit and loss account. A.2.14.Financial guarantees Financial guarantee contracts require the issuer to make specified payments to reimburse the holder for a loss it incurs if a specified debtor fails to make payment when due under the original or modified terms of a debt instrument. Signed financial guarantees are generally accounted for and disclosed as off-balance sheet items. In regards to the accounting treatment of the financial guarantees on balance sheet, all financial guarantees are measured initially at fair value (the net present value of premium receivable which is equal to the initial expected loss), and subsequently at the higher of the amount determined as contingent liability, or the original fair value less amortisation of the premium. Financial guarantees measured at fair value on balance sheet are recorded under the caption Other liabilities. Any fair value changes are recorded in the income statement as Net results on financial operations. When a financial guarantee operation measured on balance sheet at fair value is considered as impaired and therefore provisioned, its value previously recorded under Other liabilities is transferred to the caption Provisions for guarantees issued on the balance sheet. This provision is intended to cover risks inherent in the Group’s activity of issuing guarantees in favour of financial intermediaries or issued in respect of loans granted by third parties. A provision for guarantees issued is established if there is objective evidence that the Group will have to incur a loss in respect of a given guarantee granted. The provision for financial guarantees is recognised in the income statement as Value adjustments in respect of loans and advances and provisions for contingent liabilities. A.2.15.Provision for commitment on investment funds This provision is intended to cover risks inherent in the Group’s commitment on investment funds signed but not yet disbursed. A.2.16.Reserves A.2.16.1. Reserve fund As provided for under Article 22(-1) of the Statute, “a reserve fund of up to 10% of the subscribed capital shall be built up progressively” from the retained profit of the Bank. A.2.16.2. Additional reserves Additional reserves contain the remaining retained earnings of the Group. 96


A.2.16.3. Special activities reserve As provided for under Article 16(-5) of the Statute, “the special activities of the Bank […] will have a specific allocation of reserve”. The special activities reserve is a dedicated reserve for the capital allocation covering the unexpected loss of those activities which have a risk profile higher than what is generally accepted by the Bank, including venture capital activities. The reserve is based on the capital allocation of each operation and is calculated monthly according to the evolution of the underlying assets. A.2.16.4. General loan reserve In 2009 a “general loan reserve” was introduced for the expected loss of the Bank’s loan and guarantee portfolio, modelled upon the Group’s policy guidelines. It is calculated monthly according to the evolution of the underlying assets. A.2.17.Prepayments and accrued income Expenditure incurred during the financial year but relating to a subsequent financial year, together with any income for which payment is not due until the expiry of the underlying instrument. A.2.18.Accruals and deferred income Income received before the balance sheet date but relating to a subsequent financial year, together with any charges which, though relating to the financial year in question, will be paid only in the course of a subsequent financial year. A.2.19. Interest receivable and similar income Revenues on loans are mainly composed of interest revenue, commitment fees, front-end fees and prepayment indemnities. Prepayment indemnities are recognised in the profit and loss account when received, as the revenue is earned. A.2.20.Interest payable and similar charges Interest payable and similar charges includes interest on amounts owed to credit institutions and customers, interest expense on debt instruments and derivatives. A.2.21.Dividend income Dividends are recognised in the profit and loss account when the entity’s right to receive payment is established. A.2.22.Taxation The Protocol on the Privileges and Immunities of the European Union appended to the Treaty on European Union and the Treaty on the Functioning of the European Union, stipulates that the assets, revenues, and other property of the institutions of the Union are exempt from all direct taxes. A.2.23.Reclassification of prior year figures Certain prior year figures have been reclassified to conform with the current year’s presentation. This relates to reclassification of participating interests as follows: • • • • From (Shares and other variable-yield securities) EUR’000 - 186,704 To (Participating interests) EUR’000 186,704 From (Net result on financial operations) EUR’000 8,216 To (Value (re-)adjustments in respect of transferable securities held as financial fixed assets, participating interests and shares in affiliated undertakings) EUR’000 -8,216 97


EIB Group Consolidated Financial Statements under EU directives Note B – Cash in hand, balances with central banks and post office banks and debt securities portfolio (in EUR ‘000) B.1. Cash in hand, balances with central banks and post office banks The cash in hand and balances with central banks and post office banks equals to EUR ’000 162,483 at 31 December 2017 (2016: EUR ‘000 316,769). The EIB is an eligible counterparty in the Eurosystem’s monetary policy operations, and has therefore been given access to the monetary policy operations of the European Central Bank. The Bank conducts the operations via the Central Bank of Luxembourg, where it maintains a deposit to cover the minimum reserve requirement. The balance of this deposit amounts to EUR ‘000 162,448 as at 31 December 2017 (2016: EUR ‘000 316,734). B.2. Debt securities portfolio The details of these portfolios and their classification as at 31 December 2017 and 2016 are as follows: 31.12.2017 31.12.2016 Treasury bills and other bills eligible for refinancing with central banks Debt securities including fixed-income securities 41,508,248 15,671,727 51,636,687 15,859,460 57,179,975 67,496,147 (*)of which EUR ‘000 7,454,103 unlisted in 2017 and EUR ‘000 16,967,160 in 2016. Premiums/ discounts to be amortised Value at final maturity At 31.12.2017 Purchase price Book value Market value Group long term hedge portfolio 555,406 539,519 -6,219 533,300 656,034 Treasury Monetary portfolios (TMP) - Money market securities 27,893,290 27,776,497 -102,988 27,673,509 27,778,004 Securities liquidity portfolios: - P1: Fixed rate portfolio - P2: Floating rate portfolio Operational portfolio - EIF ABS portfolio - EIF 4,608,110 2,933,347 1,231,074 332,386 4,580,490 2,927,615 1,235,847 199,404 0 0 -12,927 67,915 4,507,870 2,909,194 1,192,006 267,319 4,580,490 2,927,615 1,235,847 213,023 Loan substitutes (Note D) 19,950,153 19,920,603 -26,043 19,894,560 20,187,353 (*)of which cash and cash equivalents EUR'000 18,863,479 Premiums/ discounts to be amortised Value at final maturity At 31.12.2016 Purchase price Book value Market value Group long term hedge portfolio 570,296 555,209 -8,409 546,800 694,244 Treasury Monetary portfolios (TMP) - Money market securities 37,497,614 37,445,855 -91,942 37,353,913 37,439,129 Securities liquidity portfolios: - P1: Fixed rate portfolio - P2: Floating rate portfolio Operational portfolio - EIF ABS portfolio - EIF 3,018,597 4,203,006 1,240,110 202,473 2,961,469 4,180,075 1,269,985 178,545 571 0 -20,199 -10,156 2,900,157 4,145,601 1,195,106 202,333 2,961,469 4,180,075 1,269,985 178,544 Loan substitutes (Note D) 25,284,564 20,905,009 -29,331 20,875,678 21,243,750 (*)of which cash and cash equivalents EUR'000 23,483,405 Loan substitutes, which represent acquisitions of interests in pools of loans or receivables in connection with securitisation transactions are considered to be part of the aggregate loans (Note D). Some of these transactions have been structured by adding credit or project-related remedies, thus offering additional recourse. No value adjustment is required and has thus not been accounted for as at 31 December 2017 and 2016. 98 Total debt securities(*) 72,016,660 67,496,147 -159,466 67,219,588 67,967,196 Total debt securities(*) 57,503,766 57,179,975 -80,262 56,977,758 57,578,366 Total debt securities(*)


EU sovereign exposure in bond holdings The Group did not record value adjustments in 2016 and 2017 in respect of its held to maturity EU sovereign and EU sovereign guaranteed exposure as at year-end, in view of the Bank’s as well as EIF’s preferred creditor status and the protection given by the Bank’s Statute as well as a detailed review of any value adjustment requirements. The following tables show the exposure to debt issued or guaranteed by EU sovereigns in the Group’s debt securities portfolios as at 31 December 2017 and 2016: Value at final maturity At 31.12.2017 Purchase price Book value Market value EU sovereigns Austria Belgium Czech Republic Denmark Finland France Germany Greece Hungary Ireland Italy Lithuania Luxembourg Netherlands Poland Portugal Romania Slovakia Slovenia Spain Sweden United Kingdom 101,227 1,158,802 834,807 551,718 327,436 4,721,956 1,710,718 15,778 35,221 126,837 3,701,573 14,839 5,161 130,925 171,505 10,242 105,601 49,600 24,884 2,497,564 373,471 2,041,012 101,575 1,157,722 793,509 551,407 327,374 4,703,472 1,710,194 15,266 36,323 126,153 3,693,262 13,065 5,450 128,432 165,590 10,210 103,060 48,441 25,305 2,465,821 373,149 2,040,910 98,706 1,156,752 765,265 550,713 328,525 4,682,296 1,708,596 15,000 36,510 125,000 3,649,822 13,000 5,000 127,708 160,354 10,000 100,000 46,739 24,629 2,450,104 372,747 1,983,043 101,568 1,157,704 871,264 551,426 327,509 4,712,803 1,773,522 15,461 38,189 126,180 3,721,672 13,065 5,450 140,556 167,802 10,210 103,99 49,194 25,267 2,466,263 373,018 2,040,864 18,710,877 38,792,889 18,595,690 38,584,285 18,410,509 38,567,249 18,792,089 38,786,277 Non-EU sovereign and other bonds Value at final maturity At 31.12.2016 Purchase price Book value Market value EU sovereigns Austria Belgium Bulgaria Czech Republic Denmark Finland France Germany Greece Hungary Ireland Italy Lithuania Luxembourg Netherlands Poland Portugal Slovakia Slovenia Spain Sweden United Kingdom 1,276,089 911,414 6,159 739,227 107,820 50,773 6,387,663 4,049,900 32,852 17,472 26,411 6,936,707 26,139 15,128 1,305,471 143,047 841,612 126,818 11,206 2,910,069 472,044 23,986 1,270,296 908,687 6,129 704,226 107,736 49,230 6,369,786 4,042,008 32,432 18,647 27,271 6,928,216 24,247 16,961 1,299,133 137,020 842,049 121,278 11,804 2,902,620 471,382 23,774 1,253,421 907,500 6,000 669,849 107,608 49,870 6,344,300 4,037,049 35,000 19,000 25,000 6,887,100 23,000 15,000 1,296,700 127,000 841,000 116,293 11,118 2,879,070 471,081 23,717 1,269,700 909,233 6,132 823,657 107,745 49,230 6,379,691 4,114,502 31,971 21,184 27,271 6,957,761 24,247 16,959 1,313,057 140,058 842,101 122,199 11,790 2,903,383 471,308 23,774 26,418,007 45,598,653 26,314,932 41,181,215 26,145,676 41,073,912 26,566,953 41,400,243 Non-EU sovereign and other bonds 102 Total 72,016,660 67,496,147 67,219,588 67,967,196 Total 57,503,766 57,179,975 56,977,758 57,578,366


EIB Group Consolidated Financial Statements under EU directives Note C – Loans and advances to credit institutions and to customers – other loans and advances (in EUR ‘000) 31.12.2017 31.12.2016 Term deposits Overnight deposits Tripartite reverse repos Loans and advances to credit institutions Loans and advances to customers 25,746,869 200,000 7,951,330 33,898,199 1,741,983 24,642,065 174,000 10,416,016 35,232,081 2,219,989 of which cash and cash equivalents 31,958,799 30,492,322 Note D – Summary statement of loans D.1. Aggregate loans granted (in EUR ‘000) Aggregate loans granted comprise both the disbursed and undisbursed portions of loans. The analysis is as follows: To intermediary credit institutions Directly to final beneficiaries 31.12.2017 31.12.2016 Disbursed portion Undisbursed loans 121,541,456 28,890,536 313,411,970 84,037,546 434,953,426 112,928,082 434,468,006 113,320,448 Loan instalments receivable Loan substitutes portfolio (Note B.2) 18,902 208,419 227,321 19,920,603 116,986 20,905,009 D.2. Value adjustments for loans (in EUR ‘000) Movements in the value adjustments are detailed below: 2017 2016 At 1 January Release during the year Use during the year Allowance during the year Foreign exchange adjustment 533,147 -184,333 -2,616 124,344 -5,035 625,547 -125,635 0 38,205 -4,970 (1)The value adjustment of EUR '000 465,507 relates only to disbursed loans including arrears. The Group has additionally recorded value adjustments in regards to accrued interest of a total amount of EUR '000 5,691 (2016: EUR '000 5,539), which is recorded under the caption of Prepayments and accrued income. 100 At 31 December 465,507(1) 533,147 Aggregate loans including loan substitutes portfolio (Note D.3) 568,029,432 568,810,449 Aggregate loans granted 150,431,992 397,449,516 547,881,508 547,788,454 Total other loans and advances 35,640,182 37,452,070


D.3. Geographical breakdown of lending by country in which projects are located (in EUR ‘000) D.3.1. Loans for projects within the European Union Countries and territories in which projects are located Number of loans Aggregate loans granted Disbursed portion Undisbursed portion % of total 2017 % of total 2016 Spain Italy France Germany Poland United Kingdom Portugal Greece Austria Netherlands Belgium Sweden Hungary Finland Czech Republic Romania Ireland Slovakia Croatia Slovenia Denmark Cyprus Bulgaria Lithuania Estonia Latvia Luxembourg Malta 800 760 565 406 374 324 267 162 187 137 146 103 90 156 117 111 68 72 63 55 44 52 47 25 31 18 14 13 92,328,784 67,230,297 56,386,893 45,732,687 43,974,743 43,371,379 18,921,269 17,874,033 14,733,586 14,423,170 12,994,636 10,739,979 9,848,970 9,640,731 7,594,867 7,037,913 6,098,165 4,705,862 4,299,965 3,599,740 3,034,387 2,687,981 2,327,287 1,899,038 1,362,749 1,013,564 641,615 436,153 84,752,463 54,960,144 42,801,665 37,082,012 32,854,541 37,650,623 17,175,369 16,068,919 12,600,101 11,753,738 9,664,515 6,895,633 7,995,109 7,144,067 6,921,230 4,318,570 4,678,565 3,264,496 3,412,892 3,043,451 1,956,368 1,988,034 1,606,640 1,579,843 1,029,779 705,071 360,014 328,396 7,576,321 12,270,153 13,585,228 8,650,675 11,120,202 5,720,756 1,745,900 1,805,114 2,133,485 2,669,432 3,330,121 3,844,346 1,853,861 2,496,664 673,637 2,719,343 1,419,600 1,441,366 887,073 556,289 1,078,019 699,947 720,647 319,195 332,970 308,493 281,601 107,757 16.27% 11.86% 9.93% 8.05% 7.74% 7.64% 3.33% 3.15% 2.59% 2.54% 2.30% 1.89% 1.73% 1.70% 1.34% 1.24% 1.07% 0.83% 0.76% 0.63% 0.53% 0.47% 0.41% 0.33% 0.24% 0.18% 0.11% 0.08% 16.08% 11.90% 9.72% 8.24% 7.43% 8.16% 3.38% 3.08% 2.70% 2.31% 2.31% 1.63% 1.82% 1.66% 1.36% 1.18% 0.97% 0.84% 0.72% 0.69% 0.48% 0.46% 0.46% 0.35% 0.25% 0.17% 0.15% 0.07% 101 Sub-total 5,207 504,940,443 414,592,248 90,348,195 88.94% 88.57%


EIB Group Consolidated Financial Statements under EU directives D.3.2. Loans for projects outside the European Union D.3.2.1. Candidate Countries Countries and territories in which projects are located Number of loans Aggregate loans granted Disbursed portion Undisbursed portion % of total 2017 % of total 2016 Turkey Serbia Montenegro FYROM Albania 182 71 42 13 13 18,023,851 3,253,631 447,603 351,624 232,152 15,958,710 2,387,057 322,013 285,284 197,652 2,065,141 866,574 125,590 66,340 34,500 D.3.2.2. ACP states Countries and territories in which projects are located Number of loans Aggregate loans granted Disbursed portion Undisbursed portion % of total 2017 % of total 2016 Kenya Madagascar Zambia Senegal Tanzania, United republic of Ivory Coast Uganda Guinea Dominican Republic Regional - West Africa Lesotho Burkina Faso Mozambique Benin Malawi Burundi Cameroon Fiji Islands New Guinea Liberia Mali Cape Verde Mauritius Rwanda Congo (Democratic Republic) Ghana Ethiopia Seychelles Namibia Niger Congo Mauritania Regional - Caribbean Sao Tome and Principe Swaziland Belize Dominica Jamaica Botswana Togo Saint Vincent and Grenadines 7 5 5 6 3 2 2 2 2 5 4 5 5 4 4 1 2 1 1 1 1 2 5 1 1 1 1 2 4 1 1 2 2 1 2 1 1 1 1 1 1 411,864 399,324 326,477 311,860 198,386 152,700 126,139 125,000 114,233 107,800 105,248 96,172 93,246 89,383 78,100 70,000 64,788 62,536 53,367 50,000 50,000 49,677 45,789 45,000 43,492 42,538 40,000 30,537 29,922 21,000 20,894 19,605 19,159 12,000 9,797 7,380 5,621 4,947 2,960 2,806 2,306 180,502 190,724 89,447 36,860 52,412 0 64,932 0 30,851 71,459 105,248 63,286 59,291 35,883 13,500 0 49,788 0 0 50,000 26,000 49,677 45,789 0 43,492 42,538 5,000 12,623 29,922 3,000 17,632 4,605 19,159 0 9,797 0 5,621 4,947 2,960 2,806 2,306 231,362 208,600 237,030 275,000 145,974 152,700 61,207 125,000 83,382 36,341 0 32,886 33,955 53,500 64,600 70,000 15,000 62,536 53,367 0 24,000 0 0 45,000 0 0 35,000 17,914 0 18,000 3,262 15,000 0 12,000 0 7,380 0 0 0 0 0 102 Sub-total 100 3,542,053 1,422,057 2,119,996 0.62% 0.53% Sub-total 321 22,308,861 19,150,716 3,158,145 3.93% 4.34%


D.3.2.3. Asia Countries and territories in which projects are located Number of loans Aggregate loans granted Disbursed portion Undisbursed portion % of total 2017 % of total 2016 China India Kazakhstan Vietnam Bangladesh Sri Lanka Nepal Pakistan Kyrgyzstan Mongolia Tajikistan Lao People's Democratic Rep. Maldives Indonesia 7 13 7 6 3 5 3 3 3 4 2 2 2 2 1,911,293 1,744,160 420,000 401,982 317,000 212,480 180,759 156,254 112,000 89,196 78,456 58,202 54,186 14,345 847,486 891,969 0 156,982 32,000 162,480 2,764 6,254 0 16,035 8,456 41,526 9,186 14,345 1,063,807 852,191 420,000 245,000 285,000 50,000 177,995 150,000 112,000 73,161 70,000 16,676 45,000 0 D.3.2.4. Potential Candidate Countries Countries and territories in which projects are located Number of loans Aggregate loans granted Disbursed portion Undisbursed portion % of total 2017 % of total 2016 Bosnia and Herzegovina Kosovo 35 2 1,452,014 52,000 1,129,679 10,000 322,335 42,000 D.3.2.5. Latin America Countries and territories in which projects are located Number of loans Aggregate loans granted Disbursed portion Undisbursed portion % of total 2017 % of total 2016 Brazil Ecuador Panama Nicaragua Regional - Central America Paraguay Argentina Mexico Peru Bolivia Chile Honduras Costa Rica Colombia 7 7 5 5 3 3 4 4 3 2 2 1 1 2 679,986 574,023 531,102 399,263 305,440 193,257 168,761 151,620 131,729 125,136 85,942 74,377 55,277 28,311 618,588 188,566 447,720 67,738 182,940 55,928 109,922 151,620 90,038 48,985 85,942 20,631 30,954 28,311 61,398 385,457 83,382 331,525 122,500 137,329 58,839 0 41,691 76,151 0 53,746 24,323 0 D.3.2.6. European Free Trade Association (EFTA) Countries Countries and territories in which projects are located Number of loans Aggregate loans granted Disbursed portion Undisbursed portion % of total 2017 % of total 2016 Norway Iceland Switzerland 11 8 7 1,122,433 490,269 104,284 922,433 420,269 61,556 200,000 70,000 42,728 103 Sub-total 26 1,716,986 1,404,258 312,728 0.30% 0.28% Sub-total 49 3,504,224 2,127,883 1,376,341 0.62% 0.70% Sub-total 37 1,504,014 1,139,679 364,335 0.26% 0.28% Sub-total 62 5,750,313 2,189,483 3,560,830 1.01% 0.86%


EIB Group Consolidated Financial Statements under EU directives D.3.2.7. Mediterranean Countries Countries and territories in which projects are located Number of loans Aggregate loans granted Disbursed portion Undisbursed portion % of total 2017 % of total 2016 Egypt Morocco Tunisia Israel Lebanon Jordan Algeria Syrian Arab Republic Gaza-West Bank 43 65 63 10 25 11 1 9 7 4,692,491 4,510,635 3,804,621 1,006,453 904,744 517,359 398,750 309,720 92,990 2,423,270 2,990,939 2,263,479 853,923 360,313 315,636 398,750 261,719 41,517 2,269,221 1,519,696 1,541,142 152,530 544,431 201,723 0 48,001 51,473 D.3.2.8. Overseas Countries and Territories (OCT) Countries and territories in which projects are located Number of loans Aggregate loans granted Disbursed portion Undisbursed portion % of total 2017 % of total 2016 French Polynesia New Caledonia 2 1 19,010 18,889 11,510 18,889 7,500 0 D.3.2.9. Eastern Europe, Southern Caucasus, Russia Countries and territories in which projects are located Number of loans Aggregate loans granted Disbursed portion Undisbursed portion % of total 2017 % of total 2016 Ukraine Georgia Moldova, Republic of Armenia Russian Federation Azerbaijan 29 23 18 14 4 2 4,415,496 1,459,552 742,721 310,559 208,867 39,770 1,010,604 411,922 206,088 197,724 208,867 19,770 3,404,892 1,047,630 536,633 112,835 0 20,000 D.3.2.10. South Africa Countries and territories in which projects are located Number of loans Aggregate loans granted Disbursed portion Undisbursed portion % of total 2017 % of total 2016 South Africa 22 1,082,590 852,785 229,805 (1)Including loan substitutes (Notes B.2 and D.1) and excluding loan instalments receivables (2017: EUR 227 million, 2016: EUR 117 million) D.4. Provisions in respect of guarantee operations A provision for guarantees issued has been recognized as there is objective evidence that the Group will have to incur a loss in respect of guarantees granted. This provision amounts to EUR ‘000 23,460 as at 31 December 2017 (2016: EUR ‘000 42,479). 104 Total loans for projects outside the Union 944 62,861,668 40,281,781 22,579,887 11.06% 11.43% Total loans 2017(1) 6,151 567,802,111 454,874,029 112,928,082 100.00% Total loans 2016(1) 6,041 568,693,463 455,373,015 113,320,448 100.00% Sub-total 22 1,082,590 852,785 229,805 0.19% 0.22% Sub-total 90 7,176,965 2,054,975 5,121,990 1.26% 1.38% Sub-total 3 37,899 30,399 7,500 0.01% 0.01% Sub-total 234 16,237,763 9,909,546 6,328,217 2.86% 2.83%


Note E – Composition of the Group, Shares, other variable-yield securities and participating interests E.1 Composition of the Group E.1.1 The European Investment Fund The European Investment Fund (the ‘Fund’ or ‘EIF’) was incorporated on 14 June 1994, in Luxembourg, as an international financial institution. The address of its registered office is 37 B, avenue J.F. Kennedy, L-2968 Luxembourg. The primary task of the Fund, while providing adequate return on equity, is to contribute to the pursuit of European Union objectives through: • • • • the provision of guarantees to financial institutions that cover credits to small and medium sized entities (‘SME’); the acquisition, holding, managing and disposal of equity participations; the administration of special resources entrusted by third parties; and related activities. The Bank holds 58.47% (2016: 59.88%) of the subscribed capital of the EIF. E.1.2 EU Microfinance Platform FCP FIS EU MICROFINANCE PLATFORM FCP-FIS (‘EUMPF’) is structured as a Luxembourg “fonds commun de placement – fonds d’investissement spécialisé” governed by the law of 13 February 2007 relating to specialised investment funds (the “2007 Law”) and launched on 22 November 2010. It is established as an umbrella fund, which may have several sub-funds. It has been launched with an unlimited duration provided that the fund will however be automatically put into liquidation upon the termination of a sub-fund if no further sub-fund is active at that time. Currently, the only sub-fund of the EUMPF is the European Progress Microfinance Fund (“EPMF”). The EUMPF is an unincorporated co-ownership of securities and other eligible assets and does not have legal personality. The EUMPF is therefore managed in the exclusive interests of the Unitholders by the Management Company (“EIF”) in accordance with Luxembourg laws and the Management Regulations. As per the Management Regulations, the European Investment Fund (“EIF”) serves as Management Company to the EUMPF umbrella fund and the EPMF compartment. In line with regulatory prescriptions thereon, standard investment decisions on behalf of EUMPF are taken by EIF in its capacity as Management Company and with strict adherence to the relevant Management Regulations agreed with investors. The address of its registered office is located at 37B, avenue J.F. Kennedy, L-2968 Luxembourg. The overall investment objective of the EUMPF is to invest its assets in a wide range of securities and other assets permitted to a specialised investment fund governed by the 2007 Law as amended with the purpose of spreading investment risks and affording its investors the results of the management of its portfolio. The specific investment objective of the EUMPF is to increase access to, and availability of range of financial products and services in the area of microfinance for: • • • Persons starting their own enterprise, including self-employment; Enterprises, especially microenterprises; Capacity building, professionalization and quality management of microfinance institutions and of organisation active in the area of microfinance; Local and regional employment and economic development initiatives. • The Bank holds 55.56% (2016: 55.56%) of the total committed units of EUMPF. The Bank, the EIF and the EUMPF together are defined as the ‘Group’. 105


EIB Group Consolidated Financial Statements under EU directives E.2 Shares, other variable-yield securities and participating interests This balance comprises (in EUR ‘000): Participating interests Shares and other variable-yield securities Venture Capital Operations(1) Venture Capital Operations(1) Investment funds(1) EBRD shares(2) Total(3) Cost: At 1 January 2017 Additions Reflows 202,278 85,699 -7,027 3,833,383 1,163,769 -484,786 157,500 0 0 705,719 321,549 -184,797 4,696,602 1,485,318 -669,583 Value adjustments: At 1 January 2017 Additions Releases -15,574 -4,358 2,435 -504,160 -62,835 130,288 0 0 0 -46,144 -5,186 11,490 -550,304 -68,021 141,778 Net book value: (1) The amounts signed but not yet disbursed disclosed off-balance sheet are respectively: In relation to Shares and other variable-yield securities: • for venture capital operations EUR ‘000 5,323,061 (2016: EUR ‘000 5,215,963) • for investment funds EUR ‘000 2,649,089 (2016: EUR ‘000 1,113,939) In relation to participating interests: • for venture capital operations EUR ‘000 600,531 (2016: EUR ‘000 597,512) (2) The amount of EUR ‘000 157,500 (2016: EUR ‘000 157,500) corresponds to the capital paid in by the Bank as at 31 December 2017 with respect to its subscription of EUR ‘000 900,440 to the capital of the EBRD (European Bank for Reconstruction and Development). (3) The total amount includes only shares and other variable-yield securities As at 31 December 2017, the Bank holds 3.03% of the subscribed capital of the EBRD. Based on the audited 2016 EBRD financial statements prepared in accordance with International Financial Reporting Standards, the share of underlying net equity of the Bank in EBRD amounted to EUR 467.5 million (2015: EUR 442.6 million). In EUR million % held Total own funds Total net result Total assets EBRD (31.12.2015) 3.03 14,586 442 55,026 EBRD (31.12.2016) 3.03 15,431 804 56,150 106 At 31 December 2017 263,453 4,075,659 157,500 802,631 5,035,790 At 31 December 2016 185,786 3,330,141 157,500 659,575 4,147,216 At 31 December 2017 -17,497 -436,707 0 -39,840 -476,547 At 31 December 2017 280,950 4,512,366 157,500 842,471 5,512,337


Note F – Intangible and tangible assets (in EUR ‘000) Luxembourg buildings Furniture and equipment Total tangible assets Total intangible assets Land Cost: At 1 January 2017 Additions Disposals 20,145 0 0 375,046 6,728 0 94,256 17,520 -19,230 489,447 24,248 -19,230 22,172 13,273 -6,503 Accumulated depreciation: At 1 January 2017 Depreciation Disposals 0 0 0 -167,174 -9,792 0 -49,373 -22,018 19,230 -216,547 -31,810 19,230 -5,953 -7,388 5,663 Net book value: The Luxembourg buildings category includes cost relating to the construction of a new building for an amount of EUR ’000 38,513 (2016: EUR ’000 31,785), which is expected to be completed in 2021. Note G – Other assets and other liabilities (in EUR ‘000) Other assets 31.12.2017 31.12.2016 Receivables on sale of Venture Capital Operations Commission receivable on guarantees and Venture Capital Operations Staff housing loans and advances(*) Fair value of derivatives Other 19,655 88,702 2,485 7,680 43,788 20,389 62,372 3,278 2,759 50,529 (*)The balance relates to staff housing loans disbursed previously to the Bank's employees by the Bank. Since 1999 these housing loans have been replaced by an arrangement with an external financial institution, whereby permanently employed staff members of the Group may be granted staff housing loans in accordance with the Group's Staff Regulations. The same interest rates, terms and conditions are applicable to all said employees. Other liabilities 31.12.2017 31.12.2016 Optional Supplementary Provident Scheme (Note L) Personnel costs payable Fair value of derivatives Financial guarantees Accounts payable and sundry creditors Transitory account on loans Payable on HIPC initiative Western Balkans infrastructure fund First Lost Piece Contribution Other 526,536 114,925 10,941 91,808 53,349 12,777 13,596 393 8,164 22,339 470,839 92,495 31,489 85,878 49,590 222,445 13,596 886 101,079 100,057 107 Total 854,828 1,168,354 Total 162,310 139,327 At 31 December 2017 20,145 204,808 40,385 265,338 21,264 At 31 December 2016 20,145 207,872 44,883 272,900 16,219 At 31 December 2017 0 -176,966 -52,161 -229,127 -7,678 At 31 December 2017 20,145 381,774 92,546 494,465 28,942


EIB Group Consolidated Financial Statements under EU directives Note H – Subscribed capital, Group own funds and appropriation of profit H.1. Consolidated own funds and appropriation of profit Statement of movements in consolidated own funds (in EUR ‘000) 2017 2016 Equity attributable to minority interest (in EUR ‘000) 2017 2016 - Balance at 1 January - Movement on reserves - Dividend paid to minority interest - Appropriation of the result of the financial year Total equity attributable to minority interest at 31 December 899,004 833,433 (1) On 24 April 2017, the Board of Governors decided to appropriate the profit of the Bank for the year ended 31 December 2016, which amounted to EUR ‘000 2,856,601 to the Additional reserves, the Special activities reserve and the General loan reserve. The fact that amounts are being released from / added to the General loan reserve or the Special activities reserve is the consequence of the evolution of the risks of the underlying operations. (2) The difference between the statutory profit of the Bank and the consolidated profit of the Group amounting to EUR ‘000 69,799 was allocated to the Additional reserves attributable to the equity holders of the Bank. (3) This balance comprises EUR ‘000 -16,633 (2016: EUR ‘000 -352) resulting from the consolidation of EUMPF, purchases and sales of EIF shares and from the capital increase of the EIF. H.2. Subscribed capital and reserves, called but not paid On 1 July 2013, the subscribed capital increased from EUR 242,392,989,000 to EUR 243,284,154,500 by virtue of the contributions of Croatia, a new Member State that joined on 1 July 2013. The contributions of the new Member State to the Paid-in capital and to the Reserves amount to EUR 79.5 million and EUR 128.4 million respectively. The total amount to be paid by the new Member State has been equally spread over 8 instalments due on 30 November 2013, 30 November 2014, 30 November 2015, 31 May 2016, 30 November 2016, 31 May 2017, 30 November 2017, and 31 May 2018. The instalments up to and including 30 November 2017 were settled in full. The amount of EUR ‘000 25,983 shown in the balance sheet under the caption Subscribed capital and reserves, called but not paid relates to net receivable from the new Member State, Croatia. Statement of movements in own funds (in EUR ‘000) 31.12.2017 31.12.2016 Subscribed capital called but not paid (Croatia) Reserves called but not paid (Croatia) 9,936 16,047 29,807 48,143 108 Total 25,983 77,950 833,433 53,922 -9,842 21,491 749,147 55,968 -9,085 37,403 Share capital: - Subscribed capital - Uncalled capital - Called capital - Capital called but not paid - Paid in capital Reserves and profit for the year: Reserve fund: - Balance at beginning of the year - Balance at end of the year - Receivable from Member States - Paid-in balance at end of the year Additional reserves: - Balance at beginning of the year - Appropriation of prior year's profit(1,2) - Changes in ownership interests (3) - Balance at end of the year Special activities reserve: - Balance at beginning of the year - Appropriation of prior year's profit(1) - Balance at end of the year General loan reserve: - Balance at beginning of the year - Appropriation of prior year's profit(1) - Balance at end of the year Profit for the financial year attributable to equity holders of the Bank 243,284,155 -221,585,020 243,284,155 -221,585,020 21,699,135 -9,936 21,699,135 -29,807 21,689,199 24,328,415 24,328,415 -16,047 21,669,328 24,328,415 24,328,415 -48,143 24,312,368 7,525,684 2,803,271 -16,633 24,280,272 5,554,033 1,972,003 -352 10,312,322 6,776,060 728,031 7,525,684 5,933,881 842,179 7,504,091 3,305,458 -604,902 6,776,060 3,318,610 -13,152 2,700,556 2,858,647 3,305,458 2,926,400 Total consolidated own funds attributable to equity holders of the Bank 69,377,183 66,483,202


Note I – ‘Prepayments and accrued income’ and ‘Accruals and deferred income’ (in EUR ‘000) Prepayments and accrued income: 31.12.2017 31.12.2016 Foreign exchange on currency swap contracts Interest and commission receivable Redemption premiums on swaps receivable(*) Deferred borrowing charges Investment Facility’s commission receivable Other 8,281,162 7,729,280 157,017 351,058 45,104 32,550 20,669,791 8,315,105 243,360 225,131 43,483 28,720 Accruals and deferred income: 31.12.2017 31.12.2016 Interest and commission payable Foreign exchange on currency swap contracts Redemption premiums on swaps payable(*) Deferred borrowing proceeds Deferred income on loans Interest subsidies received in advance(**) Prepaid management fees Other 8,640,163 9,888,606 793,826 838,045 194,318 101,077 14,504 61,254 9,130,084 6,490,094 833,758 688,232 177,053 106,693 16,638 14,122 (*) Redemption premiums on swaps receivable and payable represent end payments of the underlying swap agreements for those agreements which include such features. (**) Part of the amounts received from the European Commission has been made available as a long-term advance and is entered on the liabilities side under item Accruals and deferred income and comprises: • amounts in respect of interest subsidies for loans granted for projects outside the European Union, under Conventions signed with the ACP States and Protocols concluded with the Mediterranean Countries; and • interest subsidies, concerning certain lending operations put in place within the EU from the Bank's own resources, made available in conjunction with the EMS under Council Regulation (EEC) No 1736/79 of 3 August 1979 and in conjunction with the financial mechanism established by the EFTA Countries under the EFTA Agreement signed on 2 May 1992. Note J – Amounts owed to credit institutions and customers with agreed maturity dates or periods of notice (in EUR ‘000) J.1. Amounts owed to credit institutions 31.12.2017 31.12.2016 Repayable on demand Short term deposits Repo with banks Cash deposited on swaps payable 4,953,852 57,475 0 0 12,425,692 213,202 315,000 166,019 J.2. Amounts owed to customers 31.12.2017 31.12.2016 Overnight deposits European Union and Member States' accounts: - For Special Section operations and related unsettled amounts - Deposit accounts Short term deposits 4,160 12,971 372,158 1,546,248 8,349 375,451 1,538,908 25,030 109 Total 1,930,915 1,952,360 Total 5,011,327 13,119,913 Total 20,531,793 17,456,674 Total 16,596,171 29,525,590


EIB Group Consolidated Financial Statements under EU directives Note K – Debts evidenced by certificates In its financing activity, one of the Group’s objectives is to align its funding strategy with the funds required for the loans granted, notably in terms of currencies. The caption ‘Debts evidenced by certificates’ includes ’Debt securities in issue’ (securities offered to the general investing public) and ‘Others’ (private placements). The table below discloses the details per currency of debts outstanding at 31 December 2017 and 2016, together with the average rates and due dates. Debts evidenced by certificates (in EUR '000) Outstanding at 31.12.2017 Average rate 2017(*) Outstanding at 31.12.2016 Average rate 2016(*) Due dates Payable in EUR USD GBP AUD CHF SEK NOK TRY ZAR JPY CAD PLN MXN NZD CZK HUF RUB DKK RON HKD CNY 233,246,441 119,928,350 49,311,992 11,111,557 6,831,909 5,369,877 4,071,522 4,008,066 3,778,963 3,698,520 3,562,299 2,097,199 1,007,979 459,941 410,718 290,658 230,574 124,133 18,890 12,974 12,801 2.00 1.75 2.63 4.54 2.16 2.57 1.98 8.23 7.83 1.00 2.00 2.65 4.96 3.74 2.18 0.07 6.75 3.46 1.15 4.96 3.28 2018/2057 2018/2058 2018/2054 2018/2042 2018/2036 2018/2040 2018/2037 2018/2027 2018/2032 2018/2053 2018/2045 2021/2026 2020/2027 2018/2021 2018/2034 2020/2021 2018/2020 2024/2026 2019/2019 2019/2019 2018/2018 220,901,207 146,683,436 51,872,036 12,317,012 8,002,794 5,214,132 5,240,229 3,498,782 3,683,341 6,732,871 3,784,938 872,846 369,743 577,253 399,456 291,127 307,154 124,308 19,388 30,584 0 2.21 1.67 2.86 4.85 2.14 2.96 2.70 7.38 7.60 1.11 2.02 2.83 4.34 4.21 2.16 0.66 6.73 3.46 0 5.27 0 (*) Weighted average interest rates at the balance sheet date The principal and interest of certain structured borrowings are index linked to stock exchange indexes (historical value: EUR 500 million in 2017 EUR 500 million in 2016). All borrowings are fully hedged through structured swap operations. The table below provides the movements in 2017 and 2016 for debts evidenced by certificates (including short-term commercial papers): (In EUR million) 2017 2016 Balance at 1 January Issuance during the year Contractual redemptions Early redemptions and buy-backs Exchange adjustments 470,923 123,644 -122,247 -810 -21,925 469,255 165,544 -158,542 -2,013 -3,321 110 Balance at 31 December 449,585 470,923 Total 449,585,363 470,922,637


Note L – Provisions – pension plans and health insurance scheme (in EUR ’000) The Group’s main pension scheme is a defined-benefit pension scheme funded by contributions from staff and from the Group covering all employees. All contributions of the Group and its staff are invested in the assets of the Group. The pension plans and health insurance scheme provisions are as follows (in EUR ‘000): 2017 2016 Staff pension plan: Provision at 1 January Payments made during the year Recognition of actuarial losses Annual contributions and interest 2,191,571 -77,489 82,300 219,699 2,021,884 -72,014 25,864 215,837 Management Committee pension plan: Management Committee pension plan Recognition of actuarial losses 36,489 1,485 35,559 148 Health insurance scheme: Provision at 1 January Payments made during the year Recognition of actuarial losses Annual contributions and interest 262,636 -16,027 28,411 37,063 231,243 -15,553 7,519 39,427 The above figures do not include the liability towards members of staff in respect of the Optional Supplementary Provident Scheme (a defined-contribution pension scheme). The corresponding amount of EUR 527 million (2016: EUR 471 million) is classified under ‘Other liabilities’ (Note G). The provision in respect of future retirement and health insurance benefits was valued as at 30 September 2017 by an independent actuary using the projected unit credit method. The actuarial valuation was updated as at 31 December 2017 with an extrapolation (‘roll forward’ method) for the last three months of 2017, using the prevailing market rates of 31 December 2017 and the following assumptions (for the staff pension and medical plans): • a discount rate of 2.09% (2016: 1.95%) for determining the actuarial present value of benefits accrued in the pension and health insurance schemes, corresponding to 22.88 year duration (2016: 19.90 year duration); • in the light of past experience, the Bank estimates that the overall expected remuneration of post-employment reserves is set at a rate of 1.5% (2016: 1.5%) above the discount rate mentioned above; • progressive retirement between the age of 55 and 65 (same as 2016); • a combined average impact of the increase in the cost of living and career progression of 3.5% (2016: 3.5%); • a variation in the probable resignation rate between 30% and 0% decreasing with age (same as 2016); • a rate of adjustment of pensions of 1.75% per annum (2016: 1.75%); • use of the ISCLT longevity table 2013 (same as 2016); • a medical cost inflation rate of 4% per annum (same as 2016); and • a medical cost profile per age updated in 2017. The provisions for these schemes are adjusted when needed (Note A.2.11) according to the actuarial valuation, as per the tables above. Cumulative prior year actuarial deficits or surpluses in excess of 10% of the commitments for retirement benefits are recognised over the expected average remaining service lives of the participants on a straight-line basis. In 2016, the actuarial valuation of the pension plans and the healthcare scheme displayed an unrecognised loss of EUR’000 2,228,581. EUR ’000 1,757,052 was reported in excess of the 10% corridor, and recognised over the expected average remaining service lives of the participants on a straight-line basis from 1 January 2017. Thus, the net loss recognised in 2017 is EUR ’000 112,195. In 2017, the actuarial valuation of the pension plans and the healthcare scheme displayed an unrecognised loss of EUR ‘000 2,799,701. EUR ‘000 2,243,117 was reported in excess of the 10% corridor, and the net loss which will be recognised in 2018 will be EUR ‘000 146,398. Note M – Profit for the financial year The appropriation of the balance of the statutory profit and loss account for the year ended 31 December 2017, amounting to EUR ‘000 2,805,711 will be submitted to the Board of Governors for approval by 27 April 2018. The difference between the statutory profit of the Bank and the consolidated profit of the Group amounting to EUR ‘000 69,799 was allocated to the Additional reserves attributable to the equity holders of the Bank. 111 Sub-total health insurance scheme Total provisions at 31 December 312,083 2,766,138 262,636 2,489,914 Sub-total Management Committee pension plan 37,974 35,707 Sub-total staff pension plan 2,416,081 2,191,571


EIB Group Consolidated Financial Statements under EU directives Note N – ‘Interest receivable and similar income’ and ‘Interest payable and similar charges’ N.1. Net interest income (in EUR ‘000) 2017 2016 Interest receivable and similar income: Cash in hand, balance with central banks and post office banks Treasury bills and other bills eligible for refinancing with central banks and debt securities including fixed income securities Loans and advances to credits institutions and customers Derivatives Negative interest on interest bearing liabilities Other 0 25 760,523 7,297,054 15,299,723 51,422 3,497 307,651 7,796,311 14,038,219 42,114 579 Interest payable and similar charges: Amounts owed to credit institutions and customers Debts evidenced by certificates Derivatives Negative interest on interest bearing assets Other -6,425 -10,648,831 -8,642,043 -708,005 -116,292 -5,483 -11,691,394 -6,773,763 -220,945 -148,296 N.2. Geographical analysis of ‘Interest receivable and similar income’ (in EUR ‘000) 2017 2016 EU countries Spain United Kingdom Poland Italy Greece France Germany Austria Portugal Netherlands Hungary Belgium Romania Sweden Ireland Finland Croatia Slovakia Slovenia Lithuania Bulgaria Czech Republic Latvia Cyprus Denmark Malta Luxembourg Estonia 1,027,808 931,453 630,037 578,496 515,589 451,220 334,986 263,401 257,552 174,261 172,129 152,630 100,416 95,272 75,996 70,219 67,802 66,304 52,717 47,289 45,546 32,904 15,158 12,693 12,531 11,034 5,011 4,710 1,118,128 964,993 637,446 638,363 530,992 445,719 505,739 268,674 284,249 161,291 201,243 162,852 112,477 91,836 115,130 68,806 68,341 67,350 54,427 49,386 47,983 63,122 15,550 13,885 29,137 11,150 5,166 11,700 Outside the European Union 1,002,148 1,007,719 Income not analysed per country(1) 16,204,907 14,432,045 (1)Income not analysed by country: · · · · · · Revenue from Long Term Hedge portfolios, loan substitutes and ABS portfolio EIF Revenue from Securities Liquidity portfolios and Operational Portfolio - EIF Revenue from money-market securities Revenue from money-market operations Income from derivatives Other 180,168 118,173 462,182 141,164 15,299,723 3,497 172,483 132,295 2,873 85,596 14,038,219 579 112 16,204,907 14,432,045 Total interest receivable and similar income 23,412,219 22,184,899 Total 7,207,312 7,752,854 Total EU countries 6,205,164 6,745,135 Total -20,121,596 -18,839,881 Net interest income 3,290,623 3,345,018 Total 23,412,219 22,184,899


Note O – Commission receivable (in EUR ‘000) 2017 2016 Commission on guarantees Commission on Investment Facility - Cotonou Commission on Jaspers Commission on Jeremie Commission on Jessica Commission income on loans Commission on Yaoundé/Lomé conventions Commission on InnovFin Commission on other mandates 80,279 47,447 31,063 8,124 9,691 5,025 2,459 30,429 133,024 53,951 45,846 32,510 8,941 12,353 7,318 2,696 28,572 105,134 Note P – Net result on financial operations (in EUR ‘000) 2017 2016 Net result on shares and other variable yield securities Net result on translation of balance sheet positions Net result on repurchase of debts evidenced by certificates Net result on derivatives Net result on securities liquidity portfolios (securities only) Net result on guarantees 42,691 -3,074 -2,999 26,590 -57,394 -8,769 -94,543 3,268 -1,284 112,257 -58,521 -7,850 Note Q – Other operating income (in EUR ‘000) 2017 2016 Reversal of previous year’s unutilised accruals Rental income Other 8,776 199 2,063 4,370 3 3,961 In January 2016, the EIF sold its building for EUR'000 6,782. The gain on sale of EUR'000 2,872 is recorded under Other in the above table. Note R – General administrative expenses (in EUR ‘000) 2017 2016 Salaries and allowances(*) Welfare contributions and other staff costs -435,311 -336,049 -354,968 -274,476 Other general administrative expenses -258,604 -251,583 (*)Of which the amount for members of the Management Committee is EUR ‘000 2,844 at 31 December 2017 and EUR ‘000 3,230 at 31 December 2016. The number of persons employed by the Group was 3,682 at 31 December 2017 (3,291 at 31 December 2016). Note S – Off-balance sheet special deposits for servicing borrowings This item represents the amount of coupons and bonds due, paid by the Bank to the paying agents, but not yet presented for payment by the holders of bonds issued by the Bank. 113 Total general administrative expenses -1,029,964 -881,027 Staff costs -771,360 -629,444 Total 11,038 8,334 Total net result on financial operations -2,955 -46,673 Total 347,541 297,321


EIB Group Consolidated Financial Statements under EU directives Note T – Fair value of financial instruments At the balance sheet date, the Group records balance sheet financial instruments on the basis of their historical cost in foreign currency (apart from the SLP portfolio) representing the amount received in the event of a liability or the amount paid to acquire an asset. The fair value of the financial instruments (mainly loans, treasury, securities and borrowings) entered under assets or liabilities compared with their accounting value is shown in the table below: Accounting value At 31 December 2017 (in EUR million) Fair value Financial assets: Cash in hand, balances with central banks and post office banks Loans and advances to credit institutions and customers, excluding loan substitutes Treasury bills and debt securities portfolios including loan substitutes (Note B.2) Shares, other variable yield securities and participating interests (Note E) 162 471,293 57,180 5,299 162 502,432 57,578 7,245 Financial liabilities: Amounts owed to credit institutions and customers (Note J) Debts evidenced by certificates (Note K) 6,942 449,585 6,941 493,107 Accounting value At 31 December 2016 (in EUR million) Fair value Financial assets: Cash in hand, balances with central banks and post office banks Loans and advances to credit institutions and customers, excluding loan substitutes Treasury bills and debt securities portfolios including loan substitutes (Note B.2) Shares, other variable yield securities and participating interests (Note E) 317 472,369 67,496 4,333 317 505,136 67,967 6,028 Financial liabilities: Amounts owed to credit institutions and customers (Note J) Debts evidenced by certificates (Note K) 15,072 470,923 15,067 520,784 114 Total financial liabilities 485,995 535,851 Total financial assets 544,515 579,448 Total financial liabilities 456,527 500,048 Total financial assets 533,934 567,417


Note U – Risk management This note presents information about the Group’s exposure to and its management and control of risks, in particular the primary risks associated with its use of financial instruments. These are: • • Credit risk - the risk of loss resulting from client or counterparty default and arising from credit exposure in all forms, including settlement risk; Interest rate risk - the risk that an investment's value will change due to a change in the absolute level of interest rates, in the shape of the yield curve or in any other interest rate relationship; Liquidity and funding risk - the risk that the Group will be unable to fund assets or meet obligations at a reasonable price or, in extreme situations, at any price; Foreign exchange rate risk - the risk of an investment's value changing due to changes in currency exchange rates and Operational risk - the potential loss resulting from inadequate or failed internal processes, people and systems or from external events. • • • U.1. Risk Management Organisation Each entity within the Group has its own management and control of risks. Risk management information presented in this note will distinguish between the Bank and the Fund. Moreover, the Bank has established within its Risk Management Directorate the Regulation & EIB Group Risk Department to strengthen the risk management of the overall Group. The high-level principles of the Bank’s risk management level on a consolidated are set out in the Group Risk Management Charter, which is intended to provide a Group-wide view of the Group’s risks and an integrated approach to risk management. U.1.1. Risk Management Organisation of the Bank The Bank’s objective is to analyse and manage risks so as to obtain the strongest possible protection for its assets, its financial result, and consequently its capital. While the Bank is not subject to full regulation, it aims to comply with the relevant EU banking directives and the recommendations of the banking supervisors of the EU Member States, EU legislation and the competent supranational bodies, such as the Basel Committee on Banking Supervision (BCBS) and the European Banking Authority (EBA). Within the Bank, the Risk Management Directorate (RM) independently identifies, assesses, monitors and reports credit, market, liquidity, funding and operational risks to which the Bank is exposed. In order to preserve segregation of duties, RM is independent of the Front Offices and provides second opinion on all proposals made which have risk implications. The Director General of RM reports to the Management Committee and meets regularly with the Audit Committee to discuss topics relating to credit, market, liquidity, funding and operational risks. He is also responsible for overseeing risk reporting to the Management Committee, the Risk Policy Committee and the Board of Directors. The management and monitoring of loans post signature is, for significant parts of the portfolio, the responsibility of Transaction Monitoring and Restructuring Directorate (TMR), a Directorate independent from RM. TMR focuses on monitoring higher risk counterparts and certain forms of security and it also manages transactions requiring particular attention. All of its proposals which have credit risk implications are subject to an independent second opinion by the RM. The following sections disclose the credit, market, liquidity and funding and operational risks to which the Bank is exposed on its activities performed at own risk. For additional details, please refer to the EIB Group Risk Management Disclosure Report. U.1.1.1. Risk measurement and reporting system The Bank aligns its risk management systems to changing economic conditions and evolving regulatory standards. It adapts them on an on-going basis as market practice develops. Systems are in place to control and report on the main risks inherent in the Bank’s operations, i.e. credit, market, liquidity and funding and operational risks. Risks are assessed and measured both under normal circumstances and under possible stressed conditions, with the purpose to quantify their impact on the Bank’s solvency, liquidity, earnings and operations. Risk measurements combine metrics of capitalisation, earnings, liquidity, exposure to market and operational risk. Detailed information on credit, ALM, liquidity, financial and operational risks is reported to the Management Committee and to the Board of Directors on a monthly basis. Such information is presented and explained to the Management Committee and to the Board of Directors’ Risk Policy Committee on a quarterly basis. U.1.1.2. The Bank’s risk tolerance The Bank has defined its risk tolerance level and set prudent boundaries for the risks arising from the pursuit of the Bank’s business strategy. In setting these boundaries, the Bank ensures that its risk profile is aligned with its business strategy and stakeholders’ expectations. As a public institution, the Bank does not aim to make profits from speculative exposures to risks. As a consequence, the Bank does not consider its treasury or funding activities as profit-maximising centres, even though performance objectives are attached to those activities. Investment activities are conducted within the primary objective of protection of the capital invested. With respect to exposures arising from the Bank’s lending and borrowing operations, the main principle of the Bank’s financial risk policy is therefore to ensure that all material financial risks are hedged. All new types of transactions introducing operational or financial risks must be authorised by the Management Committee, after the approval of the New Products Committee, and are managed within approved limits. 115


EIB Group Consolidated Financial Statements under EU directives U.1.1.3. Sustainability of revenue and self-financing capacity The Bank’s ALM policy forms an integral part of the Bank’s overall financial risk management. It reflects the expectations of the main stakeholders of the Bank in terms of stability of earnings, preservation of the economic value of own funds, and the self-financing of the Bank’s growth in the long term. To achieve these aims, the ALM policy employs a medium to long term indexation for the investment of own funds to promote stability of revenues and enhance overall returns. This indexation policy implies an exposure to medium to long term yields and is not influenced by any short-term views on interest rates trends. This is accomplished by targeting a duration for the Bank’s own funds of between 4.5 and 5.5 years. The Asset/Liability Committee (ALCO) provides a high-level discussion forum for considering the Bank’s ALM Strategy, loan rate setting principles and the financial risks arising from the activities of the Bank. U.1.2. Risk Management Organisation of the Fund (EIF) The mission of the Fund is to provide access to risk financing for small and mid-size enterprises (SME) finance for start-up, growth and development essentially within the European Union. Most of the Private Equity (PE), Venture Capital and Portfolio Guarantees, Securitisation & Microfinance (GSM) operations for both entities of the Group are managed by the Fund. The Fund aligns its risk management systems to changing economic conditions. It therefore adapts them on an on-going basis as best market practices develop. Credit, market and operational systems are in place to control and report on the main risks inherent in its operations. Risk management is embedded in the corporate culture of EIF, based on a three-lines-of-defence model permeating all areas of EIF’s business functions and processes: (i) front office, (ii) independent risk functions and (iii) audit and assurance. Investment and Risk Committees (IRCs) chaired by the Head of General Secretariat advise the Chief Executive and the Deputy Chief Executive on each and every transaction. IRCs quarterly meetings also oversee risk and investment-related aspects of the EIF portfolio, inter alia: approving transaction rating/grading, impairment and provisioning actions, relevant market risk events and potential stress testing. Finally, the IRCs oversee the Enterprise Risk arising from EIF’s role as a fund manager. Risk and Portfolio Management actions form part of the assurance process presided by the EIF Audit Board. Moreover, within the EIB Group context, the Fund’s Risk Management Department operates in regular contact with the Bank’s Risk Management Directorate, particularly with regard to the Group Risk Management Charter and to the Group risk exposure relating to guarantee and securitisation operations, the PE operations under the Bank’s Risk Capital Resources mandate (RCR), the different windows under the Bank’s EIB Group Risk Enhancement Mandate (EREM) and general EIF policy matters. The Fund’s treasury management has mostly been outsourced to the Bank under a treasury management agreement signed by both parties and mandating the responsible EIB services to perform selection, execution, settlement and monitoring of transactions. Management follows treasury guidelines annexed to the agreement, which mirror closely the relevant sections of the EIB’s own treasury guidelines. U.1.2.1. Risk assessment private equity Under its private equity operations, the Fund has a fund-of-funds approach, taking mostly minority equity participations in venture capital, private equity and mezzanine funds managed by mostly independent teams or acting under co-investment agreements in order to leverage further commitments from a wide range of investors. The Fund’s PE operations include investments in funds focussed on seed-and early-stage capital, but also investment in well-established funds targeting mid-, later-stage and mezzanine investments, which, generally speaking, have a lower risk profile. Over the last years, the Fund has developed a tool-set to design, manage and monitor portfolios of PE funds tailored to the dynamics of this market place. This tool-set is based on an internal model, the Grading-based Economic Model (GEM), which allows the Fund to better assess and verify each funds’ but also each portfolio of funds’ valuations, risks and expected future cash flows and performances. Before committing to a PE fund, the Fund assigns a grading which is based on the outcome of an extensive due diligence performed by the Fund’s transaction team and reviewed by its risk management team. During the funds’ lifetimes, gradings are periodically reviewed with a frequency and intensity depending on the level of risk. These efforts, supported by the development of a proprietary IT system and an integrated software (front to back), improve the investment decision-making process and the management of the portfolio’s financial risks and of liquidity, in particular enabling forward-looking and stress-test based decision making. U.1.2.2. Risk assessment guarantees The Fund extends portfolio guarantees to financial intermediaries involved in SME financing and provides credit enhancement to SME securitisation transactions. By taking on these risks, it facilitates access to funding, and, in turn, it helps to finance SMEs. For its guarantee & securitisation business, over the last years, the Fund has developed a tool-set to analyse portfolio guarantees and structured finance transactions in line with best market practices. Before the Fund enters legally into a guarantee transaction, an internal rating is assigned to each new own risk guarantee transaction in accordance with the Fund’s Credit Risk Policy and Model Review Guidelines. The rating is based on internal models, which analyse and summarise the transaction’s credit quality (expected loss concept), considering not only quantitative parameters but also qualitative aspects. Guarantee transactions are monitored regularly, at least quarterly; their statuses are regularly reviewed by EIF IRCs which, depending on their performances, may review their internal ratings. A four-eye principle applies throughout the process, with actions initiated by the front office and reviewed by Risk Management. 116


The guarantees portfolio is valued according to a mark-to -model approach. The main impact on the valuation of the transactions in the portfolio stems from the assigned rating and the possible subsequent rating changes. The EIF’s monitoring follows potential negative rating migration and provides the basis for appropriate management of transactions.The Fund’s stress testing methodology is applied at the outset of a transaction and throughout the life of the portfolio, i.e. its scenario analysis with regard to portfolio downgrades and defaults in the portfolio and related impacts on capital allocation and expected losses, as well as on the profit and loss. As is the case for PE, stress tests on the guarantee portfolio are presented regularly to the EIF Board of Directors. U.2. Credit risk Credit risk concerns mainly the Group’s lending activities and, to a lesser extent, treasury instruments such as fixed-income securities held in the investment and operational portfolios, certificates of deposit and interbank term deposits as well as the derivative transactions of the Group and the Fund’s guarantee transactions funded by own resources. No credit risk is attached to the Group’s venture capital operations, which are performed entirely through equity participations and are, hence, only exposed to market risk. The credit risk associated with the use of derivatives is analysed in the ‘Derivatives’ section (Note V). Credit risk is managed pursuant to detailed internal guidelines approved by the governing bodies. The purpose of these guidelines is to ensure that credit risk is managed prudently. As operations inside and outside the EU may have different risk profiles, there are separate guidelines for EU and non-EU activities. Whether or not a given entity is acceptable to the Bank as a counterpart in a lending operation is determined on the basis of a careful analysis and evaluation of the entity using quantitative and qualitative metrics but also relying on experience and expert judgment. They set out minimum credit quality levels for both borrowers and guarantors in lending operations and identify the types of security that are deemed acceptable. They also detail the minimum requirements that loan contracts must meet in terms of key legal clauses and other contractual stipulations to ensure that the Bank's position is adequately safeguarded. In addition, via a counterparty and sector limit system, the credit guidelines ensure an acceptable degree of diversification in the loan portfolio. In order to ensure that the additional risk involved in complex or structured lending transactions is adequately analysed, quantified and mitigated, specific detailed guidelines have been developed in respect of certain types of operations complementing the general guidelines. The guidelines also set out the minimum credit quality of counterparties of derivatives and treasury transactions as well as the contractual framework for each type of transaction. The Fund manages exposures and risks in the frame of conservative policies deriving from statutory provisions and credit risk operational guidelines approved by the Fund’s Board of Directors or guidelines as set out under mandates. Credit guidelines undergo periodic adaptations to incorporate evolving operational circumstances and respond to new mandates that the Group may receive from its shareholders. Management of credit risk is based on an assessment of the level of credit risk vis-à-vis counterparties and on the level of security provided to the Group in case of the counterparty’s insolvency. The aggregate amount outstanding at any time of loans and guarantees granted by the Bank is limited by its Statutory Gearing Ratio (Article 16.5 of Statute). For the purpose of calculating this ratio the Bank uses data drawn from the EU Accounting Directives (AD) framework. At year-end 2017 EIB’s Statutory Gearing Ratio under EU Accounting Directive stand-alone accounts stood at 208% and under EU AD consolidated accounts stood at 211% (max. 250% under Article 16.5 of the Statute). U.2.1. Loans In order to measure and manage credit risk on loans, the Group has graded its lending operations according to generally accepted criteria, based on the quality of the borrower and, where appropriate, the security. The structure of borrowers and guarantors relating to the loan portfolio as at 31 December 2017 is analysed below, including undisbursed portions. Loans outside the European Union (apart from those under EIB Own-Risk Facilities (*)) are, as the last resort, secured by guarantees of the European Union budget or the Member States (loans in the ACP Countries and the OCT). These guarantees are either Comprehensive (covering all risks) or limited to defined Political Risks (non-transfer of currency, expropriation, war or civil disturbance, denial of justice upon breach of contract). (*) Own-Risk Facilities are geographical or thematic lending frameworks decided by the Board of Governors pursuant to Article 16 (previously Article 18) of the Bank’s Statute. Currently under implementation are the Pre Accession Facility, the Neighbourhood Finance Facility, the EFTA Facility, the Climate Action and Environment Facility, and the Strategic Projects Facility. Lending under these Facilities is from the Bank’s own resources and at the Bank’s full own risk. 117


EIB Group Consolidated Financial Statements under EU directives The table below shows (in EUR million) the loans for projects inside and outside the European Union granted under the Facilities and under the risk-sharing operations: Guarantor Public institutions Not guaranteed (1) States Banks Corporates Total 2017 Total 2016 Borrower States Public institutions Banks Corporates 0 34,151 40,141 11,320 0 18,580 22,820 9,082 0 431 26,467 15,524 0 373 27,120 35,334 56,424 81,211 29,535 98,160 56,424 134,746 146,083 169,420 53,924 128,045 149,033 174,563 (1) These amounts include loans for which no formal guarantee independent of the borrower and the loan itself was required, the borrower’s level of solvency itself representing adequate security. In the event of certain occurrences, appropriate contractual clauses ensure the Bank’s right to access independent security. (2) The loans in risk-sharing operations amount to EUR 5,202 million as of 31 December 2017 (2016: EUR 6,518 million). (3) This amount does not include loan substitutes (2017: EUR 19,921 million; 2016: EUR 20,905 million). (4) These amounts exclude loans to current European Union Member States granted before their accession to the European Union and guaranteed by the European Union budget or the Member States. The Group did not record value adjustments in 2016 and 2017 in respect of its EU sovereign and EU sovereign guaranteed exposure as at the year end as the preferred creditor status of the Bank as well as of the EIF and the protection given by the Bank’s Statute are deemed to guarantee a full recovery of the Group’s assets on maturity. The disbursed exposure on borrowers located in the United Kingdom through the Group’s lending activities, including guarantees and equity type investments, amounted to EUR 37.0 billion as at December 31, 2017 (2016: EUR 36.0 billion), while the exposure on foreign borrowers with a guarantor from the United Kingdom amounted to EUR 1.5 billion (2016: EUR 1.8 billion). The Bank had no direct exposure to the United Kingdom acting as borrower at the end of December 2017 whereas disbursed loans guaranteed by the United Kingdom amounted to EUR 2.0 billion as at the end of December 2017 (2016: EUR 1.3 billion). The table below discloses information regarding the sovereign credit risk on loans granted inside and outside the European Union granted under the Facilities and the risk-sharing operations: 2017 2016 (in EUR million) Acting as guarantor Acting as guarantor Acting as borrower Acting as borrower Country Disbursed Undisbursed Signed Disbursed Undisbursed Signed Austria Belgium Bulgaria Croatia Cyprus Czech Republic Denmark Estonia Finland France Germany Greece Hungary Ireland Italy Latvia Lithuania Luxembourg Malta Netherlands Poland Portugal Romania Slovakia Slovenia Spain Sweden United Kingdom Non EU –Countries 0 0 858 645 922 2,005 0 472 51 0 0 7,882 5,911 950 2,967 353 1,343 150 0 0 9,694 1,142 1,774 1,895 606 4,696 0 0 1,099 0 0 350 0 225 0 0 215 0 0 0 300 1,140 490 400 200 0 150 72 0 1,872 325 2,291 820 400 3 0 0 1,756 77 104 0 2,945 1,356 80 47 118 98 2,410 1,412 7,691 1,247 1,198 4,513 47 55 66 301 80 16,417 4,965 0 0 1,990 29,388 44 2,085 6,878 0 0 864 453 850 2,082 0 489 108 0 0 7,473 5,795 950 3,040 357 1,396 0 0 0 10,173 1,112 1,910 1,820 615 3,978 0 0 1,110 0 0 603 210 389 0 0 215 0 0 0 700 1,477 0 0 200 0 300 72 0 492 250 1,756 895 400 358 0 0 1,032 82 118 0 2,699 1,285 130 51 118 318 1,420 1,925 7,650 1,131 1,240 5,374 56 87 77 313 80 16,883 5,420 0 0 2,236 29,428 45 2,161 7,791 118 Total 45,415 11,009 85,612 44,575 9,349 88,118 Total 2017(1)(2)(3)(4) 85,612 50,482 42,422 62,827 265,330 506,673 Total 2016(1)(2)(3)(4) 88,118 52,662 49,224 62,669 252,892 505,565


The table below shows (in EUR million) the loans for projects outside the European Union (apart from Article 16 Facility and those falling under the Pre Accession Facility, the Neighbourhood Finance Facility, the EFTA Facility, the Climate Action and Environment Facility, and the Strategic Projects Facility): Secured by: 31.12.2017 31.12.2016 Member States European Union budget(1) 3,580 42,831 3,098 45,643 (1) Of which EUR 5,202 million in risk-sharing operations as explained above (2016: EUR 6,518 million). (2) Including loans to current European Union Member States granted before their accession to the European Union and guaranteed by the European Union budget or the Member States. (3) Financial guarantees that have been granted by the Group for a total amount of EUR 433.6 million (2016: EUR 493.3 million), are secured by Member States or the EU budget. The aforementioned guarantees are not included in the analysis as provided in table above. 119 Total(2)(3) 46,411 48,741


EIB Group Consolidated Financial Statements under EU directives LOANS FOR PROJECTS OUTSIDE THE EUROPEAN UNION (in EUR million) (including loans in the new Member States before accession) BREAKDOWN OF LOANS OUTSTANDING BY GUARANTEE AGREEMENT 31.12.2017 31.12.2016 75% Member States global guarantee - ACP/OCT Group 4th Lomé Convention - ACP/OCT Group 4th Lomé Convention/2nd Financial Protocol 1 84 2 108 75% Member States guarantee - - - - Cotonou partnership agreement Cotonou partnership 2nd agreement Cotonou Protocol 3 - OR / ACP Cotonou Protocol 3 - OR / OCT 385 1,533 1,558 19 439 1,627 902 20 100% European Union budget guarantee - - - - ALA interim (100% guarantee) –153m CEEC –3bn - BG Decision 02.05.94 Russia – 100 m - 2001-2005 Russia – 500 m - 2004-2007 0 1 27 195 0 2 37 212 75% European Union budget guarantee - Mediterranean Protocols 47 70 70% European Union budget guarantee - - - - - - South Africa – 375m – Decision 29.01.97 ALA II – 900m Bosnia–Herzegovina – 100m 99/2001 Euromed (EIB) –2 310m – Decision 29.01.97 FYROM (Former Yugoslav Republic of Macedonia) – 150m – 1998/2000 CEEC–3,520m–Decision 29.01.97 25 10 38 83 25 307 31 22 45 129 34 425 - - - - - - - - - - - - - - - - - - - - 65% European Union budget guarantee South Africa – 825m – 7/2000-7/2007 South Africa – Decision 2/2007–12/2013 ALA III – 2,480m –-2/2000 – 7/2007 ALA Decision – 2/2007–12/2013 Euromed II – 6,520m – 2/2000 –-1/2007 South Eastern Neighbours – 9,185m – 2/2000 – 7/2007 Turkey special action – 450m – 2001-2006 Turkey TERRA – 600m – 11/1999 – 11/2002 PEV EE/CAS/RUS 1/2/2007 – 31/12/2013 PEV MED 1/2/2007 – 31/12/2013 Pre-Accession – 8,700m – 2007 – 2013 Climate Change Mandate 2011 - 2013 ELM Asia 2014-2020 ELM Central Asia 2014-2020 ELM East-Russia 2014-2020 ELM Latin America 2014-2020 ELM MED 2014-2020 ELM Pre-Accession 2014-2020 ELM RSA 2014-2020 161 543 242 2,353 2,406 3,945 122 317 2,472 7,474 7,448 1,616 624 182 4,252 1,156 4,661 1,902 197 188 687 350 3,029 2,866 4,799 128 333 3,621 8,329 8,214 1,728 529 160 3,664 1,044 3,077 1,740 150 (1)Financial guarantees that have been granted by the Bank for a total amount of EUR 433.6 million (2016: EUR 493.3 million), are secured by Member States or the EU budget. The aforementioned guarantees are not included in the analysis as provided in table above. 120 Total 65% European Union budget guarantee 42,073 44,636 Total European Union budget guarantee 42,831 45,643 Total(1) 46,411 48,741 Total 70% European Union budget guarantee 488686 Total 75% European Union budget guarantee 4770 Total 100% European Union budget guarantee 223 251 Total 75% Member States guarantee 3,495 2,988 Total Member States guarantee 3,580 3,098 Total 75% Member States global guarantee 85 110


Collateral on loans (in EUR million) Among other credit mitigant instruments, the Bank uses pledges of financial securities. These pledges are formalised through a Pledge Agreement, enforceable in the relevant jurisdiction. The portfolio of collateral received in pledge contracts amounts to EUR 26,280 million (2016: EUR 32,366 million), with the following composition: As at 31 December 2017 Loan Financial Collateral (in EUR million) Bonds Moody's or equivalent rating Secured Bonds (covered bonds) Bank and Corporate Bonds Cash Total Government Supra-national Agency ABS Aaa Aa1 to Aa3 A1 Below A1 Non-Rated 40 239 1,421 14,005 30 27 7 0 0 0 6 18 0 1,644 0 268 561 3,730 43 0 112 395 623 1,447 761 391 0 0 0 0 0 0 0 0 512 844 1,220 5,774 17,139 1,303 As at 31 December 2016 Loan Financial Collateral (in EUR million) Bonds Moody's or equivalent rating Secured Bonds (covered bonds) Bank and Corporate Bonds Cash Total Government Supra-national Agency ABS Aaa Aa1 to Aa3 A1 Below A1 Non-Rated 210 506 1,582 21,272 0 76 0 0 0 0 0 4 0 0 0 1,023 608 647 2,114 0 0 403 502 2,337 0 578 0 0 0 0 0 0 0 0 504 1,887 1,521 2,731 25,723 504 A breakdown of disbursed loans outstanding (in EUR million) at 31 December according to the sectors in which borrowers are engaged is set out below: Maturity not more than 1 year more than 5 years Sector 1 year to 5 years Total 2017 Total 2016 129,953 90,159 66,097 33,753 28,443 28,388 27,603 15,816 11,197 3,545 Transports Global Loans(1) Energy Health, education Water, sewerage Industry Miscellaneous infrastructure Services Telecommunications Agriculture, fisheries, forestry 6,646 12,575 4,979 2,443 1,724 4,664 1,258 1,117 960 133 30,623 49,521 23,641 8,257 8,091 16,463 5,773 7,556 6,800 864 92,684 28,063 37,477 23,053 18,628 7,261 20,572 7,143 3,437 2,548 128,541 91,668 65,572 33,299 29,821 28,236 26,821 15,565 11,635 3,310 (1)A global loan is a line of credit to an intermediary financing institution or a bank which then on-lends the proceeds, at its own risk, to finance small and medium-sized projects being undertaken by private or public sector promoters. Arrears on loans Amounts in arrears are identified, monitored and reported according to the procedures defined into the Bank-wide “Financial Monitoring Guidelines and Procedures”. These procedures are adopted for all loans managed by the Group. Loans not secured by global guarantees of the European Union budget or the Member States: As of 31 December 2017, arrears above 90 days on loans from own resources not secured by guarantees of the European Union budget or the Member States amount to EUR 180.0 million (2016: EUR 89.6 million). The outstanding principal amount related to those arrears is EUR 479.5 million (2016: EUR 273.3 million) and value adjustments of EUR 188.8 million (2016: EUR 206.5 million) cover the outstanding exposure (incl. outstanding principal and amounts in arrears) as of 31 December 2017. 121 Total 2017 36,499 157,589 240,866 434,954 Total 2016 37,857 159,555 237,056 434,468 Total 23,570 76 4 4,392 3,242 578 504 32,366 Total 15,735 34 1,668 4,602 3,338 391 512 26,280


EIB Group Consolidated Financial Statements under EU directives Loans secured by guarantees of the European Union budget or the Member States: Loans for projects that are located outside the European Union and carried out on the basis of mandates are guaranteed by the European Union, the Member States or on a risk-sharing basis. For such loans, if an amount is due, the primary guarantee is first called, where available, otherwise the guarantee of the Member States or of the European Union is officially invoked. As of 31 December 2017, these arrears above 90 days amount to EUR 2.2 million (2016: EUR 4.0 million). Loans called under guarantees of the European Union budget or the Member States: During 2017, EUR 89.6 million have been called under the European Union budget guarantee and nothing was called under the Member States guarantee. Corresponding amounts in 2016 were EUR 147.7 million and EUR 4.9 million respectively. The table below gives an overview of the arrears above 90 days on loans: (EUR'000) 31.12.2017 31.12.2016 Amount in arrears Related principal outstanding 180,038 479,514 89,560 273,316 Amount in arrears 2,163 3,964 Amount called (during the year) 89,577 152,613 Cumulative amount called and not refunded as at year end 502,285 489,243 Loan renegotiation and forbearance The Group considers loans to be forborne loans (i.e. loans, debt securities and loan commitments) in respect of which forbearance measures have been extended. Forbearance measures consist of “concessions” that the Group decides to make towards an obligor who is considered unable to comply with the contractual debt service terms and conditions due to its financial difficulties, in order to enable the obligor to service the debt or to refinance, totally or partially, the contract. Forbearance measures occur in situations in which the borrower is considered to be unable to meet the debt service terms and conditions of the contract due to financial difficulties. Based on these difficulties, the Group decides to modify the debt service terms and conditions of the contract to allow the borrower sufficient ability to service the debt or refinance the contract, either totally or partially. Exposures shall be treated as forborne if a concession has been made, irrespective of whether (i) any amount is past-due, (ii) the exposure is classified as impaired or (iii) the exposure is classified as defaulted. Exposures shall not be treated as forborne when the obligor is not in financial difficulties. In the normal course of business, the Loan Grading (LG) of the loans in question would have deteriorated and the loans would have been included in the Watch List before renegotiation. Once renegotiated, the EIB will continue to closely monitor these loans. If the renegotiated payment terms will not recover the original carrying amount of the asset, the Bank will consider accounting for value adjustments in the profit and loss account. The corresponding value adjustment will be calculated based on the forecasted cash flows discounted at the original effective interest rate. The need for a value adjustment for all loans whose LG deteriorated to E-is assessed regularly; all loans with a LG of F require a value adjustment. Once the Loan Grading of a loan has improved sufficiently, the loan will be removed from the Watch List in line with the Bank’s procedures. Forbearance measures and practices undertaken by the Bank’s restructuring team during the reporting period includes, but not limited to, extension of maturities, deferral of capital only, deferral of capital and interest, breach of material covenants and capitalisation of arrears. Operations subject to forbearance measures are reported as such in the tables below. (in EUR million) 31.12.2017 31.12.2016 Number of contracts subject to forbearance practices Carrying values (incl. interest and amounts in arrears) of which being subject to value adjustments Value adjustments recognised Interest income in respect of forborne contracts Exposures written off (following the termination/sale of the operation) 51 2,824 943 428 83 3 30 1,714 1,025 339 39 0 Forbearance measures Breach of material financial covenants Contractual repayment and termination (1) Deferral of capital and interest Extension of maturities (in EUR million) 31.12.2016 Other 31.12.2017 Public Bank Corporate 251 4 1,459 51 0 79 0 6 406 730 0 62 0 0 89 0 0 -313 1,032 10 1,782 (1) Decreases are explained by repayments of capital, interest and amounts in arrears as well as write-off which occured during the year on operations already considered as forborne as of 31 December 2016 and by termination during the year. 122 Total 1,714 130 412 792 89 -313 2,824 Loans called under the EU or Member State guarantees Loans secured by EU or Member State guarantees (callable) Loans not secured by EU or Member State guarantees


U.2.2. Treasury The credit risk associated with treasury (securities, commercial paper, term accounts, etc.) is managed through selecting sound counterparties and issuers. Limits governing the structure of the securities portfolio and outstanding treasury instruments have been laid down by the Management. These limits are reviewed regularly by the Risk Management Directorate. The Group enters into collateralised reverse repurchase and repurchase agreement transactions that may result in credit exposure if the counterparty to the transaction is unable to fulfil its contractual obligations. The Group controls credit risk associated with these activities by monitoring counterparty credit exposure and collateral values on a daily basis and requiring additional collateral to be deposited with the Group when deemed necessary. Tripartite reverse repo operations are carried out with a third-party custodian who undertakes, on the basis of a framework contract, to guarantee compliance with the contractual terms and conditions, notably with respect to: - - - delivery against payment; verification of collateral; the collateral margin required by the lender which must always be available and adequate, with the market value of the securities being verified daily by the said custodian; and organisation of substitute collateral provided that this meets all the contractual requirements. - The table below provides a percentage breakdown of the credit risk associated with the securities in the Treasury portfolios and the money markets products (deposits and reverse repos) in terms of the credit rating of counterparties and issuers: Moody’s or equivalent rating Securities portfolio % Treasury instruments % 31.12.2017 31.12.2016 31.12.2017 31.12.2016 Aaa Aa1 to Aa3 A1 to A3 Below A3 15 41 26 18 17 41 19 23 32 30 34 4 3 51 43 3 Collateral on Treasury transactions Collateral received The Treasury transactions include EUR 7,951 million (2016: EUR 10,369 million) of tripartite reverse repurchase agreements and the tripartite repurchase agreements stood at nil at 31 December 2017 (2016: EUR 315 million). These transactions are governed by Tripartite Agreements, for which the exposure is fully collateralised, with daily margin calls. The market value of the collateral portfolio at 31 December 2017 is EUR 8,275 million (2016: EUR 10,512 million), with the following classification: Tripartite Agreements Collateral (in EUR million) At 31 December 2017 Bonds Secured Bonds (covered bonds) Bank and Corporate Bonds Moody's or equivalent rating Government Supra-national ABS Total Aaa Aa1 to Aa3 A1 Below A1 519 723 366 3,687 562 95 0 19 1,056 91 0 21 100 291 54 618 73 0 0 0 2,310 1,200 420 4,345 Tripartite Agreements Collateral (in EUR million) At 31 December 2016 Bonds Secured Bonds (covered bonds) Bank and Corporate Bonds Total Moody's or equivalent rating Government Supra-national ABS Aaa Aa1 to Aa3 A1 Below A1 537 491 30 4,722 66 62 0 0 1,992 246 230 0 36 474 183 1,161 282 0 0 0 2,913 1,273 443 5,883 Securities deposited In the context of the Eurosystem’s monetary policy operations, the EIB deposited securities with the Central Bank of Luxembourg with a market value of EUR 3.1 billion as at 31 December 2017 (2016: EUR 2.6 billion). 123 Total 5,780 128 2,468 1,854 282 10,512 Total 5,295 676 1,168 1,063 73 8,275 Total 100 100 100 100


EIB Group Consolidated Financial Statements under EU directives U.2.3. Guarantees granted by the Group in respect of loans granted by third parties At year end of 2017, the signed exposure guaranteed by the Group amounted to EUR 15.8 billion (2016: EUR 12.7 billion) out of which there is EUR 7.6 billion (2016: EUR 5.1 billion) of disbursed exposure of the loans guaranteed and such provisions on guarantees amount to EUR 23.5 million (2016: EUR 42.5 million). The Credit Risk Policy Guidelines ensure that the Group continues to develop a diversified guarantee portfolio in terms of product range, geographic coverage, counterparty exposure, obligor exposure, industry concentration and also set out the capital allocation rules based on the ratings of the exposures. Concentration risk is limited because of the granular nature of the Group’s transactions; typically the underlying portfolios are highly diversified in terms of single obligor concentration, sectors, and also with regard to regional diversification. To cover concentration risk, the Group has strict limits (based on capital allocation) for individual transactions and on originator level (maximum aggregate exposures for originators and originator groups). In the context of the Group’s guarantee operations, the credit risk is tracked from the very beginning on a deal-by-deal basis whilst adopting a different model analysis approach depending on the granularity and homogeneity of the underlying portfolios. The industry sector exposures are analysed on a deal-by-deal basis through their impact on the ratings assigned by the Group to each transaction or tranche. For instance, dependent on the financial model to analyse the transaction, industry exposures can be reflected in implicit correlation or can be indirectly captured through the assumption on default rate volatility, as a key model input variable. Furthermore, concentration exposures are analysed in the context of each deal using qualitative measures such as current status and forecast for sectors with high concentrations in the portfolio. Exceptionally, some deals have a concentrated exposure in the same (broad) sector. This is typically captured through increased credit enhancement (e.g. subordination) to the benefit of the Group. Typically, deals with replenishing features have portfolio criteria, such as maximum single obligor, maximum top five obligors, and maximum industry concentration levels. Furthermore, the consideration of sector exposures is part of the Group’s overall portfolio analysis. Counterparty risk is mitigated by the quality of the Group’s counterparties which are usually major market players. The Group performs additional on-site monitoring visits to ensure compliance with procedures and processes during the transaction life. Stress-test scenarios for the portfolio of guarantees, including extreme case assumptions, are regularly carried out to determine the ability of the capital base to sustain adverse shocks. U.3. Interest rate risk Interest rate risk is the volatility in the economic value of, or in the income derived from, the Group’s positions due to adverse movements in market yields or the term structure of interest rates. Exposure to interest rate risk occurs when there are differences in repricing and maturity characteristics of the different asset, liability and hedge instruments. In measuring and managing interest rate risk, the Group refers to the relevant key principles of the Basel Committee on Banking Supervision (BCBS) and the European Banking Authority (EBA). The main sources of interest rate risk are: repricing risk, yield curve risk, basis risk and spread risk. An interest rate risk that is particularly relevant for the Group is spread risk. Spread risk is the volatility in the economic value of, or in the income derived from, the Group’s positions due to movements in the funding or lending spread of the Group. The Group manages its global structural interest rate position on the basis of a notional reference portfolio. The majority of the financial risk indicators and controls in use by the Group apply to this portfolio. Financial indicators and controls for the rest of the activities outside this portfolio only relate to the risks, which are not transferred to it via the transfer pricing system which therefore remain with their respective activities, such as the equity risk in the venture capital activity or the interest rate or credit risks taken in the treasury portfolios predominantly managed for yield-enhancement purposes. U.3.1. Value-at-Risk for the own funds of the Group The Group’s ALM strategy aims at maintaining a balanced and sustainable revenue profile as well as limiting the volatility of the economic value of the Group. A clear preference has been given to the revenue profile in light of the objective of self-financing of the Group’s growth. This overall objective is achieved by investing the Group’s own funds according to a medium to long term investment profile, implying an own funds duration target of 4.5 – 5.5 years. Apart from the duration target for own funds, the Group’s balance sheet should be match-funded with respect to currency and interest rate characteristics. However, small deviations are authorised for operational reasons. The net residual positions that arise from outstanding operations are managed within pre-set limits to constrain market risk to minimum levels. The Risk Management Directorate quantifies the Value at Risk (VaR) of own funds for both interest rates and foreign exchange risk factors. This is a parametric VaR calculated using the Riskmetrics methodology, where volatility and correlation data are computed internally on the basis of historical market data. It is measured on the Group’s positions using a 99% confidence level and a one-day time horizon. As at 31 December 2017, the VaR of the Group’s own funds amounted to EUR 186 million (2016: EUR 258 million). The evolution of the VaR of the Group’s own funds since 2016 reflects the effective decrease of the volatility of the risk factors and not a change in the risk profile of the Group’s positions. More generally, the VaR does not purport to measure the worst loss that could be experienced. For this reason, it is complemented by regular stress testing using interest rate shocks. As of 31 December 2017, the impact of a 200 basis point upward parallel shift of the interest rate curves would reduce the economic value of own funds by EUR 7.87 billion (2016: EUR 7.65 billion). Among the financial instruments in the Group’s portfolio, some deals (borrowings and associated swaps) present callability options and may be redeemed early, introducing uncertainty as to their final maturity. 124


At cash flow level all such borrowings are fully hedged by swaps so that they can be considered synthetic floating rate notes indexed to Libor/Euribor. Below is a summary of the features of the Group’s callable portfolio as of 31 December 2017 and 31 December 2016, where the total nominal amount, the average natural maturity and the average expected maturity (both weighted by the nominal amount of the concerned transactions) are shown per funding currency and per main risk factor involved: By funding currency (after swaps): 31.12.2017 (in EUR million) EUR JPY USD Total EUR Pay Notional Average maturity date -2,679 17.11.2042 -21 09.02.2032 -2,810 17.04.2037 -5,510 27.12.2039 Average expected maturity 13.06.2028 11.02.2029 16.10.2025 04.02.2027 31.12.2016 (in EUR million) EUR JPY USD Total EUR Pay Notional Average maturity date -2,614 24.09.2042 -77 25.08.2022 -2,776 29.01.2036 -5,467 25.01.2039 Average expected maturity 07.10.2028 01.10.2020 24.05.2026 13.06.2027 By risk factor involved: 31.12.2017 Risk factor (in EUR million) FX level IR curve level IR curve shape Total EUR Pay Notional Average maturity date -712 27.09.2037 -4,659 10.08.2040 -139 16.09.2030 -5,510 27.12.2039 Average expected maturity 05.06.2026 22.05.2027 21.09.2020 04.02.2027 31.12.2016 Risk factor (in EUR million) FX level IR curve level IR curve shape Total EUR Pay Notional Average maturity date -1,004 22.12.2034 -4,324 15.04.2040 -139 16.09.2030 -5,467 25.01.2039 Average expected maturity 24.07.2024 23.04.2028 03.07.2021 13.06.2027 U.3.2. Interest rate risk management for the Group The sensitivity of earnings quantifies the amount of net interest income that would change during the forthcoming 12 months if all interest rate curves would rise by one percentage point or decrease by one percentage point. Such exposure stems from the mismatch between interest rate repricing periods, volumes and rates of assets and liabilities that the Group accepts within the approved limits. With the positions in place as of 31 December 2017, the earnings would increase by EUR 118.1 million (2016: EUR 104.3 million) if interest rates were to increase by 100 basis points and decrease by EUR 111.7 million (2016: EUR 119.8 million) if interest rates were to decrease by 100 basis points. The Group computes the sensitivity measure with a dedicated software that simulates earnings on a deal by deal basis. The sensitivity of earnings is measured on an accruals basis and is calculated under the ‘’ongoing’’ assumption that, over the time horizon analysed, the Group realises the new loan business forecast in the Operational Plan, maintains exposures within approved limits and executes monetary trades to refinance funding shortages or invest cash excesses. Earnings are simulated on monthly timely basis, assuming that all the fixed rate items carry their contractual rate and that all floating rate items are subject to interest rate repricing according to the interest rate scenario applied in the simulation. The monetary trades to refinance funding shortages or invest cash excesses carry rates equal to the money market rates prevailing according to the interest rate scenario applied in the simulation. In line with the current practice, the model uses the hypothesis that simulated earnings are not distributed to the shareholders, but are used to refinance the Group’s business. The administrative costs are projected according to the forecasts of the Operational Plan. The sensitivity of the EIF is computed by taking into consideration all the positions present in the EIF treasury and loan portfolio managed by the Group on a deal by deal basis. Each fixed rate treasury asset is assumed to be reinvested at maturity in a new asset with the same residual life of the previous one as of end of year’s date. Positions in floating rate treasury assets are assumed to have quarterly repricing. U.4. Liquidity risk Liquidity risk refers to the ability of the Group to fund increases in assets and meet obligations as they come due, without incurring unacceptable losses. It can be further split into funding liquidity risk and market liquidity risk. 125


EIB Group Consolidated Financial Statements under EU directives Funding liquidity risk is connected to the risk for the Group to be unable to refinance the asset side of its balance sheet and to meet payment obligations punctually and in full out of readily available liquid resources. Funding liquidity risk may have an impact on the volatility in the economic value of, or in the income derived from Group’s positions, due to potentially increasing immediate risks to meet payment obligations and the consequent need to borrow at unattractive conditions. Market liquidity risk is the volatility in the economic value of, or in the income derived from, the Group’s positions due to potential inability to execute a transaction to offset, eliminate or reduce outstanding positions at reasonable market prices. Such an inability may force early liquidation of assets at unattractive prices when it would be better to avoid such liquidation. This risk is tied to the size of the position compared to the liquidity of the instrument being transacted, as well as to potential deterioration of market availability and efficiency. Liquidity risk management of the Bank Liquidity risk is managed in order to ensure the regular functioning of the Bank’s core activities at reasonable cost. The main objective of liquidity policy is to ensure that the Bank can always meet its payment obligations punctually and in full. In contrast to commercial banks, the EIB does not have retail deposits but relies on its access to capital markets to raise the funds it on-lends to its clients. The Bank manages the calendar of its new issues so as to maintain a prudential liquidity buffer. Liquidity planning takes into account the Bank’s needs to service its debt, make disbursements on loans and cash inflows from the loan portfolio. It also takes into account the sizeable amount of signed but un-disbursed loans, whose disbursements typically take place at the borrowers’ request. The Bank further assures management of liquidity risk by maintaining a sufficient level of short-term liquid assets and by spreading the maturity dates of its placements according to the forecasts of liquidity needs. Liquidity risk policy also incorporates a floor on treasury levels. The Bank's total liquidity ratio (liquidity as a percentage of the next 12 months projected net cash flows) must at all times exceed 25%. The Bank has in place a Contingency Liquidity Plan (CLP), which specifies appropriate decision making procedures and corresponding responsibilities. The CLP has been benchmarked against the “Principles for Sound Liquidity Risk Management and Supervision” by the Basel Committee on Banking Supervision (September 2008). The CLP is subject to ad-hoc updates and is presented to the Management Committee annually for approval. Regular stress-testing analyses tailored to the specific business model of the EIB are executed as a part of the liquidity risk monitoring and drive the size of the Bank’s liquidity buffer. On 8 July 2009, the Bank became an eligible counterparty in the Eurosystem’s monetary policy operations, and therefore has been given access to the monetary policy operations of the European Central Bank. The Bank conducts the operations via the Central Bank of Luxembourg, where the Bank maintains deposits to cover the minimum reserve requirement. Liquidity risk management of the Fund Liquidity risk is managed in such a way as to protect the value of the paid–in capital, ensure an adequate level of liquidity of the Fund to meet possible guarantee calls, private equity commitments and administrative expenditure and earn a reasonable return on assets invested with due regard to minimisation of risk. Liquidity risk measurement The table hereafter analyses the assets and liabilities of the Group by maturity on the basis of the period remaining between the balance sheet date and the contractual maturity date. Assets and liabilities for which there is no contractual maturity date are classified under "Maturity undefined". 126


 Liquidity risk (in EUR million) More than 3 months to 1 year More than 1 year to 5 years 3 months or less More than 5 years Maturity undefined Maturity at 31 December 2017 Total 2017 Assets: Cash in hand, balances with central banks and post office banks Treasury bills and other bills eligible for refinancing with central banks Other loans and advances: - Current accounts - Credit institutions - Customers 162 0 0 0 0 162 13,239 8,306 11,963 8,000 0 41,508 938 30,288 0 3,610 0 0 0 0 0 0 938 33,898 1,679 63 0 0 0 1,742 32,905 3,673 0 0 0 36,578 Loans: - Credit institutions - Customers 2,403 12,038 57,710 49,390 19 121,560 3,806 18,243 99,720 191,340 46 313,155 6,209 30,281 157,430 240,730 65 434,715 Debt securities including fixed-income securities Shares, other variable-yield securities and participating interests Other assets 2,870 3,935 2,722 0 15,672 6,145 0 0 0 26 0 125 0 67 5,299 16,854 5,299 17,072 Liabilities: Amounts owed to credit institutions Amounts owed to customers Debts evidenced by certificates Capital, reserves, profit and minority interest Other liabilities 5,011 1,931 34,735 0 9 0 0 31,634 0 11 0 0 217,182 0 516 0 0 166,034 0 257 0 0 0 70,302 23,384 5,011 1,931 449,585 70,302 24,177 Some of the borrowings and associated swaps include early termination triggers or call options granted to the investors or the hedging swap counterparties and the Bank as well has the right to call the related bonds before maturity. If the Group were to exercise all the call options on its bonds at their next contractual exercise date, cumulated early redemptions for the period 2018 - 2020 would amount to EUR 2.7 billion. Liquidity risk (in EUR million) More than 3 months to 1 year More than 1 year to 5 years 3 months or less More than 5 years Maturity undefined Maturity at 31 December 2016 Total 2016 Assets: Cash in hand, balances with central banks and post office banks Treasury bills and other bills eligible for refinancing with central banks - Current accounts - Credit institutions - Customers 317 0 0 0 0 317 15,751 865 28,396 15,015 0 6,836 12,619 0 0 8,252 0 0 0 0 0 51,637 865 35,232 2,096 124 0 0 0 2,220 31,357 6,960 0 0 0 38,317 Loans: - Credit institutions - Customers 3,228 12,931 59,577 48,590 3 124,329 3,858 17,307 99,978 188,466 114 309,723 7,086 30,238 159,555 237,056 117 434,052 Debt securities including fixed-income securities Shares, other variable-yield securities and participating interests Other assets 8,408 2,055 2,616 2,780 0 15,859 0 57 0 74 0 145 0 71 4,333 29,685 4,333 30,032 Liabilities: Amounts owed to credit institutions Amounts owed to customers Debts evidenced by certificates Capital, reserves, profit and minority interest Other liabilities 12,954 1,952 36,099 0 1 166 0 42,173 0 41 0 0 229,347 0 466 0 0 163,304 0 327 0 0 0 67,395 20,322 13,120 1,952 470,923 67,395 21,157 127 Off balance sheet currency swaps 1,330 3,211 7,345 2,294 0 14,180 Total liabilities 51,006 42,380 229,813 163,631 87,717 574,547 Total assets 62,976 54,342 174,935 248,159 34,135 574,547 Off balance sheet currency swaps -321 475 2,826 -1,373 0 1,607 Total liabilities 41,686 31,645 217,698 166,291 93,686 551,006 Total assets 58,660 45,156 173,453 251,519 22,218 551,006


EIB Group Consolidated Financial Statements under EU directives U.5. Foreign exchange rate risk The foreign exchange (FX) risk is the volatility in the economic value of, or in the income derived from, the Bank’s positions due to adverse movements of foreign exchange rates. The Bank is exposed to a foreign exchange risk whenever there is a currency mismatch between its assets and liabilities. In compliance with its Statute, the Bank does not engage in currency operations not directly required to carry out its lending operations or fulfil commitments arising from loans or guarantees granted by it. Mismatches of currencies in the asset-liability structure of the Bank are kept within tight limits. The foreign exchange risk implicit in interest margin accruing in currencies different from EUR is regularly hedged. The hedging programme addresses the interest rate loan margins expressed in USD and in GBP for the next 3 years on a rolling basis. Foreign exchange position (in EUR million) Pound Sterling Other currencies Sub-total except Euro Currency at 31 December 2017 Euro US Dollar Total 2017 Assets: Cash in hand, balances with central banks and post office banks Treasury bills and other bills eligible for refinancing with central banks Other loans and advances: - Current accounts - Credit institutions - Customers 162 0 0 0 0 162 36,941 1,362 3,205 0 4,567 41,508 849 25,882 36 257 5 1,140 48 6,619 89 8,016 938 33,898 614 0 0 1,128 1,128 1,742 27,345 293 1,145 7,795 9,233 36,578 Loans: - Credit institutions - Customers 121,560 101,632 2,023 11,494 6,411 19,928 249,871 34,702 9,959 18,623 63,284 313,155 351,503 36,725 21,453 25,034 83,212 434,715 Debt securities including fixed-income securities Shares, other variable-yield securities and participating interests Other assets 2,892 2,583 4,692 5,505 12,780 15,672 4,246 16,305 673 342 227 181 153 244 1,053 767 5,299 17,072 Liabilities: Amounts owed to credit institutions Amounts owed to customers Debts evidenced by certificates: - Debt securities in issue - Others 4,704 1,708 0 7 259 75 48 141 307 223 5,011 1,931 225,341 49,205 118,961 42,223 210,389 435,730 7,906 107 967 4,875 5,949 13,855 233,247 70,302 24,155 49,312 0 879 119,928 0 287 47,098 0 -1,144 216,338 0 22 449,585 70,302 24,177 Capital, reserves, profit and minority interest Other liabilities 128 Total liabilities 334,116 50,198 120,549 46,143 216,890 551,006 Off balance sheet currency swaps -105,284 8,269 89,594 7,421 105,284 Net position -6 49 -52 9 6 Total assets 439,394 41,978 30,903 38,731 111,612 551,006


 Foreign exchange position (in EUR million) Pound Sterling Other currencies Sub-total except Euro Currency at 31 December 2016 Euro US Dollar Total 2016 Assets: Cash in hand, balances with central banks and post office banks Treasury bills and other bills eligible for refinancing with central banks Other loans and advances: - Current accounts - Credit institutions - Customers 317 0 0 0 0 317 50,103 464 1,070 0 1,534 51,637 699 26,361 23 58 9 2,963 134 5,850 166 8,871 865 35,232 1,228 0 0 992 992 2,220 28,288 81 2,972 6,976 10,029 38,317 Loans: - Credit institutions - Customers 102,556 2,785 12,190 6,798 21,773 124,329 247,152 32,916 11,914 17,741 62,571 309,723 349,708 35,701 24,104 24,539 84,344 434,052 Debt securities including fixed-income securities Shares, other variable-yield securities and participating interests Other assets 8,251 375 2,465 4,768 7,608 15,859 3,447 26,306 602 1,290 147 1,103 137 1,333 886 3,726 4,333 30,032 Liabilities: Amounts owed to credit institutions Amounts owed to customers Debts evidenced by certificates: - Debt securities in issue - Others 12,230 1,715 25 31 784 86 81 120 890 237 13,120 1,952 212,909 51,676 145,501 45,575 242,752 455,661 7,993 196 1,182 5,891 7,269 15,262 220,902 67,395 16,468 51,872 0 1,922 146,683 0 1,215 51,466 0 1,552 250,021 0 4,689 470,923 67,395 21,157 Capital, reserves, profit and minority interest Other liabilities U.6. Operational risk Operational Risk is a potential failure in process, people, systems or other external events resulting in direct financial exposures or near-misses on the Group. The definition includes legal and reputational risk, but excludes strategic risk. Operational risk is inherent in the Group’s activities and can manifest itself in various ways, including human factors, inappropriate employee behavior, cyber and technology related events, inadequate or failed processes, business interruptions or security, failure of information systems, 3rd party outsourcing failures or fraudulent acts. The goal is to keep operational risk at minimum levels in light of the Group’s financial strength, the characteristics of its businesses and the markets in which it operates. The Operational Risk Management is responsible for defining the operational risk framework and related policies while the responsibility for implementing the framework lies with the Bank’s departments. The key elements of the framework of best banking practices as recommended by Basel Committee on Banking Supervision (BCBS) are risk identification, assessment, monitoring as well as risk control and mitigation. The Bank employs an assessment methodology that takes into account all available information including internal loss history, scenario analysis and the business and control environment through a set of operational risk indicators organized in scorecards. Specifically, operational risk provides oversight of the significant operational risk events that have or could lead to actual operational risk losses and areas of emerging risk. The EIB uses the SAS system to monitor on an on-going basis operational risk exposures and loss events by major business processes. In addition, a statistical model and a Value at Risk calculation engine complete the operational risk environment. The management of operational risk is carried out at all levels within the organisation and is a responsibility of all the various departments of the Bank. In terms of reporting, all information concerning operational risk internal loss history, scenario analysis and operational risk indicators are regularly forwarded to the Vice President, Directors General and Audit Committee and the report on the activities of the New Products Committee to senior management in the Bank. 129 Total liabilities 318,710 53,850 148,768 53,219 255,837 574,547 Off balance sheet currency swaps -147,800 15,417 116,891 15,492 147,800 Net position -90 80 -16 26 90 Total assets 466,420 38,513 31,861 37,753 108,127 574,547


EIB Group Consolidated Financial Statements under EU directives Note V – Derivatives The Group uses derivative instruments mainly as part of its asset and liability management activities to manage exposures to interest rate and foreign currency risks, including exposures arising from forecast transactions. Derivatives are contractual financial instruments, the value of which fluctuates according to trends in the underlying assets, interest rates, exchange rates or indices. Derivatives transactions are not used for trading, but only in connection with fund-raising and for the reduction of market risk exposure. The majority of the Group’s swaps are concluded with a view to hedging specific bond issues, as part of its resource-raising operations (funding activity). All swaps linked to the borrowing portfolio have maturities matching the corresponding borrowings and are therefore of a long-term nature. The Group also enters into swaps as part of its hedging operations on loans, treasury, or for the global Assets and Liabilities Management (ALM) position (ALM hedging activity) (see note V.1.). The Group also enters into short-term currency swap contracts in order to adjust currency positions in its operational treasury in relation to its benchmark currency, the euro, and to cater for demand for currencies in conjunction with loan disbursements (see Note V.2.). Future contracts (futures) can be used in the context of the treasury activities, to hedge the exposure deriving from some investments in government bonds. Futures are standardised derivatives, negotiated on regulated markets, and they do not fall within the general policy for counterparty risk measurement and control (see note V.2.). Forward rate agreements are used by the Bank to hedge the interest rate risk of its short-term treasury position (see Note V.2.). V.1. Funding and ALM derivatives The derivatives used in the context of funding and ALM hedging activities are: • • • Currency swaps; Interest rate swaps; and Structured swaps. V.1.1. Currency swaps Currency swaps are contracts under which it is agreed to convert funds raised in one currency into another currency and, simultaneously, a forward exchange contract is concluded to re-exchange the two currencies in the future in order to be able to repay the funds raised on the due dates. The Group enters into currency swaps, in which, at inception, the proceeds of a borrowing are converted into a different currency, mainly as part of its resource-raising operations, and, thereafter, the Group will obtain the amounts needed to service the borrowing in the original currency. The following table shows the maturities of currency swaps (excluding short-term currency swaps – see Note V.2.), sub-divided according to their notional amount and fair value. The notional amounts are disclosed off balance sheet. More than 1 year and up to 5 years More than 5 years and up to 10 years More than 10 years Currency swaps at 31 December 2017 (in EUR million) 1 year or less Total 2017 Notional amount (receivable) Fair value (i.e. net discounted value including CVA and 36,128 35 108,446 -1,717 40,132 1,995 19,371 1,423 204,077 1,736 DVA)(*) More than 1 year and up to 5 years More than 5 years and up to 10 years More than 10 years Currency swaps at 31 December 2016 (in EUR million) 1 year or less Total 2016 Notional amount (receivable) Fair value (i.e. net discounted value including CVA and 34,392 3,865 125,331 8,323 36,858 2,443 15,651 2,064 212,232 16,695 DVA)(*) (*)Including the fair value of macro-hedging currency swaps which stood at EUR 500 million as at 31 December 2017 (2016: EUR 1,994 million). V.1.2. Interest rate swaps Interest rate swaps are contracts under which, generally, it is agreed to exchange floating-rate interest for fixed-rate interest or vice versa. Interest rate swaps enable the Group to modify the interest rate structure of its borrowing portfolio and other portfolios in order to accommodate requests from its clients and also to reduce funding costs by exchanging its advantageous conditions of access to certain capital markets with its counterparties. 130


The following table shows the maturities of interest rate swaps (including synthetic swaps, whereby interest computed in a foreign currency is synthetically converted to EUR), sub-divided according to their notional amount and fair value. The notional amounts are disclosed off balance sheet. More than 1 year and up to 5 years More than 5 years and up to 10 years More than 10 years Interest rate swaps at 31 December 2017 (in EUR million) 1 year or less Total 2017 Notional amount Fair value (i.e. net discounted value including CVA and 44,391 -350 202,704 4,158 126,652 4,267 136,260 1,345 510,007 9,420 DVA)(*) More than 1 year and up to 5 years More than 5 years and up to 10 years More than 10 years Interest rate swaps at 31 December 2016 (in EUR million) 1 year or less Total 2016 Notional amount Fair value (i.e. net discounted value including CVA and 75,265 587 197,166 5,027 116,008 6,987 131,914 607 523,353 13,208 DVA)(*) (*)Including the fair value of macro-hedging interest rate swaps which stood at EUR -333 million as at 31 December 2017 (2016: EUR -461 million). V.1.3. Structured swaps The Group does not generally enter into any options contracts in conjunction with its risk hedging policy. However, as part of its strategy of raising funds on the financial markets at a lesser cost, the Group enters into borrowing contracts and loans encompassing notably interest rate or stock exchange index options. Such structured borrowings and loans are entirely covered by swap contracts to hedge the corresponding market risk. The table below further details the number, value and notional amounts of structured swaps: Special structure coupon or similar Early termination embedded Stock exchange index 2017 2016 2017 2016 2017 2016 Number of transactions Notional amount (in EUR million) 136 5,490 138 5,465 1 500 1 500 306 19,437 300 33,084 Net discounted value (in EUR million) 444 512 -33 -19 -2,461 -2,207 The fair value of swap transactions is computed using the income approach, applying valuation techniques to convert future amounts to a single present amount (discounted). The estimate of fair value is based on the value indicated by marketplace expectations about those future amounts. Valuation techniques can range from simple discounted known cash flows to complex option models. The valuation models applied are consistent with accepted economic methodologies for pricing financial instruments, and incorporate the factors that market participants consider when setting a price. For a portion of derivative transactions, internal estimates and assumptions might be used in the valuation techniques when the market inputs are not directly available. All option contracts embedded in, or linked with, borrowings are negotiated over the counter. The structured deals include a variety of transactions dependent on interest rates, FX rates, inflation rates, stock indexes and IR volatilities. V.1.4. Derivatives credit risk mitigation policy The credit risk with respect to derivatives lies in the loss that the Group would incur if the counterparty is unable to honour its contractual obligations. In view of the special nature and complexity of the derivatives transactions, a series of procedures has been put in place to safeguard the Group against losses arising from the use of such instruments. • Contractual framework: All of the Group’s derivative transactions are concluded in the contractual framework of ISDA Swap Agreements and where applicable Credit Support Annexes, which specify the conditions of exposure collateralisation. These are generally accepted and practised contract types. • Counterparty selection: The minimum rating at the outset is set at A3. The EIB has the right of early termination if the rating drops below a certain level. 134


EIB Group Consolidated Financial Statements under EU directives • Collateralisation: - Exposures (exceeding limited thresholds) are collateralised by cash and bonds. - Complex and illiquid transactions could require collateralisation over and above the current market value. - Both the derivatives portfolio with individual counterparties and the collateral received are regularly monitored and valued, with a subsequent call for additional collateral or release. The market value of collateral received for swaps amounts to EUR 16,279 million as at 31 December 2017 (2016: EUR 37,963 million), with the following composition, detailed based on the nature of the collateral and based on Moody’s equivalent rating: Swap collateral (in EUR million) Bonds Agency, supranational, covered bonds Moody's equivalent rating Cash Total 2017 Government 4,394 2,430 96 4,419 2 4,938 Aaa Aa1 to Aa3 A1 to A3 Baa1 to Baa3 Below Baa3 Non-Rated 2,877 2,430 96 4,419 2 0 1,517 0 0 0 0 0 0 0 0 0 0 4,938 Swap collateral (in EUR million) Bonds Agency, supranational, covered bonds Moody's equivalent rating Cash Total 2016 Government Aaa Aa1 to Aa3 A1 to A3 Baa1 to Baa3 Below Baa3 Non-Rated 3,470 11,899 134 5,496 221 0 3,870 0 110 0 0 0 0 0 0 0 0 12,763 7,340 11,899 244 5,496 221 12,763 • Credit risk measurement for derivatives: The credit risk associated with derivatives varies according to a number of factors (such as interest and exchange rates) and generally corresponds to only a small portion of their notional value. The Group measures the credit risk exposure related to swaps and derivatives transactions using the Current Unsecured Exposure and the Potential Future Exposure for reporting and limit monitoring, and the Credit Risk Equivalent for capital allocation according to the recommendations of the Basel Committee on Banking Supervision (BCBS) sponsored by the BIS. The Group computes the Current Unsecured Exposure, which is the larger of zero and the market value of the portfolio of transactions within the netting set with a counterparty, less the value of collateral received. It is the amount that would be lost upon the default of the counterparty, using the received collateral and assuming no recovery on the value of those transactions in bankruptcy as well as immediate replacement of the swap counterparty for all the transactions. As of 31 December 2017 the Current Unsecured Exposure stood at EUR 364 million (EUR 448 million as of 31 December 2016). In addition, the Group computes the Potential Future Exposure, which takes into account the possible increase in the netting set’s exposure over the margin period of risk, which ranges between 10 and 20 days, depending on the portfolio of transactions. The EIB computes the Potential Future Exposure at 90% confidence level using stressed market parameters to arrive at conservative estimates. This is in line with the recommendations issued by regulators in order to take into consideration the conditions that will prevail in case of default of an important market participant. As of 31 December 2017 the Potential Future Exposure at origin stood at EUR 7,366 million (EUR 9,499 million as of 31 December 2016). • Limits: The limit system for banks covers the Potential Future Exposure in 3 time buckets (under 1 year, between 1 and 5 years and over 5 years) and in 2 rating scenarios (current and downgrade below A3). The derivatives portfolio is valued and compared against limits on a daily basis. 132 Total 2016 21,220 3,980 12,763 37,963 Total 2017 9,824 1,517 4,938 16,279


The following table provides a breakdown of counterparties by internal rating. Grouped ratings Percentage of nominal Current Unsecured Exposure (in EUR million) Potential Future Exposure (in EUR million) Moody’s equivalent rating 2017 2016 2017 2016 2017 2016 Aaa Aa1 to Aa3 A1 to A3 Below A3 0.32% 23.48% 65.33% 10.87% 0.35% 24.57% 65.68% 9.40% 119 224 0 21 91 224 124 9 140 1,904 5,094 228 169 2,785 6,365 180 V.2. As part of liquidity management The Group also enters into short-term currency swap contracts in order to adjust currency positions in its operational treasury portfolios in relation to its benchmark currency, the euro, and to cater for demand for currencies in conjunction with loan disbursements. The notional amount of short-term currency swaps receivable stood at EUR 43,942 million at 31 December 2017 against EUR 46,312 million at 31 December 2016. The fair value of these contracts was EUR -23 million at 31 December 2017 (2016: EUR 847 million). The notional amount of short-term currency forwards was EUR 585 million at 31 December 2017 (2016: EUR 667 million). The fair value of these contracts was EUR 39 million at 31 December 2017 (2016: EUR 18 million). Note W – Conversion rates The following conversion rates were used for drawing up the balance sheets at 31 December 2017 and 2016: 31.12.2017 31.12.2016 Bulgarian lev (BGN) Czech koruna (CZK) Danish krone (DKK) Pound sterling (GBP) Hungarian forint (HUF) Polish zloty (PLN) Romanian leu (RON) Swedish krona (SEK) 1.9558 25.5350 7.4449 0.8872 310.3300 4.1770 4.6585 9.8438 1.9558 27.0210 7.4344 0.8562 309.8300 4.4103 4.5390 9.5525 Australian dollar (AUD) Canadian dollar (CAD) Swiss franc (CHF) Chinese yuan-renminbi (CNY) Dominican peso (DOP) Egyptian pound (EGP) Hong Kong dollar (HKD) Iceland króna (ISK) Japanese yen (JPY) Kenyan shilling (KES) Moroccan dirham (MAD) Mexican peso (MXN) Norwegian krone (NOK) New Zealand dollar (NZD) Russian ruble (RUB) Serbia dinars (RSD) Tunisia dinars (TND) Turkish lira (TRY) Taiwan dollar (TWD) Ukraine hryvnia (UAH) United States dollar (USD) CFA Franc (XOF) 1.5346 1.5039 1.1702 7.8044 57.1465 21.2725 9.3720 124.7000 135.0100 123.7000 11.2144 23.6612 9.8403 1.6850 69.3920 118.2700 2.9821 4.5464 35.5849 33.7627 1.1993 655.9570 1.4596 1.4188 1.0739 7.3202 48.7476 19.0008 8.1751 214.9400 123.4000 108.0600 10.6711 21.7719 9.0863 1.5158 64.3000 123.4000 2.4255 3.7072 34.1539 28.5012 1.0541 655.9570 South African rand (ZAR) 14.8054 14.4570 133 Non-EU currencies Non-euro currencies of EU member states Total 100.00% 100.00% 364 448 7,366 9,499


EIB Group Consolidated Financial Statements under EU directives Note X – Related party transactions X.1. Participating interest The amounts included in the Financial Statements concerning participating interests are disclosed as follows: (in EUR´ 000) 31.12.2017 31.12.2016 Participating interests Result from participating interests Participating interests uncalled 263,453 -1,923 600,531 185,786 -8,216 597,512 X.2. Key Management Personnel The Group has identified members of the Board of Directors, the Audit Committee, the Management Committee and the Directors General heading the different EIB organisational directorates as key management personnel. Key management personnel compensation for the relevant reporting periods, included within General administrative expenses (Note R), is disclosed in the following table: (in EUR ’000) 2017 2016 Short-term benefits(1) Post employment benefits(2) Termination benefits 9,569 864 2,344 9,821 910 9 (1)Short-term employee benefits comprise salaries and allowances, bonuses and social security contributions of the Management Committee, the Directors General and other Directors, and benefits paid to the members of the Board of Directors and the Audit Committee. (2)Post employment benefits comprise pensions and expenses for post employment health insurance paid to members of the Management Committee and Directors General and other Directors. Open balances with key management personnel as at 31 December 2017 comprise the compulsory and optional supplementary pension plan and health insurance scheme liabilities, and payments outstanding as at the year end: (in EUR ’000) 31.12.2017 31.12.2016 Pension plans and health insurance (Note L) Other liabilities (Note G) -44,709 -16,796 -40,081 -15,573 Note Y – Post balance sheet events There have been no material events after the balance sheet date that would require adjustment of, or disclosure in, the Financial Statements as at 31 December 2017. Note Z – Management of third party funds Z.1. Investment Facility – Cotonou The Investment Facility, which is managed by the EIB, has been established under Cotonou Agreement on cooperation and development between the African, Caribbean and Pacific Group of States and the European Union and its Member States on 23 June 2000 and subsequently revised. The EIB prepares separate financial statements for the Investment Facility. Z.2. Guarantee Fund The Guarantee Fund for External Actions was set up in 1994 to cover defaults on loans and loan guarantees granted to non-Member States or for projects in non-Member States. The European Commission (‘EC’) entrusted the financial management of the Guarantee Fund to the EIB under an agreement signed between the two parties in November 1994 and the subsequent amendments to the Agreement. The EIB prepares separate financial statements for the Guarantee Fund. Z.3. NER300 The EIB supports the EC as an agent in the implementation of the NER 300 initiative - a funding programme for carbon capture and storage demonstration projects and innovative renewable energy technologies. The Facility covers two activities which are i) the monetisation of EU Allowance Units (‘EUAs’) and ii) the management and disbursement of cash received via the EUA monetisation activity. The EIB prepares separate financial statements for NER300. 135 12,777 10,740


Z.4. JESSICA (‘Holding Funds’) JESSICA (Joint European Support for Sustainable Investment in City Areas) is an initiative developed by the EC and the EIB, in collaboration with the Council of Europe Development Bank. JESSICA Holding Funds are used in the context of the JESSICA initiative. Under new procedures, Managing Authorities are being given the option of using some of their EU grant funding to make repayable investments in projects forming part of an integrated plan for sustainable urban development. As manager, EIB gathers the funding received from the Managing Authorities and invests it in Urban Development Funds, according to investment guidelines agreed with the donors. The EIB prepares separate financial statements for JESSICA. Z.5. InnovFin The InnovFin or “InnovFin-EU Finance for Innovators” is a joint initiative between the EIB, the EIF and the European Commission under the new EU research programme for 2014-2020 “Horizon 2020”. On 11 December 2013, Regulation (EU) N 1291/2013 of the European Parliament and the Council establishing Horizon 2020 – the Framework Programme for Research and Innovation (2014-2020) and repealing Decision N 1982/2006/EC (“Horizon 2020 Regulation”) was adopted. On 12 June 2014 the European Commission, the EIB and the EIF signed a Delegation Agreement establishing the financial instrument InnovFin. InnovFin consists of a series of integrated and complementary financing tools and advisory services offered by the EIB Group, covering the entire value chain of research and innovation (R&I) in order to support investments from the smallest to the largest enterprise. The EIB prepares separate financial statements for the InnovFin. Z.6. Risk-Sharing Finance Facility (‘RSFF’) The RSFF has been established under the Co-operation Agreement that entered into force on 5 June 2007 between the EC on behalf of the European Union and the EIB. The RSFF aims to foster investment in research, technological development and demonstration, and innovation. As part of the RSFF, the EIF set up the Risk Sharing Instrument for Innovative and Research oriented SMEs and small Mid-Caps (‘RSI’). The RSI provides guarantees to banks and leasing companies for loans and financial leases to research-based small and medium-sized enterprises (SMEs) and small Mid-Caps. The EIB prepares separate consolidated financial statements for the RSFF including RSI. Z.7. EU-Africa Infrastructure (‘EUAI’) Trust Fund The EUAI Trust Fund has been created under Trust Fund Agreement between the EC on behalf of the European Union as the Founding Donor and the EIB as Manager and is also open to Member States of the European Union that subsequently accede to that agreement as Donors. On 9 February 2006, the EC and the EIB signed a Memorandum of Understanding to promote jointly the EU-Africa Infrastructure Partnership and, in particular, to establish a supporting EU-Africa Infrastructure Trust Fund. The EIB prepares separate financial statements for the EUAI Trust Fund. Z.8. Connecting Europe Facility (‘CEF’) The Connecting Europe Facility (CEF) is a joint agreement between the EIB and the European Commission which aims to provide union financial assistance to trans-European networks in order to support projects of common interest in the sectors of transport, telecommunications and energy infrastructures. The Commission entrusted EIB with the implementation and management of the debt instrument under the CEF, which ensures continuity of the Loan Guarantee Instrument for TEN-T Projects (LGTT) and to the Pilot phase of Project Bond Initiative (PBI). The LGTT and PBI were merged together under the CEF on 1 January 2016. The CEF Delegation Agreement foresees an updated and common risk sharing arrangement. The EIB prepares separate financial statements for the CEF. Z.9. Fund of Funds (‘JESSICA II’) The Fund of Funds (“FoF”) consists of Decentralised Financial Instruments (DFIs) financed by the European Structural and Investment Funds (the "ESIF") from the Member States Operational Programmes during 2014-2020. The FoF facilitates access to finance for final recipients through the implementation of loans, equity and guarantees, in cooperation with selected Financial Intermediaries. As a fund manager, EIB gathers the funding (contributions) from the Managing Authorities and invests it via Financial Intermediaries, according to investment strategies agreed with the donors. The EIB prepares separate financial statements for each Fund of Fund. Z.10. JEREMIE JEREMIE (The Joint European Resources for Micro to Medium Enterprises) is an initiative of the European Commission’s Directorate General for Regional Policy (DG Regio) and the EIB Group. The EIF prepares separate financial statements for the JEREMIE. Z.11. GF Greece The Fund is a joint initiative between the Hellenic Republic, the EC and the EIB and was set up to support the lending to SMEs in Greece. Established by using unabsorbed Structural Funds for Greece, the Fund will guarantee EIB loans to SMEs via partner banks in Greece. The EIB prepares separate financial statements for the GF Greece. 135


EIB Group Consolidated Financial Statements under EU directives Z.12. Special Section The Special Section was set up by the Board of Governors on 27 May 1963. Under a decision taken on 4 August 1977, its purpose was redefined as being that of recording financing operations carried out by the EIB for the account of and under mandate from third parties. It includes the FED, MED/FEMIP, IPA (Instrument for Pre-Accession),Turkey mandates and the guarantee component of the European Development Finance Institutions Private Sector Development Facility. Z.13. European Structural Investment Fund (‘ESIF’) Under the European Structural Investment Fund (ESIF), Member States appointed EIF to manage ESIF funds as Holding Fund manager since November 2015. The ESIF initiative is aimed at promoting SME access to finance and financial engineering products, such as private equity funds, guarantee funds and loan funds. EIF is currently managing 2 ESIF Funding Agreements signed with Member States and regions: Basse-Normandie and Languedoc-Roussillon. The EIF prepares separate financial statements for ESIF. Z.14. COSME LGF & EFG To address the difficulties in access to finance for SMEs, COSME establishes the Loan Guarantee Facility (LGF) and the Equity For Growth (EFG). The LGF and the EFG aim to improve access to finance for SMEs in the form of debt and equity respectively. The Financial Instruments also include the mechanism of the EU Contribution under the SME Initiative. The EFG has been structured in the form of an equity financial instrument supporting Union enterprises growth and Research Innovation. The LGF has been structured in the form of a direct and indirect guarantee financial instrument. The objective of LGF is to contribute to the reduction of the structural shortcoming of the SME financing market and to support the creation of a more diversified SME finance market. Through direct and indirect guarantee, LGF aims to guarantee debt financing which addresses the particular difficulties that viable SMEs face in accessing finance. Furthermore, by guaranteeing the mezzanine tranche of eligible and transparent securitisation transactions, LGF aims to provide new avenues of financing for SMEs. The EIF prepares separate financial statements for the COSME LGF & EFG. Z.15. SME Initiative Italy During 2016, in the context of the SME Initiative, the EIF and the Managing Authorities of Finland, Bulgaria, Romania and Italy entered into four separate Funding Agreements in respect of the implementation and management of a dedicated window, which shall be implemented in connection with a specific allocation under H2020 Financial Instruments dedicated to Finland, Bulgaria, Romania and accordingly in connection with COSME LGF for Italy. These SME Initiatives aim at providing uncapped guarantees in connection with H2020 for new portfolios of debt finance to eligible SMEs in the respective countries. The EIF prepares separate financial statements for SME Initiative Italy. Z.16. European Neighbourhood and Partnership Instrument (‘ENPI’) The Framework Agreement between the European Union and the EIB on the implementation of operations financed from the general budget of the European Union in the countries covered by the European Neighbourhood Policy is channelled through ENPI. The EIB prepares separate financial statements for ENPI. Z.17. DCFTA Initiative East (‘DCFTA’) The European Investment Bank and the European Commission signed on 19 December 2016 the Delegation Agreement for the Deep and Comprehensive Free Trade Area (DCFTA). DCFTA Initiative East aims to strengthen economic development in the countries which have signed an association agreement with the EU - namely Georgia, Moldova and Ukraine - by providing targeted financial and technical support to small and medium-sized enterprises (SMEs) in these three countries. As part of the DCFTA, the EIF implements and manages the Guarantee Facility Window. The Guarantee Facility Window implemented and deployed by EIF consists of a first loss SME portfolio guarantee, in order to incentivise local intermediary banks to take on more risk and reach out underserved segments of the economy. The EIB prepares separate consolidated financial statements for the DCFTA including the Guarantee Facility Window. Z.18. SME Initiative Bulgaria During 2016, in the context of the SME Initiative, the EIF and the Managing Authorities of Finland, Bulgaria, Romania and Italy entered into four separate Funding Agreements in respect of the implementation and management of a dedicated window, which shall be implemented in connection with a specific allocation under H2020 Financial Instruments dedicated to Finland, Bulgaria, Romania and accordingly in connection with COSME LGF for Italy. These SME Initiatives aim at providing uncapped guarantees in connection with H2020 for new portfolios of debt finance to eligible SMEs in the respective countries. The EIF prepares separate financial statements for SME Initiative Bulgaria. Z.19. SME Initiative Romania During 2016, in the context of the SME Initiative, the EIF and the Managing Authorities of Finland, Bulgaria, Romania and Italy entered into four separate Funding Agreements in respect of the implementation and management of a dedicated window, which shall be implemented in connection with a specific allocation under H2020 Financial Instruments dedicated to Finland, Bulgaria, Romania and accordingly in connection with COSME LGF for Italy. These SME Initiatives aim at providing uncapped guarantees in connection with H2020 for new portfolios of debt finance to eligible SMEs in the respective countries. The EIF prepares separate financial statements for SME Initiative Romania. 139


Z.20. SMEG 2007 In the SMEG 2007 under the Competitiveness and Innovation Framework Programme (CIP/SMEG 2007), the EIF is empowered to issue guarantees in its own name but on behalf and at the risk of the Commission. The EIF prepares separate financial statements for the SMEG 2007. Z.21. InnovFin SME Guarantee In the context of the “Access to Risk Finance Programme” of Horizon 2020 and specific programme provides for the establishment of a financial instrument for debt and a financial instrument for equity. A Risk-Sharing facility called InnovFin SME Guarantee has been structured in the form of a guarantee, using the EU’s contribution for first defaulted amount taking and the risk-taking capacity of the EIF for second-Defaulted Amount taking. The objective of the Facility is to incentivise Intermediaries to extend loans or financial leases to small and medium sized enterprises and Small Mid-caps with significant activities in Research, Development and Innovation. The EIF prepares separate financial statements for the InnovFin SME Guarantee. Z.22. MAP Equity Under the Multi-Annual Programme (MAP) for enterprises and entrepreneurship, the EIF manages resources on behalf and at the risk of the EC. The EIF prepares separate financial statements for MAP Equity. Z.23. InnovFin Private Equity The Horizon 2020 Financial Instruments aim to ease the access to risk financing for Final Recipients in order to support eligible Research and Innovation. This covers loans, guarantees, equity and other forms of risk finance. The Horizon 2020 Financial Instruments aim also to promote early-stage investment and the development of existing and new venture capital funds; improve knowledge transfer and the market for intellectual property; attract funds for the venture capital market; and, overall; help to catalyse the transition from the conception, development and demonstration of new products and services to their commercialisation. The Horizon 2020 debt financial instrument also includes the implementation mechanism of the EU Contribution under the SME Initiative. The InnovFin Equity facility for early-stage aims at promoting early-stage investment and the development of existing and new venture capital funds providing equity finance for innovative enterprises, in particular in the form of venture or mezzanine capital in their early stage. The EIF prepares separate financial statements for the InnovFin Private Equity. Z.24. GIF 2007 In the GIF 2007 under the Competitiveness and Innovation Framework Programme and the Technology Transfer Pilot Project (CIP/GIF 2007), the EIF is empowered to acquire, manage and dispose of investments, in its own name but on behalf and at the risk of the Commission. The EIF prepares separate financial statements for the GIF 2007. Z.25. AECID This partnership agreement signed between the Kingdom of Spain (the Spanish Agency for International Development Cooperation (AECID) and the EIB was set up to invest in operations in the countries covered by the FEMIP together with Mauritania (the "Southern Mediterranean region"), targeting mainly risk capital activities involving micro and small/medium sized enterprises as well as engaging in the wider development of the private sector in the region. The EIB prepares separate financial statements for the AECID. Z.26. Employment and Social Innovation (‘EaSI’) The EaSI Guarantee financial Instrument consists, inter alia, of the EaSI Microfinance Guarantee which is the successor to the micro-credit guarantees under the European Progress Microfinance facility (“Progress Microfinance”). It will extend the support given to microcredit providers under Progress Microfinance. In addition, the EaSI Guarantee financial Instrument consists of the EaSI Social Entrepreneurship Guarantee, which is a new product which will facilitate access to finance for social enterprises and support the development of the social investment market. The EIF prepares separate financial statements for the EaSI. Z.27. WB EDIF The Western Balkan Enterprise Development & Innovation Facility (“WB EDIF”) is a joint initiative signed in December 2012 by the EC (DG ELARG), EIB Group and the European Bank for Reconstruction and Development (EBRD). It aims at improving access to finance for SMEs in the Western Balkans and to foster economic development in the region through the deployment of the Instrument for Pre-Accession Assistance (IPA) funds. Within WB EDIF, EIF acts as platform coordinator, Trustee on behalf of the EC for the Enterprise Expansion Fund (ENEF), Trustee on behalf of the EC for the Enterprise Innovation Fund (ENIF), and manager of the Guarantee Facility. The EIF prepares separate financial statements for the WB EDIF. 140


EIB Group Consolidated Financial Statements under EU directives Z.28. FEMIP Trust Fund The FEMIP (Facility for Euro-Mediterranean Investment and Partnership) Trust Fund, which is also managed by the EIB, was set up to enhance the existing activities of the EIB in the Mediterranean Partner Countries, with the support of a number of donor countries and with a view of directing resources to operations in certain priority sectors through the provision of technical assistance and risk capital. The EIB prepares separate financial statements for the FEMIP Trust Fund. Z.29. Greater Anatolia Guarantee Facility (‘GAGF’) Under the GAGF signed in May 2010, the EIF manages the Instrument for Pre-Accession Assistance (IPA) funds allocated for the Regional Competitiveness Operational Programme by the European Union and Turkey. The facility provides tailor-made financial help to SMEs and micro-enterprises in Turkey’s least developed provinces in partnership with major Turkish banks. The EIF prepares separate financial statements for the GAGF. Z.30. Neighbourhood Investment Facility (‘NIF’) Trust Fund The NIF Trust Fund, which is managed by the EIB was set up to achieve the strategic objective of the European Neighbourhood Policy (ENP) through targeted funding with particular focus on establishing better and more sustainable energy and transport interconnections, improving energy efficiency and promoting the use of renewable energy sources, addressing climate change as well as threats to the environment more broadly and promoting smart, sustainable and inclusive growth through support to SMEs, to the social sector including human capital development, and to municipal infrastructure development. The EIB prepares separate financial statements for the NIF Trust Fund. Z.31. SME Initiative Finland During 2016, in the context of the SME Initiative, the EIF and the Managing Authorities of Finland, Bulgaria, Romania and Italy entered into four separate Funding Agreements in respect of the implementation and management of a dedicated window, which shall be implemented in connection with a specific allocation under H2020 Financial Instruments dedicated to Finland, Bulgaria, Romania and accordingly in connection with COSME LGF for Italy. These SME Initiatives aim at providing uncapped guarantees in connection with H2020 for new portfolios of debt finance to eligible SMEs in the respective countries. The EIF prepares separate financial statements for SME Initiative Finland. Z.32. Heavily Indebted Poor Countries (‘HIPC’) Initiative The HIPC Initiative (the ’Initiative’) is an international debt relief mechanism that provides special assistance to the world's poorest countries. It was launched in 1996 following a proposal from the World Bank and the International Monetary Fund. The principal objective of the Initiative is to reduce the debt burden of poor countries to sustainable levels. The EIB prepares separate financial statements for the Initiative. Z.33. MAP Guarantee This resource is split equally between private equity and guarantee products. The equity segment known as ESU 1998 (G&E) and ESU 2001 (MAP) covers the ETF start-up investments. The guarantees segment known as SMEG 1998 (G&E) and SMEG 2001 (MAP), provides guarantees against the beneficiary’s undertaking. The EIF prepares separate financial statements for the MAP Guarantee. Z.34. Private Finance for Energy Efficiency Instrument (‘PF4EE’) The Private Finance for Energy Efficiency (PF4EE) instrument is a joint agreement between the EIB and the European Commission that aims to address the limited access to adequate and affordable commercial financing for energy efficiency investments. The instrument targets projects which support the implementation of National Energy Efficiency Action Plans or other energy efficiency programmes of EU Member States. In December 2014 the European Commission and the EIB signed a Delegation Agreement establishing the financial Instrument PF4EE. The EIB prepares separate financial statements for the PF4EE. The EIF prepares separate financial statements for the PF4EE. Z.35. EPTA Trust Fund The EPTA (The Eastern Partnership Technical Assistance) Trust Fund is focused on increasing the quality and development impact of EIB Eastern Partnership operations by offering a multi-purpose, multi-sector funding facility for technical assistance. It will be complementary to the Neighbourhood Investment Facility. The EIB prepares separate financial statements for the EPTA Trust Fund. Z.36. Neighbourhood Investment Facility (‘NIF’) Risk Capital Facility The Neighbourhood Investment Facility (‘NIF’) Risk Capital Facility is financed from the general budget of the European Union. Its main purpose is focused on providing access to equity and debt finance to SMEs in the Southern Neighbourhood region in order to support private sector development, inclusive growth and private sector job creation. The Facility comprises a Financial Instrument Window which consists of equity and debt finance instruments and Additional Tasks Window which consists of the technical assistance services. The EIB prepares separate financial statements for Financial Instrument Window. 138


Z.37. Instrument for Pre-accession Assistance II (‘IPA II’) The Instrument for Pre-accession Assistance (IPA) is the means by which the EU supports reforms in the 'enlargement countries' with financial and technical help. The pre-accession funds also help the EU reach its own objectives regarding a sustainable economic recovery, energy supply, transport, the environment and climate change, etc. The successor of IPA I, IPA II, will build on the results already achieved by dedicating EUR 11.7 billion for the period 2014-2020. The most important novelty of IPA II is its strategic focus. The Framework Partnership Agreement, signed at the end of the year 2015, is implemented by the EIB, allocating resources from DG NEAR via the signature of various “Specific Grant Agreements”. The EIB prepares financial statements for the specific grant agreements under IPA II. Z.38. Cultural and Creative Sectors Guarantee Facility The financial instrument, set-up under Creative Europe - the main EU programme dedicated to the cultural and creative sectors - will be managed by the EIF on behalf of the European Commission. The initiative will allow the EIF to provide guarantees and counter-guarantees to selected financial intermediaries to enable them to provide more debt finance to entrepreneurs in the cultural and creative arena. Loans generated are expected to support more than ten thousand SMEs in a wide range of sectors such as audiovisual (including film, television, animation, video games and multimedia), festivals, music, literature, architecture, archives, libraries and museums, artistic crafts, cultural heritage, design, performing arts, publishing, radio and the visual arts. The EIF prepares separate financial statements for Cultural and Creative Sectors Guarantee Facility. Z.39. SME Initiative Malta In 19 January 2015, the European Commission, the EIB and the ElF signed an amendment to the Horizon 2020 delegation agreement setting out the terms and conditions applicable to certain terms of the dedicated window corresponding to the SME Initiative and the contribution of the EU to such dedicated windows of the H2020 Financial Instruments. SME Initiatives in Spain and Malta were launched in the previous year. The EIF prepares separate financial statements for SME Initiative Malta. Z.40. Student Loan Guarantee Facility (‘Erasmus’) Under the European Structural Investment Fund (ESIF), Member States appointed EIF to manage ESIF funds as Holding Fund manager since November 2015. The ESIF initiative is aimed at promoting SME access to finance and financial engineering products, such as private equity funds, guarantee funds and loan funds. EIF is currently managing 2 ESIF Funding Agreements signed with Member States and regions: Basse-Normandie and Languedoc-Roussillon. The EIF prepares separate financial statements for the Student Loan Guarantee. Z.41. European Fund for Strategic Investments (‘EFSI’) On the basis of applicable EFSI Regulations the European Commission and the EIB concluded agreements on the management of the EFSI, on the granting of the EU guarantee (the EFSI Agreement) as well as for the implementation of the European Investment Advisory Hub (‘EIAH’) (the EIAH Agreement). Under the EFSI Agreement, the EC is providing an EU guarantee to EIB for projects supported by the EFSI. Assets covering the EU guarantee are directly managed by the European Commission. Projects supported by the EFSI are subject to the normal EIB project cycle and governance. In addition, EFSI has its own dedicated governance structure which has been set in place to ensure that investments made under EFSI remain focused on the specific objective of addressing the market failure in risk-taking which hinders investment in Europe. The EIAH aims to enhance the non-financial support for projects and investments. The EIAH consists of three complementary components: a) a point of entry to a wide range of advisory and technical assistance programmes and initiatives for public and private beneficiaries, b) a cooperation platform to leverage, exchange and disseminate expertise among partner institutions and c) a reinforcement or extension of existing advisory services or creation of new ones to address unmet needs. The EIB prepares separate financial statements for the EIAH. Z.42. SME Guarantee Facility The EIF is empowered to issue guarantees in its own name but on behalf and at the risk of the European Union according to the Fiduciary and Management Agreement concluded with the European Union. The EIF prepares separate financial statements for SME Guarantee Facility. Z.43. NPI Securitisation Initiative (‘ENSI’) The EIF and several National Promotional Institutions (NPIs) including KfW, bpifrance, CDP, Malta Development Bank Working Group, IFD, ICO and BBB have launched the EIF-NPI Securitisation Initiative (ENSI), a cooperation and risk sharing platform aiming at providing more funding to small and medium-sized enterprises (SMEs) via the capital markets. The objective of this joint cooperation in SME Securitisation transactions is to stimulate the availability of finance to SMEs in Europe by revitalising the SME Securitisation market while catalysing resources from the private sector. This reflects the spirit of the European Fund for Strategic Investments aiming to achieve a much wider outreach in support of SMEs. Z.44. Natural Capital Finance Facility (‘NCFF’) The Natural Capital Finance Facility (NCFF) is a joint agreement between the EIB and the European Commission which aims to address market gaps and barriers for revenue generating or cost saving projects that are aimed at preserving natural capital, including climate change adaptation 139


EIB Group Consolidated Financial Statements under EU directives projects and thereby to contribute to the achievement of EU and Member States' objectives for biodiversity and climate change adaptation. The EIB prepares separate financial statements for the NCFF. Z.45. National Promotional Institutions (‘NPI’) This is the second programme with CDP (Italy) Social Impact Investing in the framework of the partnership between EIF and CDP. The focus of this programme signed as of 29 November 2017 will be the domain of social finance in Italy. It is a multi-product tailored investment programme that will include equity investments into intermediaries, direct equity and debt investments. Z.46. Bundesministerium für Wirtschaft und Technologie The EIF manages funds on behalf of the German Bundesministerium für Wirtschaft und Technologie (Federal Ministry of Economics and Technology) and the European Recovery Programme. Z.47. G43 Trust Fund Under G43 Anatolian Venture Capital Fund, signed in August 2012, the EIF is entrusted with a mandate by Central Finance Unit of Turkey (CFCU). It is dedicated to make investments in SMEs in South-Eastern Anatolia region of Turkey. The EIF prepares separate financial statements for the G43. Z.48. European Technology Facility (‘ETF’) Under the ETF Start-Up Facility, the EIF is empowered to acquire, manage and dispose of ETF start-up investments, in its own name but on behalf of and at the risk of the EC. Z.49. Alpine Growth Investment Platform (‘AlpGIP’) In September 2017 EIF launched an innovative regional equity platform (non-corporate structure) targeting the late venture capital and growth segment in the EU Alpine Macroregion. The Italian regions Lombardia, Piemonte, Val d’Aosta and Alto Adige (Bolzano region) have already invested in the Platform other regions are expected to join at a later stage. Z.50. European Parliament Preparatory Action (‘EPPA’) In 2010, the EIF signed the EPPA with DG REGIO. The EIF is providing risk capital and financial support for capacity building purposes in order to help a select number of microfinance institutions to reach a meaningful size and improve their prospects for sustainability. The EIF prepares separate financial statements for the EPPA. Z.51. PGFF The Polish Growth Fund-of-Funds (“PGFF”), signed in April 2013, is a fund-of-funds, structured as a partnership, which invests in venture capital and private equity funds and focused on Poland. It is funded jointly by the EIB Group and the Bank Gospodarstwa Krajowego. The EIF prepares separate financial statements for the PGFF. Z.52. BIF The Baltic Innovation Fund (“BIF”), signed in September 2012, is a fund-of-funds, structured as a partnership, which invests in venture capital and private equity funds and focused on the Baltic region. It is funded jointly by the EIB Group and the following Baltic national agencies: Fund KredEx in Estonia, Latvijas Garantiju Agentiira in Latvia and lnvesticiju ir verslo garantijosin Lithuania. The EIF prepares separate financial statements for the BIF. Z.53. Research and Innovations Advisory (‘RDI Advisory’) The RDI Advisory was set up in partnership with the European Commission under a 7 year framework agreement signed in June 2014, as part of the InnovFin programme under Horizon 2020. It has two main lines of activity: (i) upstream project related advisory and (ii) horizontal activities destined to improve the overall framework conditions for RDI investments as well as the financing tools under Horizon 2020. The EIB prepares separate financial statements for the RDI Advisory. Z.54. GEEREF (‘Fund and Technical Support Facility’) GEEREF (Global Energy Efficiency and Renewable Energy Fund) is a fund of funds set-up at the initiative of the EC. Its objective is to make investments in private equity funds that focus on the fields of renewable energy and energy efficiency in emerging markets (ACP, ALA and European Neighbour countries). The EIF also holds a technical assistance mandate for which related activities are implemented by the GEEREF front office. 140


Z.55. JASPERS JASPERS (Joint Assistance to Support Projects in European Regions) is a technical assistance facility between the EIB, the European Commission and the EBRD. It provides support to the majority of EU and Candidate Countries to help improve the quality of the major projects to be submitted for grant financing under the Structural and Investment Funds. JASPERS assistance may cover project preparation support, from identification to submission of the request for EU grant finance; independent quality review of projects; horizontal assignments; strategic support: capacity building, including a Competence Centre; and implementation support. JASPERS’ work is organised in seven divisions (Roads; Rail, Air and Maritime; Water and Waste; Energy and Solid Waste; Smart Development; Networking and Competence Centre; and Independent Quality Review). In its first ten years of operations (2005-2015), JASPERS has assisted over 1000 projects. The investment value of the projects assisted by JASPERS and approved by the European Commission for grant financing is over EUR 72 billion. The EIB prepares separate financial statements for JASPERS. Z.56. LfA-EIF Facility LfA-EIF Facility, signed in 2009, is a joint EIF and LfA Förderbank Bayern venture providing investments to support technology-oriented early and expansion stage companies in the region of Bavaria, Germany. Z.57. Technology Transfer Pilot Project (‘TTP’) Under the TTP, financed by the EC and signed in November 2008, the EIF has supported a technology transfer structure through pre-seed funding and seed funding. The EIF prepares separate financial statements for the TTP. Z.58. Mezzanine Dachfonds fur Deutschland (‘MDD’) The MDD in an investment programme signed in June 2013 and funded by the German Federal Ministry of Economics and Technology (BMWi) and various institutions of the Federal states to subscribe into hybrid debt and equity funds investing in German MidCaps. Z.59. SME Initiative for Spain On 26 January 2015 the Delegation Agreement between the Kingdom of Spain and European Investment Fund was signed. EIF will provide uncapped guarantees for new portfolios of debt finance to eligible SMEs and securitisation of existing debt finance to SMEs and other enterprises with less than 500 employees and/or new portfolios of debt finance to SMEs. The EU contribution to the SME Initiative for Spain, received by the EIF, is subject to the treasury asset management to be carried out by the EIB, which is governed by the signed Asset Management Side Letter between the European Investment Fund and the European Investment Bank. The EIF prepares separate financial statements for the SME Initiative for Spain. Z.60. Green for Growth Fund (‘GGF’) The Green for Growth Fund was set up by the EIF in December 2009 and focuses on energy efficiency financings in South East Europe including Turkey. Z.61. GEEREF Under the Global Energy Efficiency and Renewable Energy Fund (GEEREF), EIF has been acting since December 2007 as investment advisor. GEEREF is supported by the EC, the Federal Government of Germany and the Kingdom of Norway and its objective is to invest primarily in regional funds with assets in projects and companies involved in energy efficiency and renewable energy enhancing access to clean energy in developing countries and economies in transition. The GEEREF business development is formally delegated to the EIB under a sub-advisory agreement. Z.62. TTA Turkey TTA Turkey is an initiative designed by the EIF in cooperation with the Ministry of Science, Industry and Technology (MoSIT), the Scientific and Research Council of Turkey (TUBITAK), the Delegation of the European Union to Turkey and the DG Regional Policy of the European Commission. TTA Turkey is co-financed by the EU and the Republic of Turkey under the Regional Development Component of the Instrument for Pre-Accession Assistance (IPA) funds and managed by EIF. TTA Turkey aims at achieving two objectives: setting-up a financially sustainable fund by facilitating the commercialisation of scientific research and development (R&D) confined in universities and research centres and catalysing development of the technology transfer market in Turkey, with a particular emphasis on spill-overs to the less developed/developing regions of Turkey. Z.63. Financial Instruments (‘FI’) compass advisory platform The fi-compass advisory platform provides EU Member States and their managing authorities as well as microcredit providers with advisory support and learning opportunities for developing financial instruments, within the scope of European Structural Investment Funds (ESIF) and the Programme for Employment and Social Innovation (EaSI). It is implemented by the EIB and funded by the EC under a Framework Contract for the period 2014-2020. The EIB prepares separate financial statements for Financial Instrument compass advisory platform. 141


EIB Group Consolidated Financial Statements under EU directives Statement of Special Section(1) as at 31 December 2017 and 2016 (in EUR ‘000) ASSETS 31.12.2017 31.12.2016 Turkey From resources of Member States Disbursed loans outstanding 0 271 Instrument for Pre-Accession ('IPA') From resources of Member States Disbursed loans outstanding 0 0 Mediterranean Countries From resources of the European Union Disbursed loans outstanding Risk capital operations - amounts to be disbursed - amounts disbursed 36,934 49,130 29,260 39,288 39,738 53,090 68,998 92,378 African, Caribbean and Pacific State and Overseas Countries and Territories From resources of the European Union · Yaoundé Conventions Loans disbursed Contributions to the formation of risk capital - amounts disbursed 352 764 419 419 · Lomé Conventions Operations from risk capital resources - amounts to be disbursed - amounts disbursed 0 0 194,336 219,272 194,336 219,272 LIABILITIES 31.12.2017 31.12.2016 Funds under trust management Under mandate from the European Union - Financial Protocols with the Mediterranean Countries - Financial Protocols with the instrument for Pre-Accession ('IPA') - Yaoundé Conventions - Lomé Conventions - Other resources under the Lomé Conventions 76,672 0 771 194,336 0 102,220 0 1,183 219,272 0 271,779 0 322,675 271 Under mandate from Member States Total funds under trust management 271,779 322,946 Funds to be disbursed On loans and risk capital operations in the Mediterranean countries On operations from risk capital resources under the Lomé Conventions 29,260 0 39,288 0 Total funds to be disbursed 29,260 39,288 Total 301,039 362,234 For information: Total amounts disbursed and not yet repaid on loans on special conditions made available by the Commission in respect of which the Bank has accepted an EU mandate for recovering principal and interest: a) Under the First, Second and Third Lomé Conventions as at 31 December 2017 EUR ‘000 229,159 (2016: EUR ‘000 321,166) b) Under Financial Protocols signed with the Mediterranean Countries as at 31 December 2017 EUR ‘000 54,433 (2016: EUR ‘000 60,557) In the context of the European Union – European Development Finance Institutions Private Sector Development Facility, the implementation agreement for the Guarantee Component was signed on 20 August 2014. Total amount of the EU guarantee issued is EUR ‘000 4,280 as at 31 December 2017 (2016: EUR ‘000 4,280). Total amount of the EU guarantee to be issued is EUR ‘000 38,920 as at 31 December 2017 (2016: EUR ‘000 38,920). Note (1): The Special Section was set up by the Board of Governors on 27 May 1963. Under a decision taken on 4 August 1977, its purpose was redefined as being that of recording financing operations carried out by the European Investment Bank for the account of and under mandate from third parties. However, for the Investment Facility under the Cotonou Agreement, the EU-Africa Infrastructure Trust Fund, the Neighbourhood 142 Total(6) 194,336 219,272 Total 301,039 362,234 Total(5) 771 1,183 Total(4) 105,932 141,508 Total(3) 0 0 Total(2) 0 271


Investment Facility (NIF) Trust Fund and the FEMIP Trust Fund, separate financial statements are presented. In addition, since 2005, the EIB also prepares financial statements of different types for other mandates. The Statement of Special Section reflects amounts disbursed or to be disbursed, less cancellations and repayments, under mandate from the European Union and the Member States. Amounts disbursed and to be disbursed and funds received and to be received are carried at nominal value. No account is taken in the Statement of Special Section of provisions or value adjustments, which may be required to cover risks associated with such operations except for definite write-offs. Amounts in foreign currency are translated at exchange rates prevailing on 31 December. Note (2): Initial amount of contracts signed for financing projects in Turkey under mandate, for the account and at the risk of Member States. Initial amount: add: less: 405,899 20,547 exchange adjustments cancellations repayments 215 426,231 -426,446 Note (3): Initial amount of contracts signed for financing projects under the Instrument for Pre-Accession, for the account and at the risk of the European Union. Initial amount: less: 29,640 exchange adjustments cancellations repayments 10,517 0 19,123 -29,640 Note (4): Initial amount of contracts signed for financing projects in the Maghreb and Mashreq countries, Malta, Cyprus, Turkey and Greece (EUR 10 million lent prior to accession to the EC on 1 January 1981) under mandate, for the account and at the risk of the European Union. Initial amount: less: 840,457 exchange adjustments cancellations repayments 58,999 164,335 511,191 -734,525 Note (5): Initial amount of contracts signed for financing projects in the Associated African States, Madagascar and Mauritius and the Overseas Countries, Territories and Departments (AASMM-OCTD) under mandate, for the account and at the risk of the European Union. Loans on special conditions Contributions to the formation of risk capital Initial amount: add: 139,483 2,503 141,986 capitalised interest exchange adjustments 1,178 9,823 11,001 less: cancellations repayments 3,310 148,906 -152,216 143 771 105,932 0 0


EIB Group Consolidated Financial Statements under EU directives Note (6): Initial amount of contracts signed for financing projects in the African, Caribbean and Pacific States and the Overseas Countries and Territories (ACP-OCT) under mandate, for the account and at the risk of the European Union: Loans from risk capital resources: Conditional and subordinated loans Equity participations Initial amount: add: 3,116,097 121,002 3,237,099 9,548 capitalised interest less: cancellations repayments exchange adjustments 731,474 2,264,829 56,008 -3,052,311 194,336 Loans from other resources: Initial amount: add: less: 16,500 58 exchange adjustments cancellations repayments 8,414 8,144 -16,558 0 144 194,336


Independent Auditor’s Report To the Chairman of the Audit Committee of EUROPEAN INVESTMENT BANK 98-100, Boulevard Konrad Adenauer L-2950 LUXEMBOURG REPORT OF THE REVISEUR D’ENTREPRISES AGREE Report on the audit of the consolidated financial state-ments Opinion We have audited the consolidated financial statements of EUROPEAN INVESTMENT BANK and its subsidiaries (the “Group”), which comprise the consolidated balance sheet as at 31 December 2017, and the consolidated profit and loss account and the consolidated cash flow statement for the year then ended, and notes to the consolidated finan-cial statements, including a summary of significant ac-counting policies and other explanatory information. Standards on Auditing (“ISAs”) as adopted for Luxembourg by the “Commission de Surveillance du Secteur Financier” (“CSSF”). Our responsibilities under those Regulation, Law and standards are further described in the “Responsibilities of “Réviseur d’Entreprises agréé for the audit of the consoli-dated financial statements” section of our report. We are also independent of the Group in accordance with the In-ternational Ethics Standards Board for Accountants’ Code of Ethics for Professional Accountants (“IESBA Code”) as adopted for Luxembourg by the CSSF together with the ethical requirements that are relevant to our audit of the consolidated financial statements, and have fulfilled our other ethical responsibilities under those ethical require-ments. We believe that the audit evidence we have ob-tained is sufficient and appropriate to provide a basis for our opinion. In our opinion, the accompanying consolidated financial statements give a true and fair view of the consolidated fi-nancial position of the Group as at 31 December 2017, and of the consolidated results of its operations and its consol-idated cash flows for the year then ended in accordance with the general principles of the Directive 86/635/EEC of the Council of the European Communities of 8 December 1986 on the annual accounts and consolidated financial statements of banks and other financial institutions, as amended by Directive 2001/65/EC of 27 September 2001, by Directive 2003/51/EC of 18 June 2003 and by Directive 2006/46/EC of 14 June 2006 (the “Directives”). Key audit matters Key audit matters are those matters that, in our profes-sional judgment, were of most significance in our audit of the consolidated financial statements of the current peri-od. These matters were addressed in the context of the audit of the consolidated financial statements as a whole, and in forming our opinion thereon, and we do not pro-vide a separate opinion on these matters. Basis for Opinion We conducted our audit in accordance with the EU Regula-tion N° 537/2014, the Law of 23 July 2016 on the audit pro-fession (“Law of 23 July 2016”) and with International 145


EIB Group Consolidated Financial Statements under EU Directives 1Value adjustments of loans and advances to custom-ers and financial institutions review, further critically assessed whether the Group re-vised its estimates and assumptions for specific allowanc-es established in prior years. Description We also tested a sample of individually significant expo-sures, which had not been identified as potentially im-paired by the Group and assessed whether appropriate consideration was given to the collectability of future cash flows and the valuation of the underlying collaterals. As at 31 December 2017, the Group reports loans and ad-vances accounted for at amortized cost of EUR 435,181 mil-lion representing 79% of total assets and recognized individually assessed value adjustments on loans amount-ing to EUR 466 million. We assessed the disclosures in the consolidated financial statements in relation to impairment of loans and advanc-es with reference to the requirements of the prevailing ac-counting standards. Management follows its Specific Provisioning Guidelines embedded in the Financial Monitoring Guidelines to esti-mate the level of specific provisions on loans and advanc-es on an individual basis. Allowances for credit losses reflected the difference between the carrying loan amount and the present value of all the expected future cash-flows generated by the impaired asset. The Group neither applies general nor collective value adjustments. 2 Valuation of venture capital investments Description Venture capital investments, for which no quoted markets prices are available amount to EUR 4,339 million as at 31 December 2017. Those investments are initially record-ed at cost. Their carrying value is subsequently measured adjusted to the lower of cost or market value. Manage-ment has determined the fair value of these unlisted in-vestments applying the Group’s percentage ownership in the underlying vehicle to the Net Asset Value (“NAV”) re-flected in the most recent report adjusted for cash flows. Unrealized losses due to administrative expenses and management fees for investments in existence for less than two years are not taken into consideration in deter-mining the attributable NAV. These loans and advances are not traded in an active mar-ket, therefore significant judgments and estimates are re-quired to be applied by Management in its assessment of recoverable amount. Inappropriate judgments made in relation to the methodology and inputs used or the as-sumptions taken may have a material impact on the allow-ances for credit losses. These critical judgements include matters such as the identification and assessment of potential indicators of impairment, as well as discounted cash flows forecast techniques, estimation of guarantees obtained, valuation of collaterals received and forbearance measures applied. These investments are not traded in an active market, therefore significant judgments and estimates are re-quired to be applied by Management in its assessment of their fair value. Inappropriate judgments made in relation to the methodology and inputs used or the assumptions taken may have a material impact on the valuation of the investment portfolio. The key inputs and assumptions used by Management in its assessment of loan impairment are detailed in notes A.2.7.1 and U.2.1 to the consolidated financial statements as well as the value adjustments in note D.2. How our audit addressed the area of focus Our procedures included the assessment of Key controls over the approval, recording, monitoring and restructur-ing of loans and advances to customers, the loan grading process and the measurement of impairment allowances for individually assessed loans and advances. The key inputs and assumptions used by Management in its assessment of the fair value of unlisted investments are detailed in note A.2.8 as well further disclosures are pre-sented in note E.2 to the consolidated financial state-ments. For a sample of loans with specific allowances for credit losses, we evaluated the Group's individual assessment of each loan and specifically challenged the Group's assump-tions used, including the value of realisable collateral and the estimated recoverability. Based on a retrospective How our audit addressed the area of focus Our procedures over the valuation of the private equity in-vestments included, but were not limited to: 146


We obtained an understanding of Management’s process-es and controls for determining the fair valuation of in-vestments in private equity investments by performing walkthrough procedures. This included discussing with Management the valuation governance structure and pro-tocols around their oversight of the valuation process and corroborating our understanding by attending the Invest-ment & Risk Committee meeting. there is a material misstatement of this other information, we are required to report this fact. We have nothing to re-port in this regard. Responsibilities of the Management and Those Charged with Governance for the consolidated financial statements The Management is responsible for the preparation and fair presentation of these consolidated financial state-ments in accordance with the general principles of the Di-rectives, and for such internal control as the Management determines is necessary to enable the preparation of con-solidated financial statements that are free from material misstatement, whether due to fraud or error. We have identified key controls in the process, assessed the design adequacy and tested the operating effective-ness of some of these controls. In addition, we obtained the ISAE 3402 report on EIF’s internal controls, compared our understanding of identified key controls in the pro-cess and inspected the conclusions reached based on the testing of operating effectiveness of those controls and noted no observations or exceptions in the report, which allow us to rely on controls over value adjustments of ven-ture capital. In preparing the consolidated financial statements, the Management is responsible for assessing the Group’s abil-ity to continue as a going concern, disclosing, as applica-ble, matters related to going concern and using the going concern basis of accounting unless the Management either intends to liquidate the Group or to cease opera-tions, or has no realistic alternative but to do so. We sought explanations from Management where there are judgments applied in their application of the valuation guidelines, discussed and assessed their appropriateness. This included assessing the annual back-testing exercise on the accuracy of estimated fair values of private equity funds valuation during the year and the prior year fair val-ue, to further assess the reasonableness of the current year valuation assumptions used by Management in perform-ing the value adjustments assessment. Responsibilities of the Réviseur d’Entreprises agréé for the audit of the consolidated financial statements The objectives of our audit are to obtain reasonable assur-ance about whether the consolidated financial statements as a whole are free from material misstatement, whether due to fraud or error, and to issue a report of “Réviseur d’Entreprises agréé” that includes our opinion. Reasonable assurance is a high level of assurance, but is not a guarantee that an audit conducted in accordance with the EU Regula-tion N° 537/2014, the Law of 23 July 2016 and with ISAs as adopted for Luxembourg by the CSSF will always detect a material misstatement when it exists. Misstatements can arise from fraud or error and are considered material if, indi-vidually or in the aggregate, they could reasonably be ex-pected to influence the economic decisions of users taken on the basis of these consolidated financial statements. On a sample basis, we reconciled the latest available NAV statements provided by private equity fund managers to the value adjustment file prepared by EIF and we recalcu-lated the mathematical accuracy of the unrealized results on the revaluation of investments on a sample basis. Other information The Management is responsible for the other information. The other information comprises the information included in the sections called “Highlights, Preface, Borrowing ac-tivities, Treasury Activities, EIB Statutory Bodies and Audit and control”; but does not include the consolidated finan-cial statements and our report of “Réviseur d’Entreprises agréé” thereon. As part of an audit in accordance with the EU Regulation N° 537/2014, the Law of 23 July 2016 and with ISAs as adopted for Luxembourg by the CSSF, we exercise profes-sional judgment and maintain professional skepticism throughout the audit. We also: Our opinion on the consolidated financial statements does not cover the other information and we do not ex-press any form of assurance conclusion thereon. • Identify and assess the risks of material misstatement of the consolidated financial statements, whether due to fraud or error, design and perform audit procedures responsive to those risks, and obtain audit evidence that is sufficient and appropriate to provide a basis for our opinion. The risk of not detecting a material mis-statement resulting from fraud is higher than for one resulting from error, as fraud may involve collusion, forgery, intentional omissions, misrepresentations, or the override of internal control. In connection with our audit of the consolidated financial statements, our responsibility is to read the other informa-tion and, in doing so, consider whether the other informa-tion is materially inconsistent with the consolidated financial statements or our knowledge obtained in the au-dit or otherwise appears to be materially misstated. If, based on the work we have performed, we conclude that 147


EIB Group Consolidated Financial Statements under EU Directives • Obtain an understanding of internal control relevant to the audit in order to design audit procedures that are appropriate in the circumstances, but not for the purpose of expressing an opinion on the effectiveness of the Group’s internal control. • Obtain sufficient appropriate audit evidence regard-ing the financial information of the entities and busi-ness activities within the Group to express an opinion on the consolidated financial statements. We are re-sponsible for the direction, supervision and perfor-mance of the Group audit. We remain solely responsible for our audit opinion. • Evaluate the appropriateness of accounting policies used and the reasonableness of accounting estimates and related disclosures made by the Management. We communicate with those charged with governance re-garding, among other matters, the planned scope and timing of the audit and significant audit findings, includ-ing any significant deficiencies in internal control that we identify during our audit. • Conclude on the appropriateness of Management’s use of the going concern basis of accounting and, based on the audit evidence obtained, whether a ma-terial uncertainty exists related to events or conditions that may cast significant doubt on the Group’s ability to continue as a going concern. If we conclude that a material uncertainty exists, we are required to draw at-tention in our report of “Réviseur d’Entreprises agréé” to the related disclosures in the consolidated financial statements or, if such disclosures are inadequate, to modify our opinion. Our conclusions are based on the audit evidence obtained up to the date of our report of “Réviseur d’Entreprises agréé”. However, future events or conditions may cause the Group to cease to continue as a going concern. We also provide those charged with governance with a statement that we have complied with relevant ethical re-quirements regarding independence, and to communi-cate with them all relationships and other matters that may reasonably be thought to bear on our independence, and where applicable, related safeguards. From the matters communicated with those charged with governance, we determine those matters that were of most significance in the audit of the consolidated financial statements of the current period and are therefore the key audit matters. We describe these matters in our report un-less law or regulation precludes public disclosure about the matter. • Evaluate the overall presentation, structure and con-tent of the consolidated financial statements, includ-ing the disclosures, and whether the consolidated financial statements represent the underlying transac-tions and events in a manner that achieves fair presen-tation. Luxembourg, 15 March 2018 KPMG Luxembourg, Société coopérative Cabinet de révision agréé 39, Avenue John F. Kennedy L-1855 Luxembourg Société coopérative de droit luxembourgeois R.C.S. Luxembourg B 149133 Capital EUR 12 503 S. CHAMBOURDON 148


Statement by the Audit Committee The Audit Committee reports to the Board of Governors, the following statement being communicated to the Gov-ernors prior to their approval of the Annual Report and the financial statements for the past financial year. Statement by the Audit Committee on the EIB’s consoli-dated financial statements prepared in accordance with the general principles of the ‘Directives’ The Committee, instituted in pursuance of Article 12 of the Statute and Chapter V of the Rules of Procedure of the European Investment Bank for the purpose of verifying that the operations of the Bank are conducted and its books kept in a proper manner, having: • met regularly the Head of Internal Audit and dis-cussed the relevant internal audit reports, and stud-ied the documents which it deemed necessary to examine in the discharge of its duties, received assurance from the Management Commit-tee concerning the effectiveness of the internal con-trol structure and internal administration, • and considering • the consolidated financial statements for the financial year ended 31 December 2017 adopted by the Board of Directors at its meeting on 15 March 2018; that the foregoing provides a reasonable basis for its statement and, Articles 24, 25 & 26 of the Rules of Procedure, • designated KPMG as external auditors, reviewed their audit planning process, examined and discussed their reports, and in particular their independent Auditor’s Report, noted that the opinion of KPMG on the consolidated financial statements of the European Investment Bank for the year ended 31 December 2017 prepared in ac-cordance with the general principles of the Directive 86/635/EEC of the Council of the European Communi-ties of 8 December 1986 on the annual accounts and consolidated accounts of banks and other financial in-stitutions, as amended by Directive 2001/65/EC of 27 September 2001, by Directive 2003/51/EC of 18 June 2003 and by Directive 2006/46/EC of 14 June 2006 (the ‘Directives’), is unqualified, convened on a regular basis with the Heads of Direc-torates and relevant services including, • the Financial Controller, • the Directors General of Risk Management, Trans-action Monitoring and Restructuring and Compli-ance, • • • to the best of its knowledge and judgement: • confirms that the consolidated financial statements of the European Investment Bank, which comprise the consolidated balance sheet as at 31 December 2017, the consolidated profit and loss account and the consolidated cash flow statement for the year then ended, and notes to the consolidated financial state-ments, including a summary of significant accounting policies and other explanatory information, give a true and fair view of the consolidated financial posi-tion of the European Investment Bank as of 31 De-cember 2017, and of the consolidated results of its operations and its consolidated cash flows for the year then ended in accordance with the general prin-ciples of the Directives. • Luxembourg, 15 March 2018 Audit Committee P. KRIER D. PITTA FERRAZ J. SUTHERLAND J. DOMINIK M. MACIJAUSKAS V. IUGA 149


EIB Group Consolidated Financial Statements under IFRS 150 EIB Group Consolidated Financial Statements under IFRS as at 31 December 2017


Consolidated balance sheet as at 31 December 2017 (in EUR ’000) The accompanying notes form an integral part of these consolidated financial statements. 151 Assets 31.12.2017 31.12.2016 1. Cash in hand, balances with central banks and post office banks (Note B.1) 2. Treasury bills and other bills eligible for refinancing with central banks (Note B.2) 3. Loans and advances to credit institutions a) repayable on demand b) other loans and advances (Note C) c) loans (Note D.1) 4. Loans and advances to customers a) other loans and advances (Note C) b) loans (Note D.1) c) impairment on loans and advances, net of reversals (Note D.2) 5. Debt securities including fixed-income securities (Note B.2) a) issued by public bodies b) issued by other borrowers 6. Shares and other variable-yield securities (Note B.3) 7. Derivative assets (Note Q) 8. Property, furniture and equipment (Note E) 9. Intangible assets (Note E) 10. Other assets (Note G.1) 11. Subscribed capital and reserves, called but not paid (Note W.1) 12. Prepayments 162,483 41,642,957 937,805 33,889,316 123,174,159 316,769 51,759,729 865,097 35,216,160 126,110,230 162,191,487 2,219,000 332,737,553 -476,692 334,479,861 8,673,315 7,240,070 15,913,385 6,028,211 63,651,371 272,900 16,219 136,568 76,656 75,217 158,001,280 1,740,923 334,098,532 -409,657 335,429,798 7,060,841 8,704,556 15,765,397 7,245,151 43,861,007 265,338 21,264 154,631 25,724 82,827 Total assets 602,657,857 634,918,373


EIB Group Consolidated Financial Statements under IFRS Consolidated balance sheet (continued) as at 31 December 2017 (in EUR ’000) The accompanying notes form an integral part of these consolidated financial statements. 152 Liabilities and equity 31.12.2017 31.12.2016 Liabilities 1. Amounts owed to credit institutions (Note H.1) a) repayable on demand b) with agreed maturity or periods of notice 2. Amounts owed to customers (Note H.2) a) repayable on demand b) with agreed maturity or periods of notice 3. Debts evidenced by certificates (Note I) a) debt securities in issue b) others 4. Derivative liabilities (Note Q) 5. Other liabilities (Note G.2) 6. Deferred income (Note F) 7. Provisions a) pension plans and health insurance scheme (Note J) b) provisions for guarantees issued (Note D.4) 4,952,467 57,526 12,420,433 694,207 1,927,330 25,030 499,728,861 18,173,985 4,715,296 42,479 13,114,640 1,952,360 517,902,846 32,869,229 1,682,462 171,233 4,757,775 5,009,993 1,922,566 8,346 1,930,912 473,489,010 16,538,646 490,027,656 32,651,732 1,730,478 180,315 5,565,841 23,460 5,589,301 Total liabilities 537,120,387 572,450,545 Equity 8. Capital (Note W) a) subscribed b) uncalled 9. Consolidated reserves a) reserve fund b) additional reserves c) fair value reserve d) special activities reserve e) general loan reserve 10. Profit/loss for the financial year (Note K) 243,284,155 -221,585,020 243,284,155 -221,585,020 21,699,135 24,328,415 4,379,438 2,181,108 6,776,060 3,305,458 40,970,479 -276,892 21,699,135 24,328,415 3,449,568 2,470,292 7,504,091 2,700,556 40,452,922 3,317,978 Total equity attributable to the equity holders of the Bank 11. Non-controlling interests 65,470,035 62,392,722 67,435 75,106 Total equity 65,537,470 62,467,828 Total liabilities and equity 602,657,857 634,918,373


Consolidated income statement for the year ended 31 December 2017 (in EUR ‘000) 1. 2. 3. 4. 5. 6. 7. 8. 9. 10. 11. 12. 13. The accompanying notes form an integral part of these consolidated financial statements. 153 2017 2016 Interest and similar income (Note L) Interest expense and similar charges (Note L) Income from shares and other variable-yield securities Fee and commission income (Note O) Fee and commission expense Result on financial operations (Note M) Other operating income (Note N) Other operating expense Change in impairment on loans and advances and provisions for guarantees, net of reversals (Notes D.2, D.4) Change in impairment on transferable securities held as financial fixed assets, shares and other variable-yield securities, net of reversals General administrative expenses (Notes J, P) a) staff costs (Note J) b) other administrative costs Depreciation and amortisation: property, furniture and equipment, investment property and intangible assets (Note E) a) property, furniture and equipment b) intangible assets 23,410,596 -20,137,070 336,162 347,541 -112,257 513,900 11,038 0 80,352 -24,719 -810,859 -265,176 22,183,575 -18,764,977 241,540 297,321 -64,896 -3,214,362 8,334 -153 26,011 -47,892 -650,360 -257,919 -908,279 -28,369 -6,651 -35,020 -1,076,035 -31,810 -7,388 -39,198 Profit/loss for the financial year 3,310,310 -278,798 Attributable to: Non-controlling interests -7,668 -1,906 Equity holders of the Bank 3,317,978 -276,892


EIB Group Consolidated Financial Statements under IFRS Consolidated statement of profit or loss and other comprehensive income for the year ended 31 December 2017 (in EUR ’000) The accompanying notes form an integral part of these consolidated financial statements. 154 2017 2016 Profit/loss for the financial year Other comprehensive income/loss Items that will never be reclassified to profit or loss: Remeasurements of the defined-benefit liability Items that are or may be reclassified to profit or loss: Available for sale financial assets – fair value reserve 1. Net unrealised gains and losses on financial assets available for sale 2. Impairment charges transferred to the consolidated income statement 3. Realised gains and losses transferred to the consolidated income statement Total available for sale financial assets Total other comprehensive income/loss 3,310,310 -518,504 328,138 16,962 -55,774 -278,798 -1,277,685 69,653 0 38,219 107,872 -1,169,813 289,326 -229,178 Total comprehensive income/loss 3,081,132 -1,448,611 Attributable to: Non-controlling interests -7,668 -1,906 Equity holders of the Bank 3,088,800 -1,446,705


Consolidated statement of changes in equity for the year ended 31 December 2017 (in EUR ’000) Profit/loss for the year before appropriation Special activities reserve Non-Total Subscribed capital Callable capital Additional reserves Fair value reserve General loan reserve Reserve Fund Total controlling consolidated interests equity Balance at 1 January 2016 Comprehensive income Profit + / Loss (-) Other comprehensive income Total comprehensive income Appropriation of prior year’s profit 243,284,155 -221,585,020 24,328,415 2,205,500 2,074,342 5,933,881 3,318,610 4,277,398 63,837,281 71,012 63,908,293 0 0 0 0 0 0 0 0 0 0 0 0 0 -1,277,685 -1,277,685 3,448,371 0 107,872 107,872 0 0 0 0 842,179 0 0 0 -13,152 -276,892 0 -276,892 -4,277,398 -276,892 -1,169,813 -1,446,705 0 -1,906 0 -1,906 0 -278,798 -1,169,813 -1,448,611 0 Transactions with owners of the Group Other Movement of non-controlling interest subsidiary Total transactions with owners of the Group Balance at 31 December 2016 Comprehensive income Profit Other comprehensive income Total comprehensive income Appropriation of prior year’s loss 0 0 0 3,252 -1,106 0 0 0 2,146 0 2,146 0 0 0 0 0 0 0 0 0 6,000 6,000 0 243,284,155 0 -221,585,020 0 24,328,415 3,252 4,379,438 -1,106 2,181,108 0 6,776,060 0 3,305,458 0 -276,892 2,146 62,392,722 6,000 75,106 8,146 62,467,828 0 0 0 0 0 0 0 0 0 0 0 0 0 -518,504 -518,504 -400,021 0 289,326 289,326 0 0 0 0 728,031 0 0 0 -604,902 3,317,978 0 3,317,978 276,892 3,317,978 -229,178 3,088,800 0 -7,668 0 -7,668 0 3,310,310 -229,178 3,081,132 0 Transactions with owners of the Group Other Movement of non-controlling interest subsidiary Total transactions with owners of the Group Balance at 31 December 2017 0 0 0 0 0 0 -11,345 0 -142 0 0 0 0 0 0 0 -11,487 0 0 -3 -11,487 -3 0 0 0 -11,345 -142 0 0 0 -11,487 -3 -11,490 243,284,155 -221,585,020 24,328,415 3,449,568 2,470,292 7,504,091 2,700,556 3,317,978 65,470,035 67,435 65,537,470 The accompanying notes form an integral part of these consolidated financial statements. 155


EIB Group Consolidated Financial Statements under IFRS Consolidated cash flow statement for the year ended 31 December 2017 (in EUR ‘000) 2016 -278,798 -26,011 32,173 40,842 -4,796 762,033 2,324,779 104,951 -3,418,598 225,520 Profit on operating activities -532,370 -237,905 -54,320,048 52,252,742 -110,672 -750,621 -2,451,126 335,816 -61,904 15,297 233,552 22,488,638 -16,613,136 B. Cash flows from investing activities: Securities in Long Term Hedge Portfolio purchased during the year Securities from Long Term Hedge Portfolio matured during the year Purchase of loan substitutes and ABS portfolio EIF included in the debt securities portfolios Redemption of loan substitutes and ABS portfolio EIF included in the debt securities portfolios Additions on shares and other variable-yield securities Reflows on shares and other variable-yield securities Purchase of property, furniture and equipment, intangible assets, investment property and non-current assets held for sale Disposal of property, furniture and equipment and non-current assets held for sale Proceeds from sale of non-current assets held for sale 0 13,500 -4,250,895 5,046,227 -1,571,017 676,610 -37,521 840 0 -105,529 1,606,000 -5,443,890 3,045,166 -1,364,640 577,470 -42,686 2,220 6,782 Net cash used from/(used in) investing activities -122,256 -1,719,107 Summary statement of cash flows: Cash and cash equivalents at beginning of financial year 54,840,859 50,334,953 Cash and cash equivalents at end of financial year 51,760,118 54,840,859 156 Cash and cash equivalents are composed of: Cash in hand, balances with central banks and post office banks, excluding deposits with Central Bank of Luxembourg to cover minimum reserve requirement (Note B.1) Money market securities maturing within three months of issue Loans and advances to credit institutions and customers: Repayable on demand Other loans and advances (Note C) 35 18,863,479 937,805 31,958,799 35 23,483,405 865,097 30,492,322 51,760,118 54,840,859 Net cash from: Operating activities Investing activities Financing activities Effects of exchange rate changes on cash held -2,390,178 -122,256 719,093 -1,287,400 780,633 -1,719,107 5,098,843 345,537 C. Cash flows from financing activities: Issuance of debts evidenced by certificates Redemption of debts evidenced by certificates Member States contribution Sale of EIF shares Return on capital EUMPF Capital increase Dividend paid to non-controlling interest 123,643,914 -123,056,139 51,967 2,550 42,227 44,416 -9,842 165,543,970 -160,554,709 51,967 3,198 22,514 40,988 -9,085 Net cash used from/(used in) financing activities 719,093 5,098,843 Disbursements of loans and advances to credit institutions and customers Repayments of loans and advances to credit institutions and customers Change in deposits with central banks Change in treasury securities liquidity portfolios Change in amounts owed to credit institutions and customers Change in provisions for pension plans and health insurance scheme Change in provisions for commitment on investment funds and guarantees issued Change in interest accrued on cash and cash equivalents Change in other assets and other liabilities (excluding non-controlling interest) Interest received Interest paid -48,759,528 47,480,834 154,286 4,351,930 -8,126,095 355,150 -19,019 -69,083 -29,545 21,663,852 -18,860,590 Net cash used from/(used in) operating activities -2,390,178 780,633 2017 A. Cash flows from operating activities: Profit for the financial year Adjustments for: Value (re-)adjustments in respect of loans and advances and provisions for contingent liabilities Depreciation and amortisation on property, furniture and equipment, intangible assets and investment property, net result on sale of non-current assets held for sale and write-off Changes in impairment of shares and other variable-yield securities Change in fair value of trading debt securities Fair value adjustments on loans and associated swaps Fair value adjustments on borrowings and associated swaps Fair value adjustments on other derivatives Net interest income Effect of exchange rate changes 3,310,310 -80,352 39,198 24,719 -22,753 -1,905,081 1,874,364 -521,601 -3,273,526 22,352


Consolidated cash flow statement (continued) for the year ended 31 December 2017 (in EUR ‘000) Non-cash changes Fair value adjustment and accrued interest on borrowings Exchange adjustments (In EUR'000) 2016 Cash flows 2017 Long-term borrowings Short-term borrowings 495,700,513 22,202,333 1,635,068 -1,047,293 -20,059,650 -1,865,399 -6,537,916 0 470,738,015 19,289,641 Total liabilities from financing activities 517,902,846 587,775 -21,925,049 -6,537,916 490,027,656 The accompanying notes form an integral part of these consolidated financial statements. 157


EIB Group Consolidated Financial Statements under IFRS European Investment Bank Group Notes to the consolidated financial statements as at 31 December 2017 The European Investment Bank (the ‘Bank’ or ‘EIB’) was created by the Treaty of Rome in 1958 as the long term lending bank of the European Union (‘EU’). The task of the Bank is to contribute towards the integration, balanced development and economic and social cohesion of the EU Member States. The EIB raises substantial volumes of funds on the capital markets and lends these funds on favourable terms to projects furthering EU policy objectives. The EIB continuously adapts its activities to developments in EU policies. The Bank has its registered office at 98-100, boulevard Konrad Adenauer, Luxembourg. The Bank and its subsidiaries are defined as the ‘Group’. The subsidiaries held by the Bank are disclosed in Note B.4.1. Note A – Significant accounting policies A.1. Basis of preparation A.1.1. Statement of compliance The European Investment Bank Group’s consolidated financial statements (the ’Financial Statements’) have been prepared in accordance with International Financial Reporting Standards (‘IFRS’), as adopted by the European Union. On a proposal from the Management Committee, the Board of Directors adopted the Financial Statements on 15 March 2018 and authorised their submission to the Board of Governors for approval by 27 April 2018. A.1.2. Basis of measurement The Financial Statements have been prepared on an amortised cost basis, except for derivative financial instruments, available-for-sale financial assets, assets and liabilities designated at fair value through profit or loss, financial assets held for trading and financial guarantees, which have been measured at fair value. The liability for the defined-benefit obligation is recognised as the present value of the defined-benefit obligation, plus any unrecognised actuarial gains, less any unrecognised past service cost or unrecognised actuarial losses. The Financial Statements are presented in euro rounded to the nearest thousand, unless otherwise indicated. A.2. Significant accounting judgments and estimates In preparing the Financial Statements, the Management Committee is required to make estimates and assumptions that affect reported income, expenses, assets, liabilities and disclosure of contingent assets and liabilities. Use of available information and application of judgment are inherent in the formation of estimates. Actual results in the future could differ from such estimates and the differences may be material to the Financial Statements. The most significant use of judgments and estimates is as follows: Fair value of financial instruments Where the fair values of financial assets and financial liabilities recorded on the balance sheet cannot be derived from active markets, they are determined using a variety of valuation techniques that include the use of mathematical models. The input to these models is taken from observable markets where possible, but where this is not feasible, a degree of judgment is required in establishing fair values. The judgments include considerations of liquidity and model inputs such as correlation and volatility for longer dated derivatives. Impairment losses on loans and advances The Group reviews its loans and advances at each reporting date to assess whether an allowance for impairment should be recorded. In particular, judgment by management is required in the estimation of the amount and timing of future cash flows when determining the level of allowance required. Such estimates are based on assumptions about a number of factors and actual results may differ, resulting in future changes to the allowance. In addition to a specific allowance against individually significant loans and advances, the Group also makes a collective impairment test on exposures which, although not specifically identified as requiring a specific allowance, have a greater risk of default than when the loans and advances were originally granted. Provisions on financial guarantees The Group recognises a liability at the fair value of the obligation at the inception of a financial guarantee contract. The guarantee is subsequently measured at the higher of the best estimate of the obligation or the amount initially recognised less, where appropriate, cumulative amortisation recognised. Financial guarantee provisions correspond to the cost of settling the obligation, which is the expected loss, estimated on the basis of all relevant factors and information existing at the consolidated balance sheet date. 158


Valuation of unquoted equity investments Valuation of unquoted equity investments is normally based on one of the following: • • • • recent arm’s length market transactions; current fair value of another instrument that is substantially the same; the expected cash flows discounted at current rates applicable for items with similar terms and risk characteristics; or other valuation models. The determination of the cash flows and discount factors for unquoted equity investments requires significant estimation. The Group calibrates the valuation techniques periodically and tests them for validity using either prices from observable current market transactions in the same instrument or from other available observable market data. Impairment of equity investments The Group treats available-for-sale equity investments as impaired when there has been a significant or prolonged decline in the fair value below its cost or where other objective evidence of impairment exists. The determination of what is “significant" or “prolonged" requires judgment. The Group treats “significant" generally as 30% or more and “prolonged" as greater than 24 months. In addition, the Group evaluates other factors, including normal volatility in the share price for quoted equities and the future cash flows and discount factors for unquoted equities. Pension and other post-employment benefits The cost of defined-benefit pension plans and other post-employment medical benefits is determined using actuarial valuations. The actuarial valuation involves making assumptions about discount rates, mortality rates and future salary and pension increases. Due to the long term nature of these plans, such estimates are subject to significant uncertainty. Consolidation of entities in which the Group holds an interest The Group made significant judgments that none of the entities (except for the European Investment Fund (‘the EIF’) and EU MICROFINANCE PLATFORM FCP-FIS (“EUMPF”)) in which it holds an interest are controlled by the Group. This is due to the fact that in all such entities, either the General Partner or the Fund Manager or the Management Board have sole responsibility for the management and control of the activities and affairs of the partnership and have the power and authority to do whatever necessary to carry out the purpose and objectives of the partnership in compliance with the investment and policy guidelines. Group’s exposure to the United Kingdom On March 29, 2017 the U.K. government triggered Article 50 of the Treaty on European Union (‘TEU’), which officially commenced the process of the U.K.’s withdrawal from E.U. membership. On 8 December 2017, the negotiators of the EU and the UK Government published a “Joint report from the negotiators of the European Union and the United Kingdom Government on progress during phase 1 of negotiations under Article 50 TEU on the United Kingdom's orderly withdrawal from the European Union” (the Joint Report). The Joint Report was put forward with a view to the meeting of the European Council (Article 50) of 14-15 December 2017. “Under the caveat that nothing is agreed until everything is agreed, the joint commitments set out in this Joint Report shall be reflected in the Withdrawal Agreement in full detail. This does not prejudge any adaptations that might be appropriate in case transitional arrangements were to be agreed in the second phase of the negotiations, and is without prejudice to discussions on the framework of the future relationship”. The following principles with respect to the callable - and the paid in capital are included in the Joint Report: “The UK will provide a guarantee for an amount equal to its callable capital on the day of withdrawal” (callable capital currently amounts to EUR 35.7 billion). “This guarantee will decrease in line with the amortisation of the stock of EIB operations at the date of withdrawal, starting on the date on which the outstanding stock represents an amount equal to the total subscribed capital on the date of withdrawal and ending on the date it equals the total paid-in capital on the date of withdrawal, both as defined in the EIB Statute”. “The UK share of the paid-in capital” (amounting to EUR 3.5 billion) “will be reimbursed in twelve annual instalments starting at the end of 2019. The UK remains liable for the reimbursed amount of paid-in capital until the outstanding stock of EIB operations equals the total paid-in capital on the date of withdrawal, at which point the liability will start to be amortised in line with the remaining non-amortised operations. Apart from these reimbursements, the EIB will not make any other payment, return or remuneration on account of the withdrawal of the UK from the EIB or on account of the provision by the UK of a guarantee”. A.3. Changes in accounting policies Except for the changes below, the Group has consistently applied the accounting policies set out in Note A.4. to all periods presented in these consolidated financial statements. The Group has adopted the following new standards and amendments to standards. Standards adopted The following interpretation as well as the amendments to and revisions of existing standards became effective for the Group’s consolidated financial statements as of 1 January 2017: Amendments to IAS 7 ‘Statement of cash flows’ – Disclosure initiative; The amendments require disclosures that enable users of financial statements to evaluate changes in liabilities arising from financing activities, including both changes arising from cash flow and non-cash changes. Amendments are effective for annual reporting periods beginning on or after 1 January 2017, with early adoption permitted. 159


EIB Group Consolidated Financial Statements under IFRS Additional disclosures of relevance for the Group include changes arising from: - - cash flows, such as drawdowns and repayments of borrowings; and non-cash changes, such as acquisitions, disposals and unrealised exchange differences. Annual improvements 2014-2016 Cycle - various standards (Amendments to IFRS 12). This amendment clarifies that the disclosure requirement of IFRS 12 is applicable to interest in entities classified as held for sale except for summarised financial information. Previously, it was unclear whether all other IFRS 12 requirements were applicable for these interests. The adoption of these amendments had no material impact on the Group’s consolidated financial statements. Standards issued but not yet adopted The following standards, amendments to standards and interpretations are effective for annual periods beginning after 1 January 2017. The Group has not applied the following new or amended standards in preparing these consolidated financial statements. IFRS 9 Financial instruments Estimated impact of the adoption of IFRS 9 - Financial instruments The last part of the standard was issued on 24 July 2014 and replaces the existing guidance in IAS 39 Financial Instruments: Recognition and Measurement. IFRS 9 addresses the classification, measurement and derecognition of financial assets and financial liabilities, introduces a new expected credit loss model for impairment on financial assets and introduces new rules for hedge accounting. IFRS 9 has been endorsed by the EU on 22 November 2016 and is effective for annual reporting periods beginning on or after 1 January 2018, with early adoption permitted. The Group did not adopt the standard earlier than its effective date. The Group has assessed the estimated impact that the initial application of IFRS 9 will have on its equity in the consolidated financial statements. (in EUR'000) (+increase/-decrease) Estimated adjustment to equity at 1 January 2018 Estimated adjusted opening balance at 1 January 2018 As reported at 31 December 2017 Group Equity 65,470,035 273,968 65,744,003 This impact is based on the assessments undertaken to date and is summarised below. The actual impacts of adopting IFRS 9 at 1 January 2018 may change because: • • The Group has not finalised the testing and assessment of controls over its new IT systems; and The new accounting policies are subject to change until the Group presents its first financial statements that include the date of initial application. Classification and measurement IFRS 9 contains a new classification and measurement approach for financial assets that reflects the business model in which assets are managed and their cash flow characteristics. IFRS 9 contains three principal classification categories for financial assets: measured at amortised cost (‘AC’), fair value through other comprehensive income (‘FVOCI’) and fair value through profit or loss (‘FVTPL’). The standard eliminates the existing IAS 39 categories of held to maturity, loans and receivables and available for sale. In addition, under IFRS 9, derivatives embedded in contracts where the host is a financial asset in the scope of the standard are never bifurcated. Instead, the hybrid financial instrument as a whole is assessed for classification. Based on its assessment, the Group does not expect the new guidance to have a significant impact on the classification and measurement of its financial assets and financial liabilities except for: • those items currently designated under the Fair Value Option (‘FVO’) for which the majority is expected to be eligible for hedge accounting under IFRS 9. The change of accounting classification from Fair Value Option to Hedge Accounting will concern EUR 125.3 billion loans (86% of the current FVO loans population), and EUR 356.6 billion borrowings (94% of the current FVO borrowings population). • quasi-equity loans, which are a category of “debt” bearing equity-type risks: the cash flows of those types of products have equity-type features that are unrelated to a basic lending arrangement. According to the requirements of IFRS 9, EUR 457.5 million quasi-equity loans of the Group will be reclassified from loans and receivables under IAS 39 to FVTPL under IFRS 9, and EUR 5.5 million provisions on quasi-equity loans will be released through the Group’s reserve fund. However, the positive effect on reserves from provisions release will be partially offset by the fair value adjustments, where they are negative. These net fair value adjustments amount to EUR 1.1 million. • equity investments: there are two types of equity investments at EIB Group: (i) strategic participations into EBRD and (ii) other equity investments comprised of venture capital operations and investment funds. At 31 December 2017, the Group had classified other equity investments, as available-for-sale with a fair value of EUR 6.4 billion and as FVTPL with a fair value of EUR 342 million. Under IFRS 9, the Group has designated these investments as measured at FVTPL. Related impairments of EUR 1.1 billion will be released against unrealised losses while the total fair value adjustment released against Group retained earnings amounts to EUR 2.1 billion. Strategic participations, however, currently classified as available-for-sale, with a fair value of EUR 467 million will be designated at FVOCI. Consequently, all fair value gains and losses will be reported in OCI, no impairment losses will be recognized in profit or loss and no gains or losses will be reclassified to profit or loss on disposal. IFRS 9 largely retains the existing requirements in IAS 39 for the classification of financial liabilities. However, under IAS 39 all fair value changes of liabilities designated as at FVTPL are recognised in profit or loss, whereas under IFRS 9 these fair value changes may be presented as follows: 160


- the amount of change in the fair value that is attributable to changes in the credit risk of the liability so called “own credit adjustment”, (‘OCA’) is presented in ’OCI’; and the remaining amount of change in the fair value is presented in profit or loss. - Where borrowings are not eligible for hedge accounting but meet the eligibility criteria of the FVO and have been designated on initial recognition as such, they are measured at FVTPL. For these items, the amount of change related to the Group’s own credit risk recognised previously in profit or loss will be transferred to OCI as a liability credit reserve. At 31 December 2017, the Group’s own credit risk (‘OCA’) amounts to nil (Note R). Impairment IFRS 9 replaces the ‘incurred loss’ model in IAS 39 with a forward-looking ‘expected credit loss’ (‘ECL’) model. This will require judgement as to how changes in economic factors affect ECLs, which will be determined on a probability-weighted basis. Within EIB Group, the new impairment model will apply to financial assets measured at AC as well as to off-balance commitments. Under IFRS 9, loss allowances will be measured on either of the following bases: - - 12-month ECL’s: these are the ECLs that result from possible default events within the 12 months after the reporting date; and Lifetime ECLs: these are the ECLs that result from all possible default events over the expected life of a financial instrument. The IFRS 9 Standard sets out a “three-stage” model for impairment based on changes in credit quality since initial recognition. Financial instruments are classified in Stage 1 except for those instruments for which significant increase in credit risk (‘SICR’) since initial recognition is identified. For determining whether there is a significant increase in credit risk since initial recognition, the Bank considers reasonable and supportable information that is relevant and available without undue cost or effort. This includes both quantitative and qualitative information and analysis, based on the Bank’s historical experience and expert credit and including forward-looking information. If significant increase in credit risk has occured, the financial instrument is moved to Stage 2 but is not yet deemed to be credit-impaired. If the financial instrument is credit-impaired, the financial instrument is then moved to Stage 3. The Group’s assessment of the Stage is based on a sequential approach using counterparty or instrument specific information (Internal Default Event, Special High Risk, Watch List, Rating deterioration, Days in arrears – more than 30 days past due). Lifetime ECL measurement applies to stage 2 and stage 3 assets, while 12-month ECL measurement applies to stage 1 assets. The Group believes that impairment losses are likely to increase and become more volatile for assets in the scope of the IFRS 9 impairment model. Based on the impairment methodology described below, the Group has estimated that application of IFRS 9’s impairment requirements at 1 January 2018 results in additional impairment losses as follows: (in EUR million) Estimated additional impairment recognised at 1 January 2018 Loans and advances to credit institutions Loans substitutes Treasury assets Financial guarantee contracts Undisbursed loans 312 2 3 53 17 Treasury assets are composed of high credit quality securities, therefore, the Group decided to make use of the IFRS 9 practical expedient for low credit risk financial instruments. The expected credit losses were calculated based on the following variables: • • • Probability of default (PD); Loss Given default (LGD); Exposure at default (EAD). The PD represents the likelihood of a counterpart defaulting on its financial obligation, either over the next 12 months, or over the remaining lifetime of the obligation. PD estimates are estimates at a certain date, which are calculated based on statistical rating models, and assessed using rating tools tailored to the various categories of counterparties and exposures. Ratings are primary input into the determination of the term structure of PD for exposures. The Group collects performance and default information about its credit risk exposures. The collected data are segmented by type of industry and by type of region. Different industries and regions reacting in an homogenous manner to credit cycles are analysed together. The Group employs statistical models to analyse the data collected and generate estimates of the remaining lifetime PD of exposures and how these are expected to change as a result of the passage of time. This analysis includes the identification and calibration of relationships between changes in default rates and changes in key macro-economic factors. The Group identified the gross domestic product (‘GDP’) growth as the relevant macro-economic factor. Based on projections of that variable, three macro-economic scenario’s are generated, which are then translated into credit cycles and finally into PD’s. The LGD represents the Group’s expectation of the extent of loss on a defaulted exposure. The LGD definition retained by the Group is derived from the following definition of Recovery rate (i.e. “1-LGD”): the recovery rate for each defaulted contract is the ratio between the discounted cash flows received after the default date and the capital outstanding at the default date. LGD varies by type of counterparty, type and seniority of claim and availability of collateral or other credit support. Recovery rates are defined across four main classes of borrowers: EU Sovereigns, non-EU Sovereigns and Public Institutions, Financial Institutions and Corporates. The EAD represents the expected exposure in the event of a default EAD and is based on the current exposure to the counterparty and potential changes to the current amount allowed under the contract including amortisation. The EAD of a financial asset is its gross carrying amount, the outstanding signed on-balance exposures. For lending commitments and financial guarantees, the EAD includes the amount drawn, as well as potential future amounts that may be drawn under the contract. 161 Gross additional impairment losses387


EIB Group Consolidated Financial Statements under IFRS The Group estimated that the application of IFRS 9 impairment requirements at 1 January 2018 results in an increase of EUR 387 million over the impairment recognised under IAS 39. The following table provides information about the estimated exposure to credit and ECLs for loans and advances to credit institutions and customers, loans substitutes, undisbursed loans and financial guarantee contracts: For an overview of credit risk on treasury transactions, see note S.2.4.1. Disbursed amount Undisbursed Estimated impairment (in EUR million) * Credit impaired amount ** loss allowance Stage 1 Stage 2 Stage 3 395,590 40,931 1,903 113,907 5,151 71 82 297 433 No No Yes * Excluding disbursed and undisbursed amounts of operations measured at FVTPL. ** For Stage 3, the undisbursed amounts relate to Financial Guarantee contracts. Hedge Accounting IFRS 9 offers at the time of adoption the opportunity to revoke the Fair Value Option and to replace it by the Hedge Accounting methodology. Group will make use of that opportunity to transfer part of its loans and borrowings currently at the Fair Value Option to Hedge Accounting. IFRS 9 will require the Group to ensure that hedge accounting relationships are aligned with the Group’s risk management objectives and strategy and to apply a qualitative and forward-looking approach to assessing hedge effectiveness. IFRS 9 also introduces new requirements on rebalancing hedge relationships and prohibiting voluntary discontinuation of hedge accounting. Under the new model, it is possible that more risk management strategies will qualify for hedge accounting. To demonstrate that hedge relationships meet the requirements of IFRS 9, the Group will regularly assess their hedge effectiveness. Under IFRS 9, a hedging relationship qualifies for hedge accounting if it meets all of the following effectiveness requirements: • • • There is an economic relationship between the hedged item and the hedging instrument; The effect of credit risk does not dominate the value changes that result from that economic relationship; The hedge ratio of the hedging relationship is the same as that resulting from the quantity of hedged item that the Group actually hedges and the quantity of the hedging instrument that the Group actually uses to hedge that quantity of hedged item. In order to show an economic relationship between the hedged item and the hedging instrument the Group assesses whether the critical terms of the hedging instrument and the hedged item match or are closely aligned in which case the hedging relationship can be assumed to be highly effective. In order to show that the component of the fair value change due to credit risk is not dominating over the total fair value change the Group has defined qualitative measurements. From the three types of hedging relationships recognised by IFRS 9, the Group will only apply fair value hedge accounting. A fair value hedge is a hedge of the exposure to changes in fair value of a recognised asset or liability or an unrecognised firm commitment, or a component of any such item, that is attributable to a particular risk and could affect profit or loss. Currently, Group’s fair value hedge accounting relationships only cover interest rate risk and/or FX risk through interest rate swaps or cross-currency swaps. The Group’s makes use of the possibility provided by the Standard to separate the foreign currency basis spread (‘CBS’) and account for it under the cost of hedging approach. Consequently, this non-designated amount is recorded in OCI to the extent that it relates to the hedged item and is further accumulated within equity as a separate component of OCI. The initial CBS of the hedging instrument, measured at the date of designation, is amortised linearly over the residual lifetime of the hedge. Subsequent changes in the fair value of the CBS are recognised directly in OCI. The estimated impact on reserves at 1 January 2018 as a result of the application of the IFRS hedge accounting requirements is an increase of EUR 646 million of the Group’s equity. The initial CBS has been estimated at EUR -661 million as at 31 December 2017. Disclosures IFRS 9 will require extensive new disclosures, in particular about hedge accounting, credit risk and expected credit losses. The Group’s preliminary assessment included an analysis to identify data gaps against current processes. The Group has planned to implement the system and controls changes that it believes will be necessary to capture the required data. Transition Changes in accounting policies resulting from the adoption of IFRS 9 will generally be applied retrospectively, except as described below: • The Group will take advantage of the exemption allowing it not to restate comparative information for prior periods with respect to classification and measurement (including impairment) changes. Differences in the carrying amounts of financial assets and financial liabilities resulting from the adoption of IFRS 9 will generally be recognised in the Group’s equity as at 1 January 2018. The new hedge accounting requirements should generally be applied prospectively, including the accounting for foreign basis spreads. The following assessments have to be made on basis of the facts and circumstances that exist at the date of initial application: • • - - - The determination of the business model within which a financial asset is held; The designation and revocation of previous designations of certain financial assets and financial liabilities as measured at FVTPL; The designation of certain investments in equity instruments not held for trading as at FVOCI. IFRS 15 Revenue from Contracts with Customers IFRS 15 establishes a comprehensive framework for determining whether, how much and when revenue is recognised. It replaces existing revenue recognition guidance, including IAS 18 Revenue, IAS 11 Construction Contracts and IFRIC 13 Customer Loyalty Programmes. 162 Total438,424119,129812


The core principle of IFRS 15 is that an entity should recognize revenue to depict the transfer of promised goods or services to customers in an amount that reflects the consideration to which the entity expects to be entitled in exchange for those goods or services. Specifically, the Standard introduces a five-step approach to revenue recognition: • • • • • Identify the contract with the customer; Identify the performance obligations in the contract; Determine the transaction price; Allocate the transaction price to the performance obligations in the contracts; Recognize revenue when (or as) the entity satisfies the performance obligation. Under IFRS 15, an entity recognizes revenue when (or as) a performance obligation is satisfied, i.e. when ‘control’ of the goods or services underlying the particular performance obligation is transferred to the customer. Additional disclosures are required when IFRS 15 is to be effective. The standard gives a range of possible transition methods including (i) a full retrospective approach, (ii) a modified retrospective approach with optional practical expedients and (iii) a cumulative effect method with no restatement of comparative information. At this stage, the Group has finalised the assessment of the effects of applying the new standard on the consolidated financial statements. The nature of the following four main income types has been further analysed in order to assess whether the Standard applies to them or not: • • • • Interest and similar income Result on financial operations Other operating income Fee and commission income The Group’s analysis indicated that only fee and commission income is in scope of IFRS 15. Regarding Fee and commission income on loans and guarantees, the Group has performed an assessment per type of fee. The assessment is based on the fact that the fee, which is an integral part of the effective interest rate calculation, is considered as out of IFRS 15 scope (in scope of IFRS 9). For the types of fees that are in scope of IFRS 15, the Group assessed the revenue recognition pattern of each type according to the 5-step approach of IFRS 15 and compared it with the existing one. Regarding Fee and commission income on mandates, the Group performed an assessment of IFRS 15 requirements per contract with mandates or group of mandates with similar characteristics and similar types of fees. The outcome of the 5-step assessment of IFRS 15 has been compared with the existing revenue recognition method. IFRS 15 has been endorsed by the EU on 22 September 2016 and is effective for annual reporting periods beginning on or after 1 January 2018. The Group intends to adopt the standard using the modified retrospective approach which means that the cumulative impact of the adoption will be recognised in retained earnings as of 1 January 2018 and that comparatives will not be restated. Based on the detailed assessment of the impact resulting from the application of IFRS 15 by the Group, it is not expected that this new standard will have a significant impact on the Group’s consolidated financial statements. IFRS 16 Leases IFRS 16 was issued in January 2016 and replaces the current guidance of IAS 17. It will result in almost all leases being recognised on the balance sheet, as the distinction between operating and finance leases is removed. Under the new standard, an asset (the right to use the leased item) and a financial liability to pay rentals are recognised. The only exemptions are short-term and low-value leases. The accounting for lessors will not significantly change. IFRS 16 has been endorsed by the EU on 31 October 2017 and is effective for annual reporting periods beginning on or after 1 January 2019, with early adoption permitted if IFRS 15 is applied. The Group does not plan to adopt this standard early and does not expect to cause any material impact on the Group’s consolidated financial statements. IFRIC 22 Foreign currency transactions and advance consideration The Interpretation applies where an entity either pays or receives consideration in advance for foreign currency-denominated contract. It considers how to determine the date of the transaction when applying the standard on foreign currency transactions, IAS 21 and provides guidance whether the date of the transaction is the date when the asset, expense or income is initially recognised, or the earlier date on which the advance consideration is paid or received, resulting in recognition of a prepayment or deferred income. The Interpretation has not yet been adopted by the EU. According to the latest update of EFRAG, endorsement is not expected by the end of the year. The Group does not plan to adopt this interpretation early and does not expect to cause any material impact on the Group’s consolidated financial statements. A.4. Summary of significant accounting policies A.4.1. Basis of consolidation Subsidiaries Subsidiaries are entities controlled by the Group. The Group controls an entity when it is exposed to, or has rights to, variable returns from its involvement with the entity and has the ability to affect those returns through its power over the entity. The financial statements of subsidiaries are included in the consolidated financial statements from the date on which control commences until the date on which control ceases. 163


EIB Group Consolidated Financial Statements under IFRS The Financial Statements comprise those of the European Investment Bank (the ‘Bank’ or ‘EIB’) and its subsidiaries, the European Investment Fund (the ‘Fund’ or ‘EIF’) and the EU Microfinance Platform FCP FIS (‘EUMPF’). The financial statements of both subsidiaries are prepared for the same reporting year as the Bank, using consistent accounting policies. The Bank holds 58.47% (2016: 59.88%) of the subscribed capital of the EIF and it holds 55.56% (2016: 55.56%) of the total committed units of the EUMPF and therefore has applied the principles provided for under IFRS 10 in preparing consolidated financial statements. Hence, the Group consolidates the financial statements of the EIB, the EIF and the EUMPF line by line by adding together like items of assets, liabilities, equity, income and expenses. After aggregation of the balance sheets and income statements, all intra-group balances, transactions, income and expenses resulting from intra-group transactions are eliminated. Commitment on EIF shares held by third party investors Under the terms of a replacement share purchase undertaking in respect of the 1,869 shares held by the EIF’s non-controlling shareholders (2016: 1,758 shares), the EIB is offering to buy these on an annual basis. The exercise price is determined on the basis of the audited annual accounts of the EIF and corresponds to the part of each share in the called capital of the EIF, increased by the share premium account, the statutory reserves, the fair value reserve, the retained earnings and profit for the year, net of the dividend decided by the EIF’s General Meeting. The commitment to purchase is shown in the consolidated balance sheet as a debt item under “Other liabilities” (see also Note G). IFRS 10 requires that the acquisition of a non-controlling interest be accounted for as an equity transaction. The carrying amounts of the controlling and non-controlling interests are adjusted to reflect the change in their relative interests in EIF net assets. Any difference between the amount by which the non-controlling interest is adjusted and the fair value of the financial liability is recognised directly in equity under “Other” and attributed to owners of the parent. Any changes in the fair value of the financial liability subsequent to the acquisition date are recognised in the income statement under “Interest expense and similar charges”. Interests in associates and joint ventures The Group’s interests in investees comprise interests in associates and joint ventures. Associates are those entities in which the Group has significant influence, but not control or joint control, over the financial and operating policies. A joint venture is an arrangement in which the Group has joint control, whereby the Group has rights to the net assets of the arrangement, rather than the rights to its assets and obligations for its liabilities. The accounting treatment for associates and joint ventures is further explained in Note A.4.7.3. Transactions eliminated on consolidation Intra-group balances and transactions, and any unrealised income and expenses arising from intra-group transactions are eliminated. Unrealised gains arising from transactions with equity-accounted investees are eliminated against the investment to the extent of the Group’s interest in the investee. Unrealised losses are eliminated in the same way as unrealised gains, but only to the extent that there is no evidence of impairment. A.4.2. Foreign currency translation The Financial Statements are presented in euro (‘EUR’), as the functional currency of the Bank and unit of measurement for the capital accounts of the Member States. The Group conducts its operations in euro, in other currencies of the Member States and in non-EU currencies. Its resources are derived from its capital, borrowings and accumulated earnings in various currencies. Foreign currency transactions are translated at the exchange rate prevailing on the date of the transaction. Monetary assets and liabilities denominated in currencies other than euro are translated into euro at the exchange rate prevailing at the balance sheet date. The gain or loss arising from such translation is recorded in the consolidated income statement. Non-monetary items that are measured in terms of historical cost in a foreign currency are translated using the exchange rates at the dates of the initial transactions. Non-monetary items measured at fair value in a foreign currency are translated using the exchange rates at the date when the fair value was determined. Exchange differences on non-monetary financial assets are a component of the change in their fair value. Depending on the classification of a non-monetary financial asset, exchange differences are either recognised in the income statement or within the equity reserves. Exchange differences arising on the settlement of transactions at rates different from those at the date of the transaction and unrealised foreign exchange differences on unsettled foreign currency monetary assets and liabilities are recognised in the consolidated income statement. A.4.3. Derivatives All derivative instruments of the Group are measured at fair value through profit or loss and are reported as derivative assets or liabilities. Fair values are obtained from quoted market prices, discounted cash flow models and option pricing models, which consider current market and contractual prices for the underlying instrument, as well as time the value of money, yield curve and volatility of the underlying. The Group uses derivative instruments mainly for hedging market exposure on borrowings and lending transactions, and also as part of its asset and liability management activities to manage exposures to interest rate and foreign currency risk, including exposures arising from forecast 164


transactions. The Group applies the amended Fair Value Option of IAS 39 when balance sheet items together with one or more derivative transactions meet the eligibility criteria of the amended Fair Value Option and a significant reduction of the accounting mismatch is thus obtained. The Group currently does not use any of the hedge accounting possibilities available under IAS 39. Derivatives are recorded at fair value and carried as assets when their fair value is positive and as liabilities when their fair value is negative. Changes in the fair value of derivatives are included in “Result on financial operations”. The majority of the Group’s swaps are concluded with a view to hedging specific bond issues. The Group enters into currency swaps, whereby the proceeds of a borrowing are initially converted into a different currency and on maturity the Bank will obtain the amounts needed to service the borrowing in the original currency. Macro-hedging swaps used as part of asset/liability management are marked to market (fair value) using internal valuation models. Realised and unrealised gains and losses are recognised in “Result on financial operations”. Accrued interest on derivatives is part of the fair value recorded. A derivative may be embedded in a “host contract”. Such combinations are known as hybrid instruments and arise predominantly from the issuance of certain structured debt instruments. If the host contract is not carried at fair value with changes in fair value reported in the consolidated income statement, the embedded derivative is separated from the host contract and accounted for as a stand-alone derivative instrument at fair value if, and only if, the economic characteristics and risks of the embedded derivative are not closely related to the economic characteristics and risks of the host contract and the embedded derivative actually meets the definition of a derivative. A.4.4. Financial instruments Derivative financial instruments are initially recognised using the trade date basis. Non-derivative financial instruments are initially recognised using the settlement date basis. Fair value of financial instruments Fair value is the price that would be received on selling an asset or paid on transferring a liability in an orderly transaction between market participants at the measurement date in the principal, or in its absence, the most advantageous market to which the Group has access at that date. The fair value of a liability reflects its non-performance risk. When applicable, the Group measures the fair value of an instrument using the quoted price in an active market for that instrument. A market is regarded as active if transactions for the asset or liability take place with sufficient frequency and volume to provide pricing information on an on-going basis. Where the fair values of financial assets and financial liabilities recorded on the balance sheet cannot be derived from active markets, they are determined using a variety of valuation techniques that include the use of mathematical models. The input to these models is taken from observable markets where possible, but where this is not feasible, a degree of judgment is required in establishing fair values. The chosen valuation technique incorporates all the factors that market participants would take into account in pricing a transaction. Portfolios of financial assets or financial liabilities that are exposed to market or credit risk that are managed by the Group on the basis of the net exposure to either market or credit risk are measured on the basis of a price that would be received on selling a net long position or paid on transferring a net short position for a particular risk exposure. These portfolio level adjustments are allocated to the individual assets and liabilities on the basis of the relative risk adjustment of each of the individual instruments in the portfolio. The Group measures fair values using the following fair value hierarchy that reflects the significance of the inputs used in making the measurements: • • Level 1: inputs that are unadjusted quoted market prices in active markets for identical instruments to which the Group has access. Level 2: inputs other than quoted prices included within Level 1 that are observable either directly (i.e. as prices) or indirectly (i.e. derived from prices). This category includes instruments valued using quoted market prices in active markets for similar instruments, quoted prices for identical or similar instruments in markets that are considered less than active or other valuation techniques where all significant inputs are directly or indirectly observable from market data. Level 3: inputs that are not observable. This category includes all instruments where the valuation technique includes inputs not based on observable data and the unobservable inputs have a significant effect on the instrument’s valuation. This category includes instruments that are valued based on quoted prices for similar instruments where significant unobservable adjustments or assumptions are required to reflect differences between the instruments. • The Group recognises transfers between levels of the fair value hierarchy as of the end of the reporting period during which the change has occurred. A.4.5. Cash and cash equivalents The Group defines cash and cash equivalents as short-term, highly liquid securities and interest-earning deposits with maturities of 90 days or less. A.4.6. Fee and commission income The Group earns fee income from a diverse range of services it provides to its customers. Fee income can be divided into two broad categories: • income earned from services that are provided over a certain period of time, for which customers are generally billed on an annual or semi-annual basis; and 165


EIB Group Consolidated Financial Statements under IFRS • income earned from providing transaction-type services. Fees earned from services that are provided over a certain period of time are recognised on an accruals basis over the service period. Fees earned from providing transaction-type services are recognised when the service has been completed. Fees or components of fees that are performance linked are recognised when the performance criteria are fulfilled. A.4.7.Treasury bills and other bills eligible for refinancing with central banks and debt securities including fixed-income securities and shares and other variable-yield securities A.4.7.1.Held for trading portfolio The held for trading portfolio (Operational portfolios P1 and P2) comprises listed debt securities issued and guaranteed by financial institutions. The debt securities are owned by the Group. Securities held in this portfolio are marked to market in the consolidated balance sheet, any gain or loss arising from a change in fair value being included in the consolidated income statement in the period in which it arises. Gains and losses realised on disposal or redemption and unrealised gains and losses from changes in the fair value of trading portfolio assets are reported as Net trading income in the account “Result on financial operations”. Interest income on trading portfolio assets is included in “Interest and similar income”. The determination of fair values of trading portfolio assets is based on quoted market prices in active markets or dealer price quotations, pricing models (using assumptions based on market and economic conditions), or management estimates, as applicable. A.4.7.2.Held-to-maturity portfolio The held-to-maturity portfolio comprises of the Group’s Long Term Hedge Portfolio (‘LTHP’), the Treasury Monetary Portfolio (‘TMP’) and the Loan substitutes portfolio (see Note B.2). The Group’s long term hedge portfolio contains securities of the Bank’s LTHP portfolio and the EIF investment portfolio and consists of securities purchased with the intention of holding them to maturity. These securities are issued or guaranteed by: - Governments of the European Union Member States, G10 countries and their agencies; or - Supranational public institutions, including multinational development banks. These securities are initially recorded at fair value plus any directly attributable transaction costs. The difference between entry price and redemption value is amortised in accordance with the effective interest method over the remaining life of the securities. Treasury Monetary Portfolio TMP of the Group is held for the purpose of maintaining an adequate level of liquidity in the Group and comprises money market products with a maximum maturity of twelve months, including treasury bills and negotiable debt securities issued by public bodies or credit institutions. The securities are held until their final maturity and presented in the Financial Statements at their amortised cost. The Loan substitutes portfolio mainly consists of obligations in the form of bonds, notes or certificates issued by Special Purpose Vehicles (‘SPVs’) or trust vehicles. These securities are classified as held-to-maturity and recorded at amortised cost. The Group assesses at each balance sheet date whether there is any objective evidence that a financial asset or group of financial assets is impaired. A financial asset or group of financial assets is deemed to be impaired if, and only if, there is objective evidence of impairment as a result of one or more events that has occurred after the initial recognition of the asset (an incurred “loss event") and that loss event (or events) has an impact on the estimated future cash flows of the financial asset or group of financial assets that can be reliably estimated. Impairment loss is recognised in profit and loss and the amount of the loss is measured as the difference between the carrying value and the present value of estimated future cash flows discounted at the instrument’s original effective interest rate. A.4.7.3.Available-for-sale portfolio The available-for-sale portfolio comprises the remaining securities formerly held in the operational money market portfolio A2 and operational bond portfolio B1 (currently SLP portfolio, see Note B.2), of the Unitary Fund and operational portfolio of the Fund and shares and other variable-yield securities (see Note B.3). Securities are classified as available-for-sale where they do not appropriately belong to one of the other categories of financial instruments recognised under IAS 39, i.e. "held for trading" or "held-to-maturity". The Management Committee determines the appropriate classification of its investments at the time of the constitution of a portfolio. Financial instruments within one portfolio always have the same classification. Available-for-sale financial investments may be sold in response to or in anticipation of needs for liquidity or changes in interest rates, credit quality, foreign exchange rates or equity prices. Available-for-sale financial investments are carried at fair value. They are initially recorded at fair value plus transaction costs. Unrealised gains or losses, excluding foreign currency translation gains and losses, are reported in comprehensive income and accumulated in the fair value reserve until such investment is sold, collected or otherwise disposed of, or until such investment is determined to be impaired. Foreign currency translation gains and losses are reported in the consolidated income statement. If an available-for-sale investment is determined to be impaired, the cumulative unrealised gain or loss previously recognised in the fair value reserve is included in the consolidated income statement for the period. A financial investment is considered to be impaired if its carrying value exceeds the recoverable amount. Quoted financial investments are considered to be impaired if the decline in market price below cost is of such a magnitude that recovery of the cost value cannot be reasonably expected within the foreseeable future. For non-quoted equity investments, the recoverable amount is determined by applying recognised valuation techniques. Financial assets are derecognised when the right to receive cash flows from the financial assets has expired or where the Group has transferred substantially all risks and rewards of ownership. On disposal of an available-for-sale investment, the accumulated unrealised gain or loss included in the fair value reserve is transferred to consolidated income statement for the period. Gains and losses on disposal are determined using the weighted average cost method. Interest and dividend income on available-for-sale financial investments are included in “Interest and similar income” 166


and “Income from shares and other variable-yield securities”. Interest on available-for-sale debt securities and other fixed income securities is recognised in the income statement using the effective interest method. Dividends on equity investments are recognised in the income statement when the Group’s right to receive payment is established. The determination of fair values of available-for-sale financial investments is based on quoted market rates in active markets, dealer price quotations, discounted expected cash flows using market rates that are commensurate with the credit quality and maturity of the investment or based upon review of the investee’s financial results, condition and prospects including comparisons with similar companies for which quoted market prices are available. Venture capital operations and investment funds held represent medium and long term investments. They are measured at fair value, which is determined by applying the aggregated Net Asset Value (‘NAV’) method. This valuation method implicitly assumes that if the NAVs of underlying funds (as derived from the latest available before year-end fund managers’ reports) can be considered to be equivalent to fair value as determined under IAS 39, then the aggregation of the NAVs of all funds will itself be equivalent to the fair value as determined under IAS 39. In order to bridge the interval between the last available NAVs and the year-end reporting, a subsequent event review procedure is performed and if materially different the reported NAVs are adjusted. For specific investments where NAVs cannot readily be determined, other guidelines (for example the international private equity and venture capital valuation guidelines, International Private Equity and Venture Capital Valuation (‘IPEV’) Guidelines, as published by European Private Equity and Venture Capital Association (‘EVCA’) might be used and more detailed monitoring and review will be required. In accordance with this method, the funds are internally classified into three categories: • Category I – funds that have adopted the fair value requirements of IAS 39 or IPEV Guidelines for which a specific review is performed to ensure that the NAV is a reliable estimate of fair value. Category II – funds that have adopted other valuation guidelines (such as the former 2001 EVCA) or standards that can be considered to be in line with IAS 39, for which a specific review is performed to ensure that the NAV is a reliable estimate of fair value. Category III – funds that have not adopted the fair value requirements of IAS 39 or any other valuation guidelines in line with IAS 39. • • The Group assesses at each balance sheet date whether there is any objective evidence that a financial asset or a group of financial assets is impaired. A financial asset or group of financial assets is deemed to be impaired if, and only if, there is objective evidence of impairment as a result of one or more events occurring after the initial recognition of the asset (an incurred “loss event") and that loss event (or events) has an impact on the estimated future cash flows of the financial asset or group of financial assets that can be reliably estimated. In the case of equity investments classified as available-for-sale, this would include a significant or prolonged decline in the fair value of the investments below its cost. Where there is evidence of impairment, the cumulative loss measured as the difference between the acquisition cost and the current fair value, less any impairment loss on that financial asset previously recognised in the consolidated income statement, is removed from equity and recognised in the income statement. Impairment losses on equity investments are not reversed through the consolidated income statement; increases in their fair value after impairment are recognised directly in equity. In contrast, if in a subsequent period, the fair value of a debt instrument classified as available-for-sale increases and the increase can be objectively related to an event occurring after the impairment loss was recognised, the impairment loss is reversed through the income statement. The Group complies with conditions to use the private equity and similar entities exemption in IAS 28 and IFRS 11 and does not use equity accounting on, or proportionately consolidate investments in joint ventures, if any. Upon initial recognition, any holdings in joint ventures or associates are designated at fair value through profit or loss, and measured subsequently at fair value in accordance with IAS 39, with changes in fair value being recognised in the consolidated income statement during the period of the change. Joint ventures are contractual agreements whereby the Group and other parties undertake an economic activity that is subject to joint control. A joint control is the contractually agreed sharing of control over an economic activity, and exists only when the strategic financial and operating decisions relating to the activity require the unanimous consent of the parties sharing the control (the venturers). The participations acquired by the Group for its own account or on behalf of its mandate providers typically represent investments in private equity or venture capital funds. According to industry practice, such investments are generally investments jointly subscribed by a number of investors, none of whom is in a position to individually influence the daily operations and the investment activity of such a fund. As a consequence, any membership by an investor in a governing body of such fund does not in principle entitle such investor to influence the day-to-day operations of the fund. In addition, individual investors in a private equity or venture capital fund do not determine the policies of a fund such as distribution policies on dividends or other distributions. Such decisions are typically taken by the management of a fund on the basis of the shareholders agreement governing the rights and obligations of the management and all shareholders of the fund. The shareholders’ agreement also generally prevents individual investors from bilaterally executing material transactions with the fund, interchanging managerial personnel or obtaining privileged access to essential technical information. The Group’s investments, made for its own account or on behalf of its mandate providers, are executed in line with the above stated industry practice. A.4.8. Loans and advances to credit institutions and customers Loans and advances to credit institutions and customers (or “Loans and receivables”) include loans where money is provided directly to the borrower. Loans and receivables are recognised when cash is advanced to borrowers. They are initially recorded at cost (their net disbursed amounts), which is the fair value of the cash given to originate the loan, including any transaction costs, and are subsequently measured at amortised cost using the effective interest rate method. Undisbursed parts of loans are recorded in the memorandum items at their nominal value. Where loans meet the eligibility criteria of the amended Fair Value Option and have been designated on initial recognition as at fair value through profit or loss, they are measured at their fair value. The fair value measurement technique used is based on a discounted cash flow technique. Loans designated at fair value are recorded at fair value in the balance sheet. Changes in fair value are recorded in “Result on financial operations”. 167


EIB Group Consolidated Financial Statements under IFRS A.4.8.1.Interest on loans Interest on loans originated by the Group is recorded in the consolidated income statement under “Interest and similar income” using the effective interest rate method and on the consolidated balance sheet under “Loans and advances”. A.4.8.2.Reverse repurchase operations (reverse repos) A reverse repurchase operation is one under which the Group lends liquid funds to a credit institution which provides collateral in the form of securities. The two parties enter into an irrevocable commitment to complete the operation on a date and at a price fixed at the outset. The operation is based on the principle of delivery against payment: the borrower of the liquid funds transfers the securities to the Group’s custodian in exchange for settlement at the agreed price, which generates a return for the Group linked to the money market. This type of operation is considered for the purposes of the Group to be a loan at a guaranteed rate of interest. Generally treated as collateralised financing transactions, they are carried at the amounts of cash advanced or received, plus accrued interest. Reverse repos are entered on the assets side of the consolidated balance sheet under “Loans and advances to credit institutions - b) other loans and advances”. Securities received under reverse repurchase agreements are not recognised in the consolidated balance sheet, unless control of the contractual rights comprised in these securities is assumed. The Group monitors the market value of the securities received on a daily basis and requests additional collateral in accordance with the underlying agreements. Interest earned on reverse repurchase agreements is recognised as interest income over the life of each agreement. A.4.8.3.Fees on loans Front-end fees on loans are deferred, together with the related direct costs of originating and maintaining the commitment, and are recognised as an adjustment to the effective yield, being recorded in the consolidated income statement over the period from disbursement to repayment of the related loan. If the commitment expires without the loan being drawn down, the fee is recognised as income on expiry. The front-end fees are deferred and recognised under “Interest and similar income” in the income statement over the life of the underlying loan. A.4.8.4.Interest subsidies Interest subsidies received in advance (see Note F) are deferred in accordance with IAS 18, and are recognised as an adjustment to the effective yield, being recorded in the consolidated income statement over the period from disbursement to repayment of the subsidised loan. A.4.9. Impairment on loans and advances Impairment on loans and advances or provisions on commitments are recorded if there is objective evidence that the Group will be unable to collect all amounts due on a claim according to the original contractual terms or an equivalent value. A “claim” means a loan, a commitment such as a letter of credit, a guarantee, a commitment to extend credit, or some other credit product. Impairment is reported as a reduction of the carrying amount of a claim on the consolidated balance sheet, whereas for an off-balance sheet item such as a commitment a provision for credit loss is reported in “Provisions”. Additional impairment or provisions for credit losses are made through “Change in impairment on loans and advances and provisions on guarantees, net of reversals”. A.4.9.1.Impairment allowances related to individual loans and advances Impairment losses have been made for individual loans and advances outstanding at the end of the financial year where objective evidence exists of risks of non-recovery of all or part of the amounts outstanding according to the original contractual terms or the equivalent value. Changes to these provisions are recorded in the consolidated income statement as "Change in impairment on loans and advances and provisions on guarantees, net of reversals". Allowances and provisions for credit losses are evaluated on the basis of the following counterparty-specific principles. A claim is considered impaired when the Bank determines that it is probable that the Group will not be able to collect all amounts due according to the original contractual terms or an equivalent value. Individual credit exposures are evaluated based upon the borrower’s character, overall financial condition, resources and payment record, the prospects for support from any financially responsible guarantors and, where applicable, the realisable value of any collateral. The estimated recoverable amount is the present value of expected future cash flows, which may result from restructuring or liquidation. Impairment is measured and allowances for credit losses are established for the difference between the carrying amount and the estimated recoverable amount of any claim considered as impaired. The amount of the loss is the difference between the asset’s carrying amount and the present value of expected future cash flows discounted at the financial instrument’s original effective interest rate. All impaired claims are reviewed and analysed at least semi-annually. Any subsequent changes to the amounts and timing of the expected future cash flows compared to the prior estimates will result in a change in the provision for credit losses and be charged or credited to credit loss expense. An allowance for impairment is reversed only when the credit quality has improved such that there is reasonable assurance of timely collection of principal and interest in accordance with the original contractual terms of the claim agreement. A write-off is made when all or part of a claim is deemed uncollectible or forgiven. Write-offs are charged against previously established provisions for credit losses or directly to credit loss expense and reduce the principal amount of a claim. Recoveries in part or in full of amounts previously written off are credited to credit loss expense. For non-performing loans, upon impairment the accrual of interest income based on the original terms of the claim may be discontinued. 168


A.4.10.Financial guarantees Financial guarantee contracts are contracts that require the Group to make specified payments to reimburse the holder for a loss it incurs because a specified debtor fails to make payments when due in accordance with the terms of a debt instrument. Under the existing rules, these guarantees do not meet the definition of an insurance contract (IFRS 4 Insurance Contracts) and are accounted for under IAS 39 Financial Instruments: Recognition and Measurement, either as “Derivatives” or as “Financial Guarantees”, depending on their features and characteristics as defined by IAS 39. The accounting policy for derivatives is disclosed under Note A.4.3. Financial guarantees are initially recognised in the consolidated balance sheet under “Other liabilities” at fair value plus transaction costs that are directly attributable to the issuance of the financial guarantees. At initial recognition the obligation to pay corresponds to the Net Present Value (‘NPV’) of expected premium inflows or the initial expected loss. Subsequent to initial recognition, financial guarantees are measured at the higher of 1) the amount initially recognised less, where appropriate, cumulative amortisation recognised in accordance with IAS 18 Revenue and 2) the best estimate of expenditure required to settle any present financial obligation arising as a result of the guarantee in accordance with IAS 37 Provisions, Contingent Liabilities and Contingent Assets. The best estimate of expenditure is determined in accordance with IAS 37. Financial guarantee provisions correspond to the cost of settling the obligation, which is the expected loss, estimated on the basis of all relevant factors and information existing at the statement of financial position date. When a financial guarantee operation measured under IAS 39 is derecognised and treated under IAS 37, its value previously recorded under “Other liabilities” is transferred to the caption “Provisions for guarantees issued” on the balance sheet. Any increase or decrease in the net liability (as measured per IAS 39) relating to financial guarantees other than the payment of guarantee calls is recognised in the consolidated income statement under “Result on financial operations”. The provision for financial guarantees (as measured per IAS 37) is recognised in the consolidated income statement under “Change in impairment on loans and advances and provisions for guarantees, net of reversals”. The premium received is recognised in the consolidated income statement in “Fee and commission income” on the basis of an amortisation schedule in accordance with IAS 18 over the life of the financial guarantee. A.4.11.Property, furniture and equipment Property, furniture and equipment include land, Group-occupied properties and other machines and equipment. Property, furniture and equipment are reviewed periodically for impairment. Land is stated at acquisition cost and buildings are stated at acquisition cost less accumulated depreciation. The costs of the Group's headquarters building in Luxembourg-Kirchberg and its building in Luxembourg-Weimershof are depreciated on a straight-line basis as set out below. Permanent equipment, fixtures and fittings, furniture, office equipment and vehicles are recorded in the consolidated balance sheet at their acquisition cost, less accumulated depreciation. Depreciation is calculated on a straight-line basis over the estimated life of each item purchased, as set out below: • • • • Buildings in Kirchberg and Weimershof: 30 years Permanent equipment, fixtures and fittings: 10 years Furniture: 5 years Office equipment and vehicles: 3 years A.4.12. Investment property Investment property is property held to earn rentals or for capital appreciation or both. Investment property is stated at cost less accumulated depreciation and impairment losses and is reviewed for signs of impairment at the balance sheet date. Depreciation is calculated on a straight-line basis using the same estimated useful lives as property, furniture and equipment. A.4.13.Intangible assets Intangible assets comprise computer software. Software development costs are capitalised if they meet certain criteria relating to identifiability, to the probability that future economic benefits will flow to the enterprise, and to the reliability of cost measurement. Intangible assets are recognised as assets and are amortised on a straight-line basis over their estimated useful economic lives. At each consolidated balance sheet date, intangible assets are reviewed for indications of impairment or changes in estimated future benefits. If such indications exist, an analysis is performed to assess whether the carrying amounts are fully recoverable. A write-down is made if the carrying amount exceeds the recoverable amount. 169


EIB Group Consolidated Financial Statements under IFRS Internally developed software meeting these criteria is carried at cost less accumulated amortisation calculated on a straight-line basis over three years from completion. A.4.14.Non-current assets held for sale Non-current assets classified as held for sale include assets reclassified from investment property for which the sale is highly probable and the asset is available for immediate sale in its current condition. They are classified as held for sale as their carrying amount will be recovered through a sale transaction rather than through continuing use and are measured at the lower of carrying amount and fair value less costs to sell. A.4.15.Pension plans and health insurance scheme The Group operates defined-benefit pension plans to provide retirement benefits to its entire staff. The Group also provides certain additional post-employment healthcare benefits to former employees of the EIB. These benefits are unfunded, as defined by IAS 19. The cost of providing benefits under the plans is determined separately for each plan using the projected unit credit actuarial valuation method. The charge to the consolidated income statement in respect of the defined-benefit pension plan is based on the current service cost and interest cost as determined by qualified external actuaries. A.4.15.1. Pension plans for staff The Bank’s main pension plan is a defined-benefit pension plan funded by contributions from staff and from the Bank, covering all Bank employees. Commitments for retirement benefits are valued at least every year using the projected unit credit method, in order to ensure that the liability entered in the accounts is adequate. The latest valuation was performed as at 30 September 2017, with an extrapolation to 31 December 2017. The main actuarial assumptions used by the actuary are set out in Note J. Cumulative actuarial surpluses and deficits are recognised in full in Other comprehensive income. Net interest cost is recognised in the income statement under “Interest expense and similar charges”. The main pension plan of the EIF is a defined-benefit plan funded by contributions from staff and from the EIF, covering all EIF employees. The scheme entered into force in March 2003, replacing the previous defined contribution scheme. A.4.15.2. Health insurance plan The Bank has set up its own health insurance plan for the benefit of staff, financed by contributions from the Bank and its employees. The plan is an unfunded plan treated as a defined-benefit plan. A specific provision is set aside on the liability side of the consolidated balance sheet for staff at retirement age. The Fund has subscribed to a health insurance scheme with an insurance company for the benefit of staff at retirement age, financed by a contribution from the Fund and its employees. Entitlement to these benefits is based on the employees remaining in service up to retirement age and the completion of a minimum service period. The expected costs of these benefits are accrued over the period of employment, using a methodology similar to that for defined-benefit pension plans. The health insurance liabilities are determined based on actuarial calculations as per the same dates as the pension plans. A.4.15.3. Pension plan for members of the Management Committee The related provision shown on the liability side of the Group’s balance sheet is determined, as for all plans, in conformity with IAS 19. Benefits are based on years of service and a percentage of final gross base salary as defined under the plan. The Pension plan for members of the Management Committee is managed and accounted for under the same principles as the pension plan for staff (Note A.4.15.1). A.4.15.4. Optional Supplementary Provident Scheme The Optional Supplementary Provident Scheme is a defined-contribution pension scheme, funded by voluntary staff and employer contributions. It is accounted for on the basis of the contributions from staff and employer and the corresponding liability is recorded in “Other liabilities”. A.4.16. Amounts owed to credit institutions and customers Amounts owed to credit institutions and customers are initially recorded at cost and are presented in the financial statements at amortised cost. Interest on amounts owed to credit institutions and customers is recorded in the income statement as Interest expense and similar charges using the effective interest method. A.4.17.Debts evidenced by certificates Debts evidenced by certificates are initially measured at cost, which is the fair value of the consideration received. Transaction costs and net premiums (discounts) are included in the initial measurement. Subsequent measurement is at amortised cost, and any difference between net proceeds and the redemption value is recognised in the consolidated income statement over the period of the borrowings using the effective interest method. Where borrowings meet the eligibility criteria of the amended Fair Value Option and have been designated on initial recognition as at fair value through profit or loss, they are measured at their fair value and recorded in the balance sheet at fair value. Changes in fair value are recorded in “Result on financial operations”. The fair value measurement technique employed, in the event of absence of liquid market prices, is a discounted cash flow technique, using current yield curves. 170


Combined debt instruments that are related to foreign exchange rates or indices are considered structured instruments. For all the debt instruments including embedded derivatives, the Group has concluded a swap agreement to fully hedge the exposure. It is Group policy to hedge the fixed interest rate risk on debt issues and to apply the amended Fair Value Option when this results in a significant reduction of an accounting mismatch. The effect is such that the carrying value of the thus selected debt instruments is adjusted for changes in fair value rather than carried and accrued at cost (see Note Q – Derivative financial instruments). Interest expense on debt instruments is included in the account “Interest expense and similar charges” in the consolidated income statement and under the liabilities caption including the underlying debt instruments in the consolidated balance sheet. Issuance fees and redemption premiums or discounts are amortised over the period to maturity of the related borrowings, unless those borrowings are measured at fair value, in which case the recognition in the consolidated income statement is immediate. A.4.18.Prepayments – Deferred income These accounts comprise: • • Prepayments: expenditure incurred during the financial year, but relating to a subsequent financial year. Deferred income: income received before the balance sheet date, but relating to a subsequent financial year. A.4.19. Reserves A.4.19.1. Reserve fund As provided for under Article 22(-1) of the Statute, “a reserve fund of up to 10% of the subscribed capital shall be built up progressively” from the retained profit of the Bank. A.4.19.2. Additional reserves Additional reserves contain the remaining retained earnings of the Group. A.4.19.3. Fair value reserve The fair value reserve includes the change in fair value of available for sale financial assets (other than impairments). A.4.19.4. Special activities reserve As provided for under Article 16(-5) of the Statute, “the special activities of the Bank […] will have a specific allocation of reserve”. The special activities reserve is a dedicated reserve for the capital allocation covering the unexpected loss of those activities which have a risk profile higher than what is generally accepted by the Bank, including venture capital activities. The reserve is based on the capital allocation of each operation and is calculated monthly according to the evolution of the underlying assets. A.4.19.5. General loan reserve In 2009 a “general loan reserve” was introduced for the expected loss of the Bank’s loan and guarantees portfolio, modelled upon the Group’s policy guidelines. It is calculated monthly according to the evolution of the underlying assets. A.4.20.Taxation The Protocol on the Privileges and Immunities of the European Union appended to the Treaty on European Union and the Treaty on the Functioning of the European Union, stipulates that the assets, revenues, and other property of the institutions of the Union are exempt from all direct taxes. A.4.21.Interest income and expense Interest income and interest expense are recognised in the income statement for all interest bearing instruments on an accruals basis using the effective interest method based on the actual purchase price including direct transaction costs. This is a method of calculating the amortised cost of a financial asset and allocating the interest income over the relevant period. The effective interest rate is the rate that exactly discounts estimated future cash receipts through the expected life of the financial instrument to the net carrying amount of the financial asset. In addition to interest and commission on loans, deposits and other revenue from the securities portfolio, this heading includes the indemnities received by the Group in respect of early loan reimbursement payments made by its borrowers. In accordance with the provisions of IAS 39 – Financial Instruments: Recognition and Measurement - the Group records the indemnities received for early repayment of loans immediately in the consolidated income statement at the time of derecognition of the related loans. In accordance with IAS 32 – Financial Instruments: Presentation, as a result of the replacement share purchase undertaking (Note A.4.1), EIF non-controlling interests are presented under “Interest expense and similar charges”, in conformity with the anticipated acquisition method. 171


EIB Group Consolidated Financial Statements under IFRS A.4.22.Dividend income Dividends are recognised in the income statement income from shares and other variable-yield securities when the entity’s right to receive payment is established. Note B – Cash in hand, balances with central banks and post office banks, debt securities portfolio, shares and other variable-yield securities and interest in other entities (in EUR ‘000) B.1. Cash in hand, balances with central banks and post office banks The cash in hand and balances with central banks and post office banks equals to EUR ’000 162,483 at 31 December 2017 (2016: EUR ‘000 316,769). The EIB is an eligible counterparty in the Eurosystem’s monetary policy operations, and has therefore been given access to the monetary policy operations of the European Central Bank. The Bank conducts the operations via the Central Bank of Luxembourg, where it maintains a deposit to cover the minimum reserve requirement. The balance of this deposit amounts to EUR ‘000 162,448 as at 31 December 2017 (2016: EUR ‘000 316,734). B.2. Debt securities portfolio The details of each portfolio as at 31 December 2017 and 2016 are as follows: 31.12.2017 31.12.2016 Treasury bills and other bills eligible for refinancing with central banks Debt securities including fixed-income securities 41,642,957 15,765,397 51,759,729 15,913,385 57,408,354 67,673,114 (*)of which EUR ‘000 7,472,799 unlisted at 31 December 2017 (2016: EUR ‘000 16,976,819). At 31.12.2017 Classification Book value Fair value(1) Group long term hedge portfolio Held-to-maturity 551,119 667,634 Treasury Monetary Portfolios - Money market securities Securities liquidity portfolios: Held-to-maturity 27,930,209 27,931,715 - - - P1: Fixed rate portfolio P2: Floating rate portfolio P2: Floating rate portfolio Trading Available for sale Trading Available for sale Loans and receivable 4,594,500 20,284(2) 2,917,196 1,249,000(3) 199,422 4,594,501 20,284 2,917,196 1,249,000 199,422 Operational portfolio – EIF ABS Portfolio EIF Loan substitutes portfolio (Note D) Loan substitutes portfolio (Note D) Held-to-maturity Loans and receivable 4,414,515 15,532,109 4,624,358 15,589,015 (1)Fair value including accrued interest (2)Including unrealised gain of EUR ’000 252 (3)Including unrealised gain of EUR ’000 30,914 (4)Of which cash and cash equivalents EUR'000 18,969,421 At 31.12.2016 Classification Book value Fair value(1) Group long term hedge portfolio Held-to-maturity 567,001 706,035 Treasury Monetary Portfolios - Money market securities Securities liquidity portfolios: Held-to-maturity 37,537,451 37,530,726 - - - P1: Fixed rate portfolio P2: Floating rate portfolio P2: Floating rate portfolio Trading Available for sale Trading Available for sale Loans and receivable 2,987,023 66,679(2) 4,133,731 1,285,902(3) 178,677 2,987,023 66,679 4,133,731 1,285,902 178,677 Operational portfolio – EIF ABS Portfolio EIF Loan substitutes portfolio (Note D) Loan substitutes portfolio (Note D) Held-to-maturity Loans and receivable 6,769,389 14,147,261 7,123,683 14,131,708 (1)Fair value including accrued interest (2)Including unrealised gain of EUR ’000 1,750 (3)Including unrealised gain of EUR ’000 54,680 (4)Of which cash and cash equivalents EUR'000 23,483,405 172 Total debt securities 67,673,114(4) 68,144,164 Total debt securities 57,408,354(4)57,793,125 Total debt securities(*)


Loan substitutes, which represent acquisitions of interests in pools of loans or receivables in connection with securitisation transactions, are considered to be part of the aggregate loans (Note D). Some of these transactions have been structured by adding credit or project related remedies, thus offering additional recourse. No impairment has occurred on any asset in this portfolio and hence no impairment has been accounted for as at 31 December 2017 and 2016. EU sovereign exposure The Group did not record impairment in 2017 and 2016 in respect of its held to maturity and available for sale EU sovereign and EU sovereign guaranteed exposure as at year-end, in view of the Bank’s as well as EIF’s preferred creditor status and the protection given by the Bank’s Statute as well as on a detailed review of any fair value adjustment requirements. The following tables show the exposure to debt issued or guaranteed by EU sovereigns in the Group’s debt securities portfolios as at 31 December 2017 and 2016: Fair value(1) At 31.12.2017 Book value EU sovereigns Austria Belgium Czech Republic Denmark Finland France Germany Greece Hungary Ireland Italy Lithuania Luxembourg Netherlands Poland Portugal Romania Slovakia Slovenia Spain Sweden United Kingdom 103,019 1,157,756 808,754 551,407 327,465 4,706,614 1,720,388 15,534 37,213 126,381 3,708,226 13,630 5,555 130,298 169,117 10,453 106,550 49,254 25,626 2,510,083 373,442 2,050,906 103,012 1,157,739 886,509 551,426 327,600 4,715,944 1,783,716 15,729 39,079 126,408 3,736,636 13,630 5,555 142,422 171,328 10,453 106,592 50,007 25,588 2,510,525 373,311 2,050,860 18,707,671 38,700,683 18,904,069 38,889,056 Non-EU sovereign and other bonds (1)Fair value including accrued interest Fair value(1) At 31.12.2016 Book value EU sovereigns Austria Belgium Bulgaria Czech Republic Denmark Finland France Germany Greece Hungary Ireland Italy Lithuania Luxembourg Netherlands Poland Portugal Slovakia Slovenia Spain Sweden United Kingdom 1,290,326 910,402 6,251 720,360 107,736 49,432 6,374,307 4,054,557 33,009 19,272 27,499 6,943,382 25,247 17,241 1,312,866 140,671 842,383 124,920 12,162 2,917,113 471,382 23,955 1,289,730 910,947 6,254 839,791 107,745 49,432 6,384,212 4,127,051 32,548 21,810 27,499 6,972,927 25,247 17,241 1,326,790 143,709 842,434 125,841 12,147 2,917,877 471,308 23,955 26,424,473 41,248,641 26,676,495 41,467,669 Non-EU sovereign and other bonds (1)Fair value including accrued interest 173 Total 67,673,114 68,144,164 Total 57,408,354 57,793,125


EIB Group Consolidated Financial Statements under IFRS B.3. Shares and other variable-yield securities The balance comprises: Venture capital operations Investment funds EBRD shares Total Cost: At 1 January 2017 Additions Disposals 4,898,880 1,571,017 -676,610 4,035,661 1,249,468 -491,813 157,500 0 0 705,719 321,549 -184,797 Unrealised gains/losses At 1 January 2017 Unrealised gains Unrealised losses 1,748,576 635,730 -329,782 285,097 24,874 0 183,646 60,177 -43,747 2,217,319 720,781 -373,529 Impairment At 1 January 2017 Net additions -1,038,156 -29,543 0 0 -49,832 4,824 -1,087,988 -24,719 Net book value: (1) The amount of EUR ‘000 157,500 (2016: EUR ‘000 157,500) corresponds to the capital paid in by the Group as at 31 December 2017 with respect to its subscription of EUR ‘000 900,440 to the capital of the European Bank for Reconstruction and Development (‘EBRD’). As at 31 December 2017, the Group holds 3.03% of the subscribed capital of the EBRD (2016: 3.03%). B.4. Interest in other entities B.4.1. Composition of the Group B.4.1.1.The European Investment Fund The European Investment Fund (the ‘Fund’ or ‘EIF’) was incorporated on 14 June 1994, in Luxembourg, as an international financial institution. The address of its registered office is 37 B, avenue J.F. Kennedy, L-2968 Luxembourg. The Bank holds 58.47% (2016: 59.88%) of the subscribed capital of the EIF amounting to EUR 4.5 billion (2016: EUR 4.38 billion). The primary task of the EIF, while providing an adequate return on equity, is to contribute to the pursuit of EU objectives through: • • • • the provision of guarantees to financial institutions that cover credits to small and medium sized enterprises (‘SMEs’); the acquisition, holding, managing and disposal of equity participations; the administration of special resources entrusted by third parties; and related activities. The EIF has share capital consisting solely of ordinary shares, which are held directly by the Bank and the proportion of ownership interests held equals to the voting rights held by Bank. The country of incorporation or registration is also its principal place of business. B.4.1.2.EU Microfinance Platform FCP FIS The EUMPF is structured as a Luxembourg “fonds commun de placement – fonds d’investissement spécialisé” governed by the Law of 13 February 2007 relating to specialised investment funds (the “2007 Law”) and launched on 22 November 2010. It was established as an umbrella fund, which may have several sub-funds. It was launched with an unlimited duration, provided that the fund is, however, automatically put into liquidation upon the termination of a sub-fund if no further sub-fund is active at that time. Currently, the only sub-fund of the EUMPF is the European Progress Microfinance Fund. The EUMPF is an unincorporated co-ownership of securities and other eligible assets and does not have legal personality. It is therefore managed in the exclusive interests of the Unitholders by the Management Company (“EIF”) in accordance with Luxembourg laws and the Management Regulations. As per the Management Regulations, the EIF serves as Management Company to the EUMPF umbrella fund and the EPMF compartment. In line with regulatory requirements thereon, standard investment decisions on behalf of the EUMPF are taken by the EIF in its capacity as Management Company and with strict adherence to the relevant Management Regulations agreed with investors. The overall investment objective of the EUMPF is to invest its assets in a wide range of securities and other assets permitted to a specialised investment fund governed by the 2007 Law as amended with the purpose of spreading investment risks and affording its investors the results of the management of its portfolio. The specific investment objective of the EUMPF is to increase access to and the availability of a range of financial products and services in the area of microfinance for: 174 At 31 December 2017 5,780,141 467,471 997,539 7,245,151 At 31 December 2016 4,746,081 442,597 839,533 6,028,211 At 31 December 2017 -1,067,699 0 -45,008 -1,112,707 At 31 December 2017 2,054,524 309,971 200,076 2,564,571 At 31 December 2017 4,793,316 157,500(1) 842,471 5,793,287


• • • Persons starting their own enterprise, including self-employment; Enterprises, especially microenterprises; Capacity building, professionalisation and quality management of microfinance institutions and of organisations active in the area of microfinance; Local and regional employment and economic development initiatives. • The Bank holds 55.56% (2016: 55.56%) of the total committed units of the EUMPF amounting to EUR 180.0 million. As of 1 January 2015, the Bank has decided to consolidate EUMPF. The non-controlling interest amounts to EUR 67.4 million as at 31 December 2017 (2016: EUR 75.1 million). The Bank, the EIF and the EUMPF together are defined as the ‘Group’. B.4.2. Involvement with unconsolidated structured entities Definition of a structured entity A structured entity is one that has been designed so that voting or similar rights are not the dominant factor in deciding, who controls the entity. IFRS 12 observes that a structured entity often has some or all of the following features: • • Restricted activities; A narrow and well-defined objective, such as to effect a tax-efficient lease, carry out research and development activities, provide a source of capital or funding to an entity or provide investment opportunities for investors by passing on risks and rewards associated with the assets of the structured entity to investors; Insufficient equity to permit the structured entity to finance its activities without subordinated financial support; Financing in the form of multiple contractually linked instruments to investors that create concentrations of credit or other risks (tranches). • • Unconsolidated structured entities The term 'unconsolidated structured entities' refers to all structured entities that are not controlled by the Group and includes interests in structured entities that are not consolidated. Definition of Interests in structured entities: IFRS 12 defines "interests" broadly to include any contractual or non-contractual involvement that exposes the reporting entity to variability in returns from the performance of the entity. Examples of such interests include the holding of equity interests and other forms of involvement such as the provision of funding, liquidity support, credit enhancements, commitments and guarantees to the other entity. IFRS 12 states that a reporting entity does not necessarily have an interest in another entity solely because of a typical customer supplier relationship. Type of structured entity Nature and purpose Interest held by the Group Project Finance - lending to Special Purposes Vehicles (“SPVs”) Project Finance Transactions (PF Operations) are transactions where the Group relies for the servicing of its debt on a borrower whose sole or main source of revenue is generated by a single or limited number of assets being financed by such debt or other pre-existing assets contractually linked to the project. PF operations are often financed through SPVs. Net disbursed amounts Interest income Venture capital and investment funds The Group finances venture capital and investment funds. Venture capital and Investments in units/shares investment funds pool and manage money from investors seeking private equity issued by venture capital and stakes in small and medium-size enterprises with strong growth potential as well investment funds as financing infrastructure projects. Dividends received as dividend income Assets Backed Securities issued by SPVs Investing in notes issued by SPVs is a Group’s alternative mean of providing funds Investments in notes issued by to a project promoter or intermediary. Asset Backed Securities are issued by a the SPVs segregated SPV and are backed by a pool of assets originated by a financial or Interest income another institution. It should be noted that the Group does not act as sponsor/promoter of such SPVs. The Group enters into guarantees and unfunded securities transactions that can Guaranteed exposures Guarantees granted in respect of loans granted by be granted to financial institutions, public entities or SPVs. third parties SPVs Guarantee fees The Group manages mandates on behalf of third parties and is entrusted with the Management fees for services management of external funds and provides related back-office and accounting services. Mandate management 175


EIB Group Consolidated Financial Statements under IFRS The table below shows the carrying amounts of unconsolidated structured entities in which the Group has an interest at the reporting date, as well as the Group’s maximum exposure to credit risk in relation to those entities. The maximum exposure to credit risk includes the carrying amounts and the related undisbursed commitments. 31.12.2017 31.12.2016 (in EUR million) Maximum Exposure to Credit Risk Maximum Exposure to Credit Risk Carrying amount Carrying amount Caption Project finance - lending to SPVs Loans and advances to customers Shares and other variable-yield securities 14,281 15,766 15,157 16,288 Venture capital and investment funds (refer to Note B.3) 6,778 15,324 5,586 12,440 Loan substitutes – Investments in Asset Backed Securities issued by SPVs (refer to Note S.2.3.6) Debt securities including fixed-income securities 5,873 5,873 7,318 7,318 Guarantees granted in respect of loans granted by third parties SPV (Notes S.2.5.3) Provisions for guarantees issued 23 6,818 42 6,069 Total 26,955 43,781 28,103 42,115 Note C – Loans and advances to credit institutions and to customers – other loans and advances (in EUR ‘000) 31.12.2017 31.12.2016 Term deposits Overnight deposits Tripartite reverse repos 25,740,610 200,000 7,948,706 24,631,472 174,000 10,410,688 Of which cash and cash equivalents 31,958,799 30,492,322 Note D – Summary statement of loans (in EUR ‘000) D.1. Aggregate loans granted Aggregate loans granted comprise both the disbursed and undisbursed portions of loans. The analysis is as follows: To intermediary credit institutions Directly to final beneficiaries Total 2017 Total 2016 Disbursed portion Undisbursed loans 123,155,257 28,890,536 333,890,113 84,037,546 457,045,370 112,928,082 458,730,797 113,320,448 Loan instalments receivable Loan substitutes portfolio (Note B.2) 18,902 208,419 227,321 19,946,624 116,986 20,916,650 176 Aggregate loans including loan substitutes portfolio 590,147,397 593,084,881 Aggregate loans granted 152,045,793 417,927,659 569,973,452 572,051,245 Loans and advances to credit institutions Loans and advances to customers Total other loans and advances 33,889,316 1,740,923 35,630,239 35,216,160 2,219,000 37,435,160


D.2. Impairment on loans and advances, net of reversals Specific impairment is created when there is objective evidence of impairment. The amount of such provisioning reflects the difference between the loan’s nominal value and the present value of all the expected future cash flows generated by the impaired asset. Movements in the specific impairment are detailed below: 2017 2016 At 1 January Release during the year Use during the year Allowance during the year Foreign exchange adjustment 476,692 -180,039 -2,616 120,922 -5,302 489,284 -46,504 0 38,882 -4,970 The accrued interest on impaired loans as at 31 December 2017 amounts to EUR ‘000 7,000 (2016: EUR ‘000 8,667). The financial collateral held for impaired loans is disclosed in Note S.2.3.4. D.3. Geographical breakdown of lending by country in which projects are located Loans for projects within the European Union: Countries and territories in which projects are located Number of loans Aggregate loans granted(*) Disbursed portion(*) Undisbursed portion % of total 2017 % of total 2016 Spain Italy France United Kingdom Germany Poland Greece Portugal Austria Netherlands Belgium Sweden Hungary Finland Czech Republic Romania Ireland Slovakia Croatia Slovenia Denmark Cyprus Bulgaria Lithuania Estonia Latvia Luxembourg Malta 800 760 565 324 406 374 162 267 187 137 146 103 90 156 117 111 68 72 63 55 44 52 47 25 31 18 14 13 95,539,859 68,660,891 57,552,726 49,802,981 46,443,535 45,679,978 19,973,129 19,391,630 15,937,173 14,851,737 13,509,816 10,977,523 10,273,633 9,673,938 7,645,779 7,154,426 6,278,004 5,062,251 4,359,903 3,707,862 3,056,026 2,693,869 2,430,176 1,947,336 1,366,724 1,096,764 652,326 454,083 87,963,538 56,390,738 43,967,498 44,082,225 37,792,860 34,559,776 18,168,015 17,645,730 13,803,688 12,182,305 10,179,695 7,133,177 8,419,772 7,177,274 6,972,142 4,435,083 4,858,404 3,620,884 3,472,830 3,151,573 1,978,007 1,993,922 1,709,529 1,628,141 1,033,754 788,271 370,725 346,326 7,576,321 12,270,153 13,585,228 5,720,756 8,650,675 11,120,202 1,805,114 1,745,900 2,133,485 2,669,432 3,330,121 3,844,346 1,853,861 2,496,664 673,637 2,719,343 1,419,600 1,441,367 887,073 556,289 1,078,019 699,947 720,647 319,195 332,970 308,493 281,601 107,757 16.18% 11.63% 9.76% 8.44% 7.87% 7.74% 3.39% 3.29% 2.70% 2.52% 2.29% 1.86% 1.74% 1.64% 1.30% 1.21% 1.06% 0.86% 0.74% 0.63% 0.52% 0.46% 0.41% 0.33% 0.23% 0.19% 0.11% 0.08% 16.06% 11.69% 9.54% 8.92% 8.03% 7.45% 3.35% 3.34% 2.82% 2.30% 2.31% 1.60% 1.82% 1.60% 1.32% 1.15% 0.96% 0.87% 0.70% 0.68% 0.46% 0.44% 0.46% 0.35% 0.24% 0.18% 0.15% 0.07% 177 Sub-total 5,207 526,174,078 435,825,882 90,348,196 89.18% 88.86% At 31 December 409,657 476,692


EIB Group Consolidated Financial Statements under IFRS Loans for projects outside the European Union: Countries and territories in which projects are located Number of loans Aggregate loans granted(*) Disbursed portion(*) Undisbursed portion % of total 2017 % of total 2016 Candidate Countries Mediterranean Countries Eastern Europe, Southern Caucasus and Russia Asia ACP States Latin America EFTA Countries Potential Candidate Countries South Africa Overseas Countries and Territories 321 234 22,802,822 16,562,702 19,644,678 10,234,486 3,158,144 6,328,216 3.87% 2.81% 4.27% 2.77% 90 62 100 49 26 37 22 3 7,181,325 5,766,435 3,541,655 3,524,659 1,737,840 1,507,666 1,083,018 37,876 2,059,335 2,205,604 1,421,658 2,148,319 1,425,112 1,143,331 853,213 30,376 5,121,990 3,560,831 2,119,997 1,376,340 312,728 364,335 229,805 7,500 1.22% 0.98% 0.60% 0.60% 0.29% 0.26% 0.18% 0.01% 1.33% 0.83% 0.67% 0.51% 0.27% 0.27% 0.21% 0.01% (*) Aggregate loans including loan substitutes and excluding loan instalments receivables (2017: EUR 227 million, 2016: EUR 117 million). D.4. Change in provisions on guarantee operations A provision for guarantees issued has been recognised as there is objective evidence that the Group will have to incur a loss in respect of guarantees granted. This provision amounts to EUR ‘000 23,460 as at 31 December 2017 (2016: EUR ‘000 42,479). Note E – Property, furniture, equipment and intangible assets (in EUR ‘000) Total property, furniture and equipment Luxembourg buildings Furniture and equipment Total intangible assets Land Cost: At 1 January 2017 Additions Disposals 20,145 0 0 375,046 6,728 0 94,256 17,520 -19,230 489,447 24,248 -19,230 22,172 13,273 -6,503 Accumulated depreciation: At 1 January 2017 Depreciation Disposals 0 0 0 -167,174 -9,792 0 -49,373 -22,018 19,230 -216,547 -31,810 19,230 -5,953 -7,388 5,663 Net book value: All land and buildings are used by the Group for its own activities. For subsequent measurement purposes the Group uses the “cost model” under IAS 16. The Luxembourg buildings category includes cost relating to the construction of a new building for an amount of EUR ’000 38,513 (2016: EUR ’000 31,785), which is expected to be completed in 2021. 178 At 31 December 2017 20,145 204,808 40,385 265,338 21,264 At 31 December 2016 20,145 207,872 44,883 272,900 16,219 At 31 December 2017 0 -176,966 -52,161 -229,127 -7,678 At 31 December 2017 20,145 381,774 92,546 494,465 28,942 Total 2017(*) 6,151 589,920,076 476,991,994 112,928,082 100.00% Total 2016(*) 6,041 592,967,895 479,647,447 113,320,448 100.00% Sub-total 944 63,745,998 41,166,112 22,579,886 10.82% 11.14%


Note F – Deferred income (in EUR ‘000) 31.12.2017 31.12.2016 Interest subsidies received in advance(1) Prepaid management fees Other 101,077 14,504 64,734 106,693 16,638 47,902 (1) Part of the amounts received from the European Commission has been made available as a long term advance which is entered on the liabilities side under item Deferred income, and comprises: • amounts in respect of interest subsidies for loans granted for projects outside the Union, under Conventions signed with the ACP States and Protocols concluded with the Mediterranean Countries; and • interest subsidies, concerning certain lending operations put in place within the Union from the Group's own resources, made available in conjunction with the EMS under Council Regulation (EEC) No 1736/79 of 3 August 1979 and in conjunction with the financial mechanism established by the EFTA Countries under the EFTA Agreement signed on 2 May 1992. Note G – Other assets and other liabilities (in EUR ‘000) G.1. Other assets 31.12.2017 31.12.2016 Commission receivable on guarantees and Venture Capital Operations Other Receivables on sale of Venture Capital Operations Staff housing loans and advances(1) 88,702 43,789 19,655 2,485 62,372 50,529 20,389 3,278 (1) The balance above relates to staff housing loans disbursed previously to employees by the Bank. Since 1999 these housing loans have been replaced by an arrangement with an external financial institution, whereby permanently employed staff members of the Group may be granted staff housing loans in accordance with the Group’s Staff Regulations. The same interest rates, terms and conditions are applicable to all employees concerned. G.2. Other liabilities 31.12.2017 31.12.2016 Commitment to purchase EIF non-controlling interest(2) Optional Supplementary Provident Scheme (Note J) Personnel costs payable Financial guarantees Accounts payable and sundry creditors Payable on HIPC Initiative First Loss Piece Contribution Western Balkans infrastructure fund Other 813,042 526,536 114,925 91,807 53,349 13,596 8,164 393 108,666 753,544 470,839 92,495 85,878 49,590 13,596 101,079 886 114,555 (2) As at 31 December 2017, the portion of EIF non-controlling interest on the balance sheet amounts to EUR 813 million (2016: EUR 754 million) and on the consolidated result (Note L) amounts to EUR -36 million (2016: EUR -49 million). 179 Total 1,730,478 1,682,462 Total 154,631 136,568 180,315 171,233


EIB Group Consolidated Financial Statements under IFRS Note H – Amounts owed to credit institutions and customers (in EUR ‘000) H.1. Amounts owed to credit institutions 31.12.2017 31.12.2016 Repayable on demand Short term deposits Repo with banks Cash deposited on swaps payable 4,952,467 57,526 0 0 12,420,433 213,198 314,990 166,019 H.2. Amounts owed to customers 31.12.2017 31.12.2016 Overnight deposits European Union and Member States' accounts: - For Special Section operations and related unsettled amounts - Deposit accounts Short term deposits 4,160 12,971 372,158 1,546,248 8,346 375,451 1,538,908 25,030 Note I – Debts evidenced by certificates (in EUR ‘000) In its financing activity, one of the Group’s objectives is to align its funding strategy with the funds required for the loans granted. The caption ‘Debts evidenced by certificates’ includes ’Debt securities in issue’ (securities offered to the general investing public) and ‘Others’ (private placements). The table below discloses the details per currency of debts outstanding at 31 December 2017 and 2016, together with the average rates and due dates. Debts evidenced by certificates (in EUR '000) Outstanding at 31.12.2017 Average rate 2017(*) Outstanding at 31.12.2016 Average rate 2016(*) Due dates Payable in EUR USD GBP AUD CHF SEK NOK TRY ZAR JPY CAD PLN MXN NZD CZK HUF RUB DKK RON HKD CNY 233,246,441 119,928,350 49,311,992 11,111,557 6,831,909 5,369,877 4,071,522 4,008,066 3,778,963 3,698,520 3,562,299 2,097,199 1,007,979 459,941 410,718 290,658 230,574 124,133 18,890 12,974 12,801 2.00 1.75 2.63 4.54 2.16 2.57 1.98 8.23 7.83 1.00 2.00 2.65 4.96 3.74 2.18 0.07 6.75 3.46 1.15 4.96 3.28 2018/2057 2018/2058 2018/2054 2018/2042 2018/2036 2018/2040 2018/2037 2018/2027 2018/2032 2018/2053 2018/2045 2021/2026 2020/2027 2018/2021 2018/2034 2020/2021 2018/2020 2024/2026 2019/2019 2019/2019 2018/2018 220,901,207 146,683,436 51,872,036 12,317,012 8,002,794 5,214,132 5,240,229 3,498,782 3,683,341 6,732,871 3,784,938 872,846 369,743 577,253 399,456 291,127 307,154 124,308 19,388 30,584 0 2.21 1.67 2.86 4.85 2.14 2.96 2.70 7.38 7.60 1.11 2.02 2.83 4.34 4.21 2.16 0.66 6.73 3.46 0 5.27 0 Outstanding at 31.12.2017 Outstanding at 31.12.2016 Fair value adjustment and accrued interest on borrowings 40,442,293 46,980,209 (*) Weighted average interest rates at the balance sheet date (**) The notional value of debts evidenced by certificates held at fair value through profit or loss as at 31 December 2017 amounts to EUR 379.1 billion (2016: EUR 399.1 billion). The notional value of debts evidenced by certificates held at amortised cost as at 31 December 2017 amounts to EUR 70.5 billion (2016: EUR 71.8billion). Refer to Note A.4.17. for the definition of Fair value on borrowings. 180 Total debts evidenced by certificates 490,027,656 517,902,846 Total (notional value)(**) 449,585,363 470,922,637 Total 449,585,363 470,922,637 Total 1,930,912 1,952,360 Total 5,009,993 13,114,640


Note J – Pension plans and health insurance scheme (in EUR’000) The Group operates three defined-benefit pension plans. The Group also provides certain post-employment healthcare benefits to former employees of the EIB. These benefits are unfunded as defined by IAS19 and the plan is not regulated. The cost of providing benefits under the plans is determined separately for each plan using the projected unit credit actuarial valuation method. Actuarial valuation took place at 30 September 2017 and was rolled forward to 31 December 2017. The plans typically expose the Group to actuarial risks such as interest risk, longevity risk and salary risk. An additional risk is associated with the payment to the dependants of plan members (widow and orphan benefits). An additional plan is not included in the figures below: the Optional Supplementary Provident Scheme (a defined-contribution pension scheme). The corresponding amount of EUR 527 million (2016: EUR 471 million) is classified under Other liabilities (Note G). The principal assumptions used in determining pension and post-employment benefit obligations for the Group’s plans are shown below: in % 2017 2016 Discount rate for pension plans Discount rate for health insurance plan Future salary increase (including inflation) Future pension increases Healthcare cost increase rate Average longevity at 60 of current pensioners (years) Average longevity at 60 of current employees (years) Actuarial tables 2.09 2.09 3.50 1.75 4.00 25.10 26.80 ISCLT 1.95 1.95 3.50 1.75 4.00 25.00 26.70 ISCLT A periodic update of secondary actuarial demographic parameters was performed in 2017 and the related actuarial gains and losses were accounted for in “Change in demographic assumptions”. Sensitivity analysis: Significant actuarial assumptions for the determination of the defined obligation are discount rate, expected salary increase and mortality. The sensitivity analyses below have been determined based on reasonably possible changes of the respective assumptions occurring at the end of the reporting period, while keeping all other assumptions constant. EIB Pension: • • • If the discount rate is 1% higher (lower), the defined benefit obligation would decrease by 19% (increase by 25%). If the expected salary growth increases (decreases) by 1%, the defined benefit obligation would increase by 6% (decrease by 5%). If the life expectancy increases (decreases) by 1 year for men and women, the defined benefit obligation would increase by 4% (decrease by 4%). If the expected future pension increases (decreases) by 1% due to inflation, the defined benefit obligation would increase by 18% (decrease by 14%). • EIF Pension: • • • If the discount rate is 1% higher (lower), the defined benefit obligation would decrease by 25% (increase by 36%). If the expected salary growth increases (decreases) by 1%, the defined benefit obligation would increase by 12% (decrease by 10%). If the life expectancy increases (decreases) by 1 year for men and women, the defined benefit obligation would increase by 4% (decrease by 4%). If the expected future pension increases (decreases) by 1% due to inflation, the defined benefit obligation would increase by 22% (decrease by 17%). • Management Committee Pension: • • • If the discount rate is 1% higher (lower), the defined benefit obligation would decrease by 13% (increase by 15%). If the expected salary growth increases (decreases) by 1%, the defined benefit obligation would increase by 6% (decrease by 5%). If the life expectancy increases (decreases) by 1 year for men and women, the defined benefit obligation would increase by 5% (decrease by 5%). If the expected future pension increases (decreases) by 1% due to inflation, the defined benefit obligation would increase by 9% (decrease by 8%). • 181 Interest risk The present value of the defined-benefit liability is calculated using a discount rate determined by reference to high quality corporate bond yields. A decrease in the bond interest rate will increase the pension liability. Longevity risk The present value of the defined-benefit plan liability is calculated by reference to the best estimate of the mortality of the plan participants both during and after their employment. An increase in the life expectancy of the plan participants will increase the plan’s liability. Salary risk The present value of the defined-benefit plan liability is calculated by reference to the future salaries of plan participants. An increase in the salary of the plan participants will increase the plan’s liability.


EIB Group Consolidated Financial Statements under IFRS Health Insurance for EIB • • If the discount rate is 1% higher (lower), the defined benefit obligation would decrease by 23% (increase by 33%). If the life expectancy increases (decreases) by 1 year for men and women, the defined benefit obligation would increase by 6% (decrease by 6%). If the expected future healthcare cost increases (decreases) by 1% due to inflation, the defined benefit obligation would increase by 32% (decrease by 23%). • Health Insurance for EIF • • If the discount rate is 1% higher (lower), the defined benefit obligation would decrease by 29% (increase by 44%). If the life expectancy increases (decreases) by 1 year for men and women, the defined benefit obligation would increase by 6% (decrease by 6%). If the expected future healthcare cost increases (decreases) by 1% due to inflation, the defined benefit obligation would increase by 42% (decrease by 29%). • The sensitivity analysis presented above may not be representative of the actual change in the defined obligation as it is unlikely that the change in assumptions would occur in isolation of one another as some of the assumptions may be correlated. Furthermore, in presenting the above sensitivity analysis, the present value of the defined benefit obligation has been calculated using the projected unit credit method at the end of the reporting period, which is the same as that applied in calculating the defined benefit obligation liability recognised in the balance sheet. There was no change in the method and assumptions used in preparing the sensitivity analysis from prior years. The table below shows the actuarial experience (gain)/loss for the different Plans and the total defined benefit obligation: Management Committee Pension Total defined benefit obligation Health Insurance EIB Pension EIF Pension Total 2017 2016 2015 2014 267,349 -67,192 -142,817 -1,343 2,409 -772 -4,122 -2,628 24,013 -3,163 10,131 1,690 -39,610 -17,963 5,078 881 254,161 -89,090 -131,730 -1,400 5,565,841 4,715,296 3,163,451 3,580,970 182


The tables below show the evolution of the Defined Benefit Obligation during 2017 and 2016: Management Committee Pension Health Insurance EIB Pension EIF Pension Total 2017 Obligation at the beginning of the year a) Current service cost b) Interest cost c) Past service cost 3,644,435 158,919 71,919 2,263 53,702 2,696 1,052 0 228,906 20,751 4,652 74 788,253 74,891 16,048 0 4,715,296 257,257 93,671 2,337 Total profit or loss 233,101 3,748 25,477 90,939 353,265 a) Experience (gain)/loss b) Change in demographic assumptions c) Change in financial assumptions 267,349 426,873 -134,833 2,409 499 -1,131 24,013 32,505 -13,052 -39,610 -31,581 1,476 254,161 428,296 -147,540 Total OCI(*) 559,389 1,777 43,466 -69,715 534,917 a) Employee contributions b) Benefit payments 37,464 -71,564 0 -2,225 3,937 -1,414 1,563 -5,398 42,964 -80,601 Total Other -34,100 -2,225 2,523 -3,835 -37,637 Benefit obligation as at 31 December 2017 4,402,825 57,002 300,372 805,642 5,565,841 (*) Attributable to the Equity holders of the Bank (EUR'000 518,504) and to non-controlling interest (EUR'000 16,413). Management Committee Pension Health Insurance EIB Pension EIF Pension Total 2016 Obligation at the beginning of the year a) Current service cost b) Interest cost c) Past service cost 2,599,190 96,240 102,292 3,350 41,541 2,448 1,629 0 133,252 10,863 5,451 544 389,468 28,458 15,690 0 3,163,451 138,009 125,062 3,894 Total profit or loss 201,882 4,077 16,858 44,148 266,965 a) Experience (gain)/loss b) Change in demographic assumptions c) Change in financial assumptions -67,192 7,502 936,250 -772 137 10,912 -3,163 375 76,910 -17,963 1,638 374,358 -89,090 9,652 1,398,430 Total OCI(*) 876,560 10,277 74,122 358,033 1,318,992 a) Employee contributions b) Benefit payments 29,112 -62,309 0 -2,193 3,238 1,436 1,461 -4,857 33,811 -67,923 Total Other -33,197 -2,193 4,674 -3,396 -34,112 Benefit obligation as at 31 December 2016 3,644,435 53,702 228,906 788,253 4,715,296 (*) Attributable to the Equity holders of the Bank (EUR'000 1,277,685) and to non-controlling interest (EUR'000 41,307). 183


EIB Group Consolidated Financial Statements under IFRS EIB employees pay a fixed contribution reviewed every five years. For the period from 1.1.2014 to 31.12.2018, the employee’s contribution represents 10.9% of their pensionable salary. The residual contribution (including back service payments) is paid by the Group. All contributions of the Group and its staff are invested in the assets of the Group. The funding requirements are based on the local actuarial measurement framework. In this framework the discount rate is set on a risk free rate. Furthermore, premiums are determined on a current salary base. The Group is liable for all pension payments stemming from the defined benefit plan. The average duration of the benefit obligation at 31 December 2017 is split as follows: EIB Pension: • • • Active members: 25.76 years (2016: 26.25 years) Deferred members (*): 25.30 years (2016: 27.61 years) Retired members: 11.45 years (2016: 11.16 years) EIF Pension: • • • Active members: 30.08 years (2016: 31.12 years) Deferred members (*): 35.26 years (2016: 33.10 years) Retired members: 16.56 years (2016: 15.38 years) Management Committee Pension: • • • Active members: 20.35 years (2016: 20.59 years) Deferred members (*): 20.42 years (2016: 20.42 years) Retired members: 9.72 years (2016: 9.82 years) Health Insurance for EIB • • • Active members: 30.69 years (2016: 31.11 years) Deferred members (*): 24.63 years (2016: 25.50 years) Retired members: 15.02 years (2016: 17.00 years) Health Insurance for EIF • • Active members: 36.13 years (2016: 36.58 years) Retired members: 20.70 years (2016: 22.68 years) The amount that the Group expects to recognise in the profit or loss relating to the defined benefit plans during the next financial year is EUR ‘000 432,283. (*) Staff members who left the Group before the normal retirement age and have a right to a deferred pension. Note K – Result for the financial year The appropriation of the profit of the stand-alone financial statements of the Bank for the year ended 31 December 2017, prepared under EU Accounting Directives, which amounts to EUR’000 2,805,711 will be submitted to the Board of Governors for approval by 27 April 2018. 184


Note L – Interest and similar income and Interest expense and similar charges (in EUR ‘000) L.1. Net interest income 2017 2016 Interest and similar income: Derivatives Loans and advances to credit institutions and customers Treasury bills and other bills eligible for refinancing with central banks and debt securities including fixed-income securities Interest subsidy from the EU Cash in hand, balances with central banks and post office banks Negative interest on interest bearing liabilities Other 15,299,723 7,274,721 14,038,219 7,773,297 760,523 19,675 0 51,422 4,532 307,651 20,655 25 42,115 1,613 Interest expense and similar charges: Debts evidenced by certificates Derivatives Interest cost on benefit obligation (Note J) Commitment to purchase EIF non-controlling interest (Note G.2) Interest on third party mandates Amounts owed to credit institutions and to customers Negative interest on interest bearing assets Other -10,627,994 -8,642,078 -93,671 -36,277 -13,395 -6,435 -708,005 -9,215 -11,567,322 -6,773,763 -125,062 -49,169 -11,741 -5,335 -220,945 -11,640 The table below sets out the net interest income relating to each class of financial assets and liabilities: 2017 2016 Interest and similar income: Derivatives Loans and receivables Designated at fair value through profit and loss Held-to-maturity Available-for-sale Trading debt securities Other 15,299,723 3,723,116 3,687,010 578,042 17,792 100,381 4,532 14,038,219 3,086,726 4,783,505 141,290 21,843 110,379 1,613 Interest expense and similar charges: Designated at fair value through profit and loss Derivatives Held-to-maturity Financial liabilities measured at amortised cost Non-financial liabilities -9,989,940 -8,642,078 -707,732 -657,873 -139,447 -10,852,494 -6,773,763 -220,945 -731,903 -185,872 185 Total -20,137,070 -18,764,977 Net interest income 3,273,526 3,418,598 Total 23,410,596 22,183,575 Total -20,137,070 -18,764,977 Net interest income 3,273,526 3,418,598 Total 23,410,596 22,183,575


EIB Group Consolidated Financial Statements under IFRS L.2. Geographical analysis of Interest and similar income 2017 2016 EU countries: Spain United Kingdom Poland Italy Greece France Germany Austria Portugal Netherlands Hungary Belgium Romania Sweden Ireland Finland Croatia Slovakia Slovenia Lithuania Bulgaria Czech Republic Latvia Cyprus Denmark Malta Luxembourg Estonia 1,027,724 930,177 629,938 578,333 515,584 451,100 334,715 263,350 257,414 174,247 172,112 152,584 100,416 95,270 75,994 70,219 67,800 66,175 52,716 47,289 45,546 32,879 15,158 12,693 12,486 11,034 5,011 4,696 1,117,789 964,700 637,253 638,169 530,830 445,583 505,585 268,592 284,162 161,242 201,182 162,802 112,443 91,808 115,095 68,785 68,320 67,329 54,410 49,371 47,968 63,103 15,545 13,881 29,128 11,147 5,164 11,696 Outside the European Union 1,001,994 1,007,412 Income not analysed per country(1) 16,205,942 14,433,081 (1)Income not analysed by country: · · · · · · · Revenue from Long Term Hedge portfolios, loan substitutes and ABS portfolio EIF Revenue from Securities Liquidity portfolios and Operational portfolio - EIF Revenue from money-market securities Revenue from money-market operations Income from derivatives Unwinding of interest income from the present value adjustment of paid-in capital and reserve receivable Other 180,168 118,173 462,182 141,164 15,299,723 1,035 3,497 172,483 132,294 2,874 85,598 14,038,219 1,034 579 186 16,205,942 14,433,081 Total interest and similar income 23,410,596 22,183,575 Total 7,204,654 7,750,494 Total EU countries 6,202,660 6,743,082


Note M – Result on financial operations (in EUR ‘000) M.1. By nature of result 2017 2016 Net result on derivatives(1) Net result on loans under the fair value option and associated swaps(2) Net result on borrowings under the fair value option and associated swaps(3) 521,601 1,905,081 -104,951 -762,033 -1,874,364 -2,324,779 552,318 -3,074 988 -2,999 396 -24,960 -8,769 -3,191,763 3,268 77,566 -1,284 -34,396 -59,903 -7,850 Foreign exchange gain and loss Gain and loss on unwind of swaps Gain and loss on buy back of debts evidenced by certificates Net result on shares and variable yield securities(4) Net result on securities liquidity portfolios (securities only) Net result on financial guarantees (1) The net result on derivatives includes for the majority the fair value of Macro-hedging swaps and Treasury Asset swaps. On 31 December 2017 these swaps evidence a positive impact of EUR ‘000 521,601 compared to a negative impact of EUR ‘000 104,951 in 2016. (2) The Fair Value Option is applied on loans hedged by derivatives. As at 31 December 2017, the carrying value of loans designated at fair value stands at EUR 166 billion (2016: EUR 162 billion). The use of Fair Value Option on loans generates an increase of EUR '000 1,905,081 on the income statement at 31 December 2017 (2016: a decrease of EUR' 000 762,033). The positive variation in the combined fair value of the EIB loans under the Fair Value Option and their associated swaps is essentially due to a change in swap curves as a result of market condition changes. (3) The Fair Value Option is applied on borrowings hedged by derivatives. The majority of the borrowings are systematically hedged, and the carrying value of borrowings designated at fair value amounts to EUR 419 billion as at 31 December 2017 (2016: EUR 445 billion). The net impact on the income statement at 31 December 2017 on borrowings and associated swaps is a loss for the year by EUR '000 1,874,364 (2016: loss of EUR ’000 2,324,779). The negative variation in the combined fair value of the EIB borrowings under the Fair Value Option and their associated swaps mainly due to a change in swap curves and the Bank’s credit spreads. (4) Including EUR ‘000 18,342 on funds accounted for at FVTPL in line with Group’s accounting policies (Note A.4.7.3). M.2. By category of assets and liabilities 2017 2016 Financial liabilities designated at fair value through profit or loss Financial assets available-for-sale Financial liabilities measured at amortised cost Financial instruments held for trading Financial assets designated at fair value through profit or loss Derivatives held for risk management Other 5,951,604 27 0 -42,950 -2,169,302 -3,238,440 12,961 -2,214,009 -41,145 -1,284 -60,321 2,050,956 -2,951,828 3,269 Note N – Other operating income (in EUR ‘000) 2017 2016 Reversal of previous year’s unutilised accruals of general administrative expenses Rental income Other 8,776 199 2,063 4,370 3 3,961 In January 2016, the EIF sold its building for EUR'000 6,782. The gain on sale of Non-current assets held for sale of EUR'000 2,872 is recorded under Other in the above table. 187 Total Other operating income 11,038 8,334 Result on financial operations 513,900 -3,214,362 Result on financial operations 513,900 -3,214,362


EIB Group Consolidated Financial Statements under IFRS Note O – Fee and commission income (in EUR ‘000) 2017 2016 Commission on guarantees Commission on Investment Facility - Cotonou Commission on Jaspers Commission on Jeremie Commission on Jessica Commission income on loans Commission on Yaoundé/Lomé conventions Commission on InnovFin Commission on other mandates 80,279 47,447 31,063 8,124 9,691 5,025 2,459 30,429 133,024 53,951 45,846 32,510 8,941 12,353 7,318 2,696 28,572 105,134 Note P – General administrative expenses (in EUR ‘000) 2017 2016 Salaries and allowances(1) Welfare contributions and other staff costs -435,311 -375,548 -354,968 -295,392 Other general administrative expenses -265,176 -257,919 (1) Of which the amount for members of the Management Committee is EUR ‘000 2,844 at 31 December 2017 and EUR ‘000 3,230 at 31 December 2016. The number of persons employed by the Group was 3,682 at 31 December 2017 (3,291 at 31 December 2016). Note Q – Derivative financial instruments Q.1. Use of derivative financial instruments In the funding activity of the Group The Group uses derivatives mainly as part of its funding strategy in order to bring the characteristics of the funds raised, in terms of currencies and interest rates into line with those of loans granted and also to reduce funding costs. It also uses long-term swaps to hedge certain treasury transactions and for ALM purposes. Long-term derivatives transactions are used in connection with fund-raising, hedging loans and treasury transactions, and for the reduction of market risk exposure. The derivatives most commonly used are: Currency swaps Currency swaps are contracts under which it is agreed to convert funds in one currency into another currency and, simultaneously, a forward exchange contract is concluded to re-exchange the two currencies in the future in order to be able to repay the funds raised on the due dates. Interest rate swaps Interest rate swaps are contracts under which, generally, it is agreed to exchange floating-rate interest for fixed-rate interest or vice versa. Interest rate and currency swaps allow the Group to modify the interest rates and currencies of its borrowing portfolio and other portfolios in order to accommodate requests from its customers and also to reduce funding costs by exchanging its advantageous conditions of access to certain capital markets with its swap counterparties. In the liquidity management of the Group The Group enters into short-term currency swap contracts and currency forwards in order to adjust currency positions in its operational treasury in relation to its benchmark currency, the euro, and to cater for demand for currencies in connection with loan disbursements. The notional amount of short-term currency swaps stood at EUR 43,942 million at 31 December 2017 against EUR 46,312 million at 31 December 2016. The notional amount of short-term currency forwards was EUR 585 million at 31 December 2017 (2016: EUR 667 million). The fair value was EUR -23 million at 31 December 2017 for short-term currency swaps and EUR 39 million for short-term currency forwards (2016: respectively EUR 847 million and EUR 18 million). 188 Total general administrative expenses -1,076,035 -908,279 Staff costs -810,859 -650,360 Total Fee and commission income 347,541 297,321


Forward rate agreements are used by the Bank to hedge the interest rate risk of its short-term treasury position. The notional amount of forward rate agreements stood at EUR nil at 31 December 2017 (2016: EUR nil) and their fair value at EUR nil (2016: EUR nil). In the Asset Liability Management (ALM) of the Group The Group’s ALM policy aims to maintain a high and stable level of income as well as to limit the volatility of the economic value of the Group. Accordingly, the Group: • • has adopted an own funds investment profile ensuring a stable and high flow of income; and manages residual interest rate risks in relation to this investment profile. With a view to managing residual interest rate risks, the Group operates natural hedges in respect of loans and borrowings or concludes global hedging operations (interest rate swaps). Macro hedging swaps used as part of asset/liability management are fair valued in accordance with IAS 39. Q.2. Fair value of derivative financial instruments Financial instruments measured at fair value require disclosure of fair value measurements by level of the following hierarchy: • Level 1 – Quoted (unadjusted) prices in active markets for identical assets or liabilities. • Level 2 – Valuation techniques with inputs other than quoted prices included within Level 1 that are observable for the asset or liability, either directly (i.e. as prices) or indirectly (i.e. derived from prices). • Level 3 – Valuation techniques which use inputs for the asset or liability that are not based on observable market data (unobservable inputs). Internal valuation models are used to determine the fair values of these instruments. Valuation techniques include net present value and discounted cash flow models, Hull-White and Libor Market Model interest rate models and Black-Scholes option model. Assumptions and inputs used in valuation techniques include risk-free interest rates, basis swap spreads and currency basis swaps spreads, foreign currency exchange rates and forward exchange rates, equity and equity index prices and expected price volatilities and correlations, Consumer Price Indices values and expected volatilities and correlations. The objective of valuation techniques is to arrive at a fair value determination that reflects the price of the financial instrument at the reporting date that would have been determined by market participants acting at arm’s length. The valuation models applied are consistent with accepted economic methodologies for pricing financial instruments and incorporate the factors that market participants consider when setting a price. For a portion of derivative transactions, internal estimates and assumptions might be used in the valuation techniques when the market inputs are not directly available, typically in the estimation of correlations in some interest rate and cross-currency models and in the estimation of volatilities for some long dated equity-linked and inflation-linked transactions. The table below shows the fair value of derivative financial instruments, recorded as assets or liabilities (between those whose fair value is based on quoted market prices, those whose valuation technique is where all the model inputs are observable in the market and those where the valuation techniques involve the use of non-market observable inputs) together with their nominal amounts. The nominal amounts indicate the volume of transactions outstanding at year-end and are indicative of neither the market risk nor the credit risk. 189


EIB Group Consolidated Financial Statements under IFRS Derivatives by valuation method as at 31 December 2017 (in EUR million) Derivatives assets Level 1 Level 2 Level 3 Valuation techniques – market observable inputs Valuation techniques – non market observable inputs Total 2017 Quoted market price Notional amount Notional amount Notional amount Notional amount Fair value Fair value Fair value Fair value Interest Rate Swaps Cross Currency Swaps Short-term foreign exchange contracts Warrants 0 0 0 0 0 0 0 0 257,463 96,701 18,086 0 32,853 10,387 341 0 1,477 673 0 3 88 134 0 58 258,940 97,374 18,086 3 32,941 10,521 341 58 Total 0 0 372,250 43,581 2,153 280 374,403 43,861 Derivatives liabilities Level 1 Level 2 Level 3 Valuation techniques – market observable inputs Valuation techniques – non market observable inputs Total 2017 Quoted market price Notional amount Notional amount Notional amount Notional amount Fair value Fair value Fair value Fair value Interest Rate Swaps Cross Currency Swaps Short-term foreign exchange contracts Other 0 0 0 0 0 0 0 0 250,225 106,005 26,441 0 23,466 8,691 325 0 842 556 0 0 55 94 0 21 251,067 106,561 26,441 0 23,521 8,785 325 21 Total 0 0 382,671 32,482 1,398 170 384,069 32,652 Derivatives by valuation method as at 31 December 2016 (in EUR million) Level 1 Level 2 Level 3 Derivatives assets Valuation techniques – market observable inputs Valuation techniques – non market observable inputs Total 2016 Quoted market price Notional amount Notional amount Notional amount Notional amount Fair value Fair value Fair value Fair value Interest Rate Swaps Cross Currency Swaps Short-term foreign exchange contracts Warrants 0 0 0 0 0 0 0 0 298,493 161,080 31,413 0 40,106 21,928 1,127 0 2,057 1,465 0 14 225 251 0 14 300,550 162,545 31,413 14 40,331 22,179 1,127 14 Total 0 0 490,986 63,161 3,536 490 494,522 63,651 Derivatives liabilities Level 1 Level 2 Level 3 Valuation techniques – market observable inputs Valuation techniques – non market observable inputs Total 2016 Quoted market price Notional amount Notional amount Notional amount Notional amount Fair value Fair value Fair value Fair value Interest Rate Swaps Cross Currency Swaps Short-term foreign exchange contracts 0 0 0 0 0 0 221,866 48,824 15,566 27,076 5,349 262 937 863 0 47 135 0 222,803 49,687 15,566 27,123 5,484 262 Total 0 0 286,256 32,687 1,800 182 288,056 32,869 Quoted prices for the majority of the Bank’s derivative transactions are not available in the market. For such instruments the fair values are estimated using valuation techniques or models, based wherever possible on observable market data prevailing at the balance sheet date. The fair value of swap transactions is computed using the income approach, applying valuation techniques to convert future amounts to a single present amount (discounted). The estimate of fair value is based on the value indicated by marketplace expectations about those future amounts. Valuation techniques can range from simple discounted known cash flows to complex option models. The valuation models applied are consistent with accepted economic methodologies for pricing financial instruments, and incorporate the factors that market participants consider when setting a price. For a portion of derivative transactions, internal estimates and assumptions might be used in the valuation techniques when the market inputs are not directly available. 190


The table below sets out information about significant unobservable inputs used at year end in measuring derivatives financial instruments categorised as Level 3 in the fair value hierarchy (EUR million): Fair values of level 3 swaps at 31 December 2017 Type of financial instrument Fair value at 31 December 2017 Valuation technique Significant unobservable input Range of estimates for unobservable inputs From 2 to 3 factors. Correlations of adjacent rates between 60% and 100% and volatility of volatility between 80% and Number of factors for the curves, correlation between forward rates and volatility of volatility 33 Stochastic IR OTC interest rate swaps 9,420 models 120% OTC Cross currency swaps 40 Stochastic CC Correlations between yield curves and FX rates Correlations between 30% and 50%. 1,736 models Fair values of level 3 swaps at 31 December 2016 Type of financial instrument Fair value at 31 December 2016 Valuation technique Significant unobservable input Range of estimates for unobservable inputs From 1 to 3 factors. Correlations of adjacent rates between 65% and 100% Number of factors for the curves and correlation between forward rates 178 Stochastic IR OTC interest rate swaps 13,208 models OTC Cross currency swaps 116 Stochastic CC Correlations between yield curves and FX rates Correlations between 30% and 50%. 16,695 models Significant unobservable inputs are developed as follows: • Correlations and volatilities are derived through extrapolation of observable volatilities, recent transaction prices, quotes from other market participants, data from consensus pricing services and historical data adjusted for current conditions. Risk adjusted spreads are derived from the CDS market, where available, and from historical default and prepayment trends adjusted for current conditions. • With the application of IFRS 13, valuation adjustments are included in the fair valuations of derivatives at 31 December 2017, namely: • Credit valuation adjustments (CVA), reflecting counterparty credit risk on derivative transactions, amounting to EUR -145.5 million (2016: EUR -342.9 million) recorded in: swaps hedging loans of EUR -54.4 million (2016: EUR -115.4 million) swaps hedging borrowings of EUR -73.2 million (2016: EUR -207.0 million) ALM swaps of EUR -17.6 million (2016: EUR -19.8 million) long-term treasury swaps of EUR -0.2 million (2016: EUR -0.3 million) short-term treasury swaps (FX swaps and FX forwards) of EUR -0.1 million (2016: EUR -0.4 million). o o o o o • Debit valuation adjustments (DVA), reflecting own credit risk on derivative transactions, amounting to EUR 263.2 million (2016: 365.8 million) recorded in: swaps hedging loans of EUR 106.4 million (2016: EUR 154.7 million) swaps hedging borrowings of EUR 121.8 million (2016: EUR 186.3 million) ALM swaps of EUR 34.1 million (2016: EUR 23.5 million) long-term treasury swaps of EUR 0.6 million (2016: EUR 0.7 million) short-term treasury swaps (FX swaps and FX forwards) of EUR 0.3 million (2016: EUR 0.6 million). o o o o o • In addition to CVA and DVA above, Collateral Valuation adjustment (COLVA), reflecting specific marginal adjustments linked to collateral posted by EIB counterparties on derivative transactions at 31 December 2017, amounting to EUR 1.6 million. For the majority of the derivatives, the collateral posted by the EIB counterparties is already included in the CVA value. But for some marginal cases, the collateral is not directly taken into account (specific CSAs, cash collateral) and is thus separated out in a specific COLVA adjustment. Q.3. Sensitivity of Fair Value for Level 3 Instruments Although the Group believes that its estimates of fair value are appropriate, the use of different methodologies or assumptions could lead to different measurements of fair value. The unobservable inputs may add a degree of uncertainty and variation into the valuation of Level 3 instruments. To asses and quantify it, the Bank performs alternative valuations using reasonably possible range of assumptions for the unobservable inputs. Alternative assumptions are specific to valuation models and can be applied separately. Level 3 derivatives can be grouped into two swap types according to the underlying asset and valuation model: a. Structured interest rate swaps b. Cross currency and FX-linked swaps c. Equity-linked swaps 191


EIB Group Consolidated Financial Statements under IFRS Structured interest rate swaps are modelled with the dynamics of a multi-factor Libor Market Model (LMM), calibrated using swaptions and spread options, where a volatility of volatility (‘vol-of-vol’) parameter is exogenously specified. For this category, (a), alternative valuations are obtained by tweaking the vol-of-vol up by 10 pct points, and down by 10 pct points, both leading to unfavourable impacts. The first led to a valuation decrease of EUR’ 000 447, and the other led to a decrease of EUR’ 000 47. Cross currency and FX-linked swaps are valued according to 1 factor Hull & White model for interest rates modelling while FX rates are modelled according to the Black Scholes model. The model is calibrated to interest rates, swaptions volatilities, FX rates, FX option volatilities and correlations between interest and FX rates. Correlations between interest and FX rates are estimated from the time series. For these categories, alternative valuations are obtained by tweaking the correlation structure in two directions: increased dependence, and independence. For this category, (b), the first scenario turned out to have a favourable impact leading to an increase of EUR 1.3 million, and the other of an unfavourable impact leading to a decrease of EUR 6.4 million. Equity linked swaps are modelled with BS model capturing the volatilities from the market. Interest rates and dividends are also taken from market quotes. For long-term swaps the volatilities and dividends are extrapolated for the long maturities. For this category, alternative valuations are obtained by decreasing volatility by 0.10% and increasing dividends by 0.10%. The other scenario is constructed by increasing volatility by 0.10% and decreasing dividends by 0.10%. The favourable scenario led to an increase of EUR 8.0 million and the unfavourable scenario to a decrease of EUR 5.1 million. The following table summarizes Level 3 derivatives by type of financial instrument for which alternative assumptions would change fair value (in EUR million): Significant unobservable input 31 December 2017 Favourable ImpactUnfavourable Impact Valuation technique Structured interest rate swaps (OTC) Changing vol-of-vol for the stochastic volatility 0 -0.5 Stochastic IR models Cross currency and FX-linked swaps Correlations between Interest rates and FX rates 1.3 -6.4 Stochastic CC models Changing volatility and dividends Equity-linked swaps 8 -5.1 Stochastic Equity models Significant unobservable input 31 December 2016 Favourable ImpactUnfavourable Impact Valuation technique Target correlations for Constant Maturity Swaps Structured interest rate swaps 1.9 -2.2 Stochastic IR models (OTC) (CMS) rates Cross currency and FX-linked swaps Correlations between Interest rates and FX rates 1.8 -0.1 Stochastic CC models 192


Note R – Fair value of financial assets and liabilities (in EUR million) The tables below set out a comparison of the fair values, by the level of the fair value hierarchy, and the carrying amounts of the Group’s financial assets and financial liabilities that are carried in the financial statements. The tables do not include the fair values of non-financial assets and non-financial liabilities. 31 December 2017 Fair value Carrying amount Level 1 Level 2 Level 3 Total Assets carried at fair value: Available-for-sale financial assets Securities liquidity portfolios Operational portfolio - EIF Shares and other variable-yield securities Financial assets designated at fair value through profit or loss Loans and advances to credit institutions and to customers Shares and other variable-yield securities Financial assets held for trading Securities liquidity portfolios Derivative assets held for risk management 1,259 20 1,239 0 0 0 0 7,448 7,448 0 10 0 10 0 126,025 126,025 0 64 64 43,581 6,903 0 0 6,903 40,259 39,917 342 0 0 280 8,172 20 1,249 6,903 166,284 165,942 342 7,512 7,512 43,861 8,172 20 1,249 6,903 166,284 165,942 342 7,512 7,512 43,861 Total 8,707 169,680 47,442 225,829 225,829 Assets carried at amortised cost: Held-to-maturity investments Group long term hedge portfolio Treasury Monetary Portfolios Loan substitutes portfolio Loans and receivables ABS Portfolio - EIF Loan substitutes portfolio Loans and advances to credit institutions and to customers Cash in hand, balances with central banks and post office banks 25,383 662 24,150 571 304 0 142 0 162 7,841 5 3,782 4,054 352,136 199 15,447 336,490 0 0 0 0 0 0 0 0 0 0 33,224 667 27,932 4,625 352,440 199 15,589 336,490 162 32,895 551 27,929 4,415 343,383 199 15,533 327,489 162 Total 25,687 359,977 0 385,664 376,278 Total financial assets 34,394 529,657 47,442 611,493 602,107 Liabilities carried at fair value: Derivative liabilities held for risk management Financial liabilities designated at fair value through profit or loss Debts evidenced by certificates 0 405,010 405,010 32,482 11,812 11,812 170 1,741 1,741 32,652 418,563 418,563 32,652 418,563 418,563 Total 405,010 44,294 1,911 451,215 451,215 Liabilities carried at amortised cost: Liabilities measured at amortised cost Amounts owed to credit institutions and customers Debts evidenced by certificates 53,651 0 53,651 27,838 6,941 20,897 0 0 0 81,489 6,941 74,548 78,406 6,941 71,465 Total 53,651 27,838 0 81,489 78,406 Total financial liabilities 458,661 72,132 1,911 532,704 529,621 193


EIB Group Consolidated Financial Statements under IFRS 31 December 2016 Fair value Carrying amount Level 1 Level 2 Level 3 Total Assets carried at fair value: Available-for-sale financial assets Securities liquidity portfolios Operational portfolio - EIF Shares and other variable-yield securities Financial assets designated at fair value through profit or loss Loans and advances to credit institutions and to customers Shares and other variable-yield securities Financial assets held for trading Securities liquidity portfolios Derivative assets held for risk management 1,332 66 1,266 0 0 0 0 7,068 7,068 0 20 0 20 0 121,892 121,892 0 53 53 63,161 5,782 0 0 5,782 39,918 39,672 246 0 0 490 7,134 66 1,286 5,782 161,810 161,564 246 7,121 7,121 63,651 7,134 66 1,286 5,782 161,810 161,564 246 7,121 7,121 63,651 Total 8,400 185,126 46,190 239,716 239,716 Assets carried at amortised cost: Held-to-maturity investments Group long term hedge portfolio Treasury Monetary Portfolios Loan substitutes portfolio Loans and receivables ABS Portfolio - EIF Loan substitutes portfolio Loans and advances to credit institutions and to customers Cash in hand, balances with central banks and post office banks 25,747 701 24,306 740 313 0 313 0 0 19,613 5 13,225 6,383 357,886 179 13,818 343,572 317 0 0 0 0 0 0 0 0 0 45,360 706 37,531 7,123 358,199 179 14,131 343,572 317 44,874 567 37,538 6,769 349,750 179 14,147 335,107 317 Total 26,060 377,499 0 403,559 394,624 Total financial assets 34,460 562,625 46,190 643,275 634,340 Liabilities carried at fair value: Derivative liabilities held for risk management Financial liabilities designated at fair value through profit or loss Debts evidenced by certificates 0 430,871 430,871 32,687 12,264 12,264 182 1,916 1,916 32,869 445,051 445,051 32,869 445,051 445,051 Total 430,871 44,951 2,098 477,920 477,920 Liabilities carried at amortised cost: Liabilities measured at amortised cost Amounts owed to credit institutions and customers Debts evidenced by certificates 53,471 0 53,471 38,340 15,067 23,273 0 0 0 91,811 15,067 76,744 87,919 15,067 72,852 Total 53,471 38,340 0 91,811 87,919 Total financial liabilities 484,342 83,291 2,098 569,731 565,839 The following describes the methodologies and assumptions used to determine the fair value of the financial assets and financial liabilities. Assets for which carrying value approximates to fair value For financial assets and financial liabilities that are liquid or have a short-term maturity (less than three months), it is assumed that the carrying amounts approximate to their fair value. Assets and liabilities recorded at fair value Published price quotations in an active market are the first source for determining the fair value of a financial instrument. For instruments without available market price, fair values are estimated using valuation techniques or models based wherever possible on observable market data prevailing at the balance sheet date. The fair value of such instruments is determined by using valuation techniques to convert future amounts to a single discounted present amount. The estimate of fair value is based on the value indicated by marketplace expectations about those future amounts. Valuation techniques can range from simple discounted known cash flows to complex option models. The valuation models applied are consistent with accepted economic methodologies for pricing financial instruments, and incorporate the factors that market participants consider when setting a price. Internal estimates and assumptions might be used in the valuation techniques when the market inputs are not directly available. With the application of IFRS 13, own credit adjustments (OCA), reflecting own credit risk on unquoted or illiquid borrowings hedged by swaps, amounts to almost nil at 31 December 2017 (2016: EUR 95 million). In 2017, the Group made transfers from Level 1 to 2 of the fair value hierarchy: - Financial held for trading of EUR 20.9 million (2016: EUR 0 million) - Loans and receivables of EUR 305.3 million (2016: EUR 0 million) - Financial liabilities designated at fair value through profit or loss of EUR 200.1 million (2016: EUR 0 million) During the current year, due to changes in market conditions for certain securities, quoted prices in active markets were no longer available for these securities. However, there was sufficient information available to measure fair values of these securities based on observable market inputs, hence the transfers from Level 1 to 2. The Group made also the following transfer from level 2 to 1 of the fair value hierarchy: - Financial assets held for trading of EUR 20.9 million (2016: EUR 0 million) 194


- Financial assets held to maturity of EUR 31.6 million (2016: EUR 0 million) - Loans and receivables of EUR 141.9 million (2016: EUR 0 million) - Financial liabilities designated at fair value through profit or loss of EUR 594.4 million (2016: EUR 1,113 million). During the current year, quoted prices in active markets were available for these securities, hence the transfers from Level 2 to 1. The following table presents the changes in Level 3 instruments for the year ended 31 December 2017 (in EUR million): Financial liabilities designated at fair value through P/L Financial assets designated at fair value through P/L Financial liabilities held for trading(*) Financial assets held for trading(*) Available for sale financial assets Balance at 1 January 2017 Total gains or losses: - in profit or loss - in other comprehensive income Purchases Sales Issues Settlement Aggregate transfers into Level 3 Aggregate transfers out of Level 3 490 39,918 5,782 -182 -1,916 3 0 44 0 0 -3 0 -254 -1,321 0 3,454 0 0 -259 0 -1,533 -42 347 1,485 0 0 -669 0 0 -7 0 27 0 0 -26 0 18 105 0 0 0 -1 94 -233 210 (*)Derivative balances are included within Financial assets or liabilities held for trading. The following table presents the changes in Level 3 instruments for the year ended 31 December 2016 (in EUR million): Financial liabilities designated at fair value through P/L Financial assets designated at fair value through P/L Financial liabilities held for trading(*) Financial assets held for trading(*) Available for sale financial assets Balance at 1 January 2016 Total gains or losses: - in profit or loss - in other comprehensive income Purchases Sales Issues Settlement Aggregate transfers into Level 3 Aggregate transfers out of Level 3 2,319 35,365 5,175 -3,061 -7,036 18 0 14 0 0 -436 0 -1,425 -700 0 5,647 0 0 -485 129 -38 -56 113 1,273 0 0 -723 0 0 -12 0 -14 0 0 0 -22 2,927 -94 0 0 0 -54 902 -650 5,016 (*)Derivative balances are included within Financial assets or liabilities held for trading. Total gains or losses on Level 3 instruments in the table below are presented in the consolidated statement of comprehensive income for the year ended 31 December 2017 as follows (in EUR million): Financial liabilities designated at fair value through P/L Financial assets designated at fair value through P/L Financial liabilities held for trading(*) Financial assets held for trading(*) Available for sale financial assets Total gains or losses included in profit or loss for the year: - Result on financial operations Total gains or losses recognised in other comprehensive income - available for sale financial assets Total gains or losses for the year included in profit or loss attributable to changes in unrealised gains and losses on assets and liabilities held as at 31 December 2017 - Result on financial operations - Change in impairment on transferable securities held as financial fixed assets, shares and other variable yield securities, net of reversals 3 -1,321 -42 -7 105 0 0 347 0 0 3 -1,321 -42 -7 105 0 0 42 0 0 (*)Derivative balances are included within Financial assets or liabilities held for trading. 195 Balance at 31 December 2016 490 39,918 5,782 -182 -1,916 Balance at 31 December 2017 280 40,259 6,903 -170 -1,741


EIB Group Consolidated Financial Statements under IFRS Total gains or losses on Level 3 instruments in the table below are presented in the consolidated statement of comprehensive income for the year ended 31 December 2016 as follows (in EUR million): Financial liabilities designated at fair value through P/L Financial assets designated at fair value through P/L Financial liabilities held for trading(*) Financial assets held for trading(*) Available for sale financial assets Total gains or losses included in profit or loss for the year: - Result on financial operations Total gains or losses recognised in other comprehensive income - available for sale financial assets Total gains or losses for the year included in profit or loss attributable to changes in unrealised gains and losses on assets and liabilities held as at 31 December 2016 - Result on financial operations - Change in impairment on transferable securities held as financial fixed assets, shares and other variable yield securities, net of reversals 18 -700 -56 -12 -94 0 0 113 0 0 18 -700 -56 -12 -94 0 0 56 0 0 (*)Derivative balances are included within Financial assets or liabilities held for trading. Change in fair value of financial instruments designated at fair value through profit or loss using a valuation technique based on non-market observable input, due to alternative assumptions Although the Group believes that its estimates of fair value are appropriate, the use of different methodologies or assumptions could lead to different measurements of fair value. The potential effect of using reasonable possible alternative non-market observable assumptions as input to valuation techniques from which the fair values of financial instruments designated at fair value through profit or loss (FVTPL) are determined has been quantified as a reduction of approximately EUR 9.3 million using most unfavourable assumptions and an increase of approximately EUR 11.4 million using most favourable assumptions for 31 December 2017 and a reduction of approximately EUR 1.8 million using most unfavourable assumptions and an increase of approximately EUR 1.6 million using most favourable assumptions for 31 December 2016. The alternative assumptions are used to calculate the fair value of borrowings and loans belonging to the Level 3 valuation category. Fair value of borrowings and loans in Level 3 is derived from the value of derivatives which hedge these borrowings and loans. Hence the alternative assumptions are first applied to valuation of Level 3 derivatives and then the impact is applied to Level 3 borrowings and loans. Level 3 derivatives can be grouped into three swap types according to the underlying asset and/or valuation model: a. b. c. Structured interest rate swaps Cross currency and FX-linked swaps Equity-linked swaps Structured interest rate swaps are modelled with the dynamics of a multi-factor Libor Market Model (LMM), calibrated using swaptions and spread options, where a vol-of-vol parameter is exogenously specified. Cross currency and FX-linked swaps are valued according to 1 factor Hull & White model for interest rates modelling while FX rates are modelled according to the Black Scholes model. The model is calibrated to interest rates, swaptions volatilities, FX rates, FX option volatilities and correlations between interest and FX rates. Category (c) consists of one large position in an equity swap, embedded in which is an Asian call option. The value of the optionality is heavily affected by the dividends and volatilities, which have to be proxied. Financial assets designated at fair value through profit or loss Included in financial assets designated at fair value through profit or loss is a portfolio of loans hedged by Interest Rates Swaps and Currency Swaps. The maximum credit exposure of the disbursed loans and advances to credit institutions and customers designated at fair value through profit or loss amounts to EUR 148,531 million (2016: EUR 145,607 million). The cumulative change in the fair value of the loans attributable to change in credit risk of the Group’s counterparts amounts to a loss of EUR 538.7 million (2016: loss of EUR 659.6 million). The changes in fair value of financial assets designated at fair value through profit or loss attributable to changes in credit risk have been calculated by determining the change in the Expected Credit Loss on these loans. No credit derivatives have been concluded to hedge the credit risk of the financial assets designated at fair value through profit or loss. Financial liabilities designated at fair value through profit or loss The financial liabilities designated at fair value through profit or loss comprise debts evidenced by certificates issued by the Group and hedged by Interest Rate Swaps and Currency Swaps. 196


The cumulative change in fair value of the financial liabilities designated at fair value through profit or loss attributable to change in credit risk of the Group amounts to EUR -6,073 million (2016: EUR -4,068 million). The amount that the Group would contractually be requested to pay at maturity of financial instruments designated at fair value through profit or loss is EUR 31,519 million (2016: EUR 39,077 million) less than the carrying amount as at 31 December 2017. Offsetting financial assets and financial liabilities The disclosures set out in the tables below include financial assets and financial liabilities that: • • are offset in the Group's balance sheet; or are subject to an enforceable master netting arrangement or similar agreement that covers similar financial instruments, irrespective of whether they are offset in the consolidated balance sheet. The similar agreements include global master repurchase agreements. Similar financial instruments include repurchase agreements and reverse repurchase agreements. Financial instruments such as loans and deposits are not disclosed in the tables below unless they are offset in the balance sheet. The Group's derivative transactions that are not transacted on an exchange are entered into under International Swaps and Derivatives Association (ISDA) Master Agreements. In general, under such agreements the amounts payable by each party on any day in respect of the same transaction and in the same currency are aggregated into a single net amount being payable by one party to the other. In certain circumstances, for example when an event of default occurs, all outstanding transactions under the agreement are terminated, the termination value is assessed and only a single net amount is payable in settlement of all transactions. The Group's repurchase and reverse repurchase transactions are covered by master agreements with netting terms similar to those of ISDA Master Agreements. The above ISDA and similar master netting arrangements do not meet the criteria for offsetting in the balance sheet. This is because they create a right of set-off of recognised amounts that is enforceable only after termination of outstanding transactions following an event of default, including insolvency or bankruptcy, of either party. The Group receives and accepts collateral in the form of cash and marketable securities in respect of the following transactions: • • derivatives; and repurchase and reverse repurchase agreements. Collateral received in respect of derivatives is subject to the standard industry terms of the ISDA Credit Support Annex. This means that securities received as collateral can be pledged or sold during the term of the transaction but must be returned on maturity of the transaction. The terms also give the Group the right to terminate the related transactions upon the counterparty’s failure to post collateral. Financial assets subject to offsetting, enforceable master netting arrangements and similar agreements (in EUR million) Related amounts not offset in the balance sheet Gross amounts of recognised Net amounts of financial financial assets liabilities offset presented in the Gross amounts of recognised financial assets Cash collateral received 31 December 2017 Bonds Net amount in the balance sheet balance sheet Financial assets: Derivative assets held for risk management Reverse repos 44,328 -467 43,861 11,341 4,938 27,582 7,949 0 7,949 8,275 0 -326 Total 52,277 -467 51,810 19,616 4,938 27,256 Related amounts not offset in the balance sheet Gross amounts of recognised Net amounts of financial financial assets liabilities offset presented in the Gross amounts of recognised financial assets Cash collateral received 31 December 2016 Bonds Net amount in the balance sheet balance sheet Financial assets: Derivative assets held for risk management 64,123 -472 63,651 25,200 12,763 25,688 Reverse repos 10,411 0 10,411 10,512 0 -101 Total 74,534 -472 74,062 35,712 12,763 25,587 197


EIB Group Consolidated Financial Statements under IFRS Financial liabilities subject to offsetting, enforceable master netting arrangements and similar agreements (in EUR million) Related amounts not offset in the balance sheet Gross amounts of recognised financial assets Net amounts of financial liabilities Gross amounts of recognised financial liabilities Financial instruments Cash collateral pledged 31 December 2017 Net amount offset in the presented in the balance sheet balance sheet Financial liabilities: Derivative liabilities held for risk management Debts evidenced by certificates 32,674 -22 32,652 0 0 32,652 416 -416 0 0 0 0 Total 33,090 -438 32,652 0 0 32,652 Related amounts not offset in the balance sheet Gross amounts of recognised financial assets Net amounts of financial liabilities Gross amounts of recognised financial liabilities Financial instruments Cash collateral pledged 31 December 2016 Net amount offset in the presented in the balance sheet balance sheet Financial liabilities: Derivative liabilities held for risk management Repos Debts evidenced by certificates 32,892 315 417 -23 0 -417 32,869 315 0 0 0 0 0 0 0 32,869 315 0 Total 33,624 -440 33,184 0 0 33,184 The gross amounts of financial assets and financial liabilities and their net amounts as presented in the balance sheet that are disclosed in the above tables are measured in the balance sheet on the following bases: • • derivative assets and liabilities - fair value; assets and liabilities resulting from sale and repurchase agreements, reverse sale and repurchase agreements and securities lending and borrowing - amortised cost; loans and advances to customers - amortised cost or fair value; and amounts owed to customers - amortised cost. • • 198


The amounts in the above tables that are offset in the balance sheet are measured on the same basis. The tables below reconcile the 'Net amounts of financial assets and financial liabilities presented in the balance sheet', as set out above, with the line items presented in the balance sheet (in EUR million). Financial assets not in scope of offsetting disclosures Line item in balance sheet Carrying amount on 31 December 2017 Net amounts balance sheet Financial assets: Derivative assets held for risk management 43,861 Derivative assets 43,861 0 Loans and advances to credit institutions Reverse repos 7,949 158,001 150,052 Financial liabilities not in scope of offsetting disclosures Line item in balance sheet Carrying amount on 31 December 2017 Net amounts balance sheet Financial liabilities: Derivative liabilities held for risk management 32,652 Derivative liabilities 32,652 0 Repos 0 Amounts owed to credit institutions 5,010 5,010 Debts evidenced by certificates 0 Debts evidenced by certificates 490,028 490,028 Financial assets not in scope of offsetting disclosures Line item in balance sheet Carrying amount on 31 December 2016 Net amounts balance sheet Financial assets: Derivative assets held for risk management 63,651 Derivative assets 63,651 0 Loans and advances to credit institutions Reverse repos 10,411 162,191 151,780 Financial liabilities not in scope of offsetting disclosures Line item in balance sheet Carrying amount on 31 December 2016 Net amounts balance sheet Financial liabilities: Derivative liabilities held for risk management Repos 32,869 Derivative liabilities 32,869 0 315 Amounts owed to credit institutions 13,115 12,800 Debts evidenced by certificates 0 Debts evidenced by certificates 517,903 517,903 199


EIB Group Consolidated Financial Statements under IFRS Note S – Risk management This note presents information about the Group’s exposure to and its management and control of risks, in particular the primary risks associated with its use of financial instruments. These are: • • • Credit risk - the risk of loss resulting from client or counterparty default and arising on credit exposure in all forms, including settlement risk; Market risk - exposure to observable market variables such as interest rates, exchange rates and equity market prices; Liquidity and funding risk - the risk that the Group is unable to fund assets or meet obligations at a reasonable price or, in extreme situations, at any price; and Operational risk - the potential loss resulting from inadequate or failed internal processes, people and systems or from external events. • S.1. Risk Management Organisation Each entity within the Group has its own management and control of risks and therefore, risk management information presented in this note will distinguish between the Bank and the Fund. Moreover, the Bank has established within its Risk Management Directorate the Regulation & EIB Group Risk Department to strengthen the risk management of the overall Group. The Regulation & EIB Group Risk Department is mainly responsible for risk reporting, compliance with prudential regulation and prudential best banking practice (including Risk Appetite Framework, Internal Capital Adequacy Assessment Process (ICAAP) and Stress Testing Framework) as well as internal modelling and validation. The high-level principles of the Bank’s risk management on a consolidated level are set out in the Group Risk Management Charter. The Group Risk Management Charter aims at ensuring a group-wide view of the Group’s risks and integrated approach to risk management. S.1.1. Risk Management Organisation of the Bank The Bank’s objective is to analyse and manage risks so as to obtain the strongest possible protection for its assets, its financial result, and consequently its capital. While the Bank is not subject to full regulation, it aims to comply with the relevant EU banking directives and the recommendations of the banking supervisors of the EU Member States, EU legislation and the competent supranational bodies, such as the Basel Committee on Banking Supervision (BCBS) and the European Banking Authority (EBA). Within the Bank, the Risk Management Directorate (RM) independently identifies, assesses, monitors and reports credit, market, liquidity and funding and operational risks to which the Bank is exposed. In order to preserve segregation of duties, RM is independent of the Front Offices and provides second opinion on all proposals made which have risk implications. The Director General of RM reports to the Management Committee and meets regularly with the Audit Committee to discuss topics relating to credit, market, liquidity, funding and operational risks. He is also responsible for overseeing risk reporting to the Management Committee, the Risk Policy Committee and the Board of Directors. The management and monitoring of loans post signature is, for significant parts of the portfolio, the responsibility of Transaction Monitoring and Restructuring Directorate (TMR), a Directorate independent from RM. TMR focuses on monitoring higher risk counterparts and certain forms of security and it also manages transactions requiring particular attention. All of its proposals which have credit risk implications are subject to an independent second opinion by the RM. The following sections disclose the credit, market, liquidity and funding and operational risks to which the Bank is exposed on its activities performed at own risk. For additional details, please refer to the EIB Group Risk Management Disclosure Report. S.1.1.1 Risk measurement and reporting system The Bank aligns its risk management systems to changing economic conditions and evolving regulatory standards. It adapts them on an on-going basis as market practice develops. Systems are in place to control and report on the main risks inherent in the Bank’s operations, i.e. credit, market, liquidity and funding and operational risks. Risks are assessed and measured both under normal circumstances and under possible stressed conditions, with the purpose to quantify their impact on the Bank’s solvency, liquidity, earnings and operations. Risk measurements combine metrics of capitalisation, earnings, liquidity, exposure to market and operational risk. Detailed information on credit, ALM, liquidity and financial risks is presented and explained to the Management Committee on a monthly basis and to the Board of Directors on a quarterly basis. S.1.1.2.The Bank’s risk tolerance The Bank has defined its risk tolerance level and set prudent boundaries for the risks arising from the pursuit of the Bank’s business strategy. In setting these high level boundaries, the Bank ensures that its risk profile is aligned with its business strategy and stakeholders’ expectations. As a public institution, the Bank does not aim to make profits from speculative exposures to risks. As a consequence, the Bank does not consider its treasury or funding activities as profit maximising centres, even though performance objectives are attached to these activities. Investment activities are conducted within the primary objective of protection of the capital invested. With respect to exposures arising from the Bank’s lending and borrowing operations, the main principle of the Bank’s financial risk policy is therefore to ensure that all material financial risks are hedged. All new types of transactions introducing operational or financial risks must be authorised by the Management Committee, after the approval of the New Products Committee, and are managed within approved limits. 200


S.1.1.3.Sustainability of revenue and self-financing capacity The Bank’s ALM policy forms an integral part of the Bank’s overall financial risk management. It reflects the expectations of the main stakeholders of the Bank in terms of stability of earnings, preservation of the economic value of own funds, and the self-financing of the Bank’s growth in the long term. To achieve these aims, the ALM policy employs a medium to long term indexation for the investment of own funds to promote stability of revenues and enhance overall returns. This indexation policy implies an exposure to medium to long term yields and is not influenced by any short-term views on interest rates trends. This is accomplished by targeting a duration for the Bank’s own funds of between 4.5 and 5.5 years. The Asset/Liability Committee (ALCO) provides a high-level discussion forum for considering the Bank’s ALM Strategy, loan rate setting principles and the financial risks arising from the activities of the Bank. S.1.2. Risk Management Organisation of the Fund (EIF) Most of the Private Equity (PE), Venture Capital and Portfolio Guarantees, Securitisation & Microfinance (GSM) operations for both entities of the Group are managed by the Fund. The mandate of the Fund is to support small and mid-size enterprise (SME) finance for start-up, growth and development within European Union objectives for SME. The Fund aligns its risk management systems to changing economic conditions. Credit, market and operational systems are in place to control and report on the main risks inherent in its operations. Risk management is embedded in the corporate culture of EIF, based on a three-lines-of-defence model permeating all areas of EIF’s business functions and processes: (i) front office, (ii) independent risk functions and (iii) audit and assurance. Investment and Risk Committees (IRCs) chaired by the Head of General Secretariat advice the Chief Executive and the Deputy Chief Executive on each and every transaction. IRCs quarterly meetings also oversee risk and investment-related aspects of the EIF portfolio, inter alia: approving transaction rating/grading, impairment and provisioning actions, relevant market risk events and potential stress testing. Finally, the IRCs oversee the Enterprise Risk arising from EIF’s role as a fund manager. Risk and Portfolio Management actions form part of the assurance process presided by the EIF Audit Board. Moreover, within the EIB Group context, the Fund’s Risk Management Department operates in regular contact with the Bank’s Risk Management Directorate, particularly with regard to the Group Risk Management Charter and to the Group risk exposure relating to guarantee and securitisation operations, the PE operations under the Bank’s Risk Capital Resources mandate (RCR), the different windows under the Bank’s EIB Group Risk Enhancement Mandate (EREM) and general EIF policy matters. The Fund’s treasury management has been fully outsourced to the Bank under a treasury management agreement signed by both parties and mandating the responsible EIB services to perform selection, execution, settlement and monitoring of transactions. Management follows treasury guidelines annexed to the agreement, which mirror closely the relevant sections of the EIB’s own treasury guidelines. S.1.2.1.Risk assessment private equity Under its private equity operations, the Fund has a fund-of-funds approach, taking mostly minority equity participations in business angels, venture capital, private equity and mezzanine funds managed by mostly independent teams in order to leverage further commitments from a wide range of investors. The Fund’s PE operations include investments in funds focussed on seed-and early-stage capital, but also investments in well-established funds targeting mid-and later-stage or mezzanine investments, which, generally speaking, have a lower risk profile. Over the last years, the Fund has developed a tool-set to design, manage and monitor portfolios of PE funds tailored to the dynamics of this market place. This tool-set is based on an internal model, the Grading-based Economic Model (GEM), which allows the Fund to better assess and verify each funds’ but also each portfolio of funds’ valuations, risks and expected future cash flows and performances. Before committing to a PE fund, the Fund assigns a grading which is based on the outcome of an extensive due diligence performed by the Fund’s transaction team and reviewed by its risk management team. During the funds’ lifetimes, gradings are periodically reviewed with a frequency and intensity depending on the level of risk. These efforts, supported by the development of a proprietary IT system and an integrated software (front to back), improve the investment decision-making process and the management of the portfolio’s financial risks and of liquidity, in particular enabling forward-looking and stress-test based decision making. S.1.2.2.Risk assessment guarantees The Fund extends portfolio guarantees to financial intermediaries involved in SME financing and provides credit enhancement to SME securitisation transactions. By taking on these risks, it facilitates access to funding, and, in turn, it helps to finance SMEs. For its guarantee & securitisation business, over the last years, the Fund has developed a tool-set to analyse portfolio guarantees and structured finance transactions in line with best market practices. Before the Fund enters legally into a guarantee transaction, an internal rating is assigned to each new own risk guarantee transaction in accordance with the Fund’s Credit Risk Policy and Model Review Guidelines. The rating is based on internal models, which analyse and summarise the transaction’s credit quality (expected loss concept), considering not only quantitative parameters but also qualitative aspects. Guarantee transactions are monitored regularly, at least quarterly; their statuses are regularly reviewed by EIF IRCs which, depending on their performances, may review their internal ratings. A four-eyes principle applies throughout the process, with actions initiated by the front office and reviewed by Risk Management. 201


EIB Group Consolidated Financial Statements under IFRS The guarantees portfolio is valued according to a mark-to-model approach under the IFRS principles. The main impact on the valuation of the transactions in the portfolio stems from the assigned ratings (internal and external as the case may be) and the possible subsequent rating changes. The EIF’s monitoring follows potential negative rating migrations and provides the basis for appropriate management of transactions. The Fund’s stress testing methodology is applied at the outset of a transaction and throughout the life of the portfolio, i.e. its scenario analysis with regard to downgrades and defaults in the portfolio and related impacts on capital allocation, expected losses, as well as on the profit and loss. S.2. Credit risk S.2.1. Credit risk policies Credit risk concerns mainly the Group’s lending activities and, to a lesser extent, treasury instruments such as fixed-income securities held in the investment and operational portfolios, certificates of deposit and interbank term deposits as well as the derivative transactions of the Group and the Fund’s guarantee transactions funded by own resources. No credit risk is attached to the Group’s venture capital operations, which are performed entirely through equity participations and are, hence, only exposed to market risk. Credit risk is managed pursuant to detailed internal guidelines approved by the governing bodies. The purpose of these guidelines is to ensure that credit risk is managed prudently. As operations inside and outside the EU may have different risk profiles, there are separate guidelines for EU and non-EU activities. Whether or not a given entity is acceptable to the Bank as a counterpart in a lending operation is determined on the basis of a careful analysis and evaluation of the entity using quantitative and qualitative metrics but also relying on experience and expert judgment. They set out minimum credit quality levels for both borrowers and guarantors in lending operations and identify the types of security that are deemed acceptable. They also detail the minimum requirements that loan contracts must meet in terms of key legal clauses and other contractual stipulations to ensure that the Bank's position is adequately safeguarded. In addition, via a counterparty and sector limit system, the guidelines ensure an acceptable degree of diversification in the Group's loan portfolio. In order to ensure that the additional risk involved in complex or structured lending transactions is adequately analysed, quantified and mitigated, specific detailed guidelines have been developed in respect of certain types of operations complementing the general guidelines. The guidelines also set out the minimum credit quality of counterparties of derivatives and treasury transactions as well as the contractual framework for each type of transaction. The Fund manages exposures and risks in the frame of conservative policies deriving from statutory provisions and credit risk operational guidelines approved by the Fund’s Board of Directors or guidelines as set out under mandates. Credit guidelines undergo periodic adaptations to incorporate evolving operational circumstances and respond to new mandates that the Group may receive from its shareholders. Management of credit risk is based on an assessment of the level of credit risk vis-à-vis counterparties and on the level of security provided to the Bank in case of the counterparty’s insolvency. S.2.2. Maximum exposure to credit risk without taking into account any collateral and other credit enhancements The table below shows the maximum exposure to credit risk for the components of the balance sheet, including derivatives. The maximum exposure is shown gross, before the effect of mitigation through the use of collateral agreements (Note S.2.3.4). Maximum exposure (in EUR million) 31.12.2017 31.12.2016 Financial assets: Loans and receivables Financial assets held for trading Derivative assets held for risk management Financial assets designated at fair value through profit or loss Financial assets – Available-for-sale Financial assets – Held-to-maturity 343,383 7,512 43,861 166,284 8,172 32,895 349,750 7,121 63,651 161,810 7,134 44,874 Total 602,107 634,340 Off-balance-sheet: Contingent liabilities and guarantees Commitments – Undisbursed loans – Undisbursed Venture Capital operations – Other 16,020 12,736 112,928 5,924 4,061 113,320 5,813 2,160 Total 138,933 134,029 Total credit risk exposure 741,040 768,369 202


S.2.3. Credit risk on loans S.2.3.1.Credit risk measurement for loans and advances to credit institutions and customers An internal loan grading system (based on the expected loss methodology) is implemented for lending operations. This is an important part of the loan appraisal process and of credit risk monitoring, as well as providing a reference point for pricing credit risk when appropriate. The loan grading (LG) system comprises the methodologies, processes, databases and IT systems supporting the assessment of credit risk in lending operations and the quantification of expected loss estimates. It summarises a large amount of information with the purpose of offering a relative ranking of loans’ credit risks. LG reflects the present value of the estimated level of the lifetime “expected loss”, this being the Net Present Value of the product of the probability of default, the loan exposure at risk and the loss given default. LG is used for the following purposes: • • • • • as an aid to a finer and more quantitative assessment of lending risks; as indicator of credit risk variations for the purposes of prioritising monitoring efforts; as a description of the loan’s portfolio quality at a given date; as a benchmark for calculating the annual additions to the General loan reserve; and as an input in risk-pricing decisions. The following factors are used to determine a LG: i) The borrower’s creditworthiness: RM independently reviews borrowers and assesses their creditworthiness based on internal methodologies and external data. In line with the Basel III Internal Ratings Based Approach chosen, the Bank has developed an internal rating methodology (IRM) to determine the internal ratings of borrowers and guarantors. This is based on a set of scoring sheets specific to defined counterparty types. ii) The default correlation: it quantifies the chances of simultaneous financial difficulties arising for both the borrower and the guarantor. The higher the correlation between the borrower and the guarantor’s default, the lower the value of the guarantee and therefore the lower (worse) the LG. iii) The value of guarantee instruments and of securities: this value is assessed on the basis of the combination of the issuer’s creditworthiness and the type of instrument used. iv) The applicable recovery rate: being the amount assumed to be recovered following a default by the relevant counterpart expressed as a percentage of the relevant loan exposure. v) The contractual framework: a sound contractual framework will add to the loan’s quality and enhance its LG. vi) The duration of the loan or, more generally, the cash-flows of the loan: all else being equal, the longer the loan, the higher the risk of incurring difficulties in the servicing of the loan. A loan's expected loss is computed by combining the five elements above and is used as a component of the fair value measurement technique used for loans which meet the eligibility criteria of the amended fair value option and which have been designated on initial recognition at fair value through profit or loss. Depending on the level of this expected loss, a loan is assigned to one of the following LG classes listed below. “A” Prime quality loans of which there are three sub-categories. “A0” comprising loans to or guaranteed by an EU Member State which have an expected loss of 0% (based on the Bank’s preferred creditor status and statutory protection which are deemed to assure a full recovery of the Bank’s assets upon maturity). “A+” comprising loans granted to (or guaranteed by) entities other than EU Member States in respect of which there is no expectation of deterioration in quality over their term. “A-“ includes those lending operations where there is some doubt about the maintenance of their current status but where any downside is expected to be limited. “B” High quality loans: these represent an asset class with which the EIB feels comfortable, although a minor deterioration is not ruled out in the future. B+ and B-are used to denote the relative likelihood of the possibility of such deterioration occurring. “C” Good quality loans: an example could be unsecured loans to solid banks and corporates, with a reasonable maturity and adequate protective clauses. “D” Borderline between acceptable quality loans (designated as D+) and those that have a risk profile which is worse than that generally accepted by the Bank (designated as D-). Operations whose LG is D-or below are classified as Special Activities (see section below) and are subject to specific rules, including specific size restrictions, reserve allocations and risk pricing rules. “E” Comprising loans that have explicitly been approved as higher risk Special Activity operations or loans whose quality has materially deteriorated such that a loss cannot be excluded. The sub-classes E+ and E-further differentiate the risk profile of the loans, with those operations graded E-being in a position where there is a possibility that debt service cannot be maintained on a timely basis and therefore some form of debt restructuring may be required, possibly leading to an impairment loss. “F” (fail) denotes loans representing unacceptable risks. F-graded loans can only arise out of outstanding transactions that have experienced unforeseen, exceptional and dramatic adverse circumstances after signature. All operations where there is a loss of principal are graded F and a specific provision is raised. 203


EIB Group Consolidated Financial Statements under IFRS Generally, loans internally graded D-or below are placed on the internal Watch List. However, if a loan was originally approved with a risk profile of D-or weaker, it will only be placed on the Watch List as a result of a material credit event causing a deterioration of its LG classification below the one at approval. In addition to the deal-by-deal analysis of each loan, the EIB, also developed a portfolio view of credit exposures via its Economic Capital framework, integrating the concentration and correlation effects created by the dependence of various obligors on common risk factors. By adding a portfolio dimension of credit risks and by focussing on unexpected losses (i.e. losses which may occur on top of the expected ones up to a certain level of confidence), it is possible to complement the LG’s deal-by-deal approach and thus provide a finer and more comprehensive risk assessment of the credit risks in the EIB’s loan book. The aggregate amount outstanding at any time of loans and guarantees granted by the Bank is limited by its Statutory Gearing Ratio (Article 16.5 of Statute). For the purpose of calculating this ratio the Bank uses data drawn from the EU Accounting Directives (AD) framework. At year-end 2017 EIB’s Statutory Gearing Ratio under EU AD stand-alone accounts stood at 208% and under EU AD consolidated accounts stood at 211% (max. 250% under Article 16.5 of the Statute). S.2.3.2.Loans secured by Guarantees of the European Union budget or the Member States Loans outside the European Union (apart from those under the Facilities are, in the last resort, secured by guarantees of the European Union budget or the Member States (loans in the ACP Countries and the OCT). The agreements decided by the Council of the European Union on 14 April 1997 (Decision 97/256/EC) introduced the concept of risk sharing whereby certain loans of the Bank, including some which are secured by third-party guarantees with respect to the commercial risk, are covered by the budgetary guarantee applying in the case of political risks solely arising from currency non-transferability, expropriation, war and civil disturbance. Loans under the Facilities are those granted under Article 16 (previously Article 18) of the Bank’s statute and those granted for example under the Pre Accession Facility, the Mediterranean Partnership Facility, the Energy Sustainability Facility and the EFTA Facility. Said loans are not secured by guarantees of the European Union budget or the Member States. Therefore, lending under the Facilities is from the Bank’s own resources and at the Bank’s own risk. In accordance with the terms of the Guarantees, the European Union and the Member States secure up to 65%, 70%, 75% and 100% of pool of signed(1) operations in each portfolio. This results in an effectively full coverage of the Group's exposure. For this reason, the Group deems the credit risk associated to each individual loan as fully covered and therefore excludes them from the section S.2.3. (Group's lending activities). The carrying value of the disbursed part of loans signed under this category amounts to EUR 24,970 million as at 31 December 2017 (2016: EUR 25,595 million) and the undisbursed part amount to EUR 17,022 million as at 31 December 2017 (2016: EUR 17,517 million). These amounts also include loans granted to current European Union Member States but granted before their accession to the European Union and are guaranteed by the European Union budget or Member States. (1 )Under the Guarantee Agreement with the Commission signed on 1 and 29 August 2007, all European Union guaranteed operations signed on and after 17 April 2007 shall be covered up to 65% of "the aggregate amount of credits disbursed". The residual risk borne by the Group in connection with operations is managed in accordance with the Group’s fundamental credit rules and procedures. 204


S.2.3.3.Analysis of lending credit risk exposure In detail, the tables below show the maximum exposure to credit risk on loans (the repayable on demand and other loans and advances to credit institutions are not included) signed and disbursed as well as the part of the exposure that has been signed but not disbursed yet for all exposure where the Group is at risk. Therefore, loans outside the European Union secured by the European Union budget or the Member States are not included (Note S.2.3.2). 2017 (in EUR million) Guarantor Not guaran-teed(1) Total disbursed Signed not disbursed Corporate Bank Public State Corporates Banks Public institutions States 31,581 21,980 295 0 16,090 21,661 332 0 8,720 19,521 16,234 0 12,396 32,396 31,504 0 82,437 24,222 63,709 48,997 151,224 119,780 112,074 48,997 26,622 27,906 30,369 11,009 Borrower 2016 (in EUR million) Guarantor Not guaran-teed(1) Total disbursed Signed not disbursed Corporate Bank Public State Corporates Banks Public institutions States 33,158 22,907 572 0 18,827 24,085 488 0 7,952 21,788 16,228 0 17,131 32,303 28,095 0 78,646 21,099 61,186 48,670 155,714 122,182 106,569 48,670 27,965 28,618 29,872 9,349 Borrower (1) These amounts include loans for which no formal guarantee independent from the borrower and the loan itself was required, the borrower’s level of solvency itself representing adequate security. In the event of certain occurrences, appropriate contractual clauses ensure the Bank’s right to access independent security. (2) These amounts include loans granted under Facilities. (3) These amounts do not include Loan substitutes (2017: EUR 19,947 million; 2016: EUR 20,917 million). (4) These amounts exclude loans to current European Union Member States but granted before their accession to the European Union and guaranteed by the European Union budget or the Member States. Regarding the lending activities, the Group’s total direct exposure(5) to the banking sector amounts to EUR 147,686 million at the end of December 2017 (2016: EUR 150,800 million), which is equal to 28.0% (2016: 28.5%) of the total of EUR 527,981 million in loans disbursed and undisbursed as at 31 December 2017 (2016: EUR 528,939 million). Unsecured loans to corporates at the end of December 2017 amounted to EUR 101,367 million(3), (2016: EUR 96,193 million). Unsecured exposure to corporate clients is controlled by bilateral limits and generally individual exposures are capped at 5% of Group’s Own Funds. The Group has also introduced a number of sector limits. S.2.3.3.1. Credit quality on loans Loans internally graded A to D+ represent 94.3% of the loan portfolios as at 31 December 2017, compared with 94.9% at 31 December 2016. The share of loans internally graded D-and below (for which allocations to the Special Activities Reserve are being made), was 5.7% (2016: 5.1%) of the risk portfolio, corresponding to EUR 30.2 billion (2016: EUR 26.8 billion). The credit quality of the loan portfolio stabilised during the year and the Bank’s efforts in mitigating credit risk resulted in a significant increase in loan collateralisation. Both these factors contributed to an improvement in the LG breakdown and led to a decrease of the internal Watch List of loans which are subject to heightened monitoring (all loans graded D-or below, if signed at D+ or above, and all other loans signed at D-or below for which a material credit event has been diagnosed and the LG lowered) to EUR 4,658 million (2016: EUR 6,470 million). To mitigate credit risk, the Group uses, amongst others, the following instruments: • • • Guarantees issued by third parties of acceptable credit quality; Financial collaterals; Mortgages, claims on revenues etc. (5) Including exposure signed but not disbursed yet. 205 Total disbursed(2)(3)(4) 56,637 43,400 45,968 77,529 209,601 433,135 Signed not disbursed(2)(3)(4) 8,192 7,337 9,057 15,735 55,483 95,804 Total disbursed(2)(3)(4) 53,856 38,083 44,475 76,296 219,365 432,075 Signed not disbursed(2)(3)(4) 10,735 5,726 8,137 13,866 57,442 95,906


EIB Group Consolidated Financial Statements under IFRS Credit quality analysis per type of borrower The tables below show the credit quality analysis of the Group’s loans portfolio as at 31 December 2017 and 31 December 2016 by the Loan Grading application, based on the exposures signed (disbursed and undisbursed). Standard Grade Min. Accept. Risk 2017 (in EUR million) Sovereign High Grade High Risk Total A0 A to B-C D+ D-and below Corporates Banks Public institutions States 12,622 38,588 36,335 57,148 61,871 81,822 99,894 503 46,806 16,200 1,852 1,563 32,741 6,492 2,505 792 23,806 4,584 1,857 0 177,846 147,686 142,443 60,006 Borrower Total 144,693 244,090 66,421 42,530 30,247 527,981 Standard Grade Min. Accept. Risk 2016 (in EUR million) Sovereign High Grade High Risk Total A0 A to B-C D+ D-and below Corporates Banks Public institutions States 19,198 33,674 30,015 54,059 64,446 92,347 101,300 2,689 51,239 15,532 2,370 1,007 27,222 6,051 796 200 21,574 3,196 1,960 64 183,679 150,800 136,441 58,019 Borrower Total 136,946 260,782 70,148 34,269 26,794 528,939 Credit risk exposure for each internal risk rating The Group uses an internal rating methodology in line with the Internal ratings based approach under Basel III. The majority of the Group’s counterparties have been assigned an internal rating according to this methodology. The table below shows a breakdown of the Group’s loan portfolio by the better of the borrower’s or guarantor’s internal ratings, where available. In cases where an internal rating is not available, the external rating has been used for this analysis. The table shows both the exposures signed (disbursed and undisbursed) and the risk-weighted exposures, based on an internal methodology that the Group uses for limit management. 2017 2016 Moody’s equiv. grade (in EUR million) Rating grade Exposures signed Weighted exposures(*) Exposures signed Weighted exposures(*) Internal Rating 1 1 Aaa 4,768 716 5,783 772 2+ 2 2-Aa1 Aa2 Aa3 29,704 22,447 26,106 4,901 6,432 8,945 30,110 23,664 24,572 4,797 6,230 9,135 Internal Rating 2 3+ 3 3-A1 A2 A3 41,492 28,257 72,504 17,053 18,399 26,800 40,907 26,807 78,199 18,081 15,169 31,311 Internal Rating 3 4+ 4 4-Baa1 Baa2 Baa3 99,788 62,841 50,564 52,199 36,087 22,045 98,722 64,415 38,925 49,728 38,280 19,031 Internal Rating 4 5+ 5 5-Ba1 Ba2 Ba3 22,261 24,597 13,079 17,401 6,742 6,123 39,005 13,337 12,738 17,521 5,054 3,986 Internal Rating 5 6+ 6 6-B1 B2 B3 2,684 1,820 20,841 2,446 1,098 1,889 5,396 2,084 3,271 3,740 1,276 1,232 Internal Rating 6 Internal Rating 7 Total 7 Below B3 4,228 3,851 21,004 3,120 527,981 233,127 528,939 228,463 (*) Risk-weights are percentages (from 0% to 100%) applied to the outstanding nominal amounts of loans or other credit exposures (e.g. deposits, derivatives and securities). They depend on the perceived credit risk represented both by the types of claims and by the nature of the main obligator or guarantor. The main risk-weights are 0% (Member States, German and Austrian Länder), 20% (public institutions), 50% (bank guaranteed) and 100% (unsecured corporates and banks). The Group continually monitors events affecting its borrowers and guarantors, especially banks. In particular, the Group is assessing on a case by case basis its contractual rights in case of rating deterioration and is seeking mitigating measures. It is also closely following the renewals of bank guarantees received for its loans to ensure that these are replaced or action is taken in a timely manner if need be. Taking into account the above and the Group's contractual protections, which if breached enable the Group to negotiate remedies, there was no need for a collective impairment allowance as at 31 December 2017 and 2016. The Group did not record impairments in respect of its EU sovereign and EU sovereign guaranteed exposure as at the year end as the preferred creditor status of the Bank as well as of the EIF and the protection given by the Bank’s Statute are deemed to guarantee a full recovery of the Group’s assets on maturity. 206


The disbursed exposure on borrowers located in the United Kingdom through the Group’s lending activities, including guarantees and equity type investments, amounted to EUR 37.0 billion as at December 31, 2017 (2016: EUR 36.0 billion), while the exposure on foreign borrowers with a guarantor from the United Kingdom amounted to EUR 1.5 billion (2016: EUR 1.8 billion). The Bank had no direct exposure to the United Kingdom acting as borrower at the end of December 2017 whereas disbursed loans guaranteed by the United Kingdom amounted to EUR 2.0 billion as at the end of December 2017 (2016: EUR 1.3 billion). The table below discloses information regarding the sovereign credit risk on loans granted inside the European Union and outside the European Union granted under the Facilities and under the risk-sharing operations: 2017 2016 (in EUR million) Acting as guarantor Acting as guarantor Acting as borrower Acting as borrower Country Disbursed Undisbursed Signed Disbursed Undisbursed Signed Austria Belgium Bulgaria Croatia Cyprus Czech Republic Denmark Estonia Finland France Germany Greece Hungary Ireland Italy Latvia Lithuania Luxembourg Malta Netherlands Poland Portugal Romania Slovakia Slovenia Spain Sweden United Kingdom Non EU-countries 0 0 934 676 927 2,032 0 472 51 0 0 9,402 6,303 963 3,311 436 1,390 151 0 0 9,935 1,282 1,861 2,226 635 4,907 0 0 1,103 0 0 350 0 225 0 0 215 0 0 0 300 1,140 490 400 200 0 150 72 0 1,872 325 2,291 820 400 3 0 0 1,756 77 114 0 2,972 1,356 81 47 118 98 2,426 1,434 8,268 1,263 1,247 4,608 47 55 75 319 80 17,839 5,104 0 0 2,063 30,861 44 2,696 6,871 0 0 951 487 856 2,145 0 489 109 0 0 9,208 6,211 963 3,430 453 1,455 0 0 0 10,470 1,269 2,010 2,188 650 4,215 0 0 1,113 0 0 603 210 389 0 0 215 0 0 0 700 1,476 0 0 200 0 300 72 0 492 250 1,756 895 400 358 0 0 1,032 82 130 0 2,732 1,285 131 51 118 318 1,418 1,950 8,316 1,146 1,300 5,491 56 87 85 333 80 18,509 5,587 0 0 2,321 31,159 45 2,752 7,782 Total 48,997 11,009 90,163 48,672 9,348 93,264 In addition, as stated in the note S.2.3.2, loans outside the European Union (apart from those under the Facilities) are in the last resort secured by guarantees of the European Union budget or the Member States (loans in the African, Caribbean and Pacific Group of States Countries and the Overseas Countries and Territories). The nominal amount of loans signed under this category as at 31 December 2017 amounts to EUR 47,203 million (2016: EUR 49,652 million). Out of this EUR 47,203 million, EUR 43,623 million (2016: EUR 46,559 million) were guaranteed by the European Union and EUR 3,580 million by the Member States (2016: EUR 3,093 million). 207


EIB Group Consolidated Financial Statements under IFRS S.2.3.3.2. Risk concentrations of maximum exposure to credit risk on loans The Group’s loans portfolio can be analysed by the following geographical regions (based on the country of the borrower): (in EUR million) 2017 2016 Exposures signed Weighted exposures(4) Exposures signed Weighted exposures(4) EU(1) Thereof : – Germany – Spain – Italy – France – United Kingdom Enlargement countries(2) Partner countries(3) 508,099 223,691 507,619 218,527 45,528 86,235 79,162 56,871 61,583 9,262 10,620 23,743 33,760 40,547 29,775 38,420 2,685 6,751 46,173 99,513 78,121 58,339 59,283 10,414 10,906 23,295 35,548 45,864 29,837 45,730 2,800 7,136 Total 527,981 233,127 528,939 228,463 (1) Including loans outside the EU, approved by the Board of Governors according to Article 16 (previously Article 18) of the Bank’s Statute, as well as loans in EFTA countries. (2) Enlargement Countries as per end 2017 include Albania, Bosnia and Herzegovina, Kosovo, FYROM, Montenegro, Serbia and Turkey. (3) Loans in Partner Countries include loans under the Mediterranean Partnership Facility, the Pre-Accession Facility, and Risk Sharing loans. (4) Risk-weights are percentages (from 0% to 100%) applied to the outstanding nominal amounts of loans or other credit exposures (e.g. deposits, derivatives and securities). They depend on the perceived credit risk represented both by the types of claims and by the nature of the main obligator or guarantor. The main risk-weights are 0% (Member States, German and Austrian regions), 20% (public institutions), 50% (bank guaranteed) and 100% (unsecured corporates and banks). A critical element of risk management is to ensure adequate diversification of credit exposures. The Group tracks its global exposure by industry (shown in the following table), paying particular attention to industries that might be cyclical, volatile or undergoing substantial changes. An industry sector analysis of the Group’s loan portfolio (based on the industry sector of the borrower) is as follows: (in EUR million) 2017 2016 Exposures signed Weighted exposures(1) Exposures signed Weighted exposures(1) Energy Transport Telecommunications Water and sewerage Miscellaneous Infrastructure Agriculture, forestry and fisheries Industry Services(2) Health and education 56,350 73,861 10,916 19,347 2,899 213 28,169 325,593 10,633 46,922 23,539 9,902 12,187 1,693 213 24,962 110,421 3,288 59,177 74,724 10,534 19,069 3,319 231 28,661 323,345 9,879 48,613 22,378 9,251 12,112 1,783 150 24,817 106,359 3,000 Total 527,981 233,127 528,939 228,463 (1) Risk-weights are percentages (from 0% to 100%) applied to the outstanding nominal amounts of loans or other credit exposures (e.g. deposits, derivatives and securities). They depend on the perceived credit risk represented both by the types of claims and by the nature of the main obligator or guarantor. The main risk-weights are 0% (Member States, German and Austrian regions), 20% (public institutions), 50% (bank guaranteed) and 100% (unsecured corporates and banks). (2) The category “Services” includes the credit exposure of the banking sector. At the end of 2017, the total amount of loans directly exposed to counterparts of the banking sector amounted to EUR 147,686 million (EUR 150,800 million at the end of 2016), or EUR 61,455 million in risk-weighted terms (EUR 60,723 million at the end of 2016). Exposure to bank counterparts is subject to limits approved by the Management Committee. In specific cases, available limits have been temporarily suspended, restricted or withdrawn. The Group systematically follows on daily basis publicly available news and, in particular, external rating movements. The Group places limits on the maximum amount that can be lent to a single borrower, group of debtors or sectors. In addition, it follows the evolution of credit risk concentration using the concept of Credit Value at Risk (CVaR). This is done using a tool for assessing portfolio risk due to changes in debt value caused by changes in obligor credit quality. Importantly, this methodology assesses risk within the full context of a portfolio and addresses the correlation of credit quality moves across obligors. This allows the Group to directly calculate the diversification benefits or potential over-concentrations across the portfolio. 208


The table below shows the concentration indexes the Group follows as at 31 December 2017 and 31 December 2016: Largest nominal and risk-weighted Group exposures(1) 31.12.2017 31.12.2016 Nominal exposures (% of Group Loan Portfolio): – Top 3 – Top 5 – Top 10 4.2% 6.2% 10.2% 4.0% 6.5% 10.4% N° of exposures (% of Group Own Funds): – over 10% – over 15% – over 20% 3 0 0 5 0 0 N° of SSSR exposures over 5% of Group Own Funds(2) 1 0 Sum of all large risk-weighted exposures (% of Group Own Funds)(3) 44.2% 44.8% (1) Including also the net market exposure of treasury operations. The term "single signature and single risk” (or for brevity, "unsecured” or “SSSR”) is used to indicate those lending operations where the Group, irrespective of the number of signatures provided, has no genuine recourse to an independent third party, or to other forms of autonomous security. The Group defines a Large Individual Exposure as a consolidated group exposure that, when computed in risk-weighted terms, is at or above 5% of the Group’s own funds. This definition applies to borrowers or guarantors, excluding loans to Member States and loans fully covered by an explicit guarantee from, or secured by bonds issued by Member States. (2) (3) S.2.3.4.Collateral on loans In addition to the guarantees received by the Group on its lending exposures as disclosed in the note S.2.3.3, the Group also uses pledges of financial securities. These pledges are formalised through a Pledge Agreement, enforceable in the relevant jurisdiction. The portfolio of collateral received in pledge contracts amounts to EUR 25,869 million at the end of 2017 (2016: EUR 27,915 million). The fair value of the portfolio of collateral received by the Group under pledge contracts that the Group is allowed to sell or repledge amounts to EUR 15,597 million (2016: EUR 15,829 million). None of these collaterals has been sold or re-pledged to third parties. Fair value of collateral held against disbursed loans is shown below: Collateral held Gross exposure (in EUR million) Net exposure Bonds Equities Cash Total 870(1) 0 1,916 1. Against individually impaired 2. Against collectively impaired 3. Against past due but not impaired 4. Against neither past due nor impaired(1) 5. Against fair value through profit and loss 870 0 2,058 0 0 134 0 0 0 0 0 8 0 0 142 288,175 21,410 0 452 21,862 266,313 165,942 3,816 0 49 3,865 162,077 Total 2017 457,045 25,360 0 509 25,869 431,176 Total 2016 458,731 27,425 0 490 27,915 430,816 (1) The carrying value of loans individually impaired amounts to EUR 870 million as at 31 December 2017 (2016: EUR 1,419 million). Impairments on these loans have been accounted for and amount to EUR 409.7 million as of 31 December 2017 (2016: EUR 476.7 million). The Group has also received additional security from the counterparties of these loans in the form of debts acknowledgement. S.2.3.5. Arrears on loans Amounts in arrears are identified, monitored and reported according to the procedures defined into the bank-wide “Financial Monitoring Guidelines and Procedures”. These procedures are adopted for all loans managed by the Group. Loans not secured by global guarantees of the European Union budget or the Member States: As of 31 December 2017, the arrears above 90 days on loans from own resources not secured by guarantees of the European Union budget or the Member States amount to EUR 180.0 million (2016: EUR 89.6 million). The outstanding principal amount related to these arrears is EUR 479.5 million as of 31 December 2017 (2016: EUR 273.3 million). These arrears on loans are covered by a provision for impairment of EUR 188.8 million (2016: EUR 206.5 million). Loans secured by guarantees of the European Union budget or the Member States: Loans for projects located outside the European Union and carried out on the basis of mandates are guaranteed by the European Union, the Member States or on a risk-sharing basis. For such loans, if an amount is due, the primary guarantee is first called, where available, otherwise the guarantee of the Member States or of the European Union is officially invoked. As of 31 December 2017, these arrears above 90 days amount to EUR 2.2 million (2016: EUR 4.0 million). 209


EIB Group Consolidated Financial Statements under IFRS Loans called under guarantees of the European Union budget or the Member States: During 2017 EUR 89.6 million have been called under the guarantee of the European Union budget and nothing was called under the Member States guarantee. Corresponding amounts in 2016 were EUR 147.7 million and EUR 4.9 million respectively. The table below gives an overview of the arrears above 90 days on loans: (EUR'000) 31.12.2017 31.12.2016 Amount in arrears Nominal amount of related principal outstanding 180,038 479,514 89,560 273,316 Amount in arrears 2,163 3,964 Amount called (during the year) 89,577 152,613 Cumulative amount called and not refunded as at year end 502,285 489,243 Loan renegotiation and forbearance The Group considers loans to be forborne loans (i.e. loans, debt securities and loan commitments) in respect of which forbearance measures have been extended. Forbearance measures consist of “concessions” that the Group decides to make towards an obligor who is considered unable to comply with the contractual debt service terms and conditions due to its financial difficulties, in order to enable the obligor to service the debt or to refinance, totally or partially, the contract. Forbearance measures occur in situations in which the borrower is considered to be unable to meet the debt service terms and conditions of the contract due to financial difficulties. Based on these difficulties, the Group decides to modify the debt service terms and conditions of the contract to allow the borrower sufficient ability to service the debt or refinance the contract, either totally or partially. Exposures shall be treated as forborne if a concession has been made, irrespective of whether (i) any amount is past-due, (ii) the exposure is classified as impaired or (iii) the exposure is classified as defaulted. Exposures shall not be treated as forborne when the obligor is not in financial difficulties. In the normal course of business, the Loan Grading (LG) of the loans in question would have deteriorated and the loans would have been included in the Watch List before renegotiation. Once renegotiated, the Group will continue to closely monitor these loans. If the renegotiated payment terms will not recover the original carrying amount of the asset, the Bank will consider accounting for value adjustments in the profit and loss account. The corresponding value adjustment will be calculated based on the forecasted cash flows discounted at the original effective interest rate. The need for a value adjustment for all loans whose LG deteriorated to E-is assessed regularly; all loans with a LG of F require a value adjustment. Once the Loan Grading of a loan has improved sufficiently, the loan will be removed from the Watch List in line with the Bank’s procedures. Forbearance measures and practices undertaken by the Bank’s restructuring team during the reporting period includes, but not limited to, extension of maturities, deferral of capital only, deferral of capital and interest, breach of material covenants and capitalisation of arrears. Operations subject to forbearance measures are reported as such in the tables below. (in EUR million) 31.12.2017 31.12.2016 Number of contracts subject to forbearance practices 51 30 Carrying values (incl. interest and amounts in arrears) 2,824 1,714 of which being subject to impairment 943 1,025 Impairment recognised 428 339 Interest income in respect of forborne contracts 83 39 Exposures written off (following the termination/sale of the operation) 3 0 Forbearance measures Breach of material financial covenants Contractual repayment and termination(1) Deferral of capital and interest Extension of maturities (in EUR million) 31.12.2016 Other 31.12.2017 Public Bank Corporate 251 4 1,459 51 0 79 0 6 406 730 0 62 0 0 89 0 0 -313 1,032 10 1,782 (1) Decreases are explained by repayments of capital, interest and amount in arrears as well as write-off which occurred during the year on operations already considered as forborne as of 31 December 2016 and by termination during the year. 210 Total 1,714 130 412 792 89 -313 2,824 Loans called under the EU or Member State guarantees Loans secured by EU or Member State guarantees (callable) Loans not secured by EU or Member State guarantees


S.2.3.6.Securitised loans and loan substitutes Regarding the Group’s exposure to securitised loans and loan substitutes, this portfolio comprises Covered Bonds and Asset Backed Securities (ABS). Covered Bonds offer full recourse to the issuer, while ABS are issued by Special Purpose Vehicles backing the underlying issues. Some of these transactions have been structured by adding a credit or project related remedies, thus offering additional recourse. As of 31 December 2017, the securitised loans and loan substitutes amount to EUR 20,872 million (2016: EUR 22,242 million). This amount is composed of EUR 19,947 million (2016: EUR 20,917 million) of loan substitutes included in debt securities portfolio (Note B.2) and of EUR 925 million (2016: EUR 1,325 million) of securitised loans included in loans and advances to credit institutions and to customers (Note D). The following table summarises the breakdown of the securitised loans and loan substitutes portfolio by asset class: Securitised loans (in EUR million) Asset class 31.12.2017 31.12.2016 Asset Backed Securities Asset Backed Securities Asset Backed Securities Covered Bonds Covered Bonds Covered Bonds Structured Public Sector Bonds Government Bonds Total Diversified Payment Rights Mortgage Backed Securities Small and Medium Entities Mortgage Backed Securities Public Sector Small and Medium Entities Public Sector Sovereign bonds 977 2,166 2,730 10,756 1,621 53 0 2,569 1,254 2,415 3,649 11,280 1,843 393 224 1,184 20,872 22,242 While Covered Bonds are mostly backed by residential mortgage pools in the majority of ABS structures the securitised assets are SME loans or leases. Aside from eighteen transactions with Turkey (amounting to EUR 1,532 million (2016: EUR 1,566 million)), all the promoters of the Bank’s Loan Substitutes portfolio are domiciled in the European Union, with the majority being located in Spain (65%) and in Italy (9%). EUR 240 million (1%) of the outstanding securitised loans have one external AAA rating, EUR 14,508 million (70%) have at least one AA rating, EUR 2,301 million (11%) at least one single A rating, and EUR 1,024 million (5%) a BBB rating. EUR 2,799 million (13%) has an undefined or lower rating. Embedded credit mitigants and requirements imposed by the regulation and rating agencies are the initial remedies which are triggered in case of credit event on the issuer. As mentioned above, in some ABS transactions credit or project remedies are available and represent a second way out. Overall no loan substitute transaction is on the Bank’s Watch List. S.2.4. Credit risk on treasury transactions S.2.4.1.Credit risk measurement on treasury transactions Treasury investments are divided into three categories: (i) monetary treasury assets, with the primary objective of maintaining liquidity, (ii) operational bond portfolios, as a second liquidity line, and (iii) Group Long Term Hedge Portfolio (former Group Investment Portfolio) composed of EU sovereign bonds. Credit risk policy for treasury transactions is monitored through the attribution of credit limits to the counterparts for monetary and bond transactions. The weighted exposure for each counterpart must not exceed the authorised limits. The tables below provide an illustration of the credit exposure of the Group on various treasury portfolios as at 31 December 2017 and 31 December 2016: Credit Risk Exposures as at 31 December 2017 (based on book values in EUR million) Total < A or NR A AA AAA TMP max maturity 12 months Deposits Overnight deposits Tripartite reverse repos Discount paper, bonds P1 Portfolio P2 Portfolio EIF - AFS ABS Portfolio EIF Group Long term hedge portfolio Loan substitutes 15,162 345 0 1,100 13,717 739 248 202 0 180 1,320 17,733 8,570 200 3,921 5,042 976 896 513 44 47 1,698 26,462 17,891 0 2,928 5,643 1,149 1,212 284 126 76 16,518 4,204 676 0 0 3,528 1,731 582 250 29 248 411 63,561 27,482 200 7,949 27,930 4,595 2,938 1,249 199 551 19,947 Total treasury funds 17,851 21,907 45,827 7,455 93,040 Of which EU sovereign exposures 14,071 689 2,230 1,717 18,707 211


EIB Group Consolidated Financial Statements under IFRS Credit Risk Exposures as at 31 December 2016 (based on book values in EUR million) Total < A or NR A AA AAA 74,972 26,850 174 10,411 37,537 2,987 4,200 1,287 179 567 20,916 TMP max maturity 12 months Deposits Overnight deposits Tripartite reverse repos Discount paper, bonds P1 Portfolio P2 Portfolio EIF - AFS ABS Portfolio EIF Long term hedge portfolio Loan substitutes 795 51 0 0 744 249 232 20 29 0 1,796 22,846 13,835 174 1,904 6,933 482 1,185 433 96 48 3,274 44,233 11,902 0 8,507 23,824 1,610 2,259 529 54 341 15,075 7,098 1,062 0 0 6,036 646 524 305 0 178 771 Total treasury funds 3,121 28,364 64,101 9,522 105,108 Of which EU sovereign exposures 20 1,893 18,548 5,964 26,425 The credit risk associated with treasury (securities, commercial paper, term accounts, etc.) is managed through selecting sound counterparties and issuers. Limits governing the structure of the securities portfolio and outstanding treasury instruments have been laid down by Management, in particular on the basis of internal ratings as well as ratings awarded to counterparties by rating agencies (these limits are reviewed regularly by the Risk Management Directorate). The Group enters into collateralised reverse repurchase and repurchase agreement transactions that may result in credit exposure in the event that the counterparty to the transaction is unable to fulfil its contractual obligations. The Group controls the credit risk associated with these activities by monitoring counterparty credit exposure and collateral values on a daily basis and requiring additional collateral to be deposited with the Group when deemed necessary. Tripartite reverse repos are carried out with a third-party custodian who undertakes, on the basis of a framework contract, to guarantee compliance with the contractual terms and conditions, notably with respect to: - - - delivery against payment; verification of collateral; the collateral margin required by the lender which must always be available and adequate, with the market value of the securities being verified daily by the said custodian; and the organisation of substitute collateral provided that this meets all the contractual requirements. - The total Treasury investments are distributed over different portfolios and diversified products (deposits, securities and derivative products). S.2.4.2.Collateral on treasury transactions Collateral received Part of treasury transactions are tripartite reverse repurchase agreements with a nominal balance of EUR 7,949 million (2016: EUR 10,411 million) and tripartite repurchase agreements with a nominal balance that stood at nil at 31 December 2017 (2016: 315 EUR million). These transactions are governed by Tripartite Agreement Guidelines and are implemented depending on the acceptability of collateral. The exposure is fully collateralised, with daily margin calls. The market value of the collateral portfolio is monitored and additional collateral is requested when needed in accordance with the underlying agreement. The market value of the securities received as collateral as at 31 December 2017 amounts to EUR 8,275 million (2016: EUR 10,512 million). During the 2017 and 2016 years, the Group did not take possession of any of the above mentioned collaterals. Collateral deposited As at 31 December 2017, the Group has deposited with the Central Bank of Luxembourg securities with a market value of EUR 3.1 billion (2016: EUR 2.6 billion). S.2.4.3 Transferred assets that are not derecognised at the balance sheet date No assets of the Group were transferred but not derecognised at the balance sheet date. S.2.5. Credit risk on derivatives S.2.5.1.Credit risk policies for derivatives The credit risk policy for derivative transactions is based on the definition of eligibility conditions and rating-related limits for swap counterparts. In order to reduce credit exposures, the Group has signed Credit Support Annexes with most of its active swap counterparts and receives collaterals when the exposure exceeds certain contractually defined thresholds. 212


The credit risk with respect to derivatives lies in the loss which the Group would incur were a counterparty be unable to honour its contractual obligations. In view of the special nature and complexity of the derivatives transactions, a series of procedures has been put in place to safeguard the Bank against losses arising out of the use of such instruments. Contractual framework: All the Group’s derivative transactions are concluded in the contractual framework of Master Swap Agreements and where applicable Credit Support Annexes, which specify the conditions of exposure collateralisation. These are generally accepted and practised contract types. Counterparty selection: The minimum rating at the outset is set at A3. The EIB has the right of early termination if the rating drops below a certain level. Collateralisation: - Generally, there is a reduced credit risk on swaps, because exposures (exceeding limited thresholds) are collateralised by cash and bonds. - Complex and illiquid transactions could require collateralisation over and above the current market value. - Both the derivatives portfolio with individual counterparties and the collateral received are monitored and valued on a daily basis, with a subsequent call for additional collateral or release. The amount of collateral required depends on an assessment of the credit risk of the counterparty. Guidelines are implemented regarding the acceptability of collaterals and valuations parameters. As part of the ISDA agreements, the Group has received securities and cash that it is allowed to sell or repledge. The fair value of the securities accepted under these terms as at 31 December 2017 amounts to EUR 16,279 million (2016: EUR 37,963 million) with the following composition detailed based on the nature of the collateral and based on ratings: Swap collateral (in EUR million) Bonds Agency, supranational, Pfandbriefe Moody's equivalent rating Cash Total 2017 Government Aaa Aa1 to Aa3 A1 to A3 Baa1 to Baa3 Below Baa3 Non-Rated 2,877 2,430 96 4,419 2 0 1,517 0 0 0 0 0 0 0 0 0 0 4,938 4,394 2,430 96 4,419 2 4,938 Total 2017 9,824 1,517 4,938 16,279 Swap collateral (in EUR million) Bonds Agency, supranational, Pfandbriefe Moody's equivalent rating Cash Total 2016 Government Aaa Aa1 to Aa3 A1 to A3 Baa1 to Baa3 Below Baa3 Non-Rated 3,470 11,899 134 5,496 221 0 3,870 0 110 0 0 0 0 0 0 0 0 12,763 7,340 11,899 244 5,496 221 12,763 Total 2016 21,220 3,980 12,763 37,963 S.2.5.2.Credit risk measurement for derivatives The credit risk associated with derivatives varies according to a number of factors (such as interest and exchange rates) and generally corresponds to only a small portion of their notional value. The EIB measures the credit risk exposure related to swaps and derivatives transactions using the Current Unsecured Exposure and the Potential Future Exposure for reporting and limit monitoring, and the Credit Risk Equivalent for capital allocation according to the recommendations of the Basel Committee on Banking Supervision (BCBS) sponsored by the BIS. The EIB computes the Current Unsecured Exposure, which is the larger of zero and the market value of the portfolio of transactions within the netting set with a counterparty less the value of collateral received. It is the amount that would be lost upon the default of the counterparty, using the received collateral and assuming no recovery on the value of those transactions as well as immediate replacement of the swap counterparty 213


EIB Group Consolidated Financial Statements under IFRS for all the transactions. As of 31 December 2017 the Current Unsecured Exposure stood at EUR 364 million (EUR 448 million as of 31 December 2016). In addition, the EIB computes the Potential Future Exposure, which takes into account the possible increase in the netting set’s exposure over the margin period of risk, which ranges between 10 and 20 days, depending on the portfolio of transactions. The EIB computes the Potential Future Exposure at 90% confidence level using stressed market parameters to arrive at conservative estimates. This is in line with the recommendations issued by regulators in order to take into consideration the conditions that will prevail in case of default of an important market participant. As of 31 December 2017 the Potential Future Exposure at origin stood at EUR 7,366 million (EUR 9,499 million as of 31 December 2016). Limits: The limit system for banks covers the Potential Future Exposure in 3 time buckets (under 1 year, between 1 and 5 years and over 5 years) and in 2 rating scenarios (current and downgrade below A3). The derivatives portfolio is valued and compared against limits on a daily basis. The new Potential Future Exposure measure introduced in 2017 coincides at origin with the Total Unsecured Exposure reported until 2016. As from the following table, the majority of the derivative portfolio is concentrated on counterparties rated A3 or above: Current Unsecured ExposureTotal Unsecured Exposure Grouped ratings Percentage of nominal (in EUR million) (in EUR million) Moody’s equivalent rating 2017 2016 2017 2016 2017 2016 Aaa Aa1 to Aa3 A1 to A3 Below A3 Non-rated 0.3% 23.5% 65.3% 10.9% 0.0% 0.3% 24.6% 65.7% 9.4% 0.0% 119 224 0 21 0 91 224 124 9 0 140 1,904 5,094 228 0 169 2,785 6,365 180 0 Total 100.0% 100.0% 364 448 7,366 9,499 The table below shows the concentration on main derivative counterparts as at 31 December 2017 and 2016: 2017 2016 Nominal Exposure (% of Group derivative portfolio): – Top 3 – Top 10 – Top 25 33.0% 65.3% 95.2% 28.4% 62.0% 93.5% Current Unsecured Exposure: – Top 3 – Top 10 – Top 25 56.0% 98.2% 100.0% 48.6% 97.6% 100.0% Potential Future Exposure: – Top 3 – Top 10 – Top 25 36.8% 77.1% 97.4% 30.0% 68.7% 96.4% The following table shows the maturities of currency swaps (excluding short-term currency swaps), sub-divided according to their notional amount and fair value: More than 1 year and up to 5 years More than 5 years and up to 10 years More than 10 years Currency swaps at 31 December 2017 (in EUR million) 1 year or less Total 2017 Notional amount Fair value (i.e. net discounted value including CVA and DVA)(*) 36,128 35 108,446 -1,717 40,132 1,995 19,371 1,423 204,077 1,736 More than 1 year and up to 5 years More than 5 years and up to 10 years More than 10 years Currency swaps at 31 December 2016 (in EUR million) 1 year or less Total 2016 Notional amount Fair value (i.e. net discounted value including CVA and DVA)(*) 34,392 3,865 125,331 8,323 36,858 2,443 15,651 2,064 212,232 16,695 (*)Including the fair value of macro-hedging currency swaps which stood at EUR 500 million as at 31 December 2017 (2016: EUR 1,994 million). 214


The following table shows the maturities of interest rate swaps sub-divided according to their notional amount and fair value: More than 1 year and up to 5 years More than 5 years and up to 10 years More than 10 years Interest rate swaps at 31 December 2017 (in EUR million) 1 year or less Total 2017 Notional amount Fair value (i.e. net discounted value including CVA and DVA)(*) 44,391 -350 202,704 4,158 126,652 4,267 136,260 1,345 510,007 9,420 More than 1 year and up to 5 years More than 5 years and up to 10 years More than 10 years Interest rate swaps at 31 December 2016 (in EUR million) 1 year or less Total 2016 Notional amount Fair value (i.e. net discounted value including CVA and DVA)(*) 75,265 587 197,166 5,027 116,008 6,987 134,914 607 523,353 13,208 (*)Including the fair value of macro-hedging interest rate swaps which stood at EUR -333 million as at 31 December EUR -461 million) 2017 (2016: The Group does not generally enter into options contracts in conjunction with its risk hedging policy. However, as part of its strategy of raising funds on the financial markets at a lesser cost, the Bank enters into borrowing contracts and loans whose value depends on a variety of interest rates, FX rates, inflation rates, stock indexes and IR volatilities. Such structured borrowings and loans are entirely covered by swap contracts to hedge the corresponding market risk. All embedded option contracts are negotiated over the counter. The Notional amount and fair value of structured swaps is included in the tables above, depending whether or not they incorporate a cross currency element. The table below further details the number, value and notional amounts of structured swaps: Special structure coupon or similar Early termination embedded Stock exchange index 2017 2016 2017 2016 2017 2016 Number of transactions Notional amount (in EUR million) Net discounted value (in EUR 136 5,490 138 5,465 1 500 1 500 306 19,437 300 33,084 million) 444 512 -33 -19 -2,461 -2,207 The fair value of swap transactions is computed using the income approach, applying valuation techniques to convert future amounts to a single present amount (discounted). The estimate of fair value is based on the value indicated by marketplace expectations about those future amounts. Valuation techniques can range from simple discounted known cash flows to complex option models. The valuation models applied are consistent with accepted economic methodologies for pricing financial instruments, and incorporate the factors that market participants consider when setting a price. For a portion of derivative transactions, internal estimates and assumptions might be used in the valuation techniques when the market inputs are not directly available. Generally, there is a reduced credit risk on these swaps, because security exists in the form of regularly monitored collateral. All option contracts embedded in, or linked with, borrowings are negotiated over the counter. The structured deals include a variety of transactions dependent on interest rates, FX rates, inflation rates, stock indexes and IR volatilities. As at 31 December 2017, no futures contracts are outstanding (same in 2016). S.2.5.3.Credit risk on guarantees and securitisations (GS) Credit risk arising from the Group’s guarantees and securitisations transactions funded by own resources is managed by risk management policies covered by the Statute and the Credit Risk Policy Guidelines. As at 31 December 2017, the signed exposures amount to EUR 15.8 billion (2016: EUR 12.7 billion). The disbursed exposure of the loans guaranteed by the Group amount to EUR 7.6 billion (2016: EUR 5.1 billion), and such provisions on guarantees amount to EUR 23.5 million (2016: EUR 42.5 million). The Credit Risk Policy Guidelines ensure that the Group continues to develop a diversified guarantee portfolio in terms of product range, geographic coverage, counterparty exposure, obligor exposure, industry concentration and also set out the capital allocation rules based on the ratings of the exposures. Concentration risk is limited because of the granular nature of the Group’s transactions; typically the underlying portfolios are highly diversified in terms of single obligor concentration, sectors, and also with regard to regional diversification. To cover concentration risk, the Group has strict limits (based on capital allocation) for individual transactions and on originator level (maximum aggregate exposures for originators and originator groups). 215


EIB Group Consolidated Financial Statements under IFRS In the context of the Group’s own risk guarantee operations, the credit risk is tracked from the very beginning on a deal-by-deal basis whilst adopting a different model analysis approach depending on the granularity and homogeneity of the underlying portfolios. The industry sector exposures are analysed on a deal-by-deal basis through their impact on the ratings assigned by the Group to each transaction or tranche. For instance, dependent on the financial model used to analyse the transaction, industry exposures can be reflected in implicit correlation or can be indirectly captured through the assumption on default rate volatility, as a key model input variable. Furthermore, concentration exposures are analysed in the context of each deal using qualitative measures such as current status and forecast for sectors with high concentrations in the portfolio. Exceptionally, some deals have a concentrated exposure in the same (broad) sector. This is typically captured through increased credit enhancement (e.g. subordination) to the benefit of the Group. Typically, deals with replenishing features have portfolio criteria, such as maximum single obligor, maximum top five obligors, and maximum industry concentration levels. Furthermore, the consideration of sector exposures is part of the Group’s overall portfolio analysis. Counterparty risk is mitigated by the quality of the Group’s counterparties which are usually major market players. The Group performs additional on-site monitoring visits to ensure compliance with procedures and processes during the transaction life. Stress-test scenarios for the portfolio of guarantees, including extreme case assumptions, are regularly carried out to determine the ability of the capital base to sustain adverse shocks. S.3. Liquidity risk Liquidity risk refers to the ability of the Group to fund increases in assets and meet obligations as they come due, without incurring unacceptable losses. It can be further split into funding liquidity risk and market liquidity risk. Funding liquidity risk is connected to the risk for the Group to be unable to refinance the asset side of its balance sheet and to meet payment obligations punctually and in full out of readily available liquid resources. Funding liquidity risk may have an impact on the volatility in the economic value of, or in the income derived from Group’s positions, due to potentially increasing immediate risks to meet payment obligations and the consequent need to borrow at unattractive conditions. Market liquidity risk is the volatility in the economic value of, or in the income derived from, the Group’s positions due to potential inability to execute a transaction to offset, eliminate or reduce outstanding positions at reasonable market prices. Such an inability may force early liquidation of assets at unattractive prices when it would be better to avoid such liquidation. This risk is tied to the size of the position compared to the liquidity of the instrument being transacted, as well as to potential deterioration of market availability and efficiency. S.3.1. Liquidity risk management Liquidity risk management of the Bank Liquidity risk is managed prudently in order to ensure the regular functioning of the Bank’s core activities at reasonable cost. The main objective of liquidity policy is to ensure that the Bank can always meet its payment obligations punctually and in full. In contrast to commercial banks, the EIB does not have retail deposits but relies on its access to capital markets to raise the funds it on-lends to its clients. The Bank manages the calendar of its new issues so as to maintain a prudential liquidity buffer. Liquidity planning takes into account the cash outflows due to debt servicing and loan disbursements, as well as the cash inflows from the loan portfolio. It also takes into account the sizeable amount of signed but un-disbursed loans, whose disbursements typically take place at the borrowers’ request. The Bank further assures management of liquidity risk by maintaining a sufficient level of short-term liquid assets, and by spreading the maturity dates of its placements according to the forecasts of liquidity needs. Liquidity risk policy also incorporates a floor on treasury levels. The Bank's total liquidity ratio (defined as a target percentage of annual projected net cash flows) must at all times exceed 25% of the forecasted net annual cash flows for the following year. The Bank has in place a Contingency Liquidity Plan (CLP), which specifies appropriate decision making procedures and corresponding responsibilities. The CLP has been benchmarked against the “Principles for Sound Liquidity Risk Management and Supervision” by the Basel Committee on Banking Supervision (September 2008). The CLP is subject to ad-hoc updates and is presented to the Management Committee annually for approval. Regular stress-testing analyses tailored to the specific business model of the EIB are executed as a part of the liquidity risk monitoring and drive the size of the Bank’s liquidity buffer. On 8 July 2009, the Bank became an eligible counterparty in the Eurosystem’s monetary policy operations, and therefore has been given access to the monetary policy operations of the European Central Bank. The Bank conducts the operations via the Central Bank of Luxembourg, where the Bank maintains deposits to cover the minimum reserve requirement. Liquidity risk management of the Fund Liquidity risk is managed in such a way as to protect the value of the paid–in capital, ensure an adequate level of liquidity to meet possible guarantee calls, private equity commitments and administrative expenditure and earn a reasonable return on assets invested with due regard to minimisation of risk. 216


S.3.2. Liquidity risk measurement The table hereafter analyses the financial liabilities of the Group by maturity on the basis of the period remaining between the consolidated balance sheet date and the contractual maturity date (based on contractual undiscounted cash flows). Liabilities for which there is no contractual maturity date are classified under "Maturity undefined". The numbers represent undiscounted cash flows inclusive of interest coupons and therefore do not generally reconcile with the Balance Sheet figures. Principal cash flows and interests are slotted in the bucket corresponding to their first potential contractual payment date. This therefore does not represent an expected scenario, but rather a theoretical scenario. Some of the borrowings and associated swaps include early termination triggers or call options granted to the hedging swap counterparties, and the Group also has the right to call the related bonds before maturity. In these cases, the cash flow is represented in the bucket corresponding to the first possible termination date. However, this is a conservative measure, as the Group is contractually not obliged to redeem early the related callable bonds and under realistic scenarios there would be no reason to call all such bonds at first possible occasions. Outflows for committed but undisbursed loans are represented in line with the internal methodology for liquidity stress-testing. In particular, the maximum amount of loans that under severe conditions of stress could possibly be subject to early disbursement is represented in the first maturity bucket. Net cash flows are represented for interest rate swaps and forward rate agreements. Gross cash flows are represented in the maturity analysis for interest rate derivatives where settlement is gross (essentially Cross Currency Interest Rate Swaps) and foreign exchange derivatives such as FX-forwards and FX-swaps. Maturity profile of non-derivative financial liabilities More than 3 months to 1 year More than 1 year to 5 years Gross nominal outflow 3 months or less More than 5 years Maturity undefined Carrying amount (in EUR million as at 31.12.2017) Amounts owed to customers and credit institutions Commercial paper Debts evidenced by certificates – first call date scenario Others (issued guarantees, share subscription commitments etc.) Outflows for committed but un-disbursed loans 6,942 18,941 0 379 0 0 0 0 0 0 6,942 19,320 6,941 19,290 18,179 39,360 246,768 197,173 0 501,480 470,738 0 0 813 0 25,130 25,943 15,667 3,236 4,965 24 89,036 112,928 Maturity profile of non-derivative financial liabilities More than 3 months to 1 year More than 1 year to 5 years Gross nominal outflow 3 months or less More than 5 years Maturity undefined Carrying amount (in EUR million as at 31.12.2016) Amounts owed to customers and credit institutions Commercial paper Debts evidenced by certificates – first call date scenario Others (issued guarantees, share subscription commitments etc.) Outflows for committed but un-disbursed loans 14,906 18,520 0 3,707 0 0 0 0 0 0 14,906 22,227 15,067 22,202 527,552 495,701 20,665 46,410 260,854 199,623 0 0 0 754 0 20,379 21,133 14,932 4,047 4,582 221 89,538 113,320 Maturity profile of derivative financial liabilities Gross nominal inflow/ outflow More than 3 months to 1 year More than 1 year to 5 years 3 months or less More than 5 years (in EUR million as at 31.12.2017) Net settling interest rate derivatives Gross settling interest rate derivatives – inflows Gross settling interest rate derivatives – outflows Foreign exchange derivatives – inflows Foreign exchange derivatives – outflows -95 11,980 -11,175 38,766 -38,773 1,724 26,944 -25,770 3,520 -3,456 4,382 118,310 -114,934 273 -266 4,459 69,090 -64,705 0 0 10,470 226,324 -216,584 42,559 -42,495 Total 703 2,962 7,765 8,844 20,274 217 Total 69,023 54,918 265,436 199,844 109,917 699,138 532,970 Total 59,729 43,788 251,733 197,197 114,166 666,613 496,969


EIB Group Consolidated Financial Statements under IFRS Maturity profile of derivative financial liabilities Gross nominal inflow/ outflow More than 3 months to 1 year More than 1 year to 5 years 3 months or less More than 5 years (in EUR million as at 31.12.2016) Net settling interest rate derivatives Gross settling interest rate derivatives – inflows Gross settling interest rate derivatives – outflows Foreign exchange derivatives – inflows Foreign exchange derivatives – outflows 903 9,549 -7,713 38,597 -37,623 2,255 28,931 -23,589 6,724 -6,658 6,116 134,385 -120,533 376 -377 6,304 59,938 -54,916 0 0 15,578 232,803 -206,751 45,697 -44,658 Total 3,713 7,663 19,967 11,326 42,669 S.4. Market risk Market risk is the risk that the net present value of future cash flows of financial instruments will fluctuate due to changes in market variables such as interest rates, foreign exchange rates and equity prices. S.4.1. Market risk management Market risk for the Bank: As is the case with the “four-eyes principle” applied in lending activities via the Bank’s credit policies, so the market risk policy of the Bank establishes that the Risk management Directorate shall monitor all financial activities of the Group that introduce material market risks, and with respect to financial transactions that may create credit risk, such as treasury hedging or derivatives operations. Market risks are identified, measured, managed and reported according to a set of policies and procedures updated on a regular basis called the “Financial Risk Guidelines” (FRG). The general principles underpinning these policies are described below. Stress testing is a widely used method to analyse the impact of possible scenarios on the Bank’s earnings and economic value of own funds, especially when analysis of historical market movements are viewed to be insufficient to assess future risks. Scenarios applied may relate to changes in market rates (interest rates, FX rates, spreads, equity prices etc.), liquidity conditions, or to worst-case events that may impact the former, such as sudden and adverse macroeconomic changes, simultaneous default of sizeable obligors, widespread system failures and the like. Stress testing is performed on a regular basis and the results of the change in the economic value of the Bank and of the change of the earnings profile is reported within the Bank’s market risk measurement process. Market risk for the Fund: The Fund’s market risk exposure arises mainly in the form of interest rate risk attached to cash and cash equivalent positions as well as investments in debt securities. Currently all of these assets held have an average duration of up to 5 years, thereby safeguarding the Fund against the substantial fluctuations in its long term revenues. S.4.2. Interest rate risk Interest rate risk is the volatility in the economic value of, or in the income derived from, the Group’s positions due to adverse movements in market yields or the term structure of interest rates. Exposure to interest rate risk occurs when there are differences in re-pricing and maturity characteristics of the different asset, liability and hedge instruments. Interest rate risk management of the Group: In measuring and managing interest rate risk, the Group refers to the relevant key principles of the Basel Committee on Banking Supervision (BCBS) and the European Banking Authority (EBA). The main sources of interest rate risk are: re-pricing risk, yield curve risk, basis risk and spread risk. An interest rate risk that is particularly relevant for the Group is spread risk. Spread risk is the volatility in the economic value of, or in the income derived from, the Group’s positions due to movements in the funding or lending spread of the Group. The Group manages its global structural interest rate position on a basis of the notional reference portfolio. The majority of the financial risk indicators and controls in use at the Group apply to this portfolio. Financial indicators and controls for the rest of the activities outside this portfolio only relate to the risks, which are not transferred to it via the transfer pricing system, and therefore remain with their respective activities, such as the equity risk in the venture capital activity or the interest rate or credit risks taken in the treasury portfolios predominantly managed for yield-enhancement purposes. S.4.2.1.Value-at-Risk for the own funds of the Group (economic perspective) Group’s ALM strategy aims at maintaining a balanced and sustainable revenue profile as well as limiting the volatility of the economic value of the Group. A clear preference has been given to the revenue profile in light of the objective of self-financing of the Group’s growth. This overall objective is achieved by investing the Group's own funds according to a medium to long term investment profile, implying an own funds duration target of 4.5 – 5.5 years. 218


Apart from the duration target for own funds, the Group’s balance sheet should be match-funded with respect to currency and interest rate characteristics. However, small deviations are authorised for operational reasons. The net residual positions that arise from outstanding operations are managed within pre-set limits to constrain market risk to minimum levels. The Group Risk Management Directorate quantifies the Value at Risk (VaR) of own funds for both interest rates and foreign exchange risk factors. This is a parametric VaR calculated using the Riskmetrics methodology, where volatility and correlation data are computed internally on the basis of historical market data. It is measured on the Group’s positions using a 99% confidence level and a one-day time horizon. As at 31 December 2017, the VaR of the Group’s own funds amounted to EUR 186 million (2016: EUR 258 million). The evolution of the VaR of the Group’s own funds since 2016 reflects the effective decrease of the volatility of the risk factors and not a change in the risk profile of the Group’s positions. More generally, the VaR does not purport to measure the worst loss that could be experienced. For this reason, it is complemented by regular stress testing using interest rate shocks. As of 31 December 2017, the impact of a 200 basis point upward parallel shift of the interest rate curves would reduce the economic value of own funds by EUR 7.87 billion (2016: EUR 7.65 billion). Among the financial instruments in the Group’s portfolio, some deals (borrowings and associated swaps) present callability options and may be redeemed early, introducing uncertainty as to their final maturity. At cash flow level all such borrowings are fully hedged by swaps so that they can be considered synthetic floating rate notes indexed to Libor/Euribor. Below is a summary of the features of the Group’s callable portfolio as of 31 December 2017 and 31 December 2016, where the total nominal amount, the average natural maturity and the average expected maturity (both weighted by the nominal amount of the concerned transactions) are shown per funding currency and per main risk factor involved: By funding currency (after swap): 31.12.2017 (in EUR million) Pay currency Total EUR JPY USD EUR pay notional Average maturity date Average expected maturity -2,679 17.11.2042 13.06.2028 -21 09.02.2032 11.02.2029 -2,810 17.04.2037 16.10.2025 -5,510 27.12.2039 04.02.2027 31.12.2016 (in EUR million) Pay currency Total EUR JPY USD EUR pay notional Average maturity date Average expected maturity -2,614 24.09.2042 07.10.2028 -77 25.08.2022 01.10.2020 -2,776 29.01.2036 24.05.2026 -5,467 25.01.2039 13.06.2027 By risk factor involved: 31.12.2017 (in EUR million) Risk factor IR curve shape Total FX level IR curve level EUR pay notional Average maturity date Average expected maturity -712 27.09.2037 05.06.2026 -4,659 10.08.2040 22.05.2027 -139 16.09.2030 21.09.2020 -5,510 27.12.2039 04.02.2027 31.12.2016 (in EUR million) Risk factor Total IR curve shape FX level IR curve level EUR pay notional Average maturity date Average expected maturity -1,004 22.12.2034 24.07.2024 -4,324 15.04.2040 23.04.2028 -139 16.09.2030 03.07.2021 -5,467 25.01.2039 13.06.2027 S.4.2.2.Interest rate risk management for the Group (Earnings perspective) The sensitivity of earnings quantifies the change in the Group’s net interest income over the forthcoming 12 months if all interest rate curves would rise by one percentage point or decrease by one percentage point. Such exposure stems from the mismatches that the Group accepts, within approved limits, between interest rate re-pricing periods, volumes and rates of assets and liabilities. With the positions in place as of 31 December 2017, the earnings would increase by EUR 118.1 million (2016: EUR 104.3 million) if interest rates were to increase by 100 basis points and decrease by EUR 111.7 million (2016: EUR 119.8 million) if interest rates were to decrease by 100 basis points. The Group computes the sensitivity measure with dedicated software that simulates earnings on a deal by deal basis. The sensitivity of earnings is measured on an accrual basis and is calculated under the ‘’ongoing’’ assumption that, over the time horizon analysed, the Group realises the new loan business forecast in the Operational Plan, maintains exposures within approved limits and executes monetary trades to refinance funding shortages or invest cash excesses. Earnings are simulated on a monthly timely basis, assuming that all the fixed rate items carry their contractual rate and that all floating rate items are subject to interest rate repricing according to the interest rate scenario applied in the simulation. The monetary 219


EIB Group Consolidated Financial Statements under IFRS trades to refinance funding shortages or invest cash excesses carry rates equal to the money market rates prevailing according to the interest rate scenario applied in the simulation. In line with the current practice of the Group, the model uses the hypothesis that simulated earnings are not distributed to the shareholders, but are used to refinance the Group’s business. The administrative costs are projected according to the forecasts of the Operational Plan. The sensitivity of the EIF is computed by taking into consideration the coupon re-pricing of all the positions present in the EIF treasury and loan portfolio managed by the Group on a deal-by-deal basis. Each fixed rate treasury asset is assumed to be reinvested at maturity in a new asset with the same residual life of the previous one as of end of year’s date. Positions in floating rate treasury assets are assumed to have quarterly repricings. S.4.3. Foreign exchange risk The foreign exchange (FX) risk is the volatility in the economic value of, or in the income derived from, the Bank’s positions due to adverse movements of foreign exchange rates. The Bank is exposed to a foreign exchange risk whenever there is a currency mismatch between its assets and liabilities. In compliance with its Statute, the Bank does not engage in currency operations not directly required to carry out its lending operations or fulfil commitments arising from loans or guarantees granted by it. Mismatches of currencies in the asset-liability structure of the Bank are kept within tight limits. The foreign exchange risk implicit in interest margin accruing in currencies different from EUR is regularly hedged. The hedging programme addresses the interest rate loan margins expressed in USD and in GBP for the next 3 years on a rolling basis. S.4.3.1. Foreign exchange position Net position (in million) 2017 2016 Pound Sterling (GBP) US Dollar (USD) Other currencies 49 -52 9 -80 16 -26 S.4.3.2.Foreign exchange risk management In compliance with its statute, the Bank actively hedges its FX risk exposures. The main objective of the Bank’s FX risk management policy is to minimise the impact of a variation of FX rates on the income statement by keeping FX positions within the limits approved by the Management Committee. Related to the quantification of the VaR of own funds for both interest rates and foreign exchange risk factors, refer to Note S.4.2.1. S.4.4. Equity price risk Equity price risk is the risk that the fair values of equities decrease as the result of changes in the levels of equity indices and the value of individual equity investments. As of 31 December 2017, equity price risk was limited to those strategic activities approved by the Board of Directors (venture capital investments made by the Fund on behalf of the Bank and on its own resources; infrastructure funds; equity-like investments as Special Activity; participation in the EBRD). These activities are subject to special forms of monitoring and the resulting exposures are supported by sound capitalisation. The value of privately held equity positions is not readily available for the purposes of monitoring and control on a continuous basis. For such positions, the best indications available include prices for similar assets and the results of any relevant valuation techniques. The effect on Own Funds for the Group (as a result of a change in the fair value of equity investments at 31 December 2017 and 31 December 2016) due to a reasonable possible change in equity indices, with all other variables held constant is as follows: 2017 2016 Change in equity price % Effect on Own Funds EUR ’000 Change in equity price % Effect on Own Funds EUR ’000 Venture Capital Operations (1) EBRD shares Investment funds -11 -10 -10 -557,233 -46,747 -99,754 -10 -10 -10 -380,317 -44,260 -83,953 (1)The sensitivity of Venture Capital operations is calculated by the EIF based on the market risk of the positions on the public market. 220 Subtotal except Euro 6 -90 Euro (EUR) -6 90


S.5. Operational risk Operational Risk is a potential failure in process, people, systems or other external events resulting in direct financial exposures or near-misses on the EIB. The definition includes legal and reputational risk, but excludes strategic risk. Operational risk is inherent in the EIB’s activities and can manifest itself in various ways, including human factors, inappropriate employee behavior, cyber and technology related events, inadequate or failed processes, business interruptions or security, failure of information systems, 3rd party outsourcing failures or fraudulent acts. The goal is to keep operational risk at minimum levels in light of the EIB’s financial strength, the characteristics of its businesses and the markets in which it operates. The Operational Risk Management is responsible for defining the operational risk framework and related policies while the responsibility for implementing the framework lies with the Bank’s departments. The key elements of the framework of best banking practices as recommended by Basel Committee on Banking Supervision (BCBS) are risk identification, assessment, monitoring as well as risk control and mitigation. The Bank employs an assessment methodology that takes into account all available information including internal loss history, scenario analysis and the business and control environment through a set of operational risk indicators organized in scorecards. Specifically, operational risk provides oversight of the significant operational risk events that have or could lead to actual operational risk losses and areas of emerging risk. The EIB uses the SAS system to monitor on an on-going basis operational risk exposures and loss events by major business processes. In addition, a statistical model and a Value at Risk calculation engine complete the operational risk environment. The management of operational risk is carried out at all levels within the organisation and is a responsibility of all the various departments of the Bank. In terms of reporting, all information concerning operational risk internal loss history, scenario analysis and operational risk indicators are regularly forwarded to the Vice President, Directors General and Audit Committee and the report on the activities of the New Products Committee to senior management in the Bank. Note T – Accounting classifications and fair values of assets and liabilities (in EUR million) The table below sets out the Group’s classification of each class and category of assets and liabilities: Financial liabilities measured at amorti-sed cost Cash and Loans and receiva-bles Non Designated at fair value through P/L Total cash Trading Held to maturity Available for sale financial carrying 31 December 2017 Note equiva-assets/ liabilities amount lents Cash in hand, balances with central banks and post office banks Treasury bills and debt securities portfolios Loans and advances to credit institutions and to customers Shares and other variable-yield securities Derivative assets Property, furniture and equipment Intangible assets Other assets Prepayments B.1 162 0 0 0 0 0 0 0 162 B.2 0 7,512 0 32,895 15,732 1,269 0 0 57,408 493,431 C/D 0 0 165,942 0 327,489 0 0 0 B.3 Q 0 0 0 43,861 342 0 0 0 0 0 6,903 0 0 0 0 0 7,245 43,861 E E G.1 / W.1 0 0 0 0 0 0 0 0 0 0 0 0 0 0 0 0 0 0 0 0 0 0 0 0 0 0 0 0 265 21 181 84 265 21 181 84 Amounts owed to credit institutions and to customers Debts evidenced by certificates Derivative liabilities Other liabilities Deferred income Provisions 6,941 H 0 0 0 0 0 0 6,941 0 I Q G.2 F J / D.4 0 0 0 0 0 0 32,652 0 0 0 418,563 0 0 0 0 0 0 0 0 0 0 0 0 0 0 0 0 0 0 0 71,465 0 0 0 0 0 0 1,730 180 5,589 490,028 32,652 1,730 180 5,589 221 0 32,652 418,563 0 0 0 78,406 7,499 537,120 162 51,373 166,284 32,895 343,221 8,172 0 551 602,658


EIB Group Consolidated Financial Statements under IFRS Cash and cash equiva-lents Financial liabilities measured at amorti-sed cost Loans and receiva-bles Non Designated at fair value through P/L Total Held to maturity Available for sale financial 31 December 2016 Note Trading assets/ carrying amount liabilities Cash in hand, balances with central banks and post office banks Treasury bills and debt securities portfolios Loans and advances to credit institutions and to customers Shares and other variable-yield securities Derivative assets Property, furniture and equipment Intangible assets Other assets Prepayments B.1 317 0 0 0 0 0 0 0 317 B.2 0 7,121 0 44,874 14,326 1,352 0 0 67,673 C/D 0 0 161,564 0 335,107 0 0 0 496,671 B.3 Q 0 0 0 63,651 246 0 0 0 0 0 5,782 0 0 0 0 0 6,028 63,651 E E G / W.1 0 0 0 0 0 0 0 0 0 0 0 0 0 0 0 0 0 0 0 0 0 0 0 0 0 0 0 0 273 16 214 75 273 16 214 75 Amounts owed to credit institutions and to customers Debts evidenced by certificates Derivative liabilities Other liabilities Deferred income Provisions H 0 0 0 0 0 0 15,067 0 15,067 I Q G F J 0 0 0 0 0 0 32,869 0 0 0 445,051 0 0 0 0 0 0 0 0 0 0 0 0 0 0 0 0 0 0 0 72,852 0 0 0 0 0 0 1,682 171 4,759 517,903 32,869 1,682 171 4,759 222 Total 0 32,869 445,051 0 0 0 87,919 6,612 572,451 Total 317 70,772 161,810 44,874 349,433 7,134 0 578 634,918


The table below sets out the fair value of each of the Group’s classes and categories of assets and liabilities. Fair value is set to book value for non-financial assets and non-financial liabilities. Financial liabilities measured at amorti-sed cost Cash and cash equiva-lents Non financial assets/ liabilities Designated at fair value through P/L Loans and receiva-bles Total fair value Held to maturity Available for sale 31 December 2017 Trading Cash in hand, balances with central banks and post office banks Treasury bills and debt securities portfolios 162 162 0 0 0 0 0 0 0 0 7,512 0 33,224 15,788 1,269 0 0 57,793 Loans and advances to credit institutions and to customers Shares and other variable-yield securities Derivative assets Property, furniture and equipment Intangible assets Other assets Prepayments 0 0 165,942 0 336,490 0 0 0 502,432 0 0 0 43,861 342 0 0 0 0 0 6,903 0 0 0 0 0 7,245 43,861 0 0 0 0 0 0 0 0 0 0 0 0 0 0 0 0 0 0 0 0 0 0 0 0 0 0 0 0 265 21 181 84 265 21 181 84 Amounts owed to credit institutions and to customers 6,941 0 0 0 0 0 0 6,941 0 Debts evidenced by certificates Derivatives liabilities Other liabilities Deferred income Provisions 0 0 0 0 0 0 32,652 0 0 0 418,563 0 0 0 0 0 0 0 0 0 0 0 0 0 0 0 0 0 0 0 74,548 0 0 0 0 0 0 1,730 180 5,589 493,111 32,652 1,730 180 5,589 223 Total 0 32,652 418,563 0 0 0 81,489 7,499 540,203 Total 162 51,373 166,284 33,224 352,278 8,172 0 551 612,044


EIB Group Consolidated Financial Statements under IFRS Financial liabilities measured at amorti-sed cost Cash and cash equiva-lents Non financial assets/ liabilities Designated at fair value through P/L Loans and receiva-bles Total fair value Held to maturity Available for sale 31 December 2016 Trading Cash in hand, balances with central banks and post office banks Treasury bills and debt securities portfolios 317 0 0 0 0 0 0 0 317 0 7,121 0 45,360 14,310 1,352 0 0 68,143 Loans and advances to credit institutions and to customers Shares and other variable-yield securities Derivative assets Property, furniture and equipment Intangible assets Other assets Prepayments 0 0 161,564 0 343,572 0 0 0 505,136 0 0 0 63,651 246 0 0 0 0 0 5,782 0 0 0 0 0 6,028 63,651 0 0 0 0 0 0 0 0 0 0 0 0 0 0 0 0 0 0 0 0 0 0 0 0 0 0 0 0 273 16 214 75 273 16 214 75 Amounts owed to credit institutions and customers Debts evidenced by certificates Derivative liabilities Other liabilities Deferred income Provisions 0 0 0 0 0 0 0 0 32,869 0 0 0 0 445,051 0 0 0 0 0 0 0 0 0 0 0 0 0 0 0 0 0 0 0 0 0 0 15,067 76,744 0 0 0 0 0 0 0 1,682 171 4,759 15,067 521,795 32,869 1,682 171 4,759 224 Total 0 32,869 445,051 0 0 0 91,811 6,612 576,343 Total 317 70,772 161,810 45,360 357,882 7,134 0 578 643,853


Note U – Segment reporting (in EUR million) The segment information disclosed in this note has been prepared in accordance with the "management approach" applied by IFRS 8 meaning that the definition of segments as well as the preparation of information used for segment reporting are both based on information prepared for internal management decisions. The EIB Group has one single reportable segment which is the EIB long term finance activity comprising EIB lending operations inside and outside Europe, borrowing and treasury operations. The Management Committee as the Group’s chief operating decision maker reviews internal management reports on the performance of the Bank’s long term finance activity on at least a quarterly basis. The financial support of SME’s carried out by the European Investment Fund through venture capital investments and the provision of guarantees as well as the investing activities of EUMPF do not meet any of the quantitative thresholds for determining a reportable segment in 2017 or 2016. Long term lending finance activity Information about reportable segment 2017 2016 External revenues: Net interest income Net income from shares Net fee and commission income Result on financial operations Other operating expenses Other operating income 3,284 308 87 510 0 11 3,442 218 109 -3,214 0 5 Total segment revenue 4,200 560 Other material non-cash items: Impairment losses on loans and shares -22 -37 -22 -37 Reportable segment profit 3,264 -328 Reportable segment assets 600,229 632,608 Reportable segment liabilities 535,782 571,280 Reconciliation of reportable segment revenues, profit and loss and assets and liabilities 2017 2016 Revenues: Total revenues for reportable segment Other revenues Consolidated revenue 4,200 170 560 126 4,370 686 Profit or loss: Total profit for reportable segment Other profit or loss Consolidated profit 3,264 46 -328 49 3,310 -279 Assets: Total assets for reportable segment Other assets Consolidated total assets 600,229 2,429 632,608 2,310 602,658 634,918 Liabilities: Total liabilities for reportable segment Other liabilities Consolidated total liabilities 535,782 1,338 571,280 1,171 537,120 572,451 225


EIB Group Consolidated Financial Statements under IFRS Note V – Commitments, contingent liabilities, pledged assets and other memorandum items (in EUR ’000) The Group utilises various lending-related financial instruments in order to meet the financial needs of its customers. The Group issues commitments to extend credit, standby and other letters of credit, guarantees, commitments to enter into repurchase agreements, note issuance facilities and revolving underwriting facilities. Guarantees represent irrevocable assurances, subject to the satisfaction of certain conditions, that the Group will make payment in the event that the customer fails to fulfil its obligation to third parties. The contractual amount of these instruments is the maximum amount at risk for the Group if the customer fails to meet its obligations. The risk is similar to the risk involved in extending loan facilities and is monitored with the same risk control processes and specific credit risk policies. As at 31 December 2017 and 2016, commitments, contingent liabilities and other memorandum items were as follows (in nominal amounts and in EUR ‘000): 226 31.12.2017 31.12.2016 Commitments: - EBRD capital uncalled (Note B.3) - Undisbursed loans (Note D.1) credit institutions customers - Undisbursed venture capital (Note B.3) - Undisbursed investment funds (Note B.3) - Securities receivable - Borrowings launched but not yet settled Contingent liabilities and guarantees: - In respect of loans granted by third parties Assets held on behalf of third parties: - Investment Facility - Cotonou - Guarantee Fund - NER300 - JESSICA (Holding Funds) - InnovFin - RSFF (incl. RSI) - EU-Africa Infrastructure Trust Fund - CEF (incl. former PBI and LGTT) - Funds of Funds (JESSICA II) - JEREMIE - GF Greece - Special Section - ESIF - COSME LGF & EFG - SME initiative Italy - ENPI - DCFTA - SME initiative Bulgaria - SME initiative Romania - SMEG 2007 - InnovFin SME Guarantee - MAP Equity - InnovFin Equity - GIF 2007 - AECID - EaSI - WB EDIF - FEMIP Trust Fund - GAGF - NIF Trust Fund - SME initiative Finland - HIPC - MAP guarantee - Private Finance for Energy Efficiency Instrument - EPTA Trust Fund - NIF Risk Capital Facility - IPA II - Cultural Creative Sectors Guarantee Facility 712,630 28,890,536 84,037,546 29,925,074 83,395,374 712,630 113,320,448 5,813,475 1,113,939 109,100 223,950 12,735,555 112,928,082 5,923,592 2,649,089 419,864 279,008 15,810,651 3,024,653 2,560,762 2,086,410 975,912 941,251 762,989 594,869 523,636 419,539 335,889 307,794 301,039 270,451 243,949 180,442 124,540 103,070 94,635 91,396 90,098 86,811 83,512 83,438 82,575 71,766 55,790 50,715 49,128 47,359 46,485 37,238 35,408 32,425 31,235 22,754 19,546 18,435 17,377 2,870,139 2,506,053 2,106,441 1,396,000 697,996 839,290 647,629 492,898 203,350 254,622 305,234 362,234 160,090 199,371 0 142,089 0 95,256 0 99,610 50,523 60,037 116,205 89,717 76,958 48,536 55,912 48,811 53,530 48,691 20,460 35,438 25,043 17,988 22,205 19,816 17,778 5,676


(*) This item represents the amount of coupons and bonds due, paid by the Group to the paying agents, but not yet presented for payment by the holders of bonds issued by the Group. V.1. Investment Facility – Cotonou The Investment Facility, which is managed by the EIB, has been established under Cotonou Agreement on cooperation and development between the African, Caribbean and Pacific Group of States and the European Union and its Member States on 23 June 2000 and subsequently revised. The EIB prepares separate financial statements for the Investment Facility. V.2. Guarantee Fund The Guarantee Fund for External Actions was set up in 1994 to cover defaults on loans and loan guarantees granted to non-Member States or for projects in non-Member States. The European Commission (‘EC’) entrusted the financial management of the Guarantee Fund to the EIB under an agreement signed between the two parties in November 1994 and the subsequent amendments to the Agreement. The EIB prepares separate financial statements for the Guarantee Fund. V.3. NER300 The EIB supports the EC as an agent in the implementation of the NER 300 initiative - a funding programme for carbon capture and storage demonstration projects and innovative renewable energy technologies. The Facility covers two activities which are i) the monetisation of EU Allowance Units (‘EUAs’) and ii) the management and disbursement of cash received via the EUA monetisation activity. The EIB prepares separate financial statements for NER300. 227 - SME initiative Malta - Student Loan Guarantee Facility - EFSI-EIAH - SME Guarantee Facility - NPI Securitisation Initiative (ENSI) - Natural Capital Financing Facility - NPI - Bundesministerium für Wirtschaft und Technologie - G43 Trust Fund - European Technology Facility - Alp GIP - EPPA - PGFF - BIF - RDI Advisory - GEEREF Technical Support Facility - JASPERS - LFA-EIF Facility - TTP - MDD - SME initiative Spain - GGF - GEEREF - TTA Turkey - Fi-compass Other items: - Nominal value of interest-rate swaps incl. commitment (Note S.2.5.2) - Nominal value of treasury currency swap contracts payable - Nominal value of currency swap contracts receivable (Note S.2.5.2) - Nominal value of short-term currency swap contracts receivable (Note Q.1) - Nominal value of short-term currency swap contracts payable - Currency forwards (Note Q.1) - Currency swaps launched but not yet settled payable - Currency swaps launched but not yet settled receivable (Note S.2.5.2) - Special deposits for servicing borrowings (*) 31.12.2017 31.12.2016 14,346,964 523,352,665 198,881,468 212,232,364 46,311,642 45,328,388 666,973 0 0 3,001 14,692 14,466 13,973 12,186 11,976 11,757 11,052 7,336 5,679 5,604 4,282 1,972 1,393 1,223 1,156 1,056 814 805 397 193 192 12 5 3 0 13,503 15,939 8,868 17,444 5,040 11,150 0 1,302 10,578 4,329 0 1,977 2,913 6,199 5,762 1,165 2,237 551 385 987 177 7,210 5 35,062 2,555 15,027,545 510,007,074 205,439,795 203,935,206 43,942,480 43,909,464 584,605 144,078 142,263 34,411


EIB Group Consolidated Financial Statements under IFRS V.4. JESSICA (‘Holding Funds’) JESSICA (Joint European Support for Sustainable Investment in City Areas) is an initiative developed by the EC and the EIB, in collaboration with the Council of Europe Development Bank. JESSICA Holding Funds are used in the context of the JESSICA initiative. Under new procedures, Managing Authorities are being given the option of using some of their EU grant funding to make repayable investments in projects forming part of an integrated plan for sustainable urban development. As manager, EIB gathers the funding received from the Managing Authorities and invests it in Urban Development Funds, according to investment guidelines agreed with the donors. The EIB prepares separate financial statements for JESSICA. V.5. InnovFin The InnovFin or “InnovFin-EU Finance for Innovators” is a joint initiative between the EIB, the EIF and the European Commission under the new EU research programme for 2014-2020 “Horizon 2020”. On 11 December 2013, Regulation (EU) N 1291/2013 of the European Parliament and the Council establishing Horizon 2020 – the Framework Programme for Research and Innovation (2014-2020) and repealing Decision N 1982/2006/EC (“Horizon 2020 Regulation”) was adopted. On 12 June 2014 the European Commission, the EIB and the EIF signed a Delegation Agreement establishing the financial instrument InnovFin. InnovFin consists of a series of integrated and complementary financing tools and advisory services offered by the EIB Group, covering the entire value chain of research and innovation (R&I) in order to support investments from the smallest to the largest enterprise. The EIB prepares separate financial statements for the InnovFin. V.6. Risk-Sharing Finance Facility (‘RSFF’) The RSFF has been established under the Co-operation Agreement that entered into force on 5 June 2007 between the EC on behalf of the European Union and the EIB. The RSFF aims to foster investment in research, technological development and demonstration, and innovation. As part of the RSFF, the EIF set up the Risk Sharing Instrument for Innovative and Research oriented SMEs and small Mid-Caps (‘RSI’). The RSI provides guarantees to banks and leasing companies for loans and financial leases to research-based small and medium-sized enterprises (SMEs) and small Mid-Caps. The EIB prepares separate consolidated financial statements for the RSFF including RSI. V.7. EU-Africa Infrastructure (‘EUAI’) Trust Fund The EUAI Trust Fund has been created under Trust Fund Agreement between the EC on behalf of the European Union as the Founding Donor and the EIB as Manager and is also open to Member States of the European Union that subsequently accede to that agreement as Donors. On 9 February 2006, the EC and the EIB signed a Memorandum of Understanding to promote jointly the EU-Africa Infrastructure Partnership and, in particular, to establish a supporting EU-Africa Infrastructure Trust Fund. The EIB prepares separate financial statements for the EUAI Trust Fund. V.8. Connecting Europe Facility (‘CEF’) The Connecting Europe Facility (CEF) is a joint agreement between the EIB and the European Commission which aims to provide union financial assistance to trans-European networks in order to support projects of common interest in the sectors of transport, telecommunications and energy infrastructures. The Commission entrusted EIB with the implementation and management of the debt instrument under the CEF, which ensures continuity of the Loan Guarantee Instrument for TEN-T Projects (LGTT) and to the Pilot phase of Project Bond Initiative (PBI). The LGTT and PBI were merged together under the CEF on 1 January 2016. The CEF Delegation Agreement foresees an updated and common risk sharing arrangement. The EIB prepares separate financial statements for the CEF. V.9. Fund of Funds (‘JESSICA II’) The Fund of Funds (“FoF”) consists of Decentralised Financial Instruments (DFIs) financed by the European Structural and Investment Funds (the "ESIF") from the Member States Operational Programmes during 2014-2020. The FoF facilitates access to finance for final recipients through the implementation of loans, equity and guarantees, in cooperation with selected Financial Intermediaries. As a fund manager, EIB gathers the funding (contributions) from the Managing Authorities and invests it via Financial Intermediaries, according to investment strategies agreed with the donors. The EIB prepares separate financial statements for each Fund of Fund. V.10. JEREMIE JEREMIE (The Joint European Resources for Micro to Medium Enterprises) is an initiative of the European Commission’s Directorate General for Regional Policy (DG Regio) and the EIB Group. The EIF prepares separate financial statements for the JEREMIE. V.11. GF Greece The Fund is a joint initiative between the Hellenic Republic, the EC and the EIB and was set up to support the lending to SMEs in Greece. Established by using unabsorbed Structural Funds for Greece, the Fund will guarantee EIB loans to SMEs via partner banks in Greece. The EIB prepares separate financial statements for the GF Greece. 228


V.12. Special Section The Special Section was set up by the Board of Governors on 27 May 1963. Under a decision taken on 4 August 1977, its purpose was redefined as being that of recording financing operations carried out by the EIB for the account of and under mandate from third parties. It includes the FED, MED/FEMIP, IPA (Instrument for Pre-Accession), Turkey mandates and the guarantee component of the European Development Finance Institutions Private Sector Development Facility. V.13. European Structural Investment Fund (‘ESIF’) Under the European Structural Investment Fund (ESIF), Member States appointed EIF to manage ESIF funds as Holding Fund manager since November 2015. The ESIF initiative is aimed at promoting SME access to finance and financial engineering products, such as private equity funds, guarantee funds and loan funds. EIF is currently managing 2 ESIF Funding Agreements signed with Member States and regions: Basse-Normandie and Languedoc-Roussillon. The EIF prepares separate financial statements for ESIF. V.14. COSME LGF & EFG To address the difficulties in access to finance for SMEs, COSME establishes the Loan Guarantee Facility (LGF) and the Equity For Growth (EFG). The LGF and the EFG aim to improve access to finance for SMEs in the form of debt and equity respectively. The Financial Instruments also include the mechanism of the EU Contribution under the SME Initiative. The EFG has been structured in the form of an equity financial instrument supporting Union enterprises growth and Research Innovation. The LGF has been structured in the form of a direct and indirect guarantee financial instrument. The objective of LGF is to contribute to the reduction of the structural shortcoming of the SME financing market and to support the creation of a more diversified SME finance market. Through direct and indirect guarantee, LGF aims to guarantee debt financing which addresses the particular difficulties that viable SMEs face in accessing finance. Furthermore, by guaranteeing the mezzanine tranche of eligible and transparent securitisation transactions, LGF aims to provide new avenues of financing for SMEs. The EIF prepares separate financial statements for the COSME LGF & EFG. V.15. SME Initiative Italy During 2016, in the context of the SME Initiative, the EIF and the Managing Authorities of Finland, Bulgaria, Romania and Italy entered into four separate Funding Agreements in respect of the implementation and management of a dedicated window, which shall be implemented in connection with a specific allocation under H2020 Financial Instruments dedicated to Finland, Bulgaria, Romania and accordingly in connection with COSME LGF for Italy. These SME Initiatives aim at providing uncapped guarantees in connection with H2020 for new portfolios of debt finance to eligible SMEs in the respective countries. The EIF prepares separate financial statements for SME Initiative Italy. V.16. European Neighbourhood and Partnership Instrument (‘ENPI’) The Framework Agreement between the European Union and the EIB on the implementation of operations financed from the general budget of the European Union in the countries covered by the European Neighbourhood Policy is channelled through ENPI. The EIB prepares separate financial statements for ENPI. V.17. DCFTA Initiative East (‘DCFTA’) The European Investment Bank and the European Commission signed on 19 December 2016 the Delegation Agreement for the Deep and Comprehensive Free Trade Area (DCFTA). DCFTA Initiative East aims to strengthen economic development in the countries which have signed an association agreement with the EU - namely Georgia, Moldova and Ukraine - by providing targeted financial and technical support to small and medium-sized enterprises (SMEs) in these three countries. As part of the DCFTA, the EIF implements and manages the Guarantee Facility Window. The Guarantee Facility Window implemented and deployed by EIF consists of a first loss SME portfolio guarantee, in order to incentivise local intermediary banks to take on more risk and reach out underserved segments of the economy. The EIB prepares separate consolidated financial statements for the DCFTA including the Guarantee Facility Window. V.18. SME Initiative Bulgaria During 2016, in the context of the SME Initiative, the EIF and the Managing Authorities of Finland, Bulgaria, Romania and Italy entered into four separate Funding Agreements in respect of the implementation and management of a dedicated window, which shall be implemented in connection with a specific allocation under H2020 Financial Instruments dedicated to Finland, Bulgaria, Romania and accordingly in connection with COSME LGF for Italy. These SME Initiatives aim at providing uncapped guarantees in connection with H2020 for new portfolios of debt finance to eligible SMEs in the respective countries. The EIF prepares separate financial statements for SME Initiative Bulgaria. V.19. SME Initiative Romania During 2016, in the context of the SME Initiative, the EIF and the Managing Authorities of Finland, Bulgaria, Romania and Italy entered into four separate Funding Agreements in respect of the implementation and management of a dedicated window, which shall be implemented in connection with a specific allocation under H2020 Financial Instruments dedicated to Finland, Bulgaria, Romania and accordingly in connection with COSME 229


EIB Group Consolidated Financial Statements under IFRS LGF for Italy. These SME Initiatives aim at providing uncapped guarantees in connection with H2020 for new portfolios of debt finance to eligible SMEs in the respective countries. The EIF prepares separate financial statements for SME Initiative Romania. V.20. SMEG 2007 In the SMEG 2007 under the Competitiveness and Innovation Framework Programme (CIP/SMEG 2007), the EIF is empowered to issue guarantees in its own name but on behalf and at the risk of the Commission. The EIF prepares separate financial statements for the SMEG 2007. V.21. InnovFin SME Guarantee In the context of the “Access to Risk Finance Programme” of Horizon 2020 and specific programme provides for the establishment of a financial instrument for debt and a financial instrument for equity. A Risk-Sharing facility called InnovFin SME Guarantee has been structured in the form of a guarantee, using the EU’s contribution for first defaulted amount taking and the risk-taking capacity of the EIF for second-Defaulted Amount taking. The objective of the Facility is to incentivise Intermediaries to extend loans or financial leases to small and medium sized enterprises and Small Mid-caps with significant activities in Research, Development and Innovation. The EIF prepares separate financial statements for the InnovFin SME Guarantee. V.22. MAP Equity Under the Multi-Annual Programme (MAP) for enterprises and entrepreneurship, the EIF manages resources on behalf and at the risk of the EC. The EIF prepares separate financial statements for MAP Equity. V.23. InnovFin Private Equity The Horizon 2020 Financial Instruments aim to ease the access to risk financing for Final Recipients in order to support eligible Research and Innovation. This covers loans, guarantees, equity and other forms of risk finance. The Horizon 2020 Financial Instruments aim also to promote early-stage investment and the development of existing and new venture capital funds; improve knowledge transfer and the market for intellectual property; attracts funds for the venture capital market; and, overall; help to catalyse the transition from the conception, development and demonstration of new products and services to their commercialisation. The Horizon 2020 debt financial instrument also includes the implementation mechanism of the EU Contribution under the SME Initiative. The InnovFin Equity facility for early-stage aims at promoting early-stage investment and the development of existing and new venture capital funds providing equity finance for innovative enterprises, in particular in the form of venture or mezzanine capital in their early stage. The EIF prepares separate financial statements for the InnovFin Private Equity. V.24. GIF 2007 In the GIF 2007 under the Competitiveness and Innovation Framework Programme and the Technology Transfer Pilot Project (CIP/GIF 2007), the EIF is empowered to acquire, manage and dispose of investments, in its own name but on behalf and at the risk of the Commission. The EIF prepares separate financial statements for the GIF 2007. V.25. AECID This partnership agreement signed between the Kingdom of Spain (the Spanish Agency for International Development Cooperation (AECID)) and the EIB was set up to invest in operations in the countries covered by the FEMIP together with Mauritania (the "Southern Mediterranean region"), targeting mainly risk capital activities involving micro and small/medium sized enterprises as well as engaging in the wider development of the private sector in the region. The EIB prepares separate financial statements for the AECID. V.26. Employment and Social Innovation (‘EaSI’) The EaSI Guarantee financial Instrument consists, inter alia, of the EaSI Microfinance Guarantee which is the successor to the micro-credit guarantees under the European Progress Microfinance facility (“Progress Microfinance”). It will extend the support given to microcredit providers under Progress Microfinance. In addition, the EaSI Guarantee financial Instrument consists of the EaSI Social Entrepreneurship Guarantee, which is a new product which will facilitate access to finance for social enterprises and support the development of the social investment market. The EIF prepares separate financial statements for the EaSI. V.27. WB EDIF The Western Balkan Enterprise Development & Innovation Facility (“WB EDIF”) is a joint initiative signed in December 2012 by the EC (DG ELARG), EIB Group and the European Bank for Reconstruction and Development (EBRD). It aims at improving access to finance for SMEs in the Western Balkans and to foster economic development in the region through the deployment of the Instrument for Pre-Accession Assistance (IPA) funds. Within WB EDIF, EIF acts as platform coordinator, Trustee on behalf of the EC for the Enterprise Expansion Fund (ENEF), Trustee on behalf of 230


the EC for the Enterprise Innovation Fund (ENIF), and manager of the Guarantee Facility. The EIF prepares separate financial statements for the WB EDIF. V.28. FEMIP Trust Fund The FEMIP (Facility for Euro-Mediterranean Investment and Partnership) Trust Fund, which is also managed by the EIB, was set up to enhance the existing activities of the EIB in the Mediterranean Partner Countries, with the support of a number of donor countries and with a view of directing resources to operations in certain priority sectors through the provision of technical assistance and risk capital. The EIB prepares separate financial statements for the FEMIP Trust Fund. V.29. Greater Anatolia Guarantee Facility (‘GAGF’) Under the GAGF signed in May 2010, the EIF manages the Instrument for Pre-Accession Assistance (IPA) funds allocated for the Regional Competitiveness Operational Programme by the European Union and Turkey. The facility provides tailor-made financial help to SMEs and micro-enterprises in Turkey’s least developed provinces in partnership with major Turkish banks. The EIF prepares separate financial statements for the GAGF. V.30. Neighbourhood Investment Facility (‘NIF’) Trust Fund The NIF Trust Fund, which is managed by the EIB was set up to achieve the strategic objective of the European Neighbourhood Policy (ENP) through targeted funding with particular focus on establishing better and more sustainable energy and transport interconnections, improving energy efficiency and promoting the use of renewable energy sources, addressing climate change as well as threats to the environment more broadly and promoting smart, sustainable and inclusive growth through support to SMEs, to the social sector including human capital development, and to municipal infrastructure development. The EIB prepares separate financial statements for the NIF Trust Fund. V.31. SME Initiative Finland During 2016, in the context of the SME Initiative, the EIF and the Managing Authorities of Finland, Bulgaria, Romania and Italy entered into four separate Funding Agreements in respect of the implementation and management of a dedicated window, which shall be implemented in connection with a specific allocation under H2020 Financial Instruments dedicated to Finland, Bulgaria, Romania and accordingly in connection with COSME LGF for Italy. These SME Initiatives aim at providing uncapped guarantees in connection with H2020 for new portfolios of debt finance to eligible SMEs in the respective countries. The EIF prepares separate financial statements for SME Initiative Finland. V.32. Heavily Indebted Poor Countries (‘HIPC’) Initiative The HIPC Initiative (the ’Initiative’) is an international debt relief mechanism that provides special assistance to the world's poorest countries. It was launched in 1996 following a proposal from the World Bank and the International Monetary Fund. The principal objective of the Initiative is to reduce the debt burden of poor countries to sustainable levels. The EIB prepares separate financial statements for the Initiative. V.33. MAP Guarantee This resource is split equally between private equity and guarantee products. The equity segment known as ESU 1998 (G&E) and ESU 2001 (MAP) covers the ETF start-up investments. The guarantees segment known as SMEG 1998 (G&E) and SMEG 2001 (MAP), provides guarantees against the beneficiary’s undertaking. The EIF prepares separate financial statements for the MAP Guarantee. V.34. Private Finance for Energy Efficiency Instrument (‘PF4EE’) The Private Finance for Energy Efficiency (PF4EE) instrument is a joint agreement between the EIB and the European Commission that aims to address the limited access to adequate and affordable commercial financing for energy efficiency investments. The instrument targets projects which support the implementation of National Energy Efficiency Action Plans or other energy efficiency programmes of EU Member States. In December 2014 the European Commission and the EIB signed a Delegation Agreement establishing the financial Instrument PF4EE. The EIB prepares separate financial statements for the PF4EE. The EIF prepares separate financial statements for the PF4EE. V.35. EPTA Trust Fund The EPTA (The Eastern Partnership Technical Assistance) Trust Fund is focused on increasing the quality and development impact of EIB Eastern Partnership operations by offering a multi-purpose, multi-sector funding facility for technical assistance. It will be complementary to the Neighbourhood Investment Facility. The EIB prepares separate financial statements for the EPTA Trust Fund. V.36. Neighbourhood Investment Facility (‘NIF’) Risk Capital Facility The Neighbourhood Investment Facility (‘NIF’) Risk Capital Facility is financed from the general budget of the European Union. Its main purpose is focused on providing access to equity and debt finance to SMEs in the Southern Neighbourhood region in order to support private sector development, inclusive growth and private sector job creation. The Facility comprises a Financial Instrument Window which consists of equity and 231


EIB Group Consolidated Financial Statements under IFRS debt finance instruments and Additional Tasks Window which consists of the technical assistance services. The EIB prepares separate financial statements for Financial Instrument Window. V.37. Instrument for Pre-accession Assistance II (‘IPA II’) The Instrument for Pre-accession Assistance (IPA) is the means by which the EU supports reforms in the 'enlargement countries' with financial and technical help. The pre-accession funds also help the EU reach its own objectives regarding a sustainable economic recovery, energy supply, transport, the environment and climate change, etc. The successor of IPA I, IPA II, will build on the results already achieved by dedicating EUR 11.7 billion for the period 2014-2020. The most important novelty of IPA II is its strategic focus. The Framework Partnership Agreement, signed at the end of the year 2015, is implemented by the EIB, allocating resources from DG NEAR via the signature of various “Specific Grant Agreements”. The EIB prepares financial statements for the specific grant agreements under IPA II. V.38. Cultural and Creative Sectors Guarantee Facility The financial instrument, set-up under Creative Europe - the main EU programme dedicated to the cultural and creative sectors - will be managed by the EIF on behalf of the European Commission. The initiative will allow the EIF to provide guarantees and counter-guarantees to selected financial intermediaries to enable them to provide more debt finance to entrepreneurs in the cultural and creative arena. Loans generated are expected to support more than ten thousand SMEs in a wide range of sectors such as audiovisual (including film, television, animation, video games and multimedia), festivals, music, literature, architecture, archives, libraries and museums, artistic crafts, cultural heritage, design, performing arts, publishing, radio and the visual arts. The EIF prepares separate financial statements for Cultural and Creative Sectors Guarantee Facility. V.39. SME Initiative Malta In 19 January 2015, the European Commission, the EIB and the ElF signed an amendment to the Horizon 2020 delegation agreement setting out the terms and conditions applicable to certain terms of the dedicated window corresponding to the SME Initiative and the contribution of the EU to such dedicated windows of the H2020 Financial Instruments. SME Initiatives in Spain and Malta were launched in the previous year. The EIF prepares separate financial statements for SME Initiative Malta. V.40. Student Loan Guarantee Facility (‘Erasmus’) Under the European Structural Investment Fund (ESIF), Member States appointed EIF to manage ESIF funds as Holding Fund manager since November 2015. The ESIF initiative is aimed at promoting SME access to finance and financial engineering products, such as private equity funds, guarantee funds and loan funds. EIF is currently managing 2 ESIF Funding Agreements signed with Member States and regions: Basse-Normandie and Languedoc-Roussillon. The EIF prepares separate financial statements for the Student Loan Guarantee. V.41. European Fund for Strategic Investments (‘EFSI’) On the basis of applicable EFSI Regulations the European Commission and the EIB concluded agreements on the management of the EFSI, on the granting of the EU guarantee (the EFSI Agreement) as well as for the implementation of the European Investment Advisory Hub (‘EIAH’) (the EIAH Agreement). Under the EFSI Agreement, the EC is providing an EU guarantee to EIB for projects supported by the EFSI. Assets covering the EU guarantee are directly managed by the European Commission. Projects supported by the EFSI are subject to the normal EIB project cycle and governance. In addition, EFSI has its own dedicated governance structure which has been set in place to ensure that investments made under EFSI remain focused on the specific objective of addressing the market failure in risk-taking which hinders investment in Europe. The EIAH aims to enhance the non-financial support for projects and investments. The EIAH consists of three complementary components: a) a point of entry to a wide range of advisory and technical assistance programmes and initiatives for public and private beneficiaries, b) a cooperation platform to leverage, exchange and disseminate expertise among partner institutions and c) a reinforcement or extension of existing advisory services or creation of new ones to address unmet needs. The EIB prepares separate financial statements for the EIAH. V.42. SME Guarantee Facility The EIF is empowered to issue guarantees in its own name but on behalf and at the risk of the European Union according to the Fiduciary and Management Agreement concluded with the European Union. The EIF prepares separate financial statements for SME Guarantee Facility. V.43. NPI Securitisation Initiative (‘ENSI’) The EIF and several National Promotional Institutions (NPIs) including KfW, bpifrance, CDP, Malta Development Bank Working Group, IFD, ICO and BBB have launched the EIF-NPI Securitisation Initiative (ENSI), a cooperation and risk sharing platform aiming at providing more funding to small and medium-sized enterprises (SMEs) via the capital markets. The objective of this joint cooperation in SME Securitisation transactions is to 232


stimulate the availability of finance to SMEs in Europe by revitalising the SME Securitisation market while catalysing resources from the private sector. This reflects the spirit of the European Fund for Strategic Investments aiming to achieve a much wider outreach in support of SMEs. V.44. Natural Capital Finance Facility (‘NCFF’) The Natural Capital Finance Facility (NCFF) is a joint agreement between the EIB and the European Commission which aims to address market gaps and barriers for revenue generating or cost saving projects that are aimed at preserving natural capital, including climate change adaptation projects and thereby to contribute to the achievement of EU and Member States' objectives for biodiversity and climate change adaptation. The EIB prepares separate financial statements for the NCFF. V.45. National Promotional Institutions (‘NPI’) This is the second programme with CDP (Italy) Social Impact Investing in the framework of the partnership between EIF and CDP. The focus of this programme signed as of 29 November 2017 will be the domain of social finance in Italy. It is a multi-product tailored investment programme that will include equity investments into intermediaries, direct equity and debt investments. V.46. Bundesministerium für Wirtschaft und Technologie The EIF manages funds on behalf of the German Bundesministerium für Wirtschaft und Technologie (Federal Ministry of Economics and Technology) and the European Recovery Programme. V.47. G43 Trust Fund Under G43 Anatolian Venture Capital Fund, signed in August 2012, the EIF is entrusted with a mandate by Central Finance Unit of Turkey (CFCU). It is dedicated to make investments in SMEs in South-Eastern Anatolia region of Turkey. The EIF prepares separate financial statements for the G43. V.48. European Technology Facility (‘ETF’) Under the ETF Start-Up Facility, the EIF is empowered to acquire, manage and dispose of ETF start-up investments, in its own name but on behalf of and at the risk of the EC. V.49. Alpine Growth Investment Platform (‘AlpGIP’) In September 2017 EIF launched an innovative regional equity platform (non-corporate structure) targeting the late venture capital and growth segment in the EU Alpine Macroregion. The Italian regions Lombardia, Piemonte, Val d’Aosta and Alto Adige (Bolzano region) have already invested in the Platform other regions are expected to join at a later stage. V.50. European Parliament Preparatory Action (‘EPPA’) In 2010, the EIF signed the EPPA with DG REGIO. The EIF is providing risk capital and financial support for capacity building purposes in order to help a select number of microfinance institutions to reach a meaningful size and improve their prospects for sustainability. The EIF prepares separate financial statements for the EPPA. V.51. PGFF The Polish Growth Fund-of-Funds (“PGFF”), signed in April 2013, is a fund-of-funds, structured as a partnership, which invests in venture capital and private equity funds and focused on Poland. It is funded jointly by the EIB Group and the Bank Gospodarstwa Krajowego. The EIF prepares separate financial statements for the PGFF. V.52. BIF The Baltic Innovation Fund (“BIF”), signed in September 2012, is a fund-of-funds, structured as a partnership, which invests in venture capital and private equity funds and focused on the Baltic region. It is funded jointly by the EIB Group and the following Baltic national agencies: Fund KredEx in Estonia, Latvijas Garantiju Agentiira in Latvia and lnvesticiju ir verslo garantijosin Lithuania. The EIF prepares separate financial statements for the BIF. V.53. Research and Innovations Advisory (‘RDI Advisory’) The RDI Advisory was set up in partnership with the European Commission under a 7 year framework agreement signed in June 2014, as part of the InnovFin programme under Horizon 2020. It has two main lines of activity: (i) upstream project related advisory and (ii) horizontal activities destined to improve the overall framework conditions for RDI investments as well as the financing tools under Horizon 2020. The EIB prepares separate financial statements for the RDI Advisory. 233


EIB Group Consolidated Financial Statements under IFRS V.54. GEEREF (‘Fund and Technical Support Facility’) GEEREF (Global Energy Efficiency and Renewable Energy Fund) is a fund of funds set-up at the initiative of the EC. Its objective is to make investments in private equity funds that focus on the fields of renewable energy and energy efficiency in emerging markets (ACP, ALA and European Neighbour countries). The EIF also holds a technical assistance mandate for which related activities are implemented by the GEEREF front office. V.55. JASPERS JASPERS (Joint Assistance to Support Projects in European Regions) is a technical assistance facility between the EIB, the European Commission and the EBRD. It provides support to the majority of EU and Candidate Countries to help improve the quality of the major projects to be submitted for grant financing under the Structural and Investment Funds. JASPERS assistance may cover project preparation support, from identification to submission of the request for EU grant finance; independent quality review of projects; horizontal assignments; strategic support: capacity building, including a Competence Centre; and implementation support. JASPERS’ work is organised in seven divisions (Roads; Rail, Air and Maritime; Water and Waste; Energy and Solid Waste; Smart Development; Networking and Competence Centre; and Independent Quality Review). In its first ten years of operations (2005-2015), JASPERS has assisted over 1000 projects. The investment value of the projects assisted by JASPERS and approved by the European Commission for grant financing is over EUR 72 billion. The EIB prepares separate financial statements for JASPERS. V.56. LfA-EIF Facility LfA-EIF Facility, signed in 2009, is a joint EIF and LfA Förderbank Bayern venture providing investments to support technology-oriented early and expansion stage companies in the region of Bavaria, Germany. V.57. Technology Transfer Pilot Project (‘TTP’) Under the TTP, financed by the EC and signed in November 2008, the EIF has supported a technology transfer structure through pre-seed funding and seed funding. The EIF prepares separate financial statements for the TTP. V.58. Mezzanine Dachfonds für Deutschland (‘MDD’) The MDD in an investment programme signed in June 2013 and funded by the German Federal Ministry of Economics and Technology (BMWi) and various institutions of the Federal states to subscribe into hybrid debt and equity funds investing in German MidCaps. V.59. SME Initiative for Spain On 26 January 2015 the Delegation Agreement between the Kingdom of Spain and European Investment Fund was signed. EIF will provide uncapped guarantees for new portfolios of debt finance to eligible SMEs and securitisation of existing debt finance to SMEs and other enterprises with less than 500 employees and/or new portfolios of debt finance to SMEs. The EU contribution to the SME Initiative for Spain, received by the EIF, is subject to the treasury asset management to be carried out by the EIB, which is governed by the signed Asset Management Side Letter between the European Investment Fund and the European Investment Bank. The EIF prepares separate financial statements for the SME Initiative for Spain. V.60. Green for Growth Fund (‘GGF’) The Green for Growth Fund was set up by the EIF in December 2009 and focuses on energy efficiency financings in South East Europe including Turkey. V.61. GEEREF Under the Global Energy Efficiency and Renewable Energy Fund (GEEREF), EIF has been acting since December 2007 as investment advisor. GEEREF is supported by the EC, the Federal Government of Germany and the Kingdom of Norway and its objective is to invest primarily in regional funds with assets in projects and companies involved in energy efficiency and renewable energy enhancing access to clean energy in developing countries and economies in transition. The GEEREF business development is formally delegated to the EIB under a sub-advisory agreement. V.62. TTA Turkey TTA Turkey is an initiative designed by the EIF in cooperation with the Ministry of Science, Industry and Technology (MoSIT), the Scientific and Research Council of Turkey (TUBITAK), the Delegation of the European Union to Turkey and the DG Regional Policy of the European Commission. TTA Turkey is co-financed by the EU and the Republic of Turkey under the Regional Development Component of the Instrument for Pre-Accession Assistance (IPA) funds and managed by EIF. TTA Turkey aims at achieving two objectives: setting-up a financially sustainable fund by facilitating the commercialisation of scientific research and development (R&D) confined in universities and research centres and catalysing development of the technology transfer market in Turkey, with a particular emphasis on spill-overs to the less developed/developing regions of Turkey. 234


V.63. Financial Instruments (‘FI’) compass advisory platform The fi-compass advisory platform provides EU Member States and their managing authorities as well as microcredit providers with advisory support and learning opportunities for developing financial instruments, within the scope of European Structural Investment Funds (ESIF) and the Programme for Employment and Social Innovation (EaSI). It is implemented by the EIB and funded by the EC under a Framework Contract for the period 2014-2020. The EIB prepares separate financial statements for Financial Instrument compass advisory platform. 235


EIB Group Consolidated Financial Statements under IFRS Statement of Special Section(1) as at 31 December 2017 and 2016 (in EUR ‘000) ASSETS 31.12.2017 31.12.2016 Turkey From resources of Member States Disbursed loans outstanding 0 271 Instrument for Pre-Accession ('IPA') From resources of Member States Disbursed loans outstanding 0 0 Mediterranean Countries From resources of the European Union Disbursed loans outstanding Risk capital operations - amounts to be disbursed - amounts disbursed 36,934 49,130 29,260 39,288 39,738 53,090 68,998 92,378 African, Caribbean and Pacific State and Overseas Countries and Territories From resources of the European Union · Yaoundé Conventions Loans disbursed Contributions to the formation of risk capital - amounts disbursed 352 764 419 419 · Lomé Conventions Operations from risk capital resources - amounts to be disbursed - amounts disbursed 0 0 194,336 219,272 194,336 219,272 LIABILITIES 31.12.2017 31.12.2016 Funds under trust management Under mandate from the European Union - Financial Protocols with the Mediterranean Countries - Financial Protocols with the instrument for Pre-Accession ('IPA') - Yaoundé Conventions - Lomé Conventions - Other resources under the Lomé Conventions 76,672 0 771 194,336 0 102,220 0 1,183 219,272 0 271,779 0 322,675 271 Under mandate from Member States Total funds under trust management 271,779 322,946 Funds to be disbursed On loans and risk capital operations in the Mediterranean countries On operations from risk capital resources under the Lomé Conventions 29,260 0 39,288 0 Total funds to be disbursed 29,260 39,288 Total 301,039 362,234 For information: Total amounts disbursed and not yet repaid on loans on special conditions made available by the Commission in respect of which the Bank has accepted an EU mandate for recovering principal and interest: a) Under the First, Second and Third Lomé Conventions as at 31 December 2017 EUR ‘000 229,159 (2016: EUR ‘000 321,166) b) Under Financial Protocols signed with the Mediterranean Countries as at 31 December 2017 EUR ‘000 54,433 (2016: EUR ‘000 60,557) In the context of the European Union – European Development Finance Institutions Private Sector Development Facility, the implementation agreement for the Guarantee Component was signed on 20 August 2014. Total amount of the EU guarantee issued is EUR ‘000 4,280 as at 31 December 2017 (2016: EUR ‘000 4,280). Total amount of the EU guarantee to be issued is EUR ‘000 38,920 as at 31 December 2017 (2016: EUR ‘000 38,920). Note (1): The Special Section was set up by the Board of Governors on 27 May 1963. Under a decision taken on 4 August 1977, its purpose was redefined as being that of recording financing operations carried out by the European Investment Bank for the account of and under mandate from third parties. However, for the Investment Facility under the Cotonou Agreement, the EU-Africa Infrastructure Trust Fund, the Neighbourhood 236 Total(6) 194,336 219,272 Total 301,039 362,234 Total(5) 771 1,183 Total(4) 105,932 141,508 Total(3) 0 0 Total(2) 0 271


Investment Facility (NIF) Trust Fund and the FEMIP Trust Fund, separate financial statements are presented. In addition, since 2005, the EIB also prepares financial statements of different types for other mandates. The Statement of Special Section reflects amounts disbursed or to be disbursed, less cancellations and repayments, under mandate from the European Union and the Member States. Amounts disbursed and to be disbursed and funds received and to be received are carried at nominal value. No account is taken in the Statement of Special Section of provisions or value adjustments, which may be required to cover risks associated with such operations except for definite write-offs. Amounts in foreign currency are translated at exchange rates prevailing on 31 December. Note (2): Initial amount of contracts signed for financing projects in Turkey under mandate, for the account and at the risk of Member States. Initial amount: add: less: 405,899 20,547 exchange adjustments cancellations repayments 215 426,231 -426,446 Note (3): Initial amount of contracts signed for financing projects under the Instrument for Pre-Accession, for the account and at the risk of the European Union. Initial amount: less: 29,640 exchange adjustments cancellations repayments 10,517 0 19,123 -29,640 Note (4): Initial amount of contracts signed for financing projects in the Maghreb and Mashreq countries, Malta, Cyprus, Turkey and Greece (EUR 10 million lent prior to accession to the EC on 1 January 1981) under mandate, for the account and at the risk of the European Union. Initial amount: less: 840,457 exchange adjustments cancellations repayments 58,999 164,335 511,191 -734,525 Note (5): Initial amount of contracts signed for financing projects in the Associated African States, Madagascar and Mauritius and the Overseas Countries, Territories and Departments (AASMM-OCTD) under mandate, for the account and at the risk of the European Union. Loans on special conditions Contributions to the formation of risk capital Initial amount: add: 139,483 2,503 141,986 capitalised interest exchange adjustments 1,178 9,823 11,001 less: cancellations repayments 3,310 148,906 -152,216 237 771 105,932 0 0


EIB Group Consolidated Financial Statements under IFRS Note (6): Initial amount of contracts signed for financing projects in the African, Caribbean and Pacific States and the Overseas Countries and Territories (ACP-OCT) under mandate, for the account and at the risk of the European Union: Loans from risk capital resources: Conditional and subordinated loans Equity participations Initial amount: add: 3,116,097 121,002 3,237,099 9,548 capitalised interest less: cancellations repayments exchange adjustments 731,474 2,264,829 56,008 -3,052,311 194,336 Loans from other resources: Initial amount: add: less: 16,500 58 exchange adjustments cancellations repayments 8,414 8,144 -16,558 0 Note W – Capital and Reserves W.1. Share capital and reserves The European Investment Bank (EIB), the financing institution of the European Union, was created by the Treaty of Rome of 25 March 1957. The members of the EIB are the Member States of the European Union, who have all subscribed to the Group's capital. The subscribed capital of the Bank amounts to EUR 243,284,154,500 (31 December 2016: EUR 243,284,154,500) and the uncalled capital to EUR 221,585,019,550 as of 31 December 2017 (31 December 2016: EUR 221,585,019,550). New Member States or Member States that increase their share in the Bank's subscribed capital pay their part of the called capital plus their part of the reserves, provisions equivalent to reserves and similar amounts, normally in several equal instalments over the course of several years. The Accession Treaties and/or the Board of Governors decisions to increase the Bank's capital establish the specific modalities of such payments, including the calculation of the share of the new Member States in the Bank's capital, which is normally based on the national GDP figures officially published by Eurostat. As at 1 July 2013, the subscribed capital has increased from EUR 242,392,989,000 to EUR 243,284,154,500, by virtue of the contributions of a new Member State that joined on 1 July 2013: Croatia. As a consequence of this capital increase, the new Member State had to contribute to its share of Paid-in capital (EUR 79.5 million), and also its share of the reserves (EUR 128.4 million) for the amounts outstanding as of 30 June 2013. The total amount to be paid has been equally spread over 8 instalments: 30 November 2013, 30 November 2014, 30 November 2015, 31 May 2016, 30 November 2016, 31 May 2017, 30 November 2017 and 31 May 2018. The instalments up to and including 30 November 2017 were settled in full. The amount of EUR ‘000 25,724 shown in the balance sheet under the caption Subscribed capital and reserves, called but not paid (31 December 2016: EUR 76,656) is the discounted valued of EUR ‘000 25,983 (31 December 2016: EUR 77,950) which relates to net receivable from the new Member State, Croatia. Voting powers in the Bank's Board of Governors and Board of Directors are established partly on the share of capital subscribed by each Member State, partly on different criteria, set forth in Articles 8 and 10 of the Bank's statute, applied jointly or exclusively depending on the specific voting procedure. Withdrawal from the status of EU Member State or decrease of the subscribed capital amount for a Member State is not foreseen by the legal provisions currently in force. W.2. Capital management Maintaining a strong capital position is one of the major objectives of the Group. The Group’s own funds for capital adequacy purposes comprise of paid-in capital plus reserves, net of expected losses and provisions. The Group’s capital is entirely composed of Core Equity Tier 1 instruments. In addition, the Group benefits from subscribed unpaid capital, which can be called by the Bank if the need arises. The Group plans its capital on a forward looking basis in accordance with its operational plan and risk tolerance. The Group is not subject to prudential supervision, but it aims to comply with relevant EU banking directives and best banking practice. In particular, this applies to the Capital Requirements Directive and Regulation (575/2013/EP of 26 June 2013), which translates the Basel III framework into EU law. The Group monitors both regulatory and economic capital requirements and conducts stress tests to assess the sensitivity of capital requirements to changes in the macroeconomic environment and in the activities of the Group. 238 194,336


The Group’s Core Equity Tier 1 ratio, calculated in accordance with the Capital Requirements Regulation and based on the EIB Group Consolidated Financial Statements under EU Accounting Directives, stood at 25.8% as at 31 December 2017 (24.6% at the end of 2016). The ratio’s increase compared to the prior year was driven by a steady growth in the regulatory own funds which offset a slight increase of risk weighted assets due to the additional riskiness of new business of the Group’s portfolio. As at 31 December 2017, and based on the statutory financial statements, the Bank’s Core Equity Tier 1 ratio stood at 28.5% (26.4% at the end of 2016). Note X – Conversion rates The following conversion rates were used for establishing the balance sheets at 31 December 2017 and 2016: 31.12.2017 31.12.2016 Bulgarian lev (BGN) Czech koruna (CZK) Danish krone (DKK) Pound sterling (GBP) Hungarian forint (HUF) Polish zloty (PLN) Romanian leu (RON) Swedish krona (SEK) 1.9558 25.5350 7.4449 0.8872 310.3300 4.1770 4.6585 9.8438 1.9558 27.0210 7.4344 0.8562 309.8300 4.4103 4.5390 9.5525 Australian dollar (AUD) Canadian dollar (CAD) Swiss franc (CHF) Chinese yuan-renminbi (CNY) Dominican peso (DOP) Egyptian pound (EGP) Hong Kong dollar (HKD) Iceland króna (ISK) Japanese yen (JPY) Kenyan shilling (KES) Moroccan dirham (MAD) Mexican peso (MXN) Norwegian krone (NOK) New Zealand dollar (NZD) Russian ruble (RUB) Serbia dinars (RSD) Tunisia dinars (TND) Turkish lira (TRY) Taiwan dollar (TWD) Ukraine hryvnia (UAH) United States dollar (USD) CFA Franc (XOF) 1.5346 1.5039 1.1702 7.8044 57.1465 21.2725 9.3720 124.7000 135.0100 123.7000 11.2144 23.6612 9.8403 1.6850 69.3920 118.2700 2.9821 4.5464 35.5849 33.7627 1.1993 655.9570 1.4596 1.4188 1.0739 7.3202 48.7476 19.0008 8.1751 214.9400 123.4000 108.0600 10.6711 21.7719 9.0863 1.5158 64.3000 123.4000 2.4255 3.7072 34.1539 28.5012 1.0541 655.9570 South African rand (ZAR) 14.8054 14.4570 239 Non-EU currencies Non-euro currencies of EU member states


EIB Group Consolidated Financial Statements under IFRS Note Y – Related party transactions – Key Management Personnel The Group has identified members of the Board of Directors, the Management Committee and the Directors General heading the different EIB organisational directorates as key management personnel. Key management personnel compensation for the relevant reporting periods, included within General administrative expenses (Note P), is disclosed in the following table: (in EUR ’000) 2017 2016 Short-term benefits(1) Post employment benefits(2) Termination benefits 9,569 864 2,344 9,821 910 9 (1)Short-term employee benefits comprise salaries and allowances, bonuses and social security contributions of the Management Committee, the Directors General and other Directors, and benefits paid to the members of the Board of Directors and the Audit Committee. (2)Post employment benefits comprise pensions and expenses for post employment health insurance paid to members of the Management Committee and Directors General and other Directors. Open balances with key management personnel as at 31 December 2017 comprise the compulsory and optional supplementary pension plan and health insurance scheme liabilities, and payments outstanding as at the year end: (in EUR ’000) 31.12.2017 31.12.2016 Pension plans and health insurance (Note J) Other liabilities (Note G) -76,253 -16,796 -66,438 -15,573 Note Z – Post balance sheet events There have been no material events after the balance sheet date that would require adjustment of, or disclosure in, the consolidated financial statements as at 31 December 2017. 240 12,777 10,740


Independent Auditor’s Report To the Chairman of the Audit Committee of EUROPEAN INVESTMENT BANK 98-100, Boulevard Konrad Adenauer L-2950 LUXEMBOURG REPORT OF THE REVISEUR D’ENTREPRISES AGREE Report on the audit of the consolidated financial state-ments Opinion We have audited the consolidated financial statements of EUROPEAN INVESTMENT BANK, which comprise the con-solidated balance sheet as at 31 December 2017, and the consolidated income statement, consolidated statement of profit or loss and other comprehensive income, consoli-dated statement of changes in equity and consolidated statement of cash flows for the year then ended, and notes to the consolidated financial statements, including a summary of significant accounting policies and other ex-planatory information. by the “Commission de Surveillance du Secteur Financier” (the “CSSF”). Our responsibilities under those Regulation, Law and standards are further described in the “Responsi-bilities of Réviseur d’Entreprises agréé for the audit of the consolidated financial statements” section of our report. We are also independent of the Group in accordance with the International Ethics Standards Board for Accountants’ Code of Ethics for Professional Accountants (the “IESBA Code”) as adopted for Luxembourg by the CSSF together with the ethical requirements that are relevant to our audit of the consolidated financial statements, and have fulfilled our other ethical responsibilities under those ethical re-quirements. We believe that the audit evidence we have obtained is sufficient and appropriate to provide a basis for our opinion. In our opinion, the accompanying consolidated financial statements give a true and fair view of the consolidated fi-nancial position of the Group as at 31 December 2017, and of its consolidated financial performance and its consoli-dated cash flows for the year then ended in accordance with International Financial Reporting Standards (IFRSs) as adopted by the European Union. Key audit matters Key audit matters are those matters that, in our profes-sional judgment, were of most significance in our audit of the consolidated financial statements of the current peri-od. These matters were addressed in the context of the audit of the consolidated financial statements as a whole, and in forming our opinion thereon, and we do not pro-vide a separate opinion on these matters. Basis for Opinion We conducted our audit in accordance with the EU Regula-tion N° 537/2014, the Law of 23 July 2016 on the audit pro-fession (the “Law of 23 July 2016”) and with International Standards on Auditing (ISAs) as adopted for Luxembourg 241


EIB Group Consolidated Financial Statements under IFRS 1Impairment of loans and advances to customers and financial institutions the estimated recoverability. Based on a retrospective review, further critically assessed whether the Group re-vised its estimates and assumptions for specific allowanc-es established in prior years. Description As at 31 December 2017, the Group reports loans and ad-vances accounted for at amortized cost of EUR 327,489 mil-lion representing 54% of total assets and recognized individually assessed impairments on loans amounting to EUR 410 million. We also tested a sample of individually significant expo-sures, which had not been identified as potentially im-paired by the Group and assessed whether appropriate consideration was given to the collectability of future cash flows and the valuation of the underlying collaterals. Management follows its Specific Provisioning Guidelines embedded in the Financial Monitoring Guidelines to esti-mate the impairment level on loans and advances on an individual basis. Allowances for credit losses reflected the difference between the carrying loan amount and the present value of all the expected future cash-flows gener-ated by the impaired asset. The Group neither applies general nor collective impairment. We assessed the disclosures in the consolidated financial statements in relation to impairment of loans and advanc-es with reference to the requirements of the prevailing ac-counting standards. 2 Valuation of complex financial instruments (deriva-tives, assets and liabilities designated at Fair Value through Profit or Loss) These loans and advances are not traded in an active mar-ket, therefore significant judgments and estimates are re-quired to be applied by Management in its assessment of their recoverable amount. Inappropriate judgments made in relation to the methodology and inputs used or the as-sumptions taken may have a material impact on the allow-ances for credit losses. Description As at 31 December 2017, Loans and advances designated at fair value through profit or loss (Loans at FVTPL) amount to EUR 165,942 million and non-quoted Debts evidenced by certificates designated at fair value through profit or loss (Borrowings at FVTPL) amount to EUR 13,553 million representing 28% and 2% of total assets and total liabili-ties respectively. Additionally, the Group holds derivative assets of EUR 43,861 million and derivative liabilities of EUR 32,652 million. These critical judgements include matters such as the identification and assessment of potential indicators of impairment, as well as discounted cash flows forecast techniques, estimation of guarantees obtained, valua-tion of collaterals received and forbearance measures ap-plied. The Group applies the Fair Value option on loans and bor-rowings to reduce the accounting mismatch for such in-struments which market risk is covered with a derivatives instrument at inception. The key inputs and assumptions used by Management in its assessment of loan impairment are detailed in notes A.4.9 and S.2.3 to the consolidated financial statements as well as the impairment in note D.2. The valuation of such financial instruments, measured at fair value, is based on a combination of market data and valuation models which often require a considerable num-ber of inputs. Many of these inputs are obtained from readily available data, in particular for level 1 and level 2 financial instruments in the fair value hierarchy, the valua-tion techniques for which use quoted market prices and observable inputs, respectively. Where such observable data is not readily available, as in the case of level 3 finan-cial instruments, estimates need to be developed which can involve significant Management judgment. The Group has developed its own models to value level 2 and level 3 financial instruments, which also involve significant Man-agement judgment. How our audit addressed the area of focus Our procedures included the assessment of Key controls over the approval, recording, monitoring and restructur-ing of loans and advances to customers, the loan grading process and the measurement of impairment allowances for individually assessed loans and advances. For a sample of loans with specific allowances for credit losses, we evaluated the Group's individual assessment of each loan and specifically challenged the Group's assump-tions used, including the value of realisable collateral and 242


In particular, the Group classifies its loans at FVTPL, its non-quoted Borrowings at FVTPL and its derivatives either as level 2 or level 3 financial instruments. These are the fi-nancial instruments object of this key audit matter. 3 Valuation of venture capital investments Description Venture capital investments, for which no quoted markets prices are available amount to EUR 5,780 million as at 31 December 2017. Management has based its valuation of the unlisted investments on the International Private Equi-ty and Venture Capital Valuations (IPEV) guidelines. Those investments are treated as available for sale or designated at fair value through profit and loss. For the available for sale investments, fair value changes are recognized in oth-er comprehensive income unless there is evidence of im-pairment for which the decline in the investment fair value is recognised in the consolidated income statement. The key inputs and assumptions used by Management in its assessment of Financial instruments are detailed in notes A.4.4 to the consolidated financial statements, as well as the Derivative Financial instruments disclosure on note Q, the Fair value of financial assets and liabilities on note R and the reconciliation disclosure between the bal-ance sheet accounting classifications and fair values of as-sets and liabilities on note T. How our audit addressed the area of focus Our audit procedures to assess the fair value of Derivatives, Loans at FVTPL and non-quoted Borrowing at FVTPL in-cluded the assessment of the design, implementation and operating effectiveness of key internal controls over the valuation, price verification, front office and back office reconciliations and model approval for financial instru-ments. These investments are not traded in an active market, therefore significant judgments and estimates are re-quired to be applied by Management in its assessment of their fair value and impairment. Inappropriate judgments made in relation to the methodology and inputs used or the assumptions taken may have a material impact on the valuation of the investment portfolio. In respect of Derivatives, we engaged our internal valua-tion specialists to assist us in performing independent val-uations on a sample basis and comparing these with the Group’s valuations. Our procedures included developing parallel models based on contractual arrangements and obtaining inputs independently. Our specialist also as-sessed the appropriate application of Credit Value and Debit Value Adjustments (“CVA/DVA”) that form an inte-gral part of fair values, inquiring of Management about any changes in the CVA/DVA methodology and assessing the appropriateness of the inputs applied. The key inputs and assumptions used by Management in its assessment of the fair value of unlisted investments are detailed in note A.4.7.3 as well further disclosures are pre-sented in note B.3 to the consolidated financial state-ments. How our audit addressed the area of focus Our procedures over the valuation of the venture capital investments included, but were not limited to: We obtained an understanding of Management’s process-es and controls for determining the fair valuation of ven-ture capital investments by performing walkthrough procedures. This included discussing with Management the valuation governance structure and protocols around their oversight of the valuation process and corroborating our understanding by attending the Investment & Risk Committee meeting. In respect of Loans at FVTPL and non-quoted Borrowings at FVTPL, classified as level 2 instruments, we recomputed on a sample basis the fair value of loans using a net pre-sent value technique and compared our valuations to the Group’s valuations. For level 3 instruments, we compared that the fair values reported tied with their related deriva-tive fair values. We additionally, assessed the appropriate application of the Own credit adjustment (OCA) on Bor-rowings at FVTPL. We have identified key controls in the process, assessed the design adequacy and tested the operating effective-ness of some of these controls. In addition, we obtained the ISAE 3402 report on EIF’s internal controls, compared our understanding of identified key controls in the pro-cess and inspected the conclusions reached based on the testing of operating effectiveness of those controls and noted no observations or exceptions in the report, which Additionally, we also assessed whether the disclosures in the consolidated financial statements, including fair value hierarchy information and sensitivity to key inputs, appro-priately reflected the Group’s exposure to financial instru-ment valuation risk with reference to the requirements of the prevailing accounting standards. 243


EIB Group Consolidated Financial Statements under IFRS allow us to rely on controls over valuation and impairment of venture capital investments. Responsibilities of Management and Those Charged with Governance for the consolidated financial state-ments We compared Management’s valuation methodology to IFRS and the IPEV guidelines. We sought explanations from Management where there are judgments applied in their application of the guidelines, discussed and assessed their appropriateness. This included assessing the annual back-testing exercise on the accuracy of estimated fair val-ues of venture capital investments valuation during the year and the prior year fair values, to further assess the reasonableness of the current year valuation assumptions used by Management in performing the valuation esti-mate and the impairment assessment. The Management is responsible for the preparation and fair presentation of the consolidated financial statements in accordance with IFRSs as adopted by the European Un-ion, and for such internal control as the Management de-termines is necessary to enable the preparation of consolidated financial statements that are free from mate-rial misstatement, whether due to fraud or error. In preparing the consolidated financial statements, the Management is responsible for assessing the Group’s abil-ity to continue as a going concern, disclosing, as applica-ble, matters related to going concern and using the going concern basis of accounting unless the Management ei-ther intends to liquidate the Group or to cease operations, or has no realistic alternative but to do so. On a sample basis, we reconciled the latest available Net Asset Value (“NAV”) statements provided by private equity fund managers to the value adjustment file prepared by EIF and we recalculated the mathematical accuracy of the unrealised results on the revaluation of investments on a sample basis. Those charged with governance are responsible for over-seeing the Group’s financial reporting process. We inspected the correct classification of investments un-der the impairment decision matrix. We discussed with Management, inspected the minutes of the EIF Invest-ment & Risk Committee (IRC) meetings and understood the rationale in the cases of private equity funds with pre-sumption of impairment which were not impaired. Responsibilities of the Réviseur d’Entreprises agréé for the audit of the consolidated financial statements The objectives of our audit are to obtain reasonable assur-ance about whether the consolidated financial statements as a whole are free from material misstatement, whether due to fraud or error, and to issue a report of “Réviseur d’Entreprises agréé” that includes our opinion. Reasona-ble assurance is a high level of assurance, but is not a guar-antee that an audit conducted in accordance with the EU Regulation N° 537/2014, the Law of 23 July 2016 and with ISAs as adopted for Luxembourg by the CSSF will always detect a material misstatement when it exists. Misstate-ments can arise from fraud or error and are considered material if, individually or in the aggregate, they could rea-sonably be expected to influence the economic decisions of users taken on the basis of these consolidated financial statements. Other information The Management is responsible for the other information. The other information comprises the information included in the “Highlights, Preface, Borrowing activities, Treasury Activities, EIB Statutory Bodies and Audit and control”; but does not include the consolidated financial statements and our report of “Réviseur d’Entreprises agréé” thereon. Our opinion on the consolidated financial statements does not cover the other information and we do not ex-press any form of assurance conclusion thereon. In connection with our audit of the consolidated financial statements, our responsibility is to read the other informa-tion and, in doing so, consider whether the other informa-tion is materially inconsistent with the consolidated financial statements or our knowledge obtained in the au-dit or otherwise appears to be materially misstated. If, based on the work we have performed, we conclude that there is a material misstatement of this other information we are required to report this fact. We have nothing to re-port in this regard. As part of an audit in accordance with the EU Regulation N° 537/2014, the Law of 23 July 2016 and with ISAs as adopted for Luxembourg by the CSSF, we exercise profes-sional judgment and maintain professional skepticism throughout the audit. We also: • Identify and assess the risks of material misstatement of the consolidated financial statements, whether due to fraud or error, design and perform audit procedures responsive to those risks, and obtain audit evidence 244


that is sufficient and appropriate to provide a basis for our opinion. The risk of not detecting a material mis-statement resulting from fraud is higher than for one resulting from error, as fraud may involve collusion, forgery, intentional omissions, misrepresentations, or the override of internal control. ing the disclosures, and whether the consolidated financial statements represent the underlying transac-tions and events in a manner that achieves fair presen-tation. • Obtain sufficient appropriate audit evidence regard-ing the financial information of the entities and busi-ness activities within the Group to express an opinion on the consolidated financial statements. We are re-sponsible for the direction, supervision and perfor-mance of the Group audit. We remain solely responsible for our audit opinion. • Obtain an understanding of internal control relevant to the audit in order to design audit procedures that are appropriate in the circumstances, but not for the purpose of expressing an opinion on the effectiveness of the Group’s internal control. • Evaluate the appropriateness of accounting policies used and the reasonableness of accounting estimates and related disclosures made by the Management. We communicate with those charged with governance re-garding, among other matters, the planned scope and timing of the audit and significant audit findings, includ-ing any significant deficiencies in internal control that we identify during our audit. • Conclude on the appropriateness of Management’s use of the going concern basis of accounting and, based on the audit evidence obtained, whether a ma-terial uncertainty exists related to events or conditions that may cast significant doubt on the Group’s ability to continue as a going concern. If we conclude that a material uncertainty exists, we are required to draw at-tention in our report of “Réviseur d’Entreprises agréé” to the related disclosures in the consolidated financial statements or, if such disclosures are inadequate, to modify our opinion. Our conclusions are based on the audit evidence obtained up to the date of report of “Réviseur d’Entreprises agréé”. However, future events or conditions may cause the Group to cease to contin-ue as a going concern. We also provide those charged with governance with a statement that we have complied with relevant ethical re-quirements regarding independence, and to communi-cate with them all relationships and other matters that may reasonably be thought to bear on our independence, and where applicable, related safeguards. From the matters communicated with those charged with governance, we determine those matters that were of most significance in the audit of the consolidated financial statements of the current period and are therefore the key audit matters. We describe these matters in our report un-less law or regulation precludes public disclosure about the matter. • Evaluate the overall presentation, structure and con-tent of the consolidated financial statements, includ-Luxembourg, 15 March 2018 KPMG Luxembourg, Société coopérative Cabinet de révision agréé 39, Avenue John F. Kennedy L-1855 Luxembourg Société coopérative de droit luxembourgeois R.C.S. Luxembourg B 149133 Capital EUR 12 503 S. CHAMBOURDON 245


EIB Group Consolidated Financial Statements under IFRS Statement by the Audit Committee The Audit Committee reports to the Board of Governors, the following statement being communicated to the Gov-ernors prior to their approval of the Annual Report and the financial statements for the past financial year. Statement by the Audit Committee on the EIB’s consoli-dated financial statements prepared in accordance with International Financial Reporting Standards as adopted by the European Union (IFRS) The Committee, instituted in pursuance of Article 12 of the Statute and Chapter V of the Rules of Procedure of the European Investment Bank for the purpose of verifying that the operations of the Bank are conducted and its books kept in a proper manner, having: examine in the discharge of its duties, received assurance from the Management Commit-tee concerning the effectiveness of the internal con-trol structure and internal administration, • and considering • the consolidated financial statements for the finan-cial year ended 31 December 2017 adopted by the Board of Directors at its meeting on 15 March 2018, that the foregoing provides a reasonable basis for its statement and, Articles 24, 25 & 26 of the Rules of Procedure, • • • designated KPMG as external auditors, reviewed their audit planning process, examined and dis-cussed their reports, and in particular their inde-pendent Auditor’s Report, noted that the opinion of KPMG on the consolidated financial statements of the European Investment Bank for the year ended 31 December 2017 prepared in accordance with IFRS is unqualified, convened on a regular basis with the Heads of Direc-torates and relevant services including, • the Financial Controller, • the Directors General of Risk Management, Transaction Monitoring and Restructuring and Compliance, met regularly the Head of Internal Audit and dis-cussed the relevant internal audit reports, and stud-ied the documents which it deemed necessary to to the best of its knowledge and judgement: • confirms that the consolidated financial statements of the European Investment Bank, which comprise the consolidated balance sheet as at 31 December 2017, the consolidated income statement, the con-solidated statement of profit or loss and other com-prehensive income, the consolidated statement of changes in equity and the consolidated cash flow statement for the year then ended, and notes to the consolidated financial statements, including a sum-mary of significant accounting policies and other ex-planatory information, give a true and fair view of the consolidated financial position of the European Investment Bank as of 31 December 2017, and of its consolidated financial performance and its consoli-dated cash flows for the year then ended in accord-ance with International Financial Reporting Standards as adopted by the European Union. • • • Luxembourg, 15 March 2018 Audit Committee P. KRIER D. PITTA FERRAZ J. SUTHERLAND J. DOMINIK M. MACIJAUSKAS V. IUGA 246


EXHIBIT II EUROPEAN INVESTMENT BANK Schedule of debts evidenced by certificates as of December 31, 2017 USD (1) AUD AUD AUD AUD AUD AUD AUD AUD AUD AUD AUD AUD AUD AUD AUD AUD AUD AUD AUD AUD AUD AUD AUD AUD AUD AUD AUD AUD AUD AUD AUD AUD AUD AUD AUD AUD AUD AUD AUD AUD AUD 11190100 12480200 14250100 14960100 16170100 16170200 16170300 16170400 16170500 16170600 16170700 17520100 17520200 17520300 17520400 17520500 18430100 18460100 18460200 18570100 18690100 18790100 19240100 19480100 19480200 19480300 19480400 19480500 19480600 20430100 20430200 20650100 20700100 20700200 20700300 20700400 21000100 21190100 21190200 21680100 21710100 10/03/2006 TF 07/01/2008 TV 02/04/2008 TF 18/12/2008 TF 07/08/2009 TF 26/08/2009 TF 08/10/2009 TF 20/01/2010 TF 15/04/2010 TF 29/06/2010 TF 29/06/2011 TF 06/08/2010 TF 10/09/2010 TF 24/01/2011 TF 10/02/2011 TF 26/03/2012 TF 21/06/2011 TF 08/06/2011 TF 08/03/2012 TF 21/07/2011 TF 10/08/2011 TF 26/10/2011 TF 10/04/2012 TF 22/08/2012 TF 22/01/2013 TF 20/03/2013 TF 18/07/2017 TF 01/08/2017 TF 11/10/2017 TF 29/11/2013 TF 04/04/2014 TF 30/01/2014 TF 07/02/2014 TF 07/03/2014 TF 19/05/2014 TF 20/06/2014 TF 08/04/2014 TV 30/05/2014 TF 20/01/2015 TF 17/04/2015 TF 30/04/2015 TF 5.56 3.07 6.70 0.50 6.50 6.50 6.50 6.50 6.50 6.50 6.50 6.00 6.00 6.00 6.00 6.00 0.50 6.25 6.25 0.50 0.50 0.50 6.45 5.00 5.00 5.00 5.00 5.00 5.00 4.25 4.25 3.62 4.75 4.75 4.75 4.75 2.15 3.25 3.25 2.90 2.50 10/03/2021 20/08/2020 23/03/2018 18/12/2020 07/08/2019 07/08/2019 07/08/2019 07/08/2019 07/08/2019 07/08/2019 07/08/2019 06/08/2020 06/08/2020 06/08/2020 06/08/2020 06/08/2020 21/06/2023 08/06/2021 08/06/2021 21/07/2023 10/08/2023 26/10/2023 10/04/2042 22/08/2022 22/08/2022 22/08/2022 22/08/2022 22/08/2022 22/08/2022 15/03/2019 15/03/2019 30/01/2019 07/08/2024 07/08/2024 07/08/2024 07/08/2024 15/03/2019 30/05/2018 30/05/2018 17/10/2025 30/04/2020 -222,110,000.00 -250,000,000.00 -280,000,000.00 -24,850,000.00 -750,000,000.00 -300,000,000.00 -600,000,000.00 -450,000,000.00 -500,000,000.00 -500,000,000.00 -350,000,000.00 -1,000,000,000.00 -600,000,000.00 -600,000,000.00 -400,000,000.00 -250,000,000.00 -1,100,000,000.00 -500,000,000.00 -600,000,000.00 -550,000,000.00 -500,000,000.00 -220,000,000.00 -30,000,000.00 -650,000,000.00 -400,000,000.00 -200,000,000.00 -250,000,000.00 -200,000,000.00 -400,000,000.00 -250,000,000.00 -300,000,000.00 -44,100,000.00 -200,000,000.00 -100,000,000.00 -150,000,000.00 -225,000,000.00 -100,000,000.00 -700,000,000.00 -300,000,000.00 -200,000,000.00 -675,000,000.00 -229,520,369.00 -22,400,000.00 -280,000,000.00 -24,850,000.00 -750,000,000.00 -300,000,000.00 -600,000,000.00 -450,000,000.00 -500,000,000.00 -500,000,000.00 -350,000,000.00 -1,000,000,000.00 -600,000,000.00 -600,000,000.00 -400,000,000.00 -250,000,000.00 -643,000,000.00 -500,000,000.00 -600,000,000.00 -480,200,000.00 -455,000,000.00 -220,000,000.00 -30,000,000.00 -650,000,000.00 -400,000,000.00 -200,000,000.00 -250,000,000.00 -200,000,000.00 -400,000,000.00 -250,000,000.00 -300,000,000.00 -44,100,000.00 -200,000,000.00 -100,000,000.00 -150,000,000.00 -225,000,000.00 -100,000,000.00 -700,000,000.00 -300,000,000.00 -200,000,000.00 -675,000,000.00 -149,563,644.60 -14,596,637.56 -182,457,969.50 -16,193,144.79 -488,726,704.03 -195,490,681.61 -390,981,363.22 -293,236,022.42 -325,817,802.68 -325,817,802.68 -228,072,461.88 -651,635,605.37 -390,981,363.22 -390,981,363.22 -260,654,242.15 -162,908,901.34 -419,001,694.25 -325,817,802.68 -390,981,363.22 -312,915,417.70 -296,494,200.44 -143,359,833.18 -19,549,068.16 -423,563,143.49 -260,654,242.15 -130,327,121.07 -162,908,901.34 -130,327,121.07 -260,654,242.15 -162,908,901.34 -195,490,681.61 -28,737,130.20 -130,327,121.07 -65,163,560.54 -97,745,340.81 -146,618,011.21 -65,163,560.54 -456,144,923.76 -195,490,681.61 -130,327,121.07 -439,854,033.62 -179,371,678.97 -17,505,747.43 -218,821,842.83 -19,420,438.55 -586,129,936.14 -234,451,974.46 -468,903,948.91 -351,677,961.68 -390,753,290.76 -390,753,290.76 -273,527,303.53 -781,506,581.52 -468,903,948.91 -468,903,948.91 -312,602,632.61 -195,376,645.38 -502,508,731.92 -390,753,290.76 -468,903,948.91 -375,279,460.45 -355,585,494.59 -171,931,447.93 -23,445,197.45 -507,979,277.99 -312,602,632.61 -156,301,316.30 -195,376,645.38 -156,301,316.30 -312,602,632.61 -195,376,645.38 -234,451,974.46 -34,464,440.25 -156,301,316.30 -78,150,658.15 -117,225,987.23 -175,838,980.84 -78,150,658.15 -547,054,607.06 -234,451,974.46 -156,301,316.30 -527,516,942.53 1 Currency Borrowing number Value Date Interest rate Rate Maturity date Initial amount in currency of borrowing Nominal outstanding in currency of borrowing Nominal outstanding in EUR Nominal outstanding in


AUD AUD AUD AUD AUD AUD AUD AUD AUD AUD AUD AUD AUD AUD 21770100 21820100 22040100 22040200 22130100 22130200 22130300 22130400 22130500 22130600 22610100 23100100 23100200 XS1597289435 02/07/2015 TF 27/07/2015 TF 15/01/2016 TF 09/02/2016 TF 17/02/2016 TF 23/05/2016 TF 25/11/2016 TF 31/01/2017 TF 30/03/2017 TF 30/05/2017 TF 13/12/2016 TF 03/08/2017 TF 28/09/2017 TF 07/04/2017 TF 3.65 3.73 2.80 2.80 3.10 3.10 3.10 3.10 3.10 3.10 1.75 3.30 3.30 1.66 02/07/2040 27/07/2040 15/01/2021 15/01/2021 17/08/2026 17/08/2026 17/08/2026 17/08/2026 17/08/2026 17/08/2026 13/12/2024 03/02/2028 03/02/2028 06/04/2018 -65,000,000.00 -68,000,000.00 -300,000,000.00 -200,000,000.00 -150,000,000.00 -100,000,000.00 -100,000,000.00 -150,000,000.00 -100,000,000.00 -200,000,000.00 -60,000,000.00 -200,000,000.00 -125,000,000.00 -100,000,000.00 -65,000,000.00 -73,160,353.40 -300,000,000.00 -200,000,000.00 -150,000,000.00 -100,000,000.00 -100,000,000.00 -150,000,000.00 -100,000,000.00 -200,000,000.00 -60,000,000.00 -200,000,000.00 -125,000,000.00 -99,564,640.60 -42,356,314.35 -47,673,891.18 -195,490,681.61 -130,327,121.07 -97,745,340.81 -65,163,560.54 -65,163,560.54 -97,745,340.81 -65,163,560.54 -130,327,121.07 -39,098,136.32 -130,327,121.07 -81,454,450.67 -64,879,864.85 -50,797,927.80 -57,175,297.69 -234,451,974.46 -156,301,316.30 -117,225,987.23 -78,150,658.15 -78,150,658.15 -117,225,987.23 -78,150,658.15 -156,301,316.30 -46,890,394.89 -156,301,316.30 -97,688,322.69 -77,810,421.92 -17,839,060,000.00 -17,051,795,363.00 -11,111,556,994.01 -13,326,090,302.91 USD (1) CAD CAD CAD CAD CAD CAD CAD CAD CAD CAD CAD 07810100 12920100 13080100 13080200 20060100 20300100 20680100 20680200 21600100 21980100 22410100 15/11/2004 TF 30/01/2007 TF 21/03/2007 TF 21/03/2007 TF 24/04/2013 TF 24/09/2013 TF 04/02/2014 TF 10/06/2014 TF 18/02/2015 TF 05/11/2015 TF 16/09/2016 TF 5.40 4.60 4.52 4.54 1.75 2.63 2.13 2.13 1.13 1.25 1.13 05/01/2045 30/01/2037 28/05/2037 28/05/2037 24/04/2018 24/09/2018 04/02/2019 04/02/2019 18/02/2020 05/11/2020 16/09/2021 -300,000,000.00 -850,000,000.00 -103,828,000.00 -51,604,000.00 -500,000,000.00 -500,000,000.00 -500,000,000.00 -700,000,000.00 -1,400,000,000.00 -500,000,000.00 -500,000,000.00 -222,300,000.00 -284,303,000.00 -167,374,466.28 -83,364,096.48 -500,000,000.00 -500,000,000.00 -500,000,000.00 -700,000,000.00 -1,400,000,000.00 -500,000,000.00 -500,000,000.00 -147,815,679.23 -189,043,819.40 -111,293,614.12 -55,431,941.27 -332,468,914.16 -332,468,914.16 -332,468,914.16 -465,456,479.82 -930,912,959.64 -332,468,914.16 -332,468,914.16 -177,275,344.11 -226,720,252.61 -133,474,431.42 -66,479,527.17 -398,729,968.75 -398,729,968.75 -398,729,968.75 -558,221,956.25 -1,116,443,912.49 -398,729,968.75 -398,729,968.75 -5,905,432,000.00 -5,357,341,562.76 -3,562,299,064.27 -4,272,265,267.78 USD (1) CHF CHF CHF CHF CHF CHF CHF CHF CHF CHF CHF 08960100 08960200 08960300 08960400 08960500 08960600 12040100 12040200 12040300 12040400 12790100 11/07/2005 TF 02/08/2005 TF 07/02/2006 TF 20/09/2007 TF 07/12/2009 TF 08/02/2010 TF 30/06/2006 TF 21/07/2006 TF 16/11/2007 TF 06/02/2009 TF 08/02/2007 TF 2.38 2.38 2.38 2.38 2.38 2.38 3.13 3.13 3.13 3.13 2.50 10/07/2020 10/07/2020 10/07/2020 10/07/2020 10/07/2020 10/07/2020 30/06/2036 30/06/2036 30/06/2036 30/06/2036 08/02/2019 -400,000,000.00 -100,000,000.00 -500,000,000.00 -150,000,000.00 -125,000,000.00 -200,000,000.00 -225,000,000.00 -75,000,000.00 -75,000,000.00 -240,000,000.00 -300,000,000.00 -207,500,000.00 -100,000,000.00 -500,000,000.00 -150,000,000.00 -125,000,000.00 -200,000,000.00 -213,200,000.00 -75,000,000.00 -75,000,000.00 -240,000,000.00 -242,500,000.00 -177,320,116.22 -85,455,477.70 -427,277,388.48 -128,183,216.54 -106,819,347.12 -170,910,955.39 -182,191,078.45 -64,091,608.27 -64,091,608.27 -205,093,146.47 -207,229,533.41 -212,660,015.38 -102,486,754.40 -512,433,772.00 -153,730,131.60 -128,108,443.00 -204,973,508.80 -218,501,760.38 -76,865,065.80 -76,865,065.80 -245,968,210.56 -248,530,379.42 2 Currency Borrowing number Value Date Interest rate Rate Maturity date Initial amount in currency of borrowing Nominal outstanding in currency of borrowing Nominal outstanding in EUR Nominal outstanding in Currency Borrowing number Value Date Interest rate Rate Maturity date Initial amount in currency of borrowing Nominal outstanding in currency of borrowing Nominal outstanding in EUR Nominal outstanding in


CHF CHF CHF CHF CHF CHF CHF CHF CHF CHF CHF CHF CHF CHF CHF CHF CHF CHF CHF CHF CHF CHF CHF CHF CHF CHF CHF CHF CHF CHF CHF CHF CHF CHF CHF CHF CHF CHF CHF CHF CHF CHF CHF CHF CHF CHF 12790200 12790300 12790400 12790500 12790600 12790700 12790800 13550100 14280100 15460100 15910100 16670100 16670200 16830100 16830200 17110100 17500100 17500200 17500300 17500400 17500500 17560100 17660100 17810100 18850100 18850200 18850300 18850400 18880100 18880200 19170100 19170200 19170300 19170400 19380100 19380200 19380300 19380400 19380500 19380600 19380700 19380800 19560100 19560200 19560300 19560400 25/02/2008 TF 25/02/2008 TF 11/02/2009 TF 06/07/2009 TF 24/08/2009 TF 19/10/2009 TF 18/03/2010 TF 15/10/2007 TF 30/04/2008 TF 14/04/2009 TF 10/06/2009 TF 11/02/2010 TF 02/03/2011 TF 22/03/2010 TF 15/07/2010 TF 23/04/2010 TF 24/08/2010 TF 24/08/2010 TF 31/05/2011 TF 31/05/2011 TF 26/07/2011 TF 18/08/2010 TF 06/10/2010 TF 30/11/2010 TF 23/11/2011 TF 23/11/2011 TF 20/04/2012 TF 14/02/2014 TF 02/02/2012 TF 02/02/2012 TF 02/04/2012 TF 02/04/2012 TF 21/05/2012 TF 16/05/2014 TF 02/08/2012 TF 02/08/2012 TF 02/08/2012 TF 09/04/2013 TF 28/10/2013 TF 22/11/2013 TF 22/11/2013 TF 01/04/2014 TF 26/10/2012 TF 26/07/2013 TF 26/07/2013 TF 28/08/2013 TF 2.50 2.50 2.50 2.50 2.50 2.50 2.50 3.38 3.25 3.00 2.74 2.63 2.63 2.13 2.13 2.63 2.00 2.00 2.00 2.00 2.00 2.17 2.00 2.00 1.63 1.63 1.63 1.63 1.25 1.25 1.63 1.63 1.63 1.63 1.50 1.50 1.50 1.50 1.50 1.50 1.50 1.50 1.13 1.13 1.13 1.13 08/02/2019 08/02/2019 08/02/2019 08/02/2019 08/02/2019 08/02/2019 08/02/2019 15/10/2027 30/04/2018 14/04/2021 10/09/2018 11/02/2025 11/02/2025 22/01/2020 22/01/2020 23/04/2030 24/08/2022 24/08/2022 24/08/2022 24/08/2022 24/08/2022 18/08/2025 06/10/2031 30/11/2035 23/11/2023 23/11/2023 23/11/2023 23/11/2023 02/08/2019 02/08/2019 02/04/2026 02/04/2026 02/04/2026 02/04/2026 02/08/2024 02/08/2024 02/08/2024 02/08/2024 02/08/2024 02/08/2024 02/08/2024 02/08/2024 26/04/2023 26/04/2023 26/04/2023 26/04/2023 -125,000,000.00 -75,000,000.00 -150,000,000.00 -225,000,000.00 -100,000,000.00 -75,000,000.00 -100,000,000.00 -200,000,000.00 -300,000,000.00 -200,000,000.00 -100,000,000.00 -200,000,000.00 -75,000,000.00 -250,000,000.00 -75,000,000.00 -100,000,000.00 -175,000,000.00 -50,000,000.00 -150,000,000.00 -50,000,000.00 -50,000,000.00 -50,000,000.00 -50,000,000.00 -100,000,000.00 -160,000,000.00 -50,000,000.00 -100,000,000.00 -250,000,000.00 -325,000,000.00 -50,000,000.00 -150,000,000.00 -30,000,000.00 -50,000,000.00 -75,000,000.00 -110,000,000.00 -40,000,000.00 -70,000,000.00 -50,000,000.00 -130,000,000.00 -50,000,000.00 -25,000,000.00 -125,000,000.00 -100,000,000.00 -100,000,000.00 -50,000,000.00 -100,000,000.00 -125,000,000.00 -75,000,000.00 -150,000,000.00 -225,000,000.00 -100,000,000.00 -75,000,000.00 -100,000,000.00 -200,000,000.00 -295,000,000.00 -200,000,000.00 -100,000,000.00 -182,500,000.00 -75,000,000.00 -250,000,000.00 -75,000,000.00 -100,000,000.00 -111,000,000.00 -50,000,000.00 -150,000,000.00 -50,000,000.00 -50,000,000.00 -50,000,000.00 -50,000,000.00 -100,000,000.00 -38,000,000.00 -50,000,000.00 -100,000,000.00 -250,000,000.00 -325,000,000.00 -50,000,000.00 -150,000,000.00 -30,000,000.00 -50,000,000.00 -75,000,000.00 -110,000,000.00 -40,000,000.00 -70,000,000.00 -50,000,000.00 -130,000,000.00 -50,000,000.00 -25,000,000.00 -125,000,000.00 -100,000,000.00 -100,000,000.00 -50,000,000.00 -100,000,000.00 -106,819,347.12 -64,091,608.27 -128,183,216.54 -192,274,824.82 -85,455,477.70 -64,091,608.27 -85,455,477.70 -170,910,955.39 -252,093,659.20 -170,910,955.39 -85,455,477.70 -155,956,246.80 -64,091,608.27 -213,638,694.24 -64,091,608.27 -85,455,477.70 -94,855,580.24 -42,727,738.85 -128,183,216.54 -42,727,738.85 -42,727,738.85 -42,727,738.85 -42,727,738.85 -85,455,477.70 -32,473,081.52 -42,727,738.85 -85,455,477.70 -213,638,694.24 -277,730,302.51 -42,727,738.85 -128,183,216.54 -25,636,643.31 -42,727,738.85 -64,091,608.27 -94,001,025.47 -34,182,191.08 -59,818,834.39 -42,727,738.85 -111,092,121.00 -42,727,738.85 -21,363,869.42 -106,819,347.12 -85,455,477.70 -85,455,477.70 -42,727,738.85 -85,455,477.70 -128,108,443.00 -76,865,065.80 -153,730,131.60 -230,595,197.40 -102,486,754.40 -76,865,065.80 -102,486,754.40 -204,973,508.80 -302,335,925.48 -204,973,508.80 -102,486,754.40 -187,038,326.78 -76,865,065.80 -256,216,886.00 -76,865,065.80 -102,486,754.40 -113,760,297.39 -51,243,377.20 -153,730,131.60 -51,243,377.20 -51,243,377.20 -51,243,377.20 -51,243,377.20 -102,486,754.40 -38,944,966.67 -51,243,377.20 -102,486,754.40 -256,216,886.00 -333,081,951.80 -51,243,377.20 -153,730,131.60 -30,746,026.32 -51,243,377.20 -76,865,065.80 -112,735,429.84 -40,994,701.76 -71,740,728.08 -51,243,377.20 -133,232,780.72 -51,243,377.20 -25,621,688.60 -128,108,443.00 -102,486,754.40 -102,486,754.40 -51,243,377.20 -102,486,754.40 3


CHF CHF CHF CHF CHF CHF 19560500 19830100 19830200 19830300 20140100 20570100 16/09/2013 TF 21/02/2013 TF 30/05/2013 TF 11/07/2014 TF 28/06/2013 TF 04/02/2014 TF 1.13 1.38 1.38 1.38 1.75 1.63 26/04/2023 21/02/2028 21/02/2028 21/02/2028 28/06/2033 04/02/2025 -150,000,000.00 -100,000,000.00 -60,000,000.00 -100,000,000.00 -100,000,000.00 -350,000,000.00 -150,000,000.00 -100,000,000.00 -60,000,000.00 -100,000,000.00 -100,000,000.00 -350,000,000.00 -128,183,216.54 -85,455,477.70 -51,273,286.62 -85,455,477.70 -85,455,477.70 -299,094,171.94 -153,730,131.60 -102,486,754.40 -61,492,052.64 -102,486,754.40 -102,486,754.40 -358,703,640.40 -8,465,000,000.00 -7,994,700,000.00 -6,831,909,075.37 -8,193,508,554.09 USD (1) CNY XS1699733934 11/10/2017 TF 3.28 11/01/2018 -100,000,000.00 -99,900,610.88 -12,800,549.80 -15,351,699.38 -100,000,000.00 -99,900,610.88 -12,800,549.80 -15,351,699.38 USD (1) CZK CZK CZK CZK CZK CZK CZK CZK CZK CZK CZK CZK CZK CZK CZK 03590100 03590200 04070100 04150100 04320100 05660100 05670100 12290100 14360100 16350100 18860100 20350100 21090100 21090200 21180100 25/10/2002 TF 05/03/2003 TF 20/02/2003 TF 21/02/2003 TF 27/02/2003 TF 28/08/2003 TV 28/08/2003 TV 18/08/2006 TF 30/04/2008 TF 26/10/2009 TF 16/11/2011 TF 07/11/2013 TV 25/04/2014 TV 25/04/2014 TV 05/06/2014 TV 4.00 4.00 4.69 4.70 4.47 0.55 2.80 4.41 4.23 4.04 2.50 1.00 0.80 0.80 0.94 25/10/2022 25/10/2022 20/02/2023 21/02/2028 27/02/2018 28/08/2018 28/08/2018 18/08/2030 30/04/2019 26/10/2021 16/11/2023 07/12/2023 25/04/2029 25/04/2029 05/06/2034 -550,000,000.00 -450,000,000.00 -1,398,155,000.00 -317,500,000.00 -1,038,382,400.00 -1,000,000,000.00 -500,000,000.00 -500,000,000.00 -1,000,000,000.00 -310,812,125.25 -2,550,000,000.00 -500,000,000.00 -500,000,000.00 -500,000,000.00 -1,000,000,000.00 -550,000,000.00 -450,000,000.00 -199,736,550.50 -317,500,000.00 -191,867,123.61 -1,000,000,000.00 -500,000,000.00 -803,772,341.59 -1,000,000,000.00 -424,817,329.64 -2,550,000,000.00 -500,000,000.00 -500,000,000.00 -500,000,000.00 -1,000,000,000.00 -21,539,064.03 -17,622,870.57 -7,822,069.73 -12,433,914.24 -7,513,887.75 -39,161,934.60 -19,580,967.30 -31,477,279.87 -39,161,934.60 -16,636,668.48 -99,862,933.23 -19,580,967.30 -19,580,967.30 -19,580,967.30 -39,161,934.60 -25,831,799.49 -21,135,108.67 -9,381,008.22 -14,911,993.34 -9,011,405.57 -46,966,908.17 -23,483,454.08 -37,750,701.75 -46,966,908.17 -19,952,356.51 -119,765,615.82 -23,483,454.08 -23,483,454.08 -23,483,454.08 -46,966,908.17 -12,114,849,525.25 -10,487,693,345.34 -410,718,360.89 -492,574,530.22 USD (1) DKK DKK DKK 12160200 13040100 13040200 25/05/2009 TF 27/02/2007 TF 27/02/2007 TF 2.00 4.25 4.25 30/06/2026 10/11/2024 10/11/2024 -500,000,000.00 -550,000,000.00 -450,000,000.00 -324,154,000.00 -150,000,000.00 -450,000,000.00 -43,540,410.21 -20,148,020.79 -60,444,062.38 -52,218,013.97 -24,163,521.34 -72,490,564.01 -1,500,000,000.00 -924,154,000.00 -124,132,493.38 -148,872,099.32 USD (1) EUR 00500100 07/06/1996 TF 8.50 17/06/2021 -90,151,815.66 -90,151,815.66 -90,151,815.66 -108,119,072.52 4 Currency Borrowing number Value Date Interest rate Rate Maturity date Initial amount in currency of borrowing Nominal outstanding in currency of borrowing Nominal outstanding in EUR Nominal outstanding in Currency Borrowing number Value Date Interest rate Rate Maturity date Initial amount in currency of borrowing Nominal outstanding in currency of borrowing Nominal outstanding in EUR Nominal outstanding in Currency Borrowing number Value Date Interest rate Rate Maturity date Initial amount in currency of borrowing Nominal outstanding in currency of borrowing Nominal outstanding in EUR Nominal outstanding in Currency Borrowing number Value Date Interest rate Rate Maturity date Initial amount in currency of borrowing Nominal outstanding in currency of borrowing Nominal outstanding in EUR Nominal outstanding in


EUR EUR EUR EUR EUR EUR EUR EUR EUR EUR EUR EUR EUR EUR EUR EUR EUR EUR EUR EUR EUR EUR EUR EUR EUR EUR EUR EUR EUR EUR EUR EUR EUR EUR EUR EUR EUR EUR EUR EUR EUR EUR EUR EUR EUR EUR 00580100 00590100 00600100 00610100 00620100 00630100 00640100 00650100 00720100 00720200 01230100 01250100 01250200 01460100 01480100 01520100 01550100 01570100 01740100 01870200 01980100 04690100 04870100 05520100 05980100 07350100 07350200 07590100 07590200 07590300 07590400 07900100 07900200 08230100 08260100 08270100 08810100 08820100 08840100 08990100 09010100 09410100 09470100 09630100 09690100 09850100 05/08/1996 TF 05/08/1996 TF 05/08/1996 TF 05/08/1996 TF 05/08/1996 TF 05/08/1996 TF 05/08/1996 TF 05/08/1996 TF 31/10/1996 TF 07/01/1997 TF 11/02/1998 TF 17/02/1998 TF 13/02/1998 TF 16/11/1998 TV 11/11/1998 TV 22/01/1999 TF 05/02/1999 TF 26/02/1999 TF 17/09/1999 TF 15/03/2000 TF 04/09/2000 TF 25/04/2003 TF 02/06/2003 TF 01/08/2003 TV 25/09/2003 TF 15/07/2004 TF 06/07/2005 TF 30/09/2004 TV 25/01/2005 TV 18/12/2006 TV 15/02/2007 TV 26/11/2004 TV 11/02/2005 TV 25/02/2005 TV 16/03/2005 TV 24/03/2005 TV 18/05/2005 TF 08/06/2005 TV 22/06/2005 TV 15/07/2005 TV 15/07/2005 TV 17/08/2005 TV 16/09/2005 TV 13/10/2005 TV 04/11/2005 TV 10/10/2005 TV 8.32 8.34 8.35 8.36 8.37 8.38 8.39 8.40 6.92 6.88 5.50 5.63 5.63 10.17 -0.07 4.02 2.41 5.08 5.41 6.06 5.88 5.07 4.75 3.62 5.18 4.63 4.63 0.00 0.00 0.00 0.00 0.00 0.00 1.30 0.74 0.53 4.00 0.77 1.50 1.25 0.96 0.84 4.12 1.10 1.56 1.07 30/06/2019 30/06/2020 30/06/2021 30/06/2022 30/06/2023 30/06/2024 30/06/2025 30/06/2040 05/11/2026 05/11/2026 15/02/2018 15/02/2028 15/02/2028 20/11/2018 16/11/2018 22/01/2029 05/02/2019 26/02/2029 17/09/2029 15/03/2030 04/09/2030 25/04/2023 02/06/2023 01/08/2023 25/09/2028 15/04/2020 15/04/2020 25/01/2020 25/01/2020 25/01/2020 25/01/2020 30/10/2034 30/10/2034 25/02/2020 16/03/2020 24/03/2020 15/10/2037 08/06/2020 22/06/2020 15/07/2020 15/07/2020 17/08/2030 16/09/2030 13/10/2025 04/11/2020 10/10/2020 -6,310,627.10 -6,310,627.10 -6,010,121.04 -5,709,614.99 -5,409,108.94 -5,409,108.94 -5,409,108.94 -51,086,028.87 -68,615,370.46 -35,279,139.80 -516,400,000.00 -386,400,000.00 -74,400,000.00 -143,485,051.98 -37,115,691.51 -200,000,000.00 -150,000,000.00 -75,000,000.00 -25,700,000.00 -171,170,000.00 -26,985,000.00 -16,048,263.96 -49,790,878.31 -100,000,000.00 -25,358,992.23 -4,000,000,000.00 -1,000,000,000.00 -1,000,000,000.00 -250,000,000.00 -250,000,000.00 -150,000,000.00 -30,000,000.00 -20,000,000.00 -200,000,000.00 -100,000,000.00 -135,000,000.00 -5,000,000,000.00 -150,000,000.00 -100,000,000.00 -100,000,000.00 -100,000,000.00 -125,000,000.00 -100,000,000.00 -70,000,000.00 -50,000,000.00 -100,000,000.00 -6,310,627.10 -6,310,627.10 -6,010,121.04 -5,709,614.99 -5,409,108.94 -5,409,108.94 -5,409,108.94 -51,086,028.87 -68,615,370.46 -35,279,139.80 -516,400,000.00 -386,400,000.00 -74,400,000.00 -111,930,707.90 -26,452,922.37 -163,375,000.00 -125,342,000.00 -57,000,000.00 -25,700,000.00 -105,392,964.20 -26,985,000.00 -16,048,263.96 -49,790,878.31 -100,000,000.00 -51,354,728.85 -4,000,000,000.00 -1,000,000,000.00 -597,500,000.00 -250,000,000.00 -250,000,000.00 -150,000,000.00 -30,000,000.00 -20,000,000.00 -200,000,000.00 -36,491,000.00 -107,195,000.00 -5,000,000,000.00 -103,404,000.00 -89,879,000.00 -34,000,000.00 -78,379,000.00 -93,882,000.00 -61,448,000.00 -70,000,000.00 -32,180,000.00 -17,787,000.00 -6,310,627.10 -6,310,627.10 -6,010,121.04 -5,709,614.99 -5,409,108.94 -5,409,108.94 -5,409,108.94 -51,086,028.87 -68,615,370.46 -35,279,139.80 -516,400,000.00 -386,400,000.00 -74,400,000.00 -111,930,707.90 -26,452,922.37 -163,375,000.00 -125,342,000.00 -57,000,000.00 -25,700,000.00 -105,392,964.20 -26,985,000.00 -16,048,263.96 -49,790,878.31 -100,000,000.00 -51,354,728.85 -4,000,000,000.00 -1,000,000,000.00 -597,500,000.00 -250,000,000.00 -250,000,000.00 -150,000,000.00 -30,000,000.00 -20,000,000.00 -200,000,000.00 -36,491,000.00 -107,195,000.00 -5,000,000,000.00 -103,404,000.00 -89,879,000.00 -34,000,000.00 -78,379,000.00 -93,882,000.00 -61,448,000.00 -70,000,000.00 -32,180,000.00 -17,787,000.00 -7,568,335.08 -7,568,335.08 -7,207,938.16 -6,847,541.26 -6,487,144.35 -6,487,144.35 -6,487,144.35 -61,267,474.42 -82,290,413.79 -42,310,272.36 -619,318,520.00 -463,409,520.00 -89,227,920.00 -134,238,497.98 -31,724,989.80 -195,935,637.50 -150,322,660.60 -68,360,100.00 -30,822,010.00 -126,397,781.97 -32,363,110.50 -19,246,682.97 -59,714,200.36 -119,930,000.00 -61,589,726.31 -4,797,200,000.00 -1,199,300,000.00 -716,581,750.00 -299,825,000.00 -299,825,000.00 -179,895,000.00 -35,979,000.00 -23,986,000.00 -239,860,000.00 -43,763,656.30 -128,558,963.50 -5,996,500,000.00 -124,012,417.20 -107,791,884.70 -40,776,200.00 -93,999,934.70 -112,592,682.60 -73,694,586.40 -83,951,000.00 -38,593,474.00 -21,331,949.10 5


EUR EUR EUR EUR EUR EUR EUR EUR EUR EUR EUR EUR EUR EUR EUR EUR EUR EUR EUR EUR EUR EUR EUR EUR EUR EUR EUR EUR EUR EUR EUR EUR EUR EUR EUR EUR EUR EUR EUR EUR EUR EUR EUR EUR EUR EUR 09990100 12400100 12470100 12700100 12700200 12700300 12700400 12700500 12710100 12710200 12710300 12710400 12710500 12720200 12720300 12720400 12720500 12730100 12730200 12730300 12730400 12730500 12740200 13070100 13070200 13070300 13070400 13070500 14920100 14970100 14980100 15010100 15060100 15100100 15100200 15100300 15440100 15470100 15660100 15670100 15700100 15710100 15720100 15730100 15740100 15770100 18/11/2005 TV 18/09/2006 TV 22/09/2006 TF 08/01/2007 TF 20/02/2007 TF 23/07/2007 TF 08/01/2008 TF 08/10/2008 TF 08/01/2007 TF 20/02/2007 TF 23/07/2007 TF 08/01/2008 TF 08/10/2008 TF 20/02/2007 TF 23/07/2007 TF 08/01/2008 TF 08/10/2008 TF 08/01/2007 TF 20/02/2007 TF 23/07/2007 TF 08/01/2008 TF 08/10/2008 TF 20/02/2007 TF 07/03/2007 TF 23/01/2009 TF 26/03/2009 TF 16/04/2009 TF 17/02/2011 TF 08/12/2008 TV 15/01/2009 TF 02/02/2009 TF 22/01/2009 TF 06/03/2009 TF 11/02/2009 TF 03/04/2009 TF 14/01/2010 TF 20/03/2009 TF 01/04/2009 TF 06/04/2009 TF 24/04/2009 TV 09/04/2009 TF 09/04/2009 TF 09/04/2009 TF 14/04/2009 TF 14/04/2009 TF 27/04/2009 TF 0.86 1.54 4.03 1.49 1.49 1.49 1.93 1.49 1.47 1.47 1.47 1.95 1.50 1.42 1.42 1.94 1.48 1.29 1.29 1.29 1.83 1.37 1.14 4.13 4.13 4.13 4.13 4.13 0.00 4.38 4.38 4.38 3.76 4.25 4.25 4.25 5.02 4.53 4.40 0.32 4.50 4.58 4.68 4.52 4.52 4.31 18/11/2025 18/09/2031 31/12/2035 08/01/2027 08/01/2027 08/01/2027 08/01/2027 08/01/2027 08/01/2032 08/01/2032 08/01/2032 08/01/2032 08/01/2032 08/01/2037 08/01/2037 08/01/2037 08/01/2037 08/01/2047 08/01/2047 08/01/2047 08/01/2047 08/01/2047 08/01/2057 15/04/2024 15/04/2024 15/04/2024 15/04/2024 15/04/2024 20/06/2018 15/01/2029 02/02/2029 22/01/2029 20/02/2029 15/04/2019 15/04/2019 15/04/2019 20/03/2034 03/04/2029 06/04/2029 24/04/2039 09/04/2029 10/04/2028 09/04/2029 16/04/2029 16/04/2029 27/04/2024 -50,000,000.00 -20,000,000.00 -60,350,000.00 -34,777,325.00 -12,013,985.00 -48,204,720.00 -18,626,000.00 -16,070,850.00 -29,780,750.00 -15,012,000.00 -42,290,750.00 -14,172,675.00 -7,723,950.00 -20,063,490.00 -43,661,820.00 -14,311,320.00 -9,852,750.00 -24,828,550.00 -24,588,950.00 -30,758,650.00 -13,779,350.00 -10,690,350.00 -25,322,550.00 -3,000,000,000.00 -1,750,000,000.00 -500,000,000.00 -1,000,000,000.00 -1,000,000,000.00 -40,000,000.00 -60,000,000.00 -60,000,000.00 -51,000,000.00 -67,900,000.00 -2,000,000,000.00 -1,250,000,000.00 -1,750,000,000.00 -49,963,007.50 -66,000,000.00 -36,000,000.00 -100,000,000.00 -30,000,000.00 -30,000,000.00 -62,000,000.00 -52,000,000.00 -15,000,000.00 -30,000,000.00 -50,000,000.00 -20,000,000.00 -63,352,655.00 -2,759,988.39 -13,929,316.49 -55,889,765.21 -22,129,362.43 -18,364,949.23 -723,491.45 -17,363,794.35 -48,916,059.59 -16,868,922.67 -8,834,063.43 -19,111,523.03 -50,285,545.75 -17,005,683.69 -11,248,676.85 -1,386,031.76 -27,950,094.34 -34,963,150.90 -16,222,217.21 -4,267,607.69 -16,628,811.98 -3,000,000,000.00 -1,750,000,000.00 -500,000,000.00 -1,000,000,000.00 -1,000,000,000.00 -40,000,000.00 -60,000,000.00 -60,000,000.00 -51,000,000.00 -90,813,472.00 -2,000,000,000.00 -1,250,000,000.00 -1,750,000,000.00 -73,930,677.18 -66,000,000.00 -36,000,000.00 -100,000,000.00 -30,000,000.00 -30,000,000.00 -62,000,000.00 -52,000,000.00 -15,000,000.00 -30,000,000.00 -50,000,000.00 -20,000,000.00 -63,352,655.00 -2,759,988.39 -13,929,316.49 -55,889,765.21 -22,129,362.43 -18,364,949.23 -723,491.45 -17,363,794.35 -48,916,059.59 -16,868,922.67 -8,834,063.43 -19,111,523.03 -50,285,545.75 -17,005,683.69 -11,248,676.85 -1,386,031.76 -27,950,094.34 -34,963,150.90 -16,222,217.21 -4,267,607.69 -16,628,811.98 -3,000,000,000.00 -1,750,000,000.00 -500,000,000.00 -1,000,000,000.00 -1,000,000,000.00 -40,000,000.00 -60,000,000.00 -60,000,000.00 -51,000,000.00 -90,813,472.00 -2,000,000,000.00 -1,250,000,000.00 -1,750,000,000.00 -73,930,677.18 -66,000,000.00 -36,000,000.00 -100,000,000.00 -30,000,000.00 -30,000,000.00 -62,000,000.00 -52,000,000.00 -15,000,000.00 -30,000,000.00 -59,965,000.00 -23,986,000.00 -75,978,839.14 -3,310,054.08 -16,705,429.27 -67,028,595.42 -26,539,744.36 -22,025,083.61 -867,683.30 -20,824,398.56 -58,665,030.27 -20,230,898.96 -10,594,692.27 -22,920,449.57 -60,307,455.02 -20,394,916.45 -13,490,538.15 -1,662,267.89 -33,520,548.14 -41,931,306.87 -19,455,305.10 -5,118,141.91 -19,942,934.21 -3,597,900,000.00 -2,098,775,000.00 -599,650,000.00 -1,199,300,000.00 -1,199,300,000.00 -47,972,000.00 -71,958,000.00 -71,958,000.00 -61,164,300.00 -108,912,596.97 -2,398,600,000.00 -1,499,125,000.00 -2,098,775,000.00 -88,665,061.14 -79,153,800.00 -43,174,800.00 -119,930,000.00 -35,979,000.00 -35,979,000.00 -74,356,600.00 -62,363,600.00 -17,989,500.00 -35,979,000.00 6


EUR EUR EUR EUR EUR EUR EUR EUR EUR EUR EUR EUR EUR EUR EUR EUR EUR EUR EUR EUR EUR EUR EUR EUR EUR EUR EUR EUR EUR EUR EUR EUR EUR EUR EUR EUR EUR EUR EUR EUR EUR EUR EUR EUR EUR EUR 15790100 15800100 15830100 15830200 15830300 15830400 15830500 15860100 15870100 15920100 15930100 15990100 16010100 16050100 16060100 16070100 16080100 16120100 16190100 16200100 16220100 16230100 16230200 16230300 16230400 16230500 16230600 16230700 16230800 16230900 16231000 16231100 16240100 16270100 16280100 16290100 16320100 16450100 16460100 16480100 16490100 16540100 16550100 16560100 16600100 16660100 27/04/2009 TF 28/04/2009 TF 07/05/2009 TF 03/06/2009 TF 17/06/2009 TF 23/03/2010 TF 12/04/2011 TF 20/05/2009 TF 20/05/2009 TF 29/05/2009 TF 03/06/2009 TF 08/06/2009 TF 02/07/2009 TF 17/06/2009 TF 22/06/2009 TV 19/06/2009 TF 22/06/2009 TF 21/07/2009 TF 07/08/2009 TF 07/08/2009 TF 20/08/2009 TF 03/09/2009 TV 14/10/2009 TV 15/01/2010 TV 21/05/2012 TV 14/09/2012 TV 06/03/2013 TV 01/08/2013 TV 07/10/2013 TV 04/02/2014 TV 16/05/2014 TV 03/06/2014 TV 10/09/2009 TF 01/10/2009 TV 15/10/2009 TV 15/10/2009 TV 08/10/2009 TF 18/11/2009 TF 23/11/2009 TF 23/11/2009 TF 26/11/2009 TF 27/11/2009 TF 11/12/2009 TF 11/12/2009 TF 15/01/2010 TF 20/01/2010 TF 4.31 4.43 4.50 4.50 4.50 4.50 4.50 4.65 4.55 4.62 4.67 4.65 4.85 4.70 0.28 4.66 4.66 4.69 4.51 4.53 4.44 0.00 0.00 0.00 0.00 0.00 0.00 0.00 0.00 0.00 0.00 0.00 4.00 1.81 0.00 0.00 4.43 4.44 4.18 4.24 4.22 4.28 4.20 4.06 4.32 4.58 27/04/2024 27/04/2029 15/10/2025 15/10/2025 15/10/2025 15/10/2025 15/10/2025 20/05/2027 20/05/2024 29/05/2031 03/06/2031 08/06/2028 02/07/2029 17/06/2030 22/06/2039 19/06/2034 22/06/2033 21/07/2034 07/08/2034 07/08/2034 20/08/2029 15/01/2020 15/01/2020 15/01/2020 15/01/2020 15/01/2020 15/01/2020 15/01/2020 15/01/2020 15/01/2020 15/01/2020 15/01/2020 10/09/2024 01/10/2029 26/11/2025 29/10/2024 08/10/2029 21/11/2039 23/11/2027 23/11/2029 26/11/2030 28/11/2039 12/12/2039 11/12/2029 16/01/2040 20/01/2040 -20,000,000.00 -30,000,000.00 -3,500,000,000.00 -1,000,000,000.00 -500,000,000.00 -1,750,000,000.00 -1,000,000,000.00 -500,000,000.00 -500,000,000.00 -53,000,000.00 -51,000,000.00 -40,000,000.00 -40,000,000.00 -65,000,000.00 -100,000,000.00 -50,000,000.00 -50,000,000.00 -64,000,000.00 -52,000,000.00 -50,000,000.00 -50,000,000.00 -1,000,000,000.00 -500,000,000.00 -250,000,000.00 -250,000,000.00 -500,000,000.00 -350,000,000.00 -250,000,000.00 -250,000,000.00 -250,000,000.00 -350,000,000.00 -250,000,000.00 -50,000,000.00 -60,000,000.00 -40,000,000.00 -60,000,000.00 -42,023,714.75 -60,000,000.00 -100,000,000.00 -100,000,000.00 -40,000,000.00 -50,000,000.00 -60,000,000.00 -70,000,000.00 -50,000,000.00 -49,970,034.98 -20,000,000.00 -30,000,000.00 -3,500,000,000.00 -1,000,000,000.00 -500,000,000.00 -1,750,000,000.00 -1,000,000,000.00 -500,000,000.00 -500,000,000.00 -53,000,000.00 -51,000,000.00 -40,000,000.00 -40,000,000.00 -65,000,000.00 -100,000,000.00 -71,980,663.82 -71,980,663.82 -64,000,000.00 -52,000,000.00 -50,000,000.00 -70,779,079.39 -1,000,000,000.00 -500,000,000.00 -250,000,000.00 -250,000,000.00 -500,000,000.00 -350,000,000.00 -250,000,000.00 -250,000,000.00 -250,000,000.00 -350,000,000.00 -250,000,000.00 -50,000,000.00 -60,000,000.00 -40,000,000.00 -60,000,000.00 -59,442,444.89 -60,000,000.00 -100,000,000.00 -100,000,000.00 -40,000,000.00 -50,000,000.00 -60,000,000.00 -70,000,000.00 -50,000,000.00 -68,367,565.59 -20,000,000.00 -30,000,000.00 -3,500,000,000.00 -1,000,000,000.00 -500,000,000.00 -1,750,000,000.00 -1,000,000,000.00 -500,000,000.00 -500,000,000.00 -53,000,000.00 -51,000,000.00 -40,000,000.00 -40,000,000.00 -65,000,000.00 -100,000,000.00 -71,980,663.82 -71,980,663.82 -64,000,000.00 -52,000,000.00 -50,000,000.00 -70,779,079.39 -1,000,000,000.00 -500,000,000.00 -250,000,000.00 -250,000,000.00 -500,000,000.00 -350,000,000.00 -250,000,000.00 -250,000,000.00 -250,000,000.00 -350,000,000.00 -250,000,000.00 -50,000,000.00 -60,000,000.00 -40,000,000.00 -60,000,000.00 -59,442,444.89 -60,000,000.00 -100,000,000.00 -100,000,000.00 -40,000,000.00 -50,000,000.00 -60,000,000.00 -70,000,000.00 -50,000,000.00 -68,367,565.59 -23,986,000.00 -35,979,000.00 -4,197,550,000.00 -1,199,300,000.00 -599,650,000.00 -2,098,775,000.00 -1,199,300,000.00 -599,650,000.00 -599,650,000.00 -63,562,900.00 -61,164,300.00 -47,972,000.00 -47,972,000.00 -77,954,500.00 -119,930,000.00 -86,326,410.12 -86,326,410.12 -76,755,200.00 -62,363,600.00 -59,965,000.00 -84,885,349.91 -1,199,300,000.00 -599,650,000.00 -299,825,000.00 -299,825,000.00 -599,650,000.00 -419,755,000.00 -299,825,000.00 -299,825,000.00 -299,825,000.00 -419,755,000.00 -299,825,000.00 -59,965,000.00 -71,958,000.00 -47,972,000.00 -71,958,000.00 -71,289,324.16 -71,958,000.00 -119,930,000.00 -119,930,000.00 -47,972,000.00 -59,965,000.00 -71,958,000.00 -83,951,000.00 -59,965,000.00 -81,993,221.41 7


EUR EUR EUR EUR EUR EUR EUR EUR EUR EUR EUR EUR EUR EUR EUR EUR EUR EUR EUR EUR EUR EUR EUR EUR EUR EUR EUR EUR EUR EUR EUR EUR EUR EUR EUR EUR EUR EUR EUR EUR EUR EUR EUR EUR EUR EUR 16680100 16730100 16730200 16730300 16730400 16730500 16730600 16730700 16730800 16840100 17020100 17120100 17120200 17120300 17120400 17150100 17150200 17150300 17150400 17150500 17210100 17220100 17230100 17250100 17350100 17350200 17350300 17350400 17350500 17350600 17350700 17350800 17390100 17400100 17610100 17630100 17640100 17640200 17640300 17640400 17640500 17640600 17640700 17640800 17640900 17641000 04/02/2010 TF 04/02/2010 TV 28/06/2010 TV 11/02/2011 TV 10/05/2012 TV 11/10/2012 TV 23/01/2014 TV 12/02/2014 TV 27/02/2014 TV 03/03/2010 TF 06/04/2010 TF 16/04/2010 TV 28/04/2010 TV 04/06/2010 TV 12/05/2014 TV 29/04/2010 TF 17/01/2011 TF 13/07/2011 TF 15/02/2012 TF 15/06/2012 TF 18/05/2010 TF 18/05/2010 TF 21/05/2010 TF 04/06/2010 TF 16/06/2010 TF 22/07/2010 TF 23/08/2010 TF 29/11/2010 TF 13/03/2012 TF 27/06/2012 TF 25/10/2012 TF 19/02/2016 TF 01/07/2010 TF 06/08/2010 TF 13/09/2010 TF 16/09/2010 TF 16/09/2010 TF 03/11/2010 TF 16/11/2010 TF 03/03/2011 TF 24/08/2011 TF 15/05/2012 TF 28/06/2012 TF 12/11/2012 TF 16/04/2013 TF 12/02/2014 TF 4.12 0.00 0.00 0.00 0.00 0.00 0.00 0.00 0.00 4.02 4.45 0.00 0.00 0.00 0.00 4.00 4.00 4.00 4.00 4.00 3.75 4.45 4.50 3.72 2.63 2.63 2.63 2.63 2.63 2.63 2.63 2.63 4.43 3.10 3.17 3.03 2.50 2.50 2.50 2.50 2.50 2.50 2.50 2.50 2.50 2.50 04/02/2030 15/01/2018 15/01/2018 15/01/2018 15/01/2018 15/01/2018 15/01/2018 15/01/2018 15/01/2018 03/03/2028 06/04/2040 16/04/2025 16/04/2025 16/04/2025 16/04/2025 15/04/2030 15/04/2030 15/04/2030 15/04/2030 15/04/2030 19/05/2031 18/05/2040 21/05/2040 04/06/2032 15/03/2018 15/03/2018 15/03/2018 15/03/2018 15/03/2018 15/03/2018 15/03/2018 15/03/2018 01/07/2050 06/08/2018 13/09/2034 16/09/2037 16/09/2019 16/09/2019 16/09/2019 16/09/2019 16/09/2019 16/09/2019 16/09/2019 16/09/2019 16/09/2019 16/09/2019 -50,000,000.00 -600,000,000.00 -400,000,000.00 -500,000,000.00 -300,000,000.00 -250,000,000.00 -350,000,000.00 -250,000,000.00 -300,000,000.00 -90,000,000.00 -50,109,307.27 -50,000,000.00 -95,000,000.00 -100,000,000.00 -55,000,000.00 -3,000,000,000.00 -500,000,000.00 -1,000,000,000.00 -1,000,000,000.00 -1,000,000,000.00 -50,000,000.00 -50,181,322.36 -50,196,002.92 -50,000,000.00 -750,000,000.00 -250,000,000.00 -250,000,000.00 -250,000,000.00 -500,000,000.00 -250,000,000.00 -650,000,000.00 -300,000,000.00 -60,512,730.31 -34,519,000.00 -47,284,376.53 -44,666,312.99 -1,000,000,000.00 -250,000,000.00 -500,000,000.00 -250,000,000.00 -500,000,000.00 -250,000,000.00 -650,000,000.00 -500,000,000.00 -300,000,000.00 -250,000,000.00 -50,000,000.00 -600,000,000.00 -400,000,000.00 -500,000,000.00 -300,000,000.00 -250,000,000.00 -350,000,000.00 -250,000,000.00 -300,000,000.00 -90,000,000.00 -67,963,777.44 -50,000,000.00 -95,000,000.00 -100,000,000.00 -55,000,000.00 -3,000,000,000.00 -500,000,000.00 -1,000,000,000.00 -1,000,000,000.00 -1,000,000,000.00 -50,000,000.00 -68,038,648.94 -68,309,824.41 -50,000,000.00 -750,000,000.00 -250,000,000.00 -250,000,000.00 -250,000,000.00 -500,000,000.00 -250,000,000.00 -650,000,000.00 -300,000,000.00 -81,936,637.25 -5,423,800.00 -58,829,029.08 -55,046,030.15 -1,000,000,000.00 -250,000,000.00 -500,000,000.00 -250,000,000.00 -500,000,000.00 -250,000,000.00 -650,000,000.00 -500,000,000.00 -300,000,000.00 -250,000,000.00 -50,000,000.00 -600,000,000.00 -400,000,000.00 -500,000,000.00 -300,000,000.00 -250,000,000.00 -350,000,000.00 -250,000,000.00 -300,000,000.00 -90,000,000.00 -67,963,777.44 -50,000,000.00 -95,000,000.00 -100,000,000.00 -55,000,000.00 -3,000,000,000.00 -500,000,000.00 -1,000,000,000.00 -1,000,000,000.00 -1,000,000,000.00 -50,000,000.00 -68,038,648.94 -68,309,824.41 -50,000,000.00 -750,000,000.00 -250,000,000.00 -250,000,000.00 -250,000,000.00 -500,000,000.00 -250,000,000.00 -650,000,000.00 -300,000,000.00 -81,936,637.25 -5,423,800.00 -58,829,029.08 -55,046,030.15 -1,000,000,000.00 -250,000,000.00 -500,000,000.00 -250,000,000.00 -500,000,000.00 -250,000,000.00 -650,000,000.00 -500,000,000.00 -300,000,000.00 -250,000,000.00 -59,965,000.00 -719,580,000.00 -479,720,000.00 -599,650,000.00 -359,790,000.00 -299,825,000.00 -419,755,000.00 -299,825,000.00 -359,790,000.00 -107,937,000.00 -81,508,958.28 -59,965,000.00 -113,933,500.00 -119,930,000.00 -65,961,500.00 -3,597,900,000.00 -599,650,000.00 -1,199,300,000.00 -1,199,300,000.00 -1,199,300,000.00 -59,965,000.00 -81,598,751.67 -81,923,972.41 -59,965,000.00 -899,475,000.00 -299,825,000.00 -299,825,000.00 -299,825,000.00 -599,650,000.00 -299,825,000.00 -779,545,000.00 -359,790,000.00 -98,266,609.05 -6,504,763.34 -70,553,654.58 -66,016,703.96 -1,199,300,000.00 -299,825,000.00 -599,650,000.00 -299,825,000.00 -599,650,000.00 -299,825,000.00 -779,545,000.00 -599,650,000.00 -359,790,000.00 -299,825,000.00 8


EUR EUR EUR EUR EUR EUR EUR EUR EUR EUR EUR EUR EUR EUR EUR EUR EUR EUR EUR EUR EUR EUR EUR EUR EUR EUR EUR EUR EUR EUR EUR EUR EUR EUR EUR EUR EUR EUR EUR EUR EUR EUR EUR EUR EUR EUR 17641100 17650100 17690100 17690200 17690300 17690400 17690500 17690600 17690700 17690800 17690900 17691000 17691100 17691200 17691300 17691400 17691500 18020100 18030100 18050100 18160100 18160200 18160300 18160400 18370100 18540100 18620100 18700100 18740100 18740200 18740300 18740400 18740500 18740600 18760100 18760200 18760300 18760400 18810100 18810200 18960100 18970100 19020100 19040100 19050100 19060100 14/02/2014 TF 01/10/2010 TF 28/09/2010 TF 25/11/2010 TF 09/02/2011 TF 02/03/2011 TF 17/05/2011 TF 18/08/2011 TF 25/08/2011 TF 26/01/2012 TF 06/02/2012 TF 09/03/2012 TF 20/06/2012 TF 06/02/2013 TF 10/05/2013 TF 18/08/2016 TF 31/08/2016 TF 04/02/2011 TF 14/02/2011 TF 17/02/2011 TV 17/03/2011 TF 20/04/2011 TF 27/05/2011 TF 04/07/2011 TF 25/05/2011 TF 07/07/2011 TF 25/07/2011 TF 12/08/2011 TV 29/08/2011 TF 10/02/2012 TF 07/03/2012 TF 11/05/2012 TF 22/04/2013 TF 22/05/2013 TF 13/09/2011 TF 04/07/2012 TF 27/08/2012 TF 24/10/2013 TF 18/10/2011 TF 01/02/2012 TF 02/02/2012 TF 02/02/2012 TF 15/02/2012 TF 01/03/2012 TF 01/03/2012 TF 21/02/2012 TF 2.50 4.15 3.00 3.00 3.00 3.00 3.00 3.00 3.00 3.00 3.00 3.00 3.00 3.00 3.00 3.00 3.00 4.14 4.56 1.26 3.63 3.63 3.63 3.63 3.96 0.50 4.65 0.00 2.50 2.50 2.50 2.50 2.50 2.50 2.75 2.75 2.75 2.75 2.50 2.50 4.07 4.37 4.00 3.50 4.02 2.63 16/09/2019 30/09/2050 28/09/2022 28/09/2022 28/09/2022 28/09/2022 28/09/2022 28/09/2022 28/09/2022 28/09/2022 28/09/2022 28/09/2022 28/09/2022 28/09/2022 28/09/2022 28/09/2022 28/09/2022 04/02/2031 14/02/2051 17/02/2031 15/01/2021 15/01/2021 15/01/2021 15/01/2021 25/05/2036 07/07/2021 25/07/2051 12/08/2031 15/03/2019 15/03/2019 15/03/2019 15/03/2019 15/03/2019 15/03/2019 15/09/2021 15/09/2021 15/09/2021 15/09/2021 15/10/2018 15/10/2018 02/02/2052 02/02/2052 15/02/2052 01/03/2032 01/03/2052 16/03/2020 -250,000,000.00 -50,143,840.18 -1,000,000,000.00 -250,000,000.00 -500,000,000.00 -250,000,000.00 -500,000,000.00 -500,000,000.00 -250,000,000.00 -500,000,000.00 -250,000,000.00 -250,000,000.00 -300,000,000.00 -250,000,000.00 -250,000,000.00 -300,000,000.00 -250,000,000.00 -50,000,000.00 -50,000,000.00 -200,000,000.00 -3,000,000,000.00 -1,000,000,000.00 -1,500,000,000.00 -1,000,000,000.00 -40,000,000.00 -35,000,000.00 -60,391,201.68 -50,000,000.00 -1,000,000,000.00 -500,000,000.00 -500,000,000.00 -400,000,000.00 -250,000,000.00 -250,000,000.00 -3,000,000,000.00 -1,000,000,000.00 -1,000,000,000.00 -1,000,000,000.00 -3,000,000,000.00 -2,000,000,000.00 -25,141,981.51 -31,984,968.54 -49,989,372.00 -29,000,000.00 -25,629,946.97 -1,000,000,000.00 -250,000,000.00 -66,647,540.77 -1,000,000,000.00 -250,000,000.00 -500,000,000.00 -250,000,000.00 -500,000,000.00 -500,000,000.00 -250,000,000.00 -500,000,000.00 -250,000,000.00 -250,000,000.00 -300,000,000.00 -250,000,000.00 -250,000,000.00 -300,000,000.00 -250,000,000.00 -50,000,000.00 -65,318,897.00 -200,000,000.00 -3,000,000,000.00 -1,000,000,000.00 -1,500,000,000.00 -1,000,000,000.00 -50,496,074.40 -35,000,000.00 -79,324,811.28 -50,000,000.00 -1,000,000,000.00 -500,000,000.00 -500,000,000.00 -400,000,000.00 -250,000,000.00 -250,000,000.00 -3,000,000,000.00 -1,000,000,000.00 -1,000,000,000.00 -1,000,000,000.00 -3,000,000,000.00 -2,000,000,000.00 -30,692,147.42 -39,611,778.80 -60,819,712.80 -29,000,000.00 -31,212,744.32 -1,000,000,000.00 -250,000,000.00 -66,647,540.77 -1,000,000,000.00 -250,000,000.00 -500,000,000.00 -250,000,000.00 -500,000,000.00 -500,000,000.00 -250,000,000.00 -500,000,000.00 -250,000,000.00 -250,000,000.00 -300,000,000.00 -250,000,000.00 -250,000,000.00 -300,000,000.00 -250,000,000.00 -50,000,000.00 -65,318,897.00 -200,000,000.00 -3,000,000,000.00 -1,000,000,000.00 -1,500,000,000.00 -1,000,000,000.00 -50,496,074.40 -35,000,000.00 -79,324,811.28 -50,000,000.00 -1,000,000,000.00 -500,000,000.00 -500,000,000.00 -400,000,000.00 -250,000,000.00 -250,000,000.00 -3,000,000,000.00 -1,000,000,000.00 -1,000,000,000.00 -1,000,000,000.00 -3,000,000,000.00 -2,000,000,000.00 -30,692,147.42 -39,611,778.80 -60,819,712.80 -29,000,000.00 -31,212,744.32 -1,000,000,000.00 -299,825,000.00 -79,930,395.64 -1,199,300,000.00 -299,825,000.00 -599,650,000.00 -299,825,000.00 -599,650,000.00 -599,650,000.00 -299,825,000.00 -599,650,000.00 -299,825,000.00 -299,825,000.00 -359,790,000.00 -299,825,000.00 -299,825,000.00 -359,790,000.00 -299,825,000.00 -59,965,000.00 -78,336,953.17 -239,860,000.00 -3,597,900,000.00 -1,199,300,000.00 -1,798,950,000.00 -1,199,300,000.00 -60,559,942.03 -41,975,500.00 -95,134,246.17 -59,965,000.00 -1,199,300,000.00 -599,650,000.00 -599,650,000.00 -479,720,000.00 -299,825,000.00 -299,825,000.00 -3,597,900,000.00 -1,199,300,000.00 -1,199,300,000.00 -1,199,300,000.00 -3,597,900,000.00 -2,398,600,000.00 -36,809,092.40 -47,506,406.31 -72,941,081.56 -34,779,700.00 -37,433,444.26 -1,199,300,000.00 9


EUR EUR EUR EUR EUR EUR EUR EUR EUR EUR EUR EUR EUR EUR EUR EUR EUR EUR EUR EUR EUR EUR EUR EUR EUR EUR EUR EUR EUR EUR EUR EUR EUR EUR EUR EUR EUR EUR EUR EUR EUR EUR EUR EUR EUR EUR 19060200 19060300 19060400 19060500 19060600 19060700 19080100 19090100 19160100 19180100 19190100 19190200 19220100 19220200 19220300 19220400 19220500 19220600 19220700 19220800 19250100 19250200 19250300 19250400 19250500 19250600 19250700 19300100 19330100 19370100 19390100 19430100 19450100 19450200 19450300 19450400 19450500 19450600 19450700 19450800 19450900 19451000 19451100 19451200 19451300 19451400 24/05/2012 TF 18/06/2012 TF 23/08/2012 TF 15/11/2012 TF 15/05/2013 TF 07/10/2015 TF 05/03/2012 TF 02/03/2012 TF 02/04/2012 TF 14/03/2012 TF 14/03/2012 TF 29/05/2012 TF 29/03/2012 TV 19/10/2012 TV 14/11/2012 TV 27/03/2013 TV 11/04/2013 TV 28/03/2014 TV 27/05/2014 TV 20/06/2014 TV 03/04/2012 TV 25/04/2012 TV 29/06/2012 TV 07/09/2012 TV 26/09/2012 TV 27/02/2013 TV 22/01/2014 TV 23/04/2012 TF 29/05/2012 TF 28/06/2012 TF 04/07/2012 TF 26/07/2012 TF 23/07/2012 TF 31/08/2012 TF 17/09/2012 TF 26/10/2012 TF 17/01/2013 TF 11/02/2013 TF 10/05/2013 TF 05/08/2013 TF 07/08/2013 TF 21/01/2014 TF 08/05/2014 TF 22/05/2014 TF 24/07/2015 TF 12/08/2015 TF 2.63 2.63 2.63 2.63 2.63 2.63 4.20 3.63 4.10 4.23 3.50 3.50 0.17 0.17 0.17 0.17 0.17 0.17 0.17 0.17 0.05 0.05 0.05 0.05 0.05 0.05 0.05 4.00 3.75 2.97 0.92 3.55 2.75 2.75 2.75 2.75 2.75 2.75 2.75 2.75 2.75 2.75 2.75 2.75 2.75 2.75 16/03/2020 16/03/2020 16/03/2020 16/03/2020 16/03/2020 16/03/2020 05/03/2052 14/03/2042 02/04/2052 14/03/2052 15/04/2027 15/04/2027 04/01/2022 04/01/2022 04/01/2022 04/01/2022 04/01/2022 04/01/2022 04/01/2022 04/01/2022 15/01/2019 15/01/2019 15/01/2019 15/01/2019 15/01/2019 15/01/2019 15/01/2019 23/04/2052 29/05/2052 30/06/2042 30/06/2026 26/07/2052 15/09/2025 15/09/2025 15/09/2025 15/09/2025 15/09/2025 15/09/2025 15/09/2025 15/09/2025 15/09/2025 15/09/2025 15/09/2025 15/09/2025 15/09/2025 15/09/2025 -250,000,000.00 -350,000,000.00 -500,000,000.00 -750,000,000.00 -300,000,000.00 -250,000,000.00 -70,016,089.77 -1,000,000,000.00 -40,086,747.01 -110,803,078.20 -3,000,000,000.00 -1,000,000,000.00 -300,000,000.00 -250,000,000.00 -250,000,000.00 -250,000,000.00 -250,000,000.00 -250,000,000.00 -250,000,000.00 -250,000,000.00 -300,000,000.00 -250,000,000.00 -250,000,000.00 -250,000,000.00 -250,000,000.00 -250,000,000.00 -250,000,000.00 -60,000,000.00 -40,134,127.25 -50,000,000.00 -307,908,615.79 -50,043,447.68 -500,000,000.00 -350,000,000.00 -250,000,000.00 -500,000,000.00 -450,000,000.00 -250,000,000.00 -350,000,000.00 -250,000,000.00 -900,000,000.00 -250,000,000.00 -300,000,000.00 -500,000,000.00 -250,000,000.00 -250,000,000.00 -250,000,000.00 -350,000,000.00 -500,000,000.00 -750,000,000.00 -300,000,000.00 -250,000,000.00 -86,007,524.79 -1,000,000,000.00 -49,006,587.57 -136,273,482.40 -3,000,000,000.00 -1,000,000,000.00 -300,000,000.00 -250,000,000.00 -250,000,000.00 -250,000,000.00 -250,000,000.00 -250,000,000.00 -250,000,000.00 -250,000,000.00 -300,000,000.00 -250,000,000.00 -250,000,000.00 -250,000,000.00 -250,000,000.00 -250,000,000.00 -250,000,000.00 -72,999,174.00 -48,245,228.50 -50,000,000.00 -167,118,744.60 -59,579,621.24 -500,000,000.00 -350,000,000.00 -250,000,000.00 -500,000,000.00 -450,000,000.00 -250,000,000.00 -350,000,000.00 -250,000,000.00 -900,000,000.00 -250,000,000.00 -300,000,000.00 -500,000,000.00 -250,000,000.00 -250,000,000.00 -250,000,000.00 -350,000,000.00 -500,000,000.00 -750,000,000.00 -300,000,000.00 -250,000,000.00 -86,007,524.79 -1,000,000,000.00 -49,006,587.57 -136,273,482.40 -3,000,000,000.00 -1,000,000,000.00 -300,000,000.00 -250,000,000.00 -250,000,000.00 -250,000,000.00 -250,000,000.00 -250,000,000.00 -250,000,000.00 -250,000,000.00 -300,000,000.00 -250,000,000.00 -250,000,000.00 -250,000,000.00 -250,000,000.00 -250,000,000.00 -250,000,000.00 -72,999,174.00 -48,245,228.50 -50,000,000.00 -167,118,744.60 -59,579,621.24 -500,000,000.00 -350,000,000.00 -250,000,000.00 -500,000,000.00 -450,000,000.00 -250,000,000.00 -350,000,000.00 -250,000,000.00 -900,000,000.00 -250,000,000.00 -300,000,000.00 -500,000,000.00 -250,000,000.00 -250,000,000.00 -299,825,000.00 -419,755,000.00 -599,650,000.00 -899,475,000.00 -359,790,000.00 -299,825,000.00 -103,148,824.48 -1,199,300,000.00 -58,773,600.47 -163,432,787.44 -3,597,900,000.00 -1,199,300,000.00 -359,790,000.00 -299,825,000.00 -299,825,000.00 -299,825,000.00 -299,825,000.00 -299,825,000.00 -299,825,000.00 -299,825,000.00 -359,790,000.00 -299,825,000.00 -299,825,000.00 -299,825,000.00 -299,825,000.00 -299,825,000.00 -299,825,000.00 -87,547,909.38 -57,860,502.54 -59,965,000.00 -200,425,510.40 -71,453,839.75 -599,650,000.00 -419,755,000.00 -299,825,000.00 -599,650,000.00 -539,685,000.00 -299,825,000.00 -419,755,000.00 -299,825,000.00 -1,079,370,000.00 -299,825,000.00 -359,790,000.00 -599,650,000.00 -299,825,000.00 -299,825,000.00 10


EUR EUR EUR EUR EUR EUR EUR EUR EUR EUR EUR EUR EUR EUR EUR EUR EUR EUR EUR EUR EUR EUR EUR EUR EUR EUR EUR EUR EUR EUR EUR EUR EUR EUR EUR EUR EUR EUR EUR EUR EUR EUR EUR EUR EUR EUR 19451500 19451600 19451700 19470100 19530100 19530200 19530300 19610100 19630100 19640100 19670100 19680100 19690100 19690200 19690300 19690400 19690500 19690600 19690700 19690800 19690900 19810100 19810200 19810300 19810400 19810500 19840100 19910100 19910200 19910300 19910400 19910500 19920100 20000100 20000200 20000300 20020100 20020200 20020300 20020400 20020500 20030100 20050100 20050200 20050300 20050400 08/03/2016 TF 07/02/2017 TF 05/05/2017 TF 14/08/2012 TF 25/09/2012 TF 16/01/2013 TF 17/04/2013 TF 19/11/2012 TF 13/11/2012 TF 26/11/2012 TF 04/12/2012 TF 29/11/2012 TF 27/11/2012 TF 18/01/2013 TF 08/05/2013 TF 13/08/2013 TF 29/08/2013 TF 13/05/2015 TF 04/06/2015 TF 15/07/2015 TF 14/10/2015 TF 23/01/2013 TF 14/05/2013 TF 13/08/2013 TF 22/10/2013 TF 26/08/2014 TF 24/01/2013 TF 05/02/2013 TF 26/02/2013 TF 19/06/2013 TF 22/08/2013 TF 14/08/2014 TF 11/02/2013 TF 13/03/2013 TF 23/04/2013 TF 09/04/2014 TF 21/03/2013 TV 21/10/2013 TV 21/01/2014 TV 30/05/2014 TV 17/06/2014 TV 21/03/2013 TF 18/04/2013 TF 22/08/2013 TF 27/08/2013 TF 17/02/2014 TF 2.75 2.75 2.75 2.22 2.25 2.25 2.25 2.95 2.44 2.90 2.18 3.55 1.38 1.38 1.38 1.38 1.38 1.38 1.38 1.38 1.38 2.63 2.63 2.63 2.63 2.63 1.00 2.75 2.75 2.75 2.75 2.75 3.80 1.50 1.50 1.50 0.00 0.00 0.00 0.00 0.00 2.82 1.38 1.38 1.38 1.38 15/09/2025 15/09/2025 15/09/2025 14/08/2024 14/10/2022 14/10/2022 14/10/2022 19/11/2042 01/04/2025 26/11/2043 04/12/2024 29/11/2052 15/09/2020 15/09/2020 15/09/2020 15/09/2020 15/09/2020 15/09/2020 15/09/2020 15/09/2020 15/09/2020 15/03/2035 15/03/2035 15/03/2035 15/03/2035 15/03/2035 13/07/2018 15/03/2040 15/03/2040 15/03/2040 15/03/2040 15/03/2040 11/02/2053 15/07/2020 15/07/2020 15/07/2020 15/01/2021 15/01/2021 15/01/2021 15/01/2021 15/01/2021 23/03/2048 15/09/2021 15/09/2021 15/09/2021 15/09/2021 -400,000,000.00 -350,000,000.00 -300,000,000.00 -150,000,000.00 -3,000,000,000.00 -1,500,000,000.00 -1,250,000,000.00 -225,000,000.00 -120,000,000.00 -75,000,000.00 -50,000,000.00 -50,043,447.68 -500,000,000.00 -500,000,000.00 -250,000,000.00 -450,000,000.00 -300,000,000.00 -300,000,000.00 -450,000,000.00 -300,000,000.00 -500,000,000.00 -500,000,000.00 -350,000,000.00 -250,000,000.00 -300,000,000.00 -300,000,000.00 -5,000,000,000.00 -850,000,000.00 -250,000,000.00 -250,000,000.00 -350,000,000.00 -300,000,000.00 -52,000,000.00 -4,000,000,000.00 -1,000,000,000.00 -1,000,000,000.00 -300,000,000.00 -250,000,000.00 -250,000,000.00 -250,000,000.00 -250,000,000.00 -136,000,000.00 -500,000,000.00 -300,000,000.00 -250,000,000.00 -350,000,000.00 -400,000,000.00 -350,000,000.00 -300,000,000.00 -150,000,000.00 -3,000,000,000.00 -1,500,000,000.00 -1,250,000,000.00 -225,000,000.00 -120,000,000.00 -75,000,000.00 -50,000,000.00 -59,579,621.24 -500,000,000.00 -500,000,000.00 -250,000,000.00 -450,000,000.00 -300,000,000.00 -300,000,000.00 -450,000,000.00 -300,000,000.00 -500,000,000.00 -500,000,000.00 -350,000,000.00 -250,000,000.00 -300,000,000.00 -300,000,000.00 -5,000,000,000.00 -850,000,000.00 -250,000,000.00 -250,000,000.00 -350,000,000.00 -300,000,000.00 -60,366,049.64 -4,000,000,000.00 -1,000,000,000.00 -1,000,000,000.00 -300,000,000.00 -250,000,000.00 -250,000,000.00 -250,000,000.00 -250,000,000.00 -136,000,000.00 -500,000,000.00 -300,000,000.00 -250,000,000.00 -350,000,000.00 -400,000,000.00 -350,000,000.00 -300,000,000.00 -150,000,000.00 -3,000,000,000.00 -1,500,000,000.00 -1,250,000,000.00 -225,000,000.00 -120,000,000.00 -75,000,000.00 -50,000,000.00 -59,579,621.24 -500,000,000.00 -500,000,000.00 -250,000,000.00 -450,000,000.00 -300,000,000.00 -300,000,000.00 -450,000,000.00 -300,000,000.00 -500,000,000.00 -500,000,000.00 -350,000,000.00 -250,000,000.00 -300,000,000.00 -300,000,000.00 -5,000,000,000.00 -850,000,000.00 -250,000,000.00 -250,000,000.00 -350,000,000.00 -300,000,000.00 -60,366,049.64 -4,000,000,000.00 -1,000,000,000.00 -1,000,000,000.00 -300,000,000.00 -250,000,000.00 -250,000,000.00 -250,000,000.00 -250,000,000.00 -136,000,000.00 -500,000,000.00 -300,000,000.00 -250,000,000.00 -350,000,000.00 -479,720,000.00 -419,755,000.00 -359,790,000.00 -179,895,000.00 -3,597,900,000.00 -1,798,950,000.00 -1,499,125,000.00 -269,842,500.00 -143,916,000.00 -89,947,500.00 -59,965,000.00 -71,453,839.75 -599,650,000.00 -599,650,000.00 -299,825,000.00 -539,685,000.00 -359,790,000.00 -359,790,000.00 -539,685,000.00 -359,790,000.00 -599,650,000.00 -599,650,000.00 -419,755,000.00 -299,825,000.00 -359,790,000.00 -359,790,000.00 -5,996,500,000.00 -1,019,405,000.00 -299,825,000.00 -299,825,000.00 -419,755,000.00 -359,790,000.00 -72,397,003.33 -4,797,200,000.00 -1,199,300,000.00 -1,199,300,000.00 -359,790,000.00 -299,825,000.00 -299,825,000.00 -299,825,000.00 -299,825,000.00 -163,104,800.00 -599,650,000.00 -359,790,000.00 -299,825,000.00 -419,755,000.00 11


EUR EUR EUR EUR EUR EUR EUR EUR EUR EUR EUR EUR EUR EUR EUR EUR EUR EUR EUR EUR EUR EUR EUR EUR EUR EUR EUR EUR EUR EUR EUR EUR EUR EUR EUR EUR EUR EUR EUR EUR EUR EUR EUR EUR EUR EUR 20050500 20050600 20050700 20050800 20050900 20051000 20051100 20051200 20130100 20160100 20160200 20160300 20200100 20200200 20200300 20200400 20200500 20200600 20200700 20200800 20240100 20240200 20240300 20310100 20310200 20620100 20620200 20620300 20860100 21030100 21050100 21070100 21130100 21150100 21150200 21150300 21150400 21150500 21150600 21360100 21360200 21360300 21360400 21360500 21360600 21360700 10/06/2014 TF 26/01/2015 TF 18/02/2015 TF 09/06/2015 TF 15/07/2015 TF 02/10/2015 TF 16/10/2015 TF 19/02/2016 TF 06/06/2013 TF 11/06/2013 TF 25/06/2013 TF 10/09/2013 TF 18/07/2013 TF 09/09/2013 TF 05/11/2013 TF 20/01/2014 TF 25/02/2014 TF 04/03/2014 TF 22/05/2014 TF 02/03/2015 TF 09/08/2013 TF 29/08/2014 TF 27/10/2017 TF 01/10/2013 TF 15/01/2014 TF 28/01/2014 TF 15/05/2014 TF 19/06/2014 TF 12/03/2014 TF 04/04/2014 TF 14/04/2014 TF 05/05/2014 TF 15/05/2014 TF 19/05/2014 TF 02/07/2014 TF 14/01/2015 TF 20/04/2015 TF 27/10/2015 TF 07/03/2016 TF 08/09/2014 TF 22/07/2015 TF 20/08/2015 TF 05/11/2015 TF 29/04/2016 TF 10/03/2017 TF 24/03/2017 TF 1.38 1.38 1.38 1.38 1.38 1.38 1.38 1.38 3.35 2.00 2.00 2.00 1.38 1.38 1.38 1.38 1.38 1.38 1.38 1.38 2.75 2.75 2.75 3.00 3.00 2.13 2.13 2.13 1.50 2.57 2.55 3.25 3.02 1.63 1.63 1.63 1.63 1.63 1.63 1.75 1.75 1.75 1.75 1.75 1.75 1.75 15/09/2021 15/09/2021 15/09/2021 15/09/2021 15/09/2021 15/09/2021 15/09/2021 15/09/2021 06/06/2053 14/04/2023 14/04/2023 14/04/2023 15/11/2019 15/11/2019 15/11/2019 15/11/2019 15/11/2019 15/11/2019 15/11/2019 15/11/2019 13/09/2030 13/09/2030 13/09/2030 14/10/2033 14/10/2033 15/01/2024 15/01/2024 15/01/2024 15/04/2021 04/04/2043 14/04/2034 05/05/2054 15/05/2054 15/03/2023 15/03/2023 15/03/2023 15/03/2023 15/03/2023 15/03/2023 15/09/2045 15/09/2045 15/09/2045 15/09/2045 15/09/2045 15/09/2045 15/09/2045 -300,000,000.00 -500,000,000.00 -500,000,000.00 -350,000,000.00 -250,000,000.00 -250,000,000.00 -500,000,000.00 -300,000,000.00 -89,933,192.16 -3,000,000,000.00 -1,000,000,000.00 -1,000,000,000.00 -650,000,000.00 -250,000,000.00 -250,000,000.00 -350,000,000.00 -500,000,000.00 -250,000,000.00 -350,000,000.00 -400,000,000.00 -500,000,000.00 -250,000,000.00 -300,000,000.00 -3,000,000,000.00 -1,000,000,000.00 -3,000,000,000.00 -1,000,000,000.00 -1,000,000,000.00 -5,000,000,000.00 -30,000,000.00 -72,000,000.00 -50,000,000.00 -50,000,000.00 -500,000,000.00 -500,000,000.00 -500,000,000.00 -500,000,000.00 -250,000,000.00 -400,000,000.00 -500,000,000.00 -250,000,000.00 -300,000,000.00 -250,000,000.00 -250,000,000.00 -250,000,000.00 -350,000,000.00 -300,000,000.00 -500,000,000.00 -500,000,000.00 -350,000,000.00 -250,000,000.00 -250,000,000.00 -500,000,000.00 -300,000,000.00 -102,603,443.04 -3,000,000,000.00 -1,000,000,000.00 -1,000,000,000.00 -650,000,000.00 -250,000,000.00 -250,000,000.00 -350,000,000.00 -500,000,000.00 -250,000,000.00 -350,000,000.00 -400,000,000.00 -500,000,000.00 -250,000,000.00 -300,000,000.00 -3,000,000,000.00 -1,000,000,000.00 -3,000,000,000.00 -1,000,000,000.00 -1,000,000,000.00 -5,000,000,000.00 -30,000,000.00 -72,000,000.00 -55,035,154.00 -54,668,180.00 -500,000,000.00 -500,000,000.00 -500,000,000.00 -500,000,000.00 -250,000,000.00 -400,000,000.00 -500,000,000.00 -250,000,000.00 -300,000,000.00 -250,000,000.00 -250,000,000.00 -250,000,000.00 -350,000,000.00 -300,000,000.00 -500,000,000.00 -500,000,000.00 -350,000,000.00 -250,000,000.00 -250,000,000.00 -500,000,000.00 -300,000,000.00 -102,603,443.04 -3,000,000,000.00 -1,000,000,000.00 -1,000,000,000.00 -650,000,000.00 -250,000,000.00 -250,000,000.00 -350,000,000.00 -500,000,000.00 -250,000,000.00 -350,000,000.00 -400,000,000.00 -500,000,000.00 -250,000,000.00 -300,000,000.00 -3,000,000,000.00 -1,000,000,000.00 -3,000,000,000.00 -1,000,000,000.00 -1,000,000,000.00 -5,000,000,000.00 -30,000,000.00 -72,000,000.00 -55,035,154.00 -54,668,180.00 -500,000,000.00 -500,000,000.00 -500,000,000.00 -500,000,000.00 -250,000,000.00 -400,000,000.00 -500,000,000.00 -250,000,000.00 -300,000,000.00 -250,000,000.00 -250,000,000.00 -250,000,000.00 -350,000,000.00 -359,790,000.00 -599,650,000.00 -599,650,000.00 -419,755,000.00 -299,825,000.00 -299,825,000.00 -599,650,000.00 -359,790,000.00 -123,052,309.24 -3,597,900,000.00 -1,199,300,000.00 -1,199,300,000.00 -779,545,000.00 -299,825,000.00 -299,825,000.00 -419,755,000.00 -599,650,000.00 -299,825,000.00 -419,755,000.00 -479,720,000.00 -599,650,000.00 -299,825,000.00 -359,790,000.00 -3,597,900,000.00 -1,199,300,000.00 -3,597,900,000.00 -1,199,300,000.00 -1,199,300,000.00 -5,996,500,000.00 -35,979,000.00 -86,349,600.00 -66,003,660.19 -65,563,548.27 -599,650,000.00 -599,650,000.00 -599,650,000.00 -599,650,000.00 -299,825,000.00 -479,720,000.00 -599,650,000.00 -299,825,000.00 -359,790,000.00 -299,825,000.00 -299,825,000.00 -299,825,000.00 -419,755,000.00 12


EUR EUR EUR EUR EUR EUR EUR EUR EUR EUR EUR EUR EUR EUR EUR EUR EUR EUR EUR EUR EUR EUR EUR EUR EUR EUR EUR EUR EUR EUR EUR EUR EUR EUR EUR EUR EUR EUR EUR EUR EUR EUR EUR EUR EUR EUR 21380100 21380200 21380300 21380400 21380500 21380600 21450100 21450200 21450300 21460100 21460200 21460300 21460400 21460500 21460600 21460700 21460800 21460900 21461000 21461100 21570100 21570200 21570300 21570400 21570500 21570600 21570700 21670100 21670200 21740100 21750100 21750200 21750300 21750400 21750500 21750600 21750700 21750800 21750900 21760100 21760200 21800100 21800200 21800300 21800400 21800500 10/09/2014 TF 18/09/2014 TF 12/01/2015 TF 31/03/2015 TF 18/02/2016 TF 03/02/2017 TF 06/11/2014 TV 22/12/2014 TV 21/01/2015 TV 19/11/2014 TV 19/02/2015 TV 13/04/2015 TV 05/06/2015 TV 14/10/2015 TV 29/10/2015 TV 27/11/2015 TV 15/01/2016 TV 04/04/2016 TV 18/10/2016 TV 12/01/2017 TV 05/02/2015 TF 29/07/2015 TF 13/10/2015 TF 28/10/2015 TF 27/07/2016 TF 24/08/2016 TF 05/04/2017 TF 26/03/2015 TF 04/02/2016 TF 10/06/2015 TF 17/06/2015 TF 19/08/2015 TF 19/10/2015 TF 24/11/2015 TF 26/04/2016 TF 21/06/2016 TF 03/08/2016 TF 26/08/2016 TF 21/04/2017 TF 26/06/2015 TV 01/04/2016 TV 14/07/2015 TF 10/08/2015 TF 14/08/2015 TF 09/10/2015 TF 15/10/2015 TF 1.25 1.25 1.25 1.25 1.25 1.25 0.00 0.00 0.00 8.70 8.86 9.35 9.46 11.88 12.03 10.93 11.97 11.14 9.73 9.23 1.00 1.00 1.00 1.00 1.00 1.00 1.00 0.13 0.13 0.65 0.88 0.88 0.88 0.88 0.88 0.88 0.88 0.88 0.88 9.04 10.71 0.13 0.13 0.13 0.13 0.13 13/11/2026 13/11/2026 13/11/2026 13/11/2026 13/11/2026 13/11/2026 15/07/2024 15/07/2024 15/07/2024 19/06/2018 19/06/2018 19/06/2018 19/06/2018 19/06/2018 19/06/2018 19/06/2018 19/06/2018 19/06/2018 19/06/2018 19/06/2018 14/03/2031 14/03/2031 14/03/2031 14/03/2031 14/03/2031 14/03/2031 14/03/2031 15/04/2025 15/04/2025 10/06/2025 13/09/2024 13/09/2024 13/09/2024 13/09/2024 13/09/2024 13/09/2024 13/09/2024 13/09/2024 13/09/2024 17/12/2018 17/12/2018 15/06/2020 15/06/2020 15/06/2020 15/06/2020 15/06/2020 -500,000,000.00 -250,000,000.00 -250,000,000.00 -250,000,000.00 -250,000,000.00 -300,000,000.00 -500,000,000.00 -300,000,000.00 -350,000,000.00 -31,407,035.18 -23,133,867.98 -14,607,069.82 -14,450,867.05 -13,805,798.44 -14,769,370.60 -15,000,000.00 -22,831,050.23 -18,398,135.66 -28,097,780.28 -37,004,144.46 -1,000,000,000.00 -300,000,000.00 -250,000,000.00 -250,000,000.00 -300,000,000.00 -300,000,000.00 -300,000,000.00 -2,000,000,000.00 -1,000,000,000.00 -100,000,000.00 -500,000,000.00 -250,000,000.00 -300,000,000.00 -300,000,000.00 -450,000,000.00 -350,000,000.00 -400,000,000.00 -400,000,000.00 -300,000,000.00 -28,544,515.17 -14,462,361.70 -500,000,000.00 -300,000,000.00 -300,000,000.00 -250,000,000.00 -450,000,000.00 -500,000,000.00 -250,000,000.00 -250,000,000.00 -250,000,000.00 -250,000,000.00 -300,000,000.00 -500,000,000.00 -300,000,000.00 -350,000,000.00 -31,407,035.18 -23,133,867.98 -14,607,069.82 -14,450,867.05 -13,805,798.44 -14,769,370.60 -15,000,000.00 -22,831,050.23 -18,398,135.66 -28,097,780.28 -37,004,144.46 -1,000,000,000.00 -300,000,000.00 -250,000,000.00 -250,000,000.00 -300,000,000.00 -300,000,000.00 -300,000,000.00 -2,000,000,000.00 -1,000,000,000.00 -100,000,000.00 -500,000,000.00 -250,000,000.00 -300,000,000.00 -300,000,000.00 -450,000,000.00 -350,000,000.00 -400,000,000.00 -400,000,000.00 -300,000,000.00 -28,544,515.17 -14,462,361.70 -500,000,000.00 -300,000,000.00 -300,000,000.00 -250,000,000.00 -450,000,000.00 -500,000,000.00 -250,000,000.00 -250,000,000.00 -250,000,000.00 -250,000,000.00 -300,000,000.00 -500,000,000.00 -300,000,000.00 -350,000,000.00 -31,407,035.18 -23,133,867.98 -14,607,069.82 -14,450,867.05 -13,805,798.44 -14,769,370.60 -15,000,000.00 -22,831,050.23 -18,398,135.66 -28,097,780.28 -37,004,144.46 -1,000,000,000.00 -300,000,000.00 -250,000,000.00 -250,000,000.00 -300,000,000.00 -300,000,000.00 -300,000,000.00 -2,000,000,000.00 -1,000,000,000.00 -100,000,000.00 -500,000,000.00 -250,000,000.00 -300,000,000.00 -300,000,000.00 -450,000,000.00 -350,000,000.00 -400,000,000.00 -400,000,000.00 -300,000,000.00 -28,544,515.17 -14,462,361.70 -500,000,000.00 -300,000,000.00 -300,000,000.00 -250,000,000.00 -450,000,000.00 -599,650,000.00 -299,825,000.00 -299,825,000.00 -299,825,000.00 -299,825,000.00 -359,790,000.00 -599,650,000.00 -359,790,000.00 -419,755,000.00 -37,666,457.29 -27,744,447.87 -17,518,258.84 -17,330,924.85 -16,557,294.07 -17,712,906.16 -17,989,500.00 -27,381,278.54 -22,064,884.10 -33,697,667.89 -44,379,070.45 -1,199,300,000.00 -359,790,000.00 -299,825,000.00 -299,825,000.00 -359,790,000.00 -359,790,000.00 -359,790,000.00 -2,398,600,000.00 -1,199,300,000.00 -119,930,000.00 -599,650,000.00 -299,825,000.00 -359,790,000.00 -359,790,000.00 -539,685,000.00 -419,755,000.00 -479,720,000.00 -479,720,000.00 -359,790,000.00 -34,233,437.04 -17,344,710.39 -599,650,000.00 -359,790,000.00 -359,790,000.00 -299,825,000.00 -539,685,000.00 13


EUR EUR EUR EUR EUR EUR EUR EUR EUR EUR EUR EUR EUR EUR EUR EUR EUR EUR EUR EUR EUR EUR EUR EUR EUR EUR EUR EUR EUR EUR EUR EUR EUR EUR EUR EUR EUR EUR EUR EUR EUR EUR EUR EUR EUR EUR 21840100 21840200 21840300 21840400 21840500 21840600 21840700 21840800 21840900 21841000 21841100 21890100 21890200 21890300 21890400 21900100 21900200 21930100 21990100 22070100 22090100 22120100 22120200 22120300 22120400 22150100 22240100 22320100 22320200 22390100 22440100 22440200 22450100 22460100 22460200 22470100 22470200 22470300 22490100 22510100 22510200 22510300 22510400 22530100 22530200 22530300 05/08/2015 TF 17/08/2015 TF 25/08/2015 TF 20/10/2015 TF 04/12/2015 TF 09/02/2016 TF 01/03/2016 TF 16/06/2016 TF 09/02/2017 TF 14/02/2017 TF 10/03/2017 TF 27/08/2015 TF 08/10/2015 TF 12/01/2016 TF 27/01/2017 TF 09/09/2015 TF 15/01/2016 TF 09/10/2015 TF 18/11/2015 TV 27/01/2016 TV 26/01/2016 TF 10/02/2016 TF 18/05/2016 TF 22/08/2016 TF 07/04/2017 TF 11/03/2016 TV 12/04/2016 TF 31/05/2016 TF 18/01/2017 TF 14/09/2016 TF 05/10/2016 TF 21/03/2017 TF 06/10/2016 TF 12/10/2016 TF 04/10/2017 TF 17/10/2016 TF 29/03/2017 TF 12/12/2017 TF 24/10/2016 TF 27/10/2016 TF 28/09/2017 TF 06/11/2017 TF 29/11/2017 TF 09/11/2016 TF 20/01/2017 TF 21/02/2017 TF 0.38 0.38 0.38 0.38 0.38 0.38 0.38 0.38 0.38 0.38 0.38 0.50 0.50 0.50 0.50 0.25 0.25 0.21 0.00 14.16 0.00 1.13 1.13 1.13 1.13 12.61 0.38 1.00 1.00 0.00 0.50 0.50 0.75 0.25 0.25 0.88 0.88 0.88 0.88 0.00 0.00 0.00 0.00 0.00 0.00 0.00 15/03/2022 15/03/2022 15/03/2022 15/03/2022 15/03/2022 15/03/2022 15/03/2022 15/03/2022 15/03/2022 15/03/2022 15/03/2022 15/11/2023 15/11/2023 15/11/2023 15/11/2023 15/10/2020 15/10/2020 09/10/2021 18/05/2029 27/06/2019 15/01/2019 15/09/2036 15/09/2036 15/09/2036 15/09/2036 11/03/2019 14/04/2026 14/04/2032 14/04/2032 16/10/2023 13/11/2037 13/11/2037 06/10/2048 14/09/2029 14/09/2029 13/09/2047 13/09/2047 13/09/2047 24/10/2051 13/03/2026 13/03/2026 13/03/2026 13/03/2026 15/03/2024 15/03/2024 15/03/2024 -500,000,000.00 -300,000,000.00 -250,000,000.00 -300,000,000.00 -250,000,000.00 -300,000,000.00 -300,000,000.00 -350,000,000.00 -400,000,000.00 -250,000,000.00 -500,000,000.00 -600,000,000.00 -400,000,000.00 -500,000,000.00 -400,000,000.00 -3,000,000,000.00 -1,000,000,000.00 -200,000,000.00 -500,000,000.00 -23,014,959.72 -5,000,000,000.00 -500,000,000.00 -350,000,000.00 -400,000,000.00 -250,000,000.00 -34,052,213.39 -5,000,000,000.00 -3,000,000,000.00 -1,000,000,000.00 -4,000,000,000.00 -500,000,000.00 -500,000,000.00 -50,000,000.00 -500,000,000.00 -250,000,000.00 -500,000,000.00 -400,000,000.00 -250,000,000.00 -50,000,000.00 -500,000,000.00 -250,000,000.00 -300,000,000.00 -300,000,000.00 -500,000,000.00 -350,000,000.00 -250,000,000.00 -500,000,000.00 -300,000,000.00 -250,000,000.00 -300,000,000.00 -250,000,000.00 -300,000,000.00 -300,000,000.00 -350,000,000.00 -400,000,000.00 -250,000,000.00 -500,000,000.00 -600,000,000.00 -400,000,000.00 -500,000,000.00 -400,000,000.00 -3,000,000,000.00 -1,000,000,000.00 -200,000,000.00 -500,000,000.00 -23,014,959.72 -5,000,000,000.00 -500,000,000.00 -350,000,000.00 -400,000,000.00 -250,000,000.00 -34,052,213.39 -5,000,000,000.00 -3,000,000,000.00 -1,000,000,000.00 -4,000,000,000.00 -500,000,000.00 -500,000,000.00 -50,375,500.00 -500,000,000.00 -250,000,000.00 -500,000,000.00 -400,000,000.00 -250,000,000.00 -50,440,500.00 -500,000,000.00 -250,000,000.00 -300,000,000.00 -300,000,000.00 -500,000,000.00 -350,000,000.00 -250,000,000.00 -500,000,000.00 -300,000,000.00 -250,000,000.00 -300,000,000.00 -250,000,000.00 -300,000,000.00 -300,000,000.00 -350,000,000.00 -400,000,000.00 -250,000,000.00 -500,000,000.00 -600,000,000.00 -400,000,000.00 -500,000,000.00 -400,000,000.00 -3,000,000,000.00 -1,000,000,000.00 -200,000,000.00 -500,000,000.00 -23,014,959.72 -5,000,000,000.00 -500,000,000.00 -350,000,000.00 -400,000,000.00 -250,000,000.00 -34,052,213.39 -5,000,000,000.00 -3,000,000,000.00 -1,000,000,000.00 -4,000,000,000.00 -500,000,000.00 -500,000,000.00 -50,375,500.00 -500,000,000.00 -250,000,000.00 -500,000,000.00 -400,000,000.00 -250,000,000.00 -50,440,500.00 -500,000,000.00 -250,000,000.00 -300,000,000.00 -300,000,000.00 -500,000,000.00 -350,000,000.00 -250,000,000.00 -599,650,000.00 -359,790,000.00 -299,825,000.00 -359,790,000.00 -299,825,000.00 -359,790,000.00 -359,790,000.00 -419,755,000.00 -479,720,000.00 -299,825,000.00 -599,650,000.00 -719,580,000.00 -479,720,000.00 -599,650,000.00 -479,720,000.00 -3,597,900,000.00 -1,199,300,000.00 -239,860,000.00 -599,650,000.00 -27,601,841.19 -5,996,500,000.00 -599,650,000.00 -419,755,000.00 -479,720,000.00 -299,825,000.00 -40,838,819.52 -5,996,500,000.00 -3,597,900,000.00 -1,199,300,000.00 -4,797,200,000.00 -599,650,000.00 -599,650,000.00 -60,415,337.15 -599,650,000.00 -299,825,000.00 -599,650,000.00 -479,720,000.00 -299,825,000.00 -60,493,291.65 -599,650,000.00 -299,825,000.00 -359,790,000.00 -359,790,000.00 -599,650,000.00 -419,755,000.00 -299,825,000.00 14


EUR EUR EUR EUR EUR EUR EUR EUR EUR EUR EUR EUR EUR EUR EUR EUR EUR EUR EUR EUR EUR EUR EUR EUR 22530400 22530500 22670100 22670200 22670300 22670400 22670500 22680100 22680200 22740100 22900100 23000100 23040100 23040200 23050100 23060100 23060200 23060300 23060400 23080100 23090100 23130100 23160100 XS1721759964 12/04/2017 TF 16/11/2017 TF 23/01/2017 TV 11/05/2017 TV 02/06/2017 TV 22/06/2017 TV 13/12/2017 TV 23/01/2017 TV 05/05/2017 TV 25/01/2017 TF 08/03/2017 TF 16/05/2017 TF 09/06/2017 TV 02/10/2017 TV 26/06/2017 TV 28/06/2017 TV 13/11/2017 TV 01/12/2017 TV 22/12/2017 TV 05/07/2017 TF 28/07/2017 TV 20/09/2017 TF 13/12/2017 TV 17/11/2017 TF 0.00 0.00 7.28 7.51 8.00 7.88 8.36 7.51 7.66 0.50 0.25 1.13 0.00 0.00 7.67 0.00 0.00 0.00 0.00 1.50 0.00 0.05 0.00 -0.90 15/03/2024 15/03/2024 23/01/2020 23/01/2020 23/01/2020 23/01/2020 23/01/2020 23/01/2019 23/01/2019 15/01/2027 14/10/2024 13/04/2033 09/06/2020 09/06/2020 26/01/2021 28/06/2021 28/06/2021 28/06/2021 28/06/2021 15/11/2047 28/07/2021 15/12/2023 13/04/2022 20/02/2018 -250,000,000.00 -450,000,000.00 -51,851,851.85 -28,735,632.18 -33,692,722.37 -27,367,268.75 -19,349,845.20 -29,551,700.70 -28,985,507.25 -5,000,000,000.00 -5,000,000,000.00 -3,000,000,000.00 -27,472,527.47 -13,397,642.02 -27,008,777.85 -47,554,347.83 -13,157,894.74 -26,058,631.92 -38,610,038.61 -1,000,000,000.00 -13,495,276.65 -3,000,000,000.00 -39,271,127.87 -76,318,300.00 -250,000,000.00 -450,000,000.00 -51,851,851.85 -28,735,632.18 -33,692,722.37 -27,367,268.75 -19,349,845.20 -29,551,700.70 -28,985,507.25 -5,000,000,000.00 -5,000,000,000.00 -3,000,000,000.00 -27,472,527.47 -13,397,642.02 -27,008,777.85 -47,554,347.83 -13,157,894.74 -26,058,631.92 -38,610,038.61 -1,000,000,000.00 -13,495,276.65 -3,000,000,000.00 -39,271,127.87 -76,415,837.49 -250,000,000.00 -450,000,000.00 -51,851,851.85 -28,735,632.18 -33,692,722.37 -27,367,268.75 -19,349,845.20 -29,551,700.70 -28,985,507.25 -5,000,000,000.00 -5,000,000,000.00 -3,000,000,000.00 -27,472,527.47 -13,397,642.02 -27,008,777.85 -47,554,347.83 -13,157,894.74 -26,058,631.92 -38,610,038.61 -1,000,000,000.00 -13,495,276.65 -3,000,000,000.00 -39,271,127.87 -76,415,837.49 -299,825,000.00 -539,685,000.00 -62,185,925.92 -34,462,643.67 -40,407,681.94 -32,821,565.41 -23,206,269.35 -35,441,354.65 -34,762,318.84 -5,996,500,000.00 -5,996,500,000.00 -3,597,900,000.00 -32,947,802.19 -16,067,792.07 -32,391,627.28 -57,031,929.35 -15,780,263.16 -31,252,117.26 -46,305,019.30 -1,199,300,000.00 -16,184,885.29 -3,597,900,000.00 -47,097,863.65 -91,645,513.90 -233,976,469,463.80 -233,246,440,481.07 -233,246,440,481.07 -279,732,456,068.95 USD (1) GBP GBP GBP GBP GBP GBP GBP GBP GBP GBP GBP GBP GBP GBP GBP GBP GBP 01340500 01340600 01340700 01340800 01340900 01341000 01341100 01341200 01341300 01341400 01341500 01341600 01341700 01341800 01341900 01342000 01342100 07/12/1998 TF 25/02/1999 TF 19/10/1999 TF 22/11/1999 TF 07/01/2000 TF 11/02/2000 TF 06/03/2000 TF 15/03/2000 TF 30/03/2000 TF 06/04/2000 TF 19/04/2000 TF 09/05/2000 TF 24/05/2000 TF 12/07/2000 TF 01/09/2000 TF 18/09/2000 TF 12/01/2001 TF 6.00 6.00 6.00 6.00 6.00 6.00 6.00 6.00 6.00 6.00 6.00 6.00 6.00 6.00 6.00 6.00 6.00 07/12/2028 07/12/2028 07/12/2028 07/12/2028 07/12/2028 07/12/2028 07/12/2028 07/12/2028 07/12/2028 07/12/2028 07/12/2028 07/12/2028 07/12/2028 07/12/2028 07/12/2028 07/12/2028 07/12/2028 -100,000,000.00 -250,000,000.00 -75,000,000.00 -175,000,000.00 -125,000,000.00 -100,000,000.00 -150,000,000.00 -100,000,000.00 -200,000,000.00 -350,000,000.00 -100,000,000.00 -100,000,000.00 -100,000,000.00 -100,000,000.00 -100,000,000.00 -100,000,000.00 -100,000,000.00 -54,321,000.00 -250,000,000.00 -75,000,000.00 -125,000,000.00 -125,000,000.00 -100,000,000.00 -150,000,000.00 -100,000,000.00 -145,000,000.00 -350,000,000.00 -100,000,000.00 -100,000,000.00 -100,000,000.00 -100,000,000.00 -100,000,000.00 -100,000,000.00 -100,000,000.00 -61,225,386.88 -281,775,864.21 -84,532,759.26 -140,887,932.10 -140,887,932.10 -112,710,345.68 -169,065,518.52 -112,710,345.68 -163,430,001.24 -394,486,209.89 -112,710,345.68 -112,710,345.68 -112,710,345.68 -112,710,345.68 -112,710,345.68 -112,710,345.68 -112,710,345.68 -73,427,606.48 -337,933,793.94 -101,380,138.18 -168,966,896.97 -168,966,896.97 -135,173,517.58 -202,760,276.37 -135,173,517.58 -196,001,600.49 -473,107,311.52 -135,173,517.58 -135,173,517.58 -135,173,517.58 -135,173,517.58 -135,173,517.58 -135,173,517.58 -135,173,517.58 15 Currency Borrowing number Value Date Interest rate Rate Maturity date Initial amount in currency of borrowing Nominal outstanding in currency of borrowing Nominal outstanding in EUR Nominal outstanding in


GBP GBP GBP GBP GBP GBP GBP GBP GBP GBP GBP GBP GBP GBP GBP GBP GBP GBP GBP GBP GBP GBP GBP GBP GBP GBP GBP GBP GBP GBP GBP GBP GBP GBP GBP GBP GBP GBP GBP GBP GBP GBP GBP GBP GBP GBP 01342200 01420100 01420200 01420300 01420400 01420500 01420600 01420700 01420800 01420900 01421000 01421100 01421200 01421300 01421400 01421500 01421600 01590100 01590200 01590300 01590400 01610100 01610200 01620100 01620200 01620300 01620400 01620500 01620600 01620700 01620800 01620900 01621000 01621100 01621200 01621300 01621400 01621500 01621600 01621700 01621800 01621900 01622000 01690100 01920100 01920200 17/06/2004 TF 12/10/1998 TF 04/05/1999 TF 07/06/1999 TF 08/10/1999 TF 05/11/1999 TF 12/11/1999 TF 08/12/1999 TF 08/02/2000 TF 19/04/2000 TF 11/05/2000 TF 22/06/2000 TF 14/09/2000 TF 05/10/2000 TF 30/11/2000 TF 12/01/2001 TF 30/08/2002 TF 19/02/1999 TF 18/10/2000 TF 20/12/2000 TF 26/04/2001 TF 01/04/1999 TF 26/04/2001 TF 27/04/1999 TF 28/04/2000 TF 14/06/2000 TF 10/07/2000 TF 21/07/2000 TF 29/11/2000 TF 28/12/2000 TF 15/03/2001 TF 22/06/2004 TF 16/08/2004 TF 18/01/2006 TF 01/06/2006 TF 17/08/2006 TF 15/09/2006 TF 11/10/2006 TF 09/11/2006 TF 21/03/2007 TF 24/04/2007 TF 16/05/2007 TF 10/11/2011 TF 15/06/1999 TF 18/04/2000 TF 03/05/2000 TF 6.00 5.38 5.38 5.38 5.38 5.38 5.38 5.38 5.38 5.38 5.38 5.38 5.38 5.38 5.38 5.38 5.38 4.80 5.11 4.72 5.16 4.77 5.14 5.00 5.00 5.00 5.00 5.00 5.00 5.00 5.00 5.00 5.00 5.00 5.00 5.00 5.00 5.00 5.00 5.00 5.00 5.00 5.00 5.14 5.50 5.50 07/12/2028 07/06/2021 07/06/2021 07/06/2021 07/06/2021 07/06/2021 07/06/2021 07/06/2021 07/06/2021 07/06/2021 07/06/2021 07/06/2021 07/06/2021 07/06/2021 07/06/2021 07/06/2021 07/06/2021 07/12/2028 07/12/2028 07/12/2028 07/12/2028 15/03/2038 15/03/2038 15/04/2039 15/04/2039 15/04/2039 15/04/2039 15/04/2039 15/04/2039 15/04/2039 15/04/2039 15/04/2039 15/04/2039 15/04/2039 15/04/2039 15/04/2039 15/04/2039 15/04/2039 15/04/2039 15/04/2039 15/04/2039 15/04/2039 15/04/2039 15/03/2038 15/04/2025 15/04/2025 -100,000,000.00 -250,000,000.00 -100,000,000.00 -100,000,000.00 -125,000,000.00 -150,000,000.00 -100,000,000.00 -100,000,000.00 -100,000,000.00 -100,000,000.00 -100,000,000.00 -100,000,000.00 -175,000,000.00 -100,000,000.00 -100,000,000.00 -75,000,000.00 -100,000,000.00 -123,575,000.00 -40,009,125.00 -55,140,000.00 -24,895,000.00 -49,792,301.00 -74,932,500.00 -200,000,000.00 -75,000,000.00 -75,000,000.00 -125,000,000.00 -75,000,000.00 -75,000,000.00 -75,000,000.00 -110,000,000.00 -125,000,000.00 -65,000,000.00 -100,000,000.00 -100,000,000.00 -50,000,000.00 -50,000,000.00 -50,000,000.00 -50,000,000.00 -50,000,000.00 -50,000,000.00 -100,000,000.00 -50,000,000.00 -33,319,663.88 -250,000,000.00 -100,000,000.00 -100,000,000.00 -200,000,000.00 -100,000,000.00 -100,000,000.00 -125,000,000.00 -150,000,000.00 -100,000,000.00 -100,000,000.00 -100,000,000.00 -100,000,000.00 -100,000,000.00 -100,000,000.00 -175,000,000.00 -100,000,000.00 -100,000,000.00 -75,000,000.00 -100,000,000.00 -92,216,113.70 -40,009,125.00 -55,140,000.00 -24,895,000.00 -49,792,301.00 -74,932,500.00 -50,000,000.00 -75,000,000.00 -75,000,000.00 -125,000,000.00 -75,000,000.00 -75,000,000.00 -75,000,000.00 -110,000,000.00 -125,000,000.00 -65,000,000.00 -100,000,000.00 -100,000,000.00 -50,000,000.00 -50,000,000.00 -50,000,000.00 -50,000,000.00 -50,000,000.00 -50,000,000.00 -100,000,000.00 -50,000,000.00 -33,319,663.88 -175,000,000.00 -100,000,000.00 -112,710,345.68 -225,420,691.37 -112,710,345.68 -112,710,345.68 -140,887,932.10 -169,065,518.52 -112,710,345.68 -112,710,345.68 -112,710,345.68 -112,710,345.68 -112,710,345.68 -112,710,345.68 -197,243,104.94 -112,710,345.68 -112,710,345.68 -84,532,759.26 -112,710,345.68 -103,937,100.53 -45,094,423.09 -62,148,484.61 -28,059,240.56 -56,121,074.58 -84,456,679.78 -56,355,172.84 -84,532,759.26 -84,532,759.26 -140,887,932.10 -84,532,759.26 -84,532,759.26 -84,532,759.26 -123,981,380.25 -140,887,932.10 -73,261,724.69 -112,710,345.68 -112,710,345.68 -56,355,172.84 -56,355,172.84 -56,355,172.84 -56,355,172.84 -56,355,172.84 -56,355,172.84 -112,710,345.68 -56,355,172.84 -37,554,708.34 -197,243,104.94 -112,710,345.68 -135,173,517.58 -270,347,035.15 -135,173,517.58 -135,173,517.58 -168,966,896.97 -202,760,276.37 -135,173,517.58 -135,173,517.58 -135,173,517.58 -135,173,517.58 -135,173,517.58 -135,173,517.58 -236,553,655.76 -135,173,517.58 -135,173,517.58 -101,380,138.18 -135,173,517.58 -124,651,764.66 -54,081,741.61 -74,534,677.59 -33,651,447.20 -67,306,004.74 -101,288,896.06 -67,586,758.79 -101,380,138.18 -101,380,138.18 -168,966,896.97 -101,380,138.18 -101,380,138.18 -101,380,138.18 -148,690,869.33 -168,966,896.97 -87,862,786.43 -135,173,517.58 -135,173,517.58 -67,586,758.79 -67,586,758.79 -67,586,758.79 -67,586,758.79 -67,586,758.79 -67,586,758.79 -135,173,517.58 -67,586,758.79 -45,039,361.71 -236,553,655.76 -135,173,517.58 16


GBP GBP GBP GBP GBP GBP GBP GBP GBP GBP GBP GBP GBP GBP GBP GBP GBP GBP GBP GBP GBP GBP GBP GBP GBP GBP GBP GBP GBP GBP GBP GBP GBP GBP GBP GBP GBP GBP GBP GBP GBP GBP GBP GBP GBP GBP 01920300 01920400 01920500 01920600 01920700 01920800 01920900 01921000 01921100 01921200 01921300 01960200 01960300 01960400 01960500 01960600 01960700 01960800 01960900 01961000 01961100 01961200 01961300 01961400 01961500 01961600 01961700 01961800 01961900 01962000 01962100 01962200 02020100 02020200 02220100 02240100 02280100 02280200 02420100 02430100 03450100 03870100 03870200 03870300 03870400 03870500 05/01/2001 TF 24/09/2002 TF 25/10/2002 TF 25/03/2004 TF 14/07/2004 TF 23/07/2004 TF 02/09/2004 TF 13/01/2006 TF 03/02/2006 TF 24/01/2008 TF 14/02/2008 TF 07/08/2000 TF 14/09/2000 TF 27/09/2000 TF 17/10/2000 TF 21/03/2001 TF 24/04/2001 TF 10/05/2001 TF 05/07/2001 TF 21/10/2002 TF 02/04/2004 TF 11/06/2004 TF 25/06/2004 TF 12/07/2004 TF 03/09/2004 TF 07/02/2006 TF 04/05/2006 TF 01/09/2006 TF 14/11/2006 TF 27/07/2007 TF 14/08/2007 TF 27/03/2008 TF 06/11/2000 TV 05/12/2000 TV 30/04/2001 TV 17/05/2001 TV 23/07/2001 TV 04/06/2004 TV 23/10/2001 TF 23/10/2001 TF 25/06/2002 TF 14/01/2003 TF 29/01/2003 TF 23/05/2005 TF 08/07/2005 TF 18/01/2008 TF 5.50 5.50 5.50 5.50 5.50 5.50 5.50 5.50 5.50 5.50 5.50 5.63 5.63 5.63 5.63 5.63 5.63 5.63 5.63 5.63 5.63 5.63 5.63 5.63 5.63 5.63 5.63 5.63 5.63 5.63 5.63 5.63 2.65 2.65 8.29 4.71 2.40 2.40 4.94 4.91 6.88 4.75 4.75 4.75 4.75 4.75 15/04/2025 15/04/2025 15/04/2025 15/04/2025 15/04/2025 15/04/2025 15/04/2025 15/04/2025 15/04/2025 15/04/2025 15/04/2025 07/06/2032 07/06/2032 07/06/2032 07/06/2032 07/06/2032 07/06/2032 07/06/2032 07/06/2032 07/06/2032 07/06/2032 07/06/2032 07/06/2032 07/06/2032 07/06/2032 07/06/2032 07/06/2032 07/06/2032 07/06/2032 07/06/2032 07/06/2032 07/06/2032 16/04/2020 16/04/2020 30/04/2031 31/03/2034 22/07/2030 22/07/2030 31/03/2020 31/03/2021 25/01/2019 15/10/2018 15/10/2018 15/10/2018 15/10/2018 15/10/2018 -75,000,000.00 -100,000,000.00 -100,000,000.00 -75,000,000.00 -100,000,000.00 -100,000,000.00 -150,000,000.00 -150,000,000.00 -100,000,000.00 -100,000,000.00 -100,000,000.00 -100,000,000.00 -100,000,000.00 -100,000,000.00 -75,000,000.00 -100,000,000.00 -50,000,000.00 -75,000,000.00 -50,000,000.00 -100,000,000.00 -150,000,000.00 -150,000,000.00 -75,000,000.00 -150,000,000.00 -150,000,000.00 -100,000,000.00 -100,000,000.00 -100,000,000.00 -100,000,000.00 -100,000,000.00 -100,000,000.00 -100,000,000.00 -250,000,000.00 -100,000,000.00 -30,646,000.00 -70,000,000.00 -50,000,000.00 -75,000,000.00 -6,573,167.30 -6,071,540.00 -35,261,000.00 -250,000,000.00 -150,000,000.00 -100,000,000.00 -100,000,000.00 -150,000,000.00 -75,000,000.00 -100,000,000.00 -100,000,000.00 -75,000,000.00 -100,000,000.00 -100,000,000.00 -150,000,000.00 -150,000,000.00 -100,000,000.00 -100,000,000.00 -100,000,000.00 -40,000,000.00 -100,000,000.00 -100,000,000.00 -75,000,000.00 -100,000,000.00 -50,000,000.00 -75,000,000.00 -50,000,000.00 -100,000,000.00 -150,000,000.00 -150,000,000.00 -75,000,000.00 -150,000,000.00 -150,000,000.00 -100,000,000.00 -100,000,000.00 -100,000,000.00 -100,000,000.00 -100,000,000.00 -100,000,000.00 -100,000,000.00 -244,630,000.00 -100,000,000.00 -16,972,980.64 -46,372,200.00 -50,000,000.00 -75,000,000.00 -6,573,167.30 -6,071,540.00 -35,261,000.00 -250,000,000.00 -150,000,000.00 -100,000,000.00 -100,000,000.00 -150,000,000.00 -84,532,759.26 -112,710,345.68 -112,710,345.68 -84,532,759.26 -112,710,345.68 -112,710,345.68 -169,065,518.52 -169,065,518.52 -112,710,345.68 -112,710,345.68 -112,710,345.68 -45,084,138.27 -112,710,345.68 -112,710,345.68 -84,532,759.26 -112,710,345.68 -56,355,172.84 -84,532,759.26 -56,355,172.84 -112,710,345.68 -169,065,518.52 -169,065,518.52 -84,532,759.26 -169,065,518.52 -169,065,518.52 -112,710,345.68 -112,710,345.68 -112,710,345.68 -112,710,345.68 -112,710,345.68 -112,710,345.68 -112,710,345.68 -275,723,318.64 -112,710,345.68 -19,130,305.15 -52,266,266.92 -56,355,172.84 -84,532,759.26 -7,408,639.59 -6,843,253.72 -39,742,794.99 -281,775,864.21 -169,065,518.52 -112,710,345.68 -112,710,345.68 -169,065,518.52 -101,380,138.18 -135,173,517.58 -135,173,517.58 -101,380,138.18 -135,173,517.58 -135,173,517.58 -202,760,276.37 -202,760,276.37 -135,173,517.58 -135,173,517.58 -135,173,517.58 -54,069,407.03 -135,173,517.58 -135,173,517.58 -101,380,138.18 -135,173,517.58 -67,586,758.79 -101,380,138.18 -67,586,758.79 -135,173,517.58 -202,760,276.37 -202,760,276.37 -101,380,138.18 -202,760,276.37 -202,760,276.37 -135,173,517.58 -135,173,517.58 -135,173,517.58 -135,173,517.58 -135,173,517.58 -135,173,517.58 -135,173,517.58 -330,674,976.05 -135,173,517.58 -22,942,974.97 -62,682,933.92 -67,586,758.79 -101,380,138.18 -8,885,181.46 -8,207,114.19 -47,663,534.03 -337,933,793.94 -202,760,276.37 -135,173,517.58 -135,173,517.58 -202,760,276.37 17


GBP GBP GBP GBP GBP GBP GBP GBP GBP GBP GBP GBP GBP GBP GBP GBP GBP GBP GBP GBP GBP GBP GBP GBP GBP GBP GBP GBP GBP GBP GBP GBP GBP GBP GBP GBP GBP GBP GBP GBP GBP GBP GBP GBP GBP GBP 03870600 03870700 03870800 04240100 04350100 05380100 06470100 07600100 07600200 07600300 07600400 07600500 07600600 07600700 07600800 07600900 07601000 07601100 07601200 07960100 08670100 13210100 13210200 13210300 13210400 13210500 13210600 13210700 13210800 13330100 13330200 13430100 13510100 15310100 15310200 15310300 15310400 15310600 18240100 18240200 18990100 18990200 18990300 18990400 19260100 19260200 15/02/2008 TF 01/04/2008 TF 26/02/2009 TF 14/02/2003 TF 26/02/2003 TV 09/07/2003 TV 15/01/2004 TV 12/10/2004 TF 10/03/2006 TF 10/03/2006 TF 31/05/2006 TF 31/05/2006 TF 12/10/2006 TF 09/11/2006 TF 27/04/2007 TF 25/06/2007 TF 24/08/2007 TF 16/02/2012 TF 26/03/2012 TF 15/12/2004 TV 04/05/2005 TV 18/04/2007 TF 26/06/2007 TF 31/07/2007 TF 22/02/2008 TF 19/10/2011 TF 10/11/2011 TF 09/03/2012 TF 29/03/2012 TF 31/05/2007 TF 15/02/2011 TF 04/07/2007 TF 08/08/2007 TV 16/03/2009 TF 16/03/2009 TF 30/06/2011 TF 04/11/2011 TF 14/02/2012 TF 20/04/2011 TF 13/07/2011 TF 07/02/2012 TF 10/10/2012 TF 07/06/2013 TF 26/07/2013 TF 12/04/2012 TF 12/11/2012 TF 4.75 4.75 4.75 4.36 3.40 2.28 3.46 4.63 4.63 4.63 4.63 4.63 4.63 4.63 4.63 4.63 4.63 4.63 4.63 2.86 2.85 4.50 4.50 4.50 4.50 4.50 4.50 4.50 4.50 5.38 5.38 8.94 2.10 4.50 4.50 4.50 4.50 4.50 4.25 4.25 3.88 3.88 3.88 3.88 3.75 3.75 15/10/2018 15/10/2018 15/10/2018 10/01/2023 31/03/2031 31/03/2038 30/09/2034 12/10/2054 12/10/2054 12/10/2054 12/10/2054 12/10/2054 12/10/2054 12/10/2054 12/10/2054 12/10/2054 12/10/2054 12/10/2054 12/10/2054 30/09/2037 31/03/2038 07/03/2044 07/03/2044 07/03/2044 07/03/2044 07/03/2044 07/03/2044 07/03/2044 07/03/2044 07/03/2019 07/03/2019 18/07/2019 22/11/2022 07/06/2029 07/06/2029 07/06/2029 07/06/2029 07/06/2029 07/12/2021 07/12/2021 08/06/2037 08/06/2037 08/06/2037 08/06/2037 07/12/2027 07/12/2027 -150,000,000.00 -100,000,000.00 -225,000,000.00 -387,808,473.00 -105,000,000.00 -50,000,000.00 -100,000,000.00 -200,000,000.00 -50,000,000.00 -25,000,000.00 -40,000,000.00 -20,000,000.00 -75,000,000.00 -50,000,000.00 -40,000,000.00 -50,000,000.00 -50,000,000.00 -100,000,000.00 -75,000,000.00 -175,000,000.00 -115,000,000.00 -350,000,000.00 -50,000,000.00 -50,000,000.00 -50,000,000.00 -50,000,000.00 -85,000,000.00 -50,000,000.00 -50,000,000.00 -250,000,000.00 -50,000,000.00 -47,000,000.00 -100,000,000.00 -550,000,000.00 -50,000,000.00 -150,000,000.00 -125,000,000.00 -100,000,000.00 -300,000,000.00 -100,000,000.00 -600,000,000.00 -150,000,000.00 -250,000,000.00 -150,000,000.00 -300,000,000.00 -100,000,000.00 -150,000,000.00 -100,000,000.00 -225,000,000.00 -142,126,648.00 -64,676,430.00 -36,408,050.00 -68,993,200.00 -200,000,000.00 -50,000,000.00 -25,000,000.00 -40,000,000.00 -20,000,000.00 -75,000,000.00 -50,000,000.00 -40,000,000.00 -50,000,000.00 -50,000,000.00 -100,000,000.00 -75,000,000.00 -134,231,300.00 -90,064,435.00 -350,000,000.00 -50,000,000.00 -50,000,000.00 -50,000,000.00 -50,000,000.00 -85,000,000.00 -50,000,000.00 -50,000,000.00 -250,000,000.00 -50,000,000.00 -47,000,000.00 -100,000,000.00 -530,000,000.00 -50,000,000.00 -150,000,000.00 -125,000,000.00 -100,000,000.00 -300,000,000.00 -100,000,000.00 -600,000,000.00 -150,000,000.00 -250,000,000.00 -150,000,000.00 -300,000,000.00 -100,000,000.00 -169,065,518.52 -112,710,345.68 -253,598,277.79 -160,191,436.27 -72,897,027.83 -41,035,639.01 -77,762,474.22 -225,420,691.37 -56,355,172.84 -28,177,586.42 -45,084,138.27 -22,542,069.14 -84,532,759.26 -56,355,172.84 -45,084,138.27 -56,355,172.84 -56,355,172.84 -112,710,345.68 -84,532,759.26 -151,292,562.24 -101,511,936.03 -394,486,209.89 -56,355,172.84 -56,355,172.84 -56,355,172.84 -56,355,172.84 -95,803,793.83 -56,355,172.84 -56,355,172.84 -281,775,864.21 -56,355,172.84 -52,973,862.47 -112,710,345.68 -597,364,832.12 -56,355,172.84 -169,065,518.52 -140,887,932.10 -112,710,345.68 -338,131,037.05 -112,710,345.68 -676,262,074.10 -169,065,518.52 -281,775,864.21 -169,065,518.52 -338,131,037.05 -112,710,345.68 -202,760,276.37 -135,173,517.58 -304,140,414.55 -192,117,589.52 -87,425,405.47 -49,214,041.87 -93,260,535.33 -270,347,035.15 -67,586,758.79 -33,793,379.39 -54,069,407.03 -27,034,703.52 -101,380,138.18 -67,586,758.79 -54,069,407.03 -67,586,758.79 -67,586,758.79 -135,173,517.58 -101,380,138.18 -181,445,169.90 -121,743,264.88 -473,107,311.52 -67,586,758.79 -67,586,758.79 -67,586,758.79 -67,586,758.79 -114,897,489.94 -67,586,758.79 -67,586,758.79 -337,933,793.94 -67,586,758.79 -63,531,553.26 -135,173,517.58 -716,419,643.16 -67,586,758.79 -202,760,276.37 -168,966,896.97 -135,173,517.58 -405,520,552.73 -135,173,517.58 -811,041,105.46 -202,760,276.37 -337,933,793.94 -202,760,276.37 -405,520,552.73 -135,173,517.58 18


GBP GBP GBP GBP GBP GBP GBP GBP GBP GBP GBP GBP GBP GBP GBP GBP GBP GBP GBP GBP GBP GBP GBP GBP GBP GBP GBP GBP GBP GBP GBP GBP GBP GBP GBP GBP GBP GBP GBP GBP GBP GBP GBP GBP GBP GBP 19620100 19620200 19620300 19620400 19620500 19620600 19620700 19620800 19620900 19710100 19710200 19710300 19710400 19710500 19710600 19710700 19710800 19710900 19711000 19870100 19870200 19870300 19870400 19870500 19870600 19870700 19870800 19870900 19871000 19871100 19871200 19871300 19871400 19871500 19970100 19970200 19970300 19970500 19970600 19970700 19970800 20320100 20320200 20320300 20320500 20320600 31/10/2012 TF 31/10/2012 TF 17/05/2013 TF 12/06/2013 TF 07/02/2014 TF 21/09/2015 TF 01/03/2016 TF 14/10/2016 TF 07/07/2017 TF 14/01/2013 TF 23/01/2013 TF 13/03/2013 TF 11/04/2013 TF 26/04/2013 TF 29/01/2014 TF 30/05/2014 TF 18/06/2014 TF 13/03/2015 TF 11/09/2015 TF 01/02/2013 TF 27/03/2013 TF 18/04/2013 TF 30/05/2013 TF 18/03/2014 TF 23/05/2014 TF 30/05/2014 TF 01/09/2014 TF 07/05/2015 TF 05/08/2015 TF 16/09/2015 TF 16/09/2015 TF 19/01/2016 TF 15/02/2016 TF 12/05/2016 TF 01/03/2013 TV 01/03/2013 TV 28/05/2013 TV 07/03/2014 TV 14/05/2014 TV 21/05/2014 TV 31/07/2015 TV 16/10/2013 TV 16/01/2014 TV 07/02/2014 TV 15/04/2014 TV 15/05/2014 TV 2.50 2.50 2.50 2.50 2.50 2.50 2.50 2.50 2.50 1.38 1.38 1.38 1.38 1.38 1.38 1.38 1.38 1.38 1.38 1.50 1.50 1.50 1.50 1.50 1.50 1.50 1.50 1.50 1.50 1.50 1.50 1.50 1.50 1.50 0.77 0.77 0.77 0.77 0.77 0.77 0.77 0.63 0.63 0.63 0.63 0.63 31/10/2022 31/10/2022 31/10/2022 31/10/2022 31/10/2022 31/10/2022 31/10/2022 31/10/2022 31/10/2022 15/01/2018 15/01/2018 15/01/2018 15/01/2018 15/01/2018 15/01/2018 15/01/2018 15/01/2018 15/01/2018 15/01/2018 01/02/2019 01/02/2019 01/02/2019 01/02/2019 01/02/2019 01/02/2019 01/02/2019 01/02/2019 01/02/2019 01/02/2019 01/02/2019 01/02/2019 01/02/2019 01/02/2019 01/02/2019 25/05/2018 25/05/2018 25/05/2018 25/05/2018 25/05/2018 25/05/2018 25/05/2018 16/04/2019 16/04/2019 16/04/2019 16/04/2019 16/04/2019 -200,000,000.00 -100,000,000.00 -200,000,000.00 -150,000,000.00 -50,000,000.00 -300,000,000.00 -300,000,000.00 -500,000,000.00 -200,000,000.00 -1,000,000,000.00 -250,000,000.00 -500,000,000.00 -150,000,000.00 -100,000,000.00 -250,000,000.00 -225,000,000.00 -150,000,000.00 -750,000,000.00 -375,000,000.00 -500,000,000.00 -150,000,000.00 -100,000,000.00 -250,000,000.00 -500,000,000.00 -200,000,000.00 -100,000,000.00 -200,000,000.00 -500,000,000.00 -100,000,000.00 -175,000,000.00 -200,000,000.00 -1,500,000,000.00 -600,000,000.00 -500,000,000.00 -400,000,000.00 -200,000,000.00 -200,000,000.00 -750,000,000.00 -100,000,000.00 -100,000,000.00 -200,000,000.00 -400,000,000.00 -1,000,000,000.00 -250,000,000.00 -50,000,000.00 -200,000,000.00 -200,000,000.00 -100,000,000.00 -200,000,000.00 -150,000,000.00 -50,000,000.00 -300,000,000.00 -300,000,000.00 -500,000,000.00 -200,000,000.00 -1,000,000,000.00 -250,000,000.00 -500,000,000.00 -150,000,000.00 -100,000,000.00 -250,000,000.00 -225,000,000.00 -150,000,000.00 -750,000,000.00 -375,000,000.00 -250,000,000.00 -150,000,000.00 -100,000,000.00 -250,000,000.00 -500,000,000.00 -200,000,000.00 -100,000,000.00 -200,000,000.00 -500,000,000.00 -100,000,000.00 -175,000,000.00 -200,000,000.00 -1,500,000,000.00 -600,000,000.00 -500,000,000.00 -400,000,000.00 -200,000,000.00 -200,000,000.00 -551,000,000.00 -100,000,000.00 -100,000,000.00 -200,000,000.00 -400,000,000.00 -1,000,000,000.00 -250,000,000.00 -30,000,000.00 -200,000,000.00 -225,420,691.37 -112,710,345.68 -225,420,691.37 -169,065,518.52 -56,355,172.84 -338,131,037.05 -338,131,037.05 -563,551,728.41 -225,420,691.37 -1,127,103,456.83 -281,775,864.21 -563,551,728.41 -169,065,518.52 -112,710,345.68 -281,775,864.21 -253,598,277.79 -169,065,518.52 -845,327,592.62 -422,663,796.31 -281,775,864.21 -169,065,518.52 -112,710,345.68 -281,775,864.21 -563,551,728.41 -225,420,691.37 -112,710,345.68 -225,420,691.37 -563,551,728.41 -112,710,345.68 -197,243,104.94 -225,420,691.37 -1,690,655,185.24 -676,262,074.10 -563,551,728.41 -450,841,382.73 -225,420,691.37 -225,420,691.37 -621,034,004.71 -112,710,345.68 -112,710,345.68 -225,420,691.37 -450,841,382.73 -1,127,103,456.83 -281,775,864.21 -33,813,103.70 -225,420,691.37 -270,347,035.15 -135,173,517.58 -270,347,035.15 -202,760,276.37 -67,586,758.79 -405,520,552.73 -405,520,552.73 -675,867,587.89 -270,347,035.15 -1,351,735,175.77 -337,933,793.94 -675,867,587.89 -202,760,276.37 -135,173,517.58 -337,933,793.94 -304,140,414.55 -202,760,276.37 -1,013,801,381.83 -506,900,690.91 -337,933,793.94 -202,760,276.37 -135,173,517.58 -337,933,793.94 -675,867,587.89 -270,347,035.15 -135,173,517.58 -270,347,035.15 -675,867,587.89 -135,173,517.58 -236,553,655.76 -270,347,035.15 -2,027,602,763.66 -811,041,105.46 -675,867,587.89 -540,694,070.31 -270,347,035.15 -270,347,035.15 -744,806,081.85 -135,173,517.58 -135,173,517.58 -270,347,035.15 -540,694,070.31 -1,351,735,175.77 -337,933,793.94 -40,552,055.27 -270,347,035.15 19


GBP GBP GBP GBP GBP GBP GBP GBP GBP GBP GBP GBP GBP GBP GBP GBP GBP GBP GBP GBP GBP GBP GBP GBP GBP GBP GBP GBP GBP GBP GBP GBP 20320700 20720100 20720200 20720300 20720400 20720500 20720600 20720700 20720800 20970100 20970200 20970300 20970400 20970500 21140100 21140300 21140400 21140600 21620100 21620200 22300100 22300200 22300300 22300400 22400100 22400200 22650100 22650200 22650300 23120100 XS1721759709 XS1739955398 13/06/2014 TV 17/02/2014 TV 15/04/2014 TV 09/05/2014 TV 22/01/2015 TV 08/05/2015 TV 27/07/2015 TV 26/10/2015 TV 25/04/2016 TV 08/04/2014 TF 24/04/2015 TF 28/07/2015 TF 02/02/2016 TF 02/02/2016 TF 23/05/2014 TV 19/02/2015 TV 15/06/2015 TV 17/03/2016 TV 19/02/2015 TV 04/08/2015 TV 26/05/2016 TF 06/03/2017 TF 16/10/2017 TF 28/11/2017 TF 21/09/2016 TF 03/02/2017 TF 17/01/2017 TF 28/03/2017 TF 12/05/2017 TF 13/09/2017 TF 17/11/2017 TF 18/12/2017 TF 0.63 0.78 0.78 0.78 0.78 0.78 0.78 0.78 0.78 2.25 2.25 2.25 2.25 2.25 0.72 0.72 0.72 0.72 0.60 0.60 1.13 1.13 1.13 1.13 1.00 1.00 0.63 0.63 0.63 0.88 0.12 -0.04 16/04/2019 17/02/2020 17/02/2020 17/02/2020 17/02/2020 17/02/2020 17/02/2020 17/02/2020 17/02/2020 07/03/2020 07/03/2020 07/03/2020 07/03/2020 07/03/2020 21/05/2021 21/05/2021 21/05/2021 21/05/2021 18/02/2022 18/02/2022 07/09/2021 07/09/2021 07/09/2021 07/09/2021 21/09/2026 21/09/2026 17/01/2020 17/01/2020 17/01/2020 15/12/2023 16/02/2018 17/04/2018 -200,000,000.00 -500,000,000.00 -150,000,000.00 -100,000,000.00 -1,000,000,000.00 -250,000,000.00 -450,000,000.00 -125,000,000.00 -300,000,000.00 -500,000,000.00 -500,000,000.00 -300,000,000.00 -350,000,000.00 -150,000,000.00 -300,000,000.00 -650,000,000.00 -250,000,000.00 -300,000,000.00 -500,000,000.00 -150,000,000.00 -1,000,000,000.00 -250,000,000.00 -250,000,000.00 -250,000,000.00 -500,000,000.00 -500,000,000.00 -1,000,000,000.00 -250,000,000.00 -250,000,000.00 -500,000,000.00 -416,114,000.00 -190,000,000.00 -200,000,000.00 -500,000,000.00 -150,000,000.00 -100,000,000.00 -1,000,000,000.00 -250,000,000.00 -450,000,000.00 -125,000,000.00 -300,000,000.00 -500,000,000.00 -500,000,000.00 -300,000,000.00 -350,000,000.00 -150,000,000.00 -300,000,000.00 -650,000,000.00 -250,000,000.00 -300,000,000.00 -500,000,000.00 -150,000,000.00 -1,000,000,000.00 -250,000,000.00 -250,000,000.00 -250,000,000.00 -500,000,000.00 -500,000,000.00 -1,000,000,000.00 -250,000,000.00 -250,000,000.00 -500,000,000.00 -416,049,721.07 -190,022,282.37 -225,420,691.37 -563,551,728.41 -169,065,518.52 -112,710,345.68 -1,127,103,456.83 -281,775,864.21 -507,196,555.57 -140,887,932.10 -338,131,037.05 -563,551,728.41 -563,551,728.41 -338,131,037.05 -394,486,209.89 -169,065,518.52 -338,131,037.05 -732,617,246.94 -281,775,864.21 -338,131,037.05 -563,551,728.41 -169,065,518.52 -1,127,103,456.83 -281,775,864.21 -281,775,864.21 -281,775,864.21 -563,551,728.41 -563,551,728.41 -1,127,103,456.83 -281,775,864.21 -281,775,864.21 -563,551,728.41 -468,931,078.83 -214,174,771.33 -270,347,035.15 -675,867,587.89 -202,760,276.37 -135,173,517.58 -1,351,735,175.77 -337,933,793.94 -608,280,829.10 -168,966,896.97 -405,520,552.73 -675,867,587.89 -675,867,587.89 -405,520,552.73 -473,107,311.52 -202,760,276.37 -405,520,552.73 -878,627,864.25 -337,933,793.94 -405,520,552.73 -675,867,587.89 -202,760,276.37 -1,351,735,175.77 -337,933,793.94 -337,933,793.94 -337,933,793.94 -675,867,587.89 -675,867,587.89 -1,351,735,175.77 -337,933,793.94 -337,933,793.94 -675,867,587.89 -562,389,042.84 -256,859,803.26 -45,196,137,770.18 -43,751,078,657.96 -49,311,991,995.27 -59,139,871,999.92 USD (1) HKD 06920100 15/04/2004 TF 4.96 27/12/2019 -121,596,535.47 -121,596,535.47 -12,974,448.94 -15,560,256.61 -121,596,535.47 -121,596,535.47 -12,974,448.94 -15,560,256.61 USD (1) HUF HUF HUF 21850100 22000100 22000200 10/08/2015 TV 02/12/2015 TV 20/04/2016 TV 0.03 0.09 0.09 10/08/2020 02/06/2021 02/06/2021 -30,000,000,000.00 -30,200,000,000.00 -30,000,000,000.00 -30,000,000,000.00 -30,200,000,000.00 -30,000,000,000.00 -96,671,285.41 -97,315,760.64 -96,671,285.41 -115,937,872.59 -116,710,791.74 -115,937,872.59 20 Currency Borrowing number Value Date Interest rate Rate Maturity date Initial amount in currency of borrowing Nominal outstanding in currency of borrowing Nominal outstanding in EUR Nominal outstanding in Currency Borrowing number Value Date Interest rate Rate Maturity date Initial amount in currency of borrowing Nominal outstanding in currency of borrowing Nominal outstanding in EUR Nominal outstanding in


-90,200,000,000.00 -90,200,000,000.00 -290,658,331.45 -348,586,536.91 USD (1) JPY JPY JPY JPY JPY JPY JPY JPY JPY JPY JPY JPY JPY JPY JPY JPY JPY JPY JPY JPY JPY JPY JPY JPY JPY JPY JPY JPY JPY JPY JPY JPY JPY JPY JPY JPY JPY JPY JPY JPY JPY 01000100 02340100 02530100 02660100 03030100 05490100 07660100 07690100 08380100 08620100 08870100 10570100 10570200 12640100 12820100 12840100 12910100 13000100 13090100 13410100 13580100 13830100 14540100 15450100 15900100 15900200 17270100 17360100 17440100 18090100 18090200 18090300 19310100 19790100 20280100 20290100 20360100 20370100 20380100 20410100 20420100 27/03/1997 TF 25/09/2001 TV 07/01/2002 TV 22/01/2002 TV 26/03/2002 TV 12/08/2003 TV 28/10/2004 TV 12/11/2004 TV 16/03/2005 TV 27/04/2005 TV 13/06/2005 TV 26/01/2006 TF 04/02/2008 TF 14/12/2006 TV 23/01/2007 TV 18/01/2007 TF 13/02/2007 TV 05/03/2007 TV 27/03/2007 TV 18/07/2007 TV 20/09/2007 TV 10/12/2007 TF 26/06/2008 TV 25/03/2009 TV 02/06/2009 TV 08/02/2012 TV 07/06/2010 TF 29/06/2010 TV 15/07/2010 TF 22/03/2011 TV 22/03/2011 TV 22/03/2011 TV 10/05/2012 TV 18/01/2013 TF 24/09/2013 TV 08/10/2013 TV 26/11/2013 TV 03/12/2013 TV 21/11/2013 TV 25/11/2013 TF 11/12/2013 TV 5.56 2.28 2.66 1.51 1.60 0.38 0.88 0.86 1.17 1.72 1.97 1.90 1.90 5.00 8.50 2.15 8.50 4.19 9.26 10.00 0.01 2.41 0.50 0.39 0.38 0.38 1.29 3.40 1.17 0.33 0.34 0.33 3.50 1.70 3.00 3.00 2.35 2.74 2.00 1.74 3.30 28/03/2022 21/09/2021 15/12/2031 15/03/2032 15/03/2032 12/08/2033 28/10/2019 12/11/2019 16/03/2020 27/04/2020 13/06/2025 26/01/2026 26/01/2026 15/12/2036 23/01/2037 18/01/2027 13/02/2037 05/03/2037 27/03/2037 17/07/2037 21/09/2027 10/12/2047 22/06/2018 25/03/2019 02/06/2021 02/06/2021 05/06/2020 29/06/2040 15/07/2020 22/03/2018 22/03/2018 22/03/2018 15/12/2033 18/01/2033 25/09/2043 09/10/2043 27/11/2043 04/12/2043 21/11/2033 25/11/2053 11/12/2043 -5,000,000,000.00 -1,000,000,000.00 -1,200,000,000.00 -1,000,000,000.00 -2,000,000,000.00 -1,000,000,000.00 -5,000,000,000.00 -16,300,000,000.00 -1,000,000,000.00 -2,000,000,000.00 -1,000,000,000.00 -50,000,000,000.00 -25,000,000,000.00 -2,000,000,000.00 -1,000,000,000.00 -50,000,000,000.00 -3,000,000,000.00 -5,200,000,000.00 -3,500,000,000.00 -1,000,000,000.00 -1,082,000,000.00 -2,317,798,963.00 -11,885,000,000.00 -50,000,000,000.00 -50,000,000,000.00 -25,000,000,000.00 -60,000,000,000.00 -20,000,000,000.00 -40,000,000,000.00 -2,467,500,000.00 -2,444,500,000.00 -2,454,000,000.00 -1,650,000,000.00 -14,290,000,000.00 -1,000,000,000.00 -1,000,000,000.00 -1,000,000,000.00 -1,000,000,000.00 -1,000,000,000.00 -10,000,000,000.00 -1,100,000,000.00 -5,000,000,000.00 -1,000,000,000.00 -100,000,000.00 -1,000,000,000.00 -200,000,000.00 -1,000,000,000.00 -5,000,000,000.00 -8,300,000,000.00 -1,000,000,000.00 -2,000,000,000.00 -1,000,000,000.00 -34,530,700,000.00 -25,000,000,000.00 -2,000,000,000.00 -1,000,000,000.00 -50,000,000,000.00 -3,000,000,000.00 -5,200,000,000.00 -3,500,000,000.00 -1,000,000,000.00 -1,082,000,000.00 -2,939,981,759.00 -4,717,000,000.00 -50,000,000,000.00 -50,000,000,000.00 -25,000,000,000.00 -60,000,000,000.00 -20,000,000,000.00 -40,000,000,000.00 -2,467,500,000.00 -2,444,500,000.00 -2,454,000,000.00 -1,650,000,000.00 -10,851,509,360.00 -1,000,000,000.00 -1,000,000,000.00 -1,000,000,000.00 -1,000,000,000.00 -1,000,000,000.00 -10,000,000,000.00 -1,100,000,000.00 -37,034,293.76 -7,406,858.75 -740,685.88 -7,406,858.75 -1,481,371.75 -7,406,858.75 -37,034,293.76 -61,476,927.63 -7,406,858.75 -14,813,717.50 -7,406,858.75 -255,764,017.48 -185,171,468.78 -14,813,717.50 -7,406,858.75 -370,342,937.56 -22,220,576.25 -38,515,665.51 -25,924,005.63 -7,406,858.75 -8,014,221.17 -21,776,029.62 -34,938,152.73 -370,342,937.56 -370,342,937.56 -185,171,468.78 -444,411,525.07 -148,137,175.02 -296,274,350.05 -18,276,423.97 -18,106,066.22 -18,176,431.38 -12,221,316.94 -80,375,597.07 -7,406,858.75 -7,406,858.75 -7,406,858.75 -7,406,858.75 -7,406,858.75 -74,068,587.51 -8,147,544.63 -44,415,228.50 -8,883,045.70 -888,304.57 -8,883,045.70 -1,776,609.14 -8,883,045.70 -44,415,228.50 -73,729,279.31 -8,883,045.70 -17,766,091.40 -8,883,045.70 -306,737,786.16 -222,076,142.51 -17,766,091.40 -8,883,045.70 -444,152,285.02 -26,649,137.10 -46,191,837.64 -31,090,659.95 -8,883,045.70 -9,611,455.45 -26,115,992.32 -41,901,326.57 -444,152,285.02 -444,152,285.02 -222,076,142.51 -532,982,742.02 -177,660,914.01 -355,321,828.01 -21,918,915.27 -21,714,605.21 -21,798,994.15 -14,657,025.41 -96,394,453.56 -8,883,045.70 -8,883,045.70 -8,883,045.70 -8,883,045.70 -8,883,045.70 -88,830,457.00 -9,771,350.27 21 Currency Borrowing number Value Date Interest rate Rate Maturity date Initial amount in currency of borrowing Nominal outstanding in currency of borrowing Nominal outstanding in EUR Nominal outstanding in


JPY JPY JPY JPY JPY JPY JPY JPY JPY JPY JPY JPY JPY JPY JPY JPY JPY JPY JPY JPY JPY JPY JPY JPY JPY JPY JPY JPY JPY JPY JPY JPY JPY JPY JPY JPY JPY JPY JPY JPY JPY JPY JPY JPY JPY JPY 20470100 20480100 20490100 20500100 20510100 20550100 20580100 20600100 20670100 20710100 20730100 20740100 20750100 20770100 20830100 20840100 20850100 20870100 20880100 20900100 20910100 20930100 20940100 20960100 20980100 21020100 21040100 21080100 21110100 21120100 21220100 21260100 21270100 21320100 21410100 21430100 21530100 21580100 21920100 21950100 22010100 22080100 22140100 22340100 22350100 22360100 19/12/2013 TV 17/12/2013 TV 17/12/2013 TV 18/12/2013 TV 14/01/2014 TV 23/01/2014 TV 24/01/2014 TV 29/01/2014 TV 12/02/2014 TV 03/03/2014 TV 10/03/2014 TV 24/02/2014 TV 03/03/2014 TV 07/03/2014 TV 24/03/2014 TV 25/03/2014 TV 25/03/2014 TV 28/03/2014 TV 28/03/2014 TV 28/03/2014 TV 28/03/2014 TV 14/04/2014 TV 08/04/2014 TV 14/04/2014 TV 14/04/2014 TV 25/04/2014 TV 25/04/2014 TV 28/04/2014 TF 12/05/2014 TV 13/05/2014 TV 26/06/2014 TV 25/07/2014 TV 08/08/2014 TV 12/09/2014 TV 17/10/2014 TV 17/10/2014 TV 12/02/2015 TV 19/02/2015 TV 15/10/2015 TV 23/10/2015 TV 08/12/2015 TV 16/02/2016 TV 14/03/2016 TV 24/06/2016 TV 27/06/2016 TV 26/08/2016 TV 0.49 3.70 4.30 2.90 3.00 2.85 3.00 1.70 3.25 2.93 4.00 3.55 2.26 3.66 2.63 3.07 2.12 1.24 3.06 2.77 2.72 2.48 3.70 2.48 3.00 4.50 1.98 1.00 3.50 2.40 2.64 4.15 3.97 2.45 3.16 3.16 1.01 2.38 2.28 3.20 3.25 3.00 2.10 3.00 3.00 2.35 19/12/2033 18/12/2028 18/12/2028 18/12/2043 15/01/2044 23/01/2034 24/01/2034 30/01/2034 12/02/2044 03/03/2044 10/03/2034 23/02/2029 03/03/2044 07/03/2029 24/03/2034 25/03/2044 25/03/2039 28/03/2034 28/03/2029 31/03/2044 28/03/2044 14/04/2044 09/01/2029 14/04/2044 15/03/2044 28/04/2034 28/04/2044 28/03/2034 13/05/2044 13/05/2044 27/06/2034 25/07/2044 08/08/2029 12/09/2034 17/10/2044 17/10/2044 13/02/2045 20/02/2035 16/10/2045 23/10/2040 08/12/2045 16/02/2046 15/03/2046 24/06/2036 27/06/2036 26/08/2036 -1,000,000,000.00 -2,100,000,000.00 -2,700,000,000.00 -1,000,000,000.00 -1,000,000,000.00 -4,100,000,000.00 -1,000,000,000.00 -1,200,000,000.00 -1,000,000,000.00 -1,000,000,000.00 -800,000,000.00 -600,000,000.00 -600,000,000.00 -1,100,000,000.00 -3,000,000,000.00 -500,000,000.00 -5,000,000,000.00 -500,000,000.00 -500,000,000.00 -1,000,000,000.00 -1,000,000,000.00 -500,000,000.00 -1,000,000,000.00 -1,000,000,000.00 -10,000,000,000.00 -500,000,000.00 -500,000,000.00 -1,000,000,000.00 -1,300,000,000.00 -500,000,000.00 -500,000,000.00 -500,000,000.00 -500,000,000.00 -500,000,000.00 -1,000,000,000.00 -1,000,000,000.00 -600,000,000.00 -1,000,000,000.00 -500,000,000.00 -500,000,000.00 -500,000,000.00 -800,000,000.00 -500,000,000.00 -900,000,000.00 -500,000,000.00 -500,000,000.00 -1,000,000,000.00 -2,100,000,000.00 -2,700,000,000.00 -1,000,000,000.00 -1,000,000,000.00 -4,100,000,000.00 -1,000,000,000.00 -1,200,000,000.00 -1,000,000,000.00 -1,000,000,000.00 -800,000,000.00 -600,000,000.00 -600,000,000.00 -1,100,000,000.00 -3,000,000,000.00 -500,000,000.00 -5,000,000,000.00 -500,000,000.00 -500,000,000.00 -1,000,000,000.00 -1,000,000,000.00 -500,000,000.00 -1,000,000,000.00 -1,000,000,000.00 -10,000,000,000.00 -500,000,000.00 -500,000,000.00 -1,000,000,000.00 -1,300,000,000.00 -500,000,000.00 -500,000,000.00 -500,000,000.00 -500,000,000.00 -500,000,000.00 -1,000,000,000.00 -1,000,000,000.00 -600,000,000.00 -1,000,000,000.00 -500,000,000.00 -500,000,000.00 -500,000,000.00 -800,000,000.00 -500,000,000.00 -900,000,000.00 -500,000,000.00 -500,000,000.00 -7,406,858.75 -15,554,403.38 -19,998,518.63 -7,406,858.75 -7,406,858.75 -30,368,120.88 -7,406,858.75 -8,888,230.50 -7,406,858.75 -7,406,858.75 -5,925,487.00 -4,444,115.25 -4,444,115.25 -8,147,544.63 -22,220,576.25 -3,703,429.38 -37,034,293.76 -3,703,429.38 -3,703,429.38 -7,406,858.75 -7,406,858.75 -3,703,429.38 -7,406,858.75 -7,406,858.75 -74,068,587.51 -3,703,429.38 -3,703,429.38 -7,406,858.75 -9,628,916.38 -3,703,429.38 -3,703,429.38 -3,703,429.38 -3,703,429.38 -3,703,429.38 -7,406,858.75 -7,406,858.75 -4,444,115.25 -7,406,858.75 -3,703,429.38 -3,703,429.38 -3,703,429.38 -5,925,487.00 -3,703,429.38 -6,666,172.88 -3,703,429.38 -3,703,429.38 -8,883,045.70 -18,654,395.97 -23,984,223.39 -8,883,045.70 -8,883,045.70 -36,420,487.37 -8,883,045.70 -10,659,654.84 -8,883,045.70 -8,883,045.70 -7,106,436.56 -5,329,827.42 -5,329,827.42 -9,771,350.27 -26,649,137.10 -4,441,522.85 -44,415,228.50 -4,441,522.85 -4,441,522.85 -8,883,045.70 -8,883,045.70 -4,441,522.85 -8,883,045.70 -8,883,045.70 -88,830,457.00 -4,441,522.85 -4,441,522.85 -8,883,045.70 -11,547,959.41 -4,441,522.85 -4,441,522.85 -4,441,522.85 -4,441,522.85 -4,441,522.85 -8,883,045.70 -8,883,045.70 -5,329,827.42 -8,883,045.70 -4,441,522.85 -4,441,522.85 -4,441,522.85 -7,106,436.56 -4,441,522.85 -7,994,741.13 -4,441,522.85 -4,441,522.85 22


JPY JPY JPY 22760100 22770100 23110100 13/02/2017 TF 13/02/2017 TF 21/08/2017 TF 3.00 2.00 2.75 13/02/2047 13/02/2037 21/08/2042 -500,000,000.00 -500,000,000.00 -500,000,000.00 -500,000,000.00 -500,000,000.00 -500,000,000.00 -3,703,429.38 -3,703,429.38 -3,703,429.38 -4,441,522.85 -4,441,522.85 -4,441,522.85 -535,690,798,963.00 -499,337,191,119.00 -3,698,520,043.84 -4,435,635,088.58 USD (1) MXN MXN MXN MXN MXN MXN MXN MXN MXN MXN MXN MXN MXN MXN MXN MXN MXN MXN MXN MXN MXN MXN MXN MXN MXN MXN MXN MXN MXN MXN MXN MXN MXN MXN MXN MXN MXN MXN 21610100 21610200 21610300 21610400 21610500 21610600 21610700 21610800 21610900 21611000 21611100 21611200 21611300 21611400 21611500 21611600 21611700 21611800 21611900 21612000 21612100 22020100 22020200 22020300 22020400 22020500 22020600 22020700 22020800 22020900 22021000 22021100 22021200 22570100 22570200 22570300 22640100 22690100 25/02/2015 TF 06/08/2015 TF 12/11/2015 TF 27/01/2016 TF 10/02/2016 TF 14/04/2016 TF 07/07/2016 TF 02/08/2016 TF 02/09/2016 TF 22/09/2016 TF 11/10/2016 TF 28/10/2016 TF 28/10/2016 TF 17/11/2016 TF 07/12/2016 TF 12/01/2017 TF 07/02/2017 TF 17/02/2017 TF 17/10/2017 TF 13/12/2017 TF 13/12/2017 TF 19/01/2016 TF 03/10/2016 TF 19/10/2016 TF 10/11/2016 TF 02/12/2016 TF 19/01/2017 TF 26/01/2017 TF 30/01/2017 TF 02/03/2017 TF 11/05/2017 TF 13/10/2017 TF 21/12/2017 TF 28/11/2016 TF 26/01/2017 TF 09/11/2017 TF 11/01/2017 TF 20/01/2017 TF 4.00 4.00 4.00 4.00 4.00 4.00 4.00 4.00 4.00 4.00 4.00 4.00 4.00 4.00 4.00 4.00 4.00 4.00 4.00 4.00 4.00 4.75 4.75 4.75 4.75 4.75 4.75 4.75 4.75 4.75 4.75 4.75 4.75 5.50 5.50 5.50 8.00 7.50 25/02/2020 25/02/2020 25/02/2020 25/02/2020 25/02/2020 25/02/2020 25/02/2020 25/02/2020 25/02/2020 25/02/2020 25/02/2020 25/02/2020 25/02/2020 25/02/2020 25/02/2020 25/02/2020 25/02/2020 25/02/2020 25/02/2020 25/02/2020 25/02/2020 19/01/2021 19/01/2021 19/01/2021 19/01/2021 19/01/2021 19/01/2021 19/01/2021 19/01/2021 19/01/2021 19/01/2021 19/01/2021 19/01/2021 23/01/2023 23/01/2023 23/01/2023 11/01/2027 09/06/2022 -500,000,000.00 -250,000,000.00 -250,000,000.00 -275,000,000.00 -275,000,000.00 -275,000,000.00 -275,000,000.00 -275,000,000.00 -275,000,000.00 -400,000,000.00 -300,000,000.00 -350,000,000.00 -150,000,000.00 -500,000,000.00 -550,000,000.00 -750,000,000.00 -1,250,000,000.00 -1,200,000,000.00 -500,000,000.00 -500,000,000.00 -500,000,000.00 -1,000,000,000.00 -500,000,000.00 -350,000,000.00 -400,000,000.00 -400,000,000.00 -550,000,000.00 -550,000,000.00 -350,000,000.00 -500,000,000.00 -1,250,000,000.00 -500,000,000.00 -1,500,000,000.00 -500,000,000.00 -550,000,000.00 -500,000,000.00 -500,000,000.00 -1,000,000,000.00 -500,000,000.00 -250,000,000.00 -250,000,000.00 -275,000,000.00 -275,000,000.00 -275,000,000.00 -275,000,000.00 -275,000,000.00 -275,000,000.00 -400,000,000.00 -300,000,000.00 -350,000,000.00 -150,000,000.00 -500,000,000.00 -550,000,000.00 -750,000,000.00 -1,250,000,000.00 -1,200,000,000.00 -500,000,000.00 -500,000,000.00 -500,000,000.00 -1,000,000,000.00 -500,000,000.00 -350,000,000.00 -400,000,000.00 -400,000,000.00 -550,000,000.00 -550,000,000.00 -350,000,000.00 -500,000,000.00 -1,250,000,000.00 -500,000,000.00 -1,500,000,000.00 -500,000,000.00 -550,000,000.00 -500,000,000.00 -500,000,000.00 -1,000,000,000.00 -21,131,641.67 -10,565,820.84 -10,565,820.84 -11,622,402.92 -11,622,402.92 -11,622,402.92 -11,622,402.92 -11,622,402.92 -11,622,402.92 -16,905,313.34 -12,678,985.00 -14,792,149.17 -6,339,492.50 -21,131,641.67 -23,244,805.84 -31,697,462.51 -52,829,104.19 -50,715,940.02 -21,131,641.67 -21,131,641.67 -21,131,641.67 -42,263,283.35 -21,131,641.67 -14,792,149.17 -16,905,313.34 -16,905,313.34 -23,244,805.84 -23,244,805.84 -14,792,149.17 -21,131,641.67 -52,829,104.19 -21,131,641.67 -63,394,925.02 -21,131,641.67 -23,244,805.84 -21,131,641.67 -21,131,641.67 -42,263,283.35 -25,343,177.86 -12,671,588.93 -12,671,588.93 -13,938,747.82 -13,938,747.82 -13,938,747.82 -13,938,747.82 -13,938,747.82 -13,938,747.82 -20,274,542.29 -15,205,906.72 -17,740,224.50 -7,602,953.36 -25,343,177.86 -27,877,495.65 -38,014,766.79 -63,357,944.65 -60,823,626.87 -25,343,177.86 -25,343,177.86 -25,343,177.86 -50,686,355.72 -25,343,177.86 -17,740,224.50 -20,274,542.29 -20,274,542.29 -27,877,495.65 -27,877,495.65 -17,740,224.50 -25,343,177.86 -63,357,944.65 -25,343,177.86 -76,029,533.58 -25,343,177.86 -27,877,495.65 -25,343,177.86 -25,343,177.86 -50,686,355.72 23 Currency Borrowing number Value Date Interest rate Rate Maturity date Initial amount in currency of borrowing Nominal outstanding in currency of borrowing Nominal outstanding in EUR Nominal outstanding in


MXN MXN MXN MXN MXN 22720100 22720200 22720300 22960100 22960200 27/01/2017 TF 16/10/2017 TF 13/12/2017 TF 07/04/2017 TF 31/07/2017 TF 7.00 7.00 7.00 6.50 6.50 27/07/2020 27/07/2020 27/07/2020 07/07/2027 07/07/2027 -1,000,000,000.00 -300,000,000.00 -300,000,000.00 -1,000,000,000.00 -750,000,000.00 -1,000,000,000.00 -300,000,000.00 -300,000,000.00 -1,000,000,000.00 -750,000,000.00 -42,263,283.35 -12,678,985.00 -12,678,985.00 -42,263,283.35 -31,697,462.51 -50,686,355.72 -15,205,906.72 -15,205,906.72 -50,686,355.72 -38,014,766.79 -23,850,000,000.00 -23,850,000,000.00 -1,007,979,307.90 -1,208,869,583.96 USD (1) NOK NOK NOK NOK NOK NOK NOK NOK NOK NOK NOK NOK NOK NOK NOK NOK NOK NOK NOK NOK NOK NOK NOK NOK NOK NOK NOK NOK NOK NOK NOK NOK NOK NOK NOK NOK 09970100 09970200 18260100 18260200 18260300 18260400 18820100 18820200 18820300 18820400 19500100 19500200 19500300 19500400 19500500 19500600 19500700 19500800 19740100 19740200 19740300 19740400 19880100 19880200 19880300 19880400 19930100 19930200 19930300 20090100 20090200 20150100 20150200 20920100 21010100 21500100 03/11/2005 TF 15/01/2010 TF 03/05/2011 TF 24/08/2011 TF 04/10/2011 TF 13/04/2012 TF 31/10/2011 TF 26/03/2012 TF 12/04/2012 TF 30/07/2012 TF 05/09/2012 TF 23/01/2013 TF 19/04/2013 TF 15/05/2013 TF 09/07/2013 TF 12/03/2014 TF 28/03/2014 TF 17/06/2014 TF 17/01/2013 TF 01/02/2013 TF 03/05/2013 TF 04/06/2014 TF 04/02/2013 TF 24/05/2013 TF 30/06/2014 TF 30/06/2015 TF 27/02/2013 TV 27/02/2013 TV 07/02/2014 TV 24/05/2013 TF 02/06/2014 TF 13/06/2013 TF 13/06/2013 TF 02/04/2014 TF 11/04/2014 TV 26/01/2015 TV 4.17 4.17 4.88 4.88 4.88 4.88 3.75 3.75 3.75 3.75 3.00 3.00 3.00 3.00 3.00 3.00 3.00 3.00 2.50 2.50 2.50 2.50 3.00 3.00 3.00 3.00 1.00 1.00 1.00 3.25 3.25 4.00 4.00 3.25 0.90 0.84 03/11/2025 03/11/2025 25/05/2021 25/05/2021 25/05/2021 25/05/2021 31/10/2018 31/10/2018 31/10/2018 31/10/2018 22/05/2019 22/05/2019 22/05/2019 22/05/2019 22/05/2019 22/05/2019 22/05/2019 22/05/2019 17/01/2018 17/01/2018 17/01/2018 17/01/2018 04/02/2020 04/02/2020 04/02/2020 04/02/2020 27/02/2018 27/02/2018 27/02/2018 24/05/2023 24/05/2023 13/06/2033 13/06/2033 14/03/2024 11/04/2019 26/01/2022 -300,000,000.00 -200,000,000.00 -1,000,000,000.00 -225,000,000.00 -310,000,000.00 -380,000,000.00 -1,000,000,000.00 -250,000,000.00 -300,000,000.00 -200,000,000.00 -500,000,000.00 -300,000,000.00 -700,000,000.00 -150,000,000.00 -250,000,000.00 -250,000,000.00 -300,000,000.00 -150,000,000.00 -750,000,000.00 -250,000,000.00 -300,000,000.00 -300,000,000.00 -500,000,000.00 -250,000,000.00 -150,000,000.00 -300,000,000.00 -500,000,000.00 -500,000,000.00 -500,000,000.00 -500,000,000.00 -250,000,000.00 -1,000,000,000.00 -1,000,000,000.00 -850,000,000.00 -500,000,000.00 -1,200,000,000.00 -300,000,000.00 -200,000,000.00 -1,000,000,000.00 -225,000,000.00 -310,000,000.00 -380,000,000.00 -1,000,000,000.00 -250,000,000.00 -300,000,000.00 -200,000,000.00 -500,000,000.00 -300,000,000.00 -700,000,000.00 -150,000,000.00 -250,000,000.00 -250,000,000.00 -300,000,000.00 -150,000,000.00 -750,000,000.00 -250,000,000.00 -300,000,000.00 -300,000,000.00 -500,000,000.00 -250,000,000.00 -150,000,000.00 -300,000,000.00 -500,000,000.00 -500,000,000.00 -500,000,000.00 -500,000,000.00 -250,000,000.00 -1,000,000,000.00 -1,000,000,000.00 -850,000,000.00 -500,000,000.00 -1,200,000,000.00 -30,486,875.40 -20,324,583.60 -101,622,918.00 -22,865,156.55 -31,503,104.58 -38,616,708.84 -101,622,918.00 -25,405,729.50 -30,486,875.40 -20,324,583.60 -50,811,459.00 -30,486,875.40 -71,136,042.60 -15,243,437.70 -25,405,729.50 -25,405,729.50 -30,486,875.40 -15,243,437.70 -76,217,188.50 -25,405,729.50 -30,486,875.40 -30,486,875.40 -50,811,459.00 -25,405,729.50 -15,243,437.70 -30,486,875.40 -50,811,459.00 -50,811,459.00 -50,811,459.00 -50,811,459.00 -25,405,729.50 -101,622,918.00 -101,622,918.00 -86,379,480.30 -50,811,459.00 -121,947,501.60 -36,562,909.67 -24,375,273.11 -121,876,365.56 -27,422,182.25 -37,781,673.32 -46,313,018.91 -121,876,365.56 -30,469,091.39 -36,562,909.67 -24,375,273.11 -60,938,182.78 -36,562,909.67 -85,313,455.89 -18,281,454.83 -30,469,091.39 -30,469,091.39 -36,562,909.67 -18,281,454.83 -91,407,274.17 -30,469,091.39 -36,562,909.67 -36,562,909.67 -60,938,182.78 -30,469,091.39 -18,281,454.83 -36,562,909.67 -60,938,182.78 -60,938,182.78 -60,938,182.78 -60,938,182.78 -30,469,091.39 -121,876,365.56 -121,876,365.56 -103,594,910.72 -60,938,182.78 -146,251,638.67 24 Currency Borrowing number Value Date Interest rate Rate Maturity date Initial amount in currency of borrowing Nominal outstanding in currency of borrowing Nominal outstanding in EUR Nominal outstanding in


NOK NOK NOK NOK NOK NOK NOK NOK NOK NOK NOK NOK NOK NOK NOK NOK NOK NOK NOK NOK NOK NOK NOK NOK NOK NOK NOK NOK NOK NOK NOK NOK NOK NOK NOK NOK NOK NOK NOK NOK NOK NOK NOK NOK NOK NOK 21500200 21500300 21500400 21630100 21630200 21630300 21630400 21630500 21630600 21630700 21630800 21630900 21631000 21631100 21631200 21631300 21631400 21631500 21631600 21631700 21631800 21631900 21720100 21720200 21720300 21720400 21720500 21720600 21720700 21720800 21720900 21721000 21721100 21721200 21721300 21880100 21880200 21880300 21880400 21880500 22250100 22250200 22250300 22250400 22250500 22730100 26/01/2015 TV 03/02/2015 TV 03/02/2015 TV 27/02/2015 TF 24/04/2015 TF 02/06/2015 TF 11/09/2015 TF 19/01/2016 TF 27/01/2016 TF 08/02/2016 TF 10/02/2016 TF 25/07/2016 TF 06/09/2016 TF 27/09/2016 TF 30/11/2016 TF 18/01/2017 TF 22/03/2017 TF 22/03/2017 TF 05/05/2017 TF 08/06/2017 TF 04/10/2017 TF 04/10/2017 TF 12/05/2015 TF 13/01/2016 TF 21/03/2016 TF 08/06/2016 TF 22/06/2016 TF 18/08/2016 TF 30/09/2016 TF 16/01/2017 TF 20/01/2017 TF 22/02/2017 TF 14/03/2017 TF 30/03/2017 TF 15/05/2017 TF 01/09/2015 TF 10/09/2015 TF 29/09/2015 TF 29/09/2015 TF 17/03/2016 TF 14/04/2016 TF 28/09/2016 TF 27/04/2017 TF 16/05/2017 TF 14/06/2017 TF 26/01/2017 TF 0.84 0.84 0.84 1.13 1.13 1.13 1.13 1.13 1.13 1.13 1.13 1.13 1.13 1.13 1.13 1.13 1.13 1.13 1.13 1.13 1.13 1.13 1.50 1.50 1.50 1.50 1.50 1.50 1.50 1.50 1.50 1.50 1.50 1.50 1.50 1.25 1.25 1.25 1.25 1.25 1.00 1.00 1.00 1.00 1.00 1.50 26/01/2022 26/01/2022 26/01/2022 15/05/2020 15/05/2020 15/05/2020 15/05/2020 15/05/2020 15/05/2020 15/05/2020 15/05/2020 15/05/2020 15/05/2020 15/05/2020 15/05/2020 15/05/2020 15/05/2020 15/05/2020 15/05/2020 15/05/2020 15/05/2020 15/05/2020 12/05/2022 12/05/2022 12/05/2022 12/05/2022 12/05/2022 12/05/2022 12/05/2022 12/05/2022 12/05/2022 12/05/2022 12/05/2022 12/05/2022 12/05/2022 01/09/2020 01/09/2020 01/09/2020 01/09/2020 01/09/2020 25/05/2021 25/05/2021 25/05/2021 25/05/2021 25/05/2021 26/01/2024 -300,000,000.00 -500,000,000.00 -250,000,000.00 -750,000,000.00 -750,000,000.00 -500,000,000.00 -500,000,000.00 -2,000,000,000.00 -600,000,000.00 -500,000,000.00 -500,000,000.00 -250,000,000.00 -750,000,000.00 -250,000,000.00 -250,000,000.00 -300,000,000.00 -250,000,000.00 -200,000,000.00 -250,000,000.00 -250,000,000.00 -250,000,000.00 -250,000,000.00 -1,000,000,000.00 -300,000,000.00 -250,000,000.00 -250,000,000.00 -200,000,000.00 -650,000,000.00 -500,000,000.00 -250,000,000.00 -250,000,000.00 -250,000,000.00 -500,000,000.00 -400,000,000.00 -250,000,000.00 -1,000,000,000.00 -1,000,000,000.00 -500,000,000.00 -500,000,000.00 -500,000,000.00 -1,000,000,000.00 -500,000,000.00 -250,000,000.00 -250,000,000.00 -250,000,000.00 -1,000,000,000.00 -300,000,000.00 -500,000,000.00 -250,000,000.00 -750,000,000.00 -750,000,000.00 -500,000,000.00 -500,000,000.00 -2,000,000,000.00 -600,000,000.00 -500,000,000.00 -500,000,000.00 -250,000,000.00 -750,000,000.00 -250,000,000.00 -250,000,000.00 -300,000,000.00 -250,000,000.00 -200,000,000.00 -250,000,000.00 -250,000,000.00 -250,000,000.00 -250,000,000.00 -1,000,000,000.00 -300,000,000.00 -250,000,000.00 -250,000,000.00 -200,000,000.00 -650,000,000.00 -500,000,000.00 -250,000,000.00 -250,000,000.00 -250,000,000.00 -500,000,000.00 -400,000,000.00 -250,000,000.00 -1,000,000,000.00 -1,000,000,000.00 -500,000,000.00 -500,000,000.00 -500,000,000.00 -1,000,000,000.00 -500,000,000.00 -250,000,000.00 -250,000,000.00 -250,000,000.00 -1,000,000,000.00 -30,486,875.40 -50,811,459.00 -25,405,729.50 -76,217,188.50 -76,217,188.50 -50,811,459.00 -50,811,459.00 -203,245,836.00 -60,973,750.80 -50,811,459.00 -50,811,459.00 -25,405,729.50 -76,217,188.50 -25,405,729.50 -25,405,729.50 -30,486,875.40 -25,405,729.50 -20,324,583.60 -25,405,729.50 -25,405,729.50 -25,405,729.50 -25,405,729.50 -101,622,918.00 -30,486,875.40 -25,405,729.50 -25,405,729.50 -20,324,583.60 -66,054,896.70 -50,811,459.00 -25,405,729.50 -25,405,729.50 -25,405,729.50 -50,811,459.00 -40,649,167.20 -25,405,729.50 -101,622,918.00 -101,622,918.00 -50,811,459.00 -50,811,459.00 -50,811,459.00 -101,622,918.00 -50,811,459.00 -25,405,729.50 -25,405,729.50 -25,405,729.50 -101,622,918.00 -36,562,909.67 -60,938,182.78 -30,469,091.39 -91,407,274.17 -91,407,274.17 -60,938,182.78 -60,938,182.78 -243,752,731.12 -73,125,819.33 -60,938,182.78 -60,938,182.78 -30,469,091.39 -91,407,274.17 -30,469,091.39 -30,469,091.39 -36,562,909.67 -30,469,091.39 -24,375,273.11 -30,469,091.39 -30,469,091.39 -30,469,091.39 -30,469,091.39 -121,876,365.56 -36,562,909.67 -30,469,091.39 -30,469,091.39 -24,375,273.11 -79,219,637.61 -60,938,182.78 -30,469,091.39 -30,469,091.39 -30,469,091.39 -60,938,182.78 -48,750,546.22 -30,469,091.39 -121,876,365.56 -121,876,365.56 -60,938,182.78 -60,938,182.78 -60,938,182.78 -121,876,365.56 -60,938,182.78 -30,469,091.39 -30,469,091.39 -30,469,091.39 -121,876,365.56 25


NOK NOK NOK 22730200 22730300 22790100 08/06/2017 TF 10/07/2017 TF 09/02/2017 TF 1.50 1.50 2.25 26/01/2024 26/01/2024 09/02/2037 -250,000,000.00 -500,000,000.00 -750,000,000.00 -250,000,000.00 -500,000,000.00 -750,000,000.00 -25,405,729.50 -50,811,459.00 -76,217,188.50 -30,469,091.39 -60,938,182.78 -91,407,274.17 -40,065,000,000.00 -40,065,000,000.00 -4,071,522,209.69 -4,882,976,586.08 USD (1) NZD NZD NZD NZD NZD NZD NZD NZD 18500100 18670100 20590100 20590200 20590300 21280100 21370100 21370200 16/06/2011 TV 04/08/2011 TF 22/01/2014 TF 30/09/2014 TF 16/02/2015 TF 30/07/2014 TF 10/09/2014 TF 26/02/2015 TF 2.40 0.50 4.75 4.75 4.75 4.63 4.25 4.25 16/06/2021 04/08/2021 22/01/2019 22/01/2019 22/01/2019 30/07/2020 10/09/2018 10/09/2018 -200,000,000.00 -50,000,000.00 -125,000,000.00 -75,000,000.00 -50,000,000.00 -100,000,000.00 -125,000,000.00 -50,000,000.00 -200,000,000.00 -50,000,000.00 -125,000,000.00 -75,000,000.00 -50,000,000.00 -100,000,000.00 -125,000,000.00 -50,000,000.00 -118,694,362.02 -29,673,590.50 -74,183,976.26 -44,510,385.76 -29,673,590.50 -59,347,181.01 -74,183,976.26 -29,673,590.50 -142,350,148.37 -35,587,537.09 -88,968,842.73 -53,381,305.64 -35,587,537.09 -71,175,074.18 -88,968,842.73 -35,587,537.09 -775,000,000.00 -775,000,000.00 -459,940,652.82 -551,606,824.93 USD (1) PLN PLN PLN PLN PLN PLN PLN PLN PLN PLN PLN PLN PLN PLN PLN 19570100 19570200 19570300 19570400 19570500 21780100 22280100 22280200 22280300 22280400 22420100 22420200 22420300 22420400 23030100 25/10/2012 TF 19/09/2013 TF 19/03/2014 TF 14/10/2014 TF 09/04/2015 TF 02/07/2015 TF 28/04/2016 TF 28/04/2016 TF 01/02/2017 TF 27/10/2017 TF 29/09/2016 TF 29/09/2016 TF 23/03/2017 TF 27/11/2017 TF 07/06/2017 TF 4.25 4.25 4.25 4.25 4.25 2.75 2.25 2.25 2.25 2.25 2.75 2.75 2.75 2.75 3.00 25/10/2022 25/10/2022 25/10/2022 25/10/2022 25/10/2022 02/07/2022 25/05/2021 25/05/2021 25/05/2021 25/05/2021 25/08/2026 25/08/2026 25/08/2026 25/08/2026 24/05/2024 -100,000,000.00 -50,000,000.00 -50,000,000.00 -50,000,000.00 -310,000,000.00 -200,000,000.00 -1,350,000,000.00 -400,000,000.00 -1,500,000,000.00 -750,000,000.00 -900,000,000.00 -200,000,000.00 -900,000,000.00 -500,000,000.00 -1,500,000,000.00 -100,000,000.00 -50,000,000.00 -50,000,000.00 -50,000,000.00 -310,000,000.00 -200,000,000.00 -1,350,000,000.00 -400,000,000.00 -1,500,000,000.00 -750,000,000.00 -900,000,000.00 -200,000,000.00 -900,000,000.00 -500,000,000.00 -1,500,000,000.00 -23,940,627.24 -11,970,313.62 -11,970,313.62 -11,970,313.62 -74,215,944.46 -47,881,254.49 -323,198,467.80 -95,762,508.98 -359,109,408.67 -179,554,704.33 -215,465,645.20 -47,881,254.49 -215,465,645.20 -119,703,136.22 -359,109,408.67 -28,711,994.25 -14,355,997.13 -14,355,997.13 -14,355,997.13 -89,007,182.19 -57,423,988.51 -387,611,922.43 -114,847,977.02 -430,679,913.81 -215,339,956.91 -258,407,948.29 -57,423,988.51 -258,407,948.29 -143,559,971.27 -430,679,913.81 -8,760,000,000.00 -8,760,000,000.00 -2,097,198,946.61 -2,515,170,696.67 USD (1) RON 21170100 27/05/2014 TV 1.15 27/05/2019 -88,000,000.00 -88,000,000.00 -18,890,200.71 -22,655,017.71 -88,000,000.00 -88,000,000.00 -18,890,200.71 -22,655,017.71 26 Currency Borrowing number Value Date Interest rate Rate Maturity date Initial amount in currency of borrowing Nominal outstanding in currency of borrowing Nominal outstanding in EUR Nominal outstanding in Currency Borrowing number Value Date Interest rate Rate Maturity date Initial amount in currency of borrowing Nominal outstanding in currency of borrowing Nominal outstanding in EUR Nominal outstanding in Currency Borrowing number Value Date Interest rate Rate Maturity date Initial amount in currency of borrowing Nominal outstanding in currency of borrowing Nominal outstanding in EUR Nominal outstanding in


USD (1) RUB RUB RUB RUB RUB RUB RUB RUB RUB RUB RUB 19400100 19400200 19400300 19400400 19400500 19400600 19960100 19960200 19960300 23070100 23070200 16/07/2012 TF 26/07/2012 TF 06/09/2012 TF 06/09/2012 TF 12/07/2017 TF 16/08/2017 TF 15/02/2013 TF 10/04/2013 TF 18/06/2013 TF 13/07/2017 TF 20/10/2017 TF 7.50 7.50 7.50 7.50 7.50 7.50 6.00 6.00 6.00 6.00 6.00 16/07/2019 16/07/2019 16/07/2019 16/07/2019 16/07/2019 16/07/2019 15/02/2018 15/02/2018 15/02/2018 13/07/2020 13/07/2020 -750,000,000.00 -500,000,000.00 -500,000,000.00 -750,000,000.00 -2,500,000,000.00 -3,000,000,000.00 -2,000,000,000.00 -500,000,000.00 -500,000,000.00 -3,000,000,000.00 -2,000,000,000.00 -750,000,000.00 -500,000,000.00 -500,000,000.00 -750,000,000.00 -2,500,000,000.00 -3,000,000,000.00 -2,000,000,000.00 -500,000,000.00 -500,000,000.00 -3,000,000,000.00 -2,000,000,000.00 -10,808,162.32 -7,205,441.55 -7,205,441.55 -10,808,162.32 -36,027,207.75 -43,232,649.30 -28,821,766.20 -7,205,441.55 -7,205,441.55 -43,232,649.30 -28,821,766.20 -12,962,229.08 -8,641,486.05 -8,641,486.05 -12,962,229.08 -43,207,430.25 -51,848,916.30 -34,565,944.20 -8,641,486.05 -8,641,486.05 -51,848,916.30 -34,565,944.20 -16,000,000,000.00 -16,000,000,000.00 -230,574,129.58 -276,527,553.61 USD (1) SEK SEK SEK SEK SEK SEK SEK SEK SEK SEK SEK SEK SEK SEK SEK SEK SEK SEK SEK SEK SEK SEK SEK SEK SEK SEK SEK 08750100 08750200 08750300 08750400 08750500 08750700 08750800 08750900 08751000 08751100 08910100 08910200 08910300 12450100 12450200 12450300 12450400 12450500 12450600 13130100 13130200 13280100 13280200 13280300 16380100 16380200 17310100 13/05/2005 TF 23/08/2006 TF 12/04/2007 TF 15/10/2007 TF 27/05/2008 TF 28/01/2010 TF 09/07/2010 TF 08/11/2010 TF 21/10/2011 TF 15/09/2015 TF 10/06/2005 TF 17/08/2012 TF 11/09/2012 TF 21/09/2006 TV 21/09/2006 TV 05/01/2007 TV 02/02/2007 TV 13/02/2007 TV 10/04/2007 TV 02/04/2007 TF 02/04/2007 TF 14/05/2007 TV 15/06/2007 TV 22/12/2009 TV 04/11/2009 TV 03/07/2015 TV 14/06/2010 TF 5.00 5.00 5.00 5.00 5.00 5.00 5.00 5.00 5.00 5.00 3.65 3.65 3.65 4.00 4.00 4.00 4.00 4.00 4.00 4.00 4.00 3.50 3.50 3.50 0.00 0.00 3.50 01/12/2020 01/12/2020 01/12/2020 01/12/2020 01/12/2020 01/12/2020 01/12/2020 01/12/2020 01/12/2020 01/12/2020 10/06/2025 10/06/2025 10/06/2025 01/12/2020 01/12/2020 01/12/2020 01/12/2020 01/12/2020 01/12/2020 01/12/2028 01/12/2028 01/12/2028 01/12/2028 01/12/2028 01/12/2020 01/12/2020 14/01/2021 -1,300,000,000.00 -200,000,000.00 -500,000,000.00 -500,000,000.00 -400,000,000.00 -132,000,000.00 -1,750,000,000.00 -200,000,000.00 -325,000,000.00 -1,000,000,000.00 -300,000,000.00 -200,000,000.00 -300,000,000.00 -1,000,000,000.00 -500,000,000.00 -500,000,000.00 -250,000,000.00 -1,000,000,000.00 -600,000,000.00 -400,000,000.00 -125,000,000.00 -750,000,000.00 -500,000,000.00 -310,000,000.00 -800,000,000.00 -500,000,000.00 -1,000,000,000.00 -518,000,000.00 -200,000,000.00 -500,000,000.00 -500,000,000.00 -400,000,000.00 -132,000,000.00 -1,750,000,000.00 -200,000,000.00 -325,000,000.00 -1,000,000,000.00 -300,000,000.00 -200,000,000.00 -300,000,000.00 -1,000,000,000.00 -500,000,000.00 -500,000,000.00 -250,000,000.00 -1,000,000,000.00 -600,000,000.00 -400,000,000.00 -125,000,000.00 -750,000,000.00 -500,000,000.00 -310,000,000.00 -800,000,000.00 -500,000,000.00 -1,000,000,000.00 -52,621,954.94 -20,317,357.12 -50,793,392.80 -50,793,392.80 -40,634,714.24 -13,409,455.70 -177,776,874.78 -20,317,357.12 -33,015,705.32 -101,586,785.59 -30,476,035.68 -20,317,357.12 -30,476,035.68 -101,586,785.59 -50,793,392.80 -50,793,392.80 -25,396,696.40 -101,586,785.59 -60,952,071.35 -40,634,714.24 -12,698,348.20 -76,190,089.19 -50,793,392.80 -31,491,903.53 -81,269,428.47 -50,793,392.80 -101,586,785.59 -63,109,510.55 -24,366,606.39 -60,916,515.98 -60,916,515.98 -48,733,212.78 -16,081,960.22 -213,207,805.93 -24,366,606.39 -39,595,735.39 -121,833,031.96 -36,549,909.59 -24,366,606.39 -36,549,909.59 -121,833,031.96 -60,916,515.98 -60,916,515.98 -30,458,257.99 -121,833,031.96 -73,099,819.18 -48,733,212.78 -15,229,128.99 -91,374,773.97 -60,916,515.98 -37,768,239.91 -97,466,425.57 -60,916,515.98 -121,833,031.96 27 Currency Borrowing number Value Date Interest rate Rate Maturity date Initial amount in currency of borrowing Nominal outstanding in currency of borrowing Nominal outstanding in EUR Nominal outstanding in Currency Borrowing number Value Date Interest rate Rate Maturity date Initial amount in currency of borrowing Nominal outstanding in currency of borrowing Nominal outstanding in EUR Nominal outstanding in


SEK SEK SEK SEK SEK SEK SEK SEK SEK SEK SEK SEK SEK SEK SEK SEK SEK SEK SEK SEK SEK SEK SEK SEK SEK SEK SEK SEK SEK SEK SEK SEK SEK SEK SEK SEK SEK SEK SEK SEK SEK SEK SEK SEK SEK SEK 17310200 17310300 17310400 18490100 18490200 18530100 18530200 18730100 19290100 19290200 19290300 19290400 19290500 19320100 19320200 19320300 19320400 19320500 19650100 19650200 19650300 19650400 19650500 19650600 20210100 20210200 20210300 20210400 20460100 20460200 20560100 20560200 21520100 21520200 21520300 21520400 21520500 21520600 21520700 21520800 21520900 21521000 21521100 21521200 21521300 21521400 06/07/2010 TF 04/08/2010 TF 17/04/2013 TF 10/06/2011 TF 10/06/2011 TF 17/06/2011 TF 30/06/2011 TF 18/08/2011 TF 23/04/2012 TF 31/07/2012 TF 30/04/2013 TF 19/02/2014 TF 10/06/2014 TF 19/04/2012 TF 26/04/2012 TF 06/07/2012 TF 19/10/2012 TF 26/08/2016 TF 13/11/2012 TF 17/02/2016 TF 15/03/2016 TF 23/09/2016 TF 23/09/2016 TF 12/10/2016 TF 24/07/2013 TV 07/08/2013 TV 13/06/2014 TV 27/01/2015 TV 10/12/2013 TV 27/06/2014 TV 15/01/2014 TF 08/05/2014 TF 23/01/2015 TF 06/03/2015 TF 01/04/2015 TF 24/04/2015 TF 22/01/2016 TF 22/07/2016 TF 05/08/2016 TF 24/08/2016 TF 13/09/2016 TF 06/10/2016 TF 09/02/2017 TF 22/02/2017 TF 31/05/2017 TF 22/06/2017 TF 3.50 3.50 3.50 4.25 4.25 4.38 4.38 3.50 3.00 3.00 3.00 3.00 3.00 3.75 3.75 3.75 3.75 3.75 2.75 2.75 2.75 2.75 2.75 2.75 0.00 0.00 0.00 0.00 0.00 0.00 2.25 2.25 1.25 1.25 1.25 1.25 1.25 1.25 1.25 1.25 1.25 1.25 1.25 1.25 1.25 1.25 14/01/2021 14/01/2021 14/01/2021 01/06/2022 01/06/2022 30/03/2039 30/03/2039 18/08/2031 23/04/2019 23/04/2019 23/04/2019 23/04/2019 23/04/2019 01/06/2032 01/06/2032 01/06/2032 01/06/2032 01/06/2032 13/11/2023 13/11/2023 13/11/2023 13/11/2023 13/11/2023 13/11/2023 24/07/2020 24/07/2020 24/07/2020 24/07/2020 10/12/2018 10/12/2018 12/03/2019 12/03/2019 12/05/2025 12/05/2025 12/05/2025 12/05/2025 12/05/2025 12/05/2025 12/05/2025 12/05/2025 12/05/2025 12/05/2025 12/05/2025 12/05/2025 12/05/2025 12/05/2025 -1,150,000,000.00 -300,000,000.00 -225,000,000.00 -500,000,000.00 -250,000,000.00 -1,000,000,000.00 -1,000,000,000.00 -1,000,000,000.00 -1,000,000,000.00 -600,000,000.00 -500,000,000.00 -900,000,000.00 -750,000,000.00 -2,000,000,000.00 -1,200,000,000.00 -200,000,000.00 -300,000,000.00 -350,000,000.00 -750,000,000.00 -300,000,000.00 -375,000,000.00 -250,000,000.00 -250,000,000.00 -250,000,000.00 -750,000,000.00 -400,000,000.00 -400,000,000.00 -250,000,000.00 -900,000,000.00 -500,000,000.00 -1,250,000,000.00 -500,000,000.00 -800,000,000.00 -250,000,000.00 -450,000,000.00 -850,000,000.00 -250,000,000.00 -250,000,000.00 -250,000,000.00 -250,000,000.00 -250,000,000.00 -250,000,000.00 -600,000,000.00 -250,000,000.00 -1,500,000,000.00 -250,000,000.00 -1,150,000,000.00 -300,000,000.00 -225,000,000.00 -500,000,000.00 -250,000,000.00 -1,000,000,000.00 -1,000,000,000.00 -1,000,000,000.00 -1,000,000,000.00 -600,000,000.00 -500,000,000.00 -900,000,000.00 -750,000,000.00 -2,000,000,000.00 -1,200,000,000.00 -200,000,000.00 -300,000,000.00 -350,000,000.00 -750,000,000.00 -300,000,000.00 -375,000,000.00 -250,000,000.00 -250,000,000.00 -250,000,000.00 -750,000,000.00 -400,000,000.00 -400,000,000.00 -250,000,000.00 -900,000,000.00 -500,000,000.00 -1,250,000,000.00 -500,000,000.00 -800,000,000.00 -250,000,000.00 -450,000,000.00 -850,000,000.00 -250,000,000.00 -250,000,000.00 -250,000,000.00 -250,000,000.00 -250,000,000.00 -250,000,000.00 -600,000,000.00 -250,000,000.00 -1,500,000,000.00 -250,000,000.00 -116,824,803.43 -30,476,035.68 -22,857,026.76 -50,793,392.80 -25,396,696.40 -101,586,785.59 -101,586,785.59 -101,586,785.59 -101,586,785.59 -60,952,071.35 -50,793,392.80 -91,428,107.03 -76,190,089.19 -203,173,571.18 -121,904,142.71 -20,317,357.12 -30,476,035.68 -35,555,374.96 -76,190,089.19 -30,476,035.68 -38,095,044.60 -25,396,696.40 -25,396,696.40 -25,396,696.40 -76,190,089.19 -40,634,714.24 -40,634,714.24 -25,396,696.40 -91,428,107.03 -50,793,392.80 -126,983,481.99 -50,793,392.80 -81,269,428.47 -25,396,696.40 -45,714,053.52 -86,348,767.75 -25,396,696.40 -25,396,696.40 -25,396,696.40 -25,396,696.40 -25,396,696.40 -25,396,696.40 -60,952,071.35 -25,396,696.40 -152,380,178.39 -25,396,696.40 -140,107,986.75 -36,549,909.59 -27,412,432.19 -60,916,515.98 -30,458,257.99 -121,833,031.96 -121,833,031.96 -121,833,031.96 -121,833,031.96 -73,099,819.18 -60,916,515.98 -109,649,728.76 -91,374,773.97 -243,666,063.92 -146,199,638.35 -24,366,606.39 -36,549,909.59 -42,641,561.19 -91,374,773.97 -36,549,909.59 -45,687,386.98 -30,458,257.99 -30,458,257.99 -30,458,257.99 -91,374,773.97 -48,733,212.78 -48,733,212.78 -30,458,257.99 -109,649,728.76 -60,916,515.98 -152,291,289.95 -60,916,515.98 -97,466,425.57 -30,458,257.99 -54,824,864.38 -103,558,077.17 -30,458,257.99 -30,458,257.99 -30,458,257.99 -30,458,257.99 -30,458,257.99 -30,458,257.99 -73,099,819.18 -30,458,257.99 -182,749,547.94 -30,458,257.99 28


SEK SEK SEK SEK SEK SEK SEK SEK SEK SEK SEK SEK SEK SEK SEK SEK SEK SEK SEK SEK 21521500 22050100 22060100 22060200 22060300 22060400 22060500 22060600 22060700 22060800 22060900 22061000 22270100 22700100 22870100 22870200 22870300 22870400 22870500 22930100 08/11/2017 TF 20/01/2016 TF 21/01/2016 TF 04/02/2016 TF 22/07/2016 TF 05/08/2016 TF 22/08/2016 TF 13/09/2016 TF 23/01/2017 TF 15/03/2017 TF 09/10/2017 TF 21/11/2017 TF 14/04/2016 TF 19/01/2017 TF 02/03/2017 TF 02/03/2017 TF 15/05/2017 TF 16/08/2017 TF 30/08/2017 TF 21/03/2017 TF 1.25 0.63 1.75 1.75 1.75 1.75 1.75 1.75 1.75 1.75 1.75 1.75 0.50 0.50 1.50 1.50 1.50 1.50 1.50 2.13 12/05/2025 20/01/2021 12/11/2026 12/11/2026 12/11/2026 12/11/2026 12/11/2026 12/11/2026 12/11/2026 12/11/2026 12/11/2026 12/11/2026 14/04/2021 19/07/2022 02/03/2027 02/03/2027 02/03/2027 02/03/2027 02/03/2027 21/03/2040 -500,000,000.00 -1,000,000,000.00 -1,000,000,000.00 -250,000,000.00 -250,000,000.00 -250,000,000.00 -250,000,000.00 -250,000,000.00 -250,000,000.00 -250,000,000.00 -250,000,000.00 -250,000,000.00 -1,200,000,000.00 -3,000,000,000.00 -500,000,000.00 -250,000,000.00 -250,000,000.00 -250,000,000.00 -500,000,000.00 -800,000,000.00 -500,000,000.00 -1,000,000,000.00 -1,000,000,000.00 -250,000,000.00 -250,000,000.00 -250,000,000.00 -250,000,000.00 -250,000,000.00 -250,000,000.00 -250,000,000.00 -250,000,000.00 -250,000,000.00 -1,200,000,000.00 -3,000,000,000.00 -500,000,000.00 -250,000,000.00 -250,000,000.00 -250,000,000.00 -500,000,000.00 -800,000,000.00 -50,793,392.80 -101,586,785.59 -101,586,785.59 -25,396,696.40 -25,396,696.40 -25,396,696.40 -25,396,696.40 -25,396,696.40 -25,396,696.40 -25,396,696.40 -25,396,696.40 -25,396,696.40 -121,904,142.71 -304,760,356.77 -50,793,392.80 -25,396,696.40 -25,396,696.40 -25,396,696.40 -50,793,392.80 -81,269,428.47 -60,916,515.98 -121,833,031.96 -121,833,031.96 -30,458,257.99 -30,458,257.99 -30,458,257.99 -30,458,257.99 -30,458,257.99 -30,458,257.99 -30,458,257.99 -30,458,257.99 -30,458,257.99 -146,199,638.35 -365,499,095.88 -60,916,515.98 -30,458,257.99 -30,458,257.99 -30,458,257.99 -60,916,515.98 -97,466,425.57 -53,642,000,000.00 -52,860,000,000.00 -5,369,877,486.34 -6,440,094,069.36 USD (1) TRY TRY TRY TRY TRY TRY TRY TRY TRY TRY TRY TRY TRY TRY TRY TRY TRY TRY TRY TRY TRY 13530100 13530200 13530300 13530400 13530500 13530600 13530700 13530800 13530900 13531000 13531100 13531200 13531300 13531400 13531500 13531600 13531700 13531800 13531900 13532000 13532100 05/09/2007 TF 03/08/2011 TF 24/10/2012 TF 24/10/2012 TF 14/05/2014 TF 30/05/2014 TF 08/07/2014 TF 08/10/2014 TF 18/02/2015 TF 05/03/2015 TF 26/03/2015 TF 09/06/2015 TF 30/10/2015 TF 05/02/2016 TF 08/04/2016 TF 07/12/2016 TF 24/01/2017 TF 15/02/2017 TF 15/03/2017 TF 05/04/2017 TF 28/04/2017 TF 11.39 8.64 6.79 6.79 9.48 9.27 8.90 9.87 8.54 8.74 8.95 9.55 9.79 10.49 10.03 10.74 10.99 10.93 10.71 10.64 10.59 05/09/2022 05/09/2022 05/09/2022 05/09/2022 05/09/2022 05/09/2022 05/09/2022 05/09/2022 05/09/2022 05/09/2022 05/09/2022 05/09/2022 05/09/2022 05/09/2022 05/09/2022 05/09/2022 05/09/2022 05/09/2022 05/09/2022 05/09/2022 05/09/2022 -29,737,500.00 -59,812,500.00 -15,690,000.00 -10,460,000.00 -70,612,500.00 -48,000,000.00 -74,737,500.00 -71,212,500.00 -40,368,750.00 -79,912,500.00 -79,162,500.00 -77,437,500.00 -79,080,000.00 -77,700,000.00 -81,187,500.00 -55,600,000.00 -83,437,500.00 -140,312,500.00 -100,100,000.00 -101,062,500.00 -174,750,000.00 -87,463,930.70 -99,112,346.23 -21,602,855.90 -14,401,903.95 -95,389,780.66 -64,187,502.81 -97,920,723.04 -93,684,557.94 -49,777,257.44 -98,656,852.70 -97,719,501.40 -95,071,855.91 -94,041,204.07 -91,091,634.57 -93,004,599.24 -60,049,303.81 -89,064,170.22 -148,803,188.01 -105,211,665.36 -105,568,692.50 -181,342,527.79 -19,238,063.24 -21,800,181.73 -4,751,639.96 -3,167,759.97 -20,981,387.62 -14,118,314.01 -21,538,079.15 -20,606,316.63 -10,948,719.30 -21,699,994.00 -21,493,819.59 -20,911,458.72 -20,684,762.46 -20,035,992.12 -20,456,756.83 -13,208,099.55 -19,590,042.72 -32,729,893.54 -23,141,752.89 -23,220,282.53 -39,887,059.61 -23,072,209.24 -26,144,957.95 -5,698,641.80 -3,799,094.54 -25,162,978.17 -16,932,093.99 -25,830,618.32 -24,713,155.54 -13,130,799.06 -26,024,802.80 -25,777,537.84 -25,079,112.44 -24,807,235.62 -24,029,165.35 -24,533,788.46 -15,840,473.79 -23,494,338.23 -39,252,961.33 -27,753,904.25 -27,848,084.84 -47,836,550.58 29 Currency Borrowing number Value Date Interest rate Rate Maturity date Initial amount in currency of borrowing Nominal outstanding in currency of borrowing Nominal outstanding in EUR Nominal outstanding in


TRY TRY TRY TRY TRY TRY TRY TRY TRY TRY TRY TRY TRY TRY TRY TRY TRY TRY TRY TRY TRY TRY TRY TRY TRY TRY TRY TRY TRY TRY TRY TRY TRY TRY TRY TRY TRY TRY TRY TRY TRY TRY TRY TRY TRY TRY 13532200 13532300 13532400 14790100 14830100 16740100 16740200 18650100 18650200 18650300 18650400 18650500 18650600 18650700 18650800 18650900 18651000 18651100 18651200 18651300 18651400 18651500 18651600 18651700 18651800 18651900 18652000 18652100 18652200 18652300 18652400 18652500 18652600 18800100 19800100 19800200 19800300 19800400 19800500 19800600 19800700 19800800 19800900 19801000 19801100 19801200 05/05/2017 TF 11/05/2017 TF 31/05/2017 TF 17/10/2008 TF 12/11/2008 TF 12/02/2010 TF 25/04/2014 TF 20/07/2011 TF 22/02/2013 TF 04/09/2013 TF 11/10/2013 TF 05/12/2013 TF 15/01/2014 TF 23/01/2014 TF 10/02/2014 TF 03/03/2014 TF 27/03/2014 TF 07/04/2014 TF 29/04/2014 TF 10/06/2014 TF 16/07/2014 TF 04/09/2014 TF 23/09/2014 TF 09/04/2015 TF 07/05/2015 TF 27/05/2015 TF 19/06/2015 TF 26/08/2015 TF 11/11/2015 TF 08/02/2016 TF 12/04/2016 TF 20/05/2016 TF 11/01/2017 TF 26/10/2011 TF 30/01/2013 TF 22/02/2013 TF 03/05/2013 TF 13/06/2013 TF 27/06/2013 TF 30/07/2013 TF 09/09/2013 TF 10/10/2013 TF 28/11/2013 TF 10/01/2014 TF 14/02/2014 TF 07/04/2014 TF 10.37 10.33 10.52 14.95 16.80 10.50 10.50 9.25 9.25 9.25 9.25 9.25 9.25 9.25 9.25 9.25 9.25 9.25 9.25 9.25 9.25 9.25 9.25 9.25 9.25 9.25 9.25 9.25 9.25 9.25 9.25 9.25 9.25 0.50 5.75 5.75 5.75 5.75 5.75 5.75 5.75 5.75 5.75 5.75 5.75 5.75 05/09/2022 05/09/2022 05/09/2022 17/10/2018 12/11/2018 12/03/2019 12/03/2019 20/07/2018 20/07/2018 20/07/2018 20/07/2018 20/07/2018 20/07/2018 20/07/2018 20/07/2018 20/07/2018 20/07/2018 20/07/2018 20/07/2018 20/07/2018 20/07/2018 20/07/2018 20/07/2018 20/07/2018 20/07/2018 20/07/2018 20/07/2018 20/07/2018 20/07/2018 20/07/2018 20/07/2018 20/07/2018 20/07/2018 26/10/2018 03/04/2018 03/04/2018 03/04/2018 03/04/2018 03/04/2018 03/04/2018 03/04/2018 03/04/2018 03/04/2018 03/04/2018 03/04/2018 03/04/2018 -427,750,000.00 -266,400,000.00 -88,500,000.00 -55,000,000.00 -30,000,000.00 -50,000,000.00 -35,000,000.00 -100,000,000.00 -30,000,000.00 -35,000,000.00 -35,000,000.00 -30,000,000.00 -50,000,000.00 -75,000,000.00 -100,000,000.00 -150,000,000.00 -95,000,000.00 -175,000,000.00 -150,000,000.00 -100,000,000.00 -75,000,000.00 -75,000,000.00 -100,000,000.00 -75,000,000.00 -100,000,000.00 -100,000,000.00 -100,000,000.00 -100,000,000.00 -100,000,000.00 -100,000,000.00 -100,000,000.00 -125,000,000.00 -100,000,000.00 -50,000,000.00 -75,000,000.00 -50,000,000.00 -35,000,000.00 -40,000,000.00 -50,000,000.00 -40,000,000.00 -40,000,000.00 -50,000,000.00 -30,000,000.00 -35,000,000.00 -55,000,000.00 -50,000,000.00 -442,696,240.79 -275,223,737.11 -90,973,861.40 -55,000,000.00 -30,000,000.00 -50,000,000.00 -35,000,000.00 -100,000,000.00 -30,000,000.00 -35,000,000.00 -35,000,000.00 -30,000,000.00 -50,000,000.00 -75,000,000.00 -100,000,000.00 -150,000,000.00 -95,000,000.00 -175,000,000.00 -150,000,000.00 -100,000,000.00 -75,000,000.00 -75,000,000.00 -100,000,000.00 -75,000,000.00 -100,000,000.00 -100,000,000.00 -100,000,000.00 -100,000,000.00 -100,000,000.00 -100,000,000.00 -100,000,000.00 -125,000,000.00 -100,000,000.00 -50,000,000.00 -75,000,000.00 -50,000,000.00 -35,000,000.00 -40,000,000.00 -50,000,000.00 -40,000,000.00 -40,000,000.00 -50,000,000.00 -30,000,000.00 -35,000,000.00 -55,000,000.00 -50,000,000.00 -97,372,919.41 -60,536,630.55 -20,010,087.41 -12,097,483.72 -6,598,627.49 -10,997,712.48 -7,698,398.73 -21,995,424.95 -6,598,627.49 -7,698,398.73 -7,698,398.73 -6,598,627.49 -10,997,712.48 -16,496,568.71 -21,995,424.95 -32,993,137.43 -20,895,653.70 -38,491,993.67 -32,993,137.43 -21,995,424.95 -16,496,568.71 -16,496,568.71 -21,995,424.95 -16,496,568.71 -21,995,424.95 -21,995,424.95 -21,995,424.95 -21,995,424.95 -21,995,424.95 -21,995,424.95 -21,995,424.95 -27,494,281.19 -21,995,424.95 -10,997,712.48 -16,496,568.71 -10,997,712.48 -7,698,398.73 -8,798,169.98 -10,997,712.48 -8,798,169.98 -8,798,169.98 -10,997,712.48 -6,598,627.49 -7,698,398.73 -12,097,483.72 -10,997,712.48 -116,779,342.24 -72,601,581.01 -23,998,097.83 -14,508,512.23 -7,913,733.94 -13,189,556.57 -9,232,689.60 -26,379,113.14 -7,913,733.94 -9,232,689.60 -9,232,689.60 -7,913,733.94 -13,189,556.57 -19,784,334.86 -26,379,113.14 -39,568,669.72 -25,060,157.49 -46,163,448.00 -39,568,669.72 -26,379,113.14 -19,784,334.86 -19,784,334.86 -26,379,113.14 -19,784,334.86 -26,379,113.14 -26,379,113.14 -26,379,113.14 -26,379,113.14 -26,379,113.14 -26,379,113.14 -26,379,113.14 -32,973,891.43 -26,379,113.14 -13,189,556.57 -19,784,334.86 -13,189,556.57 -9,232,689.60 -10,551,645.26 -13,189,556.57 -10,551,645.26 -10,551,645.26 -13,189,556.57 -7,913,733.94 -9,232,689.60 -14,508,512.23 -13,189,556.57 30


TRY TRY TRY TRY TRY TRY TRY TRY TRY TRY TRY TRY TRY TRY TRY TRY TRY TRY TRY TRY TRY TRY TRY TRY TRY TRY TRY TRY TRY TRY TRY TRY TRY TRY TRY TRY TRY TRY TRY TRY TRY TRY TRY TRY TRY TRY 19801300 19801400 19801500 19801600 19801700 19801800 19801900 19802000 19802100 20120100 20120200 20120300 20120400 20120500 20120600 20120700 20120800 20120900 20121000 20121100 20121200 20121300 20121400 20121500 20121600 20121700 20121800 20121900 20400100 20400200 20400300 20400400 20400500 20400600 20400700 20400800 20400900 20401000 20401100 20401200 20401300 20401400 20401500 20401600 20401700 20401800 08/05/2014 TF 06/06/2014 TF 02/09/2014 TF 29/09/2014 TF 09/03/2015 TF 30/03/2015 TF 20/05/2015 TF 30/10/2015 TF 20/05/2016 TF 03/06/2013 TF 03/09/2013 TF 27/09/2013 TF 21/10/2013 TF 03/12/2013 TF 17/01/2014 TF 27/02/2014 TF 14/03/2014 TF 28/04/2014 TF 08/07/2014 TF 04/09/2014 TF 30/09/2014 TF 05/11/2014 TF 17/02/2015 TF 24/02/2015 TF 19/03/2015 TF 22/05/2015 TF 16/10/2015 TF 13/01/2017 TF 22/11/2013 TF 08/01/2014 TF 24/03/2014 TF 11/04/2014 TF 21/05/2014 TF 10/06/2014 TF 02/07/2014 TF 31/07/2014 TF 04/09/2014 TF 08/10/2014 TF 19/01/2015 TF 30/03/2015 TF 20/05/2015 TF 31/07/2015 TF 11/12/2015 TF 09/06/2016 TF 16/01/2017 TF 23/02/2017 TF 5.75 5.75 5.75 5.75 5.75 5.75 5.75 5.75 5.75 5.25 5.25 5.25 5.25 5.25 5.25 5.25 5.25 5.25 5.25 5.25 5.25 5.25 5.25 5.25 5.25 5.25 5.25 5.25 8.50 8.50 8.50 8.50 8.50 8.50 8.50 8.50 8.50 8.50 8.50 8.50 8.50 8.50 8.50 8.50 8.50 8.50 03/04/2018 03/04/2018 03/04/2018 03/04/2018 03/04/2018 03/04/2018 03/04/2018 03/04/2018 03/04/2018 03/09/2018 03/09/2018 03/09/2018 03/09/2018 03/09/2018 03/09/2018 03/09/2018 03/09/2018 03/09/2018 03/09/2018 03/09/2018 03/09/2018 03/09/2018 03/09/2018 03/09/2018 03/09/2018 03/09/2018 03/09/2018 03/09/2018 25/07/2019 25/07/2019 25/07/2019 25/07/2019 25/07/2019 25/07/2019 25/07/2019 25/07/2019 25/07/2019 25/07/2019 25/07/2019 25/07/2019 25/07/2019 25/07/2019 25/07/2019 25/07/2019 25/07/2019 25/07/2019 -50,000,000.00 -50,000,000.00 -75,000,000.00 -125,000,000.00 -75,000,000.00 -75,000,000.00 -100,000,000.00 -75,000,000.00 -100,000,000.00 -75,000,000.00 -50,000,000.00 -50,000,000.00 -75,000,000.00 -30,000,000.00 -50,000,000.00 -50,000,000.00 -50,000,000.00 -70,000,000.00 -75,000,000.00 -75,000,000.00 -75,000,000.00 -75,000,000.00 -75,000,000.00 -100,000,000.00 -100,000,000.00 -100,000,000.00 -100,000,000.00 -100,000,000.00 -75,000,000.00 -30,000,000.00 -50,000,000.00 -70,000,000.00 -75,000,000.00 -75,000,000.00 -75,000,000.00 -75,000,000.00 -75,000,000.00 -75,000,000.00 -75,000,000.00 -100,000,000.00 -100,000,000.00 -100,000,000.00 -75,000,000.00 -75,000,000.00 -100,000,000.00 -100,000,000.00 -50,000,000.00 -50,000,000.00 -75,000,000.00 -125,000,000.00 -75,000,000.00 -75,000,000.00 -100,000,000.00 -75,000,000.00 -100,000,000.00 -75,000,000.00 -50,000,000.00 -50,000,000.00 -75,000,000.00 -30,000,000.00 -50,000,000.00 -50,000,000.00 -50,000,000.00 -70,000,000.00 -75,000,000.00 -75,000,000.00 -75,000,000.00 -75,000,000.00 -75,000,000.00 -100,000,000.00 -100,000,000.00 -100,000,000.00 -100,000,000.00 -100,000,000.00 -75,000,000.00 -30,000,000.00 -50,000,000.00 -70,000,000.00 -75,000,000.00 -75,000,000.00 -75,000,000.00 -75,000,000.00 -75,000,000.00 -75,000,000.00 -75,000,000.00 -100,000,000.00 -100,000,000.00 -100,000,000.00 -75,000,000.00 -75,000,000.00 -100,000,000.00 -100,000,000.00 -10,997,712.48 -10,997,712.48 -16,496,568.71 -27,494,281.19 -16,496,568.71 -16,496,568.71 -21,995,424.95 -16,496,568.71 -21,995,424.95 -16,496,568.71 -10,997,712.48 -10,997,712.48 -16,496,568.71 -6,598,627.49 -10,997,712.48 -10,997,712.48 -10,997,712.48 -15,396,797.47 -16,496,568.71 -16,496,568.71 -16,496,568.71 -16,496,568.71 -16,496,568.71 -21,995,424.95 -21,995,424.95 -21,995,424.95 -21,995,424.95 -21,995,424.95 -16,496,568.71 -6,598,627.49 -10,997,712.48 -15,396,797.47 -16,496,568.71 -16,496,568.71 -16,496,568.71 -16,496,568.71 -16,496,568.71 -16,496,568.71 -16,496,568.71 -21,995,424.95 -21,995,424.95 -21,995,424.95 -16,496,568.71 -16,496,568.71 -21,995,424.95 -21,995,424.95 -13,189,556.57 -13,189,556.57 -19,784,334.86 -32,973,891.43 -19,784,334.86 -19,784,334.86 -26,379,113.14 -19,784,334.86 -26,379,113.14 -19,784,334.86 -13,189,556.57 -13,189,556.57 -19,784,334.86 -7,913,733.94 -13,189,556.57 -13,189,556.57 -13,189,556.57 -18,465,379.20 -19,784,334.86 -19,784,334.86 -19,784,334.86 -19,784,334.86 -19,784,334.86 -26,379,113.14 -26,379,113.14 -26,379,113.14 -26,379,113.14 -26,379,113.14 -19,784,334.86 -7,913,733.94 -13,189,556.57 -18,465,379.20 -19,784,334.86 -19,784,334.86 -19,784,334.86 -19,784,334.86 -19,784,334.86 -19,784,334.86 -19,784,334.86 -26,379,113.14 -26,379,113.14 -26,379,113.14 -19,784,334.86 -19,784,334.86 -26,379,113.14 -26,379,113.14 31


TRY TRY TRY TRY TRY TRY TRY TRY TRY TRY TRY TRY TRY TRY TRY TRY TRY TRY TRY TRY TRY TRY TRY TRY TRY TRY TRY TRY TRY TRY TRY TRY TRY TRY TRY TRY TRY TRY TRY TRY TRY TRY TRY TRY TRY TRY 20401900 20402000 20402100 20402200 20990100 20990200 20990300 20990400 21100100 21100200 21100300 21100400 21100500 21230100 21230200 21230300 21230400 21230500 21230600 21230700 21230800 21230900 21231000 21231100 21231200 21231300 21231400 21231500 21231600 21310100 21310200 21400100 21400200 21400300 21400400 21400500 21400600 21400700 21400800 21400900 21401000 21401100 21401200 21401300 21401400 21401500 31/03/2017 TF 05/05/2017 TF 15/06/2017 TF 26/07/2017 TF 09/04/2014 TF 25/01/2016 TF 20/01/2017 TF 15/05/2017 TF 29/04/2014 TF 23/03/2015 TF 05/11/2015 TF 18/01/2017 TF 10/04/2017 TF 18/06/2014 TF 11/08/2014 TF 24/09/2014 TF 10/10/2014 TF 13/03/2015 TF 12/05/2015 TF 19/10/2015 TF 17/06/2016 TF 13/01/2017 TF 26/01/2017 TF 16/02/2017 TF 08/03/2017 TF 07/04/2017 TF 05/05/2017 TF 05/05/2017 TF 08/06/2017 TF 18/08/2014 TF 13/02/2017 TF 03/10/2014 TF 08/06/2015 TF 05/11/2015 TF 01/04/2016 TF 20/07/2016 TF 27/10/2016 TF 17/11/2016 TF 10/01/2017 TF 25/01/2017 TF 09/02/2017 TF 28/02/2017 TF 04/05/2017 TF 01/06/2017 TF 13/06/2017 TF 13/11/2017 TF 8.50 8.50 8.50 8.50 10.75 10.75 10.75 10.75 10.50 10.50 10.50 10.50 10.50 8.75 8.75 8.75 8.75 8.75 8.75 8.75 8.75 8.75 8.75 8.75 8.75 8.75 8.75 8.75 8.75 8.75 8.75 9.25 9.25 9.25 9.25 9.25 9.25 9.25 9.25 9.25 9.25 9.25 9.25 9.25 9.25 9.25 25/07/2019 25/07/2019 25/07/2019 25/07/2019 15/11/2019 15/11/2019 15/11/2019 15/11/2019 29/04/2024 29/04/2024 29/04/2024 29/04/2024 29/04/2024 18/09/2021 18/09/2021 18/09/2021 18/09/2021 18/09/2021 18/09/2021 18/09/2021 18/09/2021 18/09/2021 18/09/2021 18/09/2021 18/09/2021 18/09/2021 18/09/2021 18/09/2021 18/09/2021 06/07/2020 06/07/2020 03/10/2024 03/10/2024 03/10/2024 03/10/2024 03/10/2024 03/10/2024 03/10/2024 03/10/2024 03/10/2024 03/10/2024 03/10/2024 03/10/2024 03/10/2024 03/10/2024 03/10/2024 -100,000,000.00 -250,000,000.00 -150,000,000.00 -350,000,000.00 -100,000,000.00 -75,000,000.00 -100,000,000.00 -100,000,000.00 -75,000,000.00 -75,000,000.00 -75,000,000.00 -100,000,000.00 -100,000,000.00 -100,000,000.00 -100,000,000.00 -75,000,000.00 -75,000,000.00 -100,000,000.00 -100,000,000.00 -100,000,000.00 -100,000,000.00 -100,000,000.00 -100,000,000.00 -100,000,000.00 -100,000,000.00 -100,000,000.00 -150,000,000.00 -350,000,000.00 -250,000,000.00 -100,000,000.00 -100,000,000.00 -100,000,000.00 -100,000,000.00 -100,000,000.00 -100,000,000.00 -100,000,000.00 -100,000,000.00 -100,000,000.00 -100,000,000.00 -100,000,000.00 -100,000,000.00 -100,000,000.00 -200,000,000.00 -200,000,000.00 -100,000,000.00 -150,000,000.00 -100,000,000.00 -250,000,000.00 -150,000,000.00 -350,000,000.00 -100,000,000.00 -75,000,000.00 -100,000,000.00 -100,000,000.00 -75,000,000.00 -75,000,000.00 -75,000,000.00 -100,000,000.00 -100,000,000.00 -100,000,000.00 -100,000,000.00 -75,000,000.00 -75,000,000.00 -100,000,000.00 -100,000,000.00 -100,000,000.00 -100,000,000.00 -100,000,000.00 -100,000,000.00 -100,000,000.00 -100,000,000.00 -100,000,000.00 -150,000,000.00 -350,000,000.00 -250,000,000.00 -100,000,000.00 -100,000,000.00 -100,000,000.00 -100,000,000.00 -100,000,000.00 -100,000,000.00 -100,000,000.00 -100,000,000.00 -100,000,000.00 -100,000,000.00 -100,000,000.00 -100,000,000.00 -100,000,000.00 -200,000,000.00 -200,000,000.00 -100,000,000.00 -150,000,000.00 -21,995,424.95 -54,988,562.38 -32,993,137.43 -76,983,987.33 -21,995,424.95 -16,496,568.71 -21,995,424.95 -21,995,424.95 -16,496,568.71 -16,496,568.71 -16,496,568.71 -21,995,424.95 -21,995,424.95 -21,995,424.95 -21,995,424.95 -16,496,568.71 -16,496,568.71 -21,995,424.95 -21,995,424.95 -21,995,424.95 -21,995,424.95 -21,995,424.95 -21,995,424.95 -21,995,424.95 -21,995,424.95 -21,995,424.95 -32,993,137.43 -76,983,987.33 -54,988,562.38 -21,995,424.95 -21,995,424.95 -21,995,424.95 -21,995,424.95 -21,995,424.95 -21,995,424.95 -21,995,424.95 -21,995,424.95 -21,995,424.95 -21,995,424.95 -21,995,424.95 -21,995,424.95 -21,995,424.95 -43,990,849.90 -43,990,849.90 -21,995,424.95 -32,993,137.43 -26,379,113.14 -65,947,782.86 -39,568,669.72 -92,326,896.01 -26,379,113.14 -19,784,334.86 -26,379,113.14 -26,379,113.14 -19,784,334.86 -19,784,334.86 -19,784,334.86 -26,379,113.14 -26,379,113.14 -26,379,113.14 -26,379,113.14 -19,784,334.86 -19,784,334.86 -26,379,113.14 -26,379,113.14 -26,379,113.14 -26,379,113.14 -26,379,113.14 -26,379,113.14 -26,379,113.14 -26,379,113.14 -26,379,113.14 -39,568,669.72 -92,326,896.01 -65,947,782.86 -26,379,113.14 -26,379,113.14 -26,379,113.14 -26,379,113.14 -26,379,113.14 -26,379,113.14 -26,379,113.14 -26,379,113.14 -26,379,113.14 -26,379,113.14 -26,379,113.14 -26,379,113.14 -26,379,113.14 -52,758,226.29 -52,758,226.29 -26,379,113.14 -39,568,669.72 32


TRY TRY TRY TRY TRY TRY TRY TRY TRY TRY TRY TRY TRY TRY TRY TRY TRY TRY TRY TRY TRY TRY TRY TRY TRY TRY TRY TRY TRY 21401600 21470100 21470200 21470300 21470400 21470500 21470600 21470700 21470800 21470900 21471000 21471100 21471200 21650100 21650200 21650300 21700100 21700200 21700300 21700400 21700500 21700600 21700700 22220100 22220200 22810100 22890100 22890200 22890300 13/12/2017 TF 25/11/2014 TF 25/02/2015 TF 09/04/2015 TF 21/04/2015 TF 08/06/2015 TF 14/09/2015 TF 20/05/2016 TF 12/01/2017 TF 13/03/2017 TF 25/04/2017 TF 06/06/2017 TF 28/11/2017 TF 12/03/2015 TF 11/02/2016 TF 29/03/2017 TF 07/05/2015 TF 26/10/2015 TF 24/05/2016 TF 03/02/2017 TF 17/03/2017 TF 08/06/2017 TF 24/11/2017 TF 08/04/2016 TF 20/01/2017 TF 16/02/2017 TF 07/03/2017 TF 14/07/2017 TF 21/11/2017 TF 9.25 8.00 8.00 8.00 8.00 8.00 8.00 8.00 8.00 8.00 8.00 8.00 8.00 8.50 8.50 8.50 9.13 9.13 9.13 9.13 9.13 9.13 9.13 10.34 10.97 10.16 10.00 10.00 10.00 03/10/2024 01/04/2020 01/04/2020 01/04/2020 01/04/2020 01/04/2020 01/04/2020 01/04/2020 01/04/2020 01/04/2020 01/04/2020 01/04/2020 01/04/2020 27/03/2019 27/03/2019 27/03/2019 07/10/2020 07/10/2020 07/10/2020 07/10/2020 07/10/2020 07/10/2020 07/10/2020 05/04/2024 05/04/2024 16/02/2027 07/03/2022 07/03/2022 07/03/2022 -150,000,000.00 -100,000,000.00 -100,000,000.00 -100,000,000.00 -100,000,000.00 -100,000,000.00 -100,000,000.00 -100,000,000.00 -100,000,000.00 -100,000,000.00 -100,000,000.00 -100,000,000.00 -200,000,000.00 -100,000,000.00 -75,000,000.00 -100,000,000.00 -100,000,000.00 -100,000,000.00 -100,000,000.00 -100,000,000.00 -100,000,000.00 -100,000,000.00 -150,000,000.00 -113,875,000.00 -118,000,000.00 -114,000,000.00 -150,000,000.00 -100,000,000.00 -200,000,000.00 -150,000,000.00 -100,000,000.00 -100,000,000.00 -100,000,000.00 -100,000,000.00 -100,000,000.00 -100,000,000.00 -100,000,000.00 -100,000,000.00 -100,000,000.00 -100,000,000.00 -100,000,000.00 -200,000,000.00 -100,000,000.00 -75,000,000.00 -100,000,000.00 -100,000,000.00 -100,000,000.00 -100,000,000.00 -100,000,000.00 -100,000,000.00 -100,000,000.00 -150,000,000.00 -125,552,265.49 -120,659,318.62 -114,000,000.00 -150,000,000.00 -100,000,000.00 -200,000,000.00 -32,993,137.43 -21,995,424.95 -21,995,424.95 -21,995,424.95 -21,995,424.95 -21,995,424.95 -21,995,424.95 -21,995,424.95 -21,995,424.95 -21,995,424.95 -21,995,424.95 -21,995,424.95 -43,990,849.90 -21,995,424.95 -16,496,568.71 -21,995,424.95 -21,995,424.95 -21,995,424.95 -21,995,424.95 -21,995,424.95 -21,995,424.95 -21,995,424.95 -32,993,137.43 -27,615,754.33 -26,539,529.87 -25,074,784.44 -32,993,137.43 -21,995,424.95 -43,990,849.90 -39,568,669.72 -26,379,113.14 -26,379,113.14 -26,379,113.14 -26,379,113.14 -26,379,113.14 -26,379,113.14 -26,379,113.14 -26,379,113.14 -26,379,113.14 -26,379,113.14 -26,379,113.14 -52,758,226.29 -26,379,113.14 -19,784,334.86 -26,379,113.14 -26,379,113.14 -26,379,113.14 -26,379,113.14 -26,379,113.14 -26,379,113.14 -26,379,113.14 -39,568,669.72 -33,119,574.17 -31,828,858.18 -30,072,188.98 -39,568,669.72 -26,379,113.14 -52,758,226.29 -17,848,898,750.00 -18,222,271,477.66 -4,008,066,047.35 -4,806,873,610.58 USD USD USD USD USD USD USD USD USD USD USD USD USD USD 00730100 00730200 11070100 11350100 11360100 11370100 11380100 11390100 11400100 11410100 11420100 11430100 11440100 11450100 06/11/1996 TF 07/04/1998 TF 02/03/2006 TF 22/03/2006 TF 22/03/2006 TF 22/03/2006 TF 22/03/2006 TF 22/03/2006 TF 22/03/2006 TF 22/03/2006 TF 22/03/2006 TF 22/03/2006 TF 22/03/2006 TF 22/03/2006 TF 7.02 6.07 4.88 5.12 5.13 5.13 5.13 5.13 5.13 5.14 5.14 5.14 5.15 5.15 06/11/2026 06/11/2026 15/02/2036 14/01/2020 14/01/2021 14/06/2021 02/07/2021 14/09/2021 14/12/2021 14/04/2025 13/06/2025 12/09/2025 12/12/2025 14/04/2026 -130,620,000.00 -55,644,600.00 -1,000,000,000.00 -5,966,153.26 -8,060,052.56 -34,870,629.52 -4,652,255.00 -62,293,964.07 -61,502,787.21 -30,164,402.20 -29,909,642.36 -29,540,125.65 -29,136,292.04 -67,132,387.78 -107,903,875.80 -55,644,600.00 -1,000,000,000.00 -10,569,975.57 -14,287,524.84 -61,812,870.53 -8,232,879.24 -111,880,048.89 -109,082,093.19 -54,236,399.88 -53,099,192.16 -53,099,192.17 -51,747,495.72 -120,773,858.79 -89,972,380.39 -46,397,565.25 -833,819,728.17 -8,813,454.16 -11,913,220.08 -51,540,790.90 -6,864,737.13 -93,287,791.95 -90,954,801.29 -45,223,380.21 -44,275,153.97 -44,275,153.98 -43,148,082.81 -100,703,626.11 -107,903,875.80 -55,644,600.00 -1,000,000,000.00 -10,569,975.57 -14,287,524.84 -61,812,870.53 -8,232,879.24 -111,880,048.89 -109,082,093.19 -54,236,399.88 -53,099,192.16 -53,099,192.17 -51,747,495.72 -120,773,858.79 33


USD USD USD USD USD USD USD USD USD USD USD USD USD USD USD USD USD USD USD USD USD USD USD USD USD USD USD USD USD USD USD USD USD USD USD USD USD USD USD USD USD USD USD USD USD USD 11460100 11470100 11480100 14590100 14590200 14930100 16310100 16360100 16410100 16650100 17070100 17330100 17340100 17460100 17600100 17620100 17620200 17910100 18040100 18300100 18360100 18380100 18390100 18410100 18420100 18440100 18450100 18480100 18510100 18520100 18580100 18610100 18710100 18720100 19010100 19110100 19110200 19120100 19410100 19490100 19490200 19730100 19950100 20040100 20340100 20530100 22/03/2006 TF 22/03/2006 TF 22/03/2006 TF 09/07/2008 TF 20/08/2008 TF 08/12/2008 TV 05/10/2009 TF 22/10/2009 TF 12/11/2009 TF 22/01/2010 TF 31/03/2010 TV 17/06/2010 TV 17/06/2010 TV 26/07/2010 TF 08/09/2010 TV 15/09/2010 TF 24/09/2010 TF 24/01/2011 TV 16/02/2011 TF 19/05/2011 TF 23/05/2011 TF 24/05/2011 TF 27/05/2011 TF 01/06/2011 TF 01/06/2011 TF 01/06/2011 TF 07/06/2011 TF 07/06/2011 TF 20/06/2011 TF 29/06/2011 TF 21/07/2011 TF 11/07/2011 TF 28/07/2011 TF 25/08/2011 TF 07/02/2012 TF 01/03/2012 TV 15/05/2017 TV 01/03/2012 TV 06/07/2012 TV 28/08/2012 TF 30/11/2012 TF 15/01/2013 TF 11/02/2013 TF 16/04/2013 TF 30/10/2013 TF 14/01/2014 TF 5.15 5.15 5.15 4.85 4.78 1.34 4.43 10.05 4.50 4.68 1.72 1.78 1.78 3.63 4.67 2.88 2.88 1.43 4.00 0.50 5.32 5.38 5.25 5.40 5.37 5.32 5.38 5.35 5.26 0.50 0.50 5.40 5.27 0.50 2.13 3.45 5.07 3.28 1.53 1.88 1.88 1.00 1.63 1.00 1.63 1.88 12/06/2026 14/09/2026 14/12/2026 09/07/2058 09/07/2058 20/06/2018 05/10/2039 22/10/2019 12/11/2039 22/01/2030 31/03/2020 17/06/2040 17/06/2040 26/07/2040 08/09/2020 15/09/2020 15/09/2020 24/01/2018 16/02/2021 19/05/2021 23/05/2041 24/05/2041 27/05/2041 01/06/2041 01/06/2041 01/06/2041 07/06/2041 07/06/2041 20/06/2041 29/06/2021 21/07/2021 11/07/2041 28/07/2041 25/08/2021 15/03/2019 01/03/2022 01/03/2022 01/03/2019 06/07/2022 15/10/2019 15/10/2019 15/03/2018 16/03/2020 15/06/2018 18/12/2018 15/03/2019 -66,574,220.27 -65,723,441.50 -64,886,291.09 -45,745,950.00 -26,227,638.00 -50,000,000.00 -36,776,929.50 -16,540,948.28 -50,196,000.00 -44,067,499.30 -100,000,000.00 -50,000,000.00 -50,000,000.00 -300,000,000.00 -19,760,614.27 -2,000,000,000.00 -1,000,000,000.00 -150,000,000.00 -2,000,000,000.00 -30,000,000.00 -25,000,000.00 -25,000,000.00 -25,000,000.00 -25,000,000.00 -25,000,000.00 -25,000,000.00 -25,000,000.00 -25,000,000.00 -59,293,632.00 -30,000,000.00 -30,000,000.00 -25,000,000.00 -25,000,000.00 -30,000,000.00 -1,500,000,000.00 -110,350,428.82 -18,775,816.75 -51,312,949.40 -150,000,000.00 -1,250,000,000.00 -500,000,000.00 -5,000,000,000.00 -1,250,000,000.00 -5,000,000,000.00 -3,000,000,000.00 -4,500,000,000.00 -118,239,107.93 -118,239,107.94 -115,273,692.20 -70,075,264.80 -39,734,820.00 -50,000,000.00 -52,020,873.00 -35,589,484.13 -71,383,765.44 -60,696,605.20 -100,000,000.00 -50,000,000.00 -50,000,000.00 -300,000,000.00 -19,760,614.27 -2,000,000,000.00 -1,000,000,000.00 -150,000,000.00 -2,000,000,000.00 -10,000,000.00 -34,119,692.75 -34,236,485.00 -33,983,854.75 -34,275,489.75 -34,216,996.50 -34,119,693.75 -34,236,485.00 -34,178,048.75 -80,646,993.00 -9,000,000.00 -12,000,000.00 -34,275,490.00 -34,022,618.75 -21,000,000.00 -1,500,000,000.00 -110,350,428.80 -18,775,816.75 -51,312,949.40 -150,000,000.00 -1,250,000,000.00 -500,000,000.00 -5,000,000,000.00 -1,250,000,000.00 -5,000,000,000.00 -3,000,000,000.00 -4,500,000,000.00 -98,590,100.83 -98,590,100.84 -96,117,478.70 -58,430,138.25 -33,131,676.81 -41,690,986.41 -43,376,030.18 -29,675,213.98 -59,521,191.90 -50,610,026.85 -83,381,972.82 -41,690,986.41 -41,690,986.41 -250,145,918.45 -16,476,790.02 -1,667,639,456.35 -833,819,728.17 -125,072,959.23 -1,667,639,456.35 -8,338,197.28 -28,449,672.93 -28,547,056.62 -28,336,408.53 -28,579,579.55 -28,530,806.72 -28,449,673.77 -28,547,056.62 -28,498,331.32 -67,245,053.78 -7,504,377.55 -10,005,836.74 -28,579,579.75 -28,368,730.72 -17,510,214.29 -1,250,729,592.26 -92,012,364.55 -15,655,646.42 -42,785,749.52 -125,072,959.23 -1,042,274,660.22 -416,909,864.09 -4,169,098,640.87 -1,042,274,660.22 -4,169,098,640.87 -2,501,459,184.52 -3,752,188,776.79 -118,239,107.93 -118,239,107.94 -115,273,692.20 -70,075,264.80 -39,734,820.00 -50,000,000.00 -52,020,873.00 -35,589,484.13 -71,383,765.44 -60,696,605.20 -100,000,000.00 -50,000,000.00 -50,000,000.00 -300,000,000.00 -19,760,614.27 -2,000,000,000.00 -1,000,000,000.00 -150,000,000.00 -2,000,000,000.00 -10,000,000.00 -34,119,692.75 -34,236,485.00 -33,983,854.75 -34,275,489.75 -34,216,996.50 -34,119,693.75 -34,236,485.00 -34,178,048.75 -80,646,993.00 -9,000,000.00 -12,000,000.00 -34,275,490.00 -34,022,618.75 -21,000,000.00 -1,500,000,000.00 -110,350,428.80 -18,775,816.75 -51,312,949.40 -150,000,000.00 -1,250,000,000.00 -500,000,000.00 -5,000,000,000.00 -1,250,000,000.00 -5,000,000,000.00 -3,000,000,000.00 -4,500,000,000.00 34


USD USD USD USD USD USD USD USD USD USD USD USD USD USD USD USD USD USD USD USD USD USD USD USD USD USD USD USD USD USD USD USD USD USD USD USD USD USD USD USD USD USD USD USD USD USD 20660100 20780100 20820100 20890100 21160100 21210100 21250100 21250200 21250300 21250400 21250500 21250600 21250700 21250800 21250900 21251000 21300100 21300200 21300300 21300400 21300500 21300600 21300700 21300800 21300900 21350100 21440100 21490100 21560100 21560200 21560300 21560400 21590100 21640100 21660100 21690100 21730100 21790100 21810100 21940100 21940200 21960100 21970100 22030100 22100100 22110100 29/01/2014 TF 17/03/2014 TF 20/03/2014 TF 19/03/2014 TF 20/05/2014 TF 04/06/2014 TV 09/07/2014 TV 09/02/2015 TV 17/06/2016 TV 11/07/2016 TV 21/07/2016 TV 18/08/2016 TV 20/09/2016 TV 21/02/2017 TV 05/04/2017 TV 20/04/2017 TV 27/08/2014 TF 28/09/2015 TF 28/10/2015 TF 11/12/2015 TF 07/06/2017 TF 20/06/2017 TF 01/08/2017 TF 03/10/2017 TF 13/10/2017 TF 05/09/2014 TF 15/10/2014 TF 14/01/2015 TF 06/02/2015 TV 12/04/2017 TV 30/05/2017 TV 28/07/2017 TV 10/02/2015 TF 10/03/2015 TV 10/03/2015 TF 22/04/2015 TF 27/05/2015 TF 06/07/2015 TV 21/07/2015 TF 09/10/2015 TV 18/03/2016 TV 14/10/2015 TF 22/10/2015 TF 12/01/2016 TF 25/02/2016 TV 09/02/2016 TF 3.25 5.00 4.60 2.50 1.75 1.62 6.54 6.77 7.18 7.08 7.03 7.08 6.89 7.20 7.20 7.20 9.80 11.69 12.25 11.60 8.38 7.99 7.67 7.07 7.52 2.13 2.50 1.63 6.45 6.92 6.94 6.91 1.88 1.35 1.25 1.38 1.13 1.41 2.25 1.42 1.42 1.63 5.30 2.00 2.00 1.25 29/01/2024 17/03/2034 20/03/2044 15/04/2021 17/06/2019 04/06/2024 09/07/2019 09/07/2019 09/07/2019 09/07/2019 09/07/2019 09/07/2019 09/07/2019 09/07/2019 09/07/2019 09/07/2019 27/08/2021 27/08/2021 27/08/2021 27/08/2021 27/08/2021 27/08/2021 27/08/2021 27/08/2021 27/08/2021 15/10/2021 15/10/2024 16/03/2020 06/02/2020 06/02/2020 06/02/2020 06/02/2020 10/02/2025 10/03/2022 15/05/2018 15/06/2020 15/08/2018 06/07/2018 15/08/2022 09/10/2018 09/10/2018 15/12/2020 22/10/2045 15/03/2021 25/02/2021 15/05/2019 -3,500,000,000.00 -35,000,000.00 -59,672,913.50 -3,000,000,000.00 -5,000,000,000.00 -100,000,000.00 -210,000,000.00 -149,760,383.39 -71,482,317.53 -80,000,000.00 -25,000,000.00 -30,000,000.00 -50,075,872.53 -74,476,861.92 -55,009,380.86 -34,971,857.41 -28,563,970.10 -13,071,895.42 -16,109,388.84 -17,815,420.56 -21,744,843.39 -27,236,842.11 -17,613,456.05 -18,134,469.70 -23,809,523.81 -3,000,000,000.00 -1,000,000,000.00 -4,000,000,000.00 -80,385,852.09 -37,489,690.34 -37,397,157.82 -18,778,637.42 -3,000,000,000.00 -100,000,000.00 -4,000,000,000.00 -5,000,000,000.00 -3,000,000,000.00 -300,000,000.00 -3,000,000,000.00 -500,000,000.00 -500,000,000.00 -4,000,000,000.00 -20,000,000.00 -4,500,000,000.00 -100,000,000.00 -4,000,000,000.00 -3,500,000,000.00 -35,000,000.00 -59,672,913.50 -3,000,000,000.00 -5,000,000,000.00 -100,000,000.00 -210,000,000.00 -149,760,383.39 -71,482,317.53 -80,000,000.00 -25,000,000.00 -30,000,000.00 -50,075,872.53 -74,476,861.92 -55,009,380.86 -34,971,857.41 -37,811,233.35 -16,156,349.68 -19,923,480.39 -21,519,649.05 -22,149,127.07 -27,642,306.84 -17,709,705.87 -18,134,469.70 -23,809,523.81 -3,000,000,000.00 -1,000,000,000.00 -4,000,000,000.00 -80,385,852.09 -37,489,690.34 -37,397,157.82 -18,778,637.42 -3,000,000,000.00 -100,000,000.00 -4,000,000,000.00 -5,000,000,000.00 -3,000,000,000.00 -300,000,000.00 -3,000,000,000.00 -500,000,000.00 -500,000,000.00 -4,000,000,000.00 -22,120,000.00 -4,500,000,000.00 -100,000,000.00 -4,000,000,000.00 -2,918,369,048.61 -29,183,690.49 -49,756,452.51 -2,501,459,184.52 -4,169,098,640.87 -83,381,972.82 -175,102,142.92 -124,873,162.17 -59,603,366.57 -66,705,578.25 -20,845,493.20 -25,014,591.85 -41,754,250.42 -62,100,276.76 -45,867,907.00 -29,160,224.64 -31,527,752.31 -13,471,483.10 -16,612,591.00 -17,943,507.92 -18,468,379.11 -23,048,700.78 -14,766,702.13 -15,120,878.60 -19,852,850.67 -2,501,459,184.52 -833,819,728.17 -3,335,278,912.70 -67,027,309.34 -31,259,643.41 -31,182,487.97 -15,657,998.35 -2,501,459,184.52 -83,381,972.82 -3,335,278,912.70 -4,169,098,640.87 -2,501,459,184.52 -250,145,918.45 -2,501,459,184.52 -416,909,864.09 -416,909,864.09 -3,335,278,912.70 -18,444,092.39 -3,752,188,776.79 -83,381,972.82 -3,335,278,912.70 -3,500,000,000.00 -35,000,000.00 -59,672,913.50 -3,000,000,000.00 -5,000,000,000.00 -100,000,000.00 -210,000,000.00 -149,760,383.39 -71,482,317.53 -80,000,000.00 -25,000,000.00 -30,000,000.00 -50,075,872.53 -74,476,861.92 -55,009,380.86 -34,971,857.41 -37,811,233.35 -16,156,349.68 -19,923,480.39 -21,519,649.05 -22,149,127.07 -27,642,306.84 -17,709,705.87 -18,134,469.70 -23,809,523.81 -3,000,000,000.00 -1,000,000,000.00 -4,000,000,000.00 -80,385,852.09 -37,489,690.34 -37,397,157.82 -18,778,637.42 -3,000,000,000.00 -100,000,000.00 -4,000,000,000.00 -5,000,000,000.00 -3,000,000,000.00 -300,000,000.00 -3,000,000,000.00 -500,000,000.00 -500,000,000.00 -4,000,000,000.00 -22,120,000.00 -4,500,000,000.00 -100,000,000.00 -4,000,000,000.00 35


USD USD USD USD USD USD USD USD USD USD USD USD USD USD USD USD USD USD USD USD USD USD USD USD USD USD USD USD USD USD USD USD USD USD USD USD USD USD USD USD USD USD USD USD USD USD 22160100 22160200 22160300 22160400 22160500 22160600 22170100 22180100 22200100 22210100 22230100 22260100 22290100 22310100 22330100 22370100 22380100 22430100 22480100 22500100 22520100 22540100 22550100 22560100 22580100 22590100 22600100 22620100 22630100 22660100 22710100 22750100 22780100 22800100 22820100 22830100 22840100 22850100 22860100 22880100 22910100 22920100 22940100 22950100 22950200 22970100 04/03/2016 TV 21/10/2016 TV 08/03/2017 TV 03/04/2017 TV 28/04/2017 TV 12/05/2017 TV 08/03/2016 TF 31/03/2016 TF 20/04/2016 TF 06/04/2016 TF 12/04/2016 TF 13/04/2016 TF 18/05/2016 TF 02/06/2016 TF 31/05/2016 TF 10/08/2016 TF 30/08/2016 TF 03/10/2016 TF 20/10/2016 TF 25/10/2016 TF 09/11/2016 TF 25/11/2016 TF 21/11/2016 TF 29/11/2016 TF 05/12/2016 TF 28/11/2016 TF 13/12/2016 TF 29/12/2016 TV 29/12/2016 TF 12/01/2017 TF 24/01/2017 TV 27/01/2017 TV 02/02/2017 TF 14/02/2017 TF 23/02/2017 TF 16/02/2017 TF 22/02/2017 TF 23/02/2017 TF 28/02/2017 TF 27/02/2017 TF 14/03/2017 TF 14/03/2017 TF 17/03/2017 TF 24/03/2017 TV 05/04/2017 TV 27/04/2017 TV 6.98 6.82 6.81 6.62 6.58 6.55 1.63 3.41 3.24 3.50 3.45 2.13 1.13 3.52 1.20 1.00 1.38 1.00 1.17 1.25 4.17 3.50 1.50 3.52 3.64 3.70 3.70 1.69 2.59 2.25 5.34 1.47 3.94 1.75 3.82 1.70 3.93 3.90 3.90 6.00 3.90 2.38 4.03 1.78 1.78 1.33 04/03/2019 04/03/2019 04/03/2019 04/03/2019 04/03/2019 04/03/2019 15/06/2021 31/03/2031 20/04/2046 06/04/2046 12/04/2046 13/04/2026 15/08/2019 02/06/2036 31/05/2026 10/08/2026 15/09/2021 03/10/2026 20/10/2019 16/12/2019 09/11/2046 25/11/2046 21/11/2026 29/11/2046 05/12/2046 28/11/2046 13/12/2046 29/12/2021 29/12/2026 15/03/2022 24/01/2020 27/01/2020 02/02/2047 15/05/2020 23/02/2047 16/02/2024 22/02/2047 23/02/2047 28/02/2047 27/02/2047 14/03/2047 15/06/2022 17/03/2047 24/03/2021 24/03/2021 27/04/2020 -29,154,943.94 -14,927,601.13 -14,956,625.79 -15,372,790.16 -15,470,297.03 -15,544,846.88 -3,500,000,000.00 -30,000,000.00 -200,000,000.00 -50,000,000.00 -50,000,000.00 -1,500,000,000.00 -3,000,000,000.00 -30,000,000.00 -204,000,000.00 -136,500,000.00 -3,500,000,000.00 -40,000,000.00 -150,000,000.00 -4,500,000,000.00 -50,000,000.00 -50,000,000.00 -298,856,000.00 -20,000,000.00 -50,000,000.00 -25,000,000.00 -130,000,000.00 -66,338,000.00 -79,968,000.00 -4,000,000,000.00 -29,269,720.47 -500,000,000.00 -20,000,000.00 -3,000,000,000.00 -30,000,000.00 -296,186,000.00 -20,000,000.00 -20,000,000.00 -50,000,000.00 -20,000,000.00 -30,000,000.00 -3,000,000,000.00 -20,000,000.00 -1,000,000,000.00 -250,000,000.00 -200,000,000.00 -29,154,943.94 -14,927,601.13 -14,956,625.79 -15,372,790.16 -15,470,297.03 -15,544,846.88 -3,500,000,000.00 -31,059,000.00 -206,480,000.00 -50,000,000.00 -50,000,000.00 -1,500,000,000.00 -3,000,000,000.00 -31,095,000.00 -204,000,000.00 -136,500,000.00 -3,500,000,000.00 -40,000,000.00 -150,000,000.00 -4,500,000,000.00 -52,175,000.00 -50,000,000.00 -298,856,000.00 -20,704,000.00 -50,000,000.00 -25,000,000.00 -130,000,000.00 -66,338,000.00 -79,968,000.00 -4,000,000,000.00 -29,269,720.47 -500,000,000.00 -20,000,000.00 -3,000,000,000.00 -30,000,000.00 -296,186,000.00 -20,000,000.00 -20,000,000.00 -50,000,000.00 -20,000,000.00 -30,000,000.00 -3,000,000,000.00 -20,000,000.00 -1,000,000,000.00 -250,000,000.00 -200,000,000.00 -24,309,967.43 -12,446,928.32 -12,471,129.65 -12,818,135.71 -12,899,438.86 -12,961,600.00 -2,918,369,048.61 -25,897,606.94 -172,167,097.47 -41,690,986.41 -41,690,986.41 -1,250,729,592.26 -2,501,459,184.52 -25,927,624.45 -170,099,224.55 -113,816,392.90 -2,918,369,048.61 -33,352,789.13 -125,072,959.23 -3,752,188,776.79 -43,504,544.32 -41,690,986.41 -249,192,028.68 -17,263,403.65 -41,690,986.41 -20,845,493.20 -108,396,564.66 -55,313,933.13 -66,678,896.02 -3,335,278,912.70 -24,405,670.37 -416,909,864.09 -16,676,394.56 -2,501,459,184.52 -25,014,591.85 -246,965,730.01 -16,676,394.56 -16,676,394.56 -41,690,986.41 -16,676,394.56 -25,014,591.85 -2,501,459,184.52 -16,676,394.56 -833,819,728.17 -208,454,932.04 -166,763,945.63 -29,154,943.94 -14,927,601.13 -14,956,625.79 -15,372,790.16 -15,470,297.03 -15,544,846.88 -3,500,000,000.00 -31,059,000.00 -206,480,000.00 -50,000,000.00 -50,000,000.00 -1,500,000,000.00 -3,000,000,000.00 -31,095,000.00 -204,000,000.00 -136,500,000.00 -3,500,000,000.00 -40,000,000.00 -150,000,000.00 -4,500,000,000.00 -52,175,000.00 -50,000,000.00 -298,856,000.00 -20,704,000.00 -50,000,000.00 -25,000,000.00 -130,000,000.00 -66,338,000.00 -79,968,000.00 -4,000,000,000.00 -29,269,720.47 -500,000,000.00 -20,000,000.00 -3,000,000,000.00 -30,000,000.00 -296,186,000.00 -20,000,000.00 -20,000,000.00 -50,000,000.00 -20,000,000.00 -30,000,000.00 -3,000,000,000.00 -20,000,000.00 -1,000,000,000.00 -250,000,000.00 -200,000,000.00 36


USD USD USD USD USD USD USD USD USD USD USD USD USD USD USD USD USD USD USD USD USD USD USD USD USD USD USD USD USD USD USD USD USD USD USD USD USD USD USD USD USD USD USD USD USD USD 22980100 23010100 23020100 23150100 US29878SAB25 US29878SAJ50 US29878SAN62 US29878SAN62 US29878SB139 US29878SB212 XS1667344011 XS1671550223 XS1673609126 XS1673802473 XS1683407370 XS1684200212 XS1684214783 XS1686560761 XS1687276581 XS1691334418 XS1692842534 XS1692842534 XS1692842534 XS1694636892 XS1696651766 XS1700391656 XS1706950034 XS1708318966 XS1715319262 XS1718315473 XS1719256650 XS1720573739 XS1721698725 XS1722885297 XS1724487803 XS1724638199 XS1724638199 XS1726285593 XS1729871845 XS1731652001 XS1734558528 XS1735564897 XS1735564897 XS1735564897 XS1739341490 XS1739583588 28/04/2017 TF 24/05/2017 TF 24/05/2017 TF 18/10/2017 TF 13/10/2017 TF 18/10/2017 TF 18/10/2017 TF 20/12/2017 TF 27/10/2017 TF 02/10/2017 TF 14/08/2017 TF 22/08/2017 TF 25/08/2017 TF 25/08/2017 TF 11/09/2017 TF 12/09/2017 TF 12/09/2017 TF 15/09/2017 TF 18/09/2017 TF 25/09/2017 TF 28/09/2017 TF 28/09/2017 TF 28/09/2017 TF 03/10/2017 TF 05/10/2017 TF 12/10/2017 TF 23/10/2017 TF 25/10/2017 TF 06/11/2017 TF 10/11/2017 TF 13/11/2017 TF 15/11/2017 TF 21/11/2017 TF 20/11/2017 TF 21/11/2017 TF 24/11/2017 TF 24/11/2017 TF 28/11/2017 TF 30/11/2017 TF 04/12/2017 TF 11/12/2017 TF 11/12/2017 TF 11/12/2017 TF 11/12/2017 TF 15/12/2017 TF 15/12/2017 TF 1.80 2.38 1.63 2.00 1.21 1.22 1.22 1.22 1.26 1.25 1.15 1.19 1.19 1.19 1.18 1.18 1.19 1.20 1.19 1.22 1.24 1.24 1.24 1.24 1.20 1.22 1.22 1.25 1.26 1.32 1.21 1.28 1.28 1.30 1.30 1.30 1.30 1.30 1.30 1.30 1.30 1.30 1.30 1.30 1.41 1.40 28/04/2024 24/05/2027 14/08/2020 15/12/2022 11/01/2018 18/01/2018 22/01/2018 22/01/2018 01/02/2018 02/02/2018 14/02/2018 22/02/2018 26/02/2018 25/05/2018 11/01/2018 16/01/2018 12/03/2018 16/01/2018 18/01/2018 26/02/2018 29/01/2018 29/01/2018 29/01/2018 02/02/2018 08/01/2018 12/01/2018 23/01/2018 25/01/2018 06/02/2018 10/08/2018 16/01/2018 15/02/2018 21/02/2018 26/02/2018 27/02/2018 26/02/2018 26/02/2018 28/02/2018 05/03/2018 06/03/2018 14/03/2018 16/01/2018 16/01/2018 16/01/2018 15/03/2018 16/01/2018 -42,390,000.00 -1,500,000,000.00 -3,000,000,000.00 -3,000,000,000.00 -100,000,000.00 -100,000,000.00 -100,000,000.00 -100,000,000.00 -15,000,000.00 -100,000,000.00 -10,000,000.00 -100,000,000.00 -100,000,000.00 -100,000,000.00 -1,000,000,000.00 -1,000,000,000.00 -200,000,000.00 -100,000,000.00 -100,000,000.00 -200,000,000.00 -95,000,000.00 -95,000,000.00 -95,000,000.00 -1,000,000,000.00 -74,000,000.00 -1,000,000,000.00 -800,000,000.00 -800,000,000.00 -800,000,000.00 -20,000,000.00 -200,000,000.00 -100,000,000.00 -100,000,000.00 -700,000,000.00 -600,000,000.00 -62,400,000.00 -62,400,000.00 -93,000,000.00 -1,000,000,000.00 -1,000,000,000.00 -1,200,000,000.00 -200,000,000.00 -200,000,000.00 -200,000,000.00 -1,500,000,000.00 -20,000,000.00 -42,390,000.00 -1,500,000,000.00 -3,000,000,000.00 -3,000,000,000.00 -99,963,027.78 -99,939,000.00 -99,925,444.45 -599,395,000.00 -14,983,200.00 -99,886,333.33 -9,985,709.00 -99,825,864.69 -99,812,337.52 -99,523,992.10 -999,640,122.71 -999,476,610.63 -199,532,428.39 -99,947,104.86 -99,940,614.99 -199,615,672.43 -94,905,316.19 -94,905,505.89 -199,800,665.66 -998,865,817.37 -73,980,328.96 -999,596,253.63 -799,377,112.68 -799,306,386.80 -798,965,282.84 -19,838,511.23 -199,893,117.85 -99,836,977.71 -99,815,713.93 -698,564,247.64 -598,745,365.22 -62,271,994.51 -1,995,881,533.64 -92,802,514.43 -997,692,376.12 -997,656,065.95 -1,196,841,212.01 -199,884,594.47 -749,567,333.33 -69,959,530.49 -1,495,660,116.82 -19,987,548.86 -35,345,618.28 -1,250,729,592.26 -2,501,459,184.52 -2,501,459,184.52 -83,351,144.65 -83,331,109.81 -83,319,806.93 -499,787,375.97 -12,493,287.75 -83,287,195.31 -8,326,281.16 -83,236,775.36 -83,225,496.14 -82,985,068.04 -833,519,655.39 -833,383,315.79 -166,374,075.20 -83,337,867.81 -83,332,456.42 -166,443,485.73 -79,133,924.95 -79,134,083.12 -166,597,736.73 -832,874,024.32 -61,686,257.78 -833,483,076.49 -666,536,406.80 -666,477,434.17 -666,193,014.96 -16,541,742.04 -166,674,825.19 -83,246,041.62 -83,228,311.46 -582,476,651.08 -499,245,697.67 -51,923,617.54 -1,664,205,397.85 -77,380,567.36 -831,895,585.86 -831,865,309.72 -997,949,814.07 -166,667,718.23 -625,004,030.13 -58,333,636.70 -1,247,110,912.05 -16,666,012.56 -42,390,000.00 -1,500,000,000.00 -3,000,000,000.00 -3,000,000,000.00 -99,963,027.78 -99,939,000.00 -99,925,444.45 -599,395,000.00 -14,983,200.00 -99,886,333.33 -9,985,709.00 -99,825,864.69 -99,812,337.52 -99,523,992.10 -999,640,122.71 -999,476,610.63 -199,532,428.39 -99,947,104.86 -99,940,614.99 -199,615,672.43 -94,905,316.19 -94,905,505.89 -199,800,665.66 -998,865,817.37 -73,980,328.96 -999,596,253.63 -799,377,112.68 -799,306,386.80 -798,965,282.84 -19,838,511.23 -199,893,117.85 -99,836,977.71 -99,815,713.93 -698,564,247.64 -598,745,365.22 -62,271,994.51 -1,995,881,533.64 -92,802,514.43 -997,692,376.12 -997,656,065.95 -1,196,841,212.01 -199,884,594.47 -749,567,333.33 -69,959,530.49 -1,495,660,116.82 -19,987,548.86 37


USD USD USD USD USD USD USD USD USD USD USD USD USD USD USD USD USD USD USD USD USD USD USD USD USD USD USD XS1740288854 XS1740288854 XS1740288854 XS1740288854 XS1740288854 XS1740288854 XS1740865677 XS1740865677 XS1740865677 XS1740865677 XS1740865677 XS1740865677 XS1740865677 XS1740865677 XS1740866303 XS1740866303 XS1740866303 XS1740866303 XS1741218777 XS1741218777 XS1742516906 XS1742516906 XS1742516906 XS1742516906 XS1742516906 XS1742516906 XS1743724624 19/12/2017 TF 19/12/2017 TF 19/12/2017 TF 19/12/2017 TF 19/12/2017 TF 19/12/2017 TF 20/12/2017 TF 20/12/2017 TF 20/12/2017 TF 20/12/2017 TF 20/12/2017 TF 20/12/2017 TF 20/12/2017 TF 20/12/2017 TF 20/12/2017 TF 20/12/2017 TF 20/12/2017 TF 20/12/2017 TF 20/12/2017 TF 20/12/2017 TF 21/12/2017 TF 21/12/2017 TF 21/12/2017 TF 21/12/2017 TF 21/12/2017 TF 21/12/2017 TF 22/12/2017 TF 1.50 1.50 1.50 1.50 1.50 1.50 1.65 1.65 1.65 1.65 1.65 1.65 1.65 1.65 1.65 1.65 1.65 1.65 1.65 1.65 1.55 1.55 1.55 1.55 1.55 1.55 1.45 19/01/2018 19/01/2018 19/01/2018 19/01/2018 19/01/2018 19/01/2018 22/01/2018 22/01/2018 22/01/2018 22/01/2018 22/01/2018 22/01/2018 22/01/2018 22/01/2018 20/03/2018 20/03/2018 20/03/2018 20/03/2018 20/02/2018 20/02/2018 22/01/2018 22/01/2018 22/01/2018 22/01/2018 22/01/2018 22/01/2018 16/01/2018 -20,000,000.00 -20,000,000.00 -20,000,000.00 -20,000,000.00 -20,000,000.00 -20,000,000.00 -50,000,000.00 -50,000,000.00 -50,000,000.00 -50,000,000.00 -50,000,000.00 -50,000,000.00 -50,000,000.00 -50,000,000.00 -200,000,000.00 -200,000,000.00 -200,000,000.00 -200,000,000.00 -75,000,000.00 -75,000,000.00 -200,000,000.00 -200,000,000.00 -200,000,000.00 -200,000,000.00 -200,000,000.00 -200,000,000.00 -50,000,000.00 -19,984,160.77 -99,920,935.46 -4,996,046.77 -74,940,701.59 -19,984,187.09 -13,188,521.31 -49,949,659.47 -199,798,028.63 -124,874,148.68 -89,909,387.05 -199,798,028.63 -29,969,795.68 -49,949,659.47 -39,962,164.87 -199,278,808.25 -49,819,702.06 -996,388,600.14 -267,829,255.72 -74,825,184.27 -199,533,824.71 -199,810,511.50 -199,810,511.50 -249,763,139.37 -99,905,408.11 -29,971,576.73 -119,886,489.73 -49,967,810.19 -16,663,187.50 -83,316,047.24 -4,165,802.36 -62,487,035.43 -16,663,209.45 -10,996,849.25 -41,649,011.48 -166,595,537.92 -104,122,528.71 -74,968,220.67 -166,595,537.92 -24,989,406.89 -41,649,011.48 -33,321,241.45 -166,162,601.73 -41,540,650.43 -830,808,471.73 -223,321,317.20 -62,390,714.81 -166,375,239.48 -166,605,946.39 -166,605,946.39 -208,257,432.98 -83,303,100.23 -24,990,891.96 -99,963,720.28 -41,664,145.91 -19,984,160.77 -99,920,935.46 -4,996,046.77 -74,940,701.59 -19,984,187.09 -13,188,521.31 -49,949,659.47 -199,798,028.63 -124,874,148.68 -89,909,387.05 -199,798,028.63 -29,969,795.68 -49,949,659.47 -39,962,164.87 -199,278,808.25 -49,819,702.06 -996,388,600.14 -267,829,255.72 -74,825,184.27 -199,533,824.71 -199,810,511.50 -199,810,511.50 -249,763,139.37 -99,905,408.11 -29,971,576.73 -119,886,489.73 -49,967,810.19 -139,255,061,211.02 -143,830,069,115.47 -119,928,349,133.22 -143,830,069,115.47 USD (1) ZAR ZAR ZAR ZAR ZAR ZAR ZAR ZAR ZAR ZAR ZAR ZAR ZAR ZAR 01360100 14270100 14270200 14270300 14270400 14270500 14270600 14270700 14270800 14270900 14271000 14271100 14271200 14271400 30/04/1998 TF 15/04/2008 TF 02/09/2009 TF 27/01/2010 TF 21/07/2010 TF 18/10/2010 TF 18/11/2010 TF 30/11/2010 TF 18/01/2011 TF 08/02/2011 TF 23/02/2011 TF 17/03/2011 TF 27/07/2011 TF 29/01/2013 TF 12.69 9.00 9.00 9.00 9.00 9.00 9.00 9.00 9.00 9.00 9.00 9.00 9.00 9.00 31/12/2018 21/12/2018 21/12/2018 21/12/2018 21/12/2018 21/12/2018 21/12/2018 21/12/2018 21/12/2018 21/12/2018 21/12/2018 21/12/2018 21/12/2018 21/12/2018 -337,900,000.00 -500,000,000.00 -275,000,000.00 -225,000,000.00 -150,000,000.00 -200,000,000.00 -150,000,000.00 -200,000,000.00 -300,000,000.00 -300,000,000.00 -150,000,000.00 -200,000,000.00 -300,000,000.00 -150,000,000.00 -75,055,192.75 -225,000,000.00 -275,000,000.00 -225,000,000.00 -150,000,000.00 -200,000,000.00 -150,000,000.00 -200,000,000.00 -300,000,000.00 -300,000,000.00 -150,000,000.00 -200,000,000.00 -300,000,000.00 -150,000,000.00 -5,069,447.14 -15,197,157.79 -18,574,303.97 -15,197,157.79 -10,131,438.53 -13,508,584.71 -10,131,438.53 -13,508,584.71 -20,262,877.06 -20,262,877.06 -10,131,438.53 -13,508,584.71 -20,262,877.06 -10,131,438.53 -6,079,787.96 -18,225,951.34 -22,276,162.75 -18,225,951.34 -12,150,634.23 -16,200,845.64 -12,150,634.23 -16,200,845.64 -24,301,268.46 -24,301,268.46 -12,150,634.23 -16,200,845.64 -24,301,268.46 -12,150,634.23 38 Currency Borrowing number Value Date Interest rate Rate Maturity date Initial amount in currency of borrowing Nominal outstanding in currency of borrowing Nominal outstanding in EUR Nominal outstanding in


ZAR ZAR ZAR ZAR ZAR ZAR ZAR ZAR ZAR ZAR ZAR ZAR ZAR ZAR ZAR ZAR ZAR ZAR ZAR ZAR ZAR ZAR ZAR ZAR ZAR ZAR ZAR ZAR ZAR ZAR ZAR ZAR ZAR ZAR ZAR ZAR ZAR ZAR ZAR ZAR ZAR ZAR ZAR ZAR ZAR ZAR 14271500 14271600 14271700 14271800 14271900 14272000 14272100 14272200 14272300 14272400 14272500 14272600 14272700 14272800 14272900 14273000 14273100 14273200 14273300 18150500 18150700 18150800 18150900 18151000 18151100 18151200 18151300 19580100 19580200 19580300 19580400 19580500 19580600 19580700 19580800 19580900 19581000 19581100 19581200 19581300 19581400 19581500 19581600 19581700 19581800 19581900 26/02/2013 TF 11/03/2013 TF 26/03/2013 TF 09/04/2013 TF 24/04/2013 TF 10/06/2013 TF 10/06/2013 TF 08/08/2013 TF 10/10/2013 TF 12/11/2013 TF 06/12/2013 TF 09/01/2014 TF 17/01/2014 TF 30/01/2014 TF 21/02/2014 TF 27/03/2014 TF 10/06/2014 TF 02/07/2014 TF 31/07/2015 TF 23/08/2011 TF 28/02/2014 TF 11/06/2014 TF 01/04/2016 TF 29/04/2016 TF 09/06/2016 TF 22/08/2016 TF 22/08/2016 TF 26/10/2012 TF 11/01/2013 TF 24/01/2013 TF 07/02/2013 TF 22/03/2013 TF 26/04/2013 TF 11/06/2013 TF 02/07/2013 TF 08/08/2013 TF 12/09/2013 TF 30/10/2013 TF 07/11/2013 TF 21/11/2013 TF 11/12/2013 TF 21/01/2014 TF 21/02/2014 TF 24/04/2014 TF 11/06/2014 TF 25/06/2014 TF 9.00 9.00 9.00 9.00 9.00 9.00 9.00 9.00 9.00 9.00 9.00 9.00 9.00 9.00 9.00 9.00 9.00 9.00 9.00 9.00 9.00 9.00 9.00 9.00 9.00 9.00 9.00 6.00 6.00 6.00 6.00 6.00 6.00 6.00 6.00 6.00 6.00 6.00 6.00 6.00 6.00 6.00 6.00 6.00 6.00 6.00 21/12/2018 21/12/2018 21/12/2018 21/12/2018 21/12/2018 21/12/2018 21/12/2018 21/12/2018 21/12/2018 21/12/2018 21/12/2018 21/12/2018 21/12/2018 21/12/2018 21/12/2018 21/12/2018 21/12/2018 21/12/2018 21/12/2018 31/03/2021 31/03/2021 31/03/2021 31/03/2021 31/03/2021 31/03/2021 31/03/2021 31/03/2021 21/10/2019 21/10/2019 21/10/2019 21/10/2019 21/10/2019 21/10/2019 21/10/2019 21/10/2019 21/10/2019 21/10/2019 21/10/2019 21/10/2019 21/10/2019 21/10/2019 21/10/2019 21/10/2019 21/10/2019 21/10/2019 21/10/2019 -150,000,000.00 -250,000,000.00 -150,000,000.00 -125,000,000.00 -125,000,000.00 -400,000,000.00 -150,000,000.00 -250,000,000.00 -200,000,000.00 -150,000,000.00 -200,000,000.00 -200,000,000.00 -250,000,000.00 -250,000,000.00 -250,000,000.00 -325,000,000.00 -300,000,000.00 -400,000,000.00 -400,000,000.00 -150,000,000.00 -250,000,000.00 -300,000,000.00 -350,000,000.00 -300,000,000.00 -300,000,000.00 -500,000,000.00 -250,000,000.00 -300,000,000.00 -300,000,000.00 -300,000,000.00 -300,000,000.00 -300,000,000.00 -300,000,000.00 -300,000,000.00 -300,000,000.00 -500,000,000.00 -200,000,000.00 -250,000,000.00 -300,000,000.00 -300,000,000.00 -300,000,000.00 -300,000,000.00 -300,000,000.00 -650,000,000.00 -500,000,000.00 -400,000,000.00 -150,000,000.00 -250,000,000.00 -150,000,000.00 -125,000,000.00 -125,000,000.00 -400,000,000.00 -150,000,000.00 -250,000,000.00 -200,000,000.00 -150,000,000.00 -200,000,000.00 -200,000,000.00 -250,000,000.00 -250,000,000.00 -250,000,000.00 -325,000,000.00 -300,000,000.00 -400,000,000.00 -400,000,000.00 -150,000,000.00 -250,000,000.00 -300,000,000.00 -350,000,000.00 -300,000,000.00 -300,000,000.00 -500,000,000.00 -250,000,000.00 -300,000,000.00 -300,000,000.00 -300,000,000.00 -300,000,000.00 -300,000,000.00 -300,000,000.00 -300,000,000.00 -300,000,000.00 -500,000,000.00 -200,000,000.00 -250,000,000.00 -300,000,000.00 -300,000,000.00 -300,000,000.00 -300,000,000.00 -300,000,000.00 -650,000,000.00 -500,000,000.00 -400,000,000.00 -10,131,438.53 -16,885,730.88 -10,131,438.53 -8,442,865.44 -8,442,865.44 -27,017,169.41 -10,131,438.53 -16,885,730.88 -13,508,584.71 -10,131,438.53 -13,508,584.71 -13,508,584.71 -16,885,730.88 -16,885,730.88 -16,885,730.88 -21,951,450.15 -20,262,877.06 -27,017,169.41 -27,017,169.41 -10,131,438.53 -16,885,730.88 -20,262,877.06 -23,640,023.23 -20,262,877.06 -20,262,877.06 -33,771,461.76 -16,885,730.88 -20,262,877.06 -20,262,877.06 -20,262,877.06 -20,262,877.06 -20,262,877.06 -20,262,877.06 -20,262,877.06 -20,262,877.06 -33,771,461.76 -13,508,584.71 -16,885,730.88 -20,262,877.06 -20,262,877.06 -20,262,877.06 -20,262,877.06 -20,262,877.06 -43,902,900.29 -33,771,461.76 -27,017,169.41 -12,150,634.23 -20,251,057.05 -12,150,634.23 -10,125,528.52 -10,125,528.52 -32,401,691.27 -12,150,634.23 -20,251,057.05 -16,200,845.64 -12,150,634.23 -16,200,845.64 -16,200,845.64 -20,251,057.05 -20,251,057.05 -20,251,057.05 -26,326,374.16 -24,301,268.46 -32,401,691.27 -32,401,691.27 -12,150,634.23 -20,251,057.05 -24,301,268.46 -28,351,479.87 -24,301,268.46 -24,301,268.46 -40,502,114.09 -20,251,057.05 -24,301,268.46 -24,301,268.46 -24,301,268.46 -24,301,268.46 -24,301,268.46 -24,301,268.46 -24,301,268.46 -24,301,268.46 -40,502,114.09 -16,200,845.64 -20,251,057.05 -24,301,268.46 -24,301,268.46 -24,301,268.46 -24,301,268.46 -24,301,268.46 -52,652,748.32 -40,502,114.09 -32,401,691.27 39


ZAR ZAR ZAR ZAR ZAR ZAR ZAR ZAR ZAR ZAR ZAR ZAR ZAR ZAR ZAR ZAR ZAR ZAR ZAR ZAR ZAR ZAR ZAR ZAR ZAR ZAR ZAR ZAR ZAR ZAR ZAR ZAR ZAR ZAR ZAR ZAR ZAR ZAR ZAR ZAR ZAR ZAR ZAR ZAR ZAR ZAR 19582000 19582100 19582200 19582300 19582400 19582500 19582600 19582700 19582800 19582900 20230100 20230200 20230300 20230400 20230500 20230600 20230700 20230800 20230900 20231000 20231100 20231200 20330100 20330200 20330300 20330400 20330500 20330600 20810100 20810200 21200100 21200200 21200300 21200400 21290100 21290200 21290300 21290400 21290500 21290600 21340100 21340200 21340300 21340400 21340500 21340600 14/07/2014 TF 15/09/2014 TF 21/11/2014 TF 14/01/2015 TF 10/04/2015 TF 11/05/2015 TF 08/09/2015 TF 18/11/2015 TF 22/12/2015 TF 02/06/2016 TF 12/08/2013 TF 12/08/2013 TF 04/11/2013 TF 17/01/2014 TF 01/04/2014 TF 13/06/2014 TF 17/07/2014 TF 16/01/2015 TF 12/03/2015 TF 31/03/2016 TF 04/08/2016 TF 21/09/2016 TF 25/10/2013 TF 03/04/2014 TF 14/05/2014 TF 17/06/2014 TF 22/07/2014 TF 31/03/2016 TF 12/03/2014 TF 02/12/2014 TF 13/06/2014 TF 22/07/2014 TF 10/10/2014 TF 20/06/2016 TF 29/07/2014 TF 11/08/2014 TF 03/03/2015 TF 25/08/2017 TF 10/11/2017 TF 10/11/2017 TF 10/09/2014 TF 16/01/2015 TF 23/04/2015 TF 31/03/2016 TF 29/09/2016 TF 01/12/2017 TF 6.00 6.00 6.00 6.00 6.00 6.00 6.00 6.00 6.00 6.00 7.50 7.50 7.50 7.50 7.50 7.50 7.50 7.50 7.50 7.50 7.50 7.50 7.50 7.50 7.50 7.50 7.50 7.50 7.75 7.75 8.25 8.25 8.25 8.25 8.38 8.38 8.38 8.38 8.38 8.38 7.50 7.50 7.50 7.50 7.50 7.50 21/10/2019 21/10/2019 21/10/2019 21/10/2019 21/10/2019 21/10/2019 21/10/2019 21/10/2019 21/10/2019 21/10/2019 30/01/2019 30/01/2019 30/01/2019 30/01/2019 30/01/2019 30/01/2019 30/01/2019 30/01/2019 30/01/2019 30/01/2019 30/01/2019 30/01/2019 15/01/2020 15/01/2020 15/01/2020 15/01/2020 15/01/2020 15/01/2020 12/03/2018 12/03/2018 13/09/2021 13/09/2021 13/09/2021 13/09/2021 29/07/2022 29/07/2022 29/07/2022 29/07/2022 29/07/2022 29/07/2022 10/09/2020 10/09/2020 10/09/2020 10/09/2020 10/09/2020 10/09/2020 -400,000,000.00 -400,000,000.00 -400,000,000.00 -500,000,000.00 -500,000,000.00 -500,000,000.00 -400,000,000.00 -500,000,000.00 -500,000,000.00 -500,000,000.00 -500,000,000.00 -250,000,000.00 -250,000,000.00 -250,000,000.00 -300,000,000.00 -250,000,000.00 -375,000,000.00 -500,000,000.00 -500,000,000.00 -400,000,000.00 -300,000,000.00 -300,000,000.00 -500,000,000.00 -200,000,000.00 -300,000,000.00 -400,000,000.00 -400,000,000.00 -300,000,000.00 -300,000,000.00 -200,000,000.00 -500,000,000.00 -400,000,000.00 -600,000,000.00 -500,000,000.00 -500,000,000.00 -500,000,000.00 -500,000,000.00 -500,000,000.00 -500,000,000.00 -250,000,000.00 -500,000,000.00 -500,000,000.00 -500,000,000.00 -500,000,000.00 -500,000,000.00 -500,000,000.00 -400,000,000.00 -400,000,000.00 -400,000,000.00 -500,000,000.00 -500,000,000.00 -500,000,000.00 -400,000,000.00 -500,000,000.00 -500,000,000.00 -500,000,000.00 -500,000,000.00 -250,000,000.00 -250,000,000.00 -250,000,000.00 -300,000,000.00 -250,000,000.00 -375,000,000.00 -500,000,000.00 -500,000,000.00 -400,000,000.00 -300,000,000.00 -300,000,000.00 -500,000,000.00 -200,000,000.00 -300,000,000.00 -400,000,000.00 -400,000,000.00 -300,000,000.00 -300,000,000.00 -200,000,000.00 -500,000,000.00 -400,000,000.00 -600,000,000.00 -500,000,000.00 -500,000,000.00 -500,000,000.00 -500,000,000.00 -500,000,000.00 -500,000,000.00 -250,000,000.00 -500,000,000.00 -500,000,000.00 -500,000,000.00 -500,000,000.00 -500,000,000.00 -500,000,000.00 -27,017,169.41 -27,017,169.41 -27,017,169.41 -33,771,461.76 -33,771,461.76 -33,771,461.76 -27,017,169.41 -33,771,461.76 -33,771,461.76 -33,771,461.76 -33,771,461.76 -16,885,730.88 -16,885,730.88 -16,885,730.88 -20,262,877.06 -16,885,730.88 -25,328,596.32 -33,771,461.76 -33,771,461.76 -27,017,169.41 -20,262,877.06 -20,262,877.06 -33,771,461.76 -13,508,584.71 -20,262,877.06 -27,017,169.41 -27,017,169.41 -20,262,877.06 -20,262,877.06 -13,508,584.71 -33,771,461.76 -27,017,169.41 -40,525,754.12 -33,771,461.76 -33,771,461.76 -33,771,461.76 -33,771,461.76 -33,771,461.76 -33,771,461.76 -16,885,730.88 -33,771,461.76 -33,771,461.76 -33,771,461.76 -33,771,461.76 -33,771,461.76 -33,771,461.76 -32,401,691.27 -32,401,691.27 -32,401,691.27 -40,502,114.09 -40,502,114.09 -40,502,114.09 -32,401,691.27 -40,502,114.09 -40,502,114.09 -40,502,114.09 -40,502,114.09 -20,251,057.05 -20,251,057.05 -20,251,057.05 -24,301,268.46 -20,251,057.05 -30,376,585.57 -40,502,114.09 -40,502,114.09 -32,401,691.27 -24,301,268.46 -24,301,268.46 -40,502,114.09 -16,200,845.64 -24,301,268.46 -32,401,691.27 -32,401,691.27 -24,301,268.46 -24,301,268.46 -16,200,845.64 -40,502,114.09 -32,401,691.27 -48,602,536.91 -40,502,114.09 -40,502,114.09 -40,502,114.09 -40,502,114.09 -40,502,114.09 -40,502,114.09 -20,251,057.05 -40,502,114.09 -40,502,114.09 -40,502,114.09 -40,502,114.09 -40,502,114.09 -40,502,114.09 40


41 ZAR 21390100 17/09/2014 TF 8.50 17/09/2024 -1,500,000,000.00 -1,500,000,000.00 -101,314,385.29 -121,506,342.28 ZAR 21390200 02/12/2014 TF 8.50 17/09/2024 -400,000,000.00 -400,000,000.00 -27,017,169.41 -32,401,691.27 ZAR 21390300 11/02/2015 TF 8.50 17/09/2024 -1,100,000,000.00 -1,100,000,000.00 -74,297,215.88 -89,104,651.01 ZAR 21390400 28/05/2015 TF 8.50 17/09/2024 -500,000,000.00 -500,000,000.00 -33,771,461.76 -40,502,114.09 ZAR 21390500 12/01/2016 TF 8.50 17/09/2024 -750,000,000.00 -750,000,000.00 -50,657,192.65 -60,753,171.14 ZAR 21390600 06/04/2016 TF 8.50 17/09/2024 -400,000,000.00 -400,000,000.00 -27,017,169.41 -32,401,691.27 ZAR 21390700 02/06/2016 TF 8.50 17/09/2024 -500,000,000.00 -500,000,000.00 -33,771,461.76 -40,502,114.09 ZAR 21390800 07/09/2016 TF 8.50 17/09/2024 -400,000,000.00 -400,000,000.00 -27,017,169.41 -32,401,691.27 ZAR 21390900 06/11/2017 TF 8.50 17/09/2024 -550,000,000.00 -550,000,000.00 -37,148,607.94 -44,552,325.50 ZAR 21391000 20/12/2017 TF 8.50 17/09/2024 -500,000,000.00 -500,000,000.00 -33,771,461.76 -40,502,114.09 ZAR 21510100 22/01/2015 TF 8.13 21/12/2026 -500,000,000.00 -500,000,000.00 -33,771,461.76 -40,502,114.09 ZAR 21510200 11/03/2015 TF 8.13 21/12/2026 -500,000,000.00 -500,000,000.00 -33,771,461.76 -40,502,114.09 ZAR 21510300 28/04/2015 TF 8.13 21/12/2026 -500,000,000.00 -500,000,000.00 -33,771,461.76 -40,502,114.09 ZAR 21510400 06/08/2015 TF 8.13 21/12/2026 -500,000,000.00 -500,000,000.00 -33,771,461.76 -40,502,114.09 ZAR 21510500 23/11/2015 TF 8.13 21/12/2026 -500,000,000.00 -500,000,000.00 -33,771,461.76 -40,502,114.09 ZAR 21510600 19/01/2016 TF 8.13 21/12/2026 -500,000,000.00 -500,000,000.00 -33,771,461.76 -40,502,114.09 ZAR 21510700 20/06/2016 TF 8.13 21/12/2026 -500,000,000.00 -500,000,000.00 -33,771,461.76 -40,502,114.09 ZAR 21510800 30/08/2016 TF 8.13 21/12/2026 -400,000,000.00 -400,000,000.00 -27,017,169.41 -32,401,691.27 ZAR 21510900 30/08/2016 TF 8.13 21/12/2026 -250,000,000.00 -250,000,000.00 -16,885,730.88 -20,251,057.05 ZAR 21511000 14/10/2016 TF 8.13 21/12/2026 -500,000,000.00 -500,000,000.00 -33,771,461.76 -40,502,114.09 ZAR 21511100 29/03/2017 TF 8.13 21/12/2026 -500,000,000.00 -500,000,000.00 -33,771,461.76 -40,502,114.09 ZAR 21511200 01/06/2017 TF 8.13 21/12/2026 -500,000,000.00 -500,000,000.00 -33,771,461.76 -40,502,114.09 ZAR 21511300 22/06/2017 TF 8.13 21/12/2026 -500,000,000.00 -500,000,000.00 -33,771,461.76 -40,502,114.09 ZAR 21511400 27/07/2017 TF 8.13 21/12/2026 -500,000,000.00 -500,000,000.00 -33,771,461.76 -40,502,114.09 ZAR 21511500 24/08/2017 TF 8.13 21/12/2026 -500,000,000.00 -500,000,000.00 -33,771,461.76 -40,502,114.09 ZAR 21511600 29/09/2017 TF 8.13 21/12/2026 -500,000,000.00 -500,000,000.00 -33,771,461.76 -40,502,114.09 ZAR 21550100 09/02/2015 TF 7.25 28/02/2023 -500,000,000.00 -500,000,000.00 -33,771,461.76 -40,502,114.09 ZAR 21550200 08/09/2016 TF 7.25 28/02/2023 -300,000,000.00 -300,000,000.00 -20,262,877.06 -24,301,268.46 ZAR 21550300 19/07/2017 TF 7.25 28/02/2023 -500,000,000.00 -500,000,000.00 -33,771,461.76 -40,502,114.09 ZAR 21550400 17/11/2017 TF 7.25 28/02/2023 -500,000,000.00 -500,000,000.00 -33,771,461.76 -40,502,114.09 ZAR 21830100 29/07/2015 TF 8.50 10/12/2024 -1,000,000,000.00 -1,000,000,000.00 -67,542,923.53 -81,004,228.19 ZAR 21860100 18/08/2015 TF 8.75 18/08/2025 -500,000,000.00 -500,000,000.00 -33,771,461.76 -40,502,114.09 ZAR 21860200 09/11/2017 TF 8.75 18/08/2025 -500,000,000.00 -500,000,000.00 -33,771,461.76 -40,502,114.09 ZAR 22190100 04/04/2016 TF 8.50 14/06/2019 -1,000,000,000.00 -1,000,000,000.00 -67,542,923.53 -81,004,228.19 ZAR 22190200 09/06/2016 TF 8.50 14/06/2019 -500,000,000.00 -500,000,000.00 -33,771,461.76 -40,502,114.09 ZAR 22990100 05/05/2017 TF 8.00 05/05/2027 -500,000,000.00 -500,000,000.00 -33,771,461.76 -40,502,114.09 ZAR 23140100 18/10/2017 TF 9.00 18/10/2032 -549,000,000.00 -549,000,000.00 -37,081,065.02 -44,471,321.27 -56,486,900,000.00 -55,949,055,192.75 -3,778,962,756.34 -4,532,110,033.68 Totals -449,585,362,708.85 -539,187,725,496.73 (1) The USD equivalent amount may be calculated using the EUR/USD conversion rate of 1.1993 utilized for establishing the balance sheet of the registrant as at December 31, 2017


EXHIBIT III


Breakdown of registered
securities held by or
for the account of the registrant


Amount held by or


Amount as to which


for the account of 


Title of Issue


registration is effective


the Registrant


1.250% Notes due May 15, 2019


USD

4,000,000,000


USD

15,330,000


1.625% Notes due December 15, 2020


USD

4,000,000,000


USD

20,879,000


1.375% Notes due September 15, 2021


USD

3,500,000,000


USD

16,396,000


2.250% Notes due August 15, 2022


USD

3,000,000,000


USD

39,981,000


EXHIBIT IV


Consent of Independent Auditors


Board of Directors

European Investment Bank


We consent to the incorporation by reference in the registration statements (Nos. 333-198097 and 333-99603) under Schedule B of the European Investment Bank of our reports dated March 15, 2018, with respect to:


·                  the unconsolidated financial statements of the European Investment Bank, which consist of the balance sheet as at December 31, 2017, the profit and loss account and the cash flow statement for the year then ended, and a summary of significant accounting policies and other explanatory information, prepared in accordance with the general principles of the Directive 86/635/EEC of the Council of the European Communities of December 8, 1986 as amended by Directive 2001/65/EC of September 27, 2001, by Directive 2003/51/EC of June 18, 2003 and by Directive 2006/46/EC of June 14, 2006 (the “Directives”);


·                  the consolidated financial statements of the European Investment Bank, which consist of the consolidated balance sheet as at December 31, 2017, the consolidated profit and loss account and the consolidated cash flow statement for the year then ended, and a summary of significant accounting policies and other explanatory information, prepared in accordance with the Directives; and


·                  the consolidated financial statements of the European Investment Bank, which consist of the consolidated balance sheet as at December 31, 2017, the consolidated income statement,  consolidated statement of profit or loss and other comprehensive income, consolidated statement of changes in equity and consolidated cash flow statement for the year then ended, and a summary of significant accounting policies and other explanatory information, prepared in accordance with International Financial Reporting Standards as adopted by the European Union,


which reports appear in Exhibit I of the December 31, 2017 annual report on Form 18-K of the European Investment Bank.


Luxembourg, May 3, 2018


/s/ KPMG LUXEMBOURG, SOCIÉTÉ COOPÉRATIVE


EXHIBIT V


EIB Group


Reconciliation of the Consolidated Financial Statements of the EIB Group as at 31 December 2017 prepared in accordance with EU Accounting Directives and IFRS


EIB GROUP - EU ACCOUNTING DIRECTIVES TO IFRS RECONCILIATION
CONSOLIDATED BALANCE SHEET AS AT DECEMBER 31, 2017 (in EUR ’000)


EU Accounting Directives


Adjustment


IFRS


ASSETS


31/12/2017


Ref.


31/12/2017


1. Cash in hand, balances with central banks and post office banks


162 483


0


162 483


2. Treasury bills and other bills eligible for refinancing with central banks


41 508 248


134 709


A.1


41 642 957


3. Loans and advances to credit institutions


a) repayable on demand


937 805


0


937 805


b) other loans and advances


33 898 199


- 8 883


B.2


33 889 316


c) loans


121 560 358


1 613 801


B.2


123 174 159


156 396 362


158 001 280


4. Loans and advances to customers


a) other loans and advances


1 741 983


- 1 060


B.2


1 740 923


b) loans


313 620 389


20 478 143


B.2


334 098 532


c) impairment on loans and advances, net of reversals


- 465 507


55 850


F


- 409 657


314 896 865


335 429 798


5. Debt securities including fixed-income securities


a) issued by public bodies


7 024 316


36 525


A.1


7 060 841


b) issued by other borrowers


8 647 411


57 145


A.1


8 704 556


15 671 727


15 765 397


6. Shares and other variable-yield securities


5 035 790


2 209 361


A.2


7 245 151


7. Participating interests


263 453


- 263 453


A.3


0


8. Derivative assets


0


43 861 007


B.1


43 861 007


9. Property, furniture and equipment


265 338


0


265 338


10. Intangible assets


21 264


0


21 264


11. Other assets


162 310


- 7 679


B.1


154 631


12. Subscribed capital and reserves, called but not paid


25 983


- 259


E


25 724


13. Prepayments


16 596 171


- 16 513 344


A.1, B.1, B.2, B.3, B.4


82 827


TOTAL ASSETS


551 005 994


602 657 857


LIABILITIES AND EQUITY


31/12/2017


Ref.


31/12/2017


1. Amounts owed to credit institutions


a) repayable on demand


4 953 852


- 1 385


B.3


4 952 467


b) with agreed maturity dates or periods of notice


57 475


51


B.3


57 526


5 011 327


5 009 993


2. Amounts owed to customers


a) repayable on demand


1 922 566


0


1 922 566


b) with agreed maturity dates or periods of notice


8 349


- 3


B.3


8 346


1 930 915


1 930 912


3. Debts evidenced by certificates


a) debt securities in issue


435 730 418


37 758 592


B.4


473 489 010


b) others


13 854 945


2 683 701


B.4


16 538 646


449 585 363


490 027 656


4. Derivatives liabilities


0


32 651 732


B.1


32 651 732


5. Other liabilities


854 828


875 650


B.1, B.2, D


1 730 478


6. Deferred income


20 531 793


- 20 351 478


A.1, B.1, B.2, B.3, B.4


180 315


7. Provisions


a) pension plans and health insurance scheme


2 766 138


2 799 703


C


5 565 841


b) provision for guarantees issued


23 460


0


23 460


2 789 598


5 589 301


TOTAL LIABILITIES


480 703 824


537 120 387


8. Capital


a) subscribed


243 284 155


0


243 284 155


b) uncalled


- 221 585 020


0


- 221 585 020


21 699 135


21 699 135


9. Consolidated reserves


a) reserve fund


24 328 415


0


24 328 415


b) additional reserves


10 312 322


- 6 862 754


A.1, A.2, A.3, B.1, B.2, B.3, B.4, C, D, E, F, G


3 449 568


c) fair value reserve


0


2 470 292


A.1, A.2, A.3


2 470 292


d) special activities reserve


7 504 091


0


7 504 091


e) general loan reserve


2 700 556


0


2 700 556


44 845 384


40 452 922


10. Profit for the financial year


2 858 647


459 331


A.1 , A.2, A.3, B.1, B.2, B.3, B.4, C, D, E, F, G


3 317 978


Total equity attributable to the equity holders of the Bank


65 470 035


11. Non-controlling interests


899 004


- 831 569


D


67,435


TOTAL EQUITY


70 302 170


65 537 470


TOTAL LIABILITIES AND EQUITY


551 005 994


602 657 857


EIB GROUP - EU ACCOUNTING DIRECTIVES TO IFRS RECONCILIATION
Consolidated income statement for the period ended December 31, 2017 (in EUR ’000)


EU Accounting Directives
2017


Adjustment
Ref.


IFRS
2017


1.  Interest and similar income


23 412 219


- 1 623


B.1, B.2, E


23 410 596


2.  Interest expense and similar charges


- 20 121 596


- 15 474


B.1, B.3, B.4, C, D, E


- 20 137 070


3.  Income from shares and other variable-yield securities


336 162


0


336 162


4.  Fee and commission income


347 541


0


347 541


5.  Fee and commission expense


- 112 257


0


- 112 257


6.  Result on financial operations


- 2 955


516 855


A.1, A.2, A.3, B.1, B.2, B.3, B.4


513 900


7.  Other operating income


11 038


0


11 038


8.  Other operating expense


0


0


0


9.  Change in impairment on loans and advances and provisions for guarantees, net of
reversals


81 071


- 719


F


80 352


10. Change in impairment on transferable securities held as financial fixed assets, shares and other variable-yield securities, net of reversals


- 1 923


- 22 796


A.1, A.2, A.3


- 24 719


11. General administrative expenses


a) staff costs


- 771 360


- 39 499


C


- 810 859


b) other administrative costs


- 258 604


- 6 572


G


- 265 176


- 1 029 964


- 1 076 035


12. Depreciation and amortisation: property, furniture and equipment, and intangible assets


a) property, furniture and equipment


- 31 810


0


- 31 810


b) intangible assets


- 7 388


0


- 7 388


- 39 198


- 39 198


13.  Profit/loss for the financial year


2 880 138


3 310 310


Attributable to:


Non-controlling interests


21 491


- 29 159


D


- 7 668


Equity holders of the Bank


2 858 647


3 317 978


Valuation and income recognition differences between IFRS and EU Accounting Directives


A                         Financial assets classified as available-for-sale


1                 Debt securities portfolio


Under EU Accounting Directives, debt securities portfolios are recorded at market value. The value adjustments are reported under “Net result on financial operations” in the profit and loss for the period in which they are made.


Accrued interest is recorded under balance sheet items “Prepayments and accrued income” or “Accruals and deferred income”.


Under IFRS, debt securities portfolios are carried at fair value with changes in fair value reflected directly in equity.


Impairment is recognised in the profit and loss for the year when negative changes in the fair valuation are other than temporary. It is reported separately on the face of the income statement.


Accrued interest and accrued discounts / premiums are reported on the balance sheet within the balance of the instrument to which they relate.


2                 Shares and other variable-yield securities


Under EU Accounting Directives, shares and other variable-yield securities are initially recorded at acquisition cost. Their carrying value is adjusted to the lower of cost or market value at subsequent measurement at the balance sheet date.


Under IFRS, shares and other variable-yield securities are carried at fair value with changes in fair value reflected directly in equity.


Impairment is recognised in the profit and loss for the year when negative changes in the fair valuation are other than temporary. It is reported separately on the face of the income statement.


3                 Participating interests


Under EU Accounting Directive, “Participating interests” are accounted based on the equity accounting using methods consistent with EIB Group’s accounting policies.


Starting from 2017, under EU Accounting Directives, Participating interests were reclassified as follows: from “Shares and other variable-yield securities” to “Participating interests” and from “Net result on financial operations” to “Value (re-)adjustments in respect of transferable securities held as financial fixed assets, participating interests and shares in affiliated undertakings”.


B                         Financial assets and liabilities designated at fair value through profit or loss


1                                         Derivative assets and liabilities


a                                Treasury derivatives


Under EU Accounting Directives, derivative instruments in the Bank’s available for sale and trading portfolios are marked to market and recorded under “Other assets” or “Other liabilities”.


Issuance fees are not amortised and they are recorded under “Interest payable and similar charges”.


Interest accrued under derivative instruments is presented under “Prepayments and accrued income” and “Accruals and deferred income”.


Under EU Accounting Directives, the amortisation of premium discount of FX swaps and FX forwards are recorded under “Interest payable and similar expense” and “Interest receivable and similar income”, while under IFRS it is under “Result on financial operations”.


Under IFRS, all derivative assets and liabilities are recognised on balance sheet as such and carried at their replacement values.


With the application of IFRS 13, Credit valuation adjustments (CVA), reflecting counterparty credit risk on derivative transactions, and Debit valuation adjustments (DVA), reflecting own credit risk on derivative transactions, are included in the fair valuations of derivatives.


Changes in fair values of derivatives are recognised in the income statement.


b                                Hedging derivatives


Under EU Accounting Directives, hedging derivative instruments are not recognised on the balance sheet. They are carried off balance sheet at nominal amount.


Interest accrued under derivative instruments is presented under “Prepayments and accrued income” and “Accruals and deferred income”.


Issuance fees and redemption premiums or discounts are amortised over the period to maturity of the related derivatives under “Interest payable and similar expense”.


Under IFRS, all derivative assets and liabilities are recognised on balance sheet and carried at their replacement values.


Issuance fees and redemption premiums or discounts are recognised in the income statement under “Result on financial operations”.


With the application of IFRS 13, Credit valuation adjustments (CVA), reflecting counterparty credit risk on derivative transactions, and Debit valuation adjustments (DVA), reflecting own credit risk on derivative transactions, are included in the fair valuations of derivatives.


Under IFRS, EIB has two transactions that meet the offsetting of financial assets and financial liabilities criteria.


Changes in fair values of derivatives are recognised in the income statement.


2                 Loans and advances


Under EU Accounting Directives, all loans and advances are carried at amortised cost. Accrued interest is recorded under balance sheet items “Prepayments and accrued income” or “Accruals and deferred income”.


Under EU Accounting Directives, the front-end fees on loans are amortised and recognised in the income statement under “Interest and similar income”.


Under IFRS certain loans are classified on initial recognition as “fair value loans” and valued at fair value through profit or loss. Accrued interest/accrued subsidy remuneration/up-front interest revenue/incoming payments unallocated from loans, are reported on the balance sheet within the balance of the asset to which it relates.


Under IFRS the front-end fees on loans are recognised under “Result on financial operations” in the income statement for the loans that are measured at fair value.


Under IFRS the front-end fees on loans are recognised in balance sheet under “Loans and advances to customers/credit institutions” for the loans that are treated at amortised cost.


Transitory accounts on loans are reclassified from other liabilities to the loan balance to which they relate.


Changes in fair values of loans are recognised in the income statement.


3                 Amounts owed to credit institutions and to customers


Under EU Accounting Directives, “Amounts owed to credit institutions/customers” are presented in the financial statements at their redemption amounts.


Under EU Accounting Directives, interest on amounts owed to credit institutions and customers is recorded in the profit and loss account on an accruals basis as “Interest payable and similar charges”. Accrued interest is included in “Accruals and deferred income” under liabilities.


Under IFRS, “Amounts owed to credit institutions/customers” are initially recorded at cost and are presented in the financial statements at amortised cost.


Under IFRS, interest on amounts owed to credit institutions and customers is recorded in the income statement as “Interest expense and similar charges” using the effective interest method.


4                 Borrowings


Under EU Accounting Directives, borrowings are recorded at amortised cost. Accrued interest is recorded under balance sheet item “Accruals and deferred income”.


Under IFRS, EIB applies the fair value option to a significant portion of its issued debt. Accrued interest is reported on the balance sheet within the balance of the debt instrument to which it relates.


Issuance fees and redemption premiums or discounts are amortised over the period to maturity of the related borrowings, unless those borrowings are measured at fair value, in which case the recognition in the income statement is under “Result on financial operations”.


With the application of IFRS 13, own credit adjustments (OCA), reflecting own credit risk on unquoted or illiquid borrowings hedged by swaps, is calculated.


Under IFRS, EIB has one transaction that meets the offsetting of financial assets and financial liabilities criteria.


Changes in fair values of borrowings are recognised in the income statement.


C                         Pension funds


Under EU Accounting Directives, a 10% corridor approach is adopted, whereby prior year cumulative actuarial surpluses or deficits in excess of 10% of the commitments for retirement benefits are recognised over the average remaining service lives of the plan’s participants.


Under IFRS, the Group applies IAS 19 revised for determining the income or expense related to its post-employment defined benefit plans.


Cumulative actuarial surpluses and deficits are recognised in full in “Other comprehensive income”. Net interest cost is recognised in the income statement under “Interest expense and similar charges”.


D                         Non-controlling interest adjustment


The Bank, the European Investment Fund (the EIF) and the EU MICROFINANCE PLATFORM FCP-FIS (the EUMPF) together are defined as the Group.


EIB granted a put option to the minority shareholders on their entire holding of one of its subsidiaries, the EIF.


Under EU Accounting Directives, this put option does not influence the accounting treatment of minority interest on consolidation.


Under IFRS, the put option results in the non-controlling interest balance being classified as liability rather than equity and being carried at fair value through profit or loss.


The non-controlling interest in the IFRS profit for the year is therefore included in the interest expense for the year. Fair value adjustment is reported under “Interest expense and similar charges”.


E                         Subscribed capital and reserves, called but not paid


Under EU Accounting Directives, the caption “Subscribed capital and reserves, called but not paid” contains net receivable from the new Member State, Croatia.


Under IFRS, the capital and reserves to be received are discounted using discounted cash flow method.


Discounted interest is reported under “Interest expense and similar charges” and its amortisation under “Interest and similar income”.


F                          Change in impairment on loans and advances and provisions for guarantees, net of reversals


Impairment loss is recognised in profit and loss and the amount of the loss is measured as the difference between the carrying value and the present value of estimated future cash flows discounted at the instrument’s original effective interest rate.


Impairment loss is recognised in the profit and loss for the year when negative changes in the fair valuation are other than temporary.


It is reported separately on the face of the consolidated income statement under the caption “Change in impairment on loans and advances and provisions for guarantees, net of reversals”.


Under IFRS, any impairment already recognised in the statutory accounts under EUGAAP for loans that are treated under the fair value option, is fully reversed.


G                        Other operating expense


This caption relates to fees and administrative charges in relation to the EUMPF only. Under EU Accounting Directives they are recorded under “General administrative expenses b) other administrative costs” under profit and loss.