| 2022 FINANCIAL REPORT OVERVIEW1 Since 1958, the European Investment Bank (EIB, or the Bank) has been promoting the policies and priorities of the European Union, while standing ready to scale up its support during exceptional times of crisis. Russia’s invasion of Ukraine in February 2022 has brought additional challenges to a global economy still dealing with the aftermath of the coronavirus pandemic. The European Union has adapted its policies in response, redirecting substantial resources, including political, financial and humanitarian assistance to Ukraine and the unfolding energy crisis. The EIB stands by the government and the people of Ukraine. In March 2022, the Bank, in agreement with the European Commission, provided a EUR 668 million financial support package to help Ukraine meet its most immediate and urgent financial needs. In July 2022, the EIB proposed a second support package of EUR 1.59 billion, to help the country fix damaged infrastructure, restart municipal services, and support urgent energy efficiency measures in preparation for the cold season. Disbursements under both packages benefit from guarantees from the European Union and complement other initiatives announced by EU institutions and the Member States of the European Union (EU Member States). The Bank also provided a EUR 4.0 billion package for the EU Member States hosting Ukrainian refugees, financing key infrastructure and services for refugees and host communities. The EIB continues to work on new initiatives to assist Ukraine over the short- and medium-term and to support its long-term goal of acceding to the European Union. The war in Ukraine and its impact on energy exports have also triggered a shock to the EU economy with significant challenges to the security and affordability of our energy supplies. This crisis adds a new strategic rationale to the European Union’s decarbonisation goal and calls for an acceleration of the clean energy transition already underway. In this context, the EIB welcomes the REPowerEU plan proposed by the European Commission and strongly supports the objective of phasing out the European Union’s dependency on Russian gas, oil and coal imports as soon as possible. With this objective in mind, the EIB and the European Investment Fund (EIF and together, the EIB Group) announced in October 2022 a financing package of an additional EUR 30 billion over the next five years for renewables, energy efficiency, grids and storage, electric-vehicle charging infrastructure, and breakthrough technologies, such as low-carbon hydrogen. Through the second year of implementation of its Climate Bank Roadmap, introduced in 2020, the EIB Group has remained strongly committed to financing projects supporting climate action and environmental sustainability. In 2022, the EIB signed EUR 36.6 billion of finance supporting climate action and environmental sustainability globally (58% of the Bank’s total financing, compared to 51% in 2021)2 .. This represents an increase of approximately EUR 10 billion compared with 2021, driven to a large degree by an increase in renewable energy, energy efficiency and innovation in support. During COP27, the United Nations Climate Conference in Egypt, the Bank stepped up its efforts for the protection, restoration and sustainable use of nature, with the introduction of its Environment Framework, which promotes a green, resilient, equitable and inclusive development approach. The new Environment Framework consolidates the EIB’s efforts and activities contributing to environmental sustainability. It supports the EIB’s putting into action of its commitment, taken at the COP26, the United Nations Climate Conference in Glasgow, along with other multilateral development banks, to step up 1. This section covers the activities and financial information of the European Investment Bank. The figures presented have to be viewed together with the Statutory Financial Statements of the Bank prepared in accordance with the EU Accounting Directives (unless otherwise stated). 2. 2022 data under the Bank’s own resources are preliminary and unaudited. 1 |
| Overview efforts towards the protection, restoration and sustainable use of nature. The EIB remains dedicated to its statutory mission of supporting the European Union’s economic and social cohesion and contributing to innovation and digitalisation investment, as well as to the European Union’s competitiveness. In 2022 alone, EIB financing to the European Union’s cohesion priority regions amounted to EUR 24.8 billion, equivalent to 45.9% of the Bank's total signatures in the European Union (compared to EUR 19.8 billion or 41% in 2021). The EIB Group continues to support a transition towards environmentally sustainable economies and societies, for example, by helping regions that depend greatly on coal, oil and other fossil fuels to make the switch towards low-carbon and resilient economies. As in previous crises, the EIB Group is acting as a countercyclical force, supporting investment and growth in the European Union and beyond. Since the start of the coronavirus pandemic, the EIB Group has mobilised its resources to counter the disease and the economic fallout of the pandemic. In 2022, the EIB Group signed EUR 8.6 billion in new support related to its pandemic response programmes. Moreover, in light of the additional burdens weighing on the recovery from the pandemic, the allocation period for the guarantee products under the EIB pan-European Guarantee Fund (EGF), launched in 2020, was extended until the end of 2022. Delivering on EU mandates in the context of the 2021-2027 Multiannual Financial Framework (MFF) was an important part of the EIB Group’s activity in 2022. In March 2022, the EIB Group signed the InvestEU Guarantee Agreement and the InvestEU Advisory Hub Agreement, each with the European Commission. InvestEU is a key pillar of the European Union’s largest ever stimulus package, designed to support recovery from the pandemic and help build a greener, more digital and more resilient European economy. The EIB Group is proud to be the privileged partner in the InvestEU scheme, implementing 75% of the EU budget guarantee (EUR 19.7 billion) to support finance and investment operations. The EIB continues to support the EU Member States by helping them leverage the resources of the Recovery and Resilience Facility, the European Union’s centrepiece to address the medium and long-term negative economic effects of the COVID-19 crisis and facilitate the implementation of new investment projects. EIB Global was launched in January 2022 as a direct response to the request by the Council of the European Union to strengthen the impact of EIB operations beyond the European Union based on dedicated strategies, stronger partnerships and an inclusive association of development policy makers. As such, it is an integral part of the European Union’s external and development financing toolbox. EIB Global benefits from the engagement and support of the EU Member States, the European Commission and increasing cooperation with development stakeholders. It supports the delivery and works within the parameters of EU external action policies in partner and candidate countries and is strengthening its presence at the country level within EU delegations. EIB Global is well placed to contribute to the EU global and geopolitical agenda and deploy its unique expertise in financing the green and digital transitions. It stands ready to provide a key contribution to addressing the extraordinary challenges many countries beyond the European Union are facing. In 2022, new financing signed by the Bank amounted to EUR 65.1 billion3 (of which EUR 62.6 billion under the Bank’s own resources), close to the upper end of the target range set in the 2022-24 Operational Plan4 (compared to EUR 65.4 billion, of which EUR 54.3 billion under the Bank’s own resources in 2021). Total disbursements reached EUR 57.6 billion5 in 2022 (of which EUR 56.7 billion under the Bank’s own resources). In 2021, total disbursements amounted to EUR 41.4 billion (of which EUR 40.4 billion under the Bank’s own resources). 3. Includes all resources: loans, equities and guarantees. 4. The annual Operational Plan includes performance orientations and elaborates on major priorities and activities of the EIB Group for the coming three years. 5. Includes all resources: loans, equities and guarantees. 2 |
| 2022 FINANCIAL REPORT Over the course of 2022, the Bank raised EUR 44.3 billion on the international capital markets, to finance lending activities and other cashflow needs. The EIB is a leading issuer in the sovereigns, supranationals and agencies (SSA) segment, and actively contributes to innovation and development in the capital markets, promoting cutting-edge standards. The EIB reaffirmed its presence in the global climate and sustainability bond markets, having issued a record EUR 19.9 billion in Climate and Sustainability Awareness Bonds (CABs and SABs) in 2022. The EIB increased the climate and sustainability funding share in its total funding from 21% in 2021 to a record 45% in 2022. The growth of climate action and environmental sustainability lending facilitated substantial growth in climate and sustainability funding, including the first benchmark-sized climate and sustainability issues by the Bank. This led to a significant increase of benchmark issuances in the total funding. The EIB also continued to spearhead developments in the digitalisation of capital markets with the issuance of EUR-denominated digital bonds on a private blockchain in November 2022. Outstanding borrowings and commercial paper amounted to EUR 431.6 billion at the end of 2022, compared to EUR 440.1 billion at the end of 2021. The EIB has a prudent approach to liquidity management, focusing on liquid and very high-quality investments. Treasury assets totalled EUR 77.5 billion at the end of 2022 (compared to EUR 105.6 billion at the end of 2021). The Bank’s total liquidity ratio remains well within internal limits, covering 95.4% of 2023 projected net cash outflows (compared to 117.2% at the end of 2021), while the liquidity coverage ratio stood at 348.0% and the net stable funding ratio (NSFR) amounted to 124.6% (compared to 564.9% and 130.0% respectively in ‘2021). Importantly, the EIB’s access to the Eurosystem’s refinancing facility provides additional protection in circumstances of extreme liquidity stress. The EIB's risk management strategy is based on a robust due diligence process, adequate levels of security and guarantees, as well as standard protective clauses included in its loan agreements. The level of loan impairments is only 0.4% at the end of 2022 (0.3% at the end of 2021) supported by securities, guarantees and portfolio credit enhancements in place. The portion of payments overdue by more than 90 days remains very low, totalling EUR 77.7 million at the end of 2022 (EUR 118.7 million at the end of 2021) and representing only 0.02% of the risk portfolio. Provisions on loans decreased from EUR 443.9 million at the end of 2021 to EUR 402.5 million at the end of 2022. The latter includes the recording of a collective provision to reflect the potential effects of the Russian invasion of Ukraine on the loan portfolio. In 2022, the EIB generated positive financial results, booking an annual surplus of EUR 2.4 billion as compared to EUR 2.6 billion in 2021. The annual surplus is fully retained, contributing to the Bank’s own funds and supporting its long-term financing capacity. The EIB Common Equity Tier 1 (CET1) ratio increased from 32.3% at the end of 2021 to 35.1% at the end of 2022, essentially due to the positive development of the stock and the retained annual surplus. The Capital Requirement Regulation II leverage ratio increased from 10.9% to 11.8% during 2022, mainly due to the increase in Tier 1 capital from the annual surplus accumulation. 3 |
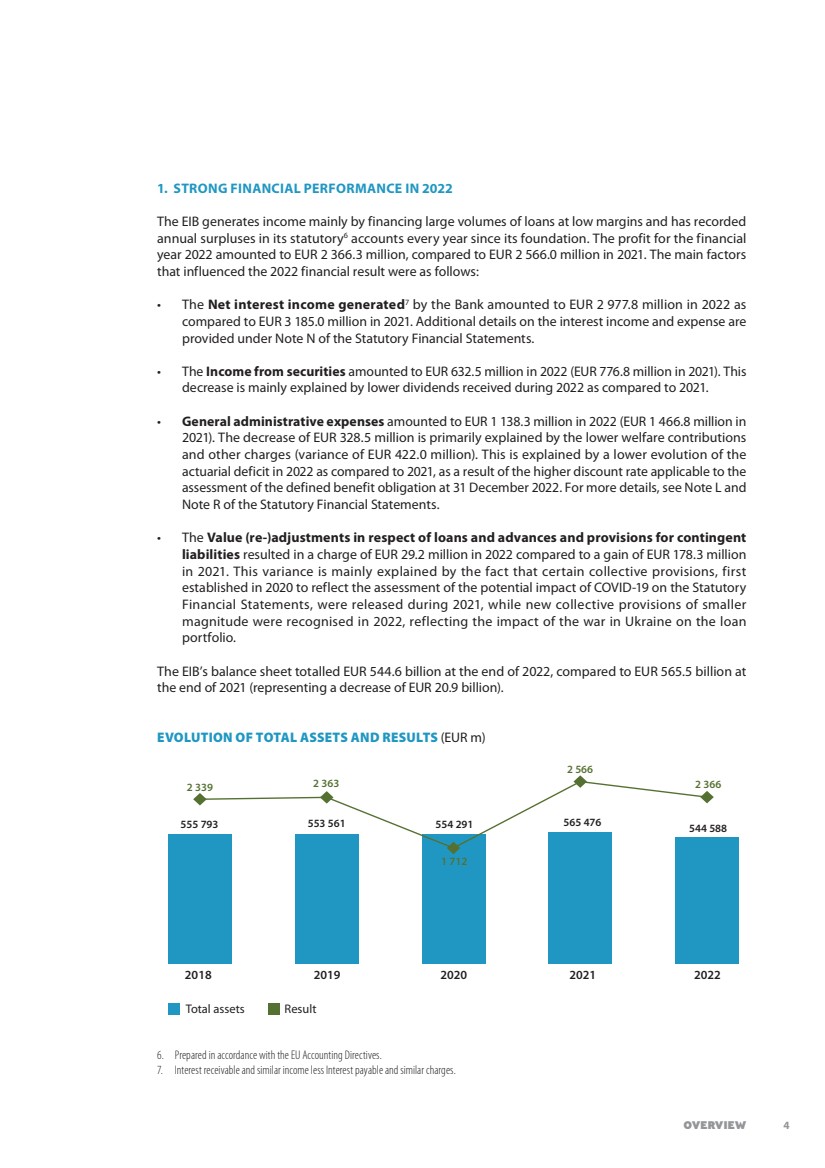
| Overview 1. STRONG FINANCIAL PERFORMANCE IN 2022 The EIB generates income mainly by financing large volumes of loans at low margins and has recorded annual surpluses in its statutory6 accounts every year since its foundation. The profit for the financial year 2022 amounted to EUR 2 366.3 million, compared to EUR 2 566.0 million in 2021. The main factors that influenced the 2022 financial result were as follows: • The Net interest income generated7 by the Bank amounted to EUR 2 977.8 million in 2022 as compared to EUR 3 185.0 million in 2021. Additional details on the interest income and expense are provided under Note N of the Statutory Financial Statements. • The Income from securities amounted to EUR 632.5 million in 2022 (EUR 776.8 million in 2021). This decrease is mainly explained by lower dividends received during 2022 as compared to 2021. • General administrative expenses amounted to EUR 1 138.3 million in 2022 (EUR 1 466.8 million in 2021). The decrease of EUR 328.5 million is primarily explained by the lower welfare contributions and other charges (variance of EUR 422.0 million). This is explained by a lower evolution of the actuarial deficit in 2022 as compared to 2021, as a result of the higher discount rate applicable to the assessment of the defined benefit obligation at 31 December 2022. For more details, see Note L and Note R of the Statutory Financial Statements. • The Value (re-)adjustments in respect of loans and advances and provisions for contingent liabilities resulted in a charge of EUR 29.2 million in 2022 compared to a gain of EUR 178.3 million in 2021. This variance is mainly explained by the fact that certain collective provisions, first established in 2020 to reflect the assessment of the potential impact of COVID-19 on the Statutory Financial Statements, were released during 2021, while new collective provisions of smaller magnitude were recognised in 2022, reflecting the impact of the war in Ukraine on the loan portfolio. The EIB’s balance sheet totalled EUR 544.6 billion at the end of 2022, compared to EUR 565.5 billion at the end of 2021 (representing a decrease of EUR 20.9 billion). 6. Prepared in accordance with the EU Accounting Directives. 7. Interest receivable and similar income less Interest payable and similar charges. 2 339 555 793 553 561 2018 2019 2020 2021 2022 554 291 565 476 544 588 2 363 1 712 2 566 2 366 Total assets Result EVOLUTION OF TOTAL ASSETS AND RESULTS (EUR m) 4 |
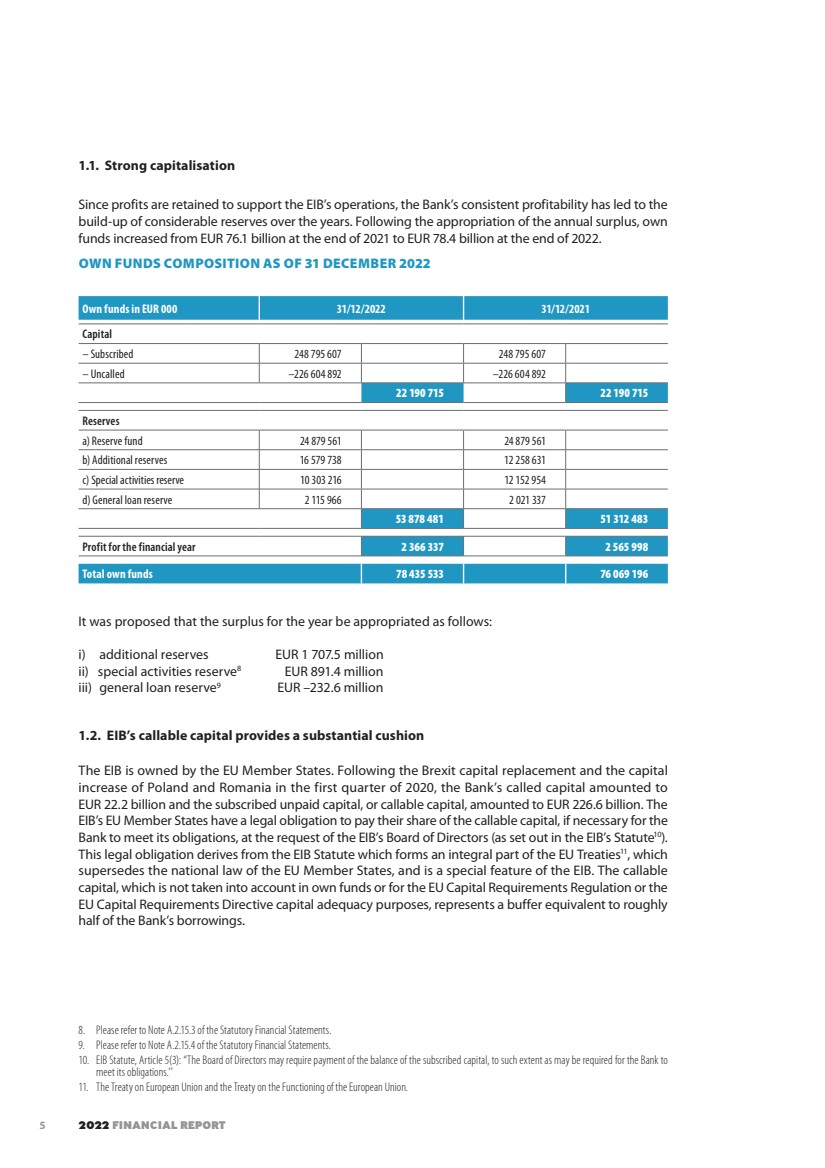
| 2022 FINANCIAL REPORT 1.1. Strong capitalisation Since profits are retained to support the EIB’s operations, the Bank’s consistent profitability has led to the build-up of considerable reserves over the years. Following the appropriation of the annual surplus, own funds increased from EUR 76.1 billion at the end of 2021 to EUR 78.4 billion at the end of 2022. It was proposed that the surplus for the year be appropriated as follows: i) additional reserves EUR 1 707.5 million ii) special activities reserve8 EUR 891.4 million iii) general loan reserve9 EUR –232.6 million 1.2. EIB’s callable capital provides a substantial cushion The EIB is owned by the EU Member States. Following the Brexit capital replacement and the capital increase of Poland and Romania in the first quarter of 2020, the Bank’s called capital amounted to EUR 22.2 billion and the subscribed unpaid capital, or callable capital, amounted to EUR 226.6 billion. The EIB’s EU Member States have a legal obligation to pay their share of the callable capital, if necessary for the Bank to meet its obligations, at the request of the EIB’s Board of Directors (as set out in the EIB’s Statute10). This legal obligation derives from the EIB Statute which forms an integral part of the EU Treaties11, which supersedes the national law of the EU Member States, and is a special feature of the EIB. The callable capital, which is not taken into account in own funds or for the EU Capital Requirements Regulation or the EU Capital Requirements Directive capital adequacy purposes, represents a buffer equivalent to roughly half of the Bank’s borrowings. 8. Please refer to Note A.2.15.3 of the Statutory Financial Statements. 9. Please refer to Note A.2.15.4 of the Statutory Financial Statements. 10. EIB Statute, Article 5(3): “The Board of Directors may require payment of the balance of the subscribed capital, to such extent as may be required for the Bank to meet its obligations.’’ 11. The Treaty on European Union and the Treaty on the Functioning of the European Union. Own funds in EUR 000 31/12/2022 31/12/2021 Capital – Subscribed 248 795 607 248 795 607 – Uncalled –226 604 892 –226 604 892 22 190 715 22 190 715 Reserves a) Reserve fund 24 879 561 24 879 561 b) Additional reserves 16 579 738 12 258 631 c) Special activities reserve 10 303 216 12 152 954 d) General loan reserve 2 115 966 2 021 337 53 878 481 51 312 483 Profit for the financial year 2 366 337 2 565 998 Total own funds 78 435 533 76 069 196 OWN FUNDS COMPOSITION AS OF 31 DECEMBER 2022 5 |
| Overview 1.3. Outlook The EIB Group Operational Plan 2023-202512 was approved by the EIB’s Board of Directors on 14 December 2022 and was published on 2 February 2023. In addition to the EIB Group's backing for Ukraine’s reconstruction efforts, the financing programme for 2023-2025 presents how the EIB Group intends to focus on accelerating the green and digital transitions, innovation, and investing in the European Union’s strategic autonomy. The EIB Group remains committed to supporting growth, employment and economic prosperity in the European Union and beyond. The Operational Plan summarises the major priorities and activities to deliver the EIB Group’s strategy for the next three years. It also proposes financing targets using the EIB Group's own and third party resources. The EIB Group’s signature volume target for 2023 is EUR 80.4 billion13, of which EUR 60.0 billion is by the EIB inside the European Union, EUR 8.5 billion by EIB Global (that is, by the EIB outside of the European Union) and EUR 13.0 billion by the EIF. The EIB Group disbursement target range for 2023 is EUR 47.6 billion to EUR 56.1 billion. The Operational Plan foresees an overall increase of financing volumes in response to the emerging policy priorities and it has been calibrated to optimise additionality and impact while ensuring the EIB Group’s longer-term financial sustainability. Higher risk and mandate activities are expected to grow, with increased amounts of own higher risk activity to complement the limited capacity available under the MFF 2021-2027. In view of persisting uncertainties in the market environment, the Operational Plan incorporates a flexibility margin of +15%/-10% for signatures. The EIB Group will continue to review its activities throughout the year to account for developments related to the impacts of Russia‘s war on Ukraine, as well as the unfolding energy and food crises, external market demand for new EIB Group financing and the actual pace of project origination and signature. The EIB Group’s financing remains focused on its public policy goals, which are aligned with the European Union’s political priorities, namely: • sustainable cities and regions • sustainable energy and natural resources • innovation, digital and human capital • financing of small and medium firms and mid-caps. In addition, the EIB has two transversal indicators of climate action and environmental sustainability, and EU economic and social cohesion and convergence. The 2023-2025 planning period also encompasses the EIB Group’s contribution to REPowerEU, to help accelerate the green transition towards the goal of net-zero emissions and reduced dependency on Russian fossil fuels. The Operational Plan envisages an ambitious level of signatures and disbursements for EIB Global within the planning period with the overarching objective of strengthening the impact of the Bank’s operations beyond the European Union, and to turn the European Union’s policy initiatives and priorities into solutions on the ground. The funding programme outlined in the Operational Plan reflects the anticipated borrowings needed to achieve the operational targets. The EIB’s Board of Directors approved a global borrowing authorisation of up to EUR 50 billion for 2023 and the Bank announced an expected funding programme amounting to EUR 45 billion. The Bank’s high credit standing is key to its business model. Therefore, the EIB accepts credit, market and liquidity risk in line with its risk appetite and public mission. By pursuing a prudent financial policy, the Bank seeks to self finance its growth in the long term. 12. The annual Operational Plan includes performance orientations and elaborates on the major priorities and activities of the Group (link) 13. Total Group signatures avoid double counting of joint transactions (for example. EIF operations back-to-back guaranteed by EIB) for EUR 1.1 billion 6 |
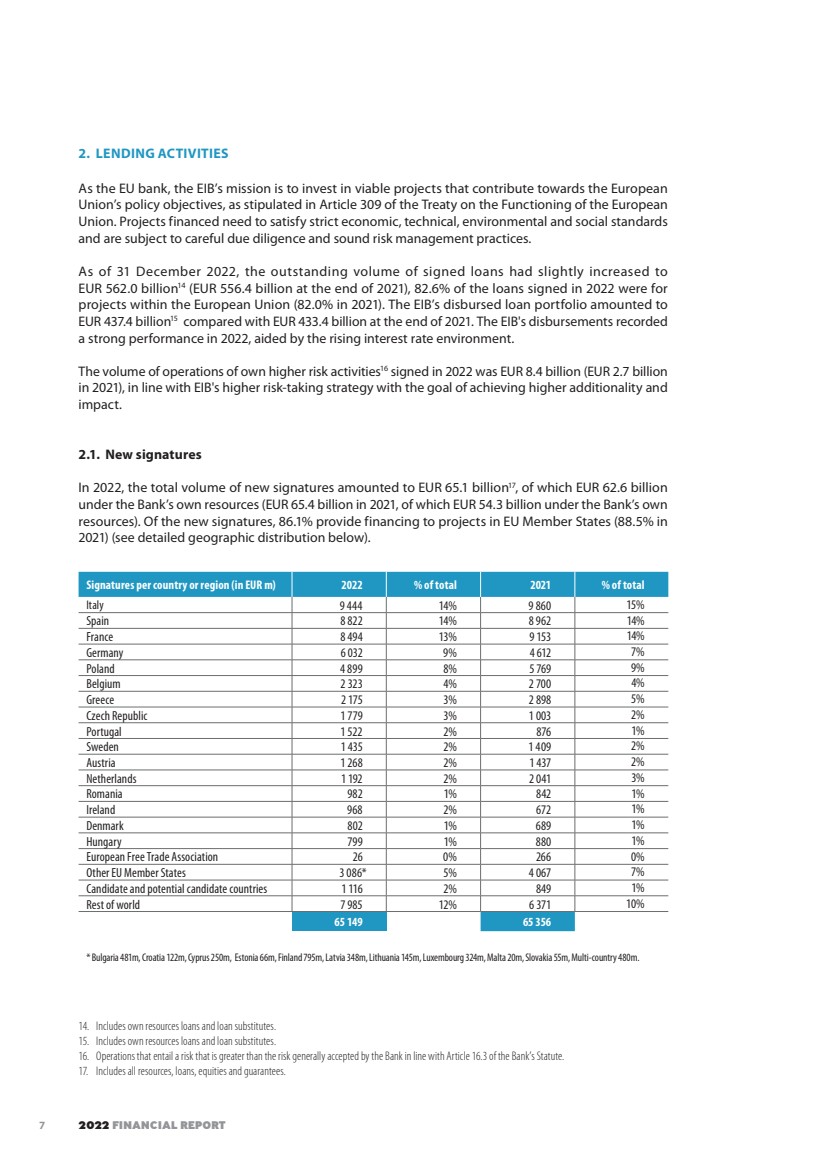
| 2022 FINANCIAL REPORT 2. LENDING ACTIVITIES As the EU bank, the EIB’s mission is to invest in viable projects that contribute towards the European Union’s policy objectives, as stipulated in Article 309 of the Treaty on the Functioning of the European Union. Projects financed need to satisfy strict economic, technical, environmental and social standards and are subject to careful due diligence and sound risk management practices. As of 31 December 2022, the outstanding volume of signed loans had slightly increased to EUR 562.0 billion14 (EUR 556.4 billion at the end of 2021), 82.6% of the loans signed in 2022 were for projects within the European Union (82.0% in 2021). The EIB’s disbursed loan portfolio amounted to EUR 437.4 billion15 compared with EUR 433.4 billion at the end of 2021. The EIB's disbursements recorded a strong performance in 2022, aided by the rising interest rate environment. The volume of operations of own higher risk activities16 signed in 2022 was EUR 8.4 billion (EUR 2.7 billion in 2021), in line with EIB's higher risk-taking strategy with the goal of achieving higher additionality and impact. 2.1. New signatures In 2022, the total volume of new signatures amounted to EUR 65.1 billion17, of which EUR 62.6 billion under the Bank’s own resources (EUR 65.4 billion in 2021, of which EUR 54.3 billion under the Bank’s own resources). Of the new signatures, 86.1% provide financing to projects in EU Member States (88.5% in 2021) (see detailed geographic distribution below). 14. Includes own resources loans and loan substitutes. 15. Includes own resources loans and loan substitutes. 16. Operations that entail a risk that is greater than the risk generally accepted by the Bank in line with Article 16.3 of the Bank’s Statute. 17. Includes all resources, loans, equities and guarantees. Signatures per country or region (in EUR m) 2022 % of total 2021 % of total Italy 9 444 14% 9 860 15% Spain 8 822 14% 8 962 14% France 8 494 13% 9 153 14% Germany 6 032 9% 4 612 7% Poland 4 899 8% 5 769 9% Belgium 2 323 4% 2 700 4% Greece 2 175 3% 2 898 5% Czech Republic 1 779 3% 1 003 2% Portugal 1 522 2% 876 1% Sweden 1 435 2% 1 409 2% Austria 1 268 2% 1 437 2% Netherlands 1 192 2% 2 041 3% Romania 982 1% 842 1% Ireland 968 2% 672 1% Denmark 802 1% 689 1% Hungary 799 1% 880 1% European Free Trade Association 26 0% 266 0% Other EU Member States 3 086* 5% 4 067 7% Candidate and potential candidate countries 1 116 2% 849 1% Rest of world 7 985 12% 6 371 10% 65 149 65 356 * Bulgaria 481m, Croatia 122m, Cyprus 250m, Estonia 66m, Finland 795m, Latvia 348m, Lithuania 145m, Luxembourg 324m, Malta 20m, Slovakia 55m, Multi-country 480m. 7 |
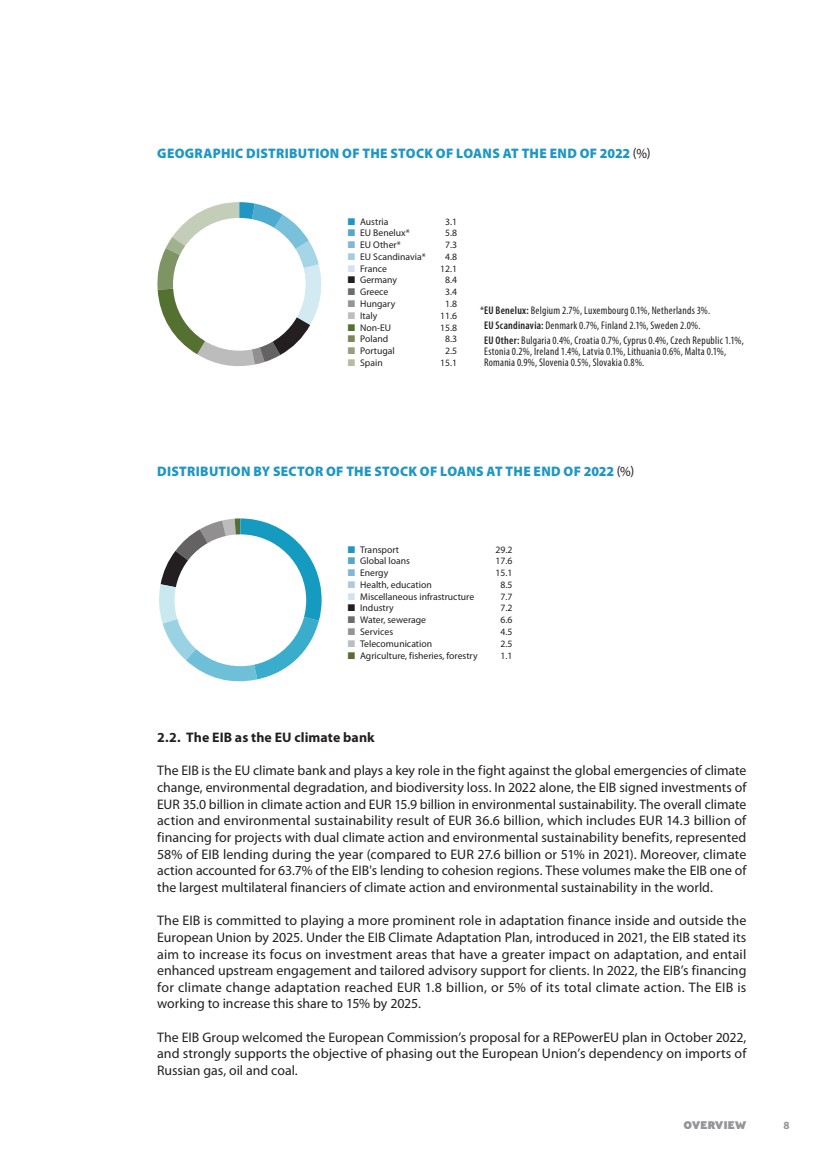
| Overview 2.2. The EIB as the EU climate bank The EIB is the EU climate bank and plays a key role in the fight against the global emergencies of climate change, environmental degradation, and biodiversity loss. In 2022 alone, the EIB signed investments of EUR 35.0 billion in climate action and EUR 15.9 billion in environmental sustainability. The overall climate action and environmental sustainability result of EUR 36.6 billion, which includes EUR 14.3 billion of financing for projects with dual climate action and environmental sustainability benefits, represented 58% of EIB lending during the year (compared to EUR 27.6 billion or 51% in 2021). Moreover, climate action accounted for 63.7% of the EIB's lending to cohesion regions. These volumes make the EIB one of the largest multilateral financiers of climate action and environmental sustainability in the world. The EIB is committed to playing a more prominent role in adaptation finance inside and outside the European Union by 2025. Under the EIB Climate Adaptation Plan, introduced in 2021, the EIB stated its aim to increase its focus on investment areas that have a greater impact on adaptation, and entail enhanced upstream engagement and tailored advisory support for clients. In 2022, the EIB’s financing for climate change adaptation reached EUR 1.8 billion, or 5% of its total climate action. The EIB is working to increase this share to 15% by 2025. The EIB Group welcomed the European Commission’s proposal for a REPowerEU plan in October 2022, and strongly supports the objective of phasing out the European Union’s dependency on imports of Russian gas, oil and coal. Austria 3.1 EU Benelux* 5.8 EU Other* 7.3 EU Scandinavia* 4.8 France 12.1 Germany 8.4 Greece 3.4 Hungary 1.8 Italy 11.6 Non-EU 15.8 Poland 8.3 Portugal 2.5 Spain 15.1 Transport 29.2 Global loans 17.6 Energy 15.1 Health, education 8.5 Miscellaneous infrastructure 7.7 Industry 7.2 Water, sewerage 6.6 Services 4.5 Telecomunication 2.5 Agriculture, fisheries, forestry 1.1 *EU Benelux: Belgium 2.7%, Luxembourg 0.1%, Netherlands 3%. EU Scandinavia: Denmark 0.7%, Finland 2.1%, Sweden 2.0%. EU Other: Bulgaria 0.4%, Croatia 0.7%, Cyprus 0.4%, Czech Republic 1.1%, Estonia 0.2%, Ireland 1.4%, Latvia 0.1%, Lithuania 0.6%, Malta 0.1%, Romania 0.9%, Slovenia 0.5%, Slovakia 0.8%. GEOGRAPHIC DISTRIBUTION OF THE STOCK OF LOANS AT THE END OF 2022 (%) DISTRIBUTION BY SECTOR OF THE STOCK OF LOANS AT THE END OF 2022 (%) 8 |
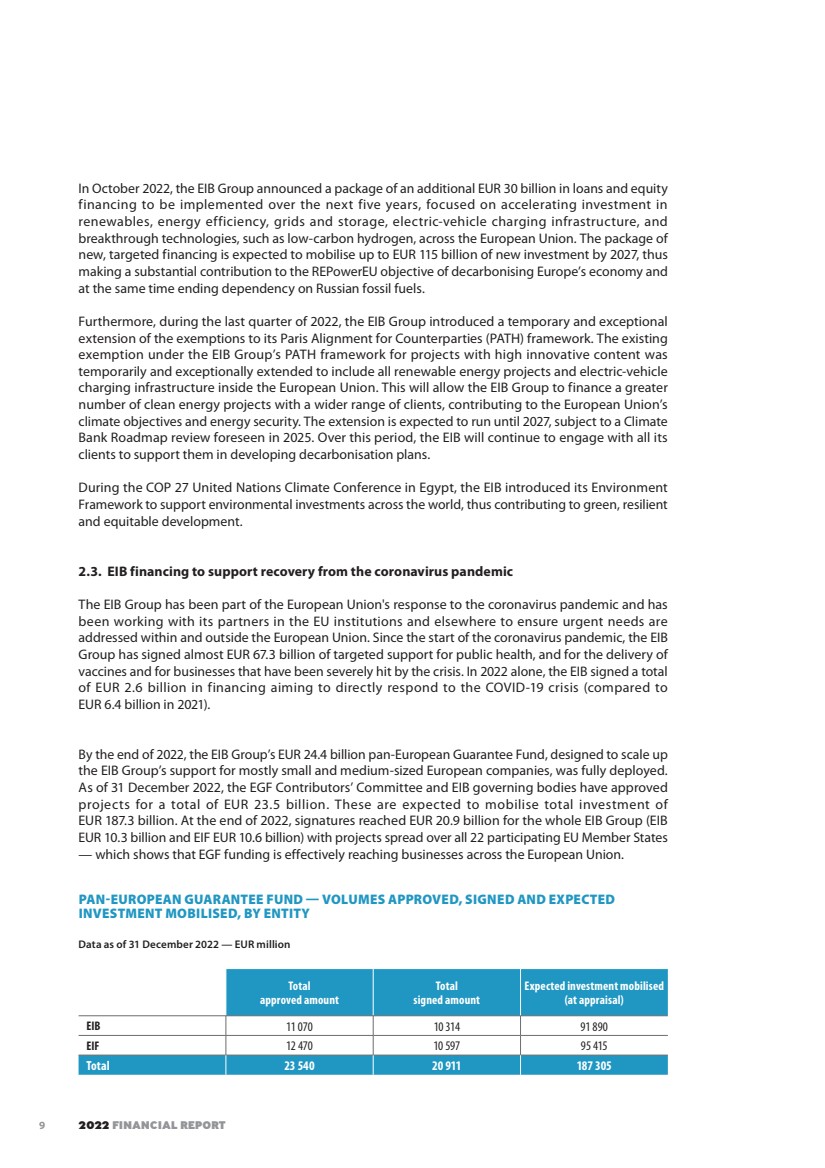
| 2022 FINANCIAL REPORT In October 2022, the EIB Group announced a package of an additional EUR 30 billion in loans and equity financing to be implemented over the next five years, focused on accelerating investment in renewables, energy efficiency, grids and storage, electric-vehicle charging infrastructure, and breakthrough technologies, such as low-carbon hydrogen, across the European Union. The package of new, targeted financing is expected to mobilise up to EUR 115 billion of new investment by 2027, thus making a substantial contribution to the REPowerEU objective of decarbonising Europe’s economy and at the same time ending dependency on Russian fossil fuels. Furthermore, during the last quarter of 2022, the EIB Group introduced a temporary and exceptional extension of the exemptions to its Paris Alignment for Counterparties (PATH) framework. The existing exemption under the EIB Group’s PATH framework for projects with high innovative content was temporarily and exceptionally extended to include all renewable energy projects and electric-vehicle charging infrastructure inside the European Union. This will allow the EIB Group to finance a greater number of clean energy projects with a wider range of clients, contributing to the European Union’s climate objectives and energy security. The extension is expected to run until 2027, subject to a Climate Bank Roadmap review foreseen in 2025. Over this period, the EIB will continue to engage with all its clients to support them in developing decarbonisation plans. During the COP 27 United Nations Climate Conference in Egypt, the EIB introduced its Environment Framework to support environmental investments across the world, thus contributing to green, resilient and equitable development. 2.3. EIB financing to support recovery from the coronavirus pandemic The EIB Group has been part of the European Union's response to the coronavirus pandemic and has been working with its partners in the EU institutions and elsewhere to ensure urgent needs are addressed within and outside the European Union. Since the start of the coronavirus pandemic, the EIB Group has signed almost EUR 67.3 billion of targeted support for public health, and for the delivery of vaccines and for businesses that have been severely hit by the crisis. In 2022 alone, the EIB signed a total of EUR 2.6 billion in financing aiming to directly respond to the COVID-19 crisis (compared to EUR 6.4 billion in 2021). By the end of 2022, the EIB Group’s EUR 24.4 billion pan-European Guarantee Fund, designed to scale up the EIB Group’s support for mostly small and medium-sized European companies, was fully deployed. As of 31 December 2022, the EGF Contributors’ Committee and EIB governing bodies have approved projects for a total of EUR 23.5 billion. These are expected to mobilise total investment of EUR 187.3 billion. At the end of 2022, signatures reached EUR 20.9 billion for the whole EIB Group (EIB EUR 10.3 billion and EIF EUR 10.6 billion) with projects spread over all 22 participating EU Member States — which shows that EGF funding is effectively reaching businesses across the European Union. PAN-EUROPEAN GUARANTEE FUND — VOLUMES APPROVED, SIGNED AND EXPECTED INVESTMENT MOBILISED, BY ENTITY Data as of 31 December 2022 — EUR million Total approved amount Total signed amount Expected investment mobilised (at appraisal) EIB 11070 10314 91890 EIF 12470 10597 95415 Total 23 540 20 911 187 305 9 |
| Overview The pan-European Guarantee Fund instrument has acted as an incentive for financial intermediaries to lend more money to companies under better conditions, helping businesses access rapid and advantageous financing and recover from the economic fallout of the coronavirus pandemic. The approval and signature of EGF guarantee products18 were finalised in December 2021, while the allocation period for the EGF guarantee products was extended until 31 December 2022 by the European Commission, in its state aid decision of June 2022. The extension was requested in the context of additional burdens on the European Union’s recovery from the pandemic. Similar to guarantee products, the approval of equity and equity-type operations under the EGF ended in 2021, while signatures continued until February 2022. 30 June 2022 marked the end of the signature period for the last product that was launched under the EGF, the synthetic Asset Backed Securities. The EIB Group made full use of the EUR 1.4 billion budget envisaged for the product and expects to mobilise investments of EUR 15.3 billion. In addition to the pan-European Guarantee Fund initiative, the EIB Group continued to make investments in the healthcare sector. These investments are available for medical infrastructure, further research, or other vaccine and treatment-related financing. The Bank directly supports innovative European biopharmaceutical and medtech companies developing therapeutic and diagnostic solutions against devastating diseases such as COVID-19, including vaccine development. Since the EIB Group tends to finance or guarantee parts of projects, also in healthcare, it is expected that the current pipeline would mobilise an even larger figure in supported investments. As of 31 December 2022, loans signed by the EIB in the healthcare sector amounted to EUR 5.1 billion, including EUR 1 billion on applied research related to vaccines and cures. 2.4. The EIB cooperates with the European Commission and other institutional partners The EIB Group works closely with EU institutions and other partners to optimise use of mandate capacity available to the EIB Group under the 2021-2027 Multiannual Financial Framework. Over the last decade, the European Fund for Strategic Investments (EFSI) pioneered the use of large EU budget guarantees to support investments. It had a clear impact on the EU economy, not only in relatively conventional areas, but also in sectors like research and innovation and in its contribution to climate change mitigation. The last projects under the EFSI mandate were approved in December 2020. However, the EIB was able to approve new sub-operations under already approved EFSI global authorisations/envelopes until the end of 2022. EFSI signatures operations ran until 31 December 2022 and enabled the EIB to mobilise EUR 504.4 billion in investments, benefiting over 0.8 million small and medium-sized enterprises (SMEs). On 7 March 2022, the EIB Group and the European Commission signed the InvestEU Guarantee Agreement. Building on the successful model of European Fund for Strategic Investments, and part of the new 2021-2027 Multiannual Financial Framework, the InvestEU programme aims to give an additional boost to sustainable investment, innovation, social inclusion and job creation in Europe. By providing a EUR 26.2 billion EU budgetary guarantee, the InvestEU programme is expected to mobilise at least EUR 372 billion in additional investment by 2027. The EIB Group is the privileged implementing partner of InvestEU, assigned with 75% (EUR 19.7 billion) of the available budget guarantee and the same share of the advisory budget under the InvestEU Advisory Hub. 18. This includes linked risk sharing products, including supply-chain facilities and basket bond transactions. 10 |
| 2022 FINANCIAL REPORT The operations benefiting from the EU budgetary guarantee finance investments in four policy areas to support the European Union’s goals in sustainability, scientific excellence and social inclusion. These four policy areas include: • sustainable infrastructure • research, innovation and digitalisation • small and medium firms and small mid-caps • social investment and skills. At least 30% of all the investments are expected to be made in areas directly supporting Europe's green transition. With the benefit of the InvestEU Advisory Hub, the EIB draws together financial and technical expertise to provide an integrated response across the project cycle. Advisory services provide targeted support across all four of the InvestEU policy windows to public and private sector promoters. The services also support the identification, preparation and implementation of InvestEU-guaranteed investment projects and investment platforms across the European Union. The InvestEU programme also includes an EU Member State compartment, in which EU countries have the possibility to contribute a part of their shared management funds to the InvestEU Fund. The first projects under InvestEU were approved in March 2022, and total approvals reached almost EUR 9.1 billion by the end of December 2022. An amount of almost EUR 2.4 billion was signed and EUR 726.0 million was disbursed by the end of December 2022. In November 2022, the EIB Group signed a new contractual framework with Greece for the EIF to manage an additional EUR 400 million of Recovery and Resilience Facility investments to help small and medium-sized businesses in the country. This is on top of the EUR 5 billion in Recovery and Resilience Facility funds already entrusted to the EIB. In March 2022, the EIB’s Board of Directors approved the Strategic European Security Initiative (SESI), which aims to mobilise investment in support of Europe’s dual-use security and defence systems by backing Europe’s technology industry and security of civilian infrastructure. In particular, SESI may include dual-use Research, Development and Innovation (RDI) projects, such as development of dual-use aviation platforms or of satellite constellations, modernisation of non-core security and defence infrastructure, and development of cybersecurity technologies. SESI does not change what is eligible for EIB financing or modify the definition of the EIB’s excluded activities or excluded sectors. The EIB will not invest in ammunition or weaponry and the EIB cannot finance investments in core defence. SESI projects must be dual-use, meaning they need to be primarily motivated by their civil applications. As part of SESI, the EIB intends to strengthen institutional partnerships, such as with the European Commission, the European Space Agency and the EU Agency for the Space Programme. SESI is expected to make available financing of up to EUR 6 billion for eligible projects between 2022 and 2027. In 2022, the value of the financing provided by the Bank to investment projects under SESI amounted to around EUR 1.5 billion. The EIB Group’s cooperation with the European Commission is essential to uphold and promote the European Union’s values, principles and geopolitical interests worldwide. The implementation of EIB Global’s business outside the European Union is underpinned by EU mandates. It is also the key implementing partner in the Neighbourhood, Development and International Cooperation Instrument (NDICI) – Global Europe and a participant in its governance as a member of the European Fund for Sustainable Development Plus (EFSD+) Strategic Board. NDICI – Global Europe establishes the overall framework for EIB operations outside the European Union under the 2021-2027 Multiannual Financial Framework. It streamlines and simplifies the structure of the funding architecture for the European Union’s external actions. 11 |
| Overview On 29 April 2022, the EIB and the European Commission signed a guarantee agreement in the context of the EFSD+ framework, through which the European Commission will support up to EUR 26.7 billion of EIB financial operations to enable crucial public investments in sectors like clean energy, digital and transport infrastructure, health, and education over the next seven years. This supports the implementation of the European Union’s Global Gateway strategy, which is set to mobilise up to EUR 300 billion of investments between 2021 and 2027 in new sustainable infrastructure worldwide. 2.5. Operations outside the European Union19 The EIB has decades of experience as a leading multilateral development bank, actively contributing to the European Union’s external policy objectives for nearly 60 years. Over the last ten years, the Bank has provided over EUR 70 billion in more than 100 low and middle-income countries. Nonetheless, it is ultimately not the financing volumes that matter but the impact: real positive change in people’s lives. The Bank uses its Additionality and Impact Measurement (AIM) system to assess and track the results and impact of its operations as well as the added benefit that comes from EIB involvement. Since the start of 2022, the EIB’s development finance role has moved forward and intensified through the establishment of EIB Global, the Bank’s development branch focused on activities outside the European Union. EIB Global brings the resources of the EIB to bear on our operations outside the European Union through an integrated and impact-driven product offering while reinforcing and deepening our upstream policy dialogue and cooperation with partner countries, clients, EU Member States, development finance institutions, UN agencies, civil society and other partners. EIB Global is an internal organisational unit within the EIB, operating under the Bank’s current legal framework. It brings together EIB development staff under a dedicated management. The branch has a dedicated capital allocation provided annually by the EIB’s Board of Directors under the EIB Group Operational Plan, and benefits from a dedicated Board Advisory Group involving European development stakeholders. It has flexibility to establish its own policies and strategies and develop its own products. The branch nonetheless operates fully within EIB Group-wide financial policies on areas such as risk management, as determined by the EIB’s Board of Directors. As part of its operating model, EIB Global maintains a strong local presence on the ground through a network of 30 external representations located in partner countries, with further openings and more staff being planned where needs are the greatest and where local presence will have the greatest impact by bringing the Bank closer to its clients. Recently, the Nairobi office in Kenya was upgraded into a regional hub to provide more direct support to the East Africa region. Demand outside the European Union remained high, with EUR 98.1 billion worth of projects signed, of which EUR 9.1 billion of signatures in 2022. In addition to these amounts, EIB Global repurposed EUR 1.7 billion of existing loans signed in 2022 as immediate support to Ukraine. Most of EIB Global’s outstanding portfolio is covered by guarantees from the European Union (the EU External Lending Mandate) which include comprehensive guarantees (the EU Comprehensive Guarantees) and political risk guarantees (the EU Political Risk Guarantees), or guarantees from the EU Member States within the Cotonou Agreement framework. Under the current EU long term budget (MFF), EIB Global’s business implementation will continue to rely on the new generation of EU mandates within the NDICI – Global Europe framework to deliver on key priorities as the EU bank within Team Europe.20 19. Figures presented under this section include own resources loans and loans substitutes unless otherwise stated. 20. Team Europe is the EU initiative first launched to support partner countries in the fight against the coronavirus pandemic, and that combines resources from the European Union, the EU Member States, as well as the EIB and the European Bank for Reconstruction and Development (EBRD). 12 |
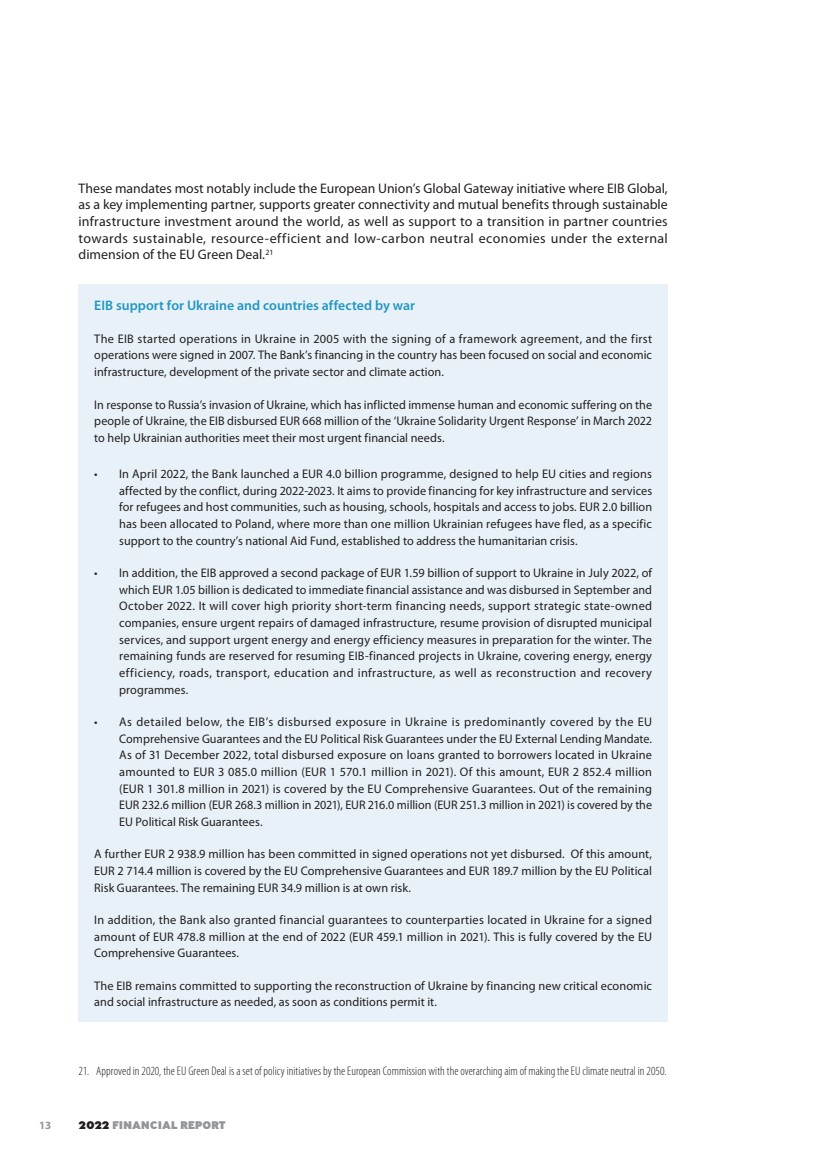
| 2022 FINANCIAL REPORT These mandates most notably include the European Union’s Global Gateway initiative where EIB Global, as a key implementing partner, supports greater connectivity and mutual benefits through sustainable infrastructure investment around the world, as well as support to a transition in partner countries towards sustainable, resource-efficient and low-carbon neutral economies under the external dimension of the EU Green Deal.21 21. Approved in 2020, the EU Green Deal is a set of policy initiatives by the European Commission with the overarching aim of making the EU climate neutral in 2050. EIB support for Ukraine and countries affected by war The EIB started operations in Ukraine in 2005 with the signing of a framework agreement, and the first operations were signed in 2007. The Bank’s financing in the country has been focused on social and economic infrastructure, development of the private sector and climate action. In response to Russia’s invasion of Ukraine, which has inflicted immense human and economic suffering on the people of Ukraine, the EIB disbursed EUR 668 million of the ‘Ukraine Solidarity Urgent Response’ in March 2022 to help Ukrainian authorities meet their most urgent financial needs. • In April 2022, the Bank launched a EUR 4.0 billion programme, designed to help EU cities and regions affected by the conflict, during 2022-2023. It aims to provide financing for key infrastructure and services for refugees and host communities, such as housing, schools, hospitals and access to jobs. EUR 2.0 billion has been allocated to Poland, where more than one million Ukrainian refugees have fled, as a specific support to the country’s national Aid Fund, established to address the humanitarian crisis. • In addition, the EIB approved a second package of EUR 1.59 billion of support to Ukraine in July 2022, of which EUR 1.05 billion is dedicated to immediate financial assistance and was disbursed in September and October 2022. It will cover high priority short-term financing needs, support strategic state-owned companies, ensure urgent repairs of damaged infrastructure, resume provision of disrupted municipal services, and support urgent energy and energy efficiency measures in preparation for the winter. The remaining funds are reserved for resuming EIB-financed projects in Ukraine, covering energy, energy efficiency, roads, transport, education and infrastructure, as well as reconstruction and recovery programmes. • As detailed below, the EIB’s disbursed exposure in Ukraine is predominantly covered by the EU Comprehensive Guarantees and the EU Political Risk Guarantees under the EU External Lending Mandate. As of 31 December 2022, total disbursed exposure on loans granted to borrowers located in Ukraine amounted to EUR 3 085.0 million (EUR 1 570.1 million in 2021). Of this amount, EUR 2 852.4 million (EUR 1 301.8 million in 2021) is covered by the EU Comprehensive Guarantees. Out of the remaining EUR 232.6 million (EUR 268.3 million in 2021), EUR 216.0 million (EUR 251.3 million in 2021) is covered by the EU Political Risk Guarantees. A further EUR 2 938.9 million has been committed in signed operations not yet disbursed. Of this amount, EUR 2 714.4 million is covered by the EU Comprehensive Guarantees and EUR 189.7 million by the EU Political Risk Guarantees. The remaining EUR 34.9 million is at own risk. In addition, the Bank also granted financial guarantees to counterparties located in Ukraine for a signed amount of EUR 478.8 million at the end of 2022 (EUR 459.1 million in 2021). This is fully covered by the EU Comprehensive Guarantees. The EIB remains committed to supporting the reconstruction of Ukraine by financing new critical economic and social infrastructure as needed, as soon as conditions permit it. 13 |
| Overview Russia The Bank has restricted its lending activities in Russia since 2014 to stay consistent with the overall objectives of EU common foreign and security policy, including applicable sanctions. The Bank has robust compliance controls, including a dedicated Sanctions Compliance Programme, which ensures that its activities that relate to Russia, even indirectly, comply with all applicable sanctions, and will continue to comply with any new ones, that may be imposed on Russia. The EIB’s remaining disbursed debt exposure in Russia amounted to EUR 13.8 million as of the end of 2022 (EUR 16.1 million in 2021) with no debt exposure at the EIB’s own risk. Belarus The EIB’s total disbursed exposure in Belarus is rather limited and consists of three operations for an amount of EUR 45.2 million at the end of 2022 (EUR 173.3 million in 2021), of which EUR 36.3 million, or 80% (EUR 163.3 million in 2021) is secured by the EU Comprehensive Guarantees. One operation related to the private sector is guaranteed by an EU-based bank and benefits from the supplementary EU Political Risk Guarantees. The Bank has been observing developments in Belarus with great concern. The EIB stopped signatures in Belarus following the country’s disputed presidential elections in August 2020 and will continue to maintain the same stance, in line with EU policy and existing applicable sanctions. Türkiye The EIB’s total disbursed exposure in Türkiye amounted to EUR 7.8 billion at the end of 2022 (EUR 9.1 billion in 2021). Of this amount, EUR 5.5 billion, or 71% (EUR 5.9 billion in 2021) is covered by the EU Comprehensive Guarantees while EUR 2.3 billion, or 29% (EUR 3.2 billion in 2021) is at the EIB’s own risk. A further EUR 0.3 billion has been committed in signed operations not yet disbursed, of which EUR 0.2 billion is secured by the EU Comprehensive Guarantees. Lebanon The credit standing of Lebanese counterparties has been impacted by the political and economic turbulence in the country. The EIB’s total disbursed exposure in Lebanon amounted to EUR 294.9 million at the end of 2022 (EUR 407.8 million in 2021), of which EUR 258.8 million, or 88% (EUR 356.4 million in 2021) is secured by the EU Comprehensive Guarantees. A further EUR 792.2 million has been committed in signed operations not yet disbursed, which are fully secured by the EU Comprehensive Guarantees. Tunisia Tunisia is experiencing a protracted period of political and economic uncertainty since the second half of 2021. The country’s situation has been exacerbated by the COVID-19 pandemic, the impact of the war in Ukraine and the possibility of enduring delays in reform-dependent funding. The EIB’s total disbursed exposure in Tunisia amounted to EUR 1 582.1 million at the end of 2022 (EUR 1 717.3 million in 2021), of which EUR 1 436.7 million (EUR 1 537.1 million in 2021), or 91%, is secured by the EU Comprehensive Guarantees. A further EUR 1 035.4 million has been committed in signed operations not yet disbursed, of which only EUR 9.0 million is expected to be at the EIB’s own risk. The Bank is closely monitoring the evolving situation and reviewing the need for further specific provisions on its risk portfolio. 14 |
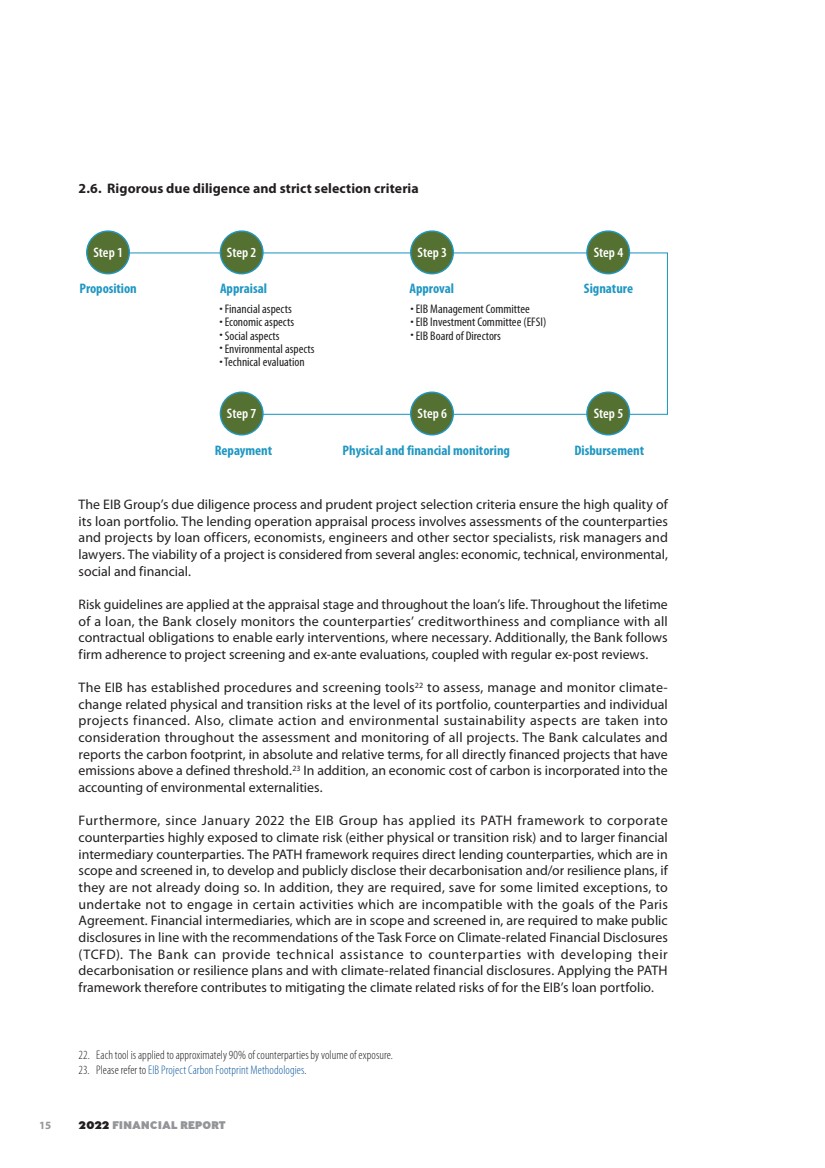
| 2022 FINANCIAL REPORT 2.6. Rigorous due diligence and strict selection criteria Step 1 Proposition Appraisal Repayment Approval • EIB Management Committee • EIB Investment Committee (EFSI) • EIB Board of Directors • Financial aspects • Economic aspects • Social aspects • Environmental aspects • Technical evaluation Physical and financial monitoring Signature Disbursement Step 2 Step 7 Step 3 Step 6 Step 4 Step 5 The EIB Group’s due diligence process and prudent project selection criteria ensure the high quality of its loan portfolio. The lending operation appraisal process involves assessments of the counterparties and projects by loan officers, economists, engineers and other sector specialists, risk managers and lawyers. The viability of a project is considered from several angles: economic, technical, environmental, social and financial. Risk guidelines are applied at the appraisal stage and throughout the loan’s life. Throughout the lifetime of a loan, the Bank closely monitors the counterparties’ creditworthiness and compliance with all contractual obligations to enable early interventions, where necessary. Additionally, the Bank follows firm adherence to project screening and ex-ante evaluations, coupled with regular ex-post reviews. The EIB has established procedures and screening tools22 to assess, manage and monitor climate-change related physical and transition risks at the level of its portfolio, counterparties and individual projects financed. Also, climate action and environmental sustainability aspects are taken into consideration throughout the assessment and monitoring of all projects. The Bank calculates and reports the carbon footprint, in absolute and relative terms, for all directly financed projects that have emissions above a defined threshold.23 In addition, an economic cost of carbon is incorporated into the accounting of environmental externalities. Furthermore, since January 2022 the EIB Group has applied its PATH framework to corporate counterparties highly exposed to climate risk (either physical or transition risk) and to larger financial intermediary counterparties. The PATH framework requires direct lending counterparties, which are in scope and screened in, to develop and publicly disclose their decarbonisation and/or resilience plans, if they are not already doing so. In addition, they are required, save for some limited exceptions, to undertake not to engage in certain activities which are incompatible with the goals of the Paris Agreement. Financial intermediaries, which are in scope and screened in, are required to make public disclosures in line with the recommendations of the Task Force on Climate-related Financial Disclosures (TCFD). The Bank can provide technical assistance to counterparties with developing their decarbonisation or resilience plans and with climate-related financial disclosures. Applying the PATH framework therefore contributes to mitigating the climate related risks of for the EIB’s loan portfolio. 22. Each tool is applied to approximately 90% of counterparties by volume of exposure. 23. Please refer to EIB Project Carbon Footprint Methodologies. 15 |
| Overview In February 2022, the EIB published its updated Environmental and Social Standards, promoting an integrated approach to impact assessment and risk management by ensuring that environmental, climate, social and human rights considerations are addressed and taken into account in the decision-making processes. These Standards outline promoters’ responsibilities for assessing and managing environmental, climate and social impacts and risks in EIB-financed projects. As part of the update, the ten earlier environmental and social standards were revised and a new standard, on intermediated finance, was added. 2.7. A highly secured and high-quality loan portfolio Despite the general context of uncertainty and various risks resulting from the Russian invasion of Ukraine, the credit quality of the loan portfolio is deemed stable at present. A significant portion of the Bank’s loan portfolio benefits from credit enhancements or recourse to EU or EU Member State guarantees. Credit enhancements are largely in the form of portfolio guarantees from EU sovereigns, the EU budget, investment grade banks and corporates and high-quality financial collateral and assignments of rights or pledges at transaction level. Unsecured loans24 to banks and corporates had a combined value of EUR 151.1 billion25, representing 29.6% of the risk portfolio at the end of 2022 (EUR 140.6 billion and 27.7% as the end of 2021). The asset quality of the EIB’s risk portfolio is high. The share of best of borrower or guarantor internal ratings of investment-grade level26 stood at 84.0%27 of the Bank’s risk portfolio at the end of 2022 (83.5% at the end of 2021). At the end of 2022 the disbursed sovereign exposure28 of the Bank amounted to EUR 45.3 billion (EUR 45.5 billion in 2021) and the sovereign-guaranteed signed exposure29 was EUR 79.3 billion (EUR 78.4 billion in 2021). The Bank has not recorded any impairment in respect of its holding of EU sovereign and EU sovereign-guaranteed exposures. The Bank’s preferred creditor status and the protection given by its Statute are deemed to guarantee full recovery of these EU sovereign assets. The EIB follows the non-performing exposure30 regulatory requirements in the context of its Best Banking Practice Guiding Principles. The level of non-performing signed exposure31 in the risk portfolio stood at EUR 2.9 billion at the end of 2022 (EUR 3.2 billion at the end of 2021), while disbursed exposure amounted to EUR 2.6 billion (EUR 2.9 billion at the end of 2021). The non-performing exposures are assessed based on the situation of the counterparty, disregarding any collateral arrangements or portfolio guarantees. Of the non-performing exposure, there was impaired loan exposure subject to specific provisions of EUR 1.8 billion (EUR 1.5 billion in 2021). These operations represent 0.4% of the total loan portfolio (0.4 % in 2021), for which the Bank has specific provisions for gross exposure (disbursed exposures, accrued interest and exposures in arrears) of EUR 326.5 million (EUR 443.9 million in 2021). The level of specific provisions is relatively low in view of the security, guarantees and portfolio credit enhancements in place. 24. Unsecured loans refer to lending operations where the EIB has no genuine recourse to an independent third party. 25. Includes own resources loans and loan substitutes. 26. Above Baa3 rating. 27. Includes own resources loans and loan substitutes. 28. Includes own resources loans and loan substitutes. 29. Includes own resources loans and loan substitutes. 30. Non-performing exposure is defined as material exposures which are more than 90 days past-due or unlikely to pay regardless of the existence of any past-due amount based on methodology for identification and management of deterioration in the portfolio during the entire loan cycle. 31. Including loans, (incl. quasi-equities), loan substitutes and guarantees. 16 |
| 2022 FINANCIAL REPORT As a result of the war in Ukraine, the Bank assessed the potential impact of the crisis on clients, including the effect of sanctions, soaring energy and raw material prices and supply chain disruptions. In that context, additional provisions were recorded in the Statutory Financial Statements in December 2022, amounting to EUR 76.0 million in the form of collective provisions on loans. At the end of 2022, arrears32 over 90 days amounted to EUR 77.7 million (EUR 118.7 million in 2021). 3. FUNDING ACTIVITIES The EIB raises long term funds through bond issuance on the international capital markets to meet its lending needs. Funding activities aim to reach set volume targets with a maturity structure suitable for the Bank’s asset and liability management, and to optimise cost on a sustainable basis. Diversification of sources and tenors of funding support the flexibility of the Bank, which maintains a regular presence in different funding markets. Funding in 2022 faced fresh challenges from global fixed income market conditions, characterised by rising yields and increased volatility, amid persistent economic disruptions linked to the exit from the coronavirus pandemic and onset of war in Ukraine. The EIB completed 2022 with a total issuance equivalent of EUR 44.3 billion in 17 currencies (EUR 55.3 billion in 21 currencies in 2021), in line with the announced funding programme of EUR 45 billion and the borrowing authorisation of up to EUR 50 billion. The 2022 funding target factored in the pre-funding already secured in 2021 (EUR 0.8 billion) and took into consideration the Bank’s lending targets, debt service and prudent liquidity requirements. Net issuance33 was negative by EUR 6.0 billion in 2022, but slightly less than in 2021 (net negative by EUR 9.7 billion). The Bank's funding strategy relies on the issuance of large and liquid benchmark transactions in the world’s main currencies, complemented by targeted issuance (plain vanilla and structured), the latter usually driven by reverse inquiries. Benchmark transactions represented about 70% of funding in 2022. Such transactions helped to secure volume and manage cost and duration against the volatile backdrop. Also, the growth of climate action and environmental sustainability lending facilitated substantial growth in climate and sustainability funding, which reached a record share of 45% of the funding programme in 2022 amounting to EUR 19.9 billion (EUR 11.5 billion and 21% in 2021), including the first benchmark- sized climate and sustainability issues by the EIB. As in previous years, the Bank frontloaded its funding activities at the beginning of the year, when issuance activity on the capital markets worldwide was at its peak. In January 2022, the EIB opened up the sovereigns, supranationals and agencies (SSA) US dollar market with its USD 5.0 billion 5-year Global Bond issue, which recorded the EIB’s second-largest USD Global Bond order-book ever. This was followed by the first public, syndicated Kangaroo Sustainability Awareness Bond (SAB), the largest single SSA Kangaroo tranche ever launched for AUD 1.5 billion (EUR 1.0 billion). Moreover, in February 2022, the Bank registered its largest 5-year order-book on record for a new EIB Euro Area Reference Note (EARN), which was significantly oversubscribed. Funding highlights in 2022 also included the first ever EARN to be issued in Climate Awareness Bond format in May 2022, and a well-received USD 3.0 billion 7 year Global Bond issue on 1 March 2022, in spite of the markets’ gyrations that followed the unfolding crisis in Ukraine. A remarkable innovation in 2022 was the issuance of digital bonds on a private blockchain platform in November 2022. 32. For more details on arrears over 90 days on the loan portfolio, please refer to Note U of the Statutory Financial Statements. 33. Gross issuance minus redemption and repayment during 2022. 17 |
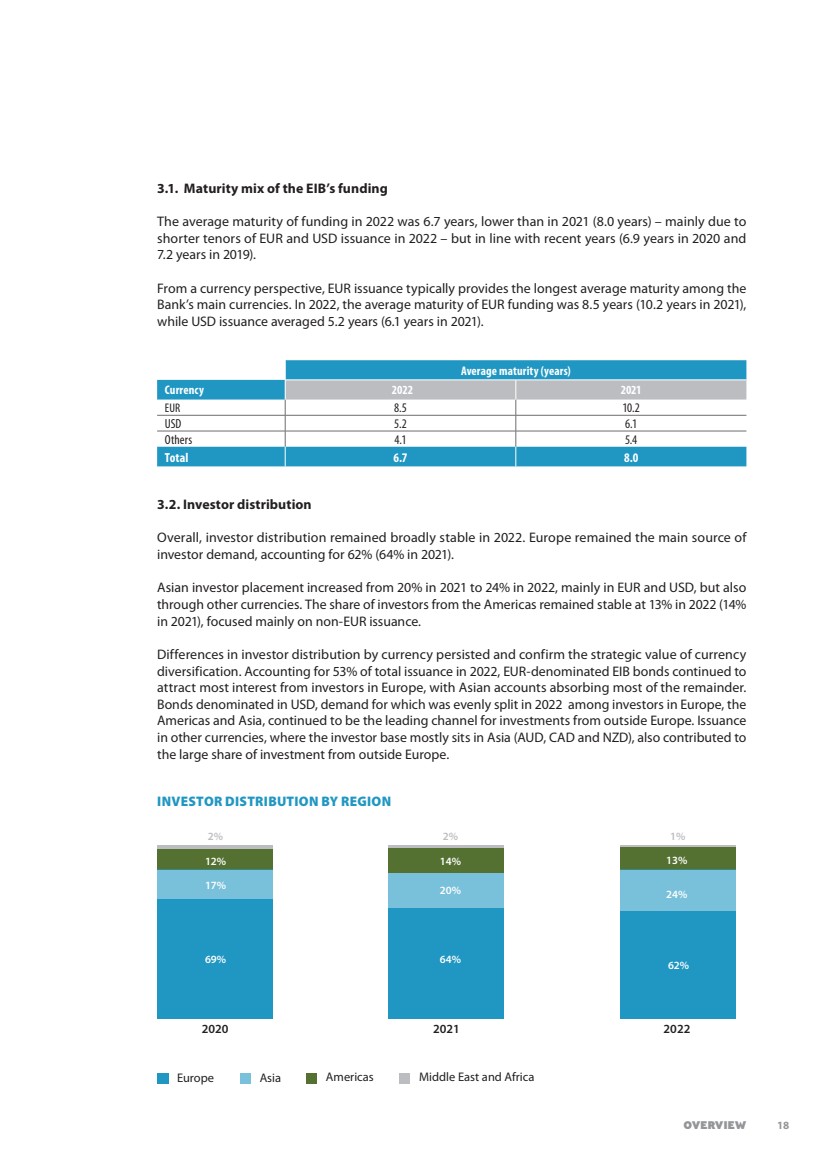
| Overview 2020 2021 2022 Europe Asia Americas Middle East and Africa 69% 17% 12% 2% 64% 62% 20% 14% 2% 24% 13% 1% 3.1. Maturity mix of the EIB’s funding The average maturity of funding in 2022 was 6.7 years, lower than in 2021 (8.0 years) – mainly due to shorter tenors of EUR and USD issuance in 2022 – but in line with recent years (6.9 years in 2020 and 7.2 years in 2019). From a currency perspective, EUR issuance typically provides the longest average maturity among the Bank’s main currencies. In 2022, the average maturity of EUR funding was 8.5 years (10.2 years in 2021), while USD issuance averaged 5.2 years (6.1 years in 2021). Average maturity (years) Currency 2022 2021 EUR 8.5 10.2 USD 5.2 6.1 Others 4.1 5.4 Total 6.7 8.0 3.2. Investor distribution Overall, investor distribution remained broadly stable in 2022. Europe remained the main source of investor demand, accounting for 62% (64% in 2021). Asian investor placement increased from 20% in 2021 to 24% in 2022, mainly in EUR and USD, but also through other currencies. The share of investors from the Americas remained stable at 13% in 2022 (14% in 2021), focused mainly on non-EUR issuance. Differences in investor distribution by currency persisted and confirm the strategic value of currency diversification. Accounting for 53% of total issuance in 2022, EUR-denominated EIB bonds continued to attract most interest from investors in Europe, with Asian accounts absorbing most of the remainder. Bonds denominated in USD, demand for which was evenly split in 2022 among investors in Europe, the Americas and Asia, continued to be the leading channel for investments from outside Europe. Issuance in other currencies, where the investor base mostly sits in Asia (AUD, CAD and NZD), also contributed to the large share of investment from outside Europe. INVESTOR DISTRIBUTION BY REGION 18 |
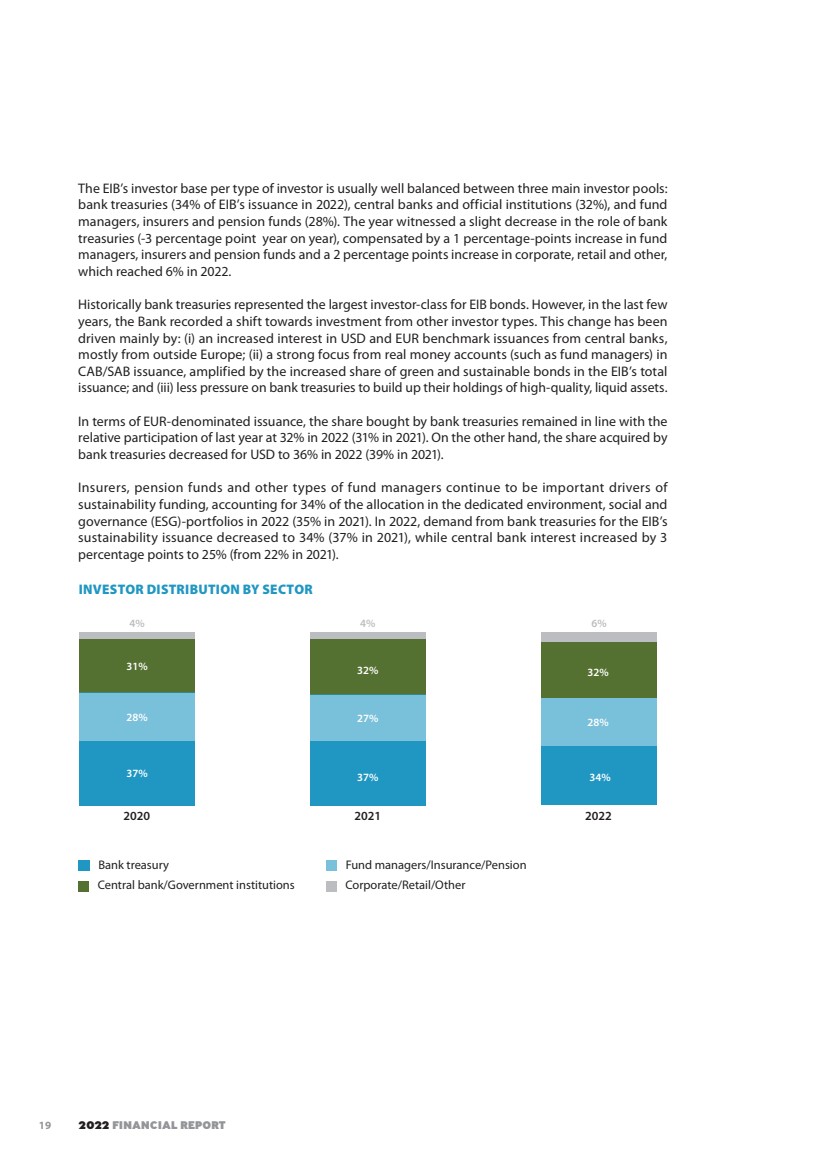
| 2022 FINANCIAL REPORT The EIB’s investor base per type of investor is usually well balanced between three main investor pools: bank treasuries (34% of EIB’s issuance in 2022), central banks and official institutions (32%), and fund managers, insurers and pension funds (28%). The year witnessed a slight decrease in the role of bank treasuries (-3 percentage point year on year), compensated by a 1 percentage-points increase in fund managers, insurers and pension funds and a 2 percentage points increase in corporate, retail and other, which reached 6% in 2022. Historically bank treasuries represented the largest investor-class for EIB bonds. However, in the last few years, the Bank recorded a shift towards investment from other investor types. This change has been driven mainly by: (i) an increased interest in USD and EUR benchmark issuances from central banks, mostly from outside Europe; (ii) a strong focus from real money accounts (such as fund managers) in CAB/SAB issuance, amplified by the increased share of green and sustainable bonds in the EIB’s total issuance; and (iii) less pressure on bank treasuries to build up their holdings of high-quality, liquid assets. In terms of EUR-denominated issuance, the share bought by bank treasuries remained in line with the relative participation of last year at 32% in 2022 (31% in 2021). On the other hand, the share acquired by bank treasuries decreased for USD to 36% in 2022 (39% in 2021). Insurers, pension funds and other types of fund managers continue to be important drivers of sustainability funding, accounting for 34% of the allocation in the dedicated environment, social and governance (ESG)-portfolios in 2022 (35% in 2021). In 2022, demand from bank treasuries for the EIB’s sustainability issuance decreased to 34% (37% in 2021), while central bank interest increased by 3 percentage points to 25% (from 22% in 2021). 2020 2021 2022 Bank treasury Fund managers/Insurance/Pension Central bank/Government institutions Corporate/Retail/Other 37% 28% 31% 4% 37% 34% 27% 32% 4% 28% 32% 6% INVESTOR DISTRIBUTION BY SECTOR 19 |
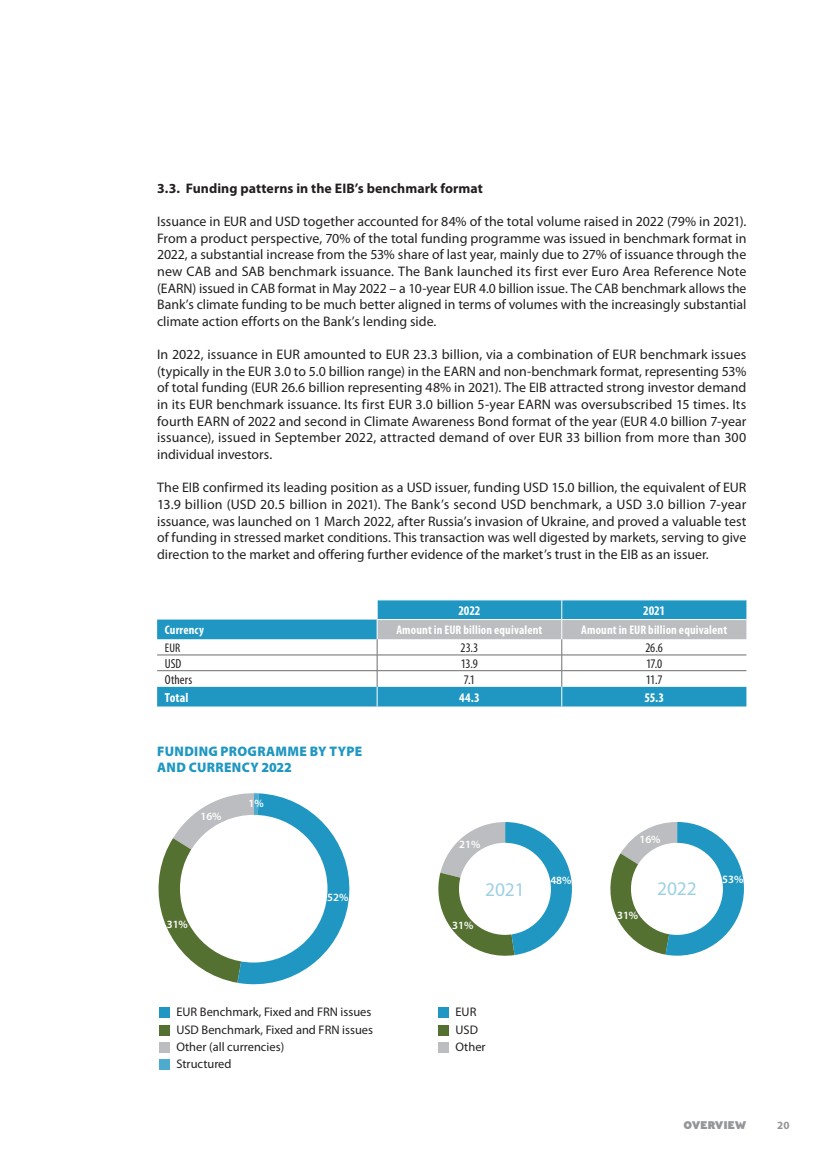
| Overview 3.3. Funding patterns in the EIB’s benchmark format Issuance in EUR and USD together accounted for 84% of the total volume raised in 2022 (79% in 2021). From a product perspective, 70% of the total funding programme was issued in benchmark format in 2022, a substantial increase from the 53% share of last year, mainly due to 27% of issuance through the new CAB and SAB benchmark issuance. The Bank launched its first ever Euro Area Reference Note (EARN) issued in CAB format in May 2022 – a 10-year EUR 4.0 billion issue. The CAB benchmark allows the Bank’s climate funding to be much better aligned in terms of volumes with the increasingly substantial climate action efforts on the Bank’s lending side. In 2022, issuance in EUR amounted to EUR 23.3 billion, via a combination of EUR benchmark issues (typically in the EUR 3.0 to 5.0 billion range) in the EARN and non-benchmark format, representing 53% of total funding (EUR 26.6 billion representing 48% in 2021). The EIB attracted strong investor demand in its EUR benchmark issuance. Its first EUR 3.0 billion 5-year EARN was oversubscribed 15 times. Its fourth EARN of 2022 and second in Climate Awareness Bond format of the year (EUR 4.0 billion 7-year issuance), issued in September 2022, attracted demand of over EUR 33 billion from more than 300 individual investors. The EIB confirmed its leading position as a USD issuer, funding USD 15.0 billion, the equivalent of EUR 13.9 billion (USD 20.5 billion in 2021). The Bank’s second USD benchmark, a USD 3.0 billion 7-year issuance, was launched on 1 March 2022, after Russia’s invasion of Ukraine, and proved a valuable test of funding in stressed market conditions. This transaction was well digested by markets, serving to give direction to the market and offering further evidence of the market’s trust in the EIB as an issuer. 2022 2021 Currency Amount in EUR billion equivalent Amount in EUR billion equivalent EUR 23.3 26.6 USD 13.9 17.0 Others 7.1 11.7 Total 44.3 55.3 FUNDING PROGRAMME BY TYPE AND CURRENCY 2022 Structured EUR Benchmark, Fixed and FRN issues USD Benchmark, Fixed and FRN issues Other (all currencies) 52% 31% 16% 1% EUR USD Other 31% 21% 48% 2021 31% 16% 53% 2022 20 |
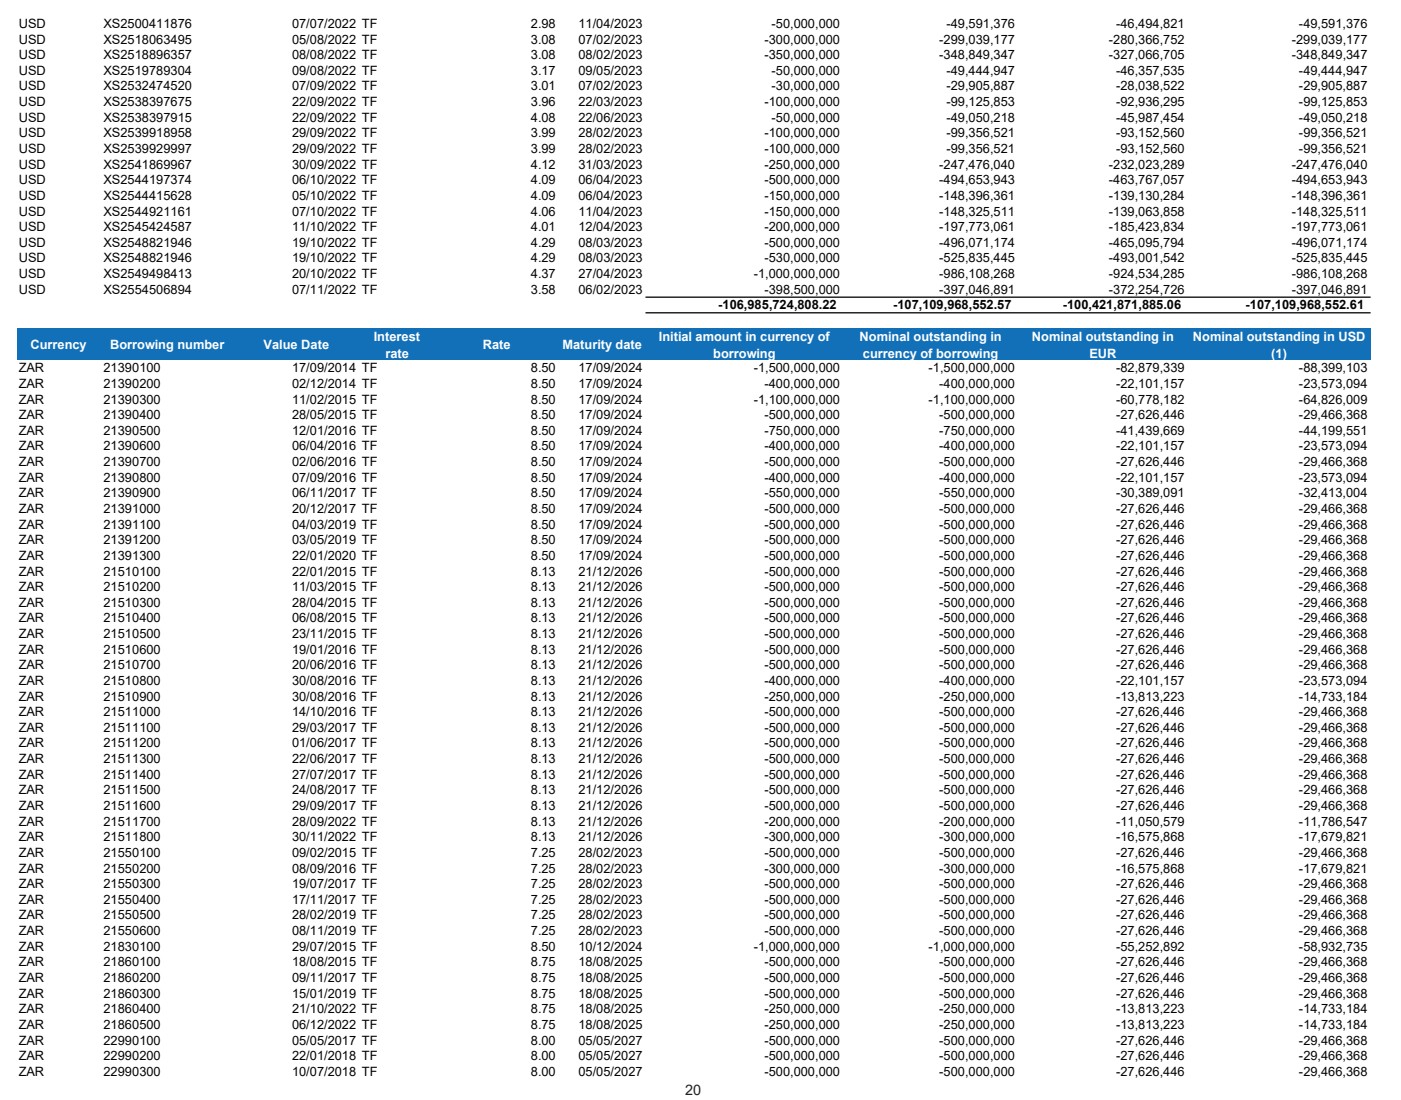
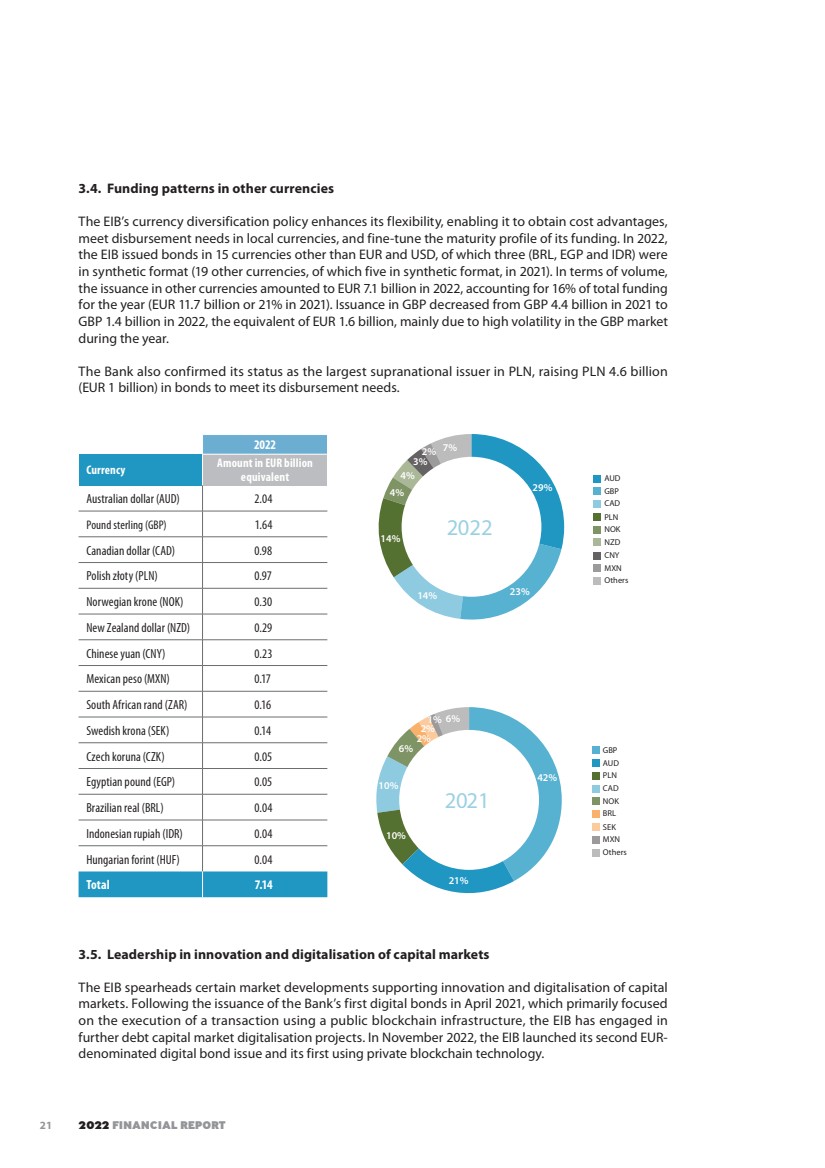
| 2022 FINANCIAL REPORT 3.4. Funding patterns in other currencies The EIB’s currency diversification policy enhances its flexibility, enabling it to obtain cost advantages, meet disbursement needs in local currencies, and fine-tune the maturity profile of its funding. In 2022, the EIB issued bonds in 15 currencies other than EUR and USD, of which three (BRL, EGP and IDR) were in synthetic format (19 other currencies, of which five in synthetic format, in 2021). In terms of volume, the issuance in other currencies amounted to EUR 7.1 billion in 2022, accounting for 16% of total funding for the year (EUR 11.7 billion or 21% in 2021). Issuance in GBP decreased from GBP 4.4 billion in 2021 to GBP 1.4 billion in 2022, the equivalent of EUR 1.6 billion, mainly due to high volatility in the GBP market during the year. The Bank also confirmed its status as the largest supranational issuer in PLN, raising PLN 4.6 billion (EUR 1 billion) in bonds to meet its disbursement needs. 3.5. Leadership in innovation and digitalisation of capital markets The EIB spearheads certain market developments supporting innovation and digitalisation of capital markets. Following the issuance of the Bank’s first digital bonds in April 2021, which primarily focused on the execution of a transaction using a public blockchain infrastructure, the EIB has engaged in further debt capital market digitalisation projects. In November 2022, the EIB launched its second EUR-denominated digital bond issue and its first using private blockchain technology. 2022 Currency Amount in EUR billion equivalent Australian dollar (AUD) 2.04 Pound sterling (GBP) 1.64 Canadian dollar (CAD) 0.98 Polish złoty (PLN) 0.97 Norwegian krone (NOK) 0.30 New Zealand dollar (NZD) 0.29 Chinese yuan (CNY) 0.23 Mexican peso (MXN) 0.17 South African rand (ZAR) 0.16 Swedish krona (SEK) 0.14 Czech koruna (CZK) 0.05 Egyptian pound (EGP) 0.05 Brazilian real (BRL) 0.04 Indonesian rupiah (IDR) 0.04 Hungarian forint (HUF) 0.04 Total 7.14 14% 29% 23% 14% 4% 4% 3% 2% 7% 2022 AUD GBP CAD PLN NOK NZD CNY Others MXN 42% 21% 10% 10% 6% 2% 2% 1% 6% 2021 GBP AUD PLN CAD NOK BRL SEK MXN Others 21 |
| Overview The EUR 100 million 2-year digital bond was issued, recorded and settled using private blockchain-based technology. Terms and conditions of the digital bond are governed by the laws of the Grand Duchy of Luxembourg. The settlement was facilitated by central bank digital currency tokens issued by Banque de France and Banque Centrale du Luxembourg. With its second digital bond issue, the EIB is continuing to set an example for markets in the field of blockchain technology. 3.6. EIB’s sustainability funding in the context of the European Union’s Sustainability Agenda In 2022, the year that marked the 15th anniversary of the world’s first green bond issued by the EIB in 2007, a record of EUR 19.9 billion or 45% of the Bank’s funding programme was issued in Climate and Sustainability Awareness Bonds (CABs and SABs) format (EUR 11.5 billion or 21% in 2021). This impressive growth of sustainability funding is the result of different factors: the gradual extension of eligibilities for CAB/SAB allocations, in the context of the Climate Bank Roadmap implementation; the increase in the volume of eligible disbursements; and the performance attractiveness of certain Climate Awareness Bonds and Sustainability Awareness Bonds in the secondary market. The EIB’s sustainability funding instruments are allocated exclusively to lending activities that contribute substantially to sustainability objectives. Climate Awareness Bonds focus on climate change mitigation, while Sustainability Awareness Bonds focus on other EU objectives for environmental and social sustainability. In 2022, the Climate Awareness Bonds framework was extended to further EU Taxonomy Regulation-eligible low-carbon activities in transport, manufacturing, waste and energy sectors. Climate Awareness Bonds Sustainability Awareness Bonds During 2022, the EIB issued EUR 13.6 billion34 of Climate Awareness Bonds. In the course of the year, EUR 12.7 billion of disbursements were found eligible for allocation of proceeds from CAB issuance and EUR 12.7 billion of CAB proceeds were allocated to such disbursements following the EIB’s allocation procedures. The balance of unallocated CAB proceeds in the treasury CAB portfolio amounted to EUR 0.0 billion at the beginning of the year and to EUR 0.9 billion at the end of the year. During 2022, the EIB issued EUR 5.9 billion35 of Sustainability Awareness Bonds. In the course of the year, EUR 4.2 billion of disbursements were found eligible for allocation of proceeds from SAB issuance and EUR 4.2 billion of SAB proceeds were allocated to such disbursements following the EIB’s allocation procedures. The balance of unallocated SAB proceeds in the treasury SAB portfolio amounted to EUR 0.3 billion at the beginning of the year and to EUR 2.0 billion at the end of the year. 4. TREASURY ACTIVITIES In the general context of uncertainty in the global financial markets, the EIB continues to maintain a robust liquidity position and flexibility to access the necessary liquidity resources under a prudent approach to liquidity management. 4.1. High-quality assets Treasury management fills the dual roles of ensuring that the Bank has the capacity to continually meet its financial commitments and of implementing the Bank’s asset and liability policy. Funds are invested in designated portfolios with defined criteria based on a low-risk strategy of diversification. The Bank’s portfolio management must at all times comply with the guidelines, prudential limits and indicators laid down by the EIB’s governing bodies. 34. Data are preliminary and based on net proceeds from Climate Awareness Bonds. 35. Data are preliminary and based on net proceeds from Sustainability Awareness Bonds. 22 |
| 2022 FINANCIAL REPORT At the end of 2022, the operational treasury included the following portfolios: • Treasury Monetary Portfolio (TMP), designed for daily liquidity management. At the end of the year, the bulk of these assets (92%) was held in the Treasury Monetary Portfolio invested in short-term instruments with a maturity of up to one year. • Securities Liquidity Portfolio (SLP), which invests in EUR, GBP and USD and aims to provide diversification while enhancing the return on treasury assets. Operating under the constraint of holding 65% in ECB-eligible assets, the SLP also serves as an additional line of liquidity. • Long-Term High Quality Liquid Assets Portfolio (LTHP), which originated from the previous long-term hedge portfolio. The LTHP portfolio is managed with the objective of constituting a core long-term liquidity reserve for the Bank in EUR and USD composed of highly rated liquid bonds. For a breakdown of the credit exposure of the treasury portfolio, please refer to Note B of the Statutory Financial Statements. 4.2. Prudent liquidity management Treasury activities are conducted with the primary objective of protecting the capital invested and ensuring that the Bank can meet its payment obligations on time and in full. Liquidity is consistently maintained within the set prudential limits to cater for the EIB’s operating environment. In the general context of uncertainty in the global financial markets, the EIB continues to maintain a robust liquidity position and flexibility to access all necessary liquidity resources, under a prudent approach to liquidity management. In 2022, all the Bank's liquidity risk indicators have constantly remained well above their respective limits. At the end of 2022, total treasury assets amounted to EUR 77.5 billion (EUR 105.6 billion in 2021) and the Bank’s total liquidity ratio stood at 95.4% (117.2% in 2021), in excess of the minimum liquidity requirement of 25%.36 The liquidity coverage ratio (LCR) stood at 348.0% at the end of 2022 (564.9% in 2021), while the net stable funding ratio (NSFR) amounted to 124.6% at the end of the year (130.0% in 2021). Both LCR and NSFR ratios remained comfortably above their regulatory limit of 100% during 2022. As an eligible counterparty in the Eurosystem’s monetary policy operations, the EIB also benefits from access to the monetary policy operations of the European Central Bank (ECB). The Bank has access to the Eurosystem’s open market operations and standing facilities through Banque Centrale du Luxembourg. The ability to reuse ECB-eligible collateral in repo transaction adds substantially to the operational liquidity resilience of the EIB. As of the end of 2022, the total value of securities held in the EIB’s inventory, which are eligible to be reused within the Eurosystem at Banque Centrale du Luxembourg, stood at EUR 20.1 billion, composed by proprietary assets for EUR 14.5 billion and reusable received collateral for EUR 5.6 billion. By comparison, in 2021, the total value of securities held in the EIB’s inventory stood at EUR 28.7 billion, of which EUR 16.3 billion was EIB-owned assets and EUR 12.4 billion was eligible reusable collateral received. The overnight placement with Banque Centrale du Luxembourg amounted to EUR 53.9 billion at the end of 2022 (EUR 56.7 billion at the end of 2021). 36. The minimum liquidity ratio is 25% of the forecast net cash outflows for the following 12 months. 23 |
| Overview 4.3. Treasury financial result in 2022 The financial result from the EIB's treasury portfolios for the year was EUR 431.6 million (EUR -165.2 million in 2021). This figure reflects a gross result, mainly the interests received by the treasury, which started to turn positive in the second half of the year, hence benefiting overall the results of the investments. Taking into consideration the cost of funding used to finance the treasury assets, the net treasury result remained positive in 2022, reaching EUR 115.5 million (EUR 96.6 million in 2021). The positive net treasury result reflects better placement rates on investments over the internal transfer price. The average rate of return on the Bank’s treasury was 0.4% in 2022 (-0.3% in 2021), in a market environment characterised by rising EU interest rates, which encouraged investments predominantly focused on very short tenors. 4.4. Asset and liability management The interest rate, foreign exchange and basis risk positions of the Bank’s assets and liabilities are managed within prescribed limits. This involves rebalancing the various risk profiles using standard derivative instruments to achieve a target exposure of the managed risk factors. The Interest Rate Risk Strategy aims to ensure the self-sustainability of the Bank’s business and the growth of its own funds. 5. CONSERVATIVE RISK MANAGEMENT ALIGNED WITH BEST BANKING PRACTICE In order to clarify and reinforce the EIB’s best banking practice (BBP) framework, the Bank’s Board of Governors approved the BBP Guiding Principles. The BBP Guiding Principles is a high-level document, defining the overall principles and the general scope of the banking rules and guidelines applicable to the EIB as best practice. It also sets forth assessment criteria aimed at identifying the relevant rules and considers specificities of the EIB’s business model by way of general adjustments. The document is regularly reviewed by the Bank’s governing bodies and is available on its website. The Audit Committee, an independent body that reports directly to the EIB’s Board of Governors, is statutorily tasked with verifying that the Bank’s activities conform to best banking practice. As part of this role, the Audit Committee has implemented an internal review and evaluation process (EIB REP). Since March 2021, this process is framed by the EIB’s Review and Evaluation Guiding Principles, which were subsequently detailed by the EIB REP implementing rules and a review and evaluation methodology specific to the EIB Group. Globally, this framework is based on the European Banking Authority’s Guidelines on the Supervisory Review and Evaluation Process, while considering the EIB’s specific nature, policy mission, specific tasks and governance structure. The EIB REP supports the Audit Committee in its role to ensure that the Bank complies with applicable best banking practice. The approach to determining annual operational targets and orientations takes into account the Bank’s objective of maintaining a robust credit standing, the long-term nature of its lending business and the granularity of its portfolio. The Bank has defined a set of indicators (such as comprehensive risk appetite metrics) to monitor the credit, liquidity, market and operational risks inherent in its activities including, among others, minimum capital requirements, and the credit quality distribution of the Bank’s loan portfolio, risk concentration measures and liquidity measures. The EIB’s lending policies establish minimum credit quality criteria for both borrowers and guarantors in lending operations and identify the acceptable transaction structure. In analysing risks, the Bank applies an internal loan grading system and assigns internal ratings to counterparties. Diversification of the loan portfolio is supported by a counterparty limit framework and sector limits for its key industries. 24 |
| 2022 FINANCIAL REPORT The EIB Group Risk and Compliance Directorate is responsible for both financial risks and non-financial risks relating to the EIB Group’s business. Such risks include, inter alia, credit, market, liquidity and funding risks, operational risk, climate risk, reputational risk and strategic risk. With the approval of the EIB Group Risk Management Charter in June 2019, and subsequently of its Implementing Provisions, risk oversight was also extended across all relevant business lines of the EIB Group, aiming at fully recognising the economic substance of all EIB Group risk exposures and enabling the EIB Group to make fully informed decisions on risk taking. This charter sets out the main principles of the EIB Group Risk Management Framework, the purpose of which is to ensure that EIB Group risks are overseen and managed in an effective and consistent manner. The EIB has put in place a robust capital adequacy framework designed to ensure that the capital position of the Bank remains strong. Through the EIB’s adherence to best banking practices, the Bank’s capital adequacy framework is built in line with frameworks of commercial banks and is benchmarked against regulatory requirements. The EIB’s capital position is disclosed through the EIB Group Risk Management Disclosure Report. For more details on risk management, see Note U of the Statutory Financial Statements, and the EIB Group Risk Management Disclosure Report on the EIB website. 6. CORPORATE RESPONSIBILITY AND SUSTAINABILITY The remit of the EIB is to foster balanced and steady development within the European Union and beyond. Sustainability is at the heart of what the Bank does and it is integrated in lending, borrowing and advisory activities. As the EU climate bank, the EIB Group is committed to: (i) align all financing operations with the principles and goals of the Paris Agreement for addressing climate change, (ii) gradually increase EIB annual financing dedicated to climate action and environmental sustainability to exceed 50% of total financing by 2025 and beyond, and (iii) support EUR 1.0 trillion of investment in climate action and environmental sustainability in the decade from 2021-2030. From a governance perspective, in line with the Climate Bank Roadmap and the Bank’s commitment to align its activities with the objectives of the Paris Agreement, climate-related risks and opportunities are integrated into the Bank’s governance structure. The current governing structure places emphasis on the management of climate risks and opportunities at Board of Directors’ level. Similarly, climate-related responsibilities are assigned at the management level, such as ad-hoc committees, specific departments or teams. To oversee the implementation of the Climate Bank Roadmap, a specific Climate and Environmental Steering Committee has been created. In parallel, the EIB strives to be exemplary in terms of transparency and accountability. The Bank proactively publishes information about its projects and activities and engages regularly with a broad spectrum of stakeholders. In terms of reporting, the EIB has pioneered sustainability disclosures for well over a decade. Every year, the Bank issues an externally audited Sustainability Report, including the carbon footprint of its financed projects, a carbon footprint report for its own emissions, a report in line with the recommendations of the TCFD, as well the Global Reporting Initiative (GRI) disclosures and Sustainability Accounting Standards Board (SASB) disclosures. All reports are available on a dedicated page on the Bank’s website. 25 |
| Overview 7. THE EIB GROUP’S FINANCIAL PERFORMANCE37 The EIB Group consists of the European Investment Bank and the European Investment Fund. 7.1. EIB consolidated financial statements under the EU Accounting Directives The EIB Group’s consolidated result under the EU Accounting Directives amounted to EUR 2 460.2 million in 2022 as compared to EUR 2 647.5 million in 2021 (representing a decrease of EUR 187.3 million or 7.1%). It is closely aligned with the EIB’s statutory surplus as the consolidated EU Accounting Directives result is almost wholly driven by the unconsolidated result of the Bank. As of 31 December 2022, the total EIB Group balance sheet stood at EUR 547.3 billion, showing a decrease of EUR 20.7 billion or 3.6% as compared to EUR 568.0 billion as of 31 December 2021. Additional information on the EU Accounting Directives results is provided under the notes to the EIB Group Consolidated Financial Statements under the EU Accounting Directives. 7.2. EIB consolidated financial statements under the International Financial Reporting Standards The EIB Group’s consolidated result under the International Financial Reporting Standards (IFRS) amounted to EUR 2 327.0 million in 2022 as compared to EUR 8 277.3 million in 2021, representing a decrease of EUR 5 950.3 million year on year, or 71.9%. As of 31 December 2022, the total EIB Group balance sheet stood at EUR 566.3 billion, showing a decrease of EUR 57.7 billion or 9.2% as compared to EUR 623.9 billion as of 31 December 2021. Additional information on the IFRS results is provided under the Notes to the EIB Group Consolidated Financial Statements under IFRS. 37. This section covers the Consolidated Financial Statements of the EIB Group prepared in accordance with the EU Accounting Directives and with the International Financial Reporting Standards. 26 |
| EIB Statutory Bodies Situation at 26/04/2023 The composition of the Bank's statutory bodies, the curricula vitae of their members and additional information on the remuneration arrangements are regularly updated and posted on the EIB's website: www.eib.org. Board of Governors Chairman Elisabeth SVANTESSON (Sweden) Minister for Finance Belgium Vincent VAN PETEGHEM Deputy Prime Minister and Minister of Finance Bulgaria Rositza VELKOVA-JELEVA Minister of Finance Czech Republic Zbyněk STANJURA Minister of Finance Denmark Morten BØDSKOV Minister for Industry, Business and Financial Affairs Germany Christian LINDNER Federal Minister of Finance Estonia Mart VÕRKLAEV Minister of Finance Ireland Michael McGRATH Minister for Finance Greece Christos STAIKOURAS Minister of Finance Spain Nadia CALVIÑO First Vice President of the Government and Minister of Economic Affairs and Digital Transformation France Bruno LE MAIRE Minister of Economy, Finance and Industrial and Digital Sovereignty Croatia Marko PRIMORAC Minister of Finance Italy Giancarlo GIORGETTI Minister of Economy and Finance Cyprus Makis KERAVNOS Minister of Finance Latvia Arvils AŠERADENS Minister for Finance Lithuania Gintarė SKAISTĖ Minister of Finance Luxembourg Yuriko BACKES Minister of Finance Hungary Márton NAGY Minister for Economic Development Malta Clyde CARUANA Minister of Finance and Employment Netherlands Sigrid KAAG Minister of Finance Austria Magnus BRUNNER Federal Minister of Finance Poland Magdalena RZECZKOWSKA Minister of Finance Portugal Fernando MEDINA Minister of Finance Romania Adrian CÂCIU Minister of Finance Slovenia Klemen BOŠTJANČIČ Minister of Finance Slovakia Eduard HEGER Minister of Finance Finland Annika SAARIKKO Minister of Finance Audit Committee Chairman Members Vacant Nuno GRACIAS FERNANDES Professor of Finance, IESE Business School, Spain Katja PLUTO Former Chief Risk Officer, Europe & Middle East, Zurich Insurance Company, Zurich Ivan ŠRAMKO Chairman of supervisory board of Slovenské Elektrárne, a.s. Eva-Lena NORGREN Chief Judge and Head of Authority, Södertörn District Court Christoph HAAS Independent Director and Advisor Observers John SUTHERLAND Former Senior Advisor, Financial Conduct Authority, UK Beatrice DEVILLON-COHEN Independent Non-Executive Director for MUFG Securities EMEA Vasile IUGA Former PwC Audit Partner, Romania Management Committee President Werner HOYER Vice-Presidents Ambroise FAYOLLE Lilyana PAVLOVA Thomas ÖSTROS Teresa Tatiana CZERWIŃSKA Vacant Ricardo MOURINHO FÉLIX Kris PEETERS Gelsomina VIGLIOTTI 27 2022 FINANCIAL REPORT |
| Board of Directors The Board of Directors consists of 28 directors, with one director nominated by each Member State and one by the European Commission. There are 31 alternates. Furthermore, in order to broaden the Board of Directors’ professional expertise in certain fields, the Board is able to co-opt a maximum of six experts (three directors and three alternates), who participate in the board meetings in an advisory capacity, without voting rights. Directors Vacant (Belgium) Marinela PETROVA Director at European Affairs and Economic Analyses Directorate, Ministry of Finance Bulgaria Petr PAVELEK Director of Debt and Financial Assets Management Department, Ministry of Finance, Prague Julie SONNE Head of Division, Ministry for Industry, Business and Financial Affairs, Copenhagen Elke KALLENBACH Deputy Director General for Financial Market Policy, Federal Ministry of Finance, Berlin Andres KUNINGAS Head of EU and International Affairs Department, Ministry of Finance, Tallinn Des CARVILLE Head of Shareholding and Financial Advisory Division, Department of Finance, Dublin Konstantin J. ANDREOPOULOS Member of the Board of Directors of the EIB, Athens Enrique RUIZ de VILLA SAIZ Deputy Director General for Economic and Financial Affairs of the European Union at the Spanish Ministry of Economic Affairs and Digital Transformation, Madrid Muriel LACOUE-LABARTHE Deputy Director General of the French Treasury, Directorate-General of the Treasury, Ministry for the Economy and Finance, Paris Silvija BELAJEC Head of Sector for EU Affairs and International Financial Relations, Ministry of Finance, Zagreb Francesca UTILI Head of International Financial Relations Directorate, Ministry of the Economy and Finance, Rome Kyriacos KAKOURIS Director of Finance, Directorate of International Financial Institutions and Financial Management of Central Government, Ministry of Finance, Nicosia Armands EBERHARDS Deputy State Secretary, Ministry of Finance, Riga Darius TRAKELIS Director of EU and International Affairs Department, Ministry of Finance, Vilnius Arsène JACOBY Director of Multilateral Affairs, Development Aid, Cooperation and Compliance, Ministry of Finance, Luxembourg László BARANYAY Member of the Board of Directors of the EIB, Budapest Paul DEBATTISTA Consultant, Member of the Board of Directors of the EIB, Valletta Robin UYTERLINDE Deputy Director of the International Affairs Directorate, Ministry of Finance, The Hague Karin RYSAVY Senior Expert at European Affairs, Federal Ministry of Finance, Vienna Piotr PATKOWSKI Undersecretary of State, Chief Spokesman for Public Finance Discipline, Ministry of Finance, Warsaw Filipe CARTAXO Member of the Board of Directors of the EIB, Lisbon Attila GYÖRGY Secretary of State, Ministry of Public Finance, Bucharest Nina MARIN Legal expert at Pravno svetovanje Nina Marin s.p. Peter FRÖHLICH Chief Executive Officer, Slovak Investment Holding (SIH), Bratislava Kristina SARJO Financial Counsellor, Director of Unit for International Affairs, Financial Markets Department, Ministry of Finance, Helsinki Anna BJÖRNERMARK Senior Adviser, International and Economics Department, Ministry of Finance, Stockholm Elena FLORES GUAL Deputy Director General, Directorate-General for Economic and Financial Affairs (ECFIN), European Commission, Brussels Experts Giorgio GOBBI Head of the Milan Regional Branch, Banca d’Italia, Rome Vacant Joes LEOPOLD Capitium B.V., Managing Partner and Director, Amsterdam EIB STATUTORY BODIES 28 |
| Alternates Ludivine HALBRECQ Advisor at Treasury, Administration of International and European Financial Affairs (IEFA), Federal Public Service Finance, Brussels Gergana BEREMSKA Director, International Financial Institutions, Ministry of Finance, Sofia Radek HŘEBĺK Head of State Financing and Treasury Liquidity Management Division, Ministry of Finance, Prague Morten PRÆSTEGAARD KLINGE Special advisor at Department of Financial Affairs, Ministry of Industry, Business and Financial Affairs, Copenhagen Hendrik KAELBLE Head of Division, Directorate General European Policy, Federal Minister for Economic Affairs and Energy, Berlin Susanne BLOMENHOFER Policy Advisor, Directorate General for European Affairs, Federal Ministry of Finance, Berlin Riina LAIGO Advisor in the EU and Int. Affairs Department, Ministry of Finance, Tallinn Des O’LEARY Member of the Board of Directors of the EIB, Dublin Nikos MANTZOUFAS Governor of the Recovery and Resilience Fund Agency at the Ministry of Finance, Athens Isabel GARAYO ORBE Alternate Deputy Director General, EU Economic and Financial Affairs department, Ministry of Economic Affairs and Digital Transformation, Madrid Matthieu PHILIPPOT Head of the European Bilateral Economic Relations and Financial Instruments Unit, Directorate General of the Treasury, Ministry for the Economy and Finance, Paris Estelle de BEAUCÉ Deputy Head of the Unit in charge of European Financial Instruments, Directorate General of the Treasury, Ministry for the Economy and Finance, Paris Ana ZORIĆ Director of the Directorate for Economy and Financial System, Ministry of Finance, Zagreb Francesca MERCUSA Director, International Financial Relations Directorate, Department of the Treasury, Ministry of Economy and Finance, Rome Francesca ROMAGNOLI Head of Unit RRF, Ministry of Economy and Finance, Rome Eleni PITTA Economic Officer, Directorate of International Financial Institutions and General Financial Management, Ministry of Finance, Nicosia Aija ZITCERE Director of Financial Market Policy Department, Ministry of Finance, Riga Jurgita UZIELIENE Senior Advisor of EU and International Affairs Department, Ministry of Finance, Vilnius Miguel MARQUES Deputy Director, Multilateral affairs and Development Aid, Ministry of Finance, Luxembourg Vacant (Hungary) Paulanne MAMO Accountant General, Treasury Department, Ministry for Finance, Valletta Jan de BOER Senior policy advisor, Foreign Financial Relations Department, Ministry of Finance, The Hague Christian REININGER Economic Advisor for Budgetary Affairs, Federal Ministry of Finance, Vienna Maciej TABACZAR Chief Specialist, International Financial Cooperation, Department, Ministry of Finance, Warsaw Rosa CAETANO Deputy Director General of the Office for Economic Policy and International Relations, Ministry of Finance, Lisbon Boni Florinela CUCU General Director, General Directorate for International Financial Relations, Ministry of Public Finance, Bucharest Urška GRMEK Sole proprietor, Slovenia Martin POLÓNYI Director General of International Relations Section, Ministry of Finance, Bratislava Anne af URSIN Financial Counsellor, Ministry of Finance, Helsinki Anna EKSTAM Desk Officer, International and Economic Affairs Department, Ministry of Finance, Stockholm Saila VALTONEN Adviser to the Deputy Director-General of Directorate-General for Economic and Financial Affairs (DG ECFIN), European Commission, Luxembourg Alternate experts Vacant Olivier BAILLY Deputy Managing Director and Director for Global Issues, EEAS, Brussels Antonio OPORTO Secretary General, Circulo de Empresarios, Madrid, Spain 29 2022 FINANCIAL REPORT |
| Audit and control AUDIT AND CONTROL AUDIT COMMITTEE The Audit Committee is an independent statutory body, appointed by and reporting directly to the Board of Governors, in compliance with the formalities and procedures defined in the Bank’s Statute and Rules of Procedure. The role of the Audit Committee is to verify that the Bank’s operations have been conducted and its books kept in a proper manner and that the activities of the Bank conform to best banking practice applicable to it. The Audit Committee is responsible for the auditing of the Bank’s accounts. The Audit Committee is made up of six members who are appointed by the Board of Governors for a non-renewable term of six years. Members are chosen from among people having independence, competence and integrity and who possess financial, auditing or banking supervisory expertise in the private or public sector, and they should cover the whole range of expertise between them. In addition, the Board of Governors, on a joint proposal from the President of the Bank and the Chair of the Audit Committee, may appoint a maximum of three observers for a non-renewable six-year term, on the basis of their particular qualifications, especially with regard to banking supervision. The Audit Committee provides statements each year on whether the financial statements, as well as any other financial information contained in the annual accounts drawn up by the Board of Directors, give a true and fair view of the financial position and of the results of the operations and cash flows of the Bank, the EIB Group (which comprises the EIB and the European Investment Fund (EIF)) and the Investment Facility, a mandate administered by the Bank, for the year then ended. The Audit Committee is required to give the Board of Governors a detailed report on the results of its work during the preceding financial year, including verification that the activities of the Bank conform to best banking practice applicable to it. In fulfilling its role, the Audit Committee meets with representatives of the other statutory bodies, including the EIF Audit Board; oversees the verification procedures and practical arrangements for carrying out and maintaining the framework of best banking practices applicable to the Bank’s services; takes note of the work performed by the internal auditors; monitors the work of the external auditors in relation to the financial statements; safeguards the independence of the external audit function; and coordinates audit work in general. Regular meetings with Bank staff and reviews of internal and external reports enable the Audit Committee to understand and monitor how management is providing for adequate and effective internal control systems, risk management and internal administration. The Inspector General, the head of Internal Audit, the Group Chief Risk Officer, the head of the Office of the Chief Compliance Officer and the Financial Controller have direct access to the Audit Committee. EXTERNAL AUDITORS The EIB’s external auditors, KPMG, report directly to the Audit Committee, which is empowered to delegate the day-to-day work of auditing the financial statements to them. The external auditors are not allowed to carry out any work of an advisory nature or act in any other capacity that might compromise their independence when performing their audit tasks. A summary of services provided by the external auditors is available on the Bank’s external website. 30 |
| 2022 FINANCIAL REPORT FINANCIAL CONTROL Financial Control (FC) is an independent directorate and reports directly to the Bank’s Management Committee. Its main responsibilities relate to the Bank’s books and records and its various financial statements. Furthermore, Financial Control’s role in relation to the Bank’s Internal Control Framework (ICF) has been strengthened, incorporating additional capabilities to oversee control risk, to provide a common platform for the implementation and maintenance of the Bank-wide Internal Control Framework and, lastly, to report to senior management and the Audit Committee on noteworthy control deficiencies, covering key activities of the Bank. This role is being carried out within the provisions established by the EIB ICF Policy, which was approved by the board in June 2018. Together with the Secretary General, the Financial Controller manages the relationship with the external auditors, the Audit Committee and the European Court of Auditors. INTERNAL AUDIT As an independent function, the head of Internal Audit reports to the EIB President and functionally to the EIB Audit Committee and, regarding EIF stand-alone activities, to the EIF Audit Board. It caters for audit needs at all levels of management of the EIB Group and acts with the guarantees of independence and professional standards conferred upon it by its Group Charter. Internal Audit examines and evaluates the relevance and effectiveness of the internal control systems and the procedures involved in managing risk within the Group. Action plans agreed with the EIB and EIF departments are a catalyst for improving procedures and strengthening controls. In support of the Audit Committee’s mandate on best banking practice, Internal Audit includes such assessments in all elements of its work. Internal Audit therefore reviews and tests key controls on a rotational basis using a risk-based approach. INSPECTORATE GENERAL The Inspectorate General (IG) comprises, under the authority of the independent Inspector General, three independent control and accountability functions: EVALUATION The Evaluation Division (IG/EV) assesses the relevance and performance of EIB Group activities and identifies what works, what does not work and why. EIB Group activities are evaluated for their contribution to achieving the policy goals of the Group and the European Union. The division carries out independent, accurate, transparent and credible evidence-based evaluations of ongoing and completed initiatives in all areas of the EIB Group’s activity, including policies, strategies, programmes, partnerships, and financing instruments. It operates in line with international principles and standards for evaluation. INVESTIGATION Under the EIB Group’s Anti-Fraud Policy approved by the board, the Inspectorate General, through the Investigations Division (IG/IN), is the sole office within the Bank that is mandated to conduct independent investigations into allegations of possible fraud, corruption, collusion, coercion, obstruction, theft at EIB Group premises, misuse of EIB Group resources or assets, money laundering or terrorism financing involving EIB operations or activities. IG/IN may also call on external assistance or experts in accordance with the requirements of the investigation and works closely with the services of the European Anti-Fraud Office (OLAF). IG/IN also acts as the EIB’s contact point for the European Public Prosecutor’s Office. The division’s mandate extends to proactive fraud detection activities to address fraud and corruption issues that might remain undetected by usual monitoring or not be reported. This activity is based on a Proactive Integrity Review (PIR) methodology, which identifies red flags and 31 |
| Audit and control indicators of fraud and/or corruption. Projects are selected for PIRs independently by IG/IN on the basis of a risk assessment process. Moreover, IG/IN is responsible for the implementation of the Bank’s Exclusion Policy, which serves to exclude entities found to have engaged in fraud or corruption. COMPLAINTS MECHANISM The EIB Group Complaints Mechanism, as defined by its published policy and procedures, is a tool of horizontal accountability of the EIB Group vis-à-vis its stakeholders as regards the handling of complaints concerning the activities of the EIB Group. The mechanism was established to support stakeholders that wish to voice their concerns. Such requests can lead to complaint investigations or dispute resolution initiatives. Any member of the public has access to a two-tier sequential mechanism: an internal part — the Complaints Mechanism Division (EIB-CM) — and, if a complainant is not satisfied with the outcome of the internal mechanism, an external one — the European Ombudsman (EO). The EIB-CM coordinates the EIB Group’s reply in case of complaints submitted to other non-judicial review mechanisms (such as the European Ombudsman, Aarhus Convention Compliance Committee, etc.). Finally, the independent Inspector General chairs the Procurement Complaints Committee, the internal mechanism handling complaints regarding a Bank decision related to an alleged infringement of the Guide to Procurement. OFFICE OF THE CHIEF COMPLIANCE OFFICER As part of the second line of defence, the objective of the EIB Group’s Compliance function is to assess, monitor and report on relevant non-financial risks for the EIB Group, including compliance, conduct, operational, information and cybersecurity risks. The function ensures compliance with legal and regulatory requirements and is involved in EIB operations throughout their life cycle, providing expert advice and guidance on anti-money laundering and combating financing of terrorism (AML-CFT), good tax governance and sanctions, and monitoring to ensure that risks and controls are effectively managed. Operational and information security risks are captured as non-financial risks in the EIB’s Risk Appetite Framework. The independent Operational Risk Management Unit is responsible for the implementation of a sound Operational Risk Management Framework, whereas the Information Security Risk Unit enforces sound risk management approaches in line with the Bank’s information security framework and industry-specific best practices. The Compliance function also acts as the second line of defence in its advisory and decisional role on ethics and integrity issues, providing opinions and recommendations to ensure compliance with the principles and standards of professional ethics at the highest level. The function provides training and awareness-raising on compliance matters and enforces the EIB Group Staff Code of Conduct and Whistleblowing Policy to instil a culture of integrity throughout the Group. MANAGEMENT SUPPORT Within the Secretariat General, the Planning, Budget and Analytics Division brings together key management support functions, namely operational planning, budget/cost accounting and associated analyses. This structure ensures that the overall planning and management reporting processes are coordinated and support the achievement of the Bank-wide objectives, and that the results achieved are monitored. Key tools include the Group Operational Plan and the budget, and independent opinions and analysis on proposals affecting them, plus the associated management accounting and control systems. A suite of integrated reports facilitates ongoing monitoring of the situation in relation to the operational strategy (including financial objectives). 32 |
| EIB STATUTORY FINANCIAL STATEMENTS EIB STATUTORY FINANCIAL STATEMENTS as at 31 December 2022 33 |

| 2022 FINANCIAL REPORT 42 Balance sheet as at 31 December 2022 (in EUR ’000) Assets 31.12.2022 31.12.2021 1. Cash in hand, balances with central banks and post office banks (Note B.1) 112,655 1,483,285 2. Treasury bills and other bills eligible for refinancing with central banks (Note B.2) 20,349,770 35,678,436 3. Loans and advances to credit institutions a) repayable on demand 658,339 562,513 b) other loans and advances (Note C) 63,986,798 74,551,456 c) loans (Note D.1) 93,274,087 93,558,227 d) value adjustments (Note D.2) -3,485 -57,842 157,915,739 168,614,354 4. Loans and advances to customers a) other loans and advances (Note C) 125,883 677,437 b) loans (Note D.1) 326,861,203 322,374,311 c) value adjustments (Note D.2) -388,263 -381,166 326,598,823 322,670,582 5. Debt securities including fixed-income securities (Note B.2) a) issued by public bodies 4,508,676 4,891,107 b) issued by other borrowers 5,414,808 5,891,460 9,923,484 10,782,567 6. Shares and other variable-yield securities (Note E.1) 8,942,605 8,397,569 7. Participating interests (Note E.1) 353,462 318,380 8. Shares in affiliated undertakings (Note E.2) 1,549,444 1,549,444 9. Intangible assets (Note F) 69,096 57,189 10. Tangible assets (Note F) 249,301 242,445 11. Other assets (Note G) 334,465 157,329 12. Subscribed capital and reserves, called but not paid (Note H.3) 799,248 1,118,948 13. Prepayments and accrued income (Note I) 17,389,622 14,405,918 Total assets 544,587,714 565,476,446 The accompanying notes form an integral part of these financial statements. 34 |
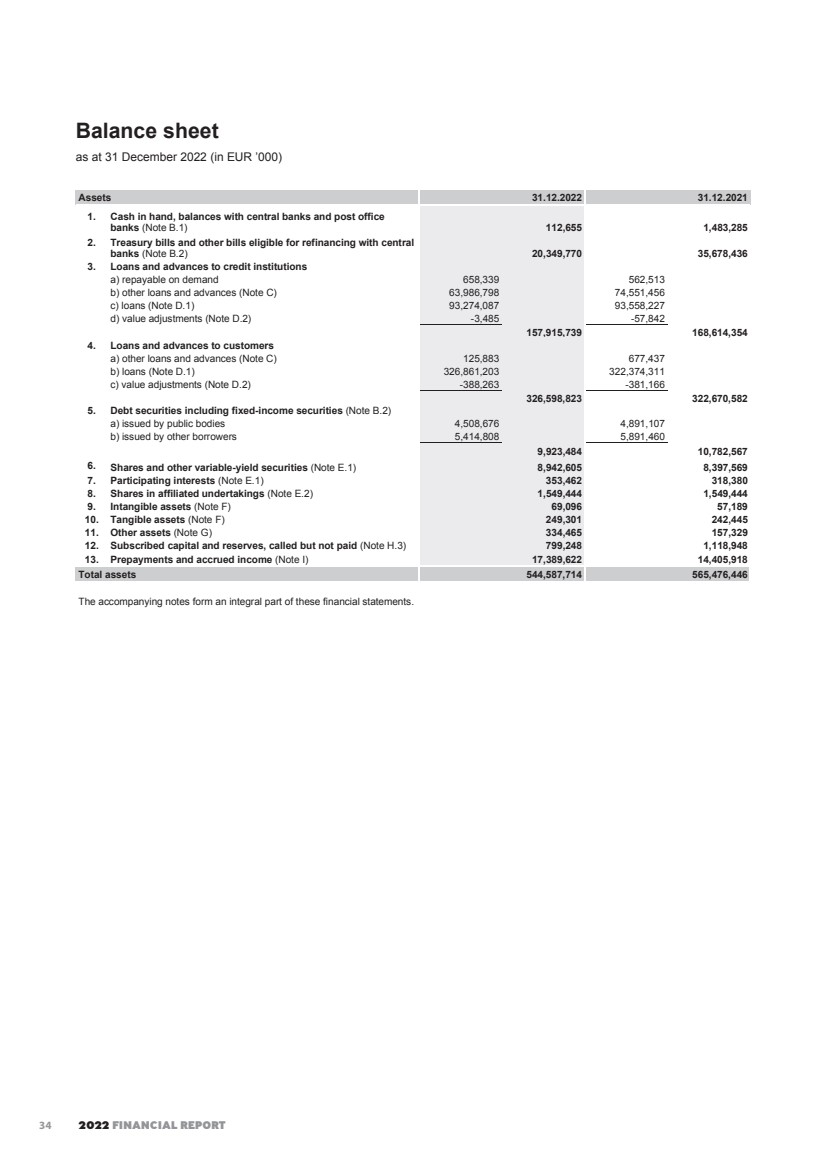
| EIB STATUTORY FINANCIAL STATEMENTS 43 Balance sheet (continued) as at 31 December 2022 (in EUR ’000) Liabilities 31.12.2022 31.12.2021 1. Amounts owed to credit institutions (Note J) a) repayable on demand 2,371,014 4,777,422 b) with agreed maturity or periods of notice 3,071,084 18,895,071 5,442,098 23,672,493 2. Amounts owed to customers (Note J) a) repayable on demand 1,437,246 1,648,539 b) with agreed maturity or periods of notice 57,543 175,542 1,494,789 1,824,081 3. Debts evidenced by certificates (Note K) a) debt securities in issue 422,523,581 431,104,111 b) others 9,173,893 9,010,748 431,697,474 440,114,859 4. Other liabilities (Note G) 4,260,011 4,373,509 5. Accruals and deferred income (Note I) 18,802,756 15,233,362 6. Provisions a) pension plans and health insurance scheme (Note L) 4,368,469 4,161,030 b) provision in respect of guarantee operations (Note D.4) 86,584 27,916 4,455,053 4,188,946 7. Subscribed capital (Note H) a) subscribed 248,795,607 248,795,607 b) uncalled -226,604,892 -226,604,892 22,190,715 22,190,715 8. Reserves (Note H) a) reserve fund 24,879,561 24,879,561 b) additional reserves 16,579,738 12,258,631 c) special activities reserve 10,303,216 12,152,954 d) general loan reserve 2,115,966 2,021,337 53,878,481 51,312,483 9. Profit for the financial year (Note M) 2,366,337 2,565,998 Total liabilities 544,587,714 565,476,446 The accompanying notes form an integral part of these financial statements. 35 |
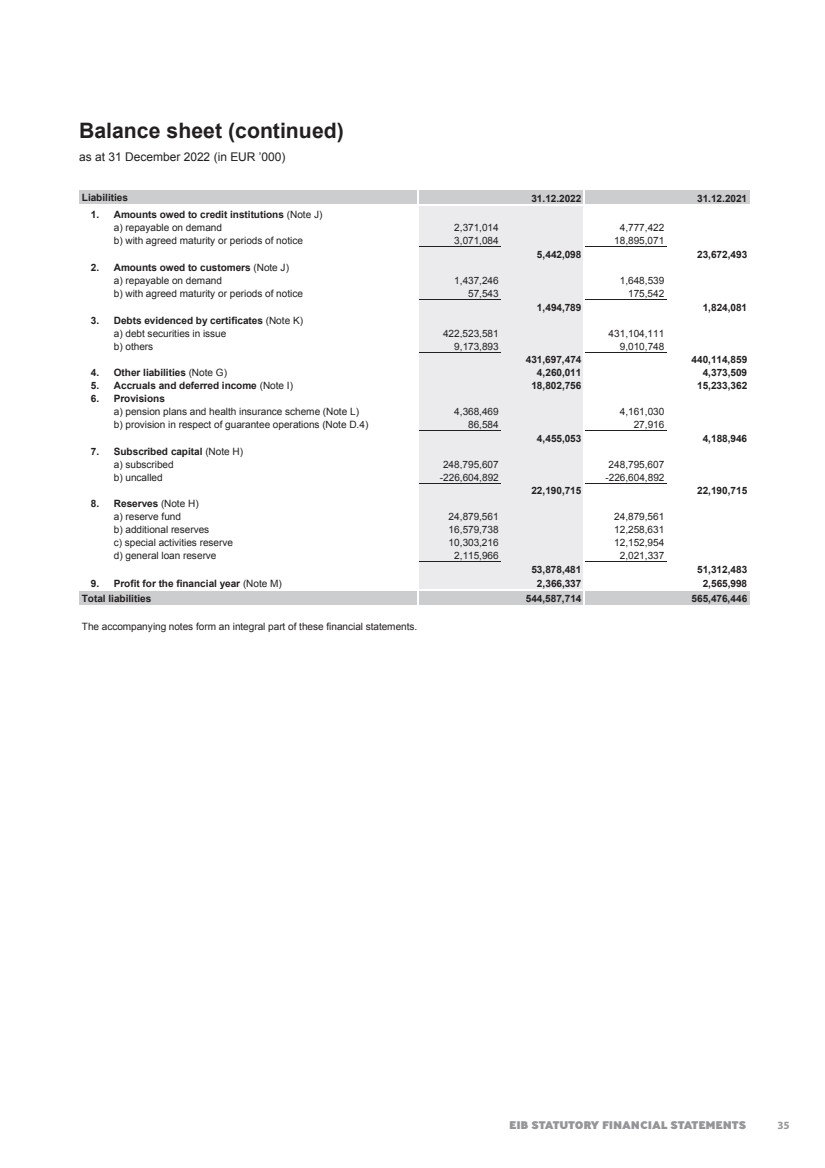
| 2022 FINANCIAL REPORT 44 Off balance sheet as at 31 December 2022 (in EUR ’000) 31.12.2022 31.12.2021 Commitments: - EIF capital uncalled (Notes E.2, X.1) 3,468,800 3,468,800 - Undisbursed loans (Note D.1) - credit institutions 31,375,087 31,913,008 - customers 93,274,466 91,041,283 124,649,553 122,954,291 - Undisbursed shares and other variable-yield securities - Undisbursed private equity and venture capital operations (Note E.1) 4,084,606 4,121,195 - Undisbursed investment and infrastructure funds (Note E.1) 3,435,704 3,203,307 - EBRD capital uncalled 712,630 712,630 8,232,940 8,037,132 - Undisbursed participating interests - Undisbursed private equity and venture capital operations (Note E.1) 410,831 497,631 - Borrowings launched but not yet settled 223,950 223,950 Contingent liabilities and guarantees: - In respect of loans granted by third parties (Note U.1.3.) 24,376,731 22,565,034 Assets held on behalf of third parties(*) (Note Z): - Innovation Fund 6,913,187 4,202,032 - Investment Facility Cotonou 4,334,223 4,128,779 - Modernisation fund 3,906,016 2,957,006 - EIF 2,334,013 2,304,236 - InnovFin 2,112,847 2,044,056 - NER300 1,035,191 1,143,332 - CEF 828,423 908,683 - Pan-European Guarantee Fund 676,011 595,239 - EU-Africa Infrastructure Trust Fund 414,850 425,628 - InvestEU 241,292 0 - Decentralised Financial Instruments 216,990 1,021,159 - Partnership Platform for Funds 213,415 187,785 - JESSICA (Holding Funds) 176,684 600,667 - Special Section 128,487 132,372 - RSFF (incl. RSI) 101,216 93,428 - RRF-FI 90,202 0 - ENPI 78,773 77,781 - AECID 56,934 58,885 - Private Finance for Energy Efficiency Instrument 54,610 55,007 - DCFTA 51,063 50,727 - GF Greece 42,417 162,254 - NIF Trust Fund 37,721 38,259 - NIF Risk Capital Facility 37,623 35,865 - EFSI-EIAH 33,339 35,559 - IPA II 24,333 52,626 - FEMIP Trust Fund 20,492 22,577 - EPTA Trust Fund 17,340 15,987 - Natural Capital Financing Facility 10,468 10,397 - EU Support to Boost Africa 5,789 824 - GEF-UNEP 1,431 0 - EU Trade and Competitiveness Program 880 968 - AIP Zambia 298 338 - AIP Kulima 221 246 - EFSD Guarantee "Access to Finance Initiative" 157 148 - EPIC 8 0 24,196,944 21,362,850 36 |
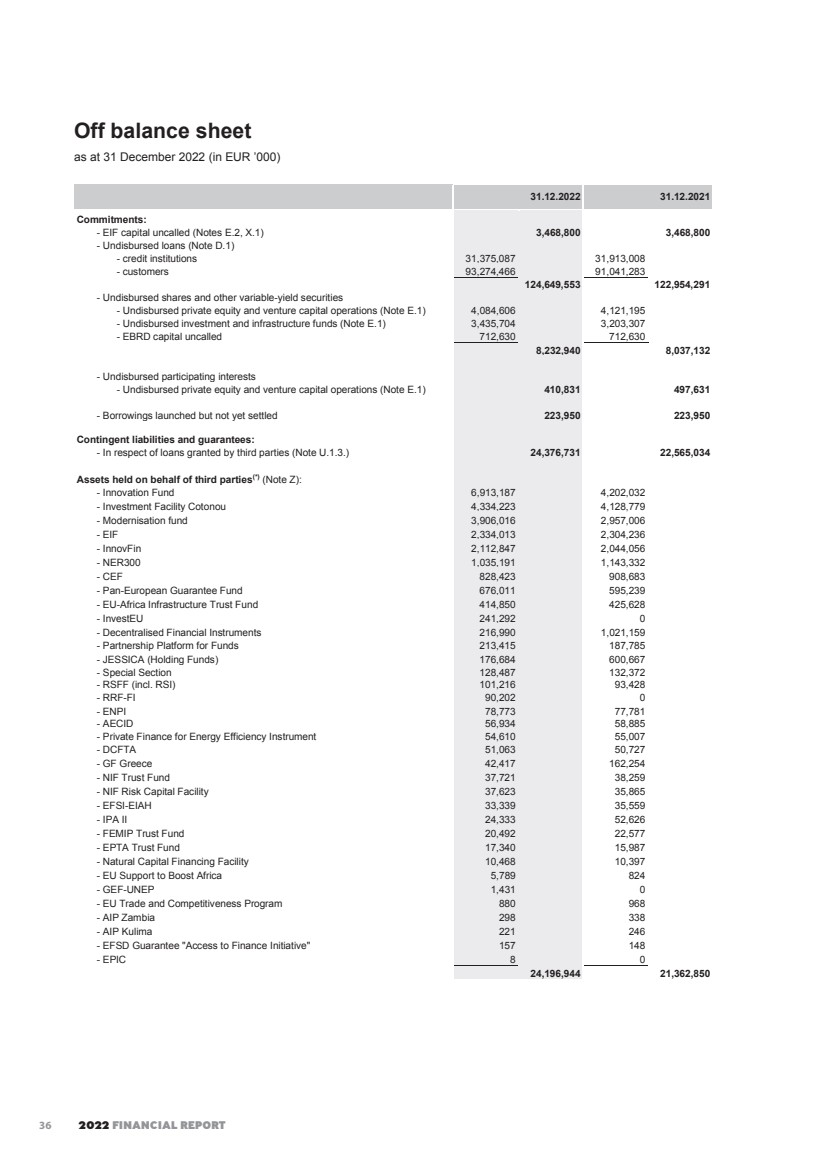
| EIB STATUTORY FINANCIAL STATEMENTS 45 Off balance sheet (continued) as at 31 December 2022 (in EUR ’000) 31.12.2022 31.12.2021 Other items: - Nominal value of interest-rate swaps (Note V.1.2) 573,024,821 559,081,060 - Nominal value of currency swap contracts receivable (Note V.1.1) 243,344,964 247,683,252 - Nominal value of currency swap contracts payable 242,236,843 245,975,779 - Nominal value of short-term currency swap contracts payable 21,731,627 24,956,095 - Nominal value of short-term currency swap contracts receivable (Note V.2) 21,411,941 25,123,575 - Notional amount of futures contracts (Note V.2) 8,804,329 8,274,106 - Put option granted to EIF minority shareholders (Note E.2) 419,763 340,341 - Notional amount of currency forwards (Note V.2) 267,069 402,384 - Special deposits for servicing borrowings (Note S) 560 582 (*) Assets under management are disclosed as off balance sheet item based on the latest available figures. Comparative figures might be restated in order to reflect most recent available information. The accompanying notes form an integral part of these financial statements. 37 |
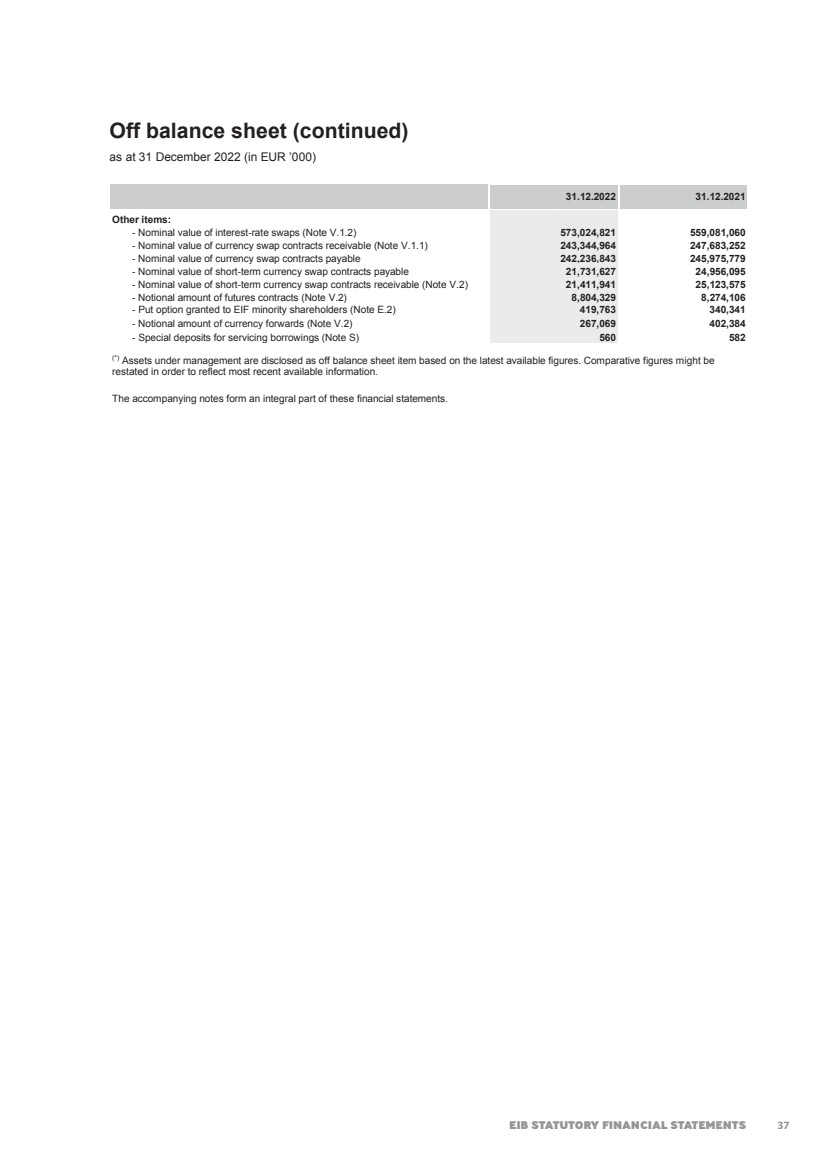
| 2022 FINANCIAL REPORT 46 Profit and loss account for the year ended 31 December 2022 (in EUR ‘000) 2022 2021 1. Interest receivable and similar income (Note N) 18,664,920 16,460,213 2. Interest payable and similar charges (Note N) -15,687,107 -13,275,218 3. Income from securities a) income from shares and other variable-yield securities 623,205 776,756 b) income from shares in affiliated undertakings 9,305 0 632,510 776,756 4. Commissions receivable (Note O) 451,031 374,641 5. Commissions payable (Note O) -437,108 -499,623 6. Net result on financial operations (Note P) -43,055 41,643 7. Net other operating income and expense (Note Q) 16,507 10,254 8. General administrative expenses (Note R) a) staff costs (Note L) -832,264 -1,216,123 b) other administrative expenses -306,074 -250,692 -1,138,338 -1,466,815 9. Value adjustments in respect of tangible and intangible assets (Note F) a) tangible assets -32,721 -28,863 b) intangible assets -29,656 -21,020 -62,377 -49,883 10. Value (re-)adjustments in respect of transferable securities held as financial fixed assets, participating interests and shares in affiliated undertakings -1,451 15,726 11. Value (re-)adjustments in respect of loans and advances and provisions for contingent liabilities -29,195 178,304 12. Profit for the financial year (Note M) 2,366,337 2,565,998 The accompanying notes form an integral part of these financial statements. 38 |
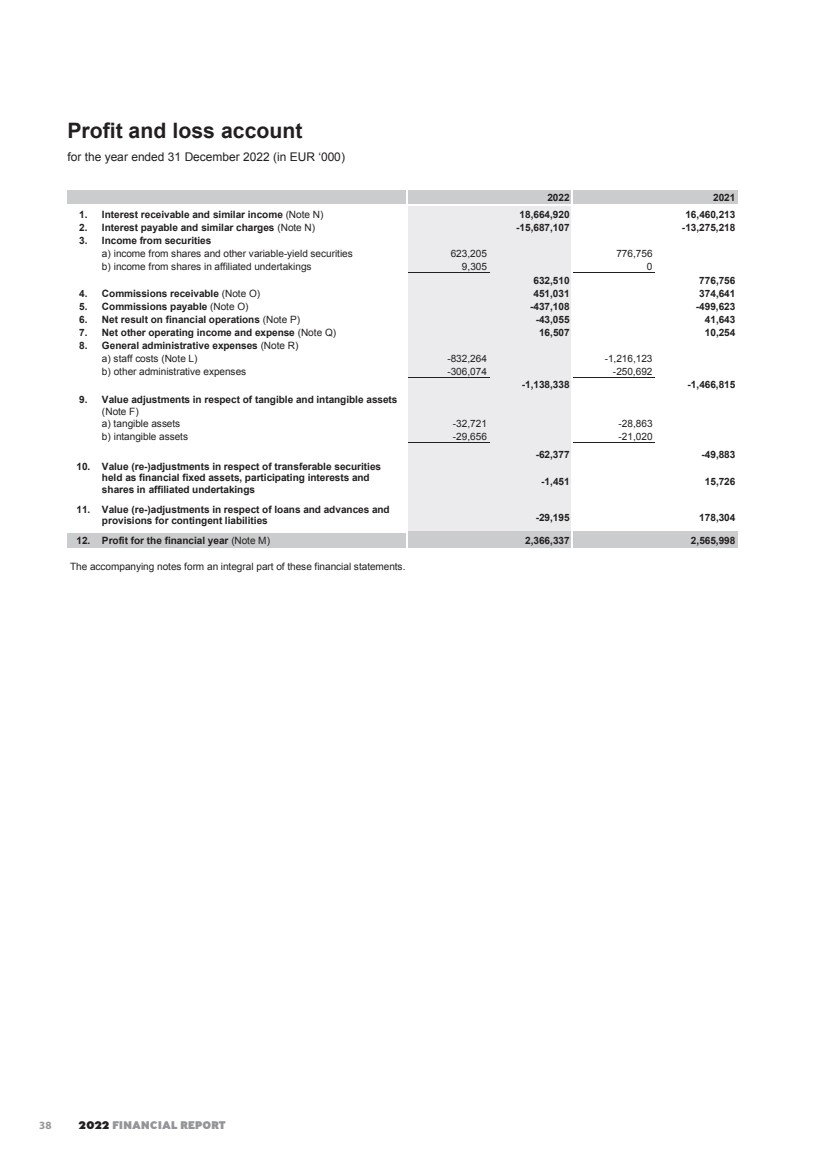
| EIB STATUTORY FINANCIAL STATEMENTS 47 Cash flow statement for the year ended 31 December 2022 (in EUR ‘000) 2022 2021 A. Cash flows from operating activities: Profit for the financial year (Note M) 2,366,337 2,565,998 Adjustments for: Value (re-)adjustments in respect of loans and advances and provisions for contingent liabilities 29,195 -178,304 Value adjustments in respect of tangible and intangible assets, and write-off (Note F) 62,377 49,991 Value (re-)adjustments in respect of transferable securities held as financial fixed assets, shares, other variable-yield securities and participating interests (Note E.1) -1,055 -79,961 Net interest income (Note N) -2,977,813 -3,184,995 Effect of exchange rate changes -171,829 42,462 Loss on operating activities -692,788 -784,809 Disbursements of loans and advances to credit institutions and customers -50,141,816 -37,670,096 Repayments of loans and advances to credit institutions and customers 44,748,413 50,380,405 Change in other loans and advances (Note C) 6,721,674 8,693,821 Change in deposit with Central Bank of Luxembourg to cover minimum reserve requirement (Note B.1) 57,213 -35,110 Change in treasury operational portfolios 17,555,084 -7,904,926 Change in amounts owed to credit institutions and customers (Note J) -18,559,687 7,277,699 Change in provisions on pension plans and health insurance scheme (Note L) 207,439 614,599 Change in provision in respect of guarantee operations (Note D.4) 58,668 17,170 Change in other assets and other liabilities (Note G) -290,634 -325,277 Change in prepayments and accrued income and in accruals and deferred income 6,305,595 1,375,527 Interest received 16,039,887 16,097,396 Interest paid -13,648,305 -12,253,421 Net cash used from/(used in) operating activities 8,360,743 25,482,978 B. Cash flows from investing activities: Purchase / Subscription of EIF shares 0 -736,355 Securities in Long-Term HQLA Portfolio purchased during the year -1,778,122 -385,243 Securities from Long-Term HQLA Portfolio matured or sold during the year 450,000 701,588 Purchase of loan substitutes included in the debt securities portfolios -3,953,827 -2,169,847 Redemption of loan substitutes included in the debt securities portfolios 4,550,236 4,298,703 Additions on shares and other variable-yield securities (Note E.1) -2,132,239 -2,303,579 Reflows on shares and other variable-yield securities (Note E.1) 1,590,693 2,033,717 Additions on participating interests (Note E.1) -76,231 -83,732 Reflows on participating interests (Note E.1) 39,744 115,465 Purchase of tangible and intangible assets (Note F) -81,140 -62,456 Net cash used from/(used in) investing activities -1,390,886 1,408,261 C. Cash flows from financing activities: Issuance of debts evidenced by certificates (Note K) 84,649,253 100,348,462 Redemption of debts evidenced by certificates (Note K) -97,048,909 -107,709,303 Member States’ contribution 319,700 319,700 Net cash used from/(used in) financing activities -12,079,956 -7,041,141 Summary statement of cash flows: Cash and cash equivalents at the beginning of financial year 68,738,510 47,846,444 Net cash from: Operating activities 8,360,743 25,482,978 Investing activities -1,390,886 1,408,261 Financing activities -12,079,956 -7,041,141 Effect of exchange rate changes on cash held -92,395 1,041,968 Cash and cash equivalents at the end of financial year 63,536,016 68,738,510 Cash and cash equivalents are composed of: Cash in hand, balances with central banks and post office banks, excluding deposit with Central Bank of Luxembourg to cover minimum reserve requirement (Note B.1) 25,389 1,338,806 Money market securities (Note B.2) 552,038 142,403 Loans and advances to credit institutions and customers: Repayable on demand 658,339 562,513 Other loans and advances (Note C) 62,300,250 66,694,788 63,536,016 68,738,510 The accompanying notes form an integral part of these financial statements. 39 |
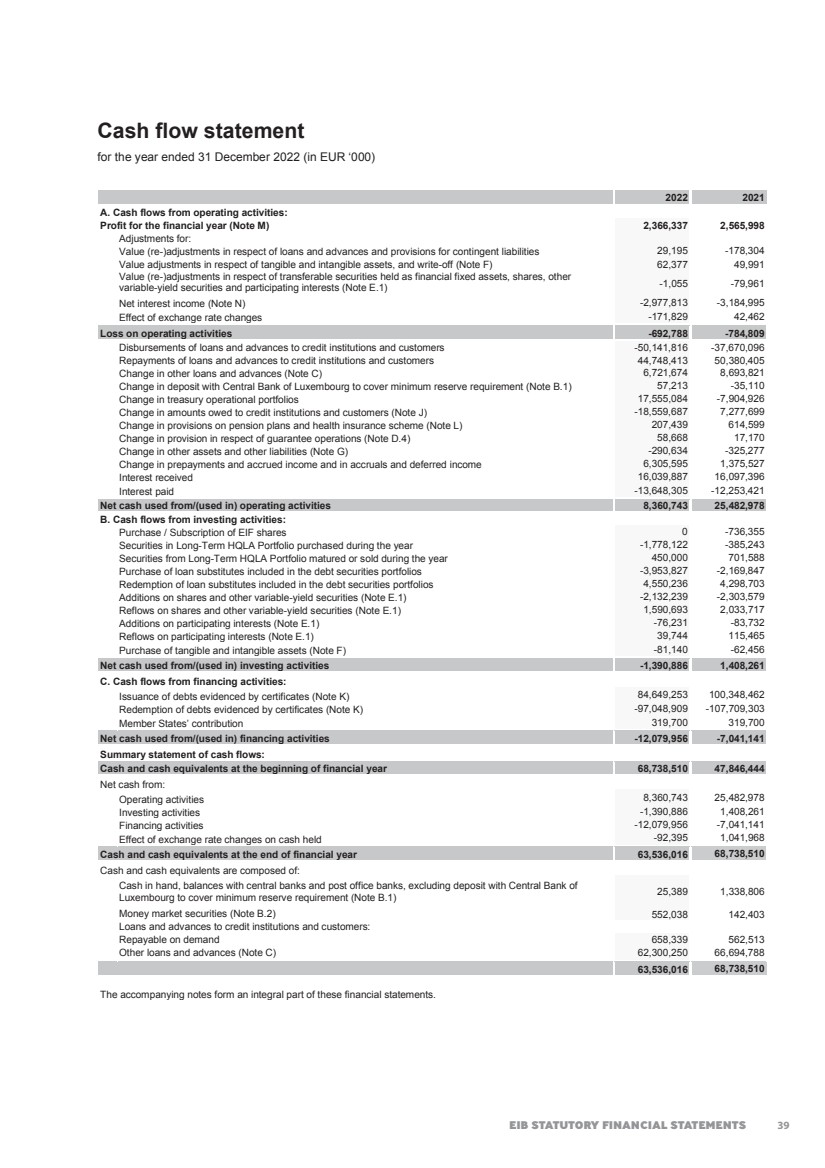
| 2022 FINANCIAL REPORT 48 European Investment Bank Notes to the financial statements as at 31 December 2022 The European Investment Bank (the ‘Bank’ or ‘EIB’) was created by the Treaty of Rome in 1958 as the long-term lending bank of the European Union (‘EU’). The task of the Bank is to contribute towards the integration, balanced development and economic and social cohesion of the EU Member States. The EIB raises substantial volumes of funds on the capital markets and lends these funds on favourable terms to projects furthering EU policy objectives. The EIB continuously adapts its activities to developments in EU policies. The Bank has its registered office at 98-100, boulevard Konrad Adenauer, L-2950 Luxembourg. Note A – Significant accounting policies A.1. Basis of preparation A.1.1. Accounting standards The unconsolidated financial statements (the ‘Financial Statements’) of the European Investment Bank have been prepared in accordance with the general principles of Directive 86/635/EEC of the Council of the European Communities of 8 December 1986 on the annual accounts and consolidated accounts of banks and other financial institutions, as amended by Directive 2001/65/EC of 27 September 2001, by Directive 2003/51/EC of 18 June 2003 and by Directive 2006/46/EC of 14 June 2006 on the annual and consolidated accounts of certain types of companies, banks and other financial institutions (the ‘Directives’) and on a going concern basis. On a proposal from the Management Committee, the Board of Directors adopted the Financial Statements on 29 March 2023 and authorised their submission to the Board of Governors for approval by 25 April 2023. The Bank also publishes consolidated financial statements as at the same date as the annual Financial Statements. A.1.2. Significant accounting judgments and estimates In preparing the Financial Statements, the Management Committee is required to make estimates and assumptions that affect reported income, expenses, assets, liabilities and disclosure of contingent assets and liabilities. Use of available information and application of judgement are inherent in the formation of estimates. Actual results in the future could differ from such estimates and the resulting differences may be material to the Financial Statements. The most significant use of judgments and estimates is as follows: Value adjustments on loans and advances and loan substitutes The Bank reviews its loans and advances and loan substitutes at each reporting date to assess whether an allowance for value adjustments should be recorded. In particular, judgment by management is required in the estimation of the amount and timing of future cash flows when determining the level of allowance required. Such estimates are based on assumptions about a number of factors and actual results may differ, resulting in future changes to the allowance. In addition to a specific allowance against individually significant loans and advances and loan substitutes, the Bank also makes a collective provisioning test on exposures that, although not specifically identified as requiring a specific allowance, have a greater risk of default than when the loans and advances and loan substitutes were originally granted (see Note A.2.6). Value adjustments on shares and other variable-yield securities and participating interests In order to determine the lower of cost or market value, the Bank reviews its indirect equity investments at each reporting date to assess whether a value adjustment should be recorded. In particular, the Bank determines the attributable EIB share of the net asset value (‘NAV’) of its indirect equity investments either by (i) considering the latest available fund manager report based on applicable industry guidelines and standards, (ii) any NAV derived from any other equivalent guidelines or standard or (iii) internally based on information provided by the fund manager. Fair values for most of the underlying investments have been estimated in the absence of readily ascertainable market values. Due to the inherent uncertainty of valuations, and current market conditions, actual results in the future could differ from the fund managers’ estimates of values and such differences could be material to the financial statements. Moreover, any attributable NAV available only after the balance sheet date are only considered if management considers they materially affect the financial statements (see Note A.2.7.1). Provisions in respect of guarantee operations The Bank initially recognises the financial guarantee contract at fair value, corresponding to the net present value (‘NPV’) of expected premium inflows or the initial expected loss. The financial guarantee is subsequently measured as the deficit of the net present value of expected future premium over the higher of the corresponding loss allowance and the premium received on initial recognition less income recognised. The Bank also makes a collective provisioning test on exposures that, although not specifically identified as requiring a specific allowance, have a greater risk of default than when the guarantees were originally signed and issued (see Note A.2.13). 40 |
| EIB STATUTORY FINANCIAL STATEMENTS 49 Pension and other post-employment benefits The cost of defined-benefit pension plans and other post-employment medical benefits is determined using actuarial valuations. The actuarial valuation involves making assumptions about discount rates, mortality rates and future salary and pension increases. Due to the long-term nature of these plans, such estimates are subject to significant uncertainty (see Note A.2.10). A.1.3. Bank’s exposure to the United Kingdom (‘UK’) On 29 March 2017, the United Kingdom notified the European Council of its decision to withdraw from the European Union (‘EU’) pursuant to Article 50 of the Treaty on European Union (‘TEU’). As of 1 February 2020, in accordance with Article 50 TEU and the Agreement on the withdrawal of the United Kingdom of Great Britain and Northern Ireland from the European Union and the European Atomic Energy Community (the “Withdrawal Agreement”), the United Kingdom ceased to be an EU Member State. The withdrawal of the United Kingdom from the EU automatically resulted in the termination of its membership of the European Investment Bank (‘EIB’) and its share of the EIB’s subscribed capital. Effective 1 February 2020, the share of the United Kingdom in respect of the EIB’s subscribed capital was fully replaced by a pro rata capital increase of the remaining EU Member States. This capital replacement (Symmetrical Capital Replacement) covered both the called part as well as the uncalled part of the subscribed capital of the United Kingdom in the EIB. The replacement of the called part was financed by converting EIB reserves into called subscribed capital. As a result of the capital increase, each remaining EU Member State increased pro rata its uncalled (but callable) stake in the EIB’s subscribed capital. In addition, the capital subscribed by Poland and Romania in the EIB increased by EUR 5,386,000,000 and EUR 125,452,381, respectively. This capital increase (Asymmetrical Capital Increase) took effect on 1 March 2020, one month after the withdrawal of the United Kingdom from the EU. Poland and Romania will pay the called portion of their increase in the EIB’s subscribed capital and contribute to the EIB reserves in ten equal semi-annual instalments. The Withdrawal Agreement contains, among other things, several provisions governing the financial settlement in respect of the EIB as a result of the termination of UK membership of the EIB. In accordance with the provisions laid down in Article 150 of the Withdrawal Agreement, the United Kingdom shall remain liable, under its former share of the subscribed capital in the EIB, for the EIB’s pre-withdrawal exposure. In this respect as at 31 December 2022, the EIB’s pre-withdrawal exposure amounts to EUR 444,380 million whereas the limit of the United Kingdom’s liability amounts to EUR 39,195 million. The United Kingdom shall also remain liable for other EIB risks as long as such risks are not related to post-withdrawal lending. In addition, in accordance with the provisions laid down in Article 150 of the Withdrawal Agreement, the EIB shall pay to the United Kingdom on behalf of the EU an amount equal to the UK share of the called capital of the EIB in twelve annual instalments. Except for such repayment of the UK called capital, the EIB shall not be obliged to make any other payment, return or remuneration to the United Kingdom in connection with the termination of its membership of the EIB or on account of the retention by the United Kingdom of certain liabilities as described in the relevant provisions of the Withdrawal Agreement. A.2. Summary of significant accounting policies A.2.1. Foreign currency translation The EIB uses the euro (‘EUR’) as the unit of measurement for the capital accounts of Member States and for presenting its Financial Statements. The Bank conducts its operations in euro, in other currencies of the EU Member States and in non-EU currencies. Its resources are derived from its capital, borrowings and accumulated earnings in various currencies. Foreign currency transactions are translated at the exchange rate prevailing on the date of the transaction. The Bank's monetary assets and liabilities denominated in currencies other than euro are translated into euro at the closing exchange rates prevailing at the balance sheet date. The gain or loss arising from such translation is recorded in the profit and loss account under “Net result on financial operations”. A.2.2. Derivatives The Bank uses derivative instruments, mainly currency and interest rate swaps, as part of its asset and liability management (‘ALM’) activities to manage exposures to interest rate and foreign currency risks. All derivatives transactions are recorded at their nominal values as off-balance sheet items at the date of the transaction. The majority of the Bank’s swaps are concluded with a view to hedging bond issues and treasury bonds from Long-Term HQLA Portfolio (‘LTHP’). The Bank enters into currency and interest rate swaps, whereby the proceeds of a borrowing are initially converted into a different currency and at maturity the Bank will obtain the amounts needed to service the borrowing in the original currency or in order to modify the interest rate positions of a borrowing or treasury bond. The Bank also enters into currency, interest rate and overnight index swaps as part of its hedging operations on loans or for the global ALM position. The corresponding interest is accounted for on a pro rata temporis basis. The Bank also uses short-term derivative instruments, primarily FX swaps, as part of its treasury operations, as well as derivatives hedging the actively managed portfolio (Securities liquidity portfolio). 41 |
| 2022 FINANCIAL REPORT 50 A.2.2.1. Derivatives under Securities liquidity portfolio As part of the Securities liquidity portfolio (‘SLP’), derivatives are entered in and recorded at market value in the balance sheet as “Other assets” when their market value is positive or “Other liabilities” when their market value is negative. Changes in the market value are included in “Net result on financial operations”. Market values are obtained from quoted market prices, discounted cash flow models and option pricing models, which consider current market and contractual prices for the underlying instrument, as well as the time value of money, yield curve and volatility of the underlying. Interest on derivative instruments is accrued pro rata temporis under “Prepayments and accrued income” or “Accruals and deferred income”. Interest rate swaps Interest rate swap contracts are entered into in order to modify the interest rate positions. The interest received and paid under interest rate swaps is accrued pro rata temporis and reported in the profit and loss account under “Interest receivable and similar income” or “Interest payable and similar charges”. The market value is recorded under “Other assets” when their market value is positive or “Other liabilities” when their market value is negative. Changes in the market value are included in “Net result on financial operations”. Futures contracts Interest rate and bond futures contracts (futures) are entered to hedge the exposure deriving from investments in government and other bonds. Futures are highly standardised derivative contracts, traded on regulated markets and are subject to daily margin requirements. The market value is recorded under “Other assets” when their market value is positive or “Other liabilities” when their market value is negative. Changes in the market value are included in “Net result on financial operations”. A.2.2.2. Other derivatives Currency swaps Currency swap contracts are entered into in order to adjust currency positions. The revaluation of the spot leg of a currency swap is neutralised in “Accruals and deferred income” or “Prepayments and accrued income”. The forward leg of the currency swap is recorded off-balance sheet at settlement amount and is not revalued. The premium/discount between the spot and forward settlement amounts is amortised pro rata temporis through the profit and loss account in “Interest receivable and similar income” or “Interest payable and similar charges”. Interest rate swaps Interest rate swap contracts are entered into in order to modify the interest rate positions. The hedging interest rate swaps are not revalued and their nominal is recorded off-balance sheet. The interest received and paid under interest rate swaps is accrued pro rata temporis and reported in the profit and loss account under “Interest receivable and similar income” or “Interest payable and similar charges”. Currency forwards Currency forwards are entered into in order to adjust future currency positions. The forward leg is recorded off-balance sheet at the settlement amount and is not revalued. The difference between the spot amounts and the forward settlement amounts is amortised pro rata temporis through the profit and loss account in “Interest receivable and similar income” or “Interest payable and similar charges”. Interest on derivative instruments is accrued pro rata temporis under “Prepayments and accrued income” or “Accruals and deferred income”. A.2.3. Financial assets and liabilities Financial assets and liabilities are accounted for using the settlement date basis. A.2.4. Cash and cash equivalents Cash and cash equivalents are disclosed in the cash flow statement and comprise cash on hand, unrestricted balances held with central banks, on demand amounts due, and highly liquid money market securities or term deposits with initial maturity of 3 months or less from the date of acquisition. These instruments are subject to an insignificant risk of changes in their value, readily convertible to cash and are used by the Bank in the management of its short-term commitments. 42 |
| EIB STATUTORY FINANCIAL STATEMENTS 51 A.2.5. Treasury bills and other bills eligible for refinancing with central banks and debt securities including fixed-income securities A.2.5.1. Long-Term High Quality Liquid Assets (HQLA) Portfolio (‘LTHP’) The former long-term hedge portfolio (‘LTHP’) was reformed during 2021 into Long-Term High Quality Liquid Assets (HQLA) Portfolio (‘LTHP’). This reform, among others, implied changes to the size of portfolio, new eligible currency and scope of authorised investments. There has been no change in the business model for securities purchased under the new portfolio which are still kept with the intention to hold them to maturity. Under the new reform, investments are authorised in securities that are issued or guaranteed by: • Governments of the European Union Member States and the United States of America (USA); • European Union, European Stability Mechanism, European Financial Stability Facility. These securities are initially recorded at the purchase price. Value adjustments are accounted for, if these are other than temporary. The difference between the entry price and redemption value is accounted for pro rata temporis over the life of the securities as “Interest receivable and similar income” or “Interest payable and similar charges”. A.2.5.2. Operational portfolios Treasury Monetary Portfolio (‘TMP’) In order to maintain an adequate level of liquidity, the Bank purchases money market products with a maximum maturity of 12 months, in particular treasury bills and negotiable debt securities issued by public bodies and credit institutions. The securities in the Treasury Monetary Portfolio are held until their final maturity and are initially recorded at purchase price and subsequently presented in the Financial Statements at amortised cost. The difference between purchase price and redemption value is accounted for pro rata temporis over the life of the securities as “Interest receivable and similar income” or “Interest payable and similar charges”. Value adjustments are accounted for under “Value (re-)adjustments in respect of transferable securities held as financial fixed assets, participating interests and shares in affiliated undertakings”, if these are other than temporary. Securities liquidity portfolio (‘SLP’) SLP comprises listed debt securities issued or guaranteed by national governments, supranational institutions, financial institutions and corporations. The portfolio is largely driven by an active management and follow the initial recognition at purchase price and subsequently the securities of this portfolio are presented in the Financial Statements at market value. Changes in market value are recorded under “Net result on financial operations” in the profit and loss account. The market value of SLP is based on published price quotations in an active market as the first source. For instruments without available published price quotations, the market values are determined by obtaining quotes from market participants and/or by using valuation techniques or models, based whenever possible on observable market data prevailing at the balance sheet date. A.2.5.3. Loan substitutes The Loan substitutes portfolios mainly consist of obligations in the form of bonds, notes or certificates issued by special purpose vehicles (‘SPVs’), trust vehicles or financial institutions. These securities are kept with the intention to be held to maturity and initially recorded at purchase price and subsequently valued at amortised cost. The difference between purchase price and redemption value is accounted for pro rata temporis over the life of the securities as “Interest receivable and similar income”. Individual value adjustments are accounted for, if these are other than temporary. Collective value adjustments are recorded to capture contracts which are impaired but have not yet been identified as such respectively for losses incurred but not yet reported. Individual and collective value adjustments are recorded in the profit and loss account as “Value (re-)adjustments in respect of transferable securities held as financial fixed assets and participating interests” and are deducted from the appropriate asset items on the balance sheet. Undisbursed parts of loan substitutes are recorded in off balance sheet at their nominal value. A.2.5.4 Preferred creditor status (‘PCS’) The principle of supremacy of EU primary law and the principle that the property of the EIB shall be exempt from all forms of requisition and expropriation, as enshrined in the EIB Statute, are deemed to guarantee a full recovery of the EU Sovereign Exposures on maturity. This financial protection and the benefit of the preferred creditor status result in no credit risk or impairment loss from Member States sovereign exposure or guarantees. However, similarly to other creditors, the EIB is bound by the majority decision based on collective action clauses (‘CAC’) included in debt instruments issued by EU Sovereigns. A.2.6. Loans and advances to credit institutions and customers A.2.6.1. Loans and advances Loans and advances are included in the assets of the Bank at their net disbursed amounts. Individual value adjustments have been recorded for loans outstanding at the end of the period and presenting risks of non-recovery of all or part of their amounts. Collective value adjustments have been recorded to capture loans in the portfolio which are impaired but have not yet been identified as such or for losses which have been incurred but not yet reported. Such value adjustments are held in the same currency as the assets to which they relate. Value adjustments are accounted for in the profit and loss account as “Value (re-)adjustments in respect of loans and advances and provisions for contingent liabilities” and are deducted from the appropriate asset items on the balance sheet. Undisbursed parts of loans and advances are recorded in off balance sheet at their nominal value. 43 |
| 2022 FINANCIAL REPORT 52 A.2.6.2. Interests on loans Interests on loans are recorded in the profit and loss account on an accrual basis, i.e. over the life of the loans. On the balance sheet, accrued interest is included in “Prepayments and accrued income” under assets. Value adjustments to interest amounts on these loans are determined on a case-by-case basis by the Bank’s Management and deducted from the appropriate asset item on the balance sheet. For non-performing loans, upon value adjustment, the accrual of interest income based on the original terms of the claim may be discontinued. A.2.6.3. Reverse repurchase agreements (‘Reverse repos’) A reverse repurchase agreement is one under which the Bank lends liquid funds to a credit institution which in return provides collateral in the form of securities. The two parties enter into an irrevocable commitment to complete the operation on a date and at a price fixed at the outset. The operation is based on the principle of delivery against payment: the borrower of the liquid funds transfers the securities to the EIB’s custodian in exchange for settlement at the agreed price, which generates a return for the EIB linked to the money market. This type of operation is considered for the purposes of the Bank to be a loan at a guaranteed rate of interest. Generally treated as collateralised financing transactions, they are carried at the amounts of cash advanced or received, plus accrued interest. Reverse repos are entered at their nominal amount on the assets side of the statutory balance sheet under “Loans and advances to credit institutions - b) other loans and advances”. Securities received under reverse repurchase agreements are not recognised in the statutory balance sheet, unless control of the contractual rights comprised in these securities is assumed. The Bank monitors the market value of the securities received on a daily basis and requests additional collateral in accordance with the underlying agreements. Interest on reverse repurchase agreements is recognised as “Interest receivable and similar income” or “Interest payable and similar charges” over the life of each agreement. A.2.6.4. Interest subsidies Interest subsidies received in advance (see Note I) are deferred and recognised in the profit and loss account over the period from disbursement to repayment of the subsidised loan. A.2.6.5. Term and on-demand deposits (‘Deposits’) Deposits are operations under which the Bank lends liquid funds to a credit institution or customer for a certain period or on-demand against a return agreed between the parties. Deposits are entered at their nominal amount on the assets side of the statutory balance sheet under “Loans and advances to credit institutions or customers - other loans and advances”. Interest on deposits is recognised as “Interest receivable and similar income” or “Interest payable and similar charges” over the life of deposit term. A.2.7. Shares, other variable-yield securities, participating interests and shares in affiliated undertakings A.2.7.1. Shares, other variable-yield securities and participating interests The Bank holds shares, other variable-yield securities and participating interests when it enters into private equity and venture capital operations, debt funds, infrastructure funds, investment funds or participations in the form of direct equity. These investments are initially recorded at acquisition cost, reduced by any reflow resulting from repayments. Their carrying value is adjusted to the lower of cost or market value at subsequent measurement at the balance sheet date. In certain co-investments performed by the Bank, the investments are initially recognised at cost and the net-paid-in represents the drawdowns paid net of any capital repayments allocated in accordance with the agreed waterfall. Based on the reports received from fund managers, the portfolios of investments are valued on a line-by-line basis at the lower of cost or attributable NAV, thus excluding any attributable unrealised gain that may be prevailing in the portfolio. The attributable NAV is determined by applying in order of priority, and subject to availability at the reporting date, either: • the Bank share of NAV at the latest available date, submitted by the respective fund manager, or; • the number of shares or units held by the Bank multiplied by the price per share or units latest available date reported by fund manager, or; • the Bank’s percentage ownership in the specific compartment multiplied by the specific compartment net asset value (the “NAV”) reflected in the most recent fund manager’s report, or; • the Bank’s percentage of ownership in the fund multiplied by the latest available fund NAV. In certain co-investments performed by the Bank, the attributable NAV may be determined based on the agreed waterfall calculation. The attributable NAV is adjusted for events occurring between the date of the latest available NAV and the balance sheet date to the extent that such adjustment is considered to be material by the Management Committee. The undrawn but committed part of these investments is recorded as off balance sheet commitments at their nominal value. 44 |
| EIB STATUTORY FINANCIAL STATEMENTS 53 Secondary sales Secondary sale transactions on venture capital funds and investment funds lead to derecognition of the underlying assets. Gains or losses from secondary sales are recorded in “Net result on financial operations” and are calculated as the difference between the sales proceeds and the net carrying amount. Participating interest The shares acquired by the EIB for its own account typically represent investments in venture capital operations, debt funds, infrastructure funds and investment funds. According to industry practice, such investments are generally subscribed by a number of investors, none of whom is in a position to individually influence the daily operations and the investment activity of such funds. As a consequence, any membership by an investor in a governing body of such a fund does not, in principle, entitle said investor to influence the day-to-day operations of the fund. In addition, individual investors in venture capital operations, infrastructure funds or investment funds do not determine policies of a fund such as distribution policies on capital repayments or other distributions. Such decisions are typically taken by the management of a fund on the basis of the shareholders’ agreement governing the rights and obligations of the management and all shareholders of the fund. The shareholders’ agreement also generally prevents individual investors from bilaterally executing material transactions with the fund, interchanging managerial personnel or obtaining privileged access to essential technical information. Such above-mentioned criteria are assessed by the EIB through a comprehensive analysis involving judgement in order to determine whether it has significant influence or joint control over those entities they acquired shares in. In case there is significant influence or joint control over the entity, it is disclosed under “Participating interest”. Capital subscribed by the Bank but uncalled from the investment in EBRD is recorded off balance sheet. A.2.7.2. Shares in affiliated undertakings Shares in affiliated undertakings represent medium and long-term investments and are accounted for at cost. Value adjustments are accounted for, if these are other than temporary. Commitments provided in the form of a put option in respect of the shares held by any of the minority shareholders, are recorded off-balance in the amount of the exercise price. A.2.8. Tangible assets Tangible assets include land, Bank-occupied properties, other machines and equipment. Land is stated at acquisition cost and buildings are stated at acquisition cost less accumulated depreciation, less accumulated impairment. The costs of the Bank's headquarters buildings in Luxembourg-Kirchberg and its building in Luxembourg-Weimershof are depreciated on a straight-line basis as set out below. Permanent equipment, fixtures and fittings, furniture, office equipment and vehicles have been recorded in the balance sheet at their acquisition cost, less accumulated depreciation, less accumulated impairment. Depreciation is calculated on a straight-line basis over the estimated life of each item purchased, as set out below: • Buildings in Kirchberg and Weimershof: 30 years; • Permanent equipment, fixtures and fittings: 10 years; • Furniture: 5 years; • Office equipment and vehicles: 3 years. There is no depreciation of the accumulated costs of work-in-progress assets until they are completed and the assets are ready to use for the intended purpose. A.2.9. Intangible assets Intangible assets comprise computer software. Software development costs are capitalised if they meet certain criteria relating to identifiability, the probability that future economic benefits will flow to the enterprise and to the reliability of cost measurement. Internally developed software meeting these criteria is carried at cost less accumulated amortisation, which is calculated on a straight-line basis over three years from completion, less accumulated impairment. There is no amortisation of the accumulated costs of work-in-progress assets until they are completed and the assets are ready to use for the intended purpose. A.2.10. Pension plans and health insurance scheme A.2.10.1. Pension plan for staff The Bank operates defined-benefit pension plans to provide retirement benefits to substantially its entire staff. The Bank's main pension scheme is a defined-benefit pension scheme funded by contributions from staff and from the Bank which covers all employees. All contributions of the Bank and its staff are invested in the assets of the Bank. 45 |
| 2022 FINANCIAL REPORT 54 Commitments for retirement benefits are valued at least every year using the projected unit credit method, in order to ensure that the provision entered in the accounts is adequate. The latest valuation was carried out as at 31 December 2022 based on membership data as at 30 September 2022 and cashflows to 31 December 2022. The main assumptions used by the actuary are set out in Note L. Cumulative current year actuarial gains or losses in excess of 10% of the commitments for retirement benefits are recognised over a period of 7 years on a straight-line basis. Once the provision has reached the amortisable portion of the actuarial value of the retirement and health insurance benefits, no further amortisation is recognised in the profit and loss account. Furthermore, in case the provision should exceed the actuarial value of the retirement and health insurance benefits, any excess will not be released to the profit and loss account in subsequent periods. A.2.10.2. Health insurance scheme The Bank has set up its own health insurance scheme for the benefit of staff, financed by contributions from the Bank and its employees. The health insurance scheme is managed and accounted for under the same principles as the pension plan for staff described in Note A.2.10.1. The latest valuation was carried out as at 31 December 2022 based on membership data as at 30 September 2022 and cashflows to 31 December 2022. A.2.10.3. The Management Committee pension plan The Management Committee pension plan is a defined-benefit pension scheme funded by contributions from the Bank only which covers all Management Committee members. All contributions of the Bank are invested in the assets of the Bank. The Management Committee pension plan is managed and accounted for under the same principles as the pension plan for staff described in Note A.2.10.1. A.2.10.4. Optional Supplementary Provident Scheme The Optional Supplementary Provident Scheme is a defined-contribution pension scheme, funded by voluntary staff contributions and employer contributions. The corresponding liability is recorded in “Other liabilities”. A.2.11. Amounts owed to credit institutions and customers Amounts owed to credit institutions and customers are presented in the financial statements at their redemption amounts. Interest on amounts owed to credit institutions and customers is recorded in the profit and loss account on an accrual basis as “Interest payable and similar charges“ or “Interest receivable and similar income”, if interest rate is negative. Accrued interest is included in “Accruals and deferred income” under liabilities. In the context of the Bank’s participation in monetary operations with the ECB, the amount borrowed from the BCL is recorded at its nominal value and presented in the statutory financial statements under “Amounts owed to credit institutions- b) with agreed maturity or periods of notice” - Borrowings from central banks. A.2.11.1 Repurchase agreements (‘Repos’) A repurchase agreement is one under which the Bank borrows liquid funds from a credit institution and provides collateral in the form of securities. The two parties enter into an irrevocable commitment to complete the operation on a date and at a price fixed at the outset. The operation is based on the principle of delivery against payment, which is mentioned in note A.2.6.3. This type of operation is considered for the purposes of the Bank to be a borrowing with an agreed rate of interest. Generally treated as collateralised financing transactions, they are carried at the amounts of cash owed, plus accrued interest. Repos are entered at their nominal amounts on the liabilities side of the balance sheet under “Amounts owed to credit institutions- b) with agreed maturity or periods of notice”. Interest on repurchase agreements is recognised as “Interest receivable and similar income” or “Interest payable and similar charges” over the life of each agreement. A.2.11.2 Collateral call accounts Under unilateral Collateral Support Annexes, the Bank receives cash as collateral to mitigate counterparty credit exposures on Derivatives, Lending and Treasury portfolios. The cash collateral received is recorded at its nominal value and presented in the statutory financial statements under “Amounts owed to credit institutions - a) repayable on demand” - Overnight deposits. A.2.12. Debts evidenced by certificates Debts evidenced by certificates are presented at their redemption amounts, except for zero-coupon bonds which are presented at their amortised cost. Transaction costs and premiums/ discounts are amortised in the profit and loss account on a straight-line basis over the life of the debt through “Accruals and deferred income” or “Prepayments and accrued income”. Interest on debt instruments is included in “Interest payable and similar charges” or “Interest receivable and similar income” in the profit and loss account. A.2.13. Financial guarantees Financial guarantee contracts require the issuer to make specified payments to reimburse the holder for a loss it incurs, if a specified debtor fails to make payment when due under the original or modified terms of a debt instrument. Signed financial guarantees are generally accounted for and disclosed as off-balance sheet items. 46 |
| EIB STATUTORY FINANCIAL STATEMENTS 55 Net liabilities from financial guarantees are presented in the balance sheet under “Provision in respect of guarantee operations”. This provision is intended to cover risks inherent in the Bank’s activity of issuing guarantees in favour of financial intermediaries or issued in respect of loans granted by third parties. Financial guarantees are initially recognised at fair value corresponding to the net present value (‘NPV’) of expected premium inflows or the initial expected loss. Subsequent to initial recognition, financial guarantees are measured as the deficit of the net present value of expected future premium inflows over the higher of: • the amount of the expected credit loss; and • the fair value initially recognised less any cumulative amount of income/amortisation recognised. Unrealised gains representing the excess of the net present value of expected future premium inflows over the amount of the expected payment obligations remain unrecognised. Any increase or decrease in the net liability relating to financial guarantees is recognised in the profit and loss account under “Value (re-)adjustments in respect of loans and advances and provisions for contingent liabilities”. Any premium received is recognised in the profit and loss account in “Commissions receivable”. Any upfront fees received are recognised in ”Accruals and deferred income” in the balance sheet and amortised in the profit and loss account on a straight-line basis over the life of the financial guarantee. A.2.14. Provision for commitments This provision is intended to cover risks inherent in the Bank’s commitment on loans, infrastructure and investment funds as well as private equity and venture capital operations signed but not yet disbursed. A.2.15. Reserves A.2.15.1. Reserve fund As provided for under Article 22(-1) of the Statute, “a reserve fund of up to 10% of the subscribed capital shall be built up progressively” from the retained profit of the Bank. A.2.15.2. Additional reserves Additional reserves contain the remaining retained earnings of the Bank. A.2.15.3. Special activities reserve As provided for under Article 16(-5) of the Statute, “the special activities of the Bank […] will have a specific allocation of reserve”. The special activities reserve is a dedicated notional reserve for the allocation of own funds covering unexpected losses of those activities, which have a risk profile higher than what is generally accepted by the Bank, including venture capital activities. The reserve is based on an allocation of each operation and is calculated according to the evolution of the underlying assets. A.2.15.4. General loan reserve In 2009, a “general loan reserve” was introduced for the Bank’s loan and guarantee portfolio, representing a notional reserve for allocation of own funds. It is calculated based on the Bank’s internal loan grading system according to the evolution of the underlying assets. A.2.16. Prepayments and accrued income Expenditure incurred during the financial year but relating to a subsequent financial year, together with any income for which payment is not due until the expiry of the underlying instrument. A.2.17. Accruals and deferred income Income received before the balance sheet date but relating to a subsequent financial year, together with any charges which, though relating to the financial year in question, will be paid only in the course of a subsequent financial year. A.2.18. Interest receivable and similar income “Interest receivable and similar income” includes mainly interest on loans and advances to credit institutions and customers, debt and money market instruments and derivatives. 47 |
| 2022 FINANCIAL REPORT 56 A.2.19. Interest payable and similar charges “Interest payable and similar charges” includes mainly interest on amounts owed to credit institutions and customers, interest expense on debt and money market instruments and derivatives. A.2.20. Income from securities “Income from securities” is mainly composed by reflows exceeding the capital. A.2.21. Taxation The Protocol on the Privileges and Immunities of the European Union appended to the Treaty on European Union and the Treaty on the Functioning of the European Union, stipulates that the assets, revenues, and other property of the institutions of the Union are exempt from all direct taxes. 48 |

| EIB STATUTORY FINANCIAL STATEMENTS 57 Note B – Cash in hand, balances with central banks and post office banks and debt securities portfolio (in EUR ‘000) B.1. Cash in hand, balances with central banks and post office banks The cash in hand and balances with central banks and post office banks equals to EUR ’000 112,655 at 31 December 2022 (2021: EUR ‘000 1,483,285). The EIB is an eligible counterparty in the Eurosystem’s monetary policy operations, therefore has been given access to the monetary policy operations of the European Central Bank. The Bank conducts the operations via the Central Bank of Luxembourg, where it maintains a deposit to cover the minimum reserve requirement. The balance of this deposit amounts to EUR ‘000 87,266 as at 31 December 2022 (2021: EUR ‘000 144,479). B.2. Debt security portfolios The debt security portfolios are composed of the Long-Term HQLA Portfolio (‘LTHP’), the treasury monetary portfolio (‘TMP’), the securities liquidity portfolio (‘SLP’) and the loan substitutes portfolio. The details of the debt security portfolios as at 31 December 2022 and 2021 are as follows: 31.12.2022 31.12.2021 Treasury bills and other bills eligible for refinancing with central banks 20,349,770 35,678,436 Debt securities including fixed-income securities 9,923,484 10,782,567 Total debt securities(*) 30,273,254 46,461,003 (*) of which EUR ‘000 6,664,380 are unlisted as at 31 December 2022 (2021: EUR ‘000 6,550,937). At 31.12.2022 Purchase price Book value Value Adjustments Premiums/ discounts to be amortised Value at final maturity Market value(**) LTHP 2,716,467 2,692,420 0 -56,400 2,636,020 2,263,503 TMP 6,964,454 6,995,106 0 33,930 7,029,036 6,986,325 SLP 3,329,029 3,172,836 0 0 3,328,249 3,172,836 Loan substitutes (Note D) 17,449,652 17,412,892 1,289 -3,126 17,411,055 16,800,313 Total debt securities(*) 30,459,602 30,273,254 1,289 -25,596 30,404,360 29,222,977 (*) of which cash and cash equivalents EUR '000 552,038. (**) Market value does not include accrued interest. At 31.12.2021 Purchase price Book value Value Adjustments Premiums/ discounts to be amortised Value at final maturity Market value(**) LTHP 1,384,662 1,340,985 0 -97,342 1,243,643 1,418,398 TMP 22,484,695 22,434,606 0 -35,118 22,399,488 22,435,374 SLP 4,761,521 4,733,721 0 0 4,714,307 4,733,721 Loan substitutes (Note D) 17,993,220 17,951,691 1,243 -6,339 17,946,595 18,033,089 Total debt securities(*) 46,624,098 46,461,003 1,243 -138,799 46,304,033 46,620,582 (*) of which cash and cash equivalents EUR '000 142,403. (**) Market value does not include accrued interest. Loan substitutes, which represent acquisitions of interests in pools of loans or receivables in connection with securitisation transactions, are considered to be part of the aggregate loans (Note D). Some of these transactions have been structured by adding credit or project related remedies, thus offering additional recourse. Following detailed review of loan substitutes portfolio for any value adjustment, an individual value adjustment for one transaction (2021: one transaction) has been recorded as at 31 December 2022 in the amount of EUR ‘000 1,262 (2021: EUR ‘000 1,243). A collective value adjustment on the loan substitutes portfolio was recorded in 2022 in relation to the war in Ukraine, amounting to EUR ‘000 27. The collective value adjustment recorded in 2020 to capture the effect of COVID-19 on the loan substitutes portfolio amounting to EUR ‘000 42 has been released as of 31 December 2021. 49 |
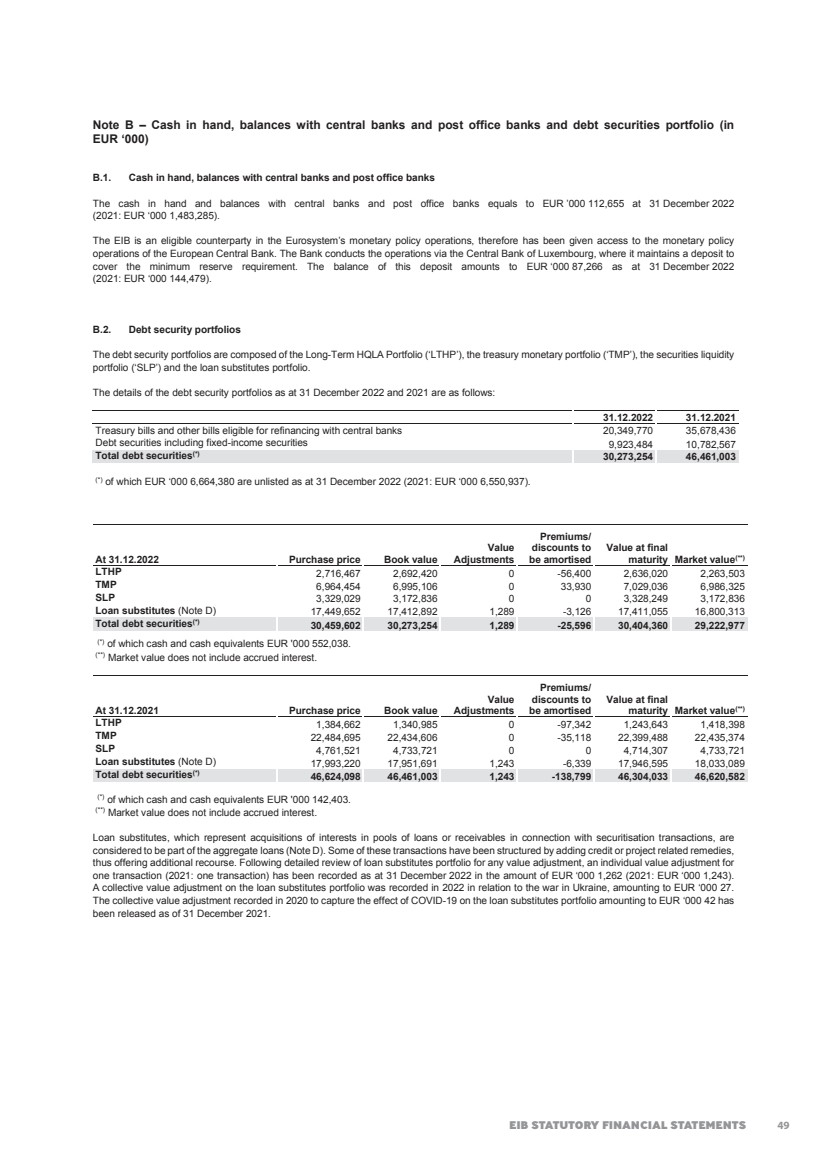
| 2022 FINANCIAL REPORT 58 EU sovereign exposure in bond holdings The Bank did not record value adjustments in 2022 and 2021 in respect of its held to maturity EU sovereign and EU sovereign guaranteed exposure as at year-end, in view of the Bank’s preferred creditor status and the protection given by the Bank’s Statute as well as a detailed review of any value adjustment requirements. The following tables show the exposure to debt issued or guaranteed by EU sovereigns in the Bank’s debt securities portfolios (including loan substitutes) as at 31 December 2022 and 2021: At 31.12.2022 Purchase price Book value Value at final maturity Market value EU sovereigns Austria 206,873 205,999 222,451 154,085 Belgium 158,851 158,294 150,000 121,080 Czech Republic 309,932 273,865 269,530 269,567 Finland 98,135 98,214 100,000 60,753 France 1,817,992 1,825,653 1,878,755 1,795,256 Germany 1,158,153 1,151,824 1,145,133 1,129,927 Italy 601,812 601,088 600,000 599,292 Netherlands 414,241 407,125 403,000 398,225 Poland 1,734,097 1,734,097 1,734,097 1,671,754 Slovenia 10,049 10,002 10,000 9,995 Spain 1,373,976 1,378,255 1,391,066 1,373,620 7,884,111 7,844,416 7,904,032 7,583,554 Non EU- sovereign and other bonds 22,575,491 22,428,838 22,500,328 21,639,423 Total 30,459,602 30,273,254 30,404,360 29,222,977 At 31.12.2021 Purchase price Book value Value at final maturity Market value EU sovereigns Austria 60,407 56,707 55,500 56,657 Belgium 62,150 62,072 62,000 62,114 Czech Republic 426,516 385,879 378,085 390,877 Denmark 17,615 17,616 17,658 17,616 France 1,256,636 1,243,705 1,240,288 1,245,478 Germany 983,045 971,840 951,664 1,021,546 Ireland 704,819 705,945 706,339 706,040 Italy 7,484,756 7,459,403 7,439,999 7,465,218 Lithuania 9,242 8,878 8,829 8,872 Luxembourg 25,233 25,223 25,000 25,223 Netherlands 366,403 355,095 348,000 367,345 Poland 547,662 547,489 547,480 466,185 Romania 88,047 83,733 83,214 83,665 Spain 5,839,387 5,827,451 5,823,235 5,826,979 Sweden 96,478 95,644 95,487 95,635 17,968,396 17,846,680 17,782,778 17,839,450 Non EU- sovereign and other bonds 28,655,702 28,614,323 28,521,255 28,781,132 Total 46,624,098 46,461,003 46,304,033 46,620,582 50 |
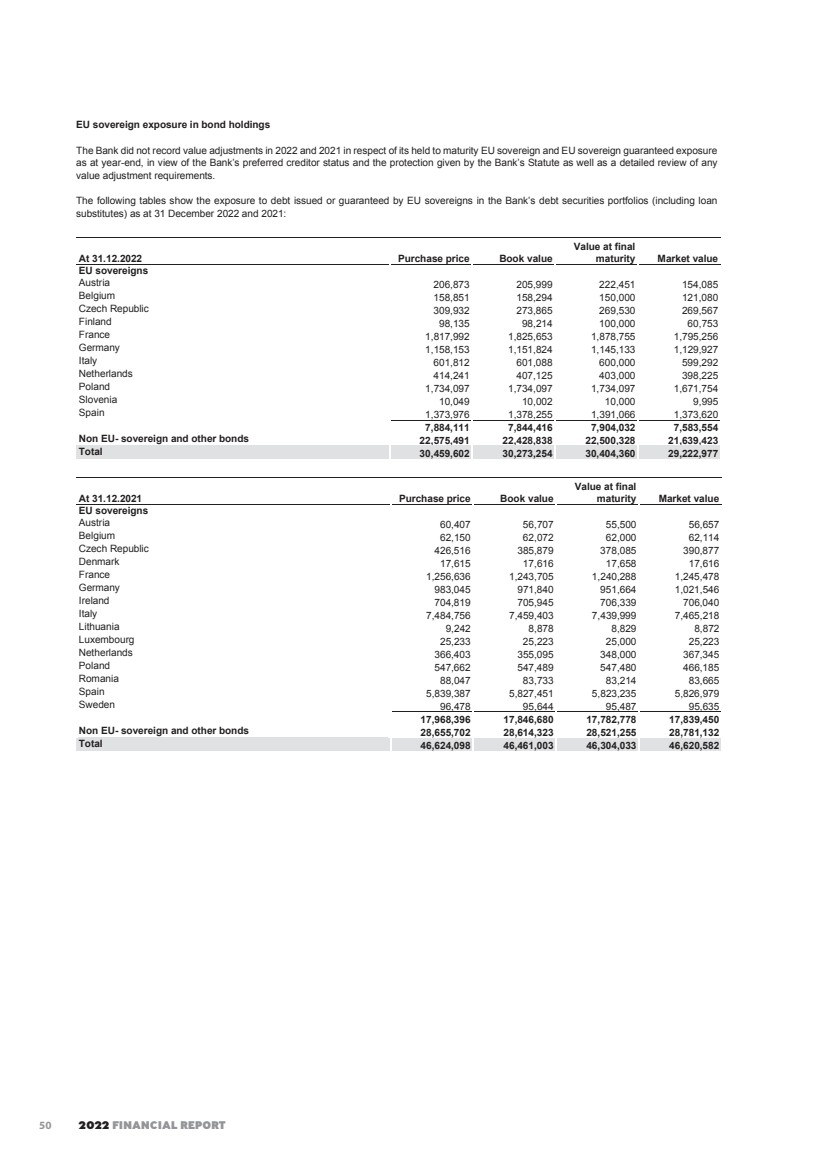
| EIB STATUTORY FINANCIAL STATEMENTS 59 Note C – Loans and advances to credit institutions and to customers – other loans and advances (in EUR ‘000) 31.12.2022 31.12.2021 Term deposits(*) 56,591,105 60,416,600 On-demand deposits 14,411 240,697 Reverse repos 7,381,282 13,894,159 Other loans and advances to credit institutions 63,986,798 74,551,456 Other loans and advances to customers 125,883 677,437 Total other loans and advances 64,112,681 75,228,893 of which cash and cash equivalents 62,300,250 66,694,788 (*) It includes deposits with Central Bank of Luxembourg of EUR 53.9 billion in 2022 (2021: EUR 56.7 billion). Note D – Summary statement of loans D.1. Aggregate loans granted (in EUR ‘000) Aggregate loans granted comprise both the disbursed and undisbursed portions of loans. The analysis is as follows: To intermediary credit institutions Directly to final beneficiaries 31.12.2022 31.12.2021 Disbursed portion 93,252,341 326,715,856 419,968,197 415,459,685 Undisbursed loans 31,375,087 93,274,466 124,649,553 122,954,291 Aggregate loans granted 124,627,428 419,990,322 544,617,750 538,413,976 Loan instalments receivable 21,746 145,347 167,093 472,853 Loan substitutes portfolio 17,414,181 17,952,934 Aggregate loans including loan substitutes portfolio (Note D.3) 562,199,024 556,839,763 D.2. Value adjustments for loans (in EUR ‘000) Movements in the value adjustments are detailed below: 2022 2021 At 1 January 439,008 647,769 Release during the year (1) -147,677 -229,532 Use during the year(2) -16,587 -31,561 Allowance during the year(1) 114,772 35,843 Foreign exchange adjustment 2,232 16,489 At 31 December(3) 391,748 439,008 (1) In 2020, the Bank recognised a collective provision in the view of the unfolding of COVID-19. In 2021, this collective provision was fully released in the view of (1) the update of the yearly counterparty rating re-assessment allowing a more granular view of the COVID-19 effect on the loan book and (2) the reduction of the expected credit losses for the remaining lifetime of the respective loans. In 2022, collective provision is re-introduced in the context of the war in Ukraine, in order to address the Bank’s need to capture the effect of this event and its broader economic consequences on its portfolio. Given the expected impact of the crisis on clients, it was deemed likely that there were financial assets in the portfolio which were impaired but had not yet been identified or losses which had incurred but had not been reported. In accordance with core principles of prudence and true and fair view of the EU-AD, these potential losses were reflected in the Bank’s financial statements. Consequently, the Bank assessed the potential impact of the crisis on its clients, including the effect of sanctions, soaring energy and raw material prices and supply chain disruptions. A vulnerability assessment has been performed in order to identify the sub-populations of exposures where losses might have been incurred but had not yet been individually identified. For those sub-populations, a collective provision has been computed on underlying exposures. The Bank recorded in 2022 a collective provision amounting to EUR ‘000 76,020 on loans (2021:nil) (2) In 2022, the Bank: • Completed a restructuring of 1 loan operation that was specifically provisioned at the beginning of the period: EUR ‘000 1,700 was used against the existing provision (2021: EUR '000 2,444 on one loan operation); • Wrote-off 3 loan operations that were specifically provisioned at the beginning of the year: EUR '000 6,872 was used against the existing provision (2021: EUR '000 6,750 on two loan operations); • Wrote-off 1 loan operation that had been specifically provisioned during the course of 2022: EUR '000 8,015 was used against the existing provision (2021: nil); • Completed no sale transaction of non-performing loan operations (2021: EUR '000 22,367 on two loan operations). (3) The value adjustments relate only to disbursed loans, including arrears. The Bank has additionally recorded value adjustments in regards to accrued interest of a total amount of EUR '000 10,788 (2021: EUR '000 4,919), which is recorded under the caption of "Prepayments and accrued income". 51 |
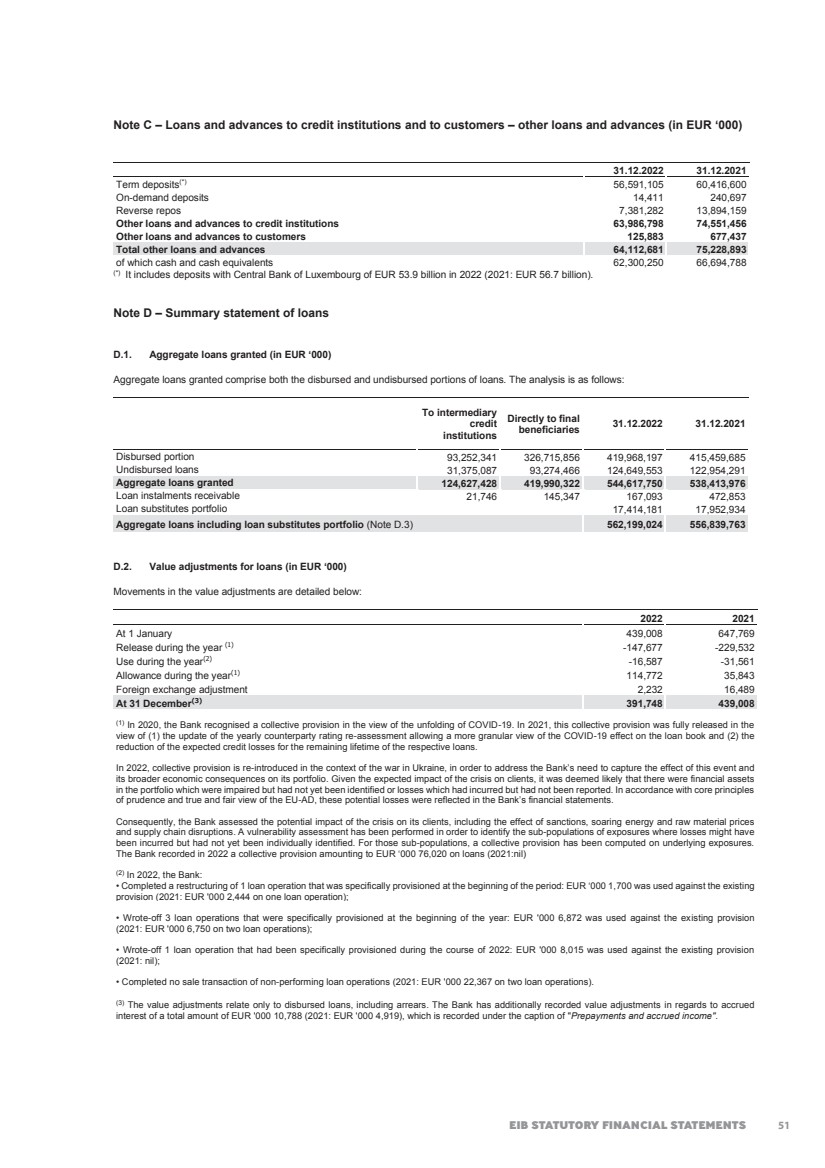
| 2022 FINANCIAL REPORT 60 D.3. Geographical breakdown of lending by country in which projects are located (in EUR ‘000) D.3.1. Loans for projects within the European Union Countries and territories in which projects are located Aggregate loans granted Disbursed portion Undisbursed portion % of total 2022 % of total 2021 Spain 75,382,451 65,778,480 9,603,971 13.42% 13.90% France 68,788,222 52,991,879 15,796,343 12.24% 11.49% Italy 64,321,697 50,715,315 13,606,382 11.45% 11.66% Germany 46,226,551 36,698,796 9,527,755 8.22% 8.01% Poland 45,410,360 36,431,234 8,979,126 8.08% 7.85% Greece 19,640,878 14,689,667 4,951,211 3.49% 3.58% Belgium 16,696,919 12,185,503 4,511,416 2.97% 2.79% Netherlands 16,555,295 13,124,835 3,430,460 2.95% 3.06% Austria 15,425,740 13,771,350 1,654,390 2.74% 2.70% Portugal 13,651,324 11,022,126 2,629,198 2.43% 2.43% Sweden 12,140,145 8,662,815 3,477,330 2.16% 2.19% Finland 10,807,665 9,000,038 1,807,627 1.92% 1.96% Hungary 9,943,661 7,819,150 2,124,511 1.77% 1.80% Ireland 8,012,122 6,188,129 1,823,993 1.43% 1.36% Czech Republic 7,874,206 4,943,481 2,930,725 1.40% 1.24% Romania 7,167,843 4,137,733 3,030,110 1.28% 1.21% Slovakia 4,437,227 3,809,733 627,494 0.79% 0.82% Denmark 3,901,255 3,057,925 843,330 0.69% 0.63% Croatia 3,497,538 2,917,826 579,712 0.62% 0.71% Lithuania 2,749,962 2,547,076 202,886 0.49% 0.49% Cyprus 2,640,543 1,923,842 716,701 0.47% 0.50% Slovenia 2,629,362 2,154,406 474,956 0.47% 0.51% Bulgaria 2,317,413 1,836,826 480,587 0.41% 0.40% Estonia 1,514,648 985,289 529,359 0.27% 0.29% Latvia 980,890 582,745 398,145 0.17% 0.22% Luxembourg 821,249 123,298 697,951 0.15% 0.12% Malta 408,737 253,960 154,777 0.07% 0.07% Sub-total 463,943,903 368,353,457 95,590,446 82.55% 81.99% D.3.2. Loans for projects outside the European Union1 D.3.2.1. Candidate Countries Countries and territories in which projects are located Aggregate loans granted Disbursed portion Undisbursed portion % of total 2022 % of total 2021 Türkiye 8,343,786 8,062,281 281,505 Ukraine* 6,023,946 3,085,020 2,938,926 Serbia 3,810,995 2,441,076 1,369,919 Bosnia and Herzegovina 1,959,881 1,217,797 742,084 Moldova, Republic of 954,190 475,406 478,784 Montenegro 696,320 470,956 225,364 North Macedonia 479,889 326,149 153,740 Albania 330,527 238,027 92,500 Sub-total 22,599,534 16,316,712 6,282,822 4.02% 2.63% * Total disbursed exposure amounts to EUR 3,085 million in 2022 (2021: EUR 1,570 million). Of this amount, EUR 2,852 million (2021: EUR 1,302 million) is covered by the Comprehensive Guarantee of the European Union under the External Lending Mandate. Of the remainder of EUR 233 million at own risk, EUR 216 million is covered by the EU Political Risk Guarantee under the EU External Lending Mandate. A further EUR 2,939 million has been committed in signed operations not yet disbursed. Of this amount, EUR 2,714 million is covered by the Comprehensive Guarantee of the European Union under the External Lending Mandate. Of the remainder of EUR 225 million at own risk, EUR 190 million is covered by the EU Political Risk Guarantee under the EU External Lending Mandate. 1 The percentages are reflecting the composition of each country cluster relevant for the year of presentation. 52 |
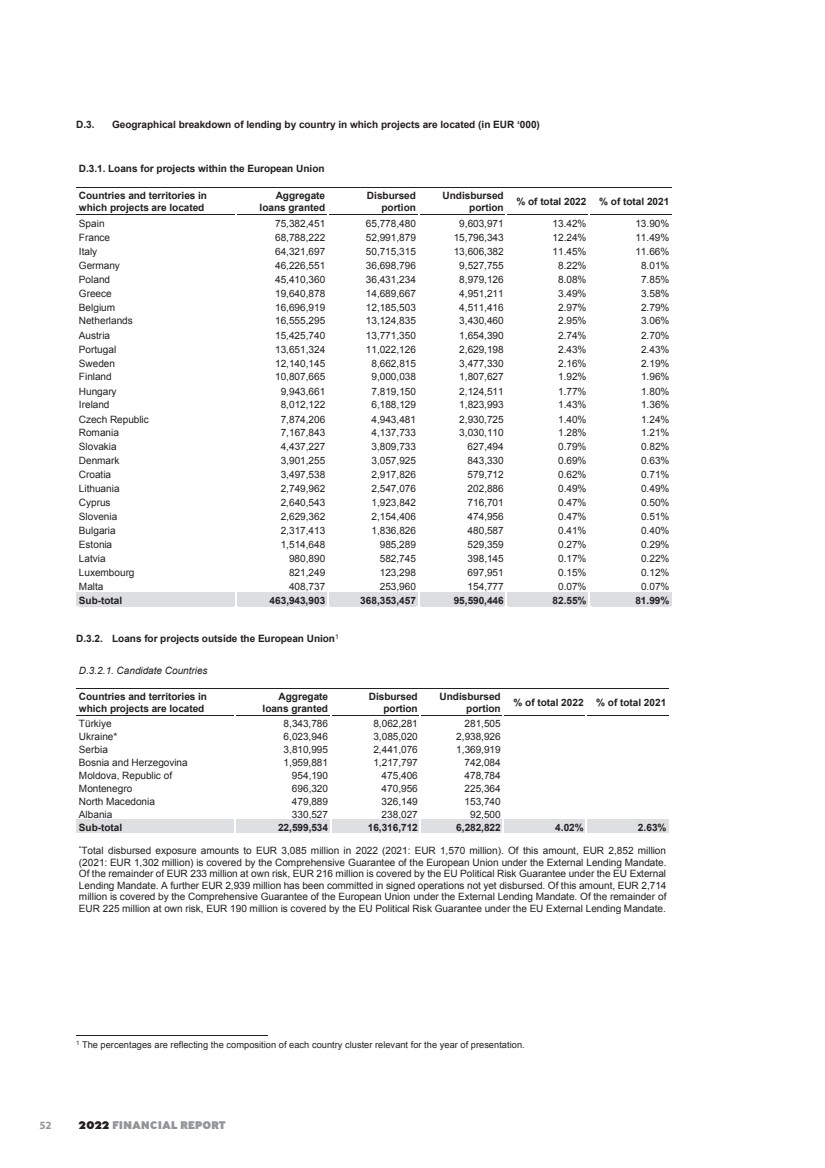
| EIB STATUTORY FINANCIAL STATEMENTS 61 D.3.2.2. African, Caribbean and Pacific (‘ACP’) states Countries and territories in which projects are located Aggregate loans granted Disbursed portion Undisbursed portion % of total 2022 % of total 2021 Regional - Africa 1,084,015 71,503 1,012,512 Senegal 715,385 285,879 429,506 Guinea 437,279 129,870 307,409 Madagascar 417,192 243,216 173,976 Zambia 405,670 144,950 260,720 Kenya 372,528 176,511 196,017 Benin 365,072 76,847 288,225 Ghana 277,255 27,482 249,773 Malawi 217,983 95,643 122,340 Dominican Republic 176,438 49,618 126,820 Mozambique 176,127 76,127 100,000 Nigeria 175,000 0 175,000 Rwanda 167,000 0 167,000 Cameroon 157,961 51,961 106,000 Chad 156,200 0 156,200 Côte d'Ivoire 152,700 102,421 50,279 Niger 151,677 31,677 120,000 Lesotho 151,053 69,053 82,000 Angola 150,000 4,039 145,961 Tanzania, United republic of 136,170 95,622 40,548 Regional - ACP 130,000 0 130,000 Uganda 103,861 103,861 0 Burkina Faso 100,591 47,591 53,000 Mali 88,747 37,797 50,950 Fiji 70,317 7,915 62,402 Burundi 70,000 62,500 7,500 Gambia 65,000 21,442 43,558 Regional - West Africa 63,099 63,099 0 Barbados 59,755 10,000 49,755 Liberia 56,980 36,980 20,000 Papua New Guinea 54,199 32,815 21,384 Cape Verde 49,496 49,496 0 Mauritania 42,708 5,584 37,124 Ethiopia 40,000 31,000 9,000 Seychelles 36,635 24,135 12,500 Kingdom of Eswatini 36,400 31,729 4,671 Sao Tome and Principe 32,940 1,000 31,940 Congo 30,394 4,394 26,000 Congo (Democratic Republic) 23,723 23,723 0 Saint Lucia 13,500 0 13,500 Togo 13,174 13,174 0 Namibia 8,503 8,503 0 Mauritius 3,173 3,173 0 Regional - Caribbean 3,112 3,112 0 Dominica 1,554 1,554 0 Belize 1,095 1,095 0 Botswana 220 220 0 Sub-total 7,241,881 2,358,311 4,883,570 1.29% 1.09% 53 |
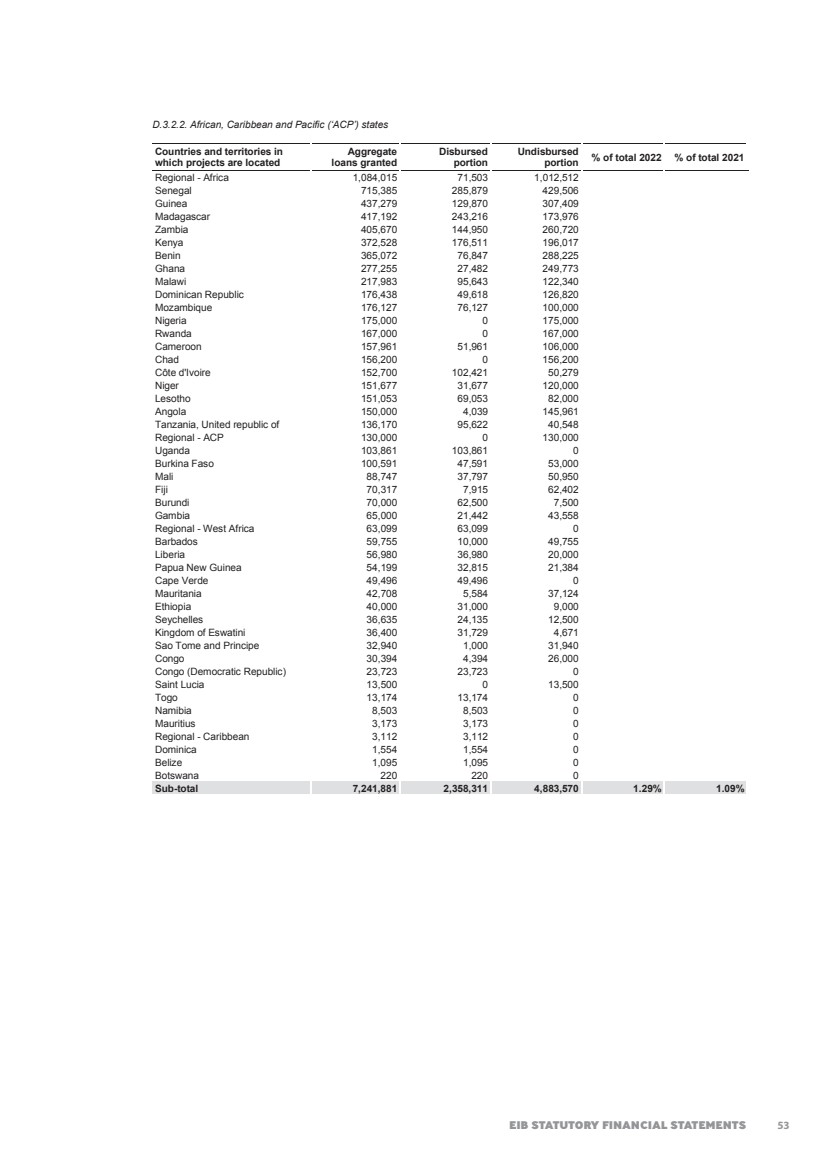
| 2022 FINANCIAL REPORT 62 D.3.2.3. Asia Countries and territories in which projects are located Aggregate loans granted Disbursed portion Undisbursed portion % of total 2022 % of total 2021 India 3,603,277 1,937,941 1,665,336 China 2,372,029 1,158,827 1,213,202 Bangladesh 634,400 184,038 450,362 Uzbekistan 332,199 113,025 219,174 Nepal 292,569 48,229 244,340 Kazakhstan 264,894 7,049 257,845 Cambodia 234,240 80,890 153,350 Viet Nam 201,950 156,450 45,500 Lao People's Democratic Rep. 178,942 71,677 107,265 Regional - Asia 167,000 0 167,000 Sri Lanka 145,738 95,738 50,000 Kyrgyzstan 112,000 51,000 61,000 Tajikistan 106,729 68,366 38,363 Maldives 105,019 50,496 54,523 Mongolia 79,172 60,162 19,010 Pakistan 50,000 0 50,000 Regional - Central Asia 20,000 0 20,000 Sub-total 8,900,158 4,083,888 4,816,270 1.58% 1.48% D.3.2.4. Potential Candidate Countries Countries and territories in which projects are located Aggregate loans granted Disbursed portion Undisbursed portion % of total 2022 % of total 2021 Kosovo 232,800 32,800 200,000 Sub-total 232,800 32,800 200,000 0.04% 0.40% D.3.2.5. Latin America Countries and territories in which projects are located Aggregate loans granted Disbursed portion Undisbursed portion % of total 2022 % of total 2021 Brazil 2,087,892 1,260,426 827,466 Regional - Latin America 839,290 483,780 355,510 Ecuador 797,942 439,784 358,158 Argentina 617,661 197,580 420,081 Nicaragua 299,961 171,291 128,670 Mexico 283,721 283,721 0 Panama 275,029 228,151 46,878 Peru 210,013 116,257 93,756 Chile 200,000 0 200,000 Colombia 193,137 0 193,137 Paraguay 157,160 97,869 59,291 Bolivia 115,936 95,434 20,502 Honduras 81,072 71,542 9,530 Costa Rica 60,253 60,253 0 El Salvador 37,503 9,778 27,725 Sub-total 6,256,570 3,515,866 2,740,704 1.11% 0.87% D.3.2.6. European Free Trade Association (‘EFTA’) Countries Countries and territories in which projects are located Aggregate loans granted Disbursed portion Undisbursed portion % of total 2022 % of total 2021 Norway 977,893 841,493 136,400 Iceland 547,369 547,369 0 Switzerland 48,192 13,992 34,200 Sub-total 1,573,454 1,402,854 170,600 0.28% 0.32% 54 |
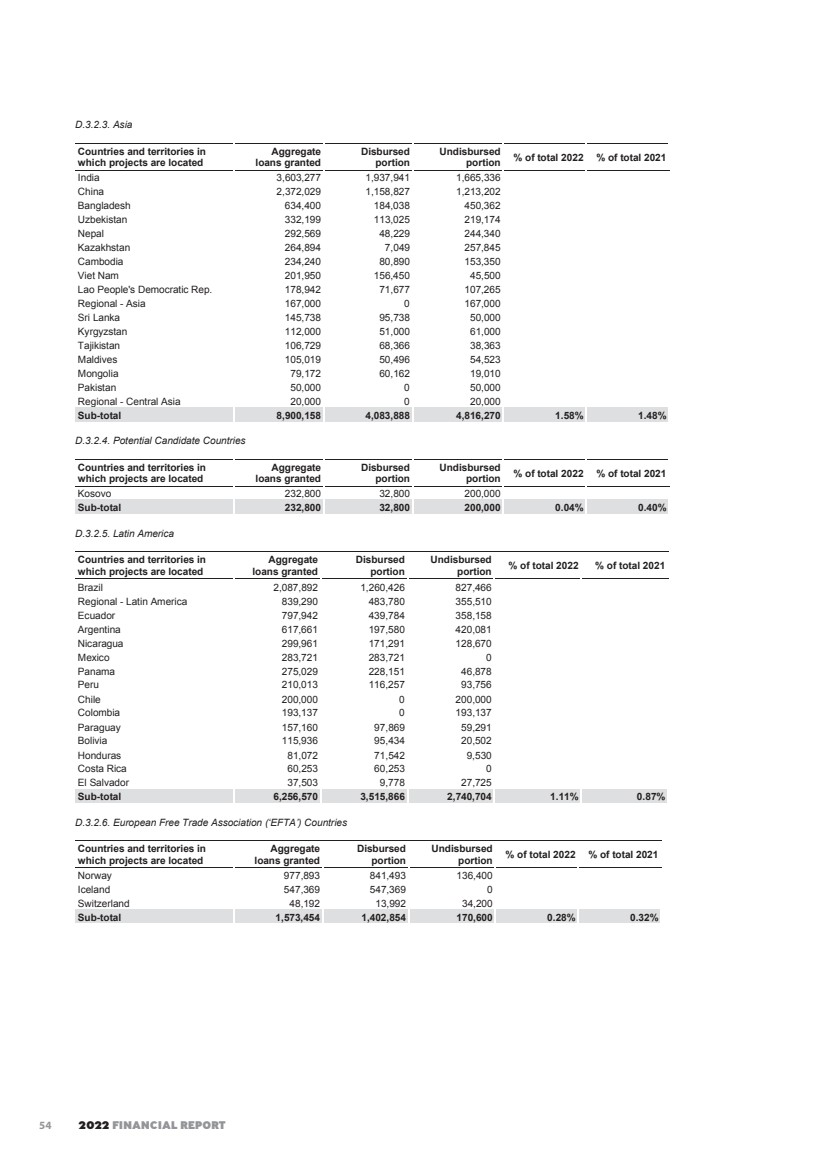
| EIB STATUTORY FINANCIAL STATEMENTS 63 D.3.2.7. Mediterranean Countries Countries and territories in which projects are located Aggregate loans granted Disbursed portion Undisbursed portion % of total 2022 % of total 2021 Egypt 7,480,135 4,317,891 3,162,244 Morocco 5,171,232 3,407,577 1,763,655 Tunisia 2,617,522 1,582,112 1,035,410 Jordan 1,528,810 829,036 699,774 Israel 1,250,253 707,528 542,725 Lebanon 1,141,729 349,573 792,156 Palestine 399,439 89,857 309,582 Algeria 266,250 266,250 0 Syrian Arab Republic 55,949 55,949 0 Regional - Mediterranean 54,664 21,664 33,000 Regional - North Africa 38,500 0 38,500 Sub-total 20,004,483 11,627,437 8,377,046 3.56% 3.51% D.3.2.8. Overseas Countries and Territories (‘OCT’) Countries and territories in which projects are located Aggregate loans granted Disbursed portion Undisbursed portion % of total 2022 % of total 2021 New Caledonia 49,103 49,103 0 Sint Maarten 45,103 15,470 29,633 French Polynesia 11,346 11,346 0 Sub-total 105,552 75,919 29,633 0.02% 0.02% D.3.2.9. Eastern Europe, Southern Caucasus, Russia Countries and territories in which projects are located Aggregate loans granted Disbursed portion Undisbursed portion % of total 2022 % of total 2021 Georgia 1,669,535 1,053,500 616,035 Belarus* 405,222 45,222 360,000 Armenia 365,254 247,795 117,459 Russian Federation* 13,799 13,799 0 Azerbaijan 3,305 3,305 0 Sub-total 2,457,115 1,363,621 1,093,494 0.44% 1.71% * Total disbursed exposure for Belarus amounts to EUR 45 million (2021: EUR 173 million). Of this amount EUR 36 million is secured by the Comprehensive Guarantee of the European Union under the External Lending Mandate and EUR 9 million is covered by the EU Political Risk Guarantee under the EU External Lending Mandate. A further EUR 360 million has been committed in signed operations not yet disbursed, of which only EUR 10 million is expected to be at the EIB’s own risk, but covered by the EU Political Risk Guarantee under the EU External Lending Mandate. The EIB’s total disbursed exposure to borrowers in the Russian Federation amounts to EUR 14 million (2021: EUR 16 million) with no exposure at the EIB’s own risk; it is recalled that the EIB continues to follow applicable EU policy guidelines in the country. D.3.2.10. United Kingdom Countries and territories in which projects are located Aggregate loans granted Disbursed portion Undisbursed portion % of total 2022 % of total 2021 United Kingdom 28,118,931 27,875,963 242,968 Sub-total 28,118,931 27,875,963 242,968 5.00% 5.87% D.3.2.11. South Africa Countries and territories in which projects are located Aggregate loans granted Disbursed portion Undisbursed portion % of total 2022 % of total 2021 South Africa 597,550 375,550 222,000 Sub-total 597,550 375,550 222,000 0.11% 0.11% Total loans for projects outside the European Union 98,088,028 69,028,921 29,059,107 17.45% 18.01% Total loans 2022(1) 562,031,931 437,382,378 124,649,553 100.00% Total loans 2021(1) 556,366,910 433,412,619 122,954,291 100.00% (1) Including loan substitutes (Notes B.2 and D.1), excluding loan instalments receivables (2022: EUR 167 million, 2021: EUR 473 million). D.4. Provisions in respect of guarantee operations A provision for guarantees issued has been recognised corresponding to the loss for which the Bank is expected to be liable towards the beneficiary. This provision amounts to EUR ‘000 86,584 as at 31 December 2022 (2021: EUR ‘000 27,916). 55 |
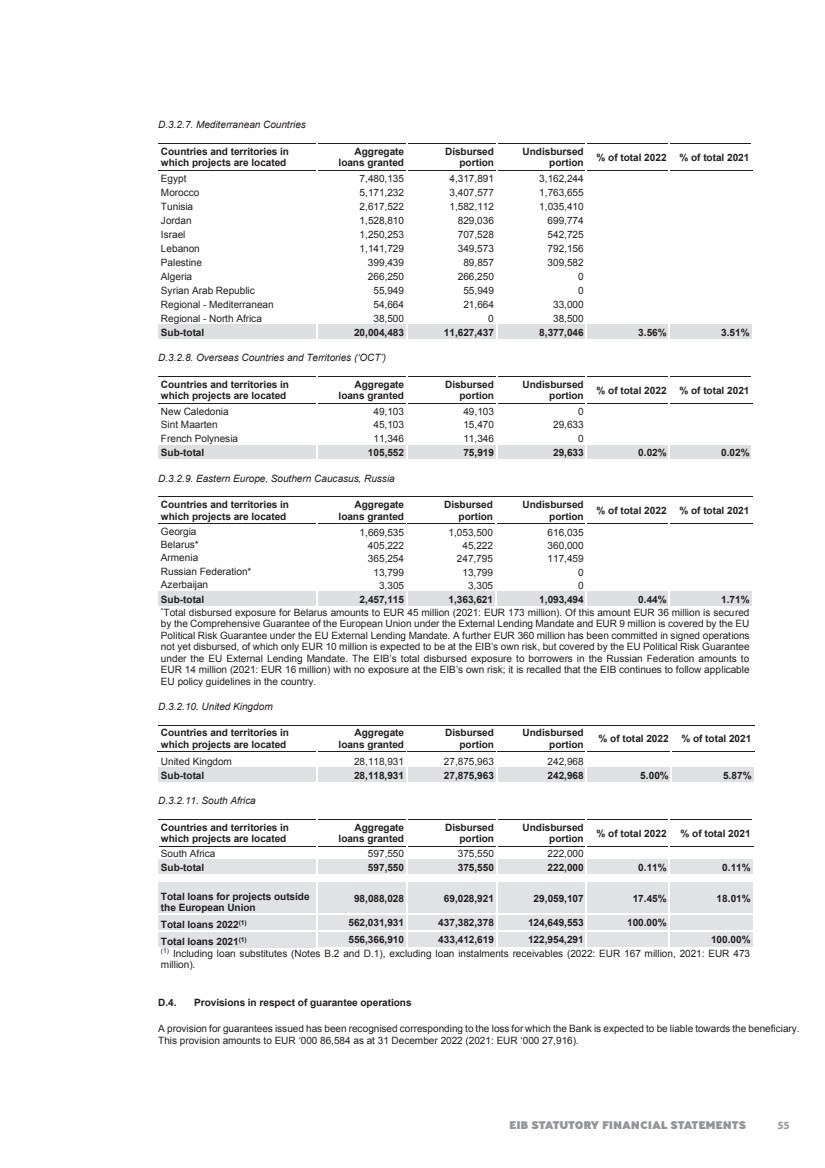
| 2022 FINANCIAL REPORT 64 Note E – Shares and other variable-yield securities, participating interests and shares in affiliated undertakings (EUR ‘000) E.1. Shares, other variable-yield securities and participating interests Participating interests Shares and other variable-yield securities Private Equity and Venture Capital Operations(1) Private Equity and Venture Capital Operations(1) EBRD shares(2) Equity Investments and Infrastructure funds(1) Other equity investments Total(3) Cost: At 1 January 2022 337,234 5,675,541 157,500 3,018,393 264 8,851,698 Additions(4) 76,231 1,177,660 0 954,579 1,030 2,133,269 Reflows/Terminations(4) -39,744 -1,235,602 0 -355,091 0 -1,590,693 At 31 December 2022 373,721 5,617,599 157,500 3,617,881 1,294 9,394,274 Value adjustments: At 1 January 2022 -18,854 -359,857 0 -94,272 0 -454,129 Additions -3,630 -96,406 0 -25,977 0 -122,383 Releases 2,225 83,065 0 41,778 0 124,843 At 31 December 2022 -20,259 -373,198 0 -78,471 0 -451,669 Net book value: At 31 December 2022 353,462 5,244,401 157,500 3,539,410 1,294 8,942,605 At 31 December 2021 318,380 5,315,684 157,500 2,924,121 264 8,397,569 (1) The amounts signed but not yet disbursed disclosed off-balance sheet are respectively: In relation to Shares and other variable-yield securities: • for private equity and venture capital operations EUR ‘000 4,084,606 (2021: EUR ‘000 4,121,195) • for equity investments and infrastructure funds EUR ‘000 3,435,704 (2021: EUR ‘000 3,203,307) In relation to participating interests: • for private equity and venture capital operations EUR ‘000 410,831 (2021: EUR ‘000 497,631) (2) The amount of EUR ‘000 157,500 (2021: EUR ‘000 157,500) corresponds to the capital paid in by the Bank as at 31 December 2022 with respect to its subscription of EUR ‘000 900,440 to the capital of the European Bank for Reconstruction and Development (‘EBRD’). (3) The total amount includes only shares and other variable-yield securities. (4) The “Additions” and “Reflows/Terminations” amounts include foreign exchange movements. As at 31 December 2022, the Bank holds 3.03% of the subscribed capital of the EBRD (2021: 3.03%). Based on the audited 2021 EBRD financial statements prepared in accordance with International Financial Reporting Standards, the share of underlying net equity of the Bank in EBRD amounted to EUR 616 million. In EUR million % held Total own funds Total net result Total assets EBRD (31.12.2021)* 3.03 20,345 2,502 74,773 * The data is based on the most recent audited financial statements of EBRD. E.2. Shares in affiliated undertakings The European Investment Fund As a result of the General Meeting’s approval of the EIF’s capital increase in February 2021, the EIF’s authorised capital has been increased during the year 2021 from EUR 4.5 billion to EUR 7.4 billion through the issuance of 2,870 new shares; each new share having a nominal value of EUR 1,000,000. The issuance of the new shares occurred through a single subscription round with subscription possible in a single subscription period as further detailed below. Each newly authorised share which is subscribed is paid-in as to 20% of its nominal value. The remaining 80% can be called upon decision of the EIF General Meeting. The subscription price for any newly authorised shares which were subscribed in the capital increase was fixed at EUR 435,970.88 based on the Replacement Share Purchase Undertaking (‘RSPU’) formula and determined on the basis of financial data of the EIF as of 30 September 2020 as reviewed by external auditors and including the paid-in portion of newly issued shares. In line with Article 5 of the EIF Statutes, each shareholder of the EIF was entitled to subscribe to a fraction of the increase corresponding to the ratio, which existed between the shares subscribed by that member and the overall number of EIF shares subscribed, before the capital increase. Consequently, the EIB has subscribed to its pro-rata share of 1,689 shares for an amount of approximatively EUR 736 million in February 2021. 56 |
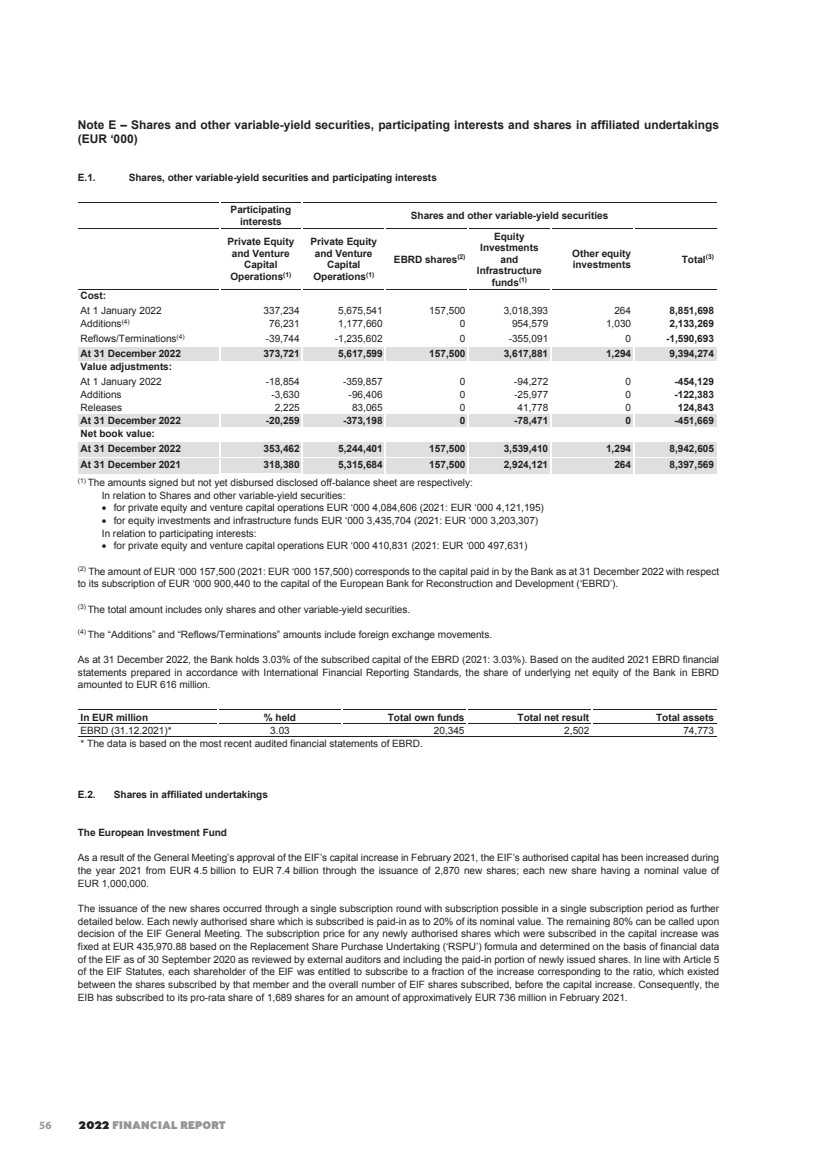
| EIB STATUTORY FINANCIAL STATEMENTS 65 A balance of EUR ‘000 1,549,444 (2021: EUR ‘000 1,549,444) corresponds to the amount paid in by the Bank in respect of its subscription of EUR ‘000 4,336,000 (2021: EUR ‘000 4,336,000) to the capital of the European Investment Fund (‘EIF’ or ‘Fund’), with its registered office in Luxembourg. The Bank holds 59.40% (2021: 59.40%) of the subscribed capital of the EIF amounting to EUR 7.3 billion (2021: EUR 7.3 billion). During 2022, the Bank neither bought shares from other investors nor sold any such shares to other investors. As a result, as at 31 December 2022 the Bank holds 4,336 shares in EIF. During the year 2021, the RSPU with respect to subscribed shares of the EIF held by the European Commission (‘EC’) was terminated, while the RSPU with respect to the subscribed shares from the EIF’s minority shareholders other than the EC remains in place. Consequently, with respect to the 774 EIF shares subscribed by these minority shareholders, the EIB is offering to buy these shares at any time under the RSPU at a price per share of currently EUR 542,329.82. This price corresponds to the part of each share in the called capital of the EIF, increased by the share premium account, the statutory reserves, the retained earnings, the fair value reserve and the profit of the year, adjusted by the dividend for the year. The agreed formula is being applied to the approved and audited annual accounts of the EIF for the financial year in which the option is exercised. The nominal value of EUR ‘000 419,763 (2021: EUR ‘000 340,341) of the put option granted to this minority shareholder group, shown off-balance sheet, has been calculated on the basis of the 2021 audited EIF statutory accounts prepared according to the International Financial Reporting Standards. In EUR ‘000 % held Total own funds Total net result Total assets EIF (31.12.2021)* 59.40 3,974,049 564,357 5,186,617 EIF (31.12.2022)** 59.40 4,368,892 70,414 5,495,946 * The data is based on the most recent audited financial statements of EIF. ** The data is based on the preliminary unaudited financial statements of EIF. 57 |
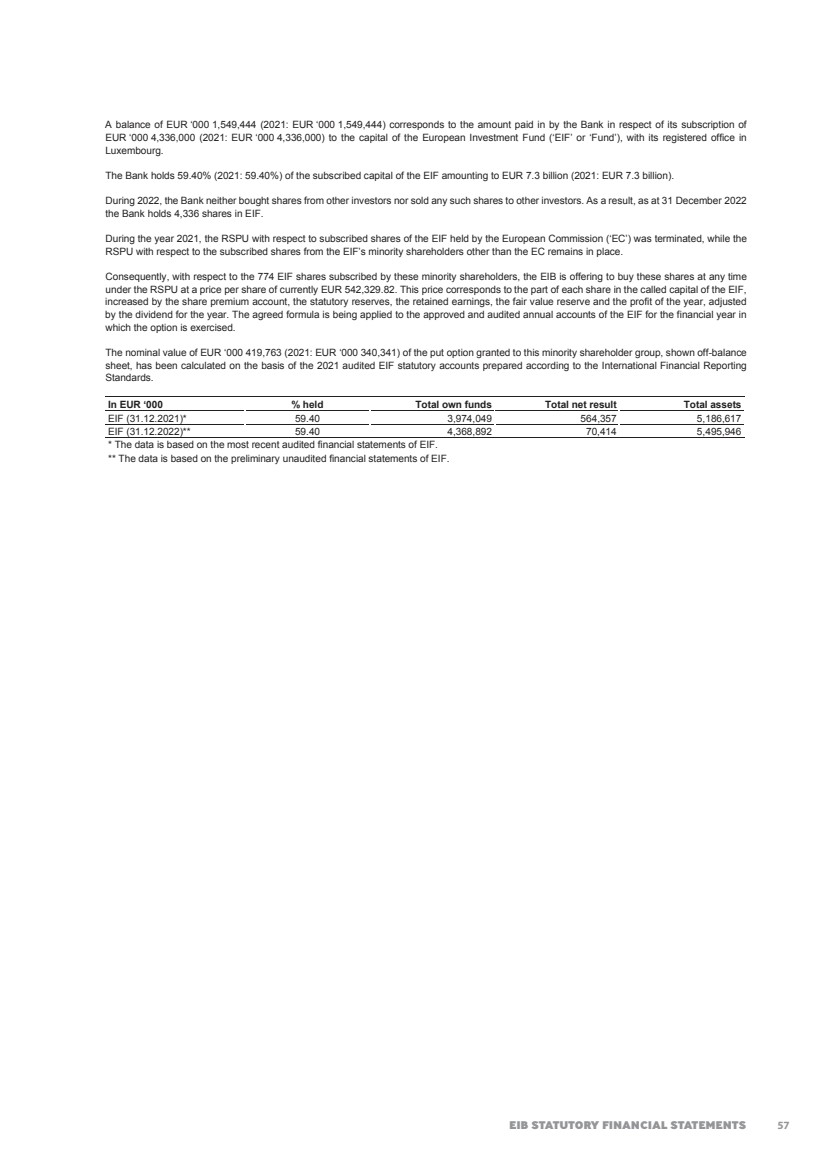
| 2022 FINANCIAL REPORT 66 Note F – Intangible and tangible assets (in EUR ‘000) Land Luxembourg buildings Furniture and equipment Total tangible assets Total intangible assets Cost: At 1 January 2022 20,145 410,649 63,956 494,750 78,374 Additions 0 11,385 28,192 39,577 41,563 Disposals 0 0 -26,152 -26,152 -18,148 At 31 December 2022 20,145 422,034 65,996 508,175 101,789 Accumulated depreciation/amortisation: At 1 January 2022 0 -216,134 -36,171 -252,305 -21,185 Depreciation/amortisation 0 -9,792 -22,929 -32,721 -29,656 Disposals 0 0 26,152 26,152 18,148 At 31 December 2022 0 -225,926 -32,948 -258,874 -32,693 Carrying amount: At 31 December 2022 20,145 196,108 33,048 249,301 69,096 At 31 December 2021 20,145 194,515 27,785 242,445 57,189 The Luxembourg buildings category includes cost relating to the construction of a new building for an amount of EUR ’000 79,305 (2021: EUR ’000 67,920), which is expected to be completed in 2025. Note G – Other assets and Other liabilities (in EUR ‘000) Other assets 31.12.2022 31.12.2021 Fair value of derivatives 128,737 18,124 Accounts receivable and sundry debtors 93,314 99,724 Guarantee call receivable 55,811 12,831 EGF management fee receivable 53,555 22,448 Advances on salaries and allowances 972 1,100 Other 2,076 3,102 Total 334,465 157,329 Other liabilities 31.12.2022 31.12.2021 Capital repayable to the UK(*) 2,595,904 2,895,904 Optional Supplementary Provident Scheme (Note L) 753,701 705,302 EIF Pension Plan 294,164 262,011 First Loss Piece Contribution 233,227 202,171 Transitory account on loans 99,031 35,601 Accounts payable and sundry creditors 98,542 71,786 Personnel costs payable 74,705 74,105 Payable on HIPC initiative(**) 13,596 13,596 Fair value of derivatives 576 10,606 Western Balkans infrastructure fund 97 393 Other 96,468 102,034 Total 4,260,011 4,373,509 (*) In accordance with the Article 150(4) of the Agreement on the withdrawal of the United Kingdom of Great Britain and Northern Ireland from the European Union and the European Atomic Energy Community, and as amended by COUNCIL DECISION (EU) 2020/769 of 10 June 2020, the EIB will repay to the UK EUR 3.5 billion of called capital in twelve annual instalments starting with 15 October 2020 (the first eleven instalments will be EUR 300,000,000 each and the final one will be EUR 195,903,950). The instalments due on 15 October 2020, 15 October 2021 and 14 October 2022 were settled in full. (**) Heavily Indebted Poor Countries (‘HIPC’) initiative. 58 |
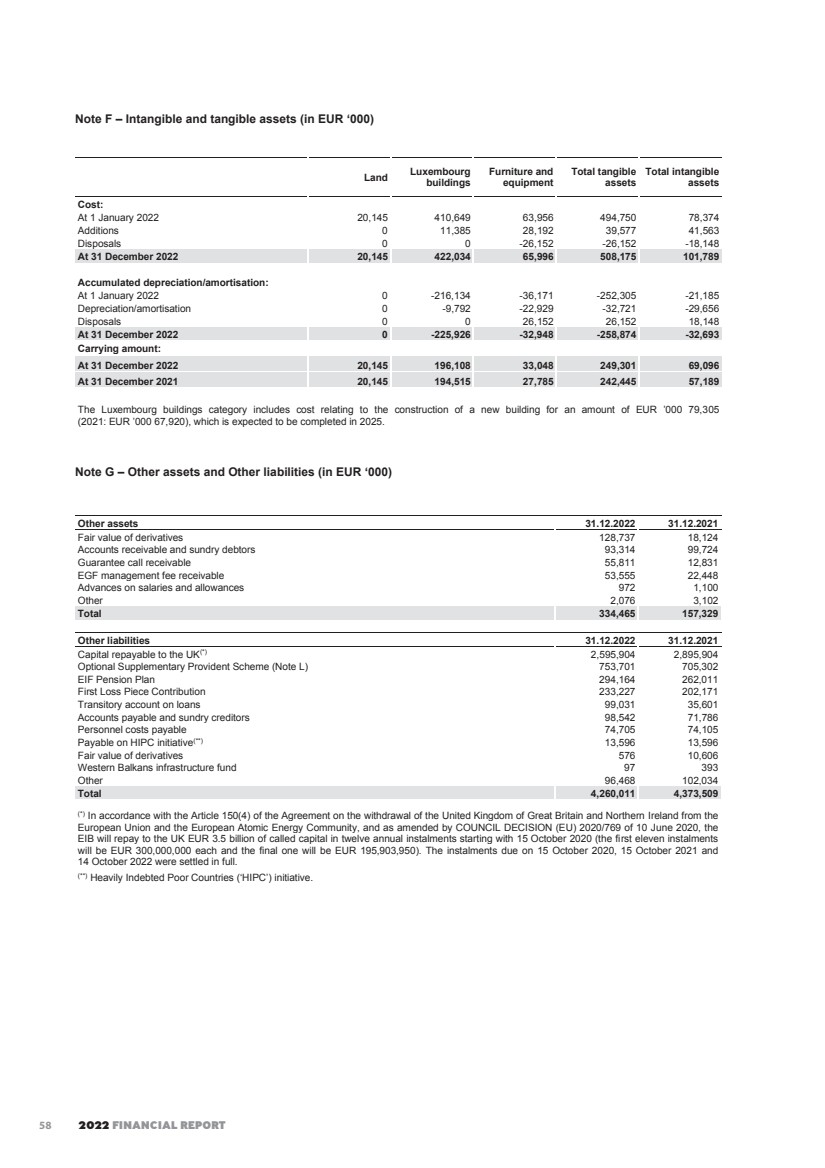
| EIB STATUTORY FINANCIAL STATEMENTS 67 Note H – Subscription to the capital of the Bank, own funds and appropriation of prior year’s profit H.1. Statement of Subscriptions to the Capital of the Bank As at 31 December 2022 and 31 December 2021 (in EUR) Member States Subscribed capital Uncalled capital(*) Called capital Germany 46,722,369,149 42,555,081,742 4,167,287,407 France 46,722,369,149 42,555,081,742 4,167,287,407 Italy 46,722,369,149 42,555,081,742 4,167,287,407 Spain 28,033,421,847 25,533,049,371 2,500,372,476 Belgium 12,951,115,777 11,795,972,691 1,155,143,086 Netherlands 12,951,115,777 11,795,972,691 1,155,143,086 Poland 11,366,679,827 10,352,856,629 1,013,823,198 Sweden 8,591,781,713 7,825,458,763 766,322,950 Denmark 6,557,521,657 5,972,639,556 584,882,101 Austria 6,428,994,386 5,855,575,961 573,418,425 Finland 3,693,702,498 3,364,251,741 329,450,757 Greece 3,512,961,713 3,199,631,688 313,330,025 Portugal 2,263,904,037 2,061,980,655 201,923,382 Czech Republic 2,206,922,328 2,010,081,290 196,841,038 Hungary 2,087,849,195 1,901,628,594 186,220,601 Ireland 1,639,379,073 1,493,158,667 146,220,406 Romania 1,639,379,073 1,493,158,667 146,220,406 Croatia 1,062,312,542 967,562,174 94,750,368 Slovakia 751,236,149 684,231,479 67,004,670 Slovenia 697,455,090 635,247,290 62,207,800 Bulgaria 510,041,217 464,549,338 45,491,879 Lithuania 437,633,208 398,599,585 39,033,623 Luxembourg 327,878,318 298,634,014 29,244,304 Cyprus 321,508,011 292,831,891 28,676,120 Latvia 267,076,094 243,254,895 23,821,199 Estonia 206,248,240 187,852,433 18,395,807 Malta 122,381,664 111,466,131 10,915,533 Total 248,795,606,881 226,604,891,420 22,190,715,461 (*) Can be called by decision of the Board of Directors to such extent as may be required for the Bank to meet its obligations. 59 |
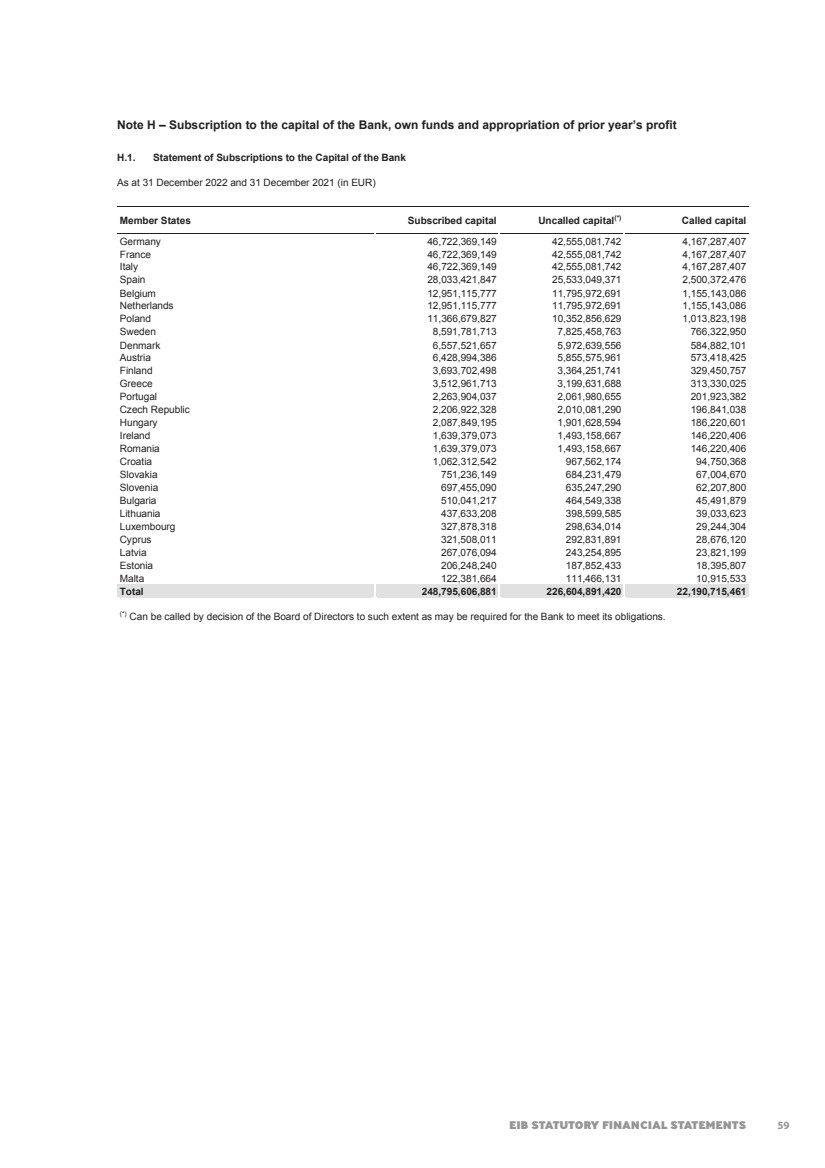
| 2022 FINANCIAL REPORT 68 H.2. Own funds and appropriation of prior year’s profit (in EUR ‘000) Statement of movements in own funds 2022 2021 Share Capital: - Subscribed capital (2) 248,795,607 248,795,607 - Uncalled(2) -226,604,892 -226,604,892 - Called capital 22,190,715 22,190,715 Reserves and profit for the year: Reserve fund: - Balance at beginning of the year 24,879,561 24,328,415 - Appropriation of prior year's profit(1) 0 551,146 - Balance at end of the year 24,879,561 24,879,561 Additional reserves: - Balance at beginning of the year 12,258,631 11,398,958 - Appropriation of prior year's profit(1) 4,321,107 859,673 - Balance at end of the year 16,579,738 12,258,631 Special activities reserve: - Balance at beginning of the year 12,152,954 11,736,896 - Appropriation of prior year's profit(1) -1,849,738 416,058 - Balance at end of the year 10,303,216 12,152,954 General loan reserve: - Balance at beginning of the year 2,021,337 2,135,891 - Appropriation of prior year's profit(1) 94,629 -114,554 - Balance at end of the year 2,115,966 2,021,337 Profit for the financial year 2,366,337 2,565,998 Total own funds 78,435,533 76,069,196 (1) On 22 April 2022 the Board of Governors decided to appropriate the profit of the Bank for the year ended 31 December 2021, which amounted to EUR ‘000 2,565,998, to the additional reserves, the special activities reserve and the general loan reserve. The fact that amounts are being released from / added to the general loan reserve or the special activities reserve is the consequence of the evolution of the risks of the underlying operations. (2) Please refer to Note H.3. H.3. Subscribed capital and reserves, called but not paid (in EUR ‘000) On 1 March 2020, the subscribed capital increased (Asymmetrical Capital Increase) from EUR 243,284,154,500 to EUR 248,795,606,881 by virtue of the contributions of Poland and Romania (by EUR 5,386,000,000 and EUR 125,452,381, respectively). The contributions to the Subscribed capital called and to the Reserves amount to EUR 0.5 million and EUR 1.1 million respectively. The total amount to be paid by the Member States has been equally spread over ten equal semi-annual instalments due on 31 December 2020, 30 June 2021, 31 December 2021, 30 June 2022, 31 December 2022, 30 June 2023, 31 December 2023, 30 June 2024, 31 December 2024, and 30 June 2025. The instalments due including 31 December 2022 were settled in full. 31.12.2022 31.12.2021 Subscribed capital called but not paid (Poland and Romania) 245,790 344,106 Reserves called but not paid (Poland and Romania) 553,458 774,842 Total 799,248 1,118,948 60 |
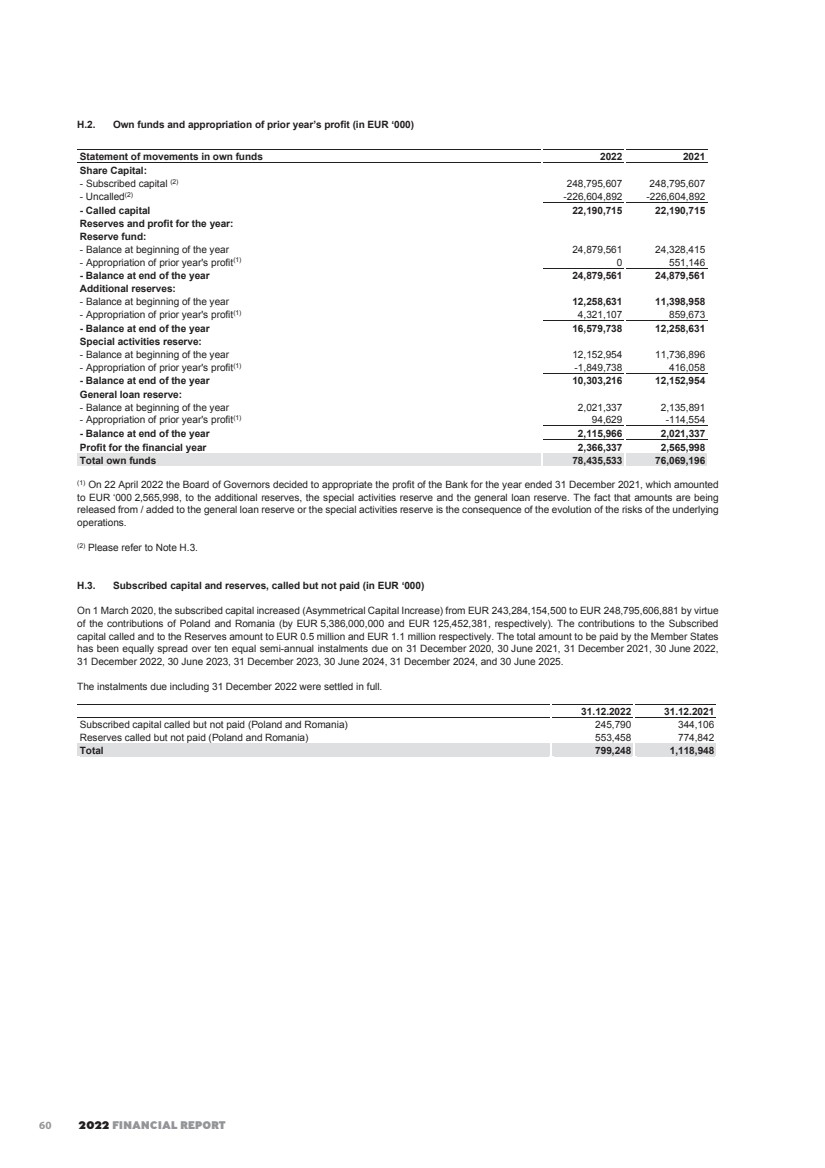
| EIB STATUTORY FINANCIAL STATEMENTS 69 Note I – Prepayments and accrued income and Accruals and deferred income (in EUR ‘000) Prepayments and accrued income 31.12.2022 31.12.2021 Impact from foreign exchange changes on currency swap contracts 9,479,121 7,305,157 Interest and commission receivable 7,064,823 6,608,018 Deferred borrowings and swaps charges 723,463 370,279 Mandates' commission receivable 99,222 91,745 Redemption premiums on swaps receivable(*) 21,581 28,774 Other 1,412 1,945 Total 17,389,622 14,405,918 Accruals and deferred income 31.12.2022 31.12.2021 Impact from foreign exchange changes on currency swap contracts 8,813,681 5,472,236 Interest and commission payable 7,826,213 7,392,104 Deferred borrowings and swaps proceeds 1,410,707 1,606,502 Redemption premiums on swaps payable(*) 322,653 370,728 Deferred income on loans and guarantees 297,451 292,267 Interest subsidies received in advance 128,426 92,233 Prepaid management fees 2,192 4,380 Other 1,433 2,912 Total 18,802,756 15,233,362 (*) Redemption premiums on swaps receivable and payable represent end payments of the underlying swap agreements for those agreements which include such features. Note J – Amounts owed to credit institutions and customers (in EUR ‘000) J.1. Amounts owed to credit institutions 31.12.2022 31.12.2021 Repayable on demand 2,371,014 4,777,422 - Overnight deposits 2,371,014 4,777,422 With agreed maturity or periods of notice 3,071,084 18,895,071 - Short-term deposits 6,003 178,248 - Repo with credit institutions 3,065,081 5,716,823 - Borrowings from central banks (1) 0 13,000,000 Total 5,442,098 23,672,493 (1) This amount represents the Bank’s participation in monetary operations with the ECB. J.2. Amounts owed to customers 31.12.2022 31.12.2021 Repayable on demand 1,437,246 1,648,539 - Overnight deposits 46 163 - European Union and Member States' accounts: - For Special Section operations and related unsettled amounts 395,981 412,934 - Deposit accounts 1,041,219 1,235,442 With agreed maturity or periods of notice 57,543 175,542 - Short-term deposits 57,543 175,542 Total 1,494,789 1,824,081 61 |
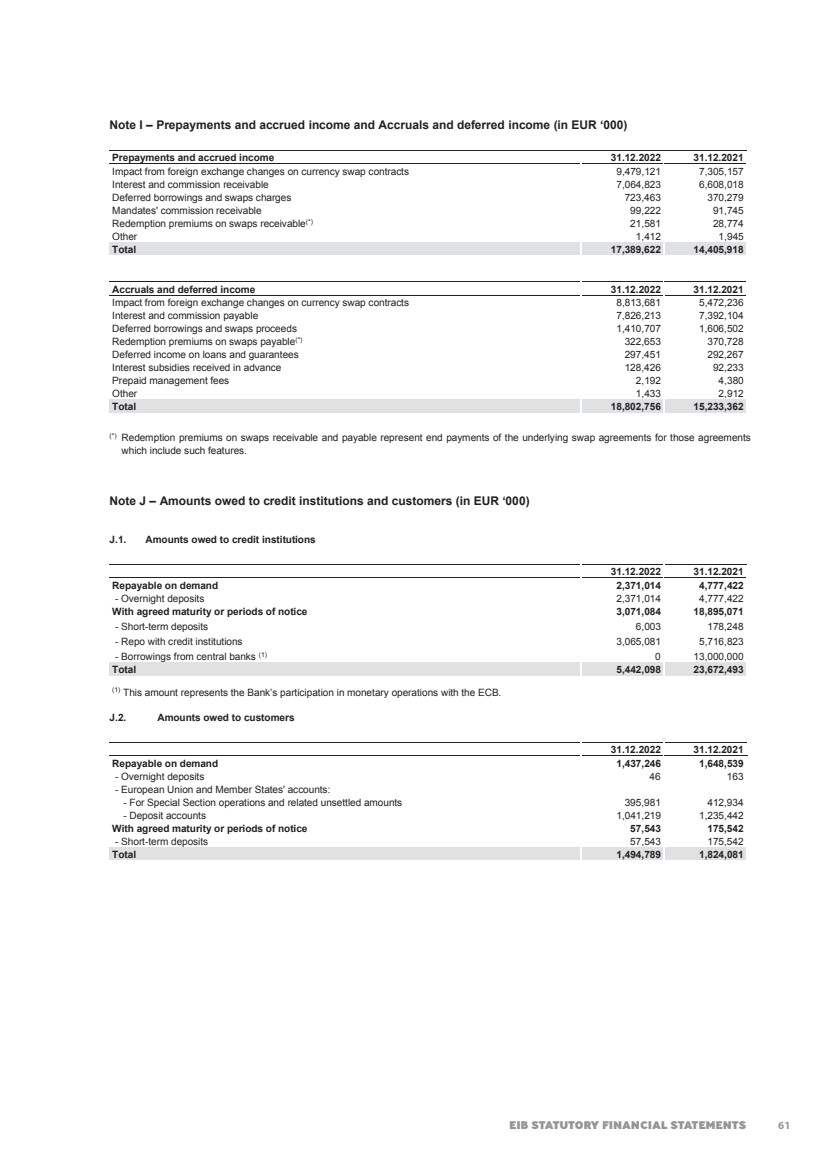
| 2022 FINANCIAL REPORT 70 Note K – Debts evidenced by certificates (in EUR ‘000) In its financing activity, one of the Bank’s objectives is to align its funding strategy with the funds required for the loans granted, notably in terms of currencies. The caption “Debts evidenced by certificates” includes “Debt securities in issue” (securities offered to the general investing public) and “Others” (private placements). The table below discloses the details of debts outstanding as at 31 December 2022 and 31 December 2021 per currency, together with the average rates and due dates (earliest/latest). Payable in Outstanding as at 31.12.2022 Average rate 2022(*) Due dates Outstanding as at 31.12.2021 Average rate 2021(*) EUR 251,275,921 1.29 2023/2061 246,913,410 1.30 USD 100,421,872 2.11 2023/2058 105,073,224 1.48 GBP 37,274,935 2.97 2023/2054 43,705,819 2.15 AUD 10,025,515 2.32 2023/2040 9,703,908 2.59 PLN 6,868,484 4.05 2023/2037 6,169,375 2.23 CAD 5,325,718 2.15 2023/2045 4,765,848 2.10 SEK 5,094,499 1.58 2023/2040 6,234,940 1.41 NOK 4,118,397 2.64 2023/2037 5,541,206 1.77 CHF 3,918,655 1.96 2023/2036 4,179,005 1.90 ZAR 2,138,328 8.00 2023/2035 2,331,323 7.75 JPY 1,374,409 2.27 2023/2053 1,520,384 1.46 MXN 1,219,817 6.00 2023/2028 1,174,850 6.35 DKK 783,185 0.87 2024/2031 783,195 0.70 NZD 550,661 3.21 2023/2028 271,428 2.57 CNY 499,851 2.82 2023/2026 472,292 2.56 CZK 362,397 4.18 2023/2034 339,828 2.52 TRY 248,852 10.59 2023/2027 677,022 10.41 RUB 85,960 3.89 2024/2026 140,679 4.75 HUF 53,134 9.06 2024/2025 17,065 3.25 HKD 36,074 0.53 2025/2025 79,246 0.41 RON 20,810 2.23 2026/2026 20,812 2.23 Total 431,697,474 440,114,859 (*) Weighted average interest rates as at the balance sheet date. The principal and interest of certain structured borrowings are index linked to stock exchange indexes (historical value: EUR 500 million in 2022; EUR 500 million in 2021). All such borrowings are fully hedged through structured swap operations. The table below provides the movements in 2022 and 2021 for debts evidenced by certificates: (In EUR million) 2022 2021 Balance as at 1 January 440,115 435,264 Issuances during the year 84,649 100,348 Contractual redemptions -96,370 -106,974 Early redemptions and buy-backs -679 -735 Exchange adjustments 3,983 12,212 Balance as at 31 December 431,698 440,115 62 |
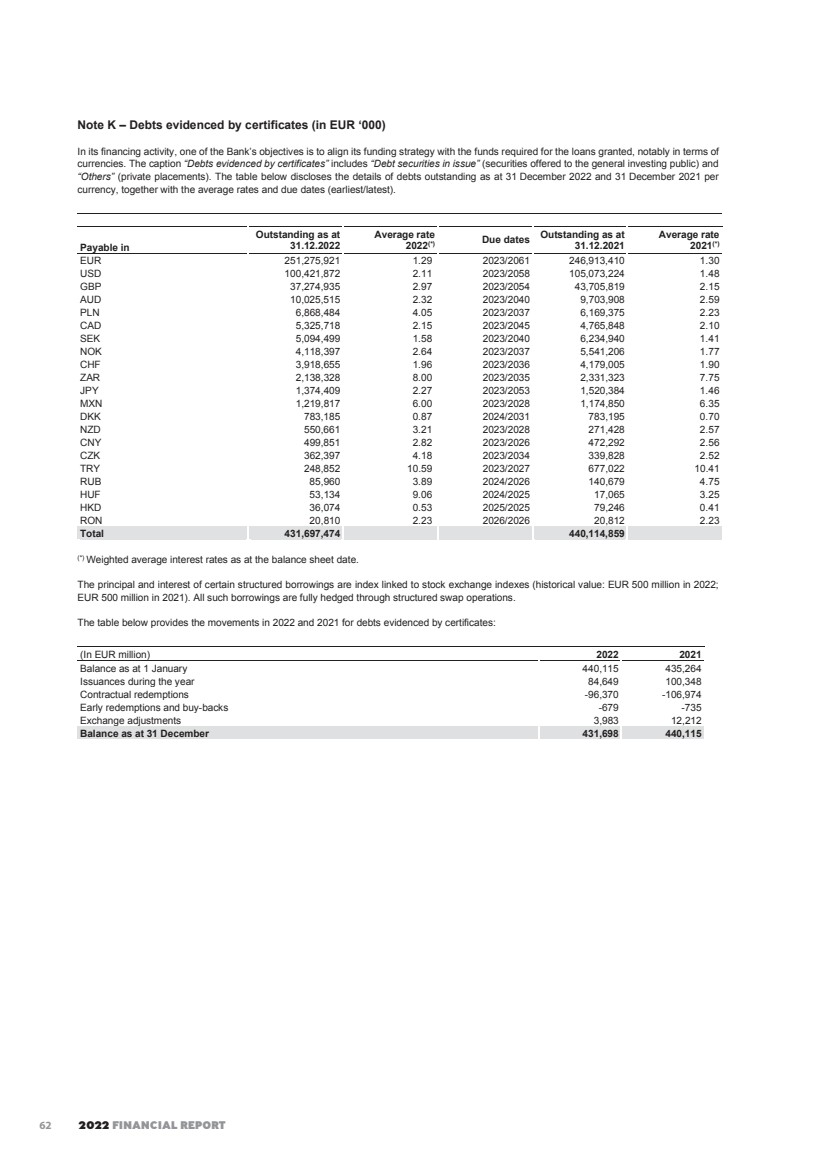
| EIB STATUTORY FINANCIAL STATEMENTS 71 Note L – Provisions – pension plans and health insurance scheme (in EUR ’000) The Bank's main pension scheme is a defined-benefit pension scheme funded by contributions from staff and from the Bank covering all employees. All contributions of the Bank and its staff are invested in the assets of the Bank. The pension plans and health insurance scheme provisions are as follows (in EUR ‘000): 2022 2021 Staff pension plan: Provision at 1 January 3,643,155 3,102,089 Payments made during the year -91,564 -86,150 Recognition of actuarial losses 55,374 435,612 Annual contributions and interest 219,924 191,604 Sub-total staff pension plan 3,826,889 3,643,155 Management Committee pension plan Management Committee pension plan 40,750 38,932 Recognition of actuarial losses 1,528 4,110 Annual contributions 3,313 3,164 Sub-total Management Committee pension plan 45,591 46,206 Health insurance scheme: Provision at 1 January 471,669 403,282 Payments made during the year -30,965 -27,658 Recognition of actuarial losses 14,778 60,143 Annual contributions and interest 40,507 35,902 Sub-total health insurance scheme 495,989 471,669 Total provisions at 31 December 4,368,469 4,161,030 The above figures do not include the liability towards members of staff in respect of the Optional Supplementary Provident Scheme (a defined contribution pension scheme). The corresponding amount of EUR 754 million (2021: EUR 705 million) is classified under “Other liabilities” (Note G). The developments in the current economic environment, notably the increase in the interest rates and inflation, had an impact on the assumptions used in the calculation of the defined benefit obligation. Details of the principal assumptions used in the estimate of the defined benefit obligation are detailed below. The provision in respect of future retirement and health insurance benefits was valued as at 31 December 2022 by an independent actuary using the projected unit credit method based on membership data as at 30 September 2022 and cashflows to 31 December 2022. The actuarial valuation was updated as at 31 December 2022, using the prevailing market rates of 31 December 2022 and the following assumptions (for the staff pension and medical plans): • a discount rate of 3.88% (2021: 1.35%) for determining the actuarial present value of benefits accrued in the pension and health insurance scheme, corresponding to 21.04 year duration (2021: 25.5 year duration); • the Bank expects the remuneration of post-employment reserves to be set at a rate of 1.5% (2021: 1.5%) on top of the discount rate of 3.88%; • progressive retirement assumed between the age of 55 and 65 and depending on NRA (normal age of retirement) (2021: same assumption); • a combined average impact of the increase in the cost of living and career progression of 3.3% (2021: 3.5%); • expected annual resignation rates ranging from 27% to 1% (2021: from 27% to 1%), decreasing with age; • a rate of adjustment of pensions of 2.3% per annum (2021: 1.75%); • use of the ICSLT longevity table 2018 projected to 2022 (2021: ICSLT longevity table 2018 projected to 2021); • a medical cost inflation rate of 4.3% per annum (2021: 3.75%). The provisions for these schemes are adjusted when needed according to the actuarial valuation, as per the tables above. The actuarial valuation of the pension plans and the healthcare scheme as of 31 December 2022 displayed an unrecognised loss of EUR ‘000 1,034,924 (2021: EUR ‘000 3,794,769) out of which EUR ‘000 501,752 (2021: EUR ‘000 2,999,189) was reported in excess of the 10% corridor and the total amortisation recorded in the profit and loss account 2022 amounted to EUR ‘000 71,679 (2021: EUR ‘000 499,865). Note M – Profit for the financial year The appropriation of the balance of the profit and loss account for the year ended 31 December 2022, amounting to EUR ‘000 2,366,337 will be submitted to the Board of Governors for approval by 25 April 2023. The proposed surplus for the financial year to be appropriated is as follows: • Additional reserves EUR 1,707.5m; • Special activities reserve EUR 891.4m; • General loan reserve EUR -232.6m. 63 |

| 2022 FINANCIAL REPORT 72 Note N – Interest receivable and similar income and Interest payable and similar charges N.1. Net interest income (in EUR ‘000) 2022 2021 Interest receivable and similar income: Cash in hand, balance with central banks and post office banks 404 0 Treasury bills and other bills eligible for refinancing with central banks and debt securities including fixed-income securities 344,903 186,035 Loans and advances to credits institutions and customers 7,693,706 5,954,225 Derivatives 10,490,333 10,189,276 Negative interest on interest bearing liabilities 135,574 130,677 Total 18,664,920 16,460,213 Interest payable and similar charges: Amounts owed to credit institutions and customers -12,972 -1,712 Debts evidenced by certificates -7,483,457 -7,134,932 Derivatives -7,766,282 -5,583,363 Negative interest on interest bearing assets -251,650 -409,124 Other -172,746 -146,087 Total -15,687,107 -13,275,218 Net interest income 2,977,813 3,184,995 N.2. Geographical analysis of Interest receivable and similar income (in EUR ‘000) 2022 2021 EU countries Poland 838,559 485,490 Spain 819,323 759,172 France 576,209 448,293 Italy 524,472 424,701 Greece 426,007 449,134 Germany 366,919 296,208 Austria 274,321 255,563 Hungary 233,410 130,417 Netherlands 189,118 159,011 Belgium 172,338 150,872 Sweden 159,803 124,908 Portugal 137,956 145,230 Czech Republic 114,166 31,005 Ireland 92,695 87,233 Romania 80,383 69,839 Finland 71,792 66,435 Slovakia 70,406 66,574 Croatia 49,791 48,123 Slovenia 40,042 39,729 Bulgaria 38,055 38,922 Denmark 31,281 18,151 Lithuania 17,462 18,172 Latvia 16,023 14,475 Cyprus 15,833 9,356 Malta 8,088 9,197 Estonia 7,049 4,169 Luxembourg 2,231 19,964 Total EU countries 5,373,732 4,370,343 Outside the European Union 2,046,685 1,573,979 Total income analysed per country 7,420,417 5,944,322 Income not analysed per country(1) 11,244,503 10,515,891 Total interest receivable and similar income 18,664,920 16,460,213 (1) Income not analysed per country: · Revenue from Long-Term HQLA Portfolio and loan substitutes portfolio 247,044 144,153 · Revenue from Securities Liquidity portfolio 36,832 30,765 · Revenue from money-market securities 61,022 11,104 · Revenue from other securities 5 13 · Revenue from short-term investments and other operations 409,267 140,580 · Income from derivatives 10,490,333 10,189,276 11,244,503 10,515,891 64 |
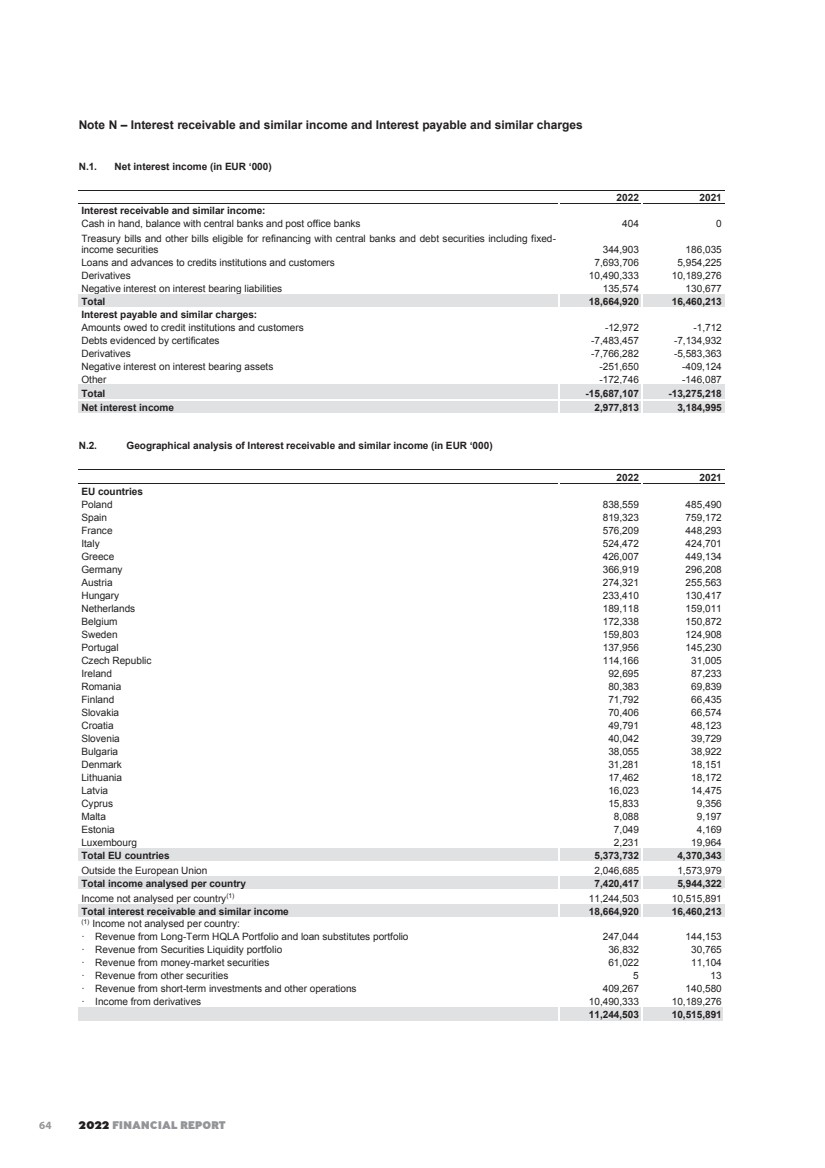
| EIB STATUTORY FINANCIAL STATEMENTS 73 Note O – Commissions receivable and Commissions payable (in EUR ‘000) 2022 2021 Commissions receivable: Commissions on guarantees 179,758 135,013 Commissions on EGF 51,140 23,534 Commissions on Investment Facility - Cotonou 36,994 55,682 Commission income on loans 32,589 35,014 Commissions on Jaspers 28,688 27,214 Commissions on EFSI 17,974 17,624 Commissions on Modernisation Fund 12,080 9,268 Commissions on RRF 10,709 0 Commissions on DFIs (2014-20, 2021-27)(*) 9,995 7,545 Commissions on InnovFin 6,834 13,694 Commissions on Fi-Compass(*) 5,463 5,359 Commissions on Trust Fund Management fees(*) 5,172 4,109 Commissions on Innovation Fund(*) 4,639 1,466 Commissions on Connecting Europe Facility 4,581 1,926 Commissions on JESSICA Holding Funds(*) 3,841 3,987 Commissions on Neighbourhood Investment Facility 2,232 1,939 Commissions on InvestEU Advisory Hub 2,002 0 Commissions on Yaoundé/Lomé Conventions 1,150 1,250 Commissions receivable from intra-group services 7,889 7,277 Commissions on other mandates(*) 27,301 22,740 Total commissions receivable 451,031 374,641 2022 2021 Commissions payable Risk remuneration for guarantees received -357,519 -410,647 Commissions payable from intra-group services -53,100 -65,246 Other commissions payable -26,489 -23,730 Total commissions payable -437,108 -499,623 (*) A reclassification was made between the captions in order to improve the readability of financial statements. Note P – Net result on financial operations (in EUR ‘000) 2022 2021 Net result on derivatives 197,575 44,214 Net result on repurchase of debts evidenced by certificates 253 0 Net result on translation of balance sheet positions -2,131 252 Net result on shares and other variable-yield securities -35,408 29,885 Net result on debt securities portfolios -203,344 -32,708 Total net result on financial operations -43,055 41,643 Note Q – Net other operating income and expense (in EUR ‘000) 2022 2021 Rental income 11,918 11,775 Reversal of previous year’s unutilised accruals 4,179 4,276 Other 410 -5,797 Total net other operating income and expense 16,507 10,254 65 |
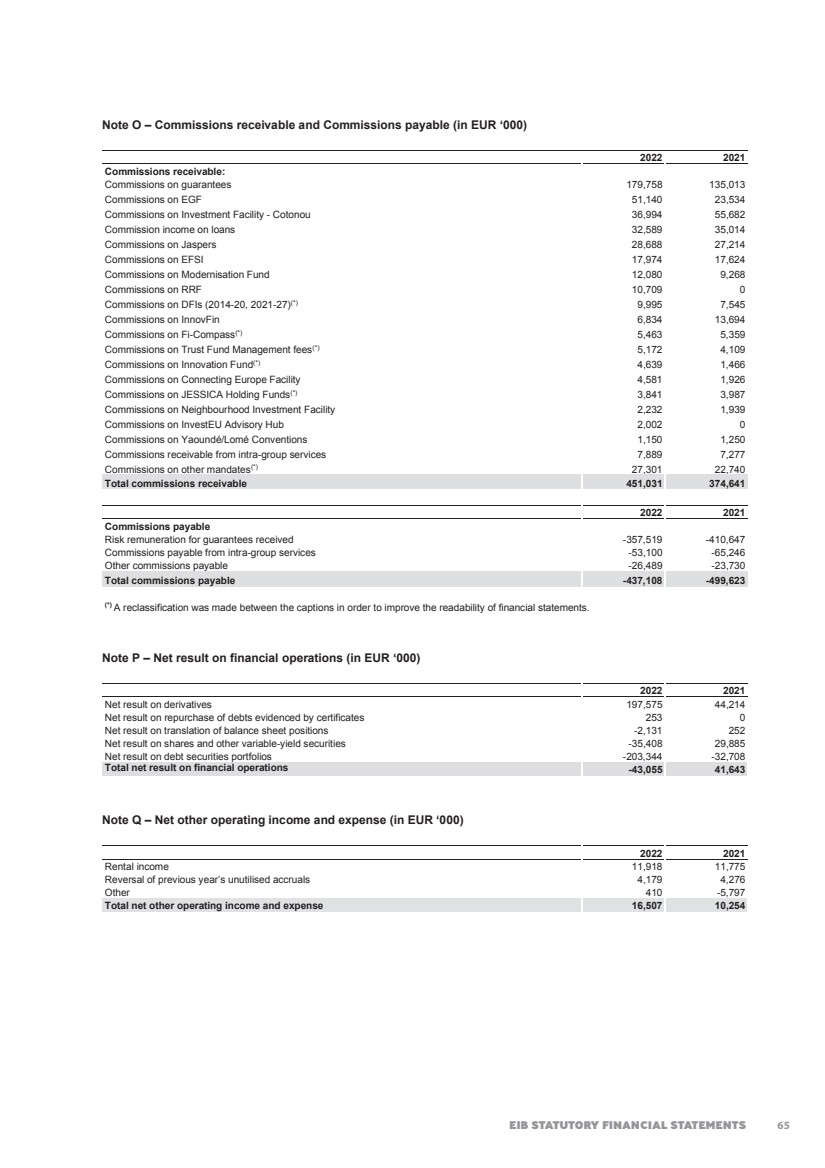
| 2022 FINANCIAL REPORT 74 Note R – General administrative expenses (in EUR ‘000) 2022 2021 Salaries and allowances(*) -526,278 -488,110 Welfare contributions and other staff costs -305,986 -728,013 Staff costs -832,264 -1,216,123 Other administrative expenses -306,074 -250,692 Total general administrative expenses -1,138,338 -1,466,815 (*) Of which the amount for members of the Management Committee is EUR ‘000 3,753 at 31 December 2022 and EUR ‘000 3,441 at 31 December 2021. The number of persons employed by the Bank was 4,020 at 31 December 2022 (3,816 at 31 December 2021). Note S – Off-balance sheet special deposits for servicing borrowings This item represents the amount of coupons and bonds due, paid by the Bank to the paying agents, but not yet presented for payment by the holders of bonds issued by the Bank. Note T – Fair value of financial instruments(*) At the balance sheet date, the Bank records balance sheet financial instruments on the basis of their historical cost in foreign currency (apart from the securities liquidity portfolio) representing the amount received in the event of a liability or the amount paid to acquire an asset. The fair value of the financial instruments (mainly loans, treasury, securities and borrowings) entered under assets or liabilities compared with their carrying amount is shown in the table below: At 31 December 2022 (in EUR million) Carrying amount Fair value(**) Financial assets: Cash in hand, balances with central banks and post office banks 113 113 Loans and advances to credit institutions and customers, excluding loan substitutes 484,515 461,177 Treasury bills and debt securities portfolios including loan substitutes 30,273 29,297 Shares, other variable-yield securities and participating interests 9,296 17,242 Total financial assets 524,197 507,829 Financial liabilities: Amounts owed to credit institutions and customers 6,937 6,938 Debts evidenced by certificates 431,698 406,993 Total financial liabilities 438,635 413,931 (*) Derivatives are not included in the table. Please refer to Note V. (**) Fair value including accrued interest. At 31 December 2021 (in EUR million) Carrying amount Fair value(**) Financial assets: Cash in hand, balances with central banks and post office banks 1,483 1,483 Loans and advances to credit institutions and customers, excluding loan substitutes 491,285 519,818 Treasury bills and debt securities portfolios including loan substitutes 46,461 46,681 Shares, other variable-yield securities and participating interests 8,716 17,343 Total financial assets 547,945 585,325 Financial liabilities: Amounts owed to credit institutions and customers 25,497 25,396 Debts evidenced by certificates 440,115 478,602 Total financial liabilities 465,612 503,998 (*) Derivatives are not included in the table. Please refer to Note V. (**) Fair value including accrued interest. 66 |
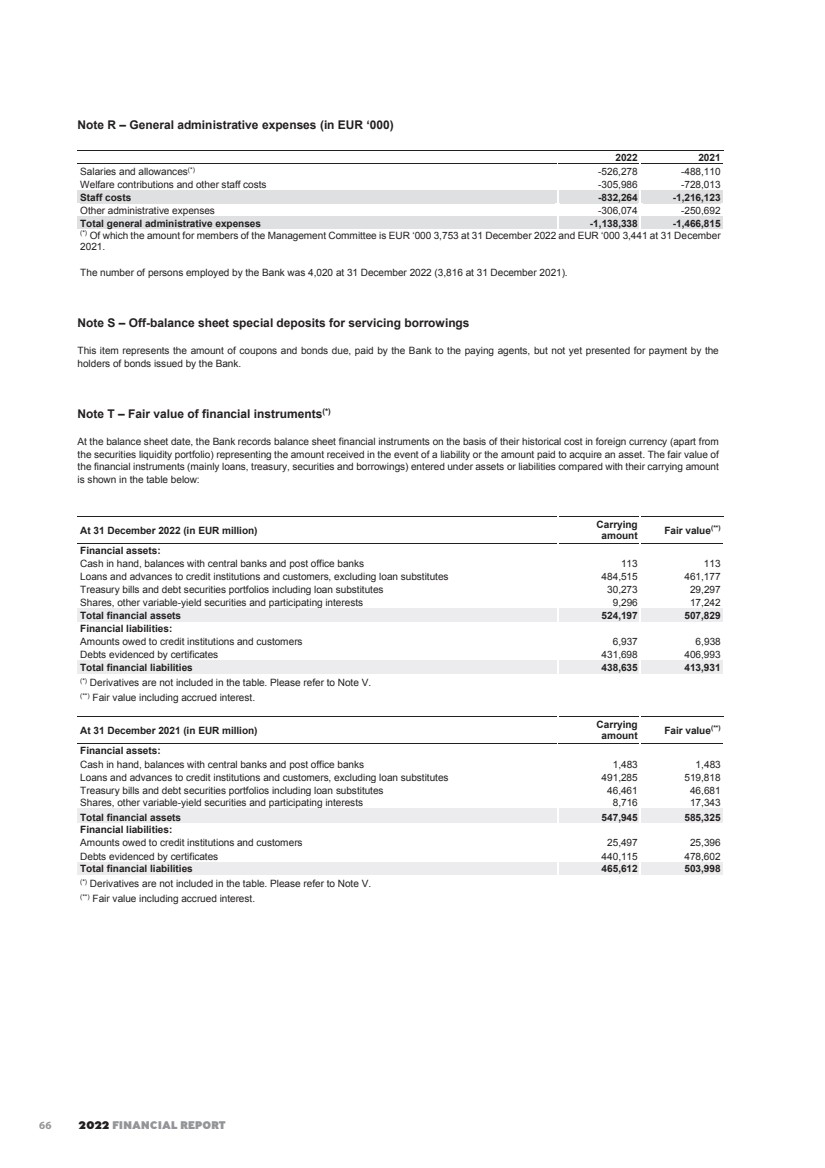
| EIB STATUTORY FINANCIAL STATEMENTS 75 Note U – Risk management This note presents information about the Bank’s exposure to risks and their management and control, in particular the primary risks associated with its use of financial instruments. These are: Credit risk - the risk of loss resulting from client or counterparty default and arising from credit exposure in all forms, including settlement risk2; • Interest rate risk - from the Bank’s positions, the risk to the economic value or to the net interest income arising from adverse movements in interest rates that affect interest rates sensitive instruments. It includes gap risk, basis risk and option risk; • Liquidity and funding risk - the risk that the Bank is unable to fund assets or meet obligations at a reasonable price or, in extreme situations, at any price; • Foreign exchange rate risk - the risk to the economic value or to the income derived from the Bank’s positions due to adverse movements in currency exchange rates; and • Operational risk - the risk of loss resulting from inadequate or failed internal processes, people and systems or from external events3. In 2022, the staff was teleworking part of the time, including the teams dedicated to risk management and monitoring. With respect to such activities, the position keeping systems were available in remote mode to the staff of Front, Middle and Back Office, as well as to Risk Management, with the same functionalities available under normal conditions. Risk management organisation The Bank’s objective is to analyse and manage risks so as to obtain the strongest possible protection for its assets, its financial result, and consequently its capital. While the Bank is generally not subject to legislative acts and guidelines applicable to commercial banks issued or adopted by the EU institutions, bodies and agencies (“EU Legislative Acts and Guidelines”), it has voluntarily decided to comply with these EU Legislative Acts and Guidelines to the extent determined by its Best Banking Practice framework, including the Best Banking Practice Guiding Principles, published by the Bank. The Group Risk and Compliance Directorate (‘GR&C’) independently identifies, assesses, monitors and reports credit, market, liquidity and funding and operational risks to which the Bank is exposed. In order to preserve segregation of duties and in accordance with the three lines of defence principle, GR&C is independent from the Front Offices and provides second opinions on all proposals having risk implications. The Group has established a Group Risk Function under the responsibility of the Group Chief Risk Officer (‘GCRO’). Without prejudice to the statutory responsibilities of the President and the EIB Management Committee, respectively, the GCRO reports on Group Risks to the EIB Management Committee under the oversight of the MC member in charge of risk. The GCRO participates in all meetings of the EIB Management Committee relating to matters within his/her terms of reference and relevant meetings of the other EIB governing bodies. The following sections disclose the credit, market, liquidity and funding and operational risks to which the Bank is exposed on its activities performed at own risk. For additional details, please refer to the EIB Group Risk Management Disclosure Report. Risk measurement and reporting system The Bank aligns its risk management systems to changing economic conditions and evolving regulatory standards. It adapts them on an on-going basis as market practice develops. Systems are in place to control and report on the main risks inherent in the Bank’s operations, i.e. credit, interest rate, liquidity and funding, foreign exchange rate and operational risks. With the purpose to quantify their impact on the Bank’s solvency, liquidity, earnings and operations, risks are assessed and measured both under normal circumstances and under possible stressed conditions. Risk measurements consider the relevant metrics related to capitalisation, earnings, liquidity, exposure to market and operational risks. Information on credit, market, liquidity, financial and operational risks is reported to the Management Committee and to the Board of Directors on a monthly basis. Such information is presented and explained to the Management Committee and to the Board of Directors’ Risk Policy Committee on a regular basis. The Bank’s risk appetite The risk appetite is the level of risk that the EIB is willing and able to incur in pursuing its activities in the context of its public mission and objectives. Key to this is the EIB’s capacity to provide attractive long-term financing to serve EU objectives across all EU Member States (and beyond in Partner Countries). A primary pillar of the Bank’s business model is to retain the long-term AAA rating from the major rating agencies. The processes and activities performed by the Bank to manage its risk appetite are formalised in the EIB Risk Appetite Framework (‘RAF’) approved by the BoD. The RAF covers the major financial risks (including credit, liquidity, market and equity risks) and non-financial risks categories: (i) operational (e.g. people, information security, financial crime, technology, conduct, fraud, compliance and model risks) and (ii) other (e.g. climate change and environmental and reputational risks). It helps to embed a healthy organisational risk culture within the EIB through the implementation and the monitoring of measurable risk appetite metrics, which are subject to boundaries (limits for financial risk metrics) and (where applicable) cascaded further down within the Bank. The EIB’s RAF covers lending operations at its own risk and under risk-sharing agreements, its activities mandated to the EIF as well as its funding and treasury activities. As a public institution, the Bank does not aim to make profits from speculative exposures to risks. As a consequence, the Bank does not consider its treasury or funding activities as profit-maximising centres, even though performance objectives are attached to these activities. Investment activities are conducted within the primary objective of protection of the capital invested. With respect to exposures arising from the Bank’s lending, borrowing and treasury operations, the main financial risk principle of the Bank is therefore to ensure that all material market risks are hedged. 2 Settlement risk is defined as the risk of potential losses due to transactions which remain unsettled after their due delivery date and/or due to transactions that are settled later than the applicable market standard. Due to the nature of the Group’s operations, the most relevant instruments affected by settlement risk are those derivatives entered into by the Bank which imply an exchange of foreign currencies. Settlement risk management is covered in the Financial Risk Guidelines. 3 The definition of external events excludes cases of client bankruptcy or unfavourable market movements or similar events, which represent triggers for Credit and respectively Market Risk. 67 |
| 2022 FINANCIAL REPORT 76 The Bank has a framework in place for managing interest rate (IR) risk (gap and basis risks4), as well as FX risk. The Bank monitors and manages on a daily basis its IR & FX positions within pre-approved limits. All new types of transactions introducing operational or financial risks must be authorised by the Management Committee, after the approval of the New Products Committee. Sustainability of revenue and self-financing capacity The Bank’s Interest Rate Risk Strategy forms an integral part of the Bank’s overall financial risk management. It reflects the expectations of the main stakeholders of the Bank in terms of stability of earnings, preservation of the economic value of own funds, and the self-financing of the Bank’s growth in the long term. To achieve these aims, the Interest Rate Risk Strategy considers a medium-to-long term horizon for the investment of the Bank’s own funds, in order to promote stability of revenues and to enhance overall returns. In practice, this is achieved by defining an investment profile producing a target duration for the Bank’s own funds between 4.5 and 5.5 years. In that context, the Asset/Liability Committee (‘ALCO’) performs regular checkpoints on the investment profile related to the Interest Rate Risk Strategy framework. U.1. Credit risk Credit risk concerns mainly the Bank's lending activities, treasury instruments such as debt securities, certificates of deposit and interbank term deposits, as well as the derivative and guarantee transactions. The credit risk associated with the use of derivatives is analysed in the ‘Derivatives’ section (Note V). Credit risk is managed in line with the detailed internal guidelines. The purpose of these guidelines is to ensure that credit risk is managed prudently. Whether or not a given entity is acceptable to the Bank as a counterpart in a lending operation is determined on the basis of a careful analysis and evaluation of the entity using quantitative and qualitative metrics but also relying on experience and expert judgment. The guidelines set out minimum credit quality levels for both borrowers and guarantors in lending operations and identify the acceptable transaction structure. They also detail the minimum requirements that loan contracts must meet in terms of key legal clauses and other contractual stipulations to ensure that the Bank's position is adequately safeguarded. Diversification of the loan portfolio is supported by a counterparty limit framework and sector limits for key industries. In order to ensure that the additional risk involved in complex or structured lending transactions is adequately analysed, quantified and mitigated, specific detailed guidelines have been developed in respect of certain types of operations complementing the general guidelines. In analysing risks, the Bank applies an internal loan grading system and assigns internal ratings to counterparts. Credit guidelines undergo periodic adaptations to incorporate evolving operational circumstances changes in the applicable Best Banking Principles and respond to new mandates that the Bank may receive. Despite the general context of uncertainty and various risks resulting from the Russian invasion of Ukraine, the credit quality of the loan portfolio is deemed stable at present. It relies on a risk management strategy based on a robust due diligence process, adequate levels of security and guarantees, as well as standard protective clauses included in its loan agreements. In addition to the collaterals and the guarantees provided for lending exposures, the EIB benefits of additional credit enhancements granted as part of different mandates. The aggregate amount outstanding (loans and guarantees granted by the Bank) is limited at any time by its Statutory Gearing Ratio (Article 16.5 of Statute). For the purpose of calculating this ratio the Bank uses data drawn from the EU Accounting Directives (‘AD’) framework. At year-end 2022, EIB’s Statutory Gearing Ratio under EU Accounting Directive stand-alone accounts stood at 204.0% (2021: 202.7%) and under EU-AD consolidated accounts stood at 207.5% (2021: 206.6%, max. 250% under Article 16.5 of the Statute). 4 The exposure to ‘option risk’ was not material in 2022. 68 |
| EIB STATUTORY FINANCIAL STATEMENTS 77 U.1.1. Loans In order to measure and manage credit risk on loans, the Bank has graded its lending operations according to generally accepted criteria, based on the quality of the borrower and structure of the transaction, including, where appropriate, the security provided. The structure of borrowers and guarantors relating to the loan portfolio as at 31 December 2022 is analysed below, including undisbursed portions. The table below shows the signed loans for projects granted by EIB, excluding those outside the European Union which are granted under the External Lending Mandate (ELM), European Fund for Sustainable Development (EFSD), Neighbourhood, Development and International Cooperation Instrument (NDICI)/European Fund for Sustainable Development Plus (EFSD+) and Cotonou Agreement where the Bank is, as the last resort, secured by the European Union budget or by the Member States guarantees (loans in the ACP Countries and the OCT) (*): (*) These guarantees are either Comprehensive (covering all risks) or limited to defined Political Risks (non-transfer of currency, expropriation, war or civil disturbance, denial of justice upon breach of contract). In EUR million States Public institutions Banks Corporates Not guaranteed (1) Total 2022 Total 2021 Guarantor Borrower States 0 0 0 0 59,287 59,287 61,631 Public institutions 32,376 23,674 338 200 90,650 147,238 145,123 Banks 37,488 20,563 14,187 12,640 32,340 117,218 116,663 Corporates 7,713 4,950 6,198 35,150 116,023 170,034 166,110 Total 2022(2)(3)(4)(5) 77,577 49,187 20,723 47,990 298,300 493,777 Total 2021(2)(3)(4)(5) 77,858 49,958 22,781 50,423 288,507 489,527 (1) These amounts include loans for which no formal guarantee independent of the borrower and the loan itself was required, the borrower’s level of solvency itself representing adequate security. In the event of certain occurrences, appropriate contractual clauses ensure the Bank’s right to access independent security. (2) The loans in risk-sharing operations (credit enhanced by the Member States guarantee or the EU budget in the form of a political risk guarantee) amount to EUR 2,193 million as of 31 December 2022 (2021: EUR 2,687 million). (3) This amount does not include signed loan substitutes (2022: EUR 17,414 million; 2021: EUR 17,953 million). (4) These amounts exclude loans to current European Union Member States granted before their accession to the European Union and guaranteed by the European Union budget or the Member States. (5) The Bank has signed, in the context of EFSI SME window and European Guarantee Fund, funding lines for a total commitment not exceeding EUR 9,187 million (2021: EUR 9,187 million). The Bank recognises an undisbursed exposure when a firm commitment is signed with the respective underlying risk counterpart, for which the funding lines are expected to be drawn. 69 |
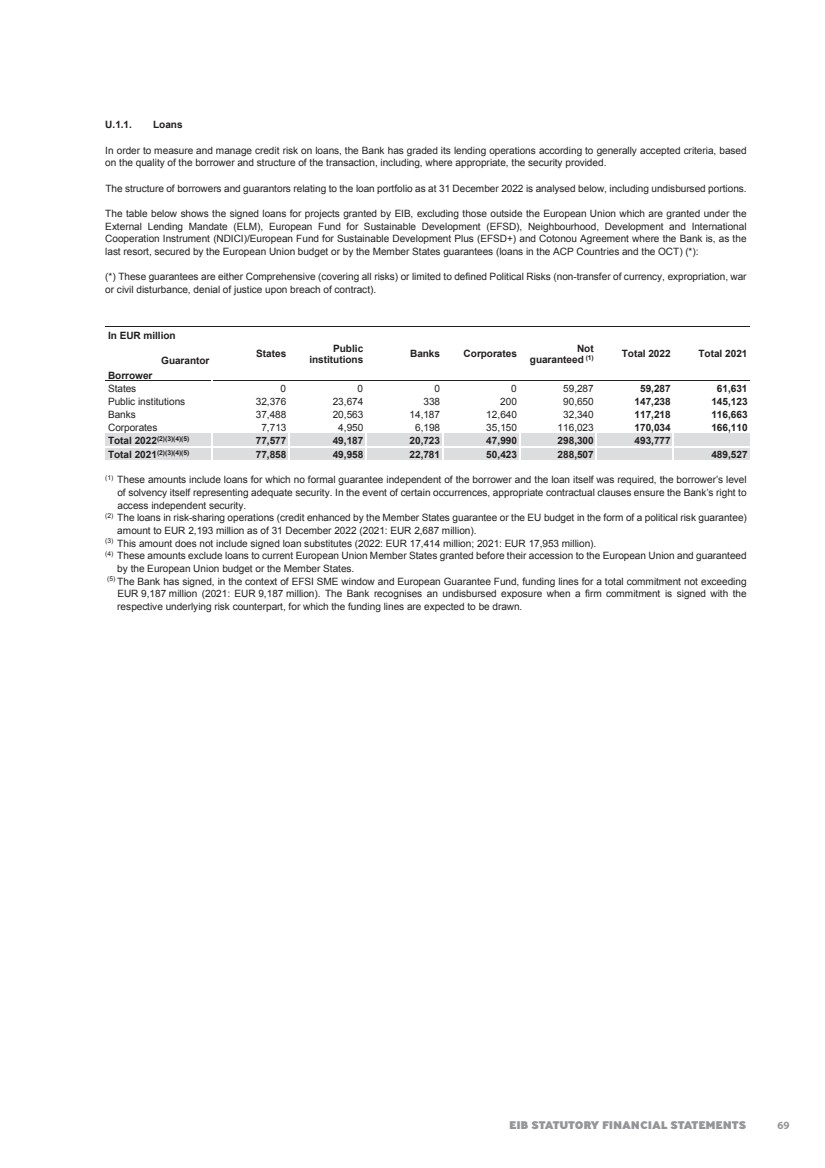
| 2022 FINANCIAL REPORT 78 The Bank did not record value adjustments in 2021 and 2022 in respect of its EU sovereign and EU sovereign guaranteed exposure as at the year-end as the Bank’s preferred creditor status and the protection given by the Bank’s Statute are deemed to guarantee a full recovery of the Bank’s assets upon maturity. The table below discloses information regarding the sovereign credit risk on loans (apart from loans outside the EU benefiting from EU budget or MS guarantees under the ELM, EFSD, NDICI/EFSD+ and Cotonou Agreements), where the Bank has either full own risk or bears a residual risk due to credit enhancement: (in EUR million) 2022 2021 Acting as borrower Acting as guarantor Acting as borrower Acting as guarantor Country Disbursed Undisbursed Signed Disbursed Undisbursed Signed Austria 0 0 190 0 0 146 Belgium 0 0 272 0 0 186 Bulgaria 1,060 0 119 1,107 0 115 Croatia 806 0 2,242 633 210 2,702 Cyprus 928 509 1,033 900 359 1,348 Czech Republic 915 1,009 0 1,068 784 0 Denmark 0 0 242 0 0 271 Estonia 500 0 84 452 120 91 Finland 0 0 113 0 0 92 France 0 0 3,986 0 0 3,428 Germany 0 0 2,002 0 0 1,659 Greece 7,379 1,210 9,262 7,756 1,192 8,852 Hungary 5,647 1,351 1,080 6,011 1,143 1,099 Ireland 1,665 240 1,095 1,665 0 1,154 Italy 4,989 2,560 6,941 4,755 2,160 6,397 Latvia 258 200 6 337 400 12 Lithuania 2,035 0 55 2,110 0 54 Luxembourg 0 9 231 150 0 236 Malta 0 72 280 0 72 297 Netherlands 0 0 294 0 0 205 Poland 6,631 330 17,925 6,254 1,472 17,123 Portugal 1,299 830 3,426 1,163 600 3,903 Romania 2,113 2,258 0 1,847 2,052 0 Slovakia 2,499 441 94 2,399 541 88 Slovenia 512 400 1,242 530 400 1,366 Spain 3,741 0 21,502 4,215 0 22,558 Sweden 0 0 199 0 0 136 Non EU–Countries 2,013 2,878 3,662 1,813 4,961 4,340 Total 44,990 14,297 77,577 45,165 16,466 77,858 The table below shows (in EUR million) the signed loans for projects outside the European Union under the ELM, EFSD, NDICI/EFSD+ and Cotonou Agreement benefiting from EU Budget or Member States guarantees: Secured by: 31.12.2022 31.12.2021 Member States 3,867 3,945 European Union budget(1) 49,167 47,629 Total(2)(3) 53,034 51,574 (1) Of which EUR 2,193 million in risk-sharing operations (credit enhanced by the Member States guarantee or the EU budget in the form of a political risk guarantee) as explained above (2021: EUR 2,687 million). (2) Including loans to current European Union Member States granted before their accession to the European Union and guaranteed by the European Union budget or the Member States. (3) Financial guarantees granted by the Bank for a total amount of EUR 487.5 million (2021: EUR 459.1 million) which are secured by Member States or the EU budget. The aforementioned guarantees are not included in the analysis as provided in table above. 70 |
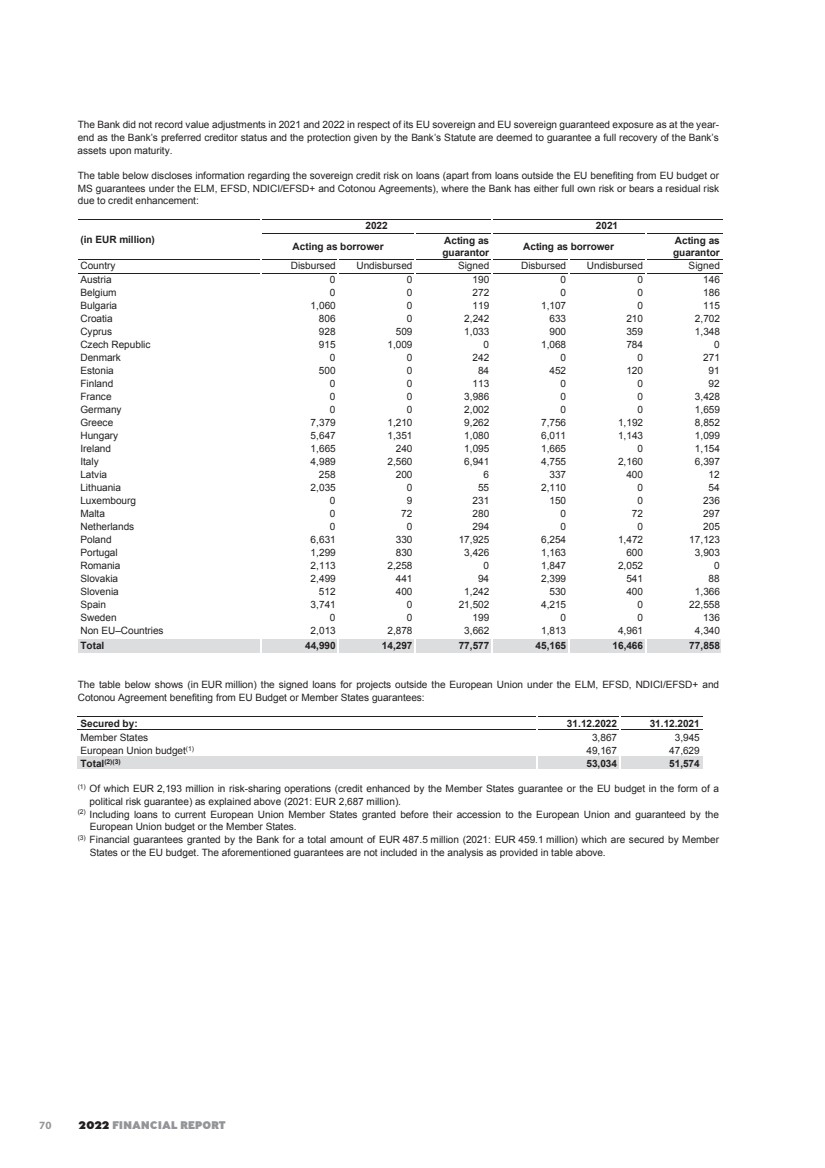
| EIB STATUTORY FINANCIAL STATEMENTS 79 LOANS FOR PROJECTS OUTSIDE THE EU UNDER THE EU BUDGET OR MEMBER STATE GUARANTEE (in EUR million) (including loans in the new Member States before accession) BREAKDOWN OF LOANS SIGNED BY GUARANTEE AGREEMENT 31.12.2022 31.12.2021 75% Member States global guarantee - ACP/OCT Group 4th Lomé Convention/2nd Financial Protocol 0 8 Total 75% Member States global guarantee 0 8 75% Member States guarantee - Cotonou partnership agreement 185 198 - Cotonou partnership 2nd agreement 1,108 1,172 - Cotonou Protocol 3 – OR / ACP 2,480 2,473 - Cotonou Protocol 3 – OR / OCT 94 94 Total 75% Member States guarantee 3,867 3,937 Total Member States guarantee 3,867 3,945 100% European Union budget guarantee - Russia – 100 m – 2001-2005 14 16 - Russia – 500 m – 2004-2007 114 131 - EFSD 93 0 Total 100% European Union budget guarantee 221 147 75% European Union budget guarantee 70% European Union budget guarantee - South Africa – 375m – Decision 29.01.97 9 14 - Bosnia–Herzegovina – 100m 99/2001 8 11 - Euromed (EIB) – 2 310m – Decision 29.01.97 7 14 - North Macedonia – 150m – 1998/2000 5 9 - CEEC – 3 520m – Decision 29.01.97 32 75 Total 70% European Union budget guarantee 61 123 65% European Union budget guarantee - South Africa – 825m – 7/2000-1/2007 73 86 - South Africa – Decision 2/2007-12/2013 102 142 - ALA III – 2 480m –- 2/2000 – 7/2007 60 88 - ALA Decision – 2/2007-12/2013 1,327 1,484 - Euromed II – 6 520m – 2/2000-1/2007 710 928 - South Eastern Neighbours – 9 185m – 2/2000 – 7/2007 2,272 2,542 - Türkiye special action – 450m – 2001-2006 92 98 - Türkiye TERRA – 600m – 11/1999-11/2002 223 244 - PEV EE/CAS/RUS 1/2/2007 – 31/12/2013 1,755 1,877 - PEV MED 1/2/2007 – 31/12/2013 4,630 5,180 - Pre-Accession – 9 048m – 2007 – 2013 4,713 5,127 - Climate Change Mandate 2011 - 2013 1,031 1,056 - ELM Asia 2014-2020 1,289 1,276 - ELM Central Asia 2014-2020 355 352 - ELM East-Russia 2014-2020 6,996 7,258 - ELM Latin America 2014-2020 2,906 2,757 - ELM MED 2014-2020 9,121 9,650 - ELM Pre-Accession 2014-2020 4,018 4,151 - ELM RSA 2014-2020 140 272 - ELM ERI Private Mandate 1,160 1,394 - ELM ERI Public Mandate 1,403 1,397 - Global Europe NDICI 4,509 0 Total 65% European Union budget guarantee 48,885 47,359 Total European Union budget guarantee 49,167 47,629 Total(1) 53,034 51,574 (1) Financial guarantees granted by the Bank for a total amount of EUR 487.5 million (2021: EUR 459.1 million) which are secured by Member States or the EU budget. The aforementioned guarantees are not included in the analysis as provided in table above. 71 |
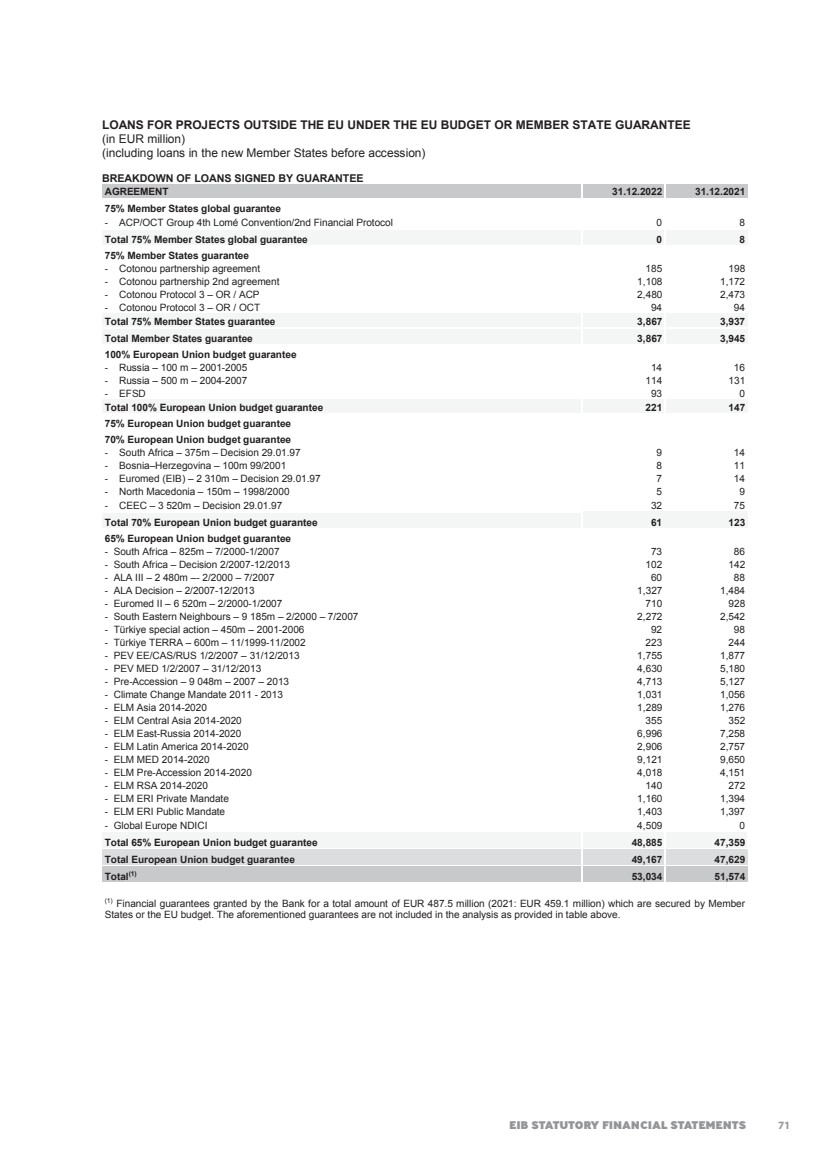
| 2022 FINANCIAL REPORT 80 Collateral on loans (in EUR million) Among other credit mitigant instruments, the Bank uses pledges of financial securities. These pledges are formalised through a Pledge Agreement, enforceable in the relevant jurisdiction. The portfolio of collateral received in pledge contracts amounts to EUR 8,215 million (2021: EUR 12,596 million), with the following composition: As at 31 December 2022 Loan Financial Collateral (in EUR million) Moody's or equivalent rating Bonds Cash Total Government Supra-national Agency Secured Bonds (covered bonds) Bank and Corporate Bonds Aaa 234 65 0 68 9 0 376 Aa1 to Aa3 1,000 10 167 142 194 0 1,513 A1 0 0 0 0 6 0 6 Below A1 4,969 0 3 602 518 0 6,092 Non-Rated 40 0 0 0 29 159 228 Total 6,243 75 170 812 756 159 8,215 As at 31 December 2021 Loan Financial Collateral (in EUR million) Moody's or equivalent rating Bonds Cash Total Government Supra-national Agency Secured Bonds (covered bonds) Bank and Corporate Bonds Aaa 189 181 4 40 62 0 476 Aa1 to Aa3 1,042 14 10 694 149 0 1,909 A1 48 0 0 17 14 0 79 Below A1 8,212 0 39 94 598 0 8,943 Non-Rated 41 0 0 0 705 443 1,189 Total 9,532 195 53 845 1,528 443 12,596 A breakdown of disbursed loans outstanding (in EUR million) at 31 December, according to the sectors of the contract is set out below: Sector 2022 2021 Transports 126,633 129,253 Global Loans(1) 64,600 66,306 Energy 64,590 62,255 Health, education 36,901 36,296 Miscellaneous infrastructure 33,346 32,571 Industry 31,438 28,518 Water, sewerage 28,324 27,761 Services 18,262 16,980 Telecommunications 10,913 11,282 Agriculture, fisheries, forestry 4,961 4,238 Total(2) 419,968 415,460 (1) A global loan is a line of credit to an intermediary financing institution or a bank, which subsequently lends the proceeds, at its own risk, to finance small and medium-sized projects being undertaken by private or public sector promoters. (2) This amount does not include disbursed loan substitutes (2022: EUR 17,414 million; 2021: EUR 17,953 million). Arrears on loans Amounts in arrears are identified, monitored and reported according to the procedures defined in the bank-wide “Financial Monitoring Guidelines and Procedures”. These procedures follow best banking practices and are adopted for all loans managed by the EIB. As of 31 December 2022, the arrears above 90 days on loans from own resources amount to EUR 78 million (2021: EUR 119 million). For arrears above 90 days on own resources not secured by comprehensive guarantees of the European Union or Member States, the outstanding principal nominal amount is EUR 150 million as of 31 December 2022 (2021: EUR 531 million). These are covered by a loan loss allowance of EUR 70 million (2021: EUR 75 million). During 2022, EUR 156 million of arrears have been called under the guarantees of the European Union and nothing was called under the Member States guarantees. Corresponding amounts in 2021 were EUR 93 million and nil respectively. Also, during the course of the year, EUR 4 million of arrears previously invoked under the guarantees of the European Union or the Member States have been refunded (2021: EUR 1 million). During 2022, no calls have been executed under first demand private guarantees (2021: EUR 358 million). 72 |
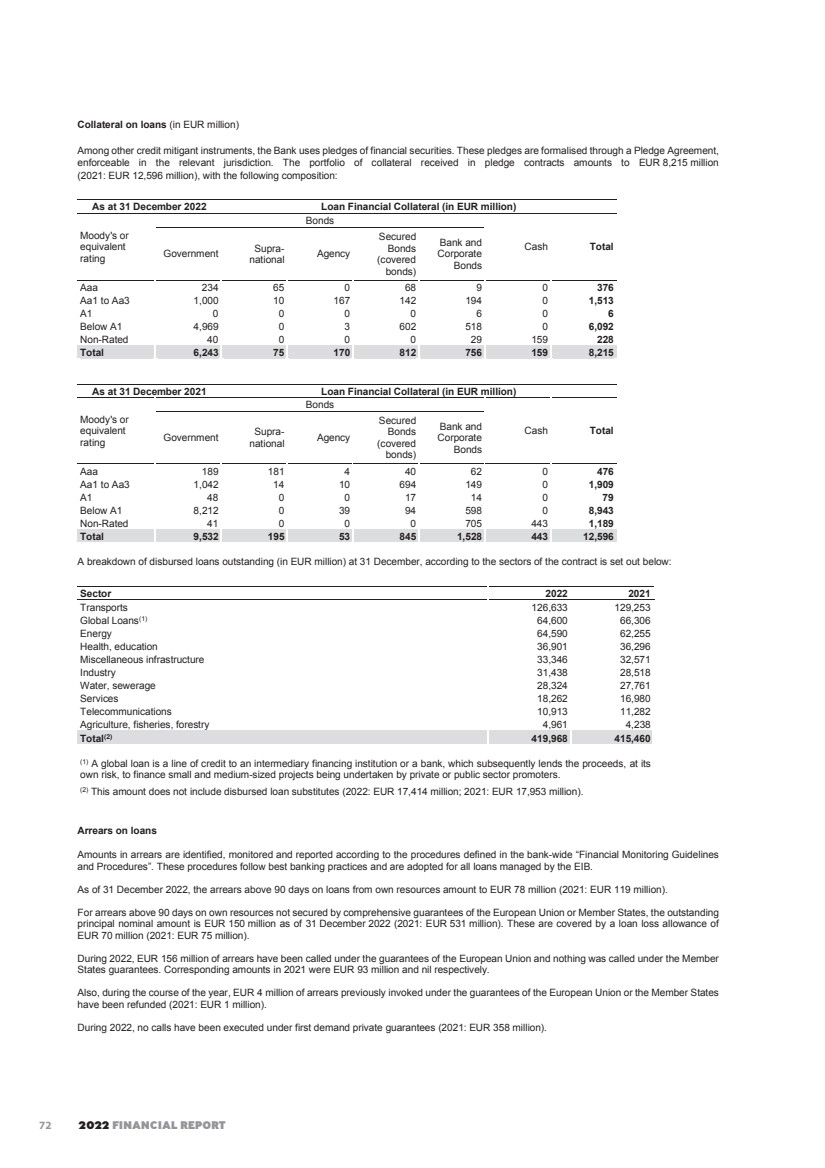
| EIB STATUTORY FINANCIAL STATEMENTS 81 Loan renegotiation and forbearance The EIB considers loans to be forborne loans (i.e. loans, debt securities and loan commitments) in respect of which forbearance measures have been extended. Forbearance measures consist of “concessions” that the EIB decides to make towards an obligor who is considered unable to comply with the contractual debt service terms and conditions due to its financial difficulties, in order to enable the obligor, to service the debt or to refinance, totally or partially, the contract. Exposures shall be treated as forborne if a concession has been made, irrespective of whether any amount is past-due, or the exposure is classified as defaulted. Exposures shall not be treated as forborne when the obligor is not in financial difficulties. Once renegotiated, the EIB will continue to closely monitor these loans. If the renegotiated payment terms will not recover the original carrying amount of the asset, the Bank will consider accounting for value adjustments in the profit and loss account. The need for a value adjustment for all loans whose LG deteriorated to E– is assessed regularly. The Bank has provided a number of supportive measures available to its borrowers in response to the specific economic effects of the Covid-19, which include, among other things, (i) the temporary easing (including waivers) of financial covenants and other key clauses, (ii) the re-profiling of cash flows by setting new repayment schedules or the temporary standstill of repayment obligations and (iii) certain other complementary supportive measures, such as the signing of new contracts, accelerating loan disbursements and increasing amounts lent to borrowers. The Bank assessed requests for such measures on a case-by-case basis within the limits of certain specific conditions. These measures were intended to be extended to borrowers which were not experiencing any structural financial difficulties or solvency issues and were considered to be a going concern at the time of granting such measures. If, as a result of the assessment, a borrower did not meet these requirements or the Bank identified risks for the long-term sustainability of the borrower’s business model, it has considered any other appropriate measures and, if necessary, follow the Bank’s standard restructuring processes. Such supportive measures are not made available by the Bank any longer since June 2021. Forbearance measures and practices undertaken by the Bank’s restructuring team during the reporting period include, but are not limited to, extension of maturities, deferral of capital only, deferral of capital and interest, breach of material covenants and capitalisation of arrears. 73 |
| 2022 FINANCIAL REPORT 82 Operations subject to forbearance measures are reported as such in the tables below. (in EUR million) 31.12.2022 31.12.2021 Performing Non-Performing Performing Non-Performing Number of contracts subject to forbearance practices 53 79 88 74 Carrying values (incl. interest and amounts in arrears) 2,256 2,054 4,693 2,511 of which being subject to value adjustments 0 1,418 0 1,243 Value adjustments recognised 0 307 0 407 Interest income in respect of forborne contracts 75 70 121 73 Exposures derecognised (following restructuring, write-off or sale of the operation) 0 3 0 34 Forbearance measures (in EUR million) 31.12.2021 Extension of maturities Deferral of capital only Deferral of capital and interest Breach of material financial covenants Other Contractual repayment and termination(1) 31.12.2022 Public 2,929 0 0 0 229 0 -2,138 1,020 Bank 280 0 0 0 36 9 -190 135 Corporate 3,995 40 0 0 90 160 -1,130 3,155 Total 7,204 40 0 0 355 169 -3,458 4,310 (1) Decreases are explained by repayments of capital, interest and amounts in arrears as well as write-offs which occurred during the year on operations already considered as forborne as of 31 December 2021 and by termination during the year. U.1.2. Treasury The credit risk associated with treasury instruments (securities, commercial papers, term deposits, etc.) is managed through selecting sound counterparties and issuers. The structure of the securities portfolio and limits governing outstanding treasury instruments have been laid down by the Management. These limits are reviewed regularly by the Group Risk and Compliance Directorate. The table below provides a percentage breakdown of the credit risk associated with the securities in the Treasury portfolios and the money markets products (deposits and reverse repos) in terms of the credit rating of counterparties and ultimate obligor rating or issue rating where relevant: Moody’s or equivalent rating Securities portfolio % Money market products % 31.12.2022 31.12.2021 31.12.2022 31.12.2021 Aaa 34 12 89 82 Aa1 to Aa3 39 22 4 8 A1 to A3 21 39 5 9 Below A3 6 27 2 1 Total 100 100 100 100 The total nominal amount of EIB Treasury assets with maturity above 1 year and a minimum rating of Aa3 stood at EUR 4,399 million at 31 December 2022 (2021: EUR 3,221 million). Collateral on treasury transactions The Bank enters into collateralised reverse repurchase and repurchase agreement transactions that may result in credit exposure in the event that the counterparty to the transaction is unable to fulfil its contractual obligations. The Bank controls credit risk associated with these activities by monitoring counterparty credit exposure and collateral values on a daily basis and requiring additional collateral to be deposited with the Bank when deemed necessary. Tripartite repo and reverse repo operations are carried out with a third-party custodian who undertakes, on the basis of a framework contract, to guarantee compliance with the contractual terms and conditions, notably with respect to: - delivery against payment; - verification of collateral; - the collateral margin required by the lender which must always be available and adequate, with the market value of the securities being verified daily by the custodian; and - organisation of substitute collateral provided that this meets all the contractual requirements. 74 |
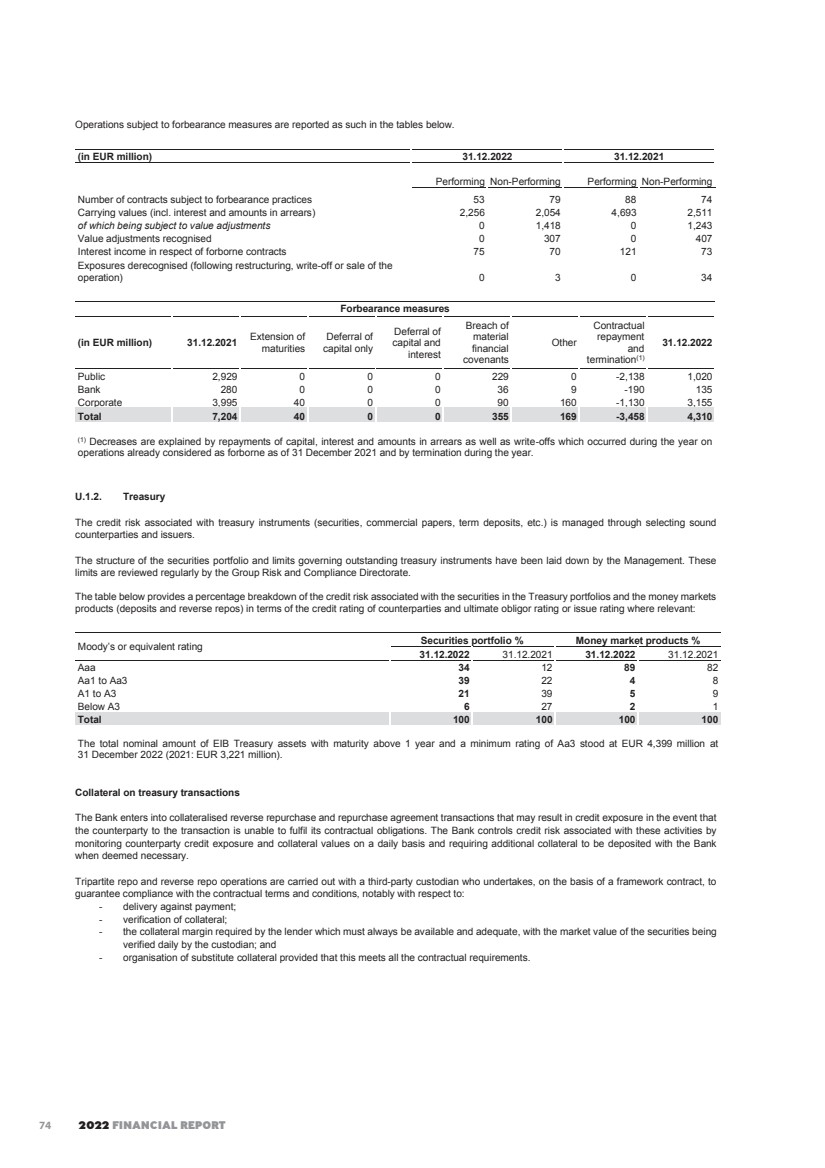
| EIB STATUTORY FINANCIAL STATEMENTS 83 Collateral received The treasury transactions include EUR 7,381 million (2021: EUR 13,894 million) of bilateral and tripartite reverse repurchase agreements, out of which for EUR 7,381 million (2021: EUR 13,334 million) the Bank received financial collaterals and for EUR 0 (2021: EUR 560 million) commodities. Bilateral and tripartite repurchase agreements stood at EUR 3,065 million at 31 December 2022 (2021: EUR 5,717 million). The exposure is fully collateralised with subsequent call for additional collateral or release in accordance with the underlying agreement. The market value of the financial collateral portfolio at 31 December 2022 is EUR 7,000 million (2021: EUR 13,557 million), with the following classification: Reverse Repurchase Agreements Financial Collateral (in EUR million) At 31 December 2022 Bonds Cash Moody's or equivalent rating Government Supra-national Agency Secured Bonds (covered bonds) Bank and Corporate Bonds Total Aaa 319 23 51 1,310 2,354 0 4,057 Aa1 to Aa3 241 0 29 8 215 0 493 A1 8 0 233 0 343 0 584 Below A1 217 0 44 4 1,169 0 1,434 Non Rated 425 0 0 0 6 1 432 Total 1,210 23 357 1,322 4,087 1 7,000 Reverse Repurchase Agreements Financial Collateral (in EUR million) At 31 December 2021 Bonds Cash Moody's or equivalent rating Government Supra-national Agency Secured Bonds (covered bonds) Bank and Corporate Bonds Total Aaa 998 655 712 1,480 4,192 0 8,037 Aa1 to Aa3 2,047 78 389 8 300 0 2,822 A1 583 0 65 0 130 0 778 Below A1 1,637 0 20 0 222 0 1,879 Non Rated 38 0 0 0 1 2 41 Total 5,303 733 1,186 1,488 4,845 2 13,557 Securities deposited In the context of the Eurosystem’s monetary policy operations, the Bank deposited securities with the Central Bank of Luxembourg with a market value of EUR 141 million as at 31 December 2022 (2021: EUR 14.9 billion). The market value of the collateral deposited (except to BCL) under bilateral and tripartite repurchase agreements stood at EUR 3,054 million as at 31 December 2022 (2021: EUR 5,711 million). U.1.3. Guarantees granted by the Bank in respect of loans granted by third parties Credit risk arising from the Bank’s guarantees and securitisations transactions funded by own resources is managed in line with dedicated internal guidelines. At year-end of 2022, the signed exposure guaranteed by EIB amounted to EUR 24.4 billion (2021: EUR 22.6 billion) out of which there is EUR 10.1 billion (2021: EUR 5.7 billion) of disbursed exposure of the loans guaranteed and provisions on guarantees amount to EUR 86.6 million (2021: EUR 27.9 million). Part of the EIB guarantee type of operations derives from the risk sharing operations where the EIB guarantees on a loan-by-loan basis underlying loan type of exposures originated by a financial intermediary based on established delegation models. The financial intermediary originating the underlying risk exposures on which the EIB takes risk is subject to a detailed due diligence in order to make sure that the EIB can delegate credit management tasks to the financial intermediary in question. Whereas the remaining EIB guarantee type operations are typically done as synthetic transactions, whereby EIB usually covers the risk of an existing portfolio to a given financial intermediary. The EIB has established a dedicated framework to limit concentration risk for this type of transactions. Depending on the specificities of the transaction, this may include setting eligibility criteria including but not limited to lowest eligible rating categories, certain sector, obligor and/or obligor group exposure. Formally speaking there is limited counterparty risk on the financial intermediary as the credit risk is on the underlying exposures originated by the financial intermediary i.e. counterparty risk is limited to (1) the payment of the guarantee fees and (2) the potential recoveries due to the EIB in case of a default of an underlying exposure guaranteed and paid out by the EIB. In any case, the EIB has established a number of mitigating measures, including but not limited to detailed due diligence as well as security rights, step-in rights, consent rights on material amendments of the underlying risk exposures or termination rights. U.2. Interest rate risk From the Bank’s positions, the Interest Rate Risk is the risk to the economic value or to the net interest income arising from adverse movements in interest rates that affect interest rates sensitive instruments. Exposure to interest rate risk occurs when there are differences in the repricing and maturity characteristics of the different asset, liability and hedge instruments. 75 |
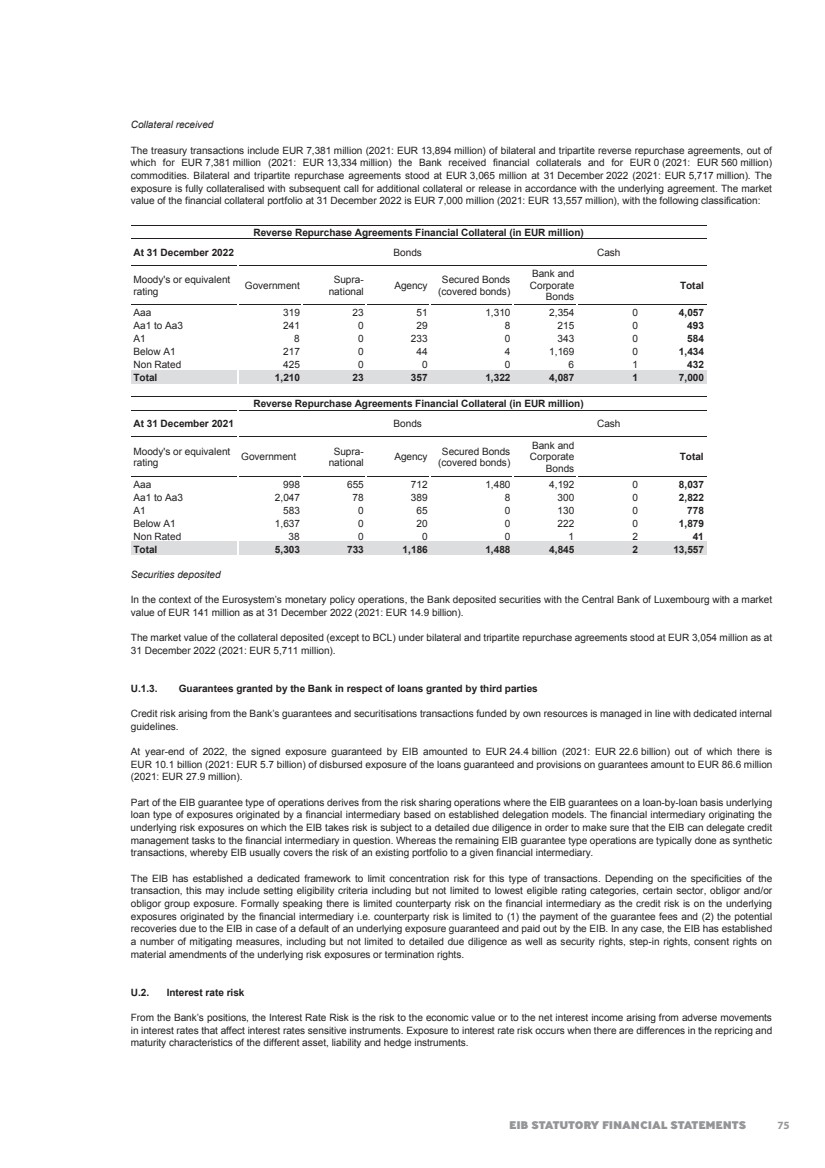
| 2022 FINANCIAL REPORT 84 In measuring and managing interest rate risk, the Bank refers to the relevant key principles of the Basel Committee on Banking Supervision (‘BCBS’), as implemented in the EU, and to the regulatory guidance issued by the European Banking Authority (‘EBA’). The main sources of interest rate risk are: gap risk, basis risk and option risk. Gap risk is the most relevant interest rate risk for the Bank and is defined as the risk to the economic value or to the net interest income generated by the differences in the term structure of interest rate sensitive instruments on the Bank’s balance sheet. Following regulatory guidance, the Bank has articulated its appetite for interest rate risk in terms of both the maximum Risk to Economic Value and the maximum Risk to Earnings that the Bank is prepared to take (while, when applicable, adhering to the maximum thresholds defined in the EBA Supervisory Outlier Tests). The Bank’s investment strategy for its own funds – the Interest Rate Risk Strategy – complies with such interest rate risk appetite. The effect of the Russian invasion of Ukraine has contributed to rising inflationary trends and high inflation was followed by increases in interest rates, being translated into positive impact on the Bank’s net interest revenue. IBOR Reform: Interest rate benchmarks, such as the London InterBank Offered Rate (‘LIBOR’) were widely used in financial contracts. The global transition to alternative interest rate benchmark rates is one of the most challenging reforms undertaken in the financial markets. Similarly to other Banks, EIB has significant exposure to IBORs on its financial instruments that are in the scope of the reform as part of these market-wide initiatives. Internal preparations In February 2018, the Assets & Liabilities Committee (‘ALCO’) set up a dedicated sub-ALCO working group on IBORs, the IBOR Working Group to proactively follow and monitor the developments related to the transition to alternative interest rates. The objectives of the IBOR Working Group included the monitoring of the developments related to the interest rate benchmark reform. This oversight covers, among others, the progress on contracts amendments, bilateral negotiations with clients, IT systems and applications updates, introduction of fall-back language in new contracts and regular monitoring of the exposure to IBORs per currency, asset class and jurisdiction of the interest rate benchmarks earmarked for discontinuation. The progress in the implementation of the established work-plan has been regularly monitored and discussed at the ALCO and periodically reported to the Senior Management and the Audit Committee. Risk considerations The main risks in the context of the IBOR reform are operational and financial. They are related to e.g. updating of IT systems including booking, settlement/ payment, valuation and risk systems; revision of operational controls related to the reform; operational challenges associated with the amendment of contracts (including bilateral negotiations for loan contracts) and introduction of fall-back provisions; potential basis risk among the different transaction types. The latter is mitigated with the introduction of robust and, to the extent possible and practicable, consistent fall-backs across financial products. Transition status per financial instruments class As part of its lending and funding activities, the Bank is mainly exposed to the IBOR Reform on Floating Rates Loans granted to customers and credit institutions and bonds issued to fund its activity. In order to manage exposures to interest rate and foreign currency risks, the Bank uses derivative instruments (e.g. to hedge fixed rates loans and borrowings operations). Derivatives are the largest financial instrument class directly exposed to IBOR rates as a large part of their corresponding cash flows are referenced to IBOR rates (i.e., “floating interest rate”). In 2021, the Bank adhered to the ISDA IBOR Fallback Protocol and Supplement, which provide an amendment mechanism for counterparties to incorporate robust fallback provisions to be applied upon the cessation of an interest rate index, ensuring a smooth transition of the derivatives legacy portfolio. All EIB’s counterparties to LIBOR-linked swaps have also adhered to that Protocol and Supplement. Through the application of this Protocol and Supplement, the Bank had migrated in its systems all of its derivative notional exposure referring to LIBORs (in GBP, CHF, JPY and USD) by the end of 2022. Floating Rate Loans are the second largest financial instrument class directly exposed to IBOR rates. As at 31 December 2022, no contract originally indexed to CHF, JPY and GBP is linked to LIBOR any longer. During 2022, the Bank has pursued the migration of the loans indexed to USD LIBOR. The USD LIBOR legacy portfolio is larger than that previously pertaining to GBP, CHF and JPY LIBOR and it is also more geographically diversified (with circa 75% clients located in outside-EU countries). 75% of borrowers have already expressed their product preference and relevant repapering is expected to be signed in early 2023. While the majority of the exposure is expected to be migrated by the first interest payment date after the cessation date of 30 June 2023, a partial reliance on synthetic LIBOR is likely to be needed. In parallel to the migration, the Bank has adapted its lending products portfolio for new loan origination. On the funding side, the Bank has been issuing bond products referencing new RFRs in its balance sheet since 2018. In addition, the Bank has focused on supporting the relevant RFR markets with the required liquidity, under the preferred market structural formats. As at 31 December 2022, of the bonds indexed to USD LIBOR, 56% of the carrying amount will mature before end-June 2023. The remaining 44% will be assessed during the first semester of 2023 and appropriate exposure mitigation opportunities will be considered. U.2.1. Interest rate risk on the Economic Value of the Own Funds/Equity The Bank’s Interest Rate Risk strategy aims at maintaining a balanced and sustainable revenue profile as well as limiting the risk to the economic value of the Bank. A clear preference has been given to the revenue profile in light of the objective of self-financing future growth. This overall objective is achieved by investing the own funds according to a medium to long term investment profile. Of course, this strategy needs to comply with the limits for the RAF metrics “Risk to Earnings” and “Risk to Economic Value”. Apart from the Interest Rate Strategy underpinning the investment of the Bank’s own funds (implying an own funds duration target within the range of currently 4.5 – 5.5 years), the Bank’s balance sheet should be match-funded with respect to interest rate risk. As it is not operationally practical to perfectly match-fund the Bank’s balance sheet, small deviations to gap and basis risks are allowed. Those net residual interest rate risk positions are managed within pre-approved limits, the latter being dimensioned to ensure the individual risks remain within the risk appetite boundaries. 76 |
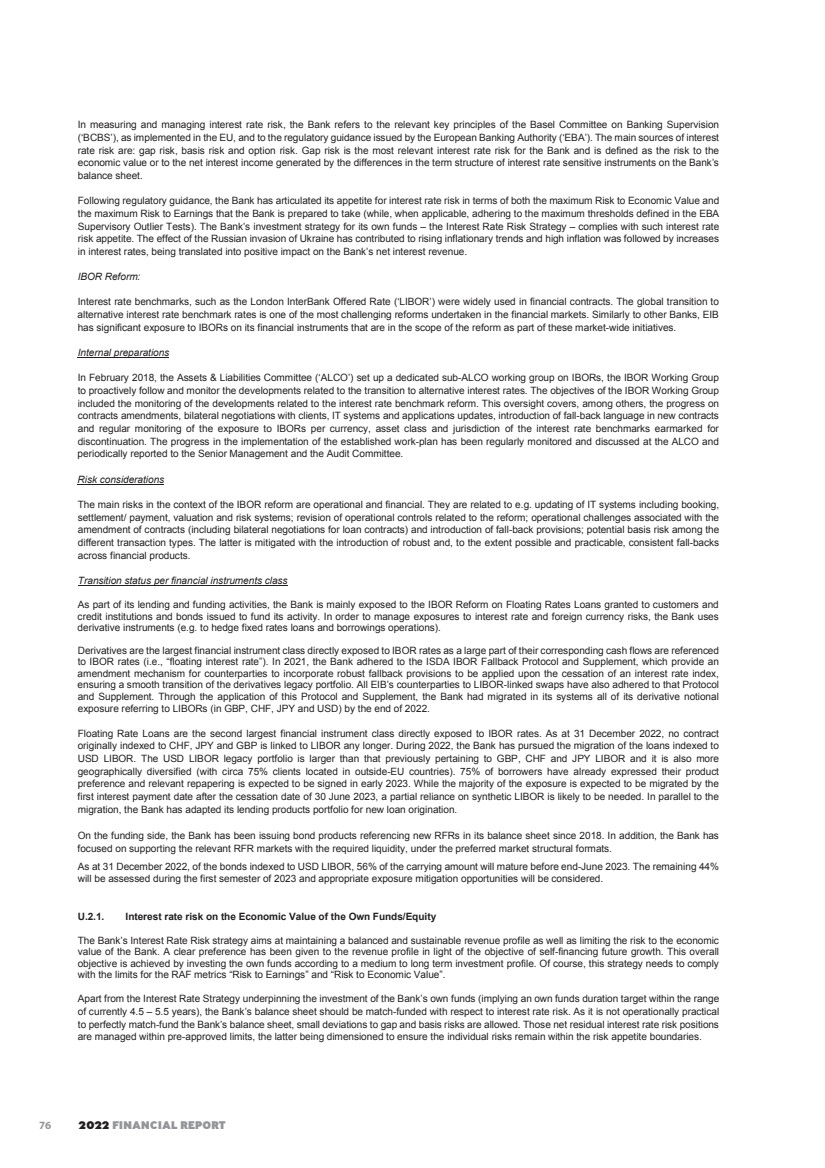
| EIB STATUTORY FINANCIAL STATEMENTS 85 In addition to its interest rate risk limits framework, the Bank performs regular stress testing, based on EBA standardised shock scenarios5 and internally defined ones, to its projected earnings and to its economic value. The exercise serves the purpose of identifying potential adverse consequences arising from severe changes in the interest rates environment. As of 31 December 2022, the worst impact of the EBA supervisory outlier test scenarios would reduce the economic value of own funds by EUR 5.37 billion (2021: EUR 4.49 billion)6. Among the financial instruments in the Bank’s portfolio, some operations (borrowings and associated swaps) present callability options and may be redeemed early, hence introducing uncertainty as to their final maturity. However, as those packages (borrowings and associated swaps) are fully back-to-back (up to the cashflow level), they can be considered at the end as simple synthetic floating rate notes indexed to Libor/Euribor and bearing limited interest rate risk. The table hereafter is a summary of the features of the Bank’s callable borrowings portfolio as of 31 December 2022 and 31 December 2021, where the total nominal amount, the average natural maturity and the average expected maturity (both weighted by the nominal amount of the concerned transactions) are shown per funding currency and per main risk factor involved: By funding currency (after swaps): 31.12.2022 (in EUR million) EUR USD Total EUR Pay Notional -2,467 -1,149 -3,616 Average maturity date 05.04.2046 09.06.2037 17.06.2043 Average expected maturity 01.04.2039 21.10.2033 08.07.2037 31.12.2021 (in EUR million) EUR USD Total EUR Pay Notional -2,659 -1,284 -3,943 Average maturity date 19.03.2047 06.09.2038 07.06.2044 Average expected maturity 02.01.2031 07.07.2027 13.11.2029 By risk factor involved: 31.12.2022 Risk factor (in EUR million) FX level IR curve level Total EUR Pay Notional -283 -3,333 -3,616 Average maturity date 18.07.2035 17.02.2044 17.06.2043 Average expected maturity 21.05.2032 15.12.2037 08.07.2037 31.12.2021 Risk factor (in EUR million) FX level IR curve level Total EUR Pay Notional -323 -3,620 -3,943 Average maturity date 01.01.2036 09.03.2045 07.06.2044 Average expected maturity 13.02.2029 07.12.2029 13.11.2029 U.2.2. Interest rate risk on the Earnings The Risk to Earnings quantifies the amount of net interest income that would change during the forthcoming 36 months if all interest rate curves would decrease by two percentage points. Such exposure stems primarily from the mismatch between interest rate repricing periods of assets and liabilities, and has to stay within the limit defined in the Risk Appetite Framework. With the positions in place as of 31 December 2022, the earnings would decrease by EUR 920.5 million (2021: EUR 992.4 million) if interest rates were to decrease by 200 basis points. For enriching the analysis of the earnings’ sensitivity, the earnings would increase by EUR 937.3 million (2021: EUR 1,014.7 million) if interest rates were to increase by 200 basis points. The Bank uses a dedicated software that allows to simulate the sensitivity of earnings on a deal by deal basis. Such sensitivity of earnings is measured on an accruals basis and is calculated under the ‘’ongoing’’ assumption that, over the time horizon analysed, the Bank realises (at market rates defined in the underlying scenario) the new business forecast in the Operational Plan, maintains exposures within approved limits and executes monetary trades to refinance funding shortages or invest cash excesses. In line with the Bank’s current practice, the model uses the hypothesis that simulated earnings are not distributed to the shareholders, but are used to refinance the Bank’s business. The administrative costs are projected according to the forecasts of the Operational Plan. 5 EBA/GL/2018/02. 6 The stress test is performed on all risk-sensitive banking book instruments, including the pension and health insurance liabilities (defined benefit obligations, DBO) as calculated by an actuarial provider. 77 |

| 2022 FINANCIAL REPORT 86 U.3. Liquidity and funding risk Liquidity risk refers to the ability of the Bank to fund increases in assets and meet obligations as they come due, without incurring unacceptable losses. It can be further split into funding liquidity risk and market liquidity risk. Funding liquidity risk is connected to the risk for the Bank of being unable to refinance the asset side of its balance sheet and meet payment obligations punctually and in full out of readily available liquid resources. Funding liquidity risk may have an impact on the volatility in the economic value of, or in the income derived from the Bank’s positions, due to potentially increasing immediate risks to meet payment obligations and the consequent need to borrow at unattractive conditions. Market liquidity risk is the volatility in the economic value of, or in the income derived from, the Bank’s positions due to potential inability to execute a transaction to offset, eliminate or reduce outstanding positions at reasonable market prices. Such an inability may force early liquidation of assets at unattractive prices when it would be better to avoid such liquidation. This risk is tied to the size of the position compared to the liquidity of the instrument being transacted, as well as to potential deterioration of market availability and efficiency. The liquidity risk of the Bank is managed in order to ensure the regular functioning of its core activities at reasonable cost. The main objective of liquidity policy is to ensure that the Bank can always meet its payment obligations punctually and in full. In contrast to commercial banks, the EIB does not have retail deposits but relies on its access to capital markets to raise the funds it on-lends to its clients. The Bank manages the calendar of its new issues so as to maintain a prudential liquidity buffer. Liquidity planning takes into account the Bank’s needs to service its debt, make disbursements on loans and cash inflows from the loan portfolio. It also takes into account the sizeable amount of signed but undisbursed loans, whose disbursements typically take place at the borrowers’ request. The Bank further assures management of liquidity risk by maintaining a sufficient level of short-term liquid assets and by spreading the maturity dates of its placements according to the forecasts of liquidity needs. The liquidity risk policy also incorporates a floor on treasury levels: indeed, the Bank's total liquidity ratio (liquidity as a percentage of the next 12 months projected net cash flows) must at all times exceed 25%. The Bank has in place a Group Contingency Funding Plan (‘Group CFP’), which specifies appropriate decision-making procedures and corresponding responsibilities. The Group CFP is regularly tested and benchmarked against applicable best banking practices, including relevant guidelines issued by the European Banking Authority in this respect. The Group CFP is approved annually by the Board of Directors of the Bank. Regular stress-testing analyses are executed as a part of the liquidity risk monitoring and drive the size of the Bank’s liquidity buffer. On 8 July 2009, the Bank became an eligible counterparty in the Eurosystem’s monetary policy operations, and therefore has been given access to the monetary policy operations of the European Central Bank. The Bank conducts the operations via the Central Bank of Luxembourg, where the Bank maintains deposits to cover the minimum reserve requirement and for other operational needs. The Liquidity Coverage Ratio (‘LCR’) is calculated on a daily basis in line with EU CRR both in its functional currency (EUR) as well as in the other significant currencies. Consistency of the currency denomination of its liquid assets with its net liquidity outflows is ensured by the Bank on an ongoing basis, in order to prevent an excessive currency mismatch. As at 31 December 2022, the LCR stood at 348.0% (end 2021: 564.9%). In addition, the net stable funding ratio (‘NSFR’) is also computed, in line with EU CRR, both in the functional currency of the Bank (EUR) as well as in the other significant currencies. As at 31 December 2022, the NSFR stood at 124.6% (end 2021: 130.0%). The Bank continues to maintain a robust liquidity position and flexibility to access the necessary liquidity resources mainly as a result of its prudent approach to liquidity management. As a consequence, the war in Ukraine had very limited impact on liquidity and funding. The table hereafter analyses the assets and liabilities of the Bank by maturity on the basis of the period remaining between the balance sheet date and the contractual maturity date. Assets and liabilities for which there is no contractual maturity date are classified under "Maturity undefined". 78 |

| EIB STATUTORY FINANCIAL STATEMENTS 87 Liquidity risk (in EUR million) Maturity at 31 December 2022 3 months or less More than 3 months to 1 year More than 1 year to 5 years More than 5 years Maturity undefined Total 2022 Assets: Cash in hand, balances with central banks and post office banks 113 0 0 0 0 113 Treasury bills and other bills eligible for refinancing with central banks 3,132 5,518 7,141 4,559 0 20,350 Other loans and advances: - Current accounts 658 0 0 0 0 658 - Credit institutions 63,787 200 0 0 0 63,987 - Customers 126 0 0 0 0 126 64,571 200 0 0 0 64,771 Loans: - Credit institutions 2,913 11,446 40,885 38,004 23 93,271 - Customers 5,595 18,108 115,010 187,671 89 326,473 8,508 29,554 155,895 225,675 112 419,744 Debt securities including fixed-income securities 1,304 480 2,508 5,631 0 9,923 Shares, other variable-yield securities and participating interests 0 0 0 0 9,296 9,296 Shares in affiliated undertakings 0 0 0 0 1,549 1,549 Other assets 615 1,859 6,181 1,881 8,306 18,842 Total assets 78,243 37,611 171,725 237,746 19,263 544,588 Liabilities: Amounts owed to credit institutions 5,442 0 0 0 0 5,442 Amounts owed to customers 1,495 0 0 0 0 1,495 Debts evidenced by certificates 20,747 48,006 200,968 161,977 0 431,698 Subscribed capital, reserves and profit 0 0 0 0 78,435 78,435 Other liabilities 981 1,698 5,425 3,630 15,784 27,518 Total liabilities 28,665 49,704 206,393 165,607 94,219 544,588 Some of the borrowings and associated swaps include early termination triggers or call options granted to the hedging swap counterparties and the Bank as well has the right to call the related bonds before maturity. If the Bank were to exercise all the call options on its bonds at their next contractual exercise date, cumulated early redemptions for the period 2023 – 2025 would amount to EUR 1.88 billion. Maturity at 31 December 2021 3 months or less More than 3 months to 1 year More than 1 year to 5 years More than 5 years Maturity undefined Total 2021 Assets: Cash in hand, balances with central banks and post office banks 1,483 0 0 0 0 1,483 Treasury bills and other bills eligible for refinancing with central banks 7,169 15,543 9,758 3,208 0 35,678 Other loans and advances: - Current accounts 563 0 0 0 0 563 - Credit institutions 71,203 3,349 0 0 0 74,552 - Customers 677 0 0 0 0 677 72,443 3,349 0 0 0 75,792 Loans: - Credit institutions 2,443 9,928 46,113 35,010 6 93,500 - Customers 5,083 19,702 107,548 189,266 394 321,993 7,526 29,630 153,661 224,276 400 415,493 Debt securities including fixed-income securities 1,322 2,795 3,023 3,643 0 10,783 Shares, other variable-yield securities and participating interests 0 0 0 0 8,716 8,716 Shares in affiliated undertakings 0 0 0 0 1,549 1,549 Other assets 288 773 5,414 1,978 7,529 15,982 Total assets 90,231 52,090 171,856 233,105 18,194 565,476 Liabilities: Amounts owed to credit institutions 10,478 13,195 0 0 0 23,673 Amounts owed to customers 1,824 0 0 0 0 1,824 Debts evidenced by certificates 19,307 43,516 213,006 164,286 0 440,115 Subscribed capital, reserves and profit 0 0 0 0 76,069 76,069 Other liabilities 331 1,472 3,774 3,163 15,055 23,795 Total liabilities 31,940 58,183 216,780 167,449 91,124 565,476 79 |

| 2022 FINANCIAL REPORT 88 U.4. Foreign exchange rate risk The foreign exchange (‘FX’) risk is the risk to the economic value or to the income derived from, the Bank’s positions due to adverse movements of foreign exchange rates. The Bank is exposed to a foreign exchange risk whenever there is a currency mismatch between its assets, liabilities and hedging instruments. In compliance with its Statute, the Bank does not engage in currency operations not directly required to carry out its lending operations or fulfil commitments arising from loans or guarantees granted by it. Mismatches of currencies in the asset-liability structure of the Bank are kept within pre-approved tight limits. Consequently, the Russian invasion of Ukraine had no adverse impact on the Bank’s FX risk management. Foreign exchange position (in EUR million) Currency at 31 December 2022 Euro Pound Sterling US Dollar Other currencies Sub-total except Euro Total 2022 Assets: Cash in hand, balances with central banks and post office banks 113 0 0 0 0 113 Treasury bills and other bills eligible for refinancing with central banks 16,205 653 3,492 0 4,145 20,350 Other loans and advances: - Current accounts 444 67 53 94 214 658 - Credit institutions 59,442 0 36 4,509 4,545 63,987 - Customers 75 0 0 51 51 126 59,961 67 89 4,654 4,810 64,771 Loans: - Credit institutions 70,970 757 13,483 8,061 22,301 93,271 - Customers 270,031 27,231 9,404 19,807 56,442 326,473 341,001 27,988 22,887 27,868 78,743 419,744 Debt securities including fixed-income securities 5,274 34 2,547 2,068 4,649 9,923 Shares, other variable-yield securities and participating interests 7,690 488 770 348 1,606 9,296 Shares in affiliated undertakings 1,549 0 0 0 0 1,549 Other assets 14,993 1,379 1,605 865 3,849 18,842 Total assets 446,786 30,609 31,390 35,803 97,802 544,588 Liabilities: Amounts owed to credit institutions 5,425 0 11 6 17 5,442 Amounts owed to customers 1,217 21 98 159 278 1,495 Debts evidenced by certificates: - Debt securities in issue 245,409 37,162 100,100 39,853 177,115 422,524 - Others 5,868 113 322 2,871 3,306 9,174 251,277 37,275 100,422 42,724 180,421 431,698 Subscribed capital, reserves and profit 78,435 0 0 0 0 78,435 Other liabilities 23,385 1,319 1,783 1,031 4,133 27,518 Total liabilities 359,739 38,615 102,314 43,920 184,849 544,588 Off balance sheet currency swaps -87,076 8,020 70,938 8,118 87,076 Net position -29 14 14 1 29 80 |
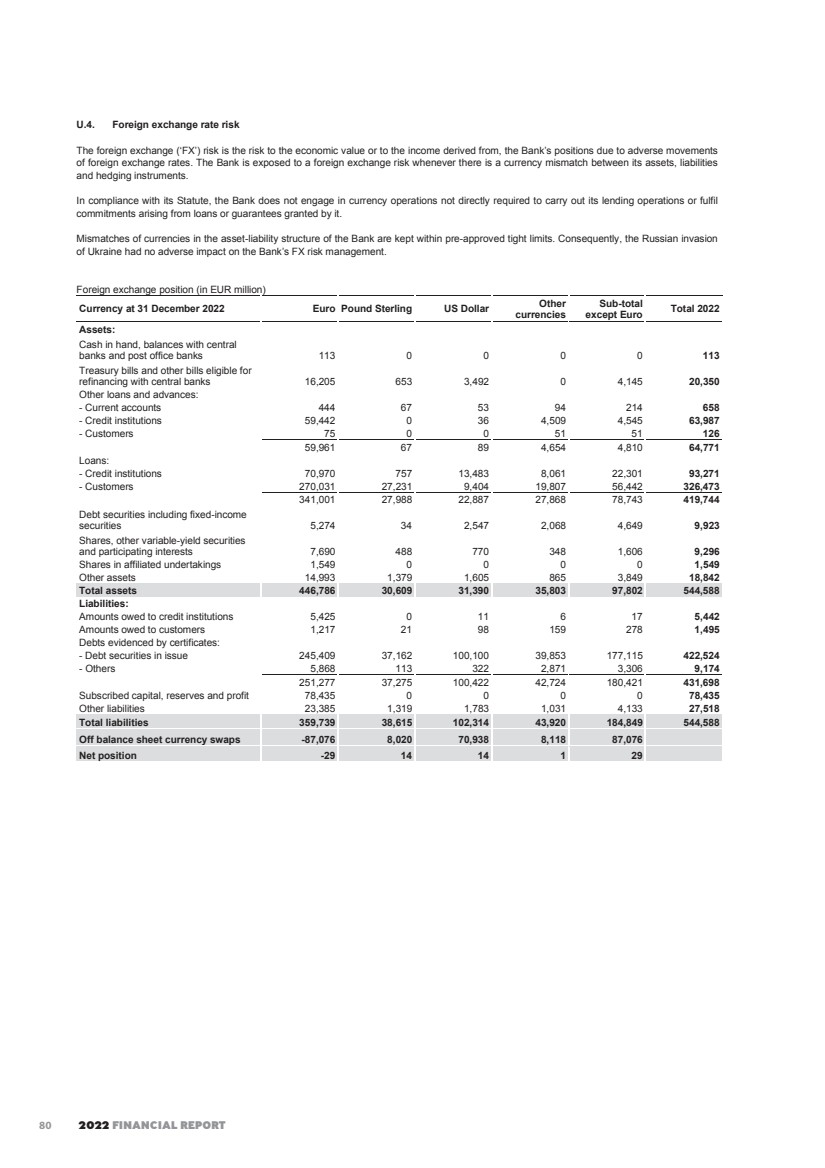
| EIB STATUTORY FINANCIAL STATEMENTS 89 Foreign exchange position (in EUR million) Currency at 31 December 2021 Euro Pound Sterling US Dollar Other currencies Sub-total except Euro Total 2021 Assets: Cash in hand, balances with central banks and post office banks 1,483 0 0 0 0 1,483 Treasury bills and other bills eligible for refinancing with central banks 27,999 1,388 6,291 0 7,679 35,678 Other loans and advances: - Current accounts 358 48 45 112 205 563 - Credit institutions 64,511 2,052 1,035 6,954 10,041 74,552 - Customers 600 0 0 77 77 677 65,469 2,100 1,080 7,143 10,323 75,792 Loans: - Credit institutions 71,836 829 13,310 7,525 21,664 93,500 - Customers 261,909 30,971 8,225 20,888 60,084 321,993 333,745 31,800 21,535 28,413 81,748 415,493 Debt securities including fixed-income securities 4,100 0 1,809 4,874 6,683 10,783 Shares, other variable-yield securities and participating interests 7,067 664 671 314 1,649 8,716 Shares in affiliated undertakings 1,549 0 0 0 0 1,549 Other assets 12,906 1,242 1,064 770 3,076 15,982 Total assets 454,318 37,194 32,450 41,514 111,158 565,476 Liabilities: Amounts owed to credit institutions 23,473 0 44 156 200 23,673 Amounts owed to customers 1,560 6 93 165 264 1,824 Debts evidenced by certificates: - Debt securities in issue 240,681 43,587 104,778 42,058 190,423 431,104 - Others 6,235 119 295 2,362 2,776 9,011 246,916 43,706 105,073 44,420 193,199 440,115 Subscribed capital, reserves and profit 76,069 0 0 0 0 76,069 Other liabilities 19,940 1,666 1,270 919 3,855 23,795 Total liabilities 367,958 45,378 106,480 45,660 197,518 565,476 Off balance sheet currency swaps -86,378 8,190 74,023 4,165 86,378 Net position -18 6 -7 19 18 U.5. Operational Risk As defined in the EIB Group Operational Risk Policy, Operational Risk means the risk of loss resulting from inadequate or failed internal processes, people and systems or from external events7. All EIB’s activities may be affected by Operational Risk and therefore the Bank aims to systematically identify, assess, monitor, and report Operational Risks on a regular basis, and to ensure that sufficient controls and risk mitigants are in place to limit the exposure to Operational Risk. The Operational Risk Unit in GR&C and the Internal Controls and Assertion Division in Financial Control are responsible for defining the Operational Risk Framework and related policies while the responsibility for implementing the Framework lies with all the Departments of the Bank. The EIB organises its Operational Risk Management activities in compliance with the applicable Best Banking Practice (“BBP”). The Bank revised in 2022 its Operational Risk Policy to align with a new, unified non-financial risk classification at Group level. In addition, the Bank developed a comprehensive operational risk event reporting procedure in 2022 at Group level, which has strengthened the implementation of the policy and developed a key network of operational risk champions. The Bank has also enhanced its Risk Appetite Framework with a streamlined definition of operational (key) risk indicators. In terms of reporting, the EIB Group Operational Risk Report is approved by the Group Chief Risk Officer (‘GCRO’) responsible for overall aspects of managing and monitoring Operational Risk at the Bank and then submitted to the Management Committee (‘MC’), the Audit Committee (‘AC’) and Directors General (‘DGs’). In addition, losses/gains above EUR 0.25 million are immediately escalated to the President. The Bank has robust compliance controls, including a dedicated Sanctions Compliance Programme, ensuring that its activities comply with all existing EU sanctions and applicable U.S. and UK sanctions. With specific reference to sanctions targeting the Russian invasion of Ukraine, no material impact has been identified on the Bank’s business activities. 7 The definition of external events excludes cases of client bankruptcy or unfavourable market movements or similar events, which represent triggers for Credit and respectively Market Risk. 81 |

| 2022 FINANCIAL REPORT 90 The Bank is a crucial institution of the European Union, and as such, it is a likely target for cyber-attacks. With the ongoing crisis in Ukraine, the risk of direct and spill-over attacks has increased, and the Bank is closely monitoring this risk in collaboration with the Computer Emergency Response Team for the EU institutions, bodies and agencies (‘CERT-EU’). To ensure the security and integrity of its operations, the Bank has implemented robust security measures to protect against cyber-attacks. Note V – Derivatives The Bank uses derivative instruments as part of its asset and liability management activities to manage exposures to interest rate and foreign currency risks, including exposures arising from committed transactions settling in the future, and as part of its liquidity management. Derivatives are financial instruments, the payoff of which depends on the prices of the underlying assets, interest rates, exchange rates or indices. The majority of the Bank’s swaps are concluded to hedge borrowings, loans and bond holdings or for the global Assets and Liabilities Management (‘ALM’) position and are therefore of a long-term nature (see note V.1.). The Bank also enters into short-term currency swap contracts in order to adjust currency positions in its operational treasury in relation to its benchmark currency, the euro, and to cater for demand for currencies in conjunction with loan disbursements (see Note V.2.). Future contracts (futures) can be used in the context of the treasury activities, to hedge the exposure deriving from some investments in government bonds. Futures are standardised derivatives, traded on regulated markets, and they do not fall within the general policy for counterparty risk measurement and control. V.1. Hedging and asset liability management (‘ALM’) derivatives The derivatives used in the context of hedging and ALM hedging activities are: • Currency swaps; • Interest rate swaps; and • Structured swaps. V.1.1. Currency swaps Currency swaps are contracts under which it is agreed to exchange principal and interest payments in one currency against another currency. The Bank enters into currency swaps mainly to hedge its borrowings and loans. The following table shows the maturities of currency swaps (including structured swaps – see Note V.1.3 and excluding short-term currency swaps – see Note V.2.), sub-divided according to their notional amount and fair value. The notional amounts are disclosed off balance sheet. Currency swaps at 31 December 2022 (in EUR million) 1 year or less More than 1 year and up to 5 years More than 5 years and up to 10 years More than 10 years Total 2022 Notional amount (receivable) 43,783 136,262 36,102 27,198 243,345 Fair value (i.e. net discounted value including CVA, DVA and CollVA)(*) 221 1,816 -744 26 1,319 Currency swaps at 31 December 2021 (in EUR million) 1 year or less More than 1 year and up to 5 years More than 5 years and up to 10 years More than 10 years Total 2021 Notional amount (receivable) 34,954 137,297 45,792 29,640 247,683 Fair value (i.e. net discounted value including CVA, DVA and CollVA)(*) -740 3,085 985 1,041 4,371 (*) Including the fair value of macro-hedging currency swaps which stood at EUR 2,530 million as at 31 December 2022 (2021: EUR 3,133 million). 82 |
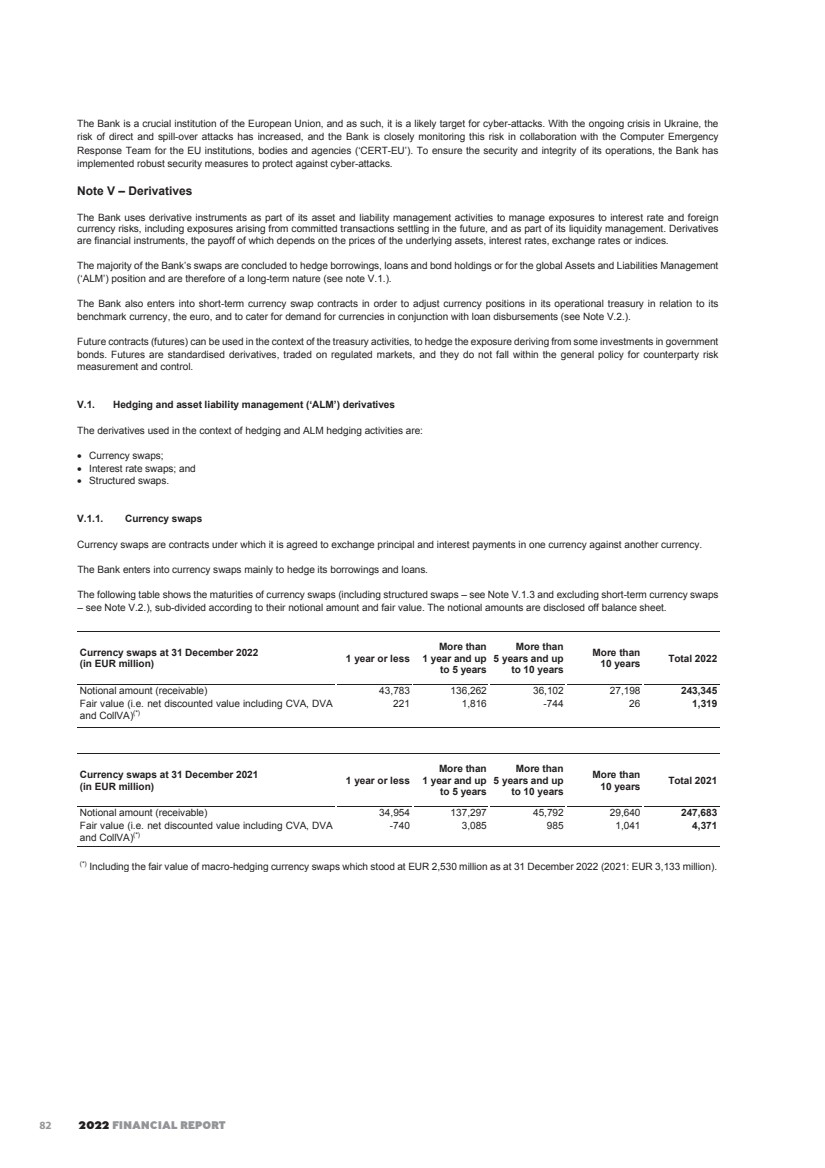
| EIB STATUTORY FINANCIAL STATEMENTS 91 V.1.2. Interest rate swaps Interest rate swaps are contracts under which, generally, it is agreed to exchange floating-rate interest for fixed-rate interest payments, or floating-rate interest payments linked to different rates (basis swaps), in the same currency. Interest rate swaps enable the Bank to hedge the interest rate risk of its borrowings, loans and bond holdings, and modify the interest rate structure of the balance sheet. The following table shows the maturities of interest rate swaps (including structured swaps – see Note V.1.3 and including synthetic swaps, whereby interest computed in a foreign currency is synthetically converted to EUR), sub-divided according to their notional amount and fair value. The notional amounts are disclosed off balance sheet. Interest rate swaps at 31 December 2022 (in EUR million) 1 year or less More than 1 year and up to 5 years More than 5 years and up to 10 years More than 10 years Total 2022 Notional amount 75,935 230,220 131,299 135,571 573,025 Fair value (i.e. net discounted value including CVA, DVA and CollVA)(*) -700 -5,269 -4,092 993 -9,068 Interest rate swaps at 31 December 2021 (in EUR million) 1 year or less More than 1 year and up to 5 years More than 5 years and up to 10 years More than 10 years Total 2021 Notional amount 53,438 243,656 127,981 134,006 559,081 Fair value (i.e. net discounted value including CVA, DVA and CollVA)(*) 301 4,748 3,036 229 8,314 (*) Including the fair value of macro-hedging interest rate swaps which stood at EUR -349 million as at 31 December 2022 (2021: EUR -789 million). V.1.3. Structured swaps The Bank enters into borrowing contracts and loans encompassing options on interest rates, exchange rates, inflation rates and stock indices. Such structured borrowings and loans are entirely covered by swap contracts to hedge the corresponding market risk. The table below further details the number, fair value and notional amounts of structured swaps: Structured swaps at 31 December Early termination embedded Structured coupon 2022 2021 2022 2021 Number of transactions 119 127 156 162 Notional amount (in EUR million) 4,909 4,568 10,413 12,083 Fair value (i.e. net discounted value including CVA, DVA and CollVA) (in EUR million) -774 518 -2,310 -2,960 The fair value of structured swap transactions is computed using option pricing models, calibrated to available market prices of options. For a portion of derivative transactions, internal estimates and assumptions might be used in the valuation techniques when the market inputs are not directly available. All option contracts embedded in, or linked with, borrowings are negotiated over the counter. V.1.4. Derivatives credit risk mitigation policy The credit risk policy for derivative transactions is based on the definition of eligibility conditions and rating-related limits for swap counterparts. In order to reduce credit exposures, the Bank has signed Credit Support Annexes with most of its active swap counterparts and receives collaterals when the exposure exceeds certain contractually defined thresholds. The credit risk with respect to derivatives lies in the loss that the Bank would incur if the counterparty is unable to honour its contractual obligations. In view of the special nature and complexity of the derivatives transactions, a series of procedures has been put in place to safeguard the Bank against losses arising from the use of such instruments. 83 |
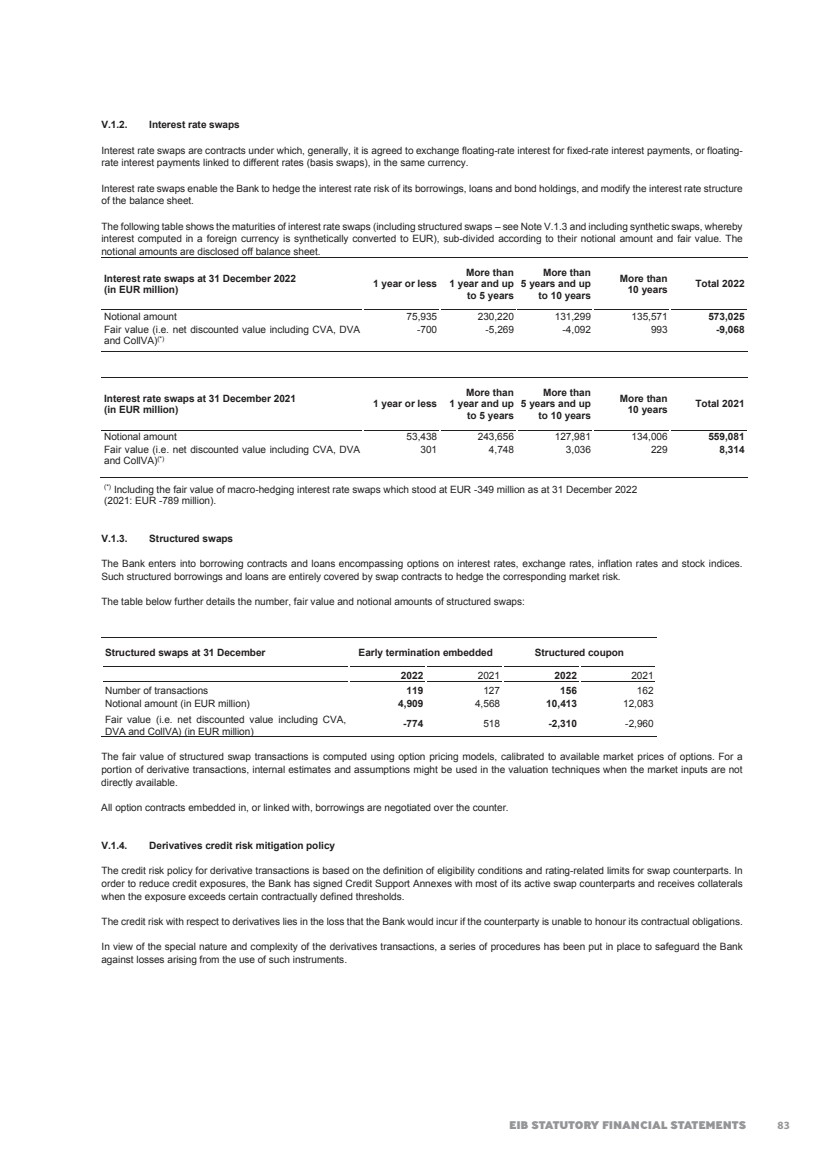
| 2022 FINANCIAL REPORT 92 • Contractual framework: All of the Bank’s derivative transactions are concluded in the contractual framework of ISDA Swap Agreements and where applicable Credit Support Annexes, which specify the conditions of exposure collateralisation. These are generally accepted and practised contract types. Minimum conditions for new agreements are specified in the risk guidelines. • Counterparty selection: The minimum rating at the outset is set in the risk guidelines at A3. The EIB has in most cases the right of early termination if the counterparty rating drops below a certain level. • Collateralisation: − Exposures (in some cases subject to thresholds) are collateralised by cash and bonds. − Certain transactions are collateralised above the current market value. − Both the derivatives portfolio with individual counterparties and the collateral received are regularly monitored and valued, with a subsequent call for additional collateral or release. As part of the ISDA agreements, the Bank has received securities and cash that it is allowed to sell or repledge. The fair value of the securities accepted under these terms amounts to EUR 6,902 million as at 31 December 2022 (2021: EUR 15,399 million), with the following composition, detailed based on the nature of the collateral and based on Moody’s equivalent rating: Swap collateral (in EUR million) Moody's equivalent rating Bonds Cash Total 2022 Government Agency, supranational, covered bonds Aaa 780 546 0 1,326 Aa1 to Aa3 254 0 0 254 A1 to A3 0 0 0 0 Baa1 to Baa3 2,951 0 0 2,951 Non-Rated 0 0 2,371 2,371 Total 2022 3,985 546 2,371 6,902 Swap collateral (in EUR million) Moody's equivalent rating Bonds Cash Total 2021 Government Agency, supranational, covered bonds Aaa 1,042 962 0 2,004 Aa1 to Aa3 3,130 0 0 3,130 A1 to A3 6 0 0 6 Baa1 to Baa3 5,484 0 0 5,484 Non-Rated 0 0 4,775 4,775 Total 2021 9,662 962 4,775 15,399 The Bank has implemented the usage of an IT system, the Collateral management system (‘CMS’). The key objective of the CMS is to ensure that the Bank is capable to utilise for repos a real-time inventory of assets and collateral accepted in secured markets. Securities received as collateral for loans, derivatives and reverse repos, repos are valued in CMS on a daily basis, by using prices quoted in active markets, supplied by a Market Price Service Provider (i.e. Bloomberg) or, if quoted prices are not available, by using market-based valuations. • Credit risk measurement for derivatives: The credit risk associated with derivatives varies according to a number of factors (such as interest and exchange rates) and generally corresponds to only a small portion of their notional value. The Bank, for internal purposes, measures the credit risk exposure related to swaps and derivatives transactions using the Current Unsecured Exposure and the Potential Future Exposure for reporting and limit monitoring. It uses the Standardised Approach for Counterparty Credit Risk (SA-CCR) for regulatory capital allocation according to the Capital Requirements Regulation (CRR). The Bank computes the Current Unsecured Exposure, which is the larger of zero and the market value of the portfolio of transactions within the netting set with a counterparty, less the value of collateral received. It is the amount that would be lost upon the default of the counterparty, using the received collateral and assuming no recovery on the value of those transactions in bankruptcy as well as immediate replacement of the swap counterparty for all the transactions. As of 31 December 2022 the current unsecured exposure stood at EUR 165 million (EUR 927 million as of 31 December 2021). In addition, the Bank computes the Potential Future Exposure, which takes into account the possible increase in the netting set’s exposure over the margin period of risk of 20 business days. The EIB computes the Potential Future Exposure at 90% confidence level using stressed market parameters to arrive at conservative estimates. This is in line with the recommendations issued by regulators in order to take into consideration the conditions that will prevail in case of default of an important market participant. As of 31 December 2022 the Potential Future Exposure at origin stood at EUR 2,266 million (EUR 10,001 million as of 31 December 2021). 84 |
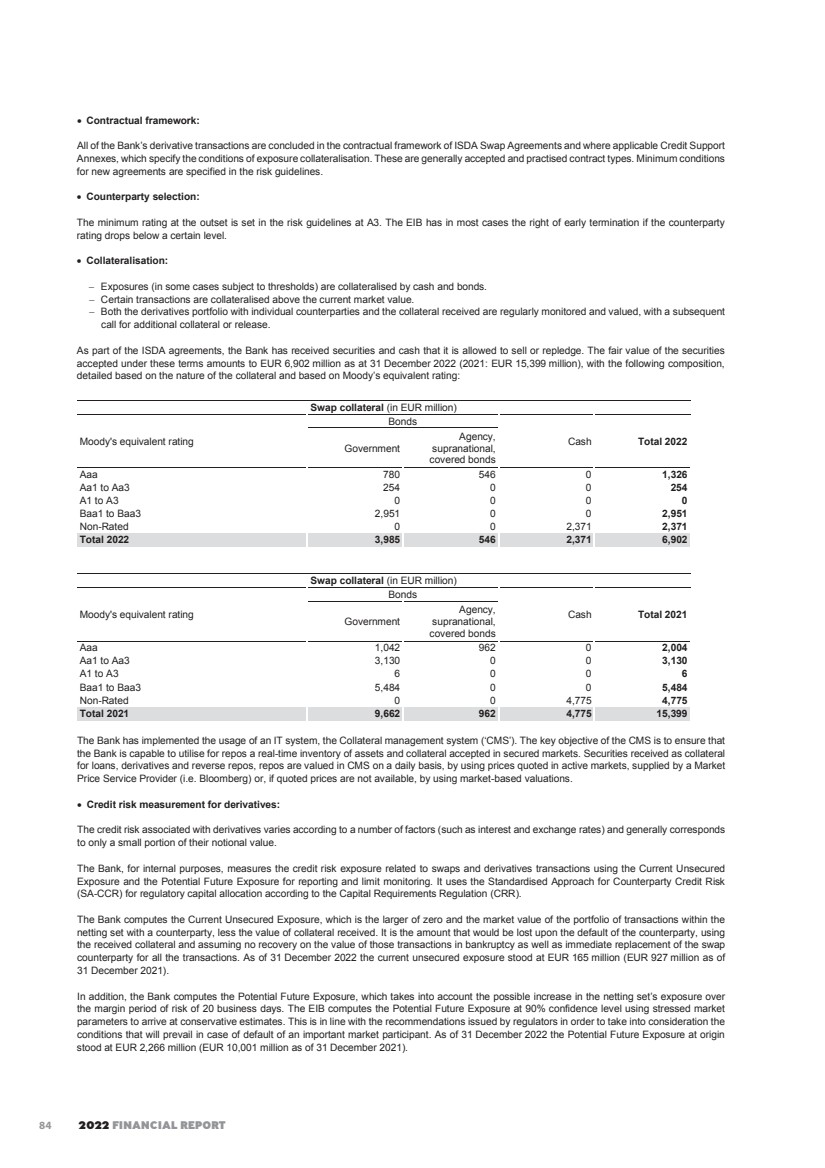
| EIB STATUTORY FINANCIAL STATEMENTS 93 • Limits: The limit system for banks covers the Potential Future Exposure in 3-time buckets (under 1 year, between 1 and 5 years and over 5 years) and in 2 rating scenarios (current and downgrade below A3). The derivatives portfolio is valued and compared against limits on a daily basis. The following table provides a breakdown of counterparties by internal rating. Grouped ratings Percentage of nominal Current Unsecured Exposure Potential Future Exposure (in EUR million) (in EUR million) Moody’s equivalent rating 2022 2021 2022 2021 2022 2021 Aaa 0.47% 0.47% 0 496 0 920 Aa1 to Aa3 18.10% 19.31% 4 236 370 2,273 A1 to A3 75.46% 74.76% 146 195 1,783 6,628 Below A3 5.97% 5.46% 15 0 113 180 Total 100.00% 100.00% 165 927 2,266 10,001 V.2. As part of the treasury management Long-term futures are also used by the Bank to adjust the interest rate exposure of its SLP bond portfolios. The notional amount of long-term futures stood at EUR 8,804 million at 31 December 2022 (2021: EUR 8,274 million), with a EUR 29 million fair value (2021: EUR 3 million). The Bank also enters into short-term currency swap contracts in order to adjust currency positions in its operational treasury portfolios in relation to its benchmark currency, the euro, and to cater for demand for currencies in conjunction with loan disbursements. The notional amount of short-term currency swaps receivable stood at EUR 21,412 million at 31 December 2022 against EUR 25,124 million at 31 December 2021. The fair value of these contracts was EUR -366 million at 31 December 2022 (2021: EUR 147 million). The notional amount of short-term currency forwards was EUR 267 million at 31 December 2022 (2021: EUR 402 million). The fair value of these contracts was EUR 4 million at 31 December 2022 (2021: EUR -12 million). 85 |
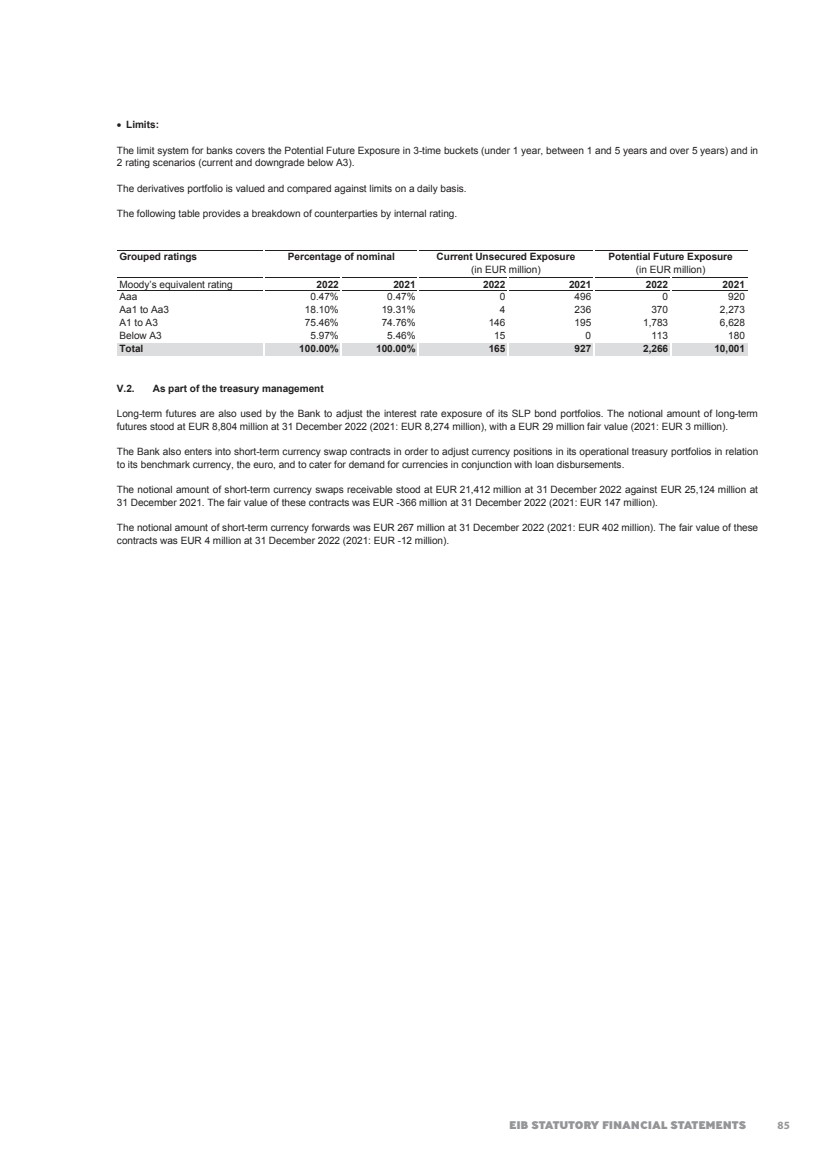
| 2022 FINANCIAL REPORT 94 Note W – Conversion rates The following conversion rates were used for drawing up the balance sheets as at 31 December 2022 and 2021: 31.12.2022 31.12.2021 Non-euro currencies of EU member states Bulgarian Lev (BGN) 1.9558 1.9558 Czech Koruna (CZK) 24.1160 24.8580 Danish Krone (DKK) 7.4365 7.4364 Croatian Kuna (HRK) 7.5365 7.5156 Hungarian Forint (HUF) 400.8700 369.1900 Polish Zloty (PLN) 4.6808 4.5969 Romanian Leu (RON) 4.9495 4.9490 Swedish Krona (SEK) 11.1218 10.2503 Non-EU currencies Australian Dollar (AUD) 1.5693 1.5615 Azerbaijani Manat (AZN) 1.8103 1.9207 Canadian Dollar (CAD) 1.4440 1.4393 Swiss Franc (CHF) 0.9847 1.0331 Chinese Renminbi (CNY) 7.3582 7.1947 Dominican Peso (DOP) 59.8400 64.8310 Egyptian Pound (EGP) 26.4223 17.7663 Ethiopian Birr (ETB) 56.9660 55.8100 Pound Sterling (GBP) 0.8869 0.8403 Georgian Lari (GEL) 2.8462 3.4806 Hong Kong Dollar (HKD) 8.3163 8.8333 Indian Rupees (INR) 88.1710 84.2292 Japanese Yen (JPY) 140.6600 130.3800 Kenyan Shilling (KES) 131.6800 128.2600 Kazakhstani Tenge (KZT) 494.0400 493.3100 Moroccan Dirham (MAD) 11.1556 10.5191 Moldovan Leu (MDL) 20.3700 20.0900 Mexican Peso (MXN) 20.8560 23.1438 Norwegian Krone (NOK) 10.5138 9.9888 New Zealand Dollar (NZD) 1.6798 1.6579 Serbian Dinars (RSD) 117.2000 117.5100 Russian Ruble (RUB) 76.8960 85.3004 Tunisia Dinar (TND) 3.3055 3.2611 Turkish Lira (TRY) 19.9649 15.2335 Taiwan Dollar (TWD) 32.7869 31.4420 Ukraine Hryvnia (UAH) 39.4092 30.9151 United States Dollar (USD) 1.0666 1.1326 Central African CFA Franc (XAF) 655.9570 655.9570 West African CFA Franc (XOF) 655.9570 655.9570 South African Rand (ZAR) 18.0986 18.0625 86 |
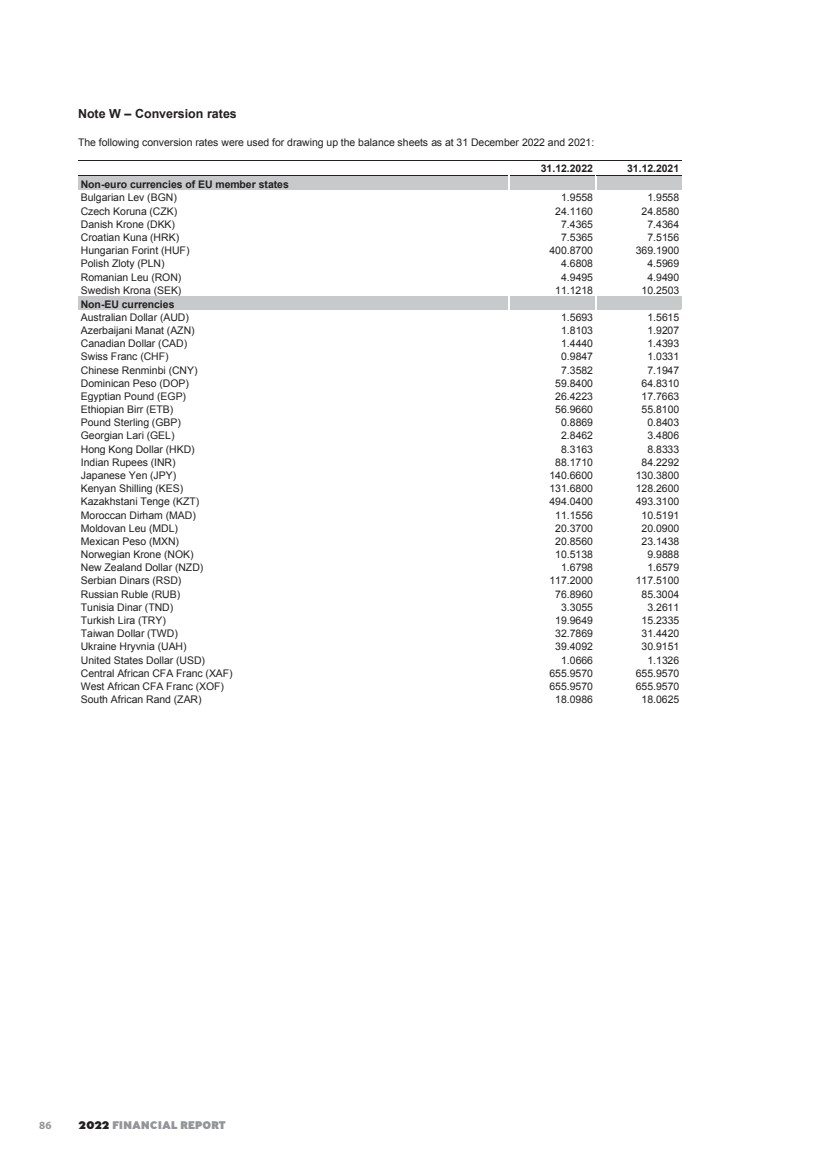
| EIB STATUTORY FINANCIAL STATEMENTS 95 Note X – Related party transactions X.1. Shares in affiliated undertakings and participating interest (in EUR ‘000) Related party transactions with the European Investment Fund (‘EIF’) are mainly associated with EIB’s shareholding in the EIF, the management by the Bank of the EIF treasury, the IT, the EIF pension fund and other services provided on behalf of the EIF. In addition, the EIF manages the private equity/venture capital and infrastructure fund activities of the Bank (including participating interests) and provides fronting and monitoring services for a part of the Bank’s guarantee and securitisation portfolio. The amounts included in the Financial Statements concerning the related party transactions with the Bank are disclosed as follows: 31.12.2022 31.12.2021 Assets: Shares in affiliated undertakings 1,549,444 1,549,444 Participating interests 353,462 318,380 Loans and advances to credit institutions c) loans 157,740 0 Prepayments and accrued income 25,129 2,013 Other assets 38,852 25,646 Total assets 2,124,627 1,895,483 Liabilities: Amounts owed to customers -4,129 -3,385 Other liabilities -355,092 -333,043 Total liabilities -359,221 -336,428 Profit and loss account: Income from shares in affiliated undertakings 9,305 0 Value (re-)adjustments in respect of transferable securities held as financial fixed assets, participating interests and shares in affiliated undertakings -1,405 15,703 Commissions receivable 7,580 7,279 Commissions payable -53,892 -65,246 Net other operating income and expense 11,817 11,678 General administrative expenses -42 48 Interest receivable and similar income 294 0 Interest payable and similar charges -649 0 Total profit and loss account -26,992 -30,538 Off balance sheet: EIF capital – uncalled 3,468,800 3,468,800 EIF treasury management 2,334,013 2,304,236 Put option granted to EIF minority shareholders 419,763 340,341 Undisbursed participating interests 410,831 497,631 Guarantees issued to EIF 17,729,471 17,452,179 Total off balance sheet 24,362,878 24,063,187 87 |
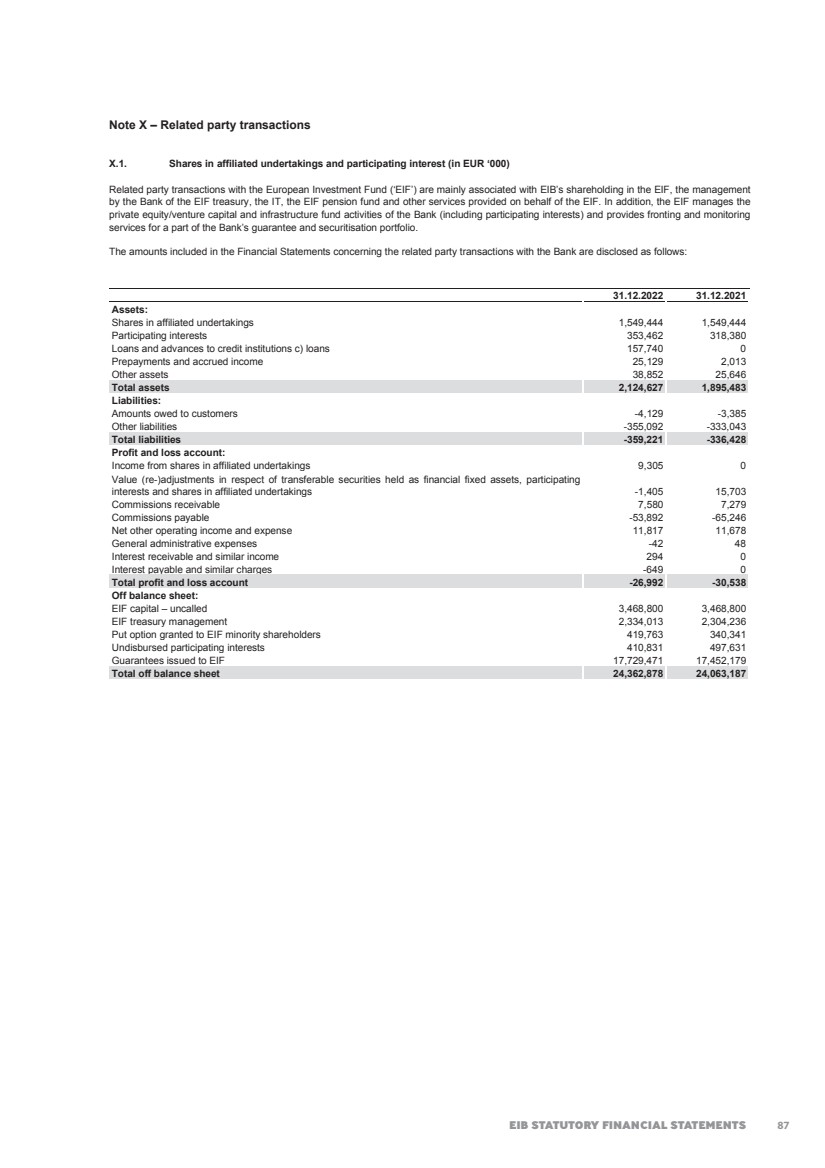
| 2022 FINANCIAL REPORT 96 X.2. Key Management Personnel (in EUR ‘000) The Bank has identified members of the Board of Directors, the Audit Committee, the Management Committee, the GCRO and the Directors General heading the different EIB organisational directorates, as well as the head of Internal Audit independent department, as key management personnel. Key management personnel compensation for the relevant reporting periods, included within “General administrative expenses” (Note R), is disclosed in the following table: 2022 2021 Short-term benefits(1) 11,342 10,772 Post-employment benefits(2) 874 919 Termination benefits 315 965 Total 12,531 12,656 (1) Short-term employee benefits comprise salaries and allowances, bonuses and social security contributions of the Management Committee, the GRCO, Directors General and other Directors, and benefits paid to the members of the Board of Directors and the Audit Committee. (2) Post-employment benefits comprise pensions and expenses for post-employment health insurance paid to members of the Management Committee, the GRCO, the Directors General and other Directors. There were neither advances or credit granted to key management personnel, nor commitments entered into on their behalf by way of guarantee of any kind. Open balances with key management personnel as at 31 December 2022 comprise the compulsory and optional supplementary pension plan and health insurance scheme liabilities, and payments outstanding as at the year-end: 31.12.2022 31.12.2021 Pension plans and health insurance (Note L) 100,113 74,834 Other liabilities (Note G) 15,288 18,737 Note Y – Post balance sheet events There have been no material events after the balance sheet date that would require adjustment of, or disclosure in, the Financial Statements as at 31 December 2022. In the context of the war in Ukraine and its broader economic consequences, the Bank continues to monitor the situation closely notably as part of the subsequent event review. 88 |
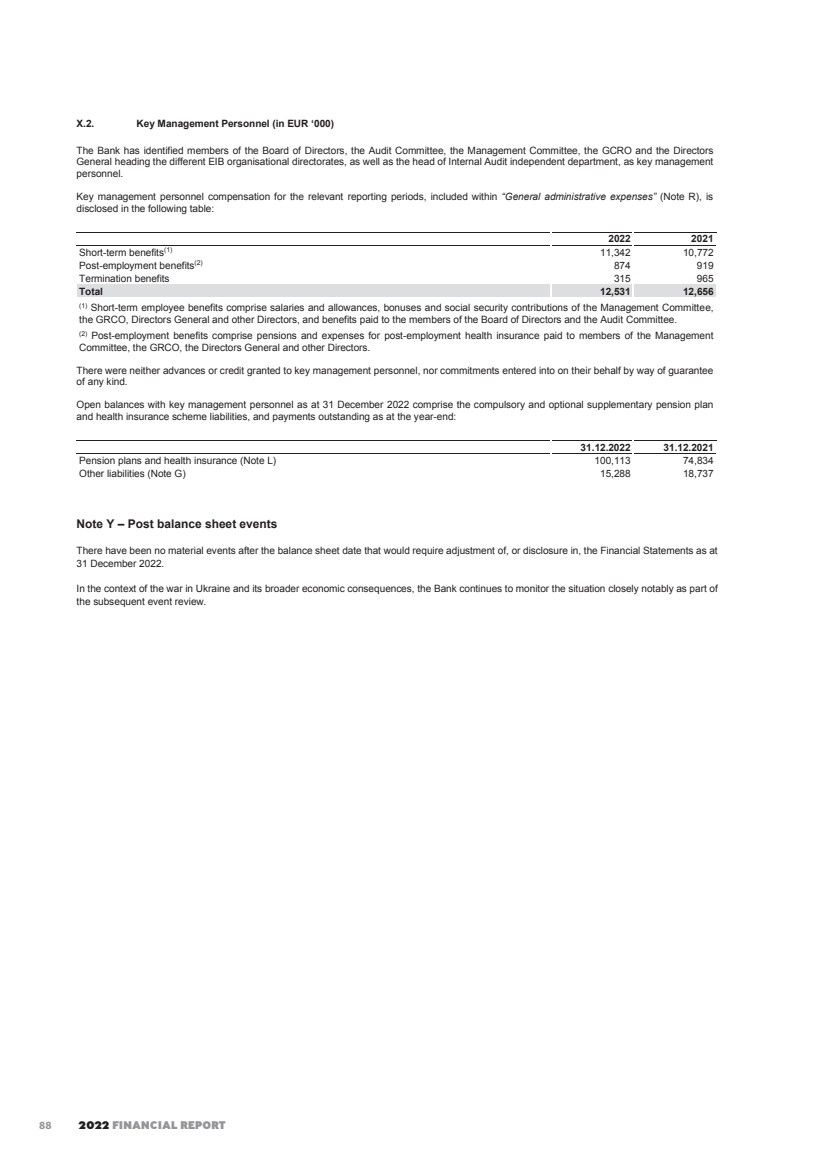
| EIB STATUTORY FINANCIAL STATEMENTS 97 Note Z – Management of third party funds Z.1. Innovation Fund The Innovation Fund is established by Article 10a(8) of Directive 2003/87/EC to support across all Member States innovation in low-carbon technologies and processes, including environmentally safe carbon capture and utilisation ('CCU') that contributes substantially to mitigating climate change, as well as products substituting carbon intensive ones produced and to help stimulate the construction and operation of projects that aim at the environmentally safe capture and geological storage ('CCS') of CO2, as well as of innovative renewable energy and energy storage technologies. The EIB prepares separate financial statements for Innovation Fund. Z.2. Investment Facility – Cotonou The Investment Facility, which is managed by the EIB, has been established under Cotonou Agreement on cooperation and development between the African, Caribbean and Pacific Group of States and the European Union and its Member States on 23 June 2000 and subsequently revised. The EIB prepares separate financial statements for Investment Facility. Z.3. Modernisation Fund The Modernisation Fund, set up under Article 10d of the revised EU Emissions Trading System (ETS) Directive, aims to modernise energy systems and improve energy efficiency of 10 EU beneficiary Member States (MS): Bulgaria, Czech Republic, Croatia, Estonia, Hungary, Latvia, Lithuania, Poland, Romania and Slovakia. The Modernisation fund supports investments in generation and use of energy from renewable sources, energy efficiency, energy storage, modernisation of energy networks, including district heating, pipelines and grids, redeployment, re-skilling and upskilling workers, education, job-seeking initiatives and start-ups, The EIB prepares separate financial statements for Modernisation Fund. Z.4. EIF treasury The EIF treasury is managed by the Bank in accordance with the treasury management agreement signed between the two parties in December 2000. Z.5. InnovFin The InnovFin or “InnovFin-EU Finance for Innovators” is a joint initiative between the EIB, the EIF and the European Commission under the new EU research programme for 2014-2020 “Horizon 2020”. On 11 December 2013, Regulation (EU) N 1291/2013 of the European Parliament and the Council establishing Horizon 2020 – the Framework Programme for Research and Innovation (2014-2020) and repealing Decision N 1982/2006/EC (“Horizon 2020 Regulation”) was adopted. On 12 June 2014 the European Commission, the EIB and the EIF signed a Delegation Agreement establishing the financial instrument InnovFin. InnovFin consists of a series of integrated and complementary financing tools and advisory services offered by the EIB Group, covering the entire value chain of research and innovation (‘R&I’) in order to support investments from the smallest to the largest enterprise. The EIB prepares separate financial statements for InnovFin. Z.6. NER300 The EIB supports the EC as an agent in the implementation of the NER 300 initiative - a funding programme for carbon capture and storage demonstration projects and innovative renewable energy technologies. The Facility covers two activities which are i) the monetisation of EU Allowance Units (‘EUAs’) and ii) the management and disbursement of cash received via the EUA monetisation activity. The EIB prepares separate financial statements for NER300. Z.7. Connecting Europe Facility (‘CEF’) The Connecting Europe Facility (‘CEF’) is a joint agreement between the EIB and the European Commission which aims to provide union financial assistance to trans-European networks in order to support projects of common interest in the sectors of transport, telecommunications and energy infrastructures. The Commission entrusted EIB with the implementation and management of the debt instrument under the CEF, which ensures continuity of the Loan Guarantee Instrument for TEN-T Projects (‘LGTT’) and to the Pilot phase of Project Bond Initiative (‘PBI’). The LGTT and PBI were merged under the CEF on 1 January 2016. The CEF Delegation Agreement foresees an updated and common risk sharing arrangement. The EIB prepares separate financial statements for CEF. Z.8. Pan-European Guarantee Fund (“EGF”) EGF was endorsed by the European Council on 23 April 2020 as part of the overall EU Covid-19 response package. As of July 2021, 22 Member States confirmed their participation with an expected guarantee volume of approximately EUR 24.4 billion, while only entities in participating countries are eligible for support. The EGF is designed to finance high-risk operations and final beneficiaries that would meet financial intermediaries’ requirements for commercial financing, but are struggling due to the economic impact of the COVID-19 pandemic. For this reason, the focus of the EGF are SMEs, which will benefit from at least 65% of the EGF-supported financing. The EGF is jointly implemented by EIB and EIF, each responsible for approximately half of the amount and with a different product mix. While EIF envisaged capped and uncapped portfolio guarantees and indirect equity-type investments (funds), on EIB side, the deployed products are linked risk sharing, venture debt and synthetic Asset Based Securities. The EIB prepares separate financial statements for EGF. 89 |
| 2022 FINANCIAL REPORT 98 Z.9. EU-Africa Infrastructure (‘EUAI’) Trust Fund The EUAI Trust Fund has been created under Trust Fund Agreement between the EC on behalf of the European Union as the Founding Donor and the EIB as Manager and is also open to Member States of the European Union that subsequently accede to that agreement as Donors. On 9 February 2006, the EC and the EIB signed a Memorandum of Understanding to promote jointly the EU-Africa Infrastructure Partnership and, in particular, to establish a supporting EU-Africa Infrastructure Trust Fund. The EIB prepares separate financial statements for EUAI Trust Fund. Z.10. InvestEU On 7 March 2022 the EU, the EIB and the EIF signed a Guarantee Agreement (“Agreement”) establishing the EU guarantee under the InvestEU. The InvestEU programme aims to give an additional boost to sustainable investment, innovation, social inclusion and job creation in Europe. The InvestEU is expected to stimulate public and private investments by using a EUR 26.2 billion EU budgetary guarantee, 75% of this EU budgetary guarantee being granted separately to the EIB and the EIF. On 1 April 2022, all operations in the EFSI Debt Standard Portfolio and in the EFSI Hybrid Portfolio were transferred to the InvestEU. These operations which were originally guaranteed under the EFSI Agreement, are defined as the “Pre-2021 Operations”. The EIB prepares separate financial statements for InvestEU. Z.11. Decentralised Financial Instruments (‘DFIs’) (former Fund of Funds (‘JESSICA II’)) The Decentralised Financial Instruments (‘DFIs’) consists of Fund of Funds (‘FoF’) and Holding Funds (‘HF’) financed by the European Structural and Investment Funds (the ‘ESIF’) from the Member States Operational Programmes during 2014-2020 and 2021-2027, respectively. The DFI facilitates access to finance for final recipients through the implementation of loans, equity and guarantees, in cooperation with selected Financial Intermediaries. As a fund manager, EIB gathers the funding (contributions) from the Managing Authorities and invests it via Financial Intermediaries, according to investment strategies agreed with the donors. Z.12. Partnership Platform for Funds (‘PPF’) The PPF is an EIB-managed multi-region, multi-contributor and multi-sector Platform incorporating multiple funds, and was established considering the need to increase financial flows for sustainable development and building on the successful experience of the European Investment Bank. The funds under the PPF implemented in accordance with the Platform Rules. The EIB prepares a separate combined financial report for PPF. Z.13. JESSICA Holding Funds JESSICA (Joint European Support for Sustainable Investment in City Areas) is an initiative developed by the EC and the EIB, in collaboration with the Council of Europe Development Bank. JESSICA Holding Funds are used in the context of the JESSICA initiative. Under new procedures, Managing Authorities are being given the option of using some of their EU grant funding to make repayable investments in projects forming part of an integrated plan for sustainable urban development. As manager, EIB gathers the funding received from the Managing Authorities and invests it in Urban Development Funds, according to investment guidelines agreed with the donors. The EIB prepares separate financial statements for some JESSICA Holding Funds. Z.14. Special Section The Special Section was set up by the Board of Governors on 27 May 1963. Under a decision taken on 4 August 1977, its purpose was redefined as being that of recording financing operations carried out by the EIB for the account of and under mandate from third parties. It includes the FED, MED/FEMIP and the guarantee component of the European Development Finance Institutions Private Sector Development Facility. Z.15. Risk-Sharing Finance Facility (‘RSFF’) The RSFF has been established under the Co-operation Agreement that entered into force on 5 June 2007 between the EC on behalf of the European Union and the EIB. The RSFF aims to foster investment in research, technological development and demonstration, and innovation. As part of the RSFF, the EIF set up the Risk Sharing Instrument for Innovative and Research oriented SMEs and small Mid-Caps (‘RSI’). The RSI provides guarantees to banks and leasing companies for loans and financial leases to research-based small and medium-sized enterprises (‘SMEs’) and small Mid-Caps. The EIB prepares separate consolidated financial statements for RSFF including RSI. Z.16. Recovery and Resilience Facility Financial Instruments (‘RRF-FI’) EIB manages and invests RRF resources on behalf of the respective EU Member States according to an investment strategy and business plan agreed in a funding agreement between the EIB and the mandator. Furthermore, the EIB performs fund administration tasks (incl. monitoring, reporting, treasury management). If requested by the EU Member States, the mandate can also embed the Bank’s advisory support. 90 |
| EIB STATUTORY FINANCIAL STATEMENTS 99 RRF-FI can be deployed under three implementation modalities: (i) direct implementation, where EIB directly selects and appraises underlying operations, (ii) indirect implementation through a financial intermediary, and (iii) blending. Z.17. European Neighbourhood and Partnership Instrument (‘ENPI’) The Framework Agreement between the European Union and the EIB on the implementation of operations financed from the general budget of the European Union in the countries covered by the European Neighbourhood Policy is channelled through ENPI. The EIB prepares separate financial statements for ENPI. Z.18. AECID This partnership agreement signed between the Kingdom of Spain (the Spanish Agency for International Development Cooperation (‘AECID’)) and the EIB was set up to invest in operations in the countries covered by the FEMIP together with Mauritania (the "Southern Mediterranean region"), targeting mainly risk capital activities involving micro and small/medium sized enterprises as well as engaging in the wider development of the private sector in the region. The EIB prepares separate financial statements for AECID. Z.19. Private Finance for Energy Efficiency (‘PF4EE’) Instrument The Private Finance for Energy Efficiency (‘PF4EE’) instrument is a joint agreement between the EIB and the European Commission that aims to address the limited access to adequate and affordable commercial financing for energy efficiency investments. The instrument targets projects which support the implementation of National Energy Efficiency Action Plans or other energy efficiency programmes of EU Member States. In December 2014 the European Commission and the EIB signed a Delegation Agreement establishing the financial Instrument PF4EE. The EIB prepares separate financial statements for PF4EE. Z.20. DCFTA Initiative East (‘DCFTA’) The European Investment Bank and the European Commission signed on 19 December 2016 the Delegation Agreement for the Deep and Comprehensive Free Trade Area (‘DCFTA’). DCFTA Initiative East aims to strengthen economic development in the countries which have signed an association agreement with the EU - namely Georgia, Moldova and Ukraine - by providing targeted financial and technical support to small and medium-sized enterprises (‘SME’s) in these three countries. As part of the DCFTA, the EIF implements and manages the Guarantee Facility Window. The EIB prepares separate consolidated financial statements for DCFTA including Guarantee Facility Window. Z.21. GF Greece The Fund is a joint initiative between the Hellenic Republic, the EC and the EIB and was set up to support the lending to SMEs in Greece. Established by using unabsorbed Structural Funds for Greece, the Fund will guarantee EIB loans to SMEs via partner banks in Greece. The EIB prepares separate financial statements for GF Greece. Z.22. Neighbourhood Investment Facility (‘NIF’) Trust Fund The NIF Trust Fund, which is managed by the EIB was set up to achieve the strategic objective of the European Neighbourhood Policy (‘ENP’) through targeted funding with particular focus on establishing better and more sustainable energy and transport interconnections, improving energy efficiency and promoting the use of renewable energy sources, addressing climate change as well as threats to the environment more broadly and promoting smart, sustainable and inclusive growth through support to SMEs, to the social sector including human capital development, and to municipal infrastructure development. The EIB prepares separate financial statements for NIF Trust Fund. Z.23. Neighbourhood Investment Facility (‘NIF’) Risk Capital Facility The Neighbourhood Investment Facility (‘NIF’) Risk Capital Facility is financed from the general budget of the European Union. Its main purpose is focused on providing access to equity and debt finance to SMEs in the Southern Neighbourhood region in order to support private sector development, inclusive growth and private sector job creation. The Facility comprises a Financial Instrument Window which consists of equity and debt finance instruments and Additional Tasks Window which consists of the technical assistance services. The EIB prepares separate financial statements for Financial Instrument Window. Z.24. European Fund for Strategic Investments (‘EFSI’) On the basis of applicable EFSI Regulations the European Commission and the EIB concluded agreements on the management of the EFSI, on the granting of the EU guarantee (the EFSI Agreement) as well as for the implementation of the European Investment Advisory Hub (‘EIAH’) (the EIAH Agreement). Under the EFSI Agreement, the EC is providing an EU guarantee to EIB for projects supported by the EFSI. Assets covering the EU guarantee are directly managed by the European Commission. Projects supported by the EFSI are subject to the normal EIB project cycle and governance. In addition, EFSI has its own dedicated governance structure which has been set in place to ensure that investments made under EFSI remain focused on the specific objective of addressing the market failure in risk-taking which hinders investment in Europe. 91 |
| 2022 FINANCIAL REPORT 100 The EIAH aims to enhance the non-financial support for projects and investments. The EIAH consists of three complementary components: a) a point of entry to a wide range of advisory and technical assistance programmes and initiatives for public and private beneficiaries, b) a cooperation platform to leverage, exchange and disseminate expertise among partner institutions and c) a reinforcement or extension of existing advisory services or creation of new ones to address unmet needs. The EIB prepares separate financial statements for EIAH. Z.25. Instrument for Pre-accession Assistance II (‘IPA II’) The Instrument for Pre-accession Assistance (‘IPA’) is the means by which the EU supports reforms in the 'enlargement countries' with financial and technical help. The pre-accession funds also help the EU reach its own objectives regarding a sustainable economic recovery, energy supply, transport, the environment and climate change, etc. The successor of IPA I, IPA II, built on the results already achieved by dedicating EUR 11.7 billion for the period 2014-2020. The most important novelty of IPA II is its strategic focus. The Framework Partnership Agreement, signed at the end of the year 2015, is implemented by the EIB, allocating resources from DG NEAR via the signature of various “Specific Grant Agreements”. Although, the IPA II Regulation applied until 31 December 2020, the implementation is still ongoing The EIB prepares financial statements for specific grant agreements under IPA II. Z.26. FEMIP Trust Fund The FEMIP (Facility for Euro-Mediterranean Investment and Partnership) Trust Fund, which is also managed by the EIB, was set up to enhance the existing activities of the EIB in the Mediterranean Partner Countries, with the support of a number of donor countries and with a view of directing resources to operations in certain priority sectors through the provision of technical assistance and risk capital. The EIB prepares separate financial statements for FEMIP Trust Fund. Z.27. EPTA Trust Fund The EPTA (The Eastern Partnership Technical Assistance) Trust Fund is focused on increasing the quality and development impact of EIB Eastern Partnership operations by offering a multi-purpose, multi-sector funding facility for technical assistance. It will be complementary to the Neighbourhood Investment Facility. The EIB prepares separate financial statements for EPTA Trust Fund. Z.28. Natural Capital Finance Facility (‘NCFF’) The Natural Capital Finance Facility (‘NCFF’) is a joint agreement between the EIB and the European Commission which aims to address market gaps and barriers for revenue generating or cost saving projects that are aimed at preserving natural capital, including climate change adaptation projects and thereby to contribute to the achievement of EU and Member States' objectives for biodiversity and climate change adaptation. The EIB prepares separate financial statements for NCFF. Z.29. EU support to Boost Africa The “EU Support Boost Africa” is a joint initiative between the EIB and the African Development Bank. Its core objectives are to enable and enhance entrepreneurship and innovation across Africa in a commercially viable way and to address a current gap in the Sub-Saharan market, by providing early stage venture capital paired with skills development. The Facility comprises a Financial Instrument Window, which consists of equity and quasi-equity instruments, and Additional Tasks Window, which consists of the technical assistance services. The EIB prepares separate financial statements for Financial Instrument Window. Z.30. GEF-UNEP This is a Global Environment Facility (GEF) in cooperation with United Nations Environment Programme (UNEP) for the execution of the Technical Assistance supporting the identification, selection and design of future investments which are primarily capital investment projects with outcomes leading to nutrient reduction, which will indirectly contribute to the long-term outcome of depollution of the Mediterranean Sea. 92 |
| EIB STATUTORY FINANCIAL STATEMENTS 101 Z.31. EU Trade and Competitiveness Program (‘EUTCP’) In line with the EU policy objectives of boosting economic growth, supporting private sector development, enhancing regional integration and climate change mitigation and adaptation, EIB joins forces with the EC in order to develop the EUTCP. The EUTCP does combine: (i) EIB long-term Loan for Value Chains with; (ii) a guarantee instrument (Risk Sharing Facility); and (iii) technical assistance (Expert Support Facility) in order to address market failures in the selected countries. It also represents a strategically important initiative for the EIB for its positioning in the respective countries. It is expected that the Program will result in significant investments in SMEs along selected value chains in the target countries as it enables new guarantee instruments that will complement EIB’s classical products. The EIB prepares separate financial statements for Risk Sharing Facility of EUTCP. Z.32. AIP Zambia The “Zambia Agriculture Value Chain Facility Programme” developed under AIP aims to support the Government of Zambia's policy objectives to reduce rural poverty and malnutrition and to improve rural livelihoods. The EIB Project aims to address market failures in the agriculture value chains by supporting the access to finance for private agriculture value chain actors through financial intermediaries, as well as by strengthening the capacity of financial intermediaries to lend to those actors. The EIB prepares separate financial statements for the programme. Z.33. AIP Kulima The “Support for Kulima Access to Finance Programme” developed under the Africa Investment Platform (“AIP”) comprises an intermediated facility for on-lending to eligible private agri-food sector investments in Malawi. It aims to promote sustainable agricultural growth to increase incomes, employment and food security in the context of a changing climate. The EIB prepares separate financial statements for the programme. Z.34. EFSD Guarantee "Access to Finance Initiative" The EFSD Guarantee “SME Access to Finance Initiative” is a guarantee facility targeting SMEs, underserved entrepreneurs with a particular focus on young entrepreneurs, female entrepreneurs, start-ups and certain other groups in certain target countries and with the overriding objective of addressing some of the root causes of migration. The Programme aims to provide local banks and financial institutions selected by EIB with first loss credit protection for portfolios of loans extended to, and bank guarantees and letters of credit opened for, SMEs or micro-SMEs managed or owned by these underserved entrepreneurs who have less access to finance than other entrepreneurs because their local financial institutions associate them with higher levels of risk. The target countries will be located in the eastern and southern European Neighbourhood. The EIB prepares separate financial statements for the programme. Z.35. EPIC EPIC (Technical Assistance for Eastern Partnership Investment in Connectivity) is a technical assistance facility under the Neighbourhood Investment Platform (NIP) which contributes to improve connectivity both within the Eastern Partnership region and between the Eastern Partnership countries and the EU. EIB prepares separate financial statements for EPIC. 93 |
| 2022 FINANCIAL REPORT 102 Statement of Special Section(1) as at 31 December 2022 and 31 December 2021 (in EUR ‘000) ASSETS 31.12.2022 31.12.2021 Mediterranean Countries From resources of the European Union Disbursed loans outstanding 4,550 5,828 Risk capital operations - amounts to be disbursed 21,523 21,523 - amounts disbursed 27,783 28,479 49,306 50,002 Total(2) 53,856 55,830 · Lomé Conventions Operations from risk capital resources - amounts disbursed 74,631 76,542 Total(3) 74,631 76,542 Total 128,487 132,372 LIABILITIES 31.12.2022 31.12.2021 Funds under trust management Under mandate from the European Union - Financial Protocols with the Mediterranean Countries 32,333 34,307 - Lomé Conventions 74,631 76,542 Total funds under trust management 106,964 110,849 Funds to be disbursed On loans and risk capital operations in the Mediterranean countries 21,523 21,523 Total funds to be disbursed 21,523 21,523 Total 128,487 132,372 For information: Total amounts disbursed and not yet repaid on loans on special conditions made available by the Commission in respect of which the Bank has accepted an EU mandate for recovering principal and interest: a) Under the First, Second and Third Lomé Conventions as at 31 December 2022 EUR ‘000 191,538 (2021: EUR ‘000 211,266). b) Under Financial Protocols signed with the Mediterranean Countries as at 31 December 2022 EUR ‘000 25,216 (2021: EUR ‘000 29,660). In the context of the European Union – European Development Finance Institutions Private Sector Development Facility, the implementation agreement for the Guarantee Component was signed on 20 August 2014. The total amount of the EU guarantee to be issued is EUR ‘000 38,920 as at 31 December 2022 (2021: EUR ‘000 38,920). Note (1): The Special Section was set up by the Board of Governors on 27 May 1963. Under a decision taken on 4 August 1977, its purpose was redefined as being that of recording financing operations carried out by the European Investment Bank for the account of and under mandate from third parties. However, for the Investment Facility under the Cotonou Agreement, the EU-Africa Infrastructure Trust Fund, the Neighbourhood Investment Facility (‘NIF’) Trust Fund and the FEMIP Trust Fund, separate financial statements are presented. In addition, since 2005, the EIB also prepares financial statements of different types for other mandates. The Statement of Special Section reflects amounts disbursed or to be disbursed, less cancellations and repayments, under mandate from the European Union and the Member States. Amounts disbursed and to be disbursed and funds received and to be received are carried at nominal value. No account is taken in the Statement of Special Section of provisions or value adjustments, which may be required to cover risks associated with such operations except for definite write-offs. Amounts in foreign currency are translated at exchange rates prevailing on 31 December. 94 |
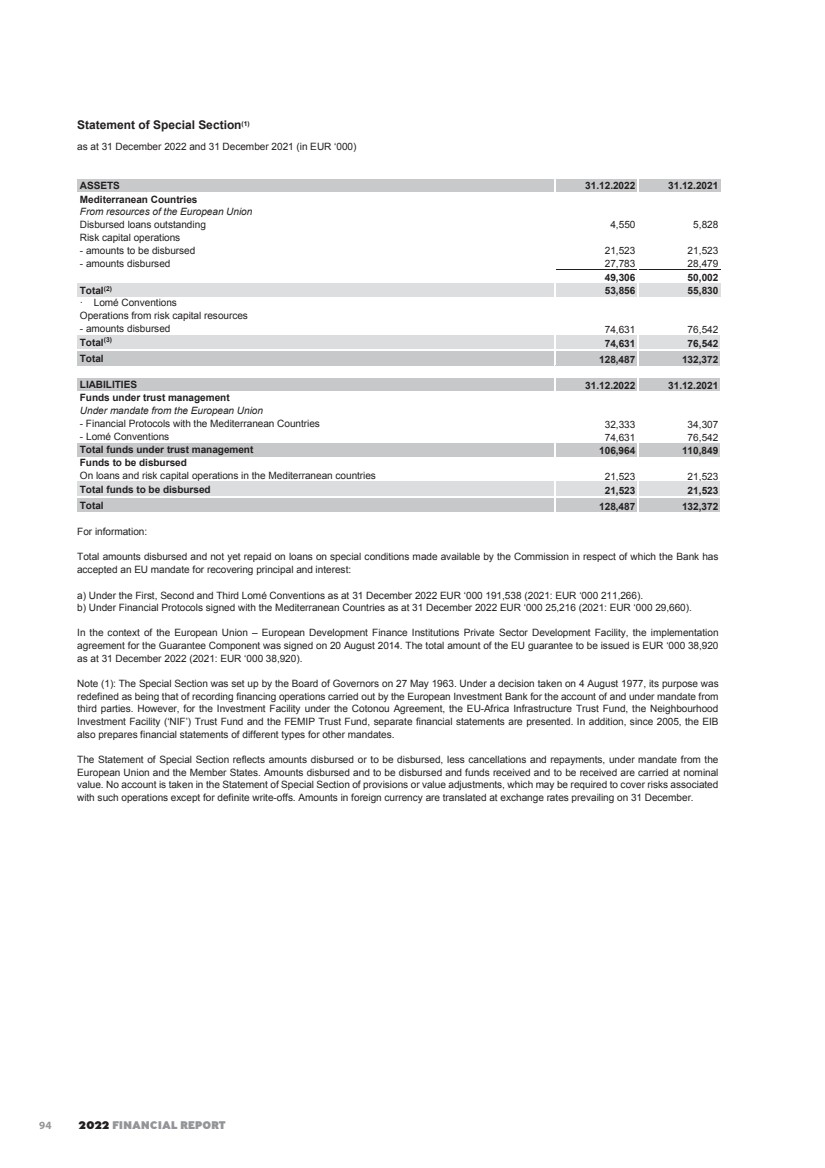
| EIB STATUTORY FINANCIAL STATEMENTS 103 Note (2): Initial amount of contracts signed for financing projects in the Maghreb and Mashreq countries, Malta, Cyprus, Türkiye and Greece (EUR 10 million lent prior to accession to the EC on 1 January 1981) under mandate, for the account and at the risk of the European Union. Initial amount: 840,457 less: exchange adjustments 56,283 cancellations 178,863 repayments 551,455 -786,601 53,856 Note (3): Initial amount of contracts signed for financing projects in the African, Caribbean and Pacific States and the Overseas Countries and Territories (‘ACP-OCT’) under mandate, for the account and at the risk of the European Union: Loans from risk capital resources: Conditional and subordinated loans 3,116,097 Equity participations 121,002 Initial amount: 3,237,099 add: capitalised interests 9,548 less: cancellations 742,432 repayments 2,374,004 exchange adjustments 55,580 -3,172,016 74,631 95 |
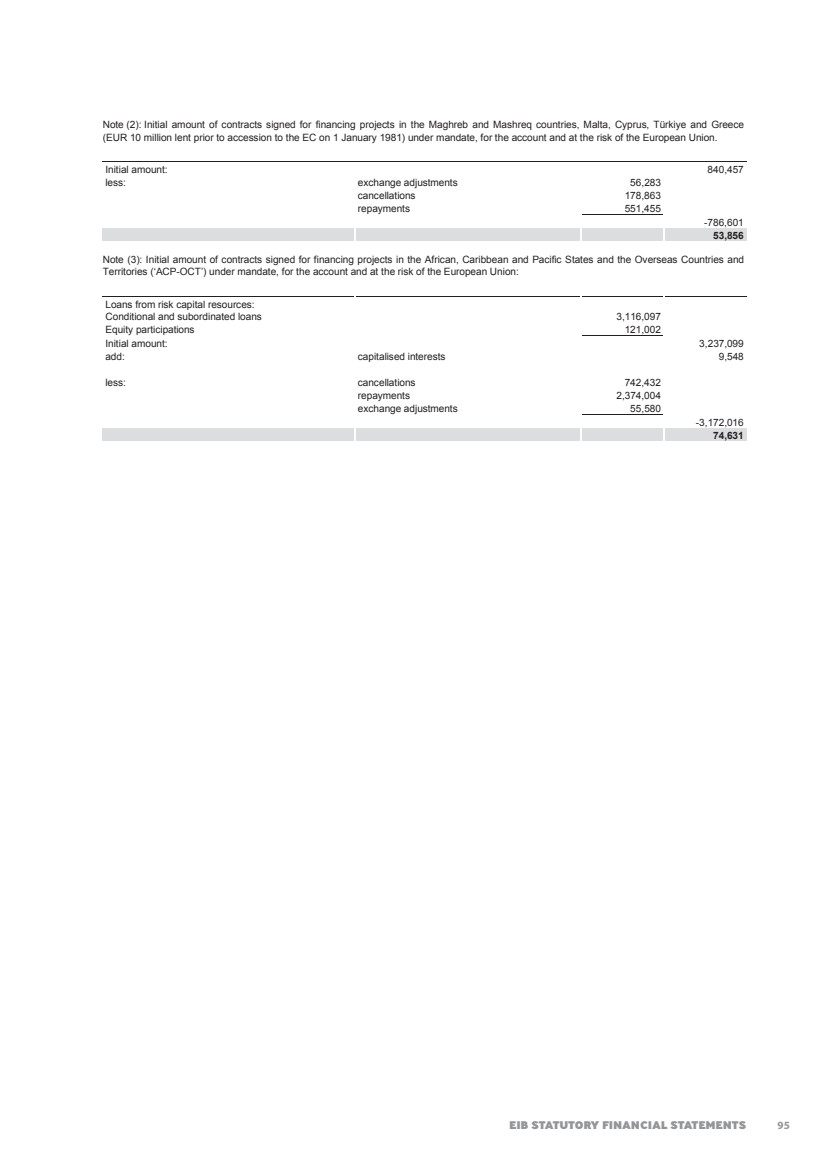
| 2022 FINANCIAL REPORT INDEPENDENT AUDITOR’S REPORT KPMG Audit S.à r.l. 39, Avenue John F. Kennedy L-1855 Luxembourg Tel.: +352 22 51 51 1 Fax: +352 22 51 71 E-mail: info@kpmg.lu Internet: www.kpmg.lu © 2023 KPMG Audit S.à r.l., a Luxembourg entity and a member firm of the KPMG global organization of independent member firms affiliated with KPMG International Limited, a private English company limited by guarantee. All rights reserved. R.C.S Luxembourg B 149133 To the Chairman of the Audit Committee of EUROPEAN INVESTMENT BANK 98-100, boulevard Konrad Adenauer L-2950 Luxembourg REPORT OF THE REVISEUR D’ENTREPRISES AGREE Report on the audit of the financial statements Opinion We have audited the financial statements of EUROPEAN INVESTMENT BANK (“the Bank”), which comprise the balance sheet as at 31 December 2022, and the profit and loss account and the cash flow statement for the year then ended, and notes to the financial statements, including a summary of significant accounting policies and other explanatory information. In our opinion, the accompanying financial statements give a true and fair view of the financial position of the EUROPEAN INVESTMENT BANK as at 31 December 2022, and of the results of its operations and its cash flows for the year then ended in accordance with the general principles of the Directive 86/635/EEC of the Council of the European Communities of 8 December 1986 on the annual accounts and consolidated accounts of banks and other financial institutions, as amended by Directive 2001/65/EC of 27 September 2001, by Directive 2003/51/EC of 18 June 2003 and by Directive 2006/46/EC of 14 June 2006 (the “Directives”). Basis for opinion We conducted our audit in accordance with the Law of 23 July 2016 on the audit profession (“Law of 23 July 2016”) and with International Standards on Auditing (“ISAs”) as adopted for Luxembourg by the “Commission de Surveillance du Secteur Financier” (“CSSF”). Our responsibilities under the Law of 23 July 2016 and ISAs as adopted for Luxembourg by the CSSF are further described in the “Responsibilities of “réviseur d’entreprises agréé” for the audit of the financial statements” section of our report. We are also independent of the EUROPEAN INVESTMENT BANK in accordance with the International Code of Ethics for Professional Accountants, including International Independence Standards, issued by the International Ethics Standards Board for Accountants (“IESBA Code”) as adopted for Luxembourg by the CSSF together with the ethical requirements that are relevant to our audit of the financial statements, and have fulfilled our other ethical responsibilities under those ethical requirements. We believe that the audit evidence we have obtained is sufficient and appropriate to provide a basis for our opinion. Key audit matters Key audit matters are those matters that, in our professional judgment, were of most significance in our audit of the financial statements of the current period. These matters were addressed in the context of the audit of the financial statements as a whole, and in forming our opinion thereon, and we do not provide a separate opinion on these matters. 104 96 |
| INDEPENDENT AUDITOR’S REPORT 1 Value adjustments of loans to customers and credit institutions Why the matter was considered to be one of most significance in our audit As at 31 December 2022, the Bank reports loans accounted for a cost of EUR 420,135 million (31 December 2021: EUR 415,933 million), representing 77% of total assets (31 December 2021: 74%) and recognized individually assessed value adjustments on loans amounting to EUR 316 million (31 December 2021: EUR 439 million). The Bank reviews its loans at each reporting date to assess whether an allowance for value adjustments should be recorded. These loans are not traded in an active market, therefore significant judgments and estimates are required to be applied by Management in its assessment of their recoverable amount. Inappropriate judgments made in relation to the methodology and inputs used or the assumptions taken may have a material impact on the amount of value adjustment recorded. These critical judgments include matters such as the identification and assessment of potential indicators of value adjustments, as well as discounted cash flows forecast techniques, estimation of guarantees obtained, valuation of collaterals received and forbearance measures applied. The effects of the Covid 19 pandemic and the Russia’s invasion of Ukraine have resulted in unprecedent economic conditions that vary across countries and industry sectors. The uncertainty caused by those events increased the level of judgement involved in the determination and calculation of value adjustments on loans. The key inputs and assumptions used by Management in its assessment of loans value adjustments are detailed in Note A.1.2 to the financial statements as well as the accounting policy for the value adjustment in Note A.2.6.1 and the detail of specific value adjustments in Note D.2. The loans accounted for at cost are disclosed in Note D.1 to the financial statements as well as the accounting policy for the loans in Note A.2.6.1. How the matter was addressed in our audit Our procedures included the assessment of key controls over the approval, recording, monitoring and restructuring of loans to customers and credit institutions, the loan grading process and the measurement of allowance for value adjustment for individually assessed loans. For a sample of loans with specific allowances for value adjustment, we evaluated the Bank's individual assessment of each loan by specifically challenging the Bank's assumptions used as well as underlying data, including the value of realisable collateral and the estimated recoverability. Based on a retrospective review, we further critically assessed whether the Bank revised its estimates and assumptions for specific allowances established in prior years. The impact of the Russia’s invasion of Ukraine and its broader economic consequences and Covid-19 pandemic were followed-up both in assessing the value adjustment of the evaluated exposure and in determining our sample of exposures where we drew a particular attention to the sectors most vulnerable to the effects of the pandemic. Such effect on the Bank’s lending portfolio was assessed as part of our audit procedures. We also tested a sample of individually significant exposures potentially impaired for which no value adjustment had been recorded as well as a sample of exposures which had not been identified by the Bank as being potentially impaired. For both types, we assessed whether appropriate consideration had been given to the collectability of future cash flows and the valuation of the underlying collaterals. 105 We assessed the disclosures in the financial statements in relation to allowance for value adjustment of loans with reference to the requirements of the prevailing accounting standards. Other information The Management is responsible for the other information. The other information comprises the information stated in the sections called “Highlights, Overview, EIB Statutory Bodies and Audit and control”, which are mainly based on statutory EU Directives information, but does not include the financial statements and our report of the “réviseur d’entreprises agréé” thereon. Our opinion on the financial statements does not cover the other information and we do not express any form of assurance conclusion thereon. In connection with our audit of the financial statements, our responsibility is to read the other information and, in doing so, consider whether the other information is materially inconsistent with the financial statements or our knowledge obtained in the audit or otherwise appears to be materially misstated. If, based on the work we have performed, we conclude that there is a material misstatement of this other information we are required to report this fact. We have nothing to report in this regard. Responsibilities of the Management and Those Charged with Governance for the financial statements The Management is responsible for the preparation and fair presentation of the financial statements in accordance with the general principles of the Directives, and for such internal control as the Management determines is necessary to enable the preparation of financial statements that are free from material misstatement, whether due to fraud or error. In preparing the financial statements, the Management is responsible for assessing the Bank’s ability to continue as a going concern, disclosing, as applicable, matters related to going concern and using the going concern basis of accounting unless the Management either intends to liquidate the Bank or to cease operations, or has no realistic alternative but to do so. Those charged with governance are responsible for overseeing the Bank’s financial reporting process. Responsibilities of the réviseur d’entreprises agréé for the audit of the financial statements The objectives of our audit are to obtain reasonable assurance about whether the financial statements as a whole are free from material misstatement, whether due to fraud or error, and to issue a report of the “réviseur d’entreprises agréé” that includes our opinion. Reasonable assurance is a high level of assurance, but is not a guarantee that an audit conducted in accordance with the Law of 23 July 2016 and with ISAs as adopted for Luxembourg by the CSSF will always detect a material misstatement when it exists. Misstatements can arise from fraud or error and are considered material if, individually or in the aggregate, they could reasonably be expected to influence the economic decisions of users taken on the basis of these financial statements. 106 97 |
| 2022 FINANCIAL REPORT We assessed the disclosures in the financial statements in relation to allowance for value adjustment of loans with reference to the requirements of the prevailing accounting standards. Other information The Management is responsible for the other information. The other information comprises the information stated in the sections called “Highlights, Overview, EIB Statutory Bodies and Audit and control”, which are mainly based on statutory EU Directives information, but does not include the financial statements and our report of the “réviseur d’entreprises agréé” thereon. Our opinion on the financial statements does not cover the other information and we do not express any form of assurance conclusion thereon. In connection with our audit of the financial statements, our responsibility is to read the other information and, in doing so, consider whether the other information is materially inconsistent with the financial statements or our knowledge obtained in the audit or otherwise appears to be materially misstated. If, based on the work we have performed, we conclude that there is a material misstatement of this other information we are required to report this fact. We have nothing to report in this regard. Responsibilities of the Management and Those Charged with Governance for the financial statements The Management is responsible for the preparation and fair presentation of the financial statements in accordance with the general principles of the Directives, and for such internal control as the Management determines is necessary to enable the preparation of financial statements that are free from material misstatement, whether due to fraud or error. In preparing the financial statements, the Management is responsible for assessing the Bank’s ability to continue as a going concern, disclosing, as applicable, matters related to going concern and using the going concern basis of accounting unless the Management either intends to liquidate the Bank or to cease operations, or has no realistic alternative but to do so. Those charged with governance are responsible for overseeing the Bank’s financial reporting process. Responsibilities of the réviseur d’entreprises agréé for the audit of the financial statements The objectives of our audit are to obtain reasonable assurance about whether the financial statements as a whole are free from material misstatement, whether due to fraud or error, and to issue a report of the “réviseur d’entreprises agréé” that includes our opinion. Reasonable assurance is a high level of assurance, but is not a guarantee that an audit conducted in accordance with the Law of 23 July 2016 and with ISAs as adopted for Luxembourg by the CSSF will always detect a material misstatement when it exists. Misstatements can arise from fraud or error and are considered material if, individually or in the aggregate, they could reasonably be expected to influence the economic decisions of users taken on the basis of these financial statements. 106 As part of an audit in accordance with the Law of 23 July 2016 and with ISAs as adopted for Luxembourg by the CSSF, we exercise professional judgment and maintain professional skepticism throughout the audit. We also: • Identify and assess the risks of material misstatement of the financial statements, whether due to fraud or error, design and perform audit procedures responsive to those risks, and obtain audit evidence that is sufficient and appropriate to provide a basis for our opinion. The risk of not detecting a material misstatement resulting from fraud is higher than for one resulting from error, as fraud may involve collusion, forgery, intentional omissions, misrepresentations, or the override of internal control. • Obtain an understanding of internal control relevant to the audit in order to design audit procedures that are appropriate in the circumstances, but not for the purpose of expressing an opinion on the effectiveness of the Bank’s internal control. • Evaluate the appropriateness of accounting policies used and the reasonableness of accounting estimates and related disclosures made by the Management. • Conclude on the appropriateness of Management’s use of the going concern basis of accounting and, based on the audit evidence obtained, whether a material uncertainty exists related to events or conditions that may cast significant doubt on the Bank’s ability to continue as a going concern. If we conclude that a material uncertainty exists, we are required to draw attention in our report of the “réviseur d’entreprises agréé” to the related disclosures in the financial statements or, if such disclosures are inadequate, to modify our opinion. Our conclusions are based on the audit evidence obtained up to the date of our report of the “réviseur d’entreprises agréé”. However, future events or conditions may cause the Bank to cease to continue as a going concern. • Evaluate the overall presentation, structure and content of the financial statements, including the disclosures, and whether the financial statements represent the underlying transactions and events in a manner that achieves fair presentation. We communicate with those charged with governance regarding, among other matters, the planned scope and timing of the audit and significant audit findings, including any significant deficiencies in internal control that we identify during our audit. We also provide those charged with governance with a statement that we have complied with relevant ethical requirements regarding independence, and to communicate with them all relationships and other matters that may reasonably be thought to bear on our independence, and where applicable, related safeguards. From the matters communicated with those charged with governance, we determine those matters that were of most significance in the audit of the financial statements of the current period and are therefore the key audit matters. We describe these matters in our report unless law or regulation precludes public disclosure about the matter or when, in extremely rare circumstances, we determine that a matter should not be communicated in our report because the adverse consequences of doing so would reasonably be expected to outweigh the public interest benefits of such communication. 107 As part of an audit in accordance with the Law of 23 July 2016 and with ISAs as adopted for Luxembourg by the CSSF, we exercise professional judgment and maintain professional skepticism throughout the audit. We also: • Identify and assess the risks of material misstatement of the financial statements, whether due to fraud or error, design and perform audit procedures responsive to those risks, and obtain audit evidence that is sufficient and appropriate to provide a basis for our opinion. The risk of not detecting a material misstatement resulting from fraud is higher than for one resulting from error, as fraud may involve collusion, forgery, intentional omissions, misrepresentations, or the override of internal control. • Obtain an understanding of internal control relevant to the audit in order to design audit procedures that are appropriate in the circumstances, but not for the purpose of expressing an opinion on the effectiveness of the Bank’s internal control. • Evaluate the appropriateness of accounting policies used and the reasonableness of accounting estimates and related disclosures made by the Management. • Conclude on the appropriateness of Management’s use of the going concern basis of accounting and, based on the audit evidence obtained, whether a material uncertainty exists related to events or conditions that may cast significant doubt on the Bank’s ability to continue as a going concern. If we conclude that a material uncertainty exists, we are required to draw attention in our report of the “réviseur d’entreprises agréé” to the related disclosures in the financial statements or, if such disclosures are inadequate, to modify our opinion. Our conclusions are based on the audit evidence obtained up to the date of our report of the “réviseur d’entreprises agréé”. However, future events or conditions may cause the Bank to cease to continue as a going concern. • Evaluate the overall presentation, structure and content of the financial statements, including the disclosures, and whether the financial statements represent the underlying transactions and events in a manner that achieves fair presentation. We communicate with those charged with governance regarding, among other matters, the planned scope and timing of the audit and significant audit findings, including any significant deficiencies in internal control that we identify during our audit. We also provide those charged with governance with a statement that we have complied with relevant ethical requirements regarding independence, and to communicate with them all relationships and other matters that may reasonably be thought to bear on our independence, and where applicable, related safeguards. From the matters communicated with those charged with governance, we determine those matters that were of most significance in the audit of the financial statements of the current period and are therefore the key audit matters. We describe these matters in our report unless law or regulation precludes public disclosure about the matter or when, in extremely rare circumstances, we determine that a matter should not be communicated in our report because the adverse consequences of doing so would reasonably be expected to outweigh the public interest benefits of such communication. 107 98 |
| INDEPENDENT AUDITOR’S REPORT As part of an audit in accordance with the Law of 23 July 2016 and with ISAs as adopted for Luxembourg by the CSSF, we exercise professional judgment and maintain professional skepticism throughout the audit. We also: • Identify and assess the risks of material misstatement of the financial statements, whether due to fraud or error, design and perform audit procedures responsive to those risks, and obtain audit evidence that is sufficient and appropriate to provide a basis for our opinion. The risk of not detecting a material misstatement resulting from fraud is higher than for one resulting from error, as fraud may involve collusion, forgery, intentional omissions, misrepresentations, or the override of internal control. • Obtain an understanding of internal control relevant to the audit in order to design audit procedures that are appropriate in the circumstances, but not for the purpose of expressing an opinion on the effectiveness of the Bank’s internal control. • Evaluate the appropriateness of accounting policies used and the reasonableness of accounting estimates and related disclosures made by the Management. • Conclude on the appropriateness of Management’s use of the going concern basis of accounting and, based on the audit evidence obtained, whether a material uncertainty exists related to events or conditions that may cast significant doubt on the Bank’s ability to continue as a going concern. If we conclude that a material uncertainty exists, we are required to draw attention in our report of the “réviseur d’entreprises agréé” to the related disclosures in the financial statements or, if such disclosures are inadequate, to modify our opinion. Our conclusions are based on the audit evidence obtained up to the date of our report of the “réviseur d’entreprises agréé”. However, future events or conditions may cause the Bank to cease to continue as a going concern. • Evaluate the overall presentation, structure and content of the financial statements, including the disclosures, and whether the financial statements represent the underlying transactions and events in a manner that achieves fair presentation. We communicate with those charged with governance regarding, among other matters, the planned scope and timing of the audit and significant audit findings, including any significant deficiencies in internal control that we identify during our audit. We also provide those charged with governance with a statement that we have complied with relevant ethical requirements regarding independence, and to communicate with them all relationships and other matters that may reasonably be thought to bear on our independence, and where applicable, related safeguards. From the matters communicated with those charged with governance, we determine those matters that were of most significance in the audit of the financial statements of the current period and are therefore the key audit matters. We describe these matters in our report unless law or regulation precludes public disclosure about the matter or when, in extremely rare circumstances, we determine that a matter should not be communicated in our report because the adverse consequences of doing so would reasonably be expected to outweigh the public interest benefits of such communication. 107 As part of an audit in accordance with the Law of 23 July 2016 and with ISAs as adopted for Luxembourg by the CSSF, we exercise professional judgment and maintain professional skepticism throughout the audit. We also: • Identify and assess the risks of material misstatement of the financial statements, whether due to fraud or error, design and perform audit procedures responsive to those risks, and obtain audit evidence that is sufficient and appropriate to provide a basis for our opinion. The risk of not detecting a material misstatement resulting from fraud is higher than for one resulting from error, as fraud may involve collusion, forgery, intentional omissions, misrepresentations, or the override of internal control. • Obtain an understanding of internal control relevant to the audit in order to design audit procedures that are appropriate in the circumstances, but not for the purpose of expressing an opinion on the effectiveness of the Bank’s internal control. • Evaluate the appropriateness of accounting policies used and the reasonableness of accounting estimates and related disclosures made by the Management. • Conclude on the appropriateness of Management’s use of the going concern basis of accounting and, based on the audit evidence obtained, whether a material uncertainty exists related to events or conditions that may cast significant doubt on the Bank’s ability to continue as a going concern. If we conclude that a material uncertainty exists, we are required to draw attention in our report of the “réviseur d’entreprises agréé” to the related disclosures in the financial statements or, if such disclosures are inadequate, to modify our opinion. Our conclusions are based on the audit evidence obtained up to the date of our report of the “réviseur d’entreprises agréé”. However, future events or conditions may cause the Bank to cease to continue as a going concern. • Evaluate the overall presentation, structure and content of the financial statements, including the disclosures, and whether the financial statements represent the underlying transactions and events in a manner that achieves fair presentation. We communicate with those charged with governance regarding, among other matters, the planned scope and timing of the audit and significant audit findings, including any significant deficiencies in internal control that we identify during our audit. We also provide those charged with governance with a statement that we have complied with relevant ethical requirements regarding independence, and to communicate with them all relationships and other matters that may reasonably be thought to bear on our independence, and where applicable, related safeguards. From the matters communicated with those charged with governance, we determine those matters that were of most significance in the audit of the financial statements of the current period and are therefore the key audit matters. We describe these matters in our report unless law or regulation precludes public disclosure about the matter or when, in extremely rare circumstances, we determine that a matter should not be communicated in our report because the adverse consequences of doing so would reasonably be expected to outweigh the public interest benefits of such communication. 107 As part of an audit in accordance with the Law of 23 July 2016 and with ISAs as adopted for Luxembourg by the CSSF, we exercise professional judgment and maintain professional skepticism throughout the audit. We also: • Identify and assess the risks of material misstatement of the financial statements, whether due to fraud or error, design and perform audit procedures responsive to those risks, and obtain audit evidence that is sufficient and appropriate to provide a basis for our opinion. The risk of not detecting a material misstatement resulting from fraud is higher than for one resulting from error, as fraud may involve collusion, forgery, intentional omissions, misrepresentations, or the override of internal control. • Obtain an understanding of internal control relevant to the audit in order to design audit procedures that are appropriate in the circumstances, but not for the purpose of expressing an opinion on the effectiveness of the Bank’s internal control. • Evaluate the appropriateness of accounting policies used and the reasonableness of accounting estimates and related disclosures made by the Management. • Conclude on the appropriateness of Management’s use of the going concern basis of accounting and, based on the audit evidence obtained, whether a material uncertainty exists related to events or conditions that may cast significant doubt on the Bank’s ability to continue as a going concern. If we conclude that a material uncertainty exists, we are required to draw attention in our report of the “réviseur d’entreprises agréé” to the related disclosures in the financial statements or, if such disclosures are inadequate, to modify our opinion. Our conclusions are based on the audit evidence obtained up to the date of our report of the “réviseur d’entreprises agréé”. However, future events or conditions may cause the Bank to cease to continue as a going concern. • Evaluate the overall presentation, structure and content of the financial statements, including the disclosures, and whether the financial statements represent the underlying transactions and events in a manner that achieves fair presentation. We communicate with those charged with governance regarding, among other matters, the planned scope and timing of the audit and significant audit findings, including any significant deficiencies in internal control that we identify during our audit. We also provide those charged with governance with a statement that we have complied with relevant ethical requirements regarding independence, and to communicate with them all relationships and other matters that may reasonably be thought to bear on our independence, and where applicable, related safeguards. From the matters communicated with those charged with governance, we determine those matters that were of most significance in the audit of the financial statements of the current period and are therefore the key audit matters. We describe these matters in our report unless law or regulation precludes public disclosure about the matter or when, in extremely rare circumstances, we determine that a matter should not be communicated in our report because the adverse consequences of doing so would reasonably be expected to outweigh the public interest benefits of such communication. 107 Report on other requirements In accordance with the Framework Agreement (“the Agreement”) dated 19 February 2009, renewed on 3 March 2017, as extended for the period 2022-2024 on 14 December 2020, signed between European Investment Bank and KPMG Luxembourg Société anonyme, we have been appointed to carry the audit services defined in the Agreement. The duration of our uninterrupted engagement, including previous renewals and reappointments, is 14 years. We confirm that the audit opinion is consistent with the communication to the audit committee or equivalent. We confirm that the prohibited non-audit services referred to in IESBA Code of Ethics were not provided and that we remained independent of the Bank in conducting the audit. Luxembourg, 29 March 2023 KPMG Audit S.à r.l. Cabinet de révision agréé S. Chambourdon Partner 108 As part of an audit in accordance with the Law of 23 July 2016 and with ISAs as adopted for Luxembourg by the CSSF, we exercise professional judgment and maintain professional skepticism throughout the audit. We also: • Identify and assess the risks of material misstatement of the financial statements, whether due to fraud or error, design and perform audit procedures responsive to those risks, and obtain audit evidence that is sufficient and appropriate to provide a basis for our opinion. The risk of not detecting a material misstatement resulting from fraud is higher than for one resulting from error, as fraud may involve collusion, forgery, intentional omissions, misrepresentations, or the override of internal control. • Obtain an understanding of internal control relevant to the audit in order to design audit procedures that are appropriate in the circumstances, but not for the purpose of expressing an opinion on the effectiveness of the Bank’s internal control. • Evaluate the appropriateness of accounting policies used and the reasonableness of accounting estimates and related disclosures made by the Management. • Conclude on the appropriateness of Management’s use of the going concern basis of accounting and, based on the audit evidence obtained, whether a material uncertainty exists related to events or conditions that may cast significant doubt on the Bank’s ability to continue as a going concern. If we conclude that a material uncertainty exists, we are required to draw attention in our report of the “réviseur d’entreprises agréé” to the related disclosures in the financial statements or, if such disclosures are inadequate, to modify our opinion. Our conclusions are based on the audit evidence obtained up to the date of our report of the “réviseur d’entreprises agréé”. However, future events or conditions may cause the Bank to cease to continue as a going concern. • Evaluate the overall presentation, structure and content of the financial statements, including the disclosures, and whether the financial statements represent the underlying transactions and events in a manner that achieves fair presentation. We communicate with those charged with governance regarding, among other matters, the planned scope and timing of the audit and significant audit findings, including any significant deficiencies in internal control that we identify during our audit. We also provide those charged with governance with a statement that we have complied with relevant ethical requirements regarding independence, and to communicate with them all relationships and other matters that may reasonably be thought to bear on our independence, and where applicable, related safeguards. From the matters communicated with those charged with governance, we determine those matters that were of most significance in the audit of the financial statements of the current period and are therefore the key audit matters. We describe these matters in our report unless law or regulation precludes public disclosure about the matter or when, in extremely rare circumstances, we determine that a matter should not be communicated in our report because the adverse consequences of doing so would reasonably be expected to outweigh the public interest benefits of such communication. 107 99 |
| 2022 FINANCIAL REPORT STATEMENT BY THE AUDIT COMMITTEE The Audit Committee reports to the Board of Governors, the following statement being communicated to the Governors prior to their approval of the Annual Report and the financial statements for the past financial year. Statement by the Audit Committee on the EIB’s unconsolidated financial statements prepared in accordance with the general principles of the ‘Directives’ The Audit Committee, instituted in pursuance of Article 12 of the Statute and Chapter V of the Rules of Procedure of the European Investment Bank for the purpose of verifying that the operations of the Bank are conducted and its books kept in a proper manner, having: - designated KPMG as external auditors, reviewed their audit planning process, examined and discussed their reports, and in particular their independent Auditor’s Report, - noted that the opinion of KPMG on the unconsolidated financial statements of the European Investment Bank for the year ended 31 December 2022 prepared in accordance with the general principles of the Directive 86/635/EEC of the Council of the European Communities of 8 December 1986 on the annual accounts and consolidated accounts of banks and other financial institutions, as amended by Directive 2001/65/EC of 27 September 2001, by Directive 2003/51/EC of 18 June 2003 and by Directive 2006/46/EC of 14 June 2006 (the ‘Directives’), is unqualified, - convened on a regular basis with the Heads of Directorates and relevant services including, • Financial Control, • Risk Management, Transaction Monitoring and Restructuring and Compliance, - met regularly the Head of Internal Audit and discussed the relevant internal audit reports, and studied the documents which it deemed necessary to examine in the discharge of its duties, - received assurance from the Management Committee concerning the effectiveness of the internal control structure and internal administration, and considering - the financial statements for the financial year ended 31 December 2022 adopted by the Board of Directors on 29 March 2023, - that the foregoing provides a reasonable basis for its statement and, - Articles 24, 25 & 26 of the Rules of Procedure, 100 |
| STATEMENT BY THE AUDIT COMMITTEE 109 to the best of its knowledge and judgement: - confirms that the activities of the Bank are conducted in a proper manner, in particular with regard to risk management and monitoring; - has verified that the operations of the Bank have been conducted and its books kept in a proper manner and that, to this end, it has verified that the Bank's operations have been carried out in compliance with the formalities and procedures laid down by the Statute and Rules of Procedure; - confirms that the financial statements of the European Investment Bank, which comprise the balance sheet as at 31 December 2022, the profit and loss account and the cash flow statement for the year then ended, and notes to the financial statements, including a summary of significant accounting policies and other explanatory information, give a true and fair view of the financial position of the European Investment Bank as of 31 December 2022, and of the results of its operations and its cash flows for the year then ended in accordance with the general principles of the Directives. Luxembourg, 29 March 2023 Audit Committee 101 |
| EIB GROUP CONSOLIDATED FINANCIAL STATEMENTS UNDER EU DIRECTIVES EIB GROUP CONSOLIDATED FINANCIAL STATEMENTS UNDER EU DIRECTIVES as at 31 December 2022 102 |
| 2022 FINANCIAL REPORT 111 Consolidated balance sheet as at 31 December 2022 (in EUR ’000) Assets 31.12.2022 31.12.2021 1. Cash in hand, balances with central banks and post office banks (Note B.1) 112,655 1,483,285 2. Treasury bills and other bills eligible for refinancing with central banks (Note B.2) 21,845,483 37,160,351 3. Loans and advances to credit institutions a) repayable on demand 984,212 797,488 b) other loans and advances (Note C) 64,211,244 74,749,439 c) loans (Note D.1) 93,129,454 93,562,111 d) value adjustments (Note D.2) -3,485 -57,842 158,321,425 169,051,196 4. Loans and advances to customers a) other loans and advances (Note C) 125,883 677,437 b) loans (Note D.1) 326,861,203 322,374,311 c) value adjustments (Note D.2) -388,263 -381,166 326,598,823 322,670,582 5. Debt securities including fixed-income securities (Note B.2) a) issued by public bodies 4,563,328 4,946,262 b) issued by other borrowers 6,596,468 7,025,006 11,159,796 11,971,268 6. Shares and other variable-yield securities (Note E.2) 9,908,923 9,223,497 7. Participating interests (Note E.2) 386,651 345,023 8. Intangible assets (Note F) 70,167 58,408 9. Tangible assets (Note F) 249,497 242,687 10. Other assets (Note G) 307,070 141,673 11. Subscribed capital and reserves, called but not paid (Note H.2) 799,248 1,118,948 12. Prepayments and accrued income (Note I) 17,544,735 14,565,820 Total assets 547,304,473 568,032,738 The accompanying notes form an integral part of these consolidated financial statements. 103 |
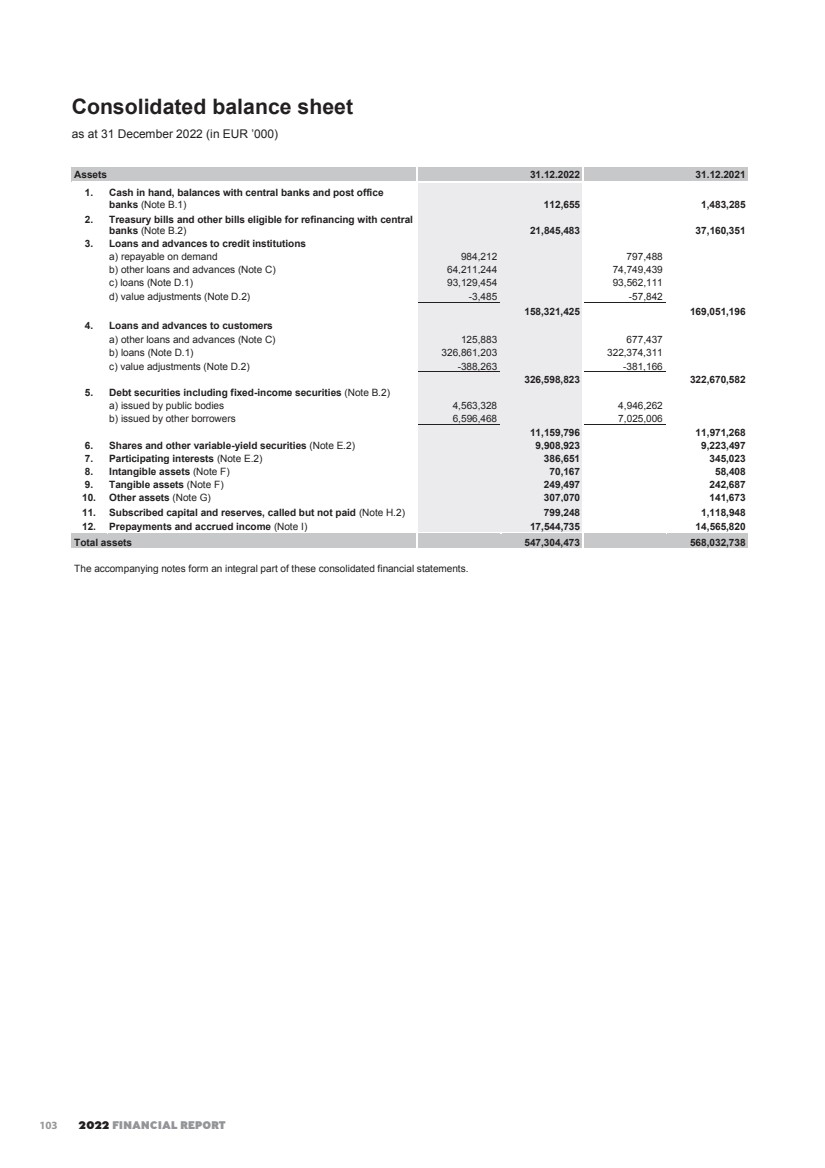
| EIB GROUP CONSOLIDATED FINANCIAL STATEMENTS UNDER EU DIRECTIVES 112 Consolidated balance sheet (continued) as at 31 December 2022 (in EUR ’000) Liabilities 31.12.2022 31.12.2021 1. Amounts owed to credit institutions (Note J) a) repayable on demand 2,371,014 4,777,422 b) with agreed maturity or periods of notice 3,071,084 18,895,071 5,442,098 23,672,493 2. Amounts owed to customers (Note J) a) repayable on demand 1,433,117 1,645,154 b) with agreed maturity or periods of notice 57,543 175,542 1,490,660 1,820,696 3. Debts evidenced by certificates (Note K) a) debt securities in issue 422,523,581 431,104,111 b) others 9,173,893 9,010,748 431,697,474 440,114,859 4. Other liabilities (Note G) 4,123,808 4,265,084 5. Accruals and deferred income (Note I) 19,042,661 15,470,655 6. Provisions a) pension plans and health insurance scheme (Note L) 4,751,928 4,510,251 b) provision in respect of guarantee operations (Note D.4) 99,634 39,332 4,851,562 4,549,583 7. Subscribed capital (Note H) a) subscribed 248,795,607 248,795,607 b) uncalled -226,604,892 -226,604,892 22,190,715 22,190,715 8. Reserves (Note H) a) reserve fund 24,879,561 24,879,561 b) additional reserves 17,176,068 12,776,663 c) special activities reserve 10,303,216 12,152,954 d) general loan reserve 2,115,966 2,021,337 54,474,811 51,830,515 9. Profit for the financial year 2,460,190 2,647,454 10. Equity attributable to minority interest (Note H) 1,530,494 1,470,684 Total liabilities 547,304,473 568,032,738 The accompanying notes form an integral part of these consolidated financial statements. 104 |
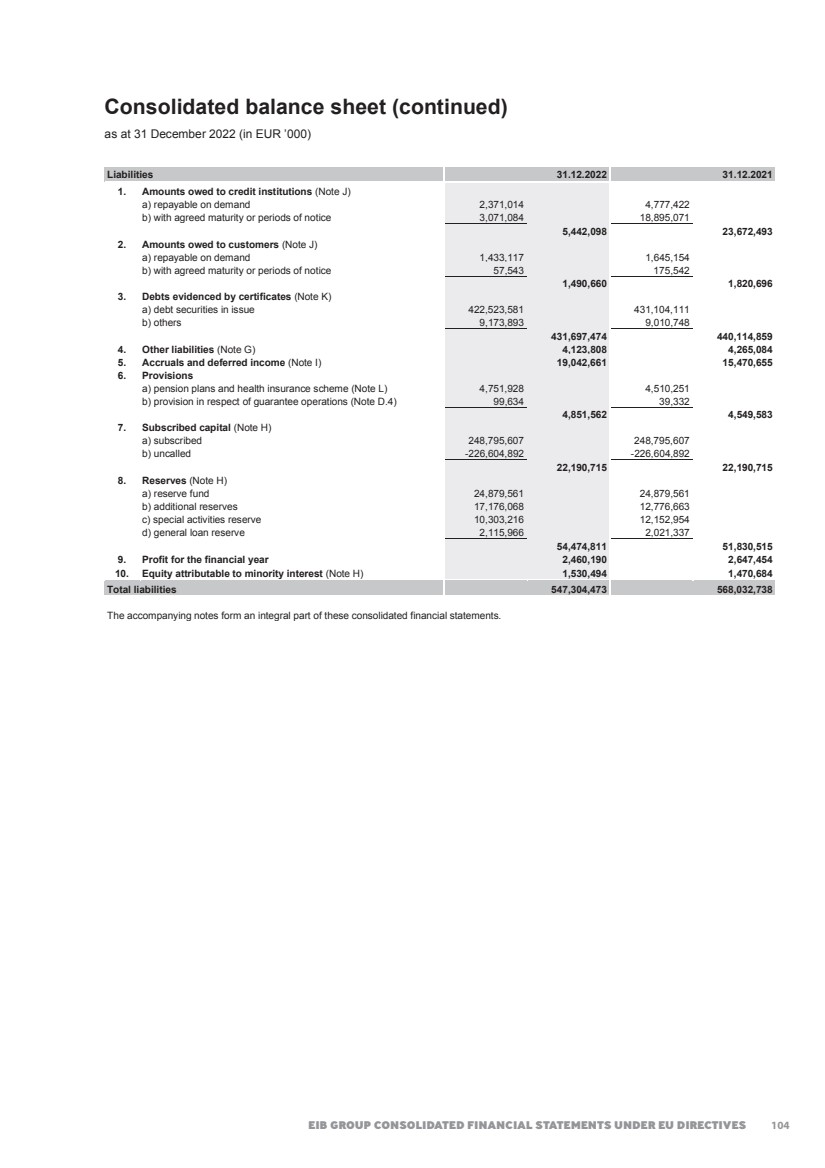
| 2022 FINANCIAL REPORT 113 Consolidated off-balance sheet as at 31 December 2022 (in EUR ’000) 31.12.2022 31.12.2021 Commitments: - Undisbursed loans (Note D.1) - credit institutions 30,757,433 31,936,008 - customers 93,274,466 91,041,283 124,031,899 122,977,291 - Undisbursed shares and other variable-yield securities - Undisbursed private equity and venture capital operations (Note E.2) 4,824,700 4,948,960 - Undisbursed investment and infrastructure funds (Note E.2) 3,435,704 3,203,307 - EBRD capital uncalled 712,630 712,630 - Undisbursed other Investments (Note E.2) 651,129 0 9,624,163 8,864,897 - Undisbursed participating interests - Undisbursed private equity and venture capital operations (Note E.2) 483,923 576,951 - Borrowings launched but not yet settled 223,950 223,950 Contingent liabilities and guarantees: - In respect of loans granted by third parties (Note U.2.3) 31,931,060 30,901,227 Assets held on behalf of third parties(*) (Note Z): - Innovation Fund 6,913,187 4,202,032 - Investment Facility Cotonou 4,334,223 4,128,779 - Modernisation fund 3,906,016 2,957,006 - InnovFin 2,112,847 2,044,056 - NER300 1,035,191 1,143,332 - CEF 828,423 908,683 - Pan-European Guarantee Fund 676,011 595,239 - COSME LGF & EFG 654,491 606,867 - ESIF 529,774 458,942 - EU-Africa Infrastructure Trust Fund 414,850 425,628 - SME initiative Italy 383,301 263,392 - JEREMIE 289,474 275,376 - REG 246,115 193,115 - InvestEU 241,292 0 - SME initiative Romania 239,330 236,188 - Decentralised Financial Instruments 216,990 1,021,159 - Partnership Platform for Funds 213,415 187,785 - European Fund for Strategic Investments (‘EFSI EIF’) 206,949 248,261 - GIF 2007 176,814 110,383 - JESSICA (Holding Funds) 176,684 600,667 - RRF-FI 156,874 0 - Special Section 128,487 132,372 - EaSI 101,690 103,276 - RSFF (incl. RSI) 101,216 93,428 - InnovFin SME Guarantee 86,149 99,327 - SME initiative Bulgaria 84,638 87,104 - ENPI 78,773 77,781 - Cultural Creative Sectors Guarantee Facility 64,861 52,087 - SME initiative Finland 59,375 62,275 - NPI 59,375 43,245 - AECID 56,934 58,885 - WB EDIF 56,684 46,649 - SMEG 2007 55,941 56,658 - InnovFin Equity 54,638 77,164 - Private Finance for Energy Efficiency Instrument 54,610 55,007 - DCFTA 51,063 50,727 - GF Greece 42,417 162,254 - NIF Trust Fund 37,721 38,259 - NIF Risk Capital Facility 37,623 35,865 - EFSI-EIAH 33,339 35,559 - MAP guarantee 30,856 30,652 - GAGF 29,404 30,060 - SME initiative Malta 26,945 26,629 - IPA II 24,333 52,626 - Bundesministerium für Wirtschaft und Technologie 22,254 19,680 105 |
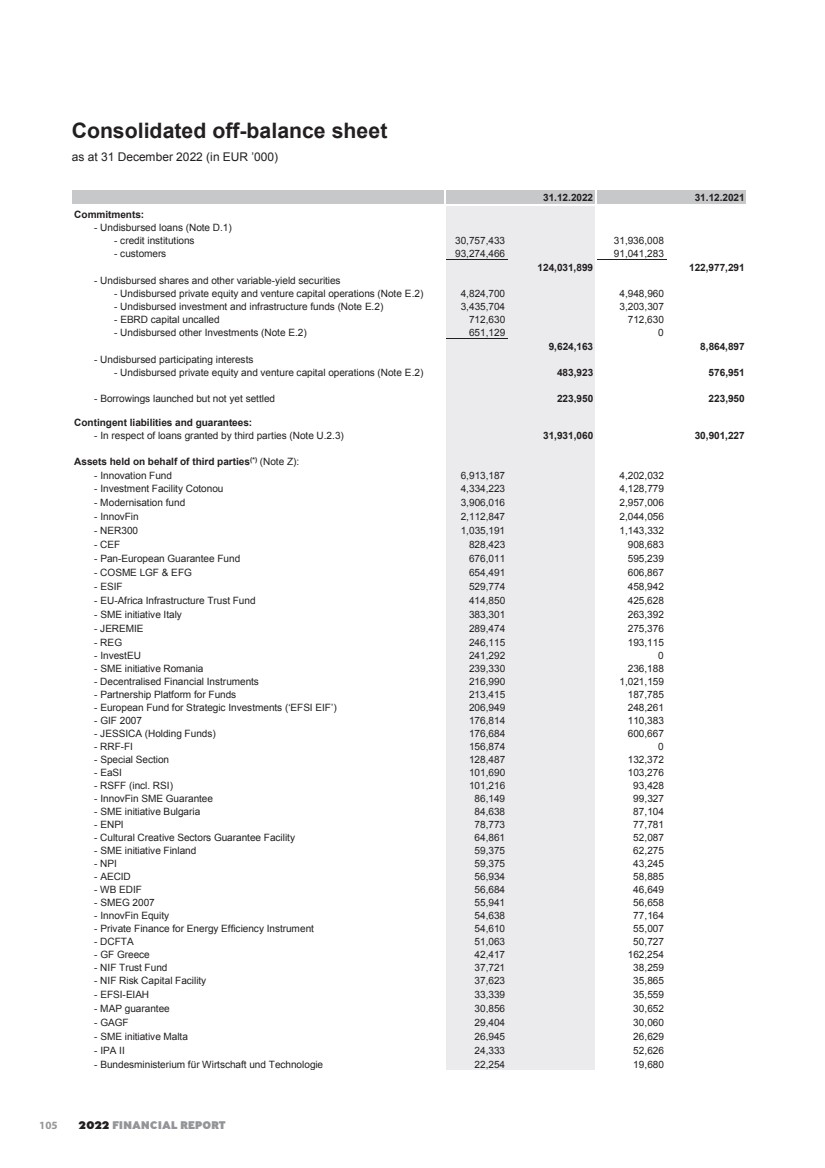
| EIB GROUP CONSOLIDATED FINANCIAL STATEMENTS UNDER EU DIRECTIVES 114 Consolidated off-balance sheet (continued) as at 31 December 2022 (in EUR ’000) 31.12.2022 31.12.2021 - FEMIP Trust Fund 20,492 22,577 - SME initiative Spain 19,405 2,022 - EPTA Trust Fund 17,340 15,987 - AGRI 14,225 17,297 - TTA Türkiye 13,016 9,113 - MAP Equity 11,819 64,594 - Natural Capital Financing Facility 10,468 10,397 - German Future Fund Growth Facility 7,208 2,849 - EU Support to Boost Africa 5,789 824 - BIF 5,005 3,907 - PGFF 3,684 2,990 - Student Loan Guarantee Facility 3,447 3,570 - GEEREF 3,372 3,457 - German Corona Matching Facility (CMF) 2,229 3,630 - Central Europe FoF 2,037 526 - GEF-UNEP 1,431 0 - Alp GIP 1,082 1,409 - EU Trade and Competitiveness Program 880 968 - LFA-EIF Facility 847 1,115 - AIP Zambia 298 338 - G43 Trust Fund 284 284 - MDD 255 1,809 - AIP Kulima 221 246 - TTP 204 516 - EFSD GUARANTEE "ACCESS TO FINANCE INITIATIVE" 157 148 - European Technology Facility 77 412 - EPIC 8 0 - GGF 7 7 - GEEREF Technical Support Facility 0 775 25,476,864 22,306,226 Other items: - Nominal value of interest-rate swaps (Note V.1.2) 573,024,821 559,081,060 - Nominal value of currency swap contracts receivable (Note V.1.1) 243,344,964 247,683,252 - Nominal value of currency swap contracts payable 242,236,843 245,975,779 - Nominal value of short-term currency swap contracts payable 21,731,627 24,956,095 - Nominal value of short-term currency swap contracts receivable (Note V.2) 21,411,941 25,123,575 - Notional amount of futures contracts (Note V.2) 8,804,329 8,274,106 - Put option granted to EIF minority shareholders (Note E.2) 419,763 340,341 - Notional amount of currency forwards (Note V.2) 267,069 402,384 - Special deposits for servicing borrowings (Note S) 560 582 (*) Assets under management are disclosed as off balance sheet item based on the latest available figures. Comparative figures might be restated in order to reflect most recent available information. The accompanying notes form an integral part of these consolidated financial statements. 106 |
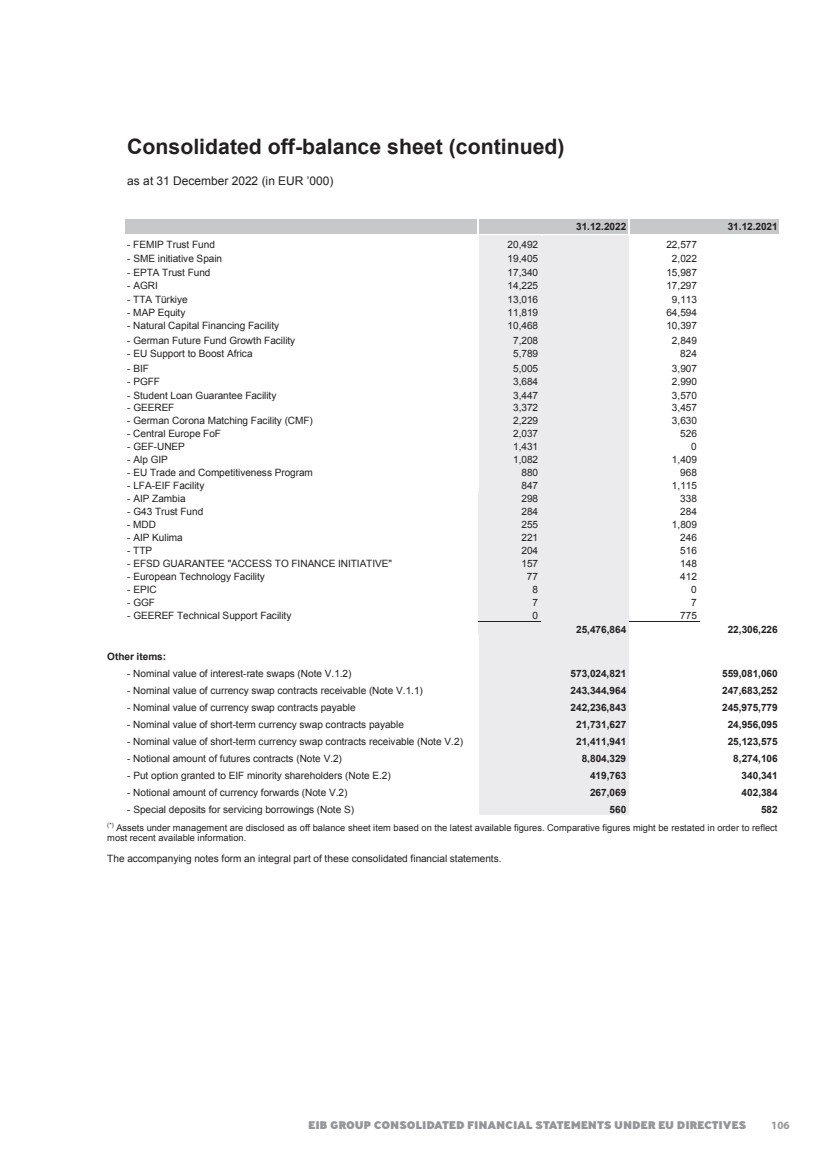
| 2022 FINANCIAL REPORT 115 Consolidated profit and loss account for the year ended 31 December 2022 (in EUR ‘000) 2022 2021 1. Interest receivable and similar income (Note N) 18,684,205 16,473,694 2. Interest payable and similar charges (Note N) -15,696,562 -13,285,486 3. Income from securities 672,023 838,815 4. Commissions receivable (Note O) 670,036 573,701 5. Commissions payable (Note O) -383,216 -434,377 6. Net result on financial operations (Note P) -46,746 51,958 7. Net other operating income and expense (Note Q) 10,477 -1,397 8. General administrative expenses (Note R) a) staff costs (Note L) -943,538 -1,371,657 b) other administrative expenses -346,295 -288,287 -1,289,833 -1,659,944 9. Value adjustments in respect of tangible and intangible assets (Note F) a) tangible assets -32,767 -28,909 b) intangible assets -29,696 -21,035 -62,463 -49,944 10. Value (re-)adjustments in respect of transferable securities held as financial fixed assets and participating interests -1,473 16,618 11. Value (re-)adjustments in respect of loans and advances and provisions for contingent liabilities -30,341 178,967 12. Profit for the financial year 2,526,107 2,702,605 13. Profit attributable to minority interest 65,917 55,151 14. Profit attributable to equity holders of the Bank 2,460,190 2,647,454 The accompanying notes form an integral part of these consolidated financial statements. 107 |
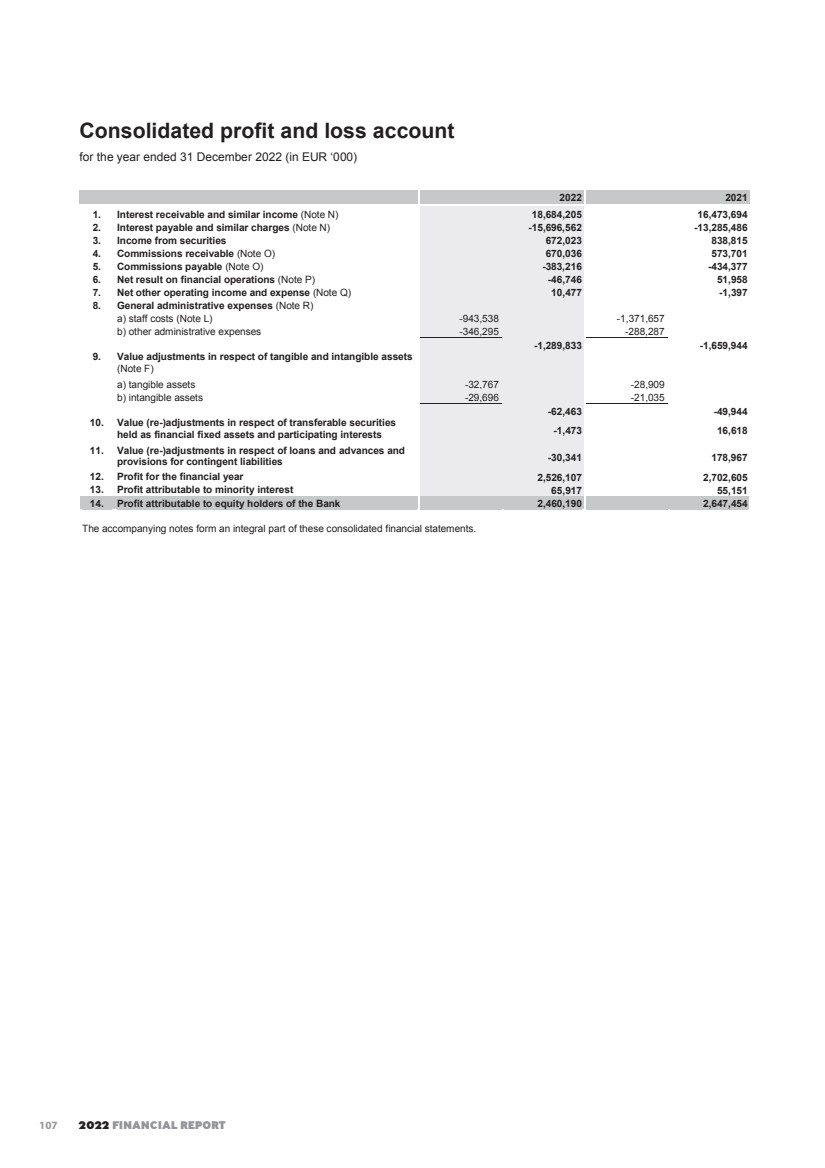
| EIB GROUP CONSOLIDATED FINANCIAL STATEMENTS UNDER EU DIRECTIVES 116 Consolidated cash flow statement for the year ended 31 December 2022 (in EUR ‘000) 2022 2021 A. Cash flows from operating activities: Profit for the financial year 2,526,107 2,702,605 Adjustments for: Value (re-)adjustments in respect of loans and advances and provisions for contingent liabilities 30,341 -178,967 Value (re-)adjustments in respect of transferable securities held as financial fixed assets and participating interests 1,473 -16,618 Value adjustments in respect of tangible and intangible assets, and write-off (Note F) 62,463 50,052 Value (re-)adjustments in respect of shares and other variable-yield securities (Note E.2) 91 -84,609 Net interest income (Note N) -2,987,643 -3,188,208 Effect of exchange rate changes -159,454 79,838 Loss on operating activities -526,622 -635,907 Disbursements of loans and advances to credit institutions and customers -49,994,020 -37,670,096 Repayments of loans and advances to credit institutions and customers 44,590,423 50,381,755 Change in other loans and advances (Note C) 6,673,633 8,658,820 Change in deposit with Central Bank of Luxembourg to cover minimum reserve requirement (Note B.1) 57,213 -35,110 Change in treasury operational portfolios 17,526,222 -9,007,313 Change in amounts owed to credit institutions and customers (Note J) -18,560,431 7,276,336 Change in provisions on pension plans and health insurance scheme (Note L) 241,677 692,202 Change in provision in respect of guarantee operations (Note D.4) 60,302 16,692 Change in other assets and other liabilities (Note G) -306,673 -289,028 Change in prepayments and accrued income and in accruals and deferred income 6,305,595 1,375,527 Interest received 16,201,029 16,107,529 Interest paid -13,652,025 -12,257,300 Net cash used from/(used in) operating activities 8,616,323 24,614,107 B. Cash flows from investing activities: Securities in Long-Term HQLA Portfolio purchased during the year -1,778,122 -385,243 Securities from Long-Term HQLA Portfolio matured or sold during the year 450,000 701,588 Purchase of loan substitutes and ABS portfolio EIF included in the debt securities portfolios -4,070,061 -2,266,247 Redemption of loan substitutes and ABS portfolio EIF included in the debt securities portfolios 4,633,922 4,335,592 Additions on shares and other variable-yield securities (Note E.2) -2,450,317 -2,627,018 Reflows on shares and other variable-yield securities (Note E.2) 1,767,371 2,217,195 Additions on participating interests (Note E.2) -86,799 -93,908 Reflows on participating interests (Note E.2) 43,745 128,668 Purchase of tangible and intangible assets (Note F) -81,032 -63,109 Net cash used from/(used in) investing activities -1,571,293 1,947,518 C. Cash flows from financing activities: Issuance of debts evidenced by certificates (Note K) 84,649,253 100,348,462 Redemption of debts evidenced by certificates (Note K) -97,048,909 -107,709,303 Member States’ contribution 319,700 319,700 Purchase / Subscription of EIF shares 0 484,363 Dividend paid to EIF minority shareholders -5,737 0 Net cash used from/(used in) financing activities -12,085,693 -6,556,778 Summary statement of cash flows: Cash and cash equivalents at the beginning of financial year 69,121,468 48,074,653 Net cash from: Operating activities 8,616,323 24,614,107 Investing activities -1,571,293 1,947,518 Financing activities -12,085,693 -6,556,778 Effect of exchange rate changes on cash held -92,395 1,041,968 Cash and cash equivalents at the end of financial year 63,988,410 69,121,468 Cash and cash equivalents are composed of: Cash in hand, balances with central banks and post office banks, excluding deposit with Central Bank of Luxembourg to cover minimum reserve requirement (Note B.1) 25,389 1,338,806 Money market securities (Note B.2) 552,038 142,403 Loans and advances to credit institutions and customers: Repayable on demand 984,212 797,488 Other loans and advances (Note C) 62,426,771 66,842,771 63,988,410 69,121,468 The accompanying notes form an integral part of these consolidated financial statements. 108 |
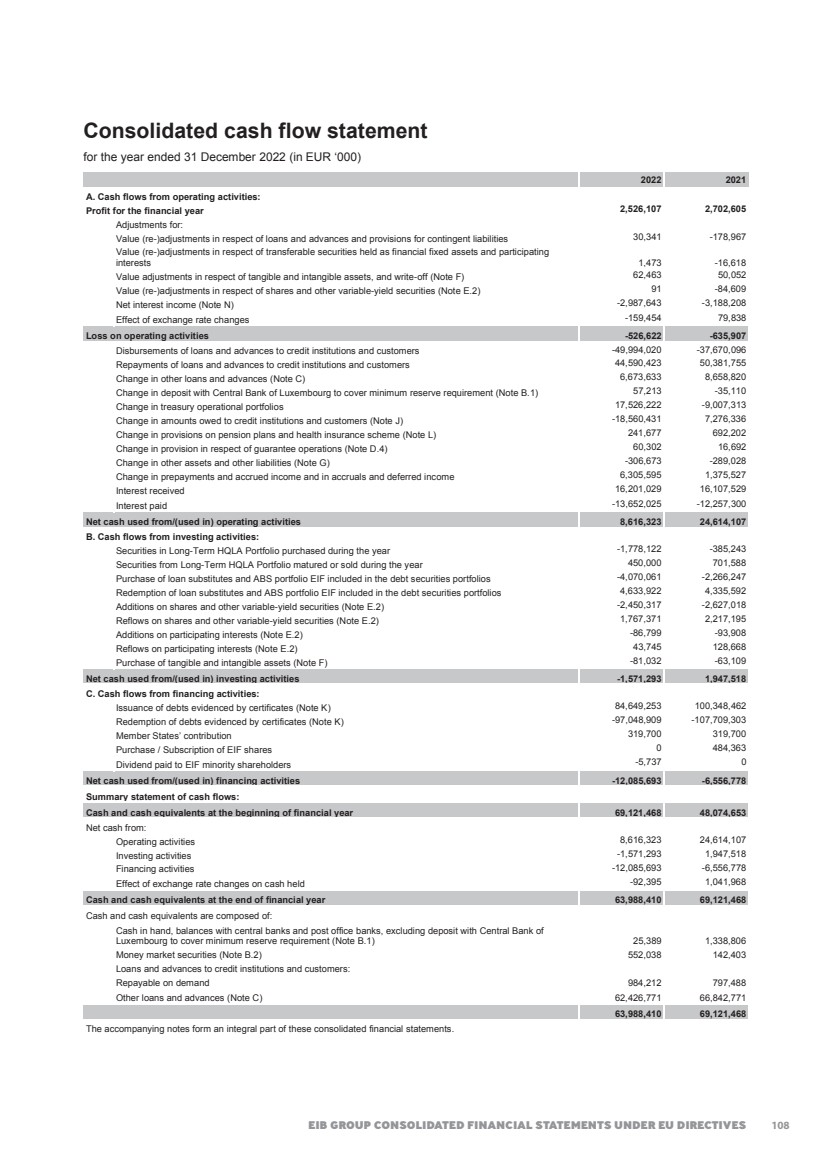
| 2022 FINANCIAL REPORT 117 European Investment Bank Group Notes to the consolidated financial statements as at 31 December 2022 The European Investment Bank (the ‘Bank’ or ‘EIB’) was created by the Treaty of Rome in 1958 as the long-term lending bank of the European Union (‘EU’). The task of the Bank is to contribute towards the integration, balanced development and economic and social cohesion of the EU Member States. The EIB raises substantial volumes of funds on the capital markets and lends these funds on favourable terms to projects furthering EU policy objectives. The EIB continuously adapts its activities to developments in EU policies. The Bank has its registered office at 98-100, boulevard Konrad Adenauer, L-2950 Luxembourg. The Bank and its subsidiary are defined as the ‘Group’ or ‘EIB Group’. The subsidiary held by the Bank is disclosed in note E.1. Note A – Significant accounting policies A.1. Basis of preparation A.1.1. Accounting standards The consolidated financial statements (the ‘Financial Statements’) of the European Investment Bank have been prepared in accordance with the general principles of Directive 86/635/EEC of the Council of the European Communities of 8 December 1986 on the annual accounts and consolidated accounts of banks and other financial institutions, as amended by Directive 2001/65/EC of 27 September 2001, by Directive 2003/51/EC of 18 June 2003 and by Directive 2006/46/EC of 14 June 2006 on the annual and consolidated accounts of certain types of companies, banks and other financial institutions (the ‘Directives’) and on a going concern basis. On a proposal from the Management Committee, the Board of Directors adopted the Financial Statements on 29 March 2023 and authorised their submission to the Board of Governors for approval by 25 April 2023. The Group also publishes consolidated financial statements, which have been prepared in accordance with International Financial Reporting Standards (‘IFRS’), as endorsed by the European Union. A.1.2. Significant accounting judgments and estimates In preparing the Financial Statements, the Management Committee is required to make estimates and assumptions that affect reported income, expenses, assets, liabilities and disclosure of contingent assets and liabilities. Use of available information and application of judgement are inherent in the formation of estimates. Actual results in the future could differ from such estimates and the resulting differences may be material to the Financial Statements. The most significant use of judgments and estimates is as follows: Value adjustments on loans and advances and loan substitutes The Group reviews its loans and advances and loan substitutes at each reporting date to assess whether an allowance for value adjustments should be recorded. In particular, judgment by management is required in the estimation of the amount and timing of future cash flows when determining the level of allowance required. Such estimates are based on assumptions about a number of factors and actual results may differ, resulting in future changes to the allowance. In addition to a specific allowance against individually significant loans and advances and loan substitutes, the Group also makes a collective provisioning test on exposures that, although not specifically identified as requiring a specific allowance, have a greater risk of default than when the loans and advances and loan substitutes were originally granted (see Note A.2.7). Value adjustments on shares and other variable-yield securities and participating interests In order to determine the lower of cost or market value, the Bank reviews its indirect equity investments at each reporting date to assess whether a value adjustment should be recorded. In particular, the Bank determines the attributable EIB share of the net asset value (‘NAV’) of its indirect equity investments either by (i) considering the latest available fund manager report based on applicable industry guidelines and standards, (ii) any NAV derived from any other equivalent guidelines or standard or (iii) internally based on information provided by the fund manager. Fair values for most of the underlying investments have been estimated in the absence of readily ascertainable market values. Due to the inherent uncertainty of valuations, and current market conditions, actual results in the future could differ from the fund managers’ estimates of values and such differences could be material to the financial statements. Moreover, any attributable NAV available only after the balance sheet date are only considered if management considers they materially affect the financial statements (see Note A.2.8). 109 |
| EIB GROUP CONSOLIDATED FINANCIAL STATEMENTS UNDER EU DIRECTIVES 118 Provisions in respect of guarantee operations The Group initially recognises the financial guarantee contract at fair value, corresponding to the net present value (‘NPV’) of expected premium inflows or the initial expected loss. The financial guarantee is subsequently measured as the deficit of the net present value of expected future premium over the higher of the corresponding loss allowance and the premium received on initial recognition less income recognised. The Bank also makes a collective provisioning test on exposures that, although not specifically identified as requiring a specific allowance, have a greater risk of default than when the guarantees were originally signed and issued (see Note A.2.14). Pension and other post-employment benefits The cost of defined-benefit pension plans and other post-employment medical benefits is determined using actuarial valuations. The actuarial valuation involves making assumptions about discount rates, mortality rates and future salary and pension increases. Due to the long-term nature of these plans, such estimates are subject to significant uncertainty (see Note A.2.11). A.1.3. Bank’s exposure to the United Kingdom (‘UK’) On 29 March 2017, the United Kingdom notified the European Council of its decision to withdraw from the European Union (‘EU’) pursuant to Article 50 of the Treaty on European Union (‘TEU’). As of 1 February 2020, in accordance with Article 50 TEU and the Agreement on the withdrawal of the United Kingdom of Great Britain and Northern Ireland from the European Union and the European Atomic Energy Community (the “Withdrawal Agreement”), the United Kingdom ceased to be an EU Member State. The withdrawal of the United Kingdom from the EU automatically resulted in the termination of its membership of the European Investment Bank (‘EIB’) and its share of the EIB’s subscribed capital. Effective 1 February 2020, the share of the United Kingdom in respect of the EIB’s subscribed capital was fully replaced by a pro rata capital increase of the remaining EU Member States. This capital replacement (Symmetrical Capital Replacement) covered both the called part as well as the uncalled part of the subscribed capital of the United Kingdom in the EIB. The replacement of the called part was financed by converting EIB reserves into called subscribed capital. As a result of the capital increase, each remaining EU Member State increased pro rata its uncalled (but callable) stake in the EIB’s subscribed capital. In addition, the capital subscribed by Poland and Romania in the EIB increased by EUR 5,386,000,000 and EUR 125,452,381, respectively. This capital increase (Asymmetrical Capital Increase) took effect on 1 March 2020, one month after the withdrawal of the United Kingdom from the EU. Poland and Romania will pay the called portion of their increase in the EIB’s subscribed capital and contribute to the EIB reserves in ten equal semi-annual instalments. The Withdrawal Agreement contains, among other things, several provisions governing the financial settlement in respect of the EIB as a result of the termination of UK membership of the EIB. In accordance with the provisions laid down in Article 150 of the Withdrawal Agreement, the United Kingdom shall remain liable, under its former share of the subscribed capital in the EIB, for the EIB’s pre-withdrawal exposure. In this respect as at 31 December 2022, the EIB’s pre-withdrawal exposure amounts to EUR 444,380 million, whereas the limit of the United Kingdom’s liability amounts to EUR 39,195 million. The United Kingdom shall also remain liable for other EIB risks as long as such risks are not related to post-withdrawal lending. In addition, in accordance with the provisions laid down in Article 150 of the Withdrawal Agreement, the EIB shall pay to the United Kingdom on behalf of the EU an amount equal to the UK share of the called capital of the EIB in twelve annual instalments. Except for such repayment of the UK called capital, the EIB shall not be obliged to make any other payment, return or remuneration to the United Kingdom in connection with the termination of its membership of the EIB or on account of the retention by the United Kingdom of certain liabilities as described in the relevant provisions of the Withdrawal Agreement. A.2. Summary of significant accounting policies A.2.1. Foreign currency translation The Group uses the euro (‘EUR’) as the unit of measurement for the capital accounts of Member States and for presenting its Financial Statements. The Group conducts its operations in euro, in other currencies of the EU Member States and in non-EU currencies. Its resources are derived from its capital, borrowings and accumulated earnings in various currencies. Foreign currency transactions are translated at the exchange rate prevailing on the date of the transaction. The Group's monetary assets and liabilities denominated in currencies other than euro are translated into euro at the closing exchange rates prevailing at the balance sheet date. The gain or loss arising from such translation is recorded in the profit and loss account under “Net result on financial operations”. A.2.2. Basis of consolidation Subsidiaries Subsidiaries are all entities directly or indirectly controlled by the Group. EIB Group is required to consolidate entities under its control which it is exposed to, or has rights to, variable returns from its involvement and has the ability to affect those returns through its power over the entities. All significant subsidiaries are included in these consolidated financial statements, while entities immaterial to the Group are excluded from the scope of consolidation. The financial statements of any subsidiary are included in the consolidated financial statements from the date on which control commences until the date on which control ceases. The Financial Statements of EIB Group comprise those of the European Investment Bank (the ‘Bank’ or ‘EIB’) and those of its subsidiary, the European Investment Fund (the ‘Fund’ or ‘EIF’). The financial statements of its subsidiary are prepared for the same reporting year as the Bank, using consistent accounting policies. 110 |
| 2022 FINANCIAL REPORT 119 Minority interest Minority interest in EIB’s subsidiary represents the portion of profit or loss and net assets not owned directly or indirectly, by the Group and is presented separately in the consolidated balance sheet under “Equity attributable to minority interest” and respectively in the consolidated profit and loss account under “Profit attributable to minority interest”. The commitment provided in form of a put option in respect of the shares held by the EIF’s minority shareholders other than the European Commission, is recorded off-balance in the amount of the applicable exercise price. Transactions eliminated on consolidation After aggregation of the balance sheet and the profit and loss accounts, all intra-group balances and transactions, income and expenses resulting from intra-group transactions are eliminated. Assets held in an agency or fiduciary capacity are not assets of the Group and are reported in Note Z. A.2.3. Derivatives The Group uses derivative instruments, mainly currency and interest rate swaps, as part of its asset and liability management (‘ALM’) activities to manage exposures to interest rate and foreign currency risks. All derivatives transactions are recorded at their nominal values as off-balance sheet items at the date of the transaction. The majority of the Group’s swaps are concluded with a view to hedging bond issues and treasury bonds from Long-Term HQLA Portfolio (‘LTHP’). The Group enters into currency and interest rate swaps, whereby the proceeds of a borrowing are initially converted into a different currency and at maturity the Group will obtain the amounts needed to service the borrowing in the original currency or in order to modify the interest rate positions of a borrowing or treasury bond. The Group also enters into currency, interest rate and overnight index swaps as part of its hedging operations on loans or for the global ALM position. The corresponding interest is accounted for on a pro rata temporis basis. The Group also uses short-term derivative instruments, primarily FX swaps, as part of its treasury operations, as well as derivatives hedging the actively managed portfolio (Securities liquidity portfolio). A.2.3.1. Derivatives under Securities liquidity portfolio As part of the Securities liquidity portfolio (‘SLP’), derivatives are entered in and recorded at market value in the balance sheet as “Other assets” when their market value is positive or “Other liabilities” when their market value is negative. Changes in the market value are included in “Net result on financial operations”. Market values are obtained from quoted market prices, discounted cash flow models and option pricing models, which consider current market and contractual prices for the underlying instrument, as well as the time value of money, yield curve and volatility of the underlying. Interest on derivative instruments is accrued pro rata temporis under “Prepayments and accrued income” or “Accruals and deferred income”. Interest rate swaps Interest rate swap contracts are entered into in order to modify the interest rate positions. The interest received and paid under interest rate swaps is accrued pro rata temporis and reported in the profit and loss account under “Interest receivable and similar income” or “Interest payable and similar charges”. The market value is recorded under “Other assets” when their market value is positive or “Other liabilities” when their market value is negative. Changes in the market value are included in “Net result on financial operations”. Futures contracts Interest rate and bond futures contracts (futures) are entered to hedge the exposure deriving from investments in government and other bonds. Futures are highly standardised derivative contracts, traded on regulated markets and are subject to daily margin requirements. The market value is recorded under “Other assets” when their market value is positive or “Other liabilities” when their market value is negative. Changes in the market value are included in “Net result on financial operations”. A.2.3.2. Other derivatives Currency swaps Currency swap contracts are entered into in order to adjust currency positions. The revaluation of the spot leg of a currency swap is neutralised in “Accruals and deferred income” or “Prepayments and accrued income”. The forward leg of the currency swap is recorded off-balance sheet at settlement amount and is not revalued. The premium/discount between the spot and forward settlement amounts is amortised pro rata temporis through the profit and loss account in “Interest receivable and similar income” or “Interest payable and similar charges”. 111 |
| EIB GROUP CONSOLIDATED FINANCIAL STATEMENTS UNDER EU DIRECTIVES 120 Interest rate swaps Interest rate swap contracts are entered into in order to modify the interest rate positions. The hedging interest rate swaps are not revalued and their nominal is recorded off-balance sheet. The interest received and paid under interest rate swaps is accrued pro rata temporis and reported in the profit and loss account under “Interest receivable and similar income” or “Interest payable and similar charges”. Currency forwards Currency forwards are entered into in order to adjust future currency positions. The forward leg is recorded off-balance sheet at the settlement amount and is not revalued. The difference between the spot amounts and the forward settlement amounts is amortised pro rata temporis through the profit and loss account in “Interest receivable and similar income” or “Interest payable and similar charges”. Interest on derivative instruments is accrued pro rata temporis under “Prepayments and accrued income” or “Accruals and deferred income”. A.2.4. Financial assets and liabilities Financial assets and liabilities are accounted for using the settlement date basis. A.2.5. Cash and cash equivalents Cash and cash equivalents are disclosed in the consolidated cash flow statement and comprise cash on hand, unrestricted balances held with central banks, on demand amounts due, and highly liquid money market securities or term deposits with initial maturity of 3 months or less from the date of acquisition. These instruments are subject to an insignificant risk of changes in their value, readily convertible to cash and are used by the Group in the management of its short-term commitments. A.2.6. Treasury bills and other bills eligible for refinancing with central banks and debt securities including fixed-income securities A.2.6.1. Long-Term High Quality Liquid Assets (‘HQLA’) Portfolio (‘LTHP’) The former long-term hedge portfolio (‘LTHP’) was reformed during 2021 into Long-Term High Quality Liquid Assets (HQLA) Portfolio (LTHP). This reform, among others, implied changes to the size of portfolio, new eligible currency and scope of authorised investments. There has been no change in the business model for securities purchased under the new portfolio which are still kept with the intention to hold them to maturity. Under the new reform, investments are authorised in securities that are issued or guaranteed by: • Governments of the European Union Member States and the United States of America (USA); • European Union, European Stability Mechanism, European Financial Stability Facility. These securities are initially recorded at the purchase price. Value adjustments are accounted for, if these are other than temporary. The difference between the entry price and redemption value is accounted for pro rata temporis over the life of the securities, as “Interest receivable and similar income” or “Interest payable and similar charges”. A.2.6.2. Operational portfolios Treasury Monetary Portfolio (‘TMP’) In order to maintain an adequate level of liquidity, the Bank purchases money market products with a maximum maturity of 12 months, in particular treasury bills and negotiable debt securities issued by public bodies and credit institutions. The securities in the Treasury Monetary Portfolio are held until their final maturity and are initially recorded at purchase price and subsequently presented in the Financial Statements at amortised cost. The difference between purchase price and redemption value is accounted for pro rata temporis over the life of the securities as “Interest receivable and similar income” or “Interest payable and similar charges”. Value adjustments are accounted for under “Value (re-)adjustments in respect of transferable securities held as financial fixed assets, participating interests and shares in affiliated undertakings”, if these are other than temporary. Securities liquidity portfolio (‘SLP’) SLP comprises listed debt securities issued or guaranteed by national governments, supranational institutions, financial institutions and corporations. The portfolio is largely driven by an active management and follow the initial recognition at purchase price and subsequently the securities of this portfolio are presented in the Financial Statements at market value. Changes in market value are recorded under “Net result on financial operations” in the profit and loss account. The market value of SLP is based on published price quotations in an active market as the first source. For instruments without available published price quotations, the market values are determined by obtaining quotes from market participants and/or by using valuation techniques or models, based whenever possible on observable market data prevailing at the balance sheet date. Operational portfolio EIF The Operational portfolio EIF comprises listed debt securities with a maximum residual maturity of 10 years. These securities are measured at amortised cost. 112 |
| 2022 FINANCIAL REPORT 121 A.2.6.3. Loan substitutes portfolio (EIB) and ABS portfolio (EIF) The Loan substitutes portfolio (EIB) and ABS portfolio (EIF) mainly consist of obligations in the form of bonds, notes or certificates issued by special purpose vehicles (‘SPVs’), trust vehicles or financial institutions. These securities are kept with the intention to be held to maturity and initially recorded at purchase price and subsequently valued at amortised cost. The difference between purchase price and redemption value is accounted for pro rata temporis over the life of the securities as “Interest receivable and similar income”. Individual value adjustments are accounted for, if these are other than temporary. Collective value adjustments are recorded to capture contracts which are impaired but have not yet been identified as such respectively for losses incurred but not yet reported. Individual and collective value adjustments are recorded in the profit and loss account as “Value (re-) adjustments in respect of transferable securities held as financial fixed assets and participating interests” and are deducted from the appropriate asset items on the balance sheet. Undisbursed parts of loan substitutes are recorded in off balance sheet at their nominal value. A.2.6.4. Preferred creditor status (‘PCS’) The principle of supremacy of EU primary law and the principle that the property of the EIB shall be exempt from all forms of requisition and expropriation, as enshrined in the EIB Statute, are deemed to guarantee a full recovery of the EU Sovereign Exposures on maturity. This financial protection and the benefit of the preferred creditor status result in no credit risk or impairment loss from Member States sovereign exposure or guarantees. However, similarly to other creditors, the EIB is bound by the majority decision based on collective action clauses (‘CAC’) included in debt instruments issued by EU Sovereigns. A.2.7. Loans and advances to credit institutions and customers A.2.7.1. Loans and advances Loans and advances are included in the assets of the Group at their net disbursed amounts. Individual value adjustments have been recorded for loans outstanding at the end of the period and presenting risks of non-recovery of all or part of their amounts. Collective value adjustments have been recorded to capture loans in the portfolio which are impaired but have not yet been identified as such or for losses which have been incurred but not yet reported. Such value adjustments are held in the same currency as the assets to which they relate. Value adjustments are accounted for in the profit and loss account as “Value (re-) adjustments in respect of loans and advances and provisions for contingent liabilities” and are deducted from the appropriate asset items on the balance sheet. Undisbursed parts of loans and advances are recorded in off balance sheet at their nominal value. A.2.7.2. Interests on loans Interests on loans are recorded in the profit and loss account on an accrual basis, i.e. over the life of the loans. On the balance sheet, accrued interest is included in “Prepayments and accrued income” under assets. Value adjustments to interest amounts on these loans are determined on a case-by-case basis by the Group’s Management and deducted from the appropriate asset item on the balance sheet. For non-performing loans, upon value adjustment, the accrual of interest income based on the original terms of the claim may be discontinued. A.2.7.3. Reverse repurchase agreements (‘Reverse repos’) A reverse repurchase agreement is one under which the Group lends liquid funds to a credit institution which in return provides collateral in the form of securities. The two parties enter into an irrevocable commitment to complete the operation on a date and at a price fixed at the outset. The operation is based on the principle of delivery against payment: the borrower of the liquid funds transfers the securities to the Group’s custodian in exchange for settlement at the agreed price, which generates a return for the Group linked to the money market. This type of operation is considered for the purposes of the Group to be a loan at a guaranteed rate of interest. Generally treated as collateralised financing transactions, they are carried at the amounts of cash advanced or received, plus accrued interest. Reverse repos are entered at their nominal amount on the assets side of the consolidated balance sheet under “Loans and advances to credit institutions - b) other loans and advances”. Securities received under reverse repurchase agreements are not recognised in the consolidated balance sheet, unless control of the contractual rights comprised in these securities is assumed. The Group monitors the market value of the securities received on a daily basis and requests additional collateral in accordance with the underlying agreements. Interest on reverse repurchase agreements is recognised as “Interest receivable and similar income” or “Interest payable and similar charges” over the life of each agreement. A.2.7.4. Interest subsidies Interest subsidies received in advance (see Note I) are deferred and recognised in the profit and loss account over the period from disbursement to repayment of the subsidised loan. A.2.7.5. Term and on-demand deposits (‘Deposits’) Deposits are operations under which the Bank lends liquid funds to a credit institution or customer for a certain period or on-demand against a return agreed between the parties. Deposits are entered at their nominal amount on the assets side of the statutory balance sheet under “Loans and advances to credit institutions or customers - other loans and advances”. Interest on deposits is recognised as “Interest receivable and similar income” or “Interest payable and similar charges” over the life of deposit term. 113 |
| EIB GROUP CONSOLIDATED FINANCIAL STATEMENTS UNDER EU DIRECTIVES 122 A.2.8. Shares, other variable-yield securities and participating interests The Group holds shares, other variable-yield securities and participating interests when it enters into private equity and venture capital operations, debt funds, infrastructure funds, investment funds or participations in the form of direct equity. These investments are initially recorded at acquisition cost, reduced by any reflow resulting from repayments. Their carrying value is adjusted to the lower of cost or market value at subsequent measurement at the balance sheet date. In certain co-investments performed by the Group, the investments are initially recognised at cost and the net-paid-in represents the drawdowns paid net of any capital repayments allocated in accordance with the agreed waterfall. Based on the reports received from fund managers, the portfolios of investments are valued on a line-by-line basis at the lower of cost or attributable NAV, thus excluding any attributable unrealised gain that may be prevailing in the portfolio. The attributable NAV is determined by applying in order of priority, and subject to availability at the reporting date, either: • the Group share of NAV at the latest available date, submitted by the respective fund manager, or; • the number of shares or units held by the Group multiplied by the price per share or units latest available date reported by fund manager, or; • the Group’s percentage ownership in the specific compartment multiplied by the specific compartment net asset value (the “NAV”) reflected in the most recent fund manager’s report, or; • the Group’s percentage of ownership in the fund multiplied by the latest available fund NAV. In certain co-investments performed by the Group, the attributable NAV may be determined based on the agreed waterfall calculation. The attributable NAV is adjusted for events occurring between the date of the latest available NAV and the balance sheet date to the extent that such adjustment is considered to be material by the Management Committee. The undrawn but committed part of these investments is recorded as off balance sheet commitments at their nominal value. Secondary sales Secondary sale transactions on venture capital funds and investment funds lead to derecognition of the underlying assets. Gains or losses from secondary sales are recorded in “Net result on financial operations” and are calculated as the difference between the sales proceeds and the net carrying amount. Participating interests The shares acquired by the Group for its own account typically represent investments in venture capital operations, debt funds, infrastructure funds and investment funds. According to industry practice, such investments are generally subscribed by a number of investors, none of whom is in a position to individually influence the daily operations and the investment activity of such funds. As a consequence, any membership by an investor in a governing body of such a fund does not, in principle, entitle said investor to influence the day-to-day operations of the fund. In addition, individual investors in venture capital operations, infrastructure funds or investment funds do not determine policies of a fund such as distribution policies on capital repayments or other distributions. Such decisions are typically taken by the management of a fund on the basis of the shareholders’ agreement governing the rights and obligations of the management and all shareholders of the fund. The shareholders’ agreement also generally prevents individual investors from bilaterally executing material transactions with the fund, interchanging managerial personnel or obtaining privileged access to essential technical information. Such above-mentioned criteria are assessed by the EIB through a comprehensive analysis involving judgement in order to determine whether it has significant influence or joint control over those entities they acquired shares in. In case there is significant influence or joint control over the entity, it is disclosed under “Participating interests”. Capital subscribed by the Group but uncalled from the investment in EBRD is recorded off balance sheet. A.2.9. Tangible assets Tangible assets include land, Group-occupied properties, other machines and equipment. Land is stated at acquisition cost and buildings are stated at acquisition cost less accumulated depreciation, less accumulated impairment. The costs of the Group's headquarters buildings in Luxembourg-Kirchberg and its building in Luxembourg-Weimershof are depreciated on a straight-line basis as set out below. Permanent equipment, fixtures and fittings, furniture, office equipment and vehicles have been recorded in the consolidated balance sheet at their acquisition cost, less accumulated depreciation, less accumulated impairment. Depreciation is calculated on a straight-line basis over the estimated life of each item purchased, as set out below: • Buildings in Kirchberg and Weimershof: 30 years; • Permanent equipment, fixtures and fittings: 10 years; • Furniture: 5 years; • Office equipment and vehicles: 3 years. There is no depreciation of the accumulated costs of work-in-progress assets until they are completed and the assets are ready to use for the intended purpose. 114 |
| 2022 FINANCIAL REPORT 123 A.2.10. Intangible assets Intangible assets comprise computer software. Software development costs are capitalised if they meet certain criteria relating to identifiability, the probability that future economic benefits will flow to the enterprise and to the reliability of cost measurement. Internally developed software meeting these criteria is carried at cost less accumulated amortisation, which is calculated on a straight-line basis over three years from completion, less accumulated impairment. There is no amortisation of the accumulated costs of work-in-progress assets until they are completed and the assets are ready to use for the intended purpose. A.2.11. Pension plans and health insurance scheme A.2.11.1. Pension plan for staff The Group operates defined-benefit pension plans to provide retirement benefits to substantially its entire staff. The Bank’s main pension scheme is a defined-benefit pension scheme funded by contributions from staff and from the Bank which covers all employees. All contributions of the Bank and its staff are invested in the assets of the Bank. The main pension scheme of the EIF is a defined-benefit scheme funded by contributions from staff and from the EIF which covers all employees. The scheme entered into force in March 2003, replacing the previous defined-contribution scheme. Commitments for retirement benefits are valued at least every year using the projected unit credit method, in order to ensure that the provision entered in the accounts is adequate. The latest valuation was carried out as at 31 December 2022 based on membership data as at 30 September 2022 and cashflows to 31 December 2022. The main assumptions used by the actuary are set out in Note L. Cumulative current year actuarial gains or losses in excess of 10% of the commitments for retirement benefits are recognised over a period of 7 years on a straight-line basis. Once the provision has reached the amortisable portion of the actuarial value of the retirement and health insurance benefits, no further amortisation is recognised in the profit and loss account. Furthermore, in case the provision should exceed the actuarial value of the retirement and health insurance benefits, any excess will not be released to the profit and loss account in subsequent periods. A.2.11.2. Health insurance scheme The Group has set up its own health insurance scheme for the benefit of staff, financed by contributions from the Group and its employees. The health insurance scheme is managed and accounted for under the same principles as the pension plan for staff described in Note A.2.11.1. The latest valuation was carried out as at 31 December 2022 based on membership data as at 30 September 2022 and cashflows to 31 December 2022. A.2.11.3. The Management Committee pension plan The Management Committee pension plan is a defined-benefit pension scheme funded by contributions from the Group only which covers all Management Committee members. All contributions of the Group are invested in the assets of the Group. The Management Committee pension plan is managed and accounted for under the same principles as the pension plan for staff described in Note A.2.11.1. A.2.11.4. Optional Supplementary Provident Scheme The Optional Supplementary Provident Scheme is a defined-contribution pension scheme, funded by voluntary staff contributions and employer contributions. The corresponding liability is recorded in “Other liabilities”. A.2.12. Amounts owed to credit institutions and customers Amounts owed to credit institutions and customers are presented in the financial statements at their redemption amounts. Interest on amounts owed to credit institutions and customers is recorded in the profit and loss account on an accrual basis as “Interest payable and similar charges”, or “Interest receivable and similar income”, if interest rate is negative. Accrued interest is included in “Accruals and deferred income” under liabilities. In the context of the Group’s participation in monetary operations with the ECB, the amount borrowed from the BCL is recorded at its nominal value and presented in the consolidated financial statements under “Amounts owed to credit institutions- b) with agreed maturity or periods of notice” - Borrowings from central banks. A.2.12.1. Repurchase agreements (‘Repos’) A repurchase agreement is one under which the Group borrows liquid funds from a credit institution and provides collateral in the form of securities. The two parties enter into an irrevocable commitment to complete the operation on a date and at a price fixed at the outset. The operation is based on the principle of delivery against payment, which is mentioned in note A.2.7.3. This type of operation is considered for the purposes of the Group to be a borrowing with an agreed rate of interest. Generally treated as collateralised financing transactions, they are carried at the amounts of cash owed, plus accrued interest. Repos are entered at their nominal amounts on the liabilities side of the consolidated balance sheet under “Amounts owed to credit institutions- b) with agreed maturity or periods of notice”. Interest on repurchase agreements is recognised as “Interest receivable and similar income” or “Interest payable and similar charges” over the life of each agreement. 115 |
| EIB GROUP CONSOLIDATED FINANCIAL STATEMENTS UNDER EU DIRECTIVES 124 A.2.12.2. Collateral call accounts Under unilateral Collateral Support Annexes, the Group receives cash as collateral to mitigate counterparty credit exposures on Derivatives, Lending and Treasury portfolios. The cash collateral received is recorded at its nominal value and presented in the consolidated financial statements under “Amounts owed to credit institutions - a) repayable on demand” - Overnight deposits. A.2.13. Debts evidenced by certificates Debts evidenced by certificates are presented at their redemption amounts, except for zero coupon bonds which are presented at their amortised cost. Transaction costs and premiums/ discounts are amortised in the profit and loss account on a straight-line basis over the life of the debt through “Accruals and deferred income” or “Prepayments and accrued income”. Interest on debt instruments is included in “Interest payable and similar charges” or “Interest receivable and similar income” in the consolidated profit and loss account. A.2.14. Financial guarantees Financial guarantee contracts require the issuer to make specified payments to reimburse the holder for a loss it incurs, if a specified debtor fails to make payment when due under the original or modified terms of a debt instrument. Signed financial guarantees are generally accounted for and disclosed as off-balance sheet items. Net liabilities from financial guarantees are presented in the balance sheet under “Provision in respect of guarantee operations”. This provision is intended to cover risks inherent in the Group’s activity of issuing guarantees in favour of financial intermediaries or issued in respect of loans granted by third parties. Financial guarantees are initially recognised at fair value corresponding to the net present value (‘NPV’) of expected premium inflows or the initial expected loss. Subsequent to initial recognition, financial guarantees are measured as the deficit of the net present value of expected future premium inflows over the higher of: • the amount of the expected credit loss; and • the fair value initially recognised less any cumulative amount of income/amortisation recognised. Unrealised gains representing the excess of the net present value of expected future premium inflows over the amount of the expected payment obligations remain unrecognised. Any increase or decrease in the net liability relating to financial guarantees is recognised in the profit and loss account under “Value (re-)adjustments in respect of loans and advances and provisions for contingent liabilities”. Any premium received is recognised in the profit and loss account in “Commissions receivable”. Any upfront fees received are recognised in ”Accruals and deferred income” in the balance sheet and amortised in the profit and loss account on a straight-line basis over the life of the financial guarantee. A.2.15. Provision for commitments This provision is intended to cover risks inherent in the Group’s commitment on loans, infrastructure and investment funds as well as private equity and venture capital operations signed but not yet disbursed. A.2.16. Reserves A.2.16.1. Reserve fund As provided for under Article 22(-1) of the Statute, “a reserve fund of up to 10% of the subscribed capital shall be built up progressively” from the retained profit of the Bank. A.2.16.2. Additional reserves Additional reserves contain the remaining retained earnings of the Group. A.2.16.3. Special activities reserve As provided for under Article 16(-5) of the Statute, “the special activities of the Bank […] will have a specific allocation of reserve”. The special activities reserve is a dedicated notional reserve for the allocation of own funds covering unexpected losses of those activities, which have a risk profile higher than what is generally accepted by the Bank, including venture capital activities. The reserve is based on an allocation of each operation and is calculated according to the evolution of the underlying assets. 116 |
| 2022 FINANCIAL REPORT 125 A.2.16.4. General loan reserve In 2009 a “general loan reserve” was introduced for the Bank’s loan and guarantee portfolio, representing a notional reserve for allocation of own funds. It is calculated based on the Bank’s internal loan grading system according to the evolution of the underlying assets. A.2.17. Prepayments and accrued income Expenditure incurred during the financial year but relating to a subsequent financial year, together with any income for which payment is not due until the expiry of the underlying instrument. A.2.18. Accruals and deferred income Income received before the balance sheet date but relating to a subsequent financial year, together with any charges which, though relating to the financial year in question, will be paid only in the course of a subsequent financial year. A.2.19. Interest receivable and similar income “Interest receivable and similar income” includes mainly interest on loans and advances to credit institutions and customers, debt and money market instruments and derivatives. A.2.20. Interest payable and similar charges “Interest payable and similar charges” includes mainly interest on amounts owed to credit institutions and customers, interest expense on debt and money market instruments and derivatives. A.2.21. Income from securities “Income from securities” is mainly composed by reflows exceeding the capital. A.2.22. Taxation The Protocol on the Privileges and Immunities of the European Union appended to the Treaty on European Union and the Treaty on the Functioning of the European Union, stipulates that the assets, revenues, and other property of the institutions of the Union are exempt from all direct taxes. 117 |

| EIB GROUP CONSOLIDATED FINANCIAL STATEMENTS UNDER EU DIRECTIVES 126 Note B – Cash in hand, balances with central banks and post office banks and debt securities portfolio B.1. Cash in hand, balances with central banks and post office banks The cash in hand and balances with central banks and post office banks equals to EUR ’000 112,655 at 31 December 2022 (2021: EUR ‘000 1,483,285). The EIB is an eligible counterparty in the Eurosystem’s monetary policy operations, therefore has been given access to the monetary policy operations of the European Central Bank. The Bank conducts the operations via the Central Bank of Luxembourg, where it maintains a deposit to cover the minimum reserve requirement. The balance of this deposit amounts to EUR ‘000 87,266 as at 31 December 2022 (2021: EUR ‘000 144,479). B.2. Debt security portfolios (in EUR ’000) The debt security portfolios are composed of the Long-Term HQLA Portfolio (‘LTHP’), the treasury monetary portfolio (‘TMP’), the securities liquidity portfolio (‘SLP’), the loan substitutes portfolio and of the ABS and Operational portfolios of the EIF. The details of these portfolios as at 31 December 2022 and 2021 are as follows: 31.12.2022 31.12.2021 Treasury bills and other bills eligible for refinancing with central banks 21,845,483 37,160,351 Debt securities including fixed-income securities 11,159,796 11,971,268 Total debt securities(*) 33,005,279 49,131,619 (*) of which EUR ‘000 6,697,136 are unlisted as at 31 December 2022 (2021: EUR ‘000 6,550,937). At 31.12.2022 Purchase price Book value Value Adjustments Premiums/ discounts to be amortised Value at final maturity Market value(**) LTHP 2,716,467 2,692,420 0 -56,400 2,636,020 2,263,503 TMP 6,964,454 6,995,106 0 33,930 7,029,036 6,986,325 SLP 3,329,029 3,172,836 0 0 3,328,249 3,172,836 Operational portfolio - EIF 2,338,156 2,318,325 0 -37,844 2,280,481 2,050,890 ABS portfolio - EIF 480,297 413,700 0 0 413,700 401,976 Loan substitutes (Note D) 17,449,652 17,412,892 1,289 -3,126 17,411,055 16,800,313 Total debt securities(*) 33,278,055 33,005,279 1,289 -63,440 33,098,541 31,675,843 (*) of which cash and cash equivalents EUR '000 552,038 (**) Market value does not include accrued interest. At 31.12.2021 Purchase price Book value Value Adjustments Premiums/ discounts to be amortised Value at final maturity Market value(**) LTHP 1,384,662 1,340,985 0 -97,342 1,243,643 1,418,398 TMP 22,484,695 22,434,606 0 -35,118 22,399,488 22,435,374 SLP 4,761,521 4,733,721 0 0 4,714,307 4,733,721 Operational portfolio - EIF 2,302,307 2,289,463 0 -48,327 2,241,136 2,282,898 ABS portfolio - EIF 409,395 381,153 0 0 381,153 380,709 Loan substitutes (Note D) 17,993,220 17,951,691 1,243 -6,339 17,946,595 18,033,089 Total debt securities(*) 49,335,800 49,131,619 1,243 -187,126 48,926,322 49,284,189 (*) of which cash and cash equivalents EUR '000 142,403 (**) Market value does not include accrued interest. Loan substitutes, which represent acquisitions of interests in pools of loans or receivables in connection with securitisation transactions are considered to be part of the aggregate loans (Note D). Some of these transactions have been structured by adding credit or project-related remedies, thus offering additional recourse. Following detailed review of loan substitutes portfolio for any value adjustment, an individual value adjustment for one transaction (2021: one transaction) has been recorded as at 31 December 2022 in the amount of EUR ‘000 1,262 (2021: EUR ‘000 1,243). A collective value adjustment on the loan substitutes portfolio was recorded in 2022 in relation to the war in Ukraine, amounting to EUR ‘000 27. The collective value adjustment recorded in 2020 to capture the effect of COVID-19 on the loan substitutes portfolio amounting to EUR ‘000 42 has been released as of 31 December 2021. 118 |
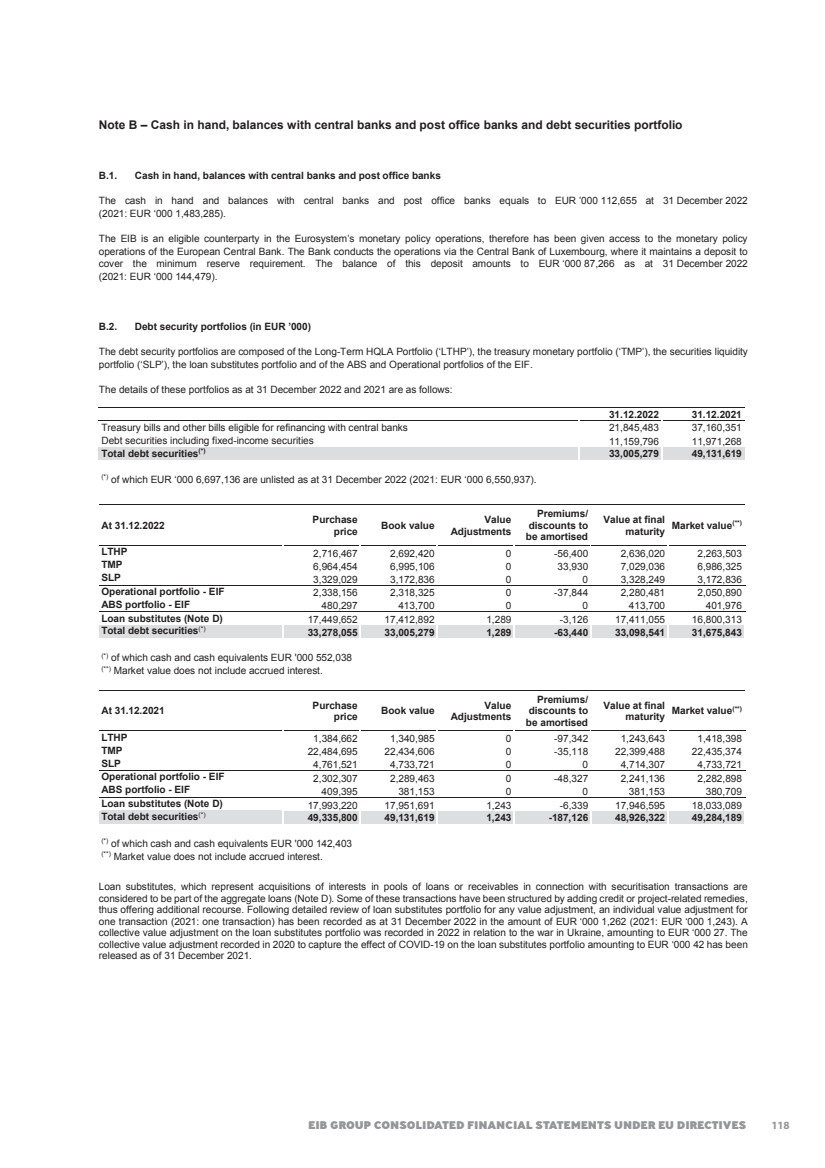
| 2022 FINANCIAL REPORT 127 EU sovereign exposure in bond holdings The Group did not record value adjustments in 2022 and 2021 in respect of its held to maturity EU sovereign and EU sovereign guaranteed exposure as at year-end, in view of the Bank’s as well as EIF’s preferred creditor status and the protection given by the Bank’s Statute as well as a detailed review of any value adjustment requirements. The following tables show the exposure to debt issued or guaranteed by EU sovereigns in the Group’s debt securities portfolios (including loan substitutes and EIF ABS portfolio) as at 31 December 2022 and 2021: At 31.12.2022 Purchase price Book value Value at final maturity Market value EU sovereigns Austria 206,873 205,999 222,451 154,085 Belgium 168,879 168,315 160,000 130,686 Bulgaria 41,191 40,210 37,515 32,341 Czech Republic 309,932 273,865 269,530 269,567 Finland 98,135 98,214 100,000 60,753 France 1,877,800 1,885,405 1,938,255 1,849,313 Germany 1,177,213 1,170,875 1,164,133 1,148,600 Hungary 16,827 16,509 16,000 14,220 Italy 631,452 630,807 630,000 627,021 Latvia 19,900 19,936 20,000 19,935 Lithuania 31,266 31,085 30,950 28,069 Luxembourg 4,985 4,997 5,000 4,862 Netherlands 414,241 407,125 403,000 398,225 Poland 1,797,269 1,795,373 1,792,375 1,722,413 Portugal 47,184 47,053 46,500 37,499 Slovakia 7,960 7,981 8,000 7,441 Slovenia 49,539 49,272 49,000 40,577 Spain 1,424,860 1,428,605 1,440,216 1,421,055 8,325,506 8,281,626 8,332,925 7,966,662 Non-EU sovereign and other bonds 24,952,549 24,723,653 24,765,616 23,709,181 Total 33,278,055 33,005,279 33,098,541 31,675,843 At 31.12.2021 Purchase price Book value Value at final maturity Market value EU sovereigns Austria 60,407 56,707 55,500 56,657 Belgium 62,150 62,072 62,000 62,114 Bulgaria 41,191 40,768 37,515 40,285 Czech Republic 426,516 385,879 378,085 390,877 Denmark 17,615 17,616 17,658 17,616 France 1,284,757 1,271,840 1,268,288 1,273,797 Germany 992,034 980,836 960,664 1,030,645 Hungary 16,827 16,663 16,000 16,585 Ireland 704,819 705,945 706,339 706,040 Italy 7,484,756 7,459,403 7,439,999 7,465,218 Latvia 14,962 14,984 15,000 15,056 Lithuania 32,567 32,071 31,779 32,331 Luxembourg 30,218 30,217 30,000 30,293 Netherlands 366,403 355,095 348,000 367,345 Poland 610,834 609,454 605,758 527,211 Portugal 47,184 47,124 46,500 47,237 Romania 88,047 83,733 83,214 83,665 Slovakia 7,960 7,973 8,000 8,167 Slovenia 39,490 39,335 39,000 38,909 Spain 5,880,531 5,868,301 5,863,235 5,867,975 Sweden 96,478 95,644 95,487 95,635 18,305,746 18,181,660 18,108,021 18,173,658 Non-EU sovereign and other bonds 31,030,054 30,949,959 30,818,301 31,110,531 Total 49,335,800 49,131,619 48,926,322 49,284,189 119 |
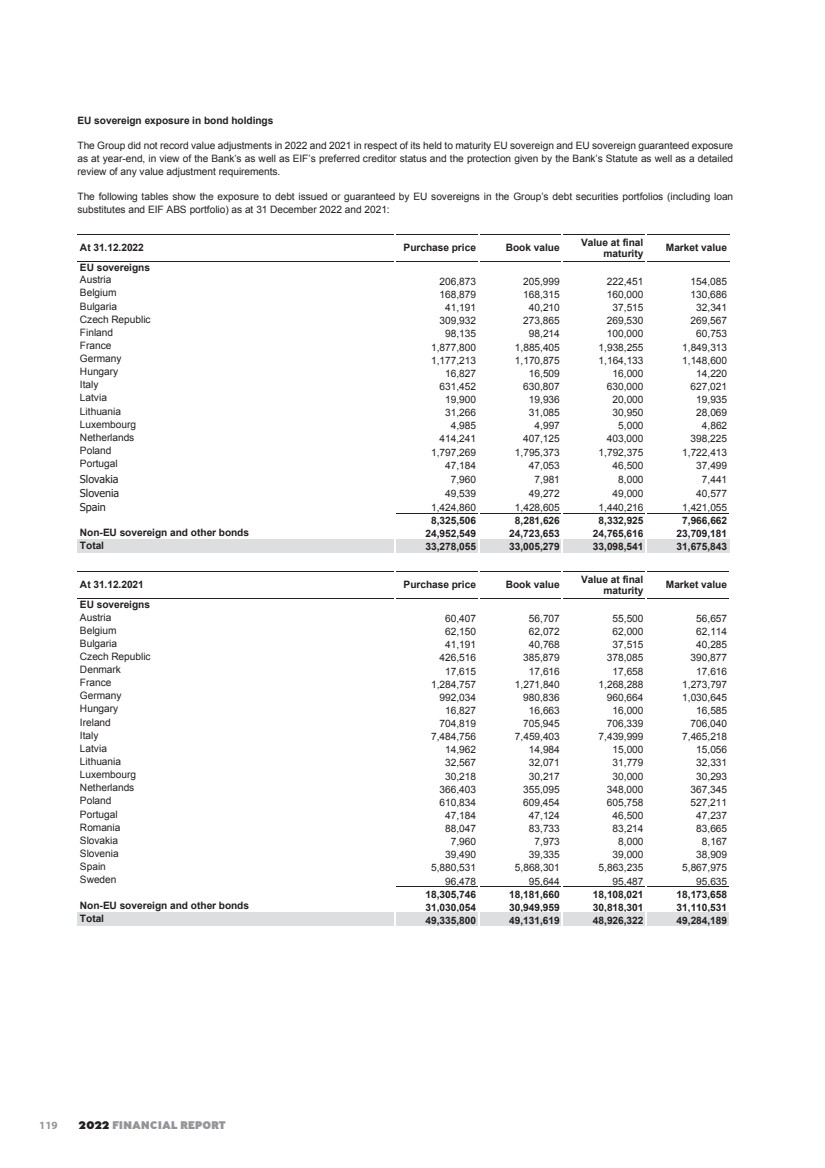
| EIB GROUP CONSOLIDATED FINANCIAL STATEMENTS UNDER EU DIRECTIVES 128 Note C – Loans and advances to credit institutions and to customers – other loans and advances (in EUR ‘000) 31.12.2022 31.12.2021 Term deposits(*) 56,815,551 60,466,600 On-demand deposits 14,411 388,680 Reverse repos 7,381,282 13,894,159 Other loans and advances to credit institutions 64,211,244 74,749,439 Other loans and advances to customers 125,883 677,437 Total other loans and advances 64,337,127 75,426,876 of which cash and cash equivalents 62,426,771 66,842,771 (*) It includes deposits with Central Bank of Luxembourg of EUR 53.9 billion in 2022 (2021: EUR 56.7 billion). Note D – Summary statement of loans D.1. Aggregate loans granted (in EUR ‘000) Aggregate loans granted comprise both the disbursed and undisbursed portions of loans. The analysis is as follows: To intermediary credit institutions Directly to final beneficiaries 31.12.2022 31.12.2021 Disbursed portion 93,107,708 326,715,856 419,823,564 415,463,569 Undisbursed loans 30,757,433 93,274,466 124,031,899 122,977,291 Aggregate loans granted 123,865,141 419,990,322 543,855,463 538,440,860 Loan instalments receivable 21,746 145,347 167,093 472,853 Loan substitutes portfolio 17,414,181 17,952,934 Aggregate loans including loan substitutes portfolio (Note D.3) 561,436,737 556,866,647 D.2. Value adjustments for loans (in EUR ‘000) Movements in the value adjustments are detailed below: 2022 2021 At 1 January 439,008 647,769 Release during the year (1) -147,677 -229,532 Use during the year(2) -16,587 -31,561 Allowance during the year(1) 114,772 35,843 Foreign exchange adjustment 2,232 16,489 At 31 December(3) 391,748 439,008 (1) In 2020, the Group recognized a collective provision in the view of the unfolding of COVID-19. In 2021, this collective provision was fully released in the view of (1) the update of the yearly counterparty rating re-assessment allowing a more granular view of the COVID-19 effect on the loan book and (2) the reduction of the expected credit losses for the remaining lifetime of the respective loans. In 2022, collective provision is re-introduced in the context of the war in Ukraine, in order to address the Group’s need to capture the effect of this event and its broader economic consequences on its portfolio. Given the expected impact of the crisis on clients, it was deemed likely that there were financial assets in the portfolio which were impaired, but had not yet been identified or losses which had incurred but had not been reported. In accordance with core principles of prudence and true and fair view of the EU-AD, these potential losses were reflected in the Group’s financial statements. Consequently, the Bank assessed the potential impact of the crisis on its clients, including the effect of sanctions, soaring energy and raw material prices and supply chain disruptions. A vulnerability assessment has been performed in order to identify the sub-populations of exposures where losses might have been incurred but had not yet been individually identified. For those sub-populations, a collective provision has been computed on underlying exposures. The Bank recorded in 2022 a collective provision amounting to EUR ‘000 76,020 on loans (2021:nil) (2) In 2022, the Bank: • Completed a restructuring of 1 loan operation that was specifically provisioned at the beginning of the period: EUR ‘000 1,700 was used against the existing provision (2021: EUR '000 2,444 on one loan operation); • Wrote-off 3 loan operations that were specifically provisioned at the beginning of the year: EUR '000 6,872 was used against the existing provision (2021: EUR '000 6,750 on two loan operations); • Wrote-off 1 loan operation that had been specifically provisioned during the course of 2022: EUR '000 8,015 was used against the existing provision (2021: nil); • Completed no sale transaction of non-performing loan operations (2021: EUR '000 22,367 on two loan operations) (3) The value adjustments relate only to disbursed loans, including arrears. The Group has additionally recorded value adjustments in regards to accrued interest of a total amount of EUR '000 10,788 (2021: EUR '000 4,919), which is recorded under the caption of "Prepayments and accrued income". 120 |
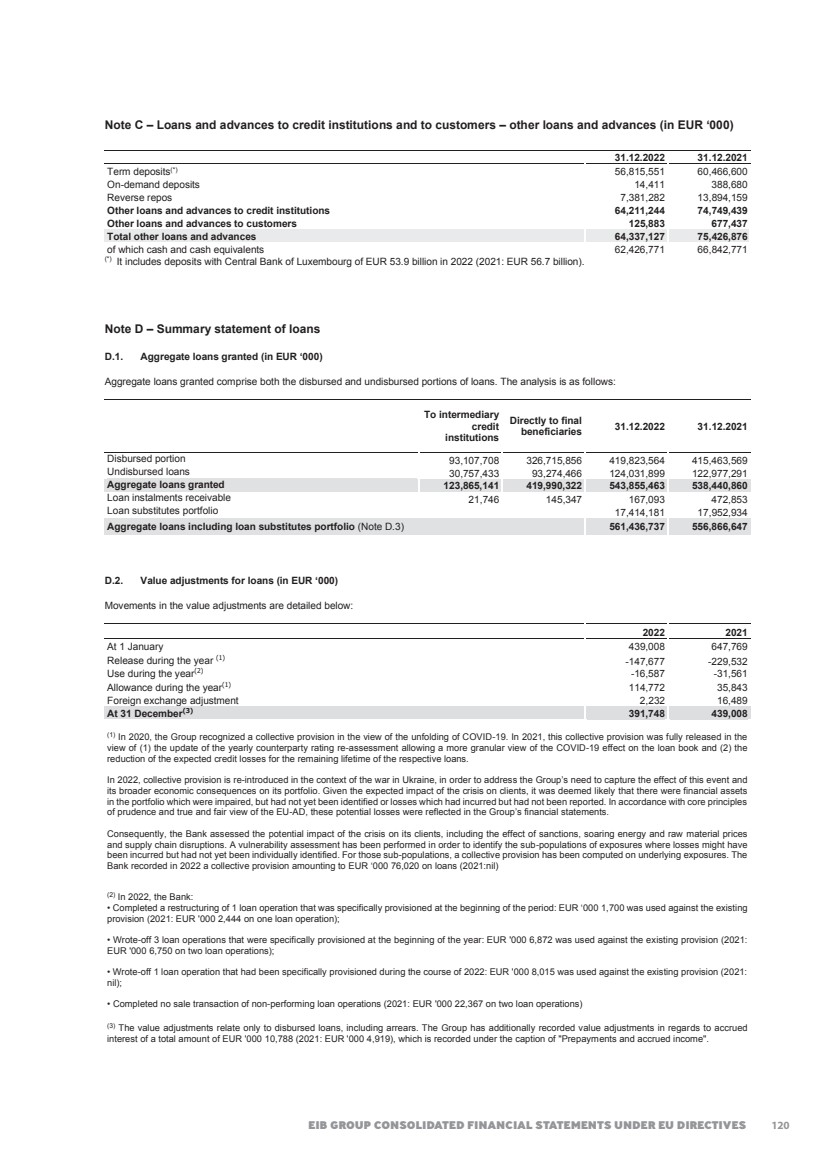
| 2022 FINANCIAL REPORT 129 D.3. Geographical breakdown of lending by country in which projects are located (in EUR ‘000) D.3.1. Loans for projects within the European Union Countries and territories in which projects are located Aggregate loans granted Disbursed portion Undisbursed portion % of total 2022 % of total 2021 Spain 75,263,517 65,754,686 9,508,831 13.42% 13.90% France 68,667,984 52,967,824 15,700,160 12.23% 11.49% Italy 64,216,047 50,694,738 13,521,309 11.45% 11.66% Germany 46,146,288 36,682,974 9,463,314 8.22% 8.01% Poland 45,334,594 36,416,076 8,918,518 8.08% 7.85% Greece 19,605,988 14,682,687 4,923,301 3.49% 3.58% Belgium 16,667,820 12,179,681 4,488,139 2.97% 2.79% Netherlands 16,526,216 13,119,017 3,407,199 2.94% 3.06% Austria 15,399,219 13,766,338 1,632,881 2.74% 2.70% Portugal 13,629,245 11,017,709 2,611,536 2.43% 2.43% Sweden 12,119,159 8,658,911 3,460,248 2.16% 2.19% Finland 10,788,525 8,996,209 1,792,316 1.92% 1.96% Hungary 9,925,938 7,815,604 2,110,334 1.77% 1.80% Ireland 7,997,896 6,185,282 1,812,614 1.43% 1.36% Czech Republic 7,860,660 4,940,771 2,919,889 1.40% 1.24% Romania 7,155,648 4,135,758 3,019,890 1.27% 1.21% Slovakia 4,429,343 3,808,156 621,187 0.79% 0.82% Denmark 3,894,519 3,056,577 837,942 0.69% 0.63% Croatia 3,491,339 2,916,586 574,753 0.62% 0.71% Lithuania 2,745,384 2,546,407 198,977 0.49% 0.49% Cyprus 2,635,848 1,922,903 712,945 0.47% 0.50% Slovenia 2,624,699 2,153,473 471,226 0.47% 0.51% Bulgaria 2,313,299 1,836,003 477,296 0.41% 0.40% Estonia 1,512,183 984,984 527,199 0.27% 0.29% Latvia 979,141 582,395 396,746 0.17% 0.22% Luxembourg 842,795 132,950 709,845 0.15% 0.12% Malta 408,322 254,125 154,197 0.07% 0.07% Sub-total 463,181,616 368,208,824 94,972,792 82.52% 81.99% 121 |
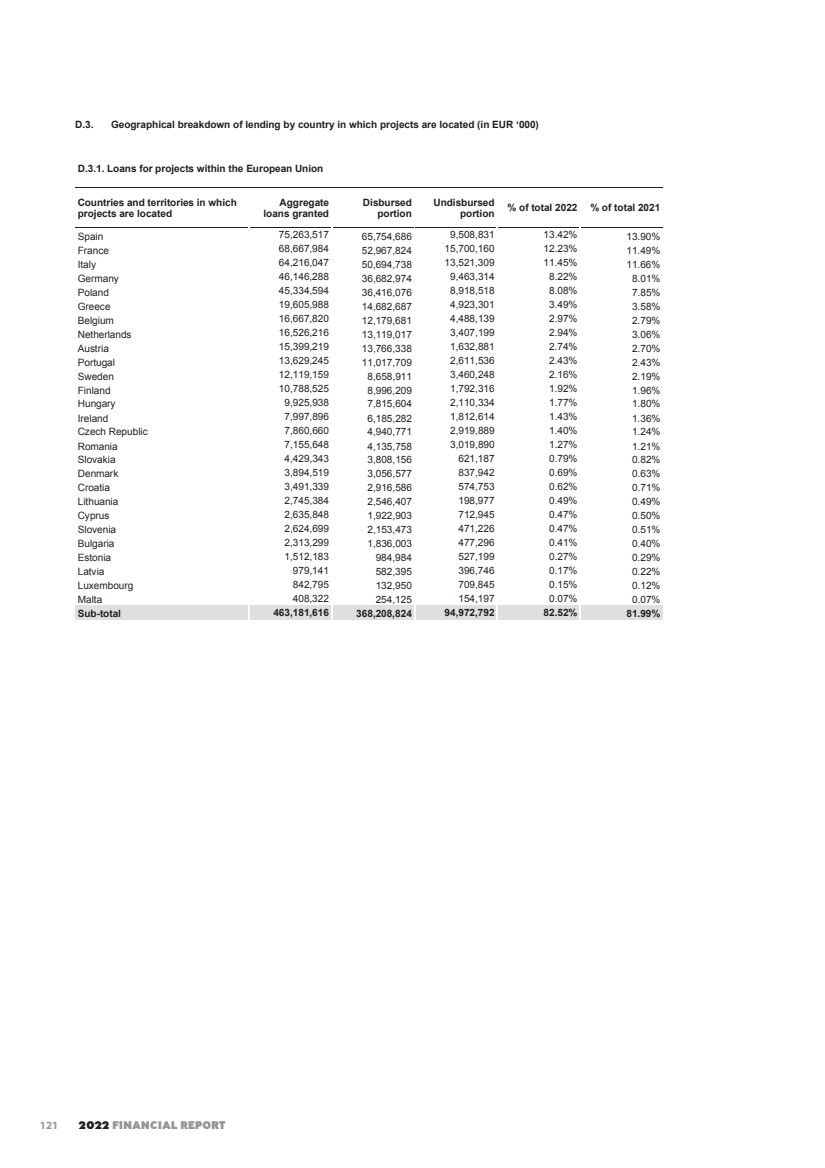
| EIB GROUP CONSOLIDATED FINANCIAL STATEMENTS UNDER EU DIRECTIVES 130 D.3.2. Loans for projects outside the European Union1 D.3.2.1. Candidate Countries Countries and territories in which projects are located Aggregate loans granted Disbursed portion Undisbursed portion % of total 2022 % of total 2021 Türkiye 8,343,786 8,062,281 281,505 Ukraine* 6,023,946 3,085,020 2,938,926 Serbia 3,810,995 2,441,076 1,369,919 Bosnia and Herzegovina 1,959,881 1,217,797 742,084 Moldova, Republic of 954,190 475,406 478,784 Montenegro 696,320 470,956 225,364 North Macedonia 479,889 326,149 153,740 Albania 330,527 238,027 92,500 Sub-total 22,599,534 16,316,712 6,282,822 4.03% 2.63% * Total disbursed exposure amounts to EUR 3,085 million 2022 (2021: EUR 1,570 million). Of this amount, EUR 2,852 million (2021: EUR 1,302 million) is covered by the Comprehensive Guarantee of the European Union under the External Lending Mandate. Of the remainder of EUR 233 million at own risk, EUR 216 million is covered by the EU Political Risk Guarantee under the EU External Lending Mandate. A further EUR 2,939 million has been committed in signed operations not yet disbursed. Of this amount, EUR 2,714 million is covered by the Comprehensive Guarantee of the European Union under the External Lending Mandate. Of the remainder of EUR 225 million at own risk, EUR 190 million is covered by the EU Political Risk Guarantee under the EU External Lending Mandate. 1 The percentages are reflecting the composition of each country cluster relevant for the year of presentation. 122 |
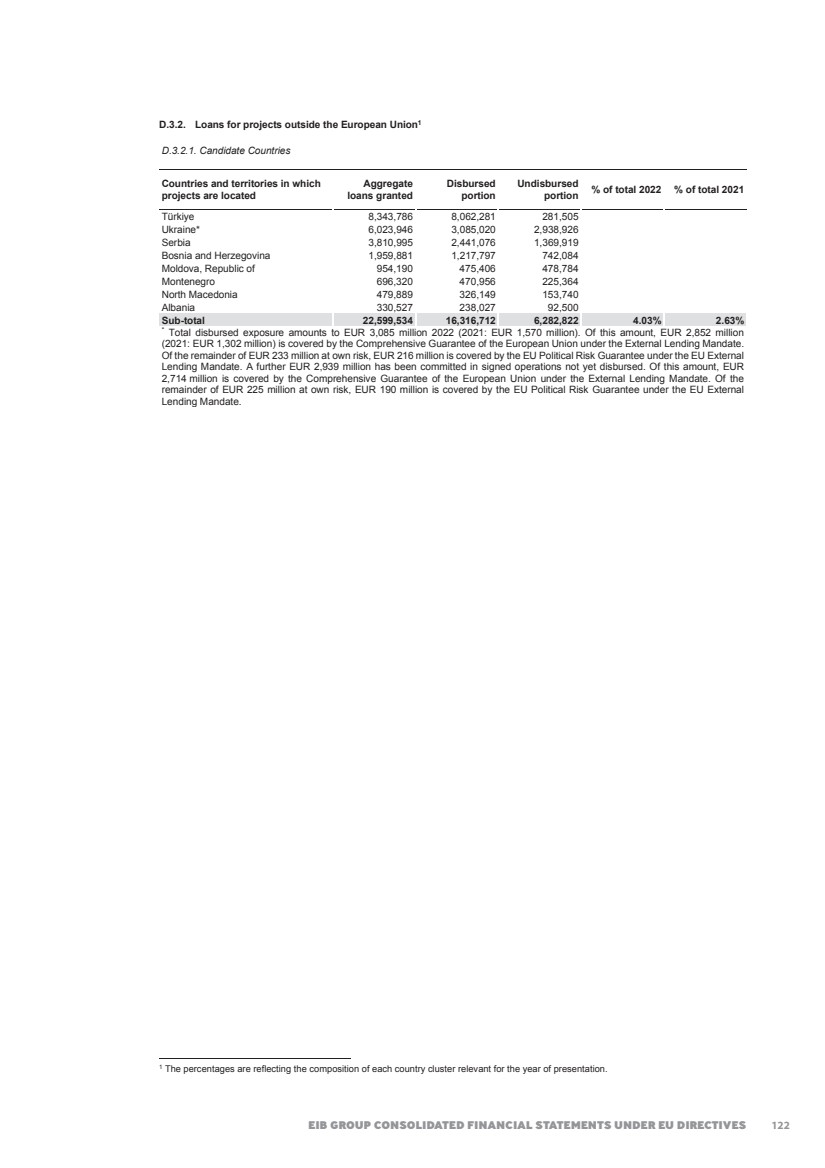
| 2022 FINANCIAL REPORT 131 D.3.2.2. African, Caribbean and Pacific (‘ACP’) states Countries and territories in which projects are located Aggregate loans granted Disbursed portion Undisbursed portion % of total 2022 % of total 2021 Regional - Africa 1,084,015 71,503 1,012,512 Senegal 715,385 285,879 429,506 Guinea 437,279 129,870 307,409 Madagascar 417,192 243,216 173,976 Zambia 405,670 144,950 260,720 Kenya 372,528 176,511 196,017 Benin 365,072 76,847 288,225 Ghana 277,255 27,482 249,773 Malawi 217,983 95,643 122,340 Dominican Republic 176,438 49,618 126,820 Mozambique 176,127 76,127 100,000 Nigeria 175,000 0 175,000 Rwanda 167,000 0 167,000 Cameroon 157,961 51,961 106,000 Chad 156,200 0 156,200 Côte d'Ivoire 152,700 102,421 50,279 Niger 151,677 31,677 120,000 Lesotho 151,053 69,053 82,000 Angola 150,000 4,039 145,961 Tanzania, United republic of 136,170 95,622 40,548 Regional - ACP 130,000 0 130,000 Uganda 103,861 103,861 0 Burkina Faso 100,591 47,591 53,000 Mali 88,747 37,797 50,950 Fiji 70,317 7,915 62,402 Burundi 70,000 62,500 7,500 Gambia 65,000 21,442 43,558 Regional - West Africa 63,099 63,099 0 Barbados 59,755 10,000 49,755 Liberia 56,980 36,980 20,000 Papua New Guinea 54,199 32,815 21,384 Cape Verde 49,496 49,496 0 Mauritania 42,708 5,584 37,124 Ethiopia 40,000 31,000 9,000 Seychelles 36,635 24,135 12,500 Kingdom of Eswatini 36,400 31,729 4,671 Sao Tome and Principe 32,940 1,000 31,940 Congo 30,394 4,394 26,000 Congo (Democratic Republic) 23,723 23,723 0 Saint Lucia 13,500 0 13,500 Togo 13,174 13,174 0 Namibia 8,503 8,503 0 Mauritius 3,173 3,173 0 Regional - Caribbean 3,112 3,112 0 Dominica 1,554 1,554 0 Belize 1,095 1,095 0 Botswana 220 220 0 Sub-total 7,241,881 2,358,311 4,883,570 1.29% 1.09% 123 |
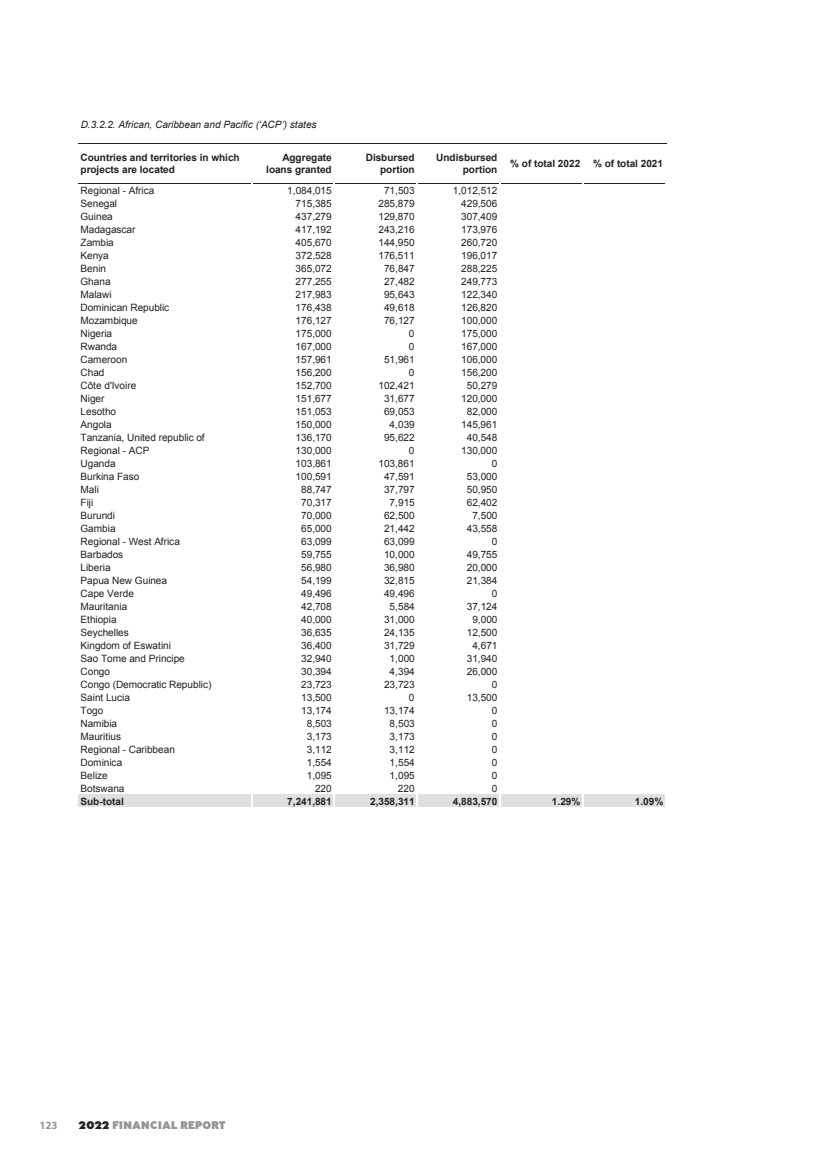
| EIB GROUP CONSOLIDATED FINANCIAL STATEMENTS UNDER EU DIRECTIVES 132 D.3.2.3. Asia Countries and territories in which projects are located Aggregate loans granted Disbursed portion Undisbursed portion % of total 2022 % of total 2021 India 3,603,277 1,937,941 1,665,336 China 2,372,029 1,158,827 1,213,202 Bangladesh 634,400 184,038 450,362 Uzbekistan 332,199 113,025 219,174 Nepal 292,569 48,229 244,340 Kazakhstan 264,894 7,049 257,845 Cambodia 234,240 80,890 153,350 Viet Nam 201,950 156,450 45,500 Lao People's Democratic Rep. 178,942 71,677 107,265 Regional - Asia 167,000 0 167,000 Sri Lanka 145,738 95,738 50,000 Kyrgyzstan 112,000 51,000 61,000 Tajikistan 106,729 68,366 38,363 Maldives 105,019 50,496 54,523 Mongolia 79,172 60,162 19,010 Pakistan 50,000 0 50,000 Regional - Central Asia 20,000 0 20,000 Sub-total 8,900,158 4,083,888 4,816,270 1.59% 1.48% D.3.2.4. Potential Candidate Countries Countries and territories in which projects are located Aggregate loans granted Disbursed portion Undisbursed portion % of total 2022 % of total 2021 Kosovo 232,800 32,800 200,000 Sub-total 232,800 32,800 200,000 0.04% 0.40% D.3.2.5. Latin America Countries and territories in which projects are located Aggregate loans granted Disbursed portion Undisbursed portion % of total 2022 % of total 2021 Brazil 2,087,892 1,260,426 827,466 Regional - Latin America 839,290 483,780 355,510 Ecuador 797,942 439,784 358,158 Argentina 617,661 197,580 420,081 Nicaragua 299,961 171,291 128,670 Mexico 283,721 283,721 0 Panama 275,029 228,151 46,878 Peru 210,013 116,257 93,756 Chile 200,000 0 200,000 Colombia 193,137 0 193,137 Paraguay 157,160 97,869 59,291 Bolivia 115,936 95,434 20,502 Honduras 81,072 71,542 9,530 Costa Rica 60,253 60,253 0 El Salvador 37,503 9,778 27,725 Sub-total 6,256,570 3,515,866 2,740,704 1.11% 0.87% D.3.2.6. European Free Trade Association (‘EFTA’) Countries Countries and territories in which projects are located Aggregate loans granted Disbursed portion Undisbursed portion % of total 2022 % of total 2021 Norway 977,893 841,493 136,400 Iceland 547,369 547,369 0 Switzerland 48,192 13,992 34,200 Sub-total 1,573,454 1,402,854 170,600 0.28% 0.32% 124 |
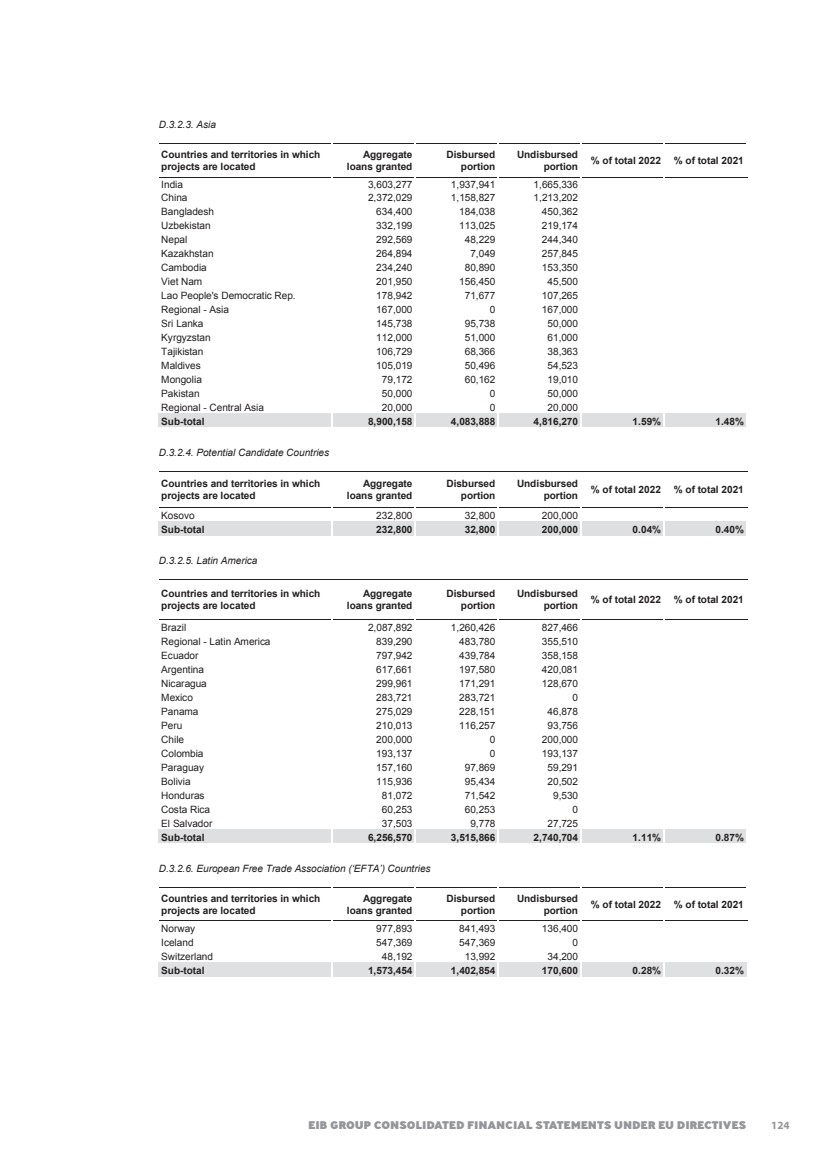
| 2022 FINANCIAL REPORT 133 D.3.2.7. Mediterranean Countries Countries and territories in which projects are located Aggregate loans granted Disbursed portion Undisbursed portion % of total 2022 % of total 2021 Egypt 7,480,135 4,317,891 3,162,244 Morocco 5,171,232 3,407,577 1,763,655 Tunisia 2,617,522 1,582,112 1,035,410 Jordan 1,528,810 829,036 699,774 Israel 1,250,253 707,528 542,725 Lebanon 1,141,729 349,573 792,156 Palestine 399,439 89,857 309,582 Algeria 266,250 266,250 0 Syrian Arab Republic 55,949 55,949 0 Regional - Mediterranean 54,664 21,664 33,000 Regional - North Africa 38,500 0 38,500 Sub-total 20,004,483 11,627,437 8,377,046 3.56% 3.51% D.3.2.8. Overseas Countries and Territories (‘OCT’) Countries and territories in which projects are located Aggregate loans granted Disbursed portion Undisbursed portion % of total 2022 % of total 2021 New Caledonia 49,103 49,103 0 Sint Maarten 45,103 15,470 29,633 French Polynesia 11,346 11,346 0 Sub-total 105,552 75,919 29,633 0.02% 0.02% D.3.2.9. Eastern Europe, Southern Caucasus, Russia Countries and territories in which projects are located Aggregate loans granted Disbursed portion Undisbursed portion % of total 2022 % of total 2021 Georgia 1,669,535 1,053,500 616,035 Belarus* 405,222 45,222 360,000 Armenia 365,254 247,795 117,459 Russian Federation* 13,799 13,799 0 Azerbaijan 3,305 3,305 0 Sub-total 2,457,115 1,363,621 1,093,494 0.44% 1.71% * Total disbursed exposure for Belarus amounts to EUR 45 million (2021: EUR 173 million). Of this amount EUR 36 million is secured by the Comprehensive Guarantee of the European Union under the External Lending Mandate and EUR 9 million is covered by the EU Political Risk Guarantee under the EU External Lending Mandate. A further EUR 360 million has been committed in signed operations not yet disbursed, of which only EUR 10 million is expected to be at the EIB’s own risk, but covered by the EU Political Risk Guarantee under the EU External Lending Mandate. The EIB’s total disbursed exposure to borrowers in the Russian Federation amounts to EUR 14 million (2021: EUR 16 million) with no exposure at the EIB’s own risk; it is recalled that the EIB continues to follow applicable EU policy guidelines in the country. D.3.2.10. United Kingdom Countries and territories in which projects are located Aggregate loans granted Disbursed portion Undisbursed portion % of total 2022 % of total 2021 United Kingdom 28,118,931 27,875,963 242,968 Sub-total 28,118,931 27,875,963 242,968 5.01% 5.87% D.3.2.11. South Africa Countries and territories in which projects are located Aggregate loans granted Disbursed portion Undisbursed portion % of total 2022 % of total 2021 South Africa 597,550 375,550 222,000 Sub-total 597,550 375,550 222,000 0.11% 0.11% Total loans for projects outside the European Union 98,088,028 69,028,921 29,059,107 17.48% 18.01% Total loans 2022(1) 561,269,644 437,237,745 124,031,899 100.00% Total loans 2021(1) 556,393,794 433,416,503 122,977,291 100.00% (1) Including loan substitutes (Notes B.2 and D.1), excluding loan instalments receivables (2022: EUR 167 million, 2021: EUR 473 million). 125 |
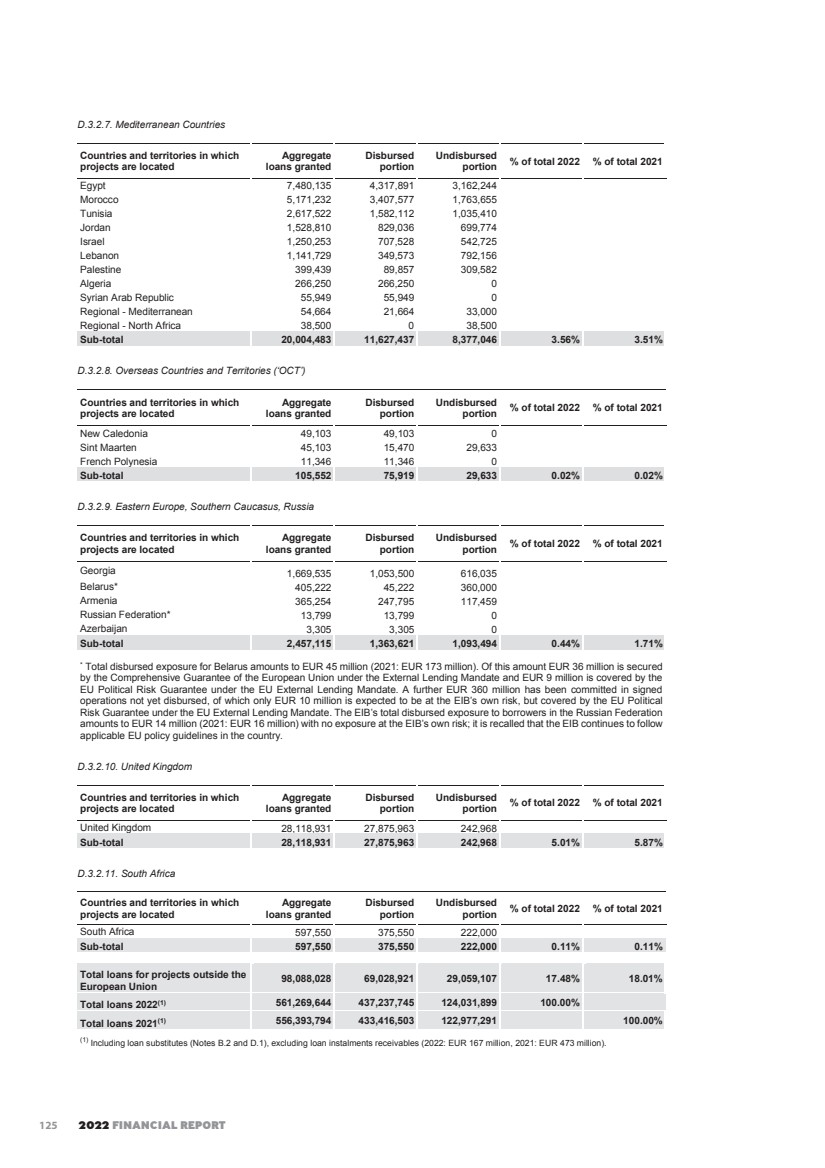
| EIB GROUP CONSOLIDATED FINANCIAL STATEMENTS UNDER EU DIRECTIVES 134 D.4. Provisions in respect of guarantee operations A provision for guarantees issued has been recognised corresponding to the loss for which the Group is expected to be liable towards the beneficiary. This provision amounts to EUR ‘000 99,634 as at 31 December 2022 (2021: EUR ‘000 39,332). Note E – Composition of the Group, Shares, other variable-yield securities and participating interests E.1 Composition of the Group The European Investment Fund The European Investment Fund (the ‘Fund’ or ‘EIF’) was incorporated on 14 June 1994, in Luxembourg, as an international financial institution. The address of its registered office is 37B, avenue J.F. Kennedy, L-2968 Luxembourg. The primary task of the Fund, while providing adequate return on equity, is to contribute to the pursuit of European Union objectives through: • the provision of guarantees to financial institutions that cover credits to small and medium sized entities (‘SME’); • the acquisition, holding, managing and disposal of equity participations; • the administration of special resources entrusted by third parties; and • related activities. The EIF has share capital consisting solely of ordinary shares, which are held directly by the Bank and the proportion of ownership interests held equals to the voting rights held by Bank. The country of incorporation or registration is also its principal place of business. As a result of the General Meeting’s approval of the EIF’s capital increase in February 2021, the EIF’s authorised capital has been increased during the year 2021 from EUR 4.5 billion to EUR 7.4 billion through the issuance of 2,870 new shares; each new share having a nominal value of EUR 1,000,000. The issuance of the new shares occurred through a single subscription round with subscription possible in a single subscription period as further detailed below. Each newly authorised share which is subscribed is paid-in as to 20% of its nominal value. The remaining 80% can be called upon decision of the EIF General Meeting. The subscription price for any newly authorised shares which were subscribed in the capital increase was fixed at EUR 435,970.88 based on the Replacement Share Purchase Undertaking (‘RSPU’) formula and determined on the basis of financial data of the EIF as of 30 September 2020 as reviewed by external auditors and including the paid-in portion of newly issued shares. In line with Article 5 of the EIF Statutes, each shareholder of the EIF was entitled to subscribe to a fraction of the increase corresponding to the ratio, which existed between the shares subscribed by that member and the overall number of EIF shares subscribed, before the capital increase. Consequently, the EIB has subscribed to its pro-rata share of 1,689 shares for an amount of approximatively EUR 736 million in February 2021. The Bank holds 59.40% (2021: 59.40%) of the subscribed capital of the EIF amounting to EUR 7.3 billion (2021: EUR 7.3 billion). During 2022, the Bank neither bought shares from other investors nor sold any such shares to other investors. As a result, as at 31 December 2022 the Bank holds 4,336 shares in EIF. During the year 2021, the RSPU with respect to subscribed shares of the EIF held by the European Commission (‘EC’) was terminated while the RSPU with respect to the subscribed shares from the EIF’s minority shareholders other than the EC remains in place. Consequently, with respect to the 774 EIF shares subscribed by these minority shareholders, the EIB is offering to buy these shares at any time under the RSPU at a price per share of currently EUR 542,329.82. This price corresponds to the part of each share in the called capital of the EIF, increased by the share premium account, the statutory reserves, the retained earnings, the fair value reserve and the profit of the year, adjusted by the dividend for the year. The agreed formula is being applied to the approved and audited annual accounts of the EIF for the financial year in which the option is exercised. The nominal value of EUR ‘000 419,763 (2021: EUR ‘000 340,341) of the put option granted to this minority shareholder group, shown off-balance sheet, has been calculated on the basis of the 2021 audited EIF statutory accounts prepared according to the International Financial Reporting Standards. 126 |
| 2022 FINANCIAL REPORT 135 E.2 Shares, other variable-yield securities and participating interests (EUR ‘000): Participating interests Shares and other variable-yield securities Private Equity and Venture Capital Operations(1) Private Equity and Venture Capital Operations(1) EBRD shares(2) Equity investments and Infrastructure funds(1) Other equity investments Other investments(3) Total(4) Cost: At 1 January 2022 364,955 6,536,661 157,500 3,018,393 264 0 9,712,818 Additions(5) 86,799 1,422,915 0 954,579 1,145 72,823 2,451,462 Reflows / Terminations(5) -43,745 -1,412,280 0 -355,091 0 0 -1,767,371 At 31 December 2022 408,009 6,547,296 157,500 3,617,881 1,409 72,823 10,396,909 Value adjustments: At 1 January 2022 -19,932 -395,049 0 -94,272 0 0 -489,321 Additions -3,826 -104,000 0 -25,977 0 3,682 -126,295 Releases 2,400 89,534 0 41,778 0 -3,682 127,630 At 31 December 2022 -21,358 -409,515 0 -78,471 0 0 -487,986 Net book value: At 31 December 2022 386,651 6,137,781 157,500 3,539,410 1,409 72,823 9,908,923 At 31 December 2021 345,023 6,141,612 157,500 2,924,121 264 0 9,223,497 (1) The amounts signed but not yet disbursed disclosed off-balance sheet are respectively: In relation to Shares and other variable-yield securities: • for private equity and venture capital operations EUR ‘000 4,824,700 (2021: EUR ‘000 4,948,960); • for equity investments and infrastructure funds EUR ‘000 3,435,704 (2021: EUR ‘000 3,203,307). In relation to participating interests: • for private equity and venture capital operations EUR ‘000 483,923 (2021: EUR ‘000 576,951). (2) The amount of EUR ‘000 157,500 (2021: EUR ‘000 157,500) corresponds to the capital paid in by the Bank as at 31 December 2022 with respect to its subscription of EUR ‘000 900,440 to the capital of the European Bank for Reconstruction and Development (‘EBRD’). (3) The amount of EUR ‘000 72,823 corresponds to the net paid in in respect of private equity operations which are deployed by the EIF in the context of the InvestEU Programme. These operations are fully guaranteed by the EU represented by the European Commission. The latter is exposed to the upside and downside arising from these equity operations whereas the Group retains ultimately only an interest component in order to cover its cost of funding. Therefore, from an economical and risk perspective, the Group, as beneficiary of the EU Guarantee, is exposed ultimately to the credit risk of the European Commission and not the equity risk stemming from the underlying investments. The fair value of such operations, disregarding the guarantee of EC, amounts to EUR ‘000 69,140. The amounts signed but not yet disbursed disclosed off-balance sheet in relation to Other investments amounts to EUR’000 651,129 (2021: EUR ‘000 – nil). (4) The total amount includes only shares and other variable-yield securities. (5) The “Additions” and “Reflows/Terminations” amounts include foreign exchange movements. As at 31 December 2022, the Bank holds 3.03% of the subscribed capital of the EBRD (2021: 3.03%). Based on the audited 2021 EBRD financial statements prepared in accordance with International Financial Reporting Standards, the share of underlying net equity of the Bank in EBRD amounted to EUR 616 million. In EUR million % held Total own funds Total net result Total assets EBRD (31.12.2021)* 3.03 20,345 2,502 74,773 * The data is based on the most recent audited financial statements of EBRD. 127 |
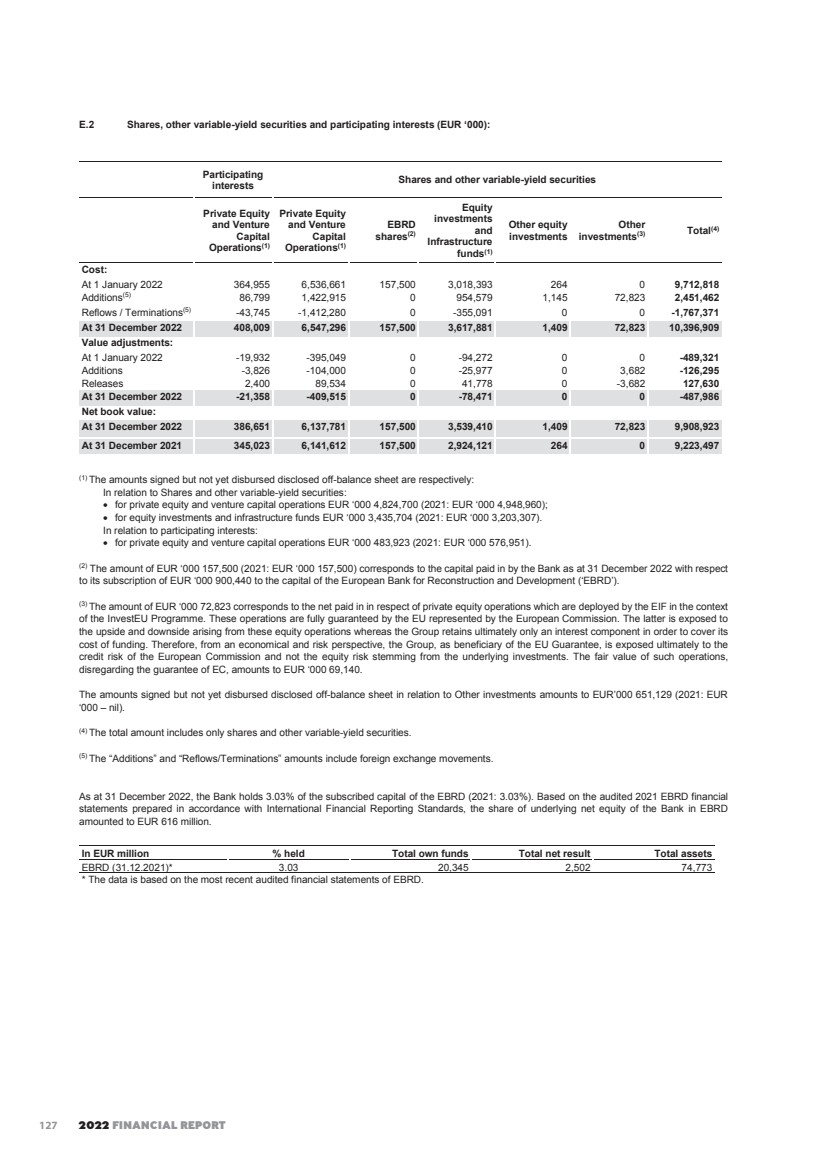
| EIB GROUP CONSOLIDATED FINANCIAL STATEMENTS UNDER EU DIRECTIVES 136 Note F – Intangible and tangible assets (in EUR ‘000) Land Luxembourg buildings Furniture and equipment Total tangible assets Total intangible assets Cost: At 1 January 2022 20,145 410,649 71,411 502,205 79,620 Additions 0 11,385 28,192 39,577 41,455 Disposals 0 0 -26,152 -26,152 -18,148 At 31 December 2022 20,145 422,034 73,451 515,630 102,927 Accumulated depreciation/amortisation: At 1 January 2022 0 -216,134 -43,384 -259,518 -21,212 Depreciation/amortisation 0 -9,792 -22,975 -32,767 -29,696 Disposals 0 0 26,152 26,152 18,148 At 31 December 2022 0 -225,926 -40,207 -266,133 -32,760 Carrying amount: At 31 December 2022 20,145 196,108 33,244 249,497 70,167 At 31 December 2021 20,145 194,515 28,027 242,687 58,408 The Luxembourg buildings category includes cost relating to the construction of a new building for an amount of EUR ’000 79,305 (2021: EUR ’000 67,920), which is expected to be completed in 2025. Note G – Other assets and Other liabilities (in EUR ‘000) Other assets 31.12.2022 31.12.2021 Fair value of derivatives 128,737 18,124 Accounts receivable and sundry debtors 62,058 78,202 EGF management fee receivable 56,041 26,440 Guarantee call receivable 55,811 12,831 Advances on salaries and allowances 2,264 2,985 Other 2,159 3,091 Total 307,070 141,673 Other liabilities 31.12.2022 31.12.2021 Capital repayable to the UK(*) 2,595,904 2,895,904 Optional Supplementary Provident Scheme (Note L) 848,290 792,891 First Loss Piece Contribution 233,227 202,171 Accounts payable and sundry creditors 113,953 95,935 Personnel costs payable 103,082 104,190 Transitory account on loans 99,031 35,601 Payable amounts under mandates 49,482 44,856 Payable on HIPC initiative(**) 13,596 13,596 Fair value of derivatives 576 10,606 Western Balkans infrastructure fund 97 393 Other 66,570 68,941 Total 4,123,808 4,265,084 (*) In accordance with the Article 150(4) of the Agreement on the withdrawal of the United Kingdom of Great Britain and Northern Ireland from the European Union and the European Atomic Energy Community, and as amended by COUNCIL DECISION (EU) 2020/769 of 10 June 2020, the EIB will repay to the UK EUR 3.5 billion of called capital in twelve annual instalments starting with 15 October 2020 (the first eleven instalments will be EUR 300,000,000 each and the final one will be EUR 195,903,950). The instalments due on 15 October 2020, 15 October 2021 and 14 October 2022 were settled in full. (**) Heavily Indebted Poor Countries (‘HIPC’) initiative. 128 |
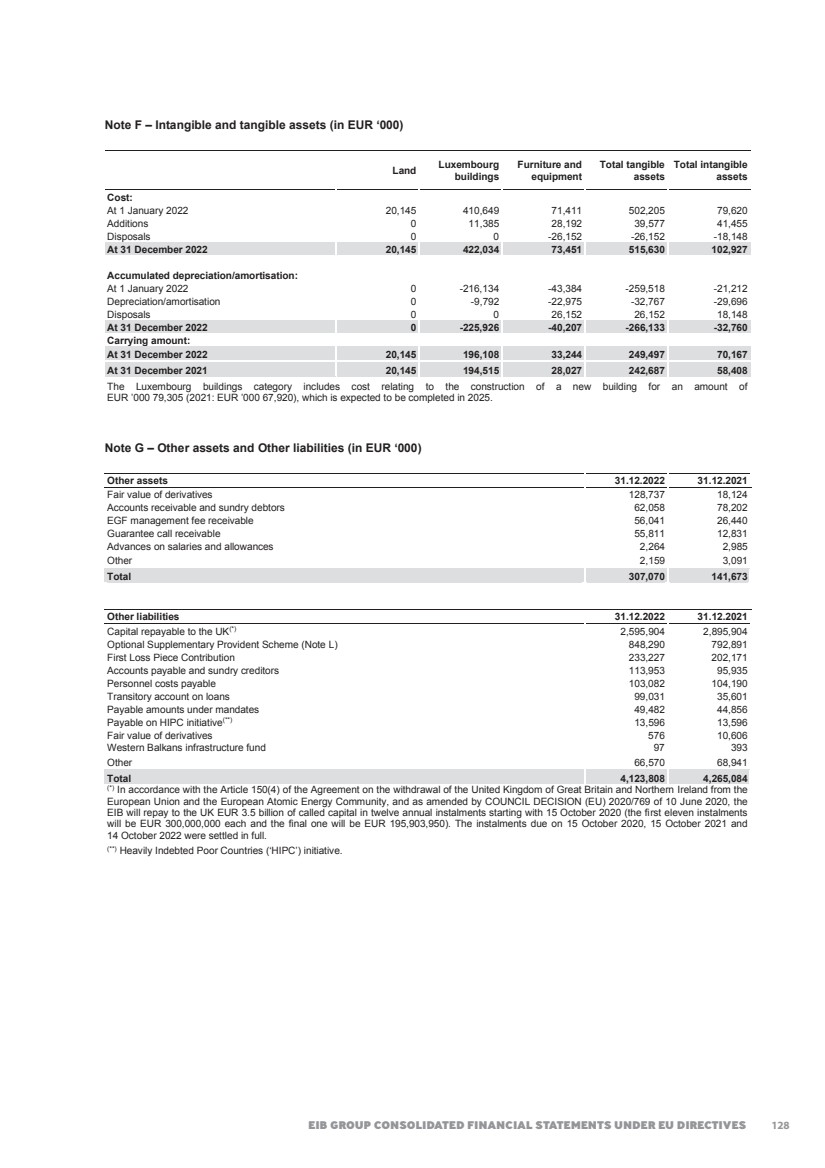
| 2022 FINANCIAL REPORT 137 Note H – Subscribed capital, Group own funds and appropriation of prior year’s profit (in EUR ‘000) H.1. Consolidated own funds and appropriation of prior year’s profit Statement of movements in consolidated own funds 2022 2021 Share capital: - Subscribed capital(2) 248,795,607 248,795,607 - Uncalled capital(2) -226,604,892 -226,604,892 - Called capital 22,190,715 22,190,715 Reserves and profit for the year: Reserve fund: - Balance at beginning of the year 24,879,561 24,328,415 - Appropriation of prior year's profit(1) 0 551,146 - Balance at end of the year 24,879,561 24,879,561 Additional reserves: - Balance at beginning of the year 12,776,663 11,888,087 - Appropriation of prior year's profit(1) (3) 4,402,563 897,203 - Changes in ownership interests (4) -3,158 -8,627 - Balance at end of the year 17,176,068 12,776,663 Special activities reserve: - Balance at beginning of the year 12,152,954 11,736,896 - Appropriation of prior year's profit(1) -1,849,738 416,058 - Balance at end of the year 10,303,216 12,152,954 General loan reserve: - Balance at beginning of the year 2,021,337 2,135,891 - Appropriation of prior year's profit(1) 94,629 -114,554 - Balance at end of the year 2,115,966 2,021,337 Profit for the financial year attributable to equity holders of the Bank 2,460,190 2,647,454 Total consolidated own funds attributable to equity holders of the Bank 79,125,716 76,668,684 Equity attributable to minority interest 2022 2021 - Balance at 1 January 1,470,684 932,916 - Movement on reserves -370 482,617 - Dividend paid to minority interest -5,737 0 - Appropriation of the result of the financial year 65,917 55,151 Total equity attributable to minority interest at 31 December 1,530,494 1,470,684 (1) On 22 April 2022, the Board of Governors decided to appropriate the profit of the Bank for the year ended 31 December 2021, which amounted to EUR ‘000 2,565,998 to the additional reserves, the special activities reserve and the general loan reserve. The fact that amounts are being released from / added to the general loan reserve or the special activities reserve is the consequence of the evolution of the risks of the underlying operations. (2) Please refer to Note H.2. (3) The difference between the statutory profit of the Bank and the consolidated profit of the Group amounting to EUR ‘000 81,456 was allocated to the “Additional reserves attributable to the equity holders of the Bank”. (4) This balance is related to consolidation of EIF, purchases / subscriptions and sales of EIF shares. H.2. Subscribed capital and reserves, called but not paid The amount of EUR ‘000 799,248 shown in the balance sheet under the caption “Subscribed capital and reserves, called but not paid” contains receivable from the Member States Poland and Romania following the Asymmetrical Capital Increase on 1 March 2020. The contributions to the Subscribed capital called and to the Reserves amount to EUR 0.5 million and EUR 1.1 million respectively. The total amount to be paid by the Member States has been equally spread over ten equal semi-annual instalments due on 31 December 2020, 30 June 2021, 31 December 2021, 30 June 2022, 31 December 2022, 30 June 2023, 31 December 2023, 30 June 2024, 31 December 2024, and 30 June 2025. The instalments due including 31 December 2022 were settled in full. 31.12.2022 31.12.2021 Subscribed capital called but not paid (Poland and Romania) 245,790 344,106 Reserves called but not paid (Poland and Romania) 553,458 774,842 Total 799,248 1,118,948 129 |
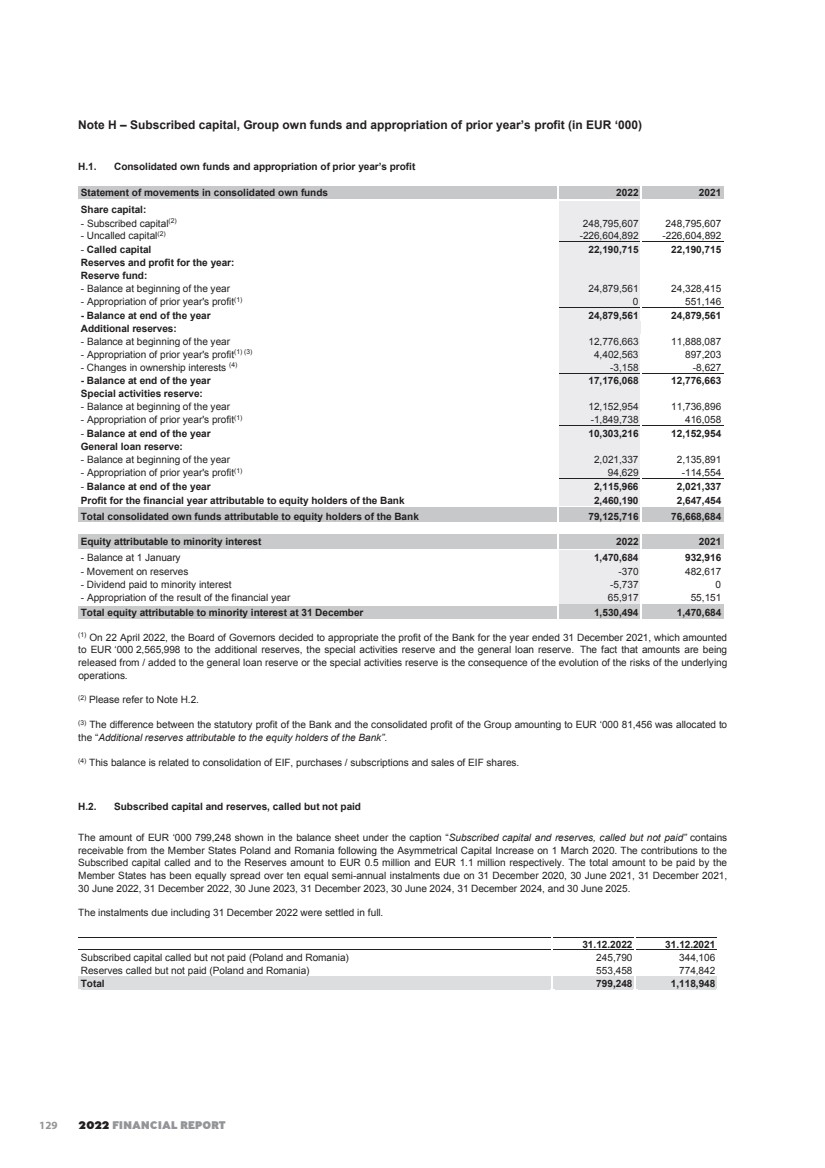
| EIB GROUP CONSOLIDATED FINANCIAL STATEMENTS UNDER EU DIRECTIVES 138 Note I – Prepayments and accrued income and Accruals and deferred income (in EUR ‘000) Prepayments and accrued income: 31.12.2022 31.12.2021 Impact from foreign exchange changes on currency swap contracts 9,479,121 7,305,157 Interest and commission receivable 7,101,329 6,639,214 Deferred borrowings and swaps charges 723,463 370,279 Mandates' commission receivable 217,828 220,451 Redemption premiums on swaps receivable(*) 21,581 28,774 Other 1,413 1,945 Total 17,544,735 14,565,820 Accruals and deferred income: 31.12.2022 31.12.2021 Impact from foreign exchange changes on currency swap contracts 8,813,681 5,472,236 Interest and commission payable 7,826,213 7,392,104 Deferred borrowings and swaps proceeds 1,410,707 1,606,502 Redemption premiums on swaps payable(*) 322,653 370,728 Deferred income on loans and guarantees 297,451 292,267 Prepaid management fees 242,097 241,673 Interest subsidies received in advance 128,426 92,233 Other 1,433 2,912 Total 19,042,661 15,470,655 (*) Redemption premiums on swaps receivable and payable represent end payments of the underlying swap agreements for those agreements which include such features. 130 |
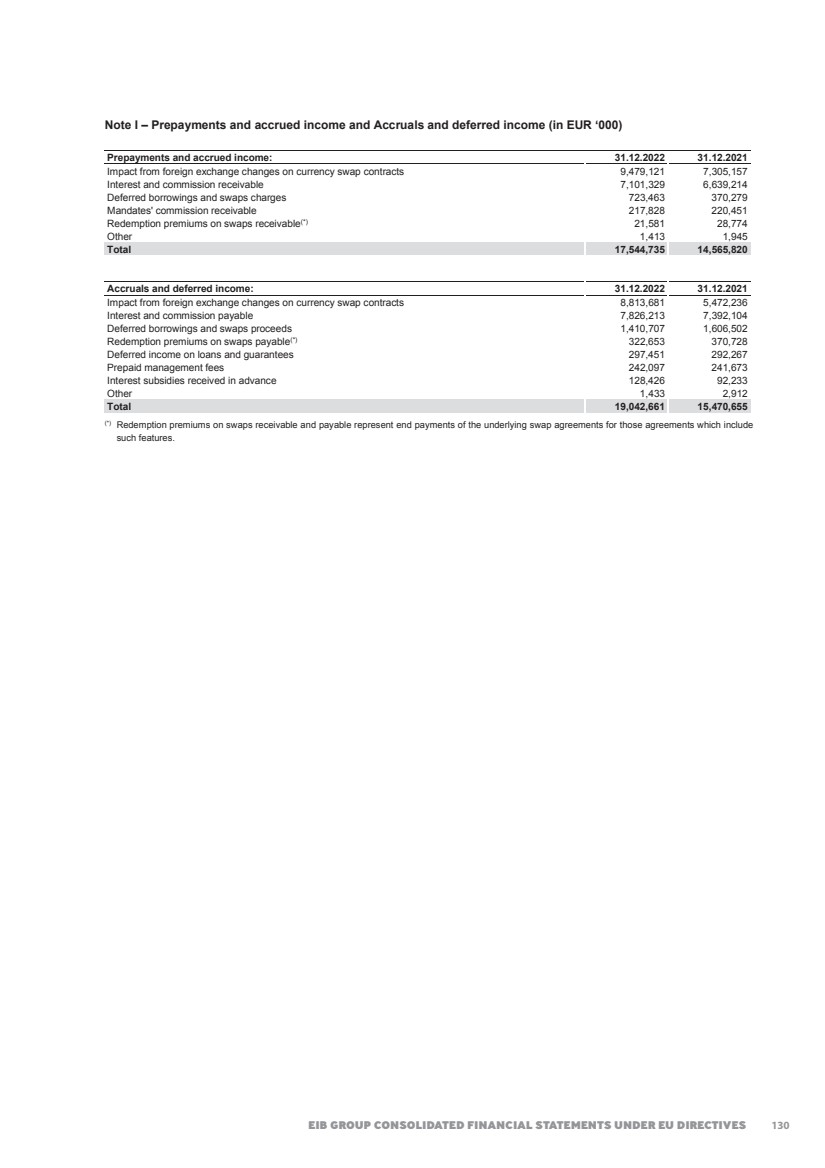
| 2022 FINANCIAL REPORT 139 Note J – Amounts owed to credit institutions and customers (in EUR ‘000) J.1. Amounts owed to credit institutions 31.12.2022 31.12.2021 Repayable on demand 2,371,014 4,777,422 - Overnight deposits 2,371,014 4,777,422 With agreed maturity or periods of notice 3,071,084 18,895,071 - Short-term deposits 6,003 178,248 - Repo with credit institutions 3,065,081 5,716,823 - Borrowings from central banks (1) 0 13,000,000 Total 5,442,098 23,672,493 (1) This amount represents the Bank’s participation in monetary operations with the ECB. J.2. Amounts owed to customers 31.12.2022 31.12.2021 Repayable on demand 1,433,117 1,645,154 - Overnight deposits 46 163 - European Union and Member States' accounts: - For Special Section operations and related unsettled amounts 395,981 412,934 - Deposit accounts 1,037,090 1,232,057 With agreed maturity or periods of notice 57,543 175,542 - Short-term deposits 57,543 175,542 Total 1,490,660 1,820,696 Note K – Debts evidenced by certificates (in EUR ‘000) In its financing activity, one of the Group’s objectives is to align its funding strategy with the funds required for the loans granted, notably in terms of currencies. The caption “Debts evidenced by certificates” includes “Debt securities in issue” (securities offered to the general investing public) and “Others” (private placements). The table below discloses the details of debts outstanding as at 31 December 2022 and 31 December 2021 per currency, together with the average rates and due dates (earliest/latest). Payable in Outstanding as at 31.12.2022 Average rate 2022(*) Due dates Outstanding as at 31.12.2021 Average rate 2021(*) EUR 251,275,921 1.29 2023/2061 246,913,410 1.30 USD 100,421,872 2.11 2023/2058 105,073,224 1.48 GBP 37,274,935 2.97 2023/2054 43,705,819 2.15 AUD 10,025,515 2.32 2023/2040 9,703,908 2.59 PLN 6,868,484 4.05 2023/2037 6,169,375 2.23 CAD 5,325,718 2.15 2023/2045 4,765,848 2.10 SEK 5,094,499 1.58 2023/2040 6,234,940 1.41 NOK 4,118,397 2.64 2023/2037 5,541,206 1.77 CHF 3,918,655 1.96 2023/2036 4,179,005 1.90 ZAR 2,138,328 8.00 2023/2035 2,331,323 7.75 JPY 1,374,409 2.27 2023/2053 1,520,384 1.46 MXN 1,219,817 6.00 2023/2028 1,174,850 6.35 DKK 783,185 0.87 2024/2031 783,195 0.70 NZD 550,661 3.21 2023/2028 271,428 2.57 CNY 499,851 2.82 2023/2026 472,292 2.56 CZK 362,397 4.18 2023/2034 339,828 2.52 TRY 248,852 10.59 2023/2027 677,022 10.41 RUB 85,960 3.89 2024/2026 140,679 4.75 HUF 53,134 9.06 2024/2025 17,065 3.25 HKD 36,074 0.53 2025/2025 79,246 0.41 RON 20,810 2.23 2026/2026 20,812 2.23 Total 431,697,474 440,114,859 (*) Weighted average interest rates as at the balance sheet date. The principal and interest of certain structured borrowings are index linked to stock exchange indexes (historical value: EUR 500 million in 2022, EUR 500 million in 2021). All such borrowings are fully hedged through structured swap operations. 131 |
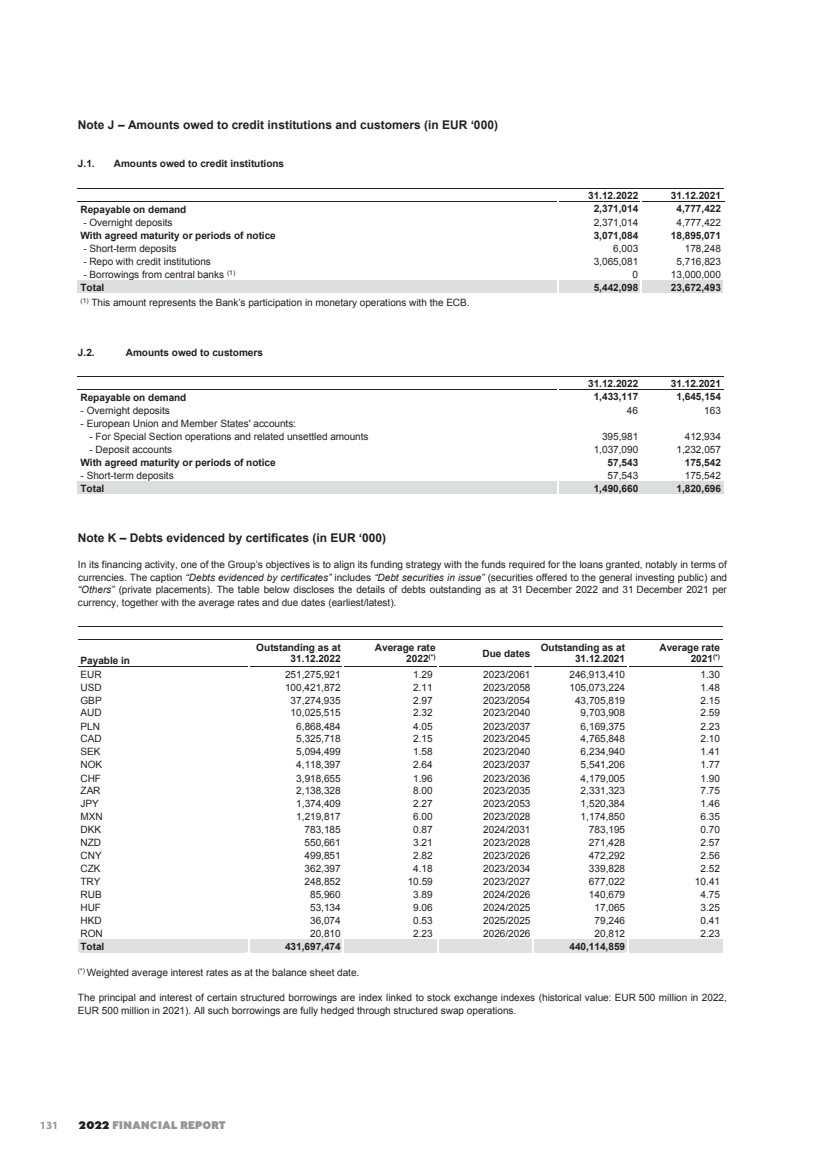
| EIB GROUP CONSOLIDATED FINANCIAL STATEMENTS UNDER EU DIRECTIVES 140 The table below provides the movements in 2022 and 2021 for debts evidenced by certificates: (In EUR million) 2022 2021 Balance as at 1 January 440,115 435,264 Issuances during the year 84,649 100,348 Contractual redemptions -96,370 -106,974 Early redemptions and buy-backs -679 -735 Exchange adjustments 3,983 12,212 Balance as at 31 December 431,698 440,115 Note L – Provisions – pension plans and health insurance scheme (in EUR ’000) The Group’s main pension scheme is a defined-benefit pension scheme funded by contributions from staff and from the Group covering all employees. All contributions of the Group and its staff are invested in the assets of the Group. The pension plans and health insurance scheme provisions are as follows (in EUR ‘000): 2022 2021 Staff pension plan: Provision as at 1 January 3,919,077 3,315,119 Payments made during the year -88,680 -85,433 Recognition of actuarial losses 57,232 479,391 Annual contributions and interest 240,351 210,000 Sub-total staff pension plan 4,127,980 3,919,077 Management Committee pension plan: Management Committee pension plan 40,750 38,932 Recognition of actuarial losses 1,528 4,110 Annual contributions 3,313 3,164 Sub-total Management Committee pension plan 45,591 46,206 Health insurance scheme: Provision as at 1 January 544,968 461,870 Payments made during the year -31,000 -27,680 Recognition of actuarial losses 14,777 60,142 Annual contributions and interest 49,612 50,636 Sub-total health insurance scheme 578,357 544,968 Total provisions as at 31 December 4,751,928 4,510,251 The above figures do not include the liability towards members of staff in respect of the Optional Supplementary Provident Scheme (a defined-contribution pension scheme). The corresponding amount of EUR 848 million (2021: EUR 793 million) is classified under “Other liabilities” (Note G). The developments in the current economic environment, notably the increase in the interest rates and inflation, had an impact on the assumptions used in the calculation of the defined benefit obligation. Details of the principal assumptions used in the estimate of the defined benefit obligation are detailed below. The provision in respect of future retirement and health insurance benefits was valued as at 31 December 2022 by an independent actuary using the projected unit credit method based on membership data as at 30 September 2022 and cashflows to 31 December 2022. The actuarial valuation was updated as at 31 December 2022, using the prevailing market rates of 31 December 2022 and the following assumptions (for the staff pension and medical plans): • a discount rate of 3.88% (2021: 1.35%) for determining the actuarial present value of benefits accrued in the pension and health insurance scheme, corresponding to 21.04 year duration (2021: 25.5 year duration); • the Group expects the remuneration of post-employment reserves to be set at a rate of 1.5% (2021: 1.5%) on top of the discount rate of 3.88%; • progressive retirement assumed between the age of 55 and 65 and depending on NRA (normal age of retirement) (2021: same assumption); • a combined average impact of the increase in the cost of living and career progression of 3.3% (2021: 3.5%); • expected annual resignation rates ranging from 27% to 1% (2021: from 27% to 1%), decreasing with age; • a rate of adjustment of pensions of 2.3% per annum (2021: 1.75%); • use of the ICSLT longevity table 2018 projected to 2022 (2021: ICSLT longevity table 2018 projected to 2021); • a medical cost inflation rate of 4.3% per annum (2021: 3.75%). The provisions for these schemes are adjusted when needed according to the actuarial valuation, as per the tables above. The actuarial valuation of the pension plans and the healthcare scheme as of 31 December 2022 displayed an unrecognised loss of EUR ‘000 1,044,397 (2021: EUR ‘000 4,113,082) out of which EUR ‘000 514,756 (2021: EUR ‘000 3,250,748) was reported in excess of the 10% corridor and the total amortisation recorded in the consolidated profit and loss account 2022 amounted to EUR ‘000 73,537 (2021: EUR ‘000 543,644). 132 |
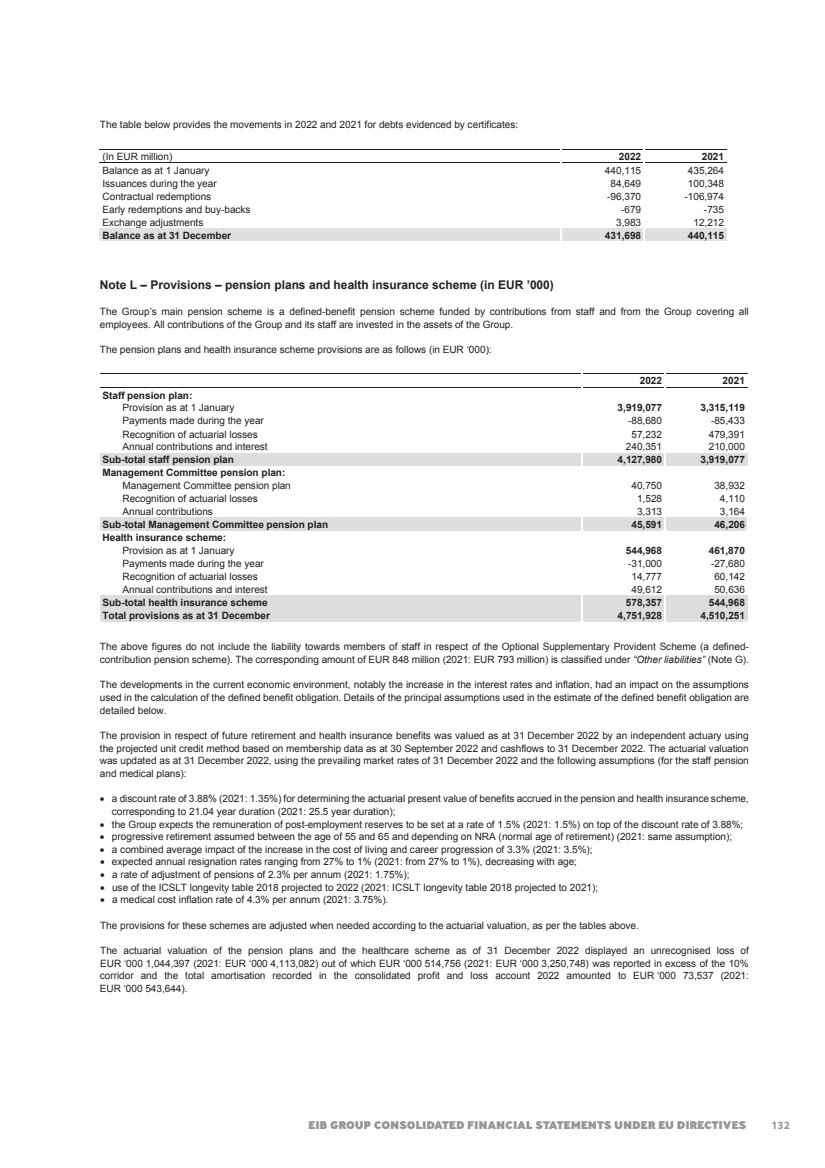
| 2022 FINANCIAL REPORT 141 Note M – Profit for the financial year The appropriation of the balance of the statutory profit and loss account for the year ended 31 December 2022, amounting to EUR ‘000 2,366,337 will be submitted to the Board of Governors for approval by 25 April 2023. Please refer to the Overview to the Bank’s Financial Statements for further details on the proposed Bank surplus for the financial year appropriation. Note N – Interest receivable and similar income and Interest payable and similar charges N.1. Net interest income (in EUR ‘000) 2022 2021 Interest receivable and similar income: Cash in hand, balance with central banks and post office banks 404 0 Treasury bills and other bills eligible for refinancing with central banks and debt securities including fixed income securities 356,845 194,911 Loans and advances to credits institutions and customers 7,695,098 5,954,381 Derivatives 10,490,333 10,189,276 Negative interest on interest bearing liabilities 135,574 130,677 Other 5,951 4,449 Total 18,684,205 16,473,694 Interest payable and similar charges: Amounts owed to credit institutions and customers -12,973 -1,943 Debts evidenced by certificates -7,483,457 -7,134,932 Derivatives -7,766,282 -5,583,363 Negative interest on interest bearing assets -252,807 -411,488 Other -181,043 -153,760 Total -15,696,562 -13,285,486 Net interest income 2,987,643 3,188,208 133 |
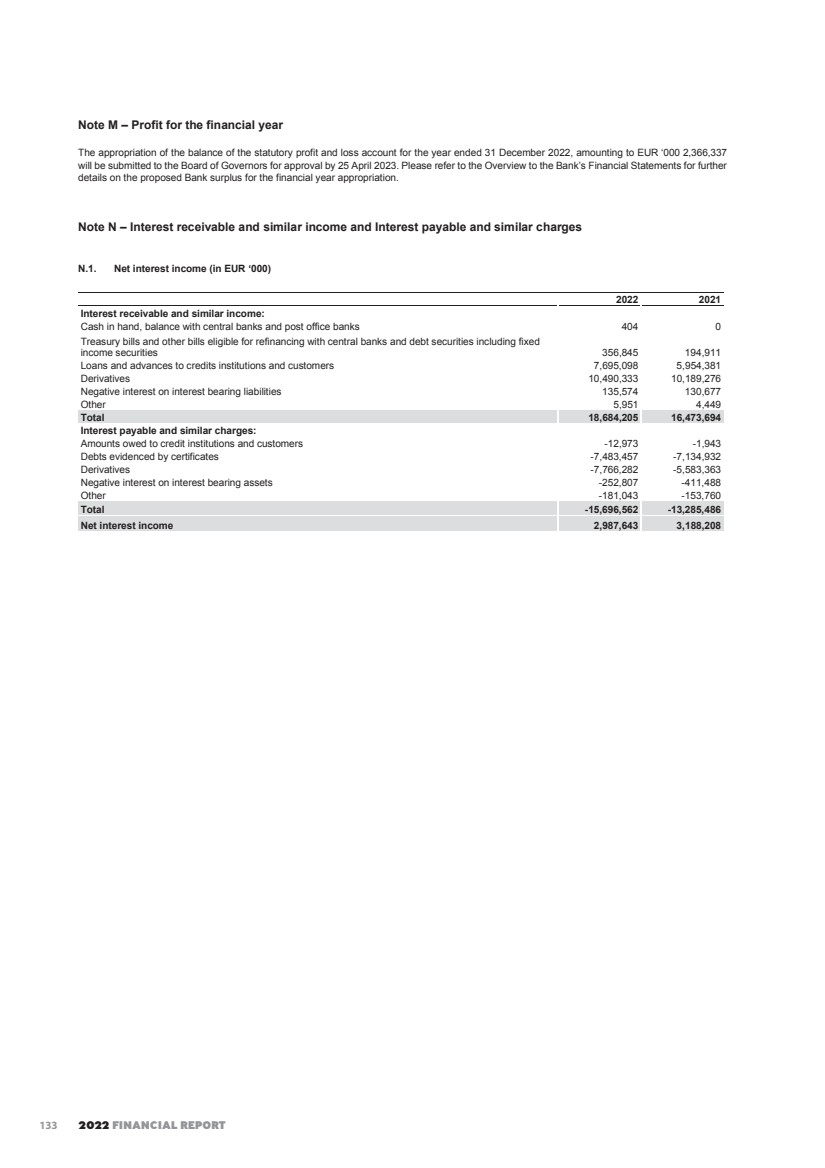
| EIB GROUP CONSOLIDATED FINANCIAL STATEMENTS UNDER EU DIRECTIVES 142 N.2. Geographical analysis of Interest receivable and similar income (in EUR ‘000) 2022 2021 EU countries Poland 838,559 485,490 Spain 819,323 759,172 France 576,209 448,293 Italy 524,483 424,709 Greece 426,007 449,134 Germany 366,921 296,209 Austria 274,323 255,564 Hungary 233,410 130,417 Netherlands 189,118 159,011 Belgium 172,338 150,872 Sweden 159,806 124,909 Portugal 137,956 145,230 Czech Republic 114,166 31,005 Ireland 92,695 87,233 Romania 80,396 69,850 Finland 71,792 66,435 Slovakia 70,406 66,574 Croatia 49,791 48,123 Slovenia 40,042 39,729 Bulgaria 38,055 38,922 Denmark 31,281 18,151 Lithuania 17,466 18,174 Latvia 16,023 14,475 Cyprus 15,833 9,356 Malta 8,091 9,199 Estonia 7,052 4,173 Luxembourg 2,409 19,964 Total EU countries 5,373,951 4,370,373 Outside the European Union 2,046,685 1,573,979 Total income analysed per country 7,420,636 5,944,352 Income not analysed per country(1) 11,263,569 10,529,342 Total interest receivable and similar income 18,684,205 16,473,694 (1) Income not analysed per country: · Revenue from Long-Term HQLA Portfolio, loan substitutes and EIF ABS portfolio 252,450 147,472 · Revenue from Securities Liquidity portfolio and EIF Operational portfolio 43,368 36,322 · Revenue from money-market securities 61,022 11,104 · Revenue from other securities 5 13 · Revenue from short-term investments and other operations 410,440 140,706 · Income from derivatives 10,490,333 10,189,276 · Other 5,951 4,449 11,263,569 10,529,342 134 |
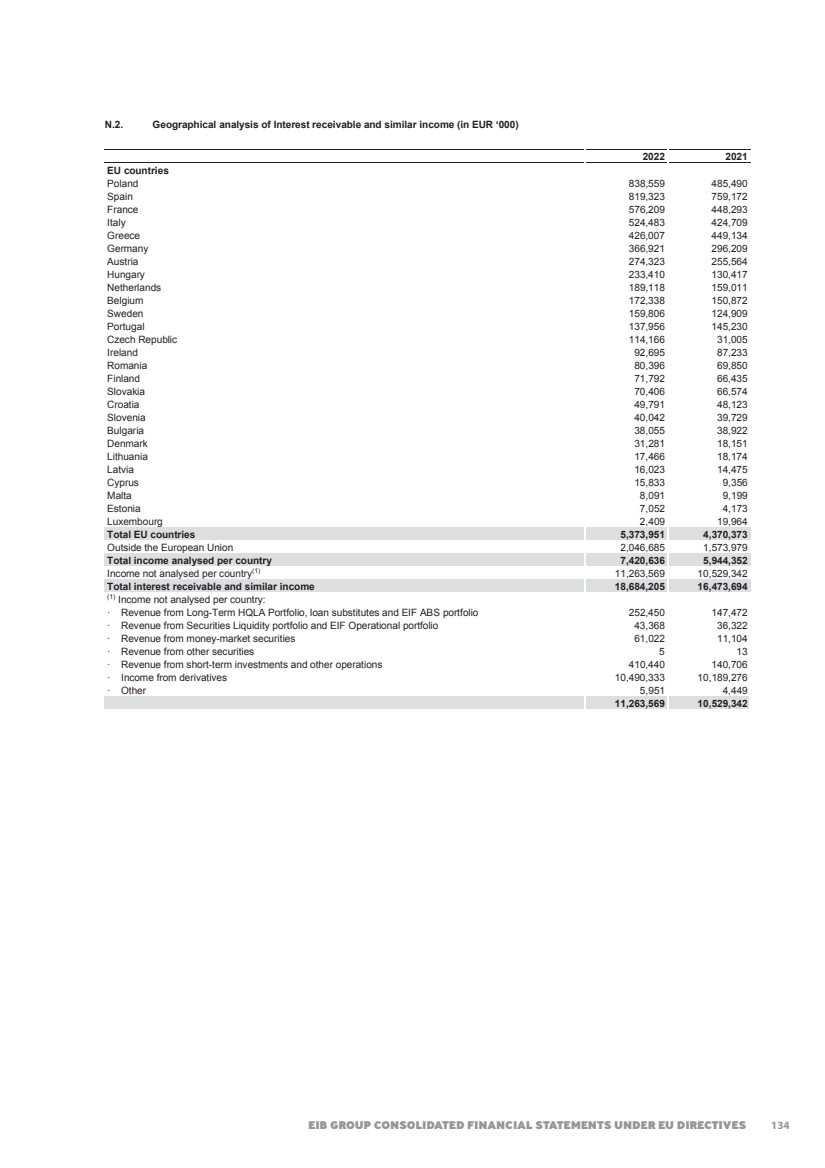
| 2022 FINANCIAL REPORT 143 Note O – Commissions receivable and Commissions payable (in EUR ‘000) 2022 2021 Commissions receivable: Commissions on guarantees 256,243 210,162 Commissions on EGF 86,786 46,596 Commissions on EFSI 39,993 45,052 Commissions on Investment Facility - Cotonou 36,994 55,682 Commission income on loans 32,589 35,014 Commissions on Jaspers 28,688 27,214 Commissions on InnovFin 17,737 18,157 Commissions on Jeremie/ESIF 14,211 12,778 Commissions on Modernisation Fund 12,080 9,268 Commission on InvestEU Advisory Hub 11,247 0 Commissions on RRF 10,709 0 Commissions on DFIs (2014-20, 2021-27)(**) 9,995 7,545 Commission on Fi-Compass (**) 5,463 5,359 Commission on Trust Fund Management fees(**) 5,172 4,109 Commission on Innovation Fund(**) 4,639 1,466 Commissions on Connecting Europe Facility 4,581 1,926 Commission JESSICA Holding Funds(**) 3,841 3,987 Commissions on Neighbourhood Investment Facility 2,232 1,939 Commissions on Yaoundé/Lomé Conventions 1,150 1,250 Commissions on other mandates(**) 85,686 86,197 Total commissions receivable(*) 670,036 573,701 2022 2021 Commissions payable: Risk remuneration for guarantees received -357,519 -410,647 Other commissions payable -25,697 -23,730 Total commissions payable -383,216 -434,377 (*) For certain mandates, a deferred income mechanism is established by the Group, affecting revenue recognition of commission income by EUR '000 -32,398 (2021: EUR '000 -11,546). (**) A reclassification was made between the captions in order to improve the readability of financial statements. Note P – Net result on financial operations (in EUR ‘000) 2022 2021 Net result on derivatives 197,575 44,214 Net result on repurchase of debts evidenced by certificates 253 0 Net result on translation of balance sheet positions -1,291 13,263 Net result on shares and other variable-yield securities(*) -38,916 27,272 Net result on debt securities portfolios -204,367 -32,791 Total net result on financial operations -46,746 51,958 (*) The total for 2022 includes an amount of EUR’000 3,682 stemming from the InvestEU Programme Guarantee as described in note E.2. Note Q – Net other operating income and expense (in EUR ‘000) 2022 2021 Reversal of previous year’s unutilised accruals 4,179 4,276 Rental income 89 78 Other 6,209 -5,751 Total net other operating income and expense 10,477 -1,397 135 |
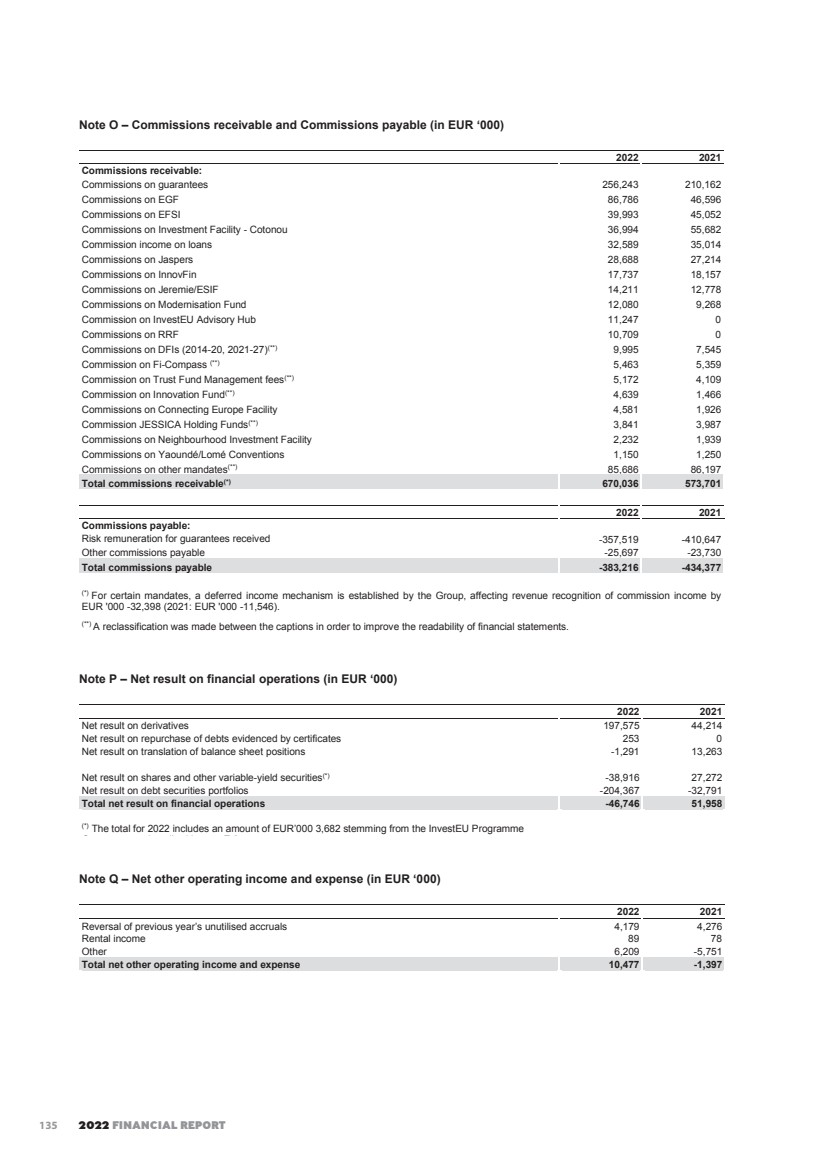
| EIB GROUP CONSOLIDATED FINANCIAL STATEMENTS UNDER EU DIRECTIVES 144 Note R – General administrative expenses (in EUR ‘000) 2022 2021 Salaries and allowances(*) -589,807 -547,408 Welfare contributions and other staff costs -353,731 -824,249 Staff costs -943,538 -1,371,657 Other administrative expenses -346,295 -288,287 Total general administrative expenses -1,289,833 -1,659,944 (*) Of which the amount for members of the Management Committee is EUR ‘000 3,753 at 31 December 2022 and EUR ‘000 3,441 at 31 December 2021. The number of persons employed by the Group was 4,648 at 31 December 2022 (4,412 at 31 December 2021). Note S – Off-balance sheet special deposits for servicing borrowings This item represents the amount of coupons and bonds due, paid by the Group to the paying agents, but not yet presented for payment by the holders of bonds issued by the Group. Note T – Fair value of financial instruments(*) At the balance sheet date, the Group records balance sheet financial instruments on the basis of their historical cost in foreign currency (apart from the securities liquidity portfolio) representing the amount received in the event of a liability or the amount paid to acquire an asset. The fair value of the financial instruments (mainly loans, treasury, securities and borrowings) entered under assets or liabilities compared with their carrying amount is shown in the table below: At 31 December 2022 (in EUR million) Carrying amount Fair value(**) Financial assets: Cash in hand, balances with central banks and post office banks 113 113 Loans and advances to credit institutions and customers, excluding loan substitutes 484,920 461,583 Treasury bills and debt securities portfolios including loan substitutes 33,005 31,760 Shares, other variable yield securities and participating interests 10,296 18,893 Total financial assets 528,334 512,349 Financial liabilities: Amounts owed to credit institutions and customers 6,933 6,933 Debts evidenced by certificates 431,698 406,993 Total financial liabilities 438,631 413,926 (*) Derivatives are not included in the table. Please refer to Note V. (**) Fair value including accrued interest. At 31 December 2021 (in EUR million) Carrying amount Fair value(**) Financial assets: Cash in hand, balances with central banks and post office banks 1,483 1,483 Loans and advances to credit institutions and customers, excluding loan substitutes 491,722 520,255 Treasury bills and debt securities portfolios including loan substitutes 49,132 49,354 Shares, other variable yield securities and participating interests 9,569 18,872 Total financial assets 551,906 589,964 Financial liabilities: Amounts owed to credit institutions and customers 25,493 25,393 Debts evidenced by certificates 440,115 478,602 Total financial liabilities 465,608 503,995 (*) Derivatives are not included in the table. Please refer to Note V. (**) Fair value including accrued interest. Note U – Risk management This note presents information about the Group’s exposure to risks and their management and control, in particular the primary risks associated with its use of financial instruments. These are: • Credit risk - the risk of loss resulting from client or counterparty default and arising from credit exposure in all forms, including settlement risk2; 2 Settlement risk is defined as the risk of potential losses due to transactions which remain unsettled after their due delivery date and/or due to transactions that are settled later than the applicable market standard. Due to the nature of the Group’s operations, the most relevant instruments affected by settlement risk are those derivatives entered into by the Bank which imply an exchange of foreign currencies. Settlement risk management is covered in the Financial Risk Guidelines. 136 |
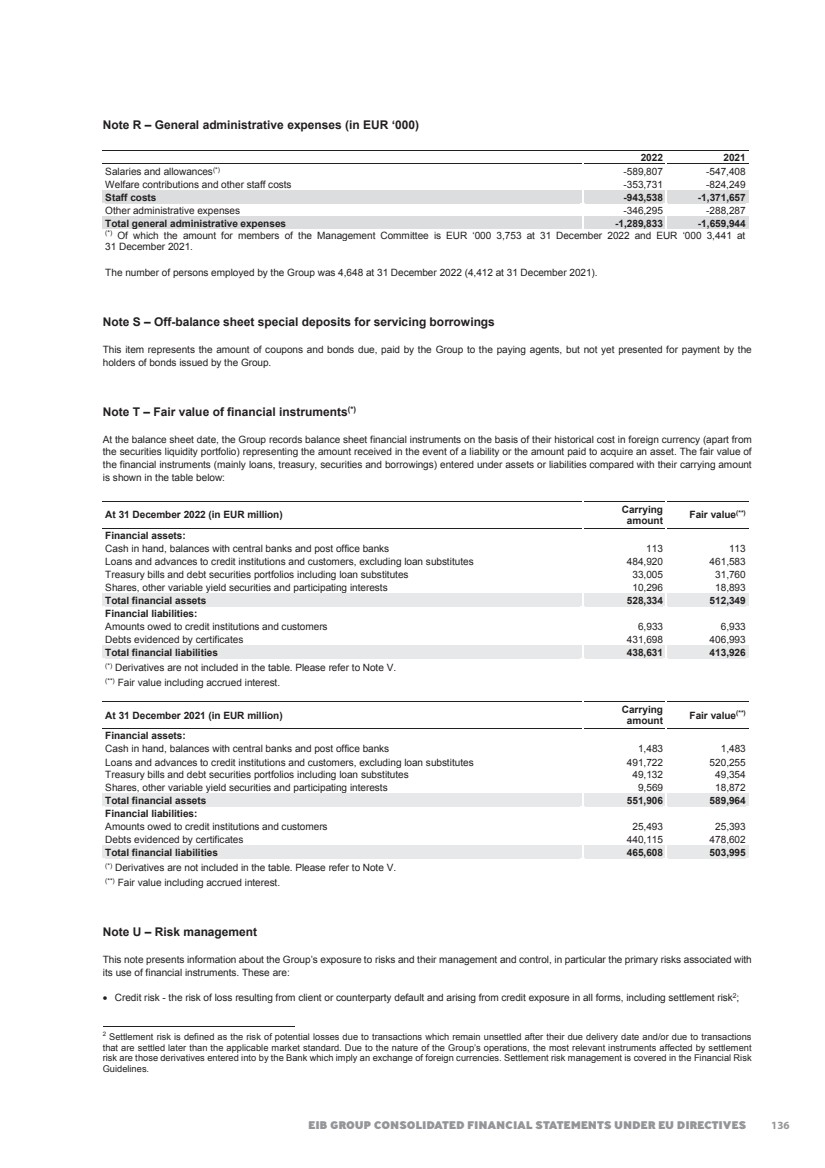
| 2022 FINANCIAL REPORT 145 • Interest rate risk - from the Group’s positions, the risk to the economic value or to the net interest income arising from adverse movements in interest rates that affect interest rates sensitive instruments. It includes gap risk, basis risk and option risk; • Liquidity and funding risk - the risk that the Group is unable to fund assets or meet obligations at a reasonable price or, in extreme situations, at any price; • Foreign exchange rate risk - the risk to the economic value or to the income derived from the Group’s positions due to adverse movements in currency exchange rates; and • Operational risk - the risk of loss resulting from inadequate or failed internal processes, people and systems or from external events3. In 2022, the staff was teleworking part of the time, including the teams dedicated to risk management and monitoring. With respect to such activities, the position keeping systems were available in remote mode to the staff of Front, Middle and Back Office, as well as to Risk Management, with the same functionalities available under normal conditions. U.1. Risk Management Organisation Each entity within the Group carries out its own management and control of risks. Risk management information presented in this note will distinguish between the Bank and the Fund. The high-level principles of the Group’s risk management are set out in the EIB Group Risk Management Charter, which is intended to provide Group-wide view of the Group’s risks and integrated approach to risk management. The Group has established a Group Risk Function under the responsibility of the Group Chief Risk Officer (‘GCRO’). Without prejudice to the statutory responsibilities of the President and the EIB Management Committee, respectively, the GCRO reports on Group Risks to the EIB Management Committee under the oversight of the MC member in charge of risk. On key risk policy matters related to Group Risks, the GCRO participates in all meetings of the EIB Management Committee and relevant meetings of the other EIB governing bodies, and is invited to relevant meetings of the EIF Board of Directors and to discussions with the EIF Management. The EIF reports on Group Risk matters to the EIB through the GCRO. Group Risk Appetite The risk appetite is the level of risk that the Group is willing and able to incur in pursuing its activities in the context of its public mission and objectives. Key to this is the Group’s capacity to provide attractive long-term financing to serve EU objectives across all EU Member States (and beyond in Partner Countries). A primary pillar of the Group’s business model is to retain the long-term AAA rating from the major rating agencies. The processes and activities performed by the Group to manage its risk appetite are formalised in the Group Risk Appetite Framework (‘RAF’) approved by the EIB BoD. The Group RAF covers the major financial risks (including credit, liquidity, market and treasury risks) and non-financial risks categories: (i) operational (e.g.: people, information security, financial crime, technology, fraud, compliance and model risks) and (ii) other (e.g.: climate change and environmental and reputational risks). It helps to embed a healthy organisational risk culture within the Group through the implementation and the monitoring of measurable risk appetite metrics, which are subject to risk limits and (where applicable) cascaded further down within the Group entities. As a public institution, the Group does not aim to make profits from speculative exposures to risks. As a consequence, the Group does not consider its treasury or funding activities as profit maximising centres. Investment activities are conducted within the primary objective of protection of the capital invested. U.1.1. Risk Management Organisation of the Bank Extending from the principles set out in the Group Risk Appetite Framework, the Bank’s objective is also to analyse and manage risks so as to obtain the strongest possible protection for its assets, its financial result, and consequently its capital. While the Bank is generally not subject to legislative acts and guidelines applicable to commercial banks issued or adopted by the EU institutions, bodies and agencies (“EU Legislative Acts and Guidelines”), it has voluntarily decided to comply with these EU Legislative Acts and Guidelines to the extent determined by its Best Banking Practice framework including the Best Banking Practice Guiding Principles, published by the Bank. Within the Bank, the Group Risk and Compliance Directorate (‘GR&C’) independently identifies, assesses, monitors and reports credit, market, liquidity and funding and operational risks to which the Bank is exposed. In order to preserve segregation of duties and in accordance with the three lines of defence principle, GR&C is independent from the Front Offices and provides second opinions on all proposals made having risk implications. The following sections disclose the credit, market, liquidity and funding and operational risks to which the Bank is exposed on its activities performed at own risk. For additional details, please refer to the EIB Group Risk Management Disclosure Report. U.1.1.1. Risk measurement and reporting system The Bank aligns its risk management systems to changing economic conditions and evolving regulatory standards. It adapts them on an on-going basis as market practice develops. Systems are in place to control and report on the main risks inherent in the Bank’s operations, i.e. credit, interest rate, liquidity and funding, foreign exchange rate and operational risks. With the purpose to quantify their impact on the Bank’s solvency, liquidity, earnings and operations, risks are assessed and measured both under normal circumstances and under possible stressed conditions. Risk measurements consider the relevant metrics related to capitalisation, earnings, liquidity, exposure to market and non-financial risks. 3 The definition of external events excludes cases of client bankruptcy or unfavourable market movements or similar events, which represent triggers for Credit and respectively Market Risk. 137 |
| EIB GROUP CONSOLIDATED FINANCIAL STATEMENTS UNDER EU DIRECTIVES 146 Information on credit, market, liquidity, financial and operational risks is reported to the Management Committee and to the Board of Directors on a monthly basis. Such information is presented and explained to the Management Committee and to the Board of Directors’ Risk Policy Committee on a regular basis. The Bank has a framework in place for managing interest rate (‘IR’) risk (gap and basis risks4), as well as FX risk. The Bank monitors and manages on a daily basis its IR & FX positions within the pre-approved limits. All new types of transactions introducing operational or financial risks must be authorised by the Management Committee(‘MC’), after the approval of the New Products Committee(‘NPC’). U.1.1.2. Sustainability of revenue and self-financing capacity The Bank’s Interest Rate Risk Strategy forms an integral part of the Bank’s overall financial risk management. It reflects the expectations of the main stakeholders of the Bank in terms of stability of earnings, preservation of the economic value of own funds, and the self-financing of the Bank’s growth in the long-term. To achieve these aims, the Interest Rate Risk Strategy considers a medium-to-long term horizon for the investment of the Bank’s own funds, in order to promote stability of revenues and to enhance overall returns. In practice, this is achieved by defining an investment profile producing a target duration for the Bank’s own funds between 4.5 and 5.5 years. In that context, the Asset/Liability Committee (‘ALCO’) performs regular checkpoints on the investment profile related to the Interest Rate Risk Strategy framework. U.1.2. Risk Management Organisation of the Fund (‘EIF’) The mandate of the Fund is to support small and mid-size enterprises (‘SME’) finance for start-up, growth and development within the European Union objectives for SME. Most of the Private Equity (‘PE’), Venture Capital and Portfolio Guarantees, Securitisation & Microfinance (‘GSM’) operations for both entities of the Group are managed by the Fund. The Fund aligns its risk management systems to changing economic conditions. Credit, market, liquidity and operational risk systems are in place to control and report on the main risks inherent in its operations. The Fund maintains robust risk policies and methodologies to ensure the Fund’s risk profile is within the parameters set out in its risk appetite framework. Risk management is embedded in the corporate culture of EIF, based on a three-lines-of-defence model permeating all areas of EIF’s business functions and processes: (i) front office, (ii) independent risk functions and (iii) internal and external audit. Investment and Risk Committees (‘IRCs’) chaired by the Head of General Secretariat advise the Chief Executive and the Deputy Chief Executive on each and every transaction. Portfolio IRCs regular meetings, chaired by the Chief Risk Officer, oversee risk and investment-related aspects of the EIF portfolio, inter alia: approving transaction rating/grading changes, impairment and provisioning actions, relevant market risk events and potential stress testing. Risk and Portfolio Management actions form part of the assurance process presided by the EIF Audit Board. Moreover, within the EIB Group context, the Fund’s Risk Management Department operates in regular contact with the Group Risk and Compliance Directorate, particularly with regard to the Group Risk Management Charter and to the Group risk exposure relating to guarantee and securitisation operations, and Private Equity operations under the Bank’s Risk Capital Resources mandate (‘RCR’), the different windows under the Bank’s EIB Group Risk Enhancement Mandate (‘EREM’) and general EIF policy matters. The Fund’s treasury management has been fully outsourced to the Bank under a treasury management agreement signed by both parties and mandating the responsible EIB services to perform selection, execution, settlement and monitoring of transactions. Management follows treasury guidelines annexed to the agreement. Operational short-term liquidity management is conducted by EIF. U.1.2.1. Risk assessment private equity Under its private equity operations, the Fund has a fund-of-funds approach, taking mostly minority equity participations in business angels, venture capital, private equity and mezzanine funds managed by mostly independent teams in order to leverage further commitments from a wide range of investors. The Fund’s PE operations include investments in venture capital funds across all investment stages (seed, early stages, late stages, growth, etc.) but also investments in mid-market funds or mezzanine funds, which, generally speaking, have a lower risk profile. Over the last years, the Fund has developed a tool-set to design, manage and monitor portfolios of PE funds tailored to the dynamics of this market place. This tool-set is based on an internal model, the Grading-based Economic Model (‘GEM’), which allows the Fund to better assess and verify each funds’ but also each portfolio of funds’ valuations, risks and expected future cash flows and performances. Before committing to a PE fund, the Fund assigns an Equity score which is based on the outcome of an extensive due diligence performed by the Fund’s transaction team and reviewed by its risk management team. The funds are monitored by the Fund’s transaction team with a frequency and intensity depending on the underlying level of risk and Equity scores are annually reviewed by the Fund’s risk management team. These efforts, supported by the development of a proprietary IT system and an integrated software (front to back), improve the investment decision-making process and the management of the portfolio’s financial risks and of liquidity, in particular enabling forward-looking and stress-test based decision making. 4 The exposure to ‘option risk’ was not material in 2022. 138 |
| 2022 FINANCIAL REPORT 147 U.1.2.2. Risk assessment guarantees and securitisations The Fund extends portfolio guarantees to financial intermediaries involved in SME financing and participates in SME securitisation transactions. By taking on these risks, it facilitates access to funding and/or reduces the cost of capital for originators, and, in turn, it improves the conditions and facilitates access to finance to SMEs. For its guarantee & securitisation business, over the last years, the Fund has developed internal methodologies and models to analyse portfolio guarantees and structured finance transactions in line with best market practices. Before the Fund enters legally into a guarantee transaction, an internal rating is assigned to each new own risk guarantee transaction in accordance with the Fund’s internal methodology. The rating is based on internal models, which analyse and summarise the transaction’s credit quality (expected loss concept), considering not only quantitative parameters but also qualitative aspects. A four-eye principle applies throughout the process, with actions initiated by the front office and reviewed by Risk Management. Guarantee transactions are monitored regularly, at least quarterly; their statuses are regularly reviewed by EIF IRCs which, depending on their performances, may lead to a review of their internal ratings. This latter process is initiated by Risk Management and reviewed by the front office. The guarantees portfolio is valued according to a mark-to model approach under the relevant accounting principles. The main impact on the valuation of the transactions in the portfolio stems from the changes in the point in time cumulative default rate assumptions used for the assets. The EIF’s monitoring follows potential negative or positive rating migrations and provides the basis for appropriate management of transactions. U.2. Credit risk Credit risk concerns mainly the Group’s lending activities, treasury instruments such as debt securities, certificates of deposit and interbank term deposits as well as the derivative and guarantee transactions of the Group. The credit risk associated with the use of derivatives is analysed in the ‘Derivatives’ section (Note V). Credit risk within the Bank is managed in line with the detailed internal guidelines. The purpose of these guidelines is to ensure that credit risk is managed prudently. Whether or not a given entity is acceptable to the Bank as a counterpart in a lending operation is determined on the basis of a careful analysis and evaluation of the entity using quantitative and qualitative metrics but also relying on experience and expert judgment. The guidelines set out minimum credit quality levels for both borrowers and guarantors in lending operations and identify the acceptable transaction structure. They also detail the minimum requirements that loan contracts must meet in terms of key legal clauses and other contractual stipulations to ensure that the Bank's position is adequately safeguarded. Diversification of the loan portfolio is supported by a counterparty limit framework and sector limits for key industries. In order to ensure that the additional risk involved in complex or structured lending transactions is adequately analysed, quantified and mitigated, specific detailed guidelines have been developed in respect of certain types of operations complementing the general guidelines. In analysing risks, the Bank applies an internal loan grading system and assigns internal ratings to counterparts. The Fund manages exposures and risks in the frame of conservative policies deriving from statutory provisions and credit risk operational guidelines approved by the Fund’s Board of Directors or guidelines as set out under mandates. Credit guidelines undergo periodic adaptations to incorporate evolving operational circumstances, changes in the applicable Best Banking Principles and respond to new mandates that the Group may receive. Despite the general context of uncertainty and various risks resulting from the Russian invasion of Ukraine, the credit quality of the loan portfolio is deemed stable at present. It relies on a risk management strategy based on a robust due diligence process, adequate levels of security and guarantees, as well as standard protective clauses included in its loan agreements. In addition to the collaterals and the guarantees provided for lending exposures, the EIB benefits of additional credit enhancements granted as part of different mandates. The aggregate amount (outstanding loans and guarantees granted by the Bank) is limited at any time by its Statutory Gearing Ratio (Article 16.5 of Statute). For the purpose of calculating this ratio the Bank uses data drawn from the EU Accounting Directives (‘AD’) framework. At year-end 2022, EIB’s Statutory Gearing Ratio under EU Accounting Directive stand-alone accounts stood at 204.0% (2021: 202.7%) and under EU AD consolidated accounts stood at 207.8% (2021: 206.6%, max. 250% under Article 16.5 of the Statute). Credit risk related to the EIF guarantees portfolio is presented in note U.1.2.2. 139 |
| EIB GROUP CONSOLIDATED FINANCIAL STATEMENTS UNDER EU DIRECTIVES 148 U.2.1. Loans In order to measure and manage credit risk on loans, the Group has graded its lending operations according to generally accepted criteria, based on the quality of the borrower and structure of the transaction, including, where appropriate, the security provided. The structure of borrowers and guarantors relating to the loan portfolio as at 31 December 2022 is analysed below, including undisbursed portions. The table below shows (in EUR million) the signed loans for projects granted by the Group, excluding those outside the European Union which are granted under the External Lending Mandate (ELM), European Fund for Sustainable Development (EFSD), Neighbourhood, Development and International Cooperation Instrument (NDICI)/European Fund for Sustainable Development Plus (EFSD+) and Cotonou Agreement where the Group is, as the last resort, secured by the European Union budget or by the Member States guarantees (loans in the ACP Countries and the OCT) (*). (*) These guarantees are either Comprehensive (covering all risks) or limited to defined Political Risks (non-transfer of currency, expropriation, war or civil disturbance, denial of justice upon breach of contract). Guarantor States Public institutions Banks Corporates Not guaranteed (1) Total 2022 Total 2021 Borrower States 0 0 0 0 59,287 59,287 61,631 Public institutions 32,376 23,674 338 200 90,650 147,238 145,123 Banks 37,488 20,563 14,187 12,640 31,577 116,455 116,690 Corporates 7,713 4,950 6,198 35,150 116,023 170,034 166,110 Total 2022(2)(3)(4)(5) 77,577 49,187 20,723 47,990 297,537 493,014 Total 2021(2)(3)(4)(5) 77,858 49,958 22,781 50,423 288,534 489,554 (1) These amounts include loans, for which no formal guarantee independent of the borrower and the loan itself was required, the borrower’s level of solvency itself representing adequate security. In the event of certain occurrences, appropriate contractual clauses ensure the Group’s right to access independent security. (2) The loans in risk-sharing operations (credit enhanced by the Member States guarantee or the EU budget in the form of a political risk guarantee) amount to EUR 2,193 million as of 31 December 2022 (2021: EUR 2,687 million). (3) This amount does not include signed loan substitutes (2022: EUR 17,414 million; 2021: EUR 17,953 million). (4) These amounts exclude loans to current European Union Member States granted before their accession to the European Union and guaranteed by the European Union budget or the Member States. (5) The Group has signed, in the context of EFSI SME window and European Guarantee Fund, funding lines for a total commitment not exceeding EUR 9,187 million (2021: EUR 9,187 million). The Group recognises an undisbursed exposure when a firm commitment is signed with the respective underlying risk counterpart, for which the funding lines are expected to be drawn. 140 |
| 2022 FINANCIAL REPORT 149 The Group did not record value adjustments in 2022 and 2021 in respect of its EU sovereign and EU sovereign guaranteed exposure as at the year-end as the preferred creditor status of the Bank as well as of the EIF and the protection given by the Bank’s Statute are deemed to guarantee a full recovery of the Group’s assets upon maturity. The table below discloses information regarding the sovereign credit risk on loans (apart from loans outside the EU benefiting from EU budget or MS guarantees under the ELM, EFSD, NDICI/EFSD+ and Cotonou Agreements), where the Group has either full own risk or bears a residual risk due to credit enhancement (“risk portfolio”): (in EUR million) 2022 2021 Acting as borrower Acting as guarantor Acting as borrower Acting as guarantor Country Disbursed Undisbursed Signed Disbursed Undisbursed Signed Austria 0 0 190 0 0 146 Belgium 0 0 272 0 0 186 Bulgaria 1,060 0 119 1,107 0 115 Croatia 806 0 2,242 633 210 2,702 Cyprus 928 509 1,033 900 359 1,348 Czech Republic 915 1,009 0 1,068 784 0 Denmark 0 0 242 0 0 271 Estonia 500 0 84 452 120 91 Finland 0 0 113 0 0 92 France 0 0 3,986 0 0 3,428 Germany 0 0 2,002 0 0 1,659 Greece 7,379 1,210 9,262 7,756 1,192 8,852 Hungary 5,647 1,351 1,080 6,011 1,143 1,099 Ireland 1,665 240 1,095 1,665 0 1,154 Italy 4,989 2,560 6,941 4,755 2,160 6,397 Latvia 258 200 6 337 400 12 Lithuania 2,035 0 55 2,110 0 54 Luxembourg 0 9 231 150 0 236 Malta 0 72 280 0 72 297 Netherlands 0 0 294 0 0 205 Poland 6,631 330 17,925 6,254 1,472 17,123 Portugal 1,299 830 3,426 1,163 600 3,903 Romania 2,113 2,258 0 1,847 2,052 0 Slovakia 2,499 441 94 2,399 541 88 Slovenia 512 400 1,242 530 400 1,366 Spain 3,741 0 21,502 4,215 0 22,558 Sweden 0 0 199 0 0 136 Non EU–Countries 2,013 2,878 3,662 1,813 4,961 4,340 Total 44,990 14,297 77,577 45,165 16,466 77,858 The table below shows (in EUR million) the signed loans for projects outside the European Union under the ELM, EFSD, NDICI/EFSD+ and Cotonou Agreement benefiting from EU Budget or Member States guarantees: Secured by: 31.12.2022 31.12.2021 Member States 3,867 3,945 European Union budget(1) 49,167 47,629 Total(2)(3) 53,034 51,574 (1) Of which EUR 2,193 million in risk-sharing operations (credit enhanced by the Member States guarantee or the EU budget in the form of a political risk guarantee) as explained above (2021: EUR 2,687 million). (2) Including loans to current European Union Member States granted before their accession to the European Union and guaranteed by the European Union budget or the Member States. (3) Financial guarantees granted by the Group for a total amount of EUR 487.5 million (2021: EUR 459.1 million) which are secured by Member States or the EU budget. The aforementioned guarantees are not included in the analysis as provided in table above. 141 |
| EIB GROUP CONSOLIDATED FINANCIAL STATEMENTS UNDER EU DIRECTIVES 150 LOANS FOR PROJECTS OUTSIDE THE EU UNDER THE EU BUDGET OR MEMBER STATE GUARANTEE (in EUR million) (including loans in the new Member States before accession) BREAKDOWN OF LOANS SIGNED BY GUARANTEE AGREEMENT 31.12.2022 31.12.2021 75% Member States global guarantee - ACP/OCT Group 4th Lomé Convention/2nd Financial Protocol 0 8 Total 75% Member States global guarantee 0 8 75% Member States guarantee - Cotonou partnership agreement 185 198 - Cotonou partnership 2nd agreement 1,108 1,172 - Cotonou Protocol 3 – OR / ACP 2,480 2,473 - Cotonou Protocol 3 – OR / OCT 94 94 Total 75% Member States guarantee 3,867 3,937 Total Member States guarantee 3,867 3,945 100% European Union budget guarantee - Russia – 100 m – 2001-2005 14 16 - Russia – 500 m – 2004-2007 114 131 - EFSD 93 0 Total 100% European Union budget guarantee 221 147 75% European Union budget guarantee 70% European Union budget guarantee - South Africa – 375m – Decision 29.01.97 9 14 - Bosnia–Herzegovina – 100m 99/2001 8 11 - Euromed (EIB) – 2 310m – Decision 29.01.97 7 14 - North Macedonia – 150m – 1998/2000 5 9 - CEEC – 3 520m – Decision 29.01.97 32 75 Total 70% European Union budget guarantee 61 123 65% European Union budget guarantee - South Africa – 825m – 7/2000-1/2007 73 86 - South Africa – Decision 2/2007-12/2013 102 142 - ALA III – 2 480m –- 2/2000 – 7/2007 60 88 - ALA Decision – 2/2007-12/2013 1,327 1,484 - Euromed II – 6 520m – 2/2000-1/2007 710 928 - South Eastern Neighbours – 9 185m – 2/2000 – 7/2007 2,272 2,542 - Türkiye special action – 450m – 2001-2006 92 98 - Türkiye TERRA – 600m – 11/1999-11/2002 223 244 - PEV EE/CAS/RUS 1/2/2007 – 31/12/2013 1,755 1,877 - PEV MED 1/2/2007 – 31/12/2013 4,630 5,180 - Pre-Accession – 9 048m – 2007 – 2013 4,713 5,127 - Climate Change Mandate 2011 - 2013 1,031 1,056 - ELM Asia 2014-2020 1,289 1,276 - ELM Central Asia 2014-2020 355 352 - ELM East-Russia 2014-2020 6,996 7,258 - ELM Latin America 2014-2020 2,906 2,757 - ELM MED 2014-2020 9,121 9,650 - ELM Pre-Accession 2014-2020 4,018 4,151 - ELM RSA 2014-2020 140 272 - ELM ERI Private Mandate 1,160 1,394 - ELM ERI Public Mandate 1,403 1,397 - Global Europe NDICI 4,509 0 Total 65% European Union budget guarantee 48,885 47,359 Total European Union budget guarantee 49,167 47,629 Total(1) 53,034 51,574 (1) Financial guarantees granted by the Group for a total amount of EUR 487.5 million (2021: EUR 459.1 million) which are secured by Member States or the EU budget. The aforementioned guarantees are not included in the analysis as provided in table above. 142 |
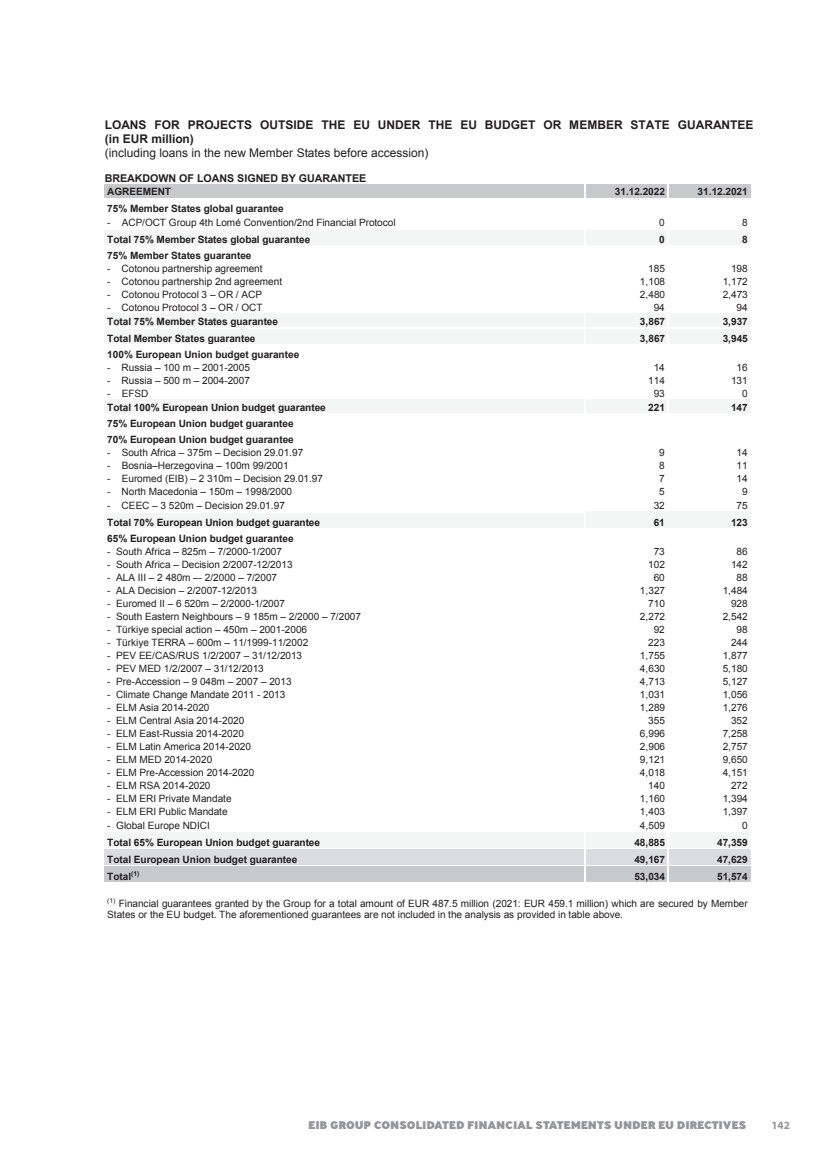
| 2022 FINANCIAL REPORT 151 Collateral on loans (in EUR million) Among other credit mitigant instruments, the Group uses pledges of financial securities. These pledges are formalised through a Pledge Agreement, enforceable in the relevant jurisdiction. The portfolio of collateral received in pledge contracts amounts to EUR 8,215 million (2021: EUR 12,596 million), with the following composition: As at 31 December 2022 Loan Financial Collateral (in EUR million) Moody's or equivalent rating Bonds Cash Total Government Supra-national Agency Secured Bonds (covered bonds) Bank and Corporate Bonds Aaa 234 65 0 68 9 0 376 Aa1 to Aa3 1,000 10 167 142 194 0 1,513 A1 0 0 0 0 6 0 6 Below A1 4,969 0 3 602 518 0 6,092 Non-Rated 40 0 0 0 29 159 228 Total 6,243 75 170 812 756 159 8,215 As at 31 December 2021 Loan Financial Collateral (in EUR million) Moody's or equivalent rating Bonds Cash Total Government Supra-national Agency Secured Bonds (covered bonds) Bank and Corporate Bonds Aaa 189 181 4 40 62 0 476 Aa1 to Aa3 1,042 14 10 694 149 0 1,909 A1 48 0 0 17 14 0 79 Below A1 8,212 0 39 94 598 0 8,943 Non-Rated 41 0 0 0 705 443 1,189 Total 9,532 195 53 845 1,528 443 12,596 A breakdown of disbursed loans outstanding (in EUR million) at 31 December, according to the sectors of the contract is set out below: Sector 2022 2021 Transports 126,633 129,253 Global Loans(1) 64,531 66,310 Energy 64,589 62,255 Health, education 36,902 36,296 Miscellaneous infrastructure 33,346 32,571 Industry 31,438 28,518 Water, sewerage 28,324 27,761 Services 18,187 16,980 Telecommunications 10,913 11,282 Agriculture, fisheries, forestry 4,961 4,238 Total (2) 419,824 415,464 (1) A global loan is a line of credit to an intermediary financing institution or a bank which subsequently lends the proceeds, at its own risk, to finance small and medium-sized projects being undertaken by private or public sector promoters. (2) This amount does not include disbursed loan substitutes (2022: EUR 17,414 million, 2021: EUR 17,953 million). Arrears on loans Amounts in arrears are identified, monitored and reported according to the procedures defined in the bank-wide “Financial Monitoring Guidelines and Procedures”. These procedures follow best banking practices and are adopted for all loans managed by the EIB. As of 31 December 2022, the arrears above 90 days on loans from own resources amount to EUR 78 million (2021: EUR 119 million). For arrears above 90 days on own resources not secured by comprehensive guarantees of the European Union or Member States, the outstanding principal nominal amount is EUR 150 million as of 31 December 2022 (2021: EUR 531 million). These are covered by a loan loss allowance of EUR 70 million (2021: EUR 75 million). During 2022, EUR 156 million of arrears have been called under the guarantees of the European Union and nothing was called under the Member States guarantees. Corresponding amounts in 2021 were EUR 93 million and nil respectively. Also, during the course of the year, EUR 4 million of arrears previously invoked under the guarantees of the European Union or the Member States have been refunded (2021: EUR 1 million). During 2022, no calls have been executed under first demand private guarantees (2021: EUR 358 million). 143 |
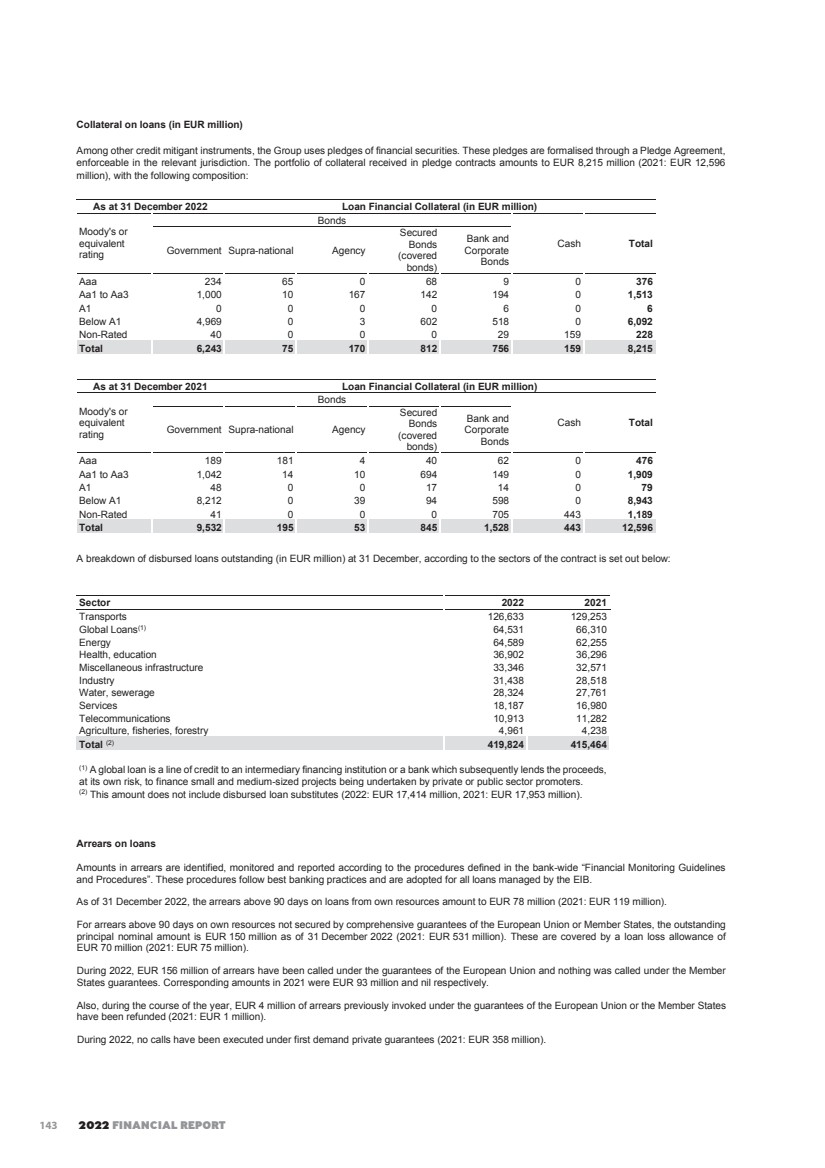
| EIB GROUP CONSOLIDATED FINANCIAL STATEMENTS UNDER EU DIRECTIVES 152 Loan renegotiation and forbearance The Group considers loans to be forborne loans (i.e. loans, debt securities and loan commitments) in respect of which forbearance measures have been extended. Forbearance measures consist of “concessions” that the Group decides to make towards an obligor who is considered unable to comply with the contractual debt service terms and conditions due to its financial difficulties, in order to enable the obligor to service the debt or to refinance, totally or partially, the contract. Exposures shall be treated as forborne if a concession has been made, irrespective of whether any amount is past-due, or the exposure is classified as defaulted. Exposures shall not be treated as forborne when the obligor is not in financial difficulties. Once renegotiated, the Group will continue to closely monitor these loans. If the renegotiated payment terms will not recover the original carrying amount of the asset, the Group will consider accounting for value adjustments in the profit and loss account. The need for a value adjustment for all loans whose Loan Grading (‘LG’) deteriorated to E- is assessed regularly. The Group has provided a number of supportive measures available to its borrowers in response to the specific economic effects of the Covid-19, which include, among other things, (i) the temporary easing (including waivers) of financial covenants and other key clauses, (ii) the re-profiling of cash flows by setting new repayment schedules or the temporary standstill of repayment obligations and (iii) certain other complementary supportive measures, such as the signing of new contracts, accelerating loan disbursements and increasing amounts lent to borrowers. The Group assessed requests for such measures on a case-by-case basis within the limits of certain specific conditions. These measures were intended to be extended to borrowers which were not experiencing any structural financial difficulties or solvency issues and were considered to be a going concern at the time of granting such measures. If, as a result of the assessment, a borrower did not meet these requirements or the Group identified risks for the long-term sustainability of the borrower’s business model, it has considered any other appropriate measures and, if necessary, follow the Group’s standard restructuring processes. Such supportive measures are not made available by the Group any longer since June 2021. Forbearance measures and practices undertaken by the Group’s restructuring activities during the reporting period include, but are not limited to, extension of maturities, deferral of capital only, deferral of capital and interest, breach of material covenants and capitalisation of arrears. Operations subject to forbearance measures are reported as such in the tables below. (in EUR million) 31.12.2022 31.12.2021 Performing Non-Performing Performing Non-Performing Number of contracts subject to forbearance practices 53 79 88 74 Carrying values (incl. interest and amounts in arrears) 2,256 2,054 4,693 2,511 of which being subject to value adjustments 0 1,418 0 1,243 Value adjustments recognised 0 307 0 407 Interest income in respect of forborne contracts 75 70 121 73 Exposures derecognised (following restructuring, write-off or sale of the operation) 0 3 0 34 Forbearance measures (in EUR million) 31.12.2021 Extension of maturities Deferral of capital only Deferral of capital and interest Breach of material financial covenants Other Contractual repayment and termination(1) 31.12.2022 Public 2,929 0 0 0 229 0 -2,138 1,020 Bank 280 0 0 0 36 9 -190 135 Corporate 3,995 40 0 0 90 160 -1,130 3,155 Total 7,204 40 0 0 355 169 -3,458 4,310 (1) Decreases are explained by repayments of capital, interest and amounts in arrears as well as write-offs which occurred during the year on operations already considered as forborne as of 31 December 2021 and by termination during the year. 144 |
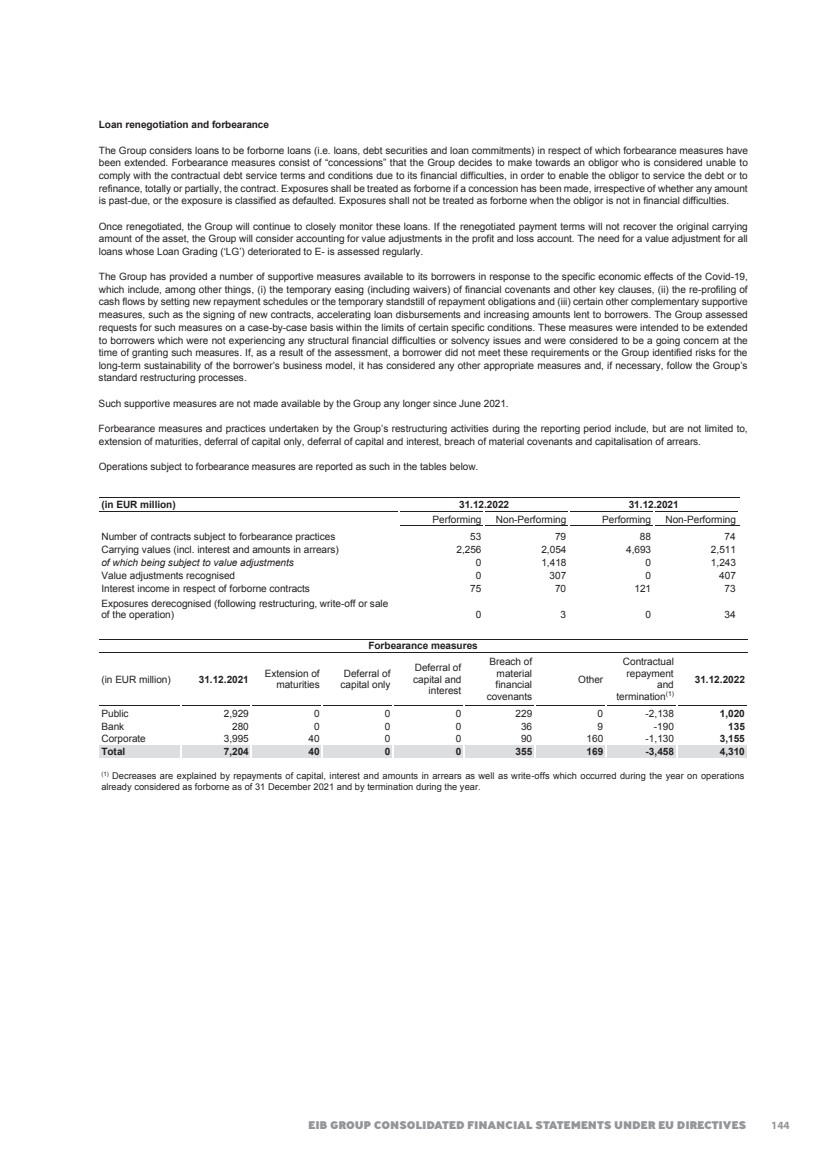
| 2022 FINANCIAL REPORT 153 U.2.2. Treasury The credit risk associated with treasury instruments (securities, commercial papers, term deposits, etc.) is managed through selecting sound counterparties and issuers. The structure of the securities portfolio and limits governing outstanding treasury instruments have been laid down by the Management. These limits are reviewed regularly by the Group Risk and Compliance Directorate. The table below provides a percentage breakdown of the credit risk associated with the securities in the Treasury portfolios and the money markets products (deposits and reverse repos) in terms of the credit rating of counterparties and ultimate obligor rating or issue rating where relevant: Moody’s or equivalent rating Securities portfolio % Money market products % 31.12.2022 31.12.2021 31.12.2022 31.12.2021 Aaa 32 13 89 82 Aa1 to Aa3 36 21 4 8 A1 to A3 22 39 5 9 Below A3 10 27 2 1 Total 100 100 100 100 The total nominal amount of the Group's consolidated treasury assets with maturity above 1 year and a minimum rating of Aa3 stood at EUR 5,193 million at 31 December 2022 (2021: EUR 3,907 million). Collateral on treasury transactions The Group enters into collateralised reverse repurchase and repurchase agreement transactions that may result in credit exposure in the event that the counterparty to the transaction is unable to fulfil its contractual obligations. The Group controls credit risk associated with these activities by monitoring counterparty credit exposure and collateral values on a daily basis and requiring additional collateral to be deposited with the Group when deemed necessary. Tripartite repo and reverse repo operations are carried out with a third-party custodian who undertakes, on the basis of a framework contract, to guarantee compliance with the contractual terms and conditions, notably with respect to: - delivery against payment; - verification of collateral; - the collateral margin required by the lender which must always be available and adequate, with the market value of the securities being verified daily by the custodian; and - organisation of substitute collateral provided that this meets all the contractual requirements. Collateral received The treasury transactions include EUR 7,381 million (2021: EUR 13,894 million) of bilateral and tripartite reverse repurchase agreements, out of which for EUR 7,381 million (2021: EUR 13,334 million) the Group received financial collaterals and for EUR 0 (2021: EUR 560 million) commodities. Bilateral and tripartite repurchase agreements stood at EUR 3,065 million at 31 December 2022 (2021: EUR 5,717 million). The exposure is fully collateralised with subsequent call for additional collateral or release in accordance with the underlying agreement. The market value of the financial collateral portfolio at 31 December 2022 is EUR 7,000 million (2021: EUR 13,557 million), with the following classification: Reverse Repurchase Agreements Financial Collateral (in EUR million) At 31 December 2022 Bonds Cash Moody's or equivalent rating Government Supra-national Agency Secured Bonds (covered bonds) Bank and Corporate Bonds Total Aaa 319 23 51 1,310 2,354 0 4,057 Aa1 to Aa3 241 0 29 8 215 0 493 A1 8 0 233 0 343 0 584 Below A1 217 0 44 4 1,169 0 1,434 Non Rated 425 0 0 0 6 1 432 Total 1,210 23 357 1,322 4,087 1 7,000 Reverse Repurchase Agreements Financial Collateral (in EUR million) At 31 December 2021 Bonds Cash Moody's or equivalent rating Government Supra-national Agency Secured Bonds (covered bonds) Bank and Corporate Bonds Total Aaa 998 655 712 1,480 4,192 0 8,037 Aa1 to Aa3 2,047 78 389 8 300 0 2,822 A1 583 0 65 0 130 0 778 Below A1 1,637 0 20 0 222 0 1,879 Non Rated 38 0 0 0 1 2 41 Total 5,303 733 1,186 1,488 4,845 2 13,557 145 |
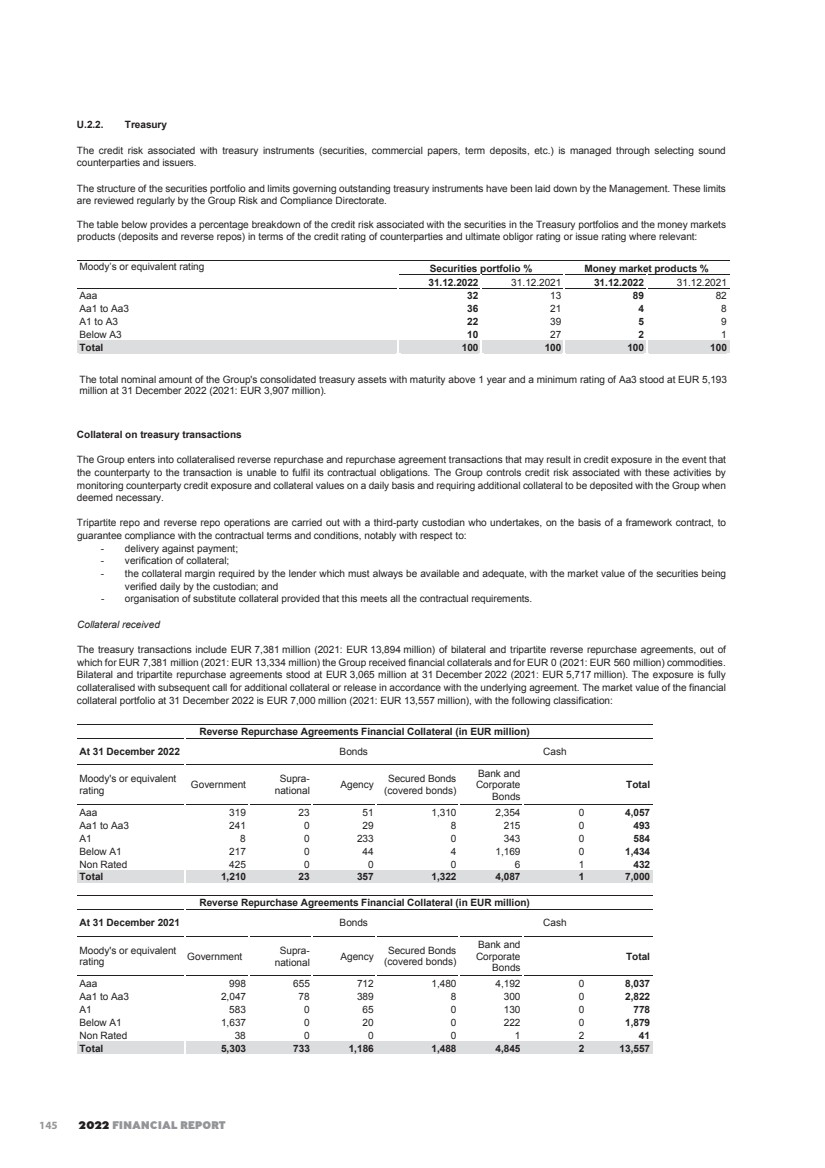
| EIB GROUP CONSOLIDATED FINANCIAL STATEMENTS UNDER EU DIRECTIVES 154 Securities deposited In the context of the Eurosystem’s monetary policy operations, the Group deposited securities with the Central Bank of Luxembourg with a market value of EUR 141 million as at 31 December 2022 (2021: EUR 14.9 billion). The market value of the collateral deposited (except to BCL) under bilateral and tripartite repurchase agreements stood at EUR 3,054 million as at 31 December 2022 (2021: EUR 5,711 million). U.2.3. Guarantees & securitisations entered into by the Group Credit risk arising from the Group’s guarantees and securitisations transactions funded by own resources is managed in line with dedicated internal guidelines. At year-end of 2022, the signed exposure guaranteed by the Group amounted to EUR 31.9 billion (2021: EUR 30.9 billion) out of which there is EUR 20.3 billion (2021: EUR 16.7 billion) of disbursed exposure of the loans guaranteed and provisions on guarantees amount to EUR 98.0 million (2021: EUR 39.3 million). Part of the Group guarantee type of operations derives from the risk sharing operations where the Group guarantees either (i) on a loan-by-loan or (ii) a portfolio basis underlying loan type of exposures originated by a financial intermediary based on established delegation models. The financial intermediary originating the underlying risk exposures on which the Group takes risk is subject to a detailed due diligence in order to make sure that the Group can delegate credit management tasks to the financial intermediary in question. In these types of transactions, the Group might be exposed on a pro-rata basis or via a structure with a certain degree of subordination. In addition to this, the Group can also enter into securitisations transactions. The EIB has established a dedicated framework to limit concentration risk for this type of transactions. Depending on the specificities of the transaction, this may include setting eligibility criteria including but not limited to lowest eligible rating categories, certain sector, obligor and/or obligor group exposure. Formally speaking there is limited counterparty risk on the financial intermediary as the credit risk is on the underlying exposures originated by the financial intermediary i.e. counterparty risk is limited to (1) the payment of the guarantee fees and (2) the potential recoveries due to the EIB in case of a default of an underlying exposure guaranteed and paid out by the EIB. In any case, the Group has established a number of mitigating measures, including but not limited to detailed due diligence as well as security rights, step-in rights, consent rights on material amendments of the underlying risk exposures or termination rights. U.3. Interest Rate Risk for the Group From the Group’s positions, the Interest Rate Risk is the risk to the economic value or to the net interest income arising from adverse movements in interest rates that affect interest rates sensitive instruments. Exposure to interest rate risk occurs when there are differences in repricing and maturity characteristics of the different asset, liability and hedge instruments. The Group Risk Appetite Framework contains two interest rate risk indicators managed within pre-approved limits: The “Risk to Economic Value” and the “Risk to Earnings” (see U.3.1.), which are, however defined on EIB standalone level. The EIF’s Risk Appetite Framework does not currently include such interest rate risk indicators, but EIF instead allocates economic capital to cover its interest rate risk exposures. In doing so, the EIF is following the Group capital measurement methodology for Interest Rate Risk in the Banking Book (‘IRRBB’). The following sections detail the operational implementation of the Interest Rate Risk management framework of each entity. U.3.1. Interest rate risk management for the Bank (‘EIB’) In measuring and managing interest rate risk, the Bank refers to the relevant key principles of the Basel Committee on Banking Supervision (‘BCBS’) as implemented in the EU, and to the regulatory guidance issued by the European Banking Authority (‘EBA’). The main sources of interest rate risk are: gap risk, basis risk and option risk. Gap risk is the most relevant interest rate risk for the Bank and is defined as the risk to the economic value or to the net interest income generated by the differences in the term structure of interest rate sensitive instruments on the Bank’s balance sheet. Following regulatory guidance, the Bank has articulated its appetite for interest rate risk in terms of both the maximum Risk to Economic Value and the maximum Risk to Earnings that the Bank is prepared to take (while, when applicable, adhering to the maximum thresholds defined in the EBA Supervisory Outlier Tests). The Bank’s investment strategy for its own funds – the Interest Rate Risk Strategy – complies with such interest rate risk appetite. The effect of the Russian invasion of Ukraine has contributed to rising inflationary trends and high inflation was followed by increases in interest rates, being translated into positive impact on the Bank’s net interest revenue. IBOR Reform Interest rate benchmarks, such as the London InterBank Offered Rate (‘LIBOR’) were widely used in financial contracts. The global transition to alternative interest rate benchmark rates is one of the most challenging reforms undertaken in the financial markets. Similarly to other Banks, EIB has significant exposure to IBORs on its financial instruments that are in the scope of the reform as part of these market-wide initiatives. 146 |
| 2022 FINANCIAL REPORT 155 Internal preparations In February 2018, the Assets & Liabilities Committee (‘ALCO’) set up a dedicated sub-ALCO working group on IBORs, the IBOR Working Group to proactively follow and monitor the developments related to the transition to alternative interest rates. The objectives of the IBOR Working Group included the monitoring of the developments related to the interest rate benchmark reform. This oversight covers, among others, the progress on contracts amendments, bilateral negotiations with clients, IT systems and applications updates, introduction of fall-back language in new contracts and regular monitoring of the exposure to IBORs per currency, asset class and jurisdiction of the interest rate benchmarks earmarked for discontinuation. The progress in the implementation of the established work-plan has been regularly monitored and discussed at the ALCO, and periodically reported to the Senior Management and the Audit Committee. Risk considerations The main risks in the context of the IBOR reform are operational and financial. They are related to e.g. updating of IT systems including booking, settlement/payment, valuation and risk systems; revision of operational controls related to the reform; operational challenges associated with the amendment of contracts (including bilateral negotiations for loan contracts) and introduction of fall-back provisions; potential basis risk among the different transaction types. The latter is mitigated with the introduction of robust and, to the extent possible and practicable, consistent fall-backs across financial products. Transition status per financial instruments class As part of its lending and funding activities, the Bank is mainly exposed to the IBOR Reform on Floating Rates Loans granted to customers and credit institutions and bonds issued to fund its activity. In order to manage exposures to interest rate and foreign currency risks, the Bank uses derivative instruments (e.g. to hedge fixed rates loans and borrowings operations). Derivatives are the largest financial instrument class directly exposed to IBOR rates as a large part of their corresponding cash flows are referenced to IBOR rates (i.e., “floating interest rate”). In 2021, the Bank adhered to the ISDA IBOR Fallback Protocol and Supplement, which provide an amendment mechanism for counterparties to incorporate robust Fallback provisions to be applied upon the cessation of an interest rate index, ensuring a smooth transition of the derivatives legacy portfolio. All EIB’s counterparties to LIBOR-linked swaps have also adhered to that Protocol and Supplement. Through the application of this Protocol and Supplement, the Bank had migrated in its systems all of its derivative notional exposure referring to LIBORs (in GBP, CHF, JPY and USD) by the end of 2022. Floating Rate Loans are the second largest financial instrument class directly exposed to IBOR rates. As at 31 December 2022, no contract originally indexed to CHF, JPY and GBP is linked to LIBOR any longer. During 2022, the Bank has pursued the migration of the loans indexed to USD LIBOR. The USD LIBOR legacy portfolio is larger than that previously pertaining to GBP, CHF and JPY LIBOR and it is also more geographically diversified (with circa 75% clients located in outside-EU countries). 75% of borrowers have already expressed their product preference and relevant repapering is expected to be signed in early 2023. While the majority of the exposure is expected to be migrated by the first interest payment date after the cessation date of 30 June 2023, a partial reliance on synthetic LIBOR is likely to be needed. In parallel to the migration, the Bank has adapted its lending products portfolio for new loan origination. On the funding side, the Bank has been issuing bond products referencing new RFRs in its balance sheet since 2018. In addition, the Bank has focused on supporting the relevant RFR markets with the required liquidity, under the preferred market structural formats. As at 31 December 2022, of the bonds indexed to USD LIBOR, 56% of the carrying amount will mature before end-June 2023. The remaining 44% will be assessed during the first semester of 2023 and appropriate exposure mitigation opportunities will be considered. U.3.1.1. Interest rate risk on the Economic Value of the Own Funds/Equity of the Bank The Bank’s Interest Rate Risk strategy aims at maintaining a balanced and sustainable revenue profile as well as limiting the risk of the economic value of the Group. A clear preference has been given to the revenue profile in light of the objective of self-financing future growth. This overall objective is achieved by investing the own funds according to a medium to long-term investment profile. Of course, this strategy needs to comply with the limits for the RAF metrics “Risk to Earnings” and “Risk to Economic Value”. Apart from the Interest Rate Strategy underpinning the investment of the Bank’s own funds (implying an own funds duration target within the range of currently 4.5 – 5.5 years), the Bank’s balance sheet should be match-funded with respect to interest rate risk. As it is not operationally practical to perfectly match-fund the Bank’s balance sheet, small deviations to gap and basis risks are allowed. Those net residual interest rate risk positions are managed within pre-approved limits, the latter being dimensioned to ensure the individual risks remain within the risk appetite boundaries. In addition to its interest rate risk limits framework, the Bank performs regular stress testing, based on EBA standardised shock scenarios5 and internally defined ones, to its projected earnings and to its economic value. The exercise serves the purpose of identifying potential adverse consequences arising from severe changes in the interest rates environment. The stress test on the economic value is performed on Group level. As of 31 December 2022, the worst impact of the EBA supervisory outlier test scenarios would reduce the economic value of own funds of the EIB Group by EUR 5.44 billion (2021: EUR 4.37 billion) 6. Among the financial instruments in the Bank’s portfolio, some operations (borrowings and associated swaps) present callability options and may be redeemed early, hence introducing uncertainty as to their final maturity. However, as those packages (borrowings and associated swaps) are fully back-to-back (up to the cashflow level), they can be considered at the end as simple synthetic floating rate notes indexed to Libor/Euribor and bearing limited interest rate risk. The table hereafter is a summary of the features of the Group’s callable borrowings portfolio as of 31 December 2022 and 31 December 2021, where the total nominal amount, the average natural maturity and the average expected maturity (both weighted by the nominal amount of the concerned transactions) are shown per funding currency and per main risk factor involved: 5 EBA/GL/2018/02. 6 The stress test is performed on all risk-sensitive banking book instruments, including the pension and health insurance liabilities (defined benefit obligations, DBO) as calculated by an actuarial provider. 147 |
| EIB GROUP CONSOLIDATED FINANCIAL STATEMENTS UNDER EU DIRECTIVES 156 By risk factor involved: 31.12.2022 Risk factor (in EUR million) FX level IR curve level Total EUR Pay Notional -283 -3,333 -3,616 Average maturity date 18.07.2035 17.02.2044 17.06.2043 Average expected maturity 21.05.2032 15.12.2037 08.07.2037 31.12.2021 Risk factor (in EUR million) FX level IR curve level Total EUR Pay Notional -323 -3,620 -3,943 Average maturity date 01.01.2036 09.03.2045 07.06.2044 Average expected maturity 13.02.2029 07.12.2029 13.11.2029 U.3.1.2. Interest rate risk on the Earnings of the Bank The Risk to Earnings quantifies the amount of net interest income that would change during the forthcoming 36 months if all interest rate curves would decrease by two percentage points. Such exposure stems primarily from the mismatch between interest rate repricing periods of assets and liabilities, and has to stay within the limit defined in the Risk Appetite Framework. With the positions in place as of 31 December 2022, the earnings would decrease by EUR 920.5 million (2021: EUR 992.4 million) if interest rates were to decrease by 200 basis points. For enriching the analysis of the earnings’ sensitivity, the earnings would increase by EUR 937.3 million (2021: EUR 1,014.7 million) if interest rates were to increase by 200 basis points. The Bank uses a dedicated software that allows to simulate the sensitivity of earnings on a deal-by-deal basis. The sensitivity of earnings is measured on an accruals basis and is calculated under the ‘’ongoing’’ assumption that, over the time horizon analysed, the Bank realises (at market rates defined in the underlying scenario) the new loan business forecast in the Operational Plan, maintains exposures within approved limits and executes monetary trades to refinance funding shortages or invest cash excesses. In line with the Bank’s current practice, the model uses the hypothesis that simulated earnings are not distributed to the shareholders, but are used to refinance the Bank’s business. The administrative costs are projected according to the forecasts of the Operational Plan. U.3.2. Interest rate risk management for the Fund (‘EIF’) Even though EIF does not fund itself on capital/money markets, EIF is exposed to Interest Rate Risk, primarily to the gap risk. The major interest rate sensitive exposures at EIF are its pension Defined Benefit Obligations (DBO) on the liabilities side and its fixed income treasury book on the assets side. Although EIF’s risk appetite statement does not currently include interest rate risk indicators and does not have an articulated Interest Rate Risk Strategy, EIF allocates economic capital to cover its interest rate risk exposures. EIF is following the Group capital measurement methodology for Interest Rate Risk in the Banking Book (‘IRRBB’), i.e. EIF interest rate risk is assessed from both the Normative and from the Economic perspectives, with the worse of the two being considered under the Economic Capital (‘ECap’) ratio. U.4. Liquidity and funding risk Liquidity risk refers to the ability of the Group to fund increases in assets and meet obligations as they come due, without incurring unacceptable losses. It can be further split into funding liquidity risk and market liquidity risk. Funding liquidity risk is connected to the risk for the Group to be unable to refinance the asset side of its balance sheet and to meet payment obligations punctually and in full out of readily available liquid resources. Funding liquidity risk may have an impact on the volatility in the economic value of, or in the income derived from Group’s positions, due to potentially increasing immediate risks to meet payment obligations and the consequent need to borrow at unattractive conditions. By funding currency (after swaps): 31.12.2022 (in EUR million) EUR USD Total EUR Pay Notional -2,467 -1,149 -3,616 Average maturity date 05.04.2046 09.06.2037 17.06.2043 Average expected maturity 01.04.2039 21.10.2033 08.07.2037 31.12.2021 (in EUR million) EUR USD Total EUR Pay Notional -2,659 -1,284 -3,943 Average maturity date 19.03.2047 06.09.2038 07.06.2044 Average expected maturity 02.01.2031 07.07.2027 13.11.2029 148 |
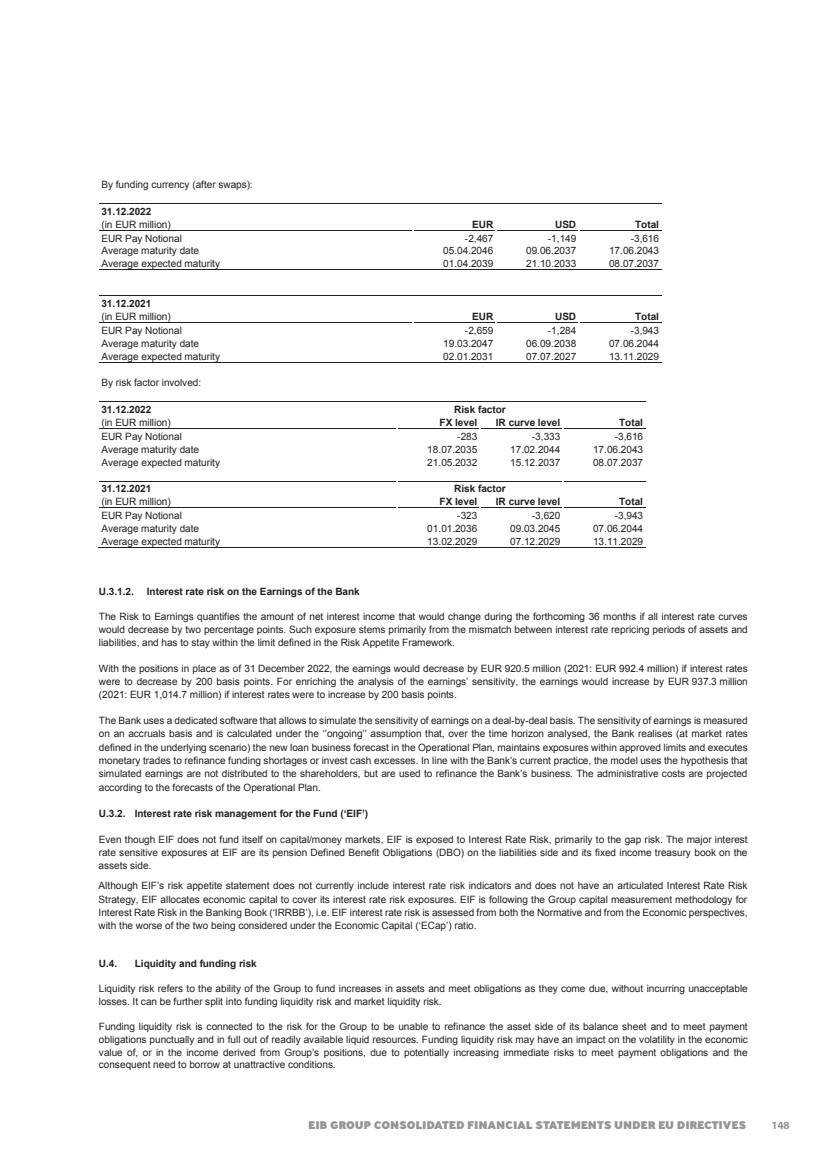
| 2022 FINANCIAL REPORT 157 Market liquidity risk is the volatility in the economic value of, or in the income derived from, the Group’s positions due to potential inability to execute a transaction to offset, eliminate or reduce outstanding positions at reasonable market prices. Such an inability may force early liquidation of assets at unattractive prices when it would be better to avoid such liquidation. This risk is tied to the size of the position compared to the liquidity of the instrument being transacted, as well as to potential deterioration of market availability and efficiency. Liquidity risk management of the Bank Liquidity risk is managed in order to ensure the regular functioning of the Bank’s core activities at reasonable cost. The main objective of liquidity policy is to ensure that the Bank can always meet its payment obligations punctually and in full. In contrast to commercial banks, the EIB does not have retail deposits but relies on its access to capital markets to raise the funds it on-lends to its clients. The Bank manages the calendar of its new issues so as to maintain a prudential liquidity buffer. Liquidity planning takes into account the Bank’s needs to service its debt, make disbursements on loans and cash inflows from the loan portfolio. It also takes into account the sizeable amount of signed but undisbursed loans, whose disbursements typically take place at the borrowers’ request. The Bank further assures management of liquidity risk by maintaining a sufficient level of short-term liquid assets and by spreading the maturity dates of its placements according to the forecasts of liquidity needs. The liquidity risk policy also incorporates a floor on treasury levels: indeed the Bank's total liquidity ratio (liquidity as a percentage of the next 12 months projected net cash flows) must at all times exceed 25%. The Group has in place a Group Contingency Funding Plan (‘Group CFP’), which specifies appropriate decision-making procedures and corresponding responsibilities. The Group CFP is regularly tested and benchmarked against applicable best banking practices, including relevant Guidelines issued by the European Banking Authority in this respect. The Group CFP is approved annually by the Board of Directors of the Bank. Regular stress-testing analyses are executed as a part of the liquidity risk monitoring and drive the size of the liquidity buffers of EIB and EIF. On 8 July 2009, the Bank became an eligible counterparty in the Eurosystem’s monetary policy operations, and therefore has been given access to the monetary policy operations of the European Central Bank. The Bank conducts the operations via the Central Bank of Luxembourg, where the Bank maintains deposits to cover the minimum reserve requirement and for other operational needs. The Liquidity Coverage Ratio (‘LCR’) is computed on a daily basis in line with EU CRR both in the functional currency (EUR) as well as in the other significant currencies. Consistency of the currency denomination of the liquid assets with the net liquidity outflows is ensured on an ongoing basis, in order to prevent an excessive currency mismatch. As at 31 December 2022, the Bank’s LCR stood at 348.0% (2021: 564.9%) and the Group LCR stood at 352.4% (2021: 586.0%). In addition, also the net stable funding ratio (‘NSFR’) is computed in line with EU CRR both in the functional currency (EUR) as well as in the other significant currencies. As at 31 December 2022, the Bank’s NSFR stood at 124.6% (2021: 130.0%) and the Group NSFR stood at 124.9% (2021: 130.1%). The Group continues to maintain a robust liquidity position and flexibility to access the necessary liquidity resources mainly as a result of its prudent approach to liquidity management. As a consequence, the war in Ukraine had very limited impact on liquidity and funding. Liquidity risk management of the Fund Liquidity risk is managed in such a way as to protect the value of the paid–in capital, ensure an adequate level of liquidity of the Fund to meet possible guarantee calls, private equity commitments and administrative expenditure and earn a reasonable return on assets invested with due regard to minimisation of risk. Liquidity risk measurement The table hereafter analyses the assets and liabilities of the Group by maturity on the basis of the period remaining between the balance sheet date and the contractual maturity date. Assets and liabilities for which there is no contractual maturity date are classified under "Maturity undefined". 149 |

| EIB GROUP CONSOLIDATED FINANCIAL STATEMENTS UNDER EU DIRECTIVES 158 Liquidity risk (in EUR million) Maturity at 31 December 2022 3 months or less More than 3 months to 1 year More than 1 year to 5 years More than 5 years Maturity undefined Total 2022 Assets: Cash in hand, balances with central banks and post office banks 113 0 0 0 0 113 Treasury bills and other bills eligible for refinancing with central banks 3,155 5,644 7,911 5,135 0 21,845 Other loans and advances: - Current accounts 984 0 0 0 0 984 - Credit institutions 64,011 200 0 0 0 64,211 - Customers 126 0 0 0 0 126 65,121 200 0 0 0 65,321 Loans: - Credit institutions 2,913 11,446 40,888 37,856 23 93,126 - Customers 5,595 18,108 115,010 187,671 89 326,473 8,508 29,554 155,898 225,527 112 419,599 Debt securities including fixed-income securities 1,319 519 3,114 6,208 0 11,160 Shares, other variable-yield securities and participating interests 0 0 0 73 10,223 10,296 Other assets 615 1,859 6,181 1,881 8,434 18,970 Total assets 78,831 37,776 173,104 238,824 18,769 547,304 Liabilities: Amounts owed to credit institutions 5,442 0 0 0 0 5,442 Amounts owed to customers 1,491 0 0 0 0 1,491 Debts evidenced by certificates 20,747 48,006 200,968 161,977 0 431,698 Subscribed capital, reserves, profit and minority interest 0 0 0 0 80,656 80,656 Other liabilities 981 1,698 5,425 3,630 16,283 28,017 Total liabilities 28,661 49,704 206,393 165,607 96,939 547,304 Some of the borrowings and associated swaps include early termination triggers or call options granted to the hedging swap counterparties and the Bank as well has the right to call the related bonds before maturity. If the Bank were to exercise all the call options on its bonds at their next contractual exercise date, cumulated early redemptions for the period 2023 – 2025 would amount to EUR 1.88 billion. Liquidity risk (in EUR million) Maturity at 31 December 2021 3 months or less More than 3 months to 1 year More than 1 year to 5 years More than 5 years Maturity undefined Total 2021 Assets: Cash in hand, balances with central banks and post office banks 1,483 0 0 0 0 1,483 Treasury bills and other bills eligible for refinancing with central banks 7,198 15,702 10,405 3,855 0 37,160 Other loans and advances: - Current accounts 798 0 0 0 0 798 - Credit institutions 71,400 3,349 0 0 0 74,749 - Customers 677 0 0 0 0 677 72,875 3,349 0 0 0 76,224 Loans: - Credit institutions 2,443 9,928 46,116 35,011 6 93,504 - Customers 5,083 19,702 107,548 189,266 394 321,993 7,526 29,630 153,664 224,277 400 415,497 Debt securities including fixed-income securities 1,358 2,856 3,461 4,296 0 11,971 Shares, other variable-yield securities and participating interests 0 0 0 0 9,569 9,569 Other assets 288 773 5,414 1,978 7,676 16,129 Total assets 90,728 52,310 172,944 234,406 17,645 568,033 Liabilities: Amounts owed to credit institutions 10,478 13,195 0 0 0 23,673 Amounts owed to customers 1,821 0 0 0 0 1,821 Debts evidenced by certificates 19,307 43,516 213,006 164,286 0 440,115 Subscribed capital, reserves, profit and minority interest 0 0 0 0 78,139 78,139 Other liabilities 331 1,472 3,774 3,163 15,545 24,285 Total liabilities 31,937 58,183 216,780 167,449 93,684 568,033 150 |
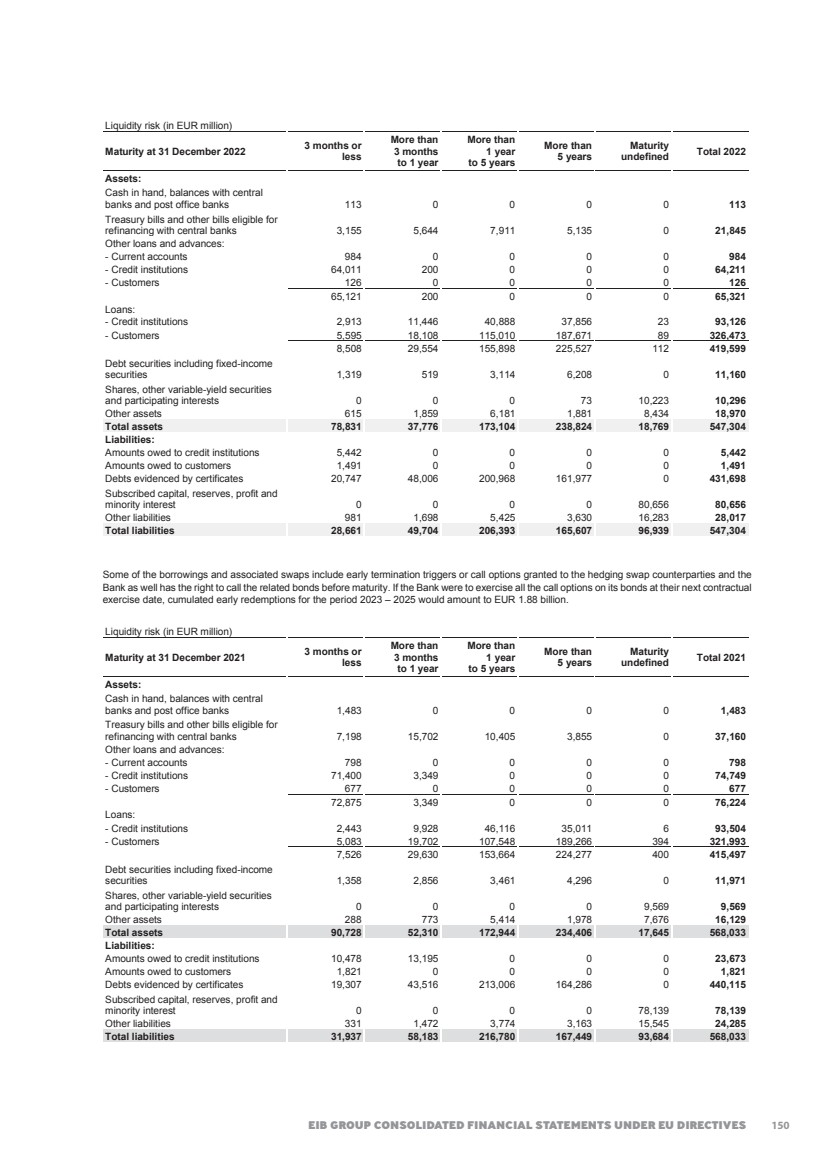
| 2022 FINANCIAL REPORT 159 U.5. Foreign exchange rate risk The foreign exchange (‘FX’) risk is the risk to the economic value or to the income derived from, the Group’s positions due to adverse movements of foreign exchange rates. The Group is exposed to a foreign exchange risk whenever there is a currency mismatch between its assets, liabilities and hedging instruments. In compliance with the Bank’s Statute and with the EIF Risk Appetite Framework, the Group does not engage in currency operations not directly required to carry out its core activities (more specifically: for the Bank, mismatches of currencies in the asset-liability structure are kept within pre-approved tight limits while, for EIF, open FX positions may arise from its Equity investments, in line with its Statutes and Risk Appetite Framework). Consequently, the Russian invasion of Ukraine had no adverse impact on the Group’s FX risk management. Foreign exchange position (in EUR million) Currency at 31 December 2022 Euro Pound Sterling US Dollar Other currencies Sub-total except Euro Total 2022 Assets: Cash in hand, balances with central banks and post office banks 113 0 0 0 0 113 Treasury bills and other bills eligible for refinancing with central banks 17,700 653 3,492 0 4,145 21,845 Other loans and advances: - Current accounts 737 83 57 107 247 984 - Credit institutions 59,640 0 36 4,535 4,571 64,211 - Customers 75 0 0 51 51 126 60,452 83 93 4,693 4,869 65,321 Loans: - Credit institutions 70,825 757 13,483 8,061 22,301 93,126 - Customers 270,031 27,231 9,404 19,807 56,442 326,473 340,856 27,988 22,887 27,868 78,743 419,599 Debt securities including fixed-income securities 6,511 34 2,547 2,068 4,649 11,160 Shares, other variable-yield securities and participating interests 8,584 512 831 369 1,712 10,296 Other assets 15,120 1,379 1,605 866 3,850 18,970 Total assets 449,336 30,649 31,455 35,864 97,968 547,304 Liabilities: Amounts owed to credit institutions 5,425 0 11 6 17 5,442 Amounts owed to customers 1,213 21 98 159 278 1,491 Debts evidenced by certificates: - Debt securities in issue 245,409 37,162 100,100 39,853 177,115 422,524 - Others 5,868 113 322 2,871 3,306 9,174 251,277 37,275 100,422 42,724 180,421 431,698 Subscribed capital, reserves, profit and minority interest 80,656 0 0 0 0 80,656 Other liabilities 23,882 1,320 1,783 1,032 4,135 28,017 Total liabilities 362,453 38,616 102,314 43,921 184,851 547,304 Off balance sheet currency swaps -87,076 8,020 70,938 8,118 87,076 Net position -193 53 79 61 193 151 |
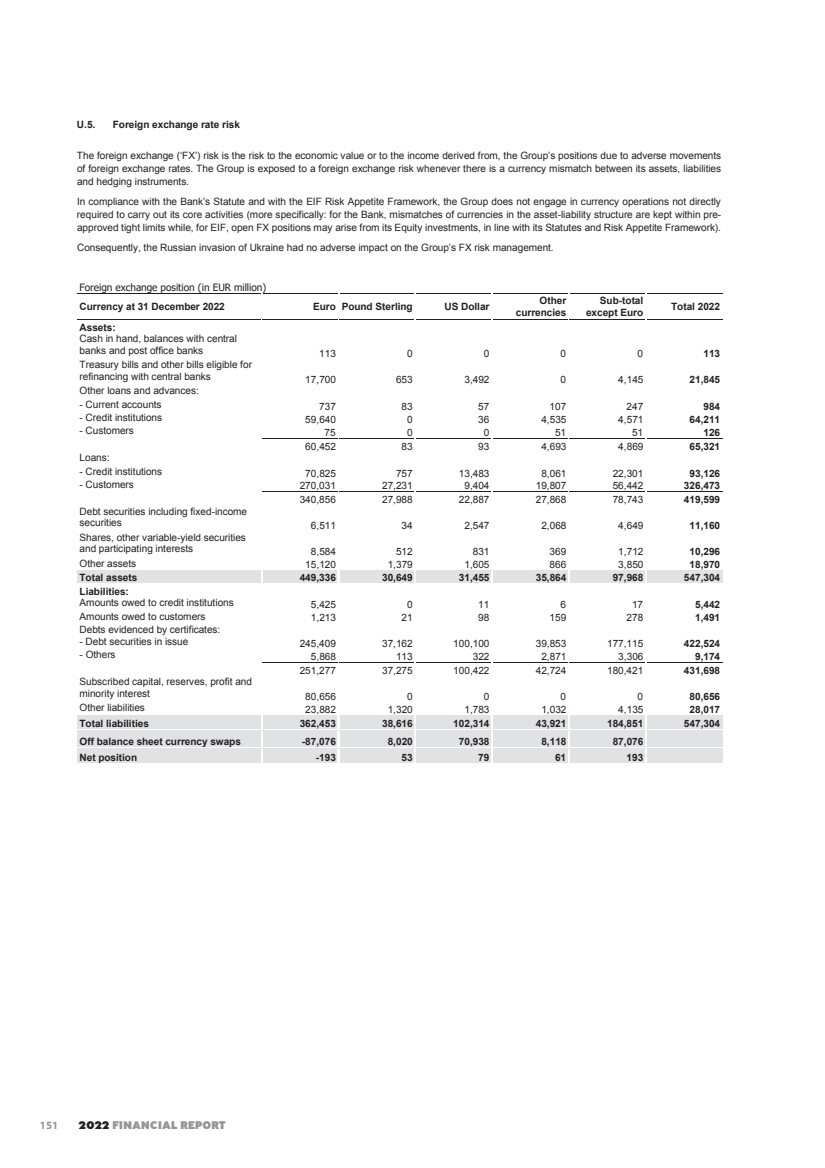
| EIB GROUP CONSOLIDATED FINANCIAL STATEMENTS UNDER EU DIRECTIVES 160 Foreign exchange position (in EUR million) Currency at 31 December 2021 Euro Pound Sterling US Dollar Other currencies Sub-total except Euro Total 2021 Assets: Cash in hand, balances with central banks and post office banks 1,483 0 0 0 0 1,483 Treasury bills and other bills eligible for refinancing with central banks 29,481 1,388 6,291 0 7,679 37,160 Other loans and advances: - Current accounts 579 58 46 115 219 798 - Credit institutions 64,708 2,052 1,035 6,954 10,041 74,749 - Customers 600 0 0 77 77 677 65,887 2,110 1,081 7,146 10,337 76,224 Loans: - Credit institutions 71,840 829 13,310 7,525 21,664 93,504 - Customers 261,909 30,971 8,225 20,888 60,084 321,993 333,749 31,800 21,535 28,413 81,748 415,497 Debt securities including fixed-income securities 5,288 0 1,809 4,874 6,683 11,971 Shares, other variable-yield securities and participating interests 7,809 699 729 332 1,760 9,569 Other assets 13,050 1,242 1,064 773 3,079 16,129 Total assets 456,747 37,239 32,509 41,538 111,286 568,033 Liabilities: Amounts owed to credit institutions 23,473 0 44 156 200 23,673 Amounts owed to customers 1,557 6 93 165 264 1,821 Debts evidenced by certificates: - Debt securities in issue 240,681 43,587 104,778 42,058 190,423 431,104 - Others 6,235 119 295 2,362 2,776 9,011 246,916 43,706 105,073 44,420 193,199 440,115 Subscribed capital, reserves, profit and minority interest 78,139 0 0 0 0 78,139 Other liabilities 20,413 1,670 1,270 932 3,872 24,285 Total liabilities 370,498 45,382 106,480 45,673 197,535 568,033 Off balance sheet currency swaps -86,378 8,190 74,023 4,165 86,378 Net position -129 47 52 30 129 U.6. Operational Risk As defined in the EIB Group Operational Risk Policy, Operational Risk means the risk of loss resulting from inadequate or failed internal processes, people and systems or from external events7. All Group’s activities may be affected by Operational Risk and therefore the Group aims to systematically identify, assess, monitor and report Operational Risks on a regular basis, and ensure that sufficient controls and risk mitigants are in place to limit the exposure to Operational Risk. The Operational Risk Unit in the EIB Group Risk & Compliance, the EIF Risk Management, and the Internal Controls and Assertion Division in Financial Control at the EIB, are responsible for defining the Group Operational Risk Framework and related policies while the responsibility for implementing the Framework lies with all the Departments of the Group. The Group organises its Operational Risk Management activities in compliance with the applicable Best Banking Practice (“BBP”). The Group revised in 2022 its Operational Risk Policy to align with a new, unified non-financial risk classification at Group level. In addition, the Group developed a comprehensive operational risk event reporting procedure in 2022, which has strengthened the implementation of the policy and developed a key network of operational risk champions in the EIB. The Group has also enhanced its Risk Appetite Framework with a streamlined definition of operational (key) risk indicators. In terms of reporting, the EIB Group Operational Risk Report is approved by the Group Chief Risk Officer (‘GCRO’) responsible for overall aspects of managing and monitoring Operational Risk and then submitted to the Management Committee (‘MC’), the Audit Committee (‘AC’) and Directors General (‘DGs’). In addition, losses/gains above EUR 0.25 million are immediately escalated to the President. At the EIF, the Operational Risk function within Risk Management provides regular reporting to the Audit Board (‘AB’) and the Senior Management. The Group has robust compliance controls, including a dedicated Sanctions Compliance Programme, ensuring that its activities comply with all existing EU sanctions and applicable U.S. and UK sanctions. With specific reference to sanctions targeting the Russian invasion of Ukraine, no material impact has been identified on Group’s business activities. 7 The definition of external events excludes cases of client bankruptcy or unfavourable market movements or similar events, which represent triggers for Credit and respectively Market Risk. 152 |
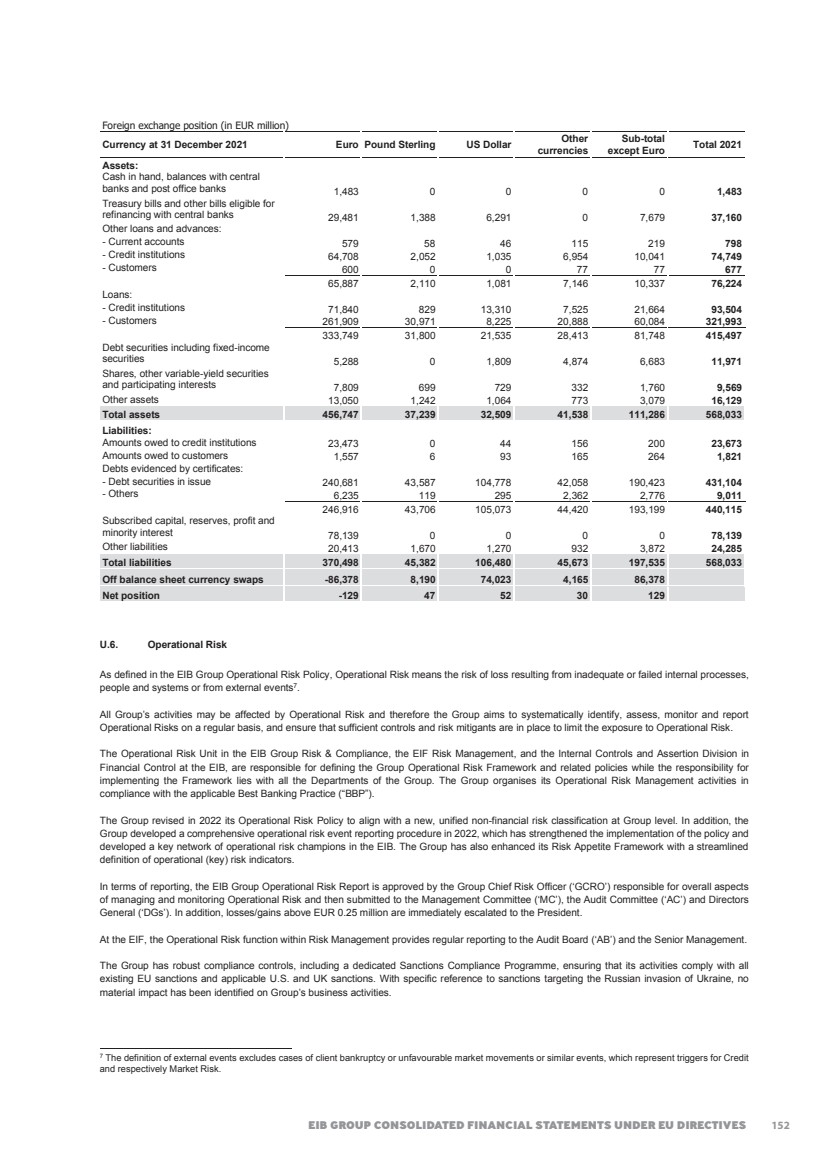
| 2022 FINANCIAL REPORT 161 The Group is a crucial institution of the European Union, and as such, it is a likely target for cyber-attacks. With the ongoing crisis in Ukraine, the risk of direct and spill-over attacks has increased, and the Group is closely monitoring this risk in collaboration with the Computer Emergency Response Team for the EU institutions, bodies and agencies (‘CERT-EU’). To ensure the security and integrity of its operations, the Group has implemented robust security measures to protect against cyber-attacks. Note V – Derivatives The Bank uses derivative instruments as part of its asset and liability management activities to manage exposures to interest rate and foreign currency risks, including exposures arising from committed transactions settling in the future, and as part of its liquidity management. Derivatives are financial instruments, the payoff of which depends on the prices of the underlying assets, interest rates, exchange rates or indices. The Fund does not use derivatives instruments. The majority of the Bank swaps are concluded to hedge borrowings, loans and bond holdings or for the global Assets and Liabilities Management (‘ALM’) position and are therefore of a long-term nature (see Note V.1.). The Bank also enters into short-term currency swap contracts in order to adjust currency positions in its operational treasury in relation to its benchmark currency, the euro, and to cater for demand for currencies in conjunction with loan disbursements (see Note V.2.). Future contracts (futures) can be used in the context of the treasury activities, to hedge the exposure deriving from some investments in government bonds. Futures are standardised derivatives, traded on regulated markets, and they do not fall within the general policy for counterparty risk measurement and control. V.1. Hedging and asset liability management (‘ALM’) derivatives The derivatives used in the context of hedging and ALM hedging activities are: • Currency swaps; • Interest rate swaps; and • Structured swaps. V.1.1. Currency swaps Currency swaps are contracts under which it is agreed to exchange principal and interest payments in one currency against another currency. The Bank enters into currency swaps mainly to hedge its borrowings and loans. The following table shows the maturities of currency swaps (including structured swaps – see Note V.1.3 and excluding short-term currency swaps – see Note V.2.), sub-divided according to their notional amount and fair value. The notional amounts are disclosed off balance sheet. Currency swaps at 31 December 2022 (in EUR million) 1 year or less More than 1 year and up to 5 years More than 5 years and up to 10 years More than 10 years Total 2022 Notional amount (receivable) 43,783 136,262 36,102 27,198 243,345 Fair value (i.e. net discounted value including CVA, DVA and CollVA)(*) 221 1,816 -744 26 1,319 Currency swaps at 31 December 2021 (in EUR million) 1 year or less More than 1 year and up to 5 years More than 5 years and up to 10 years More than 10 years Total 2021 Notional amount (receivable) 34,954 137,297 45,792 29,640 247,683 Fair value (i.e. net discounted value including CVA, DVA and CollVA)(*) -740 3,085 985 1,041 4,371 (*) Including the fair value of macro-hedging currency swaps which stood at EUR 2,530 million as at 31 December 2022 (2021: EUR 3,133 million). 153 |
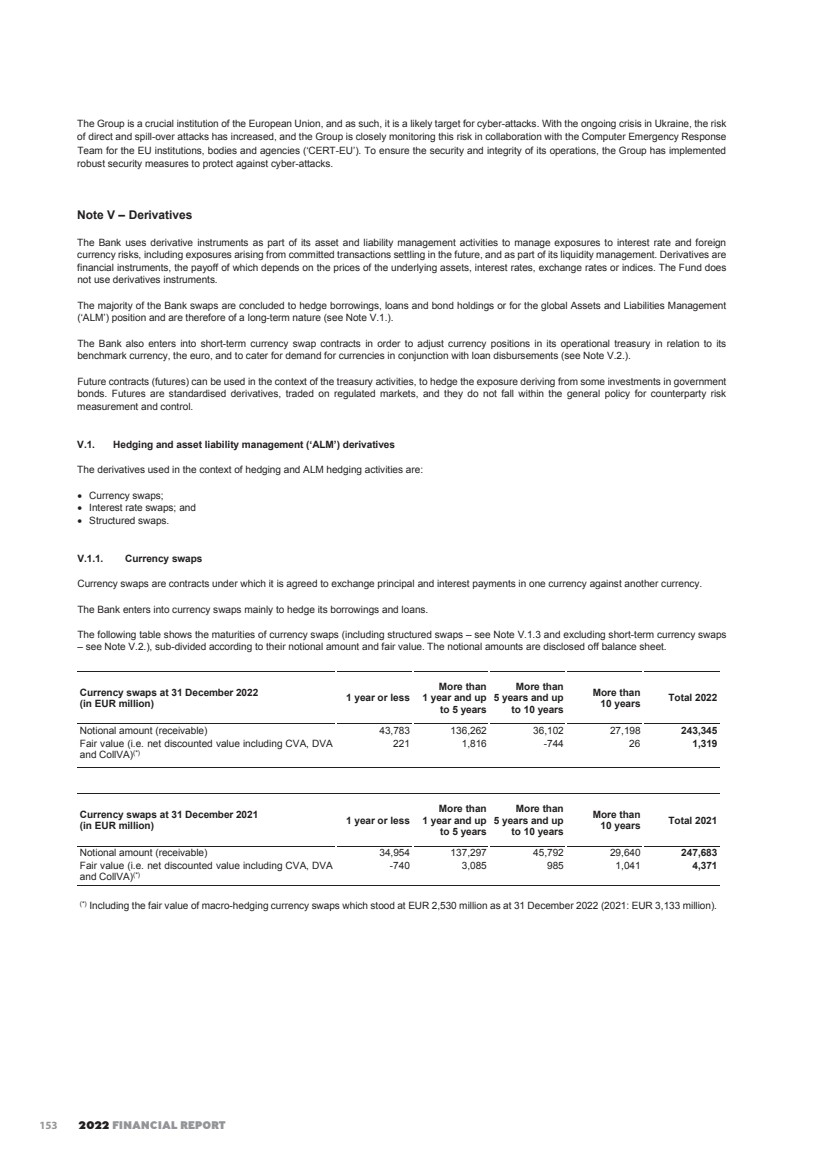
| EIB GROUP CONSOLIDATED FINANCIAL STATEMENTS UNDER EU DIRECTIVES 162 V.1.2. Interest rate swaps Interest rate swaps are contracts under which, generally, it is agreed to exchange floating-rate interest for fixed-rate interest payments, or floating-rate interest payments linked to different rates (basis swaps), in the same currency. Interest rate swaps enable the Bank to hedge the interest rate risk of its borrowings, loans and bond holdings, and modify the interest rate structure of the balance sheet. The following table shows the maturities of interest rate swaps (including structured swaps – see Note V.1.3 and including synthetic swaps, whereby interest computed in a foreign currency is synthetically converted to EUR), sub-divided according to their notional amount and fair value. The notional amounts are disclosed off balance sheet. Interest rate swaps at 31 December 2022 (in EUR million) 1 year or less More than 1 year and up to 5 years More than 5 years and up to 10 years More than 10 years Total 2022 Notional amount 75,935 230,220 131,299 135,571 573,025 Fair value (i.e. net discounted value including CVA, DVA and CollVA)(*) -700 -5,269 -4,092 993 -9,068 Interest rate swaps at 31 December 2021 (in EUR million) 1 year or less More than 1 year and up to 5 years More than 5 years and up to 10 years More than 10 years Total 2021 Notional amount 53,438 243,656 127,981 134,006 559,081 Fair value (i.e. net discounted value including CVA, DVA and CollVA)(*) 301 4,748 3,036 229 8,314 (*) Including the fair value of macro-hedging interest rate swaps which stood at EUR -349 million as at 31 December 2022 (2021: EUR -789 million). V.1.3. Structured swaps The Bank enters into borrowing contracts and loans encompassing options on interest rates, exchange rates, inflation rates and stock indices. Such structured borrowings and loans are entirely covered by swap contracts to hedge the corresponding market risk. The table below further details the number, value and notional amounts of structured swaps: Structured swaps at 31 December Early termination embedded Structured coupon 2022 2021 2022 2021 Number of transactions 119 127 156 162 Notional amount (in EUR million) 4,909 4,568 10,413 12,083 Fair value (i.e. net discounted value including CVA, DVA and CollVA) (in EUR million) -774 518 -2,310 -2,960 The fair value of structured swap transactions is computed using option pricing models, calibrated to available market prices of options. For a portion of derivative transactions, internal estimates and assumptions might be used in the valuation techniques when the market inputs are not directly available. All option contracts embedded in, or linked with, borrowings are negotiated over the counter. V.1.4. Derivatives credit risk mitigation policy The credit risk policy for derivative transactions is based on the definition of eligibility conditions and rating-related limits for swap counterparts. In order to reduce credit exposures, the Bank has signed Credit Support Annexes with most of its active swap counterparts and receives collaterals when the exposure exceeds certain contractually defined thresholds. The credit risk with respect to derivatives lies in the loss that the Bank would incur if the counterparty is unable to honour its contractual obligations. In view of the special nature and complexity of the derivatives transactions, a series of procedures has been put in place to safeguard the Bank against losses arising from the use of such instruments. 154 |
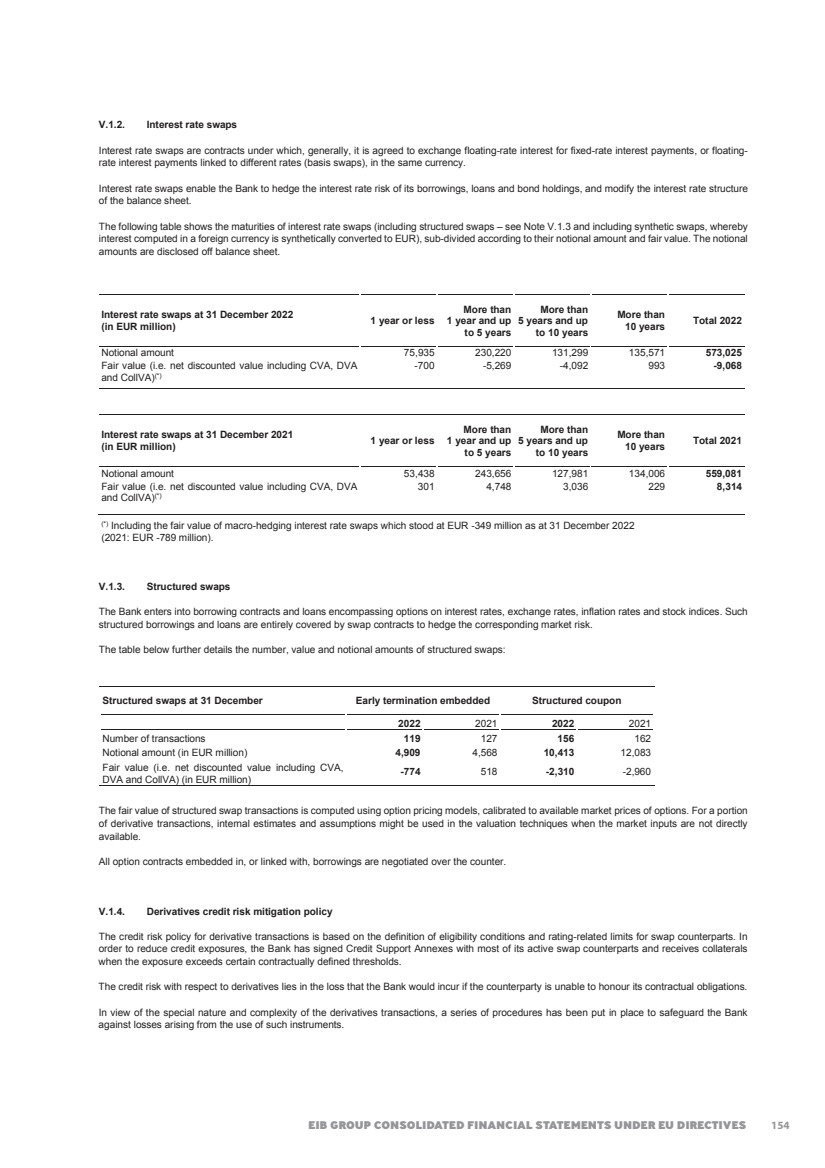
| 2022 FINANCIAL REPORT • Contractual framework: All of the Bank’s derivative transactions are concluded in the contractual framework of ISDA Swap Agreements and where applicable Credit Support Annexes, which specify the conditions of exposure collateralisation. These are generally accepted and practised contract types. Minimum conditions for new agreements are specified in the risk guidelines. • Counterparty selection: The minimum rating at the outset is set in the risk guidelines at A3. The EIB has in most cases the right of early termination if the counterparty rating drops below a certain level. • Collateralisation: − Exposures (in some cases subject to thresholds) are collateralised by cash and bonds. − Certain transactions are collateralised above the current market value. − Both the derivatives portfolio with individual counterparties and the collateral received are regularly monitored and valued, with a subsequent call for additional collateral or release. As part of the ISDA agreements, the Bank has received securities and cash that it is allowed to sell or repledge. The fair value of the securities accepted under these terms amounts to EUR 6,902 million as at 31 December 2022 (2021: EUR 15,399 million), with the following composition, detailed based on the nature of the collateral and based on Moody’s equivalent rating: Swap collateral (in EUR million) Moody's equivalent rating Bonds Cash Total 2022 Government Agency, supranational, covered bonds Aaa 780 546 0 1,326 Aa1 to Aa3 254 0 0 254 A1 to A3 0 0 0 0 Baa1 to Baa3 2,951 0 0 2,951 Non-Rated 0 0 2,371 2,371 Total 2022 3,985 546 2,371 6,902 Swap collateral (in EUR million) Moody's equivalent rating Bonds Cash Total 2021 Government Agency, supranational, covered bonds Aaa 1,042 962 0 2,004 Aa1 to Aa3 3,130 0 0 3,130 A1 to A3 6 0 0 6 Baa1 to Baa3 5,484 0 0 5,484 Non-Rated 0 0 4,775 4,775 Total 2021 9,662 962 4,775 15,399 The Bank has implemented the usage of an IT system, the Collateral management system (‘CMS’). The key objective of the CMS is to ensure that the Bank is capable to utilise for repos a real-time inventory of assets and collateral accepted in secured markets. Securities received as collateral for loans, derivatives and reverse repos, repos are valued in CMS on a daily basis, by using prices quoted in active markets, supplied by a Market Price Service Provider (i.e. Bloomberg) or, if quoted prices are not available, by using market-based valuations. • Credit risk measurement for derivatives: The credit risk associated with derivatives varies according to a number of factors (such as interest and exchange rates) and generally corresponds to only a small portion of their notional value. The Bank, for internal purposes, measures the credit risk exposure related to swaps and derivatives transactions using the Current Unsecured Exposure and the Potential Future Exposure for reporting and limit monitoring. It uses the Standardised Approach for Counterparty Credit Risk (SA-CCR) for regulatory capital allocation according to the Capital Requirements Regulation (CRR). The Bank computes the Current Unsecured Exposure, which is the larger of zero and the market value of the portfolio of transactions within the netting set with a counterparty, less the value of collateral received. It is the amount that would be lost upon the default of the counterparty, using the received collateral and assuming no recovery on the value of those transactions in bankruptcy as well as immediate replacement of the swap counterparty for all the transactions. As of 31 December 2022 the current unsecured exposure stood at EUR 165 million (EUR 927 million as of 31 December 2021). In addition, the Bank computes the Potential Future Exposure, which takes into account the possible increase in the netting set’s exposure over the margin period of risk of 20 business days. The EIB computes the Potential Future Exposure at 90% confidence level using stressed market parameters to arrive at conservative estimates. This is in line with the recommendations issued by regulators in order to take into consideration the conditions that will prevail in case of default of an important market participant. As of 31 December 2022 the Potential Future Exposure at origin stood at EUR 2,266 million (EUR 10,001 million as of 31 December 2021). 155 |
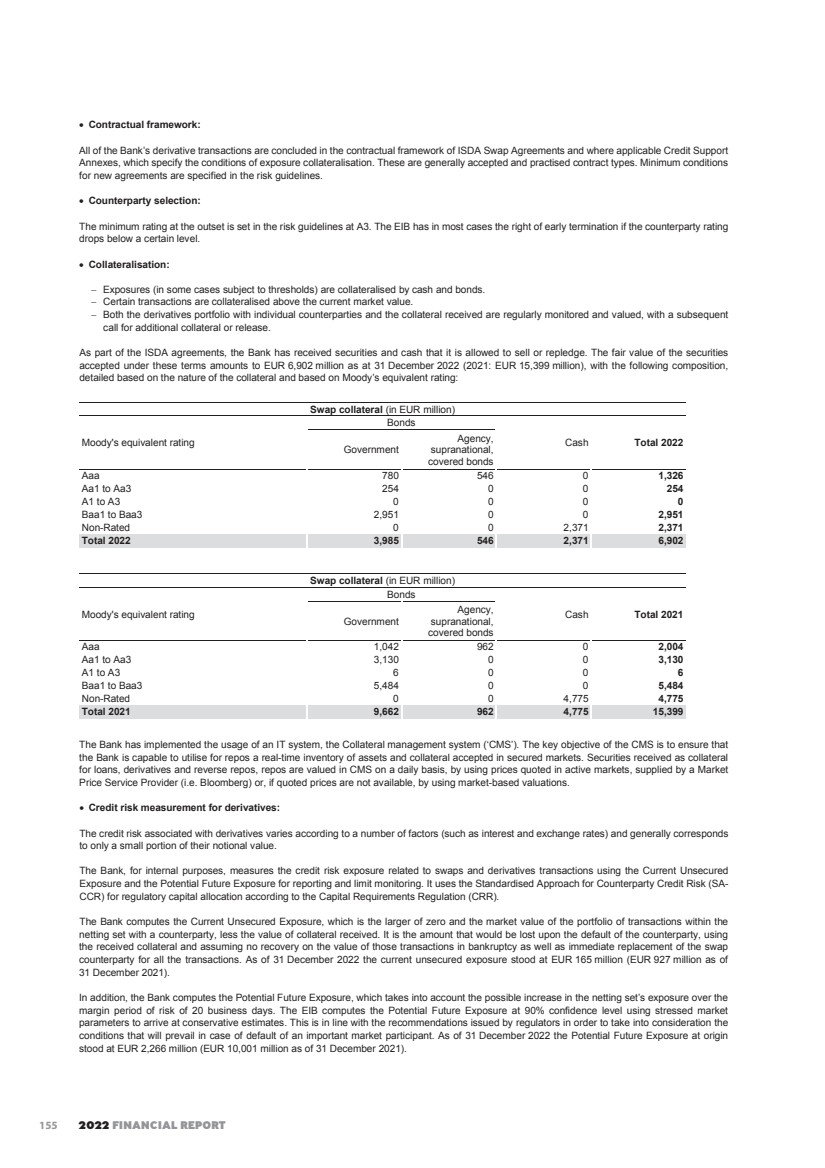
| EIB GROUP CONSOLIDATED FINANCIAL STATEMENTS UNDER EU DIRECTIVES • Limits: The limit system for banks covers the Potential Future Exposure in 3 time buckets (under 1 year, between 1 and 5 years and over 5 years) and in 2 rating scenarios (current and downgrade below A3). The derivatives portfolio is valued and compared against limits on a daily basis. The following table provides a breakdown of counterparties by internal rating. Grouped ratings Percentage of nominal Current Unsecured Exposure Potential Future Exposure (in EUR million) (in EUR million) Moody’s equivalent rating 2022 2021 2022 2021 2022 2021 Aaa 0.47% 0.47% 0 496 0 920 Aa1 to Aa3 18.10% 19.31% 4 236 370 2,273 A1 to A3 75.46% 74.76% 146 195 1,783 6,628 Below A3 5.97% 5.46% 15 0 113 180 Total 100.00% 100.00% 165 927 2,266 10,001 V.2. As part of the treasury management Long-term futures are also used by the Bank to adjust the interest rate exposure of its SLP bond portfolios. The notional amount of long-term futures stood at EUR 8,804 million at 31 December 2022 (2021: EUR 8,274 million), with a EUR 29 million fair value (2021: EUR 3 million). The Bank also enters into short-term currency swap contracts in order to adjust currency positions in its operational treasury portfolios in relation to its benchmark currency, the euro, and to cater for demand for currencies in conjunction with loan disbursements. The notional amount of short-term currency swaps receivable stood at EUR 21,412 million at 31 December 2022 against EUR 25,124 million at 31 December 2021. The fair value of these contracts was EUR -366 million at 31 December 2022 (2021: EUR 147 million). The notional amount of short-term currency forwards was EUR 267 million at 31 December 2022 (2021: EUR 402 million). The fair value of these contracts was EUR 4 million at 31 December 2022 (2021: EUR -12 million). The EIF does not use derivatives as part of treasury management activities. 156 |
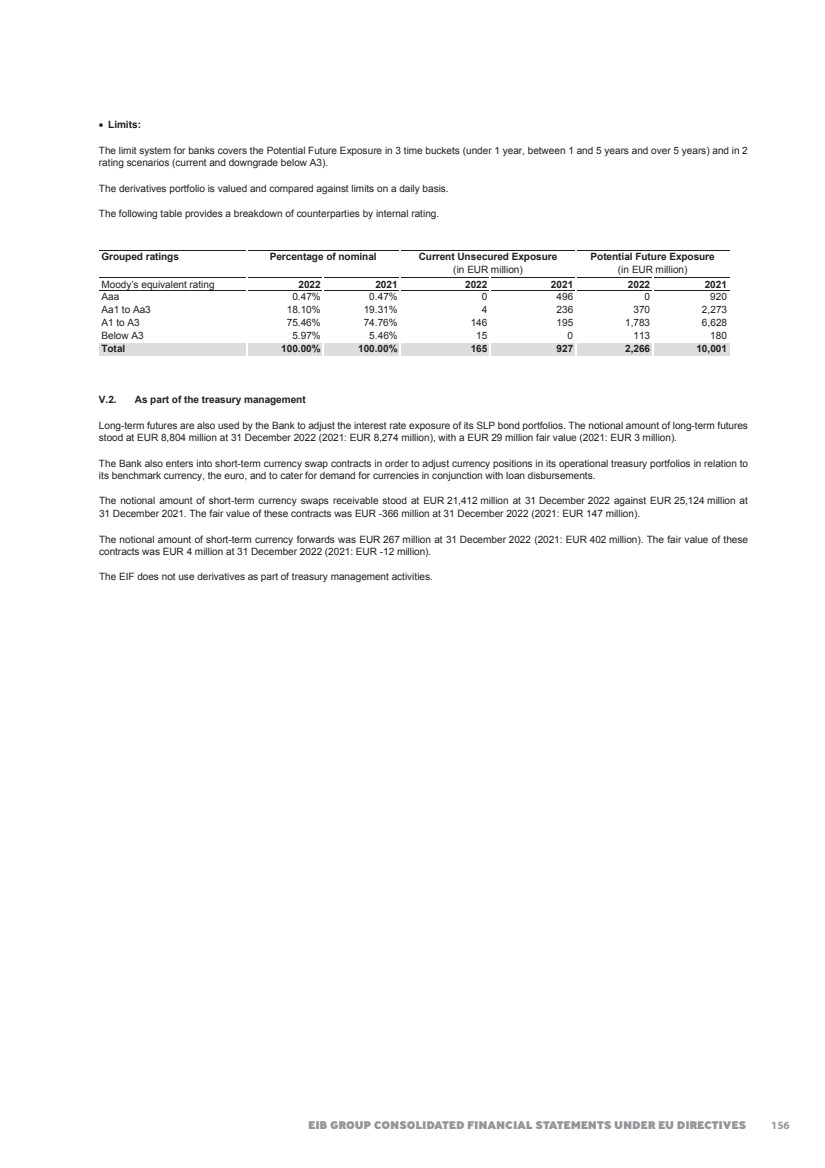
| 2022 FINANCIAL REPORT 165 Note W – Conversion rates The following conversion rates were used for drawing up the balance sheets as at 31 December 2022 and 2021: 31.12.2022 31.12.2021 Non-euro currencies of EU member states Bulgarian Lev (BGN) 1.9558 1.9558 Czech Koruna (CZK) 24.1160 24.8580 Danish Krone (DKK) 7.4365 7.4364 Croatian Kuna (HRK) 7.5365 7.5156 Hungarian Forint (HUF) 400.8700 369.1900 Polish Zloty (PLN) 4.6808 4.5969 Romanian Leu (RON) 4.9495 4.9490 Swedish Krona (SEK) 11.1218 10.2503 Non-EU currencies Australian Dollar (AUD) 1.5693 1.5615 Azerbaijani Manat (AZN) 1.8103 1.9207 Canadian Dollar (CAD) 1.4440 1.4393 Swiss Franc (CHF) 0.9847 1.0331 Chinese Renminbi (CNY) 7.3582 7.1947 Dominican Peso (DOP) 59.8400 64.8310 Egyptian Pound (EGP) 26.4223 17.7663 Ethiopian Birr (ETB) 56.9660 55.8100 Pound Sterling (GBP) 0.8869 0.8403 Georgian Lari (GEL) 2.8462 3.4806 Hong Kong Dollar (HKD) 8.3163 8.8333 Indian Rupees (INR) 88.1710 84.2292 Japanese Yen (JPY) 140.6600 130.3800 Kenyan Shilling (KES) 131.6800 128.2600 Kazakhstani Tenge (KZT) 494.0400 493.3100 Moroccan Dirham (MAD) 11.1556 10.5191 Moldovan Leu (MDL) 20.3700 20.0900 Mexican Peso (MXN) 20.8560 23.1438 Norwegian Krone (NOK) 10.5138 9.9888 New Zealand Dollar (NZD) 1.6798 1.6579 Serbian Dinars (RSD) 117.2000 117.5100 Russian Ruble (RUB) 76.8960 85.3004 Tunisia Dinar (TND) 3.3055 3.2611 Turkish Lira (TRY) 19.9649 15.2335 Taiwan Dollar (TWD) 32.7869 31.4420 Ukraine Hryvnia (UAH) 39.4092 30.9151 United States Dollar (USD) 1.0666 1.1326 Central African CFA Franc (XAF) 655.9570 655.9570 West African CFA Franc (XOF) 655.9570 655.9570 South African Rand (ZAR) 18.0986 18.0625 157 |
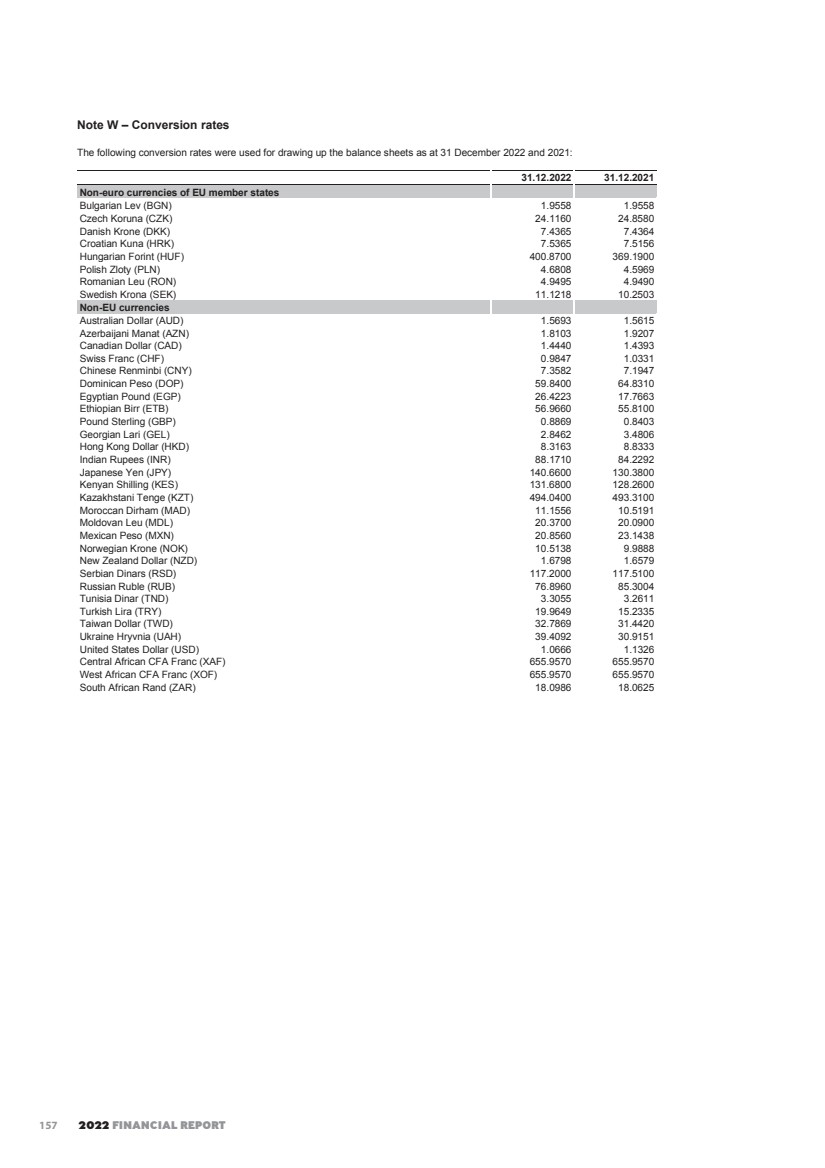
| EIB GROUP CONSOLIDATED FINANCIAL STATEMENTS UNDER EU DIRECTIVES 166 Note X – Related party transactions (in EUR ’000) X.1. Participating interests The amounts included in the consolidated financial statements concerning participating interests are disclosed as follows: 31.12.2022 31.12.2021 Participating interests 386,651 345,023 Value (re-)adjustments in respect of transferable securities held as financial fixed assets and participating interests -1,427 16,595 Participating interests - uncalled 483,923 576,951 X.2. Key Management Personnel The Group has identified members of the Board of Directors, the Audit Committee, the Management Committee, the GCRO and the Directors General heading the different EIB organisational directorates, as well as the head of Internal Audit independent department, as key management personnel. Key management personnel compensation for the relevant reporting periods, included within “General administrative expenses” (Note R), is disclosed in the following table: 2022 2021 Short-term benefits(1) 11,342 10,772 Post-employment benefits(2) 874 919 Termination benefits 315 965 Total 12,531 12,656 (1) Short-term employee benefits comprise salaries and allowances, bonuses and social security contributions of the Management Committee, the GRCO, Directors General and other Directors, and benefits paid to the members of the Board of Directors and the Audit Committee. (2) Post-employment benefits comprise pensions and expenses for post-employment health insurance paid to members of the Management Committee, the GRCO, the Directors General and other Directors. There were neither advances or credit granted to key management personnel, nor commitments entered into on their behalf by way of guarantee of any kind. Open balances with key management personnel as at 31 December 2022 comprise the compulsory and optional supplementary pension plan and health insurance scheme liabilities, and payments outstanding as at the year-end: 31.12.2022 31.12.2021 Pension plans and health insurance (Note L) 100,113 74,834 Other liabilities (Note G) 15,288 18,737 Note Y – Post balance sheet events There have been no material events after the balance sheet date that would require adjustment of, or disclosure in, the consolidated Financial Statements as at 31 December 2022. In the context of the war in Ukraine and its broader economic consequences, the Group continues to monitor the situation closely notably as part of the subsequent event review. 158 |
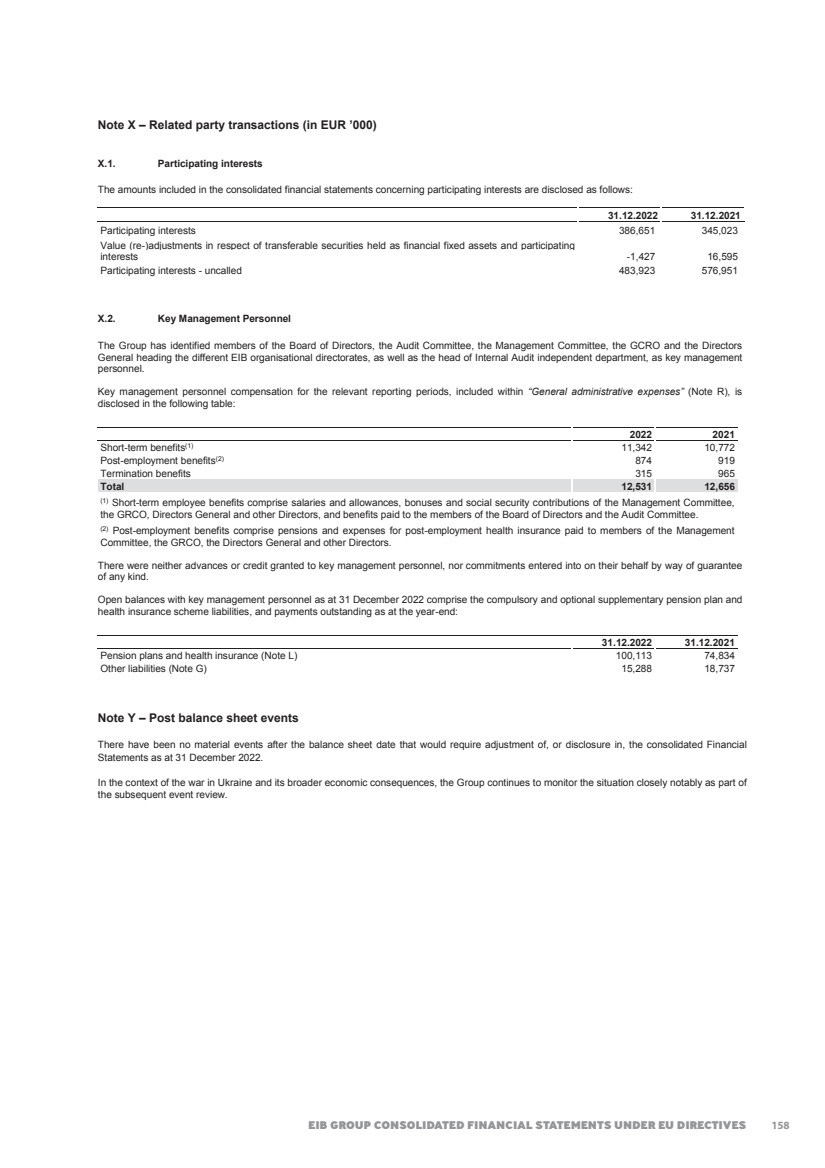
| 2022 FINANCIAL REPORT 167 Note Z – Management of third party funds Z.1. Innovation Fund The Innovation Fund is established by Article 10a(8) of Directive 2003/87/EC to support across all Member States innovation in low-carbon technologies and processes, including environmentally safe carbon capture and utilisation ('CCU') that contributes substantially to mitigating climate change, as well as products substituting carbon intensive ones produced and to help stimulate the construction and operation of projects that aim at the environmentally safe capture and geological storage ('CCS') of CO2, as well as of innovative renewable energy and energy storage technologies. The EIB prepares separate financial statements for Innovation Fund. Z.2. Investment Facility - Cotonou The Investment Facility, which is managed by the EIB, has been established under Cotonou Agreement on cooperation and development between the African, Caribbean and Pacific Group of States and the European Union and its Member States on 23 June 2000 and subsequently revised. The EIB prepares separate financial statements for the Investment Facility. Z.3. Modernisation Fund The Modernisation Fund, set up under Article 10d of the revised EU Emissions Trading System (ETS) Directive, aims to modernise energy systems and improve energy efficiency of 10 EU beneficiary Member States (MS): Bulgaria, Czech Republic, Croatia, Estonia, Hungary, Latvia, Lithuania, Poland, Romania and Slovakia. The Modernisation fund supports investments in generation and use of energy from renewable sources, energy efficiency, energy storage, modernisation of energy networks, including district heating, pipelines and grids, redeployment, re-skilling and upskilling workers, education, job-seeking initiatives and start-ups. The EIB prepares separate financial statements for Modernisation Fund. Z.4. InnovFin The InnovFin or “InnovFin-EU Finance for Innovators” is a joint initiative between the EIB, the EIF and the European Commission under the new EU research programme for 2014-2020 “Horizon 2020”. On 11 December 2013, Regulation (EU) N 1291/2013 of the European Parliament and the Council establishing Horizon 2020 – the Framework Programme for Research and Innovation (2014-2020) and repealing Decision N 1982/2006/EC (“Horizon 2020 Regulation”) was adopted. On 12 June 2014, the European Commission, the EIB and the EIF signed a Delegation Agreement establishing the financial instrument InnovFin. InnovFin consists of a series of integrated and complementary financing tools and advisory services offered by the EIB Group, covering the entire value chain of research and innovation (‘R&I’) in order to support investments from the smallest to the largest enterprise. The EIB prepares separate financial statements for InnovFin. Z.5. NER300 The EIB supports the EC as an agent in the implementation of the NER 300 initiative - a funding programme for carbon capture and storage demonstration projects and innovative renewable energy technologies. The Facility covers two activities which are i) the monetisation of EU Allowance Units (‘EUAs’) and ii) the management and disbursement of cash received via the EUA monetisation activity. The EIB prepares separate financial statements for NER300. Z.6. Connecting Europe Facility (‘CEF’) The Connecting Europe Facility (‘CEF’) is a joint agreement between the EIB and the European Commission, which aims to provide union financial assistance to trans-European networks in order to support projects of common interest in the sectors of transport, telecommunications and energy infrastructures. The Commission entrusted EIB with the implementation and management of the debt instrument under the CEF, which ensures continuity of the Loan Guarantee Instrument for TEN-T Projects (‘LGTT’) and to the Pilot phase of Project Bond Initiative (‘PBI’). The LGTT and PBI were merged under the CEF on 1 January 2016. The CEF Delegation Agreement foresees an updated and common risk sharing arrangement. The EIB prepares separate financial statements for CEF. Z.7. Pan-European Guarantee Fund (“EGF”) EGF was endorsed by the European Council on 23 April 2020 as part of the overall EU Covid-19 response package. As of July 2021, 22 Member States confirmed their participation with an expected guarantee volume of approximately EUR 24.4 billion, while only entities in participating countries are eligible for support. The EGF is designed to finance high-risk operations and final beneficiaries that would meet financial intermediaries’ requirements for commercial financing, but are struggling due to the economic impact of the COVID-19 pandemic. For this reason, the focus of the EGF are SMEs, which will benefit from at least 65% of the EGF-supported financing. The EGF is jointly implemented by EIB and EIF, each responsible for approximately half of the amount and with a different product mix. While EIF envisaged capped and uncapped portfolio guarantees and indirect equity-type investments (funds), on EIB side, the deployed products are linked risk sharing, venture debt and synthetic Asset Based Securities. The EIB prepares separate financial statements for EGF. Z.8. COSME LGF & EFG To address the difficulties in access to finance for SMEs, COSME establishes the Loan Guarantee Facility (‘LGF’) and the Equity For Growth (‘EFG’). The LGF and the EFG aim to improve access to finance for SMEs in the form of debt and equity respectively. The Financial Instruments also include the mechanism of the EU Contribution under the SME Initiative. The EFG has been structured in the form of an equity financial instrument supporting 159 |
| EIB GROUP CONSOLIDATED FINANCIAL STATEMENTS UNDER EU DIRECTIVES 168 Union enterprises growth and Research Innovation. The LGF has been structured in the form of a direct and indirect guarantee financial instrument. The objective of LGF is to contribute to the reduction of the structural shortcoming of the SME financing market and to support the creation of a more diversified SME finance market. Through direct and indirect guarantee, LGF aims to guarantee debt financing which addresses the particular difficulties that viable SMEs face in accessing finance. Furthermore, by guaranteeing the mezzanine tranche of eligible and transparent securitisation transactions, LGF aims to provide new avenues of financing for SMEs. The EIF prepares separate financial statements for COSME LGF & EFG. Z.9. European Structural Investment Fund (‘ESIF’) Under the European Structural Investment Fund (‘ESIF’), Member States appointed EIF to manage ESIF funds as Holding Fund manager since November 2015. The ESIF initiative is aimed at promoting SME access to finance and financial engineering products, such as private equity funds, guarantee funds and loan funds. EIF is currently managing 19 ESIF Funding Agreements signed with Member States and regions: Basse-Normandie and Languedoc-Roussillon. The EIF prepares separate financial statements for ESIF. Z.10. EU-Africa Infrastructure (‘EUAI’) Trust Fund The EUAI Trust Fund has been created under Trust Fund Agreement between the EC on behalf of the European Union as the Founding Donor and the EIB as Manager and is also open to Member States of the European Union that subsequently accede to that agreement as Donors. On 9 February 2006, the EC and the EIB signed a Memorandum of Understanding to promote jointly the EU-Africa Infrastructure Partnership and, in particular, to establish a supporting EU-Africa Infrastructure Trust Fund. The EIB prepares separate financial statements for EUAI Trust Fund. Z.11. SME Initiative Italy During 2016, in the context of the SME Initiative, the EIF and the Managing Authorities of Finland, Bulgaria, Romania and Italy entered into four separate Funding Agreements in respect of the implementation and management of a dedicated window, which shall be implemented in connection with a specific allocation under Horizon 2020 Financial Instruments dedicated to Finland, Bulgaria, Romania and accordingly in connection with COSME LGF for Italy. These SME Initiatives aim at providing uncapped guarantees in connection with Horizon 2020 for new portfolios of debt finance to eligible SMEs in the respective countries. The EIF prepares separate financial statements for SME Initiative Italy. Z.12. JEREMIE JEREMIE (The Joint European Resources for Micro to Medium Enterprises) is an initiative of the European Commission’s Directorate General for Regional Policy (DG Regio) and the EIB Group. The EIF prepares separate financial statements for JEREMIE. Z.13. REG This corresponds to three regional mandates. Irish Economic Robustness Investment Platform (‘Irish SMEs’). Irish SMEs is a mandate signed by the Irish Government with the EIF to set up an uncapped counter-guarantee with the Irish National Promotional Bank dedicated mainly to medium-term loans and to all SMEs supported by a structure similar to the SME Initiative, with national funds covering the First Loss Piece, EIB Group covering mezzanine (EIB through EFSI) and senior risk (EIB and potentially EIF). Under the French “Investment Plan 2018-2022” (known as the Macron Investment Plan), a window dedicated to agriculture has been set up in order to mobilise EUR 5 billion of investments in the sector. In this context, the French Ministry of Agriculture has requested the EIF to design a guarantee instrument with the aim of triggering between EUR 750 million and EUR 1.1 billion of new debt financing to French farmers. In light of this, the French Ministry of Agriculture has decided to allocate EUR 60 million for this instrument and has requested the EIF to combine the FMA contribution with an EFSI contribution for an amount up to EUR 45 million. Prêt Participatif Grand Est is a new financial instrument launched in France as a result of the close collaboration between the Région Grand Est and the EIF. It is an important component of the region’s ambitious recovery program known as “Business Act Region Grand-Est” and it aims to mobilise over EUR 250 million of subordinated loans (prêts participatifs) for local entrepreneurs. This financial instrument is funded by Région Grand Est’s own resources and builds on EIF’s standard model of First Loss Portfolio Guarantee (FLPG) deployed through financial intermediaries. It is expected to: • generate a significant leverage on the regional resources committed to this initiative; • create substantial impact on the market by supporting SMEs, including those impacted by the crisis but still intending to pursue viable projects for their growth; and • offer preferential credit conditions for Grand Est based entrepreneurs. Z.14. InvestEU On 7 March 2022 the EU, the EIB and the EIF signed a Guarantee Agreement (“Agreement”) establishing the EU guarantee under the InvestEU. The InvestEU programme aims to give an additional boost to sustainable investment, innovation, social inclusion and job creation in Europe. The InvestEU is expected to stimulate public and private investments by using a EUR 26.2 billion EU budgetary guarantee, 75% of this EU budgetary guarantee being granted separately to the EIB and the EIF. On 1 April 2022, all operations in the EFSI Debt Standard Portfolio and in the EFSI Hybrid Portfolio were transferred to the InvestEU. These operations which were originally guaranteed under the EFSI Agreement, are defined as the “Pre-2021 Operations”. The EIB prepares separate financial statements for InvestEU. 160 |
| 2022 FINANCIAL REPORT 169 Z.15. SME Initiative Romania During 2016, in the context of the SME Initiative, the EIF and the Managing Authorities of Finland, Bulgaria, Romania and Italy entered into four separate Funding Agreements in respect of the implementation and management of a dedicated window, which shall be implemented in connection with a specific allocation under Horizon 2020 Financial Instruments dedicated to Finland, Bulgaria, Romania and accordingly in connection with COSME LGF for Italy. These SME Initiatives aim at providing uncapped guarantees in connection with Horizon 2020 for new portfolios of debt finance to eligible SMEs in the respective countries. The EIF prepares separate financial statements for SME Initiative Romania. Z.16. Decentralised Financial Instruments (‘DFIs’) (former Fund of Funds (‘JESSICA II’)) The Decentralised Financial Instruments (‘DFIs’) consists of Fund of Funds (‘FoF’) and Holding Funds (‘HF’) financed by the European Structural and Investment Funds (the ‘ESIF’) from the Member States Operational Programmes during 2014-2020 and 2021-2027, respectively. The DFI facilitates access to finance for final recipients through the implementation of loans, equity and guarantees, in cooperation with selected Financial Intermediaries. As a fund manager, EIB gathers the funding (contributions) from the Managing Authorities and invests it via Financial Intermediaries, according to investment strategies agreed with the donors. Z.17. Partnership Platform for Funds (‘PPF’) The PPF is an EIB-managed multi-region, multi-contributor and multi-sector Platform incorporating multiple funds, and was established considering the need to increase financial flows for sustainable development and building on the successful experience of the European Investment Bank. The funds under the PPF implemented in accordance with the Platform Rules. The EIB prepares a separate combined financial report for PPF. Z.18. European Fund for Strategic Investments (‘EFSI EIF’) On the basis of applicable EFSI Regulations the European Commission and the EIB concluded agreements on the management of the EFSI, on the granting of the EU guarantee (the EFSI Agreement) as well as for the implementation of the European Investment Advisory Hub (‘EIAH’) (the EIAH Agreement). Under the EFSI Agreement, the EC is providing an EU guarantee to EIB for projects supported by the EFSI. Assets covering the EU guarantee are directly managed by the European Commission. Projects supported by the EFSI are subject to the normal EIB project cycle and governance. In addition, EFSI has its own dedicated governance structure which has been set in place to ensure that investments made under EFSI remain focused on the specific objective of addressing the market failure in risk-taking which hinders investment in Europe. The EIAH aims to enhance the non-financial support for projects and investments. The EIAH consists of three complementary components: a) a point of entry to a wide range of advisory and technical assistance programmes and initiatives for public and private beneficiaries, b) a cooperation platform to leverage, exchange and disseminate expertise among partner institutions and c) a reinforcement or extension of existing advisory services or creation of new ones to address unmet needs. The EIB prepares separate financial statements for EIAH. EFSI – European Fund Strategic Investment EFSI is an initiative launched jointly by the EIB Group and the European Commission to help overcome the current investment gap in the EU by mobilising private financing for strategic investments. EFSI is a EUR 16 billion guarantee from the EU budget, complemented by an allocation of EUR 5 billion of EIB’s own capital. EFSI comprises both the Innovation and Infrastructure Window ("IIW") and the SME Window ("SMEW"), to be respectively implemented by the EIB and the EIF. A total amount of EUR 5 billion is initially allocated to the SMEW under EFSI, as follows: (i) up to EUR 2.5 billion to be indirectly backed by the EU Guarantee; and (ii) EUR 2.5 billion to be contributed by the EIB at its own risk to increase the currently existing RCR Mandate. The EFSI Steering Board is entitled to increase the allocation of the EU Guarantee to the SMEW by an additional EUR 0.5 billion (i.e., up to a maximum amount of EUR 3 billion from time to time). EFSI - Private Credit The Programme will comprise two complimentary products, the Cash Investment Product and Investor Guarantee Product. The Cash Investment Product will enable EIF’s direct investment into eligible DDFs, prioritising first closings. These fund investments will support fund creation and give EIF the opportunity to provide input on fund governance and investment strategy. EIF’s direct investment aims at catalysing other fund investors, who take considerable comfort from EIF’s participation and due diligence. The Investor Guarantee Product will enable EIF to further support fundraising by partially guaranteeing (up to 50%) the investment made by institutional investors into DDFs where EIF has already committed to invest. The guarantee product is expected to crowd in investors who are new to this nascent asset class but also encourage larger investments from investors already considering an investment. The Investor Guarantee Product can contribute to scaling up the asset class. EFSI - Combination Product Framework product for combining EFSI resources together with EAFRD national resources to create new financial instruments. Aims to address financing gaps and support specific high priority investment objectives where Member State and EU policy objectives align. Agriculture has initially been prioritised as a sector where SMEs experience a significant financing gap. 161 |
| EIB GROUP CONSOLIDATED FINANCIAL STATEMENTS UNDER EU DIRECTIVES 170 EFSI - Skills & Education Skills and Education Guarantee Pilot is aiming at enhancing access to finance in the field of education, training and skills in the form of a capped (counter-) guarantee instrument, and it is one of the products to pilot under EFSI 2 in preparation of the next MFF. It will have a broad eligibility covering a wide spectrum of education/training programmes both for students and adulthood learners (may also cover SMEs) and be implemented through various intermediaries. • Category A: Students and Learners; • Category B: Enterprises investing in skills and skills utilisation of their workforce; and • Category C: Organisations supplying education, training, skills and related services (including kindergartens, nursery schools, early childhood services, etc.). EFSI-ESCALAR ESCALAR is a EUR 300 million pilot mandate targeting the financing gap experienced by high growth European companies (scale-ups). ESCALAR invests in funds with an investment focus on scale-ups. ESCALAR will make equity investments in funds, and side vehicles of funds, through a different share class or fund unit to other investors. ESCALAR investments will have different terms to the investments made by other investors, namely a (1) Preference on fund distributions in certain predefined downside scenarios, and (2) Subordination, and reduced claim, on investment returns. Z.19. GIF 2007 In the GIF 2007 under the Competitiveness and Innovation Framework Programme and the Technology Transfer Pilot Project (CIP/GIF 2007), the EIF is empowered to acquire, manage and dispose of investments, in its own name but on behalf and at the risk of the Commission. The EIF prepares separate financial statements for GIF 2007. Z.20. JESSICA (Holding Funds) JESSICA (Joint European Support for Sustainable Investment in City Areas) is an initiative developed by the EC and the EIB, in collaboration with the Council of Europe Development Bank. JESSICA Holding Funds are used in the context of the JESSICA initiative. Under new procedures, Managing Authorities are being given the option of using some of their EU grant funding to make repayable investments in projects forming part of an integrated plan for sustainable urban development. As manager, EIB gathers the funding received from the Managing Authorities and invests it in Urban Development Funds, according to investment guidelines agreed with the donors. The EIB prepares separate financial statements for some JESSICA Holding Funds. Z.21. Recovery and Resilience Facility Financial Instruments (‘RRF-FI’) EIB manages and invests RRF resources on behalf of the respective EU Member Stats according to an investment strategy and business plan agreed in a funding agreement between the EIB and the mandator. Furthermore, the EIB performs fund administration tasks (incl. monitoring, reporting, treasury management). If requested by the EU Member States, the mandate can also embed the Bank’s advisory support. RRF-FI can be deployed under three implementation modalities: (i) direct implementation, where EIB directly selects and appraises underlying operations, (ii) indirect implementation through a financial intermediary, and (iii) blending. RRF Equity Cyprus RRF Equity Cyprus is the first equity mandate signed between the EIF and the Republic of Cyprus. The mandate is structured as a direct award of EUR 30 million to EIF, financed by the National Recovery and Resilience Plan of Cyprus (EUR 20 million) and reflows from the JEREMIE programme of the 2007-2013 PP. The mandate foresees the deployment of a generalist VC fund targeting innovative enterprises and start-ups in their (pre-) seed and early stages of development. This will be the first VC fund deployed in the country with the support of public resources. Signature of the underlying fund is expected in Q1 2023. RRF Equity Bulgaria The RRF Equity Bulgaria mandate is structured as a direct award of EUR 180 million to EIF under the National Recovery and Resilience Plan of Bulgarian, in connection with the country's Recovery and Resilience Facility established by Regulation (EU) 2021/241. Equity financing will be provided to support investments under three windows, namely: - Equity instruments for Growth (initial budget allocation of up to EUR 75 million); - Equity instruments for Innovation (initial budget allocation of up to EUR 75 million); and - Equity instruments for climate neutrality and digital transformation investments (initial budget allocation of up to EUR 30 million). The mandate will contribute in alleviating the negative impacts of the pandemic from the Bulgarian market in general and more risky undertakings, in particular, by providing equity financing to TT projects, SMEs and mid-caps that will be used to foster innovation and help the transition to the knowledge economy; it will also finance equity investments (e.g. infrastructure projects) supporting climate neutrality and digital transformation. Z.22. Special Section The Special Section was set up by the Board of Governors on 27 May 1963. Under a decision taken on 4 August 1977, its purpose was redefined as being that of recording financing operations carried out by the EIB for the account of and under mandate from third parties. It includes the FED, MED/FEMIP and the guarantee component of the European Development Finance Institutions Private Sector Development Facility. 162 |
| 2022 FINANCIAL REPORT 171 Z.23. Employment and Social Innovation (‘EaSI’) The EaSI Guarantee financial Instrument consists, inter alia, of the EaSI Microfinance Guarantee, which is the successor to the micro-credit guarantees under the European Progress Microfinance facility (“Progress Microfinance”). It will extend the support given to microcredit providers under Progress Microfinance. In addition, the EaSI Guarantee financial Instrument consists of the EaSI Social Entrepreneurship Guarantee, which is a new product, which will facilitate access to finance for social enterprises and support the development of the social investment market. The EIF prepares separate financial statements for EaSI. The Employment and Social Innovation funded instrument ("EaSI Funded Instrument") has been set up as a new sub-fund of the EU Microfinance FCP-FIS. This mandate is the successor of the European Progress Microfinance sub-fund which was launched in 2010 and has a target size of EUR 200 million, blending resources from the European Commission, the EIB and the EIF. EaSI Funded Instrument contributes to the development of the new social entrepreneurship ecosystem whilst at the same time consolidates EIF's role in the microfinance market. The loan products provided by the EaSI Funded Instrument will address in particular the funding gap for small intermediaries, such as non-banks and small/niche banks (ethical banks for instance), which usually have limited access to deposit funding, as opposed to larger banks which, having access to secured funding for their lending activity, may seek additional risk coverage through guarantee instruments. Z.24. Risk-Sharing Finance Facility (‘RSFF’) The RSFF has been established under the Co-operation Agreement that entered into force on 5 June 2007 between the EC on behalf of the European Union and the EIB. The RSFF aims to foster investment in research, technological development and demonstration, and innovation. As part of the RSFF, the EIF set up the Risk Sharing Instrument for Innovative and Research oriented SMEs and small Mid-Caps (‘RSI’). The RSI provides guarantees to banks and leasing companies for loans and financial leases to research-based small and medium-sized enterprises (‘SMEs’) and small Mid-Caps. The EIB prepares separate consolidated financial statements for RSFF including RSI. Z.25. InnovFin SME Guarantee In the context of the “Access to Risk Finance Programme” of Horizon 2020 and specific programme provides for the establishment of a financial instrument for debt and a financial instrument for equity. A Risk-Sharing facility called InnovFin SME Guarantee has been structured in the form of a guarantee, using the EU’s contribution for first defaulted amount taking and the risk-taking capacity of the EIF for second-Defaulted Amount taking. The objective of the Facility is to incentivise Intermediaries to extend loans or financial leases to small and medium sized enterprises and Small Mid-caps with significant activities in Research, Development and Innovation. The EIF prepares separate financial statements for InnovFin SME Guarantee. Z.26. SME Initiative Bulgaria During 2016, in the context of the SME Initiative, the EIF and the Managing Authorities of Finland, Bulgaria, Romania and Italy entered into four separate Funding Agreements in respect of the implementation and management of a dedicated window, which shall be implemented in connection with a specific allocation under Horizon 2020 Financial Instruments dedicated to Finland, Bulgaria, Romania and accordingly in connection with COSME LGF for Italy. These SME Initiatives aim at providing uncapped guarantees in connection with Horizon 2020 for new portfolios of debt finance to eligible SMEs in the respective countries. The EIF prepares separate financial statements for SME Initiative Bulgaria. Z.27. European Neighbourhood and Partnership Instrument (‘ENPI’) The Framework Agreement between the European Union and the EIB on the implementation of operations financed from the general budget of the European Union in the countries covered by the European Neighbourhood Policy is channelled through ENPI. The EIB prepares separate financial statements for ENPI. Z.28. Cultural and Creative Sectors Guarantee Facility The financial instrument, set-up under Creative Europe - the main EU programme dedicated to the cultural and creative sectors - will be managed by the EIF on behalf of the European Commission. The initiative will allow the EIF to provide guarantees and counter-guarantees to selected financial intermediaries to enable them to provide more debt finance to entrepreneurs in the cultural and creative arena. Loans generated are expected to support more than ten thousand SMEs in a wide range of sectors such as audio-visual (including film, television, animation, video games and multimedia), festivals, music, literature, architecture, archives, libraries and museums, artistic crafts, cultural heritage, design, performing arts, publishing, radio and the visual arts. The EIF prepares separate financial statements for Cultural and Creative Sectors Guarantee Facility. Z.29. SME Initiative Finland During 2016, in the context of the SME Initiative, the EIF and the Managing Authorities of Finland, Bulgaria, Romania and Italy entered into four separate Funding Agreements in respect of the implementation and management of a dedicated window, which shall be implemented in connection with a specific allocation under Horizon 2020 Financial Instruments dedicated to Finland, Bulgaria, Romania and accordingly in connection with COSME LGF for Italy. These SME Initiatives aim at providing uncapped guarantees in connection with Horizon 2020 for new portfolios of debt finance to eligible SMEs in the respective countries. The EIF prepares separate financial statements for SME Initiative Finland. 163 |
| EIB GROUP CONSOLIDATED FINANCIAL STATEMENTS UNDER EU DIRECTIVES 172 Z.30. National Promotional Institutions (‘NPI’) NPI securitisation initiative (‘ENSI’) The EIF and several National Promotional Institutions (‘NPIs’) including KfW, bpifrance, CDP, Malta Development Bank Working Group, IFD, ICO and BBB have launched the EIF-NPI Securitisation Initiative (‘ENSI’), a cooperation and risk sharing platform aiming at providing more funding to small and medium-sized enterprises (‘SMEs’) via the capital markets. The objective of this joint cooperation in SME Securitisation transactions is to stimulate the availability of finance to SMEs in Europe by revitalising the SME Securitisation market while catalysing resources from the private sector. This reflects the spirit of the European Fund for Strategic Investments aiming to achieve a much wider outreach in support of SMEs. Under this mandate, EIF is enabled to manage up to EUR 100 million of resources from Cassa Depositi e Prestiti (''CDP''). CDP resources under the Mandate will be deployed through investments in technology transfer funds/platforms alongside 1:1 match funding from EIF in the form of co-investment, resulting in total resources managed by EIF under this programme of up to EUR 200 million. NPI equity platform The EIF-NPI Equity Platform is a collaborative initiative launched by the EIF in 2016, which promotes knowledge sharing and best practices between the EIF and national promotional institutions (NPIs) or banks (NPBs) across EU Member States. Its goal is to enhance access to funding for SMEs and midcaps, support the defragmentation of equity markets, and match national, EU and private sources of funding. NPI ICF TT Investment partnership between EIF and Institut Català de Finances (''ICF'') to commit EUR 30 million of ICF resources into a technology transfer fund focussed on investments in technology transfer projects and/or companies linked to Spain’s Catalonia region. Resources from ICF will be matched by at least EUR 15 million of EIF-managed resources. Under this partnership, both EIF and ICF will invest in the selected technology transfer fund, each acting as Limited Partner investor in its own right. Z.31. AECID This partnership agreement signed between the Kingdom of Spain (the Spanish Agency for International Development Cooperation (‘AECID’)) and the EIB was set up to invest in operations in the countries covered by the FEMIP together with Mauritania (the "Southern Mediterranean region"), targeting mainly risk capital activities involving micro and small/medium sized enterprises as well as engaging in the wider development of the private sector in the region. The EIB prepares separate financial statements for AECID. Z.32. WB EDIF The Western Balkan Enterprise Development & Innovation Facility (‘WB EDIF’) is a joint initiative signed in December 2012 by the EC (‘DG ELARG’), EIB Group and the European Bank for Reconstruction and Development (‘EBRD’). It aims at improving access to finance for SMEs in the Western Balkans and to foster economic development in the region through the deployment of the Instrument for Pre-Accession Assistance (‘IPA’) funds. Within WB EDIF, EIF acts as platform coordinator, Trustee on behalf of the EC for the Enterprise Expansion Fund (‘ENEF’), Trustee on behalf of the EC for the Enterprise Innovation Fund (‘ENIF’), and manager of the Guarantee Facility. The EIF prepares separate financial statements for WB EDIF. As a response to the COVID-19 crisis and the successive energy crisis in the Western Balkans region, the Commission allocated to EIF EUR 60 million for a guarantee facility to be deployed in the WB6 economies. Such guarantee facility would follow the model of the existing WB EDIF GF II, with the changes in the product necessary to make it fit for the different purpose. The facility will be labelled and deployed under the Western Balkan Investment Framework (“WBIF”), a multi-IFI and multi-product platform regulated by the NDICI framework and serving as the main gateway for private sector development measures in the Western Balkans. The ultimate objective of the WB GF4SME resilience is to facilitate and increase access to, and availability of, finance for SMEs in the Western Balkans. The guarantees and counter-guarantees issued by EIF under this facility shall cover portfolios of newly granted debt instruments provided for the ultimate benefit of SMEs which qualify as Final Beneficiaries under this agreement. The guarantees are financed by EU and are issued by EIF in its own name but on account and risk of the EU. Z.33. SMEG 2007 In the SMEG 2007 under the Competitiveness and Innovation Framework Programme (CIP/SMEG 2007), the EIF is empowered to issue guarantees in its own name but on behalf and at the risk of the Commission. The EIF prepares separate financial statements for SMEG 2007. Z.34. InnovFin Equity The Horizon 2020 Financial Instruments aim to ease the access to risk financing for Final Recipients in order to support eligible Research and Innovation. This covers loans, guarantees, equity and other forms of risk finance. The Horizon 2020 Financial Instruments aim also to promote early-stage investment and the development of existing and new venture capital funds; improve knowledge transfer and the market for intellectual property; attracts funds for the venture capital market; and, overall; help to catalyse the transition from the conception, development and demonstration of new products and services to their commercialisation. The Horizon 2020 debt financial instrument also includes the implementation mechanism of the EU Contribution under the SME Initiative. The InnovFin Equity facility for early-stage aims at promoting early-stage investment and the development of existing and new venture capital funds providing equity finance for innovative enterprises, in particular in the form of venture or mezzanine capital in their early stage. The EIF prepares separate financial statements for InnovFin Private Equity. 164 |
| 2022 FINANCIAL REPORT 173 Z.35. Private Finance for Energy Efficiency (‘PF4EE’) Instrument The Private Finance for Energy Efficiency (‘PF4EE’) instrument is a joint agreement between the EIB and the European Commission that aims to address the limited access to adequate and affordable commercial financing for energy efficiency investments. The instrument targets projects which support the implementation of National Energy Efficiency Action Plans or other energy efficiency programmes of EU Member States. In December 2014 the European Commission and the EIB signed a Delegation Agreement establishing the financial Instrument PF4EE. The EIB prepares separate financial statements for the PF4EE. The EIF prepares separate financial statements for PF4EE. Z.36. DCFTA Initiative East (‘DCFTA’) The European Investment Bank and the European Commission signed on 19 December 2016 the Delegation Agreement for the Deep and Comprehensive Free Trade Area (‘DCFTA’). DCFTA Initiative East aims to strengthen economic development in the countries, which have signed an association agreement with the EU - namely Georgia, Moldova and Ukraine - by providing targeted financial and technical support to small and medium-sized enterprises (‘SME’s) in these three countries. As part of the DCFTA, the EIF implements and manages the Guarantee Facility Window. The EIB prepares separate consolidated financial statements for the DCFTA including the Guarantee Facility Window. Z.37. GF Greece The Fund is a joint initiative between the Hellenic Republic, the EC and the EIB and was set up to support the lending to SMEs in Greece. Established by using unabsorbed Structural Funds for Greece, the Fund will guarantee EIB loans to SMEs via partner banks in Greece. The EIB prepares separate financial statements for GF Greece. Z.38. Neighbourhood Investment Facility (‘NIF’) Trust Fund The NIF Trust Fund, which is managed by the EIB was set up to achieve the strategic objective of the European Neighbourhood Policy (‘ENP’) through targeted funding with particular focus on establishing better and more sustainable energy and transport interconnections, improving energy efficiency and promoting the use of renewable energy sources, addressing climate change as well as threats to the environment more broadly and promoting smart, sustainable and inclusive growth through support to SMEs, to the social sector including human capital development, and to municipal infrastructure development. The EIB prepares separate financial statements for NIF Trust Fund. Z.39. Neighbourhood Investment Facility (‘NIF’) Risk Capital Facility The Neighbourhood Investment Facility (‘NIF’) Risk Capital Facility is financed from the general budget of the European Union. Its main purpose is focused on providing access to equity and debt finance to SMEs in the Southern Neighbourhood region in order to support private sector development, inclusive growth and private sector job creation. The Facility comprises a Financial Instrument Window which consists of equity and debt finance instruments and Additional Tasks Window, which consists of the technical assistance services. The EIB prepares separate financial statements for Financial Instrument Window. Z.40. EFSI-EIAH Please refer to paragraph Z.18. above. Z.41. MAP Guarantee This resource is split equally between private equity and guarantee products. The equity segment known as ESU 1998 (‘G&E’) and ESU 2001 (‘MAP’) covers the ETF start-up investments. The guarantees segment known as SMEG 1998 G&E and SMEG 2001 MAP, provides guarantees against the beneficiary’s undertaking. The EIF prepares separate financial statements for MAP Guarantee. Z.42. Greater Anatolia Guarantee Facility (‘GAGF’) Under the GAGF signed in May 2010, the EIF manages the Instrument for Pre-Accession Assistance (IPA) funds allocated for the Regional Competitiveness Operational Programme by the European Union and Türkiye. The facility provides tailor-made financial help to SMEs and micro-enterprises in Türkiye’s least developed provinces in partnership with major Turkish banks. The EIF prepares separate financial statements for GAGF. Z.43. SME Initiative Malta In 19 January 2015, the European Commission, the EIB and the ElF signed an amendment to the Horizon 2020 delegation agreement setting out the terms and conditions applicable to certain terms of the dedicated window corresponding to the SME Initiative and the contribution of the EU to such dedicated windows of the Horizon 2020 Financial Instruments. SME Initiatives in Spain and Malta were launched in the previous year. The EIF prepares separate financial statements for SME Initiative Malta. Z.44. Instrument for Pre-accession Assistance II (‘IPA II’) The Instrument for Pre-accession Assistance (‘IPA’) is the means by which the EU supports reforms in the 'enlargement countries' with financial and technical help. The pre-accession funds also help the EU reach its own objectives regarding a sustainable economic recovery, energy supply, transport, the environment and climate change, etc. 165 |
| EIB GROUP CONSOLIDATED FINANCIAL STATEMENTS UNDER EU DIRECTIVES 174 The successor of IPA I, IPA II, built on the results already achieved by dedicating EUR 11.7 billion for the period 2014-2020. The most important novelty of IPA II is its strategic focus. The Framework Partnership Agreement, signed at the end of the year 2015, is implemented by the EIB, allocating resources from DG NEAR via the signature of various “Specific Grant Agreements”. Although, the IPA II Regulation applied until 31 December 2020, the implementation is still ongoing The EIB prepares financial statements for the specific grant agreements under IPA II. Z.45. Bundesministerium für Wirtschaft und Technologie The EIF manages funds on behalf of the German Bundesministerium für Wirtschaft und Technologie (Federal Ministry of Economics and Technology) and the European Recovery Programme. Z.46. FEMIP Trust Fund The FEMIP (Facility for Euro-Mediterranean Investment and Partnership) Trust Fund, which is also managed by the EIB, was set up to enhance the existing activities of the EIB in the Mediterranean Partner Countries, with the support of a number of donor countries and with a view of directing resources to operations in certain priority sectors through the provision of technical assistance and risk capital. The EIB prepares separate financial statements for FEMIP Trust Fund. Z.47. SME Initiative for Spain On 26 January 2015, the Delegation Agreement between the Kingdom of Spain and European Investment Fund was signed. EIF will provide uncapped guarantees for new portfolios of debt finance to eligible SMEs and securitisation of existing debt finance to SMEs and other enterprises with less than 500 employees and/or new portfolios of debt finance to SMEs. The EU contribution to the SME Initiative for Spain, received by the EIF, is subject to the treasury asset management to be carried out by the EIB, which is governed by the signed Asset Management Side Letter between the European Investment Fund and the European Investment Bank. The EIF prepares separate financial statements for SME Initiative for Spain. Z.48. EPTA Trust Fund The EPTA (The Eastern Partnership Technical Assistance) Trust Fund is focused on increasing the quality and development impact of EIB Eastern Partnership operations by offering a multi-purpose, multi-sector funding facility for technical assistance. It will be complementary to the Neighbourhood Investment Facility. The EIB prepares separate financial statements for EPTA Trust Fund. Z.49. Multi-Regional Guarantee Platform for Italy (‘AGRI’) The Italian Agri Platform was formally launched with the signing of the Funding Agreement between the EIF and 6 Italian Regions (Veneto, Emilia Romagna, Umbria, Campania, Calabria, Puglia). Two additional Italian Regions (Piemonte and Toscana) joined in 2018. The Agriculture Platform in Italy is using Structural funds from European Agricultural Fund for Rural Development (‘EARFD’) to deploy the financial instrument using each participating Rural Development Programme (‘RDP’) resources to cover the first losses. The aim of the Platform is to steer the Regional Managing Authorities towards standard products, to foster new business at regional level while supporting new lending to farmers and agri-businesses. Z.50. TTA Türkiye TTA Türkiye is an initiative designed by the EIF in cooperation with the Ministry of Science, Industry and Technology (‘MoSIT’), the Scientific and Research Council of Türkiye (‘TUBITAK’), the Delegation of the European Union to Türkiye and the DG Regional Policy of the European Commission. TTA Türkiye is co-financed by the EU and the Republic of Türkiye under the Regional Development Component of the Instrument for Pre-Accession Assistance (‘IPA’) funds and managed by EIF. TTA Türkiye aims at achieving two objectives: setting-up a financially sustainable fund by facilitating the commercialisation of scientific research and development (‘R&D’) confined in universities and research centres and catalysing development of the technology transfer market in Türkiye, with a particular emphasis on spill-overs to the less developed/developing regions of Türkiye. Z.51. MAP Equity Under the Multi-Annual Programme (MAP) for enterprises and entrepreneurship, the EIF manages resources on behalf and at the risk of the EC. The EIF prepares separate financial statements for MAP Equity. Z.52. Natural Capital Finance Facility (‘NCFF’) The Natural Capital Finance Facility (‘NCFF’) is a joint agreement between the EIB and the European Commission which aims to address market gaps and barriers for revenue generating or cost saving projects that are aimed at preserving natural capital, including climate change adaptation projects and thereby to contribute to the achievement of EU and Member States' objectives for biodiversity and climate change adaptation. The EIB prepares separate financial statements for NCFF. Z.53. German Future Fund Growth Facility (‘GFFGF’) German coalition government programme, which foresees the development of equity instruments with a particular focus on digitalisation and clean-tech (overall targeted volume EUR 10bn) called the German Future Fund. A potential amount of up to EUR 3bn could be allocated to EIF for investments into German growth funds and co-investments in companies in a delegated way, or via blind-pool co-investment vehicles. The mandate will have an investment period for initial commitments in funds over 10 years. 166 |
| 2022 FINANCIAL REPORT 175 Z.54. EU support to Boost Africa The “EU Support Boost Africa” is a joint initiative between the EIB and the African Development Bank. Its core objectives are to enable and enhance entrepreneurship and innovation across Africa in a commercially viable way and to address a current gap in the Sub-Saharan market, by providing early stage venture capital paired with skills development. The Facility comprises a Financial Instrument Window, which consists of equity and quasi-equity instruments, and Additional Tasks Window, which consists of the technical assistance services. The EIB prepares separate financial statements for Financial Instrument Window. Z.55. Baltic Innovation Fund (‘BIF’) The Baltic Innovation Fund (‘BIF’), signed in September 2012, is a fund-of-funds, structured as a partnership, which invests in venture capital and private equity funds and focused on the Baltic region. It is funded jointly by the EIB Group and the following Baltic national agencies: Fund KredEx in Estonia, Latvijas Garantiju Agentiira in Latvia and lnvesticiju ir verslo garantijosin Lithuania. The EIF prepares separate financial statements for BIF. Baltic Innovation Fund 2 (“BIF 2”) is a successor Fund of Funds to the EIF managed Baltic Innovation Fund (“BIF”). The BIF 2 is envisaged to have an identical structure to BIF (virtual FoF that minimises costs and enables synergies with similar initiatives), with a slightly increased size of EUR 156 million (BIF size is EUR 130 million). The three Baltic States would commit in aggregate EUR 78 million (EUR 26 million each) alongside EUR 78 million from EIF-managed RCR resources. EIF will act as a manager of the facility. BIF 2 would be more focused towards the growth capital to complement the local initiatives for early stage investments. The target level of contributions by the three Baltic NPIs is as follows: • KredEx (Estonia): EUR 26 million; • Altum (Latvia): EUR 26 million; • INVEGA (Lithuania): EUR 26 million. Z.56. Polish Growth Fund-of-Funds (‘PGFF’) The Polish Growth Fund-of-Funds (‘PGFF’), signed in April 2013, is a fund-of-funds, structured as a partnership, which invests in venture capital and private equity funds and focused on Poland. It is funded jointly by the EIB Group and the Bank Gospodarstwa Krajowego. The EIF prepares separate financial statements for PGFF. Z.57. Student Loan Guarantee Facility (‘Erasmus’) Under the European Structural Investment Fund (‘ESIF’), Member States appointed EIF to manage ESIF funds as Holding Fund manager since November 2015. The ESIF initiative is aimed at promoting SME access to finance and financial engineering products, such as private equity funds, guarantee funds and loan funds. EIF is currently managing 2 ESIF Funding Agreements signed with Member States and regions: Basse-Normandie and Languedoc-Roussillon. The EIF prepares separate financial statements for Student Loan Guarantee. Z.58. GEEREF Under the Global Energy Efficiency and Renewable Energy Fund (‘GEEREF’), EIF has been acting since December 2007 as investment advisor. GEEREF is supported by the EC, the Federal Government of Germany and the Kingdom of Norway and its objective is to invest primarily in regional funds with assets in projects and companies involved in energy efficiency and renewable energy enhancing access to clean energy in developing countries and economies in transition. The GEEREF business development is formally delegated to the EIB under a sub-advisory agreement. Z.59. German Corona Matching Facility (CMF) The German Government, as part of its COVID-19 crisis measures for the German economy, aims to provide automatic and standardised pari-passu co-investments to VC funds for all German portfolio companies in all financing rounds until 30 June 2021. Z.60. Central Europe Fund of Funds (‘CEFoF’) The Central Europe Fund of Funds (‘CEFoF’) is a fund-of-funds initiative created by the European Investment Fund (‘EIF’) in close co-operation with the governments and national agencies of Austria, Czech Republic, Slovakia, Hungary and Slovenia (the CE countries) to boost equity investments into small and medium-sized enterprises (‘SMEs’) and small mid-caps across the region, establishing a sound market-based risk financing infrastructure, implementing the best market standards for equity investments in businesses and attracting institutional investors and investment managers to Central Europe. Z.61. GEF-UNEP This is a Global Environment Facility (GEF) in cooperation with United Nations Environment Programme (UNEP) for the execution of the Technical Assistance supporting the identification, selection and design of future investments which are primarily capital investment projects with outcomes leading to nutrient reduction, which will indirectly contribute to the long-term outcome of depollution of the Mediterranean Sea. 167 |
| EIB GROUP CONSOLIDATED FINANCIAL STATEMENTS UNDER EU DIRECTIVES 176 Z.62. Alpine Growth Investment Platform (‘AlpGIP’) In September 2017, EIF launched an innovative regional equity platform (non-corporate structure) targeting the late venture capital and growth segment in the EU Alpine Macroregion. The Italian regions Lombardia, Piemonte, Val d’Aosta and Alto Adige (Bolzano region) have already invested in the Platform other regions are expected to join at a later stage. Z.63. EU Trade and Competitiveness Program (‘EUTCP’) In line with the EU policy objectives of boosting economic growth, supporting private sector development, enhancing regional integration and climate change mitigation and adaptation, EIB joins forces with the EC in order to develop the EUTCP. The EUTCP does combine: (i) EIB long-term Loan for Value Chains with; (ii) a guarantee instrument (Risk Sharing Facility); and (iii) technical assistance (Expert Support Facility) in order to address market failures in the selected countries. It also represents a strategically important initiative for the EIB for its positioning in the respective countries. It is expected that the Program will result in significant investments in SMEs along selected value chains in the target countries as it enables new guarantee instruments that will complement EIB’s classical products. The EIB prepares separate financial statements for the Risk Sharing Facility of EUTCP. Z.64. LfA-EIF Facility LfA-EIF Facility, signed in 2009, is a joint EIF and LfA Förderbank Bayern venture providing investments to support technology-oriented early and expansion stage companies in the region of Bavaria, Germany. Z.65. AIP Zambia The “Zambia Agriculture Value Chain Facility Programme” developed under AIP aims to support the Government of Zambia's policy objectives to reduce rural poverty and malnutrition and to improve rural livelihoods. The EIB Project aims to address market failures in the agriculture value chains by supporting the access to finance for private agriculture value chain actors through financial intermediaries, as well as by strengthening the capacity of financial intermediaries to lend to those actors. The EIB prepares separate financial statements for the programme. Z.66. G43 Trust Fund Under G43 Anatolian Venture Capital Fund, signed in August 2012, the EIF is entrusted with a mandate by Central Finance Unit of Türkiye (‘CFCU’). It is dedicated to make investments in SMEs in South-Eastern Anatolia region of Türkiye. The EIF prepares separate financial statements for the G43. Z.67. Mezzanine Dachfonds fur Deutschland (‘MDD’) The MDD in an investment programme signed in June 2013 and funded by the German Federal Ministry of Economics and Technology (‘BMWi’) and various institutions of the Federal states to subscribe into hybrid debt and equity funds investing in German Mid-Caps. Z.68. AIP Kulima The “Support for Kulima Access to Finance Programme” developed under the Africa Investment Platform (“AIP”) comprises an intermediated facility for on-lending to eligible private agri-food sector investments in Malawi. It aims to promote sustainable agricultural growth to increase incomes, employment and food security in the context of a changing climate. The EIB prepares separate financial statements for the programme. Z.69. Technology Transfer Pilot Project (‘TTP’) Under the TTP, financed by the EC and signed in November 2008, the EIF has supported a technology transfer structure through pre-seed funding and seed funding. The EIF prepares separate financial statements for TTP. Z.70. EFSD Guarantee "Access to Finance Initiative" The EFSD Guarantee “SME Access to Finance Initiative” is a guarantee facility targeting SMEs, underserved entrepreneurs with a particular focus on young entrepreneurs, female entrepreneurs, start-ups and certain other groups in certain target countries and with the overriding objective of addressing some of the root causes of migration. The Programme aims to provide local banks and financial institutions selected by EIB with first loss credit protection for portfolios of loans extended to, and bank guarantees and letters of credit opened for, SMEs or micro-SMEs managed or owned by these underserved entrepreneurs who have less access to finance than other entrepreneurs because their local financial institutions associate them with higher levels of risk. The target countries will be located in the eastern and southern European Neighbourhood. The EIB prepares separate financial statements for the programme. Z.71. European Technology Facility (‘ETF’) Under the ETF Start-Up Facility, the EIF is empowered to acquire, manage and dispose of ETF start-up investments, in its own name but on behalf of and at the risk of the EC. 168 |
| 2022 FINANCIAL REPORT 177 Z.72. EPIC EPIC (Technical Assistance for Eastern Partnership Investment in Connectivity) is a technical assistance facility under the Neighbourhood Investment Platform (NIP) which contributes to improve connectivity both within the Eastern Partnership region and between the Eastern Partnership countries and the EU. EIB prepares separate financial statements for EPIC. Z.73. Green for Growth Fund (‘GGF’) The Green for Growth Fund was set up by the EIF in December 2009 and focuses on energy efficiency financings in South East Europe including Türkiye. Z.74. GEEREF (‘Fund and Technical Support Facility’) GEEREF (Global Energy Efficiency and Renewable Energy Fund) is a fund of funds set-up at the initiative of the EC. Its objective is to make investments in private equity funds that focus on the fields of renewable energy and energy efficiency in emerging markets (ACP, ALA and European Neighbour countries). The EIF also holds a technical assistance mandate for which related activities are implemented by the GEEREF front office. 169 |
| EIB GROUP CONSOLIDATED FINANCIAL STATEMENTS UNDER EU DIRECTIVES 178 Statement of Special Section(1) as at 31 December 2022 and 31 December 2021 (in EUR ‘000) ASSETS 31.12.2022 31.12.2021 Mediterranean Countries From resources of the European Union Disbursed loans outstanding 4,550 5,828 Risk capital operations - amounts to be disbursed 21,523 21,523 - amounts disbursed 27,783 28,479 49,306 50,002 Total(2) 53,856 55,830 · Lomé Conventions Operations from risk capital resources - amounts disbursed 74,631 76,542 Total(3) 74,631 76,542 Total 128,487 132,372 LIABILITIES 31.12.2022 31.12.2021 Funds under trust management Under mandate from the European Union - Financial Protocols with the Mediterranean Countries 32,333 34,307 - Lomé Conventions 74,631 76,542 Total funds under trust management 106,964 110,849 Funds to be disbursed On loans and risk capital operations in the Mediterranean countries 21,523 21,523 Total funds to be disbursed 21,523 21,523 Total 128,487 132,372 For information: Total amounts disbursed and not yet repaid on loans on special conditions made available by the Commission in respect of which the Bank has accepted an EU mandate for recovering principal and interest: a) Under the First, Second and Third Lomé Conventions as at 31 December 2022 EUR ‘000 191,538 (2021: EUR ‘000 211,266). b) Under Financial Protocols signed with the Mediterranean Countries as at 31 December 2022 EUR ‘000 25,216 (2021: EUR ‘000 29,660). In the context of the European Union – European Development Finance Institutions Private Sector Development Facility, the implementation agreement for the Guarantee Component was signed on 20 August 2014. The total amount of the EU guarantee to be issued is EUR ‘000 38,920 as at 31 December 2022 (2021: EUR ‘000 38,920). Note (1): The Special Section was set up by the Board of Governors on 27 May 1963. Under a decision taken on 4 August 1977, its purpose was redefined as being that of recording financing operations carried out by the European Investment Bank for the account of and under mandate from third parties. However, for the Investment Facility under the Cotonou Agreement, the EU-Africa Infrastructure Trust Fund, the Neighbourhood Investment Facility (‘NIF’) Trust Fund and the FEMIP Trust Fund, separate financial statements are presented. In addition, since 2005, the EIB also prepares financial statements of different types for other mandates. The Statement of Special Section reflects amounts disbursed or to be disbursed, less cancellations and repayments, under mandate from the European Union and the Member States. Amounts disbursed and to be disbursed and funds received and to be received are carried at nominal value. No account is taken in the Statement of Special Section of provisions or value adjustments, which may be required to cover risks associated with such operations except for definite write-offs. Amounts in foreign currency are translated at exchange rates prevailing on 31 December. 170 |
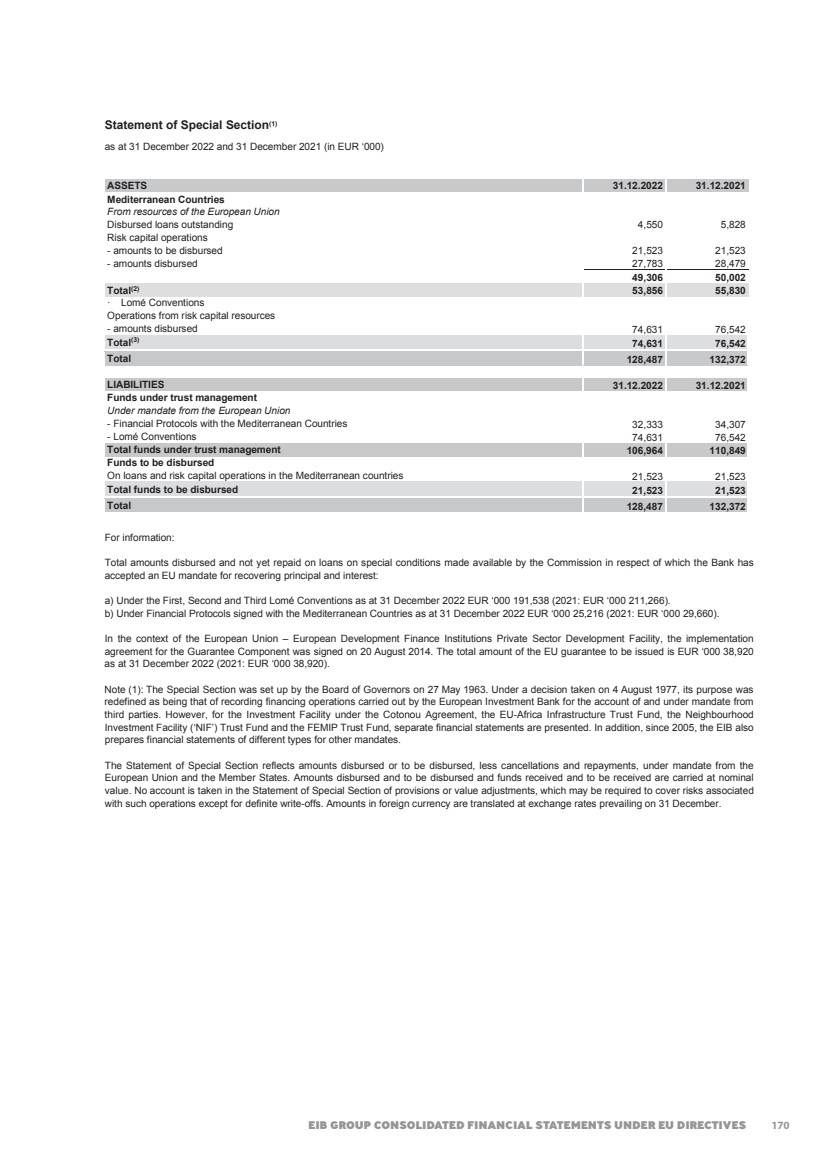
| 2022 FINANCIAL REPORT 179 Note (2): Initial amount of contracts signed for financing projects in the Maghreb and Mashreq countries, Malta, Cyprus, Türkiye and Greece (EUR 10 million lent prior to accession to the EC on 1 January 1981) under mandate, for the account and at the risk of the European Union. Initial amount: 840,457 less: exchange adjustments 56,283 cancellations 178,863 repayments 551,455 -786,601 53,856 Note (3): Initial amount of contracts signed for financing projects in the African, Caribbean and Pacific States and the Overseas Countries and Territories (‘ACP-OCT’) under mandate, for the account and at the risk of the European Union: Loans from risk capital resources: Conditional and subordinated loans 3,116,097 Equity participations 121,002 Initial amount: 3,237,099 add: capitalised interests 9,548 less: cancellations 742,432 repayments 2,374,004 exchange adjustments 55,580 -3,172,016 74,631 171 |
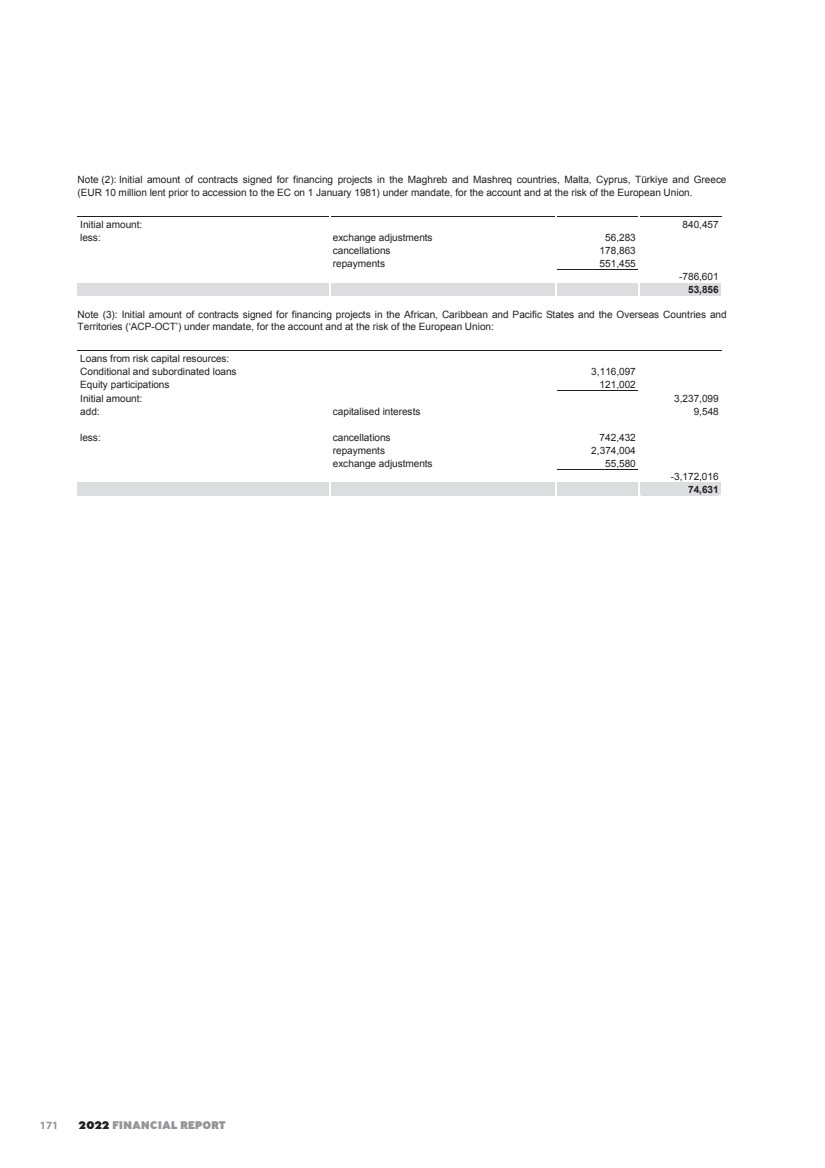
| INDEPENDENT AUDITOR’S REPORT INDEPENDENT AUDITOR’S REPORT KPMG Audit S.à r.l. 39, Avenue John F. Kennedy L-1855 Luxembourg Tel.: +352 22 51 51 1 Fax: +352 22 51 71 E-mail: info@kpmg.lu Internet: www.kpmg.lu © 2023 KPMG Audit S.à r.l., a Luxembourg entity and a member firm of the KPMG global organization of independent member firms affiliated with KPMG International Limited, a private English company limited by guarantee. All rights reserved. R.C.S Luxembourg B 149133 To the Chairman of the Audit Committee of EUROPEAN INVESTMENT BANK 98-100, boulevard Konrad Adenauer L-2950 Luxembourg REPORT OF THE REVISEUR D’ENTREPRISES AGREE Report on the audit of the consolidated financial statements Opinion We have audited the consolidated financial statements of EUROPEAN INVESTMENT BANK and its subsidiary (the “Group”), which comprise the consolidated balance sheet as at 31 December 2022, and the consolidated profit and loss account and the consolidated cash flow statement for the year then ended, and notes to the consolidated financial statements, including a summary of significant accounting policies and other explanatory information. In our opinion, the accompanying consolidated financial statements give a true and fair view of the consolidated financial position of the Group as at 31 December 2022, and of the consolidated results of its operations and its consolidated cash flows for the year then ended in accordance with the general principles of the Directive 86/635/EEC of the Council of the European Communities of 8 December 1986 on the annual accounts and consolidated financial statements of banks and other financial institutions, as amended by Directive 2001/65/EC of 27 September 2001, by Directive 2003/51/EC of 18 June 2003 and by Directive 2006/46/EC of 14 June 2006 (the “Directives”). Basis for opinion We conducted our audit in accordance with the Law of 23 July 2016 on the audit profession (“Law of 23 July 2016”) and with International Standards on Auditing (“ISAs”) as adopted for Luxembourg by the “Commission de Surveillance du Secteur Financier” (“CSSF”). Our responsibilities under the Law of 23 July 2016 and ISAs as adopted for Luxembourg by the CSSF are further described in the “Responsibilities of “réviseur d’entreprises agréé” for the audit of the consolidated financial statements” section of our report. We are also independent of the Group in accordance with the International Code of Ethics for Professional Accountants, including International Independence Standards, issued by the International Ethics Standards Board for Accountants (“IESBA Code”) as adopted for Luxembourg by the CSSF together with the ethical requirements that are relevant to our audit of the consolidated financial statements, and have fulfilled our other ethical responsibilities under those ethical requirements. We believe that the audit evidence we have obtained is sufficient and appropriate to provide a basis for our opinion. 180 172 |
| 2022 FINANCIAL REPORT Key audit matters Key audit matters are those matters that, in our professional judgment, were of most significance in our audit of the consolidated financial statements of the current period. These matters were addressed in the context of the audit of the consolidated financial statements as a whole, and in forming our opinion thereon, and we do not provide a separate opinion on these matters. 1 Value adjustments of loans to customers and credit institutions Why the matter was considered to be one of most significance in our audit As at 31 December 2022, the Group reports loans accounted for at cost of EUR 419,991 million (31 December 2021: EUR 415,936 million) representing 77% of total assets (31 December 2020: 73%) and recognized individually assessed value adjustments on loans amounting to EUR 316 million (31 December 2021: EUR 439 million). The Group reviews its loans at each reporting date to assess whether an allowance for value adjustments should be recorded. These loans are not traded in an active market, therefore significant judgments and estimates are required to be applied by Management in its assessment of recoverable amount. Inappropriate judgments made in relation to the methodology and inputs used or the assumptions taken may have a material impact on the amount of value adjustment recorded. These critical judgments include matters such as the identification and assessment of potential indicators of value adjustments, as well as discounted cash flows forecast techniques, estimation of guarantees obtained, valuation of collaterals received and forbearance measures applied. The effects of the Covid 19 pandemic and the Russia’s invasion of Ukraine have resulted in unprecedent economic conditions that vary across countries and industry sectors. The uncertainty caused by those events increased the level of judgement involved in the determination and calculation of value adjustments on loans. The key inputs and assumptions used by Management in its assessment of loan value adjustments are detailed in Note A.1.2 to the consolidated financial statements as well as the accounting policy for the value adjustment in Note A.2.7.1 and the detail of specific value adjustments in Note D.2. The loans accounted for at cost are disclosed in Note D.1 to the consolidated financial statements as well as the accounting policy for the loans in Note A.2.7.1. How the matter was addressed in our audit Our procedures included the assessment of key controls over the approval, recording, monitoring and restructuring of loans to customers and credit institutions, the loan grading process and the measurement of allowance for value adjustment for individually assessed loans. For a sample of loans with specific allowances for value adjustment, we evaluated the Group's individual assessment of each loan by specifically challenging the Group 's assumptions used as well as underlying data, including the value of realisable collateral and the estimated recoverability. Based on a retrospective review, we further critically assessed whether the Group revised its estimates and assumptions for specific allowances established in prior years. 181 173 |
| INDEPENDENT AUDITOR’S REPORT The impact of the Russia’s invasion of Ukraine and its broader economic consequences and Covid-19 pandemic were followed-up both in assessing the value adjustment of the evaluated exposure and in determining our sample of exposures where we drew a particular attention to the sectors most vulnerable to the effects of the pandemic. Such effect on the Bank’s lending portfolio was assessed as part of our audit procedures. We also tested a sample of individually significant exposures potentially impaired for which no value adjustment had been recorded as well as a sample of exposures which had not been identified by the Group as being potentially impaired. For both types, we assessed whether appropriate consideration had been given to the collectability of future cash flows and the valuation of the underlying collaterals. We assessed the disclosures in the consolidated financial statements in relation to allowance for value adjustment of loans with reference to the requirements of the prevailing accounting standards. Other information The Management is responsible for the other information. The other information comprises the information stated in the sections called “Highlights, Overview, EIB Statutory Bodies and Audit and control”, which are mainly based on statutory EU Directives information, but does not include the consolidated financial statements and our report of the “réviseur d’entreprises agréé” thereon. Our opinion on the consolidated financial statements does not cover the other information and we do not express any form of assurance conclusion thereon. In connection with our audit of the consolidated financial statements, our responsibility is to read the other information and, in doing so, consider whether the other information is materially inconsistent with the consolidated financial statements or our knowledge obtained in the audit or otherwise appears to be materially misstated. If, based on the work we have performed, we conclude that there is a material misstatement of this other information, we are required to report this fact. We have nothing to report in this regard. Responsibilities of the Management and Those Charged with Governance for the consolidated financial statements The Management is responsible for the preparation and fair presentation of these consolidated financial statements in accordance with the general principles of the Directives, and for such internal control as the Management determines is necessary to enable the preparation of consolidated financial statements that are free from material misstatement, whether due to fraud or error. In preparing the consolidated financial statements, the Management is responsible for assessing the Group’s ability to continue as a going concern, disclosing, as applicable, matters related to going concern and using the going concern basis of accounting unless the Management either intends to liquidate the Group or to cease operations, or has no realistic alternative but to do so. Those charged with governance are responsible for overseeing the Group’s financial reporting process. 182 174 |
| 2022 FINANCIAL REPORT Responsibilities of the réviseur d’entreprises agréé for the audit of the consolidated financial statements The objectives of our audit are to obtain reasonable assurance about whether the consolidated financial statements as a whole are free from material misstatement, whether due to fraud or error, and to issue a report of the “réviseur d’entreprises agréé” that includes our opinion. Reasonable assurance is a high level of assurance, but is not a guarantee that an audit conducted in accordance with the Law of 23 July 2016 and with ISAs as adopted for Luxembourg by the CSSF will always detect a material misstatement when it exists. Misstatements can arise from fraud or error and are considered material if, individually or in the aggregate, they could reasonably be expected to influence the economic decisions of users taken on the basis of these consolidated financial statements. As part of an audit in accordance with the Law of 23 July 2016 and with ISAs as adopted for Luxembourg by the CSSF, we exercise professional judgment and maintain professional skepticism throughout the audit. We also: • Identify and assess the risks of material misstatement of the consolidated financial statements, whether due to fraud or error, design and perform audit procedures responsive to those risks, and obtain audit evidence that is sufficient and appropriate to provide a basis for our opinion. The risk of not detecting a material misstatement resulting from fraud is higher than for one resulting from error, as fraud may involve collusion, forgery, intentional omissions, misrepresentations, or the override of internal control. • Obtain an understanding of internal control relevant to the audit in order to design audit procedures that are appropriate in the circumstances, but not for the purpose of expressing an opinion on the effectiveness of the Group’s internal control. • Evaluate the appropriateness of accounting policies used and the reasonableness of accounting estimates and related disclosures made by the Management. • Conclude on the appropriateness of Management’s use of the going concern basis of accounting and, based on the audit evidence obtained, whether a material uncertainty exists related to events or conditions that may cast significant doubt on the Group’s ability to continue as a going concern. If we conclude that a material uncertainty exists, we are required to draw attention in our report of the “réviseur d’entreprises agréé” to the related disclosures in the consolidated financial statements or, if such disclosures are inadequate, to modify our opinion. Our conclusions are based on the audit evidence obtained up to the date of our report of the “réviseur d’entreprises agréé”. However, future events or conditions may cause the Group to cease to continue as a going concern. • Evaluate the overall presentation, structure and content of the consolidated financial statements, including the disclosures, and whether the consolidated financial statements represent the underlying transactions and events in a manner that achieves fair presentation. • Obtain sufficient appropriate audit evidence regarding the financial information of the entities and business activities within the Group to express an opinion on the consolidated financial statements. We are responsible for the direction, supervision and performance of the Group audit. We remain solely responsible for our audit opinion. 183 175 |
| INDEPENDENT AUDITOR’S REPORT We communicate with those charged with governance regarding, among other matters, the planned scope and timing of the audit and significant audit findings, including any significant deficiencies in internal control that we identify during our audit. We also provide those charged with governance with a statement that we have complied with relevant ethical requirements regarding independence, and to communicate with them all relationships and other matters that may reasonably be thought to bear on our independence, and where applicable, related safeguards. From the matters communicated with those charged with governance, we determine those matters that were of most significance in the audit of the consolidated financial statements of the current period and are therefore the key audit matters. We describe these matters in our report unless law or regulation precludes public disclosure about the matter or when, in extremely rare circumstances, we determine that a matter should not be communicated in our report because the adverse consequences of doing so would reasonably be expected to outweigh the public interest benefits of such communication. Report on other requirements In accordance with the Framework Agreement (“the Agreement”) dated 19 February 2009, renewed on 3 March 2017 , as extended for the period 2022-2024 on 14 December 2020, signed between European Investment Bank and KPMG Luxembourg Société anonyme, we have been appointed to carry the audit services defined in the Agreement. The duration of our uninterrupted engagement, including previous renewals and reappointments, is 13 years. We confirm that the audit opinion is consistent with the communication to the audit committee or equivalent. We confirm that the prohibited non-audit services referred to in IESBA Code of Ethics were not provided and that we remained independent of the Group in conducting the audit. Luxembourg, 29 March 2023 KPMG Audit S.à r.l. Cabinet de révision agréé S. Chambourdon Partner 184 176 |
| 2022 FINANCIAL REPORT STATEMENT BY THE AUDIT COMMITTEE The Audit Committee reports to the Board of Governors, the following statement being communicated to the Governors prior to their approval of the Annual Report and the financial statements for the past financial year. Statement by the Audit Committee on the EIB’s consolidated financial statements prepared in accordance with the general principles of the ‘Directives’ The Audit Committee, instituted in pursuance of Article 12 of the Statute and Chapter V of the Rules of Procedure of the European Investment Bank for the purpose of verifying that the operations of the Bank are conducted and its books kept in a proper manner, having: - designated KPMG as external auditors, reviewed their audit planning process, examined and discussed their reports, and in particular their independent Auditor’s Report, - noted that the opinion of KPMG on the consolidated financial statements of the European Investment Bank for the year ended 31 December 2022 prepared in accordance with the general principles of the Directive 86/635/EEC of the Council of the European Communities of 8 December 1986 on the annual accounts and consolidated accounts of banks and other financial institutions, as amended by Directive 2001/65/EC of 27 September 2001, by Directive 2003/51/EC of 18 June 2003 and by Directive 2006/46/EC of 14 June 2006 (the ‘Directives’), is unqualified, - convened on a regular basis with the Heads of Directorates and relevant services including, • Financial Control, • Risk Management, Transaction Monitoring and Restructuring and Compliance, - met regularly the Head of Internal Audit and discussed the relevant internal audit reports, and studied the documents which it deemed necessary to examine in the discharge of its duties, - received assurance from the Management Committee concerning the effectiveness of the internal control structure and internal administration, and considering - the consolidated financial statements for the financial year ended 31 December 2022 adopted by the Board of Directors on 29 March 2023, - that the foregoing provides a reasonable basis for its statement and, - Articles 24, 25 & 26 of the Rules of Procedure, 177 |
| STATEMENT BY THE AUDIT COMMITTEE 185 to the best of its knowledge and judgement: confirms that the consolidated financial statements of the European Investment Bank, which comprise the consolidated balance sheet as at 31 December 2022, the consolidated profit and loss account and the consolidated cash flow statement for the year then ended, and notes to the consolidated financial statements, including a summary of significant accounting policies and other explanatory information, give a true and fair view of the consolidated financial position of the European Investment Bank as of 31 December 2022, and of the consolidated results of its operations and its consolidated cash flows for the year then ended in accordance with the general principles of the Directives. Luxembourg, 29 March 2023 Audit Committee 178 |
| EIB GROUP CONSOLIDATED FINANCIAL STATEMENTS UNDER IFRS EIB GROUP CONSOLIDATED FINANCIAL STATEMENTS UNDER IFRS as at 31 December 2022 179 |
| 2022 FINANCIAL REPORT 187 Consolidated balance sheet as at 31 December 2022 (in EUR ’000) Assets 31.12.2022 31.12.2021 1. Cash in hand, balances with central banks and post office banks (Note B.1) 112,703 1,483,285 2. Treasury bills and other bills eligible for refinancing with central banks (Note B.2) 21,620,352 37,237,861 3. Loans and advances to credit institutions a) repayable on demand 984,212 797,488 b) other loans and advances (Note C) 64,218,218 74,741,569 c) loans (Note D.1) 91,623,813 94,682,744 d) impairment on loans and advances, net of reversals (Note D.2) -32,444 -75,226 156,793,799 170,146,575 4. Loans and advances to customers a) other loans and advances (Note C) 125,976 677,197 b) loans (Note D.1) 321,262,627 339,994,473 c) impairment on loans and advances, net of reversals (Note D.2) -295,939 -288,259 321,092,664 340,383,411 5. Debt securities including fixed-income securities (Note B.2) a) issued by public bodies 4,443,133 5,024,595 b) issued by other borrowers 6,539,924 7,034,187 10,983,057 12,058,782 6. Shares and other variable-yield securities (Note B.3) 18,892,954 18,872,305 7. Derivative assets (Note Q) 35,044,316 41,734,302 8. Property, furniture and equipment (Note E) 344,591 374,320 9. Intangible assets (Note E) 70,167 58,408 10. Other assets (Note G.1) 223,367 183,884 11. Subscribed capital and reserves, called but not paid (Note W.1) 811,264 1,133,642 12. Prepayments 286,131 271,753 Total assets 566,275,365 623,938,528 The accompanying notes form an integral part of these consolidated financial statements. 180 |
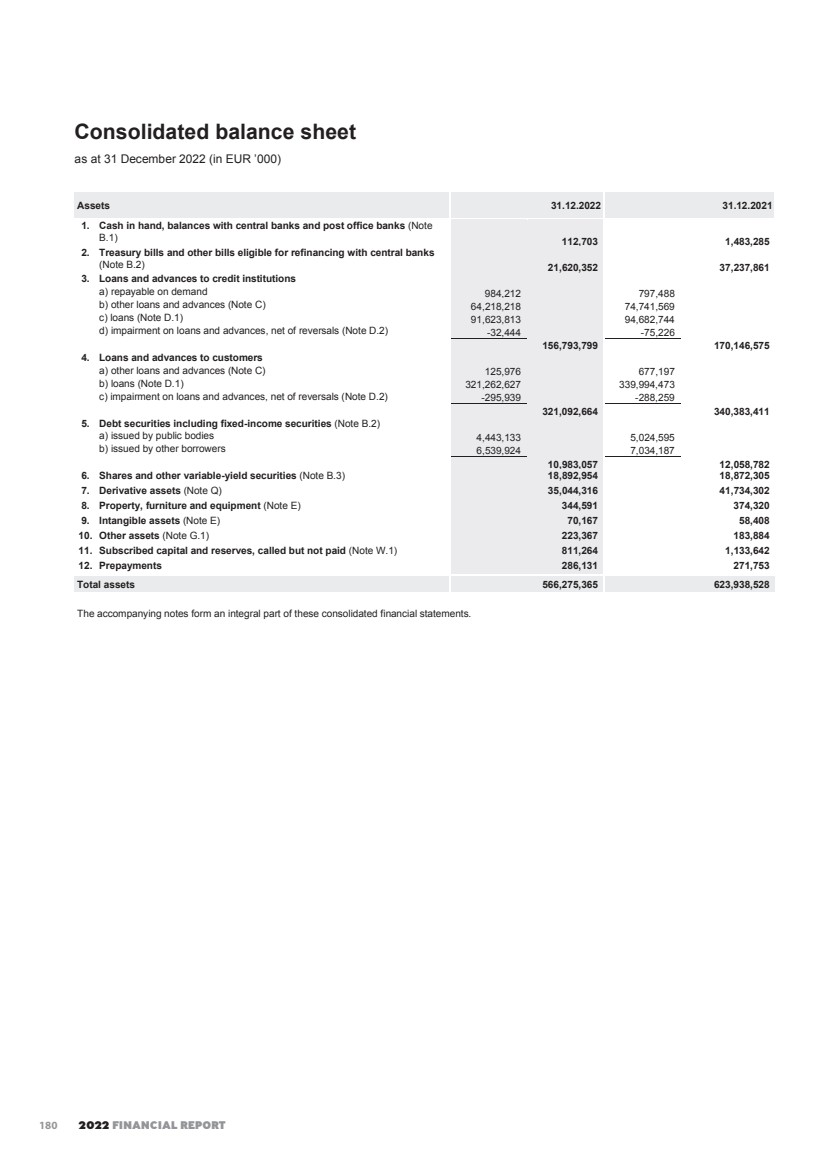
| EIB GROUP CONSOLIDATED FINANCIAL STATEMENTS UNDER IFRS 188 Consolidated balance sheet (continued) as at 31 December 2022 (in EUR ’000) Liabilities and equity 31.12.2022 31.12.2021 Liabilities 1. Amounts owed to credit institutions (Note H.1) a) repayable on demand 2,371,014 4,775,575 b) with agreed maturity or periods of notice 3,071,698 18,796,352 5,442,712 23,571,927 2. Amounts owed to customers (Note H.2) a) repayable on demand 1,433,117 1,645,154 b) with agreed maturity or periods of notice 57,637 175,496 1,490,754 1,820,650 3. Debts evidenced by certificates (Note I) a) debt securities in issue 407,336,160 461,915,358 b) others 10,081,802 11,987,275 417,417,962 473,902,633 4. Derivative liabilities (Note Q) 43,757,867 29,529,619 5. Other liabilities (Note G.2) 5,040,120 4,981,663 6. Deferred income (Note F) 479,339 443,133 7. Provisions a) pension plans and health insurance scheme (Note J) 5,722,781 8,623,332 b) provisions for guarantees issued and commitments (Note D) 48,537 42,537 5,771,318 8,665,869 Total liabilities 479,400,072 542,915,494 Equity 8. Capital (Note W) a) subscribed 248,795,607 248,795,607 b) uncalled -226,604,892 -226,604,892 22,190,715 22,190,715 9. Reserves a) reserve fund 24,879,561 24,879,561 b) additional reserves 22,998,138 9,736,449 c) fair value reserve 750,044 575,725 d) special activities reserve 10,303,216 12,152,954 e) general loan reserve 2,115,966 2,021,337 61,046,925 49,366,026 10. Profit for the financial year (Note K) 2,326,985 8,277,324 Total equity attributable to the equity holders of the Bank 85,564,625 79,834,065 11. Non-controlling interests 1,310,668 1,188,969 Total equity 86,875,293 81,023,034 Total liabilities and equity 566,275,365 623,938,528 The accompanying notes form an integral part of these consolidated financial statements. 181 |
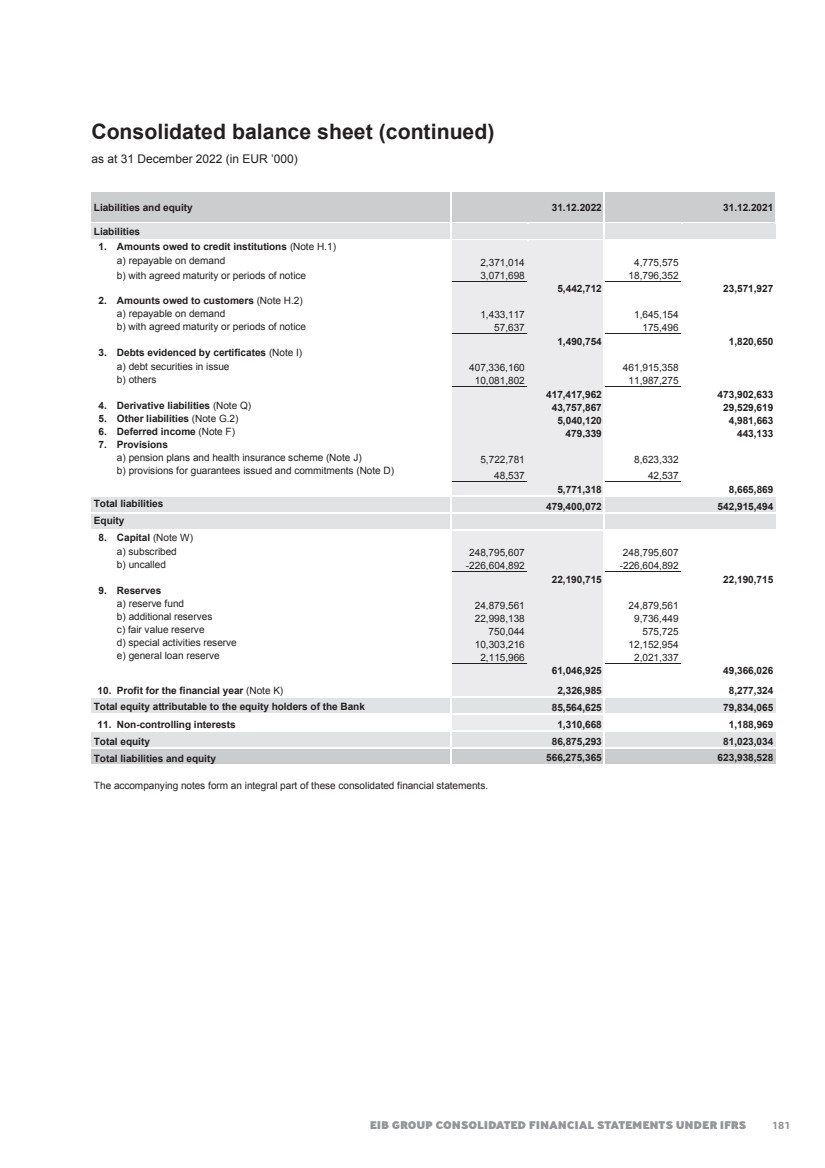
| 2022 FINANCIAL REPORT 189 Consolidated income statement for the year ended 31 December 2022 (in EUR ‘000) 2022 2021 1. Interest and similar income (Note L) (1) 18,309,260 16,312,260 2. Interest expense and similar charges (Note L) -15,623,347 -13,272,582 3. Income from shares and other variable-yield securities 672,023 838,815 4. Fee and commission income (Note O) 670,069 585,247 5. Fee and commission expense (Note O) -383,216 -434,377 6. Result on financial operations (Note M) (2) 240,240 5,630,207 7. Net other operating income and expense (Note N) 10,477 -1,397 8. Change in impairment on loans and advances and provisions for guarantees, net of reversals (Notes D.2, D.4) 41,499 291,582 9. Change in impairment on transferable securities held as financial fixed assets, shares and other variable-yield securities, net of reversals 1,240 38,890 10. General administrative expenses (Note P) a) staff costs -1,174,273 -1,207,031 b) other administrative expenses -306,561 -246,922 -1,480,834 -1,453,953 11. Depreciation and amortisation: property, furniture and equipment and intangible assets (Note E) a) property, furniture and equipment -76,360 -70,272 b) intangible assets -29,696 -21,035 -106,056 -91,307 12. Profit for the financial year 2,351,355 8,443,385 Attributable to: Non-controlling interests 24,370 166,061 Equity holders of the Bank 2,326,985 8,277,324 (1) For the year ended 31 December 2022, Interests and similar income included EUR '000 7,137,966 (2021: EUR '000 5,493,411) calculated on assets held at amortised cost based on effective interest method. (2) For the year ended 31 December 2022, Result on financial operations included EUR nil (2021: EUR '000 2,649) net gains resulting from the derecognition of financial assets measured at amortised cost. The accompanying notes form an integral part of these consolidated financial statements. 182 |
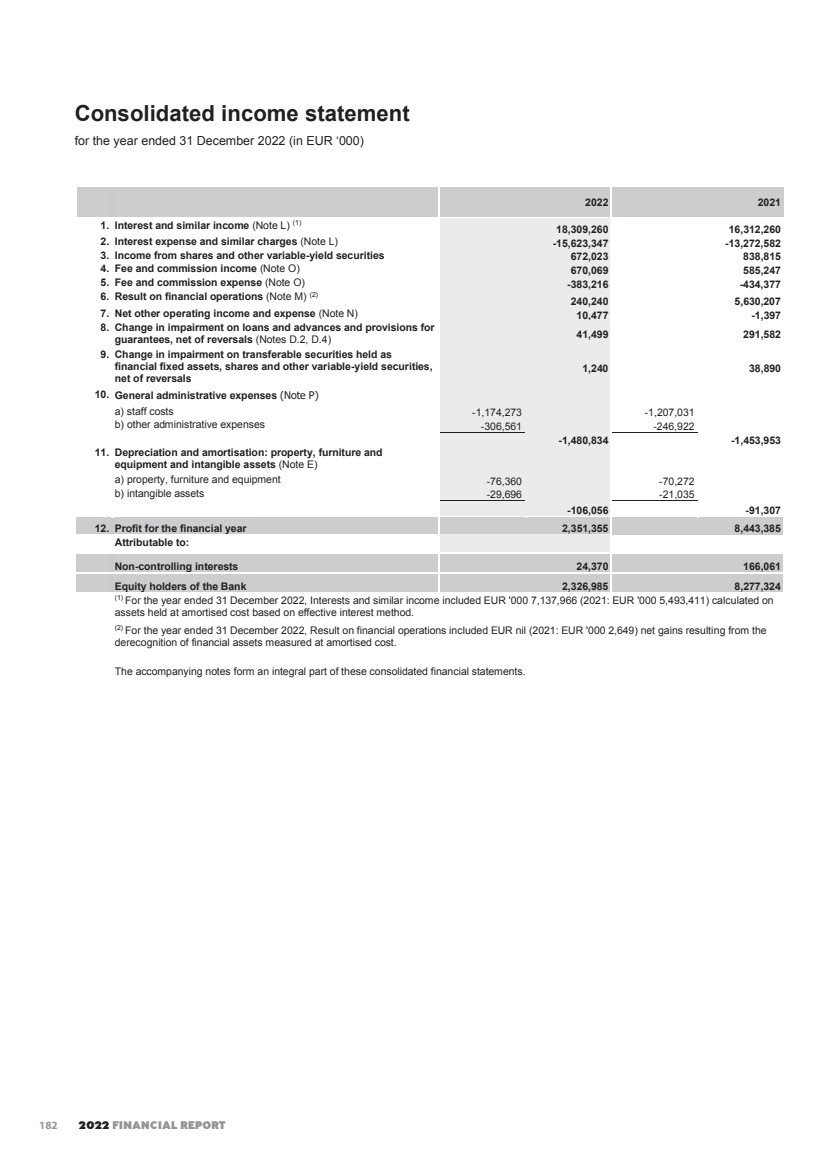
| EIB GROUP CONSOLIDATED FINANCIAL STATEMENTS UNDER IFRS 189 Consolidated income statement for the year ended 31 December 2022 (in EUR ‘000) 2022 2021 1. Interest and similar income (Note L) (1) 18,309,260 16,312,260 2. Interest expense and similar charges (Note L) -15,623,347 -13,272,582 3. Income from shares and other variable-yield securities 672,023 838,815 4. Fee and commission income (Note O) 670,069 585,247 5. Fee and commission expense (Note O) -383,216 -434,377 6. Result on financial operations (Note M) (2) 240,240 5,630,207 7. Net other operating income and expense (Note N) 10,477 -1,397 8. Change in impairment on loans and advances and provisions for guarantees, net of reversals (Notes D.2, D.4) 41,499 291,582 9. Change in impairment on transferable securities held as financial fixed assets, shares and other variable-yield securities, net of reversals 1,240 38,890 10. General administrative expenses (Note P) a) staff costs -1,174,273 -1,207,031 b) other administrative expenses -306,561 -246,922 -1,480,834 -1,453,953 11. Depreciation and amortisation: property, furniture and equipment and intangible assets (Note E) a) property, furniture and equipment -76,360 -70,272 b) intangible assets -29,696 -21,035 -106,056 -91,307 12. Profit for the financial year 2,351,355 8,443,385 Attributable to: Non-controlling interests 24,370 166,061 Equity holders of the Bank 2,326,985 8,277,324 (1) For the year ended 31 December 2022, Interests and similar income included EUR '000 7,137,966 (2021: EUR '000 5,493,411) calculated on assets held at amortised cost based on effective interest method. (2) For the year ended 31 December 2022, Result on financial operations included EUR nil (2021: EUR '000 2,649) net gains resulting from the derecognition of financial assets measured at amortised cost. The accompanying notes form an integral part of these consolidated financial statements. 190 Consolidated statement of profit or loss and other comprehensive income for the year ended 31 December 2022 (in EUR ’000) 2022 2021 Profit for the financial year 2,351,355 8,443,385 Other comprehensive income Items that will not be reclassified to profit or loss: Remeasurements of defined benefit liability (Note J) 3,395,787 1,474,982 Changes in fair value attributable to change in the own credit risk of financial liabilities designated at the FVO - fair value reserve (Note R) 230,741 66,183 Net gains / losses on investment in equity instruments designated at FVOCI (Note B.3) -50,349 83,048 Items that are or may be reclassified to profit or loss: Changes in fair value attributable to the currency basis spread of hedging derivatives - fair value reserve (Note Q) 4,800 -96,038 Total other comprehensive income 3,580,979 1,528,175 Total comprehensive income 5,932,334 9,971,560 Attributable to: Non-controlling interests 162,205 251,427 Equity holders of the Bank 5,770,129 9,720,133 The accompanying notes form an integral part of these consolidated financial statements. 183 |
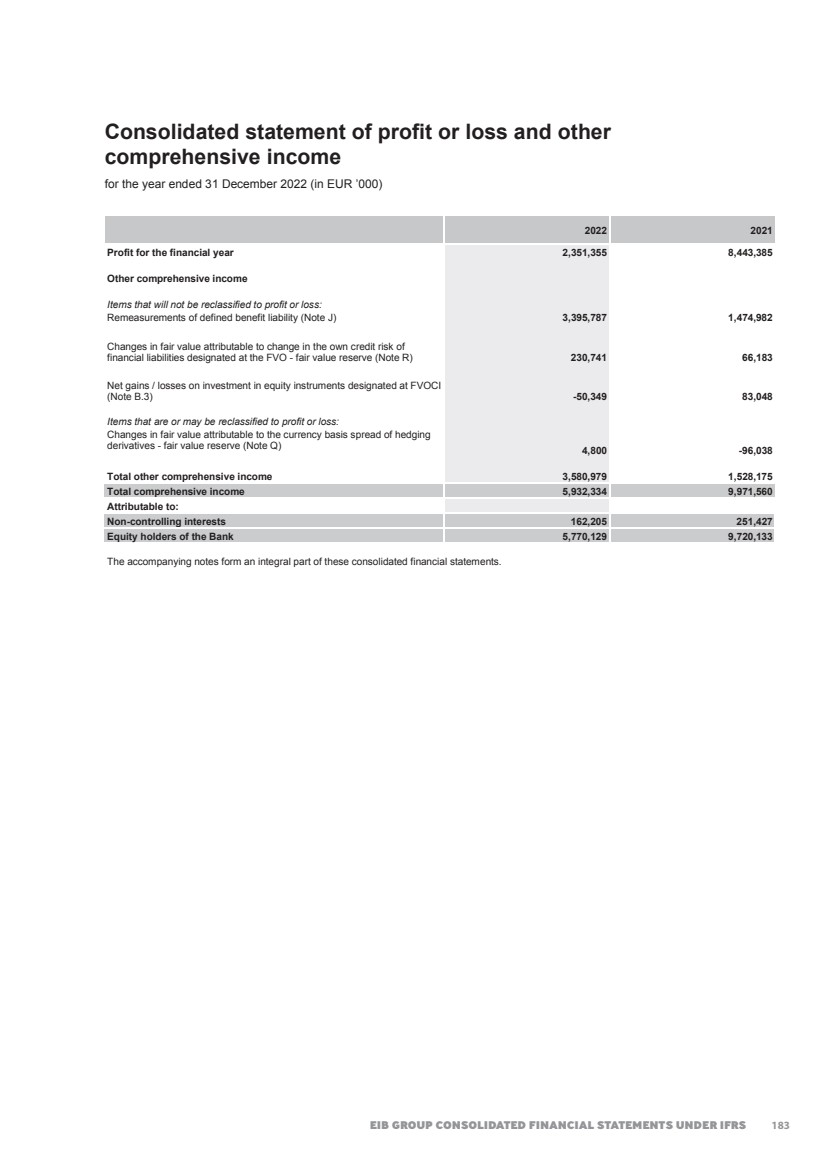
| 2022 FINANCIAL REPORT 191 Consolidated statement of changes in equity for the year ended 31 December 2022 (in EUR ’000) Subscribed capital Uncalled capital Reserve Fund Additional reserves Fair value reserve Special activities reserve General loan reserve Result of the year before appropriation Total Non-controlling interests Total consolidated equity Balance at 1 January 2021 248,795,607 -226,604,892 24,328,415 6,486,767 522,532 11,736,896 2,135,891 2,637,423 70,038,639 0 70,038,639 Comprehensive income Profit / Loss for the financial year 0 0 0 0 0 0 0 8,277,324 8,277,324 166,061 8,443,385 Other comprehensive income 0 0 0 1,389,616 53,193 0 0 0 1,442,809 85,366 1,528,175 Total comprehensive income 0 0 0 1,389,616 53,193 0 0 8,277,324 9,720,133 251,427 9,971,560 Appropriation of prior year’s result 0 0 551,146 1,784,773 0 416,058 -114,554 -2,637,423 0 0 0 Other 0 0 0 75,293 0 0 0 0 75,293 0 75,293 Transactions with owners of the Group Movement of non-controlling interest subsidiary 0 0 0 0 0 0 0 0 0 937,542 937,542 Total transactions with owners of the Group 0 0 0 0 0 0 0 0 0 937,542 937,542 Balance at 31 December 2021 248,795,607 -226,604,892 24,879,561 9,736,449 575,725 12,152,954 2,021,337 8,277,324 79,834,065 1,188,969 81,023,034 Comprehensive income Profit / Loss for the financial year 0 0 0 0 0 0 0 2,326,985 2,326,985 24,370 2,351,355 Other comprehensive income 0 0 0 3,257,952 185,192 0 0 0 3,443,144 137,835 3,580,979 Total comprehensive income 0 0 0 3,257,952 185,192 0 0 2,326,985 5,770,129 162,205 5,932,334 Appropriation of prior year’s result 0 0 0 10,032,433 0 -1,849,738 94,629 -8,277,324 0 0 0 Other 0 0 0 -28,696 -10,873 0 0 0 -39,569 0 -39,569 Transactions with owners of the Group Movement of non-controlling interest subsidiary 0 0 0 0 0 0 0 0 0 -40,506 -40,506 Total transactions with owners of the Group 0 0 0 0 0 0 0 0 0 -40,506 -40,506 Balance at 31 December 2022 248,795,607 -226,604,892 24,879,561 22,998,138 750,044 10,303,216 2,115,966 2,326,985 85,564,625 1,310,668 86,875,293 The accompanying notes form an integral part of these consolidated financial statements. 184 |
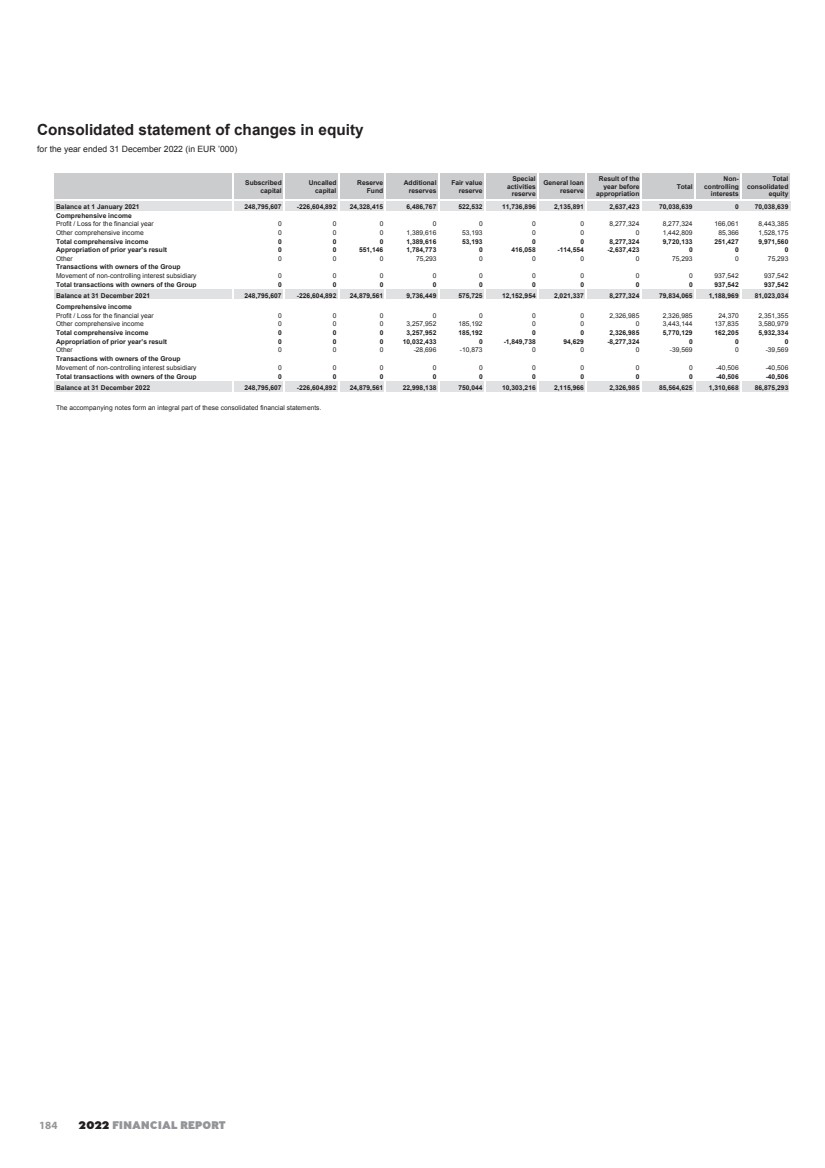
| EIB GROUP CONSOLIDATED FINANCIAL STATEMENTS UNDER IFRS 192 Consolidated cash flow statement for the year ended 31 December 2022 (in EUR ‘000) 2022 2021 A. Cash flows from operating activities: Profit for the financial year 2,351,355 8,443,385 Adjustments for: Change in impairment on loans and advances and provisions for guarantees (Notes D.2, D.4) -41,499 -291,582 Depreciation and amortisation on property, furniture and equipment and intangible assets, and write-off (Note E) 106,056 91,415 Change in impairment on transferable securities held as financial fixed assets, shares and other variable-yield securities -1,240 38,890 Change in fair value adjustment of debt securities 139,720 216,851 IFRS adjustments on loans and associated swaps (Note M.1) 576,878 182,635 IFRS adjustments on borrowings and associated swaps (Note M.1) -793,275 -278,609 IFRS adjustments on other derivatives (Note M.1) -21,284 -81,535 Net interest income (Note L.1) -2,685,913 -3,039,678 Effect of exchange rate changes -159,454 79,838 Profit on operating activities -528,656 5,361,610 Disbursements of loans and advances to credit institutions and customers -49,994,020 -37,670,096 Repayments of loans and advances to credit institutions and customers 44,590,423 50,381,755 Change in other loans and advances (Note C) 6,673,633 8,658,820 Change in deposit with Central Bank of Luxembourg to cover minimum reserve requirement (Note B.1) 57,213 -35,110 Change in treasury operational portfolios 17,386,502 -9,224,164 Change in amounts owed to credit institutions and customers (Note H) -18,560,431 7,276,336 Change in provisions for pension plans and health insurance scheme 33,696 -2,210,900 Change in provisions for guarantees issued and commitments (Note D.4) 60,302 16,692 Change in interest accrued on cash and cash equivalents 903 1,058 Change in other assets and other liabilities 6,064,303 -867,565 Interest received 16,524,214 15,224,602 Interest paid -13,652,025 -12,257,565 Net cash used from/(used in) operating activities 8,656,057 24,655,473 B. Cash flows from investing activities: Securities in Long-Term HQLA Portfolio purchased during the year -1,778,122 -385,243 Securities from Long-Term HQLA Portfolio matured or sold during the year 450,000 701,588 Purchase of loan substitutes and ABS portfolio EIF included in the debt securities portfolios -4,070,061 -2,266,247 Redemption of loan substitutes and ABS portfolio EIF included in the debt securities portfolios 4,633,922 4,335,592 Additions on shares and other variable-yield securities (Note B.3) -2,537,116 -2,720,926 Reflows on shares and other variable-yield securities (Note B.3) 1,811,116 2,345,863 Purchase of property, furniture and equipment and intangible assets (Note E) -81,032 -63,109 Net cash used from/(used in) investing activities -1,571,293 1,947,518 C. Cash flows from financing activities: Issuance of debts evidenced by certificates 84,649,253 100,348,462 Redemption of debts evidenced by certificates -97,048,909 -107,709,303 Member States' contribution 319,700 319,700 Purchase / Subscription of EIF shares 0 484,363 Dividend paid to non-controlling interests -5,737 0 Payment of lease liabilities -39,734 -41,366 Net cash used from/(used in) financing activities -12,125,427 -6,598,144 Summary statement of cash flows: Cash and cash equivalents at beginning of financial year 69,121,468 48,074,653 Net cash from: Operating activities 8,656,057 24,655,473 Investing activities -1,571,293 1,947,518 Financing activities -12,125,427 -6,598,144 Effect of exchange rate changes on cash held -92,395 1,041,968 Cash and cash equivalents at end of financial year 63,988,410 69,121,468 Cash and cash equivalents are composed of: Cash in hand, balances with central banks and post office banks, excluding deposit with Central Bank of Luxembourg to cover minimum reserve requirement (Note B.1) 25,389 1,338,806 Money market securities (Note B.2) 552,038 142,403 Loans and advances to credit institutions and customers: Repayable on demand 984,212 797,488 Other loans and advances (Note C) 62,426,771 66,842,771 63,988,410 69,121,468 185 |
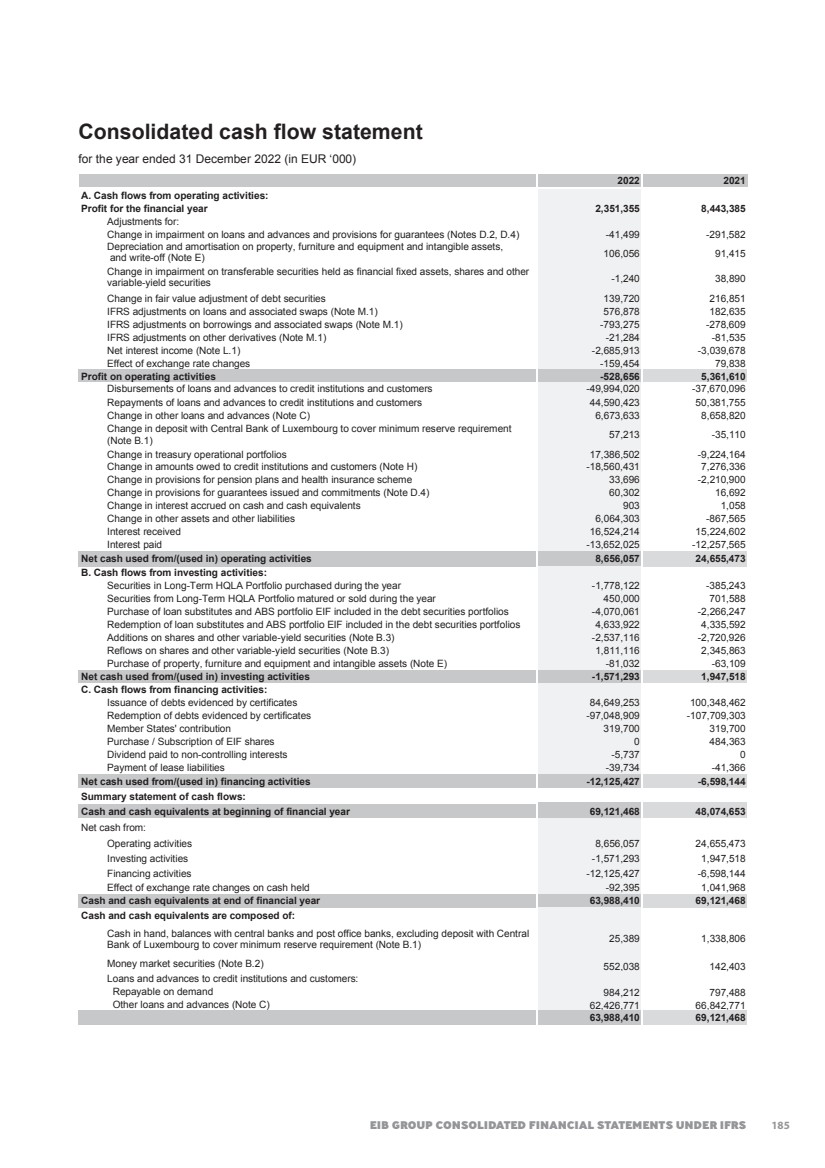
| 2022 FINANCIAL REPORT 193 Consolidated cash flow statement (continued) for the year ended 31 December 2022 (in EUR ‘000) Non-cash changes (In EUR '000) 31.12.2021 Cash flows Exchange adjustments Fair value adjustment and accrued interest on financial liabilities Other changes 31.12.2022 Long-term borrowings 459,717,547 -6,065,578 3,490,674 -48,067,286 0 409,075,357 Lease liability 132,151 -39,734 -3,511 1,061 7,055 97,022 Short-term borrowings 14,185,086 -6,334,078 491,597 0 0 8,342,605 Changes in liabilities arising from financing activities 474,034,784 -12,439,390 3,978,760 -48,066,225 7,055 417,514,984 The accompanying notes form an integral part of these consolidated financial statements. 186 |
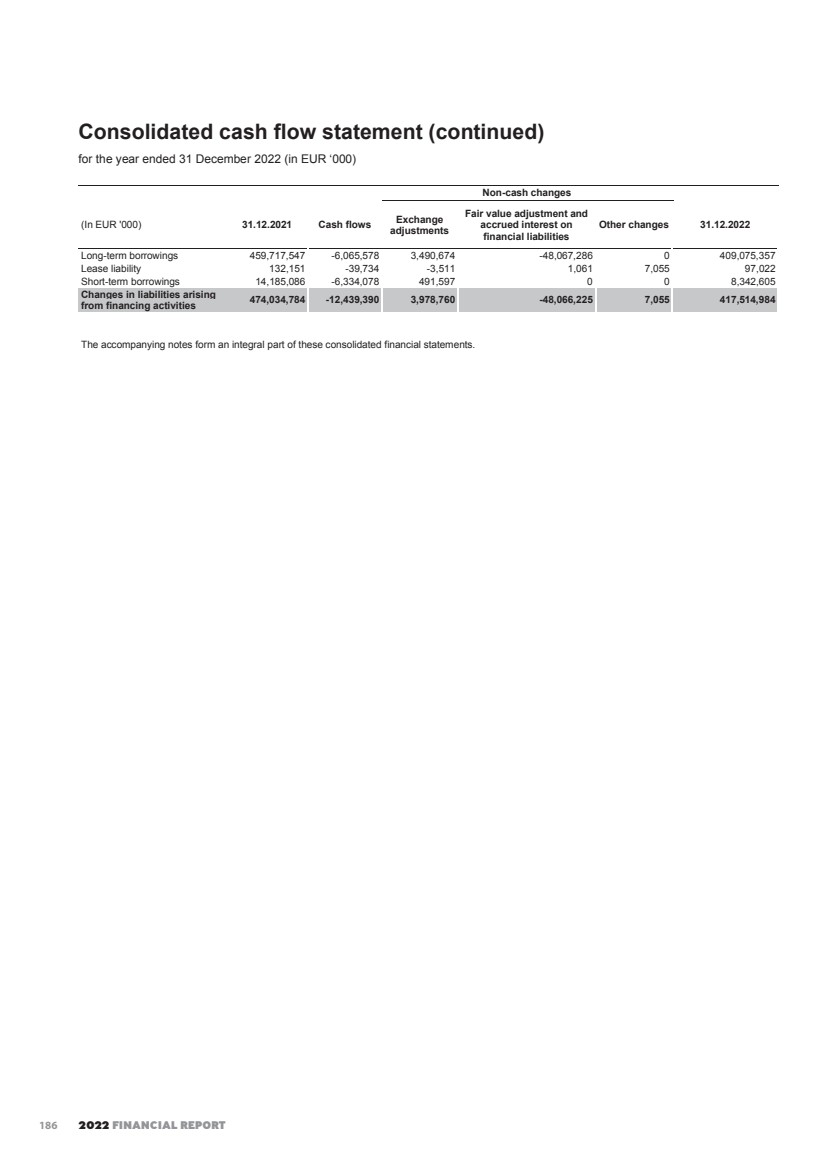
| EIB GROUP CONSOLIDATED FINANCIAL STATEMENTS UNDER IFRS 194 European Investment Bank Group Notes to the consolidated financial statements as at 31 December 2022 The European Investment Bank (the ‘Bank’ or ‘EIB’) was created by the Treaty of Rome in 1958 as the long term lending bank of the European Union (‘EU’). The task of the Bank is to contribute towards the integration, balanced development and economic and social cohesion of the EU Member States. The EIB raises substantial volumes of funds on the capital markets and lends these funds on favourable terms to projects furthering EU policy objectives. The EIB continuously adapts its activities to developments in EU policies. The Bank has its registered office at 98-100, boulevard Konrad Adenauer, L-2950 Luxembourg. The Bank and its subsidiary are defined as the ‘Group’ or ‘EIB Group’. The subsidiary held by the Bank is disclosed in Note B.4.1. Note A – Significant accounting policies A.1. Basis of preparation A.1.1. Statement of compliance The European Investment Bank Group’s consolidated financial statements (the ’Financial Statements’) have been prepared on a going concern basis and in accordance with International Financial Reporting Standards (‘IFRS’), as adopted by the European Union. On a proposal from the Management Committee, the Board of Directors adopted the Financial Statements on 29 March 2023 and authorised their submission to the Board of Governors for approval by 25 April 2023. A.1.2. Basis of measurement The consolidated financial statements have been prepared on an amortised cost basis, except for derivative financial instruments, financial assets at fair value through other comprehensive income, financial assets and liabilities designated at fair value through profit or loss, financial instruments mandatorily measured at fair value through profit or loss and financial guarantees, which have been measured at the higher of the amount initially recognised less amortisation (when appropriate) under IFRS 15 and the loss allowance determined in accordance with IFRS 9. The receiver leg of financial guarantees is measured at fair value through profit or loss by discounting the future cash flows according to IFRS 9. The amortised cost (‘AC’) of financial assets and financial liabilities, designated as hedged items in qualifying fair value hedging relationships, are adjusted for hedging gains or losses. The liability for the defined-benefit obligation is recognised as the present value of the defined-benefit obligation, plus any unrecognised actuarial gains, less any unrecognised past service cost or unrecognised actuarial losses. The Financial Statements are presented in euro rounded to the nearest thousand, unless otherwise indicated. A.1.3. Bank’s exposure to the United Kingdom (‘UK’) On 29 March 2017, the United Kingdom notified the European Council of its decision to withdraw from the European Union (‘EU’) pursuant to Article 50 of the Treaty on European Union (‘TEU’). As of 1 February 2020, in accordance with Article 50 TEU and the Agreement on the withdrawal of the United Kingdom of Great Britain and Northern Ireland from the European Union and the European Atomic Energy Community (the “Withdrawal Agreement”), the United Kingdom ceased to be an EU Member State. The withdrawal of the United Kingdom from the EU automatically resulted in the termination of its membership of the European Investment Bank (‘EIB’) and its share of the EIB’s subscribed capital. Effective 1 February 2020, the share of the United Kingdom in respect of the EIB’s subscribed capital was fully replaced by a pro rata capital increase of the remaining EU Member States. This capital replacement (Symmetrical Capital Replacement) covered both the called part as well as the uncalled part of the subscribed capital of the United Kingdom in the EIB. The replacement of the called part was financed by converting EIB reserves into called subscribed capital. As a result of the capital increase, each remaining EU Member State increased pro rata its uncalled (but callable) stake in the EIB’s subscribed capital. In addition, the capital subscribed by Poland and Romania in the EIB increased by EUR 5,386,000,000 and EUR 125,452,381, respectively. This capital increase (Asymmetrical Capital Increase) took effect on 1 March 2020, one month after the withdrawal of the United Kingdom from the EU. Poland and Romania will pay the called portion of their increase in the EIB’s subscribed capital and contribute to the EIB reserves in ten equal semi-annual instalments. The Withdrawal Agreement contains, among other things, several provisions governing the financial settlement in respect of the EIB as a result of the termination of UK membership of the EIB. In accordance with the provisions laid down in Article 150 of the Withdrawal Agreement, the United Kingdom shall remain liable, under its former share of the subscribed capital in the EIB, for the EIB’s pre-withdrawal exposure. In this respect as at 31 December 2022, the EIB’s pre-withdrawal exposure amounts to EUR 444,380 million, whereas the limit of the United Kingdom’s liability amounts to EUR 39,195 million. 187 |
| 2022 FINANCIAL REPORT 195 The United Kingdom shall also remain liable for other EIB risks as long as such risks are not related to post-withdrawal lending. In addition, in accordance with the provisions laid down in Article 150 of the Withdrawal Agreement, the EIB shall pay to the United Kingdom on behalf of the EU an amount equal to the UK share of the called capital of the EIB in twelve annual instalments. Except for such repayment of the UK called capital, the EIB shall not be obliged to make any other payment, return or remuneration to the United Kingdom in connection with the termination of its membership of the EIB or on account of the retention by the United Kingdom of certain liabilities as described in the relevant provisions of the Withdrawal Agreement. A.2. Significant accounting judgments and estimates In preparing the consolidated Financial Statements, the Management Committee is required to make estimates and assumptions that affect reported income, expenses, assets, liabilities and disclosure of contingent assets and liabilities. Use of available information and application of judgment are inherent in the formation of estimates. Actual results in the future could differ from such estimates and the differences may be material to the Financial Statements. Estimates and underlying assumptions are reviewed on an ongoing basis. Revisions of estimates are recognised prospectively. The most significant use of judgments and estimates is as follows: Fair value of financial instruments Where the fair values of financial instruments recorded on the consolidated balance sheet cannot be derived from active markets, they are determined using a variety of valuation techniques that include the use of mathematical models. The input to these models is taken from observable markets where possible, but where this is not feasible, a degree of judgment is required in establishing fair values. The judgments include model choice and considerations of liquidity and model inputs such as correlation and volatility for longer dated derivatives (Note A.4.6). Impairment losses on financial instruments The expected credit loss (‘ECL’) measurement requires management to apply significant judgments, in particular, the assessment of a significant increase in credit risk since initial recognition, the incorporation of forward looking information and further the estimation of the amount and timing of future cash flows and collateral values when determining impairment losses. These estimates are driven by a number of factors, which can result in significant changes in the timing and amount of allowance for credit loss to be recognised (Note A.4.4); relevant assumptions on the effects on impairment resulting from the general context of uncertainty and various risks resulting from the Russian invasion of Ukraine are detailed in Note A.4.4 and Note S. Valuation of unquoted equity investments Valuation of unquoted equity investments is normally based on one of the following: • recent arm’s length market transactions; • current fair value of another instrument that is substantially the same; • the expected cash flows discounted at current rates applicable for items with similar terms and risk characteristics; or • other valuation models. The determination of the cash flows and discount factors for unquoted equity investments requires significant estimation. The Group calibrates the valuation techniques periodically and tests them for validity using either prices from observable current market transactions in the same instrument or from other available observable market data (Note A.4.6). Pension and other post-employment benefits The cost of defined-benefit pension plans and other post-employment medical benefits is determined using actuarial valuations. The actuarial valuation involves making assumptions about discount rates, mortality rates and future salary and pension increases. Due to the long-term nature of these plans, such estimates are subject to significant uncertainty (Note A.4.14). Consolidation of entities in which the Group holds an interest The Group made significant judgments that none of the entities (except for the European Investment Fund (‘EIF’), in which it holds an interest, are controlled by the Group at the end of the year based on its aggregate economic interests in the individual entities (comprising any carried interests and expected management fees) and the rights to remove the decision making body. In all cases, based on the assessment of the aforementioned factors, the Group is not able to control individually either the General Partner or the Fund Manager or the Management Board which have sole responsibility for the management and control of the activities and affairs of the investees and have the power and authority to do whatever necessary to carry out the purpose and objectives of the investees (Note B.4). 188 |
| EIB GROUP CONSOLIDATED FINANCIAL STATEMENTS UNDER IFRS 196 Uncertainty arising from IBOR reform The Group considered uncertainty over the timing and amount of the IBOR reform not to be present as at 31 December 2022 for benchmarks ceasing to exist immediately after 31 December 2021, namely GBP, CFH and JPY LIBOR. Accordingly, the Group stopped applying the exemptions of the IASB Phase 1 amendments to the Interest Rate Benchmark reform for those LIBORs. For benchmarks ceasing to exist immediately after 30 June 2023, namely USD LIBOR, the Group applies IASB Phase 1 amendments related to the uncertainty. A.3. Changes in accounting policies Except for the changes below, the Group has consistently applied the accounting policies set out in Note A.4. to all periods presented in these consolidated financial statements. New and amended standards adopted by the Group The following amendments to existing standards, became effective for the Group’s consolidated financial statements as of 1 January 2022: • Annual Improvements to IFRS Standards 2018-2020. • Reference to the Conceptual Framework – Amendments to IFRS 3. • Property, Plant and Equipment: Proceeds before Intended Use – Amendments to IAS 16. • Onerous Contracts – Cost of Fulfilling a Contract – Amendments to IAS 37. The amendments listed above did not have any impact on the amounts recognised in prior periods and are not expected to significantly affect the current or future periods. New standards, amendments, and interpretations not yet adopted by the Group As at 31 December 2022, the following Standards and amendments to existing Standards had been issued but were not mandatory for annual reporting periods ending on 31 December 2022: Standards and amendments to existing Standards endorsed by the EU, and which are effective for annual periods beginning on or after 1 January 2023: • Amendments to IAS 12 Income Taxes: Deferred Tax related to Assets and Liabilities arising from a Single Transaction; • Amendments to IAS 1 Presentation of Financial Statements and IFRS Practice Statement 2: Disclosure of Accounting policies; • Amendments to IAS 8 Accounting policies, Changes in Accounting Estimates and Errors: Definition of Accounting Estimates; • IFRS 17 Insurance Contracts (issued on 18 May 2017); including Amendments to IFRS 17 (issued on 25 June 2020); • Amendments to IFRS 17 Insurance contracts: Initial Application of IFRS 17 and IFRS 9 – Comparative Information. Amendments to existing Standards not / not yet endorsed by the EU: • Amendments to IAS 1 Presentation of Financial Statements: - Classification of Liabilities as Current or Non-current (issued on 23 January 2020); - Classification of Liabilities as Current or Non-current - Deferral of Effective Date (issued on 15 July 2020); and - Non-current Liabilities with Covenants (issued on 31 October 2022) • Amendments to IFRS 16 Leases: Lease Liability in a Sale and Leaseback (issued on 22 September 2022). At the date of authorisation of these consolidated financial statements none of the above listed Standards or amendments to existing Standards have been adopted early by the Group and no Interpretations have been issued that are applicable and need to be taken into consideration by the Group at either reporting date. Management anticipates that all relevant pronouncements will be adopted for the first period beginning on or after the effective date of the pronouncement, and that there will be not any material impact on the Group’s financial statements. 189 |
| 2022 FINANCIAL REPORT 197 A.4. Summary of significant accounting policies A.4.1. Basis of consolidation Subsidiaries Subsidiaries are all entities directly or indirectly controlled by the Group. The Group controls an entity when it is exposed to, or has rights to, variable returns from its involvement with the entity and has the ability to affect those returns through its power over the entity. All significant subsidiaries are included in the consolidated financial statements under IFRS, while entities immaterial to the Group are excluded from the scope of consolidation. The financial statements of any subsidiary are included in the consolidated financial statements from the date on which control commences until the date on which control ceases. The Financial Statements of EIB Group comprise those of the European Investment Bank (the ‘Bank’ or ‘EIB’) and those of its subsidiary, the European Investment Fund (the ‘Fund’ or ‘EIF’). The financial statements of its subsidiary are prepared for the same reporting year as the Bank, using consistent accounting policies. The Bank exercises control over the EIF and therefore has applied the principles provided for under IFRS 10 in preparing consolidated financial statements. Hence, the Group consolidates the financial statements of the EIB and the EIF line by line by adding together like items of assets, liabilities, equity, income and expenses. Non-controlling interests Under IFRS, non-controlling interests are measured at their proportionate share of the subsidiaries net identifiable assets. They represent the portion of profit or loss and net assets not owned, directly or indirectly, by the Bank. The non-controlling interest attributable to the European Commission (‘EC’) as one of the minority shareholders of the EIF is presented separately in the consolidated balance sheet under “Equity attributable to non-controlling interest” and consolidated income statement under “Profit attributable to non-controlling interest”. Commitment on EIF shares held by third party investors Under the terms of a replacement share purchase undertaking (‘RSPU’) in respect of the shares held by the EIF’s non-controlling shareholders other than the EC, the EIB is offering to buy these on an annual basis. The exercise price is determined on the basis of the audited annual accounts of the EIF and corresponds to the part of each share in the called capital of the EIF, increased by the share premium account, the statutory reserves, the retained earnings, the fair value reserve and the profit for the year, net of the dividend decided by the EIF’s General Meeting (see also Note G). Under IFRS, the RSPU is considered as a written put option over the above non-controlling interest, reflecting a contractual obligation to pay cash in the future to purchase the EIF shares from this minority shareholder group. As per IAS 32, such an arrangement gives rise to a financial liability in the amount of the present value of the redemption amount even if the payment of that cash is conditional on the option being exercised by the holder. Accordingly, under IFRS, the commitment is reclassified from “Non-controlling interest” and a corresponding financial liability in the amount of the fair value of the option’s exercise price (equivalent to the yearly established agreed price) is recognised under “Other liabilities” and attributed to owners of the parent. Subsequently, this financial liability is measured in accordance with IFRS 9, i.e. any changes in the fair value of the financial liability subsequent to the acquisition date are recognised in the consolidated income statement under “Interest expense and similar charges”. Any excess or deficit of non-controlling interest over the agreed price is reclassified to “consolidated reserves”. Interests in associates and joint ventures The Group’s interests in investees comprise interests in associates and joint ventures. Associates are those entities in which the Group has significant influence, but not control or joint control, over the financial and operating policies. A joint venture is an arrangement in which the Group has joint control, whereby the Group has rights to the net assets of the arrangement, rather than the rights to its assets and obligations for its liabilities. The accounting treatment for associates and joint ventures is further explained in Note A.4.8.6. Transactions eliminated on consolidation After aggregation of the balance sheet and the income statement accounts, all intra-group balances and transactions, income and expenses resulting from intra-group transactions are eliminated. A.4.2. Foreign currency translation The consolidated Financial Statements are presented in euro (‘EUR’), as the functional currency of the Group and unit of measurement for the capital accounts of the Member States. The Group conducts its operations in euro, in other currencies of the Member States and in non-EU currencies. Its resources are derived from its capital, borrowings and accumulated earnings in various currencies. Foreign currency transactions are translated at the exchange rate prevailing on the date of the transaction. Monetary assets and liabilities denominated in currencies other than euro are translated into euro at the exchange rate prevailing at the balance sheet date. The gain or loss arising from such translation is recorded in the consolidated income statement under “Result on financial operations”. Non-monetary items that are measured in terms of historical cost in a foreign currency are translated using the exchange rates at the date of the initial transaction. Non-monetary items measured at fair value in a foreign currency are translated using the exchange rates at the date when the fair value was determined. Exchange differences on non-monetary financial assets are a component of the change in their fair value. Depending on the classification of a non-monetary financial asset, exchange differences are either recognised in the consolidated income statement or within the equity reserves. Exchange differences arising on the settlement of transactions at rates different from those at the date of the transaction and unrealised foreign exchange differences on unsettled foreign currency monetary assets and liabilities are recognised in the consolidated income statement under “Result on financial operations”. 190 |
| EIB GROUP CONSOLIDATED FINANCIAL STATEMENTS UNDER IFRS 198 A.4.3. Classification and measurement Financial assets and financial liabilities At initial measurement, the Group measures a financial asset or a financial liability at fair value plus or minus, for an item not at fair value through profit or loss (‘FVTPL’), transaction costs that are directly attributable to its acquisition or issue. The fair value at initial recognition is generally its cost. On initial recognition, a financial asset is classified as measured at amortised cost (‘AC’), fair value through other comprehensive income (‘FVOCI’) or FVTPL and a financial liability is classified as measured at AC or FVTPL. Under IFRS 9, classification starts with determining whether the financial asset shall be considered as a debt or equity instrument. IFRS 9 refers to the definitions in IAS 32 Financial Instruments: Presentation. Debt instruments are those instruments that meet the definition of a financial liability from the issuer’s perspective according to IAS 32, such as loans, government and corporate bonds. A debt instrument is classified at amortised cost if it meets both of the following conditions and is not designated as at fair value through profit or loss: • the asset is held within a business model whose objective is to hold assets to collect contractual cash flows; and • the contractual terms of the financial asset give rise on specified dates to cash flows that are solely payments of principal and interest on the principal amount outstanding (‘SPPI criteria’). A debt instrument is classified at fair value through other comprehensive income only if it meets both of the following conditions and is not designated as at fair value through profit or loss: • the asset is held within a business model whose objective is achieved by both collecting contractual cash flows and selling financial assets, and • the contractual terms of the financial asset give rise on specific dates to cash flows that are fulfilling the SPPI criteria. The above requirements should be applied to an entire financial asset, even if it contains an embedded derivative. Equity instruments are instruments that meet the definition of equity from the issuer’s perspective according to IAS 32, that is, instruments that do not contain a contractual obligation to pay and that evidence a residual interest in the issuer’s net assets. On initial recognition of an equity investment that is not held for trading, the Group may irrevocably elect to present subsequent changes in other comprehensive income. This election is made on an investment-by-investment basis. All other financial assets are classified as measured at fair value through profit or loss. A financial liability is measured at amortised cost except for financial liabilities: • that meet the definition of held for trading (e.g. derivative liabilities); and • that are designated as measured at fair value through profit or loss. In addition, on initial recognition, the Group may irrevocably designate a financial asset or liability that otherwise meets the requirements to be measured at amortised cost as at fair value through profit or loss (so called “fair value option” (‘FVO’) when elected or FVTPL) if doing so eliminates or significantly reduces an accounting mismatch that would otherwise arise or if the financial assets and financial liabilities are managed and its performance is evaluated on a fair value basis. The main financial instruments designated at the FVO are hedged loans and debts evidenced by certificates that are not eligible for hedge accounting. For the purpose of disclosure requirements, the Group has defined the classes of financial instruments based on similarity of characteristics. Business model assessment EIB Group makes an assessment of the objective of a business model in which a debt instrument is held at a portfolio level because this best reflects the way the business is managed and information is provided to management. The information considered includes: • the stated policies and objectives for the portfolio and the operation of those policies in practice. In particular, whether management´s strategy focuses on earning contractual interest revenue, maintaining a particular interest rate profile, matching the duration of the financial assets to the duration of the liabilities that are funding those assets or realising cash flows through the sale of the assets; • how the performance of the portfolio is evaluated and reported to the Group’s management; • the risks that affect the performance of the business model (and the financial assets held within that business model) and how those risks are managed; and • the frequency, volume and timing of sales in prior periods, the reasons for such sales and its expectation about future sales activity. However, information about sales activity is not considered in isolation, but as part of an overall assessment of how the Group’s stated objective for managing the financial assets is achieved and how cash flows are realised. Solely payment of principal and interests (‘SPPI’) criteria For the purpose of this assessment, ‘principal’ is defined as the fair value of the debt instrument on initial recognition. ‘Interest’ is defined as consideration for the time value of money and for the credit risk associated with the principal amount outstanding during a particular period of time and for other basic lending risks and costs (e.g. liquidity risk and administrative costs), as well as profit margin. In assessing whether the contractual cash flows are solely payments of principal and interest, EIB Group considers the contractual terms of the instrument. This includes assessing whether the financial asset contains a contractual term that could change the timing or amount of contractual cash flows such that it would not meet this condition. 191 |
| 2022 FINANCIAL REPORT 199 Derecognition The Group derecognises a financial asset when the contractual rights to the cash flows from the financial asset expire or it transfers the rights to receive the contractual cash flows in a transaction in which substantially all of the risks and rewards of ownership of the financial asset are transferred or which the Group neither transfers nor retains substantially all of the risks and rewards of ownership and it does not retain control of the financial asset. The Group derecognises a financial liability when its contractual obligations are discharged, cancelled or expired. On derecognition of a financial asset or financial liability, the difference between the carrying amount of the asset or liability (or the carrying amount allocated to the portion of the asset or liability derecognised) and the sum of (i) the consideration received or paid and (ii) any cumulative gain or loss that had been recognised in other comprehensive income is recognised in profit or loss except for the cumulative gains or losses recognised in other comprehensive income for equity investments measured at fair value through other comprehensive income which are transferred to the additional reserves rather than to the income statement on disposal. In the context of IBOR reform, the Group’s assessment of whether a change to an amortised cost financial instrument is substantial, is made after applying the practical expedient introduced by IBOR reform Phase 2. As per the amendments issued by the IASB, the Group does not derecognise a financial instrument, which contractual cash flows are modified as a direct consequence from the reform and the change is economically equivalent to the previous basis for determining the contractual cash flows (i.e. the basis immediately before the change). Reclassification Financial assets are not reclassified subsequent to their initial recognition, except in the period after the Group changes its business model for managing financial assets. Modification A financial asset measured at amortised cost is considered modified when its contractual cash flows are renegotiated or otherwise modified. Renegotiation or modification may or may not lead to derecognition of the old and recognition of the new financial instrument. A substantial contractual modification on the cash flows of a financial asset measured at amortised cost which results in the derecognition of the financial asset, leads to the recognition of the new financial asset at its fair value, and the recording of the modification gain or loss impact in the consolidated income statement under “Result on financial operations”. A contractual modification is deemed substantial if the discounted present value of the cash flows under the revised terms (discounted using the original effective interest rate) is at least 10% different from the discounted present value of the remaining cash flows of the original financial asset. Qualitative factors such as a change in the currency on which the financial asset is denominated and conversion features are also considered. In the context of IBOR reform, the Group’s assessment of whether a change to an amortised cost financial instrument is substantial, is made after applying the practical expedient introduced by IBOR reform Phase 2. The Group updates the effective interest rate, without modifying the carrying amount of the financial instrument if the basis for determining the contractual cash flows of the financial instrument, measured at amortised cost, changes as a direct consequence from the reform and if the change is economically equivalent to the previous basis (i.e., the basis immediately before the change). Offsetting The Group offsets financial assets and liabilities in the Group's consolidated balance sheet if the corresponding criteria under IAS 32 are met. Furthermore, the financial assets and liabilities might be subject to a legally enforceable master netting arrangement or similar agreement that covers similar financial instruments, irrespective of whether they are offset in the consolidated balance sheet. The similar agreements include global master repurchase agreements. Similar financial instruments include repurchase agreements and reverse repurchase agreements. A.4.4. Impairment IFRS 9 is based on a forward-looking ‘expected credit loss’ (‘ECL’) model. This requires judgment as to how changes in economic factors affect expected credit losses, which are determined on a probability-weighted basis. Within the Group, the IFRS 9 impairment model applies to financial assets measured at amortised cost as well as to off-balance sheet commitments and financial guarantees. Under IFRS 9, loss allowances are measured on either of the following bases: • 12-month ECL’s: these are the ECLs that result from possible default events within the 12 months after the reporting date; and • Lifetime ECL’s: these are the ECLs that result from all possible default events over the expected life of a financial instrument. The IFRS 9 standard sets out a “three-stage” model for impairment based on changes in credit quality since initial recognition. Financial instruments are classified in Stage 1 except for those instruments for which significant increase in credit risk (‘SICR’) since initial recognition is identified. This includes both quantitative and qualitative information and analysis, based on the Group’s expertise, including forward-looking information. Further details on credit risk policies are detailed under Note S.2. The Group’s assessment of the significant increase in credit risk is based on a sequential approach which is using counterparty or instrument specific information consistent to the policies laid out in the Credit Risk Guidelines (‘CRG’) and the Financial Monitoring Guidelines and Procedures (‘FMGPs’), notably covering early warning trigger, internal rating (a decrease of 3 notches or more when compared to the historical internal rating for counterparties which current internal rating is below investment grade) and arrears (more than 30 days past due). In line with guidance issued by standard setters and market practises, the Group has considered that the application of COVID-19 short-term forbearance measures to performing counterparties (applied until June 2021), aimed at addressing the adverse systemic economic impact of the COVID-19 pandemic, should not be considered by themselves as an automatic trigger to conclude that SICR has occurred. As disclosed under note S.2.3.3.3., the Group applies expert judgement when assessing the credit risk of such counterparties. 192 |
| EIB GROUP CONSOLIDATED FINANCIAL STATEMENTS UNDER IFRS 200 The Group considers that any general context of uncertainty and various risks resulting from the Russian invasion of Ukraine are reflected within the existing forward-looking ECL model which is deemed sufficiently robust to factor in such extreme events. Notably, respective impacts, if any, have been directly captured through the macroeconomic projections and the PD terms structures. If significant increase in credit risk has occurred, the financial instrument is moved to Stage 2 but is not yet deemed to be credit-impaired. If the financial instrument is credit-impaired, the financial instrument is then moved to Stage 3. To identify Stage 3 exposures, the Bank determines whether or not there is objective evidence of a non-performing exposure. For that, the Group considers a financial asset to be in default when the borrower is unlikely to pay its credit obligations to the Group in full, without recourse by the Group or the borrower is past due more than 90 days on any material credit obligation to the Group. In this respect, a financial asset is considered credit impaired when it is determined that it is probable that the Group will not be able to collect all amounts due according to the original contractual terms or an equivalent value. Individual credit exposures are evaluated based upon the borrower’s characteristics, overall financial condition, resources and payment record, the prospects for support from any financially responsible guarantors and, where applicable, the realisable value of any collateral. All impaired claims are reviewed and analysed at least semi-annually. Any subsequent changes to the amounts and timing of the expected future cash flows compared to the prior estimates will result in a change in the provision for credit losses and be charged or credited to the consolidated income statement. An allowance for impairment is reversed only when the credit quality has improved such that there is reasonable assurance of timely collection of principal and interest in accordance with the original contractual terms of the claim agreement. A write-off is made when all or part of a claim is deemed uncollectible or forgiven. Write-offs are charged against previously established impairments or directly to the consolidated income statement and reduce the principal amount of a claim. Recoveries in part or in full of amounts previously written off are credited to the consolidated income statement. Financial assets that are written off could still be subject to enforcement activities in order to comply with the Group's procedures for recovery of amounts due. Measuring ECL – Inputs, Assumptions and Techniques Lifetime ECL measurement applies to Stage 2 and Stage 3 assets, while 12-month ECL measurement applies to Stage 1 assets. The measurement of the expected credit losses was performed based on the following credit risk parameters: • Probability of default (‘PD’); • Loss Given default (‘LGD’); and • Exposure at default (‘EAD’). The probability of default represents the likelihood of a counterpart defaulting on its financial obligation, either over the next 12 months, or over the remaining lifetime of the obligation. PD is an estimate at a certain date, which is calculated based on statistical rating models, and assessed using rating tools tailored to the various categories of counterparties and exposures. Ratings are primary input into the determination of the term structure of probability of default for exposures. The Group collects performance and default information about its credit risk exposures. The collected data are segmented by industry and region. Different industries and regions reacting in a homogenous manner to changes in the credit conditions and macroeconomic environment are analysed together. The Group employs statistical models to estimate the multi-period probability of default incorporating macroeconomic projections. The loss given default represents the expectation of the ratio of the loss on an exposure due to the default of a counterparty to the amount outstanding at default. Loss given default can be also defined as “1 - Recovery Rate”. LGD estimates are determined mainly by geography and by type of counterparty, with five main exposure classes: Sovereigns, Public Institutions, Financial Institutions, Corporate and Project Finance. LGD values can be further adjusted based on the product and contract specific features of the exposure. The Group incorporates forward-looking information into both its assessment of whether the credit risk of an instrument has increased significantly since its initial recognition and its measurement of expected credit losses. For the measurement of ECL, the Group has developed a conditional modelling approach for calculating PD term structures involving: • the definition of an economically reasonable link function between the credit cycle and macroeconomic variables, and • a set of three macro-economic scenarios (one baseline and two scenarios reflecting downturn and upturn in the economy) with multi-year potential realisation for the GDP and their associated likelihoods. To generate macroeconomic scenarios, the Bank uses a macro semi-structural multi-country and multi-equation model of the global economy with country specific blocks. The central / baseline scenario is designed to be consistent with the most recent European Commission (‘EC’) forecasts. The positive and negative scenarios are designed around the central scenario by the deployment of the multi-country/multi-equation model. The scenarios are derived shocking GDP, which is the key measure of economic activity. The shocks to real GDP are calibrated to replicate the observed volatility of the variable. Also, expert judgment is applied, when appropriate, to refine the size and persistency of GDP shocks. As a result, shocks are determined together with a decay function to determine the impact of the shocks over time. Probabilities attached to each scenario are defined reflecting market (volatility) indicators and internally developed indicators/trackers deployed in a consistent manner over time to capture uncertainty. The EAD represents the expected exposure in the event of a default and is based on the current exposure to the counterparty and potential changes to the current amount allowed under the contract including amortisation. The EAD of a financial asset is its gross carrying amount. For lending commitments and financial guarantees, the EAD includes the amount drawn, as well as potential future amounts that may be drawn under the contract. Preferred creditor status (‘PCS’) The principle of supremacy of EU primary law and the principle that the property of the EIB shall be exempt from all forms of requisition and expropriation, as enshrined in the EIB Statute, are deemed to guarantee a full recovery of the EU Sovereign Exposures on maturity. This financial protection and the benefit of the preferred creditor status result in no credit risk or impairment loss from Member States sovereign exposure or guarantees. However, similarly to other creditors, the EIB is bound by the majority decision based on collective action clauses (‘CAC’) included in debt instruments issued by EU Sovereigns. 193 |
| 2022 FINANCIAL REPORT 201 A.4.5. Derivatives and hedging activities The Group uses derivative instruments mainly for hedging market exposure on borrowings, treasury and lending transactions, and also as part of its asset and liability management activities to manage exposures to interest rate and foreign currency risk, including exposures arising from forecast transactions. All derivative instruments of the Group are measured at fair value through profit or loss and are reported as derivative assets or liabilities. Accrued interest on derivatives is part of the fair value recorded. Fair values are obtained from market inputs, discounted cashflow models and option pricing models, which consider current market and contractual prices for the underlying instrument, as well as the time value of money, yield curve and volatility of the underlying. Changes in the fair value of derivatives are included in “Result on financial operations”. The Group’s hedging activities are designed to mitigate interest rate and currency risk by using swaps to convert the interest rate risk profile, on both assets and liabilities, into standard floating rate risk. Where the Group enters into a micro-hedge, each hedge relationship includes one or multiple hedged items, hedged fully or partially. Dependent on the hedging instrument, the hedged risk of the hedged item is determined as follows: • in case of using interest rate swap, only the interest rate risk with respect to the benchmark interest rate curve of the hedged item is hedged; and • in case of using a currency interest rate swap, the interest rate risk with respect to the benchmark interest rate curve and the currency risk with respect to the benchmark currency of the hedged item are hedged. From the three types of hedging relationships recognised by IFRS 9, the Group currently only applies fair value hedge accounting. A fair value hedge is a hedge arrangement to mitigate risk related to changes in fair value of a recognised asset or liability or an unrecognised firm commitment, or a component of any such item, that is attributable to a particular risk and could affect profit or loss. The objective of hedge accounting is to represent, in the financial statements, the effect of the Group’s risk management activities that use financial instruments, on a micro-basis, to manage exposures arising from particular risks that could affect profit or loss. The Group also hedges interest rate risk and basis risk on a macro basis as part of asset-liability management without application of hedge accounting. To qualify for hedge accounting, a hedge relationship has to consist of eligible hedging instruments and eligible hedged items. A derivative measured at fair value through profit or loss may be designated as a hedging instrument. The Group uses the following eligible hedging instruments and combinations of them: • Interest rate swaps; and • Currency swaps. A qualifying hedging instrument is designated in its entirety as a hedging instrument, with the exception that the foreign currency basis spread in case of currency swaps, which is separated and excluded from the designation. A hedged item can be a recognised asset or liability or an unrecognised firm commitment. The hedged item can be a single item or a group of items and can also be a component of such an item or group of items. The following eligible hedged items are designated by the Group: • Borrowings; • Loan substitutes; • Loans; and • Treasury debt securities. The Group may also designate as hedged item or hedging instrument components of nominal amount of the aforementioned eligible financial assets and liabilities. In applying fair value hedge of interest rate risk, the Group designates as hedged risk the non-contractually specified benchmark interest component that is separately identifiable and reliably measurable. For outstanding hedging relationships that are yet to transition from LIBOR to an alternative risk free rate (RFR), the Group applies the IBOR reform phase 1 temporary relief where the requirement that the risk component is separately identifiable needs to be met only at the inception of the hedging relationship and not to be reassessed subsequently. On initial designation of the hedging relationship, the Group documents the relationship between hedging instruments and hedged items, including the risk management objective and strategy in undertaking the hedge, together with the method that will be used to assess the effectiveness of the hedging relationship on a continuous basis. As a result of the adoption of IBOR reform Phase 2 amendments, the Group applies temporary reliefs that allow the Group’s hedging relationships to continue upon the replacement of an existing IBOR with an RFR. A hedging relationship qualifies for hedge accounting if it meets all of the following effectiveness requirements: • there is an economic relationship between the hedged item and the hedging instrument; • the effect of credit risk does not dominate the value changes that result from that economic relationship; and • the hedge ratio of the hedging relationship is the same as that resulting from the quantity of hedged item that the Group actually hedges and the quantity of the hedging instrument that the Group actually uses to hedge that quantity of hedged item. In order to show an economic relationship between the hedged item and the hedging instrument, the Group performs a qualitative analysis by assessing whether the critical terms of the hedging instrument and the hedged item match or are closely aligned, in which case the hedging relationship can be assumed highly effective. In certain circumstances, under which the critical terms of the hedged item do not match exactly with the critical terms of the hedging instrument, the hedge effectiveness is assessed through a quantitative analysis between the hedged item and the hedging instrument based on the correlation between the sensitivities of both instruments. For the purpose of evaluating whether the hedging relationship is expected to be highly effective, the Group considers that the benchmark interest rate is not altered as a result of IBOR reform. In order to show that the component of the fair value change due to credit risk is not dominating over the total fair value change, the Group is assessing the creditworthiness holistically considering all circumstances for both hedged items and hedging instruments. 194 |
| EIB GROUP CONSOLIDATED FINANCIAL STATEMENTS UNDER IFRS 202 In case an economic hedge relation does not qualify for a hedge relation according to IFRS 9, the Group designates the hedged item irrevocably at the fair value option (‘FVO’) at deal inception to reduce a potential accounting mismatch, i.e. the hedged items are measured subsequently at fair value through profit or loss (‘FVTPL’). When the Group designates a financial liability as the fair value option (‘FVO’), the amount of change in the fair value attributable to changes in its credit risk (so called “own credit adjustment”, ‘OCA’) is presented in other comprehensive income in the “fair value reserve” (Note R). As long as a fair value hedge meets the qualifying criteria mentioned above, the hedging relationship shall be accounted for as follows: • the fair value gain or loss on the hedging instrument shall be recognised on consolidated balance sheet and in the consolidated income statement; and • the fair value hedge gain or loss on the hedged item shall adjust the carrying amount of the hedged item (if applicable) and be recognised in the consolidated income statement (so called “basis adjustment”). When a hedged item is an unrecognised firm commitment, the cumulative change in the fair value of the hedged item subsequent to its designation is recognised as an asset or a liability (recognised under respective consolidated balance sheet line, e.g. loans and advances to customers) with a corresponding gain or loss recognised in the consolidated income statement. The designation of the hedge relationship and the calculation of the fair value of the hedged item start at trade date. In case of a late designation, the fair value gain or loss on the hedged item at the designation day is calculated and amortised in accordance with the effective interest method over the period of the hedge relationship. Subsequently, the accounting treatment follows the normal course of the hedging relationship described above. As allowed by IFRS 9, the Group separates the fair value of the foreign currency basis spread (‘CBS’) from the hedging instrument (‘CCIRS’) and applies a special treatment known as the cost of hedging approach, to the extent that it interrelates to the hedged item. The initial CBS of the hedging instrument, measured and stored at the date of designation, is amortised linearly over the residual lifetime of the hedge. Subsequent changes in the fair value of the CBS are recognised directly in a separate account within other comprehensive income. The fair value of the CBS converges at maturity to zero and therefore no amount recorded in other comprehensive income will have to be reclassified to the consolidated income statement. Typical reasons for a (partial) de-designation of a hedge relation are amendments of the contractual terms of the hedged items and/or hedging instruments, which lead to a violation of the hedge effectiveness criteria, partial prepayments/buy-backs/early expirations and an increase of credit risk, which lead to dominance of credit component of hedged item or hedging instrument. Termination may occur in case of full prepayment/full buy-back of the hedged item or any other event that will cause the hedged item to disappear from the consolidated balance sheet. Hedge ineffectiveness is defined as the difference between the hedging gains or losses of the hedging instrument and the hedged item. Possible sources of ineffectiveness are as follows: • the CVA/DVA/CollVA of the swap, which is not reflected in the fair value of the hedged item attributable to the change in interest rate; • the different discount and forward curves used for the valuation of the hedging instruments and the hedged items; and • minor deviations (within accepted thresholds) of the critical terms. • as a result of the IBOR reform, minor one-time (2021 transition) valuation difference arising from the re-measurements of i) the hedging instrument following the application of the ISDA Fall-back Protocol amendments; and ii) the hedged item due to the adjustment of the discount curve for GBP, CHF and JPY LIBOR (see below). The profit or loss result of hedge accounting, which is recognised within “Result on financial operations” in the consolidated income statement, is also impacted by the amortisation of initial CBS, due to the cost of hedging approach. Also included within this caption of the consolidated income statement are the gains and losses attributable to derivatives that the Group uses for hedging interest-rate risk on a macro basis, but for which the Group does not apply hedge accounting. Determination of fair value of hedged items, hedging instruments and other derivatives in the context of IBOR Reform In the context of the IBOR reform, for fair value hedging relations in USD, the Group applies the Phase 1 of IASB IBOR project. The Bank has adhered to ISDA IBOR fallback protocol in March 2021. It has accordingly implemented the fallback rates to determine the cash flows of the hedging instruments for the relevant LIBOR benchmarks. Likewise, the Bank has applied economically equivalent revised discount rates when determining the fair value of the hedged item in GBP, CHF and JPY currencies while the fair value of the hedged items in USD currency is determined using USD LIBOR discount curve. The hedging relationships are not discontinued when the basis for determining the contractual cash flows of the hedging instrument changes as a direct consequence from the reform and if it is economically equivalent to the previous basis (i.e., the basis immediately before the change). Moreover, and since the introduction by the Group of the hedge accounting under IFRS 9, the Group’s formal hedging documentation for all existing and new hedge relationships included, in anticipation of the IBOR Reform, the reference to the alternative benchmarks. Hence, it is considered by the Group that the hedged risk becomes the LIBOR successor upon cessation of phase 11. The Group then remeasures accordingly the cumulative changes in the hedging instruments and hedged items based on new relevant alternative benchmark rates. The one-time transition difference is recorded in the Bank’s profit or loss accounts under “Result on financial operations”. Similar to the hedging derivatives, the cash flows of derivatives other than hedge accounting were accordingly determined using the ISDA fallback rates in replacement of LIBOR benchmarks2. A.4.6. Fair value of financial instruments Derivative financial instruments are initially recognised using the trade date basis. Fair value of financial instruments Fair value is the price that would be received on selling an asset or paid on transferring a liability in an orderly transaction between market participants at the measurement date in the principal, or in its absence, the most advantageous market to which the Group has access at that date. The fair value of a liability reflects its non-performance risk. When applicable, the Group measures the fair value of an instrument using the quoted price in an active market for that instrument. A market is regarded as active if transactions for the asset or liability take place with sufficient frequency and volume to provide pricing information on an on-going basis. 1 when the uncertainty arising from IBOR reform is no longer present. 2 Cash flows referenced to USD LIBOR are defined using the LIBOR benchmarks when the USD LIBOR settings are not yet terminated. 195 |
| 2022 FINANCIAL REPORT 203 Where the fair values of financial assets and financial liabilities recorded on the consolidated balance sheet cannot be derived from active markets, they are determined using valuation techniques that include the use of mathematical models. The input to these models is taken from observable markets where possible, but where this is not feasible, a degree of judgment is required in establishing fair values. The chosen valuation technique incorporates all the factors that market participants would take into account in pricing a transaction. Portfolios of financial assets or financial liabilities that are exposed to market or credit risk that are managed by the Group on the basis of the net exposure to either market or credit risk are measured on the basis of a price that would be received on selling a net long position or paid on transferring a net short position for a particular risk exposure. These portfolio level adjustments are allocated to the individual assets and liabilities on the basis of the relative risk adjustment of each of the individual instruments in the portfolio. The Group measures fair values using the following fair value hierarchy that reflects the significance of the inputs used in making the measurements: • Level 1: inputs that are unadjusted quoted market prices in active markets for identical instruments to which the Group has access; • Level 2: inputs other than quoted prices included within Level 1 that are observable either directly (i.e. as prices) or indirectly (i.e. derived from prices). This category includes instruments valued using quoted market prices in active markets for similar instruments, quoted prices for identical or similar instruments in markets that are considered less than active or other valuation techniques where all significant inputs are directly or indirectly observable from market data; and • Level 3: inputs that are not observable. This category includes all instruments where the valuation technique includes inputs not based on observable data and the unobservable inputs have a significant effect on the instrument’s valuation. This category includes instruments that are valued based on quoted prices for similar instruments where significant unobservable adjustments or assumptions are required to reflect differences between the instruments. The Group recognises transfers between levels of the fair value hierarchy as of the end of the reporting period during which the change has occurred. A.4.7. Fee and commission income The Group earns fee and commission income from a diverse range of services it provides to its customers, which are accounted for in accordance with IFRS 15. The Group recognises the revenue when performance obligations are satisfied by transferring control of the promised service to the customer. As a general rule, customer obtains control when it has the ability of direct use or ability of obtaining substantially all the benefits from this service. In some circumstances, judgment might be needed to determine when control transfers. Fee and commission income can be divided into two broad categories based on the following: • Over time: the Group satisfies the performance obligation and, therefore, transfers control over time; and • Point in time: the Group satisfies the performance obligation and transfers control to the customer at a point in time. Main sources of commission income are guarantees, loans and services provided for third party mandates. The amount of commission income received is fixed or variable, based on certain criteria depending on different variable components such as percentage (%) of the EU contribution committed or linked to this single performance obligation. If the consideration includes a variable amount, the Group estimates the amount of consideration to which it will be entitled to in exchange for transferring the services to the customer. The variable consideration is estimated at contract inception and constrained to an extent that is highly probable that a significant revenue reversal in the amount of cumulative revenue recognised will not occur when the associated uncertainty with the variable consideration is subsequently resolved. Fee and commission income from revenues that are satisfied over time is recognised on an accruals basis over the service period. Fee and commission income earned from providing or fulfilling point-in-time services is recognised when the service has been completed. Regarding the performance obligations satisfied over time, the Group uses the “Input Method” to recognise income on the basis of its efforts or inputs to the satisfaction of these performance obligations and recognise over the time such fees. Regarding the performance obligations, maximum amounts, or “caps” on management fees are applicable to certain mandates. Where this applies, management fees will likely cease to be received before the end of the mandate, which is typically in 15 to 25 years, and will be paid over a limited timeframe such as in the first few years of the mandate, and which is therefore not correlated with the services performed and costs incurred by the Group. To address this issue, the Group uses a deferred income policy (further referred to as “contract liabilities mechanism”). The contract liabilities mechanism is based on the total costs to be incurred by the Group in relation to the mandate using ex-ante financial models for all new mandates as part of their approval process. This deferral policy ensures sustainable operations and revenue recognition based on percentage of completion of the contract. Respective adjustments are recorded in the consolidated balance sheet under “Deferred income”. A.4.8. Treasury bills and other bills eligible for refinancing with central banks and debt securities including fixed-income securities and shares and other variable-yield securities The consolidated balance sheet captions “Treasury bills and other bills eligible for refinancing with central banks” and “Debt securities including fixed-income securities” include: • debt securities measured at amortised cost; • debt securities mandatorily measured at fair value through profit or loss; and • debt securities designated to be measured at fair value through profit or loss. A.4.8.1. Treasury monetary portfolio The treasury monetary portfolio (‘TMP’) of the Group is held for the purpose of: • being the primary liquidity buffer for the Bank, timely providing the cash needed in any currency for which the Bank has implemented a treasury activity; and • covering the relevant transfer price, compatibly with the conditions of the financial markets and the respect of the previous - overarching – objective of maintaining an adequate level of liquidity in the Group. 196 |
| EIB GROUP CONSOLIDATED FINANCIAL STATEMENTS UNDER IFRS 204 The portfolio comprises money market products with a maximum maturity of twelve months, including treasury bills and negotiable debt securities issued by public bodies or credit institutions. These securities are initially recorded at fair value plus any directly attributable transaction costs. The difference between entry price and redemption value is amortised in accordance with the effective interest method over the remaining life of the securities. The securities in this portfolio are held with the intention to collect contractual cash flows and classified at amortised cost. As part of this business model, sales are considered to be infrequent or insignificant in volume. A.4.8.2. Securities liquidity portfolio (‘SLP’) The securities liquidity portfolio (‘SLP’) comprises listed debt securities issued or guaranteed by national governments, supranational institutions, financial institutions and corporations. As the business model of the portfolio is largely driven by an active management of the Group making use of derivatives and sales of long-term asset in order to allow for a rapid readjustment of the duration and the mitigation of credit risks by moving the asset class allocation, the securities in this portfolio are mandatorily measured at fair value through profit or loss. Gains and losses realised on disposal or redemption and unrealised gains and losses from changes in the fair value are reported in the account “Result on financial operations”. Interest income from the SLP assets is included in “Interest and similar income”. The market value of “Securities liquidity portfolios” is based on published price quotations in an active market as the first source. For instruments without available published price quotations, the market values are determined by obtaining quotes from market participants and/or by using valuation techniques or models, based whenever possible on observable market data prevailing at the balance sheet date. A.4.8.3. Long-Term High Quality Liquid Assets (HQLA) Portfolio (‘LTHP’) The former long-term hedge portfolio (‘LTHP’) was reformed during 2021 into Long-Term High Quality Liquid Assets (HQLA) Portfolio (‘LTHP’). This reform, besides others, implied changes to the size of portfolio, new eligible currency and scope of authorised investments. The main purpose of the portfolio is to serve as a core long-term liquidity reserve for the Bank in EUR and USD, composed of highly-rated liquid bonds. Under the new reform, investments are authorised in securities that are issued or guaranteed by: • Governments of the European Union Member States and the United States of America (USA); • European Union, European Stability Mechanism, European Financial Stability Facility. No change in the business model for securities purchased under the reformed portfolio, as they continue to be purchased with the intention of holding them to maturity and to collect the contractual cash flows and are consequently classified at amortised cost. As part of this business model, sales are considered to be infrequent or insignificant in volume. Where an LTHP security meets the eligibility criteria of hedge accounting (Note A.4.5), the amortised cost is adjusted for the fair value attributable to the risks being hedged and is recognised in the consolidated income statement in “Result on financial operations”. The hedge fair value measurement is based on discounted cashflow technique. A.4.8.4. EIF Operational Portfolio The EIF Operational Portfolio has the following two objectives: • to provide returns commensurate with the long-term nature of the investments; and • serve as a 2nd line of liquidity. It consists of investments in long-term debt instruments, e.g. bonds, notes and other obligations. The securities in this portfolio are held with the intention of holding them to maturity and to collect the contractual cash flows and are consequently classified at amortised cost. As part of this business model, sales are considered to be infrequent or insignificant in volume. A.4.8.5. Loan substitutes portfolio and ABS Portfolio EIF The loan substitutes portfolio and ABS Portfolio EIF mainly consist of obligations in the form of bonds, notes or certificates issued by special purpose vehicles (‘SPVs’) or trust vehicles with the intention of holding them to maturity and to collect the contractual cash flows. A loan substitute can take the form of a contractually linked multiple or single tranche instrument. Where an investment in this portfolio meets the SPPI criterion, it is classified at amortised cost unless it has the nature of a fixed rate loan substitute and qualifies for hedge accounting (Note A.4.5) in which case it is designated in a hedge relation and the amortised cost is adjusted for the fair value attributable to the risks being hedged. The hedge fair value measurement is based on discounted cashflow technique. Economically hedged loan substitutes that cannot be included in hedge accounting are designated irrevocably to the fair value option to reduce the accounting mismatch due to the classification of the hedging instrument at fair value through profit or loss. Contractually linked multiple or single tranche instruments included in the loan substitutes portfolio not fulfilling the SPPI criterion are mandatorily measured at fair value through profit or loss. Front-end fees on loan substitutes are deferred and are recognised as an adjustment to the effective yield, being recorded in the consolidated income statement over the period from disbursement to repayment of the related loan substitute. The front-end fees are deferred and recognised under “Interest and similar income” in the income statement over the life of the underlying loan substitute. Undisbursed parts of loan substitutes are recorded in the consolidated off balance sheet at their nominal value. 197 |
| 2022 FINANCIAL REPORT 205 Impairment on debt securities The Group assumes that the credit risk on treasury portfolios has not increased significantly since initial recognition due to inherent low credit risk. The credit risk associated with treasury debt securities (bonds, discount papers, etc.) is managed by selecting sound counterparties and issuers with a minimum rating at the outset set above investment grade per internal policies. Further, a regular assessment is performed to ensure that at each financial reporting date, the treasury assets meet the low credit risk criteria (see Note S.2.4). Consequently, the loss allowances relating to treasury assets measured at amortised cost are determined at an amount equal to 12-month ECL. As regards the loan substitutes, the ECL impairment model applied on loans and advances equally applies to instruments within the loan substitutes portfolio measured at amortised cost as well as to related undisbursed commitments. Respective loss allowances under IFRS 9 are calculated on either 12-month ECLs or Lifetime ECLs as per the impairment model explained in Note A.4.4. A.4.8.6. Shares and other variable-yield securities This caption in the consolidated balance sheet includes: • instruments mandatorily measured at fair value through profit or loss; • instruments designated as at fair value through other comprehensive income; and • instruments designated at fair value through profit or loss. The Group’s equity portfolio is mainly composed of private equity and venture capital operations, debt funds, infrastructure funds, investment funds and the participation in the European Bank for Reconstruction and Development (‘EBRD’) and is carried at fair value. Private equity, venture capital, debt funds, infrastructure funds and investment funds Private equity and Venture capital (‘VC’) operations, debt, infrastructure and investment funds are measured mandatorily at fair value through profit or loss with changes in the fair value recorded in “Result on financial operations”. In certain co-investments performed by the Bank, the investments are initially recognised at cost and the net-paid-in represents the drawdowns paid net of any capital repayments allocated in accordance with the agreed waterfall. The undrawn but committed part of these investments is recorded as consolidated off-balance sheet commitments at their nominal value. The fair value (before application of a waterfall if applicable) is determined by applying the aggregated net asset value (‘NAV’) method (thereby assuming that, despite the absence of readily ascertainable market value, NAV is the best estimate of the fair value). This valuation method implicitly assumes that if the NAVs of underlying funds (as derived from the latest available before year-end fund managers’ reports) can be considered to be the best estimate of the fair value as determined under IFRS 13, then the aggregation of the NAVs of all funds will itself be equivalent to the fair value as determined under IFRS 13. The fair value is determined by applying where available, and in order of priority, either: • the Group share value at the latest available date, submitted by the respective fund manager, or; • the number of shares or units held by the Group multiplied by the price per share or units latest available date reported by fund manager, or; • the Group’s percentage ownership in the specific compartment multiplied by the specific compartment net asset value (the “NAV”) reflected in the most recent fund manager’s report, or; • the Group’s percentage of ownership in the fund multiplied by the latest available fund NAV. In certain co-investments performed by the Bank, the fair value may be determined based on the agreed waterfall calculation. The attributable NAV is adjusted for events occurring between the date of the latest available NAV and the balance sheet date to the extent that such adjustment is considered to be material by the Management Committee. In that respect, following the general context of uncertainty, various risks resulting from the war in Ukraine and the volatility observed in terms of performance, the Group enhanced its valuation techniques to estimate any adjustment on the fair value of the VC investments for the NAVs not reported by the fund managers at the reporting date of the Group financial statements. In particular, the Group considers the below elements to determine the fair value of these investments: • Insight information collected from the markets; • Comparison of the performance of relevant benchmarks with the performance of the portfolio by reviewing the correlation between the portfolios; • Observable trends from the last quarter NAVs available at the reporting date. Based on the three elements considered all together, the Group is able to determine an adjustment rate, if any, to be applied on the portfolio to derive a best estimate. For specific investments where NAVs cannot readily be determined, other guidelines for example the International Private Equity and Venture Capital Valuation (‘IPEV’) Guidelines, as published by the IPEV Board might be used and more detailed monitoring and review will be required. In accordance with this method, the funds are internally classified into three categories: • Category I – funds that have adopted the fair value requirements of IFRS 13 or IPEV Guidelines for which a specific review is performed to ensure that the NAV is a reliable estimate of fair value; • Category II – funds that have adopted other valuation guidelines (such as the former 2001 EVCA) or standards that can be considered to be in line with IFRS 13, for which an equivalent NAV can be calculated; and • Category III – funds that have not adopted the fair value requirements of IFRS 13 or any other valuation guidelines in line with IFRS 13. 198 |
| EIB GROUP CONSOLIDATED FINANCIAL STATEMENTS UNDER IFRS 206 Secondary sales Secondary sale transactions on venture capital funds and investment funds lead to derecognition of the underlying assets. Gains or losses from secondary sales are recorded in “Result on financial operations” and are calculated as the difference between the sales proceeds and the net carrying amount. Interests in joint ventures and associates The Group complies with the conditions necessary to use the venture capital organisations and similar entities measurement exemption included in IFRS 11 and IAS 28 and consequently decides not to use equity accounting on, or proportionately consolidate investments in respect of such investments. Upon initial recognition, holdings in joint ventures or associates are designated at fair value through profit or loss, and measured subsequently at fair value in accordance with IFRS 9, with changes in fair value recognised in the consolidated income statement during the year of the change. Joint ventures are contractual agreements whereby the Group and other parties undertake an economic activity that is subject to joint control. A joint control is the contractually agreed sharing of control over an economic activity, and exists only when the strategic financial and operating decisions relating to the activity require the unanimous consent of the parties sharing the control (the venturers). The participations acquired by the Group for its own account or on behalf of its mandate providers typically represent investments in private equity or venture capital funds. According to industry practice, such investments are generally investments jointly subscribed by a number of investors, none of whom is in a position to individually influence the daily operations and the investment activity of such a fund. As a consequence, any membership by an investor in a governing body of such fund does not in principle entitle such investor to influence the day-to-day operations of the fund. In addition, individual investors in a private equity or venture capital fund do not determine the policies of a fund such as distribution policies on dividends or other distributions. Such decisions are typically taken by the management of a fund on the basis of the shareholders agreement governing the rights and obligations of the management and all shareholders of the fund. The shareholders’ agreement also generally prevents individual investors from bilaterally executing material transactions with the fund, interchanging managerial personnel or obtaining privileged access to essential technical information. The Group’s investments, made for its own account or on behalf of its mandate providers, are executed in line with the above stated industry practice. In addition, the Group is exposed to variability of returns from these investments. Therefore, in considering whether it has control, the Group evaluates whether it manages key decisions that most significantly affect these investments’ returns. As a result and according to IFRS 10, the Group has concluded that it does not control those vehicles. Associates are entities in which the Group has significant influence, but not control or joint control, over the financial and operating policies. Participation in EBRD The Group also holds a participation in the EBRD for which the Group’s management has elected to irrevocably designate it at fair value through other comprehensive income as this investment was made for long-term strategic purposes. At initial recognition, the Group measures this participation at its fair value plus transaction costs. Subsequently, changes in fair value gains and losses, including foreign currency translation gains and losses, are recognised in other comprehensive income and are never reclassified to profit or loss, even on disposal. Capital subscribed by the Group but uncalled from the investment in the EBRD is recorded as consolidated off-balance sheet commitments. A.4.9. Loans and advances to credit institutions and customers Loans and advances to credit institutions and customers mainly include loans where money is provided directly to the borrower. Loans and advances are recognised when cash is advanced to borrowers. They are initially recorded at cost (their net disbursed amounts), which is the fair value of the cash given to originate the loan, including any transaction costs, and are subsequently measured at amortised cost using the effective interest rate method. Undisbursed parts of loans are recorded as consolidated off-balance sheet commitments at their nominal value. Where loans meet the eligibility criteria of hedge accounting (Note A.4.5), the fair value hedge gain or loss on the loans shall adjust their carrying amount and be recognised in the consolidated income statement in “Result on financial operations”. Where loans meet the eligibility criteria of the fair value option or do not meet the criteria for being classified at amortised cost or fair value through other comprehensive income (Note A.4.3), they are designated on initial recognition as at fair value through the consolidated income statement, and are measured at their fair value. The fair value measurement technique used is based on a discounted cash flow technique. Loans designated at fair value are recorded at fair value in the consolidated balance sheet. Changes in fair value are recorded in “Result on financial operations”. For part of loans mandatorily at fair value through profit or loss, the Bank refined in 2022 the methodology for the estimation of the sensitivity of each instrument to the market benchmark in order to better reflect the market conditions. For the impact of the IBOR reform on remeasurement of loans and advances to credit institutions and customers at amortised cost, please refer to the dedicated paragraph in Note A.4.3 – Classification and Measurement / Modification. For the impact of the IBOR reform on remeasurement of loans and advances to credit institutions and customers meeting eligibility criteria of hedge accounting, please refer to the dedicated paragraphs in Note A.4.5 – Derivatives and hedging activities / Determination of fair value of hedged items, hedging instruments and other derivatives in the context of IBOR Reform. For the impact of the IBOR reform on remeasurement of loans and advances to credit institutions and customers in GBP, CHF and JPY currencies reported under Fair Value Option, the Bank has applied economically equivalent discount rates, while the fair value of the hedged items in USD currency is determined using USD LIBOR discount curve. A.4.9.1. Interest on loans Interest on loans originated by the Group is recorded in the consolidated income statement under “Interest and similar income” using the effective interest rate method and on the consolidated balance sheet under “Loans and advances”. A.4.9.2. Reverse repurchase agreements (‘Reverse repos’) A reverse repurchase agreement is one under which the Group lends liquid funds to a credit institution which provides collateral in the form of securities. The two parties enter into an irrevocable commitment to complete the operation on a date and at a price fixed at the outset. 199 |
| 2022 FINANCIAL REPORT 207 The operation is based on the principle of delivery against payment: the borrower of the liquid funds transfers the securities to the Group’s custodian in exchange for settlement at the agreed price, which generates a return for the Group linked to the money market. This type of operation is considered for the purposes of the Group to be a loan at a guaranteed rate of interest. Generally treated as collateralised financing transactions, they are carried at the amounts of cash advanced or received, plus accrued interest. Reverse repos are entered on the assets side of the consolidated balance sheet under “Loans and advances to credit institutions - b) other loans and advances”. Securities received under reverse repurchase agreements are not recognised in the consolidated balance sheet, unless control of the contractual rights comprised in these securities is assumed. The Group monitors the market value of the securities received on a daily basis and requests additional collateral in accordance with the underlying agreements. A.4.9.3. Term and on-demand deposits (‘Deposits’) Deposits are operations under which the Group lends liquid funds to a credit institution or customer for a certain period or on-demand against a return agreed between the parties. Deposits are entered at their nominal amount on the assets side of the consolidated balance sheet under “Loans and advances to credit institutions or customers - other loans and advances”. A.4.9.3.1. Interest on deposits and reverse repurchase agreements Interest on deposits and reverse repurchase agreements are recognised as interest income or expense over the life of each agreement. Interest on deposits and reverse repurchase agreements is recognised as “Interest and similar income” or “Interest expense and similar charges” over the life of each agreement. A.4.9.4. Fees on loans Front-end fees on loans are deferred, together with the related direct costs of originating and maintaining the commitment, and are recognised as an adjustment to the effective yield, being recorded in the consolidated income statement over the period from disbursement to repayment of the related loan. If the commitment expires without the loan being drawn down, the fee is recognised as income on expiry. The front-end fees are deferred and recognised under “Interest and similar income” in the income statement over the life of the underlying loan. A.4.9.5. Interest subsidies Interest subsidies received in advance (Note F) are deferred and are recognised as an adjustment to the effective yield, being recorded under “Interest and similar income” in the consolidated income statement over the period from disbursement to repayment of the subsidised loan. A.4.10. Impairments on loans and advances Within the Group, the expected credit loss impairment model applies to loans and advances measured at amortised cost as well as to consolidated off-balance sheet commitments. Loss allowances, under IFRS 9, are measured on either 12-month ECL or Lifetime ECL as per the impairment model, which is analysed in note A.4.4. A.4.11. Financial guarantees Financial guarantee contracts require the Group to make specified payments to reimburse the holder for a loss it incurs if a specified debtor fails to make payments when due in accordance with the terms of a debt instrument. Signed financial guarantees are generally accounted and disclosed as off-balance sheet items. Financial guarantees are initially accounted for using the gross approach with offsetting of the receiver and the payer leg and recognised in the consolidated balance sheet at fair value. As EIB Group’s financial guarantee contracts are issued to unrelated parties in a stand-alone arm's length transaction, their fair value at inception is deemed to equal the premium received. At initial recognition, the obligation to pay corresponds to the net present value ('NPV') of expected premium inflows or the initial expected loss. Subsequently, financial guarantees are accounted for using the gross approach with future premiums to be received recorded separately as a financial asset and measured at fair value while the financial liability is measured at the higher of: • the amount of the loss allowance as determined under IFRS 9; and • the amount initially recognised i.e. NPV less, where appropriate, cumulative amortisation recognised in accordance with the principles of IFRS 15. Where eligible, the net present value (‘NPV’) of expected premium inflows and the amount of the expected payment obligations are offset. As per IAS 32, a financial asset and a financial liability shall be offset (net presentation) and the net amount presented in the consolidated balance sheet when, and only when, an entity: • currently has a legally enforceable right to set off the recognised amounts; and • intends either to settle on a net basis, or to realise the asset and settle the liability simultaneously. In case the measurement of a financial guarantee contract results in a net asset position, the respective guarantee is presented in the consolidated balance sheet under “Other assets”. In case the measurement of a financial guarantee results in a net liability position, the respective operations are presented in the consolidated balance sheet: • Under “Other liabilities” for contracts for which the amortised initial NPV is higher than the 12-months ECL or lifetime ECL; and • Under “Provision for guarantees issued and commitments” for contracts that are credit-impaired and hence a loss allowance based on lifetime ECL is recognised. 200 |
| EIB GROUP CONSOLIDATED FINANCIAL STATEMENTS UNDER IFRS 208 When a financial guarantee is not eligible for net presentation the asset side and liability side are presented separately on the Group’s balance sheet. Any increase or decrease in the “Other assets” or “Other liabilities” relating to financial guarantees is recognised in the consolidated income statement under “Result on financial operations”. Any increase or decrease in the “Provision for guarantees issued and commitments” relating to financial guarantees other than the settlement of guarantee calls is recognised in the consolidated income statement under "Change in impairment on loans and advances and provisions for guarantees, net of reversals". Any premiums received are recognised in the consolidated income statement in "Fee and commission income". Any upfront fees received are recognised in "Deferred income" in the consolidated balance sheet and amortised in the consolidated income statement on a straight-line basis over the life of the financial guarantee. A.4.12. Property, furniture and equipment Property, furniture and equipment include land, Group-occupied properties and other machines and equipment. Property, furniture and equipment are reviewed periodically for impairment. Land is stated at acquisition cost and buildings are stated at acquisition cost less accumulated depreciation, less accumulated impairment. The costs of the Group's headquarters buildings in Luxembourg-Kirchberg and its building in Luxembourg-Weimershof are depreciated on a straight-line basis, as set out below. Permanent equipment, fixtures and fittings, furniture, office equipment and vehicles are recorded in the consolidated balance sheet at their acquisition cost, less accumulated depreciation, less accumulated impairment. Depreciation is calculated on a straight-line basis over the estimated life of each item purchased, as set out below: • Buildings in Kirchberg and Weimershof: 30 years; • Permanent equipment, fixtures and fittings: 10 years; • Furniture: 5 years; • Office equipment and vehicles: 3 years. There is no depreciation of the accumulated costs of work-in-progress assets until they are completed and the assets are ready to use for the intended purpose. A.4.13. Intangible assets Intangible assets comprise computer software. Software development costs are capitalised if they meet certain criteria relating to identifiability, to the probability that future economic benefits will flow to the enterprise, and to the reliability of cost measurement. Intangible assets are recognised as assets and are amortised on a straight-line basis over their estimated useful economic lives. At each consolidated balance sheet date, intangible assets are reviewed for indications of impairment or changes in estimated future benefits. If such indications exist, an analysis is performed to assess whether the carrying amounts are fully recoverable. A write-down is made if the carrying amount exceeds the recoverable amount. Internally developed software meeting these criteria is carried at cost less accumulated amortisation, less accumulated impairment calculated on a straight-line basis over three years from completion. There is no amortisation of the accumulated costs of work-in-progress assets until they are completed and the assets are ready to use for the intended purpose. A.4.14. Pension plans and health insurance scheme The Group operates defined-benefit pension plans to provide retirement benefits to substantially its entire staff. The Group also provides certain additional post-employment healthcare benefits to former employees of the EIB. These benefits are unfunded, as defined by IAS 19. The cost of providing benefits under the plans is determined separately for each plan using the projected unit credit actuarial valuation method. The charge to the consolidated income statement in respect of the defined-benefit pension plan is based on the current service cost and interest cost as determined by qualified external actuaries. A.4.14.1. Pension plans for staff The Bank’s main pension scheme is a defined-benefit pension scheme funded by contributions from staff and from the Bank, which covers all Bank employees. All contributions of the Bank and its staff are invested in the assets of the Bank. Commitments for retirement benefits are valued at least every year using the projected unit credit method, in order to ensure that the liability entered in the accounts is adequate. The latest valuation was carried out as at 31 December 2022 based on membership data as at 30 September 2022 and cashflows to 31 December 2022. The main assumptions used by the actuary are set out in Note J. Cumulative actuarial surpluses and deficits are recognised in full in “Other comprehensive income”. Net interest cost is recognised in the consolidated income statement under “Interest expense and similar charges”. The main pension plan of the EIF is a defined-benefit plan funded by contributions from staff and from the EIF, covering all EIF employees. The scheme entered into force in March 2003, replacing the previous defined contribution scheme. 201 |
| 2022 FINANCIAL REPORT 209 A.4.14.2. Health insurance plan The Bank has set up its own health insurance plan for the benefit of staff, financed by contributions from the Bank and its employees. The plan is an unfunded plan treated as a defined-benefit plan. A specific provision is set aside on the liability side of the consolidated balance sheet for staff at retirement age. The Fund has subscribed to a health insurance scheme with an insurance company for the benefit of staff at retirement age, financed by a contribution from the Fund and its employees. Entitlement to these benefits is based on the employees remaining in service up to retirement age and the completion of a minimum service period. The expected costs of these benefits are accrued over the period of employment, using a methodology similar to that for defined-benefit pension plans. The health insurance liabilities are determined based on actuarial calculations as per the same dates as the pension plans. A.4.14.3. Pension plan for members of the Management Committee The related provision shown on the liability side of the Group’s consolidated balance sheet is determined, as for all plans, in conformity with IAS 19. Benefits are based on years of service and a percentage of final gross base salary as defined under the plan. The pension plan for members of the Management Committee is managed and accounted for under the same principles as the pension plan for staff (Note A.4.14.1). A.4.14.4. Optional supplementary provident scheme The optional supplementary provident scheme is a defined-contribution pension scheme, funded by voluntary staff and employer contributions. It is accounted for on the basis of the contributions from staff and employer and the corresponding liability is recorded in “Other liabilities”. A.4.15. Amounts owed to credit institutions and customers Amounts owed to credit institutions and customers are initially recorded at cost and are presented in the consolidated financial statements at amortised cost. Interest on amounts owed to credit institutions and customers is recorded in the consolidated income statement as “Interest expense and similar charges” or “Interest and similar income” if interest rate is negative using the effective interest method. In the context of the Bank’s participation in monetary operations with the ECB, the amount borrowed from the BCL is initially recorded at cost and is presented in the consolidated financial statements at amortised cost under “Amounts owed to credit institutions- b) with agreed maturity or periods of notice” - Borrowings from central banks. In that respect, the Group has assessed the contractual terms of respective transaction in regards to the interest rate and has not identified significant benefit as compared to available funding conditions of a similar transaction in the market. Therefore, the Group considers it as an arm’s length transaction. The borrowing rate of this transaction may be reduced subject to the achievement of predefined lending performance thresholds, which will only be settled in arrears, notably on the maturity of the operation or on early repayment. Taking into consideration the materiality perspective of this rebate component for the Group, and the fact that the eligibility criteria cannot be reliably estimated as of the end of the year, the Group considers appropriate to exclude it from the calculation of the effective interest rate of the transaction. As a result, this part of the borrowing rate is not entitled to IFRS 9 requirements but accounted under the scope of IFRS 15. Based on the characteristics of the transaction and in line with the Group’s accounting policies, the possible future rebate is recognised at point in time. A.4.15.1. Repurchase agreements (‘Repos’) A repurchase agreement is one under which the Group borrows liquid funds from a credit institution and provides collateral in the form of securities. The two parties enter into an irrevocable commitment to complete the operation on a date and at a price fixed at the outset. The operation is based on the principle of delivery against payment, which is mentioned in note A.4.9.2. This type of operation is considered for the purposes of the Group to be a borrowing with an agreed rate of interest. Generally treated as collateralised financing transactions, they are carried at the amounts of cash owed, plus accrued interest. Repos are entered at their nominal amounts on the liabilities side of the consolidated balance sheet under “Amounts owed to credit institutions- b) with agreed maturity or periods of notice”. A.4.15.1.1. Interest on repurchase agreements Interest on repurchase agreements is recognised as interest expense or income over the life of each agreement. A.4.15.2. Collateral call accounts Under unilateral Collateral Support Annexes, the Group receives cash as collateral to mitigate counterparty credit exposures on Derivatives, Lending and Treasury portfolios. The cash collateral received is recorded at its nominal value and presented in the consolidated balance sheet under “Amounts owed to credit institutions - a) repayable on demand” - Overnight deposits. A.4.16. Debts evidenced by certificates Debts evidenced by certificates are initially measured at cost, which is the fair value of the consideration received. Transaction costs and net premiums (discounts) are included in the initial measurement. Subsequent measurement is at amortised cost, and any difference between net proceeds and the redemption value is amortised over the lifetime of the borrowings using the effective interest method. For the impact of the IBOR reform on remeasurement of Debts evidenced by certificates meeting eligibility criteria of hedge accounting, please refer to the dedicated paragraphs in Note A.4.5 – Derivatives and hedging activities / Determination of fair value of hedged items, hedging instruments and other derivatives in the context of IBOR Reform. For the impact of the IBOR reform on remeasurement of non-quoted debts evidenced by certificates reported under Fair Value Option, the Bank has applied economically equivalent discount rates. Borrowings are designated in a hedge relation in case they are eligible for hedge accounting under IFRS 9 (Note A.4.5) and their amortised cost is subsequently adjusted for the fair value attributable to the risks being hedged. Firm commitments in borrowings with a settlement date in the future may be hedged and designated to hedge accounting as well. 202 |
| EIB GROUP CONSOLIDATED FINANCIAL STATEMENTS UNDER IFRS 210 The hedge fair value of borrowings is calculated based on a discounted cash flow method. Where borrowings are not included in hedge accounting and meet the eligibility criteria of the fair value option and have been designated on initial recognition as such, they are measured at fair value through profit or loss. The fair value measurement technique employed, in the event of absence of liquid market prices, is a discounted cash flow technique, using current yield curves. When the Group designates a borrowing as at fair value through profit or loss, the amount of change in the fair value attributable to changes in its credit risk (so called “own credit adjustment”, ‘OCA’) is presented in other comprehensive income. On initial recognition of the financial liability, the Group assesses whether presenting the amount of change in own credit adjustment in other comprehensive income would create or enlarge an accounting mismatch in profit or loss. This assessment is made by comparing: • The expected changes in the fair value of the borrowing related to changes in own credit adjustment; with • The impact of profit or loss of expected changes in the fair value of the related instruments. Amounts presented in the other comprehensive income are not subsequently transferred to profit or loss. When these instruments are derecognised, the related cumulative amount in the other comprehensive income is transferred to the Group’s additional reserves. For structured debt instruments that are related to foreign exchange rates and indices, including an embedded derivative, the Group has concluded swap agreements to fully hedge the exposure. Accrued interest on debt instruments is included under the liabilities caption including the underlying debt instruments in the consolidated balance sheet. A.4.17. Prepayments – Deferred income These accounts comprise: • Prepayments: expenditure incurred during the financial year but relating to a subsequent financial year; • Deferred income: income received before the balance sheet date but relating to a subsequent financial year. A.4.18. Leases At inception of a contract, the Group assesses whether a contract is a lease, if the contract conveys the right to control the use of an identified asset for a period of time in exchange for consideration. After the commencement date, the Group recognises a right-of-use asset and a lease liability. The lease liability is initially measured at the present value of the lease payments, which comprise the contractual future fixed and variable lease payments, payments to be made under residual value guarantees, exercise price of a purchase option and penalties for termination. The lease liability is discounted using the Group’s incremental borrowing rate. Subsequently, the lease liability is measured at amortised cost using the effective interest method and is adjusted to reflect the lease payments made and interest from the unwind of the lease liability, with further re-measurements to reflect any reassessment or lease modifications. The right-of-use assets is initially measured at the amount of the lease liability, plus any initial direct costs incurred by the lessee and any lease payments made at or before the commencement date, less any lease incentives received and any dismantling costs (at termination date, if any). EIB Group elected by class of underlying asset, not to separate non-lease components from lease components, and consequently account for each lease component and any associated non-lease components as a single lease component. Subsequently, the Group carries the right-of-use asset applying a cost model, depreciating the right-of-use asset from the commencement date to the end of the lease agreements and assessing for any impairment, on an annual basis in accordance with IAS 36. As a lessee, the Group has grouped its leased assets in scope for IFRS 16 accounting, into two class of assets: real estate (both commercial buildings and residential houses) and cars. The grouping was done based on underlying assets, which are of similar characteristics, nature and use in an EIB’s Group operations. The Group presents right-of-use assets under “Property, furniture and equipment” and corresponding lease liability in “Other liabilities” in the consolidated balance sheet. Short-term leases and leases of low-value assets The Group has elected not to recognise right-of-use assets and lease liabilities for leases of low-value assets and short-term leases (e.g. IT and office equipment). The Group recognises the lease payments associated with these leases as an expense on a straight-line basis over the lease term. A.4.19. Reserves A.4.19.1. Reserve fund As provided for under Article 22(-1) of the Statute, “a reserve fund of up to 10% of the subscribed capital shall be built up progressively” from the retained profit of the Bank. 203 |
| 2022 FINANCIAL REPORT 211 A.4.19.2. Additional reserves Additional reserves contain the remaining retained earnings of the Group. A.4.19.3. Fair value reserve The fair value reserve includes the fair value attributable to changes in own credit risk for financial liabilities designated at fair value option, the fair value of the currency basis spread and the fair value changes attributable to equity investments designated at fair value through other comprehensive income. A.4.19.4. Special activities reserve As provided for under Article 16(-5) of the Statute, “the special activities of the Bank […] will have a specific allocation of reserve”. The special activities reserve is a dedicated notional reserve for the allocation of own funds covering unexpected losses of those activities which have a risk profile higher than what is generally accepted by the Bank, including venture capital activities. The reserve is based on an allocation of each operation and is calculated according to the evolution of the underlying assets. A.4.19.5. General loan reserve In 2009, a “general loan reserve” was introduced for the Bank’s loan and guarantee portfolio, representing a notional reserve for allocation of own funds. It is calculated based on the Bank’s internal loan grading system according to the evolution of the underlying assets. It is also noted that, with the introduction of IFRS 9, provisions for expected credit losses are accounted for on the Group financial assets measured at amortised cost as well as on the Group consolidated off-balance sheet commitments. The latter affects the consolidated income statement and should not be confused with the general loan reserve, which represents a notional allocation within the own funds and concerns the loan and guarantee operations granted by the Bank. A.4.20. Taxation The Protocol on the Privileges and Immunities of the European Union appended to the Treaty on European Union and the treaty on the Functioning of the European Union, stipulates that the assets, revenues, and other property of the institutions of the Union are exempt from all direct taxes. A.4.21. Interest income and expense Interest income and interest expense are recognised in the consolidated income statement for all interest bearing instruments on an accruals basis using the effective interest method based on the actual purchase price, including direct transaction costs. This is a method of calculating the amortised cost of a financial instrument and allocating the interest income over the relevant period. The effective interest rate is the rate that exactly discounts estimated future cash receipts through the expected life of the financial instrument to the net carrying amount of the financial instrument. In case of negative interest calculation, the corresponding interest is reclassified from interest income to interest expense and vice versa. In addition to interest and commission on loans, deposits and other revenue from the securities portfolio, this heading includes the indemnities received by the Group in respect of early loan reimbursement payments made by its borrowers. The Group records the indemnities received for early repayment of loans immediately in the consolidated income statement at the time of derecognition of the related loans. In accordance with IAS 32 – Financial Instruments: Presentation, as a result of the replacement share purchase undertaking (Note A.4.1), fair value movements on the EIF put option are presented under “Interest expense and similar charges”. A.4.22. Income from shares and other variable-yield securities “Income from shares and other variable-yield securities” is mainly composed by any reflows exceeding the capital. A.4.23. Cash and cash equivalents Cash and cash equivalents are disclosed in the consolidated cash flow statement and comprise cash on hand, unrestricted balances held with central banks, on demand amounts due, and highly liquid money market securities or term deposits with initial maturity of 3 months or less from the date of acquisition. These instruments are subject to an insignificant risk of changes in their value, readily convertible to cash and are used by the Group in the management of its short-term commitments. Items under cash and cash equivalents are carried at amortised cost in the consolidated financial statements. 204 |
| EIB GROUP CONSOLIDATED FINANCIAL STATEMENTS UNDER IFRS 212 Note B – Cash in hand, balances with central banks and post office banks, debt securities portfolio, shares and other variable-yield securities and interest in other entities (in EUR ‘000) B.1. Cash in hand, balances with central banks and post office banks The cash in hand and balances with central banks and post office banks equals to EUR ’000 112,703 at 31 December 2022 (2021: EUR ‘000 1,483,285). The EIB is an eligible counterparty in the Eurosystem’s monetary policy operations, and has therefore been given access to the monetary policy operations of the European Central Bank. The Bank conducts the operations via the Central Bank of Luxembourg, where it maintains a deposit to cover the minimum reserve requirement. The balance of this deposit amounts to EUR ‘000 87,266 as at 31 December 2022 (2021: EUR ‘000 144,479). B.2. Debt securities portfolio The details of each portfolio as at 31 December 2022 and 31 December 2021 are as follows: 31.12.2022 31.12.2021 Treasury bills and other bills eligible for refinancing with central banks 21,620,352 37,237,861 Debt securities including fixed-income securities 10,983,057 12,058,782 Total debt securities(*) 32,603,409 49,296,643 (*) Of which EUR ‘000 6,615,093 are unlisted as at 31 December 2022 (2021: EUR ‘000 6,510,405). At 31.12.2022 Classification Carrying amount Fair value LTHP AC 2,526,234 2,290,208 TMP AC 7,000,595 6,991,823 SLP Mandatorily at FVTPL 3,184,745 3,184,745 Operational portfolio – EIF AC 2,326,520 2,059,529 ABS Portfolio EIF Mandatorily at FVTPL 402,815 402,815 Loan substitutes portfolio (Note D) AC 16,370,081 16,038,219 Loan substitutes portfolio (Note D) Mandatorily at FVTPL 612,364 612,364 Loan substitutes portfolio (Note D) Designated at FVTPL 180,055 180,055 Total debt securities 32,603,409(1) 31,759,758 (1) Of which cash and cash equivalents EUR '000 552,038. At 31.12.2021 Classification Carrying amount Fair value LTHP AC 1,443,699 1,436,504 TMP AC 22,456,300 22,457,103 SLP Mandatorily at FVTPL 4,747,686 4,747,686 Operational portfolio – EIF AC 2,297,749 2,291,361 ABS Portfolio EIF Mandatorily at FVTPL 381,039 381,039 Loan substitutes portfolio (Note D) AC 16,865,124 16,935,383 Loan substitutes portfolio (Note D) Mandatorily at FVTPL 903,348 903,348 Loan substitutes portfolio (Note D) Designated at FVTPL 201,698 201,698 Total debt securities 49,296,643(1) 49,354,122 (1) Of which cash and cash equivalents EUR '000 142,403. Loan substitutes, which represent acquisitions of interests in pools of loans or receivables in connection with securitisation transactions, are considered to be part of the aggregate loans (Note D). Some of these transactions have been structured by adding credit or project related remedies, thus offering additional recourse. 205 |
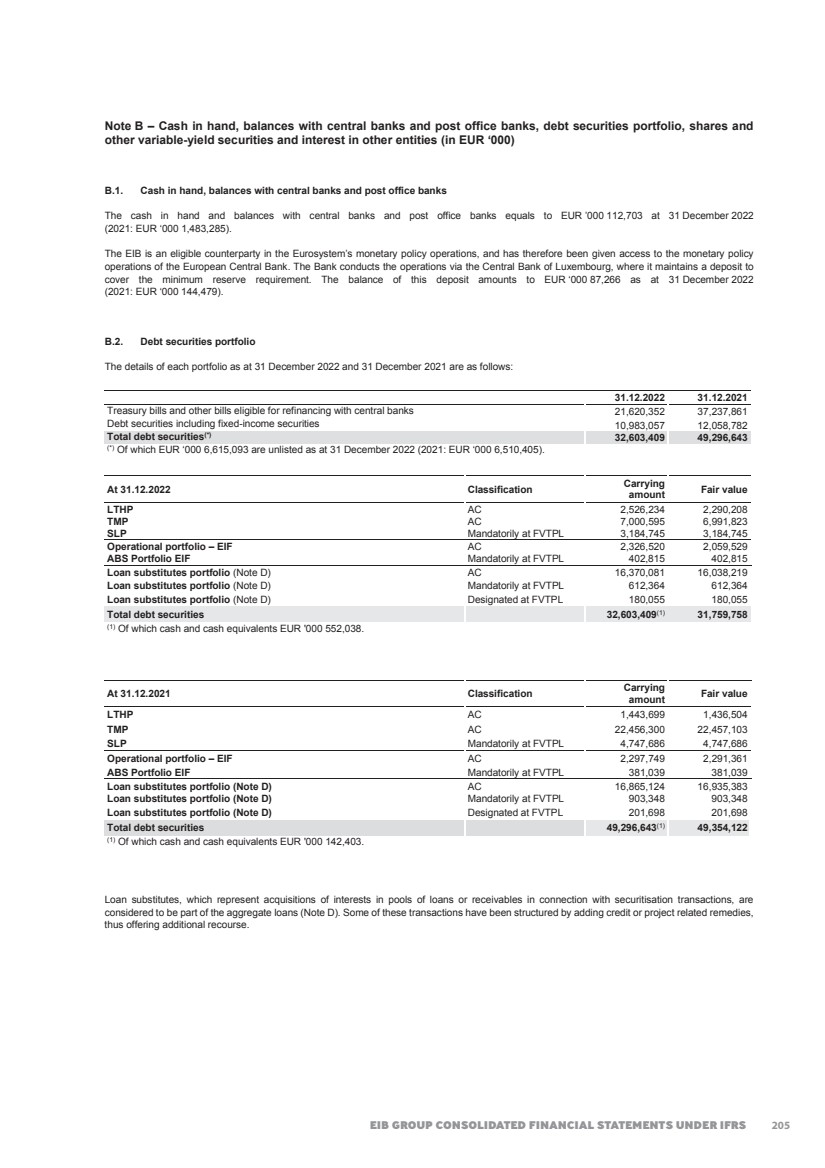
| 2022 FINANCIAL REPORT 213 EU sovereign exposure The Group did not record impairment in 2022 and 2021 in respect of its held to maturity EU sovereign and EU sovereign guaranteed exposure as at year-end, in view of the Bank’s as well as EIF’s preferred creditor status and the protection given by the Bank’s Statute as well as on a detailed review of any fair value adjustment requirements. The following tables show the exposure to debt issued or guaranteed by EU sovereigns in the Group’s debt securities portfolios as at 31 December 2022 and 31 December 2021: At 31.12.2022 Book value Fair value EU sovereigns Austria 165,057 154,436 Belgium 163,662 131,678 Bulgaria 40,679 32,810 Czech Republic 275,646 277,988 Finland 80,097 61,109 France 1,832,932 1,850,483 Germany 1,181,246 1,159,915 Hungary 16,631 14,342 Italy 633,802 630,016 Latvia 19,984 19,983 Lithuania 31,202 28,187 Luxembourg 5,006 4,872 Netherlands 410,738 401,832 Poland 1,728,650 1,733,123 Portugal 47,098 37,544 Slovakia 7,994 7,454 Slovenia 49,384 40,688 Spain 1,431,257 1,423,707 8,121,065 8,010,167 Non-EU sovereign and other bonds 24,482,344 23,749,591 Total 32,603,409 31,759,758 At 31.12.2021 Book value Fair value EU sovereigns Austria 57,523 57,473 Belgium 62,072 62,114 Bulgaria 41,238 40,755 Czech Republic 397,333 400,545 Denmark 17,620 17,620 France 1,277,213 1,276,540 Germany 988,825 1,038,633 Hungary 16,784 16,706 Ireland 705,945 706,040 Italy 7,462,310 7,468,126 Latvia 14,997 15,070 Lithuania 32,371 32,630 Luxembourg 30,227 30,303 Netherlands 357,993 370,237 Poland 585,712 532,983 Portugal 47,169 47,282 Romania 85,980 85,911 Slovakia 7,986 8,180 Slovenia 39,446 39,021 Spain 5,876,519 5,876,193 Sweden 96,096 96,087 18,201,359 18,218,449 Non-EU sovereign and other bonds 31,095,284 31,135,673 Total 49,296,643 49,354,122 206 |
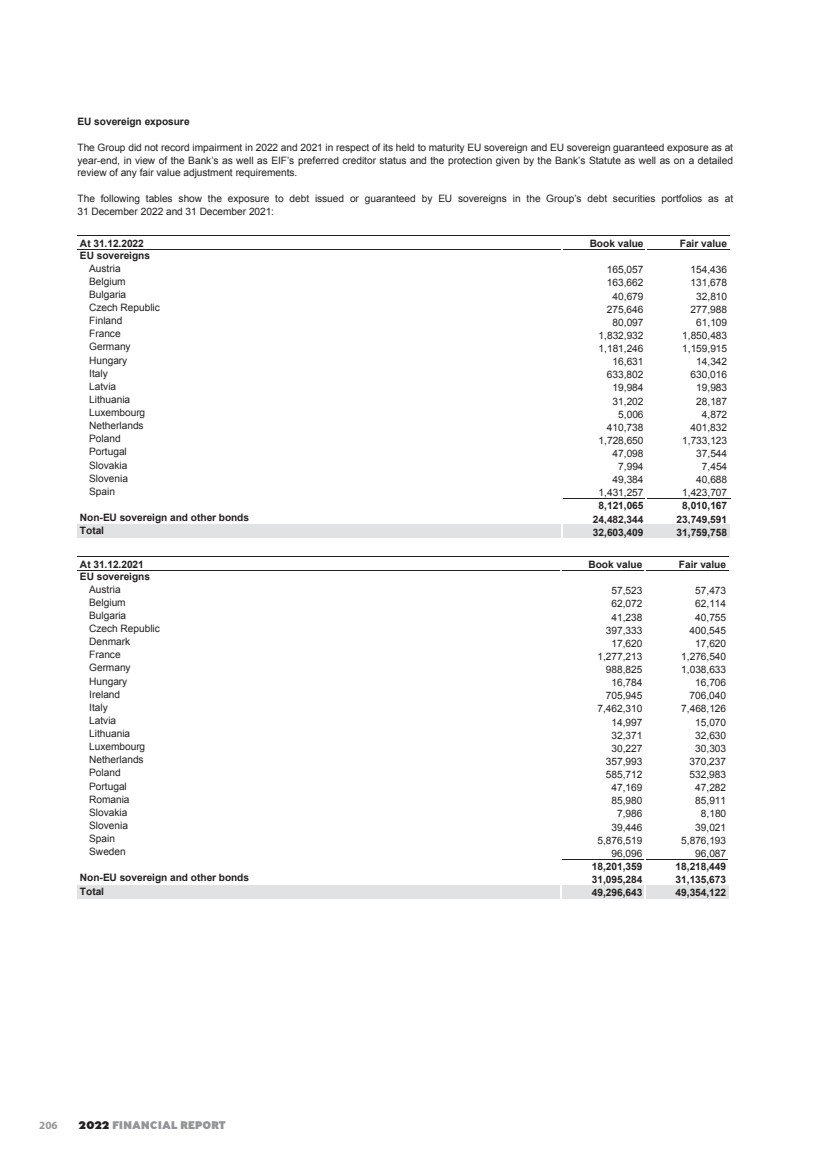
| EIB GROUP CONSOLIDATED FINANCIAL STATEMENTS UNDER IFRS 214 Debt securities portfolio – Loss allowances The following table shows the reconciliation from the opening to the closing balance of the loss allowance for debt securities portfolio under the ECL IFRS 9 model. 2022 (in EUR '000) 12-month ECL Lifetime ECL not credit-impaired Lifetime ECL credit-impaired Total Debt securities measured at AC Balance at 1 January 374 5,416 0 5,790 Transfer to 12-month ECL 0 -2 0 -2 Transfer to lifetime ECL not credit-impaired 0 9 0 9 Net remeasurement of loss allowance 708 -2,688 0 -1,980 New financial assets originated or purchased 149 643 0 792 Financial assets that have been derecognised -57 0 0 -57 Balance at 31 December 1,174 3,378 0 4,552 2021 (in EUR '000) 12-month ECL Lifetime ECL not credit-impaired Lifetime ECL credit-impaired Total Debt securities measured at AC Balance at 1 January 1,808 11,468 0 13,276 Transfer to 12-month ECL 0 -23 0 -23 Transfer to lifetime ECL not credit-impaired 0 0 0 0 Net remeasurement of loss allowance -1,198 -6,029 0 -7,227 New financial assets originated or purchased 175 0 0 175 Financial assets that have been derecognised -411 0 0 -411 Balance at 31 December 374 5,416 0 5,790 B.3. Shares and other variable-yield securities The balance comprises: Shares and other variable-yield securities Private Equity and Venture Capital Operations EBRD shares Equity investments and Infrastructure funds Other equity investments Other investments(3) Total Cost: At 1 January 2022 6,901,616 157,500 3,018,393 264 0 10,077,773 Additions (2) 1,509,714 0 954,579 1,270 72,823 2,538,386 Reflows / Terminations (2) -1,456,025 0 -355,091 0 0 -1,811,116 At 31 December 2022 6,955,305 157,500(1) 3,617,881 1,534 72,823 10,805,043 Unrealised gains/losses At 1 January 2022 7,535,551 440,427 818,142 412 0 8,794,532 Unrealised gains 921,460 0 487,128 1,837 3,682 1,414,107 Unrealised losses -2,057,976 -50,349 -8,721 0 -3,682 -2,120,728 At 31 December 2022 6,399,035 390,078 1,296,549 2,249 0 8,087,911 Net book value: At 31 December 2022 13,354,340 547,578 4,914,430 3,783 72,823 18,892,954 At 31 December 2021 14,437,167 597,927 3,836,535 676 0 18,872,305 (1) The amount of EUR ‘000 157,500 (2021: EUR ‘000 157,500) corresponds to the capital paid in by the Group as at 31 December 2022 with respect to its subscription of EUR ‘000 900,440 to the capital of the European Bank for Reconstruction and Development (‘EBRD’). As at 31 December 2022, the Group holds 3.03% of the subscribed capital of the EBRD (2021: 3.03%). (2) The “Additions” and “Reflows/Terminations” amounts include foreign exchange movements. (3) The amount of EUR ‘000 72,823 corresponds to the net paid in in respect of private equity operations which are deployed by the EIF in the context of the InvestEU Programme. These operations are fully guaranteed by the EU represented by the European Commission. The latter is exposed to the upside and downside arising from these equity operations whereas the Group retains ultimately only an interest component in order to cover its cost of funding. Therefore, from an economical and risk perspective, the Group, as beneficiary of the EU Guarantee, is exposed ultimately to the credit risk of the European Commission and not the equity risk stemming from the underlying investments. The fair value of such operations, disregarding the guarantee of EC, amounts to EUR ‘000 69,140 whereas the valuation of the guarantee provided by the EC is valued at EUR ‘000 3,682. 207 |
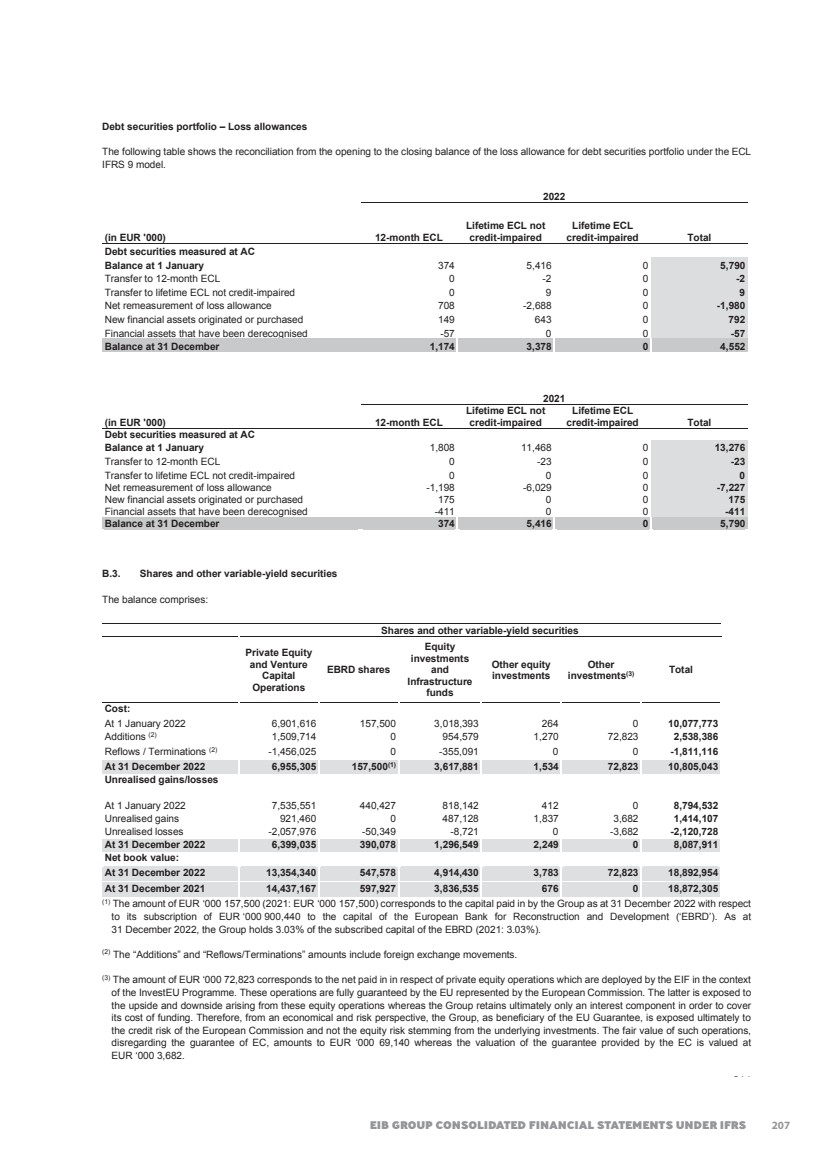
| 2022 FINANCIAL REPORT 215 The Group designated the investment in EBRD as at fair value through other comprehensive income because the investment is expected to be held for the long-term for strategic purposes and there are no plans to dispose this investment in the short or medium term. There was no dividend recognised during the year 2022 nor transfers of any cumulative gain or loss within equity relating to this investment. B.4. Interest in other entities B.4.1 Composition of the Group The European Investment Fund (the ‘Fund’ or ‘EIF’) was incorporated on 14 June 1994, in Luxembourg, as an international financial institution. The address of its registered office is 37B, avenue J.F. Kennedy, L-2968 Luxembourg. The primary task of the Fund, while providing adequate return on equity, is to contribute to the pursuit of European Union objectives through: • the provision of guarantees to financial institutions that cover credits to small and medium sized entities (‘SMEs’); • the acquisition, holding, managing and disposal of equity participations; • the administration of special resources entrusted by third parties; and • related activities. The EIF has share capital consisting solely of ordinary shares, which are held directly by the Bank and the proportion of ownership interests held equals to the voting rights held by Bank. The country of incorporation or registration is also its principal place of business. As a result of the General Meeting’s approval of the EIF’s capital increase in February 2021, the EIF’s authorised capital has been increased during the year 2021 from EUR 4.5 billion to EUR 7.4 billion through the issuance of 2,870 new shares; each new share having a nominal value of EUR 1,000,000. The issuance of the new shares occurred through a single subscription round with subscription possible in a single subscription period as detailed below. Each newly authorised share which is subscribed is paid-in as to 20% of its nominal value. The remaining 80% can be called upon decision of the EIF General Meeting. The subscription price for any newly authorised shares which were subscribed in the capital increase was fixed at EUR 435,970.88 based on the Replacement Share Purchase Undertaking (‘RSPU’) formula and determined on the basis of financial data of the EIF as of 30 September 2020 as reviewed by external auditors and including the paid-in portion of newly issued shares. In line with Article 5 of the EIF Statutes, each shareholder of the EIF was entitled to subscribe to a fraction of the increase corresponding to the ratio, which existed between the shares subscribed by that member and the overall number of EIF shares subscribed, before the capital increase. Consequently, the EIB has subscribed to its pro-rata share of 1,689 shares for an amount of approximatively EUR 736 million in February 2021. The Bank holds 59.40% (2021: 59.40%) of the subscribed capital of the EIF amounting to EUR 7.3 billion (2021: EUR 7.3 billion). During 2022, the Bank neither bought shares from other investors nor sold any such shares to other investors. As a result, as at 31 December 2022 the Bank holds 4,336 shares in EIF. During the year 2021, the RSPU with respect to subscribed shares of the EIF held by the European Commission (‘EC’) was terminated while the RSPU with respect to the subscribed shares from the EIF’s minority shareholders other than the EC remains in place. Consequently, with respect to the 774 EIF shares subscribed by these minority shareholders, the EIB is offering to buy these shares at any time under the ‘RSPU’ at a price per share of currently EUR 542,329.82. This price corresponds to the part of each share in the called capital of the EIF, increased by the share premium account, the statutory reserves, the retained earnings, the fair value reserve and the profit of the year, adjusted by the dividend for the year. The agreed formula is being applied to the approved and audited annual accounts of the EIF for the financial year in which the option is exercised. B.4.2 Involvement with unconsolidated structured entities Definition of a structured entity A structured entity is one that has been designed so that voting or similar rights are not the dominant factor in deciding who controls the entity. IFRS 12 observes that a structured entity often has some or all of the following features: • Restricted activities; • A narrow and well-defined objective, such as to effect a tax-efficient lease, carry out research and development activities, provide a source of capital or funding to an entity or provide investment opportunities for investors by passing on risks and rewards associated with the assets of the structured entity to investors; • Insufficient equity to permit the structured entity to finance its activities without subordinated financial support; and • Financing in the form of multiple contractually linked instruments to investors that create concentrations of credit or other risks (tranches). Unconsolidated structured entities The term ‘unconsolidated structured entities’ refers to all structured entities that are not controlled by the Group and includes interests in structured entities that are not consolidated. 208 |
| EIB GROUP CONSOLIDATED FINANCIAL STATEMENTS UNDER IFRS 216 Definition of Interests in structured entities: IFRS 12 defines "interests" broadly to include any contractual or non-contractual involvement that exposes the reporting entity to variability in returns from the performance of the entity. Examples of such interests include the holding of equity interests and other forms of involvement such as the provision of funding, liquidity support, credit enhancements, commitments and guarantees to the other entity. IFRS 12 states that a reporting entity does not necessarily have an interest in another entity solely because of a typical customer supplier relationship. Type of structured entity Nature and purpose Interest held by the Group Project Finance - lending to Special Purposes Vehicles ('SPVs') Project Finance Transactions ('PF Operations') are transactions where the Group relies for the servicing of its debt on a borrower whose sole or main source of revenue is generated by a single or limited number of assets being financed by such debt or other pre-existing assets contractually linked to the project. PF operations are often financed through SPVs. Net disbursed amounts Interest income Private equity and venture capital, equity investments and infrastructure funds and other investments The Group finances venture capital and investment funds. Venture capital and investment funds pool and manage money from investors seeking private equity stakes in small and medium-size enterprises with strong growth potential as well as financing infrastructure projects. Investments in units/shares issued by venture capital and investment funds Dividends received as dividend income Assets Backed Securities issued by SPVs Investing in notes issued by SPVs is a Group’s alternative mean of providing funds to a project promoter or intermediary. Asset Backed Securities are issued by a segregated SPV and are backed by a pool of assets originated by a financial or another institution. It should be noted that the Group does not act as sponsor/promoter of such SPVs. Investments in notes issued by the SPVs Interest income Guarantees granted in respect of loans granted by third party SPVs The Group enters into guarantees and unfunded securities transactions that can be granted to financial institutions, public entities or SPVs. Guaranteed exposures Guarantee fees Mandate management The Group manages mandates on behalf of third parties and is entrusted with the management of external funds and provides related back-office and accounting services. Management fees for services The table below shows the carrying amounts of unconsolidated structured entities in which the Group has an interest at the reporting date, as well as the Group’s maximum exposure to credit risk in relation to those entities or maximum exposure to loss for private equity and venture capital, equity investments and infrastructure funds and other investments. The maximum exposure to credit risk or maximum exposure to loss (for venture capital and investment funds) includes the carrying amounts and the related undisbursed commitments. 31.12.2022 31.12.2021 (in EUR million) Caption Carrying amount Maximum Exposure to Credit Risk or loss* Carrying amount Maximum Exposure to Credit Risk or loss* Project finance - lending to SPVs Loans and advances to customers 7,638 8,595 8,530 9,212 Private equity and venture capital, equity investments and infrastructure funds and other investments (refer to Note B.3) Shares and other variable-yield securities 18,342 27,737 18,274 27,003 Loan substitutes – Investments in Asset Backed Securities issued by SPVs and other structured entities Debt securities including fixed-income securities 5,940 5,940 5,213 5,213 Guarantees granted in respect of loans granted by third party SPV (Notes S.2.5.3) Provisions for guarantees issued 98 10,674 39 11,834 Total 32,018 52,946 32,056 53,262 * Maximum exposure to credit risk is not applicable for private equity and venture capital, equity investments and infrastructure funds and other investments, as they carry no credit risk. No support is provided to structured entities by EIB Group beyond the above disclosed carrying amount. Note C – Loans and advances to credit institutions and to customers – other loans and advances (in EUR ‘000) 31.12.2022 31.12.2021 Term deposits 56,821,267 60,466,570 On-demand deposits 14,411 386,649 Reverse repos 7,382,540 13,888,350 Other loans and advances to credit institutions 64,218,218 74,741,569 Other loans and advances to customers 125,976 677,197 Total other loans and advances 64,344,194 75,418,766 Of which cash and cash equivalents 62,426,771 66,842,771 209 |
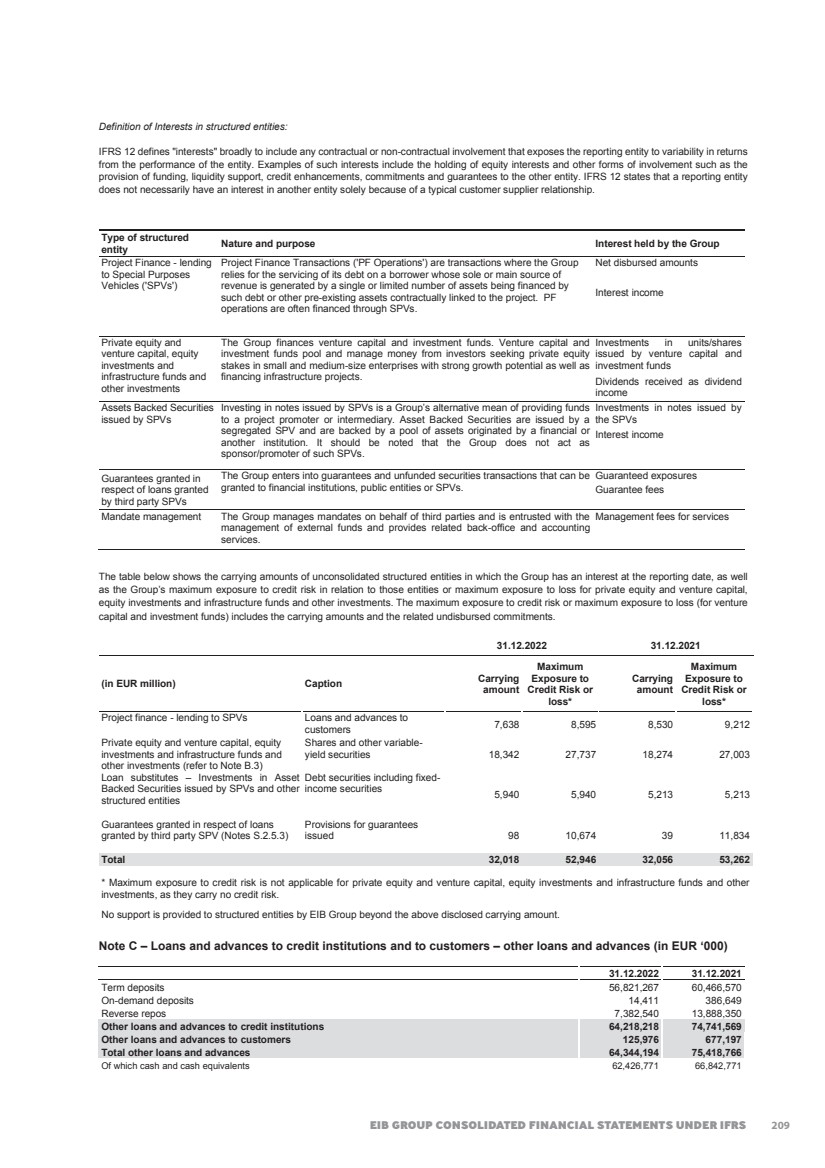
| 2022 FINANCIAL REPORT 217 Note D – Summary statement of loans (in EUR ‘000) D.1. Aggregate loans granted Aggregate loans granted comprise both the disbursed and undisbursed portions of loans. The analysis is as follows: To intermediary credit institutions Directly to final beneficiaries 31.12.2022 31.12.2021 Disbursed portion 91,602,067 321,117,280 412,719,347 434,204,364 Undisbursed loans 30,757,433 93,274,466 124,031,899 122,977,291 Aggregate loans granted 122,359,500 414,391,746 536,751,246 557,181,655 Loan instalments receivable 21,746 145,347 167,093 472,853 Loan substitutes portfolio 17,162,500 17,970,168 Aggregate loans including loan substitutes portfolio 554,080,839 575,624,676 D.2. Impairment on loans and advances – Loss allowances The following tables show the reconciliation from the opening to the closing balance of the loss allowance for disbursed loans and advances and undisbursed loans (loan commitments) under the ECL IFRS 9 model. 2022 12-month ECL Lifetime ECL not credit-impaired Lifetime ECL credit-impaired Total Loans and advances to credit institutions measured at AC Balance at 1 January 2022 1,863 21,053 52,310 75,226 Transfer to 12-month ECL 252 -1,081 0 -829 Transfer to lifetime ECL not credit-impaired -1 28 0 27 Transfer to lifetime ECL credit impaired 0 -22 0 -22 Net measurement of loss allowance 4,501 1,795 -43,857 -37,561 New financial assets originated or purchased 2,290 4,604 0 6,894 Financial assets that have been derecognised -181 -2,837 -8,273 -11,291 Write-offs 0 0 0 0 Balance at 31 December 2022 8,724 23,540 180 32,444 The evolution of the loss allowance on Loans and advances to credit institutions is mainly explained by the following: • Decrease due to the net movement between 12-month ECL, Lifetime ECL not credit-impaired and Lifetime ECL credit-impaired by an amount of EUR ‘000 824. • Increase due to new financial assets originated or purchased by an amount of EUR ‘000 6,894. • Decrease due to the net measurement of loss allowance of existing operations within the same staging level by an amount of EUR ‘000 37,561. • Decrease due to the full derecognition of financial assets by an amount of EUR ‘000 11,291. 2021 12-month ECL Lifetime ECL not credit-impaired Lifetime ECL credit-impaired Total Loans and advances to credit institutions measured at AC Balance at 1 January 2021 14,905 49,994 61,023 125,922 Transfer to 12-month ECL 5 -322 0 -317 Transfer to lifetime ECL not credit-impaired -814 1,169 0 355 Transfer to lifetime ECL credit impaired 0 -1,844 4,823 2,979 Net measurement of loss allowance -10,505 -20,652 -10,279 -41,436 New financial assets originated or purchased 213 2,623 0 2,836 Financial assets that have been derecognised -1,941 -9,915 -3,257 -15,113 Write-offs 0 0 0 0 Balance at 31 December 2021 1,863 21,053 52,310 75,226 210 |
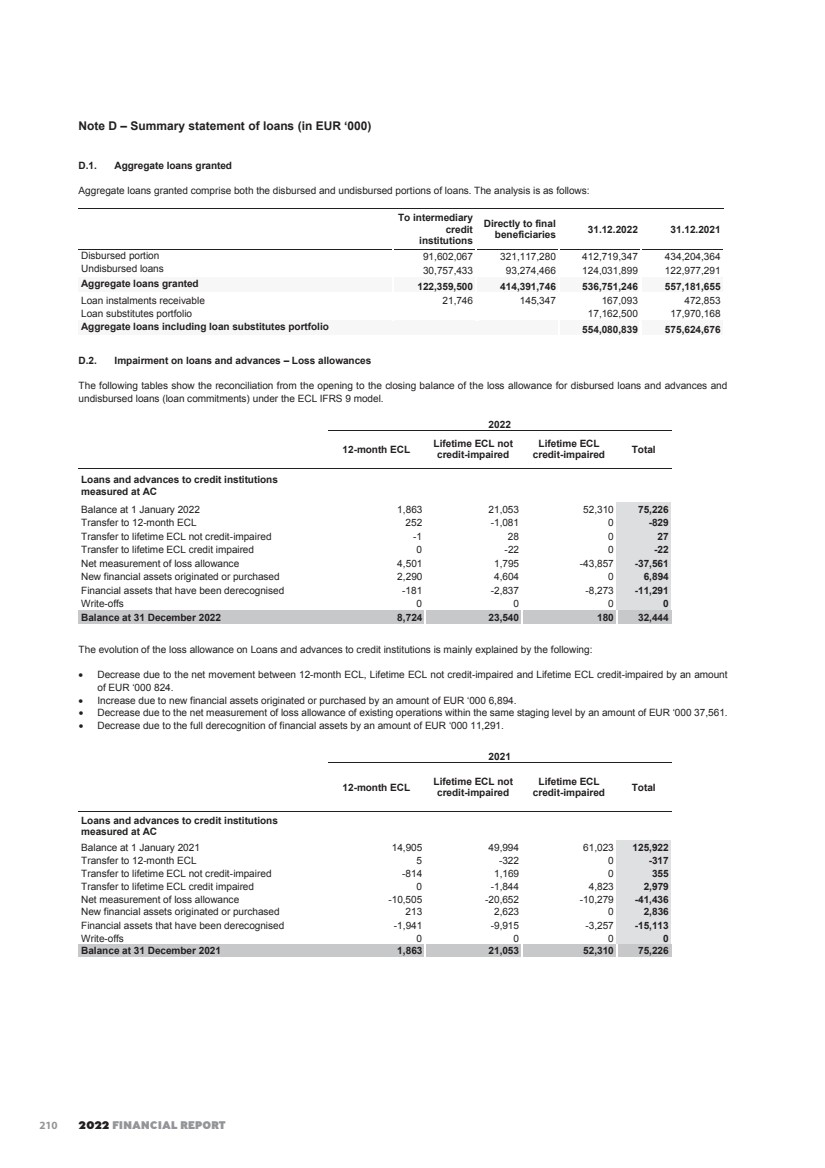
| EIB GROUP CONSOLIDATED FINANCIAL STATEMENTS UNDER IFRS 218 2022 12-month ECL Lifetime ECL not credit-impaired Lifetime ECL credit-impaired Total Loans and advances to customers measured at AC Balance at 1 January 2022 15,286 104,941 168,032 288,259 Transfer to 12-month ECL 793 -14,623 0 -13,830 Transfer to lifetime ECL not credit-impaired -3,381 37,092 -1,991 31,720 Transfer to lifetime ECL credit impaired -489 -4,594 2,190 -2,893 Net measurement of loss allowance 9,548 -213 -62,893(1) -53,558 New financial assets originated or purchased 6,462 19,554 25,556 51,572 Financial assets that have been derecognised -712 -1,847 -2,772 -5,331 Write-offs 0 0 0 0 Balance at 31 December 2022 27,507 140,310 128,122 295,939 (1) There is nil amount related to the use of ECL due to derecognition of the corresponding asset following its modification as there were none in 2022. Moreover no assets were derecognised and subsequently reinstated in 2022. The evolution of the loss allowance on Loans and advances to customers is mainly explained by the following: • Increase due to the net movement between 12-month ECL, Lifetime ECL not credit-impaired and Lifetime ECL credit-impaired by an amount of EUR ‘000 14,997. • Increase due to new financial assets originated or purchased by an amount of EUR ‘000 51,572. • Decrease due to the full derecognition of financial assets by an amount of EUR ‘000 5,331. • Decrease due to the net measurement of loss allowance of existing operations within the same staging level by an amount of EUR ‘000 53,558. 2021 12-month ECL Lifetime ECL not credit-impaired Lifetime ECL credit-impaired Total Loans and advances to customers measured at AC Balance at 1 January 2021 57,747 176,796 247,637 482,180 Transfer to 12-month ECL 302 -15,129 0 -14,827 Transfer to lifetime ECL not credit-impaired -4,342 13,872 0 9,530 Transfer to lifetime ECL credit impaired -16 -132 390 242 Net measurement of loss allowance -37,566 -61,446 -52,717(1) -151,729 New financial assets originated or purchased 1,955 4,841 0 6,796 Financial assets that have been derecognised -2,794 -13,861 -24,834 -41,489 Write-offs 0 0 -2,444 -2,444 Balance at 31 December 2021 15,286 104,941 168,032 288,259 (1) This amount includes EUR '000 21,217 related to the use of ECL due to derecognition of the corresponding asset following its modification. Moreover an amount of EUR '000 43,739, corresponding to assets which were derecognised in 2020, has been reinstated during 2021. No ECL amount was deemed necessary for those reinstated assets. 2022 12-month ECL Lifetime ECL not credit-impaired Lifetime ECL credit-impaired Total Loan commitments measured at AC Balance at 1 January 2022 3,466 26,519 3,101 33,086 Transfer to 12-month ECL 349 -7,936 0 -7,587 Transfer to lifetime ECL not credit-impaired -41 12,488 -3,101 9,346 Transfer to lifetime ECL credit impaired -369 -5 250 -124 Net measurement of loss allowance 2,150 -8,641 25 -6,466 New financial assets originated or purchased 8,541 6,642 0 15,183 Financial assets that have been derecognised -1,276 -2,957 0 -4,233 Write-offs 0 0 0 0 Balance at 31 December 2022 12,820 26,110 275 39,205 211 |
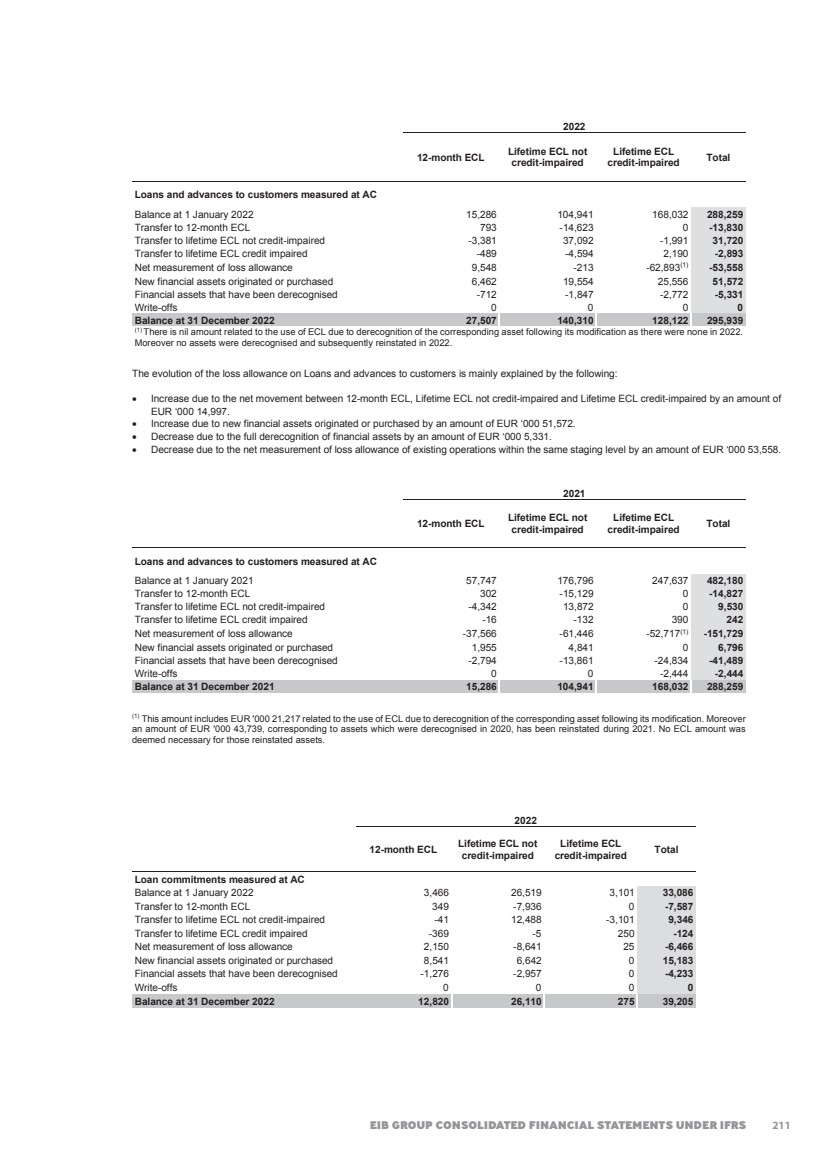
| 2022 FINANCIAL REPORT 219 The evolution of the loss allowance on Loan commitments is mainly explained by the following: • Increase due to the net movement between 12-month ECL, Lifetime ECL not credit-impaired and Lifetime ECL credit-impaired by an amount of EUR ‘000 1,635. • Increase due to new financial assets originated or purchased by an amount of EUR ‘000 15,183. • Decrease due to the full derecognition of financial assets by an amount of EUR ‘000 4,233. • Decrease due to the net measurement of loss allowance of existing operations within the same staging level by an amount of EUR ‘000 6,466. 2021 12-month ECL Lifetime ECL not credit-impaired Lifetime ECL credit-impaired Total Loan commitments measured at AC Balance at 1 January 2021 9,655 37,518 3,101 50,274 Transfer to 12-month ECL 15 -1,253 0 -1,238 Transfer to lifetime ECL not credit-impaired -781 1,443 0 662 Transfer to lifetime ECL credit impaired -14 0 0 -14 Net measurement of loss allowance -3,725 -17,821 0 -21,546 New financial assets originated or purchased 2,051 10,692 0 12,743 Financial assets that have been derecognised -3,735 -4,060 0 -7,795 Write-offs 0 0 0 0 Balance at 31 December 2021 3,466 26,519 3,101 33,086 D.3. Geographical breakdown of lending by country in which projects are located Loans for projects within the European Union: Countries and territories in which projects are located Aggregate loans granted Disbursed portion Undisbursed portion % of total 2022 % of total 2021 Spain 74,168,087 64,659,256 9,508,831 13.39% 13.93% France 66,984,192 51,284,032 15,700,160 12.10% 11.31% Italy 62,973,303 49,451,994 13,521,309 11.37% 11.43% Germany 45,131,464 35,668,150 9,463,314 8.15% 7.88% Poland 44,559,127 35,640,608 8,918,519 8.04% 7.78% Greece 19,185,753 14,262,452 4,923,301 3.46% 3.72% Netherlands 16,405,099 12,997,901 3,407,198 2.96% 3.05% Belgium 16,225,648 11,737,509 4,488,139 2.93% 2.78% Austria 15,203,898 13,571,017 1,632,881 2.74% 2.80% Portugal 13,435,636 10,824,100 2,611,536 2.43% 2.38% Sweden 11,896,160 8,435,912 3,460,248 2.15% 2.14% Finland 10,716,860 8,924,544 1,792,316 1.93% 1.90% Hungary 9,526,551 7,416,218 2,110,333 1.72% 1.75% Czech Republic 7,794,653 4,874,764 2,919,889 1.41% 1.20% Ireland 7,694,439 5,881,826 1,812,613 1.39% 1.34% Romania 7,031,275 4,011,384 3,019,891 1.27% 1.18% Slovakia 4,276,299 3,655,112 621,187 0.77% 0.86% Denmark 3,827,043 2,989,102 837,941 0.69% 0.62% Croatia 3,492,330 2,917,576 574,754 0.63% 0.69% Cyprus 2,631,587 1,918,643 712,944 0.48% 0.48% Slovenia 2,571,006 2,099,780 471,226 0.46% 0.51% Lithuania 2,548,651 2,349,674 198,977 0.46% 0.48% Bulgaria 2,305,773 1,828,476 477,297 0.42% 0.40% Estonia 1,522,274 995,074 527,200 0.27% 0.28% Latvia 987,166 590,419 396,747 0.18% 0.22% Luxembourg 843,307 133,462 709,845 0.15% 0.12% Malta 409,141 254,944 154,197 0.07% 0.07% Sub-total 454,346,722 359,373,929 94,972,793 82.02% 81.30% 212 |
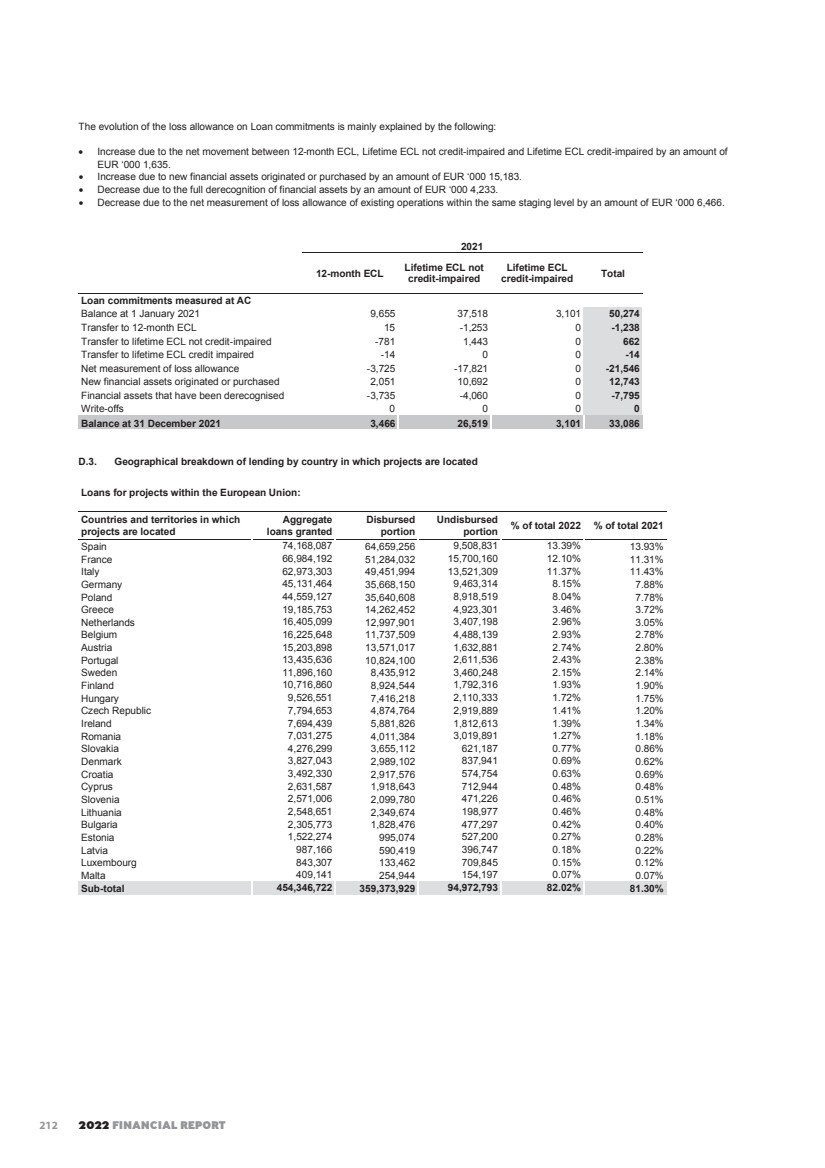
| EIB GROUP CONSOLIDATED FINANCIAL STATEMENTS UNDER IFRS 220 Loans for projects outside the European Union: Countries and territories in which projects are located Aggregate loans granted Disbursed portion Undisbursed portion % of total 2022 % of total 2021 United Kingdom 29,762,447 29,519,479 242,968 5.37% 6.85% Candidate countries(**) (***) 22,607,433 16,324,611 6,282,822 4.08% 2.62% Mediterranean countries 19,907,931 11,530,886 8,377,045 3.60% 3.42% Asia 8,908,021 4,091,750 4,816,271 1.61% 1.43% ACP States 7,238,381 2,354,811 4,883,570 1.31% 1.05% Latin America 6,208,045 3,467,342 2,740,703 1.12% 0.84% Russia, Eastern Europe, Southern Caucasus(**) (****) 2,439,654 1,346,160 1,093,494 0.44% 1.66% EFTA 1,564,381 1,393,781 170,600 0.28% 0.32% South Africa 592,257 370,257 222,000 0.11% 0.10% Potential candidate countries(**) 232,856 32,856 200,000 0.04% 0.39% OCT 105,618 75,985 29,633 0.02% 0.02% Sub-total 99,567,024 70,507,918 29,059,106 17.98% 18.70% Total 2022(*) 553,913,746 429,881,847 124,031,899 100.00% Total 2021(*) 575,151,823 452,174,532 122,977,291 100.00% (*) Aggregate loans including loan substitutes and excluding loan instalments receivables (2022: EUR 167 million, 2021: EUR 473 million). (**) Bosnia and Herzegovina, Republic of Moldova and Ukraine fall under the “Candidate countries” caption. Comparative figures in the column “% of total 2021” are reflecting the composition of each country cluster relevant for the year of presentation. (***) The total disbursed exposure for Ukraine amounts to EUR 3,088 million in 2022 (2021: EUR 1,574 million). Of this amount, EUR 2,855 million (2021: EUR 1,304 million) is covered by the Comprehensive Guarantee of the European Union under the External Lending Mandate. Of the remainder of EUR 233 million at own risk, EUR 216 million is covered by the EU Political Risk Guarantee under the EU External Lending Mandate. A further EUR 2,939 million has been committed in signed operations not yet disbursed. Of this amount, EUR 2,714 million is covered by the Comprehensive Guarantee of the European Union under the External Lending Mandate. Of the remainder of EUR 225 million at own risk, EUR 190 million is covered by the EU Political Risk Guarantee under the EU External Lending Mandate. (****) The total disbursed exposure for Belarus amounts to EUR 45 million (2021: EUR 173 million). Of this amount, EUR 36 million is secured by the Comprehensive Guarantee of the European Union under the External Lending Mandate and EUR 9 million is covered by the EU Political Risk Guarantee under the EU External Lending Mandate. A further EUR 360 million has been committed in signed operations not yet disbursed, of which only EUR 10 million is expected to be at the EIB’s own risk, but covered by the EU Political Risk Guarantee under the EU External Lending Mandate. The EIB’s total disbursed exposure to borrowers in the Russian Federation amounts to EUR 14 million (2021: EUR 16 million) with no exposure at the EIB’s own risk; it is recalled that The EIB continues to follow applicable EU policy guidelines in the country. 213 |
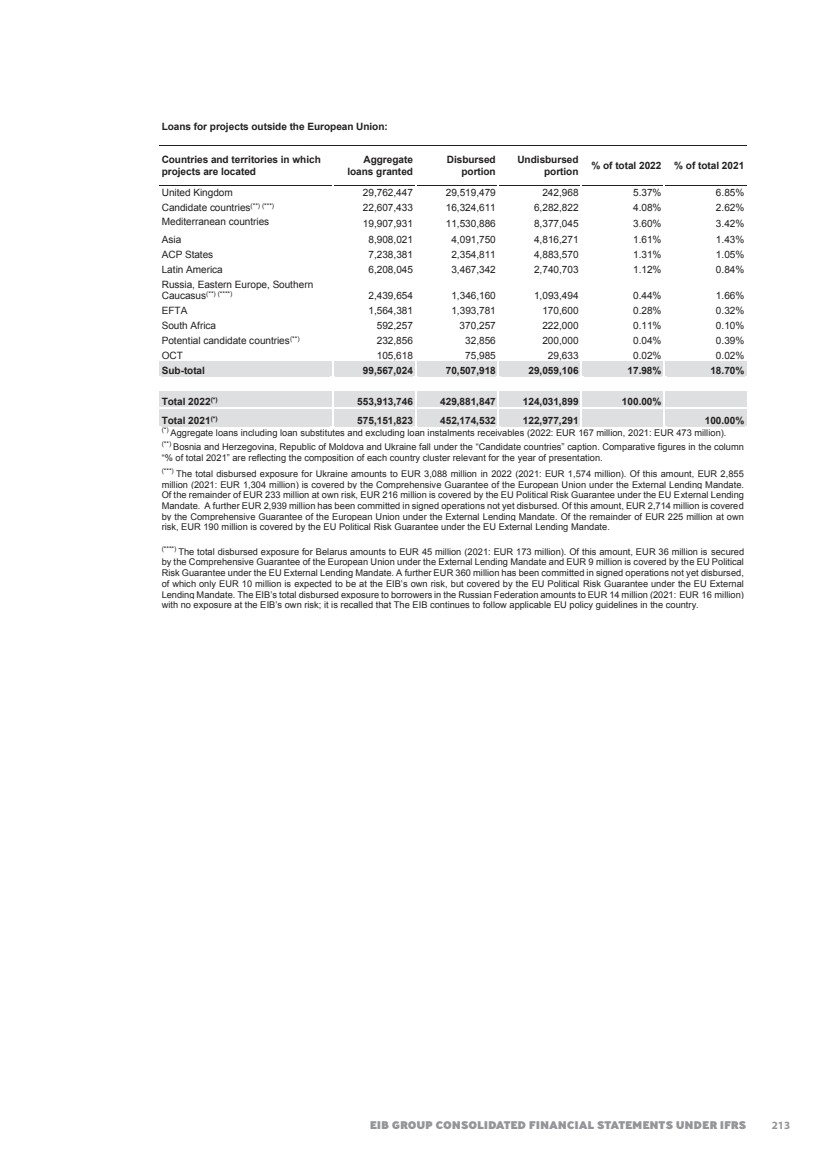
| 2022 FINANCIAL REPORT 221 D.4. Movement in guarantee operations The following table shows the reconciliation from the opening to the closing balance of the financial guarantees. Comparative amounts for 2021 are disclosed below. 2022 Other liabilities Provisions 12-month ECL Lifetime ECL not credit-impaired Lifetime ECL credit-impaired Total Financial Guarantees Balance at 1 January 29,675 203 9,451 39,329 Transfer to 12-month ECL 0 0 0 0 Transfer to lifetime ECL not credit-impaired 0 0 0 0 Transfer to lifetime ECL credit impaired 0 -22 0 -22 Net remeasurement 41,426 -20 58 41,464 Use of provision 0 0 0 0 New guarantees originated or purchased 19,731 0 0 19,731 Guarantees that have been derecognised -2,243 -27 -177 -2,447 Balance at 31 December 88,589 134 9,332 98,055 2021 Other liabilities Provisions 12-month ECL Lifetime ECL not credit-impaired Lifetime ECL credit-impaired Total Financial Guarantees Balance at 1 January 11,680 149 10,810 22,639 Transfer to 12-month ECL 0 -87 0 -87 Transfer to lifetime ECL not credit-impaired -1 42 0 41 Transfer to lifetime ECL credit impaired 0 0 0 0 Net remeasurement 18,915 98 -1,295 17,718 Use of provision 0 0 -63 -63 New guarantees originated or purchased 1,340 1 0 1,341 Guarantees that have been derecognised -2,259 0 -1 -2,260 Balance at 31 December 29,675 203 9,451 39,329 214 |
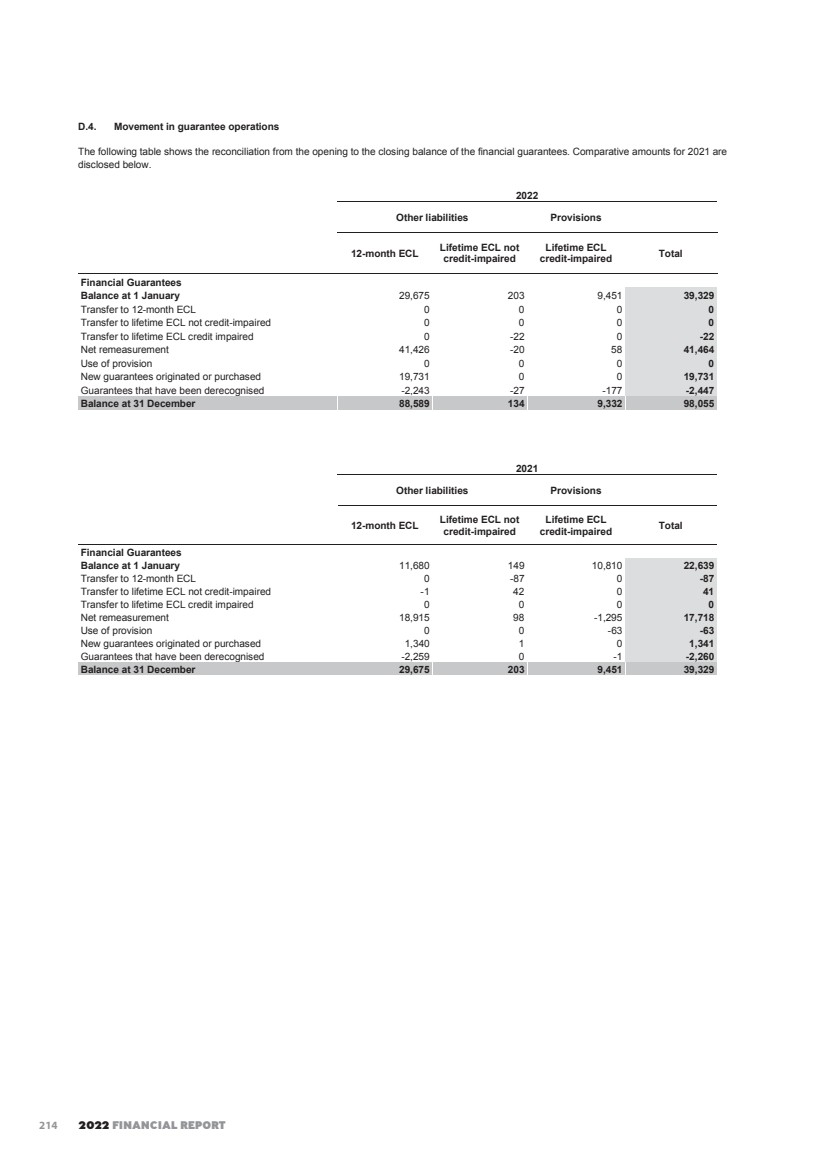
| EIB GROUP CONSOLIDATED FINANCIAL STATEMENTS UNDER IFRS 222 Note E – Property, furniture, equipment and intangible assets (in EUR ‘000) Land Luxembourg buildings(1) Furniture and equipment Right-of-use assets(2) Total property, furniture and equipment Total intangible assets Cost at 1 January 2022 20,145 410,649 71,411 250,451 752,656 79,620 Additions 0 11,385 28,192 21,501 61,078 41,455 Disposals 0 0 -26,152 -12,238 -38,390 -18,148 At 31 December 2022 20,145 422,034 73,451 259,714 775,344 102,927 Accumulated depreciation/amortisation: At 1 January 2022 0 -216,134 -43,384 -118,818 -378,336 -21,212 Depreciation/amortisation 0 -9,792 -22,975 -43,593 -76,360 -29,696 Disposals 0 0 26,152 -2,209 23,943 18,148 At 31 December 2022 0 -225,926 -40,207 -164,620 -430,753 -32,760 Carrying amount: At 31 December 2022 20,145 196,108 33,244 95,094 344,591 70,167 At 31 December 2021 20,145 194,515 28,027 131,633 374,320 58,408 (1) All land and buildings are used by the Group for its own activities. For subsequent measurement purposes the Group uses the “cost model” under IAS 16. The Luxembourg buildings category includes cost relating to the construction of a new building for an amount of EUR ’000 79,305 (2021: EUR ’000 67,920), which is expected to be completed in 2025. (2) Right-of-use assets - is composed of the two classes of assets: real estate (both commercial and residential properties) and cars. The depreciation charge during 2022 for the real estate was EUR ’000 43,388 (2021: EUR ’000 41,174) and for the cars was EUR ’000 205 (2021: EUR ’000 189). The carrying amount as at 31 December 2022 was EUR ’000 94,874 for the real estate (2021: EUR ’000 131,474) and for the cars was EUR ’000 220 (2021: EUR ’000 159). Note F – Deferred income (in EUR ‘000) 31.12.2022 31.12.2021 Prepaid and deferred management fees 291,046 290,656 Interest subsidies received in advance 128,426 92,233 Deferred income on loans and guarantees 53,494 51,768 Other 6,373 8,476 Total 479,339 443,133 215 |
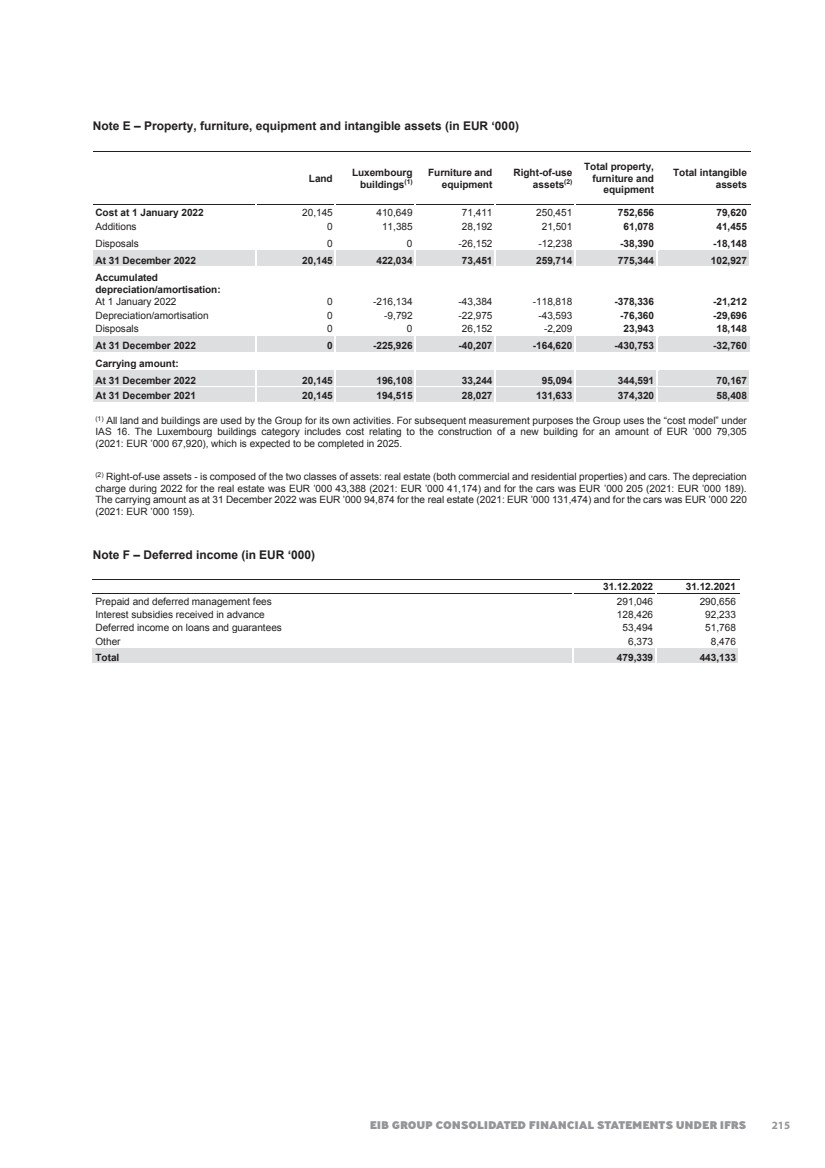
| 2022 FINANCIAL REPORT 223 Note G – Other assets and other liabilities (in EUR ‘000) G.1. Other assets 31.12.2022 31.12.2021 Accounts receivable and sundry debtors 72,654 81,480 EGF management fee receivable 56,041 26,440 Guarantee call receivable 55,811 12,831 Net assets from financial guarantee contracts 34,304 57,062 Advances on salaries and allowances 2,264 2,985 Other 2,293 3,086 Total 223,367 183,884 G.2. Other liabilities 31.12.2022 31.12.2021 Capital repayable to the UK(*) 2,595,904 2,895,904 Optional Supplementary Provident Scheme 848,289 792,891 Commitment to purchase EIF non-controlling interest(**) 419,763 340,341 First Loss Piece Contribution 233,227 202,171 Accounts payable and sundry creditors 113,952 95,935 Personnel costs payable 103,478 104,190 Lease Liability 97,022 132,151 Net liabilities from financial guarantee contracts (Note D.4.) 88,723 29,878 Payable amounts under mandates 49,482 44,856 Payable on HIPC initiative(***) 13,596 13,596 Western Balkans infrastructure fund 97 393 Other 476,587 329,357 Total 5,040,120 4,981,663 (*) In accordance with the Article 150(4) of the Agreement on the withdrawal of the United Kingdom of Great Britain and Northern Ireland from the European Union and the European Atomic Energy Community, and as amended by COUNCIL DECISION (EU) 2020/769 of 10 June 2020, the EIB will repay to the UK EUR 3.5bn of called capital in twelve annual instalments starting with 15 October 2020 (the first eleven instalments will be EUR 300,000,000 each and the final one will be EUR 195,903,950). The annual instalments due from 2020 until 2022 have been fully settled (last settlement 14 October 2022). (**) As at 31 December 2022, the portion of EIF non-controlling interest on the consolidated other liabilities amounts to EUR 420 million (2021: EUR 340 million) and on the consolidated result (Note L) amounts to EUR -9 million (2021: EUR -59 million). (***) Heavily Indebted Poor Countries (‘HIPC’) initiative. 216 |
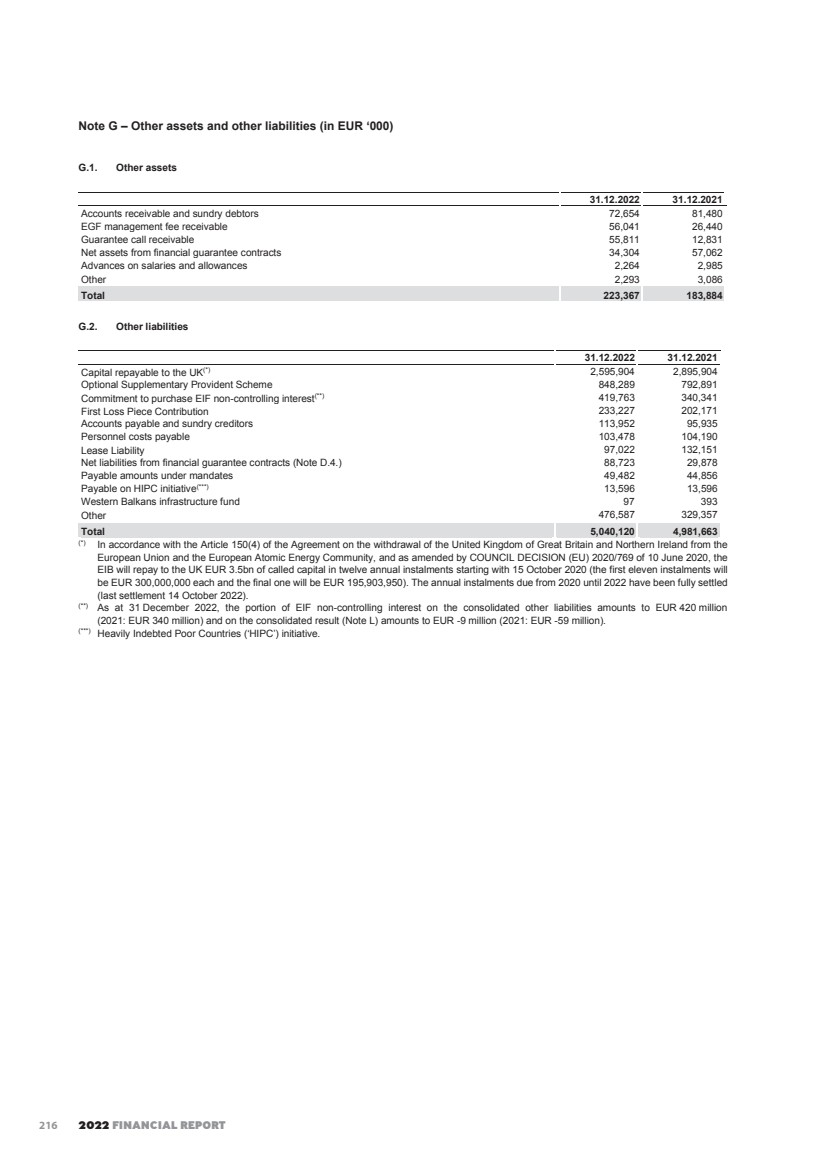
| EIB GROUP CONSOLIDATED FINANCIAL STATEMENTS UNDER IFRS 224 Note H – Amounts owed to credit institutions and customers (in EUR ‘000) H.1. Amounts owed to credit institutions 31.12.2022 31.12.2021 Repayable on demand 2,371,014 4,775,575 - Overnight deposits 2,371,014 4,775,575 With agreed maturity or periods of notice 3,071,698 18,796,352 - Short-term deposits 6,005 178,404 - Repo with credit institutions 3,065,693 5,711,476 - Borrowings from central banks(1) 0 12,906,472 Total 5,442,712 23,571,927 (1) This amount represents the Bank’s participation in monetary operations with the ECB. H.2. Amounts owed to customers 31.12.2022 31.12.2021 Repayable on demand 1,433,117 1,645,154 - Overnight deposits 46 163 - European Union and Member States' accounts: - For Special Section operations and related unsettled amounts 395,981 412,934 - Deposit accounts 1,037,090 1,232,057 With agreed maturity or periods of notice 57,637 175,496 - Short-term deposits 57,637 175,496 Total 1,490,754 1,820,650 Note I – Debts evidenced by certificates (in EUR ‘000) In its financing activity, one of the Group’s objectives is to align its funding strategy with the funds required for the loans granted. The caption “Debts evidenced by certificates” includes “Debt securities in issue” (securities offered to the general investing public) and “Others” (private placements). The table below discloses the details of debts outstanding as at 31 December 2022 and 31 December 2021 per currency, together with the average rates and due dates (earliest/latest). Debts evidenced by certificates (in EUR '000) Payable in Nominal at 31.12.2022 Average rate 2022(*) Due dates 2022 Nominal at 31.12.2021 Average rate 2021(*) EUR 251,275,921 1.29 2023/2061 246,913,410 1.30 USD 100,421,872 2.11 2023/2058 105,073,224 1.48 GBP 37,274,935 2.97 2023/2054 43,705,819 2.15 AUD 10,025,515 2.32 2023/2040 9,703,908 2.59 PLN 6,868,484 4.05 2023/2037 6,169,375 2.23 CAD 5,325,718 2.15 2023/2045 4,765,848 2.10 SEK 5,094,499 1.58 2023/2040 6,234,940 1.41 NOK 4,118,397 2.64 2023/2037 5,541,206 1.77 CHF 3,918,655 1.96 2023/2036 4,179,005 1.90 ZAR 2,138,328 8.00 2023/2035 2,331,323 7.75 JPY 1,374,409 2.27 2023/2053 1,520,384 1.46 MXN 1,219,817 6.00 2023/2028 1,174,850 6.35 DKK 783,185 0.87 2024/2031 783,195 0.70 NZD 550,661 3.21 2023/2028 271,428 2.57 CNY 499,851 2.82 2023/2026 472,292 2.56 CZK 362,397 4.18 2023/2034 339,828 2.52 TRY 248,852 10.59 2023/2027 677,022 10.41 RUB 85,960 3.89 2024/2026 140,679 4.75 HUF 53,134 9.06 2024/2025 17,065 3.25 HKD 36,074 0.53 2025/2025 79,246 0.41 RON 20,810 2.23 2026/2026 20,812 2.23 Total 431,697,474 440,114,859 Outstanding at 31.12.2022 Outstanding at 31.12.2021 Total nominal value(**) 431,697,474 440,114,859 IFRS adjustments on borrowings -14,279,512 33,787,774 Total debts evidenced by certificates 417,417,962 473,902,633 (*) Weighted average interest rates at the balance sheet date. (**) The nominal value of debts evidenced by certificates held for hedge accounting purposes amounts to EUR 322.8 billion (2021: EUR 324.4 billion), the nominal value of debts evidenced by certificates held at fair value through profit or loss to EUR 23.0 billion (2021: EUR 27.6 billion), and the nominal value of debts evidenced by certificates held at amortised cost amounts to EUR 85.9 billion as at 31 December 2022 (2021: EUR 88.1 billion). 217 |
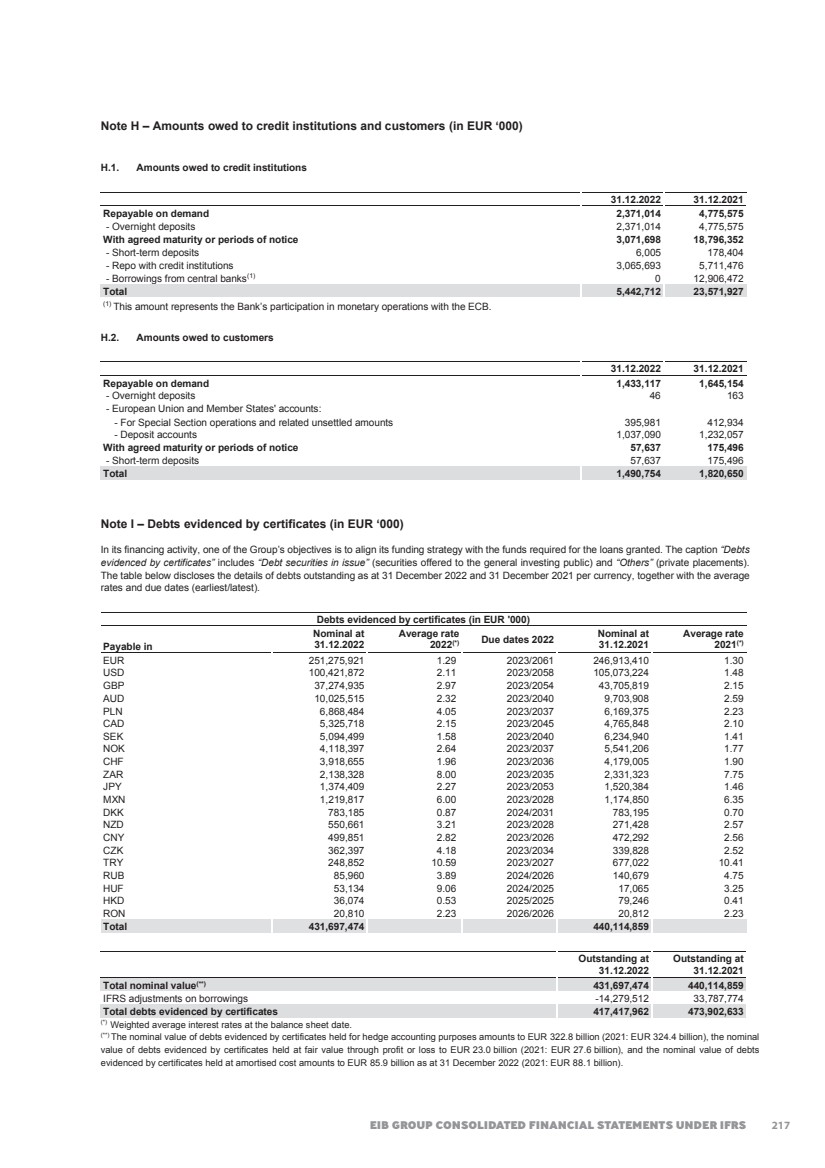
| 2022 FINANCIAL REPORT 225 Note J – Pension plans and health insurance scheme (in EUR ’000) The Group operates three defined-benefit pension plans. The Group also provides certain post-employment healthcare benefits to former employees of the EIB. These benefits are unfunded as defined by IAS19 and the plan is not regulated. The cost of providing benefits under the plans is determined separately for each plan using the projected unit credit actuarial valuation method. Actuarial valuation took place at 31 December 2022. The plans typically expose the Group to actuarial risks such as interest risk, longevity risk, inflation risk and salary risk. An additional risk is associated with the payment to the dependants of plan members (widow and orphan benefits). Interest risk The present value of the defined-benefit liability is calculated using a discount rate determined by reference to high quality corporate bond yields. A decrease in the bond interest rate will increase the pension liability. Longevity risk The present value of the defined-benefit plan liability is calculated by reference to the best estimate of the mortality of the plan participants both during and after their employment. An increase in the life expectancy of the plan participants will increase the plan’s liability. Inflation risk The present value of the defined benefit plan liability is calculated by reference to the future pension increases, which are linked to Luxembourg inflation. An increase in Luxembourg inflation will increase the plan’s liability. Salary risk The present value of the defined-benefit plan liability is calculated by reference to the future salaries of plan participants. An increase in the salary of the plan participants will increase the plan’s liability. An additional plan is not included in the figures below: the Optional Supplementary Provident Scheme (a defined-contribution pension scheme). The corresponding amount of EUR 848 million (2021: EUR 793 million) is classified under “Other liabilities” (Note G). The developments in the current economic environment, notably the increase in the interest rates and inflation, had an impact on the assumptions used in the calculation of the defined benefit obligation. The principal assumptions used in determining pension and post-employment benefit obligations for the Group’s plans are shown below: in % 2022 2021 Discount rate for pension plans 3.88 1.35 Discount rate for health insurance plan 3.88 1.35 Future salary increase (including inflation) 3.30(*) 3.50 Future pension increases 2.30 1.75 Healthcare cost increase rate 4.30 3.75 Dependency cost increase rate 2.30 1.75 Average longevity at 60 of a male member (years)(**) 27.10 26.90 Average longevity at 60 of a female member (years)(**) 29.60 29.40 Actuarial tables ICSLT 2018 - Static 2022 ICSLT 2018 - Static 2021 (*) Representative nominal rate reflecting average career progression assumption. (**) The name of the caption has changed in order to reflect better the nature of the amounts disclosed. Sensitivity analysis: Significant actuarial assumptions for the determination of the defined obligation are discount rate, expected salary increase and mortality. The sensitivity analyses below have been determined based on reasonably possible changes of the respective assumptions occurring at the end of the reporting period, while keeping all other assumptions constant. EIB Pension: • If the discount rate is 0.5% higher (lower), the defined benefit obligation would decrease by 9.0% (increase by 10.3%). • If the expected salary growth increases (decreases) by 1%, the defined benefit obligation would increase by 4.9% (decrease by 4.3%). • If the life expectancy increases (decreases) by 1 year for men and women, the defined benefit obligation would increase by 2.9% (decrease by 2.9%). • If the expected future pension increases (decreases) by 1% due to inflation, the defined benefit obligation would increase by 14.4% (decrease by 11.9%). EIF Pension: • If the discount rate is 0.5% higher (lower), the defined benefit obligation would decrease by 11.9% (increase by 14.0%). • If the expected salary growth increases (decreases) by 1%, the defined benefit obligation would increase by 7.8% (decrease by 6.6%). • If the life expectancy increases (decreases) by 1 year for men and women, the defined benefit obligation would increase by 2.6% (decrease by 2.6%). • If the expected future pension increases (decreases) by 1% due to inflation, the defined benefit obligation would increase by 15.1% (decrease by 12.4%). 218 |
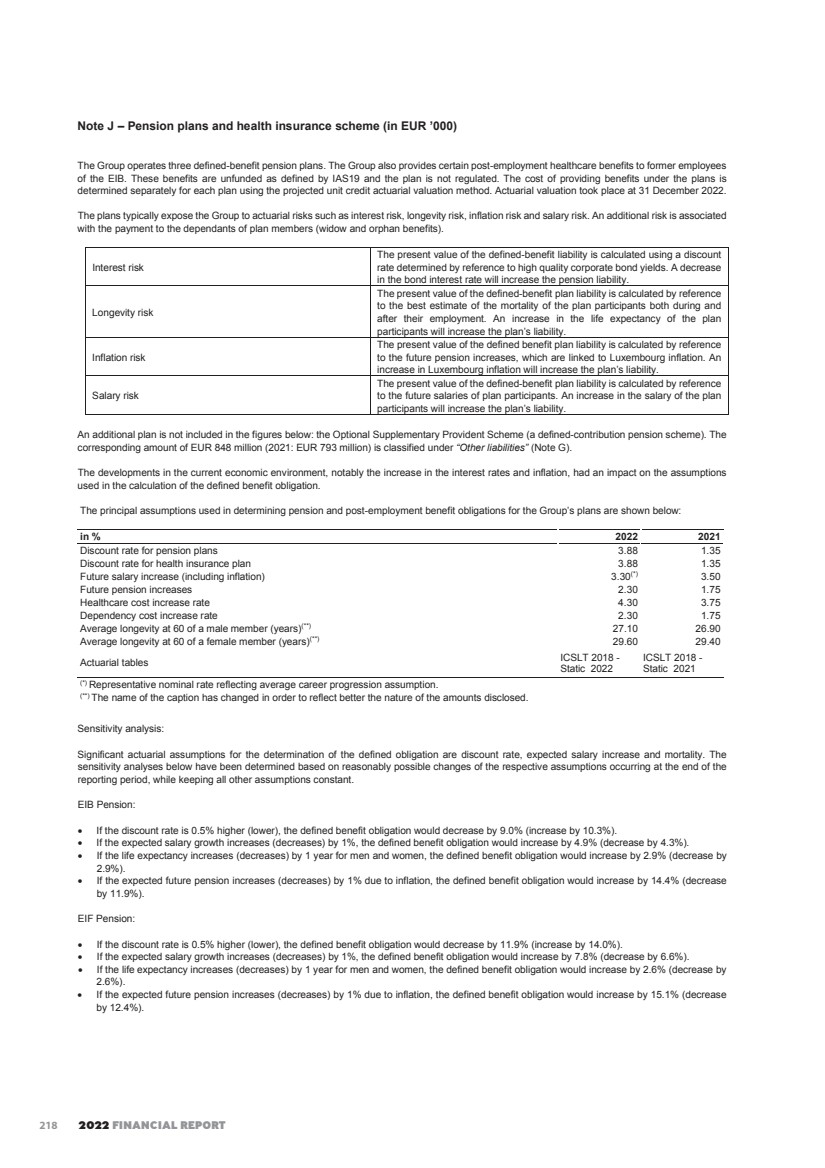
| EIB GROUP CONSOLIDATED FINANCIAL STATEMENTS UNDER IFRS 226 Management Committee Pension: • If the discount rate is 0.5% higher (lower), the defined benefit obligation would decrease by 6.4% (increase by 7.2%). • If the expected salary growth increases (decreases) by 1%, the defined benefit obligation would increase by 0.9% (decrease by 0.8%). • If the life expectancy increases (decreases) by 1 year for men and women, the defined benefit obligation would increase by 3.5% (decrease by 3.4%). • If the expected future pension increases (decreases) by 1% due to inflation, the defined benefit obligation would increase by 12.3% (decrease by 10.4%). Health Insurance for EIB: • If the discount rate is 0.5% higher (lower), the defined benefit obligation would decrease by 11.3% (increase by 13.5%). • If the life expectancy increases (decreases) by 1 year for men and women, the defined benefit obligation would increase by 4.5% (decrease by 4.5%). • If the expected future healthcare cost increases (decreases) by 1% due to inflation, the defined benefit obligation would increase by 32.6% (decrease by 24.0%). Health Insurance for EIF: • If the discount rate is 0.5% higher (lower), the defined benefit obligation would decrease by 14.2% (increase by 17.0%). • If the life expectancy increases (decreases) by 1 year for men and women, the defined benefit obligation would increase by 4.3% (decrease by 4.3%). • If the expected future healthcare cost increases (decreases) by 1% due to inflation, the defined benefit obligation would increase by 42.0% (decrease by 29.7%). The sensitivity analysis presented above may not be representative of the actual change in the defined obligation as it is unlikely that the change in assumptions would occur in isolation of one another as some of the assumptions may be correlated. Furthermore, in presenting the above sensitivity analysis, the present value of the defined benefit obligation has been calculated using the projected unit credit method at the end of the reporting period, which is the same as that applied in calculating the defined benefit obligation liability recognised in the consolidated balance sheet. There was no change in the method and assumptions used in preparing the sensitivity analysis from prior years. The table below shows the actuarial experience (gain)/loss for the different plans and the total defined benefit obligation: EIB Pension Management Committee Pension EIF Pension Health Insurance Total Total defined benefit obligation 2022 209,645 675 16,885 82,842 310,047 5,722,781 2021 -23,091 -1,088 5,063 102,798 83,682 8,623,332 2020 25,397 1,754 19,479 -97,605 -50,975 9,569,495 2019 -3,987 -2,545 1,420 -29,060 -34,172 7,892,289 219 |
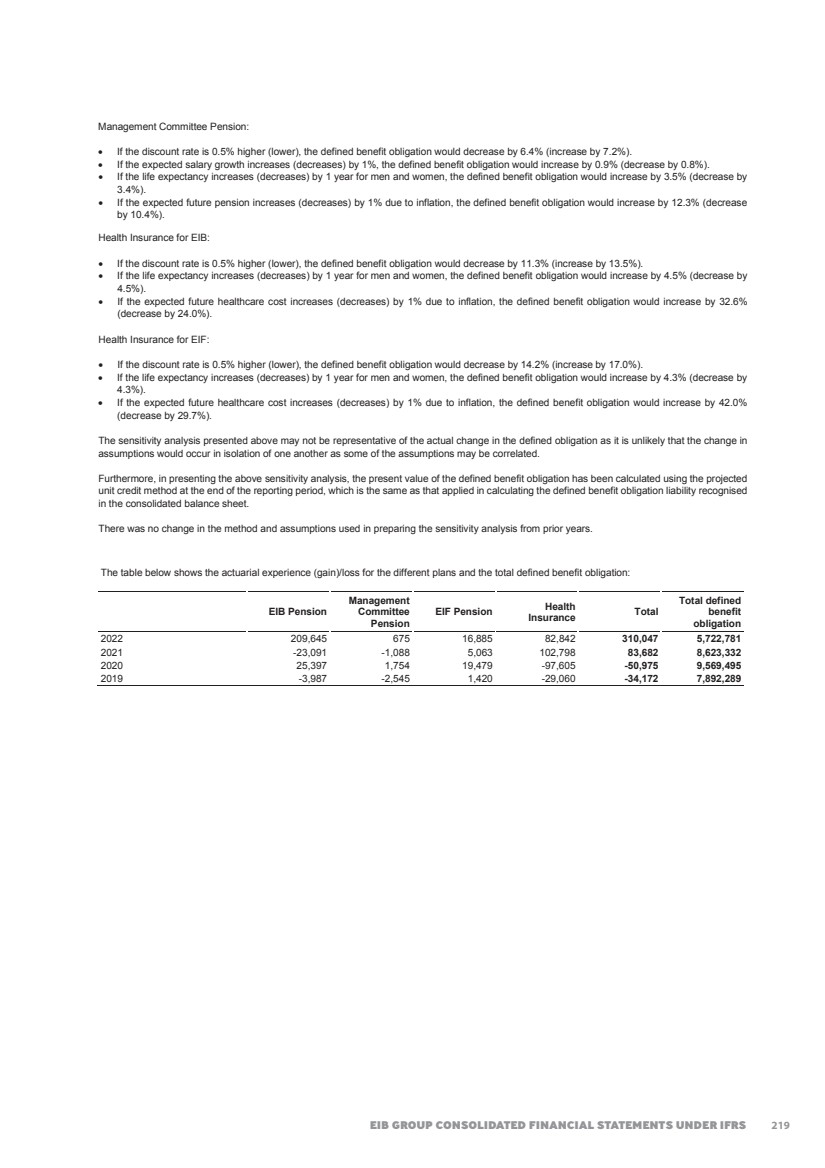
| 2022 FINANCIAL REPORT 227 The tables below show the evolution of the Defined Benefit Obligation during 2022 and 2021 (in EUR ‘000): EIB Pension Management Committee Pension EIF Pension Health Insurance Total 2022 Obligation at the beginning of the year 6,952,029 78,737 598,425 994,141 8,623,332 a) Current service cost 293,459 2,697 40,179 84,116 420,451 b) Interest cost 93,237 1,047 8,075 13,372 115,731 c) Past service cost 3,463 0 0 0 3,463 Total profit or loss 390,159 3,744 48,254 97,488 539,645 a) Experience (gain)/loss 209,645 675 16,885 82,842 310,047 b) Change in demographic assumptions -295,452 356 -44,095 14,168 -325,023 c) Change in financial assumptions -2,591,485 -20,334 -278,218 -490,774 -3,380,811 Total OCI(*) -2,677,292 -19,303 -305,428 -393,764 -3,395,787 a) Employee contributions 47,855 0 6,202 3,124 57,181 b) Benefit payments -91,496 -2,337 -529 -7,228 -101,590 Total Other -43,641 -2,337 5,673 -4,104 -44,409 Benefit obligation as at 31 December 2022 4,621,255 60,841 346,924 693,761 5,722,781 (*) Attributable to the Equity holders of the Bank (EUR '000 3,257,952) and to non-controlling interests (EUR '000 137,835). EIB Pension Management Committee Pension EIF Pension Health Insurance Total 2021 Obligation at the beginning of the year 7,704,597 86,317 711,503 1,067,078 9,569,495 a) Current service cost 340,801 3,132 49,885 104,226 498,044 b) Interest cost 57,461 639 5,331 7,979 71,410 c) Past service cost 2,713 0 70 0 2,783 Total profit or loss 400,975 3,771 55,286 112,205 572,237 a) Experience (gain)/loss -43,103 -1,088 5,063 102,798 63,670 b) Change in demographic assumptions 20,012 418 -55,653 -88,179 -123,402 c) Change in financial assumptions -1,089,024 -8,462 -122,195 -195,570 -1,415,251 Total OCI(*) -1,112,115 -9,132 -172,785 -180,951 -1,474,983 a) Employee contributions 44,723 0 5,803 1,806 52,332 b) Benefit payments -86,151 -2,219 -1,382 -5,997 -95,749 Total Other -41,428 -2,219 4,421 -4,191 -43,417 Benefit obligation as at 31 December 2021 6,952,029 78,737 598,425 994,141 8,623,332 (*) Attributable to the Equity holders of the Bank (EUR '000 1,389,615) and to non-controlling interests (EUR '000 85,365). 220 |
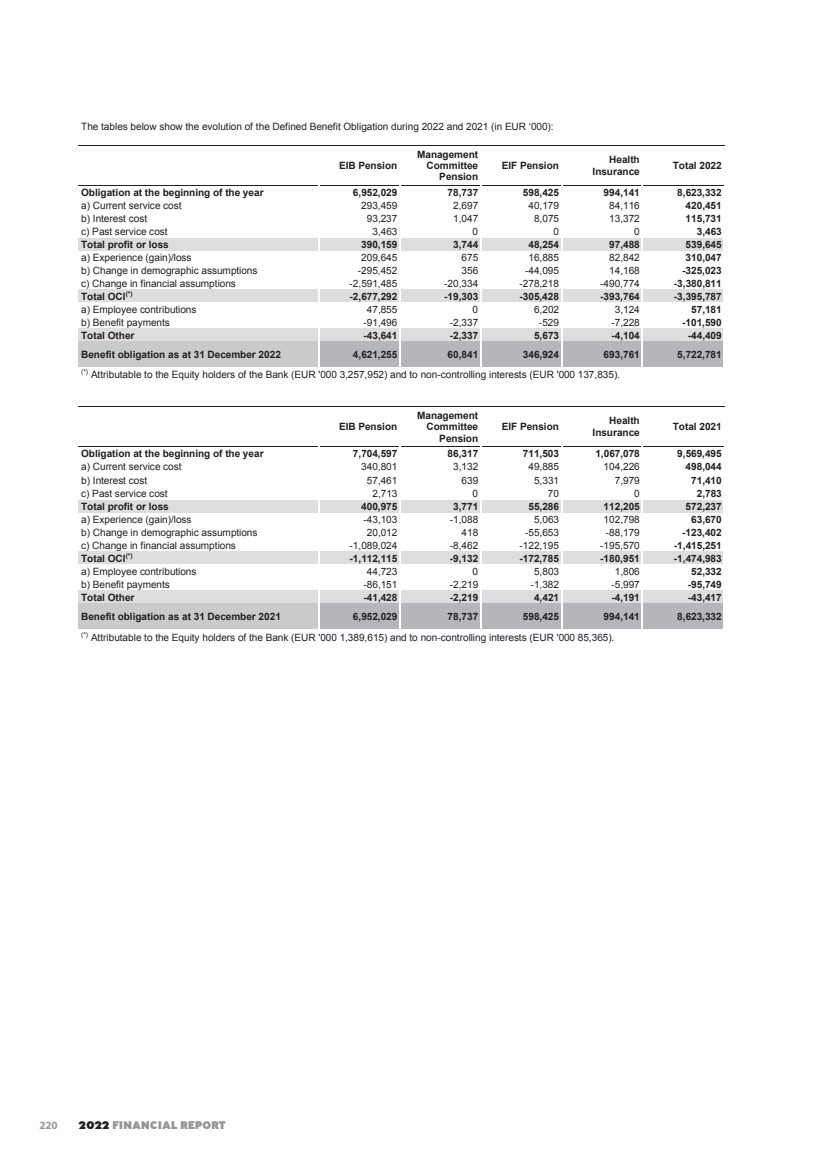
| EIB GROUP CONSOLIDATED FINANCIAL STATEMENTS UNDER IFRS 228 EIB employees pay a fixed contribution reviewed every five years. For the period from 1 January 2019 to 31 December 2023, the employee’s contribution represents 11.3% of their pensionable salary. The residual contribution (including back service payments) is paid by the Group. All contributions of the Group and its staff are invested in the assets of the Group. The funding requirements are based on the local actuarial measurement framework. In this framework the discount rate is set on a risk free rate. Furthermore, premiums are determined on a current salary base. The Group is liable for all pension payments stemming from the defined benefit plan. The average duration of the benefit obligation at 31 December 2022 is split as follows: EIB Pension: • Active members: 24.97 years (2021: 28.88 years) • Deferred members (*): 26.04 years (2021: 29.30 years) • Retired members: 11.94 years (2021: 14.09 years) EIF Pension: • Active members: 27.61 years (2021: 32.85 years) • Deferred members (*): 27.66 years (2021: 31.31 years) • Retired members: 14.78 years (2021: 18.92 years) Management Committee Pension: • Active members: 17.96 years (2021: 21.34 years) • Deferred members (*): 19.57 years (2021: 23.52 years) • Retired members: 10.29 years (2021: 12.29 years) Health Insurance for EIB • Active members: 30.62 years (2021: 33.85 years) • Deferred members (*): 28.60 years (2021: 27.63 years) • Retired members: 15.20 years (2021: 17.63 years) Health Insurance for EIF • Active members: 33.30 years (2021: 36.48 years) • Deferred members (*): 24.82 years (2021: 28.25 years) • Retired members: 17.64 years (2021: 21.98 years) The amount that the Group expects to recognise in the profit or loss relating to the defined benefit plans during the next financial year is EUR ‘000 415,384 (2021: EUR 000 539,123). (*) Staff members who left the Group before the normal retirement age and have a right to a deferred pension. Note K – Result for the financial year The appropriation of the profit of the stand-alone financial statements of the Bank for the year ended 31 December 2022, prepared under EU Accounting Directives, which amounts to EUR ’000 2,366,337 will be submitted to the Board of Governors for approval by 25 April 2023. Please refer to the Overview to the Bank’s Financial Statements for further details on the proposed Bank surplus for the financial year appropriation. 221 |
| 2022 FINANCIAL REPORT 229 Note L – Interest and similar income and Interest expense and similar charges (in EUR ‘000) L.1. Net interest income 2022 2021 Interest and similar income: Derivatives 10,117,070 10,018,309 Loans and advances to credit institutions and customers 7,676,214 5,946,535 Treasury bills and other bills eligible for refinancing with central banks and debt securities including fixed-income securities 356,705 194,580 Negative interest on interest bearing liabilities 135,573 130,677 Interest subsidy from the EU 17,343 17,710 Cash in hand, balances with central banks and post office banks 404 0 Other 5,951 4,449 Total 18,309,260 16,312,260 Interest expense and similar charges: Debts evidenced by certificates -7,571,687 -7,051,168 Derivatives -7,569,661 -5,592,829 Negative interest on interest bearing assets -252,807 -411,488 Interest cost on benefit obligation (Note J) -115,731 -71,410 Interest on third party mandates -67,998 -62,686 Amounts owed to credit institutions and customers -12,973 -1,943 Commitment to purchase EIF non-controlling interest (Note G.2) -8,613 -58,690 Other (1) -23,877 -22,368 Total -15,623,347 -13,272,582 Net interest income 2,685,913 3,039,678 (1) Includes the interest expense on lease liability amounted to EUR '000 1,061 (2021: EUR '000 265). The table below sets out the net interest income relating to each class of financial assets and liabilities: 2022 2021 Interest and similar income: Derivatives held for risk management 10,117,070 10,018,309 Financial assets measured at AC 7,137,966 5,493,411 Financial instruments designated at FVTPL (FVO) (*) 706,330 529,283 Financial instruments mandatorily at FVTPL (*) 206,371 136,132 Other 141,523 135,125 Total 18,309,260 16,312,260 Interest expense and similar charges: Financial liabilities measured at AC -6,922,894 -7,008,910 Derivatives held for risk management -7,569,661 -5,592,829 Financial instruments designated at FVTPL (FVO) (*) -668,583 -44,217 Non-financial liabilities (*) -125,521 -96,626 Other (*) -336,688 -530,000 Total -15,623,347 -13,272,582 Net interest income 2,685,913 3,039,678 (*) A reclassification was made in order to improve the readability of financial statements. 222 |
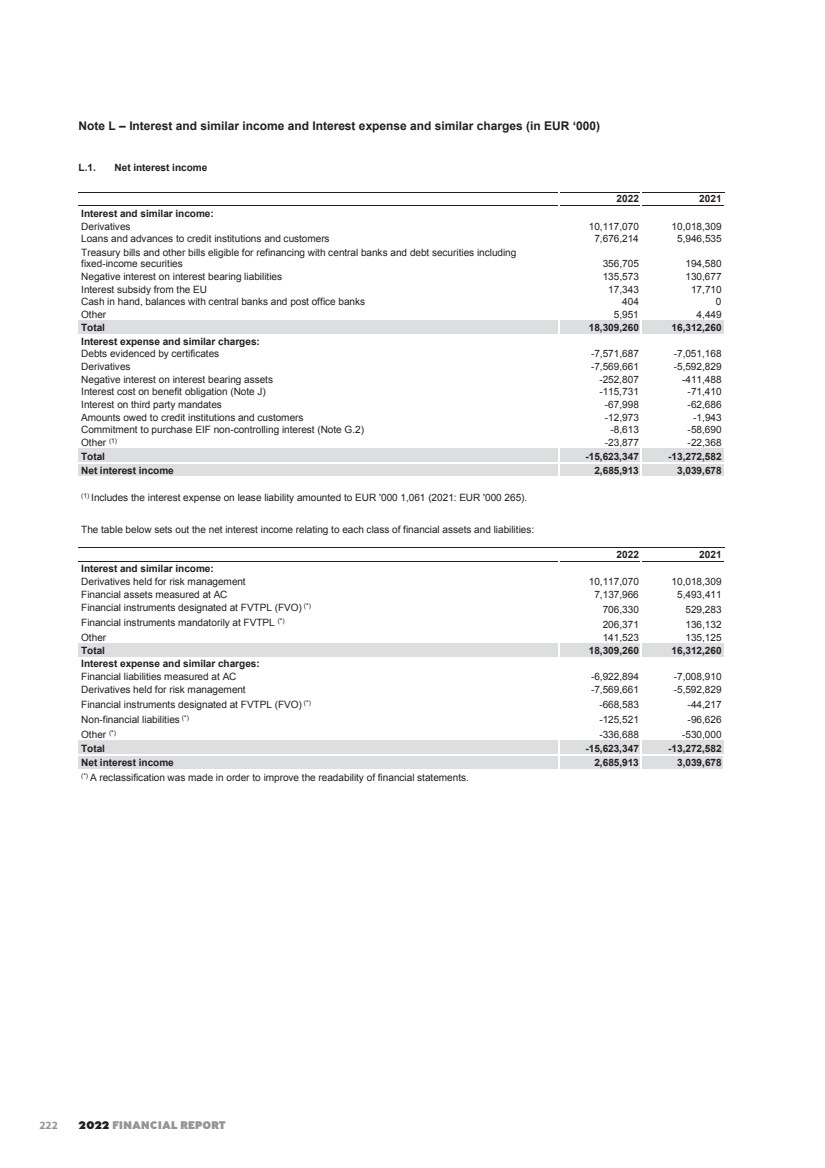
| EIB GROUP CONSOLIDATED FINANCIAL STATEMENTS UNDER IFRS 230 L.2. Geographical analysis of Interest and similar income 2022 2021 EU countries: Poland 838,559 485,490 Spain 819,306 759,149 France 576,154 448,268 Italy 524,484 424,708 Greece 426,007 449,134 Germany 366,816 296,424 Austria 274,322 255,563 Hungary 233,410 130,417 Netherlands 189,108 159,001 Belgium 172,277 150,811 Sweden 159,804 124,908 Portugal 137,699 144,992 Czech Republic 114,166 31,007 Ireland 92,692 87,233 Romania 80,365 69,827 Finland 71,792 66,438 Slovakia 70,277 66,445 Croatia 49,791 48,123 Slovenia 40,042 39,729 Bulgaria 38,055 38,922 Denmark 31,281 18,151 Lithuania 17,466 18,174 Latvia 16,023 14,475 Cyprus 15,833 9,356 Malta 8,091 9,199 Estonia 7,052 4,173 Luxembourg 2,409 19,964 Total EU countries 5,373,281 4,370,081 Outside the European Union 2,045,813 1,584,135 Total income analysed per country 7,419,094 5,954,216 Income not analysed per country(1) 10,890,166 10,358,044 Total interest and similar income 18,309,260 16,312,260 (1) Income not analysed per country: · Revenue from Long-Term HQLA Portfolio and loan substitutes portfolio 252,310 147,141 · Revenue from Securities Liquidity portfolio and EIF Operational portfolio 43,368 36,322 · Revenue from money-market securities 61,022 11,104 · Revenue from other securities 5 13 · Revenue from money-market operations 410,440 140,706 · Income from derivatives 10,117,070 10,018,309 · Other 5,951 4,449 10,890,166 10,358,044 223 |
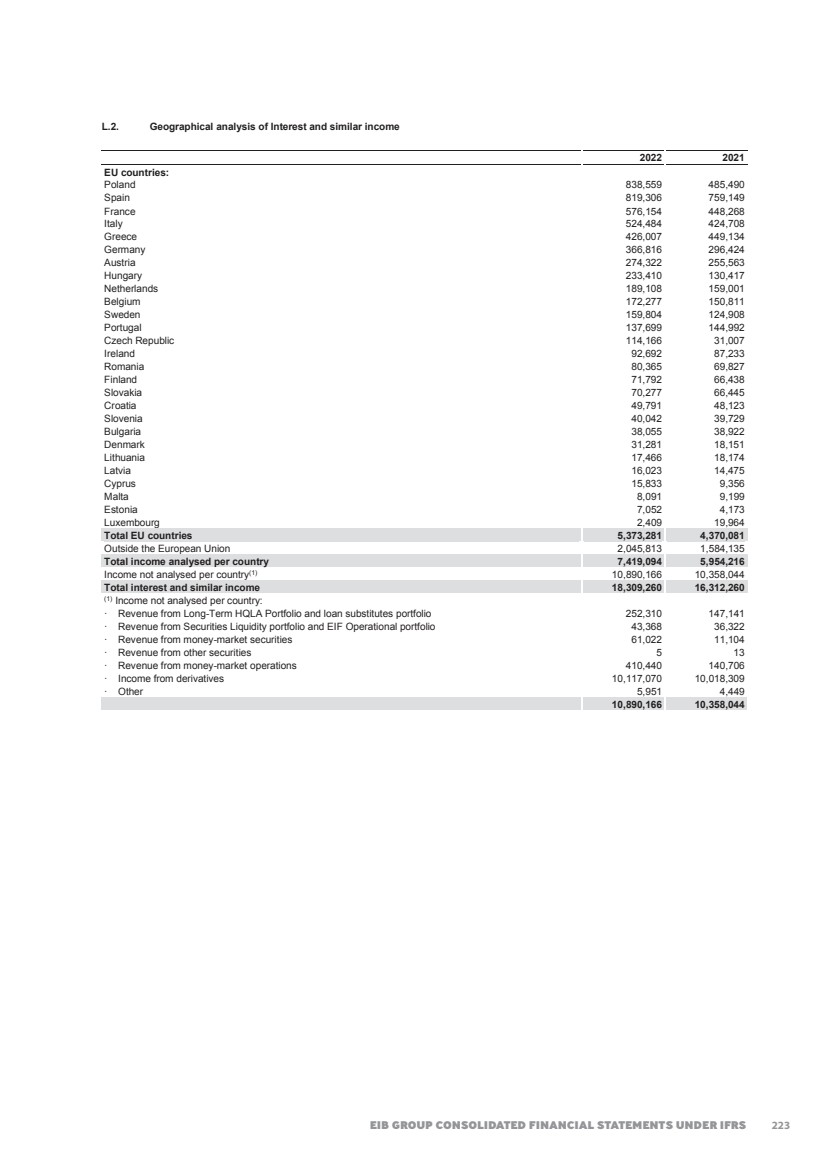
| 2022 FINANCIAL REPORT 231 Note M – Result on financial operations (in EUR ‘000) M.1. By nature of result 2022 2021 Net result on derivatives(1)(8) 1,014,954 81,535 Net result on loans under the FVO and associated swaps(2)(8) -60,920 30,139 Net result on borrowings under the FVO and associated swaps(3)(8) 50,283 -39,984 Net result from hedge accounting on loans and associated swaps(4)(8) -156,992 -212,774 Net result from hedge accounting on borrowings and associated swaps(5)(8) 679,078 318,593 Net result from hedge accounting on treasury bonds and associated swaps(6) 15,022 21,064 1,541,425 198,573 Foreign exchange gain and loss 2,559 14,614 Gain and loss on unwind of swaps 17,104 -5,638 Net result on repurchase of debts evidenced by certificates 253 0 Net result on shares and other variable yield securities(7) -696,523 5,017,547 Net result on debt securities portfolios -231,327 -36,771 Net result on financial guarantees -81,094 -5,456 Net result on loans and loan substitutes under FVTPL(9) -358,121 397,557 Net result on loans and loan substitutes under AC -846 2,611 Amortization of initial CBS 46,810 47,170 Result on financial operations 240,240 5,630,207 (1) The net result on derivatives includes for the majority the fair value adjustment on Macro-hedging swaps and Treasury derivative instruments. On 31 December 2022, these derivatives evidence a positive impact of EUR ‘000 1,014,954 compared to a positive impact of EUR ‘000 81,535 in 2021. (2) The fair value option is applied on loans and loan substitutes hedged by derivatives, which do not qualify for hedge accounting. As at 31 December 2022, the carrying value of loans and loan substitutes designated at fair value amounts to EUR 13 billion (2021: EUR 17 billion). The combined effect from applying the fair value option on loans and loan substitutes results in a negative impact of EUR '000 60,920 on the consolidated income statement at 31 December 2022 (2021: positive impact of EUR ’000 30,139). (3) The fair value option is applied on borrowings hedged by derivatives, which do not qualify for hedge accounting. As at 31 December 2022 the carrying value of borrowings designated at fair value amounts to EUR 24 billion (2021: EUR 31 billion). The combined effect from applying the fair value option on borrowings results in a positive impact of EUR '000 50,283 on the consolidated income statement at 31 December 2022 (2021: negative impact of EUR ’000 39,984). (4) Hedge accounting is applied on eligible loans and loan substitutes, which are qualifying the hedge accounting criteria under IFRS 9. As at 31 December 2022, the carrying value of loans and loan substitutes designated under hedge accounting amounts to EUR 127 billion (2021: EUR 147 billion). The combined effect from applying hedge accounting on loans and loan substitutes and associated swaps results in a negative impact of EUR '000 156,992 on the consolidated income statement at 31 December 2022 (2021: negative impact of EUR '000 212,774). (5) Hedge accounting is applied on eligible borrowings, which are qualifying the hedge accounting criteria under IFRS 9. As at 31 December 2022, the carrying value of borrowings under hedge accounting amounts to EUR 306 billion (2021: EUR 353 billion). The combined effect from applying hedge accounting on borrowings and associated swaps results in a positive impact of EUR '000 679,078 on the consolidated income statement at 31 December 2022 (2021: positive impact of EUR '000 318,593). (6) Starting 1 October 2021, hedge accounting is applied on the treasury LTHP bonds if the required hedge accounting criteria are met under IFRS9. As at 31 December 2022, the carrying value of LTHP bonds under hedge accounting amounts to EUR 0.8 billion (2021: EUR 0.5 billion). The combined effect from applying hedge accounting on LTHP bonds and associated swaps results in a positive impact of EUR '000 15,022 on the consolidated income statement at 31 December 2022 (2021: positive impact of EUR '000 21,064). (7) The item is mainly composed of unrealised and realised gains and losses on equity instruments. The negative P&L impact EUR ‘000 696,523 is primarily driven by the negative valuation effects observed in private equity markets during 2022 (2021: positive impact of EUR '000 5,017,547). Furthermore, the total for 2022 includes an amount of EUR’000 3,682 stemming from the InvestEU Programme Guarantee as described in note B.3. (8) Please see Note S.4.2 Interest rate risk for the impact from the IBOR Reform. (9) This item is mainly composed of the unrealised and realised gains and losses on loan operations measured at FVTPL. The negative impact on the consolidated income statement of EUR ‘000 358,121 is primarily driven by valuation effects during 2022 (2021: positive impact of EUR '000 397,557). M.2. By category of assets and liabilities 2022 2021 Financial assets mandatorily at FVTPL (excluding derivative assets) -1,231,186 5,164,660 Financial assets designated at FVTPL (FVO) -2,540,984 166,361 Financial liabilities designated at FVTPL (FVO) 2,196,145 372,280 Financial assets measured at AC -24,084,654 -7,917,553 Financial liabilities measured at AC 44,516,759 15,890,499 Derivatives designated as hedging instruments -19,896,918 -7,821,710 Derivatives held for risk management purposes, other than HA 1,312,803 -280,231 Other(1) -31,725 55,901 Result on financial operations 240,240 5,630,207 (1)Includes amortisation of initial CBS 224 |
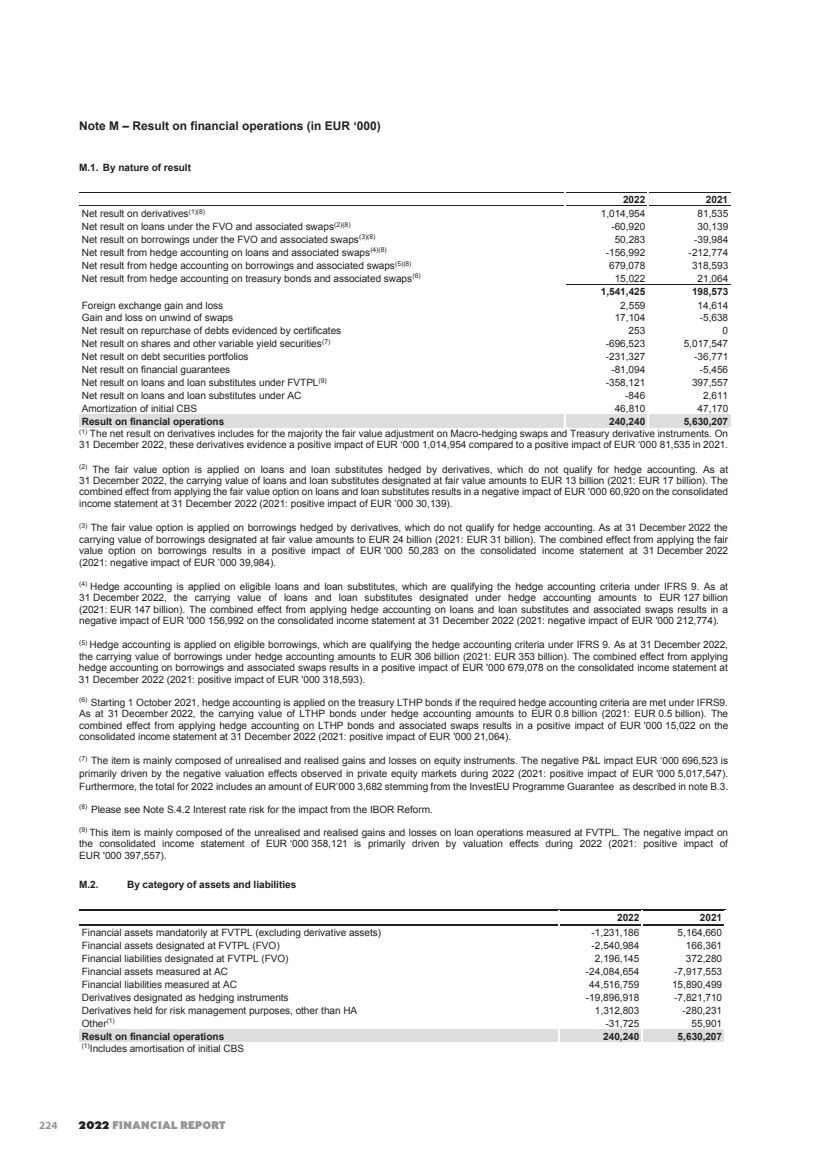
| EIB GROUP CONSOLIDATED FINANCIAL STATEMENTS UNDER IFRS 232 Note N – Net other operating income and expense (in EUR ‘000) 2022 2021 Reversal of previous year’s unutilised accruals 4,179 4,276 Rental income 89 78 Other 6,209 -5,751 Total net other operating income and expense 10,477 -1,397 Note O – Fee and commission income and Fee and commission expense (in EUR ‘000) 2022 2021 Fee and commission income: Commissions on guarantees 256,243 210,162 Commissions on EGF 86,786 46,596 Commissions on EFSI 39,993 45,052 Commissions on Investment Facility - Cotonou 36,994 55,682 Commission income on loans 32,589 35,014 Commissions on Jaspers 28,688 27,214 Commissions on InnovFin 14,262 22,980 Commissions on Jeremie/ESIF 14,235 12,802 Commissions on Modernisation Fund 12,080 9,268 Commission on InvestEU Advisory Hub 11,247 0 Commissions on RRF 10,709 0 Commissions on DFIs (2014-20, 2021-27)(*) 9,995 7,543 Commission on Fi-Compass(*) 5,463 5,359 Commission on Trust Fund Management fees(*) 5,172 4,109 Commission on Innovation Fund(*) 4,639 1,466 Commissions on Connecting Europe Facility 4,581 1,926 Commission JESSICA Holding Funds(*) 3,841 3,987 Commissions on Neighbourhood Investment Facility 2,232 1,939 Commissions on Yaoundé/Lomé Conventions 1,150 1,250 Commissions on other mandates(*) 89,170 92,898 Total fee and commission income 670,069 585,247 2022 2021 Commissions on Neighbourhood Investment Facility Risk remuneration for guarantees received -357,519 -410,647 Other commissions payable -25,697 -23,730 Total fee and commission expense -383,216 -434,377 (*) A reclassification was made between the captions in order to improve the readability of financial statements. Note P – General administrative expenses (in EUR ‘000) 2022 2021 Salaries and allowances(1) -589,807 -547,408 Welfare contributions and other staff costs -584,466 -659,623 Staff costs -1,174,273 -1,207,031 Other administrative expenses -306,561 -246,922 Total general administrative expenses -1,480,834 -1,453,953 (1) Of which the amount for members of the Management Committee is EUR ‘000 3,753 at 31 December 2022 and EUR ‘000 3,441 at 31 December 2021 (Note Y.2). The number of persons employed by the Group was 4,648 at 31 December 2022 (4,412 at 31 December 2021). Note Q – Derivatives and hedging activities Q.1. Use of derivative financial instruments In the hedging activity of the Group The Bank uses long-term derivative instruments to hedge borrowings, loans and bond holdings. The Fund does not use derivative instruments. 225 |
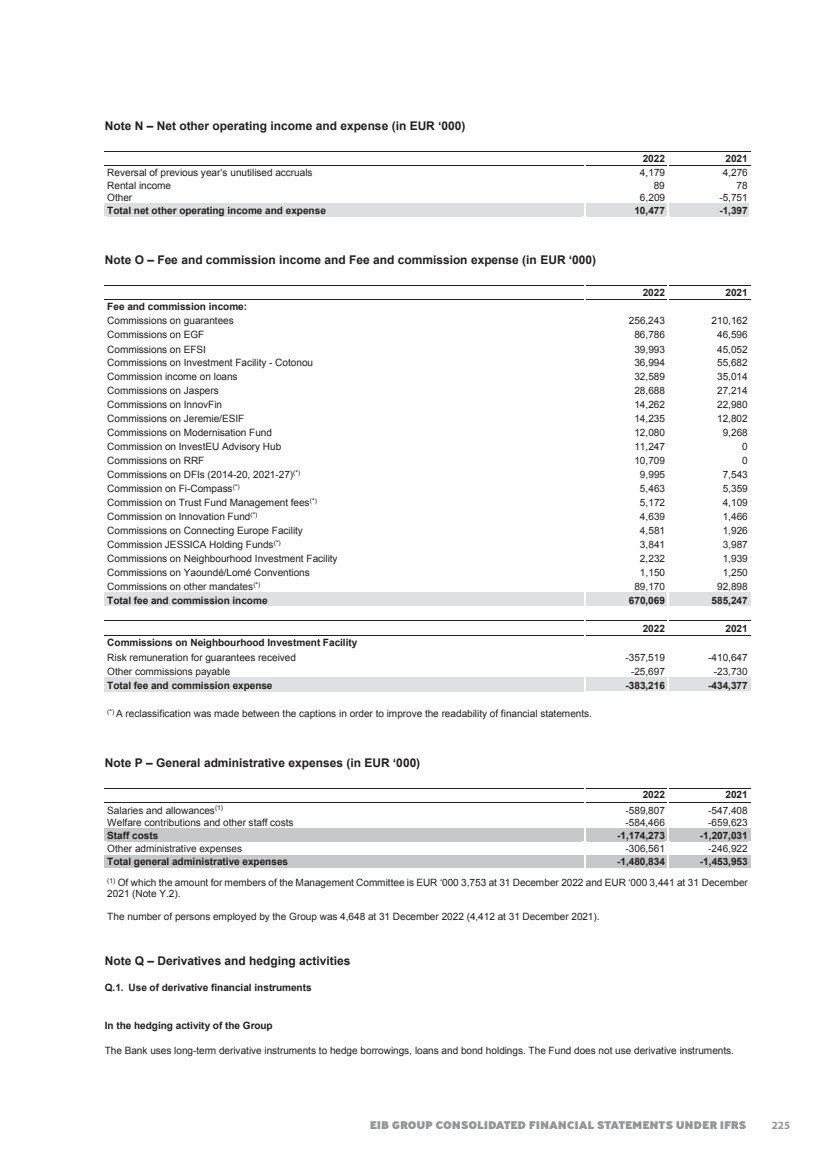
| 2022 FINANCIAL REPORT 233 The derivatives most commonly used are: Currency swaps Currency swaps are contracts under which it is agreed to exchange principal and interest payments in one currency against another currency. Interest rate swaps Interest rate swaps are contracts under which, generally, it is agreed to exchange floating-rate interest for fixed-rate interest payments, or floating-rate interest payments linked to different rates (basis swaps), in the same currency. In the treasury management of the Group The Bank enters into short-term currency swap contracts and currency forwards in order to adjust currency positions in its operational treasury portfolios in relation to its benchmark currency, the euro, and to cater for demand for currencies in connection with loan disbursements (see Note Q.3 for the disclosure of notional amounts and fair values of short-term currency foreign exchange contracts). Future contracts (futures) can be used in the context of the treasury activities, to hedge the exposure deriving from some investments in the SLP bond portfolio. In the Asset Liability Management (‘ALM’) of the Group With a view of managing interest rate risks, the Bank uses when possible natural hedges (loans and borrowings) or concludes global hedging operations (interest rate swaps). The macro hedging swaps used as part of asset/liability management are fair valued in accordance with IFRS 9. For further information regarding the risk management, please refer to Note S. Q.2. Hedging activities Fair value hedge of interest rate risk The amounts relating to items designated as hedging instruments are as follows (in EUR million): 2022 Notional amount Carrying amount Change in fair value used for calculating hedge ineffectiveness Assets Liabilities Interest rate swaps 442,249 19,188 -25,178 -17,395 Currency swaps(*) 35,208 2,467 -4,083 -2,502 Total 477,457 21,655 -29,261 -19,897 (*) Main currencies covered are USD, AUD and CAD. The Group used the notional amount of the receive leg of the currency swaps. Interest rate swaps and currency swaps mentioned in the table above are presented in the consolidated balance sheet under “Derivative assets” and “Derivative liabilities”. 2021 Notional amount Carrying amount Change in fair value used for calculating hedge ineffectiveness Assets Liabilities Interest rate swaps 444,031 27,230 14,826 -6,582 Currency swaps(*) 33,786 3,799 3,115 -1,235 Total 477,817 31,029 17,941 -7,817 (*) Main currencies covered are USD, AUD and CAD. The Group used the notional amount of the receive leg of the currency swaps. Interest rate swaps and currency swaps mentioned in the table above are presented in the consolidated balance sheet under “Derivative assets” and “Derivative liabilities”. The Bank migrated in its systems all its derivative notional exposure referring to LIBORs by the end of 2022. Excluding all transactions maturing before the anticipated USD LIBOR replacement date after June 2023, the notional amount directly impacted by IBOR reform is nil as at 31 December 2022 (for further information please refer to Note S.4). As at 31 December 2021 the notional amount of interest rate swaps directly impacted by IBOR reform amounted to nil for USD LIBOR (excluding all transactions maturing before the anticipated USD LIBOR replacement date after June 2023), EUR 478 million for GBP LIBOR and EUR 126 million for other LIBOR rates. There was no impact for currency swaps under hedge accounting. 226 |
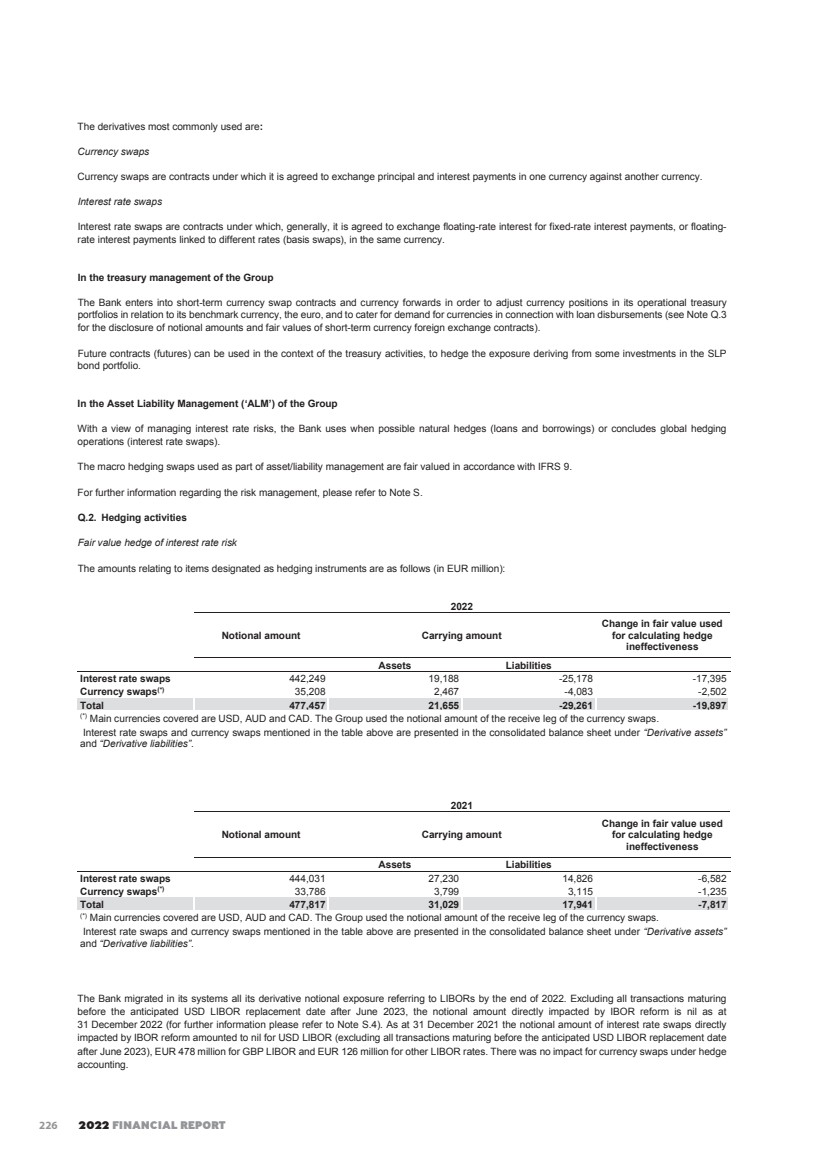
| EIB GROUP CONSOLIDATED FINANCIAL STATEMENTS UNDER IFRS 234 The amounts relating to items designated as hedged items are as follows (in EUR million): 2022 Carrying amount Accumulated amount of fair value hedge adjustments Line item in the consolidated balance sheet Change in value used for calculating hedge ineffectiveness Accumulated amount of fair value hedge adjustments remaining in the consolidated balance sheet for hedged items that have ceased to be adjusted for hedging gains and losses Assets Liabilities Loans and advances 22,549 0 -1,786 Loans and advances to credit institutions -2,763 6 100,765 0 -9,691 Loans and advances to customers -20,783 49 Loan substitutes 1,943 0 -149 Treasury bills and other bills eligible for refinancing with central banks -183 0 1,620 0 -85 Debt securities - a) issued by public bodies -56 0 417 0 -33 Debt securities - b) issued by other borrowers -19 0 Treasury bonds 241 0 -127 Treasury bills and other bills eligible for refinancing with central banks -130 0 586 0 -67 Debt securities - a) issued by public bodies -149 0 Debts evidenced by certificates 0 299,689 20,383 Debts evidenced by certificates - a) debt securities in issue 43,257 -30 0 6,760 -143 Debts evidenced by certificates - b) other 1,260 0 Total 128,121 306,449 8,302 20,434 25 2021 Carrying amount Accumulated amount of fair value hedge adjustments Line item in the consolidated balance sheet Change in value used for calculating hedge ineffectiveness Accumulated amount of fair value hedge adjustments remaining in the consolidated balance sheet for hedged items that have ceased to be adjusted for hedging gains and losses Assets Liabilities Loans and advances 24,177 0 977 Loans and advances to credit institutions -1,209 6 120,024 0 11,092 Loans and advances to customers -6,675 49 Loan substitutes 2,126 0 34 Treasury bills and other bills eligible for refinancing with central banks -48 0 697 0 -29 Debt securities - a) issued by public bodies -67 0 450 0 -14 Debt securities - b) issued by other borrowers -33 0 Treasury bonds 15 0 3 Treasury bills and other bills eligible for refinancing with central banks 3 0 512 0 82 Debt securities - a) issued by public bodies 82 0 Debts evidenced by certificates 0 346,091 -22,874 Debts evidenced by certificates - a) debt securities in issue 15,414 -32 0 7,349 -1,403 Debts evidenced by certificates - b) other 477 0 Total 148,001 353,440 -12,132 7,944 23 The hedge ineffectiveness – i.e. the difference between the hedging gains or losses of the hedging instrument and the hedged item - recognised in the consolidated income statement is EUR 537 million for 2022 (2021: EUR 127 million) and is included in line "Result on financial operations". 227 |
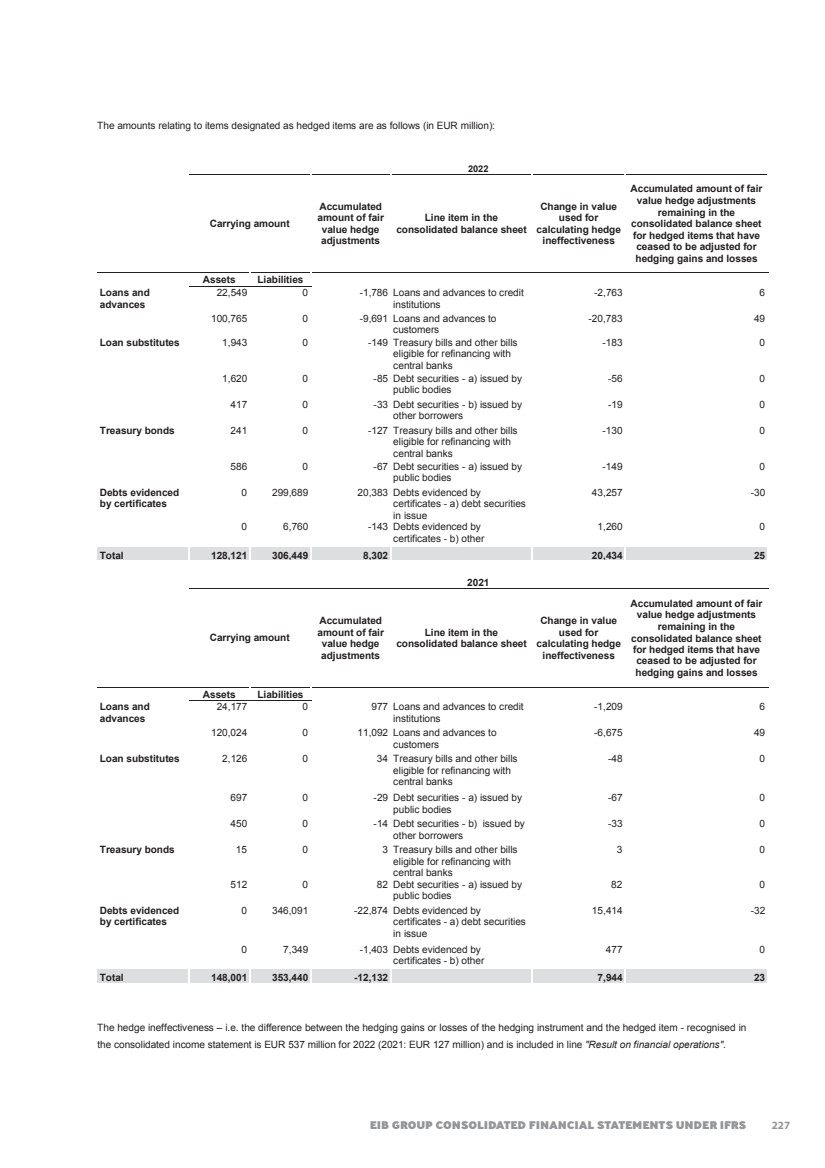
| 2022 FINANCIAL REPORT 235 The following table shows a reconciliation of each component of equity and an analysis of other comprehensive income in relation to hedge accounting (in EUR million): Fair value reserve - Cost of hedging 2022 2021 Balance as at 1 January -49 -145 Amortisation and revaluation of cross currency basis spread -5 96 Amount reclassified to profit or loss 0 0 Balance as at 31 December -54 -49 Q.3. Fair value of derivative financial instruments Financial instruments measured at fair value require disclosure of fair value measurements by level of the following hierarchy: • Level 1 – Quoted (unadjusted) prices in active markets for identical assets or liabilities. • Level 2 – Valuation techniques with inputs other than quoted prices included within Level 1 that are observable for the asset or liability, either directly (i.e. as prices) or indirectly (i.e. derived from prices). • Level 3 – Valuation techniques which use inputs for the asset or liability that are not based on observable market data (unobservable inputs). Internal valuation models are used to determine the fair values of these instruments. Valuation techniques include discounted cash flow, Hull-White and Libor Market Model (LMM) as interest rate models and Black-Scholes option model. Assumptions and inputs used in valuation techniques include risk-free interest rates, basis swap spreads and currency basis swaps spreads, foreign currency exchange rates and forward exchange rates, equity index prices and expected price volatilities and correlations, Consumer Price Indices values and expected volatilities and correlations. The objective of valuation techniques is to arrive at a fair value determination that reflects the price of the financial instrument at the reporting date that would have been determined by market participants acting at arm’s length. The valuation models applied are consistent with accepted economic methodologies for pricing financial instruments and incorporate the factors that market participants consider when setting a price. For a portion of derivative transactions, internal estimates and assumptions might be used in the valuation techniques when the market inputs are not directly available, typically in the estimation of correlations in some interest rate and cross-currency models and in the estimation of volatilities for some long dated equity, interest rate or inflation-linked transactions. The table below shows the fair value of derivative financial instruments, recorded as assets or liabilities (between those whose fair value is based on quoted market prices, those whose valuation technique is where all the model inputs are observable in the market and those where the valuation techniques involve the use of non-market observable inputs) together with their nominal amounts. The nominal amounts indicate the volume of transactions outstanding at year-end and are indicative of neither the market risk nor the credit risk. Derivatives by valuation method as at 31 December 2022 (in EUR million) Derivatives assets Level 1 Level 2 Level 3 Total 2022 Quoted market price Valuation techniques – market observable inputs Valuation techniques – non market observable inputs Notional amount Fair value Notional amount Fair value Notional amount Fair value Notional amount Fair value Interest Rate Swaps 0 0 229,113 24,287 896 116 230,009 24,403 Currency Swaps 0 0 128,077 10,455 106 18 128,183 10,473 Short-term foreign exchange contracts 0 0 5,311 139 0 0 5,311 139 Futures contracts 8,801 29 0 0 0 0 8,801 29 Total 8,801 29 362,501 34,881 1,002 134 372,304 35,044 Derivatives liabilities Level 1 Level 2 Level 3 Total 2022 Quoted market price Valuation techniques – market observable inputs Valuation techniques – non market observable inputs Notional amount Fair value Notional amount Fair value Notional amount Fair value Notional amount Fair value Interest Rate Swaps 0 0 338,327 32,612 4,689 859 343,016 33,471 Currency Swaps 0 0 114,674 9,070 488 84 115,162 9,154 Short-term foreign exchange contracts 0 0 16,368 501 0 0 16,368 501 Futures contracts 3 1 0 0 0 0 3 1 Other 0 0 0 0 0 631 0 631 Total 3 1 469,369 42,183 5,177 1,574 474,549 43,758 228 |
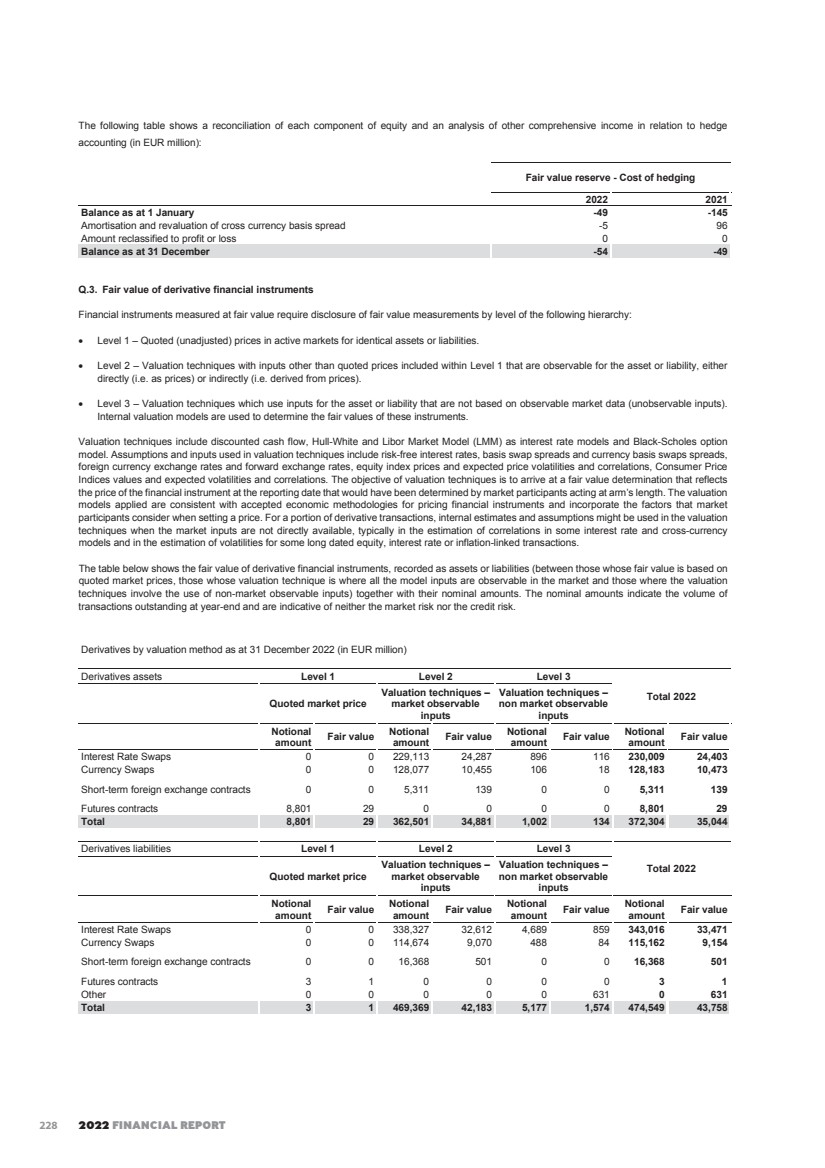
| EIB GROUP CONSOLIDATED FINANCIAL STATEMENTS UNDER IFRS 236 Derivatives by valuation method as at 31 December 2021 (in EUR million) Derivatives assets Level 1 Level 2 Level 3 Total 2021 Quoted market price Valuation techniques – market observable inputs Valuation techniques – non market observable inputs Notional amount Fair value Notional amount Fair value Notional amount Fair value Notional amount Fair value Interest Rate Swaps 0 0 325,704 31,016 2,399 300 328,103 31,316 Currency Swaps 0 0 155,209 10,051 417 86 155,626 10,137 Short-term foreign exchange contracts 0 0 9,545 278 0 0 9,545 278 Futures contracts 6,383 3 0 0 0 0 6,383 3 Total 6,383 3 490,458 41,345 2,816 386 499,657 41,734 Derivatives liabilities Level 1 Level 2 Level 3 Total 2021 Quoted market price Valuation techniques – market observable inputs Valuation techniques – non market observable inputs Notional amount Fair value Notional amount Fair value Notional amount Fair value Notional amount Fair value Interest Rate Swaps 0 0 228,910 22,911 2,068 91 230,978 23,002 Currency Swaps 0 0 91,812 5,723 245 43 92,057 5,766 Short-term foreign exchange contracts 0 0 15,981 143 0 0 15,981 143 Futures contracts 1,891 0 0 0 0 0 1,891 0 Other 0 0 0 0 0 619 0 619 Total 1,891 0 336,703 28,777 2,313 753 340,907 29,530 Quoted prices for the majority of the Bank’s derivative transactions are not available in the market. For such instruments the fair values are estimated using valuation techniques or models, based wherever possible on observable market data prevailing at the balance sheet date. The fair value of swap transactions is computed using option pricing models, calibrated to available market prices of options. The valuation models applied are consistent with accepted economic methodologies for pricing financial instruments and incorporate the factors that market participants consider when setting a price. For a portion of derivative transactions, internal estimates and assumptions might be used in the valuation techniques when the market inputs are not directly available. Following the discontinuation of EONIA and the evolution of the markets, the Bank switched from EONIA discounting to ESTER discounting in December 2022, resulting in a P&L impact of EUR -3.4 million. 229 |
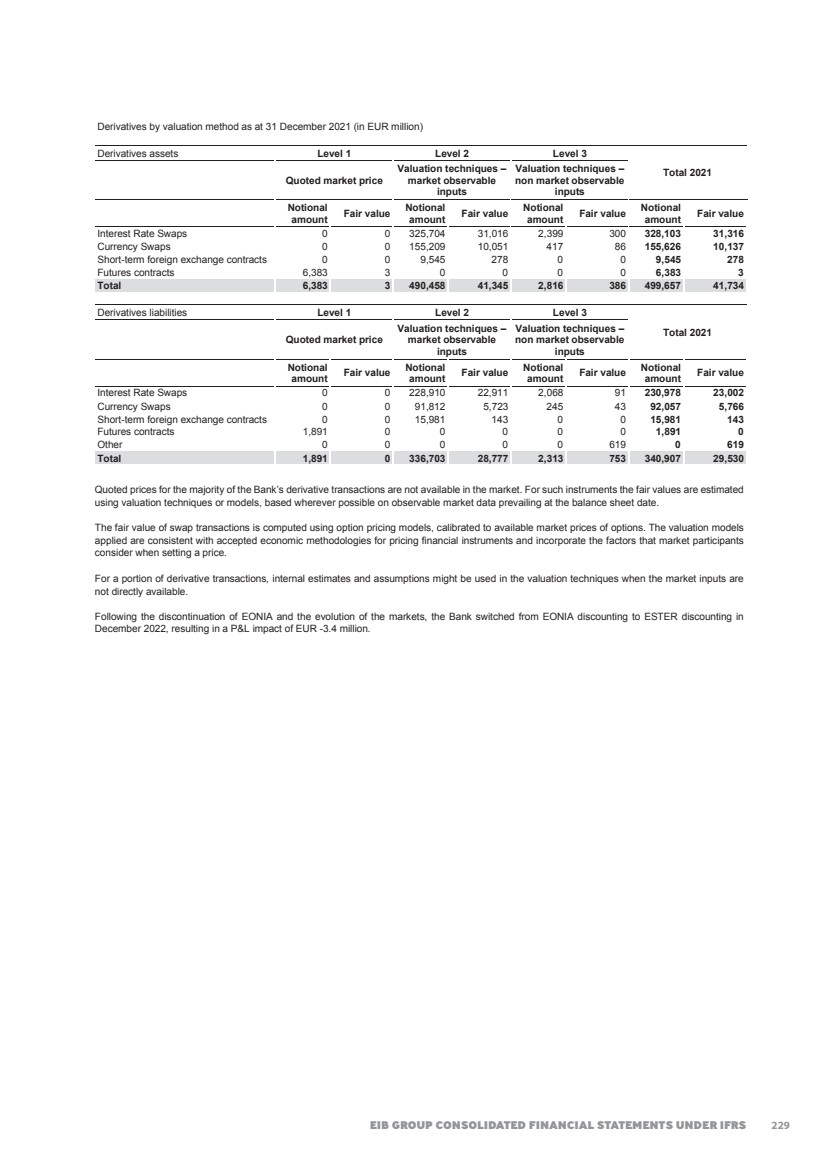
| 2022 FINANCIAL REPORT 237 The table below sets out information about significant unobservable inputs used at year end in measuring derivatives financial instruments categorised as Level 3 in the fair value hierarchy (EUR million): Type of financial instrument Fair value at 31 December 2022 Fair values of level 3 swaps at 31 December 2022 Valuation technique Significant unobservable input Range of estimates for unobservable inputs Interest Rate Swaps -8,988 -663 Stochastic IR models Stochastic volatility parameters, such as mean reversion or volatility of volatility for LMM. Mean reversion level for HW1F. Volatility of volatility or mean reversion speed moving by 20% up and down. Changing the mean reversion by +-0.2%. Currency Swaps 1,319 -66 Stochastic CC models Correlations between yield curves and FX rates using volatility smile Using a different observation window for correlation and using local vol model to capture more volatility strikes. Equity Swaps -80 -80 Stochastic Equity models Dividend yields and volatility Using a different dividend yield and volatility (+-20% relative). Type of financial instrument Fair value at 31 December 2021 Fair values of level 3 swaps at 31 December 2021 Valuation technique Significant unobservable input Range of estimates for unobservable inputs Interest Rate Swaps 8,295 190 Stochastic IR models Stochastic volatility parameters, such as mean reversion or volatility of volatility. Shift for shifted lognormal models. Volatility of volatility or mean reversion speed moving by 20% up and down. Shift moving up and down 1pp. Currency Swaps 4,371 43 Stochastic CC models Correlations between yield curves and FX rates using volatility smile Using a different observation window for correlation and using local vol model to capture more volatility strikes. Equity Swaps 19 19 Stochastic Equity models Dividend yields and volatility Using a different dividend yield and volatility (+-20% relative). Significant unobservable inputs are developed as follows: • Correlations and volatilities are derived through extrapolation of observable volatilities, recent transaction prices, quotes from other market participants, data from consensus pricing services and historical data adjusted for current conditions. • Risk adjusted spreads are derived from the CDS market. With the application of IFRS 13, valuation adjustments are included in the fair valuations of derivatives at 31 December 2022, namely: • Credit valuation adjustments (CVA), reflecting counterparty credit risk on derivative transactions, amounting to EUR -63.7 million (2021: EUR -73.0 million) recorded in: o swaps hedging loans and loan substitutes of EUR -26.8 million (2021: EUR -21.5 million); o swaps hedging borrowings of EUR -22.6 million (2021: EUR -24.3 million); o ALM swaps of EUR -14.1 million (2021: EUR -27.1 million); o long-term treasury swaps of EUR -0.1 million (2021: EUR -0.1 million); o short-term treasury swaps (FX swaps and FX forwards) of EUR -0.1 million (2021: EUR 0 million). • Debit valuation adjustments (DVA), reflecting own credit risk on derivative transactions, amounting to EUR 170.4 million (2021: EUR 62.5 million) recorded in: o swaps hedging loans and loan substitutes of EUR 53.7 million (2021: EUR 23.5 million); o swaps hedging borrowings of EUR 58.8 million (2021: EUR 22.0 million); o ALM swaps of EUR 57.3 million (2021: EUR 16.7 million); o long-term treasury swaps of EUR 0.5 million (2021: EUR 0.2 million); o short-term treasury swaps (FX swaps and FX forwards) of EUR 0.1 million (2021: EUR 0.1 million). • In addition to CVA and DVA above, Collateral Valuation adjustment (CollVA), reflecting specific marginal adjustments linked to collateral posted by EIB counterparties on derivative transactions at 31 December 2022, amounting to EUR -11.5 million (2021: EUR -5.1 million). The credit risk mitigating aspect of collateral posted by the EIB counterparties is already reflected in the CVA value. But the collateral remuneration effects are separated out in a specific CollVA adjustment. 230 |
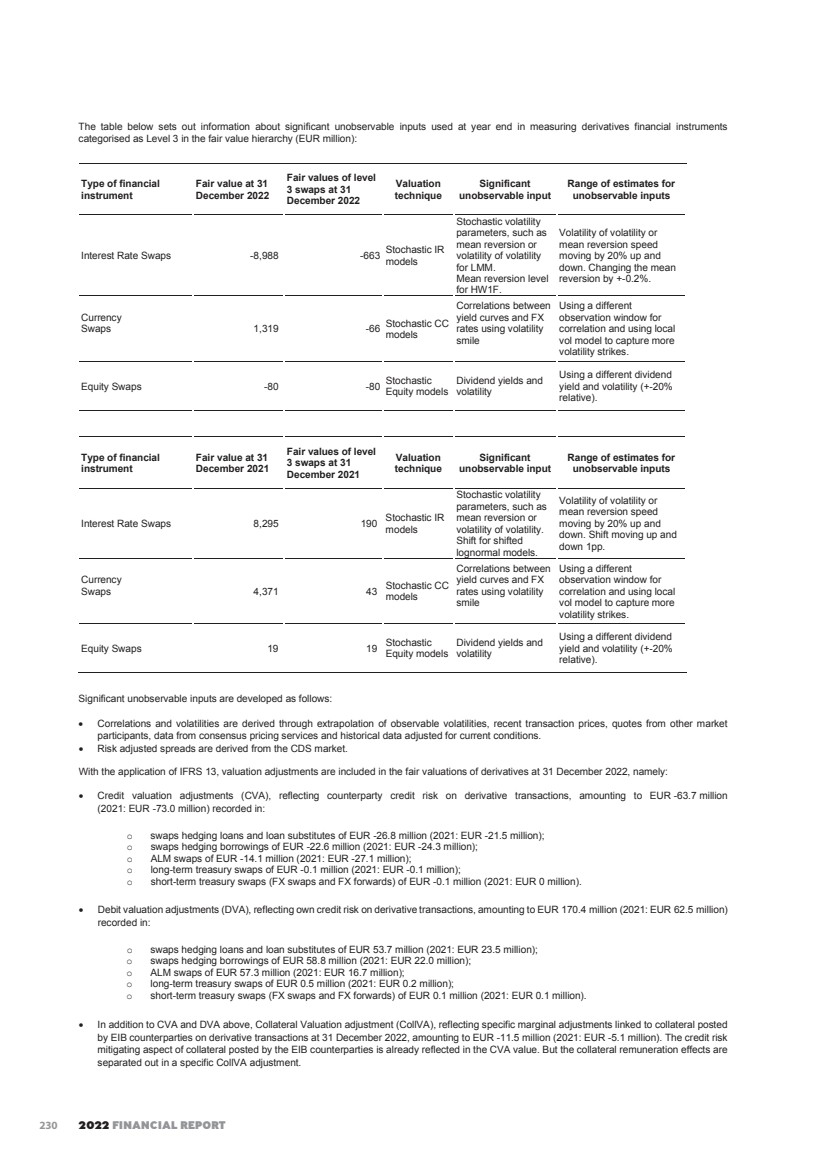
| EIB GROUP CONSOLIDATED FINANCIAL STATEMENTS UNDER IFRS 238 Q.4. Sensitivity of Fair Value for Level 3 Instruments Although the Group believes that its estimates of fair value are appropriate, the use of different methodologies or assumptions could lead to different measurements of fair value. The unobservable inputs may add a degree of uncertainty and variation into the valuation of Level 3 instruments. To assess and quantify it, the Bank performs alternative valuations using reasonably possible range of assumptions for the unobservable inputs. Alternative assumptions are specific to valuation models and can be applied separately. Level 3 derivatives can be grouped into three swap types according to the underlying asset and valuation model: a. Structured interest rate swaps b. Cross currency and FX-linked swaps c. Equity-linked swap a. Structured interest rate swaps are modelled with the dynamics of a Hull-White model with an exogenous mean reversion level, or a multi-factor Libor Market Model (LMM), calibrated using swaptions and spread options, where a volatility of volatility (‘vol-of-vol’) parameter is exogenously specified for a subset of models. The LMM models also incorporate an exogenously set speed of volatility mean reversion. For this category, (a), alternative valuations are obtained by moving the ‘vol-of-vol’ up and down by 20% and the mean reversion up and down by 20% (floored at 1%) and by changing assumptions in IR shifts, in cases where rates are low, for LMM with stochastic volatility, for Hull-White, the mean reversion level was changed by plus and minus 0.2%. For this category, (a), the first scenario yielded a decrease of EUR 5.2 million when moving down the ‘vol-of-vol’, increasing mean reversion speed and increasing the HW mean reversion; and the second scenario an increase of EUR 1.6 million. b. Cross currency and FX-linked swaps are valued according to 1 factor Hull & White model for interest rates modelling while FX rates are modelled according to the Black Scholes model. The model is calibrated to interest rates, swaptions volatilities, FX rates, FX option volatilities and correlations between interest and FX rates. Correlations between interest and FX rates are estimated from the time series. For these categories, alternative valuations are obtained by calculating correlation from a shorter time window (half the size) in the first scenario and considering volatility smile in the second scenario. For this category, (b), the second scenario turned out to have an unfavourable impact leading to a decrease of EUR 3.0 million, and the other of a favourable impact leading to an increase of EUR 0.1 million. c. Equity linked swaps are modelled with BS model capturing the volatilities from the market. Interest rates and dividends are also taken from market quotes. For long-term swaps the volatilities and dividends are extrapolated for the long maturities. The scenarios consisted of a relative change of 20%, up and down, in the volatility and dividends assumptions. The favourable scenario led to an increase of EUR 5.5 million and the unfavourable scenario to a decrease of EUR 3.5 million. The following table summarises Level 3 derivatives by type of financial instrument for which alternative assumptions would change fair value (in EUR million): 31 December 2022 Favourable Impact Unfavourable Impact Valuation technique Significant unobservable input Structured interest rate swaps (OTC) 1.6 -5.2 Stochastic IR models Mean reversion and volatility of volatility parameters Mean reversion in Hull White models Cross currency and FX-linked swaps 0.1 -3.0 Stochastic CC models Correlations between Interest rates and FX rates and volatility smile Equity-linked swap 5.5 -3.5 Stochastic Equity models Volatility and dividends 31 December 2021 Favourable Impact Unfavourable Impact Valuation technique Significant unobservable input Structured interest rate swaps (OTC) 1.8 -0.2 Stochastic IR models Changing mean reversion and volatility of volatility parameters Changing shift in shifted lognormal models Cross currency and FX-linked swaps 1.3 0 Stochastic CC models Correlations between Interest rates and FX rates and considering the volatility smile Equity-linked swap 10.0 -8.2 Stochastic Equity models Changing volatility and dividends 231 |
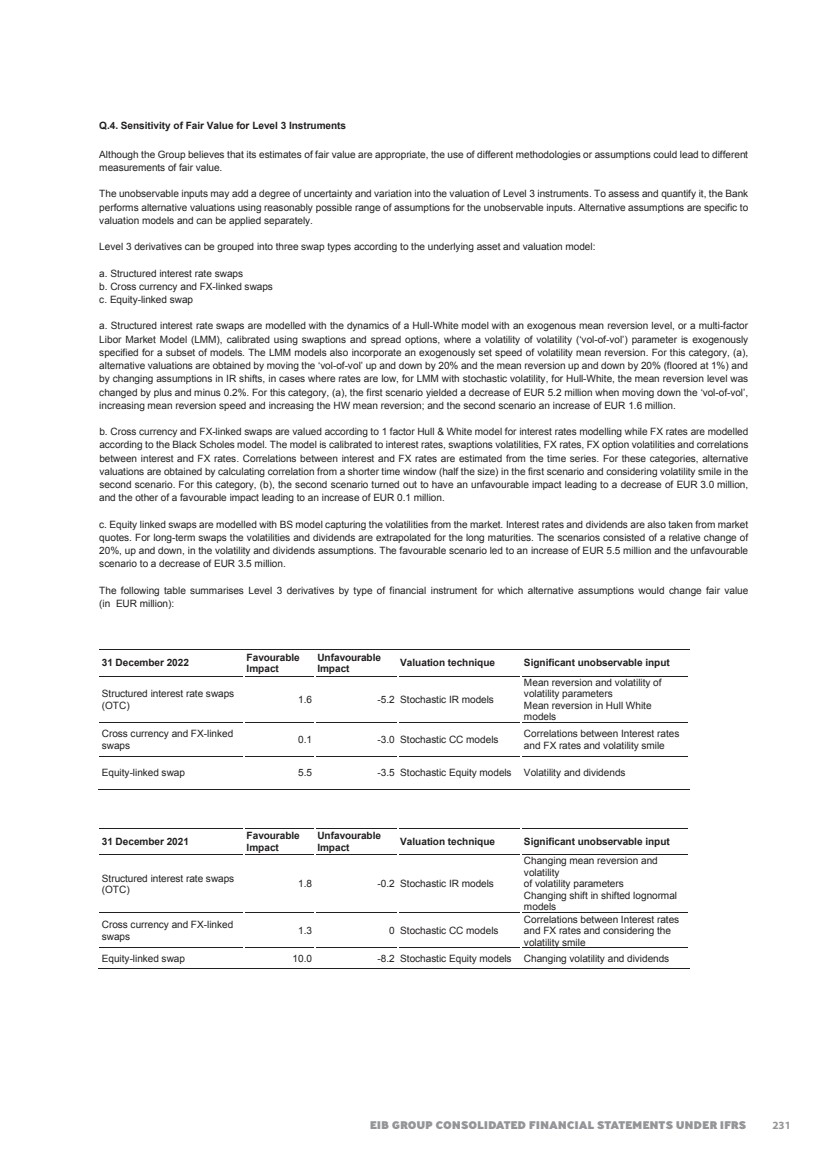
| 2022 FINANCIAL REPORT 239 Note R – Fair value of financial assets and liabilities (in EUR million) The tables below set out a comparison of the fair values, by the level of the fair value hierarchy, and the carrying amounts of the Group’s financial assets and financial liabilities that are carried in the consolidated financial statements. The tables do not include the fair values of non-financial assets and non-financial liabilities. 31 December 2022 Fair value Carrying amount Level 1 Level 2 Level 3 Total Assets carried at fair value: Financial assets designated at FVTPL 0 4,957 9,230 14,187 14,187 Loans and advances to credit institutions and to customers 0 4,777 8,458 13,235 13,235 Shares and other variable-yield securities 0 0 772 772 772 Loan substitutes portfolio 0 180 0 180 180 Financial assets mandatorily measured at FVTPL 2,891 35,204 20,956 59,051 59,051 Derivative assets 29 34,881 134 35,044 35,044 SLP 2,862 323 0 3,185 3,185 Shares and other variable-yield securities 0 0 17,573 17,573 17,573 Loans and advances to credit institutions and to customers 0 0 2,234 2,234 2,234 Loan substitutes portfolio 0 0 612 612 612 ABS Portfolio EIF 0 0 403 403 403 Financial assets measured at FVOCI (no recycling) 0 0 548 548 548 Shares and other variable-yield securities 0 0 548 548 548 Total 2,891 40,161 30,734 73,786 73,786 Assets carried at AC: Held-to-collect 9,285 420,948 44,185 474,418 491,565 LTHP 2,269 21 0 2,290 2,526 TMP 4,630 2,362 0 6,992 7,001 Operational portfolio - EIF 1,995 65 0 2,060 2,326 Loan substitutes portfolio 278 10,030 5,730 16,038 16,370 Loans and advances to credit institutions and to customers 0 407,659 38,455 446,114 462,418 Cash in hand, balances with central banks and post office banks 113 0 0 113 113 Subscribed capital and reserves, called but not paid 0 811 0 811 811 Total 9,285 420,948 44,185 474,418 491,565 Total financial assets 12,176 461,109 74,919 548,204 565,351 Liabilities carried at fair value: Financial liabilities mandatorily measured at FVTPL 1 42,603 1,574 44,178 44,178 Derivative liabilities 1 42,183 1,574 43,758 43,758 Other liabilities 0 420 0 420 420 Financial liabilities designated at FVTPL 16,236 2,560 4,953 23,749 23,749 Debts evidenced by certificates 16,236 2,560 4,953 23,749 23,749 Total 16,237 45,163 6,527 67,927 67,927 Liabilities carried at AC Liabilities measured at AC 362,190 28,800 2,359 393,349 403,774 Amounts owed to credit institutions and customers 0 6,933 0 6,933 6,933 Debts evidenced by certificates 362,190 18,695 2,359 383,244 393,669 Other payables and lease liabilities 0 3,172 0 3,172 3,172 Total 362,190 28,800 2,359 393,349 403,774 Total financial liabilities 378,427 73,963 8,886 461,276 471,701 232 |
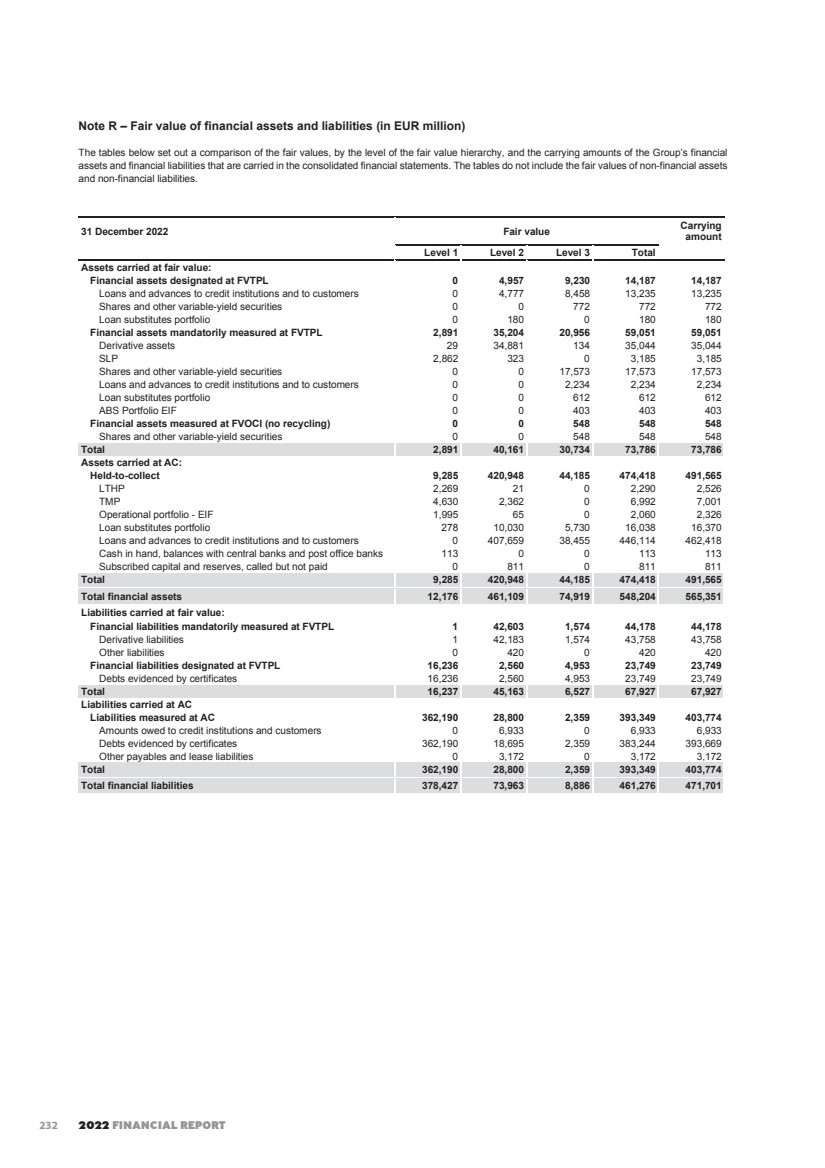
| EIB GROUP CONSOLIDATED FINANCIAL STATEMENTS UNDER IFRS 240 31 December 2021 Fair value Carrying Level 1 Level 2 Level 3 Total amount Assets carried at fair value: Financial assets designated at FVTPL 0 6,475 11,624 18,099 18,099 Loans and advances to credit institutions and to customers 0 6,273 10,840 17,113 17,113 Shares and other variable-yield securities 0 0 784 784 784 Loan substitutes portfolio 0 202 0 202 202 Financial assets mandatorily measured at FVTPL 4,751 41,345 21,974 68,070 68,070 Derivative assets 3 41,345 386 41,734 41,734 SLP 4,748 0 0 4,748 4,748 Shares and other variable-yield securities 0 0 17,490 17,490 17,490 Loans and advances to credit institutions and to customers 0 0 2,814 2,814 2,814 Loan substitutes portfolio 0 0 903 903 903 ABS Portfolio EIF 0 0 381 381 381 Financial assets measured at FVOCI (no recycling) 0 0 598 598 598 Shares and other variable-yield securities 0 0 598 598 598 Total 4,751 47,820 34,196 86,767 86,767 Assets carried at AC: Held-to-collect 20,430 473,855 51,780 546,065 536,283 LTHP 1,437 0 0 1,437 1,444 TMP 14,845 7,612 0 22,457 22,456 Operational portfolio - EIF 2,264 27 0 2,291 2,298 Loan substitutes portfolio 401 10,134 6,400 16,935 16,865 Loans and advances to credit institutions and to customers 0 454,948 45,380 500,328 490,603 Cash in hand, balances with central banks and post office banks 1,483 0 0 1,483 1,483 Subscribed capital and reserves, called but not paid 0 1,134 0 1,134 1,134 Total 20,430 473,855 51,780 546,065 536,283 Total financial assets 25,181 521,675 85,976 632,832 623,050 Liabilities carried at fair value: Financial liabilities mandatorily measured at FVTPL 0 29,117 753 29,870 29,870 Derivative liabilities 0 28,777 753 29,530 29,530 Other liabilities 0 340 0 340 340 Financial liabilities designated at FVTPL 20,171 6,614 3,892 30,677 30,677 Debts evidenced by certificates 20,171 6,614 3,892 30,677 30,677 Total 20,171 35,731 4,645 60,547 60,547 Liabilities carried at AC Liabilities measured at AC 418,696 58,002 0 476,698 471,999 Amounts owed to credit institutions and customers 0 25,393 0 25,393 25,393 Debts evidenced by certificates 418,696 29,229 0 447,925 443,226 Other payables and lease liabilities(*) 0 3,380 0 3,380 3,380 Total 418,696 58,002 0 476,698 471,999 Total financial liabilities 438,867 93,733 4,645 537,245 532,546 (*) A reclassification was made in order to improve the readability of financial statements. The following describes the methodologies and assumptions used to determine the fair value of the financial assets and financial liabilities. Assets and liabilities for which carrying amount approximates to fair value For financial assets and financial liabilities that are liquid or have a short-term maturity (less than three months), it is assumed that the carrying amounts approximate to their fair value. Assets and liabilities recorded at fair value Published price quotations in an active market are the first source for determining the fair value of a financial instrument. For instruments without available market price, fair values are estimated using valuation techniques or models based wherever possible on observable market data prevailing at the balance sheet date. The fair value of such instruments is determined by using valuation techniques to convert future amounts to a single discounted present amount. The estimate of fair value is based on the value indicated by marketplace expectations about those future amounts. Valuation techniques can range from simple discounted known cash flows to complex option models. The valuation models applied are consistent with accepted economic methodologies for pricing financial instruments, and incorporate the factors that market participants consider when setting a price. Internal estimates and assumptions might be used in the valuation techniques when the market inputs are not directly available. With the application of IFRS 13, own credit adjustments (‘OCA’), reflecting own credit risk on financial liabilities designated at fair value through profit or loss, amounts to EUR 305.9 million as at 31 December 2022 (2021: EUR 86.0 million). 233 |
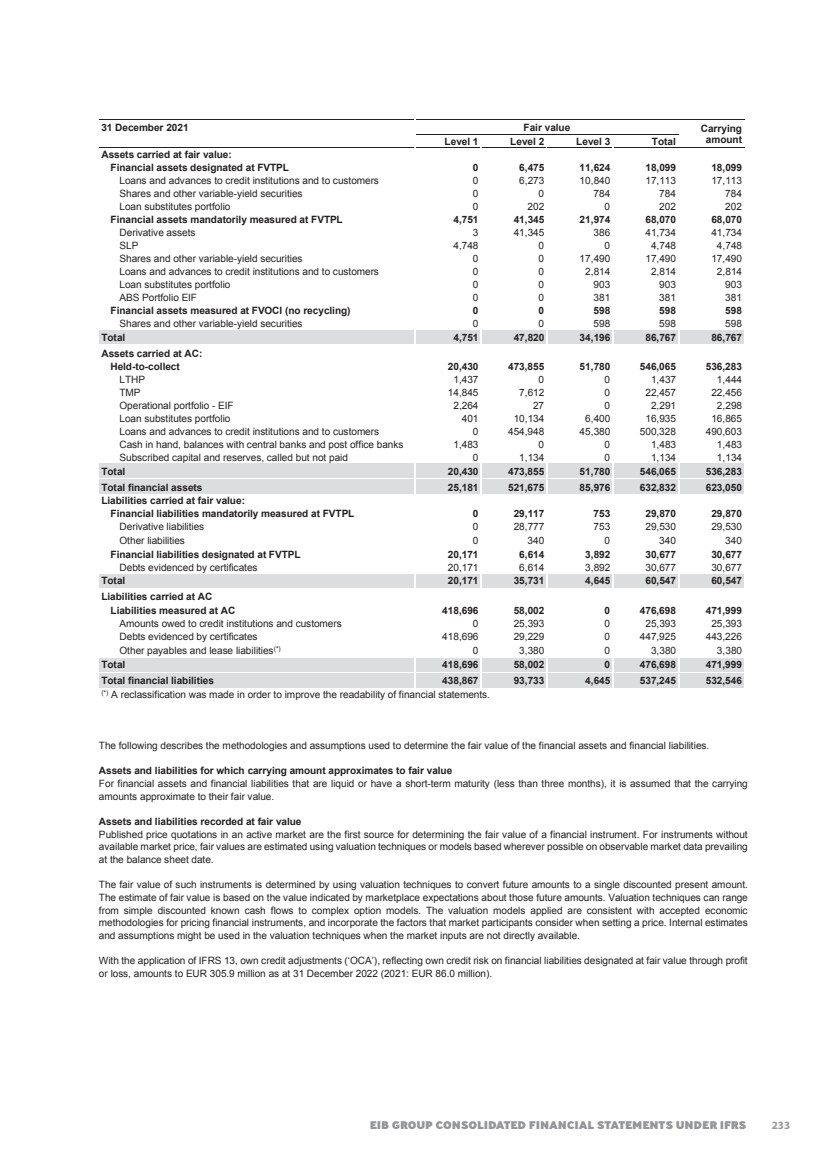
| 2022 FINANCIAL REPORT 241 In 2022, the Group made transfers from Level 1 to 2 of the fair value hierarchy: • Financial assets mandatorily measured at FVTPL of EUR 170.0 million (2021: EUR 0.0 million) • Financial assets carried at amortised cost of EUR 26.1 million (2021: EUR 0.0 million) • Financial liabilities designated at fair value through profit or loss of EUR 306.1 million (2021: EUR nil) The Group made also the following transfer from level 2 to 1 of the fair value hierarchy: • Financial assets mandatorily measured at FVTPL of EUR 0.0 million (2021: EUR 63.0 million) • Financial assets at amortised cost of EUR 0.0 million (2021: EUR 27.7 million) • Financial liabilities designated at fair value through profit or loss of EUR 718.8 million (2021: EUR 182.7 million). During the current year, quoted prices in active markets were available for these securities, hence the transfers from Level 2 to 1. The following table presents the changes in Level 3 instruments for the year ended 31 December 2022 (in EUR million): Financial assets mandatorily measured at FVTPL Financial assets designated at FVTPL Financial assets measured at FVOCI Financial liabilities mandatorily measured at FVTPL Financial liabilities designated at FVTPL Balance at 1 January 2022 21,974 11,624 598 753 3,892 Total gains or losses: - in profit or loss -1,498 -1,755 0 422 -543 - in other comprehensive income 0 0 -50 0 -64 Purchases 2,829 87 0 55 0 Sales -1,413 -44 0 0 0 Issues 0 6 0 0 252 Settlement -972 -688 0 -9 -240 Aggregate transfers into Level 3 36 0 0 355 1,762 Aggregate transfers out of Level 3 0 0 0 -2 -106 Balance at 31 December 2022 20,956 9,230 548 1574 4,953 The following table presents the changes in Level 3 instruments for the year ended 31 December 2021 (in EUR million): Financial assets mandatorily measured at FVTPL Financial assets designated at FVTPL Financial assets measured at FVOCI Financial liabilities mandatorily measured at FVTPL Financial liabilities designated at FVTPL Balance at 1 January 2021 15,737 11,040 515 242 3,182 Total gains or losses: - in profit or loss 5,343 554 0 509 27 - in other comprehensive income 0 0 83 0 -12 Purchases 3,448 94 0 0 0 Sales -1,816 -129 0 0 0 Issues 0 68 0 0 0 Settlement -826 -3 0 0 -128 Aggregate transfers into Level 3 88 0 0 2 884 Aggregate transfers out of Level 3 0 0 0 0 -61 Balance at 31 December 2021 21,974 11,624 598 753 3,892 During the years ended 31 December 2022 and 31 December 2021, certain financial assets and financial liabilities were transferred into or out of Level 3 of the fair value hierarchy. The reason for such transfers is the availability of quoted prices in active markets and the change in the inputs and assumptions used in the fair value measurement compared to previous year. 234 |
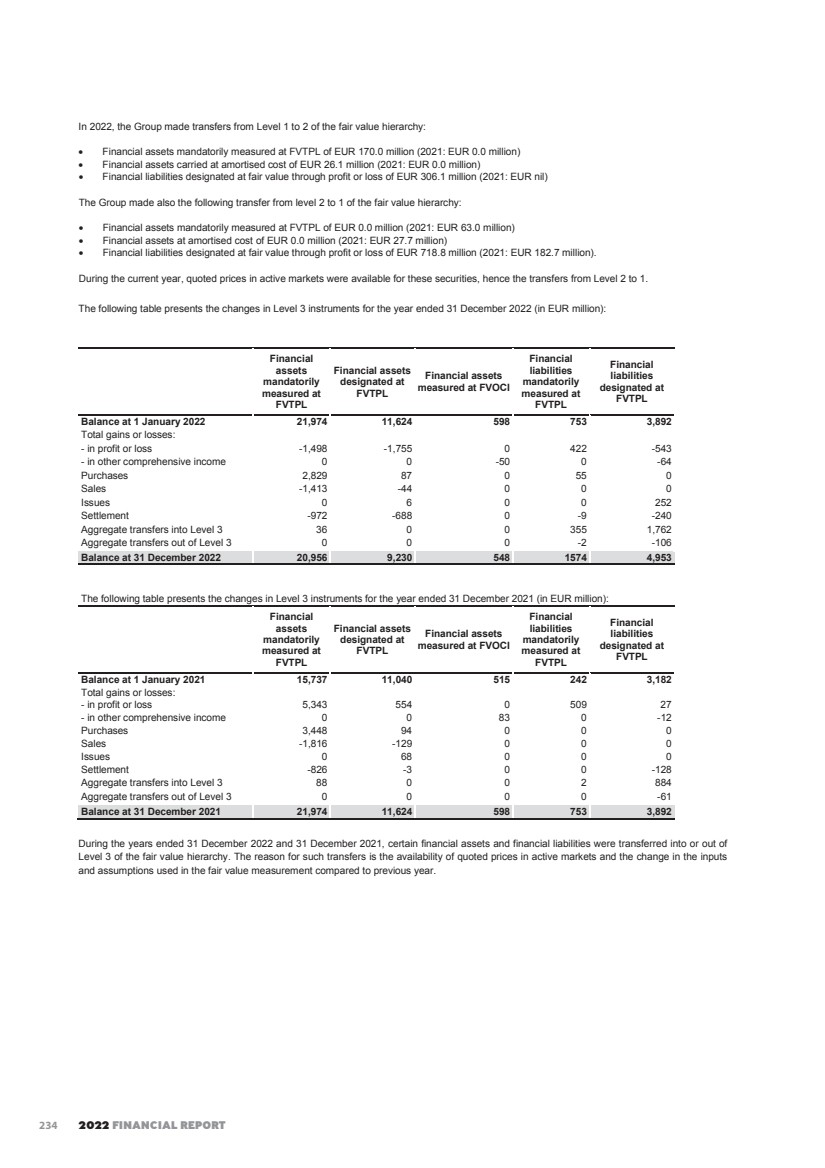
| EIB GROUP CONSOLIDATED FINANCIAL STATEMENTS UNDER IFRS 242 Total gains or losses on Level 3 instruments in the table below are presented in the consolidated statement of profit and loss and other comprehensive income for the year ended 31 December 2022 as follows (in EUR million): Financial assets mandatorily measured at FVTPL Financial assets designated at FVTPL Financial assets measured at FVOCI Financial liabilities mandatorily measured at FVTPL Financial liabilities designated at FVTPL Total gains or losses included in profit or loss for the year: - Result on financial operations -1,498 -1,755 0 422 -543 Total gains or losses recognised in other comprehensive income - financial assets at FVOCI and OCA 0 0 -50 0 -64 Total gains or losses for the year included in profit or loss attributable to changes in unrealised gains and losses on assets and liabilities held as at 31 December 2022 - Result on financial operations -1,498 -1,755 0 422 -543 Total gains or losses on Level 3 instruments in the table below are presented in the consolidated statement of profit and loss and other comprehensive income for the year ended 31 December 2021 as follows (in EUR million): Financial assets mandatorily measured at FVTPL Financial assets designated at FVTPL Financial assets measured at FVOCI Financial liabilities mandatorily measured at FVTPL Financial liabilities designated at FVTPL Total gains or losses included in profit or loss for the year: - Result on financial operations 5,343 554 0 509 27 Total gains or losses recognised in other comprehensive income - financial assets at FVOCI and OCA 0 0 83 0 -12 Total gains or losses for the year included in profit or loss attributable to changes in unrealised gains and losses on assets and liabilities held as at 31 December 2021 - Result on financial operations 5,343 554 0 509 27 Change in fair value of financial instruments designated at fair value through profit or loss using a valuation technique based on non-market observable input, due to alternative assumptions Although the Group believes that its estimates of fair value are appropriate, the use of different methodologies or assumptions could lead to different measurements of fair value. The potential effect of using reasonable possible alternative non market observable assumptions as input to valuation techniques from which the fair values of financial instruments designated at fair value through profit or loss are determined has been quantified as a reduction of approximately EUR 11.7 million using most unfavourable assumptions and an increase of approximately EUR 7.2 million using most favourable assumptions for 31 December 2022 and a decrease of approximately EUR 8.4 million using most unfavourable assumptions and an increase of approximately EUR 13.1 million using most favourable assumptions for 31 December 2021. The alternative assumptions are used to calculate the fair value of borrowings and loans belonging to the Level 3 valuation category. Fair value of borrowings and loans in Level 3 is derived from the value of derivatives which hedge these borrowings and loans. Hence the alternative assumptions are first applied to valuation of Level 3 derivatives and then the impact is applied to Level 3 borrowings and loans. Level 3 derivatives can be grouped into three swap types according to the underlying asset and/or valuation model: a. Structured interest rate swaps b. Cross currency and FX-linked swaps c. Equity-linked swap 235 |
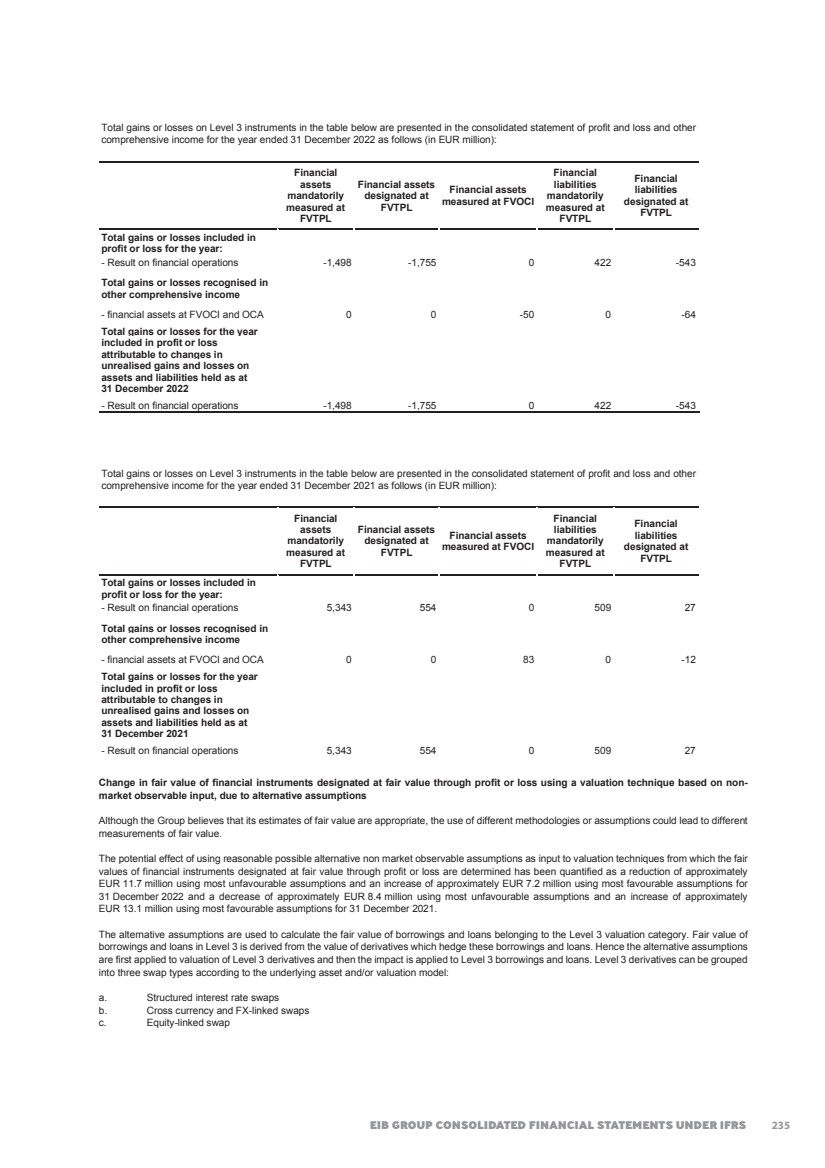
| 2022 FINANCIAL REPORT 243 Structured interest rate swaps with CMS rates as underlyings are modelled with the dynamics of a multi-factor Libor Market Model (LMM), calibrated using swaptions and spread options, where a ‘vol-of-vol’ parameter is exogenously specified, while those with IBOR/RFR rates as underlying are modelled with the dynamics of a Hull-White 1 factor model (HW1F), calibrated using swaptions and a mean reversion parameter exogenously specified. Cross currency and FX-linked swaps are valued according to Hull-White 1 factor model for interest rates modelling while FX rates are modelled according to the Black Scholes model. The model is calibrated to interest rates, swaptions volatilities, FX rates, FX option volatilities and correlations between interest and FX rates. Category (c) consists of one large position in an equity swap, embedded in which is an Asian call option. The value of the optionality is heavily affected by the dividends and volatilities, which have to be proxied. Financial assets designated at fair value through profit or loss The financial assets designated at fair value through profit or loss include the portfolio of loans and loan substitutes hedged by Interest Rate Swaps and Currency Swaps that are not eligible for hedge accounting. The maximum credit exposure of the disbursed loans and advances to credit institutions and customers (including loan substitutes) designated at fair value through profit or loss amounts to EUR 10,634 million (2021: EUR 12,264 million). The cumulative change in the fair value of the loans and loan substitutes attributable to change in credit risk of the Group’s counterparts amounts to a loss of EUR 103.2 million (2021: loss of EUR 156.5 million). The changes in fair value of financial assets designated at fair value through profit or loss attributable to changes in credit risk have been calculated by determining the change in the Expected Credit Loss on these loans and loan substitutes. No credit derivatives have been concluded to hedge the credit risk of the financial assets designated at fair value through profit or loss. Financial liabilities designated at fair value through profit or loss The financial liabilities designated at fair value through profit or loss comprise debts evidenced by certificates issued by the Group and hedged by Interest Rate Swaps and Currency Swaps. For the financial liabilities designated at FVTPL, the Group is required to present the effects of changes in that liability's credit risk in other comprehensive income. The following table sets out the required information for these financial liabilities for the financial year ended 31 December 2022: (in EUR million) Cumulative change in fair value attributable to changes in credit risk Transfer within equity during the period Realised amount due to derecognition during the period Difference between carrying amount and contractually required to pay at maturity Financial liabilities designated at FVTPL 306 -11 -11 -359 During the period, a cumulative gain of EUR 11 million related to the OCA has been transferred from "Fair value reserve" to the "Additional reserves" as a result of the early derecognition of the underlying "Debts evidenced by certificates". As a result the corresponding impact in the OCI for the period ended 31 December 2022 was EUR 231 million (2021: EUR 66 million). The following table sets out the required information for these financial liabilities for the financial year ended 31 December 2021: (in EUR million) Cumulative change in fair value attributable to changes in credit risk Transfer within equity during the period Realised amount due to derecognition during the period Difference between carrying amount and contractually required to pay at maturity Financial liabilities designated at FVTPL 86 0 -1 -2,537 The Group concluded that presenting the amount of change in own credit risk in OCI would reduce an accounting mismatch in profit or loss as there is no direct economic relationship between the credit risk characteristics of its borrowings designated at FVTPL and the hedging instruments. Offsetting financial assets and financial liabilities The disclosures set out in the tables below include financial assets and financial liabilities that are: • offset in the Group's consolidated balance sheet as per EIB Group accounting policy; or • subject to a currently legally enforceable master netting arrangement or similar agreement that covers similar financial instruments, irrespective of whether they are offset in the consolidated balance sheet. The similar agreements include global master repurchase agreements. Similar financial instruments include repurchase agreements and reverse repurchase agreements. Financial instruments such as loans and deposits are not disclosed in the tables below unless they are offset in the consolidated balance sheet. The Group's derivative transactions that are not transacted on an exchange are entered into under International Swaps and Derivatives Association (ISDA) Master Agreements. In general, under such agreements the amounts payable by each party on any day in respect of the same transaction and in the same currency are aggregated into a single net amount being payable by one party to the other. In certain circumstances, for example when an event of default occurs, all outstanding transactions under the agreement are terminated, the termination value is assessed and only a single net amount is payable in settlement of all transactions. 236 |
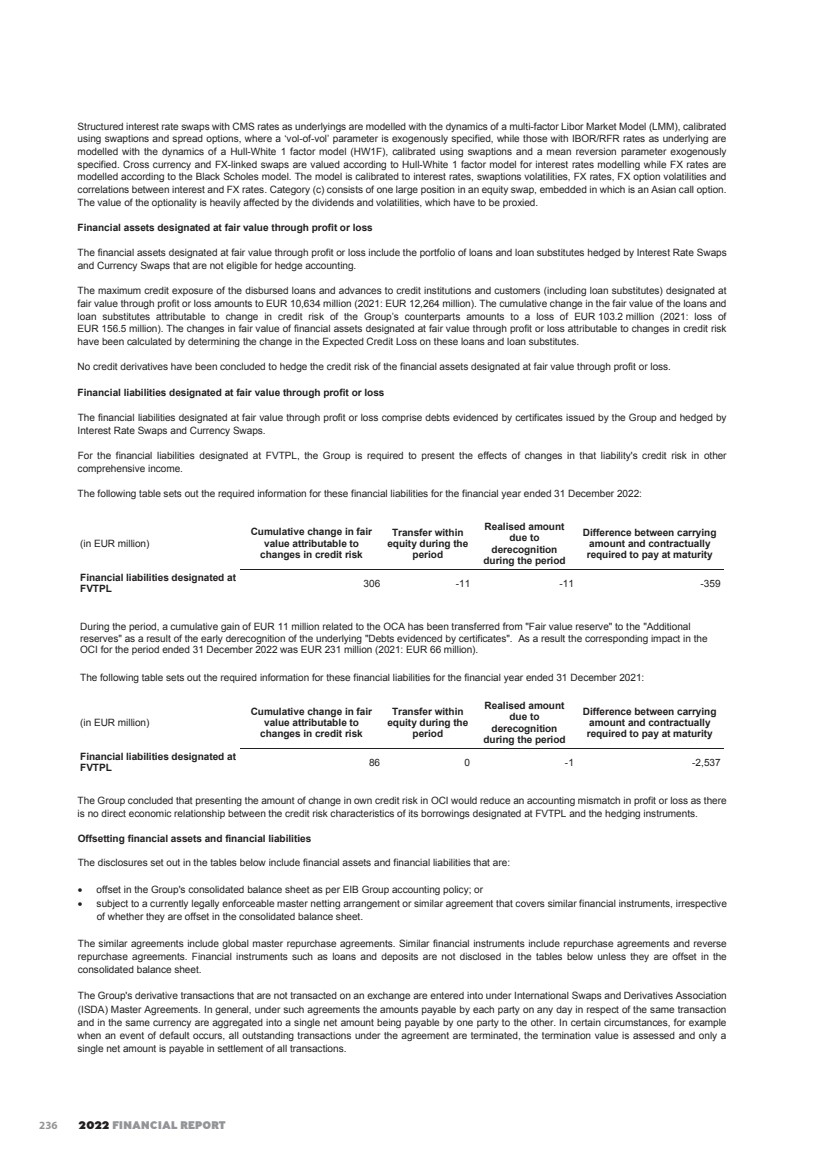
| EIB GROUP CONSOLIDATED FINANCIAL STATEMENTS UNDER IFRS 244 The Group's repurchase and reverse repurchase transactions are covered by master agreements with netting terms similar to those of ISDA Master Agreements. The above ISDA and similar master netting arrangements do not meet the criteria for offsetting in the consolidated balance sheet. This is because they create a right of set-off of recognised amounts that is enforceable only after termination of outstanding transactions following an event of default, including insolvency or bankruptcy, of either party. The Group receives and deposits collateral in the form of cash and marketable securities in respect of the following transactions: • derivatives; and • repurchase and reverse repurchase agreements. Collateral received in respect of OTC derivatives is subject to 1-way ISDA Credit Support Annexes. This means that securities received as collateral can be pledged or sold during the term of the transaction but must be returned on request of the counterparty, if the exposure to that counterparty decreases. The terms also give the Group the right to terminate the related transactions upon the counterparty’s failure to post collateral. Financial assets subject to offsetting, legally enforceable master netting arrangements and similar agreements (in EUR million) Related amounts not offset in the balance sheet 31 December 2022 Gross amounts of recognised financial assets Gross amounts of recognised financial liabilities offset in the balance sheet Net amounts of financial assets presented in the balance sheet Bonds Cash collateral received Net amount Financial assets: Derivative assets held for risk management 35,453 -438 35,015 4,531 2,371 28,113 Reverse repos 7,383 0 7,383 6,999 1 383 Financial Guarantees 400 -366 34 0 0 34 Total 43,236 -804 42,432 11,530 2,372 28,530 Related amounts not offset in the balance sheet 31 December 2021 Gross amounts of recognised financial assets Gross amounts of recognised financial liabilities offset in the balance sheet Net amounts of financial assets presented in the balance sheet Bonds Cash collateral received Net amount Financial assets: Derivative assets held for risk management 42,229 -498 41,731 10,624 4,775 26,332 Reverse repos 13,888 0 13,888 13,556 2 330 Financial Guarantees 830 -773 57 0 0 57 Total 56,947 -1,271 55,676 24,180 4,777 26,719 237 |
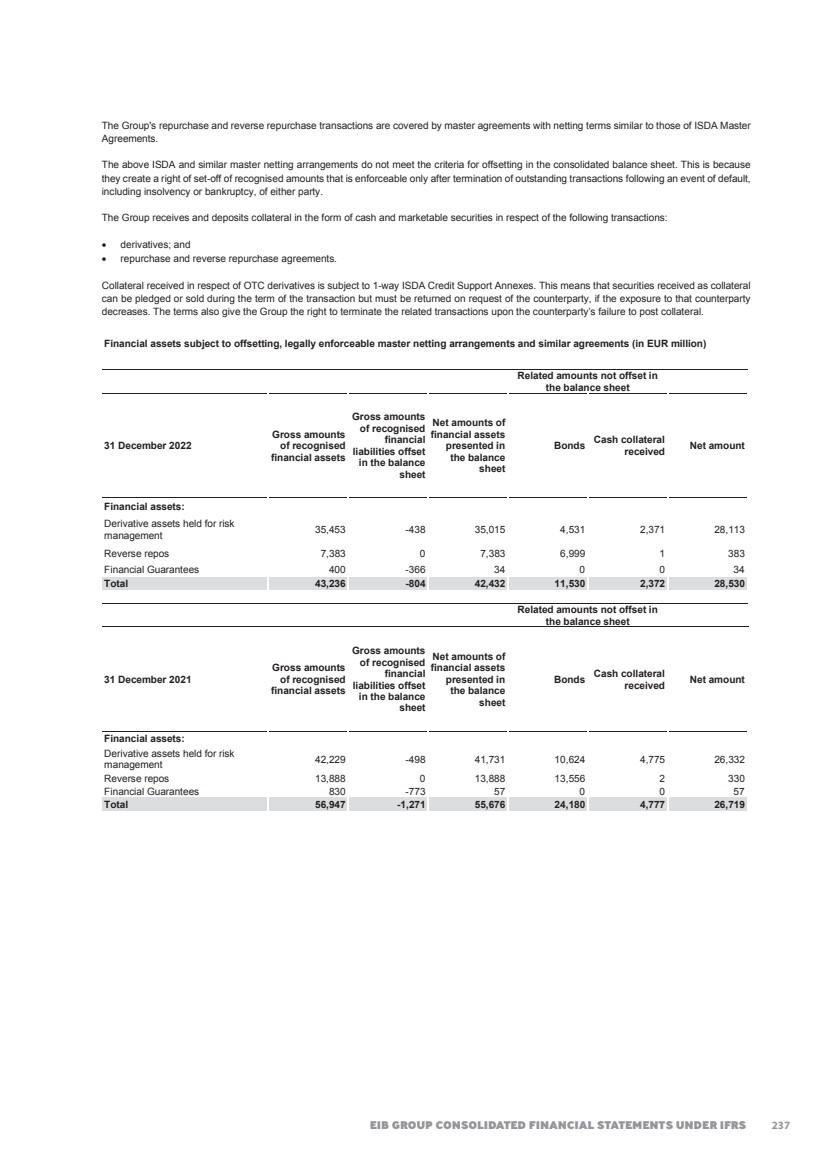
| 2022 FINANCIAL REPORT 245 Financial liabilities subject to offsetting, legally enforceable master netting arrangements and similar agreements (in EUR million) Related amounts not offset in the balance sheet 31 December 2022 Gross amounts of recognised financial liabilities Gross amounts of recognised financial assets offset in the balance sheet Net amounts of financial liabilities presented in the balance sheet Financial instruments Cash collateral pledged Net amount Financial liabilities: Derivative liabilities held for risk management 43,145 -19 43,126 0 0 43,126 Repos 3,066 0 3,066 3,054 0 12 Debts evidenced by certificates 407 -407 0 0 0 0 Financial Guarantees 529 -431 98 0 0 98 Total 47,147 -857 46,290 3,054 0 43,236 Related amounts not offset in the balance sheet 31 December 2021 Gross amounts of recognised financial liabilities Gross amounts of recognised financial assets offset in the balance sheet Net amounts of financial liabilities presented in the balance sheet Financial collateral Cash collateral pledged Net amount Financial liabilities: Derivative liabilities held for risk management 28,940 -29 28,911 0 0 28,911 Repos 5,711 0 5,711 5,711 0 0 Debts evidenced by certificates 453 -453 0 0 0 0 Financial Guarantees 276 -237 39 0 0 39 Total 35,380 -719 34,661 5,711 0 28,950 The gross amounts of financial assets and financial liabilities and their net amounts as presented in the balance sheet that are disclosed in the above tables are measured in the balance sheet on the following bases: • derivative assets and liabilities - fair value; • assets and liabilities resulting from sale and repurchase agreements, reverse sale and repurchase agreements and securities lending and borrowing - amortised cost or fair value; • loans and advances to customers - amortised cost or fair value; • amounts owed to customers - amortised cost; and • financial guarantee contracts (Note A.4.11.) 238 |
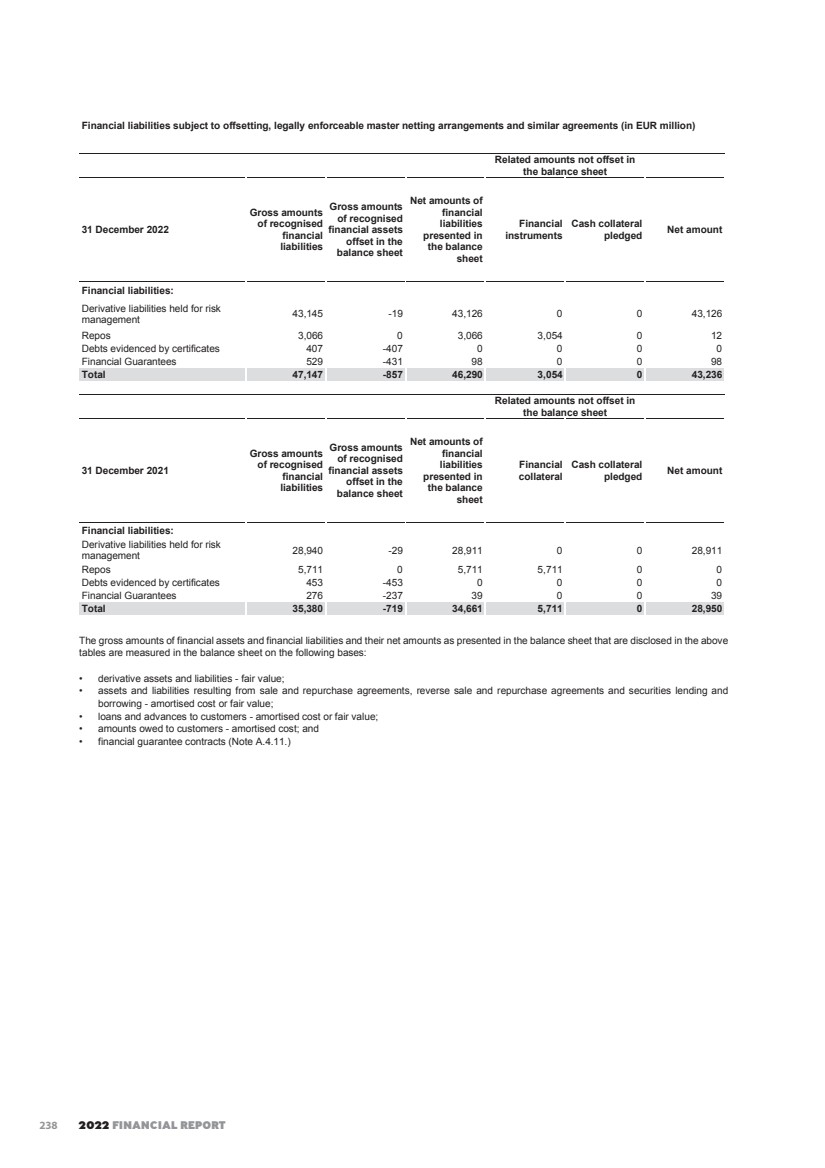
| EIB GROUP CONSOLIDATED FINANCIAL STATEMENTS UNDER IFRS 246 The amounts in the above tables that are offset in the balance sheet are measured on the same basis with the exemption of financial guarantee contracts (Note A.4.11.). The tables below reconcile the 'Net amounts of financial assets and financial liabilities presented in the balance sheet', as set out above, with the line items presented in the balance sheet or the respective captions in Note G (in EUR million). 31 December 2022 Net amounts Line item in consolidated balance sheet Carrying amount on consolidated balance sheet Financial assets not in scope of offsetting disclosures Financial assets: Derivative assets held for risk management 35,015 Derivative assets 35,044 29 Reverse repos 7,383 Loans and advances to credit institutions 156,794 149,411 Financial Guarantees 34 Other assets (Note G) 34 0 31 December 2022 Net amounts Line item in consolidated balance sheet Carrying amount on consolidated balance sheet Financial liabilities not in scope of offsetting disclosures Financial liabilities: Derivative liabilities held for risk management 43,126 Derivative liabilities 43,758 632 Repos 3,066 Amounts owed to credit institutions 5,443 2,377 Debts evidenced by certificates 0 Debts evidenced by certificates 417,418 417,418 Financial Guarantees 98 Provisions for guarantees and commitments / Other Liabilities (Note D.4) 98 0 31 December 2021 Net amounts Line item in consolidated balance sheet Carrying amount on consolidated balance sheet Financial assets not in scope of offsetting disclosures Financial assets: Derivative assets held for risk management 41,731 Derivative assets 41,734 3 Reverse repos 13,888 Loans and advances to credit institutions 170,147 156,259 Financial Guarantees 57 Other assets (Note G) 57 0 31 December 2021 Net amounts Line item in consolidated balance sheet Carrying amount on consolidated balance sheet Financial liabilities not in scope of offsetting disclosures Financial liabilities: Derivative liabilities held for risk management 28,911 Derivative liabilities 29,530 619 Repos 5,711 Amounts owed to credit institutions 23,572 17,861 Debts evidenced by certificates 0 Debts evidenced by certificates 473,903 473,903 Financial Guarantees 39 Provisions for guarantees and commitments / Other Liabilities (Note D.4) 39 0 239 |
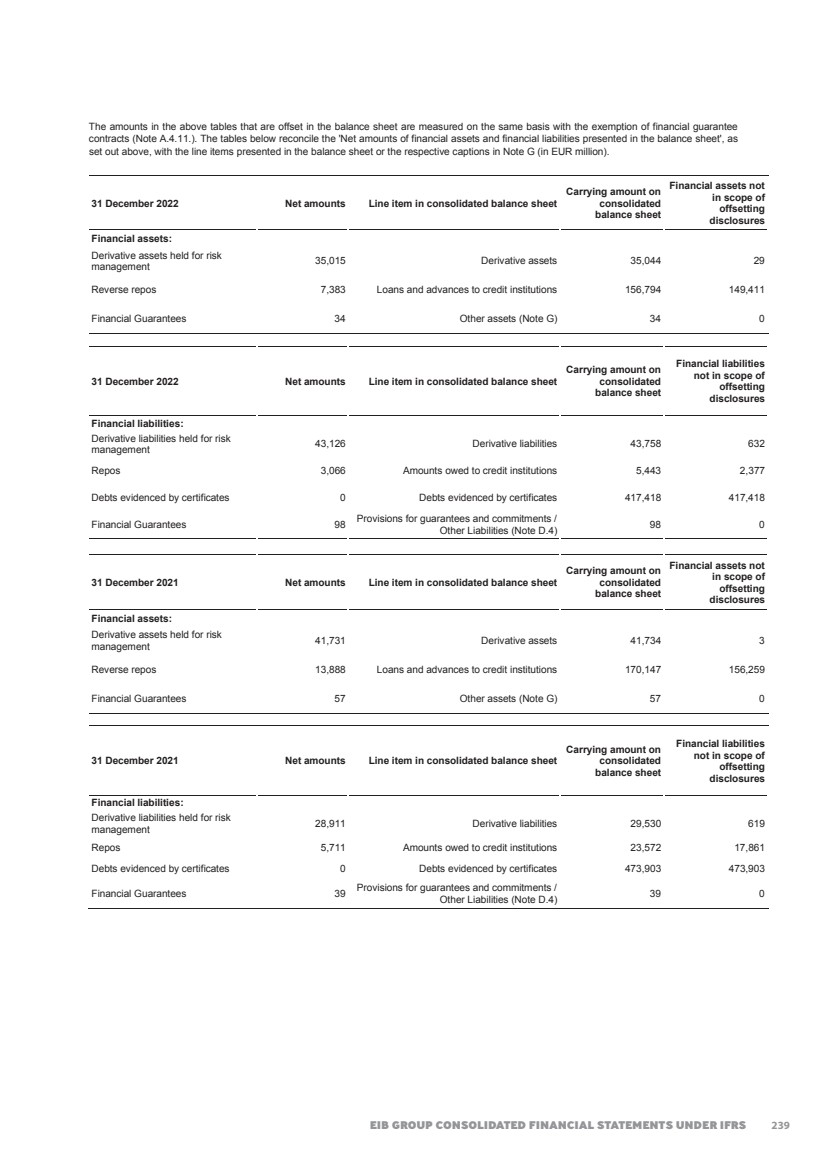
| 2022 FINANCIAL REPORT 247 Note S – Risk management This note presents information about the Group’s exposure to risks and their management and control, in particular the primary risks associated with its use of financial instruments. These are: • Credit risk - the risk of loss resulting from client or counterparty default and arising from credit exposure in all forms, including settlement risk3; • Interest rate risk - from the Group’s positions, the risk to the economic value or to the net interest income arising from adverse movements in interest rates that affect interest rates sensitive instruments. It includes gap risk, basis risk and option risk; • Liquidity and funding risk - the risk that the Group is unable to fund assets or meet obligations at a reasonable price or, in extreme situations, at any price; • Foreign exchange rate risk - the risk to the economic value or to the income derived from the Group’s positions due to adverse movements in currency exchange rates; and • Operational risk - the risk of loss resulting from inadequate or failed internal processes, people and systems or from external events4. In 2022, the staff was teleworking part of the time, including the teams dedicated to risk management and monitoring. With respect to such activities, the position keeping systems were available in remote mode to the staff of Front, Middle and Back Office, as well as to Risk Management, with the same functionalities available under normal conditions. S.1. Risk Management Organisation Each entity within the Group carries out its own management and control of risks. Risk management information presented in this note will distinguish between the Bank and the Fund. The high-level principles of the Group’s risk management are set out in the EIB Group Risk Management Charter, which is intended to provide Group-wide view of the Group’s risks and integrated approach to risk management. The Group has established a Group Risk Function under the responsibility of the Group Chief Risk Officer (‘GCRO’). Without prejudice to the statutory responsibilities of the President and the EIB Management Committee, respectively, the GCRO reports on Group Risks to the EIB Management Committee under the oversight of the MC member in charge of risk. On key risk policy matters related to Group Risks, the GCRO participates in all meetings of the EIB Management Committee and relevant meetings of the other EIB governing bodies, and is invited to relevant meetings of the EIF Board of Directors and to discussions with the EIF Management. The EIF reports on Group Risk matters to the EIB through the GCRO. Group Risk Appetite The risk appetite is the level of risk that the Group is willing and able to incur in pursuing its activities in the context of its public mission and objectives. Key to this is the Group’s capacity to provide attractive long-term financing to serve EU objectives across all EU Member States (and beyond in Partner Countries). A primary pillar of the Group’s business model is to retain the long-term AAA rating from the major rating agencies. The processes and activities performed by the Group to manage its risk appetite are formalised in the Group Risk Appetite Framework (‘RAF’) approved by the EIB BoD. The Group RAF covers the major financial risks (including credit, liquidity, market and treasury risks) and non-financial risks categories: (i) operational (e.g.: people, information security, financial crime, technology, fraud, compliance and model risks) and (ii) other (e.g.: climate change and environmental and reputational risks). It helps to embed a healthy organisational risk culture within the Group through the implementation and the monitoring of measurable risk appetite metrics, which are subject to risk limits and (where applicable) cascaded further down within the Group entities. As a public institution, the Group does not aim to make profits from speculative exposures to risks. As a consequence, the Group does not consider its treasury or funding activities as profit maximising centres. Investment activities are conducted within the primary objective of protection of the capital invested. S.1.1. Risk Management Organisation of the Bank Extending from the principles set out in the Group Risk Appetite Framework, the Bank’s objective is also to analyse and manage risks so as to obtain the strongest possible protection for its assets, its financial result, and consequently its capital. While the Bank is generally not subject to legislative acts and guidelines applicable to commercial banks issued or adopted by the EU institutions, bodies and agencies, (“EU Legislative Acts and Guidelines”), it has voluntarily decided to comply with these EU Legislative Acts and Guidelines to the extent determined by its Best Banking Practice framework including the Best Banking Practice Guiding Principles published by the Bank. Within the Bank, the Group Risk and Compliance Directorate (‘GR&C’) independently identifies, assesses, monitors and reports credit, market, liquidity and funding and operational risks to which the Bank is exposed. In order to preserve segregation of duties and in accordance with the three lines of defence principle, GR&C is independent from the Front Offices and provides second opinions on all proposals having risk implications. The following sections disclose the credit, market, liquidity and funding and operational risks to which the Bank is exposed on its activities performed at own risk. For additional details, please refer to the EIB Group Risk Management Disclosure Report. 3 Settlement risk is defined as the risk of potential losses due to transactions which remain unsettled after their due delivery date and/or due to transactions that are settled later than the applicable market standard. Due to the nature of the Group’s operations, the most relevant instruments affected by settlement risk are those derivatives entered into by the Bank which imply an exchange of foreign currencies. Settlement risk management is covered in the Financial Risk Guidelines. 4 The definition of external events excludes cases of client bankruptcy or unfavourable market movements or similar events, which represent triggers for Credit and respectively Market Risk. 240 |
| EIB GROUP CONSOLIDATED FINANCIAL STATEMENTS UNDER IFRS 248 S.1.1.1 Risk measurement and reporting system The Bank aligns its risk management systems to changing economic conditions and evolving regulatory standards. It adapts them on an on-going basis as market practice develops. Systems are in place to control and report on the main risks inherent in the Bank’s operations, i.e. credit, interest rate, liquidity and funding, foreign exchange rate and non-financial risks. With the purpose to quantify their impact on the Bank’s solvency, liquidity, earnings and operations, risks are assessed and measured both under normal circumstances and under possible stressed conditions. Risk measurements consider the relevant metrics related to capitalisation, earnings, liquidity, exposure to market and operational risks. Information on credit, market, liquidity, financial and operational risks is reported to the Management Committee and to the Board of Directors on a monthly basis. Such information is presented and explained to the Management Committee and to the Board of Directors’ Risk Policy Committee on a regular basis. The Bank has a framework in place for managing interest rate (‘IR’) risk (gap and basis risks5), as well as FX risk. The Bank monitors and manages on a daily basis its IR & FX positions within the pre-approved limits. All new types of transactions introducing operational or financial risks must be authorised by the Management Committee (‘MC’), after the approval of the New Products Committee (‘NPC’). S.1.1.2. Sustainability of revenue and self-financing capacity The Bank’s Interest Rate Risk Strategy forms an integral part of the Bank’s overall financial risk management. It reflects the expectations of the main stakeholders of the Bank in terms of stability of earnings, preservation of the economic value of own funds, and the self-financing of the Bank’s growth in the long term. To achieve these aims, the Interest Rate Risk Strategy considers a medium-to-long term horizon for the investment of the Bank’s own funds, in order to promote stability of revenues and to enhance overall returns. In practice, this is achieved by defining an investment profile producing a target duration for the Bank’s own funds between 4.5 and 5.5 years. In that context, the Asset/Liability Committee (‘ALCO’) performs regular checkpoints on the investment profile related to the Interest Rate Risk Strategy framework. S.1.2. Risk Management Organisation of the Fund (‘EIF’) The mandate of the Fund is to support small and mid-size enterprises (‘SME’) finance for start-up, growth and development within the European Union objectives for SME. Most of the Private Equity (‘PE’), Venture Capital and Portfolio Guarantees, Securitisation & Microfinance (‘GSM’) operations for both entities of the Group are managed by the Fund. The Fund aligns its risk management systems to changing economic conditions. Credit, market, liquidity and operational risk systems are in place to control and report on the main risks inherent in its operations. The Fund maintains robust risk policies and methodologies to ensure the Fund’s risk profile is within the parameters set out in its risk appetite framework. Risk management is embedded in the corporate culture of EIF, based on a three-lines-of-defence model permeating all areas of EIF’s business functions and processes: (i) front office, (ii) independent risk functions and (iii) internal and external audit. Investment and Risk Committees (‘IRCs’) chaired by the Head of General Secretariat advise the Chief Executive and the Deputy Chief Executive on each and every transaction. Portfolio IRCs regular meetings, chaired by the Chief Risk Officer, oversee risk and investment-related aspects of the EIF portfolio, inter alia: approving transaction rating/grading changes, impairment and provisioning actions, relevant market risk events and potential stress testing. Risk and Portfolio Management actions form part of the assurance process presided by the EIF Audit Board. Moreover, within the EIB Group context, the Fund’s Risk Management Department operates in regular contact with the Group Risk and Compliance Directorate, particularly with regard to the Group Risk Management Charter and to the Group risk exposure relating to guarantee and securitisation operations, and Private Equity operations under the Bank’s Risk Capital Resources mandate (‘RCR’), the different windows under the Bank’s EIB Group Risk Enhancement Mandate (‘EREM’) and general EIF policy matters. The Fund’s treasury management has been fully outsourced to the Bank under a treasury management agreement signed by both parties and mandating the responsible EIB services to perform selection, execution, settlement and monitoring of transactions. Management follows treasury guidelines annexed to the agreement. Operational short-term liquidity management is conducted by EIF. S.1.2.1. Risk assessment private equity Under its private equity operations, the Fund has a fund-of-funds approach, taking mostly minority equity participations in business angels, venture capital, private equity and mezzanine funds managed by mostly independent teams in order to leverage further commitments from a wide range of investors. The Fund’s PE operations include investments in venture capital funds across all investment stages (seed, early-stages, late stages, growth, etc.) but also investments in mid-market funds or mezzanine funds, which, generally speaking, have a lower risk profile. Over the last years, the Fund has developed a tool-set to design, manage and monitor portfolios of PE funds tailored to the dynamics of this market place. This tool-set is based on an internal model, the Grading-based Economic Model (‘GEM’), which allows the Fund to better assess and verify each funds’ but also each portfolio of funds’ valuations, risks and expected future cash flows and performances. Before committing to a PE fund, the Fund assigns an Equity score which is based on the outcome of an extensive due diligence performed by the Fund’s transaction team and reviewed by its risk management team. The funds are monitored by the Fund’s transaction team with a frequency and intensity depending on the underlying level of risk and Equity scores are annually reviewed by the Fund’s risk management team. 5 The exposure to ‘option risk’ was not material in 2022. 241 |
| 2022 FINANCIAL REPORT 249 These efforts, supported by the development of a proprietary IT system and an integrated software (front to back), improve the investment decision-making process and the management of the portfolio’s financial risks and of liquidity, in particular enabling forward-looking and stress-test based decision making. S.1.2.2. Risk assessment guarantees and securitisations The Fund extends portfolio guarantees to financial intermediaries involved in SME financing and participates in SME securitisation transactions. By taking on these risks, it facilitates access to funding and/or reduces the cost of capital for the originators, and, in turn, it improves the conditions and facilitates access to finance to SMEs. For its guarantee & securitisation business, over the last years, the Fund has developed internal methodologies and models to analyse portfolio guarantees and structured finance transactions in line with best market practices. Before the Fund enters legally into a guarantee transaction, an internal rating is assigned to each new own risk guarantee transaction in accordance with the Fund’s internal methodology. The rating is based on internal models, which analyse and summarise the transaction’s credit quality (expected loss concept), considering not only quantitative parameters but also qualitative aspects. A four-eye principle applies throughout the process, with actions initiated by the front office and reviewed by Risk Management. Guarantee transactions are monitored regularly, at least quarterly; their statuses are regularly reviewed by EIF IRCs which, depending on their performances, may lead to a review of their internal ratings. This latter process is initiated by Risk Management and reviewed by the front office. The guarantees portfolio is valued according to a mark-to model approach under the IFRS principles. The main impact on the valuation of the transactions in the portfolio stems from the changes in the point in time cumulative default rate assumptions used for the assets. The EIF’s monitoring follows potential negative or positive rating migrations and provides the basis for appropriate management or transactions. The Fund’s stress testing methodology for guarantees and securitisations is applied at the outset of a transaction and throughout the life of the portfolio and is integrated in the EIB Group Stress Testing activities. S.2. Credit risk S.2.1. Credit risk policies Credit risk concerns mainly the Group’s lending activities, treasury instruments such as debt securities, certificates of deposit and interbank term deposits as well as the derivative and guarantee transactions of the Group. Credit risk within the Bank is managed in line with detailed internal guidelines. The purpose of these guidelines is to ensure that credit risk is managed prudently. Whether or not a given entity is acceptable to the Bank as a counterpart in a lending operation is determined on the basis of a careful analysis and evaluation of the entity using quantitative and qualitative metrics but also relying on experience and expert judgment. The guidelines set out minimum credit quality levels for both borrowers and guarantors in lending operations and identify the acceptable transaction structure. They also detail the minimum requirements that loan contracts must meet in terms of key legal clauses and other contractual stipulations to ensure that the Bank's position is adequately safeguarded. Diversification of the loan portfolio is supported by a counterparty limit framework and sector limits for key industries. In order to ensure that the additional risk involved in complex or structured lending transactions is adequately analysed, quantified and mitigated, specific detailed guidelines have been developed in respect of certain types of operations complementing the general guidelines. In analysing risks, the Bank applies an internal loan grading system and assigns internal ratings to counterparts. The Fund manages exposures and risks in the frame of conservative policies deriving from statutory provisions and credit risk operational guidelines approved by the Fund’s Board of Directors or guidelines as set out under mandates. Credit guidelines undergo periodic adaptations to incorporate evolving operational circumstances, changes in the applicable Best Banking Principles and respond to new mandates that the Group may receive. 242 |
| EIB GROUP CONSOLIDATED FINANCIAL STATEMENTS UNDER IFRS 250 S.2.2. Credit risk exposure and allowances to credit risk S.2.2.1. Maximum exposure to credit risk without taking into account any collateral and other credit enhancements The table below shows the maximum exposure to credit risk for the components of the consolidated balance sheet, including derivatives. The maximum exposure is shown gross, before the effect of mitigation through the use of collateral agreements (Note S.2.3.4). Maximum exposure (in EUR million) 31.12.2022 31.12.2021 Financial assets: Financial assets measured at AC 491,565 536,283 Financial assets mandatorily measured at FVTPL 6,435 8,846 Derivative assets held for risk management 35,044 41,734 Financial assets designated at FVTPL 13,415 17,315 Total 546,459 604,178 Off-balance-sheet: Contingent liabilities and guarantees 31,931 30,901 Commitments - Undisbursed loans 124,032 122,977 Total 155,963 153,878 Total credit risk exposure(*) 702,422 758,056 (*) Exposures on equity investments have been excluded as they carry no credit risk. Prior year figures have been updated for comparative purposes. S.2.2.2 Summary of credit risk allowances The following tables show the breakdown of the credit risk allowances under the ECL IFRS 9 model for financial assets measured at amortised cost and the off-balance sheet commitments. 2022 12-month ECL Lifetime ECL not credit - impaired Lifetime ECL impaired Total Financial assets measured at amortised cost Loans and advances to credit institutions and customers (D.2.) 36,231 163,850 128,302 328,383 Treasury bills and debt securities portfolios (B.2.) 1,174 3,378 0 4,552 Off-Balance sheet commitments Financial Guarantees (D.4.) 88,589 134 9,332 98,055 Loan commitments measured at amortised cost (D.2.) 12,820 26,110 275 39,205 Loss allowance / Provision 138,814 193,472 137,909 470,195 2021 12-month ECL Lifetime ECL not credit - impaired Lifetime ECL impaired Total Financial assets measured at amortised cost Loans and advances to credit institutions and customers (D.2.) 17,149 125,994 220,342 363,485 Treasury bills and debt securities portfolios (B.2.) 374 5,416 0 5,790 Off-Balance sheet commitments Financial Guarantees (D.4.) 29,675 203 9,451 39,329 Loan commitments measured at amortised cost (D.2.) 3,466 26,519 3,101 33,086 Loss allowance / Provision 50,664 158,132 232,894 441,690 The allowances also include the impact triggered from the recalibration of the Credit Cycle, point-in time (PIT) Probability of Default (PD) and PIT Loss Given Default (LGD) models. The recalibration resulted in an immaterial impact for both, undisbursed and disbursed loans. 243 |
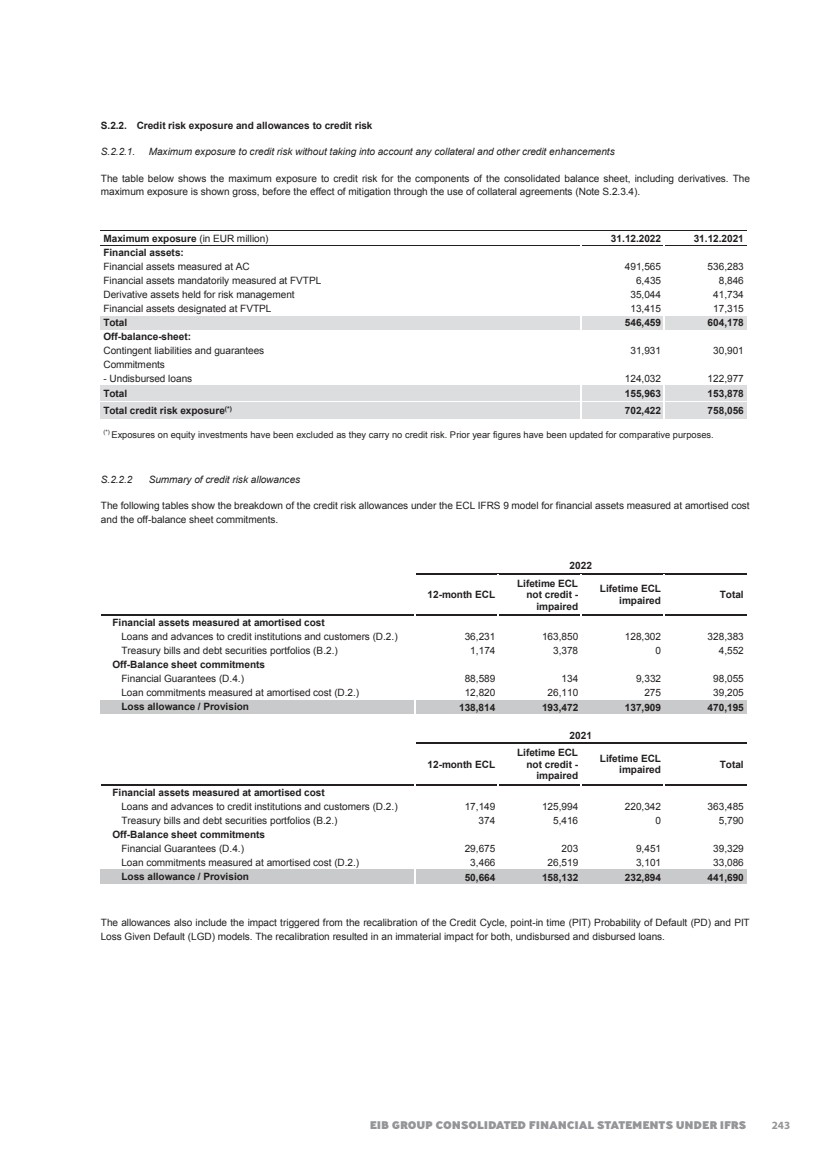
| 2022 FINANCIAL REPORT 251 S.2.3. Credit risk on loans S.2.3.1. Credit risk measurement for loans and advances to credit institutions and customers An internal loan grading system (based on the expected loss methodology) is implemented for lending operations. This is an important part of the loan appraisal process and of credit risk monitoring, as well as providing a reference point for pricing credit risk when appropriate. The loan grading (‘LG’) system comprises the methodologies, processes, databases and IT systems supporting the assessment of credit risk in lending operations and the quantification of expected loss estimates. It summarises a large amount of information with the purpose of offering a relative ranking of loans’ credit risks. LG reflects the present value of the estimated level of the lifetime “expected loss”, this being the Net Present Value of the product of the probability of default, the loan exposure at risk and the loss given default. LG is used for the following purposes: • as an aid to a finer and more quantitative assessment of lending risks; • as indicator of credit risk variations for the purposes of prioritising monitoring efforts; • as a description of the loan’s portfolio quality at a given date; • as a benchmark for calculating the annual additions to the General loan reserve and Special Activities Reserve; and • as an input in risk-pricing decisions. The following factors are used to determine a LG: i) The borrower’s creditworthiness: GR&C independently reviews borrowers and assesses their creditworthiness based on internal methodologies and external data. In line with the Basel III Internal Ratings Based Approach chosen, the Bank has developed an internal rating methodology (‘IRM’) to determine the internal ratings of borrowers and guarantors. This is based on a set of scoring sheets specific to defined counterparty types. ii) The default correlation: it quantifies the chances of simultaneous financial difficulties arising for both the borrower and the guarantor. The higher the correlation between the borrower and the guarantor’s default, the lower the value of the guarantee and therefore the lower (worse) the LG. iii) The value of guarantee instruments and of securities: this value is assessed on the basis of the combination of the issuer’s creditworthiness and the type of instrument used. iv)The applicable recovery rate: being the amount assumed to be recovered following a default by the relevant counterpart expressed as a percentage of the relevant loan exposure. v) The contractual framework: a sound contractual framework will add to the loan’s quality and enhance its LG. vi)The duration of the loan or, more generally, the cash-flows of the loan: all else being equal, the longer the loan, the higher the risk of incurring difficulties in the servicing of the loan. A loan's expected loss is computed by combining the six elements above and determines the fair value of loans which meet the eligibility criteria of the amended fair value option and which have been designated on initial recognition at fair value through profit or loss. Depending on the level of this expected loss, a loan is assigned to one of the following LG classes listed below. “A0” comprising EU sovereign "risks” that is loans granted to, or fully, explicitly and unconditionally guaranteed by, Member States where no repayment difficulties are expected (i.e. expected loss of 0% (based on the Bank’s preferred creditor status and statutory protection which are deemed to assure a full recovery of the Bank’s assets upon maturity) as well as loans with a comprehensive EU or MS guarantee. “A” comprising loans granted to (or guaranteed by) entities other than EU Member States in respect of which there is no or only limited expectation of deterioration in quality over their term. “B” High quality loans: these represent an asset class with which the EIB feels comfortable, although a minor deterioration is not ruled out in the future. B+ and B- are used to denote the relative likelihood of the possibility of such deterioration occurring. “C” Good quality loans: an example could be "single-signature" (unsecured) loans to solid corporates (e.g. equivalent internal rating of Baa1/BBB+), with a reasonable maturity and adequate protective clauses. “D” This grading class represents (aside from loans initially approved at this level) the borderline exposure that have a risk profile generally accepted by the Bank. This watershed in loan grading is more precisely determined by the sub-classifications D+ and D-. “E” includes loans that (aside from Special Activity operations initially approved at these levels), in the course of their lives, have experienced severe problems and their sliding into a situation of loss cannot be excluded. The sub-classes E+ and E- further differentiate the risk profile of the loans, with those operations graded E- being in a position where there is a strong possibility that debt service cannot be maintained on a timely basis and therefore some form of debt restructuring is required, possibly leading to an impairment loss. “F” (fail) denotes loans representing unacceptable risks. F-graded loans can only arise out of outstanding transactions that have experienced unforeseen, exceptional and dramatic adverse circumstances after signature. Operations where there is a loss of principle to the Bank will be graded F and specific provisions is applied. The Group’s assessment of the IFRS9 staging is based on a sequential approach which is using counterparty or instrument specific information consistent to internal guidelines and procedures. In addition to the deal-by-deal analysis of each loan, the EIB, also developed a portfolio view of credit exposures via its Economic Capital framework, integrating the concentration and correlation effects created by the dependence of various obligors on common risk factors. By adding a portfolio dimension of credit risks and by focussing on unexpected losses (i.e. losses which may occur on top of the expected ones up to a certain level of confidence), it is possible to complement the LG’s deal-by-deal approach and thus provide a finer and more comprehensive risk assessment of the credit risks in the EIB’s loan book. 244 |
| EIB GROUP CONSOLIDATED FINANCIAL STATEMENTS UNDER IFRS 252 The aggregate amount (outstanding of loans and guarantees granted by the Bank) is limited at any time by its Statutory Gearing Ratio (Article 16.5 of Statute). For the purpose of calculating this ratio the Bank uses data drawn from the EU Accounting Directives (‘AD’) framework. At year-end 2022 EIB’s Statutory Gearing Ratio under EU Accounting Directive stand-alone accounts stood at 204.0% (2021: 202.7%) and under EU-AD consolidated accounts stood at 207.8% (2021: 206.6%), (max. 250% under Article 16.5 of the Statute). S.2.3.2. Loans secured by Guarantees of the European Union or the Member States under External Lending Mandate, European Fund for Sustainable Development, Neighbourhood, Development and International Cooperation Instrument/European Fund for Sustainable Development Plus or Cotonou Agreement Loans signed for projects under the ELM, EFSD, NDICI/EFSD+ or Cotonou Agreement are secured by Guarantees of the European Union budget or the Member States (loans in the ACP Countries and the OCT). These Guarantees are either Comprehensive (covering all risks) or limited to defined Political Risks (non-transfer of currency, expropriation, war or civil disturbance, denial of justice upon breach of contract). In accordance with the terms of the Guarantees, the European Union and the Member States provide credit enhancements up to 65%, 70%, 75% and 100% of pool of signed6 operations in each portfolio. Under the comprehensive guarantees, the Group deems the credit risk associated to each individual loan as fully covered for the purpose of specific risks described above and therefore excludes them from the section S.2.3 (Credit risk on lending activities)7. The carrying value of the disbursed part of loans secured by Guarantees of the European Union or the Member States amounts to EUR 31,969 million as at 31 December 2022 (2021: EUR 31,428 million) and the undisbursed part amount to EUR 20,909 million as at 31 December 2022 (2021: EUR 20,753 million). These amounts also include loans granted to current European Union Member States but granted before their accession to the European Union and are guaranteed by the European Union or Member States. 6 Under the Guarantee Agreement with the Commission signed on 1 and 29 August 2007, all European Union guaranteed operations signed on and after 17 April 2007 shall be covered up to 65% of "the aggregate amount of credits disbursed". Credit enhancements are provided in the form of first-loss protection. The residual risk borne by the Group in connection with the portfolio of operations covered by such guarantee is managed in accordance with the EIB’s internal credit risk guidelines and procedures. 7 The exposures signed under the Guarantees of the European Union or the Member States for which the credit risk is deemed as fully covered amounts to EUR 50,739 million (2021: EUR 49,521 million). 245 |
| 2022 FINANCIAL REPORT 253 S.2.3.3. Analysis of lending credit risk exposure In detail, the tables below show the maximum exposure to credit risk on loans (the repayable on demand and other loans and advances to credit institutions and to customers are not included) signed and disbursed as well as the part of the exposure that has been signed but not disbursed yet for all exposure where the Group is at risk. Therefore, loans outside the European Union under the ELM, EFSD, NDICI/EFSD+ and Cotonou Agreement secured by the Comprehensive Guarantee of the European Union budget or the Member States are not included (Note S.2.3.2). 2022 Guarantor Not guaran-teed(1) Total disbursed Signed not (in EUR million) Corporates Banks disbursed Public institutions States Borrower Corporates 28,800 6,219 4,069 6,863 94,011 139,962 29,828 Banks 10,432 11,677 17,661 25,503 20,398 85,671 29,327 Public institutions 185 182 18,922 28,752 66,202 114,243 29,875 States 0 0 0 7 42,802 42,809 14,297 Total disbursed(2)(3)(4)(5) 39,417 18,078 40,652 61,125 223,413 382,685 Signed not disbursed(2)(3)(4)(5) 8,740 3,119 7,975 15,031 68,462 103,327 2021 Guarantor Not guaran-teed(1) Total disbursed Signed not (in EUR million) Corporates Banks disbursed Public institutions States Borrower Corporates 32,798 8,087 4,433 8,107 90,803 144,228 28,453 Banks 11,561 12,741 17,000 26,235 20,469 88,006 29,801 Public institutions 224 198 20,050 33,167 71,967 125,606 27,800 States 0 0 0 0 47,301 47,301 16,466 Total disbursed(2)(3)(4)(5) 44,583 21,026 41,483 67,509 230,540 405,141 Signed not disbursed(2)(3)(4)(5) 7,049 3,125 10,352 14,532 67,462 102,520 (1) These amounts include loans for which no formal guarantee independent from the borrower and the loan itself was required, the borrower’s level of solvency itself representing adequate security. In the event of certain occurrences, appropriate contractual clauses ensure the Group’s right to access independent security. (2) The loans in risk-sharing operations (credit enhanced by the Member States or the EU budget in the form of political risk guarantee) amount to EUR 2,139 million as of 31 December 2022 (2021: EUR 2,660 million). (3) These amounts do not include Loan substitutes (2022: EUR 17,162 million; 2021: EUR 17,970 million). (4) These amounts exclude loans to current European Union Member States but granted before their accession to the European Union and guaranteed by the European Union budget or the Member States. (5) The Group has signed, in the context of EFSI SME window agreement and European Guarantee Fund, funding lines for a total commitment not exceeding EUR 9,187 million (2021: EUR 9,187 million). The Group recognises an undisbursed exposure when a firm commitment is signed with the respective underlying risk counterpart, for which the funding line is expected to be drawn. Regarding the lending activities, the Group’s total direct exposure(8) to the banking sector amounts to EUR 114,998 million at the end of December 2022 (2021: EUR 117,807 million), which is equal to 23.7% (2021: 23.2%) of the total of EUR 486,012 million in loans disbursed and undisbursed as at 31 December 2022 (2021: EUR 507,661 million). Unsecured loans to corporates at the end of December 2022 amounted to EUR 114,891 million, (2021: EUR 113,362 million). Unsecured exposure to corporate clients is managed as per a dedicated framework. S.2.3.3.1. Credit quality on loans Loans internally graded9 A to D+ represent 97.5% of the loan portfolio as at 31 December 2022, compared with 97.7% at 31 December 2021. The share of loans internally graded D- and below was 2.5% (2021: 2.3%) of the loan portfolio, corresponding to EUR 12.0 billion (2021: EUR 11.8 billion). Despite the general context of uncertainty and various risks resulting from the war in Ukraine, the credit quality of the loan portfolio is deemed stable at present. It relies on a risk management strategy based on a robust due diligence process, adequate levels of security and guarantees, as well as standard protective clauses included in its loan agreements. In addition to the collaterals and the guarantees provided for lending exposures, the EIB benefits of additional credit enhancements granted as part of different mandates. To mitigate credit risk, the Group uses, amongst others: • Guarantees issued by third parties of acceptable credit quality; • Financial collaterals; • Claims on revenues ; • Contractual clauses etc. 8 Including exposure signed but not disbursed yet. 9 Loan grading is reflecting the credit enhancement provided by external guarantors on a portfolio basis. 246 |
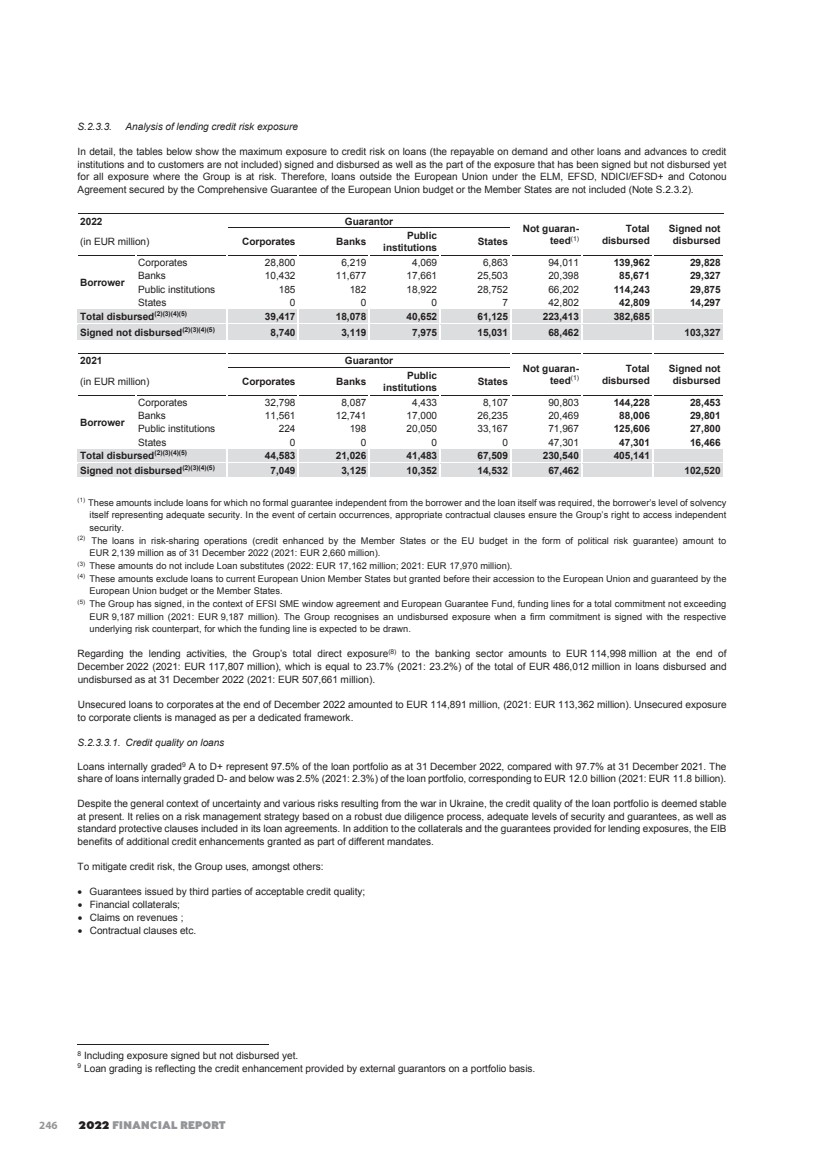
| EIB GROUP CONSOLIDATED FINANCIAL STATEMENTS UNDER IFRS 254 Credit quality analysis per type of borrower The tables below show the credit quality analysis of the Group’s loans portfolio as at 31 December 2022 and 31 December 2021 by the Loan Grading application, based on the exposures signed (disbursed and undisbursed). 2022 Sovereign High Grade Standard Grade Min. Accept. Risk High Risk Equity type risk Total ECL (in EUR million) A0 A to B- C D+ D- and below Disbursed loans Stage 1 91,349 216,800 22,226 7,419 1,872 n/a 339,666 36 Stage 2 3,863 13,134 2,268 3,852 2,649 n/a 25,766 164 Stage 3 89 924 0 0 974 n/a 1,987 129 Against FVTPL 1,304 9,192 1,829 138 724 2,079 15,266 n/a TOTAL 2022 96,605 240,050 26,323 11,409 6,219 2,079 382,685 329 2022 Sovereign High Grade Standard Grade Min. Accept. Risk High Risk Equity type risk Total ECL (in EUR million) A0 A to B- C D+ D- and below Undisbursed loans Stage 1 26,899 43,676 17,309 5,711 5,273 n/a 98,869 13 Stage 2 10 970 220 852 368 n/a 2,420 26 Stage 3 0 134 0 0 160 n/a 294 0 Against FVTPL 0 0 0 0 0 1,744 1,744 n/a TOTAL 2022 26,909 44,780 17,529 6,563 5,801 1,744 103,327 39 2021 Sovereign High Grade Standard Grade Min. Accept. Risk High Risk Equity type risk Total ECL (in EUR million) A0 A to B- C D+ D- and below Disbursed loans Stage 1 94,786 216,236 23,932 8,998 3,520 n/a 347,472 17 Stage 2 9,185 16,715 3,144 3,579 3,340 n/a 35,963 126 Stage 3 116 906 0 0 879 n/a 1,901 220 Against FVTPL 1,593 11,471 1,721 1,259 1,003 2,758 19,805 n/a TOTAL 2021 105,680 245,328 28,797 13,836 8,742 2,758 405,141 363 2021 Sovereign High Grade Standard Grade Min. Accept. Risk High Risk Equity type risk Total ECL (in EUR million) A0 A to B- C D+ D- and below Undisbursed loans Stage 1 27,059 42,320 16,507 9,014 2,154 n/a 97,054 3 Stage 2 110 1,558 470 404 852 n/a 3,394 27 Stage 3 35 174 0 0 62 n/a 271 3 Against FVTPL 0 127 95 0 0 1,579 1,801 n/a TOTAL 2021 27,204 44,179 17,072 9,418 3,068 1,579 102,520 33 Credit risk exposure for each internal risk rating The Group uses an internal rating methodology in line with the Internal ratings based approach as per European prudential regulatory framework. The majority of the Group’s counterparties have been assigned an internal rating according to this methodology. The table below shows a breakdown of the Group’s loan portfolio by the better of the borrower’s or guarantor’s internal ratings, where available. In cases where an internal rating is not available, the external rating has been used for this analysis. The table shows both the exposures signed (disbursed and undisbursed), based on an internal methodology that the Group uses for limit management. 247 |
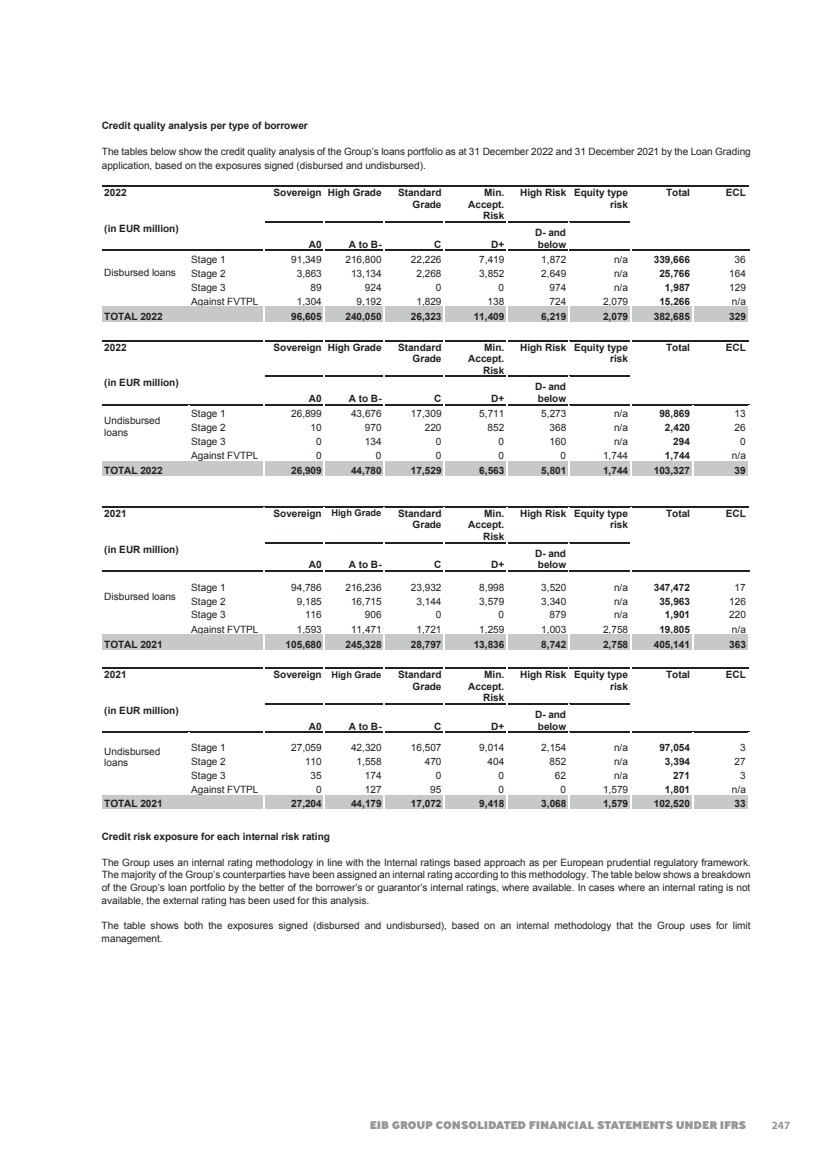
| 2022 FINANCIAL REPORT 255 2022 (in EUR million) 12-month ECL measured at AC Lifetime ECL not credit-impaired measured at AC Lifetime ECL credit-impaired measured at AC FVTPL Total Loans and advances to credit institutions and customers Internal Rating 1 - minimal credit risk 5,624 248 58 0 5,930 Internal Rating 2 - very low credit risk 50,646 1,111 88 1,700 53,545 Internal Rating 3 - low credit risk 116,448 1,896 25 963 119,332 Internal Rating 4 - moderate credit risk 133,702 3,992 129 8,011 145,834 Internal Rating 5 - financially weak counterpart 31,447 13,254 0 1,701 46,402 Internal Rating 6 - high credit risk 1,799 4,948 0 701 7,448 Internal Rating 7 - very high credit risk 0 317 17 0 334 Internal Rating 8 - counterpart in default 0 0 1,670 111 1,781 Loans and advances to credit institutions and customers measured at FVTPL n/a n/a n/a 2,079 2,079 Carrying amount 339,666 25,766 1,987 15,266 382,685 Loss allowance -36 -164 -129 n/a -329 Loan commitments Internal Rating 1 - minimal credit risk 3,295 0 0 0 3,295 Internal Rating 2 - very low credit risk 13,904 0 0 0 13,904 Internal Rating 3 - low credit risk 30,296 175 0 0 30,471 Internal Rating 4 - moderate credit risk 35,304 428 28 0 35,760 Internal Rating 5 - financially weak counterpart 13,781 1,339 0 0 15,120 Internal Rating 6 - high credit risk 2,289 424 0 0 2,713 Internal Rating 7 - very high credit risk 0 54 5 0 59 Internal Rating 8 - counterpart in default 0 0 261 0 261 FVTPL n/a n/a n/a 1,744 1,744 Carrying amount 98,869 2,420 294 1,744 103,327 Loss allowance -13 -26 0 n/a -39 2021 (in EUR million) 12-month ECL measured at AC Lifetime ECL not credit-impaired measured at AC Lifetime ECL credit-impaired measured at AC FVTPL Total Loans and advances to credit institutions and customers Internal Rating 1 - minimal credit risk 5,567 270 70 0 5,907 Internal Rating 2 - very low credit risk 53,484 1,459 78 2,172 57,193 Internal Rating 3 - low credit risk 124,570 5,626 16 1,537 131,749 Internal Rating 4 - moderate credit risk 130,427 5,642 181 9,864 146,114 Internal Rating 5 - financially weak counterpart 31,027 17,300 0 2,004 50,331 Internal Rating 6 - high credit risk 2,381 5,314 1 1,331 9,027 Internal Rating 7 - very high credit risk 16 352 0 0 368 Internal Rating 8 - counterpart in default 0 0 1,555 139 1,694 Loans and advances to credit institutions and customers measured at FVTPL n/a n/a n/a 2,758 2,758 Carrying amount 347,472 35,963 1,901 19,805 405,141 Loss allowance -17 -126 -220 n/a -363 Loan commitments Internal Rating 1 - minimal credit risk 2,783 0 0 0 2,783 Internal Rating 2 - very low credit risk 14,920 60 0 0 14,980 Internal Rating 3 - low credit risk 27,664 425 0 0 28,089 Internal Rating 4 - moderate credit risk 37,803 561 95 95 38,554 Internal Rating 5 - financially weak counterpart 11,117 1,822 0 127 13,066 Internal Rating 6 - high credit risk 2,767 93 0 0 2,860 Internal Rating 7 - very high credit risk 0 433 0 0 433 Internal Rating 8 - counterpart in default 0 0 176 0 176 FVTPL n/a n/a n/a 1,579 1,579 Carrying amount 97,054 3,394 271 1,801 102,520 Loss allowance -3 -27 -3 n/a -33 248 |
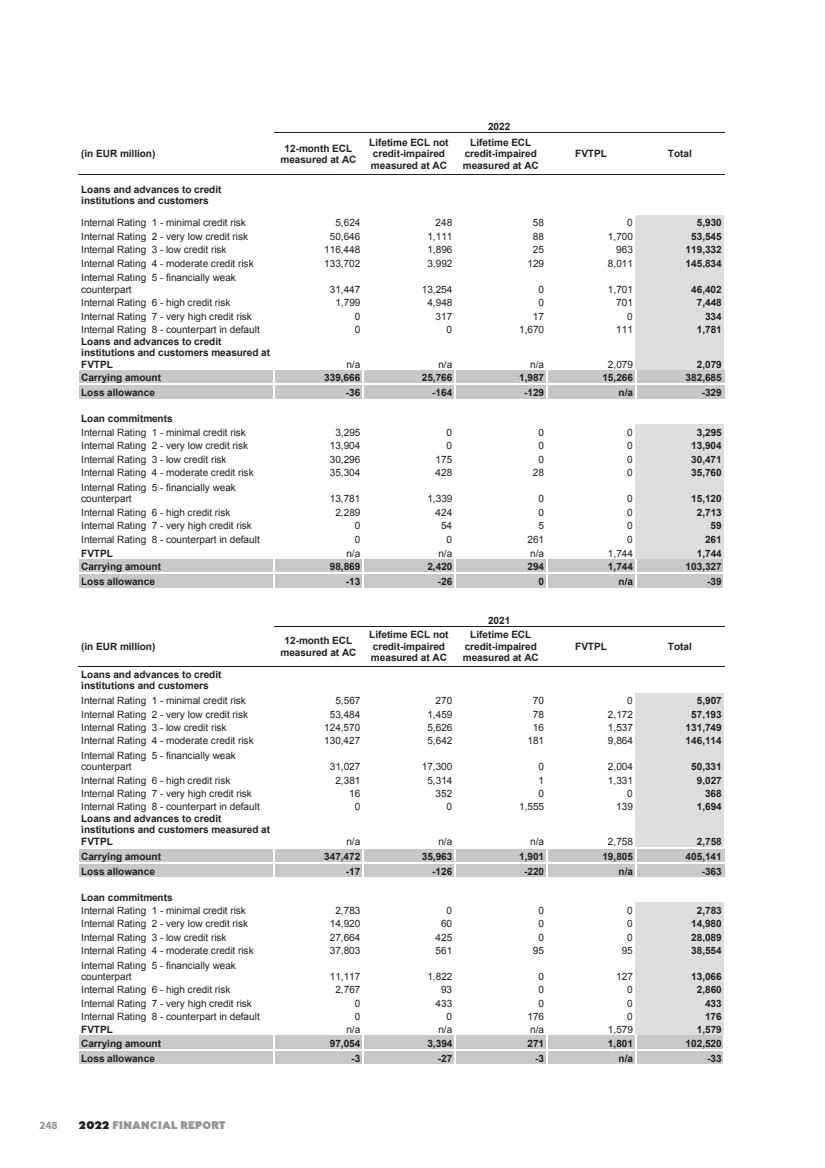
| EIB GROUP CONSOLIDATED FINANCIAL STATEMENTS UNDER IFRS 256 The Group continually monitors events affecting its borrowers and guarantors. In particular, the Group is assessing on a case by case basis its contractual rights in case of rating deterioration and is seeking mitigating measures. It is also closely following the renewals of bank guarantees received for its loans to ensure that these are replaced or action is taken in a timely manner if need be. The Group did not record impairments in respect of its EU sovereign and EU sovereign guaranteed exposure as at year-end as the preferred creditor status of the Bank as well as of the EIF and the protection given by the Bank’s Statute are deemed to guarantee a full recovery of the Group’s assets on maturity. The table below discloses information regarding the sovereign credit risk on loans (apart from loans outside the EU benefiting from comprehensive EU budget or MS guarantees under the ELM, EFSD, NDICI/EFSD+ and Cotonou Agreements), where the Group has either full own risk or bears a residual risk due to credit enhancement (“risk portfolio”): (in EUR million) 2022 2021 Acting as borrower Acting as guarantor Acting as borrower Acting as guarantor Country Disbursed Undisbursed Signed Disbursed Undisbursed Signed Austria 0 0 190 0 0 146 Belgium 0 0 273 0 0 191 Bulgaria 1,046 0 120 1,175 0 115 Croatia 807 0 2,242 657 210 2,713 Cyprus 926 509 1,032 905 359 1,348 Czech Republic 911 1,009 0 1,065 784 0 Denmark 0 0 242 0 0 270 Estonia 502 0 84 452 120 91 Finland 0 0 113 0 0 92 France 0 0 3,401 0 0 3,489 Germany 0 0 1,999 0 0 1,668 Greece 7,046 1,210 9,205 8,821 1,192 9,278 Hungary 5,321 1,351 1,041 6,038 1,143 1,096 Ireland 1,546 240 1,098 1,680 0 1,179 Italy 4,613 2,560 6,698 4,934 2,160 6,497 Latvia 265 200 6 374 400 12 Lithuania 1,837 0 55 2,102 0 54 Luxembourg 0 9 232 151 0 240 Malta 0 72 281 0 72 311 Netherlands 0 0 294 0 0 205 Poland 6,341 330 17,734 6,357 1,472 18,199 Portugal 1,266 830 3,439 1,253 600 3,955 Romania 1,978 2,258 0 1,885 2,052 0 Slovakia 2,412 441 94 2,671 541 88 Slovenia 470 400 1,234 568 400 1,428 Spain 3,510 0 21,011 4,399 0 24,030 Sweden 0 0 199 0 0 136 Non-EU Countries 2,012 2,878 3,839 1,814 4,961 5,210 Total 42,809 14,297 76,156 47,301 16,466 82,041 In addition, as stated in the note S.2.3.2, loans outside the European Union under ELM, EFSD, NDICI/EFSD+ and Cotonou Agreement are in the last resort secured by guarantees of the European Union or the Member States (loans in the African, Caribbean and Pacific Group of States Countries and the Overseas Countries Territories). The signed exposure of loans falling under this category as at 31 December 2022 amounts to EUR 52,878 million (2021: EUR 52,181 million10). Out of this EUR 52,878 million, EUR 49,014 million (2021: EUR 48,229 million) were guaranteed by the European Union and EUR 3,864 million by the Member States (2021: EUR 3,952 million). 10 Of which EUR 2,139 million (2021: EUR 2,660 million) in risk-sharing operations (credit enhanced by the Member States guarantee or the EU budget in the form of a political risk guarantee). 249 |
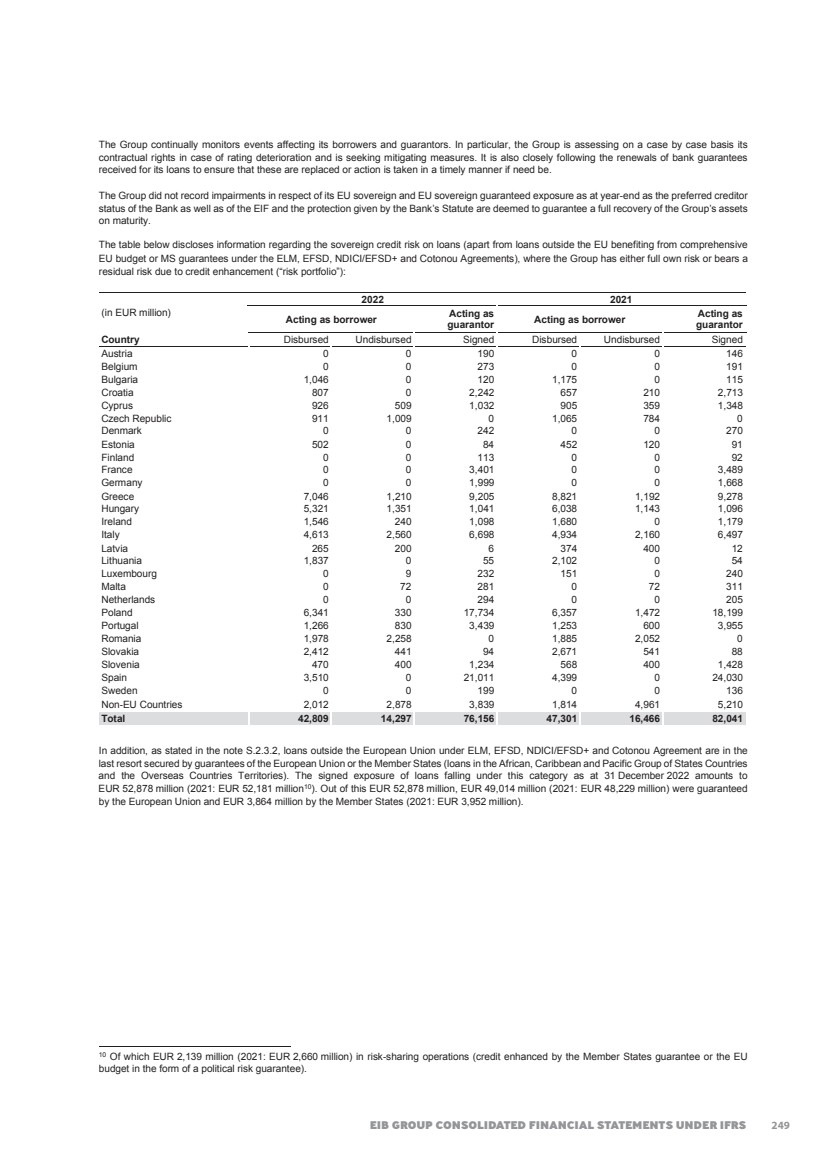
| 2022 FINANCIAL REPORT 257 S.2.3.3.2. Risk concentrations of maximum exposure to credit risk on loans The Group’s loans portfolio can be analysed by the following geographical regions (based on the country of the borrower): (in EUR million) 2022 2021 Exposures signed Exposures signed EU(1) 469,716 491,558 Thereof : – Germany 41,826 42,771 – Spain 65,279 70,286 – Italy 56,617 60,016 – France 64,841 63,316 – United Kingdom 29,777 39,450 Enlargement countries(2) 3,709 4,129 Partner countries(3) 12,587 11,974 Total 486,012 507,661 (1) Including loans outside the EU, approved by the Board of Governors according to Article 16 (previously Article 18) of the Bank’s Statute, as well as loans in EFTA countries and United Kingdom. (2) Enlargement Countries as per end 2022 include Albania, Bosnia and Herzegovina, Kosovo, Montenegro, Republic of Moldova, North Macedonia, Serbia, Türkiye and Ukraine. (3) Loans in Partner Countries include loans under the Mediterranean Partnership Facility, the Pre-Accession Facility, and Risk Sharing loans. Diversification of credit exposures is supported by limits on the maximum amount that can be lent to a single borrower, group of debtors or industries. An industry sector analysis of the Group’s loan portfolio (based on the industry sector of the borrower) is as follows: (in EUR million) 2022 2021 Exposures signed Exposures signed Services(1) 301,624 311,969 Transport 62,077 70,514 Energy 50,096 51,038 Industry 29,667 29,917 Water, sewerage 15,923 17,207 Health and education 12,802 12,916 Telecommunications 8,852 9,345 Miscellaneous Infrastructure 4,588 4,405 Agriculture, fisheries, forestry 383 350 Total 486,012 507,661 (1) The category “Services” includes the credit exposure of the banking sector. At the end of 2022, the total amount of loans directly exposed to counterparts of the banking sector amounted to EUR 114,998 million (EUR 117,807 million at the end of 2021). Exposure to bank counterparts is subject to a dedicated thresholds/limit framework. The table below shows the concentration indexes the Group follows as at 31 December 2022 and 31 December 2021: Largest nominal Group exposures(1) 31.12.2022 31.12.2021 Nominal exposures (% of Group Loan Portfolio): – Top 3 3.3% 3.8% – Top 5 5.4% 5.9% – Top 10 9.4% 10.3% N° of exposures(2) (% of Group Own Funds): – over 10% 0 0 – over 15% 0 0 – over 20% 0 0 N° of SSSR exposures over 5% of Group Own Funds(3) 3 3 (1) This definition of exposures applies to borrowers/guarantors excluding sovereigns and subsovereigns and deducting loans fully covered by an explicit sovereign guarantee. (2) Including also the net market exposure of treasury operations. (3) The term "single signature and single risk” (or for brevity, ‘unsecured’ or ‘SSSR’) is used to indicate those lending operations where the Group, irrespective of the number of signatures provided, has no genuine recourse to an independent third party, or to other forms of autonomous security. 250 |
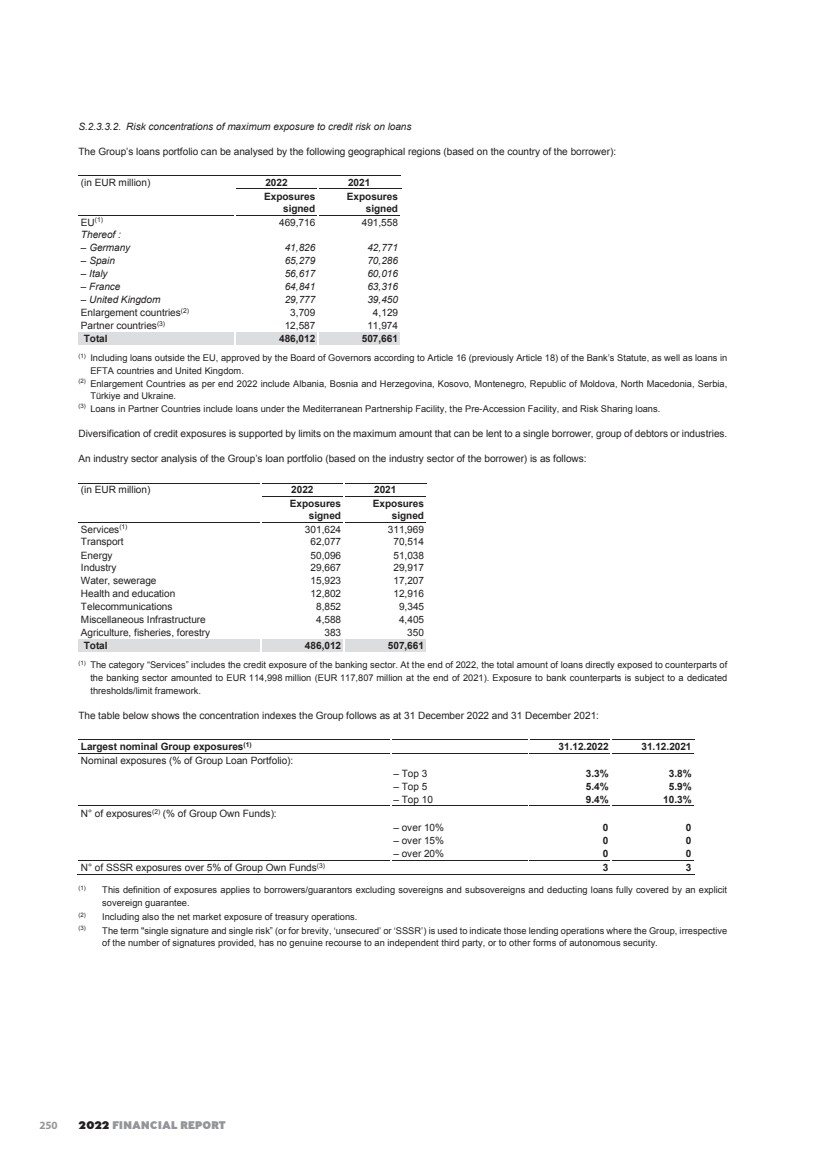
| EIB GROUP CONSOLIDATED FINANCIAL STATEMENTS UNDER IFRS 258 S.2.3.3.3 Arrears on loans Amounts in arrears are identified, monitored and reported according to the procedures defined in the bank-wide “Financial Monitoring Guidelines and Procedures”. These procedures follow best banking practices and are adopted for all loans managed by the EIB. As of 31 December 2022, the arrears above 90 days on loans from own resources amount to EUR 78 million (2021: EUR 119 million). For arrears above 90 days on own resources not secured by comprehensive guarantees of the European Union or Member States, the outstanding principal nominal amount is EUR 150 million as of 31 December 2022 (2021: EUR 531 million). During 2022, EUR 156 million of arrears have been called under the guarantees of the European Union and nothing was called under the Member States guarantees. Corresponding amounts in 2021 were EUR 93 million and nil respectively. Also, during the course of the year, EUR 4 million of arrears previously invoked under the guarantees of the European Union or the Member States have been refunded (2021: EUR 1 million). During 2022, no calls have been executed under first demand private guarantees (2021: EUR 358 million). The nominal amount of the credit enhancement11 received by the European Union or the Member States amounted to a total of EUR 29,027.2 million as at 31 December 2022 (2021: EUR 28,578.8 million). Loan renegotiation and forbearance The Group considers loans to be forborne loans (i.e. loans, debt securities and loan commitments) in respect of which forbearance measures have been extended. Forbearance measures consist of “concessions” that the Group decides to make towards an obligor who is considered unable to comply with the contractual debt service terms and conditions due to its financial difficulties, in order to enable the obligor to service the debt or to refinance, totally or partially, the contract. Exposures shall be treated as forborne if a concession has been made, irrespective of whether any amount is past-due, or the exposure is classified as defaulted. Exposures shall not be treated as forborne when the obligor is not in financial difficulties. The Group has provided a number of supportive measures available to its borrowers in response to the specific economic effects of the Covid-19, which include, among other things, (i) the temporary easing (including waivers) of financial covenants and other key clauses, (ii) the re-profiling of cash flows by setting new repayment schedules or the temporary standstill of repayment obligations and (iii) certain other complementary supportive measures, such as the signing of new contracts, accelerating loan disbursements and increasing amounts lent to borrowers. The Group assessed requests for such measures on a case-by-case basis within the limits of certain specific conditions. These measures were intended to be extended to borrowers which were not experiencing any structural financial difficulties or solvency issues and were considered to be a going concern at the time of granting such measures. If, as a result of the assessment, a borrower did not meet these requirements or the Group identified risks for the long-term sustainability of the borrower’s business model, it has considered any other appropriate measures and, if necessary, follow the Group’s standard restructuring processes. Such supportive measures are not made available by the Group any longer since June 2021. Forbearance measures and practices undertaken by the Group as part of its restructuring activities during the reporting period include, but are not limited to, extension of maturities, deferral of capital only, deferral of capital and interest, breach of material covenants and capitalisation of arrears. 11 Excluding loans outside the European Union which are, as the last resort, secured by guarantees of the European Union budget or Member States. 251 |
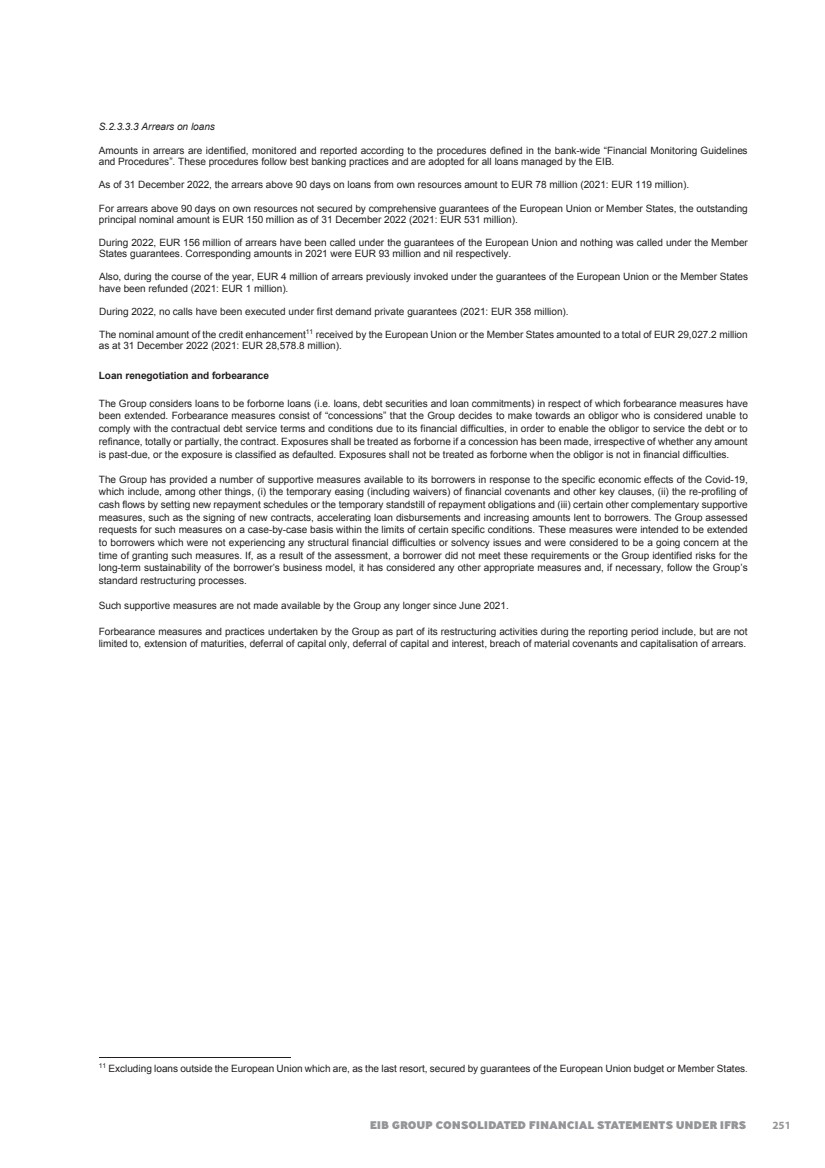
| 2022 FINANCIAL REPORT 259 Operations subject to forbearance measures are reported as such in the tables below. (in EUR million) 31.12.2022 31.12.2021 Performing Non-Performing Performing Non-Performing Number of contracts subject to forbearance practices 53 79 88 74 Carrying values (incl. interest and amounts in arrears) 2,258 1,866 4,979 2,341 ECL allowance recognised 18 89 7 150 Interest income in respect of forborne contracts 75 70 121 73 Exposures derecognised (following the write off/sale of the operation) 0 3 0 34 Forbearance measures (in EUR million) 31.12.2021 Extension of maturities Deferral of capital only Deferral of capital and interest Breach of material financial covenants Other Contractual repayment and termination(1) 31.12.2022 Public 3,078 0 0 0 218 0 -2,288 1,008 Bank 273 0 0 0 36 9 -188 130 Corporate 3,970 40 0 0 90 141 -1,255 2,986 Total 7,321 40 0 0 344 150 -3,731 4,124 (1) Decreases are explained by (i) repayments of capital, interest and amounts in arrears, (ii) write-off which occurred during the year on operations already considered as forborne as of 31 December 2021, and (iii) terminations during the year. Forbearance measures (in EUR million) 31.12.2020 Extension of maturities Deferral of capital only Deferral of capital and interest Breach of material financial covenants Other Contractual repayment and termination 31.12.2021 Public 3,024 0 0 0 94 139 -179 3,078 Bank 76 0 0 0 124 108 -35 273 Corporate 4,256 81 54 23 448 39 -931 3,970 Total 7,356 81 54 23 666 286 -1,145 7,321 S.2.3.4. Collateral on loans In addition to the guarantees received on its lending exposures as disclosed in the note S.2.3.3, the Group also uses pledges of financial securities. These pledges are formalised through a Pledge Agreement, enforceable in the relevant jurisdiction. The portfolio of collateral received in pledge contracts amounts to EUR 9,573 million at the end of 2022 (2021: EUR 11,504 million). The fair value of the portfolio of collateral received by the Group under pledge contracts that the Group is allowed to sell or re-pledge amounts to EUR 2,493 million (2021: EUR 4,352 million). None of these collaterals has been sold or re-pledged to third parties. 252 |
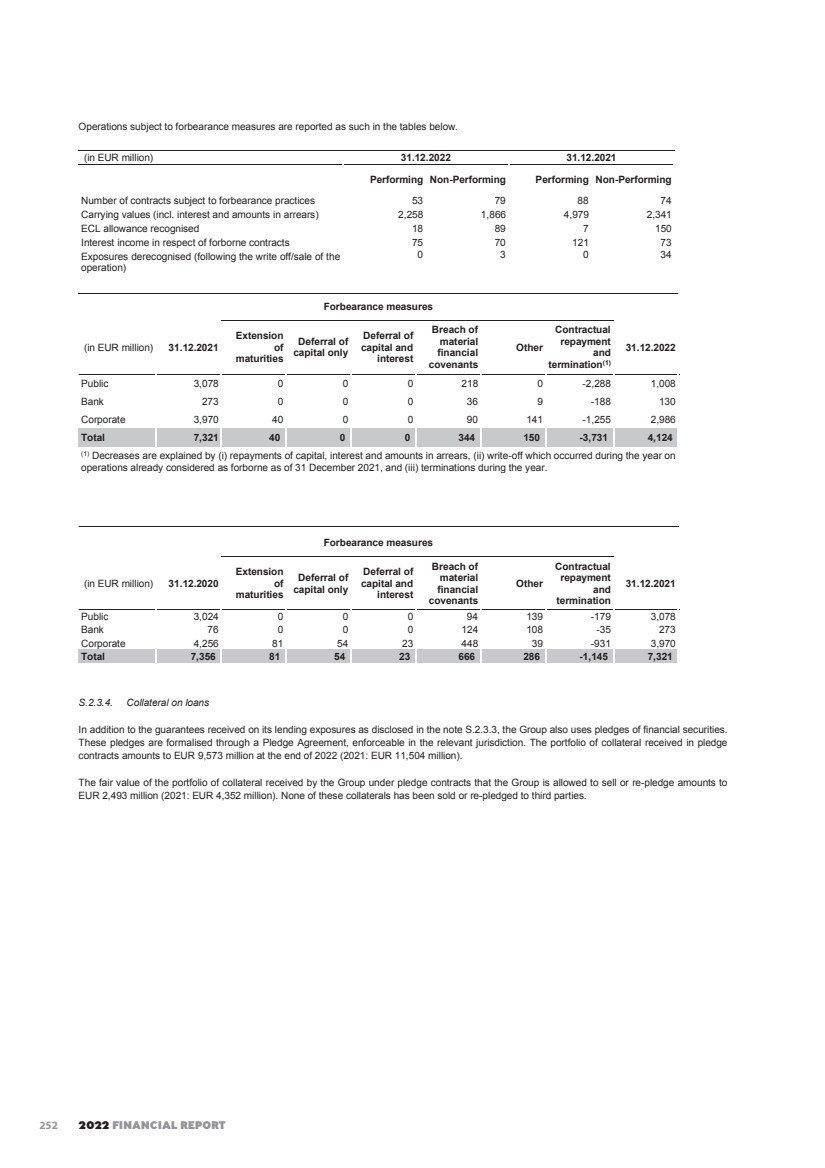
| EIB GROUP CONSOLIDATED FINANCIAL STATEMENTS UNDER IFRS 260 Fair value of collateral held against disbursed loans is shown below: 2022 (in EUR million) Gross exposure Collateral held Net exposure ECL Bonds Cash Total Stage 1 356,141 7,026 61 7,087 349,054 36 Stage 2 38,372 2,244 194 2,438 35,934 164 Stage 3 2,793 9 0 9 2,784 128 Against FVTPL 15,413 39 0 39 15,374 0 Total 2022(*) 412,719 9,318 255 9,573 403,146 328 (*) During the year 2022 the Group did not take possession of any of the above-mentioned collaterals. 2021 (in EUR million) Gross exposure Collateral held Net exposure ECL Bonds Cash Total Stage 1 367,759 7,856 56 7,912 359,847 17 Stage 2 43,846 3,177 265 3,442 40,404 126 Stage 3 2,722 96 0 96 2,626 220 Against FVTPL 19,877 54 0 54 19,823 0 Total 2021(*) 434,204 11,183 321 11,504 422,700 363 (*) During the year 2021 the Group did not take possession of any of the above-mentioned collaterals. S.2.3.5. Sensitivity on ECL to future economic conditions The ECL are sensitive to judgments and assumptions made regarding formulation of forward-looking scenarios. The Group performs a sensitivity analysis on the ECL recognised on material classes of its assets. The forecasts of future economic conditions (via macroeconomic scenarios) are inputs to forecasting model producing conditional risk parameters, which are an input to loss allowance calculation. The scenarios are derived shocking GDP, which is the key measure of economic activity. The shocks to real GDP are calibrated to replicate the past volatility of the variable. In addition, expert judgment is applied, when appropriate, to refine the size and persistency of GDP shocks. Long-term and short-term interest rates are also modeled and included as part of the macroeconomic scenarios. Probabilities attached to each scenario are defined reflecting market (volatility) indicators and internally developed indicators consistently deployed over time to capture uncertainty. The weighting of positive and negative shocks depends on the balance of risks in the economy. Negative and positive shocks, with a probability of 45% and 5% respectively, were applied on quarterly projections in the last exercise. The table below shows the loss allowance on loans and advances to credit institutions and customers. Each forward-looking scenario (e.g. baseline, positive and negative) were weighted 100% instead of applying scenario probability weights across the three scenarios. (in EUR million) as at 31.12.2022 Positive Baseline Negative Gross exposure Credit Institutions 93,176 93,176 93,176 Customers 316,086 316,086 316,086 Loss allowance Credit Institutions 23 29 37 Customers 253 281 318 (in EUR million) as at 31.12.2021 Positive Baseline Negative Gross exposure Credit Institutions 93,268 93,268 93,268 Customers 309,622 309,622 309,622 Loss allowance Credit Institutions 65 72 84 Customers 252 279 318 253 |
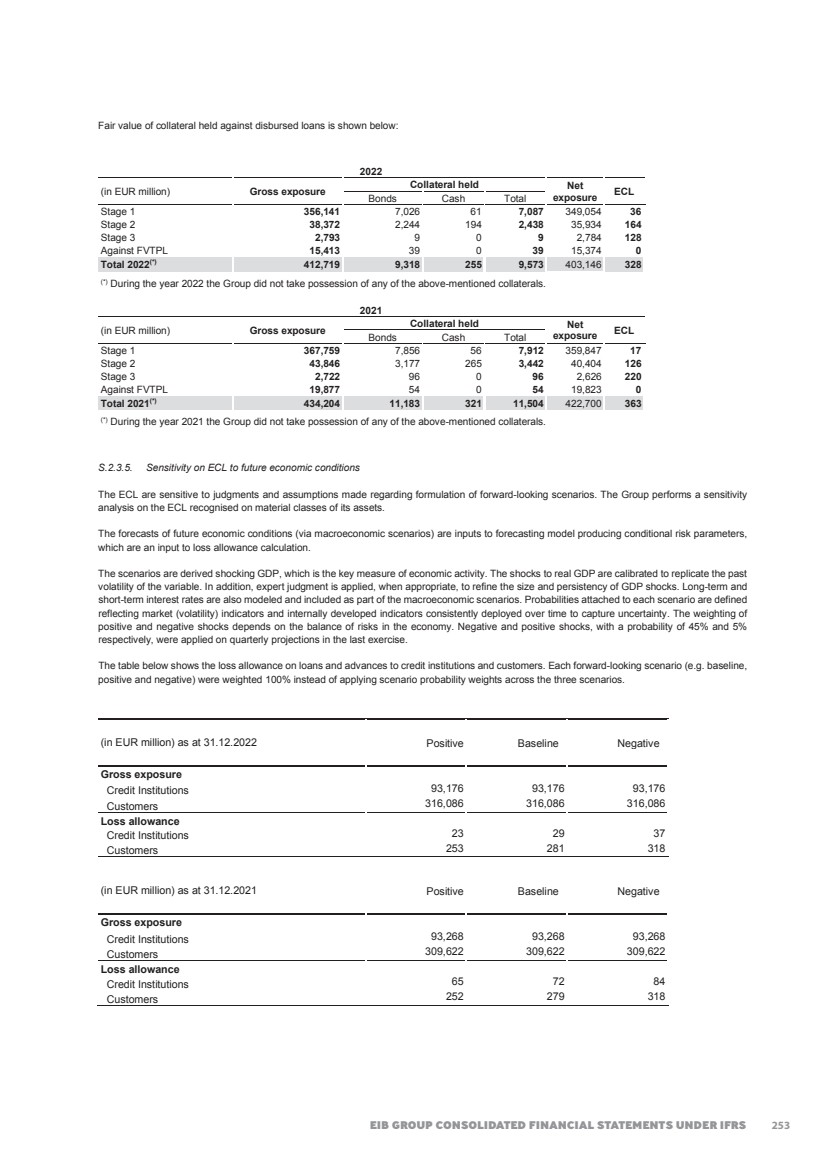
| 2022 FINANCIAL REPORT 261 S.2.4. Credit risk on treasury transactions and loan substitutes S.2.4.1. Credit risk measurement on treasury transactions and loan substitutes Treasury investments of the Bank are divided into three categories: (i) the Treasury Monetary Portfolio, with the primary objective of maintaining liquidity, (ii) the Security Liquidity Portfolio, as a second liquidity line, and (iii) the Long Term HQLA Portfolio. The loan substitutes portfolio comprises Covered Bonds and Asset Backed Securities (‘ABS’). Covered Bonds offer full recourse to the issuer, while ABS are issued by Special Purpose Vehicles backing the underlying issues. While Covered Bonds are mostly backed by residential mortgage pools, the majority of ABS structures are securitised by SME loans or leases. Some of these transactions have been structured by adding a credit or project related remedies, thus offering additional recourse. The Fund’s long term treasury management has been fully outsourced to the Bank under a treasury management agreement signed by both parties and mandating the responsible EIB services to perform selection, execution, settlement and monitoring of transactions. Management follows treasury guidelines annexed to the agreement. Operational short term liquidity management is conducted by EIF. Credit risk on treasury transactions is monitored through the attribution of credit limits to the counterparts. The weighted exposure for each counterpart must not exceed the authorised limits. For loan substitutes, embedded credit mitigants and requirements imposed by the regulation and rating agencies are the initial remedies which are triggered in case of credit event on the issuer. The credit risk associated with treasury instruments (securities, commercial papers, term deposits, etc.) is managed through selecting sound counterparties and issuers. The structure of the portfolios and the limits governing outstanding treasury instruments have been laid down by the Management. These limits are reviewed regularly by the Group Risk and Compliance Directorate. Credit Risk Exposures by Moody's equivalent rating (Based on gross carrying amount) 2022 (in EUR million) 12-month ECL Lifetime ECL not credit-impaired Lifetime ECL credit-impaired Total Treasury assets and loan substitutes at AC Aaa 57,260 0 0 57,260 Aa1 to Aa3 22,142 0 0 22,142 A1 to A3 6,512 0 0 6,512 Baa1 to Baa3 5,665 0 0 5,665 Below Baa3 561 407 7 975 Gross carrying amount at AC 92,140 407 7 92,554 Loss allowance -1 -3 0 -4 Net carrying amount at AC 92,139 404 7 92,550 2021 (in EUR million) 12-month ECL Lifetime ECL not credit-impaired Lifetime ECL credit-impaired Total Treasury assets and loan substitutes at AC Aaa 59,529 0 0 59,529 Aa1 to Aa3 28,275 300 0 28,575 A1 to A3 17,677 0 0 17,677 Baa1 to Baa3 11,220 108 0 11,328 Below Baa3 771 361 0 1,132 Gross carrying amount at AC 117,472 769 0 118,241 Loss allowance 0 -5 0 -5 Net carrying amount at AC 117,472 764 0 118,236 (in EUR million) 2022 2021 Treasury assets and loan substitutes at FVTPL Aaa 1,427 1,701 Aa1 to Aa3 1,250 1,833 A1 to A3 793 1,520 Baa1 to Baa3 332 459 Below Baa3 493 636 Non-Rated 85 85 Carrying amount at FVTPL 4,380 6,234 254 |
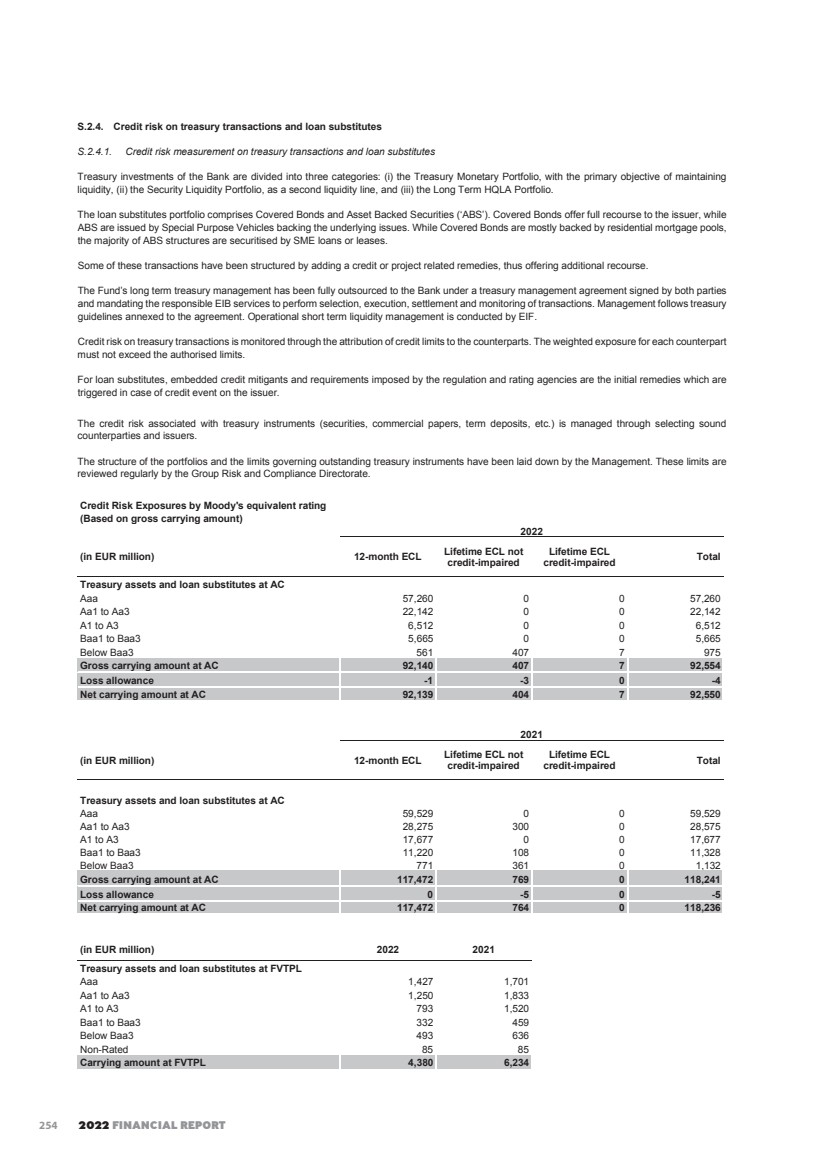
| EIB GROUP CONSOLIDATED FINANCIAL STATEMENTS UNDER IFRS 262 S.2.4.2. Collateral on treasury transactions The Group enters into collateralised reverse repurchase and repurchase agreement transactions that may result in credit exposure if the counterparty to the transaction is unable to fulfil its contractual obligations. The Group controls credit risk associated with these activities by monitoring counterparty credit exposure and collateral values on a daily basis and requiring additional collateral to be deposited with the Group when deemed necessary. Tripartite repo and reverse repo operations are carried out with a third-party custodian who undertakes, on the basis of a framework contract, to guarantee compliance with the contractual terms and conditions, notably with respect to: • delivery against payment; • verification of collateral; • the collateral margin required by the lender which must always be available and adequate, with the market value of the securities being verified daily by the custodian; and • the organisation of substitute collateral provided that this meets all the contractual requirements. Collateral received Operations which involve the receipt of collateral on treasury transactions are bilateral and tripartite reverse repurchase agreements with a nominal balance as at 31 December 2022 of EUR 7,381 million (2021: EUR 13,894 million), out of which for EUR 7,381 million (2021: EUR 13,334 million) the Group received financial collaterals and for EUR 0 million (2021: EUR 560 million) commodities. The exposures are fully collateralised, with daily margin calls. The market value of the collateral portfolio is monitored and additional collateral, in accordance with the underlying agreements, is requested when needed. The market value of the financial collateral portfolio as at 31 December 2022 amounts to EUR 7,000 million (2021: EUR 13,558 million). At year-end 2022 and 2021, the Group did not take possession of any of the above mentioned collaterals received. The collateral received by the Group has been re-used during the year for funding operations. Collateral deposited Operations which involve the placements of collateral for treasury transactions are bilateral and tripartite repurchase agreements, with a nominal balance of EUR 3,065 million at 31 December 2022 (2021: EUR 5,717 million). The market value of the collateral deposited (except to BCL) under bilateral and tripartite repurchase agreements stood at EUR 3,054 million as at 31 December 2022 (2021: EUR 5,711 million). The Group deposited as at 31 December 2022, securities with the Central Bank of Luxembourg with a market value of EUR 141 million (2021: EUR 14.9 billion), out of which EUR 141 million (2021: EUR 14.0 billion) is encumbered. The cash collateral placed for futures contracts as at 31 December 2022 stood at EUR 11.0 million (2021: EUR 3.8 million). S.2.4.3. Transferred assets that are not derecognised at the balance sheet date No assets of the Group were transferred at the balance sheet date. S.2.5. Credit risk on derivatives S.2.5.1. Credit risk policies for derivatives The credit risk policy for derivative transactions is based on the definition of eligibility conditions and rating-related limits for swap counterparts. In order to reduce credit exposures, the Bank has signed Credit Support Annexes with most of its active swap counterparts and receives collaterals when the exposure exceeds certain contractually defined thresholds. The Fund does not use derivatives instruments. The credit risk with respect to derivatives lies in the loss, which the Bank would incur were a counterparty be unable to honour its contractual obligations. In view of the special nature and complexity of the derivatives transactions, a series of procedures has been put in place to safeguard the Bank against losses arising out of the use of such instruments. Contractual framework: All of the Bank’s derivative transactions are concluded in the contractual framework of ISDA Swap Agreements and where applicable Credit Support Annexes, which specify the conditions of exposure collateralisation. These are generally accepted and practised contract types. Minimum conditions for new agreements are specified in the risk guidelines. Counterparty selection: The minimum rating at the outset is set in the risk guidelines at A3. The EIB has in most cases the right of early termination if the counterparty rating drops below a certain level. 255 |
| 2022 FINANCIAL REPORT 263 Collateralisation: • Exposures (in some cases subject to thresholds) are collateralised by cash and bonds. • Certain transactions are collateralised above the current market value. • Both the derivatives portfolio with individual counterparties and the collateral received are regularly monitored and valued, with a subsequent call for additional collateral or release. The amount of collateral required depends on an assessment of the credit risk of the counterparty. Guidelines are implemented regarding the acceptability of collaterals and valuations parameters. As part of the ISDA agreements, the Bank has received securities and cash that it is allowed to sell or repledge. The fair value of the securities accepted under these terms as at 31 December 2022 amounts to EUR 6,902 million (2021: EUR 15,399 million), with the following composition detailed based on the nature of the collateral and based on Moody’s equivalent rating: Swap collateral (in EUR million) Moody's equivalent rating Bonds Cash Total 2022 Government Agency, supranational, covered bonds Aaa 780 546 0 1,326 Aa1 to Aa3 254 0 0 254 A1 to A3 0 0 0 0 Baa1 to Baa3 2,951 0 0 2,951 Non-Rated 0 0 2,371 2,371 Total 2022 3,985 546 2,371 6,902 Swap collateral (in EUR million) Moody's equivalent rating Bonds Cash Total 2021 Government Agency, supranational, covered bonds Aaa 1,042 962 0 2,004 Aa1 to Aa3 3,130 0 0 3,130 A1 to A3 6 0 0 6 Baa1 to Baa3 5,484 0 0 5,484 Non-Rated 0 0 4,775 4,775 Total 2021 9,662 962 4,775 15,399 The Bank has implemented the usage of an IT system, the Collateral management system (‘CMS’). The key objective of the CMS is to ensure that the Bank is capable to utilise for repos a real-time inventory of assets and collateral accepted in secured markets. Securities received as collateral for loans, derivatives and reverse repos, repos are valued in CMS on a daily basis, by using prices quoted in active markets, supplied by a Market Price Service Provider (i.e. Bloomberg) or, if quoted prices are not available, by using market-based valuations. S.2.5.2. Credit risk measurement for derivatives The credit risk associated with derivatives varies according to a number of factors (such as interest and exchange rates) and generally corresponds to only a small portion of their notional value. The Bank for internal purposes measures the credit risk exposure related to swaps and derivatives transactions using the Current Unsecured Exposure and the Potential Future Exposure for reporting and limit monitoring. It uses the Standardised Approach for Counterparty Credit Risk (SA-CCR) for regulatory capital allocation according to the Capital Requirements Regulation (CRR). The Bank computes the Current Unsecured Exposure, which is the larger of zero and the market value of the portfolio of transactions within the netting set with a counterparty less the value of collateral received. It is the amount that would be lost upon the default of the counterparty, using the received collateral and assuming no recovery on the value of those transactions as well as immediate replacement of the swap counterparty for all the transactions. As of 31 December 2022 the current unsecured exposure stood at EUR 165 million (EUR 927 million as of 31 December 2021). In addition, the Bank computes the Potential Future Exposure, which takes into account the possible increase in the netting set’s exposure over the margin period of risk of 20 business days. The EIB computes the Potential Future Exposure at 90% confidence level using stressed market parameters to arrive at conservative estimates. This is in line with the recommendations issued by regulators in order to take into consideration the conditions that will prevail in case of default of an important market participant. As of 31 December 2022 the Potential Future Exposure at origin stood at EUR 2,266 million (EUR 10,001 million as of 31 December 2021). Limits: The limit system for banks covers the Potential Future Exposure in 3 time buckets (under 1 year, between 1 and 5 years and over 5 years) and in 2 rating scenarios (current and downgrade below A3). The derivatives portfolio is valued and compared against limits on a daily basis. 256 |
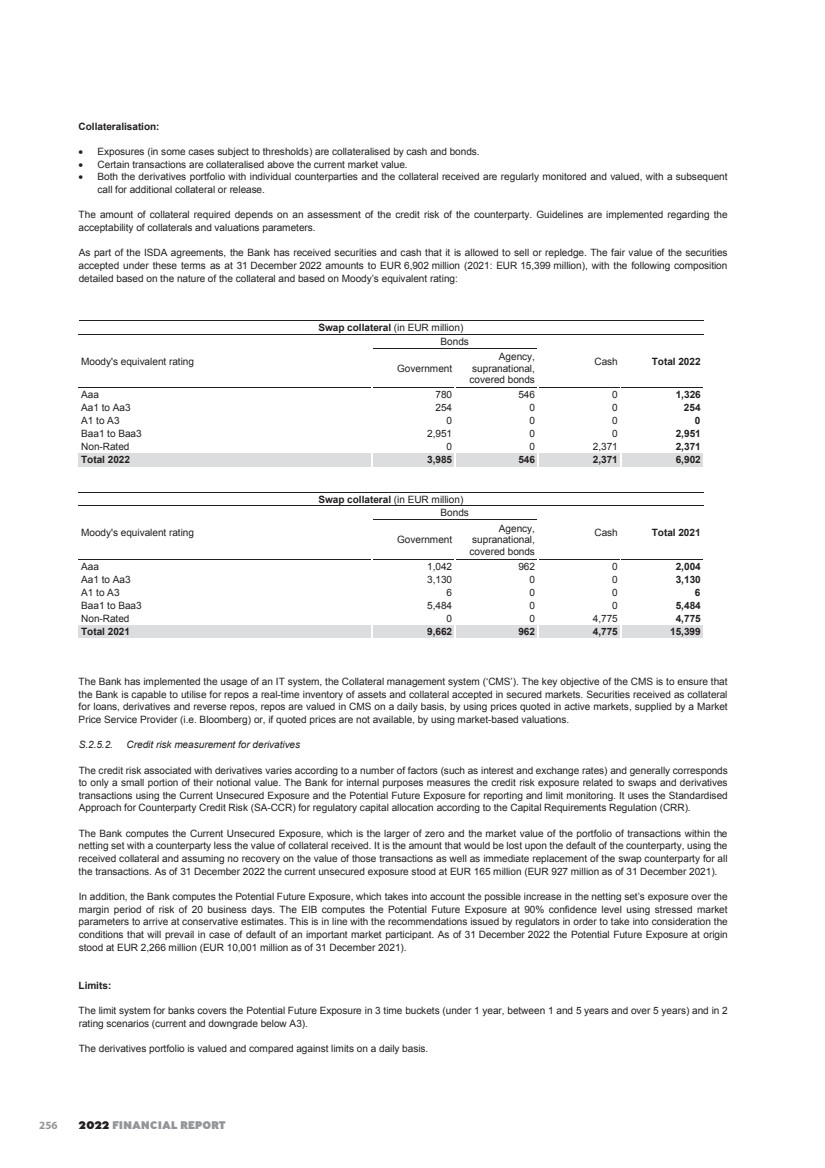
| EIB GROUP CONSOLIDATED FINANCIAL STATEMENTS UNDER IFRS 264 As from the following table, the majority of the derivative portfolio is concentrated on counterparties rated A3 or above: Grouped ratings Percentage of nominal Current Unsecured Exposure Potential Future Exposure (in EUR million) (in EUR million) Moody’s equivalent rating 2022 2021 2022 2021 2022 2021 Aaa 0.47% 0.47% 0 496 0 920 Aa1 to Aa3 18.10% 19.31% 4 236 370 2,273 A1 to A3 75.46% 74.76% 146 195 1,783 6,628 Below A3 5.97% 5.46% 15 0 113 180 Total 100.00% 100.00% 165 927 2,266 10,001 The table below shows the concentration on main derivative counterparts as at 31 December 2022 and 2021: 2022 2021 Nominal Exposure (% of Bank derivative portfolio): – Top 3 30.4% 31.7% – Top 10 70.7% 71.7% – Top 25 96.7% 97.1% Current Unsecured Exposure: – Top 3 97.6% 70.9% – Top 10 100.0% 95.5% – Top 25 100.0% 100.0% Potential Future Exposure: – Top 3 50.4% 34.8% – Top 10 91.0% 72.0% – Top 25 100.0% 96.5% The following table shows the maturities of currency swaps (including structured swaps and excluding short-term currency swaps), sub-divided according to their notional amount and fair value: Currency swaps at 31 December 2022 (in EUR million) 1 year or less More than 1 year and up to 5 years More than 5 years and up to 10 years More than 10 years Total 2022 Notional amount (receivable) 43,783 136,262 36,102 27,198 243,345 Fair value (i.e. net discounted value including CVA, DVA and CollVA)(*) 221 1,816 -744 26 1,319 Currency swaps at 31 December 2021 (in EUR million) 1 year or less More than 1 year and up to 5 years More than 5 years and up to 10 years More than 10 years Total 2021 Notional amount (receivable) 34,954 137,297 45,792 29,640 247,683 Fair value (i.e. net discounted value including CVA, DVA and CollVA)(*) -740 3,085 985 1,041 4,371 (*) Including the fair value of macro-hedging currency swaps, which stood at EUR 2,530 million as at 31 December 2022 (2021: EUR 3,133 million). The following table shows the maturities of interest rate swaps (including structured swaps) sub-divided according to their notional amount and fair value: Interest rate swaps at 31 December 2022 (in EUR million) 1 year or less More than 1 year and up to 5 years More than 5 years and up to 10 years More than 10 years Total 2022 Notional amount 75,935 230,220 131,299 135,571 573,025 Fair value (i.e. net discounted value including CVA, DVA and CollVA)(*) -700 -5,269 -4,092 993 -9,068 Interest rate swaps at 31 December 2021 (in EUR million) 1 year or less More than 1 year and up to 5 years More than 5 years and up to 10 years More than 10 years Total 2021 Notional amount 53,438 243,656 127,981 134,006 559,081 Fair value (i.e. net discounted value including CVA, DVA and CollVA)(*) 301 4,748 3,036 229 8,314 (*) Including the fair value of macro-hedging interest rate swaps which stood at EUR -349 million as at 31 December 2022 (2021: EUR -789 million). The Bank enters into borrowing contracts and loans encompassing options on interest rates, exchange rates, inflation rates and stock indices. Such structured borrowings and loans are entirely covered by swap contracts to hedge the corresponding market risk. 257 |
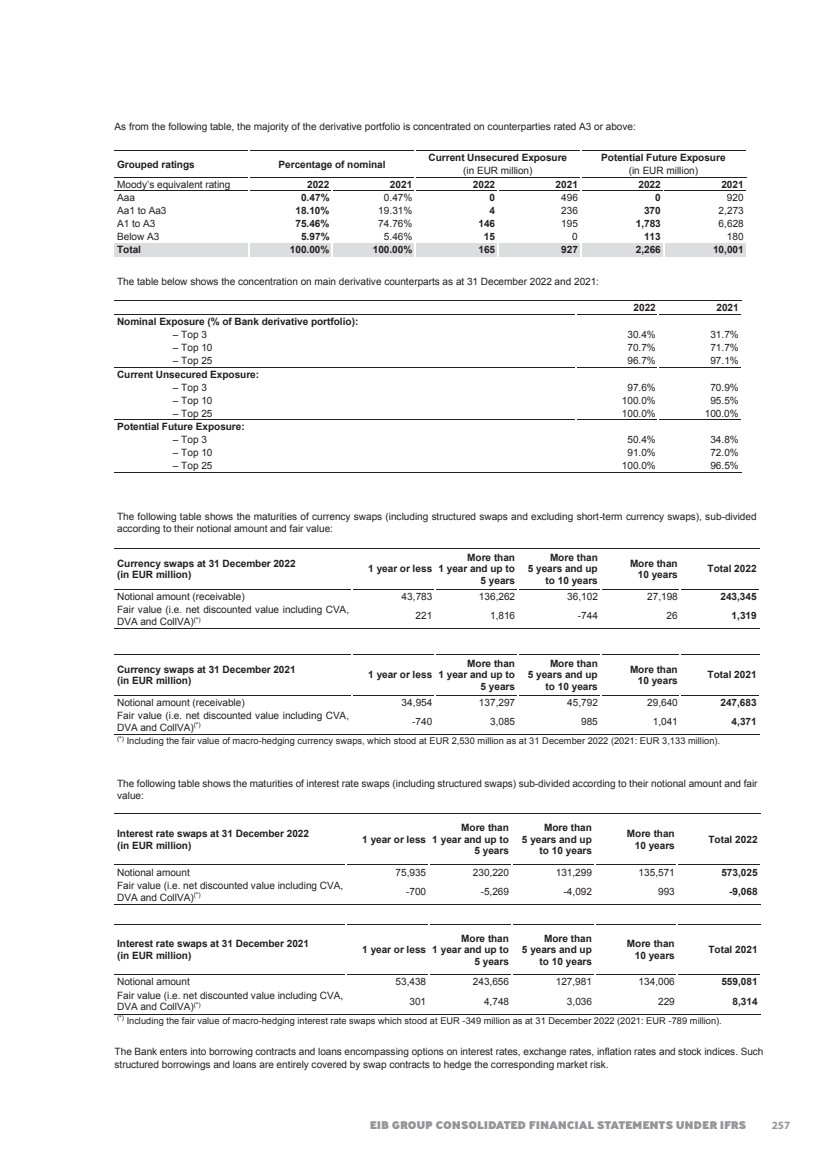
| 2022 FINANCIAL REPORT 265 The notional amount and fair value of structured swaps is included in the tables above, depending whether or not they incorporate a cross currency element. The table below further details the number, fair value and notional amounts of structured swaps: Structured swaps at 31 December Early termination embedded Structured coupon 2022 2021 2022 2021 Number of transactions 119 127 156 162 Notional amount (in EUR million) 4,909 4,568 10,413 12,083 Fair value (i.e. net discounted value including CVA, DVA and CollVA) (in EUR million) -774 518 -2,310 -2,960 The fair value of structured swap transactions is computed using option pricing models, calibrated to available market prices of options. For a portion of derivative transactions, internal estimates and assumptions might be used in the valuation techniques when the market inputs are not directly available. All option contracts embedded in, or linked with, borrowings are negotiated over the counter. As at 31 December 2022, there are no forward rate agreements outstanding (same as at 31 December 2021). S.2.5.3. Credit risk on guarantees Credit risk arising from the Group’s guarantees transactions funded by own resources is managed in line with dedicated internal guidelines. As at 31 December 2022, the signed exposures amount to EUR 31.9 billion (2021: EUR 30.9 billion). The disbursed exposure of the loans guaranteed by the Group amount to EUR 20.3 billion (2021: EUR 16.7 billion), and related liabilities and provisions recorded for guarantees amount to EUR 98.0 million (2021: EUR 39.3 million) (Note D.4). Part of the Group guarantee type of operations derives from the risk sharing operations where the Group guarantees either (i) on a loan-by-loan or (ii) a portfolio basis underlying loan type of exposures originated by a financial intermediary based on established delegation models. The financial intermediary originating the underlying risk exposures on which the EIB takes risk is subject to a detailed due diligence in order to make sure that the Group can delegate credit management tasks to the financial intermediary in question. In these types of transactions, the Group might be exposed on a pro-rata basis or via a structure with a certain degree of subordination. In addition to this, the Group can also enter into securitisation transactions. The EIB has established a dedicated framework to limit concentration risk for this type of transactions. Depending on the specificities of the transaction, this may include setting eligibility criteria including but not limited to lowest eligible rating categories, certain sector, obligor and/or obligor group exposure. Formally speaking there is limited counterparty risk on the financial intermediary as the credit risk is on the underlying exposures originated by the financial intermediary i.e. counterparty risk is limited to (1) the payment of the guarantee fees and (2) the potential recoveries due to the EIB in case of a default of an underlying exposure guaranteed and paid out by the EIB. In any case, the Group has established a number of mitigating measures, including but not limited to detailed due diligence as well as security rights, step-in rights, consent rights on material amendments of the underlying risk exposures or termination rights. 258 |
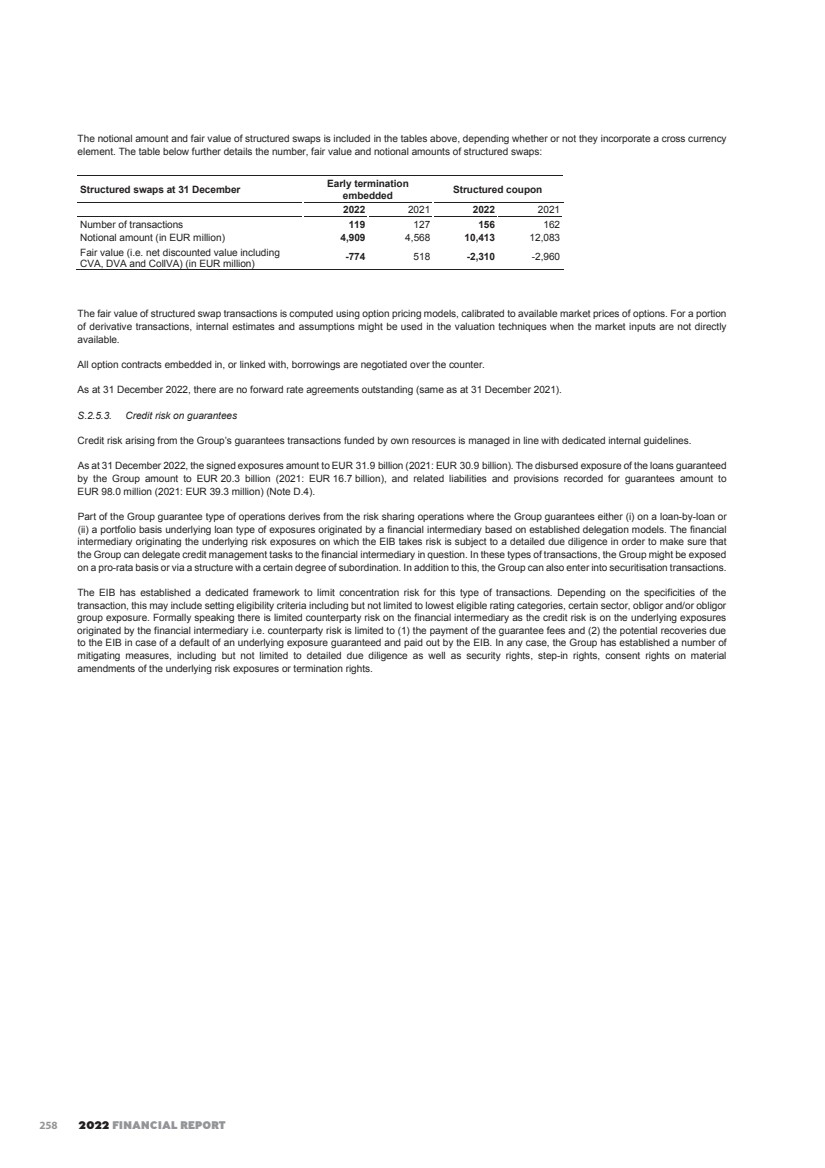
| EIB GROUP CONSOLIDATED FINANCIAL STATEMENTS UNDER IFRS 266 Credit risk exposure for each internal rating (in EUR million) 2022 12-month ECL Lifetime ECL not credit-impaired Lifetime ECL credit-impaired Total Financial Guarantees Internal Rating 1 - minimal credit risk 110 0 0 110 Internal Rating 2 - very low credit risk 3,091 0 0 3,091 Internal Rating 3 - low credit risk 18,791 4 0 18,795 Internal Rating 4 - moderate credit risk 3,577 0 0 3,577 Internal Rating 5 - financially weak counterpart 3,320 107 0 3,427 Internal Rating 6 - high credit risk 1,979 257 0 2,236 Internal Rating 7 - very high credit risk 0 578 106 684 Internal Rating 8 - counterpart in default 0 0 12 12 Total Credit Risk Exposure 30,868 946 118 31,932 Carrying amount 89 0 9 98 2021 12-month ECL Lifetime ECL not credit-impaired Lifetime ECL credit-impaired Total Financial Guarantees Internal Rating 1 - minimal credit risk 15 0 0 15 Internal Rating 2 - very low credit risk 3,540 0 0 3,540 Internal Rating 3 - low credit risk 18,790 45 0 18,835 Internal Rating 4 - moderate credit risk 2,409 397 0 2,806 Internal Rating 5 - financially weak counterpart 2,006 391 0 2,397 Internal Rating 6 - high credit risk 2,288 746 0 3,034 Internal Rating 7 - very high credit risk 134 1 129 264 Internal Rating 8 - counterpart in default 0 0 10 10 Total Credit Risk Exposure 29,182 1,580 139 30,901 Carrying amount 30 0 9 39 S.3. Liquidity and Funding risk Liquidity risk refers to the ability of the Group to fund increases in assets and meet obligations as they become due, without incurring unacceptable losses. It can be further split into funding liquidity risk and market liquidity risk. Funding liquidity risk is connected to the risk for the Group to be unable to refinance the asset side of its consolidated balance sheet and to meet payment obligations punctually and in full out of readily available liquidity resources. Funding liquidity risk may have an impact on the volatility in the economic value of, or in the income derived from Group’s positions, due to potentially increasing immediate risks to meet payment obligations and the consequent need to borrow at unattractive conditions. Market liquidity risk is the volatility in the economic value of, or in the income derived from, the Group’s positions due to potential inability to execute a transaction to offset, eliminate or reduce outstanding positions at reasonable market prices. Such an inability may force early liquidation of assets at unattractive prices when it would be better to avoid such liquidation. This risk is tied to the size of the position compared to the liquidity of the instrument being transacted, as well as to potential deterioration of market availability and efficiency. S.3.1. Liquidity risk management Liquidity risk management of the Bank Liquidity risk is managed prudently in order to ensure the regular functioning of the Bank’s core activities at reasonable cost. The main objective of liquidity policy is to ensure that the Bank can always meet its payment obligations punctually and in full. In contrast to commercial banks, the EIB does not have retail deposits but relies on its access to capital markets to raise the funds it on-lends to its clients. The Bank manages the calendar of its new issues so as to maintain a prudential liquidity buffer. Liquidity planning takes into account the cash outflows due to debt servicing and loan disbursements, as well as the cash inflows from the loan portfolio. It also takes into account the sizeable amount of signed but undisbursed loans, whose disbursements typically take place at the borrowers’ request. The Bank further assures management of liquidity risk by maintaining a sufficient level of short-term liquid assets, and by spreading the maturity dates of its placements according to the forecasts of liquidity needs. The liquidity risk policy also incorporates a floor on treasury levels. Indeed, the Bank's total liquidity ratio (defined as a target percentage of annual projected net cash flows) must at all times exceed 25% of the forecasted net annual cash flows for the following year. 259 |
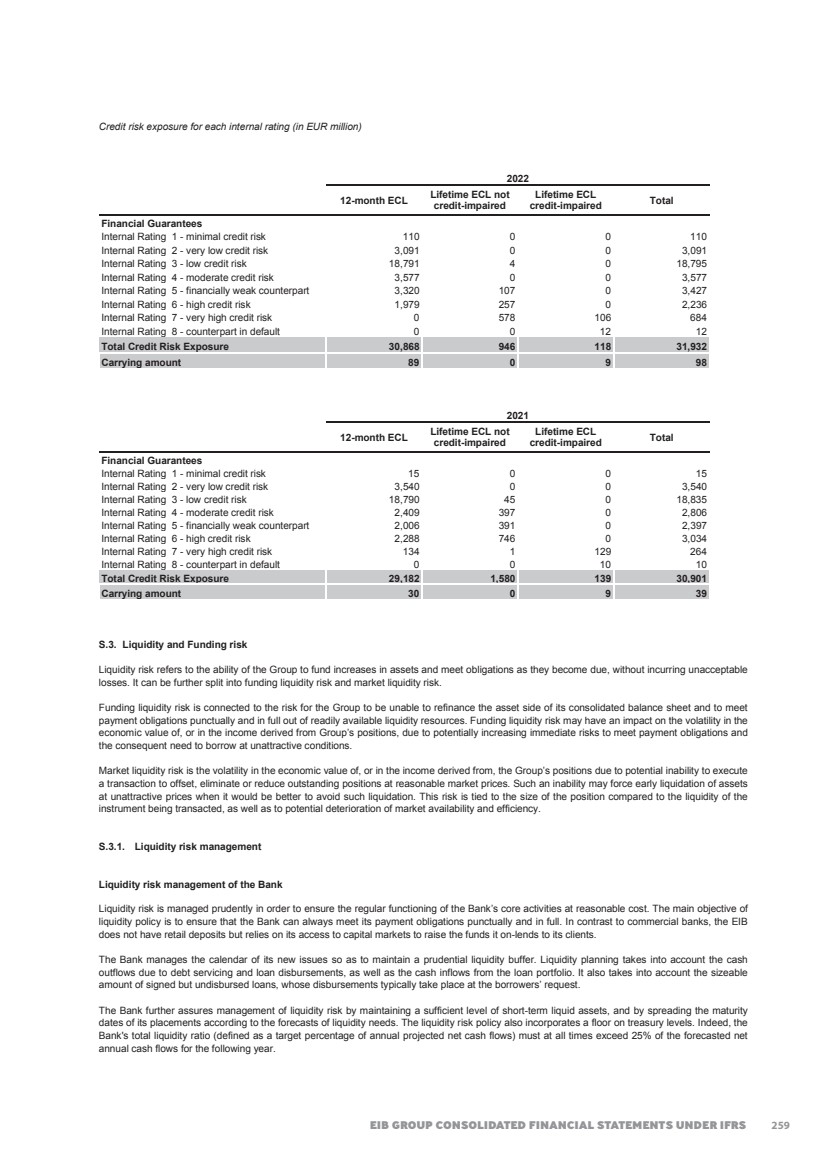
| 2022 FINANCIAL REPORT 267 The Group has in place a Group Contingency Funding Plan (‘Group CFP’), which specifies appropriate decision-making procedures and corresponding responsibilities. The Group CFP is regularly tested and benchmarked against applicable best banking practices, including relevant Guidelines issued by the European Banking Authority in this respect. The Group CFP is approved annually by the Board of Directors of the Bank. Regular stress-testing analyses are executed as a part of the liquidity risk monitoring and drive the size of the liquidity buffers of EIB and EIF. On 8 July 2009, the Bank became an eligible counterparty in the Eurosystem’s monetary policy operations, and therefore has been given access to the monetary policy operations of the European Central Bank. The Bank conducts the operations via the Central Bank of Luxembourg, where the Bank maintains deposits to cover the minimum reserve requirement and for other operational needs. The Liquidity Coverage Ratio (‘LCR’) is computed on a daily basis in line with EU CRR both in the functional currency (EUR) as well as in the other significant currencies. Consistency of the currency denomination of liquid assets with net liquidity outflows is ensured on an ongoing basis, in order to prevent an excessive currency mismatch. As of end 2022 the Bank’s LCR stood at 348.0% (end 2021: 546.9%) and the Group LCR, which stood at 352.4% (2021: 586.0%). In addition, also the Net Stable Funding Ratio (‘NSFR’) is computed in line with EU CRR both in the functional currency (EUR) as well as in the other significant currencies. As of end 2022, the Bank’s NSFR stood at 124.6% (2021: 130.0%) and the Group NSFR stood at 124.9% (2021: 130.1%). The Group currently continues to maintain a robust liquidity position and flexibility to access the necessary liquidity resources mainly as a result of its prudent approach to liquidity management. As a consequence, the war in Ukraine had very limited impact on liquidity and funding. Liquidity risk management of the Fund Liquidity risk is managed in such a way as to protect the value of the paid–in capital, ensure an adequate level of liquidity of the Fund to meet possible guarantee calls, private equity commitments and administrative expenditure and earn a reasonable return on assets invested with due regard to minimisation of risk. S.3.2. Liquidity risk measurement The table hereafter analyses the financial liabilities of the Group by maturity, based on the period remaining between the consolidated balance sheet date and the contractual maturity date (based on contractual undiscounted cash flows). Liabilities for which there is no contractual maturity date are classified under "Maturity undefined". The numbers represent undiscounted cash flows inclusive of interest coupons and therefore do not generally reconcile with the consolidated balance sheet figures. Principal cash flows and interests are slotted in the bucket corresponding to their first potential contractual payment date. This therefore does not represent an expected scenario, but rather a theoretical scenario. Some of the borrowings and associated swaps include early termination triggers or call options granted to the hedging swap counterparties, and the Group also has the right to call the related bonds before maturity. In these cases, the cash flow is represented in the bucket corresponding to the first possible termination date. However, this is a conservative measure, as the Group is contractually not obliged to redeem early the related callable bonds and under realistic scenarios there would be no reason to call all such bonds at first possible occasions. Outflows for committed but undisbursed loans are represented in line with the internal methodology for liquidity stress-testing. In particular, the maximum amount of loans that under severe conditions of stress could possibly be subject to early disbursement is represented in the first maturity bucket. Net cash flows are represented for interest rate swaps and forward rate agreements. Gross cash flows are represented in the maturity analysis for interest rate derivatives where settlement is gross (essentially Cross Currency Interest Rate Swaps) and foreign exchange derivatives such as FX-forwards and FX-swaps. 260 |
| EIB GROUP CONSOLIDATED FINANCIAL STATEMENTS UNDER IFRS 268 Maturity profile of non-derivative financial liabilities (in EUR million as at 31.12.2022) 3 months or less More than 3 months to 1 year More than 1 year to 5 years More than 5 years Maturity undefined Gross nominal outflow Carrying amount Amounts owed to credit institutions and customers 6,937 0 0 0 0 6,937 6,933 Commercial papers 0 8,405 0 0 0 8,405 8,343 Debts evidenced by certificates – first call date scenario 17,474 51,967 221,715 181,346 0 472,502 409,075 Other liabilities 8 745 1,260 1,096 479 3,588 3,592 Issued guarantees and other Off Balance sheet items 0 0 0 0 42,040 42,040 Outflows for committed but undisbursed loans 13,840 2,375 6,271 234 101,312 124,032 Total 38,259 63,492 229,246 182,676 143,831 657,504 427,943 Maturity profile of non-derivative financial liabilities (in EUR million as at 31.12.2021) 3 months or less More than 3 months to 1 year More than 1 year to 5 years More than 5 years Maturity undefined Gross nominal outflow Carrying amount Amounts owed to credit institutions and customers 12,301 13,195 0 0 0 25,496 25,393 Commercial paper 6,015 8,177 0 0 0 14,192 14,185 Debts evidenced by certificates – first call date scenario 15,717 42,103 233,597 185,210 0 476,627 459,718 Other liabilities(*) 10 670 1,289 1,396 352 3,717 3,720 Issued guarantees and other Off Balance sheet items 0 0 0 0 40,344 40,344 Outflows for committed but undisbursed loans 14,857 2,120 6,416 188 99,396 122,977 Total 48,900 66,265 241,302 186,794 140,092 683,353 503,016 (*)A reclassification was made in order to improve the readability of financial statements Maturity profile of derivative financial liabilities (in EUR million as at 31.12.2022) 3 months or less More than 3 months to 1 year More than 1 year to 5 years More than 5 years Gross nominal inflow/ outflow Net settling interest rate derivatives -544 -2,875 -4,664 -663 -8,746 Gross settling interest rate derivatives – inflows 15,389 35,505 156,257 78,712 285,863 Gross settling interest rate derivatives – outflows -16,843 -34,684 -153,571 -77,874 -282,972 Foreign exchange derivatives – inflows 19,276 2,276 127 0 21,679 Foreign exchange derivatives – outflows -19,507 -2,366 -126 0 -21,999 Total -2,229 -2,144 -1,977 175 -6,175 Maturity profile of derivative financial liabilities (in EUR million as at 31.12.2021) 3 months or less More than 3 months to 1 year More than 1 year to 5 years More than 5 years Gross nominal inflow/ outflow Net settling interest rate derivatives 402 2,152 3,505 2,655 8,714 Gross settling interest rate derivatives – inflows 9,659 27,379 143,949 82,624 263,611 Gross settling interest rate derivatives – outflows -8,825 -27,354 -139,636 -79,971 -255,786 Foreign exchange derivatives – inflows 18,470 6,260 0 0 24,730 Foreign exchange derivatives – outflows -18,418 -6,146 0 0 -24,564 Total 1,288 2,291 7,818 5,308 16,705 S.4. Interest rate risk Interest Rate Risk for the Group From the Group’s positions, the Interest Rate Risk is the risk to the economic value or to the net interest income arising from adverse movements in interest rates that affect interest rates sensitive instruments. Exposure to interest rate risk occurs when there are differences in repricing and maturity characteristics of the different asset, liability and hedging instruments. The Group Risk Appetite Framework contains two interest rate risk indicators managed within pre-approved limits: the “Risk to Economic Value” and the “Risk to Earnings”– see S.4.1.), which are, however defined on EIB standalone level. The EIF’s Risk Appetite Framework does not currently include such interest rate risk indicators, but EIF instead allocates economic capital to cover its interest rate risk exposures. In doing so, the EIF is following the Group capital measurement methodology for Interest Rate Risk in the Banking Book (‘IRRBB’). The following sections detail the operational implementation of the Interest Rate Risk management framework of each entity. 261 |
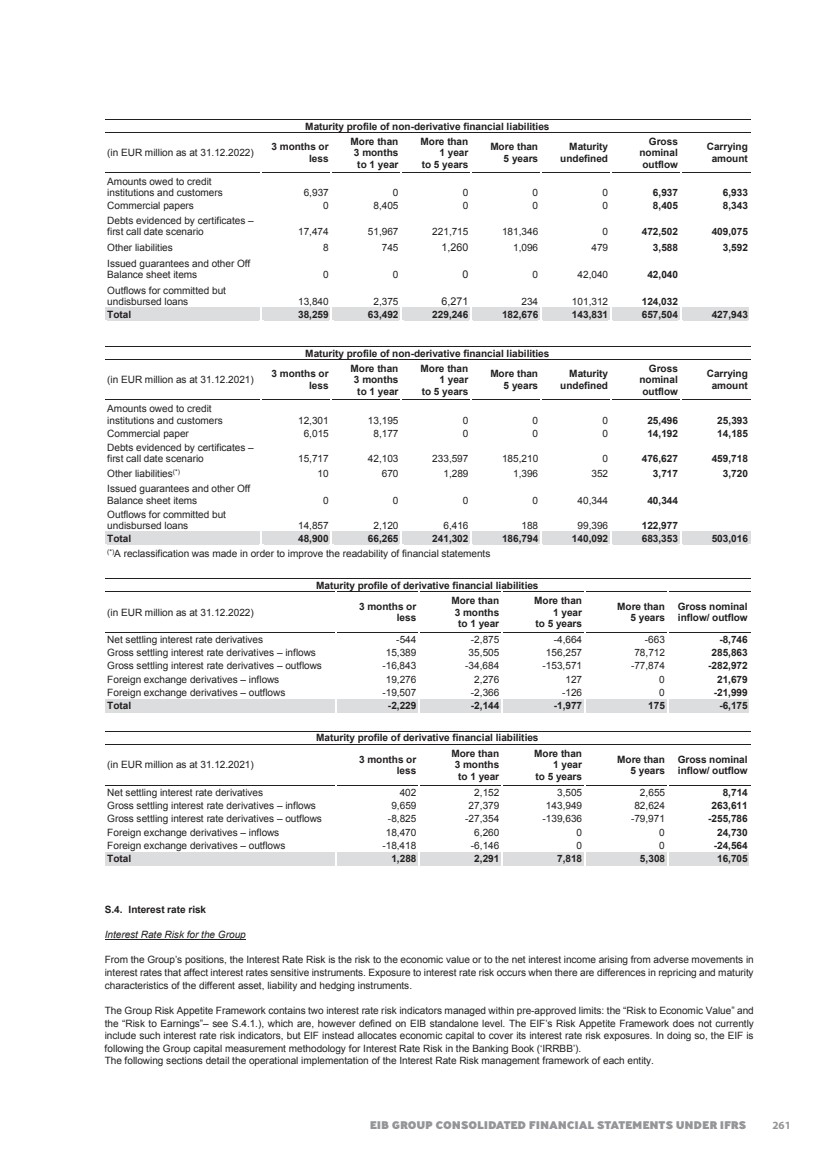
| 2022 FINANCIAL REPORT 269 S.4.1 Interest rate risk management for the Bank In measuring and managing interest rate risk, the Bank refers to the relevant key principles of the Basel Committee on Banking Supervision (‘BCBS’) as implemented in the EU, and to the regulatory guidance issued by the European Banking Authority (‘EBA’). The main sources of interest rate risk are: gap risk, basis risk and option risk. Gap risk is the most relevant interest rate risk for the Bank and is defined as the risk to the economic value or to the net interest income generated by the differences in the term structure of interest rate sensitive instruments on the Bank’s balance sheet. Following regulatory guidance, the Bank has articulated its appetite for interest rate risk in terms of both the maximum Risk to Economic Value and the maximum Risk to Earnings that the Bank is prepared to take (while, when applicable, adhering to the maximum thresholds defined in the EBA Supervisory Outlier Tests). The Bank’s investment strategy for its own funds – the Interest Rate Risk Strategy – complies with such interest rate risk appetite. The effect of the Russian invasion of Ukraine has contributed to rising inflationary trends and high inflation was followed by increases in interest rates, being translated into positive impact on the Bank’s net interest revenue. IBOR Reform Interest rate benchmarks, such as the London InterBank Offered Rate (‘LIBOR’) were widely used in financial contracts. The global transition to alternative interest rate benchmark rates is one of the most challenging reforms undertaken in the financial markets. Similarly to other Banks, EIB had significant exposure to IBORs on its financial instruments that are in the scope of the reform as part of these market-wide initiatives. Internal preparations In February 2018, the Assets & Liabilities Committee (‘ALCO’) set up a dedicated sub-ALCO working group on IBORs, the IBOR Working Group to proactively follow and monitor the developments related to the transition to alternative interest rates. The objectives of the IBOR Working Group included the monitoring of the developments related to the interest rate benchmark reform. This oversight covers, among others, the progress on contracts amendments, bilateral negotiations with clients, IT systems and applications updates, introduction of fall-back language in new contracts and regular monitoring of the exposure to IBORs per currency, asset class and jurisdiction of the interest rate benchmarks earmarked for discontinuation. The progress in the implementation of the established work-plan has been regularly monitored and discussed at the ALCO and periodically reported to the Senior Management and the Audit Committee. Transition status per financial instruments class As part of its lending and funding activities, the Bank is mainly exposed to the IBOR Reform on Floating Rates Loans granted to customers and bonds issued to fund its activity. In order to manage exposures to interest rate and foreign currency risks, the Bank uses derivative instruments (e.g. to hedge fixed rates loans and borrowings operations). Derivatives are the largest financial instrument class directly exposed to IBOR rates as a large part of their corresponding cash flows are referenced to IBOR rates (i.e., “floating interest rate”)12. In 2021, the Bank adhered to the ISDA IBOR Fallback Protocol and Supplement, which provide an amendment mechanism for counterparties to incorporate robust fallback provisions to be applied upon the cessation of an interest rate index, ensuring a smooth transition of the derivatives legacy portfolio. All EIB’s counterparties to LIBOR-linked swaps have also adhered to that Protocol and Supplement. Through the application of this Protocol and Supplement, the Bank had migrated in its systems all of its derivative notional exposure referring to LIBORs (in GBP, CHF, JPY and USD) by the end of 2022. Floating Rate Loans are the second largest financial instrument class directly exposed to IBOR rates. As at 31 December 2022, no contract originally indexed to CHF, JPY and GBP is linked to LIBOR any longer. During 2022, the Bank has pursued the migration of the loans indexed to USD LIBOR. The USD LIBOR legacy portfolio is larger than that previously pertaining to GBP, CHF and JPY LIBOR and it is also more geographically diversified (with circa 75% clients located in outside-EU countries). 75% of borrowers have already expressed their product preference and relevant repapering is expected to be signed early 2023. While the majority of the exposure is expected to be migrated by the first interest payment date after the cessation date of 30 June 2023, a partial reliance on synthetic LIBOR is likely to be needed. In parallel to the migration, the Bank has adapted its lending products portfolio for new loan origination. The Bank will remeasure in 2023 its loans in USD meeting eligibility criteria either for fair value hedge accounting or for fair value option to reflect the impact of the application in 2023 of an economically equivalent revised discount curve for USD LIBOR (please refer to the methodology described under note A.4.5 and A.4.9 respectively). Therefore, there is no impact for those loans in 2022, as evidenced below in the table disclosing the impact of the IBOR reform transition on Financial Operations by nature of result for the period. On the funding side, the Bank has been issuing bond products referencing new RFRs in its balance sheet since 2018. In addition, the Bank has focused on supporting the relevant RFR markets with the required liquidity, under the preferred market structural formats. As at 31 December 2022, of the bonds indexed to USD LIBOR, 61% of the carrying amount will mature before end-June 2023. The remaining 39% will be assessed during the first semester of 2023 and appropriate exposure mitigation opportunities will be considered. The Bank will remeasure in 2023 its funding bonds (“borrowings”) in USD meeting eligibility criteria for fair value hedge accounting to reflect the impact of the application in 2023 of an economically equivalent revised discount curve for USD LIBOR (please refer to the methodology described under note A.4.5 and A.4.9 respectively). Therefore, there is no impact for those borrowings in 2022, as evidenced below in the table disclosing the impact of the IBOR reform transition on Financial Operations by nature of result for the period. 12 Derivatives are re-measured in accordance with the methodology described under note A.4.5. 262 |
| EIB GROUP CONSOLIDATED FINANCIAL STATEMENTS UNDER IFRS 270 As at 31 December 2022, the carrying amount of instruments exposed to IBOR reform risk due to their floating interest rate is as follows: Carrying amount (EUR million) USD LIBOR GBP LIBOR Other Non-derivative financial assets Loans and advances to credit institutions a) repayable on demand 0 0 0 b) other loans and advances 0 0 0 c) loans 7,685 0 0 Loans and advances to customers a) other loans and advances 0 0 0 b) loans 3,819 0 0 Treasury bills and other bills eligible for refinancing with central banks 879 0 0 Debt securities including fixed-income securities b) issued by other borrowers 279 0 0 Total non-derivative financial assets 12,662 0 0 Non-derivative financial liabilities Debts evidenced by certificates a) debt securities in issue 530 0 0 b) others 69 0 0 Total non-derivative financial liabilities 599 0 0 Loan Commitments 9,394 0 0 Notional amount (EUR million) USD LIBOR GBP LIBOR Other Derivative financial instruments Derivative assets Interest rate swaps 0 0 0 Cross currency swaps 0 0 0 Total derivative assets 0 0 0 Derivative liabilities Interest rate swaps 0 0 0 Cross currency swaps 0 0 0 Total derivative liabilities 0 0 0 The USD contracts maturing before the anticipated USD LIBOR replacement date in June 2023 have not been included. As at 31 December 2022, the carrying amount of the instruments exposed to IBOR reform risk following the review of the discount curve (initially IBOR rate based) is as follows: Carrying amount (EUR million) USD LIBOR GBP LIBOR Other Non-derivative financial assets Loans and advances to credit institutions a) repayable on demand 0 0 0 b) other loans and advances 0 0 0 c) loans 3,701 0 0 Loans and advances to customers a) other loans and advances 0 0 0 b) loans 3,690 0 0 Total non-derivative financial assets 7,391 0 0 Non-derivative financial liabilities Debts evidenced by certificates a) debt securities in issue 77,706 0 0 b) others 173 0 0 Total non-derivative financial liabilities 77,879 0 0 263 |
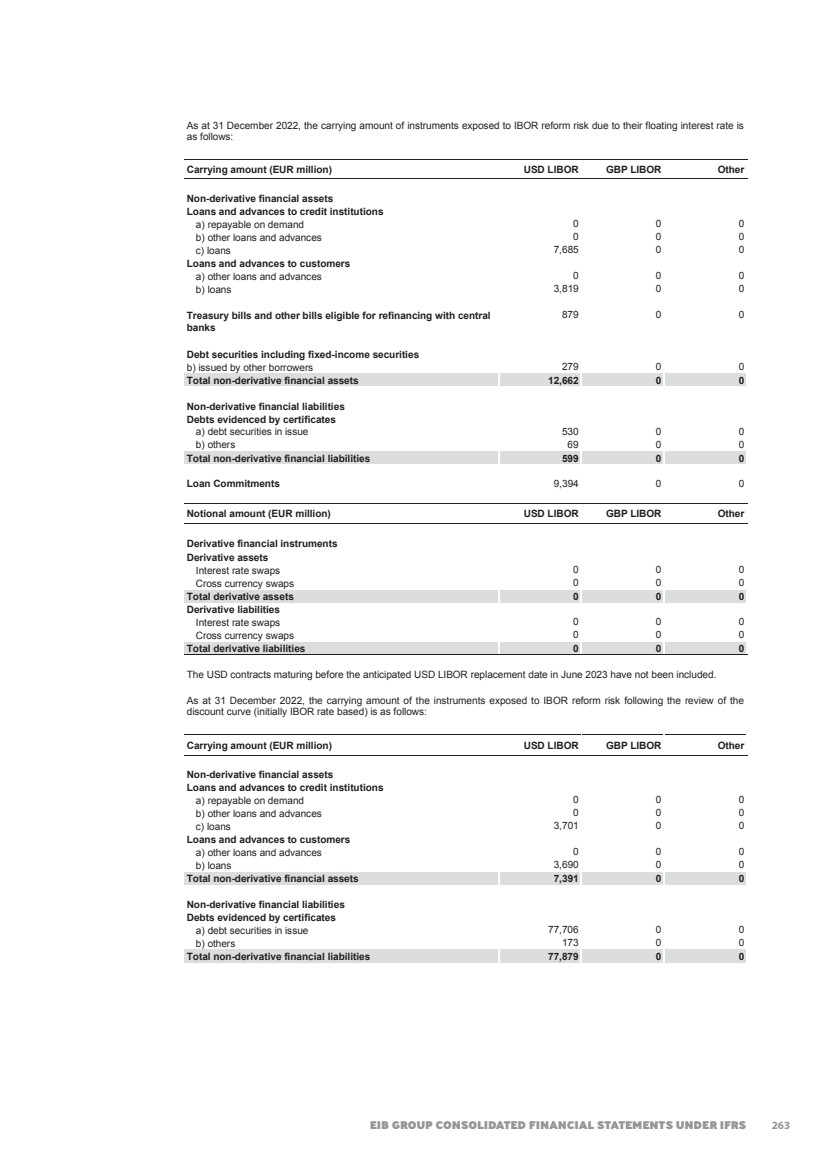
| 2022 FINANCIAL REPORT 271 As at 31 December 2021, the carrying amount of instruments exposed to IBOR reform risk due to their floating interest rate is as follows: Carrying amount (EUR million) USD LIBOR GBP LIBOR Other Non-derivative financial assets Loans and advances to credit institutions a) repayable on demand 0 0 0 b) other loans and advances 0 0 0 c) loans 8,956 0 0 Loans and advances to customers a) other loans and advances 0 0 0 b) loans 4,173 1,056 0 Treasury bills and other bills eligible for refinancing with central banks 823 0 0 Debt securities including fixed-income securities b) issued by other borrowers 334 0 0 Total non-derivative financial assets 14,286 1,056 0 Non-derivative financial liabilities Debts evidenced by certificates a) debt securities in issue 599 0 0 b) others 95 0 0 Total non-derivative financial liabilities 694 0 0 Loan Commitments 20,683 0 0 Notional amount (EUR million) USD LIBOR GBP LIBOR Other Derivative financial instruments(1) Derivative assets Interest rate swaps 31 478 279 Cross currency swaps 31 0 115 Total derivative assets 62 478 394 Derivative liabilities Interest rate swaps 370 0 0 Cross currency swaps 0 0 0 Total derivative liabilities 370 0 0 (1) All LIBOR-linked derivatives were covered by the ISDA Fallback Protocol, the carrying amounts refer to transactions not migrated in the systems as of 31 December 2021. As reported above, those have actually been migrated in the systems in early 2022. The USD contracts maturing before the anticipated USD LIBOR replacement date in June 2023 have not been included. As at 31 December 2021, the carrying amount of the instruments exposed to IBOR reform risk following the review of the discount curve (initially IBOR rate based) is as follows: Carrying amount (EUR million) USD LIBOR GBP LIBOR Other Non-derivative financial assets Loans and advances to credit institutions a) repayable on demand 0 0 0 b) other loans and advances 0 0 0 c) loans 2,746 0 0 Loans and advances to customers a) other loans and advances 0 0 0 b) loans 2,748 0 0 Total non-derivative financial assets 5,494 0 0 Non-derivative financial liabilities Debts evidenced by certificates a) debt securities in issue 83,746 0 0 b) others 303 0 733 Total non-derivative financial liabilities 84,049 0 733 264 |
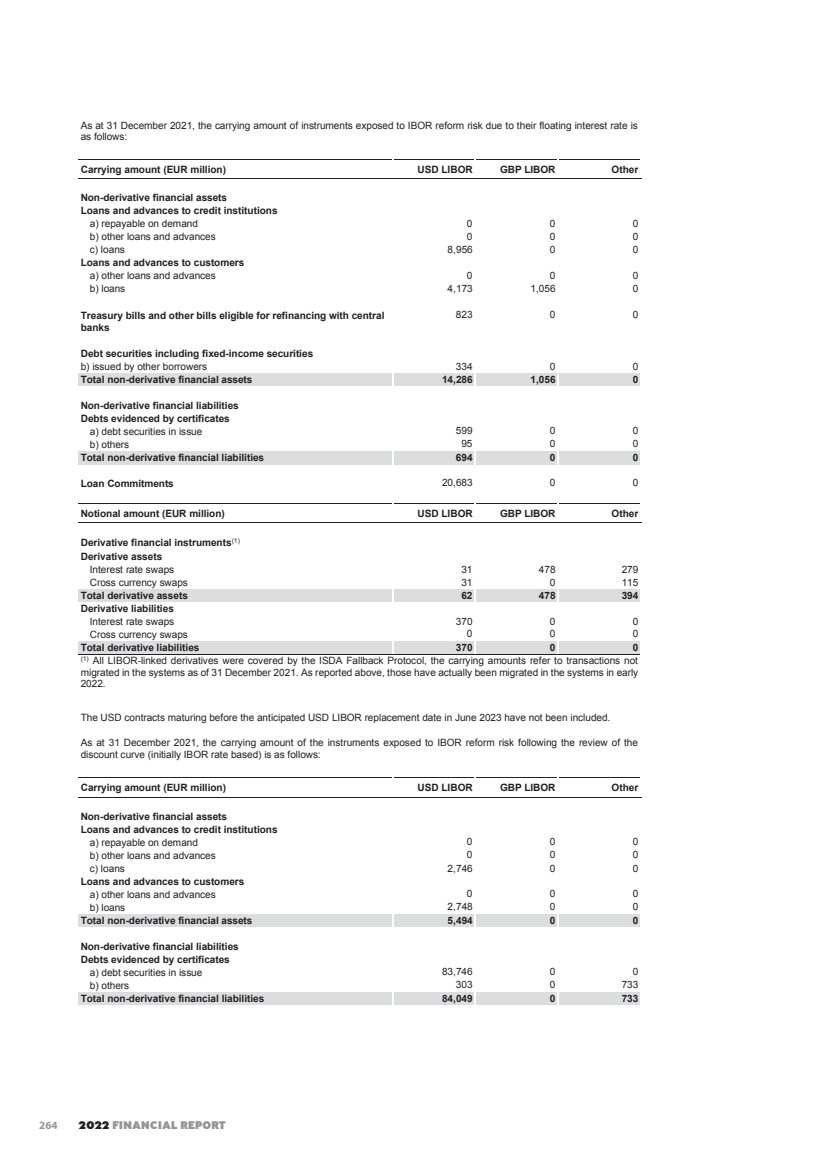
| EIB GROUP CONSOLIDATED FINANCIAL STATEMENTS UNDER IFRS 272 During 2022, the impact of the IBOR reform transition on Financial Operations by nature of result is as follows: in EUR million Outstanding Amount Result on financial operations Net result on Swaps/derivatives 0 0 Net result on FVO Non-quoted borrowings 0 0 Net result from hedge accounting on loans 0 0 Net result from hedge accounting on borrowings 0 0 Total result 0 During 2021, the impact of the IBOR reform transition on Financial Operations by nature of result is as follows: in EUR million Outstanding Amount Result on financial operations Net result on Swaps/derivatives 289,861 7 Net result on FVO Non-quoted borrowings -2,238 -1 Net result from hedge accounting on loans 15,295 -13 Net result from hedge accounting on borrowings -36,318 23 Total result 16 S.4.1.1. Interest rate risk on the Economic Value of the Own Funds/Equity of the Bank The Bank’s Interest Rate Risk strategy aims at maintaining a balanced and sustainable revenue profile as well as limiting the risk to the economic value of the Group. A clear preference has been given to the revenue profile in light of the objective of self-financing future growth. This overall objective is achieved by investing the own funds according to a medium to long term investment profile. Of course, this strategy needs to comply with the limits for the RAF metrics “Risk to Earnings” and “Risk to Economic Value”. Apart from the Interest Rate Strategy underpinning the investment of the Bank’s own funds (implying an own funds duration target within the range of currently 4.5 – 5.5 years), the Bank’s balance sheet should be match-funded with respect to interest rate risk. As it is not operationally practical to perfectly match-fund the Bank’s balance sheet, small deviations to gap and basis risks are allowed. Those net residual interest rate risk positions are managed within pre-approved limits, the latter being dimensioned to ensure the individual risks remain within the risk appetite boundaries. In addition to its interest rate risk limits framework, the Bank performs regular stress testing, based on EBA standardised shock scenarios13, to its projected earnings and to its economic value. The exercise serves the purpose of identifying potential adverse consequences arising from severe changes in the interest rates environment. The stress test on the economic value is performed on Group level as well and as of 31 December 2022, the worst impact of the EBA supervisory outlier test scenarios would reduce the economic value of own funds of the EIB Group by EUR 5.44 billion (2021: EUR 4.37 billion) 14. Among the financial instruments in the Bank’s portfolio, some operations (borrowings and associated swaps) present callability options and may be redeemed early, hence introducing uncertainty as to their final maturity. However, as those packages (borrowings and associated swaps) are fully back-to-back (up to the cashflow level), they can be considered at the end as simple synthetic floating rate notes indexed to Libor/Euribor and bearing limited interest rate risk. 13 EBA/GL/2018/02. 14 The stress test is performed on all risk-sensitive banking book instruments, including the pension and health insurance liabilities (DBO) as calculated by an actuarial provider. 265 |
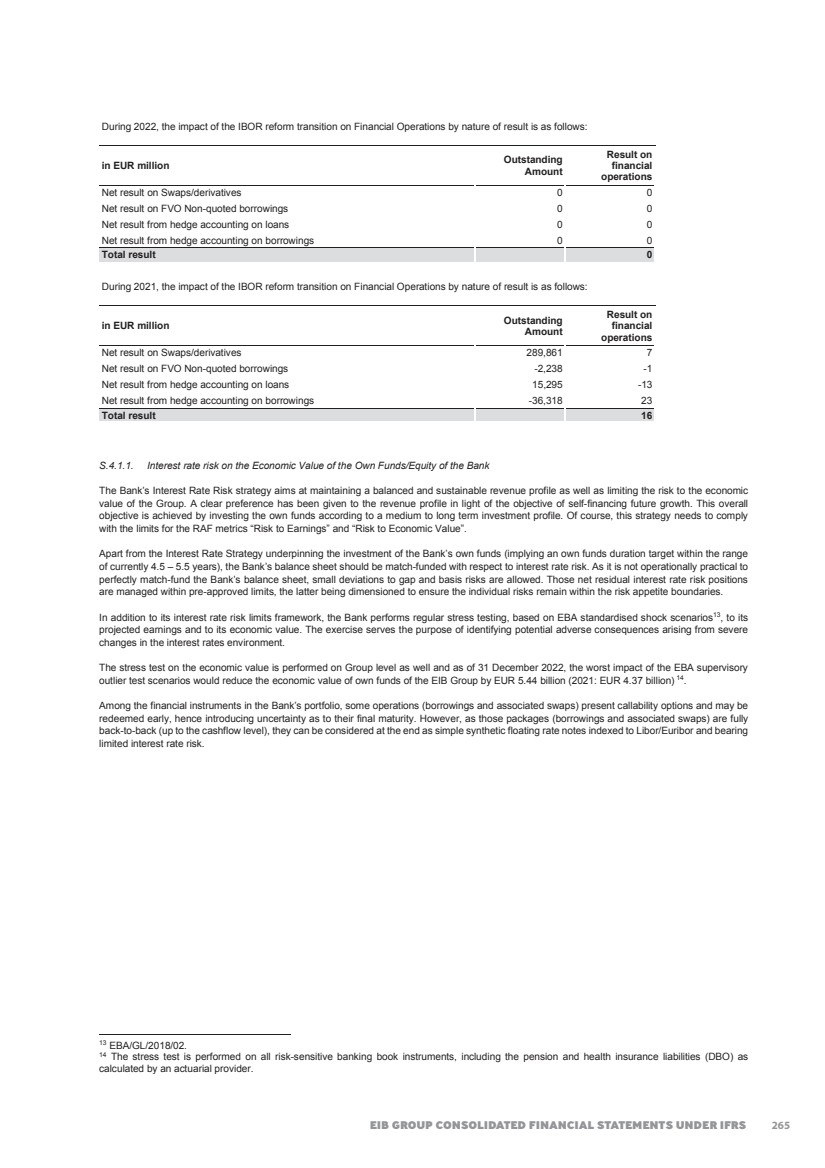
| 2022 FINANCIAL REPORT 273 The table hereafter is a summary of the features of the Group’s callable borrowings portfolio as of 31 December 2022 and 31 December 2021, where the total nominal amount, the average natural maturity and the average expected maturity (both weighted by the nominal amount of the concerned transactions) are shown per funding currency and per main risk factor involved: By funding currency (after swaps): 31.12.2022 Pay currency Total (in EUR million) EUR USD EUR pay notional -2,467 -1,149 -3,616 Average maturity date 05.04.2046 09.06.2037 17.06.2043 Average expected maturity 01.04.2039 21.10.2033 08.07.2037 31.12.2021 Pay currency Total (in EUR million) EUR USD EUR pay notional -2,659 -1,284 -3,943 Average maturity date 19.03.2047 06.09.2038 07.06.2044 Average expected maturity 02.01.2031 07.07.2027 13.11.2029 By risk factor involved: 31.12.2022 Risk factor Total (in EUR million) FX level IR curve level EUR pay notional -283 -3,333 -3,616 Average maturity date 18.07.2035 17.02.2044 17.06.2043 Average expected maturity 21.05.2032 15.12.2037 08.07.2037 31.12.2021 Risk factor Total (in EUR million) FX level IR curve level EUR pay notional -323 -3,620 -3,943 Average maturity date 01.01.2036 09.03.2045 07.06.2044 Average expected maturity 13.02.2029 07.12.2029 13.11.2029 S.4.1.2. Interest rate risk on the earnings of the Bank Preliminary remark: The sensitivity of earnings is not yet accounting for market value changes of instruments classified at fair-value. The Bank is planning to upgrade its risk system in 2023-24 for including this dimension and therefore being able to produce an ‘IFRS Risk to Earnings’. The Risk to Earnings quantifies the amount of net interest income that would change during the forthcoming 36 months if all interest rate curves would decrease by two percentage points. Such exposure stems primarily from the mismatch between interest rate repricing periods of assets and liabilities, and has to stay within the limit defined in the Risk Appetite Framework. With the positions in place as of 31 December 2022, the earnings would decrease by EUR 920.5 million (2021: EUR 992.4 million) if interest rates were to decrease by 200 basis points. For enriching the analysis of the earnings’ sensitivity, the earnings would increase by EUR 937.3 million (2021: EUR 1,014.7 million) if interest rates were to increase by 200 basis points. The Bank uses a dedicated software that allows to simulate the sensitivity of earnings on a deal by deal basis. The sensitivity of earnings is measured on an accruals basis and is calculated under the ‘’ongoing’’ assumption that, over the time horizon analysed, the Bank realises (at market rates defined in the underlying scenario) the new loan business forecast in the Operational Plan, maintains exposures within approved limits and executes monetary trades to refinance funding shortages or invest cash excesses. In line with the Bank’s current practice, the model uses the hypothesis that simulated earnings are not distributed to the shareholders, but are used to refinance the Bank’s business. The administrative costs are projected according to the forecasts of the Operational Plan. S.4.2 Interest rate risk management for the Fund (EIF) Even though EIF does not fund itself on capital/money markets, EIF is exposed to Interest Rate Risk, primarily to the gap risk. The major interest rate sensitive exposures at EIF are its pension Defined Benefit Obligations (DBO) on the liabilities side and its fixed income treasury book on the assets side. Although EIF’s risk appetite statement does not currently include interest rate risk indicators and does not have an articulated Interest Rate Risk Strategy, EIF allocates economic capital to cover its interest rate risk exposures. EIF is following the Group capital measurement methodology for Interest Rate Risk in the Banking Book (‘IRRBB’), i.e. EIF interest rate risk is assessed from both the Normative and from the Economic perspectives, with the worse of the two being considered under the Economic Capital (‘ECap’) ratio. 266 |
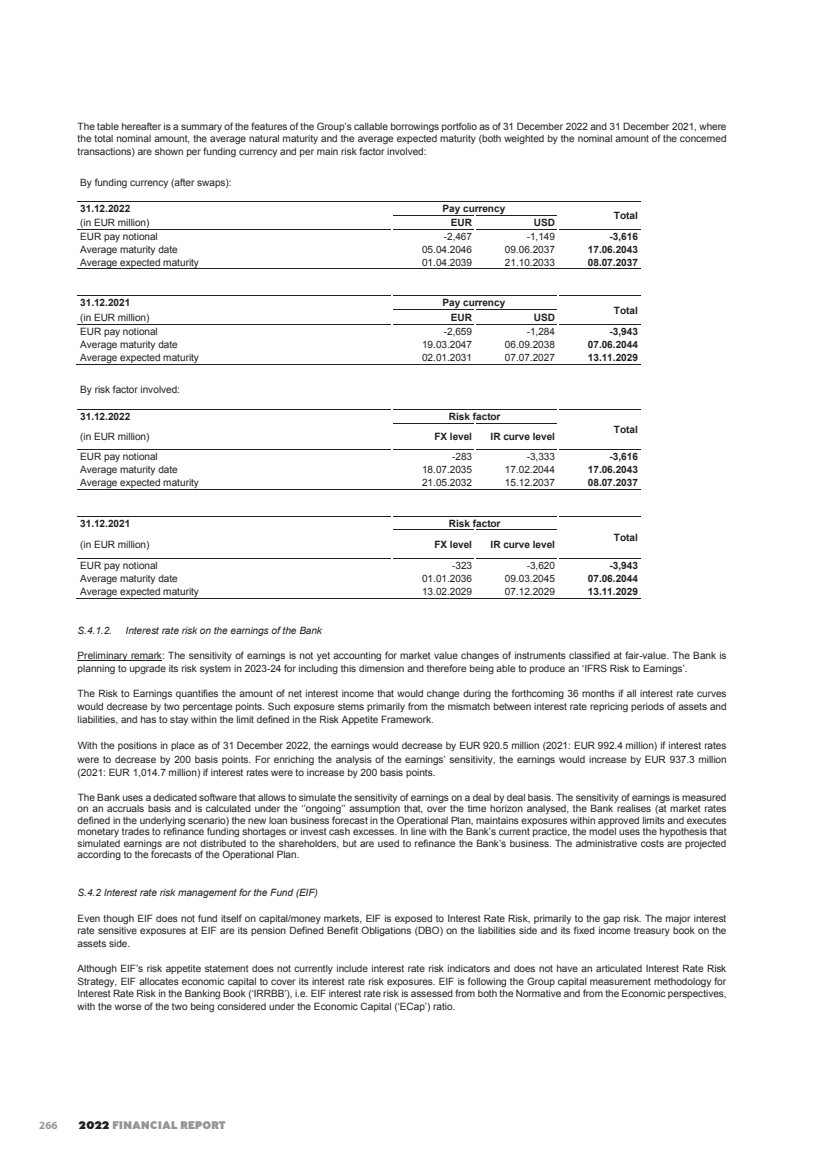
| EIB GROUP CONSOLIDATED FINANCIAL STATEMENTS UNDER IFRS 274 S.4.3. Foreign exchange risk The foreign exchange (‘FX’) risk is the risk to the economic value or to the income derived from, the Group’s positions due to adverse movements of foreign exchange rates. The Group is exposed to a foreign exchange risk whenever there is a currency mismatch between its assets, liabilities and hedging instruments. In compliance with the Bank’s Statute and with the EIF Risk Appetite Framework, the Group does not engage in currency operations not directly required to carry out its core activities (more specifically: for the Bank, mismatches of currencies in the asset-liability structure are kept within pre-approved tight limits while, for EIF, open FX positions may arise from its Equity investments, in line with its Statutes and Risk Appetite Framework). Consequently, the Russian invasion of Ukraine had no adverse impact on the Group’s FX risk management. S.4.3.1. Foreign exchange position Net position (in million) 2022 2021 Euro (EUR) -193 -129 Pound Sterling (GBP) 53 47 US Dollar (USD) 79 52 Other currencies 61 30 Subtotal except Euro 193 129 S.4.4. Equity price risk Equity price risk is the risk that the fair values of equities decrease as the result of changes in the levels of equity indices and the value of individual equity investments. As of 31 December 2022, equity price risk was primarily limited to those strategic activities approved by the Board of Directors (private equity / venture capital and infrastructure fund investments made by the Fund on behalf of the Bank and on its own resources; investment funds; equity-like investments as Special Activity; participation in the EBRD). These activities are subject to special forms of monitoring and the resulting exposures are supported by sound capitalisation. The value of privately held equity positions is not readily available for the purposes of monitoring and control on a continuous basis. For such positions, the best indications available include prices for similar assets and the results of any relevant valuation techniques. The effect on Own Funds for the Group (as a result of a change in the fair value of equity investments at 31 December 2022 and 31 December 2021) due to a reasonable possible change in equity indices, with all other variables held constant is as follows: 2022 2021 Change in equity price Effect on Own Funds Change in equity price Effect on Own Funds % EUR ’000 % EUR ’000 Private Equity / Venture Capital Operations / Infrastructure Funds(1) -10 -1,328,159 -10 -1,352,194 EBRD shares -10 -54,758 -10 -59,793 Investment funds -10 -481,786 -10 -381,026 (1) The sensitivity of Private Equity / Venture Capital operations and Infrastructure Funds is calculated by the EIF based on the market risk of the positions on the public market. S.5. Operational Risk As defined in the EIB Group Operational Risk Policy, Operational Risk means the risk of loss resulting from inadequate or failed internal processes, people and systems or from external events15. All Group’s activities may be affected by Operational Risk and therefore the Group aims to systematically identify, assess, monitor and report Operational Risks on a regular basis, and ensure that sufficient controls and risk mitigants are in place to limit the exposure to Operational Risk. The Operational Risk Unit in the EIB Group Risk & Compliance, the EIF Risk Management, and the Internal Controls and Assertion Division in Financial Control at the EIB, are responsible for defining the Group Operational Risk Framework and related policies while the responsibility for implementing the Framework lies with all the Departments of the Group. The Group organises its Operational Risk Management activities in compliance with the applicable Best Banking Practice (“BBP”). The EIB Group revised in 2022 its Operational Risk Policy to align with a new, unified non-financial risk classification at Group level. In addition, the Group developed a comprehensive operational risk event reporting procedure in 2022, which has strengthened the implementation of the policy and developed a key network of operational risk champions in the EIB. The Group has also enhanced its Risk Appetite Framework with a streamlined definition of operational (key) risk indicators. 15 The definition of external events excludes cases of client bankruptcy or unfavourable market movements or similar events, which represent triggers for Credit and respectively Market Risk. 267 |
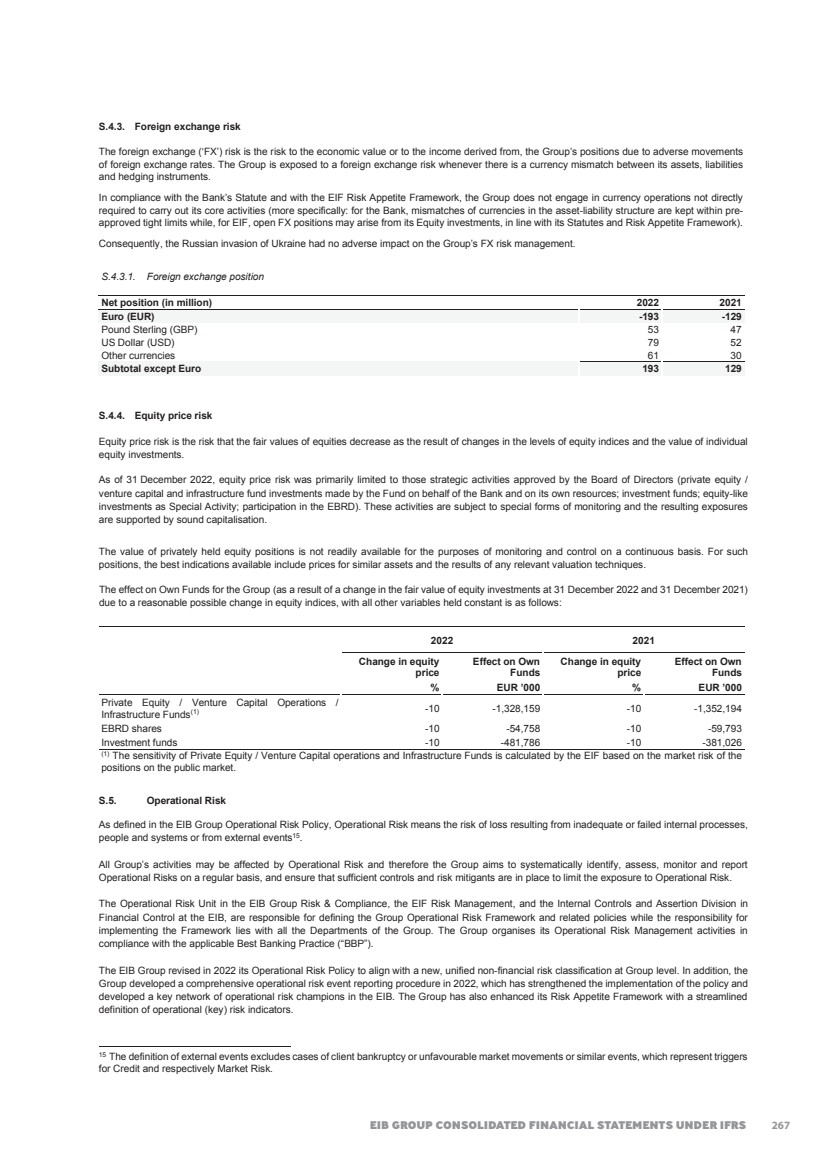
| 2022 FINANCIAL REPORT 275 In terms of reporting, the EIB Group Operational Risk Report is approved by the Group Chief Risk Officer (‘GCRO’) responsible for overall aspects of managing and monitoring Operational Risk and then submitted to the Management Committee (‘MC’), the Audit Committee (‘AC’) and Directors General (‘DGs’). In addition, losses/gains above EUR 0.25 million are immediately escalated to the President. At the EIF, the Operational Risk function within Risk Management provides regular reporting to the Audit Board (‘AB’) and the Senior Management. The Group has robust compliance controls, including a dedicated Sanctions Compliance Programme, ensuring that its activities comply with all existing EU sanctions and applicable U.S. and UK sanctions. With specific reference to sanctions targeting the war in Ukraine, no material impact has been identified on Group’s business activities. The Group is a crucial institution of the European Union, and as such, it is a likely target for cyber-attacks. With the war in Ukraine, the risk of direct and spill-over attacks has increased, and the Group is closely monitoring this risk in collaboration with the Computer Emergency Response Team for the EU institutions, bodies and agencies (‘CERT-EU’). To ensure the security and integrity of its operations, the Group has implemented robust security measures to protect against cyber-attacks. S.6. Climate Change and Environmental risks As a provider of long-term financing, the EIB Group is exposed to potential Climate Change and Environmental Risks related financial impacts. As a AAA-rated entity and in its capacity as the EU climate bank, the Group is fully committed to establishing a comprehensive and prudent climate risk management framework following the prevailing regulatory requirements and best banking and market practices. Climate Change and Environmental Risks have a pervasive impact on the various risk categories that the Group is exposed to (credit, interest rate, liquidity and funding, foreign exchange rate, equity price, operational and reputational) and consequently have been identified and managed by the EIB Group on an overall basis. The Group defines Climate Change and Environmental Risks as the risks of a negative impact on its primary risks, by distinguishing between: • Transition risks arising from the transition to a low-carbon, climate-resilient and more environmentally sustainable economy; and • Physical risks arising from the physical effect of climate change (that lead to more frequent extreme events such as floodings, droughts or storms) as well as of environmental degradation of water, air, land and biodiversity, among others. From a short-term period perspective (up to one year horizon) Climate Change and Environmental Risks are not deemed material for EIB Group IFRS financial statements. Nevertheless, due to their long-term impact horizon (beyond ten years) and potential for exponentially growing negative effects, the Group is committed to keep enhancing and pro-actively managing those risks. From a credit risk angle, in the short to medium term (up to ten years), the Group’s lending and equity portfolios will be more sensitive to transition risk and this risk may become material, if the Group’s counterparties fail to accomplish their climate transition. Particularly on the Climate Change-related Risks please refer to Section “Risk Management” of the annually published Group’s TCFD report regarding: • Identifying and assessing climate-related risks – for a detailed impact assessment across the various time horizons that the Climate Change-related risk may have on the various risk categories that the Group is exposed to; • Managing Climate-related Risks; and • Integration of Climate Change-related Risks into the Group’s overall risk management in areas such as Risk appetite framework, Capital adequacy assessment, Climate risk stress testing and scenario analyses as well as Risk reporting. 268 |
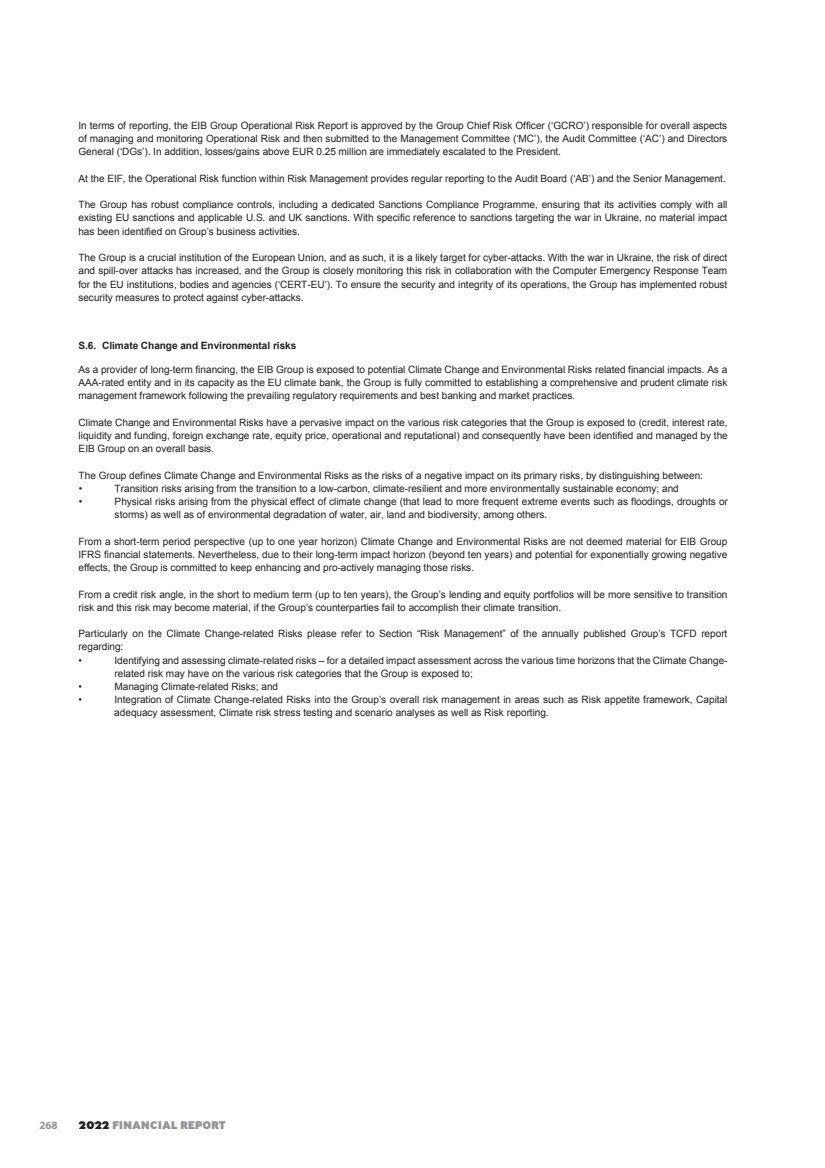
| EIB GROUP CONSOLIDATED FINANCIAL STATEMENTS UNDER IFRS 276 Note T – Accounting classifications and fair values of assets and liabilities (in EUR million) The table below sets out the Group’s classification of each class and category of assets and liabilities: 31 December 2022 Note AC Designated at FVTPL (FVO) Mandatorily at FVTPL FVOCI - equity instruments Non financial assets/ liabilities Total carrying amount Cash in hand, balances with central banks and post office banks B.1 113 0 0 0 0 113 Treasury bills and debt securities portfolios B.2 28,223 180 4,200 0 0 32,603 Loans and advances to credit institutions and to customers C/D 462,418 13,235 2,234 0 0 477,887 Shares and other variable-yield securities B.3 0 772 17,573 548 0 18,893 Derivative assets Q 0 0 35,044 0 0 35,044 Property, furniture and equipment E 0 0 0 0 345 345 Intangible assets E 0 0 0 0 70 70 Other assets/Subscribed capital and reserves, called but not paid G.1/W.1 811 0 0 0 223 1,034 Prepayments 0 0 0 0 286 286 Total 491,565 14,187 59,051 548 924 566,275 Amounts owed to credit institutions and customers H 6,933 0 0 0 0 6,933 Debts evidenced by certificates I 393,669 23,749 0 0 0 417,418 Derivative liabilities Q 0 0 43,758 0 0 43,758 Other liabilities G.2 3,172 0 420 0 1,448 5,040 Deferred income F 0 0 0 0 479 479 Provisions J/D.4 0 0 0 0 5,771 5,771 Total 403,774 23,749 44,178 0 7,698 479,399 269 |
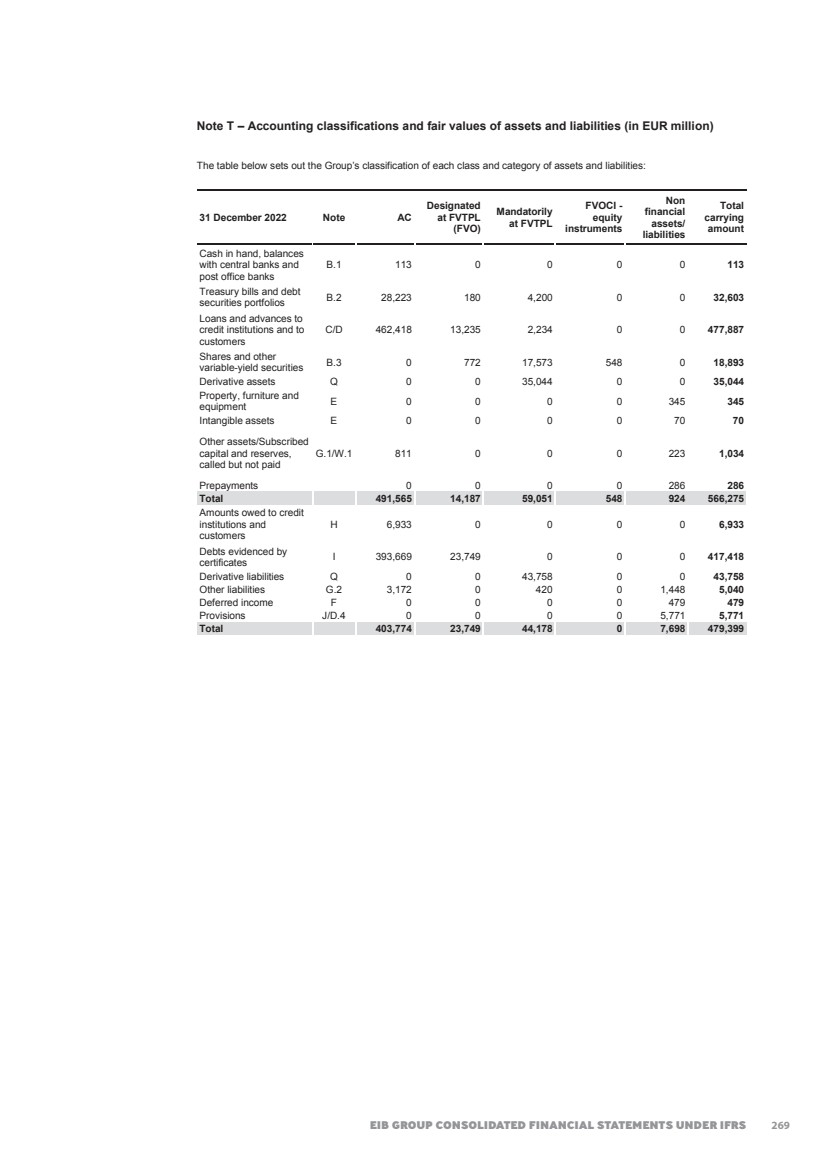
| 2022 FINANCIAL REPORT 277 31 December 2021 Note AC Designated at FVTPL (FVO) Mandatorily at FVTPL FVOCI - equity investments Non financial assets/ liabilities Total carrying amount Cash in hand, balances with central banks and post office banks B.1 1,483 0 0 0 0 1,483 Treasury bills and debt securities portfolios B.2 43,063 202 6,032 0 0 49,297 Loans and advances to credit institutions and to customers C/D 490,603 17,113 2,814 0 0 510,530 Shares and other variable-yield securities B.3 0 784 17,490 598 0 18,872 Derivative assets Q 0 0 41,734 0 0 41,734 Property, furniture and equipment E 0 0 0 0 374 374 Intangible assets E 0 0 0 0 58 58 Other assets / Subscribed capital and reserves, called but not paid G.1/W.1 1,134 0 0 0 183 1,317 Prepayments 0 0 0 0 272 272 Assets held for sale 0 0 0 0 0 0 Total 536,283 18,099 68,070 598 887 623,937 Amounts owed to credit institutions and customers H 25,393 0 0 0 0 25,393 Debts evidenced by certificates I 443,226 30,677 0 0 0 473,903 Derivative liabilities Q 0 0 29,530 0 0 29,530 Other liabilities (*) G.2 3,380 0 340 0 1,262 4,982 Deferred income F 0 0 0 0 443 443 Provisions J / D.4 0 0 0 0 8,666 8,666 Total 471,999 30,677 29,870 0 10,371 542,917 (*) A reclassification was made between the captions in order to improve the readability of financial statements. 270 |
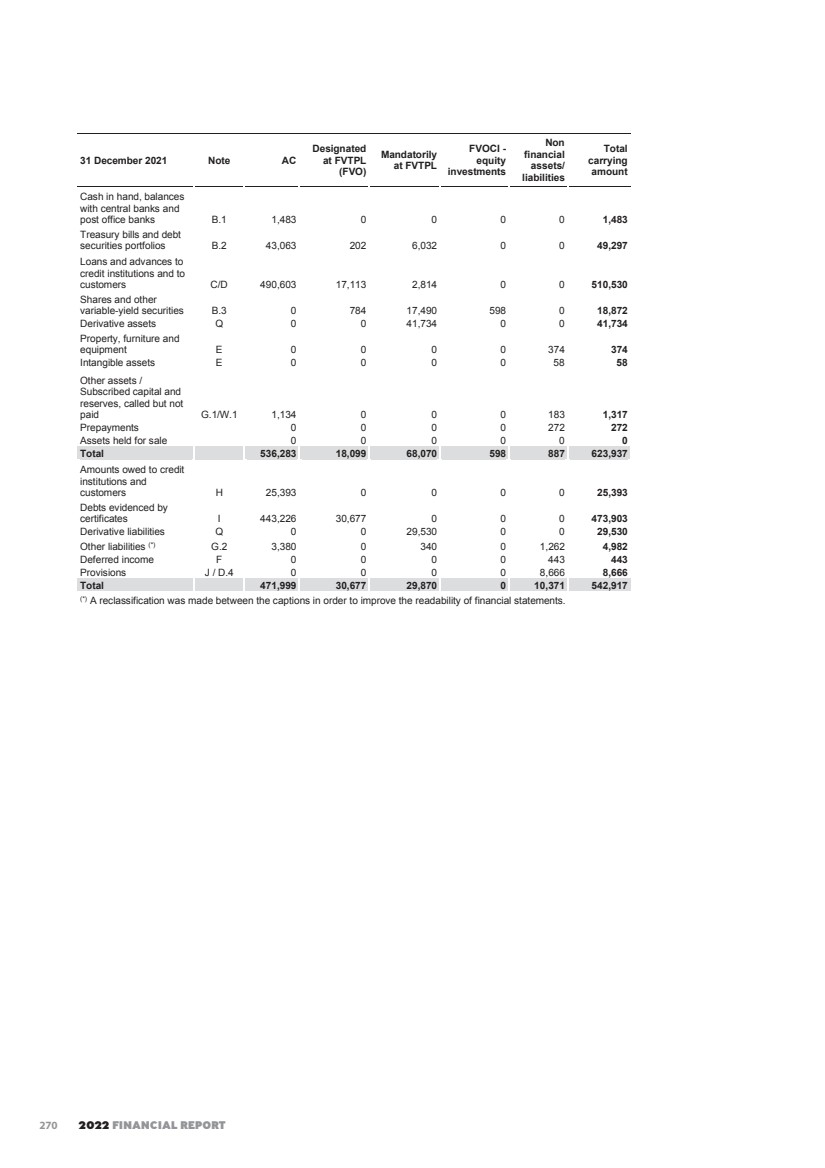
| EIB GROUP CONSOLIDATED FINANCIAL STATEMENTS UNDER IFRS 278 The table below sets out the fair value of each of the Group’s classes and categories of assets and liabilities. Fair value is set to book value for non-financial assets and non-financial liabilities. 31 December 2022 AC Designated at FVTPL (FVO) Mandatorily at FVTPL FVOCI - equity instruments Non financial assets/ liabilities Total fair value Cash in hand, balances with central banks and post office banks 113 0 0 0 0 113 Treasury bills and debt securities portfolios 27,380 180 4,200 0 0 31,760 Loans and advances to credit institutions and to customers 446,114 13,235 2,234 0 0 461,583 Shares and other variable-yield securities 0 772 17,573 548 0 18,893 Derivative assets 0 0 35,044 0 0 35,044 Property, furniture and equipment 0 0 0 0 345 345 Intangible assets 0 0 0 0 70 70 Other assets/Subscribed capital and reserves, called but not paid 811 0 0 0 223 1,034 Prepayments 0 0 0 0 286 286 Total 474,418 14,187 59,051 548 924 549,128 Amounts owed to credit institutions and customers 6,933 0 0 0 0 6,933 Debts evidenced by certificates 383,244 23,749 0 0 0 406,993 Derivative liabilities 0 0 43,758 0 0 43,758 Other liabilities 3,172 0 420 0 1,448 5,040 Deferred income 0 0 0 0 479 479 Provisions 0 0 0 0 5,771 5,771 Total 393,349 23,749 44,178 0 7,698 468,974 31 December 2021 AC Designated at FVTPL (FVO) Mandatorily at FVTPL FVOCI - equity investments Non financial assets/ liabilities Total fair value Cash in hand, balances with central banks and post office banks 1,483 0 0 0 0 1,483 Treasury bills and debt securities portfolios 43,120 202 6,032 0 0 49,354 Loans and advances to credit institutions and to customers 500,328 17,113 2,814 0 0 520,255 Shares and other variable-yield securities 0 784 17,490 598 0 18,872 Derivative assets 0 0 41,734 0 0 41,734 Property, furniture and equipment 0 0 0 0 374 374 Intangible assets 0 0 0 0 58 58 Other assets 1,134 0 0 0 183 1,317 Prepayments 0 0 0 0 272 272 Total 546,065 18,099 68,070 598 887 633,719 Amounts owed to credit institutions and customers 25,393 0 0 0 0 25,393 Debts evidenced by certificates 447,925 30,677 0 0 0 478,602 Derivative liabilities 0 0 29,530 0 0 29,530 Other liabilities (*) 3,380 0 340 0 1,262 4,982 Deferred income 0 0 0 0 443 443 Provisions 0 0 0 0 8,666 8,666 Total 476,698 30,677 29,870 0 10,371 547,616 (*) A reclassification was made between the captions in order to improve the readability of financial statements. 271 |
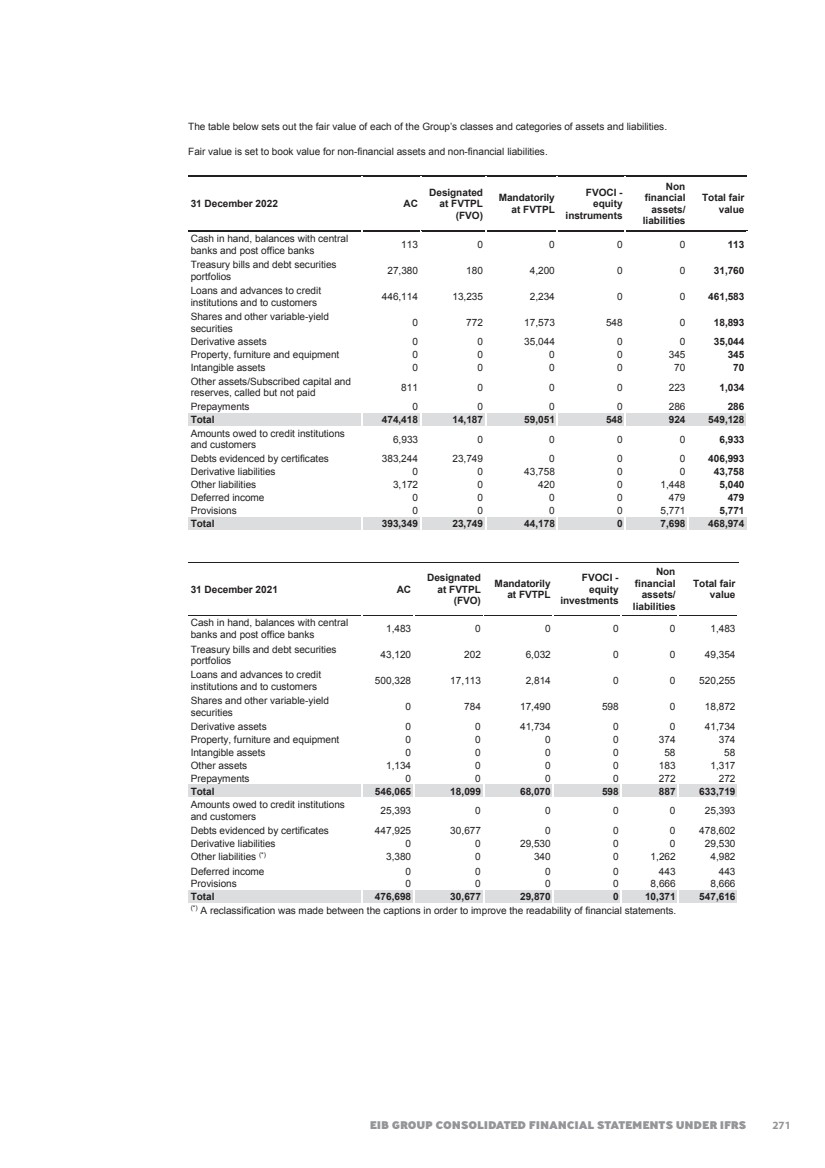
| 2022 FINANCIAL REPORT 279 Note U – Segment reporting (in EUR million) The segment information disclosed in this note has been prepared in accordance with the "management approach" applied by IFRS 8 meaning that the definition of segments as well as the preparation of information used for segment reporting are both based on information prepared for internal management decisions. The EIB Group has one single reportable segment, which is the EIB long-term finance activity comprising EIB lending operations inside and outside Europe, borrowing and treasury operations. The EIB has as well venture capital investments that alone do not meet any of the quantitative thresholds for determining a reportable segment in 2022 and as such are reported together with the EIB long-term finance activity. The Management Committee as the Group’s chief operating decision maker reviews internal management reports on the performance of the Bank’s long-term finance activity on at least a quarterly basis. The financial support of SME’s carried out by the European Investment Fund through private equity / venture capital and infrastructure investments, as well as the provision of guarantees do not meet any of the quantitative thresholds for determining a reportable segment in 2022 or 2021 and are disclosed as “other” in the reconciliation of reportable segment revenues, profit or loss and assets and liabilities. Information about reportable segment Long term lending finance activity 2022 2021 External revenues: Net interest income 2,688 3,097 Net income from shares 623 777 Net fee and commission income 60 -67 Result on financial operations 317 5,216 Net other operating income and expense 5 -1 Total segment revenue 3,693 9,022 Other material non-cash items: Impairment losses on loans and shares 43 330 43 330 Reportable segment profit 2,327 7,994 Reportable segment assets 561,151 619,097 Reportable segment liabilities 478,488 541,726 Reconciliation of reportable segment revenues, profit and assets and liabilities 2022 2021 Revenues: Total revenues for reportable segment 3,693 9,022 Other revenues 222 636 Consolidated revenue 3,915 9,658 Profit Total profit for reportable segment 2,327 7,994 Other profit 44 449 Consolidated profit 2,371 8,443 Assets: Total assets for reportable segment 561,151 619,097 Other assets 5,144 4,842 Consolidated total assets 566,295 623,939 Liabilities: Total liabilities for reportable segment 478,488 541,726 Other liabilities 912 1,189 Consolidated total liabilities 479,400 542,915 272 |
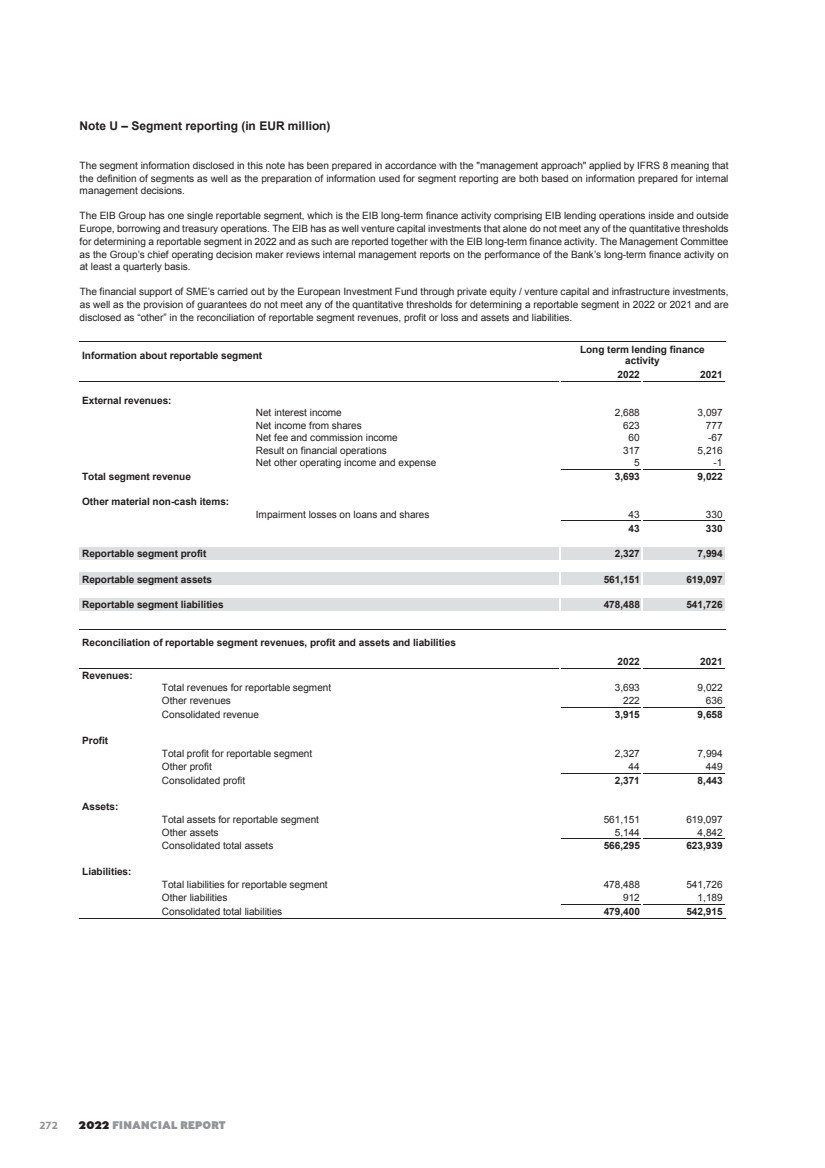
| EIB GROUP CONSOLIDATED FINANCIAL STATEMENTS UNDER IFRS 280 Note V – Commitments, contingent liabilities, pledged assets and other memorandum items (in EUR ’000) The Group utilises various lending-related financial instruments in order to meet the financial needs of its customers. The Group issues commitments to extend credit, standby and other letters of credit, guarantees, commitments to enter into repurchase agreements, note issuance facilities and revolving underwriting facilities. Guarantees represent irrevocable assurances, subject to the satisfaction of certain conditions, that the Group will make payment in the event that the customer fails to fulfil its obligation to third parties. The contractual amount of these instruments is the maximum amount at risk for the Group if the customer fails to meet its obligations. The risk is similar to the risk involved in extending loan facilities and is monitored with the same risk control processes and specific credit risk policies. As at 31 December 2022 and 31 December 2021, commitments, contingent liabilities and other memorandum items were as follows (in nominal amounts and in EUR ‘000): 31.12.2022 31.12.2021 Commitments: - EBRD capital uncalled 712,630 712,630 - Undisbursed loans (Note D.1) credit institutions 30,757,433 31,936,008 customers 93,274,466 91,041,283 124,031,899 122,977,291 - Undisbursed private equity and venture capital operations 5,308,623 5,525,911 - Undisbursed investment and infrastructure funds 3,435,704 3,203,307 - Undisbursed other investments 651,129 0 - Borrowings launched but not yet settled 223,950 223,950 Contingent liabilities and guarantees: - In respect of loans granted by third parties 31,931,060 30,901,227 Assets held on behalf of third parties(*): - Innovation Fund 6,913,187 4,202,032 - Investment Facility Cotonou 4,334,223 4,128,779 - Modernisation fund 3,906,016 2,957,006 - InnovFin 2,112,847 2,044,056 - NER300 1,035,191 1,143,332 - CEF 828,423 908,683 - Pan-European Guarantee Fund 676,011 595,239 - COSME LGF & EFG 654,491 606,867 - ESIF 529,774 458,942 - EU-Africa Infrastructure Trust Fund 414,850 425,628 - SME initiative Italy 383,301 263,392 - JEREMIE 289,474 275,376 - REG 246,115 193,115 - InvestEU 241,292 0 - SME initiative Romania 239,330 236,188 - Decentralised Financial Instruments 216,990 1,021,159 - Partnership Platform for Funds 213,415 187,785 - European Fund for Strategic Investments (‘EFSI EIF’) 206,949 248,261 - GIF 2007 176,814 110,383 - JESSICA (Holding Funds) 176,684 600,667 - RRF-FI 156,874 0 - Special Section 128,487 132,372 - EaSI 101,690 103,276 - RSFF (incl. RSI) 101,216 93,428 - InnovFin SME Guarantee 86,149 99,327 - SME initiative Bulgaria 84,638 87,104 - ENPI 78,773 77,781 - Cultural Creative Sectors Guarantee Facility 64,861 52,087 - SME initiative Finland 59,375 62,275 - NPI 59,375 43,245 - AECID 56,934 58,885 - WB EDIF 56,684 46,649 - SMEG 2007 55,941 56,658 - InnovFin Equity 54,638 77,164 - Private Finance for Energy Efficiency Instrument 54,610 55,007 - DCFTA 51,063 50,727 - GF Greece 42,417 162,254 - NIF Trust Fund 37,721 38,259 - NIF Risk Capital Facility 37,623 35,865 - EFSI-EIAH 33,339 35,559 273 |
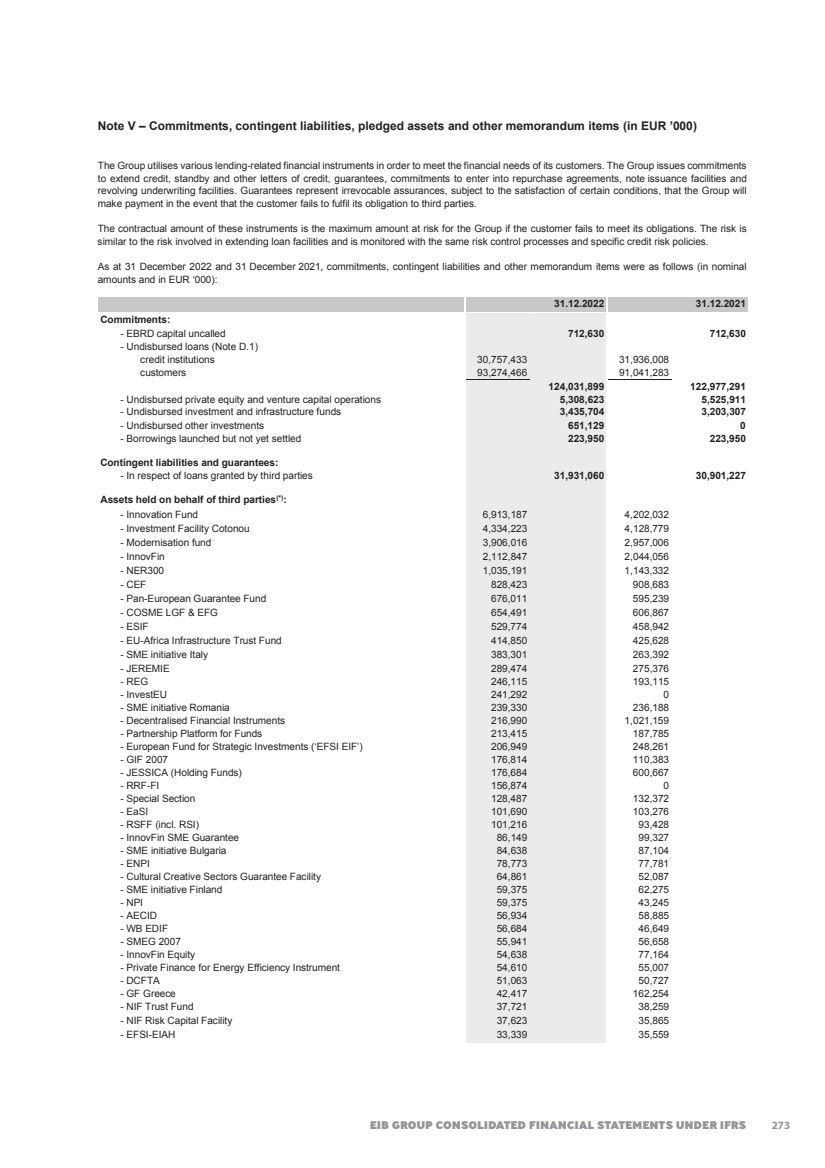
| 2022 FINANCIAL REPORT 281 31.12.2022 31.12.2021 - MAP guarantee 30,856 30,652 - GAGF 29,404 30,060 - SME initiative Malta 26,945 26,629 - IPA II 24,333 52,626 - Bundesministerium für Wirtschaft und Technologie 22,254 19,680 - FEMIP Trust Fund 20,492 22,577 - SME initiative Spain 19,405 2,022 - EPTA Trust Fund 17,340 15,987 - AGRI 14,225 17,297 - TTA Türkiye 13,016 9,113 - MAP Equity 11,819 64,594 - Natural Capital Financing Facility 10,468 10,397 - German Future Fund Growth Facility 7,208 2,849 - EU Support to Boost Africa 5,789 824 - BIF 5,005 3,907 - PGFF 3,684 2,990 - Student Loan Guarantee Facility 3,447 3,570 - GEEREF 3,372 3,457 - German Corona Matching Facility (CMF) 2,229 3,630 - Central Europe FoF 2,037 526 - GEF-UNEP 1,431 0 - Alp GIP 1,082 1,409 - EU Trade and Competitiveness Program 880 968 - LFA-EIF Facility 847 1,115 - AIP Zambia 298 338 - G43 Trust Fund 284 284 - MDD 255 1,809 - AIP Kulima 221 246 - TTP 204 516 - EFSD GUARANTEE "ACCESS TO FINANCE INITIATIVE" 157 148 - European Technology Facility 77 412 - EPIC 8 0 - GGF 7 7 - GEEREF Technical Support Facility 0 775 25,476,864 22,306,226 Other items: - Nominal value of interest-rate swaps (Note S.2.5.2) 573,024,821 559,081,060 - Nominal value of currency swap contracts receivable (Note S.2.5.2) 243,344,964 247,683,252 - Nominal value of currency swap contracts payable 242,236,843 245,975,779 - Nominal value of short-term currency swap contracts payable 21,731,627 24,956,095 - Nominal value of short-term currency swap contracts receivable (Note Q.3) 21,411,941 25,123,575 - Future contracts 8,804,329 8,274,106 - Currency forwards (Note Q.3) 267,069 402,384 - Special deposits for servicing borrowings(**) 560 582 (*) Assets under management are disclosed as off balance sheet item based on the latest available figures. Comparative figures might be restated in order to reflect most recent available information. (**) This item represents the amount of coupons and bonds due, paid by the Group to the paying agents, but not yet presented for payment by the holders of bonds issued by the Group. 274 |
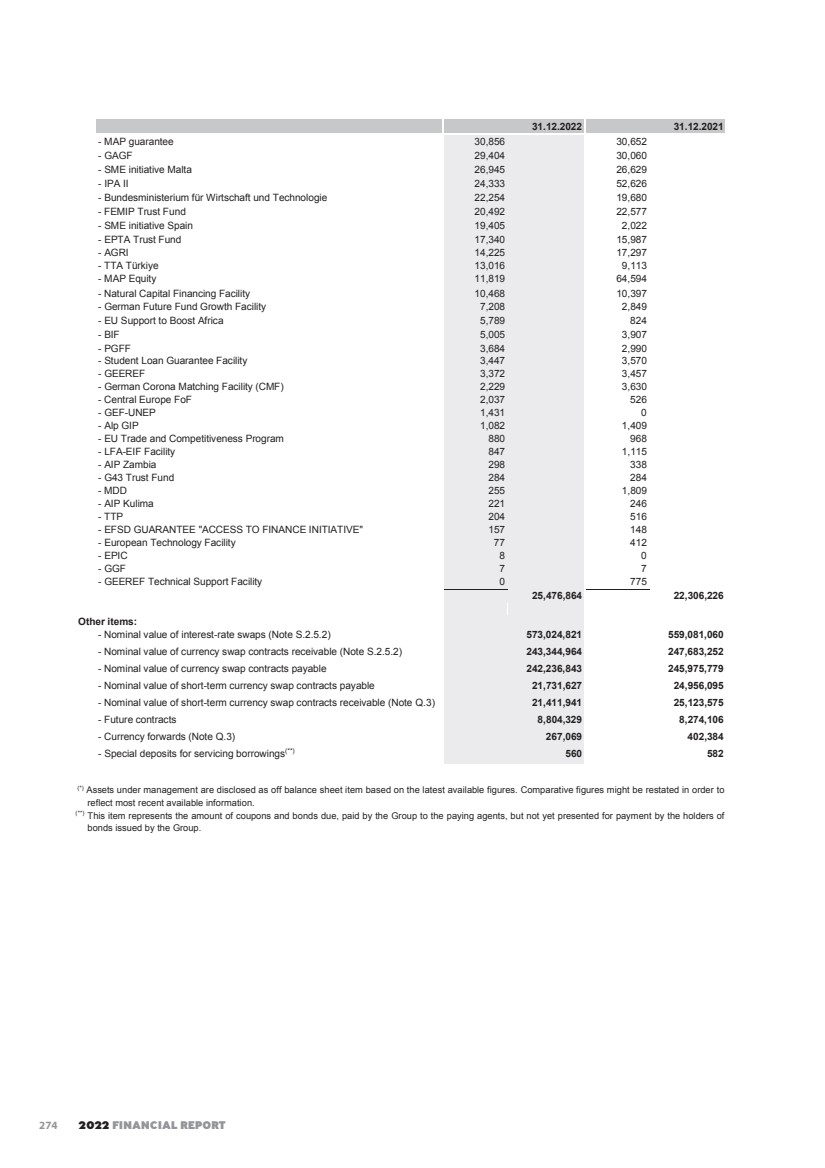
| EIB GROUP CONSOLIDATED FINANCIAL STATEMENTS UNDER IFRS 282 V.1. Innovation Fund The Innovation Fund is established by Article 10a(8) of Directive 2003/87/EC to support across all Member States innovation in low-carbon technologies and processes, including environmentally safe carbon capture and utilisation ('CCU') that contributes substantially to mitigating climate change, as well as products substituting carbon intensive ones produced and to help stimulate the construction and operation of projects that aim at the environmentally safe capture and geological storage ('CCS') of CO2, as well as of innovative renewable energy and energy storage technologies. The EIB prepares separate financial statements for Innovation Fund. V.2. Investment Facility - Cotonou The Investment Facility, which is managed by the EIB, has been established under Cotonou Agreement on cooperation and development between the African, Caribbean and Pacific Group of States and the European Union and its Member States on 23 June 2000 and subsequently revised. The EIB prepares separate financial statements for the Investment Facility. V.3. Modernisation Fund The Modernisation Fund, set up under Article 10d of the revised EU Emissions Trading System (ETS) Directive, aims to modernise energy systems and improve energy efficiency of 10 EU beneficiary Member States (MS): Bulgaria, Czech Republic, Croatia, Estonia, Hungary, Latvia, Lithuania, Poland, Romania and Slovakia. The Modernisation fund supports investments in generation and use of energy from renewable sources, energy efficiency, energy storage, modernisation of energy networks, including district heating, pipelines and grids, redeployment, re-skilling and upskilling workers, education, job-seeking initiatives and start-ups. The EIB prepares separate financial statements for Modernisation Fund. V.4. InnovFin The InnovFin or “InnovFin-EU Finance for Innovators” is a joint initiative between the EIB, the EIF and the European Commission under the new EU research programme for 2014-2020 “Horizon 2020”. On 11 December 2013, Regulation (EU) N 1291/2013 of the European Parliament and the Council establishing Horizon 2020 – the Framework Programme for Research and Innovation (2014-2020) and repealing Decision N 1982/2006/EC (“Horizon 2020 Regulation”) was adopted. On 12 June 2014 the European Commission, the EIB and the EIF signed a Delegation Agreement establishing the financial instrument InnovFin. InnovFin consists of a series of integrated and complementary financing tools and advisory services offered by the EIB Group, covering the entire value chain of research and innovation (‘R&I’) in order to support investments from the smallest to the largest enterprise. The EIB prepares separate financial statements for InnovFin. V.5. NER300 The EIB supports the EC as an agent in the implementation of the NER 300 initiative - a funding programme for carbon capture and storage demonstration projects and innovative renewable energy technologies. The Facility covers two activities which are i) the monetisation of EU Allowance Units (‘EUAs’) and ii) the management and disbursement of cash received via the EUA monetisation activity. The EIB prepares separate financial statements for NER300. V.6. Connecting Europe Facility (‘CEF’) The Connecting Europe Facility (‘CEF’) is a joint agreement between the EIB and the European Commission, which aims to provide union financial assistance to trans-European networks in order to support projects of common interest in the sectors of transport, telecommunications and energy infrastructures. The Commission entrusted EIB with the implementation and management of the debt instrument under the CEF, which ensures continuity of the Loan Guarantee Instrument for TEN-T Projects (‘LGTT’) and to the Pilot phase of Project Bond Initiative (‘PBI’). The LGTT and PBI were merged under the CEF on 1 January 2016. The CEF Delegation Agreement foresees an updated and common risk sharing arrangement. The EIB prepares separate financial statements for CEF. V.7. Pan-European Guarantee Fund (“EGF”) EGF was endorsed by the European Council on 23 April 2020 as part of the overall EU Covid-19 response package. As of July 2021, 22 Member States confirmed their participation with an expected guarantee volume of approximately EUR 24.4 billion, while only entities in participating countries are eligible for support. The EGF is designed to finance high-risk operations and final beneficiaries that would meet financial intermediaries’ requirements for commercial financing, but are struggling due to the economic impact of the COVID-19 pandemic. For this reason, the focus of the EGF are SMEs, which will benefit from at least 65% of the EGF-supported financing. The EGF is jointly implemented by EIB and EIF, each responsible for approximately half of the amount and with a different product mix. While EIF envisaged capped and uncapped portfolio guarantees and indirect equity-type investments (funds), on EIB side, the deployed products are linked risk sharing, venture debt and synthetic Asset Based Securities. The EIB prepares separate financial statements for EGF. V.8. COSME LGF & EFG To address the difficulties in access to finance for SMEs, COSME establishes the Loan Guarantee Facility (‘LGF’) and the Equity For Growth (‘EFG’). The LGF and the EFG aim to improve access to finance for SMEs in the form of debt and equity respectively. The Financial Instruments also include the mechanism of the EU Contribution under the SME Initiative. The EFG has been structured in the form of an equity financial instrument supporting Union enterprises growth and Research Innovation. The LGF has been structured in the form of a direct and indirect guarantee financial instrument. The objective of LGF is to contribute to the reduction of the structural shortcoming of the SME financing market and to support the creation of a more diversified SME finance market. Through direct and indirect guarantee, LGF aims to guarantee debt financing which addresses the particular difficulties that viable SMEs face in accessing finance. Furthermore, by guaranteeing the mezzanine tranche of eligible and transparent securitisation transactions, LGF aims to provide new avenues of financing for SMEs. The EIF prepares separate financial statements for COSME LGF & EFG. 275 |
| 2022 FINANCIAL REPORT 283 V.9. European Structural Investment Fund (‘ESIF’) Under the European Structural Investment Fund (‘ESIF’), Member States appointed EIF to manage ESIF funds as Holding Fund manager since November 2015. The ESIF initiative is aimed at promoting SME access to finance and financial engineering products, such as private equity funds, guarantee funds and loan funds. EIF is currently managing 19 ESIF Funding Agreements signed with Member States and regions: Basse-Normandie and Languedoc-Roussillon. The EIF prepares separate financial statements for ESIF. V.10. EU-Africa Infrastructure (‘EUAI’) Trust Fund The EUAI Trust Fund has been created under Trust Fund Agreement between the EC on behalf of the European Union as the Founding Donor and the EIB as Manager and is also open to Member States of the European Union that subsequently accede to that agreement as Donors. On 9 February 2006, the EC and the EIB signed a Memorandum of Understanding to promote jointly the EU-Africa Infrastructure Partnership and, in particular, to establish a supporting EU-Africa Infrastructure Trust Fund. The EIB prepares separate financial statements for EUAI Trust Fund. V.11. SME Initiative Italy During 2016, in the context of the SME Initiative, the EIF and the Managing Authorities of Finland, Bulgaria, Romania and Italy entered into four separate Funding Agreements in respect of the implementation and management of a dedicated window, which shall be implemented in connection with a specific allocation under Horizon 2020 Financial Instruments dedicated to Finland, Bulgaria, Romania and accordingly in connection with COSME LGF for Italy. These SME Initiatives aim at providing uncapped guarantees in connection with Horizon 2020 for new portfolios of debt finance to eligible SMEs in the respective countries. The EIF prepares separate financial statements for SME Initiative Italy. V.12. JEREMIE JEREMIE (The Joint European Resources for Micro to Medium Enterprises) is an initiative of the European Commission’s Directorate General for Regional Policy (DG Regio) and the EIB Group. The EIF prepares separate financial statements for JEREMIE. V.13. REG This corresponds to three regional mandates. Irish Economic Robustness Investment Platform (‘Irish SMEs’). Irish SMEs is a mandate signed by the Irish Government with the EIF to set up an uncapped counter-guarantee with the Irish National Promotional Bank dedicated mainly to medium-term loans and to all SMEs supported by a structure similar to the SME Initiative, with national funds covering the First Loss Piece, EIB Group covering mezzanine (EIB through EFSI) and senior risk (EIB and potentially EIF). Under the French “Investment Plan 2018-2022” (known as the Macron Investment Plan), a window dedicated to agriculture has been set up in order to mobilise EUR 5 billion of investments in the sector. In this context, the French Ministry of Agriculture has requested the EIF to design a guarantee instrument with the aim of triggering between EUR 750 million and EUR 1.1 billion of new debt financing to French farmers. In light of this, the French Ministry of Agriculture has decided to allocate EUR 60 million for this instrument and has requested the EIF to combine the FMA contribution with an EFSI contribution for an amount up to EUR 45 million. Prêt Participatif Grand Est is a new financial instrument launched in France as a result of the close collaboration between the Région Grand Est and the EIF. It is an important component of the region’s ambitious recovery program known as “Business Act Region Grand-Est” and it aims to mobilise over EUR 250 million of subordinated loans (prêts participatifs) for local entrepreneurs. This financial instrument is funded by Région Grand Est’s own resources and builds on EIF’s standard model of First Loss Portfolio Guarantee (FLPG) deployed through financial intermediaries. It is expected to: • generate a significant leverage on the regional resources committed to this initiative; • create substantial impact on the market by supporting SMEs, including those impacted by the crisis but still intending to pursue viable projects for their growth; and • offer preferential credit conditions for Grand Est based entrepreneurs. V.14. InvestEU On 7 March 2022 the EU, the EIB and the EIF signed a Guarantee Agreement (“Agreement”) establishing the EU guarantee under the InvestEU. The InvestEU programme aims to give an additional boost to sustainable investment, innovation, social inclusion and job creation in Europe. The InvestEU is expected to stimulate public and private investments by using a EUR 26.2 billion EU budgetary guarantee, 75% of this EU budgetary guarantee being granted separately to the EIB and the EIF. On 1 April 2022, all operations in the EFSI Debt Standard Portfolio and in the EFSI Hybrid Portfolio were transferred to the InvestEU. These operations which were originally guaranteed under the EFSI Agreement, are defined as the “Pre-2021 Operations”. The EIB prepares separate financial statements for InvestEU. 276 |
| EIB GROUP CONSOLIDATED FINANCIAL STATEMENTS UNDER IFRS 284 V.15. SME Initiative Romania During 2016, in the context of the SME Initiative, the EIF and the Managing Authorities of Finland, Bulgaria, Romania and Italy entered into four separate Funding Agreements in respect of the implementation and management of a dedicated window, which shall be implemented in connection with a specific allocation under Horizon 2020 Financial Instruments dedicated to Finland, Bulgaria, Romania and accordingly in connection with COSME LGF for Italy. These SME Initiatives aim at providing uncapped guarantees in connection with Horizon 2020 for new portfolios of debt finance to eligible SMEs in the respective countries. The EIF prepares separate financial statements for SME Initiative Romania. V.16. Decentralised Financial Instruments (‘DFIs’) (former Fund of Funds (‘JESSICA II’)) The Decentralised Financial Instruments (‘DFIs’) consists of Fund of Funds (‘FoF’) and Holding Funds (‘HF’) financed by the European Structural and Investment Funds (the ‘ESIF’) from the Member States Operational Programmes during 2014-2020 and 2021-2027, respectively. The DFI facilitates access to finance for final recipients through the implementation of loans, equity and guarantees, in cooperation with selected Financial Intermediaries. As a fund manager, EIB gathers the funding (contributions) from the Managing Authorities and invests it via Financial Intermediaries, according to investment strategies agreed with the donors. V.17. Partnership Platform for Funds (‘PPF’) The PPF is an EIB-managed multi-region, multi-contributor and multi-sector Platform incorporating multiple funds, and was established considering the need to increase financial flows for sustainable development and building on the successful experience of the European Investment Bank. The funds under the PPF implemented in accordance with the Platform Rules. The EIB prepares a separate combined financial report for PPF. V.18. European Fund for Strategic Investments (‘EFSI EIF’) On the basis of applicable EFSI Regulations the European Commission and the EIB concluded agreements on the management of the EFSI, on the granting of the EU guarantee (the EFSI Agreement) as well as for the implementation of the European Investment Advisory Hub (‘EIAH’) (the EIAH Agreement). Under the EFSI Agreement, the EC is providing an EU guarantee to EIB for projects supported by the EFSI. Assets covering the EU guarantee are directly managed by the European Commission. Projects supported by the EFSI are subject to the normal EIB project cycle and governance. In addition, EFSI has its own dedicated governance structure which has been set in place to ensure that investments made under EFSI remain focused on the specific objective of addressing the market failure in risk-taking which hinders investment in Europe. The EIAH aims to enhance the non-financial support for projects and investments. The EIAH consists of three complementary components: a) a point of entry to a wide range of advisory and technical assistance programmes and initiatives for public and private beneficiaries, b) a cooperation platform to leverage, exchange and disseminate expertise among partner institutions and c) a reinforcement or extension of existing advisory services or creation of new ones to address unmet needs. The EIB prepares separate financial statements for EIAH. EFSI – European Fund Strategic Investment EFSI is an initiative launched jointly by the EIB Group and the European Commission to help overcome the current investment gap in the EU by mobilising private financing for strategic investments. EFSI is a EUR 16 billion guarantee from the EU budget, complemented by an allocation of EUR 5 billion of EIB’s own capital. EFSI comprises both the Innovation and Infrastructure Window ("IIW") and the SME Window ("SMEW"), to be respectively implemented by the EIB and the EIF. A total amount of EUR 5 billion is initially allocated to the SMEW under EFSI, as follows: (i) up to EUR 2.5 billion to be indirectly backed by the EU Guarantee; and (ii) EUR 2.5 billion to be contributed by the EIB at its own risk to increase the currently existing RCR Mandate. The EFSI Steering Board is entitled to increase the allocation of the EU Guarantee to the SMEW by an additional EUR 0.5 billion (i.e., up to a maximum amount of EUR 3 billion from time to time). EFSI - Private Credit The Programme will comprise two complimentary products, the Cash Investment Product and Investor Guarantee Product. The Cash Investment Product will enable EIF’s direct investment into eligible DDFs, prioritising first closings. These fund investments will support fund creation and give EIF the opportunity to provide input on fund governance and investment strategy. EIF’s direct investment aims at catalysing other fund investors, who take considerable comfort from EIF’s participation and due diligence. The Investor Guarantee Product will enable EIF to further support fundraising by partially guaranteeing (up to 50%) the investment made by institutional investors into DDFs where EIF has already committed to invest. The guarantee product is expected to crowd in investors who are new to this nascent asset class but also encourage larger investments from investors already considering an investment. The Investor Guarantee Product can contribute to scaling up the asset class. EFSI - Combination Product Framework product for combining EFSI resources together with EAFRD national resources to create new financial instruments. Aims to address financing gaps and support specific high priority investment objectives where Member State and EU policy objectives align. Agriculture has initially been prioritised as a sector where SMEs experience a significant financing gap. 277 |
| 2022 FINANCIAL REPORT 285 EFSI - Skills & Education Skills and Education Guarantee Pilot is aiming at enhancing access to finance in the field of education, training and skills in the form of a capped (counter-) guarantee instrument, and it is one of the products to pilot under EFSI 2 in preparation of the next MFF. It will have a broad eligibility covering a wide spectrum of education/training programmes both for students and adulthood learners (may also cover SMEs) and be implemented through various intermediaries. • Category A: Students and Learners; • Category B: Enterprises investing in skills and skills utilisation of their workforce; and • Category C: Organisations supplying education, training, skills and related services (including kindergartens, nursery schools, early childhood services, etc.). EFSI-ESCALAR ESCALAR is a EUR 300 million pilot mandate targeting the financing gap experienced by high growth European companies (scale-ups). ESCALAR invests in funds with an investment focus on scale-ups. ESCALAR will make equity investments in funds, and side vehicles of funds, through a different share class or fund unit to other investors. ESCALAR investments will have different terms to the investments made by other investors, namely a (1) Preference on fund distributions in certain predefined downside scenarios, and (2) Subordination, and reduced claim, on investment returns. V.19. GIF 2007 In the GIF 2007 under the Competitiveness and Innovation Framework Programme and the Technology Transfer Pilot Project (CIP/GIF 2007), the EIF is empowered to acquire, manage and dispose of investments, in its own name but on behalf and at the risk of the Commission. The EIF prepares separate financial statements for GIF 2007. V.20. JESSICA (Holding Funds) JESSICA (Joint European Support for Sustainable Investment in City Areas) is an initiative developed by the EC and the EIB, in collaboration with the Council of Europe Development Bank. JESSICA Holding Funds are used in the context of the JESSICA initiative. Under new procedures, Managing Authorities are being given the option of using some of their EU grant funding to make repayable investments in projects forming part of an integrated plan for sustainable urban development. As manager, EIB gathers the funding received from the Managing Authorities and invests it in Urban Development Funds, according to investment guidelines agreed with the donors. The EIB prepares separate financial statements for some JESSICA Holding Funds. V.21. Recovery and Resilience Facility Financial Instruments (‘RRF-FI’) EIB manages and invests RRF resources on behalf of the respective EU Member Stats according to an investment strategy and business plan agreed in a funding agreement between the EIB and the mandator. Furthermore, the EIB performs fund administration tasks (incl. monitoring, reporting, treasury management). If requested by the EU Member States, the mandate can also embed the Bank’s advisory support. RRF-FI can be deployed under three implementation modalities: (i) direct implementation, where EIB directly selects and appraises underlying operations, (ii) indirect implementation through a financial intermediary, and (iii) blending. RRF Equity Cyprus RRF Equity Cyprus is the first equity mandate signed between the EIF and the Republic of Cyprus. The mandate is structured as a direct award of EUR 30 million to EIF, financed by the National Recovery and Resilience Plan of Cyprus (EUR 20 million) and reflows from the JEREMIE programme of the 2007-2013 PP. The mandate foresees the deployment of a generalist VC fund targeting innovative enterprises and start-ups in their (pre-) seed and early stages of development. This will be the first VC fund deployed in the country with the support of public resources. Signature of the underlying fund is expected in Q1 2023. RRF Equity Bulgaria The RRF Equity Bulgaria mandate is structured as a direct award of EUR 180 million to EIF under the National Recovery and Resilience Plan of Bulgarian, in connection with the country's Recovery and Resilience Facility established by Regulation (EU) 2021/241. Equity financing will be provided to support investments under three windows, namely: - Equity instruments for Growth (initial budget allocation of up to EUR 75 million) - Equity instruments for Innovation (initial budget allocation of up to EUR 75 million) - Equity instruments for climate neutrality and digital transformation investments (initial budget allocation of up to EUR 30 million) The mandate will contribute in alleviating the negative impacts of the pandemic from the Bulgarian market in general and more risky undertakings, in particular, by providing equity financing to TT projects, SMEs and mid-caps that will be used to foster innovation and help the transition to the knowledge economy; it will also finance equity investments (e.g. infrastructure projects) supporting climate neutrality and digital transformation. V.22. Special Section The Special Section was set up by the Board of Governors on 27 May 1963. Under a decision taken on 4 August 1977, its purpose was redefined as being that of recording financing operations carried out by the EIB for the account of and under mandate from third parties. It includes the FED, MED/FEMIP and the guarantee component of the European Development Finance Institutions Private Sector Development Facility. 278 |
| EIB GROUP CONSOLIDATED FINANCIAL STATEMENTS UNDER IFRS 286 V.23. Employment and Social Innovation (‘EaSI’) The EaSI Guarantee financial Instrument consists, inter alia, of the EaSI Microfinance Guarantee, which is the successor to the micro-credit guarantees under the European Progress Microfinance facility (“Progress Microfinance”). It will extend the support given to microcredit providers under Progress Microfinance. In addition, the EaSI Guarantee financial Instrument consists of the EaSI Social Entrepreneurship Guarantee, which is a new product, which will facilitate access to finance for social enterprises and support the development of the social investment market. The EIF prepares separate financial statements for EaSI. The Employment and Social Innovation funded instrument ("EaSI Funded Instrument") has been set up as a new sub-fund of the EU Microfinance FCP-FIS. This mandate is the successor of the European Progress Microfinance sub-fund which was launched in 2010 and has a target size of EUR 200 million, blending resources from the European Commission, the EIB and the EIF. EaSI Funded Instrument contributes to the development of the new social entrepreneurship ecosystem whilst at the same time consolidates EIF's role in the microfinance market. The loan products provided by the EaSI Funded Instrument will address in particular the funding gap for small intermediaries, such as non-banks and small/niche banks (ethical banks for instance), which usually have limited access to deposit funding, as opposed to larger banks which, having access to secured funding for their lending activity, may seek additional risk coverage through guarantee instruments. V.24. Risk-Sharing Finance Facility (‘RSFF’) The RSFF has been established under the Co-operation Agreement that entered into force on 5 June 2007 between the EC on behalf of the European Union and the EIB. The RSFF aims to foster investment in research, technological development and demonstration, and innovation. As part of the RSFF, the EIF set up the Risk Sharing Instrument for Innovative and Research oriented SMEs and small Mid-Caps (‘RSI’). The RSI provides guarantees to banks and leasing companies for loans and financial leases to research-based small and medium-sized enterprises (‘SMEs’) and small Mid-Caps. The EIB prepares separate consolidated financial statements for RSFF including RSI. V.25. InnovFin SME Guarantee In the context of the “Access to Risk Finance Programme” of Horizon 2020 and specific programme provides for the establishment of a financial instrument for debt and a financial instrument for equity. A Risk-Sharing facility called InnovFin SME Guarantee has been structured in the form of a guarantee, using the EU’s contribution for first defaulted amount taking and the risk-taking capacity of the EIF for second-Defaulted Amount taking. The objective of the Facility is to incentivise Intermediaries to extend loans or financial leases to small and medium sized enterprises and Small Mid-caps with significant activities in Research, Development and Innovation. The EIF prepares separate financial statements for InnovFin SME Guarantee. V.26. SME Initiative Bulgaria During 2016, in the context of the SME Initiative, the EIF and the Managing Authorities of Finland, Bulgaria, Romania and Italy entered into four separate Funding Agreements in respect of the implementation and management of a dedicated window, which shall be implemented in connection with a specific allocation under Horizon 2020 Financial Instruments dedicated to Finland, Bulgaria, Romania and accordingly in connection with COSME LGF for Italy. These SME Initiatives aim at providing uncapped guarantees in connection with Horizon 2020 for new portfolios of debt finance to eligible SMEs in the respective countries. The EIF prepares separate financial statements for SME Initiative Bulgaria. V.27. European Neighbourhood and Partnership Instrument (‘ENPI’) The Framework Agreement between the European Union and the EIB on the implementation of operations financed from the general budget of the European Union in the countries covered by the European Neighbourhood Policy is channelled through ENPI. The EIB prepares separate financial statements for ENPI. V.28. Cultural and Creative Sectors Guarantee Facility The financial instrument, set-up under Creative Europe - the main EU programme dedicated to the cultural and creative sectors - will be managed by the EIF on behalf of the European Commission. The initiative will allow the EIF to provide guarantees and counter-guarantees to selected financial intermediaries to enable them to provide more debt finance to entrepreneurs in the cultural and creative arena. Loans generated are expected to support more than ten thousand SMEs in a wide range of sectors such as audio-visual (including film, television, animation, video games and multimedia), festivals, music, literature, architecture, archives, libraries and museums, artistic crafts, cultural heritage, design, performing arts, publishing, radio and the visual arts. The EIF prepares separate financial statements for Cultural and Creative Sectors Guarantee Facility. V.29. SME Initiative Finland During 2016, in the context of the SME Initiative, the EIF and the Managing Authorities of Finland, Bulgaria, Romania and Italy entered into four separate Funding Agreements in respect of the implementation and management of a dedicated window, which shall be implemented in connection with a specific allocation under Horizon 2020 Financial Instruments dedicated to Finland, Bulgaria, Romania and accordingly in connection with COSME LGF for Italy. These SME Initiatives aim at providing uncapped guarantees in connection with Horizon 2020 for new portfolios of debt finance to eligible SMEs in the respective countries. The EIF prepares separate financial statements for SME Initiative Finland. 279 |
| 2022 FINANCIAL REPORT 287 V.30. National Promotional Institutions (‘NPI’) NPI securitisation initiative (‘ENSI’) The EIF and several National Promotional Institutions (‘NPIs’) including KfW, bpifrance, CDP, Malta Development Bank Working Group, IFD, ICO and BBB have launched the EIF-NPI Securitisation Initiative (‘ENSI’), a cooperation and risk sharing platform aiming at providing more funding to small and medium-sized enterprises (‘SMEs’) via the capital markets. The objective of this joint cooperation in SME Securitisation transactions is to stimulate the availability of finance to SMEs in Europe by revitalising the SME Securitisation market while catalysing resources from the private sector. This reflects the spirit of the European Fund for Strategic Investments aiming to achieve a much wider outreach in support of SMEs. Under this mandate, EIF is enabled to manage up to EUR 100 million of resources from Cassa Depositi e Prestiti (''CDP''). CDP resources under the Mandate will be deployed through investments in technology transfer funds/platforms alongside 1:1 match funding from EIF in the form of co-investment, resulting in total resources managed by EIF under this programme of up to EUR 200 million. NPI equity platform The EIF-NPI Equity Platform is a collaborative initiative launched by the EIF in 2016, which promotes knowledge sharing and best practices between the EIF and national promotional institutions (NPIs) or banks (NPBs) across EU Member States. Its goal is to enhance access to funding for SMEs and midcaps, support the defragmentation of equity markets, and match national, EU and private sources of funding. NPI ICF TT Investment partnership between EIF and Institut Català de Finances (''ICF'') to commit EUR 30 million of ICF resources into a technology transfer fund focussed on investments in technology transfer projects and/or companies linked to Spain’s Catalonia region. Resources from ICF will be matched by at least EUR 15 million of EIF-managed resources. Under this partnership, both EIF and ICF will invest in the selected technology transfer fund, each acting as Limited Partner investor in its own right. V.31. AECID This partnership agreement signed between the Kingdom of Spain (the Spanish Agency for International Development Cooperation (‘AECID’)) and the EIB was set up to invest in operations in the countries covered by the FEMIP together with Mauritania (the "Southern Mediterranean region"), targeting mainly risk capital activities involving micro and small/medium sized enterprises as well as engaging in the wider development of the private sector in the region. The EIB prepares separate financial statements for AECID. V.32. WB EDIF The Western Balkan Enterprise Development & Innovation Facility (‘WB EDIF’) is a joint initiative signed in December 2012 by the EC (‘DG ELARG’), EIB Group and the European Bank for Reconstruction and Development (‘EBRD’). It aims at improving access to finance for SMEs in the Western Balkans and to foster economic development in the region through the deployment of the Instrument for Pre-Accession Assistance (‘IPA’) funds. Within WB EDIF, EIF acts as platform coordinator, Trustee on behalf of the EC for the Enterprise Expansion Fund (‘ENEF’), Trustee on behalf of the EC for the Enterprise Innovation Fund (‘ENIF’), and manager of the Guarantee Facility. The EIF prepares separate financial statements for WB EDIF. As a response to the COVID-19 crisis and the successive energy crisis in the Western Balkans region, the Commission allocated to EIF EUR 60 million for a guarantee facility to be deployed in the WB6 economies. Such guarantee facility would follow the model of the existing WB EDIF GF II, with the changes in the product necessary to make it fit for the different purpose. The facility will be labelled and deployed under the Western Balkan Investment Framework (“WBIF”), a multi-IFI and multi-product platform regulated by the NDICI framework and serving as the main gateway for private sector development measures in the Western Balkans. The ultimate objective of the WB GF4SME resilience is to facilitate and increase access to, and availability of, finance for SMEs in the Western Balkans. The guarantees and counter-guarantees issued by EIF under this facility shall cover portfolios of newly granted debt instruments provided for the ultimate benefit of SMEs which qualify as Final Beneficiaries under this agreement. The guarantees are financed by EU and are issued by EIF in its own name but on account and risk of the EU. V.33. SMEG 2007 In the SMEG 2007 under the Competitiveness and Innovation Framework Programme (CIP/SMEG 2007), the EIF is empowered to issue guarantees in its own name but on behalf and at the risk of the Commission. The EIF prepares separate financial statements for SMEG 2007. V.34. InnovFin Equity The Horizon 2020 Financial Instruments aim to ease the access to risk financing for Final Recipients in order to support eligible Research and Innovation. This covers loans, guarantees, equity and other forms of risk finance. The Horizon 2020 Financial Instruments aim also to promote early-stage investment and the development of existing and new venture capital funds; improve knowledge transfer and the market for intellectual property; attracts funds for the venture capital market; and, overall; help to catalyse the transition from the conception, development and demonstration of new products and services to their commercialisation. The Horizon 2020 debt financial instrument also includes the implementation mechanism of the EU Contribution under the SME Initiative. The InnovFin Equity facility for early-stage aims at promoting early-stage investment and the development of existing and new venture capital funds providing equity finance for innovative enterprises, in particular in the form of venture or mezzanine capital in their early stage. The EIF prepares separate financial statements for InnovFin Private Equity. 280 |
| EIB GROUP CONSOLIDATED FINANCIAL STATEMENTS UNDER IFRS 288 V.35. Private Finance for Energy Efficiency (‘PF4EE’) Instrument The Private Finance for Energy Efficiency (‘PF4EE’) instrument is a joint agreement between the EIB and the European Commission that aims to address the limited access to adequate and affordable commercial financing for energy efficiency investments. The instrument targets projects which support the implementation of National Energy Efficiency Action Plans or other energy efficiency programmes of EU Member States. In December 2014 the European Commission and the EIB signed a Delegation Agreement establishing the financial Instrument PF4EE. The EIB prepares separate financial statements for the PF4EE. The EIF prepares separate financial statements for PF4EE. V.36. DCFTA Initiative East (‘DCFTA’) The European Investment Bank and the European Commission signed on 19 December 2016 the Delegation Agreement for the Deep and Comprehensive Free Trade Area (‘DCFTA’). DCFTA Initiative East aims to strengthen economic development in the countries, which have signed an association agreement with the EU - namely Georgia, Moldova and Ukraine - by providing targeted financial and technical support to small and medium-sized enterprises (‘SME’s) in these three countries. As part of the DCFTA, the EIF implements and manages the Guarantee Facility Window. The EIB prepares separate consolidated financial statements for the DCFTA including the Guarantee Facility Window. V.37. GF Greece The Fund is a joint initiative between the Hellenic Republic, the EC and the EIB and was set up to support the lending to SMEs in Greece. Established by using unabsorbed Structural Funds for Greece, the Fund will guarantee EIB loans to SMEs via partner banks in Greece. The EIB prepares separate financial statements for GF Greece. V.38. Neighbourhood Investment Facility (‘NIF’) Trust Fund The NIF Trust Fund, which is managed by the EIB was set up to achieve the strategic objective of the European Neighbourhood Policy (‘ENP’) through targeted funding with particular focus on establishing better and more sustainable energy and transport interconnections, improving energy efficiency and promoting the use of renewable energy sources, addressing climate change as well as threats to the environment more broadly and promoting smart, sustainable and inclusive growth through support to SMEs, to the social sector including human capital development, and to municipal infrastructure development. The EIB prepares separate financial statements for NIF Trust Fund. V.39. Neighbourhood Investment Facility (‘NIF’) Risk Capital Facility The Neighbourhood Investment Facility (‘NIF’) Risk Capital Facility is financed from the general budget of the European Union. Its main purpose is focused on providing access to equity and debt finance to SMEs in the Southern Neighbourhood region in order to support private sector development, inclusive growth and private sector job creation. The Facility comprises a Financial Instrument Window which consists of equity and debt finance instruments and Additional Tasks Window, which consists of the technical assistance services. The EIB prepares separate financial statements for Financial Instrument Window. V.40. EFSI-EIAH Please refer to paragraph V.18. above. V.41. MAP Guarantee This resource is split equally between private equity and guarantee products. The equity segment known as ESU 1998 (‘G&E’) and ESU 2001 (‘MAP’) covers the ETF start-up investments. The guarantees segment known as SMEG 1998 G&E and SMEG 2001 MAP, provides guarantees against the beneficiary’s undertaking. The EIF prepares separate financial statements for MAP Guarantee. V.42. Greater Anatolia Guarantee Facility (‘GAGF’) Under the GAGF signed in May 2010, the EIF manages the Instrument for Pre-Accession Assistance (IPA) funds allocated for the Regional Competitiveness Operational Programme by the European Union and Türkiye. The facility provides tailor-made financial help to SMEs and micro-enterprises in Türkiye’s least developed provinces in partnership with major Turkish banks. The EIF prepares separate financial statements for GAGF. V.43. SME Initiative Malta In 19 January 2015, the European Commission, the EIB and the ElF signed an amendment to the Horizon 2020 delegation agreement setting out the terms and conditions applicable to certain terms of the dedicated window corresponding to the SME Initiative and the contribution of the EU to such dedicated windows of the Horizon 2020 Financial Instruments. SME Initiatives in Spain and Malta were launched in the previous year. The EIF prepares separate financial statements for SME Initiative Malta. V.44. Instrument for Pre-accession Assistance II (‘IPA II’) The Instrument for Pre-accession Assistance (‘IPA’) is the means by which the EU supports reforms in the 'enlargement countries' with financial and technical help. The pre-accession funds also help the EU reach its own objectives regarding a sustainable economic recovery, energy supply, transport, the environment and climate change, etc. 281 |
| 2022 FINANCIAL REPORT 289 The successor of IPA I, IPA II, built on the results already achieved by dedicating EUR 11.7 billion for the period 2014-2020. The most important novelty of IPA II is its strategic focus. The Framework Partnership Agreement, signed at the end of the year 2015, is implemented by the EIB, allocating resources from DG NEAR via the signature of various “Specific Grant Agreements”. Although, the IPA II Regulation applied until 31 December 2020, the implementation is still ongoing The EIB prepares financial statements for the specific grant agreements under IPA II. V.45. Bundesministerium für Wirtschaft und Technologie The EIF manages funds on behalf of the German Bundesministerium für Wirtschaft und Technologie (Federal Ministry of Economics and Technology) and the European Recovery Programme. V.46. FEMIP Trust Fund The FEMIP (Facility for Euro-Mediterranean Investment and Partnership) Trust Fund, which is also managed by the EIB, was set up to enhance the existing activities of the EIB in the Mediterranean Partner Countries, with the support of a number of donor countries and with a view of directing resources to operations in certain priority sectors through the provision of technical assistance and risk capital. The EIB prepares separate financial statements for FEMIP Trust Fund. V.47. SME Initiative for Spain On 26 January 2015, the Delegation Agreement between the Kingdom of Spain and European Investment Fund was signed. EIF will provide uncapped guarantees for new portfolios of debt finance to eligible SMEs and securitisation of existing debt finance to SMEs and other enterprises with less than 500 employees and/or new portfolios of debt finance to SMEs. The EU contribution to the SME Initiative for Spain, received by the EIF, is subject to the treasury asset management to be carried out by the EIB, which is governed by the signed Asset Management Side Letter between the European Investment Fund and the European Investment Bank. The EIF prepares separate financial statements for SME Initiative for Spain. V.48. EPTA Trust Fund The EPTA (The Eastern Partnership Technical Assistance) Trust Fund is focused on increasing the quality and development impact of EIB Eastern Partnership operations by offering a multi-purpose, multi-sector funding facility for technical assistance. It will be complementary to the Neighbourhood Investment Facility. The EIB prepares separate financial statements for EPTA Trust Fund. V.49. Multi-Regional Guarantee Platform for Italy (‘AGRI’) The Italian Agri Platform was formally launched with the signing of the Funding Agreement between the EIF and 6 Italian Regions (Veneto, Emilia Romagna, Umbria, Campania, Calabria, Puglia). Two additional Italian Regions (Piemonte and Toscana) joined in 2018. The Agriculture Platform in Italy is using Structural funds from European Agricultural Fund for Rural Development (‘EARFD’) to deploy the financial instrument using each participating Rural Development Programme (‘RDP’) resources to cover the first losses. The aim of the Platform is to steer the Regional Managing Authorities towards standard products, to foster new business at regional level while supporting new lending to farmers and agri-businesses. V.50. TTA Türkiye TTA Türkiye is an initiative designed by the EIF in cooperation with the Ministry of Science, Industry and Technology (‘MoSIT’), the Scientific and Research Council of Türkiye (‘TUBITAK’), the Delegation of the European Union to Türkiye and the DG Regional Policy of the European Commission. TTA Türkiye is co-financed by the EU and the Republic of Türkiye under the Regional Development Component of the Instrument for Pre-Accession Assistance (‘IPA’) funds and managed by EIF. TTA Türkiye aims at achieving two objectives: setting-up a financially sustainable fund by facilitating the commercialisation of scientific research and development (‘R&D’) confined in universities and research centres and catalysing development of the technology transfer market in Türkiye, with a particular emphasis on spill-overs to the less developed/developing regions of Türkiye. V.51. MAP Equity Under the Multi-Annual Programme (MAP) for enterprises and entrepreneurship, the EIF manages resources on behalf and at the risk of the EC. The EIF prepares separate financial statements for MAP Equity. V.52. Natural Capital Finance Facility (‘NCFF’) The Natural Capital Finance Facility (‘NCFF’) is a joint agreement between the EIB and the European Commission which aims to address market gaps and barriers for revenue generating or cost saving projects that are aimed at preserving natural capital, including climate change adaptation projects and thereby to contribute to the achievement of EU and Member States' objectives for biodiversity and climate change adaptation. The EIB prepares separate financial statements for NCFF. V.53. German Future Fund Growth Facility (‘GFFGF’) German coalition government programme, which foresees the development of equity instruments with a particular focus on digitalisation and clean-tech (overall targeted volume EUR 10 billion) called the German Future Fund. A potential amount of up to EUR 3 billion could be allocated to EIF for investments into German growth funds and co-investments in companies in a delegated way, or via blind-pool co-investment vehicles. The mandate will have an investment period for initial commitments in funds over 10 years. 282 |
| EIB GROUP CONSOLIDATED FINANCIAL STATEMENTS UNDER IFRS 290 V.54. EU support to Boost Africa The “EU Support Boost Africa” is a joint initiative between the EIB and the African Development Bank. Its core objectives are to enable and enhance entrepreneurship and innovation across Africa in a commercially viable way and to address a current gap in the Sub-Saharan market, by providing early stage venture capital paired with skills development. The Facility comprises a Financial Instrument Window, which consists of equity and quasi-equity instruments, and Additional Tasks Window, which consists of the technical assistance services. The EIB prepares separate financial statements for Financial Instrument Window. V.55. Baltic Innovation Fund (‘BIF’) The Baltic Innovation Fund (‘BIF’), signed in September 2012, is a fund-of-funds, structured as a partnership, which invests in venture capital and private equity funds and focused on the Baltic region. It is funded jointly by the EIB Group and the following Baltic national agencies: Fund KredEx in Estonia, Latvijas Garantiju Agentiira in Latvia and lnvesticiju ir verslo garantijosin Lithuania. The EIF prepares separate financial statements for BIF. Baltic Innovation Fund 2 (“BIF 2”) is a successor Fund of Funds to the EIF managed Baltic Innovation Fund (“BIF”). The BIF 2 is envisaged to have an identical structure to BIF (virtual FoF that minimises costs and enables synergies with similar initiatives), with a slightly increased size of EUR 156 million (BIF size is EUR 130 million). The three Baltic States would commit in aggregate EUR 78 million (EUR 26 million each) alongside EUR 78 million from EIF-managed RCR resources. EIF will act as a manager of the facility. BIF 2 would be more focused towards the growth capital to complement the local initiatives for early stage investments. The target level of contributions by the three Baltic NPIs is as follows: • KredEx (Estonia): EUR 26 million, • Altum (Latvia): EUR 26 million, • INVEGA (Lithuania): EUR 26 million. V.56. Polish Growth Fund-of-Funds (‘PGFF’) The Polish Growth Fund-of-Funds (‘PGFF’), signed in April 2013, is a fund-of-funds, structured as a partnership, which invests in venture capital and private equity funds and focused on Poland. It is funded jointly by the EIB Group and the Bank Gospodarstwa Krajowego. The EIF prepares separate financial statements for PGFF. V.57. Student Loan Guarantee Facility (‘Erasmus’) Under the European Structural Investment Fund (‘ESIF’), Member States appointed EIF to manage ESIF funds as Holding Fund manager since November 2015. The ESIF initiative is aimed at promoting SME access to finance and financial engineering products, such as private equity funds, guarantee funds and loan funds. EIF is currently managing 2 ESIF Funding Agreements signed with Member States and regions: Basse-Normandie and Languedoc-Roussillon. The EIF prepares separate financial statements for Student Loan Guarantee. V.58. GEEREF Under the Global Energy Efficiency and Renewable Energy Fund (‘GEEREF’), EIF has been acting since December 2007 as investment advisor. GEEREF is supported by the EC, the Federal Government of Germany and the Kingdom of Norway and its objective is to invest primarily in regional funds with assets in projects and companies involved in energy efficiency and renewable energy enhancing access to clean energy in developing countries and economies in transition. The GEEREF business development is formally delegated to the EIB under a sub-advisory agreement. V.59. German Corona Matching Facility (CMF) The German Government, as part of its COVID-19 crisis measures for the German economy, aims to provide automatic and standardised pari-passu co-investments to VC funds for all German portfolio companies in all financing rounds until 30 June 2021. V.60. Central Europe Fund of Funds (‘CEFoF’) The Central Europe Fund of Funds (‘CEFoF’) is a fund-of-funds initiative created by the European Investment Fund (‘EIF’) in close co-operation with the governments and national agencies of Austria, Czech Republic, Slovakia, Hungary and Slovenia (the CE countries) to boost equity investments into small and medium-sized enterprises (‘SMEs’) and small mid-caps across the region, establishing a sound market-based risk financing infrastructure, implementing the best market standards for equity investments in businesses and attracting institutional investors and investment managers to Central Europe. V.61. GEF-UNEP This is a Global Environment Facility (GEF) in cooperation with United Nations Environment Programme (UNEP) for the execution of the Technical Assistance supporting the identification, selection and design of future investments which are primarily capital investment projects with outcomes leading to nutrient reduction, which will indirectly contribute to the long-term outcome of depollution of the Mediterranean Sea. 283 |
| 2022 FINANCIAL REPORT 291 V.62. Alpine Growth Investment Platform (‘AlpGIP’) In September 2017, EIF launched an innovative regional equity platform (non-corporate structure) targeting the late venture capital and growth segment in the EU Alpine Macroregion. The Italian regions Lombardia, Piemonte, Val d’Aosta and Alto Adige (Bolzano region) have already invested in the Platform other regions are expected to join at a later stage. V.63. EU Trade and Competitiveness Program (‘EUTCP’) In line with the EU policy objectives of boosting economic growth, supporting private sector development, enhancing regional integration and climate change mitigation and adaptation, EIB joins forces with the EC in order to develop the EUTCP. The EUTCP does combine: (i) EIB long-term Loan for Value Chains with; (ii) a guarantee instrument (Risk Sharing Facility); and (iii) technical assistance (Expert Support Facility) in order to address market failures in the selected countries. It also represents a strategically important initiative for the EIB for its positioning in the respective countries. It is expected that the Program will result in significant investments in SMEs along selected value chains in the target countries as it enables new guarantee instruments that will complement EIB’s classical products. The EIB prepares separate financial statements for the Risk Sharing Facility of EUTCP. V.64. LfA-EIF Facility LfA-EIF Facility, signed in 2009, is a joint EIF and LfA Förderbank Bayern venture providing investments to support technology-oriented early and expansion stage companies in the region of Bavaria, Germany. V.65. AIP Zambia The “Zambia Agriculture Value Chain Facility Programme” developed under AIP aims to support the Government of Zambia's policy objectives to reduce rural poverty and malnutrition and to improve rural livelihoods. The EIB Project aims to address market failures in the agriculture value chains by supporting the access to finance for private agriculture value chain actors through financial intermediaries, as well as by strengthening the capacity of financial intermediaries to lend to those actors. The EIB prepares separate financial statements for the programme. V.66. G43 Trust Fund Under G43 Anatolian Venture Capital Fund, signed in August 2012, the EIF is entrusted with a mandate by Central Finance Unit of Türkiye (‘CFCU’). It is dedicated to make investments in SMEs in South-Eastern Anatolia region of Türkiye. The EIF prepares separate financial statements for the G43. V.67. Mezzanine Dachfonds fur Deutschland (‘MDD’) The MDD in an investment programme signed in June 2013 and funded by the German Federal Ministry of Economics and Technology (‘BMWi’) and various institutions of the Federal states to subscribe into hybrid debt and equity funds investing in German Mid-Caps. V.68. AIP Kulima The “Support for Kulima Access to Finance Programme” developed under the Africa Investment Platform (“AIP”) comprises an intermediated facility for on-lending to eligible private agri-food sector investments in Malawi. It aims to promote sustainable agricultural growth to increase incomes, employment and food security in the context of a changing climate. The EIB prepares separate financial statements for the programme. V.69. Technology Transfer Pilot Project (‘TTP’) Under the TTP, financed by the EC and signed in November 2008, the EIF has supported a technology transfer structure through pre-seed funding and seed funding. The EIF prepares separate financial statements for TTP. V.70. EFSD Guarantee "Access to Finance Initiative" The EFSD Guarantee “SME Access to Finance Initiative” is a guarantee facility targeting SMEs, underserved entrepreneurs with a particular focus on young entrepreneurs, female entrepreneurs, start-ups and certain other groups in certain target countries and with the overriding objective of addressing some of the root causes of migration. The Programme aims to provide local banks and financial institutions selected by EIB with first loss credit protection for portfolios of loans extended to, and bank guarantees and letters of credit opened for, SMEs or micro-SMEs managed or owned by these underserved entrepreneurs who have less access to finance than other entrepreneurs because their local financial institutions associate them with higher levels of risk. The target countries will be located in the eastern and southern European Neighbourhood. The EIB prepares separate financial statements for the programme. V.71. European Technology Facility (‘ETF’) Under the ETF Start-Up Facility, the EIF is empowered to acquire, manage and dispose of ETF start-up investments, in its own name but on behalf of and at the risk of the EC. 284 |
| EIB GROUP CONSOLIDATED FINANCIAL STATEMENTS UNDER IFRS 292 V.72. EPIC EPIC (Technical Assistance for Eastern Partnership Investment in Connectivity) is a technical assistance facility under the Neighbourhood Investment Platform (NIP) which contributes to improve connectivity both within the Eastern Partnership region and between the Eastern Partnership countries and the EU. EIB prepares separate financial statements for EPIC. V.73. Green for Growth Fund (‘GGF’) The Green for Growth Fund was set up by the EIF in December 2009 and focuses on energy efficiency financings in South East Europe including Türkiye. V.74. GEEREF (‘Fund and Technical Support Facility’) GEEREF (Global Energy Efficiency and Renewable Energy Fund) is a fund of funds set-up at the initiative of the EC. Its objective is to make investments in private equity funds that focus on the fields of renewable energy and energy efficiency in emerging markets (ACP, ALA and European Neighbour countries). The EIF also holds a technical assistance mandate for which related activities are implemented by the GEEREF front office. 285 |

| 2022 FINANCIAL REPORT 293 Statement of Special Section(1) as at 31 December 2022 and 31 December 2021 (in EUR ‘000) ASSETS 31.12.2022 31.12.2021 Mediterranean Countries From resources of the European Union Disbursed loans outstanding 4,550 5,828 Risk capital operations - amounts to be disbursed 21,523 21,523 - amounts disbursed 27,783 28,479 49,306 50,002 Total(2) 53,856 55,830 · Lomé Conventions Operations from risk capital resources - amounts disbursed 74,631 76,542 Total(3) 74,631 76,542 Total 128,487 132,372 LIABILITIES 31.12.2022 31.12.2021 Funds under trust management Under mandate from the European Union - Financial Protocols with the Mediterranean Countries 32,333 34,307 - Lomé Conventions 74,631 76,542 Total funds under trust management 106,964 110,849 Funds to be disbursed On loans and risk capital operations in the Mediterranean countries 21,523 21,523 Total funds to be disbursed 21,523 21,523 Total 128,487 132,372 For information: Total amounts disbursed and not yet repaid on loans on special conditions made available by the Commission in respect of which the Bank has accepted an EU mandate for recovering principal and interest: a) Under the First, Second and Third Lomé Conventions as at 31 December 2022 EUR ‘000 191,538 (2021: EUR ‘000 211,266). b) Under Financial Protocols signed with the Mediterranean Countries as at 31 December 2022 EUR ‘000 25,216 (2021: EUR ‘000 29,660). In the context of the European Union – European Development Finance Institutions Private Sector Development Facility, the implementation agreement for the Guarantee Component was signed on 20 August 2014. The total amount of the EU guarantee to be issued is EUR ‘000 38,920 as at 31 December 2022 (2021: EUR ‘000 38,920). Note (1): The Special Section was set up by the Board of Governors on 27 May 1963. Under a decision taken on 4 August 1977, its purpose was redefined as being that of recording financing operations carried out by the European Investment Bank for the account of and under mandate from third parties. However, for the Investment Facility under the Cotonou Agreement, the EU-Africa Infrastructure Trust Fund, the Neighbourhood Investment Facility (‘NIF’) Trust Fund and the FEMIP Trust Fund, separate financial statements are presented. In addition, since 2005, the EIB also prepares financial statements of different types for other mandates. The Statement of Special Section reflects amounts disbursed or to be disbursed, less cancellations and repayments, under mandate from the European Union and the Member States. Amounts disbursed and to be disbursed and funds received and to be received are carried at nominal value. No account is taken in the Statement of Special Section of provisions or value adjustments, which may be required to cover risks associated with such operations except for definite write-offs. Amounts in foreign currency are translated at exchange rates prevailing on 31 December. 286 |
| EIB GROUP CONSOLIDATED FINANCIAL STATEMENTS UNDER IFRS 294 Note (2): Initial amount of contracts signed for financing projects in the Maghreb and Mashreq countries, Malta, Cyprus, Türkiye and Greece (EUR 10 million lent prior to accession to the EC on 1 January 1981) under mandate, for the account and at the risk of the European Union. Initial amount: 840,457 less: exchange adjustments 56,283 cancellations 178,863 repayments 551,455 -786,601 53,856 Note (3): Initial amount of contracts signed for financing projects in the African, Caribbean and Pacific States and the Overseas Countries and Territories (‘ACP-OCT’) under mandate, for the account and at the risk of the European Union: Loans from risk capital resources: Conditional and subordinated loans 3,116,097 Equity participations 121,002 Initial amount: 3,237,099 add: capitalised interests 9,548 less: cancellations 742,432 repayments 2,374,004 exchange adjustments 55,580 -3,172,016 74,631 Note W – Capital and Reserves W.1. Share capital and reserves The European Investment Bank (EIB), the financing institution of the European Union, was created by the Treaty of Rome of 25 March 1957. The members of the EIB are the Member States of the European Union, who have all subscribed to the Group's capital. The subscribed capital of the Bank amounts to EUR 248,795,606,881 (31 December 2021: EUR 248,795,606,881) and the uncalled capital to EUR 226,604,891,420 as of 31 December 2022 (31 December 2021: EUR 226,604,891,420). New Member States or Member States that increase their share in the Bank's subscribed capital pay their part of the called capital plus their part of the reserves, provisions equivalent to reserves and similar amounts, normally in several equal instalments over the course of several years. The Accession Treaties and/or the Board of Governors decisions to increase the Bank's capital establish the specific modalities of such payments, including the calculation of the share of the new Member States in the Bank's capital, which is normally based on the national GDP figures officially published by Eurostat. On 29 March 2017, the United Kingdom notified the European Council of its decision to withdraw from the European Union (“EU”) pursuant to Article 50 of the Treaty on European Union (“TEU”). As of 1 February 2020, in accordance with Article 50 TEU and the Agreement on the withdrawal of the United Kingdom of Great Britain and Northern Ireland from the European Union and the European Atomic Energy Community (the “Withdrawal Agreement”), the United Kingdom ceased to be an EU Member State. The withdrawal of the United Kingdom from the EU automatically resulted in the termination of its membership of the European Investment Bank (“EIB”) and its share of the EIB’s subscribed capital. Effective 1 February 2020, the share of the United Kingdom in respect of the EIB’s subscribed capital was fully replaced by a pro rata capital increase of the remaining EU Member States. This capital replacement (Symmetrical Capital Replacement) covered both the called part as well as the uncalled part of the subscribed capital of the United Kingdom in the EIB. The replacement of the called part was financed by converting EIB reserves into subscribed capital. As a result of the capital increase, each remaining EU Member State increased pro rata its uncalled (but callable) stake in the EIB’s subscribed capital. On 1 March 2020, the subscribed capital increased (Asymmetrical Capital Increase) from EUR 243,284,154,500 to EUR 248,795,606,881 by virtue of the contributions of Poland and Romania (by EUR 5,386,000,000 and EUR 125,452,381, respectively). The contributions to the Subscribed capital called and to the Reserves amount to EUR 0.5 million and EUR 1.1 million respectively. The total amount to be paid by the Member States has been equally spread over ten equal semi-annual instalments due on 31 December 2020, 30 June 2021, 31 December 2021, 30 June 2022, 31 December 2022, 30 June 2023, 31 December 2023, 30 June 2024, 31 December 2024, and 30 June 2025. The instalments due including 31 December 2022 were settled in full. The amount of EUR ‘000 811,264 shown in the balance sheet under the caption Subscribed capital and reserves, called but not paid contains the discounted amount receivable (EUR ‘000 799,248) from the Member States Poland and Romania following the Asymmetrical Capital Increase on 1 March 2020. Voting powers in the Bank's Board of Governors and Board of Directors are established partly on the share of capital subscribed by each Member State, partly on different criteria, set forth in Articles 8 and 10 of the Bank's statute, applied jointly or exclusively depending on the specific voting procedure. 287 |
| 2022 FINANCIAL REPORT 295 W.2. Capital management Maintaining a strong capital position is one of the major objectives of the Group. The Group’s own funds for capital adequacy purposes comprise called capital plus reserves. The Group’s capital is entirely composed of Core Equity Tier 1 instruments. In addition, the Group benefits from uncalled subscribed capital, which can be called by the Bank if the need arises. The Group plans its capital on a forward looking basis in accordance with its operational plan and risk tolerance. Although the Group is not subject to prudential supervision, it aims to comply with relevant EU banking directives and best banking practice in particular, the Capital Requirements Directive (Directive 2013/36/EU) and Capital Requirements Regulation (Regulation 575/2013), as amended from time to time, which translates the Basel Committee on Banking Supervision (BCBS) standards (such as Basel III principles) into EU legal framework. The Group proactively monitors and implements current and upcoming EU prudential banking regulatory requirements as part of its Best Banking Practice Framework16. The Group’s Core Equity Tier 1 ratio, calculated in accordance with the Capital Requirements Regulation and based on the EIB Group Consolidated Financial Statements under EU Accounting Directives, stood at 34.5% as at 31 December 2022 (32.0% at the end of 2021). The ratio’s increase compared to the prior year was driven mainly by the positive development of the stock and the retained annual surplus. As at 31 December 2022, and based on the statutory financial statements, the Bank’s Core Equity Tier 1 ratio stood at 35.1% (32.3% at the end of 2021). 16 Please refer to the Best Banking Practice Guiding Principles of the European Investment Bank, publicly available in its website. 288 |

| EIB GROUP CONSOLIDATED FINANCIAL STATEMENTS UNDER IFRS 296 Note X – Conversion rates The following conversion rates were used for establishing the consolidated balance sheet at 31 December 2022 and 2021: 31.12.2022 31.12.2021 Non-euro currencies of EU member states Bulgarian Lev (BGN) 1.9558 1.9558 Czech Koruna (CZK) 24.1160 24.8580 Danish Krone (DKK) 7.4365 7.4364 Croatian Kuna (HRK) 7.5365 7.5156 Hungarian Forint (HUF) 400.8700 369.1900 Polish Zloty (PLN) 4.6808 4.5969 Romanian Leu (RON) 4.9495 4.9490 Swedish Krona (SEK) 11.1218 10.2503 Non-EU currencies Australian Dollar (AUD) 1.5693 1.5615 Azerbaijani Manat (AZN) 1.8103 1.9207 Canadian Dollar (CAD) 1.4440 1.4393 Swiss Franc (CHF) 0.9847 1.0331 Chinese Renminbi (CNY) 7.3582 7.1947 Dominican Peso (DOP) 59.8400 64.8310 Egyptian Pound (EGP) 26.4223 17.7663 Ethiopian Birr (ETB) 56.9660 55.8100 Pound Sterling (GBP) 0.8869 0.8403 Georgian Lari (GEL) 2.8462 3.4806 Hong Kong Dollar (HKD) 8.3163 8.8333 Indian Rupees (INR) 88.1710 84.2292 Japanese Yen (JPY) 140.6600 130.3800 Kenyan Shilling (KES) 131.6800 128.2600 Kazakhstani Tenge (KZT) 494.0400 493.3100 Moroccan Dirham (MAD) 11.1556 10.5191 Moldovan Leu (MDL) 20.3700 20.0900 Mexican Peso (MXN) 20.8560 23.1438 Norwegian Krone (NOK) 10.5138 9.9888 New Zealand Dollar (NZD) 1.6798 1.6579 Serbian Dinars (RSD) 117.2000 117.5100 Russian Ruble (RUB) 76.8960 85.3004 Tunisia Dinar (TND) 3.3055 3.2611 Turkish Lira (TRY) 19.9649 15.2335 Taiwan Dollar (TWD) 32.7869 31.4420 Ukraine Hryvnia (UAH) 39.4092 30.9151 United States Dollar (USD) 1.0666 1.1326 Central African CFA Franc (XAF) 655.9570 655.9570 West African CFA Franc (XOF) 655.9570 655.9570 South African Rand (ZAR) 18.0986 18.0625 289 |
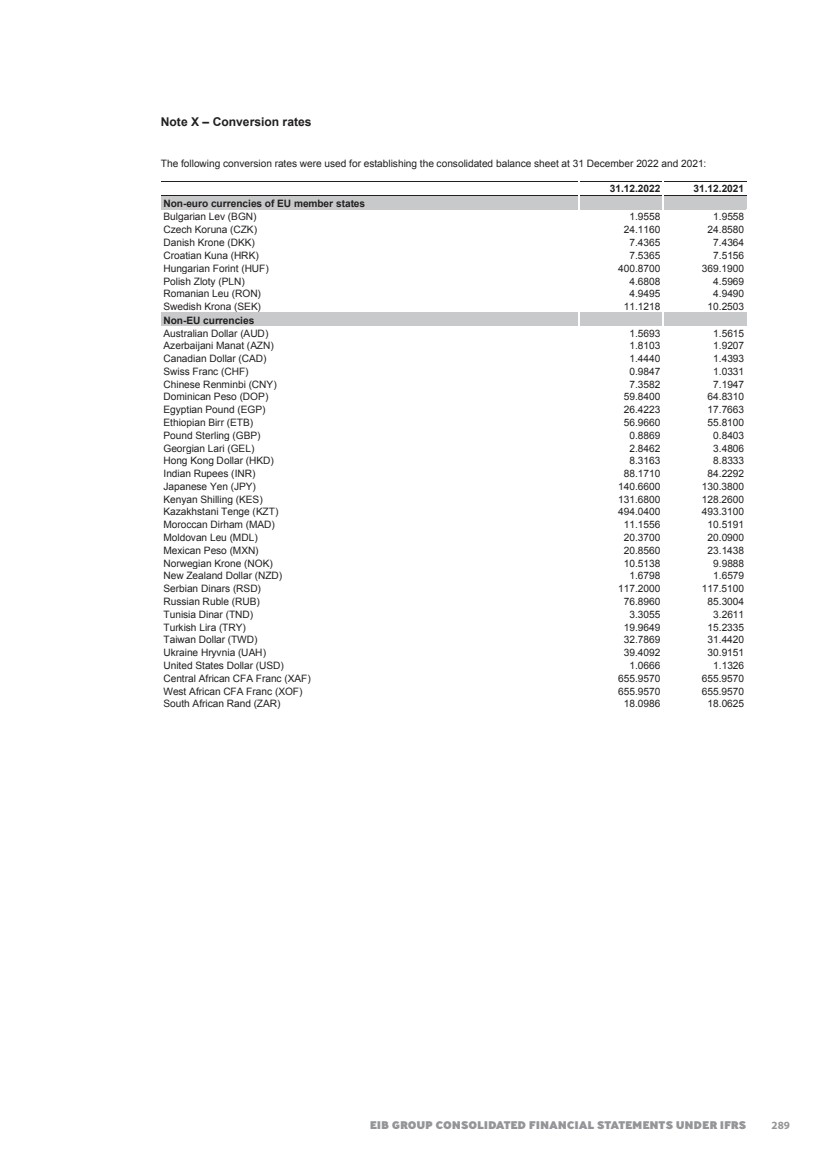
| 2022 FINANCIAL REPORT 297 Note Y – Related party transactions Y.1 Associates (in EUR ’000) The amounts included in the consolidated financial statements concerning associates are disclosed as follows: 31.12.2022 31.12.2021 Shares and other variable-yield securities 772,465 783,945 Result on financial operations -54,535 243,089 Undisbursed private equity / venture capital operations 483,923 576,951 Y.2 Key Management Personnel (in EUR ’000) The Group has identified members of the Board of Directors, the Audit Committee, the Management Committee and the Directors General heading the different EIB organisational directorates, as well as the head of Internal Audit independent department, as key management personnel. Key management personnel compensation for the relevant reporting periods, included within General administrative expenses (Note P), is disclosed in the following table: 2022 2021 Short-term benefits(1) 11,342 10,772 Post-employment benefits(2) 874 919 Termination benefits 315 965 Total 12,531 12,656 (1) Short-term employee benefits comprise salaries and allowances, bonuses and social security contributions of the Management Committee, the GRCO, Directors General and other Directors, and benefits paid to the members of the Board of Directors and the Audit Committee. (2) Post-employment benefits comprise pensions and expenses for post-employment health insurance paid to members of the Management Committee, the GRCO, the Directors General and other Directors. There were neither advances or credit granted to key management personnel, nor commitments entered into on their behalf by way of guarantee of any kind. Open balances with key management personnel as at 31 December 2022 comprise the compulsory and optional supplementary pension plan and health insurance scheme liabilities, and payments outstanding as at the year-end: 31.12.2022 31.12.2021 Pension plans and health insurance (Note J) 84,603 111,689 Other liabilities (Note G) 15,288 18,737 Note Z – Post balance sheet events There have been no material events after the balance sheet date that would require adjustment of, or disclosure in, the consolidated financial statements as at 31 December 2022. In the context of the war in Ukraine and its broader economic consequences, the Group continues to monitor the situation closely notably as part of the subsequent event review. 290 |
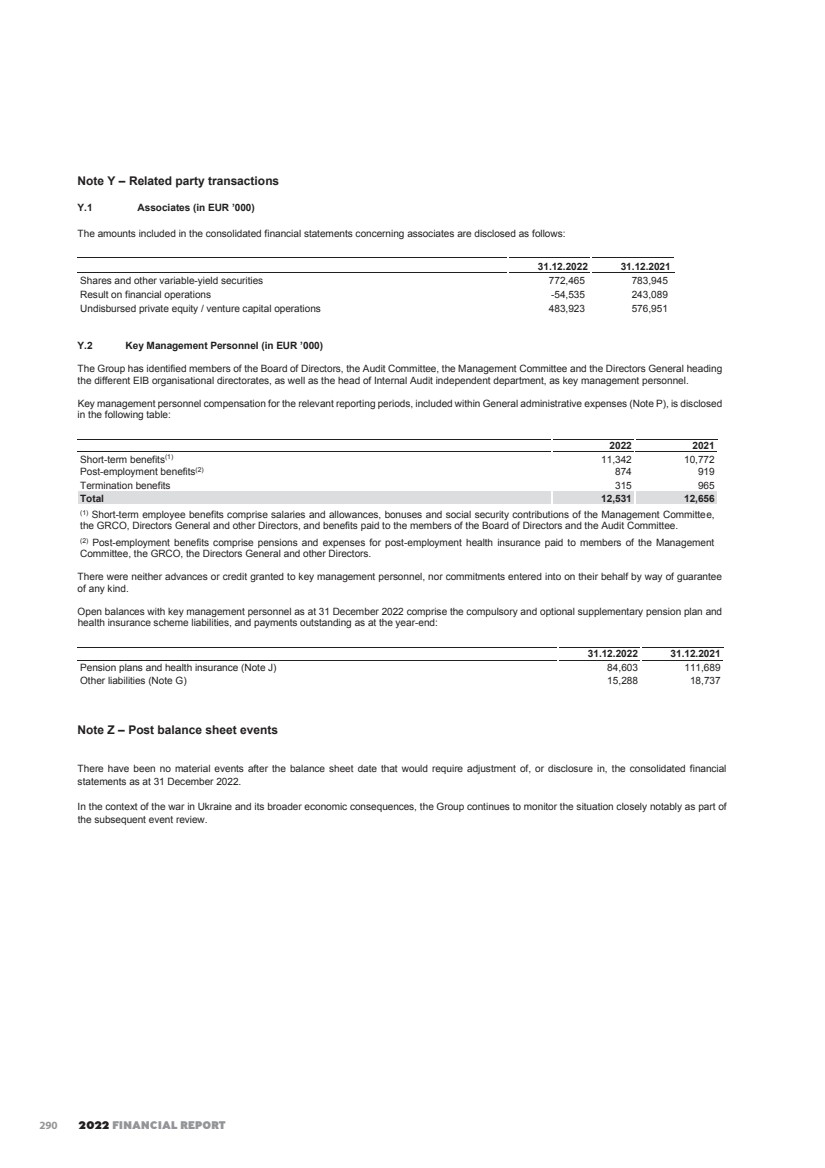
| INDEPENDENT AUDITOR’S REPORT INDEPENDENT AUDITOR’S REPORT KPMG Audit S.à r.l. 39, Avenue John F. Kennedy L-1855 Luxembourg Tel.: +352 22 51 51 1 Fax: +352 22 51 71 E-mail: info@kpmg.lu Internet: www.kpmg.lu © 2023 KPMG Audit S.à r.l., a Luxembourg entity and a member firm of the KPMG global organization of independent member firms affiliated with KPMG International Limited, a private English company limited by guarantee. All rights reserved. R.C.S Luxembourg B 149133 To the Chairman of the Audit Committee of EUROPEAN INVESTMENT BANK 98-100, boulevard Konrad Adenauer L-2950 Luxembourg REPORT OF THE REVISEUR D’ENTREPRISES AGREE Report on the audit of the consolidated financial statements Opinion We have audited the consolidated financial statements of EUROPEAN INVESTMENT BANK and its subsidiary (the “Group”), which comprise the consolidated balance sheet as at 31 December 2022, and the consolidated income statement, consolidated statement of profit or loss and other comprehensive income, consolidated statement of changes in equity and consolidated cash flow statement for the year then ended, and notes to the consolidated financial statements, including a summary of significant accounting policies and other explanatory information. In our opinion, the accompanying consolidated financial statements give a true and fair view of the consolidated financial position of the Group as at 31 December 2022, and of its consolidated financial performance and its consolidated cash flows for the year then ended in accordance with International Financial Reporting Standards (IFRSs) as adopted by the European Union. Basis for opinion We conducted our audit in accordance with the Law of 23 July 2016 on the audit profession (“Law of 23 July 2016”) and with International Standards on Auditing (“ISAs”) as adopted for Luxembourg by the “Commission de Surveillance du Secteur Financier” (“CSSF”). Our responsibilities under the Law of 23 July 2016 and ISAs as adopted for Luxembourg by the CSSF are further described in the “Responsibilities of “réviseur d’entreprises agréé” for the audit of the consolidated financial statements” section of our report. We are also independent of the Group in accordance with the International Code of Ethics for Professional Accountants, including International Independence Standards, issued by the International Ethics Standards Board for Accountants (“IESBA Code”) as adopted for Luxembourg by the CSSF together with the ethical requirements that are relevant to our audit of the consolidated financial statements, and have fulfilled our other ethical responsibilities under those ethical requirements. We believe that the audit evidence we have obtained is sufficient and appropriate to provide a basis for our opinion. 291 |
| 2022 FINANCIAL REPORT 2 Key audit matters Key audit matters are those matters that, in our professional judgment, were of most significance in our audit of the consolidated financial statements of the current period. These matters were addressed in the context of the audit of the consolidated financial statements as a whole, and in forming our opinion thereon, and we do not provide a separate opinion on these matters. 1 Impairment of loans to customers and credit institutions Why the matter was considered to be one of most significance in our audit As at 31 December 2022, the Group reports loans accounted for at amortized cost of EUR 397,250 million (31 December 2021: EUR 414,277 million) representing 70% of total assets (31 December 2021: 66%) and recognized individually assessed impairments on loans amounting to EUR 328 million (31 December 2021: EUR 363 million). The impairment amount for loans consists out of three different components being: • Management’s estimate of expected credit loss (“ECL”) for loans considered credit-impaired (Stage 3), amounting to EUR 128 million as at 31 December 2022 (31 December 2021: 220 million); • The lifetime expected credit loss determined by model for loans where there has been a significant increase in credit risk since initial recognition (stage 2), amounting to EUR 164 million as at 31 December 2022 (31 December 2021: 126 million); and • The 12-month expected credit loss determined by model for the remaining population (stage 1), amounting to EUR 36 million as at 31 December 2022 (31 December 2021: 17 million). These loans are not traded in an active market, therefore significant judgments and estimates are required to be applied by Management in its assessment of their recoverable amount, irrespective of the stage allocation. Inappropriate judgments made in relation to the methodology and inputs used or the assumptions taken may have a material impact on the impairment amount recorded. These critical judgments include matters such as the definition of criteria to identify significant increase in credit risk or default, as well as estimation of input parameter for determining ECL, namely probability of default and loss given default which are derived from statistical models and should include forward-looking-information. For credit-impaired assets where impairment is based on management’s best estimate, the critical judgments include estimating recoverable cash flow, the effect of guarantees received, as well as valuation of collaterals. The impact of the war in Ukraine and its broader economic consequences have resulted in uncertain economic conditions that vary across countries and industry sectors. The uncertainty increased in the determination and calculation of expected credit losses on loans accounted for at amortized cost. The key inputs and assumptions used by Management in its assessment of loan impairment are detailed in Note A.2 to the consolidated financial statements as well as the accounting policy for the impairment in Note A.4.4 and the detail of the impairment in Note D.2. The loans accounted for at amortized cost are disclosed in Note T to the consolidated financial statements as well as the accounting policy for the loans in Note A.4.9. How the matter was addressed in our audit Our procedures included the assessment of key controls over the approval, recording, monitoring and restructuring of loans to customers and credit institutions, the loan grading process and the measurement of impairment amounts. 292 |
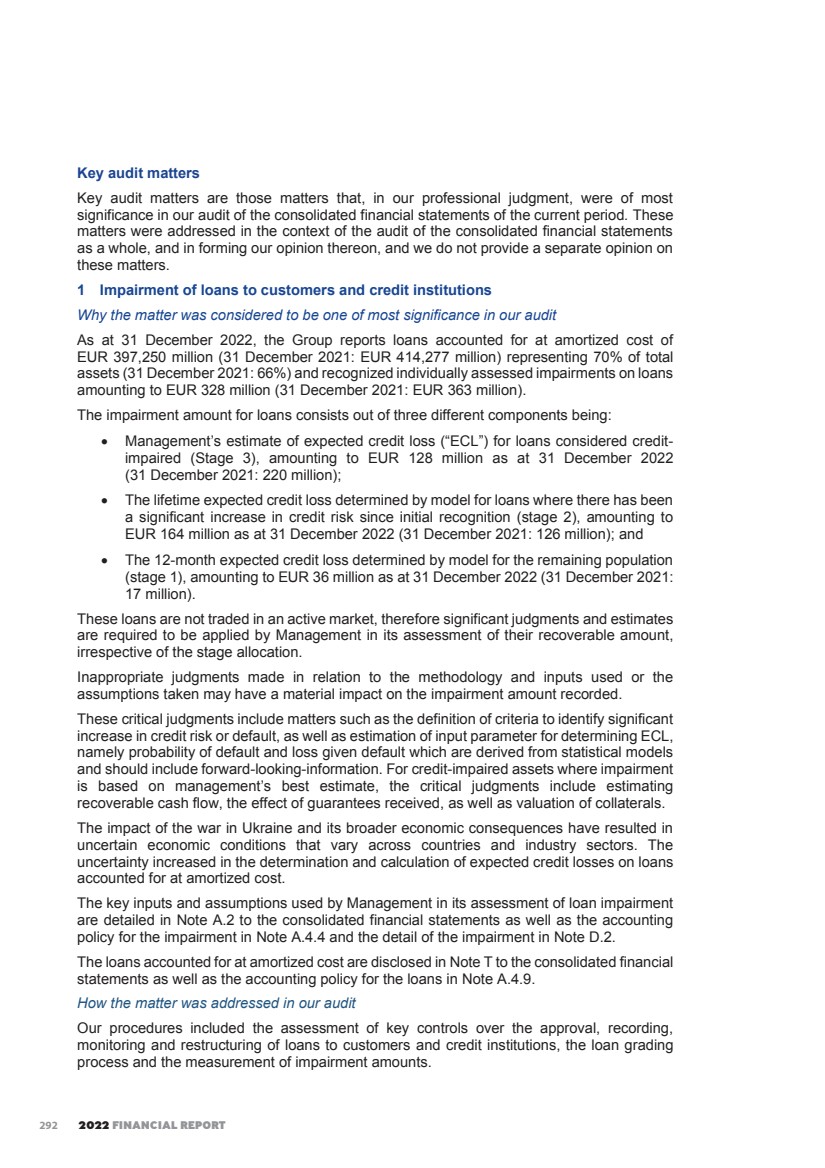
| INDEPENDENT AUDITOR’S REPORT 3 We assessed the methodology to determine ECL based on the policies and procedures in place by comparing it against IFRS 9 requirements, as well as the key input data used and model application as at 31 December 2022. We also assessed the appropriateness of modelling methodologies, giving specific consideration to the current economic uncertainty triggered by the war in Ukraine and whether management judgemental adjustments were needed. For the allocation of loans to the different stages in the impairment model as at 31 December 2022, we assessed whether it has been performed in line with criteria defined by reperforming the allocation for a sample of loans. For ECL determined based on the implemented statistical model (stage 1 and 2), we tested the calculations performed at year-end as well as the underlying data used in this on a sample basis. For a sample of loans in stage 3, where provisions are based on management’s best estimate, we evaluated the Group's individual assessment of each loan by specifically challenging the Group's assumptions used as well as underlying data, including the value of realisable collateral and the estimated recoverability. The impact of the current economic uncertainty triggered by the war in Ukraine was followed-up both in assessing the provision of the evaluated exposure and in determining our sample of exposures where we drew a particular attention to the sectors most vulnerable to it. We assessed the disclosures in the consolidated financial statements in relation to impairment of loans with reference to the requirements of the prevailing accounting standards. 2 Hedge Accounting Why the matter was considered to be one of most significance in our audit As at 31 December 2022, the Group applied fair value hedge accounting to loans and advances as well as to loan substitutes and treasury debt securities with a reported hedge fair value of EUR 128,121 million (31 December 2021: EUR 148,001 million) representing 23% of total assets (31 December 2021: 24%) and to borrowings with a reported hedge fair value of EUR 306,449 million (31 December 2021: EUR 353,440 million) representing 64% of total liabilities (31 December 2021: 65%). The Group enters into derivative contracts in order to manage and hedge risks such as interest rate risk and FX risk through interest rate swaps or cross-currency swaps. Application of hedge accounting and ensuring hedge effectiveness are processes requiring reliance on several interconnected systems and subsequent potential manual updates, that makes the process susceptible to errors and therefore requires close monitoring from management. The key inputs and assumptions used by Management in its application of fair value hedge accounting and accounting policies are detailed in Note A.4.5 to the consolidated financial statements as well as detail of the hedging activities in Note Q.2. How the matter was addressed in our audit We tested key controls on the eligibility of the hedging instruments and hedged items for hedge accounting as well as the underlying data used in this on a sample basis. We determined whether the methodology applied to assess the economic relationship between hedged item and hedging instrument as well as non-dominance of credit risk on hedged item and hedging instrument is compliant with IFRS 9. We tested key controls over designation and compliance monitoring of the hedge accounting relationship with those requirements, both at inception and during its life as well as the underlying data used in this on a sample basis. 293 |
| 2022 FINANCIAL REPORT 4 We assessed the valuation methodology of the Group for the calculation of its hedged fair value and its cost of hedging based on the policies and procedures in place, by comparing to the applicable IFRS 9 requirements. We performed independent valuations with the assistance of our valuation specialists on a sample basis and comparing these with the Group’s valuations, including separate identification of the cost of hedging determination. We assessed the appropriateness of the key input data used for determining hedge fair values as at 31 December 2022. We assessed the disclosures in the consolidated financial statements in relation to hedge accounting with reference to the requirements of the prevailing accounting standards. 3 Valuation of complex financial instruments (derivative assets and liabilities) Why the matter was considered to be one of most significance in our audit As at 31 December 2022, the Group holds derivative assets (complex and non complex) of EUR 35,044 million (31 December 2021: EUR 41,734 million) and derivative liabilities (complex and non complex) of EUR 43,758 million (31 December 2021: EUR 29,530) representing respectively 6% of total assets and 9% of total liabilities (31 December 2021: respectively 7% and 5% ). The valuation of such financial instruments, measured at fair value, is based on a combination of market data and valuation models which often require a considerable number of inputs. Most of these inputs are obtained from readily available data such as quoted market prices as well as observable inputs however the valuation of the derivatives is derived from complex models that are requiring a sound knowledge of complex financial instruments valuation techniques and a sophisticated valuation process which can therefore be subject to error especially for instruments that are not priced using a plain vanilla model. In addition, the Russia’s invasion of Ukraine and Covid 19 pandemic effects have triggered a downturn in the global economy, resulting in newly generated inflationary pressures and increasing markets volatility, therefore impacting the valuation of derivative assets and liabilities either at level 2 or level 3. These are the financial instruments objects of this key audit matter. The key inputs and assumptions used by Management in its assessment of derivative financial instruments are detailed in Notes A.2 and A.4.6 to the consolidated financial statements, as well as the accounting policies in Note A.4.5, the detail of derivative financial instruments in Note Q.3 and the fair value of financial assets and liabilities in Note R. How the matter was addressed in our audit Our audit procedures to assess the fair value of derivatives included the testing of the design, implementation and operating effectiveness of key internal controls over the valuation, price verification and front office and back office reconciliations for derivative financial instruments. We engaged our valuation specialists to assist us in performing independent valuations on a sample basis and comparing these with the Group’s valuations. Our specialist also assessed the appropriate application of Credit Value and Debit Value Adjustments (“CVA/DVA”) that form an integral part of fair values, inquiring of Management about any changes in the CVA/DVA methodology and assessing the appropriateness of the inputs applied. We also reviewed the appropriateness of the Group methodology used in order to classify its derivatives either as level 2 or level 3. 294 |
| INDEPENDENT AUDITOR’S REPORT 5 Finally, we also assessed whether the disclosures in the consolidated financial statements, including fair value hierarchy information and sensitivity to key inputs for level 3 instruments, appropriately reflected the Group’s exposure to financial instrument valuation risk with reference to the requirements of the prevailing accounting standards. Other information The Management is responsible for the other information. The other information comprises the information stated in the “Highlights, Overview, EIB Statutory Bodies and Audit and control”, which are mainly based on statutory EU Directives information, but does not include the consolidated financial statements and our report of the “réviseur d’entreprises agréé” thereon. Our opinion on the consolidated financial statements does not cover the other information and we do not express any form of assurance conclusion thereon. In connection with our audit of the consolidated financial statements, our responsibility is to read the other information and, in doing so, consider whether the other information is materially inconsistent with the consolidated financial statements or our knowledge obtained in the audit or otherwise appears to be materially misstated. If, based on the work we have performed, we conclude that there is a material misstatement of this other information we are required to report this fact. We have nothing to report in this regard. Responsibilities of Management and Those Charged with Governance for the consolidated financial statements The Management is responsible for the preparation and fair presentation of the consolidated financial statements in accordance with IFRSs as adopted by the European Union, and for such internal control as the Management determines is necessary to enable the preparation of consolidated financial statements that are free from material misstatement, whether due to fraud or error. In preparing the consolidated financial statements, the Management is responsible for assessing the Group’s ability to continue as a going concern, disclosing, as applicable, matters related to going concern and using the going concern basis of accounting unless the Management either intends to liquidate the Group or to cease operations, or has no realistic alternative but to do so. Those charged with governance are responsible for overseeing the Group’s financial reporting process. Responsibilities of the réviseur d’entreprises agréé for the audit of the consolidated financial statements The objectives of our audit are to obtain reasonable assurance about whether the consolidated financial statements as a whole are free from material misstatement, whether due to fraud or error, and to issue a report of the “réviseur d’entreprises agréé” that includes our opinion. Reasonable assurance is a high level of assurance, but is not a guarantee that an audit conducted in accordance with the Law of 23 July 2016 and with ISAs as adopted for Luxembourg by the CSSF will always detect a material misstatement when it exists. Misstatements can arise from fraud or error and are considered material if, individually or in the aggregate, they could reasonably be expected to influence the economic decisions of users taken on the basis of these consolidated financial statements. 295 |
| 2022 FINANCIAL REPORT 6 As part of an audit in accordance with the Law of 23 July 2016 and with ISAs as adopted for Luxembourg by the CSSF, we exercise professional judgment and maintain professional skepticism throughout the audit. We also: • Identify and assess the risks of material misstatement of the consolidated financial statements, whether due to fraud or error, design and perform audit procedures responsive to those risks, and obtain audit evidence that is sufficient and appropriate to provide a basis for our opinion. The risk of not detecting a material misstatement resulting from fraud is higher than for one resulting from error, as fraud may involve collusion, forgery, intentional omissions, misrepresentations, or the override of internal control. • Obtain an understanding of internal control relevant to the audit in order to design audit procedures that are appropriate in the circumstances, but not for the purpose of expressing an opinion on the effectiveness of the Group’s internal control. • Evaluate the appropriateness of accounting policies used and the reasonableness of accounting estimates and related disclosures made by the Management. • Conclude on the appropriateness of Management’s use of the going concern basis of accounting and, based on the audit evidence obtained, whether a material uncertainty exists related to events or conditions that may cast significant doubt on the Group’s ability to continue as a going concern. If we conclude that a material uncertainty exists, we are required to draw attention in our report of the “réviseur d’entreprises agréé” to the related disclosures in the consolidated financial statements or, if such disclosures are inadequate, to modify our opinion. Our conclusions are based on the audit evidence obtained up to the date of our report of the “réviseur d’entreprises agréé”. However, future events or conditions may cause the Group to cease to continue as a going concern. • Evaluate the overall presentation, structure and content of the consolidated financial statements, including the disclosures, and whether the consolidated financial statements represent the underlying transactions and events in a manner that achieves fair presentation. • Obtain sufficient appropriate audit evidence regarding the financial information of the entities and business activities within the Group to express an opinion on the consolidated financial statements. We are responsible for the direction, supervision and performance of the Group audit. We remain solely responsible for our audit opinion. We communicate with those charged with governance regarding, among other matters, the planned scope and timing of the audit and significant audit findings, including any significant deficiencies in internal control that we identify during our audit. We also provide those charged with governance with a statement that we have complied with relevant ethical requirements regarding independence, and to communicate with them all relationships and other matters that may reasonably be thought to bear on our independence, and where applicable, related safeguards. From the matters communicated with those charged with governance, we determine those matters that were of most significance in the audit of the consolidated financial statements of the current period and are therefore the key audit matters. We describe these matters in our report unless law or regulation precludes public disclosure about the matter or when, in extremely rare circumstances, we determine that a matter should not be communicated in our report because the adverse consequences of doing so would reasonably be expected to outweigh the public interest benefits of such communication. 296 |
| INDEPENDENT AUDITOR’S REPORT 7 Report on other requirements In accordance with the Framework Agreement (“the Agreement”) dated 19 February 2009, renewed on 3 March 2017, as extended for the period 2022-2024 on 14 December 2020, signed between European Investment Bank and KPMG Luxembourg Société anonyme, we have been appointed to carry the audit services defined in the Agreement. The duration of our uninterrupted engagement, including previous renewals and reappointments, is 14 years. We confirm that the audit opinion is consistent with the communication to the audit committee or equivalent. We confirm that the prohibited non-audit services referred to in IESBA Code of Ethics were not provided and that we remained independent of the Group in conducting the audit. Luxembourg, 29 March 2023 KPMG Audit S.à r.l. Cabinet de révision agréé S. Chambourdon Partner We communicate with those charged with governance regarding, among other matters, the planned scope and timing of the audit and significant audit findings, including any significant deficiencies in internal control that we identify during our audit. We also provide those charged with governance with a statement that we have complied with relevant ethical requirements regarding independence, and to communicate with them all relationships and other matters that may reasonably be thought to bear on our independence, and where applicable, related safeguards. From the matters communicated with those charged with governance, we determine those matters that were of most significance in the audit of the consolidated financial statements of the current period and are therefore the key audit matters. We describe these matters in our report unless law or regulation precludes public disclosure about the matter or when, in extremely rare circumstances, we determine that a matter should not be communicated in our report because the adverse consequences of doing so would reasonably be expected to outweigh the public interest benefits of such communication. Report on other requirements In accordance with the Framework Agreement (“the Agreement”) dated 19 February 2009, renewed on 3 March 2017 , as extended for the period 2022-2024 on 14 December 2020, signed between European Investment Bank and KPMG Luxembourg Société anonyme, we have been appointed to carry the audit services defined in the Agreement. The duration of our uninterrupted engagement, including previous renewals and reappointments, is 13 years. We confirm that the audit opinion is consistent with the communication to the audit committee or equivalent. We confirm that the prohibited non-audit services referred to in IESBA Code of Ethics were not provided and that we remained independent of the Group in conducting the audit. Luxembourg, 29 March 2023 KPMG Audit S.à r.l. Cabinet de révision agréé S. Chambourdon Partner 184 297 |
| 2022 FINANCIAL REPORT STATEMENT BY THE AUDIT COMMITTEE The Audit Committee reports to the Board of Governors, the following statement being communicated to the Governors prior to their approval of the Annual Report and the financial statements for the past financial year. Statement by the Audit Committee on the EIB’s consolidated financial statements prepared in accordance with International Financial Reporting Standards as adopted by the European Union (IFRS) The Audit Committee, instituted in pursuance of Article 12 of the Statute and Chapter V of the Rules of Procedure of the European Investment Bank for the purpose of verifying that the operations of the Bank are conducted and its books kept in a proper manner, having: - designated KPMG as external auditors, reviewed their audit planning process, examined and discussed their reports, and in particular their independent Auditor’s Report, - noted that the opinion of KPMG on the consolidated financial statements of the European Investment Bank for the year ended 31 December 2022 prepared in accordance with IFRS, is unqualified, - convened on a regular basis with the Heads of Directorates and relevant services including, • Financial Control, • Risk Management, Transaction Monitoring and Restructuring and Compliance, - met regularly the Head of Internal Audit and discussed the relevant internal audit reports, and studied the documents which it deemed necessary to examine in the discharge of its duties, - received assurance from the Management Committee concerning the effectiveness of the internal control structure and internal administration, and considering - the consolidated financial statements for the financial year ended 31 December 2022 adopted by the Board of Directors on 29 March 2023, - that the foregoing provides a reasonable basis for its statement and, - Articles 24, 25 & 26 of the Rules of Procedure, 298 |
| STATEMENT BY THE AUDIT COMMITTEE to the best of its knowledge and judgement: confirms that the consolidated financial statements of the European Investment Bank, which comprise the consolidated balance sheet as at 31 December 2022, the consolidated income statement, the consolidated statement of profit or loss and other comprehensive income, the consolidated statement of changes in equity and the consolidated cash flow statement for the year then ended, and notes to the consolidated financial statements, including a summary of significant accounting policies and other explanatory information, give a true and fair view of the consolidated financial position of the European Investment Bank as of 31 December 2022, and of its consolidated financial performance and its consolidated cash flows for the year then ended in accordance with International Financial Reporting Standards as adopted by the European Union. Luxembourg, 29 March 2023 Audit Committee 306 299 |