N-CSRS
false
0000035315
N-1A
Fidelity Salem Street Trust
0000035315fmr:C000048856Member2023-11-302024-05-310000035315fmr:C000048856Member2024-05-310000035315fmr:C000048856Memberus-gaap:RealEstateSectorMember2024-05-310000035315fmr:C000048856Memberfmr:MSFinancialsSectorMember2024-05-310000035315fmr:C000048856Memberoef:IndustrialSectorMember2024-05-310000035315fmr:C000048856Memberoef:ConsumerStaplesSectorMember2024-05-310000035315fmr:C000048856Memberoef:InformationTechnologySectorMember2024-05-310000035315fmr:C000048856Memberus-gaap:EnergySectorMember2024-05-310000035315fmr:C000048856Memberus-gaap:HealthcareSectorMember2024-05-310000035315fmr:C000048856Memberoef:UtilitiesSectorMember2024-05-310000035315fmr:C000048856Memberoef:CommunicationsSectorMember2024-05-310000035315fmr:C000048856Memberoef:ConsumerDiscretionarySectorMember2024-05-310000035315fmr:C000048856Memberoef:MaterialsSectorMember2024-05-310000035315fmr:C000048856Memberfmr:AADividendPayingEquitiesMember2024-05-310000035315fmr:C000048856Memberfmr:AAPreferredStockMember2024-05-310000035315fmr:C000048856Memberfmr:AAREITsMember2024-05-310000035315fmr:C000048856Memberfmr:AAConvertiblesMember2024-05-310000035315fmr:C000048856Memberfmr:AAGlobalInfrastructureEquitiesMember2024-05-310000035315fmr:C000048856Memberfmr:AAMLPsMember2024-05-310000035315fmr:C000048856Memberfmr:AACommodityEquitiesMember2024-05-310000035315fmr:C000048856Membercountry:US2024-05-310000035315fmr:C000048856Membercountry:CA2024-05-310000035315fmr:C000048856Membercountry:GB2024-05-310000035315fmr:C000048856Membercountry:TW2024-05-310000035315fmr:C000048856Membercountry:CN2024-05-310000035315fmr:C000048856Membercountry:KR2024-05-310000035315fmr:C000048856Membercountry:JP2024-05-310000035315fmr:C000048856Membercountry:ES2024-05-310000035315fmr:C000048856Membercountry:DE2024-05-310000035315fmr:C000048856Memberfmr:OtherMember2024-05-310000035315fmr:C000048856Memberfmr:TH0Member2024-05-310000035315fmr:C000048856Memberfmr:TH1Member2024-05-310000035315fmr:C000048856Memberfmr:TH2Member2024-05-310000035315fmr:C000048856Memberfmr:TH3Member2024-05-310000035315fmr:C000048856Memberfmr:TH4Member2024-05-310000035315fmr:C000048856Memberfmr:TH5Member2024-05-310000035315fmr:C000048856Memberfmr:TH6Member2024-05-310000035315fmr:C000048856Memberfmr:TH7Member2024-05-310000035315fmr:C000048856Memberfmr:TH8Member2024-05-310000035315fmr:C000048856Memberfmr:TH9Member2024-05-310000035315fmr:C000048854Member2023-11-302024-05-310000035315fmr:C000048854Member2024-05-310000035315fmr:C000048854Memberus-gaap:RealEstateSectorMember2024-05-310000035315fmr:C000048854Memberfmr:MSFinancialsSectorMember2024-05-310000035315fmr:C000048854Memberoef:IndustrialSectorMember2024-05-310000035315fmr:C000048854Memberoef:ConsumerStaplesSectorMember2024-05-310000035315fmr:C000048854Memberoef:InformationTechnologySectorMember2024-05-310000035315fmr:C000048854Memberus-gaap:EnergySectorMember2024-05-310000035315fmr:C000048854Memberus-gaap:HealthcareSectorMember2024-05-310000035315fmr:C000048854Memberoef:UtilitiesSectorMember2024-05-310000035315fmr:C000048854Memberoef:CommunicationsSectorMember2024-05-310000035315fmr:C000048854Memberoef:ConsumerDiscretionarySectorMember2024-05-310000035315fmr:C000048854Memberoef:MaterialsSectorMember2024-05-310000035315fmr:C000048854Memberfmr:AADividendPayingEquitiesMember2024-05-310000035315fmr:C000048854Memberfmr:AAPreferredStockMember2024-05-310000035315fmr:C000048854Memberfmr:AAREITsMember2024-05-310000035315fmr:C000048854Memberfmr:AAConvertiblesMember2024-05-310000035315fmr:C000048854Memberfmr:AAGlobalInfrastructureEquitiesMember2024-05-310000035315fmr:C000048854Memberfmr:AAMLPsMember2024-05-310000035315fmr:C000048854Memberfmr:AACommodityEquitiesMember2024-05-310000035315fmr:C000048854Membercountry:US2024-05-310000035315fmr:C000048854Membercountry:CA2024-05-310000035315fmr:C000048854Membercountry:GB2024-05-310000035315fmr:C000048854Membercountry:TW2024-05-310000035315fmr:C000048854Membercountry:CN2024-05-310000035315fmr:C000048854Membercountry:KR2024-05-310000035315fmr:C000048854Membercountry:JP2024-05-310000035315fmr:C000048854Membercountry:ES2024-05-310000035315fmr:C000048854Membercountry:DE2024-05-310000035315fmr:C000048854Memberfmr:OtherMember2024-05-310000035315fmr:C000048854Memberfmr:TH0Member2024-05-310000035315fmr:C000048854Memberfmr:TH1Member2024-05-310000035315fmr:C000048854Memberfmr:TH2Member2024-05-310000035315fmr:C000048854Memberfmr:TH3Member2024-05-310000035315fmr:C000048854Memberfmr:TH4Member2024-05-310000035315fmr:C000048854Memberfmr:TH5Member2024-05-310000035315fmr:C000048854Memberfmr:TH6Member2024-05-310000035315fmr:C000048854Memberfmr:TH7Member2024-05-310000035315fmr:C000048854Memberfmr:TH8Member2024-05-310000035315fmr:C000048854Memberfmr:TH9Member2024-05-310000035315fmr:C000048855Member2023-11-302024-05-310000035315fmr:C000048855Member2024-05-310000035315fmr:C000048855Memberus-gaap:RealEstateSectorMember2024-05-310000035315fmr:C000048855Memberfmr:MSFinancialsSectorMember2024-05-310000035315fmr:C000048855Memberoef:IndustrialSectorMember2024-05-310000035315fmr:C000048855Memberoef:ConsumerStaplesSectorMember2024-05-310000035315fmr:C000048855Memberoef:InformationTechnologySectorMember2024-05-310000035315fmr:C000048855Memberus-gaap:EnergySectorMember2024-05-310000035315fmr:C000048855Memberus-gaap:HealthcareSectorMember2024-05-310000035315fmr:C000048855Memberoef:UtilitiesSectorMember2024-05-310000035315fmr:C000048855Memberoef:CommunicationsSectorMember2024-05-310000035315fmr:C000048855Memberoef:ConsumerDiscretionarySectorMember2024-05-310000035315fmr:C000048855Memberoef:MaterialsSectorMember2024-05-310000035315fmr:C000048855Memberfmr:AADividendPayingEquitiesMember2024-05-310000035315fmr:C000048855Memberfmr:AAPreferredStockMember2024-05-310000035315fmr:C000048855Memberfmr:AAREITsMember2024-05-310000035315fmr:C000048855Memberfmr:AAConvertiblesMember2024-05-310000035315fmr:C000048855Memberfmr:AAGlobalInfrastructureEquitiesMember2024-05-310000035315fmr:C000048855Memberfmr:AAMLPsMember2024-05-310000035315fmr:C000048855Memberfmr:AACommodityEquitiesMember2024-05-310000035315fmr:C000048855Membercountry:US2024-05-310000035315fmr:C000048855Membercountry:CA2024-05-310000035315fmr:C000048855Membercountry:GB2024-05-310000035315fmr:C000048855Membercountry:TW2024-05-310000035315fmr:C000048855Membercountry:CN2024-05-310000035315fmr:C000048855Membercountry:KR2024-05-310000035315fmr:C000048855Membercountry:JP2024-05-310000035315fmr:C000048855Membercountry:ES2024-05-310000035315fmr:C000048855Membercountry:DE2024-05-310000035315fmr:C000048855Memberfmr:OtherMember2024-05-310000035315fmr:C000048855Memberfmr:TH0Member2024-05-310000035315fmr:C000048855Memberfmr:TH1Member2024-05-310000035315fmr:C000048855Memberfmr:TH2Member2024-05-310000035315fmr:C000048855Memberfmr:TH3Member2024-05-310000035315fmr:C000048855Memberfmr:TH4Member2024-05-310000035315fmr:C000048855Memberfmr:TH5Member2024-05-310000035315fmr:C000048855Memberfmr:TH6Member2024-05-310000035315fmr:C000048855Memberfmr:TH7Member2024-05-310000035315fmr:C000048855Memberfmr:TH8Member2024-05-310000035315fmr:C000048855Memberfmr:TH9Member2024-05-310000035315fmr:C000048852Member2023-11-302024-05-310000035315fmr:C000048852Member2024-05-310000035315fmr:C000048852Memberus-gaap:RealEstateSectorMember2024-05-310000035315fmr:C000048852Memberfmr:MSFinancialsSectorMember2024-05-310000035315fmr:C000048852Memberoef:IndustrialSectorMember2024-05-310000035315fmr:C000048852Memberoef:ConsumerStaplesSectorMember2024-05-310000035315fmr:C000048852Memberoef:InformationTechnologySectorMember2024-05-310000035315fmr:C000048852Memberus-gaap:EnergySectorMember2024-05-310000035315fmr:C000048852Memberus-gaap:HealthcareSectorMember2024-05-310000035315fmr:C000048852Memberoef:UtilitiesSectorMember2024-05-310000035315fmr:C000048852Memberoef:CommunicationsSectorMember2024-05-310000035315fmr:C000048852Memberoef:ConsumerDiscretionarySectorMember2024-05-310000035315fmr:C000048852Memberoef:MaterialsSectorMember2024-05-310000035315fmr:C000048852Memberfmr:AADividendPayingEquitiesMember2024-05-310000035315fmr:C000048852Memberfmr:AAPreferredStockMember2024-05-310000035315fmr:C000048852Memberfmr:AAREITsMember2024-05-310000035315fmr:C000048852Memberfmr:AAConvertiblesMember2024-05-310000035315fmr:C000048852Memberfmr:AAGlobalInfrastructureEquitiesMember2024-05-310000035315fmr:C000048852Memberfmr:AAMLPsMember2024-05-310000035315fmr:C000048852Memberfmr:AACommodityEquitiesMember2024-05-310000035315fmr:C000048852Membercountry:US2024-05-310000035315fmr:C000048852Membercountry:CA2024-05-310000035315fmr:C000048852Membercountry:GB2024-05-310000035315fmr:C000048852Membercountry:TW2024-05-310000035315fmr:C000048852Membercountry:CN2024-05-310000035315fmr:C000048852Membercountry:KR2024-05-310000035315fmr:C000048852Membercountry:JP2024-05-310000035315fmr:C000048852Membercountry:ES2024-05-310000035315fmr:C000048852Membercountry:DE2024-05-310000035315fmr:C000048852Memberfmr:OtherMember2024-05-310000035315fmr:C000048852Memberfmr:TH0Member2024-05-310000035315fmr:C000048852Memberfmr:TH1Member2024-05-310000035315fmr:C000048852Memberfmr:TH2Member2024-05-310000035315fmr:C000048852Memberfmr:TH3Member2024-05-310000035315fmr:C000048852Memberfmr:TH4Member2024-05-310000035315fmr:C000048852Memberfmr:TH5Member2024-05-310000035315fmr:C000048852Memberfmr:TH6Member2024-05-310000035315fmr:C000048852Memberfmr:TH7Member2024-05-310000035315fmr:C000048852Memberfmr:TH8Member2024-05-310000035315fmr:C000048852Memberfmr:TH9Member2024-05-310000035315fmr:C000048851Member2023-11-302024-05-310000035315fmr:C000048851Member2024-05-310000035315fmr:C000048851Memberus-gaap:RealEstateSectorMember2024-05-310000035315fmr:C000048851Memberfmr:MSFinancialsSectorMember2024-05-310000035315fmr:C000048851Memberoef:IndustrialSectorMember2024-05-310000035315fmr:C000048851Memberoef:ConsumerStaplesSectorMember2024-05-310000035315fmr:C000048851Memberoef:InformationTechnologySectorMember2024-05-310000035315fmr:C000048851Memberus-gaap:EnergySectorMember2024-05-310000035315fmr:C000048851Memberus-gaap:HealthcareSectorMember2024-05-310000035315fmr:C000048851Memberoef:UtilitiesSectorMember2024-05-310000035315fmr:C000048851Memberoef:CommunicationsSectorMember2024-05-310000035315fmr:C000048851Memberoef:ConsumerDiscretionarySectorMember2024-05-310000035315fmr:C000048851Memberoef:MaterialsSectorMember2024-05-310000035315fmr:C000048851Memberfmr:AADividendPayingEquitiesMember2024-05-310000035315fmr:C000048851Memberfmr:AAPreferredStockMember2024-05-310000035315fmr:C000048851Memberfmr:AAREITsMember2024-05-310000035315fmr:C000048851Memberfmr:AAConvertiblesMember2024-05-310000035315fmr:C000048851Memberfmr:AAGlobalInfrastructureEquitiesMember2024-05-310000035315fmr:C000048851Memberfmr:AAMLPsMember2024-05-310000035315fmr:C000048851Memberfmr:AACommodityEquitiesMember2024-05-310000035315fmr:C000048851Membercountry:US2024-05-310000035315fmr:C000048851Membercountry:CA2024-05-310000035315fmr:C000048851Membercountry:GB2024-05-310000035315fmr:C000048851Membercountry:TW2024-05-310000035315fmr:C000048851Membercountry:CN2024-05-310000035315fmr:C000048851Membercountry:KR2024-05-310000035315fmr:C000048851Membercountry:JP2024-05-310000035315fmr:C000048851Membercountry:ES2024-05-310000035315fmr:C000048851Membercountry:DE2024-05-310000035315fmr:C000048851Memberfmr:OtherMember2024-05-310000035315fmr:C000048851Memberfmr:TH0Member2024-05-310000035315fmr:C000048851Memberfmr:TH1Member2024-05-310000035315fmr:C000048851Memberfmr:TH2Member2024-05-310000035315fmr:C000048851Memberfmr:TH3Member2024-05-310000035315fmr:C000048851Memberfmr:TH4Member2024-05-310000035315fmr:C000048851Memberfmr:TH5Member2024-05-310000035315fmr:C000048851Memberfmr:TH6Member2024-05-310000035315fmr:C000048851Memberfmr:TH7Member2024-05-310000035315fmr:C000048851Memberfmr:TH8Member2024-05-310000035315fmr:C000048851Memberfmr:TH9Member2024-05-310000035315fmr:C000205022Member2023-11-302024-05-310000035315fmr:C000205022Member2024-05-310000035315fmr:C000205022Memberus-gaap:RealEstateSectorMember2024-05-310000035315fmr:C000205022Memberfmr:MSFinancialsSectorMember2024-05-310000035315fmr:C000205022Memberoef:IndustrialSectorMember2024-05-310000035315fmr:C000205022Memberoef:ConsumerStaplesSectorMember2024-05-310000035315fmr:C000205022Memberoef:InformationTechnologySectorMember2024-05-310000035315fmr:C000205022Memberus-gaap:EnergySectorMember2024-05-310000035315fmr:C000205022Memberus-gaap:HealthcareSectorMember2024-05-310000035315fmr:C000205022Memberoef:UtilitiesSectorMember2024-05-310000035315fmr:C000205022Memberoef:CommunicationsSectorMember2024-05-310000035315fmr:C000205022Memberoef:ConsumerDiscretionarySectorMember2024-05-310000035315fmr:C000205022Memberoef:MaterialsSectorMember2024-05-310000035315fmr:C000205022Memberfmr:AADividendPayingEquitiesMember2024-05-310000035315fmr:C000205022Memberfmr:AAPreferredStockMember2024-05-310000035315fmr:C000205022Memberfmr:AAREITsMember2024-05-310000035315fmr:C000205022Memberfmr:AAConvertiblesMember2024-05-310000035315fmr:C000205022Memberfmr:AAGlobalInfrastructureEquitiesMember2024-05-310000035315fmr:C000205022Memberfmr:AAMLPsMember2024-05-310000035315fmr:C000205022Memberfmr:AACommodityEquitiesMember2024-05-310000035315fmr:C000205022Membercountry:US2024-05-310000035315fmr:C000205022Membercountry:CA2024-05-310000035315fmr:C000205022Membercountry:GB2024-05-310000035315fmr:C000205022Membercountry:TW2024-05-310000035315fmr:C000205022Membercountry:CN2024-05-310000035315fmr:C000205022Membercountry:KR2024-05-310000035315fmr:C000205022Membercountry:JP2024-05-310000035315fmr:C000205022Membercountry:ES2024-05-310000035315fmr:C000205022Membercountry:DE2024-05-310000035315fmr:C000205022Memberfmr:OtherMember2024-05-310000035315fmr:C000205022Memberfmr:TH0Member2024-05-310000035315fmr:C000205022Memberfmr:TH1Member2024-05-310000035315fmr:C000205022Memberfmr:TH2Member2024-05-310000035315fmr:C000205022Memberfmr:TH3Member2024-05-310000035315fmr:C000205022Memberfmr:TH4Member2024-05-310000035315fmr:C000205022Memberfmr:TH5Member2024-05-310000035315fmr:C000205022Memberfmr:TH6Member2024-05-310000035315fmr:C000205022Memberfmr:TH7Member2024-05-310000035315fmr:C000205022Memberfmr:TH8Member2024-05-310000035315fmr:C000205022Memberfmr:TH9Member2024-05-3100000353152023-11-302024-05-31
iso4217:USD
xbrli:pure
xbrli:shares
UNITED STATES
SECURITIES AND EXCHANGE COMMISSION
Washington, D.C. 20549
FORM N-CSR
CERTIFIED SHAREHOLDER REPORT OF REGISTERED
MANAGEMENT INVESTMENT COMPANIES
Investment Company Act file number 811-02105
Fidelity Salem Street Trust
(Exact name of registrant as specified in charter)
245 Summer St., Boston, MA 02210
(Address of principal executive offices) (Zip code)
Margaret Carey, Secretary
245 Summer St.
Boston, Massachusetts 02210
(Name and address of agent for service)
Registrant's telephone number, including area code:
617-563-7000
| |
Date of fiscal year end:
| November 30
|
|
|
Date of reporting period:
| May 31, 2024
|
Item 1.
Reports to Stockholders
|
|
|
|
SEMI-ANNUAL SHAREHOLDER REPORT | AS OF MAY 31, 2024
|
|
|
|
Fidelity® Strategic Dividend & Income® Fund
Fidelity Advisor® Strategic Dividend & Income® Fund Class I : FSIDX
|
|
|
|
|
This semi-annual shareholder report contains information about Fidelity® Strategic Dividend & Income® Fund for the period December 1, 2023 to May 31, 2024. You can find additional information about the Fund at fundresearch.fidelity.com/prospectus/sec. You can also request this information by contacting us at 1-877-208-0098 or by sending an e-mail to fidfunddocuments@fidelity.com.
What were your Fund costs for the last six months?
(based on hypothetical $10,000 investment)
|
Costs of a $10,000 investment
|
Costs paid as a percentage of a $10,000 investment
|
|
Class I
|
$ 36
|
0.69%
|
|
Key Fund Statistics
(as of May 31, 2024)
KEY FACTS
|
|
|
Fund Size
|
$5,200,751,501
|
|
Number of Holdings
|
594
|
|
Portfolio Turnover
|
29%
|
|
What did the Fund invest in?
(as of May 31, 2024)
MARKET SECTORS
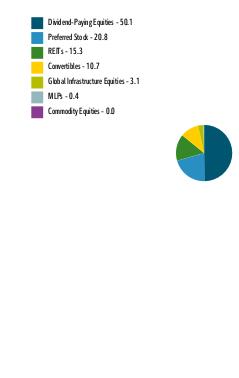
(% of Fund's net assets)
|
|
|
Real Estate
|
16.4
|
|
Financials
|
13.1
|
|
Industrials
|
8.9
|
|
Consumer Staples
|
7.6
|
|
Information Technology
|
6.7
|
|
Energy
|
5.8
|
|
Health Care
|
5.8
|
|
Utilities
|
5.2
|
|
Communication Services
|
3.3
|
|
Consumer Discretionary
|
2.9
|
|
Materials
|
1.8
|
|
|
|
Dividend-Paying Equities
|
50.1
|
Preferred Stock
|
20.8
|
REITs
|
15.3
|
Convertibles
|
10.7
|
Global Infrastructure Equities
|
3.1
|
MLPs
|
0.4
|
Commodity Equities
|
0.0
|
ASSET ALLOCATION (% of Fund's net assets)
|
|
|
Short-Term Investments and Net Other Assets (Liabilities) - (0.4)%
|
|
|
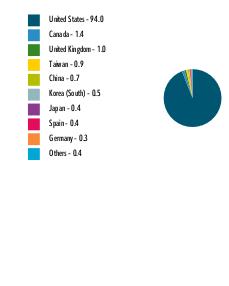
United States
|
94.0
|
Canada
|
1.4
|
United Kingdom
|
1.0
|
Taiwan
|
0.9
|
China
|
0.7
|
Korea (South)
|
0.5
|
Japan
|
0.4
|
Spain
|
0.4
|
Germany
|
0.3
|
Others
|
0.4
|
GEOGRAPHIC DIVERSIFICATION (% of Fund's net assets)
|
|
|
|
|
|
|
TOP HOLDINGS
(% of Fund's net assets)
|
|
|
Exxon Mobil Corp
|
2.9
|
|
Procter & Gamble Co/The
|
2.4
|
|
Prologis Inc
|
2.1
|
|
Coca-Cola Co/The
|
1.8
|
|
Eaton Corp PLC
|
1.7
|
|
Johnson & Johnson
|
1.6
|
|
Equinix Inc
|
1.5
|
|
McDonald's Corp
|
1.5
|
|
US Treasury Bonds
|
1.4
|
|
Cisco Systems Inc
|
1.4
|
|
|
|
18.3
|
|
|
|
Fidelity, the Fidelity Investments Logo and all other Fidelity trademarks or service marks used herein are trademarks or service marks of FMR LLC. Any third-party marks that are used herein are trademarks or service marks of their respective owners. © 2024 FMR LLC. All rights reserved.
|
|
1.9915914.100
1325-TSRS-0724
|
|
For additional information about the Fund; including its prospectus, financial information, holdings and proxy information, scan the QR code or visit fundresearch.fidelity.com/prospectus/sec
|
|
|
|
|
SEMI-ANNUAL SHAREHOLDER REPORT | AS OF MAY 31, 2024
|
|
|
|
Fidelity® Strategic Dividend & Income® Fund
Fidelity Advisor® Strategic Dividend & Income® Fund Class C : FCSDX
|
|
|
|
|
This semi-annual shareholder report contains information about Fidelity® Strategic Dividend & Income® Fund for the period December 1, 2023 to May 31, 2024. You can find additional information about the Fund at fundresearch.fidelity.com/prospectus/sec. You can also request this information by contacting us at 1-877-208-0098 or by sending an e-mail to fidfunddocuments@fidelity.com.
What were your Fund costs for the last six months?
(based on hypothetical $10,000 investment)
|
Costs of a $10,000 investment
|
Costs paid as a percentage of a $10,000 investment
|
|
Class C
|
$ 88
|
1.69%
|
|
Key Fund Statistics
(as of May 31, 2024)
KEY FACTS
|
|
|
Fund Size
|
$5,200,751,501
|
|
Number of Holdings
|
594
|
|
Portfolio Turnover
|
29%
|
|
What did the Fund invest in?
(as of May 31, 2024)
MARKET SECTORS
(% of Fund's net assets)
|
|
|
Real Estate
|
16.4
|
|
Financials
|
13.1
|
|
Industrials
|
8.9
|
|
Consumer Staples
|
7.6
|
|
Information Technology
|
6.7
|
|
Energy
|
5.8
|
|
Health Care
|
5.8
|
|
Utilities
|
5.2
|
|
Communication Services
|
3.3
|
|
Consumer Discretionary
|
2.9
|
|
Materials
|
1.8
|
|
|
|
Dividend-Paying Equities
|
50.1
|
Preferred Stock
|
20.8
|
REITs
|
15.3
|
Convertibles
|
10.7
|
Global Infrastructure Equities
|
3.1
|
MLPs
|
0.4
|
Commodity Equities
|
0.0
|
ASSET ALLOCATION (% of Fund's net assets)
|
|
|
Short-Term Investments and Net Other Assets (Liabilities) - (0.4)%
|
|
|
United States
|
94.0
|
Canada
|
1.4
|
United Kingdom
|
1.0
|
Taiwan
|
0.9
|
China
|
0.7
|
Korea (South)
|
0.5
|
Japan
|
0.4
|
Spain
|
0.4
|
Germany
|
0.3
|
Others
|
0.4
|
GEOGRAPHIC DIVERSIFICATION (% of Fund's net assets)
|
|
|
|
|
|
|
TOP HOLDINGS
(% of Fund's net assets)
|
|
|
Exxon Mobil Corp
|
2.9
|
|
Procter & Gamble Co/The
|
2.4
|
|
Prologis Inc
|
2.1
|
|
Coca-Cola Co/The
|
1.8
|
|
Eaton Corp PLC
|
1.7
|
|
Johnson & Johnson
|
1.6
|
|
Equinix Inc
|
1.5
|
|
McDonald's Corp
|
1.5
|
|
US Treasury Bonds
|
1.4
|
|
Cisco Systems Inc
|
1.4
|
|
|
|
18.3
|
|
|
|
Fidelity, the Fidelity Investments Logo and all other Fidelity trademarks or service marks used herein are trademarks or service marks of FMR LLC. Any third-party marks that are used herein are trademarks or service marks of their respective owners. © 2024 FMR LLC. All rights reserved.
|
|
1.9915912.100
1323-TSRS-0724
|
|
For additional information about the Fund; including its prospectus, financial information, holdings and proxy information, scan the QR code or visit fundresearch.fidelity.com/prospectus/sec
|
|
|
|
|
SEMI-ANNUAL SHAREHOLDER REPORT | AS OF MAY 31, 2024
|
|
|
|
Fidelity® Strategic Dividend & Income® Fund
Fidelity Advisor® Strategic Dividend & Income® Fund Class M : FTSDX
|
|
|
|
|
This semi-annual shareholder report contains information about Fidelity® Strategic Dividend & Income® Fund for the period December 1, 2023 to May 31, 2024. You can find additional information about the Fund at fundresearch.fidelity.com/prospectus/sec. You can also request this information by contacting us at 1-877-208-0098 or by sending an e-mail to fidfunddocuments@fidelity.com.
What were your Fund costs for the last six months?
(based on hypothetical $10,000 investment)
|
Costs of a $10,000 investment
|
Costs paid as a percentage of a $10,000 investment
|
|
Class M
|
$ 62
|
1.19%
|
|
Key Fund Statistics
(as of May 31, 2024)
KEY FACTS
|
|
|
Fund Size
|
$5,200,751,501
|
|
Number of Holdings
|
594
|
|
Portfolio Turnover
|
29%
|
|
What did the Fund invest in?
(as of May 31, 2024)
MARKET SECTORS
(% of Fund's net assets)
|
|
|
Real Estate
|
16.4
|
|
Financials
|
13.1
|
|
Industrials
|
8.9
|
|
Consumer Staples
|
7.6
|
|
Information Technology
|
6.7
|
|
Energy
|
5.8
|
|
Health Care
|
5.8
|
|
Utilities
|
5.2
|
|
Communication Services
|
3.3
|
|
Consumer Discretionary
|
2.9
|
|
Materials
|
1.8
|
|
|
|
Dividend-Paying Equities
|
50.1
|
Preferred Stock
|
20.8
|
REITs
|
15.3
|
Convertibles
|
10.7
|
Global Infrastructure Equities
|
3.1
|
MLPs
|
0.4
|
Commodity Equities
|
0.0
|
ASSET ALLOCATION (% of Fund's net assets)
|
|
|
Short-Term Investments and Net Other Assets (Liabilities) - (0.4)%
|
|
|
United States
|
94.0
|
Canada
|
1.4
|
United Kingdom
|
1.0
|
Taiwan
|
0.9
|
China
|
0.7
|
Korea (South)
|
0.5
|
Japan
|
0.4
|
Spain
|
0.4
|
Germany
|
0.3
|
Others
|
0.4
|
GEOGRAPHIC DIVERSIFICATION (% of Fund's net assets)
|
|
|
|
|
|
|
TOP HOLDINGS
(% of Fund's net assets)
|
|
|
Exxon Mobil Corp
|
2.9
|
|
Procter & Gamble Co/The
|
2.4
|
|
Prologis Inc
|
2.1
|
|
Coca-Cola Co/The
|
1.8
|
|
Eaton Corp PLC
|
1.7
|
|
Johnson & Johnson
|
1.6
|
|
Equinix Inc
|
1.5
|
|
McDonald's Corp
|
1.5
|
|
US Treasury Bonds
|
1.4
|
|
Cisco Systems Inc
|
1.4
|
|
|
|
18.3
|
|
|
|
Fidelity, the Fidelity Investments Logo and all other Fidelity trademarks or service marks used herein are trademarks or service marks of FMR LLC. Any third-party marks that are used herein are trademarks or service marks of their respective owners. © 2024 FMR LLC. All rights reserved.
|
|
1.9915913.100
1324-TSRS-0724
|
|
For additional information about the Fund; including its prospectus, financial information, holdings and proxy information, scan the QR code or visit fundresearch.fidelity.com/prospectus/sec
|
|
|
|
|
SEMI-ANNUAL SHAREHOLDER REPORT | AS OF MAY 31, 2024
|
|
|
|
Fidelity® Strategic Dividend & Income® Fund
Fidelity Advisor® Strategic Dividend & Income® Fund Class A : FASDX
|
|
|
|
|
This semi-annual shareholder report contains information about Fidelity® Strategic Dividend & Income® Fund for the period December 1, 2023 to May 31, 2024. You can find additional information about the Fund at fundresearch.fidelity.com/prospectus/sec. You can also request this information by contacting us at 1-877-208-0098 or by sending an e-mail to fidfunddocuments@fidelity.com.
What were your Fund costs for the last six months?
(based on hypothetical $10,000 investment)
|
Costs of a $10,000 investment
|
Costs paid as a percentage of a $10,000 investment
|
|
Class A
|
$ 49
|
0.94%
|
|
Key Fund Statistics
(as of May 31, 2024)
KEY FACTS
|
|
|
Fund Size
|
$5,200,751,501
|
|
Number of Holdings
|
594
|
|
Portfolio Turnover
|
29%
|
|
What did the Fund invest in?
(as of May 31, 2024)
MARKET SECTORS
(% of Fund's net assets)
|
|
|
Real Estate
|
16.4
|
|
Financials
|
13.1
|
|
Industrials
|
8.9
|
|
Consumer Staples
|
7.6
|
|
Information Technology
|
6.7
|
|
Energy
|
5.8
|
|
Health Care
|
5.8
|
|
Utilities
|
5.2
|
|
Communication Services
|
3.3
|
|
Consumer Discretionary
|
2.9
|
|
Materials
|
1.8
|
|
|
|
Dividend-Paying Equities
|
50.1
|
Preferred Stock
|
20.8
|
REITs
|
15.3
|
Convertibles
|
10.7
|
Global Infrastructure Equities
|
3.1
|
MLPs
|
0.4
|
Commodity Equities
|
0.0
|
ASSET ALLOCATION (% of Fund's net assets)
|
|
|
Short-Term Investments and Net Other Assets (Liabilities) - (0.4)%
|
|
|
United States
|
94.0
|
Canada
|
1.4
|
United Kingdom
|
1.0
|
Taiwan
|
0.9
|
China
|
0.7
|
Korea (South)
|
0.5
|
Japan
|
0.4
|
Spain
|
0.4
|
Germany
|
0.3
|
Others
|
0.4
|
GEOGRAPHIC DIVERSIFICATION (% of Fund's net assets)
|
|
|
|
|
|
|
TOP HOLDINGS
(% of Fund's net assets)
|
|
|
Exxon Mobil Corp
|
2.9
|
|
Procter & Gamble Co/The
|
2.4
|
|
Prologis Inc
|
2.1
|
|
Coca-Cola Co/The
|
1.8
|
|
Eaton Corp PLC
|
1.7
|
|
Johnson & Johnson
|
1.6
|
|
Equinix Inc
|
1.5
|
|
McDonald's Corp
|
1.5
|
|
US Treasury Bonds
|
1.4
|
|
Cisco Systems Inc
|
1.4
|
|
|
|
18.3
|
|
|
|
Fidelity, the Fidelity Investments Logo and all other Fidelity trademarks or service marks used herein are trademarks or service marks of FMR LLC. Any third-party marks that are used herein are trademarks or service marks of their respective owners. © 2024 FMR LLC. All rights reserved.
|
|
1.9915911.100
1321-TSRS-0724
|
|
For additional information about the Fund; including its prospectus, financial information, holdings and proxy information, scan the QR code or visit fundresearch.fidelity.com/prospectus/sec
|
|
|
|
|
SEMI-ANNUAL SHAREHOLDER REPORT | AS OF MAY 31, 2024
|
|
|
|
Fidelity® Strategic Dividend & Income® Fund
Fidelity® Strategic Dividend & Income® Fund : FSDIX
|
|
|
|
|
This semi-annual shareholder report contains information about Fidelity® Strategic Dividend & Income® Fund for the period December 1, 2023 to May 31, 2024. You can find additional information about the Fund at fundresearch.fidelity.com/prospectus/sec. You can also request this information by contacting us at 1-800-544-8544 or by sending an e-mail to fidfunddocuments@fidelity.com.
What were your Fund costs for the last six months?
(based on hypothetical $10,000 investment)
|
Costs of a $10,000 investment
|
Costs paid as a percentage of a $10,000 investment
|
|
Fidelity® Strategic Dividend & Income® Fund
|
$ 34
|
0.66%
|
|
Key Fund Statistics
(as of May 31, 2024)
KEY FACTS
|
|
|
Fund Size
|
$5,200,751,501
|
|
Number of Holdings
|
594
|
|
Portfolio Turnover
|
29%
|
|
What did the Fund invest in?
(as of May 31, 2024)
MARKET SECTORS
(% of Fund's net assets)
|
|
|
Real Estate
|
16.4
|
|
Financials
|
13.1
|
|
Industrials
|
8.9
|
|
Consumer Staples
|
7.6
|
|
Information Technology
|
6.7
|
|
Energy
|
5.8
|
|
Health Care
|
5.8
|
|
Utilities
|
5.2
|
|
Communication Services
|
3.3
|
|
Consumer Discretionary
|
2.9
|
|
Materials
|
1.8
|
|
|
|
Dividend-Paying Equities
|
50.1
|
Preferred Stock
|
20.8
|
REITs
|
15.3
|
Convertibles
|
10.7
|
Global Infrastructure Equities
|
3.1
|
MLPs
|
0.4
|
Commodity Equities
|
0.0
|
ASSET ALLOCATION (% of Fund's net assets)
|
|
|
Short-Term Investments and Net Other Assets (Liabilities) - (0.4)%
|
|
|
United States
|
94.0
|
Canada
|
1.4
|
United Kingdom
|
1.0
|
Taiwan
|
0.9
|
China
|
0.7
|
Korea (South)
|
0.5
|
Japan
|
0.4
|
Spain
|
0.4
|
Germany
|
0.3
|
Others
|
0.4
|
GEOGRAPHIC DIVERSIFICATION (% of Fund's net assets)
|
|
|
|
|
|
|
TOP HOLDINGS
(% of Fund's net assets)
|
|
|
Exxon Mobil Corp
|
2.9
|
|
Procter & Gamble Co/The
|
2.4
|
|
Prologis Inc
|
2.1
|
|
Coca-Cola Co/The
|
1.8
|
|
Eaton Corp PLC
|
1.7
|
|
Johnson & Johnson
|
1.6
|
|
Equinix Inc
|
1.5
|
|
McDonald's Corp
|
1.5
|
|
US Treasury Bonds
|
1.4
|
|
Cisco Systems Inc
|
1.4
|
|
|
|
18.3
|
|
|
|
Fidelity, the Fidelity Investments Logo and all other Fidelity trademarks or service marks used herein are trademarks or service marks of FMR LLC. Any third-party marks that are used herein are trademarks or service marks of their respective owners. © 2024 FMR LLC. All rights reserved.
|
|
1.9915915.100
1329-TSRS-0724
|
|
For additional information about the Fund; including its prospectus, financial information, holdings and proxy information, scan the QR code or visit fundresearch.fidelity.com/prospectus/sec
|
|
|
|
|
SEMI-ANNUAL SHAREHOLDER REPORT | AS OF MAY 31, 2024
|
|
|
|
Fidelity® Strategic Dividend & Income® Fund
Fidelity Advisor® Strategic Dividend & Income® Fund Class Z : FIQWX
|
|
|
|
|
This semi-annual shareholder report contains information about Fidelity® Strategic Dividend & Income® Fund for the period December 1, 2023 to May 31, 2024. You can find additional information about the Fund at fundresearch.fidelity.com/prospectus/sec. You can also request this information by contacting us at 1-877-208-0098 or by sending an e-mail to fidfunddocuments@fidelity.com.
What were your Fund costs for the last six months?
(based on hypothetical $10,000 investment)
|
Costs of a $10,000 investment
|
Costs paid as a percentage of a $10,000 investment
|
|
Class Z
|
$ 30
|
0.57%
|
|
Key Fund Statistics
(as of May 31, 2024)
KEY FACTS
|
|
|
Fund Size
|
$5,200,751,501
|
|
Number of Holdings
|
594
|
|
Portfolio Turnover
|
29%
|
|
What did the Fund invest in?
(as of May 31, 2024)
MARKET SECTORS
(% of Fund's net assets)
|
|
|
Real Estate
|
16.4
|
|
Financials
|
13.1
|
|
Industrials
|
8.9
|
|
Consumer Staples
|
7.6
|
|
Information Technology
|
6.7
|
|
Energy
|
5.8
|
|
Health Care
|
5.8
|
|
Utilities
|
5.2
|
|
Communication Services
|
3.3
|
|
Consumer Discretionary
|
2.9
|
|
Materials
|
1.8
|
|
|
|
Dividend-Paying Equities
|
50.1
|
Preferred Stock
|
20.8
|
REITs
|
15.3
|
Convertibles
|
10.7
|
Global Infrastructure Equities
|
3.1
|
MLPs
|
0.4
|
Commodity Equities
|
0.0
|
ASSET ALLOCATION (% of Fund's net assets)
|
|
|
Short-Term Investments and Net Other Assets (Liabilities) - (0.4)%
|
|
|
United States
|
94.0
|
Canada
|
1.4
|
United Kingdom
|
1.0
|
Taiwan
|
0.9
|
China
|
0.7
|
Korea (South)
|
0.5
|
Japan
|
0.4
|
Spain
|
0.4
|
Germany
|
0.3
|
Others
|
0.4
|
GEOGRAPHIC DIVERSIFICATION (% of Fund's net assets)
|
|
|
|
|
|
|
TOP HOLDINGS
(% of Fund's net assets)
|
|
|
Exxon Mobil Corp
|
2.9
|
|
Procter & Gamble Co/The
|
2.4
|
|
Prologis Inc
|
2.1
|
|
Coca-Cola Co/The
|
1.8
|
|
Eaton Corp PLC
|
1.7
|
|
Johnson & Johnson
|
1.6
|
|
Equinix Inc
|
1.5
|
|
McDonald's Corp
|
1.5
|
|
US Treasury Bonds
|
1.4
|
|
Cisco Systems Inc
|
1.4
|
|
|
|
18.3
|
|
|
|
Fidelity, the Fidelity Investments Logo and all other Fidelity trademarks or service marks used herein are trademarks or service marks of FMR LLC. Any third-party marks that are used herein are trademarks or service marks of their respective owners. © 2024 FMR LLC. All rights reserved.
|
|
1.9915916.100
3281-TSRS-0724
|
|
For additional information about the Fund; including its prospectus, financial information, holdings and proxy information, scan the QR code or visit fundresearch.fidelity.com/prospectus/sec
|
Item 2.
Code of Ethics
Not applicable.
Item 3.
Audit Committee Financial Expert
Not applicable.
Item 4.
Principal Accountant Fees and Services
Not applicable.
Item 5.
Audit Committee of Listed Registrants
Not applicable.
Item 6.
Investments
(a)
Not applicable.
(b)
Not applicable
Item 7.
Financial Statements and Financial Highlights for Open-End Management Investment Companies
Fidelity® Strategic Dividend & Income® Fund
Semi-Annual Report
May 31, 2024
Includes Fidelity and Fidelity Advisor share classes
Contents
To view a fund's proxy voting guidelines and proxy voting record for the 12-month period ended June 30, visit http://www.fidelity.com/proxyvotingresults or visit the Securities and Exchange Commission's (SEC) web site at http://www.sec.gov.
You may also call 1-800-544-8544 if you're an individual investing directly with Fidelity, call 1-800-835-5092 if you're a plan sponsor or participant with Fidelity as your recordkeeper or call 1-877-208-0098 on institutional accounts or if you're an advisor or invest through one to request a free copy of the proxy voting guidelines.
Standard & Poor's, S&P and S&P 500 are registered service marks of The McGraw-Hill Companies, Inc. and have been licensed for use by Fidelity Distributors Corporation.
Other third-party marks appearing herein are the property of their respective owners.
All other marks appearing herein are registered or unregistered trademarks or service marks of FMR LLC or an affiliated company. © 2024 FMR LLC. All rights reserved.
This report and the financial statements contained herein are submitted for the general information of the shareholders of the Fund. This report is not authorized for distribution to prospective investors in the Fund unless preceded or accompanied by an effective prospectus.
A fund files its complete schedule of portfolio holdings with the SEC for the first and third quarters of each fiscal year on Form N-PORT. Forms N-PORT are available on the SEC's web site at http://www.sec.gov. A fund's Forms N-PORT may be reviewed and copied at the SEC's Public Reference Room in Washington, DC. Information regarding the operation of the SEC's Public Reference Room may be obtained by calling 1-800-SEC-0330.
For a complete list of a fund's portfolio holdings, view the most recent holdings listing, semiannual report, or annual report on Fidelity's web site at http://www.fidelity.com, http://www.institutional.fidelity.com, or http://www.401k.com, as applicable.
NOT FDIC INSURED •MAY LOSE VALUE •NO BANK GUARANTEE
Neither the Fund nor Fidelity Distributors Corporation is a bank.
Item 7: Financial Statements and Financial Highlights for Open-End Management Investment Companies (Semi-Annual Report)
Fidelity® Strategic Dividend & Income® Fund
Schedule of Investments May 31, 2024 (Unaudited)
Showing Percentage of Net Assets
Corporate Bonds - 9.7%
|
|
|
|
Principal
Amount (a)
|
Value ($)
|
Convertible Bonds - 8.7%
|
|
|
|
COMMUNICATION SERVICES - 0.7%
|
|
|
|
Entertainment - 0.2%
|
|
|
|
Liberty Media Corp. 2.375% 9/30/53 (b)
|
|
2,269,000
|
2,424,427
|
Liberty Media Corp. Liberty Formula One 2.25% 8/15/27
|
|
2,467,000
|
2,663,222
|
Live Nation Entertainment, Inc. 3.125% 1/15/29
|
|
3,290,000
|
3,636,437
|
Sphere Entertainment Co. 3.5% 12/1/28 (b)
|
|
391,000
|
486,219
|
Zynga, Inc. 0% 12/15/26
|
|
1,969,000
|
1,724,349
|
|
|
|
|
10,934,654
|
Interactive Media & Services - 0.2%
|
|
|
|
Liberty TripAdvisor Holdings, Inc. 0.5% 6/30/51 (b)
|
|
859,000
|
795,692
|
Snap, Inc.:
|
|
|
|
0% 5/1/27
|
|
2,640,000
|
2,165,664
|
0.125% 3/1/28
|
|
4,236,000
|
3,314,082
|
0.25% 5/1/25
|
|
1,118,000
|
1,155,272
|
0.75% 8/1/26
|
|
1,190,000
|
1,228,237
|
TripAdvisor, Inc. 0.25% 4/1/26
|
|
1,081,000
|
979,927
|
|
|
|
|
9,638,874
|
Media - 0.3%
|
|
|
|
Cardlytics, Inc. 4.25% 4/1/29 (b)
|
|
542,000
|
458,935
|
DISH Network Corp.:
|
|
|
|
0% 12/15/25
|
|
4,517,000
|
3,435,255
|
3.375% 8/15/26
|
|
8,477,000
|
5,424,640
|
Liberty Broadband Corp. 3.125% 3/31/53 (b)
|
|
2,830,000
|
2,672,086
|
Liberty Media Corp. 3.75% 3/15/28
|
|
1,850,000
|
1,927,700
|
Magnite, Inc. 0.25% 3/15/26
|
|
415,000
|
371,951
|
|
|
|
|
14,290,567
|
TOTAL COMMUNICATION SERVICES
|
|
|
34,864,095
|
|
|
|
|
|
CONSUMER DISCRETIONARY - 1.0%
|
|
|
|
Automobiles - 0.2%
|
|
|
|
Ford Motor Co. 0% 3/15/26
|
|
4,719,000
|
4,697,765
|
Rivian Automotive, Inc.:
|
|
|
|
3.625% 10/15/30(b)
|
|
4,845,000
|
3,283,601
|
4.625% 3/15/29
|
|
3,345,000
|
2,597,393
|
Winnebago Industries, Inc. 3.25% 1/15/30 (b)
|
|
1,232,000
|
1,210,440
|
|
|
|
|
11,789,199
|
Broadline Retail - 0.1%
|
|
|
|
Alibaba Group Holding Ltd. 0.5% 6/1/31 (Reg. S) (b)
|
|
1,400,000
|
1,382,963
|
Etsy, Inc.:
|
|
|
|
0.125% 10/1/26
|
|
1,460,000
|
1,479,161
|
0.125% 9/1/27
|
|
1,299,000
|
1,066,250
|
0.25% 6/15/28
|
|
1,390,000
|
1,086,583
|
|
|
|
|
5,014,957
|
Diversified Consumer Services - 0.0%
|
|
|
|
Stride, Inc. 1.125% 9/1/27
|
|
1,269,000
|
1,777,869
|
|
|
|
|
|
Hotels, Restaurants & Leisure - 0.4%
|
|
|
|
Booking Holdings, Inc. 0.75% 5/1/25
|
|
1,861,000
|
3,725,841
|
Carnival Corp.:
|
|
|
|
5.75% 10/1/24
|
|
972,000
|
1,479,518
|
5.75% 12/1/27
|
|
2,475,000
|
3,489,148
|
Cracker Barrel Old Country Store, Inc. 0.625% 6/15/26
|
|
991,000
|
867,621
|
NCL Corp. Ltd. 5.375% 8/1/25
|
|
1,000,000
|
1,152,310
|
Penn Entertainment, Inc. 2.75% 5/15/26
|
|
2,550,000
|
2,692,878
|
Royal Caribbean Cruises Ltd. 6% 8/15/25
|
|
2,462,000
|
7,387,231
|
|
|
|
|
20,794,547
|
Household Durables - 0.0%
|
|
|
|
Meritage Homes Corp. 1.75% 5/15/28 (b)
|
|
2,647,000
|
2,706,558
|
|
|
|
|
|
Leisure Products - 0.1%
|
|
|
|
Peloton Interactive, Inc.:
|
|
|
|
0% 2/15/26
|
|
1,046,000
|
925,650
|
5.5% 12/1/29(b)
|
|
683,000
|
704,009
|
Topgolf Callaway Brands Corp. 2.75% 5/1/26
|
|
1,456,000
|
1,627,080
|
|
|
|
|
3,256,739
|
Specialty Retail - 0.2%
|
|
|
|
The RealReal, Inc.:
|
|
|
|
1% 3/1/28
|
|
1,813,000
|
870,059
|
3% 6/15/25
|
|
420,000
|
380,100
|
Wayfair LLC 0.625% 10/1/25
|
|
7,702,000
|
7,220,625
|
|
|
|
|
8,470,784
|
TOTAL CONSUMER DISCRETIONARY
|
|
|
53,810,653
|
|
|
|
|
|
CONSUMER STAPLES - 0.1%
|
|
|
|
Food Products - 0.1%
|
|
|
|
Freshpet, Inc. 3% 4/1/28
|
|
750,000
|
1,500,750
|
Post Holdings, Inc. 2.5% 8/15/27
|
|
1,250,000
|
1,396,875
|
|
|
|
|
2,897,625
|
ENERGY - 0.3%
|
|
|
|
Energy Equipment & Services - 0.0%
|
|
|
|
Transocean, Inc.:
|
|
|
|
4% 12/15/25
|
|
683,000
|
962,006
|
4.625% 9/30/29
|
|
500,000
|
1,007,250
|
|
|
|
|
1,969,256
|
Oil, Gas & Consumable Fuels - 0.3%
|
|
|
|
CNX Resources Corp. 2.25% 5/1/26
|
|
918,000
|
1,910,083
|
Northern Oil & Gas, Inc. 3.625% 4/15/29
|
|
2,146,000
|
2,593,441
|
Peabody Energy Corp. 3.25% 3/1/28
|
|
864,000
|
1,229,861
|
Permian Resources Operating LLC 3.25% 4/1/28
|
|
735,000
|
2,067,188
|
Pioneer Natural Resources Co. 0.25% 5/15/25
|
|
1,403,000
|
4,193,441
|
World Kinect Corp. 3.25% 7/1/28 (b)
|
|
1,110,000
|
1,203,240
|
|
|
|
|
13,197,254
|
TOTAL ENERGY
|
|
|
15,166,510
|
|
|
|
|
|
FINANCIALS - 0.4%
|
|
|
|
Capital Markets - 0.1%
|
|
|
|
Coinbase Global, Inc.:
|
|
|
|
0.25% 4/1/30(b)
|
|
2,680,000
|
2,578,160
|
0.5% 6/1/26
|
|
2,785,000
|
2,862,980
|
|
|
|
|
5,441,140
|
Consumer Finance - 0.1%
|
|
|
|
Bread Financial Holdings, Inc. 4.25% 6/15/28 (b)
|
|
935,000
|
1,182,775
|
LendingTree, Inc. 0.5% 7/15/25
|
|
3,833,000
|
3,545,525
|
SoFi Technologies, Inc.:
|
|
|
|
0% 10/15/26(b)
|
|
1,880,000
|
1,616,800
|
1.25% 3/15/29(b)
|
|
789,000
|
747,972
|
|
|
|
|
7,093,072
|
Financial Services - 0.2%
|
|
|
|
Affirm Holdings, Inc. 0% 11/15/26
|
|
2,090,000
|
1,731,565
|
Block, Inc. 0.125% 3/1/25
|
|
2,044,000
|
1,958,561
|
Global Payments, Inc. 1.5% 3/1/31 (b)
|
|
4,517,000
|
4,145,189
|
Shift4 Payments, Inc.:
|
|
|
|
0% 12/15/25
|
|
1,117,000
|
1,222,780
|
0.5% 8/1/27
|
|
739,000
|
679,511
|
|
|
|
|
9,737,606
|
TOTAL FINANCIALS
|
|
|
22,271,818
|
|
|
|
|
|
HEALTH CARE - 1.3%
|
|
|
|
Biotechnology - 0.4%
|
|
|
|
Alnylam Pharmaceuticals, Inc. 1% 9/15/27
|
|
1,675,000
|
1,559,760
|
BridgeBio Pharma, Inc. 2.25% 2/1/29
|
|
4,190,000
|
3,343,620
|
Cytokinetics, Inc. 3.5% 7/1/27
|
|
1,503,000
|
1,839,672
|
Dynavax Technologies Corp. 2.5% 5/15/26
|
|
100,000
|
128,340
|
Exact Sciences Corp.:
|
|
|
|
0.375% 3/15/27
|
|
468,000
|
405,044
|
0.375% 3/1/28
|
|
486,000
|
399,096
|
1% 1/15/25
|
|
399,000
|
387,651
|
2% 3/1/30(b)
|
|
2,988,000
|
2,680,972
|
Immunocore Holdings PLC 2.5% 2/1/30 (b)
|
|
1,289,000
|
1,172,406
|
Insmed, Inc. 0.75% 6/1/28
|
|
1,200,000
|
2,135,400
|
Mirum Pharmaceuticals, Inc. 4% 5/1/29
|
|
960,000
|
1,058,832
|
Natera, Inc. 2.25% 5/1/27
|
|
578,000
|
1,626,612
|
Novavax, Inc. 5% 12/15/27
|
|
437,000
|
585,799
|
Sarepta Therapeutics, Inc.:
|
|
|
|
1.25% 9/15/27
|
|
2,387,000
|
2,751,495
|
1.5% 11/15/24
|
|
270,000
|
479,588
|
|
|
|
|
20,554,287
|
Health Care Equipment & Supplies - 0.6%
|
|
|
|
CONMED Corp. 2.25% 6/15/27
|
|
1,080,000
|
971,028
|
DexCom, Inc.:
|
|
|
|
0.25% 11/15/25
|
|
1,976,000
|
2,012,556
|
0.375% 5/15/28
|
|
1,959,000
|
1,927,656
|
Enovis Corp. 3.875% 10/15/28 (b)
|
|
1,040,000
|
1,153,880
|
Envista Holdings Corp. 2.375% 6/1/25
|
|
1,399,000
|
1,527,568
|
Glaukos Corp. 2.75% 6/15/27
|
|
830,000
|
1,748,810
|
Haemonetics Corp. 2.5% 6/1/29 (b)
|
|
890,000
|
869,975
|
Insulet Corp. 0.375% 9/1/26
|
|
2,489,000
|
2,578,267
|
Integer Holdings Corp. 2.125% 2/15/28
|
|
1,862,000
|
2,762,277
|
iRhythm Technologies, Inc. 1.5% 9/1/29 (b)
|
|
1,050,000
|
951,626
|
Lantheus Holdings, Inc. 2.625% 12/15/27
|
|
1,200,000
|
1,512,000
|
LivaNova U.S.A., Inc.:
|
|
|
|
2.5% 3/15/29(b)
|
|
789,000
|
882,102
|
3% 12/15/25
|
|
1,360,000
|
1,597,592
|
Merit Medical Systems, Inc. 3% 2/1/29 (b)
|
|
1,749,000
|
1,975,496
|
NuVasive, Inc. 0.375% 3/15/25
|
|
1,750,000
|
1,666,875
|
Omnicell, Inc. 0.25% 9/15/25
|
|
959,000
|
902,663
|
Shockwave Medical, Inc. 1% 8/15/28 (b)
|
|
2,774,000
|
3,572,912
|
TransMedics Group, Inc. 1.5% 6/1/28
|
|
1,489,000
|
2,395,486
|
|
|
|
|
31,008,769
|
Health Care Providers & Services - 0.1%
|
|
|
|
Accolade, Inc. 0.5% 4/1/26
|
|
2,029,000
|
1,768,882
|
Guardant Health, Inc. 0% 11/15/27
|
|
5,545,000
|
4,099,419
|
Opko Health, Inc. 3.75% 1/15/29 (b)
|
|
312,000
|
385,258
|
|
|
|
|
6,253,559
|
Health Care Technology - 0.1%
|
|
|
|
Evolent Health, Inc. 3.5% 12/1/29 (b)
|
|
1,563,000
|
1,442,649
|
Health Catalyst, Inc. 2.5% 4/15/25
|
|
724,000
|
698,660
|
Teladoc Health, Inc. 1.25% 6/1/27
|
|
2,204,000
|
1,840,340
|
Veradigm, Inc. 0.875% 1/1/27
|
|
69,000
|
72,657
|
|
|
|
|
4,054,306
|
Life Sciences Tools & Services - 0.0%
|
|
|
|
Repligen Corp. 1% 12/15/28 (b)
|
|
1,537,000
|
1,523,936
|
|
|
|
|
|
Pharmaceuticals - 0.1%
|
|
|
|
Amphastar Pharmaceuticals, Inc. 2% 3/15/29 (b)
|
|
830,000
|
813,815
|
Jazz Investments I Ltd. 2% 6/15/26
|
|
1,726,000
|
1,646,604
|
Pacira Biosciences, Inc. 2.125% 5/15/29 (b)
|
|
664,000
|
677,612
|
|
|
|
|
3,138,031
|
TOTAL HEALTH CARE
|
|
|
66,532,888
|
|
|
|
|
|
INDUSTRIALS - 0.8%
|
|
|
|
Aerospace & Defense - 0.1%
|
|
|
|
Axon Enterprise, Inc. 0.5% 12/15/27
|
|
2,217,000
|
2,951,936
|
Rocket Lab U.S.A., Inc. 4.25% 2/1/29 (b)
|
|
1,110,000
|
1,210,594
|
Spirit Aerosystems, Inc. 3.25% 11/1/28 (b)
|
|
2,188,000
|
2,714,652
|
|
|
|
|
6,877,182
|
Commercial Services & Supplies - 0.1%
|
|
|
|
GEO Corrections Holdings, Inc. 6.5% 2/23/26
|
|
857,000
|
1,498,036
|
Tetra Tech, Inc. 2.25% 8/15/28 (b)
|
|
1,590,000
|
1,882,878
|
|
|
|
|
3,380,914
|
Construction & Engineering - 0.1%
|
|
|
|
Fluor Corp. 1.125% 8/15/29 (b)
|
|
1,616,000
|
1,830,928
|
Granite Construction, Inc. 3.75% 5/15/28
|
|
1,550,000
|
2,256,800
|
|
|
|
|
4,087,728
|
Electrical Equipment - 0.1%
|
|
|
|
Array Technologies, Inc. 1% 12/1/28
|
|
1,292,000
|
1,191,224
|
Bloom Energy Corp.:
|
|
|
|
3% 6/1/28(b)
|
|
1,110,000
|
1,236,318
|
3% 6/1/29(b)
|
|
1,690,000
|
1,738,165
|
Stem, Inc. 4.25% 4/1/30 (b)
|
|
2,133,000
|
914,336
|
Sunrun, Inc. 4% 3/1/30 (b)
|
|
1,110,000
|
1,188,810
|
|
|
|
|
6,268,853
|
Ground Transportation - 0.2%
|
|
|
|
Lyft, Inc. 1.5% 5/15/25
|
|
2,051,000
|
1,958,705
|
Uber Technologies, Inc.:
|
|
|
|
0% 12/15/25
|
|
1,824,000
|
1,865,396
|
0.875% 12/1/28(b)
|
|
5,102,000
|
5,621,672
|
|
|
|
|
9,445,773
|
Machinery - 0.0%
|
|
|
|
John Bean Technologies Corp. 0.25% 5/15/26
|
|
1,444,000
|
1,318,228
|
Middleby Corp. 1% 9/1/25
|
|
1,400,000
|
1,537,900
|
|
|
|
|
2,856,128
|
Passenger Airlines - 0.1%
|
|
|
|
American Airlines Group, Inc. 6.5% 7/1/25
|
|
2,342,000
|
2,420,116
|
JetBlue Airways Corp. 0.5% 4/1/26
|
|
2,740,000
|
2,402,067
|
Southwest Airlines Co. 1.25% 5/1/25
|
|
2,056,000
|
2,028,557
|
Spirit Airlines, Inc. 1% 5/15/26
|
|
770,000
|
390,005
|
|
|
|
|
7,240,745
|
Professional Services - 0.1%
|
|
|
|
CSG Systems International, Inc. 3.875% 9/15/28 (b)
|
|
840,000
|
775,740
|
Parsons Corp. 2.625% 3/1/29 (b)
|
|
2,776,000
|
2,857,731
|
|
|
|
|
3,633,471
|
TOTAL INDUSTRIALS
|
|
|
43,790,794
|
|
|
|
|
|
INFORMATION TECHNOLOGY - 2.6%
|
|
|
|
Communications Equipment - 0.1%
|
|
|
|
Lumentum Holdings, Inc.:
|
|
|
|
0.5% 12/15/26
|
|
2,633,000
|
2,307,825
|
0.5% 6/15/28
|
|
2,140,000
|
1,630,252
|
1.5% 12/15/29(b)
|
|
1,220,000
|
1,084,580
|
|
|
|
|
5,022,657
|
Electronic Equipment, Instruments & Components - 0.1%
|
|
|
|
Advanced Energy Industries, Inc. 2.5% 9/15/28 (b)
|
|
675,000
|
693,495
|
Insight Enterprises, Inc. 0.75% 2/15/25
|
|
1,204,000
|
3,445,246
|
Par Technology Corp. 1.5% 10/15/27
|
|
98,000
|
89,665
|
Vishay Intertechnology, Inc. 2.25% 9/15/30 (b)
|
|
1,280,000
|
1,240,320
|
|
|
|
|
5,468,726
|
IT Services - 0.5%
|
|
|
|
Akamai Technologies, Inc.:
|
|
|
|
0.125% 5/1/25
|
|
2,571,000
|
2,736,830
|
0.375% 9/1/27
|
|
2,716,000
|
2,648,100
|
1.125% 2/15/29(b)
|
|
2,800,000
|
2,650,200
|
BigCommerce Holdings, Inc. 0.25% 10/1/26
|
|
1,820,000
|
1,567,566
|
Cloudflare, Inc. 0% 8/15/26
|
|
2,792,000
|
2,486,276
|
Digitalocean Holdings, Inc. 0% 12/1/26
|
|
3,337,000
|
2,803,080
|
MongoDB, Inc. 0.25% 1/15/26
|
|
2,446,000
|
3,085,629
|
Okta, Inc.:
|
|
|
|
0.125% 9/1/25
|
|
1,386,000
|
1,301,454
|
0.375% 6/15/26
|
|
1,204,000
|
1,088,898
|
Perficient, Inc. 0.125% 11/15/26
|
|
1,910,000
|
1,832,645
|
Wix.com Ltd. 0% 8/15/25
|
|
2,407,000
|
2,228,882
|
|
|
|
|
24,429,560
|
Semiconductors & Semiconductor Equipment - 0.5%
|
|
|
|
MACOM Technology Solutions Holdings, Inc. 0.25% 3/15/26
|
|
1,250,000
|
1,633,750
|
Microchip Technology, Inc.:
|
|
|
|
0.125% 11/15/24
|
|
1,927,000
|
2,122,591
|
0.75% 6/1/30(b)
|
|
4,490,000
|
4,581,568
|
MKS Instruments, Inc. 1.25% 6/1/30 (b)
|
|
3,321,000
|
3,400,704
|
ON Semiconductor Corp.:
|
|
|
|
0% 5/1/27
|
|
2,254,000
|
3,307,277
|
0.5% 3/1/29
|
|
3,943,000
|
3,878,828
|
Semtech Corp.:
|
|
|
|
1.625% 11/1/27
|
|
393,000
|
481,818
|
4% 11/1/28(b)
|
|
313,000
|
647,239
|
Veeco Instruments, Inc. 2.875% 6/1/29
|
|
370,000
|
572,390
|
Wolfspeed, Inc.:
|
|
|
|
0.25% 2/15/28
|
|
2,281,000
|
1,349,212
|
1.75% 5/1/26
|
|
639,000
|
583,727
|
1.875% 12/1/29
|
|
7,345,000
|
4,083,820
|
|
|
|
|
26,642,924
|
Software - 1.2%
|
|
|
|
Altair Engineering, Inc. 1.75% 6/15/27
|
|
1,400,000
|
1,856,820
|
Bentley Systems, Inc.:
|
|
|
|
0.125% 1/15/26
|
|
1,522,000
|
1,498,409
|
0.375% 7/1/27
|
|
1,400,000
|
1,246,700
|
BlackLine, Inc. 1% 6/1/29 (b)
|
|
2,179,000
|
2,077,677
|
Box, Inc. 0% 1/15/26
|
|
907,000
|
1,064,148
|
Confluent, Inc. 0% 1/15/27
|
|
1,963,000
|
1,657,754
|
CyberArk Software Ltd. 0% 11/15/24
|
|
1,108,000
|
1,627,098
|
Datadog, Inc. 0.125% 6/15/25
|
|
1,480,000
|
1,899,580
|
Dropbox, Inc.:
|
|
|
|
0% 3/1/26
|
|
797,000
|
742,007
|
0% 3/1/28
|
|
811,000
|
734,969
|
Everbridge, Inc.:
|
|
|
|
0% 3/15/26
|
|
942,000
|
925,515
|
0.125% 12/15/24
|
|
1,506,000
|
1,479,645
|
Five9, Inc. 1% 3/15/29 (b)
|
|
1,996,000
|
1,796,346
|
Guidewire Software, Inc. 1.25% 3/15/25
|
|
1,087,000
|
1,203,309
|
HubSpot, Inc. 0.375% 6/1/25
|
|
1,108,000
|
2,397,158
|
InterDigital, Inc. 3.5% 6/1/27
|
|
1,150,000
|
1,748,690
|
LivePerson, Inc. 0% 12/15/26
|
|
1,121,000
|
470,820
|
MicroStrategy, Inc.:
|
|
|
|
0% 2/15/27
|
|
2,265,000
|
2,903,277
|
0.625% 3/15/30(b)
|
|
1,681,000
|
2,039,389
|
0.75% 12/15/25
|
|
1,147,000
|
4,405,627
|
0.875% 3/15/31(b)
|
|
1,278,000
|
1,184,067
|
Pagerduty, Inc.:
|
|
|
|
1.25% 7/1/25
|
|
645,000
|
599,592
|
1.5% 10/15/28(b)
|
|
1,220,000
|
1,184,864
|
Palo Alto Networks, Inc. 0.375% 6/1/25
|
|
2,371,000
|
7,025,273
|
Pegasystems, Inc. 0.75% 3/1/25
|
|
3,274,000
|
3,141,403
|
Progress Software Corp.:
|
|
|
|
1% 4/15/26
|
|
1,457,000
|
1,465,660
|
3.5% 3/1/30(b)
|
|
1,815,000
|
1,774,868
|
Q2 Holdings, Inc. 0.75% 6/1/26
|
|
1,070,000
|
1,063,045
|
Rapid7, Inc.:
|
|
|
|
0.25% 3/15/27
|
|
95,000
|
83,125
|
1.25% 3/15/29(b)
|
|
1,610,000
|
1,422,113
|
Tyler Technologies, Inc. 0.25% 3/15/26
|
|
2,670,000
|
2,827,530
|
Varonis Systems, Inc. 1.25% 8/15/25
|
|
911,000
|
1,343,270
|
Vertex, Inc. 0.75% 5/1/29 (b)
|
|
1,080,000
|
1,209,060
|
Workiva, Inc. 1.25% 8/15/28 (b)
|
|
1,812,000
|
1,611,774
|
Zscaler, Inc. 0.125% 7/1/25
|
|
2,474,000
|
3,054,153
|
|
|
|
|
62,764,735
|
Technology Hardware, Storage & Peripherals - 0.2%
|
|
|
|
Seagate HDD Cayman 3.5% 6/1/28 (b)
|
|
3,390,000
|
4,269,705
|
Super Micro Computer, Inc. 0% 3/1/29 (b)
|
|
2,236,000
|
2,180,100
|
Western Digital Corp. 3% 11/15/28 (b)
|
|
3,770,000
|
5,964,140
|
|
|
|
|
12,413,945
|
TOTAL INFORMATION TECHNOLOGY
|
|
|
136,742,547
|
|
|
|
|
|
MATERIALS - 0.1%
|
|
|
|
Chemicals - 0.0%
|
|
|
|
Livent Corp. 4.125% 7/15/25
|
|
447,000
|
615,462
|
|
|
|
|
|
Metals & Mining - 0.1%
|
|
|
|
ATI, Inc. 3.5% 6/15/25
|
|
688,000
|
2,729,296
|
Equinox Gold Corp. 4.75% 10/15/28 (b)
|
|
700,000
|
822,133
|
MP Materials Corp.:
|
|
|
|
0.25% 4/1/26(b)
|
|
1,143,000
|
1,013,498
|
3% 3/1/30(b)
|
|
537,000
|
540,813
|
United States Steel Corp. 5% 11/1/26
|
|
528,000
|
1,520,640
|
|
|
|
|
6,626,380
|
TOTAL MATERIALS
|
|
|
7,241,842
|
|
|
|
|
|
REAL ESTATE - 0.4%
|
|
|
|
Equity Real Estate Investment Trusts (REITs) - 0.2%
|
|
|
|
Federal Realty OP LP 3.25% 1/15/29 (b)
|
|
585,000
|
558,413
|
Rexford Industrial Realty LP:
|
|
|
|
4.125% 3/15/29(b)
|
|
1,527,000
|
1,486,790
|
4.375% 3/15/27(b)
|
|
1,514,000
|
1,488,039
|
Ventas Realty LP 3.75% 6/1/26 (b)
|
|
3,419,000
|
3,550,632
|
Welltower OP LLC 2.75% 5/15/28 (b)
|
|
3,975,000
|
4,695,668
|
|
|
|
|
11,779,542
|
Real Estate Management & Development - 0.2%
|
|
|
|
Realogy Group LLC/Realogy Co-Issuer Corp. 0.25% 6/15/26
|
|
2,142,000
|
1,776,618
|
Redfin Corp.:
|
|
|
|
0% 10/15/25
|
|
992,000
|
893,990
|
0.5% 4/1/27
|
|
5,056,000
|
2,780,800
|
Zillow Group, Inc.:
|
|
|
|
0.75% 9/1/24
|
|
1,321,000
|
1,357,988
|
1.375% 9/1/26
|
|
2,220,000
|
2,508,427
|
|
|
|
|
9,317,823
|
TOTAL REAL ESTATE
|
|
|
21,097,365
|
|
|
|
|
|
UTILITIES - 1.0%
|
|
|
|
Electric Utilities - 0.7%
|
|
|
|
Alliant Energy Corp. 3.875% 3/15/26
|
|
1,160,000
|
1,142,020
|
Duke Energy Corp. 4.125% 4/15/26
|
|
3,940,000
|
3,959,700
|
Evergy, Inc. 4.5% 12/15/27 (b)
|
|
3,200,000
|
3,258,034
|
FirstEnergy Corp. 4% 5/1/26
|
|
4,865,000
|
4,860,135
|
NextEra Energy Capital Holdings, Inc. 3% 3/1/27 (b)
|
|
1,766,000
|
2,173,178
|
NRG Energy, Inc. 2.75% 6/1/48
|
|
1,054,000
|
2,098,735
|
PG&E Corp. 4.25% 12/1/27 (b)
|
|
7,600,000
|
7,830,471
|
PPL Capital Funding, Inc. 2.875% 3/15/28
|
|
2,360,000
|
2,301,000
|
Southern Co.:
|
|
|
|
3.875% 12/15/25
|
|
3,839,000
|
3,959,929
|
4.5% 6/15/27(b)
|
|
3,321,000
|
3,382,439
|
|
|
|
|
34,965,641
|
Independent Power and Renewable Electricity Producers - 0.1%
|
|
|
|
NextEra Energy Partners LP 0% 11/15/25 (b)
|
|
4,537,000
|
4,076,495
|
Ormat Technologies, Inc. 2.5% 7/15/27
|
|
690,000
|
700,695
|
Sunnova Energy International, Inc.:
|
|
|
|
0.25% 12/1/26
|
|
1,109,000
|
483,524
|
2.625% 2/15/28
|
|
3,100,000
|
1,065,368
|
|
|
|
|
6,326,082
|
Multi-Utilities - 0.1%
|
|
|
|
CenterPoint Energy, Inc. 4.25% 8/15/26 (b)
|
|
2,040,000
|
2,040,000
|
CMS Energy Corp. 3.375% 5/1/28 (b)
|
|
1,905,000
|
1,892,618
|
WEC Energy Group, Inc.:
|
|
|
|
4.375% 6/1/27(b)
|
|
1,399,000
|
1,398,408
|
4.375% 6/1/29(b)
|
|
1,399,000
|
1,392,213
|
|
|
|
|
6,723,239
|
Water Utilities - 0.1%
|
|
|
|
American Water Capital Corp. 3.625% 6/15/26 (b)
|
|
2,639,000
|
2,594,137
|
|
|
|
|
|
TOTAL UTILITIES
|
|
|
50,609,099
|
|
|
|
|
|
TOTAL CONVERTIBLE BONDS
|
|
|
455,025,236
|
Nonconvertible Bonds - 1.0%
|
|
|
|
COMMUNICATION SERVICES - 0.1%
|
|
|
|
Media - 0.1%
|
|
|
|
Gannett Holdings LLC 6% 11/1/26 (b)
|
|
3,180,000
|
3,001,083
|
|
|
|
|
|
CONSUMER DISCRETIONARY - 0.1%
|
|
|
|
Broadline Retail - 0.1%
|
|
|
|
Match Group Holdings II LLC 3.625% 10/1/31 (b)
|
|
2,610,000
|
2,173,863
|
|
|
|
|
|
ENERGY - 0.0%
|
|
|
|
Oil, Gas & Consumable Fuels - 0.0%
|
|
|
|
Energy Transfer LP 8% 5/15/54 (c)
|
|
1,045,000
|
1,087,887
|
|
|
|
|
|
FINANCIALS - 0.5%
|
|
|
|
Capital Markets - 0.0%
|
|
|
|
Deutsche Bank AG New York Branch 6.72% 1/18/29 (c)
|
|
750,000
|
774,423
|
|
|
|
|
|
Financial Services - 0.2%
|
|
|
|
ILFC E-Capital Trust I CME Term SOFR 3 Month Index + 1.810% 7.1446% 12/21/65 (b)(c)(d)
|
|
14,050,000
|
11,252,665
|
|
|
|
|
|
Insurance - 0.3%
|
|
|
|
MetLife, Inc. 6.4% 12/15/66 (c)
|
|
8,000,000
|
8,061,464
|
Prudential Financial, Inc.:
|
|
|
|
3.7% 10/1/50(c)
|
|
2,500,000
|
2,149,708
|
5.125% 3/1/52(c)
|
|
2,350,000
|
2,182,565
|
6.75% 3/1/53(c)
|
|
2,750,000
|
2,815,684
|
|
|
|
|
15,209,421
|
TOTAL FINANCIALS
|
|
|
27,236,509
|
|
|
|
|
|
INFORMATION TECHNOLOGY - 0.0%
|
|
|
|
Software - 0.0%
|
|
|
|
Veritas U.S., Inc./Veritas Bermuda Ltd. 7.5% 9/1/25 (b)
|
|
650,000
|
593,767
|
|
|
|
|
|
UTILITIES - 0.3%
|
|
|
|
Electric Utilities - 0.1%
|
|
|
|
Southern Co. 4% 1/15/51 (c)
|
|
5,900,000
|
5,689,436
|
|
|
|
|
|
Multi-Utilities - 0.2%
|
|
|
|
CMS Energy Corp.:
|
|
|
|
3.75% 12/1/50(c)
|
|
450,000
|
371,789
|
4.75% 6/1/50(c)
|
|
3,500,000
|
3,215,579
|
Sempra 4.125% 4/1/52 (c)
|
|
7,865,000
|
7,225,833
|
|
|
|
|
10,813,201
|
TOTAL UTILITIES
|
|
|
16,502,637
|
|
|
|
|
|
TOTAL NONCONVERTIBLE BONDS
|
|
|
50,595,746
|
|
TOTAL CORPORATE BONDS
(Cost $468,941,088)
|
|
|
505,620,982
|
|
|
|
|
|
U.S. Treasury Obligations - 1.4%
|
|
|
|
Principal
Amount (a)
|
Value ($)
|
U.S. Treasury Bonds:
|
|
|
|
3.875% 2/15/43
|
|
66,000,000
|
58,997,813
|
3.875% 5/15/43
|
|
10,000,000
|
8,918,750
|
4.25% 2/15/54
|
|
5,950,000
|
5,580,914
|
4.5% 2/15/44
|
|
1,450,000
|
1,407,180
|
|
TOTAL U.S. TREASURY OBLIGATIONS
(Cost $73,780,715)
|
|
|
74,904,657
|
|
|
|
|
|
Common Stocks - 54.0%
|
|
|
|
Shares
|
Value ($)
|
COMMUNICATION SERVICES - 3.0%
|
|
|
|
Diversified Telecommunication Services - 1.2%
|
|
|
|
AT&T, Inc.
|
|
166,600
|
3,035,452
|
Cellnex Telecom SA (b)
|
|
153,499
|
5,607,329
|
Helios Towers PLC (e)
|
|
2,591,490
|
4,194,358
|
Verizon Communications, Inc.
|
|
1,175,519
|
48,372,607
|
|
|
|
|
61,209,746
|
Entertainment - 0.2%
|
|
|
|
The Walt Disney Co.
|
|
117,500
|
12,209,425
|
Interactive Media & Services - 0.1%
|
|
|
|
Alphabet, Inc. Class C
|
|
7,800
|
1,356,888
|
Meta Platforms, Inc. Class A
|
|
2,800
|
1,307,124
|
|
|
|
|
2,664,012
|
Media - 1.2%
|
|
|
|
Comcast Corp. Class A
|
|
1,334,912
|
53,436,527
|
EchoStar Corp. Class A (e)
|
|
37,600
|
721,920
|
Interpublic Group of Companies, Inc.
|
|
340,700
|
10,687,759
|
|
|
|
|
64,846,206
|
Wireless Telecommunication Services - 0.3%
|
|
|
|
T-Mobile U.S., Inc.
|
|
77,654
|
13,586,344
|
TOTAL COMMUNICATION SERVICES
|
|
|
154,515,733
|
CONSUMER DISCRETIONARY - 3.0%
|
|
|
|
Broadline Retail - 0.0%
|
|
|
|
Amazon.com, Inc. (e)
|
|
7,400
|
1,305,656
|
Diversified Consumer Services - 0.2%
|
|
|
|
H&R Block, Inc.
|
|
246,800
|
12,251,152
|
Hotels, Restaurants & Leisure - 1.4%
|
|
|
|
Churchill Downs, Inc.
|
|
7,000
|
906,500
|
Genius Sports Ltd. (e)
|
|
94,800
|
496,752
|
McDonald's Corp.
|
|
277,178
|
71,758,612
|
Norwegian Cruise Line Holdings Ltd. (e)
|
|
24,800
|
411,680
|
Super Group SGHC Ltd. (e)
|
|
316,995
|
1,150,692
|
|
|
|
|
74,724,236
|
Specialty Retail - 1.2%
|
|
|
|
Burlington Stores, Inc. (e)
|
|
75,600
|
18,147,780
|
Dick's Sporting Goods, Inc.
|
|
1,500
|
341,460
|
Lowe's Companies, Inc.
|
|
45,000
|
9,958,050
|
TJX Companies, Inc.
|
|
299,100
|
30,837,210
|
|
|
|
|
59,284,500
|
Textiles, Apparel & Luxury Goods - 0.2%
|
|
|
|
Columbia Sportswear Co. (f)
|
|
50,300
|
4,306,686
|
Tapestry, Inc.
|
|
72,200
|
3,139,978
|
|
|
|
|
7,446,664
|
TOTAL CONSUMER DISCRETIONARY
|
|
|
155,012,208
|
CONSUMER STAPLES - 7.6%
|
|
|
|
Beverages - 2.2%
|
|
|
|
Keurig Dr. Pepper, Inc.
|
|
636,652
|
21,805,331
|
The Coca-Cola Co.
|
|
1,480,847
|
93,189,702
|
|
|
|
|
114,995,033
|
Consumer Staples Distribution & Retail - 2.0%
|
|
|
|
Albertsons Companies, Inc.
|
|
128,400
|
2,650,176
|
Alimentation Couche-Tard, Inc. Class A (multi-vtg.)
|
|
272,200
|
15,887,237
|
BJ's Wholesale Club Holdings, Inc. (e)
|
|
237,500
|
20,916,625
|
Costco Wholesale Corp.
|
|
8,800
|
7,127,032
|
Dollar Tree, Inc. (e)
|
|
197,000
|
23,236,150
|
Metro, Inc.
|
|
151,500
|
8,073,257
|
Target Corp.
|
|
75,000
|
11,712,000
|
Walmart, Inc.
|
|
235,800
|
15,506,208
|
|
|
|
|
105,108,685
|
Food Products - 0.2%
|
|
|
|
Bunge Global SA
|
|
70,300
|
7,563,577
|
Lamb Weston Holdings, Inc.
|
|
6,900
|
609,201
|
|
|
|
|
8,172,778
|
Household Products - 2.4%
|
|
|
|
Procter & Gamble Co.
|
|
768,060
|
126,376,592
|
Personal Care Products - 0.8%
|
|
|
|
Estee Lauder Companies, Inc. Class A
|
|
44,700
|
5,514,192
|
Kenvue, Inc.
|
|
1,453,045
|
28,043,769
|
Unilever PLC
|
|
120,400
|
6,593,475
|
|
|
|
|
40,151,436
|
TOTAL CONSUMER STAPLES
|
|
|
394,804,524
|
ENERGY - 5.8%
|
|
|
|
Energy Equipment & Services - 0.0%
|
|
|
|
Archrock, Inc.
|
|
38,750
|
784,300
|
Kodiak Gas Services, Inc.
|
|
31,860
|
877,743
|
U.S.A. Compression Partners LP
|
|
46,280
|
1,133,860
|
|
|
|
|
2,795,903
|
Oil, Gas & Consumable Fuels - 5.8%
|
|
|
|
Canadian Natural Resources Ltd.
|
|
189,338
|
14,544,692
|
Canadian Natural Resources Ltd.
|
|
10,800
|
829,764
|
Cenovus Energy, Inc.
|
|
76,810
|
1,599,184
|
Cheniere Energy Partners LP
|
|
14,630
|
704,727
|
Cheniere Energy, Inc.
|
|
47,993
|
7,572,815
|
ConocoPhillips Co.
|
|
93,588
|
10,901,130
|
DHT Holdings, Inc.
|
|
736,346
|
8,909,787
|
Energy Transfer LP
|
|
385,094
|
6,034,423
|
EnLink Midstream LLC
|
|
79,190
|
1,004,921
|
Exxon Mobil Corp.
|
|
1,245,206
|
146,012,829
|
Frontline PLC (NY Shares)
|
|
72,300
|
2,047,536
|
Global Partners LP
|
|
12,450
|
601,709
|
Hess Corp.
|
|
46,800
|
7,211,880
|
Hess Midstream LP
|
|
30,170
|
1,048,408
|
Imperial Oil Ltd.
|
|
339,531
|
23,989,754
|
Keyera Corp.
|
|
11,760
|
311,397
|
Kinetik Holdings, Inc.
|
|
30,240
|
1,239,538
|
Mach Natural Resources LP
|
|
71,750
|
1,379,753
|
MEG Energy Corp. (e)
|
|
12,970
|
281,582
|
MPLX LP
|
|
12,066
|
490,845
|
Phillips 66 Co.
|
|
138,424
|
19,671,435
|
Plains All American Pipeline LP
|
|
289,178
|
4,918,918
|
Scorpio Tankers, Inc.
|
|
26,000
|
2,133,820
|
Sunoco Logistics Partners, LP
|
|
25,469
|
1,298,919
|
Targa Resources Corp.
|
|
73,575
|
8,698,772
|
The Williams Companies, Inc.
|
|
168,586
|
6,998,005
|
Valero Energy Corp.
|
|
109,038
|
17,134,231
|
Western Midstream Partners LP
|
|
81,489
|
3,041,169
|
|
|
|
|
300,611,943
|
TOTAL ENERGY
|
|
|
303,407,846
|
FINANCIALS - 6.8%
|
|
|
|
Banks - 3.2%
|
|
|
|
Bank of America Corp.
|
|
849,345
|
33,965,307
|
JPMorgan Chase & Co.
|
|
132,200
|
26,787,686
|
M&T Bank Corp.
|
|
116,057
|
17,594,241
|
PNC Financial Services Group, Inc.
|
|
242,102
|
38,104,434
|
U.S. Bancorp
|
|
662,600
|
26,868,430
|
Wells Fargo & Co.
|
|
383,912
|
23,004,007
|
|
|
|
|
166,324,105
|
Capital Markets - 0.7%
|
|
|
|
BlackRock, Inc. Class A
|
|
46,000
|
35,513,380
|
Consumer Finance - 0.4%
|
|
|
|
Capital One Financial Corp.
|
|
149,490
|
20,574,309
|
Financial Services - 0.2%
|
|
|
|
MasterCard, Inc. Class A
|
|
1,700
|
760,019
|
Toast, Inc. (e)
|
|
20,200
|
489,446
|
Visa, Inc. Class A
|
|
32,600
|
8,882,196
|
|
|
|
|
10,131,661
|
Insurance - 2.3%
|
|
|
|
American Financial Group, Inc.
|
|
91,700
|
11,912,747
|
Chubb Ltd.
|
|
172,336
|
46,672,036
|
Hartford Financial Services Group, Inc.
|
|
201,736
|
20,869,589
|
Marsh & McLennan Companies, Inc.
|
|
46,500
|
9,652,470
|
The Travelers Companies, Inc.
|
|
157,292
|
33,927,884
|
|
|
|
|
123,034,726
|
TOTAL FINANCIALS
|
|
|
355,578,181
|
HEALTH CARE - 5.8%
|
|
|
|
Biotechnology - 0.7%
|
|
|
|
AbbVie, Inc.
|
|
145,600
|
23,476,544
|
Gilead Sciences, Inc.
|
|
204,700
|
13,156,069
|
Moderna, Inc. (e)
|
|
10,000
|
1,425,500
|
|
|
|
|
38,058,113
|
Health Care Providers & Services - 0.4%
|
|
|
|
UnitedHealth Group, Inc.
|
|
36,904
|
18,281,134
|
Life Sciences Tools & Services - 0.5%
|
|
|
|
Danaher Corp.
|
|
108,470
|
27,855,096
|
Pharmaceuticals - 4.2%
|
|
|
|
AstraZeneca PLC sponsored ADR
|
|
416,924
|
32,528,410
|
Eli Lilly & Co.
|
|
26,933
|
22,094,217
|
GSK PLC
|
|
306,200
|
6,870,521
|
Johnson & Johnson
|
|
548,962
|
80,516,257
|
Merck & Co., Inc.
|
|
221,581
|
27,817,279
|
Roche Holding AG (participation certificate)
|
|
69,433
|
17,727,419
|
Royalty Pharma PLC
|
|
293,300
|
8,039,353
|
Sanofi SA sponsored ADR
|
|
474,055
|
23,242,917
|
|
|
|
|
218,836,373
|
TOTAL HEALTH CARE
|
|
|
303,030,716
|
INDUSTRIALS - 8.7%
|
|
|
|
Aerospace & Defense - 1.7%
|
|
|
|
General Dynamics Corp.
|
|
80,400
|
24,101,508
|
General Electric Co.
|
|
152,475
|
25,179,722
|
Huntington Ingalls Industries, Inc.
|
|
71,094
|
17,993,891
|
Northrop Grumman Corp.
|
|
26,602
|
11,991,384
|
The Boeing Co. (e)
|
|
48,499
|
8,613,907
|
|
|
|
|
87,880,412
|
Air Freight & Logistics - 0.7%
|
|
|
|
United Parcel Service, Inc. Class B
|
|
265,029
|
36,820,479
|
Building Products - 0.4%
|
|
|
|
Johnson Controls International PLC
|
|
320,890
|
23,075,200
|
Commercial Services & Supplies - 0.6%
|
|
|
|
GFL Environmental, Inc.
|
|
229,900
|
7,237,983
|
GFL Environmental, Inc.
|
|
176,031
|
5,539,696
|
Republic Services, Inc.
|
|
18,510
|
3,427,867
|
Veralto Corp.
|
|
38,190
|
3,764,770
|
Waste Connections, Inc. (United States)
|
|
26,697
|
4,386,851
|
Waste Management, Inc.
|
|
42,400
|
8,934,952
|
|
|
|
|
33,292,119
|
Construction & Engineering - 0.2%
|
|
|
|
Comfort Systems U.S.A., Inc.
|
|
3,500
|
1,145,690
|
EMCOR Group, Inc.
|
|
1,700
|
660,722
|
Ferrovial SE
|
|
80,025
|
3,162,647
|
Ferrovial SE rights (e)(f)(g)
|
|
80,025
|
26,336
|
MDU Resources Group, Inc.
|
|
168,700
|
4,257,988
|
|
|
|
|
9,253,383
|
Electrical Equipment - 1.8%
|
|
|
|
AMETEK, Inc.
|
|
39,900
|
6,766,242
|
Eaton Corp. PLC
|
|
243,703
|
81,116,544
|
Fluence Energy, Inc. (e)(f)
|
|
33,052
|
830,597
|
GE Vernova LLC
|
|
38,118
|
6,704,956
|
|
|
|
|
95,418,339
|
Ground Transportation - 0.5%
|
|
|
|
Canadian Pacific Kansas City Ltd.
|
|
23,839
|
1,891,863
|
CSX Corp.
|
|
80,184
|
2,706,210
|
Norfolk Southern Corp.
|
|
79,375
|
17,843,500
|
Union Pacific Corp.
|
|
15,019
|
3,496,724
|
|
|
|
|
25,938,297
|
Industrial Conglomerates - 0.5%
|
|
|
|
Hitachi Ltd.
|
|
132,100
|
13,604,674
|
Siemens AG
|
|
72,500
|
13,973,741
|
|
|
|
|
27,578,415
|
Machinery - 1.0%
|
|
|
|
Chart Industries, Inc. (e)
|
|
25,100
|
3,941,453
|
Fortive Corp.
|
|
34,800
|
2,590,512
|
Hillenbrand, Inc.
|
|
117,800
|
5,476,522
|
ITT, Inc.
|
|
281,600
|
37,419,008
|
|
|
|
|
49,427,495
|
Professional Services - 0.7%
|
|
|
|
Experian PLC
|
|
434,100
|
20,115,391
|
KBR, Inc.
|
|
187,900
|
12,337,514
|
Paychex, Inc.
|
|
39,800
|
4,782,368
|
|
|
|
|
37,235,273
|
Trading Companies & Distributors - 0.3%
|
|
|
|
Watsco, Inc.
|
|
32,356
|
15,365,864
|
Transportation Infrastructure - 0.3%
|
|
|
|
Aena SME SA (b)
|
|
63,529
|
12,423,902
|
Athens International Airport SA
|
|
91,741
|
822,998
|
|
|
|
|
13,246,900
|
TOTAL INDUSTRIALS
|
|
|
454,532,176
|
INFORMATION TECHNOLOGY - 6.6%
|
|
|
|
Communications Equipment - 1.3%
|
|
|
|
Cisco Systems, Inc.
|
|
1,487,380
|
69,163,170
|
IT Services - 1.1%
|
|
|
|
Accenture PLC Class A
|
|
80,102
|
22,611,994
|
Amdocs Ltd.
|
|
274,039
|
21,649,081
|
Capgemini SA
|
|
66,400
|
13,452,780
|
|
|
|
|
57,713,855
|
Semiconductors & Semiconductor Equipment - 2.5%
|
|
|
|
Analog Devices, Inc.
|
|
199,000
|
46,663,510
|
NVIDIA Corp.
|
|
1,700
|
1,863,761
|
NXP Semiconductors NV
|
|
132,000
|
35,917,200
|
Taiwan Semiconductor Manufacturing Co. Ltd. sponsored ADR
|
|
298,107
|
45,026,081
|
|
|
|
|
129,470,552
|
Software - 0.9%
|
|
|
|
Gen Digital, Inc.
|
|
286,100
|
7,103,863
|
Microsoft Corp.
|
|
74,567
|
30,954,999
|
MicroStrategy, Inc. Class A (e)
|
|
1,100
|
1,676,939
|
Roper Technologies, Inc.
|
|
13,500
|
7,192,260
|
Workiva, Inc. (e)
|
|
3,500
|
269,395
|
Zoom Video Communications, Inc. Class A (e)
|
|
21,900
|
1,343,346
|
|
|
|
|
48,540,802
|
Technology Hardware, Storage & Peripherals - 0.8%
|
|
|
|
Apple, Inc.
|
|
39,041
|
7,505,632
|
FUJIFILM Holdings Corp.
|
|
180,300
|
4,117,290
|
Samsung Electronics Co. Ltd.
|
|
517,883
|
27,474,130
|
|
|
|
|
39,097,052
|
TOTAL INFORMATION TECHNOLOGY
|
|
|
343,985,431
|
MATERIALS - 1.7%
|
|
|
|
Chemicals - 0.6%
|
|
|
|
Linde PLC
|
|
74,318
|
32,366,975
|
Containers & Packaging - 0.5%
|
|
|
|
Ball Corp.
|
|
110,300
|
7,658,129
|
Crown Holdings, Inc.
|
|
193,332
|
16,276,621
|
|
|
|
|
23,934,750
|
Metals & Mining - 0.6%
|
|
|
|
Agnico Eagle Mines Ltd. (United States)
|
|
20,000
|
1,364,200
|
Freeport-McMoRan, Inc.
|
|
575,500
|
30,346,115
|
|
|
|
|
31,710,315
|
TOTAL MATERIALS
|
|
|
88,012,040
|
REAL ESTATE - 0.8%
|
|
|
|
Equity Real Estate Investment Trusts (REITs) - 0.8%
|
|
|
|
American Tower Corp.
|
|
67,925
|
13,295,640
|
Equinix, Inc.
|
|
4,558
|
3,477,663
|
Lamar Advertising Co. Class A
|
|
131,468
|
15,527,685
|
Prologis, Inc.
|
|
24,457
|
2,702,254
|
Segro PLC
|
|
367,155
|
4,311,619
|
|
|
|
|
39,314,861
|
Real Estate Management & Development - 0.0%
|
|
|
|
Corporacion Inmobiliaria Vesta S.A.B. de CV ADR
|
|
19,621
|
683,596
|
TOTAL REAL ESTATE
|
|
|
39,998,457
|
UTILITIES - 4.2%
|
|
|
|
Electric Utilities - 2.8%
|
|
|
|
Constellation Energy Corp.
|
|
170,014
|
36,935,542
|
Exelon Corp.
|
|
153,900
|
5,778,945
|
Iberdrola SA
|
|
129,553
|
1,709,940
|
Kansai Electric Power Co., Inc.
|
|
164,986
|
2,985,787
|
NextEra Energy, Inc.
|
|
565,081
|
45,217,782
|
NRG Energy, Inc.
|
|
30,124
|
2,440,044
|
PG&E Corp.
|
|
285,600
|
5,295,024
|
Southern Co.
|
|
318,928
|
25,558,890
|
SSE PLC
|
|
175,711
|
3,952,823
|
Xcel Energy, Inc.
|
|
278,726
|
15,455,357
|
|
|
|
|
145,330,134
|
Gas Utilities - 0.1%
|
|
|
|
Southwest Gas Holdings, Inc.
|
|
95,100
|
7,378,809
|
Suburban Propane Partners LP
|
|
30,130
|
612,543
|
|
|
|
|
7,991,352
|
Independent Power and Renewable Electricity Producers - 0.6%
|
|
|
|
RWE AG
|
|
83,951
|
3,190,491
|
The AES Corp.
|
|
94,357
|
2,037,168
|
Vistra Corp.
|
|
239,315
|
23,711,330
|
|
|
|
|
28,938,989
|
Multi-Utilities - 0.7%
|
|
|
|
Ameren Corp.
|
|
143,305
|
10,514,288
|
National Grid PLC
|
|
443,795
|
5,028,194
|
National Grid PLC rights 6/10/24 (e)
|
|
159,565
|
400,613
|
Sempra
|
|
78,713
|
6,063,262
|
WEC Energy Group, Inc.
|
|
152,667
|
12,370,607
|
|
|
|
|
34,376,964
|
TOTAL UTILITIES
|
|
|
216,637,439
|
|
TOTAL COMMON STOCKS
(Cost $2,005,013,959)
|
|
|
2,809,514,751
|
|
|
|
|
|
Preferred Stocks - 8.4%
|
|
|
|
Shares
|
Value ($)
|
Convertible Preferred Stocks - 1.1%
|
|
|
|
FINANCIALS - 0.9%
|
|
|
|
Banks - 0.8%
|
|
|
|
Bank of America Corp. 7.25%
|
|
9,662
|
11,496,331
|
Wells Fargo & Co. 7.50%
|
|
24,485
|
28,564,009
|
|
|
|
|
40,060,340
|
Financial Services - 0.1%
|
|
|
|
Apollo Global Management, Inc. Series A, 6.75%
|
|
88,100
|
5,723,857
|
|
|
|
|
|
TOTAL FINANCIALS
|
|
|
45,784,197
|
|
|
|
|
|
HEALTH CARE - 0.0%
|
|
|
|
Health Care Providers & Services - 0.0%
|
|
|
|
BrightSpring Health Services, Inc. 6.75%
|
|
19,900
|
897,092
|
|
|
|
|
|
INDUSTRIALS - 0.0%
|
|
|
|
Machinery - 0.0%
|
|
|
|
RBC Bearings, Inc.
|
|
6,000
|
792,855
|
|
|
|
|
|
MATERIALS - 0.1%
|
|
|
|
Chemicals - 0.1%
|
|
|
|
Albemarle Corp. 7.25%
|
|
103,300
|
5,662,906
|
|
|
|
|
|
UTILITIES - 0.1%
|
|
|
|
Electric Utilities - 0.1%
|
|
|
|
NextEra Energy, Inc. 6.296%
|
|
118,224
|
5,353,183
|
|
|
|
|
|
TOTAL CONVERTIBLE PREFERRED STOCKS
|
|
|
58,490,233
|
Nonconvertible Preferred Stocks - 7.3%
|
|
|
|
COMMUNICATION SERVICES - 0.3%
|
|
|
|
Diversified Telecommunication Services - 0.3%
|
|
|
|
AT&T, Inc.:
|
|
|
|
4.75%
|
|
250,000
|
5,045,000
|
5.125%
|
|
85,000
|
1,802,000
|
5.35%
|
|
300,000
|
6,936,000
|
|
|
|
|
13,783,000
|
CONSUMER DISCRETIONARY - 0.0%
|
|
|
|
Leisure Products - 0.0%
|
|
|
|
Brunswick Corp. 6.375%
|
|
8,000
|
196,880
|
|
|
|
|
|
ENERGY - 0.0%
|
|
|
|
Oil, Gas & Consumable Fuels - 0.0%
|
|
|
|
Enbridge, Inc. Series L, U.S. TREASURY 5 YEAR INDEX + 3.150% 4.959% (c)(d)
|
|
62,800
|
1,309,380
|
|
|
|
|
|
FINANCIALS - 5.3%
|
|
|
|
Banks - 3.6%
|
|
|
|
Bank of America Corp.:
|
|
|
|
4.25%
|
|
665,000
|
12,422,200
|
4.375%
|
|
681,200
|
13,188,032
|
4.75%
|
|
125,000
|
2,595,000
|
5.00%
|
|
500,000
|
10,895,000
|
Series HH, 5.875%
|
|
150,000
|
3,735,000
|
Series KK, 5.375%
|
|
455,400
|
10,478,754
|
Series PP, 4.125%
|
|
675,000
|
12,352,500
|
JPMorgan Chase & Co.:
|
|
|
|
4.55%
|
|
583,400
|
11,930,530
|
4.625%
|
|
650,000
|
13,429,000
|
4.75%
|
|
325,000
|
6,922,500
|
Series DD, 5.75%
|
|
384,100
|
9,529,521
|
Series EE, 6.00%
|
|
175,000
|
4,385,500
|
Series MM, 4.20%
|
|
716,400
|
13,654,584
|
Truist Financial Corp. 4.75%
|
|
250,000
|
5,105,000
|
U.S. Bancorp:
|
|
|
|
4.50%
|
|
150,000
|
2,977,500
|
Series K, 5.50%
|
|
100,000
|
2,394,000
|
Series L, 3.75%
|
|
150,000
|
2,475,000
|
Series M, 4.00%
|
|
240,500
|
4,211,155
|
Wells Fargo & Co.:
|
|
|
|
4.25%
|
|
515,000
|
9,615,050
|
4.70%
|
|
400,000
|
8,136,000
|
Series CC, 4.375%
|
|
350,000
|
6,730,500
|
Series Y, 5.625%
|
|
200,000
|
4,718,000
|
Series Z, 4.75%
|
|
638,900
|
13,046,338
|
|
|
|
|
184,926,664
|
Capital Markets - 0.7%
|
|
|
|
Brookfield Oaktree Holdings Ll:
|
|
|
|
6.55%
|
|
140,300
|
2,963,136
|
Series A, 6.625%
|
|
105,197
|
2,261,736
|
Charles Schwab Corp. 4.45%
|
|
200,000
|
4,070,000
|
Morgan Stanley:
|
|
|
|
Series E, 3 month U.S. LIBOR + 0.000% 7.125%(c)(d)
|
|
25,000
|
634,000
|
Series I, 6.375%(c)
|
|
30,000
|
757,200
|
Series K, 5.85%(c)
|
|
429,000
|
10,506,210
|
Series L, 4.875%
|
|
175,000
|
3,890,250
|
Series O, 4.50%
|
|
483,000
|
9,177,000
|
Northern Trust Corp. Series E, 4.70%
|
|
90,000
|
1,912,500
|
State Street Corp. Series G, 5.35% (c)
|
|
20,000
|
491,000
|
Stifel Financial Corp. Series D, 4.50%
|
|
114,900
|
2,113,586
|
|
|
|
|
38,776,618
|
Financial Services - 0.1%
|
|
|
|
Apollo Global Management, Inc. (c)
|
|
30,000
|
796,200
|
Carlyle Finance LLC 4.625%
|
|
165,000
|
2,991,450
|
Equitable Holdings, Inc.:
|
|
|
|
4.30%
|
|
76,000
|
1,420,440
|
Series A 5.25%
|
|
84,500
|
1,886,885
|
|
|
|
|
7,094,975
|
Insurance - 0.9%
|
|
|
|
Allstate Corp.:
|
|
|
|
5.10%
|
|
491,000
|
10,856,010
|
Series I, 4.75%
|
|
125,000
|
2,598,750
|
Series J, 7.375%
|
|
35,000
|
954,100
|
American Financial Group, Inc. 4.50%
|
|
54,000
|
997,380
|
Athene Holding Ltd.:
|
|
|
|
Series A, 6.35%(c)
|
|
185,000
|
4,489,950
|
Series C, 6.375%(c)
|
|
199,500
|
4,985,505
|
Series D, 4.875%
|
|
340,000
|
6,528,000
|
MetLife, Inc. Series F 4.75%
|
|
150,000
|
3,057,000
|
Prudential Financial, Inc. 4.125%
|
|
100,000
|
1,904,000
|
RenaissanceRe Holdings Ltd. Series G, 4.20%
|
|
40,000
|
696,000
|
W.R. Berkley Corp.:
|
|
|
|
4.125%
|
|
200,000
|
3,676,000
|
4.25%
|
|
152,000
|
2,846,960
|
5.10%
|
|
100,000
|
2,139,000
|
|
|
|
|
45,728,655
|
TOTAL FINANCIALS
|
|
|
276,526,912
|
|
|
|
|
|
REAL ESTATE - 0.6%
|
|
|
|
Equity Real Estate Investment Trusts (REITs) - 0.6%
|
|
|
|
Pebblebrook Hotel Trust 6.375%
|
|
54,000
|
1,091,070
|
Public Storage:
|
|
|
|
3.875%
|
|
100,000
|
1,750,000
|
3.95%
|
|
100,000
|
1,766,000
|
4.00%
|
|
224,000
|
4,036,480
|
4.00%
|
|
150,000
|
2,737,500
|
Series I, 4.875%
|
|
75,000
|
1,677,000
|
Series J, 4.70%
|
|
85,000
|
1,786,700
|
Series K, 4.75%
|
|
75,000
|
1,599,750
|
Series L, 4.625%
|
|
180,000
|
3,740,400
|
Series M, 4.125%
|
|
70,000
|
1,308,300
|
Series O, 3.90%
|
|
100,000
|
1,746,000
|
Series S, 4.10%
|
|
100,000
|
1,841,000
|
Summit Hotel Properties, Inc.:
|
|
|
|
Series E, 6.25%
|
|
21,400
|
454,964
|
Series F, 5.875%
|
|
69,598
|
1,363,077
|
Sunstone Hotel Investors, Inc. Series H, 6.125%
|
|
20,000
|
427,400
|
|
|
|
|
27,325,641
|
UTILITIES - 1.1%
|
|
|
|
Electric Utilities - 0.7%
|
|
|
|
Brookfield Infrastructure Finance ULC 5.00%
|
|
40,000
|
697,200
|
Duke Energy Corp. 5.625%
|
|
50,000
|
1,231,500
|
Entergy Louisiana LLC 4.875%
|
|
30,500
|
652,395
|
Entergy New Orleans LLC 5.50%
|
|
23,717
|
538,850
|
Georgia Power Co. 5.00%
|
|
40,000
|
933,900
|
NextEra Energy Capital Holdings, Inc. 5.65%
|
|
115,000
|
2,816,350
|
SCE Trust VII:
|
|
|
|
6.95%
|
|
600,000
|
15,120,000
|
7.75%
|
|
150,000
|
4,009,500
|
Southern Co.:
|
|
|
|
4.20%
|
|
221,000
|
4,395,690
|
5.25%
|
|
41,487
|
972,040
|
Series A, 4.95%
|
|
309,588
|
6,857,374
|
|
|
|
|
38,224,799
|
Independent Power and Renewable Electricity Producers - 0.1%
|
|
|
|
Brookfield Renewable Partners LP 5.25%
|
|
125,000
|
2,300,000
|
|
|
|
|
|
Multi-Utilities - 0.3%
|
|
|
|
Brookfield Infrastructure Partners LP:
|
|
|
|
5.125%
|
|
53,000
|
968,310
|
Class A 5.00%
|
|
59,100
|
1,010,610
|
CMS Energy Corp.:
|
|
|
|
5.625%
|
|
43,258
|
1,035,164
|
5.875%
|
|
63,130
|
1,544,791
|
5.875%
|
|
157,943
|
3,821,431
|
DTE Energy Co.:
|
|
|
|
4.375%
|
|
100,000
|
1,976,000
|
4.375%
|
|
85,000
|
1,708,500
|
Series E, 5.25%
|
|
75,000
|
1,743,000
|
Sempra 5.75%
|
|
170,459
|
4,004,082
|
|
|
|
|
17,811,888
|
TOTAL UTILITIES
|
|
|
58,336,687
|
|
|
|
|
|
TOTAL NONCONVERTIBLE PREFERRED STOCKS
|
|
|
377,478,500
|
|
TOTAL PREFERRED STOCKS
(Cost $471,028,765)
|
|
|
435,968,733
|
|
|
|
|
|
Equity Funds - 15.2%
|
|
|
|
Shares
|
Value ($)
|
Fidelity Real Estate Equity Central Fund (h)
(Cost $729,244,855)
|
|
6,351,725
|
791,170,920
|
|
|
|
|
|
Preferred Securities - 10.9%
|
|
|
|
Principal
Amount (a)
|
Value ($)
|
ENERGY - 0.6%
|
|
|
|
Oil, Gas & Consumable Fuels - 0.6%
|
|
|
|
BP Capital Markets PLC 6.45% (c)(i)
|
|
6,985,000
|
7,253,797
|
Energy Transfer LP:
|
|
|
|
CME Term SOFR 3 Month Index + 4.280% 9.612% (c)(d)(i)
|
|
15,960,000
|
15,958,283
|
6.75% (c)(i)
|
|
500,000
|
494,927
|
7.125% (c)(i)
|
|
6,625,000
|
6,504,358
|
Summit Midstream Partners LP 3 month U.S. LIBOR + 7.430% 13.0209% (c)(d)(i)(j)
|
|
191,000
|
229,200
|
|
|
|
|
30,440,565
|
FINANCIALS - 9.5%
|
|
|
|
Banks - 6.8%
|
|
|
|
Bank of America Corp.:
|
|
|
|
4.375% (c)(i)
|
|
32,000,000
|
30,049,918
|
5.875% (c)(i)
|
|
33,400,000
|
33,207,332
|
6.1% (c)(i)
|
|
13,710,000
|
13,895,778
|
6.125% (c)(i)
|
|
16,000,000
|
16,048,753
|
6.3% (c)(i)
|
|
8,000,000
|
8,148,658
|
Citigroup, Inc. 3.875% (c)(i)
|
|
7,000,000
|
6,594,427
|
JPMorgan Chase & Co.:
|
|
|
|
3.65% (c)(i)
|
|
28,500,000
|
27,010,833
|
4.6% (c)(i)
|
|
35,390,000
|
35,274,767
|
5% (c)(i)
|
|
21,468,000
|
21,764,119
|
6.1% (c)(i)
|
|
21,000,000
|
21,286,958
|
6.875% (c)(i)
|
|
19,000,000
|
19,893,756
|
PNC Financial Services Group, Inc.:
|
|
|
|
3.4% (c)(i)
|
|
10,000,000
|
8,960,657
|
5% (c)(i)
|
|
10,580,000
|
10,246,670
|
6% (c)(i)
|
|
6,100,000
|
5,953,181
|
6.2% (c)(i)
|
|
2,600,000
|
2,588,773
|
6.25% (c)(i)
|
|
7,135,000
|
6,903,673
|
Truist Financial Corp.:
|
|
|
|
4.8% (c)(i)
|
|
12,000,000
|
11,867,828
|
4.95% (c)(i)
|
|
6,250,000
|
6,270,560
|
5.1% (c)(i)
|
|
6,850,000
|
6,436,261
|
U.S. Bancorp:
|
|
|
|
3.7% (c)(i)
|
|
7,000,000
|
6,263,610
|
5.3% (c)(i)
|
|
1,500,000
|
1,444,467
|
Wells Fargo & Co.:
|
|
|
|
3.9% (c)(i)
|
|
29,400,000
|
28,029,175
|
5.9% (c)(i)
|
|
20,700,000
|
21,224,320
|
7.625% (c)(i)
|
|
3,125,000
|
3,341,177
|
|
|
|
|
352,705,651
|
Capital Markets - 2.1%
|
|
|
|
Bank of New York Mellon Corp.:
|
|
|
|
3.7% (c)(i)
|
|
6,725,000
|
6,439,585
|
3.75% (c)(i)
|
|
8,500,000
|
7,865,661
|
4.625% (c)(i)
|
|
8,100,000
|
7,730,440
|
4.7% (c)(i)
|
|
4,925,000
|
4,873,934
|
Charles Schwab Corp.:
|
|
|
|
4% (c)(i)
|
|
20,515,000
|
17,291,327
|
4% (c)(i)
|
|
16,800,000
|
15,795,229
|
5% (c)(i)
|
|
6,670,000
|
6,435,796
|
5.375% (c)(i)
|
|
14,875,000
|
14,839,774
|
Goldman Sachs Group, Inc.:
|
|
|
|
3.65% (c)(i)
|
|
2,250,000
|
2,089,998
|
4.125% (c)(i)
|
|
5,400,000
|
5,017,921
|
Morgan Stanley 5.875% (c)(i)
|
|
6,770,000
|
6,667,563
|
Northern Trust Corp. 4.6% (c)(i)
|
|
4,100,000
|
3,971,991
|
State Street Corp. CME Term SOFR 3 Month Index + 2.800% 8.1299% (c)(d)(i)
|
|
6,915,000
|
7,078,068
|
|
|
|
|
106,097,287
|
Consumer Finance - 0.4%
|
|
|
|
Ally Financial, Inc.:
|
|
|
|
4.7% (c)(i)
|
|
7,885,000
|
6,958,725
|
4.7% (c)(i)
|
|
4,915,000
|
3,941,278
|
American Express Co. 3.55% (c)(i)
|
|
12,250,000
|
11,260,672
|
|
|
|
|
22,160,675
|
Financial Services - 0.0%
|
|
|
|
Equitable Holdings, Inc. 4.95% (c)(i)
|
|
1,250,000
|
1,255,449
|
Insurance - 0.2%
|
|
|
|
Allianz SE 3.2% (b)(c)(i)
|
|
3,000,000
|
2,479,595
|
MetLife, Inc. 3.85% (c)(i)
|
|
9,500,000
|
9,211,813
|
|
|
|
|
11,691,408
|
TOTAL FINANCIALS
|
|
|
493,910,470
|
INDUSTRIALS - 0.1%
|
|
|
|
Trading Companies & Distributors - 0.1%
|
|
|
|
Aircastle Ltd. 5.25% (b)(c)(i)
|
|
5,870,000
|
5,641,895
|
UTILITIES - 0.7%
|
|
|
|
Electric Utilities - 0.4%
|
|
|
|
Duke Energy Corp. 4.875% (c)(i)
|
|
8,058,000
|
8,023,825
|
Edison International:
|
|
|
|
5% (c)(i)
|
|
5,470,000
|
5,265,703
|
5.375% (c)(i)
|
|
4,500,000
|
4,437,429
|
|
|
|
|
17,726,957
|
Independent Power and Renewable Electricity Producers - 0.1%
|
|
|
|
Vistra Corp.:
|
|
|
|
7% (b)(c)(i)
|
|
3,495,000
|
3,582,004
|
8% (b)(c)(i)
|
|
3,000,000
|
3,080,332
|
|
|
|
|
6,662,336
|
Multi-Utilities - 0.2%
|
|
|
|
Dominion Energy, Inc.:
|
|
|
|
4.35% (c)(i)
|
|
1,935,000
|
1,839,312
|
4.65% (c)(i)
|
|
4,111,000
|
4,180,991
|
Sempra 4.875% (c)(i)
|
|
4,000,000
|
3,928,205
|
|
|
|
|
9,948,508
|
TOTAL UTILITIES
|
|
|
34,337,801
|
|
TOTAL PREFERRED SECURITIES
(Cost $569,303,322)
|
|
|
564,330,731
|
|
|
|
|
|
Money Market Funds - 0.3%
|
|
|
|
Shares
|
Value ($)
|
Fidelity Cash Central Fund 5.39% (k)
|
|
9,901,778
|
9,903,759
|
Fidelity Securities Lending Cash Central Fund 5.39% (k)(l)
|
|
3,868,539
|
3,868,926
|
|
TOTAL MONEY MARKET FUNDS
(Cost $13,772,102)
|
|
|
13,772,685
|
|
|
|
|
|
|
TOTAL INVESTMENT IN SECURITIES - 99.9%
(Cost $4,331,084,806)
|
5,195,283,459
|
NET OTHER ASSETS (LIABILITIES) - 0.1%
|
5,468,042
|
NET ASSETS - 100.0%
|
5,200,751,501
|
|
|
|
Legend
(a)
|
Amount is stated in United States dollars unless otherwise noted.
|
(b)
|
Security exempt from registration under Rule 144A of the Securities Act of 1933. These securities may be resold in transactions exempt from registration, normally to qualified institutional buyers. At the end of the period, the value of these securities amounted to $202,716,152 or 3.9% of net assets.
|
(c)
|
Coupon rates for floating and adjustable rate securities reflect the rates in effect at period end.
|
(d)
|
Coupon is indexed to a floating interest rate which may be multiplied by a specified factor and/or subject to caps or floors.
|
(f)
|
Security or a portion of the security is on loan at period end.
|
(g)
|
Security or a portion of the security purchased on a delayed delivery or when-issued basis.
|
(h)
|
Affiliated fund that is generally available only to investment companies and other accounts managed by Fidelity Investments. A complete unaudited schedule of portfolio holdings for each Fidelity Central Fund is filed with the SEC for the first and third quarters of each fiscal year on Form N-PORT and is available upon request or at the SEC's website at www.sec.gov. An unaudited holdings listing for the Fund, which presents direct holdings as well as the pro-rata share of securities and other investments held indirectly through its investment in underlying non-money market Fidelity Central Funds, is available at fidelity.com and/or institutional.fidelity.com, as applicable. In addition, each Fidelity Central Fund's financial statements are available on the SEC's website or upon request.
|
(i)
|
Security is perpetual in nature with no stated maturity date.
|
(j)
|
Non-income producing - Security is in default.
|
(k)
|
Affiliated fund that is generally available only to investment companies and other accounts managed by Fidelity Investments. The rate quoted is the annualized seven-day yield of the fund at period end. A complete unaudited listing of the fund's holdings as of its most recent quarter end is available upon request. In addition, each Fidelity Central Fund's financial statements are available on the SEC's website or upon request.
|
(l)
|
Investment made with cash collateral received from securities on loan.
|
Affiliated Central Funds
Fiscal year to date information regarding the Fund's investments in Fidelity Central Funds, including the ownership percentage, is presented below.
Affiliate
|
Value,
beginning
of period ($)
|
Purchases ($)
|
Sales
Proceeds ($)
|
Dividend
Income ($)
|
Realized
Gain (loss) ($)
|
Change in
Unrealized
appreciation
(depreciation) ($)
|
Value,
end
of period ($)
|
% ownership,
end
of period
|
Fidelity Cash Central Fund 5.39%
|
206,297,684
|
648,680,417
|
845,074,404
|
2,332,460
|
62
|
-
|
9,903,759
|
0.0%
|
Fidelity Real Estate Equity Central Fund
|
756,216,801
|
75,491,420
|
73,447,825
|
11,740,282
|
1,114,728
|
31,795,796
|
791,170,920
|
80.6%
|
Fidelity Securities Lending Cash Central Fund 5.39%
|
2,596,800
|
63,997,900
|
62,725,774
|
7,746
|
-
|
-
|
3,868,926
|
0.0%
|
Total
|
965,111,285
|
788,169,737
|
981,248,003
|
14,080,488
|
1,114,790
|
31,795,796
|
804,943,605
|
|
|
|
|
|
|
|
|
|
|
|
Amounts in the dividend income column in the above table include any capital gain distributions from underlying funds, which are presented in the corresponding line item in the Statement of Operations, if applicable.
Amounts in the dividend income column for Fidelity Securities Lending Cash Central Fund represents the income earned on investing cash collateral, less rebates paid to borrowers and any lending agent fees associated with the loan, plus any premium payments received for lending certain types of securities.
Amounts included in the purchases and sales proceeds columns may include in-kind transactions, if applicable.
Investment Valuation
The following is a summary of the inputs used, as of May 31, 2024, involving the Fund's assets and liabilities carried at fair value. The inputs or methodology used for valuing securities may not be an indication of the risk associated with investing in those securities. For more information on valuation inputs, and their aggregation into the levels used below, please refer to the Investment Valuation section in the accompanying Notes to Financial Statements.
Valuation Inputs at Reporting Date:
|
Description
|
Total ($)
|
Level 1 ($)
|
Level 2 ($)
|
Level 3 ($)
|
Investments in Securities:
|
|
|
|
|
|
|
Equities:
|
|
|
|
|
Communication Services
|
168,298,733
|
158,497,046
|
9,801,687
|
-
|
Consumer Discretionary
|
155,209,088
|
155,209,088
|
-
|
-
|
Consumer Staples
|
394,804,524
|
388,211,049
|
6,593,475
|
-
|
Energy
|
304,717,226
|
304,717,226
|
-
|
-
|
Financials
|
677,889,290
|
632,105,093
|
45,784,197
|
-
|
Health Care
|
303,927,808
|
278,432,776
|
25,495,032
|
-
|
Industrials
|
455,325,031
|
390,428,823
|
64,896,208
|
-
|
Information Technology
|
343,985,431
|
298,941,231
|
45,044,200
|
-
|
Materials
|
93,674,946
|
88,012,040
|
5,662,906
|
-
|
Real Estate
|
67,324,098
|
63,012,479
|
4,311,619
|
-
|
Utilities
|
280,327,309
|
257,706,278
|
22,621,031
|
-
|
|
|
Corporate Bonds
|
505,620,982
|
-
|
505,620,982
|
-
|
|
|
U.S. Government and Government Agency Obligations
|
74,904,657
|
-
|
74,904,657
|
-
|
|
|
Equity Funds
|
791,170,920
|
791,170,920
|
-
|
-
|
|
|
Preferred Securities
|
564,330,731
|
-
|
564,330,731
|
-
|
|
|
Money Market Funds
|
13,772,685
|
13,772,685
|
-
|
-
|
Total Investments in Securities:
|
5,195,283,459
|
3,820,216,734
|
1,375,066,725
|
-
|
Financial Statements (Unaudited)
Statement of Assets and Liabilities
|
|
|
|
|
May 31, 2024
(Unaudited)
|
|
|
|
|
|
|
Assets
|
|
|
|
|
Investment in securities, at value (including securities loaned of $3,854,145) - See accompanying schedule:
|
|
|
|
|
Unaffiliated issuers (cost $3,588,067,849)
|
$
|
4,390,339,854
|
|
|
Fidelity Central Funds (cost $743,016,957)
|
|
804,943,605
|
|
|
|
|
|
|
|
|
|
|
|
|
|
|
Total Investment in Securities (cost $4,331,084,806)
|
|
|
$
|
5,195,283,459
|
Foreign currency held at value (cost $214,178)
|
|
|
|
214,182
|
Receivable for investments sold
|
|
|
|
534,580
|
Receivable for fund shares sold
|
|
|
|
2,268,544
|
Dividends receivable
|
|
|
|
8,930,557
|
Interest receivable
|
|
|
|
3,767,636
|
Distributions receivable from Fidelity Central Funds
|
|
|
|
167,313
|
Prepaid expenses
|
|
|
|
782
|
Total assets
|
|
|
|
5,211,167,053
|
Liabilities
|
|
|
|
|
Payable to custodian bank
|
$
|
524,141
|
|
|
Payable for investments purchased
|
|
|
|
|
Regular delivery
|
|
144,155
|
|
|
Delayed delivery
|
|
26,336
|
|
|
Payable for fund shares redeemed
|
|
2,573,223
|
|
|
Accrued management fee
|
|
2,786,755
|
|
|
Distribution and service plan fees payable
|
|
429,378
|
|
|
Other payables and accrued expenses
|
|
62,638
|
|
|
Collateral on securities loaned
|
|
3,868,926
|
|
|
Total liabilities
|
|
|
|
10,415,552
|
Net Assets
|
|
|
$
|
5,200,751,501
|
Net Assets consist of:
|
|
|
|
|
Paid in capital
|
|
|
$
|
4,245,627,775
|
Total accumulated earnings (loss)
|
|
|
|
955,123,726
|
Net Assets
|
|
|
$
|
5,200,751,501
|
|
|
|
|
|
|
Net Asset Value and Maximum Offering Price
|
|
|
|
|
Class A :
|
|
|
|
|
Net Asset Value and redemption price per share ($905,102,885 ÷ 54,939,225 shares)(a)
|
|
|
$
|
16.47
|
Maximum offering price per share (100/94.25 of $16.47)
|
|
|
$
|
17.47
|
Class M :
|
|
|
|
|
Net Asset Value and redemption price per share ($297,800,676 ÷ 18,086,731 shares)(a)
|
|
|
$
|
16.47
|
Maximum offering price per share (100/96.50 of $16.47)
|
|
|
$
|
17.07
|
Class C :
|
|
|
|
|
Net Asset Value and offering price per share ($140,269,972 ÷ 8,547,521 shares)(a)
|
|
|
$
|
16.41
|
Strategic Dividend and Income :
|
|
|
|
|
Net Asset Value, offering price and redemption price per share ($2,995,032,448 ÷ 180,086,435 shares)
|
|
|
$
|
16.63
|
Class I :
|
|
|
|
|
Net Asset Value, offering price and redemption price per share ($616,718,104 ÷ 37,226,235 shares)
|
|
|
$
|
16.57
|
Class Z :
|
|
|
|
|
Net Asset Value, offering price and redemption price per share ($245,827,416 ÷ 14,838,543 shares)
|
|
|
$
|
16.57
|
(a)Redemption price per share is equal to net asset value less any applicable contingent deferred sales charge.
|
Statement of Operations
|
|
|
|
|
Six months ended
May 31, 2024
(Unaudited)
|
Investment Income
|
|
|
|
|
Dividends
|
|
|
$
|
60,353,886
|
Interest
|
|
|
|
12,134,567
|
Income from Fidelity Central Funds (including $7,746 from security lending)
|
|
|
|
14,080,488
|
Total income
|
|
|
|
86,568,941
|
Expenses
|
|
|
|
|
Management fee
|
$
|
15,020,735
|
|
|
Transfer agent fees
|
|
1,860,199
|
|
|
Distribution and service plan fees
|
|
2,591,970
|
|
|
Accounting fees
|
|
318,159
|
|
|
Custodian fees and expenses
|
|
29,182
|
|
|
Independent trustees' fees and expenses
|
|
7,276
|
|
|
Registration fees
|
|
65,586
|
|
|
Audit
|
|
39,544
|
|
|
Legal
|
|
3,099
|
|
|
Miscellaneous
|
|
13,950
|
|
|
Total expenses before reductions
|
|
19,949,700
|
|
|
Expense reductions
|
|
(260,520)
|
|
|
Total expenses after reductions
|
|
|
|
19,689,180
|
Net Investment income (loss)
|
|
|
|
66,879,761
|
Realized and Unrealized Gain (Loss)
|
|
|
|
|
Net realized gain (loss) on:
|
|
|
|
|
Investment Securities:
|
|
|
|
|
Unaffiliated issuers
|
|
86,716,093
|
|
|
Fidelity Central Funds
|
|
1,114,790
|
|
|
Foreign currency transactions
|
|
(101,220)
|
|
|
Total net realized gain (loss)
|
|
|
|
87,729,663
|
Change in net unrealized appreciation (depreciation) on:
|
|
|
|
|
Investment Securities:
|
|
|
|
|
Unaffiliated issuers
|
|
290,734,973
|
|
|
Fidelity Central Funds
|
|
31,795,796
|
|
|
Assets and liabilities in foreign currencies
|
|
(26,970)
|
|
|
Total change in net unrealized appreciation (depreciation)
|
|
|
|
322,503,799
|
Net gain (loss)
|
|
|
|
410,233,462
|
Net increase (decrease) in net assets resulting from operations
|
|
|
$
|
477,113,223
|
Statement of Changes in Net Assets
|
|
|
|
|
Six months ended
May 31, 2024
(Unaudited)
|
|
Year ended
November 30, 2023
|
Increase (Decrease) in Net Assets
|
|
|
|
|
Operations
|
|
|
|
|
Net investment income (loss)
|
$
|
66,879,761
|
$
|
142,820,487
|
Net realized gain (loss)
|
|
87,729,663
|
|
155,396,854
|
Change in net unrealized appreciation (depreciation)
|
|
322,503,799
|
|
(232,267,813)
|
Net increase (decrease) in net assets resulting from operations
|
|
477,113,223
|
|
65,949,528
|
Distributions to shareholders
|
|
(216,879,187)
|
|
(215,699,144)
|
|
|
|
|
|
|
Share transactions - net increase (decrease)
|
|
(52,147,442)
|
|
(192,298,975)
|
Total increase (decrease) in net assets
|
|
208,086,594
|
|
(342,048,591)
|
|
|
|
|
|
|
Net Assets
|
|
|
|
|
Beginning of period
|
|
4,992,664,907
|
|
5,334,713,498
|
End of period
|
$
|
5,200,751,501
|
$
|
4,992,664,907
|
|
|
|
|
|
|
|
|
|
|
|
|
Financial Highlights
Fidelity Advisor® Strategic Dividend & Income® Fund Class A
|
|
|
|
|
Six months ended
(Unaudited) May 31, 2024
|
|
Years ended November 30, 2023
|
|
2022
|
|
2021
|
|
2020
|
|
2019
|
Selected Per-Share Data
|
|
|
|
|
|
|
|
|
|
|
|
|
Net asset value, beginning of period
|
$
|
15.67
|
$
|
16.12
|
$
|
17.88
|
$
|
16.11
|
$
|
15.77
|
$
|
15.18
|
Income from Investment Operations
|
|
|
|
|
|
|
|
|
|
|
|
|
Net investment income (loss) A,B
|
|
.19
|
|
.41
|
|
.34
|
|
.25
|
|
.33
|
|
.34
|
Net realized and unrealized gain (loss)
|
|
1.29
|
|
(.23)
|
|
(.64)
|
|
2.39
|
|
1.01
|
|
1.23
|
Total from investment operations
|
|
1.48
|
|
.18
|
|
(.30)
|
|
2.64
|
|
1.34
|
|
1.57
|
Distributions from net investment income
|
|
(.22)
|
|
(.39)
|
|
(.36)
|
|
(.38)
|
|
(.30)
|
|
(.33)
|
Distributions from net realized gain
|
|
(.46)
|
|
(.24)
|
|
(1.10)
|
|
(.49)
|
|
(.70)
|
|
(.65)
|
Total distributions
|
|
(.68)
|
|
(.63)
|
|
(1.46)
|
|
(.87)
|
|
(1.00)
|
|
(.98)
|
Net asset value, end of period
|
$
|
16.47
|
$
|
15.67
|
$
|
16.12
|
$
|
17.88
|
$
|
16.11
|
$
|
15.77
|
Total Return C,D,E
|
|
|
|
1.28%
|
|
(2.09)%
|
|
16.99%
|
|
9.04%
|
|
11.44%
|
Ratios to Average Net Assets B,F,G
|
|
|
|
|
|
|
|
|
|
|
|
|
Expenses before reductions
|
|
.95% H
|
|
.98%
|
|
.97%
|
|
.97%
|
|
.99%
|
|
1.00%
|
Expenses net of fee waivers, if any
|
|
|
|
.97%
|
|
.97%
|
|
.97%
|
|
.99%
|
|
1.00%
|
Expenses net of all reductions
|
|
.94% H
|
|
.97%
|
|
.97%
|
|
.97%
|
|
.99%
|
|
1.00%
|
Net investment income (loss)
|
|
2.42% H
|
|
2.61%
|
|
2.07%
|
|
1.45%
|
|
2.20%
|
|
2.28%
|
Supplemental Data
|
|
|
|
|
|
|
|
|
|
|
|
|
Net assets, end of period (000 omitted)
|
$
|
905,103
|
$
|
856,477
|
$
|
880,711
|
$
|
867,690
|
$
|
666,152
|
$
|
661,327
|
Portfolio turnover rate I
|
|
|
|
34%
|
|
29%
|
|
37%
|
|
55%
|
|
58%
|
ACalculated based on average shares outstanding during the period.
BNet investment income (loss) is affected by the timing of the declaration of dividends by any underlying mutual funds or exchange-traded funds (ETFs). Net investment income (loss) of any mutual funds or ETFs is not included in the Fund's net investment income (loss) ratio.
CTotal returns for periods of less than one year are not annualized.
DTotal returns would have been lower if certain expenses had not been reduced during the applicable periods shown.
ETotal returns do not include the effect of the sales charges.
FFees and expenses of any underlying mutual funds or exchange-traded funds (ETFs) are not included in the Fund's expense ratio. The Fund indirectly bears its proportionate share of these expenses. For additional expense information related to investments in Fidelity Central Funds, please refer to the "Investments in Fidelity Central Funds" note found in the Notes to Financial Statements section of the most recent Annual or Semi-Annual report.
GExpense ratios reflect operating expenses of the class. Expenses before reductions do not reflect amounts reimbursed, waived, or reduced through arrangements with the investment adviser, brokerage services, or other offset arrangements, if applicable, and do not represent the amount paid by the class during periods when reimbursements, waivers or reductions occur.
HAnnualized.
IAmount does not include the portfolio activity of any underlying mutual funds or exchange-traded funds (ETFs).
Fidelity Advisor® Strategic Dividend & Income® Fund Class M
|
|
|
|
|
Six months ended
(Unaudited) May 31, 2024
|
|
Years ended November 30, 2023
|
|
2022
|
|
2021
|
|
2020
|
|
2019
|
Selected Per-Share Data
|
|
|
|
|
|
|
|
|
|
|
|
|
Net asset value, beginning of period
|
$
|
15.66
|
$
|
16.11
|
$
|
17.86
|
$
|
16.10
|
$
|
15.76
|
$
|
15.17
|
Income from Investment Operations
|
|
|
|
|
|
|
|
|
|
|
|
|
Net investment income (loss) A,B
|
|
.17
|
|
.37
|
|
.30
|
|
.21
|
|
.29
|
|
.30
|
Net realized and unrealized gain (loss)
|
|
1.30
|
|
(.23)
|
|
(.63)
|
|
2.38
|
|
1.01
|
|
1.23
|
Total from investment operations
|
|
1.47
|
|
.14
|
|
(.33)
|
|
2.59
|
|
1.30
|
|
1.53
|
Distributions from net investment income
|
|
(.20)
|
|
(.35)
|
|
(.32)
|
|
(.34)
|
|
(.26)
|
|
(.29)
|
Distributions from net realized gain
|
|
(.46)
|
|
(.24)
|
|
(1.10)
|
|
(.49)
|
|
(.70)
|
|
(.65)
|
Total distributions
|
|
(.66)
|
|
(.59)
|
|
(1.42)
|
|
(.83)
|
|
(.96)
|
|
(.94)
|
Net asset value, end of period
|
$
|
16.47
|
$
|
15.66
|
$
|
16.11
|
$
|
17.86
|
$
|
16.10
|
$
|
15.76
|
Total Return C,D,E
|
|
|
|
1.03%
|
|
(2.29)%
|
|
16.65%
|
|
8.77%
|
|
11.16%
|
Ratios to Average Net Assets B,F,G
|
|
|
|
|
|
|
|
|
|
|
|
|
Expenses before reductions
|
|
1.20% H
|
|
1.22%
|
|
1.22%
|
|
1.22%
|
|
1.24%
|
|
1.25%
|
Expenses net of fee waivers, if any
|
|
|
|
1.22%
|
|
1.21%
|
|
1.22%
|
|
1.24%
|
|
1.25%
|
Expenses net of all reductions
|
|
1.19% H
|
|
1.22%
|
|
1.21%
|
|
1.22%
|
|
1.23%
|
|
1.25%
|
Net investment income (loss)
|
|
2.17% H
|
|
2.37%
|
|
1.82%
|
|
1.21%
|
|
1.96%
|
|
2.04%
|
Supplemental Data
|
|
|
|
|
|
|
|
|
|
|
|
|
Net assets, end of period (000 omitted)
|
$
|
297,801
|
$
|
287,670
|
$
|
307,028
|
$
|
316,442
|
$
|
275,209
|
$
|
275,564
|
Portfolio turnover rate I
|
|
|
|
34%
|
|
29%
|
|
37%
|
|
55%
|
|
58%
|
ACalculated based on average shares outstanding during the period.
BNet investment income (loss) is affected by the timing of the declaration of dividends by any underlying mutual funds or exchange-traded funds (ETFs). Net investment income (loss) of any mutual funds or ETFs is not included in the Fund's net investment income (loss) ratio.
CTotal returns for periods of less than one year are not annualized.
DTotal returns would have been lower if certain expenses had not been reduced during the applicable periods shown.
ETotal returns do not include the effect of the sales charges.
FFees and expenses of any underlying mutual funds or exchange-traded funds (ETFs) are not included in the Fund's expense ratio. The Fund indirectly bears its proportionate share of these expenses. For additional expense information related to investments in Fidelity Central Funds, please refer to the "Investments in Fidelity Central Funds" note found in the Notes to Financial Statements section of the most recent Annual or Semi-Annual report.
GExpense ratios reflect operating expenses of the class. Expenses before reductions do not reflect amounts reimbursed, waived, or reduced through arrangements with the investment adviser, brokerage services, or other offset arrangements, if applicable, and do not represent the amount paid by the class during periods when reimbursements, waivers or reductions occur.
HAnnualized.
IAmount does not include the portfolio activity of any underlying mutual funds or exchange-traded funds (ETFs).
Fidelity Advisor® Strategic Dividend & Income® Fund Class C
|
|
|
|
|
Six months ended
(Unaudited) May 31, 2024
|
|
Years ended November 30, 2023
|
|
2022
|
|
2021
|
|
2020
|
|
2019
|
Selected Per-Share Data
|
|
|
|
|
|
|
|
|
|
|
|
|
Net asset value, beginning of period
|
$
|
15.61
|
$
|
16.05
|
$
|
17.80
|
$
|
16.03
|
$
|
15.69
|
$
|
15.10
|
Income from Investment Operations
|
|
|
|
|
|
|
|
|
|
|
|
|
Net investment income (loss) A,B
|
|
.13
|
|
.29
|
|
.21
|
|
.12
|
|
.21
|
|
.23
|
Net realized and unrealized gain (loss)
|
|
1.28
|
|
(.22)
|
|
(.63)
|
|
2.38
|
|
1.01
|
|
1.22
|
Total from investment operations
|
|
1.41
|
|
.07
|
|
(.42)
|
|
2.50
|
|
1.22
|
|
1.45
|
Distributions from net investment income
|
|
(.15)
|
|
(.27)
|
|
(.23)
|
|
(.24)
|
|
(.19)
|
|
(.21)
|
Distributions from net realized gain
|
|
(.46)
|
|
(.24)
|
|
(1.10)
|
|
(.49)
|
|
(.70)
|
|
(.65)
|
Total distributions
|
|
(.61)
|
|
(.51)
|
|
(1.33)
|
|
(.73)
|
|
(.88) C
|
|
(.86)
|
Net asset value, end of period
|
$
|
16.41
|
$
|
15.61
|
$
|
16.05
|
$
|
17.80
|
$
|
16.03
|
$
|
15.69
|
Total Return D,E,F
|
|
|
|
.55%
|
|
(2.85)%
|
|
16.12%
|
|
8.22%
|
|
10.61%
|
Ratios to Average Net Assets B,G,H
|
|
|
|
|
|
|
|
|
|
|
|
|
Expenses before reductions
|
|
1.70% I
|
|
1.74%
|
|
1.73%
|
|
1.73%
|
|
1.75%
|
|
1.75%
|
Expenses net of fee waivers, if any
|
|
|
|
1.73%
|
|
1.72%
|
|
1.73%
|
|
1.74%
|
|
1.75%
|
Expenses net of all reductions
|
|
1.69% I
|
|
1.73%
|
|
1.72%
|
|
1.73%
|
|
1.74%
|
|
1.75%
|
Net investment income (loss)
|
|
1.67% I
|
|
1.85%
|
|
1.31%
|
|
.70%
|
|
1.45%
|
|
1.53%
|
Supplemental Data
|
|
|
|
|
|
|
|
|
|
|
|
|
Net assets, end of period (000 omitted)
|
$
|
140,270
|
$
|
150,576
|
$
|
192,698
|
$
|
233,431
|
$
|
278,672
|
$
|
316,896
|
Portfolio turnover rate J
|
|
|
|
34%
|
|
29%
|
|
37%
|
|
55%
|
|
58%
|
ACalculated based on average shares outstanding during the period.
BNet investment income (loss) is affected by the timing of the declaration of dividends by any underlying mutual funds or exchange-traded funds (ETFs). Net investment income (loss) of any mutual funds or ETFs is not included in the Fund's net investment income (loss) ratio.
CTotal distributions per share do not sum due to rounding.
DTotal returns for periods of less than one year are not annualized.
ETotal returns would have been lower if certain expenses had not been reduced during the applicable periods shown.
FTotal returns do not include the effect of the contingent deferred sales charge.
GFees and expenses of any underlying mutual funds or exchange-traded funds (ETFs) are not included in the Fund's expense ratio. The Fund indirectly bears its proportionate share of these expenses. For additional expense information related to investments in Fidelity Central Funds, please refer to the "Investments in Fidelity Central Funds" note found in the Notes to Financial Statements section of the most recent Annual or Semi-Annual report.
HExpense ratios reflect operating expenses of the class. Expenses before reductions do not reflect amounts reimbursed, waived, or reduced through arrangements with the investment adviser, brokerage services, or other offset arrangements, if applicable, and do not represent the amount paid by the class during periods when reimbursements, waivers or reductions occur.
IAnnualized.
JAmount does not include the portfolio activity of any underlying mutual funds or exchange-traded funds (ETFs).
Fidelity® Strategic Dividend & Income® Fund
|
|
|
|
|
Six months ended
(Unaudited) May 31, 2024
|
|
Years ended November 30, 2023
|
|
2022
|
|
2021
|
|
2020
|
|
2019
|
Selected Per-Share Data
|
|
|
|
|
|
|
|
|
|
|
|
|
Net asset value, beginning of period
|
$
|
15.81
|
$
|
16.26
|
$
|
18.02
|
$
|
16.23
|
$
|
15.88
|
$
|
15.27
|
Income from Investment Operations
|
|
|
|
|
|
|
|
|
|
|
|
|
Net investment income (loss) A,B
|
|
.22
|
|
.45
|
|
.39
|
|
.31
|
|
.37
|
|
.39
|
Net realized and unrealized gain (loss)
|
|
1.30
|
|
(.22)
|
|
(.64)
|
|
2.40
|
|
1.02
|
|
1.24
|
Total from investment operations
|
|
1.52
|
|
.23
|
|
(.25)
|
|
2.71
|
|
1.39
|
|
1.63
|
Distributions from net investment income
|
|
(.24)
|
|
(.43)
|
|
(.41)
|
|
(.43)
|
|
(.34)
|
|
(.37)
|
Distributions from net realized gain
|
|
(.46)
|
|
(.24)
|
|
(1.10)
|
|
(.49)
|
|
(.70)
|
|
(.65)
|
Total distributions
|
|
(.70)
|
|
(.68) C
|
|
(1.51)
|
|
(.92)
|
|
(1.04)
|
|
(1.02)
|
Net asset value, end of period
|
$
|
16.63
|
$
|
15.81
|
$
|
16.26
|
$
|
18.02
|
$
|
16.23
|
$
|
15.88
|
Total Return D,E
|
|
|
|
1.55%
|
|
(1.79)%
|
|
17.30%
|
|
9.35%
|
|
11.81%
|
Ratios to Average Net Assets B,F,G
|
|
|
|
|
|
|
|
|
|
|
|
|
Expenses before reductions
|
|
.66% H
|
|
.70%
|
|
.68%
|
|
.68%
|
|
.70%
|
|
.71%
|
Expenses net of fee waivers, if any
|
|
|
|
.69%
|
|
.68%
|
|
.68%
|
|
.70%
|
|
.71%
|
Expenses net of all reductions
|
|
.65% H
|
|
.69%
|
|
.68%
|
|
.68%
|
|
.70%
|
|
.71%
|
Net investment income (loss)
|
|
2.71% H
|
|
2.89%
|
|
2.35%
|
|
1.74%
|
|
2.49%
|
|
2.57%
|
Supplemental Data
|
|
|
|
|
|
|
|
|
|
|
|
|
Net assets, end of period (000 omitted)
|
$
|
2,995,032
|
$
|
2,863,292
|
$
|
3,093,655
|
$
|
3,514,906
|
$
|
2,751,272
|
$
|
3,142,639
|
Portfolio turnover rate I
|
|
|
|
34%
|
|
29%
|
|
37%
|
|
55%
|
|
58%
|
ACalculated based on average shares outstanding during the period.
BNet investment income (loss) is affected by the timing of the declaration of dividends by any underlying mutual funds or exchange-traded funds (ETFs). Net investment income (loss) of any mutual funds or ETFs is not included in the Fund's net investment income (loss) ratio.
CTotal distributions per share do not sum due to rounding.
DTotal returns for periods of less than one year are not annualized.
ETotal returns would have been lower if certain expenses had not been reduced during the applicable periods shown.
FFees and expenses of any underlying mutual funds or exchange-traded funds (ETFs) are not included in the Fund's expense ratio. The Fund indirectly bears its proportionate share of these expenses. For additional expense information related to investments in Fidelity Central Funds, please refer to the "Investments in Fidelity Central Funds" note found in the Notes to Financial Statements section of the most recent Annual or Semi-Annual report.
GExpense ratios reflect operating expenses of the class. Expenses before reductions do not reflect amounts reimbursed, waived, or reduced through arrangements with the investment adviser, brokerage services, or other offset arrangements, if applicable, and do not represent the amount paid by the class during periods when reimbursements, waivers or reductions occur.
HAnnualized.
IAmount does not include the portfolio activity of any underlying mutual funds or exchange-traded funds (ETFs).
Fidelity Advisor® Strategic Dividend & Income® Fund Class I
|
|
|
|
|
Six months ended
(Unaudited) May 31, 2024
|
|
Years ended November 30, 2023
|
|
2022
|
|
2021
|
|
2020
|
|
2019
|
Selected Per-Share Data
|
|
|
|
|
|
|
|
|
|
|
|
|
Net asset value, beginning of period
|
$
|
15.75
|
$
|
16.20
|
$
|
17.96
|
$
|
16.18
|
$
|
15.84
|
$
|
15.23
|
Income from Investment Operations
|
|
|
|
|
|
|
|
|
|
|
|
|
Net investment income (loss) A,B
|
|
.22
|
|
.45
|
|
.38
|
|
.30
|
|
.36
|
|
.38
|
Net realized and unrealized gain (loss)
|
|
1.30
|
|
(.23)
|
|
(.64)
|
|
2.39
|
|
1.02
|
|
1.24
|
Total from investment operations
|
|
1.52
|
|
.22
|
|
(.26)
|
|
2.69
|
|
1.38
|
|
1.62
|
Distributions from net investment income
|
|
(.24)
|
|
(.43)
|
|
(.40)
|
|
(.42)
|
|
(.34)
|
|
(.36)
|
Distributions from net realized gain
|
|
(.46)
|
|
(.24)
|
|
(1.10)
|
|
(.49)
|
|
(.70)
|
|
(.65)
|
Total distributions
|
|
(.70)
|
|
(.67)
|
|
(1.50)
|
|
(.91)
|
|
(1.04)
|
|
(1.01)
|
Net asset value, end of period
|
$
|
16.57
|
$
|
15.75
|
$
|
16.20
|
$
|
17.96
|
$
|
16.18
|
$
|
15.84
|
Total Return C,D
|
|
|
|
1.53%
|
|
(1.83)%
|
|
17.25%
|
|
9.28%
|
|
11.82%
|
Ratios to Average Net Assets B,E,F
|
|
|
|
|
|
|
|
|
|
|
|
|
Expenses before reductions
|
|
.70% G
|
|
.73%
|
|
.72%
|
|
.72%
|
|
.73%
|
|
.74%
|
Expenses net of fee waivers, if any
|
|
|
|
.72%
|
|
.71%
|
|
.72%
|
|
.73%
|
|
.74%
|
Expenses net of all reductions
|
|
.69% G
|
|
.72%
|
|
.71%
|
|
.72%
|
|
.73%
|
|
.74%
|
Net investment income (loss)
|
|
2.67% G
|
|
2.87%
|
|
2.32%
|
|
1.71%
|
|
2.46%
|
|
2.54%
|
Supplemental Data
|
|
|
|
|
|
|
|
|
|
|
|
|
Net assets, end of period (000 omitted)
|
$
|
616,718
|
$
|
603,173
|
$
|
658,828
|
$
|
647,384
|
$
|
537,336
|
$
|
545,366
|
Portfolio turnover rate H
|
|
|
|
34%
|
|
29%
|
|
37%
|
|
55%
|
|
58%
|
ACalculated based on average shares outstanding during the period.
BNet investment income (loss) is affected by the timing of the declaration of dividends by any underlying mutual funds or exchange-traded funds (ETFs). Net investment income (loss) of any mutual funds or ETFs is not included in the Fund's net investment income (loss) ratio.
CTotal returns for periods of less than one year are not annualized.
DTotal returns would have been lower if certain expenses had not been reduced during the applicable periods shown.
EFees and expenses of any underlying mutual funds or exchange-traded funds (ETFs) are not included in the Fund's expense ratio. The Fund indirectly bears its proportionate share of these expenses. For additional expense information related to investments in Fidelity Central Funds, please refer to the "Investments in Fidelity Central Funds" note found in the Notes to Financial Statements section of the most recent Annual or Semi-Annual report.
FExpense ratios reflect operating expenses of the class. Expenses before reductions do not reflect amounts reimbursed, waived, or reduced through arrangements with the investment adviser, brokerage services, or other offset arrangements, if applicable, and do not represent the amount paid by the class during periods when reimbursements, waivers or reductions occur.
GAnnualized.
HAmount does not include the portfolio activity of any underlying mutual funds or exchange-traded funds (ETFs).
Fidelity Advisor® Strategic Dividend & Income® Fund Class Z
|
|
|
|
|
Six months ended
(Unaudited) May 31, 2024
|
|
Years ended November 30, 2023
|
|
2022
|
|
2021
|
|
2020
|
|
2019
|
Selected Per-Share Data
|
|
|
|
|
|
|
|
|
|
|
|
|
Net asset value, beginning of period
|
$
|
15.75
|
$
|
16.20
|
$
|
17.96
|
$
|
16.18
|
$
|
15.84
|
$
|
15.24
|
Income from Investment Operations
|
|
|
|
|
|
|
|
|
|
|
|
|
Net investment income (loss) A,B
|
|
.23
|
|
.47
|
|
.40
|
|
.32
|
|
.38
|
|
.40
|
Net realized and unrealized gain (loss)
|
|
1.30
|
|
(.23)
|
|
(.63)
|
|
2.39
|
|
1.01
|
|
1.23
|
Total from investment operations
|
|
1.53
|
|
.24
|
|
(.23)
|
|
2.71
|
|
1.39
|
|
1.63
|
Distributions from net investment income
|
|
(.25)
|
|
(.45)
|
|
(.43)
|
|
(.45)
|
|
(.36)
|
|
(.38)
|
Distributions from net realized gain
|
|
(.46)
|
|
(.24)
|
|
(1.10)
|
|
(.49)
|
|
(.70)
|
|
(.65)
|
Total distributions
|
|
(.71)
|
|
(.69)
|
|
(1.53)
|
|
(.93) C
|
|
(1.05) C
|
|
(1.03)
|
Net asset value, end of period
|
$
|
16.57
|
$
|
15.75
|
$
|
16.20
|
$
|
17.96
|
$
|
16.18
|
$
|
15.84
|
Total Return D,E
|
|
|
|
1.66%
|
|
(1.70)%
|
|
17.40%
|
|
9.43%
|
|
11.90%
|
Ratios to Average Net Assets B,F,G
|
|
|
|
|
|
|
|
|
|
|
|
|
Expenses before reductions
|
|
.58% H
|
|
.60%
|
|
.59%
|
|
.59%
|
|
.61%
|
|
.61%
|
Expenses net of fee waivers, if any
|
|
|
|
.59%
|
|
.59%
|
|
.59%
|
|
.61%
|
|
.61%
|
Expenses net of all reductions
|
|
.57% H
|
|
.59%
|
|
.59%
|
|
.59%
|
|
.60%
|
|
.61%
|
Net investment income (loss)
|
|
2.79% H
|
|
2.99%
|
|
2.44%
|
|
1.83%
|
|
2.59%
|
|
2.67%
|
Supplemental Data
|
|
|
|
|
|
|
|
|
|
|
|
|
Net assets, end of period (000 omitted)
|
$
|
245,827
|
$
|
231,477
|
$
|
201,793
|
$
|
179,880
|
$
|
140,035
|
$
|
127,236
|
Portfolio turnover rate I
|
|
|
|
34%
|
|
29%
|
|
37%
|
|
55%
|
|
58%
|
ACalculated based on average shares outstanding during the period.
BNet investment income (loss) is affected by the timing of the declaration of dividends by any underlying mutual funds or exchange-traded funds (ETFs). Net investment income (loss) of any mutual funds or ETFs is not included in the Fund's net investment income (loss) ratio.
CTotal distributions per share do not sum due to rounding.
DTotal returns for periods of less than one year are not annualized.
ETotal returns would have been lower if certain expenses had not been reduced during the applicable periods shown.
FFees and expenses of any underlying mutual funds or exchange-traded funds (ETFs) are not included in the Fund's expense ratio. The Fund indirectly bears its proportionate share of these expenses. For additional expense information related to investments in Fidelity Central Funds, please refer to the "Investments in Fidelity Central Funds" note found in the Notes to Financial Statements section of the most recent Annual or Semi-Annual report.
GExpense ratios reflect operating expenses of the class. Expenses before reductions do not reflect amounts reimbursed, waived, or reduced through arrangements with the investment adviser, brokerage services, or other offset arrangements, if applicable, and do not represent the amount paid by the class during periods when reimbursements, waivers or reductions occur.
HAnnualized.
IAmount does not include the portfolio activity of any underlying mutual funds or exchange-traded funds (ETFs).
Notes to Financial Statements
(Unaudited)For the period ended May 31, 2024
1. Organization.
Fidelity Strategic Dividend & Income Fund (the Fund) is a fund of Fidelity Salem Street Trust (the Trust) and is authorized to issue an unlimited number of shares. The Trust is registered under the Investment Company Act of 1940, as amended (the 1940 Act), as an open-end management investment company organized as a Massachusetts business trust. The Fund offers Class A, Class M, Class C, Strategic Dividend and Income, Class I and Class Z shares, each of which has equal rights as to assets and voting privileges. Class A, Class M, Class C, Class I and Class Z are Fidelity Advisor classes. Each class has exclusive voting rights with respect to matters that affect that class. Class C shares will automatically convert to Class A shares after a holding period of eight years from the initial date of purchase, with certain exceptions.
2. Investments in Fidelity Central Funds.
Funds may invest in Fidelity Central Funds, which are open-end investment companies generally available only to other investment companies and accounts managed by the investment adviser and its affiliates. The Schedule of Investments lists any Fidelity Central Funds held as an investment as of period end, but does not include the underlying holdings of each Fidelity Central Fund. An investing fund indirectly bears its proportionate share of the expenses of the underlying Fidelity Central Funds.
Based on its investment objective, each Fidelity Central Fund may invest or participate in various investment vehicles or strategies that are similar to those of the investing fund. These strategies are consistent with the investment objectives of the investing fund and may involve certain economic risks which may cause a decline in value of each of the Fidelity Central Funds and thus a decline in the value of the investing fund.
Fidelity Central Fund
|
Investment Manager
|
Investment Objective
|
Investment Practices
|
Expense RatioA
|
Fidelity Real Estate Equity Central Fund
|
Fidelity Management & Research Company LLC (FMR)
|
Seeks above-average income and long-term capital growth by investing primarily in equity securities of issuers in the real estate industry.
|
|
Less than .005%
|
Fidelity Money Market Central Funds
|
Fidelity Management & Research Company LLC (FMR)
|
Each fund seeks to obtain a high level of current income consistent with the preservation of capital and liquidity.
|
Short-term Investments
|
Less than .005%
|
A Expenses expressed as a percentage of average net assets and are as of each underlying Central Fund's most recent annual or semi-annual shareholder report.
An unaudited holdings listing for the investing fund, which presents direct holdings as well as the pro-rata share of any securities and other investments held indirectly through its investment in underlying non-money market Fidelity Central Funds, is available at fidelity.com and/or institutional.fidelity.com, as applicable. A complete unaudited list of holdings for each Fidelity Central Fund is available upon request or at the Securities and Exchange Commission website at www.sec.gov. In addition, the financial statements of the Fidelity Central Funds which contain the significant accounting policies (including investment valuation policies) of those funds, and are not covered by the Report of Independent Registered Public Accounting Firm, are available on the Securities and Exchange Commission website or upon request.
3. Significant Accounting Policies.
The Fund is an investment company and applies the accounting and reporting guidance of the Financial Accounting Standards Board (FASB) Accounting Standards Codification Topic 946 Financial Services - Investment Companies. The financial statements have been prepared in conformity with accounting principles generally accepted in the United States of America (GAAP), which require management to make certain estimates and assumptions at the date of the financial statements. Actual results could differ from those estimates. Subsequent events, if any, through the date that the financial statements were issued have been evaluated in the preparation of the financial statements. The Fund's Schedule of Investments lists any underlying mutual funds or exchange-traded funds (ETFs) but does not include the underlying holdings of these funds. The following summarizes the significant accounting policies of the Fund:
Investment Valuation. Investments are valued as of 4:00 p.m. Eastern time on the last calendar day of the period. The Board of Trustees (the Board) has designated the Fund's investment adviser as the valuation designee responsible for the fair valuation function and performing fair value determinations as needed. The investment adviser has established a Fair Value Committee (the Committee) to carry out the day-to-day fair valuation responsibilities and has adopted policies and procedures to govern the fair valuation process and the activities of the Committee. In accordance with these fair valuation policies and procedures, which have been approved by the Board, the Fund attempts to obtain prices from one or more third party pricing services or brokers to value its investments. When current market prices, quotations or currency exchange rates are not readily available or reliable, investments will be fair valued in good faith by the Committee, in accordance with the policies and procedures. Factors used in determining fair value vary by investment type and may include market or investment specific events, transaction data, estimated cash flows, and market observations of comparable investments. The frequency that the fair valuation procedures are used cannot be predicted and they may be utilized to a significant extent. The Committee manages the Fund's fair valuation practices and maintains the fair valuation policies and procedures. The Fund's investment adviser reports to the Board information regarding the fair valuation process and related material matters.
The Fund categorizes the inputs to valuation techniques used to value its investments into a disclosure hierarchy consisting of three levels as shown below:
Level 1 - unadjusted quoted prices in active markets for identical investments
Level 2 - other significant observable inputs (including quoted prices for similar investments, interest rates, prepayment speeds, etc.)
Level 3 - unobservable inputs (including the Fund's own assumptions based on the best information available)
Valuation techniques used to value the Fund's investments by major category are as follows:
Equity securities, including restricted securities, for which market quotations are readily available, are valued at the last reported sale price or official closing price as reported by a third party pricing service on the primary market or exchange on which they are traded and are categorized as Level 1 in the hierarchy. In the event there were no sales during the day or closing prices are not available, securities are valued at the last quoted bid price or may be valued using the last available price and are generally categorized as Level 2 in the hierarchy. For foreign equity securities, when market or security specific events arise, comparisons to the valuation of American Depositary Receipts (ADRs), futures contracts, Exchange-Traded Funds (ETFs) and certain indexes as well as quoted prices for similar securities may be used and would be categorized as Level 2 in the hierarchy. For equity securities, including restricted securities, where observable inputs are limited, assumptions about market activity and risk are used and these securities may be categorized as Level 3 in the hierarchy.
Debt securities, including restricted securities, are valued based on evaluated prices received from third party pricing services or from brokers who make markets in such securities. Corporate bonds, preferred securities, and U.S. government and government agency obligations are valued by pricing services who utilize matrix pricing which considers yield or price of bonds of comparable quality, coupon, maturity and type or by broker-supplied prices. When independent prices are unavailable or unreliable, debt securities may be valued utilizing pricing methodologies which consider similar factors that would be used by third party pricing services. Debt securities are generally categorized as Level 2 in the hierarchy but may be Level 3 depending on the circumstances.
Investments in open-end mutual funds, including the Fidelity Central Funds, are valued at their closing net asset value (NAV) each business day and are categorized as Level 1 in the hierarchy.
Changes in valuation techniques may result in transfers in or out of an assigned level within the disclosure hierarchy. The aggregate value of investments by input level as of May 31, 2024 is included at the end of the Fund's Schedule of Investments.
Foreign Currency. Certain Funds may use foreign currency contracts to facilitate transactions in foreign-denominated securities. Gains and losses from these transactions may arise from changes in the value of the foreign currency or if the counterparties do not perform under the contracts' terms.
Foreign-denominated assets, including investment securities, and liabilities are translated into U.S. dollars at the exchange rates at period end. Purchases and sales of investment securities, income and dividends received, and expenses denominated in foreign currencies are translated into U.S. dollars at the exchange rate in effect on the transaction date.
The effects of exchange rate fluctuations on investments are included with the net realized and unrealized gain (loss) on investment securities. Other foreign currency transactions resulting in realized and unrealized gain (loss) are disclosed separately.
Investment Transactions and Income. For financial reporting purposes, the Fund's investment holdings and NAV include trades executed through the end of the last business day of the period. The NAV per share for processing shareholder transactions is calculated as of the close of business of the New York Stock Exchange (NYSE), normally 4:00 p.m. Eastern time and includes trades executed through the end of the prior business day. Gains and losses on securities sold are determined on the basis of identified cost and include proceeds received from litigation. Commissions paid to certain brokers with whom the investment adviser, or its affiliates, places trades on behalf of a fund include an amount in addition to trade execution, which may be rebated back to a fund. Any such rebates are included in net realized gain (loss) on investments in the Statement of Operations. Dividend income is recorded on the ex-dividend date, except for certain dividends from foreign securities where the ex-dividend date may have passed, which are recorded as soon as the Fund is informed of the ex-dividend date. Non-cash dividends included in dividend income, if any, are recorded at the fair market value of the securities received. Income and capital gain distributions from Fidelity Central Funds, if any, are recorded on the ex-dividend date. Certain distributions received by the Fund represent a return of capital or capital gain. The Fund determines the components of these distributions subsequent to the ex-dividend date, based upon receipt of tax filings or other correspondence relating to the underlying investment. These distributions are recorded as a reduction of cost of investments and/or as a realized gain. Interest income is accrued as earned and includes coupon interest and amortization of premium and accretion of discount on debt securities as applicable. Investment income is recorded net of foreign taxes withheld where recovery of such taxes is uncertain. Debt obligations may be placed on non-accrual status and related interest income may be reduced by ceasing current accruals and writing off interest receivables when the collection of all or a portion of interest has become doubtful based on consistently applied procedures. A debt obligation is removed from non-accrual status when the issuer resumes interest payments or when collectability of interest is reasonably assured. Funds may file withholding tax reclaims in certain jurisdictions to recover a portion of amounts previously withheld. Any withholding tax reclaims income is included in the Statement of Operations in dividends. Any receivables for withholding tax reclaims are included in the Statement of Assets and Liabilities in dividends receivable.
Class Allocations and Expenses. Investment income, realized and unrealized capital gains and losses, common expenses of a fund, and certain fund-level expense reductions, if any, are allocated daily on a pro-rata basis to each class based on the relative net assets of each class to the total net assets of a fund. Each class differs with respect to transfer agent and distribution and service plan fees incurred, as applicable. Certain expense reductions may also differ by class, if applicable. For the reporting period, the allocated portion of income and expenses to each class as a percent of its average net assets may vary due to the timing of recording these transactions in relation to fluctuating net assets of the classes. Expenses directly attributable to a fund are charged to that fund. Expenses attributable to more than one fund are allocated among the respective funds on the basis of relative net assets or other appropriate methods. Expenses included in the accompanying financial statements reflect the expenses of that fund and do not include any expenses associated with any underlying mutual funds or exchange-traded funds (ETFs). Although not included in a fund's expenses, a fund indirectly bears its proportionate share of these expenses through the net asset value of each underlying mutual fund or exchange-traded fund (ETF). Expense estimates are accrued in the period to which they relate and adjustments are made when actual amounts ae known.
Income Tax Information and Distributions to Shareholders. Each year, the Fund intends to qualify as a regulated investment company under Subchapter M of the Internal Revenue Code, including distributing substantially all of its taxable income and realized gains. As a result, no provision for U.S. Federal income taxes is required. The Fund files a U.S. federal tax return, in addition to state and local tax returns as required. The Fund's federal income tax returns are subject to examination by the Internal Revenue Service (IRS) for a period of three fiscal years after they are filed. State and local tax returns may be subject to examination for an additional fiscal year depending on the jurisdiction. Foreign taxes are provided for based on the Fund's understanding of the tax rules and rates that exist in the foreign markets in which it invests.
Distributions are declared and recorded on the ex-dividend date. Income and capital gain distributions are declared separately for each class. Income and capital gain distributions are determined in accordance with income tax regulations, which may differ from GAAP.
Capital accounts within the financial statements are adjusted for permanent book-tax differences. These adjustments have no impact on net assets or the results of operations. Capital accounts are not adjusted for temporary book-tax differences which will reverse in a subsequent period.
Book-tax differences are primarily due to foreign currency transactions, passive foreign investment companies (PFIC), market discount, contingent interest, certain conversion ratio adjustments, equity-debt reclassifications, partnerships and losses deferred due to wash sales.
As of period end, the cost and unrealized appreciation (depreciation) in securities, and derivatives if applicable, for federal income tax purposes were as follows:
Gross unrealized appreciation
|
$1,047,056,847
|
Gross unrealized depreciation
|
(176,531,118)
|
Net unrealized appreciation (depreciation)
|
$870,525,729
|
Tax cost
|
$4,324,757,730
|
Delayed Delivery Transactions and When-Issued Securities. During the period, certain Funds transacted in securities on a delayed delivery or when-issued basis. Payment and delivery may take place after the customary settlement period for that security. The price of the underlying securities and the date when the securities will be delivered and paid for are fixed at the time the transaction is negotiated. Securities purchased on a delayed delivery or when-issued basis are identified as such in the Schedule of Investments. Compensation for interest forgone in the purchase of a delayed delivery or when-issued debt security may be received. With respect to purchase commitments, each applicable Fund identifies securities as segregated in its records with a value at least equal to the amount of the commitment. Payables and receivables associated with the purchases and sales of delayed delivery securities having the same coupon, settlement date and broker are offset. Delayed delivery or when-issued securities that have been purchased from and sold to different brokers are reflected as both payables and receivables in the Statement of Assets and Liabilities under the caption "Delayed delivery", as applicable. Losses may arise due to changes in the value of the underlying securities or if the counterparty does not perform under the contract's terms, or if the issuer does not issue the securities due to political, economic, or other factors.
Restricted Securities (including Private Placements). Funds may invest in securities that are subject to legal or contractual restrictions on resale. These securities generally may be resold in transactions exempt from registration or to the public if the securities are registered. Disposal of these securities may involve time-consuming negotiations and expense, and prompt sale at an acceptable price may be difficult. Information regarding restricted securities held at period end is included at the end of the Schedule of Investments, if applicable.
4. Purchases and Sales of Investments.
Purchases and sales of securities, other than short-term securities, U.S. Government securities, and in-kind transactions, as applicable, are noted in the table below.
|
Purchases ($)
|
Sales ($)
|
Fidelity Strategic Dividend & Income Fund
|
711,393,277
|
755,677,575
|
5. Fees and Other Transactions with Affiliates.
Management Fee. Fidelity Management & Research Company LLC (the investment adviser) and its affiliates provide the Fund with investment management related services for which the Fund pays a monthly management fee.
Effective March 1, 2024, the Fund's management contract was amended to incorporate administrative services previously covered under separate services agreements (Transfer Agent and Accounting agreements). The amended contract incorporates a management fee rate that may vary by class. The investment adviser or an affiliate pays certain expenses of managing and operating the Fund out of each class's management fee. Each class of the Fund pays a management fee to the investment adviser. The management fee is calculated and paid to the investment adviser every month. When determining a class's management fee, a mandate rate is calculated based on the monthly average net assets of a group of funds advised by FMR within a designated asset class. A discount rate is subtracted from the mandate rate once the Fund's monthly average net assets reach a certain level. The mandate rate and discount rate may vary by class. The annual management fee rate for a class of shares of the Fund is the lesser of (1) the class's mandate rate reduced by the class's discount rate (if applicable) or (2) the amount set forth in the following table.
|
Maximum Management Fee Rate %
|
Class A
|
.69
|
Class M
|
.68
|
Class C
|
.69
|
Strategic Dividend and Income
|
.66
|
Class I
|
.68
|
Class Z
|
.56
|
One-twelfth of the management fee rate for a class is applied to the average net assets of the class for the month, giving a dollar amount which is the management fee for the class for that month. A different management fee rate may be applicable to each class of the Fund. The difference between classes is the result of separate arrangements for class-level services and/or waivers of certain expenses. It is not the result of any difference in advisory or custodial fees or other expenses related to the management of the Fund's assets, which do not vary by class. For the portion of the reporting period on or after March 1, 2024, the total annualized management fee rates were as follows:
|
Total Management Fee Rate %
|
Class A
|
.67
|
Class M
|
.67
|
Class C
|
.67
|
Strategic Dividend and Income
|
.63
|
Class I
|
.67
|
Class Z
|
.56
|
Prior to March 1, 2024, the management fee was the sum of an individual fund fee rate that was based on an annual rate of .30% of the Fund's average net assets and an annualized group fee rate that averaged .22% during the period. The group fee rate was based upon the monthly average net assets of a group of registered investment companies with which the investment adviser has management contracts. The group fee rate decreased as assets under management increased and increased as assets under management decreased. For the portion of the reporting period prior to March 1, 2024, the total annualized management fee rate was .52%.
Effective March 1, 2024, the Fund's sub-advisory agreements with FMR Investment Management (UK) Limited, Fidelity Management & Research (Hong Kong) Limited, and Fidelity Management & Research (Japan) Limited were amended to provide that the investment adviser pays each sub-adviser monthly fees equal to 110% of the sub-adviser's costs for providing sub-advisory services.
Distribution and Service Plan Fees. In accordance with Rule 12b-1 of the 1940 Act, the Fund has adopted separate Distribution and Service Plans for each class of shares. Certain classes pay Fidelity Distributors Company LLC (FDC), an affiliate of the investment adviser, separate Distribution and Service Fees, each of which is based on an annual percentage of each class' average net assets. In addition, FDC may pay financial intermediaries for selling shares of the Fund and providing shareholder support services. For the period, the Distribution and Service Fee rates, total fees and amounts retained by FDC were as follows:
|
Distribution Fee
|
Service Fee
|
Total Fees ($)
|
Retained by FDC ($)
|
Class A
|
- %
|
.25%
|
1,113,751
|
20,231
|
Class M
|
.25%
|
.25%
|
742,970
|
-
|
Class C
|
.75%
|
.25%
|
735,249
|
52,895
|
|
|
|
2,591,970
|
73,126
|
Sales Load. FDC may receive a front-end sales charge of up to 5.75% for selling Class A shares and 3.50% for selling Class M shares, some of which is paid to financial intermediaries for selling shares of the Fund. Depending on the holding period, FDC may receive contingent deferred sales charges levied on Class A, Class M and Class C redemptions. The deferred sales charges are 1.00% for Class C shares, 1.00% for certain purchases of Class A shares and .25% for certain purchases of Class M shares.
For the period, sales charge amounts retained by FDC were as follows:
|
Retained by FDC ($)
|
Class A
|
115,265
|
Class M
|
8,095
|
Class CA
|
856
|
|
124,216
|
A When Class C shares are initially sold, FDC pays commissions from its own resources to financial intermediaries through which the sales are made.
Transfer Agent Fees. Fidelity Investments Institutional Operations Company LLC (FIIOC), an affiliate of the investment adviser, is the transfer, dividend disbursing and shareholder servicing agent for each class of the Fund. Effective March 1, 2024, the Fund's management contract was amended to incorporate transfer agent services and associated fees previously covered under a separate services agreement. FIIOC pays for typesetting, printing and mailing of shareholder reports, except proxy statements.
During November 2023, the Board approved a change in the transfer agent fees effective December 1, 2023 to a fixed annual rate of class-level average net assets as follows:
|
% of Class-Level Average Net Assets
|
Class A
|
.1698
|
Class M
|
.1647
|
Class C
|
.1754
|
Strategic Dividend and Income
|
.1376
|
Class I
|
.1671
|
Prior to December 1, 2023, FIIOC received account fees and asset-based fees that varied according to the account size and type of account of the shareholders of the respective classes of the Fund, except for Class Z. FIIOC received an asset-based fee of Class Z's average net assets. For the portion of the reporting period prior to March 1, 2024, the fees were equivalent to the following annualized rates:
|
Amount ($)
|
% of Class-Level Average Net AssetsA
|
Class A
|
376,568
|
.17
|
Class M
|
122,657
|
.17
|
Class C
|
65,851
|
.18
|
Strategic Dividend and Income
|
1,012,849
|
.14
|
Class I
|
257,351
|
.17
|
Class Z
|
24,923
|
.04
|
|
1,860,199
|
|
A Annualized
Accounting Fees. Fidelity Service Company, Inc. (FSC), an affiliate of the investment adviser, maintains the Fund's accounting records. Effective March 1, 2024, the Fund's management contract was amended to incorporate accounting services and associated fees previously covered under a separate services agreement.
During November 2023, the Board approved a change in the accounting fees effective December 1, 2023 to a fixed annual rate of average net assets as follows:
|
% of Average Net Assets
|
Fidelity Strategic Dividend & Income Fund
|
.0249
|
Prior to December 1, 2023, the accounting fee was based on the level of average net assets for each month. For the portion of the reporting period prior to March 1, 2024, the fees were equivalent to the following annualized rates:
|
% of Average Net Assets
|
Fidelity Strategic Dividend & Income Fund
|
.02
|
Brokerage Commissions. A portion of portfolio transactions were placed with brokerage firms which are affiliates of the investment adviser. Brokerage commissions are included in net realized gain (loss) and change in net unrealized appreciation (depreciation) in the Statement of Operations. The commissions paid to these affiliated firms were as follows:
|
Amount ($)
|
Fidelity Strategic Dividend & Income Fund
|
6,560
|
Interfund Trades. Funds may purchase from or sell securities to other Fidelity Funds under procedures adopted by the Board. The procedures have been designed to ensure these interfund trades are executed in accordance with Rule 17a-7 of the 1940 Act. Any interfund trades are included within the respective purchases and sales amounts shown in the Purchases and Sales of Investments note. Interfund trades during the period are noted in the table below.
|
Purchases ($)
|
Sales ($)
|
Realized Gain (Loss)($)
|
Fidelity Strategic Dividend & Income Fund
|
12,372,834
|
26,924,647
|
8,259,710
|
6. Committed Line of Credit.
Certain Funds participate with other funds managed by the investment adviser or an affiliate in a $4.25 billion credit facility (the "line of credit") to be utilized for temporary or emergency purposes to fund shareholder redemptions or for other short-term liquidity purposes. The participating funds have agreed to pay commitment fees on their pro-rata portion of the line of credit, which are reflected in Miscellaneous expenses on the Statement of Operations, and are listed below. During the period, there were no borrowings on this line of credit.
|
Amount ($)
|
Fidelity Strategic Dividend & Income Fund
|
4,765
|
7. Security Lending.
Funds lend portfolio securities from time to time in order to earn additional income. Lending agents are used, including National Financial Services (NFS), an affiliate of the investment adviser. Pursuant to a securities lending agreement, NFS will receive a fee, which is capped at 9.9% of a fund's daily lending revenue, for its services as lending agent. A fund may lend securities to certain qualified borrowers, including NFS. On the settlement date of the loan, a fund receives collateral (in the form of U.S. Treasury obligations, letters of credit and/or cash) against the loaned securities and maintains collateral in an amount not less than 100% of the market value of the loaned securities during the period of the loan. The market value of the loaned securities is determined at the close of business of a fund and any additional required collateral is delivered to a fund on the next business day. A fund or borrower may terminate the loan at any time, and if the borrower defaults on its obligation to return the securities loaned because of insolvency or other reasons, a fund may apply collateral received from the borrower against the obligation. A fund may experience delays and costs in recovering the securities loaned. Any cash collateral received is invested in the Fidelity Securities Lending Cash Central Fund. Any loaned securities are identified as such in the Schedule of Investments, and the value of loaned securities and cash collateral at period end, as applicable, are presented in the Statement of Assets and Liabilities. Security lending income represents the income earned on investing cash collateral, less rebates paid to borrowers and any lending agent fees associated with the loan, plus any premium payments received for lending certain types of securities. Security lending income is presented in the Statement of Operations as a component of income from Fidelity Central Funds. Affiliated security lending activity, if any, was as follows:
|
Total Security Lending Fees Paid to NFS ($)
|
Security Lending Income From Securities Loaned to NFS ($)
|
Value of Securities Loaned to NFS at Period End ($)
|
Fidelity Strategic Dividend & Income Fund
|
815
|
-
|
-
|
8. Expense Reductions.
Through arrangements with the Fund's custodian, credits realized as a result of certain uninvested cash balances were used to reduce the Fund's expenses. During the period, custodian credits reduced the Fund's expenses by $31,947.
In addition, during the period the investment adviser or an affiliate reimbursed and/or waived a portion of fund-level operating expenses in the amount of $228,573.
9. Distributions to Shareholders.
Distributions to shareholders of each class were as follows:
|
Six months ended
May 31, 2024
|
Year ended
November 30, 2023
|
Fidelity Strategic Dividend & Income Fund
|
|
|
Distributions to shareholders
|
|
|
Class A
|
$36,811,299
|
$34,896,865
|
Class M
|
11,958,072
|
11,232,837
|
Class C
|
5,749,140
|
5,885,537
|
Strategic Dividend and Income
|
126,060,593
|
127,313,172
|
Class I
|
26,133,775
|
27,077,704
|
Class Z
|
10,166,308
|
9,293,029
|
Total
|
$216,879,187
|
$215,699,144
|
10. Share Transactions.
Share transactions for each class were as follows and may contain in-kind transactions, automatic conversions between classes or exchanges between affiliated funds:
|
Shares
|
Shares
|
Dollars
|
Dollars
|
|
Six months ended
May 31, 2024
|
Year ended
November 30, 2023
|
Six months ended
May 31, 2024
|
Year ended
November 30, 2023
|
Fidelity Strategic Dividend & Income Fund
|
|
|
|
|
Class A
|
|
|
|
|
Shares sold
|
3,360,698
|
7,561,678
|
$54,022,885
|
$117,453,014
|
Reinvestment of distributions
|
2,261,288
|
2,211,255
|
35,679,528
|
33,782,563
|
Shares redeemed
|
(5,344,347)
|
(9,745,137)
|
(85,711,575)
|
(150,986,608)
|
Net increase (decrease)
|
277,639
|
27,796
|
$3,990,838
|
$248,969
|
Class M
|
|
|
|
|
Shares sold
|
1,067,122
|
1,968,340
|
$17,104,444
|
$30,561,012
|
Reinvestment of distributions
|
751,679
|
729,348
|
11,854,164
|
11,141,435
|
Shares redeemed
|
(2,102,604)
|
(3,385,051)
|
(33,770,191)
|
(52,479,665)
|
Net increase (decrease)
|
(283,803)
|
(687,363)
|
$(4,811,583)
|
$(10,777,218)
|
Class C
|
|
|
|
|
Shares sold
|
400,627
|
1,285,125
|
$6,410,988
|
$19,977,665
|
Reinvestment of distributions
|
361,557
|
381,448
|
5,680,622
|
5,807,925
|
Shares redeemed
|
(1,861,516)
|
(4,023,040)
|
(29,798,180)
|
(62,146,234)
|
Net increase (decrease)
|
(1,099,332)
|
(2,356,467)
|
$(17,706,570)
|
$(36,360,644)
|
Strategic Dividend and Income
|
|
|
|
|
Shares sold
|
9,683,433
|
15,206,763
|
$157,022,694
|
$238,823,522
|
Reinvestment of distributions
|
6,864,769
|
7,211,435
|
109,334,885
|
111,124,928
|
Shares redeemed
|
(17,567,510)
|
(31,571,198)
|
(284,345,552)
|
(493,891,504)
|
Net increase (decrease)
|
(1,019,308)
|
(9,153,000)
|
$(17,987,973)
|
$(143,943,054)
|
Class I
|
|
|
|
|
Shares sold
|
2,951,181
|
6,813,633
|
$47,658,538
|
$106,609,218
|
Reinvestment of distributions
|
1,560,550
|
1,658,668
|
24,758,082
|
25,466,578
|
Shares redeemed
|
(5,580,982)
|
(10,837,665)
|
(90,089,599)
|
(168,888,581)
|
Net increase (decrease)
|
(1,069,251)
|
(2,365,364)
|
$(17,672,979)
|
$(36,812,785)
|
Class Z
|
|
|
|
|
Shares sold
|
1,824,806
|
4,712,904
|
$29,345,504
|
$73,832,941
|
Reinvestment of distributions
|
550,144
|
522,283
|
8,729,786
|
8,014,190
|
Shares redeemed
|
(2,232,245)
|
(2,992,888)
|
(36,034,465)
|
(46,501,374)
|
Net increase (decrease)
|
142,705
|
2,242,299
|
$2,040,825
|
$35,345,757
|
11. Other.
A fund's organizational documents provide former and current trustees and officers with a limited indemnification against liabilities arising in connection with the performance of their duties to the fund. In the normal course of business, a fund may also enter into contracts that provide general indemnifications. A fund's maximum exposure under these arrangements is unknown as this would be dependent on future claims that may be made against a fund. The risk of material loss from such claims is considered remote.
12. Risk and Uncertainties.
Many factors affect a fund's performance. Developments that disrupt global economies and financial markets, such as pandemics, epidemics, outbreaks of infectious diseases, war, terrorism, and environmental disasters, may significantly affect a fund's investment performance. The effects of these developments to a fund will be impacted by the types of securities in which a fund invests, the financial condition, industry, economic sector, and geographic location of an issuer, and a fund's level of investment in the securities of that issuer. Significant concentrations in security types, issuers, industries, sectors, and geographic locations may magnify the factors that affect a fund's performance.
Item 8: Changes in and Disagreements with Accountants for Open-End Management Investment Companies
Note: This is not applicable for any fund included in this document.
Item 9: Proxy Disclosures for Open-End Management Investment Companies
Note: This is not applicable for any fund included in this document.
Item 10: Renumeration Paid to Directors, Officers, and others of Open-End Management Investment Companies
Note: This information is disclosed as part of the financial statements for each Fund as part of Item 7: Financial Statements and Financial Highlights for Open-End Management Investment companies.
Item 11: Statement Regarding Basis for Approval of Investment Advisory Contract
Board Approval of Investment Advisory Contracts
Fidelity Strategic Dividend & Income Fund
At its January 2024 meeting, the Board of Trustees, including the Independent Trustees (together, the Board), approved an amended and restated management contract with Fidelity Management & Research Company LLC (FMR) (the Management Contract), and amended and restated sub-advisory agreements (the Sub-Advisory Contracts, and together with the Management Contract, the Advisory Contracts) for the fund, including the fund's sub-advisory agreements with FMR Investment Management (UK) Limited (FMR UK), Fidelity Management & Research (Hong Kong) Limited (FMR H.K.), and Fidelity Management & Research (Japan) Limited (FMR Japan). The Advisory Contracts will be effective March 1, 2024. The Board will consider the annual renewal of the fund's Advisory Contracts in September 2024, following its review of additional materials provided by FMR.
Management Contract. The Board approved the Management Contract, which implements a new fee structure combining the management fee, transfer agent fee (TA Fee), and pricing and bookkeeping fee (P&B Fee) of the fund and each class into a single class-level fee based on tiered schedules and subject to a maximum class-level rate (the Unified Fee). In exchange for the Unified Fee, the fund will receive investment advisory, management, administrative, transfer agent, pricing and bookkeeping services under a single agreement - the Management Contract.
In its consideration of the Management Contract over several meetings, the Board received, reviewed and discussed a comprehensive set of analyses regarding the Unified Fee including (i) the legal framework, (ii) design goals for the Unified Fee, (iii) calculation methodology for the Unified Fee and illustrative examples, (iv) annual and cumulative projected impacts under various scenarios, both in the aggregate and at the fund/class level, (v) explanations of schedules, rate levers and maximum rates and (vi) shareholder benefits and projected savings.
The Board considered that the maximum Unified Fee for each class of the fund would be no higher than the sum of (i) the lowest contractual management fee under the fund's existing management contract, which is the individual fund fee, if any, plus the lowest contractual marginal group fee rate and (ii) the TA and P&B Fee rates, which are fixed fee rates since December 1, 2023 (together, the "Unified Fee Cap"). The Board noted that, as a result of this Unified Fee Cap, the Unified Fee would be no greater than the fees previously authorized to be charged for the same services. The Board noted that certain expenses such as third-party expenses, Rule 12b-1 fees, and certain other miscellaneous expenses would be outside the scope of the Unified Fee and the calculation of such fees would not change as a result of the Unified Fee. The Board considered that, under the Management Contract, a different management fee rate will be applicable to each class of the fund. The Board noted that Fidelity has represented that the difference in expenses between classes is based on differences in class-specific expenses and not due to any difference in advisory or third-party custodial fees or other expenses related to the management of the fund's assets.
The Board considered that implementation of the Unified Fee, which includes the Unified Fee Cap, would cause all funds subject to a Unified Fee, including the fund, to experience an immediate reduction on contractual fee rates for services provided under the current management contracts. The Board considered that some funds would not experience lower fees as a result of existing fee caps. The Board further considered that, in addition to the contractual fee savings, the Unified Fee offers funds and their shareholders greater protection from future rate increases for services previously offered under separate agreements that are now covered by the Management Contract because such rate increases would require shareholder, as well as Board, approval.
Sub-Advisory Contracts. In connection with the Unified Fee changes, the Board considered the Sub-Advisory Contracts, which changed the arrangements for fees paid by FMR to the sub-advisers under the agreements. The Board noted that the agreements with FMR UK, FMR H.K., and FMR Japan were amended to provide that FMR will compensate each sub-adviser at a fee equal to 110% of the sub-adviser's costs incurred in providing services under the agreement. The Board considered that, under the Sub-Advisory Contracts, FMR, and not the fund, will continue to pay the sub-advisory fees to each applicable sub-adviser.
The Board considered that the approval of the fund's Advisory Contracts will not result in any changes in the investment process or strategies employed in the management of the fund's assets or the day-to-day management of the fund or the persons primarily responsible for such management. Further, the Board considered that the Management Contract would not change the obligations and services of FMR and its affiliates on behalf of the fund, and, in particular, there would be no change in the nature and level of advisory, management, administration, transfer agent, and pricing and bookkeeping services provided to the fund by FMR and its affiliates.
In connection with its consideration of future renewals of the fund's Advisory Contracts, the Board will consider: (i) the nature, extent and quality of services provided to the funds, including shareholder and administrative services and investment performance; (ii) the competitiveness of the management fee and total expenses for the fund; (iii) the costs of the services and profitability, including the revenues earned and the expenses incurred in conducting the business of developing, marketing, distributing, managing, administering, and servicing the fund and its shareholders, to the extent applicable; and (iv) whether there have been economies of scale in respect of the Fidelity funds, whether the Fidelity funds (including the fund) have appropriately benefited from any such economies of scale, and whether there is the potential for realization of any further economies.
Based on its evaluation of all of the conclusions noted above, and after considering all factors it believed relevant, the Board concluded that the fund's management fee structure is fair and reasonable, and that the fund's Advisory Contracts should be approved.
1.802376.120
SDI-SANN-0724
Item 8.
Changes in and Disagreements with Accountants for Open-End Management Investment Companies
See Item 7.
Item 9.
Proxy Disclosures for Open-End Management Investment Companies
See Item 7.
Item 10.
Remuneration Paid to Directors, Officers, and Others of Open-End Management Investment Companies
See Item 7.
Item 11.
Statement Regarding Basis for Approval of Investment Advisory Contract
See Item 7.
Item 12.
Disclosure of Proxy Voting Policies and Procedures for Closed-End Management Investment Companies
Not applicable.
Item 13.
Portfolio Managers of Closed-End Management Investment Companies
Not applicable.
Item 14.
Purchases of Equity Securities by Closed-End Management Investment Company and Affiliated Purchasers
Not applicable.
Item 15.
Submission of Matters to a Vote of Security Holders
There were no material changes to the procedures by which shareholders may recommend nominees to the Fidelity Salem Street Trust’s Board of Trustees.
Item 16.
Controls and Procedures
(a)(i) The President and Treasurer and the Chief Financial Officer have concluded that the Fidelity Salem Street Trust’s (the “Trust”) disclosure controls and procedures (as defined in Rule 30a-3(c) under the Investment Company Act) provide reasonable assurances that material information relating to the Trust is made known to them by the appropriate persons, based on their evaluation of these controls and procedures as of a date within 90 days of the filing date of this report.
(a)(ii) There was no change in the Trust’s internal control over financial reporting (as defined in Rule 30a-3(d) under the Investment Company Act) that occurred during the period covered by this report that has materially affected, or is reasonably likely to materially affect, the Trust’s internal control over financial reporting.
Item 17.
Disclosure of Securities Lending Activities for Closed-End Management Investment Companies
Not applicable.
Item 18.
Recovery of Erroneously Awarded Compensation
(a)
Not applicable.
(b)
Not applicable.
Item 19.
Exhibits
SIGNATURES
Pursuant to the requirements of the Securities Exchange Act of 1934 and the Investment Company Act of 1940, the registrant has duly caused this report to be signed on its behalf by the undersigned, thereunto duly authorized.
Fidelity Salem Street Trust
| |
| By: | /s/Laura M. Del Prato |
|
| Laura M. Del Prato |
|
| President and Treasurer (Principal Executive Officer) |
|
|
|
| Date: | July 23, 2024 |
Pursuant to the requirements of the Securities Exchange Act of 1934 and the Investment Company Act of 1940, this report has been signed below by the following persons on behalf of the registrant and in the capacities and on the dates indicated.
| |
| By: | /s/Laura M. Del Prato |
|
| Laura M. Del Prato |
|
| President and Treasurer (Principal Executive Officer) |
|
|
|
| Date: | July 23, 2024 |
| |
| By: | /s/John J. Burke III |
|
| John J. Burke III |
|
| Chief Financial Officer (Principal Financial Officer) |
|
|
|
| Date: | July 23, 2024 |
Exhibit EX-99.CERT
I, Laura M. Del Prato, certify that:
1.
I have reviewed this report on Form N-CSR of Fidelity Salem Street Trust;
2.
Based on my knowledge, this report does not contain any untrue statement of a material fact or omit to state a material fact necessary to make the statements made, in light of the circumstances under which such statements were made, not misleading with respect to the period covered by this report;
3.
Based on my knowledge, the financial statements, and other financial information included in this report, fairly present in all material respects the financial condition, results of operations, changes in net assets, and cash flows (if the financial statements are required to include a statement of cash flows) of the registrant as of, and for, the periods presented in this report;
4.
The registrant's other certifying officer(s) and I are responsible for establishing and maintaining disclosure controls and procedures (as defined in Rule 30a-3(c) under the Investment Company Act of 1940) and internal control over financial reporting (as defined in Rule 30a-3(d) under the Investment Company Act of 1940) for the registrant and have:
a.
Designed such disclosure controls and procedures, or caused such disclosure controls and procedures to be designed under our supervision, to ensure that material information relating to the registrant, including its consolidated subsidiaries, is made known to us by others within those entities, particularly during the period in which this report is being prepared;
b.
Designed such internal control over financial reporting, or caused such internal control over financial reporting to be designed under our supervision, to provide reasonable assurance regarding the reliability of financial reporting and the preparation of financial statements for external purposes in accordance with generally accepted accounting principles;
c.
Evaluated the effectiveness of the registrant's disclosure controls and procedures and presented in this report our conclusions about the effectiveness of the disclosure controls and procedures, as of a date within 90 days prior to the filing date of this report based upon such evaluation; and
d.
Disclosed in this report any change in the registrant’s internal control over financial reporting that occurred during the period covered by this report that has materially affected, or is reasonably likely to materially affect, the registrant’s internal control over financial reporting; and
5.
The registrant's other certifying officer(s) and I have disclosed to the registrant's auditors and the audit committee of the registrant's board of directors (or persons performing the equivalent functions):
a.
All significant deficiencies and material weaknesses in the design or operation of internal control over financial reporting which are reasonably likely to adversely affect the registrant's ability to record, process, summarize, and report financial information; and
b.
Any fraud, whether or not material, that involves management or other employees who have a significant role in the registrant's internal control over financial reporting.
Date:
July 23, 2024
|
/s/Laura M. Del Prato
|
Laura M. Del Prato
|
President and Treasurer (Principal Executive Officer)
|
I, John J. Burke III, certify that:
1.
I have reviewed this report on Form N-CSR of Fidelity Salem Street Trust;
2.
Based on my knowledge, this report does not contain any untrue statement of a material fact or omit to state a material fact necessary to make the statements made, in light of the circumstances under which such statements were made, not misleading with respect to the period covered by this report;
3.
Based on my knowledge, the financial statements, and other financial information included in this report, fairly present in all material respects the financial condition, results of operations, changes in net assets, and cash flows (if the financial statements are required to include a statement of cash flows) of the registrant as of, and for, the periods presented in this report;
4.
The registrant's other certifying officer(s) and I are responsible for establishing and maintaining disclosure controls and procedures (as defined in Rule 30a-3(c) under the Investment Company Act of 1940) and internal control over financial reporting (as defined in Rule 30a-3(d) under the Investment Company Act of 1940) for the registrant and have:
a.
Designed such disclosure controls and procedures, or caused such disclosure controls and procedures to be designed under our supervision, to ensure that material information relating to the registrant, including its consolidated subsidiaries, is made known to us by others within those entities, particularly during the period in which this report is being prepared;
b.
Designed such internal control over financial reporting, or caused such internal control over financial reporting to be designed under our supervision, to provide reasonable assurance regarding the reliability of financial reporting and the preparation of financial statements for external purposes in accordance with generally accepted accounting principles;
c.
Evaluated the effectiveness of the registrant's disclosure controls and procedures and presented in this report our conclusions about the effectiveness of the disclosure controls and procedures, as of a date within 90 days prior to the filing date of this report based upon such evaluation; and
d.
Disclosed in this report any change in the registrant’s internal control over financial reporting that occurred during the period covered by this report that has materially affected, or is reasonably likely to materially affect, the registrant’s internal control over financial reporting; and
5.
The registrant's other certifying officer(s) and I have disclosed to the registrant's auditors and the audit committee of the registrant's board of directors (or persons performing the equivalent functions):
a.
All significant deficiencies and material weaknesses in the design or operation of internal control over financial reporting which are reasonably likely to adversely affect the registrant's ability to record, process, summarize, and report financial information; and
b.
Any fraud, whether or not material, that involves management or other employees who have a significant role in the registrant's internal control over financial reporting.
Date:
July 23, 2024
|
/s/John J. Burke III
|
John J. Burke III
|
Chief Financial Officer (Principal Financial Officer)
|
Exhibit EX-99.906CERT
Certification Pursuant to Section 906 of the Sarbanes-Oxley Act of 2002 (subsections (a) and (b) of section 1350, chapter 63 of title 18, United States Code)
In connection with the attached Report of Fidelity Salem Street Trust (the “Trust”) on Form N-CSR to be filed with the Securities and Exchange Commission (the “Report”), each of the undersigned officers of the Trust does hereby certify that, to the best of such officer’s knowledge:
1.
The Report fully complies with the requirements of 13(a) or 15(d) of the Securities Exchange Act of 1934; and
2.
The information contained in the Report fairly presents, in all material respects, the financial condition and results of operations of the Trust as of, and for, the periods presented in the Report.
Dated: July 23, 2024
|
/s/Laura M. Del Prato
|
Laura M. Del Prato
|
President and Treasurer (Principal Executive Officer)
|
Dated: July 23, 2024
|
/s/John J. Burke III
|
John J. Burke III
|
Chief Financial Officer (Principal Financial Officer)
|
A signed original of this written statement required by Section 906, or other document authenticating, acknowledging, or otherwise adopting the signature that appears in typed form within the electronic version of this written statement required by Section 906, has been provided to the Trust and will be retained by the Trust and furnished to the Securities and Exchange Commission or its staff upon request.
| X |
- DefinitionBoolean flag that is true when the XBRL content amends previously-filed or accepted submission.
| Name: |
dei_AmendmentFlag |
| Namespace Prefix: |
dei_ |
| Data Type: |
xbrli:booleanItemType |
| Balance Type: |
na |
| Period Type: |
duration |
|
| X |
- DefinitionFor the EDGAR submission types of Form 8-K: the date of the report, the date of the earliest event reported; for the EDGAR submission types of Form N-1A: the filing date; for all other submission types: the end of the reporting or transition period. The format of the date is YYYY-MM-DD.
| Name: |
dei_DocumentPeriodEndDate |
| Namespace Prefix: |
dei_ |
| Data Type: |
xbrli:dateItemType |
| Balance Type: |
na |
| Period Type: |
duration |
|
| X |
- DefinitionThe type of document being provided (such as 10-K, 10-Q, 485BPOS, etc). The document type is limited to the same value as the supporting SEC submission type, or the word 'Other'.
| Name: |
dei_DocumentType |
| Namespace Prefix: |
dei_ |
| Data Type: |
dei:submissionTypeItemType |
| Balance Type: |
na |
| Period Type: |
duration |
|
| X |
- DefinitionA unique 10-digit SEC-issued value to identify entities that have filed disclosures with the SEC. It is commonly abbreviated as CIK. Reference 1: http://www.xbrl.org/2003/role/presentationRef
-Publisher SEC
-Name Exchange Act
-Number 240
-Section 12
-Subsection b-2
| Name: |
dei_EntityCentralIndexKey |
| Namespace Prefix: |
dei_ |
| Data Type: |
dei:centralIndexKeyItemType |
| Balance Type: |
na |
| Period Type: |
duration |
|
| X |
- DefinitionOne of: N-1A (Mutual Fund), N-1 (Open-End Separate Account with No Variable Annuities), N-2 (Closed-End Investment Company), N-3 (Separate Account Registered as Open-End Management Investment Company), N-4 (Variable Annuity UIT Separate Account), N-5 (Small Business Investment Company), N-6 (Variable Life UIT Separate Account), S-1 or S-3 (Face Amount Certificate Company), S-6 (UIT, Non-Insurance Product). Reference 1: http://www.xbrl.org/2003/role/presentationRef
-Publisher SEC
-Name Regulation S-T
-Number 232
-Section 313
| Name: |
dei_EntityInvCompanyType |
| Namespace Prefix: |
dei_ |
| Data Type: |
dei:invCompanyType |
| Balance Type: |
na |
| Period Type: |
duration |
|
| X |
- DefinitionThe exact name of the entity filing the report as specified in its charter, which is required by forms filed with the SEC. Reference 1: http://www.xbrl.org/2003/role/presentationRef
-Publisher SEC
-Name Exchange Act
-Number 240
-Section 12
-Subsection b-2
| Name: |
dei_EntityRegistrantName |
| Namespace Prefix: |
dei_ |
| Data Type: |
xbrli:normalizedStringItemType |
| Balance Type: |
na |
| Period Type: |
duration |
|
| X |
- ReferencesReference 1: http://www.xbrl.org/2003/role/presentationRef
-Publisher SEC
-Name Form N-1A
-Section 27A
-Subsection d
-Paragraph 2
-Subparagraph instruction
-Clause 7
| Name: |
oef_ShareholderReportLineItems |
| Namespace Prefix: |
oef_ |
| Data Type: |
xbrli:stringItemType |
| Balance Type: |
na |
| Period Type: |
duration |
|
v3.24.2
Shareholder Report
|
6 Months Ended |
|
May 31, 2024
USD ($)
shares
|
|---|
| Shareholder Report [Line Items] |
|
| Document Type |
N-CSRS
|
| Amendment Flag |
false
|
| Registrant Name |
Fidelity Salem Street Trust
|
| Entity Central Index Key |
0000035315
|
| Entity Investment Company Type |
N-1A
|
| Document Period End Date |
May 31, 2024
|
| Fidelity Advisor Strategic Dividend & Income Fund - Class I |
|
| Shareholder Report [Line Items] |
|
| Fund Name |
Fidelity® Strategic Dividend & Income® Fund
|
| Class Name |
Fidelity Advisor® Strategic Dividend & Income® Fund Class I
|
| Trading Symbol |
FSIDX
|
| Annual or Semi-Annual Statement [Text Block] |
This semi-annual shareholder report contains information about Fidelity® Strategic Dividend & Income® Fund for the period December 1, 2023 to May 31, 2024.
|
| Shareholder Report Annual or Semi-Annual |
semi-annual shareholder report
|
| Additional Information [Text Block] |
You can find additional information about the Fund at fundresearch.fidelity.com/prospectus/sec. You can also request this information by contacting us at 1-877-208-0098 or by sending an e-mail to fidfunddocuments@fidelity.com.
|
| Additional Information Phone Number |
1-877-208-0098
|
| Additional Information Email |
fidfunddocuments@fidelity.com
|
| Additional Information Website |
fundresearch.fidelity.com/prospectus/sec
|
| Expenses [Text Block] |
What were your Fund costs for the last six months?
(based on hypothetical $10,000 investment)
|
Costs of a $10,000 investment
|
Costs paid as a percentage of a $10,000 investment
|
|
Class I
|
$ 36
|
0.69%
|
|
|
| Expenses Paid, Amount |
$ 36
|
| Expense Ratio, Percent |
0.69%
|
| Net Assets |
$ 5,200,751,501
|
| Holdings Count | shares |
594
|
| Investment Company Portfolio Turnover |
29.00%
|
| Additional Fund Statistics [Text Block] |
Key Fund Statistics
(as of May 31, 2024)
KEY FACTS
|
|
|
Fund Size
|
$5,200,751,501
|
|
Number of Holdings
|
594
|
|
Portfolio Turnover
|
29%
|
|
|
| Holdings [Text Block] |
MARKET SECTORS
(% of Fund's net assets)
Real Estate
16.4
Financials
13.1
Industrials
8.9
Consumer Staples
7.6
Information Technology
6.7
Energy
5.8
Health Care
5.8
Utilities
5.2
Communication Services
3.3
Consumer Discretionary
2.9
Materials
1.8
Dividend-Paying Equities
50.1
Preferred Stock
20.8
REITs
15.3
Convertibles
10.7
Global Infrastructure Equities
3.1
MLPs
0.4
Commodity Equities
0.0
ASSET ALLOCATION (% of Fund's net assets)
Short-Term Investments and Net Other Assets (Liabilities) - (0.4)%
United States
94.0
Canada
1.4
United Kingdom
1.0
Taiwan
0.9
China
0.7
Korea (South)
0.5
Japan
0.4
Spain
0.4
Germany
0.3
Others
0.4
GEOGRAPHIC DIVERSIFICATION (% of Fund's net assets)
|
| Largest Holdings [Text Block] |
TOP HOLDINGS
(% of Fund's net assets)
Exxon Mobil Corp
2.9
Procter & Gamble Co/The
2.4
Prologis Inc
2.1
Coca-Cola Co/The
1.8
Eaton Corp PLC
1.7
Johnson & Johnson
1.6
Equinix Inc
1.5
McDonald's Corp
1.5
US Treasury Bonds
1.4
Cisco Systems Inc
1.4
18.3
|
| Fidelity Advisor Strategic Dividend & Income Fund - Class C |
|
| Shareholder Report [Line Items] |
|
| Fund Name |
Fidelity® Strategic Dividend & Income® Fund
|
| Class Name |
Fidelity Advisor® Strategic Dividend & Income® Fund Class C
|
| Trading Symbol |
FCSDX
|
| Annual or Semi-Annual Statement [Text Block] |
This semi-annual shareholder report contains information about Fidelity® Strategic Dividend & Income® Fund for the period December 1, 2023 to May 31, 2024.
|
| Shareholder Report Annual or Semi-Annual |
semi-annual shareholder report
|
| Additional Information [Text Block] |
You can find additional information about the Fund at fundresearch.fidelity.com/prospectus/sec. You can also request this information by contacting us at 1-877-208-0098 or by sending an e-mail to fidfunddocuments@fidelity.com.
|
| Additional Information Phone Number |
1-877-208-0098
|
| Additional Information Email |
fidfunddocuments@fidelity.com
|
| Additional Information Website |
fundresearch.fidelity.com/prospectus/sec
|
| Expenses [Text Block] |
What were your Fund costs for the last six months?
(based on hypothetical $10,000 investment)
|
Costs of a $10,000 investment
|
Costs paid as a percentage of a $10,000 investment
|
|
Class C
|
$ 88
|
1.69%
|
|
|
| Expenses Paid, Amount |
$ 88
|
| Expense Ratio, Percent |
1.69%
|
| Net Assets |
$ 5,200,751,501
|
| Holdings Count | shares |
594
|
| Investment Company Portfolio Turnover |
29.00%
|
| Additional Fund Statistics [Text Block] |
Key Fund Statistics
(as of May 31, 2024)
KEY FACTS
|
|
|
Fund Size
|
$5,200,751,501
|
|
Number of Holdings
|
594
|
|
Portfolio Turnover
|
29%
|
|
|
| Holdings [Text Block] |
MARKET SECTORS
(% of Fund's net assets)
Real Estate
16.4
Financials
13.1
Industrials
8.9
Consumer Staples
7.6
Information Technology
6.7
Energy
5.8
Health Care
5.8
Utilities
5.2
Communication Services
3.3
Consumer Discretionary
2.9
Materials
1.8
Dividend-Paying Equities
50.1
Preferred Stock
20.8
REITs
15.3
Convertibles
10.7
Global Infrastructure Equities
3.1
MLPs
0.4
Commodity Equities
0.0
ASSET ALLOCATION (% of Fund's net assets)
Short-Term Investments and Net Other Assets (Liabilities) - (0.4)%
United States
94.0
Canada
1.4
United Kingdom
1.0
Taiwan
0.9
China
0.7
Korea (South)
0.5
Japan
0.4
Spain
0.4
Germany
0.3
Others
0.4
GEOGRAPHIC DIVERSIFICATION (% of Fund's net assets)
|
| Largest Holdings [Text Block] |
TOP HOLDINGS
(% of Fund's net assets)
Exxon Mobil Corp
2.9
Procter & Gamble Co/The
2.4
Prologis Inc
2.1
Coca-Cola Co/The
1.8
Eaton Corp PLC
1.7
Johnson & Johnson
1.6
Equinix Inc
1.5
McDonald's Corp
1.5
US Treasury Bonds
1.4
Cisco Systems Inc
1.4
18.3
|
| Fidelity Advisor Strategic Dividend & Income Fund - Class M |
|
| Shareholder Report [Line Items] |
|
| Fund Name |
Fidelity® Strategic Dividend & Income® Fund
|
| Class Name |
Fidelity Advisor® Strategic Dividend & Income® Fund Class M
|
| Trading Symbol |
FTSDX
|
| Annual or Semi-Annual Statement [Text Block] |
This semi-annual shareholder report contains information about Fidelity® Strategic Dividend & Income® Fund for the period December 1, 2023 to May 31, 2024.
|
| Shareholder Report Annual or Semi-Annual |
semi-annual shareholder report
|
| Additional Information [Text Block] |
You can find additional information about the Fund at fundresearch.fidelity.com/prospectus/sec. You can also request this information by contacting us at 1-877-208-0098 or by sending an e-mail to fidfunddocuments@fidelity.com.
|
| Additional Information Phone Number |
1-877-208-0098
|
| Additional Information Email |
fidfunddocuments@fidelity.com
|
| Additional Information Website |
fundresearch.fidelity.com/prospectus/sec
|
| Expenses [Text Block] |
What were your Fund costs for the last six months?
(based on hypothetical $10,000 investment)
|
Costs of a $10,000 investment
|
Costs paid as a percentage of a $10,000 investment
|
|
Class M
|
$ 62
|
1.19%
|
|
|
| Expenses Paid, Amount |
$ 62
|
| Expense Ratio, Percent |
1.19%
|
| Net Assets |
$ 5,200,751,501
|
| Holdings Count | shares |
594
|
| Investment Company Portfolio Turnover |
29.00%
|
| Additional Fund Statistics [Text Block] |
Key Fund Statistics
(as of May 31, 2024)
KEY FACTS
|
|
|
Fund Size
|
$5,200,751,501
|
|
Number of Holdings
|
594
|
|
Portfolio Turnover
|
29%
|
|
|
| Holdings [Text Block] |
MARKET SECTORS
(% of Fund's net assets)
Real Estate
16.4
Financials
13.1
Industrials
8.9
Consumer Staples
7.6
Information Technology
6.7
Energy
5.8
Health Care
5.8
Utilities
5.2
Communication Services
3.3
Consumer Discretionary
2.9
Materials
1.8
Dividend-Paying Equities
50.1
Preferred Stock
20.8
REITs
15.3
Convertibles
10.7
Global Infrastructure Equities
3.1
MLPs
0.4
Commodity Equities
0.0
ASSET ALLOCATION (% of Fund's net assets)
Short-Term Investments and Net Other Assets (Liabilities) - (0.4)%
United States
94.0
Canada
1.4
United Kingdom
1.0
Taiwan
0.9
China
0.7
Korea (South)
0.5
Japan
0.4
Spain
0.4
Germany
0.3
Others
0.4
GEOGRAPHIC DIVERSIFICATION (% of Fund's net assets)
|
| Largest Holdings [Text Block] |
TOP HOLDINGS
(% of Fund's net assets)
Exxon Mobil Corp
2.9
Procter & Gamble Co/The
2.4
Prologis Inc
2.1
Coca-Cola Co/The
1.8
Eaton Corp PLC
1.7
Johnson & Johnson
1.6
Equinix Inc
1.5
McDonald's Corp
1.5
US Treasury Bonds
1.4
Cisco Systems Inc
1.4
18.3
|
| Fidelity Advisor Strategic Dividend & Income Fund - Class A |
|
| Shareholder Report [Line Items] |
|
| Fund Name |
Fidelity® Strategic Dividend & Income® Fund
|
| Class Name |
Fidelity Advisor® Strategic Dividend & Income® Fund Class A
|
| Trading Symbol |
FASDX
|
| Annual or Semi-Annual Statement [Text Block] |
This semi-annual shareholder report contains information about Fidelity® Strategic Dividend & Income® Fund for the period December 1, 2023 to May 31, 2024.
|
| Shareholder Report Annual or Semi-Annual |
semi-annual shareholder report
|
| Additional Information [Text Block] |
You can find additional information about the Fund at fundresearch.fidelity.com/prospectus/sec. You can also request this information by contacting us at 1-877-208-0098 or by sending an e-mail to fidfunddocuments@fidelity.com.
|
| Additional Information Phone Number |
1-877-208-0098
|
| Additional Information Email |
fidfunddocuments@fidelity.com
|
| Additional Information Website |
fundresearch.fidelity.com/prospectus/sec
|
| Expenses [Text Block] |
What were your Fund costs for the last six months?
(based on hypothetical $10,000 investment)
|
Costs of a $10,000 investment
|
Costs paid as a percentage of a $10,000 investment
|
|
Class A
|
$ 49
|
0.94%
|
|
|
| Expenses Paid, Amount |
$ 49
|
| Expense Ratio, Percent |
0.94%
|
| Net Assets |
$ 5,200,751,501
|
| Holdings Count | shares |
594
|
| Investment Company Portfolio Turnover |
29.00%
|
| Additional Fund Statistics [Text Block] |
Key Fund Statistics
(as of May 31, 2024)
KEY FACTS
|
|
|
Fund Size
|
$5,200,751,501
|
|
Number of Holdings
|
594
|
|
Portfolio Turnover
|
29%
|
|
|
| Holdings [Text Block] |
MARKET SECTORS
(% of Fund's net assets)
Real Estate
16.4
Financials
13.1
Industrials
8.9
Consumer Staples
7.6
Information Technology
6.7
Energy
5.8
Health Care
5.8
Utilities
5.2
Communication Services
3.3
Consumer Discretionary
2.9
Materials
1.8
Dividend-Paying Equities
50.1
Preferred Stock
20.8
REITs
15.3
Convertibles
10.7
Global Infrastructure Equities
3.1
MLPs
0.4
Commodity Equities
0.0
ASSET ALLOCATION (% of Fund's net assets)
Short-Term Investments and Net Other Assets (Liabilities) - (0.4)%
United States
94.0
Canada
1.4
United Kingdom
1.0
Taiwan
0.9
China
0.7
Korea (South)
0.5
Japan
0.4
Spain
0.4
Germany
0.3
Others
0.4
GEOGRAPHIC DIVERSIFICATION (% of Fund's net assets)
|
| Largest Holdings [Text Block] |
TOP HOLDINGS
(% of Fund's net assets)
Exxon Mobil Corp
2.9
Procter & Gamble Co/The
2.4
Prologis Inc
2.1
Coca-Cola Co/The
1.8
Eaton Corp PLC
1.7
Johnson & Johnson
1.6
Equinix Inc
1.5
McDonald's Corp
1.5
US Treasury Bonds
1.4
Cisco Systems Inc
1.4
18.3
|
| Fidelity Strategic Dividend & Income Fund |
|
| Shareholder Report [Line Items] |
|
| Fund Name |
Fidelity® Strategic Dividend & Income® Fund
|
| Class Name |
Fidelity® Strategic Dividend & Income® Fund
|
| Trading Symbol |
FSDIX
|
| Annual or Semi-Annual Statement [Text Block] |
This semi-annual shareholder report contains information about Fidelity® Strategic Dividend & Income® Fund for the period December 1, 2023 to May 31, 2024.
|
| Shareholder Report Annual or Semi-Annual |
semi-annual shareholder report
|
| Additional Information [Text Block] |
You can find additional information about the Fund at fundresearch.fidelity.com/prospectus/sec. You can also request this information by contacting us at 1-800-544-8544 or by sending an e-mail to fidfunddocuments@fidelity.com.
|
| Additional Information Phone Number |
1-800-544-8544
|
| Additional Information Email |
fidfunddocuments@fidelity.com
|
| Additional Information Website |
fundresearch.fidelity.com/prospectus/sec
|
| Expenses [Text Block] |
What were your Fund costs for the last six months?
(based on hypothetical $10,000 investment)
|
Costs of a $10,000 investment
|
Costs paid as a percentage of a $10,000 investment
|
|
Fidelity® Strategic Dividend & Income® Fund
|
$ 34
|
0.66%
|
|
|
| Expenses Paid, Amount |
$ 34
|
| Expense Ratio, Percent |
0.66%
|
| Net Assets |
$ 5,200,751,501
|
| Holdings Count | shares |
594
|
| Investment Company Portfolio Turnover |
29.00%
|
| Additional Fund Statistics [Text Block] |
Key Fund Statistics
(as of May 31, 2024)
KEY FACTS
|
|
|
Fund Size
|
$5,200,751,501
|
|
Number of Holdings
|
594
|
|
Portfolio Turnover
|
29%
|
|
|
| Holdings [Text Block] |
MARKET SECTORS
(% of Fund's net assets)
Real Estate
16.4
Financials
13.1
Industrials
8.9
Consumer Staples
7.6
Information Technology
6.7
Energy
5.8
Health Care
5.8
Utilities
5.2
Communication Services
3.3
Consumer Discretionary
2.9
Materials
1.8
Dividend-Paying Equities
50.1
Preferred Stock
20.8
REITs
15.3
Convertibles
10.7
Global Infrastructure Equities
3.1
MLPs
0.4
Commodity Equities
0.0
ASSET ALLOCATION (% of Fund's net assets)
Short-Term Investments and Net Other Assets (Liabilities) - (0.4)%
United States
94.0
Canada
1.4
United Kingdom
1.0
Taiwan
0.9
China
0.7
Korea (South)
0.5
Japan
0.4
Spain
0.4
Germany
0.3
Others
0.4
GEOGRAPHIC DIVERSIFICATION (% of Fund's net assets)
|
| Largest Holdings [Text Block] |
TOP HOLDINGS
(% of Fund's net assets)
Exxon Mobil Corp
2.9
Procter & Gamble Co/The
2.4
Prologis Inc
2.1
Coca-Cola Co/The
1.8
Eaton Corp PLC
1.7
Johnson & Johnson
1.6
Equinix Inc
1.5
McDonald's Corp
1.5
US Treasury Bonds
1.4
Cisco Systems Inc
1.4
18.3
|
| Fidelity Advisor Strategic Dividend & Income Fund - Class Z |
|
| Shareholder Report [Line Items] |
|
| Fund Name |
Fidelity® Strategic Dividend & Income® Fund
|
| Class Name |
Fidelity Advisor® Strategic Dividend & Income® Fund Class Z
|
| Trading Symbol |
FIQWX
|
| Annual or Semi-Annual Statement [Text Block] |
This semi-annual shareholder report contains information about Fidelity® Strategic Dividend & Income® Fund for the period December 1, 2023 to May 31, 2024.
|
| Shareholder Report Annual or Semi-Annual |
semi-annual shareholder report
|
| Additional Information [Text Block] |
You can find additional information about the Fund at fundresearch.fidelity.com/prospectus/sec. You can also request this information by contacting us at 1-877-208-0098 or by sending an e-mail to fidfunddocuments@fidelity.com.
|
| Additional Information Phone Number |
1-877-208-0098
|
| Additional Information Email |
fidfunddocuments@fidelity.com
|
| Additional Information Website |
fundresearch.fidelity.com/prospectus/sec
|
| Expenses [Text Block] |
What were your Fund costs for the last six months?
(based on hypothetical $10,000 investment)
|
Costs of a $10,000 investment
|
Costs paid as a percentage of a $10,000 investment
|
|
Class Z
|
$ 30
|
0.57%
|
|
|
| Expenses Paid, Amount |
$ 30
|
| Expense Ratio, Percent |
0.57%
|
| Net Assets |
$ 5,200,751,501
|
| Holdings Count | shares |
594
|
| Investment Company Portfolio Turnover |
29.00%
|
| Additional Fund Statistics [Text Block] |
Key Fund Statistics
(as of May 31, 2024)
KEY FACTS
|
|
|
Fund Size
|
$5,200,751,501
|
|
Number of Holdings
|
594
|
|
Portfolio Turnover
|
29%
|
|
|
| Holdings [Text Block] |
MARKET SECTORS
(% of Fund's net assets)
Real Estate
16.4
Financials
13.1
Industrials
8.9
Consumer Staples
7.6
Information Technology
6.7
Energy
5.8
Health Care
5.8
Utilities
5.2
Communication Services
3.3
Consumer Discretionary
2.9
Materials
1.8
Dividend-Paying Equities
50.1
Preferred Stock
20.8
REITs
15.3
Convertibles
10.7
Global Infrastructure Equities
3.1
MLPs
0.4
Commodity Equities
0.0
ASSET ALLOCATION (% of Fund's net assets)
Short-Term Investments and Net Other Assets (Liabilities) - (0.4)%
United States
94.0
Canada
1.4
United Kingdom
1.0
Taiwan
0.9
China
0.7
Korea (South)
0.5
Japan
0.4
Spain
0.4
Germany
0.3
Others
0.4
GEOGRAPHIC DIVERSIFICATION (% of Fund's net assets)
|
| Largest Holdings [Text Block] |
TOP HOLDINGS
(% of Fund's net assets)
Exxon Mobil Corp
2.9
Procter & Gamble Co/The
2.4
Prologis Inc
2.1
Coca-Cola Co/The
1.8
Eaton Corp PLC
1.7
Johnson & Johnson
1.6
Equinix Inc
1.5
McDonald's Corp
1.5
US Treasury Bonds
1.4
Cisco Systems Inc
1.4
18.3
|
| X |
- DefinitionBoolean flag that is true when the XBRL content amends previously-filed or accepted submission.
| Name: |
dei_AmendmentFlag |
| Namespace Prefix: |
dei_ |
| Data Type: |
xbrli:booleanItemType |
| Balance Type: |
na |
| Period Type: |
duration |
|
| X |
- DefinitionFor the EDGAR submission types of Form 8-K: the date of the report, the date of the earliest event reported; for the EDGAR submission types of Form N-1A: the filing date; for all other submission types: the end of the reporting or transition period. The format of the date is YYYY-MM-DD.
| Name: |
dei_DocumentPeriodEndDate |
| Namespace Prefix: |
dei_ |
| Data Type: |
xbrli:dateItemType |
| Balance Type: |
na |
| Period Type: |
duration |
|
| X |
- DefinitionThe type of document being provided (such as 10-K, 10-Q, 485BPOS, etc). The document type is limited to the same value as the supporting SEC submission type, or the word 'Other'.
| Name: |
dei_DocumentType |
| Namespace Prefix: |
dei_ |
| Data Type: |
dei:submissionTypeItemType |
| Balance Type: |
na |
| Period Type: |
duration |
|
| X |
- DefinitionA unique 10-digit SEC-issued value to identify entities that have filed disclosures with the SEC. It is commonly abbreviated as CIK. Reference 1: http://www.xbrl.org/2003/role/presentationRef
-Publisher SEC
-Name Exchange Act
-Number 240
-Section 12
-Subsection b-2
| Name: |
dei_EntityCentralIndexKey |
| Namespace Prefix: |
dei_ |
| Data Type: |
dei:centralIndexKeyItemType |
| Balance Type: |
na |
| Period Type: |
duration |
|
| X |
- DefinitionOne of: N-1A (Mutual Fund), N-1 (Open-End Separate Account with No Variable Annuities), N-2 (Closed-End Investment Company), N-3 (Separate Account Registered as Open-End Management Investment Company), N-4 (Variable Annuity UIT Separate Account), N-5 (Small Business Investment Company), N-6 (Variable Life UIT Separate Account), S-1 or S-3 (Face Amount Certificate Company), S-6 (UIT, Non-Insurance Product). Reference 1: http://www.xbrl.org/2003/role/presentationRef
-Publisher SEC
-Name Regulation S-T
-Number 232
-Section 313
| Name: |
dei_EntityInvCompanyType |
| Namespace Prefix: |
dei_ |
| Data Type: |
dei:invCompanyType |
| Balance Type: |
na |
| Period Type: |
duration |
|
| X |
- DefinitionThe exact name of the entity filing the report as specified in its charter, which is required by forms filed with the SEC. Reference 1: http://www.xbrl.org/2003/role/presentationRef
-Publisher SEC
-Name Exchange Act
-Number 240
-Section 12
-Subsection b-2
| Name: |
dei_EntityRegistrantName |
| Namespace Prefix: |
dei_ |
| Data Type: |
xbrli:normalizedStringItemType |
| Balance Type: |
na |
| Period Type: |
duration |
|
| X |
- DefinitionTrading symbol of an instrument as listed on an exchange.
| Name: |
dei_TradingSymbol |
| Namespace Prefix: |
dei_ |
| Data Type: |
dei:tradingSymbolItemType |
| Balance Type: |
na |
| Period Type: |
duration |
|
| X |
- ReferencesReference 1: http://www.xbrl.org/2003/role/presentationRef
-Publisher SEC
-Name Form N-1A
-Section 27A
-Subsection e
| Name: |
oef_AddlFundStatisticsTextBlock |
| Namespace Prefix: |
oef_ |
| Data Type: |
dtr-types:textBlockItemType |
| Balance Type: |
na |
| Period Type: |
duration |
|
| X |
- ReferencesReference 1: http://www.xbrl.org/2003/role/presentationRef
-Publisher SEC
-Name Form N-1A
-Section 27A
-Subsection b
-Paragraph instruction
-Subparagraph 2
| Name: |
oef_AddlInfoEmail |
| Namespace Prefix: |
oef_ |
| Data Type: |
xbrli:stringItemType |
| Balance Type: |
na |
| Period Type: |
duration |
|
| X |
- ReferencesReference 1: http://www.xbrl.org/2003/role/presentationRef
-Publisher SEC
-Name Form N-1A
-Section 27A
-Subsection b
-Paragraph instruction
-Subparagraph 2
| Name: |
oef_AddlInfoPhoneNumber |
| Namespace Prefix: |
oef_ |
| Data Type: |
xbrli:stringItemType |
| Balance Type: |
na |
| Period Type: |
duration |
|
| X |
- ReferencesReference 1: http://www.xbrl.org/2003/role/presentationRef
-Publisher SEC
-Name Form N-1A
-Section 27A
-Subsection b
-Paragraph 4
| Name: |
oef_AddlInfoTextBlock |
| Namespace Prefix: |
oef_ |
| Data Type: |
dtr-types:textBlockItemType |
| Balance Type: |
na |
| Period Type: |
duration |
|
| X |
- ReferencesReference 1: http://www.xbrl.org/2003/role/presentationRef
-Publisher SEC
-Name Form N-1A
-Section 27A
-Subsection b
-Paragraph instruction
-Subparagraph 2
| Name: |
oef_AddlInfoWebsite |
| Namespace Prefix: |
oef_ |
| Data Type: |
xbrli:stringItemType |
| Balance Type: |
na |
| Period Type: |
duration |
|
| X |
- ReferencesReference 1: http://www.xbrl.org/2003/role/presentationRef
-Publisher SEC
-Name Form N-1A
-Section 27A
-Subsection b
-Paragraph 3
| Name: |
oef_AnnlOrSemiAnnlStatementTextBlock |
| Namespace Prefix: |
oef_ |
| Data Type: |
dtr-types:textBlockItemType |
| Balance Type: |
na |
| Period Type: |
duration |
|
| X |
- ReferencesReference 1: http://www.xbrl.org/2003/role/presentationRef
-Publisher SEC
-Name Form N-1A
-Section 27A
-Subsection b
-Paragraph instruction
-Subparagraph 2
| Name: |
oef_ClassName |
| Namespace Prefix: |
oef_ |
| Data Type: |
dei:securityTitleItemType |
| Balance Type: |
na |
| Period Type: |
duration |
|
| X |
- ReferencesReference 1: http://www.xbrl.org/2003/role/presentationRef
-Publisher SEC
-Name Form N-1A
-Section 27A
-Subsection c
-Paragraph iii
| Name: |
oef_ExpenseRatioPct |
| Namespace Prefix: |
oef_ |
| Data Type: |
dtr-types:percentItemType |
| Balance Type: |
na |
| Period Type: |
duration |
|
| X |
- ReferencesReference 1: http://www.xbrl.org/2003/role/presentationRef
-Publisher SEC
-Name Form N-1A
-Section 27A
-Subsection c
-Paragraph ii
| Name: |
oef_ExpensesPaidAmt |
| Namespace Prefix: |
oef_ |
| Data Type: |
xbrli:monetaryItemType |
| Balance Type: |
na |
| Period Type: |
duration |
|
| X |
- ReferencesReference 1: http://www.xbrl.org/2003/role/presentationRef
-Publisher SEC
-Name Form N-1A
-Section 27A
-Subsection c
| Name: |
oef_ExpensesTextBlock |
| Namespace Prefix: |
oef_ |
| Data Type: |
dtr-types:textBlockItemType |
| Balance Type: |
na |
| Period Type: |
duration |
|
| X |
- ReferencesReference 1: http://www.xbrl.org/2003/role/presentationRef
-Publisher SEC
-Name Form N-1A
-Section 27A
-Subsection b
-Paragraph 1
| Name: |
oef_FundName |
| Namespace Prefix: |
oef_ |
| Data Type: |
xbrli:normalizedStringItemType |
| Balance Type: |
na |
| Period Type: |
duration |
|
| X |
- ReferencesReference 1: http://www.xbrl.org/2003/role/presentationRef
-Publisher SEC
-Name Form N-1A
-Section 27A
-Subsection e
| Name: |
oef_HoldingsCount |
| Namespace Prefix: |
oef_ |
| Data Type: |
xbrli:integerItemType |
| Balance Type: |
na |
| Period Type: |
instant |
|
| X |
- ReferencesReference 1: http://www.xbrl.org/2003/role/presentationRef
-Publisher SEC
-Name Form N-1A
-Section 27A
-Subsection f
| Name: |
oef_HoldingsTableTextBlock |
| Namespace Prefix: |
oef_ |
| Data Type: |
dtr-types:textBlockItemType |
| Balance Type: |
na |
| Period Type: |
duration |
|
| X |
- ReferencesReference 1: http://www.xbrl.org/2003/role/presentationRef
-Publisher SEC
-Name Form N-1A
-Section 27A
-Subsection f
| Name: |
oef_LargestHoldingsTableTextBlock |
| Namespace Prefix: |
oef_ |
| Data Type: |
dtr-types:textBlockItemType |
| Balance Type: |
na |
| Period Type: |
duration |
|
| X |
- ReferencesReference 1: http://www.xbrl.org/2003/role/presentationRef
-Publisher SEC
-Name Form N-1A
-Section 27A
-Subsection b
-Paragraph 3
| Name: |
oef_ShareholderReportAnnualOrSemiAnnual |
| Namespace Prefix: |
oef_ |
| Data Type: |
oef:shareholderReportTypeItemType |
| Balance Type: |
na |
| Period Type: |
duration |
|
| X |
- ReferencesReference 1: http://www.xbrl.org/2003/role/presentationRef
-Publisher SEC
-Name Form N-1A
-Section 27A
-Subsection d
-Paragraph 2
-Subparagraph instruction
-Clause 7
| Name: |
oef_ShareholderReportLineItems |
| Namespace Prefix: |
oef_ |
| Data Type: |
xbrli:stringItemType |
| Balance Type: |
na |
| Period Type: |
duration |
|
| X |
- DefinitionAmount of net assets (liabilities). Reference 1: http://fasb.org/us-gaap/role/ref/legacyRef
-Name Accounting Standards Codification
-Section 50
-Paragraph 1
-SubTopic 30
-Topic 205
-Publisher FASB
-URI https://asc.fasb.org//1943274/2147479910/205-30-50-1
| Name: |
us-gaap_AssetsNet |
| Namespace Prefix: |
us-gaap_ |
| Data Type: |
xbrli:monetaryItemType |
| Balance Type: |
debit |
| Period Type: |
instant |
|
| X |
- DefinitionPercentage of lesser of purchase or sale of portfolio securities to average value of portfolio securities owned. Reference 1: http://www.xbrl.org/2009/role/commonPracticeRef
-Topic 946
-SubTopic 205
-Name Accounting Standards Codification
-Section 50
-Paragraph 27
-Publisher FASB
-URI https://asc.fasb.org//1943274/2147480737/946-205-50-27
| Name: |
us-gaap_InvestmentCompanyPortfolioTurnover |
| Namespace Prefix: |
us-gaap_ |
| Data Type: |
dtr-types:percentItemType |
| Balance Type: |
na |
| Period Type: |
duration |
|
| X |
- Details
| Name: |
oef_ClassAxis=fmr_C000048856Member |
| Namespace Prefix: |
|
| Data Type: |
na |
| Balance Type: |
|
| Period Type: |
|
|
| X |
- Details
| Name: |
oef_ClassAxis=fmr_C000048854Member |
| Namespace Prefix: |
|
| Data Type: |
na |
| Balance Type: |
|
| Period Type: |
|
|
| X |
- Details
| Name: |
oef_ClassAxis=fmr_C000048855Member |
| Namespace Prefix: |
|
| Data Type: |
na |
| Balance Type: |
|
| Period Type: |
|
|
| X |
- Details
| Name: |
oef_ClassAxis=fmr_C000048852Member |
| Namespace Prefix: |
|
| Data Type: |
na |
| Balance Type: |
|
| Period Type: |
|
|
| X |
- Details
| Name: |
oef_ClassAxis=fmr_C000048851Member |
| Namespace Prefix: |
|
| Data Type: |
na |
| Balance Type: |
|
| Period Type: |
|
|
| X |
- Details
| Name: |
oef_ClassAxis=fmr_C000205022Member |
| Namespace Prefix: |
|
| Data Type: |
na |
| Balance Type: |
|
| Period Type: |
|
|
v3.24.2
| X |
- ReferencesReference 1: http://www.xbrl.org/2003/role/presentationRef
-Publisher SEC
-Name Form N-1A
-Section 27A
-Subsection f
| Name: |
oef_HoldingsLineItems |
| Namespace Prefix: |
oef_ |
| Data Type: |
xbrli:stringItemType |
| Balance Type: |
na |
| Period Type: |
duration |
|
| X |
- ReferencesReference 1: http://www.xbrl.org/2003/role/presentationRef
-Publisher SEC
-Name Form N-1A
-Section 27A
-Subsection f
| Name: |
oef_PctOfNav |
| Namespace Prefix: |
oef_ |
| Data Type: |
dtr-types:percentItemType |
| Balance Type: |
na |
| Period Type: |
instant |
|
| X |
- Details
| Name: |
oef_ClassAxis=fmr_C000048856Member |
| Namespace Prefix: |
|
| Data Type: |
na |
| Balance Type: |
|
| Period Type: |
|
|
| X |
- Details
| Name: |
oef_LargestHoldingAxis=fmr_TH0Member |
| Namespace Prefix: |
|
| Data Type: |
na |
| Balance Type: |
|
| Period Type: |
|
|
| X |
- Details
| Name: |
oef_LargestHoldingAxis=fmr_TH1Member |
| Namespace Prefix: |
|
| Data Type: |
na |
| Balance Type: |
|
| Period Type: |
|
|
| X |
- Details
| Name: |
oef_LargestHoldingAxis=fmr_TH2Member |
| Namespace Prefix: |
|
| Data Type: |
na |
| Balance Type: |
|
| Period Type: |
|
|
| X |
- Details
| Name: |
oef_LargestHoldingAxis=fmr_TH3Member |
| Namespace Prefix: |
|
| Data Type: |
na |
| Balance Type: |
|
| Period Type: |
|
|
| X |
- Details
| Name: |
oef_LargestHoldingAxis=fmr_TH4Member |
| Namespace Prefix: |
|
| Data Type: |
na |
| Balance Type: |
|
| Period Type: |
|
|
| X |
- Details
| Name: |
oef_LargestHoldingAxis=fmr_TH5Member |
| Namespace Prefix: |
|
| Data Type: |
na |
| Balance Type: |
|
| Period Type: |
|
|
| X |
- Details
| Name: |
oef_LargestHoldingAxis=fmr_TH6Member |
| Namespace Prefix: |
|
| Data Type: |
na |
| Balance Type: |
|
| Period Type: |
|
|
| X |
- Details
| Name: |
oef_LargestHoldingAxis=fmr_TH7Member |
| Namespace Prefix: |
|
| Data Type: |
na |
| Balance Type: |
|
| Period Type: |
|
|
| X |
- Details
| Name: |
oef_LargestHoldingAxis=fmr_TH8Member |
| Namespace Prefix: |
|
| Data Type: |
na |
| Balance Type: |
|
| Period Type: |
|
|
| X |
- Details
| Name: |
oef_LargestHoldingAxis=fmr_TH9Member |
| Namespace Prefix: |
|
| Data Type: |
na |
| Balance Type: |
|
| Period Type: |
|
|
| X |
- Details
| Name: |
oef_IndustrySectorAxis=fmr_MSFinancialsSectorMember |
| Namespace Prefix: |
|
| Data Type: |
na |
| Balance Type: |
|
| Period Type: |
|
|
| X |
- Details
| Name: |
oef_IndustrySectorAxis=us-gaap_HealthcareSectorMember |
| Namespace Prefix: |
|
| Data Type: |
na |
| Balance Type: |
|
| Period Type: |
|
|
| X |
- Details
| Name: |
oef_IndustrySectorAxis=us-gaap_RealEstateSectorMember |
| Namespace Prefix: |
|
| Data Type: |
na |
| Balance Type: |
|
| Period Type: |
|
|
| X |
- Details
| Name: |
oef_IndustrySectorAxis=oef_IndustrialSectorMember |
| Namespace Prefix: |
|
| Data Type: |
na |
| Balance Type: |
|
| Period Type: |
|
|
| X |
- Details
| Name: |
oef_IndustrySectorAxis=oef_MaterialsSectorMember |
| Namespace Prefix: |
|
| Data Type: |
na |
| Balance Type: |
|
| Period Type: |
|
|
| X |
- Details
| Name: |
oef_IndustrySectorAxis=oef_ConsumerDiscretionarySectorMember |
| Namespace Prefix: |
|
| Data Type: |
na |
| Balance Type: |
|
| Period Type: |
|
|
| X |
- Details
| Name: |
oef_IndustrySectorAxis=oef_ConsumerStaplesSectorMember |
| Namespace Prefix: |
|
| Data Type: |
na |
| Balance Type: |
|
| Period Type: |
|
|
| X |
- Details
| Name: |
oef_IndustrySectorAxis=oef_CommunicationsSectorMember |
| Namespace Prefix: |
|
| Data Type: |
na |
| Balance Type: |
|
| Period Type: |
|
|
| X |
- Details
| Name: |
oef_IndustrySectorAxis=us-gaap_EnergySectorMember |
| Namespace Prefix: |
|
| Data Type: |
na |
| Balance Type: |
|
| Period Type: |
|
|
| X |
- Details
| Name: |
oef_IndustrySectorAxis=oef_UtilitiesSectorMember |
| Namespace Prefix: |
|
| Data Type: |
na |
| Balance Type: |
|
| Period Type: |
|
|
| X |
- Details
| Name: |
oef_GeographicRegionAxis=country_US |
| Namespace Prefix: |
|
| Data Type: |
na |
| Balance Type: |
|
| Period Type: |
|
|
| X |
- Details
| Name: |
oef_GeographicRegionAxis=country_CA |
| Namespace Prefix: |
|
| Data Type: |
na |
| Balance Type: |
|
| Period Type: |
|
|
| X |
- Details
| Name: |
oef_GeographicRegionAxis=country_GB |
| Namespace Prefix: |
|
| Data Type: |
na |
| Balance Type: |
|
| Period Type: |
|
|
| X |
- Details
| Name: |
oef_GeographicRegionAxis=country_TW |
| Namespace Prefix: |
|
| Data Type: |
na |
| Balance Type: |
|
| Period Type: |
|
|
| X |
- Details
| Name: |
oef_GeographicRegionAxis=country_CN |
| Namespace Prefix: |
|
| Data Type: |
na |
| Balance Type: |
|
| Period Type: |
|
|
| X |
- Details
| Name: |
oef_GeographicRegionAxis=country_KR |
| Namespace Prefix: |
|
| Data Type: |
na |
| Balance Type: |
|
| Period Type: |
|
|
| X |
- Details
| Name: |
oef_GeographicRegionAxis=country_JP |
| Namespace Prefix: |
|
| Data Type: |
na |
| Balance Type: |
|
| Period Type: |
|
|
| X |
- Details
| Name: |
oef_GeographicRegionAxis=country_ES |
| Namespace Prefix: |
|
| Data Type: |
na |
| Balance Type: |
|
| Period Type: |
|
|
| X |
- Details
| Name: |
oef_GeographicRegionAxis=country_DE |
| Namespace Prefix: |
|
| Data Type: |
na |
| Balance Type: |
|
| Period Type: |
|
|
| X |
- Details
| Name: |
oef_GeographicRegionAxis=fmr_OtherMember |
| Namespace Prefix: |
|
| Data Type: |
na |
| Balance Type: |
|
| Period Type: |
|
|
| X |
- Details
| Name: |
us-gaap_InvestmentTypeAxis=fmr_AADividendPayingEquitiesMember |
| Namespace Prefix: |
|
| Data Type: |
na |
| Balance Type: |
|
| Period Type: |
|
|
| X |
- Details
| Name: |
us-gaap_InvestmentTypeAxis=fmr_AAPreferredStockMember |
| Namespace Prefix: |
|
| Data Type: |
na |
| Balance Type: |
|
| Period Type: |
|
|
| X |
- Details
| Name: |
us-gaap_InvestmentTypeAxis=fmr_AAREITsMember |
| Namespace Prefix: |
|
| Data Type: |
na |
| Balance Type: |
|
| Period Type: |
|
|
| X |
- Details
| Name: |
us-gaap_InvestmentTypeAxis=fmr_AAConvertiblesMember |
| Namespace Prefix: |
|
| Data Type: |
na |
| Balance Type: |
|
| Period Type: |
|
|
| X |
- Details
| Name: |
us-gaap_InvestmentTypeAxis=fmr_AAGlobalInfrastructureEquitiesMember |
| Namespace Prefix: |
|
| Data Type: |
na |
| Balance Type: |
|
| Period Type: |
|
|
| X |
- Details
| Name: |
us-gaap_InvestmentTypeAxis=fmr_AAMLPsMember |
| Namespace Prefix: |
|
| Data Type: |
na |
| Balance Type: |
|
| Period Type: |
|
|
| X |
- Details
| Name: |
us-gaap_InvestmentTypeAxis=fmr_AACommodityEquitiesMember |
| Namespace Prefix: |
|
| Data Type: |
na |
| Balance Type: |
|
| Period Type: |
|
|
| X |
- Details
| Name: |
oef_ClassAxis=fmr_C000048854Member |
| Namespace Prefix: |
|
| Data Type: |
na |
| Balance Type: |
|
| Period Type: |
|
|
| X |
- Details
| Name: |
oef_ClassAxis=fmr_C000048855Member |
| Namespace Prefix: |
|
| Data Type: |
na |
| Balance Type: |
|
| Period Type: |
|
|
| X |
- Details
| Name: |
oef_ClassAxis=fmr_C000048852Member |
| Namespace Prefix: |
|
| Data Type: |
na |
| Balance Type: |
|
| Period Type: |
|
|
| X |
- Details
| Name: |
oef_ClassAxis=fmr_C000048851Member |
| Namespace Prefix: |
|
| Data Type: |
na |
| Balance Type: |
|
| Period Type: |
|
|
| X |
- Details
| Name: |
oef_ClassAxis=fmr_C000205022Member |
| Namespace Prefix: |
|
| Data Type: |
na |
| Balance Type: |
|
| Period Type: |
|
|
{
"version": "2.2",
"instance": {
"filing7638.htm": {
"nsprefix": "fmr",
"nsuri": "http://www.fidelity.com/20240730",
"dts": {
"inline": {
"local": [
"filing7638.htm"
]
},
"schema": {
"local": [
"fmr-20240730.xsd"
],
"remote": [
"http://www.xbrl.org/2003/xbrl-instance-2003-12-31.xsd",
"http://www.xbrl.org/2003/xbrl-linkbase-2003-12-31.xsd",
"http://www.xbrl.org/2003/xl-2003-12-31.xsd",
"http://www.xbrl.org/2003/xlink-2003-12-31.xsd",
"http://www.xbrl.org/2005/xbrldt-2005.xsd",
"http://www.xbrl.org/2006/ref-2006-02-27.xsd",
"http://www.xbrl.org/dtr/type/nonNumeric-2009-12-16.xsd",
"http://www.xbrl.org/lrr/arcrole/deprecated-2009-12-16.xsd",
"http://www.xbrl.org/lrr/role/deprecated-2009-12-16.xsd",
"http://www.xbrl.org/lrr/role/negated-2009-12-16.xsd",
"http://www.xbrl.org/lrr/role/reference-2009-12-16.xsd",
"https://www.xbrl.org/2020/extensible-enumerations-2.0.xsd",
"https://www.xbrl.org/dtr/type/2020-01-21/types.xsd",
"https://www.xbrl.org/dtr/type/2022-03-31/types.xsd",
"https://xbrl.fasb.org/srt/2023/elts/srt-2023.xsd",
"https://xbrl.fasb.org/srt/2023/elts/srt-roles-2023.xsd",
"https://xbrl.fasb.org/srt/2023/elts/srt-types-2023.xsd",
"https://xbrl.fasb.org/us-gaap/2023/elts/us-gaap-2023.xsd",
"https://xbrl.fasb.org/us-gaap/2023/elts/us-roles-2023.xsd",
"https://xbrl.fasb.org/us-gaap/2023/elts/us-types-2023.xsd",
"https://xbrl.sec.gov/country/2023/country-2023.xsd",
"https://xbrl.sec.gov/country/2023/country-2023_def.xsd",
"https://xbrl.sec.gov/dei/2023/dei-2023.xsd",
"https://xbrl.sec.gov/oef/2023/oef-2023.xsd",
"https://xbrl.sec.gov/oef/2023/oef-2023_cal.xsd",
"https://xbrl.sec.gov/oef/2023/oef-2023_lab.xsd",
"https://xbrl.sec.gov/oef/2023/oef-sr-2023.xsd"
]
}
},
"keyStandard": 25,
"keyCustom": 0,
"axisStandard": 5,
"axisCustom": 0,
"memberStandard": 19,
"memberCustom": 25,
"hidden": {
"total": 5,
"http://xbrl.sec.gov/dei/2023": 5
},
"contextCount": 241,
"entityCount": 1,
"segmentCount": 44,
"elementCount": 177,
"unitCount": 3,
"baseTaxonomies": {
"http://xbrl.sec.gov/oef/2023": 318,
"http://xbrl.sec.gov/dei/2023": 17,
"http://fasb.org/us-gaap/2023": 12
},
"report": {
"R1": {
"role": "http://xbrl.sec.gov/oef/role/NcsrCover",
"longName": "030000 - Disclosure - Form N-CSR Cover",
"shortName": "Form N-CSR Cover",
"isDefault": "true",
"groupType": "disclosure",
"subGroupType": "",
"menuCat": "Cover",
"order": "1",
"firstAnchor": {
"contextRef": "Trust",
"name": "dei:DocumentPeriodEndDate",
"unitRef": null,
"xsiNil": "false",
"lang": "en-US",
"decimals": null,
"ancestors": [
"div",
"td",
"tr",
"table",
"body",
"html"
],
"reportCount": 1,
"baseRef": "filing7638.htm",
"first": true
},
"uniqueAnchor": null
},
"R2": {
"role": "http://xbrl.sec.gov/oef/role/ShareholderReport",
"longName": "030001 - Disclosure - Shareholder Report",
"shortName": "Shareholder Report",
"isDefault": "false",
"groupType": "disclosure",
"subGroupType": "",
"menuCat": "Notes",
"order": "2",
"firstAnchor": {
"contextRef": "Trust",
"name": "dei:DocumentPeriodEndDate",
"unitRef": null,
"xsiNil": "false",
"lang": "en-US",
"decimals": null,
"ancestors": [
"div",
"td",
"tr",
"table",
"body",
"html"
],
"reportCount": 1,
"baseRef": "filing7638.htm",
"first": true
},
"uniqueAnchor": {
"contextRef": "C000048856_ClassMember",
"name": "oef:FundName",
"unitRef": null,
"xsiNil": "false",
"lang": "en-US",
"decimals": null,
"ancestors": [
"div",
"td",
"tr",
"table",
"body",
"html"
],
"reportCount": 1,
"baseRef": "filing7638.htm",
"unique": true
}
},
"R3": {
"role": "http://xbrl.sec.gov/oef/role/ShareholderReportHoldingsDetails",
"longName": "040020 - Disclosure - Shareholder Report, Holdings (Details)",
"shortName": "Shareholder Report, Holdings (Details)",
"isDefault": "false",
"groupType": "disclosure",
"subGroupType": "details",
"menuCat": "Details",
"order": "3",
"firstAnchor": {
"contextRef": "C000048856_TH_0_Member",
"name": "oef:PctOfNav",
"unitRef": "pure",
"xsiNil": "false",
"lang": null,
"decimals": "INF",
"ancestors": [
"div",
"td",
"tr",
"table",
"oef:LargestHoldingsTableTextBlock",
"div",
"body",
"html"
],
"reportCount": 1,
"baseRef": "filing7638.htm",
"first": true,
"unique": true
},
"uniqueAnchor": {
"contextRef": "C000048856_TH_0_Member",
"name": "oef:PctOfNav",
"unitRef": "pure",
"xsiNil": "false",
"lang": null,
"decimals": "INF",
"ancestors": [
"div",
"td",
"tr",
"table",
"oef:LargestHoldingsTableTextBlock",
"div",
"body",
"html"
],
"reportCount": 1,
"baseRef": "filing7638.htm",
"first": true,
"unique": true
}
}
},
"tag": {
"fmr_AACommodityEquitiesMember": {
"xbrltype": "domainItemType",
"nsuri": "http://www.fidelity.com/20240730",
"localname": "AACommodityEquitiesMember",
"presentation": [
"http://xbrl.sec.gov/oef/role/ShareholderReportHoldingsDetails"
],
"lang": {
"en-us": {
"role": {
"label": "AACommodityEquitiesMember [Member]",
"verboseLabel": "AACommodityEquitiesMember",
"terseLabel": "AACommodityEquitiesMember"
}
}
},
"auth_ref": []
},
"fmr_AAConvertiblesMember": {
"xbrltype": "domainItemType",
"nsuri": "http://www.fidelity.com/20240730",
"localname": "AAConvertiblesMember",
"presentation": [
"http://xbrl.sec.gov/oef/role/ShareholderReportHoldingsDetails"
],
"lang": {
"en-us": {
"role": {
"label": "AAConvertiblesMember [Member]",
"verboseLabel": "AAConvertiblesMember",
"terseLabel": "AAConvertiblesMember"
}
}
},
"auth_ref": []
},
"fmr_AADividendPayingEquitiesMember": {
"xbrltype": "domainItemType",
"nsuri": "http://www.fidelity.com/20240730",
"localname": "AADividendPayingEquitiesMember",
"presentation": [
"http://xbrl.sec.gov/oef/role/ShareholderReportHoldingsDetails"
],
"lang": {
"en-us": {
"role": {
"label": "AADividendPayingEquitiesMember [Member]",
"verboseLabel": "AADividendPayingEquitiesMember",
"terseLabel": "AADividendPayingEquitiesMember"
}
}
},
"auth_ref": []
},
"fmr_AAGlobalInfrastructureEquitiesMember": {
"xbrltype": "domainItemType",
"nsuri": "http://www.fidelity.com/20240730",
"localname": "AAGlobalInfrastructureEquitiesMember",
"presentation": [
"http://xbrl.sec.gov/oef/role/ShareholderReportHoldingsDetails"
],
"lang": {
"en-us": {
"role": {
"label": "AAGlobalInfrastructureEquitiesMember [Member]",
"verboseLabel": "AAGlobalInfrastructureEquitiesMember",
"terseLabel": "AAGlobalInfrastructureEquitiesMember"
}
}
},
"auth_ref": []
},
"fmr_AAMLPsMember": {
"xbrltype": "domainItemType",
"nsuri": "http://www.fidelity.com/20240730",
"localname": "AAMLPsMember",
"presentation": [
"http://xbrl.sec.gov/oef/role/ShareholderReportHoldingsDetails"
],
"lang": {
"en-us": {
"role": {
"label": "AAMLPsMember [Member]",
"verboseLabel": "AAMLPsMember",
"terseLabel": "AAMLPsMember"
}
}
},
"auth_ref": []
},
"fmr_AAPreferredStockMember": {
"xbrltype": "domainItemType",
"nsuri": "http://www.fidelity.com/20240730",
"localname": "AAPreferredStockMember",
"presentation": [
"http://xbrl.sec.gov/oef/role/ShareholderReportHoldingsDetails"
],
"lang": {
"en-us": {
"role": {
"label": "AAPreferredStockMember [Member]",
"verboseLabel": "AAPreferredStockMember",
"terseLabel": "AAPreferredStockMember"
}
}
},
"auth_ref": []
},
"fmr_AAREITsMember": {
"xbrltype": "domainItemType",
"nsuri": "http://www.fidelity.com/20240730",
"localname": "AAREITsMember",
"presentation": [
"http://xbrl.sec.gov/oef/role/ShareholderReportHoldingsDetails"
],
"lang": {
"en-us": {
"role": {
"label": "AAREITsMember [Member]",
"verboseLabel": "AAREITsMember",
"terseLabel": "AAREITsMember"
}
}
},
"auth_ref": []
},
"oef_AccountValueLineItems": {
"xbrltype": "stringItemType",
"nsuri": "http://xbrl.sec.gov/oef/2023",
"localname": "AccountValueLineItems",
"presentation": [
"http://xbrl.sec.gov/oef/role/ShareholderReportLineGraphDetails"
],
"lang": {
"en-us": {
"role": {
"label": "Account Value [Line Items]"
}
}
},
"auth_ref": [
"r36"
]
},
"oef_AccountValueTable": {
"xbrltype": "stringItemType",
"nsuri": "http://xbrl.sec.gov/oef/2023",
"localname": "AccountValueTable",
"presentation": [
"http://xbrl.sec.gov/oef/role/ShareholderReportLineGraphDetails"
],
"lang": {
"en-us": {
"role": {
"label": "Account Value [Table]"
}
}
},
"auth_ref": [
"r36"
]
},
"oef_AccountValueTableAbstract": {
"xbrltype": "stringItemType",
"nsuri": "http://xbrl.sec.gov/oef/2023",
"localname": "AccountValueTableAbstract",
"lang": {
"en-us": {
"role": {
"label": "Account Value Table [Abstract]"
}
}
},
"auth_ref": [
"r36"
]
},
"oef_AccountantChngDate": {
"xbrltype": "dateItemType",
"nsuri": "http://xbrl.sec.gov/oef/2023",
"localname": "AccountantChngDate",
"presentation": [
"http://xbrl.sec.gov/oef/role/ShareholderReport"
],
"lang": {
"en-us": {
"role": {
"label": "Accountant Change Date"
}
}
},
"auth_ref": [
"r60"
]
},
"oef_AccountantChngDisagreementsTextBlock": {
"xbrltype": "textBlockItemType",
"nsuri": "http://xbrl.sec.gov/oef/2023",
"localname": "AccountantChngDisagreementsTextBlock",
"presentation": [
"http://xbrl.sec.gov/oef/role/ShareholderReport"
],
"lang": {
"en-us": {
"role": {
"label": "Accountant Change Disagreements [Text Block]"
}
}
},
"auth_ref": [
"r61"
]
},
"oef_AccountantChngStatementTextBlock": {
"xbrltype": "textBlockItemType",
"nsuri": "http://xbrl.sec.gov/oef/2023",
"localname": "AccountantChngStatementTextBlock",
"presentation": [
"http://xbrl.sec.gov/oef/role/ShareholderReport"
],
"lang": {
"en-us": {
"role": {
"label": "Accountant Change Statement [Text Block]"
}
}
},
"auth_ref": [
"r60"
]
},
"oef_AcctVal": {
"xbrltype": "monetaryItemType",
"nsuri": "http://xbrl.sec.gov/oef/2023",
"localname": "AcctVal",
"presentation": [
"http://xbrl.sec.gov/oef/role/ShareholderReportLineGraphDetails"
],
"lang": {
"en-us": {
"role": {
"label": "Account Value"
}
}
},
"auth_ref": [
"r37"
]
},
"oef_AcquiredFundFeesAndExpensesOverAssets": {
"xbrltype": "nonNegativePure4ItemType",
"nsuri": "http://xbrl.sec.gov/oef/2023",
"localname": "AcquiredFundFeesAndExpensesOverAssets",
"calculation": {
"http://xbrl.sec.gov/rr/role/OperatingExpensesData": {
"parentTag": "oef_ExpensesOverAssets",
"weight": 1.0,
"order": 5.0
}
},
"lang": {
"en-us": {
"role": {
"label": "Acquired Fund Fees and Expenses"
}
}
},
"auth_ref": [
"r70"
]
},
"oef_AdditionalIndexAxis": {
"xbrltype": "stringItemType",
"nsuri": "http://xbrl.sec.gov/oef/2023",
"localname": "AdditionalIndexAxis",
"presentation": [
"http://xbrl.sec.gov/oef/role/ShareholderReportLineGraphDetails"
],
"lang": {
"en-us": {
"role": {
"label": "Additional Index [Axis]"
}
}
},
"auth_ref": [
"r36"
]
},
"oef_AdditionalIndexDomain": {
"xbrltype": "domainItemType",
"nsuri": "http://xbrl.sec.gov/oef/2023",
"localname": "AdditionalIndexDomain",
"presentation": [
"http://xbrl.sec.gov/oef/role/ShareholderReportLineGraphDetails"
],
"lang": {
"en-us": {
"role": {
"label": "Additional Index [Domain]"
}
}
},
"auth_ref": [
"r36"
]
},
"oef_AddlFundStatisticsSignificanceOrLimitsTextBlock": {
"xbrltype": "textBlockItemType",
"nsuri": "http://xbrl.sec.gov/oef/2023",
"localname": "AddlFundStatisticsSignificanceOrLimitsTextBlock",
"presentation": [
"http://xbrl.sec.gov/oef/role/ShareholderReport"
],
"lang": {
"en-us": {
"role": {
"label": "Additional Fund Statistics Significance or Limits [Text Block]"
}
}
},
"auth_ref": [
"r50"
]
},
"oef_AddlFundStatisticsTextBlock": {
"xbrltype": "textBlockItemType",
"nsuri": "http://xbrl.sec.gov/oef/2023",
"localname": "AddlFundStatisticsTextBlock",
"presentation": [
"http://xbrl.sec.gov/oef/role/ShareholderReport"
],
"lang": {
"en-us": {
"role": {
"label": "Additional Fund Statistics [Text Block]"
}
}
},
"auth_ref": [
"r49"
]
},
"oef_AddlInfoEmail": {
"xbrltype": "stringItemType",
"nsuri": "http://xbrl.sec.gov/oef/2023",
"localname": "AddlInfoEmail",
"presentation": [
"http://xbrl.sec.gov/oef/role/ShareholderReport"
],
"lang": {
"en-us": {
"role": {
"label": "Additional Information Email"
}
}
},
"auth_ref": [
"r28"
]
},
"oef_AddlInfoPhoneNumber": {
"xbrltype": "stringItemType",
"nsuri": "http://xbrl.sec.gov/oef/2023",
"localname": "AddlInfoPhoneNumber",
"presentation": [
"http://xbrl.sec.gov/oef/role/ShareholderReport"
],
"lang": {
"en-us": {
"role": {
"label": "Additional Information Phone Number"
}
}
},
"auth_ref": [
"r28"
]
},
"oef_AddlInfoTextBlock": {
"xbrltype": "textBlockItemType",
"nsuri": "http://xbrl.sec.gov/oef/2023",
"localname": "AddlInfoTextBlock",
"presentation": [
"http://xbrl.sec.gov/oef/role/ShareholderReport"
],
"lang": {
"en-us": {
"role": {
"label": "Additional Information [Text Block]"
}
}
},
"auth_ref": [
"r26"
]
},
"oef_AddlInfoWebsite": {
"xbrltype": "stringItemType",
"nsuri": "http://xbrl.sec.gov/oef/2023",
"localname": "AddlInfoWebsite",
"presentation": [
"http://xbrl.sec.gov/oef/role/ShareholderReport"
],
"lang": {
"en-us": {
"role": {
"label": "Additional Information Website"
}
}
},
"auth_ref": [
"r28"
]
},
"oef_AdvisoryFeesPaidAmt": {
"xbrltype": "monetaryItemType",
"nsuri": "http://xbrl.sec.gov/oef/2023",
"localname": "AdvisoryFeesPaidAmt",
"presentation": [
"http://xbrl.sec.gov/oef/role/ShareholderReport"
],
"lang": {
"en-us": {
"role": {
"label": "Advisory Fees Paid, Amount"
}
}
},
"auth_ref": [
"r49"
]
},
"dei_AmendmentDescription": {
"xbrltype": "stringItemType",
"nsuri": "http://xbrl.sec.gov/dei/2023",
"localname": "AmendmentDescription",
"presentation": [
"http://xbrl.sec.gov/oef/role/NcsrCover",
"http://xbrl.sec.gov/oef/role/ShareholderReport"
],
"lang": {
"en-us": {
"role": {
"label": "Amendment Description",
"documentation": "Description of changes contained within amended document."
}
}
},
"auth_ref": []
},
"dei_AmendmentFlag": {
"xbrltype": "booleanItemType",
"nsuri": "http://xbrl.sec.gov/dei/2023",
"localname": "AmendmentFlag",
"presentation": [
"http://xbrl.sec.gov/oef/role/NcsrCover",
"http://xbrl.sec.gov/oef/role/ShareholderReport"
],
"lang": {
"en-us": {
"role": {
"label": "Amendment Flag",
"documentation": "Boolean flag that is true when the XBRL content amends previously-filed or accepted submission."
}
}
},
"auth_ref": []
},
"oef_AnnlOrSemiAnnlStatementTextBlock": {
"xbrltype": "textBlockItemType",
"nsuri": "http://xbrl.sec.gov/oef/2023",
"localname": "AnnlOrSemiAnnlStatementTextBlock",
"presentation": [
"http://xbrl.sec.gov/oef/role/ShareholderReport"
],
"lang": {
"en-us": {
"role": {
"label": "Annual or Semi-Annual Statement [Text Block]"
}
}
},
"auth_ref": [
"r25"
]
},
"us-gaap_AssetsNet": {
"xbrltype": "monetaryItemType",
"nsuri": "http://fasb.org/us-gaap/2023",
"localname": "AssetsNet",
"crdr": "debit",
"presentation": [
"http://xbrl.sec.gov/oef/role/ShareholderReport"
],
"lang": {
"en-us": {
"role": {
"documentation": "Amount of net assets (liabilities).",
"label": "Net Assets"
}
}
},
"auth_ref": [
"r0"
]
},
"oef_AvgAnnlRtrPct": {
"xbrltype": "percentItemType",
"nsuri": "http://xbrl.sec.gov/oef/2023",
"localname": "AvgAnnlRtrPct",
"presentation": [
"http://xbrl.sec.gov/oef/role/ShareholderReportLineGraphDetails"
],
"lang": {
"en-us": {
"role": {
"label": "Average Annual Return, Percent"
}
}
},
"auth_ref": [
"r43"
]
},
"oef_AvgAnnlRtrTableTextBlock": {
"xbrltype": "textBlockItemType",
"nsuri": "http://xbrl.sec.gov/oef/2023",
"localname": "AvgAnnlRtrTableTextBlock",
"presentation": [
"http://xbrl.sec.gov/oef/role/ShareholderReport"
],
"lang": {
"en-us": {
"role": {
"label": "Average Annual Return [Table Text Block]"
}
}
},
"auth_ref": [
"r43"
]
},
"oef_BroadBasedIndexAxis": {
"xbrltype": "stringItemType",
"nsuri": "http://xbrl.sec.gov/oef/2023",
"localname": "BroadBasedIndexAxis",
"presentation": [
"http://xbrl.sec.gov/oef/role/ShareholderReportLineGraphDetails"
],
"lang": {
"en-us": {
"role": {
"label": "Broad Based Index [Axis]"
}
}
},
"auth_ref": [
"r36"
]
},
"oef_BroadBasedIndexDomain": {
"xbrltype": "domainItemType",
"nsuri": "http://xbrl.sec.gov/oef/2023",
"localname": "BroadBasedIndexDomain",
"presentation": [
"http://xbrl.sec.gov/oef/role/ShareholderReportLineGraphDetails"
],
"lang": {
"en-us": {
"role": {
"label": "Broad Based Index [Domain]"
}
}
},
"auth_ref": [
"r36"
]
},
"fmr_C000048851Member": {
"xbrltype": "domainItemType",
"nsuri": "http://www.fidelity.com/20240730",
"localname": "C000048851Member",
"presentation": [
"http://xbrl.sec.gov/oef/role/ShareholderReport",
"http://xbrl.sec.gov/oef/role/ShareholderReportHoldingsDetails",
"http://xbrl.sec.gov/oef/role/ShareholderReportLineGraphDetails"
],
"lang": {
"en-us": {
"role": {
"label": "C000048851 [Member]",
"verboseLabel": "Fidelity Strategic Dividend & Income Fund",
"terseLabel": "Fidelity Strategic Dividend & Income Fund"
}
}
},
"auth_ref": []
},
"fmr_C000048852Member": {
"xbrltype": "domainItemType",
"nsuri": "http://www.fidelity.com/20240730",
"localname": "C000048852Member",
"presentation": [
"http://xbrl.sec.gov/oef/role/ShareholderReport",
"http://xbrl.sec.gov/oef/role/ShareholderReportHoldingsDetails",
"http://xbrl.sec.gov/oef/role/ShareholderReportLineGraphDetails"
],
"lang": {
"en-us": {
"role": {
"label": "C000048852 [Member]",
"verboseLabel": "Fidelity Advisor Strategic Dividend & Income Fund - Class A",
"terseLabel": "Fidelity Advisor Strategic Dividend & Income Fund - Class A"
}
}
},
"auth_ref": []
},
"fmr_C000048854Member": {
"xbrltype": "domainItemType",
"nsuri": "http://www.fidelity.com/20240730",
"localname": "C000048854Member",
"presentation": [
"http://xbrl.sec.gov/oef/role/ShareholderReport",
"http://xbrl.sec.gov/oef/role/ShareholderReportHoldingsDetails",
"http://xbrl.sec.gov/oef/role/ShareholderReportLineGraphDetails"
],
"lang": {
"en-us": {
"role": {
"label": "C000048854 [Member]",
"verboseLabel": "Fidelity Advisor Strategic Dividend & Income Fund - Class C",
"terseLabel": "Fidelity Advisor Strategic Dividend & Income Fund - Class C"
}
}
},
"auth_ref": []
},
"fmr_C000048855Member": {
"xbrltype": "domainItemType",
"nsuri": "http://www.fidelity.com/20240730",
"localname": "C000048855Member",
"presentation": [
"http://xbrl.sec.gov/oef/role/ShareholderReport",
"http://xbrl.sec.gov/oef/role/ShareholderReportHoldingsDetails",
"http://xbrl.sec.gov/oef/role/ShareholderReportLineGraphDetails"
],
"lang": {
"en-us": {
"role": {
"label": "C000048855 [Member]",
"verboseLabel": "Fidelity Advisor Strategic Dividend & Income Fund - Class M",
"terseLabel": "Fidelity Advisor Strategic Dividend & Income Fund - Class M"
}
}
},
"auth_ref": []
},
"fmr_C000048856Member": {
"xbrltype": "domainItemType",
"nsuri": "http://www.fidelity.com/20240730",
"localname": "C000048856Member",
"presentation": [
"http://xbrl.sec.gov/oef/role/ShareholderReport",
"http://xbrl.sec.gov/oef/role/ShareholderReportHoldingsDetails",
"http://xbrl.sec.gov/oef/role/ShareholderReportLineGraphDetails"
],
"lang": {
"en-us": {
"role": {
"label": "C000048856 [Member]",
"verboseLabel": "Fidelity Advisor Strategic Dividend & Income Fund - Class I",
"terseLabel": "Fidelity Advisor Strategic Dividend & Income Fund - Class I"
}
}
},
"auth_ref": []
},
"fmr_C000205022Member": {
"xbrltype": "domainItemType",
"nsuri": "http://www.fidelity.com/20240730",
"localname": "C000205022Member",
"presentation": [
"http://xbrl.sec.gov/oef/role/ShareholderReport",
"http://xbrl.sec.gov/oef/role/ShareholderReportHoldingsDetails",
"http://xbrl.sec.gov/oef/role/ShareholderReportLineGraphDetails"
],
"lang": {
"en-us": {
"role": {
"label": "C000205022 [Member]",
"verboseLabel": "Fidelity Advisor Strategic Dividend & Income Fund - Class Z",
"terseLabel": "Fidelity Advisor Strategic Dividend & Income Fund - Class Z"
}
}
},
"auth_ref": []
},
"country_CA": {
"xbrltype": "domainItemType",
"nsuri": "http://xbrl.sec.gov/country/2023",
"localname": "CA",
"presentation": [
"http://xbrl.sec.gov/oef/role/ShareholderReportHoldingsDetails"
],
"lang": {
"en-us": {
"role": {
"label": "Canada",
"terseLabel": "Canada"
}
}
},
"auth_ref": []
},
"country_CN": {
"xbrltype": "domainItemType",
"nsuri": "http://xbrl.sec.gov/country/2023",
"localname": "CN",
"presentation": [
"http://xbrl.sec.gov/oef/role/ShareholderReportHoldingsDetails"
],
"lang": {
"en-us": {
"role": {
"label": "China",
"terseLabel": "China"
}
}
},
"auth_ref": []
},
"oef_ClassAxis": {
"xbrltype": "stringItemType",
"nsuri": "http://xbrl.sec.gov/oef/2023",
"localname": "ClassAxis",
"presentation": [
"http://xbrl.sec.gov/oef/role/ShareholderReport",
"http://xbrl.sec.gov/oef/role/ShareholderReportHoldingsDetails",
"http://xbrl.sec.gov/oef/role/ShareholderReportLineGraphDetails"
],
"lang": {
"en-us": {
"role": {
"label": "Class [Axis]"
}
}
},
"auth_ref": [
"r23"
]
},
"oef_ClassName": {
"xbrltype": "securityTitleItemType",
"nsuri": "http://xbrl.sec.gov/oef/2023",
"localname": "ClassName",
"presentation": [
"http://xbrl.sec.gov/oef/role/ShareholderReport"
],
"lang": {
"en-us": {
"role": {
"label": "Class Name"
}
}
},
"auth_ref": [
"r28"
]
},
"oef_CommunicationsSectorMember": {
"xbrltype": "domainItemType",
"nsuri": "http://xbrl.sec.gov/oef/2023",
"localname": "CommunicationsSectorMember",
"presentation": [
"http://xbrl.sec.gov/oef/role/ShareholderReportHoldingsDetails"
],
"lang": {
"en-us": {
"role": {
"label": "Communications Sector [Member]",
"terseLabel": "Communications Sector Member"
}
}
},
"auth_ref": [
"r51"
]
},
"oef_Component1OtherExpensesOverAssets": {
"xbrltype": "nonNegativePure4ItemType",
"nsuri": "http://xbrl.sec.gov/oef/2023",
"localname": "Component1OtherExpensesOverAssets",
"calculation": {
"http://xbrl.sec.gov/rr/role/OperatingExpensesData": {
"parentTag": "oef_OtherExpensesOverAssets",
"weight": 1.0,
"order": 1.0
}
},
"lang": {
"en-us": {
"role": {
"label": "Component1 Other Expenses"
}
}
},
"auth_ref": [
"r67"
]
},
"oef_Component2OtherExpensesOverAssets": {
"xbrltype": "nonNegativePure4ItemType",
"nsuri": "http://xbrl.sec.gov/oef/2023",
"localname": "Component2OtherExpensesOverAssets",
"calculation": {
"http://xbrl.sec.gov/rr/role/OperatingExpensesData": {
"parentTag": "oef_OtherExpensesOverAssets",
"weight": 1.0,
"order": 2.0
}
},
"lang": {
"en-us": {
"role": {
"label": "Component2 Other Expenses"
}
}
},
"auth_ref": [
"r67"
]
},
"oef_Component3OtherExpensesOverAssets": {
"xbrltype": "nonNegativePure4ItemType",
"nsuri": "http://xbrl.sec.gov/oef/2023",
"localname": "Component3OtherExpensesOverAssets",
"calculation": {
"http://xbrl.sec.gov/rr/role/OperatingExpensesData": {
"parentTag": "oef_OtherExpensesOverAssets",
"weight": 1.0,
"order": 3.0
}
},
"lang": {
"en-us": {
"role": {
"label": "Component3 Other Expenses"
}
}
},
"auth_ref": [
"r67"
]
},
"oef_ConsumerDiscretionarySectorMember": {
"xbrltype": "domainItemType",
"nsuri": "http://xbrl.sec.gov/oef/2023",
"localname": "ConsumerDiscretionarySectorMember",
"presentation": [
"http://xbrl.sec.gov/oef/role/ShareholderReportHoldingsDetails"
],
"lang": {
"en-us": {
"role": {
"label": "Consumer Discretionary Sector [Member]",
"terseLabel": "Consumer Discretionary Sector Member"
}
}
},
"auth_ref": [
"r51"
]
},
"oef_ConsumerStaplesSectorMember": {
"xbrltype": "domainItemType",
"nsuri": "http://xbrl.sec.gov/oef/2023",
"localname": "ConsumerStaplesSectorMember",
"presentation": [
"http://xbrl.sec.gov/oef/role/ShareholderReportHoldingsDetails"
],
"lang": {
"en-us": {
"role": {
"label": "Consumer Staples Sector [Member]",
"terseLabel": "Consumer Staples Sector Member"
}
}
},
"auth_ref": [
"r51"
]
},
"dei_CoverAbstract": {
"xbrltype": "stringItemType",
"nsuri": "http://xbrl.sec.gov/dei/2023",
"localname": "CoverAbstract",
"lang": {
"en-us": {
"role": {
"documentation": "Cover page."
}
}
},
"auth_ref": []
},
"oef_CreditQualityAxis": {
"xbrltype": "stringItemType",
"nsuri": "http://xbrl.sec.gov/oef/2023",
"localname": "CreditQualityAxis",
"presentation": [
"http://xbrl.sec.gov/oef/role/ShareholderReportHoldingsDetails"
],
"lang": {
"en-us": {
"role": {
"label": "Credit Quality [Axis]"
}
}
},
"auth_ref": [
"r51"
]
},
"oef_CreditQualityDomain": {
"xbrltype": "domainItemType",
"nsuri": "http://xbrl.sec.gov/oef/2023",
"localname": "CreditQualityDomain",
"presentation": [
"http://xbrl.sec.gov/oef/role/ShareholderReportHoldingsDetails"
],
"lang": {
"en-us": {
"role": {
"label": "Credit Quality [Domain]"
}
}
},
"auth_ref": [
"r51"
]
},
"oef_CreditQualityExplanationTextBlock": {
"xbrltype": "textBlockItemType",
"nsuri": "http://xbrl.sec.gov/oef/2023",
"localname": "CreditQualityExplanationTextBlock",
"presentation": [
"http://xbrl.sec.gov/oef/role/ShareholderReport"
],
"lang": {
"en-us": {
"role": {
"label": "Credit Quality Explanation [Text Block]"
}
}
},
"auth_ref": [
"r51"
]
},
"srt_CreditRatingAMBestAxis": {
"xbrltype": "stringItemType",
"nsuri": "http://fasb.org/srt/2023",
"localname": "CreditRatingAMBestAxis",
"presentation": [
"http://xbrl.sec.gov/oef/role/ShareholderReportHoldingsDetails"
],
"auth_ref": [
"r19",
"r73",
"r74",
"r75"
]
},
"srt_CreditRatingAMBestDomain": {
"xbrltype": "domainItemType",
"nsuri": "http://fasb.org/srt/2023",
"localname": "CreditRatingAMBestDomain",
"presentation": [
"http://xbrl.sec.gov/oef/role/ShareholderReportHoldingsDetails"
],
"auth_ref": []
},
"srt_CreditRatingFitchAxis": {
"xbrltype": "stringItemType",
"nsuri": "http://fasb.org/srt/2023",
"localname": "CreditRatingFitchAxis",
"presentation": [
"http://xbrl.sec.gov/oef/role/ShareholderReportHoldingsDetails"
],
"auth_ref": [
"r19",
"r73",
"r75"
]
},
"srt_CreditRatingMoodysAxis": {
"xbrltype": "stringItemType",
"nsuri": "http://fasb.org/srt/2023",
"localname": "CreditRatingMoodysAxis",
"presentation": [
"http://xbrl.sec.gov/oef/role/ShareholderReportHoldingsDetails"
],
"auth_ref": [
"r19",
"r73",
"r74",
"r75"
]
},
"srt_CreditRatingStandardPoorsAxis": {
"xbrltype": "stringItemType",
"nsuri": "http://fasb.org/srt/2023",
"localname": "CreditRatingStandardPoorsAxis",
"presentation": [
"http://xbrl.sec.gov/oef/role/ShareholderReportHoldingsDetails"
],
"auth_ref": [
"r19",
"r73",
"r74",
"r75"
]
},
"oef_CreditRatingsSelectionTextBlock": {
"xbrltype": "textBlockItemType",
"nsuri": "http://xbrl.sec.gov/oef/2023",
"localname": "CreditRatingsSelectionTextBlock",
"presentation": [
"http://xbrl.sec.gov/oef/role/ShareholderReport"
],
"lang": {
"en-us": {
"role": {
"label": "Credit Ratings Selection [Text Block]"
}
}
},
"auth_ref": [
"r51"
]
},
"country_DE": {
"xbrltype": "domainItemType",
"nsuri": "http://xbrl.sec.gov/country/2023",
"localname": "DE",
"presentation": [
"http://xbrl.sec.gov/oef/role/ShareholderReportHoldingsDetails"
],
"lang": {
"en-us": {
"role": {
"label": "Germany",
"terseLabel": "Germany"
}
}
},
"auth_ref": []
},
"oef_DistOfCapitalTextBlock": {
"xbrltype": "textBlockItemType",
"nsuri": "http://xbrl.sec.gov/oef/2023",
"localname": "DistOfCapitalTextBlock",
"presentation": [
"http://xbrl.sec.gov/oef/role/ShareholderReport"
],
"lang": {
"en-us": {
"role": {
"label": "Distribution of Capital [Text Block]"
}
}
},
"auth_ref": [
"r45"
]
},
"oef_DistributionAndService12b1FeesOverAssets": {
"xbrltype": "nonNegativePure4ItemType",
"nsuri": "http://xbrl.sec.gov/oef/2023",
"localname": "DistributionAndService12b1FeesOverAssets",
"calculation": {
"http://xbrl.sec.gov/rr/role/OperatingExpensesData": {
"parentTag": "oef_ExpensesOverAssets",
"weight": 1.0,
"order": 2.0
}
},
"lang": {
"en-us": {
"role": {
"label": "Distribution and Service (12b-1) Fees"
}
}
},
"auth_ref": [
"r65"
]
},
"oef_DistributionOrSimilarNon12b1FeesOverAssets": {
"xbrltype": "nonNegativePure4ItemType",
"nsuri": "http://xbrl.sec.gov/oef/2023",
"localname": "DistributionOrSimilarNon12b1FeesOverAssets",
"calculation": {
"http://xbrl.sec.gov/rr/role/OperatingExpensesData": {
"parentTag": "oef_ExpensesOverAssets",
"weight": 1.0,
"order": 3.0
}
},
"lang": {
"en-us": {
"role": {
"label": "Distribution or Similar (Non 12b-1) Fees"
}
}
},
"auth_ref": [
"r65"
]
},
"dei_DocumentPeriodEndDate": {
"xbrltype": "dateItemType",
"nsuri": "http://xbrl.sec.gov/dei/2023",
"localname": "DocumentPeriodEndDate",
"presentation": [
"http://xbrl.sec.gov/oef/role/NcsrCover",
"http://xbrl.sec.gov/oef/role/ShareholderReport"
],
"lang": {
"en-us": {
"role": {
"label": "Document Period End Date",
"documentation": "For the EDGAR submission types of Form 8-K: the date of the report, the date of the earliest event reported; for the EDGAR submission types of Form N-1A: the filing date; for all other submission types: the end of the reporting or transition period. The format of the date is YYYY-MM-DD."
}
}
},
"auth_ref": []
},
"dei_DocumentType": {
"xbrltype": "submissionTypeItemType",
"nsuri": "http://xbrl.sec.gov/dei/2023",
"localname": "DocumentType",
"presentation": [
"http://xbrl.sec.gov/oef/role/NcsrCover",
"http://xbrl.sec.gov/oef/role/ShareholderReport"
],
"lang": {
"en-us": {
"role": {
"label": "Document Type",
"documentation": "The type of document being provided (such as 10-K, 10-Q, 485BPOS, etc). The document type is limited to the same value as the supporting SEC submission type, or the word 'Other'."
}
}
},
"auth_ref": []
},
"country_ES": {
"xbrltype": "domainItemType",
"nsuri": "http://xbrl.sec.gov/country/2023",
"localname": "ES",
"presentation": [
"http://xbrl.sec.gov/oef/role/ShareholderReportHoldingsDetails"
],
"lang": {
"en-us": {
"role": {
"label": "Spain",
"terseLabel": "Spain"
}
}
},
"auth_ref": []
},
"us-gaap_EnergySectorMember": {
"xbrltype": "domainItemType",
"nsuri": "http://fasb.org/us-gaap/2023",
"localname": "EnergySectorMember",
"presentation": [
"http://xbrl.sec.gov/oef/role/ShareholderReportHoldingsDetails"
],
"lang": {
"en-us": {
"role": {
"terseLabel": "Energy Sector",
"documentation": "Sector of economy consisting of companies engaged in business activity related to energy.",
"label": "Energy Sector [Member]"
}
}
},
"auth_ref": [
"r77",
"r78",
"r79",
"r80"
]
},
"dei_EntityCentralIndexKey": {
"xbrltype": "centralIndexKeyItemType",
"nsuri": "http://xbrl.sec.gov/dei/2023",
"localname": "EntityCentralIndexKey",
"presentation": [
"http://xbrl.sec.gov/oef/role/NcsrCover",
"http://xbrl.sec.gov/oef/role/ShareholderReport"
],
"lang": {
"en-us": {
"role": {
"label": "Entity Central Index Key",
"documentation": "A unique 10-digit SEC-issued value to identify entities that have filed disclosures with the SEC. It is commonly abbreviated as CIK."
}
}
},
"auth_ref": [
"r21"
]
},
"dei_EntityInvCompanyType": {
"xbrltype": "invCompanyType",
"nsuri": "http://xbrl.sec.gov/dei/2023",
"localname": "EntityInvCompanyType",
"presentation": [
"http://xbrl.sec.gov/oef/role/NcsrCover",
"http://xbrl.sec.gov/oef/role/ShareholderReport"
],
"lang": {
"en-us": {
"role": {
"label": "Entity Investment Company Type",
"documentation": "One of: N-1A (Mutual Fund), N-1 (Open-End Separate Account with No Variable Annuities), N-2 (Closed-End Investment Company), N-3 (Separate Account Registered as Open-End Management Investment Company), N-4 (Variable Annuity UIT Separate Account), N-5 (Small Business Investment Company), N-6 (Variable Life UIT Separate Account), S-1 or S-3 (Face Amount Certificate Company), S-6 (UIT, Non-Insurance Product)."
}
}
},
"auth_ref": [
"r72"
]
},
"dei_EntityRegistrantName": {
"xbrltype": "normalizedStringItemType",
"nsuri": "http://xbrl.sec.gov/dei/2023",
"localname": "EntityRegistrantName",
"presentation": [
"http://xbrl.sec.gov/oef/role/NcsrCover",
"http://xbrl.sec.gov/oef/role/ShareholderReport"
],
"lang": {
"en-us": {
"role": {
"label": "Registrant Name",
"documentation": "The exact name of the entity filing the report as specified in its charter, which is required by forms filed with the SEC."
}
}
},
"auth_ref": [
"r21"
]
},
"oef_EtfDiscountNumDays": {
"xbrltype": "integerItemType",
"nsuri": "http://xbrl.sec.gov/oef/2023",
"localname": "EtfDiscountNumDays",
"presentation": [
"http://xbrl.sec.gov/oef/role/ShareholderReport"
],
"lang": {
"en-us": {
"role": {
"label": "ETF Discount, Number of Days"
}
}
},
"auth_ref": [
"r46"
]
},
"oef_EtfPastPerfTextBlock": {
"xbrltype": "textBlockItemType",
"nsuri": "http://xbrl.sec.gov/oef/2023",
"localname": "EtfPastPerfTextBlock",
"presentation": [
"http://xbrl.sec.gov/oef/role/ShareholderReport"
],
"lang": {
"en-us": {
"role": {
"label": "ETF Past Performance [Text Block]"
}
}
},
"auth_ref": [
"r48"
]
},
"oef_EtfPremiumDiscountTextBlock": {
"xbrltype": "textBlockItemType",
"nsuri": "http://xbrl.sec.gov/oef/2023",
"localname": "EtfPremiumDiscountTextBlock",
"presentation": [
"http://xbrl.sec.gov/oef/role/ShareholderReport"
],
"lang": {
"en-us": {
"role": {
"label": "ETF Premium Discount [Text Block]"
}
}
},
"auth_ref": [
"r46"
]
},
"oef_EtfPremiumNumDays": {
"xbrltype": "integerItemType",
"nsuri": "http://xbrl.sec.gov/oef/2023",
"localname": "EtfPremiumNumDays",
"presentation": [
"http://xbrl.sec.gov/oef/role/ShareholderReport"
],
"lang": {
"en-us": {
"role": {
"label": "ETF Premium, Number of Days"
}
}
},
"auth_ref": [
"r46"
]
},
"oef_EtfPurchaseExplanationTextBlock": {
"xbrltype": "textBlockItemType",
"nsuri": "http://xbrl.sec.gov/oef/2023",
"localname": "EtfPurchaseExplanationTextBlock",
"presentation": [
"http://xbrl.sec.gov/oef/role/ShareholderReport"
],
"lang": {
"en-us": {
"role": {
"label": "ETF Purchase Explanation [Text Block]"
}
}
},
"auth_ref": [
"r47"
]
},
"oef_ExpenseRatioPct": {
"xbrltype": "percentItemType",
"nsuri": "http://xbrl.sec.gov/oef/2023",
"localname": "ExpenseRatioPct",
"presentation": [
"http://xbrl.sec.gov/oef/role/ShareholderReport"
],
"lang": {
"en-us": {
"role": {
"label": "Expense Ratio, Percent"
}
}
},
"auth_ref": [
"r31"
]
},
"oef_ExpensesExclExtraordinaryExpensesPct": {
"xbrltype": "percentItemType",
"nsuri": "http://xbrl.sec.gov/oef/2023",
"localname": "ExpensesExclExtraordinaryExpensesPct",
"presentation": [
"http://xbrl.sec.gov/oef/role/ShareholderReport"
],
"lang": {
"en-us": {
"role": {
"label": "Expenses Excluding Extraordinary Expenses, Percent"
}
}
},
"auth_ref": [
"r34"
]
},
"oef_ExpensesOverAssets": {
"xbrltype": "nonNegativePure4ItemType",
"nsuri": "http://xbrl.sec.gov/oef/2023",
"localname": "ExpensesOverAssets",
"calculation": {
"http://xbrl.sec.gov/rr/role/OperatingExpensesData": {
"parentTag": "oef_NetExpensesOverAssets",
"weight": 1.0,
"order": 1.0
}
},
"lang": {
"en-us": {
"role": {
"label": "Expenses (as a percentage of Assets)",
"totalLabel": "Total Expenses"
}
}
},
"auth_ref": [
"r68"
]
},
"oef_ExpensesPaidAmt": {
"xbrltype": "monetaryItemType",
"nsuri": "http://xbrl.sec.gov/oef/2023",
"localname": "ExpensesPaidAmt",
"presentation": [
"http://xbrl.sec.gov/oef/role/ShareholderReport"
],
"lang": {
"en-us": {
"role": {
"label": "Expenses Paid, Amount"
}
}
},
"auth_ref": [
"r30"
]
},
"oef_ExpensesRepresentBothMasterAndFeeder": {
"xbrltype": "stringItemType",
"nsuri": "http://xbrl.sec.gov/oef/2023",
"localname": "ExpensesRepresentBothMasterAndFeeder",
"presentation": [
"http://xbrl.sec.gov/oef/role/ShareholderReport"
],
"lang": {
"en-us": {
"role": {
"label": "Expenses Represent Both Master and Feeder [Text]"
}
}
},
"auth_ref": [
"r32",
"r62"
]
},
"oef_ExpensesShortPeriodFnTextBlock": {
"xbrltype": "textBlockItemType",
"nsuri": "http://xbrl.sec.gov/oef/2023",
"localname": "ExpensesShortPeriodFnTextBlock",
"presentation": [
"http://xbrl.sec.gov/oef/role/ShareholderReport"
],
"lang": {
"en-us": {
"role": {
"label": "Expenses Short Period Footnote [Text Block]"
}
}
},
"auth_ref": [
"r33"
]
},
"oef_ExpensesTextBlock": {
"xbrltype": "textBlockItemType",
"nsuri": "http://xbrl.sec.gov/oef/2023",
"localname": "ExpensesTextBlock",
"presentation": [
"http://xbrl.sec.gov/oef/role/ShareholderReport"
],
"lang": {
"en-us": {
"role": {
"label": "Expenses [Text Block]"
}
}
},
"auth_ref": [
"r29"
]
},
"oef_ExposureBasisExplanationTextBlock": {
"xbrltype": "textBlockItemType",
"nsuri": "http://xbrl.sec.gov/oef/2023",
"localname": "ExposureBasisExplanationTextBlock",
"presentation": [
"http://xbrl.sec.gov/oef/role/ShareholderReport"
],
"lang": {
"en-us": {
"role": {
"label": "Exposure Basis Explanation [Text Block]"
}
}
},
"auth_ref": [
"r51"
]
},
"srt_ExternalCreditRatingFitchMember": {
"xbrltype": "domainItemType",
"nsuri": "http://fasb.org/srt/2023",
"localname": "ExternalCreditRatingFitchMember",
"presentation": [
"http://xbrl.sec.gov/oef/role/ShareholderReportHoldingsDetails"
],
"auth_ref": []
},
"srt_ExternalCreditRatingMoodysMember": {
"xbrltype": "domainItemType",
"nsuri": "http://fasb.org/srt/2023",
"localname": "ExternalCreditRatingMoodysMember",
"presentation": [
"http://xbrl.sec.gov/oef/role/ShareholderReportHoldingsDetails"
],
"auth_ref": []
},
"srt_ExternalCreditRatingStandardPoorsMember": {
"xbrltype": "domainItemType",
"nsuri": "http://fasb.org/srt/2023",
"localname": "ExternalCreditRatingStandardPoorsMember",
"presentation": [
"http://xbrl.sec.gov/oef/role/ShareholderReportHoldingsDetails"
],
"auth_ref": []
},
"oef_ExtraordinaryExpensesFnTextBlock": {
"xbrltype": "textBlockItemType",
"nsuri": "http://xbrl.sec.gov/oef/2023",
"localname": "ExtraordinaryExpensesFnTextBlock",
"presentation": [
"http://xbrl.sec.gov/oef/role/ShareholderReport"
],
"lang": {
"en-us": {
"role": {
"label": "Extraordinary Expenses Footnote [Text Block]"
}
}
},
"auth_ref": [
"r34"
]
},
"oef_FactorsAffectingPerfTextBlock": {
"xbrltype": "textBlockItemType",
"nsuri": "http://xbrl.sec.gov/oef/2023",
"localname": "FactorsAffectingPerfTextBlock",
"presentation": [
"http://xbrl.sec.gov/oef/role/ShareholderReport"
],
"lang": {
"en-us": {
"role": {
"label": "Factors Affecting Performance [Text Block]"
}
}
},
"auth_ref": [
"r35"
]
},
"oef_FeeWaiverOrReimbursementOverAssets": {
"xbrltype": "nonPositivePure4ItemType",
"nsuri": "http://xbrl.sec.gov/oef/2023",
"localname": "FeeWaiverOrReimbursementOverAssets",
"calculation": {
"http://xbrl.sec.gov/rr/role/OperatingExpensesData": {
"parentTag": "oef_NetExpensesOverAssets",
"weight": 1.0,
"order": 2.0
}
},
"lang": {
"en-us": {
"role": {
"label": "Fee Waiver or Reimbursement",
"negatedLabel": "Fee Waiver or Reimbursement"
}
}
},
"auth_ref": [
"r69"
]
},
"oef_FundName": {
"xbrltype": "normalizedStringItemType",
"nsuri": "http://xbrl.sec.gov/oef/2023",
"localname": "FundName",
"presentation": [
"http://xbrl.sec.gov/oef/role/ShareholderReport"
],
"lang": {
"en-us": {
"role": {
"label": "Fund Name"
}
}
},
"auth_ref": [
"r24"
]
},
"country_GB": {
"xbrltype": "domainItemType",
"nsuri": "http://xbrl.sec.gov/country/2023",
"localname": "GB",
"presentation": [
"http://xbrl.sec.gov/oef/role/ShareholderReportHoldingsDetails"
],
"lang": {
"en-us": {
"role": {
"label": "United Kingdom",
"terseLabel": "United Kingdom"
}
}
},
"auth_ref": []
},
"oef_GeographicRegionAxis": {
"xbrltype": "stringItemType",
"nsuri": "http://xbrl.sec.gov/oef/2023",
"localname": "GeographicRegionAxis",
"presentation": [
"http://xbrl.sec.gov/oef/role/ShareholderReportHoldingsDetails"
],
"lang": {
"en-us": {
"role": {
"label": "Geographic Region [Axis]"
}
}
},
"auth_ref": [
"r51"
]
},
"oef_GeographicRegionDomain": {
"xbrltype": "domainItemType",
"nsuri": "http://xbrl.sec.gov/oef/2023",
"localname": "GeographicRegionDomain",
"presentation": [
"http://xbrl.sec.gov/oef/role/ShareholderReportHoldingsDetails"
],
"lang": {
"en-us": {
"role": {
"label": "Geographic Region [Domain]"
}
}
},
"auth_ref": [
"r51"
]
},
"us-gaap_HealthcareSectorMember": {
"xbrltype": "domainItemType",
"nsuri": "http://fasb.org/us-gaap/2023",
"localname": "HealthcareSectorMember",
"presentation": [
"http://xbrl.sec.gov/oef/role/ShareholderReportHoldingsDetails"
],
"lang": {
"en-us": {
"role": {
"terseLabel": "Healthcare Sector",
"documentation": "Sector of the economy consisting of companies engaged in healthcare-related business activities.",
"label": "Healthcare Sector [Member]"
}
}
},
"auth_ref": [
"r20",
"r77",
"r78",
"r79",
"r80"
]
},
"oef_HoldingsAbstract": {
"xbrltype": "stringItemType",
"nsuri": "http://xbrl.sec.gov/oef/2023",
"localname": "HoldingsAbstract",
"lang": {
"en-us": {
"role": {
"label": "Holdings [Abstract]"
}
}
},
"auth_ref": [
"r51"
]
},
"oef_HoldingsCount": {
"xbrltype": "integerItemType",
"nsuri": "http://xbrl.sec.gov/oef/2023",
"localname": "HoldingsCount",
"presentation": [
"http://xbrl.sec.gov/oef/role/ShareholderReport"
],
"lang": {
"en-us": {
"role": {
"label": "Holdings Count"
}
}
},
"auth_ref": [
"r49"
]
},
"oef_HoldingsLineItems": {
"xbrltype": "stringItemType",
"nsuri": "http://xbrl.sec.gov/oef/2023",
"localname": "HoldingsLineItems",
"presentation": [
"http://xbrl.sec.gov/oef/role/ShareholderReportHoldingsDetails"
],
"lang": {
"en-us": {
"role": {
"label": "Holdings [Line Items]"
}
}
},
"auth_ref": [
"r51"
]
},
"oef_HoldingsTable": {
"xbrltype": "stringItemType",
"nsuri": "http://xbrl.sec.gov/oef/2023",
"localname": "HoldingsTable",
"presentation": [
"http://xbrl.sec.gov/oef/role/ShareholderReportHoldingsDetails"
],
"lang": {
"en-us": {
"role": {
"label": "Holdings [Table]"
}
}
},
"auth_ref": [
"r51"
]
},
"oef_HoldingsTableTextBlock": {
"xbrltype": "textBlockItemType",
"nsuri": "http://xbrl.sec.gov/oef/2023",
"localname": "HoldingsTableTextBlock",
"presentation": [
"http://xbrl.sec.gov/oef/role/ShareholderReport"
],
"lang": {
"en-us": {
"role": {
"label": "Holdings [Text Block]"
}
}
},
"auth_ref": [
"r51"
]
},
"oef_InabilityToMeetDistLevelTextBlock": {
"xbrltype": "textBlockItemType",
"nsuri": "http://xbrl.sec.gov/oef/2023",
"localname": "InabilityToMeetDistLevelTextBlock",
"presentation": [
"http://xbrl.sec.gov/oef/role/ShareholderReport"
],
"lang": {
"en-us": {
"role": {
"label": "Inability to Meet Distribution Level [Text Block]"
}
}
},
"auth_ref": [
"r45"
]
},
"oef_IndustrialSectorMember": {
"xbrltype": "domainItemType",
"nsuri": "http://xbrl.sec.gov/oef/2023",
"localname": "IndustrialSectorMember",
"presentation": [
"http://xbrl.sec.gov/oef/role/ShareholderReportHoldingsDetails"
],
"lang": {
"en-us": {
"role": {
"label": "Industrial Sector [Member]",
"terseLabel": "Industrial Sector Member"
}
}
},
"auth_ref": [
"r51"
]
},
"oef_IndustrySectorAxis": {
"xbrltype": "stringItemType",
"nsuri": "http://xbrl.sec.gov/oef/2023",
"localname": "IndustrySectorAxis",
"presentation": [
"http://xbrl.sec.gov/oef/role/ShareholderReportHoldingsDetails"
],
"lang": {
"en-us": {
"role": {
"label": "Industry Sector [Axis]"
}
}
},
"auth_ref": [
"r51"
]
},
"oef_IndustrySectorDomain": {
"xbrltype": "domainItemType",
"nsuri": "http://xbrl.sec.gov/oef/2023",
"localname": "IndustrySectorDomain",
"presentation": [
"http://xbrl.sec.gov/oef/role/ShareholderReportHoldingsDetails"
],
"lang": {
"en-us": {
"role": {
"label": "Industry Sector [Domain]"
}
}
},
"auth_ref": [
"r51"
]
},
"oef_InformationTechnologySectorMember": {
"xbrltype": "domainItemType",
"nsuri": "http://xbrl.sec.gov/oef/2023",
"localname": "InformationTechnologySectorMember",
"presentation": [
"http://xbrl.sec.gov/oef/role/ShareholderReportHoldingsDetails"
],
"lang": {
"en-us": {
"role": {
"label": "Information Technology Sector [Member]",
"terseLabel": "Information Technology Member"
}
}
},
"auth_ref": [
"r51"
]
},
"us-gaap_InvestmentCompanyPortfolioTurnover": {
"xbrltype": "percentItemType",
"nsuri": "http://fasb.org/us-gaap/2023",
"localname": "InvestmentCompanyPortfolioTurnover",
"presentation": [
"http://xbrl.sec.gov/oef/role/ShareholderReport"
],
"lang": {
"en-us": {
"role": {
"documentation": "Percentage of lesser of purchase or sale of portfolio securities to average value of portfolio securities owned.",
"label": "Investment Company Portfolio Turnover"
}
}
},
"auth_ref": [
"r76"
]
},
"us-gaap_InvestmentTypeAxis": {
"xbrltype": "stringItemType",
"nsuri": "http://fasb.org/us-gaap/2023",
"localname": "InvestmentTypeAxis",
"presentation": [
"http://xbrl.sec.gov/oef/role/ShareholderReportHoldingsDetails"
],
"lang": {
"en-us": {
"role": {
"documentation": "Information by type of investments.",
"label": "Investment Type [Axis]"
}
}
},
"auth_ref": [
"r1",
"r2",
"r3",
"r4",
"r5",
"r6",
"r7",
"r8",
"r9",
"r10",
"r11",
"r12",
"r13",
"r14",
"r15",
"r16",
"r17",
"r20"
]
},
"us-gaap_InvestmentTypeCategorizationMember": {
"xbrltype": "domainItemType",
"nsuri": "http://fasb.org/us-gaap/2023",
"localname": "InvestmentTypeCategorizationMember",
"presentation": [
"http://xbrl.sec.gov/oef/role/ShareholderReportHoldingsDetails"
],
"lang": {
"en-us": {
"role": {
"documentation": "Asset obtained to generate income or appreciate in value.",
"label": "Investment Type Categorization [Member]"
}
}
},
"auth_ref": [
"r1",
"r2",
"r3",
"r4",
"r5",
"r6",
"r7",
"r8",
"r9",
"r10",
"r11",
"r12",
"r13",
"r14",
"r15",
"r16",
"r17",
"r20"
]
},
"country_JP": {
"xbrltype": "domainItemType",
"nsuri": "http://xbrl.sec.gov/country/2023",
"localname": "JP",
"presentation": [
"http://xbrl.sec.gov/oef/role/ShareholderReportHoldingsDetails"
],
"lang": {
"en-us": {
"role": {
"label": "Japan",
"terseLabel": "Japan"
}
}
},
"auth_ref": []
},
"country_KR": {
"xbrltype": "domainItemType",
"nsuri": "http://xbrl.sec.gov/country/2023",
"localname": "KR",
"presentation": [
"http://xbrl.sec.gov/oef/role/ShareholderReportHoldingsDetails"
],
"lang": {
"en-us": {
"role": {
"label": "Korea, Republic of",
"terseLabel": "Korea, Republic of"
}
}
},
"auth_ref": []
},
"oef_LargestHoldingAxis": {
"xbrltype": "stringItemType",
"nsuri": "http://xbrl.sec.gov/oef/2023",
"localname": "LargestHoldingAxis",
"presentation": [
"http://xbrl.sec.gov/oef/role/ShareholderReportHoldingsDetails"
],
"lang": {
"en-us": {
"role": {
"label": "Largest Holding [Axis]"
}
}
},
"auth_ref": [
"r51"
]
},
"oef_LargestHoldingsDomain": {
"xbrltype": "domainItemType",
"nsuri": "http://xbrl.sec.gov/oef/2023",
"localname": "LargestHoldingsDomain",
"presentation": [
"http://xbrl.sec.gov/oef/role/ShareholderReportHoldingsDetails"
],
"lang": {
"en-us": {
"role": {
"label": "Largest Holdings [Domain]"
}
}
},
"auth_ref": [
"r51"
]
},
"oef_LargestHoldingsTableTextBlock": {
"xbrltype": "textBlockItemType",
"nsuri": "http://xbrl.sec.gov/oef/2023",
"localname": "LargestHoldingsTableTextBlock",
"presentation": [
"http://xbrl.sec.gov/oef/role/ShareholderReport"
],
"lang": {
"en-us": {
"role": {
"label": "Largest Holdings [Text Block]"
}
}
},
"auth_ref": [
"r51"
]
},
"oef_LineGraphAndTableMeasureName": {
"xbrltype": "stringItemType",
"nsuri": "http://xbrl.sec.gov/oef/2023",
"localname": "LineGraphAndTableMeasureName",
"presentation": [
"http://xbrl.sec.gov/oef/role/ShareholderReportLineGraphDetails"
],
"lang": {
"en-us": {
"role": {
"label": "Line Graph and Table Measure Name"
}
}
},
"auth_ref": [
"r37"
]
},
"oef_LineGraphTableTextBlock": {
"xbrltype": "textBlockItemType",
"nsuri": "http://xbrl.sec.gov/oef/2023",
"localname": "LineGraphTableTextBlock",
"presentation": [
"http://xbrl.sec.gov/oef/role/ShareholderReport"
],
"lang": {
"en-us": {
"role": {
"label": "Line Graph [Table Text Block]"
}
}
},
"auth_ref": [
"r36"
]
},
"fmr_MSFinancialsSectorMember": {
"xbrltype": "domainItemType",
"nsuri": "http://www.fidelity.com/20240730",
"localname": "MSFinancialsSectorMember",
"presentation": [
"http://xbrl.sec.gov/oef/role/ShareholderReportHoldingsDetails"
],
"lang": {
"en-us": {
"role": {
"label": "MSFinancialsSectorMember [Member]",
"verboseLabel": "MSFinancialsSectorMember",
"terseLabel": "MSFinancialsSectorMember"
}
}
},
"auth_ref": []
},
"oef_ManagementFeesOverAssets": {
"xbrltype": "nonNegativePure4ItemType",
"nsuri": "http://xbrl.sec.gov/oef/2023",
"localname": "ManagementFeesOverAssets",
"calculation": {
"http://xbrl.sec.gov/rr/role/OperatingExpensesData": {
"parentTag": "oef_ExpensesOverAssets",
"weight": 1.0,
"order": 1.0
}
},
"lang": {
"en-us": {
"role": {
"label": "Management Fees (as a percentage of Assets)"
}
}
},
"auth_ref": [
"r64"
]
},
"oef_MaterialChngDate": {
"xbrltype": "dateItemType",
"nsuri": "http://xbrl.sec.gov/oef/2023",
"localname": "MaterialChngDate",
"presentation": [
"http://xbrl.sec.gov/oef/role/ShareholderReport"
],
"lang": {
"en-us": {
"role": {
"label": "Material Change Date"
}
}
},
"auth_ref": [
"r41"
]
},
"oef_MaterialChngDescriptionTextBlock": {
"xbrltype": "textBlockItemType",
"nsuri": "http://xbrl.sec.gov/oef/2023",
"localname": "MaterialChngDescriptionTextBlock",
"presentation": [
"http://xbrl.sec.gov/oef/role/ShareholderReport"
],
"lang": {
"en-us": {
"role": {
"label": "Material Change Description [Text Block]"
}
}
},
"auth_ref": [
"r41"
]
},
"oef_MaterialFundChngAdviserTextBlock": {
"xbrltype": "textBlockItemType",
"nsuri": "http://xbrl.sec.gov/oef/2023",
"localname": "MaterialFundChngAdviserTextBlock",
"presentation": [
"http://xbrl.sec.gov/oef/role/ShareholderReport"
],
"lang": {
"en-us": {
"role": {
"label": "Material Fund Change Adviser [Text Block]"
}
}
},
"auth_ref": [
"r58"
]
},
"oef_MaterialFundChngExpensesTextBlock": {
"xbrltype": "textBlockItemType",
"nsuri": "http://xbrl.sec.gov/oef/2023",
"localname": "MaterialFundChngExpensesTextBlock",
"presentation": [
"http://xbrl.sec.gov/oef/role/ShareholderReport"
],
"lang": {
"en-us": {
"role": {
"label": "Material Fund Change Expenses [Text Block]"
}
}
},
"auth_ref": [
"r55"
]
},
"oef_MaterialFundChngNameTextBlock": {
"xbrltype": "textBlockItemType",
"nsuri": "http://xbrl.sec.gov/oef/2023",
"localname": "MaterialFundChngNameTextBlock",
"presentation": [
"http://xbrl.sec.gov/oef/role/ShareholderReport"
],
"lang": {
"en-us": {
"role": {
"label": "Material Fund Change Name [Text Block]"
}
}
},
"auth_ref": [
"r53"
]
},
"oef_MaterialFundChngNoticeTextBlock": {
"xbrltype": "textBlockItemType",
"nsuri": "http://xbrl.sec.gov/oef/2023",
"localname": "MaterialFundChngNoticeTextBlock",
"presentation": [
"http://xbrl.sec.gov/oef/role/ShareholderReport"
],
"lang": {
"en-us": {
"role": {
"label": "Material Fund Change Notice [Text Block]"
}
}
},
"auth_ref": [
"r27"
]
},
"oef_MaterialFundChngObjectivesTextBlock": {
"xbrltype": "textBlockItemType",
"nsuri": "http://xbrl.sec.gov/oef/2023",
"localname": "MaterialFundChngObjectivesTextBlock",
"presentation": [
"http://xbrl.sec.gov/oef/role/ShareholderReport"
],
"lang": {
"en-us": {
"role": {
"label": "Material Fund Change Objectives [Text Block]"
}
}
},
"auth_ref": [
"r54"
]
},
"oef_MaterialFundChngRisksChngTextBlock": {
"xbrltype": "textBlockItemType",
"nsuri": "http://xbrl.sec.gov/oef/2023",
"localname": "MaterialFundChngRisksChngTextBlock",
"presentation": [
"http://xbrl.sec.gov/oef/role/ShareholderReport"
],
"lang": {
"en-us": {
"role": {
"label": "Material Fund Change Risks Change [Text Block]"
}
}
},
"auth_ref": [
"r57"
]
},
"oef_MaterialFundChngStrategiesTextBlock": {
"xbrltype": "textBlockItemType",
"nsuri": "http://xbrl.sec.gov/oef/2023",
"localname": "MaterialFundChngStrategiesTextBlock",
"presentation": [
"http://xbrl.sec.gov/oef/role/ShareholderReport"
],
"lang": {
"en-us": {
"role": {
"label": "Material Fund Change Strategies [Text Block]"
}
}
},
"auth_ref": [
"r56"
]
},
"oef_MaterialFundChngTextBlock": {
"xbrltype": "textBlockItemType",
"nsuri": "http://xbrl.sec.gov/oef/2023",
"localname": "MaterialFundChngTextBlock",
"presentation": [
"http://xbrl.sec.gov/oef/role/ShareholderReport"
],
"lang": {
"en-us": {
"role": {
"label": "Material Fund Change [Text Block]"
}
}
},
"auth_ref": [
"r52"
]
},
"oef_MaterialsSectorMember": {
"xbrltype": "domainItemType",
"nsuri": "http://xbrl.sec.gov/oef/2023",
"localname": "MaterialsSectorMember",
"presentation": [
"http://xbrl.sec.gov/oef/role/ShareholderReportHoldingsDetails"
],
"lang": {
"en-us": {
"role": {
"label": "Materials Sector [Member]",
"terseLabel": "Materials Sector Member"
}
}
},
"auth_ref": [
"r51"
]
},
"oef_MaturityAxis": {
"xbrltype": "stringItemType",
"nsuri": "http://xbrl.sec.gov/oef/2023",
"localname": "MaturityAxis",
"presentation": [
"http://xbrl.sec.gov/oef/role/ShareholderReportHoldingsDetails"
],
"lang": {
"en-us": {
"role": {
"label": "Maturity [Axis]"
}
}
},
"auth_ref": [
"r51"
]
},
"oef_MaturityDomain": {
"xbrltype": "domainItemType",
"nsuri": "http://xbrl.sec.gov/oef/2023",
"localname": "MaturityDomain",
"presentation": [
"http://xbrl.sec.gov/oef/role/ShareholderReportHoldingsDetails"
],
"lang": {
"en-us": {
"role": {
"label": "Maturity [Domain]"
}
}
},
"auth_ref": [
"r51"
]
},
"oef_NetExpensesOverAssets": {
"xbrltype": "nonNegativePure4ItemType",
"nsuri": "http://xbrl.sec.gov/oef/2023",
"localname": "NetExpensesOverAssets",
"calculation": {
"http://xbrl.sec.gov/rr/role/OperatingExpensesData": {
"parentTag": null,
"weight": null,
"order": null,
"root": true
}
},
"lang": {
"en-us": {
"role": {
"label": "Net Expenses (as a percentage of Assets)",
"totalLabel": "Net Expenses"
}
}
},
"auth_ref": [
"r63"
]
},
"oef_NoDeductionOfTaxesTextBlock": {
"xbrltype": "textBlockItemType",
"nsuri": "http://xbrl.sec.gov/oef/2023",
"localname": "NoDeductionOfTaxesTextBlock",
"presentation": [
"http://xbrl.sec.gov/oef/role/ShareholderReport"
],
"lang": {
"en-us": {
"role": {
"label": "No Deduction of Taxes [Text Block]"
}
}
},
"auth_ref": [
"r38"
]
},
"dei_NoTradingSymbolFlag": {
"xbrltype": "trueItemType",
"nsuri": "http://xbrl.sec.gov/dei/2023",
"localname": "NoTradingSymbolFlag",
"presentation": [
"http://xbrl.sec.gov/oef/role/ShareholderReport"
],
"lang": {
"en-us": {
"role": {
"label": "No Trading Symbol Flag",
"documentation": "Boolean flag that is true only for a security having no trading symbol."
}
}
},
"auth_ref": []
},
"oef_OtherCategory1Axis": {
"xbrltype": "stringItemType",
"nsuri": "http://xbrl.sec.gov/oef/2023",
"localname": "OtherCategory1Axis",
"presentation": [
"http://xbrl.sec.gov/oef/role/ShareholderReportHoldingsDetails"
],
"lang": {
"en-us": {
"role": {
"label": "Other Category 1 [Axis]"
}
}
},
"auth_ref": [
"r51"
]
},
"oef_OtherCategory1Domain": {
"xbrltype": "domainItemType",
"nsuri": "http://xbrl.sec.gov/oef/2023",
"localname": "OtherCategory1Domain",
"presentation": [
"http://xbrl.sec.gov/oef/role/ShareholderReportHoldingsDetails"
],
"lang": {
"en-us": {
"role": {
"label": "Other Category 1 [Domain]"
}
}
},
"auth_ref": [
"r51"
]
},
"oef_OtherCategory2Axis": {
"xbrltype": "stringItemType",
"nsuri": "http://xbrl.sec.gov/oef/2023",
"localname": "OtherCategory2Axis",
"presentation": [
"http://xbrl.sec.gov/oef/role/ShareholderReportHoldingsDetails"
],
"lang": {
"en-us": {
"role": {
"label": "Other Category 2 [Axis]"
}
}
},
"auth_ref": [
"r51"
]
},
"oef_OtherCategory2Domain": {
"xbrltype": "domainItemType",
"nsuri": "http://xbrl.sec.gov/oef/2023",
"localname": "OtherCategory2Domain",
"presentation": [
"http://xbrl.sec.gov/oef/role/ShareholderReportHoldingsDetails"
],
"lang": {
"en-us": {
"role": {
"label": "Other Category 2 [Domain]"
}
}
},
"auth_ref": [
"r51"
]
},
"oef_OtherExpensesOverAssets": {
"xbrltype": "nonNegativePure4ItemType",
"nsuri": "http://xbrl.sec.gov/oef/2023",
"localname": "OtherExpensesOverAssets",
"calculation": {
"http://xbrl.sec.gov/rr/role/OperatingExpensesData": {
"parentTag": "oef_ExpensesOverAssets",
"weight": 1.0,
"order": 4.0
}
},
"lang": {
"en-us": {
"role": {
"label": "Other Expenses (as a percentage of Assets):",
"totalLabel": "Other Expenses"
}
}
},
"auth_ref": [
"r66"
]
},
"fmr_OtherMember": {
"xbrltype": "domainItemType",
"nsuri": "http://www.fidelity.com/20240730",
"localname": "OtherMember",
"presentation": [
"http://xbrl.sec.gov/oef/role/ShareholderReportHoldingsDetails"
],
"lang": {
"en-us": {
"role": {
"label": "OtherMember"
}
}
},
"auth_ref": []
},
"oef_PctOfNav": {
"xbrltype": "percentItemType",
"nsuri": "http://xbrl.sec.gov/oef/2023",
"localname": "PctOfNav",
"presentation": [
"http://xbrl.sec.gov/oef/role/ShareholderReportHoldingsDetails"
],
"lang": {
"en-us": {
"role": {
"label": "Percent of Net Asset Value"
}
}
},
"auth_ref": [
"r51"
]
},
"oef_PctOfNetLongExposure": {
"xbrltype": "percentItemType",
"nsuri": "http://xbrl.sec.gov/oef/2023",
"localname": "PctOfNetLongExposure",
"presentation": [
"http://xbrl.sec.gov/oef/role/ShareholderReportHoldingsDetails"
],
"lang": {
"en-us": {
"role": {
"label": "Percent of Net Long Exposure"
}
}
},
"auth_ref": [
"r51"
]
},
"oef_PctOfNetShortExposure": {
"xbrltype": "percentItemType",
"nsuri": "http://xbrl.sec.gov/oef/2023",
"localname": "PctOfNetShortExposure",
"presentation": [
"http://xbrl.sec.gov/oef/role/ShareholderReportHoldingsDetails"
],
"lang": {
"en-us": {
"role": {
"label": "Percent of Net Short Exposure"
}
}
},
"auth_ref": [
"r51"
]
},
"oef_PctOfTotalInv": {
"xbrltype": "percentItemType",
"nsuri": "http://xbrl.sec.gov/oef/2023",
"localname": "PctOfTotalInv",
"presentation": [
"http://xbrl.sec.gov/oef/role/ShareholderReportHoldingsDetails"
],
"lang": {
"en-us": {
"role": {
"label": "Percent of Total Investments"
}
}
},
"auth_ref": [
"r51"
]
},
"oef_PctOfTotalLongExposure": {
"xbrltype": "percentItemType",
"nsuri": "http://xbrl.sec.gov/oef/2023",
"localname": "PctOfTotalLongExposure",
"presentation": [
"http://xbrl.sec.gov/oef/role/ShareholderReportHoldingsDetails"
],
"lang": {
"en-us": {
"role": {
"label": "Percent of Total Long Exposure"
}
}
},
"auth_ref": [
"r51"
]
},
"oef_PctOfTotalShortExposure": {
"xbrltype": "percentItemType",
"nsuri": "http://xbrl.sec.gov/oef/2023",
"localname": "PctOfTotalShortExposure",
"presentation": [
"http://xbrl.sec.gov/oef/role/ShareholderReportHoldingsDetails"
],
"lang": {
"en-us": {
"role": {
"label": "Percent of Total Short Exposure"
}
}
},
"auth_ref": [
"r51"
]
},
"oef_PerfInceptionDate": {
"xbrltype": "dateItemType",
"nsuri": "http://xbrl.sec.gov/oef/2023",
"localname": "PerfInceptionDate",
"presentation": [
"http://xbrl.sec.gov/oef/role/ShareholderReport"
],
"lang": {
"en-us": {
"role": {
"label": "Performance Inception Date"
}
}
},
"auth_ref": [
"r37"
]
},
"oef_PerfTableMarketIndexChngdTextBlock": {
"xbrltype": "textBlockItemType",
"nsuri": "http://xbrl.sec.gov/oef/2023",
"localname": "PerfTableMarketIndexChngdTextBlock",
"presentation": [
"http://xbrl.sec.gov/oef/role/ShareholderReport"
],
"lang": {
"en-us": {
"role": {
"label": "Performance Table Market Index Changed [Text Block]"
}
}
},
"auth_ref": [
"r44"
]
},
"oef_PerformancePastDoesNotIndicateFuture": {
"xbrltype": "stringItemType",
"nsuri": "http://xbrl.sec.gov/oef/2023",
"localname": "PerformancePastDoesNotIndicateFuture",
"presentation": [
"http://xbrl.sec.gov/oef/role/ShareholderReport"
],
"lang": {
"en-us": {
"role": {
"label": "Performance Past Does Not Indicate Future [Text]"
}
}
},
"auth_ref": [
"r39",
"r71"
]
},
"oef_PreviousInvestmentAdviserTextBlock": {
"xbrltype": "textBlockItemType",
"nsuri": "http://xbrl.sec.gov/oef/2023",
"localname": "PreviousInvestmentAdviserTextBlock",
"presentation": [
"http://xbrl.sec.gov/oef/role/ShareholderReport"
],
"lang": {
"en-us": {
"role": {
"label": "Previous Investment Adviser [Text Block]"
}
}
},
"auth_ref": [
"r40"
]
},
"oef_PriorMarketIndexComparisonTextBlock": {
"xbrltype": "textBlockItemType",
"nsuri": "http://xbrl.sec.gov/oef/2023",
"localname": "PriorMarketIndexComparisonTextBlock",
"presentation": [
"http://xbrl.sec.gov/oef/role/ShareholderReport"
],
"lang": {
"en-us": {
"role": {
"label": "Prior Market Index Comparison [Text Block]"
}
}
},
"auth_ref": [
"r44"
]
},
"us-gaap_RealEstateSectorMember": {
"xbrltype": "domainItemType",
"nsuri": "http://fasb.org/us-gaap/2023",
"localname": "RealEstateSectorMember",
"presentation": [
"http://xbrl.sec.gov/oef/role/ShareholderReportHoldingsDetails"
],
"lang": {
"en-us": {
"role": {
"terseLabel": "Real Estate Sector",
"documentation": "Sector of the economy consisting of companies engaged in real estate business activities.",
"label": "Real Estate Sector [Member]"
}
}
},
"auth_ref": [
"r18",
"r77",
"r78",
"r79",
"r80"
]
},
"oef_SalesLoadAxis": {
"xbrltype": "stringItemType",
"nsuri": "http://xbrl.sec.gov/oef/2023",
"localname": "SalesLoadAxis",
"presentation": [
"http://xbrl.sec.gov/oef/role/ShareholderReportLineGraphDetails"
],
"lang": {
"en-us": {
"role": {
"label": "Sales Load [Axis]"
}
}
},
"auth_ref": [
"r43"
]
},
"dei_SecurityExchangeName": {
"xbrltype": "edgarExchangeCodeItemType",
"nsuri": "http://xbrl.sec.gov/dei/2023",
"localname": "SecurityExchangeName",
"presentation": [
"http://xbrl.sec.gov/oef/role/ShareholderReport"
],
"lang": {
"en-us": {
"role": {
"label": "Security Exchange Name",
"terseLabel": "Exchange",
"documentation": "Name of the Exchange on which a security is registered."
}
}
},
"auth_ref": [
"r22"
]
},
"oef_ShareClassDomain": {
"xbrltype": "domainItemType",
"nsuri": "http://xbrl.sec.gov/oef/2023",
"localname": "ShareClassDomain",
"presentation": [
"http://xbrl.sec.gov/oef/role/ShareholderReport",
"http://xbrl.sec.gov/oef/role/ShareholderReportHoldingsDetails",
"http://xbrl.sec.gov/oef/role/ShareholderReportLineGraphDetails"
],
"lang": {
"en-us": {
"role": {
"label": "Share Classes"
}
}
},
"auth_ref": [
"r23"
]
},
"oef_ShareholderReportAbstract": {
"xbrltype": "stringItemType",
"nsuri": "http://xbrl.sec.gov/oef/2023",
"localname": "ShareholderReportAbstract",
"lang": {
"en-us": {
"role": {
"label": "Shareholder Report [Abstract]"
}
}
},
"auth_ref": [
"r43"
]
},
"oef_ShareholderReportAnnualOrSemiAnnual": {
"xbrltype": "shareholderReportTypeItemType",
"nsuri": "http://xbrl.sec.gov/oef/2023",
"localname": "ShareholderReportAnnualOrSemiAnnual",
"presentation": [
"http://xbrl.sec.gov/oef/role/ShareholderReport"
],
"lang": {
"en-us": {
"role": {
"label": "Shareholder Report Annual or Semi-Annual"
}
}
},
"auth_ref": [
"r25"
]
},
"oef_ShareholderReportLineItems": {
"xbrltype": "stringItemType",
"nsuri": "http://xbrl.sec.gov/oef/2023",
"localname": "ShareholderReportLineItems",
"presentation": [
"http://xbrl.sec.gov/oef/role/NcsrCover",
"http://xbrl.sec.gov/oef/role/ShareholderReport"
],
"lang": {
"en-us": {
"role": {
"label": "Shareholder Report [Line Items]"
}
}
},
"auth_ref": [
"r43"
]
},
"oef_ShareholderReportTable": {
"xbrltype": "stringItemType",
"nsuri": "http://xbrl.sec.gov/oef/2023",
"localname": "ShareholderReportTable",
"presentation": [
"http://xbrl.sec.gov/oef/role/NcsrCover",
"http://xbrl.sec.gov/oef/role/ShareholderReport"
],
"lang": {
"en-us": {
"role": {
"label": "Shareholder Report [Table]"
}
}
},
"auth_ref": [
"r43"
]
},
"oef_SummaryOfChngLegendTextBlock": {
"xbrltype": "textBlockItemType",
"nsuri": "http://xbrl.sec.gov/oef/2023",
"localname": "SummaryOfChngLegendTextBlock",
"presentation": [
"http://xbrl.sec.gov/oef/role/ShareholderReport"
],
"lang": {
"en-us": {
"role": {
"label": "Summary of Change Legend [Text Block]"
}
}
},
"auth_ref": [
"r59"
]
},
"fmr_TH0Member": {
"xbrltype": "domainItemType",
"nsuri": "http://www.fidelity.com/20240730",
"localname": "TH0Member",
"presentation": [
"http://xbrl.sec.gov/oef/role/ShareholderReportHoldingsDetails"
],
"lang": {
"en-us": {
"role": {
"label": "TH0Member [Member]",
"verboseLabel": "TH0Member",
"terseLabel": "TH0Member"
}
}
},
"auth_ref": []
},
"fmr_TH1Member": {
"xbrltype": "domainItemType",
"nsuri": "http://www.fidelity.com/20240730",
"localname": "TH1Member",
"presentation": [
"http://xbrl.sec.gov/oef/role/ShareholderReportHoldingsDetails"
],
"lang": {
"en-us": {
"role": {
"label": "TH1Member [Member]",
"verboseLabel": "TH1Member",
"terseLabel": "TH1Member"
}
}
},
"auth_ref": []
},
"fmr_TH2Member": {
"xbrltype": "domainItemType",
"nsuri": "http://www.fidelity.com/20240730",
"localname": "TH2Member",
"presentation": [
"http://xbrl.sec.gov/oef/role/ShareholderReportHoldingsDetails"
],
"lang": {
"en-us": {
"role": {
"label": "TH2Member [Member]",
"verboseLabel": "TH2Member",
"terseLabel": "TH2Member"
}
}
},
"auth_ref": []
},
"fmr_TH3Member": {
"xbrltype": "domainItemType",
"nsuri": "http://www.fidelity.com/20240730",
"localname": "TH3Member",
"presentation": [
"http://xbrl.sec.gov/oef/role/ShareholderReportHoldingsDetails"
],
"lang": {
"en-us": {
"role": {
"label": "TH3Member [Member]",
"verboseLabel": "TH3Member",
"terseLabel": "TH3Member"
}
}
},
"auth_ref": []
},
"fmr_TH4Member": {
"xbrltype": "domainItemType",
"nsuri": "http://www.fidelity.com/20240730",
"localname": "TH4Member",
"presentation": [
"http://xbrl.sec.gov/oef/role/ShareholderReportHoldingsDetails"
],
"lang": {
"en-us": {
"role": {
"label": "TH4Member [Member]",
"verboseLabel": "TH4Member",
"terseLabel": "TH4Member"
}
}
},
"auth_ref": []
},
"fmr_TH5Member": {
"xbrltype": "domainItemType",
"nsuri": "http://www.fidelity.com/20240730",
"localname": "TH5Member",
"presentation": [
"http://xbrl.sec.gov/oef/role/ShareholderReportHoldingsDetails"
],
"lang": {
"en-us": {
"role": {
"label": "TH5Member [Member]",
"verboseLabel": "TH5Member",
"terseLabel": "TH5Member"
}
}
},
"auth_ref": []
},
"fmr_TH6Member": {
"xbrltype": "domainItemType",
"nsuri": "http://www.fidelity.com/20240730",
"localname": "TH6Member",
"presentation": [
"http://xbrl.sec.gov/oef/role/ShareholderReportHoldingsDetails"
],
"lang": {
"en-us": {
"role": {
"label": "TH6Member [Member]",
"verboseLabel": "TH6Member",
"terseLabel": "TH6Member"
}
}
},
"auth_ref": []
},
"fmr_TH7Member": {
"xbrltype": "domainItemType",
"nsuri": "http://www.fidelity.com/20240730",
"localname": "TH7Member",
"presentation": [
"http://xbrl.sec.gov/oef/role/ShareholderReportHoldingsDetails"
],
"lang": {
"en-us": {
"role": {
"label": "TH7Member [Member]",
"verboseLabel": "TH7Member",
"terseLabel": "TH7Member"
}
}
},
"auth_ref": []
},
"fmr_TH8Member": {
"xbrltype": "domainItemType",
"nsuri": "http://www.fidelity.com/20240730",
"localname": "TH8Member",
"presentation": [
"http://xbrl.sec.gov/oef/role/ShareholderReportHoldingsDetails"
],
"lang": {
"en-us": {
"role": {
"label": "TH8Member [Member]",
"verboseLabel": "TH8Member",
"terseLabel": "TH8Member"
}
}
},
"auth_ref": []
},
"fmr_TH9Member": {
"xbrltype": "domainItemType",
"nsuri": "http://www.fidelity.com/20240730",
"localname": "TH9Member",
"presentation": [
"http://xbrl.sec.gov/oef/role/ShareholderReportHoldingsDetails"
],
"lang": {
"en-us": {
"role": {
"label": "TH9Member [Member]",
"verboseLabel": "TH9Member",
"terseLabel": "TH9Member"
}
}
},
"auth_ref": []
},
"country_TW": {
"xbrltype": "domainItemType",
"nsuri": "http://xbrl.sec.gov/country/2023",
"localname": "TW",
"presentation": [
"http://xbrl.sec.gov/oef/role/ShareholderReportHoldingsDetails"
],
"lang": {
"en-us": {
"role": {
"label": "Taiwan",
"terseLabel": "Taiwan"
}
}
},
"auth_ref": []
},
"dei_TradingSymbol": {
"xbrltype": "tradingSymbolItemType",
"nsuri": "http://xbrl.sec.gov/dei/2023",
"localname": "TradingSymbol",
"presentation": [
"http://xbrl.sec.gov/oef/role/ShareholderReport"
],
"lang": {
"en-us": {
"role": {
"label": "Trading Symbol",
"terseLabel": "Ticker",
"documentation": "Trading symbol of an instrument as listed on an exchange."
}
}
},
"auth_ref": []
},
"country_US": {
"xbrltype": "domainItemType",
"nsuri": "http://xbrl.sec.gov/country/2023",
"localname": "US",
"presentation": [
"http://xbrl.sec.gov/oef/role/ShareholderReportHoldingsDetails"
],
"lang": {
"en-us": {
"role": {
"label": "United States",
"terseLabel": "United States"
}
}
},
"auth_ref": []
},
"oef_UpdPerfInfoLocationTextBlock": {
"xbrltype": "textBlockItemType",
"nsuri": "http://xbrl.sec.gov/oef/2023",
"localname": "UpdPerfInfoLocationTextBlock",
"presentation": [
"http://xbrl.sec.gov/oef/role/ShareholderReport"
],
"lang": {
"en-us": {
"role": {
"label": "Updated Performance Information Location [Text Block]"
}
}
},
"auth_ref": [
"r42"
]
},
"oef_UpdProspectusEmailAddress": {
"xbrltype": "stringItemType",
"nsuri": "http://xbrl.sec.gov/oef/2023",
"localname": "UpdProspectusEmailAddress",
"presentation": [
"http://xbrl.sec.gov/oef/role/ShareholderReport"
],
"lang": {
"en-us": {
"role": {
"label": "Updated Prospectus Email Address"
}
}
},
"auth_ref": [
"r59"
]
},
"oef_UpdProspectusPhoneNumber": {
"xbrltype": "stringItemType",
"nsuri": "http://xbrl.sec.gov/oef/2023",
"localname": "UpdProspectusPhoneNumber",
"presentation": [
"http://xbrl.sec.gov/oef/role/ShareholderReport"
],
"lang": {
"en-us": {
"role": {
"label": "Updated Prospectus Phone Number"
}
}
},
"auth_ref": [
"r59"
]
},
"oef_UpdProspectusWebAddress": {
"xbrltype": "stringItemType",
"nsuri": "http://xbrl.sec.gov/oef/2023",
"localname": "UpdProspectusWebAddress",
"presentation": [
"http://xbrl.sec.gov/oef/role/ShareholderReport"
],
"lang": {
"en-us": {
"role": {
"label": "Updated Prospectus Web Address"
}
}
},
"auth_ref": [
"r59"
]
},
"oef_UtilitiesSectorMember": {
"xbrltype": "domainItemType",
"nsuri": "http://xbrl.sec.gov/oef/2023",
"localname": "UtilitiesSectorMember",
"presentation": [
"http://xbrl.sec.gov/oef/role/ShareholderReportHoldingsDetails"
],
"lang": {
"en-us": {
"role": {
"label": "Utilities Sector [Member]",
"terseLabel": "Utilities Sector Member"
}
}
},
"auth_ref": [
"r51"
]
},
"oef_WithSalesLdMember": {
"xbrltype": "domainItemType",
"nsuri": "http://xbrl.sec.gov/oef/2023",
"localname": "WithSalesLoadMember",
"presentation": [
"http://xbrl.sec.gov/oef/role/ShareholderReportLineGraphDetails"
],
"lang": {
"en-us": {
"role": {
"label": "With Sales Load [Member]"
}
}
},
"auth_ref": [
"r43"
]
},
"oef_WithoutSalesLoadMember": {
"xbrltype": "domainItemType",
"nsuri": "http://xbrl.sec.gov/oef/2023",
"localname": "WithoutSalesLoadMember",
"presentation": [
"http://xbrl.sec.gov/oef/role/ShareholderReportLineGraphDetails"
],
"lang": {
"en-us": {
"role": {
"label": "Without Sales Load [Member]"
}
}
},
"auth_ref": [
"r43"
]
}
}
}
},
"std_ref": {
"r0": {
"role": "http://fasb.org/us-gaap/role/ref/legacyRef",
"Name": "Accounting Standards Codification",
"Section": "50",
"Paragraph": "1",
"SubTopic": "30",
"Topic": "205",
"Publisher": "FASB",
"URI": "https://asc.fasb.org//1943274/2147479910/205-30-50-1"
},
"r1": {
"role": "http://www.xbrl.org/2003/role/disclosureRef",
"Topic": "946",
"SubTopic": "210",
"Name": "Accounting Standards Codification",
"Section": "50",
"Paragraph": "1",
"Subparagraph": "(b)(1)",
"Publisher": "FASB",
"URI": "https://asc.fasb.org//1943274/2147480524/946-210-50-1"
},
"r2": {
"role": "http://www.xbrl.org/2003/role/disclosureRef",
"Topic": "946",
"SubTopic": "210",
"Name": "Accounting Standards Codification",
"Section": "50",
"Paragraph": "1",
"Subparagraph": "(c)(1)",
"Publisher": "FASB",
"URI": "https://asc.fasb.org//1943274/2147480524/946-210-50-1"
},
"r3": {
"role": "http://www.xbrl.org/2003/role/disclosureRef",
"Topic": "946",
"SubTopic": "210",
"Name": "Accounting Standards Codification",
"Section": "50",
"Paragraph": "1",
"Subparagraph": "(c)(2)",
"Publisher": "FASB",
"URI": "https://asc.fasb.org//1943274/2147480524/946-210-50-1"
},
"r4": {
"role": "http://www.xbrl.org/2003/role/disclosureRef",
"Topic": "946",
"SubTopic": "210",
"Name": "Accounting Standards Codification",
"Section": "50",
"Paragraph": "6",
"Subparagraph": "(a)(1)",
"Publisher": "FASB",
"URI": "https://asc.fasb.org//1943274/2147480524/946-210-50-6"
},
"r5": {
"role": "http://www.xbrl.org/2003/role/disclosureRef",
"Topic": "946",
"SubTopic": "210",
"Name": "Accounting Standards Codification",
"Section": "50",
"Paragraph": "6",
"Subparagraph": "(c)",
"Publisher": "FASB",
"URI": "https://asc.fasb.org//1943274/2147480524/946-210-50-6"
},
"r6": {
"role": "http://www.xbrl.org/2003/role/disclosureRef",
"Topic": "946",
"SubTopic": "320",
"Name": "Accounting Standards Codification",
"Section": "S99",
"Paragraph": "1",
"Subparagraph": "(SX 210.12-12(Column A)(Footnote 1))",
"Publisher": "FASB",
"URI": "https://asc.fasb.org//1943274/2147480032/946-320-S99-1"
},
"r7": {
"role": "http://www.xbrl.org/2003/role/disclosureRef",
"Topic": "946",
"SubTopic": "320",
"Name": "Accounting Standards Codification",
"Section": "S99",
"Paragraph": "1",
"Subparagraph": "(SX 210.12-12(Column C)(Footnote 5))",
"Publisher": "FASB",
"URI": "https://asc.fasb.org//1943274/2147480032/946-320-S99-1"
},
"r8": {
"role": "http://www.xbrl.org/2003/role/disclosureRef",
"Topic": "946",
"SubTopic": "320",
"Name": "Accounting Standards Codification",
"Section": "S99",
"Paragraph": "2",
"Subparagraph": "(SX 210.12-12A(Column C)(Footnote 4))",
"Publisher": "FASB",
"URI": "https://asc.fasb.org//1943274/2147480032/946-320-S99-2"
},
"r9": {
"role": "http://www.xbrl.org/2003/role/disclosureRef",
"Topic": "946",
"SubTopic": "320",
"Name": "Accounting Standards Codification",
"Section": "S99",
"Paragraph": "3",
"Subparagraph": "(SX 210.12-12B(Column A)(Footnote 7))",
"Publisher": "FASB",
"URI": "https://asc.fasb.org//1943274/2147480032/946-320-S99-3"
},
"r10": {
"role": "http://www.xbrl.org/2003/role/disclosureRef",
"Topic": "946",
"SubTopic": "320",
"Name": "Accounting Standards Codification",
"Section": "S99",
"Paragraph": "3",
"Subparagraph": "(SX 210.12-12B(Column C)(Footnote 2))",
"Publisher": "FASB",
"URI": "https://asc.fasb.org//1943274/2147480032/946-320-S99-3"
},
"r11": {
"role": "http://www.xbrl.org/2003/role/disclosureRef",
"Topic": "946",
"SubTopic": "320",
"Name": "Accounting Standards Codification",
"Section": "S99",
"Paragraph": "5D",
"Subparagraph": "(SX 210.12-13D(Column B)(Footnote 2))",
"Publisher": "FASB",
"URI": "https://asc.fasb.org//1943274/2147480032/946-320-S99-5D"
},
"r12": {
"role": "http://www.xbrl.org/2003/role/disclosureRef",
"Topic": "946",
"SubTopic": "320",
"Name": "Accounting Standards Codification",
"Section": "S99",
"Paragraph": "5D",
"Subparagraph": "(SX 210.12-13D(Column C)(Footnote 2))",
"Publisher": "FASB",
"URI": "https://asc.fasb.org//1943274/2147480032/946-320-S99-5D"
},
"r13": {
"role": "http://www.xbrl.org/2003/role/disclosureRef",
"Topic": "946",
"SubTopic": "320",
"Name": "Accounting Standards Codification",
"Section": "S99",
"Paragraph": "6",
"Subparagraph": "(SX 210.12-14(Column F)(Footnote 7))",
"Publisher": "FASB",
"URI": "https://asc.fasb.org//1943274/2147480032/946-320-S99-6"
},
"r14": {
"role": "http://www.xbrl.org/2003/role/disclosureRef",
"Topic": "946",
"SubTopic": "320",
"Name": "Accounting Standards Codification",
"Section": "S99",
"Paragraph": "7",
"Subparagraph": "(SX 210.12-15(Column A))",
"Publisher": "FASB",
"URI": "https://asc.fasb.org//1943274/2147480032/946-320-S99-7"
},
"r15": {
"role": "http://www.xbrl.org/2003/role/disclosureRef",
"Topic": "946",
"SubTopic": "320",
"Name": "Accounting Standards Codification",
"Section": "S99",
"Paragraph": "7",
"Subparagraph": "(SX 210.12-15(Column B))",
"Publisher": "FASB",
"URI": "https://asc.fasb.org//1943274/2147480032/946-320-S99-7"
},
"r16": {
"role": "http://www.xbrl.org/2003/role/disclosureRef",
"Topic": "946",
"SubTopic": "320",
"Name": "Accounting Standards Codification",
"Section": "S99",
"Paragraph": "7",
"Subparagraph": "(SX 210.12-15(Column C))",
"Publisher": "FASB",
"URI": "https://asc.fasb.org//1943274/2147480032/946-320-S99-7"
},
"r17": {
"role": "http://www.xbrl.org/2003/role/disclosureRef",
"Topic": "946",
"SubTopic": "320",
"Name": "Accounting Standards Codification",
"Section": "S99",
"Paragraph": "7",
"Subparagraph": "(SX 210.12-15(Column D))",
"Publisher": "FASB",
"URI": "https://asc.fasb.org//1943274/2147480032/946-320-S99-7"
},
"r18": {
"role": "http://www.xbrl.org/2003/role/exampleRef",
"Topic": "326",
"SubTopic": "20",
"Name": "Accounting Standards Codification",
"Section": "55",
"Paragraph": "12",
"Subparagraph": "(c)(1)",
"Publisher": "FASB",
"URI": "https://asc.fasb.org//1943274/2147479294/326-20-55-12"
},
"r19": {
"role": "http://www.xbrl.org/2003/role/exampleRef",
"Topic": "326",
"SubTopic": "20",
"Name": "Accounting Standards Codification",
"Section": "55",
"Paragraph": "15",
"Subparagraph": "(b)",
"Publisher": "FASB",
"URI": "https://asc.fasb.org//1943274/2147479294/326-20-55-15"
},
"r20": {
"role": "http://www.xbrl.org/2003/role/exampleRef",
"Topic": "946",
"SubTopic": "210",
"Name": "Accounting Standards Codification",
"Section": "55",
"Paragraph": "1",
"Publisher": "FASB",
"URI": "https://asc.fasb.org//1943274/2147480493/946-210-55-1"
},
"r21": {
"role": "http://www.xbrl.org/2003/role/presentationRef",
"Publisher": "SEC",
"Name": "Exchange Act",
"Number": "240",
"Section": "12",
"Subsection": "b-2"
},
"r22": {
"role": "http://www.xbrl.org/2003/role/presentationRef",
"Publisher": "SEC",
"Name": "Exchange Act",
"Number": "240",
"Section": "12",
"Subsection": "d1-1"
},
"r23": {
"role": "http://www.xbrl.org/2003/role/presentationRef",
"Publisher": "SEC",
"Name": "Form N-1A",
"Section": "1",
"Subsection": "a",
"Paragraph": "1"
},
"r24": {
"role": "http://www.xbrl.org/2003/role/presentationRef",
"Publisher": "SEC",
"Name": "Form N-1A",
"Section": "27A",
"Subsection": "b",
"Paragraph": "1"
},
"r25": {
"role": "http://www.xbrl.org/2003/role/presentationRef",
"Publisher": "SEC",
"Name": "Form N-1A",
"Section": "27A",
"Subsection": "b",
"Paragraph": "3"
},
"r26": {
"role": "http://www.xbrl.org/2003/role/presentationRef",
"Publisher": "SEC",
"Name": "Form N-1A",
"Section": "27A",
"Subsection": "b",
"Paragraph": "4"
},
"r27": {
"role": "http://www.xbrl.org/2003/role/presentationRef",
"Publisher": "SEC",
"Name": "Form N-1A",
"Section": "27A",
"Subsection": "b",
"Paragraph": "5"
},
"r28": {
"role": "http://www.xbrl.org/2003/role/presentationRef",
"Publisher": "SEC",
"Name": "Form N-1A",
"Section": "27A",
"Subsection": "b",
"Paragraph": "instruction",
"Subparagraph": "2"
},
"r29": {
"role": "http://www.xbrl.org/2003/role/presentationRef",
"Publisher": "SEC",
"Name": "Form N-1A",
"Section": "27A",
"Subsection": "c"
},
"r30": {
"role": "http://www.xbrl.org/2003/role/presentationRef",
"Publisher": "SEC",
"Name": "Form N-1A",
"Section": "27A",
"Subsection": "c",
"Paragraph": "ii"
},
"r31": {
"role": "http://www.xbrl.org/2003/role/presentationRef",
"Publisher": "SEC",
"Name": "Form N-1A",
"Section": "27A",
"Subsection": "c",
"Paragraph": "iii"
},
"r32": {
"role": "http://www.xbrl.org/2003/role/presentationRef",
"Publisher": "SEC",
"Name": "Form N-1A",
"Section": "27A",
"Subsection": "c",
"Paragraph": "instruction",
"Sentence": "1",
"Clause": "b"
},
"r33": {
"role": "http://www.xbrl.org/2003/role/presentationRef",
"Publisher": "SEC",
"Name": "Form N-1A",
"Section": "27A",
"Subsection": "c",
"Paragraph": "instruction",
"Subparagraph": "1",
"Clause": "c"
},
"r34": {
"role": "http://www.xbrl.org/2003/role/presentationRef",
"Publisher": "SEC",
"Name": "Form N-1A",
"Section": "27A",
"Subsection": "c",
"Paragraph": "instruction",
"Subparagraph": "1",
"Clause": "d"
},
"r35": {
"role": "http://www.xbrl.org/2003/role/presentationRef",
"Publisher": "SEC",
"Name": "Form N-1A",
"Section": "27A",
"Subsection": "d",
"Paragraph": "1"
},
"r36": {
"role": "http://www.xbrl.org/2003/role/presentationRef",
"Publisher": "SEC",
"Name": "Form N-1A",
"Section": "27A",
"Subsection": "d",
"Paragraph": "2"
},
"r37": {
"role": "http://www.xbrl.org/2003/role/presentationRef",
"Publisher": "SEC",
"Name": "Form N-1A",
"Section": "27A",
"Subsection": "d",
"Paragraph": "2",
"Subparagraph": "i"
},
"r38": {
"role": "http://www.xbrl.org/2003/role/presentationRef",
"Publisher": "SEC",
"Name": "Form N-1A",
"Section": "27A",
"Subsection": "d",
"Paragraph": "2",
"Subparagraph": "iii",
"Clause": "B"
},
"r39": {
"role": "http://www.xbrl.org/2003/role/presentationRef",
"Publisher": "SEC",
"Name": "Form N-1A",
"Section": "27A",
"Subsection": "d",
"Paragraph": "2",
"Subparagraph": "iiii",
"Clause": "A"
},
"r40": {
"role": "http://www.xbrl.org/2003/role/presentationRef",
"Publisher": "SEC",
"Name": "Form N-1A",
"Section": "27A",
"Subsection": "d",
"Paragraph": "2",
"Subparagraph": "instruction",
"Clause": "12"
},
"r41": {
"role": "http://www.xbrl.org/2003/role/presentationRef",
"Publisher": "SEC",
"Name": "Form N-1A",
"Section": "27A",
"Subsection": "d",
"Paragraph": "2",
"Subparagraph": "instruction",
"Clause": "14"
},
"r42": {
"role": "http://www.xbrl.org/2003/role/presentationRef",
"Publisher": "SEC",
"Name": "Form N-1A",
"Section": "27A",
"Subsection": "d",
"Paragraph": "2",
"Subparagraph": "instruction",
"Clause": "15"
},
"r43": {
"role": "http://www.xbrl.org/2003/role/presentationRef",
"Publisher": "SEC",
"Name": "Form N-1A",
"Section": "27A",
"Subsection": "d",
"Paragraph": "2",
"Subparagraph": "instruction",
"Clause": "7"
},
"r44": {
"role": "http://www.xbrl.org/2003/role/presentationRef",
"Publisher": "SEC",
"Name": "Form N-1A",
"Section": "27A",
"Subsection": "d",
"Paragraph": "2",
"Subparagraph": "instruction",
"Clause": "8"
},
"r45": {
"role": "http://www.xbrl.org/2003/role/presentationRef",
"Publisher": "SEC",
"Name": "Form N-1A",
"Section": "27A",
"Subsection": "d",
"Paragraph": "3"
},
"r46": {
"role": "http://www.xbrl.org/2003/role/presentationRef",
"Publisher": "SEC",
"Name": "Form N-1A",
"Section": "27A",
"Subsection": "d",
"Paragraph": "4"
},
"r47": {
"role": "http://www.xbrl.org/2003/role/presentationRef",
"Publisher": "SEC",
"Name": "Form N-1A",
"Section": "27A",
"Subsection": "d",
"Paragraph": "4",
"Subparagraph": "instruction",
"Clause": "3"
},
"r48": {
"role": "http://www.xbrl.org/2003/role/presentationRef",
"Publisher": "SEC",
"Name": "Form N-1A",
"Section": "27A",
"Subsection": "d",
"Paragraph": "4",
"Subparagraph": "instruction",
"Clause": "4"
},
"r49": {
"role": "http://www.xbrl.org/2003/role/presentationRef",
"Publisher": "SEC",
"Name": "Form N-1A",
"Section": "27A",
"Subsection": "e"
},
"r50": {
"role": "http://www.xbrl.org/2003/role/presentationRef",
"Publisher": "SEC",
"Name": "Form N-1A",
"Section": "27A",
"Subsection": "e",
"Paragraph": "instruction",
"Subparagraph": "6"
},
"r51": {
"role": "http://www.xbrl.org/2003/role/presentationRef",
"Publisher": "SEC",
"Name": "Form N-1A",
"Section": "27A",
"Subsection": "f"
},
"r52": {
"role": "http://www.xbrl.org/2003/role/presentationRef",
"Publisher": "SEC",
"Name": "Form N-1A",
"Section": "27A",
"Subsection": "g"
},
"r53": {
"role": "http://www.xbrl.org/2003/role/presentationRef",
"Publisher": "SEC",
"Name": "Form N-1A",
"Section": "27A",
"Subsection": "g",
"Paragraph": "1"
},
"r54": {
"role": "http://www.xbrl.org/2003/role/presentationRef",
"Publisher": "SEC",
"Name": "Form N-1A",
"Section": "27A",
"Subsection": "g",
"Paragraph": "2"
},
"r55": {
"role": "http://www.xbrl.org/2003/role/presentationRef",
"Publisher": "SEC",
"Name": "Form N-1A",
"Section": "27A",
"Subsection": "g",
"Paragraph": "3"
},
"r56": {
"role": "http://www.xbrl.org/2003/role/presentationRef",
"Publisher": "SEC",
"Name": "Form N-1A",
"Section": "27A",
"Subsection": "g",
"Paragraph": "4"
},
"r57": {
"role": "http://www.xbrl.org/2003/role/presentationRef",
"Publisher": "SEC",
"Name": "Form N-1A",
"Section": "27A",
"Subsection": "g",
"Paragraph": "5"
},
"r58": {
"role": "http://www.xbrl.org/2003/role/presentationRef",
"Publisher": "SEC",
"Name": "Form N-1A",
"Section": "27A",
"Subsection": "g",
"Paragraph": "6"
},
"r59": {
"role": "http://www.xbrl.org/2003/role/presentationRef",
"Publisher": "SEC",
"Name": "Form N-1A",
"Section": "27A",
"Subsection": "g",
"Paragraph": "instruction",
"Subparagraph": "2"
},
"r60": {
"role": "http://www.xbrl.org/2003/role/presentationRef",
"Publisher": "SEC",
"Name": "Form N-1A",
"Section": "27A",
"Subsection": "h",
"Paragraph": "1"
},
"r61": {
"role": "http://www.xbrl.org/2003/role/presentationRef",
"Publisher": "SEC",
"Name": "Form N-1A",
"Section": "27A",
"Subsection": "h",
"Paragraph": "2"
},
"r62": {
"role": "http://www.xbrl.org/2003/role/presentationRef",
"Publisher": "SEC",
"Name": "Form N-1A",
"Section": "3",
"Subsection": "instruction",
"Paragraph": "1",
"Subparagraph": "d",
"Sentence": "i"
},
"r63": {
"role": "http://www.xbrl.org/2003/role/presentationRef",
"Publisher": "SEC",
"Name": "Form N-1A",
"Section": "3",
"Subsection": "instruction",
"Paragraph": "3"
},
"r64": {
"role": "http://www.xbrl.org/2003/role/presentationRef",
"Publisher": "SEC",
"Name": "Form N-1A",
"Section": "3",
"Subsection": "instruction",
"Paragraph": "3",
"Subparagraph": "a"
},
"r65": {
"role": "http://www.xbrl.org/2003/role/presentationRef",
"Publisher": "SEC",
"Name": "Form N-1A",
"Section": "3",
"Subsection": "instruction",
"Paragraph": "3",
"Subparagraph": "b"
},
"r66": {
"role": "http://www.xbrl.org/2003/role/presentationRef",
"Publisher": "SEC",
"Name": "Form N-1A",
"Section": "3",
"Subsection": "instruction",
"Paragraph": "3",
"Subparagraph": "c",
"Sentence": "i"
},
"r67": {
"role": "http://www.xbrl.org/2003/role/presentationRef",
"Publisher": "SEC",
"Name": "Form N-1A",
"Section": "3",
"Subsection": "instruction",
"Paragraph": "3",
"Subparagraph": "c",
"Sentence": "iii"
},
"r68": {
"role": "http://www.xbrl.org/2003/role/presentationRef",
"Publisher": "SEC",
"Name": "Form N-1A",
"Section": "3",
"Subsection": "instruction",
"Paragraph": "3",
"Subparagraph": "d"
},
"r69": {
"role": "http://www.xbrl.org/2003/role/presentationRef",
"Publisher": "SEC",
"Name": "Form N-1A",
"Section": "3",
"Subsection": "instruction",
"Paragraph": "3",
"Subparagraph": "e"
},
"r70": {
"role": "http://www.xbrl.org/2003/role/presentationRef",
"Publisher": "SEC",
"Name": "Form N-1A",
"Section": "3",
"Subsection": "instruction",
"Paragraph": "3",
"Subparagraph": "f",
"Sentence": "i"
},
"r71": {
"role": "http://www.xbrl.org/2003/role/presentationRef",
"Publisher": "SEC",
"Name": "Form N-1A",
"Section": "4",
"Subsection": "b",
"Paragraph": "2",
"Subparagraph": "i"
},
"r72": {
"role": "http://www.xbrl.org/2003/role/presentationRef",
"Publisher": "SEC",
"Name": "Regulation S-T",
"Number": "232",
"Section": "313"
},
"r73": {
"role": "http://www.xbrl.org/2009/role/commonPracticeRef",
"Topic": "310",
"SubTopic": "10",
"Name": "Accounting Standards Codification",
"Section": "50",
"Paragraph": "29",
"Publisher": "FASB",
"URI": "https://asc.fasb.org//1943274/2147481962/310-10-50-29"
},
"r74": {
"role": "http://www.xbrl.org/2009/role/commonPracticeRef",
"Topic": "326",
"SubTopic": "20",
"Name": "Accounting Standards Codification",
"Section": "50",
"Paragraph": "5",
"Publisher": "FASB",
"URI": "https://asc.fasb.org//1943274/2147479319/326-20-50-5"
},
"r75": {
"role": "http://www.xbrl.org/2009/role/commonPracticeRef",
"Topic": "815",
"SubTopic": "10",
"Name": "Accounting Standards Codification",
"Section": "50",
"Paragraph": "4K",
"Subparagraph": "(a)(4)",
"Publisher": "FASB",
"URI": "https://asc.fasb.org//1943274/2147480434/815-10-50-4K"
},
"r76": {
"role": "http://www.xbrl.org/2009/role/commonPracticeRef",
"Topic": "946",
"SubTopic": "205",
"Name": "Accounting Standards Codification",
"Section": "50",
"Paragraph": "27",
"Publisher": "FASB",
"URI": "https://asc.fasb.org//1943274/2147480737/946-205-50-27"
},
"r77": {
"role": "http://www.xbrl.org/2009/role/commonPracticeRef",
"Topic": "946",
"SubTopic": "320",
"Name": "Accounting Standards Codification",
"Section": "S99",
"Paragraph": "1",
"Subparagraph": "(SX 210.12-12(Column A)(Footnote 2)(ii))",
"Publisher": "FASB",
"URI": "https://asc.fasb.org//1943274/2147480032/946-320-S99-1"
},
"r78": {
"role": "http://www.xbrl.org/2009/role/commonPracticeRef",
"Topic": "946",
"SubTopic": "320",
"Name": "Accounting Standards Codification",
"Section": "S99",
"Paragraph": "2",
"Subparagraph": "(SX 210.12-12A(Column A)(Footnote 2))",
"Publisher": "FASB",
"URI": "https://asc.fasb.org//1943274/2147480032/946-320-S99-2"
},
"r79": {
"role": "http://www.xbrl.org/2009/role/commonPracticeRef",
"Topic": "946",
"SubTopic": "320",
"Name": "Accounting Standards Codification",
"Section": "S99",
"Paragraph": "3",
"Subparagraph": "(SX 210.12-12B(Column A)(Footnote 1)(b))",
"Publisher": "FASB",
"URI": "https://asc.fasb.org//1943274/2147480032/946-320-S99-3"
},
"r80": {
"role": "http://www.xbrl.org/2009/role/commonPracticeRef",
"Topic": "946",
"SubTopic": "320",
"Name": "Accounting Standards Codification",
"Section": "S99",
"Paragraph": "6",
"Subparagraph": "(SX 210.12-14(Column A)(Footnote 2))",
"Publisher": "FASB",
"URI": "https://asc.fasb.org//1943274/2147480032/946-320-S99-6"
}
}
}