
UNITED STATES
SECURITIES AND EXCHANGE COMMISSION
Washington, D.C. 20549
FORM N-CSR
CERTIFIED SHAREHOLDER REPORT OF REGISTERED
MANAGEMENT INVESTMENT COMPANIES
Investment Company Act file number 811-02105
Fidelity Salem Street Trust
(Exact name of registrant as specified in charter)
245 Summer St., Boston, Massachusetts 02210
(Address of principal executive offices) (Zip code)
Margaret Carey, Secretary
245 Summer St.
Boston, Massachusetts 02210
(Name and address of agent for service)
Registrant's telephone number, including area code:
617-563-7000
Date of fiscal year end: | April 30 |
Date of reporting period: | April 30, 2024 |
Item 1.
Reports to Stockholders

Contents
Average Annual Total Returns
|
|||
Periods ended April 30, 2024
|
Past 1
year
|
Past 5
years
|
Past 10
years
|
Fidelity® Mid Cap Index Fund
|
16.34%
|
9.06%
|
9.40%
|
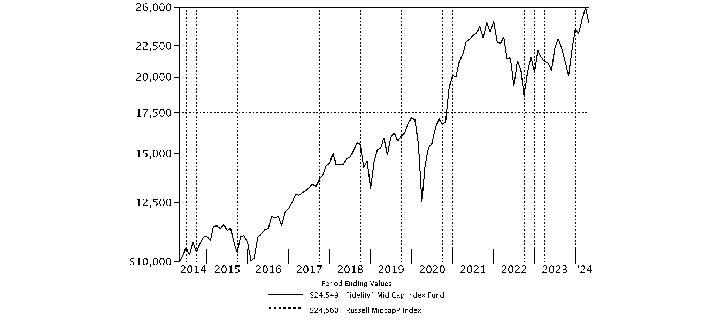
$10,000 Over 10 Years
|
Let's say hypothetically that $10,000 was invested in Fidelity® Mid Cap Index Fund on April 30, 2014.
The chart shows how the value of your investment would have changed, and also shows how the Russell Midcap® Index performed over the same period.
|
|
Top Holdings (% of Fund's net assets)
|
||
Trane Technologies PLC
|
0.7
|
|
Amphenol Corp. Class A
|
0.6
|
|
Parker Hannifin Corp.
|
0.6
|
|
TransDigm Group, Inc.
|
0.6
|
|
Phillips 66 Co.
|
0.6
|
|
Crowdstrike Holdings, Inc.
|
0.6
|
|
KKR & Co. LP
|
0.6
|
|
Constellation Energy Corp.
|
0.6
|
|
Cintas Corp.
|
0.5
|
|
Apollo Global Management, Inc.
|
0.5
|
|
5.9
|
||
Market Sectors (% of Fund's net assets)
|
||
Industrials
|
20.3
|
|
Financials
|
15.8
|
|
Information Technology
|
13.1
|
|
Consumer Discretionary
|
10.4
|
|
Health Care
|
9.7
|
|
Real Estate
|
7.4
|
|
Materials
|
5.6
|
|
Utilities
|
5.4
|
|
Energy
|
5.2
|
|
Consumer Staples
|
3.4
|
|
Communication Services
|
3.3
|
|
Asset Allocation (% of Fund's net assets)
|

|
Futures - 0.4%
|
Common Stocks - 99.6%
|
|||
Shares
|
Value ($)
|
||
COMMUNICATION SERVICES - 3.3%
|
|||
Diversified Telecommunication Services - 0.1%
|
|||
Frontier Communications Parent, Inc. (a)(b)
|
756,942
|
17,515,638
|
|
Iridium Communications, Inc.
|
377,436
|
11,621,254
|
|
29,136,892
|
|||
Entertainment - 1.7%
|
|||
AMC Entertainment Holdings, Inc. Class A (b)
|
789,496
|
2,313,223
|
|
Electronic Arts, Inc.
|
833,382
|
105,689,505
|
|
Liberty Media Corp. Liberty Formula One:
|
|||
Class A
|
74,816
|
4,658,792
|
|
Class C
|
596,275
|
41,721,362
|
|
Liberty Media Corp. Liberty Live:
|
|||
Class C
|
144,692
|
5,399,905
|
|
Series A
|
60,625
|
2,174,013
|
|
Live Nation Entertainment, Inc. (a)
|
481,710
|
42,828,836
|
|
Madison Square Garden Sports Corp. (a)
|
57,204
|
10,635,368
|
|
Playtika Holding Corp.
|
87,748
|
636,173
|
|
Roblox Corp. (a)
|
1,451,881
|
51,628,888
|
|
Roku, Inc. Class A (a)
|
383,717
|
22,125,122
|
|
Spotify Technology SA (a)
|
431,820
|
121,099,601
|
|
Take-Two Interactive Software, Inc. (a)
|
508,081
|
72,559,048
|
|
TKO Group Holdings, Inc.
|
190,693
|
18,052,906
|
|
Warner Bros Discovery, Inc. (a)
|
6,839,794
|
50,340,884
|
|
551,863,626
|
|||
Interactive Media & Services - 0.4%
|
|||
IAC, Inc. (a)
|
231,535
|
11,011,805
|
|
Match Group, Inc. (a)
|
833,403
|
25,685,480
|
|
Pinterest, Inc. Class A (a)
|
1,803,399
|
60,323,697
|
|
TripAdvisor, Inc. (a)
|
332,854
|
8,764,046
|
|
Zoominfo Technologies, Inc. (a)
|
937,531
|
14,869,242
|
|
120,654,270
|
|||
Media - 1.1%
|
|||
Cable One, Inc. (b)
|
12,573
|
4,951,876
|
|
Fox Corp.:
|
|||
Class A
|
749,380
|
23,238,274
|
|
Class B
|
415,636
|
11,920,440
|
|
Interpublic Group of Companies, Inc.
|
1,190,123
|
36,227,344
|
|
Liberty Broadband Corp.:
|
|||
Class A (a)
|
51,436
|
2,578,487
|
|
Class C (a)
|
357,755
|
17,791,156
|
|
Liberty Media Corp. Liberty SiriusXM
|
474,224
|
11,409,829
|
|
Liberty Media Corp. Liberty SiriusXM Class A
|
228,933
|
5,508,128
|
|
News Corp.:
|
|||
Class A
|
1,170,758
|
27,864,040
|
|
Class B
|
359,339
|
8,818,179
|
|
Nexstar Media Group, Inc. Class A
|
100,622
|
16,105,557
|
|
Omnicom Group, Inc.
|
607,961
|
56,443,099
|
|
Paramount Global:
|
|||
Class A (b)
|
29,561
|
611,617
|
|
Class B (b)
|
1,768,444
|
20,142,577
|
|
Sirius XM Holdings, Inc. (b)
|
1,998,793
|
5,876,451
|
|
The New York Times Co. Class A
|
498,141
|
21,435,007
|
|
The Trade Desk, Inc. (a)
|
1,359,089
|
112,600,524
|
|
383,522,585
|
|||
TOTAL COMMUNICATION SERVICES
|
1,085,177,373
|
||
CONSUMER DISCRETIONARY - 10.4%
|
|||
Automobile Components - 0.4%
|
|||
Aptiv PLC (a)
|
838,669
|
59,545,499
|
|
BorgWarner, Inc.
|
724,869
|
23,753,957
|
|
Gentex Corp.
|
721,179
|
24,736,440
|
|
Lear Corp.
|
178,743
|
22,498,381
|
|
Phinia, Inc.
|
145,987
|
5,693,493
|
|
QuantumScape Corp. Class A (a)(b)
|
861,294
|
4,668,213
|
|
140,895,983
|
|||
Automobiles - 0.2%
|
|||
Harley-Davidson, Inc.
|
398,729
|
13,712,290
|
|
Lucid Group, Inc. Class A (a)(b)
|
1,677,769
|
4,278,311
|
|
Rivian Automotive, Inc. (a)(b)
|
2,081,186
|
18,522,555
|
|
Thor Industries, Inc.
|
161,497
|
16,056,032
|
|
52,569,188
|
|||
Broadline Retail - 0.7%
|
|||
Coupang, Inc. Class A (a)
|
3,375,518
|
75,949,155
|
|
eBay, Inc.
|
1,597,839
|
82,352,622
|
|
Etsy, Inc. (a)
|
369,494
|
25,373,153
|
|
Kohl's Corp.
|
347,627
|
8,322,190
|
|
Macy's, Inc.
|
835,566
|
15,399,481
|
|
Nordstrom, Inc. (b)
|
351,142
|
6,675,209
|
|
Ollie's Bargain Outlet Holdings, Inc. (a)
|
189,658
|
13,871,586
|
|
227,943,396
|
|||
Distributors - 0.4%
|
|||
Genuine Parts Co.
|
431,846
|
67,890,510
|
|
LKQ Corp.
|
820,018
|
35,367,376
|
|
Pool Corp.
|
117,085
|
42,446,825
|
|
145,704,711
|
|||
Diversified Consumer Services - 0.3%
|
|||
ADT, Inc.
|
802,114
|
5,213,741
|
|
Bright Horizons Family Solutions, Inc. (a)
|
177,202
|
18,377,619
|
|
Grand Canyon Education, Inc. (a)
|
91,544
|
11,902,551
|
|
H&R Block, Inc.
|
441,668
|
20,859,980
|
|
Mister Car Wash, Inc. (a)(b)
|
252,792
|
1,691,178
|
|
Service Corp. International
|
441,723
|
31,675,956
|
|
89,721,025
|
|||
Hotels, Restaurants & Leisure - 3.4%
|
|||
Aramark
|
800,621
|
25,227,568
|
|
Boyd Gaming Corp.
|
217,174
|
11,620,981
|
|
Caesars Entertainment, Inc. (a)
|
633,077
|
22,676,818
|
|
Carnival Corp. (a)
|
3,063,303
|
45,398,150
|
|
Cava Group, Inc.
|
148,641
|
10,693,234
|
|
Choice Hotels International, Inc. (b)
|
90,803
|
10,738,363
|
|
Churchill Downs, Inc.
|
218,833
|
28,229,457
|
|
Darden Restaurants, Inc.
|
366,964
|
56,295,947
|
|
Domino's Pizza, Inc.
|
107,520
|
56,907,110
|
|
Doordash, Inc. (a)
|
954,631
|
123,395,603
|
|
Draftkings Holdings, Inc. (a)
|
1,288,101
|
53,533,478
|
|
Expedia Group, Inc. (a)
|
409,783
|
55,169,085
|
|
Hilton Worldwide Holdings, Inc.
|
767,176
|
151,348,481
|
|
Hyatt Hotels Corp. Class A
|
133,354
|
19,841,742
|
|
Marriott Vacations Worldwide Corp.
|
109,232
|
10,498,288
|
|
MGM Resorts International (a)
|
846,874
|
33,400,711
|
|
Norwegian Cruise Line Holdings Ltd. (a)
|
1,298,239
|
24,562,682
|
|
Penn Entertainment, Inc. (a)(b)
|
460,447
|
7,615,793
|
|
Planet Fitness, Inc. (a)
|
263,165
|
15,747,794
|
|
Royal Caribbean Cruises Ltd. (a)
|
720,580
|
100,614,585
|
|
Texas Roadhouse, Inc. Class A
|
205,742
|
33,079,199
|
|
Travel+Leisure Co.
|
216,791
|
9,439,080
|
|
Vail Resorts, Inc.
|
116,508
|
22,063,120
|
|
Wendy's Co.
|
520,347
|
10,401,737
|
|
Wingstop, Inc.
|
90,464
|
34,809,643
|
|
Wyndham Hotels & Resorts, Inc.
|
249,956
|
18,374,266
|
|
Wynn Resorts Ltd.
|
320,225
|
29,348,621
|
|
Yum! Brands, Inc.
|
863,383
|
121,952,849
|
|
1,142,984,385
|
|||
Household Durables - 1.8%
|
|||
D.R. Horton, Inc.
|
932,194
|
132,828,323
|
|
Garmin Ltd.
|
473,033
|
68,339,078
|
|
Leggett & Platt, Inc.
|
343,605
|
6,208,942
|
|
Lennar Corp.:
|
|||
Class A
|
745,656
|
113,056,363
|
|
Class B
|
40,204
|
5,644,240
|
|
Mohawk Industries, Inc. (a)
|
164,589
|
18,980,403
|
|
Newell Brands, Inc.
|
993,953
|
7,891,987
|
|
NVR, Inc. (a)
|
8,964
|
66,681,851
|
|
PulteGroup, Inc.
|
659,519
|
73,483,607
|
|
Tempur Sealy International, Inc.
|
513,461
|
25,703,858
|
|
Toll Brothers, Inc.
|
319,485
|
38,053,858
|
|
TopBuild Corp. (a)
|
97,494
|
39,452,897
|
|
Whirlpool Corp.
|
169,616
|
16,089,774
|
|
612,415,181
|
|||
Leisure Products - 0.3%
|
|||
Brunswick Corp.
|
211,294
|
17,038,748
|
|
Hasbro, Inc.
|
406,026
|
24,889,394
|
|
Mattel, Inc. (a)
|
1,083,287
|
19,845,818
|
|
Peloton Interactive, Inc. Class A (a)(b)
|
1,130,717
|
3,516,530
|
|
Polaris, Inc.
|
168,050
|
14,311,138
|
|
YETI Holdings, Inc. (a)
|
270,213
|
9,652,008
|
|
89,253,636
|
|||
Specialty Retail - 2.2%
|
|||
Advance Auto Parts, Inc.
|
185,287
|
13,522,245
|
|
AutoNation, Inc. (a)
|
87,391
|
14,083,060
|
|
Bath & Body Works, Inc.
|
695,893
|
31,607,460
|
|
Best Buy Co., Inc.
|
592,482
|
43,630,374
|
|
Burlington Stores, Inc. (a)
|
198,875
|
35,785,568
|
|
CarMax, Inc. (a)
|
486,925
|
33,096,292
|
|
Dick's Sporting Goods, Inc.
|
173,429
|
34,848,823
|
|
Five Below, Inc. (a)
|
169,075
|
24,742,436
|
|
Floor & Decor Holdings, Inc. Class A (a)(b)
|
320,835
|
35,397,726
|
|
GameStop Corp. Class A (a)(b)
|
824,224
|
9,140,644
|
|
Gap, Inc.
|
598,062
|
12,272,232
|
|
Lithia Motors, Inc. Class A (sub. vtg.)
|
83,282
|
21,185,275
|
|
Murphy U.S.A., Inc.
|
59,894
|
24,785,335
|
|
Penske Automotive Group, Inc.
|
60,190
|
9,203,653
|
|
Petco Health & Wellness Co., Inc. (a)(b)
|
425,751
|
638,627
|
|
RH (a)
|
48,516
|
11,985,878
|
|
Ross Stores, Inc.
|
1,017,878
|
131,866,095
|
|
Tractor Supply Co. (b)
|
332,714
|
90,857,539
|
|
Ulta Beauty, Inc. (a)
|
149,309
|
60,446,256
|
|
Valvoline, Inc. (a)
|
399,286
|
16,977,641
|
|
Victoria's Secret & Co. (a)
|
244,205
|
4,302,892
|
|
Wayfair LLC Class A (a)(b)
|
260,394
|
13,058,759
|
|
Williams-Sonoma, Inc.
|
196,167
|
56,256,772
|
|
729,691,582
|
|||
Textiles, Apparel & Luxury Goods - 0.7%
|
|||
Birkenstock Holding PLC
|
78,884
|
3,531,637
|
|
Capri Holdings Ltd. (a)
|
347,835
|
12,341,186
|
|
Carter's, Inc. (b)
|
111,314
|
7,614,991
|
|
Columbia Sportswear Co.
|
107,187
|
8,535,301
|
|
Crocs, Inc. (a)
|
183,625
|
22,837,441
|
|
Deckers Outdoor Corp. (a)
|
78,748
|
64,452,876
|
|
PVH Corp.
|
182,960
|
19,906,048
|
|
Ralph Lauren Corp.
|
120,966
|
19,794,876
|
|
Skechers U.S.A., Inc. Class A (sub. vtg.) (a)
|
409,870
|
27,071,914
|
|
Tapestry, Inc.
|
706,225
|
28,192,502
|
|
Under Armour, Inc.:
|
|||
Class A (sub. vtg.) (a)
|
582,041
|
3,917,136
|
|
Class C (non-vtg.) (a)
|
664,623
|
4,333,342
|
|
VF Corp. (b)
|
956,003
|
11,911,797
|
|
234,441,047
|
|||
TOTAL CONSUMER DISCRETIONARY
|
3,465,620,134
|
||
CONSUMER STAPLES - 3.4%
|
|||
Beverages - 0.3%
|
|||
Boston Beer Co., Inc. Class A (a)
|
26,036
|
7,248,683
|
|
Brown-Forman Corp.:
|
|||
Class A
|
155,091
|
7,610,315
|
|
Class B (non-vtg.)
|
558,953
|
26,745,901
|
|
Celsius Holdings, Inc. (a)
|
442,841
|
31,561,278
|
|
Molson Coors Beverage Co. Class B
|
538,031
|
30,807,655
|
|
103,973,832
|
|||
Consumer Staples Distribution & Retail - 1.2%
|
|||
Albertsons Companies, Inc.
|
1,243,847
|
25,374,479
|
|
BJ's Wholesale Club Holdings, Inc. (a)
|
409,377
|
30,572,274
|
|
Casey's General Stores, Inc.
|
114,618
|
36,629,620
|
|
Dollar Tree, Inc. (a)
|
633,492
|
74,910,429
|
|
Grocery Outlet Holding Corp. (a)
|
293,924
|
7,633,206
|
|
Kroger Co.
|
2,009,301
|
111,275,089
|
|
Maplebear, Inc. (NASDAQ)
|
69,796
|
2,382,137
|
|
Performance Food Group Co. (a)
|
471,562
|
32,009,629
|
|
U.S. Foods Holding Corp. (a)
|
697,376
|
35,043,144
|
|
Walgreens Boots Alliance, Inc.
|
2,228,777
|
39,516,216
|
|
395,346,223
|
|||
Food Products - 1.4%
|
|||
Bunge Global SA
|
445,409
|
45,324,820
|
|
Campbell Soup Co.
|
588,716
|
26,910,208
|
|
Conagra Brands, Inc.
|
1,464,441
|
45,075,494
|
|
Darling Ingredients, Inc. (a)
|
492,564
|
20,869,937
|
|
Flowers Foods, Inc.
|
578,257
|
14,421,730
|
|
Freshpet, Inc. (a)
|
133,218
|
14,130,433
|
|
Hormel Foods Corp.
|
891,026
|
31,684,885
|
|
Ingredion, Inc.
|
200,574
|
22,983,775
|
|
Kellanova
|
799,913
|
46,282,966
|
|
Lamb Weston Holdings, Inc.
|
447,423
|
37,288,233
|
|
McCormick & Co., Inc. (non-vtg.)
|
773,680
|
58,846,101
|
|
Pilgrim's Pride Corp. (a)
|
126,364
|
4,551,631
|
|
Post Holdings, Inc. (a)
|
156,335
|
16,594,960
|
|
Seaboard Corp.
|
658
|
2,178,052
|
|
The J.M. Smucker Co.
|
316,513
|
36,351,518
|
|
Tyson Foods, Inc. Class A
|
855,374
|
51,878,433
|
|
WK Kellogg Co.
|
202,335
|
4,722,499
|
|
480,095,675
|
|||
Household Products - 0.5%
|
|||
Church & Dwight Co., Inc.
|
752,109
|
81,145,040
|
|
Reynolds Consumer Products, Inc.
|
167,115
|
4,784,502
|
|
Spectrum Brands Holdings, Inc.
|
94,477
|
7,734,832
|
|
The Clorox Co.
|
381,092
|
56,352,074
|
|
150,016,448
|
|||
Personal Care Products - 0.0%
|
|||
Coty, Inc. Class A (a)
|
1,170,960
|
13,395,782
|
|
Olaplex Holdings, Inc. (a)
|
91,334
|
126,954
|
|
13,522,736
|
|||
TOTAL CONSUMER STAPLES
|
1,142,954,914
|
||
ENERGY - 5.2%
|
|||
Energy Equipment & Services - 0.8%
|
|||
Baker Hughes Co. Class A
|
3,076,757
|
100,363,813
|
|
Halliburton Co.
|
2,766,397
|
103,656,896
|
|
NOV, Inc.
|
1,182,917
|
21,872,135
|
|
TechnipFMC PLC
|
1,332,305
|
34,133,654
|
|
260,026,498
|
|||
Oil, Gas & Consumable Fuels - 4.4%
|
|||
Antero Midstream GP LP
|
1,043,312
|
14,439,438
|
|
Antero Resources Corp. (a)
|
870,262
|
29,597,611
|
|
APA Corp.
|
1,122,173
|
35,281,119
|
|
Cheniere Energy, Inc.
|
737,898
|
116,455,062
|
|
Chesapeake Energy Corp.
|
380,901
|
34,235,382
|
|
Coterra Energy, Inc.
|
2,298,269
|
62,880,640
|
|
Devon Energy Corp.
|
1,974,605
|
101,060,284
|
|
Diamondback Energy, Inc.
|
549,240
|
110,468,641
|
|
DT Midstream, Inc.
|
298,587
|
18,572,111
|
|
EQT Corp.
|
1,111,082
|
44,543,277
|
|
Hess Corp.
|
855,789
|
134,778,210
|
|
HF Sinclair Corp.
|
492,073
|
26,694,960
|
|
Marathon Oil Corp.
|
1,797,767
|
48,270,044
|
|
New Fortress Energy, Inc. (b)
|
201,080
|
5,268,296
|
|
ONEOK, Inc.
|
1,791,491
|
141,742,768
|
|
Ovintiv, Inc.
|
790,068
|
40,546,290
|
|
Phillips 66 Co.
|
1,354,648
|
193,999,140
|
|
Range Resources Corp.
|
720,429
|
25,870,605
|
|
Southwestern Energy Co. (a)
|
3,375,988
|
25,286,150
|
|
Targa Resources Corp.
|
680,534
|
77,621,708
|
|
Texas Pacific Land Corp.
|
56,942
|
32,815,675
|
|
The Williams Companies, Inc.
|
3,750,467
|
143,867,914
|
|
1,464,295,325
|
|||
TOTAL ENERGY
|
1,724,321,823
|
||
FINANCIALS - 15.8%
|
|||
Banks - 2.5%
|
|||
Bank OZK (b)
|
328,875
|
14,684,269
|
|
BOK Financial Corp.
|
85,044
|
7,545,954
|
|
Citizens Financial Group, Inc.
|
1,431,918
|
48,842,723
|
|
Columbia Banking Systems, Inc.
|
668,829
|
12,580,673
|
|
Comerica, Inc.
|
404,924
|
20,315,037
|
|
Commerce Bancshares, Inc.
|
369,246
|
20,190,371
|
|
Cullen/Frost Bankers, Inc.
|
182,146
|
19,005,114
|
|
East West Bancorp, Inc.
|
432,191
|
32,193,908
|
|
Fifth Third Bancorp
|
2,089,833
|
76,195,311
|
|
First Citizens Bancshares, Inc.
|
33,402
|
56,341,158
|
|
First Hawaiian, Inc.
|
391,358
|
8,253,740
|
|
First Horizon National Corp.
|
1,714,147
|
25,575,073
|
|
FNB Corp., Pennsylvania
|
1,100,165
|
14,676,201
|
|
Huntington Bancshares, Inc.
|
4,428,054
|
59,645,887
|
|
KeyCorp
|
2,867,811
|
41,554,581
|
|
M&T Bank Corp.
|
509,249
|
73,530,463
|
|
New York Community Bancorp, Inc.
|
1,993,529
|
5,282,852
|
|
Nu Holdings Ltd. (a)
|
7,197,299
|
78,162,667
|
|
Pinnacle Financial Partners, Inc.
|
231,502
|
17,756,203
|
|
Popular, Inc.
|
216,529
|
18,402,800
|
|
Prosperity Bancshares, Inc.
|
268,010
|
16,608,580
|
|
Regions Financial Corp.
|
2,844,959
|
54,822,360
|
|
Synovus Financial Corp.
|
446,404
|
15,976,799
|
|
TFS Financial Corp.
|
154,180
|
1,851,702
|
|
Webster Financial Corp.
|
526,093
|
23,058,656
|
|
Western Alliance Bancorp.
|
332,676
|
18,905,977
|
|
Wintrust Financial Corp.
|
187,177
|
18,088,785
|
|
Zions Bancorporation NA
|
448,978
|
18,309,323
|
|
818,357,167
|
|||
Capital Markets - 5.0%
|
|||
Affiliated Managers Group, Inc.
|
102,738
|
16,037,402
|
|
Ameriprise Financial, Inc.
|
308,501
|
127,037,627
|
|
Ares Management Corp.
|
514,468
|
68,470,546
|
|
Bank of New York Mellon Corp.
|
2,341,453
|
132,268,680
|
|
Blue Owl Capital, Inc. Class A
|
1,401,935
|
26,482,552
|
|
Carlyle Group LP
|
649,241
|
29,085,997
|
|
Cboe Global Markets, Inc.
|
323,771
|
58,651,117
|
|
Coinbase Global, Inc. (a)
|
527,590
|
107,591,429
|
|
Evercore, Inc. Class A
|
108,229
|
19,643,564
|
|
FactSet Research Systems, Inc.
|
118,140
|
49,251,385
|
|
Franklin Resources, Inc.
|
923,887
|
21,101,579
|
|
Houlihan Lokey
|
155,691
|
19,849,046
|
|
Interactive Brokers Group, Inc.
|
318,950
|
36,717,524
|
|
Invesco Ltd.
|
1,128,913
|
15,996,697
|
|
Janus Henderson Group PLC
|
411,915
|
12,859,986
|
|
Jefferies Financial Group, Inc.
|
557,411
|
24,002,118
|
|
KKR & Co. LP
|
2,043,069
|
190,148,432
|
|
Lazard, Inc. Class A
|
338,085
|
13,016,273
|
|
LPL Financial
|
231,993
|
62,436,276
|
|
MarketAxess Holdings, Inc.
|
114,454
|
22,901,101
|
|
Morningstar, Inc.
|
79,103
|
22,358,463
|
|
MSCI, Inc.
|
236,463
|
110,142,101
|
|
NASDAQ, Inc.
|
1,134,689
|
67,911,137
|
|
Northern Trust Corp.
|
622,765
|
51,309,608
|
|
Raymond James Financial, Inc.
|
582,524
|
71,067,928
|
|
Robinhood Markets, Inc. (a)
|
1,947,035
|
32,106,607
|
|
SEI Investments Co.
|
309,067
|
20,382,969
|
|
State Street Corp.
|
928,256
|
67,289,277
|
|
Stifel Financial Corp.
|
300,857
|
24,044,491
|
|
T. Rowe Price Group, Inc.
|
679,124
|
74,411,617
|
|
TPG, Inc.
|
220,466
|
9,502,085
|
|
Tradeweb Markets, Inc. Class A
|
353,215
|
35,925,498
|
|
Virtu Financial, Inc. Class A
|
260,686
|
5,656,886
|
|
XP, Inc. Class A
|
993,903
|
20,345,194
|
|
1,666,003,192
|
|||
Consumer Finance - 0.7%
|
|||
Ally Financial, Inc.
|
834,022
|
31,984,744
|
|
Credit Acceptance Corp. (a)
|
19,379
|
9,955,380
|
|
Discover Financial Services
|
768,546
|
97,397,835
|
|
OneMain Holdings, Inc.
|
346,202
|
18,040,586
|
|
SLM Corp.
|
674,382
|
14,290,155
|
|
SoFi Technologies, Inc. (a)(b)
|
2,957,563
|
20,052,277
|
|
Synchrony Financial
|
1,247,083
|
54,846,710
|
|
246,567,687
|
|||
Financial Services - 2.5%
|
|||
Affirm Holdings, Inc. (a)(b)
|
694,506
|
22,140,851
|
|
Apollo Global Management, Inc.
|
1,606,519
|
174,114,529
|
|
Block, Inc. Class A (a)
|
1,700,945
|
124,168,985
|
|
Corebridge Financial, Inc. (b)
|
696,873
|
18,508,947
|
|
Corpay, Inc. (a)
|
216,396
|
65,381,887
|
|
Equitable Holdings, Inc.
|
1,037,192
|
38,282,757
|
|
Euronet Worldwide, Inc. (a)
|
135,017
|
13,863,546
|
|
Fidelity National Information Services, Inc.
|
1,823,680
|
123,864,346
|
|
Global Payments, Inc.
|
794,400
|
97,528,488
|
|
Jack Henry & Associates, Inc.
|
223,855
|
36,418,970
|
|
MGIC Investment Corp.
|
847,408
|
17,185,434
|
|
NCR Atleos Corp.
|
200,913
|
4,004,196
|
|
Rocket Companies, Inc. (a)(b)
|
371,421
|
4,561,050
|
|
Shift4 Payments, Inc. (a)(b)
|
167,621
|
9,698,551
|
|
The Western Union Co.
|
1,120,556
|
15,060,273
|
|
Toast, Inc. (a)(b)
|
1,132,968
|
26,772,034
|
|
UWM Holdings Corp. Class A (b)
|
302,757
|
1,907,369
|
|
Voya Financial, Inc.
|
297,737
|
20,293,754
|
|
WEX, Inc. (a)
|
131,583
|
27,798,225
|
|
841,554,192
|
|||
Insurance - 4.9%
|
|||
AFLAC, Inc.
|
1,787,487
|
149,523,288
|
|
Allstate Corp.
|
807,663
|
137,351,170
|
|
American Financial Group, Inc.
|
220,240
|
28,135,660
|
|
Arch Capital Group Ltd. (a)
|
1,101,219
|
103,008,025
|
|
Arthur J. Gallagher & Co.
|
660,008
|
154,897,278
|
|
Assurant, Inc.
|
162,752
|
28,383,949
|
|
Assured Guaranty Ltd.
|
168,805
|
12,947,344
|
|
Axis Capital Holdings Ltd.
|
239,190
|
14,669,523
|
|
Brighthouse Financial, Inc. (a)
|
198,165
|
9,561,461
|
|
Brown & Brown, Inc.
|
729,899
|
59,515,964
|
|
Cincinnati Financial Corp.
|
472,633
|
54,678,912
|
|
CNA Financial Corp.
|
80,076
|
3,518,539
|
|
Everest Re Group Ltd.
|
131,886
|
48,324,349
|
|
Fidelity National Financial, Inc.
|
798,501
|
39,525,800
|
|
First American Financial Corp.
|
309,261
|
16,567,112
|
|
Globe Life, Inc.
|
266,320
|
20,285,594
|
|
Hanover Insurance Group, Inc.
|
109,213
|
14,178,032
|
|
Hartford Financial Services Group, Inc.
|
909,028
|
88,075,723
|
|
Kemper Corp.
|
186,081
|
10,850,383
|
|
Kinsale Capital Group, Inc.
|
67,171
|
24,399,866
|
|
Lincoln National Corp.
|
518,233
|
14,132,214
|
|
Loews Corp.
|
563,430
|
42,341,765
|
|
Markel Group, Inc. (a)
|
40,447
|
58,987,905
|
|
Old Republic International Corp.
|
791,628
|
23,638,012
|
|
Primerica, Inc.
|
107,128
|
22,696,138
|
|
Principal Financial Group, Inc.
|
730,296
|
57,795,625
|
|
Prudential Financial, Inc.
|
1,118,043
|
123,521,391
|
|
Reinsurance Group of America, Inc.
|
204,628
|
38,263,390
|
|
RenaissanceRe Holdings Ltd.
|
159,115
|
34,885,964
|
|
RLI Corp.
|
123,755
|
17,492,769
|
|
Ryan Specialty Group Holdings, Inc.
|
296,462
|
14,627,435
|
|
Unum Group
|
591,971
|
30,012,930
|
|
W.R. Berkley Corp.
|
615,414
|
47,368,416
|
|
White Mountains Insurance Group Ltd.
|
7,622
|
13,552,983
|
|
Willis Towers Watson PLC
|
318,410
|
79,965,487
|
|
1,637,680,396
|
|||
Mortgage Real Estate Investment Trusts - 0.2%
|
|||
AGNC Investment Corp.
|
2,152,830
|
19,698,395
|
|
Annaly Capital Management, Inc.
|
1,535,855
|
28,781,923
|
|
Rithm Capital Corp.
|
1,393,344
|
15,493,985
|
|
Starwood Property Trust, Inc. (b)
|
909,350
|
17,250,370
|
|
81,224,673
|
|||
TOTAL FINANCIALS
|
5,291,387,307
|
||
HEALTH CARE - 9.7%
|
|||
Biotechnology - 1.5%
|
|||
Alnylam Pharmaceuticals, Inc. (a)
|
387,405
|
55,766,950
|
|
Apellis Pharmaceuticals, Inc. (a)
|
312,884
|
13,826,344
|
|
Biogen, Inc. (a)
|
444,884
|
95,569,981
|
|
BioMarin Pharmaceutical, Inc. (a)
|
576,053
|
46,522,040
|
|
Exact Sciences Corp. (a)
|
552,728
|
32,804,407
|
|
Exelixis, Inc. (a)
|
945,038
|
22,170,591
|
|
Incyte Corp. (a)
|
537,411
|
27,972,243
|
|
Ionis Pharmaceuticals, Inc. (a)
|
439,423
|
18,130,593
|
|
Natera, Inc. (a)
|
335,475
|
31,158,918
|
|
Neurocrine Biosciences, Inc. (a)
|
297,449
|
40,911,135
|
|
Repligen Corp. (a)
|
171,781
|
28,206,440
|
|
Roivant Sciences Ltd. (a)
|
1,123,862
|
12,250,096
|
|
Sarepta Therapeutics, Inc. (a)
|
275,291
|
34,868,358
|
|
Ultragenyx Pharmaceutical, Inc. (a)
|
246,921
|
10,504,019
|
|
United Therapeutics Corp. (a)
|
138,935
|
32,556,639
|
|
503,218,754
|
|||
Health Care Equipment & Supplies - 3.0%
|
|||
Align Technology, Inc. (a)
|
235,689
|
66,553,860
|
|
Baxter International, Inc.
|
1,557,742
|
62,886,045
|
|
Dentsply Sirona, Inc.
|
657,794
|
19,740,398
|
|
DexCom, Inc. (a)
|
1,191,381
|
151,770,026
|
|
Enovis Corp. (a)
|
161,367
|
8,912,299
|
|
Envista Holdings Corp. (a)
|
517,958
|
10,193,413
|
|
Globus Medical, Inc. (a)
|
364,699
|
18,158,363
|
|
Hologic, Inc. (a)
|
712,113
|
53,956,802
|
|
ICU Medical, Inc. (a)
|
65,481
|
6,411,900
|
|
IDEXX Laboratories, Inc. (a)
|
253,574
|
124,951,124
|
|
Inspire Medical Systems, Inc. (a)
|
90,416
|
21,849,931
|
|
Insulet Corp. (a)
|
214,648
|
36,906,577
|
|
Integra LifeSciences Holdings Corp. (a)
|
217,049
|
6,331,319
|
|
Masimo Corp. (a)
|
133,371
|
17,926,396
|
|
Novocure Ltd. (a)
|
318,777
|
3,901,830
|
|
Penumbra, Inc. (a)
|
112,476
|
22,098,160
|
|
QuidelOrtho Corp. (a)
|
121,960
|
4,945,478
|
|
ResMed, Inc.
|
447,038
|
95,661,662
|
|
Shockwave Medical, Inc. (a)
|
111,845
|
36,930,101
|
|
STERIS PLC
|
305,367
|
62,465,874
|
|
Tandem Diabetes Care, Inc. (a)
|
198,261
|
7,274,196
|
|
Teleflex, Inc.
|
144,611
|
30,187,546
|
|
The Cooper Companies, Inc.
|
598,284
|
53,283,173
|
|
Zimmer Biomet Holdings, Inc.
|
646,592
|
77,772,086
|
|
1,001,068,559
|
|||
Health Care Providers & Services - 1.7%
|
|||
Acadia Healthcare Co., Inc. (a)
|
276,719
|
20,460,603
|
|
agilon health, Inc. (a)(b)
|
797,851
|
4,388,181
|
|
Amedisys, Inc. (a)
|
95,224
|
8,765,369
|
|
Cardinal Health, Inc.
|
759,461
|
78,254,861
|
|
Cencora, Inc.
|
517,717
|
123,760,249
|
|
Chemed Corp.
|
45,167
|
25,654,856
|
|
DaVita, Inc. (a)
|
166,192
|
23,102,350
|
|
Encompass Health Corp.
|
303,852
|
25,335,180
|
|
Henry Schein, Inc. (a)
|
401,849
|
27,840,099
|
|
Laboratory Corp. of America Holdings
|
261,259
|
52,609,725
|
|
Molina Healthcare, Inc. (a)
|
177,846
|
60,841,117
|
|
Premier, Inc.
|
377,904
|
7,890,636
|
|
Quest Diagnostics, Inc.
|
345,149
|
47,692,689
|
|
R1 RCM, Inc. (a)
|
482,394
|
5,928,622
|
|
Tenet Healthcare Corp. (a)
|
310,636
|
34,881,316
|
|
Universal Health Services, Inc. Class B
|
181,511
|
30,934,920
|
|
578,340,773
|
|||
Health Care Technology - 0.3%
|
|||
Certara, Inc. (a)
|
389,080
|
6,657,159
|
|
Doximity, Inc. (a)
|
365,546
|
8,879,112
|
|
Teladoc Health, Inc. (a)(b)
|
298,866
|
3,810,542
|
|
Veeva Systems, Inc. Class A (a)
|
447,331
|
88,822,043
|
|
108,168,856
|
|||
Life Sciences Tools & Services - 2.7%
|
|||
10X Genomics, Inc. (a)
|
226,260
|
6,624,893
|
|
Agilent Technologies, Inc.
|
899,799
|
123,308,455
|
|
Avantor, Inc. (a)
|
2,076,993
|
50,325,540
|
|
Azenta, Inc. (a)
|
168,999
|
8,865,688
|
|
Bio-Rad Laboratories, Inc. Class A (a)
|
64,031
|
17,272,362
|
|
Bio-Techne Corp.
|
482,155
|
30,477,018
|
|
Bruker Corp.
|
308,199
|
24,042,604
|
|
Charles River Laboratories International, Inc. (a)
|
156,430
|
35,822,470
|
|
Fortrea Holdings, Inc.
|
273,793
|
10,018,086
|
|
ICON PLC (a)
|
250,890
|
74,735,113
|
|
Illumina, Inc. (a)
|
490,094
|
60,306,067
|
|
IQVIA Holdings, Inc. (a)
|
560,280
|
129,856,096
|
|
Maravai LifeSciences Holdings, Inc. (a)
|
331,206
|
2,715,889
|
|
Medpace Holdings, Inc. (a)
|
71,696
|
27,843,142
|
|
Mettler-Toledo International, Inc. (a)
|
65,985
|
81,141,755
|
|
QIAGEN NV
|
680,281
|
28,796,295
|
|
Revvity, Inc.
|
383,524
|
39,299,704
|
|
Sotera Health Co. (a)
|
391,348
|
4,383,098
|
|
Waters Corp. (a)
|
180,446
|
55,765,032
|
|
West Pharmaceutical Services, Inc.
|
227,987
|
81,500,793
|
|
893,100,100
|
|||
Pharmaceuticals - 0.5%
|
|||
Catalent, Inc. (a)
|
554,435
|
30,965,195
|
|
Elanco Animal Health, Inc. (a)
|
1,504,222
|
19,795,562
|
|
Jazz Pharmaceuticals PLC (a)
|
188,324
|
20,856,883
|
|
Organon & Co.
|
792,070
|
14,740,423
|
|
Perrigo Co. PLC
|
422,026
|
13,783,369
|
|
Royalty Pharma PLC
|
1,143,012
|
31,661,432
|
|
Viatris, Inc.
|
3,687,003
|
42,658,625
|
|
174,461,489
|
|||
TOTAL HEALTH CARE
|
3,258,358,531
|
||
INDUSTRIALS - 20.3%
|
|||
Aerospace & Defense - 1.9%
|
|||
Axon Enterprise, Inc. (a)
|
216,683
|
67,964,790
|
|
BWX Technologies, Inc.
|
280,985
|
26,909,933
|
|
Curtiss-Wright Corp.
|
117,379
|
29,746,186
|
|
HEICO Corp.
|
138,889
|
28,805,579
|
|
HEICO Corp. Class A
|
249,580
|
41,392,843
|
|
Hexcel Corp.
|
260,156
|
16,704,617
|
|
Howmet Aerospace, Inc.
|
1,167,668
|
77,941,839
|
|
Huntington Ingalls Industries, Inc.
|
120,624
|
33,404,404
|
|
Mercury Systems, Inc. (a)
|
170,365
|
4,804,293
|
|
Spirit AeroSystems Holdings, Inc. Class A (a)
|
356,237
|
11,399,584
|
|
Textron, Inc.
|
602,422
|
50,958,877
|
|
TransDigm Group, Inc.
|
163,153
|
203,619,839
|
|
Woodward, Inc.
|
184,130
|
29,895,347
|
|
623,548,131
|
|||
Air Freight & Logistics - 0.3%
|
|||
C.H. Robinson Worldwide, Inc.
|
354,535
|
25,171,985
|
|
Expeditors International of Washington, Inc.
|
445,601
|
49,599,847
|
|
GXO Logistics, Inc. (a)
|
362,220
|
17,987,845
|
|
92,759,677
|
|||
Building Products - 2.5%
|
|||
A.O. Smith Corp.
|
372,504
|
30,858,231
|
|
Advanced Drain Systems, Inc.
|
206,078
|
32,354,246
|
|
Allegion PLC
|
270,087
|
32,831,776
|
|
Armstrong World Industries, Inc.
|
134,894
|
15,496,623
|
|
Builders FirstSource, Inc. (a)
|
373,436
|
68,271,570
|
|
Carlisle Companies, Inc.
|
148,957
|
57,832,555
|
|
Carrier Global Corp.
|
2,565,604
|
157,758,990
|
|
Fortune Brands Innovations, Inc.
|
389,050
|
28,439,555
|
|
Hayward Holdings, Inc. (a)
|
408,511
|
5,547,579
|
|
Lennox International, Inc.
|
98,376
|
45,589,406
|
|
Masco Corp.
|
692,138
|
47,376,846
|
|
Owens Corning
|
272,579
|
45,850,514
|
|
The AZEK Co., Inc. (a)
|
441,920
|
20,169,229
|
|
Trane Technologies PLC
|
701,214
|
222,523,242
|
|
Trex Co., Inc. (a)
|
334,219
|
29,595,092
|
|
840,495,454
|
|||
Commercial Services & Supplies - 1.8%
|
|||
Cintas Corp.
|
266,811
|
175,652,354
|
|
Clean Harbors, Inc. (a)
|
155,738
|
29,504,564
|
|
Copart, Inc.
|
2,642,042
|
143,489,301
|
|
Driven Brands Holdings, Inc. (a)
|
218,645
|
3,133,183
|
|
MSA Safety, Inc.
|
113,393
|
20,456,097
|
|
RB Global, Inc.
|
559,062
|
40,017,658
|
|
Republic Services, Inc.
|
617,793
|
118,430,918
|
|
Rollins, Inc.
|
785,715
|
35,011,460
|
|
Stericycle, Inc. (a)
|
283,363
|
12,674,827
|
|
Tetra Tech, Inc.
|
163,088
|
31,756,495
|
|
Vestis Corp.
|
365,696
|
6,736,120
|
|
616,862,977
|
|||
Construction & Engineering - 0.8%
|
|||
AECOM
|
417,835
|
38,591,241
|
|
EMCOR Group, Inc.
|
142,769
|
50,992,804
|
|
MasTec, Inc. (a)
|
191,892
|
17,018,901
|
|
MDU Resources Group, Inc.
|
621,774
|
15,357,818
|
|
Quanta Services, Inc.
|
442,575
|
114,432,192
|
|
Valmont Industries, Inc.
|
63,836
|
13,073,613
|
|
Willscot Mobile Mini Holdings (a)
|
573,304
|
21,189,316
|
|
270,655,885
|
|||
Electrical Equipment - 1.6%
|
|||
Acuity Brands, Inc.
|
94,915
|
23,567,395
|
|
AMETEK, Inc.
|
708,215
|
123,696,832
|
|
ChargePoint Holdings, Inc. Class A (a)(b)
|
1,345,518
|
1,789,539
|
|
Generac Holdings, Inc. (a)
|
185,039
|
25,157,902
|
|
Hubbell, Inc. Class B
|
164,912
|
61,103,194
|
|
nVent Electric PLC
|
506,271
|
36,486,951
|
|
Plug Power, Inc. (a)(b)
|
1,045,963
|
2,416,175
|
|
Regal Rexnord Corp.
|
203,867
|
32,898,018
|
|
Rockwell Automation, Inc.
|
354,343
|
96,012,779
|
|
Sensata Technologies, Inc. PLC
|
467,745
|
17,919,311
|
|
Sunrun, Inc. (a)(b)
|
656,627
|
6,756,692
|
|
Vertiv Holdings Co.
|
1,056,486
|
98,253,198
|
|
526,057,986
|
|||
Ground Transportation - 1.0%
|
|||
Avis Budget Group, Inc.
|
57,930
|
5,529,419
|
|
Hertz Global Holdings, Inc. (a)(b)
|
441,244
|
2,007,660
|
|
J.B. Hunt Transport Services, Inc.
|
253,380
|
41,191,987
|
|
Knight-Swift Transportation Holdings, Inc. Class A
|
481,687
|
22,268,390
|
|
Landstar System, Inc.
|
110,038
|
19,191,728
|
|
Lyft, Inc. (a)
|
1,071,949
|
16,765,282
|
|
Old Dominion Freight Lines, Inc.
|
607,478
|
110,384,827
|
|
Ryder System, Inc.
|
134,601
|
16,401,132
|
|
Saia, Inc. (a)
|
81,728
|
32,432,122
|
|
Schneider National, Inc. Class B
|
168,270
|
3,479,824
|
|
U-Haul Holding Co. (a)(b)
|
24,099
|
1,523,780
|
|
U-Haul Holding Co. (non-vtg.)
|
308,289
|
18,904,281
|
|
XPO, Inc. (a)
|
350,547
|
37,669,781
|
|
327,750,213
|
|||
Machinery - 5.1%
|
|||
AGCO Corp.
|
193,006
|
22,039,355
|
|
Allison Transmission Holdings, Inc.
|
274,717
|
20,205,435
|
|
CNH Industrial NV
|
3,012,647
|
34,344,176
|
|
Crane Co.
|
147,631
|
20,669,816
|
|
Cummins, Inc.
|
419,420
|
118,481,956
|
|
Donaldson Co., Inc.
|
372,609
|
26,902,370
|
|
Dover Corp.
|
429,461
|
77,002,357
|
|
ESAB Corp.
|
173,614
|
18,382,250
|
|
Flowserve Corp.
|
402,497
|
18,981,759
|
|
Fortive Corp.
|
1,088,858
|
81,958,342
|
|
Gates Industrial Corp. PLC (a)
|
507,256
|
8,937,851
|
|
Graco, Inc.
|
514,311
|
41,247,742
|
|
IDEX Corp.
|
232,743
|
51,310,522
|
|
Ingersoll Rand, Inc.
|
1,246,184
|
116,293,891
|
|
ITT, Inc.
|
254,296
|
32,890,645
|
|
Lincoln Electric Holdings, Inc.
|
171,772
|
37,709,107
|
|
Middleby Corp. (a)
|
164,035
|
22,795,944
|
|
Nordson Corp.
|
176,035
|
45,450,477
|
|
Oshkosh Corp.
|
200,602
|
22,521,587
|
|
Otis Worldwide Corp.
|
1,272,985
|
116,096,232
|
|
PACCAR, Inc.
|
1,578,873
|
167,534,214
|
|
Parker Hannifin Corp.
|
393,536
|
214,441,702
|
|
Pentair PLC
|
504,982
|
39,939,026
|
|
RBC Bearings, Inc. (a)
|
86,997
|
21,275,116
|
|
Snap-On, Inc.
|
160,204
|
42,928,264
|
|
Stanley Black & Decker, Inc.
|
470,734
|
43,025,088
|
|
Timken Co.
|
188,137
|
16,785,583
|
|
Toro Co.
|
320,934
|
28,110,609
|
|
Westinghouse Air Brake Tech Co.
|
548,943
|
88,423,738
|
|
Xylem, Inc.
|
730,140
|
95,429,298
|
|
1,692,114,452
|
|||
Marine Transportation - 0.0%
|
|||
Kirby Corp. (a)
|
181,363
|
19,792,144
|
|
Passenger Airlines - 0.7%
|
|||
Alaska Air Group, Inc. (a)
|
382,724
|
16,464,786
|
|
American Airlines Group, Inc. (a)
|
1,995,646
|
26,961,177
|
|
Delta Air Lines, Inc.
|
1,976,934
|
98,985,085
|
|
Southwest Airlines Co.
|
1,831,790
|
47,516,633
|
|
United Airlines Holdings, Inc. (a)
|
1,006,589
|
51,799,070
|
|
241,726,751
|
|||
Professional Services - 2.6%
|
|||
Booz Allen Hamilton Holding Corp. Class A
|
394,573
|
58,266,595
|
|
Broadridge Financial Solutions, Inc.
|
360,825
|
69,787,163
|
|
CACI International, Inc. Class A (a)
|
67,874
|
27,300,959
|
|
Clarivate PLC (a)(b)
|
1,423,418
|
9,622,306
|
|
Concentrix Corp.
|
138,185
|
7,554,574
|
|
Dayforce, Inc. (a)(b)
|
461,912
|
28,347,539
|
|
Dun & Bradstreet Holdings, Inc.
|
859,190
|
7,818,629
|
|
Equifax, Inc.
|
375,416
|
82,662,849
|
|
FTI Consulting, Inc. (a)
|
102,405
|
21,897,261
|
|
Genpact Ltd.
|
544,680
|
16,743,463
|
|
Jacobs Solutions, Inc.
|
387,308
|
55,590,317
|
|
KBR, Inc.
|
411,884
|
26,747,747
|
|
Leidos Holdings, Inc.
|
420,192
|
58,919,322
|
|
ManpowerGroup, Inc.
|
149,634
|
11,289,885
|
|
Paychex, Inc.
|
992,274
|
117,892,074
|
|
Paycom Software, Inc.
|
160,771
|
30,221,733
|
|
Paycor HCM, Inc. (a)
|
209,556
|
3,639,988
|
|
Paylocity Holding Corp. (a)
|
129,652
|
20,116,804
|
|
Robert Half, Inc.
|
317,848
|
21,976,011
|
|
Science Applications International Corp.
|
159,467
|
20,523,403
|
|
SS&C Technologies Holdings, Inc.
|
668,922
|
41,399,583
|
|
TransUnion
|
595,206
|
43,450,038
|
|
Verisk Analytics, Inc.
|
439,367
|
95,764,431
|
|
877,532,674
|
|||
Trading Companies & Distributors - 2.0%
|
|||
Air Lease Corp. Class A
|
318,345
|
15,993,653
|
|
Core & Main, Inc. (a)
|
534,078
|
30,159,385
|
|
Fastenal Co.
|
1,758,216
|
119,453,195
|
|
Ferguson PLC
|
628,815
|
131,988,269
|
|
MSC Industrial Direct Co., Inc. Class A
|
142,295
|
12,982,996
|
|
SiteOne Landscape Supply, Inc. (a)
|
137,096
|
21,508,991
|
|
United Rentals, Inc.
|
208,324
|
139,158,349
|
|
W.W. Grainger, Inc.
|
134,536
|
123,954,744
|
|
Watsco, Inc.
|
103,543
|
46,358,272
|
|
WESCO International, Inc.
|
136,490
|
20,848,848
|
|
662,406,702
|
|||
TOTAL INDUSTRIALS
|
6,791,703,046
|
||
INFORMATION TECHNOLOGY - 13.1%
|
|||
Communications Equipment - 0.3%
|
|||
Ciena Corp. (a)
|
444,373
|
20,543,364
|
|
F5, Inc. (a)
|
176,344
|
29,151,427
|
|
Juniper Networks, Inc.
|
979,638
|
34,110,995
|
|
Lumentum Holdings, Inc. (a)
|
210,376
|
9,206,054
|
|
Ubiquiti, Inc.
|
13,952
|
1,500,956
|
|
ViaSat, Inc. (a)(b)
|
375,723
|
5,977,753
|
|
100,490,549
|
|||
Electronic Equipment, Instruments & Components - 2.5%
|
|||
Amphenol Corp. Class A
|
1,795,609
|
216,855,699
|
|
Arrow Electronics, Inc. (a)
|
165,865
|
21,175,985
|
|
Avnet, Inc.
|
279,612
|
13,664,638
|
|
CDW Corp.
|
416,163
|
100,653,183
|
|
Cognex Corp.
|
537,949
|
22,346,401
|
|
Coherent Corp. (a)
|
400,647
|
21,887,346
|
|
Corning, Inc.
|
2,341,946
|
78,174,157
|
|
Crane NXT Co.
|
148,029
|
9,001,643
|
|
IPG Photonics Corp. (a)
|
94,880
|
7,968,022
|
|
Jabil, Inc.
|
383,835
|
45,046,876
|
|
Keysight Technologies, Inc. (a)
|
536,864
|
79,423,660
|
|
Littelfuse, Inc.
|
74,681
|
17,224,426
|
|
TD SYNNEX Corp.
|
208,456
|
24,564,455
|
|
Teledyne Technologies, Inc. (a)
|
143,448
|
54,722,543
|
|
Trimble, Inc. (a)
|
758,492
|
45,562,614
|
|
Vontier Corp.
|
478,910
|
19,458,113
|
|
Zebra Technologies Corp. Class A (a)
|
157,957
|
49,686,954
|
|
827,416,715
|
|||
IT Services - 2.0%
|
|||
Akamai Technologies, Inc. (a)
|
459,776
|
46,405,192
|
|
Amdocs Ltd.
|
354,237
|
29,752,366
|
|
Cloudflare, Inc. (a)
|
905,928
|
79,178,107
|
|
Cognizant Technology Solutions Corp. Class A
|
1,545,645
|
101,517,964
|
|
DXC Technology Co. (a)
|
487,888
|
9,508,937
|
|
EPAM Systems, Inc. (a)
|
170,952
|
40,218,168
|
|
Gartner, Inc. (a)
|
232,700
|
96,009,693
|
|
Globant SA (a)
|
127,277
|
22,730,399
|
|
GoDaddy, Inc. (a)
|
433,475
|
53,048,671
|
|
Kyndryl Holdings, Inc. (a)
|
698,808
|
13,738,565
|
|
MongoDB, Inc. Class A (a)
|
208,999
|
76,322,255
|
|
Okta, Inc. (a)
|
471,482
|
43,838,396
|
|
Twilio, Inc. Class A (a)
|
524,239
|
31,391,431
|
|
VeriSign, Inc. (a)
|
273,311
|
46,320,748
|
|
689,980,892
|
|||
Semiconductors & Semiconductor Equipment - 2.8%
|
|||
Allegro MicroSystems LLC (a)
|
236,967
|
7,035,550
|
|
Cirrus Logic, Inc. (a)
|
165,692
|
14,675,340
|
|
Enphase Energy, Inc. (a)
|
410,986
|
44,698,837
|
|
Entegris, Inc.
|
459,658
|
61,097,741
|
|
First Solar, Inc. (a)
|
327,959
|
57,819,172
|
|
GlobalFoundries, Inc. (a)
|
242,471
|
11,851,982
|
|
Lattice Semiconductor Corp. (a)
|
420,791
|
28,866,263
|
|
Marvell Technology, Inc.
|
2,632,562
|
173,512,161
|
|
Microchip Technology, Inc.
|
1,635,864
|
150,466,771
|
|
MKS Instruments, Inc.
|
204,707
|
24,356,039
|
|
Monolithic Power Systems, Inc.
|
141,568
|
94,755,709
|
|
ON Semiconductor Corp. (a)
|
1,330,405
|
93,341,215
|
|
Qorvo, Inc. (a)
|
301,305
|
35,204,476
|
|
Skyworks Solutions, Inc.
|
487,386
|
51,950,474
|
|
Teradyne, Inc.
|
474,438
|
55,186,628
|
|
Universal Display Corp.
|
143,769
|
22,712,627
|
|
Wolfspeed, Inc. (a)(b)
|
351,077
|
9,489,611
|
|
937,020,596
|
|||
Software - 4.5%
|
|||
ANSYS, Inc. (a)
|
267,370
|
86,863,166
|
|
AppLovin Corp. (a)
|
618,215
|
43,627,433
|
|
Aspen Technology, Inc. (a)
|
84,762
|
16,687,095
|
|
Bentley Systems, Inc. Class B
|
599,621
|
31,498,091
|
|
Bill Holdings, Inc. (a)
|
314,862
|
19,634,794
|
|
CCC Intelligent Solutions Holdings, Inc. Class A (a)
|
1,042,212
|
11,693,619
|
|
Confluent, Inc. (a)
|
593,802
|
16,697,712
|
|
Crowdstrike Holdings, Inc. (a)
|
657,268
|
192,277,181
|
|
Datadog, Inc. Class A (a)
|
857,587
|
107,627,169
|
|
DocuSign, Inc. (a)
|
621,707
|
35,188,616
|
|
Dolby Laboratories, Inc. Class A
|
179,750
|
13,959,385
|
|
DoubleVerify Holdings, Inc. (a)
|
434,960
|
12,744,328
|
|
Dropbox, Inc. Class A (a)
|
787,547
|
18,239,589
|
|
Dynatrace, Inc. (a)
|
796,552
|
36,091,771
|
|
Elastic NV (a)
|
247,112
|
25,259,789
|
|
Fair Isaac Corp. (a)
|
74,602
|
84,548,685
|
|
Five9, Inc. (a)
|
225,492
|
12,981,574
|
|
Gen Digital, Inc.
|
1,705,157
|
34,341,862
|
|
GitLab, Inc. (a)
|
280,729
|
14,729,851
|
|
Guidewire Software, Inc. (a)
|
251,008
|
27,711,283
|
|
HashiCorp, Inc. (a)
|
305,774
|
9,925,424
|
|
HubSpot, Inc. (a)
|
142,793
|
86,371,202
|
|
Informatica, Inc. (a)(b)
|
133,461
|
4,133,287
|
|
Manhattan Associates, Inc. (a)
|
189,680
|
39,085,461
|
|
nCino, Inc. (a)
|
218,782
|
6,379,683
|
|
NCR Voyix Corp. (a)
|
418,838
|
5,130,766
|
|
Nutanix, Inc. Class A (a)
|
747,838
|
45,393,767
|
|
Palantir Technologies, Inc. (a)
|
5,931,009
|
130,304,268
|
|
Pegasystems, Inc.
|
128,144
|
7,614,316
|
|
Procore Technologies, Inc. (a)
|
244,909
|
16,756,674
|
|
PTC, Inc. (a)
|
352,667
|
62,577,232
|
|
RingCentral, Inc. (a)
|
263,702
|
7,810,853
|
|
SentinelOne, Inc. (a)
|
744,805
|
15,737,730
|
|
Smartsheet, Inc. (a)
|
399,905
|
15,128,406
|
|
Teradata Corp. (a)
|
301,396
|
11,181,792
|
|
Tyler Technologies, Inc. (a)
|
128,129
|
59,137,940
|
|
UiPath, Inc. Class A (a)
|
1,178,319
|
22,352,711
|
|
Unity Software, Inc. (a)(b)
|
816,852
|
19,824,998
|
|
Zoom Video Communications, Inc. Class A (a)
|
795,370
|
48,597,107
|
|
Zscaler, Inc. (a)
|
272,447
|
47,116,984
|
|
1,502,963,594
|
|||
Technology Hardware, Storage & Peripherals - 1.0%
|
|||
Hewlett Packard Enterprise Co.
|
3,997,872
|
67,963,824
|
|
HP, Inc.
|
2,660,543
|
74,734,653
|
|
NetApp, Inc.
|
634,139
|
64,815,347
|
|
Pure Storage, Inc. Class A (a)
|
887,849
|
44,747,590
|
|
Western Digital Corp. (a)
|
999,086
|
70,765,261
|
|
323,026,675
|
|||
TOTAL INFORMATION TECHNOLOGY
|
4,380,899,021
|
||
MATERIALS - 5.6%
|
|||
Chemicals - 2.6%
|
|||
Albemarle Corp. (b)
|
362,679
|
43,633,910
|
|
Ashland, Inc.
|
153,596
|
14,642,307
|
|
Axalta Coating Systems Ltd. (a)
|
680,921
|
21,408,156
|
|
Celanese Corp. Class A
|
304,207
|
46,729,237
|
|
CF Industries Holdings, Inc.
|
592,553
|
46,793,910
|
|
Corteva, Inc.
|
2,172,494
|
117,597,100
|
|
DuPont de Nemours, Inc.
|
1,324,596
|
96,033,210
|
|
Eastman Chemical Co.
|
364,946
|
34,465,500
|
|
Element Solutions, Inc.
|
686,835
|
15,886,494
|
|
FMC Corp.
|
387,208
|
22,849,144
|
|
Ginkgo Bioworks Holdings, Inc. Class A (a)(b)
|
5,131,858
|
4,572,999
|
|
Huntsman Corp.
|
512,010
|
12,216,559
|
|
International Flavors & Fragrances, Inc.
|
786,137
|
66,546,497
|
|
LyondellBasell Industries NV Class A
|
796,579
|
79,634,003
|
|
NewMarket Corp.
|
19,166
|
10,098,949
|
|
Olin Corp.
|
370,426
|
19,365,871
|
|
PPG Industries, Inc.
|
722,758
|
93,235,782
|
|
RPM International, Inc.
|
391,423
|
41,847,033
|
|
The Chemours Co. LLC
|
462,857
|
12,381,425
|
|
The Mosaic Co.
|
1,004,728
|
31,538,412
|
|
The Scotts Miracle-Gro Co. Class A (b)
|
131,278
|
8,997,794
|
|
Westlake Corp.
|
99,580
|
14,674,109
|
|
855,148,401
|
|||
Construction Materials - 0.7%
|
|||
Eagle Materials, Inc.
|
104,971
|
26,317,279
|
|
Martin Marietta Materials, Inc.
|
190,071
|
111,584,982
|
|
Vulcan Materials Co.
|
407,902
|
105,087,792
|
|
242,990,053
|
|||
Containers & Packaging - 1.3%
|
|||
Amcor PLC
|
4,434,865
|
39,647,693
|
|
Aptargroup, Inc.
|
201,309
|
29,064,993
|
|
Ardagh Metal Packaging SA
|
457,354
|
1,806,548
|
|
Avery Dennison Corp.
|
248,546
|
54,004,075
|
|
Ball Corp.
|
940,767
|
65,449,160
|
|
Berry Global Group, Inc.
|
356,882
|
20,213,796
|
|
Crown Holdings, Inc.
|
326,507
|
26,796,429
|
|
Graphic Packaging Holding Co.
|
937,081
|
24,223,544
|
|
International Paper Co.
|
1,066,037
|
37,247,333
|
|
Packaging Corp. of America
|
272,345
|
47,110,238
|
|
Sealed Air Corp.
|
446,822
|
14,065,957
|
|
Silgan Holdings, Inc.
|
248,309
|
11,586,098
|
|
Sonoco Products Co.
|
300,851
|
16,862,699
|
|
WestRock Co.
|
781,869
|
37,498,437
|
|
425,577,000
|
|||
Metals & Mining - 1.0%
|
|||
Alcoa Corp.
|
552,726
|
19,422,792
|
|
Cleveland-Cliffs, Inc. (a)
|
1,533,055
|
25,908,630
|
|
MP Materials Corp. (a)(b)
|
330,734
|
5,291,744
|
|
Nucor Corp.
|
756,450
|
127,484,519
|
|
Reliance, Inc.
|
175,792
|
50,051,498
|
|
Royal Gold, Inc.
|
202,191
|
24,289,205
|
|
SSR Mining, Inc.
|
616,540
|
3,304,654
|
|
Steel Dynamics, Inc.
|
469,113
|
61,040,984
|
|
United States Steel Corp.
|
681,561
|
24,876,977
|
|
341,671,003
|
|||
Paper & Forest Products - 0.0%
|
|||
Louisiana-Pacific Corp.
|
197,737
|
14,472,371
|
|
TOTAL MATERIALS
|
1,879,858,828
|
||
REAL ESTATE - 7.4%
|
|||
Equity Real Estate Investment Trusts (REITs) - 6.6%
|
|||
Agree Realty Corp.
|
305,900
|
17,503,598
|
|
Alexandria Real Estate Equities, Inc.
|
535,023
|
61,993,115
|
|
American Homes 4 Rent Class A
|
1,024,928
|
36,692,422
|
|
Americold Realty Trust
|
878,193
|
19,293,900
|
|
Apartment Income (REIT) Corp.
|
452,691
|
17,374,281
|
|
AvalonBay Communities, Inc.
|
436,372
|
82,723,040
|
|
Boston Properties, Inc.
|
484,678
|
29,996,721
|
|
Brixmor Property Group, Inc.
|
921,219
|
20,358,940
|
|
Camden Property Trust (SBI)
|
319,369
|
31,834,702
|
|
Cousins Properties, Inc.
|
480,018
|
11,011,613
|
|
CubeSmart
|
689,592
|
27,887,100
|
|
Digital Realty Trust, Inc.
|
930,125
|
129,082,748
|
|
EastGroup Properties, Inc.
|
140,795
|
21,873,911
|
|
EPR Properties
|
228,387
|
9,270,228
|
|
Equity Lifestyle Properties, Inc.
|
546,837
|
32,968,803
|
|
Equity Residential (SBI)
|
1,148,476
|
73,961,854
|
|
Essex Property Trust, Inc.
|
196,528
|
48,395,020
|
|
Extra Space Storage, Inc.
|
644,298
|
86,516,335
|
|
Federal Realty Investment Trust (SBI)
|
241,515
|
25,158,618
|
|
First Industrial Realty Trust, Inc.
|
406,197
|
18,449,468
|
|
Gaming & Leisure Properties
|
787,403
|
33,645,730
|
|
Healthcare Realty Trust, Inc.
|
1,198,046
|
17,048,195
|
|
Healthpeak Properties, Inc.
|
2,185,664
|
40,675,207
|
|
Highwoods Properties, Inc. (SBI)
|
332,311
|
8,706,548
|
|
Host Hotels & Resorts, Inc.
|
2,151,759
|
40,603,692
|
|
Invitation Homes, Inc.
|
1,881,734
|
64,355,303
|
|
Iron Mountain, Inc.
|
891,535
|
69,111,793
|
|
Kilroy Realty Corp.
|
364,859
|
12,332,234
|
|
Kimco Realty Corp.
|
2,022,334
|
37,676,082
|
|
Lamar Advertising Co. Class A
|
267,440
|
30,982,924
|
|
Medical Properties Trust, Inc. (b)
|
1,815,359
|
8,350,651
|
|
Mid-America Apartment Communities, Inc.
|
357,439
|
46,467,070
|
|
National Storage Affiliates Trust
|
234,805
|
8,227,567
|
|
Net Lease Office Properties
|
47,656
|
1,089,416
|
|
NNN (REIT), Inc.
|
558,328
|
22,629,034
|
|
Omega Healthcare Investors, Inc.
|
753,159
|
22,903,565
|
|
Park Hotels & Resorts, Inc.
|
642,709
|
10,366,896
|
|
Rayonier, Inc.
|
451,715
|
13,397,867
|
|
Realty Income Corp.
|
2,562,186
|
137,179,438
|
|
Regency Centers Corp.
|
556,126
|
32,933,782
|
|
Rexford Industrial Realty, Inc.
|
647,814
|
27,732,917
|
|
SBA Communications Corp. Class A
|
330,641
|
61,538,903
|
|
Simon Property Group, Inc.
|
999,206
|
140,418,419
|
|
STAG Industrial, Inc.
|
559,343
|
19,235,806
|
|
Sun Communities, Inc.
|
378,301
|
42,112,467
|
|
UDR, Inc.
|
1,011,368
|
38,512,893
|
|
Ventas, Inc.
|
1,230,061
|
54,467,101
|
|
VICI Properties, Inc.
|
3,184,434
|
90,915,591
|
|
Vornado Realty Trust
|
542,011
|
14,108,546
|
|
Welltower, Inc.
|
1,706,531
|
162,598,274
|
|
Weyerhaeuser Co.
|
2,255,010
|
68,033,652
|
|
WP Carey, Inc.
|
668,042
|
36,635,423
|
|
2,217,339,403
|
|||
Real Estate Management & Development - 0.8%
|
|||
CBRE Group, Inc. (a)
|
935,320
|
81,269,955
|
|
CoStar Group, Inc. (a)
|
1,244,778
|
113,934,530
|
|
Howard Hughes Holdings, Inc.
|
109,500
|
7,135,020
|
|
Jones Lang LaSalle, Inc. (a)
|
146,121
|
26,404,065
|
|
Zillow Group, Inc.:
|
|||
Class A (a)
|
173,065
|
7,268,730
|
|
Class C (a)
|
475,035
|
20,222,240
|
|
256,234,540
|
|||
TOTAL REAL ESTATE
|
2,473,573,943
|
||
UTILITIES - 5.4%
|
|||
Electric Utilities - 2.8%
|
|||
Alliant Energy Corp.
|
785,175
|
39,101,715
|
|
Avangrid, Inc.
|
218,628
|
7,986,481
|
|
Constellation Energy Corp.
|
990,624
|
184,196,627
|
|
Edison International
|
1,163,864
|
82,704,176
|
|
Entergy Corp.
|
651,706
|
69,517,479
|
|
Evergy, Inc.
|
685,497
|
35,954,318
|
|
Eversource Energy
|
1,080,047
|
65,472,449
|
|
FirstEnergy Corp.
|
1,676,776
|
64,287,592
|
|
Hawaiian Electric Industries, Inc. (b)
|
254,176
|
2,503,634
|
|
IDACORP, Inc.
|
155,383
|
14,727,201
|
|
NRG Energy, Inc.
|
690,439
|
50,174,202
|
|
OGE Energy Corp.
|
615,257
|
21,318,655
|
|
PG&E Corp.
|
6,273,354
|
107,337,087
|
|
Pinnacle West Capital Corp.
|
348,492
|
25,666,436
|
|
PPL Corp.
|
2,272,548
|
62,404,168
|
|
Xcel Energy, Inc.
|
1,696,736
|
91,165,625
|
|
924,517,845
|
|||
Gas Utilities - 0.2%
|
|||
Atmos Energy Corp.
|
463,752
|
54,676,361
|
|
National Fuel Gas Co.
|
273,357
|
14,515,257
|
|
UGI Corp.
|
653,514
|
16,703,818
|
|
85,895,436
|
|||
Independent Power and Renewable Electricity Producers - 0.4%
|
|||
Brookfield Renewable Corp. (b)
|
421,192
|
9,788,502
|
|
Clearway Energy, Inc.:
|
|||
Class A
|
118,939
|
2,582,166
|
|
Class C
|
251,098
|
5,870,671
|
|
The AES Corp.
|
2,063,418
|
36,935,182
|
|
Vistra Corp.
|
1,087,759
|
82,495,643
|
|
137,672,164
|
|||
Multi-Utilities - 1.7%
|
|||
Ameren Corp.
|
806,308
|
59,561,972
|
|
CenterPoint Energy, Inc.
|
1,943,114
|
56,622,342
|
|
CMS Energy Corp.
|
895,456
|
54,273,588
|
|
Consolidated Edison, Inc.
|
1,068,505
|
100,866,872
|
|
DTE Energy Co.
|
634,351
|
69,981,602
|
|
NiSource, Inc.
|
1,272,571
|
35,453,828
|
|
Public Service Enterprise Group, Inc.
|
1,531,365
|
105,786,694
|
|
WEC Energy Group, Inc.
|
971,674
|
80,299,139
|
|
562,846,037
|
|||
Water Utilities - 0.3%
|
|||
American Water Works Co., Inc.
|
604,606
|
73,955,406
|
|
Essential Utilities, Inc.
|
774,881
|
28,345,147
|
|
102,300,553
|
|||
TOTAL UTILITIES
|
1,813,232,035
|
||
|
TOTAL COMMON STOCKS
(Cost $26,668,032,133)
|
33,307,086,955
|
||
U.S. Treasury Obligations - 0.0%
|
|||
Principal
Amount (c)
|
Value ($)
|
||
U.S. Treasury Bills, yield at date of purchase 5.3% 5/23/24 (d)
(Cost $5,980,803)
|
6,000,000
|
5,980,640
|
|
Money Market Funds - 1.6%
|
|||
Shares
|
Value ($)
|
||
Fidelity Cash Central Fund 5.39% (e)
|
115,731,995
|
115,755,141
|
|
Fidelity Securities Lending Cash Central Fund 5.39% (e)(f)
|
399,362,238
|
399,402,174
|
|
|
TOTAL MONEY MARKET FUNDS
(Cost $515,153,399)
|
515,157,315
|
||
|
TOTAL INVESTMENT IN SECURITIES - 101.2%
(Cost $27,189,166,335)
|
33,828,224,910
|
NET OTHER ASSETS (LIABILITIES) - (1.2)%
|
(387,001,437)
|
NET ASSETS - 100.0%
|
33,441,223,473
|
Futures Contracts
|
|||||
Number
of contracts
|
Expiration
Date
|
Notional
Amount ($)
|
Value ($)
|
Unrealized
Appreciation/
(Depreciation) ($)
|
|
Purchased
|
|||||
Equity Index Contracts
|
|||||
CME E-mini S&P MidCap 400 Index Contracts (United States)
|
460
|
Jun 2024
|
132,351,200
|
(1,151,029)
|
(1,151,029)
|
The notional amount of futures purchased as a percentage of Net Assets is 0.4%
|
|||||
(a)
|
Non-income producing
|
(b)
|
Security or a portion of the security is on loan at period end.
|
(c)
|
Amount is stated in United States dollars unless otherwise noted.
|
(d)
|
Security or a portion of the security was pledged to cover margin requirements for futures contracts. At period end, the value of securities pledged amounted to $5,980,640.
|
(e)
|
Affiliated fund that is generally available only to investment companies and other accounts managed by Fidelity Investments. The rate quoted is the annualized seven-day yield of the fund at period end. A complete unaudited listing of the fund's holdings as of its most recent quarter end is available upon request. In addition, each Fidelity Central Fund's financial statements, which are not covered by the Fund's Report of Independent Registered Public Accounting Firm, are available on the SEC's website or upon request.
|
(f)
|
Investment made with cash collateral received from securities on loan.
|
Affiliate
|
Value,
beginning
of period ($)
|
Purchases ($)
|
Sales
Proceeds ($)
|
Dividend
Income ($)
|
Realized
Gain (loss) ($)
|
Change in
Unrealized
appreciation
(depreciation) ($)
|
Value,
end
of period ($)
|
% ownership,
end
of period
|
Fidelity Cash Central Fund 5.39%
|
85,020,796
|
4,030,102,388
|
3,999,365,772
|
4,618,514
|
(2,271)
|
-
|
115,755,141
|
0.2%
|
Fidelity Securities Lending Cash Central Fund 5.39%
|
733,440,398
|
2,162,220,567
|
2,496,258,791
|
8,294,337
|
-
|
-
|
399,402,174
|
1.5%
|
Total
|
818,461,194
|
6,192,322,955
|
6,495,624,563
|
12,912,851
|
(2,271)
|
-
|
515,157,315
|
|
Valuation Inputs at Reporting Date:
|
||||
Description
|
Total ($)
|
Level 1 ($)
|
Level 2 ($)
|
Level 3 ($)
|
Investments in Securities:
|
||||
Equities:
|
||||
Communication Services
|
1,085,177,373
|
1,085,177,373
|
-
|
-
|
Consumer Discretionary
|
3,465,620,134
|
3,465,620,134
|
-
|
-
|
Consumer Staples
|
1,142,954,914
|
1,142,954,914
|
-
|
-
|
Energy
|
1,724,321,823
|
1,724,321,823
|
-
|
-
|
Financials
|
5,291,387,307
|
5,291,387,307
|
-
|
-
|
Health Care
|
3,258,358,531
|
3,258,358,531
|
-
|
-
|
Industrials
|
6,791,703,046
|
6,791,703,046
|
-
|
-
|
Information Technology
|
4,380,899,021
|
4,380,899,021
|
-
|
-
|
Materials
|
1,879,858,828
|
1,879,858,828
|
-
|
-
|
Real Estate
|
2,473,573,943
|
2,473,573,943
|
-
|
-
|
Utilities
|
1,813,232,035
|
1,813,232,035
|
-
|
-
|
U.S. Government and Government Agency Obligations
|
5,980,640
|
-
|
5,980,640
|
-
|
Money Market Funds
|
515,157,315
|
515,157,315
|
-
|
-
|
Total Investments in Securities:
|
33,828,224,910
|
33,822,244,270
|
5,980,640
|
-
|
Derivative Instruments:
Liabilities
|
||||
Futures Contracts
|
(1,151,029)
|
(1,151,029)
|
-
|
-
|
Total Liabilities
|
(1,151,029)
|
(1,151,029)
|
-
|
-
|
Total Derivative Instruments:
|
(1,151,029)
|
(1,151,029)
|
-
|
-
|
Primary Risk Exposure / Derivative Type
|
Value
|
|
Asset ($)
|
Liability ($)
|
|
Equity Risk
|
||
Futures Contracts (a)
|
0
|
(1,151,029)
|
Total Equity Risk
|
0
|
(1,151,029)
|
Total Value of Derivatives
|
0
|
(1,151,029)
|
Statement of Assets and Liabilities
|
||||
April 30, 2024
|
||||
Assets
|
||||
Investment in securities, at value (including securities loaned of $376,481,176) - See accompanying schedule:
|
||||
Unaffiliated issuers (cost $26,674,012,936)
|
$
|
33,313,067,595
|
||
Fidelity Central Funds (cost $515,153,399)
|
515,157,315
|
|||
Total Investment in Securities (cost $27,189,166,335)
|
$
|
33,828,224,910
|
||
Segregated cash with brokers for derivative instruments
|
604,584
|
|||
Receivable for fund shares sold
|
24,787,862
|
|||
Dividends receivable
|
14,676,570
|
|||
Distributions receivable from Fidelity Central Funds
|
796,162
|
|||
Other receivables
|
471,461
|
|||
Total assets
|
33,869,561,549
|
|||
Liabilities
|
||||
Payable to custodian bank
|
$
|
28,672
|
||
Payable for fund shares redeemed
|
25,716,122
|
|||
Accrued management fee
|
707,134
|
|||
Payable for daily variation margin on futures contracts
|
2,340,398
|
|||
Other payables and accrued expenses
|
157,503
|
|||
Collateral on securities loaned
|
399,388,247
|
|||
Total liabilities
|
428,338,076
|
|||
Net Assets
|
$
|
33,441,223,473
|
||
Net Assets consist of:
|
||||
Paid in capital
|
$
|
27,309,678,614
|
||
Total accumulated earnings (loss)
|
6,131,544,859
|
|||
Net Assets
|
$
|
33,441,223,473
|
||
Net Asset Value, offering price and redemption price per share ($33,441,223,473 ÷ 1,086,727,746 shares)
|
$
|
30.77
|
||
Statement of Operations
|
||||
Year ended
April 30, 2024
|
||||
Investment Income
|
||||
Dividends
|
$
|
482,505,575
|
||
Interest
|
341,448
|
|||
Income from Fidelity Central Funds (including $8,294,337 from security lending)
|
12,912,851
|
|||
Total income
|
495,759,874
|
|||
Expenses
|
||||
Management fee
|
$
|
7,281,241
|
||
Independent trustees' fees and expenses
|
89,931
|
|||
Total expenses before reductions
|
7,371,172
|
|||
Expense reductions
|
(53,836)
|
|||
Total expenses after reductions
|
7,317,336
|
|||
Net Investment income (loss)
|
488,442,538
|
|||
Realized and Unrealized Gain (Loss)
|
||||
Net realized gain (loss) on:
|
||||
Investment Securities:
|
||||
Unaffiliated issuers
|
(79,108,425)
|
|||
Redemptions in-kind
|
704,168,743
|
|||
Fidelity Central Funds
|
(2,271)
|
|||
Futures contracts
|
14,218,081
|
|||
Total net realized gain (loss)
|
639,276,128
|
|||
Change in net unrealized appreciation (depreciation) on:
|
||||
Investment Securities:
|
||||
Unaffiliated issuers
|
3,357,751,687
|
|||
Futures contracts
|
(3,393,175)
|
|||
Total change in net unrealized appreciation (depreciation)
|
3,354,358,512
|
|||
Net gain (loss)
|
3,993,634,640
|
|||
Net increase (decrease) in net assets resulting from operations
|
$
|
4,482,077,178
|
||
Statement of Changes in Net Assets
|
||||
Year ended
April 30, 2024
|
Year ended
April 30, 2023
|
|||
Increase (Decrease) in Net Assets
|
||||
Operations
|
||||
Net investment income (loss)
|
$
|
488,442,538
|
$
|
426,122,159
|
Net realized gain (loss)
|
639,276,128
|
108,049,289
|
||
Change in net unrealized appreciation (depreciation)
|
3,354,358,512
|
(906,965,692)
|
||
Net increase (decrease) in net assets resulting from operations
|
4,482,077,178
|
(372,794,244)
|
||
Distributions to shareholders
|
(428,689,183)
|
(498,360,885)
|
||
Share transactions
|
||||
Proceeds from sales of shares
|
9,972,651,118
|
7,390,631,102
|
||
Reinvestment of distributions
|
400,753,665
|
469,335,712
|
||
Cost of shares redeemed
|
(7,506,272,157)
|
(5,074,621,184)
|
||
Net increase (decrease) in net assets resulting from share transactions
|
2,867,132,626
|
2,785,345,630
|
||
Total increase (decrease) in net assets
|
6,920,520,621
|
1,914,190,501
|
||
Net Assets
|
||||
Beginning of period
|
26,520,702,852
|
24,606,512,351
|
||
End of period
|
$
|
33,441,223,473
|
$
|
26,520,702,852
|
Other Information
|
||||
Shares
|
||||
Sold
|
344,911,645
|
278,693,173
|
||
Issued in reinvestment of distributions
|
13,816,637
|
18,153,493
|
||
Redeemed
|
(260,581,026)
|
(191,871,923)
|
||
Net increase (decrease)
|
98,147,256
|
104,974,743
|
||
Fidelity® Mid Cap Index Fund |
Years ended April 30,
|
2024
|
2023
|
2022
|
2021
|
2020
|
|||||
Selected Per-Share Data
|
||||||||||
Net asset value, beginning of period
|
$
|
26.83
|
$
|
27.85
|
$
|
30.70
|
$
|
19.71
|
$
|
22.53
|
Income from Investment Operations
|
||||||||||
Net investment income (loss) A,B
|
.48
|
.46
|
.38
|
.34
|
.40
|
|||||
Net realized and unrealized gain (loss)
|
3.88
|
(.94)
|
(2.16)
|
11.28
|
(2.54)
|
|||||
Total from investment operations
|
4.36
|
(.48)
|
(1.78)
|
11.62
|
(2.14)
|
|||||
Distributions from net investment income
|
(.42)
|
(.41)
|
(.35)
|
(.37)
|
(.34)
|
|||||
Distributions from net realized gain
|
-
|
(.12)
|
(.72)
|
(.26)
|
(.34)
|
|||||
Total distributions
|
(.42)
|
(.54) C
|
(1.07)
|
(.63)
|
(.68)
|
|||||
Net asset value, end of period
|
$
|
30.77
|
$
|
26.83
|
$
|
27.85
|
$
|
30.70
|
$
|
19.71
|
Total Return D
|
16.34 % |
(1.65)%
|
(6.13)%
|
59.59%
|
(9.99)%
|
|||||
Ratios to Average Net Assets B,E,F
|
||||||||||
Expenses before reductions
|
.03%
|
.03%
|
.03%
|
.03%
|
.03%
|
|||||
Expenses net of fee waivers, if any
|
.03 % |
.03%
|
.03%
|
.03%
|
.03%
|
|||||
Expenses net of all reductions
|
.02%
|
.02%
|
.03%
|
.03%
|
.03%
|
|||||
Net investment income (loss)
|
1.66%
|
1.72%
|
1.24%
|
1.35%
|
1.82%
|
|||||
Supplemental Data
|
||||||||||
Net assets, end of period (000 omitted)
|
$
|
33,441,223
|
$
|
26,520,703
|
$
|
24,606,512
|
$
|
21,954,129
|
$
|
11,955,404
|
Portfolio turnover rate G
|
8 % H |
9% H
|
12% H
|
14% H
|
14%
|
Average Annual Total Returns
|
|||
Periods ended April 30, 2024
|
Past 1
year
|
Past 5
years
|
Past 10
years
|
Fidelity® Small Cap Index Fund
|
13.45%
|
5.93%
|
7.37%
|
$10,000 Over 10 Years
|
Let's say hypothetically that $10,000 was invested in Fidelity® Small Cap Index Fund on April 30, 2014.
The chart shows how the value of your investment would have changed, and also shows how the Russell 2000® Index performed over the same period.
|
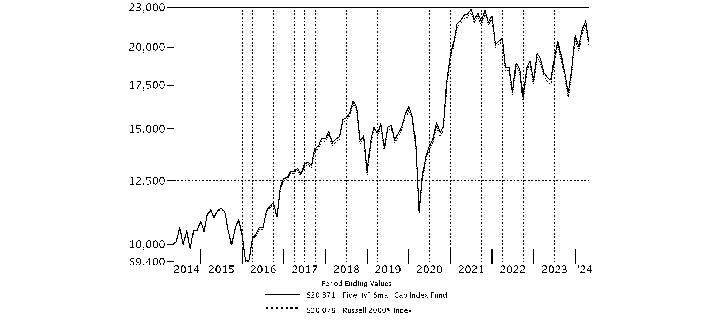
|
Top Holdings (% of Fund's net assets)
|
||
Super Micro Computer, Inc.
|
1.7
|
|
MicroStrategy, Inc. Class A
|
0.6
|
|
Comfort Systems U.S.A., Inc.
|
0.5
|
|
Onto Innovation, Inc.
|
0.4
|
|
Weatherford International PLC
|
0.4
|
|
elf Beauty, Inc.
|
0.4
|
|
Carvana Co. Class A
|
0.4
|
|
Viking Therapeutics, Inc.
|
0.3
|
|
API Group Corp.
|
0.3
|
|
Light & Wonder, Inc. Class A
|
0.3
|
|
5.3
|
||
Market Sectors (% of Fund's net assets)
|
||
Industrials
|
17.5
|
|
Financials
|
16.0
|
|
Health Care
|
14.9
|
|
Information Technology
|
14.6
|
|
Consumer Discretionary
|
10.5
|
|
Energy
|
7.5
|
|
Real Estate
|
5.6
|
|
Materials
|
4.7
|
|
Consumer Staples
|
3.3
|
|
Utilities
|
2.6
|
|
Communication Services
|
2.1
|
|
Asset Allocation (% of Fund's net assets)
|

|
Futures - 0.7%
|
Common Stocks - 99.3%
|
|||
Shares
|
Value ($)
|
||
COMMUNICATION SERVICES - 2.1%
|
|||
Diversified Telecommunication Services - 0.4%
|
|||
Anterix, Inc. (a)
|
128,151
|
4,039,320
|
|
AST SpaceMobile, Inc. (a)(b)
|
1,134,361
|
2,506,938
|
|
ATN International, Inc.
|
106,044
|
2,023,320
|
|
Bandwidth, Inc. (a)(b)
|
233,088
|
4,242,202
|
|
Cogent Communications Group, Inc. (b)
|
433,818
|
27,842,439
|
|
Consolidated Communications Holdings, Inc. (a)(b)
|
718,475
|
3,103,812
|
|
Globalstar, Inc. (a)(b)
|
7,180,831
|
9,263,272
|
|
IDT Corp. Class B (b)
|
150,679
|
5,355,132
|
|
Liberty Latin America Ltd.:
|
|||
Class A (a)
|
145,100
|
1,095,505
|
|
Class C (a)(b)
|
1,565,632
|
11,804,865
|
|
Lumen Technologies, Inc. (a)(b)
|
10,007,211
|
11,908,581
|
|
Ooma, Inc. (a)(b)
|
238,629
|
1,684,721
|
|
Shenandoah Telecommunications Co. (b)
|
478,196
|
6,130,473
|
|
91,000,580
|
|||
Entertainment - 0.4%
|
|||
Atlanta Braves Holdings, Inc. (b)
|
446,408
|
16,709,051
|
|
Atlanta Braves Holdings, Inc. Class A (b)
|
103,492
|
4,174,867
|
|
Cinemark Holdings, Inc. (a)(b)
|
1,086,479
|
18,622,250
|
|
Eventbrite, Inc. (a)(b)
|
765,800
|
4,043,424
|
|
IMAX Corp. (a)(b)
|
442,483
|
7,084,153
|
|
Lions Gate Entertainment Corp.:
|
|||
Class A (a)(b)
|
831,951
|
8,394,386
|
|
Class B (a)
|
920,534
|
8,680,636
|
|
Loop Media, Inc. (a)(b)
|
387,680
|
119,057
|
|
Madison Square Garden Entertainment Corp. (b)
|
396,011
|
15,503,831
|
|
Marcus Corp. (b)
|
230,246
|
3,002,408
|
|
Playstudios, Inc. Class A (a)
|
853,210
|
1,842,934
|
|
Reservoir Media, Inc. (a)(b)
|
190,682
|
1,706,604
|
|
Sphere Entertainment Co. (a)(b)
|
264,209
|
10,267,162
|
|
Vivid Seats, Inc. Class A (a)(b)
|
744,476
|
3,915,944
|
|
104,066,707
|
|||
Interactive Media & Services - 0.6%
|
|||
Bumble, Inc. (a)
|
999,536
|
10,095,314
|
|
CarGurus, Inc. Class A (a)
|
951,890
|
21,379,449
|
|
Cars.com, Inc. (a)(b)
|
661,389
|
11,051,810
|
|
DHI Group, Inc. (a)(b)
|
415,724
|
972,794
|
|
EverQuote, Inc. Class A (a)(b)
|
216,620
|
4,369,225
|
|
fuboTV, Inc. (a)(b)
|
2,806,714
|
3,985,534
|
|
Grindr, Inc. (a)(b)
|
401,528
|
3,930,959
|
|
MediaAlpha, Inc. Class A (a)
|
228,448
|
4,626,072
|
|
Nextdoor Holdings, Inc. (a)
|
1,483,921
|
3,027,199
|
|
Outbrain, Inc. (a)
|
393,781
|
1,594,813
|
|
QuinStreet, Inc. (a)(b)
|
525,314
|
9,502,930
|
|
Shutterstock, Inc. (b)
|
245,257
|
10,474,926
|
|
System1, Inc. (a)(b)
|
325,659
|
556,877
|
|
TrueCar, Inc. (a)
|
884,021
|
2,333,815
|
|
Vimeo, Inc. (a)
|
1,528,489
|
5,487,276
|
|
Yelp, Inc. (a)
|
661,414
|
26,615,299
|
|
Ziff Davis, Inc. (a)
|
452,562
|
22,677,882
|
|
ZipRecruiter, Inc. (a)
|
666,515
|
6,851,774
|
|
149,533,948
|
|||
Media - 0.6%
|
|||
Advantage Solutions, Inc. Class A (a)(b)
|
878,509
|
3,742,448
|
|
AMC Networks, Inc. Class A (a)
|
303,910
|
3,227,524
|
|
Boston Omaha Corp. (a)(b)
|
233,921
|
3,611,740
|
|
Cardlytics, Inc. (a)(b)
|
362,691
|
4,442,965
|
|
Clear Channel Outdoor Holdings, Inc. (a)
|
3,713,569
|
5,161,861
|
|
E.W. Scripps Co. Class A (a)(b)
|
587,625
|
2,209,470
|
|
EchoStar Corp. Class A (a)(b)
|
1,206,694
|
19,295,037
|
|
Emerald Holding, Inc. (a)
|
146,258
|
840,984
|
|
Entravision Communication Corp. Class A (b)
|
614,093
|
1,283,454
|
|
Gambling.com Group Ltd. (a)
|
157,164
|
1,359,469
|
|
Gannett Co., Inc. (a)(b)
|
1,426,467
|
3,452,050
|
|
Gray Television, Inc. (b)
|
837,832
|
4,817,534
|
|
iHeartMedia, Inc. (a)(b)
|
1,021,833
|
2,145,849
|
|
Integral Ad Science Holding Corp. (a)
|
668,946
|
6,415,192
|
|
John Wiley & Sons, Inc. Class A (b)
|
356,696
|
13,401,069
|
|
Magnite, Inc. (a)
|
1,349,709
|
11,917,930
|
|
PubMatic, Inc. (a)
|
419,412
|
9,411,605
|
|
Scholastic Corp.
|
255,893
|
9,114,909
|
|
Sinclair, Inc. Class A (b)
|
330,696
|
4,067,561
|
|
Stagwell, Inc. (a)(b)
|
829,019
|
4,932,663
|
|
TechTarget, Inc. (a)(b)
|
258,549
|
7,110,098
|
|
TEGNA, Inc.
|
1,955,997
|
26,679,799
|
|
Thryv Holdings, Inc. (a)(b)
|
305,746
|
7,035,215
|
|
Townsquare Media, Inc.
|
115,140
|
1,389,740
|
|
Urban One, Inc.:
|
|||
Class A (a)(b)
|
120,376
|
239,548
|
|
Class D (non-vtg.) (a)(b)
|
73,429
|
113,815
|
|
WideOpenWest, Inc. (a)
|
486,940
|
1,738,376
|
|
159,157,905
|
|||
Wireless Telecommunication Services - 0.1%
|
|||
Gogo, Inc. (a)(b)
|
653,598
|
5,921,598
|
|
Spok Holdings, Inc.
|
181,704
|
2,807,327
|
|
Telephone & Data Systems, Inc.
|
983,849
|
15,397,237
|
|
24,126,162
|
|||
TOTAL COMMUNICATION SERVICES
|
527,885,302
|
||
CONSUMER DISCRETIONARY - 10.5%
|
|||
Automobile Components - 1.2%
|
|||
Adient PLC (a)
|
902,382
|
26,954,150
|
|
American Axle & Manufacturing Holdings, Inc. (a)
|
1,124,806
|
8,256,076
|
|
Cooper-Standard Holding, Inc. (a)(b)
|
167,783
|
2,588,892
|
|
Dana, Inc.
|
1,285,796
|
15,982,444
|
|
Dorman Products, Inc. (a)
|
260,989
|
22,823,488
|
|
Fox Factory Holding Corp. (a)(b)
|
421,927
|
16,421,399
|
|
Gentherm, Inc. (a)
|
325,373
|
16,454,113
|
|
Holley, Inc. (a)(b)
|
526,845
|
2,117,917
|
|
LCI Industries (b)
|
245,157
|
25,491,425
|
|
Luminar Technologies, Inc. (a)(b)
|
2,868,057
|
4,216,044
|
|
Modine Manufacturing Co. (a)
|
511,322
|
47,363,757
|
|
Patrick Industries, Inc. (b)
|
209,629
|
21,904,134
|
|
Solid Power, Inc. (a)(b)
|
1,540,468
|
2,603,391
|
|
Standard Motor Products, Inc.
|
202,319
|
6,494,440
|
|
Stoneridge, Inc. (a)
|
258,147
|
3,867,042
|
|
The Goodyear Tire & Rubber Co. (a)
|
2,787,809
|
33,342,196
|
|
Visteon Corp. (a)
|
273,052
|
30,207,743
|
|
XPEL, Inc. (a)(b)
|
224,550
|
11,800,103
|
|
298,888,754
|
|||
Automobiles - 0.1%
|
|||
LiveWire Group, Inc. (a)(b)
|
184,642
|
1,235,255
|
|
Winnebago Industries, Inc.
|
282,960
|
17,424,677
|
|
Workhorse Group, Inc. (a)(b)
|
2,306,006
|
348,668
|
|
19,008,600
|
|||
Broadline Retail - 0.1%
|
|||
Big Lots, Inc. (b)
|
279,060
|
982,291
|
|
ContextLogic, Inc. (a)(b)
|
223,509
|
1,240,475
|
|
Dillard's, Inc. Class A (b)
|
33,966
|
14,876,768
|
|
Qurate Retail, Inc. (a)(b)
|
244
|
932
|
|
Savers Value Village, Inc. (b)
|
256,820
|
4,242,666
|
|
21,343,132
|
|||
Distributors - 0.0%
|
|||
Weyco Group, Inc.
|
59,472
|
1,745,503
|
|
Diversified Consumer Services - 1.1%
|
|||
2U, Inc. (a)(b)
|
785,446
|
194,791
|
|
Adtalem Global Education, Inc. (a)
|
387,515
|
19,228,494
|
|
Carriage Services, Inc.
|
132,710
|
3,394,722
|
|
Chegg, Inc. (a)
|
1,124,267
|
5,812,460
|
|
Coursera, Inc. (a)
|
1,314,720
|
13,436,438
|
|
Duolingo, Inc. (a)
|
293,849
|
66,336,412
|
|
European Wax Center, Inc. (a)(b)
|
338,277
|
3,978,138
|
|
Frontdoor, Inc. (a)
|
801,795
|
24,607,089
|
|
Graham Holdings Co.
|
34,505
|
24,200,772
|
|
Laureate Education, Inc. Class A
|
1,301,300
|
18,868,850
|
|
Lincoln Educational Services Corp. (a)
|
236,512
|
2,521,218
|
|
Nerdy, Inc. Class A (a)(b)
|
642,451
|
1,663,948
|
|
OneSpaWorld Holdings Ltd. (a)
|
830,899
|
10,569,035
|
|
Perdoceo Education Corp. (b)
|
645,031
|
11,804,067
|
|
Strategic Education, Inc.
|
224,612
|
25,794,442
|
|
Stride, Inc. (a)(b)
|
420,725
|
28,083,394
|
|
Udemy, Inc. (a)
|
894,878
|
8,966,678
|
|
Universal Technical Institute, Inc. (a)
|
394,521
|
6,004,610
|
|
WW International, Inc. (a)(b)
|
536,962
|
971,901
|
|
276,437,459
|
|||
Hotels, Restaurants & Leisure - 2.2%
|
|||
Accel Entertainment, Inc. (a)
|
534,288
|
5,738,253
|
|
Bally's Corp. (a)(b)
|
291,291
|
3,827,564
|
|
Biglari Holdings, Inc. Class B (a)
|
7,139
|
1,407,168
|
|
BJ's Restaurants, Inc. (a)
|
222,808
|
7,261,313
|
|
Bloomin' Brands, Inc. (b)
|
868,148
|
22,389,537
|
|
Bowlero Corp. Class A (b)
|
163,077
|
1,916,155
|
|
Brinker International, Inc. (a)(b)
|
434,118
|
23,268,725
|
|
Carrols Restaurant Group, Inc.
|
346,328
|
3,297,043
|
|
Century Casinos, Inc. (a)(b)
|
261,063
|
775,357
|
|
Chuy's Holdings, Inc. (a)(b)
|
171,297
|
5,046,410
|
|
Cracker Barrel Old Country Store, Inc. (b)
|
218,887
|
12,737,035
|
|
Dave & Buster's Entertainment, Inc. (a)
|
335,073
|
17,892,898
|
|
Denny's Corp. (a)(b)
|
494,659
|
3,967,165
|
|
Dine Brands Global, Inc. (b)
|
152,474
|
6,724,103
|
|
El Pollo Loco Holdings, Inc. (a)(b)
|
269,929
|
2,299,795
|
|
Empire Resorts, Inc. (c)
|
17,230
|
0
|
|
Everi Holdings, Inc. (a)
|
807,204
|
6,594,857
|
|
First Watch Restaurant Group, Inc. (a)(b)
|
223,052
|
5,692,287
|
|
Full House Resorts, Inc. (a)(b)
|
322,962
|
1,647,106
|
|
Global Business Travel Group, Inc. (a)(b)
|
323,182
|
1,955,251
|
|
Golden Entertainment, Inc.
|
201,205
|
6,448,620
|
|
Hilton Grand Vacations, Inc. (a)(b)
|
782,319
|
32,575,763
|
|
Inspired Entertainment, Inc. (a)
|
214,397
|
1,822,375
|
|
International Game Technology PLC
|
1,077,138
|
21,262,704
|
|
Jack in the Box, Inc. (b)
|
194,580
|
11,104,681
|
|
Krispy Kreme, Inc. (b)
|
867,228
|
10,970,434
|
|
Kura Sushi U.S.A., Inc. Class A (a)(b)
|
58,206
|
6,407,316
|
|
Life Time Group Holdings, Inc. (a)(b)
|
441,356
|
6,028,923
|
|
Light & Wonder, Inc. Class A (a)
|
896,270
|
80,001,060
|
|
Lindblad Expeditions Holdings (a)(b)
|
350,434
|
2,572,186
|
|
Monarch Casino & Resort, Inc. (b)
|
134,694
|
9,128,212
|
|
Mondee Holdings, Inc. (a)(b)
|
458,747
|
1,004,656
|
|
Nathan's Famous, Inc.
|
25,712
|
1,661,252
|
|
Noodles & Co. (a)(b)
|
376,132
|
567,959
|
|
Papa John's International, Inc.
|
324,140
|
19,996,197
|
|
PlayAGS, Inc. (a)
|
375,418
|
3,318,695
|
|
Portillo's, Inc. (a)(b)
|
448,813
|
5,502,447
|
|
Potbelly Corp. (a)
|
254,575
|
2,594,119
|
|
RCI Hospitality Holdings, Inc. (b)
|
87,051
|
4,418,709
|
|
Red Robin Gourmet Burgers, Inc. (a)(b)
|
146,918
|
1,109,231
|
|
Red Rock Resorts, Inc.
|
470,574
|
24,996,891
|
|
Rush Street Interactive, Inc. (a)
|
648,526
|
4,144,081
|
|
Sabre Corp. (a)
|
3,277,130
|
9,405,363
|
|
Shake Shack, Inc. Class A (a)
|
374,832
|
39,675,967
|
|
Six Flags Entertainment Corp. (a)(b)
|
723,484
|
17,059,753
|
|
Super Group SGHC Ltd. (a)
|
1,343,775
|
4,246,329
|
|
Sweetgreen, Inc. Class A (a)
|
972,098
|
21,843,042
|
|
Target Hospitality Corp. (a)(b)
|
309,175
|
3,439,572
|
|
The Cheesecake Factory, Inc. (b)
|
472,686
|
16,317,121
|
|
The ONE Group Hospitality, Inc. (a)(b)
|
213,880
|
1,146,397
|
|
United Parks & Resorts, Inc. (a)(b)
|
360,461
|
18,318,628
|
|
Xponential Fitness, Inc. (a)(b)
|
230,129
|
2,934,145
|
|
526,460,850
|
|||
Household Durables - 2.2%
|
|||
Beazer Homes U.S.A., Inc. (a)
|
293,013
|
8,213,154
|
|
Cavco Industries, Inc. (a)
|
83,251
|
30,320,847
|
|
Century Communities, Inc.
|
282,093
|
22,375,617
|
|
Cricut, Inc. (b)
|
467,170
|
2,485,344
|
|
Dream Finders Homes, Inc. (a)(b)
|
242,152
|
8,596,396
|
|
Ethan Allen Interiors, Inc.
|
228,100
|
6,441,544
|
|
GoPro, Inc. Class A (a)
|
1,222,829
|
2,115,494
|
|
Green Brick Partners, Inc. (a)
|
259,407
|
14,041,701
|
|
Helen of Troy Ltd. (a)(b)
|
235,409
|
21,824,768
|
|
Hooker Furnishings Corp.
|
105,242
|
1,789,114
|
|
Hovnanian Enterprises, Inc. Class A (a)(b)
|
48,568
|
7,179,807
|
|
Installed Building Products, Inc.
|
235,456
|
55,504,043
|
|
iRobot Corp. (a)(b)
|
267,437
|
2,289,261
|
|
KB Home
|
674,758
|
43,697,328
|
|
La-Z-Boy, Inc.
|
430,413
|
14,134,763
|
|
Landsea Homes Corp. (a)(b)
|
199,099
|
2,299,593
|
|
Legacy Housing Corp. (a)(b)
|
106,236
|
2,164,027
|
|
LGI Homes, Inc. (a)(b)
|
206,211
|
18,544,555
|
|
Lovesac (a)(b)
|
142,180
|
3,153,552
|
|
M/I Homes, Inc. (a)
|
267,569
|
31,096,869
|
|
Meritage Homes Corp.
|
361,096
|
59,848,051
|
|
Purple Innovation, Inc.
|
542,045
|
823,908
|
|
Skyline Champion Corp. (a)
|
537,130
|
40,279,379
|
|
Snap One Holdings Corp. (a)(b)
|
183,063
|
1,936,807
|
|
Sonos, Inc. (a)
|
1,226,522
|
20,728,222
|
|
Taylor Morrison Home Corp. (a)
|
1,027,161
|
57,531,288
|
|
Traeger, Inc. (a)(b)
|
351,525
|
755,779
|
|
TRI Pointe Homes, Inc. (a)
|
952,118
|
35,085,548
|
|
United Homes Group, Inc. (a)(b)
|
54,461
|
363,799
|
|
Vizio Holding Corp. (a)(b)
|
758,299
|
8,037,969
|
|
VOXX International Corp. (a)(b)
|
112,685
|
664,842
|
|
Worthington Enterprises, Inc.
|
306,038
|
17,493,132
|
|
541,816,501
|
|||
Leisure Products - 0.4%
|
|||
Acushnet Holdings Corp. (b)
|
301,102
|
18,361,200
|
|
AMMO, Inc. (a)(b)
|
891,663
|
2,264,824
|
|
Clarus Corp.
|
296,733
|
1,878,320
|
|
Escalade, Inc. (b)
|
98,073
|
1,221,990
|
|
Funko, Inc. (a)(b)
|
366,654
|
2,232,923
|
|
JAKKS Pacific, Inc. (a)
|
74,412
|
1,407,131
|
|
Johnson Outdoors, Inc. Class A (b)
|
53,133
|
2,178,984
|
|
Latham Group, Inc. (a)(b)
|
388,926
|
1,088,993
|
|
Malibu Boats, Inc. Class A (a)(b)
|
201,844
|
6,866,733
|
|
Marine Products Corp.
|
86,791
|
933,003
|
|
MasterCraft Boat Holdings, Inc. (a)(b)
|
168,435
|
3,407,440
|
|
Smith & Wesson Brands, Inc. (b)
|
455,996
|
7,738,252
|
|
Solo Brands, Inc. Class A (a)(b)
|
195,076
|
366,743
|
|
Sturm, Ruger & Co., Inc.
|
171,520
|
7,929,370
|
|
Topgolf Callaway Brands Corp. (a)(b)
|
1,425,570
|
22,837,631
|
|
Vista Outdoor, Inc. (a)
|
571,993
|
20,071,234
|
|
100,784,771
|
|||
Specialty Retail - 2.7%
|
|||
1-800-FLOWERS.com, Inc. Class A (a)(b)
|
256,385
|
2,325,412
|
|
Abercrombie & Fitch Co. Class A (a)
|
484,652
|
58,894,911
|
|
Academy Sports & Outdoors, Inc.
|
716,733
|
41,785,534
|
|
America's Car Mart, Inc. (a)(b)
|
57,825
|
3,309,903
|
|
American Eagle Outfitters, Inc.
|
1,813,346
|
43,991,774
|
|
Arko Corp.
|
784,721
|
3,374,300
|
|
Asbury Automotive Group, Inc. (a)(b)
|
205,364
|
43,175,727
|
|
BARK, Inc. (a)(b)
|
1,312,920
|
1,444,212
|
|
Beyond, Inc. (a)(b)
|
449,016
|
9,038,692
|
|
Big 5 Sporting Goods Corp. (b)
|
216,396
|
766,042
|
|
Boot Barn Holdings, Inc. (a)(b)
|
299,645
|
31,903,203
|
|
Build-A-Bear Workshop, Inc.
|
127,818
|
3,854,991
|
|
Caleres, Inc. (b)
|
339,826
|
12,515,792
|
|
Camping World Holdings, Inc. (b)
|
412,335
|
8,358,030
|
|
CarParts.com, Inc. (a)
|
531,434
|
653,664
|
|
Carvana Co. Class A (a)(b)
|
1,023,076
|
84,833,462
|
|
Designer Brands, Inc. Class A (b)
|
417,475
|
3,878,343
|
|
Destination XL Group, Inc. (a)(b)
|
555,491
|
1,783,126
|
|
Duluth Holdings, Inc. (a)(b)
|
120,137
|
505,777
|
|
Envela Corp. (a)(b)
|
75,218
|
322,685
|
|
EVgo, Inc. Class A (a)(b)
|
1,019,978
|
1,846,160
|
|
Foot Locker, Inc. (b)
|
814,040
|
16,972,734
|
|
Genesco, Inc. (a)(b)
|
108,722
|
2,751,754
|
|
Group 1 Automotive, Inc.
|
135,283
|
39,775,908
|
|
GrowGeneration Corp. (a)(b)
|
579,160
|
1,731,688
|
|
Guess?, Inc. (b)
|
280,595
|
7,514,334
|
|
Haverty Furniture Companies, Inc. (b)
|
146,645
|
4,516,666
|
|
Hibbett, Inc. (b)
|
115,287
|
9,942,351
|
|
J. Jill, Inc. (a)(b)
|
44,774
|
1,115,768
|
|
Lands' End, Inc. (a)
|
144,448
|
1,976,049
|
|
Lazydays Holdings, Inc. (a)(b)
|
72,257
|
255,790
|
|
Leslie's, Inc. (a)(b)
|
1,756,409
|
6,902,687
|
|
MarineMax, Inc. (a)(b)
|
216,315
|
5,336,491
|
|
Monro, Inc. (b)
|
293,670
|
8,002,508
|
|
National Vision Holdings, Inc. (a)
|
771,051
|
13,431,708
|
|
OneWater Marine, Inc. Class A (a)(b)
|
115,824
|
2,398,715
|
|
PetMed Express, Inc. (b)
|
211,113
|
833,896
|
|
Rent the Runway, Inc. Class A (a)(b)
|
25,605
|
259,891
|
|
Revolve Group, Inc. (a)(b)
|
394,680
|
7,858,079
|
|
Sally Beauty Holdings, Inc. (a)(b)
|
1,069,727
|
11,606,538
|
|
Shoe Carnival, Inc.
|
181,948
|
6,084,341
|
|
Signet Jewelers Ltd.
|
433,286
|
42,475,027
|
|
Sleep Number Corp. (a)(b)
|
210,522
|
2,802,048
|
|
Sonic Automotive, Inc. Class A (sub. vtg.) (b)
|
144,967
|
8,384,891
|
|
Sportsman's Warehouse Holdings, Inc. (a)(b)
|
361,764
|
1,157,645
|
|
Stitch Fix, Inc. (a)(b)
|
874,739
|
1,854,447
|
|
The Aaron's Co., Inc.
|
298,417
|
2,062,061
|
|
The Buckle, Inc.
|
305,563
|
11,425,001
|
|
The Cato Corp. Class A (sub. vtg.)
|
174,244
|
839,856
|
|
The Children's Place, Inc. (a)(b)
|
116,597
|
811,515
|
|
The ODP Corp. (a)
|
316,420
|
16,108,942
|
|
thredUP, Inc. (a)(b)
|
722,167
|
1,155,467
|
|
Tile Shop Holdings, Inc. (a)
|
285,686
|
1,919,810
|
|
Tilly's, Inc. (a)(b)
|
208,690
|
1,266,748
|
|
Torrid Holdings, Inc. (a)(b)
|
116,269
|
589,484
|
|
Upbound Group, Inc.
|
532,137
|
16,501,568
|
|
Urban Outfitters, Inc. (a)
|
633,214
|
24,670,017
|
|
Warby Parker, Inc. (a)(b)
|
855,062
|
10,038,428
|
|
Winmark Corp.
|
28,052
|
10,079,645
|
|
Zumiez, Inc. (a)(b)
|
154,724
|
2,661,253
|
|
664,633,489
|
|||
Textiles, Apparel & Luxury Goods - 0.5%
|
|||
Allbirds, Inc. Class A (a)(b)
|
942,593
|
568,666
|
|
Figs, Inc. Class A (a)(b)
|
1,263,416
|
6,456,056
|
|
Fossil Group, Inc. (a)(b)
|
433,030
|
336,811
|
|
G-III Apparel Group Ltd. (a)
|
408,990
|
11,513,069
|
|
Hanesbrands, Inc. (a)(b)
|
3,481,507
|
15,875,672
|
|
Kontoor Brands, Inc. (b)
|
556,841
|
34,557,552
|
|
Movado Group, Inc.
|
151,884
|
3,868,485
|
|
Oxford Industries, Inc. (b)
|
149,081
|
16,067,950
|
|
Rocky Brands, Inc. (b)
|
69,043
|
1,779,238
|
|
Steven Madden Ltd.
|
731,477
|
29,558,986
|
|
Vera Bradley, Inc. (a)
|
250,742
|
1,652,390
|
|
Wolverine World Wide, Inc.
|
770,103
|
8,270,906
|
|
130,505,781
|
|||
TOTAL CONSUMER DISCRETIONARY
|
2,581,624,840
|
||
CONSUMER STAPLES - 3.3%
|
|||
Beverages - 0.4%
|
|||
Coca-Cola Consolidated, Inc.
|
47,422
|
39,170,572
|
|
Duckhorn Portfolio, Inc. (a)(b)
|
524,748
|
4,444,616
|
|
MGP Ingredients, Inc. (b)
|
157,836
|
12,380,656
|
|
National Beverage Corp. (a)(b)
|
234,765
|
10,447,043
|
|
Primo Water Corp.
|
1,553,504
|
29,314,620
|
|
The Vita Coco Co., Inc. (a)(b)
|
374,513
|
9,078,195
|
|
Zevia PBC (a)(b)
|
227,127
|
195,534
|
|
105,031,236
|
|||
Consumer Staples Distribution & Retail - 0.6%
|
|||
Andersons, Inc.
|
320,698
|
17,619,148
|
|
Chefs' Warehouse Holdings (a)(b)
|
350,524
|
11,595,334
|
|
HF Foods Group, Inc. (a)(b)
|
375,334
|
1,095,975
|
|
Ingles Markets, Inc. Class A
|
140,813
|
10,103,333
|
|
Natural Grocers by Vitamin Cottage, Inc.
|
93,470
|
1,529,169
|
|
PriceSmart, Inc.
|
252,619
|
20,358,565
|
|
SpartanNash Co.
|
341,610
|
6,521,335
|
|
Sprouts Farmers Market LLC (a)(b)
|
1,009,803
|
66,677,292
|
|
United Natural Foods, Inc. (a)
|
582,957
|
5,205,806
|
|
Village Super Market, Inc. Class A
|
85,057
|
2,379,044
|
|
Weis Markets, Inc.
|
163,300
|
10,309,129
|
|
153,394,130
|
|||
Food Products - 0.9%
|
|||
Alico, Inc.
|
68,229
|
1,904,271
|
|
B&G Foods, Inc. Class A (b)
|
770,736
|
8,555,170
|
|
Benson Hill, Inc. (a)(b)
|
1,610,371
|
295,503
|
|
Beyond Meat, Inc. (a)(b)
|
584,574
|
3,963,412
|
|
BRC, Inc. Class A (a)(b)
|
407,103
|
1,587,702
|
|
Cal-Maine Foods, Inc.
|
408,671
|
22,611,766
|
|
Calavo Growers, Inc.
|
172,107
|
4,638,284
|
|
Dole PLC (b)
|
710,581
|
8,647,771
|
|
Forafric Global PLC (a)(b)
|
42,779
|
439,340
|
|
Fresh Del Monte Produce, Inc.
|
337,190
|
8,621,948
|
|
J&J Snack Foods Corp.
|
149,705
|
20,552,999
|
|
John B. Sanfilippo & Son, Inc.
|
89,077
|
8,880,977
|
|
Lancaster Colony Corp.
|
193,971
|
37,011,607
|
|
Limoneira Co. (b)
|
173,299
|
3,427,854
|
|
Mission Produce, Inc. (a)(b)
|
482,185
|
5,472,800
|
|
Seneca Foods Corp. Class A (a)(b)
|
48,143
|
2,796,627
|
|
SunOpta, Inc. (a)(b)
|
930,589
|
6,095,358
|
|
The Hain Celestial Group, Inc. (a)
|
876,186
|
5,379,782
|
|
The Simply Good Foods Co. (a)(b)
|
900,779
|
32,833,395
|
|
TreeHouse Foods, Inc. (a)(b)
|
502,864
|
18,882,543
|
|
Utz Brands, Inc. Class A (b)
|
716,661
|
12,921,398
|
|
Vital Farms, Inc. (a)
|
310,414
|
8,306,679
|
|
Westrock Coffee Holdings (a)(b)
|
281,142
|
2,850,780
|
|
226,677,966
|
|||
Household Products - 0.3%
|
|||
Central Garden & Pet Co. (a)(b)
|
292,359
|
11,972,101
|
|
Central Garden & Pet Co. Class A (non-vtg.)
|
291,405
|
10,324,479
|
|
Energizer Holdings, Inc. (b)
|
707,846
|
20,329,337
|
|
Oil-Dri Corp. of America
|
48,800
|
3,379,400
|
|
WD-40 Co. (b)
|
134,656
|
30,449,761
|
|
76,455,078
|
|||
Personal Care Products - 0.9%
|
|||
BellRing Brands, Inc. (a)
|
1,305,026
|
71,998,284
|
|
Edgewell Personal Care Co. (b)
|
490,709
|
18,460,473
|
|
elf Beauty, Inc. (a)
|
535,500
|
87,034,815
|
|
Herbalife Ltd. (a)(b)
|
974,688
|
8,431,051
|
|
Inter Parfums, Inc.
|
181,683
|
21,144,268
|
|
MediFast, Inc. (b)
|
106,179
|
2,923,108
|
|
Nature's Sunshine Products, Inc. (a)
|
128,199
|
2,493,471
|
|
Nu Skin Enterprises, Inc. Class A
|
487,332
|
5,731,024
|
|
The Beauty Health Co. (a)(b)
|
798,170
|
2,578,089
|
|
USANA Health Sciences, Inc. (a)
|
109,822
|
4,559,809
|
|
Waldencast PLC (a)(b)
|
348,964
|
1,699,455
|
|
227,053,847
|
|||
Tobacco - 0.2%
|
|||
Ispire Technology, Inc. (b)
|
175,894
|
909,372
|
|
Turning Point Brands, Inc.
|
170,897
|
4,928,669
|
|
Universal Corp.
|
240,257
|
12,356,418
|
|
Vector Group Ltd.
|
1,444,418
|
14,949,726
|
|
33,144,185
|
|||
TOTAL CONSUMER STAPLES
|
821,756,442
|
||
ENERGY - 7.5%
|
|||
Energy Equipment & Services - 2.6%
|
|||
Archrock, Inc.
|
1,380,630
|
26,494,290
|
|
Atlas Energy Solutions, Inc. (b)
|
179,020
|
3,976,034
|
|
Borr Drilling Ltd.
|
2,187,899
|
11,595,865
|
|
Bristow Group, Inc. (a)
|
231,708
|
6,096,237
|
|
Cactus, Inc. (b)
|
650,148
|
32,273,347
|
|
Championx Corp.
|
1,942,168
|
65,198,580
|
|
Core Laboratories, Inc.
|
461,027
|
7,284,227
|
|
Diamond Offshore Drilling, Inc. (a)
|
1,014,248
|
12,414,396
|
|
DMC Global, Inc. (a)
|
192,430
|
3,050,016
|
|
Dril-Quip, Inc. (a)
|
336,903
|
6,124,897
|
|
Expro Group Holdings NV (a)(b)
|
891,334
|
16,721,426
|
|
Forum Energy Technologies, Inc. (a)
|
92,568
|
1,726,393
|
|
Helix Energy Solutions Group, Inc. (a)
|
1,426,237
|
15,317,785
|
|
Helmerich & Payne, Inc. (b)
|
966,113
|
37,997,224
|
|
KLX Energy Services Holdings, Inc. (a)(b)
|
118,731
|
787,187
|
|
Kodiak Gas Services, Inc.
|
156,436
|
4,251,930
|
|
Liberty Oilfield Services, Inc. Class A
|
1,630,244
|
35,865,368
|
|
Mammoth Energy Services, Inc. (a)(b)
|
212,116
|
689,377
|
|
Nabors Industries Ltd. (a)(b)
|
89,691
|
6,460,443
|
|
Newpark Resources, Inc. (a)
|
751,813
|
5,217,582
|
|
Noble Corp. PLC
|
1,118,011
|
49,617,328
|
|
Oceaneering International, Inc. (a)(b)
|
995,645
|
22,810,227
|
|
Oil States International, Inc. (a)(b)
|
605,974
|
2,417,836
|
|
Patterson-UTI Energy, Inc.
|
3,503,899
|
37,912,187
|
|
ProFrac Holding Corp. (a)(b)
|
258,108
|
1,876,445
|
|
ProPetro Holding Corp. (a)
|
928,604
|
8,097,427
|
|
Ranger Energy Services, Inc. Class A
|
144,699
|
1,423,838
|
|
RPC, Inc.
|
846,432
|
5,662,630
|
|
SEACOR Marine Holdings, Inc. (a)
|
239,088
|
2,921,655
|
|
Seadrill Ltd. (a)
|
464,536
|
22,553,223
|
|
Select Water Solutions, Inc. Class A
|
791,828
|
7,316,491
|
|
Solaris Oilfield Infrastructure, Inc. Class A
|
295,569
|
2,603,963
|
|
TETRA Technologies, Inc. (a)
|
1,242,693
|
5,331,153
|
|
Tidewater, Inc. (a)
|
461,059
|
42,348,269
|
|
U.S. Silica Holdings, Inc. (a)
|
742,478
|
11,456,436
|
|
Valaris Ltd. (a)(b)
|
589,569
|
38,357,359
|
|
Weatherford International PLC (a)
|
705,617
|
87,228,374
|
|
649,477,445
|
|||
Oil, Gas & Consumable Fuels - 4.9%
|
|||
Amplify Energy Corp. (a)
|
358,221
|
2,529,040
|
|
Ardmore Shipping Corp. (b)
|
416,807
|
6,981,517
|
|
Berry Corp.
|
752,352
|
6,387,468
|
|
California Resources Corp. (b)
|
690,637
|
36,507,072
|
|
Centrus Energy Corp. Class A (a)
|
122,037
|
5,239,048
|
|
Chord Energy Corp.
|
415,024
|
73,450,948
|
|
Chord Energy Corp.:
|
|||
warrants 9/1/24 (a)
|
29,463
|
1,053,008
|
|
warrants 9/1/25 (a)
|
14,729
|
385,753
|
|
Civitas Resources, Inc.
|
803,257
|
57,802,374
|
|
Clean Energy Fuels Corp. (a)(b)
|
1,664,318
|
3,861,218
|
|
CNX Resources Corp. (a)(b)
|
1,549,203
|
36,437,255
|
|
Comstock Resources, Inc. (b)
|
910,215
|
9,156,763
|
|
CONSOL Energy, Inc. (b)
|
303,291
|
25,100,363
|
|
Crescent Energy, Inc. Class A (b)
|
765,332
|
8,143,132
|
|
CVR Energy, Inc.
|
295,340
|
8,972,429
|
|
Delek U.S. Holdings, Inc.
|
629,278
|
17,198,168
|
|
DHT Holdings, Inc.
|
1,349,995
|
15,416,943
|
|
Dorian LPG Ltd. (b)
|
342,150
|
14,137,638
|
|
Empire Petroleum Corp. (a)(b)
|
149,416
|
773,975
|
|
enCore Energy Corp. (a)(b)
|
1,635,508
|
7,212,590
|
|
Energy Fuels, Inc. (a)(b)
|
1,592,144
|
8,247,306
|
|
Equitrans Midstream Corp.
|
4,331,595
|
58,606,480
|
|
Evolution Petroleum Corp. (b)
|
314,483
|
1,698,208
|
|
Excelerate Energy, Inc. (b)
|
180,050
|
3,035,643
|
|
FLEX LNG Ltd. (b)
|
295,484
|
7,685,539
|
|
FutureFuel Corp.
|
253,048
|
1,371,520
|
|
Gevo, Inc. (a)(b)
|
2,282,982
|
1,504,029
|
|
Golar LNG Ltd. (b)
|
980,361
|
24,038,452
|
|
Granite Ridge Resources, Inc. (b)
|
331,819
|
2,163,460
|
|
Green Plains, Inc. (a)
|
583,667
|
12,064,397
|
|
Gulfport Energy Corp. (a)
|
108,480
|
17,216,861
|
|
Hallador Energy Co. (a)
|
224,024
|
1,144,763
|
|
HighPeak Energy, Inc.
|
120,766
|
1,716,085
|
|
International Seaways, Inc. (b)
|
403,388
|
22,303,323
|
|
Kinetik Holdings, Inc.
|
365,140
|
13,999,468
|
|
Kosmos Energy Ltd. (a)(b)
|
4,517,411
|
25,613,720
|
|
Magnolia Oil & Gas Corp. Class A (b)
|
1,749,175
|
43,851,817
|
|
Matador Resources Co.
|
1,123,620
|
70,001,526
|
|
Murphy Oil Corp.
|
1,439,214
|
64,246,513
|
|
NACCO Industries, Inc. Class A
|
39,935
|
1,099,810
|
|
Nextdecade Corp. (a)(b)
|
765,857
|
4,916,802
|
|
Nordic American Tanker Shipping Ltd. (b)
|
2,043,483
|
7,969,584
|
|
Northern Oil & Gas, Inc.
|
873,077
|
35,612,811
|
|
Overseas Shipholding Group, Inc.
|
575,399
|
3,498,426
|
|
Par Pacific Holdings, Inc. (a)(b)
|
548,392
|
16,890,474
|
|
PBF Energy, Inc. Class A
|
1,094,681
|
58,313,657
|
|
Peabody Energy Corp.
|
1,117,508
|
24,518,126
|
|
Permian Resource Corp. Class A
|
4,526,807
|
75,824,017
|
|
PrimeEnergy Corp. (a)(b)
|
6,798
|
696,523
|
|
Rex American Resources Corp. (a)
|
154,313
|
8,538,138
|
|
Riley Exploration Permian, Inc.
|
88,975
|
2,307,122
|
|
Ring Energy, Inc. (a)(b)
|
1,175,436
|
2,233,328
|
|
SandRidge Energy, Inc.
|
314,628
|
4,310,404
|
|
Scorpio Tankers, Inc.
|
473,585
|
33,321,441
|
|
SFL Corp. Ltd.
|
1,143,523
|
15,243,162
|
|
SilverBow Resources, Inc. (a)(b)
|
231,303
|
7,105,628
|
|
Sitio Royalties Corp. (b)
|
821,904
|
19,101,049
|
|
SM Energy Co. (b)
|
1,148,864
|
55,708,415
|
|
Talos Energy, Inc. (a)(b)
|
1,376,215
|
18,138,514
|
|
Teekay Corp. (a)
|
610,410
|
4,468,201
|
|
Teekay Tankers Ltd.
|
238,154
|
13,877,234
|
|
Tellurian, Inc. (a)(b)
|
5,761,909
|
2,478,197
|
|
Uranium Energy Corp. (a)(b)
|
3,825,711
|
25,823,549
|
|
VAALCO Energy, Inc.
|
1,049,328
|
6,715,699
|
|
Verde Clean Fuels, Inc. (a)(b)
|
37,678
|
184,622
|
|
Vertex Energy, Inc. (a)(b)
|
633,889
|
824,056
|
|
Vital Energy, Inc. (a)(b)
|
230,639
|
12,228,480
|
|
Vitesse Energy, Inc. (b)
|
253,053
|
5,615,246
|
|
W&T Offshore, Inc. (b)
|
931,032
|
2,094,822
|
|
World Kinect Corp. (b)
|
592,030
|
13,912,705
|
|
1,200,826,054
|
|||
TOTAL ENERGY
|
1,850,303,499
|
||
FINANCIALS - 16.0%
|
|||
Banks - 8.4%
|
|||
1st Source Corp.
|
164,709
|
8,169,566
|
|
ACNB Corp.
|
82,131
|
2,672,543
|
|
Amalgamated Financial Corp.
|
178,136
|
4,371,457
|
|
Amerant Bancorp, Inc. Class A
|
256,136
|
5,547,906
|
|
Ameris Bancorp
|
657,273
|
31,207,322
|
|
Ames National Corp.
|
83,938
|
1,615,807
|
|
Arrow Financial Corp.
|
144,945
|
3,227,925
|
|
Associated Banc-Corp.
|
1,498,095
|
31,564,862
|
|
Atlantic Union Bankshares Corp.
|
883,781
|
28,077,722
|
|
Axos Financial, Inc. (a)(b)
|
543,588
|
27,510,989
|
|
Banc of California, Inc. (b)
|
1,363,112
|
18,661,003
|
|
BancFirst Corp.
|
219,151
|
19,541,695
|
|
Bancorp, Inc., Delaware (a)
|
510,565
|
15,286,316
|
|
Bank First National Corp. (b)
|
92,056
|
7,105,803
|
|
Bank of Hawaii Corp. (b)
|
389,766
|
22,095,835
|
|
Bank of Marin Bancorp
|
156,953
|
2,253,845
|
|
Bank7 Corp. (b)
|
37,695
|
1,029,074
|
|
BankUnited, Inc.
|
736,648
|
19,690,601
|
|
Bankwell Financial Group, Inc.
|
57,427
|
1,316,801
|
|
Banner Corp.
|
338,986
|
14,789,959
|
|
Bar Harbor Bankshares
|
146,278
|
3,668,652
|
|
BayCom Corp.
|
106,310
|
2,102,812
|
|
BCB Bancorp, Inc.
|
148,602
|
1,399,831
|
|
Berkshire Hills Bancorp, Inc.
|
429,485
|
9,156,620
|
|
Blue Foundry Bancorp (a)(b)
|
208,650
|
1,781,871
|
|
Blue Ridge Bankshares, Inc. (b)
|
174,095
|
435,238
|
|
Bridgewater Bancshares, Inc. (a)(b)
|
198,880
|
2,163,814
|
|
Brookline Bancorp, Inc., Delaware
|
880,612
|
7,309,080
|
|
Burke & Herbert Financial Services Corp. (b)
|
63,120
|
3,306,226
|
|
Business First Bancshares, Inc.
|
237,015
|
4,785,333
|
|
Byline Bancorp, Inc.
|
241,694
|
5,237,509
|
|
C & F Financial Corp. (b)
|
30,948
|
1,212,233
|
|
Cadence Bank
|
1,808,786
|
50,049,109
|
|
Cambridge Bancorp
|
75,666
|
4,643,622
|
|
Camden National Corp.
|
141,088
|
4,404,767
|
|
Capital Bancorp, Inc.
|
92,018
|
1,785,149
|
|
Capital City Bank Group, Inc.
|
129,875
|
3,444,285
|
|
Capitol Federal Financial, Inc.
|
1,226,361
|
5,849,742
|
|
Carter Bankshares, Inc. (a)
|
217,297
|
2,644,504
|
|
Cathay General Bancorp
|
691,150
|
23,803,206
|
|
Central Pacific Financial Corp.
|
266,090
|
5,305,835
|
|
Chemung Financial Corp. (b)
|
32,145
|
1,355,394
|
|
ChoiceOne Financial Services, Inc. (b)
|
68,977
|
1,714,768
|
|
Citizens & Northern Corp.
|
149,306
|
2,545,667
|
|
Citizens Financial Services, Inc.
|
36,466
|
1,473,226
|
|
City Holding Co. (b)
|
144,934
|
14,641,233
|
|
Civista Bancshares, Inc.
|
149,848
|
2,139,829
|
|
CNB Financial Corp., Pennsylvania
|
201,901
|
3,836,119
|
|
Coastal Financial Corp. of Washington (a)
|
110,228
|
4,263,619
|
|
Codorus Valley Bancorp, Inc.
|
90,345
|
2,005,659
|
|
Colony Bankcorp, Inc.
|
158,409
|
1,721,906
|
|
Columbia Financial, Inc. (a)(b)
|
284,096
|
4,715,994
|
|
Community Bank System, Inc. (b)
|
528,535
|
22,843,283
|
|
Community Trust Bancorp, Inc.
|
153,340
|
6,441,813
|
|
Community West Bank
|
157,072
|
2,696,926
|
|
ConnectOne Bancorp, Inc.
|
365,796
|
6,551,406
|
|
CrossFirst Bankshares, Inc. (a)(b)
|
444,745
|
5,372,520
|
|
Customers Bancorp, Inc. (a)(b)
|
285,542
|
13,040,703
|
|
CVB Financial Corp.
|
1,321,613
|
21,595,156
|
|
Dime Community Bancshares, Inc.
|
349,894
|
6,368,071
|
|
Eagle Bancorp, Inc.
|
293,278
|
5,422,710
|
|
Eastern Bankshares, Inc.
|
1,541,451
|
19,360,625
|
|
Enterprise Bancorp, Inc.
|
94,871
|
2,305,365
|
|
Enterprise Financial Services Corp.
|
362,278
|
13,770,187
|
|
Equity Bancshares, Inc. (b)
|
144,013
|
4,797,073
|
|
Esquire Financial Holdings, Inc.
|
70,240
|
3,305,494
|
|
ESSA Bancorp, Inc. (b)
|
82,294
|
1,333,163
|
|
Evans Bancorp, Inc. (b)
|
49,306
|
1,261,741
|
|
Farmers & Merchants Bancorp, Inc. (b)
|
124,907
|
2,560,594
|
|
Farmers National Banc Corp. (b)
|
360,362
|
4,263,082
|
|
FB Financial Corp.
|
354,558
|
12,994,551
|
|
Fidelity D & D Bancorp, Inc. (b)
|
46,198
|
2,097,389
|
|
Financial Institutions, Inc.
|
151,593
|
2,610,431
|
|
First Bancorp, North Carolina
|
397,351
|
12,083,444
|
|
First Bancorp, Puerto Rico
|
1,662,899
|
28,685,008
|
|
First Bancshares, Inc.
|
304,722
|
7,295,045
|
|
First Bank Hamilton New Jersey
|
197,861
|
2,311,016
|
|
First Busey Corp.
|
515,755
|
11,521,967
|
|
First Business Finance Services, Inc.
|
77,236
|
2,554,195
|
|
First Commonwealth Financial Corp.
|
1,011,180
|
13,337,464
|
|
First Community Bankshares, Inc.
|
169,153
|
5,612,497
|
|
First Community Corp.
|
66,890
|
1,105,692
|
|
First Financial Bancorp, Ohio
|
935,740
|
20,689,211
|
|
First Financial Bankshares, Inc. (b)
|
1,293,578
|
38,238,166
|
|
First Financial Corp., Indiana
|
111,766
|
4,069,400
|
|
First Foundation, Inc.
|
505,996
|
2,772,858
|
|
First Interstate Bancsystem, Inc.
|
823,314
|
21,982,484
|
|
First Merchants Corp.
|
588,213
|
19,658,078
|
|
First Mid-Illinois Bancshares, Inc.
|
219,354
|
6,791,200
|
|
First of Long Island Corp.
|
209,862
|
1,987,393
|
|
First Western Financial, Inc. (a)(b)
|
78,341
|
1,305,944
|
|
Five Star Bancorp
|
127,670
|
2,760,225
|
|
Flushing Financial Corp.
|
275,808
|
3,039,404
|
|
FS Bancorp, Inc.
|
63,985
|
1,994,412
|
|
Fulton Financial Corp.
|
1,596,028
|
26,414,263
|
|
FVCBankcorp, Inc. (a)(b)
|
155,469
|
1,789,448
|
|
German American Bancorp, Inc.
|
278,485
|
8,836,329
|
|
Glacier Bancorp, Inc.
|
1,106,701
|
40,040,442
|
|
Great Southern Bancorp, Inc. (b)
|
86,498
|
4,445,997
|
|
Greene County Bancorp, Inc. (b)
|
69,303
|
2,038,894
|
|
Guaranty Bancshares, Inc. Texas
|
79,869
|
2,294,636
|
|
Hancock Whitney Corp.
|
862,012
|
39,126,725
|
|
Hanmi Financial Corp.
|
304,441
|
4,657,947
|
|
HarborOne Bancorp, Inc.
|
391,259
|
3,963,454
|
|
HBT Financial, Inc.
|
129,862
|
2,396,603
|
|
Heartland Financial U.S.A., Inc.
|
419,261
|
17,655,081
|
|
Heritage Commerce Corp.
|
594,564
|
4,720,838
|
|
Heritage Financial Corp., Washington
|
344,097
|
6,104,281
|
|
Hilltop Holdings, Inc.
|
454,897
|
13,310,286
|
|
Hingham Institution for Savings (b)
|
14,546
|
2,456,819
|
|
Home Bancorp, Inc.
|
69,579
|
2,435,265
|
|
Home Bancshares, Inc.
|
1,868,744
|
44,251,858
|
|
HomeStreet, Inc.
|
178,980
|
2,192,505
|
|
HomeTrust Bancshares, Inc.
|
143,209
|
3,680,471
|
|
Hope Bancorp, Inc.
|
1,149,101
|
11,513,992
|
|
Horizon Bancorp, Inc. Indiana
|
434,528
|
4,988,381
|
|
Independent Bank Corp.
|
200,304
|
4,969,542
|
|
Independent Bank Corp.
|
438,644
|
22,037,475
|
|
Independent Bank Group, Inc.
|
358,948
|
13,367,224
|
|
International Bancshares Corp.
|
534,517
|
29,745,871
|
|
John Marshall Bankcorp, Inc. (b)
|
122,873
|
2,029,862
|
|
Kearny Financial Corp.
|
535,917
|
2,893,952
|
|
Lakeland Bancorp, Inc.
|
619,675
|
7,553,838
|
|
Lakeland Financial Corp. (b)
|
247,132
|
14,523,948
|
|
LCNB Corp. (b)
|
108,738
|
1,533,206
|
|
Live Oak Bancshares, Inc. (b)
|
335,358
|
10,838,771
|
|
Macatawa Bank Corp.
|
261,184
|
3,656,576
|
|
Mainstreet Bancshares, Inc.
|
67,721
|
1,034,100
|
|
Mercantile Bank Corp.
|
157,495
|
5,682,420
|
|
Metrocity Bankshares, Inc.
|
181,631
|
4,173,880
|
|
Metropolitan Bank Holding Corp. (a)
|
102,905
|
4,085,329
|
|
Mid Penn Bancorp, Inc.
|
139,654
|
2,825,200
|
|
Middlefield Banc Corp. (b)
|
77,024
|
1,653,705
|
|
Midland States Bancorp, Inc.
|
206,136
|
4,514,378
|
|
MidWestOne Financial Group, Inc.
|
138,943
|
2,802,480
|
|
MVB Financial Corp.
|
111,187
|
1,998,030
|
|
National Bank Holdings Corp.
|
366,991
|
12,011,615
|
|
National Bankshares, Inc. (b)
|
56,587
|
1,517,097
|
|
NBT Bancorp, Inc.
|
455,804
|
15,957,698
|
|
Nicolet Bankshares, Inc. (b)
|
130,269
|
9,969,487
|
|
Northeast Bank
|
66,302
|
3,429,139
|
|
Northeast Community Bancorp, Inc.
|
119,326
|
1,882,964
|
|
Northfield Bancorp, Inc.
|
391,625
|
3,266,153
|
|
Northrim Bancorp, Inc. (b)
|
52,836
|
2,525,561
|
|
Northwest Bancshares, Inc.
|
1,272,215
|
13,485,479
|
|
Norwood Financial Corp. (b)
|
71,545
|
1,723,519
|
|
Oak Valley Bancorp Oakdale California (b)
|
65,323
|
1,577,550
|
|
OceanFirst Financial Corp.
|
582,560
|
8,598,586
|
|
OFG Bancorp
|
459,973
|
16,609,625
|
|
Old National Bancorp, Indiana (b)
|
3,127,947
|
51,736,243
|
|
Old Second Bancorp, Inc.
|
428,328
|
5,868,094
|
|
Orange County Bancorp, Inc. (b)
|
50,591
|
2,186,037
|
|
Origin Bancorp, Inc.
|
288,668
|
8,573,440
|
|
Orrstown Financial Services, Inc.
|
101,745
|
2,667,754
|
|
Pacific Premier Bancorp, Inc.
|
949,523
|
20,414,745
|
|
Park National Corp. (b)
|
142,477
|
18,765,646
|
|
Parke Bancorp, Inc. (b)
|
103,208
|
1,698,804
|
|
Pathward Financial, Inc.
|
257,606
|
12,975,614
|
|
PCB Bancorp
|
107,169
|
1,560,381
|
|
Peapack-Gladstone Financial Corp.
|
166,043
|
3,716,042
|
|
Penns Woods Bancorp, Inc. (b)
|
70,037
|
1,224,247
|
|
Peoples Bancorp, Inc.
|
348,707
|
10,126,451
|
|
Peoples Financial Services Corp. (b)
|
66,820
|
2,530,473
|
|
Pioneer Bancorp, Inc. (a)
|
100,041
|
885,863
|
|
Plumas Bancorp
|
53,448
|
1,879,232
|
|
Ponce Financial Group, Inc. (a)(b)
|
180,168
|
1,448,551
|
|
Preferred Bank, Los Angeles (b)
|
128,356
|
9,715,266
|
|
Premier Financial Corp.
|
354,859
|
6,877,167
|
|
Primis Financial Corp.
|
199,277
|
1,936,972
|
|
Princeton Bancorp, Inc.
|
49,080
|
1,430,682
|
|
Provident Financial Services, Inc.
|
741,069
|
10,878,893
|
|
QCR Holdings, Inc.
|
164,468
|
9,039,161
|
|
RBB Bancorp
|
165,881
|
2,946,047
|
|
Red River Bancshares, Inc. (b)
|
46,124
|
2,085,266
|
|
Renasant Corp.
|
550,503
|
15,997,617
|
|
Republic Bancorp, Inc., Kentucky Class A
|
83,582
|
4,239,279
|
|
S&T Bancorp, Inc.
|
386,418
|
11,650,503
|
|
Sandy Spring Bancorp, Inc.
|
435,030
|
8,896,364
|
|
Seacoast Banking Corp., Florida
|
839,443
|
19,365,950
|
|
ServisFirst Bancshares, Inc. (b)
|
506,463
|
29,861,058
|
|
Shore Bancshares, Inc.
|
297,890
|
3,083,162
|
|
Sierra Bancorp
|
130,363
|
2,583,795
|
|
Simmons First National Corp. Class A
|
1,234,573
|
21,098,853
|
|
SmartFinancial, Inc.
|
153,673
|
3,157,980
|
|
South Plains Financial, Inc.
|
112,634
|
2,919,473
|
|
Southern First Bancshares, Inc. (a)
|
73,423
|
1,895,782
|
|
Southern Missouri Bancorp, Inc.
|
93,704
|
3,757,530
|
|
Southern States Bancshares, Inc.
|
73,727
|
1,781,982
|
|
Southside Bancshares, Inc.
|
284,789
|
7,592,475
|
|
Southstate Corp.
|
755,894
|
57,221,176
|
|
Stellar Bancorp, Inc. (b)
|
484,589
|
10,757,876
|
|
Sterling Bancorp, Inc. (a)(b)
|
170,652
|
807,184
|
|
Stock Yards Bancorp, Inc. (b)
|
272,013
|
12,118,179
|
|
Summit Financial Group, Inc.
|
110,503
|
2,925,014
|
|
Texas Capital Bancshares, Inc. (a)(b)
|
466,684
|
26,787,662
|
|
The Bank of NT Butterfield & Son Ltd.
|
488,742
|
16,617,228
|
|
The First Bancorp, Inc.
|
96,716
|
2,135,489
|
|
Third Coast Bancshares, Inc. (a)
|
126,622
|
2,458,999
|
|
Timberland Bancorp, Inc./Washington
|
70,576
|
1,722,054
|
|
Tompkins Financial Corp.
|
137,148
|
6,031,769
|
|
TowneBank
|
695,729
|
17,998,509
|
|
Trico Bancshares
|
309,132
|
10,748,520
|
|
Triumph Bancorp, Inc. (a)(b)
|
219,994
|
15,478,778
|
|
Trustco Bank Corp., New York
|
184,484
|
4,910,964
|
|
Trustmark Corp.
|
604,592
|
17,895,923
|
|
UMB Financial Corp.
|
439,528
|
35,012,800
|
|
United Bankshares, Inc., West Virginia
|
1,297,153
|
42,105,586
|
|
United Community Bank, Inc. (b)
|
1,150,000
|
29,014,500
|
|
Unity Bancorp, Inc.
|
70,311
|
1,892,772
|
|
Univest Corp. of Pennsylvania
|
285,387
|
5,956,027
|
|
USCB Financial Holdings, Inc.
|
101,062
|
1,125,831
|
|
Valley National Bancorp (b)
|
4,285,864
|
30,043,907
|
|
Veritex Holdings, Inc.
|
521,674
|
10,162,210
|
|
Virginia National Bankshares C (b)
|
47,208
|
1,331,738
|
|
WaFd, Inc.
|
675,471
|
18,298,509
|
|
Washington Trust Bancorp, Inc.
|
170,594
|
4,343,323
|
|
WesBanco, Inc.
|
578,235
|
15,612,345
|
|
West Bancorp., Inc.
|
158,412
|
2,575,779
|
|
Westamerica Bancorp.
|
257,329
|
11,978,665
|
|
WSFS Financial Corp.
|
600,149
|
25,644,367
|
|
2,077,978,601
|
|||
Capital Markets - 1.4%
|
|||
Alti Global, Inc. Class A (a)(b)
|
232,097
|
1,067,646
|
|
Artisan Partners Asset Management, Inc. (b)
|
610,227
|
24,976,591
|
|
Assetmark Financial Holdings, Inc. (a)
|
218,744
|
7,395,735
|
|
B. Riley Financial, Inc. (b)
|
202,901
|
6,979,794
|
|
Bakkt Holdings, Inc. Class A (a)(b)
|
27,924
|
187,370
|
|
BGC Group, Inc. Class A
|
3,549,203
|
27,790,259
|
|
BrightSphere Investment Group, Inc.
|
312,135
|
6,941,882
|
|
Cohen & Steers, Inc. (b)
|
258,602
|
17,786,646
|
|
Diamond Hill Investment Group, Inc.
|
27,088
|
4,042,071
|
|
Donnelley Financial Solutions, Inc. (a)
|
244,576
|
15,354,481
|
|
Forge Global Holdings, Inc. Class A (a)(b)
|
1,086,424
|
1,988,156
|
|
GCM Grosvenor, Inc. Class A (b)
|
417,513
|
3,941,323
|
|
Hamilton Lane, Inc. Class A
|
362,739
|
40,525,201
|
|
MarketWise, Inc. Class A
|
323,372
|
504,460
|
|
Moelis & Co. Class A
|
663,148
|
32,547,304
|
|
Open Lending Corp. (a)(b)
|
984,417
|
5,020,527
|
|
P10, Inc. (b)
|
432,871
|
3,073,384
|
|
Patria Investments Ltd.
|
556,760
|
7,460,584
|
|
Perella Weinberg Partners Class A
|
420,663
|
6,276,292
|
|
Piper Jaffray Companies
|
172,526
|
33,778,866
|
|
PJT Partners, Inc. (b)
|
235,133
|
22,217,717
|
|
Silvercrest Asset Management Group Class A
|
94,068
|
1,378,096
|
|
StepStone Group, Inc. Class A
|
548,129
|
19,771,013
|
|
StoneX Group, Inc. (a)
|
266,427
|
19,342,600
|
|
Value Line, Inc.
|
8,421
|
304,840
|
|
Victory Capital Holdings, Inc.
|
265,210
|
13,488,581
|
|
Virtus Investment Partners, Inc.
|
67,660
|
14,839,191
|
|
WisdomTree Investments, Inc.
|
1,368,555
|
12,180,140
|
|
351,160,750
|
|||
Consumer Finance - 0.8%
|
|||
Atlanticus Holdings Corp. (a)(b)
|
45,036
|
1,191,202
|
|
Bread Financial Holdings, Inc.
|
494,941
|
18,268,272
|
|
Consumer Portfolio Services, Inc. (a)(b)
|
79,587
|
681,265
|
|
Encore Capital Group, Inc. (a)(b)
|
229,031
|
9,410,884
|
|
Enova International, Inc. (a)
|
281,383
|
17,032,113
|
|
FirstCash Holdings, Inc.
|
373,599
|
42,209,215
|
|
Green Dot Corp. Class A (a)
|
456,830
|
3,997,263
|
|
LendingClub Corp. (a)(b)
|
1,087,144
|
8,175,323
|
|
LendingTree, Inc. (a)
|
105,922
|
5,112,855
|
|
Navient Corp.
|
818,080
|
12,287,562
|
|
Nelnet, Inc. Class A (b)
|
126,015
|
11,868,093
|
|
NerdWallet, Inc. (a)
|
339,648
|
4,269,375
|
|
OppFi, Inc. Class A
|
103,769
|
277,063
|
|
PRA Group, Inc. (a)(b)
|
382,935
|
9,110,024
|
|
PROG Holdings, Inc.
|
439,771
|
14,617,988
|
|
Regional Management Corp.
|
79,390
|
2,001,422
|
|
Upstart Holdings, Inc. (a)(b)
|
736,868
|
16,306,889
|
|
World Acceptance Corp. (a)(b)
|
40,452
|
5,564,982
|
|
182,381,790
|
|||
Financial Services - 2.4%
|
|||
A-Mark Precious Metals, Inc. (b)
|
185,520
|
7,433,786
|
|
Acacia Research Corp. (a)(b)
|
378,548
|
1,843,529
|
|
Alerus Financial Corp. (b)
|
176,639
|
3,479,788
|
|
AvidXchange Holdings, Inc. (a)
|
1,499,449
|
17,483,575
|
|
Banco Latinoamericano de Comer Series E
|
274,644
|
7,802,636
|
|
Cannae Holdings, Inc. (a)(b)
|
662,224
|
12,880,257
|
|
Cantaloupe, Inc. (a)(b)
|
575,734
|
3,333,500
|
|
Cass Information Systems, Inc. (b)
|
136,769
|
5,907,053
|
|
Compass Diversified Holdings
|
632,416
|
13,894,180
|
|
Enact Holdings, Inc.
|
294,210
|
8,746,863
|
|
Essent Group Ltd.
|
1,039,985
|
55,088,005
|
|
EVERTEC, Inc.
|
647,193
|
24,289,153
|
|
Federal Agricultural Mortgage Corp. Class C (non-vtg.)
|
90,237
|
16,795,813
|
|
Finance of America Companies, Inc. (a)(b)
|
491,270
|
235,810
|
|
Flywire Corp. (a)
|
1,055,306
|
21,633,773
|
|
i3 Verticals, Inc. Class A (a)
|
224,600
|
5,100,666
|
|
International Money Express, Inc. (a)
|
313,364
|
6,339,354
|
|
Jackson Financial, Inc. (b)
|
792,662
|
54,154,668
|
|
Marqeta, Inc. Class A (a)
|
4,679,262
|
25,969,904
|
|
Merchants Bancorp
|
159,582
|
6,435,942
|
|
Mr. Cooper Group, Inc. (a)(b)
|
638,583
|
49,298,608
|
|
Newtekone, Inc. (b)
|
235,821
|
2,544,509
|
|
NMI Holdings, Inc. (a)
|
790,038
|
24,380,573
|
|
Ocwen Financial Corp. (a)(b)
|
59,996
|
1,400,307
|
|
PagSeguro Digital Ltd. (a)
|
1,972,239
|
24,554,376
|
|
Payoneer Global, Inc. (a)
|
2,649,000
|
13,086,060
|
|
Paysafe Ltd. (a)(b)
|
322,407
|
4,584,628
|
|
Paysign, Inc. (a)(b)
|
324,099
|
1,490,855
|
|
PennyMac Financial Services, Inc.
|
252,358
|
21,611,939
|
|
Priority Technology Holdings, Inc. (a)
|
146,673
|
470,820
|
|
Radian Group, Inc.
|
1,523,431
|
45,504,884
|
|
Remitly Global, Inc. (a)
|
1,348,066
|
24,036,017
|
|
Repay Holdings Corp. (a)
|
823,795
|
8,377,995
|
|
Security National Financial Corp. Class A
|
123,531
|
812,834
|
|
StoneCo Ltd. Class A (a)
|
2,886,889
|
45,035,468
|
|
SWK Holdings Corp. (a)(b)
|
31,375
|
544,043
|
|
Velocity Financial, Inc. (a)(b)
|
84,410
|
1,447,632
|
|
Walker & Dunlop, Inc. (b)
|
316,199
|
28,973,314
|
|
Waterstone Financial, Inc.
|
169,274
|
1,919,567
|
|
598,922,684
|
|||
Insurance - 1.9%
|
|||
AMBAC Financial Group, Inc. (a)
|
432,202
|
6,245,319
|
|
American Coastal Insurance Cor (a)(b)
|
197,722
|
2,070,149
|
|
American Equity Investment Life Holding Co.
|
774,942
|
43,481,996
|
|
Amerisafe, Inc.
|
187,666
|
8,557,570
|
|
CNO Financial Group, Inc.
|
1,110,102
|
29,228,986
|
|
Crawford & Co. Class A
|
143,977
|
1,336,107
|
|
Donegal Group, Inc. Class A
|
152,084
|
2,044,009
|
|
eHealth, Inc. (a)
|
273,005
|
1,168,461
|
|
Employers Holdings, Inc.
|
253,285
|
10,787,408
|
|
Enstar Group Ltd. (a)
|
117,756
|
34,192,810
|
|
F&G Annuities & Life, Inc. (b)
|
187,812
|
7,103,050
|
|
Fidelis Insurance Holdings Ltd.
|
606,237
|
11,263,883
|
|
Genworth Financial, Inc. Class A (a)
|
4,443,731
|
26,351,325
|
|
GoHealth, Inc. (a)(b)
|
35,690
|
359,398
|
|
Goosehead Insurance (a)(b)
|
214,782
|
12,223,244
|
|
Greenlight Capital Re, Ltd. (a)(b)
|
254,150
|
3,080,298
|
|
Hamilton Insurance Group Ltd.
|
166,589
|
2,262,279
|
|
HCI Group, Inc. (b)
|
72,521
|
8,280,448
|
|
Hippo Holdings, Inc. (a)(b)
|
106,685
|
2,281,992
|
|
Horace Mann Educators Corp. (b)
|
406,481
|
14,982,890
|
|
Investors Title Co.
|
11,981
|
1,922,112
|
|
James River Group Holdings Ltd.
|
366,514
|
3,258,309
|
|
Kingsway Financial Services, Inc. (a)(b)
|
115,029
|
1,023,758
|
|
Lemonade, Inc. (a)(b)
|
504,777
|
8,697,308
|
|
Maiden Holdings Ltd. (a)(b)
|
872,985
|
1,815,809
|
|
MBIA, Inc. (b)
|
445,902
|
2,804,724
|
|
Mercury General Corp.
|
266,770
|
13,941,400
|
|
National Western Life Group, Inc.
|
22,413
|
10,955,923
|
|
NI Holdings, Inc. (a)
|
73,516
|
1,093,183
|
|
Oscar Health, Inc. (a)
|
1,599,684
|
27,786,511
|
|
Palomar Holdings, Inc. (a)
|
243,025
|
19,118,777
|
|
ProAssurance Corp. (b)
|
503,871
|
6,731,717
|
|
Safety Insurance Group, Inc.
|
142,753
|
11,358,856
|
|
Selective Insurance Group, Inc.
|
596,614
|
60,645,813
|
|
Selectquote, Inc. (a)(b)
|
1,354,841
|
2,045,810
|
|
Siriuspoint Ltd. (a)
|
706,901
|
8,327,294
|
|
Skyward Specialty Insurance Group, Inc. (a)
|
296,798
|
10,364,186
|
|
Stewart Information Services Corp.
|
265,479
|
16,462,353
|
|
The Baldwin Insurance Group, Inc. (a)(b)
|
599,796
|
15,978,565
|
|
Tiptree, Inc.
|
239,437
|
3,814,231
|
|
Trupanion, Inc. (a)(b)
|
392,063
|
8,821,418
|
|
United Fire Group, Inc.
|
208,081
|
4,596,509
|
|
Universal Insurance Holdings, Inc.
|
240,711
|
4,698,679
|
|
473,564,867
|
|||
Mortgage Real Estate Investment Trusts - 1.1%
|
|||
Angel Oak Mortgage (REIT), Inc. (b)
|
125,526
|
1,321,789
|
|
Apollo Commercial Real Estate Finance, Inc.
|
1,447,271
|
13,937,220
|
|
Arbor Realty Trust, Inc. (b)
|
1,839,752
|
23,604,018
|
|
Ares Commercial Real Estate Corp.
|
539,422
|
3,662,675
|
|
Armour Residential REIT, Inc.
|
494,920
|
8,992,696
|
|
Blackstone Mortgage Trust, Inc. (b)
|
1,723,440
|
30,401,482
|
|
BrightSpire Capital, Inc.
|
1,360,090
|
8,554,966
|
|
Chimera Investment Corp.
|
2,262,618
|
9,321,986
|
|
Claros Mortgage Trust, Inc. (b)
|
914,577
|
7,956,820
|
|
Dynex Capital, Inc.
|
563,837
|
6,579,978
|
|
Ellington Financial LLC
|
756,872
|
8,658,616
|
|
Franklin BSP Realty Trust, Inc. (b)
|
860,244
|
10,744,448
|
|
Granite Point Mortgage Trust, Inc.
|
532,602
|
2,284,863
|
|
Hannon Armstrong Sustainable Infrastructure Capital, Inc. (b)
|
1,091,064
|
27,287,511
|
|
Invesco Mortgage Capital, Inc.
|
498,341
|
4,260,816
|
|
KKR Real Estate Finance Trust, Inc. (b)
|
593,789
|
5,587,554
|
|
Ladder Capital Corp. Class A
|
1,153,020
|
12,371,905
|
|
MFA Financial, Inc.
|
1,036,311
|
10,974,533
|
|
New York Mortgage Trust, Inc.
|
918,562
|
6,292,150
|
|
Nexpoint Real Estate Finance, Inc.
|
83,287
|
1,079,400
|
|
Orchid Island Capital, Inc. (b)
|
516,924
|
4,305,977
|
|
PennyMac Mortgage Investment Trust
|
871,810
|
12,074,569
|
|
Ready Capital Corp.
|
1,628,029
|
13,870,807
|
|
Redwood Trust, Inc.
|
1,306,369
|
7,224,221
|
|
TPG RE Finance Trust, Inc.
|
696,855
|
5,107,947
|
|
Two Harbors Investment Corp.
|
1,046,129
|
13,212,609
|
|
259,671,556
|
|||
TOTAL FINANCIALS
|
3,943,680,248
|
||
HEALTH CARE - 14.9%
|
|||
Biotechnology - 7.5%
|
|||
2seventy bio, Inc. (a)(b)
|
498,484
|
2,273,087
|
|
4D Molecular Therapeutics, Inc. (a)(b)
|
402,878
|
9,640,871
|
|
89Bio, Inc. (a)(b)
|
782,050
|
6,655,246
|
|
Aadi Bioscience, Inc. (a)
|
155,786
|
299,109
|
|
ACADIA Pharmaceuticals, Inc. (a)
|
1,215,093
|
20,304,204
|
|
Acelyrin, Inc. (b)
|
716,551
|
2,995,183
|
|
Acrivon Therapeutics, Inc. (a)(b)
|
120,966
|
1,099,581
|
|
Actinium Pharmaceuticals, Inc. (a)(b)
|
274,138
|
2,110,863
|
|
Adicet Bio, Inc. (a)(b)
|
523,236
|
779,622
|
|
ADMA Biologics, Inc. (a)
|
2,120,443
|
13,825,288
|
|
Aerovate Therapeutics, Inc. (a)
|
111,435
|
2,229,814
|
|
Agenus, Inc. (b)
|
186,140
|
2,256,017
|
|
Agios Pharmaceuticals, Inc. (a)
|
553,345
|
17,983,713
|
|
Akero Therapeutics, Inc. (a)(b)
|
609,320
|
12,119,375
|
|
Aldeyra Therapeutics, Inc. (a)(b)
|
462,746
|
1,823,219
|
|
Alector, Inc. (a)(b)
|
716,743
|
3,641,054
|
|
Alkermes PLC (a)(b)
|
1,643,385
|
40,328,668
|
|
Allakos, Inc. (a)(b)
|
654,393
|
687,113
|
|
Allogene Therapeutics, Inc. (a)(b)
|
930,606
|
2,568,473
|
|
Allovir, Inc. (a)(b)
|
495,530
|
393,649
|
|
Alpine Immune Sciences, Inc. (a)(b)
|
381,353
|
24,631,590
|
|
Altimmune, Inc. (a)(b)
|
534,573
|
3,501,453
|
|
ALX Oncology Holdings, Inc. (a)(b)
|
261,398
|
4,448,994
|
|
Amicus Therapeutics, Inc. (a)
|
2,874,141
|
28,712,669
|
|
AnaptysBio, Inc. (a)(b)
|
184,446
|
4,489,416
|
|
Anavex Life Sciences Corp. (a)(b)
|
716,827
|
2,616,419
|
|
Anika Therapeutics, Inc. (a)
|
144,333
|
3,736,781
|
|
Annexon, Inc. (a)(b)
|
664,820
|
3,024,931
|
|
Apogee Therapeutics, Inc.
|
410,480
|
20,647,144
|
|
Arbutus Biopharma Corp. (a)(b)
|
1,250,362
|
3,413,488
|
|
Arcellx, Inc. (a)
|
380,562
|
19,035,711
|
|
Arcturus Therapeutics Holdings, Inc. (a)(b)
|
231,696
|
5,924,467
|
|
Arcus Biosciences, Inc. (a)(b)
|
532,279
|
8,106,609
|
|
Arcutis Biotherapeutics, Inc. (a)(b)
|
784,895
|
6,530,326
|
|
Ardelyx, Inc. (a)(b)
|
2,291,089
|
14,662,970
|
|
ArriVent Biopharma, Inc. (b)
|
96,666
|
1,596,922
|
|
Arrowhead Pharmaceuticals, Inc. (a)(b)
|
1,150,579
|
26,026,097
|
|
Ars Pharmaceuticals, Inc. (a)(b)
|
247,048
|
2,149,318
|
|
Astria Therapeutics, Inc. (a)
|
496,066
|
4,553,886
|
|
Atara Biotherapeutics, Inc. (a)(b)
|
956,978
|
660,315
|
|
Aura Biosciences, Inc. (a)
|
354,991
|
2,626,933
|
|
Aurinia Pharmaceuticals, Inc. (a)(b)
|
1,340,464
|
6,822,962
|
|
Avid Bioservices, Inc. (a)(b)
|
621,523
|
4,742,220
|
|
Avidity Biosciences, Inc. (a)(b)
|
734,571
|
17,725,198
|
|
Avita Medical, Inc. (a)
|
250,432
|
2,103,629
|
|
Beam Therapeutics, Inc. (a)(b)
|
740,056
|
15,703,988
|
|
BioAtla, Inc. (a)(b)
|
436,430
|
984,150
|
|
BioCryst Pharmaceuticals, Inc. (a)(b)
|
1,888,225
|
7,798,369
|
|
Biohaven Ltd. (a)(b)
|
678,603
|
26,329,796
|
|
Biomea Fusion, Inc. (a)(b)
|
196,511
|
2,110,528
|
|
BioVie, Inc. (a)(b)
|
126,099
|
61,789
|
|
BioXcel Therapeutics, Inc. (a)(b)
|
204,352
|
514,967
|
|
bluebird bio, Inc. (a)(b)
|
1,874,007
|
1,662,432
|
|
Blueprint Medicines Corp. (a)(b)
|
602,628
|
55,044,042
|
|
BridgeBio Pharma, Inc. (a)(b)
|
1,155,736
|
29,609,956
|
|
Cabaletta Bio, Inc. (a)(b)
|
341,753
|
3,637,961
|
|
CareDx, Inc. (a)(b)
|
516,358
|
4,006,938
|
|
Cargo Therapeutics, Inc. (b)
|
212,058
|
4,050,308
|
|
Caribou Biosciences, Inc. (a)(b)
|
811,067
|
2,944,173
|
|
Carisma Therapeutics, Inc. (a)(b)
|
262,758
|
428,296
|
|
Cartesian Therapeutics, Inc. (b)
|
38,364
|
846,693
|
|
Cartesian Therapeutics, Inc. rights (a)(b)(c)
|
1,117,119
|
145,225
|
|
Catalyst Pharmaceutical Partners, Inc. (a)(b)
|
1,106,599
|
16,654,315
|
|
Celcuity, Inc. (a)(b)
|
180,857
|
2,852,115
|
|
Celldex Therapeutics, Inc. (a)
|
616,098
|
23,054,387
|
|
Century Therapeutics, Inc. (a)(b)
|
231,403
|
673,383
|
|
Cerevel Therapeutics Holdings (a)(b)
|
709,095
|
30,285,447
|
|
CG Oncology, Inc. (b)
|
229,577
|
9,226,700
|
|
Chinook Therapeutics, Inc. rights (a)(c)
|
86,210
|
1
|
|
Cogent Biosciences, Inc. (a)(b)
|
821,954
|
5,342,701
|
|
Coherus BioSciences, Inc. (a)(b)
|
1,038,172
|
2,034,817
|
|
Compass Therapeutics, Inc. (a)(b)
|
896,065
|
1,290,334
|
|
Crinetics Pharmaceuticals, Inc. (a)
|
654,392
|
28,675,457
|
|
Cue Biopharma, Inc. (a)(b)
|
353,767
|
672,157
|
|
Cullinan Oncology, Inc. (a)
|
256,946
|
6,940,111
|
|
Cytokinetics, Inc. (a)(b)
|
946,540
|
58,041,833
|
|
Day One Biopharmaceuticals, Inc. (a)
|
620,381
|
10,608,515
|
|
Deciphera Pharmaceuticals, Inc. (a)
|
531,358
|
13,427,417
|
|
Denali Therapeutics, Inc. (a)
|
1,184,062
|
18,281,917
|
|
Design Therapeutics, Inc. (a)
|
311,153
|
1,095,259
|
|
Disc Medicine, Inc. (a)(b)
|
93,832
|
2,612,283
|
|
Dynavax Technologies Corp. (a)(b)
|
1,281,749
|
14,573,486
|
|
Dyne Therapeutics, Inc. (a)(b)
|
586,922
|
14,854,996
|
|
Eagle Pharmaceuticals, Inc. (a)(b)
|
101,946
|
416,959
|
|
Editas Medicine, Inc. (a)(b)
|
814,892
|
4,245,587
|
|
Emergent BioSolutions, Inc. (a)(b)
|
504,043
|
947,601
|
|
Enanta Pharmaceuticals, Inc. (a)
|
199,821
|
2,745,541
|
|
Entrada Therapeutics, Inc. (a)
|
211,782
|
2,509,617
|
|
Erasca, Inc. (a)(b)
|
798,383
|
1,604,750
|
|
Fate Therapeutics, Inc. (a)(b)
|
841,439
|
3,323,684
|
|
Fennec Pharmaceuticals, Inc. (a)(b)
|
180,902
|
1,660,680
|
|
FibroGen, Inc. (a)(b)
|
917,496
|
1,027,596
|
|
Foghorn Therapeutics, Inc. (a)(b)
|
200,456
|
1,094,490
|
|
Genelux Corp. (a)(b)
|
187,389
|
582,780
|
|
Generation Bio Co. (a)(b)
|
451,078
|
1,276,551
|
|
Geron Corp. (a)(b)
|
5,087,530
|
19,993,993
|
|
Gritstone Bio, Inc. (a)(b)
|
883,369
|
706,695
|
|
Halozyme Therapeutics, Inc. (a)(b)
|
1,284,876
|
48,953,776
|
|
Heron Therapeutics, Inc. (a)(b)
|
1,024,353
|
2,376,499
|
|
HilleVax, Inc. (a)
|
263,002
|
3,471,626
|
|
Humacyte, Inc. Class A (a)(b)
|
608,571
|
2,385,598
|
|
Ideaya Biosciences, Inc. (a)(b)
|
653,380
|
26,559,897
|
|
IGM Biosciences, Inc. (a)(b)
|
132,148
|
1,272,585
|
|
Immuneering Corp. (a)(b)
|
218,974
|
310,943
|
|
ImmunityBio, Inc. (a)(b)
|
1,314,174
|
10,500,250
|
|
Immunovant, Inc. (a)(b)
|
535,432
|
14,692,254
|
|
Inhibrx, Inc. (a)
|
339,826
|
11,567,677
|
|
Inozyme Pharma, Inc. (a)(b)
|
474,304
|
2,091,681
|
|
Insmed, Inc. (a)
|
1,367,535
|
33,805,465
|
|
Intellia Therapeutics, Inc. (a)(b)
|
891,945
|
19,087,623
|
|
Iovance Biotherapeutics, Inc. (a)(b)
|
2,353,240
|
27,721,167
|
|
Ironwood Pharmaceuticals, Inc. Class A (a)(b)
|
1,363,747
|
10,569,039
|
|
iTeos Therapeutics, Inc. (a)
|
243,041
|
2,610,260
|
|
Janux Therapeutics, Inc. (a)(b)
|
171,812
|
9,793,284
|
|
Kalvista Pharmaceuticals, Inc. (a)(b)
|
309,758
|
3,515,753
|
|
Karyopharm Therapeutics, Inc. (a)(b)
|
1,116,976
|
1,150,485
|
|
Keros Therapeutics, Inc. (a)
|
255,181
|
14,389,657
|
|
Kezar Life Sciences, Inc. (a)
|
687,916
|
567,187
|
|
Kiniksa Pharmaceuticals Ltd. (a)(b)
|
318,104
|
5,954,907
|
|
Kodiak Sciences, Inc. (a)(b)
|
322,411
|
1,034,939
|
|
Krystal Biotech, Inc. (a)(b)
|
214,434
|
32,834,134
|
|
Kura Oncology, Inc. (a)
|
702,284
|
13,778,812
|
|
Kymera Therapeutics, Inc. (a)(b)
|
405,719
|
13,640,273
|
|
Larimar Therapeutics, Inc. (a)
|
258,635
|
1,781,995
|
|
Lenz Therapeutics, Inc. (b)
|
40,535
|
643,290
|
|
Lexeo Therapeutics, Inc. (b)
|
76,912
|
957,554
|
|
Lexicon Pharmaceuticals, Inc. (a)(b)
|
906,929
|
1,396,671
|
|
Lineage Cell Therapeutics, Inc. (a)(b)
|
1,316,252
|
1,434,715
|
|
Lyell Immunopharma, Inc. (a)(b)
|
1,722,648
|
3,738,146
|
|
Macrogenics, Inc. (a)
|
603,877
|
8,925,302
|
|
Madrigal Pharmaceuticals, Inc. (a)(b)
|
146,573
|
29,903,823
|
|
MannKind Corp. (a)(b)
|
2,595,641
|
10,668,085
|
|
MeiraGTx Holdings PLC (a)
|
323,656
|
1,579,441
|
|
Merrimack Pharmaceuticals, Inc. (a)(b)
|
105,966
|
1,561,939
|
|
Mersana Therapeutics, Inc. (a)
|
1,097,403
|
3,478,768
|
|
MiMedx Group, Inc. (a)
|
1,157,001
|
7,127,126
|
|
Mineralys Therapeutics, Inc. (a)(b)
|
192,713
|
2,360,734
|
|
Mirum Pharmaceuticals, Inc. (a)(b)
|
245,754
|
6,170,883
|
|
Monte Rosa Therapeutics, Inc. (a)(b)
|
306,670
|
1,631,484
|
|
Morphic Holding, Inc. (a)(b)
|
377,632
|
10,298,025
|
|
Mural Oncology PLC
|
161,938
|
599,171
|
|
Myriad Genetics, Inc. (a)
|
869,587
|
17,017,818
|
|
Nkarta, Inc. (a)(b)
|
299,962
|
2,003,746
|
|
Novavax, Inc. (a)(b)
|
1,120,815
|
4,853,129
|
|
Nurix Therapeutics, Inc. (a)(b)
|
473,034
|
5,685,869
|
|
Nuvalent, Inc. Class A (a)(b)
|
263,715
|
18,164,689
|
|
Nuvectis Pharma, Inc. (a)(b)
|
74,056
|
450,260
|
|
Ocean Biomedical, Inc. Class A (a)(b)
|
84,842
|
118,779
|
|
Olema Pharmaceuticals, Inc. (a)(b)
|
266,879
|
2,714,159
|
|
Omega Therapeutics, Inc. (a)(b)
|
240,115
|
535,456
|
|
Omniab, Inc. (a)(b)(c)
|
45,323
|
188,997
|
|
Omniab, Inc. (a)(b)(c)
|
45,323
|
176,760
|
|
Oncternal Therapeutics, Inc. rights (a)(c)
|
4,336
|
0
|
|
Organogenesis Holdings, Inc. Class A (a)
|
699,823
|
1,644,584
|
|
ORIC Pharmaceuticals, Inc. (a)(b)
|
388,140
|
3,427,276
|
|
Outlook Therapeutics, Inc. (a)(b)
|
77,459
|
690,934
|
|
Ovid Therapeutics, Inc. (a)(b)
|
584,998
|
1,784,244
|
|
PDS Biotechnology Corp. (a)(b)
|
276,306
|
925,625
|
|
PepGen, Inc. (a)(b)
|
99,322
|
1,219,674
|
|
PMV Pharmaceuticals, Inc. (a)(b)
|
400,346
|
720,623
|
|
Poseida Therapeutics, Inc. (a)(b)
|
674,027
|
1,631,145
|
|
Precigen, Inc. (a)(b)
|
1,295,350
|
1,709,862
|
|
Prelude Therapeutics, Inc. (a)(b)
|
145,462
|
548,392
|
|
Prime Medicine, Inc. (a)(b)
|
394,159
|
1,939,262
|
|
ProKidney Corp. (a)(b)
|
447,530
|
924,149
|
|
Protagonist Therapeutics, Inc. (a)
|
569,433
|
14,298,463
|
|
Protalix BioTherapeutics, Inc. (a)(b)
|
659,830
|
752,206
|
|
Prothena Corp. PLC (a)(b)
|
417,762
|
8,497,279
|
|
PTC Therapeutics, Inc. (a)(b)
|
712,658
|
22,911,955
|
|
Rallybio Corp. (a)(b)
|
303,735
|
583,171
|
|
RAPT Therapeutics, Inc. (a)(b)
|
291,006
|
2,240,746
|
|
Recursion Pharmaceuticals, Inc. (a)(b)
|
1,384,099
|
10,823,654
|
|
REGENXBIO, Inc. (a)
|
407,117
|
6,249,246
|
|
Relay Therapeutics, Inc. (a)
|
952,742
|
6,211,878
|
|
Reneo Pharmaceuticals, Inc. (a)(b)
|
117,993
|
197,048
|
|
Replimune Group, Inc. (a)
|
486,888
|
3,091,739
|
|
Revolution Medicines, Inc. (a)
|
1,381,909
|
51,517,568
|
|
Rhythm Pharmaceuticals, Inc. (a)(b)
|
530,492
|
21,092,362
|
|
Rigel Pharmaceuticals, Inc. (a)
|
1,668,129
|
1,751,535
|
|
Rocket Pharmaceuticals, Inc. (a)
|
623,565
|
13,419,119
|
|
Sage Therapeutics, Inc. (a)(b)
|
521,364
|
7,267,814
|
|
Sagimet Biosciences, Inc. (b)
|
226,773
|
884,415
|
|
Sana Biotechnology, Inc. (a)(b)
|
952,749
|
8,574,741
|
|
Sangamo Therapeutics, Inc. (a)(b)
|
1,463,076
|
753,338
|
|
Savara, Inc. (a)(b)
|
905,924
|
4,149,132
|
|
Scholar Rock Holding Corp. (a)(b)
|
571,219
|
8,379,783
|
|
Seres Therapeutics, Inc. (a)(b)
|
952,623
|
943,668
|
|
SpringWorks Therapeutics, Inc. (a)
|
679,670
|
31,733,792
|
|
Stoke Therapeutics, Inc. (a)(b)
|
277,086
|
3,056,259
|
|
Summit Therapeutics, Inc. (a)(b)
|
1,144,433
|
4,497,622
|
|
Sutro Biopharma, Inc. (a)
|
602,064
|
2,044,007
|
|
Syndax Pharmaceuticals, Inc. (a)(b)
|
780,527
|
16,492,536
|
|
Tango Therapeutics, Inc. (a)
|
441,926
|
3,402,830
|
|
Tenaya Therapeutics, Inc. (a)
|
460,716
|
2,091,651
|
|
TG Therapeutics, Inc. (a)(b)
|
1,374,454
|
18,775,042
|
|
Tobira Therapeutics, Inc. rights (a)(c)
|
9,663
|
0
|
|
Travere Therapeutics, Inc. (a)(b)
|
719,363
|
3,978,077
|
|
Turnstone Biologics Corp. (b)
|
151,942
|
395,049
|
|
Twist Bioscience Corp. (a)(b)
|
575,303
|
17,966,713
|
|
Tyra Biosciences, Inc. (a)(b)
|
138,428
|
2,367,119
|
|
UroGen Pharma Ltd. (a)(b)
|
274,993
|
3,800,403
|
|
Vanda Pharmaceuticals, Inc. (a)
|
551,992
|
2,627,482
|
|
Vaxcyte, Inc. (a)
|
1,051,037
|
63,640,290
|
|
Vaxxinity, Inc. Class A (a)(b)
|
413,687
|
50,759
|
|
Vera Therapeutics, Inc. (a)(b)
|
397,768
|
15,715,814
|
|
Veracyte, Inc. (a)(b)
|
721,822
|
14,126,057
|
|
Vericel Corp. (a)(b)
|
472,702
|
21,682,841
|
|
Verve Therapeutics, Inc. (a)(b)
|
656,038
|
3,942,788
|
|
Vigil Neuroscience, Inc. (a)(b)
|
156,942
|
409,619
|
|
Viking Therapeutics, Inc. (a)(b)
|
1,015,150
|
80,785,637
|
|
Vir Biotechnology, Inc. (a)(b)
|
824,432
|
6,974,695
|
|
Viridian Therapeutics, Inc. (a)(b)
|
491,250
|
6,513,975
|
|
Vor Biopharma, Inc. (a)(b)
|
371,289
|
638,617
|
|
Voyager Therapeutics, Inc. (a)(b)
|
389,487
|
3,045,788
|
|
X4 Pharmaceuticals, Inc. (a)
|
1,237,911
|
1,386,460
|
|
Xencor, Inc. (a)
|
573,063
|
11,999,939
|
|
XOMA Corp. (a)(b)
|
71,503
|
1,811,886
|
|
Y-mAbs Therapeutics, Inc. (a)(b)
|
366,433
|
5,573,446
|
|
Zentalis Pharmaceuticals, Inc. (a)(b)
|
576,783
|
6,379,220
|
|
Zura Bio Ltd. Class A (a)(b)
|
166,495
|
710,934
|
|
Zymeworks, Inc. (a)
|
553,111
|
4,745,692
|
|
1,861,640,617
|
|||
Health Care Equipment & Supplies - 2.7%
|
|||
Accuray, Inc. (a)(b)
|
920,128
|
1,959,873
|
|
Alphatec Holdings, Inc. (a)
|
912,503
|
11,515,788
|
|
Angiodynamics, Inc. (a)
|
373,875
|
2,164,736
|
|
Artivion, Inc. (a)(b)
|
389,680
|
7,645,522
|
|
Atricure, Inc. (a)(b)
|
460,816
|
11,114,882
|
|
Atrion Corp. (b)
|
13,641
|
5,774,099
|
|
Avanos Medical, Inc. (a)
|
456,594
|
8,255,220
|
|
AxoGen, Inc. (a)(b)
|
407,951
|
2,614,966
|
|
Axonics, Inc. (a)
|
493,443
|
32,848,501
|
|
Beyond Air, Inc. (a)(b)
|
296,519
|
320,241
|
|
Butterfly Network, Inc. Class A (a)(b)
|
1,395,301
|
1,082,893
|
|
Cerus Corp. (a)(b)
|
1,758,197
|
2,936,189
|
|
ClearPoint Neuro, Inc. (a)(b)
|
227,075
|
1,233,017
|
|
CONMED Corp. (b)
|
302,979
|
20,596,512
|
|
Cutera, Inc. (a)(b)
|
178,160
|
431,147
|
|
CVRx, Inc. (a)
|
111,594
|
1,730,823
|
|
Embecta Corp. (b)
|
568,201
|
5,755,876
|
|
Glaukos Corp. (a)(b)
|
470,093
|
45,128,928
|
|
Haemonetics Corp. (a)
|
496,611
|
45,663,381
|
|
Inari Medical, Inc. (a)
|
529,961
|
19,788,744
|
|
InMode Ltd. (a)(b)
|
771,372
|
13,259,885
|
|
Inogen, Inc. (a)
|
229,983
|
1,563,884
|
|
Integer Holdings Corp. (a)
|
328,689
|
36,691,553
|
|
IRadimed Corp.
|
72,958
|
2,962,824
|
|
iRhythm Technologies, Inc. (a)(b)
|
304,178
|
33,331,825
|
|
KORU Medical Systems, Inc. (a)(b)
|
300,828
|
652,797
|
|
Lantheus Holdings, Inc. (a)
|
674,714
|
44,895,470
|
|
LeMaitre Vascular, Inc. (b)
|
196,034
|
12,703,003
|
|
LivaNova PLC (a)
|
537,906
|
29,988,260
|
|
Merit Medical Systems, Inc. (a)
|
562,674
|
41,694,143
|
|
Neogen Corp. (a)(b)
|
2,156,714
|
26,592,284
|
|
Nevro Corp. (a)(b)
|
354,914
|
3,754,990
|
|
Omnicell, Inc. (a)
|
446,971
|
11,983,293
|
|
OraSure Technologies, Inc. (a)(b)
|
706,402
|
3,736,867
|
|
Orchestra BioMed Holdings, Inc. (a)(b)
|
143,113
|
631,128
|
|
Orthofix International NV (a)
|
347,233
|
4,514,029
|
|
OrthoPediatrics Corp. (a)(b)
|
157,506
|
4,666,903
|
|
Outset Medical, Inc. (a)(b)
|
489,806
|
1,239,209
|
|
Paragon 28, Inc. (a)(b)
|
435,607
|
4,016,297
|
|
PROCEPT BioRobotics Corp. (a)(b)
|
401,023
|
21,246,199
|
|
Pulmonx Corp. (a)(b)
|
366,466
|
2,788,806
|
|
Pulse Biosciences, Inc. (a)(b)
|
160,409
|
1,182,214
|
|
RxSight, Inc. (a)
|
283,769
|
14,792,878
|
|
Sanara Medtech, Inc. (a)(b)
|
38,089
|
1,212,754
|
|
Semler Scientific, Inc. (a)
|
46,113
|
1,177,265
|
|
SI-BONE, Inc. (a)(b)
|
392,711
|
5,600,059
|
|
Sight Sciences, Inc. (a)(b)
|
215,197
|
1,194,343
|
|
Silk Road Medical, Inc. (a)
|
380,721
|
7,401,216
|
|
Staar Surgical Co. (a)(b)
|
487,687
|
22,414,095
|
|
SurModics, Inc. (a)
|
136,430
|
3,504,887
|
|
Tactile Systems Technology, Inc. (a)
|
231,949
|
3,193,938
|
|
Tela Bio, Inc. (a)(b)
|
159,637
|
719,165
|
|
TransMedics Group, Inc. (a)(b)
|
314,506
|
29,604,450
|
|
Treace Medical Concepts, Inc. (a)
|
447,726
|
4,642,919
|
|
UFP Technologies, Inc. (a)(b)
|
70,640
|
14,547,602
|
|
Utah Medical Products, Inc.
|
33,602
|
2,224,452
|
|
Varex Imaging Corp. (a)(b)
|
385,492
|
6,264,245
|
|
Vicarious Surgical, Inc. (a)(b)
|
1,003,806
|
281,668
|
|
Zimvie, Inc. (a)
|
256,546
|
3,899,499
|
|
Zynex, Inc. (a)(b)
|
180,671
|
1,981,961
|
|
657,314,597
|
|||
Health Care Providers & Services - 2.5%
|
|||
23andMe Holding Co. Class A (a)(b)
|
3,047,157
|
1,530,282
|
|
Accolade, Inc. (a)(b)
|
690,399
|
5,267,744
|
|
AdaptHealth Corp. (a)(b)
|
948,877
|
9,346,438
|
|
Addus HomeCare Corp. (a)
|
155,594
|
14,960,363
|
|
Agiliti, Inc. (a)(b)
|
294,181
|
2,985,937
|
|
AirSculpt Technologies, Inc. (a)(b)
|
126,323
|
696,040
|
|
Alignment Healthcare, Inc. (a)(b)
|
840,737
|
4,329,796
|
|
AMN Healthcare Services, Inc. (a)
|
377,502
|
22,642,570
|
|
Astrana Health, Inc. (a)(b)
|
431,962
|
16,047,388
|
|
Aveanna Healthcare Holdings, Inc. (a)(b)
|
435,301
|
979,427
|
|
BrightSpring Health Services, Inc. (b)
|
533,040
|
5,698,198
|
|
Brookdale Senior Living, Inc. (a)
|
1,846,045
|
12,534,646
|
|
CareMax, Inc. Class A (a)(b)
|
21,421
|
76,473
|
|
Castle Biosciences, Inc. (a)(b)
|
246,634
|
5,201,511
|
|
Community Health Systems, Inc. (a)
|
1,246,405
|
4,113,137
|
|
Corvel Corp. (a)
|
86,657
|
20,698,024
|
|
Cross Country Healthcare, Inc. (a)(b)
|
339,139
|
5,968,846
|
|
DocGo, Inc. Class A (a)(b)
|
772,120
|
2,609,766
|
|
Enhabit Home Health & Hospice (a)
|
496,465
|
5,009,332
|
|
Fulgent Genetics, Inc. (a)
|
200,299
|
4,076,085
|
|
Guardant Health, Inc. (a)
|
1,120,865
|
20,175,570
|
|
HealthEquity, Inc. (a)
|
843,785
|
66,583,074
|
|
Hims & Hers Health, Inc. (a)(b)
|
1,230,002
|
15,411,925
|
|
InfuSystems Holdings, Inc. (a)(b)
|
178,255
|
1,338,695
|
|
Innovage Holding Corp. (a)(b)
|
162,653
|
577,418
|
|
LifeStance Health Group, Inc. (a)(b)
|
1,051,036
|
6,495,402
|
|
Modivcare, Inc. (a)(b)
|
125,188
|
2,938,162
|
|
Nano-X Imaging Ltd. (a)(b)
|
473,807
|
4,245,311
|
|
National Healthcare Corp. (b)
|
124,288
|
11,294,051
|
|
National Research Corp. Class A
|
141,654
|
4,851,650
|
|
NeoGenomics, Inc. (a)(b)
|
1,262,776
|
17,577,842
|
|
Opko Health, Inc. (a)(b)
|
3,972,731
|
4,846,732
|
|
Option Care Health, Inc. (a)
|
1,662,944
|
49,705,396
|
|
Owens & Minor, Inc. (a)(b)
|
737,516
|
18,246,146
|
|
P3 Health Partners, Inc. Class A (a)(b)
|
398,279
|
213,955
|
|
Patterson Companies, Inc.
|
828,262
|
21,095,833
|
|
Pediatrix Medical Group, Inc. (a)
|
828,521
|
7,348,981
|
|
Pennant Group, Inc. (a)
|
284,092
|
5,940,364
|
|
PetIQ, Inc. Class A (a)(b)
|
271,676
|
4,433,752
|
|
Privia Health Group, Inc. (a)(b)
|
1,118,393
|
20,578,431
|
|
Progyny, Inc. (a)(b)
|
789,465
|
25,310,248
|
|
Quipt Home Medical Corp. (a)
|
401,530
|
1,445,508
|
|
RadNet, Inc. (a)
|
597,395
|
28,973,658
|
|
Select Medical Holdings Corp.
|
1,028,388
|
29,175,368
|
|
Surgery Partners, Inc. (a)(b)
|
750,559
|
18,726,447
|
|
The Ensign Group, Inc.
|
540,217
|
63,940,084
|
|
The Joint Corp. (a)(b)
|
139,999
|
1,671,588
|
|
U.S. Physical Therapy, Inc. (b)
|
147,933
|
15,016,679
|
|
Viemed Healthcare, Inc. (a)(b)
|
338,488
|
2,772,217
|
|
615,702,490
|
|||
Health Care Technology - 0.4%
|
|||
American Well Corp. (a)
|
2,486,430
|
1,269,323
|
|
Definitive Healthcare Corp. (a)(b)
|
496,245
|
3,443,940
|
|
Evolent Health, Inc. Class A (a)(b)
|
1,116,562
|
30,973,430
|
|
Health Catalyst, Inc. (a)
|
584,169
|
3,633,531
|
|
HealthStream, Inc.
|
239,481
|
6,171,425
|
|
MultiPlan Corp. Class A (a)(b)
|
3,798,222
|
2,468,085
|
|
OptimizeRx Corp. (a)(b)
|
159,901
|
1,630,990
|
|
Phreesia, Inc. (a)(b)
|
530,724
|
11,007,216
|
|
Schrodinger, Inc. (a)(b)
|
541,235
|
13,195,309
|
|
Sharecare, Inc. Class A (a)(b)
|
2,976,478
|
2,130,861
|
|
Simulations Plus, Inc. (b)
|
158,197
|
7,174,234
|
|
TruBridge, Inc. (a)(b)
|
139,809
|
1,104,491
|
|
84,202,835
|
|||
Life Sciences Tools & Services - 0.2%
|
|||
Adaptive Biotechnologies Corp. (a)(b)
|
1,123,811
|
2,944,385
|
|
Akoya Biosciences, Inc. (a)(b)
|
231,920
|
885,934
|
|
BioLife Solutions, Inc. (a)(b)
|
352,161
|
6,176,904
|
|
Codexis, Inc. (a)(b)
|
689,770
|
2,007,231
|
|
CryoPort, Inc. (a)(b)
|
429,834
|
6,959,012
|
|
Cytek Biosciences, Inc. (a)(b)
|
1,200,894
|
7,217,373
|
|
Harvard Bioscience, Inc. (a)(b)
|
393,014
|
1,501,313
|
|
MaxCyte, Inc. (a)(b)
|
861,611
|
3,127,648
|
|
Mesa Laboratories, Inc. (b)
|
50,808
|
5,389,713
|
|
Nautilus Biotechnology, Inc. (a)(b)
|
493,091
|
1,252,451
|
|
OmniAb, Inc. (a)(b)
|
921,986
|
4,093,618
|
|
Pacific Biosciences of California, Inc. (a)(b)
|
2,479,639
|
4,091,404
|
|
Quanterix Corp. (a)
|
352,418
|
5,680,978
|
|
Quantum-Si, Inc. (a)(b)
|
1,009,790
|
1,625,762
|
|
Seer, Inc. (a)
|
566,481
|
1,178,280
|
|
54,132,006
|
|||
Pharmaceuticals - 1.6%
|
|||
Aclaris Therapeutics, Inc. (a)
|
675,181
|
816,969
|
|
Amneal Intermediate, Inc. (a)(b)
|
1,211,976
|
7,332,455
|
|
Amphastar Pharmaceuticals, Inc. (a)(b)
|
375,569
|
15,492,221
|
|
Amylyx Pharmaceuticals, Inc. (a)(b)
|
508,105
|
919,670
|
|
ANI Pharmaceuticals, Inc. (a)
|
146,403
|
9,662,598
|
|
Arvinas Holding Co. LLC (a)
|
500,423
|
15,898,439
|
|
Assertio Holdings, Inc. (a)(b)
|
880,949
|
779,728
|
|
Atea Pharmaceuticals, Inc. (a)
|
748,717
|
2,770,253
|
|
Axsome Therapeutics, Inc. (a)(b)
|
353,747
|
26,092,379
|
|
Biote Corp. Class A (a)(b)
|
136,738
|
753,426
|
|
Bright Green Corp. (a)(b)
|
715,468
|
179,511
|
|
Cara Therapeutics, Inc. (a)
|
451,873
|
339,763
|
|
Cassava Sciences, Inc. (a)(b)
|
398,399
|
8,824,538
|
|
Citius Pharmaceuticals, Inc. (a)(b)
|
1,294,307
|
965,941
|
|
Collegium Pharmaceutical, Inc. (a)
|
323,470
|
11,945,747
|
|
Corcept Therapeutics, Inc. (a)(b)
|
807,462
|
18,830,014
|
|
CorMedix, Inc. (a)(b)
|
547,006
|
2,874,517
|
|
Edgewise Therapeutics, Inc. (a)(b)
|
572,263
|
10,266,398
|
|
Enliven Therapeutics, Inc. (a)(b)
|
231,617
|
4,027,820
|
|
Evolus, Inc. (a)
|
417,226
|
4,910,750
|
|
Eyenovia, Inc. (a)(b)
|
309,313
|
232,294
|
|
Eyepoint Pharmaceuticals, Inc. (a)(b)
|
370,596
|
6,522,490
|
|
Harmony Biosciences Holdings, Inc. (a)(b)
|
320,699
|
9,912,806
|
|
Harrow, Inc. (a)(b)
|
298,904
|
3,045,832
|
|
Ikena Oncology, Inc. (a)(b)
|
296,339
|
391,167
|
|
Innoviva, Inc. (a)(b)
|
570,633
|
8,622,265
|
|
Intra-Cellular Therapies, Inc. (a)
|
995,008
|
71,451,524
|
|
Ligand Pharmaceuticals, Inc. Class B (a)(b)
|
166,306
|
11,623,126
|
|
Liquidia Corp. (a)(b)
|
500,174
|
6,427,236
|
|
Longboard Pharmaceuticals, Inc. (a)(b)
|
247,082
|
5,262,847
|
|
Marinus Pharmaceuticals, Inc. (a)(b)
|
542,982
|
765,605
|
|
Neumora Therapeutics, Inc.
|
147,592
|
1,341,611
|
|
Novartis AG rights (a)(c)
|
526,013
|
6
|
|
Nuvation Bio, Inc. (a)(b)
|
1,448,236
|
4,330,226
|
|
Ocular Therapeutix, Inc. (a)(b)
|
1,148,208
|
5,442,506
|
|
Omeros Corp. (a)(b)
|
603,462
|
1,900,905
|
|
OptiNose, Inc. (a)(b)
|
697,551
|
572,689
|
|
Pacira Biosciences, Inc. (a)(b)
|
450,171
|
11,816,989
|
|
Phathom Pharmaceuticals, Inc. (a)(b)
|
316,205
|
2,855,331
|
|
Phibro Animal Health Corp. Class A
|
201,290
|
3,361,543
|
|
Pliant Therapeutics, Inc. (a)(b)
|
563,814
|
6,664,281
|
|
Prestige Brands Holdings, Inc. (a)(b)
|
492,933
|
35,372,872
|
|
Revance Therapeutics, Inc. (a)(b)
|
863,118
|
3,115,856
|
|
Scilex Holding Co. (a)(h)
|
528,042
|
405,473
|
|
scPharmaceuticals, Inc. (a)(b)
|
277,674
|
1,241,203
|
|
SIGA Technologies, Inc. (b)
|
458,958
|
4,029,651
|
|
Supernus Pharmaceuticals, Inc. (a)(b)
|
488,684
|
14,709,388
|
|
Taro Pharmaceutical Industries Ltd. (a)
|
80,864
|
3,435,103
|
|
Tarsus Pharmaceuticals, Inc. (a)(b)
|
289,402
|
9,095,905
|
|
Terns Pharmaceuticals, Inc. (a)
|
429,877
|
2,170,879
|
|
Theravance Biopharma, Inc. (a)(b)
|
477,559
|
4,030,598
|
|
Third Harmonics Bio, Inc. (a)(b)
|
193,729
|
2,158,141
|
|
Trevi Therapeutics, Inc. (a)(b)
|
418,260
|
1,225,502
|
|
Ventyx Biosciences, Inc. (a)(b)
|
462,167
|
1,728,505
|
|
Verrica Pharmaceuticals, Inc. (a)(b)
|
207,869
|
1,447,808
|
|
WAVE Life Sciences (a)
|
731,716
|
3,607,360
|
|
Xeris Biopharma Holdings, Inc. (a)(b)
|
1,304,947
|
2,283,657
|
|
Zevra Therapeutics, Inc. (a)(b)
|
362,426
|
1,659,911
|
|
397,944,228
|
|||
TOTAL HEALTH CARE
|
3,670,936,773
|
||
INDUSTRIALS - 17.5%
|
|||
Aerospace & Defense - 0.9%
|
|||
AAR Corp. (a)
|
335,216
|
23,176,834
|
|
AeroVironment, Inc. (a)
|
267,766
|
42,786,329
|
|
AerSale Corp. (a)(b)
|
335,505
|
2,392,151
|
|
Archer Aviation, Inc. Class A (a)(b)
|
1,519,538
|
5,895,807
|
|
Astronics Corp. (a)(b)
|
276,920
|
4,643,948
|
|
Cadre Holdings, Inc.
|
193,495
|
6,453,058
|
|
Ducommun, Inc. (a)
|
131,671
|
7,122,084
|
|
Eve Holding, Inc. (a)(b)
|
175,876
|
947,972
|
|
Kratos Defense & Security Solutions, Inc. (a)(b)
|
1,426,864
|
25,426,716
|
|
Leonardo DRS, Inc. (a)(b)
|
686,274
|
14,768,616
|
|
Moog, Inc. Class A
|
286,155
|
45,518,676
|
|
National Presto Industries, Inc.
|
51,766
|
4,244,294
|
|
Park Aerospace Corp.
|
184,099
|
2,627,093
|
|
Redwire Corp. (a)(b)
|
81,916
|
309,642
|
|
Rocket Lab U.S.A., Inc. Class A (a)(b)
|
2,810,226
|
10,566,450
|
|
Terran Orbital Corp. Class A (a)(b)
|
956,906
|
1,263,116
|
|
Triumph Group, Inc. (a)(b)
|
642,591
|
8,585,016
|
|
V2X, Inc. (a)
|
113,185
|
5,498,527
|
|
Virgin Galactic Holdings, Inc. (a)(b)
|
3,521,296
|
3,063,880
|
|
215,290,209
|
|||
Air Freight & Logistics - 0.2%
|
|||
Air Transport Services Group, Inc. (a)(b)
|
507,722
|
6,508,996
|
|
Forward Air Corp. (b)
|
254,068
|
5,594,577
|
|
Hub Group, Inc. Class A
|
623,757
|
25,087,507
|
|
Radiant Logistics, Inc. (a)
|
356,419
|
1,760,710
|
|
38,951,790
|
|||
Building Products - 2.0%
|
|||
AAON, Inc.
|
671,946
|
63,223,399
|
|
American Woodmark Corp. (a)
|
160,032
|
14,735,747
|
|
Apogee Enterprises, Inc.
|
219,824
|
13,580,727
|
|
AZZ, Inc.
|
285,609
|
20,458,173
|
|
CSW Industrials, Inc.
|
152,934
|
36,340,177
|
|
Gibraltar Industries, Inc. (a)
|
303,210
|
21,667,387
|
|
Griffon Corp.
|
390,426
|
25,580,712
|
|
Insteel Industries, Inc.
|
187,517
|
6,019,296
|
|
Janus International Group, Inc. (a)
|
842,423
|
12,139,315
|
|
Jeld-Wen Holding, Inc. (a)
|
845,602
|
17,334,841
|
|
Masonite International Corp. (a)
|
216,849
|
28,743,335
|
|
MasterBrand, Inc. (a)
|
1,270,368
|
21,177,035
|
|
Quanex Building Products Corp.
|
332,093
|
11,032,129
|
|
Resideo Technologies, Inc. (a)
|
1,452,381
|
28,365,001
|
|
Simpson Manufacturing Co. Ltd.
|
425,902
|
74,060,099
|
|
UFP Industries, Inc.
|
595,745
|
67,140,462
|
|
Zurn Elkay Water Solutions Cor (b)
|
1,466,964
|
45,886,634
|
|
507,484,469
|
|||
Commercial Services & Supplies - 1.6%
|
|||
ABM Industries, Inc.
|
624,276
|
27,280,861
|
|
ACCO Brands Corp.
|
906,474
|
4,369,205
|
|
ACV Auctions, Inc. Class A (a)(b)
|
1,261,472
|
22,012,686
|
|
Aris Water Solution, Inc. Class A (b)
|
300,737
|
4,219,340
|
|
BrightView Holdings, Inc. (a)
|
412,204
|
4,637,295
|
|
Casella Waste Systems, Inc. Class A (a)(b)
|
558,528
|
50,490,931
|
|
CECO Environmental Corp. (a)
|
296,124
|
6,402,201
|
|
Cimpress PLC (a)(b)
|
178,730
|
15,240,307
|
|
CompX International, Inc. Class A (b)
|
15,673
|
493,543
|
|
CoreCivic, Inc. (a)
|
1,124,543
|
16,755,691
|
|
Deluxe Corp. (b)
|
436,923
|
8,629,229
|
|
Ennis, Inc.
|
255,863
|
5,091,674
|
|
Enviri Corp. (a)
|
780,565
|
6,072,796
|
|
Healthcare Services Group, Inc. (a)
|
732,991
|
7,784,364
|
|
HNI Corp.
|
459,748
|
19,286,429
|
|
Interface, Inc.
|
572,118
|
8,747,684
|
|
LanzaTech Global, Inc. (a)(b)
|
206,548
|
447,176
|
|
Li-Cycle Holdings Corp. (a)(b)
|
1,379,870
|
903,953
|
|
Liquidity Services, Inc. (a)(b)
|
228,413
|
3,942,408
|
|
Matthews International Corp. Class A
|
295,412
|
7,970,216
|
|
Millerknoll, Inc. (b)
|
732,165
|
18,618,956
|
|
Montrose Environmental Group, Inc. (a)
|
280,036
|
12,159,163
|
|
NL Industries, Inc.
|
75,141
|
616,908
|
|
OpenLane, Inc. (a)(b)
|
1,051,442
|
18,063,774
|
|
Performant Financial Corp. (a)(b)
|
680,298
|
1,809,593
|
|
Pitney Bowes, Inc. (b)
|
1,774,769
|
7,560,516
|
|
Quad/Graphics, Inc.
|
303,310
|
1,361,862
|
|
SP Plus Corp. (a)
|
190,578
|
9,730,913
|
|
Steelcase, Inc. Class A (b)
|
918,870
|
11,054,006
|
|
The Brink's Co.
|
442,696
|
38,718,192
|
|
The GEO Group, Inc. (a)
|
1,193,880
|
17,741,057
|
|
UniFirst Corp.
|
148,522
|
23,782,828
|
|
Viad Corp. (a)
|
202,463
|
6,980,924
|
|
VSE Corp.
|
130,571
|
10,193,678
|
|
399,170,359
|
|||
Construction & Engineering - 2.0%
|
|||
Ameresco, Inc. Class A (a)(b)
|
318,272
|
6,661,433
|
|
API Group Corp. (a)
|
2,076,586
|
80,093,922
|
|
Arcosa, Inc.
|
481,076
|
36,571,398
|
|
Argan, Inc.
|
125,524
|
7,564,076
|
|
Bowman Consulting Group Ltd. (a)(b)
|
107,112
|
3,480,069
|
|
Comfort Systems U.S.A., Inc.
|
351,450
|
108,742,145
|
|
Concrete Pumping Holdings, Inc. (a)(b)
|
245,418
|
1,632,030
|
|
Construction Partners, Inc. Class A (a)(b)
|
426,130
|
22,005,353
|
|
Dycom Industries, Inc. (a)(b)
|
284,348
|
39,814,407
|
|
Fluor Corp. (a)
|
1,415,197
|
57,074,895
|
|
Granite Construction, Inc.
|
438,014
|
24,309,777
|
|
Great Lakes Dredge & Dock Corp. (a)(b)
|
645,640
|
4,261,224
|
|
IES Holdings, Inc. (a)
|
82,016
|
11,082,002
|
|
INNOVATE Corp. (a)(b)
|
492,701
|
345,728
|
|
Limbach Holdings, Inc. (a)(b)
|
91,617
|
4,152,999
|
|
MYR Group, Inc. (a)
|
163,344
|
27,155,940
|
|
Northwest Pipe Co. (a)
|
96,531
|
3,055,206
|
|
Primoris Services Corp.
|
527,043
|
24,560,204
|
|
Southland Holdings, Inc. (a)(b)
|
35,404
|
155,070
|
|
Sterling Construction Co., Inc. (a)
|
297,648
|
30,241,037
|
|
Tutor Perini Corp. (a)
|
422,907
|
7,032,943
|
|
499,991,858
|
|||
Electrical Equipment - 1.4%
|
|||
374Water, Inc. (a)(b)
|
611,460
|
911,075
|
|
Allient, Inc.
|
129,018
|
3,791,839
|
|
Amprius Technologies, Inc. (a)(b)
|
56,239
|
105,167
|
|
Array Technologies, Inc. (a)(b)
|
1,501,438
|
18,527,745
|
|
Atkore, Inc. (b)
|
369,520
|
64,776,856
|
|
Babcock & Wilcox Enterprises, Inc. (a)(b)
|
587,606
|
599,358
|
|
Blink Charging Co. (a)(b)
|
555,671
|
1,405,848
|
|
Bloom Energy Corp. Class A (a)(b)
|
1,910,261
|
21,261,205
|
|
Dragonfly Energy Holdings Corp. (a)(b)
|
283,667
|
243,330
|
|
Encore Wire Corp.
|
149,266
|
41,698,950
|
|
Energy Vault Holdings, Inc. Class A (a)(b)
|
974,375
|
1,237,456
|
|
EnerSys
|
404,414
|
36,579,246
|
|
Enovix Corp. (a)(b)
|
1,376,228
|
8,615,187
|
|
Eos Energy Enterprises, Inc. (a)(b)
|
1,520,085
|
1,175,330
|
|
ESS Tech, Inc. Class A (a)(b)
|
899,689
|
678,276
|
|
Fluence Energy, Inc. (a)(b)
|
582,380
|
10,389,659
|
|
FTC Solar, Inc. (a)(b)
|
702,947
|
323,356
|
|
FuelCell Energy, Inc. (a)(b)
|
4,475,569
|
4,152,433
|
|
GrafTech International Ltd. (b)
|
1,899,252
|
3,266,713
|
|
LSI Industries, Inc.
|
276,428
|
4,035,849
|
|
Nextracker, Inc. Class A (a)
|
1,248,790
|
53,435,724
|
|
NuScale Power Corp. (a)(b)
|
553,911
|
3,212,684
|
|
Powell Industries, Inc. (b)
|
92,324
|
13,202,332
|
|
Preformed Line Products Co.
|
24,487
|
2,963,662
|
|
SES AI Corp. Class A (a)(b)
|
1,241,404
|
1,961,418
|
|
Shoals Technologies Group, Inc. (a)
|
1,701,851
|
14,380,641
|
|
SKYX Platforms Corp. (a)(b)
|
618,516
|
637,071
|
|
Stem, Inc. (a)(b)
|
1,417,842
|
2,608,829
|
|
SunPower Corp. (a)(b)
|
855,452
|
1,762,231
|
|
Thermon Group Holdings, Inc. (a)
|
332,742
|
10,624,452
|
|
TPI Composites, Inc. (a)(b)
|
406,223
|
1,291,789
|
|
Vicor Corp. (a)
|
220,020
|
7,124,248
|
|
336,979,959
|
|||
Ground Transportation - 0.4%
|
|||
ArcBest Corp.
|
236,273
|
26,205,038
|
|
Covenant Transport Group, Inc. Class A
|
83,041
|
3,752,623
|
|
FTAI Infrastructure LLC
|
983,779
|
7,122,560
|
|
Heartland Express, Inc.
|
459,127
|
4,563,722
|
|
Marten Transport Ltd.
|
572,840
|
9,692,453
|
|
P.A.M. Transportation Services, Inc. (a)
|
60,315
|
1,033,196
|
|
RXO, Inc. (a)(b)
|
1,150,499
|
21,755,936
|
|
Universal Logistics Holdings, Inc. (b)
|
67,240
|
3,004,283
|
|
Werner Enterprises, Inc. (b)
|
623,870
|
21,336,354
|
|
98,466,165
|
|||
Industrial Conglomerates - 0.0%
|
|||
Brookfield Business Corp. Class A (b)
|
255,578
|
5,201,012
|
|
Machinery - 3.7%
|
|||
3D Systems Corp. (a)(b)
|
1,285,982
|
4,308,040
|
|
Alamo Group, Inc. (b)
|
100,246
|
19,485,817
|
|
Albany International Corp. Class A
|
309,720
|
24,700,170
|
|
Astec Industries, Inc.
|
225,754
|
9,436,517
|
|
Atmus Filtration Technologies, Inc.
|
831,559
|
25,187,922
|
|
Barnes Group, Inc.
|
485,929
|
16,871,455
|
|
Blue Bird Corp. (a)
|
276,912
|
9,125,635
|
|
Chart Industries, Inc. (a)(b)
|
426,761
|
61,479,190
|
|
Columbus McKinnon Corp. (NY Shares)
|
282,850
|
11,673,220
|
|
Commercial Vehicle Group, Inc. (a)
|
315,340
|
1,895,193
|
|
Desktop Metal, Inc. (a)(b)
|
2,812,452
|
2,200,462
|
|
Douglas Dynamics, Inc.
|
224,532
|
5,083,404
|
|
Energy Recovery, Inc. (a)
|
553,190
|
8,242,531
|
|
Enerpac Tool Group Corp. Class A
|
541,612
|
19,297,636
|
|
EnPro Industries, Inc. (b)
|
208,396
|
31,286,491
|
|
ESCO Technologies, Inc.
|
253,783
|
25,746,285
|
|
Federal Signal Corp.
|
594,966
|
48,370,736
|
|
Franklin Electric Co., Inc.
|
458,082
|
44,099,554
|
|
Gencor Industries, Inc. (a)
|
103,122
|
1,749,980
|
|
Gorman-Rupp Co.
|
227,821
|
7,556,823
|
|
Helios Technologies, Inc.
|
328,607
|
14,820,176
|
|
Hillenbrand, Inc. (b)
|
695,391
|
33,184,059
|
|
Hillman Solutions Corp. Class A (a)(b)
|
1,950,947
|
18,651,053
|
|
Hyliion Holdings Corp. Class A (a)(b)
|
1,483,742
|
1,914,027
|
|
Hyster-Yale Materials Handling, Inc. Class A (b)
|
110,939
|
6,497,697
|
|
John Bean Technologies Corp.
|
315,562
|
28,113,419
|
|
Kadant, Inc. (b)
|
116,165
|
31,804,815
|
|
Kennametal, Inc.
|
791,537
|
18,624,866
|
|
Lindsay Corp.
|
109,473
|
12,715,289
|
|
Luxfer Holdings PLC sponsored
|
264,840
|
2,550,409
|
|
Manitowoc Co., Inc. (a)
|
344,179
|
4,164,566
|
|
Mayville Engineering Co., Inc. (a)(b)
|
111,203
|
1,530,153
|
|
Microvast Holdings, Inc. (a)(b)
|
2,161,556
|
847,114
|
|
Miller Industries, Inc.
|
110,558
|
5,385,280
|
|
Mueller Industries, Inc.
|
1,112,188
|
62,082,334
|
|
Mueller Water Products, Inc. Class A
|
1,537,785
|
24,358,514
|
|
Nikola Corp. (a)(b)
|
7,311,118
|
4,537,280
|
|
Omega Flex, Inc. (b)
|
32,325
|
2,141,855
|
|
Park-Ohio Holdings Corp.
|
84,282
|
2,151,719
|
|
Proto Labs, Inc. (a)(b)
|
257,542
|
7,849,880
|
|
REV Group, Inc.
|
316,447
|
6,917,531
|
|
Shyft Group, Inc. (The)
|
335,495
|
3,650,186
|
|
SPX Technologies, Inc. (a)
|
438,111
|
53,366,301
|
|
Standex International Corp.
|
117,206
|
20,262,573
|
|
Tennant Co.
|
183,871
|
21,417,294
|
|
Terex Corp.
|
660,178
|
37,002,977
|
|
The Greenbrier Companies, Inc. (b)
|
304,116
|
15,020,289
|
|
Titan International, Inc. (a)
|
510,603
|
5,626,845
|
|
Trinity Industries, Inc.
|
805,348
|
20,955,155
|
|
Velo3D, Inc. (a)(b)
|
915,000
|
242,109
|
|
Wabash National Corp. (b)
|
456,754
|
10,555,585
|
|
Watts Water Technologies, Inc. Class A (b)
|
271,325
|
53,847,160
|
|
910,585,571
|
|||
Marine Transportation - 0.3%
|
|||
Costamare, Inc.
|
460,496
|
5,516,742
|
|
Genco Shipping & Trading Ltd.
|
416,149
|
8,880,620
|
|
Golden Ocean Group Ltd. (b)
|
1,223,508
|
17,239,228
|
|
Himalaya Shipping Ltd.
|
299,558
|
2,447,389
|
|
Matson, Inc.
|
342,470
|
36,911,417
|
|
Pangaea Logistics Solutions Ltd.
|
360,556
|
2,596,003
|
|
Safe Bulkers, Inc.
|
645,910
|
3,223,091
|
|
76,814,490
|
|||
Passenger Airlines - 0.4%
|
|||
Allegiant Travel Co. (b)
|
156,320
|
8,528,819
|
|
Blade Air Mobility, Inc. (a)(b)
|
600,004
|
1,914,013
|
|
Frontier Group Holdings, Inc. (a)(b)
|
382,257
|
2,308,832
|
|
Hawaiian Holdings, Inc. (a)(b)
|
503,805
|
6,398,324
|
|
JetBlue Airways Corp. (a)(b)
|
3,334,321
|
18,938,943
|
|
Joby Aviation, Inc. (a)(b)
|
2,768,749
|
13,982,182
|
|
SkyWest, Inc. (a)
|
401,885
|
29,349,662
|
|
Spirit Airlines, Inc. (b)
|
1,081,877
|
3,819,026
|
|
Sun Country Airlines Holdings, Inc. (a)
|
423,238
|
5,633,298
|
|
90,873,099
|
|||
Professional Services - 2.5%
|
|||
Alight, Inc. Class A (a)(b)
|
4,105,934
|
37,035,525
|
|
ASGN, Inc. (a)
|
457,068
|
44,084,209
|
|
Asure Software, Inc. (a)(b)
|
228,175
|
1,686,213
|
|
Barrett Business Services, Inc.
|
65,158
|
7,916,697
|
|
BlackSky Technology, Inc. Class A (a)(b)
|
1,201,402
|
1,453,696
|
|
CBIZ, Inc. (a)
|
475,585
|
33,852,140
|
|
Conduent, Inc. (a)
|
1,733,546
|
5,460,670
|
|
CRA International, Inc.
|
67,554
|
9,801,410
|
|
CSG Systems International, Inc.
|
294,048
|
13,890,828
|
|
ExlService Holdings, Inc. (a)
|
1,604,126
|
46,519,654
|
|
Exponent, Inc.
|
502,335
|
46,169,610
|
|
First Advantage Corp. (b)
|
536,476
|
8,744,559
|
|
FiscalNote Holdings, Inc. Class A (a)(b)
|
586,920
|
798,211
|
|
Forrester Research, Inc. (a)
|
115,914
|
2,108,476
|
|
Franklin Covey Co. (a)
|
115,971
|
4,515,911
|
|
Heidrick & Struggles International, Inc.
|
196,863
|
5,803,521
|
|
Hirequest, Inc. (b)
|
49,526
|
634,923
|
|
HireRight Holdings Corp. (a)
|
133,802
|
1,913,369
|
|
Huron Consulting Group, Inc. (a)(b)
|
184,771
|
17,228,048
|
|
IBEX Ltd. (a)(b)
|
89,007
|
1,165,992
|
|
ICF International, Inc.
|
185,805
|
26,809,803
|
|
Innodata, Inc. (a)(b)
|
262,402
|
1,532,428
|
|
Insperity, Inc.
|
352,198
|
36,251,740
|
|
Kelly Services, Inc. Class A (non-vtg.)
|
307,214
|
7,047,489
|
|
Kforce, Inc.
|
186,826
|
11,538,374
|
|
Korn Ferry
|
517,375
|
31,415,010
|
|
LegalZoom.com, Inc. (a)
|
1,329,571
|
15,888,373
|
|
Maximus, Inc.
|
601,931
|
48,323,021
|
|
MISTRAS Group, Inc. (a)
|
203,745
|
1,782,769
|
|
NV5 Global, Inc. (a)
|
137,903
|
12,858,076
|
|
Parsons Corp. (a)
|
408,972
|
32,108,392
|
|
Planet Labs PBC Class A (a)(b)
|
1,737,140
|
2,935,767
|
|
Resources Connection, Inc.
|
318,891
|
3,523,746
|
|
Skillsoft Corp. (a)(b)
|
40,930
|
294,287
|
|
Sterling Check Corp. (a)(b)
|
305,039
|
4,615,240
|
|
TriNet Group, Inc. (b)
|
317,361
|
31,853,524
|
|
TrueBlue, Inc. (a)
|
296,928
|
3,093,990
|
|
Ttec Holdings, Inc. (b)
|
192,684
|
1,402,740
|
|
Upwork, Inc. (a)
|
1,245,428
|
14,571,508
|
|
Verra Mobility Corp. (a)(b)
|
1,356,702
|
31,991,033
|
|
Willdan Group, Inc. (a)
|
123,771
|
3,489,104
|
|
614,110,076
|
|||
Trading Companies & Distributors - 2.1%
|
|||
Alta Equipment Group, Inc.
|
240,058
|
2,667,044
|
|
Applied Industrial Technologies, Inc.
|
382,487
|
70,090,743
|
|
Beacon Roofing Supply, Inc. (a)
|
626,918
|
61,770,231
|
|
BlueLinx Corp. (a)
|
84,127
|
9,226,208
|
|
Boise Cascade Co.
|
394,349
|
52,160,542
|
|
Custom Truck One Source, Inc. Class A (a)(b)
|
559,176
|
2,790,288
|
|
Distribution Solutions Group I (a)(b)
|
100,318
|
3,307,484
|
|
DNOW, Inc. (a)
|
1,058,304
|
14,932,669
|
|
DXP Enterprises, Inc. (a)
|
130,885
|
6,381,953
|
|
EVI Industries, Inc. (b)
|
58,265
|
1,195,598
|
|
FTAI Aviation Ltd.
|
986,549
|
69,265,605
|
|
GATX Corp.
|
350,809
|
42,924,989
|
|
Global Industrial Co.
|
130,726
|
5,034,258
|
|
GMS, Inc. (a)
|
397,059
|
36,735,899
|
|
H&E Equipment Services, Inc.
|
319,987
|
15,452,172
|
|
Herc Holdings, Inc.
|
280,478
|
40,116,768
|
|
Hudson Technologies, Inc. (a)(b)
|
436,076
|
4,325,874
|
|
Karat Packaging, Inc.
|
69,442
|
1,881,878
|
|
McGrath RentCorp.
|
244,152
|
26,041,252
|
|
MRC Global, Inc. (a)
|
828,300
|
9,301,809
|
|
Rush Enterprises, Inc.:
|
|||
Class A
|
685,889
|
30,124,245
|
|
Class B
|
1,426
|
58,338
|
|
Titan Machinery, Inc. (a)
|
202,422
|
4,505,914
|
|
Transcat, Inc. (a)(b)
|
81,389
|
8,738,737
|
|
Willis Lease Finance Corp. (a)
|
26,865
|
1,305,908
|
|
Xometry, Inc. (a)(b)
|
337,851
|
6,037,397
|
|
526,373,803
|
|||
TOTAL INDUSTRIALS
|
4,320,292,860
|
||
INFORMATION TECHNOLOGY - 14.6%
|
|||
Communications Equipment - 0.5%
|
|||
ADTRAN Holdings, Inc. (b)
|
770,269
|
3,373,778
|
|
Aviat Networks, Inc. (a)(b)
|
113,923
|
3,810,724
|
|
Calix, Inc. (a)
|
586,593
|
16,266,224
|
|
Cambium Networks Corp. (a)(b)
|
116,959
|
396,491
|
|
Clearfield, Inc. (a)(b)
|
128,934
|
3,883,492
|
|
CommScope Holding Co., Inc. (a)
|
2,051,650
|
1,834,175
|
|
Comtech Telecommunications Corp. (a)(b)
|
269,401
|
506,474
|
|
Digi International, Inc. (a)(b)
|
354,181
|
10,859,189
|
|
DZS, Inc. (a)(b)
|
214,693
|
210,421
|
|
Extreme Networks, Inc. (a)
|
1,251,590
|
14,017,808
|
|
Harmonic, Inc. (a)(b)
|
1,098,071
|
11,793,283
|
|
Infinera Corp. (a)(b)
|
1,992,553
|
9,604,105
|
|
KVH Industries, Inc. (a)
|
181,073
|
869,150
|
|
NETGEAR, Inc. (a)
|
283,691
|
4,192,953
|
|
NetScout Systems, Inc. (a)
|
677,817
|
13,054,755
|
|
Ribbon Communications, Inc. (a)(b)
|
882,298
|
2,796,885
|
|
Viavi Solutions, Inc. (a)
|
2,191,531
|
17,313,095
|
|
114,783,002
|
|||
Electronic Equipment, Instruments & Components - 2.7%
|
|||
908 Devices, Inc. (a)(b)
|
222,007
|
1,265,440
|
|
Advanced Energy Industries, Inc.
|
373,168
|
35,764,421
|
|
Aeva Technologies, Inc. (a)(b)
|
161,119
|
502,691
|
|
Akoustis Technologies, Inc. (a)(b)
|
949,825
|
557,642
|
|
Arlo Technologies, Inc. (a)(b)
|
891,590
|
11,037,884
|
|
Badger Meter, Inc.
|
291,614
|
53,342,033
|
|
Bel Fuse, Inc. Class B (non-vtg.)
|
104,165
|
6,116,569
|
|
Belden, Inc.
|
412,874
|
33,554,270
|
|
Benchmark Electronics, Inc. (b)
|
350,904
|
10,600,810
|
|
Climb Global Solutions, Inc. (b)
|
41,044
|
2,645,696
|
|
CTS Corp. (b)
|
308,714
|
14,123,666
|
|
Daktronics, Inc. (a)(b)
|
381,173
|
3,602,085
|
|
ePlus, Inc. (a)
|
264,357
|
20,323,766
|
|
Evolv Technologies Holdings, Inc. (a)(b)
|
1,133,313
|
4,431,254
|
|
Fabrinet (a)
|
365,385
|
63,237,182
|
|
FARO Technologies, Inc. (a)(b)
|
188,378
|
3,532,088
|
|
Insight Enterprises, Inc. (a)(b)
|
278,484
|
50,842,824
|
|
Iteris, Inc. (a)
|
417,990
|
1,872,595
|
|
Itron, Inc. (a)
|
451,684
|
41,609,130
|
|
Kimball Electronics, Inc. (a)(b)
|
235,968
|
4,938,810
|
|
Knowles Corp. (a)(b)
|
875,518
|
13,859,450
|
|
Lightwave Logic, Inc. (a)(b)
|
1,163,935
|
4,446,232
|
|
Luna Innovations, Inc. (a)(b)
|
322,113
|
663,553
|
|
Methode Electronics, Inc. Class A
|
329,521
|
4,016,861
|
|
MicroVision, Inc. (a)(b)
|
1,894,382
|
2,746,854
|
|
Mirion Technologies, Inc. Class A (a)(b)
|
1,989,525
|
21,626,137
|
|
Napco Security Technologies, Inc.
|
330,114
|
13,435,640
|
|
nLIGHT, Inc. (a)(b)
|
445,596
|
5,075,338
|
|
Novanta, Inc. (a)(b)
|
355,187
|
55,586,766
|
|
OSI Systems, Inc. (a)(b)
|
159,524
|
20,967,835
|
|
Par Technology Corp. (a)(b)
|
270,960
|
11,456,189
|
|
PC Connection, Inc.
|
114,075
|
7,069,228
|
|
Plexus Corp. (a)
|
271,600
|
27,434,316
|
|
Presto Automation, Inc. (a)(b)
|
34,689
|
5,845
|
|
Richardson Electronics Ltd.
|
121,029
|
1,274,435
|
|
Rogers Corp. (a)(b)
|
171,237
|
20,392,614
|
|
Sanmina Corp. (a)
|
545,993
|
33,125,395
|
|
ScanSource, Inc. (a)(b)
|
246,120
|
10,243,514
|
|
Smartrent, Inc. (a)(b)
|
1,870,109
|
4,338,653
|
|
TTM Technologies, Inc. (a)
|
1,012,508
|
15,116,744
|
|
Vishay Intertechnology, Inc. (b)
|
1,258,481
|
29,121,250
|
|
Vishay Precision Group, Inc. (a)
|
120,890
|
3,989,370
|
|
Vuzix Corp. (a)(b)
|
572,171
|
760,987
|
|
670,654,062
|
|||
IT Services - 0.4%
|
|||
Applied Digital Corp. (a)(b)
|
863,641
|
2,336,149
|
|
BigBear.ai Holdings, Inc. (a)(b)
|
510,285
|
847,073
|
|
BigCommerce Holdings, Inc. (a)(b)
|
669,756
|
3,790,819
|
|
Brightcove, Inc. (a)(b)
|
421,760
|
750,733
|
|
Couchbase, Inc. (a)
|
354,367
|
8,554,419
|
|
Digitalocean Holdings, Inc. (a)(b)
|
607,357
|
19,957,751
|
|
Fastly, Inc. Class A (a)
|
1,217,895
|
15,406,372
|
|
Grid Dynamics Holdings, Inc. (a)(b)
|
563,747
|
5,507,808
|
|
Hackett Group, Inc.
|
249,947
|
5,421,350
|
|
Information Services Group, Inc.
|
351,271
|
1,183,783
|
|
Perficient, Inc. (a)
|
340,867
|
16,109,374
|
|
Rackspace Technology, Inc. (a)(b)
|
628,972
|
1,081,832
|
|
Squarespace, Inc. Class A (a)
|
562,668
|
19,614,606
|
|
Thoughtworks Holding, Inc. (a)(b)
|
899,993
|
2,087,984
|
|
Tucows, Inc. (a)(b)
|
96,731
|
1,709,237
|
|
Unisys Corp. (a)
|
661,812
|
3,593,639
|
|
107,952,929
|
|||
Semiconductors & Semiconductor Equipment - 3.1%
|
|||
ACM Research, Inc. (a)
|
486,045
|
12,403,868
|
|
AEHR Test Systems (a)(b)
|
273,860
|
3,280,843
|
|
Alpha & Omega Semiconductor Ltd. (a)(b)
|
227,718
|
4,980,193
|
|
Ambarella, Inc. (a)
|
381,638
|
17,543,899
|
|
Amkor Technology, Inc.
|
1,115,572
|
36,088,754
|
|
Atomera, Inc. (a)(b)
|
223,879
|
1,038,799
|
|
Axcelis Technologies, Inc. (a)
|
323,430
|
33,481,474
|
|
CEVA, Inc. (a)(b)
|
230,198
|
4,666,113
|
|
Cohu, Inc. (a)
|
461,544
|
13,994,014
|
|
Credo Technology Group Holding Ltd. (a)
|
1,236,743
|
22,100,597
|
|
Diodes, Inc. (a)
|
446,703
|
32,613,786
|
|
FormFactor, Inc. (a)
|
765,822
|
34,148,003
|
|
Ichor Holdings Ltd. (a)(b)
|
286,160
|
11,097,285
|
|
Impinj, Inc. (a)(b)
|
231,240
|
36,855,031
|
|
indie Semiconductor, Inc. (a)(b)
|
1,495,151
|
8,402,749
|
|
Intest Corp. (a)(b)
|
114,753
|
1,293,266
|
|
Kulicke & Soffa Industries, Inc. (b)
|
549,408
|
25,426,602
|
|
MACOM Technology Solutions Holdings, Inc. (a)
|
549,862
|
56,058,431
|
|
Maxeon Solar Technologies Ltd. (a)(b)
|
284,747
|
555,257
|
|
MaxLinear, Inc. Class A (a)
|
757,102
|
15,740,151
|
|
Navitas Semiconductor Corp. (a)(b)
|
1,122,176
|
4,859,022
|
|
NVE Corp. (b)
|
47,617
|
3,876,024
|
|
Onto Innovation, Inc. (a)(b)
|
486,169
|
90,179,488
|
|
PDF Solutions, Inc. (a)
|
307,273
|
9,242,772
|
|
Photronics, Inc. (a)
|
607,584
|
16,653,877
|
|
Power Integrations, Inc.
|
562,018
|
37,497,841
|
|
Rambus, Inc. (a)
|
1,069,280
|
58,617,930
|
|
Semtech Corp. (a)(b)
|
633,302
|
23,824,821
|
|
Silicon Laboratories, Inc. (a)(b)
|
314,779
|
38,242,501
|
|
SiTime Corp. (a)
|
176,400
|
15,720,768
|
|
SkyWater Technology, Inc. (a)(b)
|
186,800
|
1,916,568
|
|
SMART Global Holdings, Inc. (a)(b)
|
511,717
|
9,349,070
|
|
Synaptics, Inc. (a)
|
390,585
|
35,137,027
|
|
Transphorm, Inc. (a)(b)
|
297,714
|
1,429,027
|
|
Ultra Clean Holdings, Inc. (a)
|
441,440
|
18,465,435
|
|
Veeco Instruments, Inc. (a)(b)
|
505,605
|
17,868,081
|
|
754,649,367
|
|||
Software - 6.0%
|
|||
8x8, Inc. (a)(b)
|
1,218,093
|
2,691,986
|
|
A10 Networks, Inc.
|
701,425
|
9,160,611
|
|
ACI Worldwide, Inc. (a)
|
1,076,219
|
36,699,068
|
|
Adeia, Inc. (b)
|
1,062,852
|
10,458,464
|
|
Agilysys, Inc. (a)(b)
|
201,148
|
16,705,341
|
|
Alarm.com Holdings, Inc. (a)
|
475,331
|
31,609,512
|
|
Alkami Technology, Inc. (a)
|
406,068
|
9,774,057
|
|
Altair Engineering, Inc. Class A (a)(b)
|
544,983
|
43,843,882
|
|
American Software, Inc. Class A
|
320,961
|
3,244,916
|
|
Amplitude, Inc. (a)(b)
|
682,693
|
6,683,564
|
|
AppFolio, Inc. (a)(b)
|
190,518
|
43,205,672
|
|
Appian Corp. Class A (a)
|
409,009
|
15,313,297
|
|
Asana, Inc. (a)(b)
|
823,512
|
12,245,623
|
|
Aurora Innovation, Inc. (a)(b)
|
3,540,845
|
9,825,845
|
|
AvePoint, Inc. (a)(b)
|
1,480,629
|
11,504,487
|
|
Bit Digital, Inc. (a)(b)
|
900,397
|
1,832,308
|
|
Blackbaud, Inc. (a)
|
431,676
|
33,636,194
|
|
BlackLine, Inc. (a)
|
563,851
|
32,731,551
|
|
Box, Inc. Class A (a)(b)
|
1,396,336
|
36,332,663
|
|
Braze, Inc. (a)
|
532,098
|
22,294,906
|
|
C3.ai, Inc. (a)(b)
|
819,560
|
18,464,687
|
|
Cerence, Inc. (a)(b)
|
407,027
|
3,708,016
|
|
Cipher Mining, Inc. (a)(b)
|
427,892
|
1,591,758
|
|
Cleanspark, Inc. (a)(b)
|
1,912,715
|
31,330,272
|
|
Clear Secure, Inc.
|
827,747
|
14,460,740
|
|
CommVault Systems, Inc. (a)
|
437,860
|
44,867,514
|
|
Consensus Cloud Solutions, Inc. (a)
|
186,819
|
2,174,573
|
|
CoreCard Corp. (a)(b)
|
70,480
|
844,350
|
|
CS Disco, Inc. (a)(b)
|
232,884
|
1,758,274
|
|
CXApp, Inc. Class A (a)(b)
|
22,154
|
74,437
|
|
Daily Journal Corp. (a)(b)
|
13,786
|
4,621,067
|
|
Digimarc Corp. (a)(b)
|
141,603
|
2,993,487
|
|
Digital Turbine, Inc. (a)
|
939,137
|
1,793,752
|
|
Domo, Inc. Class B (a)(b)
|
320,553
|
2,413,764
|
|
E2open Parent Holdings, Inc. (a)(b)
|
1,700,695
|
8,248,371
|
|
eGain Communications Corp. (a)
|
203,759
|
1,265,343
|
|
Enfusion, Inc. Class A (a)(b)
|
392,573
|
3,654,855
|
|
Envestnet, Inc. (a)(b)
|
496,353
|
30,808,631
|
|
Everbridge, Inc. (a)
|
409,032
|
14,213,862
|
|
EverCommerce, Inc. (a)(b)
|
234,796
|
2,113,164
|
|
Expensify, Inc. (a)(b)
|
549,226
|
878,762
|
|
Freshworks, Inc. (a)
|
1,607,228
|
28,689,020
|
|
Instructure Holdings, Inc. (a)
|
194,140
|
3,713,898
|
|
Intapp, Inc. (a)(b)
|
397,304
|
12,284,640
|
|
InterDigital, Inc. (b)
|
255,163
|
25,192,243
|
|
Jamf Holding Corp. (a)(b)
|
701,781
|
13,663,676
|
|
Kaltura, Inc. (a)
|
829,482
|
1,020,263
|
|
LivePerson, Inc. (a)(b)
|
757,147
|
379,255
|
|
Liveramp Holdings, Inc. (a)
|
640,785
|
20,575,606
|
|
Marathon Digital Holdings, Inc. (a)(b)
|
2,222,691
|
35,696,417
|
|
Matterport, Inc. (a)(b)
|
2,566,798
|
11,807,271
|
|
MeridianLink, Inc. (a)
|
253,081
|
4,221,391
|
|
MicroStrategy, Inc. Class A (a)(b)
|
147,309
|
156,888,504
|
|
Mitek Systems, Inc. (a)(b)
|
432,909
|
5,467,641
|
|
Model N, Inc. (a)
|
381,781
|
11,319,807
|
|
N-able, Inc. (a)(b)
|
690,238
|
8,462,318
|
|
Nextnav, Inc. (a)(b)
|
558,840
|
5,091,032
|
|
Olo, Inc. (a)
|
1,027,999
|
4,934,395
|
|
ON24, Inc.
|
287,592
|
1,895,231
|
|
Onespan, Inc. (a)(b)
|
398,337
|
4,310,006
|
|
Pagerduty, Inc. (a)(b)
|
884,539
|
17,655,398
|
|
PowerSchool Holdings, Inc. (a)(b)
|
563,263
|
9,755,715
|
|
Progress Software Corp.
|
435,836
|
21,713,350
|
|
PROS Holdings, Inc. (a)(b)
|
442,825
|
14,502,519
|
|
Q2 Holdings, Inc. (a)(b)
|
565,734
|
29,073,070
|
|
Qualys, Inc. (a)
|
368,837
|
60,456,073
|
|
Rapid7, Inc. (a)
|
600,922
|
26,921,306
|
|
Red Violet, Inc. (a)(b)
|
112,341
|
1,885,082
|
|
Rimini Street, Inc. (a)(b)
|
524,170
|
1,394,292
|
|
Riot Platforms, Inc. (a)(b)
|
1,961,354
|
19,829,289
|
|
Sapiens International Corp. NV
|
305,812
|
9,419,010
|
|
Semrush Holdings, Inc. (a)
|
317,896
|
3,891,047
|
|
SolarWinds, Inc.
|
508,230
|
5,600,695
|
|
SoundHound AI, Inc. (a)(b)
|
1,369,393
|
5,806,226
|
|
SoundThinking, Inc. (a)
|
98,467
|
1,315,519
|
|
Sprinklr, Inc. (a)(b)
|
1,050,880
|
12,284,787
|
|
Sprout Social, Inc. (a)(b)
|
481,926
|
24,313,167
|
|
SPS Commerce, Inc. (a)
|
364,341
|
63,347,970
|
|
Tenable Holdings, Inc. (a)
|
1,153,835
|
51,887,960
|
|
TeraWulf, Inc. (a)(b)
|
1,522,330
|
3,303,456
|
|
Varonis Systems, Inc. (a)(b)
|
1,078,102
|
47,166,963
|
|
Verint Systems, Inc. (a)
|
607,216
|
18,386,500
|
|
Veritone, Inc. (a)(b)
|
263,174
|
860,579
|
|
Viant Technology, Inc. (a)
|
151,018
|
1,327,448
|
|
Weave Communications, Inc. (a)
|
344,582
|
3,683,582
|
|
Workiva, Inc. (a)(b)
|
491,637
|
38,740,996
|
|
Xperi, Inc. (a)
|
432,445
|
4,544,997
|
|
Yext, Inc. (a)
|
1,063,145
|
5,836,666
|
|
Zeta Global Holdings Corp. (a)
|
1,398,388
|
17,284,076
|
|
Zuora, Inc. (a)(b)
|
1,344,403
|
13,255,814
|
|
1,473,129,792
|
|||
Technology Hardware, Storage & Peripherals - 1.9%
|
|||
CompoSecure, Inc. (a)(b)
|
160,402
|
1,114,794
|
|
Corsair Gaming, Inc. (a)(b)
|
362,199
|
4,020,409
|
|
CPI Card Group (a)(b)
|
41,502
|
715,910
|
|
Eastman Kodak Co. (a)(b)
|
567,493
|
2,553,719
|
|
Immersion Corp.
|
305,791
|
2,223,101
|
|
Intevac, Inc. (a)(b)
|
217,667
|
920,731
|
|
IonQ, Inc. (a)(b)
|
1,628,128
|
13,920,494
|
|
Super Micro Computer, Inc. (a)
|
504,540
|
433,298,919
|
|
Turtle Beach Corp. (a)
|
162,181
|
2,286,752
|
|
Xerox Holdings Corp. (b)
|
1,161,399
|
15,434,993
|
|
476,489,822
|
|||
TOTAL INFORMATION TECHNOLOGY
|
3,597,658,974
|
||
MATERIALS - 4.7%
|
|||
Chemicals - 2.0%
|
|||
AdvanSix, Inc.
|
256,688
|
6,483,939
|
|
American Vanguard Corp.
|
259,868
|
2,959,897
|
|
Arcadium Lithium PLC (b)
|
10,148,628
|
44,653,963
|
|
Aspen Aerogels, Inc. (a)(b)
|
508,011
|
7,955,452
|
|
Avient Corp.
|
895,553
|
37,989,358
|
|
Balchem Corp.
|
316,991
|
44,816,188
|
|
Cabot Corp. (b)
|
540,058
|
49,269,491
|
|
Core Molding Technologies, Inc. (a)
|
72,145
|
1,300,053
|
|
Danimer Scientific, Inc. (a)(b)
|
859,875
|
644,906
|
|
Ecovyst, Inc. (a)(b)
|
915,888
|
8,636,824
|
|
H.B. Fuller Co.
|
535,255
|
39,988,901
|
|
Hawkins, Inc. (b)
|
192,857
|
14,612,775
|
|
Ingevity Corp. (a)
|
362,801
|
18,553,643
|
|
Innospec, Inc. (b)
|
247,566
|
29,707,920
|
|
Intrepid Potash, Inc. (a)(b)
|
102,971
|
2,071,777
|
|
Koppers Holdings, Inc. (b)
|
199,655
|
10,238,308
|
|
Kronos Worldwide, Inc. (b)
|
222,439
|
2,546,927
|
|
LSB Industries, Inc. (a)(b)
|
531,962
|
4,947,247
|
|
Mativ, Inc. (b)
|
532,068
|
9,715,562
|
|
Minerals Technologies, Inc.
|
321,748
|
23,452,212
|
|
Origin Materials, Inc. Class A (a)(b)
|
1,139,108
|
922,108
|
|
Orion SA
|
547,145
|
12,945,451
|
|
Perimeter Solutions SA (a)(b)
|
1,496,323
|
10,474,261
|
|
PureCycle Technologies, Inc. (a)(b)
|
1,151,113
|
5,375,698
|
|
Quaker Houghton (b)
|
137,486
|
25,645,264
|
|
Rayonier Advanced Materials, Inc. (a)
|
629,913
|
2,349,575
|
|
Sensient Technologies Corp.
|
416,356
|
30,485,586
|
|
Stepan Co. (b)
|
210,860
|
17,499,271
|
|
Trinseo PLC
|
340,470
|
888,627
|
|
Tronox Holdings PLC (b)
|
1,162,024
|
19,742,788
|
|
Valhi, Inc. (b)
|
18,514
|
273,452
|
|
487,147,424
|
|||
Construction Materials - 0.4%
|
|||
Knife River Holding Co.
|
561,453
|
43,900,010
|
|
Summit Materials, Inc. (a)
|
1,184,526
|
46,078,061
|
|
United States Lime & Minerals, Inc.
|
20,656
|
6,403,360
|
|
96,381,431
|
|||
Containers & Packaging - 0.3%
|
|||
Greif, Inc.:
|
|||
Class A
|
296,362
|
18,161,063
|
|
Class B
|
676
|
42,236
|
|
Myers Industries, Inc.
|
364,533
|
7,983,273
|
|
O-I Glass, Inc. (a)
|
1,539,569
|
23,031,952
|
|
Pactiv Evergreen, Inc.
|
401,062
|
6,112,185
|
|
Ranpak Holdings Corp. (A Shares) (a)(b)
|
432,918
|
3,134,326
|
|
TriMas Corp.
|
411,423
|
10,692,884
|
|
69,157,919
|
|||
Metals & Mining - 1.9%
|
|||
5E Advanced Materials, Inc. (a)(b)
|
383,302
|
440,797
|
|
Alpha Metallurgical Resources (b)
|
114,627
|
37,496,784
|
|
Arch Resources, Inc. (b)
|
178,505
|
28,343,024
|
|
ATI, Inc. (a)(b)
|
1,279,047
|
76,359,106
|
|
Caledonia Mining Corp. PLC
|
159,318
|
1,562,910
|
|
Carpenter Technology Corp.
|
485,530
|
41,609,921
|
|
Century Aluminum Co. (a)(b)
|
522,576
|
9,066,694
|
|
Coeur d'Alene Mines Corp. (a)
|
3,568,412
|
16,129,222
|
|
Commercial Metals Co.
|
1,161,342
|
62,410,519
|
|
Compass Minerals International, Inc. (b)
|
337,822
|
4,205,884
|
|
Constellium NV (a)
|
1,278,456
|
25,172,799
|
|
Contango ORE, Inc. (a)(b)
|
75,387
|
1,573,327
|
|
Dakota Gold Corp. (a)(b)
|
590,889
|
1,571,765
|
|
Haynes International, Inc.
|
125,893
|
7,572,464
|
|
Hecla Mining Co. (b)
|
6,051,177
|
28,622,067
|
|
i-80 Gold Corp. (a)(b)
|
1,925,683
|
2,272,306
|
|
Ivanhoe Electric, Inc. (a)(b)
|
631,635
|
6,379,514
|
|
Kaiser Aluminum Corp.
|
158,755
|
14,365,740
|
|
Materion Corp.
|
203,857
|
23,431,324
|
|
Metallus, Inc. (a)(b)
|
424,933
|
8,736,622
|
|
NioCorp Developments Ltd. (a)(b)
|
6,374
|
12,939
|
|
Novagold Resources, Inc. (a)(b)
|
2,376,129
|
6,890,774
|
|
Olympic Steel, Inc.
|
97,871
|
6,221,659
|
|
Perpetua Resources Corp. (a)(b)
|
374,064
|
2,042,389
|
|
Piedmont Lithium, Inc. (a)(b)
|
177,111
|
2,169,610
|
|
Radius Recycling, Inc. Class A (b)
|
258,549
|
4,503,924
|
|
Ramaco Resources, Inc. (b)
|
226,586
|
3,552,868
|
|
Ramaco Resources, Inc. Class B (b)
|
38,481
|
427,524
|
|
Ryerson Holding Corp.
|
278,725
|
7,957,599
|
|
SunCoke Energy, Inc.
|
831,663
|
8,574,446
|
|
Tredegar Corp.
|
255,335
|
1,629,037
|
|
Warrior Metropolitan Coal, Inc.
|
513,354
|
35,087,746
|
|
Worthington Steel, Inc.
|
305,549
|
9,407,854
|
|
485,801,158
|
|||
Paper & Forest Products - 0.1%
|
|||
Clearwater Paper Corp. (a)
|
162,128
|
7,302,245
|
|
Glatfelter Corp. (a)
|
422,720
|
604,490
|
|
Sylvamo Corp. (b)
|
355,132
|
22,195,750
|
|
30,102,485
|
|||
TOTAL MATERIALS
|
1,168,590,417
|
||
REAL ESTATE - 5.6%
|
|||
Equity Real Estate Investment Trusts (REITs) - 5.0%
|
|||
Acadia Realty Trust (SBI)
|
1,023,991
|
17,694,564
|
|
Alexander & Baldwin, Inc.
|
752,883
|
12,399,983
|
|
Alexanders, Inc.
|
22,879
|
4,840,281
|
|
Alpine Income Property Trust, Inc.
|
147,272
|
2,198,771
|
|
American Assets Trust, Inc.
|
506,741
|
10,818,920
|
|
Apartment Investment & Management Co. Class A (a)
|
1,431,260
|
11,450,080
|
|
Apple Hospitality (REIT), Inc.
|
2,166,463
|
31,976,994
|
|
Armada Hoffler Properties, Inc.
|
695,959
|
7,321,489
|
|
Braemar Hotels & Resorts, Inc.
|
677,630
|
1,849,930
|
|
Brandywine Realty Trust (SBI)
|
1,782,161
|
8,091,011
|
|
Broadstone Net Lease, Inc.
|
1,899,035
|
27,649,950
|
|
BRT Apartments Corp.
|
134,508
|
2,413,074
|
|
CareTrust (REIT), Inc.
|
1,199,790
|
29,658,809
|
|
CBL & Associates Properties, Inc. (b)
|
276,040
|
6,003,870
|
|
Centerspace
|
154,991
|
10,423,145
|
|
Chatham Lodging Trust
|
502,038
|
4,603,688
|
|
City Office REIT, Inc.
|
414,817
|
1,933,047
|
|
Clipper Realty, Inc.
|
126,472
|
531,182
|
|
Community Healthcare Trust, Inc.
|
275,692
|
7,314,109
|
|
COPT Defense Properties (SBI)
|
1,129,484
|
27,073,731
|
|
CTO Realty Growth, Inc.
|
240,449
|
4,171,790
|
|
DiamondRock Hospitality Co.
|
2,116,882
|
18,840,250
|
|
Diversified Healthcare Trust (SBI)
|
2,382,427
|
5,622,528
|
|
Douglas Emmett, Inc.
|
1,615,834
|
22,153,084
|
|
Easterly Government Properties, Inc.
|
993,450
|
11,613,431
|
|
Elme Communities (SBI)
|
890,391
|
13,498,328
|
|
Empire State Realty Trust, Inc.
|
1,330,579
|
12,108,269
|
|
Equity Commonwealth (a)
|
1,015,172
|
19,004,020
|
|
Essential Properties Realty Trust, Inc.
|
1,570,642
|
41,370,710
|
|
Farmland Partners, Inc.
|
469,412
|
5,050,873
|
|
Four Corners Property Trust, Inc.
|
917,858
|
21,523,770
|
|
Getty Realty Corp.
|
491,749
|
13,326,398
|
|
Gladstone Commercial Corp.
|
430,111
|
5,750,584
|
|
Gladstone Land Corp.
|
352,032
|
4,463,766
|
|
Global Medical REIT, Inc.
|
655,632
|
5,317,176
|
|
Global Net Lease, Inc.
|
1,984,832
|
13,794,582
|
|
Hudson Pacific Properties, Inc.
|
1,375,806
|
7,979,675
|
|
Independence Realty Trust, Inc.
|
2,259,074
|
35,625,597
|
|
InvenTrust Properties Corp.
|
691,427
|
17,520,760
|
|
JBG SMITH Properties
|
943,163
|
14,156,877
|
|
Kite Realty Group Trust
|
2,183,128
|
47,592,190
|
|
LTC Properties, Inc.
|
422,343
|
13,979,553
|
|
LXP Industrial Trust (REIT)
|
2,911,426
|
24,310,407
|
|
National Health Investors, Inc.
|
419,216
|
26,435,761
|
|
NETSTREIT Corp.
|
713,036
|
12,014,657
|
|
NexPoint Diversified Real Estate Trust
|
350,820
|
2,097,904
|
|
NexPoint Residential Trust, Inc.
|
229,951
|
7,873,522
|
|
Office Properties Income Trust
|
497,170
|
1,004,283
|
|
One Liberty Properties, Inc.
|
179,633
|
4,115,392
|
|
Orion Office (REIT), Inc.
|
591,340
|
1,844,981
|
|
Outfront Media, Inc.
|
1,471,808
|
23,342,875
|
|
Paramount Group, Inc.
|
1,847,804
|
8,573,811
|
|
Peakstone Realty Trust
|
360,528
|
5,036,576
|
|
Pebblebrook Hotel Trust
|
1,189,034
|
17,276,664
|
|
Phillips Edison & Co., Inc.
|
1,210,964
|
39,598,523
|
|
Piedmont Office Realty Trust, Inc. Class A
|
1,260,083
|
8,681,972
|
|
Plymouth Industrial REIT, Inc.
|
480,901
|
10,041,213
|
|
Postal Realty Trust, Inc.
|
234,885
|
3,253,157
|
|
Potlatch Corp.
|
791,492
|
31,667,595
|
|
Retail Opportunity Investments Corp.
|
1,252,114
|
15,363,439
|
|
RLJ Lodging Trust
|
1,552,644
|
17,079,084
|
|
Ryman Hospitality Properties, Inc.
|
581,133
|
61,297,909
|
|
Sabra Health Care REIT, Inc.
|
2,317,065
|
32,253,545
|
|
Safehold, Inc. (b)
|
486,074
|
8,865,990
|
|
Saul Centers, Inc.
|
123,704
|
4,504,063
|
|
Service Properties Trust
|
1,667,092
|
10,219,274
|
|
SITE Centers Corp.
|
1,916,855
|
25,858,374
|
|
SL Green Realty Corp. (b)
|
646,788
|
32,229,446
|
|
Summit Hotel Properties, Inc.
|
1,075,860
|
6,465,919
|
|
Sunstone Hotel Investors, Inc.
|
2,067,969
|
21,093,284
|
|
Tanger, Inc.
|
1,049,287
|
29,747,286
|
|
Terreno Realty Corp.
|
898,329
|
48,824,181
|
|
The Macerich Co.
|
2,157,747
|
29,690,599
|
|
UMH Properties, Inc.
|
621,695
|
9,897,384
|
|
Uniti Group, Inc.
|
2,385,424
|
13,716,188
|
|
Universal Health Realty Income Trust (SBI)
|
136,859
|
4,931,030
|
|
Urban Edge Properties
|
1,162,873
|
19,454,865
|
|
Veris Residential, Inc.
|
792,623
|
11,421,697
|
|
Whitestone REIT Class B
|
508,344
|
5,845,956
|
|
Xenia Hotels & Resorts, Inc.
|
1,064,551
|
14,765,322
|
|
1,231,404,967
|
|||
Real Estate Management & Development - 0.6%
|
|||
American Realty Investments, Inc. (a)
|
12,830
|
176,797
|
|
Anywhere Real Estate, Inc. (a)
|
1,067,906
|
5,190,023
|
|
Compass, Inc. (a)(b)
|
2,826,081
|
8,902,155
|
|
Cushman & Wakefield PLC (a)
|
1,654,503
|
15,965,954
|
|
Digitalbridge Group, Inc.
|
1,609,541
|
26,460,854
|
|
Douglas Elliman, Inc.
|
803,536
|
1,092,809
|
|
eXp World Holdings, Inc.
|
707,614
|
7,047,835
|
|
Forestar Group, Inc. (a)
|
183,165
|
5,676,283
|
|
FRP Holdings, Inc. (a)
|
127,975
|
3,878,922
|
|
Kennedy-Wilson Holdings, Inc. (b)
|
1,183,876
|
10,169,495
|
|
Marcus & Millichap, Inc. (b)
|
236,583
|
7,492,584
|
|
Maui Land & Pineapple, Inc. (a)(b)
|
73,699
|
1,435,657
|
|
Newmark Group, Inc.
|
1,355,156
|
12,968,843
|
|
Opendoor Technologies, Inc. (a)(b)
|
5,620,376
|
11,184,548
|
|
RE/MAX Holdings, Inc.
|
168,401
|
1,182,175
|
|
Redfin Corp. (a)(b)
|
1,091,210
|
6,121,688
|
|
Star Holdings (a)(b)
|
123,145
|
1,464,194
|
|
Stratus Properties, Inc. (a)(b)
|
48,615
|
1,102,588
|
|
Tejon Ranch Co. (a)
|
202,661
|
3,400,652
|
|
The RMR Group, Inc.
|
158,806
|
3,766,878
|
|
The St. Joe Co.
|
343,948
|
19,673,826
|
|
Transcontinental Realty Investors, Inc. (a)
|
16,562
|
474,501
|
|
154,829,261
|
|||
TOTAL REAL ESTATE
|
1,386,234,228
|
||
UTILITIES - 2.6%
|
|||
Electric Utilities - 0.7%
|
|||
Allete, Inc.
|
573,569
|
33,966,756
|
|
Genie Energy Ltd. Class B
|
198,344
|
3,032,680
|
|
MGE Energy, Inc. (b)
|
361,444
|
28,308,294
|
|
Otter Tail Corp. (b)
|
410,054
|
35,002,209
|
|
PNM Resources, Inc.
|
847,551
|
31,410,240
|
|
Portland General Electric Co.
|
1,007,083
|
43,536,198
|
|
175,256,377
|
|||
Gas Utilities - 0.9%
|
|||
Brookfield Infrastructure Corp. A Shares (b)
|
1,191,842
|
36,315,426
|
|
Chesapeake Utilities Corp.
|
217,388
|
23,014,868
|
|
New Jersey Resources Corp.
|
963,930
|
42,114,102
|
|
Northwest Natural Holding Co.
|
366,135
|
13,968,050
|
|
ONE Gas, Inc. (b)
|
548,839
|
35,411,092
|
|
RGC Resources, Inc. (b)
|
81,753
|
1,685,747
|
|
Southwest Gas Holdings, Inc.
|
619,812
|
46,250,371
|
|
Spire, Inc.
|
518,939
|
32,065,241
|
|
230,824,897
|
|||
Independent Power and Renewable Electricity Producers - 0.2%
|
|||
Altus Power, Inc. Class A (a)(b)
|
634,360
|
2,328,101
|
|
Montauk Renewables, Inc. (a)(b)
|
665,379
|
2,395,364
|
|
Ormat Technologies, Inc. (b)
|
534,889
|
34,141,965
|
|
Sunnova Energy International, Inc. (a)(b)
|
1,048,708
|
4,415,061
|
|
43,280,491
|
|||
Multi-Utilities - 0.4%
|
|||
Avista Corp. (b)
|
770,395
|
27,718,812
|
|
Black Hills Corp.
|
678,499
|
37,249,595
|
|
NorthWestern Energy Corp.
|
612,428
|
30,890,868
|
|
Unitil Corp.
|
159,010
|
8,099,969
|
|
103,959,244
|
|||
Water Utilities - 0.4%
|
|||
American States Water Co.
|
366,999
|
25,998,209
|
|
Artesian Resources Corp. Class A (b)
|
91,714
|
3,208,156
|
|
Cadiz, Inc. (a)(b)
|
406,969
|
927,889
|
|
California Water Service Group
|
573,608
|
28,175,625
|
|
Consolidated Water Co., Inc.
|
151,899
|
3,865,830
|
|
Global Water Resources, Inc.
|
115,438
|
1,412,961
|
|
Middlesex Water Co.
|
174,918
|
8,871,841
|
|
Pure Cycle Corp. (a)
|
202,327
|
1,930,200
|
|
SJW Group
|
316,909
|
17,255,695
|
|
York Water Co.
|
142,813
|
5,071,290
|
|
96,717,696
|
|||
TOTAL UTILITIES
|
650,038,705
|
||
|
TOTAL COMMON STOCKS
(Cost $22,864,980,502)
|
24,519,002,288
|
||
U.S. Treasury Obligations - 0.1%
|
|||
Principal
Amount (d)
|
Value ($)
|
||
U.S. Treasury Bills, yield at date of purchase 5.3% 5/23/24 (e)
(Cost $20,932,811)
|
21,000,000
|
20,932,240
|
|
Money Market Funds - 13.1%
|
|||
Shares
|
Value ($)
|
||
Fidelity Cash Central Fund 5.39% (f)
|
158,663,047
|
158,694,779
|
|
Fidelity Securities Lending Cash Central Fund 5.39% (f)(g)
|
3,075,775,786
|
3,076,083,364
|
|
|
TOTAL MONEY MARKET FUNDS
(Cost $3,234,760,180)
|
3,234,778,143
|
||
|
TOTAL INVESTMENT IN SECURITIES - 112.5%
(Cost $26,120,673,493)
|
27,774,712,671
|
NET OTHER ASSETS (LIABILITIES) - (12.5)%
|
(3,080,874,868)
|
NET ASSETS - 100.0%
|
24,693,837,803
|
Futures Contracts
|
|||||
Number
of contracts
|
Expiration
Date
|
Notional
Amount ($)
|
Value ($)
|
Unrealized
Appreciation/
(Depreciation) ($)
|
|
Purchased
|
|||||
Equity Index Contracts
|
|||||
CME E-mini Russell 2000 Index Contracts (United States)
|
1,759
|
Jun 2024
|
174,633,520
|
(3,456,006)
|
(3,456,006)
|
The notional amount of futures purchased as a percentage of Net Assets is 0.7%
|
|||||
(a)
|
Non-income producing
|
(b)
|
Security or a portion of the security is on loan at period end.
|
(c)
|
Level 3 security
|
(d)
|
Amount is stated in United States dollars unless otherwise noted.
|
(e)
|
Security or a portion of the security was pledged to cover margin requirements for futures contracts. At period end, the value of securities pledged amounted to $13,421,553.
|
(f)
|
Affiliated fund that is generally available only to investment companies and other accounts managed by Fidelity Investments. The rate quoted is the annualized seven-day yield of the fund at period end. A complete unaudited listing of the fund's holdings as of its most recent quarter end is available upon request. In addition, each Fidelity Central Fund's financial statements, which are not covered by the Fund's Report of Independent Registered Public Accounting Firm, are available on the SEC's website or upon request.
|
(g)
|
Investment made with cash collateral received from securities on loan.
|
(h)
|
Equity security is subject to lock-up or market standoff agreement and valued at a discount to the market price of the equivalent equity security. As of period end, the total fair value of equity securities discounted due to contractual sale restrictions is $405,473 and all restrictions are set to expire on or before September 30, 2024. Under normal market conditions, there are no circumstances that could cause the restrictions to lapse.
|
Affiliate
|
Value,
beginning
of period ($)
|
Purchases ($)
|
Sales
Proceeds ($)
|
Dividend
Income ($)
|
Realized
Gain (loss) ($)
|
Change in
Unrealized
appreciation
(depreciation) ($)
|
Value,
end
of period ($)
|
% ownership,
end
of period
|
Fidelity Cash Central Fund 5.39%
|
147,998,663
|
4,108,112,239
|
4,097,426,238
|
6,647,202
|
10,115
|
-
|
158,694,779
|
0.3%
|
Fidelity Securities Lending Cash Central Fund 5.39%
|
3,441,003,990
|
8,407,816,458
|
8,772,737,084
|
35,901,660
|
-
|
-
|
3,076,083,364
|
11.2%
|
Total
|
3,589,002,653
|
12,515,928,697
|
12,870,163,322
|
42,548,862
|
10,115
|
-
|
3,234,778,143
|
|
Valuation Inputs at Reporting Date:
|
||||
Description
|
Total ($)
|
Level 1 ($)
|
Level 2 ($)
|
Level 3 ($)
|
Investments in Securities:
|
||||
Equities:
|
||||
Communication Services
|
527,885,302
|
527,885,302
|
-
|
-
|
Consumer Discretionary
|
2,581,624,840
|
2,581,624,840
|
-
|
-
|
Consumer Staples
|
821,756,442
|
821,756,442
|
-
|
-
|
Energy
|
1,850,303,499
|
1,850,303,499
|
-
|
-
|
Financials
|
3,943,680,248
|
3,943,680,248
|
-
|
-
|
Health Care
|
3,670,936,773
|
3,670,020,311
|
405,473
|
510,989
|
Industrials
|
4,320,292,860
|
4,320,292,860
|
-
|
-
|
Information Technology
|
3,597,658,974
|
3,597,658,974
|
-
|
-
|
Materials
|
1,168,590,417
|
1,168,590,417
|
-
|
-
|
Real Estate
|
1,386,234,228
|
1,386,234,228
|
-
|
-
|
Utilities
|
650,038,705
|
650,038,705
|
-
|
-
|
U.S. Government and Government Agency Obligations
|
20,932,240
|
-
|
20,932,240
|
-
|
Money Market Funds
|
3,234,778,143
|
3,234,778,143
|
-
|
-
|
Total Investments in Securities:
|
27,774,712,671
|
27,752,863,969
|
21,337,713
|
510,989
|
Derivative Instruments:
Liabilities
|
||||
Futures Contracts
|
(3,456,006)
|
(3,456,006)
|
-
|
-
|
Total Liabilities
|
(3,456,006)
|
(3,456,006)
|
-
|
-
|
Total Derivative Instruments:
|
(3,456,006)
|
(3,456,006)
|
-
|
-
|
Primary Risk Exposure / Derivative Type
|
Value
|
|
Asset ($)
|
Liability ($)
|
|
Equity Risk
|
||
Futures Contracts (a)
|
0
|
(3,456,006)
|
Total Equity Risk
|
0
|
(3,456,006)
|
Total Value of Derivatives
|
0
|
(3,456,006)
|
Statement of Assets and Liabilities
|
||||
April 30, 2024
|
||||
Assets
|
||||
Investment in securities, at value (including securities loaned of $2,871,673,723) - See accompanying schedule:
|
||||
Unaffiliated issuers (cost $22,885,913,313)
|
$
|
24,539,934,528
|
||
Fidelity Central Funds (cost $3,234,760,180)
|
3,234,778,143
|
|||
Total Investment in Securities (cost $26,120,673,493)
|
$
|
27,774,712,671
|
||
Cash
|
73,959
|
|||
Receivable for fund shares sold
|
18,213,260
|
|||
Dividends receivable
|
7,428,168
|
|||
Distributions receivable from Fidelity Central Funds
|
3,229,235
|
|||
Total assets
|
27,803,657,293
|
|||
Liabilities
|
||||
Payable for investments purchased
|
$
|
2,765,466
|
||
Payable for fund shares redeemed
|
26,615,952
|
|||
Accrued management fee
|
528,767
|
|||
Payable for daily variation margin on futures contracts
|
3,869,870
|
|||
Collateral on securities loaned
|
3,076,039,435
|
|||
Total liabilities
|
3,109,819,490
|
|||
Net Assets
|
$
|
24,693,837,803
|
||
Net Assets consist of:
|
||||
Paid in capital
|
$
|
23,488,859,866
|
||
Total accumulated earnings (loss)
|
1,204,977,937
|
|||
Net Assets
|
$
|
24,693,837,803
|
||
Net Asset Value, offering price and redemption price per share ($24,693,837,803 ÷ 1,008,241,721 shares)
|
$
|
24.49
|
||
Statement of Operations
|
||||
Year ended
April 30, 2024
|
||||
Investment Income
|
||||
Dividends
|
$
|
317,902,097
|
||
Interest
|
1,083,143
|
|||
Income from Fidelity Central Funds (including $35,901,660 from security lending)
|
42,548,862
|
|||
Total income
|
361,534,102
|
|||
Expenses
|
||||
Management fee
|
$
|
5,653,956
|
||
Independent trustees' fees and expenses
|
69,789
|
|||
Total expenses before reductions
|
5,723,745
|
|||
Expense reductions
|
(121,329)
|
|||
Total expenses after reductions
|
5,602,416
|
|||
Net Investment income (loss)
|
355,931,686
|
|||
Realized and Unrealized Gain (Loss)
|
||||
Net realized gain (loss) on:
|
||||
Investment Securities:
|
||||
Unaffiliated issuers
|
22,306,185
|
|||
Redemptions in-kind
|
807,052,186
|
|||
Fidelity Central Funds
|
10,115
|
|||
Futures contracts
|
(3,816,716)
|
|||
Total net realized gain (loss)
|
825,551,770
|
|||
Change in net unrealized appreciation (depreciation) on:
|
||||
Investment Securities:
|
||||
Unaffiliated issuers
|
1,680,260,659
|
|||
Futures contracts
|
(4,448,271)
|
|||
Total change in net unrealized appreciation (depreciation)
|
1,675,812,388
|
|||
Net gain (loss)
|
2,501,364,158
|
|||
Net increase (decrease) in net assets resulting from operations
|
$
|
2,857,295,844
|
||
Statement of Changes in Net Assets
|
||||
Year ended
April 30, 2024
|
Year ended
April 30, 2023
|
|||
Increase (Decrease) in Net Assets
|
||||
Operations
|
||||
Net investment income (loss)
|
$
|
355,931,686
|
$
|
321,267,873
|
Net realized gain (loss)
|
825,551,770
|
234,318,180
|
||
Change in net unrealized appreciation (depreciation)
|
1,675,812,388
|
(1,231,339,575)
|
||
Net increase (decrease) in net assets resulting from operations
|
2,857,295,844
|
(675,753,522)
|
||
Distributions to shareholders
|
(351,836,326)
|
(230,640,532)
|
||
Share transactions
|
||||
Proceeds from sales of shares
|
9,150,147,971
|
6,708,339,746
|
||
Reinvestment of distributions
|
330,800,870
|
217,324,816
|
||
Cost of shares redeemed
|
(7,024,608,776)
|
(4,991,776,380)
|
||
Net increase (decrease) in net assets resulting from share transactions
|
2,456,340,065
|
1,933,888,182
|
||
Total increase (decrease) in net assets
|
4,961,799,583
|
1,027,494,128
|
||
Net Assets
|
||||
Beginning of period
|
19,732,038,220
|
18,704,544,092
|
||
End of period
|
$
|
24,693,837,803
|
$
|
19,732,038,220
|
Other Information
|
||||
Shares
|
||||
Sold
|
389,301,408
|
298,979,514
|
||
Issued in reinvestment of distributions
|
13,753,145
|
10,014,969
|
||
Redeemed
|
(295,232,558)
|
(222,498,112)
|
||
Net increase (decrease)
|
107,821,995
|
86,496,371
|
||
Fidelity® Small Cap Index Fund |
Years ended April 30,
|
2024
|
2023
|
2022
|
2021
|
2020
|
|||||
Selected Per-Share Data
|
||||||||||
Net asset value, beginning of period
|
$
|
21.91
|
$
|
22.98
|
$
|
28.75
|
$
|
16.60
|
$
|
20.43
|
Income from Investment Operations
|
||||||||||
Net investment income (loss) A,B
|
.37
|
.38
|
.30
|
.25
|
.27
|
|||||
Net realized and unrealized gain (loss)
|
2.57
|
(1.18)
|
(4.99)
|
12.13
|
(3.48)
|
|||||
Total from investment operations
|
2.94
|
(.80)
|
(4.69)
|
12.38
|
(3.21)
|
|||||
Distributions from net investment income
|
(.36)
|
(.27)
|
(.35)
|
(.23)
|
(.28)
|
|||||
Distributions from net realized gain
|
-
|
-
|
(.73)
|
-
|
(.35)
|
|||||
Total distributions
|
(.36)
|
(.27)
|
(1.08)
|
(.23)
|
(.62) C
|
|||||
Net asset value, end of period
|
$
|
24.49
|
$
|
21.91
|
$
|
22.98
|
$
|
28.75
|
$
|
16.60
|
Total Return D
|
13.45 % |
(3.46)%
|
(16.89)%
|
74.95%
|
(16.27)%
|
|||||
Ratios to Average Net Assets B,E,F
|
||||||||||
Expenses before reductions
|
.03%
|
.03%
|
.02% G
|
.03%
|
.03%
|
|||||
Expenses net of fee waivers, if any
|
.03 % |
.03%
|
.02% G
|
.03%
|
.03%
|
|||||
Expenses net of all reductions
|
.02%
|
.02%
|
.02% G
|
.03%
|
.03%
|
|||||
Net investment income (loss)
|
1.56%
|
1.69%
|
1.10%
|
1.09%
|
1.42%
|
|||||
Supplemental Data
|
||||||||||
Net assets, end of period (000 omitted)
|
$
|
24,693,838
|
$
|
19,732,038
|
$
|
18,704,544
|
$
|
21,215,363
|
$
|
9,927,295
|
Portfolio turnover rate H
|
9 % I |
9% I
|
24% I
|
19%
|
17%
|
Fidelity Central Fund
|
Investment Manager
|
Investment Objective
|
Investment Practices
|
Expense RatioA
|
Fidelity Money Market Central Funds
|
Fidelity Management & Research Company LLC (FMR)
|
Each fund seeks to obtain a high level of current income consistent with the preservation of capital and liquidity.
|
Short-term Investments
|
Less than .005%
|
Fidelity Mid Cap Index Fund
|
$157,512
|
Tax cost ($)
|
Gross unrealized appreciation ($)
|
Gross unrealized depreciation ($)
|
Net unrealized appreciation (depreciation)($)
|
|
Fidelity Mid Cap Index Fund
|
27,595,729,491
|
9,209,510,417
|
(2,977,014,998)
|
6,232,495,419
|
Fidelity Small Cap Index Fund
|
26,493,421,224
|
6,322,205,906
|
(5,040,914,459)
|
1,281,291,447
|
Undistributed ordinary income ($)
|
Capital loss carryforward ($)
|
Net unrealized appreciation (depreciation) on securities and other investments ($)
|
|
Fidelity Mid Cap Index Fund
|
11,344,064
|
(112,294,623)
|
6,232,495,419
|
Fidelity Small Cap Index Fund
|
34,411,317
|
(110,724,829)
|
1,281,291,447
|
Short-term ($)
|
Long-term ($)
|
Total capital loss carryforward ($)
|
|
Fidelity Mid Cap Index Fund
|
-
|
(112,294,623)
|
(112,294,623)
|
Fidelity Small Cap Index Fund
|
(110,724,829)
|
-
|
(110,724,829)
|
April 30, 2024
|
||||
Ordinary Income ($)
|
Total ($)
|
|||
Fidelity Mid Cap Index Fund
|
428,689,183
|
428,689,183
|
||
Fidelity Small Cap Index Fund
|
351,836,326
|
351,836,326
|
||
April 30, 2023
|
|||||
Ordinary Income ($)
|
Long-term Capital Gains ($)
|
Total ($)
|
|||
Fidelity Mid Cap Index Fund
|
384,865,794
|
113,495,091
|
498,360,885
|
||
Fidelity Small Cap Index Fund
|
230,640,532
|
-
|
230,640,532
|
||
Equity Risk
|
Equity risk relates to the fluctuations in the value of financial instruments as a result of changes in market prices (other than those arising from interest rate risk or foreign exchange risk), whether caused by factors specific to an individual investment, its issuer, or all factors affecting all instruments traded in a market or market segment.
|
Purchases ($)
|
Sales ($)
|
|
Fidelity Mid Cap Index Fund
|
6,702,710,486
|
2,353,899,317
|
Fidelity Small Cap Index Fund
|
6,813,456,954
|
2,115,758,246
|
Shares
|
Total net realized gain or loss ($)
|
Total Proceeds ($)
|
||
Fidelity Mid Cap Index Fund
|
40,076,242
|
704,168,743
|
1,127,161,154
|
|
Fidelity Small Cap Index Fund
|
58,645,764
|
807,052,186
|
1,432,697,305
|
|
Shares
|
Total net realized gain or loss ($)
|
Total Proceeds ($)
|
||
Fidelity Mid Cap Index Fund
|
18,229,349
|
293,092,884
|
469,588,022
|
|
Fidelity Small Cap Index Fund
|
21,136,549
|
295,395,555
|
463,390,557
|
Borrower or Lender
|
Average Loan Balance ($)
|
Weighted Average Interest Rate
|
|
Fidelity Mid Cap Index Fund
|
Borrower
|
23,368,300
|
5.35%
|
Total Security Lending Fees Paid to NFS ($)
|
Security Lending Income From Securities Loaned to NFS ($)
|
Value of Securities Loaned to NFS at Period End ($)
|
|
Fidelity Mid Cap Index Fund
|
870,249
|
47,337
|
184,062
|
Fidelity Small Cap Index Fund
|
3,841,886
|
603,092
|
5,133,643
|
Custodian credits ($)
|
|
Fidelity Mid Cap Index Fund
|
53,836
|
Fidelity Small Cap Index Fund
|
121,329
|
The Example is based on an investment of $1,000 invested at the beginning of the period and held for the entire period (November 1, 2023 to April 30, 2024).
|
Annualized Expense Ratio- A
|
Beginning Account Value November 1, 2023
|
Ending Account Value April 30, 2024
|
Expenses Paid During Period- C November 1, 2023 to April 30, 2024
|
|||||||
Fidelity® Mid Cap Index Fund
|
.03%
|
|||||||||
Actual
|
$ 1,000
|
$ 1,220.10
|
$ .17
|
|||||||
Hypothetical-B
|
$ 1,000
|
$ 1,024.71
|
$ .15
|
|||||||
Fidelity® Small Cap Index Fund
|
.03%
|
|||||||||
Actual
|
$ 1,000
|
$ 1,196.90
|
$ .16
|
|||||||
Hypothetical-B
|
$ 1,000
|
$ 1,024.71
|
$ .15
|
|||||||
Fidelity Mid Cap Index Fund
|
|
June 2023
|
97%
|
December 2023
|
77%
|
Fidelity Small Cap Index Fund
|
|
June 2023
|
74%
|
December 2023
|
59%
|
Fidelity Mid Cap Index Fund
|
|
June 2023
|
99.70%
|
December 2023
|
82.67%
|
Fidelity Small Cap Index Fund
|
|
June 2023
|
77.22%
|
December 2023
|
66.19%
|
Fidelity Mid Cap Index Fund
|
|
June 2023
|
0.31%
|
December 2023
|
17.34%
|
Fidelity Small Cap Index Fund
|
|
June 2023
|
22.49%
|
December 2023
|
19.19%
|
Fidelity Mid Cap Index Fund
|
$4,437,927
|
Fidelity Small Cap Index Fund
|
$7,337,893
|
A special meeting of shareholders was held on October 18, 2023. The results of votes taken among shareholders on the proposal before them are reported below. Each vote reported represents one dollar of net asset value held on the record date for the meeting.
|
||
Proposal 1
|
||
To elect a Board of Trustees.
|
||
# of
Votes
|
% of
Votes
|
|
Abigail P. Johnson
|
||
Affirmative
|
378,729,502,260.01
|
97.58
|
Withheld
|
9,407,876,478.96
|
2.42
|
TOTAL
|
388,137,378,738.97
|
100.00
|
Jennifer Toolin McAuliffe
|
||
Affirmative
|
378,454,868,010.95
|
97.51
|
Withheld
|
9,682,510,728.02
|
2.49
|
TOTAL
|
388,137,378,738.97
|
100.00
|
Christine J. Thompson
|
||
Affirmative
|
378,837,121,274.52
|
97.60
|
Withheld
|
9,300,257,464.45
|
2.40
|
TOTAL
|
388,137,378,738.97
|
100.00
|
Elizabeth S. Acton
|
||
Affirmative
|
378,262,110,794.85
|
97.46
|
Withheld
|
9,875,267,944.12
|
2.54
|
TOTAL
|
388,137,378,738.97
|
100.00
|
Laura M. Bishop
|
||
Affirmative
|
380,482,113,171.06
|
98.03
|
Withheld
|
7,655,265,567.91
|
1.97
|
TOTAL
|
388,137,378,738.97
|
100.00
|
Ann E. Dunwoody
|
||
Affirmative
|
380,016,034,008.12
|
97.91
|
Withheld
|
8,121,344,730.85
|
2.09
|
TOTAL
|
388,137,378,738.97
|
100.00
|
John Engler
|
||
Affirmative
|
379,432,488,394.20
|
97.76
|
Withheld
|
8,704,890,344.77
|
2.24
|
TOTAL
|
388,137,378,738.97
|
100.00
|
Robert F. Gartland
|
||
Affirmative
|
378,741,819,600.60
|
97.58
|
Withheld
|
9,395,559,138.37
|
2.42
|
TOTAL
|
388,137,378,738.97
|
100.00
|
Robert W. Helm
|
||
Affirmative
|
380,389,324,755.07
|
98.00
|
Withheld
|
7,748,053,983.90
|
2.00
|
TOTAL
|
388,137,378,738.97
|
100.00
|
Arthur E. Johnson
|
||
Affirmative
|
378,427,694,151.67
|
97.50
|
Withheld
|
9,709,684,587.30
|
2.50
|
TOTAL
|
388,137,378,738.97
|
100.00
|
Michael E. Kenneally
|
||
Affirmative
|
377,842,228,145.18
|
97.35
|
Withheld
|
10,295,150,593.79
|
2.65
|
TOTAL
|
388,137,378,738.97
|
100.00
|
Mark A. Murray
|
||
Affirmative
|
380,158,432,703.37
|
97.94
|
Withheld
|
7,978,946,035.60
|
2.06
|
TOTAL
|
388,137,378,738.97
|
100.00
|
Carol J. Zierhoffer
|
||
Affirmative
|
380,522,113,360.24
|
98.04
|
Withheld
|
7,615,265,378.73
|
1.96
|
TOTAL
|
388,137,378,738.97
|
100.00
|
Proposal 1 reflects trust-wide proposal and voting results.
|
||
 |


Contents
Average Annual Total Returns
|
|||
Periods ended April 30, 2024
|
Past 1
year
|
Past 5
years
|
Life of
Fund A
|
Fidelity® Large Cap Value Index Fund
|
13.49%
|
8.59%
|
9.24%
|
$10,000 Over Life of Fund
|
Let's say hypothetically that $10,000 was invested in Fidelity® Large Cap Value Index Fund, on June 7, 2016, when the fund started.
The chart shows how the value of your investment would have changed, and also shows how the Russell 1000® Value Index performed over the same period.
|
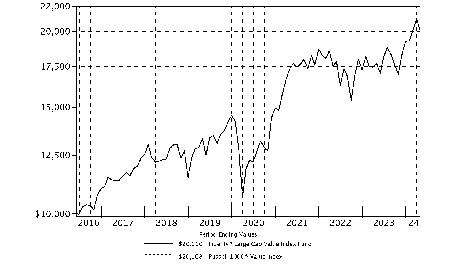
|
Top Holdings (% of Fund's net assets)
|
||
Berkshire Hathaway, Inc. Class B
|
3.5
|
|
JPMorgan Chase & Co.
|
2.7
|
|
Exxon Mobil Corp.
|
2.3
|
|
Johnson & Johnson
|
1.7
|
|
Procter & Gamble Co.
|
1.5
|
|
Chevron Corp.
|
1.3
|
|
Merck & Co., Inc.
|
1.3
|
|
Bank of America Corp.
|
1.2
|
|
Walmart, Inc.
|
1.2
|
|
Wells Fargo & Co.
|
1.0
|
|
17.7
|
||
Market Sectors (% of Fund's net assets)
|
||
Financials
|
22.5
|
|
Industrials
|
14.4
|
|
Health Care
|
14.0
|
|
Information Technology
|
9.0
|
|
Energy
|
8.3
|
|
Consumer Staples
|
8.0
|
|
Utilities
|
4.9
|
|
Consumer Discretionary
|
4.8
|
|
Materials
|
4.8
|
|
Communication Services
|
4.4
|
|
Real Estate
|
4.4
|
|
Asset Allocation (% of Fund's net assets)
|

|
Futures - 0.4%
|
Common Stocks - 99.5%
|
|||
Shares
|
Value ($)
|
||
COMMUNICATION SERVICES - 4.4%
|
|||
Diversified Telecommunication Services - 1.4%
|
|||
AT&T, Inc.
|
2,620,454
|
44,259,468
|
|
Frontier Communications Parent, Inc. (a)(b)
|
89,505
|
2,071,146
|
|
Iridium Communications, Inc.
|
2,931
|
90,245
|
|
Verizon Communications, Inc.
|
1,540,339
|
60,827,987
|
|
107,248,846
|
|||
Entertainment - 1.5%
|
|||
AMC Entertainment Holdings, Inc. Class A (b)
|
90,451
|
265,021
|
|
Electronic Arts, Inc.
|
99,009
|
12,556,321
|
|
Liberty Media Corp. Liberty Formula One:
|
|||
Class A
|
8,868
|
552,210
|
|
Class C
|
70,769
|
4,951,707
|
|
Liberty Media Corp. Liberty Live:
|
|||
Class C
|
16,940
|
632,201
|
|
Series A
|
7,297
|
261,670
|
|
Live Nation Entertainment, Inc. (a)
|
44,293
|
3,938,091
|
|
Madison Square Garden Sports Corp. (a)
|
6,795
|
1,263,326
|
|
Playtika Holding Corp.
|
1,128
|
8,178
|
|
Roku, Inc. Class A (a)
|
40,024
|
2,307,784
|
|
Take-Two Interactive Software, Inc. (a)
|
60,320
|
8,614,299
|
|
The Walt Disney Co.
|
669,342
|
74,363,896
|
|
Warner Bros Discovery, Inc. (a)
|
806,012
|
5,932,248
|
|
115,646,952
|
|||
Interactive Media & Services - 0.0%
|
|||
IAC, Inc. (a)
|
27,090
|
1,288,400
|
|
Match Group, Inc. (a)
|
9,827
|
302,868
|
|
TripAdvisor, Inc. (a)
|
39,306
|
1,034,927
|
|
Zoominfo Technologies, Inc. (a)
|
53,135
|
842,721
|
|
3,468,916
|
|||
Media - 1.1%
|
|||
Cable One, Inc. (b)
|
1,894
|
745,952
|
|
Comcast Corp. Class A
|
1,441,877
|
54,949,932
|
|
Fox Corp.:
|
|||
Class A
|
89,060
|
2,761,751
|
|
Class B
|
49,127
|
1,408,962
|
|
Interpublic Group of Companies, Inc.
|
140,970
|
4,291,127
|
|
Liberty Broadband Corp.:
|
|||
Class A (a)
|
4,843
|
242,780
|
|
Class C (a)
|
33,705
|
1,676,150
|
|
Liberty Media Corp. Liberty SiriusXM
|
56,132
|
1,350,536
|
|
Liberty Media Corp. Liberty SiriusXM Class A
|
27,156
|
653,373
|
|
News Corp.:
|
|||
Class A
|
138,926
|
3,306,439
|
|
Class B
|
42,843
|
1,051,367
|
|
Nexstar Media Group, Inc. Class A
|
7,755
|
1,241,265
|
|
Omnicom Group, Inc.
|
72,159
|
6,699,242
|
|
Paramount Global:
|
|||
Class A (b)
|
3,429
|
70,946
|
|
Class B
|
210,791
|
2,400,909
|
|
Sirius XM Holdings, Inc. (b)
|
236,112
|
694,169
|
|
The New York Times Co. Class A
|
59,036
|
2,540,319
|
|
86,085,219
|
|||
Wireless Telecommunication Services - 0.4%
|
|||
T-Mobile U.S., Inc.
|
179,120
|
29,406,130
|
|
TOTAL COMMUNICATION SERVICES
|
341,856,063
|
||
CONSUMER DISCRETIONARY - 4.8%
|
|||
Automobile Components - 0.2%
|
|||
Aptiv PLC (a)
|
99,012
|
7,029,852
|
|
BorgWarner, Inc.
|
85,294
|
2,795,084
|
|
Gentex Corp. (b)
|
85,680
|
2,938,824
|
|
Lear Corp.
|
21,191
|
2,667,311
|
|
Phinia, Inc.
|
17,060
|
665,340
|
|
QuantumScape Corp. Class A (a)(b)
|
123,672
|
670,302
|
|
16,766,713
|
|||
Automobiles - 0.6%
|
|||
Ford Motor Co.
|
1,435,923
|
17,446,464
|
|
General Motors Co.
|
421,437
|
18,766,590
|
|
Harley-Davidson, Inc.
|
46,229
|
1,589,815
|
|
Lucid Group, Inc. Class A (a)(b)
|
272,403
|
694,628
|
|
Rivian Automotive, Inc. (a)(b)
|
247,255
|
2,200,570
|
|
Thor Industries, Inc.
|
18,730
|
1,862,137
|
|
42,560,204
|
|||
Broadline Retail - 0.2%
|
|||
eBay, Inc.
|
178,061
|
9,177,264
|
|
Etsy, Inc. (a)
|
19,126
|
1,313,382
|
|
Kohl's Corp.
|
40,405
|
967,296
|
|
Macy's, Inc.
|
98,919
|
1,823,077
|
|
Nordstrom, Inc. (b)
|
41,726
|
793,211
|
|
Ollie's Bargain Outlet Holdings, Inc. (a)
|
15,300
|
1,119,042
|
|
15,193,272
|
|||
Distributors - 0.2%
|
|||
Genuine Parts Co.
|
51,304
|
8,065,502
|
|
LKQ Corp.
|
97,419
|
4,201,681
|
|
12,267,183
|
|||
Diversified Consumer Services - 0.1%
|
|||
ADT, Inc.
|
93,760
|
609,440
|
|
Bright Horizons Family Solutions, Inc. (a)
|
18,392
|
1,907,434
|
|
Grand Canyon Education, Inc. (a)
|
7,842
|
1,019,617
|
|
H&R Block, Inc.
|
18,470
|
872,338
|
|
Mister Car Wash, Inc. (a)(b)
|
27,531
|
184,182
|
|
Service Corp. International
|
33,376
|
2,393,393
|
|
6,986,404
|
|||
Hotels, Restaurants & Leisure - 1.3%
|
|||
Aramark
|
95,115
|
2,997,074
|
|
Boyd Gaming Corp.
|
25,799
|
1,380,504
|
|
Caesars Entertainment, Inc. (a)
|
44,447
|
1,592,092
|
|
Carnival Corp. (a)
|
363,507
|
5,387,174
|
|
Cava Group, Inc. (b)
|
3,991
|
287,113
|
|
Darden Restaurants, Inc.
|
23,237
|
3,564,788
|
|
Doordash, Inc. (a)
|
24,610
|
3,181,089
|
|
Expedia Group, Inc. (a)
|
13,034
|
1,754,767
|
|
Hilton Worldwide Holdings, Inc.
|
49,399
|
9,745,435
|
|
Hyatt Hotels Corp. Class A
|
15,842
|
2,357,131
|
|
Las Vegas Sands Corp.
|
9,170
|
406,781
|
|
Marriott Vacations Worldwide Corp.
|
12,795
|
1,229,727
|
|
McDonald's Corp.
|
156,695
|
42,784,003
|
|
MGM Resorts International (a)
|
100,469
|
3,962,497
|
|
Norwegian Cruise Line Holdings Ltd. (a)
|
117,309
|
2,219,486
|
|
Penn Entertainment, Inc. (a)(b)
|
54,705
|
904,821
|
|
Planet Fitness, Inc. (a)
|
16,298
|
975,272
|
|
Royal Caribbean Cruises Ltd. (a)
|
59,840
|
8,355,459
|
|
Travel+Leisure Co.
|
14,087
|
613,348
|
|
Vail Resorts, Inc.
|
12,445
|
2,356,710
|
|
Wyndham Hotels & Resorts, Inc.
|
27,587
|
2,027,920
|
|
Wynn Resorts Ltd.
|
35,664
|
3,268,606
|
|
Yum! Brands, Inc.
|
12,513
|
1,767,461
|
|
103,119,258
|
|||
Household Durables - 0.9%
|
|||
D.R. Horton, Inc.
|
110,748
|
15,780,483
|
|
Garmin Ltd.
|
56,198
|
8,118,925
|
|
Leggett & Platt, Inc.
|
48,439
|
875,293
|
|
Lennar Corp.:
|
|||
Class A
|
88,463
|
13,412,760
|
|
Class B
|
4,913
|
689,736
|
|
Mohawk Industries, Inc. (a)
|
19,336
|
2,229,828
|
|
Newell Brands, Inc.
|
139,082
|
1,104,311
|
|
NVR, Inc. (a)
|
970
|
7,215,685
|
|
PulteGroup, Inc.
|
78,353
|
8,730,091
|
|
Tempur Sealy International, Inc.
|
48,618
|
2,433,817
|
|
Toll Brothers, Inc.
|
37,955
|
4,520,820
|
|
TopBuild Corp. (a)
|
10,830
|
4,382,576
|
|
Whirlpool Corp.
|
19,561
|
1,855,556
|
|
71,349,881
|
|||
Leisure Products - 0.1%
|
|||
Brunswick Corp.
|
23,029
|
1,857,059
|
|
Hasbro, Inc.
|
47,776
|
2,928,669
|
|
Mattel, Inc. (a)
|
128,696
|
2,357,711
|
|
Polaris, Inc.
|
17,974
|
1,530,666
|
|
8,674,105
|
|||
Specialty Retail - 0.7%
|
|||
Advance Auto Parts, Inc.
|
21,707
|
1,584,177
|
|
AutoNation, Inc. (a)
|
10,383
|
1,673,220
|
|
AutoZone, Inc. (a)
|
1,042
|
3,080,569
|
|
Bath & Body Works, Inc.
|
82,676
|
3,755,144
|
|
Best Buy Co., Inc.
|
60,746
|
4,473,335
|
|
CarMax, Inc. (a)
|
54,528
|
3,706,268
|
|
Dick's Sporting Goods, Inc.
|
19,080
|
3,833,935
|
|
GameStop Corp. Class A (a)(b)
|
97,923
|
1,085,966
|
|
Gap, Inc.
|
71,054
|
1,458,028
|
|
Lithia Motors, Inc. Class A (sub. vtg.)
|
9,894
|
2,516,836
|
|
Lowe's Companies, Inc.
|
56,439
|
12,867,528
|
|
Murphy U.S.A., Inc.
|
376
|
155,596
|
|
O'Reilly Automotive, Inc. (a)
|
3,288
|
3,331,599
|
|
Penske Automotive Group, Inc.
|
7,152
|
1,093,612
|
|
Petco Health & Wellness Co., Inc. (a)(b)
|
28,599
|
42,899
|
|
RH (a)
|
4,752
|
1,173,982
|
|
Ross Stores, Inc.
|
8,103
|
1,049,744
|
|
Valvoline, Inc. (a)(b)
|
35,011
|
1,488,668
|
|
Victoria's Secret & Co. (a)
|
15,622
|
275,260
|
|
Wayfair LLC Class A (a)(b)
|
19,983
|
1,002,147
|
|
Williams-Sonoma, Inc.
|
20,299
|
5,821,347
|
|
55,469,860
|
|||
Textiles, Apparel & Luxury Goods - 0.5%
|
|||
Birkenstock Holding PLC
|
6,607
|
295,795
|
|
Capri Holdings Ltd. (a)
|
41,324
|
1,466,176
|
|
Carter's, Inc. (b)
|
13,141
|
898,976
|
|
Columbia Sportswear Co.
|
12,734
|
1,014,008
|
|
NIKE, Inc. Class B
|
200,808
|
18,526,546
|
|
PVH Corp.
|
21,680
|
2,358,784
|
|
Ralph Lauren Corp.
|
14,371
|
2,351,670
|
|
Skechers U.S.A., Inc. Class A (sub. vtg.) (a)
|
45,237
|
2,987,904
|
|
Tapestry, Inc.
|
78,391
|
3,129,369
|
|
Under Armour, Inc.:
|
|||
Class A (sub. vtg.) (a)
|
68,863
|
463,448
|
|
Class C (non-vtg.) (a)
|
73,950
|
482,154
|
|
VF Corp. (b)
|
127,817
|
1,592,600
|
|
35,567,430
|
|||
TOTAL CONSUMER DISCRETIONARY
|
367,954,310
|
||
CONSUMER STAPLES - 8.0%
|
|||
Beverages - 1.3%
|
|||
Boston Beer Co., Inc. Class A (a)
|
255
|
70,995
|
|
Brown-Forman Corp.:
|
|||
Class A
|
4,272
|
209,627
|
|
Class B (non-vtg.)
|
13,099
|
626,787
|
|
Constellation Brands, Inc. Class A (sub. vtg.)
|
53,034
|
13,441,998
|
|
Keurig Dr. Pepper, Inc.
|
348,730
|
11,752,201
|
|
Molson Coors Beverage Co. Class B
|
63,922
|
3,660,174
|
|
PepsiCo, Inc.
|
155,813
|
27,409,065
|
|
The Coca-Cola Co.
|
718,489
|
44,381,066
|
|
101,551,913
|
|||
Consumer Staples Distribution & Retail - 1.8%
|
|||
Albertsons Companies, Inc.
|
139,211
|
2,839,904
|
|
BJ's Wholesale Club Holdings, Inc. (a)
|
31,808
|
2,375,421
|
|
Casey's General Stores, Inc.
|
11,656
|
3,725,024
|
|
Dollar Tree, Inc. (a)
|
75,133
|
8,884,477
|
|
Grocery Outlet Holding Corp. (a)
|
34,701
|
901,185
|
|
Kroger Co.
|
238,715
|
13,220,037
|
|
Maplebear, Inc. (NASDAQ)
|
2,382
|
81,298
|
|
Performance Food Group Co. (a)
|
29,693
|
2,015,561
|
|
U.S. Foods Holding Corp. (a)
|
82,852
|
4,163,313
|
|
Walgreens Boots Alliance, Inc.
|
262,049
|
4,646,129
|
|
Walmart, Inc.
|
1,567,356
|
93,022,579
|
|
135,874,928
|
|||
Food Products - 1.7%
|
|||
Archer Daniels Midland Co.
|
195,343
|
11,458,820
|
|
Bunge Global SA
|
52,916
|
5,384,732
|
|
Campbell Soup Co.
|
69,941
|
3,197,003
|
|
Conagra Brands, Inc.
|
173,980
|
5,355,104
|
|
Darling Ingredients, Inc. (a)
|
57,942
|
2,455,003
|
|
Flowers Foods, Inc.
|
68,701
|
1,713,403
|
|
Freshpet, Inc. (a)
|
11,474
|
1,217,047
|
|
General Mills, Inc.
|
207,821
|
14,643,068
|
|
Hormel Foods Corp.
|
105,858
|
3,764,310
|
|
Ingredion, Inc.
|
23,828
|
2,730,451
|
|
Kellanova
|
95,032
|
5,498,552
|
|
Lamb Weston Holdings, Inc.
|
2,998
|
249,853
|
|
McCormick & Co., Inc. (non-vtg.)
|
91,917
|
6,991,207
|
|
Mondelez International, Inc.
|
497,730
|
35,806,696
|
|
Pilgrim's Pride Corp. (a)
|
15,077
|
543,074
|
|
Post Holdings, Inc. (a)
|
18,573
|
1,971,524
|
|
Seaboard Corp.
|
78
|
258,189
|
|
The Hershey Co.
|
14,148
|
2,743,580
|
|
The J.M. Smucker Co.
|
37,551
|
4,312,732
|
|
The Kraft Heinz Co.
|
293,904
|
11,347,633
|
|
Tyson Foods, Inc. Class A
|
101,625
|
6,163,556
|
|
WK Kellogg Co.
|
23,669
|
552,434
|
|
128,357,971
|
|||
Household Products - 1.9%
|
|||
Church & Dwight Co., Inc.
|
9,293
|
1,002,622
|
|
Colgate-Palmolive Co.
|
300,351
|
27,608,264
|
|
Kimberly-Clark Corp.
|
7,272
|
992,846
|
|
Procter & Gamble Co.
|
699,716
|
114,193,651
|
|
Reynolds Consumer Products, Inc.
|
19,884
|
569,279
|
|
Spectrum Brands Holdings, Inc.
|
11,041
|
903,927
|
|
145,270,589
|
|||
Personal Care Products - 0.2%
|
|||
Coty, Inc. Class A (a)
|
137,657
|
1,574,796
|
|
Estee Lauder Companies, Inc. Class A
|
57,626
|
8,454,310
|
|
Kenvue, Inc.
|
419,595
|
7,896,778
|
|
Olaplex Holdings, Inc. (a)
|
47,182
|
65,583
|
|
17,991,467
|
|||
Tobacco - 1.1%
|
|||
Altria Group, Inc.
|
653,738
|
28,640,262
|
|
Philip Morris International, Inc.
|
568,027
|
53,928,483
|
|
82,568,745
|
|||
TOTAL CONSUMER STAPLES
|
611,615,613
|
||
ENERGY - 8.3%
|
|||
Energy Equipment & Services - 0.7%
|
|||
Baker Hughes Co. Class A
|
365,352
|
11,917,782
|
|
Halliburton Co.
|
262,604
|
9,839,772
|
|
NOV, Inc.
|
143,431
|
2,652,039
|
|
Schlumberger Ltd.
|
521,430
|
24,757,496
|
|
TechnipFMC PLC
|
158,287
|
4,055,313
|
|
53,222,402
|
|||
Oil, Gas & Consumable Fuels - 7.6%
|
|||
Antero Midstream GP LP
|
82,553
|
1,142,534
|
|
Antero Resources Corp. (a)
|
103,391
|
3,516,328
|
|
APA Corp.
|
35,143
|
1,104,896
|
|
Chesapeake Energy Corp.
|
45,252
|
4,067,250
|
|
Chevron Corp.
|
629,812
|
101,569,781
|
|
ConocoPhillips Co.
|
438,536
|
55,088,892
|
|
Coterra Energy, Inc.
|
273,042
|
7,470,429
|
|
Devon Energy Corp.
|
234,472
|
12,000,277
|
|
Diamondback Energy, Inc.
|
65,252
|
13,124,135
|
|
DT Midstream, Inc.
|
35,475
|
2,206,545
|
|
EOG Resources, Inc.
|
215,088
|
28,419,577
|
|
EQT Corp.
|
131,838
|
5,285,385
|
|
Exxon Mobil Corp.
|
1,463,917
|
173,137,464
|
|
Hess Corp.
|
44,938
|
7,077,286
|
|
HF Sinclair Corp.
|
58,460
|
3,171,455
|
|
Kinder Morgan, Inc.
|
717,571
|
13,117,198
|
|
Marathon Oil Corp.
|
213,579
|
5,734,596
|
|
Marathon Petroleum Corp.
|
134,591
|
24,457,877
|
|
Occidental Petroleum Corp.
|
251,428
|
16,629,448
|
|
ONEOK, Inc.
|
201,132
|
15,913,564
|
|
Ovintiv, Inc.
|
52,282
|
2,683,112
|
|
Phillips 66 Co.
|
160,938
|
23,047,931
|
|
Pioneer Natural Resources Co.
|
85,169
|
22,937,715
|
|
Range Resources Corp.
|
85,590
|
3,073,537
|
|
Southwestern Energy Co. (a)
|
401,072
|
3,004,029
|
|
The Williams Companies, Inc.
|
445,573
|
17,092,180
|
|
Valero Energy Corp.
|
124,208
|
19,857,133
|
|
585,930,554
|
|||
TOTAL ENERGY
|
639,152,956
|
||
FINANCIALS - 22.5%
|
|||
Banks - 7.4%
|
|||
Bank of America Corp.
|
2,522,277
|
93,349,472
|
|
Bank OZK (b)
|
38,938
|
1,738,582
|
|
BOK Financial Corp.
|
10,106
|
896,705
|
|
Citigroup, Inc.
|
699,965
|
42,928,853
|
|
Citizens Financial Group, Inc.
|
170,118
|
5,802,725
|
|
Columbia Banking Systems, Inc.
|
76,007
|
1,429,692
|
|
Comerica, Inc.
|
48,105
|
2,413,428
|
|
Commerce Bancshares, Inc.
|
43,870
|
2,398,812
|
|
Cullen/Frost Bankers, Inc.
|
21,640
|
2,257,918
|
|
East West Bancorp, Inc.
|
51,346
|
3,824,764
|
|
Fifth Third Bancorp
|
248,283
|
9,052,398
|
|
First Citizens Bancshares, Inc.
|
3,536
|
5,964,383
|
|
First Hawaiian, Inc.
|
46,506
|
980,812
|
|
First Horizon National Corp.
|
203,245
|
3,032,415
|
|
FNB Corp., Pennsylvania
|
130,720
|
1,743,805
|
|
Huntington Bancshares, Inc.
|
526,068
|
7,086,136
|
|
JPMorgan Chase & Co.
|
1,056,583
|
202,589,224
|
|
KeyCorp
|
340,707
|
4,936,844
|
|
M&T Bank Corp.
|
60,502
|
8,735,884
|
|
New York Community Bancorp, Inc.
|
260,417
|
690,105
|
|
Nu Holdings Ltd. (a)
|
269,343
|
2,925,065
|
|
Pinnacle Financial Partners, Inc.
|
27,504
|
2,109,557
|
|
PNC Financial Services Group, Inc.
|
145,742
|
22,336,419
|
|
Popular, Inc.
|
25,726
|
2,186,453
|
|
Prosperity Bancshares, Inc.
|
31,845
|
1,973,435
|
|
Regions Financial Corp.
|
337,991
|
6,513,087
|
|
Synovus Financial Corp.
|
52,865
|
1,892,038
|
|
TFS Financial Corp.
|
18,104
|
217,429
|
|
Truist Financial Corp.
|
485,341
|
18,224,555
|
|
U.S. Bancorp
|
570,041
|
23,160,766
|
|
Webster Financial Corp.
|
62,501
|
2,739,419
|
|
Wells Fargo & Co.
|
1,318,124
|
78,191,116
|
|
Western Alliance Bancorp.
|
39,522
|
2,246,035
|
|
Wintrust Financial Corp.
|
22,238
|
2,149,080
|
|
Zions Bancorporation NA
|
53,190
|
2,169,088
|
|
570,886,499
|
|||
Capital Markets - 5.4%
|
|||
Affiliated Managers Group, Inc.
|
12,205
|
1,905,201
|
|
Bank of New York Mellon Corp.
|
278,177
|
15,714,219
|
|
BlackRock, Inc. Class A
|
54,406
|
41,056,944
|
|
Blue Owl Capital, Inc. Class A
|
141,735
|
2,677,374
|
|
Carlyle Group LP
|
77,132
|
3,455,514
|
|
Cboe Global Markets, Inc.
|
38,466
|
6,968,116
|
|
Charles Schwab Corp.
|
542,469
|
40,115,583
|
|
CME Group, Inc.
|
131,405
|
27,547,744
|
|
Coinbase Global, Inc. (a)
|
62,652
|
12,776,622
|
|
Evercore, Inc. Class A
|
12,858
|
2,333,727
|
|
Franklin Resources, Inc.
|
109,526
|
2,501,574
|
|
Goldman Sachs Group, Inc.
|
115,452
|
49,264,523
|
|
Houlihan Lokey
|
17,128
|
2,183,649
|
|
Interactive Brokers Group, Inc.
|
37,892
|
4,362,127
|
|
Intercontinental Exchange, Inc.
|
207,167
|
26,674,823
|
|
Invesco Ltd.
|
132,795
|
1,881,705
|
|
Janus Henderson Group PLC
|
48,937
|
1,527,813
|
|
Jefferies Financial Group, Inc.
|
66,228
|
2,851,778
|
|
KKR & Co. LP
|
183,014
|
17,033,113
|
|
Lazard, Inc. Class A
|
40,011
|
1,540,424
|
|
Moody's Corp.
|
5,110
|
1,892,386
|
|
Morgan Stanley
|
428,115
|
38,889,967
|
|
MSCI, Inc.
|
14,047
|
6,542,952
|
|
NASDAQ, Inc.
|
134,807
|
8,068,199
|
|
Northern Trust Corp.
|
73,986
|
6,095,707
|
|
Raymond James Financial, Inc.
|
69,206
|
8,443,132
|
|
Robinhood Markets, Inc. (a)(b)
|
231,316
|
3,814,401
|
|
S&P Global, Inc.
|
106,330
|
44,215,204
|
|
SEI Investments Co.
|
36,718
|
2,421,552
|
|
State Street Corp.
|
110,281
|
7,994,270
|
|
Stifel Financial Corp.
|
35,742
|
2,856,501
|
|
T. Rowe Price Group, Inc.
|
80,682
|
8,840,327
|
|
TPG, Inc.
|
18,599
|
801,617
|
|
Tradeweb Markets, Inc. Class A
|
27,404
|
2,787,261
|
|
Virtu Financial, Inc. Class A
|
30,976
|
672,179
|
|
XP, Inc. Class A
|
108,277
|
2,216,430
|
|
410,924,658
|
|||
Consumer Finance - 1.1%
|
|||
Ally Financial, Inc.
|
98,934
|
3,794,119
|
|
American Express Co.
|
142,681
|
33,391,634
|
|
Capital One Financial Corp.
|
138,697
|
19,893,311
|
|
Credit Acceptance Corp. (a)
|
2,291
|
1,176,933
|
|
Discover Financial Services
|
91,260
|
11,565,380
|
|
OneMain Holdings, Inc.
|
41,011
|
2,137,083
|
|
SLM Corp.
|
48,555
|
1,028,880
|
|
SoFi Technologies, Inc. (a)(b)
|
347,560
|
2,356,457
|
|
Synchrony Financial
|
148,159
|
6,516,033
|
|
81,859,830
|
|||
Financial Services - 4.5%
|
|||
Affirm Holdings, Inc. (a)(b)
|
82,318
|
2,624,298
|
|
Berkshire Hathaway, Inc. Class B (a)
|
670,264
|
265,913,830
|
|
Block, Inc. Class A (a)
|
126,708
|
9,249,684
|
|
Corebridge Financial, Inc. (b)
|
82,797
|
2,199,088
|
|
Corpay, Inc. (a)
|
1,793
|
541,737
|
|
Euronet Worldwide, Inc. (a)
|
8,009
|
822,364
|
|
Fidelity National Information Services, Inc.
|
216,580
|
14,710,114
|
|
Fiserv, Inc. (a)
|
158,857
|
24,252,698
|
|
Global Payments, Inc.
|
94,331
|
11,581,017
|
|
Jack Henry & Associates, Inc.
|
18,165
|
2,955,264
|
|
MGIC Investment Corp.
|
100,687
|
2,041,932
|
|
NCR Atleos Corp.
|
23,513
|
468,614
|
|
PayPal Holdings, Inc. (a)
|
37,091
|
2,519,221
|
|
Rocket Companies, Inc. (a)(b)
|
27,557
|
338,400
|
|
The Western Union Co.
|
113,561
|
1,526,260
|
|
UWM Holdings Corp. Class A (b)
|
21,862
|
137,731
|
|
Voya Financial, Inc.
|
35,375
|
2,411,160
|
|
WEX, Inc. (a)
|
8,473
|
1,790,006
|
|
346,083,418
|
|||
Insurance - 4.0%
|
|||
AFLAC, Inc.
|
212,362
|
17,764,081
|
|
Allstate Corp.
|
95,954
|
16,317,937
|
|
American Financial Group, Inc.
|
26,165
|
3,342,579
|
|
American International Group, Inc.
|
256,856
|
19,343,825
|
|
Aon PLC
|
72,531
|
20,454,467
|
|
Arch Capital Group Ltd. (a)
|
112,383
|
10,512,306
|
|
Arthur J. Gallagher & Co.
|
74,021
|
17,371,988
|
|
Assurant, Inc.
|
19,336
|
3,372,198
|
|
Assured Guaranty Ltd.
|
20,056
|
1,538,295
|
|
Axis Capital Holdings Ltd.
|
28,418
|
1,742,876
|
|
Brighthouse Financial, Inc. (a)
|
20,875
|
1,007,219
|
|
Brown & Brown, Inc.
|
52,896
|
4,313,140
|
|
Chubb Ltd.
|
148,611
|
36,950,639
|
|
Cincinnati Financial Corp.
|
56,150
|
6,495,994
|
|
CNA Financial Corp.
|
9,537
|
419,056
|
|
Everest Re Group Ltd.
|
13,553
|
4,965,955
|
|
Fidelity National Financial, Inc.
|
94,865
|
4,695,818
|
|
First American Financial Corp.
|
36,637
|
1,962,644
|
|
Globe Life, Inc.
|
31,638
|
2,409,866
|
|
Hanover Insurance Group, Inc.
|
12,976
|
1,684,544
|
|
Hartford Financial Services Group, Inc.
|
107,995
|
10,463,636
|
|
Kemper Corp.
|
22,006
|
1,283,170
|
|
Lincoln National Corp.
|
56,038
|
1,528,156
|
|
Loews Corp.
|
66,940
|
5,030,541
|
|
Markel Group, Inc. (a)
|
4,806
|
7,009,070
|
|
Marsh & McLennan Companies, Inc.
|
36,050
|
7,189,452
|
|
MetLife, Inc.
|
228,112
|
16,214,201
|
|
Old Republic International Corp.
|
94,050
|
2,808,333
|
|
Primerica, Inc.
|
4,466
|
946,167
|
|
Principal Financial Group, Inc.
|
86,762
|
6,866,345
|
|
Progressive Corp.
|
53,690
|
11,180,943
|
|
Prudential Financial, Inc.
|
132,828
|
14,674,837
|
|
Reinsurance Group of America, Inc.
|
24,311
|
4,545,914
|
|
RenaissanceRe Holdings Ltd.
|
13,894
|
3,046,260
|
|
RLI Corp.
|
11,453
|
1,618,882
|
|
The Travelers Companies, Inc.
|
83,407
|
17,695,629
|
|
Unum Group
|
70,329
|
3,565,680
|
|
W.R. Berkley Corp.
|
73,114
|
5,627,585
|
|
White Mountains Insurance Group Ltd.
|
906
|
1,610,995
|
|
Willis Towers Watson PLC
|
33,100
|
8,312,734
|
|
307,883,957
|
|||
Mortgage Real Estate Investment Trusts - 0.1%
|
|||
AGNC Investment Corp.
|
253,106
|
2,315,920
|
|
Annaly Capital Management, Inc.
|
182,797
|
3,425,616
|
|
Rithm Capital Corp.
|
176,134
|
1,958,610
|
|
Starwood Property Trust, Inc. (b)
|
107,726
|
2,043,562
|
|
9,743,708
|
|||
TOTAL FINANCIALS
|
1,727,382,070
|
||
HEALTH CARE - 14.0%
|
|||
Biotechnology - 1.6%
|
|||
Alnylam Pharmaceuticals, Inc. (a)
|
9,032
|
1,300,156
|
|
Amgen, Inc.
|
62,568
|
17,139,878
|
|
Biogen, Inc. (a)
|
52,706
|
11,322,303
|
|
BioMarin Pharmaceutical, Inc. (a)
|
60,361
|
4,874,754
|
|
Exact Sciences Corp. (a)
|
42,636
|
2,530,447
|
|
Exelixis, Inc. (a)
|
29,414
|
690,052
|
|
Gilead Sciences, Inc.
|
457,474
|
29,827,305
|
|
Incyte Corp. (a)
|
17,659
|
919,151
|
|
Ionis Pharmaceuticals, Inc. (a)
|
7,227
|
298,186
|
|
Moderna, Inc. (a)
|
121,621
|
13,416,013
|
|
Regeneron Pharmaceuticals, Inc. (a)
|
34,965
|
31,141,927
|
|
Repligen Corp. (a)
|
11,327
|
1,859,893
|
|
Roivant Sciences Ltd. (a)
|
7,351
|
80,126
|
|
United Therapeutics Corp. (a)
|
16,506
|
3,867,851
|
|
Vertex Pharmaceuticals, Inc. (a)
|
8,014
|
3,147,979
|
|
122,416,021
|
|||
Health Care Equipment & Supplies - 3.4%
|
|||
Abbott Laboratories
|
593,695
|
62,913,859
|
|
Baxter International, Inc.
|
184,913
|
7,464,938
|
|
Becton, Dickinson & Co.
|
105,990
|
24,865,254
|
|
Boston Scientific Corp. (a)
|
535,328
|
38,474,023
|
|
Dentsply Sirona, Inc.
|
77,287
|
2,319,383
|
|
Enovis Corp. (a)
|
19,170
|
1,058,759
|
|
Envista Holdings Corp. (a)
|
59,858
|
1,178,005
|
|
GE Healthcare Technologies, Inc.
|
140,953
|
10,746,257
|
|
Globus Medical, Inc. (a)
|
31,020
|
1,544,486
|
|
Hologic, Inc. (a)
|
84,599
|
6,410,066
|
|
ICU Medical, Inc. (a)(b)
|
7,414
|
725,979
|
|
Integra LifeSciences Holdings Corp. (a)
|
24,975
|
728,521
|
|
Medtronic PLC
|
486,158
|
39,009,318
|
|
QuidelOrtho Corp. (a)
|
19,535
|
792,144
|
|
Solventum Corp.
|
50,306
|
3,270,393
|
|
STERIS PLC
|
36,278
|
7,421,028
|
|
Stryker Corp.
|
96,995
|
32,638,818
|
|
Tandem Diabetes Care, Inc. (a)
|
20,375
|
747,559
|
|
Teleflex, Inc.
|
17,179
|
3,586,116
|
|
The Cooper Companies, Inc.
|
71,078
|
6,330,207
|
|
Zimmer Biomet Holdings, Inc.
|
76,816
|
9,239,428
|
|
261,464,541
|
|||
Health Care Providers & Services - 3.0%
|
|||
Acadia Healthcare Co., Inc. (a)
|
32,791
|
2,424,567
|
|
agilon health, Inc. (a)(b)
|
10,989
|
60,440
|
|
Amedisys, Inc. (a)
|
11,713
|
1,078,182
|
|
Cardinal Health, Inc.
|
44,031
|
4,536,954
|
|
Centene Corp. (a)
|
195,269
|
14,266,353
|
|
Chemed Corp.
|
1,529
|
868,472
|
|
Cigna Group
|
97,482
|
34,804,973
|
|
CVS Health Corp.
|
468,677
|
31,734,120
|
|
Elevance Health, Inc.
|
75,228
|
39,764,016
|
|
Encompass Health Corp.
|
33,645
|
2,805,320
|
|
HCA Holdings, Inc.
|
57,717
|
17,881,881
|
|
Henry Schein, Inc. (a)
|
47,658
|
3,301,746
|
|
Humana, Inc.
|
25,313
|
7,646,804
|
|
Laboratory Corp. of America Holdings
|
31,010
|
6,244,484
|
|
McKesson Corp.
|
30,157
|
16,200,642
|
|
Molina Healthcare, Inc. (a)
|
9,635
|
3,296,134
|
|
Premier, Inc.
|
43,357
|
905,294
|
|
Quest Diagnostics, Inc.
|
40,960
|
5,659,853
|
|
R1 RCM, Inc. (a)
|
55,896
|
686,962
|
|
Tenet Healthcare Corp. (a)
|
36,905
|
4,144,062
|
|
UnitedHealth Group, Inc.
|
54,098
|
26,167,203
|
|
Universal Health Services, Inc. Class B
|
21,527
|
3,668,847
|
|
228,147,309
|
|||
Health Care Technology - 0.0%
|
|||
Certara, Inc. (a)
|
27,782
|
475,350
|
|
Doximity, Inc. (a)
|
23,332
|
566,734
|
|
Teladoc Health, Inc. (a)
|
60,275
|
768,506
|
|
1,810,590
|
|||
Life Sciences Tools & Services - 1.7%
|
|||
Agilent Technologies, Inc.
|
19,990
|
2,739,430
|
|
Avantor, Inc. (a)
|
246,753
|
5,978,825
|
|
Azenta, Inc. (a)
|
20,081
|
1,053,449
|
|
Bio-Rad Laboratories, Inc. Class A (a)
|
7,522
|
2,029,060
|
|
Bio-Techne Corp.
|
3,205
|
202,588
|
|
Charles River Laboratories International, Inc. (a)
|
18,558
|
4,249,782
|
|
Danaher Corp.
|
240,903
|
59,411,498
|
|
Fortrea Holdings, Inc.
|
32,361
|
1,184,089
|
|
ICON PLC (a)
|
25,366
|
7,556,024
|
|
Illumina, Inc. (a)
|
40,603
|
4,996,199
|
|
IQVIA Holdings, Inc. (a)
|
4,858
|
1,125,939
|
|
Maravai LifeSciences Holdings, Inc. (a)
|
17,207
|
141,097
|
|
QIAGEN NV
|
80,820
|
3,421,111
|
|
Revvity, Inc.
|
45,348
|
4,646,810
|
|
Sotera Health Co. (a)
|
13,443
|
150,562
|
|
Thermo Fisher Scientific, Inc.
|
54,223
|
30,837,705
|
|
129,724,168
|
|||
Pharmaceuticals - 4.3%
|
|||
Bristol-Myers Squibb Co.
|
745,236
|
32,745,670
|
|
Catalent, Inc. (a)
|
65,762
|
3,672,808
|
|
Elanco Animal Health, Inc. (a)
|
179,171
|
2,357,890
|
|
Jazz Pharmaceuticals PLC (a)
|
10,758
|
1,191,449
|
|
Johnson & Johnson
|
882,133
|
127,547,610
|
|
Merck & Co., Inc.
|
758,660
|
98,034,045
|
|
Organon & Co.
|
93,397
|
1,738,118
|
|
Perrigo Co. PLC
|
49,323
|
1,610,889
|
|
Pfizer, Inc.
|
2,068,173
|
52,986,592
|
|
Royalty Pharma PLC
|
135,794
|
3,761,494
|
|
Viatris, Inc.
|
437,514
|
5,062,037
|
|
330,708,602
|
|||
TOTAL HEALTH CARE
|
1,074,271,231
|
||
INDUSTRIALS - 14.4%
|
|||
Aerospace & Defense - 3.5%
|
|||
BWX Technologies, Inc.
|
27,674
|
2,650,339
|
|
Curtiss-Wright Corp.
|
13,945
|
3,533,942
|
|
General Dynamics Corp.
|
89,573
|
25,715,513
|
|
General Electric Co.
|
396,816
|
64,212,765
|
|
HEICO Corp.
|
1,621
|
336,195
|
|
HEICO Corp. Class A
|
2,944
|
488,262
|
|
Hexcel Corp.
|
30,811
|
1,978,374
|
|
Howmet Aerospace, Inc.
|
138,723
|
9,259,760
|
|
Huntington Ingalls Industries, Inc.
|
14,330
|
3,968,407
|
|
L3Harris Technologies, Inc.
|
69,202
|
14,812,688
|
|
Mercury Systems, Inc. (a)
|
19,661
|
554,440
|
|
Northrop Grumman Corp.
|
48,810
|
23,674,314
|
|
RTX Corp.
|
526,361
|
53,436,169
|
|
Spirit AeroSystems Holdings, Inc. Class A (a)
|
37,768
|
1,208,576
|
|
Textron, Inc.
|
71,570
|
6,054,106
|
|
The Boeing Co. (a)
|
178,843
|
30,017,009
|
|
TransDigm Group, Inc.
|
16,108
|
20,103,267
|
|
Woodward, Inc.
|
21,876
|
3,551,787
|
|
265,555,913
|
|||
Air Freight & Logistics - 0.8%
|
|||
C.H. Robinson Worldwide, Inc.
|
9,289
|
659,519
|
|
Expeditors International of Washington, Inc.
|
45,792
|
5,097,108
|
|
FedEx Corp.
|
84,865
|
22,215,960
|
|
GXO Logistics, Inc. (a)
|
42,781
|
2,124,504
|
|
United Parcel Service, Inc. Class B
|
191,638
|
28,262,772
|
|
58,359,863
|
|||
Building Products - 1.3%
|
|||
A.O. Smith Corp.
|
39,519
|
3,273,754
|
|
Allegion PLC
|
2,402
|
291,987
|
|
Armstrong World Industries, Inc.
|
11,347
|
1,303,543
|
|
Builders FirstSource, Inc. (a)
|
44,365
|
8,110,809
|
|
Carlisle Companies, Inc.
|
17,697
|
6,870,860
|
|
Carrier Global Corp.
|
304,805
|
18,742,459
|
|
Fortune Brands Innovations, Inc.
|
46,220
|
3,378,682
|
|
Hayward Holdings, Inc. (a)
|
48,538
|
659,146
|
|
Johnson Controls International PLC
|
248,850
|
16,192,670
|
|
Lennox International, Inc.
|
11,688
|
5,416,453
|
|
Masco Corp.
|
82,227
|
5,628,438
|
|
Owens Corning
|
32,383
|
5,447,144
|
|
The AZEK Co., Inc. (a)
|
52,501
|
2,396,146
|
|
Trane Technologies PLC
|
58,732
|
18,638,013
|
|
96,350,104
|
|||
Commercial Services & Supplies - 0.5%
|
|||
Cintas Corp.
|
3,487
|
2,295,632
|
|
Clean Harbors, Inc. (a)
|
18,502
|
3,505,204
|
|
Driven Brands Holdings, Inc. (a)
|
22,249
|
318,828
|
|
MSA Safety, Inc.
|
11,195
|
2,019,578
|
|
RB Global, Inc.
|
15,608
|
1,117,221
|
|
Republic Services, Inc.
|
75,562
|
14,485,235
|
|
Stericycle, Inc. (a)
|
33,665
|
1,505,835
|
|
Tetra Tech, Inc.
|
15,869
|
3,090,012
|
|
Veralto Corp.
|
80,301
|
7,522,598
|
|
Vestis Corp.
|
42,811
|
788,579
|
|
Waste Management, Inc.
|
15,033
|
3,127,165
|
|
39,775,887
|
|||
Construction & Engineering - 0.3%
|
|||
AECOM
|
49,640
|
4,584,750
|
|
EMCOR Group, Inc.
|
11,093
|
3,962,087
|
|
MasTec, Inc. (a)
|
22,727
|
2,015,658
|
|
MDU Resources Group, Inc.
|
73,875
|
1,824,713
|
|
Quanta Services, Inc.
|
38,751
|
10,019,459
|
|
Valmont Industries, Inc.
|
7,084
|
1,450,803
|
|
Willscot Mobile Mini Holdings (a)
|
50,945
|
1,882,927
|
|
25,740,397
|
|||
Electrical Equipment - 1.7%
|
|||
Acuity Brands, Inc.
|
11,276
|
2,799,831
|
|
AMETEK, Inc.
|
84,137
|
14,695,368
|
|
Eaton Corp. PLC
|
145,752
|
46,387,032
|
|
Emerson Electric Co.
|
208,863
|
22,511,254
|
|
GE Vernova LLC
|
99,203
|
15,248,493
|
|
Generac Holdings, Inc. (a)
|
21,889
|
2,976,028
|
|
Hubbell, Inc. Class B
|
10,658
|
3,949,002
|
|
nVent Electric PLC
|
60,144
|
4,334,578
|
|
Plug Power, Inc. (a)(b)
|
193,088
|
446,033
|
|
Regal Rexnord Corp.
|
24,183
|
3,902,411
|
|
Sensata Technologies, Inc. PLC
|
55,146
|
2,112,643
|
|
Sunrun, Inc. (a)(b)
|
78,013
|
802,754
|
|
Vertiv Holdings Co.
|
116,352
|
10,820,736
|
|
130,986,163
|
|||
Ground Transportation - 1.2%
|
|||
Avis Budget Group, Inc.
|
4,470
|
426,662
|
|
CSX Corp.
|
641,996
|
21,327,107
|
|
Hertz Global Holdings, Inc. (a)(b)
|
47,971
|
218,268
|
|
J.B. Hunt Transport Services, Inc.
|
24,172
|
3,929,642
|
|
Knight-Swift Transportation Holdings, Inc. Class A
|
57,103
|
2,639,872
|
|
Landstar System, Inc.
|
2,661
|
464,105
|
|
Norfolk Southern Corp.
|
83,145
|
19,149,956
|
|
Old Dominion Freight Lines, Inc.
|
4,984
|
905,643
|
|
Ryder System, Inc.
|
15,992
|
1,948,625
|
|
Saia, Inc. (a)
|
8,642
|
3,429,405
|
|
Schneider National, Inc. Class B
|
19,739
|
408,203
|
|
U-Haul Holding Co. (a)(b)
|
1,832
|
115,837
|
|
U-Haul Holding Co. (non-vtg.)
|
22,489
|
1,379,025
|
|
Union Pacific Corp.
|
127,618
|
30,265,885
|
|
XPO, Inc. (a)
|
41,647
|
4,475,387
|
|
91,083,622
|
|||
Industrial Conglomerates - 0.8%
|
|||
3M Co.
|
201,228
|
19,420,514
|
|
Honeywell International, Inc.
|
212,257
|
40,908,292
|
|
60,328,806
|
|||
Machinery - 2.7%
|
|||
AGCO Corp.
|
22,879
|
2,612,553
|
|
Allison Transmission Holdings, Inc.
|
29,471
|
2,167,592
|
|
Caterpillar, Inc.
|
46,688
|
15,620,404
|
|
CNH Industrial NV
|
357,431
|
4,074,713
|
|
Crane Co.
|
17,540
|
2,455,775
|
|
Cummins, Inc.
|
49,829
|
14,076,194
|
|
Deere & Co.
|
6,130
|
2,399,343
|
|
Donaldson Co., Inc.
|
25,898
|
1,869,836
|
|
Dover Corp.
|
51,022
|
9,148,245
|
|
ESAB Corp.
|
20,627
|
2,183,987
|
|
Flowserve Corp.
|
47,820
|
2,255,191
|
|
Fortive Corp.
|
129,362
|
9,737,078
|
|
Gates Industrial Corp. PLC (a)
|
60,271
|
1,061,975
|
|
Graco, Inc.
|
36,112
|
2,896,182
|
|
IDEX Corp.
|
25,411
|
5,602,109
|
|
Illinois Tool Works, Inc.
|
20,268
|
4,947,621
|
|
Ingersoll Rand, Inc.
|
148,051
|
13,816,119
|
|
ITT, Inc.
|
30,212
|
3,907,620
|
|
Lincoln Electric Holdings, Inc.
|
1,322
|
290,219
|
|
Middleby Corp. (a)
|
19,446
|
2,702,411
|
|
Nordson Corp.
|
20,914
|
5,399,786
|
|
Oshkosh Corp.
|
23,833
|
2,675,731
|
|
Otis Worldwide Corp.
|
142,314
|
12,979,037
|
|
PACCAR, Inc.
|
187,578
|
19,903,902
|
|
Parker Hannifin Corp.
|
46,754
|
25,476,722
|
|
Pentair PLC
|
59,993
|
4,744,846
|
|
RBC Bearings, Inc. (a)
|
10,336
|
2,527,669
|
|
Snap-On, Inc.
|
19,033
|
5,100,083
|
|
Stanley Black & Decker, Inc.
|
55,993
|
5,117,760
|
|
Timken Co.
|
22,351
|
1,994,156
|
|
Westinghouse Air Brake Tech Co.
|
65,218
|
10,505,315
|
|
Xylem, Inc.
|
76,422
|
9,988,355
|
|
210,238,529
|
|||
Marine Transportation - 0.0%
|
|||
Kirby Corp. (a)
|
21,547
|
2,351,424
|
|
Passenger Airlines - 0.3%
|
|||
Alaska Air Group, Inc. (a)
|
45,340
|
1,950,527
|
|
American Airlines Group, Inc. (a)
|
149,382
|
2,018,151
|
|
Delta Air Lines, Inc.
|
222,772
|
11,154,194
|
|
Southwest Airlines Co.
|
217,427
|
5,640,056
|
|
United Airlines Holdings, Inc. (a)
|
119,470
|
6,147,926
|
|
26,910,854
|
|||
Professional Services - 0.7%
|
|||
Automatic Data Processing, Inc.
|
21,493
|
5,198,942
|
|
Broadridge Financial Solutions, Inc.
|
7,030
|
1,359,672
|
|
CACI International, Inc. Class A (a)
|
8,064
|
3,243,583
|
|
Clarivate PLC (a)(b)
|
169,111
|
1,143,190
|
|
Concentrix Corp.
|
16,051
|
877,508
|
|
Dayforce, Inc. (a)
|
49,939
|
3,064,756
|
|
Dun & Bradstreet Holdings, Inc.
|
99,586
|
906,233
|
|
Equifax, Inc.
|
13,728
|
3,022,768
|
|
FTI Consulting, Inc. (a)
|
9,916
|
2,120,338
|
|
Genpact Ltd.
|
48,593
|
1,493,749
|
|
Jacobs Solutions, Inc.
|
46,014
|
6,604,389
|
|
KBR, Inc.
|
31,121
|
2,020,998
|
|
Leidos Holdings, Inc.
|
49,920
|
6,999,782
|
|
ManpowerGroup, Inc.
|
17,699
|
1,335,390
|
|
Paycor HCM, Inc. (a)
|
12,876
|
223,656
|
|
Robert Half, Inc.
|
37,759
|
2,610,657
|
|
Science Applications International Corp.
|
18,945
|
2,438,222
|
|
SS&C Technologies Holdings, Inc.
|
79,468
|
4,918,275
|
|
TransUnion
|
70,623
|
5,155,479
|
|
54,737,587
|
|||
Trading Companies & Distributors - 0.6%
|
|||
Air Lease Corp. Class A
|
37,822
|
1,900,177
|
|
Core & Main, Inc. (a)
|
63,450
|
3,583,022
|
|
Fastenal Co.
|
52,430
|
3,562,094
|
|
Ferguson PLC
|
70,672
|
14,834,053
|
|
MSC Industrial Direct Co., Inc. Class A
|
16,905
|
1,542,412
|
|
SiteOne Landscape Supply, Inc. (a)
|
11,017
|
1,728,457
|
|
United Rentals, Inc.
|
19,676
|
13,143,371
|
|
Watsco, Inc.
|
9,238
|
4,136,037
|
|
WESCO International, Inc.
|
16,176
|
2,470,884
|
|
46,900,507
|
|||
TOTAL INDUSTRIALS
|
1,109,319,656
|
||
INFORMATION TECHNOLOGY - 9.0%
|
|||
Communications Equipment - 1.1%
|
|||
Ciena Corp. (a)
|
52,660
|
2,434,472
|
|
Cisco Systems, Inc.
|
1,484,252
|
69,730,159
|
|
F5, Inc. (a)
|
21,618
|
3,573,672
|
|
Juniper Networks, Inc.
|
116,393
|
4,052,804
|
|
Lumentum Holdings, Inc. (a)
|
24,433
|
1,069,188
|
|
Motorola Solutions, Inc.
|
4,838
|
1,640,808
|
|
Ubiquiti, Inc.
|
219
|
23,560
|
|
ViaSat, Inc. (a)(b)
|
42,588
|
677,575
|
|
83,202,238
|
|||
Electronic Equipment, Instruments & Components - 0.9%
|
|||
Amphenol Corp. Class A
|
106,022
|
12,804,277
|
|
Arrow Electronics, Inc. (a)
|
19,705
|
2,515,737
|
|
Avnet, Inc.
|
33,221
|
1,623,510
|
|
CDW Corp.
|
2,878
|
696,073
|
|
Cognex Corp.
|
63,157
|
2,623,542
|
|
Coherent Corp. (a)
|
47,478
|
2,593,723
|
|
Corning, Inc.
|
278,236
|
9,287,518
|
|
Crane NXT Co.
|
17,587
|
1,069,465
|
|
IPG Photonics Corp. (a)
|
10,963
|
920,673
|
|
Jabil, Inc.
|
16,963
|
1,990,778
|
|
Keysight Technologies, Inc. (a)
|
47,453
|
7,020,197
|
|
Littelfuse, Inc.
|
8,846
|
2,040,241
|
|
TD SYNNEX Corp.
|
24,765
|
2,918,308
|
|
Teledyne Technologies, Inc. (a)
|
17,042
|
6,501,182
|
|
Trimble, Inc. (a)
|
90,113
|
5,413,088
|
|
Vontier Corp.
|
37,666
|
1,530,370
|
|
Zebra Technologies Corp. Class A (a)
|
15,349
|
4,828,181
|
|
66,376,863
|
|||
IT Services - 1.2%
|
|||
Akamai Technologies, Inc. (a)
|
54,623
|
5,513,099
|
|
Amdocs Ltd.
|
42,084
|
3,534,635
|
|
Cognizant Technology Solutions Corp. Class A
|
183,630
|
12,060,818
|
|
DXC Technology Co. (a)
|
70,634
|
1,376,657
|
|
GoDaddy, Inc. (a)
|
20,290
|
2,483,090
|
|
IBM Corp.
|
332,579
|
55,274,630
|
|
Kyndryl Holdings, Inc. (a)
|
83,026
|
1,632,291
|
|
Okta, Inc. (a)
|
52,329
|
4,865,550
|
|
Twilio, Inc. Class A (a)
|
51,690
|
3,095,197
|
|
VeriSign, Inc. (a)
|
30,750
|
5,211,510
|
|
95,047,477
|
|||
Semiconductors & Semiconductor Equipment - 3.8%
|
|||
Advanced Micro Devices, Inc. (a)
|
252,867
|
40,049,075
|
|
Analog Devices, Inc.
|
182,273
|
36,565,787
|
|
Applied Materials, Inc.
|
47,403
|
9,416,606
|
|
Cirrus Logic, Inc. (a)
|
19,685
|
1,743,500
|
|
Entegris, Inc.
|
51,769
|
6,881,135
|
|
First Solar, Inc. (a)
|
38,923
|
6,862,125
|
|
GlobalFoundries, Inc. (a)
|
28,679
|
1,401,830
|
|
Intel Corp.
|
1,544,540
|
47,062,134
|
|
Lam Research Corp.
|
2,553
|
2,283,429
|
|
Marvell Technology, Inc.
|
312,663
|
20,607,618
|
|
Microchip Technology, Inc.
|
55,776
|
5,130,276
|
|
Micron Technology, Inc.
|
400,006
|
45,184,678
|
|
MKS Instruments, Inc.
|
24,266
|
2,887,169
|
|
ON Semiconductor Corp. (a)
|
157,737
|
11,066,828
|
|
Qorvo, Inc. (a)
|
35,796
|
4,182,405
|
|
Qualcomm, Inc.
|
52,267
|
8,668,482
|
|
Skyworks Solutions, Inc.
|
58,151
|
6,198,315
|
|
Teradyne, Inc.
|
9,412
|
1,094,804
|
|
Texas Instruments, Inc.
|
196,697
|
34,701,285
|
|
Universal Display Corp.
|
9,360
|
1,478,693
|
|
Wolfspeed, Inc. (a)(b)
|
45,337
|
1,225,459
|
|
294,691,633
|
|||
Software - 1.6%
|
|||
ANSYS, Inc. (a)
|
5,555
|
1,804,708
|
|
AppLovin Corp. (a)
|
54,571
|
3,851,075
|
|
Aspen Technology, Inc. (a)
|
10,041
|
1,976,772
|
|
Bentley Systems, Inc. Class B (b)
|
5,210
|
273,681
|
|
Bill Holdings, Inc. (a)
|
37,506
|
2,338,874
|
|
CCC Intelligent Solutions Holdings, Inc. Class A (a)
|
123,819
|
1,389,249
|
|
Dolby Laboratories, Inc. Class A
|
21,356
|
1,658,507
|
|
Dropbox, Inc. Class A (a)
|
10,336
|
239,382
|
|
Gen Digital, Inc.
|
170,976
|
3,443,457
|
|
Guidewire Software, Inc. (a)
|
29,821
|
3,292,238
|
|
HashiCorp, Inc. (a)
|
11,212
|
363,942
|
|
Informatica, Inc. (a)(b)
|
14,575
|
451,388
|
|
nCino, Inc. (a)
|
23,496
|
685,143
|
|
NCR Voyix Corp. (a)
|
47,213
|
578,359
|
|
Nutanix, Inc. Class A (a)
|
67,257
|
4,082,500
|
|
Oracle Corp.
|
332,609
|
37,834,274
|
|
PTC, Inc. (a)
|
19,985
|
3,546,138
|
|
Roper Technologies, Inc.
|
38,677
|
19,781,738
|
|
Salesforce, Inc.
|
84,267
|
22,662,767
|
|
SentinelOne, Inc. (a)
|
75,985
|
1,605,563
|
|
Tyler Technologies, Inc. (a)
|
3,714
|
1,714,197
|
|
UiPath, Inc. Class A (a)
|
32,411
|
614,837
|
|
Unity Software, Inc. (a)(b)
|
64,517
|
1,565,828
|
|
Zoom Video Communications, Inc. Class A (a)
|
94,301
|
5,761,791
|
|
121,516,408
|
|||
Technology Hardware, Storage & Peripherals - 0.4%
|
|||
Hewlett Packard Enterprise Co.
|
474,615
|
8,068,455
|
|
HP, Inc.
|
251,602
|
7,067,500
|
|
NetApp, Inc.
|
45,354
|
4,635,632
|
|
Pure Storage, Inc. Class A (a)
|
22,994
|
1,158,898
|
|
Western Digital Corp. (a)
|
118,607
|
8,400,934
|
|
29,331,419
|
|||
TOTAL INFORMATION TECHNOLOGY
|
690,166,038
|
||
MATERIALS - 4.8%
|
|||
Chemicals - 2.8%
|
|||
Air Products & Chemicals, Inc.
|
81,165
|
19,182,536
|
|
Albemarle Corp. (b)
|
42,823
|
5,152,035
|
|
Ashland, Inc.
|
18,249
|
1,739,677
|
|
Axalta Coating Systems Ltd. (a)
|
72,237
|
2,271,131
|
|
Celanese Corp. Class A
|
36,141
|
5,551,619
|
|
CF Industries Holdings, Inc.
|
70,397
|
5,559,251
|
|
Corteva, Inc.
|
258,103
|
13,971,115
|
|
Dow, Inc.
|
258,935
|
14,733,402
|
|
DuPont de Nemours, Inc.
|
157,370
|
11,409,325
|
|
Eastman Chemical Co.
|
43,357
|
4,094,635
|
|
Ecolab, Inc.
|
20,181
|
4,563,933
|
|
Element Solutions, Inc.
|
81,599
|
1,887,385
|
|
FMC Corp.
|
38,860
|
2,293,129
|
|
Ginkgo Bioworks Holdings, Inc. Class A (a)(b)
|
522,823
|
465,888
|
|
Huntsman Corp.
|
60,585
|
1,445,558
|
|
International Flavors & Fragrances, Inc.
|
93,398
|
7,906,141
|
|
Linde PLC
|
160,733
|
70,876,824
|
|
LyondellBasell Industries NV Class A
|
94,638
|
9,460,961
|
|
NewMarket Corp.
|
2,277
|
1,199,797
|
|
Olin Corp.
|
43,896
|
2,294,883
|
|
PPG Industries, Inc.
|
64,314
|
8,296,506
|
|
RPM International, Inc.
|
37,621
|
4,022,061
|
|
Sherwin-Williams Co.
|
14,536
|
4,355,131
|
|
The Chemours Co. LLC
|
54,347
|
1,453,782
|
|
The Mosaic Co.
|
119,104
|
3,738,675
|
|
Westlake Corp.
|
11,831
|
1,743,416
|
|
209,668,796
|
|||
Construction Materials - 0.3%
|
|||
Eagle Materials, Inc.
|
4,264
|
1,069,027
|
|
Martin Marietta Materials, Inc.
|
22,581
|
13,256,628
|
|
Vulcan Materials Co.
|
37,799
|
9,738,156
|
|
24,063,811
|
|||
Containers & Packaging - 0.6%
|
|||
Amcor PLC
|
526,874
|
4,710,254
|
|
Aptargroup, Inc.
|
23,916
|
3,452,992
|
|
Ardagh Metal Packaging SA
|
3,429
|
13,545
|
|
Avery Dennison Corp.
|
19,813
|
4,304,969
|
|
Ball Corp.
|
112,680
|
7,839,148
|
|
Berry Global Group, Inc.
|
42,398
|
2,401,423
|
|
Crown Holdings, Inc.
|
38,789
|
3,183,413
|
|
Graphic Packaging Holding Co.
|
51,763
|
1,338,074
|
|
International Paper Co.
|
126,651
|
4,425,186
|
|
Packaging Corp. of America
|
32,356
|
5,596,941
|
|
Sealed Air Corp.
|
23,540
|
741,039
|
|
Silgan Holdings, Inc.
|
29,500
|
1,376,470
|
|
Sonoco Products Co.
|
35,741
|
2,003,283
|
|
WestRock Co.
|
92,892
|
4,455,100
|
|
45,841,837
|
|||
Metals & Mining - 1.1%
|
|||
Alcoa Corp.
|
65,001
|
2,284,135
|
|
Cleveland-Cliffs, Inc. (a)
|
182,138
|
3,078,132
|
|
Freeport-McMoRan, Inc.
|
522,763
|
26,106,784
|
|
MP Materials Corp. (a)(b)
|
38,027
|
608,432
|
|
Newmont Corp.
|
422,109
|
17,154,510
|
|
Nucor Corp.
|
89,871
|
15,145,960
|
|
Reliance, Inc.
|
20,886
|
5,946,662
|
|
Royal Gold, Inc.
|
23,975
|
2,880,117
|
|
SSR Mining, Inc.
|
73,918
|
396,200
|
|
Steel Dynamics, Inc.
|
55,734
|
7,252,108
|
|
United States Steel Corp.
|
80,976
|
2,955,624
|
|
83,808,664
|
|||
Paper & Forest Products - 0.0%
|
|||
Louisiana-Pacific Corp.
|
23,492
|
1,719,379
|
|
TOTAL MATERIALS
|
365,102,487
|
||
REAL ESTATE - 4.4%
|
|||
Equity Real Estate Investment Trusts (REITs) - 4.1%
|
|||
Agree Realty Corp.
|
36,239
|
2,073,596
|
|
Alexandria Real Estate Equities, Inc.
|
63,446
|
7,351,488
|
|
American Homes 4 Rent Class A
|
121,761
|
4,359,044
|
|
Americold Realty Trust
|
103,644
|
2,277,059
|
|
Apartment Income (REIT) Corp.
|
53,623
|
2,058,051
|
|
AvalonBay Communities, Inc.
|
51,844
|
9,828,067
|
|
Boston Properties, Inc.
|
57,355
|
3,549,701
|
|
Brixmor Property Group, Inc.
|
109,442
|
2,418,668
|
|
Camden Property Trust (SBI)
|
37,941
|
3,781,959
|
|
Cousins Properties, Inc.
|
55,330
|
1,269,270
|
|
Crown Castle, Inc.
|
141,532
|
13,272,871
|
|
CubeSmart
|
81,784
|
3,307,345
|
|
Digital Realty Trust, Inc.
|
110,503
|
15,335,606
|
|
EastGroup Properties, Inc.
|
16,727
|
2,598,707
|
|
EPR Properties
|
27,137
|
1,101,491
|
|
Equinix, Inc.
|
17,013
|
12,098,114
|
|
Equity Lifestyle Properties, Inc.
|
43,722
|
2,635,999
|
|
Equity Residential (SBI)
|
136,447
|
8,787,187
|
|
Essex Property Trust, Inc.
|
23,349
|
5,749,691
|
|
Extra Space Storage, Inc.
|
76,501
|
10,272,554
|
|
Federal Realty Investment Trust (SBI)
|
29,561
|
3,079,369
|
|
First Industrial Realty Trust, Inc.
|
48,256
|
2,191,788
|
|
Gaming & Leisure Properties
|
93,545
|
3,997,178
|
|
Healthcare Realty Trust, Inc.
|
138,889
|
1,976,390
|
|
Healthpeak Properties, Inc.
|
258,279
|
4,806,572
|
|
Highwoods Properties, Inc. (SBI)
|
38,040
|
996,648
|
|
Host Hotels & Resorts, Inc.
|
255,633
|
4,823,795
|
|
Invitation Homes, Inc.
|
223,558
|
7,645,684
|
|
Iron Mountain, Inc.
|
53,490
|
4,146,545
|
|
Kilroy Realty Corp.
|
42,648
|
1,441,502
|
|
Kimco Realty Corp.
|
239,936
|
4,470,008
|
|
Lamar Advertising Co. Class A
|
7,275
|
842,809
|
|
Medical Properties Trust, Inc. (b)
|
217,029
|
998,333
|
|
Mid-America Apartment Communities, Inc.
|
42,465
|
5,520,450
|
|
National Storage Affiliates Trust
|
27,458
|
962,128
|
|
Net Lease Office Properties
|
5,211
|
119,123
|
|
NNN (REIT), Inc.
|
66,332
|
2,688,436
|
|
Omega Healthcare Investors, Inc.
|
89,480
|
2,721,087
|
|
Park Hotels & Resorts, Inc.
|
75,992
|
1,225,751
|
|
Prologis, Inc.
|
337,669
|
34,459,121
|
|
Public Storage
|
24,020
|
6,231,989
|
|
Rayonier, Inc.
|
53,666
|
1,591,734
|
|
Realty Income Corp.
|
304,288
|
16,291,580
|
|
Regency Centers Corp.
|
66,071
|
3,912,725
|
|
Rexford Industrial Realty, Inc.
|
76,960
|
3,294,658
|
|
SBA Communications Corp. Class A
|
35,314
|
6,572,642
|
|
Simon Property Group, Inc.
|
92,832
|
13,045,681
|
|
STAG Industrial, Inc.
|
66,452
|
2,285,284
|
|
Sun Communities, Inc.
|
35,147
|
3,912,564
|
|
UDR, Inc.
|
113,269
|
4,313,284
|
|
Ventas, Inc.
|
146,142
|
6,471,168
|
|
VICI Properties, Inc.
|
378,323
|
10,801,122
|
|
Vornado Realty Trust
|
64,622
|
1,682,111
|
|
Welltower, Inc.
|
202,745
|
19,317,544
|
|
Weyerhaeuser Co.
|
267,908
|
8,082,784
|
|
WP Carey, Inc.
|
79,261
|
4,346,673
|
|
315,392,728
|
|||
Real Estate Management & Development - 0.3%
|
|||
CBRE Group, Inc. (a)
|
111,117
|
9,654,956
|
|
CoStar Group, Inc. (a)
|
84,294
|
7,715,430
|
|
Howard Hughes Holdings, Inc.
|
12,318
|
802,641
|
|
Jones Lang LaSalle, Inc. (a)
|
17,326
|
3,130,808
|
|
Zillow Group, Inc.:
|
|||
Class A (a)
|
19,760
|
829,920
|
|
Class C (a)
|
56,414
|
2,401,544
|
|
24,535,299
|
|||
TOTAL REAL ESTATE
|
339,928,027
|
||
UTILITIES - 4.9%
|
|||
Electric Utilities - 3.2%
|
|||
Alliant Energy Corp.
|
93,277
|
4,645,195
|
|
American Electric Power Co., Inc.
|
192,674
|
16,575,744
|
|
Avangrid, Inc.
|
25,980
|
949,049
|
|
Constellation Energy Corp.
|
117,690
|
21,883,279
|
|
Duke Energy Corp.
|
282,120
|
27,721,111
|
|
Edison International
|
138,272
|
9,825,608
|
|
Entergy Corp.
|
77,424
|
8,258,818
|
|
Evergy, Inc.
|
81,437
|
4,271,371
|
|
Eversource Energy
|
127,517
|
7,730,081
|
|
Exelon Corp.
|
363,733
|
13,669,086
|
|
FirstEnergy Corp.
|
199,209
|
7,637,673
|
|
Hawaiian Electric Industries, Inc. (b)
|
40,119
|
395,172
|
|
IDACORP, Inc.
|
18,459
|
1,749,544
|
|
NextEra Energy, Inc.
|
751,320
|
50,315,900
|
|
NRG Energy, Inc.
|
82,026
|
5,960,829
|
|
OGE Energy Corp.
|
73,092
|
2,532,638
|
|
PG&E Corp.
|
745,288
|
12,751,878
|
|
Pinnacle West Capital Corp.
|
41,402
|
3,049,257
|
|
PPL Corp.
|
269,992
|
7,413,980
|
|
Southern Co.
|
398,826
|
29,313,711
|
|
Xcel Energy, Inc.
|
201,579
|
10,830,840
|
|
247,480,764
|
|||
Gas Utilities - 0.1%
|
|||
Atmos Energy Corp.
|
55,095
|
6,495,701
|
|
National Fuel Gas Co.
|
32,476
|
1,724,476
|
|
UGI Corp.
|
76,390
|
1,952,528
|
|
10,172,705
|
|||
Independent Power and Renewable Electricity Producers - 0.1%
|
|||
Brookfield Renewable Corp. (b)
|
48,714
|
1,132,113
|
|
Clearway Energy, Inc.:
|
|||
Class A
|
12,664
|
274,935
|
|
Class C (b)
|
29,981
|
700,956
|
|
The AES Corp.
|
95,013
|
1,700,733
|
|
Vistra Corp.
|
91,625
|
6,948,840
|
|
10,757,577
|
|||
Multi-Utilities - 1.3%
|
|||
Ameren Corp.
|
95,794
|
7,076,303
|
|
CenterPoint Energy, Inc.
|
230,843
|
6,726,765
|
|
CMS Energy Corp.
|
106,377
|
6,447,510
|
|
Consolidated Edison, Inc.
|
126,945
|
11,983,608
|
|
Dominion Energy, Inc.
|
305,871
|
15,593,304
|
|
DTE Energy Co.
|
75,365
|
8,314,267
|
|
NiSource, Inc.
|
151,175
|
4,211,736
|
|
Public Service Enterprise Group, Inc.
|
181,933
|
12,567,932
|
|
Sempra
|
230,546
|
16,514,010
|
|
WEC Energy Group, Inc.
|
115,440
|
9,539,962
|
|
98,975,397
|
|||
Water Utilities - 0.2%
|
|||
American Water Works Co., Inc.
|
71,279
|
8,718,847
|
|
Essential Utilities, Inc.
|
91,728
|
3,355,410
|
|
12,074,257
|
|||
TOTAL UTILITIES
|
379,460,700
|
||
|
TOTAL COMMON STOCKS
(Cost $6,398,385,112)
|
7,646,209,151
|
||
U.S. Treasury Obligations - 0.0%
|
|||
Principal
Amount (c)
|
Value ($)
|
||
U.S. Treasury Bills, yield at date of purchase 5.3% 5/23/24 (d)
(Cost $996,801)
|
1,000,000
|
996,773
|
|
Money Market Funds - 1.5%
|
|||
Shares
|
Value ($)
|
||
Fidelity Cash Central Fund 5.39% (e)
|
70,403,479
|
70,417,559
|
|
Fidelity Securities Lending Cash Central Fund 5.39% (e)(f)
|
43,305,263
|
43,309,594
|
|
|
TOTAL MONEY MARKET FUNDS
(Cost $113,727,153)
|
113,727,153
|
||
|
TOTAL INVESTMENT IN SECURITIES - 101.0%
(Cost $6,513,109,066)
|
7,760,933,077
|
NET OTHER ASSETS (LIABILITIES) - (1.0)%
|
(80,589,600)
|
NET ASSETS - 100.0%
|
7,680,343,477
|
Futures Contracts
|
|||||
Number
of contracts
|
Expiration
Date
|
Notional
Amount ($)
|
Value ($)
|
Unrealized
Appreciation/
(Depreciation) ($)
|
|
Purchased
|
|||||
Equity Index Contracts
|
|||||
CME E-mini S&P 500 Index Contracts (United States)
|
52
|
Jun 2024
|
13,174,200
|
90,928
|
90,928
|
CME E-mini S&P MidCap 400 Index Contracts (United States)
|
50
|
Jun 2024
|
14,386,000
|
96,404
|
96,404
|
TOTAL FUTURES CONTRACTS
|
187,332
|
||||
The notional amount of futures purchased as a percentage of Net Assets is 0.4%
|
|||||
(a)
|
Non-income producing
|
(b)
|
Security or a portion of the security is on loan at period end.
|
(c)
|
Amount is stated in United States dollars unless otherwise noted.
|
(d)
|
Security or a portion of the security was pledged to cover margin requirements for futures contracts. At period end, the value of securities pledged amounted to $996,773.
|
(e)
|
Affiliated fund that is generally available only to investment companies and other accounts managed by Fidelity Investments. The rate quoted is the annualized seven-day yield of the fund at period end. A complete unaudited listing of the fund's holdings as of its most recent quarter end is available upon request. In addition, each Fidelity Central Fund's financial statements, which are not covered by the Fund's Report of Independent Registered Public Accounting Firm, are available on the SEC's website or upon request.
|
(f)
|
Investment made with cash collateral received from securities on loan.
|
Affiliate
|
Value,
beginning
of period ($)
|
Purchases ($)
|
Sales
Proceeds ($)
|
Dividend
Income ($)
|
Realized
Gain (loss) ($)
|
Change in
Unrealized
appreciation
(depreciation) ($)
|
Value,
end
of period ($)
|
% ownership,
end
of period
|
Fidelity Cash Central Fund 5.39%
|
17,570,147
|
2,329,605,752
|
2,276,760,255
|
1,352,087
|
1,915
|
-
|
70,417,559
|
0.1%
|
Fidelity Securities Lending Cash Central Fund 5.39%
|
53,540,205
|
406,131,797
|
416,362,408
|
963,839
|
-
|
-
|
43,309,594
|
0.2%
|
Total
|
71,110,352
|
2,735,737,549
|
2,693,122,663
|
2,315,926
|
1,915
|
-
|
113,727,153
|
|
Valuation Inputs at Reporting Date:
|
||||
Description
|
Total ($)
|
Level 1 ($)
|
Level 2 ($)
|
Level 3 ($)
|
Investments in Securities:
|
||||
Equities:
|
||||
Communication Services
|
341,856,063
|
341,856,063
|
-
|
-
|
Consumer Discretionary
|
367,954,310
|
367,954,310
|
-
|
-
|
Consumer Staples
|
611,615,613
|
611,615,613
|
-
|
-
|
Energy
|
639,152,956
|
639,152,956
|
-
|
-
|
Financials
|
1,727,382,070
|
1,727,382,070
|
-
|
-
|
Health Care
|
1,074,271,231
|
1,074,271,231
|
-
|
-
|
Industrials
|
1,109,319,656
|
1,109,319,656
|
-
|
-
|
Information Technology
|
690,166,038
|
690,166,038
|
-
|
-
|
Materials
|
365,102,487
|
365,102,487
|
-
|
-
|
Real Estate
|
339,928,027
|
339,928,027
|
-
|
-
|
Utilities
|
379,460,700
|
379,460,700
|
-
|
-
|
U.S. Government and Government Agency Obligations
|
996,773
|
-
|
996,773
|
-
|
Money Market Funds
|
113,727,153
|
113,727,153
|
-
|
-
|
Total Investments in Securities:
|
7,760,933,077
|
7,759,936,304
|
996,773
|
-
|
Derivative Instruments:
Assets
|
||||
Futures Contracts
|
187,332
|
187,332
|
-
|
-
|
Total Assets
|
187,332
|
187,332
|
-
|
-
|
Total Derivative Instruments:
|
187,332
|
187,332
|
-
|
-
|
Primary Risk Exposure / Derivative Type
|
Value
|
|
Asset ($)
|
Liability ($)
|
|
Equity Risk
|
||
Futures Contracts (a)
|
187,332
|
0
|
Total Equity Risk
|
187,332
|
0
|
Total Value of Derivatives
|
187,332
|
0
|
Statement of Assets and Liabilities
|
||||
April 30, 2024
|
||||
Assets
|
||||
Investment in securities, at value (including securities loaned of $40,832,499) - See accompanying schedule:
|
||||
Unaffiliated issuers (cost $6,399,381,913)
|
$
|
7,647,205,924
|
||
Fidelity Central Funds (cost $113,727,153)
|
113,727,153
|
|||
Total Investment in Securities (cost $6,513,109,066)
|
$
|
7,760,933,077
|
||
Segregated cash with brokers for derivative instruments
|
128,066
|
|||
Cash
|
39,636
|
|||
Receivable for fund shares sold
|
15,121,008
|
|||
Dividends receivable
|
6,613,555
|
|||
Distributions receivable from Fidelity Central Funds
|
193,700
|
|||
Other receivables
|
40,722
|
|||
Total assets
|
7,783,069,764
|
|||
Liabilities
|
||||
Payable for investments purchased
|
$
|
54,287,640
|
||
Payable for fund shares redeemed
|
4,517,440
|
|||
Accrued management fee
|
223,105
|
|||
Payable for daily variation margin on futures contracts
|
389,690
|
|||
Collateral on securities loaned
|
43,308,412
|
|||
Total liabilities
|
102,726,287
|
|||
Net Assets
|
$
|
7,680,343,477
|
||
Net Assets consist of:
|
||||
Paid in capital
|
$
|
6,513,302,153
|
||
Total accumulated earnings (loss)
|
1,167,041,324
|
|||
Net Assets
|
$
|
7,680,343,477
|
||
Net Asset Value, offering price and redemption price per share ($7,680,343,477 ÷ 455,356,861 shares)
|
$
|
16.87
|
||
Statement of Operations
|
||||
Year ended
April 30, 2024
|
||||
Investment Income
|
||||
Dividends
|
$
|
152,832,131
|
||
Interest
|
74,322
|
|||
Income from Fidelity Central Funds (including $963,839 from security lending)
|
2,315,926
|
|||
Total income
|
155,222,379
|
|||
Expenses
|
||||
Management fee
|
$
|
2,305,584
|
||
Independent trustees' fees and expenses
|
20,269
|
|||
Total expenses before reductions
|
2,325,853
|
|||
Expense reductions
|
(14,910)
|
|||
Total expenses after reductions
|
2,310,943
|
|||
Net Investment income (loss)
|
152,911,436
|
|||
Realized and Unrealized Gain (Loss)
|
||||
Net realized gain (loss) on:
|
||||
Investment Securities:
|
||||
Unaffiliated issuers
|
(12,058,602)
|
|||
Redemptions in-kind
|
105,591,637
|
|||
Fidelity Central Funds
|
1,915
|
|||
Futures contracts
|
3,071,024
|
|||
Total net realized gain (loss)
|
96,605,974
|
|||
Change in net unrealized appreciation (depreciation) on:
|
||||
Investment Securities:
|
||||
Unaffiliated issuers
|
604,754,030
|
|||
Futures contracts
|
(750,242)
|
|||
Total change in net unrealized appreciation (depreciation)
|
604,003,788
|
|||
Net gain (loss)
|
700,609,762
|
|||
Net increase (decrease) in net assets resulting from operations
|
$
|
853,521,198
|
||
Statement of Changes in Net Assets
|
||||
Year ended
April 30, 2024
|
Year ended
April 30, 2023
|
|||
Increase (Decrease) in Net Assets
|
||||
Operations
|
||||
Net investment income (loss)
|
$
|
152,911,436
|
$
|
124,465,138
|
Net realized gain (loss)
|
96,605,974
|
(20,035,565)
|
||
Change in net unrealized appreciation (depreciation)
|
604,003,788
|
(20,899,227)
|
||
Net increase (decrease) in net assets resulting from operations
|
853,521,198
|
83,530,346
|
||
Distributions to shareholders
|
(131,573,825)
|
(109,382,778)
|
||
Share transactions
|
||||
Proceeds from sales of shares
|
3,471,142,691
|
2,036,584,552
|
||
Reinvestment of distributions
|
111,440,014
|
94,842,907
|
||
Cost of shares redeemed
|
(2,610,421,200)
|
(1,426,933,041)
|
||
Net increase (decrease) in net assets resulting from share transactions
|
972,161,505
|
704,494,418
|
||
Total increase (decrease) in net assets
|
1,694,108,878
|
678,641,986
|
||
Net Assets
|
||||
Beginning of period
|
5,986,234,599
|
5,307,592,613
|
||
End of period
|
$
|
7,680,343,477
|
$
|
5,986,234,599
|
Other Information
|
||||
Shares
|
||||
Sold
|
218,880,611
|
137,350,084
|
||
Issued in reinvestment of distributions
|
7,090,273
|
6,488,161
|
||
Redeemed
|
(165,204,513)
|
(96,192,584)
|
||
Net increase (decrease)
|
60,766,371
|
47,645,661
|
||
Fidelity® Large Cap Value Index Fund |
Years ended April 30,
|
2024
|
2023
|
2022
|
2021
|
2020
|
|||||
Selected Per-Share Data
|
||||||||||
Net asset value, beginning of period
|
$
|
15.17
|
$
|
15.30
|
$
|
15.35
|
$
|
10.77
|
$
|
12.58
|
Income from Investment Operations
|
||||||||||
Net investment income (loss) A,B
|
.36
|
.34
|
.30
|
.28
|
.33
|
|||||
Net realized and unrealized gain (loss)
|
1.66
|
(.17)
|
(.10)
|
4.60
|
(1.64)
|
|||||
Total from investment operations
|
2.02
|
.17
|
.20
|
4.88
|
(1.31)
|
|||||
Distributions from net investment income
|
(.32)
|
(.30)
|
(.25)
|
(.30)
|
(.28)
|
|||||
Distributions from net realized gain
|
-
|
-
|
-
|
-
|
(.22)
|
|||||
Total distributions
|
(.32)
|
(.30)
|
(.25)
|
(.30)
|
(.50)
|
|||||
Net asset value, end of period
|
$
|
16.87
|
$
|
15.17
|
$
|
15.30
|
$
|
15.35
|
$
|
10.77
|
Total Return C
|
13.49 % |
1.18%
|
1.27%
|
45.93%
|
(11.04)%
|
|||||
Ratios to Average Net Assets B,D,E
|
||||||||||
Expenses before reductions
|
.04%
|
.04%
|
.04%
|
.04%
|
.04%
|
|||||
Expenses net of fee waivers, if any
|
.04 % |
.04%
|
.04%
|
.04%
|
.04%
|
|||||
Expenses net of all reductions
|
.03%
|
.03%
|
.04%
|
.04%
|
.04%
|
|||||
Net investment income (loss)
|
2.30%
|
2.28%
|
1.90%
|
2.24%
|
2.65%
|
|||||
Supplemental Data
|
||||||||||
Net assets, end of period (000 omitted)
|
$
|
7,680,343
|
$
|
5,986,235
|
$
|
5,307,593
|
$
|
3,689,832
|
$
|
2,298,504
|
Portfolio turnover rate F
|
27 % G |
16%
|
16%
|
31%
|
27%
|
Fidelity Central Fund
|
Investment Manager
|
Investment Objective
|
Investment Practices
|
Expense RatioA
|
Fidelity Money Market Central Funds
|
Fidelity Management & Research Company LLC (FMR)
|
Each fund seeks to obtain a high level of current income consistent with the preservation of capital and liquidity.
|
Short-term Investments
|
Less than .005%
|
Gross unrealized appreciation
|
$1,615,571,771
|
Gross unrealized depreciation
|
(448,442,468)
|
Net unrealized appreciation (depreciation)
|
$1,167,129,303
|
Tax Cost
|
$6,593,803,774
|
Undistributed ordinary income
|
$22,777,776
|
Capital loss carryforward
|
$(22,865,754)
|
Net unrealized appreciation (depreciation) on securities and other investments
|
$1,167,129,303
|
Long-term
|
$(22,865,754)
|
Total capital loss carryforward
|
$(22,865,754)
|
April 30, 2024
|
April 30, 2023
|
|
Ordinary Income
|
$131,573,825
|
$109,382,778
|
Equity Risk
|
Equity risk relates to the fluctuations in the value of financial instruments as a result of changes in market prices (other than those arising from interest rate risk or foreign exchange risk), whether caused by factors specific to an individual investment, its issuer, or all factors affecting all instruments traded in a market or market segment.
|
Purchases ($)
|
Sales ($)
|
|
Fidelity Large Cap Value Index Fund
|
3,020,528,707
|
1,778,793,178
|
Shares
|
Total net realized gain or loss ($)
|
Total Proceeds ($)
|
|
Fidelity Large Cap Value Index Fund
|
14,708,782
|
105,591,637
|
229,471,197
|
Borrower or Lender
|
Average Loan Balance ($)
|
Weighted Average Interest Rate
|
|
Fidelity Large Cap Value Index Fund
|
Borrower
|
81,394,050
|
5.45%
|
Total Security Lending Fees Paid to NFS ($)
|
Security Lending Income From Securities Loaned to NFS ($)
|
Value of Securities Loaned to NFS at Period End ($)
|
|
Fidelity Large Cap Value Index Fund
|
98,731
|
19,003
|
-
|
The Example is based on an investment of $1,000 invested at the beginning of the period and held for the entire period (November 1, 2023 to April 30, 2024).
|
Annualized Expense Ratio- A
|
Beginning Account Value November 1, 2023
|
Ending Account Value April 30, 2024
|
Expenses Paid During Period- C November 1, 2023 to April 30, 2024
|
|||||||
Fidelity® Large Cap Value Index Fund
|
.04%
|
|||||||||
Actual
|
$ 1,000
|
$ 1,184.20
|
$ .22
|
|||||||
Hypothetical-B
|
$ 1,000
|
$ 1,024.69
|
$ .20
|
|||||||
A special meeting of shareholders was held on October 18, 2023. The results of votes taken among shareholders on the proposal before them are reported below. Each vote reported represents one dollar of net asset value held on the record date for the meeting.
|
||
Proposal 1
|
||
To elect a Board of Trustees.
|
||
# of
Votes
|
% of
Votes
|
|
Abigail P. Johnson
|
||
Affirmative
|
378,729,502,260.01
|
97.58
|
Withheld
|
9,407,876,478.96
|
2.42
|
TOTAL
|
388,137,378,738.97
|
100.00
|
Jennifer Toolin McAuliffe
|
||
Affirmative
|
378,454,868,010.95
|
97.51
|
Withheld
|
9,682,510,728.02
|
2.49
|
TOTAL
|
388,137,378,738.97
|
100.00
|
Christine J. Thompson
|
||
Affirmative
|
378,837,121,274.52
|
97.60
|
Withheld
|
9,300,257,464.45
|
2.40
|
TOTAL
|
388,137,378,738.97
|
100.00
|
Elizabeth S. Acton
|
||
Affirmative
|
378,262,110,794.85
|
97.46
|
Withheld
|
9,875,267,944.12
|
2.54
|
TOTAL
|
388,137,378,738.97
|
100.00
|
Laura M. Bishop
|
||
Affirmative
|
380,482,113,171.06
|
98.03
|
Withheld
|
7,655,265,567.91
|
1.97
|
TOTAL
|
388,137,378,738.97
|
100.00
|
Ann E. Dunwoody
|
||
Affirmative
|
380,016,034,008.12
|
97.91
|
Withheld
|
8,121,344,730.85
|
2.09
|
TOTAL
|
388,137,378,738.97
|
100.00
|
John Engler
|
||
Affirmative
|
379,432,488,394.20
|
97.76
|
Withheld
|
8,704,890,344.77
|
2.24
|
TOTAL
|
388,137,378,738.97
|
100.00
|
Robert F. Gartland
|
||
Affirmative
|
378,741,819,600.60
|
97.58
|
Withheld
|
9,395,559,138.37
|
2.42
|
TOTAL
|
388,137,378,738.97
|
100.00
|
Robert W. Helm
|
||
Affirmative
|
380,389,324,755.07
|
98.00
|
Withheld
|
7,748,053,983.90
|
2.00
|
TOTAL
|
388,137,378,738.97
|
100.00
|
Arthur E. Johnson
|
||
Affirmative
|
378,427,694,151.67
|
97.50
|
Withheld
|
9,709,684,587.30
|
2.50
|
TOTAL
|
388,137,378,738.97
|
100.00
|
Michael E. Kenneally
|
||
Affirmative
|
377,842,228,145.18
|
97.35
|
Withheld
|
10,295,150,593.79
|
2.65
|
TOTAL
|
388,137,378,738.97
|
100.00
|
Mark A. Murray
|
||
Affirmative
|
380,158,432,703.37
|
97.94
|
Withheld
|
7,978,946,035.60
|
2.06
|
TOTAL
|
388,137,378,738.97
|
100.00
|
Carol J. Zierhoffer
|
||
Affirmative
|
380,522,113,360.24
|
98.04
|
Withheld
|
7,615,265,378.73
|
1.96
|
TOTAL
|
388,137,378,738.97
|
100.00
|
Proposal 1 reflects trust-wide proposal and voting results.
|
||
 |


Contents
Average Annual Total Returns
|
|||
Periods ended April 30, 2024
|
Past 1
year
|
Past 5
years
|
Life of
Fund A
|
Fidelity® Series Large Cap Growth Index Fund
|
31.91%
|
16.45%
|
15.44%
|
$10,000 Over Life of Fund
|
Let's say hypothetically that $10,000 was invested in Fidelity® Series Large Cap Growth Index Fund, on August 17, 2018, when the fund started.
The chart shows how the value of your investment would have changed, and also shows how the Russell 1000® Growth Index performed over the same period.
|
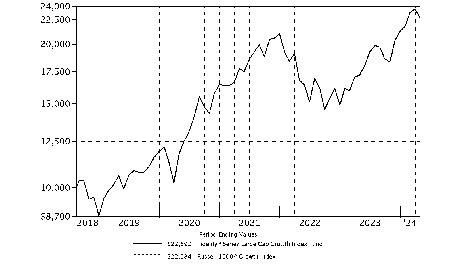
|
Top Holdings (% of Fund's net assets)
|
||
Microsoft Corp.
|
11.5
|
|
Apple, Inc.
|
9.9
|
|
NVIDIA Corp.
|
8.1
|
|
Amazon.com, Inc.
|
6.3
|
|
Alphabet, Inc. Class A
|
3.8
|
|
Meta Platforms, Inc. Class A
|
3.8
|
|
Alphabet, Inc. Class C
|
3.3
|
|
Eli Lilly & Co.
|
2.6
|
|
Broadcom, Inc.
|
2.2
|
|
Tesla, Inc.
|
2.0
|
|
53.5
|
||
Market Sectors (% of Fund's net assets)
|
||
Information Technology
|
43.5
|
|
Consumer Discretionary
|
15.0
|
|
Communication Services
|
12.5
|
|
Health Care
|
10.6
|
|
Financials
|
6.3
|
|
Industrials
|
5.7
|
|
Consumer Staples
|
4.1
|
|
Real Estate
|
0.8
|
|
Materials
|
0.7
|
|
Energy
|
0.5
|
|
Utilities
|
0.0
|
|
Asset Allocation (% of Fund's net assets)
|

|
Futures - 0.3%
|
Common Stocks - 99.7%
|
|||
Shares
|
Value ($)
|
||
COMMUNICATION SERVICES - 12.5%
|
|||
Diversified Telecommunication Services - 0.0%
|
|||
Iridium Communications, Inc.
|
5,221
|
160,755
|
|
Entertainment - 1.2%
|
|||
Live Nation Entertainment, Inc. (a)
|
1,603
|
142,523
|
|
Netflix, Inc. (a)
|
19,498
|
10,736,379
|
|
Playtika Holding Corp. (b)
|
801
|
5,807
|
|
Roblox Corp. (a)
|
21,482
|
763,900
|
|
Roku, Inc. Class A (a)
|
799
|
46,070
|
|
Spotify Technology SA (a)
|
6,399
|
1,794,536
|
|
TKO Group Holdings, Inc.
|
2,830
|
267,916
|
|
13,757,131
|
|||
Interactive Media & Services - 11.0%
|
|||
Alphabet, Inc.:
|
|||
Class A
|
271,430
|
44,183,375
|
|
Class C
|
229,279
|
37,748,495
|
|
Match Group, Inc. (a)
|
11,122
|
342,780
|
|
Meta Platforms, Inc. Class A
|
101,034
|
43,461,796
|
|
Pinterest, Inc. Class A (a)
|
26,638
|
891,041
|
|
Zoominfo Technologies, Inc. (a)
|
7,155
|
113,478
|
|
126,740,965
|
|||
Media - 0.3%
|
|||
Cable One, Inc.
|
16
|
6,302
|
|
Charter Communications, Inc. Class A (a)
|
4,599
|
1,177,068
|
|
Liberty Broadband Corp.:
|
|||
Class A (a)
|
149
|
7,469
|
|
Class C (a)
|
1,146
|
56,991
|
|
Nexstar Media Group, Inc. Class A
|
488
|
78,109
|
|
The Trade Desk, Inc. (a)
|
20,117
|
1,666,693
|
|
2,992,632
|
|||
TOTAL COMMUNICATION SERVICES
|
143,651,483
|
||
CONSUMER DISCRETIONARY - 15.0%
|
|||
Automobiles - 2.0%
|
|||
Tesla, Inc. (a)
|
126,030
|
23,098,778
|
|
Broadline Retail - 6.4%
|
|||
Amazon.com, Inc. (a)
|
411,529
|
72,017,575
|
|
Coupang, Inc. Class A (a)
|
50,010
|
1,125,225
|
|
eBay, Inc.
|
1,488
|
76,692
|
|
Etsy, Inc. (a)
|
3,011
|
206,765
|
|
Ollie's Bargain Outlet Holdings, Inc. (a)
|
964
|
70,507
|
|
73,496,764
|
|||
Distributors - 0.1%
|
|||
Pool Corp.
|
1,736
|
629,352
|
|
Diversified Consumer Services - 0.0%
|
|||
Bright Horizons Family Solutions, Inc. (a)
|
298
|
30,906
|
|
Grand Canyon Education, Inc. (a)
|
388
|
50,448
|
|
H&R Block, Inc.
|
4,187
|
197,752
|
|
Service Corp. International
|
2,357
|
169,020
|
|
448,126
|
|||
Hotels, Restaurants & Leisure - 2.9%
|
|||
Airbnb, Inc. Class A (a)
|
18,911
|
2,998,717
|
|
Booking Holdings, Inc.
|
1,593
|
5,499,084
|
|
Caesars Entertainment, Inc. (a)
|
3,807
|
136,367
|
|
Cava Group, Inc. (b)
|
1,752
|
126,039
|
|
Chipotle Mexican Grill, Inc. (a)
|
1,254
|
3,962,138
|
|
Choice Hotels International, Inc. (b)
|
1,337
|
158,114
|
|
Churchill Downs, Inc.
|
3,228
|
416,412
|
|
Darden Restaurants, Inc.
|
2,526
|
387,514
|
|
Domino's Pizza, Inc.
|
1,596
|
844,715
|
|
Doordash, Inc. (a)
|
11,082
|
1,432,459
|
|
Draftkings Holdings, Inc. (a)
|
19,079
|
792,923
|
|
Expedia Group, Inc. (a)
|
4,429
|
596,276
|
|
Hilton Worldwide Holdings, Inc.
|
5,212
|
1,028,223
|
|
Las Vegas Sands Corp.
|
15,719
|
697,295
|
|
Marriott International, Inc. Class A
|
10,955
|
2,586,804
|
|
McDonald's Corp.
|
13,760
|
3,757,030
|
|
Norwegian Cruise Line Holdings Ltd. (a)(b)
|
4,532
|
85,745
|
|
Planet Fitness, Inc. (a)
|
1,873
|
112,080
|
|
Royal Caribbean Cruises Ltd. (a)
|
3,231
|
451,145
|
|
Starbucks Corp.
|
50,773
|
4,492,903
|
|
Texas Roadhouse, Inc. Class A
|
3,059
|
491,826
|
|
Travel+Leisure Co.
|
1,492
|
64,962
|
|
Vail Resorts, Inc.
|
181
|
34,276
|
|
Wendy's Co.
|
7,811
|
156,142
|
|
Wingstop, Inc.
|
1,341
|
516,003
|
|
Wyndham Hotels & Resorts, Inc.
|
241
|
17,716
|
|
Wynn Resorts Ltd.
|
259
|
23,737
|
|
Yum! Brands, Inc.
|
11,241
|
1,587,791
|
|
33,454,436
|
|||
Household Durables - 0.0%
|
|||
NVR, Inc. (a)
|
13
|
96,705
|
|
Tempur Sealy International, Inc.
|
1,516
|
75,891
|
|
TopBuild Corp. (a)
|
86
|
34,802
|
|
207,398
|
|||
Leisure Products - 0.0%
|
|||
Brunswick Corp.
|
228
|
18,386
|
|
Peloton Interactive, Inc. Class A (a)(b)
|
16,463
|
51,200
|
|
Polaris, Inc.
|
193
|
16,436
|
|
YETI Holdings, Inc. (a)
|
4,010
|
143,237
|
|
229,259
|
|||
Specialty Retail - 3.1%
|
|||
AutoZone, Inc. (a)
|
658
|
1,945,311
|
|
Best Buy Co., Inc.
|
1,213
|
89,325
|
|
Burlington Stores, Inc. (a)
|
2,934
|
527,944
|
|
CarMax, Inc. (a)(b)
|
367
|
24,945
|
|
Dick's Sporting Goods, Inc.
|
183
|
36,772
|
|
Five Below, Inc. (a)
|
2,487
|
363,948
|
|
Floor & Decor Holdings, Inc. Class A (a)(b)
|
4,769
|
526,164
|
|
Lowe's Companies, Inc.
|
19,341
|
4,409,555
|
|
Murphy U.S.A., Inc.
|
845
|
349,678
|
|
O'Reilly Automotive, Inc. (a)
|
2,288
|
2,318,339
|
|
RH (a)
|
115
|
28,411
|
|
Ross Stores, Inc.
|
14,076
|
1,823,546
|
|
The Home Depot, Inc.
|
45,690
|
15,270,512
|
|
TJX Companies, Inc.
|
52,063
|
4,898,608
|
|
Tractor Supply Co.
|
4,932
|
1,346,831
|
|
Ulta Beauty, Inc. (a)
|
2,215
|
896,721
|
|
Valvoline, Inc. (a)
|
1,534
|
65,226
|
|
Victoria's Secret & Co. (a)
|
1,439
|
25,355
|
|
Wayfair LLC Class A (a)(b)
|
1,290
|
64,694
|
|
Williams-Sonoma, Inc.
|
381
|
109,263
|
|
35,121,148
|
|||
Textiles, Apparel & Luxury Goods - 0.5%
|
|||
Birkenstock Holding PLC
|
360
|
16,117
|
|
Crocs, Inc. (a)
|
2,706
|
336,545
|
|
Deckers Outdoor Corp. (a)
|
1,169
|
956,791
|
|
lululemon athletica, Inc. (a)
|
5,081
|
1,832,209
|
|
NIKE, Inc. Class B
|
28,613
|
2,639,835
|
|
Skechers U.S.A., Inc. Class A (sub. vtg.) (a)
|
387
|
25,561
|
|
Tapestry, Inc.
|
609
|
24,311
|
|
5,831,369
|
|||
TOTAL CONSUMER DISCRETIONARY
|
172,516,630
|
||
CONSUMER STAPLES - 4.1%
|
|||
Beverages - 1.4%
|
|||
Boston Beer Co., Inc. Class A (a)
|
400
|
111,364
|
|
Brown-Forman Corp.:
|
|||
Class A
|
1,889
|
92,693
|
|
Class B (non-vtg.)
|
6,434
|
307,867
|
|
Celsius Holdings, Inc. (a)
|
6,548
|
466,676
|
|
Constellation Brands, Inc. Class A (sub. vtg.)
|
726
|
184,012
|
|
Monster Beverage Corp. (a)
|
33,961
|
1,815,215
|
|
PepsiCo, Inc.
|
43,487
|
7,649,798
|
|
The Coca-Cola Co.
|
88,260
|
5,451,820
|
|
16,079,445
|
|||
Consumer Staples Distribution & Retail - 1.9%
|
|||
Albertsons Companies, Inc.
|
1,731
|
35,312
|
|
BJ's Wholesale Club Holdings, Inc. (a)
|
2,077
|
155,110
|
|
Casey's General Stores, Inc.
|
241
|
77,019
|
|
Costco Wholesale Corp.
|
20,237
|
14,629,327
|
|
Dollar General Corp.
|
10,003
|
1,392,318
|
|
Maplebear, Inc. (NASDAQ)
|
616
|
21,024
|
|
Performance Food Group Co. (a)
|
3,290
|
223,325
|
|
Sysco Corp.
|
22,739
|
1,689,962
|
|
Target Corp.
|
21,010
|
3,382,190
|
|
21,605,587
|
|||
Food Products - 0.1%
|
|||
Freshpet, Inc. (a)
|
591
|
62,687
|
|
Lamb Weston Holdings, Inc.
|
6,241
|
520,125
|
|
The Hershey Co.
|
5,082
|
985,501
|
|
1,568,313
|
|||
Household Products - 0.6%
|
|||
Church & Dwight Co., Inc.
|
9,982
|
1,076,958
|
|
Kimberly-Clark Corp.
|
14,473
|
1,975,999
|
|
Procter & Gamble Co.
|
20,209
|
3,298,109
|
|
The Clorox Co.
|
5,653
|
835,909
|
|
7,186,975
|
|||
Personal Care Products - 0.1%
|
|||
Estee Lauder Companies, Inc. Class A
|
3,315
|
486,344
|
|
Kenvue, Inc.
|
26,775
|
503,906
|
|
990,250
|
|||
TOTAL CONSUMER STAPLES
|
47,430,570
|
||
ENERGY - 0.5%
|
|||
Energy Equipment & Services - 0.0%
|
|||
Halliburton Co.
|
8,222
|
308,078
|
|
Oil, Gas & Consumable Fuels - 0.5%
|
|||
Antero Midstream GP LP (b)
|
5,449
|
75,414
|
|
APA Corp.
|
12,335
|
387,812
|
|
Cheniere Energy, Inc.
|
10,941
|
1,726,709
|
|
Hess Corp.
|
7,052
|
1,110,619
|
|
New Fortress Energy, Inc. (b)
|
3,057
|
80,093
|
|
ONEOK, Inc.
|
1,416
|
112,034
|
|
Ovintiv, Inc.
|
5,195
|
266,607
|
|
Targa Resources Corp.
|
10,090
|
1,150,865
|
|
Texas Pacific Land Corp. (b)
|
840
|
484,092
|
|
5,394,245
|
|||
TOTAL ENERGY
|
5,702,323
|
||
FINANCIALS - 6.3%
|
|||
Banks - 0.1%
|
|||
First Citizens Bancshares, Inc.
|
55
|
92,772
|
|
Nu Holdings Ltd. (a)
|
73,016
|
792,954
|
|
885,726
|
|||
Capital Markets - 1.2%
|
|||
Ameriprise Financial, Inc.
|
4,574
|
1,883,527
|
|
Ares Management Corp.
|
7,634
|
1,016,009
|
|
Blackstone, Inc.
|
32,558
|
3,796,588
|
|
Blue Owl Capital, Inc. Class A
|
3,052
|
57,652
|
|
FactSet Research Systems, Inc.
|
1,754
|
731,225
|
|
Houlihan Lokey
|
151
|
19,251
|
|
KKR & Co. LP
|
7,428
|
691,324
|
|
LPL Financial
|
3,445
|
927,153
|
|
MarketAxess Holdings, Inc.
|
1,689
|
337,952
|
|
Moody's Corp.
|
6,613
|
2,448,992
|
|
Morningstar, Inc.
|
1,171
|
330,983
|
|
MSCI, Inc.
|
1,757
|
818,393
|
|
S&P Global, Inc.
|
1,199
|
498,580
|
|
TPG, Inc.
|
889
|
38,316
|
|
Tradeweb Markets, Inc. Class A
|
1,824
|
185,519
|
|
XP, Inc. Class A
|
1,121
|
22,947
|
|
13,804,411
|
|||
Consumer Finance - 0.2%
|
|||
American Express Co.
|
8,693
|
2,034,423
|
|
SLM Corp.
|
3,999
|
84,739
|
|
2,119,162
|
|||
Financial Services - 4.0%
|
|||
Apollo Global Management, Inc.
|
23,818
|
2,581,395
|
|
Block, Inc. Class A (a)
|
9,354
|
682,842
|
|
Corpay, Inc. (a)
|
2,978
|
899,773
|
|
Equitable Holdings, Inc.
|
15,316
|
565,314
|
|
Euronet Worldwide, Inc. (a)
|
1,033
|
106,068
|
|
Fiserv, Inc. (a)
|
7,482
|
1,142,277
|
|
Jack Henry & Associates, Inc.
|
1,040
|
169,198
|
|
MasterCard, Inc. Class A
|
37,929
|
17,113,565
|
|
PayPal Holdings, Inc. (a)
|
44,619
|
3,030,522
|
|
Rocket Companies, Inc. (a)(b)
|
1,803
|
22,141
|
|
Shift4 Payments, Inc. (a)(b)
|
2,471
|
142,972
|
|
The Western Union Co.
|
2,587
|
34,769
|
|
Toast, Inc. (a)
|
16,658
|
393,629
|
|
UWM Holdings Corp. Class A
|
1,354
|
8,530
|
|
Visa, Inc. Class A
|
72,867
|
19,572,805
|
|
WEX, Inc. (a)
|
902
|
190,557
|
|
46,656,357
|
|||
Insurance - 0.8%
|
|||
Arch Capital Group Ltd. (a)
|
2,271
|
212,429
|
|
Arthur J. Gallagher & Co.
|
540
|
126,733
|
|
Brighthouse Financial, Inc. (a)
|
275
|
13,269
|
|
Brown & Brown, Inc.
|
4,220
|
344,099
|
|
Everest Re Group Ltd.
|
268
|
98,198
|
|
Kinsale Capital Group, Inc.
|
1,001
|
363,613
|
|
Lincoln National Corp.
|
630
|
17,180
|
|
Marsh & McLennan Companies, Inc.
|
18,108
|
3,611,278
|
|
Primerica, Inc.
|
1,053
|
223,089
|
|
Progressive Corp.
|
19,988
|
4,162,501
|
|
RenaissanceRe Holdings Ltd.
|
634
|
139,005
|
|
RLI Corp.
|
384
|
54,278
|
|
Ryan Specialty Group Holdings, Inc.
|
4,405
|
217,343
|
|
Willis Towers Watson PLC
|
586
|
147,168
|
|
9,730,183
|
|||
TOTAL FINANCIALS
|
73,195,839
|
||
HEALTH CARE - 10.6%
|
|||
Biotechnology - 2.3%
|
|||
AbbVie, Inc.
|
80,601
|
13,108,947
|
|
Alnylam Pharmaceuticals, Inc. (a)
|
4,602
|
662,458
|
|
Amgen, Inc.
|
16,592
|
4,545,212
|
|
Apellis Pharmaceuticals, Inc. (a)
|
4,569
|
201,904
|
|
BioMarin Pharmaceutical, Inc. (a)
|
1,019
|
82,294
|
|
Exact Sciences Corp. (a)
|
2,837
|
168,376
|
|
Exelixis, Inc. (a)
|
10,385
|
243,632
|
|
Incyte Corp. (a)
|
6,223
|
323,907
|
|
Ionis Pharmaceuticals, Inc. (a)
|
5,601
|
231,097
|
|
Natera, Inc. (a)
|
4,984
|
462,914
|
|
Neurocrine Biosciences, Inc. (a)
|
4,410
|
606,551
|
|
Regeneron Pharmaceuticals, Inc. (a)
|
315
|
280,558
|
|
Repligen Corp. (a)
|
1,119
|
183,740
|
|
Roivant Sciences Ltd. (a)
|
15,824
|
172,482
|
|
Sarepta Therapeutics, Inc. (a)
|
4,074
|
516,013
|
|
Ultragenyx Pharmaceutical, Inc. (a)
|
3,605
|
153,357
|
|
Vertex Pharmaceuticals, Inc. (a)
|
10,764
|
4,228,207
|
|
26,171,649
|
|||
Health Care Equipment & Supplies - 1.6%
|
|||
Abbott Laboratories
|
4,997
|
529,532
|
|
Align Technology, Inc. (a)
|
3,475
|
981,271
|
|
DexCom, Inc. (a)
|
17,658
|
2,249,453
|
|
Edwards Lifesciences Corp. (a)
|
27,496
|
2,328,086
|
|
GE Healthcare Technologies, Inc.
|
1,447
|
110,319
|
|
Globus Medical, Inc. (a)(b)
|
1,499
|
74,635
|
|
IDEXX Laboratories, Inc. (a)
|
3,760
|
1,852,778
|
|
Inspire Medical Systems, Inc. (a)
|
1,319
|
318,750
|
|
Insulet Corp. (a)
|
3,168
|
544,706
|
|
Intuitive Surgical, Inc. (a)
|
15,953
|
5,912,501
|
|
Masimo Corp. (a)
|
1,961
|
263,578
|
|
Novocure Ltd. (a)
|
5,049
|
61,800
|
|
Penumbra, Inc. (a)
|
1,663
|
326,730
|
|
ResMed, Inc.
|
6,628
|
1,418,326
|
|
Shockwave Medical, Inc. (a)
|
1,655
|
546,464
|
|
Stryker Corp.
|
4,122
|
1,387,053
|
|
Tandem Diabetes Care, Inc. (a)
|
357
|
13,098
|
|
18,919,080
|
|||
Health Care Providers & Services - 2.1%
|
|||
agilon health, Inc. (a)(b)
|
12,631
|
69,471
|
|
Cardinal Health, Inc.
|
5,769
|
594,438
|
|
Cencora, Inc.
|
7,673
|
1,834,231
|
|
Chemed Corp.
|
482
|
273,776
|
|
Cigna Group
|
976
|
348,471
|
|
DaVita, Inc. (a)
|
2,466
|
342,799
|
|
Elevance Health, Inc.
|
1,442
|
762,212
|
|
Encompass Health Corp.
|
273
|
22,763
|
|
HCA Holdings, Inc.
|
1,874
|
580,603
|
|
Humana, Inc.
|
2,427
|
733,172
|
|
McKesson Corp.
|
2,312
|
1,242,030
|
|
Molina Healthcare, Inc. (a)
|
1,433
|
490,229
|
|
UnitedHealth Group, Inc.
|
35,707
|
17,271,476
|
|
24,565,671
|
|||
Health Care Technology - 0.1%
|
|||
Certara, Inc. (a)
|
1,812
|
31,003
|
|
Doximity, Inc. (a)
|
2,207
|
53,608
|
|
Veeva Systems, Inc. Class A (a)
|
6,613
|
1,313,077
|
|
1,397,688
|
|||
Life Sciences Tools & Services - 1.3%
|
|||
10X Genomics, Inc. (a)
|
4,150
|
121,512
|
|
Agilent Technologies, Inc.
|
10,848
|
1,486,610
|
|
Bio-Techne Corp.
|
6,738
|
425,909
|
|
Bruker Corp.
|
4,554
|
355,258
|
|
ICON PLC (a)
|
557
|
165,919
|
|
Illumina, Inc. (a)
|
2,143
|
263,696
|
|
IQVIA Holdings, Inc. (a)
|
7,702
|
1,785,093
|
|
Maravai LifeSciences Holdings, Inc. (a)
|
2,650
|
21,730
|
|
Medpace Holdings, Inc. (a)
|
1,062
|
412,428
|
|
Mettler-Toledo International, Inc. (a)
|
977
|
1,201,417
|
|
Sotera Health Co. (a)
|
3,735
|
41,832
|
|
Thermo Fisher Scientific, Inc.
|
10,857
|
6,174,593
|
|
Waters Corp. (a)
|
2,674
|
826,373
|
|
West Pharmaceutical Services, Inc.
|
3,378
|
1,207,567
|
|
14,489,937
|
|||
Pharmaceuticals - 3.2%
|
|||
Eli Lilly & Co.
|
38,655
|
30,193,421
|
|
Jazz Pharmaceuticals PLC (a)
|
1,460
|
161,695
|
|
Merck & Co., Inc.
|
21,343
|
2,757,942
|
|
Zoetis, Inc. Class A
|
21,140
|
3,366,334
|
|
36,479,392
|
|||
TOTAL HEALTH CARE
|
122,023,417
|
||
INDUSTRIALS - 5.7%
|
|||
Aerospace & Defense - 0.7%
|
|||
Axon Enterprise, Inc. (a)
|
3,213
|
1,007,790
|
|
BWX Technologies, Inc.
|
698
|
66,847
|
|
HEICO Corp.
|
1,803
|
373,942
|
|
HEICO Corp. Class A
|
3,396
|
563,227
|
|
Lockheed Martin Corp.
|
9,853
|
4,580,955
|
|
Northrop Grumman Corp.
|
365
|
177,036
|
|
Spirit AeroSystems Holdings, Inc. Class A (a)
|
729
|
23,328
|
|
The Boeing Co. (a)
|
3,521
|
590,965
|
|
TransDigm Group, Inc.
|
408
|
509,196
|
|
7,893,286
|
|||
Air Freight & Logistics - 0.1%
|
|||
C.H. Robinson Worldwide, Inc.
|
4,070
|
288,970
|
|
Expeditors International of Washington, Inc.
|
889
|
98,955
|
|
United Parcel Service, Inc. Class B
|
9,173
|
1,352,834
|
|
1,740,759
|
|||
Building Products - 0.2%
|
|||
A.O. Smith Corp.
|
651
|
53,929
|
|
Advanced Drain Systems, Inc.
|
3,072
|
482,304
|
|
Allegion PLC
|
3,705
|
450,380
|
|
Armstrong World Industries, Inc.
|
575
|
66,056
|
|
Trane Technologies PLC
|
3,058
|
970,426
|
|
Trex Co., Inc. (a)
|
4,976
|
440,625
|
|
2,463,720
|
|||
Commercial Services & Supplies - 0.8%
|
|||
Cintas Corp.
|
3,519
|
2,316,698
|
|
Copart, Inc.
|
39,152
|
2,126,345
|
|
MSA Safety, Inc.
|
312
|
56,285
|
|
RB Global, Inc.
|
6,348
|
454,390
|
|
Rollins, Inc.
|
11,634
|
518,411
|
|
Tetra Tech, Inc.
|
428
|
83,340
|
|
Waste Management, Inc.
|
16,686
|
3,471,022
|
|
9,026,491
|
|||
Construction & Engineering - 0.1%
|
|||
EMCOR Group, Inc.
|
734
|
262,163
|
|
Quanta Services, Inc.
|
1,728
|
446,792
|
|
Valmont Industries, Inc.
|
55
|
11,264
|
|
Willscot Mobile Mini Holdings (a)
|
2,174
|
80,351
|
|
800,570
|
|||
Electrical Equipment - 0.2%
|
|||
ChargePoint Holdings, Inc. Class A (a)(b)
|
15,619
|
20,773
|
|
Hubbell, Inc. Class B
|
1,114
|
412,759
|
|
Rockwell Automation, Inc.
|
5,247
|
1,421,727
|
|
Vertiv Holdings Co.
|
1,152
|
107,136
|
|
1,962,395
|
|||
Ground Transportation - 1.0%
|
|||
Avis Budget Group, Inc.
|
295
|
28,158
|
|
CSX Corp.
|
9,981
|
331,569
|
|
J.B. Hunt Transport Services, Inc.
|
756
|
122,903
|
|
Landstar System, Inc.
|
1,293
|
225,512
|
|
Lyft, Inc. (a)
|
15,796
|
247,049
|
|
Old Dominion Freight Lines, Inc.
|
8,383
|
1,523,275
|
|
Saia, Inc. (a)
|
139
|
55,159
|
|
U-Haul Holding Co. (a)(b)
|
332
|
20,992
|
|
U-Haul Holding Co. (non-vtg.)
|
1,565
|
95,966
|
|
Uber Technologies, Inc. (a)
|
89,883
|
5,956,546
|
|
Union Pacific Corp.
|
11,915
|
2,825,761
|
|
11,432,890
|
|||
Industrial Conglomerates - 0.1%
|
|||
Honeywell International, Inc.
|
3,924
|
756,273
|
|
Machinery - 1.3%
|
|||
Allison Transmission Holdings, Inc.
|
355
|
26,110
|
|
Caterpillar, Inc.
|
17,480
|
5,848,284
|
|
Deere & Co.
|
11,006
|
4,307,858
|
|
Donaldson Co., Inc.
|
2,266
|
163,605
|
|
Graco, Inc.
|
3,120
|
250,224
|
|
IDEX Corp.
|
279
|
61,508
|
|
Illinois Tool Works, Inc.
|
11,143
|
2,720,118
|
|
Lincoln Electric Holdings, Inc.
|
2,376
|
521,603
|
|
Otis Worldwide Corp.
|
1,132
|
103,238
|
|
Toro Co.
|
4,790
|
419,556
|
|
Xylem, Inc.
|
1,276
|
166,773
|
|
14,588,877
|
|||
Passenger Airlines - 0.0%
|
|||
American Airlines Group, Inc. (a)
|
10,853
|
146,624
|
|
Delta Air Lines, Inc.
|
1,458
|
73,002
|
|
219,626
|
|||
Professional Services - 0.9%
|
|||
Automatic Data Processing, Inc.
|
16,200
|
3,918,618
|
|
Booz Allen Hamilton Holding Corp. Class A
|
5,842
|
862,688
|
|
Broadridge Financial Solutions, Inc.
|
4,469
|
864,349
|
|
Dayforce, Inc. (a)(b)
|
677
|
41,547
|
|
Equifax, Inc.
|
3,842
|
845,970
|
|
FTI Consulting, Inc. (a)
|
306
|
65,432
|
|
Genpact Ltd.
|
2,166
|
66,583
|
|
KBR, Inc.
|
2,203
|
143,063
|
|
Paychex, Inc.
|
14,701
|
1,746,626
|
|
Paycom Software, Inc.
|
2,339
|
439,685
|
|
Paycor HCM, Inc. (a)
|
1,248
|
21,678
|
|
Paylocity Holding Corp. (a)
|
1,935
|
300,235
|
|
Verisk Analytics, Inc.
|
6,511
|
1,419,138
|
|
10,735,612
|
|||
Trading Companies & Distributors - 0.3%
|
|||
Fastenal Co.
|
19,510
|
1,325,509
|
|
Ferguson PLC
|
509
|
106,839
|
|
SiteOne Landscape Supply, Inc. (a)
|
646
|
101,351
|
|
United Rentals, Inc.
|
632
|
422,170
|
|
W.W. Grainger, Inc.
|
2,015
|
1,856,520
|
|
Watsco, Inc.
|
379
|
169,686
|
|
3,982,075
|
|||
TOTAL INDUSTRIALS
|
65,602,574
|
||
INFORMATION TECHNOLOGY - 43.5%
|
|||
Communications Equipment - 0.5%
|
|||
Arista Networks, Inc. (a)
|
11,450
|
2,937,612
|
|
Motorola Solutions, Inc.
|
6,943
|
2,354,718
|
|
Ubiquiti, Inc. (b)
|
144
|
15,492
|
|
5,307,822
|
|||
Electronic Equipment, Instruments & Components - 0.3%
|
|||
Amphenol Corp. Class A
|
13,382
|
1,616,144
|
|
CDW Corp.
|
5,808
|
1,404,723
|
|
Jabil, Inc.
|
3,581
|
420,266
|
|
Keysight Technologies, Inc. (a)
|
2,029
|
300,170
|
|
Vontier Corp.
|
2,442
|
99,218
|
|
Zebra Technologies Corp. Class A (a)
|
422
|
132,744
|
|
3,973,265
|
|||
IT Services - 1.4%
|
|||
Accenture PLC Class A
|
28,861
|
8,684,564
|
|
Cloudflare, Inc. (a)
|
13,417
|
1,172,646
|
|
EPAM Systems, Inc. (a)
|
2,539
|
597,325
|
|
Gartner, Inc. (a)
|
3,450
|
1,423,436
|
|
Globant SA (a)
|
1,887
|
336,999
|
|
GoDaddy, Inc. (a)
|
3,895
|
476,670
|
|
MongoDB, Inc. Class A (a)
|
3,083
|
1,125,850
|
|
Okta, Inc. (a)
|
458
|
42,585
|
|
Snowflake, Inc. (a)
|
14,355
|
2,227,896
|
|
Twilio, Inc. Class A (a)
|
1,335
|
79,940
|
|
VeriSign, Inc. (a)
|
198
|
33,557
|
|
16,201,468
|
|||
Semiconductors & Semiconductor Equipment - 13.6%
|
|||
Advanced Micro Devices, Inc. (a)
|
41,658
|
6,597,794
|
|
Allegro MicroSystems LLC (a)(b)
|
3,424
|
101,659
|
|
Applied Materials, Inc.
|
32,246
|
6,405,668
|
|
Broadcom, Inc.
|
19,692
|
25,604,917
|
|
Enphase Energy, Inc. (a)
|
6,070
|
660,173
|
|
Entegris, Inc.
|
392
|
52,105
|
|
KLA Corp.
|
6,174
|
4,255,676
|
|
Lam Research Corp.
|
5,691
|
5,090,087
|
|
Lattice Semiconductor Corp. (a)
|
6,249
|
428,681
|
|
Microchip Technology, Inc.
|
17,288
|
1,590,150
|
|
Monolithic Power Systems, Inc.
|
2,097
|
1,403,585
|
|
NVIDIA Corp.
|
108,535
|
93,776,411
|
|
Qualcomm, Inc.
|
44,432
|
7,369,047
|
|
Teradyne, Inc. (b)
|
5,867
|
682,449
|
|
Texas Instruments, Inc.
|
16,914
|
2,983,968
|
|
Universal Display Corp.
|
951
|
150,239
|
|
157,152,609
|
|||
Software - 17.7%
|
|||
Adobe, Inc. (a)
|
20,623
|
9,544,943
|
|
ANSYS, Inc. (a)
|
3,273
|
1,063,332
|
|
AppLovin Corp. (a)
|
2,382
|
168,098
|
|
Atlassian Corp. PLC (a)
|
7,077
|
1,219,367
|
|
Autodesk, Inc. (a)
|
9,811
|
2,088,271
|
|
Bentley Systems, Inc. Class B
|
8,263
|
434,055
|
|
Cadence Design Systems, Inc. (a)
|
12,344
|
3,402,377
|
|
Confluent, Inc. (a)
|
8,719
|
245,178
|
|
Crowdstrike Holdings, Inc. (a)
|
9,743
|
2,850,217
|
|
Datadog, Inc. Class A (a)
|
12,712
|
1,595,356
|
|
DocuSign, Inc. (a)
|
9,213
|
521,456
|
|
DoubleVerify Holdings, Inc. (a)
|
6,323
|
185,264
|
|
Dropbox, Inc. Class A (a)
|
10,246
|
237,297
|
|
Dynatrace, Inc. (a)
|
11,751
|
532,438
|
|
Elastic NV (a)
|
3,672
|
375,352
|
|
Fair Isaac Corp. (a)
|
1,107
|
1,254,596
|
|
Five9, Inc. (a)
|
3,251
|
187,160
|
|
Fortinet, Inc. (a)
|
29,366
|
1,855,344
|
|
Gen Digital, Inc.
|
3,993
|
80,419
|
|
GitLab, Inc. (a)
|
4,159
|
218,223
|
|
HashiCorp, Inc. (a)
|
3,090
|
100,301
|
|
HubSpot, Inc. (a)
|
2,116
|
1,279,905
|
|
Informatica, Inc. (a)
|
136
|
4,212
|
|
Intuit, Inc.
|
12,478
|
7,806,486
|
|
Manhattan Associates, Inc. (a)
|
2,807
|
578,410
|
|
Microsoft Corp.
|
339,946
|
132,351,180
|
|
nCino, Inc. (a)
|
256
|
7,465
|
|
Nutanix, Inc. Class A (a)
|
2,725
|
165,408
|
|
Oracle Corp.
|
28,967
|
3,294,996
|
|
Palantir Technologies, Inc. (a)
|
87,894
|
1,931,031
|
|
Palo Alto Networks, Inc. (a)
|
13,941
|
4,055,297
|
|
Pegasystems, Inc.
|
1,925
|
114,384
|
|
Procore Technologies, Inc. (a)
|
3,598
|
246,175
|
|
PTC, Inc. (a)
|
2,733
|
484,944
|
|
RingCentral, Inc. (a)
|
3,887
|
115,133
|
|
Salesforce, Inc.
|
32,231
|
8,668,205
|
|
SentinelOne, Inc. (a)
|
1,532
|
32,371
|
|
ServiceNow, Inc. (a)
|
9,299
|
6,447,276
|
|
Smartsheet, Inc. (a)
|
5,866
|
221,911
|
|
Synopsys, Inc. (a)
|
6,937
|
3,680,703
|
|
Teradata Corp. (a)
|
4,395
|
163,055
|
|
Tyler Technologies, Inc. (a)
|
1,439
|
664,170
|
|
UiPath, Inc. Class A (a)
|
13,319
|
252,661
|
|
Unity Software, Inc. (a)(b)
|
5,221
|
126,714
|
|
Workday, Inc. Class A (a)
|
9,163
|
2,242,461
|
|
Zscaler, Inc. (a)
|
4,047
|
699,888
|
|
203,793,485
|
|||
Technology Hardware, Storage & Peripherals - 10.0%
|
|||
Apple, Inc.
|
666,161
|
113,467,203
|
|
HP, Inc.
|
8,093
|
227,332
|
|
NetApp, Inc.
|
3,742
|
382,470
|
|
Pure Storage, Inc. Class A (a)
|
10,264
|
517,306
|
|
114,594,311
|
|||
TOTAL INFORMATION TECHNOLOGY
|
501,022,960
|
||
MATERIALS - 0.7%
|
|||
Chemicals - 0.5%
|
|||
Axalta Coating Systems Ltd. (a)
|
1,257
|
39,520
|
|
Ecolab, Inc.
|
8,821
|
1,994,869
|
|
FMC Corp.
|
815
|
48,093
|
|
Ginkgo Bioworks Holdings, Inc. Class A (a)(b)
|
5,792
|
5,161
|
|
Linde PLC
|
2,082
|
918,079
|
|
PPG Industries, Inc.
|
2,697
|
347,913
|
|
RPM International, Inc.
|
1,129
|
120,701
|
|
Sherwin-Williams Co.
|
9,046
|
2,710,272
|
|
The Scotts Miracle-Gro Co. Class A (b)
|
1,949
|
133,584
|
|
6,318,192
|
|||
Construction Materials - 0.1%
|
|||
Eagle Materials, Inc.
|
1,016
|
254,721
|
|
Vulcan Materials Co.
|
1,325
|
341,360
|
|
596,081
|
|||
Containers & Packaging - 0.1%
|
|||
Ardagh Metal Packaging SA
|
5,484
|
21,662
|
|
Avery Dennison Corp.
|
1,234
|
268,124
|
|
Graphic Packaging Holding Co. (b)
|
7,307
|
188,886
|
|
Sealed Air Corp.
|
3,638
|
114,524
|
|
593,196
|
|||
Metals & Mining - 0.0%
|
|||
Southern Copper Corp. (b)
|
3,873
|
451,863
|
|
TOTAL MATERIALS
|
7,959,332
|
||
REAL ESTATE - 0.8%
|
|||
Equity Real Estate Investment Trusts (REITs) - 0.7%
|
|||
American Tower Corp.
|
21,272
|
3,649,424
|
|
Crown Castle, Inc.
|
2,062
|
193,374
|
|
Equinix, Inc.
|
2,141
|
1,522,487
|
|
Equity Lifestyle Properties, Inc.
|
2,676
|
161,336
|
|
Iron Mountain, Inc.
|
6,550
|
507,756
|
|
Lamar Advertising Co. Class A
|
3,064
|
354,964
|
|
Public Storage
|
4,163
|
1,080,090
|
|
SBA Communications Corp. Class A
|
479
|
89,151
|
|
Simon Property Group, Inc.
|
3,239
|
455,177
|
|
Sun Communities, Inc.
|
1,244
|
138,482
|
|
UDR, Inc.
|
748
|
28,484
|
|
8,180,725
|
|||
Real Estate Management & Development - 0.1%
|
|||
CoStar Group, Inc. (a)
|
7,913
|
724,277
|
|
TOTAL REAL ESTATE
|
8,905,002
|
||
UTILITIES - 0.0%
|
|||
Independent Power and Renewable Electricity Producers - 0.0%
|
|||
The AES Corp.
|
18,480
|
330,792
|
|
Vistra Corp.
|
4,702
|
356,600
|
|
687,392
|
|||
|
TOTAL COMMON STOCKS
(Cost $719,015,948)
|
1,148,697,522
|
||
U.S. Treasury Obligations - 0.0%
|
|||
Principal
Amount (c)
|
Value ($)
|
||
U.S. Treasury Bills, yield at date of purchase 5.3% 5/23/24 (d)
(Cost $398,720)
|
400,000
|
398,709
|
|
Money Market Funds - 0.7%
|
|||
Shares
|
Value ($)
|
||
Fidelity Cash Central Fund 5.39% (e)
|
5,301,114
|
5,302,174
|
|
Fidelity Securities Lending Cash Central Fund 5.39% (e)(f)
|
2,567,051
|
2,567,307
|
|
|
TOTAL MONEY MARKET FUNDS
(Cost $7,869,481)
|
7,869,481
|
||
|
TOTAL INVESTMENT IN SECURITIES - 100.4%
(Cost $727,284,149)
|
1,156,965,712
|
NET OTHER ASSETS (LIABILITIES) - (0.4)%
|
(4,995,497)
|
NET ASSETS - 100.0%
|
1,151,970,215
|
Futures Contracts
|
|||||
Number
of contracts
|
Expiration
Date
|
Notional
Amount ($)
|
Value ($)
|
Unrealized
Appreciation/
(Depreciation) ($)
|
|
Purchased
|
|||||
Equity Index Contracts
|
|||||
CME E-mini NASDAQ 100 Index Contracts (United States)
|
7
|
Jun 2024
|
2,459,975
|
31,737
|
31,737
|
CME E-mini S&P 500 Index Contracts (United States)
|
2
|
Jun 2024
|
506,700
|
4,544
|
4,544
|
TOTAL FUTURES CONTRACTS
|
36,281
|
||||
The notional amount of futures purchased as a percentage of Net Assets is 0.3%
|
|||||
(a)
|
Non-income producing
|
(b)
|
Security or a portion of the security is on loan at period end.
|
(c)
|
Amount is stated in United States dollars unless otherwise noted.
|
(d)
|
Security or a portion of the security was pledged to cover margin requirements for futures contracts. At period end, the value of securities pledged amounted to $144,532.
|
(e)
|
Affiliated fund that is generally available only to investment companies and other accounts managed by Fidelity Investments. The rate quoted is the annualized seven-day yield of the fund at period end. A complete unaudited listing of the fund's holdings as of its most recent quarter end is available upon request. In addition, each Fidelity Central Fund's financial statements, which are not covered by the Fund's Report of Independent Registered Public Accounting Firm, are available on the SEC's website or upon request.
|
(f)
|
Investment made with cash collateral received from securities on loan.
|
Affiliate
|
Value,
beginning
of period ($)
|
Purchases ($)
|
Sales
Proceeds ($)
|
Dividend
Income ($)
|
Realized
Gain (loss) ($)
|
Change in
Unrealized
appreciation
(depreciation) ($)
|
Value,
end
of period ($)
|
% ownership,
end
of period
|
Fidelity Cash Central Fund 5.39%
|
3,178,341
|
208,896,906
|
206,772,612
|
185,153
|
(461)
|
-
|
5,302,174
|
0.0%
|
Fidelity Securities Lending Cash Central Fund 5.39%
|
6,762,987
|
48,674,721
|
52,870,401
|
14,679
|
-
|
-
|
2,567,307
|
0.0%
|
Total
|
9,941,328
|
257,571,627
|
259,643,013
|
199,832
|
(461)
|
-
|
7,869,481
|
|
Valuation Inputs at Reporting Date:
|
||||
Description
|
Total ($)
|
Level 1 ($)
|
Level 2 ($)
|
Level 3 ($)
|
Investments in Securities:
|
||||
Equities:
|
||||
Communication Services
|
143,651,483
|
143,651,483
|
-
|
-
|
Consumer Discretionary
|
172,516,630
|
172,516,630
|
-
|
-
|
Consumer Staples
|
47,430,570
|
47,430,570
|
-
|
-
|
Energy
|
5,702,323
|
5,702,323
|
-
|
-
|
Financials
|
73,195,839
|
73,195,839
|
-
|
-
|
Health Care
|
122,023,417
|
122,023,417
|
-
|
-
|
Industrials
|
65,602,574
|
65,602,574
|
-
|
-
|
Information Technology
|
501,022,960
|
501,022,960
|
-
|
-
|
Materials
|
7,959,332
|
7,959,332
|
-
|
-
|
Real Estate
|
8,905,002
|
8,905,002
|
-
|
-
|
Utilities
|
687,392
|
687,392
|
-
|
-
|
U.S. Government and Government Agency Obligations
|
398,709
|
-
|
398,709
|
-
|
Money Market Funds
|
7,869,481
|
7,869,481
|
-
|
-
|
Total Investments in Securities:
|
1,156,965,712
|
1,156,567,003
|
398,709
|
-
|
Derivative Instruments:
Assets
|
||||
Futures Contracts
|
36,281
|
36,281
|
-
|
-
|
Total Assets
|
36,281
|
36,281
|
-
|
-
|
Total Derivative Instruments:
|
36,281
|
36,281
|
-
|
-
|
Primary Risk Exposure / Derivative Type
|
Value
|
|
Asset ($)
|
Liability ($)
|
|
Equity Risk
|
||
Futures Contracts (a)
|
36,281
|
0
|
Total Equity Risk
|
36,281
|
0
|
Total Value of Derivatives
|
36,281
|
0
|
Statement of Assets and Liabilities
|
||||
April 30, 2024
|
||||
Assets
|
||||
Investment in securities, at value (including securities loaned of $2,451,146) - See accompanying schedule:
|
||||
Unaffiliated issuers (cost $719,414,668)
|
$
|
1,149,096,231
|
||
Fidelity Central Funds (cost $7,869,481)
|
7,869,481
|
|||
Total Investment in Securities (cost $727,284,149)
|
$
|
1,156,965,712
|
||
Receivable for fund shares sold
|
5,085,105
|
|||
Dividends receivable
|
381,250
|
|||
Distributions receivable from Fidelity Central Funds
|
24,136
|
|||
Total assets
|
1,162,456,203
|
|||
Liabilities
|
||||
Payable for investments purchased
|
$
|
7,521,408
|
||
Payable for fund shares redeemed
|
323,961
|
|||
Payable for daily variation margin on futures contracts
|
53,222
|
|||
Payable to investment adviser
|
659
|
|||
Other payables and accrued expenses
|
19,438
|
|||
Collateral on securities loaned
|
2,567,300
|
|||
Total liabilities
|
10,485,988
|
|||
Net Assets
|
$
|
1,151,970,215
|
||
Net Assets consist of:
|
||||
Paid in capital
|
$
|
750,396,888
|
||
Total accumulated earnings (loss)
|
401,573,327
|
|||
Net Assets
|
$
|
1,151,970,215
|
||
Net Asset Value, offering price and redemption price per share ($1,151,970,215 ÷ 56,370,848 shares)
|
$
|
20.44
|
||
Statement of Operations
|
||||
Year ended
April 30, 2024
|
||||
Investment Income
|
||||
Dividends
|
$
|
7,780,851
|
||
Interest
|
20,760
|
|||
Income from Fidelity Central Funds (including $14,679 from security lending)
|
199,832
|
|||
Total income
|
8,001,443
|
|||
Expenses
|
||||
Custodian fees and expenses
|
$
|
33,276
|
||
Independent trustees' fees and expenses
|
2,869
|
|||
Interest
|
8,169
|
|||
Miscellaneous
|
23
|
|||
Total expenses before reductions
|
44,337
|
|||
Expense reductions
|
(4,623)
|
|||
Total expenses after reductions
|
39,714
|
|||
Net Investment income (loss)
|
7,961,729
|
|||
Realized and Unrealized Gain (Loss)
|
||||
Net realized gain (loss) on:
|
||||
Investment Securities:
|
||||
Unaffiliated issuers
|
5,685,689
|
|||
Fidelity Central Funds
|
(461)
|
|||
Foreign currency transactions
|
2,375
|
|||
Futures contracts
|
719,652
|
|||
Total net realized gain (loss)
|
6,407,255
|
|||
Change in net unrealized appreciation (depreciation) on:
|
||||
Investment Securities:
|
||||
Unaffiliated issuers
|
242,977,512
|
|||
Futures contracts
|
(178,451)
|
|||
Total change in net unrealized appreciation (depreciation)
|
242,799,061
|
|||
Net gain (loss)
|
249,206,316
|
|||
Net increase (decrease) in net assets resulting from operations
|
$
|
257,168,045
|
||
Statement of Changes in Net Assets
|
||||
Year ended
April 30, 2024
|
Year ended
April 30, 2023
|
|||
Increase (Decrease) in Net Assets
|
||||
Operations
|
||||
Net investment income (loss)
|
$
|
7,961,729
|
$
|
7,346,267
|
Net realized gain (loss)
|
6,407,255
|
(27,475,900)
|
||
Change in net unrealized appreciation (depreciation)
|
242,799,061
|
52,730,630
|
||
Net increase (decrease) in net assets resulting from operations
|
257,168,045
|
32,600,997
|
||
Distributions to shareholders
|
(8,147,076)
|
(9,239,181)
|
||
Share transactions
|
||||
Proceeds from sales of shares
|
292,824,105
|
297,407,219
|
||
Reinvestment of distributions
|
8,147,076
|
9,239,181
|
||
Cost of shares redeemed
|
(211,591,405)
|
(159,930,900)
|
||
Net increase (decrease) in net assets resulting from share transactions
|
89,379,776
|
146,715,500
|
||
Total increase (decrease) in net assets
|
338,400,745
|
170,077,316
|
||
Net Assets
|
||||
Beginning of period
|
813,569,470
|
643,492,154
|
||
End of period
|
$
|
1,151,970,215
|
$
|
813,569,470
|
Other Information
|
||||
Shares
|
||||
Sold
|
15,607,253
|
20,607,506
|
||
Issued in reinvestment of distributions
|
447,053
|
647,458
|
||
Redeemed
|
(11,738,549)
|
(10,783,270)
|
||
Net increase (decrease)
|
4,315,757
|
10,471,694
|
||
Fidelity® Series Large Cap Growth Index Fund |
Years ended April 30,
|
2024
|
2023
|
2022
|
2021
|
2020
|
|||||
Selected Per-Share Data
|
||||||||||
Net asset value, beginning of period
|
$
|
15.63
|
$
|
15.47
|
$
|
16.85
|
$
|
11.52
|
$
|
10.54
|
Income from Investment Operations
|
||||||||||
Net investment income (loss) A,B
|
.15
|
.15
|
.13
|
.12
|
.14
|
|||||
Net realized and unrealized gain (loss)
|
4.82
|
.20
|
(.92)
|
5.67
|
.99
|
|||||
Total from investment operations
|
4.97
|
.35
|
(.79)
|
5.79
|
1.13
|
|||||
Distributions from net investment income
|
(.16)
|
(.13)
|
(.12)
|
(.13)
|
(.10)
|
|||||
Distributions from net realized gain
|
-
|
(.06)
|
(.46)
|
(.33)
|
(.05)
|
|||||
Total distributions
|
(.16)
|
(.19)
|
(.59) C
|
(.46)
|
(.15)
|
|||||
Net asset value, end of period
|
$
|
20.44
|
$
|
15.63
|
$
|
15.47
|
$
|
16.85
|
$
|
11.52
|
Total Return D
|
31.91 % |
2.39%
|
(5.34)%
|
51.21%
|
10.77%
|
|||||
Ratios to Average Net Assets B,E,F
|
||||||||||
Expenses before reductions
|
-% G
|
.01%
|
.01%
|
.01%
|
.01%
|
|||||
Expenses net of fee waivers, if any
|
- % G |
-% G
|
-% G
|
-% G
|
.01%
|
|||||
Expenses net of all reductions
|
-% G
|
-% G
|
-% G
|
-% G
|
.01%
|
|||||
Net investment income (loss)
|
.83%
|
1.04%
|
.73%
|
.85%
|
1.24%
|
|||||
Supplemental Data
|
||||||||||
Net assets, end of period (000 omitted)
|
$
|
1,151,970
|
$
|
813,569
|
$
|
643,492
|
$
|
546,009
|
$
|
297,828
|
Portfolio turnover rate H
|
28 % |
29%
|
40%
|
40%
|
45%
|
Fidelity Central Fund
|
Investment Manager
|
Investment Objective
|
Investment Practices
|
Expense RatioA
|
Fidelity Money Market Central Funds
|
Fidelity Management & Research Company LLC (FMR)
|
Each fund seeks to obtain a high level of current income consistent with the preservation of capital and liquidity.
|
Short-term Investments
|
Less than .005%
|
Gross unrealized appreciation
|
$445,566,713
|
Gross unrealized depreciation
|
(24,565,087)
|
Net unrealized appreciation (depreciation)
|
$421,001,626
|
Tax Cost
|
$735,964,086
|
Undistributed tax-exempt income
|
$2,066,302
|
Undistributed ordinary income
|
$(21,494,601)
|
Net unrealized appreciation (depreciation) on securities and other investments
|
$421,001,626
|
Short-term
|
$(11,219,782)
|
Long-term
|
(10,274,819)
|
Total capital loss carryforward
|
$(21,494,601)
|
April 30, 2024
|
April 30, 2023
|
|
Ordinary Income
|
$8,147,076
|
$8,198,918
|
Long-term Capital Gains
|
-
|
1,040,263
|
Total
|
$8,147,076
|
$9,239,181
|
Equity Risk
|
Equity risk relates to the fluctuations in the value of financial instruments as a result of changes in market prices (other than those arising from interest rate risk or foreign exchange risk), whether caused by factors specific to an individual investment, its issuer, or all factors affecting all instruments traded in a market or market segment.
|
Purchases ($)
|
Sales ($)
|
|
Fidelity Series Large Cap Growth Index Fund
|
361,411,661
|
267,318,706
|
Borrower or Lender
|
Average Loan Balance ($)
|
Weighted Average Interest Rate
|
Interest Expense ($)
|
|
Fidelity Series Large Cap Growth Index Fund
|
Borrower
|
18,323,667
|
5.35%
|
8,169
|
Total Security Lending Fees Paid to NFS ($)
|
Security Lending Income From Securities Loaned to NFS ($)
|
Value of Securities Loaned to NFS at Period End ($)
|
|
Fidelity Series Large Cap Growth Index Fund
|
1,392
|
2,349
|
-
|
The Example is based on an investment of $1,000 invested at the beginning of the period and held for the entire period (November 1, 2023 to April 30, 2024).
|
Annualized Expense Ratio- A
|
Beginning Account Value November 1, 2023
|
Ending Account Value April 30, 2024
|
Expenses Paid During Period- C November 1, 2023 to April 30, 2024
|
|||||||
Fidelity® Series Large Cap Growth Index Fund
|
-%-D
|
|||||||||
Actual
|
$ 1,000
|
$ 1,236.80
|
$-E
|
|||||||
Hypothetical-B
|
$ 1,000
|
$ 1,024.86
|
$-E
|
|||||||
A special meeting of shareholders was held on October 18, 2023. The results of votes taken among shareholders on the proposal before them are reported below. Each vote reported represents one dollar of net asset value held on the record date for the meeting.
|
||
Proposal 1
|
||
To elect a Board of Trustees.
|
||
# of
Votes
|
% of
Votes
|
|
Abigail P. Johnson
|
||
Affirmative
|
378,729,502,260.01
|
97.58
|
Withheld
|
9,407,876,478.96
|
2.42
|
TOTAL
|
388,137,378,738.97
|
100.00
|
Jennifer Toolin McAuliffe
|
||
Affirmative
|
378,454,868,010.95
|
97.51
|
Withheld
|
9,682,510,728.02
|
2.49
|
TOTAL
|
388,137,378,738.97
|
100.00
|
Christine J. Thompson
|
||
Affirmative
|
378,837,121,274.52
|
97.60
|
Withheld
|
9,300,257,464.45
|
2.40
|
TOTAL
|
388,137,378,738.97
|
100.00
|
Elizabeth S. Acton
|
||
Affirmative
|
378,262,110,794.85
|
97.46
|
Withheld
|
9,875,267,944.12
|
2.54
|
TOTAL
|
388,137,378,738.97
|
100.00
|
Laura M. Bishop
|
||
Affirmative
|
380,482,113,171.06
|
98.03
|
Withheld
|
7,655,265,567.91
|
1.97
|
TOTAL
|
388,137,378,738.97
|
100.00
|
Ann E. Dunwoody
|
||
Affirmative
|
380,016,034,008.12
|
97.91
|
Withheld
|
8,121,344,730.85
|
2.09
|
TOTAL
|
388,137,378,738.97
|
100.00
|
John Engler
|
||
Affirmative
|
379,432,488,394.20
|
97.76
|
Withheld
|
8,704,890,344.77
|
2.24
|
TOTAL
|
388,137,378,738.97
|
100.00
|
Robert F. Gartland
|
||
Affirmative
|
378,741,819,600.60
|
97.58
|
Withheld
|
9,395,559,138.37
|
2.42
|
TOTAL
|
388,137,378,738.97
|
100.00
|
Robert W. Helm
|
||
Affirmative
|
380,389,324,755.07
|
98.00
|
Withheld
|
7,748,053,983.90
|
2.00
|
TOTAL
|
388,137,378,738.97
|
100.00
|
Arthur E. Johnson
|
||
Affirmative
|
378,427,694,151.67
|
97.50
|
Withheld
|
9,709,684,587.30
|
2.50
|
TOTAL
|
388,137,378,738.97
|
100.00
|
Michael E. Kenneally
|
||
Affirmative
|
377,842,228,145.18
|
97.35
|
Withheld
|
10,295,150,593.79
|
2.65
|
TOTAL
|
388,137,378,738.97
|
100.00
|
Mark A. Murray
|
||
Affirmative
|
380,158,432,703.37
|
97.94
|
Withheld
|
7,978,946,035.60
|
2.06
|
TOTAL
|
388,137,378,738.97
|
100.00
|
Carol J. Zierhoffer
|
||
Affirmative
|
380,522,113,360.24
|
98.04
|
Withheld
|
7,615,265,378.73
|
1.96
|
TOTAL
|
388,137,378,738.97
|
100.00
|
Proposal 1 reflects trust-wide proposal and voting results.
|
||
 |


Contents
Average Annual Total Returns
|
|||
Periods ended April 30, 2024
|
Past 1
year
|
Past 5
years
|
Life of
Fund A
|
Fidelity® Large Cap Growth Index Fund
|
31.85%
|
16.45%
|
17.07%
|
$10,000 Over Life of Fund
|
Let's say hypothetically that $10,000 was invested in Fidelity® Large Cap Growth Index Fund, on June 7, 2016, when the fund started.
The chart shows how the value of your investment would have changed, and also shows how the Russell 1000® Growth Index performed over the same period.
|
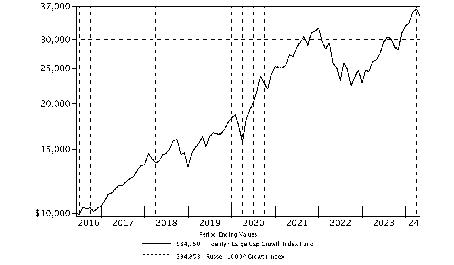
|
Top Holdings (% of Fund's net assets)
|
||
Microsoft Corp.
|
11.5
|
|
Apple, Inc.
|
9.8
|
|
NVIDIA Corp.
|
8.1
|
|
Amazon.com, Inc.
|
6.3
|
|
Alphabet, Inc. Class A
|
3.8
|
|
Meta Platforms, Inc. Class A
|
3.8
|
|
Alphabet, Inc. Class C
|
3.3
|
|
Eli Lilly & Co.
|
2.6
|
|
Broadcom, Inc.
|
2.2
|
|
Tesla, Inc.
|
2.0
|
|
53.4
|
||
Market Sectors (% of Fund's net assets)
|
||
Information Technology
|
43.5
|
|
Consumer Discretionary
|
15.0
|
|
Communication Services
|
12.5
|
|
Health Care
|
10.6
|
|
Financials
|
6.3
|
|
Industrials
|
5.7
|
|
Consumer Staples
|
4.1
|
|
Real Estate
|
0.8
|
|
Materials
|
0.7
|
|
Energy
|
0.5
|
|
Utilities
|
0.0
|
|
Asset Allocation (% of Fund's net assets)
|

|
Futures - 0.3%
|
Common Stocks - 99.7%
|
|||
Shares
|
Value ($)
|
||
COMMUNICATION SERVICES - 12.5%
|
|||
Diversified Telecommunication Services - 0.0%
|
|||
Iridium Communications, Inc.
|
100,515
|
3,094,857
|
|
Entertainment - 1.2%
|
|||
Live Nation Entertainment, Inc. (a)
|
31,004
|
2,756,566
|
|
Netflix, Inc. (a)
|
374,170
|
206,032,969
|
|
Playtika Holding Corp.
|
17,382
|
126,020
|
|
Roblox Corp. (a)
|
411,652
|
14,638,345
|
|
Roku, Inc. Class A (a)
|
13,535
|
780,428
|
|
Spotify Technology SA (a)
|
122,800
|
34,438,032
|
|
TKO Group Holdings, Inc.
|
54,105
|
5,122,120
|
|
263,894,480
|
|||
Interactive Media & Services - 11.0%
|
|||
Alphabet, Inc.:
|
|||
Class A
|
5,208,789
|
847,886,673
|
|
Class C
|
4,399,537
|
724,339,772
|
|
Match Group, Inc. (a)
|
214,021
|
6,596,127
|
|
Meta Platforms, Inc. Class A
|
1,938,772
|
834,001,551
|
|
Pinterest, Inc. Class A (a)
|
512,627
|
17,147,373
|
|
Zoominfo Technologies, Inc. (a)
|
136,216
|
2,160,386
|
|
2,432,131,882
|
|||
Media - 0.3%
|
|||
Cable One, Inc. (b)
|
344
|
135,484
|
|
Charter Communications, Inc. Class A (a)
|
88,245
|
22,585,425
|
|
Liberty Broadband Corp.:
|
|||
Class A (a)
|
3,084
|
154,601
|
|
Class C (a)
|
20,926
|
1,040,650
|
|
Nexstar Media Group, Inc. Class A
|
9,713
|
1,554,663
|
|
The Trade Desk, Inc. (a)
|
386,052
|
31,984,408
|
|
57,455,231
|
|||
TOTAL COMMUNICATION SERVICES
|
2,756,576,450
|
||
CONSUMER DISCRETIONARY - 15.0%
|
|||
Automobiles - 2.0%
|
|||
Tesla, Inc. (a)
|
2,418,450
|
443,253,516
|
|
Broadline Retail - 6.4%
|
|||
Amazon.com, Inc. (a)
|
7,897,037
|
1,381,981,475
|
|
Coupang, Inc. Class A (a)
|
959,680
|
21,592,800
|
|
eBay, Inc.
|
28,137
|
1,450,181
|
|
Etsy, Inc. (a)
|
58,529
|
4,019,186
|
|
Ollie's Bargain Outlet Holdings, Inc. (a)
|
17,358
|
1,269,564
|
|
1,410,313,206
|
|||
Distributors - 0.1%
|
|||
Pool Corp.
|
33,271
|
12,061,736
|
|
Diversified Consumer Services - 0.0%
|
|||
Bright Horizons Family Solutions, Inc. (a)
|
6,199
|
642,898
|
|
Grand Canyon Education, Inc. (a)
|
7,283
|
946,936
|
|
H&R Block, Inc.
|
81,414
|
3,845,183
|
|
Service Corp. International
|
45,739
|
3,279,944
|
|
8,714,961
|
|||
Hotels, Restaurants & Leisure - 2.9%
|
|||
Airbnb, Inc. Class A (a)
|
362,879
|
57,541,723
|
|
Booking Holdings, Inc.
|
30,572
|
105,535,461
|
|
Caesars Entertainment, Inc. (a)
|
73,746
|
2,641,582
|
|
Cava Group, Inc. (b)
|
32,547
|
2,341,431
|
|
Chipotle Mexican Grill, Inc. (a)
|
24,072
|
76,057,891
|
|
Choice Hotels International, Inc. (b)
|
25,840
|
3,055,838
|
|
Churchill Downs, Inc.
|
62,256
|
8,031,024
|
|
Darden Restaurants, Inc.
|
48,751
|
7,478,891
|
|
Domino's Pizza, Inc.
|
30,588
|
16,189,311
|
|
Doordash, Inc. (a)
|
212,655
|
27,487,785
|
|
Draftkings Holdings, Inc. (a)
|
366,112
|
15,215,615
|
|
Expedia Group, Inc. (a)
|
85,257
|
11,478,150
|
|
Hilton Worldwide Holdings, Inc.
|
99,958
|
19,719,714
|
|
Las Vegas Sands Corp.
|
300,967
|
13,350,896
|
|
Marriott International, Inc. Class A
|
210,237
|
49,643,263
|
|
McDonald's Corp.
|
264,005
|
72,083,925
|
|
Norwegian Cruise Line Holdings Ltd. (a)
|
89,193
|
1,687,532
|
|
Planet Fitness, Inc. (a)
|
35,529
|
2,126,055
|
|
Royal Caribbean Cruises Ltd. (a)
|
61,704
|
8,615,730
|
|
Starbucks Corp.
|
974,158
|
86,203,241
|
|
Texas Roadhouse, Inc. Class A
|
58,530
|
9,410,453
|
|
Travel+Leisure Co.
|
28,036
|
1,220,687
|
|
Vail Resorts, Inc.
|
3,286
|
622,270
|
|
Wendy's Co.
|
147,267
|
2,943,867
|
|
Wingstop, Inc.
|
25,736
|
9,902,955
|
|
Wyndham Hotels & Resorts, Inc.
|
5,095
|
374,533
|
|
Wynn Resorts Ltd.
|
5,532
|
507,008
|
|
Yum! Brands, Inc.
|
215,656
|
30,461,410
|
|
641,928,241
|
|||
Household Durables - 0.0%
|
|||
NVR, Inc. (a)
|
226
|
1,681,180
|
|
Tempur Sealy International, Inc.
|
29,741
|
1,488,834
|
|
TopBuild Corp. (a)
|
1,814
|
734,071
|
|
3,904,085
|
|||
Leisure Products - 0.0%
|
|||
Brunswick Corp.
|
4,826
|
389,169
|
|
Peloton Interactive, Inc. Class A (a)(b)
|
293,408
|
912,499
|
|
Polaris, Inc.
|
4,116
|
350,519
|
|
YETI Holdings, Inc. (a)(b)
|
75,842
|
2,709,076
|
|
4,361,263
|
|||
Specialty Retail - 3.1%
|
|||
AutoZone, Inc. (a)
|
12,627
|
37,330,463
|
|
Best Buy Co., Inc.
|
23,054
|
1,697,697
|
|
Burlington Stores, Inc. (a)
|
56,578
|
10,180,645
|
|
CarMax, Inc. (a)
|
7,796
|
529,894
|
|
Dick's Sporting Goods, Inc.
|
3,661
|
735,641
|
|
Five Below, Inc. (a)
|
47,974
|
7,020,515
|
|
Floor & Decor Holdings, Inc. Class A (a)(b)
|
91,125
|
10,053,821
|
|
Lowe's Companies, Inc.
|
371,035
|
84,592,270
|
|
Murphy U.S.A., Inc.
|
16,135
|
6,676,986
|
|
O'Reilly Automotive, Inc. (a)
|
43,925
|
44,507,446
|
|
RH (a)
|
2,237
|
552,651
|
|
Ross Stores, Inc.
|
270,175
|
35,001,171
|
|
The Home Depot, Inc.
|
876,638
|
292,989,952
|
|
TJX Companies, Inc.
|
999,101
|
94,005,413
|
|
Tractor Supply Co.
|
94,654
|
25,848,114
|
|
Ulta Beauty, Inc. (a)
|
42,477
|
17,196,389
|
|
Valvoline, Inc. (a)(b)
|
29,828
|
1,268,287
|
|
Victoria's Secret & Co. (a)
|
30,038
|
529,270
|
|
Wayfair LLC Class A (a)(b)
|
25,839
|
1,295,826
|
|
Williams-Sonoma, Inc.
|
7,197
|
2,063,956
|
|
674,076,407
|
|||
Textiles, Apparel & Luxury Goods - 0.5%
|
|||
Birkenstock Holding PLC
|
6,302
|
282,141
|
|
Crocs, Inc. (a)
|
52,012
|
6,468,732
|
|
Deckers Outdoor Corp. (a)
|
22,403
|
18,336,183
|
|
lululemon athletica, Inc. (a)
|
97,485
|
35,153,091
|
|
NIKE, Inc. Class B
|
548,835
|
50,635,517
|
|
Skechers U.S.A., Inc. Class A (sub. vtg.) (a)
|
8,315
|
549,206
|
|
Tapestry, Inc.
|
12,752
|
509,060
|
|
111,933,930
|
|||
TOTAL CONSUMER DISCRETIONARY
|
3,310,547,345
|
||
CONSUMER STAPLES - 4.1%
|
|||
Beverages - 1.4%
|
|||
Boston Beer Co., Inc. Class A (a)
|
7,620
|
2,121,484
|
|
Brown-Forman Corp.:
|
|||
Class A
|
34,485
|
1,692,179
|
|
Class B (non-vtg.)
|
125,929
|
6,025,703
|
|
Celsius Holdings, Inc. (a)
|
125,780
|
8,964,341
|
|
Constellation Brands, Inc. Class A (sub. vtg.)
|
14,108
|
3,575,814
|
|
Monster Beverage Corp. (a)
|
651,907
|
34,844,429
|
|
PepsiCo, Inc.
|
834,394
|
146,778,249
|
|
The Coca-Cola Co.
|
1,693,214
|
104,589,829
|
|
308,592,028
|
|||
Consumer Staples Distribution & Retail - 1.9%
|
|||
Albertsons Companies, Inc.
|
31,562
|
643,865
|
|
BJ's Wholesale Club Holdings, Inc. (a)
|
40,312
|
3,010,500
|
|
Casey's General Stores, Inc.
|
4,683
|
1,496,593
|
|
Costco Wholesale Corp.
|
388,333
|
280,725,926
|
|
Dollar General Corp.
|
191,934
|
26,715,293
|
|
Maplebear, Inc. (NASDAQ)
|
12,840
|
438,229
|
|
Performance Food Group Co. (a)
|
63,048
|
4,279,698
|
|
Sysco Corp.
|
436,300
|
32,425,816
|
|
Target Corp.
|
403,118
|
64,893,936
|
|
414,629,856
|
|||
Food Products - 0.1%
|
|||
Freshpet, Inc. (a)
|
10,422
|
1,105,462
|
|
Lamb Weston Holdings, Inc.
|
120,161
|
10,014,218
|
|
The Hershey Co.
|
97,448
|
18,897,116
|
|
30,016,796
|
|||
Household Products - 0.6%
|
|||
Church & Dwight Co., Inc.
|
191,719
|
20,684,563
|
|
Kimberly-Clark Corp.
|
277,772
|
37,924,211
|
|
Procter & Gamble Co.
|
387,952
|
63,313,766
|
|
The Clorox Co.
|
108,319
|
16,017,131
|
|
137,939,671
|
|||
Personal Care Products - 0.1%
|
|||
Estee Lauder Companies, Inc. Class A
|
63,455
|
9,309,483
|
|
Kenvue, Inc.
|
515,281
|
9,697,588
|
|
19,007,071
|
|||
TOTAL CONSUMER STAPLES
|
910,185,422
|
||
ENERGY - 0.5%
|
|||
Energy Equipment & Services - 0.0%
|
|||
Halliburton Co.
|
158,216
|
5,928,354
|
|
Oil, Gas & Consumable Fuels - 0.5%
|
|||
Antero Midstream GP LP
|
99,351
|
1,375,018
|
|
APA Corp.
|
234,645
|
7,377,239
|
|
Cheniere Energy, Inc.
|
209,930
|
33,131,153
|
|
Hess Corp.
|
135,862
|
21,396,906
|
|
New Fortress Energy, Inc. (b)
|
56,746
|
1,486,745
|
|
ONEOK, Inc.
|
27,970
|
2,212,986
|
|
Ovintiv, Inc.
|
99,570
|
5,109,932
|
|
Targa Resources Corp.
|
193,612
|
22,083,385
|
|
Texas Pacific Land Corp.
|
16,200
|
9,336,060
|
|
103,509,424
|
|||
TOTAL ENERGY
|
109,437,778
|
||
FINANCIALS - 6.3%
|
|||
Banks - 0.1%
|
|||
First Citizens Bancshares, Inc.
|
1,035
|
1,745,797
|
|
Nu Holdings Ltd. (a)
|
1,402,613
|
15,232,377
|
|
16,978,174
|
|||
Capital Markets - 1.2%
|
|||
Ameriprise Financial, Inc.
|
87,767
|
36,141,573
|
|
Ares Management Corp.
|
146,363
|
19,479,452
|
|
Blackstone, Inc.
|
624,548
|
72,828,542
|
|
Blue Owl Capital, Inc. Class A
|
59,405
|
1,122,160
|
|
FactSet Research Systems, Inc.
|
33,610
|
14,011,673
|
|
Houlihan Lokey
|
3,284
|
418,677
|
|
KKR & Co. LP
|
142,985
|
13,307,614
|
|
LPL Financial
|
66,001
|
17,762,849
|
|
MarketAxess Holdings, Inc.
|
32,438
|
6,490,519
|
|
Moody's Corp.
|
126,825
|
46,967,102
|
|
Morningstar, Inc.
|
22,503
|
6,360,473
|
|
MSCI, Inc.
|
33,636
|
15,667,312
|
|
S&P Global, Inc.
|
23,047
|
9,583,634
|
|
TPG, Inc.
|
18,191
|
784,032
|
|
Tradeweb Markets, Inc. Class A
|
34,867
|
3,546,323
|
|
XP, Inc. Class A
|
23,608
|
483,256
|
|
264,955,191
|
|||
Consumer Finance - 0.2%
|
|||
American Express Co.
|
166,765
|
39,028,013
|
|
SLM Corp.
|
75,731
|
1,604,740
|
|
40,632,753
|
|||
Financial Services - 4.0%
|
|||
Apollo Global Management, Inc.
|
457,049
|
49,534,971
|
|
Block, Inc. Class A (a)
|
179,738
|
13,120,874
|
|
Corpay, Inc. (a)
|
57,254
|
17,298,724
|
|
Equitable Holdings, Inc.
|
295,061
|
10,890,702
|
|
Euronet Worldwide, Inc. (a)
|
19,107
|
1,961,907
|
|
Fiserv, Inc. (a)
|
143,569
|
21,918,679
|
|
Jack Henry & Associates, Inc.
|
20,187
|
3,284,223
|
|
MasterCard, Inc. Class A
|
727,762
|
328,366,214
|
|
PayPal Holdings, Inc. (a)
|
856,084
|
58,145,225
|
|
Rocket Companies, Inc. (a)(b)
|
36,701
|
450,688
|
|
Shift4 Payments, Inc. (a)(b)
|
46,982
|
2,718,379
|
|
The Western Union Co.
|
46,769
|
628,575
|
|
Toast, Inc. (a)(b)
|
321,082
|
7,587,168
|
|
UWM Holdings Corp. Class A (b)
|
29,498
|
185,837
|
|
Visa, Inc. Class A
|
1,398,178
|
375,564,593
|
|
WEX, Inc. (a)
|
17,144
|
3,621,841
|
|
895,278,600
|
|||
Insurance - 0.8%
|
|||
Arch Capital Group Ltd. (a)
|
44,179
|
4,132,504
|
|
Arthur J. Gallagher & Co.
|
10,522
|
2,469,408
|
|
Brighthouse Financial, Inc. (a)
|
5,688
|
274,446
|
|
Brown & Brown, Inc.
|
80,998
|
6,604,577
|
|
Everest Re Group Ltd.
|
5,055
|
1,852,203
|
|
Kinsale Capital Group, Inc.
|
19,110
|
6,941,708
|
|
Lincoln National Corp.
|
13,576
|
370,218
|
|
Marsh & McLennan Companies, Inc.
|
347,500
|
69,301,925
|
|
Primerica, Inc.
|
19,782
|
4,191,015
|
|
Progressive Corp.
|
383,663
|
79,897,820
|
|
RenaissanceRe Holdings Ltd.
|
11,995
|
2,629,904
|
|
RLI Corp.
|
7,764
|
1,097,441
|
|
Ryan Specialty Group Holdings, Inc.
|
84,349
|
4,161,780
|
|
Willis Towers Watson PLC
|
11,325
|
2,844,161
|
|
186,769,110
|
|||
TOTAL FINANCIALS
|
1,404,613,828
|
||
HEALTH CARE - 10.6%
|
|||
Biotechnology - 2.3%
|
|||
AbbVie, Inc.
|
1,546,755
|
251,564,233
|
|
Alnylam Pharmaceuticals, Inc. (a)
|
88,169
|
12,691,928
|
|
Amgen, Inc.
|
318,391
|
87,220,031
|
|
Apellis Pharmaceuticals, Inc. (a)
|
88,482
|
3,910,020
|
|
BioMarin Pharmaceutical, Inc. (a)
|
19,352
|
1,562,868
|
|
Exact Sciences Corp. (a)
|
54,255
|
3,220,034
|
|
Exelixis, Inc. (a)
|
198,408
|
4,654,652
|
|
Incyte Corp. (a)
|
119,129
|
6,200,664
|
|
Ionis Pharmaceuticals, Inc. (a)
|
107,335
|
4,428,642
|
|
Natera, Inc. (a)
|
95,275
|
8,849,142
|
|
Neurocrine Biosciences, Inc. (a)
|
84,622
|
11,638,910
|
|
Regeneron Pharmaceuticals, Inc. (a)
|
6,108
|
5,440,151
|
|
Repligen Corp. (a)
|
21,486
|
3,528,001
|
|
Roivant Sciences Ltd. (a)
|
301,164
|
3,282,688
|
|
Sarepta Therapeutics, Inc. (a)
|
78,320
|
9,920,011
|
|
Ultragenyx Pharmaceutical, Inc. (a)
|
68,817
|
2,927,475
|
|
Vertex Pharmaceuticals, Inc. (a)
|
206,604
|
81,156,117
|
|
502,195,567
|
|||
Health Care Equipment & Supplies - 1.6%
|
|||
Abbott Laboratories
|
95,591
|
10,129,778
|
|
Align Technology, Inc. (a)
|
66,874
|
18,883,880
|
|
DexCom, Inc. (a)
|
338,837
|
43,164,445
|
|
Edwards Lifesciences Corp. (a)
|
527,612
|
44,672,908
|
|
GE Healthcare Technologies, Inc.
|
27,767
|
2,116,956
|
|
Globus Medical, Inc. (a)
|
29,402
|
1,463,926
|
|
IDEXX Laboratories, Inc. (a)
|
72,142
|
35,548,692
|
|
Inspire Medical Systems, Inc. (a)
|
25,514
|
6,165,713
|
|
Insulet Corp. (a)
|
60,701
|
10,436,930
|
|
Intuitive Surgical, Inc. (a)
|
306,116
|
113,452,712
|
|
Masimo Corp. (a)
|
37,789
|
5,079,219
|
|
Novocure Ltd. (a)
|
91,508
|
1,120,058
|
|
Penumbra, Inc. (a)
|
31,761
|
6,240,084
|
|
ResMed, Inc.
|
127,182
|
27,215,676
|
|
Shockwave Medical, Inc. (a)
|
31,750
|
10,483,533
|
|
Stryker Corp.
|
79,085
|
26,612,103
|
|
Tandem Diabetes Care, Inc. (a)
|
7,721
|
283,283
|
|
363,069,896
|
|||
Health Care Providers & Services - 2.1%
|
|||
agilon health, Inc. (a)(b)
|
226,311
|
1,244,711
|
|
Cardinal Health, Inc.
|
110,629
|
11,399,212
|
|
Cencora, Inc.
|
147,290
|
35,209,675
|
|
Chemed Corp.
|
9,189
|
5,219,352
|
|
Cigna Group
|
18,655
|
6,660,581
|
|
DaVita, Inc. (a)
|
47,281
|
6,572,532
|
|
Elevance Health, Inc.
|
27,636
|
14,607,837
|
|
Encompass Health Corp.
|
5,829
|
486,022
|
|
HCA Holdings, Inc.
|
36,079
|
11,177,996
|
|
Humana, Inc.
|
46,480
|
14,041,143
|
|
McKesson Corp.
|
44,450
|
23,878,985
|
|
Molina Healthcare, Inc. (a)
|
27,526
|
9,416,645
|
|
UnitedHealth Group, Inc.
|
685,215
|
331,438,496
|
|
471,353,187
|
|||
Health Care Technology - 0.1%
|
|||
Certara, Inc. (a)
|
37,714
|
645,287
|
|
Doximity, Inc. (a)
|
42,958
|
1,043,450
|
|
Veeva Systems, Inc. Class A (a)
|
126,867
|
25,190,712
|
|
26,879,449
|
|||
Life Sciences Tools & Services - 1.3%
|
|||
10X Genomics, Inc. (a)
|
80,377
|
2,353,439
|
|
Agilent Technologies, Inc.
|
208,116
|
28,520,217
|
|
Bio-Techne Corp.
|
128,497
|
8,122,295
|
|
Bruker Corp.
|
87,677
|
6,839,683
|
|
ICON PLC (a)
|
10,635
|
3,167,954
|
|
Illumina, Inc. (a)
|
41,275
|
5,078,889
|
|
IQVIA Holdings, Inc. (a)
|
147,761
|
34,246,567
|
|
Maravai LifeSciences Holdings, Inc. (a)
|
56,148
|
460,414
|
|
Medpace Holdings, Inc. (a)
|
20,396
|
7,920,787
|
|
Mettler-Toledo International, Inc. (a)
|
18,744
|
23,049,497
|
|
Sotera Health Co. (a)
|
76,581
|
857,707
|
|
Thermo Fisher Scientific, Inc.
|
208,298
|
118,463,239
|
|
Waters Corp. (a)
|
51,286
|
15,849,425
|
|
West Pharmaceutical Services, Inc.
|
64,823
|
23,172,926
|
|
278,103,039
|
|||
Pharmaceuticals - 3.2%
|
|||
Eli Lilly & Co.
|
741,778
|
579,402,796
|
|
Jazz Pharmaceuticals PLC (a)
|
27,701
|
3,067,886
|
|
Merck & Co., Inc.
|
409,661
|
52,936,394
|
|
Zoetis, Inc. Class A
|
405,676
|
64,599,846
|
|
700,006,922
|
|||
TOTAL HEALTH CARE
|
2,341,608,060
|
||
INDUSTRIALS - 5.7%
|
|||
Aerospace & Defense - 0.7%
|
|||
Axon Enterprise, Inc. (a)
|
61,646
|
19,335,884
|
|
BWX Technologies, Inc.
|
13,718
|
1,313,773
|
|
HEICO Corp.
|
35,891
|
7,443,793
|
|
HEICO Corp. Class A
|
63,616
|
10,550,714
|
|
Lockheed Martin Corp.
|
189,117
|
87,926,167
|
|
Northrop Grumman Corp.
|
7,064
|
3,426,252
|
|
Spirit AeroSystems Holdings, Inc. Class A (a)
|
10,278
|
328,896
|
|
The Boeing Co. (a)
|
67,414
|
11,314,766
|
|
TransDigm Group, Inc.
|
7,843
|
9,788,299
|
|
151,428,544
|
|||
Air Freight & Logistics - 0.1%
|
|||
C.H. Robinson Worldwide, Inc.
|
78,413
|
5,567,323
|
|
Expeditors International of Washington, Inc.
|
17,124
|
1,906,072
|
|
United Parcel Service, Inc. Class B
|
175,822
|
25,930,229
|
|
33,403,624
|
|||
Building Products - 0.2%
|
|||
A.O. Smith Corp.
|
11,279
|
934,352
|
|
Advanced Drain Systems, Inc.
|
58,626
|
9,204,282
|
|
Allegion PLC
|
71,073
|
8,639,634
|
|
Armstrong World Industries, Inc.
|
11,214
|
1,288,264
|
|
Trane Technologies PLC
|
58,848
|
18,674,824
|
|
Trex Co., Inc. (a)
|
95,081
|
8,419,423
|
|
47,160,779
|
|||
Commercial Services & Supplies - 0.8%
|
|||
Cintas Corp.
|
67,557
|
44,475,475
|
|
Copart, Inc.
|
751,657
|
40,822,492
|
|
MSA Safety, Inc.
|
5,450
|
983,180
|
|
RB Global, Inc.
|
121,673
|
8,709,353
|
|
Rollins, Inc.
|
223,531
|
9,960,541
|
|
Tetra Tech, Inc.
|
8,417
|
1,638,958
|
|
Waste Management, Inc.
|
320,412
|
66,652,104
|
|
173,242,103
|
|||
Construction & Engineering - 0.1%
|
|||
EMCOR Group, Inc.
|
14,052
|
5,018,953
|
|
Quanta Services, Inc.
|
33,116
|
8,562,473
|
|
Valmont Industries, Inc.
|
1,188
|
243,302
|
|
Willscot Mobile Mini Holdings (a)
|
41,104
|
1,519,204
|
|
15,343,932
|
|||
Electrical Equipment - 0.2%
|
|||
ChargePoint Holdings, Inc. Class A (a)(b)
|
312,107
|
415,102
|
|
Hubbell, Inc. Class B
|
21,394
|
7,926,905
|
|
Rockwell Automation, Inc.
|
100,663
|
27,275,646
|
|
Vertiv Holdings Co.
|
21,940
|
2,040,420
|
|
37,658,073
|
|||
Ground Transportation - 1.0%
|
|||
Avis Budget Group, Inc.
|
5,575
|
532,134
|
|
CSX Corp.
|
191,977
|
6,377,476
|
|
J.B. Hunt Transport Services, Inc.
|
14,204
|
2,309,144
|
|
Landstar System, Inc.
|
24,921
|
4,346,472
|
|
Lyft, Inc. (a)
|
305,851
|
4,783,510
|
|
Old Dominion Freight Lines, Inc.
|
160,903
|
29,237,684
|
|
Saia, Inc. (a)
|
2,553
|
1,013,107
|
|
U-Haul Holding Co. (a)(b)
|
3,874
|
244,953
|
|
U-Haul Holding Co. (non-vtg.)
|
32,386
|
1,985,910
|
|
Uber Technologies, Inc. (a)
|
1,724,884
|
114,308,063
|
|
Union Pacific Corp.
|
228,671
|
54,231,614
|
|
219,370,067
|
|||
Industrial Conglomerates - 0.1%
|
|||
Honeywell International, Inc.
|
75,278
|
14,508,329
|
|
Machinery - 1.3%
|
|||
Allison Transmission Holdings, Inc.
|
7,561
|
556,112
|
|
Caterpillar, Inc.
|
335,413
|
112,219,127
|
|
Deere & Co.
|
211,171
|
82,654,441
|
|
Donaldson Co., Inc.
|
43,994
|
3,176,367
|
|
Graco, Inc.
|
59,844
|
4,799,489
|
|
IDEX Corp.
|
5,385
|
1,187,177
|
|
Illinois Tool Works, Inc.
|
213,823
|
52,196,333
|
|
Lincoln Electric Holdings, Inc.
|
45,692
|
10,030,765
|
|
Otis Worldwide Corp.
|
21,324
|
1,944,749
|
|
Toro Co.
|
91,139
|
7,982,865
|
|
Xylem, Inc.
|
24,723
|
3,231,296
|
|
279,978,721
|
|||
Passenger Airlines - 0.0%
|
|||
American Airlines Group, Inc. (a)
|
210,904
|
2,849,313
|
|
Delta Air Lines, Inc.
|
28,755
|
1,439,763
|
|
4,289,076
|
|||
Professional Services - 0.9%
|
|||
Automatic Data Processing, Inc.
|
311,018
|
75,232,144
|
|
Booz Allen Hamilton Holding Corp. Class A
|
112,251
|
16,576,105
|
|
Broadridge Financial Solutions, Inc.
|
85,814
|
16,597,286
|
|
Dayforce, Inc. (a)
|
11,305
|
693,788
|
|
Equifax, Inc.
|
73,863
|
16,263,894
|
|
FTI Consulting, Inc. (a)
|
5,388
|
1,152,116
|
|
Genpact Ltd.
|
38,708
|
1,189,884
|
|
KBR, Inc.
|
42,646
|
2,769,431
|
|
Paychex, Inc.
|
282,296
|
33,539,588
|
|
Paycom Software, Inc.
|
45,234
|
8,503,087
|
|
Paycor HCM, Inc. (a)(b)
|
25,849
|
448,997
|
|
Paylocity Holding Corp. (a)
|
36,774
|
5,705,854
|
|
Verisk Analytics, Inc.
|
124,993
|
27,243,474
|
|
205,915,648
|
|||
Trading Companies & Distributors - 0.3%
|
|||
Fastenal Co.
|
374,653
|
25,453,925
|
|
Ferguson PLC
|
9,658
|
2,027,214
|
|
SiteOne Landscape Supply, Inc. (a)
|
12,529
|
1,965,675
|
|
United Rentals, Inc.
|
12,149
|
8,115,411
|
|
W.W. Grainger, Inc.
|
38,688
|
35,645,189
|
|
Watsco, Inc.
|
7,336
|
3,284,474
|
|
76,491,888
|
|||
TOTAL INDUSTRIALS
|
1,258,790,784
|
||
INFORMATION TECHNOLOGY - 43.5%
|
|||
Communications Equipment - 0.5%
|
|||
Arista Networks, Inc. (a)
|
219,714
|
56,369,824
|
|
Motorola Solutions, Inc.
|
133,181
|
45,168,336
|
|
Ubiquiti, Inc.
|
3,048
|
327,904
|
|
101,866,064
|
|||
Electronic Equipment, Instruments & Components - 0.4%
|
|||
Amphenol Corp. Class A
|
256,955
|
31,032,455
|
|
CDW Corp.
|
111,528
|
26,974,162
|
|
Jabil, Inc.
|
68,577
|
8,048,197
|
|
Keysight Technologies, Inc. (a)
|
39,102
|
5,784,750
|
|
Vontier Corp.
|
45,956
|
1,867,192
|
|
Zebra Technologies Corp. Class A (a)
|
8,074
|
2,539,757
|
|
76,246,513
|
|||
IT Services - 1.4%
|
|||
Accenture PLC Class A
|
553,834
|
166,654,189
|
|
Cloudflare, Inc. (a)
|
257,451
|
22,501,217
|
|
EPAM Systems, Inc. (a)
|
48,694
|
11,455,750
|
|
Gartner, Inc. (a)
|
66,202
|
27,314,283
|
|
Globant SA (a)
|
36,096
|
6,446,385
|
|
GoDaddy, Inc. (a)
|
74,731
|
9,145,580
|
|
MongoDB, Inc. Class A (a)
|
59,291
|
21,651,887
|
|
Okta, Inc. (a)
|
8,564
|
796,281
|
|
Snowflake, Inc. (a)
|
275,468
|
42,752,634
|
|
Twilio, Inc. Class A (a)
|
24,405
|
1,461,371
|
|
VeriSign, Inc. (a)
|
4,125
|
699,105
|
|
310,878,682
|
|||
Semiconductors & Semiconductor Equipment - 13.6%
|
|||
Advanced Micro Devices, Inc. (a)
|
799,421
|
126,612,298
|
|
Allegro MicroSystems LLC (a)
|
65,627
|
1,948,466
|
|
Applied Materials, Inc.
|
618,848
|
122,934,155
|
|
Broadcom, Inc.
|
377,886
|
491,353,829
|
|
Enphase Energy, Inc. (a)
|
116,559
|
12,676,957
|
|
Entegris, Inc.
|
6,821
|
906,647
|
|
KLA Corp.
|
118,507
|
81,685,690
|
|
Lam Research Corp.
|
109,234
|
97,699,982
|
|
Lattice Semiconductor Corp. (a)
|
119,282
|
8,182,745
|
|
Microchip Technology, Inc.
|
331,826
|
30,521,355
|
|
Monolithic Power Systems, Inc.
|
40,252
|
26,941,871
|
|
NVIDIA Corp.
|
2,082,740
|
1,799,529,015
|
|
Qualcomm, Inc.
|
852,685
|
141,417,807
|
|
Teradyne, Inc.
|
112,433
|
13,078,207
|
|
Texas Instruments, Inc.
|
324,622
|
57,269,813
|
|
Universal Display Corp.
|
18,508
|
2,923,894
|
|
3,015,682,731
|
|||
Software - 17.7%
|
|||
Adobe, Inc. (a)
|
395,751
|
183,165,435
|
|
ANSYS, Inc. (a)
|
62,718
|
20,375,824
|
|
AppLovin Corp. (a)
|
45,198
|
3,189,623
|
|
Atlassian Corp. PLC (a)(b)
|
135,800
|
23,398,340
|
|
Autodesk, Inc. (a)
|
188,290
|
40,077,527
|
|
Bentley Systems, Inc. Class B (b)
|
157,882
|
8,293,541
|
|
Cadence Design Systems, Inc. (a)
|
236,898
|
65,296,196
|
|
Confluent, Inc. (a)
|
167,722
|
4,716,343
|
|
Crowdstrike Holdings, Inc. (a)
|
186,991
|
54,702,347
|
|
Datadog, Inc. Class A (a)
|
243,982
|
30,619,741
|
|
DocuSign, Inc. (a)
|
177,129
|
10,025,501
|
|
DoubleVerify Holdings, Inc. (a)
|
123,149
|
3,608,266
|
|
Dropbox, Inc. Class A (a)
|
198,616
|
4,599,947
|
|
Dynatrace, Inc. (a)
|
226,105
|
10,244,818
|
|
Elastic NV (a)
|
70,302
|
7,186,270
|
|
Fair Isaac Corp. (a)
|
21,224
|
24,053,796
|
|
Five9, Inc. (a)
|
63,254
|
3,641,533
|
|
Fortinet, Inc. (a)
|
563,592
|
35,607,743
|
|
Gen Digital, Inc.
|
75,778
|
1,526,169
|
|
GitLab, Inc. (a)
|
79,590
|
4,176,087
|
|
HashiCorp, Inc. (a)
|
58,378
|
1,894,950
|
|
HubSpot, Inc. (a)
|
40,602
|
24,558,932
|
|
Informatica, Inc. (a)(b)
|
3,093
|
95,790
|
|
Intuit, Inc.
|
239,444
|
149,800,955
|
|
Manhattan Associates, Inc. (a)
|
53,962
|
11,119,410
|
|
Microsoft Corp.
|
6,523,374
|
2,539,745,189
|
|
nCino, Inc. (a)
|
5,424
|
158,164
|
|
Nutanix, Inc. Class A (a)
|
51,697
|
3,138,008
|
|
Oracle Corp.
|
555,783
|
63,220,316
|
|
Palantir Technologies, Inc. (a)
|
1,686,666
|
37,056,052
|
|
Palo Alto Networks, Inc. (a)
|
267,536
|
77,823,547
|
|
Pegasystems, Inc.
|
36,763
|
2,184,457
|
|
Procore Technologies, Inc. (a)
|
69,675
|
4,767,164
|
|
PTC, Inc. (a)
|
52,471
|
9,310,454
|
|
RingCentral, Inc. (a)
|
73,214
|
2,168,599
|
|
Salesforce, Inc.
|
618,506
|
166,341,004
|
|
SentinelOne, Inc. (a)
|
27,998
|
591,598
|
|
ServiceNow, Inc. (a)
|
178,452
|
123,726,125
|
|
Smartsheet, Inc. (a)
|
112,000
|
4,236,960
|
|
Synopsys, Inc. (a)
|
133,128
|
70,636,386
|
|
Teradata Corp. (a)
|
85,091
|
3,156,876
|
|
Tyler Technologies, Inc. (a)
|
27,558
|
12,719,395
|
|
UiPath, Inc. Class A (a)
|
255,535
|
4,847,499
|
|
Unity Software, Inc. (a)(b)
|
100,454
|
2,438,019
|
|
Workday, Inc. Class A (a)
|
175,868
|
43,040,176
|
|
Zscaler, Inc. (a)
|
77,511
|
13,404,752
|
|
3,910,685,824
|
|||
Technology Hardware, Storage & Peripherals - 9.9%
|
|||
Apple, Inc.
|
12,783,278
|
2,177,375,742
|
|
HP, Inc.
|
154,399
|
4,337,068
|
|
NetApp, Inc.
|
71,799
|
7,338,576
|
|
Pure Storage, Inc. Class A (a)
|
197,524
|
9,955,210
|
|
2,199,006,596
|
|||
TOTAL INFORMATION TECHNOLOGY
|
9,614,366,410
|
||
MATERIALS - 0.7%
|
|||
Chemicals - 0.5%
|
|||
Axalta Coating Systems Ltd. (a)
|
20,588
|
647,287
|
|
Ecolab, Inc.
|
169,362
|
38,301,216
|
|
FMC Corp.
|
16,318
|
962,925
|
|
Ginkgo Bioworks Holdings, Inc. Class A (a)(b)
|
121,247
|
108,043
|
|
Linde PLC
|
39,935
|
17,609,738
|
|
PPG Industries, Inc.
|
51,613
|
6,658,077
|
|
RPM International, Inc.
|
21,275
|
2,274,510
|
|
Sherwin-Williams Co.
|
173,628
|
52,020,685
|
|
The Scotts Miracle-Gro Co. Class A
|
36,612
|
2,509,386
|
|
121,091,867
|
|||
Construction Materials - 0.1%
|
|||
Eagle Materials, Inc.
|
19,649
|
4,926,201
|
|
Vulcan Materials Co.
|
25,529
|
6,577,036
|
|
11,503,237
|
|||
Containers & Packaging - 0.1%
|
|||
Ardagh Metal Packaging SA
|
117,893
|
465,677
|
|
Avery Dennison Corp.
|
23,256
|
5,053,064
|
|
Graphic Packaging Holding Co.
|
142,594
|
3,686,055
|
|
Sealed Air Corp.
|
69,695
|
2,193,999
|
|
11,398,795
|
|||
Metals & Mining - 0.0%
|
|||
Southern Copper Corp.
|
74,683
|
8,713,266
|
|
TOTAL MATERIALS
|
152,707,165
|
||
REAL ESTATE - 0.8%
|
|||
Equity Real Estate Investment Trusts (REITs) - 0.7%
|
|||
American Tower Corp.
|
408,030
|
70,001,627
|
|
Crown Castle, Inc.
|
40,182
|
3,768,268
|
|
Equinix, Inc.
|
41,070
|
29,205,288
|
|
Equity Lifestyle Properties, Inc.
|
50,885
|
3,067,857
|
|
Iron Mountain, Inc.
|
125,541
|
9,731,938
|
|
Lamar Advertising Co. Class A
|
58,658
|
6,795,529
|
|
Public Storage
|
79,759
|
20,693,473
|
|
SBA Communications Corp. Class A
|
9,510
|
1,770,001
|
|
Simon Property Group, Inc.
|
61,963
|
8,707,660
|
|
Sun Communities, Inc.
|
23,459
|
2,611,456
|
|
UDR, Inc.
|
16,143
|
614,725
|
|
156,967,822
|
|||
Real Estate Management & Development - 0.1%
|
|||
CoStar Group, Inc. (a)
|
152,278
|
13,938,005
|
|
TOTAL REAL ESTATE
|
170,905,827
|
||
UTILITIES - 0.0%
|
|||
Independent Power and Renewable Electricity Producers - 0.0%
|
|||
The AES Corp.
|
357,408
|
6,397,603
|
|
Vistra Corp.
|
90,046
|
6,829,089
|
|
13,226,692
|
|||
|
TOTAL COMMON STOCKS
(Cost $15,162,578,954)
|
22,042,965,761
|
||
U.S. Treasury Obligations - 0.0%
|
|||
Principal
Amount (c)
|
Value ($)
|
||
U.S. Treasury Bills, yield at date of purchase 5.3% 5/23/24 (d)
(Cost $1,993,601)
|
2,000,000
|
1,993,547
|
|
Money Market Funds - 0.9%
|
|||
Shares
|
Value ($)
|
||
Fidelity Cash Central Fund 5.39% (e)
|
140,572,893
|
140,601,008
|
|
Fidelity Securities Lending Cash Central Fund 5.39% (e)(f)
|
61,415,542
|
61,421,683
|
|
|
TOTAL MONEY MARKET FUNDS
(Cost $202,022,691)
|
202,022,691
|
||
|
TOTAL INVESTMENT IN SECURITIES - 100.6%
(Cost $15,366,595,246)
|
22,246,981,999
|
NET OTHER ASSETS (LIABILITIES) - (0.6)%
|
(128,538,345)
|
NET ASSETS - 100.0%
|
22,118,443,654
|
Futures Contracts
|
|||||
Number
of contracts
|
Expiration
Date
|
Notional
Amount ($)
|
Value ($)
|
Unrealized
Appreciation/
(Depreciation) ($)
|
|
Purchased
|
|||||
Equity Index Contracts
|
|||||
CME E-mini NASDAQ 100 Index Contracts (United States)
|
149
|
Jun 2024
|
52,362,325
|
2,585
|
2,585
|
CME E-mini S&P 500 Index Contracts (United States)
|
67
|
Jun 2024
|
16,974,450
|
(22,528)
|
(22,528)
|
TOTAL FUTURES CONTRACTS
|
(19,943)
|
||||
The notional amount of futures purchased as a percentage of Net Assets is 0.3%
|
|||||
(a)
|
Non-income producing
|
(b)
|
Security or a portion of the security is on loan at period end.
|
(c)
|
Amount is stated in United States dollars unless otherwise noted.
|
(d)
|
Security or a portion of the security was pledged to cover margin requirements for futures contracts. At period end, the value of securities pledged amounted to $1,993,547.
|
(e)
|
Affiliated fund that is generally available only to investment companies and other accounts managed by Fidelity Investments. The rate quoted is the annualized seven-day yield of the fund at period end. A complete unaudited listing of the fund's holdings as of its most recent quarter end is available upon request. In addition, each Fidelity Central Fund's financial statements, which are not covered by the Fund's Report of Independent Registered Public Accounting Firm, are available on the SEC's website or upon request.
|
(f)
|
Investment made with cash collateral received from securities on loan.
|
Affiliate
|
Value,
beginning
of period ($)
|
Purchases ($)
|
Sales
Proceeds ($)
|
Dividend
Income ($)
|
Realized
Gain (loss) ($)
|
Change in
Unrealized
appreciation
(depreciation) ($)
|
Value,
end
of period ($)
|
% ownership,
end
of period
|
Fidelity Cash Central Fund 5.39%
|
29,454,172
|
4,492,555,581
|
4,381,416,658
|
3,862,407
|
7,913
|
-
|
140,601,008
|
0.3%
|
Fidelity Securities Lending Cash Central Fund 5.39%
|
102,862,982
|
588,139,221
|
629,580,520
|
235,184
|
-
|
-
|
61,421,683
|
0.2%
|
Total
|
132,317,154
|
5,080,694,802
|
5,010,997,178
|
4,097,591
|
7,913
|
-
|
202,022,691
|
|
Valuation Inputs at Reporting Date:
|
||||
Description
|
Total ($)
|
Level 1 ($)
|
Level 2 ($)
|
Level 3 ($)
|
Investments in Securities:
|
||||
Equities:
|
||||
Communication Services
|
2,756,576,450
|
2,756,576,450
|
-
|
-
|
Consumer Discretionary
|
3,310,547,345
|
3,310,547,345
|
-
|
-
|
Consumer Staples
|
910,185,422
|
910,185,422
|
-
|
-
|
Energy
|
109,437,778
|
109,437,778
|
-
|
-
|
Financials
|
1,404,613,828
|
1,404,613,828
|
-
|
-
|
Health Care
|
2,341,608,060
|
2,341,608,060
|
-
|
-
|
Industrials
|
1,258,790,784
|
1,258,790,784
|
-
|
-
|
Information Technology
|
9,614,366,410
|
9,614,366,410
|
-
|
-
|
Materials
|
152,707,165
|
152,707,165
|
-
|
-
|
Real Estate
|
170,905,827
|
170,905,827
|
-
|
-
|
Utilities
|
13,226,692
|
13,226,692
|
-
|
-
|
U.S. Government and Government Agency Obligations
|
1,993,547
|
-
|
1,993,547
|
-
|
Money Market Funds
|
202,022,691
|
202,022,691
|
-
|
-
|
Total Investments in Securities:
|
22,246,981,999
|
22,244,988,452
|
1,993,547
|
-
|
Derivative Instruments:
Assets
|
||||
Futures Contracts
|
2,585
|
2,585
|
-
|
-
|
Total Assets
|
2,585
|
2,585
|
-
|
-
|
Liabilities
|
||||
Futures Contracts
|
(22,528)
|
(22,528)
|
-
|
-
|
Total Liabilities
|
(22,528)
|
(22,528)
|
-
|
-
|
Total Derivative Instruments:
|
(19,943)
|
(19,943)
|
-
|
-
|
Primary Risk Exposure / Derivative Type
|
Value
|
|
Asset ($)
|
Liability ($)
|
|
Equity Risk
|
||
Futures Contracts (a)
|
2,585
|
(22,528)
|
Total Equity Risk
|
2,585
|
(22,528)
|
Total Value of Derivatives
|
2,585
|
(22,528)
|
Statement of Assets and Liabilities
|
||||
April 30, 2024
|
||||
Assets
|
||||
Investment in securities, at value (including securities loaned of $58,845,801) - See accompanying schedule:
|
||||
Unaffiliated issuers (cost $15,164,572,555)
|
$
|
22,044,959,308
|
||
Fidelity Central Funds (cost $202,022,691)
|
202,022,691
|
|||
Total Investment in Securities (cost $15,366,595,246)
|
$
|
22,246,981,999
|
||
Segregated cash with brokers for derivative instruments
|
782,032
|
|||
Cash
|
3,507
|
|||
Receivable for fund shares sold
|
29,218,953
|
|||
Dividends receivable
|
7,386,522
|
|||
Distributions receivable from Fidelity Central Funds
|
271,623
|
|||
Total assets
|
22,284,644,636
|
|||
Liabilities
|
||||
Payable for investments purchased
|
$
|
90,160,371
|
||
Payable for fund shares redeemed
|
12,899,878
|
|||
Accrued management fee
|
653,216
|
|||
Payable for daily variation margin on futures contracts
|
1,060,210
|
|||
Collateral on securities loaned
|
61,427,307
|
|||
Total liabilities
|
166,200,982
|
|||
Net Assets
|
$
|
22,118,443,654
|
||
Net Assets consist of:
|
||||
Paid in capital
|
$
|
15,769,879,026
|
||
Total accumulated earnings (loss)
|
6,348,564,628
|
|||
Net Assets
|
$
|
22,118,443,654
|
||
Net Asset Value, offering price and redemption price per share ($22,118,443,654 ÷ 702,917,033 shares)
|
$
|
31.47
|
||
Statement of Operations
|
||||
Year ended
April 30, 2024
|
||||
Investment Income
|
||||
Dividends
|
$
|
143,281,465
|
||
Interest
|
157,232
|
|||
Income from Fidelity Central Funds (including $235,184 from security lending)
|
4,097,591
|
|||
Total income
|
147,536,288
|
|||
Expenses
|
||||
Management fee
|
$
|
6,176,172
|
||
Independent trustees' fees and expenses
|
51,807
|
|||
Total expenses before reductions
|
6,227,979
|
|||
Expense reductions
|
(19,060)
|
|||
Total expenses after reductions
|
6,208,919
|
|||
Net Investment income (loss)
|
141,327,369
|
|||
Realized and Unrealized Gain (Loss)
|
||||
Net realized gain (loss) on:
|
||||
Investment Securities:
|
||||
Unaffiliated issuers
|
(88,405,760)
|
|||
Redemptions in-kind
|
428,559,748
|
|||
Fidelity Central Funds
|
7,913
|
|||
Futures contracts
|
10,623,472
|
|||
Total net realized gain (loss)
|
350,785,373
|
|||
Change in net unrealized appreciation (depreciation) on:
|
||||
Investment Securities:
|
||||
Unaffiliated issuers
|
4,225,828,496
|
|||
Futures contracts
|
(2,495,269)
|
|||
Total change in net unrealized appreciation (depreciation)
|
4,223,333,227
|
|||
Net gain (loss)
|
4,574,118,600
|
|||
Net increase (decrease) in net assets resulting from operations
|
$
|
4,715,445,969
|
||
Statement of Changes in Net Assets
|
||||
Year ended
April 30, 2024
|
Year ended
April 30, 2023
|
|||
Increase (Decrease) in Net Assets
|
||||
Operations
|
||||
Net investment income (loss)
|
$
|
141,327,369
|
$
|
102,228,602
|
Net realized gain (loss)
|
350,785,373
|
(387,899,841)
|
||
Change in net unrealized appreciation (depreciation)
|
4,223,333,227
|
743,457,384
|
||
Net increase (decrease) in net assets resulting from operations
|
4,715,445,969
|
457,786,145
|
||
Distributions to shareholders
|
(135,662,713)
|
(82,379,037)
|
||
Share transactions
|
||||
Proceeds from sales of shares
|
10,051,228,797
|
6,253,077,049
|
||
Reinvestment of distributions
|
119,504,458
|
72,260,562
|
||
Cost of shares redeemed
|
(5,585,256,177)
|
(2,468,414,952)
|
||
Net increase (decrease) in net assets resulting from share transactions
|
4,585,477,078
|
3,856,922,659
|
||
Total increase (decrease) in net assets
|
9,165,260,334
|
4,232,329,767
|
||
Net Assets
|
||||
Beginning of period
|
12,953,183,320
|
8,720,853,553
|
||
End of period
|
$
|
22,118,443,654
|
$
|
12,953,183,320
|
Other Information
|
||||
Shares
|
||||
Sold
|
356,440,425
|
278,500,617
|
||
Issued in reinvestment of distributions
|
4,187,420
|
3,381,907
|
||
Redeemed
|
(196,321,249)
|
(111,204,559)
|
||
Net increase (decrease)
|
164,306,596
|
170,677,965
|
||
Fidelity® Large Cap Growth Index Fund |
Years ended April 30,
|
2024
|
2023
|
2022
|
2021
|
2020
|
|||||
Selected Per-Share Data
|
||||||||||
Net asset value, beginning of period
|
$
|
24.05
|
$
|
23.70
|
$
|
25.63
|
$
|
17.27
|
$
|
15.75
|
Income from Investment Operations
|
||||||||||
Net investment income (loss) A,B
|
.23
|
.23
|
.19
|
.18
|
.20
|
|||||
Net realized and unrealized gain (loss)
|
7.41
|
.30
|
(1.46)
|
8.60
|
1.50
|
|||||
Total from investment operations
|
7.64
|
.53
|
(1.27)
|
8.78
|
1.70
|
|||||
Distributions from net investment income
|
(.22)
|
(.18)
|
(.16)
|
(.18)
|
(.17)
|
|||||
Distributions from net realized gain
|
-
|
-
|
(.50)
|
(.24)
|
(.01)
|
|||||
Total distributions
|
(.22)
|
(.18)
|
(.66)
|
(.42)
|
(.18)
|
|||||
Net asset value, end of period
|
$
|
31.47
|
$
|
24.05
|
$
|
23.70
|
$
|
25.63
|
$
|
17.27
|
Total Return C
|
31.85 % |
2.33%
|
(5.39)%
|
51.34%
|
10.84%
|
|||||
Ratios to Average Net Assets B,D,E
|
||||||||||
Expenses before reductions
|
.04%
|
.04%
|
.04%
|
.04%
|
.04%
|
|||||
Expenses net of fee waivers, if any
|
.04 % |
.04%
|
.04%
|
.04%
|
.04%
|
|||||
Expenses net of all reductions
|
.03%
|
.03%
|
.04%
|
.04%
|
.04%
|
|||||
Net investment income (loss)
|
.80%
|
1.01%
|
.70%
|
.82%
|
1.20%
|
|||||
Supplemental Data
|
||||||||||
Net assets, end of period (000 omitted)
|
$
|
22,118,444
|
$
|
12,953,183
|
$
|
8,720,854
|
$
|
7,121,373
|
$
|
4,042,492
|
Portfolio turnover rate F
|
15 % G |
12%
|
14%
|
21%
|
15%
|
Fidelity Central Fund
|
Investment Manager
|
Investment Objective
|
Investment Practices
|
Expense RatioA
|
Fidelity Money Market Central Funds
|
Fidelity Management & Research Company LLC (FMR)
|
Each fund seeks to obtain a high level of current income consistent with the preservation of capital and liquidity.
|
Short-term Investments
|
Less than .005%
|
Gross unrealized appreciation
|
$7,257,975,324
|
Gross unrealized depreciation
|
(512,860,875)
|
Net unrealized appreciation (depreciation)
|
$6,745,114,449
|
Tax Cost
|
$15,501,867,550
|
Capital loss carryforward
|
$(396,549,821)
|
Net unrealized appreciation (depreciation) on securities and other investments
|
$6,745,114,449
|
Short-term
|
$(253,308,426)
|
Long-term
|
(143,241,395)
|
Total capital loss carryforward
|
$(396,549,821)
|
April 30, 2024
|
April 30, 2023
|
|
Ordinary Income
|
$135,662,713
|
$82,379,037
|
Equity Risk
|
Equity risk relates to the fluctuations in the value of financial instruments as a result of changes in market prices (other than those arising from interest rate risk or foreign exchange risk), whether caused by factors specific to an individual investment, its issuer, or all factors affecting all instruments traded in a market or market segment.
|
Purchases ($)
|
Sales ($)
|
|
Fidelity Large Cap Growth Index Fund
|
8,088,879,510
|
2,718,444,291
|
Shares
|
Total net realized gain or loss ($)
|
Total Proceeds ($)
|
|
Fidelity Large Cap Growth Index Fund
|
26,112,359
|
428,559,748
|
748,945,115
|
Borrower or Lender
|
Average Loan Balance ($)
|
Weighted Average Interest Rate
|
|
Fidelity Large Cap Growth Index Fund
|
Borrower
|
185,289,000
|
5.34%
|
Total Security Lending Fees Paid to NFS ($)
|
Security Lending Income From Securities Loaned to NFS ($)
|
Value of Securities Loaned to NFS at Period End ($)
|
|
Fidelity Large Cap Growth Index Fund
|
24,381
|
6,774
|
-
|
The Example is based on an investment of $1,000 invested at the beginning of the period and held for the entire period (November 1, 2023 to April 30, 2024).
|
Annualized Expense Ratio- A
|
Beginning Account Value November 1, 2023
|
Ending Account Value April 30, 2024
|
Expenses Paid During Period- C November 1, 2023 to April 30, 2024
|
|||||||
Fidelity® Large Cap Growth Index Fund
|
.03%
|
|||||||||
Actual
|
$ 1,000
|
$ 1,236.20
|
$ .17
|
|||||||
Hypothetical-B
|
$ 1,000
|
$ 1,024.71
|
$ .15
|
|||||||
A special meeting of shareholders was held on October 18, 2023. The results of votes taken among shareholders on the proposal before them are reported below. Each vote reported represents one dollar of net asset value held on the record date for the meeting.
|
||
Proposal 1
|
||
To elect a Board of Trustees.
|
||
# of
Votes
|
% of
Votes
|
|
Abigail P. Johnson
|
||
Affirmative
|
378,729,502,260.01
|
97.58
|
Withheld
|
9,407,876,478.96
|
2.42
|
TOTAL
|
388,137,378,738.97
|
100.00
|
Jennifer Toolin McAuliffe
|
||
Affirmative
|
378,454,868,010.95
|
97.51
|
Withheld
|
9,682,510,728.02
|
2.49
|
TOTAL
|
388,137,378,738.97
|
100.00
|
Christine J. Thompson
|
||
Affirmative
|
378,837,121,274.52
|
97.60
|
Withheld
|
9,300,257,464.45
|
2.40
|
TOTAL
|
388,137,378,738.97
|
100.00
|
Elizabeth S. Acton
|
||
Affirmative
|
378,262,110,794.85
|
97.46
|
Withheld
|
9,875,267,944.12
|
2.54
|
TOTAL
|
388,137,378,738.97
|
100.00
|
Laura M. Bishop
|
||
Affirmative
|
380,482,113,171.06
|
98.03
|
Withheld
|
7,655,265,567.91
|
1.97
|
TOTAL
|
388,137,378,738.97
|
100.00
|
Ann E. Dunwoody
|
||
Affirmative
|
380,016,034,008.12
|
97.91
|
Withheld
|
8,121,344,730.85
|
2.09
|
TOTAL
|
388,137,378,738.97
|
100.00
|
John Engler
|
||
Affirmative
|
379,432,488,394.20
|
97.76
|
Withheld
|
8,704,890,344.77
|
2.24
|
TOTAL
|
388,137,378,738.97
|
100.00
|
Robert F. Gartland
|
||
Affirmative
|
378,741,819,600.60
|
97.58
|
Withheld
|
9,395,559,138.37
|
2.42
|
TOTAL
|
388,137,378,738.97
|
100.00
|
Robert W. Helm
|
||
Affirmative
|
380,389,324,755.07
|
98.00
|
Withheld
|
7,748,053,983.90
|
2.00
|
TOTAL
|
388,137,378,738.97
|
100.00
|
Arthur E. Johnson
|
||
Affirmative
|
378,427,694,151.67
|
97.50
|
Withheld
|
9,709,684,587.30
|
2.50
|
TOTAL
|
388,137,378,738.97
|
100.00
|
Michael E. Kenneally
|
||
Affirmative
|
377,842,228,145.18
|
97.35
|
Withheld
|
10,295,150,593.79
|
2.65
|
TOTAL
|
388,137,378,738.97
|
100.00
|
Mark A. Murray
|
||
Affirmative
|
380,158,432,703.37
|
97.94
|
Withheld
|
7,978,946,035.60
|
2.06
|
TOTAL
|
388,137,378,738.97
|
100.00
|
Carol J. Zierhoffer
|
||
Affirmative
|
380,522,113,360.24
|
98.04
|
Withheld
|
7,615,265,378.73
|
1.96
|
TOTAL
|
388,137,378,738.97
|
100.00
|
Proposal 1 reflects trust-wide proposal and voting results.
|
||
 |


Contents
Average Annual Total Returns
|
|||
Periods ended April 30, 2024
|
Past 1
year
|
Past 5
years
|
Life of
Fund A
|
Fidelity Flex® Small Cap Index Fund
|
13.47%
|
5.95%
|
6.88%
|
$10,000 Over Life of Fund
|
Let's say hypothetically that $10,000 was invested in Fidelity Flex® Small Cap Index Fund, on March 9, 2017, when the fund started.
The chart shows how the value of your investment would have changed, and also shows how the Russell 2000® Index performed over the same period.
|
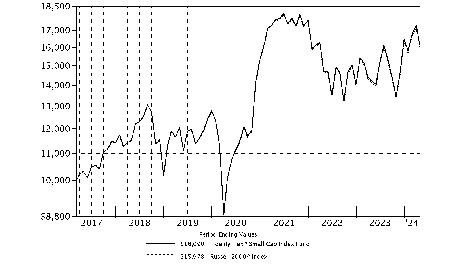
|
Top Holdings (% of Fund's net assets)
|
||
Super Micro Computer, Inc.
|
1.7
|
|
MicroStrategy, Inc. Class A
|
0.6
|
|
Comfort Systems U.S.A., Inc.
|
0.5
|
|
Onto Innovation, Inc.
|
0.4
|
|
Weatherford International PLC
|
0.4
|
|
elf Beauty, Inc.
|
0.4
|
|
Carvana Co. Class A
|
0.4
|
|
Viking Therapeutics, Inc.
|
0.3
|
|
API Group Corp.
|
0.3
|
|
Light & Wonder, Inc. Class A
|
0.3
|
|
5.3
|
||
Market Sectors (% of Fund's net assets)
|
||
Industrials
|
17.5
|
|
Financials
|
16.0
|
|
Health Care
|
14.8
|
|
Information Technology
|
14.6
|
|
Consumer Discretionary
|
10.4
|
|
Energy
|
7.5
|
|
Real Estate
|
5.6
|
|
Materials
|
4.7
|
|
Consumer Staples
|
3.3
|
|
Utilities
|
2.6
|
|
Communication Services
|
2.1
|
|
Asset Allocation (% of Fund's net assets)
|

|
Futures - 0.9%
|
Common Stocks - 99.1%
|
|||
Shares
|
Value ($)
|
||
COMMUNICATION SERVICES - 2.1%
|
|||
Diversified Telecommunication Services - 0.4%
|
|||
Anterix, Inc. (a)
|
1,823
|
57,461
|
|
AST SpaceMobile, Inc. (a)(b)
|
16,074
|
35,524
|
|
ATN International, Inc.
|
1,494
|
28,506
|
|
Bandwidth, Inc. (a)
|
3,236
|
58,895
|
|
Cogent Communications Group, Inc.
|
6,077
|
390,022
|
|
Consolidated Communications Holdings, Inc. (a)
|
10,183
|
43,991
|
|
Globalstar, Inc. (a)
|
101,360
|
130,754
|
|
IDT Corp. Class B
|
2,128
|
75,629
|
|
Liberty Latin America Ltd.:
|
|||
Class A (a)
|
4,590
|
34,655
|
|
Class C (a)
|
19,086
|
143,908
|
|
Lumen Technologies, Inc. (a)
|
139,379
|
165,861
|
|
Ooma, Inc. (a)
|
3,481
|
24,576
|
|
Shenandoah Telecommunications Co.
|
6,647
|
85,215
|
|
1,274,997
|
|||
Entertainment - 0.4%
|
|||
Atlanta Braves Holdings, Inc.
|
6,468
|
242,097
|
|
Atlanta Braves Holdings, Inc. Class A
|
1,253
|
50,546
|
|
Cinemark Holdings, Inc. (a)
|
15,223
|
260,922
|
|
Eventbrite, Inc. (a)
|
10,690
|
56,443
|
|
IMAX Corp. (a)
|
6,196
|
99,198
|
|
Lions Gate Entertainment Corp.:
|
|||
Class A (a)
|
8,870
|
89,498
|
|
Class B (a)
|
15,939
|
150,305
|
|
Loop Media, Inc. (a)(b)
|
5,522
|
1,696
|
|
Madison Square Garden Entertainment Corp.
|
5,550
|
217,283
|
|
Marcus Corp.
|
3,247
|
42,341
|
|
Playstudios, Inc. Class A (a)
|
11,933
|
25,775
|
|
Reservoir Media, Inc. (a)
|
2,830
|
25,329
|
|
Sphere Entertainment Co. (a)
|
3,713
|
144,287
|
|
Vivid Seats, Inc. Class A (a)
|
10,324
|
54,304
|
|
1,460,024
|
|||
Interactive Media & Services - 0.6%
|
|||
Bumble, Inc. (a)
|
13,972
|
141,117
|
|
CarGurus, Inc. Class A (a)
|
13,354
|
299,931
|
|
Cars.com, Inc. (a)
|
9,304
|
155,470
|
|
DHI Group, Inc. (a)
|
5,526
|
12,931
|
|
EverQuote, Inc. Class A (a)
|
3,005
|
60,611
|
|
fuboTV, Inc. (a)
|
38,846
|
55,161
|
|
Grindr, Inc. (a)
|
5,516
|
54,002
|
|
MediaAlpha, Inc. Class A (a)
|
3,157
|
63,929
|
|
Nextdoor Holdings, Inc. (a)
|
20,687
|
42,201
|
|
Outbrain, Inc. (a)
|
5,314
|
21,522
|
|
QuinStreet, Inc. (a)
|
7,313
|
132,292
|
|
Shutterstock, Inc.
|
3,424
|
146,239
|
|
System1, Inc. (a)(b)
|
4,327
|
7,399
|
|
TrueCar, Inc. (a)
|
12,568
|
33,180
|
|
Vimeo, Inc. (a)
|
21,370
|
76,718
|
|
Yelp, Inc. (a)
|
9,279
|
373,387
|
|
Ziff Davis, Inc. (a)
|
6,353
|
318,349
|
|
ZipRecruiter, Inc. (a)
|
9,381
|
96,437
|
|
2,090,876
|
|||
Media - 0.6%
|
|||
Advantage Solutions, Inc. Class A (a)
|
12,500
|
53,250
|
|
AMC Networks, Inc. Class A (a)
|
4,226
|
44,880
|
|
Boston Omaha Corp. (a)
|
3,242
|
50,056
|
|
Cardlytics, Inc. (a)
|
5,149
|
63,075
|
|
Clear Channel Outdoor Holdings, Inc. (a)
|
52,107
|
72,429
|
|
E.W. Scripps Co. Class A (a)
|
8,461
|
31,813
|
|
EchoStar Corp. Class A (a)
|
16,950
|
271,031
|
|
Emerald Holding, Inc. (a)
|
2,155
|
12,391
|
|
Entravision Communication Corp. Class A (b)
|
8,183
|
17,102
|
|
Gambling.com Group Ltd. (a)
|
2,098
|
18,148
|
|
Gannett Co., Inc. (a)
|
20,028
|
48,468
|
|
Gray Television, Inc.
|
11,655
|
67,016
|
|
iHeartMedia, Inc. (a)
|
14,755
|
30,986
|
|
Integral Ad Science Holding Corp. (a)
|
9,401
|
90,156
|
|
John Wiley & Sons, Inc. Class A
|
4,997
|
187,737
|
|
Magnite, Inc. (a)
|
18,799
|
165,995
|
|
PubMatic, Inc. (a)
|
5,817
|
130,533
|
|
Scholastic Corp.
|
3,586
|
127,733
|
|
Sinclair, Inc. Class A
|
4,622
|
56,851
|
|
Stagwell, Inc. (a)
|
11,780
|
70,091
|
|
TechTarget, Inc. (a)
|
3,620
|
99,550
|
|
TEGNA, Inc.
|
27,391
|
373,613
|
|
Thryv Holdings, Inc. (a)
|
4,287
|
98,644
|
|
Townsquare Media, Inc.
|
1,654
|
19,964
|
|
Urban One, Inc.:
|
|||
Class A (a)
|
514
|
1,023
|
|
Class D (non-vtg.) (a)
|
2,303
|
3,570
|
|
WideOpenWest, Inc. (a)
|
6,659
|
23,773
|
|
2,229,878
|
|||
Wireless Telecommunication Services - 0.1%
|
|||
Gogo, Inc. (a)
|
9,239
|
83,705
|
|
Spok Holdings, Inc.
|
2,550
|
39,398
|
|
Telephone & Data Systems, Inc.
|
13,816
|
216,220
|
|
339,323
|
|||
TOTAL COMMUNICATION SERVICES
|
7,395,098
|
||
CONSUMER DISCRETIONARY - 10.4%
|
|||
Automobile Components - 1.2%
|
|||
Adient PLC (a)
|
12,642
|
377,617
|
|
American Axle & Manufacturing Holdings, Inc. (a)
|
15,852
|
116,354
|
|
Cooper-Standard Holding, Inc. (a)
|
2,357
|
36,369
|
|
Dana, Inc.
|
18,024
|
224,038
|
|
Dorman Products, Inc. (a)
|
3,655
|
319,630
|
|
Fox Factory Holding Corp. (a)
|
5,925
|
230,601
|
|
Gentherm, Inc. (a)
|
4,565
|
230,852
|
|
Holley, Inc. (a)
|
7,502
|
30,158
|
|
LCI Industries
|
3,435
|
357,171
|
|
Luminar Technologies, Inc. (a)(b)
|
39,595
|
58,205
|
|
Modine Manufacturing Co. (a)
|
7,162
|
663,416
|
|
Patrick Industries, Inc.
|
2,934
|
306,574
|
|
Solid Power, Inc. (a)(b)
|
22,149
|
37,432
|
|
Standard Motor Products, Inc.
|
2,849
|
91,453
|
|
Stoneridge, Inc. (a)
|
3,601
|
53,943
|
|
The Goodyear Tire & Rubber Co. (a)
|
39,050
|
467,038
|
|
Visteon Corp. (a)
|
3,823
|
422,938
|
|
XPEL, Inc. (a)
|
3,151
|
165,585
|
|
4,189,374
|
|||
Automobiles - 0.1%
|
|||
LiveWire Group, Inc. (a)(b)
|
2,642
|
17,675
|
|
Winnebago Industries, Inc.
|
3,978
|
244,965
|
|
Workhorse Group, Inc. (a)(b)
|
30,862
|
4,666
|
|
267,306
|
|||
Broadline Retail - 0.1%
|
|||
Big Lots, Inc.
|
3,895
|
13,710
|
|
ContextLogic, Inc. (a)
|
3,357
|
18,631
|
|
Dillard's, Inc. Class A
|
476
|
208,483
|
|
Qurate Retail, Inc. (a)
|
162
|
619
|
|
Savers Value Village, Inc.
|
3,538
|
58,448
|
|
299,891
|
|||
Distributors - 0.0%
|
|||
Weyco Group, Inc.
|
859
|
25,212
|
|
Diversified Consumer Services - 1.1%
|
|||
2U, Inc. (a)
|
10,985
|
2,724
|
|
Adtalem Global Education, Inc. (a)
|
5,447
|
270,280
|
|
Carriage Services, Inc.
|
1,860
|
47,579
|
|
Chegg, Inc. (a)
|
15,895
|
82,177
|
|
Coursera, Inc. (a)
|
18,441
|
188,467
|
|
Duolingo, Inc. (a)
|
4,116
|
929,187
|
|
European Wax Center, Inc. (a)
|
4,710
|
55,390
|
|
Frontdoor, Inc. (a)
|
11,234
|
344,771
|
|
Graham Holdings Co.
|
484
|
339,463
|
|
Laureate Education, Inc. Class A
|
18,251
|
264,640
|
|
Lincoln Educational Services Corp. (a)
|
3,367
|
35,892
|
|
Nerdy, Inc. Class A (a)
|
8,823
|
22,852
|
|
OneSpaWorld Holdings Ltd. (a)
|
11,571
|
147,183
|
|
Perdoceo Education Corp.
|
9,000
|
164,700
|
|
Strategic Education, Inc.
|
3,149
|
361,631
|
|
Stride, Inc. (a)
|
5,896
|
393,558
|
|
Udemy, Inc. (a)
|
12,491
|
125,160
|
|
Universal Technical Institute, Inc. (a)
|
5,552
|
84,501
|
|
WW International, Inc. (a)
|
7,381
|
13,360
|
|
3,873,515
|
|||
Hotels, Restaurants & Leisure - 2.1%
|
|||
Accel Entertainment, Inc. (a)
|
7,489
|
80,432
|
|
Bally's Corp. (a)
|
4,036
|
53,033
|
|
Biglari Holdings, Inc. Class B (a)
|
99
|
19,514
|
|
BJ's Restaurants, Inc. (a)
|
3,113
|
101,453
|
|
Bloomin' Brands, Inc.
|
12,160
|
313,606
|
|
Bowlero Corp. Class A (b)
|
2,345
|
27,554
|
|
Brinker International, Inc. (a)
|
6,079
|
325,834
|
|
Carrols Restaurant Group, Inc.
|
4,841
|
46,086
|
|
Century Casinos, Inc. (a)
|
3,486
|
10,353
|
|
Chuy's Holdings, Inc. (a)
|
2,362
|
69,585
|
|
Cracker Barrel Old Country Store, Inc. (b)
|
3,070
|
178,643
|
|
Dave & Buster's Entertainment, Inc. (a)
|
4,699
|
250,927
|
|
Denny's Corp. (a)
|
6,849
|
54,929
|
|
Dine Brands Global, Inc.
|
2,146
|
94,639
|
|
El Pollo Loco Holdings, Inc. (a)
|
3,818
|
32,529
|
|
Empire Resorts, Inc. (c)
|
126
|
0
|
|
Everi Holdings, Inc. (a)
|
11,324
|
92,517
|
|
First Watch Restaurant Group, Inc. (a)
|
3,139
|
80,107
|
|
Full House Resorts, Inc. (a)
|
4,386
|
22,369
|
|
Global Business Travel Group, Inc. (a)(b)
|
4,584
|
27,733
|
|
Golden Entertainment, Inc.
|
2,796
|
89,612
|
|
Hilton Grand Vacations, Inc. (a)
|
10,958
|
456,291
|
|
Inspired Entertainment, Inc. (a)
|
3,045
|
25,883
|
|
International Game Technology PLC
|
15,091
|
297,896
|
|
Jack in the Box, Inc.
|
2,733
|
155,972
|
|
Krispy Kreme, Inc. (b)
|
12,114
|
153,242
|
|
Kura Sushi U.S.A., Inc. Class A (a)
|
811
|
89,275
|
|
Life Time Group Holdings, Inc. (a)
|
6,192
|
84,583
|
|
Light & Wonder, Inc. Class A (a)
|
12,551
|
1,120,302
|
|
Lindblad Expeditions Holdings (a)
|
4,916
|
36,083
|
|
Monarch Casino & Resort, Inc.
|
1,881
|
127,475
|
|
Mondee Holdings, Inc. (a)
|
6,208
|
13,596
|
|
Nathan's Famous, Inc.
|
381
|
24,616
|
|
Noodles & Co. (a)
|
5,250
|
7,928
|
|
Papa John's International, Inc.
|
4,542
|
280,196
|
|
PlayAGS, Inc. (a)
|
5,235
|
46,277
|
|
Portillo's, Inc. (a)
|
6,347
|
77,814
|
|
Potbelly Corp. (a)
|
3,580
|
36,480
|
|
RCI Hospitality Holdings, Inc.
|
1,211
|
61,470
|
|
Red Robin Gourmet Burgers, Inc. (a)(b)
|
2,241
|
16,920
|
|
Red Rock Resorts, Inc.
|
6,588
|
349,955
|
|
Rush Street Interactive, Inc. (a)
|
9,004
|
57,536
|
|
Sabre Corp. (a)
|
46,126
|
132,382
|
|
Shake Shack, Inc. Class A (a)
|
5,251
|
555,818
|
|
Six Flags Entertainment Corp. (a)
|
10,162
|
239,620
|
|
Super Group SGHC Ltd. (a)
|
18,734
|
59,199
|
|
Sweetgreen, Inc. Class A (a)
|
13,621
|
306,064
|
|
Target Hospitality Corp. (a)
|
4,375
|
48,672
|
|
The Cheesecake Factory, Inc.
|
6,622
|
228,591
|
|
The ONE Group Hospitality, Inc. (a)
|
2,894
|
15,512
|
|
United Parks & Resorts, Inc. (a)
|
5,053
|
256,793
|
|
Xponential Fitness, Inc. (a)
|
3,208
|
40,902
|
|
7,374,798
|
|||
Household Durables - 2.2%
|
|||
Beazer Homes U.S.A., Inc. (a)
|
4,087
|
114,559
|
|
Cavco Industries, Inc. (a)
|
1,167
|
425,033
|
|
Century Communities, Inc.
|
3,954
|
313,631
|
|
Cricut, Inc. (b)
|
6,588
|
35,048
|
|
Dream Finders Homes, Inc. (a)
|
3,399
|
120,665
|
|
Ethan Allen Interiors, Inc.
|
3,194
|
90,199
|
|
GoPro, Inc. Class A (a)
|
16,552
|
28,635
|
|
Green Brick Partners, Inc. (a)
|
3,624
|
196,167
|
|
Helen of Troy Ltd. (a)
|
3,298
|
305,758
|
|
Hooker Furnishings Corp.
|
1,481
|
25,177
|
|
Hovnanian Enterprises, Inc. Class A (a)
|
677
|
100,081
|
|
Installed Building Products, Inc.
|
3,299
|
777,673
|
|
iRobot Corp. (a)
|
3,808
|
32,596
|
|
KB Home
|
9,452
|
612,112
|
|
La-Z-Boy, Inc.
|
6,045
|
198,518
|
|
Landsea Homes Corp. (a)
|
2,762
|
31,901
|
|
Legacy Housing Corp. (a)
|
1,530
|
31,166
|
|
LGI Homes, Inc. (a)
|
2,896
|
260,437
|
|
Lovesac (a)
|
2,004
|
44,449
|
|
M/I Homes, Inc. (a)
|
3,749
|
435,709
|
|
Meritage Homes Corp.
|
5,059
|
838,479
|
|
Purple Innovation, Inc.
|
7,493
|
11,389
|
|
Skyline Champion Corp. (a)
|
7,527
|
564,450
|
|
Snap One Holdings Corp. (a)
|
2,647
|
28,005
|
|
Sonos, Inc. (a)
|
17,189
|
290,494
|
|
Taylor Morrison Home Corp. (a)
|
14,383
|
805,592
|
|
Traeger, Inc. (a)
|
4,726
|
10,161
|
|
TRI Pointe Homes, Inc. (a)
|
13,339
|
491,542
|
|
United Homes Group, Inc. (a)(b)
|
693
|
4,629
|
|
Vizio Holding Corp. (a)
|
10,575
|
112,095
|
|
VOXX International Corp. (a)
|
1,479
|
8,726
|
|
Worthington Enterprises, Inc.
|
4,292
|
245,331
|
|
7,590,407
|
|||
Leisure Products - 0.4%
|
|||
Acushnet Holdings Corp.
|
4,226
|
257,701
|
|
AMMO, Inc. (a)
|
12,611
|
32,032
|
|
Clarus Corp.
|
4,006
|
25,358
|
|
Escalade, Inc.
|
1,450
|
18,067
|
|
Funko, Inc. (a)
|
5,270
|
32,094
|
|
JAKKS Pacific, Inc. (a)
|
1,080
|
20,423
|
|
Johnson Outdoors, Inc. Class A
|
718
|
29,445
|
|
Latham Group, Inc. (a)
|
5,654
|
15,831
|
|
Malibu Boats, Inc. Class A (a)
|
2,856
|
97,161
|
|
Marine Products Corp.
|
1,166
|
12,535
|
|
MasterCraft Boat Holdings, Inc. (a)
|
2,333
|
47,197
|
|
Smith & Wesson Brands, Inc.
|
6,317
|
107,199
|
|
Solo Brands, Inc. Class A (a)
|
2,476
|
4,655
|
|
Sturm, Ruger & Co., Inc.
|
2,410
|
111,414
|
|
Topgolf Callaway Brands Corp. (a)
|
19,979
|
320,064
|
|
Vista Outdoor, Inc. (a)
|
8,025
|
281,597
|
|
1,412,773
|
|||
Specialty Retail - 2.7%
|
|||
1-800-FLOWERS.com, Inc. Class A (a)
|
3,656
|
33,160
|
|
Abercrombie & Fitch Co. Class A (a)
|
6,789
|
824,999
|
|
Academy Sports & Outdoors, Inc.
|
10,042
|
585,449
|
|
America's Car Mart, Inc. (a)
|
810
|
46,364
|
|
American Eagle Outfitters, Inc.
|
25,408
|
616,398
|
|
Arko Corp.
|
10,973
|
47,184
|
|
Asbury Automotive Group, Inc. (a)
|
2,877
|
604,860
|
|
BARK, Inc. (a)
|
19,384
|
21,322
|
|
Beyond, Inc. (a)
|
6,250
|
125,813
|
|
Big 5 Sporting Goods Corp.
|
3,067
|
10,857
|
|
Boot Barn Holdings, Inc. (a)
|
4,200
|
447,174
|
|
Build-A-Bear Workshop, Inc.
|
1,782
|
53,745
|
|
Caleres, Inc.
|
4,746
|
174,795
|
|
Camping World Holdings, Inc.
|
5,774
|
117,039
|
|
CarParts.com, Inc. (a)
|
7,303
|
8,983
|
|
Carvana Co. Class A (a)
|
14,331
|
1,188,327
|
|
Designer Brands, Inc. Class A
|
5,809
|
53,966
|
|
Destination XL Group, Inc. (a)
|
7,993
|
25,658
|
|
Duluth Holdings, Inc. (a)
|
1,596
|
6,719
|
|
Envela Corp. (a)
|
1,078
|
4,625
|
|
EVgo, Inc. Class A (a)(b)
|
14,616
|
26,455
|
|
Foot Locker, Inc.
|
11,441
|
238,545
|
|
Genesco, Inc. (a)
|
1,537
|
38,901
|
|
Group 1 Automotive, Inc.
|
1,895
|
557,168
|
|
GrowGeneration Corp. (a)
|
7,852
|
23,477
|
|
Guess?, Inc.
|
3,922
|
105,031
|
|
Haverty Furniture Companies, Inc.
|
2,076
|
63,941
|
|
Hibbett, Inc.
|
1,609
|
138,760
|
|
J. Jill, Inc. (a)
|
596
|
14,852
|
|
Lands' End, Inc. (a)
|
2,099
|
28,714
|
|
Lazydays Holdings, Inc. (a)
|
1,052
|
3,724
|
|
Leslie's, Inc. (a)
|
24,585
|
96,619
|
|
MarineMax, Inc. (a)
|
3,064
|
75,589
|
|
Monro, Inc.
|
4,133
|
112,624
|
|
National Vision Holdings, Inc. (a)
|
10,732
|
186,951
|
|
OneWater Marine, Inc. Class A (a)
|
1,601
|
33,157
|
|
PetMed Express, Inc.
|
2,888
|
11,408
|
|
Rent the Runway, Inc. Class A (a)(b)
|
350
|
3,553
|
|
Revolve Group, Inc. (a)
|
5,577
|
111,038
|
|
Sally Beauty Holdings, Inc. (a)
|
14,932
|
162,012
|
|
Shoe Carnival, Inc.
|
2,516
|
84,135
|
|
Signet Jewelers Ltd.
|
6,071
|
595,140
|
|
Sleep Number Corp. (a)
|
2,973
|
39,571
|
|
Sonic Automotive, Inc. Class A (sub. vtg.)
|
2,032
|
117,531
|
|
Sportsman's Warehouse Holdings, Inc. (a)
|
4,810
|
15,392
|
|
Stitch Fix, Inc. (a)
|
12,621
|
26,757
|
|
The Aaron's Co., Inc.
|
4,301
|
29,720
|
|
The Buckle, Inc.
|
4,283
|
160,141
|
|
The Cato Corp. Class A (sub. vtg.)
|
2,421
|
11,669
|
|
The Children's Place, Inc. (a)(b)
|
1,611
|
11,213
|
|
The ODP Corp. (a)
|
4,400
|
224,004
|
|
thredUP, Inc. (a)
|
9,663
|
15,461
|
|
Tile Shop Holdings, Inc. (a)
|
4,085
|
27,451
|
|
Tilly's, Inc. (a)
|
2,825
|
17,148
|
|
Torrid Holdings, Inc. (a)(b)
|
1,626
|
8,244
|
|
Upbound Group, Inc.
|
7,444
|
230,838
|
|
Urban Outfitters, Inc. (a)
|
8,874
|
345,731
|
|
Warby Parker, Inc. (a)
|
11,912
|
139,847
|
|
Winmark Corp.
|
393
|
141,213
|
|
Zumiez, Inc. (a)
|
2,184
|
37,565
|
|
9,308,727
|
|||
Textiles, Apparel & Luxury Goods - 0.5%
|
|||
Allbirds, Inc. Class A (a)(b)
|
12,797
|
7,720
|
|
Figs, Inc. Class A (a)
|
17,726
|
90,580
|
|
Fossil Group, Inc. (a)(b)
|
6,297
|
4,898
|
|
G-III Apparel Group Ltd. (a)
|
5,747
|
161,778
|
|
Hanesbrands, Inc. (a)
|
48,819
|
222,615
|
|
Kontoor Brands, Inc.
|
7,803
|
484,254
|
|
Movado Group, Inc.
|
2,137
|
54,429
|
|
Oxford Industries, Inc.
|
2,077
|
223,859
|
|
Rocky Brands, Inc.
|
942
|
24,275
|
|
Steven Madden Ltd.
|
10,253
|
414,324
|
|
Vera Bradley, Inc. (a)
|
3,428
|
22,591
|
|
Wolverine World Wide, Inc.
|
10,794
|
115,928
|
|
1,827,251
|
|||
TOTAL CONSUMER DISCRETIONARY
|
36,169,254
|
||
CONSUMER STAPLES - 3.3%
|
|||
Beverages - 0.4%
|
|||
Coca-Cola Consolidated, Inc.
|
664
|
548,464
|
|
Duckhorn Portfolio, Inc. (a)
|
7,292
|
61,763
|
|
MGP Ingredients, Inc.
|
2,216
|
173,823
|
|
National Beverage Corp. (a)
|
3,268
|
145,426
|
|
Primo Water Corp.
|
21,782
|
411,026
|
|
The Vita Coco Co., Inc. (a)
|
5,260
|
127,502
|
|
Zevia PBC (a)
|
3,394
|
2,922
|
|
1,470,926
|
|||
Consumer Staples Distribution & Retail - 0.6%
|
|||
Andersons, Inc.
|
4,492
|
246,790
|
|
Chefs' Warehouse Holdings (a)
|
4,922
|
162,820
|
|
HF Foods Group, Inc. (a)
|
5,355
|
15,637
|
|
Ingles Markets, Inc. Class A
|
1,949
|
139,841
|
|
Natural Grocers by Vitamin Cottage, Inc.
|
1,365
|
22,331
|
|
PriceSmart, Inc.
|
3,542
|
285,450
|
|
SpartanNash Co.
|
4,736
|
90,410
|
|
Sprouts Farmers Market LLC (a)
|
14,146
|
934,060
|
|
United Natural Foods, Inc. (a)
|
8,081
|
72,163
|
|
Village Super Market, Inc. Class A
|
1,222
|
34,179
|
|
Weis Markets, Inc.
|
2,280
|
143,936
|
|
2,147,617
|
|||
Food Products - 0.9%
|
|||
Alico, Inc.
|
992
|
27,687
|
|
B&G Foods, Inc. Class A
|
10,807
|
119,958
|
|
Benson Hill, Inc. (a)
|
24,261
|
4,452
|
|
Beyond Meat, Inc. (a)(b)
|
8,147
|
55,237
|
|
BRC, Inc. Class A (a)(b)
|
5,495
|
21,431
|
|
Cal-Maine Foods, Inc.
|
5,727
|
316,875
|
|
Calavo Growers, Inc.
|
2,438
|
65,704
|
|
Dole PLC
|
9,978
|
121,432
|
|
Forafric Global PLC (a)(b)
|
566
|
5,813
|
|
Fresh Del Monte Produce, Inc.
|
4,736
|
121,100
|
|
J&J Snack Foods Corp.
|
2,098
|
288,034
|
|
John B. Sanfilippo & Son, Inc.
|
1,248
|
124,426
|
|
Lancaster Colony Corp.
|
2,716
|
518,240
|
|
Limoneira Co.
|
2,463
|
48,718
|
|
Mission Produce, Inc. (a)
|
6,701
|
76,056
|
|
Seneca Foods Corp. Class A (a)
|
673
|
39,095
|
|
SunOpta, Inc. (a)
|
13,097
|
85,785
|
|
The Hain Celestial Group, Inc. (a)
|
12,151
|
74,607
|
|
The Simply Good Foods Co. (a)
|
12,623
|
460,108
|
|
TreeHouse Foods, Inc. (a)
|
7,022
|
263,676
|
|
Utz Brands, Inc. Class A
|
10,053
|
181,256
|
|
Vital Farms, Inc. (a)
|
4,328
|
115,817
|
|
Westrock Coffee Holdings (a)(b)
|
3,920
|
39,749
|
|
3,175,256
|
|||
Household Products - 0.3%
|
|||
Central Garden & Pet Co. (a)
|
1,374
|
56,265
|
|
Central Garden & Pet Co. Class A (non-vtg.)
|
7,142
|
253,041
|
|
Energizer Holdings, Inc.
|
9,938
|
285,419
|
|
Oil-Dri Corp. of America
|
686
|
47,506
|
|
WD-40 Co.
|
1,888
|
426,933
|
|
1,069,164
|
|||
Personal Care Products - 0.9%
|
|||
BellRing Brands, Inc. (a)
|
18,276
|
1,008,287
|
|
Edgewell Personal Care Co.
|
6,914
|
260,105
|
|
elf Beauty, Inc. (a)
|
7,501
|
1,219,138
|
|
Herbalife Ltd. (a)
|
13,784
|
119,232
|
|
Inter Parfums, Inc.
|
2,548
|
296,536
|
|
MediFast, Inc.
|
1,496
|
41,185
|
|
Nature's Sunshine Products, Inc. (a)
|
1,813
|
35,263
|
|
Nu Skin Enterprises, Inc. Class A
|
6,906
|
81,215
|
|
The Beauty Health Co. (a)
|
11,202
|
36,182
|
|
USANA Health Sciences, Inc. (a)
|
1,559
|
64,730
|
|
Waldencast PLC (a)
|
4,045
|
19,699
|
|
3,181,572
|
|||
Tobacco - 0.2%
|
|||
Ispire Technology, Inc.
|
2,345
|
12,124
|
|
Turning Point Brands, Inc.
|
2,420
|
69,793
|
|
Universal Corp.
|
3,376
|
173,628
|
|
Vector Group Ltd.
|
20,106
|
208,097
|
|
463,642
|
|||
TOTAL CONSUMER STAPLES
|
11,508,177
|
||
ENERGY - 7.5%
|
|||
Energy Equipment & Services - 2.6%
|
|||
Archrock, Inc.
|
19,341
|
371,154
|
|
Atlas Energy Solutions, Inc.
|
2,486
|
55,214
|
|
Borr Drilling Ltd.
|
30,574
|
162,042
|
|
Bristow Group, Inc. (a)
|
3,215
|
84,587
|
|
Cactus, Inc.
|
9,111
|
452,270
|
|
Championx Corp.
|
27,205
|
913,272
|
|
Core Laboratories, Inc.
|
6,491
|
102,558
|
|
Diamond Offshore Drilling, Inc. (a)
|
14,145
|
173,135
|
|
DMC Global, Inc. (a)
|
2,679
|
42,462
|
|
Dril-Quip, Inc. (a)
|
4,715
|
85,719
|
|
Expro Group Holdings NV (a)
|
12,518
|
234,838
|
|
Forum Energy Technologies, Inc. (a)
|
1,333
|
24,860
|
|
Helix Energy Solutions Group, Inc. (a)
|
20,036
|
215,187
|
|
Helmerich & Payne, Inc.
|
13,537
|
532,410
|
|
KLX Energy Services Holdings, Inc. (a)
|
1,568
|
10,396
|
|
Kodiak Gas Services, Inc.
|
2,221
|
60,367
|
|
Liberty Oilfield Services, Inc. Class A
|
22,840
|
502,480
|
|
Mammoth Energy Services, Inc. (a)
|
2,755
|
8,954
|
|
Nabors Industries Ltd. (a)
|
1,246
|
89,749
|
|
Newpark Resources, Inc. (a)
|
10,396
|
72,148
|
|
Noble Corp. PLC
|
15,661
|
695,035
|
|
Oceaneering International, Inc. (a)
|
13,960
|
319,824
|
|
Oil States International, Inc. (a)
|
8,514
|
33,971
|
|
Patterson-UTI Energy, Inc.
|
49,103
|
531,294
|
|
ProFrac Holding Corp. (a)
|
3,549
|
25,801
|
|
ProPetro Holding Corp. (a)
|
12,971
|
113,107
|
|
Ranger Energy Services, Inc. Class A
|
2,082
|
20,487
|
|
RPC, Inc.
|
11,977
|
80,126
|
|
SEACOR Marine Holdings, Inc. (a)
|
3,322
|
40,595
|
|
Seadrill Ltd. (a)
|
6,509
|
316,012
|
|
Select Water Solutions, Inc. Class A
|
11,044
|
102,047
|
|
Solaris Oilfield Infrastructure, Inc. Class A
|
4,209
|
37,081
|
|
TETRA Technologies, Inc. (a)
|
17,494
|
75,049
|
|
Tidewater, Inc. (a)
|
6,461
|
593,443
|
|
U.S. Silica Holdings, Inc. (a)
|
10,438
|
161,058
|
|
Valaris Ltd. (a)
|
8,258
|
537,265
|
|
Weatherford International PLC (a)
|
9,883
|
1,221,736
|
|
9,097,733
|
|||
Oil, Gas & Consumable Fuels - 4.9%
|
|||
Amplify Energy Corp. (a)
|
5,092
|
35,950
|
|
Ardmore Shipping Corp.
|
5,868
|
98,289
|
|
Berry Corp.
|
10,642
|
90,351
|
|
California Resources Corp.
|
9,677
|
511,526
|
|
Centrus Energy Corp. Class A (a)
|
1,729
|
74,226
|
|
Chord Energy Corp.
|
5,816
|
1,029,316
|
|
Chord Energy Corp.:
|
|||
warrants 9/1/24 (a)
|
224
|
8,006
|
|
warrants 9/1/25 (a)
|
111
|
2,907
|
|
Civitas Resources, Inc.
|
11,258
|
810,126
|
|
Clean Energy Fuels Corp. (a)
|
22,991
|
53,339
|
|
CNX Resources Corp. (a)
|
21,701
|
510,408
|
|
Comstock Resources, Inc.
|
12,755
|
128,315
|
|
CONSOL Energy, Inc.
|
4,250
|
351,730
|
|
Crescent Energy, Inc. Class A
|
10,713
|
113,986
|
|
CVR Energy, Inc.
|
4,117
|
125,074
|
|
Delek U.S. Holdings, Inc.
|
8,839
|
241,570
|
|
DHT Holdings, Inc.
|
18,956
|
216,478
|
|
Dorian LPG Ltd.
|
4,775
|
197,303
|
|
Empire Petroleum Corp. (a)(b)
|
2,039
|
10,562
|
|
enCore Energy Corp. (a)(b)
|
22,657
|
99,917
|
|
Energy Fuels, Inc. (a)(b)
|
22,255
|
115,281
|
|
Equitrans Midstream Corp.
|
60,666
|
820,811
|
|
Evolution Petroleum Corp.
|
4,554
|
24,592
|
|
Excelerate Energy, Inc.
|
2,520
|
42,487
|
|
FLEX LNG Ltd.
|
4,121
|
107,187
|
|
FutureFuel Corp.
|
3,592
|
19,469
|
|
Gevo, Inc. (a)
|
33,692
|
22,196
|
|
Golar LNG Ltd.
|
13,742
|
336,954
|
|
Granite Ridge Resources, Inc.
|
4,762
|
31,048
|
|
Green Plains, Inc. (a)
|
8,188
|
169,246
|
|
Gulfport Energy Corp. (a)
|
1,516
|
240,604
|
|
Hallador Energy Co. (a)
|
3,085
|
15,764
|
|
HighPeak Energy, Inc. (b)
|
1,646
|
23,390
|
|
International Seaways, Inc.
|
5,655
|
312,665
|
|
Kinetik Holdings, Inc.
|
5,087
|
195,036
|
|
Kosmos Energy Ltd. (a)
|
63,325
|
359,053
|
|
Magnolia Oil & Gas Corp. Class A
|
24,521
|
614,741
|
|
Matador Resources Co.
|
15,742
|
980,727
|
|
Murphy Oil Corp.
|
20,169
|
900,344
|
|
NACCO Industries, Inc. Class A
|
556
|
15,312
|
|
Nextdecade Corp. (a)
|
10,628
|
68,232
|
|
Nordic American Tanker Shipping Ltd.
|
28,534
|
111,283
|
|
Northern Oil & Gas, Inc.
|
12,241
|
499,310
|
|
Overseas Shipholding Group, Inc.
|
7,963
|
48,415
|
|
Par Pacific Holdings, Inc. (a)
|
7,689
|
236,821
|
|
PBF Energy, Inc. Class A
|
15,335
|
816,895
|
|
Peabody Energy Corp.
|
15,661
|
343,602
|
|
Permian Resource Corp. Class A
|
63,416
|
1,062,218
|
|
PrimeEnergy Corp. (a)
|
95
|
9,734
|
|
Rex American Resources Corp. (a)
|
2,170
|
120,066
|
|
Riley Exploration Permian, Inc.
|
1,239
|
32,127
|
|
Ring Energy, Inc. (a)
|
16,670
|
31,673
|
|
SandRidge Energy, Inc.
|
4,359
|
59,718
|
|
Scorpio Tankers, Inc.
|
6,637
|
466,979
|
|
SFL Corp. Ltd.
|
16,039
|
213,800
|
|
SilverBow Resources, Inc. (a)
|
3,225
|
99,072
|
|
Sitio Royalties Corp.
|
11,535
|
268,073
|
|
SM Energy Co.
|
16,098
|
780,592
|
|
Talos Energy, Inc. (a)
|
19,302
|
254,400
|
|
Teekay Corp. (a)
|
8,493
|
62,169
|
|
Teekay Tankers Ltd.
|
3,310
|
192,874
|
|
Tellurian, Inc. (a)(b)
|
80,952
|
34,817
|
|
Uranium Energy Corp. (a)
|
53,618
|
361,922
|
|
VAALCO Energy, Inc.
|
14,662
|
93,837
|
|
Vertex Energy, Inc. (a)(b)
|
9,466
|
12,306
|
|
Vital Energy, Inc. (a)
|
3,243
|
171,944
|
|
Vitesse Energy, Inc.
|
3,551
|
78,797
|
|
W&T Offshore, Inc.
|
12,617
|
28,388
|
|
World Kinect Corp.
|
8,254
|
193,969
|
|
16,810,319
|
|||
TOTAL ENERGY
|
25,908,052
|
||
FINANCIALS - 16.0%
|
|||
Banks - 8.4%
|
|||
1st Source Corp.
|
2,290
|
113,584
|
|
ACNB Corp.
|
1,155
|
37,584
|
|
Amalgamated Financial Corp.
|
2,468
|
60,565
|
|
Amerant Bancorp, Inc. Class A
|
3,620
|
78,409
|
|
Ameris Bancorp
|
9,198
|
436,721
|
|
Ames National Corp.
|
1,137
|
21,887
|
|
Arrow Financial Corp.
|
2,033
|
45,275
|
|
Associated Banc-Corp.
|
20,982
|
442,091
|
|
Atlantic Union Bankshares Corp.
|
12,376
|
393,186
|
|
Axos Financial, Inc. (a)
|
7,615
|
385,395
|
|
Banc of California, Inc.
|
19,129
|
261,876
|
|
BancFirst Corp.
|
3,063
|
273,128
|
|
Bancorp, Inc., Delaware (a)
|
7,163
|
214,460
|
|
Bank First National Corp. (b)
|
1,309
|
101,042
|
|
Bank of Hawaii Corp.
|
5,460
|
309,527
|
|
Bank of Marin Bancorp
|
2,226
|
31,965
|
|
Bank7 Corp.
|
502
|
13,705
|
|
BankUnited, Inc.
|
10,331
|
276,148
|
|
Bankwell Financial Group, Inc.
|
791
|
18,138
|
|
Banner Corp.
|
4,728
|
206,283
|
|
Bar Harbor Bankshares
|
2,083
|
52,242
|
|
BayCom Corp.
|
1,510
|
29,868
|
|
BCB Bancorp, Inc.
|
2,025
|
19,076
|
|
Berkshire Hills Bancorp, Inc.
|
6,036
|
128,688
|
|
Blue Foundry Bancorp (a)
|
2,972
|
25,381
|
|
Blue Ridge Bankshares, Inc. (b)
|
2,388
|
5,970
|
|
Bridgewater Bancshares, Inc. (a)
|
2,875
|
31,280
|
|
Brookline Bancorp, Inc., Delaware
|
12,107
|
100,488
|
|
Burke & Herbert Financial Services Corp.
|
887
|
46,461
|
|
Business First Bancshares, Inc.
|
3,375
|
68,141
|
|
Byline Bancorp, Inc.
|
3,433
|
74,393
|
|
C & F Financial Corp.
|
417
|
16,334
|
|
Cadence Bank
|
25,336
|
701,047
|
|
Cambridge Bancorp
|
1,071
|
65,727
|
|
Camden National Corp.
|
1,971
|
61,535
|
|
Capital Bancorp, Inc.
|
1,341
|
26,015
|
|
Capital City Bank Group, Inc.
|
1,816
|
48,160
|
|
Capitol Federal Financial, Inc.
|
17,242
|
82,244
|
|
Carter Bankshares, Inc. (a)
|
2,940
|
35,780
|
|
Cathay General Bancorp
|
9,674
|
333,173
|
|
Central Pacific Financial Corp.
|
3,664
|
73,060
|
|
Chemung Financial Corp.
|
483
|
20,366
|
|
ChoiceOne Financial Services, Inc.
|
935
|
23,244
|
|
Citizens & Northern Corp.
|
2,104
|
35,873
|
|
Citizens Financial Services, Inc.
|
529
|
21,372
|
|
City Holding Co.
|
2,015
|
203,555
|
|
Civista Bancshares, Inc.
|
2,161
|
30,859
|
|
CNB Financial Corp., Pennsylvania
|
2,923
|
55,537
|
|
Coastal Financial Corp. of Washington (a)
|
1,557
|
60,225
|
|
Codorus Valley Bancorp, Inc.
|
1,291
|
28,660
|
|
Colony Bankcorp, Inc.
|
2,373
|
25,795
|
|
Columbia Financial, Inc. (a)
|
4,053
|
67,280
|
|
Community Bank System, Inc.
|
7,404
|
320,001
|
|
Community Trust Bancorp, Inc.
|
2,139
|
89,859
|
|
Community West Bank
|
2,236
|
38,392
|
|
ConnectOne Bancorp, Inc.
|
5,124
|
91,771
|
|
CrossFirst Bankshares, Inc. (a)
|
6,253
|
75,536
|
|
Customers Bancorp, Inc. (a)
|
4,011
|
183,182
|
|
CVB Financial Corp.
|
18,524
|
302,682
|
|
Dime Community Bancshares, Inc.
|
4,922
|
89,580
|
|
Eagle Bancorp, Inc.
|
4,110
|
75,994
|
|
Eastern Bankshares, Inc.
|
21,578
|
271,020
|
|
Enterprise Bancorp, Inc.
|
1,374
|
33,388
|
|
Enterprise Financial Services Corp.
|
5,051
|
191,989
|
|
Equity Bancshares, Inc.
|
2,062
|
68,685
|
|
Esquire Financial Holdings, Inc.
|
971
|
45,695
|
|
ESSA Bancorp, Inc.
|
1,117
|
18,095
|
|
Evans Bancorp, Inc. (b)
|
677
|
17,324
|
|
Farmers & Merchants Bancorp, Inc.
|
1,771
|
36,306
|
|
Farmers National Banc Corp.
|
4,985
|
58,973
|
|
FB Financial Corp.
|
4,906
|
179,805
|
|
Fidelity D & D Bancorp, Inc.
|
634
|
28,784
|
|
Financial Institutions, Inc.
|
2,132
|
36,713
|
|
First Bancorp, North Carolina
|
5,549
|
168,745
|
|
First Bancorp, Puerto Rico
|
23,266
|
401,339
|
|
First Bancshares, Inc.
|
4,301
|
102,966
|
|
First Bank Hamilton New Jersey
|
2,818
|
32,914
|
|
First Busey Corp.
|
7,180
|
160,401
|
|
First Business Finance Services, Inc.
|
1,097
|
36,278
|
|
First Commonwealth Financial Corp.
|
14,095
|
185,913
|
|
First Community Bankshares, Inc.
|
2,424
|
80,428
|
|
First Community Corp.
|
928
|
15,340
|
|
First Financial Bancorp, Ohio
|
13,098
|
289,597
|
|
First Financial Bankshares, Inc. (b)
|
18,113
|
535,420
|
|
First Financial Corp., Indiana
|
1,550
|
56,436
|
|
First Foundation, Inc.
|
7,087
|
38,837
|
|
First Interstate Bancsystem, Inc.
|
11,542
|
308,171
|
|
First Merchants Corp.
|
8,238
|
275,314
|
|
First Mid-Illinois Bancshares, Inc.
|
3,075
|
95,202
|
|
First of Long Island Corp.
|
2,988
|
28,296
|
|
First Western Financial, Inc. (a)
|
1,156
|
19,271
|
|
Five Star Bancorp
|
1,800
|
38,916
|
|
Flushing Financial Corp. (b)
|
3,834
|
42,251
|
|
FS Bancorp, Inc.
|
872
|
27,180
|
|
Fulton Financial Corp.
|
22,343
|
369,777
|
|
FVCBankcorp, Inc. (a)
|
2,140
|
24,631
|
|
German American Bancorp, Inc.
|
3,905
|
123,906
|
|
Glacier Bancorp, Inc.
|
15,507
|
561,043
|
|
Great Southern Bancorp, Inc.
|
1,195
|
61,423
|
|
Greene County Bancorp, Inc.
|
1,014
|
29,832
|
|
Guaranty Bancshares, Inc. Texas
|
1,138
|
32,695
|
|
Hancock Whitney Corp.
|
12,070
|
547,857
|
|
Hanmi Financial Corp.
|
4,212
|
64,444
|
|
HarborOne Bancorp, Inc.
|
5,455
|
55,259
|
|
HBT Financial, Inc.
|
1,907
|
35,194
|
|
Heartland Financial U.S.A., Inc.
|
5,878
|
247,523
|
|
Heritage Commerce Corp.
|
8,264
|
65,616
|
|
Heritage Financial Corp., Washington
|
4,800
|
85,152
|
|
Hilltop Holdings, Inc.
|
6,385
|
186,825
|
|
Hingham Institution for Savings
|
204
|
34,456
|
|
Home Bancorp, Inc.
|
1,005
|
35,175
|
|
Home Bancshares, Inc.
|
26,166
|
619,611
|
|
HomeStreet, Inc.
|
2,570
|
31,483
|
|
HomeTrust Bancshares, Inc.
|
2,006
|
51,554
|
|
Hope Bancorp, Inc.
|
16,154
|
161,863
|
|
Horizon Bancorp, Inc. Indiana
|
6,135
|
70,430
|
|
Independent Bank Corp.
|
2,773
|
68,798
|
|
Independent Bank Corp.
|
6,143
|
308,624
|
|
Independent Bank Group, Inc.
|
5,006
|
186,423
|
|
International Bancshares Corp.
|
7,479
|
416,206
|
|
John Marshall Bankcorp, Inc.
|
1,751
|
28,927
|
|
Kearny Financial Corp.
|
7,573
|
40,894
|
|
Lakeland Bancorp, Inc.
|
8,703
|
106,090
|
|
Lakeland Financial Corp.
|
3,444
|
202,404
|
|
LCNB Corp.
|
1,683
|
23,730
|
|
Live Oak Bancshares, Inc.
|
4,678
|
151,193
|
|
Macatawa Bank Corp.
|
3,685
|
51,590
|
|
Mainstreet Bancshares, Inc. (b)
|
892
|
13,621
|
|
Mercantile Bank Corp.
|
2,196
|
79,232
|
|
Metrocity Bankshares, Inc.
|
2,546
|
58,507
|
|
Metropolitan Bank Holding Corp. (a)
|
1,428
|
56,692
|
|
Mid Penn Bancorp, Inc.
|
1,977
|
39,995
|
|
Middlefield Banc Corp.
|
1,050
|
22,544
|
|
Midland States Bancorp, Inc.
|
2,961
|
64,846
|
|
MidWestOne Financial Group, Inc.
|
1,995
|
40,239
|
|
MVB Financial Corp.
|
1,605
|
28,842
|
|
National Bank Holdings Corp.
|
5,123
|
167,676
|
|
National Bankshares, Inc.
|
769
|
20,617
|
|
NBT Bancorp, Inc.
|
6,339
|
221,928
|
|
Nicolet Bankshares, Inc.
|
1,819
|
139,208
|
|
Northeast Bank
|
923
|
47,738
|
|
Northeast Community Bancorp, Inc.
|
1,727
|
27,252
|
|
Northfield Bancorp, Inc.
|
5,454
|
45,486
|
|
Northrim Bancorp, Inc.
|
755
|
36,089
|
|
Northwest Bancshares, Inc.
|
17,732
|
187,959
|
|
Norwood Financial Corp.
|
1,040
|
25,054
|
|
Oak Valley Bancorp Oakdale California
|
973
|
23,498
|
|
OceanFirst Financial Corp.
|
8,125
|
119,925
|
|
OFG Bancorp
|
6,436
|
232,404
|
|
Old National Bancorp, Indiana
|
43,788
|
724,254
|
|
Old Second Bancorp, Inc.
|
6,077
|
83,255
|
|
Orange County Bancorp, Inc.
|
733
|
31,673
|
|
Origin Bancorp, Inc.
|
4,050
|
120,285
|
|
Orrstown Financial Services, Inc.
|
1,433
|
37,573
|
|
Pacific Premier Bancorp, Inc.
|
13,253
|
284,940
|
|
Park National Corp.
|
1,994
|
262,630
|
|
Parke Bancorp, Inc.
|
1,402
|
23,077
|
|
Pathward Financial, Inc.
|
3,614
|
182,037
|
|
PCB Bancorp
|
1,485
|
21,622
|
|
Peapack-Gladstone Financial Corp.
|
2,304
|
51,564
|
|
Penns Woods Bancorp, Inc.
|
948
|
16,571
|
|
Peoples Bancorp, Inc.
|
4,862
|
141,192
|
|
Peoples Financial Services Corp.
|
975
|
36,923
|
|
Pioneer Bancorp, Inc. (a)
|
1,465
|
12,973
|
|
Plumas Bancorp
|
736
|
25,878
|
|
Ponce Financial Group, Inc. (a)
|
2,658
|
21,370
|
|
Preferred Bank, Los Angeles
|
1,790
|
135,485
|
|
Premier Financial Corp.
|
4,939
|
95,718
|
|
Primis Financial Corp.
|
2,858
|
27,780
|
|
Princeton Bancorp, Inc.
|
719
|
20,959
|
|
Provident Financial Services, Inc.
|
10,251
|
150,485
|
|
QCR Holdings, Inc.
|
2,293
|
126,023
|
|
RBB Bancorp
|
2,330
|
41,381
|
|
Red River Bancshares, Inc.
|
655
|
29,613
|
|
Renasant Corp.
|
7,615
|
221,292
|
|
Republic Bancorp, Inc., Kentucky Class A
|
1,158
|
58,734
|
|
S&T Bancorp, Inc.
|
5,313
|
160,187
|
|
Sandy Spring Bancorp, Inc.
|
6,127
|
125,297
|
|
Seacoast Banking Corp., Florida
|
11,748
|
271,026
|
|
ServisFirst Bancshares, Inc.
|
7,095
|
418,321
|
|
Shore Bancshares, Inc.
|
4,185
|
43,315
|
|
Sierra Bancorp
|
1,880
|
37,262
|
|
Simmons First National Corp. Class A
|
17,257
|
294,922
|
|
SmartFinancial, Inc.
|
2,152
|
44,224
|
|
South Plains Financial, Inc.
|
1,597
|
41,394
|
|
Southern First Bancshares, Inc. (a)
|
1,065
|
27,498
|
|
Southern Missouri Bancorp, Inc.
|
1,312
|
52,611
|
|
Southern States Bancshares, Inc.
|
1,060
|
25,620
|
|
Southside Bancshares, Inc.
|
3,952
|
105,360
|
|
Southstate Corp.
|
10,583
|
801,133
|
|
Stellar Bancorp, Inc.
|
6,761
|
150,094
|
|
Sterling Bancorp, Inc. (a)
|
2,610
|
12,345
|
|
Stock Yards Bancorp, Inc.
|
3,771
|
167,998
|
|
Summit Financial Group, Inc.
|
1,570
|
41,558
|
|
Texas Capital Bancshares, Inc. (a)
|
6,538
|
375,281
|
|
The Bank of NT Butterfield & Son Ltd.
|
6,780
|
230,520
|
|
The First Bancorp, Inc.
|
1,402
|
30,956
|
|
Third Coast Bancshares, Inc. (a)
|
1,815
|
35,247
|
|
Timberland Bancorp, Inc./Washington
|
1,054
|
25,718
|
|
Tompkins Financial Corp.
|
1,942
|
85,409
|
|
TowneBank
|
9,742
|
252,026
|
|
Trico Bancshares
|
4,313
|
149,963
|
|
Triumph Bancorp, Inc. (a)
|
3,086
|
217,131
|
|
Trustco Bank Corp., New York
|
2,553
|
67,961
|
|
Trustmark Corp.
|
8,481
|
251,038
|
|
UMB Financial Corp.
|
6,152
|
490,068
|
|
United Bankshares, Inc., West Virginia
|
18,159
|
589,441
|
|
United Community Bank, Inc.
|
16,104
|
406,304
|
|
Unity Bancorp, Inc.
|
961
|
25,870
|
|
Univest Corp. of Pennsylvania
|
4,062
|
84,774
|
|
USCB Financial Holdings, Inc.
|
1,514
|
16,866
|
|
Valley National Bancorp
|
60,071
|
421,098
|
|
Veritex Holdings, Inc.
|
7,298
|
142,165
|
|
Virginia National Bankshares C (b)
|
644
|
18,167
|
|
WaFd, Inc.
|
9,441
|
255,757
|
|
Washington Trust Bancorp, Inc.
|
2,356
|
59,984
|
|
WesBanco, Inc.
|
8,000
|
216,000
|
|
West Bancorp., Inc.
|
2,277
|
37,024
|
|
Westamerica Bancorp.
|
3,575
|
166,416
|
|
WSFS Financial Corp.
|
8,404
|
359,103
|
|
29,107,506
|
|||
Capital Markets - 1.4%
|
|||
Alti Global, Inc. Class A (a)
|
3,131
|
14,403
|
|
Artisan Partners Asset Management, Inc.
|
8,551
|
349,992
|
|
Assetmark Financial Holdings, Inc. (a)
|
3,076
|
104,000
|
|
B. Riley Financial, Inc. (b)
|
2,807
|
96,561
|
|
Bakkt Holdings, Inc. Class A (a)(b)
|
374
|
2,510
|
|
BGC Group, Inc. Class A
|
49,718
|
389,292
|
|
BrightSphere Investment Group, Inc.
|
4,358
|
96,922
|
|
Cohen & Steers, Inc. (b)
|
3,625
|
249,328
|
|
Diamond Hill Investment Group, Inc.
|
378
|
56,405
|
|
Donnelley Financial Solutions, Inc. (a)
|
3,414
|
214,331
|
|
Forge Global Holdings, Inc. Class A (a)
|
15,756
|
28,833
|
|
GCM Grosvenor, Inc. Class A
|
5,780
|
54,563
|
|
Hamilton Lane, Inc. Class A
|
5,081
|
567,649
|
|
MarketWise, Inc. Class A
|
4,432
|
6,914
|
|
Moelis & Co. Class A
|
9,292
|
456,051
|
|
Open Lending Corp. (a)
|
13,940
|
71,094
|
|
P10, Inc.
|
6,050
|
42,955
|
|
Patria Investments Ltd.
|
7,792
|
104,413
|
|
Perella Weinberg Partners Class A
|
5,878
|
87,700
|
|
Piper Jaffray Companies
|
2,416
|
473,029
|
|
PJT Partners, Inc.
|
3,293
|
311,156
|
|
Silvercrest Asset Management Group Class A
|
1,291
|
18,913
|
|
StepStone Group, Inc. Class A
|
7,681
|
277,054
|
|
StoneX Group, Inc. (a)
|
3,744
|
271,814
|
|
Value Line, Inc.
|
115
|
4,163
|
|
Victory Capital Holdings, Inc.
|
3,735
|
189,962
|
|
Virtus Investment Partners, Inc.
|
949
|
208,135
|
|
WisdomTree Investments, Inc.
|
19,185
|
170,747
|
|
4,918,889
|
|||
Consumer Finance - 0.8%
|
|||
Atlanticus Holdings Corp. (a)
|
614
|
16,240
|
|
Bread Financial Holdings, Inc.
|
6,895
|
254,494
|
|
Consumer Portfolio Services, Inc. (a)
|
1,138
|
9,741
|
|
Encore Capital Group, Inc. (a)
|
3,206
|
131,735
|
|
Enova International, Inc. (a)
|
3,933
|
238,064
|
|
FirstCash Holdings, Inc.
|
5,230
|
590,885
|
|
Green Dot Corp. Class A (a)
|
6,381
|
55,834
|
|
LendingClub Corp. (a)
|
15,271
|
114,838
|
|
LendingTree, Inc. (a)
|
1,514
|
73,081
|
|
Navient Corp.
|
11,440
|
171,829
|
|
Nelnet, Inc. Class A
|
1,763
|
166,039
|
|
NerdWallet, Inc. (a)
|
4,815
|
60,525
|
|
OppFi, Inc. Class A
|
1,387
|
3,703
|
|
PRA Group, Inc. (a)
|
5,371
|
127,776
|
|
PROG Holdings, Inc.
|
6,135
|
203,927
|
|
Regional Management Corp.
|
1,146
|
28,891
|
|
Upstart Holdings, Inc. (a)(b)
|
10,365
|
229,377
|
|
World Acceptance Corp. (a)
|
572
|
78,690
|
|
2,555,669
|
|||
Financial Services - 2.4%
|
|||
A-Mark Precious Metals, Inc.
|
2,604
|
104,342
|
|
Acacia Research Corp. (a)
|
5,383
|
26,215
|
|
Alerus Financial Corp.
|
2,487
|
48,994
|
|
AvidXchange Holdings, Inc. (a)
|
20,943
|
244,195
|
|
Banco Latinoamericano de Comer Series E
|
3,822
|
108,583
|
|
Cannae Holdings, Inc. (a)
|
9,140
|
177,773
|
|
Cantaloupe, Inc. (a)
|
7,965
|
46,117
|
|
Cass Information Systems, Inc.
|
1,919
|
82,882
|
|
Compass Diversified Holdings
|
8,872
|
194,918
|
|
Enact Holdings, Inc.
|
4,125
|
122,636
|
|
Essent Group Ltd.
|
14,564
|
771,455
|
|
EVERTEC, Inc.
|
9,069
|
340,360
|
|
Federal Agricultural Mortgage Corp. Class C (non-vtg.)
|
1,265
|
235,454
|
|
Finance of America Companies, Inc. (a)(b)
|
7,078
|
3,397
|
|
Flywire Corp. (a)
|
14,799
|
303,380
|
|
i3 Verticals, Inc. Class A (a)
|
3,160
|
71,764
|
|
International Money Express, Inc. (a)
|
4,394
|
88,891
|
|
Jackson Financial, Inc.
|
11,105
|
758,694
|
|
Marqeta, Inc. Class A (a)
|
65,592
|
364,036
|
|
Merchants Bancorp
|
2,207
|
89,008
|
|
Mr. Cooper Group, Inc. (a)
|
8,942
|
690,322
|
|
Newtekone, Inc.
|
3,317
|
35,790
|
|
NMI Holdings, Inc. (a)
|
11,068
|
341,558
|
|
Ocwen Financial Corp. (a)
|
897
|
20,936
|
|
PagSeguro Digital Ltd. (a)
|
27,640
|
344,118
|
|
Payoneer Global, Inc. (a)
|
37,009
|
182,824
|
|
Paysafe Ltd. (a)
|
4,593
|
65,312
|
|
Paysign, Inc. (a)
|
4,473
|
20,576
|
|
PennyMac Financial Services, Inc.
|
3,536
|
302,823
|
|
Priority Technology Holdings, Inc. (a)
|
2,423
|
7,778
|
|
Radian Group, Inc.
|
21,338
|
637,366
|
|
Remitly Global, Inc. (a)
|
18,897
|
336,934
|
|
Repay Holdings Corp. (a)
|
11,512
|
117,077
|
|
Security National Financial Corp. Class A
|
1,650
|
10,857
|
|
StoneCo Ltd. Class A (a)
|
40,454
|
631,082
|
|
SWK Holdings Corp. (a)
|
432
|
7,491
|
|
Velocity Financial, Inc. (a)
|
1,157
|
19,843
|
|
Walker & Dunlop, Inc.
|
4,433
|
406,196
|
|
Waterstone Financial, Inc.
|
2,301
|
26,093
|
|
8,388,070
|
|||
Insurance - 1.9%
|
|||
AMBAC Financial Group, Inc. (a)
|
6,106
|
88,232
|
|
American Coastal Insurance Cor (a)
|
2,852
|
29,860
|
|
American Equity Investment Life Holding Co.
|
10,832
|
607,784
|
|
Amerisafe, Inc.
|
2,635
|
120,156
|
|
CNO Financial Group, Inc.
|
15,537
|
409,089
|
|
Crawford & Co. Class A
|
1,921
|
17,827
|
|
Donegal Group, Inc. Class A
|
2,082
|
27,982
|
|
eHealth, Inc. (a)
|
3,691
|
15,797
|
|
Employers Holdings, Inc.
|
3,525
|
150,130
|
|
Enstar Group Ltd. (a)
|
1,648
|
478,530
|
|
F&G Annuities & Life, Inc.
|
2,606
|
98,559
|
|
Fidelis Insurance Holdings Ltd.
|
8,476
|
157,484
|
|
Genworth Financial, Inc. Class A (a)
|
62,255
|
369,172
|
|
GoHealth, Inc. (a)
|
524
|
5,277
|
|
Goosehead Insurance (a)
|
2,991
|
170,218
|
|
Greenlight Capital Re, Ltd. (a)
|
3,559
|
43,135
|
|
Hamilton Insurance Group Ltd. (b)
|
2,368
|
32,157
|
|
HCI Group, Inc.
|
1,023
|
116,806
|
|
Hippo Holdings, Inc. (a)
|
1,503
|
32,149
|
|
Horace Mann Educators Corp.
|
5,694
|
209,881
|
|
Investors Title Co.
|
175
|
28,075
|
|
James River Group Holdings Ltd.
|
5,225
|
46,450
|
|
Kingsway Financial Services, Inc. (a)
|
1,555
|
13,840
|
|
Lemonade, Inc. (a)(b)
|
7,067
|
121,764
|
|
Maiden Holdings Ltd. (a)(b)
|
12,878
|
26,786
|
|
MBIA, Inc.
|
6,216
|
39,099
|
|
Mercury General Corp.
|
3,719
|
194,355
|
|
National Western Life Group, Inc.
|
316
|
154,467
|
|
NI Holdings, Inc. (a)
|
1,001
|
14,885
|
|
Oscar Health, Inc. (a)
|
22,412
|
389,296
|
|
Palomar Holdings, Inc. (a)
|
3,414
|
268,579
|
|
ProAssurance Corp.
|
7,001
|
93,533
|
|
Safety Insurance Group, Inc.
|
2,007
|
159,697
|
|
Selective Insurance Group, Inc.
|
8,354
|
849,184
|
|
Selectquote, Inc. (a)
|
19,150
|
28,917
|
|
Siriuspoint Ltd. (a)
|
9,960
|
117,329
|
|
Skyward Specialty Insurance Group, Inc. (a)
|
4,177
|
145,861
|
|
Stewart Information Services Corp.
|
3,732
|
231,421
|
|
The Baldwin Insurance Group, Inc. (a)
|
8,420
|
224,309
|
|
Tiptree, Inc.
|
3,304
|
52,633
|
|
Trupanion, Inc. (a)(b)
|
5,490
|
123,525
|
|
United Fire Group, Inc.
|
2,897
|
63,995
|
|
Universal Insurance Holdings, Inc.
|
3,344
|
65,275
|
|
6,633,500
|
|||
Mortgage Real Estate Investment Trusts - 1.1%
|
|||
Angel Oak Mortgage (REIT), Inc.
|
1,710
|
18,006
|
|
Apollo Commercial Real Estate Finance, Inc.
|
20,325
|
195,730
|
|
Arbor Realty Trust, Inc. (b)
|
25,781
|
330,770
|
|
Ares Commercial Real Estate Corp.
|
7,531
|
51,135
|
|
Armour Residential REIT, Inc.
|
6,924
|
125,809
|
|
Blackstone Mortgage Trust, Inc. (b)
|
24,153
|
426,059
|
|
BrightSpire Capital, Inc.
|
18,856
|
118,604
|
|
Chimera Investment Corp.
|
31,565
|
130,048
|
|
Claros Mortgage Trust, Inc.
|
12,843
|
111,734
|
|
Dynex Capital, Inc.
|
7,974
|
93,057
|
|
Ellington Financial LLC
|
10,630
|
121,607
|
|
Franklin BSP Realty Trust, Inc.
|
11,969
|
149,493
|
|
Granite Point Mortgage Trust, Inc.
|
7,491
|
32,136
|
|
Hannon Armstrong Sustainable Infrastructure Capital, Inc. (b)
|
15,288
|
382,353
|
|
Invesco Mortgage Capital, Inc.
|
6,915
|
59,123
|
|
KKR Real Estate Finance Trust, Inc.
|
8,414
|
79,176
|
|
Ladder Capital Corp. Class A
|
16,138
|
173,161
|
|
MFA Financial, Inc.
|
14,608
|
154,699
|
|
New York Mortgage Trust, Inc.
|
12,950
|
88,708
|
|
Nexpoint Real Estate Finance, Inc.
|
1,131
|
14,658
|
|
Orchid Island Capital, Inc. (b)
|
7,396
|
61,609
|
|
PennyMac Mortgage Investment Trust
|
12,266
|
169,884
|
|
Ready Capital Corp.
|
22,846
|
194,648
|
|
Redwood Trust, Inc.
|
18,227
|
100,795
|
|
TPG RE Finance Trust, Inc.
|
9,673
|
70,903
|
|
Two Harbors Investment Corp.
|
14,647
|
184,992
|
|
3,638,897
|
|||
TOTAL FINANCIALS
|
55,242,531
|
||
HEALTH CARE - 14.8%
|
|||
Biotechnology - 7.5%
|
|||
2seventy bio, Inc. (a)
|
7,135
|
32,536
|
|
4D Molecular Therapeutics, Inc. (a)
|
5,672
|
135,731
|
|
89Bio, Inc. (a)
|
11,036
|
93,916
|
|
Aadi Bioscience, Inc. (a)
|
2,198
|
4,220
|
|
ACADIA Pharmaceuticals, Inc. (a)
|
17,037
|
284,688
|
|
Acelyrin, Inc.
|
9,921
|
41,470
|
|
Acrivon Therapeutics, Inc. (a)
|
1,802
|
16,380
|
|
Actinium Pharmaceuticals, Inc. (a)
|
3,923
|
30,207
|
|
Adicet Bio, Inc. (a)
|
7,067
|
10,530
|
|
ADMA Biologics, Inc. (a)
|
29,712
|
193,722
|
|
Aerovate Therapeutics, Inc. (a)
|
1,564
|
31,296
|
|
Agenus, Inc.
|
2,539
|
30,773
|
|
Agios Pharmaceuticals, Inc. (a)
|
7,678
|
249,535
|
|
Akero Therapeutics, Inc. (a)
|
8,509
|
169,244
|
|
Aldeyra Therapeutics, Inc. (a)
|
6,609
|
26,039
|
|
Alector, Inc. (a)
|
9,929
|
50,439
|
|
Alkermes PLC (a)
|
23,032
|
565,205
|
|
Allakos, Inc. (a)
|
9,090
|
9,545
|
|
Allogene Therapeutics, Inc. (a)
|
12,993
|
35,861
|
|
Allovir, Inc. (a)
|
6,986
|
5,550
|
|
Alpine Immune Sciences, Inc. (a)
|
5,346
|
345,298
|
|
Altimmune, Inc. (a)(b)
|
7,632
|
49,990
|
|
ALX Oncology Holdings, Inc. (a)
|
3,669
|
62,446
|
|
Amicus Therapeutics, Inc. (a)
|
40,302
|
402,617
|
|
AnaptysBio, Inc. (a)
|
2,570
|
62,554
|
|
Anavex Life Sciences Corp. (a)(b)
|
10,160
|
37,084
|
|
Anika Therapeutics, Inc. (a)
|
1,988
|
51,469
|
|
Annexon, Inc. (a)
|
9,228
|
41,987
|
|
Apogee Therapeutics, Inc.
|
5,752
|
289,326
|
|
Arbutus Biopharma Corp. (a)
|
17,402
|
47,507
|
|
Arcellx, Inc. (a)
|
5,335
|
266,857
|
|
Arcturus Therapeutics Holdings, Inc. (a)
|
3,244
|
82,949
|
|
Arcus Biosciences, Inc. (a)
|
7,431
|
113,174
|
|
Arcutis Biotherapeutics, Inc. (a)
|
11,068
|
92,086
|
|
Ardelyx, Inc. (a)
|
32,152
|
205,773
|
|
ArriVent Biopharma, Inc. (b)
|
1,419
|
23,442
|
|
Arrowhead Pharmaceuticals, Inc. (a)
|
16,131
|
364,883
|
|
Ars Pharmaceuticals, Inc. (a)
|
3,438
|
29,911
|
|
Astria Therapeutics, Inc. (a)
|
6,926
|
63,581
|
|
Atara Biotherapeutics, Inc. (a)(b)
|
13,486
|
9,305
|
|
Aura Biosciences, Inc. (a)
|
5,000
|
37,000
|
|
Aurinia Pharmaceuticals, Inc. (a)
|
18,867
|
96,033
|
|
Avid Bioservices, Inc. (a)
|
8,612
|
65,710
|
|
Avidity Biosciences, Inc. (a)
|
10,321
|
249,046
|
|
Avita Medical, Inc. (a)(b)
|
3,456
|
29,030
|
|
Beam Therapeutics, Inc. (a)
|
10,391
|
220,497
|
|
BioAtla, Inc. (a)
|
6,347
|
14,312
|
|
BioCryst Pharmaceuticals, Inc. (a)
|
26,314
|
108,677
|
|
Biohaven Ltd. (a)
|
9,510
|
368,988
|
|
Biomea Fusion, Inc. (a)(b)
|
2,787
|
29,932
|
|
BioVie, Inc. (a)
|
2,021
|
990
|
|
BioXcel Therapeutics, Inc. (a)
|
2,735
|
6,892
|
|
bluebird bio, Inc. (a)
|
27,435
|
24,338
|
|
Blueprint Medicines Corp. (a)
|
8,443
|
771,184
|
|
BridgeBio Pharma, Inc. (a)
|
16,199
|
415,018
|
|
Cabaletta Bio, Inc. (a)
|
4,793
|
51,021
|
|
CareDx, Inc. (a)
|
7,142
|
55,422
|
|
Cargo Therapeutics, Inc.
|
2,943
|
56,211
|
|
Caribou Biosciences, Inc. (a)
|
11,265
|
40,892
|
|
Carisma Therapeutics, Inc. (a)(b)
|
3,373
|
5,498
|
|
Cartesian Therapeutics, Inc.
|
529
|
11,675
|
|
Cartesian Therapeutics, Inc. rights (a)(c)
|
15,874
|
2,064
|
|
Catalyst Pharmaceutical Partners, Inc. (a)
|
15,506
|
233,365
|
|
Celcuity, Inc. (a)
|
2,502
|
39,457
|
|
Celldex Therapeutics, Inc. (a)
|
8,637
|
323,197
|
|
Century Therapeutics, Inc. (a)
|
3,048
|
8,870
|
|
Cerevel Therapeutics Holdings (a)
|
9,933
|
424,238
|
|
CG Oncology, Inc.
|
3,247
|
130,497
|
|
Chinook Therapeutics, Inc. rights (a)(c)
|
702
|
0
|
|
Cogent Biosciences, Inc. (a)
|
11,539
|
75,004
|
|
Coherus BioSciences, Inc. (a)
|
14,717
|
28,845
|
|
Compass Therapeutics, Inc. (a)
|
13,212
|
19,025
|
|
Crinetics Pharmaceuticals, Inc. (a)
|
9,172
|
401,917
|
|
Cue Biopharma, Inc. (a)
|
4,671
|
8,875
|
|
Cullinan Oncology, Inc. (a)
|
3,666
|
99,019
|
|
Cytokinetics, Inc. (a)
|
13,260
|
813,103
|
|
Day One Biopharmaceuticals, Inc. (a)
|
8,712
|
148,975
|
|
Deciphera Pharmaceuticals, Inc. (a)
|
7,482
|
189,070
|
|
Denali Therapeutics, Inc. (a)
|
16,601
|
256,319
|
|
Design Therapeutics, Inc. (a)
|
4,520
|
15,910
|
|
Disc Medicine, Inc. (a)
|
1,290
|
35,914
|
|
Dynavax Technologies Corp. (a)
|
17,897
|
203,489
|
|
Dyne Therapeutics, Inc. (a)
|
8,243
|
208,630
|
|
Eagle Pharmaceuticals, Inc. (a)
|
1,450
|
5,931
|
|
Editas Medicine, Inc. (a)
|
11,280
|
58,769
|
|
Emergent BioSolutions, Inc. (a)(b)
|
6,867
|
12,910
|
|
Enanta Pharmaceuticals, Inc. (a)
|
2,815
|
38,678
|
|
Entrada Therapeutics, Inc. (a)
|
2,982
|
35,337
|
|
Erasca, Inc. (a)
|
11,402
|
22,918
|
|
Fate Therapeutics, Inc. (a)
|
12,017
|
47,467
|
|
Fennec Pharmaceuticals, Inc. (a)(b)
|
2,599
|
23,859
|
|
FibroGen, Inc. (a)
|
13,045
|
14,610
|
|
Foghorn Therapeutics, Inc. (a)
|
2,711
|
14,802
|
|
Genelux Corp. (a)
|
2,535
|
7,884
|
|
Generation Bio Co. (a)
|
6,524
|
18,463
|
|
Geron Corp. (a)
|
71,322
|
280,295
|
|
Gritstone Bio, Inc. (a)
|
12,025
|
9,620
|
|
Halozyme Therapeutics, Inc. (a)
|
18,005
|
685,991
|
|
Heron Therapeutics, Inc. (a)(b)
|
14,430
|
33,478
|
|
HilleVax, Inc. (a)
|
3,741
|
49,381
|
|
Humacyte, Inc. Class A (a)
|
8,790
|
34,457
|
|
Ideaya Biosciences, Inc. (a)
|
9,160
|
372,354
|
|
IGM Biosciences, Inc. (a)(b)
|
1,806
|
17,392
|
|
Immuneering Corp. (a)
|
3,003
|
4,264
|
|
ImmunityBio, Inc. (a)(b)
|
18,298
|
146,201
|
|
Immunovant, Inc. (a)
|
7,515
|
206,212
|
|
Inhibrx, Inc. (a)
|
4,766
|
162,235
|
|
Inozyme Pharma, Inc. (a)
|
6,635
|
29,260
|
|
Insmed, Inc. (a)
|
19,170
|
473,882
|
|
Intellia Therapeutics, Inc. (a)
|
12,473
|
266,922
|
|
Iovance Biotherapeutics, Inc. (a)
|
32,975
|
388,446
|
|
Ironwood Pharmaceuticals, Inc. Class A (a)
|
19,000
|
147,250
|
|
iTeos Therapeutics, Inc. (a)
|
3,426
|
36,795
|
|
Janux Therapeutics, Inc. (a)(b)
|
2,390
|
136,230
|
|
Kalvista Pharmaceuticals, Inc. (a)
|
4,350
|
49,373
|
|
Karyopharm Therapeutics, Inc. (a)(b)
|
14,832
|
15,277
|
|
Keros Therapeutics, Inc. (a)
|
3,550
|
200,185
|
|
Kezar Life Sciences, Inc. (a)
|
9,599
|
7,914
|
|
Kiniksa Pharmaceuticals Ltd. (a)
|
4,476
|
83,791
|
|
Kodiak Sciences, Inc. (a)
|
4,350
|
13,964
|
|
Krystal Biotech, Inc. (a)
|
3,005
|
460,126
|
|
Kura Oncology, Inc. (a)
|
9,772
|
191,727
|
|
Kymera Therapeutics, Inc. (a)
|
5,645
|
189,785
|
|
Larimar Therapeutics, Inc. (a)
|
3,498
|
24,101
|
|
Lenz Therapeutics, Inc.
|
635
|
10,077
|
|
Lexeo Therapeutics, Inc.
|
1,357
|
16,895
|
|
Lexicon Pharmaceuticals, Inc. (a)
|
12,408
|
19,108
|
|
Lineage Cell Therapeutics, Inc. (a)
|
18,809
|
20,502
|
|
Lyell Immunopharma, Inc. (a)
|
23,833
|
51,718
|
|
Macrogenics, Inc. (a)
|
8,473
|
125,231
|
|
Madrigal Pharmaceuticals, Inc. (a)
|
2,054
|
419,057
|
|
MannKind Corp. (a)
|
36,423
|
149,699
|
|
MeiraGTx Holdings PLC (a)
|
4,686
|
22,868
|
|
Merrimack Pharmaceuticals, Inc. (a)
|
1,420
|
20,931
|
|
Mersana Therapeutics, Inc. (a)
|
15,171
|
48,092
|
|
MiMedx Group, Inc. (a)
|
15,941
|
98,197
|
|
Mineralys Therapeutics, Inc. (a)
|
2,700
|
33,075
|
|
Mirum Pharmaceuticals, Inc. (a)
|
3,422
|
85,926
|
|
Monte Rosa Therapeutics, Inc. (a)
|
4,328
|
23,025
|
|
Morphic Holding, Inc. (a)
|
5,259
|
143,413
|
|
Mural Oncology PLC
|
2,244
|
8,303
|
|
Myriad Genetics, Inc. (a)
|
12,206
|
238,871
|
|
Nkarta, Inc. (a)
|
4,207
|
28,103
|
|
Novavax, Inc. (a)(b)
|
15,950
|
69,064
|
|
Nurix Therapeutics, Inc. (a)
|
6,621
|
79,584
|
|
Nuvalent, Inc. Class A (a)
|
3,678
|
253,341
|
|
Nuvectis Pharma, Inc. (a)
|
973
|
5,916
|
|
Ocean Biomedical, Inc. Class A (a)
|
1,189
|
1,665
|
|
Olema Pharmaceuticals, Inc. (a)
|
3,741
|
38,046
|
|
Omega Therapeutics, Inc. (a)(b)
|
3,352
|
7,475
|
|
Omniab, Inc. (a)(c)
|
613
|
2,556
|
|
Omniab, Inc. (a)(c)
|
613
|
2,391
|
|
Oncternal Therapeutics, Inc. rights (a)(c)
|
19
|
0
|
|
Organogenesis Holdings, Inc. Class A (a)
|
10,127
|
23,798
|
|
ORIC Pharmaceuticals, Inc. (a)(b)
|
5,527
|
48,803
|
|
Outlook Therapeutics, Inc. (a)(b)
|
1,035
|
9,232
|
|
Ovid Therapeutics, Inc. (a)
|
7,926
|
24,174
|
|
PDS Biotechnology Corp. (a)(b)
|
3,714
|
12,442
|
|
PepGen, Inc. (a)
|
1,341
|
16,467
|
|
PMV Pharmaceuticals, Inc. (a)
|
5,407
|
9,733
|
|
Poseida Therapeutics, Inc. (a)
|
9,162
|
22,172
|
|
Precigen, Inc. (a)(b)
|
18,963
|
25,031
|
|
Prelude Therapeutics, Inc. (a)
|
2,242
|
8,452
|
|
Prime Medicine, Inc. (a)(b)
|
5,677
|
27,931
|
|
ProKidney Corp. (a)(b)
|
6,690
|
13,815
|
|
Protagonist Therapeutics, Inc. (a)
|
7,921
|
198,896
|
|
Protalix BioTherapeutics, Inc. (a)(b)
|
9,075
|
10,346
|
|
Prothena Corp. PLC (a)
|
5,847
|
118,928
|
|
PTC Therapeutics, Inc. (a)
|
9,944
|
319,700
|
|
Rallybio Corp. (a)(b)
|
4,274
|
8,206
|
|
RAPT Therapeutics, Inc. (a)
|
4,118
|
31,709
|
|
Recursion Pharmaceuticals, Inc. (a)(b)
|
19,364
|
151,426
|
|
REGENXBIO, Inc. (a)
|
5,760
|
88,416
|
|
Relay Therapeutics, Inc. (a)
|
12,981
|
84,636
|
|
Reneo Pharmaceuticals, Inc. (a)
|
1,771
|
2,958
|
|
Replimune Group, Inc. (a)
|
6,828
|
43,358
|
|
Revolution Medicines, Inc. (a)
|
19,360
|
721,741
|
|
Rhythm Pharmaceuticals, Inc. (a)
|
7,438
|
295,735
|
|
Rigel Pharmaceuticals, Inc. (a)
|
23,889
|
25,083
|
|
Rocket Pharmaceuticals, Inc. (a)
|
8,661
|
186,385
|
|
Sage Therapeutics, Inc. (a)
|
7,316
|
101,985
|
|
Sagimet Biosciences, Inc. (b)
|
3,066
|
11,957
|
|
Sana Biotechnology, Inc. (a)
|
13,427
|
120,843
|
|
Sangamo Therapeutics, Inc. (a)
|
19,553
|
10,068
|
|
Savara, Inc. (a)
|
12,537
|
57,419
|
|
Scholar Rock Holding Corp. (a)
|
7,939
|
116,465
|
|
Seres Therapeutics, Inc. (a)
|
13,533
|
13,406
|
|
SpringWorks Therapeutics, Inc. (a)
|
9,526
|
444,769
|
|
Stoke Therapeutics, Inc. (a)
|
3,822
|
42,157
|
|
Summit Therapeutics, Inc. (a)(b)
|
15,872
|
62,377
|
|
Sutro Biopharma, Inc. (a)
|
8,644
|
29,346
|
|
Syndax Pharmaceuticals, Inc. (a)
|
10,955
|
231,479
|
|
Tango Therapeutics, Inc. (a)
|
6,159
|
47,424
|
|
Tenaya Therapeutics, Inc. (a)
|
6,628
|
30,091
|
|
TG Therapeutics, Inc. (a)
|
19,264
|
263,146
|
|
Travere Therapeutics, Inc. (a)
|
10,254
|
56,705
|
|
Turnstone Biologics Corp.
|
2,054
|
5,340
|
|
Twist Bioscience Corp. (a)
|
8,029
|
250,746
|
|
Tyra Biosciences, Inc. (a)
|
2,004
|
34,268
|
|
UroGen Pharma Ltd. (a)
|
3,832
|
52,958
|
|
Vanda Pharmaceuticals, Inc. (a)
|
7,867
|
37,447
|
|
Vaxcyte, Inc. (a)
|
14,727
|
891,720
|
|
Vaxxinity, Inc. Class A (a)
|
5,802
|
712
|
|
Vera Therapeutics, Inc. (a)
|
5,574
|
220,229
|
|
Veracyte, Inc. (a)
|
10,140
|
198,440
|
|
Vericel Corp. (a)
|
6,628
|
304,026
|
|
Verve Therapeutics, Inc. (a)
|
9,136
|
54,907
|
|
Vigil Neuroscience, Inc. (a)
|
2,051
|
5,353
|
|
Viking Therapeutics, Inc. (a)
|
14,221
|
1,131,707
|
|
Vir Biotechnology, Inc. (a)
|
11,440
|
96,782
|
|
Viridian Therapeutics, Inc. (a)
|
6,812
|
90,327
|
|
Vor Biopharma, Inc. (a)(b)
|
5,046
|
8,679
|
|
Voyager Therapeutics, Inc. (a)
|
5,420
|
42,384
|
|
X4 Pharmaceuticals, Inc. (a)
|
17,230
|
19,298
|
|
Xencor, Inc. (a)
|
7,987
|
167,248
|
|
XOMA Corp. (a)(b)
|
1,029
|
26,075
|
|
Y-mAbs Therapeutics, Inc. (a)
|
5,140
|
78,179
|
|
Zentalis Pharmaceuticals, Inc. (a)
|
8,081
|
89,376
|
|
Zura Bio Ltd. Class A (a)(b)
|
2,412
|
10,299
|
|
Zymeworks, Inc. (a)
|
7,662
|
65,740
|
|
26,076,390
|
|||
Health Care Equipment & Supplies - 2.7%
|
|||
Accuray, Inc. (a)
|
12,489
|
26,602
|
|
Alphatec Holdings, Inc. (a)
|
12,820
|
161,788
|
|
Angiodynamics, Inc. (a)
|
5,373
|
31,110
|
|
Artivion, Inc. (a)
|
5,485
|
107,616
|
|
Atricure, Inc. (a)
|
6,487
|
156,466
|
|
Atrion Corp.
|
192
|
81,272
|
|
Avanos Medical, Inc. (a)
|
6,411
|
115,911
|
|
AxoGen, Inc. (a)
|
5,678
|
36,396
|
|
Axonics, Inc. (a)
|
6,919
|
460,598
|
|
Beyond Air, Inc. (a)
|
3,766
|
4,067
|
|
Butterfly Network, Inc. Class A (a)(b)
|
18,830
|
14,614
|
|
Cerus Corp. (a)
|
24,563
|
41,020
|
|
ClearPoint Neuro, Inc. (a)
|
3,075
|
16,697
|
|
CONMED Corp.
|
4,251
|
288,983
|
|
Cutera, Inc. (a)(b)
|
2,504
|
6,060
|
|
CVRx, Inc. (a)
|
1,645
|
25,514
|
|
Embecta Corp.
|
8,001
|
81,050
|
|
Glaukos Corp. (a)
|
6,588
|
632,448
|
|
Haemonetics Corp. (a)
|
6,963
|
640,248
|
|
Inari Medical, Inc. (a)
|
7,431
|
277,474
|
|
InMode Ltd. (a)
|
10,739
|
184,603
|
|
Inogen, Inc. (a)
|
3,339
|
22,705
|
|
Integer Holdings Corp. (a)
|
4,608
|
514,391
|
|
IRadimed Corp.
|
1,024
|
41,585
|
|
iRhythm Technologies, Inc. (a)
|
4,264
|
467,249
|
|
KORU Medical Systems, Inc. (a)(b)
|
4,198
|
9,110
|
|
Lantheus Holdings, Inc. (a)
|
9,456
|
629,202
|
|
LeMaitre Vascular, Inc.
|
2,753
|
178,394
|
|
LivaNova PLC (a)
|
7,545
|
420,634
|
|
Merit Medical Systems, Inc. (a)
|
7,892
|
584,797
|
|
Neogen Corp. (a)
|
30,246
|
372,933
|
|
Nevro Corp. (a)
|
4,908
|
51,927
|
|
Omnicell, Inc. (a)
|
6,235
|
167,160
|
|
OraSure Technologies, Inc. (a)
|
9,800
|
51,842
|
|
Orchestra BioMed Holdings, Inc. (a)
|
1,857
|
8,189
|
|
Orthofix International NV (a)
|
4,795
|
62,335
|
|
OrthoPediatrics Corp. (a)
|
2,181
|
64,623
|
|
Outset Medical, Inc. (a)
|
7,328
|
18,540
|
|
Paragon 28, Inc. (a)
|
6,015
|
55,458
|
|
PROCEPT BioRobotics Corp. (a)
|
5,623
|
297,907
|
|
Pulmonx Corp. (a)
|
5,149
|
39,184
|
|
Pulse Biosciences, Inc. (a)
|
2,147
|
15,823
|
|
RxSight, Inc. (a)
|
3,943
|
205,549
|
|
Sanara Medtech, Inc. (a)
|
522
|
16,620
|
|
Semler Scientific, Inc. (a)
|
621
|
15,854
|
|
SI-BONE, Inc. (a)
|
5,443
|
77,617
|
|
Sight Sciences, Inc. (a)
|
2,921
|
16,212
|
|
Silk Road Medical, Inc. (a)
|
5,340
|
103,810
|
|
Staar Surgical Co. (a)
|
6,826
|
313,723
|
|
SurModics, Inc. (a)
|
1,892
|
48,605
|
|
Tactile Systems Technology, Inc. (a)
|
3,228
|
44,450
|
|
Tela Bio, Inc. (a)
|
2,189
|
9,861
|
|
TransMedics Group, Inc. (a)
|
4,409
|
415,019
|
|
Treace Medical Concepts, Inc. (a)
|
6,320
|
65,538
|
|
UFP Technologies, Inc. (a)
|
983
|
202,439
|
|
Utah Medical Products, Inc.
|
483
|
31,975
|
|
Varex Imaging Corp. (a)
|
5,402
|
87,783
|
|
Vicarious Surgical, Inc. (a)
|
14,262
|
4,002
|
|
Zimvie, Inc. (a)
|
3,556
|
54,051
|
|
Zynex, Inc. (a)(b)
|
2,615
|
28,687
|
|
9,206,320
|
|||
Health Care Providers & Services - 2.5%
|
|||
23andMe Holding Co. Class A (a)
|
40,526
|
20,352
|
|
Accolade, Inc. (a)
|
9,696
|
73,980
|
|
AdaptHealth Corp. (a)
|
13,243
|
130,444
|
|
Addus HomeCare Corp. (a)
|
2,165
|
208,165
|
|
Agiliti, Inc. (a)
|
4,102
|
41,635
|
|
AirSculpt Technologies, Inc. (a)(b)
|
1,728
|
9,521
|
|
Alignment Healthcare, Inc. (a)
|
11,786
|
60,698
|
|
AMN Healthcare Services, Inc. (a)
|
5,291
|
317,354
|
|
Astrana Health, Inc. (a)
|
6,055
|
224,943
|
|
Aveanna Healthcare Holdings, Inc. (a)(b)
|
7,372
|
16,587
|
|
BrightSpring Health Services, Inc.
|
7,489
|
80,057
|
|
Brookdale Senior Living, Inc. (a)
|
25,992
|
176,486
|
|
CareMax, Inc. Class A (a)
|
335
|
1,196
|
|
Castle Biosciences, Inc. (a)
|
3,489
|
73,583
|
|
Community Health Systems, Inc. (a)
|
17,415
|
57,470
|
|
Corvel Corp. (a)
|
1,214
|
289,964
|
|
Cross Country Healthcare, Inc. (a)
|
4,705
|
82,808
|
|
DocGo, Inc. Class A (a)
|
10,798
|
36,497
|
|
Enhabit Home Health & Hospice (a)
|
7,043
|
71,064
|
|
Fulgent Genetics, Inc. (a)
|
2,770
|
56,370
|
|
Guardant Health, Inc. (a)
|
15,688
|
282,384
|
|
HealthEquity, Inc. (a)
|
11,820
|
932,716
|
|
Hims & Hers Health, Inc. (a)
|
17,173
|
215,178
|
|
InfuSystems Holdings, Inc. (a)
|
2,449
|
18,392
|
|
Innovage Holding Corp. (a)(b)
|
2,534
|
8,996
|
|
LifeStance Health Group, Inc. (a)
|
14,829
|
91,643
|
|
Modivcare, Inc. (a)
|
1,772
|
41,589
|
|
Nano-X Imaging Ltd. (a)(b)
|
6,547
|
58,661
|
|
National Healthcare Corp.
|
1,743
|
158,386
|
|
National Research Corp. Class A
|
1,988
|
68,089
|
|
NeoGenomics, Inc. (a)
|
17,678
|
246,078
|
|
Opko Health, Inc. (a)(b)
|
56,207
|
68,573
|
|
Option Care Health, Inc. (a)
|
23,298
|
696,377
|
|
Owens & Minor, Inc. (a)
|
10,356
|
256,207
|
|
P3 Health Partners, Inc. Class A (a)
|
5,654
|
3,037
|
|
Patterson Companies, Inc.
|
11,613
|
295,783
|
|
Pediatrix Medical Group, Inc. (a)
|
11,671
|
103,522
|
|
Pennant Group, Inc. (a)
|
4,016
|
83,975
|
|
PetIQ, Inc. Class A (a)
|
3,757
|
61,314
|
|
Privia Health Group, Inc. (a)
|
15,705
|
288,972
|
|
Progyny, Inc. (a)
|
11,068
|
354,840
|
|
Quipt Home Medical Corp. (a)
|
5,448
|
19,613
|
|
RadNet, Inc. (a)
|
8,371
|
405,994
|
|
Select Medical Holdings Corp.
|
14,411
|
408,840
|
|
Surgery Partners, Inc. (a)
|
10,465
|
261,102
|
|
The Ensign Group, Inc.
|
7,566
|
895,512
|
|
The Joint Corp. (a)
|
2,016
|
24,071
|
|
U.S. Physical Therapy, Inc.
|
2,058
|
208,908
|
|
Viemed Healthcare, Inc. (a)
|
4,803
|
39,337
|
|
8,627,263
|
|||
Health Care Technology - 0.3%
|
|||
American Well Corp. (a)
|
33,619
|
17,163
|
|
Definitive Healthcare Corp. (a)
|
6,654
|
46,179
|
|
Evolent Health, Inc. Class A (a)
|
15,674
|
434,797
|
|
Health Catalyst, Inc. (a)
|
7,843
|
48,783
|
|
HealthStream, Inc.
|
3,350
|
86,330
|
|
MultiPlan Corp. Class A (a)
|
53,471
|
34,745
|
|
OptimizeRx Corp. (a)
|
2,292
|
23,378
|
|
Phreesia, Inc. (a)
|
7,345
|
152,335
|
|
Schrodinger, Inc. (a)
|
7,600
|
185,288
|
|
Sharecare, Inc. Class A (a)(b)
|
42,996
|
30,781
|
|
Simulations Plus, Inc.
|
2,205
|
99,997
|
|
TruBridge, Inc. (a)
|
1,921
|
15,176
|
|
1,174,952
|
|||
Life Sciences Tools & Services - 0.2%
|
|||
Adaptive Biotechnologies Corp. (a)
|
15,841
|
41,503
|
|
Akoya Biosciences, Inc. (a)(b)
|
3,067
|
11,716
|
|
BioLife Solutions, Inc. (a)
|
4,969
|
87,156
|
|
Codexis, Inc. (a)
|
9,879
|
28,748
|
|
CryoPort, Inc. (a)
|
6,032
|
97,658
|
|
Cytek Biosciences, Inc. (a)
|
16,662
|
100,139
|
|
Harvard Bioscience, Inc. (a)
|
5,327
|
20,349
|
|
MaxCyte, Inc. (a)
|
12,118
|
43,988
|
|
Mesa Laboratories, Inc.
|
720
|
76,378
|
|
Nautilus Biotechnology, Inc. (a)
|
6,697
|
17,010
|
|
OmniAb, Inc. (a)
|
12,721
|
56,481
|
|
Pacific Biosciences of California, Inc. (a)
|
34,484
|
56,899
|
|
Quanterix Corp. (a)
|
4,926
|
79,407
|
|
Quantum-Si, Inc. (a)
|
14,704
|
23,673
|
|
Seer, Inc. (a)
|
7,794
|
16,212
|
|
757,317
|
|||
Pharmaceuticals - 1.6%
|
|||
Aclaris Therapeutics, Inc. (a)
|
9,385
|
11,356
|
|
Amneal Intermediate, Inc. (a)
|
16,837
|
101,864
|
|
Amphastar Pharmaceuticals, Inc. (a)
|
5,266
|
217,223
|
|
Amylyx Pharmaceuticals, Inc. (a)
|
6,789
|
12,288
|
|
ANI Pharmaceuticals, Inc. (a)
|
2,062
|
136,092
|
|
Arvinas Holding Co. LLC (a)
|
7,042
|
223,724
|
|
Assertio Holdings, Inc. (a)
|
12,110
|
10,719
|
|
Atea Pharmaceuticals, Inc. (a)
|
10,577
|
39,135
|
|
Axsome Therapeutics, Inc. (a)
|
4,961
|
365,923
|
|
Biote Corp. Class A (a)
|
1,876
|
10,337
|
|
Bright Green Corp. (a)
|
8,196
|
2,056
|
|
Cara Therapeutics, Inc. (a)
|
6,356
|
4,779
|
|
Cassava Sciences, Inc. (a)(b)
|
5,630
|
124,705
|
|
Citius Pharmaceuticals, Inc. (a)
|
18,017
|
13,446
|
|
Collegium Pharmaceutical, Inc. (a)
|
4,540
|
167,662
|
|
Corcept Therapeutics, Inc. (a)
|
11,347
|
264,612
|
|
CorMedix, Inc. (a)
|
7,703
|
40,479
|
|
Edgewise Therapeutics, Inc. (a)
|
8,015
|
143,789
|
|
Enliven Therapeutics, Inc. (a)
|
3,233
|
56,222
|
|
Evolus, Inc. (a)
|
5,756
|
67,748
|
|
Eyenovia, Inc. (a)(b)
|
4,382
|
3,291
|
|
Eyepoint Pharmaceuticals, Inc. (a)
|
5,147
|
90,587
|
|
Harmony Biosciences Holdings, Inc. (a)
|
4,480
|
138,477
|
|
Harrow, Inc. (a)
|
4,135
|
42,136
|
|
Ikena Oncology, Inc. (a)(b)
|
4,104
|
5,417
|
|
Innoviva, Inc. (a)
|
7,964
|
120,336
|
|
Intra-Cellular Therapies, Inc. (a)
|
13,952
|
1,001,893
|
|
Ligand Pharmaceuticals, Inc. Class B (a)
|
2,335
|
163,193
|
|
Liquidia Corp. (a)
|
7,005
|
90,014
|
|
Longboard Pharmaceuticals, Inc. (a)
|
3,515
|
74,870
|
|
Marinus Pharmaceuticals, Inc. (a)
|
7,490
|
10,561
|
|
Neumora Therapeutics, Inc. (b)
|
1,989
|
18,080
|
|
Novartis AG rights (a)(c)
|
7,778
|
0
|
|
Nuvation Bio, Inc. (a)
|
20,000
|
59,800
|
|
Ocular Therapeutix, Inc. (a)
|
16,051
|
76,082
|
|
Omeros Corp. (a)(b)
|
8,581
|
27,030
|
|
OptiNose, Inc. (a)
|
9,339
|
7,667
|
|
Pacira Biosciences, Inc. (a)
|
6,322
|
165,953
|
|
Phathom Pharmaceuticals, Inc. (a)(b)
|
4,419
|
39,904
|
|
Phibro Animal Health Corp. Class A
|
2,882
|
48,129
|
|
Pliant Therapeutics, Inc. (a)
|
7,966
|
94,158
|
|
Prestige Brands Holdings, Inc. (a)
|
6,909
|
495,790
|
|
Revance Therapeutics, Inc. (a)
|
12,055
|
43,519
|
|
Scilex Holding Co. (a)(h)
|
7,037
|
5,404
|
|
scPharmaceuticals, Inc. (a)
|
3,833
|
17,134
|
|
SIGA Technologies, Inc.
|
6,332
|
55,595
|
|
Supernus Pharmaceuticals, Inc. (a)
|
6,837
|
205,794
|
|
Taro Pharmaceutical Industries Ltd. (a)
|
1,116
|
47,408
|
|
Tarsus Pharmaceuticals, Inc. (a)
|
4,046
|
127,166
|
|
Terns Pharmaceuticals, Inc. (a)
|
6,011
|
30,356
|
|
Theravance Biopharma, Inc. (a)
|
6,581
|
55,544
|
|
Third Harmonics Bio, Inc. (a)
|
2,794
|
31,125
|
|
Trevi Therapeutics, Inc. (a)
|
5,635
|
16,511
|
|
Ventyx Biosciences, Inc. (a)
|
6,624
|
24,774
|
|
Verrica Pharmaceuticals, Inc. (a)
|
3,078
|
21,438
|
|
WAVE Life Sciences (a)
|
10,095
|
49,768
|
|
Xeris Biopharma Holdings, Inc. (a)
|
18,590
|
32,533
|
|
Zevra Therapeutics, Inc. (a)
|
4,871
|
22,309
|
|
5,573,905
|
|||
TOTAL HEALTH CARE
|
51,416,147
|
||
INDUSTRIALS - 17.5%
|
|||
Aerospace & Defense - 0.9%
|
|||
AAR Corp. (a)
|
4,699
|
324,889
|
|
AeroVironment, Inc. (a)
|
3,752
|
599,532
|
|
AerSale Corp. (a)
|
4,787
|
34,131
|
|
Archer Aviation, Inc. Class A (a)(b)
|
21,356
|
82,861
|
|
Astronics Corp. (a)
|
3,916
|
65,671
|
|
Cadre Holdings, Inc.
|
2,715
|
90,545
|
|
Ducommun, Inc. (a)
|
1,856
|
100,391
|
|
Eve Holding, Inc. (a)
|
2,465
|
13,286
|
|
Kratos Defense & Security Solutions, Inc. (a)
|
20,009
|
356,560
|
|
Leonardo DRS, Inc. (a)
|
9,562
|
205,774
|
|
Moog, Inc. Class A
|
4,008
|
637,553
|
|
National Presto Industries, Inc.
|
713
|
58,459
|
|
Park Aerospace Corp.
|
2,616
|
37,330
|
|
Redwire Corp. (a)
|
1,114
|
4,211
|
|
Rocket Lab U.S.A., Inc. Class A (a)(b)
|
39,217
|
147,456
|
|
Terran Orbital Corp. Class A (a)
|
12,819
|
16,921
|
|
Triumph Group, Inc. (a)
|
8,978
|
119,946
|
|
V2X, Inc. (a)
|
1,597
|
77,582
|
|
Virgin Galactic Holdings, Inc. (a)(b)
|
48,933
|
42,577
|
|
3,015,675
|
|||
Air Freight & Logistics - 0.2%
|
|||
Air Transport Services Group, Inc. (a)
|
7,159
|
91,778
|
|
Forward Air Corp.
|
3,579
|
78,810
|
|
Hub Group, Inc. Class A
|
8,739
|
351,483
|
|
Radiant Logistics, Inc. (a)
|
5,135
|
25,367
|
|
547,438
|
|||
Building Products - 2.0%
|
|||
AAON, Inc.
|
9,415
|
885,857
|
|
American Woodmark Corp. (a)
|
2,242
|
206,443
|
|
Apogee Enterprises, Inc.
|
3,082
|
190,406
|
|
AZZ, Inc.
|
4,000
|
286,520
|
|
CSW Industrials, Inc.
|
2,143
|
509,220
|
|
Gibraltar Industries, Inc. (a)
|
4,250
|
303,705
|
|
Griffon Corp.
|
5,470
|
358,394
|
|
Insteel Industries, Inc.
|
2,604
|
83,588
|
|
Janus International Group, Inc. (a)
|
11,819
|
170,312
|
|
Jeld-Wen Holding, Inc. (a)
|
11,870
|
243,335
|
|
Masonite International Corp. (a)
|
3,038
|
402,687
|
|
MasterBrand, Inc. (a)
|
17,795
|
296,643
|
|
Quanex Building Products Corp.
|
4,629
|
153,775
|
|
Resideo Technologies, Inc. (a)
|
20,354
|
397,514
|
|
Simpson Manufacturing Co. Ltd.
|
5,966
|
1,037,428
|
|
UFP Industries, Inc.
|
8,345
|
940,482
|
|
Zurn Elkay Water Solutions Cor
|
20,543
|
642,585
|
|
7,108,894
|
|||
Commercial Services & Supplies - 1.6%
|
|||
ABM Industries, Inc.
|
8,751
|
382,419
|
|
ACCO Brands Corp.
|
12,510
|
60,298
|
|
ACV Auctions, Inc. Class A (a)
|
17,690
|
308,691
|
|
Aris Water Solution, Inc. Class A
|
4,276
|
59,992
|
|
BrightView Holdings, Inc. (a)
|
5,821
|
65,486
|
|
Casella Waste Systems, Inc. Class A (a)
|
7,822
|
707,109
|
|
CECO Environmental Corp. (a)
|
4,116
|
88,988
|
|
Cimpress PLC (a)
|
2,503
|
213,431
|
|
CompX International, Inc. Class A
|
204
|
6,424
|
|
CoreCivic, Inc. (a)
|
15,697
|
233,885
|
|
Deluxe Corp.
|
6,110
|
120,673
|
|
Ennis, Inc.
|
3,543
|
70,506
|
|
Enviri Corp. (a)
|
10,865
|
84,530
|
|
Healthcare Services Group, Inc. (a)
|
10,307
|
109,460
|
|
HNI Corp.
|
6,441
|
270,200
|
|
Interface, Inc.
|
8,052
|
123,115
|
|
LanzaTech Global, Inc. (a)
|
2,831
|
6,129
|
|
Li-Cycle Holdings Corp. (a)
|
18,648
|
12,216
|
|
Liquidity Services, Inc. (a)
|
3,159
|
54,524
|
|
Matthews International Corp. Class A
|
4,155
|
112,102
|
|
Millerknoll, Inc.
|
10,273
|
261,242
|
|
Montrose Environmental Group, Inc. (a)
|
3,901
|
169,381
|
|
NL Industries, Inc.
|
1,136
|
9,327
|
|
OpenLane, Inc. (a)
|
14,741
|
253,250
|
|
Performant Financial Corp. (a)
|
9,876
|
26,270
|
|
Pitney Bowes, Inc.
|
24,252
|
103,314
|
|
Quad/Graphics, Inc.
|
4,158
|
18,669
|
|
SP Plus Corp. (a)
|
2,672
|
136,432
|
|
Steelcase, Inc. Class A
|
12,933
|
155,584
|
|
The Brink's Co.
|
6,202
|
542,427
|
|
The GEO Group, Inc. (a)
|
16,653
|
247,464
|
|
UniFirst Corp.
|
2,082
|
333,391
|
|
Viad Corp. (a)
|
2,829
|
97,544
|
|
VSE Corp.
|
1,819
|
142,009
|
|
5,586,482
|
|||
Construction & Engineering - 2.0%
|
|||
Ameresco, Inc. Class A (a)
|
4,440
|
92,929
|
|
API Group Corp. (a)
|
29,084
|
1,121,770
|
|
Arcosa, Inc.
|
6,736
|
512,071
|
|
Argan, Inc.
|
1,767
|
106,479
|
|
Bowman Consulting Group Ltd. (a)
|
1,491
|
48,443
|
|
Comfort Systems U.S.A., Inc.
|
4,923
|
1,523,225
|
|
Concrete Pumping Holdings, Inc. (a)
|
3,321
|
22,085
|
|
Construction Partners, Inc. Class A (a)
|
5,970
|
308,291
|
|
Dycom Industries, Inc. (a)
|
3,983
|
557,700
|
|
Fluor Corp. (a)
|
19,824
|
799,502
|
|
Granite Construction, Inc.
|
6,136
|
340,548
|
|
Great Lakes Dredge & Dock Corp. (a)
|
8,912
|
58,819
|
|
IES Holdings, Inc. (a)
|
1,144
|
154,577
|
|
INNOVATE Corp. (a)(b)
|
9,077
|
6,369
|
|
Limbach Holdings, Inc. (a)
|
1,281
|
58,068
|
|
MYR Group, Inc. (a)
|
2,290
|
380,713
|
|
Northwest Pipe Co. (a)
|
1,348
|
42,664
|
|
Primoris Services Corp.
|
7,386
|
344,188
|
|
Southland Holdings, Inc. (a)
|
521
|
2,282
|
|
Sterling Construction Co., Inc. (a)
|
4,170
|
423,672
|
|
Tutor Perini Corp. (a)
|
5,951
|
98,965
|
|
7,003,360
|
|||
Electrical Equipment - 1.4%
|
|||
374Water, Inc. (a)(b)
|
8,497
|
12,661
|
|
Allient, Inc.
|
1,772
|
52,079
|
|
Amprius Technologies, Inc. (a)(b)
|
732
|
1,369
|
|
Array Technologies, Inc. (a)
|
21,076
|
260,078
|
|
Atkore, Inc.
|
5,176
|
907,353
|
|
Babcock & Wilcox Enterprises, Inc. (a)
|
8,143
|
8,306
|
|
Blink Charging Co. (a)(b)
|
7,593
|
19,210
|
|
Bloom Energy Corp. Class A (a)(b)
|
26,790
|
298,173
|
|
Dragonfly Energy Holdings Corp. (a)
|
3,818
|
3,275
|
|
Encore Wire Corp.
|
2,091
|
584,142
|
|
Energy Vault Holdings, Inc. Class A (a)(b)
|
13,260
|
16,840
|
|
EnerSys
|
5,665
|
512,399
|
|
Enovix Corp. (a)(b)
|
19,446
|
121,732
|
|
Eos Energy Enterprises, Inc. (a)(b)
|
20,340
|
15,727
|
|
ESS Tech, Inc. Class A (a)
|
12,434
|
9,374
|
|
Fluence Energy, Inc. (a)
|
8,217
|
146,591
|
|
FTC Solar, Inc. (a)
|
8,619
|
3,965
|
|
FuelCell Energy, Inc. (a)(b)
|
62,334
|
57,833
|
|
GrafTech International Ltd.
|
26,649
|
45,836
|
|
LSI Industries, Inc.
|
3,875
|
56,575
|
|
Nextracker, Inc. Class A (a)
|
17,495
|
748,611
|
|
NuScale Power Corp. (a)(b)
|
7,790
|
45,182
|
|
Powell Industries, Inc.
|
1,293
|
184,899
|
|
Preformed Line Products Co.
|
342
|
41,392
|
|
SES AI Corp. Class A (a)(b)
|
17,682
|
27,938
|
|
Shoals Technologies Group, Inc. (a)
|
23,922
|
202,141
|
|
SKYX Platforms Corp. (a)
|
8,488
|
8,743
|
|
Stem, Inc. (a)(b)
|
20,434
|
37,599
|
|
SunPower Corp. (a)(b)
|
12,290
|
25,317
|
|
Thermon Group Holdings, Inc. (a)
|
4,631
|
147,868
|
|
TPI Composites, Inc. (a)(b)
|
5,448
|
17,325
|
|
Vicor Corp. (a)
|
3,073
|
99,504
|
|
4,720,037
|
|||
Ground Transportation - 0.4%
|
|||
ArcBest Corp.
|
3,310
|
367,112
|
|
Covenant Transport Group, Inc. Class A
|
1,154
|
52,149
|
|
FTAI Infrastructure LLC
|
13,855
|
100,310
|
|
Heartland Express, Inc.
|
6,303
|
62,652
|
|
Marten Transport Ltd.
|
8,046
|
136,138
|
|
P.A.M. Transportation Services, Inc. (a)
|
835
|
14,304
|
|
RXO, Inc. (a)
|
16,121
|
304,848
|
|
Universal Logistics Holdings, Inc.
|
956
|
42,714
|
|
Werner Enterprises, Inc.
|
8,749
|
299,216
|
|
1,379,443
|
|||
Industrial Conglomerates - 0.0%
|
|||
Brookfield Business Corp. Class A
|
3,603
|
73,321
|
|
Machinery - 3.7%
|
|||
3D Systems Corp. (a)
|
18,269
|
61,201
|
|
Alamo Group, Inc.
|
1,406
|
273,298
|
|
Albany International Corp. Class A
|
4,340
|
346,115
|
|
Astec Industries, Inc.
|
3,171
|
132,548
|
|
Atmus Filtration Technologies, Inc.
|
11,650
|
352,879
|
|
Barnes Group, Inc.
|
6,758
|
234,638
|
|
Blue Bird Corp. (a)
|
3,874
|
127,668
|
|
Chart Industries, Inc. (a)
|
5,979
|
861,335
|
|
Columbus McKinnon Corp. (NY Shares)
|
3,899
|
160,912
|
|
Commercial Vehicle Group, Inc. (a)
|
4,558
|
27,394
|
|
Desktop Metal, Inc. (a)(b)
|
39,571
|
30,960
|
|
Douglas Dynamics, Inc.
|
3,189
|
72,199
|
|
Energy Recovery, Inc. (a)
|
7,777
|
115,877
|
|
Enerpac Tool Group Corp. Class A
|
7,556
|
269,220
|
|
EnPro Industries, Inc.
|
2,921
|
438,530
|
|
ESCO Technologies, Inc.
|
3,558
|
360,959
|
|
Federal Signal Corp.
|
8,333
|
677,473
|
|
Franklin Electric Co., Inc.
|
6,413
|
617,380
|
|
Gencor Industries, Inc. (a)
|
1,495
|
25,370
|
|
Gorman-Rupp Co.
|
3,217
|
106,708
|
|
Helios Technologies, Inc.
|
4,609
|
207,866
|
|
Hillenbrand, Inc.
|
9,746
|
465,079
|
|
Hillman Solutions Corp. Class A (a)
|
27,282
|
260,816
|
|
Hyliion Holdings Corp. Class A (a)
|
20,946
|
27,020
|
|
Hyster-Yale Materials Handling, Inc. Class A
|
1,559
|
91,311
|
|
John Bean Technologies Corp.
|
4,423
|
394,045
|
|
Kadant, Inc.
|
1,628
|
445,730
|
|
Kennametal, Inc.
|
11,087
|
260,877
|
|
Lindsay Corp.
|
1,536
|
178,406
|
|
Luxfer Holdings PLC sponsored
|
3,714
|
35,766
|
|
Manitowoc Co., Inc. (a)
|
4,901
|
59,302
|
|
Mayville Engineering Co., Inc. (a)
|
1,498
|
20,612
|
|
Microvast Holdings, Inc. (a)(b)
|
29,200
|
11,443
|
|
Miller Industries, Inc.
|
1,544
|
75,208
|
|
Mueller Industries, Inc.
|
15,578
|
869,564
|
|
Mueller Water Products, Inc. Class A
|
21,548
|
341,320
|
|
Nikola Corp. (a)(b)
|
103,584
|
64,284
|
|
Omega Flex, Inc.
|
438
|
29,022
|
|
Park-Ohio Holdings Corp.
|
1,210
|
30,891
|
|
Proto Labs, Inc. (a)
|
3,620
|
110,338
|
|
REV Group, Inc.
|
4,434
|
96,927
|
|
Shyft Group, Inc. (The)
|
4,668
|
50,788
|
|
SPX Technologies, Inc. (a)
|
6,136
|
747,426
|
|
Standex International Corp.
|
1,645
|
284,388
|
|
Tennant Co.
|
2,576
|
300,052
|
|
Terex Corp.
|
9,250
|
518,463
|
|
The Greenbrier Companies, Inc.
|
4,268
|
210,797
|
|
Titan International, Inc. (a)
|
7,177
|
79,091
|
|
Trinity Industries, Inc.
|
11,279
|
293,480
|
|
Velo3D, Inc. (a)
|
12,726
|
3,367
|
|
Wabash National Corp.
|
6,406
|
148,043
|
|
Watts Water Technologies, Inc. Class A
|
3,799
|
753,950
|
|
12,758,336
|
|||
Marine Transportation - 0.3%
|
|||
Costamare, Inc.
|
6,533
|
78,265
|
|
Genco Shipping & Trading Ltd.
|
5,815
|
124,092
|
|
Golden Ocean Group Ltd. (b)
|
17,120
|
241,221
|
|
Himalaya Shipping Ltd.
|
4,287
|
35,025
|
|
Matson, Inc.
|
4,792
|
516,482
|
|
Pangaea Logistics Solutions Ltd.
|
5,136
|
36,979
|
|
Safe Bulkers, Inc.
|
9,174
|
45,778
|
|
1,077,842
|
|||
Passenger Airlines - 0.4%
|
|||
Allegiant Travel Co.
|
2,186
|
119,268
|
|
Blade Air Mobility, Inc. (a)
|
8,627
|
27,520
|
|
Frontier Group Holdings, Inc. (a)
|
5,343
|
32,272
|
|
Hawaiian Holdings, Inc. (a)
|
7,083
|
89,954
|
|
JetBlue Airways Corp. (a)
|
46,647
|
264,955
|
|
Joby Aviation, Inc. (a)(b)
|
38,773
|
195,804
|
|
SkyWest, Inc. (a)
|
5,620
|
410,429
|
|
Spirit Airlines, Inc. (b)
|
15,411
|
54,401
|
|
Sun Country Airlines Holdings, Inc. (a)
|
5,989
|
79,714
|
|
1,274,317
|
|||
Professional Services - 2.5%
|
|||
Alight, Inc. Class A (a)
|
57,552
|
519,119
|
|
ASGN, Inc. (a)
|
6,404
|
617,666
|
|
Asure Software, Inc. (a)
|
3,093
|
22,857
|
|
Barrett Business Services, Inc.
|
916
|
111,294
|
|
BlackSky Technology, Inc. Class A (a)
|
16,234
|
19,643
|
|
CBIZ, Inc. (a)
|
6,664
|
474,344
|
|
Conduent, Inc. (a)
|
23,631
|
74,438
|
|
CRA International, Inc.
|
941
|
136,530
|
|
CSG Systems International, Inc.
|
4,090
|
193,212
|
|
ExlService Holdings, Inc. (a)
|
22,480
|
651,920
|
|
Exponent, Inc.
|
7,044
|
647,414
|
|
First Advantage Corp.
|
7,553
|
123,114
|
|
FiscalNote Holdings, Inc. Class A (a)
|
7,938
|
10,796
|
|
Forrester Research, Inc. (a)
|
1,643
|
29,886
|
|
Franklin Covey Co. (a)
|
1,610
|
62,693
|
|
Heidrick & Struggles International, Inc.
|
2,736
|
80,657
|
|
Hirequest, Inc.
|
716
|
9,179
|
|
HireRight Holdings Corp. (a)
|
1,924
|
27,513
|
|
Huron Consulting Group, Inc. (a)
|
2,590
|
241,492
|
|
IBEX Ltd. (a)
|
1,189
|
15,576
|
|
ICF International, Inc.
|
2,604
|
375,731
|
|
Innodata, Inc. (a)
|
3,571
|
20,855
|
|
Insperity, Inc.
|
4,936
|
508,062
|
|
Kelly Services, Inc. Class A (non-vtg.)
|
4,300
|
98,642
|
|
Kforce, Inc.
|
2,622
|
161,935
|
|
Korn Ferry
|
7,255
|
440,524
|
|
LegalZoom.com, Inc. (a)
|
18,612
|
222,413
|
|
Maximus, Inc.
|
8,435
|
677,162
|
|
MISTRAS Group, Inc. (a)
|
2,978
|
26,058
|
|
NV5 Global, Inc. (a)
|
1,936
|
180,513
|
|
Parsons Corp. (a)
|
5,728
|
449,705
|
|
Planet Labs PBC Class A (a)
|
24,083
|
40,700
|
|
Resources Connection, Inc.
|
4,468
|
49,371
|
|
Skillsoft Corp. (a)
|
592
|
4,256
|
|
Sterling Check Corp. (a)
|
4,331
|
65,528
|
|
TriNet Group, Inc.
|
4,445
|
446,145
|
|
TrueBlue, Inc. (a)
|
4,157
|
43,316
|
|
Ttec Holdings, Inc.
|
2,601
|
18,935
|
|
Upwork, Inc. (a)
|
17,332
|
202,784
|
|
Verra Mobility Corp. (a)
|
19,016
|
448,397
|
|
Willdan Group, Inc. (a)
|
1,721
|
48,515
|
|
8,598,890
|
|||
Trading Companies & Distributors - 2.1%
|
|||
Alta Equipment Group, Inc.
|
3,235
|
35,941
|
|
Applied Industrial Technologies, Inc.
|
5,356
|
981,487
|
|
Beacon Roofing Supply, Inc. (a)
|
8,782
|
865,290
|
|
BlueLinx Corp. (a)
|
1,172
|
128,533
|
|
Boise Cascade Co.
|
5,524
|
730,659
|
|
Custom Truck One Source, Inc. Class A (a)
|
7,804
|
38,942
|
|
Distribution Solutions Group I (a)
|
1,386
|
45,696
|
|
DNOW, Inc. (a)
|
14,829
|
209,237
|
|
DXP Enterprises, Inc. (a)
|
1,831
|
89,280
|
|
EVI Industries, Inc.
|
859
|
17,627
|
|
FTAI Aviation Ltd.
|
13,819
|
970,232
|
|
GATX Corp.
|
4,913
|
601,155
|
|
Global Industrial Co.
|
1,839
|
70,820
|
|
GMS, Inc. (a)
|
5,563
|
514,689
|
|
H&E Equipment Services, Inc.
|
4,484
|
216,532
|
|
Herc Holdings, Inc.
|
3,930
|
562,108
|
|
Hudson Technologies, Inc. (a)
|
6,024
|
59,758
|
|
Karat Packaging, Inc.
|
929
|
25,176
|
|
McGrath RentCorp.
|
3,420
|
364,777
|
|
MRC Global, Inc. (a)
|
11,554
|
129,751
|
|
Rush Enterprises, Inc.:
|
|||
Class A
|
9,351
|
410,696
|
|
Class B
|
315
|
12,887
|
|
Titan Machinery, Inc. (a)
|
2,790
|
62,105
|
|
Transcat, Inc. (a)
|
1,139
|
122,294
|
|
Willis Lease Finance Corp. (a)
|
360
|
17,500
|
|
Xometry, Inc. (a)
|
4,739
|
84,686
|
|
7,367,858
|
|||
TOTAL INDUSTRIALS
|
60,511,893
|
||
INFORMATION TECHNOLOGY - 14.6%
|
|||
Communications Equipment - 0.5%
|
|||
ADTRAN Holdings, Inc.
|
10,822
|
47,400
|
|
Aviat Networks, Inc. (a)
|
1,571
|
52,550
|
|
Calix, Inc. (a)
|
8,232
|
228,273
|
|
Cambium Networks Corp. (a)
|
1,673
|
5,671
|
|
Clearfield, Inc. (a)
|
1,799
|
54,186
|
|
CommScope Holding Co., Inc. (a)
|
29,069
|
25,988
|
|
Comtech Telecommunications Corp. (a)
|
3,688
|
6,933
|
|
Digi International, Inc. (a)
|
4,937
|
151,368
|
|
DZS, Inc. (a)
|
2,962
|
2,903
|
|
Extreme Networks, Inc. (a)
|
17,560
|
196,672
|
|
Harmonic, Inc. (a)
|
15,378
|
165,160
|
|
Infinera Corp. (a)
|
27,897
|
134,464
|
|
KVH Industries, Inc. (a)
|
2,350
|
11,280
|
|
NETGEAR, Inc. (a)
|
3,914
|
57,849
|
|
NetScout Systems, Inc. (a)
|
9,481
|
182,604
|
|
Ribbon Communications, Inc. (a)
|
12,520
|
39,688
|
|
Viavi Solutions, Inc. (a)
|
30,593
|
241,685
|
|
1,604,674
|
|||
Electronic Equipment, Instruments & Components - 2.7%
|
|||
908 Devices, Inc. (a)
|
2,960
|
16,872
|
|
Advanced Energy Industries, Inc.
|
5,233
|
501,531
|
|
Aeva Technologies, Inc. (a)
|
2,195
|
6,848
|
|
Akoustis Technologies, Inc. (a)
|
12,824
|
7,529
|
|
Arlo Technologies, Inc. (a)
|
12,418
|
153,735
|
|
Badger Meter, Inc.
|
4,086
|
747,411
|
|
Bel Fuse, Inc. Class B (non-vtg.)
|
1,470
|
86,318
|
|
Belden, Inc.
|
5,787
|
470,309
|
|
Benchmark Electronics, Inc.
|
4,897
|
147,938
|
|
Climb Global Solutions, Inc.
|
585
|
37,709
|
|
CTS Corp.
|
4,325
|
197,869
|
|
Daktronics, Inc. (a)
|
5,268
|
49,783
|
|
ePlus, Inc. (a)
|
3,708
|
285,071
|
|
Evolv Technologies Holdings, Inc. (a)(b)
|
16,054
|
62,771
|
|
Fabrinet (a)
|
5,119
|
885,945
|
|
FARO Technologies, Inc. (a)
|
2,597
|
48,694
|
|
Insight Enterprises, Inc. (a)
|
3,901
|
712,206
|
|
Iteris, Inc. (a)
|
5,690
|
25,491
|
|
Itron, Inc. (a)
|
6,331
|
583,212
|
|
Kimball Electronics, Inc. (a)
|
3,345
|
70,011
|
|
Knowles Corp. (a)
|
12,291
|
194,567
|
|
Lightwave Logic, Inc. (a)(b)
|
16,515
|
63,087
|
|
Luna Innovations, Inc. (a)
|
4,397
|
9,058
|
|
Methode Electronics, Inc. Class A
|
4,584
|
55,879
|
|
MicroVision, Inc. (a)(b)
|
26,464
|
38,373
|
|
Mirion Technologies, Inc. Class A (a)
|
27,900
|
303,273
|
|
Napco Security Technologies, Inc.
|
4,629
|
188,400
|
|
nLIGHT, Inc. (a)
|
6,251
|
71,199
|
|
Novanta, Inc. (a)
|
4,978
|
779,057
|
|
OSI Systems, Inc. (a)
|
2,237
|
294,031
|
|
Par Technology Corp. (a)
|
3,776
|
159,649
|
|
PC Connection, Inc.
|
1,587
|
98,346
|
|
Plexus Corp. (a)
|
3,809
|
384,747
|
|
Presto Automation, Inc. (a)
|
443
|
75
|
|
Richardson Electronics Ltd.
|
1,689
|
17,785
|
|
Rogers Corp. (a)
|
2,402
|
286,054
|
|
Sanmina Corp. (a)
|
7,656
|
464,490
|
|
ScanSource, Inc. (a)
|
3,430
|
142,757
|
|
Smartrent, Inc. (a)
|
25,873
|
60,025
|
|
TTM Technologies, Inc. (a)
|
14,112
|
210,692
|
|
Vishay Intertechnology, Inc.
|
17,662
|
408,699
|
|
Vishay Precision Group, Inc. (a)
|
1,678
|
55,374
|
|
Vuzix Corp. (a)(b)
|
8,026
|
10,675
|
|
9,393,545
|
|||
IT Services - 0.4%
|
|||
Applied Digital Corp. (a)(b)
|
12,126
|
32,801
|
|
BigBear.ai Holdings, Inc. (a)
|
6,901
|
11,456
|
|
BigCommerce Holdings, Inc. (a)
|
9,299
|
52,632
|
|
Brightcove, Inc. (a)
|
5,943
|
10,579
|
|
Couchbase, Inc. (a)
|
4,964
|
119,831
|
|
Digitalocean Holdings, Inc. (a)
|
8,519
|
279,934
|
|
Fastly, Inc. Class A (a)
|
17,082
|
216,087
|
|
Grid Dynamics Holdings, Inc. (a)
|
7,821
|
76,411
|
|
Hackett Group, Inc.
|
3,491
|
75,720
|
|
Information Services Group, Inc.
|
4,887
|
16,469
|
|
Perficient, Inc. (a)
|
4,790
|
226,375
|
|
Rackspace Technology, Inc. (a)(b)
|
8,282
|
14,245
|
|
Squarespace, Inc. Class A (a)
|
7,888
|
274,976
|
|
Thoughtworks Holding, Inc. (a)
|
12,342
|
28,633
|
|
Tucows, Inc. (a)
|
1,324
|
23,395
|
|
Unisys Corp. (a)
|
9,281
|
50,396
|
|
1,509,940
|
|||
Semiconductors & Semiconductor Equipment - 3.1%
|
|||
ACM Research, Inc. (a)
|
6,815
|
173,919
|
|
AEHR Test Systems (a)(b)
|
3,851
|
46,135
|
|
Alpha & Omega Semiconductor Ltd. (a)
|
3,141
|
68,694
|
|
Ambarella, Inc. (a)
|
5,361
|
246,445
|
|
Amkor Technology, Inc.
|
15,631
|
505,663
|
|
Atomera, Inc. (a)(b)
|
3,070
|
14,245
|
|
Axcelis Technologies, Inc. (a)
|
4,534
|
469,360
|
|
CEVA, Inc. (a)
|
3,206
|
64,986
|
|
Cohu, Inc. (a)
|
6,445
|
195,412
|
|
Credo Technology Group Holding Ltd. (a)
|
17,338
|
309,830
|
|
Diodes, Inc. (a)
|
6,262
|
457,189
|
|
FormFactor, Inc. (a)
|
10,733
|
478,584
|
|
Ichor Holdings Ltd. (a)
|
3,983
|
154,461
|
|
Impinj, Inc. (a)
|
3,240
|
516,391
|
|
indie Semiconductor, Inc. (a)(b)
|
21,040
|
118,245
|
|
Intest Corp. (a)
|
1,640
|
18,483
|
|
Kulicke & Soffa Industries, Inc.
|
7,702
|
356,449
|
|
MACOM Technology Solutions Holdings, Inc. (a)
|
7,704
|
785,423
|
|
Maxeon Solar Technologies Ltd. (a)
|
3,706
|
7,227
|
|
MaxLinear, Inc. Class A (a)
|
10,510
|
218,503
|
|
Navitas Semiconductor Corp. (a)
|
15,522
|
67,210
|
|
NVE Corp.
|
659
|
53,643
|
|
Onto Innovation, Inc. (a)
|
6,811
|
1,263,372
|
|
PDF Solutions, Inc. (a)
|
4,280
|
128,742
|
|
Photronics, Inc. (a)
|
8,477
|
232,355
|
|
Power Integrations, Inc.
|
7,876
|
525,487
|
|
Rambus, Inc. (a)
|
14,982
|
821,313
|
|
Semtech Corp. (a)
|
8,876
|
333,915
|
|
Silicon Laboratories, Inc. (a)
|
4,412
|
536,014
|
|
SiTime Corp. (a)
|
2,469
|
220,037
|
|
SkyWater Technology, Inc. (a)
|
2,662
|
27,312
|
|
SMART Global Holdings, Inc. (a)
|
7,195
|
131,453
|
|
Synaptics, Inc. (a)
|
5,473
|
492,351
|
|
Transphorm, Inc. (a)
|
4,394
|
21,091
|
|
Ultra Clean Holdings, Inc. (a)
|
6,200
|
259,346
|
|
Veeco Instruments, Inc. (a)
|
7,097
|
250,808
|
|
10,570,093
|
|||
Software - 6.0%
|
|||
8x8, Inc. (a)
|
17,134
|
37,866
|
|
A10 Networks, Inc.
|
9,832
|
128,406
|
|
ACI Worldwide, Inc. (a)
|
15,081
|
514,262
|
|
Adeia, Inc.
|
14,974
|
147,344
|
|
Agilysys, Inc. (a)
|
2,817
|
233,952
|
|
Alarm.com Holdings, Inc. (a)
|
6,661
|
442,957
|
|
Alkami Technology, Inc. (a)
|
5,673
|
136,549
|
|
Altair Engineering, Inc. Class A (a)
|
7,636
|
614,316
|
|
American Software, Inc. Class A
|
4,476
|
45,252
|
|
Amplitude, Inc. (a)
|
9,601
|
93,994
|
|
AppFolio, Inc. (a)
|
2,669
|
605,276
|
|
Appian Corp. Class A (a)
|
5,683
|
212,772
|
|
Asana, Inc. (a)
|
11,492
|
170,886
|
|
Aurora Innovation, Inc. (a)
|
49,742
|
138,034
|
|
AvePoint, Inc. (a)
|
20,791
|
161,546
|
|
Bit Digital, Inc. (a)(b)
|
12,995
|
26,445
|
|
Blackbaud, Inc. (a)
|
6,051
|
471,494
|
|
BlackLine, Inc. (a)
|
7,905
|
458,885
|
|
Box, Inc. Class A (a)
|
19,567
|
509,133
|
|
Braze, Inc. (a)
|
7,460
|
312,574
|
|
C3.ai, Inc. (a)(b)
|
11,509
|
259,298
|
|
Cerence, Inc. (a)
|
5,644
|
51,417
|
|
Cipher Mining, Inc. (a)
|
5,844
|
21,740
|
|
Cleanspark, Inc. (a)
|
26,793
|
438,869
|
|
Clear Secure, Inc.
|
11,530
|
201,429
|
|
CommVault Systems, Inc. (a)
|
6,135
|
628,653
|
|
Consensus Cloud Solutions, Inc. (a)
|
2,629
|
30,602
|
|
CoreCard Corp. (a)
|
942
|
11,285
|
|
CS Disco, Inc. (a)
|
3,298
|
24,900
|
|
CXApp, Inc. Class A (a)
|
264
|
887
|
|
Daily Journal Corp. (a)
|
193
|
64,694
|
|
Digimarc Corp. (a)
|
1,963
|
41,498
|
|
Digital Turbine, Inc. (a)
|
12,861
|
24,565
|
|
Domo, Inc. Class B (a)
|
4,610
|
34,713
|
|
E2open Parent Holdings, Inc. (a)
|
23,617
|
114,542
|
|
eGain Communications Corp. (a)
|
2,823
|
17,531
|
|
Enfusion, Inc. Class A (a)
|
5,457
|
50,805
|
|
Envestnet, Inc. (a)
|
6,957
|
431,821
|
|
Everbridge, Inc. (a)
|
5,734
|
199,257
|
|
EverCommerce, Inc. (a)
|
3,370
|
30,330
|
|
Expensify, Inc. (a)
|
7,446
|
11,914
|
|
Freshworks, Inc. (a)
|
22,530
|
402,161
|
|
Instructure Holdings, Inc. (a)
|
2,689
|
51,441
|
|
Intapp, Inc. (a)
|
5,553
|
171,699
|
|
InterDigital, Inc.
|
3,576
|
353,058
|
|
Jamf Holding Corp. (a)
|
9,848
|
191,741
|
|
Kaltura, Inc. (a)
|
11,240
|
13,825
|
|
LivePerson, Inc. (a)
|
10,411
|
5,215
|
|
Liveramp Holdings, Inc. (a)
|
8,985
|
288,508
|
|
Marathon Digital Holdings, Inc. (a)(b)
|
31,137
|
500,060
|
|
Matterport, Inc. (a)
|
36,082
|
165,977
|
|
MeridianLink, Inc. (a)
|
3,494
|
58,280
|
|
MicroStrategy, Inc. Class A (a)(b)
|
2,063
|
2,197,157
|
|
Mitek Systems, Inc. (a)
|
6,088
|
76,891
|
|
Model N, Inc. (a)
|
5,331
|
158,064
|
|
N-able, Inc. (a)
|
9,699
|
118,910
|
|
Nextnav, Inc. (a)
|
7,766
|
70,748
|
|
Olo, Inc. (a)
|
14,597
|
70,066
|
|
ON24, Inc.
|
4,149
|
27,342
|
|
Onespan, Inc. (a)
|
5,526
|
59,791
|
|
Pagerduty, Inc. (a)
|
12,423
|
247,963
|
|
PowerSchool Holdings, Inc. (a)
|
7,929
|
137,330
|
|
Progress Software Corp.
|
6,113
|
304,550
|
|
PROS Holdings, Inc. (a)
|
6,228
|
203,967
|
|
Q2 Holdings, Inc. (a)
|
7,931
|
407,574
|
|
Qualys, Inc. (a)
|
5,167
|
846,923
|
|
Rapid7, Inc. (a)
|
8,423
|
377,350
|
|
Red Violet, Inc. (a)
|
1,512
|
25,371
|
|
Rimini Street, Inc. (a)
|
7,077
|
18,825
|
|
Riot Platforms, Inc. (a)(b)
|
27,500
|
278,025
|
|
Sapiens International Corp. NV
|
4,257
|
131,116
|
|
Semrush Holdings, Inc. (a)
|
4,426
|
54,174
|
|
SolarWinds, Inc.
|
7,172
|
79,035
|
|
SoundHound AI, Inc. (a)(b)
|
19,409
|
82,294
|
|
SoundThinking, Inc. (a)
|
1,314
|
17,555
|
|
Sprinklr, Inc. (a)
|
14,755
|
172,486
|
|
Sprout Social, Inc. (a)
|
6,757
|
340,891
|
|
SPS Commerce, Inc. (a)
|
5,104
|
887,432
|
|
Tenable Holdings, Inc. (a)
|
16,168
|
727,075
|
|
TeraWulf, Inc. (a)
|
21,342
|
46,312
|
|
Varonis Systems, Inc. (a)
|
15,107
|
660,931
|
|
Verint Systems, Inc. (a)
|
8,533
|
258,379
|
|
Veritone, Inc. (a)
|
3,589
|
11,736
|
|
Viant Technology, Inc. (a)
|
2,172
|
19,092
|
|
Weave Communications, Inc. (a)
|
4,762
|
50,906
|
|
Workiva, Inc. (a)
|
6,891
|
543,011
|
|
Xperi, Inc. (a)
|
6,148
|
64,615
|
|
Yext, Inc. (a)
|
15,035
|
82,542
|
|
Zeta Global Holdings Corp. (a)
|
19,592
|
242,157
|
|
Zuora, Inc. (a)
|
18,895
|
186,305
|
|
20,639,549
|
|||
Technology Hardware, Storage & Peripherals - 1.9%
|
|||
CompoSecure, Inc. (a)
|
2,165
|
15,047
|
|
Corsair Gaming, Inc. (a)
|
5,044
|
55,988
|
|
CPI Card Group (a)
|
544
|
9,384
|
|
Eastman Kodak Co. (a)
|
7,973
|
35,879
|
|
Immersion Corp.
|
4,383
|
31,864
|
|
Intevac, Inc. (a)
|
3,258
|
13,781
|
|
IonQ, Inc. (a)(b)
|
22,946
|
196,188
|
|
Super Micro Computer, Inc. (a)
|
7,067
|
6,069,120
|
|
Turtle Beach Corp. (a)
|
2,233
|
31,485
|
|
Xerox Holdings Corp.
|
16,284
|
216,414
|
|
6,675,150
|
|||
TOTAL INFORMATION TECHNOLOGY
|
50,392,951
|
||
MATERIALS - 4.7%
|
|||
Chemicals - 2.0%
|
|||
AdvanSix, Inc.
|
3,583
|
90,507
|
|
American Vanguard Corp.
|
3,648
|
41,551
|
|
Arcadium Lithium PLC
|
142,248
|
625,891
|
|
Aspen Aerogels, Inc. (a)
|
7,162
|
112,157
|
|
Avient Corp.
|
12,560
|
532,795
|
|
Balchem Corp.
|
4,441
|
627,869
|
|
Cabot Corp.
|
7,568
|
690,429
|
|
Core Molding Technologies, Inc. (a)
|
969
|
17,461
|
|
Danimer Scientific, Inc. (a)
|
11,771
|
8,828
|
|
Ecovyst, Inc. (a)
|
12,695
|
119,714
|
|
H.B. Fuller Co.
|
7,500
|
560,325
|
|
Hawkins, Inc.
|
2,703
|
204,806
|
|
Ingevity Corp. (a)
|
5,043
|
257,899
|
|
Innospec, Inc.
|
3,470
|
416,400
|
|
Intrepid Potash, Inc. (a)
|
1,460
|
29,375
|
|
Koppers Holdings, Inc.
|
2,779
|
142,507
|
|
Kronos Worldwide, Inc.
|
3,173
|
36,331
|
|
LSB Industries, Inc. (a)
|
7,342
|
68,281
|
|
Mativ, Inc.
|
7,443
|
135,909
|
|
Minerals Technologies, Inc.
|
4,509
|
328,661
|
|
Origin Materials, Inc. Class A (a)
|
16,051
|
12,993
|
|
Orion SA
|
7,680
|
181,709
|
|
Perimeter Solutions SA (a)
|
20,898
|
146,286
|
|
PureCycle Technologies, Inc. (a)(b)
|
16,046
|
74,935
|
|
Quaker Houghton
|
1,928
|
359,630
|
|
Rayonier Advanced Materials, Inc. (a)
|
8,836
|
32,958
|
|
Sensient Technologies Corp.
|
5,838
|
427,458
|
|
Stepan Co.
|
2,957
|
245,401
|
|
Trinseo PLC
|
4,534
|
11,834
|
|
Tronox Holdings PLC
|
16,265
|
276,342
|
|
Valhi, Inc.
|
308
|
4,549
|
|
6,821,791
|
|||
Construction Materials - 0.4%
|
|||
Knife River Holding Co.
|
7,864
|
614,886
|
|
Summit Materials, Inc. (a)
|
16,588
|
645,273
|
|
United States Lime & Minerals, Inc.
|
289
|
89,590
|
|
1,349,749
|
|||
Containers & Packaging - 0.3%
|
|||
Greif, Inc.:
|
|||
Class A
|
3,508
|
214,970
|
|
Class B
|
605
|
37,800
|
|
Myers Industries, Inc.
|
5,081
|
111,274
|
|
O-I Glass, Inc. (a)
|
21,594
|
323,046
|
|
Pactiv Evergreen, Inc.
|
5,617
|
85,603
|
|
Ranpak Holdings Corp. (A Shares) (a)
|
5,986
|
43,339
|
|
TriMas Corp.
|
5,744
|
149,287
|
|
965,319
|
|||
Metals & Mining - 1.9%
|
|||
5E Advanced Materials, Inc. (a)(b)
|
5,312
|
6,109
|
|
Alpha Metallurgical Resources
|
1,606
|
525,355
|
|
Arch Resources, Inc.
|
2,500
|
396,950
|
|
ATI, Inc. (a)
|
17,910
|
1,069,227
|
|
Caledonia Mining Corp. PLC
|
2,182
|
21,405
|
|
Carpenter Technology Corp.
|
6,800
|
582,760
|
|
Century Aluminum Co. (a)
|
7,370
|
127,870
|
|
Coeur d'Alene Mines Corp. (a)
|
50,054
|
226,244
|
|
Commercial Metals Co.
|
16,258
|
873,705
|
|
Compass Minerals International, Inc.
|
4,807
|
59,847
|
|
Constellium NV (a)
|
17,885
|
352,156
|
|
Contango ORE, Inc. (a)(b)
|
1,099
|
22,936
|
|
Dakota Gold Corp. (a)
|
8,716
|
23,185
|
|
Haynes International, Inc.
|
1,760
|
105,864
|
|
Hecla Mining Co.
|
84,782
|
401,019
|
|
i-80 Gold Corp. (a)(b)
|
27,515
|
32,468
|
|
Ivanhoe Electric, Inc. (a)
|
8,861
|
89,496
|
|
Kaiser Aluminum Corp.
|
2,224
|
201,250
|
|
Materion Corp.
|
2,854
|
328,039
|
|
Metallus, Inc. (a)
|
5,937
|
122,065
|
|
Novagold Resources, Inc. (a)
|
33,490
|
97,121
|
|
Olympic Steel, Inc.
|
1,366
|
86,837
|
|
Perpetua Resources Corp. (a)
|
5,384
|
29,397
|
|
Piedmont Lithium, Inc. (a)(b)
|
2,414
|
29,572
|
|
Radius Recycling, Inc. Class A
|
3,672
|
63,966
|
|
Ramaco Resources, Inc.
|
3,211
|
50,348
|
|
Ramaco Resources, Inc. Class B
|
434
|
4,822
|
|
Ryerson Holding Corp.
|
3,917
|
111,830
|
|
SunCoke Energy, Inc.
|
11,571
|
119,297
|
|
Tredegar Corp.
|
3,721
|
23,740
|
|
Warrior Metropolitan Coal, Inc.
|
7,190
|
491,437
|
|
Worthington Steel, Inc.
|
4,272
|
131,535
|
|
6,807,852
|
|||
Paper & Forest Products - 0.1%
|
|||
Clearwater Paper Corp. (a)
|
2,277
|
102,556
|
|
Glatfelter Corp. (a)
|
5,671
|
8,110
|
|
Sylvamo Corp.
|
4,978
|
311,125
|
|
421,791
|
|||
TOTAL MATERIALS
|
16,366,502
|
||
REAL ESTATE - 5.6%
|
|||
Equity Real Estate Investment Trusts (REITs) - 5.0%
|
|||
Acadia Realty Trust (SBI)
|
14,265
|
246,499
|
|
Alexander & Baldwin, Inc.
|
10,399
|
171,272
|
|
Alexanders, Inc.
|
323
|
68,334
|
|
Alpine Income Property Trust, Inc.
|
1,991
|
29,726
|
|
American Assets Trust, Inc.
|
7,071
|
150,966
|
|
Apartment Investment & Management Co. Class A (a)
|
19,962
|
159,696
|
|
Apple Hospitality (REIT), Inc.
|
30,374
|
448,320
|
|
Armada Hoffler Properties, Inc.
|
9,697
|
102,012
|
|
Braemar Hotels & Resorts, Inc.
|
9,207
|
25,135
|
|
Brandywine Realty Trust (SBI)
|
24,294
|
110,295
|
|
Broadstone Net Lease, Inc.
|
26,667
|
388,272
|
|
BRT Apartments Corp.
|
2,153
|
38,625
|
|
CareTrust (REIT), Inc.
|
16,821
|
415,815
|
|
CBL & Associates Properties, Inc.
|
3,873
|
84,238
|
|
Centerspace
|
2,145
|
144,251
|
|
Chatham Lodging Trust
|
6,991
|
64,107
|
|
City Office REIT, Inc.
|
5,672
|
26,432
|
|
Clipper Realty, Inc.
|
1,723
|
7,237
|
|
Community Healthcare Trust, Inc.
|
3,834
|
101,716
|
|
COPT Defense Properties (SBI)
|
15,854
|
380,020
|
|
CTO Realty Growth, Inc.
|
3,342
|
57,984
|
|
DiamondRock Hospitality Co.
|
29,707
|
264,392
|
|
Diversified Healthcare Trust (SBI)
|
33,232
|
78,428
|
|
Douglas Emmett, Inc.
|
22,637
|
310,353
|
|
Easterly Government Properties, Inc.
|
13,894
|
162,421
|
|
Elme Communities (SBI)
|
12,465
|
188,969
|
|
Empire State Realty Trust, Inc.
|
18,575
|
169,033
|
|
Equity Commonwealth (a)
|
14,245
|
266,666
|
|
Essential Properties Realty Trust, Inc.
|
22,028
|
580,218
|
|
Farmland Partners, Inc.
|
6,367
|
68,509
|
|
Four Corners Property Trust, Inc.
|
12,890
|
302,271
|
|
Getty Realty Corp.
|
6,878
|
186,394
|
|
Gladstone Commercial Corp.
|
5,868
|
78,455
|
|
Gladstone Land Corp.
|
4,983
|
63,184
|
|
Global Medical REIT, Inc.
|
9,192
|
74,547
|
|
Global Net Lease, Inc.
|
27,857
|
193,606
|
|
Hudson Pacific Properties, Inc.
|
19,299
|
111,934
|
|
Independence Realty Trust, Inc.
|
31,703
|
499,956
|
|
InvenTrust Properties Corp.
|
9,619
|
243,745
|
|
JBG SMITH Properties
|
13,192
|
198,012
|
|
Kite Realty Group Trust
|
30,586
|
666,775
|
|
LTC Properties, Inc.
|
5,886
|
194,827
|
|
LXP Industrial Trust (REIT)
|
40,821
|
340,855
|
|
National Health Investors, Inc.
|
5,875
|
370,478
|
|
NETSTREIT Corp.
|
10,003
|
168,551
|
|
NexPoint Diversified Real Estate Trust (b)
|
4,726
|
28,261
|
|
NexPoint Residential Trust, Inc.
|
3,201
|
109,602
|
|
Office Properties Income Trust
|
7,517
|
15,184
|
|
One Liberty Properties, Inc.
|
2,489
|
57,023
|
|
Orion Office (REIT), Inc.
|
8,435
|
26,317
|
|
Outfront Media, Inc.
|
20,639
|
327,335
|
|
Paramount Group, Inc.
|
25,710
|
119,294
|
|
Peakstone Realty Trust
|
5,098
|
71,219
|
|
Pebblebrook Hotel Trust
|
16,708
|
242,767
|
|
Phillips Edison & Co., Inc.
|
16,974
|
555,050
|
|
Piedmont Office Realty Trust, Inc. Class A
|
17,638
|
121,526
|
|
Plymouth Industrial REIT, Inc.
|
6,668
|
139,228
|
|
Postal Realty Trust, Inc.
|
3,379
|
46,799
|
|
Potlatch Corp.
|
11,101
|
444,151
|
|
Retail Opportunity Investments Corp.
|
17,418
|
213,719
|
|
RLJ Lodging Trust
|
21,799
|
239,789
|
|
Ryman Hospitality Properties, Inc.
|
8,142
|
858,818
|
|
Sabra Health Care REIT, Inc.
|
32,489
|
452,247
|
|
Safehold, Inc.
|
6,813
|
124,269
|
|
Saul Centers, Inc.
|
1,747
|
63,608
|
|
Service Properties Trust
|
23,271
|
142,651
|
|
SITE Centers Corp.
|
26,884
|
362,665
|
|
SL Green Realty Corp. (b)
|
9,071
|
452,008
|
|
Summit Hotel Properties, Inc.
|
14,939
|
89,783
|
|
Sunstone Hotel Investors, Inc.
|
29,006
|
295,861
|
|
Tanger, Inc.
|
14,697
|
416,660
|
|
Terreno Realty Corp.
|
12,589
|
684,212
|
|
The Macerich Co.
|
30,250
|
416,240
|
|
UMH Properties, Inc.
|
8,750
|
139,300
|
|
Uniti Group, Inc.
|
33,292
|
191,429
|
|
Universal Health Realty Income Trust (SBI)
|
1,932
|
69,610
|
|
Urban Edge Properties
|
16,290
|
272,532
|
|
Veris Residential, Inc.
|
11,138
|
160,499
|
|
Whitestone REIT Class B
|
7,171
|
82,467
|
|
Xenia Hotels & Resorts, Inc.
|
14,917
|
206,899
|
|
17,242,553
|
|||
Real Estate Management & Development - 0.6%
|
|||
American Realty Investments, Inc. (a)
|
193
|
2,660
|
|
Anywhere Real Estate, Inc. (a)
|
14,815
|
72,001
|
|
Compass, Inc. (a)
|
39,625
|
124,819
|
|
Cushman & Wakefield PLC (a)
|
23,218
|
224,054
|
|
Digitalbridge Group, Inc.
|
22,560
|
370,886
|
|
Douglas Elliman, Inc.
|
10,798
|
14,685
|
|
eXp World Holdings, Inc. (b)
|
9,890
|
98,504
|
|
Forestar Group, Inc. (a)
|
2,547
|
78,932
|
|
FRP Holdings, Inc. (a)
|
1,814
|
54,982
|
|
Kennedy-Wilson Holdings, Inc.
|
16,699
|
143,444
|
|
Marcus & Millichap, Inc.
|
3,284
|
104,004
|
|
Maui Land & Pineapple, Inc. (a)
|
1,123
|
21,876
|
|
Newmark Group, Inc.
|
18,880
|
180,682
|
|
Opendoor Technologies, Inc. (a)
|
79,054
|
157,317
|
|
RE/MAX Holdings, Inc.
|
2,329
|
16,350
|
|
Redfin Corp. (a)
|
15,432
|
86,574
|
|
Star Holdings (a)
|
1,730
|
20,570
|
|
Stratus Properties, Inc. (a)
|
737
|
16,715
|
|
Tejon Ranch Co. (a)
|
2,909
|
48,813
|
|
The RMR Group, Inc.
|
2,199
|
52,160
|
|
The St. Joe Co.
|
4,824
|
275,933
|
|
Transcontinental Realty Investors, Inc. (a)
|
162
|
4,641
|
|
2,170,602
|
|||
TOTAL REAL ESTATE
|
19,413,155
|
||
UTILITIES - 2.6%
|
|||
Electric Utilities - 0.7%
|
|||
Allete, Inc.
|
8,032
|
475,655
|
|
Genie Energy Ltd. Class B
|
2,760
|
42,200
|
|
MGE Energy, Inc.
|
5,064
|
396,612
|
|
Otter Tail Corp.
|
5,744
|
490,308
|
|
PNM Resources, Inc.
|
11,873
|
440,013
|
|
Portland General Electric Co.
|
14,107
|
609,846
|
|
2,454,634
|
|||
Gas Utilities - 0.9%
|
|||
Brookfield Infrastructure Corp. A Shares (b)
|
16,701
|
508,879
|
|
Chesapeake Utilities Corp.
|
3,049
|
322,798
|
|
New Jersey Resources Corp.
|
13,503
|
589,946
|
|
Northwest Natural Holding Co.
|
5,143
|
196,205
|
|
ONE Gas, Inc.
|
7,692
|
496,288
|
|
RGC Resources, Inc.
|
1,108
|
22,847
|
|
Southwest Gas Holdings, Inc.
|
8,681
|
647,776
|
|
Spire, Inc.
|
7,274
|
449,460
|
|
3,234,199
|
|||
Independent Power and Renewable Electricity Producers - 0.2%
|
|||
Altus Power, Inc. Class A (a)
|
8,888
|
32,619
|
|
Montauk Renewables, Inc. (a)
|
9,485
|
34,146
|
|
Ormat Technologies, Inc.
|
7,495
|
478,406
|
|
Sunnova Energy International, Inc. (a)(b)
|
14,982
|
63,074
|
|
608,245
|
|||
Multi-Utilities - 0.4%
|
|||
Avista Corp.
|
10,794
|
388,368
|
|
Black Hills Corp.
|
9,506
|
521,879
|
|
NorthWestern Energy Corp.
|
8,578
|
432,674
|
|
Unitil Corp.
|
2,245
|
114,360
|
|
1,457,281
|
|||
Water Utilities - 0.4%
|
|||
American States Water Co.
|
5,161
|
365,605
|
|
Artesian Resources Corp. Class A
|
1,300
|
45,474
|
|
Cadiz, Inc. (a)(b)
|
5,325
|
12,141
|
|
California Water Service Group
|
8,061
|
395,956
|
|
Consolidated Water Co., Inc.
|
2,094
|
53,292
|
|
Global Water Resources, Inc.
|
1,571
|
19,229
|
|
Middlesex Water Co.
|
2,428
|
123,148
|
|
Pure Cycle Corp. (a)
|
2,747
|
26,206
|
|
SJW Group
|
4,415
|
240,397
|
|
York Water Co.
|
2,061
|
73,186
|
|
1,354,634
|
|||
TOTAL UTILITIES
|
9,108,993
|
||
|
TOTAL COMMON STOCKS
(Cost $309,490,025)
|
343,432,753
|
||
U.S. Treasury Obligations - 0.1%
|
|||
Principal
Amount (d)
|
Value ($)
|
||
U.S. Treasury Bills, yield at date of purchase 5.3% 5/23/24 (e)
(Cost $199,360)
|
200,000
|
199,355
|
|
Money Market Funds - 4.1%
|
|||
Shares
|
Value ($)
|
||
Fidelity Cash Central Fund 5.39% (f)
|
2,545,850
|
2,546,359
|
|
Fidelity Securities Lending Cash Central Fund 5.39% (f)(g)
|
11,839,157
|
11,840,341
|
|
|
TOTAL MONEY MARKET FUNDS
(Cost $14,386,700)
|
14,386,700
|
||
|
TOTAL INVESTMENT IN SECURITIES - 103.3%
(Cost $324,076,085)
|
358,018,808
|
NET OTHER ASSETS (LIABILITIES) - (3.3)%
|
(11,476,671)
|
NET ASSETS - 100.0%
|
346,542,137
|
Futures Contracts
|
|||||
Number
of contracts
|
Expiration
Date
|
Notional
Amount ($)
|
Value ($)
|
Unrealized
Appreciation/
(Depreciation) ($)
|
|
Purchased
|
|||||
Equity Index Contracts
|
|||||
CME E-mini Russell 2000 Index Contracts (United States)
|
31
|
Jun 2024
|
3,077,680
|
4,698
|
4,698
|
The notional amount of futures purchased as a percentage of Net Assets is 0.9%
|
|||||
(a)
|
Non-income producing
|
(b)
|
Security or a portion of the security is on loan at period end.
|
(c)
|
Level 3 security
|
(d)
|
Amount is stated in United States dollars unless otherwise noted.
|
(e)
|
Security or a portion of the security was pledged to cover margin requirements for futures contracts. At period end, the value of securities pledged amounted to $199,355.
|
(f)
|
Affiliated fund that is generally available only to investment companies and other accounts managed by Fidelity Investments. The rate quoted is the annualized seven-day yield of the fund at period end. A complete unaudited listing of the fund's holdings as of its most recent quarter end is available upon request. In addition, each Fidelity Central Fund's financial statements, which are not covered by the Fund's Report of Independent Registered Public Accounting Firm, are available on the SEC's website or upon request.
|
(g)
|
Investment made with cash collateral received from securities on loan.
|
(h)
|
Equity security is subject to lock-up or market standoff agreement and valued at a discount to the market price of the equivalent equity security. As of period end, the total fair value of equity securities discounted due to contractual sale restrictions is $5,404 and all restrictions are set to expire on or before September 30, 2024. Under normal market conditions, there are no circumstances that could cause the restrictions to lapse.
|
Affiliate
|
Value,
beginning
of period ($)
|
Purchases ($)
|
Sales
Proceeds ($)
|
Dividend
Income ($)
|
Realized
Gain (loss) ($)
|
Change in
Unrealized
appreciation
(depreciation) ($)
|
Value,
end
of period ($)
|
% ownership,
end
of period
|
Fidelity Cash Central Fund 5.39%
|
5,615,398
|
81,035,548
|
84,104,545
|
102,823
|
(42)
|
-
|
2,546,359
|
0.0%
|
Fidelity Securities Lending Cash Central Fund 5.39%
|
11,363,985
|
67,492,750
|
67,016,394
|
397,018
|
-
|
-
|
11,840,341
|
0.0%
|
Total
|
16,979,383
|
148,528,298
|
151,120,939
|
499,841
|
(42)
|
-
|
14,386,700
|
|
Valuation Inputs at Reporting Date:
|
||||
Description
|
Total ($)
|
Level 1 ($)
|
Level 2 ($)
|
Level 3 ($)
|
Investments in Securities:
|
||||
Equities:
|
||||
Communication Services
|
7,395,098
|
7,395,098
|
-
|
-
|
Consumer Discretionary
|
36,169,254
|
36,169,254
|
-
|
-
|
Consumer Staples
|
11,508,177
|
11,508,177
|
-
|
-
|
Energy
|
25,908,052
|
25,908,052
|
-
|
-
|
Financials
|
55,242,531
|
55,242,531
|
-
|
-
|
Health Care
|
51,416,147
|
51,403,732
|
5,404
|
7,011
|
Industrials
|
60,511,893
|
60,511,893
|
-
|
-
|
Information Technology
|
50,392,951
|
50,392,951
|
-
|
-
|
Materials
|
16,366,502
|
16,366,502
|
-
|
-
|
Real Estate
|
19,413,155
|
19,413,155
|
-
|
-
|
Utilities
|
9,108,993
|
9,108,993
|
-
|
-
|
U.S. Government and Government Agency Obligations
|
199,355
|
-
|
199,355
|
-
|
Money Market Funds
|
14,386,700
|
14,386,700
|
-
|
-
|
Total Investments in Securities:
|
358,018,808
|
357,807,038
|
204,759
|
7,011
|
Derivative Instruments:
Assets
|
||||
Futures Contracts
|
4,698
|
4,698
|
-
|
-
|
Total Assets
|
4,698
|
4,698
|
-
|
-
|
Total Derivative Instruments:
|
4,698
|
4,698
|
-
|
-
|
Primary Risk Exposure / Derivative Type
|
Value
|
|
Asset ($)
|
Liability ($)
|
|
Equity Risk
|
||
Futures Contracts (a)
|
4,698
|
0
|
Total Equity Risk
|
4,698
|
0
|
Total Value of Derivatives
|
4,698
|
0
|
Statement of Assets and Liabilities
|
||||
April 30, 2024
|
||||
Assets
|
||||
Investment in securities, at value (including securities loaned of $10,583,024) - See accompanying schedule:
|
||||
Unaffiliated issuers (cost $309,689,385)
|
$
|
343,632,108
|
||
Fidelity Central Funds (cost $14,386,700)
|
14,386,700
|
|||
Total Investment in Securities (cost $324,076,085)
|
$
|
358,018,808
|
||
Cash
|
1,008
|
|||
Receivable for fund shares sold
|
642,106
|
|||
Dividends receivable
|
102,456
|
|||
Distributions receivable from Fidelity Central Funds
|
38,764
|
|||
Total assets
|
358,803,142
|
|||
Liabilities
|
||||
Payable for investments purchased
|
$
|
38,536
|
||
Payable for fund shares redeemed
|
323,117
|
|||
Payable for daily variation margin on futures contracts
|
58,152
|
|||
Other payables and accrued expenses
|
877
|
|||
Collateral on securities loaned
|
11,840,323
|
|||
Total liabilities
|
12,261,005
|
|||
Net Assets
|
$
|
346,542,137
|
||
Net Assets consist of:
|
||||
Paid in capital
|
$
|
324,225,330
|
||
Total accumulated earnings (loss)
|
22,316,807
|
|||
Net Assets
|
$
|
346,542,137
|
||
Net Asset Value, offering price and redemption price per share ($346,542,137 ÷ 24,429,602 shares)
|
$
|
14.19
|
||
Statement of Operations
|
||||
Year ended
April 30, 2024
|
||||
Investment Income
|
||||
Dividends
|
$
|
4,456,678
|
||
Interest
|
11,243
|
|||
Income from Fidelity Central Funds (including $397,018 from security lending)
|
499,841
|
|||
Total income
|
4,967,762
|
|||
Expenses
|
||||
Independent trustees' fees and expenses
|
$
|
989
|
||
Proxy
|
132,706
|
|||
Total expenses before reductions
|
133,695
|
|||
Expense reductions
|
(124,883)
|
|||
Total expenses after reductions
|
8,812
|
|||
Net Investment income (loss)
|
4,958,950
|
|||
Realized and Unrealized Gain (Loss)
|
||||
Net realized gain (loss) on:
|
||||
Investment Securities:
|
||||
Unaffiliated issuers
|
(3,270,365)
|
|||
Fidelity Central Funds
|
(42)
|
|||
Futures contracts
|
(31,569)
|
|||
Total net realized gain (loss)
|
(3,301,976)
|
|||
Change in net unrealized appreciation (depreciation) on:
|
||||
Investment Securities:
|
||||
Unaffiliated issuers
|
36,713,238
|
|||
Futures contracts
|
(16,815)
|
|||
Total change in net unrealized appreciation (depreciation)
|
36,696,423
|
|||
Net gain (loss)
|
33,394,447
|
|||
Net increase (decrease) in net assets resulting from operations
|
$
|
38,353,397
|
||
Statement of Changes in Net Assets
|
||||
Year ended
April 30, 2024
|
Year ended
April 30, 2023
|
|||
Increase (Decrease) in Net Assets
|
||||
Operations
|
||||
Net investment income (loss)
|
$
|
4,958,950
|
$
|
4,291,098
|
Net realized gain (loss)
|
(3,301,976)
|
(3,677,136)
|
||
Change in net unrealized appreciation (depreciation)
|
36,696,423
|
(8,101,548)
|
||
Net increase (decrease) in net assets resulting from operations
|
38,353,397
|
(7,487,586)
|
||
Distributions to shareholders
|
(4,955,699)
|
(3,089,661)
|
||
Share transactions
|
||||
Proceeds from sales of shares
|
153,091,221
|
124,512,167
|
||
Reinvestment of distributions
|
3,626,735
|
2,144,309
|
||
Cost of shares redeemed
|
(126,338,692)
|
(76,140,306)
|
||
Net increase (decrease) in net assets resulting from share transactions
|
30,379,264
|
50,516,170
|
||
Total increase (decrease) in net assets
|
63,776,962
|
39,938,923
|
||
Net Assets
|
||||
Beginning of period
|
282,765,175
|
242,826,252
|
||
End of period
|
$
|
346,542,137
|
$
|
282,765,175
|
Other Information
|
||||
Shares
|
||||
Sold
|
11,216,014
|
9,634,149
|
||
Issued in reinvestment of distributions
|
259,895
|
170,455
|
||
Redeemed
|
(9,310,316)
|
(5,765,531)
|
||
Net increase (decrease)
|
2,165,593
|
4,039,073
|
||
Fidelity Flex® Small Cap Index Fund |
Years ended April 30,
|
2024
|
2023
|
2022
|
2021
|
2020
|
|||||
Selected Per-Share Data
|
||||||||||
Net asset value, beginning of period
|
$
|
12.70
|
$
|
13.32
|
$
|
16.47
|
$
|
9.52
|
$
|
11.70
|
Income from Investment Operations
|
||||||||||
Net investment income (loss) A,B
|
.21
|
.22
|
.18
|
.14
|
.15
|
|||||
Net realized and unrealized gain (loss)
|
1.50
|
(.68)
|
(2.89)
|
6.96
|
(1.98)
|
|||||
Total from investment operations
|
1.71
|
(.46)
|
(2.71)
|
7.10
|
(1.83)
|
|||||
Distributions from net investment income
|
(.22)
|
(.16)
|
(.18)
|
(.15)
|
(.16)
|
|||||
Distributions from net realized gain
|
-
|
-
|
(.26)
|
-
|
(.19)
|
|||||
Total distributions
|
(.22)
|
(.16)
|
(.44)
|
(.15)
|
(.35)
|
|||||
Net asset value, end of period
|
$
|
14.19
|
$
|
12.70
|
$
|
13.32
|
$
|
16.47
|
$
|
9.52
|
Total Return C
|
13.47 % |
(3.46)%
|
(16.88)%
|
75.01%
|
(16.23)%
|
|||||
Ratios to Average Net Assets B,D,E
|
||||||||||
Expenses before reductions
|
.04%
|
-% F
|
-% F
|
-% F
|
-% F
|
|||||
Expenses net of fee waivers, if any F
|
- % |
-%
|
-%
|
-%
|
-%
|
|||||
Expenses net of all reductions F
|
-%
|
-%
|
-%
|
-%
|
-%
|
|||||
Net investment income (loss)
|
1.55%
|
1.66%
|
1.14%
|
1.09%
|
1.36%
|
|||||
Supplemental Data
|
||||||||||
Net assets, end of period (000 omitted)
|
$
|
346,542
|
$
|
282,765
|
$
|
242,826
|
$
|
178,073
|
$
|
104,119
|
Portfolio turnover rate G
|
21 % |
16%
|
18%
|
47%
|
18%
|
Fidelity Central Fund
|
Investment Manager
|
Investment Objective
|
Investment Practices
|
Expense RatioA
|
Fidelity Money Market Central Funds
|
Fidelity Management & Research Company LLC (FMR)
|
Each fund seeks to obtain a high level of current income consistent with the preservation of capital and liquidity.
|
Short-term Investments
|
Less than .005%
|
Gross unrealized appreciation
|
$88,956,374
|
Gross unrealized depreciation
|
(60,695,847)
|
Net unrealized appreciation (depreciation)
|
$28,260,527
|
Tax Cost
|
$329,758,281
|
Undistributed ordinary income
|
$1,114,631
|
Capital loss carryforward
|
$(7,058,350)
|
Net unrealized appreciation (depreciation) on securities and other investments
|
$28,260,527
|
Short-term
|
$(4,549,550)
|
Long-term
|
(2,508,800)
|
Total capital loss carryforward
|
$(7,058,350)
|
April 30, 2024
|
April 30, 2023
|
|
Ordinary Income
|
$4,955,699
|
$3,089,661
|
Equity Risk
|
Equity risk relates to the fluctuations in the value of financial instruments as a result of changes in market prices (other than those arising from interest rate risk or foreign exchange risk), whether caused by factors specific to an individual investment, its issuer, or all factors affecting all instruments traded in a market or market segment.
|
Purchases ($)
|
Sales ($)
|
|
Fidelity Flex Small Cap Index Fund
|
110,341,974
|
67,924,774
|
Security Lending Income From Securities Loaned to NFS ($)
|
Value of Securities Loaned to NFS at Period End ($)
|
|
Fidelity Flex Small Cap Index Fund
|
6,253
|
-
|
Reimbursement ($)
|
|
Fidelity Flex Small Cap Index Fund
|
123,085
|
The Example is based on an investment of $1,000 invested at the beginning of the period and held for the entire period (November 1, 2023 to April 30, 2024).
|
Annualized Expense Ratio- A
|
Beginning Account Value November 1, 2023
|
Ending Account Value April 30, 2024
|
Expenses Paid During Period- C November 1, 2023 to April 30, 2024
|
|||||||
Fidelity Flex® Small Cap Index Fund
|
-%-D
|
|||||||||
Actual
|
$ 1,000
|
$ 1,197.00
|
$-E
|
|||||||
Hypothetical-B
|
$ 1,000
|
$ 1,024.86
|
$-E
|
|||||||
A special meeting of shareholders was held on October 18, 2023. The results of votes taken among shareholders on the proposal before them are reported below. Each vote reported represents one dollar of net asset value held on the record date for the meeting.
|
||
Proposal 1
|
||
To elect a Board of Trustees.
|
||
# of
Votes
|
% of
Votes
|
|
Abigail P. Johnson
|
||
Affirmative
|
378,729,502,260.01
|
97.58
|
Withheld
|
9,407,876,478.96
|
2.42
|
TOTAL
|
388,137,378,738.97
|
100.00
|
Jennifer Toolin McAuliffe
|
||
Affirmative
|
378,454,868,010.95
|
97.51
|
Withheld
|
9,682,510,728.02
|
2.49
|
TOTAL
|
388,137,378,738.97
|
100.00
|
Christine J. Thompson
|
||
Affirmative
|
378,837,121,274.52
|
97.60
|
Withheld
|
9,300,257,464.45
|
2.40
|
TOTAL
|
388,137,378,738.97
|
100.00
|
Elizabeth S. Acton
|
||
Affirmative
|
378,262,110,794.85
|
97.46
|
Withheld
|
9,875,267,944.12
|
2.54
|
TOTAL
|
388,137,378,738.97
|
100.00
|
Laura M. Bishop
|
||
Affirmative
|
380,482,113,171.06
|
98.03
|
Withheld
|
7,655,265,567.91
|
1.97
|
TOTAL
|
388,137,378,738.97
|
100.00
|
Ann E. Dunwoody
|
||
Affirmative
|
380,016,034,008.12
|
97.91
|
Withheld
|
8,121,344,730.85
|
2.09
|
TOTAL
|
388,137,378,738.97
|
100.00
|
John Engler
|
||
Affirmative
|
379,432,488,394.20
|
97.76
|
Withheld
|
8,704,890,344.77
|
2.24
|
TOTAL
|
388,137,378,738.97
|
100.00
|
Robert F. Gartland
|
||
Affirmative
|
378,741,819,600.60
|
97.58
|
Withheld
|
9,395,559,138.37
|
2.42
|
TOTAL
|
388,137,378,738.97
|
100.00
|
Robert W. Helm
|
||
Affirmative
|
380,389,324,755.07
|
98.00
|
Withheld
|
7,748,053,983.90
|
2.00
|
TOTAL
|
388,137,378,738.97
|
100.00
|
Arthur E. Johnson
|
||
Affirmative
|
378,427,694,151.67
|
97.50
|
Withheld
|
9,709,684,587.30
|
2.50
|
TOTAL
|
388,137,378,738.97
|
100.00
|
Michael E. Kenneally
|
||
Affirmative
|
377,842,228,145.18
|
97.35
|
Withheld
|
10,295,150,593.79
|
2.65
|
TOTAL
|
388,137,378,738.97
|
100.00
|
Mark A. Murray
|
||
Affirmative
|
380,158,432,703.37
|
97.94
|
Withheld
|
7,978,946,035.60
|
2.06
|
TOTAL
|
388,137,378,738.97
|
100.00
|
Carol J. Zierhoffer
|
||
Affirmative
|
380,522,113,360.24
|
98.04
|
Withheld
|
7,615,265,378.73
|
1.96
|
TOTAL
|
388,137,378,738.97
|
100.00
|
Proposal 1 reflects trust-wide proposal and voting results.
|
||
 |


Contents
Average Annual Total Returns
|
|||
Periods ended April 30, 2024
|
Past 1
year
|
Past 5
years
|
Life of
Fund A
|
Fidelity Flex® Mid Cap Index Fund
|
16.36%
|
9.12%
|
9.72%
|
$10,000 Over Life of Fund
|
Let's say hypothetically that $10,000 was invested in Fidelity Flex® Mid Cap Index Fund, on March 9, 2017, when the fund started.
The chart shows how the value of your investment would have changed, and also shows how the Russell Midcap® Index performed over the same period.
|
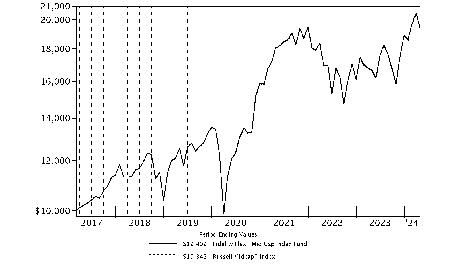
|
Top Holdings (% of Fund's net assets)
|
||
Trane Technologies PLC
|
0.7
|
|
Amphenol Corp. Class A
|
0.6
|
|
Parker Hannifin Corp.
|
0.6
|
|
TransDigm Group, Inc.
|
0.6
|
|
Phillips 66 Co.
|
0.6
|
|
Crowdstrike Holdings, Inc.
|
0.6
|
|
KKR & Co. LP
|
0.6
|
|
Constellation Energy Corp.
|
0.6
|
|
Cintas Corp.
|
0.5
|
|
Apollo Global Management, Inc.
|
0.5
|
|
5.9
|
||
Market Sectors (% of Fund's net assets)
|
||
Industrials
|
20.3
|
|
Financials
|
15.8
|
|
Information Technology
|
13.1
|
|
Consumer Discretionary
|
10.4
|
|
Health Care
|
9.8
|
|
Real Estate
|
7.4
|
|
Materials
|
5.6
|
|
Utilities
|
5.4
|
|
Energy
|
5.2
|
|
Consumer Staples
|
3.4
|
|
Communication Services
|
3.3
|
|
Asset Allocation (% of Fund's net assets)
|

|
Futures - 0.3%
|
Common Stocks - 99.7%
|
|||
Shares
|
Value ($)
|
||
COMMUNICATION SERVICES - 3.3%
|
|||
Diversified Telecommunication Services - 0.1%
|
|||
Frontier Communications Parent, Inc. (a)
|
9,155
|
211,847
|
|
GCI Liberty, Inc. Class A (Escrow) (b)
|
1,527
|
0
|
|
Iridium Communications, Inc.
|
4,615
|
142,096
|
|
353,943
|
|||
Entertainment - 1.6%
|
|||
AMC Entertainment Holdings, Inc. Class A (c)
|
9,230
|
27,044
|
|
Electronic Arts, Inc.
|
10,093
|
1,279,994
|
|
Liberty Media Corp. Liberty Formula One:
|
|||
Class A
|
887
|
55,233
|
|
Class C
|
7,254
|
507,562
|
|
Liberty Media Corp. Liberty Live:
|
|||
Class C
|
1,765
|
65,870
|
|
Series A
|
745
|
26,716
|
|
Live Nation Entertainment, Inc. (a)
|
5,845
|
519,679
|
|
Madison Square Garden Sports Corp. (a)
|
693
|
128,843
|
|
Playtika Holding Corp.
|
944
|
6,844
|
|
Roblox Corp. (a)
|
17,649
|
627,598
|
|
Roku, Inc. Class A (a)
|
4,622
|
266,505
|
|
Spotify Technology SA (a)
|
5,222
|
1,464,458
|
|
Take-Two Interactive Software, Inc. (a)
|
6,165
|
880,424
|
|
TKO Group Holdings, Inc.
|
2,315
|
219,161
|
|
Warner Bros Discovery, Inc. (a)
|
75,669
|
556,924
|
|
6,632,855
|
|||
Interactive Media & Services - 0.4%
|
|||
IAC, Inc. (a)
|
2,815
|
133,881
|
|
Match Group, Inc. (a)
|
10,034
|
309,248
|
|
Pinterest, Inc. Class A (a)
|
21,804
|
729,344
|
|
TripAdvisor, Inc. (a)
|
3,972
|
104,583
|
|
Zoominfo Technologies, Inc. (a)
|
11,258
|
178,552
|
|
1,455,608
|
|||
Media - 1.2%
|
|||
Cable One, Inc.
|
224
|
88,222
|
|
Fox Corp.:
|
|||
Class A
|
9,219
|
285,881
|
|
Class B
|
4,993
|
143,199
|
|
Interpublic Group of Companies, Inc.
|
14,457
|
440,071
|
|
Liberty Broadband Corp.:
|
|||
Class A (a)
|
765
|
38,349
|
|
Class C (a)
|
4,321
|
214,883
|
|
Liberty Media Corp. Liberty SiriusXM
|
5,762
|
138,634
|
|
Liberty Media Corp. Liberty SiriusXM Class A
|
2,762
|
66,454
|
|
News Corp.:
|
|||
Class A
|
14,064
|
334,723
|
|
Class B
|
4,489
|
110,160
|
|
Nexstar Media Group, Inc. Class A
|
1,237
|
197,994
|
|
Omnicom Group, Inc.
|
7,362
|
683,488
|
|
Paramount Global:
|
|||
Class A (c)
|
932
|
19,283
|
|
Class B (c)
|
20,912
|
238,188
|
|
Sirius XM Holdings, Inc. (c)
|
24,026
|
70,636
|
|
The New York Times Co. Class A
|
6,038
|
259,815
|
|
The Trade Desk, Inc. (a)
|
16,455
|
1,363,297
|
|
4,693,277
|
|||
TOTAL COMMUNICATION SERVICES
|
13,135,683
|
||
CONSUMER DISCRETIONARY - 10.4%
|
|||
Automobile Components - 0.4%
|
|||
Aptiv PLC (a)
|
10,111
|
717,881
|
|
BorgWarner, Inc.
|
8,838
|
289,621
|
|
Gentex Corp.
|
8,695
|
298,239
|
|
Lear Corp.
|
2,156
|
271,376
|
|
Phinia, Inc.
|
1,740
|
67,860
|
|
QuantumScape Corp. Class A (a)(c)
|
12,693
|
68,796
|
|
1,713,773
|
|||
Automobiles - 0.2%
|
|||
Harley-Davidson, Inc.
|
4,902
|
168,580
|
|
Lucid Group, Inc. Class A (a)(c)
|
29,007
|
73,968
|
|
Rivian Automotive, Inc. (a)(c)
|
21,640
|
192,596
|
|
Thor Industries, Inc.
|
1,987
|
197,548
|
|
632,692
|
|||
Broadline Retail - 0.7%
|
|||
Coupang, Inc. Class A (a)
|
40,828
|
918,630
|
|
eBay, Inc.
|
19,312
|
995,340
|
|
Etsy, Inc. (a)
|
4,451
|
305,650
|
|
Kohl's Corp.
|
4,411
|
105,599
|
|
Macy's, Inc.
|
10,101
|
186,161
|
|
Nordstrom, Inc.
|
4,253
|
80,850
|
|
Ollie's Bargain Outlet Holdings, Inc. (a)
|
2,295
|
167,856
|
|
2,760,086
|
|||
Distributors - 0.4%
|
|||
Genuine Parts Co.
|
5,222
|
820,951
|
|
LKQ Corp.
|
9,895
|
426,771
|
|
Pool Corp.
|
1,440
|
522,043
|
|
1,769,765
|
|||
Diversified Consumer Services - 0.3%
|
|||
ADT, Inc.
|
9,576
|
62,244
|
|
Bright Horizons Family Solutions, Inc. (a)
|
2,133
|
221,213
|
|
Grand Canyon Education, Inc. (a)
|
1,106
|
143,802
|
|
H&R Block, Inc.
|
5,323
|
251,405
|
|
Mister Car Wash, Inc. (a)
|
2,832
|
18,946
|
|
Service Corp. International
|
5,317
|
381,282
|
|
1,078,892
|
|||
Hotels, Restaurants & Leisure - 3.4%
|
|||
Aramark
|
9,655
|
304,229
|
|
Boyd Gaming Corp.
|
2,612
|
139,768
|
|
Caesars Entertainment, Inc. (a)
|
7,668
|
274,668
|
|
Carnival Corp. (a)
|
37,073
|
549,422
|
|
Cava Group, Inc.
|
1,793
|
128,988
|
|
Choice Hotels International, Inc. (c)
|
1,098
|
129,849
|
|
Churchill Downs, Inc.
|
2,662
|
343,398
|
|
Darden Restaurants, Inc.
|
4,434
|
680,220
|
|
Domino's Pizza, Inc.
|
1,299
|
687,522
|
|
Doordash, Inc. (a)
|
11,549
|
1,492,824
|
|
Draftkings Holdings, Inc. (a)
|
15,584
|
647,671
|
|
Expedia Group, Inc. (a)
|
4,960
|
667,765
|
|
Hilton Worldwide Holdings, Inc.
|
9,268
|
1,828,391
|
|
Hyatt Hotels Corp. Class A
|
1,608
|
239,254
|
|
Marriott Vacations Worldwide Corp.
|
1,309
|
125,808
|
|
MGM Resorts International (a)
|
10,276
|
405,285
|
|
Norwegian Cruise Line Holdings Ltd. (a)
|
15,755
|
298,085
|
|
Penn Entertainment, Inc. (a)
|
5,630
|
93,120
|
|
Planet Fitness, Inc. (a)
|
3,183
|
190,471
|
|
Royal Caribbean Cruises Ltd. (a)
|
8,719
|
1,217,434
|
|
Texas Roadhouse, Inc. Class A
|
2,478
|
398,413
|
|
Travel+Leisure Co.
|
2,607
|
113,509
|
|
Vail Resorts, Inc.
|
1,416
|
268,148
|
|
Wendy's Co.
|
6,416
|
128,256
|
|
Wingstop, Inc.
|
1,095
|
421,345
|
|
Wyndham Hotels & Resorts, Inc.
|
3,009
|
221,192
|
|
Wynn Resorts Ltd.
|
3,895
|
356,977
|
|
Yum! Brands, Inc.
|
10,430
|
1,473,238
|
|
13,825,250
|
|||
Household Durables - 1.8%
|
|||
D.R. Horton, Inc.
|
11,273
|
1,606,290
|
|
Garmin Ltd.
|
5,711
|
825,068
|
|
Leggett & Platt, Inc.
|
5,005
|
90,440
|
|
Lennar Corp.:
|
|||
Class A
|
8,962
|
1,358,818
|
|
Class B
|
546
|
76,653
|
|
Mohawk Industries, Inc. (a)
|
1,974
|
227,642
|
|
Newell Brands, Inc.
|
15,163
|
120,394
|
|
NVR, Inc. (a)
|
108
|
803,396
|
|
PulteGroup, Inc.
|
7,949
|
885,678
|
|
Tempur Sealy International, Inc.
|
6,200
|
310,372
|
|
Toll Brothers, Inc.
|
3,847
|
458,216
|
|
TopBuild Corp. (a)
|
1,176
|
475,892
|
|
Whirlpool Corp.
|
1,994
|
189,151
|
|
7,428,010
|
|||
Leisure Products - 0.3%
|
|||
Brunswick Corp.
|
2,613
|
210,712
|
|
Hasbro, Inc.
|
4,862
|
298,041
|
|
Mattel, Inc. (a)
|
13,056
|
239,186
|
|
Peloton Interactive, Inc. Class A (a)
|
12,903
|
40,128
|
|
Polaris, Inc.
|
2,069
|
176,196
|
|
YETI Holdings, Inc. (a)
|
3,222
|
115,090
|
|
1,079,353
|
|||
Specialty Retail - 2.2%
|
|||
Advance Auto Parts, Inc.
|
2,231
|
162,818
|
|
AutoNation, Inc. (a)
|
1,059
|
170,658
|
|
Bath & Body Works, Inc.
|
8,435
|
383,118
|
|
Best Buy Co., Inc.
|
7,173
|
528,220
|
|
Burlington Stores, Inc. (a)
|
2,441
|
439,234
|
|
CarMax, Inc. (a)
|
5,901
|
401,091
|
|
Dick's Sporting Goods, Inc.
|
2,101
|
422,175
|
|
Five Below, Inc. (a)
|
2,049
|
299,851
|
|
Floor & Decor Holdings, Inc. Class A (a)(c)
|
3,953
|
436,134
|
|
GameStop Corp. Class A (a)(c)
|
6,758
|
74,946
|
|
Gap, Inc.
|
7,233
|
148,421
|
|
Lithia Motors, Inc. Class A (sub. vtg.)
|
1,008
|
256,415
|
|
Murphy U.S.A., Inc.
|
723
|
299,192
|
|
Penske Automotive Group, Inc.
|
729
|
111,471
|
|
Petco Health & Wellness Co., Inc. (a)
|
3,748
|
5,622
|
|
RH (a)
|
584
|
144,277
|
|
Ross Stores, Inc.
|
12,311
|
1,594,890
|
|
Tractor Supply Co.
|
4,031
|
1,100,785
|
|
Ulta Beauty, Inc. (a)
|
1,811
|
733,165
|
|
Valvoline, Inc. (a)
|
4,845
|
206,009
|
|
Victoria's Secret & Co. (a)
|
2,935
|
51,715
|
|
Wayfair LLC Class A (a)
|
3,145
|
157,722
|
|
Williams-Sonoma, Inc.
|
2,372
|
680,242
|
|
8,808,171
|
|||
Textiles, Apparel & Luxury Goods - 0.7%
|
|||
Birkenstock Holding PLC (c)
|
966
|
43,248
|
|
Capri Holdings Ltd. (a)
|
4,205
|
149,193
|
|
Carter's, Inc.
|
1,357
|
92,832
|
|
Columbia Sportswear Co.
|
1,310
|
104,315
|
|
Crocs, Inc. (a)
|
2,222
|
276,350
|
|
Deckers Outdoor Corp. (a)
|
954
|
780,820
|
|
PVH Corp.
|
2,261
|
245,997
|
|
Ralph Lauren Corp.
|
1,472
|
240,878
|
|
Skechers U.S.A., Inc. Class A (sub. vtg.) (a)
|
5,095
|
336,525
|
|
Tapestry, Inc.
|
8,734
|
348,661
|
|
Under Armour, Inc.:
|
|||
Class A (sub. vtg.) (a)
|
7,014
|
47,204
|
|
Class C (non-vtg.) (a)
|
8,949
|
58,347
|
|
VF Corp.
|
8,315
|
103,605
|
|
2,827,975
|
|||
TOTAL CONSUMER DISCRETIONARY
|
41,923,967
|
||
CONSUMER STAPLES - 3.4%
|
|||
Beverages - 0.3%
|
|||
Boston Beer Co., Inc. Class A (a)
|
350
|
97,444
|
|
Brown-Forman Corp.:
|
|||
Class A
|
1,940
|
95,196
|
|
Class B (non-vtg.)
|
6,787
|
324,758
|
|
Celsius Holdings, Inc. (a)
|
5,347
|
381,081
|
|
Molson Coors Beverage Co. Class B
|
6,480
|
371,045
|
|
1,269,524
|
|||
Consumer Staples Distribution & Retail - 1.2%
|
|||
Albertsons Companies, Inc.
|
15,144
|
308,938
|
|
BJ's Wholesale Club Holdings, Inc. (a)
|
4,965
|
370,786
|
|
Casey's General Stores, Inc.
|
1,383
|
441,979
|
|
Dollar Tree, Inc. (a)
|
7,720
|
912,890
|
|
Grocery Outlet Holding Corp. (a)
|
3,566
|
92,609
|
|
Kroger Co.
|
24,309
|
1,346,232
|
|
Maplebear, Inc. (NASDAQ)
|
830
|
28,328
|
|
Performance Food Group Co. (a)
|
5,686
|
385,966
|
|
U.S. Foods Holding Corp. (a)
|
8,417
|
422,954
|
|
Walgreens Boots Alliance, Inc.
|
26,848
|
476,015
|
|
4,786,697
|
|||
Food Products - 1.4%
|
|||
Bunge Global SA
|
5,381
|
547,571
|
|
Campbell Soup Co.
|
7,137
|
326,232
|
|
Conagra Brands, Inc.
|
17,693
|
544,591
|
|
Darling Ingredients, Inc. (a)
|
5,907
|
250,280
|
|
Flowers Foods, Inc.
|
6,958
|
173,533
|
|
Freshpet, Inc. (a)
|
1,602
|
169,924
|
|
Hormel Foods Corp.
|
10,772
|
383,052
|
|
Ingredion, Inc.
|
2,413
|
276,506
|
|
Kellanova
|
9,672
|
559,622
|
|
Lamb Weston Holdings, Inc.
|
5,420
|
451,703
|
|
McCormick & Co., Inc. (non-vtg.)
|
9,366
|
712,378
|
|
Pilgrim's Pride Corp. (a)
|
1,513
|
54,498
|
|
Post Holdings, Inc. (a)
|
1,888
|
200,411
|
|
Seaboard Corp.
|
8
|
26,481
|
|
The J.M. Smucker Co.
|
3,882
|
445,848
|
|
Tyson Foods, Inc. Class A
|
10,360
|
628,334
|
|
WK Kellogg Co.
|
2,427
|
56,646
|
|
5,807,610
|
|||
Household Products - 0.5%
|
|||
Church & Dwight Co., Inc.
|
9,089
|
980,612
|
|
Reynolds Consumer Products, Inc.
|
2,010
|
57,546
|
|
Spectrum Brands Holdings, Inc.
|
1,129
|
92,431
|
|
The Clorox Co.
|
4,612
|
681,976
|
|
1,812,565
|
|||
Personal Care Products - 0.0%
|
|||
Coty, Inc. Class A (a)
|
14,355
|
164,221
|
|
Olaplex Holdings, Inc. (a)
|
5,475
|
7,610
|
|
171,831
|
|||
TOTAL CONSUMER STAPLES
|
13,848,227
|
||
ENERGY - 5.2%
|
|||
Energy Equipment & Services - 0.8%
|
|||
Baker Hughes Co. Class A
|
37,196
|
1,213,334
|
|
Halliburton Co.
|
33,422
|
1,252,322
|
|
NOV, Inc.
|
14,594
|
269,843
|
|
TechnipFMC PLC
|
16,108
|
412,687
|
|
3,148,186
|
|||
Oil, Gas & Consumable Fuels - 4.4%
|
|||
Antero Midstream GP LP
|
12,537
|
173,512
|
|
Antero Resources Corp. (a)
|
10,561
|
359,180
|
|
APA Corp.
|
13,591
|
427,301
|
|
Cheniere Energy, Inc.
|
8,920
|
1,407,754
|
|
Chesapeake Energy Corp. (c)
|
4,602
|
413,628
|
|
Coterra Energy, Inc.
|
27,823
|
761,237
|
|
Devon Energy Corp.
|
23,897
|
1,223,048
|
|
Diamondback Energy, Inc.
|
6,640
|
1,335,503
|
|
DT Midstream, Inc.
|
3,592
|
223,422
|
|
EQT Corp.
|
13,469
|
539,972
|
|
Hess Corp.
|
10,369
|
1,633,014
|
|
HF Sinclair Corp.
|
5,946
|
322,571
|
|
Marathon Oil Corp.
|
21,796
|
585,223
|
|
New Fortress Energy, Inc. (c)
|
2,419
|
63,378
|
|
ONEOK, Inc.
|
21,659
|
1,713,660
|
|
Ovintiv, Inc.
|
9,525
|
488,823
|
|
Phillips 66 Co.
|
16,387
|
2,346,782
|
|
Range Resources Corp.
|
8,740
|
313,853
|
|
Southwestern Energy Co. (a)
|
40,721
|
305,000
|
|
Targa Resources Corp.
|
8,227
|
938,372
|
|
Texas Pacific Land Corp.
|
689
|
397,071
|
|
The Williams Companies, Inc.
|
45,320
|
1,738,475
|
|
17,710,779
|
|||
TOTAL ENERGY
|
20,858,965
|
||
FINANCIALS - 15.8%
|
|||
Banks - 2.5%
|
|||
Bank OZK
|
3,940
|
175,921
|
|
BOK Financial Corp.
|
1,020
|
90,505
|
|
Citizens Financial Group, Inc.
|
17,469
|
595,868
|
|
Columbia Banking Systems, Inc.
|
7,770
|
146,154
|
|
Comerica, Inc.
|
4,878
|
244,729
|
|
Commerce Bancshares, Inc.
|
4,457
|
243,709
|
|
Cullen/Frost Bankers, Inc.
|
2,192
|
228,713
|
|
East West Bancorp, Inc.
|
5,201
|
387,422
|
|
Fifth Third Bancorp
|
25,237
|
920,141
|
|
First Citizens Bancshares, Inc.
|
404
|
681,451
|
|
First Hawaiian, Inc.
|
4,718
|
99,503
|
|
First Horizon National Corp.
|
20,692
|
308,725
|
|
FNB Corp., Pennsylvania
|
13,323
|
177,729
|
|
Huntington Bancshares, Inc.
|
53,427
|
719,662
|
|
KeyCorp
|
34,668
|
502,339
|
|
M&T Bank Corp.
|
6,164
|
890,020
|
|
New York Community Bancorp, Inc.
|
26,978
|
71,492
|
|
Nu Holdings Ltd. (a)
|
87,072
|
945,602
|
|
Pinnacle Financial Partners, Inc.
|
2,783
|
213,456
|
|
Popular, Inc.
|
2,607
|
221,569
|
|
Prosperity Bancshares, Inc.
|
3,232
|
200,287
|
|
Regions Financial Corp.
|
34,382
|
662,541
|
|
Synovus Financial Corp.
|
5,360
|
191,834
|
|
TFS Financial Corp.
|
1,818
|
21,834
|
|
Webster Financial Corp.
|
6,328
|
277,356
|
|
Western Alliance Bancorp.
|
4,009
|
227,831
|
|
Wintrust Financial Corp.
|
2,254
|
217,827
|
|
Zions Bancorporation NA
|
5,415
|
220,824
|
|
9,885,044
|
|||
Capital Markets - 5.0%
|
|||
Affiliated Managers Group, Inc.
|
1,239
|
193,408
|
|
Ameriprise Financial, Inc.
|
3,722
|
1,532,682
|
|
Ares Management Corp.
|
6,233
|
829,550
|
|
Bank of New York Mellon Corp.
|
28,271
|
1,597,029
|
|
Blue Owl Capital, Inc. Class A
|
16,891
|
319,071
|
|
Carlyle Group LP
|
7,849
|
351,635
|
|
Cboe Global Markets, Inc.
|
3,926
|
711,195
|
|
Coinbase Global, Inc. (a)
|
6,383
|
1,301,685
|
|
Evercore, Inc. Class A
|
1,303
|
236,495
|
|
FactSet Research Systems, Inc.
|
1,431
|
596,570
|
|
Franklin Resources, Inc.
|
11,443
|
261,358
|
|
Houlihan Lokey
|
1,874
|
238,916
|
|
Interactive Brokers Group, Inc.
|
3,861
|
444,478
|
|
Invesco Ltd.
|
14,094
|
199,712
|
|
Janus Henderson Group PLC
|
4,964
|
154,976
|
|
Jefferies Financial Group, Inc.
|
6,704
|
288,674
|
|
KKR & Co. LP
|
24,714
|
2,300,132
|
|
Lazard, Inc. Class A
|
4,095
|
157,658
|
|
LPL Financial
|
2,812
|
756,794
|
|
MarketAxess Holdings, Inc.
|
1,383
|
276,724
|
|
Morningstar, Inc.
|
953
|
269,365
|
|
MSCI, Inc.
|
2,865
|
1,334,488
|
|
NASDAQ, Inc.
|
13,764
|
823,775
|
|
Northern Trust Corp.
|
7,536
|
620,891
|
|
Raymond James Financial, Inc.
|
7,038
|
858,636
|
|
Robinhood Markets, Inc. (a)
|
23,590
|
388,999
|
|
SEI Investments Co.
|
3,725
|
245,664
|
|
State Street Corp.
|
11,239
|
814,715
|
|
Stifel Financial Corp.
|
3,618
|
289,151
|
|
T. Rowe Price Group, Inc.
|
8,217
|
900,337
|
|
TPG, Inc.
|
2,649
|
114,172
|
|
Tradeweb Markets, Inc. Class A
|
4,282
|
435,522
|
|
Virtu Financial, Inc. Class A
|
3,161
|
68,594
|
|
XP, Inc. Class A
|
12,040
|
246,459
|
|
20,159,510
|
|||
Consumer Finance - 0.7%
|
|||
Ally Financial, Inc.
|
10,185
|
390,595
|
|
Credit Acceptance Corp. (a)
|
233
|
119,697
|
|
Discover Financial Services
|
9,313
|
1,180,236
|
|
OneMain Holdings, Inc.
|
4,160
|
216,778
|
|
SLM Corp.
|
8,107
|
171,787
|
|
SoFi Technologies, Inc. (a)(c)
|
36,200
|
245,436
|
|
Synchrony Financial
|
15,066
|
662,603
|
|
2,987,132
|
|||
Financial Services - 2.5%
|
|||
Affirm Holdings, Inc. (a)
|
8,389
|
267,441
|
|
Apollo Global Management, Inc.
|
19,430
|
2,105,823
|
|
Block, Inc. Class A (a)
|
20,597
|
1,503,581
|
|
Corebridge Financial, Inc. (c)
|
8,388
|
222,785
|
|
Corpay, Inc. (a)
|
2,619
|
791,305
|
|
Equitable Holdings, Inc.
|
12,504
|
461,523
|
|
Euronet Worldwide, Inc. (a)
|
1,628
|
167,163
|
|
Fidelity National Information Services, Inc.
|
22,100
|
1,501,032
|
|
Global Payments, Inc.
|
9,626
|
1,181,784
|
|
Jack Henry & Associates, Inc.
|
2,703
|
439,751
|
|
MGIC Investment Corp.
|
10,203
|
206,917
|
|
NCR Atleos Corp.
|
2,402
|
47,872
|
|
Rocket Companies, Inc. (a)
|
4,426
|
54,351
|
|
Shift4 Payments, Inc. (a)
|
2,009
|
116,241
|
|
The Western Union Co.
|
13,533
|
181,884
|
|
Toast, Inc. (a)
|
13,684
|
323,353
|
|
UWM Holdings Corp. Class A
|
3,513
|
22,132
|
|
Voya Financial, Inc.
|
3,591
|
244,763
|
|
WEX, Inc. (a)
|
1,588
|
335,481
|
|
10,175,182
|
|||
Insurance - 4.9%
|
|||
AFLAC, Inc.
|
21,619
|
1,808,429
|
|
Allstate Corp.
|
9,777
|
1,662,677
|
|
American Financial Group, Inc.
|
2,657
|
339,432
|
|
Arch Capital Group Ltd. (a)
|
13,337
|
1,247,543
|
|
Arthur J. Gallagher & Co.
|
8,004
|
1,878,459
|
|
Assurant, Inc.
|
1,963
|
342,347
|
|
Assured Guaranty Ltd.
|
2,030
|
155,701
|
|
Axis Capital Holdings Ltd.
|
2,874
|
176,262
|
|
Brighthouse Financial, Inc. (a)
|
2,584
|
124,678
|
|
Brown & Brown, Inc.
|
8,836
|
720,487
|
|
Cincinnati Financial Corp.
|
5,705
|
660,011
|
|
CNA Financial Corp.
|
970
|
42,622
|
|
Everest Re Group Ltd.
|
1,597
|
585,157
|
|
Fidelity National Financial, Inc.
|
9,640
|
477,180
|
|
First American Financial Corp.
|
3,793
|
203,191
|
|
Globe Life, Inc.
|
3,250
|
247,553
|
|
Hanover Insurance Group, Inc.
|
1,317
|
170,973
|
|
Hartford Financial Services Group, Inc.
|
10,958
|
1,061,721
|
|
Kemper Corp.
|
2,268
|
132,247
|
|
Kinsale Capital Group, Inc.
|
814
|
295,686
|
|
Lincoln National Corp.
|
6,329
|
172,592
|
|
Loews Corp.
|
6,797
|
510,795
|
|
Markel Group, Inc. (a)
|
490
|
714,616
|
|
Old Republic International Corp.
|
9,519
|
284,237
|
|
Primerica, Inc.
|
1,293
|
273,935
|
|
Principal Financial Group, Inc.
|
8,800
|
696,432
|
|
Prudential Financial, Inc.
|
13,483
|
1,489,602
|
|
Reinsurance Group of America, Inc.
|
2,470
|
461,865
|
|
RenaissanceRe Holdings Ltd.
|
1,928
|
422,714
|
|
RLI Corp.
|
1,491
|
210,753
|
|
Ryan Specialty Group Holdings, Inc.
|
3,598
|
177,525
|
|
Unum Group
|
7,128
|
361,390
|
|
W.R. Berkley Corp.
|
7,448
|
573,273
|
|
White Mountains Insurance Group Ltd.
|
92
|
163,589
|
|
Willis Towers Watson PLC
|
3,853
|
967,642
|
|
19,813,316
|
|||
Mortgage Real Estate Investment Trusts - 0.2%
|
|||
AGNC Investment Corp. (c)
|
25,948
|
237,424
|
|
Annaly Capital Management, Inc.
|
18,695
|
350,344
|
|
Rithm Capital Corp.
|
16,637
|
185,003
|
|
Starwood Property Trust, Inc.
|
11,041
|
209,448
|
|
982,219
|
|||
TOTAL FINANCIALS
|
64,002,403
|
||
HEALTH CARE - 9.8%
|
|||
Biotechnology - 1.5%
|
|||
Alnylam Pharmaceuticals, Inc. (a)
|
4,712
|
678,292
|
|
Apellis Pharmaceuticals, Inc. (a)
|
3,788
|
167,392
|
|
Biogen, Inc. (a)
|
5,378
|
1,155,302
|
|
BioMarin Pharmaceutical, Inc. (a)
|
6,979
|
563,624
|
|
Exact Sciences Corp. (a)
|
6,663
|
395,449
|
|
Exelixis, Inc. (a)
|
11,467
|
269,016
|
|
Incyte Corp. (a)
|
6,251
|
325,365
|
|
Ionis Pharmaceuticals, Inc. (a)
|
5,344
|
220,493
|
|
Natera, Inc. (a)
|
4,056
|
376,721
|
|
Neurocrine Biosciences, Inc. (a)
|
3,601
|
495,282
|
|
Repligen Corp. (a)
|
2,096
|
344,163
|
|
Roivant Sciences Ltd. (a)(c)
|
13,509
|
147,248
|
|
Sarepta Therapeutics, Inc. (a)
|
3,337
|
422,664
|
|
Ultragenyx Pharmaceutical, Inc. (a)
|
2,972
|
126,429
|
|
United Therapeutics Corp. (a)
|
1,681
|
393,909
|
|
6,081,349
|
|||
Health Care Equipment & Supplies - 3.0%
|
|||
Align Technology, Inc. (a)
|
2,862
|
808,172
|
|
Baxter International, Inc.
|
18,868
|
761,701
|
|
Dentsply Sirona, Inc.
|
7,943
|
238,369
|
|
DexCom, Inc. (a)
|
14,417
|
1,836,582
|
|
Enovis Corp. (a)
|
1,959
|
108,196
|
|
Envista Holdings Corp. (a)
|
6,518
|
128,274
|
|
Globus Medical, Inc. (a)
|
4,513
|
224,702
|
|
Hologic, Inc. (a)
|
8,621
|
653,213
|
|
ICU Medical, Inc. (a)
|
838
|
82,057
|
|
IDEXX Laboratories, Inc. (a)
|
3,069
|
1,512,280
|
|
Inspire Medical Systems, Inc. (a)
|
1,088
|
262,926
|
|
Insulet Corp. (a)
|
2,587
|
444,809
|
|
Integra LifeSciences Holdings Corp. (a)
|
2,736
|
79,809
|
|
Masimo Corp. (a)
|
1,616
|
217,207
|
|
Novocure Ltd. (a)
|
899
|
11,004
|
|
Penumbra, Inc. (a)
|
1,378
|
270,736
|
|
QuidelOrtho Corp. (a)
|
1,074
|
43,551
|
|
ResMed, Inc.
|
5,431
|
1,162,180
|
|
Shockwave Medical, Inc. (a)
|
1,352
|
446,417
|
|
STERIS PLC
|
3,697
|
756,258
|
|
Tandem Diabetes Care, Inc. (a)
|
2,410
|
88,423
|
|
Teleflex, Inc.
|
1,774
|
370,323
|
|
The Cooper Companies, Inc.
|
7,250
|
645,685
|
|
Zimmer Biomet Holdings, Inc.
|
7,824
|
941,071
|
|
12,093,945
|
|||
Health Care Providers & Services - 1.7%
|
|||
Acadia Healthcare Co., Inc. (a)
|
3,356
|
248,143
|
|
agilon health, Inc. (a)
|
7,015
|
38,583
|
|
Amedisys, Inc. (a)
|
1,151
|
105,950
|
|
Cardinal Health, Inc.
|
9,197
|
947,659
|
|
Cencora, Inc.
|
6,264
|
1,497,409
|
|
Chemed Corp.
|
547
|
310,696
|
|
DaVita, Inc. (a)
|
2,015
|
280,105
|
|
Encompass Health Corp.
|
3,676
|
306,505
|
|
Henry Schein, Inc. (a)
|
4,870
|
337,394
|
|
Laboratory Corp. of America Holdings
|
3,163
|
636,933
|
|
Molina Healthcare, Inc. (a)
|
2,154
|
736,883
|
|
Premier, Inc.
|
4,459
|
93,104
|
|
Quest Diagnostics, Inc.
|
4,178
|
577,316
|
|
R1 RCM, Inc. (a)
|
5,780
|
71,036
|
|
Tenet Healthcare Corp. (a)
|
3,769
|
423,221
|
|
Universal Health Services, Inc. Class B
|
2,192
|
373,583
|
|
6,984,520
|
|||
Health Care Technology - 0.4%
|
|||
Certara, Inc. (a)
|
4,417
|
75,575
|
|
Doximity, Inc. (a)
|
4,388
|
106,585
|
|
Teladoc Health, Inc. (a)
|
6,958
|
88,715
|
|
Veeva Systems, Inc. Class A (a)
|
5,385
|
1,069,246
|
|
1,340,121
|
|||
Life Sciences Tools & Services - 2.7%
|
|||
10X Genomics, Inc. (a)
|
3,744
|
109,624
|
|
Agilent Technologies, Inc.
|
10,872
|
1,489,899
|
|
Avantor, Inc. (a)
|
25,080
|
607,688
|
|
Azenta, Inc. (a)
|
2,041
|
107,071
|
|
Bio-Rad Laboratories, Inc. Class A (a)
|
766
|
206,629
|
|
Bio-Techne Corp.
|
5,874
|
371,296
|
|
Bruker Corp.
|
3,707
|
289,183
|
|
Charles River Laboratories International, Inc. (a)
|
1,900
|
435,100
|
|
Fortrea Holdings, Inc.
|
3,299
|
120,710
|
|
ICON PLC (a)
|
3,030
|
902,576
|
|
Illumina, Inc. (a)
|
5,905
|
726,610
|
|
IQVIA Holdings, Inc. (a)
|
6,767
|
1,568,388
|
|
Maravai LifeSciences Holdings, Inc. (a)
|
4,094
|
33,571
|
|
Medpace Holdings, Inc. (a)
|
863
|
335,146
|
|
Mettler-Toledo International, Inc. (a)
|
799
|
982,530
|
|
QIAGEN NV
|
8,203
|
347,233
|
|
Revvity, Inc.
|
4,615
|
472,899
|
|
Sotera Health Co. (a)
|
4,590
|
51,408
|
|
Waters Corp. (a)
|
2,177
|
672,780
|
|
West Pharmaceutical Services, Inc.
|
2,755
|
984,857
|
|
10,815,198
|
|||
Pharmaceuticals - 0.5%
|
|||
Catalent, Inc. (a)
|
6,703
|
374,363
|
|
Elanco Animal Health, Inc. (a)
|
18,231
|
239,920
|
|
Jazz Pharmaceuticals PLC (a)
|
2,303
|
255,057
|
|
Organon & Co.
|
9,508
|
176,944
|
|
Perrigo Co. PLC
|
5,242
|
171,204
|
|
Royalty Pharma PLC
|
13,787
|
381,900
|
|
Viatris, Inc.
|
44,481
|
514,645
|
|
2,114,033
|
|||
TOTAL HEALTH CARE
|
39,429,166
|
||
INDUSTRIALS - 20.3%
|
|||
Aerospace & Defense - 1.9%
|
|||
Axon Enterprise, Inc. (a)
|
2,622
|
822,417
|
|
BWX Technologies, Inc.
|
3,390
|
324,660
|
|
Curtiss-Wright Corp.
|
1,416
|
358,843
|
|
HEICO Corp.
|
1,696
|
351,750
|
|
HEICO Corp. Class A
|
3,008
|
498,877
|
|
Hexcel Corp.
|
3,151
|
202,326
|
|
Howmet Aerospace, Inc.
|
14,129
|
943,111
|
|
Huntington Ingalls Industries, Inc.
|
1,452
|
402,102
|
|
Mercury Systems, Inc. (a)
|
2,041
|
57,556
|
|
Spirit AeroSystems Holdings, Inc. Class A (a)
|
4,308
|
137,856
|
|
Textron, Inc.
|
7,270
|
614,969
|
|
TransDigm Group, Inc.
|
1,974
|
2,463,611
|
|
Woodward, Inc.
|
2,218
|
360,114
|
|
7,538,192
|
|||
Air Freight & Logistics - 0.3%
|
|||
C.H. Robinson Worldwide, Inc.
|
4,280
|
303,880
|
|
Expeditors International of Washington, Inc.
|
5,371
|
597,846
|
|
GXO Logistics, Inc. (a)
|
4,422
|
219,597
|
|
1,121,323
|
|||
Building Products - 2.5%
|
|||
A.O. Smith Corp.
|
4,486
|
371,620
|
|
Advanced Drain Systems, Inc.
|
2,488
|
390,616
|
|
Allegion PLC
|
3,257
|
395,921
|
|
Armstrong World Industries, Inc.
|
1,626
|
186,795
|
|
Builders FirstSource, Inc. (a)
|
4,520
|
826,346
|
|
Carlisle Companies, Inc.
|
1,798
|
698,074
|
|
Carrier Global Corp.
|
31,056
|
1,909,633
|
|
Fortune Brands Innovations, Inc.
|
4,702
|
343,716
|
|
Hayward Holdings, Inc. (a)
|
4,999
|
67,886
|
|
Lennox International, Inc.
|
1,187
|
550,080
|
|
Masco Corp.
|
8,339
|
570,805
|
|
Owens Corning
|
3,289
|
553,243
|
|
The AZEK Co., Inc. (a)
|
5,323
|
242,942
|
|
Trane Technologies PLC
|
8,477
|
2,690,085
|
|
Trex Co., Inc. (a)
|
4,034
|
357,211
|
|
10,154,973
|
|||
Commercial Services & Supplies - 1.8%
|
|||
Cintas Corp.
|
3,226
|
2,123,805
|
|
Clean Harbors, Inc. (a)
|
1,882
|
356,545
|
|
Copart, Inc.
|
31,982
|
1,736,942
|
|
Driven Brands Holdings, Inc. (a)
|
3,019
|
43,262
|
|
MSA Safety, Inc.
|
1,364
|
246,066
|
|
RB Global, Inc.
|
6,757
|
483,666
|
|
Republic Services, Inc.
|
7,675
|
1,471,298
|
|
Rollins, Inc.
|
9,500
|
423,320
|
|
Stericycle, Inc. (a)
|
3,430
|
153,424
|
|
Tetra Tech, Inc.
|
1,969
|
383,404
|
|
Vestis Corp.
|
4,355
|
80,219
|
|
7,501,951
|
|||
Construction & Engineering - 0.8%
|
|||
AECOM
|
5,034
|
464,940
|
|
EMCOR Group, Inc.
|
1,721
|
614,690
|
|
MasTec, Inc. (a)
|
2,331
|
206,736
|
|
MDU Resources Group, Inc.
|
7,487
|
184,929
|
|
Quanta Services, Inc.
|
5,357
|
1,385,106
|
|
Valmont Industries, Inc.
|
774
|
158,515
|
|
Willscot Mobile Mini Holdings (a)
|
6,947
|
256,761
|
|
3,271,677
|
|||
Electrical Equipment - 1.6%
|
|||
Acuity Brands, Inc.
|
1,145
|
284,304
|
|
AMETEK, Inc.
|
8,540
|
1,491,596
|
|
ChargePoint Holdings, Inc. Class A (a)(c)
|
18,670
|
24,831
|
|
Generac Holdings, Inc. (a)
|
2,230
|
303,191
|
|
Hubbell, Inc. Class B
|
1,993
|
738,446
|
|
nVent Electric PLC
|
6,094
|
439,195
|
|
Plug Power, Inc. (a)(c)
|
19,976
|
46,145
|
|
Regal Rexnord Corp.
|
2,464
|
397,616
|
|
Rockwell Automation, Inc.
|
4,291
|
1,162,689
|
|
Sensata Technologies, Inc. PLC
|
5,627
|
215,570
|
|
Sunrun, Inc. (a)
|
7,785
|
80,108
|
|
Vertiv Holdings Co.
|
12,782
|
1,188,726
|
|
6,372,417
|
|||
Ground Transportation - 1.0%
|
|||
Avis Budget Group, Inc.
|
689
|
65,765
|
|
Hertz Global Holdings, Inc. (a)(c)
|
5,075
|
23,091
|
|
J.B. Hunt Transport Services, Inc.
|
3,064
|
498,114
|
|
Knight-Swift Transportation Holdings, Inc. Class A
|
5,885
|
272,064
|
|
Landstar System, Inc.
|
1,323
|
230,744
|
|
Lyft, Inc. (a)
|
13,022
|
203,664
|
|
Old Dominion Freight Lines, Inc.
|
7,351
|
1,335,750
|
|
Ryder System, Inc.
|
1,626
|
198,128
|
|
Saia, Inc. (a)
|
987
|
391,671
|
|
Schneider National, Inc. Class B
|
1,976
|
40,864
|
|
U-Haul Holding Co. (a)
|
485
|
30,667
|
|
U-Haul Holding Co. (non-vtg.)
|
3,506
|
214,988
|
|
XPO, Inc. (a)
|
4,231
|
454,663
|
|
3,960,173
|
|||
Machinery - 5.1%
|
|||
AGCO Corp.
|
2,331
|
266,177
|
|
Allison Transmission Holdings, Inc.
|
3,306
|
243,156
|
|
CNH Industrial NV
|
36,600
|
417,240
|
|
Crane Co.
|
1,784
|
249,778
|
|
Cummins, Inc.
|
5,082
|
1,435,614
|
|
Donaldson Co., Inc.
|
4,492
|
324,322
|
|
Dover Corp.
|
5,191
|
930,746
|
|
ESAB Corp.
|
2,090
|
221,289
|
|
Flowserve Corp.
|
4,844
|
228,443
|
|
Fortive Corp.
|
13,165
|
990,930
|
|
Gates Industrial Corp. PLC (a)
|
6,128
|
107,975
|
|
Graco, Inc.
|
6,201
|
497,320
|
|
IDEX Corp.
|
2,813
|
620,154
|
|
Ingersoll Rand, Inc.
|
15,073
|
1,406,612
|
|
ITT, Inc.
|
3,060
|
395,780
|
|
Lincoln Electric Holdings, Inc.
|
2,071
|
454,647
|
|
Middleby Corp. (a)
|
1,986
|
275,994
|
|
Nordson Corp.
|
2,121
|
547,621
|
|
Oshkosh Corp.
|
2,418
|
271,469
|
|
Otis Worldwide Corp.
|
15,385
|
1,403,112
|
|
PACCAR, Inc.
|
19,078
|
2,024,367
|
|
Parker Hannifin Corp.
|
4,756
|
2,591,592
|
|
Pentair PLC
|
6,102
|
482,607
|
|
RBC Bearings, Inc. (a)
|
1,054
|
257,756
|
|
Snap-On, Inc.
|
1,932
|
517,699
|
|
Stanley Black & Decker, Inc.
|
5,716
|
522,442
|
|
Timken Co.
|
2,271
|
202,619
|
|
Toro Co.
|
3,884
|
340,200
|
|
Westinghouse Air Brake Tech Co.
|
6,628
|
1,067,638
|
|
Xylem, Inc.
|
8,831
|
1,154,212
|
|
20,449,511
|
|||
Marine Transportation - 0.0%
|
|||
Kirby Corp. (a)
|
2,193
|
239,322
|
|
Passenger Airlines - 0.7%
|
|||
Alaska Air Group, Inc. (a)
|
4,702
|
202,280
|
|
American Airlines Group, Inc. (a)
|
24,525
|
331,333
|
|
Delta Air Lines, Inc.
|
23,820
|
1,192,667
|
|
Southwest Airlines Co.
|
22,150
|
574,571
|
|
United Airlines Holdings, Inc. (a)
|
12,185
|
627,040
|
|
2,927,891
|
|||
Professional Services - 2.6%
|
|||
Booz Allen Hamilton Holding Corp. Class A
|
4,761
|
703,057
|
|
Broadridge Financial Solutions, Inc.
|
4,346
|
840,560
|
|
CACI International, Inc. Class A (a)
|
817
|
328,622
|
|
Clarivate PLC (a)
|
17,317
|
117,063
|
|
Concentrix Corp.
|
1,647
|
90,041
|
|
Dayforce, Inc. (a)
|
5,667
|
347,784
|
|
Dun & Bradstreet Holdings, Inc.
|
10,660
|
97,006
|
|
Equifax, Inc.
|
4,554
|
1,002,745
|
|
FTI Consulting, Inc. (a)
|
1,239
|
264,935
|
|
Genpact Ltd.
|
6,561
|
201,685
|
|
Jacobs Solutions, Inc.
|
4,681
|
671,864
|
|
KBR, Inc.
|
4,983
|
323,596
|
|
Leidos Holdings, Inc.
|
5,063
|
709,934
|
|
ManpowerGroup, Inc.
|
1,790
|
135,056
|
|
Paychex, Inc.
|
11,991
|
1,424,651
|
|
Paycom Software, Inc.
|
1,932
|
363,177
|
|
Paycor HCM, Inc. (a)
|
2,758
|
47,906
|
|
Paylocity Holding Corp. (a)
|
1,592
|
247,015
|
|
Robert Half, Inc.
|
3,834
|
265,083
|
|
Science Applications International Corp.
|
1,919
|
246,975
|
|
SS&C Technologies Holdings, Inc.
|
8,068
|
499,329
|
|
TransUnion
|
7,223
|
527,279
|
|
Verisk Analytics, Inc.
|
5,315
|
1,158,457
|
|
10,613,820
|
|||
Trading Companies & Distributors - 2.0%
|
|||
Air Lease Corp. Class A
|
3,846
|
193,223
|
|
Core & Main, Inc. (a)
|
6,449
|
364,175
|
|
Fastenal Co.
|
21,271
|
1,445,152
|
|
Ferguson PLC
|
7,604
|
1,596,080
|
|
MSC Industrial Direct Co., Inc. Class A
|
1,712
|
156,203
|
|
SiteOne Landscape Supply, Inc. (a)
|
1,661
|
260,594
|
|
United Rentals, Inc.
|
2,521
|
1,684,003
|
|
W.W. Grainger, Inc.
|
1,645
|
1,515,621
|
|
Watsco, Inc.
|
1,254
|
561,441
|
|
WESCO International, Inc.
|
1,647
|
251,579
|
|
8,028,071
|
|||
TOTAL INDUSTRIALS
|
82,179,321
|
||
INFORMATION TECHNOLOGY - 13.1%
|
|||
Communications Equipment - 0.3%
|
|||
Ciena Corp. (a)
|
5,372
|
248,348
|
|
F5, Inc. (a)
|
2,195
|
362,855
|
|
Juniper Networks, Inc.
|
11,806
|
411,085
|
|
Lumentum Holdings, Inc. (a)
|
2,517
|
110,144
|
|
Ubiquiti, Inc.
|
160
|
17,213
|
|
ViaSat, Inc. (a)
|
4,472
|
71,150
|
|
1,220,795
|
|||
Electronic Equipment, Instruments & Components - 2.5%
|
|||
Amphenol Corp. Class A
|
21,699
|
2,620,588
|
|
Arrow Electronics, Inc. (a)
|
1,999
|
255,212
|
|
Avnet, Inc.
|
3,364
|
164,399
|
|
CDW Corp.
|
5,023
|
1,214,863
|
|
Cognex Corp.
|
6,470
|
268,764
|
|
Coherent Corp. (a)
|
4,832
|
263,972
|
|
Corning, Inc.
|
28,345
|
946,156
|
|
Crane NXT Co.
|
1,792
|
108,972
|
|
IPG Photonics Corp. (a)
|
1,177
|
98,844
|
|
Jabil, Inc.
|
4,638
|
544,316
|
|
Keysight Technologies, Inc. (a)
|
6,500
|
961,610
|
|
Littelfuse, Inc.
|
898
|
207,115
|
|
TD SYNNEX Corp.
|
2,514
|
296,250
|
|
Teledyne Technologies, Inc. (a)
|
1,737
|
662,631
|
|
Trimble, Inc. (a)
|
9,187
|
551,863
|
|
Vontier Corp.
|
5,773
|
234,557
|
|
Zebra Technologies Corp. Class A (a)
|
1,909
|
600,495
|
|
10,000,607
|
|||
IT Services - 2.1%
|
|||
Akamai Technologies, Inc. (a)
|
5,553
|
560,464
|
|
Amdocs Ltd.
|
4,264
|
358,133
|
|
Cloudflare, Inc. (a)
|
10,970
|
958,778
|
|
Cognizant Technology Solutions Corp. Class A
|
18,689
|
1,227,494
|
|
DXC Technology Co. (a)
|
7,460
|
145,395
|
|
EPAM Systems, Inc. (a)
|
2,070
|
486,988
|
|
Gartner, Inc. (a)
|
2,812
|
1,160,203
|
|
Globant SA (a)
|
1,552
|
277,172
|
|
GoDaddy, Inc. (a)
|
5,231
|
640,170
|
|
Kyndryl Holdings, Inc. (a)
|
8,455
|
166,225
|
|
MongoDB, Inc. Class A (a)
|
2,534
|
925,366
|
|
Okta, Inc. (a)
|
5,705
|
530,451
|
|
Twilio, Inc. Class A (a)
|
6,327
|
378,861
|
|
VeriSign, Inc. (a)
|
3,301
|
559,453
|
|
8,375,153
|
|||
Semiconductors & Semiconductor Equipment - 2.8%
|
|||
Allegro MicroSystems LLC (a)
|
2,944
|
87,407
|
|
Cirrus Logic, Inc. (a)
|
1,990
|
176,254
|
|
Enphase Energy, Inc. (a)
|
4,968
|
540,320
|
|
Entegris, Inc.
|
5,560
|
739,035
|
|
First Solar, Inc. (a)
|
3,969
|
699,735
|
|
GlobalFoundries, Inc. (a)(c)
|
2,939
|
143,658
|
|
Lattice Semiconductor Corp. (a)
|
5,124
|
351,506
|
|
Marvell Technology, Inc.
|
31,855
|
2,099,563
|
|
Microchip Technology, Inc.
|
19,795
|
1,820,744
|
|
MKS Instruments, Inc.
|
2,548
|
303,161
|
|
Monolithic Power Systems, Inc.
|
1,712
|
1,145,893
|
|
ON Semiconductor Corp. (a)
|
16,118
|
1,130,839
|
|
Qorvo, Inc. (a)
|
3,651
|
426,583
|
|
Skyworks Solutions, Inc.
|
5,917
|
630,693
|
|
Teradyne, Inc.
|
5,743
|
668,026
|
|
Universal Display Corp.
|
1,734
|
273,937
|
|
Wolfspeed, Inc. (a)(c)
|
3,637
|
98,308
|
|
11,335,662
|
|||
Software - 4.5%
|
|||
ANSYS, Inc. (a)
|
3,244
|
1,053,911
|
|
AppLovin Corp. (a)
|
7,480
|
527,864
|
|
Aspen Technology, Inc. (a)
|
1,029
|
202,579
|
|
Bentley Systems, Inc. Class B
|
7,315
|
384,257
|
|
Bill Holdings, Inc. (a)
|
3,845
|
239,774
|
|
CCC Intelligent Solutions Holdings, Inc. Class A (a)
|
12,654
|
141,978
|
|
Confluent, Inc. (a)
|
7,173
|
201,705
|
|
Crowdstrike Holdings, Inc. (a)
|
7,958
|
2,328,033
|
|
Datadog, Inc. Class A (a)
|
10,390
|
1,303,945
|
|
DocuSign, Inc. (a)
|
7,484
|
423,594
|
|
Dolby Laboratories, Inc. Class A
|
2,173
|
168,755
|
|
DoubleVerify Holdings, Inc. (a)
|
5,276
|
154,587
|
|
Dropbox, Inc. Class A (a)
|
9,632
|
223,077
|
|
Dynatrace, Inc. (a)
|
9,724
|
440,594
|
|
Elastic NV (a)
|
3,001
|
306,762
|
|
Fair Isaac Corp. (a)
|
904
|
1,024,530
|
|
Five9, Inc. (a)
|
2,713
|
156,187
|
|
Gen Digital, Inc.
|
20,667
|
416,233
|
|
GitLab, Inc. (a)
|
3,398
|
178,293
|
|
Guidewire Software, Inc. (a)
|
3,044
|
336,058
|
|
HashiCorp, Inc. (a)
|
3,656
|
118,674
|
|
HubSpot, Inc. (a)
|
1,733
|
1,048,240
|
|
Informatica, Inc. (a)
|
1,621
|
50,202
|
|
Manhattan Associates, Inc. (a)
|
2,298
|
473,526
|
|
nCino, Inc. (a)
|
2,665
|
77,711
|
|
NCR Voyix Corp. (a)
|
5,545
|
67,926
|
|
Nutanix, Inc. Class A (a)
|
9,057
|
549,760
|
|
Palantir Technologies, Inc. (a)
|
71,755
|
1,576,457
|
|
Pegasystems, Inc.
|
1,570
|
93,289
|
|
Procore Technologies, Inc. (a)
|
3,039
|
207,928
|
|
PTC, Inc. (a)
|
4,276
|
758,733
|
|
RingCentral, Inc. (a)
|
3,146
|
93,185
|
|
SentinelOne, Inc. (a)
|
9,003
|
190,233
|
|
Smartsheet, Inc. (a)
|
4,965
|
187,826
|
|
Teradata Corp. (a)
|
3,639
|
135,007
|
|
Tyler Technologies, Inc. (a)
|
1,553
|
716,787
|
|
UiPath, Inc. Class A (a)
|
14,500
|
275,065
|
|
Unity Software, Inc. (a)
|
8,471
|
205,591
|
|
Zoom Video Communications, Inc. Class A (a)
|
8,731
|
533,464
|
|
Zscaler, Inc. (a)
|
3,317
|
573,642
|
|
18,145,962
|
|||
Technology Hardware, Storage & Peripherals - 0.9%
|
|||
Hewlett Packard Enterprise Co.
|
48,388
|
822,596
|
|
HP, Inc.
|
32,195
|
904,358
|
|
NetApp, Inc.
|
7,665
|
783,440
|
|
Pure Storage, Inc. Class A (a)
|
10,743
|
541,447
|
|
Western Digital Corp. (a)
|
12,096
|
856,760
|
|
3,908,601
|
|||
TOTAL INFORMATION TECHNOLOGY
|
52,986,780
|
||
MATERIALS - 5.6%
|
|||
Chemicals - 2.6%
|
|||
Albemarle Corp.
|
4,375
|
526,356
|
|
Ashland, Inc.
|
1,854
|
176,742
|
|
Axalta Coating Systems Ltd. (a)
|
8,196
|
257,682
|
|
Celanese Corp. Class A
|
3,668
|
563,441
|
|
CF Industries Holdings, Inc.
|
7,170
|
566,215
|
|
Corteva, Inc.
|
26,300
|
1,423,619
|
|
DuPont de Nemours, Inc.
|
16,017
|
1,161,233
|
|
Eastman Chemical Co.
|
4,400
|
415,536
|
|
Element Solutions, Inc.
|
8,274
|
191,378
|
|
FMC Corp.
|
4,667
|
275,400
|
|
Ginkgo Bioworks Holdings, Inc. Class A (a)(c)
|
60,071
|
53,529
|
|
Huntsman Corp.
|
6,322
|
150,843
|
|
International Flavors & Fragrances, Inc.
|
9,521
|
805,953
|
|
LyondellBasell Industries NV Class A
|
9,607
|
960,412
|
|
NewMarket Corp.
|
232
|
122,245
|
|
Olin Corp.
|
4,463
|
233,326
|
|
PPG Industries, Inc.
|
8,730
|
1,126,170
|
|
RPM International, Inc.
|
4,718
|
504,401
|
|
The Chemours Co. LLC
|
5,549
|
148,436
|
|
The Mosaic Co.
|
12,253
|
384,622
|
|
The Scotts Miracle-Gro Co. Class A
|
1,640
|
112,406
|
|
Westlake Corp.
|
1,197
|
176,390
|
|
10,336,335
|
|||
Construction Materials - 0.7%
|
|||
Eagle Materials, Inc.
|
1,265
|
317,148
|
|
Martin Marietta Materials, Inc.
|
2,299
|
1,349,674
|
|
Vulcan Materials Co.
|
4,941
|
1,272,950
|
|
2,939,772
|
|||
Containers & Packaging - 1.3%
|
|||
Amcor PLC
|
53,502
|
478,308
|
|
Aptargroup, Inc.
|
2,427
|
350,410
|
|
Ardagh Metal Packaging SA
|
5,462
|
21,575
|
|
Avery Dennison Corp.
|
2,996
|
650,971
|
|
Ball Corp.
|
11,469
|
797,898
|
|
Berry Global Group, Inc.
|
4,301
|
243,609
|
|
Crown Holdings, Inc.
|
3,947
|
323,930
|
|
Graphic Packaging Holding Co.
|
11,298
|
292,053
|
|
International Paper Co.
|
12,928
|
451,704
|
|
Packaging Corp. of America
|
3,283
|
567,893
|
|
Sealed Air Corp.
|
5,529
|
174,053
|
|
Silgan Holdings, Inc.
|
2,996
|
139,793
|
|
Sonoco Products Co.
|
3,625
|
203,181
|
|
WestRock Co.
|
9,465
|
453,941
|
|
5,149,319
|
|||
Metals & Mining - 1.0%
|
|||
Alcoa Corp.
|
6,813
|
239,409
|
|
Cleveland-Cliffs, Inc. (a)
|
18,546
|
313,427
|
|
MP Materials Corp. (a)
|
3,911
|
62,576
|
|
Nucor Corp.
|
9,142
|
1,540,701
|
|
Reliance, Inc.
|
2,118
|
603,037
|
|
Royal Gold, Inc.
|
2,447
|
293,958
|
|
SSR Mining, Inc.
|
7,778
|
41,690
|
|
Steel Dynamics, Inc.
|
5,665
|
737,130
|
|
United States Steel Corp.
|
8,209
|
299,629
|
|
4,131,557
|
|||
Paper & Forest Products - 0.0%
|
|||
Louisiana-Pacific Corp.
|
2,388
|
174,778
|
|
TOTAL MATERIALS
|
22,731,761
|
||
REAL ESTATE - 7.4%
|
|||
Equity Real Estate Investment Trusts (REITs) - 6.6%
|
|||
Agree Realty Corp.
|
3,697
|
211,542
|
|
Alexandria Real Estate Equities, Inc.
|
6,472
|
749,911
|
|
American Homes 4 Rent Class A
|
12,375
|
443,025
|
|
Americold Realty Trust
|
10,626
|
233,453
|
|
Apartment Income (REIT) Corp.
|
5,583
|
214,276
|
|
AvalonBay Communities, Inc.
|
5,277
|
1,000,361
|
|
Boston Properties, Inc.
|
5,857
|
362,490
|
|
Brixmor Property Group, Inc.
|
11,082
|
244,912
|
|
Camden Property Trust (SBI)
|
3,934
|
392,141
|
|
Cousins Properties, Inc.
|
6,053
|
138,856
|
|
CubeSmart
|
8,317
|
336,339
|
|
Digital Realty Trust, Inc.
|
11,252
|
1,561,553
|
|
EastGroup Properties, Inc.
|
1,699
|
263,957
|
|
EPR Properties
|
2,743
|
111,338
|
|
Equity Lifestyle Properties, Inc.
|
6,610
|
398,517
|
|
Equity Residential (SBI)
|
13,909
|
895,740
|
|
Essex Property Trust, Inc.
|
2,378
|
585,583
|
|
Extra Space Storage, Inc.
|
7,811
|
1,048,861
|
|
Federal Realty Investment Trust (SBI)
|
2,999
|
312,406
|
|
First Industrial Realty Trust, Inc.
|
4,896
|
222,376
|
|
Gaming & Leisure Properties
|
9,482
|
405,166
|
|
Healthcare Realty Trust, Inc.
|
14,290
|
203,347
|
|
Healthpeak Properties, Inc.
|
26,867
|
499,995
|
|
Highwoods Properties, Inc. (SBI)
|
4,214
|
110,407
|
|
Host Hotels & Resorts, Inc.
|
25,966
|
489,978
|
|
Invitation Homes, Inc.
|
22,740
|
777,708
|
|
Iron Mountain, Inc.
|
10,771
|
834,968
|
|
Kilroy Realty Corp.
|
4,354
|
147,165
|
|
Kimco Realty Corp.
|
24,485
|
456,156
|
|
Lamar Advertising Co. Class A
|
3,223
|
373,385
|
|
Medical Properties Trust, Inc. (c)
|
22,356
|
102,838
|
|
Mid-America Apartment Communities, Inc.
|
4,350
|
565,500
|
|
National Storage Affiliates Trust
|
2,945
|
103,193
|
|
Net Lease Office Properties
|
579
|
13,236
|
|
NNN (REIT), Inc.
|
6,738
|
273,091
|
|
Omega Healthcare Investors, Inc.
|
9,088
|
276,366
|
|
Park Hotels & Resorts, Inc.
|
7,730
|
124,685
|
|
Rayonier, Inc.
|
5,427
|
160,965
|
|
Realty Income Corp.
|
31,045
|
1,662,149
|
|
Regency Centers Corp.
|
6,709
|
397,307
|
|
Rexford Industrial Realty, Inc.
|
7,993
|
342,180
|
|
SBA Communications Corp. Class A
|
3,702
|
689,016
|
|
Simon Property Group, Inc.
|
12,071
|
1,696,338
|
|
STAG Industrial, Inc.
|
6,741
|
231,823
|
|
Sun Communities, Inc.
|
4,579
|
509,734
|
|
UDR, Inc.
|
12,367
|
470,935
|
|
Ventas, Inc.
|
15,005
|
664,421
|
|
VICI Properties, Inc.
|
38,477
|
1,098,518
|
|
Vornado Realty Trust
|
6,588
|
171,486
|
|
Welltower, Inc.
|
20,639
|
1,966,484
|
|
Weyerhaeuser Co.
|
27,242
|
821,891
|
|
WP Carey, Inc.
|
8,083
|
443,272
|
|
26,811,340
|
|||
Real Estate Management & Development - 0.8%
|
|||
CBRE Group, Inc. (a)
|
11,263
|
978,642
|
|
CoStar Group, Inc. (a)
|
15,055
|
1,377,984
|
|
Howard Hughes Holdings, Inc.
|
1,386
|
90,312
|
|
Jones Lang LaSalle, Inc. (a)
|
1,761
|
318,213
|
|
Zillow Group, Inc.:
|
|||
Class A (a)
|
2,216
|
93,072
|
|
Class C (a)
|
5,734
|
244,096
|
|
3,102,319
|
|||
TOTAL REAL ESTATE
|
29,913,659
|
||
UTILITIES - 5.4%
|
|||
Electric Utilities - 2.8%
|
|||
Alliant Energy Corp.
|
9,465
|
471,357
|
|
Avangrid, Inc.
|
2,635
|
96,257
|
|
Constellation Energy Corp.
|
11,986
|
2,228,677
|
|
Edison International
|
14,072
|
999,956
|
|
Entergy Corp.
|
7,851
|
837,466
|
|
Evergy, Inc.
|
8,290
|
434,811
|
|
Eversource Energy
|
13,046
|
790,849
|
|
FirstEnergy Corp.
|
20,228
|
775,542
|
|
Hawaiian Electric Industries, Inc.
|
4,108
|
40,464
|
|
IDACORP, Inc.
|
1,874
|
177,618
|
|
NRG Energy, Inc.
|
8,351
|
606,867
|
|
OGE Energy Corp.
|
7,423
|
257,207
|
|
PG&E Corp.
|
76,060
|
1,301,387
|
|
Pinnacle West Capital Corp.
|
4,224
|
311,098
|
|
PPL Corp.
|
27,418
|
752,898
|
|
Xcel Energy, Inc.
|
20,613
|
1,107,536
|
|
11,189,990
|
|||
Gas Utilities - 0.2%
|
|||
Atmos Energy Corp.
|
5,590
|
659,061
|
|
National Fuel Gas Co.
|
3,290
|
174,699
|
|
UGI Corp.
|
7,986
|
204,122
|
|
1,037,882
|
|||
Independent Power and Renewable Electricity Producers - 0.4%
|
|||
Brookfield Renewable Corp.
|
5,179
|
120,360
|
|
Clearway Energy, Inc.:
|
|||
Class A
|
1,536
|
33,347
|
|
Class C
|
3,054
|
71,403
|
|
The AES Corp.
|
25,228
|
451,581
|
|
Vistra Corp.
|
13,116
|
994,717
|
|
1,671,408
|
|||
Multi-Utilities - 1.7%
|
|||
Ameren Corp.
|
9,767
|
721,488
|
|
CenterPoint Energy, Inc.
|
23,407
|
682,080
|
|
CMS Energy Corp.
|
10,803
|
654,770
|
|
Consolidated Edison, Inc.
|
12,912
|
1,218,893
|
|
DTE Energy Co.
|
7,671
|
846,265
|
|
NiSource, Inc.
|
15,327
|
427,010
|
|
Public Service Enterprise Group, Inc.
|
18,500
|
1,277,980
|
|
WEC Energy Group, Inc.
|
11,799
|
975,069
|
|
6,803,555
|
|||
Water Utilities - 0.3%
|
|||
American Water Works Co., Inc.
|
7,259
|
887,921
|
|
Essential Utilities, Inc.
|
9,291
|
339,865
|
|
1,227,786
|
|||
TOTAL UTILITIES
|
21,930,621
|
||
|
TOTAL COMMON STOCKS
(Cost $331,211,343)
|
402,940,553
|
||
Nonconvertible Preferred Stocks - 0.0%
|
|||
Shares
|
Value ($)
|
||
REAL ESTATE - 0.0%
|
|||
Real Estate Management & Development - 0.0%
|
|||
Brookfield Property Preferred LP 6.25%
(Cost $74)
|
3
|
44
|
|
Money Market Funds - 1.0%
|
|||
Shares
|
Value ($)
|
||
Fidelity Cash Central Fund 5.39% (d)
|
1,143,973
|
1,144,201
|
|
Fidelity Securities Lending Cash Central Fund 5.39% (d)(e)
|
2,938,286
|
2,938,580
|
|
|
TOTAL MONEY MARKET FUNDS
(Cost $4,082,781)
|
4,082,781
|
||
|
TOTAL INVESTMENT IN SECURITIES - 100.7%
(Cost $335,294,198)
|
407,023,378
|
NET OTHER ASSETS (LIABILITIES) - (0.7)%
|
(2,906,548)
|
NET ASSETS - 100.0%
|
404,116,830
|
Futures Contracts
|
|||||
Number
of contracts
|
Expiration
Date
|
Notional
Amount ($)
|
Value ($)
|
Unrealized
Appreciation/
(Depreciation) ($)
|
|
Purchased
|
|||||
Equity Index Contracts
|
|||||
CME E-mini S&P MidCap 400 Index Contracts (United States)
|
4
|
Jun 2024
|
1,150,880
|
(42,244)
|
(42,244)
|
The notional amount of futures purchased as a percentage of Net Assets is 0.3%
|
|||||
(a)
|
Non-income producing
|
(b)
|
Level 3 security
|
(c)
|
Security or a portion of the security is on loan at period end.
|
(d)
|
Affiliated fund that is generally available only to investment companies and other accounts managed by Fidelity Investments. The rate quoted is the annualized seven-day yield of the fund at period end. A complete unaudited listing of the fund's holdings as of its most recent quarter end is available upon request. In addition, each Fidelity Central Fund's financial statements, which are not covered by the Fund's Report of Independent Registered Public Accounting Firm, are available on the SEC's website or upon request.
|
(e)
|
Investment made with cash collateral received from securities on loan.
|
Additional information on each restricted holding is as follows:
|
||
Security
|
Acquisition Date
|
Acquisition Cost ($)
|
GCI Liberty, Inc. Class A (Escrow)
|
5/23/23
|
0
|
Affiliate
|
Value,
beginning
of period ($)
|
Purchases ($)
|
Sales
Proceeds ($)
|
Dividend
Income ($)
|
Realized
Gain (loss) ($)
|
Change in
Unrealized
appreciation
(depreciation) ($)
|
Value,
end
of period ($)
|
% ownership,
end
of period
|
Fidelity Cash Central Fund 5.39%
|
736,400
|
39,998,854
|
39,591,087
|
38,081
|
34
|
-
|
1,144,201
|
0.0%
|
Fidelity Securities Lending Cash Central Fund 5.39%
|
3,218,228
|
31,813,042
|
32,092,690
|
87,407
|
-
|
-
|
2,938,580
|
0.0%
|
Total
|
3,954,628
|
71,811,896
|
71,683,777
|
125,488
|
34
|
-
|
4,082,781
|
|
Valuation Inputs at Reporting Date:
|
||||
Description
|
Total ($)
|
Level 1 ($)
|
Level 2 ($)
|
Level 3 ($)
|
Investments in Securities:
|
||||
Equities:
|
||||
Communication Services
|
13,135,683
|
13,135,683
|
-
|
-
|
Consumer Discretionary
|
41,923,967
|
41,923,967
|
-
|
-
|
Consumer Staples
|
13,848,227
|
13,848,227
|
-
|
-
|
Energy
|
20,858,965
|
20,858,965
|
-
|
-
|
Financials
|
64,002,403
|
64,002,403
|
-
|
-
|
Health Care
|
39,429,166
|
39,429,166
|
-
|
-
|
Industrials
|
82,179,321
|
82,179,321
|
-
|
-
|
Information Technology
|
52,986,780
|
52,986,780
|
-
|
-
|
Materials
|
22,731,761
|
22,731,761
|
-
|
-
|
Real Estate
|
29,913,703
|
29,913,703
|
-
|
-
|
Utilities
|
21,930,621
|
21,930,621
|
-
|
-
|
Money Market Funds
|
4,082,781
|
4,082,781
|
-
|
-
|
Total Investments in Securities:
|
407,023,378
|
407,023,378
|
-
|
-
|
Derivative Instruments:
Liabilities
|
||||
Futures Contracts
|
(42,244)
|
(42,244)
|
-
|
-
|
Total Liabilities
|
(42,244)
|
(42,244)
|
-
|
-
|
Total Derivative Instruments:
|
(42,244)
|
(42,244)
|
-
|
-
|
Primary Risk Exposure / Derivative Type
|
Value
|
|
Asset ($)
|
Liability ($)
|
|
Equity Risk
|
||
Futures Contracts (a)
|
0
|
(42,244)
|
Total Equity Risk
|
0
|
(42,244)
|
Total Value of Derivatives
|
0
|
(42,244)
|
Statement of Assets and Liabilities
|
||||
April 30, 2024
|
||||
Assets
|
||||
Investment in securities, at value (including securities loaned of $2,751,547) - See accompanying schedule:
|
||||
Unaffiliated issuers (cost $331,211,417)
|
$
|
402,940,597
|
||
Fidelity Central Funds (cost $4,082,781)
|
4,082,781
|
|||
Total Investment in Securities (cost $335,294,198)
|
$
|
407,023,378
|
||
Segregated cash with brokers for derivative instruments
|
60,400
|
|||
Receivable for investments sold
|
32,060
|
|||
Receivable for fund shares sold
|
722,882
|
|||
Dividends receivable
|
176,943
|
|||
Distributions receivable from Fidelity Central Funds
|
7,178
|
|||
Other receivables
|
3,215
|
|||
Total assets
|
408,026,056
|
|||
Liabilities
|
||||
Payable to custodian bank
|
$
|
30,998
|
||
Payable for investments purchased
|
510,885
|
|||
Payable for fund shares redeemed
|
406,761
|
|||
Payable for daily variation margin on futures contracts
|
21,000
|
|||
Other payables and accrued expenses
|
1,032
|
|||
Collateral on securities loaned
|
2,938,550
|
|||
Total liabilities
|
3,909,226
|
|||
Net Assets
|
$
|
404,116,830
|
||
Net Assets consist of:
|
||||
Paid in capital
|
$
|
338,823,469
|
||
Total accumulated earnings (loss)
|
65,293,361
|
|||
Net Assets
|
$
|
404,116,830
|
||
Net Asset Value, offering price and redemption price per share ($404,116,830 ÷ 23,895,527 shares)
|
$
|
16.91
|
||
Statement of Operations
|
||||
Year ended
April 30, 2024
|
||||
Investment Income
|
||||
Dividends
|
$
|
5,698,460
|
||
Income from Fidelity Central Funds (including $87,407 from security lending)
|
125,488
|
|||
Total income
|
5,823,948
|
|||
Expenses
|
||||
Independent trustees' fees and expenses
|
$
|
1,049
|
||
Proxy
|
132,781
|
|||
Total expenses before reductions
|
133,830
|
|||
Expense reductions
|
(123,547)
|
|||
Total expenses after reductions
|
10,283
|
|||
Net Investment income (loss)
|
5,813,665
|
|||
Realized and Unrealized Gain (Loss)
|
||||
Net realized gain (loss) on:
|
||||
Investment Securities:
|
||||
Unaffiliated issuers
|
1,496,536
|
|||
Redemptions in-kind
|
610,106
|
|||
Fidelity Central Funds
|
34
|
|||
Futures contracts
|
106,537
|
|||
Total net realized gain (loss)
|
2,213,213
|
|||
Change in net unrealized appreciation (depreciation) on:
|
||||
Investment Securities:
|
||||
Unaffiliated issuers
|
45,216,419
|
|||
Futures contracts
|
(64,162)
|
|||
Total change in net unrealized appreciation (depreciation)
|
45,152,257
|
|||
Net gain (loss)
|
47,365,470
|
|||
Net increase (decrease) in net assets resulting from operations
|
$
|
53,179,135
|
||
Statement of Changes in Net Assets
|
||||
Year ended
April 30, 2024
|
Year ended
April 30, 2023
|
|||
Increase (Decrease) in Net Assets
|
||||
Operations
|
||||
Net investment income (loss)
|
$
|
5,813,665
|
$
|
4,589,947
|
Net realized gain (loss)
|
2,213,213
|
(2,768,507)
|
||
Change in net unrealized appreciation (depreciation)
|
45,152,257
|
(4,263,358)
|
||
Net increase (decrease) in net assets resulting from operations
|
53,179,135
|
(2,441,918)
|
||
Distributions to shareholders
|
(7,149,688)
|
(4,597,577)
|
||
Share transactions
|
||||
Proceeds from sales of shares
|
158,415,832
|
118,927,737
|
||
Reinvestment of distributions
|
5,252,514
|
3,203,047
|
||
Cost of shares redeemed
|
(99,543,480)
|
(72,465,560)
|
||
Net increase (decrease) in net assets resulting from share transactions
|
64,124,866
|
49,665,224
|
||
Total increase (decrease) in net assets
|
110,154,313
|
42,625,729
|
||
Net Assets
|
||||
Beginning of period
|
293,962,517
|
251,336,788
|
||
End of period
|
$
|
404,116,830
|
$
|
293,962,517
|
Other Information
|
||||
Shares
|
||||
Sold
|
9,997,096
|
8,137,991
|
||
Issued in reinvestment of distributions
|
328,034
|
224,077
|
||
Redeemed
|
(6,255,170)
|
(4,909,134)
|
||
Net increase (decrease)
|
4,069,960
|
3,452,934
|
||
Fidelity Flex® Mid Cap Index Fund |
Years ended April 30,
|
2024
|
2023
|
2022
|
2021
|
2020
|
|||||
Selected Per-Share Data
|
||||||||||
Net asset value, beginning of period
|
$
|
14.83
|
$
|
15.35
|
$
|
16.82
|
$
|
10.78
|
$
|
12.23
|
Income from Investment Operations
|
||||||||||
Net investment income (loss) A,B
|
.26
|
.26
|
.21
|
.19
|
.22
|
|||||
Net realized and unrealized gain (loss)
|
2.15
|
(.52)
|
(1.18)
|
6.17
|
(1.39)
|
|||||
Total from investment operations
|
2.41
|
(.26)
|
(.97)
|
6.36
|
(1.17)
|
|||||
Distributions from net investment income
|
(.24)
|
(.23)
|
(.19)
|
(.20)
|
(.18)
|
|||||
Distributions from net realized gain
|
(.08)
|
(.03)
|
(.31)
|
(.12)
|
(.10)
|
|||||
Total distributions
|
(.33) C
|
(.26)
|
(.50)
|
(.32)
|
(.28)
|
|||||
Net asset value, end of period
|
$
|
16.91
|
$
|
14.83
|
$
|
15.35
|
$
|
16.82
|
$
|
10.78
|
Total Return D
|
16.36 % |
(1.62)%
|
(6.09)%
|
59.64%
|
(9.88)%
|
|||||
Ratios to Average Net Assets B,E,F
|
||||||||||
Expenses before reductions
|
.04%
|
-% G
|
-% G
|
-% G
|
-% G
|
|||||
Expenses net of fee waivers, if any G
|
- % |
-%
|
-%
|
-%
|
-%
|
|||||
Expenses net of all reductions G
|
-%
|
-%
|
-%
|
-%
|
-%
|
|||||
Net investment income (loss)
|
1.67%
|
1.75%
|
1.27%
|
1.35%
|
1.84%
|
|||||
Supplemental Data
|
||||||||||
Net assets, end of period (000 omitted)
|
$
|
404,117
|
$
|
293,963
|
$
|
251,337
|
$
|
189,335
|
$
|
88,365
|
Portfolio turnover rate H
|
10 % I |
13%
|
13%
|
26%
|
38%
|
Fidelity Central Fund
|
Investment Manager
|
Investment Objective
|
Investment Practices
|
Expense RatioA
|
Fidelity Money Market Central Funds
|
Fidelity Management & Research Company LLC (FMR)
|
Each fund seeks to obtain a high level of current income consistent with the preservation of capital and liquidity.
|
Short-term Investments
|
Less than .005%
|
Gross unrealized appreciation
|
$98,894,076
|
Gross unrealized depreciation
|
(33,865,192)
|
Net unrealized appreciation (depreciation)
|
$65,028,884
|
Tax Cost
|
$341,994,494
|
Undistributed ordinary income
|
$1,339,312
|
Net unrealized appreciation (depreciation) on securities and other investments
|
$65,028,884
|
April 30, 2024
|
April 30, 2023
|
|
Ordinary Income
|
$5,320,320
|
$ 4,117,732
|
Long-term Capital Gains
|
1,829,368
|
479,845
|
Total
|
$7,149,688
|
$ 4,597,577
|
Equity Risk
|
Equity risk relates to the fluctuations in the value of financial instruments as a result of changes in market prices (other than those arising from interest rate risk or foreign exchange risk), whether caused by factors specific to an individual investment, its issuer, or all factors affecting all instruments traded in a market or market segment.
|
Purchases ($)
|
Sales ($)
|
|
Fidelity Flex Mid Cap Index Fund
|
102,739,625
|
34,992,318
|
Shares
|
Total net realized gain or loss ($)
|
Total Proceeds ($)
|
|
Fidelity Flex Mid Cap Index Fund
|
57,372
|
610,106
|
988,525
|
Security Lending Income From Securities Loaned to NFS ($)
|
Value of Securities Loaned to NFS at Period End ($)
|
|
Fidelity Flex Mid Cap Index Fund
|
194
|
-
|
Reimbursement ($)
|
|
Fidelity Flex Mid Cap Index Fund
|
122,372
|
The Example is based on an investment of $1,000 invested at the beginning of the period and held for the entire period (November 1, 2023 to April 30, 2024).
|
Annualized Expense Ratio- A
|
Beginning Account Value November 1, 2023
|
Ending Account Value April 30, 2024
|
Expenses Paid During Period- C November 1, 2023 to April 30, 2024
|
|||||||
Fidelity Flex® Mid Cap Index Fund
|
-%-D
|
|||||||||
Actual
|
$ 1,000
|
$ 1,220.20
|
$-E
|
|||||||
Hypothetical-B
|
$ 1,000
|
$ 1,024.86
|
$-E
|
|||||||
A special meeting of shareholders was held on October 18, 2023. The results of votes taken among shareholders on the proposal before them are reported below. Each vote reported represents one dollar of net asset value held on the record date for the meeting.
|
||
Proposal 1
|
||
To elect a Board of Trustees.
|
||
# of
Votes
|
% of
Votes
|
|
Abigail P. Johnson
|
||
Affirmative
|
378,729,502,260.01
|
97.58
|
Withheld
|
9,407,876,478.96
|
2.42
|
TOTAL
|
388,137,378,738.97
|
100.00
|
Jennifer Toolin McAuliffe
|
||
Affirmative
|
378,454,868,010.95
|
97.51
|
Withheld
|
9,682,510,728.02
|
2.49
|
TOTAL
|
388,137,378,738.97
|
100.00
|
Christine J. Thompson
|
||
Affirmative
|
378,837,121,274.52
|
97.60
|
Withheld
|
9,300,257,464.45
|
2.40
|
TOTAL
|
388,137,378,738.97
|
100.00
|
Elizabeth S. Acton
|
||
Affirmative
|
378,262,110,794.85
|
97.46
|
Withheld
|
9,875,267,944.12
|
2.54
|
TOTAL
|
388,137,378,738.97
|
100.00
|
Laura M. Bishop
|
||
Affirmative
|
380,482,113,171.06
|
98.03
|
Withheld
|
7,655,265,567.91
|
1.97
|
TOTAL
|
388,137,378,738.97
|
100.00
|
Ann E. Dunwoody
|
||
Affirmative
|
380,016,034,008.12
|
97.91
|
Withheld
|
8,121,344,730.85
|
2.09
|
TOTAL
|
388,137,378,738.97
|
100.00
|
John Engler
|
||
Affirmative
|
379,432,488,394.20
|
97.76
|
Withheld
|
8,704,890,344.77
|
2.24
|
TOTAL
|
388,137,378,738.97
|
100.00
|
Robert F. Gartland
|
||
Affirmative
|
378,741,819,600.60
|
97.58
|
Withheld
|
9,395,559,138.37
|
2.42
|
TOTAL
|
388,137,378,738.97
|
100.00
|
Robert W. Helm
|
||
Affirmative
|
380,389,324,755.07
|
98.00
|
Withheld
|
7,748,053,983.90
|
2.00
|
TOTAL
|
388,137,378,738.97
|
100.00
|
Arthur E. Johnson
|
||
Affirmative
|
378,427,694,151.67
|
97.50
|
Withheld
|
9,709,684,587.30
|
2.50
|
TOTAL
|
388,137,378,738.97
|
100.00
|
Michael E. Kenneally
|
||
Affirmative
|
377,842,228,145.18
|
97.35
|
Withheld
|
10,295,150,593.79
|
2.65
|
TOTAL
|
388,137,378,738.97
|
100.00
|
Mark A. Murray
|
||
Affirmative
|
380,158,432,703.37
|
97.94
|
Withheld
|
7,978,946,035.60
|
2.06
|
TOTAL
|
388,137,378,738.97
|
100.00
|
Carol J. Zierhoffer
|
||
Affirmative
|
380,522,113,360.24
|
98.04
|
Withheld
|
7,615,265,378.73
|
1.96
|
TOTAL
|
388,137,378,738.97
|
100.00
|
Proposal 1 reflects trust-wide proposal and voting results.
|
||
 |
Item 2.
Code of Ethics
As of the end of the period, April 30, 2024, Fidelity Salem Street Trust (the trust) has adopted a code of ethics, as defined in Item 2 of Form N-CSR, that applies to its President and Treasurer and its Chief Financial Officer. A copy of the code of ethics is filed as an exhibit to this Form N-CSR.
Item 3.
Audit Committee Financial Expert
The Board of Trustees of the trust has determined that Elizabeth S. Acton is an audit committee financial expert, as defined in Item 3 of Form N-CSR. Ms. Acton is independent for purposes of Item 3 of Form N-CSR.
Item 4.
Principal Accountant Fees and Services
Fees and Services
The following table presents fees billed by Deloitte & Touche LLP, the member firms of Deloitte Touche Tohmatsu, and their respective affiliates (collectively, “Deloitte Entities”) in each of the last two fiscal years for services rendered to Fidelity Flex Mid Cap Index Fund, Fidelity Flex Small Cap Index Fund, Fidelity Large Cap Growth Index Fund, Fidelity Large Cap Value Index Fund, Fidelity Mid Cap Index Fund, Fidelity Series Large Cap Growth Index Fund, and Fidelity Small Cap Index Fund (the “Funds”):
Services Billed by Deloitte Entities
April 30, 2024 FeesA
| | Audit Fees | Audit-Related Fees | Tax Fees | All Other Fees |
| Fidelity Flex Mid Cap Index Fund | $39,900 | $- | $7,700 | $1,000 |
| Fidelity Flex Small Cap Index Fund | $49,800 | $- | $7,700 | $1,200 |
| Fidelity Large Cap Growth Index Fund | $39,400 | $- | $9,400 | $1,000 |
| Fidelity Large Cap Value Index Fund | $39,200 | $- | $9,400 | $1,000 |
| Fidelity Mid Cap Index Fund | $43,400 | $- | $9,400 | $1,000 |
| Fidelity Series Large Cap Growth Index Fund | $39,000 | $- | $7,900 | $1,000 |
| Fidelity Small Cap Index Fund | $50,700 | $- | $9,500 | $1,200 |
April 30, 2023 FeesA
| | Audit Fees | Audit-Related Fees | Tax Fees | All Other Fees |
| Fidelity Flex Mid Cap Index Fund | $40,100 | $- | $7,700 | $1,000 |
| Fidelity Flex Small Cap Index Fund | $50,000 | $- | $7,200 | $1,200 |
| Fidelity Large Cap Growth Index Fund | $39,300 | $- | $7,400 | $1,000 |
| Fidelity Large Cap Value Index Fund | $39,200 | $- | $7,700 | $1,000 |
| Fidelity Mid Cap Index Fund | $45,800 | $- | $9,400 | $1,000 |
| Fidelity Series Large Cap Growth Index Fund | $39,200 | $- | $7,900 | $1,000 |
| Fidelity Small Cap Index Fund | $61,700 | $- | $9,200 | $1,200 |
A Amounts may reflect rounding
The following table(s) present(s) fees billed by Deloitte Entities that were required to be approved by the Audit Committee for services that relate directly to the operations and financial reporting of the Fund(s) and that are rendered on behalf of Fidelity Management & Research Company LLC ("FMR") and entities controlling, controlled by, or under common control with FMR (not including any sub-adviser whose role is primarily portfolio management and is subcontracted with or overseen by another investment adviser) that provide ongoing services to the Fund(s) (“Fund Service Providers”):
Services Billed by Deloitte Entities
| | April 30, 2024A | April 30, 2023A |
| Audit-Related Fees | $75,000 | $80,000 |
| Tax Fees | $- | $- |
| All Other Fees | $935,000 | $- |
A Amounts may reflect rounding.
“Audit-Related Fees” represent fees billed for assurance and related services that are reasonably related to the performance of the fund audit or the review of the fund's financial statements and that are not reported under Audit Fees.
“Tax Fees” represent fees billed for tax compliance, tax advice or tax planning that relate directly to the operations and financial reporting of the fund.
“All Other Fees” represent fees billed for services provided to the fund or Fund Service Provider, a significant portion of which are assurance related, that relate directly to the operations and financial reporting of the fund, excluding those services that are reported under Audit Fees, Audit-Related Fees or Tax Fees.
Assurance services must be performed by an independent public accountant.
* * *
The aggregate non-audit fees billed by Deloitte Entities for services rendered to the Fund(s), FMR (not including any sub-adviser whose role is primarily portfolio management and is subcontracted with or overseen by another investment adviser), and any Fund Service Provider for each of the last two fiscal years of the Fund(s) are as follows:
| Billed By | April 30, 2024A | April 30, 2023A |
| Deloitte Entities | $5,102,900 | $2,111,900 |
| | | |
A Amounts may reflect rounding
The trust's Audit Committee has considered non-audit services that were not pre-approved that were provided by Deloitte Entities to Fund Service Providers to be compatible with maintaining the independence of Deloitte Entities in its(their) audit of the Fund(s), taking into account representations from Deloitte Entities, in accordance with Public Company Accounting Oversight Board rules, regarding its independence from the Fund(s) and its(their) related entities and FMR’s review of the appropriateness and permissibility under applicable law of such non-audit services prior to their provision to the Fund(s) Service Providers.
Audit Committee Pre-Approval Policies and Procedures
The trust’s Audit Committee must pre-approve all audit and non-audit services provided by a fund’s independent registered public accounting firm relating to the operations or financial reporting of the fund. Prior to the commencement of any audit or non-audit services to a fund, the Audit Committee reviews the services to determine whether they are appropriate and permissible under applicable law.
The Audit Committee has adopted policies and procedures to, among other purposes, provide a framework for the Committee’s consideration of non-audit services by the audit
firms that audit the Fidelity funds. The policies and procedures require that any non-audit service provided by a fund audit firm to a Fidelity fund and any non-audit service provided by a fund auditor to a Fund Service Provider that relates directly to the operations and financial reporting of a Fidelity fund (“Covered Service”) are subject to approval by the Audit Committee before such service is provided.
All Covered Services must be approved in advance of provision of the service either: (i) by formal resolution of the Audit Committee, or (ii) by oral or written approval of the service by the Chair of the Audit Committee (or if the Chair is unavailable, such other member of the Audit Committee as may be designated by the Chair to act in the Chair’s absence). The approval contemplated by (ii) above is permitted where the Treasurer determines that action on such an engagement is necessary before the next meeting of the Audit Committee.
Non-audit services provided by a fund audit firm to a Fund Service Provider that do not relate directly to the operations and financial reporting of a Fidelity fund are reported to the Audit Committee periodically.
Non-Audit Services Approved Pursuant to Rule 2-01(c)(7)(i)(C) and (ii) of Regulation S-X (“De Minimis Exception”)
There were no non-audit services approved or required to be approved by the Audit Committee pursuant to the De Minimis Exception during the Fund’s(s’) last two fiscal years relating to services provided to (i) the Fund(s) or (ii) any Fund Service Provider that relate directly to the operations and financial reporting of the Fund(s).
The Registrant has not retained, for the preparation of the audit report on the financial statements included in the Form N-CSR, a registered public accounting firm that has a branch or office that is located in a foreign jurisdiction and that the Public Company Accounting Oversight Board (the “PCAOB”) has determined that the PCAOB is unable to inspect or investigate completely because of a position taken by an authority in the foreign jurisdiction.
The Registrant is not a “foreign issuer,” as defined in 17 CFR 240.3b-4.
Item 5.
Audit Committee of Listed Registrants
Not applicable.
Item 6.
Investments
(a)
Not applicable.
(b)
Not applicable.
Item 7.
Disclosure of Proxy Voting Policies and Procedures for Closed-End Management Investment Companies
Not applicable.
Item 8.
Portfolio Managers of Closed-End Management Investment Companies
Not applicable.
Item 9.
Purchase of Equity Securities by Closed-End Management Investment Company and Affiliated Purchasers
Not applicable.
Item 10.
Submission of Matters to a Vote of Security Holders
There were no material changes to the procedures by which shareholders may recommend nominees to the trust’s Board of Trustees.
Item 11.
Controls and Procedures
(a)(i) The President and Treasurer and the Chief Financial Officer have concluded that the trust’s disclosure controls and procedures (as defined in Rule 30a-3(c) under the Investment Company Act) provide reasonable assurances that material information relating to the trust is made known to them by the appropriate persons, based on their evaluation of these controls and procedures as of a date within 90 days of the filing date of this report.
(a)(ii) There was no change in the trust’s internal control over financial reporting (as defined in Rule 30a-3(d) under the Investment Company Act) that occurred during the period covered by this report that has materially affected, or is reasonably likely to materially affect, the trust’s internal control over financial reporting.
Item 12.
Disclosure of Securities Lending Activities for Closed-End Management
Investment Companies
Not applicable.
Item 18.
Recovery of Erroneously Awarded Compensation
(a)
Not applicable.
(b)
Not applicable.
Item 19.
Exhibits
| (a) | (1) | Code of Ethics pursuant to Item 2 of Form N-CSR is filed and attached hereto as EX-99.CODE ETH. |
| (a) | (2) | |
| (a) | (3) | Not applicable. |
| (b) | |
SIGNATURES
Pursuant to the requirements of the Securities Exchange Act of 1934 and the Investment Company Act of 1940, the registrant has duly caused this report to be signed on its behalf by the undersigned, thereunto duly authorized.
Fidelity Salem Street Trust
| By: | /s/Laura M. Del Prato |
| | Laura M. Del Prato |
| | President and Treasurer (Principal Executive Officer) |
| | |
| Date: | June 21, 2024 |
Pursuant to the requirements of the Securities Exchange Act of 1934 and the Investment Company Act of 1940, this report has been signed below by the following persons on behalf of the registrant and in the capacities and on the dates indicated.
| By: | /s/Laura M. Del Prato |
| | Laura M. Del Prato |
| | President and Treasurer (Principal Executive Officer) |
| | |
| Date: | June 21, 2024 |
| By: | /s/John J. Burke III |
| | John J. Burke III |
| | Chief Financial Officer (Principal Financial Officer) |
| | |
| Date: | June 21, 2024 |
Fidelity Investments
FIDELITY FUNDS’
CODE OF ETHICS
FOR PRESIDENT, TREASURER
AND PRINCIPAL ACCOUNTING OFFICER
2023
FIDELITY FUNDS’ CODE OF ETHICS FOR
PRESIDENT, TREASURER AND PRINCIPAL ACCOUNTING OFFICER
I. Purposes of the Code/Covered Officers
This document constitutes the Code of Ethics (Code) adopted by the Fidelity Funds (Funds) pursuant to Section 406 of the Sarbanes-Oxley Act of 2002. The Code applies to the Fidelity Funds’ President and Treasurer, and Chief Financial Officer (Covered Officers). Fidelity’s Ethics Office, within Enterprise Compliance, administers the Code.
The purposes of the Code are to deter wrongdoing and to promote, on the part of the Covered Officers:
·
honest and ethical conduct, including the ethical handling of actual or apparent conflicts of interest between personal and professional relationships;
·
full, fair, accurate, timely and understandable disclosure in reports and documents that the Fidelity Funds submit to the Securities and Exchange Commission (SEC), and in other public communications by a Fidelity Fund;
·
compliance with applicable laws and governmental rules and regulations;
·
the prompt internal reporting to an appropriate person or persons identified in the Code of violations of the Code; and
·
accountability for adherence to the Code.
Each Covered Officer should adhere to a high standard of business ethics and should be sensitive to situations that may give rise to actual as well as apparent conflicts of interest.
II.
Covered Officers Should Handle Ethically
Actual and Apparent Conflicts of Interest
Overview. A “conflict of interest” occurs when a Covered Officer’s private interest interferes with the interests of, or their service to, the Fidelity Funds. For example, a conflict of interest would arise if a Covered Officer, or a member of their family, receives improper personal benefits as a result of their position with the Fidelity Funds.
Certain conflicts of interest arise out of the relationships between Covered Officers and the Fidelity Funds and already are subject to conflict of interest provisions in the Investment Company Act of 1940 (Investment Company Act) and the Investment Advisers Act of 1940 (Investment Advisers Act). For example, Covered Officers may not individually engage in certain transactions (such as the purchase or sale of securities or other property) with a Fidelity Fund because of their status as “affiliated persons” of the Fund. Separate compliance programs and procedures of the Fidelity Funds, Fidelity Management & Research Company (FMR) and the other Fidelity companies are designed to prevent, or identify and correct, violations of these provisions. This Code does not, and is not intended to, repeat or replace these programs and procedures, and such conflicts fall outside of the parameters of this Code.
Although typically not presenting an opportunity for improper personal benefit, conflicts arise from, or as a result of, the contractual relationship between the Fidelity Funds and FMR (or another Fidelity company) of which the Covered Officers are also officers or employees. As a result, this Code recognizes that the Covered Officers will, in the normal course of their duties (whether formally for the Fidelity Funds, FMR or another Fidelity company), be involved in establishing policies and implementing decisions that have different effects on the Fidelity Funds, FMR and other Fidelity companies. The participation of the Covered Officers in such activities is inherent in the contractual relationship between the Fidelity Funds and FMR (or another Fidelity company) and is consistent with the performance by the Covered Officers of their duties as officers of the Fidelity Funds. Thus, if performed in conformity with the provisions of the Investment Company Act and the Investment Advisers Act, such activities will be deemed to have been handled ethically. In addition, it is recognized by the Funds’ Board of Trustees (Board) that the Covered Officers also may be officers or employees of one or more other Fidelity Funds covered by this Code.
Other conflicts of interest are covered by the Code, even if such conflicts of interest are not subject to provisions in the Investment Company Act and the Investment Advisers Act. The following list provides examples of conflicts of interest under the Code, but Covered Officers should keep in mind that these examples are not exhaustive. The overarching principle is that the personal interest of a Covered Officer should not be placed improperly before the interest of a Fidelity Fund.
* * *
Each Covered Officer must:
·
not use their personal influence or personal relationships improperly to influence investment decisions or financial reporting by any Fidelity Fund whereby the Covered Officer would benefit personally to the detriment of any Fidelity Fund;
·
not cause a Fidelity Fund to take action, or fail to take action, for the individual personal benefit of the Covered Officer rather than the benefit of the Fidelity Fund;
·
not engage in any outside business activity, including serving as a director or trustee, that prevents the Covered Officer from devoting appropriate time and attention to the Covered Officer’s responsibilities with the Fidelity Funds;
·
not have a consulting or employment relationship with any of the Fidelity Funds’ service providers that are not affiliated with Fidelity; and
·
not retaliate against any employee or Covered Officer for reports of actual or potential misconduct, which are made in good faith.
With respect to other fact patterns, if a Covered Officer is in doubt, other potential conflict of interest situations should be described immediately to the Fidelity Ethics Office for resolution. Similarly, any questions a Covered Officer has generally regarding the application or interpretation of the Code should be directed to the Fidelity Ethics Office immediately.
III. Disclosure and Compliance
·
Each Covered Officer should familiarize themself with the disclosure requirements generally applicable to the Fidelity Funds.
·
Each Covered Officer should not knowingly misrepresent, or cause others to misrepresent, facts about any Fidelity Fund to others, whether within or outside Fidelity, including to the Board and auditors, and to governmental regulators and self-regulatory organizations;
·
Each Covered Officer should, to the extent appropriate within their area of responsibility, consult with other officers and employees of the Fidelity Funds, FMR and the Fidelity service providers, and with the Board’s Compliance Committee, with the goal of promoting full, fair, accurate, timely and understandable disclosure in the reports and documents the Fidelity Funds file with, or submit to, the SEC and in other public communications made by the Fidelity Funds; and
·
It is the responsibility of each Covered Officer to promote compliance with the standards and restrictions imposed by applicable laws, rules and regulations.
IV. Reporting and Accountability
Each Covered Officer must:
·
upon receipt of the Code, and annually thereafter, submit to the Fidelity Ethics Office an acknowledgement stating that they have received, read, and understand the Code; and
·
notify the Fidelity Ethics Office promptly if they know of any violation of the Code. Failure to do so is itself a violation of this Code.
The Fidelity Ethics Office shall take all action it considers appropriate to investigate any actual or potential violations reported to it. Upon completion of the investigation, if necessary, the matter will be reviewed with senior management or other appropriate parties, and a determination will be made as to whether any action should be taken as detailed below. The Covered Officer will be informed of any action determined to be appropriate. The Fidelity Ethics Office will inform the Personal Trading Committee of all Code violations and actions taken in response. Without implied limitation, appropriate remedial, disciplinary or preventive action may include a written warning, a letter of censure, suspension, dismissal or, in the event of criminal or other serious violations of law, notification of the SEC or other appropriate law enforcement authorities. Additionally, other legal remedies may be pursued.
The policies and procedures described in the Code do not create any obligations to any person or entity other than the Fidelity Funds. The Code is intended solely for the internal use by the Fidelity Funds and does not constitute a promise, contract or an admission by or on behalf of any Fidelity Fund as to any fact, circumstance, or legal conclusion. The Fidelity Funds, the Fidelity companies and the Fidelity Head of Ethics retain the discretion to decide whether the Code applies to a specific situation, and how it should be interpreted.
V. Oversight
Material violations of this Code will be reported promptly by FMR (or another Fidelity company) to the Board’s Compliance Committee. In addition, at least once each year, FMR (or another Fidelity company) will provide a written report to the Board, which describes any issues arising under the Code since the last report to the Board, including, but not limited to, information about material violations of the Code and action taken in response to the material violations.
VI. Other Policies and Procedures
This Code shall be the sole code of ethics adopted by the Fidelity Funds for purposes of Section 406 of the Sarbanes-Oxley Act. Other Fidelity policies or procedures that cover the behavior or activities of Covered Officers are separate requirements applying to the Covered Officers (and others) and are not part of this Code.
VII. Amendments
Any material amendments or changes to this Code must be approved or ratified by a majority vote of the Board, including a majority of the Trustees who are not interested persons of the Fidelity Funds.
VIII. Records and Confidentiality
Records of any violation of the Code and of the actions taken as a result of such violations will be kept by the Fidelity Ethics Office. All reports and records prepared or maintained pursuant to this Code will be considered confidential and shall be maintained and protected accordingly. Except as otherwise required by law or this Code, such matters shall not be disclosed to anyone other than the Fidelity Ethics Office, the Personal Trading Committee, the Board, appropriate personnel at the relevant Fidelity company or companies and the legal counsel of any or all of the foregoing.
2023
Exhibit EX-99.CERT
I, Laura M. Del Prato, certify that:
1.
I have reviewed this report on Form N-CSR of Fidelity Salem Street Trust;
2.
Based on my knowledge, this report does not contain any untrue statement of a material fact or omit to state a material fact necessary to make the statements made, in light of the circumstances under which such statements were made, not misleading with respect to the period covered by this report;
3.
Based on my knowledge, the financial statements, and other financial information included in this report, fairly present in all material respects the financial condition, results of operations, changes in net assets, and cash flows (if the financial statements are required to include a statement of cash flows) of the registrant as of, and for, the periods presented in this report;
4.
The registrant's other certifying officer(s) and I are responsible for establishing and maintaining disclosure controls and procedures (as defined in Rule 30a-3(c) under the Investment Company Act of 1940) and internal control over financial reporting (as defined in Rule 30a-3(d) under the Investment Company Act of 1940) for the registrant and have:
a.
Designed such disclosure controls and procedures, or caused such disclosure controls and procedures to be designed under our supervision, to ensure that material information relating to the registrant, including its consolidated subsidiaries, is made known to us by others within those entities, particularly during the period in which this report is being prepared;
b.
Designed such internal control over financial reporting, or caused such internal control over financial reporting to be designed under our supervision, to provide reasonable assurance regarding the reliability of financial reporting and the preparation of financial statements for external purposes in accordance with generally accepted accounting principles;
c.
Evaluated the effectiveness of the registrant's disclosure controls and procedures and presented in this report our conclusions about the effectiveness of the disclosure controls and procedures, as of a date within 90 days prior to the filing date of this report based upon such evaluation; and
d.
Disclosed in this report any change in the registrant’s internal control over financial reporting that occurred during the period covered by this report that has materially affected, or is reasonably likely to materially affect, the registrant’s internal control over financial reporting; and
5.
The registrant's other certifying officer(s) and I have disclosed to the registrant's auditors and the audit committee of the registrant's board of directors (or persons performing the equivalent functions):
a.
All significant deficiencies and material weaknesses in the design or operation of internal control over financial reporting which are reasonably likely to adversely affect the registrant's ability to record, process, summarize, and report financial information; and
b.
Any fraud, whether or not material, that involves management or other employees who have a significant role in the registrant's internal control over financial reporting.
Date:
June 21, 2024
/s/Laura M. Del Prato |
Laura M. Del Prato |
President and Treasurer (Principal Executive Officer) |
I, John J. Burke III, certify that:
1.
I have reviewed this report on Form N-CSR of Fidelity Salem Street Trust;
2.
Based on my knowledge, this report does not contain any untrue statement of a material fact or omit to state a material fact necessary to make the statements made, in light of the circumstances under which such statements were made, not misleading with respect to the period covered by this report;
3.
Based on my knowledge, the financial statements, and other financial information included in this report, fairly present in all material respects the financial condition, results of operations, changes in net assets, and cash flows (if the financial statements are required to include a statement of cash flows) of the registrant as of, and for, the periods presented in this report;
4.
The registrant's other certifying officer(s) and I are responsible for establishing and maintaining disclosure controls and procedures (as defined in Rule 30a-3(c) under the Investment Company Act of 1940) and internal control over financial reporting (as defined in Rule 30a-3(d) under the Investment Company Act of 1940) for the registrant and have:
a.
Designed such disclosure controls and procedures, or caused such disclosure controls and procedures to be designed under our supervision, to ensure that material information relating to the registrant, including its consolidated subsidiaries, is made known to us by others within those entities, particularly during the period in which this report is being prepared;
b.
Designed such internal control over financial reporting, or caused such internal control over financial reporting to be designed under our supervision, to provide reasonable assurance regarding the reliability of financial reporting and the preparation of financial statements for external purposes in accordance with generally accepted accounting principles;
c.
Evaluated the effectiveness of the registrant's disclosure controls and procedures and presented in this report our conclusions about the effectiveness of the disclosure controls and procedures, as of a date within 90 days prior to the filing date of this report based upon such evaluation; and
d.
Disclosed in this report any change in the registrant’s internal control over financial reporting that occurred during the period covered by this report that has materially affected, or is reasonably likely to materially affect, the registrant’s internal control over financial reporting; and
5.
The registrant's other certifying officer(s) and I have disclosed to the registrant's auditors and the audit committee of the registrant's board of directors (or persons performing the equivalent functions):
a.
All significant deficiencies and material weaknesses in the design or operation of internal control over financial reporting which are reasonably likely to adversely affect the registrant's ability to record, process, summarize, and report financial information; and
b.
Any fraud, whether or not material, that involves management or other employees who have a significant role in the registrant's internal control over financial reporting.
Date:
June 21, 2024
/s/John J. Burke III |
John J. Burke III |
Chief Financial Officer (Principal Financial Officer) |
Exhibit EX-99.906CERT
Certification Pursuant to Section 906 of the Sarbanes-Oxley Act of 2002 (subsections (a) and (b) of section 1350, chapter 63 of title 18, United States Code)
In connection with the attached Report of Fidelity Salem Street Trust (the “Trust”) on Form N-CSR to be filed with the Securities and Exchange Commission (the “Report”), each of the undersigned officers of the Trust does hereby certify that, to the best of such officer’s knowledge:
1.
The Report fully complies with the requirements of 13(a) or 15(d) of the Securities Exchange Act of 1934; and
2.
The information contained in the Report fairly presents, in all material respects, the financial condition and results of operations of the Trust as of, and for, the periods presented in the Report.
Dated: June 21, 2024
/s/Laura M. Del Prato |
Laura M. Del Prato |
President and Treasurer (Principal Executive Officer) |
Dated: June 21, 2024
/s/John J. Burke III |
John J. Burke III |
Chief Financial Officer (Principal Financial Officer) |
A signed original of this written statement required by Section 906, or other document authenticating, acknowledging, or otherwise adopting the signature that appears in typed form within the electronic version of this written statement required by Section 906, has been provided to the Trust and will be retained by the Trust and furnished to the Securities and Exchange Commission or its staff upon request.