Annual Report
May 31, 2018

Elements U.S. Portfolio
Elements U.S. Small Cap Portfolio
Elements International Portfolio
Elements International Small Cap Portfolio
Elements Emerging Markets Portfolio
As filed with the Securities and Exchange Commission on XX
UNITED STATES
SECURITIES AND EXCHANGE COMMISSION
Washington, D.C. 20549
FORM N-CSR
CERTIFIED SHAREHOLDER REPORT OF REGISTERED
MANAGEMENT INVESTMENT COMPANIES
Investment Company Act file number 811-22761
Stone Ridge Trust
(Exact name of registrant as specified in charter)
510 Madison Avenue, 21st Floor
New York, NY 10022
(Address of principal executive offices) (Zip code)
Stone Ridge Asset Management LLC
510 Madison Avenue, 21st Floor
New York, NY 10022
(Name and address of agent for service)
(855) 609-3680
Registrant’s telephone number, including area code
Date of fiscal year end: May 31, 2018
Date of reporting period: May 31, 2018
Item 1. Reports to Stockholders.
Annual Report
May 31, 2018
Elements U.S. Portfolio
Elements U.S. Small Cap Portfolio
Elements International Portfolio
Elements International Small Cap Portfolio
Elements Emerging Markets Portfolio
The shareholder letter below is reprinted from the Annual Report of the Stone Ridge Funds for the year ended October 31, 2017. The letter is dated December 2017 and speaks only as of its date. No updates have been made to, and no undertaking has been made to update, any data or other information contained in the letter.
The training of an instinct, of a truly fresh way of looking at the world, demands a kind of calm.
- Joshua Ramo, The Seventh Sense
December 2017
Dear Fellow Shareholder:
Stone Ridge launched its first funds five years ago. In the interim, we’ve become a global firm providing efficient access to a wide variety of uncorrelated risks, with responsibility for $14 billion of our investors’ life savings. One particularly wonderful aspect of the journey thus far: our footprints are indistinguishable from your footprints. We’re traveling together.
Together, we have explored Reinsurance, the Variance Risk Premium (VRP), and Alternative Lending. Together, we have changed the breadth of tools available for constructing portfolios and created a home for those seeking to innovate in finance. Together, we have breathed new life into certain investment structures originally conceived of by US regulators decades ago – and barely used until we dusted them off in 2013. Together, we have formed the Stone Ridge network of forward-thinking RIAs. Together, we are just getting started.
THE REAL POWER OF COMPOUNDING
If a high-priced management consultant analyzed our firm, I’m sure he’d tell us that we’re doing it all wrong. Looking externally, he’d tell us we should have a far more diversified client base, our products should be on every possible distribution platform, and we should do lots of press and advertising. Looking internally, he’d tell us we should have co-heads for every department, we should cull the bottom 5% of staff every year, and we should have a written succession plan for every employee. I count six too many “should’s”. We do none of those things. What the consultant would be missing is that when it comes to relationships, the power of compounding is far more potent than the power of diversification.
Think about the most important relationships in your life. They are almost certainly the ones that are the longest. Your parents, your spouse, your children, perhaps a couple of very old friends? Those relationships have benefitted the most from the power of compounding. The best shot Stone Ridge has to really matter to you – to be a true partner, not a vendor – is by practicing an extreme form of continuity. That’s why our RIA investors always see the same folks from Stone Ridge showing up in their offices, that’s why they see us a lot, and that’s why we don’t seek more diversification in our investor relationships. I’ll take compounding every time.
| Elements Portfolios | Annual Report | May 31, 2018 | ||||||||||||||
1
Shareholder Letter
Viewed through that lens, perhaps it’s obvious why a key design principle of Stone Ridge since inception has been to have a smaller number of large relationships. This principle applies internally – let’s have a smaller number of phenomenally talented people, with virtually zero turnover. And it applies externally – let’s have a smaller number of large, forward thinking investors, who invest across the spectrum of Stone Ridge strategies. Indeed, 86% of the RIA firms we work with invest in multiple Stone Ridge funds, and in our last two product launches – $1.3 billion (18 months ago) and $2 billion (8 months ago), respectively – 100% of the firms at launch were existing Stone Ridge investors. We didn’t share those opportunities with any firm that wasn’t already an investor, and the trading profit for those products combined has been $610 million.
This compounding principle also applies to our partnerships with reinsurers. Many cynical industry participants assumed that in a hard market, reinsurers would share less risk with us and keep more of the higher-yielding business for themselves. Exactly the opposite has occurred. After a $100+ billion loss year for the industry, globally leading reinsurers – our core partners that we have been working with for years – made Stone Ridge their first post-event call.
While we hoped for and expected this behavior, post-event reactions were untested. That’s no longer true. Most important, our ecosystem of investors, reinsurers, and Stone Ridge funds proved to be Antifragile – the ultimate hedge against disasters. The bottom line is that the best of the reinsurance industry continues to grow with Stone Ridge, strategically leveraging our capital to extend their own lead in the market.
INTIMACY, INNOVATION, AND SERVICE
Given the extreme version of relationship continuity we practice, the resulting level of intimacy inside our firm gives us the freedom to innovate. Stone Ridge is comprised of makers and inventors. We’re ceaseless tinkerers, infected with ceaseless optimism. Our view of the world is unconcerned with things as they are – we focus on things as they might be, as they ought to be. Though each of our product launches have been “first of its kind” in the ’40 Act, we take no satisfaction in our firm being admired as creative. We just want to be left alone to actually be creative.
Our moat is our simplicity, dug deeper by our insight that charisma is as overrated as patience is underrated. I like things that take a long time.
Stone Ridge is also powered differently. We don’t build products just to sell them. Instead, we sell so we can build. The creative process is its own reward. The purity in our “sell to build, don’t build to sell” ethos inspires and untethers us. It’s extraordinarily attractive to be around. In many ways, it’s addictive.
We point our creativity towards product development, in service of our investors and our communities. In doing so, we serve our country and the broader world, the ultimate in socially responsible investing. Our Reinsurance funds enabled $1 billion to flow to the victims of the California wildfires, and Hurricanes Harvey/Irma/Maria, in their darkest hour. And every day, our Alternative Lending fund, LENDX, provides a nudge to economic growth in local neighborhoods across the United States. Finance is a powerful force for good.
AMERICA AND LENDX
Our country is blessed with limitless natural resources, giant oceans protecting us on the left and right, and friendly neighbors to the north and south. We’ve got a military that any other country would trade for theirs, a political class constrained by an ingenious system of checks and balances, and a built-in self-correcting mechanism of free elections.
| Elements Portfolios | Annual Report | May 31, 2018 | ||||||||||||||
2
Shareholder Letter
Two hundred forty years later, it is easy to forget how uniquely successful the American experiment has been. One powerful cause of this success: America allows people to bet on themselves. No one is guaranteed success, but in America we can all try. And try again. And try again.
Credit represents a powerful accelerant for those who want to bet on themselves. However, our current credit system is easily accessible and efficient only for subprime borrowers and very large borrowers. In contrast, small loans to prime and super-prime consumers, and especially to small businesses, are highly inefficient, too expensive, and often simply unavailable. This aspect of the credit formation process is largely broken, an unnecessary limiter to our country’s economic potential.
A recent Federal Reserve studyi of more than 10,000 small businesses across all 50 states revealed that “credit available for expansion” is the top financial challenge for business owners, and a staggering 59% use a credit card as their only source of borrowing. A related study by Paynetii showed that a typical small business underwriting process requires 28 separate tasks, 100 hours of work, and takes four to eight weeks, at an average cost of $6,555 per application. What if the small business only wants to borrow $5,000? Or $10,000?
LENDX is part of the solution. Since its inception in June 2016, LENDX has purchased 410,009 loans, $7 billion in all, and supported 77,749 small businesses. An incredible 92% of our small business loans have been under $10,000. These are loans to your local ice cream parlor, your local barber shop, your local gas station. Given the $6,555 average cost of loan origination via banks, it’s clear that these loans would simply not have been possible without you and LENDX.
Imagine if each of those 77,749 small businesses hired just one extra person? Maybe you even know that person. Maybe you are that person. How much does that add to your local economy, to your local neighborhood, to the fabric of your daily life?
In the context of asset allocation, the vast majority of our investors use LENDX as a substitute for traditional fixed income, which today suffers from a potentially toxic combination of low yield and high duration. LENDX is the opposite: high yield and low duration. Since inception, LENDX has materially outperformed the Barclays Aggregate benchmark, with no correlation.
And while LENDX has delivered, we’re just warming up. In this asset class, unlike most, size is not the enemy of performance. Towards the end of 2017, the fund’s size allowed us to significantly lower our already market leading borrowing costs and further reduce servicing fees from certain platforms we selected. We’ve also started accepting material investments into LENDX from some of the largest (re)insurance companies in the world – all partners in our reinsurance franchise – because as one (re)insurance CEO remarked to me, “We’re not built for zero interest rates.” No one is.
A NEW 60/40?
Since the financial crisis low in March 2009, the 60/40 portfolio has been remarkably, at times preposterously, and certainly unsustainably, good. To be precise, during this time period of almost 8 years, 60/40 has delivered annualized excess returns of 12.7%, annualized volatility of 6.9%, and a Sharpe Ratio of 1.8. To put this in perspective, the 90-year average for 60/40 is 5.0% annualized excess returns, with 12.0% annualized volatility, and a Sharpe Ratio of 0.4. So compared to the long-term average, post-crisis 60/40 has enjoyed 2.5x the annualized excess return, about 40% less volatility, and more than 4.5x the Sharpe Ratio. Wow. It’s not supposed to be this easy to make money.
| Elements Portfolios | Annual Report | May 31, 2018 | ||||||||||||||
3
Shareholder Letter
Try the following thought experiment: holding volatility constant at the long-term average, what would annualized excess returns have to be over the next 10 and 20 years, for the post-crisis Sharpe Ratio to be equal to the long term average?
The answer: negative 2.6% annualized return for the next 10 years, and positive 1.2% annualized return for the next 20 years. Another “Wow.” Imagine making essentially no money on your investments for the next 10 or 20 years. No, really, stop and think about it for a moment. What would that mean for you?
Virtually no one today is thinking that a “lost decade or two” of returns is possible. Let’s be clear: it may not occur, but it certainly is possible. Just like the (re)insurance industry is not built for zero interest rates, today the world at large is not prepared for no returns to 60/40 for the next 10-20 years. Whether it’s pension funds, 401ks, or any individual investor’s retirement goals, extended periods of no returns are blissfully ignored in most everyone’s underwriting model.
So what to do? The good news is that markets have anticipated this challenge and a second wave of financial innovation is underway. The first wave “democratized investments” by making it possible for large numbers of investors to access the equity and bond markets via lower cost mutual funds and Exchange Traded Funds (ETFs). The second wave involves “democratizing balance sheets”, uncovering a much broader array of risks arising from financial intermediation – by banks, (re)insurance companies, and market makers – and making them available in cost-efficient structures.
In this second wave, we shift risk holding from a tiny number of gigantic balance sheets to a gigantic number of tiny balance sheets. We unlock profitable business lines historically buried within financial institutions. We de-risk the financial system. And we empower investors to access valuable P&L streams that can diversify 60/40. The alternative risk premiums Stone Ridge currently provides are just the start.
PRINCIPALS VS. AGENTS
To actually break free from 60/40, investors will need to find new managers that can provide both sufficient diversification to protect their wealth and sufficient return potential to grow their wealth. As part of new manager diligence, investors will need to ask different questions. Better questions. In fact, the quality of investor questions will determine the quality of investor performance.
Again, good news. Here is a necessary and sufficient set of diligence questions for managers:
Are the Portfolio Managers (PMs) and all employees required to invest in the funds? Do they pay full fees? Do the Independent Trustees of the Fund Board take all of their compensation in fund shares? Does the manager strictly limit when investors can purchase shares? Has the manager ever returned capital to investors?
If investors ask these questions, they never even have to meet with managers. If the answers are all yes, you are aligned. If not, be careful. The advice I have for manager selection is the same advice I have for my teenage daughter about teenage boy selection: ignore everything they say and only pay attention to what they do.
At Stone Ridge, we are principals, not agents. All PMs, indeed all employees, are required to invest in all strategies at full fees. Our Board elects to take 100% of their compensation in fund shares, not cash. We strictly limit when investors can give us money. All of this has been true since the firm began. And at the end of 2016, we returned $300 million of capital to investors when we determined that one of our funds was about to get too big, relative to the opportunity set.
| Elements Portfolios | Annual Report | May 31, 2018 | ||||||||||||||
4
Shareholder Letter
Health warning: what we do is very risky. Do not get lulled into a false sense of security when looking at the consistency of our past results. In future years, there will be tragic earthquakes and hurricanes causing industry losses far worse than those this year. There will be market crashes and credit crises.
However, we’re unafraid to lead by example. The firm and employees together have over $400 million directly invested in our own funds. We’re proud of this alignment with our investors. It’s possible to go forward with no 60/40 at all. It may even be necessary.
OUR PARTNERSHIP
Stone Ridge is most proud of the 50/50 partnership we have with you, our clients. We are on the path together. You contribute the capital necessary to sustain and propel groundbreaking product development. We contribute our collective careers’ worth of experience in sourcing, structuring, execution, and risk management. Together, it works. In that spirit, I offer my deepest gratitude to you for sharing responsibility for your wealth with us this year. We look forward to serving you again in 2018.
Sincerely,
Ross Stevens
Founder, CEO
| Elements Portfolios | Annual Report | May 31, 2018 | ||||||||||||||
5
Shareholder Letter
| 1 | Federal Reserve Bank of New York, 2016 Small Business Credit Survey (April 2017). |
| 1 | Paynet, “Rediscovering C&I Lending in 2017”. |
Return on Equity (ROE): a measure of a corporations profitability.
Sharpe Ratio: a portfolio’s excess return divided by its volatility.
RIA: stands for “Registered Investment Advisor”
60/40: stands for a portfolio comprised of 60% stocks and 40% bonds
P&L: stands for “profit and loss”
The Barclays Aggregate Bond Index is a broad-based flagship benchmark that measures the investment grade, US dollar-denominated, fixed-rate taxable bond market. It is not possible to invest in an index.
RISK DISCLOSURES
The Stone Ridge Funds consist of the Stone Ridge High Yield Reinsurance Risk Premium Fund (“SHRIX”), the Stone Ridge Reinsurance Risk Premium Interval Fund (“SRRIX”), the Stone Ridge Post-Event Reinsurance Fund (“SRPEX” and, together with SHRIX and SRRIX, the “Reinsurance Funds”), the Stone Ridge U.S. Large Cap Variance Risk Premium Fund (the “U.S. Large Cap VRP Fund”), the Stone Ridge U.S. Small Cap Variance Risk Premium Fund (the “U.S. Small Cap VRP Fund”), the Stone Ridge U.S. Variance Risk Premium Master Fund (the “U.S. VRP Master Fund” and, together with the U.S. Large Cap VRP Fund and the U.S. Small Cap VRP Fund, the “U.S. VRP Funds”), the Stone Ridge International Developed Markets Variance Risk Premium Fund (the “Developed Markets VRP Fund”), the Stone Ridge Global Equity Variance Risk Premium Master Fund (the “Global VRP Master Fund” and, together with the Developed Markets VRP Fund, the “International VRP Funds”), the Stone Ridge All Asset Variance Risk Premium Fund (“AVRPX” and, together with the U.S. VRP Funds and the International VRP Funds, the “VRP Funds”) and the Stone Ridge Alternative Lending Risk Premium Fund (“LENDX” and, together with the Reinsurance Funds and the VRP Funds, the “Funds”).
The Portfolios consist of the Elements U.S. Portfolio, Elements U.S. Small Cap Portfolio, Elements International Portfolio, Elements International Small Cap Portfolio, and Elements Emerging Markets Portfolio (collectively, the “Portfolios”, and each a “Portfolio”).
The Funds and the Portfolios are generally sold to (i) institutional investors, including registered investment advisers (“RIAs”), that meet certain qualifications and have completed an educational program provided by Stone Ridge Asset Management LLC (the “Adviser”); (ii) clients of such institutional investors; and (iii) certain other eligible investors (as described in the relevant prospectus). Investors should carefully consider the Funds’ and the Portfolios’ risks and investment objectives, as an investment in the Funds and/or the Portfolios may not be appropriate for all investors and the Funds and the Portfolios are not designed to be a complete investment program. There can be no assurance that the Funds and/or the Portfolios will achieve their investment objectives. An investment in the Funds and/or the Portfolios involves a high degree of risk. It is possible that investing in a Fund and/or a Portfolio may result in a loss of some or all of the amount invested. Before making an investment/allocation decision, investors should (i) consider the suitability of this investment with respect to an investor’s or a client’s investment objectives and individual situation and (ii) consider factors such as an investor’s or a client’s net worth, income, age and risk tolerance. Investment should be avoided where an investor/client has a short-term investing horizon and/or cannot bear the loss of some or all of the investment. Before investing in a Fund and/or a Portfolio, an investor should read the discussion of the risks of investing in the Fund and/or the Portfolio in the relevant prospectus.
| Elements Portfolios | Annual Report | May 31, 2018 | ||||||||||||||
6
Shareholder Letter
Holdings and sector allocations are subject to change and are not a recommendation to buy or sell any security.
Investing in funds involves risks, as does all investing. Principal loss is possible.
The VRP Funds may invest in a variety of derivatives, including put and call options, futures contracts, options on futures contracts, swaps, swaptions, and other exchange-traded and over-the-counter derivatives contracts. The VRP Funds may invest in derivatives to generate income from premiums, for investment purposes, and for hedging and risk management purposes. A VRP Fund’s use of derivatives as part of its principal investment strategy to sell protection against the volatility of various underlying references involves the risk that, if the volatility of the underlying references is greater than expected, the VRP Fund will bear losses to the extent of its obligations under the relevant derivative contracts, which may not be outweighed by the amount of any premiums received for the sale of such derivative instruments. The use of derivatives involves risks that are in addition to, and potentially greater than, the risks of investing directly in securities and other more traditional assets. Derivatives also present other risks, including market risk, illiquidity risk, currency risk, and credit risk.
Direct or indirect investments in securities of foreign issuers involve risks not ordinarily associated with exposure to securities and instruments of U.S. issuers, including differences in accounting, auditing and financial standards; less government supervision and regulation; currency risk; risks of expropriation, confiscatory taxation, political or social instability or diplomatic developments; less publicly available information; less volume in foreign markets; and increased costs of transacting in foreign markets. These risks are heightened in emerging markets.
The reinsurance industry relies on risk modeling to analyze potential risks in a single transaction and in a portfolio of transactions. The models are based on probabilistic simulations that generate thousands or millions of potential events based on historical data, scientific and meteorological principles and extensive data on current insured properties. Sellers of reinsurance-related securities typically provide a set of risk analytics and statistics at the time of trade that include models.
Event-linked bonds, catastrophe bonds and other reinsurance-related securities carry large uncertainties and major risk exposures to adverse conditions. If a trigger event, as defined within the terms of the bond, involves losses or other metrics exceeding a specific magnitude in the geographic region and time period specified therein, a Fund may lose a portion or all of its investment in such security. Such losses may be substantial. The reinsurance-related securities in which the Funds invest are considered “high yield” or “junk bonds.”
SHRIX and SRRIX may invest in reinsurance-related securities issued by foreign sovereigns and foreign entities that are corporations, partnerships, trusts or other types of business entities. Because the majority of reinsurance-related security issuers are domiciled outside the United States, each of SHRIX and SRRIX will normally invest significant amounts of its assets in non-U.S. entities. Accordingly, each of them may invest without limitation in securities issued by non-U.S. entities, including those in emerging market countries. Foreign issuers could be affected by factors not present in the U.S., including expropriation, confiscatory taxation, lack of uniform accounting and auditing standards, less publicly available financial and other information, potential difficulties in enforcing contractual obligations, and increased costs to enforce applicable contractual obligations outside the U.S.. These risks are greater in emerging markets.
The value of LENDX’s investments in whole loans and other alternative lending-related securities, such as shares, certificates, notes or other securities representing an interest in and the right to receive principal and interest payments due on whole loans or fractions of whole loans, is entirely dependent on the
| Elements Portfolios | Annual Report | May 31, 2018 | ||||||||||||||
7
Shareholder Letter
borrowers’ continued and timely payments. If a borrower is unable or fails to make payments on a loan for any reason, LENDX may be greatly limited in its ability to recover any outstanding principal or interest due, as (among other reasons) LENDX may not have direct recourse against the borrower or may otherwise be limited in its ability to directly enforce its rights under the loan, whether through the borrower or the platform through which such loan was originated, the loan may be unsecured or under-collateralized and/or it may be impracticable to commence a legal proceeding against the defaulting borrower. LENDX generally will need to rely on the efforts of the platforms, servicers or their designated collection agencies to collect on defaulted loans and there is no guarantee that such parties will be successful in their efforts to collect on loans. Even if a loan in which LENDX has investment exposure is secured, there can be no assurance that the collateral will, when recovered and liquidated, generate sufficient (or any) funds to offset any losses associated with the defaulting loan. Although LENDX conducts diligence on the platforms, LENDX generally does not have the ability to independently verify, and will not independently diligence or confirm the truthfulness of, the information provided by the platforms, other than payment information regarding loans and other alternative lending-related securities owned by LENDX, which LENDX will observe directly as payments are received. The default history for alternative lending borrowing arrangements is limited and future defaults may be higher than historical defaults.
In general, the value of a debt security is likely to fall as interest rates rise. LENDX may invest in below-investment grade securities, which are often referred to as “junk,” or in securities that are unrated but that have similar characteristics to junk bonds. Such instruments have predominantly speculative characteristics with respect to the issuer’s capacity to pay interest and repay principal. They may also be difficult to value and illiquid. LENDX’s investments in securitization vehicles or other special purpose entities that hold alternative lending-related securities (asset-backed securities) may involve risks that differ from or are greater than risks associated with other types of investments. The risks and returns for investors like LENDX in asset-backed securities depend on the tranche in which the investor holds an interest, and the value of an investment in LENDX may be more volatile and other risks tend to be compounded if and to the extent that LENDX is exposed to asset-backed securities directly or indirectly.
LENDX may invest directly or indirectly in the alternative lending-related securities of foreign issuers. Such investments may involve risks not ordinarily associated with exposure to alternative lending-related securities of U.S. issuers. The foreign alternative lending industry may be subject to less governmental supervision and regulation than exists in the U.S.; conversely, foreign regulatory regimes applicable to the alternative lending industry may be more complex and more restrictive than those in the U.S., resulting in higher costs associated with such investments, and such regulatory regimes may be subject to interpretation or change without prior notice to investors, such as LENDX. Foreign platforms may not be subject to accounting, auditing, and financial reporting standards and practices comparable to those in the U.S. Due to difference in legal systems, there may be difficulty in obtaining or enforcing a court judgment outside the U.S.
Some Funds (or their subsidiaries) may obtain financing to make investments and may obtain leverage through derivative instruments that afford the Fund economic leverage. Therefore, such Funds are subject to leverage risk. Leverage magnifies a Fund’s exposure to declines in the value of one or more underlying reference instruments or creates investment risk with respect to a larger pool of assets than the Fund would otherwise have and may be considered a speculative technique. The value of an investment in a Fund will be more volatile and other risks tend to be compounded if and to the extent the Fund borrows or uses derivatives or other investments that have embedded leverage. This risk is enhanced for SHRIX and SRRIX because they invest substantially all their assets in reinsurance-related securities. Reinsurance-related securities can quickly lose all or much of their value if a triggering event occurs. Thus, to the extent assets subject to a triggering event are leveraged, the losses could substantially outweigh SHRIX’s or SRRIX’s investment and result in significant losses to the relevant Fund.
| Elements Portfolios | Annual Report | May 31, 2018 | ||||||||||||||
8
Shareholder Letter
Economic, political, and issuer-specific events will cause the value of securities, and the Portfolio that owns them, to rise or fall. Because the value of your investment in a Portfolio will fluctuate, you may lose money, even over the long term. Securities of smaller companies are often less liquid than those of larger companies, and smaller companies are generally more vulnerable to adverse business or economic developments and may have more limited resources. Foreign securities prices may decline or fluctuate because of economic or political actions of foreign governments and/or less regulated or liquid securities markets and may give rise to foreign currency risk. Securities of companies that exhibit other factors such as value, momentum or quality may be riskier than securities of companies that do not exhibit those factors, and may perform differently from the market as a whole. If a Portfolio uses derivatives, such Portfolio will be directly exposed to the risks of that derivative, including the risk that the counterparty is unable or unwilling to perform its obligations. Derivatives are subject to a number of additional risks, including risks associated with liquidity, interest rates, market movements and valuation. Securities lending and similar transactions involve the risk that the counterparty may fail to return the securities in a timely manner or at all and that the value of collateral securing a securities loan or similar transaction falls.
The Funds and the Portfolios may invest in illiquid or restricted securities, which may be difficult or impossible to sell at a time that a Fund or Portfolio would like or at the price that a Fund or Portfolio believes the security is currently worth.
Each Fund and each Portfolio intends to qualify for treatment as a regulated investment company (“RIC”) under the Internal Revenue Code. A Fund’s or a Portfolio’s investment strategy will potentially be limited by its intention to qualify for treatment as a RIC. The tax treatment of certain of the Funds’ and certain of the Portfolios’ investments under one or more of the qualification or distribution tests applicable to RICs is not certain. An adverse determination or future guidance by the IRS might affect a Fund’s or a Portfolio’s ability to qualify for such treatment.
If, in any year, a Fund or a Portfolio were to fail to qualify for treatment as a RIC under the Internal Revenue Code for any reason, and were unable to cure such failure, the Fund or the Portfolio would be subject to tax on its taxable income at corporate rates, and all distributions from earnings and profits, including any distributions of net tax-exempt income and net long-term capital gains, would be taxable to shareholders as ordinary income.
For additional risks, please refer to the relevant prospectus and statement of additional information.
Each of the Reinsurance Funds, the Portfolios, AVRPX and LENDX is classified as non-diversified under the 1940 Act. Accordingly, each such Fund or Portfolio may invest a greater portion of its assets in the securities of a single issuer than if it were a diversified fund, which may subject such Fund or Portfolio to a higher degree of risk associated with and developments affecting that issuer than a fund that invests more widely.
Each of AVRPX, SRRIX and LENDX has an interval fund structure pursuant to which each Fund, subject to applicable law, conducts quarterly repurchase offers of the Fund’s outstanding shares at net asset value (“NAV”), subject to approval of the Board of Trustees. In all cases, such repurchases will be for at least 5% and not more than 25% of the relevant Fund’s outstanding shares. Repurchase offers are currently expected to be 5% for SRRIX and LENDX and 10% for AVRPX. In connection with any given repurchase offer, it is possible that a Fund may offer to repurchase only the minimum amount of 5% of its outstanding shares. It is possible that a repurchase offer may be oversubscribed, with the result that shareholders may only be able to have a portion of their shares repurchased. There is no assurance that you will be able to tender your Shares when or in the amount that you desire. The Funds’ shares are not listed and the Funds do not currently intend to list their shares for trading on any national securities exchange; the shares are, therefore, not marketable, and you should consider the shares to be illiquid.
| Elements Portfolios | Annual Report | May 31, 2018 | ||||||||||||||
9
Shareholder Letter
Performance data quoted represents past performance; past performance does not guarantee future results. The investment return and principal value of an investment will fluctuate so that an investor’s shares, when redeemed, may be worth more or less than their original cost. Current performance of a Fund or a Portfolio may be lower or higher than the performance quoted. Performance data current to the most recent month end may be obtained by calling 855-609-3680. Performance over one year is annualized except where otherwise specified.
Total Annual Fund Operating Expenses before fee waiver and/or expense reimbursement / (recoupment): for VRLIX=1.55%; for VRSIX=1.77%; for VRFIX=2.07%; for VRGIX=2.05%; for SHRIX=1.81%; for AVRPX=2.76%; for LENDX=4.56%. Total Annual Fund Operating Expenses after fee waiver and/or expense reimbursement / (recoupment): for VRLIX=1.57%; for VRSIX=1.64%; for VRFIX=1.87%; for VRGIX=1.95%; for SHRIX=1.77%; for AVRPX=2.78%; for LENDX=4.57%. Total Annual Fund Operating Expenses for VRPIX=1.65%; for SRRIX=2.40%.
Standardized returns as of most recent quarter-end (06/30/18): for VRLIX 1Yr=2.09%, 5Yr=7.07%, since inception(5/1/2013)=6.90%; for VRSIX 1Yr=6.60%, 5Yr=6.04%, since inception(5/1/2013)=6.31%; for VRFIX 1Yr=2.47%, since inception(2/11/14)=3.17%; for VRGIX 1Yr=3.14%, since inception(11/14/2014)=3.63%; for VRPIX 1Yr=3.49%, 5Yr=6.59%, since inception(5/22/2013)=6.36%; for SHRIX 1Yr=-2.10%, 5Yr=5.45%, since inception(2/1/2013)=5.04%; for SRRIX 1Yr=-12.67%, since inception(12/9/2013)=2.98%; for AVRPX 1Yr=0.01%, since inception(4/2/2015)=4.65%; for LENDX 1Yr=5.98%, since inception(6/1/2016)=8.61%; for ELUSX 1Yr=14.30%, since inception (3/31/17)=13.19%; for ELSMX 1Yr=16.32%, since inception (3/31/17)=13.53%; for ELINX 1Yr=6.53%, since inception(4/28/17)=8.61%; for ELISX 1Yr=8.52%, since inception (4/28/17)=11.44%; for ELMMX 1Yr=6.63%, since inception (5/31/17)=7.21%. As of 06/30/18, 30-day SEC yield: SHRIX 5.09%; SRRIX 0.00%; LENDX 9.32% (net), 9.39% (gross of subsidized expenses). Results for the Funds reflect the reinvestment of dividends and other earnings and are net of fees and expenses. As a result of economic incentives received from platforms that may not be repeated, early LENDX performance was unusually strong for the period shown and should not be extrapolated to future periods. Results for the Portfolios reflect the reinvestment of all dividends, are net of fees and expenses, and reflect waivers of all of the Portfolios’ investment management fees and partial reimbursement of expenses. The Adviser has contractually agreed to waive its management fee and reimburse expenses as necessary to limit total annualized expenses, other than certain excluded expenses, of the Portfolios to 0.15% (for ELUSX and ELSMX) or 0.20% (for ELINX, ELISX and ELMMX) for the fiscal year ended May 31, 2018 and for the period from June 1, 2018 through September 27, 2018. Fee waivers and expense reimbursement may be discontinued in whole or in part after that date. In the absence of fee waivers and reimbursements, returns for the Portfolios would have been lower. Portfolio returns shown do not reflect the deduction of taxes that a shareholder would pay on fund distributions or the redemption of fund shares. Total annual fund operating expenses for the Portfolios as disclosed in the most recent prospectus: for ELUSX, 0.45%; for ELSMX, 0.65%; for ELINX, 0.62%; for ELISX, 0.73%; for ELMMX, 0.86%.
Information furnished by others, upon which all or portions of the information contained herein are based, are from sources believed to be reliable. Stone Ridge makes no representation as to the accuracy, adequacy or completeness of such information and it has accepted the information without further verification.
The information provided herein should not be construed in any way as tax, capital, accounting, legal or regulatory advice. Investors should seek independent legal and financial advice, including advice as to tax consequences, before making any investment decision. Opinions expressed are subject to change at any time, and are not guaranteed and should not be considered investment advice.
| Elements Portfolios | Annual Report | May 31, 2018 | ||||||||||||||
10
Shareholder Letter
The Funds’ and Portfolios’ investment objectives, risks, charges and expenses must be considered carefully before investing. The relevant prospectus contains this and other important information about the investment company. You can obtain an additional copy of the Funds’ and the Portfolios’ most recent periodic reports and certain other regulatory filings by calling 855-609-3860 or visiting www.stoneridgefunds.com for the Funds and www.elementsfunds.com for the Portfolios. The Funds’ and the Portfolios’ prospectuses, which include a statement of additional information, can be found by visiting:
Stone Ridge High Yield Reinsurance Risk Premium Fund1: Prospectus and SAI
Stone Ridge Reinsurance Risk Premium Interval Fund2: Prospectus and SAI
Stone Ridge Post-Event Reinsurance Fund2: Prospectus and SAI
Stone Ridge U.S. Large Cap Variance Risk Premium Fund, Stone Ridge U.S. Small Cap Variance Risk Premium Fund, Stone Ridge U.S. Variance Risk Premium Master Fund, Stone Ridge International Developed Markets Variance Risk Premium Fund, and Stone Ridge Global Equity Variance Risk Premium Master Fund1: Prospectus and SAI
Stone Ridge All Asset Variance Risk Premium Fund2: Prospectus and SAI
Stone Ridge Alternative Lending Risk Premium Fund2: Prospectus and SAI
Elements Portfolios1: Prospectus and SAI
1Open-end fund, 2Closed-end interval fund
The prospectuses should be read carefully before investing.
The Stone Ridge Funds and the Portfolios are distributed by ALPS Distributors, Inc. SRG000565
| Elements Portfolios | Annual Report | May 31, 2018 | ||||||||||||||
11
| ELEMENTS U.S. PORTFOLIO |
| PERFORMANCE DATA (Unaudited) |

This chart assumes an initial gross investment of $10,000 made on April 3, 2017 (commencement of operations). Returns shown reflect the reinvestment of all dividends, and are net of fees and expenses, and reflect waivers of all of the Portfolio’s investment management fee and partial reimbursement of the Portfolio’s expenses by Stone Ridge Asset Management LLC (“Stone Ridge”). Stone Ridge has contractually agreed to waive its management fee and reimburse expenses as necessary to limit total annualized expenses, other than certain excluded expenses, of the Portfolio to 0.15% for the fiscal year ended May 31, 2018 and for the period from June 1, 2018 through September 27, 2018. Fee waivers and expense reimbursement may be discontinued after that date. Returns shown do not reflect the deduction of taxes that a shareholder would pay on fund distributions or the redemption of fund shares. In the absence of fee waivers and reimbursements, returns for the Portfolio would have been lower. Past performance is not predictive of future performance. Investment return and principal value will fluctuate, so that your shares, when redeemed, may be worth more or less than the original cost.
The Russell 1000 Index is an unmanaged index that measures the performance of the stocks of the large-capitalization segment of the U.S. equity universe. Index figures do not reflect any deduction of fees, taxes or expenses, and are not available for investment. Returns shown for the index include reinvestment of all dividends.
| AVERAGE ANNUAL TOTAL RETURNS (FOR PERIODS ENDED MAY 31, 2018) | ||||||||
| 1-year period ended 5/31/18 |
Since Commencement of Operations (4/3/17) |
|||||||
| Elements U.S. Portfolio |
14.02% | 13.12% | ||||||
| Russell 1000 Index |
14.60% | 14.71% | ||||||
| Elements Portfolios | Annual Report | May 31, 2018 | ||||||||||||||
12
| ELEMENTS U.S. SMALL CAP PORTFOLIO |
| PERFORMANCE DATA (Unaudited) |
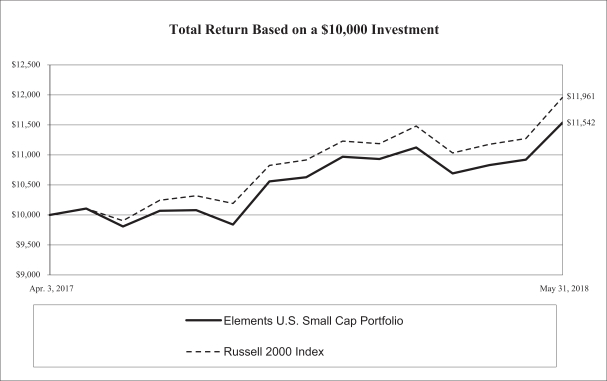
This chart assumes an initial gross investment of $10,000 made on April 3, 2017 (commencement of operations). Returns shown reflect the reinvestment of all dividends, and are net of fees and expenses, and reflect waivers of all of the Portfolio’s investment management fee and partial reimbursement of the Portfolio’s expenses by Stone Ridge. Stone Ridge has contractually agreed to waive its management fee and reimburse expenses as necessary to limit total annualized expenses, other than certain excluded expenses, of the Portfolio to 0.15% for the fiscal year ended May 31, 2018 and for the period from June 1, 2018 through September 27, 2018. Fee waivers and expense reimbursement may be discontinued after that date. Returns shown do not reflect the deduction of taxes that a shareholder would pay on fund distributions or the redemption of fund shares. In the absence of fee waivers and reimbursements, returns for the Portfolio would have been lower. Past performance is not predictive of future performance. Investment return and principal value will fluctuate, so that your shares, when redeemed, may be worth more or less than the original cost.
The Russell 2000 Index is an unmanaged index that measures the performance of the small-capitalization segment of the U.S. equity universe. Index figures do not reflect any deduction of fees, taxes or expenses, and are not available for investment. Returns shown for the index include reinvestment of all dividends.
| AVERAGE ANNUAL TOTAL RETURNS (FOR PERIODS ENDED MAY 31, 2018) | ||||||||
| 1-year period ended 5/31/18 |
Since Commencement of Operations (4/3/17) |
|||||||
| Elements U.S. Small Cap Portfolio |
17.65% | 13.14% | ||||||
| Russell 2000 Index |
20.76% | 16.66% | ||||||
| Elements Portfolios | Annual Report | May 31, 2018 | ||||||||||||||
13
| ELEMENTS INTERNATIONAL PORTFOLIO |
| PERFORMANCE DATA (Unaudited) |
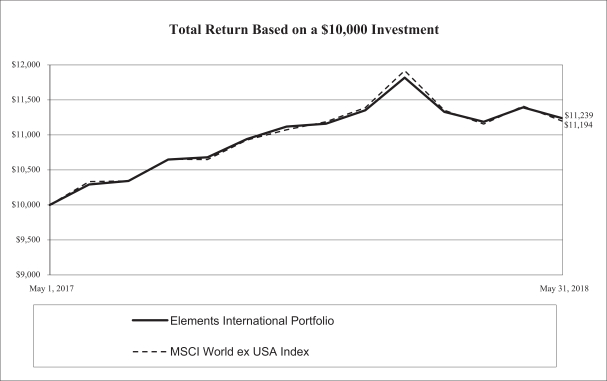
This chart assumes an initial gross investment of $10,000 made on May 1, 2017 (commencement of operations). Returns shown reflect the reinvestment of all dividends, and are net of fees and expenses, and reflect waivers of all of the Portfolio’s investment management fee and partial reimbursement of the Portfolio’s expenses by Stone Ridge. Stone Ridge has contractually agreed to waive its management fee and reimburse expenses as necessary to limit total annualized expenses, other than certain excluded expenses, of the Portfolio to 0.20% for the fiscal year ended May 31, 2018 and for the period from June 1, 2018 through September 27, 2018. Fee waivers and expense reimbursement may be discontinued after that date. Returns shown do not reflect the deduction of taxes that a shareholder would pay on fund distributions or the redemption of fund shares. In the absence of fee waivers and reimbursements, returns for the Portfolio would have been lower. Past performance is not predictive of future performance. Investment return and principal value will fluctuate, so that your shares, when redeemed, may be worth more or less than the original cost.
The MSCI World ex USA Index is a free-float adjusted index which captures large- and mid-cap representation across 22 of 23 developed market countries, as determined by MSCI, excluding the United States. Index figures do not reflect any deduction of fees, taxes or expenses, and are not available for investment. Returns shown for the index include reinvestment of all dividends net of withholding tax.
| AVERAGE ANNUAL TOTAL RETURNS (FOR PERIODS ENDED MAY 31, 2018) | ||||||||
| 1-year period ended 5/31/18 |
Since Operations |
|||||||
| Elements International Portfolio |
9.22% | 11.37% | ||||||
| MSCI World ex USA Index |
8.33% | 10.96% | ||||||
| Elements Portfolios | Annual Report | May 31, 2018 | ||||||||||||||
14
| ELEMENTS INTERNATIONAL SMALL CAP PORTFOLIO |
| PERFORMANCE DATA (Unaudited) |
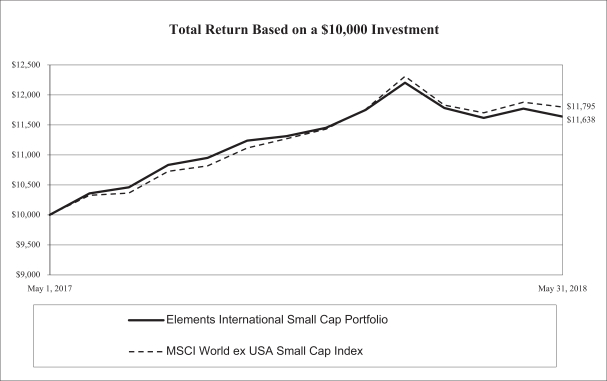
This chart assumes an initial gross investment of $10,000 made on May 1, 2017 (commencement of operations). Returns shown reflect the reinvestment of all dividends, and are net of fees and expenses, and reflect waivers of all of the Portfolio’s investment management fee and partial reimbursement of the Portfolio’s expenses by Stone Ridge. Stone Ridge has contractually agreed to waive its management fee and reimburse expenses as necessary to limit total annualized expenses, other than certain excluded expenses, of the Portfolio to 0.20% for the fiscal year ended May 31, 2018 and for the period from June 1, 2018 through September 27, 2018. Fee waivers and expense reimbursement may be discontinued after that date. Returns shown do not reflect the deduction of taxes that a shareholder would pay on fund distributions or the redemption of fund shares. In the absence of fee waivers and reimbursements, returns for the Portfolio would have been lower. Past performance is not predictive of future performance. Investment return and principal value will fluctuate, so that your shares, when redeemed, may be worth more or less than the original cost.
The MSCI World ex USA Small Cap Index is a free-float adjusted index which captures small-cap representation across 22 or 23 developed market countries, as determined by MSCI, excluding the United States. Index figures do not reflect any deduction of fees, taxes or expenses, and are not available for investment. Returns shown for the index include reinvestment of all dividends net of withholding tax.
| AVERAGE ANNUAL TOTAL RETURNS (FOR PERIODS ENDED MAY 31, 2018) | ||||||||
| 1-year period ended 5/31/18 |
Since Operations |
|||||||
| Elements International Small Cap Portfolio |
12.34% | 15.01% | ||||||
| MSCI World ex USA Small Cap Index |
14.20% | 16.44% | ||||||
| Elements Portfolios | Annual Report | May 31, 2018 | ||||||||||||||
15
| ELEMENTS EMERGING MARKETS PORTFOLIO |
| PERFORMANCE DATA (Unaudited) |

This chart assumes an initial gross investment of $10,000 made on June 1, 2017 (commencement of operations). Returns shown reflect the reinvestment of all dividends, and are net of fees and expenses, and reflect waivers of all of the Portfolio’s investment management fee and partial reimbursement of the Portfolio’s expenses by Stone Ridge. Stone Ridge has contractually agreed to waive its management fee and reimburse expenses as necessary to limit total annualized expenses, other than certain excluded expenses, of the Portfolio to 0.20% for the fiscal year ended May 31, 2018 and for the period from June 1, 2018 through September 27, 2018. Fee waivers and expense reimbursement may be discontinued after that date. Returns shown do not reflect the deduction of taxes that a shareholder would pay on fund distributions or the redemption of fund shares. In the absence of fee waivers and reimbursements, returns for the Portfolio would have been lower. Past performance is not predictive of future performance. Investment return and principal value will fluctuate, so that your shares, when redeemed, may be worth more or less than the original cost.
The MSCI Emerging Markets Index is a free float weighted equity index which captures large and mid-cap representation across Emerging Markets countries, as determined by MSCI. The index covers approximately 85% of the free float-adjusted market capitalization in each country. Index figures do not reflect any deduction of fees, taxes or expenses, and are not available for investment. Returns shown for the index include reinvestment of all dividends net of withholding tax.
| TOTAL RETURNS (FOR PERIOD ENDED MAY 31, 2018) | ||||
| Since Commencement of Operations (6/1/17) |
||||
| Elements Emerging Markets Portfolio |
13.46% | |||
| MSCI Emerging Markets Index |
13.66% | |||
| Elements Portfolios | Annual Report | May 31, 2018 | ||||||||||||||
16
| Management’s Discussion of Fund Performance |
The Elements U.S. Portfolio seeks to capture the equity risk premium by investing in a broad and diverse group of securities or derivatives on U.S. companies, with a focus on intuitive risk factors such as size, value, momentum, and quality that the Adviser believes may contribute to a positive equity risk premium.1 For the 12 months ended May 31, 2018, total returns were 14.02% for the Portfolio and 14.60% for the Russell 1000 Index.2 Periods of positive performance for the Portfolio, such as the most recently completed fiscal year, correspond to periods when the equity risk premium or factors emphasized are positive for U.S. companies. The performance of the Portfolio was primarily driven by the broad trend of the market for U.S. companies as illustrated by the Russell 1000 Index. Differences in Portfolio performance relative to the index were primarily driven by the factors, which contributed negatively in this period. There can be no assurance that the equity risk premium will be positive for the Portfolio’s investments at any time or on average and over time.
The Elements U.S. Small Cap Portfolio seeks to capture the equity risk premium by investing in a broad and diverse group of securities or derivatives on small capitalization U.S. companies, with a focus on intuitive risk factors such as size, value, momentum, and quality that the Adviser believes may contribute to a positive equity risk premium.1 For the 12 months ended May 31, 2018, total returns were 17.65% for the Portfolio and 20.76% for the Russell 2000 Index.3 Periods of positive performance for the Portfolio, such as the most recently completed fiscal year, correspond to periods when the equity risk premium or factors emphasized are positive for U.S. small capitalization companies. The performance of the Portfolio was primarily driven by the broad trend of the market for small capitalization U.S. companies as illustrated by the Russell 2000 Index. Differences in Portfolio performance relative to the index were primarily driven by the factors, which contributed negatively in this period. There can be no assurance that the equity risk premium will be positive for the Portfolio’s investments at any time or on average and over time.
The Elements International Portfolio seeks to capture the equity risk premium by investing in a broad and diverse group of securities or derivatives on companies associated with countries with developed markets, with a focus on intuitive risk factors such as size, value, momentum, and quality that the Adviser believes may contribute to a positive equity risk premium.1 For the 12 months ended May 31, 2018, total returns were 9.22% for the Portfolio and 8.33% for the MSCI World ex USA Index4 (net dividends). Periods of positive performance for the Portfolio, such as the most recently completed fiscal year, correspond to periods when the equity risk premium, factors emphasized, or relevant currencies performances versus the U.S. dollar are positive for developed markets companies. The performance of the Portfolio was primarily driven by the broad trend of the market for developed markets companies as illustrated by the MSCI World ex USA Index. Differences in Portfolio performance relative to the index were primarily driven by the factors, which contributed positively in this period. There can be no assurance that the equity risk premium will be positive for the Portfolio’s investments at any time or on average and over time.
The Elements International Small Cap Portfolio seeks to capture the equity risk premium by investing in a broad and diverse group of securities or derivatives on small capitalization companies associated with countries with developed markets, with a focus on intuitive risk factors such as size, value, momentum, and quality that the Adviser believes may contribute to a positive equity risk premium.1 For the 12 months ended May 31, 2018, total returns were 12.34% for the Portfolio and 14.20% for the MSCI World ex USA Small Cap Index5 (net dividends). Periods of positive performance for the Portfolio, such as the most recently completed fiscal year, correspond to periods when the equity risk premium, factors emphasized, or relevant currencies performances versus the U.S. dollar are positive for small capitalization developed markets companies. The performance of the Portfolio was primarily driven by the broad trend of the market for small capitalization developed markets companies as illustrated by the MSCI World ex USA Small Cap Index. Differences in Portfolio performance relative to the index were primarily driven by the factors, which contributed negatively in this period. There can be no assurance that the equity risk premium will be positive for the Portfolio’s investments at any time or on average and over time.
| 1 | The “equity risk premium” is positive if investment returns for equity securities exceed the risk-free rate, on average and over time. The “risk-free rate” is the rate of return that can be earned on high quality, short-term government debt securities. |
| 2 | The Russell 1000 Index consists of the largest 1000 companies in the Russell 3000 Index. |
| 3 | The Russell 2000 Index is comprised of the smallest 2000 companies in the Russell 3000 Index. |
| 4 | The MSCI World ex USA Index captures large and mid cap representation across 22 of 23 Developed Markets countries — excluding the United States. |
| 5 | The MSCI World ex USA Small Cap Index captures small cap representation across 22 of 23 Developed Markets countries — excluding the United States. |
Past performance does not guarantee future results. Indices are not investable and do not reflect any fees or transaction costs.
| Elements Portfolios | Annual Report | May 31, 2018 | ||||||||||||||
17
| Management’s Discussion of Fund Performance |
The Elements Emerging Markets Portfolio seeks to capture the equity risk premium by investing in a broad and diverse group of securities or derivatives associated with countries with emerging markets, with a focus on intuitive risk factors such as size, value, momentum, and quality that the Adviser believes may contribute to a positive equity risk premium.1 For the 12 months ended May 31, 2018, total returns were 13.46% for the Portfolio and 13.66% for the MSCI Emerging Markets Index6 (net dividends). Periods of positive performance for the Portfolio, such as the most recently completed fiscal year, correspond to periods when the equity risk premium, factors emphasized, or relevant currencies performances versus the U.S. dollar are positive for emerging markets companies. The performance of the Portfolio was primarily driven by the broad trend of the market for emerging markets companies as illustrated by the MSCI Emerging Markets Index. Differences in Portfolio performance relative to the index were primarily driven by the factors, which contributed negatively in this period. There can be no assurance that the equity risk premium will be positive for the Portfolio’s investments at any time or on average and over time.
Investors should carefully consider the risks and investment objectives of the Elements U.S. Portfolio, Elements U.S. Small Cap Portfolio, Elements International Portfolio, Elements International Small Cap Portfolio and Elements Emerging Markets Portfolio (collectively, the “Portfolios”), as an investment in a Portfolio may not be appropriate for all investors and the Portfolios are not designed to be a complete investment program. An investment in a Portfolio involves a high degree of risk. It is possible that investing in a Portfolio may result in a loss of some or all of the amount invested. Before making an investment/allocation decision, investors should (i) consider the suitability of this investment with respect to an investor’s or a client’s investment objectives and individual situation and (ii) consider factors such as an investor’s or a client’s net worth, income, age and risk tolerance. Investment should be avoided where an investor/client has a short-term investing horizon and/or cannot bear the loss of some or all of the investment. Before investing in a Portfolio, an investor should read the discussion of the risks of investing in the Portfolio in the prospectus.
Mutual fund investing involves risk. Principal loss is possible.
Economic, political, and issuer-specific events will cause the value of securities, and the Portfolio that owns them, to rise or fall. Because the value of your investment in a Portfolio will fluctuate, you may lose money, even over the long term. Securities of smaller companies are often less liquid than those of larger companies, and smaller companies are generally more vulnerable to adverse business or economic developments and may have more limited resources. Foreign securities prices may decline or fluctuate because of economic or political actions of foreign governments and/or less regulated or liquid securities markets and may give rise to foreign currency risk. Securities of companies that exhibit other factors such as value, momentum or quality may be riskier than securities of companies that do not exhibit those factors, and may perform differently from the market as a whole. If a Portfolio uses derivatives, such Portfolio will be directly exposed to the risks of that derivative, including the risk that the counterparty is unable or unwilling to perform its obligations. Derivatives are subject to a number of additional risks, including risks associated with liquidity, interest rates, market movements and valuation. Securities lending and similar transactions involve the risk that the counterparty may fail to return the securities in a timely manner or at all and that the value of collateral securing a securities loan or similar transaction falls. Please see the prospectus for a complete list of risks.
Each Portfolio is classified as non-diversified under the 1940 Act. Each Portfolio is an open-end management investment company.
The Portfolios’ investment objectives, risks, charges and expenses must be considered carefully before investing. The prospectus contains this and other important information about the Portfolios. You can obtain an additional copy of the Portfolios’ most recent periodic reports and certain other regulatory filings by calling 855-609-3680 or visiting www.elementsfunds.com. The Portfolios’ prospectus, which includes a statement of additional information, can be found by visiting www.elementsfunds.com. The prospectus should be read carefully before investing.
The Elements Portfolios are distributed by ALPS Distributors, Inc. SRG000566
| 6 | The MSCI Emerging Markets Index captures large and mid cap representation across 24 Emerging Markets countries. |
| Elements Portfolios | Annual Report | May 31, 2018 | ||||||||||||||
18
Past performance does not guarantee future results. Indices are not investable and do not reflect any fees or transaction costs.
| ALLOCATION OF PORTFOLIO HOLDINGS AT MAY 31, 2018 (Unaudited) |
| The accompanying Notes to the Financial Statements are an integral part of these Financial Statements. |
| Elements Portfolios | Annual Report | May 31, 2018 | ||||||||||||||
20
| Schedule of Investments | as of May 31, 2018 |
| ELEMENTS U.S. PORTFOLIO |
| The accompanying Notes to the Financial Statements are an integral part of these Financial Statements. | (Continued) |
| Elements Portfolios | Annual Report | May 31, 2018 | ||||||||||||||
22
| Schedule of Investments | as of May 31, 2018 |
| ELEMENTS U.S. PORTFOLIO |
| The accompanying Notes to the Financial Statements are an integral part of these Financial Statements. | (Continued) |
| Elements Portfolios | Annual Report | May 31, 2018 | ||||||||||||||
23
| Schedule of Investments | as of May 31, 2018 |
| ELEMENTS U.S. PORTFOLIO |
| The accompanying Notes to the Financial Statements are an integral part of these Financial Statements. | (Continued) |
| Elements Portfolios | Annual Report | May 31, 2018 | ||||||||||||||
24
| Schedule of Investments | as of May 31, 2018 |
| ELEMENTS U.S. PORTFOLIO |
| The accompanying Notes to the Financial Statements are an integral part of these Financial Statements. | (Continued) |
| Elements Portfolios | Annual Report | May 31, 2018 | ||||||||||||||
25
| Schedule of Investments | as of May 31, 2018 |
| ELEMENTS U.S. PORTFOLIO |
| The accompanying Notes to the Financial Statements are an integral part of these Financial Statements. | (Continued) |
| Elements Portfolios | Annual Report | May 31, 2018 | ||||||||||||||
26
| Schedule of Investments | as of May 31, 2018 |
| ELEMENTS U.S. PORTFOLIO |
| The accompanying Notes to the Financial Statements are an integral part of these Financial Statements. | (Continued) |
| Elements Portfolios | Annual Report | May 31, 2018 | ||||||||||||||
27
| Schedule of Investments | as of May 31, 2018 |
| ELEMENTS U.S. PORTFOLIO |
Open Futures Contracts
| DESCRIPTION | NUMBER OF CONTRACTS PURCHASED |
NOTIONAL VALUE |
VALUE/ UNREALIZED DEPRECIATION |
|||||||||
| FUTURES CONTRACTS PURCHASED | ||||||||||||
| S&P 500 E-Mini Index, June 2018 Settlement |
894 | $ | 120,935,850 | $ | (1,120,367) | |||||||
|
|
|
|
|
|||||||||
| TOTAL FUTURES CONTRACTS PURCHASED |
$ | 120,935,850 | $ | (1,120,367) | ||||||||
|
|
|
|
|
|||||||||
Total Return Swaps
| COUNTERPARTY (a) | REFERENCE ENTITY | PAY/RECEIVE RETURN
ON |
BASE FINANCING RATE (b) |
TERMINATION DATE |
PAYMENT FREQUENCY |
NOTIONAL VALUE |
NUMBER OF UNITS |
UNREALIZED APPRECIATION (DEPRECIATION) |
||||||||||||||||||
| A |
Affiliated Managers Group, Inc. | Pay | 1-Month LIBOR USD | 6/13/2018 | Term | $ | 449,020 | 2,750 | $ | 10,842 | ||||||||||||||||
| A |
Alphabet, Inc. — Class A | Pay | 1-Month LIBOR USD | 6/4/2018 | Term | 177,409 | 172 | (11,445) | ||||||||||||||||||
| A |
Alphabet, Inc. — Class A | Pay | 1-Month LIBOR USD | 6/13/2018 | Term | 3,810,924 | 3,600 | (143,880) | ||||||||||||||||||
| A |
Amazon.com, Inc. | Pay | 1-Month LIBOR USD | 6/4/2018 | Term | 501,666 | 319 | (17,207) | ||||||||||||||||||
| A |
Amazon.com, Inc. | Pay | 1-Month LIBOR USD | 6/13/2018 | Term | 5,095,648 | 3,200 | (112,189) | ||||||||||||||||||
| A |
Apple, Inc. | Pay | 1-Month LIBOR USD | 6/13/2018 | Term | 2,204,134 | 11,847 | (15,358) | ||||||||||||||||||
| B |
Arconic, Inc. | Pay | 1-Month LIBOR USD | 7/25/2018 | Term | 2,301,306 | 104,700 | 452,483 | ||||||||||||||||||
| A |
Arrow Electronics, Inc. | Pay | 1-Month LIBOR USD | 6/13/2018 | Term | 508,217 | 6,769 | 7,191 | ||||||||||||||||||
| A |
Berkshire Hathaway, Inc. — Class B | Pay | 1-Month LIBOR USD | 6/4/2018 | Term | 471,577 | 2,391 | 14,546 | ||||||||||||||||||
| A |
Best Buy Co., Inc. | Pay | 1-Month LIBOR USD | 6/4/2018 | Term | 105,853 | 1,374 | 12,283 | ||||||||||||||||||
| B |
Biogen, Inc. | Pay | 1-Month LIBOR USD | 7/25/2018 | Term | 1,926,599 | 7,430 | (252,866) | ||||||||||||||||||
| A |
Broadcom, Inc. | Pay | 1-Month LIBOR USD | 6/4/2018 | Term | 155,497 | 668 | (12,583) | ||||||||||||||||||
| B |
Broadcom, Inc. | Pay | 1-Month LIBOR USD | 7/25/2018 | Term | 3,093,446 | 13,251 | (239,254) | ||||||||||||||||||
| A |
CA, Inc. | Pay | 1-Month LIBOR USD | 6/13/2018 | Term | 577,567 | 16,712 | (23,194) | ||||||||||||||||||
| A |
CBRE Group, Inc. — Class A | Pay | 1-Month LIBOR USD | 6/13/2018 | Term | 609,585 | 13,115 | 4,634 | ||||||||||||||||||
| B |
Choice Hotels International, Inc. | Pay | 1-Month LIBOR USD | 7/25/2018 | Term | 2,352,735 | 29,100 | 20,085 | ||||||||||||||||||
| A |
Church & Dwight Co., Inc. | Pay | 1-Month LIBOR USD | 6/13/2018 | Term | 403,891 | 8,462 | 5,311 | ||||||||||||||||||
| B |
Cisco Systems, Inc. | Pay | 1-Month LIBOR USD | 7/25/2018 | Term | 3,101,660 | 70,094 | 115,444 | ||||||||||||||||||
| A |
Citigroup, Inc. | Pay | 1-Month LIBOR USD | 6/4/2018 | Term | 85,410 | 1,238 | 2,617 | ||||||||||||||||||
| A |
Dell Technologies, Inc. — Class V | Pay | 1-Month LIBOR USD | 6/4/2018 | Term | 155,262 | 2,138 | (16,887) | ||||||||||||||||||
| The accompanying Notes to the Financial Statements are an integral part of these Financial Statements. | (Continued) |
| Elements Portfolios | Annual Report | May 31, 2018 | ||||||||||||||
28
| Schedule of Investments | as of May 31, 2018 |
| ELEMENTS U.S. PORTFOLIO |
| COUNTERPARTY (a) | REFERENCE ENTITY | PAY/RECEIVE RETURN
ON |
BASE FINANCING RATE (b) |
TERMINATION DATE |
PAYMENT FREQUENCY |
NOTIONAL VALUE |
NUMBER OF UNITS |
UNREALIZED APPRECIATION (DEPRECIATION) |
||||||||||||||||||
| A |
Duke Energy Corp. | Pay | 1-Month LIBOR USD | 6/4/2018 | Term | $ | 158,263 | 1,966 | $ | 5,125 | ||||||||||||||||
| A |
Electronic Arts, Inc. | Pay | 1-Month LIBOR USD | 6/13/2018 | Term | 483,171 | 3,900 | (26,719) | ||||||||||||||||||
| A |
Exelixis, Inc. | Pay | 1-Month LIBOR USD | 6/13/2018 | Term | 421,742 | 19,462 | 18,869 | ||||||||||||||||||
| A |
Express Scripts Holdings Co. | Pay | 1-Month LIBOR USD | 6/4/2018 | Term | 162,141 | 2,100 | 3,255 | ||||||||||||||||||
| A |
Exxon Mobil Corp. | Pay | 1-Month LIBOR USD | 6/13/2018 | Term | 3,592,140 | 46,000 | (177,723) | ||||||||||||||||||
| A |
Facebook, Inc. — Class A | Pay | 1-Month LIBOR USD | 6/4/2018 | Term | 182,270 | 1,050 | (18,745) | ||||||||||||||||||
| A |
Fidelity National Financial, Inc. | Pay | 1-Month LIBOR USD | 6/13/2018 | Term | 565,315 | 15,019 | 10,984 | ||||||||||||||||||
| A |
Flir Systems, Inc. | Pay | 1-Month LIBOR USD | 6/13/2018 | Term | 734,584 | 13,327 | 15,128 | ||||||||||||||||||
| A |
Fortune Brands Home & Security, Inc. | Pay | 1-Month LIBOR USD | 6/13/2018 | Term | 527,543 | 9,519 | (8,324) | ||||||||||||||||||
| A |
Gilead Sciences, Inc. | Pay | 1-Month LIBOR USD | 6/4/2018 | Term | 169,213 | 2,291 | 15,129 | ||||||||||||||||||
| B |
Gilead Sciences, Inc. | Pay | 1-Month LIBOR USD | 7/25/2018 | Term | 3,102,499 | 41,920 | 284,592 | ||||||||||||||||||
| A |
Home Depot, Inc. | Pay | 1-Month LIBOR USD | 6/13/2018 | Term | 3,700,800 | 20,000 | (45,755) | ||||||||||||||||||
| A |
HP, Inc. | Pay | 1-Month LIBOR USD | 6/13/2018 | Term | 655,001 | 29,827 | (1,195) | ||||||||||||||||||
| A |
IBM Common Stock | Pay | 1-Month LIBOR USD | 6/4/2018 | Term | 271,281 | 1,852 | 7,195 | ||||||||||||||||||
| B |
Ingersoll-Rand PLC | Pay | 1-Month LIBOR USD | 7/25/2018 | Term | 1,031,092 | 12,384 | (50,511) | ||||||||||||||||||
| A |
Intel Corp. | Pay | 1-Month LIBOR USD | 6/13/2018 | Term | 4,783,796 | 89,200 | (133,522) | ||||||||||||||||||
| A |
Johnson & Johnson | Pay | 1-Month LIBOR USD | 6/13/2018 | Term | 426,683 | 3,480 | 7,855 | ||||||||||||||||||
| A |
JP Morgan Chase & Co. | Pay | 1-Month LIBOR USD | 6/4/2018 | Term | 140,579 | 1,285 | 3,345 | ||||||||||||||||||
| B |
Kar Auction Services, Inc. | Pay | 1-Month LIBOR USD | 7/25/2018 | Term | 2,289,472 | 43,100 | 20,620 | ||||||||||||||||||
| B |
Keysight Technologies, Inc. | Pay | 1-Month LIBOR USD | 7/25/2018 | Term | 2,369,562 | 44,200 | (221,171) | ||||||||||||||||||
| A |
Kohls Corp. | Pay | 1-Month LIBOR USD | 6/4/2018 | Term | 59,463 | 954 | (4,101) | ||||||||||||||||||
| A |
L3 Technologies, Inc. | Pay | 1-Month LIBOR USD | 6/4/2018 | Term | 116,802 | 592 | (856) | ||||||||||||||||||
| B |
Laboratory Corp. of America Holdings | Pay | 1-Month LIBOR USD | 7/25/2018 | Term | 2,756,928 | 16,600 | (234,380) | ||||||||||||||||||
| A |
Lear Corp. | Pay | 1-Month LIBOR USD | 6/13/2018 | Term | 728,813 | 3,808 | (24,177) | ||||||||||||||||||
| A |
Leidos Holdings Corp. | Pay | 1-Month LIBOR USD | 6/13/2018 | Term | 533,650 | 8,673 | 13,477 | ||||||||||||||||||
| A |
Lincoln National Corp. | Pay | 1-Month LIBOR USD | 6/13/2018 | Term | 520,866 | 7,615 | 16,778 | ||||||||||||||||||
| A |
LKQ Corp. | Pay | 1-Month LIBOR USD | 6/13/2018 | Term | 490,831 | 16,077 | (19,266) | ||||||||||||||||||
| B |
Lockheed Martin Corp. | Pay | 1-Month LIBOR USD | 7/25/2018 | Term | 2,868,800 | 8,000 | 343,416 | ||||||||||||||||||
| A |
Manpower Group, Inc. | Pay | 1-Month LIBOR USD | 6/13/2018 | Term | 466,943 | 4,865 | 24,816 | ||||||||||||||||||
| B |
McDonald’s Corp. | Pay | 1-Month LIBOR USD | 7/25/2018 | Term | 3,091,243 | 19,443 | (12,358) | ||||||||||||||||||
| B |
MGM Resorts International | Pay | 1-Month LIBOR USD | 7/25/2018 | Term | 3,099,697 | 85,698 | 411,989 | ||||||||||||||||||
| B |
Micron Technology, Inc. | Pay | 1-Month LIBOR USD | 7/25/2018 | Term | 3,083,897 | 62,911 | (531,691) | ||||||||||||||||||
| A |
Microsoft Corp. | Pay | 1-Month LIBOR USD | 6/13/2018 | Term | 2,209,283 | 23,059 | (76,542) | ||||||||||||||||||
| B |
Mondelex International, Inc. — Class A | Pay | 1-Month LIBOR USD | 7/25/2018 | Term | 3,014,145 | 74,700 | 87,963 | ||||||||||||||||||
| A |
Monsanto Co. | Pay | 1-Month LIBOR USD | 6/4/2018 | Term | 219,623 | 1,756 | (3,770) | ||||||||||||||||||
| B |
Norwegian Cruise Line Holdings Ltd. | Pay | 1-Month LIBOR USD | 7/25/2018 | Term | 4,216,809 | 74,305 | 337,880 | ||||||||||||||||||
| A |
Park Hotels & Resorts, Inc. | Pay | 1-Month LIBOR USD | 6/13/2018 | Term | 542,122 | 18,192 | (43,286) | ||||||||||||||||||
| A |
PG&E Corp. | Pay | 1-Month LIBOR USD | 6/13/2018 | Term | 453,362 | 10,600 | (5,318) | ||||||||||||||||||
| A |
Pinnacle West Capital Corp. | Pay | 1-Month LIBOR USD | 6/13/2018 | Term | 563,134 | 7,192 | (8,654) | ||||||||||||||||||
| A |
Proctor & Gamble Co. | Pay | 1-Month LIBOR USD | 6/4/2018 | Term | 430,890 | 5,918 | (1,292) | ||||||||||||||||||
| A |
Robert Half International, Inc. | Pay | 1-Month LIBOR USD | 6/13/2018 | Term | 730,213 | 11,635 | (12,966) | ||||||||||||||||||
| A |
Rockwell Collins, Inc. | Pay | 1-Month LIBOR USD | 6/4/2018 | Term | 121,828 | 916 | (4,196) | ||||||||||||||||||
| B |
Royal Caribbean Cruises Ltd. | Pay | 1-Month LIBOR USD | 7/25/2018 | Term | 3,098,454 | 25,883 | 388,748 | ||||||||||||||||||
| The accompanying Notes to the Financial Statements are an integral part of these Financial Statements. | (Continued) |
| Elements Portfolios | Annual Report | May 31, 2018 | ||||||||||||||
29
| Schedule of Investments | as of May 31, 2018 |
| ELEMENTS U.S. PORTFOLIO |
| COUNTERPARTY (a) | REFERENCE ENTITY | PAY/RECEIVE RETURN
ON |
BASE FINANCING RATE (b) |
TERMINATION DATE |
PAYMENT FREQUENCY |
NOTIONAL VALUE |
NUMBER OF UNITS |
UNREALIZED APPRECIATION (DEPRECIATION) |
||||||||||||||||||
| A |
Schlumberger, Inc. | Pay | 1-Month LIBOR USD | 6/13/2018 | Term | $ | 4,677,956 | 67,270 | $ | 64,902 | ||||||||||||||||
| B |
Spirit Aerosystems Holdings — Class A | Pay | 1-Month LIBOR USD | 7/25/2018 | Term | 2,030,616 | 25,200 | (99,166) | ||||||||||||||||||
| A |
Torchmark Corp. | Pay | 1-Month LIBOR USD | 6/13/2018 | Term | 593,664 | 6,981 | 2,275 | ||||||||||||||||||
| B |
Tyson Foods, Inc. — Class A | Pay | 1-Month LIBOR USD | 7/25/2018 | Term | 2,399,617 | 34,100 | 94,306 | ||||||||||||||||||
| A |
Universal Health Services, Inc. — Class B | Pay | 1-Month LIBOR USD | 6/13/2018 | Term | 662,306 | 5,712 | 5,872 | ||||||||||||||||||
| B |
Valmont Industries, Inc. | Pay | 1-Month LIBOR USD | 7/25/2018 | Term | 343,320 | 2,400 | (6,632) | ||||||||||||||||||
| A |
Waste Management, Inc. | Pay | 1-Month LIBOR USD | 6/4/2018 | Term | 83,205 | 1,011 | (253) | ||||||||||||||||||
| A |
Western Digital Corp. | Pay | 1-Month LIBOR USD | 6/4/2018 | Term | 152,863 | 1,890 | (4,673) | ||||||||||||||||||
|
|
|
|
|
|||||||||||||||||||||||
| $ | 98,215,896 | $ | 207,850 | |||||||||||||||||||||||
|
|
|
|
|
|||||||||||||||||||||||
| (a) | See Note 2. |
| (b) | The swaps accrue financing fees according to the relevant base financing rate, which resets periodically, plus a fixed spread. |
| The accompanying Notes to the Financial Statements are an integral part of these Financial Statements. |
| Elements Portfolios | Annual Report | May 31, 2018 | ||||||||||||||
30
| Schedule of Investments | as of May 31, 2018 |
| ELEMENTS U.S. SMALL CAP PORTFOLIO |
| The accompanying Notes to the Financial Statements are an integral part of these Financial Statements. | (Continued) |
| Elements Portfolios | Annual Report | May 31, 2018 | ||||||||||||||
32
| Schedule of Investments | as of May 31, 2018 |
| ELEMENTS U.S. SMALL CAP PORTFOLIO |
| The accompanying Notes to the Financial Statements are an integral part of these Financial Statements. | (Continued) |
| Elements Portfolios | Annual Report | May 31, 2018 | ||||||||||||||
33
| Schedule of Investments | as of May 31, 2018 |
| ELEMENTS U.S. SMALL CAP PORTFOLIO |
| The accompanying Notes to the Financial Statements are an integral part of these Financial Statements. | (Continued) |
| Elements Portfolios | Annual Report | May 31, 2018 | ||||||||||||||
34
| Schedule of Investments | as of May 31, 2018 |
| ELEMENTS U.S. SMALL CAP PORTFOLIO |
| The accompanying Notes to the Financial Statements are an integral part of these Financial Statements. | (Continued) |
| Elements Portfolios | Annual Report | May 31, 2018 | ||||||||||||||
35
| Schedule of Investments | as of May 31, 2018 |
| ELEMENTS U.S. SMALL CAP PORTFOLIO |
| The accompanying Notes to the Financial Statements are an integral part of these Financial Statements. | (Continued) |
| Elements Portfolios | Annual Report | May 31, 2018 | ||||||||||||||
36
| Schedule of Investments | as of May 31, 2018 |
| ELEMENTS U.S. SMALL CAP PORTFOLIO |
| The accompanying Notes to the Financial Statements are an integral part of these Financial Statements. | (Continued) |
| Elements Portfolios | Annual Report | May 31, 2018 | ||||||||||||||
37
| Schedule of Investments | as of May 31, 2018 |
| ELEMENTS U.S. SMALL CAP PORTFOLIO |
| The accompanying Notes to the Financial Statements are an integral part of these Financial Statements. | (Continued) |
| Elements Portfolios | Annual Report | May 31, 2018 | ||||||||||||||
38
| Schedule of Investments | as of May 31, 2018 |
| ELEMENTS U.S. SMALL CAP PORTFOLIO |
| The accompanying Notes to the Financial Statements are an integral part of these Financial Statements. | (Continued) |
| Elements Portfolios | Annual Report | May 31, 2018 | ||||||||||||||
39
| Schedule of Investments | as of May 31, 2018 |
| ELEMENTS U.S. SMALL CAP PORTFOLIO |
| The accompanying Notes to the Financial Statements are an integral part of these Financial Statements. | (Continued) |
| Elements Portfolios | Annual Report | May 31, 2018 | ||||||||||||||
40
| Schedule of Investments | as of May 31, 2018 |
| ELEMENTS U.S. SMALL CAP PORTFOLIO |
| The accompanying Notes to the Financial Statements are an integral part of these Financial Statements. | (Continued) |
| Elements Portfolios | Annual Report | May 31, 2018 | ||||||||||||||
41
| Schedule of Investments | as of May 31, 2018 |
| ELEMENTS U.S. SMALL CAP PORTFOLIO |
| The accompanying Notes to the Financial Statements are an integral part of these Financial Statements. | (Continued) |
| Elements Portfolios | Annual Report | May 31, 2018 | ||||||||||||||
42
| Schedule of Investments | as of May 31, 2018 |
| ELEMENTS U.S. SMALL CAP PORTFOLIO |
Open Futures Contracts
| DESCRIPTION | NUMBER OF CONTRACTS PURCHASED |
NOTIONAL VALUE |
VALUE/ UNREALIZED APPRECIATION |
|||||||||
| FUTURES CONTRACTS PURCHASED | ||||||||||||
| Russell 2000 Mini Index, June 2018 Settlement |
906 | $ | 74,029,260 | $ | 933,671 | |||||||
|
|
|
|
|
|||||||||
| TOTAL FUTURES CONTRACTS PURCHASED |
$ | 74,029,260 | $ | 933,671 | ||||||||
|
|
|
|
|
|||||||||
Total Return Swaps
| COUNTERPARTY (a) | REFERENCE ENTITY | PAY/RECEIVE TOTAL RETURN ON REFERENCE ENTITY |
BASE FINANCING RATE (b) |
TERMINATION DATE |
PAYMENT FREQUENCY |
NOTIONAL VALUE |
NUMBER OF UNITS |
UNREALIZED APPRECIATION (DEPRECIATION) |
||||||||||||||||||
| A |
Alphabet, Inc. — Class A | Pay | 1-Month LIBOR USD | 6/4/2018 | Term | $ | 1,807,100 | 1,752 | $ | (116,584) | ||||||||||||||||
| A |
Alphabet, Inc. — Class A | Pay | 1-Month LIBOR USD | 6/13/2018 | Term | 3,810,924 | 3,600 | (143,881) | ||||||||||||||||||
| A |
Amazon.com, Inc. | Pay | 1-Month LIBOR USD | 6/4/2018 | Term | 1,401,205 | 891 | (48,061) | ||||||||||||||||||
| A |
Amazon.com, Inc. | Pay | 1-Month LIBOR USD | 6/13/2018 | Term | 5,095,648 | 3,200 | (112,189) | ||||||||||||||||||
| A |
Berkshire Hathaway, Inc. — Class B | Pay | 1-Month LIBOR USD | 6/4/2018 | Term | 1,318,680 | 6,686 | 40,676 | ||||||||||||||||||
| A |
Best Buy Co., Inc. | Pay | 1-Month LIBOR USD | 6/4/2018 | Term | 1,079,485 | 14,012 | 125,266 | ||||||||||||||||||
| B |
Biogen, Inc. | Pay | 1-Month LIBOR USD | 7/25/2018 | Term | 273,043 | 1,053 | (35,837) | ||||||||||||||||||
| A |
Broadcom, Inc. | Pay | 1-Month LIBOR USD | 6/4/2018 | Term | 1,585,697 | 6,812 | (128,318) | ||||||||||||||||||
| B |
Broadcom, Inc. | Pay | 1-Month LIBOR USD | 7/25/2018 | Term | 438,419 | 1,878 | (33,908) | ||||||||||||||||||
| B |
Cisco Systems, Inc. | Pay | 1-Month LIBOR USD | 7/25/2018 | Term | 439,535 | 9,933 | 16,360 | ||||||||||||||||||
| A |
Citigroup, Inc. | Pay | 1-Month LIBOR USD | 6/4/2018 | Term | 870,309 | 12,615 | 26,671 | ||||||||||||||||||
| A |
Dell Technologies, Inc. — Class V | Pay | 1-Month LIBOR USD | 6/4/2018 | Term | 1,582,898 | 21,797 | (172,168) | ||||||||||||||||||
| A |
Duke Energy Corp. | Pay | 1-Month LIBOR USD | 6/4/2018 | Term | 1,613,703 | 20,046 | 52,252 | ||||||||||||||||||
| A |
Express Scripts Holding Co. | Pay | 1-Month LIBOR USD | 6/4/2018 | Term | 1,652,912 | 21,408 | 33,187 | ||||||||||||||||||
| A |
Exxon Mobil Corp. | Pay | 1-Month LIBOR USD | 6/13/2018 | Term | 3,592,140 | 46,000 | (177,723) | ||||||||||||||||||
| A |
Facebook, Inc. — Class A | Pay | 1-Month LIBOR USD | 6/4/2018 | Term | 1,858,107 | 10,704 | (191,091) | ||||||||||||||||||
| The accompanying Notes to the Financial Statements are an integral part of these Financial Statements. | (Continued) |
| Elements Portfolios | Annual Report | May 31, 2018 | ||||||||||||||
43
| Schedule of Investments | as of May 31, 2018 |
| ELEMENTS U.S. SMALL CAP PORTFOLIO |
| COUNTERPARTY (a) | REFERENCE ENTITY | PAY/RECEIVE TOTAL RETURN ON REFERENCE ENTITY |
BASE FINANCING RATE (b) |
TERMINATION DATE |
PAYMENT FREQUENCY |
NOTIONAL VALUE |
NUMBER OF UNITS |
UNREALIZED APPRECIATION (DEPRECIATION) |
||||||||||||||||||
| B |
General Motors Co. | Pay | 1-Month LIBOR USD | 7/25/2018 | Term | $ | 942,250 | 25,000 | $ | (122,972) | ||||||||||||||||
| A |
Gilead Sciences, Inc. | Pay | 1-Month LIBOR USD | 6/4/2018 | Term | 1,724,926 | 23,354 | 154,223 | ||||||||||||||||||
| B |
Gilead Sciences, Inc. | Pay | 1-Month LIBOR USD | 7/25/2018 | Term | 439,693 | 5,941 | 40,333 | ||||||||||||||||||
| A |
Home Depot, Inc. | Pay | 1-Month LIBOR USD | 6/13/2018 | Term | 3,700,801 | 20,000 | (45,755) | ||||||||||||||||||
| B |
Ingersoll-Rand PLC | Pay | 1-Month LIBOR USD | 7/25/2018 | Term | 146,121 | 1,755 | (7,158) | ||||||||||||||||||
| A |
Intel Corp. | Pay | 1-Month LIBOR USD | 6/13/2018 | Term | 4,783,796 | 89,200 | (133,522) | ||||||||||||||||||
| A |
International Business Machines Corp. | Pay | 1-Month LIBOR USD | 6/4/2018 | Term | 2,765,250 | 18,878 | 73,341 | ||||||||||||||||||
| A |
JP Morgan Chase & Co. | Pay | 1-Month LIBOR USD | 6/4/2018 | Term | 1,432,155 | 13,091 | 34,074 | ||||||||||||||||||
| A |
Kohl’s Corp. | Pay | 1-Month LIBOR USD | 6/4/2018 | Term | 606,533 | 9,731 | (41,831) | ||||||||||||||||||
| A |
L3 Technologies, Inc. | Pay | 1-Month LIBOR USD | 6/4/2018 | Term | 1,190,311 | 6,033 | (8,725) | ||||||||||||||||||
| B |
McDonald’s Corp. | Pay | 1-Month LIBOR USD | 7/25/2018 | Term | 438,017 | 2,755 | (1,751) | ||||||||||||||||||
| B |
MGM Resorts International | Pay | 1-Month LIBOR USD | 7/25/2018 | Term | 439,249 | 12,144 | 58,382 | ||||||||||||||||||
| B |
Micron Technology, Inc. | Pay | 1-Month LIBOR USD | 7/25/2018 | Term | 437,013 | 8,915 | (75,345) | ||||||||||||||||||
| A |
Monsanto Co. | Pay | 1-Month LIBOR USD | 6/4/2018 | Term | 2,239,378 | 17,905 | (38,436) | ||||||||||||||||||
| B |
Norwegian Cruise Line Holdings Ltd. | Pay | 1-Month LIBOR USD | 7/25/2018 | Term | 597,578 | 10,530 | 47,882 | ||||||||||||||||||
| A |
Proctor & Gamble Co. | Pay | 1-Month LIBOR USD | 6/4/2018 | Term | 4,392,700 | 60,331 | (13,173) | ||||||||||||||||||
| A |
Regeneron Pharmeceuticals, Inc. | Pay | 1-Month LIBOR USD | 6/4/2018 | Term | 857,757 | 2,740 | 36,549 | ||||||||||||||||||
| A |
Rockwell Collins, Inc. | Pay | 1-Month LIBOR USD | 6/4/2018 | Term | 1,242,486 | 9,342 | (42,798) | ||||||||||||||||||
| B |
Royal Caribbean Cruises, Ltd. | Pay | 1-Month LIBOR USD | 7/25/2018 | Term | 439,096 | 3,668 | 55,091 | ||||||||||||||||||
| A |
Western Digital Corp. | Pay | 1-Month LIBOR USD | 6/4/2018 | Term | 1,558,315 | 19,267 | (47,640) | ||||||||||||||||||
|
|
|
|
|
|||||||||||||||||||||||
| $ | 58,793,230 | $ | (944,579) | |||||||||||||||||||||||
|
|
|
|
|
|||||||||||||||||||||||
| (a) | See Note 2. |
| (b) | The swaps accrue financing fees according to the relevant base financing rate, which resets periodically, plus a fixed spread. |
| The accompanying Notes to the Financial Statements are an integral part of these Financial Statements. |
| Elements Portfolios | Annual Report | May 31, 2018 | ||||||||||||||
44
| Schedule of Investments | as of May 31, 2018 |
| ELEMENTS INTERNATIONAL PORTFOLIO |
| The accompanying Notes to the Financial Statements are an integral part of these Financial Statements. | (Continued) |
| Elements Portfolios | Annual Report | May 31, 2018 | ||||||||||||||
46
| Schedule of Investments | as of May 31, 2018 |
| ELEMENTS INTERNATIONAL PORTFOLIO |
| The accompanying Notes to the Financial Statements are an integral part of these Financial Statements. | (Continued) |
| Elements Portfolios | Annual Report | May 31, 2018 | ||||||||||||||
47
| Schedule of Investments | as of May 31, 2018 |
| ELEMENTS INTERNATIONAL PORTFOLIO |
| The accompanying Notes to the Financial Statements are an integral part of these Financial Statements. | (Continued) |
| Elements Portfolios | Annual Report | May 31, 2018 | ||||||||||||||
48
| Schedule of Investments | as of May 31, 2018 |
| ELEMENTS INTERNATIONAL PORTFOLIO |
| The accompanying Notes to the Financial Statements are an integral part of these Financial Statements. | (Continued) |
| Elements Portfolios | Annual Report | May 31, 2018 | ||||||||||||||
49
| Schedule of Investments | as of May 31, 2018 |
| ELEMENTS INTERNATIONAL PORTFOLIO |
| The accompanying Notes to the Financial Statements are an integral part of these Financial Statements. | (Continued) |
| Elements Portfolios | Annual Report | May 31, 2018 | ||||||||||||||
50
| Schedule of Investments | as of May 31, 2018 |
| ELEMENTS INTERNATIONAL PORTFOLIO |
Open Futures Contracts
| DESCRIPTION | NUMBER OF CONTRACTS PURCHASED |
NOTIONAL AMOUNT |
VALUE/ UNREALIZED DEPRECIATION |
|||||||||
| FUTURES CONTRACTS PURCHASED | ||||||||||||
| Australian Dollar, June 2018 Settlement |
65 | $ | 4,918,550 | $ | (4,851) | |||||||
| British Pound, June 2018 Settlement |
483 | 40,146,356 | (2,183,973) | |||||||||
| Euro FX, June 2018 Settlement |
301 | 44,023,121 | (2,794,065) | |||||||||
| Mini MSCI EAFE Index, June 2018 Settlement |
812 | 80,672,200 | (1,199,912) | |||||||||
|
|
|
|
|
|||||||||
| TOTAL FUTURES CONTRACTS PURCHASED |
$ | 169,760,227 | $ | (6,182,801) | ||||||||
|
|
|
|
|
|||||||||
Securities Sold Short
| DESCRIPTION | SHARES | FAIR VALUE | ||||||
| Securities Sold Short | ||||||||
| Germany | ||||||||
| Linde AG (a) |
1,081 | $ | 223,871 | |||||
|
|
|
|||||||
| TOTAL SECURITIES SOLD SHORT (Cost $224,275) |
$ | 223,871 | ||||||
|
|
|
|||||||
| (a) | Non-income producing security. |
| The accompanying Notes to the Financial Statements are an integral part of these Financial Statements. | (Continued) |
| Elements Portfolios | Annual Report | May 31, 2018 | ||||||||||||||
51
| Schedule of Investments | as of May 31, 2018 |
| ELEMENTS INTERNATIONAL PORTFOLIO |
Total Return Swaps
| COUNTERPARTY (a) | REFERENCE ENTITY | PAY/RECEIVE TOTAL RETURN ON REFERENCE ENTITY |
BASE FINANCING RATE (b) |
TERMINATION DATE |
PAYMENT FREQUENCY |
NOTIONAL VALUE |
NUMBER OF |
UNREALIZED APPRECIATION (DEPRECIATION) |
||||||||||||||||||
| A |
Adobe Systems, Inc. | Pay | 1-Month LIBOR USD | 6/8/2018 | Term | $ | 978,344 | 4,328 | $ | (99,028) | ||||||||||||||||
| A |
Affiliated Managers Group | Pay | 1-Month LIBOR USD | 6/13/2018 | Term | 857,873 | 5,254 | 20,714 | ||||||||||||||||||
| A |
Aflac, Inc. | Pay | 1-Month LIBOR USD | 6/8/2018 | Term | 1,012,304 | 22,774 | (18,249) | ||||||||||||||||||
| A |
AGL Energy, Ltd. | Receive | 1-Month LIBOR AUD | 6/1/2022 | Term | 8,072 | 371 | 96 | ||||||||||||||||||
| B |
Air Liquide S.A. | Receive | 1-Month LIBOR EUR | 6/1/2020 | Term | 273,559 | 2,474 | (8,534) | ||||||||||||||||||
| B |
Airbus SE | Receive | 1-Month LIBOR EUR | 6/1/2020 | Term | 466,555 | 6,359 | 186,466 | ||||||||||||||||||
| A |
Allstate Corp. | Pay | 1-Month LIBOR USD | 6/8/2018 | Term | 904,855 | 9,621 | 2,456 | ||||||||||||||||||
| A |
Alphabet, Inc. — Class A | Pay | 1-Month LIBOR USD | 6/4/2018 | Term | 4,521,877 | 4,384 | (291,726) | ||||||||||||||||||
| A |
Amazon.com, Inc. | Pay | 1-Month LIBOR USD | 6/4/2018 | Term | 2,226,830 | 1,416 | (76,380) | ||||||||||||||||||
| A |
Amazon.com, Inc. | Pay | 1-Month LIBOR USD | 6/8/2018 | Term | 1,070,583 | 681 | (37,534) | ||||||||||||||||||
| B |
Anglo American PLC | Receive | 1-Month LIBOR GBP | 6/1/2020 | Term | 659,411 | 62,114 | 663,027 | ||||||||||||||||||
| A |
Apple, Inc. | Pay | 1-Month LIBOR USD | 6/13/2018 | Term | 4,211,056 | 22,634 | (29,342) | ||||||||||||||||||
| B |
Arkema S.A. | Receive | 1-Month LIBOR EUR | 6/1/2020 | Term | 723,440 | 7,640 | 102,695 | ||||||||||||||||||
| A |
Arrow Electronics, Inc. | Pay | 1-Month LIBOR USD | 6/13/2018 | Term | 971,085 | 12,934 | 13,741 | ||||||||||||||||||
| B |
Ashtead Group PLC | Receive | 1-Month LIBOR GBP | 6/1/2020 | Term | 11,632 | 600 | 3,079 | ||||||||||||||||||
| B |
Associated British Foods PLC | Receive | 1-Month LIBOR GBP | 6/1/2020 | Term | 522,080 | 17,530 | (74,884) | ||||||||||||||||||
| B |
Atos SE | Receive | 1-Month LIBOR EUR | 6/1/2020 | Term | 601,602 | 4,742 | (51,235) | ||||||||||||||||||
| B |
Axa S.A. | Receive | 1-Month LIBOR EUR | 6/1/2020 | Term | 1,399,463 | 58,658 | (103,155) | ||||||||||||||||||
| B |
BAE Systems PLC | Receive | 1-Month LIBOR GBP | 6/1/2020 | Term | 18,851 | 3,156 | 2,387 | ||||||||||||||||||
| B |
Barratt Developments PLC | Receive | 1-Month LIBOR GBP | 6/1/2020 | Term | 808,867 | 133,264 | (57,973) | ||||||||||||||||||
| B |
Berkeley Group Holdings | Receive | 1-Month LIBOR GBP | 6/1/2020 | Term | 630,817 | 16,943 | 125,742 | ||||||||||||||||||
| A |
Berkshire Hathaway, Inc. | Pay | 1-Month LIBOR USD | 6/4/2018 | Term | 2,094,385 | 10,619 | 64,603 | ||||||||||||||||||
| A |
Berkshire Hathaway, Inc. | Pay | 1-Month LIBOR USD | 6/8/2018 | Term | 894,819 | 4,670 | 1,756 | ||||||||||||||||||
| A |
Best Buy Co., Inc. | Pay | 1-Month LIBOR USD | 6/4/2018 | Term | 2,701,947 | 35,072 | 313,540 | ||||||||||||||||||
| B |
BHP Billiton PLC | Receive | 1-Month LIBOR GBP | 6/1/2020 | Term | 745,298 | 60,310 | 441,522 | ||||||||||||||||||
| A |
BHP Billiton PLC | Receive | 1-Month LIBOR AUD | 6/1/2022 | Term | 194,945 | 5,753 | (4,779) | ||||||||||||||||||
| B |
Biogen, Inc. | Pay | 1-Month LIBOR USD | 7/25/2018 | Term | 273,043 | 1,053 | (35,837) | ||||||||||||||||||
| B |
BNP Paribas | Receive | 1-Month LIBOR EUR | 6/1/2020 | Term | 2,766,668 | 42,511 | (474,157) | ||||||||||||||||||
| A |
Boeing Co. | Pay | 1-Month LIBOR USD | 6/8/2018 | Term | 942,136 | 2,849 | (64,584) | ||||||||||||||||||
| B |
Bollore S.A. | Receive | 1-Month LIBOR EUR | 6/1/2020 | Term | 394,404 | 97,000 | 21,028 | ||||||||||||||||||
| B |
Bouygues S.A. | Receive | 1-Month LIBOR EUR | 6/1/2020 | Term | 1,757,260 | 46,735 | 181,164 | ||||||||||||||||||
| A |
Broadcom, Inc. | Pay | 1-Month LIBOR USD | 6/4/2018 | Term | 3,968,666 | 17,049 | (321,154) | ||||||||||||||||||
| B |
Broadcom, Inc. | Pay | 1-Month LIBOR USD | 7/25/2018 | Term | 438,419 | 1,878 | (33,908) | ||||||||||||||||||
| B |
BT Group PLC | Receive | 1-Month LIBOR GBP | 6/1/2020 | Term | 179,970 | 58,578 | (70,689) | ||||||||||||||||||
| B |
Bunzl PLC | Receive | 1-Month LIBOR GBP | 6/1/2020 | Term | 250,838 | 10,397 | (13,195) | ||||||||||||||||||
| B |
Burberry Group PLC | Receive | 1-Month LIBOR GBP | 6/1/2020 | Term | 800,809 | 44,842 | 182,095 | ||||||||||||||||||
| A |
CA, Inc. | Pay | 1-Month LIBOR USD | 6/13/2018 | Term | 1,103,535 | 31,931 | (44,317) | ||||||||||||||||||
| A |
Caltex Australia, Ltd. | Receive | 1-Month LIBOR AUD | 6/1/2022 | Term | 265,837 | 8,968 | (1,527) | ||||||||||||||||||
| B |
Capgemini SE | Receive | 1-Month LIBOR EUR | 6/1/2020 | Term | 118,569 | 1,207 | 20,147 | ||||||||||||||||||
| A |
Capita PLC | Pay | 1-Month LIBOR USD | 6/13/2018 | Term | 1,164,789 | 25,060 | 8,855 | ||||||||||||||||||
| B |
Carnival PLC | Receive | 1-Month LIBOR GBP | 6/1/2020 | Term | 951,798 | 19,397 | 5,134 | ||||||||||||||||||
| B |
Carrefour S.A. | Receive | 1-Month LIBOR EUR | 6/1/2020 | Term | 1,765,715 | 81,237 | (561,070) | ||||||||||||||||||
| B |
Casino Guichard Perrachon S.A. | Receive | 1-Month LIBOR EUR | 6/1/2020 | Term | 1,444,484 | 29,015 | (373,623) | ||||||||||||||||||
| B |
Centrica PLC | Receive | 1-Month LIBOR GBP | 6/1/2020 | Term | 800,359 | 425,127 | (192,524) | ||||||||||||||||||
| A |
Chevron Corp. | Pay | 1-Month LIBOR USD | 6/8/2018 | Term | 1,135,476 | 9,011 | 7,071 | ||||||||||||||||||
| B |
Christian Dior SE | Receive | 1-Month LIBOR EUR | 6/1/2020 | Term | 1,529,079 | 6,025 | 803,482 | ||||||||||||||||||
| A |
Church & Dwight Co., Inc. | Pay | 1-Month LIBOR USD | 6/13/2018 | Term | 771,699 | 16,168 | 10,147 | ||||||||||||||||||
| A |
Cimic Group, Ltd. | Receive | 1-Month LIBOR AUD | 6/1/2022 | Term | 142,967 | 3,363 | (3,295) | ||||||||||||||||||
| The accompanying Notes to the Financial Statements are an integral part of these Financial Statements. | (Continued) |
| Elements Portfolios | Annual Report | May 31, 2018 | ||||||||||||||
52
| Schedule of Investments | as of May 31, 2018 |
| ELEMENTS INTERNATIONAL PORTFOLIO |
| COUNTERPARTY (a) | REFERENCE ENTITY | PAY/RECEIVE TOTAL RETURN ON REFERENCE ENTITY |
BASE FINANCING RATE (b) |
TERMINATION DATE |
PAYMENT FREQUENCY |
NOTIONAL VALUE |
NUMBER OF |
UNREALIZED APPRECIATION (DEPRECIATION) |
||||||||||||||||||
| A |
Cisco Systems, Inc. | Pay | 1-Month LIBOR USD | 6/8/2018 | Term | $ | 1,078,648 | 24,272 | $ | 43,657 | ||||||||||||||||
| B |
Cisco Systems, Inc. | Pay | 1-Month LIBOR USD | 7/25/2018 | Term | 439,535 | 9,933 | 16,360 | ||||||||||||||||||
| A |
Citigroup, Inc. | Pay | 1-Month LIBOR USD | 6/4/2018 | Term | 2,177,669 | 31,565 | 66,736 | ||||||||||||||||||
| A |
Coca-Cola Amatil, Ltd. | Receive | 1-Month LIBOR AUD | 6/1/2022 | Term | 197,393 | 22,943 | 4,783 | ||||||||||||||||||
| B |
Coca-Cola HBC AG | Receive | 1-Month LIBOR GBP | 6/1/2020 | Term | 685,503 | 30,432 | 132,998 | ||||||||||||||||||
| B |
Compagnie De Saint Gobain |
Receive | 1-Month LIBOR EUR | 6/1/2020 | Term | 504,913 | 10,706 | (49,410) | ||||||||||||||||||
| B |
Compass Group PLC | Receive | 1-Month LIBOR GBP | 6/1/2020 | Term | 1,159,396 | 67,572 | (28,200) | ||||||||||||||||||
| B |
Credit Agricole S.A. | Receive | 1-Month LIBOR EUR | 6/1/2020 | Term | 328,708 | 21,900 | (70,517) | ||||||||||||||||||
| B |
CRH PLC | Receive | 1-Month LIBOR EUR | 6/1/2020 | Term | 1,368,687 | 43,052 | 18,349 | ||||||||||||||||||
| B |
Dassault Aviation S.A. | Receive | 1-Month LIBOR EUR | 6/1/2020 | Term | 396,297 | 311 | 140,003 | ||||||||||||||||||
| B |
Dassault Systemes S.A. | Receive | 1-Month LIBOR EUR | 6/1/2020 | Term | 108,244 | 1,138 | 33,858 | ||||||||||||||||||
| B |
DCC PLC | Receive | 1-Month LIBOR GBP | 6/1/2020 | Term | 305,878 | 4,164 | (3,789) | ||||||||||||||||||
| A |
Dell Technologies, Inc. — Class V |
Pay | 1-Month LIBOR USD | 6/4/2018 | Term | 3,961,857 | 54,556 | (430,922) | ||||||||||||||||||
| B |
Diageo PLC | Receive | 1-Month LIBOR GBP | 6/1/2020 | Term | 18,049 | 700 | 1,799 | ||||||||||||||||||
| B |
Direct Line Insurance Group PLC |
Receive | 1-Month LIBOR GBP | 6/1/2020 | Term | 481,263 | 133,846 | 33,284 | ||||||||||||||||||
| A |
Duke Energy Corp. | Pay | 1-Month LIBOR USD | 6/4/2018 | Term | 4,038,846 | 50,172 | 130,779 | ||||||||||||||||||
| B |
EDF | Receive | 1-Month LIBOR EUR | 6/1/2020 | Term | 1,036,629 | 108,939 | 330,864 | ||||||||||||||||||
| B |
Eiffage S.A. | Receive | 1-Month LIBOR EUR | 6/1/2020 | Term | 1,316,138 | 16,356 | 332,233 | ||||||||||||||||||
| A |
Electronic Arts, Inc. | Pay | 1-Month LIBOR USD | 6/13/2018 | Term | 966,342 | 7,800 | (53,439) | ||||||||||||||||||
| B |
Engie S.A. | Receive | 1-Month LIBOR EUR | 6/1/2020 | Term | 1,959,445 | 142,345 | 48,620 | ||||||||||||||||||
| B |
Eutelsat Communications S.A. |
Receive | 1-Month LIBOR EUR | 6/1/2020 | Term | 323,358 | 13,947 | (93,903) | ||||||||||||||||||
| A |
Exelixis, Inc. | Pay | 1-Month LIBOR USD | 6/13/2018 | Term | 805,821 | 37,186 | 36,053 | ||||||||||||||||||
| A |
Express Scripts Holding Co. |
Pay | 1-Month LIBOR USD | 6/4/2018 | Term | 4,136,989 | 53,581 | 83,062 | ||||||||||||||||||
| A |
Exxon Mobil Corp. | Pay | 1-Month LIBOR USD | 6/8/2018 | Term | 869,801 | 11,364 | (61,385) | ||||||||||||||||||
| A |
Facebook, Inc. | Pay | 1-Month LIBOR USD | 6/4/2018 | Term | 4,650,650 | 26,791 | (478,280) | ||||||||||||||||||
| A |
Facebook, Inc. | Pay | 1-Month LIBOR USD | 6/8/2018 | Term | 979,907 | 5,631 | (98,492) | ||||||||||||||||||
| B |
Ferguson PLC | Receive | 1-Month LIBOR GBP | 6/1/2020 | Term | 722,164 | 14,064 | 141,623 | ||||||||||||||||||
| A |
Fidelity National Financial |
Pay | 1-Month LIBOR USD | 6/13/2018 | Term | 1,080,193 | 28,698 | 20,987 | ||||||||||||||||||
| A |
FLIR Systems, Inc. | Pay | 1-Month LIBOR USD | 6/13/2018 | Term | 1,403,576 | 25,464 | 28,905 | ||||||||||||||||||
| A |
Fortune Brands Home & Security, Inc. |
Pay | 1-Month LIBOR USD | 6/13/2018 | Term | 1,008,034 | 18,189 | (15,905) | ||||||||||||||||||
| B |
Fresnillo PLC | Receive | 1-Month LIBOR GBP | 6/1/2020 | Term | 151,880 | 9,613 | (30,275) | ||||||||||||||||||
| B |
G4S PLC | Receive | 1-Month LIBOR GBP | 6/1/2020 | Term | 377,413 | 116,504 | (73,511) | ||||||||||||||||||
| B |
General Motors Co. | Pay | 1-Month LIBOR USD | 7/25/2018 | Term | 942,250 | 25,000 | (122,972) | ||||||||||||||||||
| A |
Gilead Sciences, Inc. | Pay | 1-Month LIBOR USD | 6/4/2018 | Term | 4,317,339 | 58,453 | 386,006 | ||||||||||||||||||
| B |
Gilead Sciences, Inc. | Pay | 1-Month LIBOR USD | 7/25/2018 | Term | 439,693 | 5,941 | 40,333 | ||||||||||||||||||
| B |
Glaxosmithkline PLC | Receive | 1-Month LIBOR GBP | 6/1/2020 | Term | 694,916 | 47,200 | 52,640 | ||||||||||||||||||
| B |
Glencore PLC | Receive | 1-Month LIBOR GBP | 6/1/2020 | Term | 292,623 | 94,637 | 78,948 | ||||||||||||||||||
| B |
Hargreaves Lansdown PLC |
Receive | 1-Month LIBOR GBP | 6/1/2020 | Term | 36,057 | 2,400 | 13,160 | ||||||||||||||||||
| B |
Hermes International | Receive | 1-Month LIBOR EUR | 6/1/2020 | Term | 810,442 | 1,768 | 315,233 | ||||||||||||||||||
| A |
HP, Inc. | Pay | 1-Month LIBOR USD | 6/13/2018 | Term | 1,251,522 | 56,991 | (2,283) | ||||||||||||||||||
| B |
HSBC Holdings PLC | Receive | 1-Month LIBOR GBP | 6/1/2020 | Term | 2,576,866 | 380,628 | 377,711 | ||||||||||||||||||
| B |
Icade S.A. | Receive | 1-Month LIBOR EUR | 6/1/2020 | Term | 243,204 | 3,271 | 33,313 | ||||||||||||||||||
| B |
Iliad S.A. | Receive | 1-Month LIBOR EUR | 6/1/2020 | Term | 12,079 | 57 | (4,484) | ||||||||||||||||||
| B |
Imerys S.A. | Receive | 1-Month LIBOR EUR | 6/1/2020 | Term | 488,439 | 6,330 | (19,515) | ||||||||||||||||||
| B |
Ingersoll-Rand PLC | Pay | 1-Month LIBOR USD | 7/25/2018 | Term | 146,121 | 1,755 | (7,158) | ||||||||||||||||||
| A |
Intel Corp. | Pay | 1-Month LIBOR USD | 6/8/2018 | Term | 1,177,764 | 22,528 | (70,720) | ||||||||||||||||||
| B |
Intercontinental Hotels Group |
Receive | 1-Month LIBOR GBP | 6/1/2020 | Term | 938 | 22 | 172 | ||||||||||||||||||
| The accompanying Notes to the Financial Statements are an integral part of these Financial Statements. | (Continued) |
| Elements Portfolios | Annual Report | May 31, 2018 | ||||||||||||||
53
| Schedule of Investments | as of May 31, 2018 |
| ELEMENTS INTERNATIONAL PORTFOLIO |
| COUNTERPARTY (a) | REFERENCE ENTITY | PAY/RECEIVE TOTAL RETURN ON REFERENCE ENTITY |
BASE FINANCING RATE (b) |
TERMINATION DATE |
PAYMENT FREQUENCY |
NOTIONAL VALUE |
NUMBER OF |
UNREALIZED APPRECIATION (DEPRECIATION) |
||||||||||||||||||
| A |
International Business Machines Corp. |
Pay | 1-Month LIBOR USD | 6/4/2018 | Term | $ | 6,921,034 | 47,249 | $ | 174,252 | ||||||||||||||||
| A |
International Business Machines Corp. |
Pay | 1-Month LIBOR USD | 6/8/2018 | Term | 842,001 | 5,930 | 5,333 | ||||||||||||||||||
| B |
Intertek Group PLC | Receive | 1-Month LIBOR GBP | 6/1/2020 | Term | 10,858 | 200 | 137 | ||||||||||||||||||
| A |
Johnson & Johnson | Pay | 1-Month LIBOR USD | 6/13/2018 | Term | 853,366 | 6,960 | 15,710 | ||||||||||||||||||
| B |
Johnson Matthey PLC | Receive | 1-Month LIBOR GBP | 6/1/2020 | Term | 349,989 | 11,076 | 57,972 | ||||||||||||||||||
| A |
JPMorgan Chase & Co. | Pay | 1-Month LIBOR USD | 6/4/2018 | Term | 3,584,600 | 32,766 | 85,285 | ||||||||||||||||||
| B |
Kering | Receive | 1-Month LIBOR EUR | 6/1/2020 | Term | 211,143 | 774 | 196,242 | ||||||||||||||||||
| B |
Kingfisher PLC | Receive | 1-Month LIBOR GBP | 6/1/2020 | Term | 1,038,926 | 315,393 | (69,120) | ||||||||||||||||||
| A |
Kohl’s Corp. | Pay | 1-Month LIBOR USD | 6/4/2018 | Term | 1,518,047 | 24,355 | (104,696) | ||||||||||||||||||
| A |
L3 Technologies, Inc. | Pay | 1-Month LIBOR USD | 6/4/2018 | Term | 2,979,230 | 15,100 | (21,837) | ||||||||||||||||||
| A |
Lear Corp. | Pay | 1-Month LIBOR USD | 6/13/2018 | Term | 1,392,362 | 7,275 | (46,190) | ||||||||||||||||||
| B |
Legrand S.A. | Receive | 1-Month LIBOR EUR | 6/1/2020 | Term | 472,817 | 7,751 | 38,093 | ||||||||||||||||||
| A |
Leidos Holdings, Inc. | Pay | 1-Month LIBOR USD | 6/13/2018 | Term | 1,019,675 | 16,572 | 25,751 | ||||||||||||||||||
| A |
Lincoln National Corp. | Pay | 1-Month LIBOR USD | 6/13/2018 | Term | 995,288 | 14,551 | 32,059 | ||||||||||||||||||
| A |
LKQ Corp. | Pay | 1-Month LIBOR USD | 6/13/2018 | Term | 937,851 | 30,719 | (36,813) | ||||||||||||||||||
| B |
L’Oreal S.A. | Receive | 1-Month LIBOR EUR | 6/1/2020 | Term | 1,162,819 | 6,088 | 120,730 | ||||||||||||||||||
| B |
LVMH Moet Hennessy Louis Vuitton SE |
Receive | 1-Month LIBOR EUR | 6/1/2020 | Term | 1,293,417 | 5,682 | 486,570 | ||||||||||||||||||
| A |
ManpowerGroup, Inc. | Pay | 1-Month LIBOR USD | 6/13/2018 | Term | 892,230 | 9,296 | 47,418 | ||||||||||||||||||
| B |
Marks & Spencer Group PLC |
Receive | 1-Month LIBOR GBP | 6/1/2020 | Term | 53,212 | 13,815 | (13,648) | ||||||||||||||||||
| B |
McDonald’s Corp. | Pay | 1-Month LIBOR USD | 7/25/2018 | Term | 438,017 | 2,755 | (1,751) | ||||||||||||||||||
| A |
Medibank Private, Ltd. | Receive | 1-Month LIBOR AUD | 6/1/2022 | Term | 384,951 | 132,989 | 3,537 | ||||||||||||||||||
| B |
Meggitt PLC | Receive | 1-Month LIBOR GBP | 6/1/2020 | Term | 269,047 | 53,136 | (7,193) | ||||||||||||||||||
| B |
Melrose Industries PLC | Receive | 1-Month LIBOR GBP | 6/1/2020 | Term | 916,377 | 392,377 | 11,376 | ||||||||||||||||||
| B |
MGM Resorts International |
Pay | 1-Month LIBOR USD | 7/25/2018 | Term | 439,248 | 12,144 | 58,382 | ||||||||||||||||||
| B |
Michelin | Receive | 1-Month LIBOR EUR | 6/1/2020 | Term | 1,679,000 | 14,478 | (38,513) | ||||||||||||||||||
| B |
Micron Technology, Inc. | Pay | 1-Month LIBOR USD | 7/25/2018 | Term | 437,013 | 8,915 | (75,345) | ||||||||||||||||||
| A |
Microsoft Corp. | Pay | 1-Month LIBOR USD | 6/8/2018 | Term | 1,043,613 | 11,094 | (74,469) | ||||||||||||||||||
| A |
Microsoft Corp. | Pay | 1-Month LIBOR USD | 6/13/2018 | Term | 4,221,005 | 44,056 | (127,735) | ||||||||||||||||||
| B |
Mondi PLC | Receive | 1-Month LIBOR GBP | 6/1/2020 | Term | 1,097,597 | 54,836 | 146,794 | ||||||||||||||||||
| A |
Monsanto Co. | Pay | 1-Month LIBOR USD | 6/4/2018 | Term | 5,604,887 | 44,814 | (96,201) | ||||||||||||||||||
| A |
Morgan Stanley | Pay | 1-Month LIBOR USD | 6/8/2018 | Term | 922,862 | 18,067 | 18,409 | ||||||||||||||||||
| B |
Natixis | Receive | 1-Month LIBOR EUR | 6/1/2020 | Term | 236,365 | 38,129 | 15,575 | ||||||||||||||||||
| B |
Next PLC | Receive | 1-Month LIBOR GBP | 6/1/2020 | Term | 765,296 | 17,413 | 381,251 | ||||||||||||||||||
| B |
Norwegian Cruise Line Holdings |
Pay | 1-Month LIBOR USD | 7/25/2018 | Term | 597,578 | 10,530 | 47,882 | ||||||||||||||||||
| B |
Old Mutual PLC | Receive | 1-Month LIBOR GBP | 6/1/2020 | Term | 363,725 | 188,254 | 129,436 | ||||||||||||||||||
| A |
Oracle Corp. | Pay | 1-Month LIBOR USD | 6/8/2018 | Term | 896,334 | 19,892 | (31,636) | ||||||||||||||||||
| B |
Orange S.A. | Receive | 1-Month LIBOR EUR | 6/1/2020 | Term | 191,005 | 13,250 | 6,872 | ||||||||||||||||||
| A |
P G & E Corp. | Pay | 1-Month LIBOR USD | 6/13/2018 | Term | 906,724 | 21,200 | (10,636) | ||||||||||||||||||
| A |
Park Hotels & Resorts, Inc. |
Pay | 1-Month LIBOR USD | 6/13/2018 | Term | 1,035,848 | 34,760 | (82,707) | ||||||||||||||||||
| B |
Pearson PLC | Receive | 1-Month LIBOR GBP | 6/1/2020 | Term | 280,447 | 43,353 | 151,074 | ||||||||||||||||||
| A |
PepsiCo., Inc. | Pay | 1-Month LIBOR USD | 6/8/2018 | Term | 891,478 | 9,134 | (31,299) | ||||||||||||||||||
| B |
Persimmon PLC | Receive | 1-Month LIBOR GBP | 6/1/2020 | Term | 866,047 | 34,238 | 214,877 | ||||||||||||||||||
| A |
Pfizer, Inc. | Pay | 1-Month LIBOR USD | 6/8/2018 | Term | 934,905 | 26,896 | (39,168) | ||||||||||||||||||
| A |
Pinnacle West Capital Corp. |
Pay | 1-Month LIBOR USD | 6/13/2018 | Term | 1,076,077 | 13,743 | (16,536) | ||||||||||||||||||
| A |
Procter & Gamble Co. | Pay | 1-Month LIBOR USD | 6/4/2018 | Term | 10,994,456 | 151,002 | (32,970) | ||||||||||||||||||
| The accompanying Notes to the Financial Statements are an integral part of these Financial Statements. | (Continued) |
| Elements Portfolios | Annual Report | May 31, 2018 | ||||||||||||||
54
| Schedule of Investments | as of May 31, 2018 |
| ELEMENTS INTERNATIONAL PORTFOLIO |
| COUNTERPARTY (a) | REFERENCE ENTITY | PAY/RECEIVE TOTAL RETURN ON REFERENCE ENTITY |
BASE FINANCING RATE (b) |
TERMINATION DATE |
PAYMENT FREQUENCY |
NOTIONAL VALUE |
NUMBER OF |
UNREALIZED APPRECIATION (DEPRECIATION) |
||||||||||||||||||
| A |
Procter & Gamble Co. | Pay | 1-Month LIBOR USD | 6/8/2018 | Term | $ | 782,462 | 10,965 | $ | (18,638) | ||||||||||||||||
| B |
Prudential PLC | Receive | 1-Month LIBOR GBP | 6/1/2020 | Term | 884,843 | 50,678 | 64,149 | ||||||||||||||||||
| B |
Publicis Groupe | Receive | 1-Month LIBOR EUR | 6/1/2020 | Term | 1,057,645 | 16,525 | (80,262) | ||||||||||||||||||
| B |
Puma SE | Receive | 1-Month LIBOR EUR | 6/1/2020 | Term | 16,003 | 64 | 20,121 | ||||||||||||||||||
| B |
Randgold Resources Ltd. |
Receive | 1-Month LIBOR GBP | 6/1/2020 | Term | 42,250 | 580 | (9,457) | ||||||||||||||||||
| A |
Regeneron Pharmaceuticals |
Pay | 1-Month LIBOR USD | 6/4/2018 | Term | 2,144,393 | 6,850 | 91,373 | ||||||||||||||||||
| B |
RELX PLC | Receive | 1-Month LIBOR GBP | 6/1/2020 | Term | 809,443 | 48,419 | (2,986) | ||||||||||||||||||
| B |
Remy Cointreau | Receive | 1-Month LIBOR EUR | 6/1/2020 | Term | 29,984 | 300 | 9,820 | ||||||||||||||||||
| B |
Renault S.A. | Receive | 1-Month LIBOR EUR | 6/1/2020 | Term | 1,064,281 | 12,851 | 17,656 | ||||||||||||||||||
| B |
Rexel S.A. | Receive | 1-Month LIBOR EUR | 6/1/2020 | Term | 1,164,390 | 77,391 | (200,536) | ||||||||||||||||||
| B |
Rio Tinto PLC | Receive | 1-Month LIBOR GBP | 6/1/2020 | Term | 656,102 | 20,459 | 329,289 | ||||||||||||||||||
| A |
Rio Tinto, Ltd. | Receive | 1-Month LIBOR AUD | 6/1/2022 | Term | 118,187 | 1,400 | (1,541) | ||||||||||||||||||
| A |
Robert Half International, Inc. |
Pay | 1-Month LIBOR USD | 6/13/2018 | Term | 1,395,218 | 22,231 | (24,775) | ||||||||||||||||||
| A |
Rockwell Collins, Inc. | Pay | 1-Month LIBOR USD | 6/4/2018 | Term | 3,109,673 | 23,381 | (107,114) | ||||||||||||||||||
| B |
Rolls-Royce Holdings PLC |
Receive | 1-Month LIBOR GBP | 6/1/2020 | Term | — | 1,563,349 | 2,078 | ||||||||||||||||||
| B |
Rolls-Royce Holdings PLC |
Receive | 1-Month LIBOR GBP | 6/1/2020 | Term | 191,446 | 22,019 | (15,555) | ||||||||||||||||||
| B |
Royal Bank Of Scotland Group |
Receive | 1-Month LIBOR GBP | 6/1/2020 | Term | 643,980 | 231,707 | (12,172) | ||||||||||||||||||
| B |
Royal Caribbean Cruises Ltd. |
Pay | 1-Month LIBOR USD | 7/25/2018 | Term | 439,096 | 3,668 | 55,091 | ||||||||||||||||||
| B |
Royal Dutch Shell PLC—A Shares |
Receive | 1-Month LIBOR GBP | 6/1/2020 | Term | 4,264,814 | 193,286 | 1,250,902 | ||||||||||||||||||
| B |
Royal Dutch Shell PLC—B Shares |
Receive | 1-Month LIBOR GBP | 6/1/2020 | Term | 3,576,596 | 158,387 | 1,088,656 | ||||||||||||||||||
| B |
Royal Mail PLC | Receive | 1-Month LIBOR GBP | 6/1/2020 | Term | 1,378,447 | 313,589 | 353,848 | ||||||||||||||||||
| B |
Safran S.A. | Receive | 1-Month LIBOR EUR | 6/1/2020 | Term | 919,347 | 11,677 | 345,924 | ||||||||||||||||||
| B |
Sainsbury PLC | Receive | 1-Month LIBOR GBP | 6/1/2020 | Term | 483,455 | 173,748 | 93,704 | ||||||||||||||||||
| B |
Sanofi | Receive | 1-Month LIBOR EUR | 6/1/2020 | Term | 3,507,558 | 43,041 | (803,743) | ||||||||||||||||||
| A |
Schlumberger Ltd. | Pay | 1-Month LIBOR USD | 6/13/2018 | Term | 8,938,185 | 128,533 | 124,009 | ||||||||||||||||||
| B |
Schneider Electric SE | Receive | 1-Month LIBOR EUR | 6/1/2020 | Term | 1,657,592 | 24,420 | 169,755 | ||||||||||||||||||
| B |
Schroders PLC | Receive | 1-Month LIBOR GBP | 6/1/2020 | Term | 392,891 | 12,400 | 24,761 | ||||||||||||||||||
| B |
Scor SE | Receive | 1-Month LIBOR EUR | 6/1/2020 | Term | 803,709 | 22,909 | (57,918) | ||||||||||||||||||
| A |
Simon Property Group, Inc. |
Pay | 1-Month LIBOR USD | 6/8/2018 | Term | 950,105 | 5,974 | (17,231) | ||||||||||||||||||
| B |
Sky PLC | Receive | 1-Month LIBOR GBP | 6/1/2020 | Term | 62,815 | 6,576 | 35,635 | ||||||||||||||||||
| B |
Smith & Nephew PLC | Receive | 1-Month LIBOR GBP | 6/1/2020 | Term | 181,314 | 13,052 | (1,993) | ||||||||||||||||||
| B |
Smith’s Group PLC | Receive | 1-Month LIBOR GBP | 6/1/2020 | Term | 199,749 | 12,597 | 34,016 | ||||||||||||||||||
| B |
Societe BIC S.A. | Receive | 1-Month LIBOR EUR | 6/1/2020 | Term | 319,667 | 3,329 | (38,974) | ||||||||||||||||||
| B |
Societe Generale S.A. | Receive | 1-Month LIBOR EUR | 6/1/2020 | Term | 294,838 | 6,661 | (40,934) | ||||||||||||||||||
| B |
Sodexo S.A. | Receive | 1-Month LIBOR EUR | 6/1/2020 | Term | 645,061 | 6,255 | (138,979) | ||||||||||||||||||
| A |
Sonic Healthcare, Ltd. | Receive | 1-Month LIBOR AUD | 6/1/2022 | Term | 175,848 | 7,300 | (2,929) | ||||||||||||||||||
| B |
SSE PLC | Receive | 1-Month LIBOR GBP | 6/1/2020 | Term | 239,452 | 16,401 | (8,908) | ||||||||||||||||||
| B |
Stmicroelectronics N.V. | Receive | 1-Month LIBOR EUR | 6/1/2020 | Term | 122,348 | 8,352 | 57,119 | ||||||||||||||||||
| B |
Suez S.A. | Receive | 1-Month LIBOR EUR | 6/1/2020 | Term | 1,140,850 | 71,738 | (303,359) | ||||||||||||||||||
| B |
Taylor Wimpey PLC | Receive | 1-Month LIBOR GBP | 6/1/2020 | Term | 942,117 | 471,706 | 59,444 | ||||||||||||||||||
| A |
Telstra Corp., Ltd. | Receive | 1-Month LIBOR AUD | 6/1/2022 | Term | 334,636 | 120,368 | 1,792 | ||||||||||||||||||
| B |
Tesco PLC | Receive | 1-Month LIBOR GBP | 6/1/2020 | Term | 425,588 | 214,683 | 138,087 | ||||||||||||||||||
| B |
Thales S.A. | Receive | 1-Month LIBOR EUR | 6/1/2020 | Term | 1,376,226 | 14,299 | 242,766 | ||||||||||||||||||
| A |
Torchmark Corp. | Pay | 1-Month LIBOR USD | 6/13/2018 | Term | 1,134,264 | 13,338 | 4,347 | ||||||||||||||||||
| The accompanying Notes to the Financial Statements are an integral part of these Financial Statements. | (Continued) |
| Elements Portfolios | Annual Report | May 31, 2018 | ||||||||||||||
55
| Schedule of Investments | as of May 31, 2018 |
| ELEMENTS INTERNATIONAL PORTFOLIO |
| COUNTERPARTY (a) | REFERENCE ENTITY | PAY/RECEIVE TOTAL RETURN ON REFERENCE ENTITY |
BASE FINANCING RATE (b) |
TERMINATION DATE |
PAYMENT FREQUENCY |
NOTIONAL VALUE |
NUMBER OF |
UNREALIZED APPRECIATION (DEPRECIATION) |
||||||||||||||||||
| B |
Total S.A. | Receive | 1-Month LIBOR EUR | 6/1/2020 | Term | $ | 2,513,265 | 56,928 | $ | 620,569 | ||||||||||||||||
| B |
Travis Perkins PLC | Receive | 1-Month LIBOR GBP | 6/1/2020 | Term | 490,248 | 31,389 | (80,072) | ||||||||||||||||||
| B |
Tui AG | Receive | 1-Month LIBOR GBP | 6/1/2020 | Term | 393,840 | 27,575 | 125,259 | ||||||||||||||||||
| B |
Unilever PLC | Receive | 1-Month LIBOR GBP | 6/1/2020 | Term | 204,200 | 4,752 | (3,969) | ||||||||||||||||||
| A |
Universal Health Services, Inc. |
Pay | 1-Month LIBOR USD | 6/13/2018 | Term | 1,265,362 | 10,913 | 11,219 | ||||||||||||||||||
| B |
Valeo S.A. | Receive | 1-Month LIBOR EUR | 6/1/2020 | Term | 386,832 | 6,081 | (65,245) | ||||||||||||||||||
| B |
Veolia Environnement | Receive | 1-Month LIBOR EUR | 6/1/2020 | Term | 342,903 | 17,324 | 4,678 | ||||||||||||||||||
| B |
Vinci S.A. | Receive | 1-Month LIBOR EUR | 6/1/2020 | Term | 371,342 | 4,814 | 47,977 | ||||||||||||||||||
| B |
Vodafone Group PLC | Receive | 1-Month LIBOR GBP | 6/1/2020 | Term | 94 | 41 | (13) | ||||||||||||||||||
| A |
Walt Disney Co. | Pay | 1-Month LIBOR USD | 6/8/2018 | Term | 882,026 | 8,931 | (4,978) | ||||||||||||||||||
| A |
Waste Management, Inc. |
Pay | 1-Month LIBOR USD | 6/4/2018 | Term | 4,169,236 | 50,659 | (12,659) | ||||||||||||||||||
| B |
Wendel | Receive | 1-Month LIBOR EUR | 6/1/2020 | Term | 387,015 | 2,857 | (67,433) | ||||||||||||||||||
| A |
Wesfarmers, Ltd. | Receive | 1-Month LIBOR AUD | 6/1/2022 | Term | 757,283 | 16,872 | 8,581 | ||||||||||||||||||
| A |
Western Digital Corp. | Pay | 1-Month LIBOR USD | 6/4/2018 | Term | 3,900,276 | 48,223 | (119,238) | ||||||||||||||||||
| B |
Wm Morrison Supermarkets PLC |
Receive | 1-Month LIBOR GBP | 6/1/2020 | Term | 668,662 | 271,000 | 26,592 | ||||||||||||||||||
| A |
Woolworths Ltd. | Receive | 1-Month LIBOR AUD | 6/1/2022 | Term | 1,904,360 | 66,895 | 7,982 | ||||||||||||||||||
| B |
WPP PLC | Receive | 1-Month LIBOR GBP | 6/1/2020 | Term | 606,361 | 39,041 | (156,342) | ||||||||||||||||||
|
|
|
|
|
|||||||||||||||||||||||
| $ | 237,225,489 | $ | 5,947,357 | |||||||||||||||||||||||
|
|
|
|
|
|||||||||||||||||||||||
| (a) | See Note 2. |
| (b) | The swaps accrue financing fees according to the relevant base financing rate, which resets periodically, plus a fixed spread. |
| The accompanying Notes to the Financial Statements are an integral part of these Financial Statements. |
| Elements Portfolios | Annual Report | May 31, 2018 | ||||||||||||||
56
| Schedule of Investments | as of May 31, 2018 |
| ELEMENTS INTERNATIONAL SMALL CAP PORTFOLIO |
| The accompanying Notes to the Financial Statements are an integral part of these Financial Statements. | (Continued) |
| Elements Portfolios | Annual Report | May 31, 2018 | ||||||||||||||
58
| Schedule of Investments | as of May 31, 2018 |
| ELEMENTS INTERNATIONAL SMALL CAP PORTFOLIO |
| The accompanying Notes to the Financial Statements are an integral part of these Financial Statements. | (Continued) |
| Elements Portfolios | Annual Report | May 31, 2018 | ||||||||||||||
59
| Schedule of Investments | as of May 31, 2018 |
| ELEMENTS INTERNATIONAL SMALL CAP PORTFOLIO |
| The accompanying Notes to the Financial Statements are an integral part of these Financial Statements. | (Continued) |
| Elements Portfolios | Annual Report | May 31, 2018 | ||||||||||||||
60
| Schedule of Investments | as of May 31, 2018 |
| ELEMENTS INTERNATIONAL SMALL CAP PORTFOLIO |
| The accompanying Notes to the Financial Statements are an integral part of these Financial Statements. | (Continued) |
| Elements Portfolios | Annual Report | May 31, 2018 | ||||||||||||||
61
| Schedule of Investments | as of May 31, 2018 |
| ELEMENTS INTERNATIONAL SMALL CAP PORTFOLIO |
| The accompanying Notes to the Financial Statements are an integral part of these Financial Statements. | (Continued) |
| Elements Portfolios | Annual Report | May 31, 2018 | ||||||||||||||
62
| Schedule of Investments | as of May 31, 2018 |
| ELEMENTS INTERNATIONAL SMALL CAP PORTFOLIO |
| The accompanying Notes to the Financial Statements are an integral part of these Financial Statements. | (Continued) |
| Elements Portfolios | Annual Report | May 31, 2018 | ||||||||||||||
63
| Schedule of Investments | as of May 31, 2018 |
| ELEMENTS INTERNATIONAL SMALL CAP PORTFOLIO |
| The accompanying Notes to the Financial Statements are an integral part of these Financial Statements. | (Continued) |
| Elements Portfolios | Annual Report | May 31, 2018 | ||||||||||||||
64
| Schedule of Investments | as of May 31, 2018 |
| ELEMENTS INTERNATIONAL SMALL CAP PORTFOLIO |
| The accompanying Notes to the Financial Statements are an integral part of these Financial Statements. | (Continued) |
| Elements Portfolios | Annual Report | May 31, 2018 | ||||||||||||||
65
| Schedule of Investments | as of May 31, 2018 |
| ELEMENTS INTERNATIONAL SMALL CAP PORTFOLIO |
| The accompanying Notes to the Financial Statements are an integral part of these Financial Statements. | (Continued) |
| Elements Portfolios | Annual Report | May 31, 2018 | ||||||||||||||
66
| Schedule of Investments | as of May 31, 2018 |
| ELEMENTS INTERNATIONAL SMALL CAP PORTFOLIO |
| The accompanying Notes to the Financial Statements are an integral part of these Financial Statements. | (Continued) |
| Elements Portfolios | Annual Report | May 31, 2018 | ||||||||||||||
67
| Schedule of Investments | as of May 31, 2018 |
| ELEMENTS INTERNATIONAL SMALL CAP PORTFOLIO |
| The accompanying Notes to the Financial Statements are an integral part of these Financial Statements. | (Continued) |
| Elements Portfolios | Annual Report | May 31, 2018 | ||||||||||||||
68
| Schedule of Investments | as of May 31, 2018 |
| ELEMENTS INTERNATIONAL SMALL CAP PORTFOLIO |
| The accompanying Notes to the Financial Statements are an integral part of these Financial Statements. | (Continued) |
| Elements Portfolios | Annual Report | May 31, 2018 | ||||||||||||||
69
| Schedule of Investments | as of May 31, 2018 |
| ELEMENTS INTERNATIONAL SMALL CAP PORTFOLIO |
| The accompanying Notes to the Financial Statements are an integral part of these Financial Statements. | (Continued) |
| Elements Portfolios | Annual Report | May 31, 2018 | ||||||||||||||
70
| Schedule of Investments | as of May 31, 2018 |
| ELEMENTS INTERNATIONAL SMALL CAP PORTFOLIO |
Open Futures Contracts
| DESCRIPTION | NUMBER OF CONTRACTS PURCHASED |
NOTIONAL AMOUNT |
VALUE/ UNREALIZED DEPRECIATION |
|||||||||
| FUTURES CONTRACTS PURCHASED |
||||||||||||
| British Pound, June 2018 Settlement |
224 | $ | 18,618,600 | $ | (1,012,857) | |||||||
| Euro FX, June 2018 Settlement |
51 | 7,459,069 | (492,630) | |||||||||
| Mini MSCI EAFE Index, June 2018 Settlement |
275 | 27,321,250 | (232,647) | |||||||||
|
|
|
|
|
|||||||||
| TOTAL FUTURES CONTRACTS PURCHASED |
$ | 53,398,919 | $ | (1,738,134) | ||||||||
|
|
|
|
|
|||||||||
Total Return Swaps
| COUNTERPARTY (a) | REFERENCE ENTITY |
PAY/RECEIVE TOTAL RETURN ON REFERENCE ENTITY |
BASE FINANCING RATE (b) |
TERMINATION DATE |
PAYMENT FREQUENCY |
NOTIONAL VALUE |
NUMBER OF UNITS |
UNREALIZED APPRECIATION (DEPRECIATION) |
||||||||||||||||||
| B |
888 Holdings PLC | Receive | 1-Month LIBOR GBP | 6/1/2020 | Term | $ | 259,182 | 94,554 | $ | 41,681 | ||||||||||||||||
| B |
AA PLC | Receive | 1-Month LIBOR GBP | 6/1/2020 | Term | 81,609 | 58,875 | (10,661) | ||||||||||||||||||
| B |
Abcam PLC | Receive | 1-Month LIBOR GBP | 6/1/2020 | Term | 63,906 | 6,574 | 21,345 | ||||||||||||||||||
| B |
Acacia Mining PLC | Receive | 1-Month LIBOR GBP | 6/1/2020 | Term | 19,180 | 11,401 | (6,145) | ||||||||||||||||||
| A |
Accent Group Ltd. | Receive | 1-Month LIBOR AUD | 6/1/2022 | Term | 131,791 | 84,788 | 2,282 | ||||||||||||||||||
| B |
Advanced Medical Solutions | Receive | 1-Month LIBOR GBP | 6/1/2020 | Term | 40,788 | 14,485 | 8,380 | ||||||||||||||||||
| A |
Advanced Medical Solutions | Receive | 1-Month LIBOR GBP | 6/1/2022 | Term | 6,071 | 2,130 | 1,152 | ||||||||||||||||||
| B |
Air France KLM S.A. | Receive | 1-Month LIBOR EUR | 6/1/2020 | Term | 310,377 | 28,440 | (136,897) | ||||||||||||||||||
| B |
Akwel S.A. | Receive | 1-Month LIBOR EUR | 6/1/2020 | Term | 190,951 | 5,234 | (53,714) | ||||||||||||||||||
| A |
Alphabet, Inc. — Class A | Pay | 1-Month LIBOR USD | 6/4/2018 | Term | 1,865,893 | (1,809) | (120,377) | ||||||||||||||||||
| B |
Alten S.A. | Receive | 1-Month LIBOR EUR | 6/1/2020 | Term | 247,600 | 3,160 | 30,639 | ||||||||||||||||||
| A |
Amazon.com, Inc. | Pay | 1-Month LIBOR USD | 6/4/2018 | Term | 547,272 | (348) | (18,771) | ||||||||||||||||||
| A |
ARB Corp. Ltd. | Receive | 1-Month LIBOR AUD | 6/1/2022 | Term | 2,558 | 117 | (34) | ||||||||||||||||||
| B |
Ascential PLC | Receive | 1-Month LIBOR GBP | 6/1/2020 | Term | 31,080 | 9,277 | 12,177 | ||||||||||||||||||
| B |
Ashmore Group PLC | Receive | 1-Month LIBOR GBP | 6/1/2020 | Term | 33,807 | 7,900 | (5,965) | ||||||||||||||||||
| B |
ASOS PLC | Receive | 1-Month LIBOR GBP | 6/1/2020 | Term | 271,449 | 4,270 | 12,016 | ||||||||||||||||||
| A |
ASOS PLC | Receive | 1-Month LIBOR GBP | 6/1/2022 | Term | 63 | 1 | 4 | ||||||||||||||||||
| B |
Assystem S.A. | Receive | 1-Month LIBOR EUR | 6/1/2020 | Term | 71,884 | 2,168 | (9,644) | ||||||||||||||||||
| A |
Assystem S.A. | Receive | 1-Month LIBOR EUR | 6/1/2022 | Term | 6,621 | 189 | (1,154) | ||||||||||||||||||
| B |
Aubay S.A. | Receive | 1-Month LIBOR EUR | 6/1/2020 | Term | 2,617 | 73 | 247 | ||||||||||||||||||
| A |
Automotive Groups Holdings Ltd. | Receive | 1-Month LIBOR AUD | 6/1/2022 | Term | 233,602 | 83,354 | (1,425) | ||||||||||||||||||
| B |
Aveva Group PLC | Receive | 1-Month LIBOR GBP | 6/1/2020 | Term | 67,892 | 3,414 | 63,916 | ||||||||||||||||||
| A |
Aveva Group PLC | Receive | 1-Month LIBOR GBP | 6/1/2022 | Term | 801 | 41 | 788 | ||||||||||||||||||
| B |
B&M European Value Retail S.A. | Receive | 1-Month LIBOR GBP | 6/1/2020 | Term | 27,318 | 7,600 | 4,310 | ||||||||||||||||||
| A |
Bega Cheese Ltd. | Receive | 1-Month LIBOR AUD | 6/1/2022 | Term | 2,118 | 290 | (12) | ||||||||||||||||||
| B |
Bellway PLC | Receive | 1-Month LIBOR GBP | 6/1/2020 | Term | 161,015 | 4,861 | 1,524 | ||||||||||||||||||
| B |
Beneteau | Receive | 1-Month LIBOR EUR | 6/1/2020 | Term | 247,036 | 15,335 | 45,078 | ||||||||||||||||||
| A |
Beneteau | Receive | 1-Month LIBOR EUR | 6/1/2022 | Term | 6,425 | 440 | 2,086 | ||||||||||||||||||
| A |
Berkshire Hathaway, Inc. | Pay | 1-Month LIBOR USD | 6/4/2018 | Term | 514,573 | (2,609) | 15,872 | ||||||||||||||||||
| A |
Best Buy Co., Inc. | Pay | 1-Month LIBOR USD | 6/4/2018 | Term | 1,114,846 | (14,471) | 129,369 | ||||||||||||||||||
| B |
Biffa PLC | Receive | 1-Month LIBOR GBP | 6/1/2020 | Term | 11,044 | 5,102 | 147 | ||||||||||||||||||
| B |
Biogen, Inc. | Pay | 1-Month LIBOR USD | 7/25/2018 | Term | 638,915 | (2,464) | (83,858) | ||||||||||||||||||
| A |
Blackmores Ltd. | Receive | 1-Month LIBOR AUD | 6/1/2022 | Term | 10,954 | 85 | 1,517 | ||||||||||||||||||
| B |
Bodycote PLC | Receive | 1-Month LIBOR GBP | 6/1/2020 | Term | 130,326 | 15,004 | 31,686 | ||||||||||||||||||
| B |
Boiron S.A. | Receive | 1-Month LIBOR EUR | 6/1/2020 | Term | 92,552 | 1,131 | (13,172) | ||||||||||||||||||
| A |
Boiron S.A. | Receive | 1-Month LIBOR EUR | 6/1/2022 | Term | 1,962 | 22 | (426) | ||||||||||||||||||
| B |
Bonduelle SCA | Receive | 1-Month LIBOR EUR | 6/1/2020 | Term | 102,433 | 3,051 | (1,980) | ||||||||||||||||||
| A |
Bonduelle SCA | Receive | 1-Month LIBOR EUR | 6/1/2022 | Term | 7,351 | 217 | (197) | ||||||||||||||||||
| The accompanying Notes to the Financial Statements are an integral part of these Financial Statements. | (Continued) |
| Elements Portfolios | Annual Report | May 31, 2018 | ||||||||||||||
71
| Schedule of Investments | as of May 31, 2018 |
| ELEMENTS INTERNATIONAL SMALL CAP PORTFOLIO |
| COUNTERPARTY (a) | REFERENCE ENTITY |
PAY/RECEIVE TOTAL RETURN ON REFERENCE ENTITY |
BASE FINANCING RATE (b) |
TERMINATION DATE |
PAYMENT FREQUENCY |
NOTIONAL VALUE |
NUMBER OF UNITS |
UNREALIZED APPRECIATION (DEPRECIATION) |
||||||||||||||||||
| B |
Boohoo.com PLC | Receive | 1-Month LIBOR GBP | 6/1/2020 | Term | $ | 26,746 | 13,477 | $ | 750 | ||||||||||||||||
| B |
Bourbon Corp. S.A. | Receive | 1-Month LIBOR EUR | 6/1/2020 | Term | 30,810 | 3,028 | (15,863) | ||||||||||||||||||
| B |
Bovis Homes Group PLC | Receive | 1-Month LIBOR GBP | 6/1/2020 | Term | 186,785 | 17,645 | 52,055 | ||||||||||||||||||
| A |
Bovis Homes Group PLC | Receive | 1-Month LIBOR GBP | 6/1/2022 | Term | 734 | 80 | 405 | ||||||||||||||||||
| B |
Brewin Dolphin Holdings PLC | Receive | 1-Month LIBOR GBP | 6/1/2020 | Term | 96,507 | 28,667 | 16,982 | ||||||||||||||||||
| B |
Britvic PLC | Receive | 1-Month LIBOR GBP | 6/1/2020 | Term | 28,322 | 3,591 | 1,228 | ||||||||||||||||||
| A |
Broadcom, Inc. | Pay | 1-Month LIBOR USD | 6/4/2018 | Term | 1,637,375 | (7,034) | (132,500) | ||||||||||||||||||
| B |
Broadcom, Inc. | Pay | 1-Month LIBOR USD | 7/25/2018 | Term | 1,025,546 | (4,393) | (79,318) | ||||||||||||||||||
| B |
Brown Group PLC | Receive | 1-Month LIBOR GBP | 6/1/2020 | Term | 94,394 | 35,271 | (25,591) | ||||||||||||||||||
| A |
Brown Group PLC | Receive | 1-Month LIBOR GBP | 6/1/2022 | Term | 32 | 12 | (8) | ||||||||||||||||||
| B |
BTG PLC | Receive | 1-Month LIBOR GBP | 6/1/2020 | Term | 13,846 | 1,837 | (3,914) | ||||||||||||||||||
| B |
C&C Group PLC | Receive | 1-Month LIBOR EUR | 6/1/2020 | Term | 22,250 | 6,450 | (1,953) | ||||||||||||||||||
| B |
Card Factory PLC | Receive | 1-Month LIBOR GBP | 6/1/2020 | Term | 59,532 | 23,629 | (14,150) | ||||||||||||||||||
| B |
Centamin PLC | Receive | 1-Month LIBOR GBP | 6/1/2020 | Term | 453,762 | 275,011 | (108,352) | ||||||||||||||||||
| B |
Central Asia Metals Ltd. | Receive | 1-Month LIBOR GBP | 6/1/2020 | Term | 14,781 | 4,800 | (825) | ||||||||||||||||||
| B |
CGG S.A. | Receive | 1-Month LIBOR EUR | 6/1/2020 | Term | — | 7,028 | 3,647 | ||||||||||||||||||
| B |
Chargeurs S.A. | Receive | 1-Month LIBOR EUR | 6/1/2020 | Term | 2,450 | 100 | (15) | ||||||||||||||||||
| B |
Cherming Group PLC | Receive | 1-Month LIBOR GBP | 6/1/2020 | Term | 33,504 | 18,514 | 5,241 | ||||||||||||||||||
| A |
Cherming Group PLC | Receive | 1-Month LIBOR GBP | 6/1/2022 | Term | 50 | 28 | 8 | ||||||||||||||||||
| B |
Cineworld Group Plc | Receive | 1-Month LIBOR GBP | 6/1/2020 | Term | 49,971 | 7,549 | (41,249) | ||||||||||||||||||
| B |
Cisco Systems, Inc. | Pay | 1-Month LIBOR USD | 7/25/2018 | Term | 1,028,370 | (23,240) | 38,276 | ||||||||||||||||||
| A |
Citigroup, Inc. | Pay | 1-Month LIBOR USD | 6/4/2018 | Term | 898,595 | (13,025) | 27,538 | ||||||||||||||||||
| B |
Civitas Social Housing PLC — C Shares | Receive | 1-Month LIBOR GBP | 6/1/2020 | Term | 2,340 | 2,139 | (110) | ||||||||||||||||||
| B |
Civitas Social Housing PLC — C Shares | Receive | 1-Month LIBOR GBP | 6/1/2020 | Term | 3,082 | 3,082 | (145) | ||||||||||||||||||
| B |
Clinigen Group PLC | Receive | 1-Month LIBOR GBP | 6/1/2020 | Term | 39,629 | 4,465 | (2,176) | ||||||||||||||||||
| B |
Close Brothers Group PLC | Receive | 1-Month LIBOR GBP | 6/1/2020 | Term | 61,584 | 3,866 | (4,456) | ||||||||||||||||||
| B |
CMC Markets PLC | Receive | 1-Month LIBOR GBP | 6/1/2020 | Term | 41,556 | 32,824 | 26,931 | ||||||||||||||||||
| A |
CMC Markets PLC | Receive | 1-Month LIBOR GBP | 6/1/2022 | Term | 5,240 | 4,094 | 3,287 | ||||||||||||||||||
| B |
Coface S.A. | Receive | 1-Month LIBOR EUR | 6/1/2020 | Term | 75,401 | 9,375 | 13,759 | ||||||||||||||||||
| B |
Compagnie Des Alpes | Receive | 1-Month LIBOR EUR | 6/1/2020 | Term | 95,823 | 3,610 | 19,784 | ||||||||||||||||||
| A |
Compagnie Des Alpes | Receive | 1-Month LIBOR EUR | 6/1/2022 | Term | 9,181 | 365 | 2,601 | ||||||||||||||||||
| B |
Compagnie Plastic Omnium S.A. | Receive | 1-Month LIBOR EUR | 6/1/2020 | Term | 149,742 | 4,461 | 33,735 | ||||||||||||||||||
| B |
Costain Group PLC | Receive | 1-Month LIBOR GBP | 6/1/2020 | Term | 94,035 | 19,957 | (965) | ||||||||||||||||||
| A |
Costain Group PLC | Receive | 1-Month LIBOR GBP | 6/1/2022 | Term | 9,056 | 1,936 | 10 | ||||||||||||||||||
| B |
Countrywide PLC | Receive | 1-Month LIBOR GBP | 6/1/2020 | Term | 1,080 | 799 | (464) | ||||||||||||||||||
| B |
Crest Nicholson Holdings | Receive | 1-Month LIBOR GBP | 6/1/2020 | Term | 254 | 41 | (83) | ||||||||||||||||||
| A |
Crest Nicholson Holdings | Receive | 1-Month LIBOR GBP | 6/1/2022 | Term | 150 | 24 | (49) | ||||||||||||||||||
| A |
CSR Ltd. | Receive | 1-Month LIBOR AUD | 6/1/2022 | Term | 342,367 | 66,040 | (644) | ||||||||||||||||||
| B |
CVS Group PLC | Receive | 1-Month LIBOR GBP | 6/1/2020 | Term | 52,447 | 3,849 | (20,773) | ||||||||||||||||||
| B |
CYBG PLC | Receive | 1-Month LIBOR GBP | 6/1/2020 | Term | 15,479 | 5,700 | 1,075 | ||||||||||||||||||
| B |
Dart Group PLC | Receive | 1-Month LIBOR GBP | 6/1/2020 | Term | 36,099 | 5,791 | 14,128 | ||||||||||||||||||
| A |
Dart Group PLC | Receive | 1-Month LIBOR GBP | 6/1/2022 | Term | 340 | 55 | 138 | ||||||||||||||||||
| A |
Debenhams PLC | Receive | 1-Month LIBOR GBP | 6/1/2022 | Term | 15 | 30 | (10) | ||||||||||||||||||
| B |
Dechra Pharmeceuticals PLC | Receive | 1-Month LIBOR GBP | 6/1/2020 | Term | 18,881 | 910 | 8,727 | ||||||||||||||||||
| A |
Dell Technologies, Inc. — Class V | Pay | 1-Month LIBOR USD | 6/4/2018 | Term | 1,634,676 | (22,510) | (177,800) | ||||||||||||||||||
| B |
Derichebourg | Receive | 1-Month LIBOR EUR | 6/1/2020 | Term | 142,180 | 23,527 | (21,234) | ||||||||||||||||||
| A |
Derichebourg | Receive | 1-Month LIBOR EUR | 6/1/2022 | Term | 5,156 | 817 | (963) | ||||||||||||||||||
| The accompanying Notes to the Financial Statements are an integral part of these Financial Statements. | (Continued) |
| Elements Portfolios | Annual Report | May 31, 2018 | ||||||||||||||
72
| Schedule of Investments | as of May 31, 2018 |
| ELEMENTS INTERNATIONAL SMALL CAP PORTFOLIO |
| COUNTERPARTY (a) | REFERENCE ENTITY |
PAY/RECEIVE TOTAL RETURN ON REFERENCE ENTITY |
BASE FINANCING RATE (b) |
TERMINATION DATE |
PAYMENT FREQUENCY |
NOTIONAL VALUE |
NUMBER OF UNITS |
UNREALIZED APPRECIATION (DEPRECIATION) |
||||||||||||||||||
| B |
Devoteam S.A. | Receive | 1-Month LIBOR EUR | 6/1/2020 | Term | $ | 60,636 | 857 | $ | 33,690 | ||||||||||||||||
| A |
Devoteam S.A. | Receive | 1-Month LIBOR EUR | 6/1/2022 | Term | 5,546 | 78 | 3,039 | ||||||||||||||||||
| B |
DFS Furniture PLC | Receive | 1-Month LIBOR GBP | 6/1/2020 | Term | 50,348 | 23,743 | 11,375 | ||||||||||||||||||
| B |
Dialight PLC | Receive | 1-Month LIBOR GBP | 6/1/2020 | Term | 39,119 | 3,892 | (25,670) | ||||||||||||||||||
| A |
Dialight PLC | Receive | 1-Month LIBOR GBP | 6/1/2022 | Term | 2,823 | 277 | (1,878) | ||||||||||||||||||
| B |
Diploma PLC | Receive | 1-Month LIBOR GBP | 6/1/2020 | Term | 204,850 | 18,283 | 36,165 | ||||||||||||||||||
| B |
Direct Energie | Receive | 1-Month LIBOR EUR | 6/1/2020 | Term | 32,924 | 658 | (5,920) | ||||||||||||||||||
| B |
Dixons Carphone PLC | Receive | 1-Month LIBOR GBP | 6/1/2020 | Term | 84,223 | 42,124 | (8,767) | ||||||||||||||||||
| B |
Drax Group PLC | Receive | 1-Month LIBOR GBP | 6/1/2020 | Term | 135,030 | 41,346 | 5,000 | ||||||||||||||||||
| B |
DS Smith PLC | Receive | 1-Month LIBOR GBP | 6/1/2020 | Term | 42,034 | 8,479 | 7,224 | ||||||||||||||||||
| A |
Duke Energy Corp. | Pay | 1-Month LIBOR USD | 6/4/2018 | Term | 1,666,431 | (20,701) | 53,960 | ||||||||||||||||||
| A |
Duluxgroup, Ltd. | Receive | 1-Month LIBOR AUD | 6/1/2022 | Term | 7,591 | 973 | (134) | ||||||||||||||||||
| B |
Dunlem Group PLC | Receive | 1-Month LIBOR GBP | 6/1/2020 | Term | 158,844 | 26,065 | (17,678) | ||||||||||||||||||
| B |
EI Group PLC | Receive | 1-Month LIBOR GBP | 6/1/2020 | Term | 80,510 | 56,703 | 391 | ||||||||||||||||||
| B |
Electrocomponents PLC | Receive | 1-Month LIBOR GBP | 6/1/2020 | Term | 255,998 | 45,601 | 90,562 | ||||||||||||||||||
| B |
Elementis PLC | Receive | 1-Month LIBOR GBP | 6/1/2020 | Term | 69,214 | 23,215 | 204 | ||||||||||||||||||
| A |
Elementis PLC | Receive | 1-Month LIBOR GBP | 6/1/2022 | Term | 9 | 3 | — | ||||||||||||||||||
| B |
Elior Group | Receive | 1-Month LIBOR EUR | 6/1/2020 | Term | 56,189 | 3,912 | (561) | ||||||||||||||||||
| B |
Elis S.A. | Receive | 1-Month LIBOR EUR | 6/1/2020 | Term | 27,165 | 1,437 | (255) | ||||||||||||||||||
| B |
Emis Group PLC | Receive | 1-Month LIBOR GBP | 6/1/2020 | Term | 55,084 | 5,810 | (122) | ||||||||||||||||||
| A |
Emis Group PLC | Receive | 1-Month LIBOR GBP | 6/1/2022 | Term | 56 | 6 | 1 | ||||||||||||||||||
| B |
Entertainment One Ltd. | Receive | 1-Month LIBOR GBP | 6/1/2020 | Term | 19,342 | 7,814 | 5,341 | ||||||||||||||||||
| B |
Equiniti Group PLC | Receive | 1-Month LIBOR GBP | 6/1/2020 | Term | 30,516 | 11,280 | (1,448) | ||||||||||||||||||
| B |
Eramet | Receive | 1-Month LIBOR EUR | 6/1/2020 | Term | 85,682 | 1,052 | 86,747 | ||||||||||||||||||
| B |
Essentra PLC | Receive | 1-Month LIBOR GBP | 6/1/2020 | Term | 37,121 | 6,972 | (4,064) | ||||||||||||||||||
| B |
Esure Group PLC | Receive | 1-Month LIBOR GBP | 6/1/2020 | Term | 17,798 | 6,200 | (3,562) | ||||||||||||||||||
| B |
Euronext N.V. | Receive | 1-Month LIBOR EUR | 6/1/2020 | Term | 105,849 | 2,237 | 22,166 | ||||||||||||||||||
| B |
Evraz PLC | Receive | 1-Month LIBOR GBP | 6/1/2020 | Term | 237,587 | 122,399 | 585,337 | ||||||||||||||||||
| A |
Evraz PLC | Receive | 1-Month LIBOR GBP | 6/1/2022 | Term | 64,247 | 33,462 | 161,028 | ||||||||||||||||||
| A |
Express Scripts Holding Co. | Pay | 1-Month LIBOR USD | 6/4/2018 | Term | 1,706,959 | (22,108) | 34,272 | ||||||||||||||||||
| A |
Facebook, Inc. | Pay | 1-Month LIBOR USD | 6/4/2018 | Term | 1,918,864 | (11,054) | (197,339) | ||||||||||||||||||
| B |
Fenner PLC | Receive | 1-Month LIBOR GBP | 6/1/2020 | Term | 191,033 | 46,428 | 123,846 | ||||||||||||||||||
| B |
Ferrexpo PLC | Receive | 1-Month LIBOR GBP | 6/1/2020 | Term | 367,092 | 189,014 | 75,451 | ||||||||||||||||||
| A |
Ferrexpo PLC | Receive | 1-Month LIBOR GBP | 6/1/2022 | Term | 115 | 67 | 48 | ||||||||||||||||||
| B |
Fevertree Drinks PLC | Receive | 1-Month LIBOR GBP | 6/1/2020 | Term | 19,722 | 962 | 12,175 | ||||||||||||||||||
| B |
Firstgroup PLC | Receive | 1-Month LIBOR GBP | 6/1/2020 | Term | 142,142 | 103,204 | (67,493) | ||||||||||||||||||
| B |
FNAC Darty S.A. | Receive | 1-Month LIBOR EUR | 6/1/2020 | Term | 200,693 | 2,799 | 59,615 | ||||||||||||||||||
| B |
Forterra PLC | Receive | 1-Month LIBOR GBP | 6/1/2020 | Term | 60,189 | 21,098 | 7,285 | ||||||||||||||||||
| A |
Forterra PLC | Receive | 1-Month LIBOR GBP | 6/1/2022 | Term | 11,911 | 4,529 | 3,014 | ||||||||||||||||||
| B |
Foxtons Group PLC | Receive | 1-Month LIBOR GBP | 6/1/2020 | Term | 1,252 | 1,575 | (298) | ||||||||||||||||||
| B |
Galliford Try PLC | Receive | 1-Month LIBOR GBP | 6/1/2020 | Term | 132,037 | 10,523 | (29,682) | ||||||||||||||||||
| A |
Galliford Try PLC | Receive | 1-Month LIBOR GBP | 6/1/2022 | Term | 363 | 29 | (80) | ||||||||||||||||||
| B |
Gaztransport Et Techniga S.A. | Receive | 1-Month LIBOR EUR | 6/1/2020 | Term | 160,862 | 3,871 | 53,829 | ||||||||||||||||||
| A |
Gaztransport Et Techniga S.A. | Receive | 1-Month LIBOR EUR | 6/1/2022 | Term | 25,397 | 691 | 14,135 | ||||||||||||||||||
| B |
General Motors Co. | Pay | 1-Month LIBOR USD | 7/25/2018 | Term | 796,530 | (21,000) | (98,296) | ||||||||||||||||||
| A |
Gilead Sciences, Inc. | Pay | 1-Month LIBOR USD | 6/4/2018 | Term | 1,781,355 | (24,118) | 159,268 | ||||||||||||||||||
| B |
Gilead Sciences, Inc. | Pay | 1-Month LIBOR USD | 7/25/2018 | Term | 1,028,665 | (13,899) | 94,359 | ||||||||||||||||||
| B |
GL Events S.A. | Receive | 1-Month LIBOR EUR | 6/1/2020 | Term | 54,377 | 2,303 | 6,776 | ||||||||||||||||||
| A |
GL Events S.A. | Receive | 1-Month LIBOR EUR | 6/1/2022 | Term | 6,631 | 296 | 1,359 | ||||||||||||||||||
| B |
GO-AHEAD Group PLC | Receive | 1-Month LIBOR GBP | 6/1/2020 | Term | 147,472 | 8,270 | (6,811) | ||||||||||||||||||
| A |
GO-AHEAD Group PLC | Receive | 1-Month LIBOR GBP | 6/1/2022 | Term | 37 | 2 | (2) | ||||||||||||||||||
| B |
Grafton Group PLC | Receive | 1-Month LIBOR GBP | 6/1/2020 | Term | 27,559 | 3,577 | (163) | ||||||||||||||||||
| A |
Graincorp. Ltd. | Receive | 1-Month LIBOR AUD | 6/1/2022 | Term | 366,189 | 47,611 | 11,460 | ||||||||||||||||||
| The accompanying Notes to the Financial Statements are an integral part of these Financial Statements. | (Continued) |
| Elements Portfolios | Annual Report | May 31, 2018 | ||||||||||||||
73
| Schedule of Investments | as of May 31, 2018 |
| ELEMENTS INTERNATIONAL SMALL CAP PORTFOLIO |
| COUNTERPARTY (a) | REFERENCE ENTITY |
PAY/RECEIVE TOTAL RETURN ON REFERENCE ENTITY |
BASE FINANCING RATE (b) |
TERMINATION DATE |
PAYMENT FREQUENCY |
NOTIONAL VALUE |
NUMBER OF UNITS |
UNREALIZED APPRECIATION (DEPRECIATION) |
||||||||||||||||||
| A |
Greencross Ltd. | Receive | 1-Month LIBOR AUD | 6/1/2022 | Term | $ | 223,683 | 53,554 | $ | 13,081 | ||||||||||||||||
| B |
Greene King PLC | Receive | 1-Month LIBOR GBP | 6/1/2020 | Term | 11,455 | 2,251 | 2,193 | ||||||||||||||||||
| B |
Greggs PLC | Receive | 1-Month LIBOR GBP | 6/1/2020 | Term | 244,552 | 22,586 | (4,114) | ||||||||||||||||||
| A |
Greggs PLC | Receive | 1-Month LIBOR GBP | 6/1/2022 | Term | 23,498 | 2,194 | 227 | ||||||||||||||||||
| B |
Groupe Crit S.A. | Receive | 1-Month LIBOR EUR | 6/1/2020 | Term | 44,190 | 553 | 5,944 | ||||||||||||||||||
| A |
Groupe Crit S.A. | Receive | 1-Month LIBOR EUR | 6/1/2022 | Term | 6,970 | 94 | 1,661 | ||||||||||||||||||
| B |
Guerbet S.A. | Receive | 1-Month LIBOR EUR | 6/1/2020 | Term | 41,730 | 577 | (11,389) | ||||||||||||||||||
| B |
Halfords Group PLC | Receive | 1-Month LIBOR GBP | 6/1/2020 | Term | 338,665 | 96,841 | (5,493) | ||||||||||||||||||
| A |
Halfords Group PLC | Receive | 1-Month LIBOR GBP | 6/1/2022 | Term | 6,491 | 1,793 | (237) | ||||||||||||||||||
| B |
Hastings Group Holdings PLC | Receive | 1-Month LIBOR GBP | 6/1/2020 | Term | 3,379 | 1,300 | 78 | ||||||||||||||||||
| B |
Haulotte Group S.A. | Receive | 1-Month LIBOR EUR | 6/1/2020 | Term | 34,400 | 2,326 | 4,279 | ||||||||||||||||||
| A |
Haulotte Group S.A. | Receive | 1-Month LIBOR EUR | 6/1/2022 | Term | 2,889 | 196 | 387 | ||||||||||||||||||
| B |
Hays PLC | Receive | 1-Month LIBOR GBP | 6/1/2020 | Term | 548,322 | 315,492 | 55,202 | ||||||||||||||||||
| B |
Hikma Pharmaceuticals PLC | Receive | 1-Month LIBOR GBP | 6/1/2020 | Term | 136,477 | 13,580 | 65,086 | ||||||||||||||||||
| B |
Hochschild Mining PLC | Receive | 1-Month LIBOR GBP | 6/1/2020 | Term | 75,071 | 26,636 | (22,906) | ||||||||||||||||||
| B |
Hostelworld Group PLC | Receive | 1-Month LIBOR GBP | 6/1/2020 | Term | 6,162 | 1,761 | (378) | ||||||||||||||||||
| A |
Hostelworld Group PLC | Receive | 1-Month LIBOR GBP | 6/1/2022 | Term | 1,101 | 313 | (73) | ||||||||||||||||||
| B |
Hotel Chocolat group Ltd. | Receive | 1-Month LIBOR GBP | 6/1/2020 | Term | 1,945 | 602 | 490 | ||||||||||||||||||
| B |
Howden Joinery Group PLC | Receive | 1-Month LIBOR GBP | 6/1/2020 | Term | 379,286 | 83,122 | 58,213 | ||||||||||||||||||
| A |
Howden Joinery Group PLC | Receive | 1-Month LIBOR GBP | 6/1/2022 | Term | 1,624 | 353 | 226 | ||||||||||||||||||
| B |
Ibstock PLC | Receive | 1-Month LIBOR GBP | 6/1/2020 | Term | 5,177 | 2,100 | 1,132 | ||||||||||||||||||
| B |
ID Logistics Group | Receive | 1-Month LIBOR EUR | 6/1/2020 | Term | 37,568 | 279 | 6,557 | ||||||||||||||||||
| A |
ID Logistics Group | Receive | 1-Month LIBOR EUR | 6/1/2022 | Term | 6,467 | 48 | 1,129 | ||||||||||||||||||
| B |
IG Group Holdings PLC | Receive | 1-Month LIBOR GBP | 6/1/2020 | Term | 114,587 | 16,295 | 36,876 | ||||||||||||||||||
| B |
Inchcape PLC | Receive | 1-Month LIBOR GBP | 6/1/2020 | Term | 695,776 | 88,887 | (44,795) | ||||||||||||||||||
| A |
Inchcape PLC | Receive | 1-Month LIBOR GBP | 6/1/2022 | Term | 282 | 33 | (45) | ||||||||||||||||||
| B |
Indivior PLC | Receive | 1-Month LIBOR GBP | 6/1/2020 | Term | 101,695 | 31,653 | 65,865 | ||||||||||||||||||
| A |
Indivior PLC | Receive | 1-Month LIBOR GBP | 6/1/2022 | Term | 347 | 109 | 232 | ||||||||||||||||||
| B |
Ingersoll-Rand PLC | Pay | 1-Month LIBOR USD | 7/25/2018 | Term | 341,866 | (4,106) | (16,747) | ||||||||||||||||||
| A |
Inghams Group PLC | Receive | 1-Month LIBOR AUD | 6/1/2022 | Term | 119,329 | 30,800 | 1,989 | ||||||||||||||||||
| B |
Inmarsat PLC | Receive | 1-Month LIBOR GBP | 6/1/2020 | Term | 4,724 | 1,400 | 849 | ||||||||||||||||||
| A |
International Business Machines Corp. | Pay | 1-Month LIBOR USD | 6/4/2018 | Term | 2,855,628 | (19,495) | 75,738 | ||||||||||||||||||
| B |
Interparfums S.A. | Receive | 1-Month LIBOR EUR | 6/1/2020 | Term | 55,440 | 1,727 | 16,487 | ||||||||||||||||||
| A |
Interparfums S.A. | Receive | 1-Month LIBOR EUR | 6/1/2022 | Term | 3,109 | 102 | 1,170 | ||||||||||||||||||
| B |
Iomart Group PLC | Receive | 1-Month LIBOR GBP | 6/1/2020 | Term | 15,746 | 5,251 | 7,191 | ||||||||||||||||||
| A |
Iomart Group PLC | Receive | 1-Month LIBOR GBP | 6/1/2022 | Term | 9 | 3 | 4 | ||||||||||||||||||
| B |
Ipsos S.A. | Receive | 1-Month LIBOR EUR | 6/1/2020 | Term | 298,394 | 9,156 | (33,868) | ||||||||||||||||||
| B |
Irish Continental Group PLC | Receive | 1-Month LIBOR EUR | 6/1/2020 | Term | 16,815 | 3,044 | 23 | ||||||||||||||||||
| B |
Jackpotjoy PLC | Receive | 1-Month LIBOR GBP | 6/1/2020 | Term | 66,303 | 8,413 | 8,444 | ||||||||||||||||||
| B |
Jacquet Metal Service S.A. | Receive | 1-Month LIBOR EUR | 6/1/2020 | Term | 96,994 | 3,850 | 9,839 | ||||||||||||||||||
| A |
Jacquet Metal Service S.A. | Receive | 1-Month LIBOR EUR | 6/1/2022 | Term | 4,071 | 157 | 305 | ||||||||||||||||||
| B |
Janus Henderson Group PLC | Receive | 1-Month LIBOR USD | 6/1/2020 | Term | 133,877 | 4,418 | (106) | ||||||||||||||||||
| A |
JB Hi-Fi Ltd. | Receive | 1-Month LIBOR AUD | 6/1/2022 | Term | 690,552 | 28,541 | (4,607) | ||||||||||||||||||
| B |
JD Sports Fashion PLC | Receive | 1-Month LIBOR GBP | 6/1/2020 | Term | 555,684 | 131,808 | (76,074) | ||||||||||||||||||
| B |
John Menzies PLC | Receive | 1-Month LIBOR GBP | 6/1/2020 | Term | 58,598 | 8,299 | (6,213) | ||||||||||||||||||
| A |
John Menzies PLC | Receive | 1-Month LIBOR GBP | 6/1/2022 | Term | 6,636 | 923 | (709) | ||||||||||||||||||
| A |
JP Morgan Chase & Co. | Pay | 1-Month LIBOR USD | 6/4/2018 | Term | 1,478,979 | (13,519) | 35,188 | ||||||||||||||||||
| The accompanying Notes to the Financial Statements are an integral part of these Financial Statements. | (Continued) |
| Elements Portfolios | Annual Report | May 31, 2018 | ||||||||||||||
74
| Schedule of Investments | as of May 31, 2018 |
| ELEMENTS INTERNATIONAL SMALL CAP PORTFOLIO |
| COUNTERPARTY (a) | REFERENCE ENTITY |
PAY/RECEIVE TOTAL RETURN ON REFERENCE ENTITY |
BASE FINANCING RATE (b) |
TERMINATION DATE |
PAYMENT FREQUENCY |
NOTIONAL VALUE |
NUMBER OF UNITS |
UNREALIZED APPRECIATION (DEPRECIATION) |
||||||||||||||||||
| B |
Jupiter Fund Management PLC | Receive | 1-Month LIBOR GBP | 6/1/2020 | Term | $ | 64,558 | 12,500 | $ | (6,530) | ||||||||||||||||
| B |
Just Eat PLC | Receive | 1-Month LIBOR GBP | 6/1/2020 | Term | 69,711 | 9,732 | 15,817 | ||||||||||||||||||
| B |
Kainos Group PLC | Receive | 1-Month LIBOR GBP | 6/1/2020 | Term | 8,362 | 3,543 | 8,248 | ||||||||||||||||||
| A |
Kainos Group PLC | Receive | 1-Month LIBOR GBP | 6/1/2022 | Term | 1,347 | 524 | 1,074 | ||||||||||||||||||
| B |
Kaufman & Broad S.A. | Receive | 1-Month LIBOR EUR | 6/1/2020 | Term | 106,552 | 2,710 | 6,860 | ||||||||||||||||||
| B |
KAZ Minerals PLC | Receive | 1-Month LIBOR GBP | 6/1/2020 | Term | 14,243 | 1,700 | 3,927 | ||||||||||||||||||
| B |
KCom Group PLC | Receive | 1-Month LIBOR GBP | 6/1/2020 | Term | 38,816 | 41,649 | 2,940 | ||||||||||||||||||
| A |
KCom Group PLC | Receive | 1-Month LIBOR GBP | 6/1/2022 | Term | 4,275 | 4,647 | 407 | ||||||||||||||||||
| B |
Keller Group PLC | Receive | 1-Month LIBOR GBP | 6/1/2020 | Term | 61,793 | 6,483 | 9,765 | ||||||||||||||||||
| B |
Kier Group PLC | Receive | 1-Month LIBOR GBP | 6/1/2020 | Term | 82,586 | 7,722 | 986 | ||||||||||||||||||
| B |
Kingspan Group PLC | Receive | 1-Month LIBOR EUR | 6/1/2020 | Term | 14,313 | 500 | 6,605 | ||||||||||||||||||
| A |
Kohl’s Corp. | Pay | 1-Month LIBOR USD | 6/4/2018 | Term | 626,354 | (10,049) | (43,198) | ||||||||||||||||||
| A |
L3 Technologies, Inc. | Pay | 1-Month LIBOR USD | 6/4/2018 | Term | 1,229,179 | (6,230) | (9,009) | ||||||||||||||||||
| B |
Latecoere S.A. | Receive | 1-Month LIBOR EUR | 6/1/2020 | Term | 94,638 | 19,918 | 4,371 | ||||||||||||||||||
| B |
LISI S.A. | Receive | 1-Month LIBOR EUR | 6/1/2020 | Term | 138,552 | 3,596 | (18,015) | ||||||||||||||||||
| A |
LISI S.A. | Receive | 1-Month LIBOR EUR | 6/1/2022 | Term | 1,606 | 42 | (195) | ||||||||||||||||||
| B |
LNA Sante S.A. | Receive | 1-Month LIBOR EUR | 6/1/2020 | Term | 12,115 | 200 | (1,786) | ||||||||||||||||||
| B |
Luceco PLC | Receive | 1-Month LIBOR GBP | 6/1/2020 | Term | 2,766 | 4,396 | 284 | ||||||||||||||||||
| B |
M6 Metropole Television | Receive | 1-Month LIBOR EUR | 6/1/2020 | Term | 342,701 | 16,233 | (42,337) | ||||||||||||||||||
| A |
Magellan Financial Group LTD | Receive | 1-Month LIBOR AUD | 6/1/2022 | Term | 785 | 33 | (17) | ||||||||||||||||||
| B |
Maisons Du Monde S.A. | Receive | 1-Month LIBOR EUR | 6/1/2020 | Term | 138,029 | 4,051 | 2,913 | ||||||||||||||||||
| B |
Majestic Wine PLC | Receive | 1-Month LIBOR GBP | 6/1/2020 | Term | 34,747 | 9,097 | 4,936 | ||||||||||||||||||
| A |
Majestic Wine PLC | Receive | 1-Month LIBOR GBP | 6/1/2022 | Term | 6,147 | 1,698 | 1,408 | ||||||||||||||||||
| B |
Manitou BF S.A. | Receive | 1-Month LIBOR EUR | 6/1/2020 | Term | 44,170 | 1,581 | 14,333 | ||||||||||||||||||
| A |
Manitou BF S.A. | Receive | 1-Month LIBOR EUR | 6/1/2022 | Term | 3,247 | 119 | 1,183 | ||||||||||||||||||
| B |
Marshalls PLC | Receive | 1-Month LIBOR GBP | 6/1/2020 | Term | 194,561 | 48,179 | 19,385 | ||||||||||||||||||
| A |
Marshalls PLC | Receive | 1-Month LIBOR GBP | 6/1/2022 | Term | 27,811 | 7,131 | 4,525 | ||||||||||||||||||
| B |
McCarthy & Stone PLC | Receive | 1-Month LIBOR GBP | 6/1/2020 | Term | 11,932 | 8,200 | (1,676) | ||||||||||||||||||
| B |
McDonald’s Corp. | Pay | 1-Month LIBOR USD | 7/25/2018 | Term | 1,024,850 | (6,446) | (4,097) | ||||||||||||||||||
| B |
Mersen S.A. | Receive | 1-Month LIBOR EUR | 6/1/2020 | Term | 77,026 | 2,854 | 32,508 | ||||||||||||||||||
| A |
Mersen S.A. | Receive | 1-Month LIBOR EUR | 6/1/2022 | Term | 16,872 | 659 | 8,624 | ||||||||||||||||||
| A |
Metcash Ltd. | Receive | 1-Month LIBOR AUD | 6/1/2022 | Term | 642,604 | 194,986 | (58,501) | ||||||||||||||||||
| B |
Metro Bank PLC | Receive | 1-Month LIBOR GBP | 6/1/2020 | Term | 72,211 | 2,132 | (2,002) | ||||||||||||||||||
| B |
MGM Resorts International | Pay | 1-Month LIBOR USD | 7/25/2018 | Term | 1,027,698 | (28,413) | 136,594 | ||||||||||||||||||
| B |
Micron Technology, Inc. | Pay | 1-Month LIBOR USD | 7/25/2018 | Term | 1,022,459 | (20,858) | (176,281) | ||||||||||||||||||
| A |
Mineral Resources Ltd. | Receive | 1-Month LIBOR AUD | 6/1/2022 | Term | 46,325 | 2,558 | 715 | ||||||||||||||||||
| B |
Mitie Group PLC | Receive | 1-Month LIBOR GBP | 6/1/2020 | Term | 284,634 | 109,698 | (118,959) | ||||||||||||||||||
| B |
Moneysupermarket.com Group PLC | Receive | 1-Month LIBOR GBP | 6/1/2020 | Term | 220,140 | 67,156 | (3,668) | ||||||||||||||||||
| A |
Moneysupermarket.com Group PLC | Receive | 1-Month LIBOR GBP | 6/1/2022 | Term | 71 | 21 | (4) | ||||||||||||||||||
| A |
Monsanto Co. | Pay | 1-Month LIBOR USD | 6/4/2018 | Term | 2,312,544 | (18,490) | (39,692) | ||||||||||||||||||
| B |
Morgan Advanced Materials PLC | Receive | 1-Month LIBOR GBP | 6/1/2020 | Term | 23,479 | 7,767 | 4,939 | ||||||||||||||||||
| B |
National Express Group PLC | Receive | 1-Month LIBOR GBP | 6/1/2020 | Term | 42,185 | 11,435 | 6,434 | ||||||||||||||||||
| B |
Naturex S.A. | Receive | 1-Month LIBOR EUR | 6/1/2020 | Term | 86 | 1 | 56 | ||||||||||||||||||
| B |
Neopost S.A. | Receive | 1-Month LIBOR EUR | 6/1/2020 | Term | 218,708 | 6,392 | (70,711) | ||||||||||||||||||
| B |
Nex Group PLC | Receive | 1-Month LIBOR GBP | 6/1/2020 | Term | 363,826 | 54,907 | 268,581 | ||||||||||||||||||
| B |
Nexans S.A. | Receive | 1-Month LIBOR EUR | 6/1/2020 | Term | 35,259 | 800 | (5,003) | ||||||||||||||||||
| B |
Nexity S.A. | Receive | 1-Month LIBOR EUR | 6/1/2020 | Term | 58,589 | 1,121 | (3,263) | ||||||||||||||||||
| A |
Northern Star Resources Ltd. | Receive | 1-Month LIBOR AUD | 6/1/2022 | Term | 1,319 | 212 | 8 | ||||||||||||||||||
| The accompanying Notes to the Financial Statements are an integral part of these Financial Statements. | (Continued) |
| Elements Portfolios | Annual Report | May 31, 2018 | ||||||||||||||
75
| Schedule of Investments | as of May 31, 2018 |
| ELEMENTS INTERNATIONAL SMALL CAP PORTFOLIO |
| COUNTERPARTY (a) | REFERENCE ENTITY |
PAY/RECEIVE TOTAL RETURN ON REFERENCE ENTITY |
BASE FINANCING RATE (b) |
TERMINATION DATE |
PAYMENT FREQUENCY |
NOTIONAL VALUE |
NUMBER OF UNITS |
UNREALIZED APPRECIATION (DEPRECIATION) |
||||||||||||||||||
| B |
Northgate PLC | Receive | 1-Month LIBOR GBP | 6/1/2020 | Term | $ | 23,384 | 5,037 | $ | (2,277) | ||||||||||||||||
| B |
Norwegian Cruise Line Holdings Ltd. | Pay | 1-Month LIBOR USD | 7/25/2018 | Term | 1,398,093 | (24,636) | 112,025 | ||||||||||||||||||
| B |
Ocado Group PLC | Receive | 1-Month LIBOR GBP | 6/1/2020 | Term | 586 | 200 | 1,604 | ||||||||||||||||||
| B |
Oeneo S.A. | Receive | 1-Month LIBOR EUR | 6/1/2020 | Term | 656 | 62 | (11) | ||||||||||||||||||
| B |
Onesavings Bank PLC | Receive | 1-Month LIBOR GBP | 6/1/2020 | Term | 10,355 | 2,600 | 492 | ||||||||||||||||||
| B |
Origin Enterprises PLC | Receive | 1-Month LIBOR EUR | 6/1/2020 | Term | 72,560 | 12,239 | (6,320) | ||||||||||||||||||
| A |
Origin Enterprises PLC | Receive | 1-Month LIBOR EUR | 6/1/2022 | Term | 3,932 | 574 | (838) | ||||||||||||||||||
| B |
Oxford Instruments PLC | Receive | 1-Month LIBOR GBP | 6/1/2020 | Term | 27,315 | 2,585 | (4,722) | ||||||||||||||||||
| A |
Pact Group Holdings Ltd. | Receive | 1-Month LIBOR AUD | 6/1/2022 | Term | 60,845 | 10,631 | (513) | ||||||||||||||||||
| B |
Pagegroup PLC | Receive | 1-Month LIBOR GBP | 6/1/2020 | Term | 349,169 | 70,923 | 49,000 | ||||||||||||||||||
| A |
Pagegroup PLC | Receive | 1-Month LIBOR GBP | 6/1/2022 | Term | 224 | 47 | 46 | ||||||||||||||||||
| B |
Paragon Banking Group Plc | Receive | 1-Month LIBOR GBP | 6/1/2020 | Term | 118,475 | 25,432 | 10,059 | ||||||||||||||||||
| B |
Pendragon PLC | Receive | 1-Month LIBOR GBP | 6/1/2020 | Term | 18,724 | 63,579 | (2,182) | ||||||||||||||||||
| B |
Permanent tsb Group Holdings PLC | Receive | 1-Month LIBOR EUR | 6/1/2020 | Term | 590 | 236 | (203) | ||||||||||||||||||
| B |
Petrofac Ltd. | Receive | 1-Month LIBOR GBP | 6/1/2020 | Term | 125,255 | 27,520 | 52,705 | ||||||||||||||||||
| B |
Pets at Home Group PLC | Receive | 1-Month LIBOR GBP | 6/1/2020 | Term | 227,287 | 146,429 | (50,426) | ||||||||||||||||||
| A |
Pets at Home Group PLC | Receive | 1-Month LIBOR GBP | 6/1/2022 | Term | 27,594 | 17,355 | (6,325) | ||||||||||||||||||
| B |
Phoenix Group Holdings | Receive | 1-Month LIBOR GBP | 6/1/2020 | Term | 145,587 | 18,652 | (1,496) | ||||||||||||||||||
| B |
Photo-Me International PLC | Receive | 1-Month LIBOR GBP | 6/1/2020 | Term | 10,272 | 6,300 | (3,932) | ||||||||||||||||||
| B |
Pierre et Vacances S.A. | Receive | 1-Month LIBOR EUR | 6/1/2020 | Term | 8,266 | 181 | (2,061) | ||||||||||||||||||
| A |
Pierre et Vacances S.A. | Receive | 1-Month LIBOR EUR | 6/1/2022 | Term | 765 | 16 | (221) | ||||||||||||||||||
| B |
Plastiques du Val de Loire S.A. | Receive | 1-Month LIBOR EUR | 6/1/2020 | Term | 49,666 | 2,345 | (7,278) | ||||||||||||||||||
| A |
Platinum Asset Management Ltd. | Receive | 1-Month LIBOR AUD | 6/1/2022 | Term | 148,292 | 24,391 | (186) | ||||||||||||||||||
| B |
Playtech PLC | Receive | 1-Month LIBOR GBP | 6/1/2020 | Term | 74,186 | 9,562 | 1,699 | ||||||||||||||||||
| B |
Plus 500 Ltd. | Receive | 1-Month LIBOR GBP | 6/1/2020 | Term | 116,342 | 23,556 | 386,755 | ||||||||||||||||||
| A |
Plus 500 Ltd. | Receive | 1-Month LIBOR GBP | 6/1/2022 | Term | 20,947 | 4,310 | 71,241 | ||||||||||||||||||
| B |
Polypipe Group PLC | Receive | 1-Month LIBOR GBP | 6/1/2020 | Term | 75,127 | 18,247 | (4,326) | ||||||||||||||||||
| A |
Procter & Gamble Co. | Pay | 1-Month LIBOR USD | 6/4/2018 | Term | 4,536,354 | (62,304) | (13,604) | ||||||||||||||||||
| B |
PZ Cussons PLC | Receive | 1-Month LIBOR GBP | 6/1/2020 | Term | 8,680 | 3,582 | (206) | ||||||||||||||||||
| B |
Qinetiq Group PLC | Receive | 1-Month LIBOR GBP | 6/1/2020 | Term | 15,468 | 6,400 | 2,272 | ||||||||||||||||||
| B |
Rank Group PLC | Receive | 1-Month LIBOR GBP | 6/1/2020 | Term | 31,838 | 14,473 | (5,451) | ||||||||||||||||||
| B |
Redcentric PLC | Receive | 1-Month LIBOR GBP | 6/1/2020 | Term | 54,453 | 64,752 | 13,474 | ||||||||||||||||||
| A |
Redcentric PLC | Receive | 1-Month LIBOR GBP | 6/1/2022 | Term | 2,919 | 3,394 | 619 | ||||||||||||||||||
| B |
Redde PLC | Receive | 1-Month LIBOR GBP | 6/1/2020 | Term | 127,602 | 79,146 | 21,587 | ||||||||||||||||||
| A |
Redde PLC | Receive | 1-Month LIBOR GBP | 6/1/2022 | Term | 6,017 | 3,478 | 572 | ||||||||||||||||||
| B |
Redrow PLC | Receive | 1-Month LIBOR GBP | 6/1/2020 | Term | 263,251 | 46,185 | 30,860 | ||||||||||||||||||
| A |
Redrow PLC | Receive | 1-Month LIBOR GBP | 6/1/2022 | Term | 449 | 78 | 47 | ||||||||||||||||||
| A |
Regeneron Pharmaceuticals, Inc. | Pay | 1-Month LIBOR USD | 6/4/2018 | Term | 857,757 | (2,740) | 36,549 | ||||||||||||||||||
| B |
Renishaw PLC | Receive | 1-Month LIBOR GBP | 6/1/2020 | Term | 96,556 | 2,532 | 52,836 | ||||||||||||||||||
| B |
Restaurant Group PLC | Receive | 1-Month LIBOR GBP | 6/1/2020 | Term | 159,165 | 50,764 | 1,024 | ||||||||||||||||||
| A |
Restaurant Group PLC | Receive | 1-Month LIBOR GBP | 6/1/2022 | Term | 66 | 21 | 4 | ||||||||||||||||||
| B |
RHI Magnesita N.V. | Receive | 1-Month LIBOR GBP | 6/1/2020 | Term | 4,141 | 100 | 1,266 | ||||||||||||||||||
| B |
Rightmove PLC | Receive | 1-Month LIBOR GBP | 6/1/2020 | Term | 4,341 | 100 | 798 | ||||||||||||||||||
| A |
Rockwell Collins, Inc. | Pay | 1-Month LIBOR USD | 6/4/2018 | Term | 1,283,051 | (9,647) | (44,195) | ||||||||||||||||||
| B |
Rotork PLC | Receive | 1-Month LIBOR GBP | 6/1/2020 | Term | 49,837 | 20,753 | 26,663 | ||||||||||||||||||
| A |
Rotork PLC | Receive | 1-Month LIBOR GBP | 6/1/2022 | Term | 118 | 49 | 62 | ||||||||||||||||||
| The accompanying Notes to the Financial Statements are an integral part of these Financial Statements. | (Continued) |
| Elements Portfolios | Annual Report | May 31, 2018 | ||||||||||||||
76
| Schedule of Investments | as of May 31, 2018 |
| ELEMENTS INTERNATIONAL SMALL CAP PORTFOLIO |
| COUNTERPARTY (a) | REFERENCE ENTITY |
PAY/RECEIVE TOTAL RETURN ON REFERENCE ENTITY |
BASE FINANCING RATE (b) |
TERMINATION DATE |
PAYMENT FREQUENCY |
NOTIONAL VALUE |
NUMBER OF UNITS |
UNREALIZED APPRECIATION (DEPRECIATION) |
||||||||||||||||||
| B |
Royal Caribbean Cruises Ltd. | Pay | 1-Month LIBOR USD | 7/25/2018 | Term | $ | 1,027,232 | (8,581) | $ | 128,882 | ||||||||||||||||
| B |
RPS Group PLC | Receive | 1-Month LIBOR GBP | 6/1/2020 | Term | 63,762 | 23,483 | (685) | ||||||||||||||||||
| A |
RPS Group PLC | Receive | 1-Month LIBOR GBP | 6/1/2022 | Term | 143 | 53 | 1 | ||||||||||||||||||
| B |
Rubis SCA | Receive | 1-Month LIBOR EUR | 6/1/2020 | Term | 150,570 | 2,910 | 32,836 | ||||||||||||||||||
| A |
Rubis SCA | Receive | 1-Month LIBOR EUR | 6/1/2022 | Term | 105 | 2 | 21 | ||||||||||||||||||
| B |
Saga PLC | Receive | 1-Month LIBOR GBP | 6/1/2020 | Term | 24,844 | 20,818 | 3,554 | ||||||||||||||||||
| A |
Sandfire Resources NL | Receive | 1-Month LIBOR AUD | 6/1/2022 | Term | 335,150 | 39,106 | 3,526 | ||||||||||||||||||
| B |
Sartorius Stedim Biotech | Receive | 1-Month LIBOR EUR | 6/1/2020 | Term | 108,532 | 1,636 | 35,850 | ||||||||||||||||||
| B |
Savills PLC | Receive | 1-Month LIBOR GBP | 6/1/2020 | Term | 136,608 | 15,098 | 16,343 | ||||||||||||||||||
| B |
Senior PLC | Receive | 1-Month LIBOR GBP | 6/1/2020 | Term | 126,649 | 43,572 | 14,306 | ||||||||||||||||||
| B |
Showroomprive | Receive | 1-Month LIBOR EUR | 6/1/2020 | Term | 14,629 | 605 | (12,393) | ||||||||||||||||||
| B |
SIG PLC | Receive | 1-Month LIBOR GBP | 6/1/2020 | Term | 341,905 | 227,755 | (47,542) | ||||||||||||||||||
| A |
Sigma Healthcare Ltd. | Receive | 1-Month LIBOR AUD | 6/1/2022 | Term | 80,466 | 104,155 | 980 | ||||||||||||||||||
| B |
Smurfit Kappa Group PLC | Receive | 1-Month LIBOR EUR | 6/1/2020 | Term | 62,794 | 2,333 | 25,404 | ||||||||||||||||||
| B |
Softcat PLC | Receive | 1-Month LIBOR GBP | 6/1/2020 | Term | 128,993 | 29,949 | 140,484 | ||||||||||||||||||
| B |
Solutions 30 SE | Receive | 1-Month LIBOR EUR | 6/1/2020 | Term | 49,648 | 1,363 | 6,248 | ||||||||||||||||||
| B |
Sopra Steria Group | Receive | 1-Month LIBOR EUR | 6/1/2020 | Term | 103,596 | 732 | 25,112 | ||||||||||||||||||
| B |
Spectris PLC | Receive | 1-Month LIBOR GBP | 6/1/2020 | Term | 175,322 | 6,818 | 23,330 | ||||||||||||||||||
| A |
Spectris PLC | Receive | 1-Month LIBOR GBP | 6/1/2022 | Term | 205 | 8 | 31 | ||||||||||||||||||
| B |
SPIE S.A. | Receive | 1-Month LIBOR EUR | 6/1/2020 | Term | 108,716 | 4,398 | (39,691) | ||||||||||||||||||
| B |
Spirax-Sarco Engineering PLC | Receive | 1-Month LIBOR GBP | 6/1/2020 | Term | 70,903 | 1,272 | 10,846 | ||||||||||||||||||
| B |
Sports Direct International PLC | Receive | 1-Month LIBOR GBP | 6/1/2020 | Term | 216,647 | 57,386 | 20,880 | ||||||||||||||||||
| B |
SRP Group S.A. | Receive | 1-Month LIBOR GBP | 6/1/2020 | Term | 69,322 | 13,703 | 30,685 | ||||||||||||||||||
| A |
St. Barbara Ltd. | Receive | 1-Month LIBOR AUD | 6/1/2022 | Term | 14,262 | 3,176 | 694 | ||||||||||||||||||
| B |
Staffline Group PLC | Receive | 1-Month LIBOR GBP | 6/1/2020 | Term | 25,701 | 2,090 | (6,405) | ||||||||||||||||||
| B |
Stagecoach Group PLC | Receive | 1-Month LIBOR GBP | 6/1/2020 | Term | 66,340 | 39,567 | (7,207) | ||||||||||||||||||
| B |
Stallergenes Greer PLC | Receive | 1-Month LIBOR EUR | 6/1/2020 | Term | 1,762 | 48 | (604) | ||||||||||||||||||
| B |
Stock Spirits Group PLC | Receive | 1-Month LIBOR GBP | 6/1/2020 | Term | 92,674 | 41,121 | 11,120 | ||||||||||||||||||
| A |
Stock Spirits Group PLC | Receive | 1-Month LIBOR GBP | 6/1/2022 | Term | 1,530 | 950 | 1,088 | ||||||||||||||||||
| A |
Super Retail Group Ltd. | Receive | 1-Month LIBOR AUD | 6/1/2022 | Term | 245,828 | 29,708 | 4,824 | ||||||||||||||||||
| B |
Stockland Corp. Ltd. | Receive | 1-Month LIBOR GBP | 6/1/2020 | Term | 122,713 | 8,309 | (25,858) | ||||||||||||||||||
| A |
SuperDry PLC | Receive | 1-Month LIBOR GBP | 6/1/2022 | Term | 47 | 3 | (14) | ||||||||||||||||||
| B |
Synergie S.A. | Receive | 1-Month LIBOR EUR | 6/1/2020 | Term | 49,756 | 1,135 | 5,639 | ||||||||||||||||||
| A |
Synergie S.A. | Receive | 1-Month LIBOR EUR | 6/1/2022 | Term | 2,057 | 50 | 422 | ||||||||||||||||||
| B |
Synthomer PLC | Receive | 1-Month LIBOR GBP | 6/1/2020 | Term | 40,298 | 8,088 | 4,971 | ||||||||||||||||||
| B |
Talktalk Telecom Group PLC | Receive | 1-Month LIBOR GBP | 6/1/2020 | Term | 281,019 | 178,792 | (103,384) | ||||||||||||||||||
| A |
Talktalk Telecom Group PLC | Receive | 1-Month LIBOR GBP | 6/1/2022 | Term | 3,214 | 1,859 | (1,391) | ||||||||||||||||||
| B |
Tarkett S.A. | Receive | 1-Month LIBOR EUR | 6/1/2020 | Term | 34,168 | 888 | (15,104) | ||||||||||||||||||
| B |
Tate & Lyle PLC | Receive | 1-Month LIBOR GBP | 6/1/2020 | Term | 6,467 | 1,200 | 2,370 | ||||||||||||||||||
| B |
Technicolor S.A. | Receive | 1-Month LIBOR EUR | 6/1/2020 | Term | 159,474 | 45,474 | (106,910) | ||||||||||||||||||
| B |
Ted Baker PLC | Receive | 1-Month LIBOR GBP | 6/1/2020 | Term | 5,146 | 200 | (255) | ||||||||||||||||||
| B |
Telecom Plus PLC | Receive | 1-Month LIBOR GBP | 6/1/2020 | Term | 95,461 | 7,389 | (21,792) | ||||||||||||||||||
| B |
Television Francaise 1 S.A. | Receive | 1-Month LIBOR EUR | 6/1/2020 | Term | 30,854 | 2,500 | (8,013) | ||||||||||||||||||
| B |
Telford Homes PLC | Receive | 1-Month LIBOR GBP | 6/1/2020 | Term | 30,666 | 7,481 | 5,616 | ||||||||||||||||||
| B |
Telit Communications PLC | Receive | 1-Month LIBOR GBP | 6/1/2020 | Term | 147,988 | 43,341 | (104,699) | ||||||||||||||||||
| A |
Telit Communications PLC | Receive | 1-Month LIBOR GBP | 6/1/2022 | Term | 19,894 | 5,604 | (14,539) | ||||||||||||||||||
| The accompanying Notes to the Financial Statements are an integral part of these Financial Statements. | (Continued) |
| Elements Portfolios | Annual Report | May 31, 2018 | ||||||||||||||
77
| Schedule of Investments | as of May 31, 2018 |
| ELEMENTS INTERNATIONAL SMALL CAP PORTFOLIO |
| COUNTERPARTY (a) | REFERENCE ENTITY |
PAY/RECEIVE TOTAL RETURN ON REFERENCE ENTITY |
BASE FINANCING RATE (b) |
TERMINATION DATE |
PAYMENT FREQUENCY |
NOTIONAL VALUE |
NUMBER OF UNITS |
UNREALIZED APPRECIATION (DEPRECIATION) |
||||||||||||||||||
| B |
Thomas Cook Group PLC | Receive | 1-Month LIBOR GBP | 6/1/2020 | Term | $ | 37,546 | 31,485 | $ | (2,882) | ||||||||||||||||
| B |
TP ICAP PLC | Receive | 1-Month LIBOR GBP | 6/1/2020 | Term | 26,223 | 4,988 | (6,525) | ||||||||||||||||||
| B |
Trigano S.A. | Receive | 1-Month LIBOR EUR | 6/1/2020 | Term | 64,496 | 659 | 56,282 | ||||||||||||||||||
| A |
Trigano S.A. | Receive | 1-Month LIBOR EUR | 6/1/2022 | Term | 10,580 | 107 | 9,021 | ||||||||||||||||||
| B |
UDG Healthcare PLC | Receive | 1-Month LIBOR GBP | 6/1/2020 | Term | 64,439 | 7,807 | 8,105 | ||||||||||||||||||
| B |
Ultra Electronics Holdings PLC | Receive | 1-Month LIBOR GBP | 6/1/2020 | Term | 47,751 | 3,151 | 4,692 | ||||||||||||||||||
| B |
Vedanta Resources PLC | Receive | 1-Month LIBOR GBP | 6/1/2020 | Term | 200,253 | 27,332 | (3,632) | ||||||||||||||||||
| B |
Vesuvius PLC | Receive | 1-Month LIBOR GBP | 6/1/2020 | Term | 49,862 | 8,941 | 9,683 | ||||||||||||||||||
| B |
Vicat S.A. | Receive | 1-Month LIBOR EUR | 6/1/2020 | Term | 263,031 | 4,162 | (17,054) | ||||||||||||||||||
| B |
Victrex PLC | Receive | 1-Month LIBOR GBP | 6/1/2020 | Term | 100,718 | 5,213 | 68,632 | ||||||||||||||||||
| A |
Victrex PLC | Receive | 1-Month LIBOR GBP | 6/1/2022 | Term | 20 | 1 | 12 | ||||||||||||||||||
| B |
Virbac S.A. | Receive | 1-Month LIBOR EUR | 6/1/2020 | Term | 132,652 | 1,009 | (9,011) | ||||||||||||||||||
| B |
Virgin Money Holdings (UK) PLC | Receive | 1-Month LIBOR GBP | 6/1/2020 | Term | 28,602 | 10,056 | 8,145 | ||||||||||||||||||
| A |
Virtus Health Ltd. | Receive | 1-Month LIBOR AUD | 6/1/2022 | Term | 4,411 | 763 | (146) | ||||||||||||||||||
| B |
Watkins Jones PLC | Receive | 1-Month LIBOR GBP | 6/1/2020 | Term | 10,972 | 5,590 | 1,848 | ||||||||||||||||||
| A |
Western Digital Corp. | Pay | 1-Month LIBOR USD | 6/4/2018 | Term | 1,609,269 | (19,897) | (49,199) | ||||||||||||||||||
| B |
Wetherspoon PLC | Receive | 1-Month LIBOR GBP | 6/1/2020 | Term | 44,981 | 4,389 | 11,511 | ||||||||||||||||||
| B |
WH Smith PLC | Receive | 1-Month LIBOR GBP | 6/1/2020 | Term | 456,378 | 23,609 | 6,780 | ||||||||||||||||||
| A |
WH Smith PLC | Receive | 1-Month LIBOR GBP | 6/1/2022 | Term | 1,107 | 62 | 152 | ||||||||||||||||||
| A |
Whitehaven Coal Ltd. | Receive | 1-Month LIBOR AUD | 6/1/2022 | Term | 720,726 | 155,186 | 71,832 | ||||||||||||||||||
| B |
William Hill PLC | Receive | 1-Month LIBOR GBP | 6/1/2020 | Term | 406,903 | 141,762 | 74,344 | ||||||||||||||||||
| B |
Worldline S.A. | Receive | 1-Month LIBOR EUR | 6/1/2020 | Term | 86,839 | 2,467 | 40,691 | ||||||||||||||||||
|
|
|
|
|
|||||||||||||||||||||||
| $ | 69,497,929 | $ | 2,119,535 | |||||||||||||||||||||||
|
|
|
|
|
|||||||||||||||||||||||
| (a) | See Note 2. |
| (b) | The swaps accrue financing fees according to the relevant base financing rate, which resets periodically, plus a fixed spread. |
| The accompanying Notes to the Financial Statements are an integral part of these Financial Statements. |
| Elements Portfolios | Annual Report | May 31, 2018 | ||||||||||||||
78
| Schedule of Investments | as of May 31, 2018 |
| ELEMENTS EMERGING MARKETS PORTFOLIO |
| The accompanying Notes to the Financial Statements are an integral part of these Financial Statements. | (Continued) |
| Elements Portfolios | Annual Report | May 31, 2018 | ||||||||||||||
80
| Schedule of Investments | as of May 31, 2018 |
| ELEMENTS EMERGING MARKETS PORTFOLIO |
| The accompanying Notes to the Financial Statements are an integral part of these Financial Statements. | (Continued) |
| Elements Portfolios | Annual Report | May 31, 2018 | ||||||||||||||
81
| Schedule of Investments | as of May 31, 2018 |
| ELEMENTS EMERGING MARKETS PORTFOLIO |
Open Futures Contracts
| DESCRIPTION | NUMBER OF CONTRACTS PURCHASED |
NOTIONAL VALUE |
VALUE/ UNREALIZED APPRECIATION (DEPRECIATION) |
|||||||||
| FUTURES CONTRACTS PURCHASED | ||||||||||||
| Mini MSCI Emerging Markets Index, June 2018 Settlement |
2,593 | $ | 145,428,405 | $ | (11,025,729) | |||||||
| FTSE China A50 Index, June 2018 Settlement |
125 | 1,538,438 | 6,987 | |||||||||
|
|
|
|
|
|||||||||
| TOTAL FUTURES CONTRACTS PURCHASED |
$ | 146,966,843 | $ | (11,018,742) | ||||||||
|
|
|
|
|
|||||||||
Total Return Swaps
| COUNTERPARTY (a) | REFERENCE ENTITY | PAY/RECEIVE TOTAL RETURN ON REFERENCE ENTITY |
BASE FINANCING RATE (b) |
TERMINATION DATE |
PAYMENT FREQUENCY |
NOTIONAL VALUE |
NUMBER OF UNITS |
UNREALIZED APPRECIATION (DEPRECIATION) |
||||||||||||||||||
| A |
Acer, Inc. | Receive | 1-Month LIBOR USD | 6/1/2022 | Term | $ | 211,947 | 430,000 | $ | 136,354 | ||||||||||||||||
| A |
Adobe Systems, Inc. | Pay | 1-Month LIBOR USD | 6/8/2018 | Term | 1,467,517 | 6,492 | |
(148,635) |
| ||||||||||||||||
| A |
Adobe Systems, Inc. | Pay | 1-Month LIBOR USD | 7/5/2018 | Term | 4,453,200 | 18,000 | (33,840) | ||||||||||||||||||
| A |
Advantech Co., Ltd. | Receive | 1-Month LIBOR USD | 6/1/2022 | Term | 52,844 | 7,000 | (6,428) | ||||||||||||||||||
| A |
Affiliated Managers Group, Inc. | Pay | 1-Month LIBOR USD | 6/13/2018 | Term | 815,584 | 4,995 | 19,642 | ||||||||||||||||||
| A |
Aflac, Inc. | Pay | 1-Month LIBOR USD | 6/8/2018 | Term | 1,518,412 | 34,160 | (27,469) | ||||||||||||||||||
| A |
Align Technology, Inc. | Pay | 1-Month LIBOR USD | 7/5/2018 | Term | 2,983,050 | 9,000 | (4,500) | ||||||||||||||||||
| A |
Allstate Corp. | Pay | 1-Month LIBOR USD | 6/8/2018 | Term | 1,357,236 | 14,431 | 3,599 | ||||||||||||||||||
| A |
Alphabet, Inc. — Class A | Pay | 1-Month LIBOR USD | 6/4/2018 | Term | 911,802 | 884 | (58,883) | ||||||||||||||||||
| A |
Alphabet, Inc. —Class A | Pay | 1-Month LIBOR USD | 6/13/2018 | Term | 1,905,462 | 1,800 | (72,061) | ||||||||||||||||||
| A |
Amazon.com, Inc. | Pay | 1-Month LIBOR USD | 6/4/2018 | Term | 1,613,508 | 1,026 | (55,447) | ||||||||||||||||||
| A |
Amazon.com, Inc. | Pay | 1-Month LIBOR USD | 6/8/2018 | Term | 1,606,661 | 1,022 | (56,430) | ||||||||||||||||||
| A |
Amazon.com, Inc. | Pay | 1-Month LIBOR USD | 6/13/2018 | Term | 2,547,824 | 1,600 | (56,256) | ||||||||||||||||||
| A |
Amazon.com, Inc. | Pay | 1-Month LIBOR USD | 7/5/2018 | Term | 3,737,247 | 2,300 | (10,879) | ||||||||||||||||||
| A |
Ambev S.A. | Receive | 1-Month LIBOR USD | 6/1/2022 | Term | 72,119 | 12,000 | (6,579) | ||||||||||||||||||
| A |
Amorepacific Corp. | Receive | 1-Month LIBOR USD | 6/1/2022 | Term | 195,502 | 771 | 39,201 | ||||||||||||||||||
| A |
Amorepacific Corp. —Preference Shares | Receive | 1-Month LIBOR USD | 6/1/2022 | Term | 39,341 | 245 | (2,944) | ||||||||||||||||||
| A |
Amorepacific Group | Receive | 1-Month LIBOR USD | 6/1/2022 | Term | 403,645 | 3,461 | (5,918) | ||||||||||||||||||
| A |
Apple, Inc. | Pay | 1-Month LIBOR USD | 6/13/2018 | Term | 4,003,610 | 21,519 | (12,441) | ||||||||||||||||||
| A |
Apple, Inc. | Pay | 1-Month LIBOR USD | 7/5/2018 | Term | 2,812,500 | 15,000 | 9,450 | ||||||||||||||||||
| A |
Arrow Electronics, Inc. | Pay | 1-Month LIBOR USD | 6/13/2018 | Term | 923,259 | 12,297 | 13,005 | ||||||||||||||||||
| A |
ASE Technology Holding Co. | Receive | 1-Month LIBOR USD | 6/1/2022 | Term | 450,936 | 178,500 | 780 | ||||||||||||||||||
| A |
Asia Cement Corp. | Receive | 1-Month LIBOR USD | 6/1/2022 | Term | 1,740 | 2,000 | 480 | ||||||||||||||||||
| A |
Asustek Computer, Inc. | Receive | 1-Month LIBOR USD | 6/1/2022 | Term | 493,598 | 56,000 | 16,688 | ||||||||||||||||||
| A |
AU Optronics Corp. | Receive | 1-Month LIBOR USD | 6/1/2022 | Term | 148,566 | 377,000 | 14,145 | ||||||||||||||||||
| A |
Autodesk, Inc. | Pay | 1-Month LIBOR USD | 7/5/2018 | Term | 4,786,690 | 37,000 | 9,990 | ||||||||||||||||||
| A |
Automatic Data Processing | Pay | 1-Month LIBOR USD | 7/5/2018 | Term | 5,551,775 | 42,500 | 25,925 | ||||||||||||||||||
| A |
Banco Bradesco S.A. | Receive | 1-Month LIBOR USD | 6/1/2022 | Term | 63,862 | 7,260 | (12,509) | ||||||||||||||||||
| A |
Banco Santander Brasil | Receive | 1-Month LIBOR USD | 6/1/2022 | Term | 16,124 | 2,000 | 2,621 | ||||||||||||||||||
| A |
Berkshire Hathaway, Inc. — Class B | Pay | 1-Month LIBOR USD | 6/4/2018 | Term | 1,517,882 | 7,696 | 46,722 | ||||||||||||||||||
| A |
Berkshire Hathaway, Inc. — Class B | Pay | 1-Month LIBOR USD | 6/8/2018 | Term | 1,342,036 | 7,004 | 2,549 | ||||||||||||||||||
| A |
Best Buy Co., Ltd. | Pay | 1-Month LIBOR USD | 6/4/2018 | Term | 544,750 | 7,071 | 63,179 | ||||||||||||||||||
| A |
Biogen, Inc. | Pay | 1-Month LIBOR USD | 7/5/2018 | Term | 2,208,000 | 7,500 | 3,300 | ||||||||||||||||||
| The accompanying Notes to the Financial Statements are an integral part of these Financial Statements. | (Continued) |
| Elements Portfolios | Annual Report | May 31, 2018 | ||||||||||||||
82
| Schedule of Investments | as of May 31, 2018 |
| ELEMENTS EMERGING MARKETS PORTFOLIO |
| COUNTERPARTY (a) | REFERENCE ENTITY | PAY/RECEIVE TOTAL RETURN ON REFERENCE ENTITY |
BASE FINANCING RATE (b) |
TERMINATION DATE |
PAYMENT FREQUENCY |
NOTIONAL VALUE |
NUMBER OF UNITS |
UNREALIZED APPRECIATION (DEPRECIATION) |
||||||||||||||||||
| A |
BNK Financial Group, Inc. | Receive | 1-Month LIBOR USD | 6/1/2022 | Term | $ | 247,122 | 25,500 | $ | (22,497) | ||||||||||||||||
| A |
Boeing Co. | Pay | 1-Month LIBOR USD | 6/8/2018 | Term | 1,413,038 | 4,273 | (96,954) | ||||||||||||||||||
| A |
Braskem S.A. | Receive | 1-Month LIBOR USD | 6/1/2022 | Term | 30,733 | 2,600 | 2,494 | ||||||||||||||||||
| A |
Broadcom, Inc. | Pay | 1-Month LIBOR USD | 7/5/2018 | Term | 4,364,500 | 17,500 | (46,725) | ||||||||||||||||||
| A |
Bumrungrad Hospital PCL | Receive | 1-Month LIBOR USD | 6/1/2022 | Term | 29,810 | 4,700 | (1,809) | ||||||||||||||||||
| A |
CA, Inc. | Pay | 1-Month LIBOR USD | 6/13/2018 | Term | 1,049,138 | 30,357 | (42,198) | ||||||||||||||||||
| A |
Catcher Technology Co., Ltd. | Receive | 1-Month LIBOR USD | 6/1/2022 | Term | 391,567 | 32,000 | (18,481) | ||||||||||||||||||
| A |
Cathay Financial Holding Co. | Receive | 1-Month LIBOR USD | 6/1/2022 | Term | 324,466 | 201,000 | 29,058 | ||||||||||||||||||
| A |
CBRE Group, Inc. —Class A | Pay | 1-Month LIBOR USD | 6/13/2018 | Term | 1,107,386 | 23,825 | 8,349 | ||||||||||||||||||
| A |
CBRE Group, Inc. —Class A | Pay | 1-Month LIBOR USD | 7/5/2018 | Term | 3,295,600 | 70,000 | 62,300 | ||||||||||||||||||
| A |
CCR S.A. | Receive | 1-Month LIBOR USD | 6/1/2022 | Term | 15,725 | 3,000 | (7,130) | ||||||||||||||||||
| A |
Celltrion, Inc. | Receive | 1-Month LIBOR USD | 6/1/2022 | Term | 1,998 | 20 | 2,986 | ||||||||||||||||||
| A |
Chang HWA Commercial Bank | Receive | 1-Month LIBOR USD | 6/1/2022 | Term | 647,325 | 1,187,350 | 39,524 | ||||||||||||||||||
| A |
Cheil Worldwide, Inc. | Receive | 1-Month LIBOR USD | 6/1/2022 | Term | 487,908 | 28,413 | 41,885 | ||||||||||||||||||
| A |
Chevron Corp. | Pay | 1-Month LIBOR USD | 6/8/2018 | Term | 1,703,151 | 13,516 | 10,498 | ||||||||||||||||||
| A |
Chicony Electronics Co., Ltd. | Receive | 1-Month LIBOR USD | 6/1/2022 | Term | 403,576 | 161,000 | (30,455) | ||||||||||||||||||
| A |
China Steel Corp. | Receive | 1-Month LIBOR USD | 6/1/2022 | Term | 55,849 | 68,000 | (3,185) | ||||||||||||||||||
| A |
Chunghwa Telecom Co., Ltd. | Receive | 1-Month LIBOR USD | 6/1/2022 | Term | 480,213 | 141,000 | 24,186 | ||||||||||||||||||
| A |
Church & Dwight Co., Inc. | Pay | 1-Month LIBOR USD | 6/13/2018 | Term | 733,658 | 15,371 | 9,600 | ||||||||||||||||||
| A |
CIA Brasileira de Dis | Receive | 1-Month LIBOR USD | 6/1/2022 | Term | 4,267 | 200 | (21) | ||||||||||||||||||
| A |
CIA Saneamento Basico De | Receive | 1-Month LIBOR USD | 6/1/2022 | Term | 255,686 | 24,500 | (57,853) | ||||||||||||||||||
| A |
Cisco Systems, Inc. | Pay | 1-Month LIBOR USD | 6/8/2018 | Term | 1,617,972 | 36,408 | 65,383 | ||||||||||||||||||
| A |
Citigroup, Inc. | Pay | 1-Month LIBOR USD | 6/4/2018 | Term | 439,121 | 6,365 | 15,465 | ||||||||||||||||||
| A |
Citigroup, Inc. | Pay | 1-Month LIBOR USD | 7/5/2018 | Term | 4,000,800 | 60,000 | (600) | ||||||||||||||||||
| A |
CJ Cheiljedang Corp. | Receive | 1-Month LIBOR USD | 6/1/2022 | Term | 172,029 | 535 | (55) | ||||||||||||||||||
| A |
CJ Corp. | Receive | 1-Month LIBOR USD | 6/1/2022 | Term | 458,227 | 2,844 | (73,171) | ||||||||||||||||||
| A |
CJ E&M Corp. | Receive | 1-Month LIBOR USD | 6/1/2022 | Term | 76,261 | 1,145 | 18,791 | ||||||||||||||||||
| A |
Colagate-Palmolive Co. | Pay | 1-Month LIBOR USD | 7/5/2018 | Term | 1,996,090 | 31,000 | 40,300 | ||||||||||||||||||
| A |
Compal Electronics | Receive | 1-Month LIBOR USD | 6/1/2022 | Term | 506,065 | 717,000 | (43,449) | ||||||||||||||||||
| A |
Cosan S.A. Industria Comerico | Receive | 1-Month LIBOR USD | 6/1/2022 | Term | 5,561 | 500 | (291) | ||||||||||||||||||
| A |
Coway Co., Ltd. | Receive | 1-Month LIBOR USD | 6/1/2022 | Term | 304,511 | 3,594 | (10,691) | ||||||||||||||||||
| A |
CP All PCL | Receive | 1-Month LIBOR USD | 6/1/2022 | Term | 203,164 | 95,000 | 36,807 | ||||||||||||||||||
| A |
CPRL Energia S.A. | Receive | 1-Month LIBOR USD | 6/1/2022 | Term | 157,510 | 18,500 | (44,695) | ||||||||||||||||||
| A |
CTBC Financial Holding Co., Ltd. | Receive | 1-Month LIBOR USD | 6/1/2022 | Term | 1,906 | 3,000 | 219 | ||||||||||||||||||
| A |
Daelim Industrial Co., Ltd. | Receive | 1-Month LIBOR USD | 6/1/2022 | Term | 103,607 | 1,326 | (836) | ||||||||||||||||||
| A |
Daewood Engineering & Construction Co., Ltd. | Receive | 1-Month LIBOR USD | 6/1/2022 | Term | 125,700 | 20,932 | (2,485) | ||||||||||||||||||
| A |
DB Insurance Co., Ltd. | Receive | 1-Month LIBOR USD | 6/1/2022 | Term | 325,546 | 4,682 | (64,543) | ||||||||||||||||||
| A |
Dell Technologies, Inc. | Pay | 1-Month LIBOR USD | 6/4/2018 | Term | 798,747 | 10,999 | (86,930) | ||||||||||||||||||
| A |
Delta Electronics Thailand PCL | Receive | 1-Month LIBOR USD | 6/1/2022 | Term | 178,483 | 70,200 | (35,624) | ||||||||||||||||||
| The accompanying Notes to the Financial Statements are an integral part of these Financial Statements. | (Continued) |
| Elements Portfolios | Annual Report | May 31, 2018 | ||||||||||||||
83
| Schedule of Investments | as of May 31, 2018 |
| ELEMENTS EMERGING MARKETS PORTFOLIO |
| COUNTERPARTY (a) | REFERENCE ENTITY | PAY/RECEIVE TOTAL RETURN ON REFERENCE ENTITY |
BASE FINANCING RATE (b) |
TERMINATION DATE |
PAYMENT FREQUENCY |
NOTIONAL VALUE |
NUMBER OF UNITS |
UNREALIZED APPRECIATION (DEPRECIATION) |
||||||||||||||||||
| A |
Delta Electronics, Inc. | Receive | 1-Month LIBOR USD | 6/1/2022 | Term | $ | 505,386 | 94,000 | $ | (166,577) | ||||||||||||||||
| A |
Dollar General Corp. | Pay | 1-Month LIBOR USD | 7/5/2018 | Term | 2,413,000 | 25,000 | 226,000 | ||||||||||||||||||
| A |
Dongsuh Companies, Inc. | Receive | 1-Month LIBOR USD | 6/1/2022 | Term | 70,377 | 2,900 | (294) | ||||||||||||||||||
| A |
Doosan Bobcat, Inc. | Receive | 1-Month LIBOR USD | 6/1/2022 | Term | 346,514 | 10,983 | (963) | ||||||||||||||||||
| A |
Doosan Heavy Industries Construction Co., Ltd. | Receive | 1-Month LIBOR USD | 6/1/2022 | Term | 76,025 | 4,348 | 1,398 | ||||||||||||||||||
| A |
Dr. Pepper Snapple Group, Inc. | Pay | 1-Month LIBOR USD | 7/5/2018 | Term | 4,945,830 | 41,000 | 54,530 | ||||||||||||||||||
| A |
Duke Energy Corp. | Pay | 1-Month LIBOR USD | 6/4/2018 | Term | 814,338 | 10,116 | 26,316 | ||||||||||||||||||
| A |
E.Sun Financial Holding Co. | Receive | 1-Month LIBOR USD | 6/1/2022 | Term | 1,916 | 3,222 | 336 | ||||||||||||||||||
| A |
Ebay, Inc. | Pay | 1-Month LIBOR USD | 7/5/2018 | Term | 4,958,350 | 131,000 | 17,030 | ||||||||||||||||||
| A |
Eclat Textile Company Ltd. | Receive | 1-Month LIBOR USD | 6/1/2022 | Term | 23,067 | 2,000 | 948 | ||||||||||||||||||
| A |
EDP — Energias Do Brasil S.A. | Receive | 1-Month LIBOR USD | 6/1/2022 | Term | 236,103 | 51,100 | (50,116) | ||||||||||||||||||
| A |
Electronics Arts, Inc. | Pay | 1-Month LIBOR USD | 6/13/2018 | Term | 966,342 | 7,800 | (53,500) | ||||||||||||||||||
| A |
E-Mart, Inc. | Receive | 1-Month LIBOR USD | 6/1/2022 | Term | 469,144 | 2,189 | 32,800 | ||||||||||||||||||
| A |
Engie Brasil Energia S.A. | Receive | 1-Month LIBOR USD | 6/1/2022 | Term | 112,906 | 10,000 | (9,258) | ||||||||||||||||||
| A |
Eva Airways Corp. | Receive | 1-Month LIBOR USD | 6/1/2022 | Term | 51,216 | 108,150 | 3,076 | ||||||||||||||||||
| A |
Evergreen Marine Corp. Ltd. | Receive | 1-Month LIBOR USD | 6/1/2022 | Term | 33,729 | 59,035 | (5,091) | ||||||||||||||||||
| A |
Exelixis, Inc. | Pay | 1-Month LIBOR USD | 6/13/2018 | Term | 766,100 | 35,353 | 34,228 | ||||||||||||||||||
| A |
Express Scripts Holding Co. | Pay | 1-Month LIBOR USD | 6/4/2018 | Term | 834,100 | 10,803 | 16,693 | ||||||||||||||||||
| A |
Exxon Mobil Corp. | Pay | 1-Month LIBOR USD | 6/8/2018 | Term | 1,304,624 | 17,045 | (111,015) | ||||||||||||||||||
| A |
Exxon Mobil Corp. | Pay | 1-Month LIBOR USD | 6/13/2018 | Term | 1,796,070 | 23,000 | (70,115) | ||||||||||||||||||
| A |
Facebook, Inc. —Class A | Pay | 1-Month LIBOR USD | 6/8/2018 | Term | 1,469,773 | 8,446 | (147,823) | ||||||||||||||||||
| A |
Facebook, Inc. —Class A | Pay | 1-Month LIBOR USD | 7/5/2018 | Term | 5,160,925 | 27,500 | (113,025) | ||||||||||||||||||
| A |
Far Eastern New Century Corp | Receive | 1-Month LIBOR USD | 6/1/2022 | Term | 155,685 | 192,000 | 24,384 | ||||||||||||||||||
| A |
Far EastOne Telecomm Co., Ltd. | Receive | 1-Month LIBOR USD | 6/1/2022 | Term | 456,489 | 189,000 | 16,845 | ||||||||||||||||||
| A |
Feng Tay Enterprise Co., Ltd. | Receive | 1-Month LIBOR USD | 6/1/2022 | Term | 304,788 | 67,000 | (13,123) | ||||||||||||||||||
| A |
Fidelity National Financial, Inc. | Pay | 1-Month LIBOR USD | 6/13/2018 | Term | 1,026,932 | 27,283 | 19,887 | ||||||||||||||||||
| A |
Flir Systems, Inc. | Pay | 1-Month LIBOR USD | 6/13/2018 | Term | 1,334,400 | 24,209 | 27,396 | ||||||||||||||||||
| A |
Formosa Chemicals & Fibre Corp. | Receive | 1-Month LIBOR USD | 6/1/2022 | Term | 407,766 | 134,000 | 98,923 | ||||||||||||||||||
| A |
Formosa Petrochemical Corp. | Receive | 1-Month LIBOR USD | 6/1/2022 | Term | 1,104,489 | 318,000 | 164,675 | ||||||||||||||||||
| A |
Formosa Plastics Corp. | Receive | 1-Month LIBOR USD | 6/1/2022 | Term | 30,188 | 10,000 | 5,114 | ||||||||||||||||||
| A |
Formosa Taffeta Co. | Receive | 1-Month LIBOR USD | 6/1/2022 | Term | 68,734 | 69,000 | 6,878 | ||||||||||||||||||
| A |
Fortune Brands Home & Security, Inc. | Pay | 1-Month LIBOR USD | 6/13/2018 | Term | 958,323 | 17,292 | (15,182) | ||||||||||||||||||
| A |
Foxconn Technology Co., Ltd. | Receive | 1-Month LIBOR USD | 6/1/2022 | Term | 21,125 | 7,000 | (4,303) | ||||||||||||||||||
| A |
Giant Manufacturing Co., Ltd. | Receive | 1-Month LIBOR USD | 6/1/2022 | Term | 310,271 | 61,000 | (46,369) | ||||||||||||||||||
| A |
Gilead Sciences, Inc. | Pay | 1-Month LIBOR USD | 7/5/2018 | Term | 4,061,400 | 60,000 | 17,400 | ||||||||||||||||||
| A |
Glow Energy PCL | Receive | 1-Month LIBOR USD | 6/1/2022 | Term | 215,374 | 85,400 | 18,027 | ||||||||||||||||||
| The accompanying Notes to the Financial Statements are an integral part of these Financial Statements. | (Continued) |
| Elements Portfolios | Annual Report | May 31, 2018 | ||||||||||||||
84
| Schedule of Investments | as of May 31, 2018 |
| ELEMENTS EMERGING MARKETS PORTFOLIO |
| COUNTERPARTY (a) | REFERENCE ENTITY | PAY/RECEIVE TOTAL RETURN ON REFERENCE ENTITY |
BASE FINANCING RATE (b) |
TERMINATION DATE |
PAYMENT FREQUENCY |
NOTIONAL VALUE |
NUMBER OF UNITS |
UNREALIZED APPRECIATION (DEPRECIATION) |
||||||||||||||||||
| A |
GS Engineering & Construction Corp. | Receive | 1-Month LIBOR USD | 6/1/2022 | Term | $ | 31,146 | 1,207 | $ | 23,488 | ||||||||||||||||
| A |
GS Holdings Corp. | Receive | 1-Month LIBOR USD | 6/1/2022 | Term | 221,744 | 3,491 | (32,229) | ||||||||||||||||||
| A |
GS Retail Co., Ltd. | Receive | 1-Month LIBOR EUR | 6/1/2022 | Term | 534,584 | 13,656 | (60,126) | ||||||||||||||||||
| A |
Hana Financial Group | Receive | 1-Month LIBOR USD | 6/1/2022 | Term | 617,707 | 13,769 | (87,344) | ||||||||||||||||||
| A |
Hankook Tire Co., Ltd. | Receive | 1-Month LIBOR USD | 6/1/2022 | Term | 521,927 | 9,296 | (159,229) | ||||||||||||||||||
| A |
Hanon Systems | Receive | 1-Month LIBOR USD | 6/1/2022 | Term | 367,572 | 35,239 | (35,696) | ||||||||||||||||||
| A |
Hanssem Co., Ltd. | Receive | 1-Month LIBOR USD | 6/1/2022 | Term | 82,906 | 700 | (9,789) | ||||||||||||||||||
| A |
Hanwha Chemical Cop. | Receive | 1-Month LIBOR USD | 6/1/2022 | Term | 134,767 | 4,446 | (29,501) | ||||||||||||||||||
| A |
Hanwha Corp. | Receive | 1-Month LIBOR USD | 6/1/2022 | Term | 316,318 | 7,458 | (69,739) | ||||||||||||||||||
| A |
Hanwha Life Insurance Co., Ltd. | Receive | 1-Month LIBOR USD | 6/1/2022 | Term | 277,010 | 41,281 | (61,887) | ||||||||||||||||||
| A |
Home Depot, Inc. | Pay | 1-Month LIBOR USD | 6/13/2018 | Term | 1,850,400 | 10,000 | (22,995) | ||||||||||||||||||
| A |
Home Product Center PCL | Receive | 1-Month LIBOR USD | 6/1/2022 | Term | 21,309 | 71,300 | 11,436 | ||||||||||||||||||
| A |
Hon Hai Preceision Industry | Receive | 1-Month LIBOR USD | 6/1/2022 | Term | 1,685,999 | 439,000 | (461,121) | ||||||||||||||||||
| A |
Hotai Motor Co., Ltd. | Receive | 1-Month LIBOR USD | 6/1/2022 | Term | 12,168 | 1,000 | (3,275) | ||||||||||||||||||
| A |
Hotel Shilla Co., Ltd. | Receive | 1-Month LIBOR USD | 6/1/2022 | Term | 487,893 | 8,051 | 432,669 | ||||||||||||||||||
| A |
HP, Inc. | Pay | 1-Month LIBOR USD | 6/13/2018 | Term | 1,189,837 | 54,182 | (2,246) | ||||||||||||||||||
| A |
Hua Nan Financial Holdings Co. | Receive | 1-Month LIBOR USD | 6/1/2022 | Term | 1,758 | 3,150 | 148 | ||||||||||||||||||
| A |
Hyosung Corp. | Receive | 1-Month LIBOR USD | 6/1/2022 | Term | 107,235 | 727 | (13,257) | ||||||||||||||||||
| A |
Hypera S.A. | Receive | 1-Month LIBOR USD | 6/1/2022 | Term | 461,926 | 50,900 | (70,154) | ||||||||||||||||||
| A |
Hyundai Department Store Co. | Receive | 1-Month LIBOR USD | 6/1/2022 | Term | 480,051 | 5,579 | 97,451 | ||||||||||||||||||
| A |
Hyundai Development Co. | Receive | 1-Month LIBOR USD | 6/1/2022 | Term | 306,451 | 8,274 | 49,900 | ||||||||||||||||||
| A |
Hyundai Engineering & Construction Co. | Receive | 1-Month LIBOR USD | 6/1/2022 | Term | 680,854 | 17,641 | 520,912 | ||||||||||||||||||
| A |
Hyundai Glovis Co., Ltd. | Receive | 1-Month LIBOR USD | 6/1/2022 | Term | 444,548 | 3,164 | (51,199) | ||||||||||||||||||
| A |
Hyundai Heavy Industries Co., Ltd. | Receive | 1-Month LIBOR USD | 6/1/2022 | Term | 841,218 | 6,306 | (184,666) | ||||||||||||||||||
| A |
Hyundai Heavy Industries Holdings Co. | Receive | 1-Month LIBOR USD | 6/1/2022 | Term | 468,853 | 1,200 | (39,013) | ||||||||||||||||||
| A |
Hyundai Marine & Fire Industries Co. | Receive | 1-Month LIBOR USD | 6/1/2022 | Term | 300,267 | 7,465 | (63,013) | ||||||||||||||||||
| A |
Hyundai Mobis Co., Ltd. | Receive | 1-Month LIBOR USD | 6/1/2022 | Term | 822,172 | 3,762 | (66,950) | ||||||||||||||||||
| A |
Hyundai Motor Co. | Receive | 1-Month LIBOR USD | 6/1/2022 | Term | 92,099 | 707 | (1,040) | ||||||||||||||||||
| A |
Hyundai Motor Co. —Preference Shares | Receive | 1-Month LIBOR USD | 6/1/2022 | Term | 4,013 | 43 | (425) | ||||||||||||||||||
| A |
Hyundai Steel Co. | Receive | 1-Month LIBOR USD | 6/1/2022 | Term | 187,840 | 3,516 | 12,176 | ||||||||||||||||||
| A |
IBM Common Stock | Pay | 1-Month LIBOR USD | 6/4/2018 | Term | 1,395,368 | 9,526 | 22,954 | ||||||||||||||||||
| A |
IBM Common Stock | Pay | 1-Month LIBOR USD | 6/8/2018 | Term | 1,262,859 | 8,894 | 7,919 | ||||||||||||||||||
| A |
Indorama Ventures PCL | Receive | 1-Month LIBOR USD | 6/1/2022 | Term | 120,232 | 104,300 | 69,574 | ||||||||||||||||||
| A |
ING Life Insurance Korea Ltd. | Receive | 1-Month LIBOR USD | 6/1/2022 | Term | 48,801 | 1,000 | (11,819) | ||||||||||||||||||
| A |
Innolux Corp. | Receive | 1-Month LIBOR USD | 6/1/2022 | Term | 476,570 | 999,000 | (98,687) | ||||||||||||||||||
| A |
Intel Corp. | Pay | 1-Month LIBOR USD | 6/8/2018 | Term | 1,766,593 | 33,791 | (106,189) | ||||||||||||||||||
| A |
Intel Corp. | Pay | 1-Month LIBOR USD | 6/13/2018 | Term | 2,391,898 | 44,600 | (66,913) | ||||||||||||||||||
| A |
Intercontinental Exchange, Inc. | Pay | 1-Month LIBOR USD | 7/5/2018 | Term | 4,263,770 | 59,500 | 45,815 | ||||||||||||||||||
| A |
Inventec Corp. | Receive | 1-Month LIBOR USD | 6/1/2022 | Term | 96,222 | 121,000 | (110) | ||||||||||||||||||
| A |
Iqvia Holdings, Inc. | Pay | 1-Month LIBOR USD | 7/5/2018 | Term | 4,923,520 | 49,000 | 75,950 | ||||||||||||||||||
| A |
IRPC PCL | Receive | 1-Month LIBOR USD | 6/1/2022 | Term | 242,677 | 933,600 | (51,618) | ||||||||||||||||||
| A |
Itau Unibanco Holdings | Receive | 1-Month LIBOR USD | 6/1/2022 | Term | 41,110 | 1,100 | 1,557 | ||||||||||||||||||
| The accompanying Notes to the Financial Statements are an integral part of these Financial Statements. | (Continued) |
| Elements Portfolios | Annual Report | May 31, 2018 | ||||||||||||||
85
| Schedule of Investments | as of May 31, 2018 |
| ELEMENTS EMERGING MARKETS PORTFOLIO |
| COUNTERPARTY (a) | REFERENCE ENTITY | PAY/RECEIVE TOTAL RETURN ON REFERENCE ENTITY |
BASE FINANCING RATE (b) |
TERMINATION DATE |
PAYMENT FREQUENCY |
NOTIONAL VALUE |
NUMBER OF UNITS |
UNREALIZED APPRECIATION (DEPRECIATION) |
||||||||||||||||||
| A |
Itausa-Investimentos Itau | Receive | 1-Month LIBOR USD | 6/1/2022 | Term | $ | 7,058 | 2,354 | $ | 779 | ||||||||||||||||
| A |
JBS S.A. | Receive | 1-Month LIBOR USD | 6/1/2022 | Term | 131,360 | 53,200 | (6,441) | ||||||||||||||||||
| A |
Johnson & Johnson | Pay | 1-Month LIBOR USD | 6/13/2018 | Term | 853,366 | 6,960 | 21,920 | ||||||||||||||||||
| A |
Johnson & Johnson | Pay | 1-Month LIBOR USD | 7/5/2018 | Term | 2,419,400 | 20,000 | 27,000 | ||||||||||||||||||
| A |
JP Morgan Chase & Co. | Pay | 1-Month LIBOR USD | 6/4/2018 | Term | 4,402,147 | 40,239 | 104,451 | ||||||||||||||||||
| A |
Kai Motors Corp. | Receive | 1-Month LIBOR USD | 6/1/2022 | Term | 763,524 | 23,772 | (77,045) | ||||||||||||||||||
| A |
Kakao Corp. | Receive | 1-Month LIBOR USD | 6/1/2022 | Term | 2,035 | 21 | (58) | ||||||||||||||||||
| A |
Kangwon Land, Inc. | Receive | 1-Month LIBOR USD | 6/1/2022 | Term | 337,877 | 11,960 | (39,025) | ||||||||||||||||||
| A |
Kasikornbank PCL | Receive | 1-Month LIBOR USD | 6/1/2022 | Term | 711,391 | 118,400 | (2,327) | ||||||||||||||||||
| A |
KCE Electronics | Receive | 1-Month LIBOR USD | 6/1/2022 | Term | 100,575 | 76,800 | (22,435) | ||||||||||||||||||
| A |
Kepco Plant Service & Engineering | Receive | 1-Month LIBOR USD | 6/1/2022 | Term | 278,165 | 6,859 | (18,269) | ||||||||||||||||||
| A |
Kohl’s Corp. | Pay | 1-Month LIBOR USD | 6/4/2018 | Term | 306,040 | 4,910 | (21,127) | ||||||||||||||||||
| A |
Korea Electric Power Corp. | Receive | 1-Month LIBOR USD | 6/1/2022 | Term | 273,915 | 7,032 | (58,602) | ||||||||||||||||||
| A |
Korea Gas Corp. | Receive | 1-Month LIBOR USD | 6/1/2022 | Term | 105,082 | 2,505 | 33,047 | ||||||||||||||||||
| A |
Korea Zinc Co., Ltd. | Receive | 1-Month LIBOR USD | 6/1/2022 | Term | 571,259 | 1,288 | (81,533) | ||||||||||||||||||
| A |
Korean Air Lines Co., Ltd. | Receive | 1-Month LIBOR EUR | 6/1/2022 | Term | 75,215 | 2,375 | (5,855) | ||||||||||||||||||
| A |
Kroton Educacional S.A. | Receive | 1-Month LIBOR USD | 6/1/2022 | Term | 99,163 | 19,900 | (39,352) | ||||||||||||||||||
| A |
Krung Thai Bank | Receive | 1-Month LIBOR USD | 6/1/2022 | Term | 128,689 | 233,300 | 522 | ||||||||||||||||||
| A |
KT&G Corp. | Receive | 1-Month LIBOR USD | 6/1/2022 | Term | 702,921 | 7,296 | (52,009) | ||||||||||||||||||
| A |
Kumho Petrochemical Co., Ltd. | Receive | 1-Month LIBOR USD | 6/1/2022 | Term | 193,982 | 2,142 | 14,056 | ||||||||||||||||||
| A |
L3 Technologies, Inc. | Pay | 1-Month LIBOR USD | 6/4/2018 | Term | 600,581 | 3,044 | (2,006) | ||||||||||||||||||
| A |
L3 Technologies, Inc. | Pay | 1-Month LIBOR USD | 7/5/2018 | Term | 3,084,965 | 15,500 | 10,850 | ||||||||||||||||||
| A |
Lear Corp. | Pay | 1-Month LIBOR USD | 6/13/2018 | Term | 1,323,845 | 6,917 | (44,000) | ||||||||||||||||||
| A |
Leidos Holdings, Inc. | Pay | 1-Month LIBOR USD | 6/13/2018 | Term | 969,405 | 15,755 | 24,420 | ||||||||||||||||||
| A |
LG Chem Ltd. | Receive | 1-Month LIBOR USD | 6/1/2022 | Term | 750,232 | 2,360 | (12,493) | ||||||||||||||||||
| A |
LG Chem Ltd. —Preference Shares | Receive | 1-Month LIBOR USD | 6/1/2022 | Term | 20,735 | 89 | (4,413) | ||||||||||||||||||
| A |
LG Corp. | Receive | 1-Month LIBOR USD | 6/1/2022 | Term | 607,457 | 8,380 | (40,146) | ||||||||||||||||||
| A |
LG Display Corp. | Receive | 1-Month LIBOR USD | 6/1/2022 | Term | 467,967 | 16,931 | (121,788) | ||||||||||||||||||
| A |
LG Electronics, Inc. | Receive | 1-Month LIBOR USD | 6/1/2022 | Term | 712,450 | 10,841 | 209,133 | ||||||||||||||||||
| A |
LG Household & Healthcare | Receive | 1-Month LIBOR USD | 6/1/2022 | Term | 407,698 | 435 | 130,536 | ||||||||||||||||||
| A |
LG Household & Healthcare —Preference Shares | Receive | 1-Month LIBOR USD | 6/1/2022 | Term | 84,590 | 155 | 20,314 | ||||||||||||||||||
| A |
LG Innotek Co., Ltd. | Receive | 1-Month LIBOR USD | 6/1/2022 | Term | 231,016 | 1,562 | (26,538) | ||||||||||||||||||
| A |
Lincoln National Corp. | Pay | 1-Month LIBOR USD | 6/13/2018 | Term | 946,246 | 13,834 | 30,420 | ||||||||||||||||||
| A |
Lite-On Technology Corp. | Receive | 1-Month LIBOR USD | 6/1/2022 | Term | 439,272 | 285,000 | (66,741) | ||||||||||||||||||
| A |
LKQ Corp. | Pay | 1-Month LIBOR USD | 6/13/2018 | Term | 891,598 | 29,204 | (35,054) | ||||||||||||||||||
| A |
Lojas Renner S.A. | Receive | 1-Month LIBOR USD | 6/1/2022 | Term | 69,726 | 7,300 | (11,832) | ||||||||||||||||||
| A |
Lotte Chemical Corp. | Receive | 1-Month LIBOR USD | 6/1/2022 | Term | 522,153 | 1,464 | (20,300) | ||||||||||||||||||
| A |
Lotte Corp. | Receive | 1-Month LIBOR USD | 6/1/2022 | Term | 177,906 | 3,429 | 5,206 | ||||||||||||||||||
| A |
Lotte Shopping Co. | Receive | 1-Month LIBOR USD | 6/1/2022 | Term | 579,510 | 2,704 | (16,906) | ||||||||||||||||||
| A |
M Dias Branco S.A. | Receive | 1-Month LIBOR USD | 6/1/2022 | Term | 173,126 | 10,900 | (50,735) | ||||||||||||||||||
| A |
ManPowerGroup, Inc. | Pay | 1-Month LIBOR USD | 6/13/2018 | Term | 848,271 | 8,838 | 45,028 | ||||||||||||||||||
| A |
Mediatek, Inc. | Receive | 1-Month LIBOR USD | 6/1/2022 | Term | 108,717 | 12,000 | 13,978 | ||||||||||||||||||
| A |
Medy-Tox, Inc. | Receive | 1-Month LIBOR USD | 6/1/2022 | Term | 2,210 | 4 | 548 | ||||||||||||||||||
| A |
Mega Financial Holding Co., Ltd. | Receive | 1-Month LIBOR USD | 6/1/2022 | Term | 742,450 | 915,000 | 55,430 | ||||||||||||||||||
| A |
Michael Kors Holdings Ltd. | Pay | 1-Month LIBOR USD | 7/5/2018 | Term | 4,349,520 | 72,000 | 217,440 | ||||||||||||||||||
| The accompanying Notes to the Financial Statements are an integral part of these Financial Statements. | (Continued) |
| Elements Portfolios | Annual Report | May 31, 2018 | ||||||||||||||
86
| Schedule of Investments | as of May 31, 2018 |
| ELEMENTS EMERGING MARKETS PORTFOLIO |
| COUNTERPARTY (a) | REFERENCE ENTITY | PAY/RECEIVE TOTAL RETURN ON REFERENCE ENTITY |
BASE FINANCING RATE (b) |
TERMINATION DATE |
PAYMENT FREQUENCY |
NOTIONAL VALUE |
NUMBER OF UNITS |
UNREALIZED APPRECIATION (DEPRECIATION) |
||||||||||||||||||
| A |
Microsoft Corp. | Pay | 1-Month LIBOR USD | 6/8/2018 | Term | $ | 1,565,419 | 16,641 | $ | (101,639) | ||||||||||||||||
| A |
Microsoft Corp. | Pay | 1-Month LIBOR USD | 6/13/2018 | Term | 4,013,002 | 41,885 | (121,695) | ||||||||||||||||||
| A |
Micro-Star International Co. |
Receive | 1-Month LIBOR USD | 6/1/2022 | Term | 380,143 | 153,000 | 261,387 | ||||||||||||||||||
| A |
Mohawk Industries, Inc. |
Pay | 1-Month LIBOR USD | 7/5/2018 | Term | 3,128,550 | 15,000 | 67,950 | ||||||||||||||||||
| A |
Monsanto Co. | Pay | 1-Month LIBOR USD | 6/4/2018 | Term | 1,130,007 | 9,035 | (19,468) | ||||||||||||||||||
| A |
Morgan Stanley | Pay | 1-Month LIBOR USD | 6/8/2018 | Term | 1,384,268 | 27,100 | 27,525 | ||||||||||||||||||
| A |
MSCI Emerging Markets Index |
Receive | 1-Month LIBOR USD | 6/20/2022 | Term | 14,010,321 | 21,593 | (10,068) | ||||||||||||||||||
| A |
Nan Ya Plastics Corp. |
Receive | 1-Month LIBOR USD | 6/1/2022 | Term | 516,193 | 207,000 | 52,589 | ||||||||||||||||||
| A |
Natura Cosmeticos S.A. |
Receive | 1-Month LIBOR USD | 6/1/2022 | Term | 339,980 | 42,300 | 43,279 | ||||||||||||||||||
| A |
Naver Corp. | Receive | 1-Month LIBOR USD | 6/1/2022 | Term | 111,191 | 150 | (20,156) | ||||||||||||||||||
| A |
NCSoft Corp. | Receive | 1-Month LIBOR USD | 6/1/2022 | Term | 375,959 | 1,131 | (6,355) | ||||||||||||||||||
| A |
NetMarble Corp. | Receive | 1-Month LIBOR USD | 6/1/2022 | Term | 40,899 | 300 | 2,535 | ||||||||||||||||||
| A |
NH Investment & Securities Co. | Receive | 1-Month LIBOR USD | 6/1/2022 | Term | 31,157 | 2,521 | 6,294 | ||||||||||||||||||
| A |
Nien Made Enterprise Co., Ltd. |
Receive | 1-Month LIBOR USD | 6/1/2022 | Term | 92,757 | 8,000 | (30,056) | ||||||||||||||||||
| A |
Novatek Microelectronics Corp. |
Receive | 1-Month LIBOR USD | 6/1/2022 | Term | 366,085 | 99,000 | 74,908 | ||||||||||||||||||
| A |
OCI Co., Ltd. | Receive | 1-Month LIBOR USD | 6/1/2022 | Term | 122,888 | 1,093 | 11,152 | ||||||||||||||||||
| A |
Odontoprev S.A. | Receive | 1-Month LIBOR USD | 6/1/2022 | Term | 106,814 | 26,100 | (8,818) | ||||||||||||||||||
| A |
Oracle Corp. | Pay | 1-Month LIBOR USD | 6/8/2018 | Term | 1,344,545 | 29,839 | (47,540) | ||||||||||||||||||
| A |
Orion Corp. | Receive | 1-Month LIBOR USD | 6/1/2022 | Term | 96,592 | 1,245 | 51,812 | ||||||||||||||||||
| A |
Ottogi Corp. | Receive | 1-Month LIBOR USD | 6/1/2022 | Term | 302,631 | 437 | 22,307 | ||||||||||||||||||
| A |
Park Hotels & Resorts, Inc. |
Pay | 1-Month LIBOR USD | 6/13/2018 | Term | 984,801 | 33,047 | (78,694) | ||||||||||||||||||
| A |
Pegatron Corp. | Receive | 1-Month LIBOR USD | 6/1/2022 | Term | 707,223 | 226,000 | (230,334) | ||||||||||||||||||
| A |
Pepsico, Inc. | Pay | 1-Month LIBOR USD | 6/8/2018 | Term | 1,337,218 | 13,701 | (47,034) | ||||||||||||||||||
| A |
Petrobras — Petroleo Bras |
Receive | 1-Month LIBOR USD | 6/1/2022 | Term | 364,704 | 84,400 | 133,788 | ||||||||||||||||||
| A |
Pfizer, Inc. | Pay | 1-Month LIBOR USD | 6/8/2018 | Term | 1,402,357 | 40,344 | (58,841) | ||||||||||||||||||
| A |
PG&E Corp. | Pay | 1-Month LIBOR USD | 6/13/2018 | Term | 906,724 | 21,200 | (10,693) | ||||||||||||||||||
| A |
PG&E Corp. | Pay | 1-Month LIBOR USD | 7/5/2018 | Term | 3,016,300 | 70,000 | (16,800) | ||||||||||||||||||
| A |
Pinnacle West Capital Corp. |
Pay | 1-Month LIBOR USD | 6/13/2018 | Term | 1,022,990 | 13,065 | (15,785) | ||||||||||||||||||
| A |
Porto Segura S.A. | Receive | 1-Month LIBOR USD | 6/1/2022 | Term | 494,586 | 46,400 | 56,033 | ||||||||||||||||||
| A |
Posco — ADR | Receive | 1-Month LIBOR USD | 6/1/2022 | Term | 908,862 | 2,989 | 33,797 | ||||||||||||||||||
| A |
Posco Daewood Corp. |
Receive | 1-Month LIBOR USD | 6/1/2022 | Term | 95,843 | 4,755 | 5,199 | ||||||||||||||||||
| A |
Pou Chen | Receive | 1-Month LIBOR USD | 6/1/2022 | Term | 272,776 | 204,000 | (28,063) | ||||||||||||||||||
| A |
Praxair, Inc. | Pay | 1-Month LIBOR USD | 7/5/2018 | Term | 3,286,290 | 21,000 | 4,830 | ||||||||||||||||||
| A |
President Chain Store Corp. |
Receive | 1-Month LIBOR USD | 6/1/2022 | Term | 624,172 | 72,000 | 109,087 | ||||||||||||||||||
| A |
Procter & Gamble Co. | Pay | 1-Month LIBOR USD | 6/4/2018 | Term | 2,216,700 | 30,445 | (6,791) | ||||||||||||||||||
| A |
Procter & Gamble Co. | Pay | 1-Month LIBOR USD | 6/8/2018 | Term | 1,173,658 | 16,447 | (28,030) | ||||||||||||||||||
| A |
PTT Exploration and Production PCL |
Receive | 1-Month LIBOR USD | 6/1/2022 | Term | 288,398 | 102,900 | 147,512 | ||||||||||||||||||
| A |
PTT Global Chemical PCL |
Receive | 1-Month LIBOR USD | 6/1/2022 | Term | 455,949 | 196,500 | 106,050 | ||||||||||||||||||
| A |
PTT PCL | Receive | 1-Month LIBOR USD | 6/1/2022 | Term | 1,118,751 | 890,000 | 362,655 | ||||||||||||||||||
| A |
Qualicorp S.A. | Receive | 1-Month LIBOR USD | 6/1/2022 | Term | 188,519 | 17,900 | (93,006) | ||||||||||||||||||
| A |
Quanta Computer, Inc. |
Receive | 1-Month LIBOR USD | 6/1/2022 | Term | 601,284 | 254,000 | (162,150) | ||||||||||||||||||
| A |
Raia Drogasil S.A. | Receive | 1-Month LIBOR USD | 6/1/2022 | Term | 65,919 | 3,000 | (16,341) | ||||||||||||||||||
| A |
Raytheon Co. | Pay | 1-Month LIBOR USD | 7/5/2018 | Term | 3,503,280 | 16,500 | 46,530 | ||||||||||||||||||
| A |
Realtek Semiconductor Corp. |
Receive | 1-Month LIBOR USD | 6/1/2022 | Term | 349,650 | 94,000 | 13,137 | ||||||||||||||||||
| The accompanying Notes to the Financial Statements are an integral part of these Financial Statements. | (Continued) |
| Elements Portfolios | Annual Report | May 31, 2018 | ||||||||||||||
87
| Schedule of Investments | as of May 31, 2018 |
| ELEMENTS EMERGING MARKETS PORTFOLIO |
| COUNTERPARTY (a) | REFERENCE ENTITY | PAY/RECEIVE TOTAL RETURN ON REFERENCE ENTITY |
BASE FINANCING RATE (b) |
TERMINATION DATE |
PAYMENT FREQUENCY |
NOTIONAL VALUE |
NUMBER OF UNITS |
UNREALIZED APPRECIATION (DEPRECIATION) |
||||||||||||||||||
| A |
Regeneron Pharmaceuticals, Inc. | Pay | 1-Month LIBOR USD | 6/4/2018 | Term | $ | 428,879 | 1,370 | $ | 18,247 | ||||||||||||||||
| A |
Robert Half International, Inc. | Pay | 1-Month LIBOR USD | 6/13/2018 | Term | 1,326,433 | 21,135 | (23,638) | ||||||||||||||||||
| A |
Robinson PCL | Receive | 1-Month LIBOR USD | 6/1/2022 | Term | 130,872 | 81,000 | 29,272 | ||||||||||||||||||
| A |
Rockwell Collins, Inc. | Pay | 1-Month LIBOR USD | 6/4/2018 | Term | 626,962 | 4,714 | (20,081) | ||||||||||||||||||
| A |
Rockwell Collins, Inc. | Pay | 1-Month LIBOR USD | 7/5/2018 | Term | 3,311,280 | 24,000 | 11,040 | ||||||||||||||||||
| A |
S-1 Corp. | Receive | 1-Month LIBOR USD | 6/1/2022 | Term | 502,436 | 5,953 | (13,097) | ||||||||||||||||||
| A |
Samsung C&T Corp. | Receive | 1-Month LIBOR USD | 6/1/2022 | Term | 91,933 | 779 | (1,804) | ||||||||||||||||||
| A |
Samsung Electronics Co. | Receive | 1-Month LIBOR USD | 6/1/2022 | Term | 7,485,596 | 175,150 | 797,121 | ||||||||||||||||||
| A |
Samsung Electronics Co. — Preference Shares | Receive | 1-Month LIBOR USD | 6/1/2022 | Term | 62,631 | 1,800 | 5,656 | ||||||||||||||||||
| A |
Samsung Fire & Marine Insurance Co., Ltd. | Receive | 1-Month LIBOR USD | 6/1/2022 | Term | 591,930 | 2,295 | (54,194) | ||||||||||||||||||
| A |
Samsung Heavy Industries Co., Ltd. | Receive | 1-Month LIBOR USD | 6/1/2022 | Term | 193,967 | 27,185 | (6,099) | ||||||||||||||||||
| A |
Samsung Life Insurance Co., Ltd. | Receive | 1-Month LIBOR USD | 6/1/2022 | Term | 337,152 | 3,123 | (40,201) | ||||||||||||||||||
| A |
Samsung SDS Co., Ltd. | Receive | 1-Month LIBOR USD | 6/1/2022 | Term | 797,992 | 4,894 | 152,865 | ||||||||||||||||||
| A |
Shinhan Financial Group Ltd. | Receive | 1-Month LIBOR USD | 6/1/2022 | Term | 26,470 | 560 | (3,636) | ||||||||||||||||||
| A |
Shlumberger Ltd. | Pay | 1-Month LIBOR USD | 6/13/2018 | Term | 8,497,579 | 122,197 | 117,358 | ||||||||||||||||||
| A |
Siam Cement PCL | Receive | 1-Month LIBOR USD | 6/1/2022 | Term | 667,102 | 44,400 | (43,234) | ||||||||||||||||||
| A |
Siam Commercial Bank PCL | Receive | 1-Month LIBOR USD | 6/1/2022 | Term | 370,053 | 81,700 | (23,845) | ||||||||||||||||||
| A |
Simon Property Group, Inc. | Pay | 1-Month LIBOR USD | 6/8/2018 | Term | 1,424,998 | 8,960 | (25,933) | ||||||||||||||||||
| A |
Sinopac Financial Holdings Ltd. | Receive | 1-Month LIBOR USD | 6/1/2022 | Term | 270,268 | 892,170 | 63,366 | ||||||||||||||||||
| A |
SK Holdings Co., Ltd. | Receive | 1-Month LIBOR USD | 6/1/2022 | Term | 386,872 | 1,572 | 14,652 | ||||||||||||||||||
| A |
SK Hynix, Inc. | Receive | 1-Month LIBOR USD | 6/1/2022 | Term | 1,297,949 | 20,789 | 495,880 | ||||||||||||||||||
| A |
SK Innovation Co., Ltd. | Receive | 1-Month LIBOR USD | 6/1/2022 | Term | 811,368 | 5,000 | 151,554 | ||||||||||||||||||
| A |
SK Telecom | Receive | 1-Month LIBOR USD | 6/1/2022 | Term | 902,759 | 3,835 | (106,640) | ||||||||||||||||||
| A |
S-Oil Corp. | Receive | 1-Month LIBOR USD | 6/1/2022 | Term | 7,960 | 81 | 257 | ||||||||||||||||||
| A |
Standard Foods Corp. | Receive | 1-Month LIBOR USD | 6/1/2022 | Term | 55,774 | 21,840 | (11,316) | ||||||||||||||||||
| A |
Suzano Papel E Celulose S.A. | Receive | 1-Month LIBOR USD | 6/1/2022 | Term | 25,027 | 1,800 | 14,112 | ||||||||||||||||||
| A |
Synnex Technology International Corp. | Receive | 1-Month LIBOR USD | 6/1/2022 | Term | 354,226 | 318,000 | 156,948 | ||||||||||||||||||
| A |
Taiwan Cement Corp. | Receive | 1-Month LIBOR USD | 6/1/2022 | Term | 131,171 | 115,000 | 33,898 | ||||||||||||||||||
| A |
Taiwan Mobile Co., Ltd. | Receive | 1-Month LIBOR USD | 6/1/2022 | Term | 220,021 | 62,000 | 3,473 | ||||||||||||||||||
| A |
Taiwan Semiconductor Manufacturing Co., Ltd. | Receive | 1-Month LIBOR USD | 6/1/2022 | Term | 56,562 | 8,000 | 2,132 | ||||||||||||||||||
| A |
Teco Electric & Machinery Co., Ltd. | Receive | 1-Month LIBOR USD | 6/1/2022 | Term | 348,858 | 375,000 | (53,109) | ||||||||||||||||||
| A |
Thai Oil PCL | Receive | 1-Month LIBOR USD | 6/1/2022 | Term | 341,330 | 124,400 | 28,545 | ||||||||||||||||||
| A |
Thai Union Group PCL | Receive | 1-Month LIBOR USD | 6/1/2022 | Term | 51,927 | 81,000 | (7,681) | ||||||||||||||||||
| A |
Tim Particpacoes S.A. | Receive | 1-Month LIBOR USD | 6/1/2022 | Term | 244,186 | 71,600 | 18,211 | ||||||||||||||||||
| A |
TMB Bank PCL | Receive | 1-Month LIBOR USD | 6/1/2022 | Term | 31,287 | 439,500 | 2,976 | ||||||||||||||||||
| A |
Torchmark Corp. | Pay | 1-Month LIBOR USD | 6/13/2018 | Term | 1,078,392 | 12,681 | 4,065 | ||||||||||||||||||
| A |
Ultrapar Participcoes S.A. | Receive | 1-Month LIBOR USD | 6/1/2022 | Term | 332,717 | 14,300 | (15,950) | ||||||||||||||||||
| A |
Uni-President Enterprises Co. | Receive | 1-Month LIBOR USD | 6/1/2022 | Term | 549,230 | 279,000 | 128,530 | ||||||||||||||||||
| The accompanying Notes to the Financial Statements are an integral part of these Financial Statements. | (Continued) |
| Elements Portfolios | Annual Report | May 31, 2018 | ||||||||||||||
88
| Schedule of Investments | as of May 31, 2018 |
| ELEMENTS EMERGING MARKETS PORTFOLIO |
| COUNTERPARTY (a) | REFERENCE ENTITY | PAY/RECEIVE TOTAL RETURN ON REFERENCE ENTITY |
BASE FINANCING RATE (b) |
TERMINATION DATE |
PAYMENT FREQUENCY |
NOTIONAL VALUE |
NUMBER OF UNITS |
UNREALIZED APPRECIATION (DEPRECIATION) |
||||||||||||||||||
| A |
Universal Health Services, Inc. —Class B | Pay | 1-Month LIBOR USD | 6/13/2018 | Term | $ | 1,202,981 | 10,375 | $ | 10,590 | ||||||||||||||||
| A |
Vale S.A. | Receive | 1-Month LIBOR USD | 6/1/2022 | Term | 431,170 | 42,673 | 161,494 | ||||||||||||||||||
| A |
Valero Energy Corp. | Pay | 1-Month LIBOR USD | 7/5/2018 | Term | 5,255,030 | 43,000 | 43,430 | ||||||||||||||||||
| A |
Walt Disney Co. | Pay | 1-Month LIBOR USD | 6/8/2018 | Term | 1,322,989 | 13,396 | (7,551) | ||||||||||||||||||
| A |
Waste Management, Inc. | Pay | 1-Month LIBOR USD | 6/4/2018 | Term | 840,612 | 10,214 | (2,607) | ||||||||||||||||||
| A |
WEG S.A. | Receive | 1-Month LIBOR USD | 6/1/2022 | Term | 88,847 | 19,240 | (496) | ||||||||||||||||||
| A |
Western Digital Corp. | Pay | 1-Month LIBOR USD | 7/5/2018 | Term | 4,283,235 | 49,500 | 149,490 | ||||||||||||||||||
| A |
Wistron Corp. | Receive | 1-Month LIBOR USD | 6/1/2022 | Term | 416,426 | 442,484 | (84,230) | ||||||||||||||||||
| A |
WPG Holdings Ltd. | Receive | 1-Month LIBOR USD | 6/1/2022 | Term | 275,960 | 211,000 | 27,739 | ||||||||||||||||||
| A |
Yuhan Corp. | Receive | 1-Month LIBOR USD | 6/1/2022 | Term | 264,659 | 1,342 | 30,198 | ||||||||||||||||||
| A |
Zhen Ding Technology Holdings Ltd. | Receive | 1-Month LIBOR USD | 6/1/2022 | Term | 95,237 | 41,000 | (4,281) | ||||||||||||||||||
|
|
|
|
|
|||||||||||||||||||||||
| $ | 282,936,696 | $ | 1,764,950 | |||||||||||||||||||||||
|
|
|
|
|
|||||||||||||||||||||||
| Swaps on Futures | ||||||||||||||||||||||||||
| COUNTERPARTY (a) | REFERENCE ENTITY | PAY/RECEIVE TOTAL RETURN ON REFERENCE ENTITY |
BASE FINANCING RATE (b) |
TERMINATION DATE |
PAYMENT FREQUENCY |
NOTIONAL VALUE |
NUMBER OF UNITS |
UNREALIZED DEPRECIATION |
||||||||||||||||||
| B |
RTS Index Future —June 2018 Expiration | Receive | N/A | 6/21/2018 | Term | $ | 4,995,732 | 1,949 | $ | (488,084) | ||||||||||||||||
|
|
|
|
|
|||||||||||||||||||||||
| $ | 4,995,732 | $ | (488,084) | |||||||||||||||||||||||
|
|
|
|
|
|||||||||||||||||||||||
| (a) | See Note 2. |
| (b) | The swaps accrue financing fees according to the relevant base financing rate, which resets periodically, plus a fixed spread. |
Open Forward Currency Contracts
| COUNTERPARTY (a) | FORWARD SETTLEMENT DATE |
CURRENCY TO BE RECEIVED |
AMOUNT OF CURRENCY TO BE RECEIVED IN LOCAL CURRENCY |
CURRENCY TO BE DELIVERED |
AMOUNT OF CURRENCY TO BE DELIVERED IN LOCAL CURRENCY |
UNREALIZED APPRECIATION (DEPRECIATION) |
||||||||||||||||||
| B |
06/20/2018 | Indian Rupee | 876,539,000 | U.S. Dollars | 13,194,623 | $ | (234,843 | ) | ||||||||||||||||
| B |
06/20/2018 | U.S. Dollars | 12,968,472 | Indian Rupee | 876,539,000 | 8,691 | ||||||||||||||||||
|
|
|
|||||||||||||||||||||||
| TOTAL OPEN FORWARD CURRENCY CONTRACTS |
|
$ | (226,152 | ) | ||||||||||||||||||||
|
|
|
|||||||||||||||||||||||
| (a) | See Note 2. |
| The accompanying Notes to the Financial Statements are an integral part of these Financial Statements. |
| Elements Portfolios | Annual Report | May 31, 2018 | ||||||||||||||
89
| Statement of Assets and Liabilities | May 31, 2018 |
| ELEMENTS U.S. PORTFOLIO |
ELEMENTS U.S. SMALL CAP PORTFOLIO |
|||||||
| ASSETS: | ||||||||
| Investments, at fair value(1)(2) |
$ | 935,161,515 | $ | 539,605,049 | ||||
| Unrealized appreciation of swap contracts |
2,829,955 | 794,287 | ||||||
| Dividends and interest receivable |
1,381,891 | 525,972 | ||||||
| Receivable for fund shares sold |
1,239,435 | 382,741 | ||||||
| Receivable for investments sold |
4,471,373 | 3,136,028 | ||||||
| Securities lending income receivable |
11,185 | 46,744 | ||||||
| Receivable from Adviser |
2,746 | 6,917 | ||||||
| Cash |
— | 128,771 | ||||||
| Collateral held at broker for futures |
2,522,285 | 1,531,553 | ||||||
| Collateral segregated for swaps |
890,000 | 1,706,060 | ||||||
| Other assets |
3,072 | 10,005 | ||||||
| Total assets | 948,513,457 | 547,874,127 | ||||||
| LIABILITIES: | ||||||||
| Unrealized depreciation of swap contracts |
2,622,105 | 1,738,866 | ||||||
| Due to broker |
378,800 | — | ||||||
| Payable for fund shares redeemed |
145,133 | 52,663 | ||||||
| Payable to custodian |
15,008 | — | ||||||
| Accrued distribution fees |
78,101 | 44,739 | ||||||
| Payable to Chief Compliance Officer compensation |
5,168 | 5,168 | ||||||
| Payable for securities on loan |
13,693,547 | 20,787,600 | ||||||
| Other accrued expenses |
231,330 | 167,897 | ||||||
| Total liabilities | 17,169,192 | 22,796,933 | ||||||
| Total net assets | $ | 931,344,265 | $ | 525,077,194 | ||||
| NET ASSETS CONSIST OF: | ||||||||
| Capital stock |
$ | 825,182,433 | $ | 450,599,846 | ||||
| Accumulated net investment income |
5,397,854 | 2,902,854 | ||||||
| Accumulated net realized loss |
(3,078,708 | ) | (3,227,818 | ) | ||||
| Unrealized appreciation (depreciation) on: | ||||||||
| Investments |
104,755,203 | 74,813,220 | ||||||
| Futures contracts |
(1,120,367 | ) | 933,671 | |||||
| Swap contracts |
207,850 | (944,579 | ) | |||||
| Total net assets | $ | 931,344,265 | $ | 525,077,194 | ||||
| Net Assets |
$ | 931,344,265 | $ | 525,077,194 | ||||
| Shares outstanding |
81,470,340 | 45,995,425 | ||||||
| Net asset value, offering and redemption price per share |
$ | 11.43 | $ | 11.42 | ||||
| (1) Cost of Investments |
$ | 830,406,312 | $ | 464,791,829 | ||||
| (2) Fair value of securities out on loan |
13,247,851 | 20,296,203 | ||||||
| The accompanying Notes to the Financial Statements are an integral part of these Financial Statements. | (Continued) |
| Elements Portfolios | Annual Report | May 31, 2018 | ||||||||||||||
90
| Statement of Assets and Liabilities | May 31, 2018 |
| ELEMENTS INTERNATIONAL PORTFOLIO |
ELEMENTS INTERNATIONAL SMALL CAP PORTFOLIO |
|||||||
| ASSETS: | ||||||||
| Investments, at fair value(1)(2) |
$ | 565,071,077 | $ | 220,112,030 | ||||
| Unrealized appreciation on swap contracts |
14,061,632 | 5,302,206 | ||||||
| Dividends and interest receivable |
2,339,177 | 785,775 | ||||||
| Receivable for swaps sold |
616,363 | 649,624 | ||||||
| Receivable for investments sold |
4,769,548 | 1,849,548 | ||||||
| Receivable for fund shares sold |
1,045,056 | 407,325 | ||||||
| Receivable from Adviser |
— | 24,500 | ||||||
| Securities lending income receivable |
33 | 553 | ||||||
| Cash |
645,184 | 553,089 | ||||||
| Collateral held at broker for futures |
4,651,200 | 1,309,078 | ||||||
| Foreign currencies, at value(4) |
2,208,655 | 7,962,191 | ||||||
| Foreign currency collateral held at broker for futures, at value(5) |
1,558,934 | — | ||||||
| Foreign currency collateral held at broker for swaps, at value(6) |
466,757 | 350,004 | ||||||
| Collateral segregated for swaps |
11,011,002 | 3,127,047 | ||||||
| Spot trade receivable |
3,100,000 | 1,099,958 | ||||||
| Other assets |
22,023 | 16,384 | ||||||
| Total assets | 611,566,641 | 243,549,312 | ||||||
| LIABILITIES: | ||||||||
| Unrealized depreciation on swap contracts |
8,114,275 | 3,182,671 | ||||||
| Spot trade payable |
3,100,423 | 1,100,140 | ||||||
| Securities sold short, at fair value(3) |
223,871 | — | ||||||
| Payable for swaps purchased |
109,932 | 27,247 | ||||||
| Payable for investments purchased |
8,543,952 | 5,630,550 | ||||||
| Payable for fund shares redeemed |
242,282 | 18,750 | ||||||
| Due to broker |
— | 1,835,221 | ||||||
| Payable to Adviser |
57,011 | — | ||||||
| Payable to Chief Compliance Officer compensation |
5,168 | 5,168 | ||||||
| Payable to Trustees |
1,401 | 552 | ||||||
| Payable to custodian |
17,848 | 24,366 | ||||||
| Payable for securities on loan |
406,980 | 763,943 | ||||||
| Accrued distribution fees |
50,806 | 19,731 | ||||||
| Other accrued expenses |
208,174 | 145,191 | ||||||
| Total liabilities | 21,082,123 | 12,753,530 | ||||||
| Total net assets | $ | 590,484,518 | $ | 230,795,782 | ||||
| NET ASSETS CONSIST OF: | ||||||||
| Capital stock |
$ | 556,104,588 | $ | 215,815,609 | ||||
| Accumulated net investment income |
6,848,710 | 1,828,313 | ||||||
| Accumulated net realized gain |
8,210,933 | 2,792,422 | ||||||
| Unrealized appreciation (depreciation) on: | ||||||||
| Investments |
19,600,004 | 9,990,709 | ||||||
| Securities sold short |
404 | — | ||||||
| Foreign currency translation |
(44,677 | ) | (12,672 | ) | ||||
| Futures contracts |
(6,182,801 | ) | (1,738,134 | ) | ||||
| Swap contracts |
5,947,357 | 2,119,535 | ||||||
| Total net assets | $ | 590,484,518 | $ | 230,795,782 | ||||
| Net Assets |
$ | 590,484,518 | $ | 230,795,782 | ||||
| Shares outstanding |
53,553,262 | 20,339,326 | ||||||
| Net asset value, offering and redemption price per share |
$ | 11.03 | $ | 11.35 | ||||
| (1) Cost of Investments |
$ | 545,471,073 | $ | 210,121,321 | ||||
| (2) Fair value of securities out on loan |
404,498 | 669,203 | ||||||
| (3) Proceeds from securities sold short |
224,275 | — | ||||||
| (4) Cost of foreign currencies |
2,202,181 | 7,963,180 | ||||||
| (5) Cost of foreign currencies |
1,553,031 | — | ||||||
| (6) Cost of foreign currencies |
482,624 | 348,732 | ||||||
| The accompanying Notes to the Financial Statements are an integral part of these Financial Statements. | (Continued) |
| Elements Portfolios | Annual Report | May 31, 2018 | ||||||||||||||
91
| Statement of Assets and Liabilities | May 31, 2018 |
| ELEMENTS EMERGING MARKETS PORTFOLIO |
||||
| ASSETS: | ||||
| Investments, at fair value(1)(2) |
$ | 270,672,064 | ||
| Unrealized appreciation on forward currency contracts |
8,691 | |||
| Unrealized appreciation on swap contracts |
8,278,841 | |||
| Dividends and interest receivable |
584,861 | |||
| Receivable for investments sold |
15,640,451 | |||
| Receivable for swaps sold |
1,742,977 | |||
| Receivable for fund shares sold |
478,421 | |||
| Receivable from Adviser |
6,260 | |||
| Securities lending income receivable |
17 | |||
| Foreign currencies, at value(3) |
1,499,144 | |||
| Foreign currency collateral held at broker for futures, at value(4) |
1,003 | |||
| Collateral segregated for swaps |
6,964,076 | |||
| Collateral held at broker for futures |
6,877,280 | |||
| Other assets |
82,321 | |||
| Total assets | 312,836,407 | |||
| LIABILITIES: | ||||
| Unrealized depreciation on forward currency contracts |
234,843 | |||
| Unrealized depreciation on swap contracts |
7,001,975 | |||
| Payable for investments purchased |
24,153,800 | |||
| Payable for swaps purchased |
5,520,598 | |||
| Due to broker |
56,040 | |||
| Payable to custodian |
11,298 | |||
| Payable to Chief Compliance Officer compensation |
5,168 | |||
| Payable for fund shares redeemed |
77,780 | |||
| Payable for securities on loan |
41,323 | |||
| Accrued distribution fees |
23,476 | |||
| Other accrued expenses |
140,211 | |||
| Total liabilities | 37,266,512 | |||
| Total net assets | $ | 275,569,895 | ||
| NET ASSETS CONSIST OF: | ||||
| Capital stock |
$ | 266,807,790 | ||
| Accumulated net investment income |
1,747,324 | |||
| Accumulated net realized gain |
8,616,134 | |||
| Unrealized appreciation (depreciation) on: | ||||
| Investments |
8,376,979 | |||
| Foreign currency translation |
(10,304 | ) | ||
| Forward foreign currency contracts |
(226,152 | ) | ||
| Futures contracts |
(11,018,742 | ) | ||
| Swap contracts |
1,276,866 | |||
| Total net assets | $ | 275,569,895 | ||
| Net Assets |
$ | 275,569,895 | ||
| Shares outstanding |
25,921,589 | |||
| Net asset value, offering and redemption price per share |
$ | 10.63 | ||
| (1) Cost of Investments |
$ | 262,295,085 | ||
| (2) Fair value of securities out on loan |
40,356 | |||
| (3) Cost of foreign currencies |
1,503,320 | |||
| (4) Cost of foreign currencies |
967 | |||
| The accompanying Notes to the Financial Statements are an integral part of these Financial Statements. |
| Elements Portfolios | Annual Report | May 31, 2018 | ||||||||||||||
92
| Statement of Operations | For the Year Ended May 31, 2018 |
| ELEMENTS U.S. PORTFOLIO |
ELEMENTS U.S. SMALL CAP PORTFOLIO |
|||||||
| INVESTMENT INCOME: | ||||||||
| Dividend income |
$ | 12,306,109 | $ | 6,667,165 | ||||
| Interest income |
572,541 | 413,877 | ||||||
| Securities lending income |
106,869 | 677,563 | ||||||
| Total investment income | 12,985,519 | 7,758,605 | ||||||
| EXPENSES: | ||||||||
| Advisory fees (See Note 4) |
2,473,872 | 2,539,926 | ||||||
| Distribution (12b-1) fees |
824,624 | 507,985 | ||||||
| Legal fees |
261,145 | 164,812 | ||||||
| Fund accounting and administration fees |
186,154 | 210,317 | ||||||
| Federal and state registration fees |
72,875 | 42,398 | ||||||
| Transfer agency fees and expenses |
67,964 | 48,344 | ||||||
| Audit and tax related fees |
67,117 | 61,661 | ||||||
| Offering costs |
54,627 | 46,364 | ||||||
| Chief Compliance Officer compensation |
49,107 | 49,107 | ||||||
| Custody fees |
42,383 | 27,577 | ||||||
| Trustees fees and expenses |
4,724 | 2,772 | ||||||
| Other expenses |
119,613 | 91,080 | ||||||
| Total expenses before Adviser waiver | 4,224,205 | 3,792,343 | ||||||
| Expenses waived by Adviser (See Note 4) |
(2,968,107 | ) | (3,025,254 | ) | ||||
| Total net expenses | 1,256,098 | 767,089 | ||||||
| Net investment income | 11,729,421 | 6,991,516 | ||||||
| NET REALIZED AND UNREALIZED GAIN (LOSS): | ||||||||
| Net realized gain (loss) on: | ||||||||
| Investments |
(4,763,430 | ) | (8,499,638 | ) | ||||
| Futures contracts |
3,772,940 | 3,965,977 | ||||||
| Swap contracts |
(2,070,903 | ) | 1,405,729 | |||||
| Net change in unrealized appreciation (depreciation) on: | ||||||||
| Investments |
96,802,468 | 77,995,649 | ||||||
| Futures contracts |
(1,104,790 | ) | 976,298 | |||||
| Swap contracts |
207,850 | (944,579 | ) | |||||
| Net realized and unrealized gain | 92,844,135 | 74,899,436 | ||||||
| Net increase in net assets resulting from operations | $ | 104,573,556 | $ | 81,890,952 | ||||
| The accompanying Notes to the Financial Statements are an integral part of these Financial Statements. | (Continued) |
| Elements Portfolios | Annual Report | May 31, 2018 | ||||||||||||||
93
| Statement of Operations | For the Year Ended May 31, 2018 |
| ELEMENTS INTERNATIONAL PORTFOLIO |
ELEMENTS INTERNATIONAL SMALL CAP PORTFOLIO |
|||||||
| INVESTMENT INCOME: | ||||||||
| Dividend income |
$ | 10,351,368 | $ | 3,322,856 | ||||
| Interest income |
657,738 | 265,583 | ||||||
| Securities lending income |
33 | 553 | ||||||
| Total investment income | 11,009,139 | 3,588,992 | ||||||
| EXPENSES: | ||||||||
| Advisory fees (See Note 4) |
2,323,793 | 1,029,544 | ||||||
| Distribution (12b-1) fees |
516,398 | 187,190 | ||||||
| Fund accounting and administration fees |
282,875 | 323,678 | ||||||
| Custody fees |
228,139 | 202,102 | ||||||
| Legal fees |
157,147 | 55,140 | ||||||
| Federal and state registration fees |
71,646 | 41,152 | ||||||
| Transfer agency fees and expenses |
68,292 | 16,724 | ||||||
| Audit and tax related fees |
67,289 | 67,489 | ||||||
| Chief Compliance Officer compensation |
49,107 | 49,107 | ||||||
| Offering costs |
48,128 | 47,752 | ||||||
| Trustees fees and expenses |
1,504 | 592 | ||||||
| Other expenses |
90,106 | 64,637 | ||||||
| Total expenses before Adviser waiver | 3,904,424 | 2,085,107 | ||||||
| Expenses waived by Adviser (See Note 4) |
(2,845,052 | ) | (1,699,169 | ) | ||||
| Total net expenses | 1,059,372 | 385,938 | ||||||
| Net investment income | 9,949,767 | 3,203,054 | ||||||
| NET REALIZED AND UNREALIZED GAIN (LOSS): | ||||||||
| Net realized gain (loss) on: | ||||||||
| Investments |
(33,338 | ) | (549,559 | ) | ||||
| Foreign currency translation |
2,561,773 | 1,132,919 | ||||||
| Futures contracts |
5,292,297 | 2,343,036 | ||||||
| Swap contracts |
4,198,382 | 2,214,002 | ||||||
| Net change in unrealized appreciation (depreciation) on: | ||||||||
| Investments |
19,776,530 | 10,158,446 | ||||||
| Securities sold short |
404 | — | ||||||
| Foreign currency translation |
(1,199,917 | ) | (824,324 | ) | ||||
| Futures contracts |
(6,385,881 | ) | (1,755,907 | ) | ||||
| Swap contracts |
6,044,954 | 2,066,655 | ||||||
| Net realized and unrealized gain | 30,255,204 | 14,785,268 | ||||||
| Net increase in net assets resulting from operations | $ | 40,204,971 | $ | 17,988,322 | ||||
| The accompanying Notes to the Financial Statements are an integral part of these Financial Statements. | (Continued) |
| Elements Portfolios | Annual Report | May 31, 2018 | ||||||||||||||
94
| Statement of Operations | For the Year Ended May 31, 2018 |
| ELEMENTS EMERGING MARKETS PORTFOLIO(1) |
||||
| INVESTMENT INCOME: | ||||
| Dividend income |
$ | 2,525,539 | ||
| Interest income |
1,028,258 | |||
| Securities lending income |
17 | |||
| Total investment income | 3,553,814 | |||
| EXPENSES: | ||||
| Advisory fees (See Note 4) |
1,387,503 | |||
| Distribution (12b-1) fees |
231,251 | |||
| Fund accounting and administration fees |
190,859 | |||
| Legal fees |
77,007 | |||
| Audit and tax related fees |
62,062 | |||
| Custody fees |
60,784 | |||
| Offering costs |
52,682 | |||
| Chief Compliance Officer compensation |
49,107 | |||
| Transfer agency fees and expenses |
42,236 | |||
| Federal and state registration fees |
36,191 | |||
| Other expenses |
87,573 | |||
| Total expenses before Adviser waiver | 2,277,255 | |||
| Expenses waived by Adviser (See Note 4) |
(1,765,869 | ) | ||
| Total net expenses | 511,386 | |||
| Net investment income | 3,042,428 | |||
| NET REALIZED AND UNREALIZED GAIN (LOSS): | ||||
| Net realized gain (loss) on: | ||||
| Investments |
951,559 | |||
| Foreign currency translation |
(3,162 | ) | ||
| Forward currency contracts |
(8,378 | ) | ||
| Futures contracts |
23,259,955 | |||
| Swap contracts |
(1,887,361 | ) | ||
| Net change in unrealized appreciation (depreciation) on: | ||||
| Investments |
8,376,979 | |||
| Foreign currency translation |
(10,304 | ) | ||
| Forward currency contracts |
(226,152 | ) | ||
| Futures contracts |
(11,018,742 | ) | ||
| Swap contracts |
1,276,866 | |||
| Net realized and unrealized gain | 20,711,260 | |||
| Net increase in net assets resulting from operations | $ | 23,753,688 | ||
| (1) | The Portfolio commenced operations on June 1, 2017. |
| The accompanying Notes to the Financial Statements are an integral part of these Financial Statements. |
| Elements Portfolios | Annual Report | May 31, 2018 | ||||||||||||||
95
| Statement of Changes in Net Assets |
| ELEMENTS U.S. PORTFOLIO | ELEMENTS U.S. SMALL CAP PORTFOLIO |
|||||||||||||||
| YEAR ENDED MAY 31, 2018 |
PERIOD ENDED MAY 31, 2017(1) |
YEAR ENDED MAY 31, 2018 |
PERIOD ENDED MAY 31, 2017(1) |
|||||||||||||
| OPERATIONS: | ||||||||||||||||
| Net investment income |
$ | 11,729,421 | $ | 1,400,467 | $ | 6,991,516 | $ | 724,819 | ||||||||
| Net realized gain (loss) on: | ||||||||||||||||
| Investments |
(4,763,430 | ) | 77,593 | (8,499,638 | ) | 227,496 | ||||||||||
| Futures contracts |
3,772,940 | 322,338 | 3,965,977 | 477,815 | ||||||||||||
| Swap contracts |
(2,070,903 | ) | — | 1,405,729 | — | |||||||||||
| Net change in unrealized appreciation (depreciation) on: | ||||||||||||||||
| Investments |
96,802,468 | 7,952,735 | 77,995,649 | (3,182,429 | ) | |||||||||||
| Futures contracts |
(1,104,790 | ) | (15,577 | ) | 976,298 | (42,627 | ) | |||||||||
| Swap contracts |
207,850 | — | (944,579 | ) | — | |||||||||||
| Net increase (decrease) in net assets resulting from operations |
104,573,556 | 9,737,556 | 81,890,952 | (1,794,926 | ) | |||||||||||
| DISTRIBUTIONS TO SHAREHOLDERS: | ||||||||||||||||
| From net investment income |
(7,729,315 | ) | — | (4,813,383 | ) | — | ||||||||||
| From net realized gain |
(419,965 | ) | — | (805,295 | ) | — | ||||||||||
| Total distributions |
(8,149,280 | ) | — | (5,618,678 | ) | — | ||||||||||
| CAPITAL SHARE TRANSACTIONS: | ||||||||||||||||
| Proceeds from shares sold |
274,412,617 | 608,890,382 | 116,390,890 | 425,844,395 | ||||||||||||
| Proceeds from shares issued to holders in reinvestment of dividends |
7,685,699 | — | 4,316,415 | — | ||||||||||||
| Cost of shares redeemed |
(63,253,906 | ) | (2,552,359 | ) | (95,015,674 | ) | (936,180 | ) | ||||||||
| Net increase in net assets from capital share transactions |
218,844,410 | 606,338,023 | 25,691,631 | 424,908,215 | ||||||||||||
| Total increase in net assets | 315,268,686 | 616,075,579 | 101,963,905 | 423,113,289 | ||||||||||||
| NET ASSETS: | ||||||||||||||||
| Beginning of year |
616,075,579 | — | 423,113,289 | — | ||||||||||||
| End of year | $ | 931,344,265 | $ | 616,075,579 | $ | 525,077,194 | $ | 423,113,289 | ||||||||
| Accumulated net investment income |
$ | 5,397,854 | $ | 1,400,467 | $ | 2,902,854 | $ | 724,819 | ||||||||
| (1) | The Portfolio commenced operations on April 3, 2017. |
| The accompanying Notes to the Financial Statements are an integral part of these Financial Statements. | (Continued) |
| Elements Portfolios | Annual Report | May 31, 2018 | ||||||||||||||
96
| Statement of Changes in Net Assets |
| ELEMENTS INTERNATIONAL PORTFOLIO |
ELEMENTS INTERNATIONAL SMALL CAP PORTFOLIO |
|||||||||||||||
| YEAR ENDED MAY 31, 2018 |
PERIOD ENDED MAY 31, 2017(1) |
YEAR ENDED MAY 31, 2018 |
PERIOD ENDED MAY 31, 2017(1) |
|||||||||||||
| OPERATIONS: | ||||||||||||||||
| Net investment income |
$ | 9,949,767 | $ | 115,457 | $ | 3,203,054 | $ | 51,696 | ||||||||
| Net realized gain (loss) on: | ||||||||||||||||
| Investments |
(33,338 | ) | — | (549,559 | ) | — | ||||||||||
| Foreign currency translation |
2,561,773 | 2,062,311 | 1,132,919 | 236,266 | ||||||||||||
| Futures contracts |
5,292,297 | 775,599 | 2,343,036 | 677,673 | ||||||||||||
| Swap contracts |
4,198,382 | — | 2,214,002 | — | ||||||||||||
| Net change in unrealized appreciation (depreciation) on: | ||||||||||||||||
| Investments |
19,776,530 | (176,526 | ) | 10,158,446 | (167,737 | ) | ||||||||||
| Foreign currency translation |
(1,199,917 | ) | 1,155,240 | (824,324 | ) | 811,652 | ||||||||||
| Futures contracts |
(6,385,881 | ) | 203,080 | (1,755,907 | ) | 17,773 | ||||||||||
| Securities sold short |
404 | — | — | — | ||||||||||||
| Swap contracts |
6,044,954 | (97,597 | ) | 2,066,655 | 52,880 | |||||||||||
| Net increase in net assets resulting from operations |
40,204,971 | 4,037,564 | 17,988,322 | 1,680,203 | ||||||||||||
| DISTRIBUTIONS TO SHAREHOLDERS: | ||||||||||||||||
| From net investment income |
(7,854,166 | ) | — | (2,802,025 | ) | — | ||||||||||
| From net realized gain |
(2,008,439 | ) | — | (1,886,327 | ) | — | ||||||||||
| Total distributions |
(9,862,605 | ) | — | (4,688,352 | ) | — | ||||||||||
| CAPITAL SHARE TRANSACTIONS: | ||||||||||||||||
| Proceeds from shares sold |
250,594,918 | 373,924,019 | 94,827,677 | 135,785,017 | ||||||||||||
| Proceeds from shares issued to holders in reinvestment of dividends |
9,158,096 | — | 4,394,257 | — | ||||||||||||
| Cost of shares redeemed |
(73,973,111 | ) | (3,599,334 | ) | (12,990,482 | ) | (6,200,860 | ) | ||||||||
| Net increase in net assets from capital share transactions |
185,779,903 | 370,324,685 | 86,231,452 | 129,584,157 | ||||||||||||
| Total increase in net assets | 216,122,269 | 374,362,249 | 99,531,422 | 131,264,360 | ||||||||||||
| NET ASSETS: | ||||||||||||||||
| Beginning of year |
374,362,249 | — | 131,264,360 | — | ||||||||||||
| End of year | $ | 590,484,518 | $ | 374,362,249 | $ | 230,795,782 | $ | 131,264,360 | ||||||||
| Accumulated net investment income |
$ | 6,848,710 | $ | 2,177,768 | $ | 1,828,313 | $ | 287,962 | ||||||||
| (1) | The Portfolio commenced operations on May 1, 2017. |
| The accompanying Notes to the Financial Statements are an integral part of these Financial Statements. | (Continued) |
| Elements Portfolios | Annual Report | May 31, 2018 | ||||||||||||||
97
| Statement of Changes in Net Assets |
| ELEMENTS EMERGING MARKETS PORTFOLIO |
||||
| YEAR ENDED MAY 31, 2018(1) |
||||
| OPERATIONS: | ||||
| Net investment income |
$ | 3,042,428 | ||
| Net realized gain (loss) on: | ||||
| Investments |
951,559 | |||
| Foreign currency translation |
(3,162 | ) | ||
| Forward foreign currency contracts |
(8,378 | ) | ||
| Futures contracts |
23,259,955 | |||
| Swap contracts |
(1,887,361 | ) | ||
| Net change in unrealized appreciation (depreciation) on: | ||||
| Investments |
8,376,979 | |||
| Foreign currency translation |
(10,304 | ) | ||
| Forward foreign currency contracts |
(226,152 | ) | ||
| Futures contracts |
(11,018,742 | ) | ||
| Swap contracts |
1,276,866 | |||
| Net increase in net assets resulting from operations |
23,753,688 | |||
| DISTRIBUTIONS TO SHAREHOLDERS: | ||||
| From net investment income |
(1,283,564 | ) | ||
| From net realized gain |
(13,708,019 | ) | ||
| Total distributions |
(14,991,583 | ) | ||
| CAPITAL SHARE TRANSACTIONS: | ||||
| Proceeds from shares sold |
278,569,475 | |||
| Proceeds from shares issued to holders in reinvestment of dividends |
14,277,937 | |||
| Cost of shares redeemed |
(26,039,622 | ) | ||
| Net increase in net assets from capital share transactions |
266,807,790 | |||
| Total increase in net assets | 275,569,895 | |||
| NET ASSETS: | ||||
| Beginning of year |
— | |||
| End of year | $ | 275,569,895 | ||
| Accumulated net investment income |
$ | 1,747,324 | ||
| (1) | The Portfolio commenced operations on June 1, 2017 |
| The accompanying Notes to the Financial Statements are an integral part of these Financial Statements. |
| Elements Portfolios | Annual Report | May 31, 2018 | ||||||||||||||
98
[Intentionally Left Blank]
| Financial Highlights | May 31, 2018 |
| PER SHARE DATA: | ||||||||||||||||
| Income (loss) from Investment Operations | ||||||||||||||||
| Net Asset Value, Beginning of Period |
Net Investment Income(4) |
Net Realized and Unrealized Gains (Losses) |
Total Income (Loss) from Investment Operations |
|||||||||||||
| Elements U.S. Portfolio | ||||||||||||||||
| Year Ended May 31, 2018 | $ | 10.12 | 0.16 | 1.26 | 1.42 | |||||||||||
| Period Ended May 31, 2017(1) |
$ | 10.00 | 0.03 | 0.09 | 0.12 | |||||||||||
| Elements U.S. Small Cap Portfolio | ||||||||||||||||
| Year Ended May 31, 2018 | $ | 9.81 | 0.15 | 1.58 | 1.73 | |||||||||||
| Period Ended May 31, 2017(1) |
$ | 10.00 | 0.02 | (0.21 | ) | (0.19 | ) | |||||||||
| Elements International Portfolio | ||||||||||||||||
| Year Ended May 31, 2018 | $ | 10.29 | 0.21 | 0.73 | 0.94 | |||||||||||
| Period Ended May 31, 2017(2) |
$ | 10.00 | 0.01 | 0.28 | 0.29 | |||||||||||
| Elements International Small Cap Portfolio | ||||||||||||||||
| Year Ended May 31, 2018 | $ | 10.36 | 0.19 | 1.08 | 1.27 | |||||||||||
| Period Ended May 31, 2017(2) |
$ | 10.00 | 0.01 | 0.35 | 0.36 | |||||||||||
| Elements Emerging Markets Portfolio | ||||||||||||||||
| Year Ended May 31, 2018(3) |
$ | 10.00 | 0.14 | 1.19 | 1.33 | |||||||||||
| (1) | The Portfolio commenced operations on April 3, 2017. |
| (2) | The Portfolio commenced operations on May 1, 2017. |
| (3) | The Portfolio commenced operations on June 1, 2017. |
| (4) | Net investment income per share has been calculated based on average shares outstanding during the period. Net investment income per share is net of fees and expenses that were waived or reimbursed by the Adviser. |
| (5) | Results shown reflect the reinvestment of all dividends, are net of fees and expenses, and reflect waivers of all of the Portfolio’s investment management fees and partial reimbursement of the Portfolio’s expenses by Stone Ridge. Stone Ridge has contractually agreed to waive its management fee and reimburse expenses as necessary to limit total annualized expenses, other than certain excluded expenses, of the Portfolios to 0.15% (for the Elements U.S. Portfolio and Elements U.S. Small Cap Portfolio) or 0.20% (for the Elements International Portfolio, Elements International Small Cap Portfolio and Elements Emerging Markets Portfolio) for the fiscal year ended May 31, 2018 and for the period from June 1, 2018 through September 27, 2018. Fee waivers and expense reimbursement may be discontinued after that date. In the absence of fee waivers and reimbursements, returns for the Portfolio would have been lower. Returns shown do not reflect the deduction of taxes that a shareholder would pay on fund distributions or the redemption of fund shares. |
| (6) | Not annualized. |
| (7) | Annualized. |
| (8) | Turnover calculation for the Portfolio’s single stock factor investing. Calculated as the lesser of notional bought or sold in equities and single-name equity derivatives, divided by average net assets for the period. Excludes activity that the Adviser believes contributes minimal transaction costs and activity in other products such as index derivatives. |
| The accompanying Notes to the Financial Statements are an integral part of these Financial Statements. |
| Elements Portfolios | Annual Report | May 31, 2018 | ||||||||||||||
100
| Financial Highlights | May 31, 2018 |
|
|
SUPPLEMENT DATA AND RATIOS: | |||||||||||||||||||||||||||||||||||||||||||||||||
| Distributions to Shareholders | ||||||||||||||||||||||||||||||||||||||||||||||||||
| Net Investment Income |
Net Realized Gains |
Total Distributions |
Net Asset Value, End of Period |
Total Return(5) |
Net Assets, End of Period (000’s) |
Ratio of Expenses to Average Net Assets (Before Expense Reimbursement/ Recoupment) |
Ratio of Expenses to Average Net Assets (After Expense Reimbursement/ Recoupment) |
Ratio of Net Investment Income (Loss) to Average Net Assets (Before Expense Reimbursement/ Recoupment) |
Ratio of Net Investment Income to Average Net Assets (After Expense Reimbursement/ Recoupment) |
Portfolio Turnover Rate |
Portfolio Turnover Rate(8) |
|||||||||||||||||||||||||||||||||||||||
| (0.10 | ) | (0.01 | ) | (0.11 | ) | $ | 11.43 | 14.02 | % | $ | 931,344 | 0.51 | % | 0.15 | % | 1.06 | % | 1.42 | % | 21.56 | % | 14.17 | % | |||||||||||||||||||||||||||
| — | — | — | $ | 10.12 | 1.20 | %(6) | $ | 616,076 | 0.66 | %(7) | 0.00 | %(7) | 1.16 | %(7) | 1.82 | %(7) | 0.40 | %(6) | N/A | |||||||||||||||||||||||||||||||
| (0.10 | ) | (0.02 | ) | (0.12 | ) | $ | 11.42 | 17.65 | % | $ | 525,077 | 0.75 | % | 0.15 | % | 0.78 | % | 1.38 | % | 25.19 | % | 21.06 | % | |||||||||||||||||||||||||||
| — | — | — | $ | 9.81 | (1.90 | )%(6) | $ | 423,113 | 0.91 | %(7) | 0.00 | %(7) | 0.37 | %(7) | 1.28 | %(7) | 0.01 | %(6) | N/A | |||||||||||||||||||||||||||||||
| (0.16 | ) | (0.04 | ) | (0.20 | ) | $ | 11.03 | 9.22 | % | $ | 590,485 | 0.76 | % | 0.21 | % | 1.38 | % | 1.93 | % | 20.84 | % | 13.52 | % | |||||||||||||||||||||||||||
| — | — | — | $ | 10.29 | 2.90 | %(6) | $ | 374,362 | 1.23 | %(7) | 0.00 | %(7) | (0.59 | )%(7) | 0.64 | %(7) | 0.00 | %(6) | N/A | |||||||||||||||||||||||||||||||
| (0.17 | ) | (0.11 | ) | (0.28 | ) | $ | 11.35 | 12.34 | % | $ | 230,796 | 1.11 | % | 0.21 | % | 0.81 | % | 1.71 | % | 19.19 | % | 9.84 | % | |||||||||||||||||||||||||||
| — | — | — | $ | 10.36 | 3.60 | %(6) | $ | 131,264 | 2.65 | %(7) | 0.00 | %(7) | (1.60 | )%(7) | 1.05 | %(7) | 0.00 | %(6) | N/A | |||||||||||||||||||||||||||||||
| (0.06 | ) | (0.64 | ) | (0.70 | ) | $ | 10.63 | 13.46 | % | $ | 275,570 | 0.98 | % | 0.22 | % | 0.56 | % | 1.32 | % | 60.28 | % | 4.49 | % | |||||||||||||||||||||||||||
| The accompanying Notes to the Financial Statements are an integral part of these Financial Statements. |
| Elements Portfolios | Annual Report | May 31, 2018 | ||||||||||||||
101
| Notes to Financial Statements | May 31, 2018 |
1. Organization
Stone Ridge Trust (the “Trust”) is an open-end management investment company, organized as a Delaware statutory trust and registered under the Investment Company Act of 1940, as amended (the “1940 Act”). Currently, the Trust consists of a number of different funds, each having distinct investment management objectives, strategies, risks and policies. Included in this report are the Elements U.S. Portfolio, the Elements U.S. Small Cap Portfolio, the Elements International Portfolio, the Elements International Small Cap Portfolio and the Elements Emerging Markets Portfolio, each a “Portfolio” and collectively the “Elements Portfolios.”
Each Portfolio is classified as non-diversified under the 1940 Act. The Elements U.S. Portfolio and the Elements U.S. Small Cap Portfolio commenced operations on April 3, 2017. The Elements International Portfolio and the Elements International Small Cap Portfolio commenced operations on May 1, 2017. The Elements Emerging Markets Portfolio commenced operations on June 1, 2017. Each Portfolio offers one class of shares with no front-end or back-end sales charges and a 0.10% 12b-1 fee to investors. No Portfolio charges redemption fees. Each Portfolio has an unlimited number of authorized shares.
The investment objective of each Portfolio is to seek long-term capital appreciation. The Elements U.S. Portfolio seeks to achieve its investment objective by investing in a broad and diverse group of securities of U.S. companies. The Elements U.S. Small Cap Portfolio seeks to achieve its investment objective by investing in a broad and diverse group of securities of U.S. small capitalization companies. The Elements International Portfolio seeks to achieve its investment objective by investing in a broad and diverse group of securities of companies associated with countries with developed markets. The Elements International Small Cap Portfolio seeks to achieve its investment objective by investing in a broad and diverse group of securities of small capitalization companies associated with countries with developed markets. The Elements Emerging Markets Portfolio seeks to achieve its investment objective by investing in a broad and diverse group of securities of companies associated with countries with emerging or frontier markets.
2. Summary of Significant Accounting Policies
The following is a summary of significant accounting policies consistently followed by the Elements Portfolios in the preparation of their financial statements. The financial statements have been prepared in conformity with accounting principles generally accepted in the United States of America (“GAAP”). The Elements Portfolios are investment companies and apply specific accounting and financial reporting requirements under Financial Accounting Standards Board (“FASB”) Accounting Standards Topic 946, Financial Services – Investment Companies.
Effective October 13, 2016, the U.S. Securities and Exchange Commission (“SEC”) approved a final rule, Investment Company Report Modernization. The SEC adopted new rules and forms as well as amendments to its rules and forms to modernize the reporting and disclosure of information by registered investment companies. As of May 31, 2018, the Elements Portfolios have adopted the new rules, forms and amendments. The updates to Regulation S-X have been incorporated in the Elements Portfolios’ financial statements and have no impact on the Elements Portfolios’ net assets or results of operations.
(a) Investment Valuation and Fair Value Measurement
The Board of Trustees (“Board”) has approved procedures pursuant to which each Portfolio values its investments (the “Valuation Procedures”). The Board has established an Adviser Valuation Committee comprised of employees of Stone Ridge Asset Management LLC (the “Adviser”) to which the Board has delegated responsibility for overseeing the implementation of the Valuation Procedures and fair value determinations made on behalf of the Board.
Listed below is a summary of certain of the methods generally used currently to value investments of each Portfolio under the Valuation Procedures:
Short-term debt instruments, such as commercial paper, bankers’ acceptances and U.S. Treasury Bills, having a maturity of 60 days or less, are generally valued at amortized cost, which approximates fair value.
Other debt securities, including corporate and government debt securities (of U.S. or foreign issuers) and municipal debt securities in each case having a remaining maturity in excess of 60 days, loans, mortgage-backed securities, collateralized mortgage obligations and other asset-backed securities are valued by an independent pricing service at an evaluated (or estimated) mean between the closing bid and asked prices.
| Elements Portfolios | Annual Report | May 31, 2018 | ||||||||||||||
102
| Notes to Financial Statements | May 31, 2018 |
For investments in open-end management companies that are registered under the 1940 Act, the value of the shares of such funds is calculated based upon the net asset value (“NAV”) per share of such funds. The prospectuses for such funds explain the circumstances under which they will use fair value pricing and its effects.
Equity securities are valued at the last sale, official close or if there are no reported sales at the mean between the bid and asked price on the primary exchange on which they are traded. The values of the Portfolios’ investments in publicly traded foreign equity securities generally will be the closing or final trading prices in the local trading markets but may be adjusted based on values determined by a pricing service using pricing models designed to estimate changes in the values of those securities between the times in which the trading in those securities is substantially completed and the close of the New York Stock Exchange (“NYSE”).
Exchange-traded derivatives, such as options and futures contracts, are valued at the settlement price on the exchange or mean of the bid and asked prices.
Total return swaps on exchange-traded underliers or indices are generally valued on the basis of funding accruals and underlying instruments’ total returns. Other non-exchange traded derivatives, such as forward currency contracts, are generally valued on the basis of valuations provided by a pricing service.
If market quotations are not readily available or available market quotations or other information are deemed to be unreliable by the Adviser Valuation Committee, and if the valuation of the applicable instrument is not covered by the valuation methods described above or if the valuation methods are described above, but such methods are deemed unreliable by the Adviser Valuation Committee, then such instruments will be valued as determined in good faith by the Adviser Valuation Committee. In these circumstances, a Portfolio determines fair value in a manner that seeks to reflect the market value of the security on the valuation date based on consideration by the Adviser Valuation Committee of any information or factors it deems appropriate. For purposes of determining the fair value of securities, the Adviser Valuation Committee may generally consider, without limitation: (i) indications or quotes from brokers or other third-party sources; (ii) valuations provided by a third-party pricing agent; (iii) internal models that take into consideration different factors determined to be relevant by the Adviser; or (iv) any combination of the above.
Fair value pricing may require subjective determinations about the value of a portfolio instrument. Fair values may differ from quoted or published prices, or from prices that are used by others, for the same investments. Also, the use of fair value pricing may not always result in adjustments to the prices of securities or other assets or liabilities held by a Portfolio. It is possible that the fair value determined for a security may be materially different than the value that could be realized upon the sale of such security. Thus, fair valuation may have an unintended dilutive or accretive effect on the value of shareholders’ investments in a Portfolio.
Investments initially valued in currencies other than the U.S. dollar are converted to U.S. dollars using exchange rates obtained from pricing services. As a result, the NAV of a Portfolio’s shares may be affected by changes in the value of currencies in relation to the U.S. dollar. International markets are sometimes open on days when U.S. markets are closed, which means that the value of foreign securities owned by a Portfolio could change on days when Portfolio shares cannot be bought or sold. The value of investments traded in markets outside the U.S. or denominated in currencies other than the U.S. dollar may be affected significantly on a day that the NYSE is closed, and the NAV of a Portfolio’s shares may change on days when an investor is not able to purchase, redeem or exchange shares. The calculation of a Portfolio’s NAV may not take place contemporaneously with the determination of the prices of foreign securities used in NAV calculations.
The Elements Portfolios adhere to authoritative fair valuation accounting standards that set out a hierarchy for measuring fair valuation inputs. These standards require additional disclosures about the various inputs and valuation techniques used to develop the measurements of fair value and a discussion of changes in valuation techniques and related inputs during the period. The hierarchy gives the highest priority to unadjusted quoted prices in active markets for identical assets or liabilities (Level 1 measurements) and the lowest priority to significant unobservable inputs (Level 3 measurements). The three levels of the fair value hierarchy are as follows:
Level 1 Inputs: quoted prices (unadjusted) in active markets for identical assets or liabilities that the Elements Portfolios can access at the measurement date;
| Elements Portfolios | Annual Report | May 31, 2018 | ||||||||||||||
103
| Notes to Financial Statements | May 31, 2018 |
Level 2 Inputs: inputs other than quoted prices included within Level 1 that are observable for the asset or liability, either directly or indirectly including inputs in markets that are not considered to be active or in active markets for similar assets or liabilities, observable inputs other than quoted prices and inputs that are not directly observable but are corroborated by observable market data;
Level 3 Inputs: significant unobservable inputs for the asset or liability.
Inputs are used in applying the various valuation techniques and broadly refer to the assumptions that market participants use to make valuation decisions, including assumptions about risk. A financial instrument’s level within the fair value hierarchy is based on the lowest level of any input that is significant to the fair value measurement. However, the determination of what constitutes “observable” requires significant judgment by the Adviser. The Adviser considers observable data to be that market data which is readily available, regularly distributed or updated, reliable and verifiable, not proprietary, and provided by independent sources that are actively involved in the relevant market. The categorization of a financial instrument within the hierarchy is based upon the pricing transparency of the instrument and does not necessarily correspond to the Adviser’s perceived risk of that instrument.
Transfers between levels are recognized at the end of the reporting period. There were transfers between levels 1 and 3 during the reporting period. The transfers from Level 1 to Level 3 occurred because quoted prices were no longer available for the securities. The following tables summarize the inputs used to value the Elements Portfolios’ investments as of May 31, 2018.
| DESCRIPTION | LEVEL 1 | LEVEL 2 | LEVEL 3 | TOTAL | ||||||||||||
| Elements U.S. Portfolio (1) | ||||||||||||||||
| Assets |
||||||||||||||||
| Common Stocks |
$ | 901,506,286 | $ | — | $ | — | $ | 901,506,286 | ||||||||
| Real Estate Investment Trusts |
904,559 | — | — | 904,559 | ||||||||||||
| Money Market Funds |
5,077,963 | — | — | 5,077,963 | ||||||||||||
| U.S. Treasury Bills |
— | 13,979,160 | — | 13,979,160 | ||||||||||||
| Investments Purchased with the Cash Proceeds from Securities Lending |
13,693,547 | — | — | 13,693,547 | ||||||||||||
| Total Assets |
$ | 921,182,355 | $ | 13,979,160 | $ | — | $ | 935,161,515 | ||||||||
| Other Financial Instruments * |
||||||||||||||||
| Unrealized depreciation on futures contracts |
$ | (1,120,367 | ) | $ | — | $ | — | $ | (1,120,367 | ) | ||||||
| Unrealized appreciation on swap contracts |
— | 2,829,955 | — | 2,829,955 | ||||||||||||
| Unrealized depreciation on swap contracts |
— | (2,622,105 | ) | — | (2,622,105 | ) | ||||||||||
| Total |
$ | (1,120,367 | ) | $ | 207,850 | $ | — | $ | (912,517 | ) | ||||||
| Elements U.S. Small Cap Portfolio | ||||||||||||||||
| Assets |
||||||||||||||||
| Common Stocks |
$ | 505,140,479 | $ | — | $ | 7,719 | $ | 505,148,198 | ||||||||
| Real Estate Investment Trusts |
657,259 | — | — | 657,259 | ||||||||||||
| Money Market Funds |
3,024,930 | — | — | 3,024,930 | ||||||||||||
| U.S. Treasury Bills |
— | 9,987,062 | — | 9,987,062 | ||||||||||||
| Investments Purchased with the Cash Proceeds from Securities Lending |
20,787,600 | — | — | 20,787,600 | ||||||||||||
| Total Assets |
$ | 529,610,268 | $ | 9,987,062 | $ | 7,719 | $ | 539,605,049 | ||||||||
| Other Financial Instruments * |
||||||||||||||||
| Unrealized appreciation on futures contracts |
$ | 933,671 | $ | — | $ | — | $ | 933,671 | ||||||||
| Unrealized appreciation on swap contracts |
— | 794,287 | — | 794,287 | ||||||||||||
| Unrealized depreciation on swap contracts |
— | (1,738,866 | ) | — | (1,738,866 | ) | ||||||||||
| Total |
$ | 933,671 | $ | (944,579 | ) | $ | — | $ | (10,908 | ) | ||||||
| Elements Portfolios | Annual Report | May 31, 2018 | ||||||||||||||
104
| Notes to Financial Statements | May 31, 2018 |
| DESCRIPTION | LEVEL 1 | LEVEL 2 | LEVEL 3 | TOTAL | ||||||||||||
| Elements International Portfolio (1) | ||||||||||||||||
| Assets |
||||||||||||||||
| Common Stocks |
$ | 545,783,295 | $ | — | $ | — | $ | 545,783,295 | ||||||||
| Preferred Stocks |
46,469 | — | — | 46,469 | ||||||||||||
| Real Estate Investment Trusts |
2,077,122 | — | — | 2,077,122 | ||||||||||||
| Money Market Funds |
10,767,111 | — | — | 10,767,111 | ||||||||||||
| U.S. Treasury Bills |
— | 5,990,100 | — | 5,990,100 | ||||||||||||
| Investments Purchased with the Cash Proceeds from Securities Lending |
406,980 | — | — | 406,980 | ||||||||||||
| Total Assets |
$ | 559,080,977 | $ | 5,990,100 | $ | — | $ | 565,071,077 | ||||||||
| Liabilities |
||||||||||||||||
| Securities Sold Short |
$ | 223,871 | $ | — | $ | — | $ | 223,871 | ||||||||
| Total Liabilities |
$ | 223,871 | $ | — | $ | — | $ | 223,871 | ||||||||
| Other Financial Instruments * |
||||||||||||||||
| Unrealized depreciation on futures contracts |
$ | (6,182,801 | ) | $ | — | $ | — | $ | (6,182,801 | ) | ||||||
| Unrealized appreciation on swap contracts |
— | 14,061,632 | — | 14,061,632 | ||||||||||||
| Unrealized depreciation on swap contracts |
— | (8,114,275 | ) | — | (8,114,275 | ) | ||||||||||
| Total |
$ | (6,182,801 | ) | $ | 5,947,357 | $ | — | $ | (235,444 | ) | ||||||
| Elements International Small Cap Portfolio (1) | ||||||||||||||||
| Assets |
||||||||||||||||
| Common Stocks |
$ | 209,602,617 | $ | — | $ | — | $ | 209,602,617 | ||||||||
| Preferred Stocks |
149,927 | — | — | 149,927 | ||||||||||||
| Real Estate Investment Trusts |
26,468 | — | — | 26,468 | ||||||||||||
| Rights |
11,208 | — | — | 11,208 | ||||||||||||
| Money Market Funds |
4,567,633 | — | — | 4,567,633 | ||||||||||||
| U.S. Treasury Bills |
— | 4,990,234 | — | 4,990,234 | ||||||||||||
| Investments Purchased with the Cash Proceeds from Securities Lending |
763,943 | — | — | 763,943 | ||||||||||||
| Total Assets |
$ | 215,121,796 | $ | 4,990,234 | $ | — | $ | 220,112,030 | ||||||||
| Other Financial Instruments * |
||||||||||||||||
| Unrealized depreciation on futures contracts |
$ | (1,738,134 | ) | $ | — | $ | — | $ | (1,738,134 | ) | ||||||
| Unrealized appreciation on swap contracts |
— | 5,302,206 | — | 5,302,206 | ||||||||||||
| Unrealized depreciation on swap contracts |
— | (3,182,671 | ) | — | (3,182,671 | ) | ||||||||||
| Total |
$ | (1,738,134 | ) | $ | 2,119,535 | $ | — | $ | 381,401 | |||||||
| Elements Emerging Markets Portfolio | ||||||||||||||||
| Assets |
||||||||||||||||
| Common Stocks |
$ | 251,770,371 | $ | — | $ | 70,828 | $ | 251,841,199 | ||||||||
| Real Estate Investment Trusts |
2,500,346 | — | — | 2,500,346 | ||||||||||||
| Money Market Funds |
10,296,833 | — | — | 10,296,833 | ||||||||||||
| U.S. Treasury Bills |
— | 5,992,363 | — | 5,992,363 | ||||||||||||
| Investments Purchased with the Cash Proceeds from Securities Lending |
41,323 | — | — | 41,323 | ||||||||||||
| Total Assets |
$ | 264,608,873 | $ | 5,992,363 | $ | 70,828 | $ | 270,672,064 | ||||||||
| Elements Portfolios | Annual Report | May 31, 2018 | ||||||||||||||
105
| Notes to Financial Statements | May 31, 2018 |
| DESCRIPTION | LEVEL 1 | LEVEL 2 | LEVEL 3 | TOTAL | ||||||||||||
| Other Financial Instruments * |
||||||||||||||||
| Unrealized appreciation on futures contracts |
$ | 6,987 | $ | — | $ | — | $ | 6,987 | ||||||||
| Unrealized depreciation on futures contracts |
(11,025,729 | ) | — | — | (11,025,729 | ) | ||||||||||
| Unrealized appreciation on swap contracts |
— | 8,278,841 | — | 8,278,841 | ||||||||||||
| Unrealized depreciation on swap contracts |
— | (7,001,975 | ) | — | (7,001,975 | ) | ||||||||||
| Unrealized appreciation on forward currency contracts |
— | 8,691 | — | 8,691 | ||||||||||||
| Unrealized depreciation on forward currency contracts |
— | (234,843 | ) | — | (234,843 | ) | ||||||||||
| Total |
$ | (11,018,742 | ) | $ | 1,050,714 | $ | — | $ | (9,968,028 | ) | ||||||
| * | Other financial instruments are derivatives, such as futures contracts, swap contracts and forward currency contracts. These instruments are reflected at the unrealized appreciation (depreciation) on the instrument. |
| (1) | The Elements Portfolios measure Level 3 activity as of the beginning and end of each financial reporting period. |
Below is a reconciliation that details the activity of securities in Level 3 during the year ended May 31, 2018:
| ELEMENTS U.S. SMALL CAP PORTFOLIO |
ELEMENTS EMERGING MARKETS PORTFOLIO |
|||||||
| COMMON STOCKS | COMMON STOCKS | |||||||
| Beginning Balance—June 1, 2017 |
$ | — | $ | — | ||||
| Acquisitions |
1,260 | 66,005 | ||||||
| Dispositions |
(7,826 | ) | — | |||||
| Realized gains |
19,352 | — | ||||||
| Return of capital |
(192,677 | ) | — | |||||
| Change in unrealized appreciation |
7,850 | 4,823 | ||||||
| Transfers in/(out) of Level 3 |
179,760 | — | ||||||
| Ending Balance—May 31, 2018 |
$ | 7,719 | $ | 70,828 | ||||
As of May 31, 2018, the change in unrealized appreciation (depreciation) on positions still held in the Elements International Small Cap Portfolio and Elements Emerging Markets Portfolio were $7,850 and $4,823, respectively.
Unobservable inputs used to value a Portfolio’s investment in equity securities or equity swaps potentially include the analytical data relating to the security and issuer from the issuer’s financial statements, press releases and public filings, relevant material news events and other factors deemed relevant by the Adviser Valuation Committee. Significant changes in any of these inputs could impact the fair value measurement of the position.
Derivative Transactions — All of the Elements Portfolios engaged in futures and swap transactions while the Elements Emerging Markets Portfolio also engaged in forward currency transactions. These transactions were for speculative purposes, to maintain liquidity, hedge equity and foreign exchange rate exposure or to earn an enhanced return during the year ended May 31, 2018.
Futures Contracts — All of the Elements Portfolios engage in transactions in futures contracts and options on futures contracts. Futures contracts are standardized, exchange-traded contracts that obligate a purchaser to take delivery, and a seller to make delivery, of a specific amount of an asset at a specified future date at a specified price. A futures contract on an index is an agreement pursuant to which two parties agree to take or make delivery of an amount of cash equal to the difference between the value of the index at the close of the last trading day of the contract and the price at which the index contract originally was written. Although the value of an index might be a function of the value of certain specified securities, physical delivery of these securities is not always made. A currency future is an agreement pursuant to which two parties agree to take or make delivery of an amount of cash equal to the difference between the value of the specified currencies at the close of the last trading day of the contract and the price at which the currency contract originally was written. The Elements Portfolios are also authorized to purchase or sell call and put options on futures contracts. Each Portfolio may maintain margin for non-U.S. futures transactions directly with its broker or the clearinghouse.
| Elements Portfolios | Annual Report | May 31, 2018 | ||||||||||||||
106
| Notes to Financial Statements | May 31, 2018 |
The average notional amount of futures contracts during the year ended May 31, 2018, were as follows:
| ELEMENTS U.S. PORTFOLIO |
ELEMENTS U.S. SMALL CAP PORTFOLIO |
ELEMENTS INTERNATIONAL PORTFOLIO |
ELEMENTS INTERNATIONAL SMALL CAP PORTFOLIO |
ELEMENTS EMERGING MARKETS PORTFOLIO |
||||||||||||||||
| Long futures contracts |
||||||||||||||||||||
| Equity index contracts |
$ | 55,576,585 | $ | 44,509,636 | $ | 99,732,980 | $ | 42,049,910 | $ | 133,073,513 | ||||||||||
| Total long futures contracts |
$ | 55,576,585 | $ | 44,509,636 | $ | 99,732,980 | $ | 42,049,910 | $ | 133,073,513 | ||||||||||
Total Return Swaps — All of the Elements Portfolios enter into total return swaps. In a swap transaction, two parties generally agree to exchange the returns (or differentials in rates of return) earned or realized on a particular predetermined reference instrument or instruments, which can be adjusted for an interest rate factor. The gross returns to be exchanged or “swapped” between the parties are generally calculated with respect to a “notional amount” (i.e., the return on or increase in value of a particular dollar amount invested in a particular security or other asset or in a “basket” of securities representing a particular index). Other types of swap agreements may calculate the obligations of the parties to the agreement on a “net basis.” Consequently, a party’s current obligations (or rights) under a swap agreement will generally be equal only to the net amount to be paid or received under the agreement based on the relative values of the positions held by each party to the agreement (the “net amount”). An equity swap is an agreement in which at least one party’s payments are based on the rate of return of an equity security or equity index. The other party’s payments can be based on a fixed rate, a non-equity variable rate or even a different equity index. The Elements Portfolios use swaps for speculative purposes based on performance of the underlying reference instrument.
The average notional amount of total return swaps held during the year ended May 31, 2018 were as follows:
| ELEMENTS U.S. PORTFOLIO |
ELEMENTS U.S. SMALL CAP PORTFOLIO |
ELEMENTS INTERNATIONAL PORTFOLIO |
ELEMENTS INTERNATIONAL SMALL CAP PORTFOLIO |
ELEMENTS EMERGING MARKETS PORTFOLIO |
||||||||||||||||
| Swaps |
||||||||||||||||||||
| Equity contracts |
$ | 51,368,678 | $ | 25,653,746 | $ | 147,709,874 | $ | 41,064,531 | $ | 151,437,759 | ||||||||||
| Total swaps |
$ | 51,368,678 | $ | 25,653,746 | $ | 147,709,874 | $ | 41,064,531 | $ | 151,437,759 | ||||||||||
Forward Currency Contracts — The Elements Emerging Markets Portfolio enters into, and the other Elements Portfolios may enter into forward currency contracts. When entering into a forward currency contract, in the case of a deliverable contract a Portfolio agrees to receive or deliver a fixed quantity of foreign currency for an agreed-upon price on an agreed future date or in the case of a non-deliverable contract to settle the equivalent in U.S. dollars. The Portfolio’s net equity therein, represents unrealized gain or loss on the contracts as measured by the difference between the forward foreign exchange rates at the dates of entry into the contracts and the forward rates at the reporting date. These instruments may involve market risk from movements in currencies or credit risk from the possible inability of counterparties to meet the terms of their contracts.
The average notional amount of forward currency contracts during the year ended May 31, 2018 were as follows:
| ELEMENTS EMERGING MARKETS PORTFOLIO |
||||
| Forwards |
||||
| Long foreign exchange contracts |
$ | 12,535,765 | ||
| Short foreign exchange contracts |
2,836,059 | |||
| Total forwards |
$ | 15,371,824 | ||
| Elements Portfolios | Annual Report | May 31, 2018 | ||||||||||||||
107
| Notes to Financial Statements | May 31, 2018 |
The tables below reflect the values of the derivative assets and liabilities as reflected in each Portfolio’s Statement of Assets and Liabilities.
| ASSET DERIVATIVES | ||||||
| STATEMENT OF ASSETS AND LIABILITIES LOCATION |
FAIR VALUE | |||||
| Elements U.S. Portfolio |
||||||
| Swaps |
||||||
| Equity contracts |
Unrealized appreciation on swap contracts** | $ | 2,829,955 | |||
| Elements U.S. Small Cap Portfolio |
||||||
| Futures |
||||||
| Equity contracts |
Net assets - Unrealized appreciation* | 933,671 | ||||
| Swaps |
||||||
| Equity contracts |
Unrealized appreciation on swap contracts** | 794,287 | ||||
| Elements International Portfolio |
||||||
| Swaps |
||||||
| Equity contracts |
Unrealized appreciation on swap contracts** | 14,061,632 | ||||
| Elements International Small Cap Portfolio |
||||||
| Swaps |
||||||
| Equity contracts |
Unrealized appreciation on swap contracts** | 5,302,206 | ||||
| Elements Emerging Markets Portfolio |
||||||
| Futures |
||||||
| Equity contracts |
Net assets - Unrealized appreciation* | 6,987 | ||||
| Swaps |
||||||
| Equity contracts |
Unrealized appreciation on swap contracts** | 8,278,841 | ||||
| Forwards |
||||||
| Foreign exchange contracts |
Unrealized appreciation on forward currency contracts | 8,691 | ||||
| * | Reflects cumulative unrealized appreciation of futures contracts as reported in the Schedule of Investments. |
| ** | Reflects cumulative unrealized appreciation of swap contracts as reported in the Schedule of Investments. |
| LIABILITY DERIVATIVES | ||||||
| STATEMENT OF ASSETS AND LIABILITIES LOCATION |
FAIR VALUE | |||||
| Elements U.S. Portfolio |
||||||
| Futures |
||||||
| Equity contracts |
Net assets - Unrealized depreciation* | $ | 1,120,367 | |||
| Swaps |
||||||
| Equity contracts |
Unrealized depreciation on swap contracts** | 2,622,105 | ||||
| Elements U.S. Small Cap Portfolio |
||||||
| Swaps |
||||||
| Equity contracts |
Unrealized depreciation on swap contracts** | 1,738,866 | ||||
| Elements International Portfolio |
||||||
| Futures |
||||||
| Equity contracts |
Net assets - Unrealized depreciation* |
1,199,912 | ||||
| Foreign exchange contracts |
Net assets - Unrealized depreciation* | 4,982,889 | ||||
| Swaps |
||||||
| Equity contracts |
Unrealized depreciation on swap contracts** | 8,114,275 | ||||
| Elements Portfolios | Annual Report | May 31, 2018 | ||||||||||||||
108
| Notes to Financial Statements | May 31, 2018 |
| LIABILITY DERIVATIVES | ||||||
| STATEMENT OF ASSETS AND LIABILITIES LOCATION |
FAIR VALUE | |||||
| Elements International Small Cap Portfolio |
||||||
| Futures |
||||||
| Equity contracts |
Net assets - Unrealized depreciation* | $ | 232,647 | |||
| Foreign exchange contracts |
Net assets - Unrealized depreciation* | 1,505,487 | ||||
| Swaps |
||||||
| Equity contracts |
Unrealized depreciation on swap contracts** | 3,182,671 | ||||
| Elements Emerging Markets Portfolio |
||||||
| Futures |
||||||
| Equity contracts |
Net assets - Unrealized depreciation* | 11,025,729 | ||||
| Swaps |
||||||
| Equity contracts |
Unrealized depreciation on swap contracts** | 6,513,891 | ||||
| Equity future contracts |
Unrealized depreciation on swap contracts** | 488,084 | ||||
| Forwards |
||||||
| Foreign exchange contracts |
Unrealized depreciation on forward currency contracts | 234,843 | ||||
| * | Reflects cumulative unrealized depreciation of futures contracts as reported in the Schedule of Investments. |
| ** | Reflects cumulative unrealized depreciation of swap contracts as reported in the Schedule of Investments. |
The tables below reflect the effect of derivative instruments on the Statement of Operations for the year ended May 31, 2018.
| AMOUNT OF REALIZED GAIN OR (LOSS) ON DERIVATIVES TRANSACTIONS | ||||||||||||||||
| FUTURES CONTRACTS |
SWAP CONTRACTS |
FORWARD CURRENCY CONTRACTS |
TOTAL | |||||||||||||
| Elements U.S. Portfolio |
||||||||||||||||
| Equity contracts |
$ | 3,772,940 | $ | (2,070,903 | ) | $ | — | $ | 1,702,037 | |||||||
| Elements U.S. Small Cap Portfolio |
||||||||||||||||
| Equity contracts |
3,965,977 | 1,405,729 | — | 5,371,706 | ||||||||||||
| Elements International Portfolio |
||||||||||||||||
| Equity contracts |
1,009,824 | 4,198,382 | — | 5,208,206 | ||||||||||||
| Foreign exchange contracts |
4,282,473 | — | — | 4,282,473 | ||||||||||||
| Elements International Small Cap Portfolio |
||||||||||||||||
| Equity contracts |
951,463 | 2,214,002 | — | 3,165,465 | ||||||||||||
| Foreign exchange contracts |
1,391,573 | — | — | 1,391,573 | ||||||||||||
| Elements Emerging Markets Portfolio |
||||||||||||||||
| Equity contracts |
23,259,955 | (1,887,361 | ) | — | 21,372,594 | |||||||||||
| Foreign exchange contracts |
— | — | (8,378 | ) | (8,378 | ) | ||||||||||
| CHANGE IN UNREALIZED APPRECIATION OR (DEPRECIATION) ON DERIVATIVES TRANSACTIONS | ||||||||||||||||
| FUTURES CONTRACTS |
SWAP CONTRACTS |
FORWARD CURRENCY CONTRACTS |
TOTAL | |||||||||||||
| Elements U.S. Portfolio |
||||||||||||||||
| Equity contracts |
$ | (1,104,790 | ) | $ | 207,850 | $ | — | $ | (896,940 | ) | ||||||
| Elements U.S. Small Cap Portfolio |
||||||||||||||||
| Equity contracts |
976,298 | (944,579 | ) | — | 31,719 | |||||||||||
| Elements International Portfolio |
||||||||||||||||
| Equity contracts |
(1,402,992 | ) | 6,044,954 | — | 4,641,962 | |||||||||||
| Foreign exchange contracts |
(4,982,889 | ) | — | — | (4,982,889 | ) | ||||||||||
109
| Notes to Financial Statements | May 31, 2018 |
| CHANGE IN UNREALIZED APPRECIATION OR (DEPRECIATION) ON DERIVATIVES TRANSACTIONS | ||||||||||||||||
| FUTURES CONTRACTS |
SWAP CONTRACTS |
FORWARD CURRENCY CONTRACTS |
TOTAL | |||||||||||||
| Elements International Small Cap Portfolio |
||||||||||||||||
| Equity contracts |
$ | (250,420 | ) | $ | 2,066,655 | $ | — | $ | 1,816,235 | |||||||
| Foreign exchange contracts |
(1,505,487 | ) | — | — | (1,505,487 | ) | ||||||||||
| Elements Emerging Markets Portfolio |
||||||||||||||||
| Equity contracts |
(11,018,742 | ) | 1,276,866 | — | (9,741,876 | ) | ||||||||||
| Foreign exchange contracts |
— | — | (226,152 | ) | (226,152 | ) | ||||||||||
(b) Offsetting on the Statement of Assets and Liabilities Accounting Standards Update No. 2011-11 “Disclosures about Offsetting Assets and Liabilities” (“ASU 2011-11”) intended to help investors and other financial statement users better assess the effect or potential effect of offsetting arrangements on a fund’s financial position. ASU 2011-11 requires entities to disclose both gross and net information about both instruments and transactions eligible for offset on the Statement of Assets and Liabilities, and disclose instruments and transactions subject to master netting or similar agreements. In addition, in January 2013, the FASB issued Accounting Standards Update No. 2013-1 “Clarifying the Scope of Offsetting Assets and Liabilities” (“ASU 2013-1”), specifying exactly which transactions are subject to offsetting disclosures. The scope of the disclosure requirement is limited to derivative instruments, repurchase agreements and reverse repurchase agreements, and securities lending transactions. The International Swap and Derivative Association (“ISDA”) agreements specify collateral posting arrangements. Under the agreements, collateral is routinely transferred if the total net exposure to certain transactions (net of existing collateral already in place) governed under an agreement with a counterparty in a given account exceeds a specified threshold.
The Elements Portfolios are each subject to a netting arrangement, which governs the terms of certain transactions with select counterparties. The netting arrangement allows the Elements Portfolios to individually close out and net their total exposure to a counterparty in the event of a default with respect to all the transactions governed under a single agreement with a counterparty. The netting arrangement also specifies collateral posting arrangements at prearranged exposure levels. Under the netting arrangement, collateral is routinely transferred if the total net exposure to certain transactions (net of existing collateral already in place) governed under the relevant netting arrangement with a counterparty in a given account exceeds a specified threshold depending on the counterparty and the type of netting arrangement.
| GROSS AMOUNT OF RECOGNIZED ASSETS |
GROSS AMOUNT OFFSET IN THE CONSOLIDATED STATEMENT OF ASSETS AND LIABILITIES |
NET AMOUNTS PRESENTED IN THE CONSOLIDATED STATEMENT OF ASSETS AND LIABILITIES |
GROSS AMOUNTS NOT OFFSET IN THE CONSOLIDATED STATEMENT OF ASSETS AND LIABILITIES |
|||||||||||||||||||||
| ASSETS: | FINANCIAL INSTRUMENTS |
COLLATERAL RECEIVED |
NET AMOUNT |
|||||||||||||||||||||
| Elements U.S. Portfolio | ||||||||||||||||||||||||
| Total return swap contracts |
$ | 2,829,955 | $ | — | $ | 2,829,955 | $ | (1,920,458 | ) | $ | — | $ | 909,497 | |||||||||||
| $ | 2,829,955 | $ | — | $ | 2,829,955 | $ | (1,920,458 | ) | $ | — | $ | 909,497 | ||||||||||||
| Elements U.S. Small Cap Portfolio |
|
|||||||||||||||||||||||
| Total return swap contracts |
$ | 794,287 | $ | — | $ | 794,287 | $ | (794,287 | ) | $ | — | $ | — | |||||||||||
| $ | 794,287 | $ | — | $ | 794,287 | $ | (794,287 | ) | $ | — | $ | — | ||||||||||||
| Elements International Portfolio |
|
|||||||||||||||||||||||
| Total return swap contracts |
$ | 14,061,632 | $ | — | $ | 14,061,632 | $ | (6,749,942 | ) | $ | — | $ | 7,311,690 | |||||||||||
| $ | 14,061,632 | $ | — | $ | 14,061,632 | $ | (6,749,942 | ) | $ | — | $ | 7,311,690 | ||||||||||||
| Elements International Small Cap Portfolio |
|
|||||||||||||||||||||||
| Total return swap contracts |
$ | 5,302,206 | $ | — | $ | 5,302,206 | $ | (3,182,671 | ) | $ | — | $ | 2,119,535 | |||||||||||
| $ | 5,302,206 | $ | — | $ | 5,302,206 | $ | (3,182,671 | ) | $ | — | $ | 2,119,535 | ||||||||||||
| Elements Portfolios | Annual Report | May 31, 2018 | ||||||||||||||
110
| Notes to Financial Statements | May 31, 2018 |
| GROSS AMOUNT OF RECOGNIZED ASSETS |
GROSS AMOUNT OFFSET IN THE CONSOLIDATED STATEMENT OF ASSETS AND LIABILITIES |
NET AMOUNTS PRESENTED IN THE CONSOLIDATED STATEMENT OF ASSETS AND LIABILITIES |
GROSS AMOUNTS NOT OFFSET IN THE CONSOLIDATED STATEMENT OF ASSETS AND LIABILITIES |
|||||||||||||||||||||
| ASSETS: | FINANCIAL INSTRUMENTS |
COLLATERAL RECEIVED |
NET AMOUNT |
|||||||||||||||||||||
| Elements Emerging Markets Portfolio |
|
|||||||||||||||||||||||
| Forward currency contracts |
$ | 8,691 | $ | — | $ | 8,691 | $ | (8,691 | ) | $ | — | $ | — | |||||||||||
| Total return swap contracts |
8,278,841 | — | 8,278,841 | (6,513,891 | ) | — | 1,764,950 | |||||||||||||||||
| $ | 8,287,532 | $ | — | $ | 8,287,532 | $ | (6,522,582 | ) | $ | — | $ | 1,764,950 | ||||||||||||
| GROSS AMOUNT OF RECOGNIZED LIABILITIES |
GROSS AMOUNT OFFSET IN THE CONSOLIDATED STATEMENT OF ASSETS AND LIABILITIES |
NET AMOUNTS OF ASSETS |
GROSS AMOUNTS NOT OFFSET IN THE CONSOLIDATED STATEMENT OF ASSETS AND LIABILITIES |
|||||||||||||||||||||
| LIABILITIES: | FINANCIAL INSTRUMENTS |
COLLATERAL PLEDGED |
NET AMOUNT |
|||||||||||||||||||||
| Elements U.S. Portfolio | ||||||||||||||||||||||||
| Total return swap contracts |
$ | 2,622,105 | $ | — | $ | 2,622,105 | $ | (1,920,458 | ) | $ | (701,647 | ) | $ | — | ||||||||||
| $ | 2,622,105 | $ | — | $ | 2,622,105 | $ | (1,920,458 | ) | $ | (701,647 | ) | $ | — | |||||||||||
| Elements U.S. Small Cap Portfolio |
|
|||||||||||||||||||||||
| Total return swap contracts |
$ | 1,738,866 | $ | — | $ | 1,738,866 | $ | (794,287 | ) | $ | (944,579 | ) | $ | — | ||||||||||
| $ | 1,738,866 | $ | — | $ | 1,738,866 | $ | (794,287 | ) | $ | (944,579 | ) | $ | — | |||||||||||
| Elements International Portfolio |
|
|||||||||||||||||||||||
| Total return swap contracts |
$ | 8,114,275 | $ | — | $ | 8,114,275 | $ | (6,749,942 | ) | $ | (1,364,333 | ) | $ | — | ||||||||||
| $ | 8,114,275 | $ | — | $ | 8,114,275 | $ | (6,749,942 | ) | $ | (1,364,333 | ) | $ | — | |||||||||||
| Elements International Small Cap Portfolio |
|
|||||||||||||||||||||||
| Total return swap contracts |
$ | 3,182,671 | $ | — | $ | 3,182,671 | $ | (3,182,671 | ) | $ | — | $ | — | |||||||||||
| $ | 3,182,671 | $ | — | $ | 3,182,671 | $ | (3,182,671 | ) | $ | — | $ | — | ||||||||||||
| Elements Emerging Markets Portfolio |
|
|||||||||||||||||||||||
| Forward currency contracts |
$ | 234,843 | $ | — | $ | 234,843 | $ | (8,691 | ) | $ | (226,152 | ) | $ | — | ||||||||||
| Total return swap contracts |
7,001,975 | — | 7,001,975 | (6,513,891 | ) | (488,084 | ) | — | ||||||||||||||||
| $ | 7,236,818 | $ | — | $ | 7,236,818 | $ | (6,522,582 | ) | $ | (714,236 | ) | $ | — | |||||||||||
Actual collateral pledged may be more than reported in order to satisfy broker requirements.
(c) Use of Estimates The preparation of the financial statements in conformity with GAAP requires management to make estimates and assumptions that affect the reported amounts of assets and liabilities and disclosure of contingent assets and liabilities at the date of the financial statements and the reported amounts of increases and decreases in net assets from operations during the reporting period. Actual results could differ from those estimates.
(d) Indemnifications In the normal course of business, the Elements Portfolios enter into contracts that contain a variety of representations which provide general indemnifications. The Elements Portfolios’ maximum exposure under these arrangements cannot be known; however, the Elements Portfolios expect any risk of loss to be remote.
(e) Federal Income Taxes The Elements Portfolios intend to qualify as regulated investment companies (“RIC”) under Subchapter M of the Internal Revenue Code of 1986, as amended. If so qualified, the Elements Portfolios will not be subject to federal income tax to the extent they distribute substantially all of their net investment income and capital gains to shareholders. Therefore, no federal income tax provision is required.
(f) Distributions to Shareholders The Elements Portfolios intend to distribute to their shareholders any net investment income and any net realized long- or short-term capital gains, if any, at least annually. Distributions are recorded on the
| Elements Portfolios | Annual Report | May 31, 2018 | ||||||||||||||
111
| Notes to Financial Statements | May 31, 2018 |
ex-dividend date. The Elements Portfolios each may periodically make reclassifications among certain of their capital accounts as a result of the characterization of certain income and realized gains determined annually in accordance with federal tax regulations that may differ from GAAP.
(g) Foreign Securities and Currency Transactions The Elements Portfolios’ books and records are maintained in U.S. dollars. Foreign currency denominated transactions (i.e. market value of investment securities, assets and liabilities, purchases and sales of investment securities, and income and expenses) are translated into U.S. dollars at the current rate of exchange. The Elements Portfolios do not isolate that portion of results of operations resulting from changes in foreign exchange rates on investments from the fluctuations arising from changes in market prices of securities held. Such fluctuations are reflected in net realized and unrealized gain or loss on investments.
The Elements International Portfolio, the Elements International Small Cap Portfolio and the Elements Emerging Markets Portfolio invest primarily in foreign-issued securities. Investments in foreign (non-U.S.) issuers involve risks not ordinarily associated with exposure to securities and instruments of U.S. issuers, including risks relating to political, social and economic developments affecting issuers located in foreign countries and differences between U.S. and foreign regulatory requirements and market practices, including fluctuations in foreign currency exchange rates and regulations, or foreign withholding taxes. Investing directly or indirectly in foreign securities may result in a Portfolio experiencing more rapid and extreme changes in value than a fund that obtains exposure exclusively in securities of U.S. issuers.
If the Elements Portfolios invest in foreign issuers by purchasing American Depositary Receipts (“ADRs”) (U.S. dollar-denominated depositary receipts issued generally by banks and representing the deposit with the bank of a security of a non-U.S. issuer; ADRs are publicly traded on exchanges or over-the counter in the United States), the Elements Portfolios are exposed to credit risk with respect to the issuer of the ADR, in addition to the risks of the underlying foreign securities.
(h) Other Investment transactions are recorded on the trade date. Dividend income, less any foreign tax withheld, is recognized on the ex-dividend date and interest income is recognized on an accrual basis, including amortization/accretion of premiums or discounts. Discounts and premiums on securities purchased are amortized over the lives of the respective securities using the constant yield method.
(i) Restricted Securities The Elements Portfolios may invest a portion of their assets in securities that are restricted, but eligible for purchase and sale by certain qualified institutional buyers, as defined in Rule 144A under the Securities Act of 1933, as amended, as well as other restricted securities. Restricted securities may be resold in transactions that are exempt from registration under Federal securities laws or if the securities are publicly registered. Restricted securities may be deemed illiquid.
(j) REIT Distributions The character of distributions received from real estate investment trusts (“REITs”) held by the Elements Portfolios is generally comprised of net investment income, capital gains, and return of capital. It is the policy of the Elements Portfolios to estimate the character of distributions received from underlying REITs based on historical data provided by the REITs. After each calendar year end, REITs report the actual tax character of these distributions. Differences between the estimated and actual amounts reported by the REITs are reflected in the Elements Portfolios’ records in the year in which they are reported by the REITs by adjusting related investment cost basis, capital gains and income, as necessary.
(k) Counterparties The counterparties presented in the Schedules of Investments are as follows: A: Goldman Sachs International, B: Morgan Stanley Capital Services LLC.
(l) Securities Lending The Elements U.S. Portfolio and Elements U.S. Small Cap Portfolio entered into securities lending arrangements with Securities Finance Trust Company (a “securities lending agent”). The Elements International Portfolio, Elements International Small Cap Portfolio and Elements Emerging Markets Portfolio entered into securities lending arrangements with Brown Brothers Harriman & Co. (a “securities lending agent”). Under the terms of the agreements, the securities lending agent is authorized to loan securities on behalf of the Elements Portfolios to approved borrowers. In exchange, the Elements Portfolios receive collateral in the amount of 102% of the value of securities loaned for domestic securities and 105% of the value of securities loaned with respect to foreign securities and the loans are marked to
| Elements Portfolios | Annual Report | May 31, 2018 | ||||||||||||||
112
| Notes to Financial Statements | May 31, 2018 |
market daily. The Elements Portfolios’ cash collateral is invested in short-term instruments as noted in the Schedules of Investments. Although risk is mitigated by the collateral, the borrower may fail to return the securities in a timely manner or at all. As a result, the Elements Portfolios may lose money and there may be a delay in recovering securities. In addition, the Elements Portfolios bear the risk of loss associated with the investment of collateral received. After predetermined rebates to borrowers, a percentage of the net securities lending revenue is credited to the applicable Elements Portfolio. The securities lending agent is paid a fee for administering a securities lending program for the Elements Portfolios, equal to a predetermined percentage of such net securities lending revenues. Securities lending income is disclosed in the Elements Portfolios’ Statement of Operations.
3. Federal Tax Matters
Provisions for federal income taxes or excise taxes have not been made since the Elements Portfolios intend to be taxed as RICs and intend to distribute substantially all taxable income and capital gains to shareholders and otherwise comply with the provisions of the Internal Revenue Code applicable to RICs. Distributions from net realized gains for book purposes may include short-term capital gains which are included as ordinary income to shareholders for tax purposes. Additionally, GAAP requires that certain components of net assets relating to permanent differences be reclassified between financial and tax reporting. The reclassifications have no effect on net assets or NAV per share. Permanent differences for the year ended May 31, 2018 were primarily attributable to differences in the book and tax treatment of foreign currencies realized gains and losses, distributions from real estate investment trusts and investment in passive foreign investment companies.
For the year ended May 31, 2018, the effect of permanent “book/tax” reclassifications resulted in increases and decreases to components of the Elements Portfolios’ net assets as follows:
| UNDISTRIBUTED NET INVESTMENT INCOME/(LOSS) |
ACCUMULATED NET REALIZED GAIN/(LOSS) |
PAID IN CAPITAL |
||||||||||
| Elements U.S. Portfolio |
$ | (2,719 | ) | $ | 2,719 | $ | — | |||||
| Elements U.S. Small Cap Portfolio |
(98 | ) | 98 | — | ||||||||
| Elements International Portfolio |
2,575,341 | (2,575,341 | ) | — | ||||||||
| Elements International Small Cap Portfolio |
1,139,322 | (1,139,322 | ) | — | ||||||||
| Elements Emerging Market Portfolio |
(11,540 | ) | 11,540 | — | ||||||||
As of May 31, 2018, the components of accumulated earnings (losses) for income tax purposes were as follows:
| ELEMENTS U.S. PORTFOLIO |
ELEMENTS U.S. SMALL CAP PORTFOLIO |
ELEMENTS INTERNATIONAL PORTFOLIO |
ELEMENTS INTERNATIONAL SMALL CAP PORTFOLIO |
ELEMENTS EMERGING MARKET PORTFOLIO |
||||||||||||||||
| Tax cost of Investments |
835,888,809 | 467,889,113 | 550,869,372 | 210,981,737 | 274,600,116 | |||||||||||||||
| Unrealized Appreciation |
130,697,258 | 99,045,773 | 50,116,028 | 23,840,203 | 37,037,848 | |||||||||||||||
| Unrealized Depreciation |
(31,216,702 | ) | (28,274,416 | ) | (30,418,218 | ) | (13,366,990 | ) | (39,733,675 | ) | ||||||||||
| Net unrealized appreciation (depreciation) |
99,480,556 | 70,771,357 | 19,697,810 | 10,473,213 | (2,695,827 | ) | ||||||||||||||
| Undistributed Ordinary Income |
6,681,276 | 2,902,854 | 16,085,782 | 5,061,112 | 12,830,839 | |||||||||||||||
| Undistributed Long-Term Capital Gains |
— | 803,137 | — | — | — | |||||||||||||||
| Distributable earnings |
6,681,276 | 3,705,991 | 16,085,782 | 5,061,112 | 12,830,839 | |||||||||||||||
| Post October Capital Loss/Late Year Ordinary Loss Deferral |
— | — | (1,403,662 | ) | (554,152 | ) | (1,123,695 | ) | ||||||||||||
| Other accumulated loss |
— | — | — | — | (249,212 | ) | ||||||||||||||
| Total accumulated gain/(loss) |
106,161,832 | 74,477,348 | 34,379,930 | 14,980,173 | 8,762,105 | |||||||||||||||
The differences between book-basis and tax-basis unrealized appreciation (depreciation) are primarily attributable to passive foreign investments and wash sales loss deferrals.
| Elements Portfolios | Annual Report | May 31, 2018 | ||||||||||||||
113
| Notes to Financial Statements | May 31, 2018 |
The tax character of distributions paid during the year ended May 31, 2018 was as follows:
| ELEMENTS U.S. PORTFOLIO |
ELEMENTS U.S. SMALL CAP PORTFOLIO |
ELEMENTS INTERNATIONAL PORTFOLIO |
ELEMENTS INTERNATIONAL SMALL CAP PORTFOLIO |
ELEMENTS EMERGING MARKET PORTFOLIO |
||||||||||||||||
| YEAR ENDED MAY 31, 2018 |
YEAR ENDED MAY 31, 2018 |
YEAR ENDED MAY 31, 2018 |
YEAR ENDED MAY 31, 2018 |
YEAR ENDED MAY 31, 2018 |
||||||||||||||||
| Distributions paid from: | ||||||||||||||||||||
| Ordinary Income |
$ | 7,965,223 | $ | 5,215,054 | $ | 8,060,355 | $ | 3,519,708 | $ | 6,954,814 | ||||||||||
| Long Term Capital Gain |
184,057 | 403,624 | 1,802,250 | 1,168,644 | 8,036,769 | |||||||||||||||
| Return of Capital |
— | — | — | — | — | |||||||||||||||
|
|
|
|||||||||||||||||||
| Total Distributions Paid |
$ | 8,149,280 | $ | 5,618,678 | $ | 9,862,605 | $ | 4,688,352 | $ | 14,991,583 | ||||||||||
Each of the Portfolios designated as long-term capital gain dividends, pursuant to Internal Revenue Code Section 852(b)(3), the amount necessary to reduce the earnings and profits related to net capital gains to zero for the tax year ended May 31, 2018.
The Portfolios do not have net capital losses to be carried forward to future years.
Pursuant to Federal income tax regulations applicable to RICs, the Portfolios elected to defer, on a tax basis, capital losses incurred between November 1, 2017 and May 31, 2018. These losses are deemed to arise on June 1, 2018.
| Elements U.S. Portfolio |
$ | — | ||
| Elements U.S. Small Cap Portfolio |
— | |||
| Elements International Portfolio |
1,403,662 | |||
| Elements International Small Cap Portfolio |
554,152 | |||
| Elements Emerging Market Portfolio |
1,123,695 | |||
The Portfolios did not incur Late Year Ordinary Losses between January 1, 2018 and May 31, 2018.
There is no tax liability resulting from unrecognized tax benefits relating to uncertain income tax positions taken or expected to be taken on the tax returns for the year ended May 31, 2018. As of May 31, 2018 open tax years include the periods ended May 31, 2017 and 2018. The Portfolios recognize interest and penalties, if any, related to unrecognized tax benefits as income tax expense in the Statement of Operations. During the period the Portfolios did not incur any interest or penalties.
4. Agreements
(a) Investment Management Agreement Stone Ridge Asset Management LLC (“Stone Ridge” or the “Adviser”) is the Elements Portfolios’ investment adviser. The Adviser was organized as a Delaware limited liability company in 2012. The Adviser’s primary business is to provide a variety of investment management services, including an investment program for the Elements Portfolios.
As compensation for its services, the Adviser is paid by each of the Elements Portfolios a fee, computed daily and paid monthly in arrears, at the annual rate of 0.30% of the average daily net assets for the Elements U.S. Portfolio, 0.50% of the average daily net assets for the Elements U.S. Small Cap Portfolio, 0.45% of the average daily net assets for the Elements International Portfolio, 0.55% of the average daily net assets of the Elements International Small Cap Portfolio, and 0.60% of the average daily net assets of the Elements Emerging Markets Portfolio.
Effective March 9, 2018 and through September 27, 2018 for the Elements Portfolios, the Adviser has agreed to continue to waive its management fee and/or pay or otherwise bear operating and other expenses of certain portfolios (including offering expenses, but excluding brokerage and transactional expenses, borrowing and other investment-related costs and fees including interest and commitment fees, short dividend expense, acquired fund fees and expenses, taxes, litigation and indemnification expenses, judgments and extraordinary expenses not incurred in the ordinary course of the
| Elements Portfolios | Annual Report | May 31, 2018 | ||||||||||||||
114
| Notes to Financial Statements | May 31, 2018 |
Elements Portfolios’ business) solely to the extent necessary to limit the Elements Portfolios’ total annual fund operating expenses for the period June 1, 2017 through May 31, 2018 and for the period June 1, 2018 through September 27, 2018, to 0.15% for the Elements U.S. Portfolio and the Elements U.S. Small Cap Portfolio and 0.20% for the Elements International Portfolio, the Elements International Small Cap Portfolio and the Elements Emerging Markets Portfolio.
As of May 31, 2018, the amounts waived or reimbursed by the Adviser with respect to the Elements U.S. Portfolio, the Elements U.S. Small Cap Portfolio, the Elements International Portfolio, the Elements International Small Cap Portfolio and the Elements Emerging Markets Portfolio were $2,968,107, $3,025,254, $2,845,052, $1,699,169 and $1,765,869, respectively.
(b) Custodian, Administrator and Transfer Agent The custodians to the Trust are U.S. Bank, N.A for the Elements U.S. Portfolio and the Elements U.S. Small Cap Portfolio and Brown Brothers Harriman & Co. for the Elements International Portfolio, the Elements International Small Cap Portfolio and the Elements Emerging Markets Portfolio. Prior to April 19, 2018 U.S. Bank N.A. served as the custodian for the Elements Portfolios. The administrator and transfer agent to the Trust is U.S. Bancorp Fund Services, LLC, an affiliate of U.S. Bank, N.A.
(c) Distributor ALPS Distributors, Inc. (the “Distributor”) serves as the Elements Portfolios’ distributor. Prior to August 14, 2017, Quasar Distributors, LLC served as the Elements Portfolios’ distributor.
5. Distribution Plan
The Elements Portfolios pay Rule 12b-1 fees to compensate financial intermediaries in connection with (i) personal and account maintenance services rendered to Portfolio shareholders (fees for such services, “servicing fees”) and/or (ii) activities or expenses primarily intended to result in the sale of Portfolio shares (fees for such services, if any, “distribution fees”). Servicing fees and distribution fees may be paid pursuant to a Distribution Plan (“12b-1 Plan”) adopted by each Portfolio at the maximum annual rate of 0.25% of such Portfolio’s average daily net assets. Each Portfolio currently pays a rate of 0.10% unless authorized by the Board to pay a higher rate (not to exceed 0.25%). These fees are paid out of each Portfolio’s assets on an ongoing basis and may be administered or facilitated by the Distributor. Because Rule 12b-1 fees are paid out of a Portfolio’s assets on an ongoing basis, over time these fees will increase the cost of your investment and may cost you more than other types of sales charges. The Distributor does not retain any portion of the distribution fees. The Adviser performs certain services and incurs certain expenses with respect to the promotion of Portfolio shares and the servicing of shareholders. If amounts remain from the 12b-1 fees after the Distributor has paid the intermediaries, such amounts may be used to compensate the Adviser for the services it provides and for the expenses it bears in connection with the distribution of Portfolio shares.
6. Offering Costs
Offering costs include state registration fees and legal fees regarding the preparation of the initial registration statement. Offering costs are accounted for as deferred costs until operations begin and are then amortized to expense over twelve months on a straight-line basis. The offering costs incurred were $65,320 for the Elements U.S. Portfolio, $55,474 for the Elements U.S. Small Cap Portfolio, $52,635 for the Elements International Portfolio, $52,259 for the Elements International Small Cap Portfolio and $52,682 for the Elements Emerging Markets Portfolio.
7. Related Parties
Certain officers of the Trust are also employees of the Adviser. The Officers, with the exception of a portion of the Chief Compliance Officer’s salary, are not compensated by the Trust.
| Elements Portfolios | Annual Report | May 31, 2018 | ||||||||||||||
115
| Notes to Financial Statements | May 31, 2018 |
8. Investment Transactions
For the year ended May 31. 2018, aggregate purchases and sales of securities (excluding short-term securities) by the Elements Portfolios were as follows:
| Elements U.S. Portfolio |
Elements U.S. Small Cap Portfolio |
Elements International Portfolio |
Elements International Small Cap Portfolio |
Elements Emerging Markets Portfolio |
||||||||||||||||
| Purchases |
$ | 426,568,134 | $ | 181,694,404 | $ | 353,194,234 | $ | 142,260,061 | $ | 328,634,230 | ||||||||||
| Sales |
166,478,294 | 117,843,539 | 89,616,051 | 29,377,145 | 83,615,332 | |||||||||||||||
9. Capital Share Transactions
| ELEMENTS U.S. PORTFOLIO | YEAR ENDED MAY 31, 2018 |
PERIOD ENDED MAY 31, 2017(1) |
||||||
| Shares sold |
25,543,456 | 61,134,269 | ||||||
| Shares issued to holders in reinvestment of dividends |
683,781 | — | ||||||
| Shares redeemed |
(5,638,072 | ) | (253,094 | ) | ||||
| Net increase in shares |
20,589,165 | 60,881,175 | ||||||
| Shares outstanding: |
||||||||
| Beginning of year |
60,881,175 | — | ||||||
| End of year |
81,470,340 | 60,881,175 | ||||||
| ELEMENTS U.S. SMALL CAP PORTFOLIO | YEAR ENDED MAY 31, 2018 |
PERIOD ENDED MAY 31, 2017(1) |
||||||
| Shares sold |
11,100,520 | 43,205,365 | ||||||
| Shares issued to holders in reinvestment of dividends |
400,039 | — | ||||||
| Shares redeemed |
(8,615,960 | ) | (94,539 | ) | ||||
| Net increase in shares |
2,884,599 | 43,110,826 | ||||||
| Shares outstanding: |
||||||||
| Beginning of year |
43,110,826 | — | ||||||
| End of year |
45,995,425 | 43,110,826 | ||||||
| ELEMENTS INTERNATIONAL PORTFOLIO | YEAR ENDED MAY 31, 2018 |
PERIOD ENDED MAY 31, 2017(2) |
||||||
| Shares sold |
22,998,616 | 36,727,462 | ||||||
| Shares issued to holders in reinvestment of dividends |
838,653 | — | ||||||
| Shares redeemed |
(6,657,301 | ) | (354,168 | ) | ||||
| Net increase in shares |
17,179,968 | 36,373,294 | ||||||
| Shares outstanding: |
||||||||
| Beginning of year |
36,373,294 | — | ||||||
| End of year |
53,553,262 | 36,373,294 | ||||||
| ELEMENTS INTERNATIONAL SMALL CAP PORTFOLIO | YEAR ENDED MAY 31, 2018 |
PERIOD ENDED MAY 31, 2017(2) |
||||||
| Shares sold |
8,418,582 | 13,283,032 | ||||||
| Shares issued to holders in reinvestment of dividends |
394,104 | — | ||||||
| Shares redeemed |
(1,146,308 | ) | (610,084 | ) | ||||
| Net increase in shares |
7,666,378 | 12,672,948 | ||||||
| Shares outstanding: |
||||||||
| Beginning of year |
12,672,948 | — | ||||||
| End of year |
20,339,326 | 12,672,948 | ||||||
| Elements Portfolios | Annual Report | May 31, 2018 | ||||||||||||||
116
| Notes to Financial Statements | May 31, 2018 |
| ELEMENTS EMERGING MARKETS PORTFOLIO | YEAR ENDED MAY 31, 2018(3) |
|||||||
| Shares sold |
27,019,063 | |||||||
| Shares issued to holders in reinvestment of dividends |
1,374,200 | |||||||
| Shares redeemed |
(2,471,674 | ) | ||||||
| Net increase in shares |
25,921,589 | |||||||
| Shares outstanding: |
||||||||
| Beginning of year |
— | |||||||
| End of year |
25,921,589 | |||||||
| (1) | The Portfolio commenced operations on April 3, 2017. |
| (2) | The Portfolio commenced operations on May 1, 2017. |
| (3) | The Portfolio commenced operations on June 1, 2017. |
10. Financing
The Portfolios may obtain leverage through borrowings in seeking to achieve their investment objectives. As of May 31, 2018, the Elements Portfolios, along with six other series of the Trust advised by the Adviser, shared an umbrella line of credit in the amount of $50,000,000. For the Elements Portfolios, the umbrella line of credit took the form of a secured loan agreement, which was effective November 28, 2017-November 1, 2018. Effective June 6, 2018, the Elements International Portfolio, Elements International Small Cap Portfolio and Elements Emerging Markets Portfolio no longer share this line of credit.
Through the period ended May 31, 2018, the Elements Small Cap Portfolio’s maximum borrowing was $10,500,000 and average borrowing was $61,644. This borrowing resulted in interest expenses of $2,260 at a weighted average interest rate of 3.55% and is included in Elements U.S. Small Cap Portfolio’s financial statements. As of May 31, 2018, the Elements U.S. Small Cap Portfolio did not have an outstanding loan balance.
Through the period ended May 31, 2018, the Elements International Portfolio’s maximum borrowing was $13,500,000 and average borrowing was $36,986. This borrowing resulted in interest expenses of $1,313 at a weighted average interest rate of 3.50% and is included in Elements International Portfolio’s financial statements. As of May 31, 2018, the Elements International Portfolio did not have an outstanding loan balance.
11. Subsequent Events Evaluation
In preparing these financial statements, the Elements Portfolios have evaluated events and transactions for potential recognition or disclosure resulting from subsequent events through the date the financial statements were available to be issued. This evaluation did not result in any subsequent events that necessitated disclosures and/or adjustments.
| Elements Portfolios | Annual Report | May 31, 2018 | ||||||||||||||
117
| Report of Independent Registered Public Accounting Firm | ||
The Board of Trustees and Shareholders of Stone Ridge Trust
Opinion on the Financial Statements
We have audited the accompanying statements of assets and liabilities of the Elements U.S. Portfolio, Elements U.S. Small Cap Portfolio, Elements International Portfolio, Elements International Small Cap Portfolio, and Elements Emerging Market Portfolio (collectively referred to as the “Portfolios”) (five of the portfolios constituting Stone Ridge Trust (the “Trust”)), including the schedules of investments as of May 31, 2018, and the related statements of operations, changes in net assets, and the financial highlights for each of the periods indicated in the table below and the related notes (collectively referred to as the “financial statements”). In our opinion, the financial statements present fairly, in all material respects, the financial position of each of the Portfolios comprising Stone Ridge Trust at May 31, 2018, and the results of their operations, changes in net assets and financial highlights for each of the periods indicated in the table below, in conformity with U.S. generally accepted accounting principles.
| Portfolios comprising Stone Ridge Trust |
Statement of operations |
Statements of changes in net assets |
Financial highlights | |||
| Elements U.S. Portfolio Elements U.S. Small Cap Portfolio |
For the year ended May 31, 2018 | For each of the two years in the period ended May 31, 2018 | For the year ended May 31, 2018 and the period from April 3, 2017 (commencement of operations) through May 31, 2017 | |||
| Elements International Portfolio Elements International Small Cap Portfolio | For the year ended May 31, 2018 | For each of the two years in the period ended May 31, 2018 | For the year ended May 31, 2018 and the period from May 1, 2017 (commencement of operations) through May 31, 2017 | |||
| Elements Emerging Market Portfolio | For the year ended May 31, 2018 | For the year ended May 31, 2018 | For the year ended May 31, 2018 | |||
Basis for Opinion
These financial statements are the responsibility of the Trust’s management. Our responsibility is to express an opinion on each of the Portfolios’ financial statements based on our audits. We are a public accounting firm registered with the Public Company Accounting Oversight Board (United States) (“PCAOB”) and are required to be independent with respect to the Trust in accordance with the U.S. federal securities laws and the applicable rules and regulations of the Securities and Exchange Commission and the PCAOB.
We conducted our audits in accordance with the standards of the PCAOB. Those standards require that we plan and perform the audit to obtain reasonable assurance about whether the financial statements and financial highlights are free of material misstatement, whether due to fraud or error. The Trust is not required to have, nor were we engaged to perform, an audit of the Trust’s internal control over financial reporting. As part of our audits we are required to obtain an understanding of internal control over financial reporting but not for the purpose of expressing an opinion on the effectiveness of the Trust’s internal control over financial reporting. Accordingly, we express no such opinion.
Our audits include performing procedures to assess the risks of material misstatement of the financial statements, whether due to error or fraud, and performing procedures that respond to those risks. Such procedures including examining, on a test basis, evidence regarding the amounts and disclosures in the financial statements. Our procedures included confirmation of securities owned as of May 31, 2018, by correspondence with the custodians and brokers or by other appropriate auditing procedures where replies from brokers were not received. Our audits also included evaluation the accounting principles used and significant estimated made by management, as well as evaluating the overall presentation of the financial statements. We believe that our audits provide a reasonable basis for our opinion.

We have served as the auditor of one or more of the Stone Ridge investment companies since 2013.
Minneapolis, Minnesota
July 30, 2018
| Elements Portfolios | Annual Report | May 31, 2018 | ||||||||||||||
118
| Expense Examples (Unaudited) |
As a shareholder of the Elements Portfolios, you incur ongoing costs, including investment advisory fees, distribution and/or shareholder servicing fees, and other Portfolio expenses, which are indirectly paid by shareholders. This example is intended to help you understand your ongoing costs (in U.S. dollars) of investing in a Portfolio and to compare these costs with the ongoing costs of investing in other mutual funds.
The example is based on an investment of $1,000 invested at the beginning of the period and held for the entire period from December 1, 2017 through May 31, 2018.
Actual Expenses
The first line on each table below provides information about actual account values and actual expenses. However, the table does not include shareholder specific fees, such as the $15.00 fee charged for wire redemptions by the Elements Portfolios’ transfer agent. The table also does not include portfolio trading commissions and related trading costs. You may use the information in this line, together with the amount you invested, to estimate the expenses that you paid over the period. Simply divide your account value by $1,000 (for example, an $8,600 account value divided by $1,000 = 8.6), then multiply the result by the number in the first line under the heading entitled “Expenses Paid During Period” to estimate the expenses you paid on your account during the period.
Hypothetical Example For Comparison Purposes
The second line on each table below provides information about hypothetical account values and hypothetical expenses based on the actual expense ratio for each Portfolio and an assumed rate of return of 5% per year before expenses, which is not the Portfolio’s actual return. The hypothetical account values and expenses may not be used to estimate the actual ending account balance or expenses you paid for the period. You may use this information to compare the ongoing costs of investing in the Elements Portfolios and other funds. To do so, compare this 5% hypothetical example with the 5% hypothetical examples that appear in the shareholder reports of the other funds. Please note that the expenses shown in the table are meant to highlight your ongoing costs only and do not reflect any transactional costs, such as sales charges (loads), redemption fees, or exchange fees. Therefore, the second line of the table is useful in comparing ongoing costs only, and will not help you determine the relevant total cost of owning different funds.
Elements U.S. Portfolio
| BEGINNING ACCOUNT VALUE DECEMBER 1, 2017 |
ENDING ACCOUNT VALUE MAY 31, 2018 |
EXPENSES PAID DURING PERIOD* DECEMBER 1, 2017 – MAY 31, 2018 |
||||||||||
| Actual |
$ | 1,000.00 | $ | 1,024.80 | $ | 1.21 | ||||||
| Hypothetical (5% annual return before expenses)* |
$ | 1,000.00 | $ | 1,023.73 | $ | 1.21 | ||||||
| * | Expenses are equal to the Portfolio’s annualized six month expense ratio of 0.24%, multiplied by the average account value over the period, multiplied by 182/365 to reflect the partial year period. Certain expenses were waived or reimbursed by the Adviser which has contractually agreed to waive its management fee and reimburse expenses as necessary to limit total annualized expenses, other than certain excluded expenses, of the Portfolio to 0.15% for the fiscal year ended May 31, 2018 and for the period from June 1, 2018 through September 27, 2018. Fee waivers and expense reimbursement may be discontinued after that date. |
Elements U.S. Small Cap Portfolio
| BEGINNING ACCOUNT VALUE DECEMBER 1, 2017 |
ENDING ACCOUNT VALUE MAY 31, 2018 |
EXPENSES PAID DURING PERIOD* DECEMBER 1, 2017 – MAY 31, 2018 |
||||||||||
| Actual |
$ | 1,000.00 | $ | 1,052.10 | $ | 1.23 | ||||||
| Hypothetical (5% annual return before expenses)* |
$ | 1,000.00 | $ | 1,023.73 | $ | 1.21 | ||||||
| Elements Portfolios | Annual Report | May 31, 2018 | ||||||||||||||
119
| Expense Examples (Unaudited) |
| * | Expenses are equal to the Portfolio’s annualized six month expense ratio of 0.24%, multiplied by the average account value over the period, multiplied by 182/365 to reflect the partial year period. Certain expenses were waived or reimbursed by the Adviser which has contractually agreed to waive its management fee and reimburse expenses as necessary to limit total annualized expenses, other than certain excluded expenses, of the Portfolio to 0.15% for the fiscal year ended May 31, 2018 and for the period from June 1, 2018 through September 27, 2018. Fee waivers and expense reimbursement may be discontinued after that date. |
Elements International Portfolio
| BEGINNING ACCOUNT VALUE DECEMBER 1, 2017 |
ENDING ACCOUNT VALUE MAY 31, 2018 |
EXPENSES PAID DURING PERIOD* DECEMBER 1, 2017 – MAY 31, 2018 |
||||||||||
| Actual |
$ | 1,000.00 | $ | 1,007.10 | $ | 1.60 | ||||||
| Hypothetical (5% annual return before expenses)* |
$ | 1,000.00 | $ | 1,023.34 | $ | 1.61 | ||||||
| * | Expenses are equal to the Portfolio’s annualized six month expense ratio of 0.32%, multiplied by the average account value over the period, multiplied by 182/365 to reflect the partial year period. Certain expenses were waived or reimbursed by the Adviser which has contractually agreed to waive its management fee and reimburse expenses as necessary to limit total annualized expenses, other than certain excluded expenses, of the Portfolio to 0.20% for the fiscal year ended May 31, 2018 and for the period from June 1, 2018 through September 27, 2018. Fee waivers and expense reimbursement may be discontinued after that date. |
Elements International Small Cap Portfolio
| BEGINNING ACCOUNT VALUE DECEMBER 1, 2017 |
ENDING ACCOUNT VALUE MAY 31, 2018 |
EXPENSES PAID DURING PERIOD* DECEMBER 1, 2017 – MAY 31, 2018 |
||||||||||
| Actual |
$ | 1,000.00 | $ | 1,016.40 | $ | 1.56 | ||||||
| Hypothetical (5% annual return before expenses)* |
$ | 1,000.00 | $ | 1,023.39 | $ | 1.56 | ||||||
| * | Expenses are equal to the Portfolio’s annualized six month expense ratio of 0.31%, multiplied by the average account value over the period, multiplied by 182/365 to reflect the partial year period. Certain expenses were waived or reimbursed by the Adviser which has contractually agreed to waive its management fee and reimburse expenses as necessary to limit total annualized expenses, other than certain excluded expenses, of the Portfolio to 0.20% for the fiscal year ended May 31, 2018 and for the period from June 1, 2018 through September 27, 2018. Fee waivers and expense reimbursement may be discontinued after that date. |
Elements Emerging Markets Portfolio
| BEGINNING ACCOUNT VALUE DECEMBER 1, 2017 |
ENDING ACCOUNT VALUE MAY 31, 2018 |
EXPENSES PAID DURING PERIOD* DECEMBER 1, 2017 – MAY 31, 2018 |
||||||||||
| Actual |
$ | 1,000.00 | $ | 1,029.50 | $ | 1.72 | ||||||
| Hypothetical (5% annual return before expenses)* |
$ | 1,000.00 | $ | 1,023.24 | $ | 1.72 | ||||||
| * | Expenses are equal to the Portfolio’s annualized six month expense ratio of 0.34%, multiplied by the average account value over the period, multiplied by 182/365 to reflect the partial year period. Certain expenses waived or reimbursed by the Adviser which has contractually agreed to waive its management fee and reimburse expenses as necessary to limit total annualized expenses, other than certain excluded expenses, of the Portfolio to 0.20% for the fiscal year ended May 31, 2018 and for the period from June 1, 2018 through September 27, 2018. Fee waivers and expense reimbursement may be discontinued after that date. |
| Elements Portfolios | Annual Report | May 31, 2018 | ||||||||||||||
120
| Additional Information (Unaudited) | ||
1. Disclosure Regarding Fund Trustees and Officers
| Independent Trustees | ||||||||||
| NAME (YEAR OF BIRTH) AND ADDRESS(1) |
POSITION(S) HELD WITH THE TRUST |
TERM OF OFFICE AND LENGTH OF TIME SERVED(2) |
PRINCIPAL OCCUPATION(S) DURING THE PAST 5 YEARS |
NUMBER OF PORTFOLIOS IN THE FUND COMPLEX OVERSEEN BY TRUSTEE(3) |
OTHER DIRECTORSHIPS / TRUSTEESHIPS HELD BY TRUSTEE DURING THE PAST 5 YEARS | |||||
| Jeffery Ekberg (1965) |
Trustee | since 2016 | Self-employed (personal investing) since 2011; Principal, TPG Capital, L.P. (private equity firm) until 2011; Chief Financial Officer, Newbridge Capital, LLC (private equity firm) until 2011 | 15 | None. | |||||
| Daniel Charney (1970) |
Trustee | since 2016 | Managing Director and Co-President, Cowen and Company, Cowen, Inc. (financial services firm) since 2012 | 15 | None. | |||||
| Interested Trustee | ||||||||||
| NAME (YEAR OF BIRTH) AND ADDRESS(1) |
POSITION(S) HELD WITH THE TRUST |
TERM OF OFFICE AND LENGTH OF TIME SERVED(2) |
PRINCIPAL OCCUPATION(S) DURING THE PAST 5 YEARS |
NUMBER OF PORTFOLIOS IN THE FUND COMPLEX OVERSEEN BY TRUSTEE(3) |
OTHER DIRECTORSHIPS / TRUSTEESHIPS HELD BY TRUSTEE DURING THE PAST 5 YEARS | |||||
| Ross Stevens(4) (1969) |
Trustee, Chairman | since 2016 | Founder, Chief Executive Officer and President of Stone Ridge since 2012 | 15 | None. | |||||
| (1) | Each Trustee’s mailing address is c/o Stone Ridge Asset Management LLC, 510 Madison Avenue, 21st Floor, New York, NY 10022. |
| (2) | Each Trustee serves until resignation or removal from the Board. |
| (3) | The Fund Complex includes the Trust and Stone Ridge Trust II, Stone Ridge Trust III, Stone Ridge Trust IV and Stone Ridge Trust V, other investment companies managed by the Adviser. |
| (4) | Mr. Stevens is an “interested person” of the Trust, as defined in Section 2(a)(19) of the 1940 Act, due to his position with the Adviser. |
The Statement of Additional Information includes additional information about the Portfolios’ Trustees and is available free of charge upon request by calling the Fund toll free at 1.855.609.3680
| Officers of the Trust | ||||||
| NAME (YEAR OF BIRTH) AND ADDRESS(1)(2) |
POSITION(S) HELD WITH THE TRUST |
TERM OF OFFICE AND LENGTH OF TIME SERVED(3) |
PRINCIPAL OCCUPATION(S) DURING PAST 5 YEARS | |||
| Ross Stevens (1969) |
President, Chief Executive Officer and Principal Executive Officer | since 2015 | Founder of Stone Ridge Asset Management LLC, Chief Executive Officer and President of the Adviser, since 2012. | |||
| Lauren D. Macioce (1978) |
Chief Compliance Officer, Secretary, Chief Legal Officer and Anti-Money Laundering Compliance Officer | since 2016 | General Counsel and Chief Compliance Officer of the Adviser, since 2016; prior to that Associate at Ropes & Gray LLP (law firm). | |||
| Elements Portfolios | Annual Report | May 31, 2018 | ||||||||||||||
121
| Additional Information (Unaudited) |
| Officers of the Trust | ||||||
| NAME (YEAR OF BIRTH) AND ADDRESS(1)(2) |
POSITION(S) HELD WITH THE TRUST |
TERM OF OFFICE AND LENGTH OF TIME SERVED(3) |
PRINCIPAL OCCUPATION(S) DURING PAST 5 YEARS | |||
| Anthony Zuco (1975) |
Treasurer, Principal Financial Officer, Chief Financial Officer and Chief Accounting Officer | since February 2018 | Supervising Fund Controller at the Adviser, since 2013; prior to that Controller at Owl Creek Asset Management L.P. (investment advisory firm). | |||
| Alexander Nyren (1980) |
Assistant Secretary | since January 2018 | Head of Reinsurance of the Adviser, since 2018; member of Reinsurance portfolio management team at the Adviser, since 2013. | |||
| Richard Taylor (1980) |
Assistant Treasurer | since 2016 | Head of Operations of the Adviser, since 2013; prior to that Budget Analyst at Integrated Rehabilitation and Recovery Care Service (construction firm) and Head of Operations at Ruby Capital Partners LLP (investment advisory firm). | |||
| (1) | Each Officer’s mailing address is c/o Stone Ridge Asset Management LLC, 510 Madison Avenue, 21st Floor, New York, NY 10022. |
| (2) | Each of the Officers is an affiliated person of the Adviser as a result of his or her position with the Adviser. |
| (3) | The term of office of each Officer is indefinite. |
2. Shareholder Notification of Federal Tax Status
For the fiscal year ended May 31, 2018, certain dividends paid by the Portfolios may be subject to a maximum tax rate of 15%, as provided by the Jobs and Growth Tax Relief Reconciliation Act of 2003. The percentage of dividends declared from ordinary income designated as qualified dividend income was as follows:
| QDI | ||||
| Elements U.S. Portfolio |
87.72 | % | ||
| Elements U.S. Small Cap Portfolio |
81.46 | % | ||
| Elements International Portfolio |
34.25 | % | ||
| Elements International Small Cap Portfolio |
35.04 | % | ||
| Elements Emerging Market Portfolio |
8.75 | % | ||
For corporate shareholders, the percentage of ordinary income distributions qualifying for the corporate dividend received deduction for the fiscal year ended May 31, 2018 was as follows:
| DRD | ||||
| Elements U.S. Portfolio |
86.97 | % | ||
| Elements U.S. Small Cap Portfolio |
81.70 | % | ||
| Elements International Portfolio |
3.90 | % | ||
| Elements International Small Cap Portfolio |
3.61 | % | ||
| Elements Emerging Market Portfolio |
6.67 | % | ||
The percentage of taxable ordinary income distributions that are designated as short-term capital gain distributions under Internal Revenue Section 871(k)(2)(C) for each Portfolio was as follows:
| Elements U.S. Portfolio |
2.96 | % | ||
| Elements U.S. Small Cap Portfolio |
7.70 | % | ||
| Elements International Portfolio |
2.56 | % | ||
| Elements International Small Cap Portfolio |
20.39 | % | ||
| Elements Emerging Market Portfolio |
81.54 | % | ||
| Elements Portfolios | Annual Report | May 31, 2018 | ||||||||||||||
122
| Additional Information (Unaudited) |
The percentage of taxable ordinary income distributions that are designated as interest related dividends under Internal Revenue Section 871(k)(1)(C) for each Portfolio was as follows:
| Elements U.S. Portfolio |
3.84 | % | ||
| Elements U.S. Small Cap Portfolio |
7.76 | % | ||
| Elements International Portfolio |
1.73 | % | ||
| Elements International Small Cap Portfolio |
2.29 | % | ||
| Elements Emerging Market Portfolio |
4.75 | % | ||
Pursuant to Section 853 of the Internal Revenue Code, the following Portfolios elect to pass-through to shareholders the credit for taxes paid to eligible foreign countries, which may be less than the actual amount paid for financial statement purposes.
| PER SHARE | ||||||||||||||||||||
| FUND | GROSS FOREIGN SOURCE INCOME |
FOREIGN TAXES PASSTHROUGH |
GROSS FOREIGN SOURCE INCOME |
FOREIGN TAXES PASSTHROUGH |
SHARES OUTSTANDING AT 5/31/2018 |
|||||||||||||||
| Elements International Portfolio |
10,168,154 | 1,047,817 | 0.1898699278 | 0.020000000 | 53,553,262 | |||||||||||||||
| Elements International Small Cap Portfolio |
3,353,390 | 376,143 | 0.1648722272 | 0.018493386 | 20,339,326 | |||||||||||||||
3. Availability of Quarterly Portfolio Holdings Schedules
The Elements Portfolios are required to file their complete schedule of portfolio holdings with the SEC for the first and third quarters of each fiscal year on Form N-Q. The Elements Portfolios’ Form N-Q is available without charge on the SEC’s website, www.sec.gov or by calling 1.855.609.3680. You may also obtain copies at the SEC’s Public Reference Room in Washington, D.C. Information on the operation of the Public Reference Room may be obtained by calling 1.800.SEC.0330.
4. Proxy Voting Policies and Procedures and Proxy Voting Record
A description of the policies and procedures that the Elements Portfolios use to determine how to vote proxies relating to portfolio securities is available without charge by calling 1.855.609.3680 and on the SEC’s website www.sec.gov. The Elements Portfolios are required to file how they voted proxies related to portfolio securities during the most recent 12-month period ended June 30. The information is available without charge, upon request by calling 1.855.609.3680 and on the SEC’s website, www.sec.gov.
| Elements Portfolios | Annual Report | May 31, 2018 | ||||||||||||||
123
Investment Adviser
Stone Ridge Asset Management LLC
510 Madison Avenue, 21st Floor
New York, NY 10022
Independent Registered Public Accounting Firm
Ernst & Young LLP
220 South 6th Street
Minneapolis, MN 55402
Legal Counsel
Ropes & Gray LLP
Prudential Tower
800 Boylston Street
Boston, MA 02199
Custodians
U.S. Bank, N.A.
1555 North RiverCenter Drive, Suite 302
Milwaukee, WI 53212
Brown Brothers Harriman & Co.
50 Post Office Square
Boston, MA 02110
Distributor
ALPS Distributors, Inc.
1290 Broadway #1100
Denver, CO 80203
Administrator, Transfer Agent and Dividend Disbursing Agent
U.S. Bancorp Fund Services, LLC
615 East Michigan Street
Milwaukee, WI 53202

|
Elements Portfolios P.O. Box 701 Milwaukee, WI 53201-0701
855-609-3680 www.elementsfunds.com |
XXANNU |
Item 2. Code of Ethics.
The registrant has adopted a code of ethics that applies to the registrant’s principal executive officer and principal financial officer. The registrant has not made any substantive amendments to its code of ethics during the period covered by this report. The registrant has not granted any waivers from any provisions of the code of ethics during the period covered by this report.
A copy of the registrant’s Code of Ethics is filed herewith.
Item 3. Audit Committee Financial Expert.
The registrant’s board of trustees has determined that there is at least one audit committee financial expert serving on its audit committee. Jeffery Ekberg is the “audit committee financial expert” and is considered to be “independent” as each term is defined in Item 3 of Form N-CSR.
Item 4. Principal Accountant Fees and Services.
The registrant has engaged its principal accountant to perform audit services, audit-related services, tax services and other services during the past two fiscal years. “Audit services” refer to performing an audit of the registrant’s annual financial statements or services that are normally provided by the accountant in connection with statutory and regulatory filings or engagements for those fiscal years. “Audit-related services” refer to the assurance and related services by the principal accountant that are reasonably related to the performance of the audit of the registrant’s annual financial statements and are not included as “audit services”. “Tax services” refer to professional services rendered by the principal accountant for tax compliance, tax advice, and tax planning including review of the Portfolios’ tax returns, asset diversification and income testing, excise taxes, and fiscal year end income calculations. “All other fees” refer to the aggregate fees for products and services provided by the principal accountant, other than the services reported in the foregoing three categories. The following table details the aggregate fees billed or expected to be billed for each of the last two fiscal years for audit fees, audit-related fees, tax fees and other fees by the principal accountant.
| FYE 5/31/2018 | FYE 5/31/2017 | |||||||
| Audit Fees |
$ | 186,500 | $ | 100,000 | ||||
| Audit-Related Fees |
— | — | ||||||
| Tax Fees |
94,250 | 27,000 | ||||||
| All Other Fees |
— | — | ||||||
To the extent required by applicable law, pre-approval by the audit committee is needed for all audit and permissible non-audit services rendered to the registrant and all permissible non-audit services rendered to Stone Ridge Asset Management LLC (the “Adviser”) or to various entities either controlling, controlled by, or under common control with the Adviser that provide ongoing services to the registrant if the services relate directly to the operations and financial reporting of the registrant. Pre-approval is currently on an engagement-by-engagement basis.
1
The percentage of fees billed by Ernst & Young, LLP applicable to non-audit services that were approved by the audit committee pursuant to paragraph (c)(7)(i)(C) of Rule 2-01 of Regulation S-X (which permits waiver of pre-approval, if certain conditions are satisfied) were as follows:
| FYE 5/31/2018 | FYE 5/31/2017 | |||||||
| Audit-Related Fees |
0 | % | 0 | % | ||||
| Tax Fees |
0 | % | 0 | % | ||||
| All Other Fees |
0 | % | 0 | % | ||||
All of the principal accountant’s hours spent on auditing the registrant’s financial statements were attributed to work performed by full-time permanent employees of the principal accountant.
The following table indicates the non-audit fees billed or expected to be billed by the registrant’s accountant for services to the registrant and to the registrant’s investment adviser and any entity controlling, controlled by, or under common control with the registrant’s investment adviser that provides ongoing services to the registrant for the last two fiscal years of the registrant. The audit committee of the board of trustees has considered whether the provision of any non-audit services that were rendered to the registrant’s investment adviser and any entity controlling, controlled by, or under common control with the registrant’s investment adviser that provides ongoing services to the registrant that were not pre-approved pursuant to paragraph (c)(7)(ii) of Rule 2-01 of Regulation S-X is compatible with maintaining the principal accountant’s independence.
| Non-Audit Related Fees |
FYE 5/31/2018 | FYE 5/31/2017 | ||||||
| Registrant |
$ | 94,250 | $ | 27,000 | ||||
| Registrant’s Investment Adviser |
$ | 203,622 | $ | 503,546 | ||||
Item 5. Audit Committee of Listed Registrants.
Not applicable to registrants who are not listed issuers (as defined in Rule 10A-3 under the Securities Exchange Act of 1934).
Item 6. Investments.
| (a) | Schedule of Investments is included as part of the report to shareholders filed under Item 1 of this Form. |
| (b) | Not Applicable |
Item 7. Disclosure of Proxy Voting Policies and Procedures for Closed-End Management Investment Companies.
Not applicable to open-end investment companies.
Item 8. Portfolio Managers of Closed-End Management Investment Companies.
Not applicable to open-end investment companies.
2
Item 9. Purchases of Equity Securities by Closed-End Management Investment Company and Affiliated Purchasers.
Not applicable to open-end investment companies.
Item 10. Submission of Matters to a Vote of Security Holders.
Not Applicable.
Item 11. Controls and Procedures.
| (a) | The Registrant’s Principal Executive Officer and Principal Financial Officer have reviewed the Registrant’s disclosure controls and procedures (as defined in Rule 30a-3(c) under the Investment Company Act of 1940 (the “Act”)) as of a date within 90 days of the filing of this report, as required by Rule 30a-3(b) under the Act and Rules 13a-15(b) or 15d-15(b) under the Securities Exchange Act of 1934. Based on their review, such officers have concluded that the disclosure controls and procedures are effective in ensuring that information required to be disclosed in this report is appropriately recorded, processed, summarized and reported and made known to them by others within the Registrant and by the Registrant’s service provider. |
| (b) | There were no changes in the Registrant’s internal control over financial reporting (as defined in Rule 30a-3(d) under the Act) that occurred during the second fiscal quarter of the period covered by this report that has materially affected, or is reasonably likely to materially affect, the Registrant’s internal control over financial reporting. |
Item 12. Disclosure of Securities Lending Activities for Closed-End Management Investment Companies
Not applicable to open-end investment companies.
Item 13. Exhibits.
| (a) | (1) Any code of ethics or amendment thereto, that is the subject of the disclosure required by Item 2, to the extent that the registrant intends to satisfy Item 2 requirements through filing an exhibit. Filed herewith. |
(2) A separate certification for each principal executive officer and principal financial officer pursuant to Section 302 of the Sarbanes-Oxley Act of 2002. Filed herewith.
(3) Any written solicitation to purchase securities under Rule 23c-1 under the Act sent or given during the period covered by the report by or on behalf of the registrant to 10 or more persons. Not applicable.
(4) Change in the registrant’s independent public accountant. There was no change in the registrant’s independent public accountant for the period covered by this report.
| (b) | Certifications pursuant to Section 906 of the Sarbanes-Oxley Act of 2002. Furnished herewith. |
3
SIGNATURES
Pursuant to the requirements of the Securities Exchange Act of 1934 and the Investment Company Act of 1940, the registrant has duly caused this report to be signed on its behalf by the undersigned, thereunto duly authorized.
| (Registrant) Stone Ridge Trust | ||||
| By (Signature and Title)* | /s/ Ross Stevens |
|||
| Ross Stevens, President, Chief Executive Officer and Principal Executive Officer | ||||
| Date 8/3/2018 | ||||
Pursuant to the requirements of the Securities Exchange Act of 1934 and the Investment Company Act of 1940, this report has been signed below by the following persons on behalf of the registrant and in the capacities and on the dates indicated.
| By (Signature and Title)* | /s/ Ross Stevens |
|||
| Ross Stevens, President, Chief Executive Officer and Principal Executive Officer | ||||
| Date 8/3/2018 | ||||
| By (Signature and Title)* | /s/ Anthony Zucco |
|||
| Anthony Zuco, Treasurer, Principal Financial Officer, Chief Financial Officer and Chief Accounting Officer | ||||
| Date 8/3/2018 | ||||
| * | Print the name and title of each signing officer under his or her signature. |
4
Stone Ridge Trust
Stone Ridge Trust II
Stone Ridge Trust III
Stone Ridge Trust IV
Stone Ridge Trust V
Code of Ethics for Principal Executive and Principal Financial Officers
| Implementation Date: | November 30, 2012 (Stone Ridge Trust) | |||||
| September 19, 2013 (Stone Ridge Trust II) | ||||||
| January 28, 2015 (Stone Ridge Trust III) | ||||||
| January 22, 2016 (Stone Ridge Trust IV & V) | ||||||
| Amendment Dates: | September 19, 2013 | |||||
| January 24, 2017 |
| I. | Regulatory Background |
In accordance with Sarbanes-Oxley (for purposes of this Code of Ethics, the “Act”) and the rules promulgated thereunder by the U.S. Securities and Exchange Commission (“SEC”), the Trust, on behalf of each of its series (each a “Fund” and together the “Funds”), is required to file, on a semi-annual basis, a report on Form N-CSR in which each Fund must disclose whether it has adopted, for the purposes set forth below, a code of ethics applicable to certain of its officers. The Board, including a majority of the Trustees that are not interested persons of the Trust, as defined in Section 2(a)(19) of the 1940 Act, has approved this Code of Ethics (“Code”) as compliant with the requirements of the Act and related SEC rules.
| II. | Covered Officers/Purpose of the Code |
This Code applies to the Trust’s Principal Executive Officer and Principal Financial Officer (the “Covered Officers,” each of whom are set forth in Exhibit A) for the purpose of promoting:
| • | honest and ethical conduct, including the ethical handling of actual or apparent conflicts of interest between personal and professional relationships; |
| • | full, fair, accurate, timely and understandable disclosure in reports and documents that each Fund files with, or submits to, the SEC and in other public communications made by each Fund; |
| • | compliance with applicable laws and governmental rules and regulations; |
| • | the prompt internal reporting of violations of the Code to an appropriate person or persons identified in the Code; and |
| • | accountability for adherence to the Code. |
Each Covered Officer should adhere to a high standard of business ethics and should be sensitive to situations that may give rise to actual as well as apparent conflicts of interest.
| III. | Covered Officers Should Handle Ethically Actual and Apparent Conflicts of Interest |
A “conflict of interest” occurs when a Covered Officer’s private interest interferes with the interests of, or his or her service to, the Fund. For example, a conflict of interest would arise if a Covered Officer receives improper personal benefits as a result of his or her position with the Fund.
Certain conflicts of interest may arise out of the relationships between Covered Officers and the Trust and already are subject to conflict of interest provisions in the 1940 Act and the Advisers Act. For example, Covered Officers may
59
not individually engage in certain transactions (such as the purchase or sale of securities or other property) with the Fund because of their status as “affiliated persons” of a Fund. Each Fund and certain of its service providers’ compliance programs and procedures are designed to prevent, or identify and correct, violations of these provisions. This Code does not, and is not intended to, repeat or replace these programs and procedures, and such conflicts fall outside the parameters of this Code.
Although typically not presenting an opportunity for improper personal benefit, conflicts may arise from, or as a result of, the contractual relationship between each Fund and its investment adviser, placement agent, or administrator (each an “Employer”) of which the Covered Officers may be officers or employees. As a result, this Code recognizes that the Covered Officers will, in the normal course of their duties (whether for a Fund or an Employer), be involved in establishing policies and implementing decisions that will have different effects on the Employer and a Fund. The participation of the Covered Officers in such activities is inherent in the contractual relationships between each Fund and the Employers and is consistent with the performance by the Covered Officers of their duties as officers of the Fund. Thus, if performed in conformity with the provisions of the 1940 Act and the Advisers Act, such activities normally will be deemed to have been handled ethically. In addition, it is recognized by the Board that the Covered Officers may also be officers or employees of one or more other investment companies covered by this Code or other codes of ethics.
Other conflicts of interest are covered by the Code, even if such conflicts of interest are not subject to provisions in the 1940 Act and the Advisers Act. The following list provides examples of conflicts of interest under the Code, but Covered Officers should keep in mind that these examples are not exhaustive. The overarching principle is that the personal interest of a Covered Officer should not be placed improperly before the interest of the Fund.
Each Covered Officer must:
| • | not use his or her personal influence or personal relationships improperly to influence investment decisions or financial reporting by the Fund whereby the Covered Officer would benefit personally to the detriment of the Fund; |
| • | not cause a Fund to take action, or fail to take action, for the individual personal benefit of the Covered Officer rather than the benefit of such Fund; |
| • | not use material non-public knowledge of portfolio transactions made or contemplated for the Fund to trade personally or cause others to trade personally in contemplation of the market effect of such transactions; and |
| • | report at least annually the information elicited in the Trust’s Trustee and officer questionnaire relating to potential conflicts of interest. |
There are some conflict of interest situations that must be discussed with the Trust’s Audit Committee if material. Some examples of such situations include:
| • | service as a Trustee on the board of any company (public or private), other than a management investment company; |
| • | the receipt of any non-nominal gifts; |
| • | the receipt of any entertainment from any company with which the Trust or any Fund has current or prospective business dealings unless such entertainment is business related, reasonable in cost, appropriate as to time and place, and not so frequent as to raise any question of impropriety; |
| • | any ownership interest in, or any consulting or employment relationship with, any of a Fund’s service providers, other than an Employer or any affiliated person thereof; and |
60
| • | a direct or indirect financial interest in commissions, transaction charges or spreads paid by the Fund for effecting portfolio transactions or for selling or redeeming shares other than an interest arising from the Covered Officer’s employment, such as compensation or equity ownership. |
| IV. | Disclosure and Compliance |
Each Covered Officer:
| • | should familiarize himself or herself with the disclosure requirements generally applicable to the Fund; |
| • | should not knowingly misrepresent, or cause others to misrepresent, facts about the Funds to others, whether within or outside the Trust, including to the Trustees and auditors, governmental regulators or self-regulatory organizations; |
| • | should, to the extent appropriate within his or her area of responsibility, consult with other officers and employees of the Trust, the Employers, and other Fund service providers, with the goal of promoting full, fair, accurate, timely and understandable disclosure in the reports and documents a Fund files with, or submits to, the SEC and in other public communications made by such Fund; and |
| • | has the responsibility to promote compliance with the standards and restrictions imposed by applicable laws, rules and regulations. |
| V. | Reporting and Accountability by Covered Officers |
Each Covered Officer must:
| • | upon adoption of the Code (or thereafter as applicable, upon becoming a Covered Officer), affirm in writing (in the form attached hereto as Exhibit B) to the Board that he or she has received, read, and understands the Code; |
| • | annually thereafter affirm (in the form attached hereto as Exhibit B) to the Board that he or she has complied with the requirements of the Code; |
| • | not retaliate against any other Covered Officer or any employee or agent of an affiliated person of a Fund for good faith reports of potential violations; and |
| • | notify the Trust’s Audit Committee promptly if he or she knows of any violation of this Code. Failure to do so is itself a violation of this Code. |
| VI. | Enforcement |
The Audit Committee is responsible for applying this Code to specific situations in which questions are presented under it and has the authority to interpret this Code in any particular situation. Any approvals or waivers sought by a Covered Officer will be considered by the Audit Committee. The Audit Committee is authorized to consult, as appropriate, with counsel to the Fund.
The Trust will follow these procedures in investigating and enforcing this Code:
| • | The Audit Committee will take all appropriate action to investigate any potential violations reported to the Audit Committee; |
| • | if, after such investigation, the Audit Committee believes that no violation has occurred, the Audit Committee is not required to take any further action; |
61
| • | any matter that the Audit Committee believes is a material violation will be promptly reported to the Board. The Trustees, with the exception of any person whose matter is under consideration for a waiver, shall take such actions as they consider appropriate, including imposition of any sanctions that they consider appropriate; |
| • | no person shall participate in a determination of whether he or she has committed a violation of this Code or in the imposition of any sanction against himself or herself. |
| • | the Audit Committee will be responsible for granting waivers, as appropriate; and |
| • | any amendments to or waivers of this Code will, to the extent required, be disclosed as provided by SEC rules. |
| VII. | Other Policies and Procedures |
This Code shall be the sole code of ethics adopted by the Trust for purposes of Section 406 of the Act and the rules and forms applicable to registered investment companies thereunder. Insofar as other policies or procedures of the Trust, the Employers or other service providers govern or purport to govern the behavior or activities of the Covered Officers who are subject to this Code, they are superseded by this Code to the extent that they overlap or conflict with the provisions of this Code. The Trust and any Employer code of ethics under Rule 17j-1 under the 1940 Act are separate requirements applying to the Covered Officers and others, and are not part of this Code.
| VIII. | Amendment; Interpretation of Provisions |
The Trustees may from time to time amend this Code of Ethics or adopt such interpretations of this Code of Ethics as they deem appropriate.
| IX. | Confidentiality |
All reports and records prepared or maintained pursuant to this Code shall be treated as confidential and shall not be disclosed to anyone other than the Board, the Covered Officers and Trust counsel, except as otherwise requested in accordance with applicable law.
| X. | Internal Use |
The Code is intended solely for the internal use by the Trust and does not constitute an admission, by or on behalf of the Trust, as to any fact, circumstance, or legal conclusion.
62
Stone Ridge Trust
Stone Ridge Trust II
Stone Ridge Trust III
Stone Ridge Trust IV
Stone Ridge Trust V
EXHIBIT A
Persons Covered by this Code of Ethics (Covered Officers)
Principal Executive Officer: Ross Stevens
Principal Financial Officer: Patrick Kelly
63
Stone Ridge Trust
Stone Ridge Trust II
Stone Ridge Trust III
Stone Ridge Trust IV
Stone Ridge Trust V
EXHIBIT B
Code of Ethics for Principal Executive and Principal Financial Officers
INITIAL AND ANNUAL CERTIFICATION OF
COMPLIANCE WITH THE
CODE OF ETHICS FOR PRINCIPAL EXECUTIVE AND PRINCIPAL FINANCIAL OFFICERS
| To: The | Board of Trustees |
[Initial] I hereby certify that I have received the Code of Ethics for Principal Executive and Principal Financial Officers adopted pursuant to the Sarbanes-Oxley Act of 2002 (the “Code”) and that I have read and understood the Code. I further certify that I am subject to the Code and will comply with each of the Code’s provisions to which I am subject.
[Annual] I hereby certify that I have received the Code of Ethics for Principal Executive and Principal Financial Officers adopted pursuant to the Sarbanes-Oxley Act of 2002 (the “Code”) and that I have read and understood the Code. I further certify that I have complied with and will continue to comply with each of the provisions of the Code to which I am subject.
|
(Signature) | ||
| Name: |
| |
| Date: |
| |
64
EX.99.CERT
CERTIFICATIONS
I, Ross Stevens, certify that:
| 1. | I have reviewed this report on Form N-CSR of Stone Ridge Trust; |
| 2. | Based on my knowledge, this report does not contain any untrue statement of a material fact or omit to state a material fact necessary to make the statements made, in light of the circumstances under which such statements were made, not misleading with respect to the period covered by this report; |
| 3. | Based on my knowledge, the financial statements, and other financial information included in this report, fairly present in all material respects the financial condition, results of operations, changes in net assets, and cash flows (if the financial statements are required to include a statement of cash flows) of the registrant as of, and for, the periods presented in this report; |
| 4. | The registrant’s other certifying officer(s) and I are responsible for establishing and maintaining disclosure controls and procedures (as defined in Rule 30a-3(c) under the Investment Company Act of 1940) and internal control over financial reporting (as defined in Rule 30a-3(d) under the Investment Company Act of 1940) for the registrant and have: |
| (a) | Designed such disclosure controls and procedures, or caused such disclosure controls and procedures to be designed under our supervision, to ensure that material information relating to the registrant, including its consolidated subsidiaries, is made known to us by others within those entities, particularly during the period in which this report is being prepared; |
| (b) | Designed such internal control over financial reporting, or caused such internal control over financial reporting to be designed under our supervision, to provide reasonable assurance regarding the reliability of financial reporting and the preparation of financial statements for external purposes in accordance with generally accepted accounting principles; |
| (c) | Evaluated the effectiveness of the registrant’s disclosure controls and procedures and presented in this report our conclusions about the effectiveness of the disclosure controls and procedures, as of a date within 90 days prior to the filing date of this report based on such evaluation; and |
| (d) | Disclosed in this report any change in the registrant’s internal control over financial reporting that occurred during the second fiscal quarter of the period covered by this report that has materially affected, or is reasonably likely to materially affect, the registrant’s internal control over financial reporting; and |
| 5. | The registrant’s other certifying officer(s) and I have disclosed to the registrant’s auditors and the audit committee of the registrant’s board of directors (or persons performing the equivalent functions): |
| (a) | All significant deficiencies and material weaknesses in the design or operation of internal control over financial reporting which are reasonably likely to adversely affect the registrant’s ability to record, process, summarize, and report financial information; and |
| (b) | Any fraud, whether or not material, that involves management or other employees who have a significant role in the registrant’s internal control over financial reporting. |
| Date: 8/3/2018 | /s/ Ross Stevens | |||||
| Ross Stevens President, Chief Executive Officer and Principal Executive Officer |
EX.99.CERT
CERTIFICATIONS
I, Anthony Zuco, certify that:
| 1. | I have reviewed this report on Form N-CSR of Stone Ridge Trust; |
| 2. | Based on my knowledge, this report does not contain any untrue statement of a material fact or omit to state a material fact necessary to make the statements made, in light of the circumstances under which such statements were made, not misleading with respect to the period covered by this report; |
| 3. | Based on my knowledge, the financial statements, and other financial information included in this report, fairly present in all material respects the financial condition, results of operations, changes in net assets, and cash flows (if the financial statements are required to include a statement of cash flows) of the registrant as of, and for, the periods presented in this report; |
| 4. | The registrant’s other certifying officer(s) and I are responsible for establishing and maintaining disclosure controls and procedures (as defined in Rule 30a-3(c) under the Investment Company Act of 1940) and internal control over financial reporting (as defined in Rule 30a-3(d) under the Investment Company Act of 1940) for the registrant and have: |
| (a) | Designed such disclosure controls and procedures, or caused such disclosure controls and procedures to be designed under our supervision, to ensure that material information relating to the registrant, including its consolidated subsidiaries, is made known to us by others within those entities, particularly during the period in which this report is being prepared; |
| (b) | Designed such internal control over financial reporting, or caused such internal control over financial reporting to be designed under our supervision, to provide reasonable assurance regarding the reliability of financial reporting and the preparation of financial statements for external purposes in accordance with generally accepted accounting principles; |
| (c) | Evaluated the effectiveness of the registrant’s disclosure controls and procedures and presented in this report our conclusions about the effectiveness of the disclosure controls and procedures, as of a date within 90 days prior to the filing date of this report based on such evaluation; and |
| (d) | Disclosed in this report any change in the registrant’s internal control over financial reporting that occurred during the second fiscal quarter of the period covered by this report that has materially affected, or is reasonably likely to materially affect, the registrant’s internal control over financial reporting; and |
| 5. | The registrant’s other certifying officer(s) and I have disclosed to the registrant’s auditors and the audit committee of the registrant’s board of directors (or persons performing the equivalent functions): |
| (a) | All significant deficiencies and material weaknesses in the design or operation of internal control over financial reporting which are reasonably likely to adversely affect the registrant’s ability to record, process, summarize, and report financial information; and |
| (b) | Any fraud, whether or not material, that involves management or other employees who have a significant role in the registrant’s internal control over financial reporting. |
| Date: 8/3/2018 | /s/ Anthony Zucco | |||||
| Anthony Zuco Treasurer, Principal Financial Officer, Chief Financial Officer and Chief Accounting Officer |
EX.99.906CERT
Certification Pursuant to Section 906 of the Sarbanes-Oxley Act
Pursuant to Section 906 of the Sarbanes-Oxley Act of 2002, each of the undersigned officers of Stone Ridge Trust, does hereby certify, to such officer’s knowledge, that the report on Form N-CSR of Stone Ridge Trust for the year ended May 31, 2018 fully complies with the requirements of Section 13(a) or 15(d) of the Securities Exchange Act of 1934, as applicable, and that the information contained in the Form N-CSR fairly presents, in all material respects, the financial condition and results of operations of Stone Ridge Trust for the stated period.
| /s/ Ross Stevens |
/s/ Anthony Zucco | |||
| Ross Stevens President, Chief Executive Officer and Principal Executive Officer, Stone Ridge Trust |
Anthony Zuco Treasurer, Principal Financial Officer, Chief Financial Officer and Chief Accounting Officer, Stone Ridge Trust | |||
| Dated: 8/3/2018 | Dated: 8/3/2018 | |||
This statement accompanies this report on Form N-CSR pursuant to Section 906 of the Sarbanes-Oxley Act of 2002 and shall not be deemed as filed by Stone Ridge Trust for purposes of Section 18 of the Securities Exchange Act of 1934.