
UNITED STATES
SECURITIES AND EXCHANGE COMMISSION
Washington, D.C. 20549
FORM N-CSR
CERTIFIED SHAREHOLDER REPORT OF REGISTERED
MANAGEMENT INVESTMENT COMPANIES
Investment Company Act file number 811-03518
Fidelity Newbury Street Trust
(Exact name of registrant as specified in charter)
245 Summer St., Boston, Massachusetts 02210
(Address of principal executive offices) (Zip code)
Margaret Carey, Secretary
245 Summer St.
Boston, Massachusetts 02210
(Name and address of agent for service)
Registrant's telephone number, including area code:
617-563-7000
Date of fiscal year end: | October 31 |
Date of reporting period: | October 31, 2023 |
Item 1.
Reports to Stockholders

Contents
Current 7-Day Yields
|
||
Capital Reserves Class
|
4.46%
|
|
Daily Money Class
|
4.71%
|
|
Advisor C Class
|
3.96%
|
|
Fidelity® Treasury Money Market Fund
|
4.99%
|
|
Yield refers to the income paid by the Fund over a given period. Yield for money market funds is usually for seven-day periods, as it is here, though it is expressed as an annual percentage rate. Past performance is no guarantee of future results. Yield will vary and it's possible to lose money investing in the Fund.
|
||
Effective Maturity Diversification (% of Fund's Investments)
|
||
|
Days
|
||
1 - 7
|
66.7
|
|
8 - 30
|
13.9
|
|
31 - 60
|
12.3
|
|
61 - 90
|
3.8
|
|
91 - 180
|
3.3
|
|
|
Effective maturity is determined in accordance with the requirements of Rule 2a-7 under the Investment Company Act of 1940.
|
||
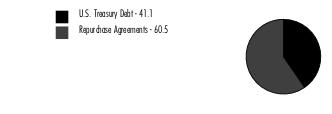
Asset Allocation (% of Fund's net assets)
|
|
Net Other Assets (Liabilities) - (1.6)%
|
U.S. Treasury Debt - 41.1%
|
||||
Yield (%)(a)
|
Principal
Amount (b)
(000s)
|
Value ($)
(000s)
|
||
U.S. Treasury Obligations - 41.1%
|
||||
U.S. Treasury Bills
|
||||
11/2/23 to 4/18/24
|
5.32 to 5.48
|
15,334,000
|
15,237,807
|
|
U.S. Treasury Notes
|
||||
11/15/23 to 7/31/25 (c)
|
5.31 to 5.58
|
2,829,059
|
2,828,906
|
|
|
TOTAL U.S. TREASURY DEBT
(Cost $18,066,713)
|
18,066,713
|
|||
U.S. Treasury Repurchase Agreement - 60.5%
|
|||
Maturity
Amount ($)
(000s)
|
Value ($)
(000s)
|
||
In a joint trading account at:
|
|||
5.3% dated 10/31/23 due 11/1/23 (Collateralized by U.S. Treasury Obligations) #
|
347,585
|
347,534
|
|
5.3% dated 10/31/23 due 11/1/23 (Collateralized by U.S. Treasury Obligations) #
|
50,007
|
50,000
|
|
With:
|
|||
ABN AMRO Bank NV at 5.3%, dated 10/31/23 due 11/1/23 (Collateralized by U.S. Treasury Obligations valued at $68,350,064, 1.00% - 2.00%, 3/15/25 - 7/31/28)
|
67,010
|
67,000
|
|
Barclays Bank PLC at:
|
|||
5.3%, dated 10/31/23 due 11/1/23 (Collateralized by U.S. Treasury Obligations valued at $303,579,000, 2.88% - 3.88%, 1/15/26 - 5/15/52)
|
296,044
|
296,000
|
|
5.32%, dated 9/21/23 due 11/2/23 (Collateralized by U.S. Treasury Obligations valued at $152,900,894, 1.25%, 11/30/26)
|
149,925
|
149,000
|
|
BMO Capital Markets Corp. at 5.31%, dated 10/26/23 due 11/2/23 (Collateralized by U.S. Treasury Obligations valued at $21,439,025, 1.88%, 2/15/32)
|
21,022
|
21,000
|
|
BNP Paribas, SA at 5.38%, dated 9/1/23 due 12/1/23 (Collateralized by U.S. Treasury Obligations valued at $112,268,630, 0.00% - 5.55%, 11/15/23 - 11/15/52) (c)(d)(e)
|
110,482
|
109,000
|
|
BofA Securities, Inc. at:
|
|||
5.32%, dated 10/30/23 due 11/7/23 (Collateralized by U.S. Treasury Obligations valued at $28,568,484, 2.75%, 7/31/27)
|
28,128
|
28,000
|
|
5.33%, dated 9/21/23 due 11/2/23 (Collateralized by U.S. Treasury Obligations valued at $10,261,936, 4.63%, 6/30/25)
|
10,062
|
10,000
|
|
CIBC Bank U.S.A. at:
|
|||
5.31%, dated 10/19/23 due 11/2/23 (Collateralized by U.S. Treasury Obligations valued at $13,285,487, 1.50% - 5.00%, 6/30/24 - 11/15/42)
|
13,027
|
13,000
|
|
5.32%, dated 9/21/23 due 11/2/23 (Collateralized by U.S. Treasury Obligations valued at $45,153,842, 0.50% - 4.63%, 2/29/24 - 5/15/53)
|
44,273
|
44,000
|
|
Credit AG at:
|
|||
5.31%, dated 10/25/23 due 11/1/23 (Collateralized by U.S. Treasury Obligations valued at $40,842,166, 2.25% - 4.75%, 2/15/37 - 5/15/41)
|
40,041
|
40,000
|
|
5.32%, dated:
|
|||
9/21/23 due 11/2/23 (Collateralized by U.S. Treasury Obligations valued at $21,549,827, 3.38% - 3.63%, 8/15/42 - 8/15/43)
|
21,130
|
21,000
|
|
10/10/23 due 11/2/23 (Collateralized by U.S. Treasury Obligations valued at $44,002,594, 2.25%, 5/15/41)
|
43,146
|
43,000
|
|
5.33%, dated 10/20/23 due 11/7/23 (Collateralized by U.S. Treasury Obligations valued at $42,916,164, 2.25%, 5/15/41)
|
42,193
|
42,000
|
|
Federal Reserve Bank of New York at 5.3%, dated 10/31/23 due 11/1/23 (Collateralized by U.S. Treasury Obligations valued at $20,893,075,552, 0.13% - 4.00%, 1/15/25 - 5/15/47)
|
20,893,075
|
20,890,000
|
|
Fixed Income Clearing Corp. - BNP at 5.31%, dated 10/31/23 due 11/1/23 (Collateralized by U.S. Treasury Obligations valued at $109,156,157, 1.38% - 5.55%, 7/31/24 - 2/15/43)
|
107,016
|
107,000
|
|
Fixed Income Clearing Corp. - BNYM at 5.3%, dated 10/31/23 due 11/1/23 (Collateralized by U.S. Treasury Obligations valued at $1,098,540,038, 3.13%, 8/31/27)
|
1,077,159
|
1,077,000
|
|
Fixed Income Clearing Corp. - SSB at:
|
|||
5.3%, dated 10/31/23 due 11/1/23 (Collateralized by U.S. Treasury Obligations valued at $1,098,074,781, 0.50% - 3.25%, 6/30/27)
|
1,077,159
|
1,077,000
|
|
5.31%, dated 10/31/23 due 11/1/23 (Collateralized by U.S. Treasury Obligations valued at $65,244,725, 0.88% - 4.63%, 9/30/26 - 10/15/26)
|
64,009
|
64,000
|
|
ING Financial Markets LLC at:
|
|||
5.3%, dated 10/31/23 due 11/1/23 (Collateralized by U.S. Treasury Obligations valued at $27,555,059, 3.88%, 11/30/27 - 12/31/27)
|
27,004
|
27,000
|
|
5.31%, dated:
|
|||
10/27/23 due 11/3/23 (Collateralized by U.S. Treasury Obligations valued at $25,518,809, 0.13% - 3.63%, 1/15/24 - 8/15/43)
|
25,026
|
25,000
|
|
10/31/23 due 11/7/23 (Collateralized by U.S. Treasury Obligations valued at $6,120,927, 3.25%, 5/15/42)
|
6,006
|
6,000
|
|
5.34%, dated 9/21/23 due 11/2/23 (Collateralized by U.S. Treasury Obligations valued at $49,261,015, 0.63% - 4.50%, 7/31/24 - 2/15/47)
|
48,299
|
48,000
|
|
Lloyds Bank PLC at:
|
|||
5.37%, dated 10/24/23 due 11/24/23 (Collateralized by U.S. Treasury Obligations valued at $27,561,868, 3.25% - 3.88%, 6/30/27 - 12/31/27)
|
27,125
|
27,000
|
|
5.4%, dated 10/30/23 due 12/20/23 (Collateralized by U.S. Treasury Obligations valued at $35,694,042, 2.50% - 3.88%, 1/31/25 - 12/31/27)
|
35,268
|
35,000
|
|
5.43%, dated:
|
|||
9/20/23 due 11/20/23 (Collateralized by U.S. Treasury Obligations valued at $19,511,803, 0.75% - 2.38%, 8/15/24 - 11/15/24)
|
19,175
|
19,000
|
|
9/29/23 due 11/29/23 (Collateralized by U.S. Treasury Obligations valued at $19,511,974, 2.38% - 2.88%, 8/15/24 - 6/15/25)
|
19,175
|
19,000
|
|
Mitsubishi UFJ Securities (U.S.A.), Inc. at 5.33%, dated 9/21/23 due 12/6/23 (Collateralized by U.S. Treasury Obligations valued at $55,414,356, 0.00% - 4.00%, 9/5/24 - 10/31/29)
|
54,608
|
54,000
|
|
Mizuho Bank, Ltd. at 5.31%, dated 10/31/23 due 11/1/23 (Collateralized by U.S. Treasury Obligations valued at $109,238,991, 1.63%, 5/15/31)
|
107,016
|
107,000
|
|
Morgan Stanley & Co., LLC at 5.3%, dated 10/31/23 due 11/1/23 (Collateralized by U.S. Treasury Obligations valued at $30,604,593, 0.00% - 2.25%, 3/7/24 - 8/31/27)
|
30,004
|
30,000
|
|
MUFG Securities (Canada), Ltd. at 5.33%, dated 9/21/23 due:
|
|||
11/2/23 (Collateralized by U.S. Treasury Obligations valued at $21,712,104, 0.25% - 4.38%, 3/31/24 - 8/15/53)
|
21,131
|
21,000
|
|
12/6/23 (Collateralized by U.S. Treasury Obligations valued at $41,155,005, 0.25% - 6.50%, 3/31/24 - 8/15/53)
|
40,450
|
40,000
|
|
MUFG Securities EMEA PLC at 5.31%, dated:
|
|||
10/31/23 due 11/1/23
|
|||
(Collateralized by U.S. Treasury Obligations valued at $86,685,388, 0.88% - 4.38%, 10/31/24 - 6/30/26)
|
85,013
|
85,000
|
|
(Collateralized by U.S. Treasury Obligations valued at $130,492,374, 0.00% - 3.88%, 12/7/23 - 2/15/39)
|
128,019
|
128,000
|
|
11/1/23 due 11/2/23 (f)
|
85,013
|
85,000
|
|
Natixis SA at:
|
|||
5.3%, dated 10/31/23 due 11/1/23 (Collateralized by U.S. Treasury Obligations valued at $55,161,207, 1.13% - 3.63%, 2/15/39 - 2/15/53)
|
54,008
|
54,000
|
|
5.34%, dated 9/21/23 due 11/2/23 (Collateralized by U.S. Treasury Obligations valued at $165,381,356, 0.00% - 4.38%, 12/12/23 - 8/15/50)
|
162,003
|
161,000
|
|
NatWest Markets Securities, Inc. at:
|
|||
5.3%, dated 10/31/23 due 11/1/23 (Collateralized by U.S. Treasury Obligations valued at $26,523,985, 4.88%, 10/31/28)
|
26,004
|
26,000
|
|
5.31%, dated 10/26/23 due 11/2/23 (Collateralized by U.S. Treasury Obligations valued at $106,173,898, 3.88% - 4.63%, 1/15/26 - 12/31/29)
|
104,107
|
104,000
|
|
Norinchukin Bank at 5.34%, dated 10/30/23 due 11/6/23 (Collateralized by U.S. Treasury Obligations valued at $21,632,318, 3.63% - 3.88%, 2/15/43 - 2/15/53)
|
21,022
|
21,000
|
|
RBC Dominion Securities at 5.32%, dated 9/21/23 due 11/2/23 (Collateralized by U.S. Treasury Obligations valued at $33,121,646, 1.63% - 6.88%, 2/28/25 - 2/15/52)
|
32,199
|
32,000
|
|
SMBC Nikko Securities America, Inc. at 5.3%, dated 10/31/23 due 11/1/23 (Collateralized by U.S. Treasury Obligations valued at $714,327,492, 0.00% - 7.50%, 11/7/23 - 2/15/53)
|
700,103
|
700,000
|
|
Societe Generale at 5.31%, dated:
|
|||
10/26/23 due 11/2/23
|
|||
(Collateralized by U.S. Treasury Obligations valued at $43,298,305, 3.63%, 2/15/53)
|
42,043
|
42,000
|
|
(Collateralized by U.S. Treasury Obligations valued at $86,776,743, 0.63% - 4.00%, 2/15/28 - 11/15/31)
|
85,088
|
85,000
|
|
10/31/23 due 11/7/23 (Collateralized by U.S. Treasury Obligations valued at $97,934,518, 3.25%, 5/15/42)
|
96,099
|
96,000
|
|
Sumitomo Mitsui Trust Bank Ltd. at 5.37%, dated 10/25/23 due 11/7/23 (Collateralized by U.S. Treasury Obligations valued at $9,308,958, 1.63% - 3.25%, 8/31/24 - 8/15/29)
|
9,019
|
9,000
|
|
Wells Fargo Bank NA at 5.36%, dated 10/11/23 due 11/13/23 (Collateralized by U.S. Treasury Obligations valued at $55,767,343, 0.00% - 4.63%, 11/16/23 - 8/15/53)
|
54,265
|
54,000
|
|
|
TOTAL U.S. TREASURY REPURCHASE AGREEMENT
(Cost $26,635,534)
|
26,635,534
|
||
|
TOTAL INVESTMENT IN SECURITIES - 101.6%
(Cost $44,702,247)
|
44,702,247
|
NET OTHER ASSETS (LIABILITIES) - (1.6)%
|
(692,190)
|
NET ASSETS - 100.0%
|
44,010,057
|
(a)
|
Yield represents either the annualized yield at the date of purchase, or the stated coupon rate, or, for floating and adjustable rate securities, the rate at period end.
|
(b)
|
Amount is stated in United States dollars unless otherwise noted.
|
(c)
|
Coupon rates for floating and adjustable rate securities reflect the rates in effect at period end.
|
(d)
|
The maturity amount is based on the rate at period end.
|
(e)
|
Coupon is indexed to a floating interest rate which may be multiplied by a specified factor and/or subject to caps or floors.
|
(f)
|
Represents a forward settling transaction and therefore no collateral securities had been allocated as of period end. The agreement contemplated the delivery of U.S. Treasury Obligations as collateral on settlement date.
|
|
Other Information
|
||
# Additional information on each counterparty to the repurchase agreement is as follows:
|
||
Repurchase Agreement / Counterparty
|
Value ($)
(000's)
|
|
$347,534,000 due 11/01/23 at 5.30%
|
||
BofA Securities, Inc.
|
2,984
|
|
Citigroup Global Markets, Inc.
|
21,357
|
|
Credit Agricole CIB New York Branch
|
21,316
|
|
ING Financial Markets LLC
|
8,526
|
|
Nomura Securities International
|
36,237
|
|
RBC Dominion Securities, Inc.
|
51,158
|
|
Royal Bank of Canada
|
94,861
|
|
Sumitomo Mitsui Banking Corp. NY
|
102,514
|
|
Wells Fargo Bank National Asso
|
8,581
|
|
347,534
|
||
$50,000,000 due 11/01/23 at 5.30%
|
||
BofA Securities, Inc.
|
2,714
|
|
Credit Agricole CIB New York Branch
|
13,932
|
|
ING Financial Markets LLC
|
5,573
|
|
Nomura Securities International
|
23,685
|
|
RBC Dominion Securities, Inc.
|
4,096
|
|
50,000
|
||
Statement of Assets and Liabilities
|
||||
Amounts in thousands (except per-share amounts)
|
October 31, 2023
|
|||
Assets
|
||||
Investment in securities, at value (including repurchase agreements of $26,635,534) - See accompanying schedule
Unaffiliated issuers (cost $44,702,247):
|
$
|
44,702,247
|
||
Cash
|
242,001
|
|||
Receivable for fund shares sold
|
380,594
|
|||
Interest receivable
|
11,351
|
|||
Prepaid expenses
|
50
|
|||
Other receivables
|
395
|
|||
Total assets
|
45,336,638
|
|||
Liabilities
|
||||
Payable for investments purchased
|
$
|
808,740
|
||
Payable for fund shares redeemed
|
445,495
|
|||
Distributions payable
|
53,631
|
|||
Accrued management fee
|
9,111
|
|||
Distribution and service plan fees payable
|
1,436
|
|||
Other affiliated payables
|
6,329
|
|||
Other payables and accrued expenses
|
1,839
|
|||
Total Liabilities
|
1,326,581
|
|||
Net Assets
|
$
|
44,010,057
|
||
Net Assets consist of:
|
||||
Paid in capital
|
$
|
44,010,205
|
||
Total accumulated earnings (loss)
|
(148)
|
|||
Net Assets
|
$
|
44,010,057
|
||
Net Asset Value and Maximum Offering Price
|
||||
Capital Reserves Class :
|
||||
Net Asset Value, offering price and redemption price per share ($1,844,255 ÷ 1,843,534 shares)
|
$
|
1.00
|
||
Daily Money Class :
|
||||
Net Asset Value, offering price and redemption price per share ($2,949,844 ÷ 2,949,411 shares)
|
$
|
1.00
|
||
Advisor C Class :
|
||||
Net Asset Value and offering price per share ($104,693 ÷ 104,678 shares)
|
$
|
1.00
|
||
Fidelity Treasury Money Market Fund :
|
||||
Net Asset Value, offering price and redemption price per share ($39,111,265 ÷ 39,111,265 shares)
|
$
|
1.00
|
||
Statement of Operations
|
||||
Amounts in thousands
|
Year ended
October 31, 2023
|
|||
Investment Income
|
||||
Interest
|
$
|
1,924,913
|
||
Expenses
|
||||
Management fee
|
$
|
98,615
|
||
Transfer agent fees
|
62,669
|
|||
Distribution and service plan fees
|
15,795
|
|||
Accounting fees and expenses
|
1,708
|
|||
Custodian fees and expenses
|
101
|
|||
Independent trustees' fees and expenses
|
133
|
|||
Registration fees
|
4,111
|
|||
Audit
|
49
|
|||
Legal
|
41
|
|||
Miscellaneous
|
305
|
|||
Total expenses before reductions
|
183,527
|
|||
Expense reductions
|
(702)
|
|||
Total expenses after reductions
|
182,825
|
|||
Net Investment income (loss)
|
1,742,088
|
|||
Realized and Unrealized Gain (Loss)
|
||||
Net realized gain (loss) on:
|
||||
Investment Securities:
|
||||
Unaffiliated issuers
|
6
|
|||
Total net realized gain (loss)
|
6
|
|||
Net increase in net assets resulting from operations
|
$
|
1,742,094
|
||
Statement of Changes in Net Assets
|
||||
Amount in thousands
|
Year ended
October 31, 2023
|
Year ended
October 31, 2022
|
||
Increase (Decrease) in Net Assets
|
||||
Operations
|
||||
Net investment income (loss)
|
$
|
1,742,088
|
$
|
239,574
|
Net realized gain (loss)
|
6
|
(227)
|
||
Net increase in net assets resulting from operations
|
1,742,094
|
239,347
|
||
Distributions to shareholders
|
(1,742,050)
|
(239,562)
|
||
Share transactions - net increase (decrease)
|
11,062,345
|
(757,238)
|
||
Total increase (decrease) in net assets
|
11,062,389
|
(757,453)
|
||
Net Assets
|
||||
Beginning of period
|
32,947,668
|
33,705,121
|
||
End of period
|
$
|
44,010,057
|
$
|
32,947,668
|
Fidelity® Treasury Money Market Fund Capital Reserves Class
|
Years ended October 31,
|
2023
|
2022
|
2021
|
2020
|
2019
|
|||||
Selected Per-Share Data
|
||||||||||
Net asset value, beginning of period
|
$
|
1.00
|
$
|
1.00
|
$
|
1.00
|
$
|
1.00
|
$
|
1.00
|
Income from Investment Operations
|
||||||||||
Net investment income (loss) A
|
.039
|
.005
|
- B
|
.003
|
.014
|
|||||
Net realized and unrealized gain (loss) B
|
-
|
-
|
-
|
-
|
-
|
|||||
Total from investment operations
|
.039
|
.005
|
- B
|
.003
|
.014
|
|||||
Distributions from net investment income
|
(.039)
|
(.005)
|
- B
|
(.003)
|
(.014)
|
|||||
Total distributions
|
(.039)
|
(.005)
|
- B
|
(.003)
|
(.014)
|
|||||
Net asset value, end of period
|
$
|
1.00
|
$
|
1.00
|
$
|
1.00
|
$
|
1.00
|
$
|
1.00
|
Total Return C
|
3.96%
|
.50%
|
.01%
|
.27%
|
1.41%
|
|||||
Ratios to Average Net Assets A,D,E
|
||||||||||
Expenses before reductions
|
.97%
|
.96%
|
.97%
|
.97%
|
.97%
|
|||||
Expenses net of fee waivers, if any
|
.95%
|
.52%
|
.08%
|
.49%
|
.94%
|
|||||
Expenses net of all reductions
|
.95%
|
.52%
|
.08%
|
.49%
|
.94%
|
|||||
Net investment income (loss)
|
3.93%
|
.46%
|
.01%
|
.17%
|
1.40%
|
|||||
Supplemental Data
|
||||||||||
Net assets, end of period (in millions)
|
$
|
1,844
|
$
|
1,487
|
$
|
1,486
|
$
|
1,320
|
$
|
1,407
|
Fidelity® Treasury Money Market Fund Daily Money Class
|
Years ended October 31,
|
2023
|
2022
|
2021
|
2020
|
2019
|
|||||
Selected Per-Share Data
|
||||||||||
Net asset value, beginning of period
|
$
|
1.00
|
$
|
1.00
|
$
|
1.00
|
$
|
1.00
|
$
|
1.00
|
Income from Investment Operations
|
||||||||||
Net investment income (loss) A
|
.041
|
.006
|
- B
|
.004
|
.017
|
|||||
Net realized and unrealized gain (loss) B
|
-
|
-
|
-
|
-
|
-
|
|||||
Total from investment operations
|
.041
|
.006
|
- B
|
.004
|
.017
|
|||||
Distributions from net investment income
|
(.041)
|
(.006)
|
- B
|
(.004)
|
(.017)
|
|||||
Total distributions
|
(.041)
|
(.006)
|
- B
|
(.004)
|
(.017)
|
|||||
Net asset value, end of period
|
$
|
1.00
|
$
|
1.00
|
$
|
1.00
|
$
|
1.00
|
$
|
1.00
|
Total Return C
|
4.22%
|
.61%
|
.01%
|
.36%
|
1.66%
|
|||||
Ratios to Average Net Assets A,D,E
|
||||||||||
Expenses before reductions
|
.72%
|
.71%
|
.71%
|
.72%
|
.72%
|
|||||
Expenses net of fee waivers, if any
|
.70%
|
.42%
|
.08%
|
.40%
|
.69%
|
|||||
Expenses net of all reductions
|
.70%
|
.42%
|
.08%
|
.40%
|
.69%
|
|||||
Net investment income (loss)
|
4.18%
|
.56%
|
.01%
|
.25%
|
1.65%
|
|||||
Supplemental Data
|
||||||||||
Net assets, end of period (in millions)
|
$
|
2,950
|
$
|
1,921
|
$
|
1,827
|
$
|
2,194
|
$
|
1,934
|
Fidelity® Treasury Money Market Fund Advisor C Class
|
Years ended October 31,
|
2023
|
2022
|
2021
|
2020
|
2019
|
|||||
Selected Per-Share Data
|
||||||||||
Net asset value, beginning of period
|
$
|
1.00
|
$
|
1.00
|
$
|
1.00
|
$
|
1.00
|
$
|
1.00
|
Income from Investment Operations
|
||||||||||
Net investment income (loss) A
|
.034
|
.003
|
- B
|
.001
|
.009
|
|||||
Net realized and unrealized gain (loss) B
|
-
|
-
|
-
|
-
|
-
|
|||||
Total from investment operations
|
.034
|
.003
|
- B
|
.001
|
.009
|
|||||
Distributions from net investment income
|
(.034)
|
(.003)
|
- B
|
(.001)
|
(.009)
|
|||||
Total distributions
|
(.034)
|
(.003)
|
- B
|
(.001)
|
(.009)
|
|||||
Net asset value, end of period
|
$
|
1.00
|
$
|
1.00
|
$
|
1.00
|
$
|
1.00
|
$
|
1.00
|
Total Return C,D
|
3.44%
|
.32%
|
.01%
|
.09%
|
.91%
|
|||||
Ratios to Average Net Assets A,E,F
|
||||||||||
Expenses before reductions
|
1.47%
|
1.46%
|
1.47%
|
1.47%
|
1.47%
|
|||||
Expenses net of fee waivers, if any
|
1.45%
|
.81%
|
.08%
|
.57%
|
1.44%
|
|||||
Expenses net of all reductions
|
1.45%
|
.81%
|
.08%
|
.57%
|
1.43%
|
|||||
Net investment income (loss)
|
3.43%
|
.17%
|
.01%
|
.08%
|
.90%
|
|||||
Supplemental Data
|
||||||||||
Net assets, end of period (in millions)
|
$
|
105
|
$
|
122
|
$
|
77
|
$
|
119
|
$
|
72
|
Fidelity® Treasury Money Market Fund
|
Years ended October 31,
|
2023
|
2022
|
2021
|
2020
|
2019
|
|||||
Selected Per-Share Data
|
||||||||||
Net asset value, beginning of period
|
$
|
1.00
|
$
|
1.00
|
$
|
1.00
|
$
|
1.00
|
$
|
1.00
|
Income from Investment Operations
|
||||||||||
Net investment income (loss) A
|
.044
|
.007
|
- B
|
.005
|
.019
|
|||||
Net realized and unrealized gain (loss) B
|
-
|
-
|
-
|
-
|
-
|
|||||
Total from investment operations
|
.044
|
.007
|
- B
|
.005
|
.019
|
|||||
Distributions from net investment income
|
(.044)
|
(.007)
|
- B
|
(.005)
|
(.019)
|
|||||
Total distributions
|
(.044)
|
(.007)
|
- B
|
(.005)
|
(.019)
|
|||||
Net asset value, end of period
|
$
|
1.00
|
$
|
1.00
|
$
|
1.00
|
$
|
1.00
|
$
|
1.00
|
Total Return C,D
|
4.51%
|
.75%
|
.01%
|
.47%
|
1.95%
|
|||||
Ratios to Average Net Assets A,E,F
|
||||||||||
Expenses before reductions
|
.42%
|
.42%
|
.42%
|
.42%
|
.42%
|
|||||
Expenses net of fee waivers, if any
|
.42%
|
.28%
|
.08%
|
.29%
|
.41%
|
|||||
Expenses net of all reductions
|
.42%
|
.28%
|
.08%
|
.29%
|
.41%
|
|||||
Net investment income (loss)
|
4.46%
|
.70%
|
.01%
|
.36%
|
1.93%
|
|||||
Supplemental Data
|
||||||||||
Net assets, end of period (in millions)
|
$
|
39,111
|
$
|
29,418
|
$
|
30,315
|
$
|
25,111
|
$
|
14,992
|
Current 7-Day Yields
|
||
Capital Reserves Class
|
3.10%
|
|
Daily Money Class
|
3.35%
|
|
Fidelity® Tax-Exempt Money Market Fund
|
3.63%
|
|
Premium Class
|
3.75%
|
|
Yield refers to the income paid by the Fund over a given period. Yield for money market funds is usually for seven-day periods, as it is here, though it is expressed as an annual percentage rate. Past performance is no guarantee of future results. Yield will vary and it's possible to lose money investing in the Fund. A portion of the Fund's expenses was reimbursed and/or waived. Absent such reimbursements and/or waivers the yield for the period ending October 31, 2023, the most recent period shown in the table, would have been 3.59% for Fidelity® Tax-Exempt Money Market Fund and 3.69% for Premium Class.
|
||
Effective Maturity Diversification (% of Fund's Investments)
|
||
|
Days
|
||
1 - 7
|
81.9
|
|
8 - 30
|
2.6
|
|
31 - 60
|
2.4
|
|
61 - 90
|
1.7
|
|
91 - 180
|
2.7
|
|
> 180
|
8.7
|
|
|
Effective maturity is determined in accordance with the requirements of Rule 2a-7 under the Investment Company Act of 1940.
|
||
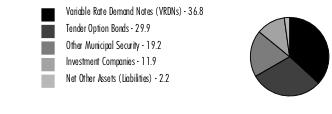
Asset Allocation (% of Fund's net assets)
|
|
Variable Rate Demand Note - 36.8%
|
|||
Principal
Amount (a)
(000s)
|
Value ($)
(000s)
|
||
Alabama - 0.3%
|
|||
Mobile Downtown Redev. Auth. Gulf Opportunity Zone Series 2011 A, 4.12% 11/7/23, LOC Bank of America NA, VRDN (b)(c)
|
9,860
|
9,860
|
|
Alaska - 1.8%
|
|||
Valdez Marine Term. Rev.:
|
|||
(ConocoPhillips Proj.) Series 1994 A, 4.25% 11/7/23 (ConocoPhillips Co. Guaranteed), VRDN (c)
|
11,200
|
11,200
|
|
(Phillips Trans. Alaska, Inc. Proj.):
|
|||
Series 1994 B, 4.25% 11/7/23 (ConocoPhillips Co. Guaranteed), VRDN (c)
|
16,500
|
16,500
|
|
Series 1994 C, 4.05% 11/7/23 (ConocoPhillips Co. Guaranteed), VRDN (c)
|
26,900
|
26,900
|
|
TOTAL ALASKA
|
54,600
|
||
Arizona - 0.8%
|
|||
Maricopa County Poll. Cont. Rev.:
|
|||
(Arizona Pub. Svc. Co. Palo Verde Proj.) Series 2009 A, 4.3% 11/7/23, VRDN (c)
|
15,825
|
15,825
|
|
Series 2009 C, 4.3% 11/7/23, VRDN (c)
|
8,000
|
8,000
|
|
Tempe Indl. Dev. Auth. Rev. (ASUF Brickyard Proj.) Series 2004 A, 4.24% 11/7/23, LOC Bank of America NA, VRDN (c)
|
2,100
|
2,100
|
|
TOTAL ARIZONA
|
25,925
|
||
Connecticut - 2.5%
|
|||
Connecticut Gen. Oblig. Series 2016 C, 4.13% 11/7/23 (Liquidity Facility Bank of America NA), VRDN (c)
|
36,785
|
36,785
|
|
Connecticut Health & Edl. Facilities Auth. Rev.:
|
|||
(Greenwich Hosp. Proj.) Series C, 3.95% 11/7/23, VRDN (c)
|
3,070
|
3,070
|
|
(Trinity College Proj.) Series L, 4.05% 11/7/23, LOC JPMorgan Chase Bank, VRDN (c)
|
7,470
|
7,470
|
|
Series 2013 O, 4.07% 11/7/23, VRDN (c)
|
3,200
|
3,200
|
|
Connecticut Hsg. Fin. Auth.:
|
|||
Series 2018 E2, 4.11% 11/7/23 (Liquidity Facility Bank of America NA), VRDN (c)
|
11,400
|
11,400
|
|
Series 2022 C2, 4.1% 11/7/23 (Liquidity Facility JPMorgan Chase Bank), VRDN (c)
|
14,625
|
14,625
|
|
TOTAL CONNECTICUT
|
76,550
|
||
Delaware - 0.2%
|
|||
Delaware Econ. Dev. Auth. Rev. (Delmarva Pwr. & Lt. Co. Proj.):
|
|||
Series 1993 C, 4.27% 11/7/23, VRDN (c)
|
2,300
|
2,300
|
|
Series 1999 A, 4.32% 11/7/23, VRDN (c)
|
3,500
|
3,500
|
|
TOTAL DELAWARE
|
5,800
|
||
Florida - 1.6%
|
|||
Escambia County Solid Waste Disp. Rev. (Gulf Pwr. Co. Proj.) Series 2009, 4.1% 11/7/23, VRDN (c)
|
3,000
|
3,000
|
|
Highlands County Health Facilities Auth. Rev.:
|
|||
(Adventist Health Sys./Sunbelt, Inc. Prog.) Series 2007 A1, 4.05% 11/7/23, VRDN (c)
|
1,735
|
1,735
|
|
Series 2021 D, 4.14% 11/7/23, VRDN (c)
|
24,500
|
24,500
|
|
Jacksonville Poll. Cont. Rev. (Florida Pwr. & Lt. Co. Proj.) Series 1995, 4.6% 11/7/23, VRDN (c)
|
8,800
|
8,800
|
|
Martin County Rev. (Florida Pwr. & Lt. Co. Proj.) Series 2022, 4.2% 11/7/23, VRDN (c)
|
5,000
|
5,000
|
|
Mississippi Bus. Fin. Corp. Poll. Cont. Rev. (Gulf Pwr. Co. Proj.) Series 2014, 4.6% 11/7/23, VRDN (c)
|
2,700
|
2,700
|
|
Palm Beach County Rev. (Raymond F. Kravis Ctr. Proj.) Series 2002, 4.13% 11/7/23, LOC Northern Trust Co., VRDN (c)
|
2,700
|
2,700
|
|
TOTAL FLORIDA
|
48,435
|
||
Georgia - 2.0%
|
|||
Burke County Indl. Dev. Auth. Poll. Cont. Rev. (Georgia Pwr. Co. Plant Vogtle Proj.):
|
|||
First Series 2009, 4.25% 11/1/23, VRDN (c)
|
24,800
|
24,800
|
|
Series 2018, 4.45% 11/1/23, VRDN (c)
|
13,000
|
13,000
|
|
Heard County Dev. Auth. Poll. Cont. Rev. (Georgia Pwr. Co. Plant Wansley Proj.) First Series 1997, 4.35% 11/1/23, VRDN (c)
|
5,100
|
5,100
|
|
Monroe County Dev. Auth. Poll. Cont. Rev.:
|
|||
(Georgia Pwr. Co. Plant Scherer Proj.):
|
|||
Series 1997, 4.28% 11/1/23, VRDN (c)
|
7,100
|
7,100
|
|
Series 2008, 4.28% 11/1/23, VRDN (c)
|
10,900
|
10,900
|
|
(Gulf Pwr. Co. Plant Scherer Proj.) Series 2010, 4.2% 11/7/23, VRDN (c)
|
1,600
|
1,600
|
|
TOTAL GEORGIA
|
62,500
|
||
Illinois - 1.8%
|
|||
Illinois Dev. Fin. Auth. Rev. (Glenwood School for Boys Proj.) Series 1998, 4.26% 11/7/23, LOC Northern Trust Co., VRDN (c)
|
2,000
|
2,000
|
|
Illinois Fin. Auth.:
|
|||
Series 2021 C, 4% 11/7/23, LOC Barclays Bank PLC, VRDN (c)
|
7,500
|
7,500
|
|
Series 2021 D, 4% 11/7/23, VRDN (c)
|
8,400
|
8,400
|
|
Illinois Fin. Auth. Rev.:
|
|||
(Chicago Symphony Orchestra Proj.) Series 2008, 4.08% 11/7/23, LOC PNC Bank NA, VRDN (c)
|
7,250
|
7,250
|
|
(Latin School Proj.) Series 2005 B, 4.1% 11/7/23, LOC JPMorgan Chase Bank, VRDN (c)
|
2,200
|
2,200
|
|
(Little Co. of Mary Hosp. Proj.):
|
|||
Series 2008 A, 4.15% 11/7/23, LOC TD Banknorth, NA, VRDN (c)
|
5,700
|
5,700
|
|
Series 2008 B, 4.15% 11/7/23, LOC TD Banknorth, NA, VRDN (c)
|
15,200
|
15,200
|
|
FHLMC Lake County Multi-family Hsg. Rev. (Whispering Oaks Apts. Proj.) Series 2008, 4.12% 11/7/23, LOC Freddie Mac, VRDN (c)
|
7,700
|
7,700
|
|
TOTAL ILLINOIS
|
55,950
|
||
Indiana - 1.9%
|
|||
Indiana Dev. Fin. Auth. Envir. Rev.:
|
|||
(Duke Energy Indiana, Inc. Proj.) Series 2009 A3, 4.16% 11/7/23, LOC Mizuho Bank Ltd., VRDN (c)
|
1,520
|
1,520
|
|
Series 2005, 4.3% 11/7/23, LOC Rabobank Nederland New York Branch, VRDN (c)
|
15,000
|
15,000
|
|
Indiana Fin. Auth. Hosp. Rev. (Parkview Health Sys. Oblig. Group Proj.) Series 2009 C, 4.2% 11/7/23, LOC Sumitomo Mitsui Banking Corp., VRDN (c)
|
7,920
|
7,920
|
|
Indiana Fin. Auth. Rev.:
|
|||
(Ascension Health Proj.) Series 2008 E4, 4.08% 11/7/23, VRDN (c)
|
5,400
|
5,400
|
|
(Ascension Health Subordinate Cr. Proj.) Series 2008 E5, 4.08% 11/7/23, VRDN (c)
|
6,625
|
6,625
|
|
(Trinity Health Cr. Group Proj.) Series 2008 D1, 4.09% 11/7/23, VRDN (c)
|
17,400
|
17,400
|
|
Series 2008 E7, 4.05% 11/7/23, VRDN (c)
|
5,700
|
5,700
|
|
TOTAL INDIANA
|
59,565
|
||
Iowa - 1.3%
|
|||
Council Bluffs Poll. Cont. Series 1995, 4.25% 11/7/23, VRDN (c)
|
5,200
|
5,200
|
|
Iowa Fin. Auth. Econ. Dev. Rev. Series 2011 A, 4.12% 11/7/23, VRDN (c)
|
1,700
|
1,700
|
|
Iowa Fin. Auth. Midwestern Disaster Area Econ. Dev. Series 2012 A, 4.12% 11/7/23, VRDN (c)
|
19,700
|
19,700
|
|
Iowa Fin. Auth. Midwestern Disaster Area Rev. (Archer-Daniels-Midland Co. Proj.) Series 2012, 4.11% 11/7/23, VRDN (c)
|
12,620
|
12,620
|
|
TOTAL IOWA
|
39,220
|
||
Kansas - 0.9%
|
|||
Burlington Envir. Impt. Rev. (Kansas City Pwr. and Lt. Co. Proj.):
|
|||
Series 2007 A, 4.1% 11/7/23, VRDN (c)
|
6,400
|
6,400
|
|
Series 2007 B, 4.1% 11/7/23, VRDN (c)
|
3,500
|
3,500
|
|
St. Mary's Kansas Poll. Cont. Rev.:
|
|||
(Kansas Gas and Elec. Co. Proj.) Series 1994, 4.1% 11/7/23, VRDN (c)
|
700
|
700
|
|
Series 1994, 4.1% 11/7/23, VRDN (c)
|
11,500
|
11,500
|
|
Wamego Kansas Poll. Cont. Rfdg. Rev.:
|
|||
(Kansas Gas & Elec. Co. Proj.) Series 1994, 4.1% 11/7/23, VRDN (c)
|
1,200
|
1,200
|
|
(Western Resources, Inc. Proj.) Series 1994, 4.1% 11/7/23, VRDN (c)
|
5,100
|
5,100
|
|
TOTAL KANSAS
|
28,400
|
||
Louisiana - 1.2%
|
|||
Louisiana Pub. Facilities Auth. Rev.:
|
|||
(Air Products & Chemicals, Inc. Proj.) Series 2009 A, 4.15% 11/7/23, VRDN (c)
|
7,200
|
7,200
|
|
(Christus Health Proj.) Series 2008 B, 4.05% 11/7/23, VRDN (c)
|
7,700
|
7,700
|
|
Saint James Parish Gen. Oblig. (Nucor Steel Louisiana LLC Proj.):
|
|||
Series 2010 A1, 4.61% 11/7/23, VRDN (c)
|
10,120
|
10,120
|
|
Series 2010 B1, 4.4% 11/7/23, VRDN (c)
|
8,500
|
8,500
|
|
FHLMC:
|
|||
Louisiana Hsg. Fin. Auth. Multi-family Hsg. Rev. (The Reserve at Jefferson Proj.) Series 2008, 4.13% 11/7/23, LOC Freddie Mac, VRDN (c)
|
1,500
|
1,500
|
|
Louisiana Pub. Facilities Auth. Rev. (River View Villas Proj.) Series 2006, 4.16% 11/7/23, LOC Freddie Mac, VRDN (c)
|
2,785
|
2,785
|
|
TOTAL LOUISIANA
|
37,805
|
||
Massachusetts - 0.5%
|
|||
Massachusetts Bay Trans. Auth. Series 2000 A2, 4.1% 11/7/23 (Liquidity Facility TD Banknorth, NA), VRDN (c)
|
2,780
|
2,780
|
|
Massachusetts Dept. of Trans. Metropolitan Hwy. Sys. Rev.:
|
|||
Series 2010 A1, 4.07% 11/7/23, LOC TD Banknorth, NA, VRDN (c)
|
9,000
|
9,000
|
|
Series 2022 A1, 4.12% 11/7/23 (Liquidity Facility TD Banknorth, NA), VRDN (c)
|
3,700
|
3,700
|
|
TOTAL MASSACHUSETTS
|
15,480
|
||
Michigan - 0.8%
|
|||
Kent Hosp. Fin. Auth. Hosp. Facilities Rev. (Spectrum Health Sys. Proj.) Series 2008 B3, 4.15% 11/7/23 (Liquidity Facility Wells Fargo Bank NA), VRDN (c)
|
12,800
|
12,800
|
|
Michigan Fin. Auth. Rev. Series 2016 E3, 4.05% 11/7/23, VRDN (c)
|
2,800
|
2,800
|
|
Michigan Strategic Fund Ltd. Oblig. Rev. (The Kroger Co. Recovery Zone Facilities Bond Proj.) Series 2010, 4.13% 11/7/23, LOC Bank of Nova Scotia, VRDN (c)
|
6,000
|
6,000
|
|
FHLMC Livonia Econ. Dev. Corp. (Madonna Univ. Proj.) Series 2009, 4.14% 11/7/23, LOC Fed. Home Ln. Bank Chicago, VRDN (c)
|
2,670
|
2,670
|
|
TOTAL MICHIGAN
|
24,270
|
||
Minnesota - 1.1%
|
|||
Hennepin County Gen. Oblig. Series 2018 B, 4.05% 11/7/23 (Liquidity Facility TD Banknorth, NA), VRDN (c)
|
11,810
|
11,810
|
|
Minneapolis Health Care Sys. Rev. (Fairview Health Svcs.) Series 2018 B, 4.1% 11/7/23, LOC JPMorgan Chase Bank, VRDN (c)
|
21,900
|
21,900
|
|
TOTAL MINNESOTA
|
33,710
|
||
Missouri - 0.5%
|
|||
Missouri Health & Edl. Facilities Auth. Rev. (Ascension Health Cr. Group Proj.):
|
|||
Series 2003 C2, 4.05% 11/7/23, VRDN (c)
|
6,195
|
6,195
|
|
Series 2003 C3, 4.16% 11/7/23, VRDN (c)
|
10,250
|
10,250
|
|
TOTAL MISSOURI
|
16,445
|
||
Nebraska - 0.4%
|
|||
Nebraska Invt. Fin. Auth. Single Family Hsg. Rev. Series 2019 C, 4.1% 11/7/23 (Liquidity Facility Fed. Home Ln. Bank Topeka), VRDN (c)
|
13,770
|
13,770
|
|
Nevada - 1.0%
|
|||
Clark County Arpt. Rev.:
|
|||
Series 2008 D 2B, 4.08% 11/7/23, LOC Sumitomo Mitsui Banking Corp., VRDN (c)
|
27,110
|
27,110
|
|
Series 2008 D3, 4.1% 11/7/23, LOC Bank of America NA, VRDN (c)
|
5,135
|
5,135
|
|
TOTAL NEVADA
|
32,245
|
||
New York - 1.3%
|
|||
Build NYC Resource Corp. Rev. (The Asia Society Proj.) Series 2015, 4.05% 11/7/23, LOC TD Banknorth, NA, VRDN (c)
|
2,300
|
2,300
|
|
New York City Gen. Oblig.:
|
|||
Series 2013 A4, 4.05% 11/7/23 (Liquidity Facility Sumitomo Mitsui Banking Corp.), VRDN (c)
|
4,500
|
4,500
|
|
Series D5, 4.08% 11/7/23, LOC PNC Bank NA, VRDN (c)
|
9,875
|
9,875
|
|
New York City Muni. Wtr. Fin. Auth. Wtr. & Swr. Sys. Rev. Series 2016 AA2, 4.09% 11/7/23 (Liquidity Facility PNC Bank NA), VRDN (c)
|
14,900
|
14,900
|
|
New York City Transitional Fin. Auth. Rev. Series 2018 C6, 4.07% 11/7/23 (Liquidity Facility Sumitomo Mitsui Banking Corp.), VRDN (c)
|
3,800
|
3,800
|
|
New York Hsg. Fin. Agcy. Rev. Series 2010 A, 4.12% 11/7/23, LOC Landesbank Hessen-Thuringen, VRDN (c)
|
3,100
|
3,100
|
|
New York Metropolitan Trans. Auth. Rev. Series 2005 E1, 4% 11/7/23, LOC Barclays Bank PLC, VRDN (c)
|
1,045
|
1,045
|
|
TOTAL NEW YORK
|
39,520
|
||
New York And New Jersey - 0.1%
|
|||
Port Auth. of New York & New Jersey Series 1997 1, 4.14% 11/30/23, VRDN (c)(d)
|
3,000
|
3,000
|
|
North Carolina - 0.0%
|
|||
Durham County Indl. and Poll. Cont. Auth. Rev. Series 2007, 4.05% 11/7/23, LOC TD Banknorth, NA, VRDN (c)
|
900
|
900
|
|
Ohio - 2.5%
|
|||
Cuyahoga County Health Care Facilities Rev. (The A.M. McGregor Home Proj.) Series 2014, 4.14% 11/7/23, LOC Northern Trust Co., VRDN (c)
|
9,120
|
9,120
|
|
Franklin County Hosp. Facilities Rev.:
|
|||
Series 2009 B, 3.98% 11/7/23 (Liquidity Facility Barclays Bank PLC), VRDN (c)
|
5,990
|
5,990
|
|
Series 2011 C, 3.95% 11/7/23, VRDN (c)
|
2,900
|
2,900
|
|
Series 2013 B, 4.06% 11/7/23 (Liquidity Facility JPMorgan Chase Bank), VRDN (c)
|
3,525
|
3,525
|
|
Series 2018 C, 3.95% 11/7/23, VRDN (c)
|
4,200
|
4,200
|
|
Hamilton County Hosp. Facilities Rev.:
|
|||
Series 2018 AA, 4.12% 11/7/23, VRDN (c)
|
10,565
|
10,565
|
|
Series 2018 Z, 4.07% 11/7/23, VRDN (c)
|
10,500
|
10,500
|
|
Ohio Cap. Facilities Lease (Adult Correctional Bldg. Fund Proj.) Series 2019 C, 4.01% 11/7/23, VRDN (c)
|
11,250
|
11,250
|
|
Ohio Hosp. Facilities Rev. Series 2019 D1, 3.95% 11/7/23, VRDN (c)
|
1,500
|
1,500
|
|
Ohio State Univ. Gen. Receipts:
|
|||
(Multiyear Debt Issuance Prog. II) Series 2023 D2, 3.95% 11/7/23, VRDN (c)
|
12,500
|
12,500
|
|
Series 2023 A1, 3.95% 11/7/23, VRDN (c)
|
6,000
|
6,000
|
|
TOTAL OHIO
|
78,050
|
||
Pennsylvania - 0.8%
|
|||
Lancaster Indl. Dev. Auth. Rev.:
|
|||
(Willow Valley Retirement Cmntys. Proj.) Series 2009 C, 4.13% 11/7/23, LOC PNC Bank NA, VRDN (c)
|
4,570
|
4,570
|
|
(Willow Valley Retirement Proj.) Series 2009 B, 4.13% 11/7/23, LOC PNC Bank NA, VRDN (c)
|
3,210
|
3,210
|
|
Lehigh County Gen. Purp. Hosp. Rev. Series 2019 B, 4.13% 11/7/23, LOC Bank of America NA, VRDN (c)
|
16,800
|
16,800
|
|
FNMA Montgomery County Redev. Auth. Multi-family Hsg. Rev. (Kingswood Apts. Proj.) Series 2001 A, 4.18% 11/7/23, LOC Fannie Mae, VRDN (c)
|
1,800
|
1,800
|
|
TOTAL PENNSYLVANIA
|
26,380
|
||
Texas - 8.0%
|
|||
Harris County Cultural Ed. Facilities Fin. Corp. Rev.:
|
|||
Series 2016 C, 4.05% 11/7/23, VRDN (c)
|
18,300
|
18,300
|
|
Series 2016 D, 4.11% 11/7/23, VRDN (c)
|
12,595
|
12,595
|
|
Series 2019 E, 4.05% 11/7/23, VRDN (c)
|
4,800
|
4,800
|
|
Series 2019 F, 4.11% 11/7/23, VRDN (c)
|
17,625
|
17,625
|
|
Houston Util. Sys. Rev.:
|
|||
Series 2004 B2, 4.1% 11/7/23, LOC Sumitomo Mitsui Banking Corp., VRDN (c)
|
3,850
|
3,850
|
|
Series 2004 B4, 4.1% 11/7/23 (Liquidity Facility JPMorgan Chase Bank), VRDN (c)
|
9,500
|
9,500
|
|
Series 2004 B5, 4.1% 11/7/23 (Liquidity Facility UBS AG), VRDN (c)
|
13,400
|
13,400
|
|
Port Arthur Navigation District Exempt Facilities (Var-Total Petrochemicals Proj.) Series 2009, 4.11% 11/7/23 (TotalEnergies SE Guaranteed), VRDN (c)
|
3,000
|
3,000
|
|
Port Arthur Navigation District Indl. Dev. Corp. Exempt Facilities Rev.:
|
|||
(Air Products Proj.) Series 2012, 4.15% 11/7/23 (TotalEnergies SE Guaranteed), VRDN (c)
|
39,500
|
39,500
|
|
(Total Petrochemicals & Refining U.S.A., Inc. Proj.) Series 2012 B, 4.11% 11/7/23 (TotalEnergies SE Guaranteed), VRDN (c)
|
4,200
|
4,200
|
|
(Total Petrochemicals and Refining U.S.A., Inc. Proj.) Series 2012 A, 4.11% 11/7/23 (TotalEnergies SE Guaranteed), VRDN (c)
|
11,700
|
11,700
|
|
Tarrant County Cultural Ed. Facilities Fin. Corp. Rev. (Christus Health Proj.):
|
|||
Series 2008 C1, 4.1% 11/7/23, LOC Sumitomo Mitsui Banking Corp., VRDN (c)
|
18,820
|
18,820
|
|
Series 2008 C3, 4.1% 11/7/23, LOC Bank of Montreal, VRDN (c)
|
5,110
|
5,110
|
|
Texas Gen. Oblig.:
|
|||
(Texas Veterans Land Board Proj.) Series 2017, 4.1% 11/7/23 (Liquidity Facility Sumitomo Mitsui Banking Corp.), VRDN (c)
|
12,400
|
12,400
|
|
Series 2011 A, 4.15% 11/7/23 (Liquidity Facility State Street Bank & Trust Co., Boston), VRDN (c)
|
11,585
|
11,585
|
|
Series 2011 B, 4.15% 11/7/23 (Liquidity Facility State Street Bank & Trust Co., Boston), VRDN (c)
|
9,105
|
9,105
|
|
Series 2012 B, 4.15% 11/7/23 (Liquidity Facility State Street Bank & Trust Co., Boston), VRDN (c)
|
5,855
|
5,855
|
|
Series 2013 B, 4.15% 11/7/23 (Liquidity Facility State Street Bank & Trust Co., Boston), VRDN (c)
|
14,945
|
14,945
|
|
Series 2014 A, 4.15% 11/7/23 (Liquidity Facility State Street Bank & Trust Co., Boston), VRDN (c)
|
9,695
|
9,695
|
|
Series 2015 A, 4.15% 11/7/23 (Liquidity Facility State Street Bank & Trust Co., Boston), VRDN (c)
|
3,200
|
3,200
|
|
Series 2019, 4.1% 11/7/23 (Liquidity Facility JPMorgan Chase Bank), VRDN (c)
|
18,410
|
18,410
|
|
TOTAL TEXAS
|
247,595
|
||
Utah - 1.2%
|
|||
Emery County Poll. Cont. Rev. (PacifiCorp Proj.) Series 1994, 4.25% 11/7/23, VRDN (c)
|
36,700
|
36,700
|
|
Virginia - 1.3%
|
|||
Fairfax County Indl. Dev. Auth.:
|
|||
(Inova Health Sys. Proj.) Series 2018 C, 4.1% 11/7/23, VRDN (c)
|
2,300
|
2,300
|
|
Series 2016 C, 4.1% 11/7/23, VRDN (c)
|
7,145
|
7,145
|
|
Norfolk Econ. Dev. Auth. Hosp. Facilities Rev. Series 2016 B, 4.05% 11/7/23, VRDN (c)
|
725
|
725
|
|
Roanoke Econ. Dev. Authority. Series 2020 C, 4.07% 11/7/23, LOC Wells Fargo Bank NA, VRDN (c)
|
11,975
|
11,975
|
|
Virginia Small Bus. Fin. Auth. Hosp. Rev.:
|
|||
Series 2008 A, 4.08% 11/7/23, LOC PNC Bank NA, VRDN (c)
|
13,100
|
13,100
|
|
Series 2008 B, 4.07% 11/7/23, LOC Wells Fargo Bank NA, VRDN (c)
|
5,000
|
5,000
|
|
TOTAL VIRGINIA
|
40,245
|
||
Washington - 0.4%
|
|||
Port of Vancouver Rev. (United Grain Corp. of Oregon Proj.) Series 2009, 4.17% 11/7/23, LOC Bank of America NA, VRDN (c)
|
5,900
|
5,900
|
|
FHLMC Washington Hsg. Fin. Commission Multi-family Hsg. Rev. (Reserve at Renton Apts. Proj.) Series 2014, 4.12% 11/7/23, LOC Fed. Home Ln. Bank, San Francisco, VRDN (c)
|
7,800
|
7,800
|
|
TOTAL WASHINGTON
|
13,700
|
||
Wisconsin - 0.2%
|
|||
Wisconsin Health & Edl. Facilities Auth. Rev. Series 2004, 4% 11/7/23, LOC JPMorgan Chase Bank, VRDN (c)
|
5,050
|
5,050
|
|
Wyoming - 0.4%
|
|||
Converse County Poll. Cont. Rev. (PacifiCorp Projs.) Series 1994, 4.25% 11/7/23, VRDN (c)
|
3,200
|
3,200
|
|
Lincoln County Poll. Cont. Rev. (PacifiCorp Proj.) Series 1994, 4.25% 11/7/23, VRDN (c)
|
10,630
|
10,630
|
|
TOTAL WYOMING
|
13,830
|
||
|
TOTAL VARIABLE RATE DEMAND NOTE
(Cost $1,145,500)
|
1,145,500
|
||
Tender Option Bond - 29.9%
|
|||
Principal
Amount (a)
(000s)
|
Value ($)
(000s)
|
||
Alabama - 0.2%
|
|||
Alabama Spl. Care Facilities Fing. Auth. Birmingham Rev. Participating VRDN Series XF 31 04, 4.12% 11/7/23 (Liquidity Facility Wells Fargo Bank NA) (c)(e)(f)
|
5,580
|
5,580
|
|
Arizona - 0.3%
|
|||
Arizona Indl. Dev. Auth. Hosp. Rev. Participating VRDN Series XM 10 13, 4.21% 11/7/23 (Liquidity Facility JPMorgan Chase Bank) (c)(e)(f)
|
445
|
445
|
|
Arizona Tourism & Sports Auth. Tax Rev. Participating VRDN Series Floaters E85, 4.12% 11/7/23 (Liquidity Facility Royal Bank of Canada) (c)(e)(f)
|
5,380
|
5,380
|
|
Salt Verde Finl. Corp. Sr. Gas Rev. Participating VRDN Series Floaters XF 25 37, 4.13% 11/7/23 (Liquidity Facility Barclays Bank PLC) (c)(e)(f)
|
2,015
|
2,015
|
|
TOTAL ARIZONA
|
7,840
|
||
California - 0.2%
|
|||
California Gen. Oblig. Participating VRDN Series Floaters XF 10 38, 4.12% 11/7/23 (Liquidity Facility Toronto-Dominion Bank) (c)(e)(f)
|
600
|
600
|
|
California Health Facilities Fing. Auth. Rev. Participating VRDN Series Floaters 013, 4.12% 11/7/23 (Liquidity Facility Barclays Bank PLC) (c)(e)(f)
|
2,100
|
2,100
|
|
Lucile Salter Packard Children's Hosp. Participating VRDN Series Floaters XG 01 48, 4.12% 11/7/23 (Liquidity Facility Morgan Stanley Bank, West Valley City Utah) (c)(e)(f)
|
2,226
|
2,226
|
|
TOTAL CALIFORNIA
|
4,926
|
||
Colorado - 1.6%
|
|||
Colorado Ctfs. of Prtn. Participating VRDN Series XG 04 26, 4.12% 11/7/23 (Liquidity Facility UBS AG) (c)(e)(f)
|
2,905
|
2,905
|
|
Colorado Health Facilities Auth. Rev. Bonds Participating VRDN:
|
|||
Series XF 30 40, 4.13% 11/7/23 (Liquidity Facility Barclays Bank PLC) (c)(e)(f)
|
2,600
|
2,600
|
|
Series XG 02 51, 4.14% 11/7/23 (Liquidity Facility Bank of America NA) (c)(e)(f)
|
390
|
390
|
|
Series XM 08 29, 4.13% 11/7/23 (Liquidity Facility Barclays Bank PLC) (c)(e)(f)
|
2,195
|
2,195
|
|
Series XM 11 24, 4.12% 11/7/23 (Liquidity Facility Barclays Bank PLC) (c)(e)(f)
|
2,345
|
2,345
|
|
Colorado State Univ. Board of Governors Enterprise Sys. Rev. Participating VRDN Series E 143, 4.12% 11/7/23 (Liquidity Facility Royal Bank of Canada) (c)(e)(f)
|
38,320
|
38,320
|
|
TOTAL COLORADO
|
48,755
|
||
Connecticut - 2.4%
|
|||
Connecticut Gen. Oblig. Participating VRDN:
|
|||
Series Floaters 014, 4.13% 11/7/23 (Liquidity Facility Barclays Bank PLC) (c)(e)(f)
|
18,045
|
18,045
|
|
Series Floaters 016, 4.13% 11/7/23 (Liquidity Facility Barclays Bank PLC) (c)(e)(f)
|
38,200
|
38,200
|
|
Series Floaters YX 10 95, 4.12% 11/7/23 (Liquidity Facility Barclays Bank PLC) (c)(e)(f)
|
4,925
|
4,925
|
|
Series XM 10 35, 4.12% 11/7/23 (Liquidity Facility JPMorgan Chase Bank) (c)(e)(f)
|
5,305
|
5,305
|
|
Connecticut Spl. Tax Oblig. Trans. Infrastructure Rev. Participating VRDN:
|
|||
Series 2022 YX 12 55, 4.12% 11/7/23 (Liquidity Facility Barclays Bank PLC) (c)(e)(f)
|
6,020
|
6,020
|
|
Series Floaters G 110, 4.12% 11/7/23 (Liquidity Facility Royal Bank of Canada) (c)(e)(f)
|
2,200
|
2,200
|
|
TOTAL CONNECTICUT
|
74,695
|
||
District Of Columbia - 0.4%
|
|||
District of Columbia Gen. Oblig. Participating VRDN Series MS 4301, 4.12% 11/7/23 (Liquidity Facility Morgan Stanley Bank, West Valley City Utah) (c)(e)(f)
|
1,500
|
1,500
|
|
Metropolitan Washington Arpts. Auth. Dulles Toll Road Rev. Participating VRDN:
|
|||
Series XF 08 53, 4.13% 11/7/23 (Liquidity Facility Toronto-Dominion Bank) (c)(e)(f)
|
1,210
|
1,210
|
|
Series XF 08 55, 4.12% 11/7/23 (Liquidity Facility JPMorgan Chase Bank) (c)(e)(f)
|
2,140
|
2,140
|
|
Series XG 02 67, 4.14% 11/7/23 (Liquidity Facility Bank of America NA) (c)(e)(f)
|
6,830
|
6,830
|
|
TOTAL DISTRICT OF COLUMBIA
|
11,680
|
||
Florida - 2.2%
|
|||
Brevard County Health Facilities Auth. Rev. Participating VRDN Series XL 02 53, 4.14% 11/7/23 (Liquidity Facility Barclays Bank PLC) (c)(e)(f)
|
2,630
|
2,630
|
|
Broward County Convention Ctr.:
|
|||
Bonds Series MS 00 11, 3.87%, tender 12/14/23 (Liquidity Facility Morgan Stanley Bank, West Valley City Utah) (c)(d)(e)(f)
|
6,600
|
6,600
|
|
Participating VRDN Series XF 16 41, 4.19% 11/7/23 (Liquidity Facility JPMorgan Chase Bank) (c)(e)(f)
|
3,075
|
3,075
|
|
Broward County School District Participating VRDN Series XM 09 96, 4.12% 11/7/23 (Liquidity Facility Barclays Bank PLC) (c)(e)(f)
|
16,000
|
16,000
|
|
Cape Coral Wtr. & Swr. Rev. Participating VRDN Series YX 13 17, 4.13% 11/7/23 (Liquidity Facility Barclays Bank PLC) (c)(e)(f)
|
2,300
|
2,300
|
|
County of Broward Tourist Dev. Tax Rev. Participating VRDN Series XL 04 29, 4.2% 11/7/23 (Liquidity Facility Wells Fargo Bank NA) (c)(e)(f)
|
600
|
600
|
|
Florida Dept. of Trans. Tpk. Rev. Participating VRDN Series XF 31 00, 4.12% 11/7/23 (Liquidity Facility Barclays Bank PLC) (c)(e)(f)
|
4,270
|
4,270
|
|
Gainesville Utils. Sys. Rev. Participating VRDN Series YX 12 84, 4.12% 11/7/23 (Liquidity Facility Barclays Bank PLC) (c)(e)(f)
|
7,825
|
7,825
|
|
Hillsborough County Indl. Dev. Participating VRDN Series XG 04 67, 4.13% 11/7/23 (Liquidity Facility Barclays Bank PLC) (c)(e)(f)
|
1,710
|
1,710
|
|
Miami-Dade County Edl. Facilities Rev. Participating VRDN Series Floaters XG 01 92, 4.13% 11/7/23 (Liquidity Facility Royal Bank of Canada) (c)(e)(f)
|
1,050
|
1,050
|
|
Miami-Dade County Expressway Auth. Participating VRDN Series Floaters XG 02 52, 4.14% 11/7/23 (Liquidity Facility Bank of America NA) (c)(e)(f)
|
4,400
|
4,400
|
|
Miami-Dade County Health Facilities Auth. Hosp. Rev. Participating VRDN Series XG 04 52, 4.12% 11/7/23 (Liquidity Facility Royal Bank of Canada) (c)(e)(f)
|
1,790
|
1,790
|
|
Miami-Dade County Wtr. & Swr. Rev. Participating VRDN Series XM 11 22, 4.12% 11/7/23 (Liquidity Facility Barclays Bank PLC) (c)(e)(f)
|
6,100
|
6,100
|
|
Orange County Health Facilities Auth. Participating VRDN Series XF 15 98, 4.13% 11/7/23 (Liquidity Facility Toronto-Dominion Bank) (c)(e)(f)
|
2,000
|
2,000
|
|
South Broward Hosp. District Rev. Participating VRDN Series XG 03 45, 4.12% 11/7/23 (Liquidity Facility Wells Fargo Bank NA) (c)(e)(f)
|
1,730
|
1,730
|
|
Tallahassee Health Facilities Rev. Participating VRDN Series BAML 50 33, 4.3% 11/1/23 (Liquidity Facility Bank of America NA) (c)(e)(f)
|
5,500
|
5,500
|
|
TOTAL FLORIDA
|
67,580
|
||
Georgia - 2.0%
|
|||
Brookhaven Dev. Auth. Rev. Participating VRDN:
|
|||
Series XG 02 44, 4.12% 11/7/23 (Liquidity Facility Bank of America NA) (c)(e)(f)
|
2,030
|
2,030
|
|
Series XL 03 07, 4.12% 11/7/23 (Liquidity Facility Wells Fargo Bank NA) (c)(e)(f)
|
3,140
|
3,140
|
|
Series XX 12 80, 4.12% 11/7/23 (Liquidity Facility Barclays Bank PLC) (c)(e)(f)
|
5,900
|
5,900
|
|
Burke County Indl. Dev. Auth. Poll. Cont. Rev. Participating VRDN:
|
|||
Series E 155, 4.13% 11/7/23 (Liquidity Facility Royal Bank of Canada) (c)(e)(f)
|
14,700
|
14,700
|
|
Series Floaters E 107, 4.14% 11/7/23 (Liquidity Facility Royal Bank of Canada) (c)(e)(f)
|
4,700
|
4,700
|
|
Fulton County Dev. Auth. Rev. Participating VRDN Series XL 02 68, 4.19% 11/7/23 (Liquidity Facility Bank of America NA) (c)(e)(f)
|
625
|
625
|
|
Georgia Muni. Elec. Auth. Pwr. Rev. Participating VRDN:
|
|||
Series XF 15 54, 4.13% 11/7/23 (Liquidity Facility Toronto-Dominion Bank) (c)(e)(f)
|
7,140
|
7,140
|
|
Series XF 31 06, 4.13% 11/7/23 (Liquidity Facility Barclays Bank PLC) (c)(e)(f)
|
3,375
|
3,375
|
|
Series XG 04 70, 4.14% 11/7/23 (Liquidity Facility Bank of America NA) (c)(e)(f)
|
1,800
|
1,800
|
|
Hosp. Auth. of Savannah Auth. Rev. Participating VRDN Series BAML 5042, 4.3% 11/1/23 (Liquidity Facility Bank of America NA) (c)(e)(f)
|
5,260
|
5,260
|
|
Main Street Natural Gas, Inc. Participating VRDN:
|
|||
Series Floaters XF 07 51, 4.12% 11/7/23 (Liquidity Facility JPMorgan Chase Bank) (c)(e)(f)
|
3,285
|
3,285
|
|
Series XF 16 01, 4.12% 11/7/23 (Liquidity Facility Royal Bank of Canada) (c)(e)(f)
|
2,200
|
2,200
|
|
Muni. Elec. Auth. of Georgia Participating VRDN Series XG 02 54, 4.14% 11/7/23 (Liquidity Facility Bank of America NA) (c)(e)(f)
|
2,110
|
2,110
|
|
Private Colleges & Univs. Auth. Rev. Participating VRDN Series Floaters XM 04 35, 4.12% 11/7/23 (Liquidity Facility Barclays Bank PLC) (c)(e)(f)
|
5,000
|
5,000
|
|
TOTAL GEORGIA
|
61,265
|
||
Hawaii - 0.1%
|
|||
Honolulu City & County Gen. Oblig. Participating VRDN Series Floaters XM 07 18, 4.12% 11/7/23 (Liquidity Facility Morgan Stanley Bank, West Valley City Utah) (c)(e)(f)
|
3,590
|
3,590
|
|
Illinois - 4.6%
|
|||
Chicago Gen. Oblig. Participating VRDN:
|
|||
Series 2022 XF 30 42, 4.13% 11/7/23 (Liquidity Facility Barclays Bank PLC) (c)(e)(f)
|
9,300
|
9,300
|
|
Series 2022 XF 30 45, 4.13% 11/7/23 (Liquidity Facility Barclays Bank PLC) (c)(e)(f)
|
3,050
|
3,050
|
|
Series Floaters XL 01 05, 4.13% 11/7/23 (Liquidity Facility Barclays Bank PLC) (c)(e)(f)
|
12,815
|
12,815
|
|
Series XX 12 64, 4.13% 11/7/23 (Liquidity Facility Barclays Bank PLC) (c)(e)(f)
|
3,400
|
3,400
|
|
Series XX 12 65, 4.13% 11/7/23 (Liquidity Facility Barclays Bank PLC) (c)(e)(f)
|
2,660
|
2,660
|
|
Chicago O'Hare Int'l. Arpt. Rev. Participating VRDN Series Floaters XF 07 36, 4.12% 11/7/23 (Liquidity Facility JPMorgan Chase Bank) (c)(e)(f)
|
3,500
|
3,500
|
|
Chicago Transit Auth. Participating VRDN Series XL 01 45, 4.13% 11/7/23 (Liquidity Facility Barclays Bank PLC) (c)(e)(f)
|
1,825
|
1,825
|
|
Illinois Fin. Auth. Participating VRDN:
|
|||
Series 2022 ZF 30 56, 4.12% 11/7/23 (Liquidity Facility Morgan Stanley Bank, West Valley City Utah) (c)(e)(f)
|
2,695
|
2,695
|
|
Series BAML 50 45, 4.18% 11/7/23 (Liquidity Facility Bank of America NA) (c)(e)(f)
|
12,400
|
12,400
|
|
Series BAML 50 47, 4.17% 11/7/23 (Liquidity Facility Bank of America NA) (c)(e)(f)
|
17,800
|
17,800
|
|
Series XF 30 36, 4.12% 11/7/23 (Liquidity Facility Morgan Stanley Bank, West Valley City Utah) (c)(e)(f)
|
4,000
|
4,000
|
|
Series XX 12 51, 4.12% 11/7/23 (Liquidity Facility Barclays Bank PLC) (c)(e)(f)
|
5,695
|
5,695
|
|
Illinois Fin. Auth. Rev. Participating VRDN:
|
|||
Series 15 XF0253, 4.19% 11/7/23 (Liquidity Facility JPMorgan Chase Bank) (c)(e)(f)
|
5,720
|
5,720
|
|
Series Floaters 017, 4.13% 11/7/23 (Liquidity Facility Barclays Bank PLC) (c)(e)(f)
|
8,200
|
8,200
|
|
Series XF 07 11, 4.12% 11/7/23 (Liquidity Facility JPMorgan Chase Bank) (c)(e)(f)
|
13,550
|
13,550
|
|
Series XF 15 40, 4.12% 11/7/23 (Liquidity Facility Royal Bank of Canada) (c)(e)(f)
|
2,500
|
2,500
|
|
Illinois Gen. Oblig. Participating VRDN:
|
|||
Series Floaters XF 10 13, 4.13% 11/7/23 (Liquidity Facility Barclays Bank PLC) (c)(e)(f)
|
5,715
|
5,715
|
|
Series Floaters XL 00 54, 4.13% 11/7/23 (Liquidity Facility Barclays Bank PLC) (c)(e)(f)
|
8,620
|
8,620
|
|
Series XF 10 10, 4.13% 11/7/23 (Liquidity Facility Barclays Bank PLC) (c)(e)(f)
|
2,900
|
2,900
|
|
Series XL 02 60, 4.13% 11/7/23 (Liquidity Facility Barclays Bank PLC) (c)(e)(f)
|
1,455
|
1,455
|
|
Series XM 07 59, 4.14% 11/7/23 (Liquidity Facility Bank of America NA) (c)(e)(f)
|
820
|
820
|
|
Series XM 10 48, 4.14% 11/7/23 (Liquidity Facility Bank of America NA) (c)(e)(f)
|
5,000
|
5,000
|
|
Series XM 10 49, 4.14% 11/7/23 (Liquidity Facility Bank of America NA) (c)(e)(f)
|
1,300
|
1,300
|
|
Series XX 11 41, 4.13% 11/7/23 (Liquidity Facility Barclays Bank PLC) (c)(e)(f)
|
800
|
800
|
|
Illinois Toll Hwy. Auth. Toll Hwy. Rev. Participating VRDN:
|
|||
Series XM 10 02, 4.12% 11/7/23 (Liquidity Facility Morgan Stanley Bank, West Valley City Utah) (c)(e)(f)
|
4,245
|
4,245
|
|
Series ZL 03 30, 4.15% 11/7/23 (Liquidity Facility JPMorgan Chase Bank) (c)(e)(f)
|
1,975
|
1,975
|
|
Metropolitan Pier & Exposition Participating VRDN Series Floaters XF 10 45, 4.21% 11/7/23 (Liquidity Facility Barclays Bank PLC) (c)(e)(f)
|
900
|
900
|
|
TOTAL ILLINOIS
|
142,840
|
||
Indiana - 0.1%
|
|||
Indiana Fin. Auth. Health Facilities Rev. Participating VRDN Series XF 15 69, 4.12% 11/7/23 (Liquidity Facility Royal Bank of Canada) (c)(e)(f)
|
2,500
|
2,500
|
|
Iowa - 0.1%
|
|||
Iowa Fin. Auth. Single Family Mtg. Participating VRDN Series XG 04 88, 4.12% 11/7/23 (Liquidity Facility Morgan Stanley Bank, West Valley City Utah) (c)(e)(f)
|
4,000
|
4,000
|
|
Kansas - 0.1%
|
|||
K-State Athletics, Inc. Participating VRDN Series XF 15 10, 4.13% 11/7/23 (Liquidity Facility Toronto-Dominion Bank) (c)(e)(f)
|
1,575
|
1,575
|
|
Wyandotte County/Kansas City Unified Govt. Util. Sys. Rev. Participating VRDN Series YX 12 23, 4.13% 11/7/23 (Liquidity Facility Barclays Bank PLC) (c)(e)(f)
|
2,200
|
2,200
|
|
TOTAL KANSAS
|
3,775
|
||
Kentucky - 0.1%
|
|||
CommonSpirit Health Participating VRDN Series MIZ 90 21, 4.19% 11/7/23 (Liquidity Facility Mizuho Cap. Markets LLC) (c)(e)(f)
|
2,700
|
2,700
|
|
Kentucky Econ. Dev. Fin. Auth. Hosp. Rev. Participating VRDN Series Floaters XG 01 23, 4.13% 11/7/23 (Liquidity Facility Barclays Bank PLC) (c)(e)(f)
|
300
|
300
|
|
TOTAL KENTUCKY
|
3,000
|
||
Louisiana - 0.8%
|
|||
Louisiana Pub. Facilities Auth. Rev. Participating VRDN Series Floater BAML 5041 D1, 4.37% 11/1/23 (Liquidity Facility Bank of America NA) (c)(e)(f)
|
2,900
|
2,900
|
|
RIB Floater Trust Various States Participating VRDN Series Floater 2023, 4.13% 11/7/23 (Liquidity Facility Barclays Bank PLC) (c)(e)(f)
|
21,905
|
21,905
|
|
TOTAL LOUISIANA
|
24,805
|
||
Maryland - 0.4%
|
|||
Baltimore County Gen. Oblig. Participating VRDN Series Floaters XF 06 82, 4.14% 11/7/23 (Liquidity Facility Toronto-Dominion Bank) (c)(e)(f)
|
3,470
|
3,470
|
|
Baltimore Proj. Rev. Bonds Series Floaters G 28, 4.29%, tender 1/2/24 (Liquidity Facility Royal Bank of Canada) (c)(d)(e)(f)
|
300
|
300
|
|
Maryland Health & Higher Edl. Facilities Auth. Rev. Participating VRDN Series XF 31 52, 4.13% 11/7/23 (Liquidity Facility Barclays Bank PLC) (c)(e)(f)
|
2,815
|
2,815
|
|
Montgomery County Gen. Oblig. Participating VRDN Series Floaters XG 02 15, 4.13% 11/7/23 (Liquidity Facility Bank of America NA) (c)(e)(f)
|
4,705
|
4,705
|
|
TOTAL MARYLAND
|
11,290
|
||
Michigan - 0.5%
|
|||
Mclaren Health Care Corp. Participating VRDN Series XL 02 71, 4.19% 11/7/23 (Liquidity Facility Bank of America NA) (c)(e)(f)
|
365
|
365
|
|
Michigan Fin. Auth. Rev. Participating VRDN:
|
|||
Series XG 04 33, 4.12% 11/7/23 (Liquidity Facility JPMorgan Chase Bank) (c)(e)(f)
|
5,800
|
5,800
|
|
Series ZF 30 32, 4.12% 11/7/23 (Liquidity Facility UBS AG) (c)(e)(f)
|
2,600
|
2,600
|
|
Michigan Hosp. Fin. Auth. Rev. Participating VRDN Series 2022 ZF 14 01, 4.12% 11/7/23 (Liquidity Facility JPMorgan Chase Bank) (c)(e)(f)
|
1,250
|
1,250
|
|
Michigan Hsg. Dev. Auth. Single Family Mtg. Rev. Participating VRDN Series XF 15 81, 4.13% 11/7/23 (Liquidity Facility Toronto-Dominion Bank) (c)(e)(f)
|
2,600
|
2,600
|
|
Trenton Pub. Schools School District Participating VRDN Series Floaters CTFS G 102, 3.99% 11/7/23 (Liquidity Facility Royal Bank of Canada) (c)(e)(f)
|
3,100
|
3,100
|
|
TOTAL MICHIGAN
|
15,715
|
||
Minnesota - 0.0%
|
|||
Minnesota Hsg. Fin. Agcy. Participating VRDN Series XF 28 79, 4.12% 11/7/23 (Liquidity Facility Morgan Stanley Bank, West Valley City Utah) (c)(e)(f)
|
1,325
|
1,325
|
|
Missouri - 0.8%
|
|||
Kansas City Spl. Oblig. Participating VRDN Series XG 03 61, 4.13% 11/7/23 (Liquidity Facility Barclays Bank PLC) (c)(e)(f)
|
1,700
|
1,700
|
|
Missouri Health & Edl. Facilities Auth. Rev. Participating VRDN Series Floaters C16, 4.14% 11/7/23 (Liquidity Facility Royal Bank of Canada) (c)(e)(f)
|
14,600
|
14,600
|
|
Missouri Health & Edl. Facilities Rev.:
|
|||
Bonds Series 2023 G 121, 4.29%, tender 12/1/23 (Liquidity Facility Royal Bank of Canada) (c)(e)(f)
|
1,400
|
1,400
|
|
Participating VRDN Series Floaters C17, 4.13% 11/7/23 (Liquidity Facility Royal Bank of Canada) (c)(e)(f)
|
4,360
|
4,360
|
|
St Louis County Spl. Oblig. Participating VRDN Series XG 03 82, 4.12% 11/7/23 (Liquidity Facility Wells Fargo Bank NA) (c)(e)(f)
|
2,400
|
2,400
|
|
TOTAL MISSOURI
|
24,460
|
||
Nebraska - 0.0%
|
|||
Central Plains Energy Proj. Rev. Participating VRDN Series 2022 ZL 03 01, 4.14% 11/7/23 (Liquidity Facility Royal Bank of Canada) (c)(e)(f)
|
900
|
900
|
|
Nevada - 0.2%
|
|||
Clark County Fuel Tax Participating VRDN Series Floaters XF 25 80, 4.12% 11/7/23 (Liquidity Facility Morgan Stanley Bank, West Valley City Utah) (c)(e)(f)
|
4,900
|
4,900
|
|
Clark County School District Participating VRDN Series XF 14 73, 4.21% 11/7/23 (Liquidity Facility JPMorgan Chase Bank) (c)(e)(f)
|
1,025
|
1,025
|
|
TOTAL NEVADA
|
5,925
|
||
New Jersey - 0.6%
|
|||
New Jersey Econ. Dev. Auth. Rev. Participating VRDN:
|
|||
Series Floaters XF 23 93, 4.13% 11/7/23 (Liquidity Facility Barclays Bank PLC) (c)(e)(f)
|
5,900
|
5,900
|
|
Series Floaters XL 00 52, 4.13% 11/7/23 (Liquidity Facility Barclays Bank PLC) (c)(e)(f)
|
2,500
|
2,500
|
|
New Jersey Trans. Trust Fund Auth. Participating VRDN:
|
|||
Series Floaters XX 10 93, 4.13% 11/7/23 (Liquidity Facility Barclays Bank PLC) (c)(e)(f)
|
7,000
|
7,000
|
|
Series YX 12 68, 4.13% 11/7/23 (Liquidity Facility Barclays Bank PLC) (c)(e)(f)
|
2,495
|
2,495
|
|
TOTAL NEW JERSEY
|
17,895
|
||
New Mexico - 0.0%
|
|||
New Mexico Mtg. Fin. Auth. Participating VRDN Series YX 11 89, 4.06% 11/7/23 (Liquidity Facility Barclays Bank PLC) (c)(e)(f)
|
1,400
|
1,400
|
|
New York - 3.1%
|
|||
New York City Gen. Oblig. Participating VRDN:
|
|||
Series E 133, 4.12% 11/7/23 (Liquidity Facility Royal Bank of Canada) (c)(e)(f)
|
23,300
|
23,300
|
|
Series Floaters E87, 4.12% 11/7/23 (Liquidity Facility Royal Bank of Canada) (c)(e)(f)
|
3,295
|
3,295
|
|
Series XX 12 31, 4.12% 11/2/23 (Liquidity Facility Barclays Bank PLC) (c)(e)(f)
|
2,700
|
2,700
|
|
New York City Muni. Wtr. Fin. Auth. Wtr. & Swr. Sys. Rev. Participating VRDN:
|
|||
Series Floaters E 129, 4.12% 11/7/23 (Liquidity Facility Royal Bank of Canada) (c)(e)(f)
|
10,000
|
10,000
|
|
Series XF 13 25, 4.12% 11/7/23 (Liquidity Facility JPMorgan Chase Bank) (c)(e)(f)
|
2,500
|
2,500
|
|
Series XF 13 36, 4.12% 11/7/23 (Liquidity Facility JPMorgan Chase Bank) (c)(e)(f)
|
2,600
|
2,600
|
|
Series XL 03 85, 4.11% 11/7/23 (Liquidity Facility Citibank NA) (c)(e)(f)
|
1,370
|
1,370
|
|
Series ZL 04 73, 4.11% 11/7/23 (Liquidity Facility Morgan Stanley Bank, West Valley City Utah) (c)(e)(f)
|
4,855
|
4,855
|
|
New York Dorm. Auth. Rev.:
|
|||
Bonds Series MS 00 09, 4.26%, tender 1/11/24 (Liquidity Facility Morgan Stanley Bank, West Valley City Utah) (c)(e)(f)
|
1,700
|
1,700
|
|
Participating VRDN Series E-146, 4.12% 11/7/23 (Liquidity Facility Royal Bank of Canada) (c)(e)(f)
|
5,100
|
5,100
|
|
New York Metropolitan Trans. Auth. Rev. Participating VRDN:
|
|||
Series XF 28 68, 4.13% 11/7/23 (Liquidity Facility Barclays Bank PLC) (c)(e)(f)
|
16,700
|
16,700
|
|
Series XF 28 78, 4.13% 11/7/23 (Liquidity Facility Barclays Bank PLC) (c)(e)(f)
|
1,700
|
1,700
|
|
Series XF 30 00, 4.13% 11/7/23 (Liquidity Facility Barclays Bank PLC) (c)(e)(f)
|
13,130
|
13,130
|
|
Series XG 02 90, 4.13% 11/7/23 (Liquidity Facility Barclays Bank PLC) (c)(e)(f)
|
7,400
|
7,400
|
|
Triborough Bridge & Tunnel Auth. Participating VRDN Series XF 13 32, 4.12% 11/7/23 (Liquidity Facility JPMorgan Chase Bank) (c)(e)(f)
|
1,110
|
1,110
|
|
TOTAL NEW YORK
|
97,460
|
||
North Carolina - 0.7%
|
|||
Charlotte Int'l. Arpt. Rev. Participating VRDN:
|
|||
Series Floaters XG 02 07, 4.12% 11/7/23 (Liquidity Facility Bank of America NA) (c)(e)(f)
|
1,900
|
1,900
|
|
Series XF 16 03, 4.12% 11/7/23 (Liquidity Facility Bank of America NA) (c)(e)(f)
|
2,925
|
2,925
|
|
Charlotte Wtr. & Swr. Sys. Rev. Participating VRDN Series 2022 XG 04 03, 4.12% 11/7/23 (Liquidity Facility Wells Fargo Bank NA) (c)(e)(f)
|
1,451
|
1,451
|
|
North Carolina Cap. Facilities Fin. Agcy. Rev. Participating VRDN Series MS 15 XF2165, 4.12% 11/7/23 (Liquidity Facility Morgan Stanley Bank, West Valley City Utah) (c)(e)(f)
|
7,585
|
7,585
|
|
North Carolina Hsg. Fin. Agcy. Home Ownership Rev. Participating VRDN Series YX 13 16, 4.12% 11/7/23 (Liquidity Facility Barclays Bank PLC) (c)(e)(f)
|
4,960
|
4,960
|
|
North Carolina Med. Care Commission Health Care Facilities Rev. Participating VRDN Series XF 13 52, 4.12% 11/7/23 (Liquidity Facility JPMorgan Chase Bank) (c)(e)(f)
|
2,500
|
2,500
|
|
TOTAL NORTH CAROLINA
|
21,321
|
||
North Dakota - 0.2%
|
|||
Grand Forks Health Care Sys. Rev. Participating VRDN Series XF 16 02, 4.13% 11/7/23 (Liquidity Facility Toronto-Dominion Bank) (c)(e)(f)
|
5,055
|
5,055
|
|
Ohio - 1.0%
|
|||
Allen County Hosp. Facilities Rev. Participating VRDN:
|
|||
Series Floaters E 134, 4.12% 11/7/23 (Liquidity Facility Royal Bank of Canada) (c)(e)(f)
|
5,380
|
5,380
|
|
Series Floaters XF 25 16, 4.18% 11/7/23 (Liquidity Facility Toronto-Dominion Bank) (c)(e)(f)
|
1,100
|
1,100
|
|
Berea Ohio City School District Participating VRDN Series RBC G 54, 3.95% 11/7/23 (Liquidity Facility Royal Bank of Canada) (c)(e)(f)
|
1,600
|
1,600
|
|
Cuyahoga County Ctfs. of Prtn. Participating VRDN Series Floaters XG 02 06, 4.19% 11/7/23 (Liquidity Facility Bank of America NA) (c)(e)(f)
|
600
|
600
|
|
Green Local School District Summit Participating VRDN Series 2022 XL 03 31, 4.21% 11/7/23 (Liquidity Facility Bank of America NA) (c)(e)(f)
|
3,750
|
3,750
|
|
Montgomery County Hosp. Rev. Participating VRDN:
|
|||
Series Floaters E 132, 4.12% 11/7/23 (Liquidity Facility Royal Bank of Canada) (c)(e)(f)
|
15,400
|
15,400
|
|
Series XX 12 48, 4.13% 11/7/23 (Liquidity Facility Barclays Bank PLC) (c)(e)(f)
|
1,365
|
1,365
|
|
Ohio Hosp. Rev. Participating VRDN Series C18, 4.13% 11/7/23 (Liquidity Facility Royal Bank of Canada) (c)(e)(f)
|
1,400
|
1,400
|
|
Ohio State Univ. Gen. Receipts Participating VRDN Series XL 03 21, 4.13% 11/7/23 (Liquidity Facility Bank of America NA) (c)(e)(f)
|
2,100
|
2,100
|
|
TOTAL OHIO
|
32,695
|
||
Oklahoma - 0.2%
|
|||
Oklahoma Dev. Fin. Auth. Health Sys. Rev. Participating VRDN Series E 140, 4.12% 11/7/23 (Liquidity Facility Royal Bank of Canada) (c)(e)(f)
|
7,540
|
7,540
|
|
Oregon - 0.2%
|
|||
Beaverton School District Participating VRDN Series 2022 XF 14 19, 4.12% 11/7/23 (Liquidity Facility JPMorgan Chase Bank) (c)(e)(f)
|
1,340
|
1,340
|
|
Multnomah County School District #1J Portland Participating VRDN Series XF 15 30, 4.12% 11/7/23 (Liquidity Facility JPMorgan Chase Bank) (c)(e)(f)
|
4,480
|
4,480
|
|
TOTAL OREGON
|
5,820
|
||
Pennsylvania - 0.8%
|
|||
Allegheny County Hosp. Dev. Auth. Rev. Participating VRDN Series Floaters XX 10 94, 4.13% 11/7/23 (Liquidity Facility Barclays Bank PLC) (c)(e)(f)
|
3,000
|
3,000
|
|
Central Bradford Progress Auth. Rev. Participating VRDN Series XF 13 46, 4.14% 11/7/23 (Liquidity Facility Bank of America NA) (c)(e)(f)
|
1,675
|
1,675
|
|
Commonwealth Fing. Auth. Tobacco Participating VRDN Series XL 00 60, 4.13% 11/7/23 (Liquidity Facility Barclays Bank PLC) (c)(e)(f)
|
1,300
|
1,300
|
|
Geisinger Auth. Health Sys. Rev. Participating VRDN Series XM 08 87, 4.29% 11/7/23 (Liquidity Facility JPMorgan Chase Bank) (c)(e)(f)
|
440
|
440
|
|
Lehigh County Gen. Purp. Hosp. Rev. Participating VRDN Series BAML 23 50 39, 4.17% 12/5/23 (Liquidity Facility Bank of America NA) (c)(e)(f)
|
3,500
|
3,500
|
|
Pennsylvania Higher Edl. Facilities Auth. Rev. Participating VRDN Series XG 02 63, 4.12% 11/7/23 (Liquidity Facility Bank of America NA) (c)(e)(f)
|
4,270
|
4,270
|
|
Pennsylvania Tpk. Commission Tpk. Rev. Participating VRDN Series XX 10 44, 4.13% 11/7/23 (Liquidity Facility Barclays Bank PLC) (c)(e)(f)
|
300
|
300
|
|
Philadelphia Wtr. & Wastewtr. Rev. Participating VRDN Series Floaters XF 07 19, 4.12% 11/7/23 (Liquidity Facility Royal Bank of Canada) (c)(e)(f)
|
1,000
|
1,000
|
|
Southcentral Pennsylvania Gen. Auth. Rev. Participating VRDN Series XL 01 04, 4.12% 11/7/23 (Liquidity Facility Morgan Stanley Bank, West Valley City Utah) (c)(e)(f)
|
3,615
|
3,615
|
|
Southeastern Pennsylvania Trans. Auth. Rev. Participating VRDN:
|
|||
Series XF 30 41, 4.12% 11/7/23 (Liquidity Facility Morgan Stanley Bank, West Valley City Utah) (c)(e)(f)
|
4,000
|
4,000
|
|
Series XG 04 13, 4.12% 11/7/23 (Liquidity Facility Royal Bank of Canada) (c)(e)(f)
|
1,265
|
1,265
|
|
Series XM 10 57, 4.14% 11/7/23 (Liquidity Facility Bank of America NA) (c)(e)(f)
|
1,400
|
1,400
|
|
TOTAL PENNSYLVANIA
|
25,765
|
||
Rhode Island - 0.0%
|
|||
Rhode Island Health and Edl. Bldg. Corp. Higher Ed. Facility Rev. Participating VRDN Series Floaters XM 07 21, 4.12% 11/7/23 (Liquidity Facility Wells Fargo Bank NA) (c)(e)(f)
|
800
|
800
|
|
South Carolina - 0.2%
|
|||
Patriots Energy Group Fing. Agcy. Participating VRDN Series XM 11 43, 4.14% 11/7/23 (Liquidity Facility Royal Bank of Canada) (c)(e)(f)
|
3,000
|
3,000
|
|
South Carolina Pub. Svc. Auth. Rev. Participating VRDN:
|
|||
Series 2017 XF 2425, 4.13% 11/7/23 (Liquidity Facility Barclays Bank PLC) (c)(e)(f)
|
1,015
|
1,015
|
|
Series XL 04 18, 4.13% 11/7/23 (Liquidity Facility Barclays Bank PLC) (c)(e)(f)
|
2,245
|
2,245
|
|
South Carolina Trans. Infrastructure Bank Rev. Participating VRDN Series Floaters XM 06 91, 4.12% 11/7/23 (Liquidity Facility JPMorgan Chase Bank) (c)(e)(f)
|
1,500
|
1,500
|
|
TOTAL SOUTH CAROLINA
|
7,760
|
||
South Dakota - 0.2%
|
|||
South Dakota Health & Edl. Facilities Auth. Rev. Participating VRDN Series 2022 XF 14 09, 4.12% 11/7/23 (Liquidity Facility Royal Bank of Canada) (c)(e)(f)
|
5,625
|
5,625
|
|
Tennessee - 0.6%
|
|||
Greeneville Health & Edl. Facilities Board Participating VRDN:
|
|||
Series Floaters XF 25 76, 4.13% 11/7/23 (Liquidity Facility Barclays Bank PLC) (c)(e)(f)
|
7,300
|
7,300
|
|
Series Floaters XG 01 94, 4.13% 11/7/23 (Liquidity Facility Royal Bank of Canada) (c)(e)(f)
|
3,100
|
3,100
|
|
Metropolitan Govt. Nashville & Davidson County Sports Auth. Rev. Participating VRDN Series XG 05 17, 4.12% 11/7/23 (Liquidity Facility Royal Bank of Canada) (c)(e)(f)
|
9,575
|
9,575
|
|
TOTAL TENNESSEE
|
19,975
|
||
Texas - 3.1%
|
|||
Aldine Independent School District Participating VRDN Series Floaters XL 00 87, 4.12% 11/7/23 (Liquidity Facility Wells Fargo Bank NA) (c)(e)(f)
|
3,400
|
3,400
|
|
Austin Elec. Util. Sys. Rev. Participating VRDN Series XF 31 13, 4.12% 11/7/23 (Liquidity Facility Barclays Bank PLC) (c)(e)(f)
|
8,000
|
8,000
|
|
Crowley Independent School Dis Participating VRDN Series XG 05 09, 4.12% 11/7/23 (Liquidity Facility Wells Fargo Bank NA) (c)(e)(f)
|
4,265
|
4,265
|
|
Cypress-Fairbanks Independent School District Participating VRDN Series XL 03 34 4.12% 11/7/23 (Liquidity Facility Bank of America NA) (c)(e)(f)
|
2,915
|
2,915
|
|
El Paso Wtr. & Swr. Rev. Bonds Series G 124, 4.29%, tender 3/1/24 (Liquidity Facility Royal Bank of Canada) (c)(d)(e)(f)(g)
|
1,000
|
1,000
|
|
Grand Parkway Trans. Corp. Participating VRDN Series XG 04 44, 4.12% 11/7/23 (Liquidity Facility Royal Bank of Canada) (c)(e)(f)
|
1,875
|
1,875
|
|
Harris County Cultural Ed. Facilities Fin. Corp. Rev. Participating VRDN Series XL 03 23, 4.12% 11/7/23 (Liquidity Facility Wells Fargo Bank NA) (c)(e)(f)
|
2,960
|
2,960
|
|
Lamar Consolidated Independent School District Participating VRDN:
|
|||
Series XF 31 31, 4.12% 11/7/23 (Liquidity Facility Barclays Bank PLC) (c)(e)(f)
|
3,200
|
3,200
|
|
Series XF 31 63, 4.12% 11/7/23 (Liquidity Facility Wells Fargo Bank NA) (c)(e)(f)
|
5,245
|
5,245
|
|
Leander Independent School District Participating VRDN Series 2022 XF 30 37, 4.12% 11/7/23 (Liquidity Facility Barclays Bank PLC) (c)(e)(f)
|
12,160
|
12,160
|
|
Lower Colorado River Auth. Rev. Participating VRDN Series XM 11 05, 4.12% 11/7/23 (Liquidity Facility Royal Bank of Canada) (c)(e)(f)
|
6,265
|
6,265
|
|
New Caney Independent School District Participating VRDN Series XF 15 82, 4.13% 11/7/23 (Liquidity Facility Toronto-Dominion Bank) (c)(e)(f)
|
4,000
|
4,000
|
|
North Ft. Bend Wtr. Auth. Participating VRDN Series ZF 30 86, 4.12% 11/7/23 (Liquidity Facility Wells Fargo Bank NA) (c)(e)(f)
|
3,985
|
3,985
|
|
San Antonio Wtr. Sys. Rev. Participating VRDN Series XF 31 36, 4.12% 11/7/23 (Liquidity Facility Barclays Bank PLC) (c)(e)(f)
|
3,100
|
3,100
|
|
Tarrant County Cultural Ed. Facilities Fin. Corp. Hosp. Rev. Participating VRDN:
|
|||
Series 16 XF0411, 4.12% 11/7/23 (Liquidity Facility JPMorgan Chase Bank) (c)(e)(f)
|
2,725
|
2,725
|
|
Series E 141, 4.12% 11/7/23 (Liquidity Facility Royal Bank of Canada) (c)(e)(f)
|
300
|
300
|
|
Series XG 04 21, 4.14% 11/7/23 (Liquidity Facility Bank of America NA) (c)(e)(f)
|
760
|
760
|
|
Texas Gen. Oblig. Participating VRDN Series MS 3390, 4.13% 11/7/23 (Liquidity Facility Toronto-Dominion Bank) (c)(e)(f)
|
4,000
|
4,000
|
|
Texas Wtr. Dev. Board Rev.:
|
|||
Bonds Series MS 00 17, 4.24%, tender 12/21/23 (Liquidity Facility Morgan Stanley Bank, West Valley City Utah) (c)(d)(e)(f)
|
1,500
|
1,500
|
|
Participating VRDN:
|
|||
Series 2022 XM 1066, 4.11% 11/7/23 (Liquidity Facility Citibank NA) (c)(e)(f)
|
4,685
|
4,685
|
|
Series Floaters XF 07 13, 4.12% 11/7/23 (Liquidity Facility Toronto-Dominion Bank) (c)(e)(f)
|
2,240
|
2,240
|
|
Series Floaters XF 27 30, 4.12% 11/7/23 (Liquidity Facility JPMorgan Chase Bank) (c)(e)(f)
|
4,400
|
4,400
|
|
Series XM 10 50, 4.12% 11/7/23 (Liquidity Facility Citibank NA) (c)(e)(f)
|
3,625
|
3,625
|
|
Series ZL 04 84, 4.11% 11/7/23 (Liquidity Facility Morgan Stanley Bank, West Valley City Utah) (c)(e)(f)
|
4,230
|
4,230
|
|
Ysleta Tex Independent School District Participating VRDN Series XF 13 95, 4.12% 11/7/23 (Liquidity Facility JPMorgan Chase Bank) (c)(e)(f)
|
4,335
|
4,335
|
|
TOTAL TEXAS
|
95,170
|
||
Virginia - 0.7%
|
|||
Chesapeake Bay Bridge and Tunnel District Gen. Resolution Rev. Participating VRDN Series XF 30 64, 4.13% 11/7/23 (Liquidity Facility Barclays Bank PLC) (c)(e)(f)
|
3,800
|
3,800
|
|
Fairfax County Indl. Dev. Auth. Participating VRDN Series Floaters XG 01 91, 4.12% 11/7/23 (Liquidity Facility Morgan Stanley Bank, West Valley City Utah) (c)(e)(f)
|
3,642
|
3,642
|
|
Norfolk Econ. Dev. Health Care Facilities Participating VRDN:
|
|||
Series 2022 C19, 4.13% 11/7/23 (Liquidity Facility Royal Bank of Canada) (c)(e)(f)
|
2,500
|
2,500
|
|
Series 2022 C20, 4.13% 11/7/23 (Liquidity Facility Royal Bank of Canada) (c)(e)(f)
|
500
|
500
|
|
Suffolk Econ. Dev. Auth. Hosp. Facilities Rev. Participating VRDN Series MIZ 90 25, 4.19% 11/7/23 (Liquidity Facility Mizuho Cap. Markets LLC) (c)(e)(f)
|
11,400
|
11,400
|
|
TOTAL VIRGINIA
|
21,842
|
||
Washington - 1.1%
|
|||
Central Puget Sound Reg'l. Trans. Auth. Sales & Use Tax Rev.:
|
|||
Bonds Series G 123, 4.29%, tender 5/1/24 (Liquidity Facility Royal Bank of Canada) (c)(d)(e)(f)
|
700
|
700
|
|
Participating VRDN Series XM 11 01, 4.1% 11/7/23 (Liquidity Facility Citibank NA) (c)(e)(f)
|
1,495
|
1,495
|
|
CommonSpirit Health Participating VRDN Series XF 1017, 4.13% 11/7/23 (Liquidity Facility Barclays Bank PLC) (c)(e)(f)
|
1,200
|
1,200
|
|
Multicare Health Sys. Participating VRDN Series E 153, 4.12% 11/7/23 (Liquidity Facility Royal Bank of Canada) (c)(e)(f)
|
7,475
|
7,475
|
|
Seattle Muni. Lt. & Pwr. Rev. Participating VRDN Series XF 15 86, 4.12% 11/7/23 (Liquidity Facility Bank of America NA) (c)(e)(f)
|
3,340
|
3,340
|
|
Washington Convention Ctr. Pub. Facilities Participating VRDN:
|
|||
Series 2022 XX 12 38, 4.13% 11/7/23 (Liquidity Facility Barclays Bank PLC) (c)(e)(f)
|
7,600
|
7,600
|
|
Series XG 02 87, 4.13% 11/7/23 (Liquidity Facility Barclays Bank PLC) (c)(e)(f)
|
2,090
|
2,090
|
|
Washington Health Care Facilities Auth. Rev. Participating VRDN:
|
|||
Series 2015 XF0150, 4.19% 11/7/23 (Liquidity Facility Bank of America NA) (c)(e)(f)
|
3,740
|
3,740
|
|
Series XF 15 14, 4.13% 11/7/23 (Liquidity Facility Toronto-Dominion Bank) (c)(e)(f)
|
4,010
|
4,010
|
|
Series YX 12 10, 4.19% 11/7/23 (Liquidity Facility Barclays Bank PLC) (c)(e)(f)
|
2,100
|
2,100
|
|
TOTAL WASHINGTON
|
33,750
|
||
Wisconsin - 0.1%
|
|||
Univ. of Wisconsin Hosp. & Clinics Auth. Participating VRDN Series XL 02 96, 4.12% 11/7/23 (Liquidity Facility Morgan Stanley Bank, West Valley City Utah) (c)(e)(f)
|
1,530
|
1,530
|
|
Wisconsin Health & Edl. Facilities Participating VRDN Series Floaters XF 07 41, 4.12% 11/7/23 (Liquidity Facility JPMorgan Chase Bank) (c)(e)(f)
|
2,320
|
2,320
|
|
TOTAL WISCONSIN
|
3,850
|
||
|
TOTAL TENDER OPTION BOND
(Cost $930,169)
|
930,169
|
||
Other Municipal Security - 19.2%
|
|||
Principal
Amount (a)
(000s)
|
Value ($)
(000s)
|
||
Alabama - 0.7%
|
|||
Black Belt Energy Gas District Bonds Series 2018 A, 4%, tender 11/30/23 (c)
|
13,975
|
13,975
|
|
Huntsville Health Care Auth. Rev. Series 2023, 3.51% 11/9/23, CP
|
8,600
|
8,600
|
|
TOTAL ALABAMA
|
22,575
|
||
Alaska - 0.1%
|
|||
Anchorage Gen. Oblig. TAN Series 2023, 4.25% 12/15/23
|
3,300
|
3,304
|
|
Colorado - 0.4%
|
|||
Colorado Ed. Ln. Prog. TRAN Series 2023 A, 5% 6/28/24
|
225
|
227
|
|
Colorado Health Facilities Auth. Rev. Bonds Series 2013 A, 5.75% 12/1/23 (Pre-Refunded to 12/1/23 @ 100)
|
2,575
|
2,578
|
|
Colorado Health Facilities Auth. Rev. Bonds Bonds Series 2016 C:
|
|||
5%, tender 11/15/23 (c)
|
1,935
|
1,936
|
|
5%, tender 11/15/23 (c)
|
530
|
530
|
|
Denver City & County Arpt. Rev. Bonds:
|
|||
Series 2016 A, 5% 11/15/23
|
4,700
|
4,702
|
|
Series 2020 A2, 5% 11/15/23
|
1,465
|
1,466
|
|
TOTAL COLORADO
|
11,439
|
||
Connecticut - 0.4%
|
|||
Danbury Gen. Oblig. BAN Series 2023, 5% 1/24/24
|
9,800
|
9,829
|
|
Hartford Conn Spl. Oblig. Bonds Series 2023, 5% 4/1/24
|
2,000
|
2,008
|
|
TOTAL CONNECTICUT
|
11,837
|
||
District Of Columbia - 0.0%
|
|||
District of Columbia Univ. Rev. Bonds Series 2017, 5% 4/1/24 (Escrowed to Maturity)
|
400
|
401
|
|
Florida - 1.7%
|
|||
Florida Dept. of Mgmt. Svcs. Ctfs. of Prtn. Bonds Series 2018 A, 5% 11/1/23
|
690
|
690
|
|
Florida Local Govt. Fin. Cmnty. Series 2023 A1:
|
|||
3.65% 11/2/23, LOC JPMorgan Chase Bank, CP
|
4,115
|
4,115
|
|
3.82% 12/5/23, LOC JPMorgan Chase Bank, CP
|
6,700
|
6,700
|
|
Miami-Dade County School Board Ctfs. of Prtn. Bonds Series 2015 A, 5% 5/1/24
|
1,600
|
1,608
|
|
Polk County Indl. Dev. Auth. Health Sys. Rev. Bonds:
|
|||
Series 2014 A, SIFMA Municipal Swap Index + 0.300% 4.39%, tender 5/28/24 (c)(g)
|
4,300
|
4,300
|
|
Series 2014 A1, SIFMA Municipal Swap Index + 0.250% 4.34%, tender 5/28/24 (c)(g)
|
17,300
|
17,300
|
|
Tampa Health Sys. Rev. Bonds Series 2012 B, SIFMA Municipal Swap Index + 0.300% 4.39%, tender 5/28/24 (c)(g)
|
16,400
|
16,400
|
|
TOTAL FLORIDA
|
51,113
|
||
Georgia - 0.2%
|
|||
Cobb County School District TAN Series 2023, 4% 12/14/23
|
690
|
690
|
|
Fayette County Hosp. Auth. Rev. Bonds (Piedmont Healthcare, Inc. Proj.) Series 2019 A, 5%, tender 7/1/24 (c)
|
1,600
|
1,602
|
|
Fulton County Gen. Oblig. TAN Series 2023, 5% 12/29/23
|
1,495
|
1,498
|
|
Houston County Hosp. Auth. Rev. Bonds Series 2016 B, 5% 4/1/24 (Pre-Refunded to 4/1/24 @ 100) (c)
|
1,100
|
1,100
|
|
TOTAL GEORGIA
|
4,890
|
||
Idaho - 0.1%
|
|||
Idaho Health Facilities Auth. Hosp. Rev. Bonds Series 2013 ID, 3.5%, tender 2/1/24 (c)
|
3,400
|
3,400
|
|
Illinois - 1.9%
|
|||
Chicago Metropolitan Wtr. Reclamation District of Greater Chicago Bonds:
|
|||
Series 2016 A, 5% 12/1/23
|
1,910
|
1,912
|
|
Series 2016 B, 5% 12/1/23
|
1,355
|
1,356
|
|
Cook County Gen. Oblig. Bonds Series 2021 B, 4% 11/15/23
|
1,055
|
1,055
|
|
Illinois Fin. Auth. Rev. Bonds:
|
|||
(Advocate Health Care Network Proj.) Series 2011 B, SIFMA Municipal Swap Index + 0.300% 4.42%, tender 5/28/24 (c)(g)
|
10,510
|
10,510
|
|
Series 2016 C, 5% 2/15/24
|
1,100
|
1,104
|
|
Illinois Gen. Oblig. Bonds:
|
|||
Series 2016:
|
|||
5% 2/1/24
|
5,300
|
5,314
|
|
5% 6/1/24
|
2,400
|
2,412
|
|
Series 2017 D:
|
|||
5% 11/1/23
|
12,590
|
12,590
|
|
5% 11/1/24
|
3,400
|
3,422
|
|
Series 2019 A:
|
|||
5% 11/1/23
|
250
|
250
|
|
5% 11/1/24
|
400
|
403
|
|
Series 2021 C, 4% 3/1/24
|
1,200
|
1,201
|
|
Series 2022 A, 5% 3/1/24
|
1,325
|
1,330
|
|
Series 2022 B, 5% 3/1/24
|
785
|
787
|
|
Series 2023 C, 5% 5/1/24
|
2,000
|
2,013
|
|
Illinois Hsg. Dev. Auth. Bonds Series 2023 G, 3.5%, tender 6/4/24 (c)
|
8,300
|
8,300
|
|
Illinois Toll Hwy. Auth. Toll Hwy. Rev. Bonds Series 2014 D, 5% 1/1/24
|
1,750
|
1,752
|
|
Macon & Moultrie County Commission Bonds Series 2013, 5.5% 12/1/23 (Pre-Refunded to 12/1/23 @ 100)
|
480
|
481
|
|
Southwestern Dev. Auth. Heath Facility Rev. Bonds Series 2013, 7.125% 11/1/23 (Pre-Refunded to 11/1/23 @ 100)
|
3,525
|
3,525
|
|
TOTAL ILLINOIS
|
59,717
|
||
Kentucky - 0.1%
|
|||
Kentucky Asset/Liability Commission Gen. Fund Rev. Bonds Series 2021 A, 5% 11/1/23
|
700
|
700
|
|
Kentucky State Property & Buildings Commission Rev. Bonds:
|
|||
Series 2016 B:
|
|||
5% 11/1/23
|
980
|
980
|
|
5% 11/1/24
|
650
|
656
|
|
Series B, 5% 8/1/24
|
500
|
503
|
|
TOTAL KENTUCKY
|
2,839
|
||
Maryland - 0.1%
|
|||
Maryland Health & Higher Edl. Facilities Auth. Rev. Bonds Series 2014, 5.25% 7/1/24 (Pre-Refunded to 7/1/24 @ 100)
|
2,300
|
2,317
|
|
Massachusetts - 0.5%
|
|||
Ashland Gen. Oblig. BAN Series 2023, 5% 10/10/24
|
3,700
|
3,740
|
|
Boston Wtr. & Swr. Commission Rev. Series 2023 A, 3.53% 11/14/23, LOC TD Banknorth, NA, CP
|
8,500
|
8,500
|
|
Chicopee Gen. Oblig. BAN Series 2023, 5% 6/13/24
|
3,930
|
3,959
|
|
TOTAL MASSACHUSETTS
|
16,199
|
||
Michigan - 0.9%
|
|||
Kent Hosp. Fin. Auth. Hosp. Facilities Rev. Bonds (Spectrum Health Sys. Proj.) Series 2015 A, SIFMA Municipal Swap Index + 0.250% 4.34%, tender 5/28/24 (c)(g)
|
8,885
|
8,885
|
|
Michigan Bldg. Auth. Rev. Series 2023, 3.92% 1/25/24, LOC JPMorgan Chase Bank, CP
|
17,600
|
17,600
|
|
Michigan Fin. Auth. Rev. Bonds:
|
|||
(Trinity Health Proj.) Series 2017, 5% 12/1/23
|
1,115
|
1,116
|
|
Series 2015 A, 5% 5/15/24
|
300
|
302
|
|
Royal Oak Hosp. Fin. Auth. Hosp. Rev. Bonds Series 2014 D:
|
|||
5% 3/1/24 (Pre-Refunded to 3/1/24 @ 100)
|
785
|
787
|
|
5% 3/1/24 (Pre-Refunded to 3/1/24 @ 100)
|
600
|
602
|
|
TOTAL MICHIGAN
|
29,292
|
||
Minnesota - 0.4%
|
|||
Minneapolis Gen. Oblig. Bonds Series 2023, 5.5% 12/1/23
|
7,400
|
7,411
|
|
Univ. of Minnesota Gen. Oblig. Series 2023 F, 3.88% 11/2/23, CP
|
6,000
|
6,000
|
|
TOTAL MINNESOTA
|
13,411
|
||
Montana - 0.0%
|
|||
Montana Board of Regents Higher Ed. Rev. Bonds Series 2013 A, 5% 11/15/23 (Pre-Refunded to 11/15/23 @ 100)
|
500
|
500
|
|
Nebraska - 0.2%
|
|||
Omaha Pub. Pwr. District Elec. Rev.:
|
|||
Series 2023 A, 3.75% 11/28/23, CP
|
4,300
|
4,300
|
|
Series 2023, 3.7% 11/28/23, CP
|
2,700
|
2,700
|
|
TOTAL NEBRASKA
|
7,000
|
||
New Jersey - 2.9%
|
|||
Beachwood BAN Series 2023 A, 5% 2/28/24
|
2,100
|
2,109
|
|
Bergen County Impt. Auth. Rev. Bonds Series 2023, 4.5% 5/31/24 (Bergen County Gen. Oblig. Guaranteed)
|
7,200
|
7,240
|
|
Branchburg Township BAN Series 2023, 5% 10/10/24
|
2,700
|
2,727
|
|
Brick Township Gen. Oblig. BAN Series 2023, 5% 6/12/24
|
5,200
|
5,241
|
|
East Brunswick Township Gen. Oblig. BAN Series 2023, 5% 7/17/24
|
10,630
|
10,734
|
|
Florence Township BAN Series 2023, 5% 5/31/24
|
3,100
|
3,126
|
|
Freehold Township BAN Series 2023, 5% 10/23/24
|
7,500
|
7,572
|
|
Jefferson Township Gen. Oblig. BAN Series 2023, 5% 6/14/24
|
2,100
|
2,115
|
|
Monroe Township Middlesex County Gen. Oblig. BAN Series 2023, 5% 6/4/24
|
6,800
|
6,856
|
|
New Jersey Econ. Dev. Auth. Bonds Series 2023 RRR, 5% 3/1/24
|
4,800
|
4,825
|
|
New Jersey Econ. Dev. Auth. Rev. Bonds (New Jersey Gen. Oblig. Proj.) Series 2017 B, 5% 11/1/23
|
1,850
|
1,850
|
|
New Jersey Trans. Trust Fund Auth. Bonds Series 2010 D, 5.25% 12/15/23
|
1,000
|
1,002
|
|
Tenafly BAN Series 2023, 4.25% 5/24/24
|
3,194
|
3,209
|
|
Union County Gen. Oblig. BAN Series 2023, 5% 6/14/24
|
21,600
|
21,784
|
|
Wood-Ridge Gen. Oblig. BAN Series 2023, 5.5% 2/27/24
|
1,300
|
1,307
|
|
Woolwich Township BAN Series 2023, 5% 5/23/24
|
7,700
|
7,773
|
|
TOTAL NEW JERSEY
|
89,470
|
||
New York - 1.4%
|
|||
Commack Union Free School District TAN Series 2023, 5% 6/26/24
|
3,800
|
3,822
|
|
Hempstead Town Gen. Oblig. BAN Series 2023, 5% 5/24/24
|
3,900
|
3,935
|
|
Horseheads Central School District BAN Series 2023, 4.75% 6/21/24
|
5,200
|
5,237
|
|
Lancaster Central School District BAN Series 2023, 5% 6/7/24
|
5,900
|
5,944
|
|
New York Pwr. Auth. Series 2023 2, 3.51% 11/9/23, CP
|
2,700
|
2,700
|
|
Queensbury Union Free School District BAN Series 2023, 5% 5/31/24
|
4,583
|
4,618
|
|
Saratoga County Gen. Oblig. BAN Series 2023, 5% 9/20/24
|
11,200
|
11,326
|
|
Webster Town BAN Series 2023, 5% 8/28/24
|
4,900
|
4,951
|
|
TOTAL NEW YORK
|
42,533
|
||
North Carolina - 0.2%
|
|||
North Carolina Tpk. Auth. Triangle Expressway Sys. Bonds Series 2020 C, 5% 2/1/24 (Escrowed to Maturity)
|
4,995
|
5,012
|
|
Wake County Bonds Series 2016 A, 5% 12/1/23
|
500
|
500
|
|
TOTAL NORTH CAROLINA
|
5,512
|
||
Ohio - 0.1%
|
|||
Allen County Hosp. Facilities Rev. Bonds Series 2017 A, 5% 8/1/24
|
445
|
449
|
|
Franklin County Rev. Bonds Series 2013 OH, 3.5%, tender 2/1/24 (c)
|
400
|
400
|
|
Wyoming City School District BAN Series 2023, 5.5% 5/15/24
|
1,000
|
1,008
|
|
TOTAL OHIO
|
1,857
|
||
Oregon - 0.1%
|
|||
Multnomah County Hosp. Facilities Auth. Rev. Bonds (Mirabella at South Waterfront Proj.) Series 2014 A, 5.5% 10/1/24 (Pre-Refunded to 10/1/24 @ 100)
|
2,300
|
2,337
|
|
Portland Gen. Oblig. TAN Series 2023, 5% 1/10/24
|
695
|
696
|
|
TOTAL OREGON
|
3,033
|
||
Pennsylvania - 0.2%
|
|||
Pennsylvania Gen. Oblig. Bonds Series 2017 1, 5% 1/1/24
|
1,015
|
1,016
|
|
Philadelphia Wtr. Series 2023 C, 3.95% 12/13/23, LOC The Toronto-Dominion Bank, CP
|
1,000
|
1,000
|
|
Univ. of Pittsburgh Commonwealth Sys. of Higher Ed. Bonds:
|
|||
Series 2019, 4.55% 2/15/24 (c)
|
210
|
210
|
|
Series 2023 B1, 3.7% tender 1/18/24, CP mode
|
4,900
|
4,900
|
|
TOTAL PENNSYLVANIA
|
7,126
|
||
South Carolina - 0.4%
|
|||
Charleston County School District:
|
|||
BAN:
|
|||
(Sales Tax Projs. - Phase V) Series 2023 B, 5% 5/9/24
|
400
|
402
|
|
Series 2023 A, 5% 11/15/23
|
600
|
600
|
|
TAN Series 2023, 4.5% 4/1/24
|
565
|
566
|
|
South Carolina Assoc. of Governmental Organizations Ctfs. of Prtn. Bonds Series 2023 B, 5% 3/1/24
|
11,110
|
11,159
|
|
TOTAL SOUTH CAROLINA
|
12,727
|
||
Tennessee - 0.1%
|
|||
Metropolitan Govt. of Nashville & Davidson County Series 2023, 3.6% 2/7/24, CP
|
2,700
|
2,700
|
|
Texas - 4.9%
|
|||
Austin Elec. Util. Sys. Rev. Series 2023 A:
|
|||
3.9% 2/6/24 (Liquidity Facility JPMorgan Chase Bank), CP
|
6,200
|
6,200
|
|
4.17% 11/6/23 (Liquidity Facility JPMorgan Chase Bank), CP
|
10,600
|
10,600
|
|
Crowley Independent School Dis Bonds Series 2023, 5% 2/1/24 (Permanent School Fund of Texas Guaranteed)
|
1,750
|
1,756
|
|
Dallas Gen. Oblig. Bonds Series 2023 A, 5% 2/15/24
|
550
|
552
|
|
Dallas Wtrwks. & Swr. Sys. Rev. Bonds Series 2015 A, 5% 10/1/24
|
620
|
625
|
|
Fort Worth Independent School District Bonds Series 2014, 5% 2/15/24 (Permanent School Fund of Texas Guaranteed) (Pre-Refunded to 2/15/24 @ 100)
|
800
|
803
|
|
Frenship Independent School District Bonds Series 2014, 5% 2/15/24 (Pre-Refunded to 2/15/24 @ 100)
|
1,100
|
1,104
|
|
Harris County Cultural Ed. Facilities Fin. Corp. Rev. Bonds:
|
|||
Series 2023 B1, 3.8% tender 2/1/24, CP mode
|
6,700
|
6,700
|
|
Series 2023 B2, 3.7% tender 12/1/23, CP mode
|
8,200
|
8,200
|
|
Series 2023 B3, 3.7% tender 1/4/24, CP mode
|
15,000
|
15,000
|
|
Houston Gen. Oblig. Bonds Series 2017 A, 5% 3/1/24
|
1,245
|
1,250
|
|
Houston Higher Ed. Fin. Corp. Higher Ed. Rev. Series 2023 A, 3.75% 11/3/23, CP
|
3,100
|
3,100
|
|
Houston Independent School District Bonds Series 2023 A, 5% 2/15/24 (Permanent School Fund of Texas Guaranteed)
|
1,250
|
1,254
|
|
Houston Util. Sys. Rev. Bonds Series 2014 D, 5% 11/15/23
|
900
|
900
|
|
Lovejoy Independent School District Bonds Series 2021, 5% 2/15/24 (Permanent School Fund of Texas Guaranteed)
|
550
|
552
|
|
Pflugerville Independent School District Bonds Series 2014, 4% 2/15/24 (Pre-Refunded to 2/15/24 @ 100)
|
2,200
|
2,201
|
|
San Antonio Independent School District Bonds Series 2015, 5% 2/15/24 (Permanent School Fund of Texas Guaranteed)
|
300
|
301
|
|
Spring Branch Independent School District Bonds Series 2022, 5% 2/1/24 (Permanent School Fund of Texas Guaranteed)
|
1,000
|
1,003
|
|
Tarrant County Cultural Ed. Facilities Fin. Corp. Hosp. Rev. Bonds (Baylor Health Care Sys. Proj.):
|
|||
Series 2011 B, SIFMA Municipal Swap Index + 0.300% 4.42%, tender 5/28/24 (c)(g)
|
9,900
|
9,900
|
|
Series 2013 B, SIFMA Municipal Swap Index + 0.300% 4.42%, tender 5/28/24 (c)(g)
|
11,600
|
11,600
|
|
Tarrant County Cultural Ed. Facilities Fin. Corp. Rev. Bonds Series 2017 A, 5% 2/15/24
|
900
|
903
|
|
Texas A&M Univ. Rev. Series 2023 B:
|
|||
3.6% 11/3/23, CP
|
3,900
|
3,900
|
|
3.9% 11/16/23, CP
|
12,800
|
12,800
|
|
Univ. of Texas Board of Regents Sys. Rev.:
|
|||
Series 2023 A:
|
|||
3.47% 11/3/23 (Liquidity Facility Univ. of Texas Invt. Mgmt. Co.), CP
|
5,400
|
5,400
|
|
3.5% 11/2/23 (Liquidity Facility Univ. of Texas Invt. Mgmt. Co.), CP
|
5,500
|
5,500
|
|
3.6% 12/1/23 (Liquidity Facility Univ. of Texas Invt. Mgmt. Co.), CP
|
5,400
|
5,400
|
|
3.6% 12/5/23 (Liquidity Facility Univ. of Texas Invt. Mgmt. Co.), CP
|
5,400
|
5,400
|
|
3.7% 2/22/24 (Liquidity Facility Univ. of Texas Invt. Mgmt. Co.), CP
|
2,900
|
2,900
|
|
3.75% 11/10/23 (Liquidity Facility Univ. of Texas Invt. Mgmt. Co.), CP
|
5,400
|
5,400
|
|
3.8% 12/13/23 (Liquidity Facility Univ. of Texas Invt. Mgmt. Co.), CP
|
4,200
|
4,200
|
|
4% 1/31/24 (Liquidity Facility Univ. of Texas Invt. Mgmt. Co.), CP
|
5,300
|
5,300
|
|
Series 2023, 3.7% 2/14/24 (Liquidity Facility Univ. of Texas Invt. Mgmt. Co.), CP
|
5,500
|
5,500
|
|
Univ. of Texas Permanent Univ. Fund Rev. Series 2023 A, 3.75% 11/10/23, CP
|
5,400
|
5,400
|
|
TOTAL TEXAS
|
151,604
|
||
Utah - 0.0%
|
|||
Utah County Hosp. Rev. Bonds Series 2018 B2, 5%, tender 8/1/24 (c)
|
335
|
336
|
|
Virginia - 0.1%
|
|||
Suffolk Bonds:
|
|||
Series 2013:
|
|||
4.5% 12/1/23 (Pre-Refunded to 12/1/23 @ 100)
|
800
|
800
|
|
4.5% 12/1/23 (Pre-Refunded to 12/1/23 @ 100)
|
910
|
910
|
|
4.5% 12/1/23 (Pre-Refunded to 12/1/23 @ 100)
|
900
|
900
|
|
Series 2023, 4.5% 12/1/23 (Pre-Refunded to 12/1/23 @ 100)
|
850
|
850
|
|
TOTAL VIRGINIA
|
3,460
|
||
Washington - 0.2%
|
|||
Alderwood Wtr. & Wastewtr. D Bonds Series 2013:
|
|||
4% 12/1/23 (Pre-Refunded to 12/1/23 @ 100)
|
735
|
735
|
|
4% 12/1/23 (Pre-Refunded to 12/1/23 @ 100)
|
825
|
825
|
|
4.5% 12/1/23 (Pre-Refunded to 12/1/23 @ 100)
|
895
|
895
|
|
King County School District #409, Tahoma Bonds Series 2015, 5% 12/1/23 (Washington Gen. Oblig. Guaranteed)
|
810
|
811
|
|
Port of Seattle Rev. Bonds Series 2021 A, 5% 12/1/23
|
1,560
|
1,562
|
|
Washington Ctfs. of Prtn. Bonds Series 2020 B, 5% 7/1/24
|
1,555
|
1,567
|
|
TOTAL WASHINGTON
|
6,395
|
||
Wisconsin - 0.9%
|
|||
Madison Metropolitan School District TRAN Series 2023, 5% 9/3/24
|
6,300
|
6,362
|
|
Wisconsin Clean Wtr. Rev. Bonds Series 2015 1, 5% 6/1/24 (Pre-Refunded to 6/1/24 @ 100)
|
1,100
|
1,107
|
|
Wisconsin Gen. Oblig. Series 2023:
|
|||
3.75% 6/28/24, CP
|
9,367
|
9,367
|
|
3.95% 7/1/24, CP
|
7,200
|
7,200
|
|
4.1% 7/15/24, CP
|
4,100
|
4,100
|
|
Wisconsin Health & Edl. Facilities Bonds Series 2019 A, 5% 11/15/23
|
1,050
|
1,050
|
|
TOTAL WISCONSIN
|
29,186
|
||
|
TOTAL OTHER MUNICIPAL SECURITY
(Cost $596,173)
|
596,173
|
||
Investment Company - 11.9%
|
|||
Shares
|
Value ($)
(000s)
|
||
Fidelity Tax-Free Cash Central Fund 4.07% (h)(i)
(Cost $370,364)
|
370,223
|
370,364
|
|
|
TOTAL INVESTMENT IN SECURITIES - 97.8%
(Cost $3,042,206)
|
3,042,206
|
NET OTHER ASSETS (LIABILITIES) - 2.2%
|
68,860
|
NET ASSETS - 100.0%
|
3,111,066
|
BAN
|
-
|
BOND ANTICIPATION NOTE
|
CP
|
-
|
COMMERCIAL PAPER
|
TAN
|
-
|
TAX ANTICIPATION NOTE
|
TRAN
|
-
|
TAX AND REVENUE ANTICIPATION NOTE
|
VRDN
|
-
|
VARIABLE RATE DEMAND NOTE (A debt instrument that is payable upon demand, either daily, weekly or monthly)
|
(a)
|
Amount is stated in United States dollars unless otherwise noted.
|
(b)
|
Security exempt from registration under Rule 144A of the Securities Act of 1933. These securities may be resold in transactions exempt from registration, normally to qualified institutional buyers. At the end of the period, the value of these securities amounted to $9,860,000 or 0.3% of net assets.
|
(c)
|
Coupon rates for floating and adjustable rate securities reflect the rates in effect at period end.
|
(d)
|
Restricted securities (including private placements) - Investment in securities not registered under the Securities Act of 1933 (excluding 144A issues). At the end of the period, the value of restricted securities (excluding 144A issues) amounted to $13,100,000 or 0.4% of net assets.
|
(e)
|
Provides evidence of ownership in one or more underlying municipal bonds.
|
(f)
|
Coupon rates are determined by re-marketing agents based on current market conditions.
|
(g)
|
Coupon is indexed to a floating interest rate which may be multiplied by a specified factor and/or subject to caps or floors.
|
(h)
|
Information in this report regarding holdings by state and security types does not reflect the holdings of the Fidelity Tax-Free Cash Central Fund.
|
(i)
|
Affiliated fund that is generally available only to investment companies and other accounts managed by Fidelity Investments. The rate quoted is the annualized seven-day yield of the fund at period end. A complete unaudited listing of the fund's holdings as of its most recent quarter end is available upon request. In addition, each Fidelity Central Fund's financial statements, which are not covered by the Fund's Report of Independent Registered Public Accounting Firm, are available on the SEC's website or upon request.
|
Additional information on each restricted holding is as follows:
|
||
Security
|
Acquisition Date
|
Cost ($)
(000s)
|
Baltimore Proj. Rev. Bonds Series Floaters G 28, 4.29%, tender 1/2/24 (Liquidity Facility Royal Bank of Canada)
|
1/03/23
|
300
|
Broward County Convention Ctr. Bonds Series MS 00 11, 3.87%, tender 12/14/23 (Liquidity Facility Morgan Stanley Bank, West Valley City Utah)
|
1/19/23
|
6,600
|
Central Puget Sound Reg'l. Trans. Auth. Sales & Use Tax Rev. Bonds Series G 123, 4.29%, tender 11/1/23 (Liquidity Facility Royal Bank of Canada)
|
2/09/23
|
1
|
El Paso Wtr. & Swr. Rev. Bonds Series G 124, 4.29%, tender 3/1/24 (Liquidity Facility Royal Bank of Canada)
|
9/01/23
|
1,000
|
Port Auth. of New York & New Jersey Series 1997 1, 4.14% 11/30/23, VRDN
|
7/31/20
|
3,000
|
Texas Wtr. Dev. Board Rev. Bonds Series MS 00 17, 4.24%, tender 12/21/23 (Liquidity Facility Morgan Stanley Bank, West Valley City Utah)
|
10/12/23
|
1,500
|
Affiliate (Amounts in thousands)
|
Value,
beginning
of period ($)
|
Purchases ($)
|
Sales
Proceeds ($)
|
Dividend
Income ($)
|
Realized
Gain (loss) ($)
|
Change in
Unrealized
appreciation
(depreciation) ($)
|
Value,
end
of period ($)
|
% ownership,
end
of period
|
Fidelity Tax-Free Cash Central Fund 4.07%
|
435,082
|
1,150,212
|
1,214,961
|
6,825
|
31
|
-
|
370,364
|
15.6%
|
Total
|
435,082
|
1,150,212
|
1,214,961
|
6,825
|
31
|
-
|
370,364
|
|
Statement of Assets and Liabilities
|
||||
Amounts in thousands (except per-share amounts)
|
October 31, 2023
|
|||
Assets
|
||||
Investment in securities, at value - See accompanying schedule:
|
||||
Unaffiliated issuers (cost $2,671,842)
|
$
|
2,671,842
|
||
Fidelity Central Funds (cost $370,364)
|
370,364
|
|||
Total Investment in Securities (cost $3,042,206)
|
$
|
3,042,206
|
||
Receivable for investments sold
|
56,400
|
|||
Receivable for fund shares sold
|
17,387
|
|||
Interest receivable
|
18,703
|
|||
Distributions receivable from Fidelity Central Funds
|
1,096
|
|||
Prepaid expenses
|
3
|
|||
Receivable from investment adviser for expense reductions
|
125
|
|||
Other receivables
|
3
|
|||
Total assets
|
3,135,923
|
|||
Liabilities
|
||||
Payable to custodian bank
|
$
|
394
|
||
Payable for investments purchased
|
14,006
|
|||
Payable for fund shares redeemed
|
8,146
|
|||
Distributions payable
|
1,203
|
|||
Accrued management fee
|
640
|
|||
Distribution and service plan fees payable
|
25
|
|||
Other affiliated payables
|
379
|
|||
Other payables and accrued expenses
|
64
|
|||
Total Liabilities
|
24,857
|
|||
Net Assets
|
$
|
3,111,066
|
||
Net Assets consist of:
|
||||
Paid in capital
|
$
|
3,111,204
|
||
Total accumulated earnings (loss)
|
(138)
|
|||
Net Assets
|
$
|
3,111,066
|
||
Net Asset Value and Maximum Offering Price
|
||||
Capital Reserves Class :
|
||||
Net Asset Value, offering price and redemption price per share ($34,621 ÷ 34,581 shares)
|
$
|
1.00
|
||
Daily Money Class :
|
||||
Net Asset Value, offering price and redemption price per share ($60,833 ÷ 60,760 shares)
|
$
|
1.00
|
||
Fidelity Tax-Exempt Money Market Fund :
|
||||
Net Asset Value, offering price and redemption price per share ($1,111,696 ÷ 1,110,389 shares)
|
$
|
1.00
|
||
Premium Class :
|
||||
Net Asset Value, offering price and redemption price per share ($1,903,916 ÷ 1,901,625 shares)
|
$
|
1.00
|
||
Statement of Operations
|
||||
Amounts in thousands
|
Year ended
October 31, 2023
|
|||
Investment Income
|
||||
Interest
|
$
|
83,714
|
||
Income from Fidelity Central Funds
|
6,815
|
|||
Total Income
|
90,529
|
|||
Expenses
|
||||
Management fee
|
$
|
7,088
|
||
Transfer agent fees
|
4,058
|
|||
Distribution and service plan fees
|
314
|
|||
Accounting fees and expenses
|
260
|
|||
Custodian fees and expenses
|
30
|
|||
Independent trustees' fees and expenses
|
10
|
|||
Registration fees
|
246
|
|||
Audit
|
40
|
|||
Legal
|
3
|
|||
Miscellaneous
|
25
|
|||
Total expenses before reductions
|
12,074
|
|||
Expense reductions
|
(1,757)
|
|||
Total expenses after reductions
|
10,317
|
|||
Net Investment income (loss)
|
80,212
|
|||
Realized and Unrealized Gain (Loss)
|
||||
Net realized gain (loss) on:
|
||||
Investment Securities:
|
||||
Unaffiliated issuers
|
101
|
|||
Fidelity Central Funds
|
31
|
|||
Capital gain distributions from Fidelity Central Funds
|
10
|
|||
Total net realized gain (loss)
|
142
|
|||
Net increase in net assets resulting from operations
|
$
|
80,354
|
||
Statement of Changes in Net Assets
|
||||
Amount in thousands
|
Year ended
October 31, 2023
|
Year ended
October 31, 2022
|
||
Increase (Decrease) in Net Assets
|
||||
Operations
|
||||
Net investment income (loss)
|
$
|
80,212
|
$
|
13,837
|
Net realized gain (loss)
|
142
|
(265)
|
||
Net increase in net assets resulting from operations
|
80,354
|
13,572
|
||
Distributions to shareholders
|
(80,206)
|
(13,836)
|
||
Share transactions - net increase (decrease)
|
343,469
|
190,729
|
||
Total increase (decrease) in net assets
|
343,617
|
190,465
|
||
Net Assets
|
||||
Beginning of period
|
2,767,449
|
2,576,984
|
||
End of period
|
$
|
3,111,066
|
$
|
2,767,449
|
Fidelity® Tax-Exempt Money Market Fund Capital Reserves Class
|
Years ended October 31,
|
2023
|
2022
|
2021
|
2020
|
2019
|
|||||
Selected Per-Share Data
|
||||||||||
Net asset value, beginning of period
|
$
|
1.00
|
$
|
1.00
|
$
|
1.00
|
$
|
1.00
|
$
|
1.00
|
Income from Investment Operations
|
||||||||||
Net investment income (loss) A
|
.022
|
.003
|
- B
|
.002
|
.007
|
|||||
Net realized and unrealized gain (loss)
|
- B
|
- B
|
.001
|
.001
|
- B
|
|||||
Total from investment operations
|
.022
|
.003
|
.001
|
.003
|
.007
|
|||||
Distributions from net investment income
|
(.022)
|
(.003)
|
- B
|
(.002)
|
(.007)
|
|||||
Distributions from net realized gain
|
-
|
-
|
(.001)
|
(.001)
|
-
|
|||||
Total distributions
|
(.022)
|
(.003)
|
(.001)
|
(.003)
|
(.007)
|
|||||
Net asset value, end of period
|
$
|
1.00
|
$
|
1.00
|
$
|
1.00
|
$
|
1.00
|
$
|
1.00
|
Total Return C
|
2.26%
|
.27%
|
.07%
|
.30%
|
.68%
|
|||||
Ratios to Average Net Assets A,D,E
|
||||||||||
Expenses before reductions
|
.97%
|
.97%
|
.97%
|
.97%
|
.97%
|
|||||
Expenses net of fee waivers, if any
|
.95%
|
.56%
|
.13%
|
.63%
|
.95%
|
|||||
Expenses net of all reductions
|
.95%
|
.56%
|
.13%
|
.63%
|
.95%
|
|||||
Net investment income (loss)
|
2.24%
|
.28%
|
.01%
|
.25%
|
.68%
|
|||||
Supplemental Data
|
||||||||||
Net assets, end of period (in millions)
|
$
|
35
|
$
|
45
|
$
|
45
|
$
|
48
|
$
|
53
|
Fidelity® Tax-Exempt Money Market Fund Daily Money Class
|
Years ended October 31,
|
2023
|
2022
|
2021
|
2020
|
2019
|
|||||
Selected Per-Share Data
|
||||||||||
Net asset value, beginning of period
|
$
|
1.00
|
$
|
1.00
|
$
|
1.00
|
$
|
1.00
|
$
|
1.00
|
Income from Investment Operations
|
||||||||||
Net investment income (loss) A
|
.025
|
.004
|
- B
|
.004
|
.009
|
|||||
Net realized and unrealized gain (loss)
|
- B
|
- B
|
.001
|
- B
|
- B
|
|||||
Total from investment operations
|
.025
|
.004
|
.001
|
.004
|
.009
|
|||||
Distributions from net investment income
|
(.025)
|
(.004)
|
- B
|
(.004)
|
(.009)
|
|||||
Distributions from net realized gain
|
-
|
-
|
(.001)
|
- B
|
-
|
|||||
Total distributions
|
(.025)
|
(.004)
|
(.001)
|
(.004)
|
(.009)
|
|||||
Net asset value, end of period
|
$
|
1.00
|
$
|
1.00
|
$
|
1.00
|
$
|
1.00
|
$
|
1.00
|
Total Return C
|
2.52%
|
.36%
|
.07%
|
.41%
|
.94%
|
|||||
Ratios to Average Net Assets A,D,E
|
||||||||||
Expenses before reductions
|
.72%
|
.72%
|
.72%
|
.72%
|
.72%
|
|||||
Expenses net of fee waivers, if any
|
.70%
|
.45%
|
.13%
|
.51%
|
.70%
|
|||||
Expenses net of all reductions
|
.70%
|
.45%
|
.13%
|
.51%
|
.70%
|
|||||
Net investment income (loss)
|
2.49%
|
.38%
|
.01%
|
.36%
|
.94%
|
|||||
Supplemental Data
|
||||||||||
Net assets, end of period (in millions)
|
$
|
61
|
$
|
44
|
$
|
53
|
$
|
62
|
$
|
70
|
Fidelity® Tax-Exempt Money Market Fund
|
Years ended October 31,
|
2023
|
2022
|
2021
|
2020
|
2019
|
|||||
Selected Per-Share Data
|
||||||||||
Net asset value, beginning of period
|
$
|
1.00
|
$
|
1.00
|
$
|
1.00
|
$
|
1.00
|
$
|
1.00
|
Income from Investment Operations
|
||||||||||
Net investment income (loss) A
|
.028
|
.005
|
- B
|
.005
|
.012
|
|||||
Net realized and unrealized gain (loss)
|
- B
|
- B
|
.001
|
- B
|
- B
|
|||||
Total from investment operations
|
.028
|
.005
|
.001
|
.005
|
.012
|
|||||
Distributions from net investment income
|
(.028)
|
(.005)
|
- B
|
(.005)
|
(.012)
|
|||||
Distributions from net realized gain
|
-
|
-
|
(.001)
|
- B
|
-
|
|||||
Total distributions
|
(.028)
|
(.005)
|
(.001)
|
(.005)
|
(.012)
|
|||||
Net asset value, end of period
|
$
|
1.00
|
$
|
1.00
|
$
|
1.00
|
$
|
1.00
|
$
|
1.00
|
Total Return C
|
2.81%
|
.49%
|
.07%
|
.53%
|
1.19%
|
|||||
Ratios to Average Net Assets A,D,E
|
||||||||||
Expenses before reductions
|
.47%
|
.47%
|
.47%
|
.47%
|
.47%
|
|||||
Expenses net of fee waivers, if any
|
.42%
|
.32%
|
.13%
|
.39%
|
.45%
|
|||||
Expenses net of all reductions
|
.42%
|
.32%
|
.13%
|
.39%
|
.45%
|
|||||
Net investment income (loss)
|
2.77%
|
.51%
|
.01%
|
.49%
|
1.18%
|
|||||
Supplemental Data
|
||||||||||
Net assets, end of period (in millions)
|
$
|
1,112
|
$
|
1,202
|
$
|
1,315
|
$
|
1,484
|
$
|
1,827
|
Fidelity® Tax-Exempt Money Market Fund Premium Class
|
Years ended October 31,
|
2023
|
2022
|
2021
|
2020
|
2019
|
|||||
Selected Per-Share Data
|
||||||||||
Net asset value, beginning of period
|
$
|
1.00
|
$
|
1.00
|
$
|
1.00
|
$
|
1.00
|
$
|
1.00
|
Income from Investment Operations
|
||||||||||
Net investment income (loss) A
|
.029
|
.006
|
- B
|
.006
|
.013
|
|||||
Net realized and unrealized gain (loss)
|
- B
|
- B
|
.001
|
- B
|
- B
|
|||||
Total from investment operations
|
.029
|
.006
|
.001
|
.006
|
.013
|
|||||
Distributions from net investment income
|
(.029)
|
(.006)
|
- B
|
(.006)
|
(.013)
|
|||||
Distributions from net realized gain
|
-
|
-
|
(.001)
|
(.001)
|
-
|
|||||
Total distributions
|
(.029)
|
(.006)
|
(.001)
|
(.006) C
|
(.013)
|
|||||
Net asset value, end of period
|
$
|
1.00
|
$
|
1.00
|
$
|
1.00
|
$
|
1.00
|
$
|
1.00
|
Total Return D
|
2.93%
|
.57%
|
.07%
|
.64%
|
1.31%
|
|||||
Ratios to Average Net Assets A,E,F
|
||||||||||
Expenses before reductions
|
.37%
|
.37%
|
.37%
|
.37%
|
.37%
|
|||||
Expenses net of fee waivers, if any
|
.30%
|
.26%
|
.13%
|
.31%
|
.33%
|
|||||
Expenses net of all reductions
|
.30%
|
.26%
|
.13%
|
.31%
|
.33%
|
|||||
Net investment income (loss)
|
2.89%
|
.58%
|
.01%
|
.56%
|
1.30%
|
|||||
Supplemental Data
|
||||||||||
Net assets, end of period (in millions)
|
$
|
1,904
|
$
|
1,476
|
$
|
1,165
|
$
|
1,406
|
$
|
1,591
|
Fidelity Central Fund
|
Investment Manager
|
Investment Objective
|
Investment Practices
|
Expense RatioA
|
Fidelity Money Market Central Funds
|
Fidelity Management & Research Company LLC (FMR)
|
Each fund seeks to obtain a high level of current income consistent with the preservation of capital and liquidity.
|
Short-term Investments
|
Less than .005%
|
Fidelity Treasury Money Market Fund
|
$396
|
Tax cost
|
Gross unrealized appreciation
|
Gross unrealized depreciation
|
Net unrealized appreciation (depreciation)
|
|
Fidelity Treasury Money Market Fund
|
$44,702,247
|
$170
|
$(170)
|
$-
|
Fidelity Tax-Exempt Money Market Fund
|
3,042,206
|
-
|
-
|
-
|
Undistributed ordinary income
|
Capital loss carryforward
|
Net unrealized appreciation (depreciation) on securities and other investments
|
|
Fidelity Treasury Money Market Fund
|
$126
|
$(245)
|
$-
|
Fidelity Tax-Exempt Money Market Fund
|
-
|
(117)
|
-
|
Short-term
|
Long-term
|
Total capital loss carryforward
|
|
Fidelity Treasury Money Market Fund
|
$-
|
$(245)
|
$(245)
|
Fidelity Tax-Exempt Money Market Fund
|
(117)
|
-
|
(117)
|
October 31, 2023
|
|||||
Tax-Exempt Income
|
Ordinary Income
|
Total
|
|||
Fidelity Treasury Money Market Fund
|
$-
|
$1,742,050
|
$1,742,050
|
||
Fidelity Tax-Exempt Money Market Fund
|
80,206
|
-
|
80,206
|
||
October 31, 2022
|
|||||
Tax-Exempt Income
|
Ordinary Income
|
Total
|
|||
Fidelity Treasury Money Market Fund
|
$-
|
$239,562
|
$239,562
|
||
Fidelity Tax-Exempt Money Market Fund
|
13,836
|
-
|
13,836
|
||
Distribution Fee
|
Service Fee
|
Total Fees
|
Retained by FDC
|
|
Fidelity Treasury Money Market Fund
|
||||
Capital Reserves Class
|
.25%
|
.25%
|
$8,929
|
$582
|
Daily Money Class
|
- %
|
.25%
|
5,829
|
570
|
Advisor C Class
|
.75%
|
.25%
|
1,037
|
235
|
$15,795
|
$1,387
|
|||
Fidelity Tax-Exempt Money Market Fund
|
||||
Capital Reserves Class
|
.25%
|
.25%
|
$202
|
$183
|
Daily Money Class
|
- %
|
.25%
|
112
|
71
|
$314
|
$254
|
Retained by FDC
|
|
Fidelity Treasury Money Market Fund
|
|
Daily Money Class
|
$8
|
Advisor C ClassA
|
$31
|
Fidelity Treasury Money Market Fund
|
|
Capital Reserves Class
|
$3,572
|
Daily Money Class
|
4,663
|
Advisor C Class
|
207
|
Fidelity Treasury Money Market Fund
|
54,227
|
$62,669
|
|
Fidelity Tax-Exempt Money Market Fund
|
|
Capital Reserves Class
|
$81
|
Daily Money Class
|
90
|
Fidelity Tax-Exempt Money Market Fund
|
2,275
|
Premium Class
|
1,612
|
$4,058
|
% of Average Net Assets
|
|
Fidelity Treasury Money Market Fund
|
-A
|
Fidelity Tax-Exempt Money Market Fund
|
.01
|
Purchases ($)
|
Sales ($)
|
Realized Gain (Loss) ($)
|
|
Fidelity Treasury Money Market Fund
|
-
|
-
|
-
|
Fidelity Tax-Exempt Money Market Fund
|
264,064
|
346,600
|
-
|
Expense Limitations
|
Reimbursement
|
|
Fidelity Treasury Money Market Fund
|
||
Capital Reserves Class
|
.95%
|
$286
|
Daily Money Class
|
.70%
|
368
|
Advisor C Class
|
1.45%
|
16
|
Fidelity Tax-Exempt Money Market Fund
|
||
Capital Reserves Class
|
.95%
|
$9
|
Daily Money Class
|
.70%
|
9
|
Fidelity Tax-Exempt Money Market Fund
|
.42%
|
589
|
Premium Class
|
.30%
|
$1,144
|
Custodian credits
|
Transfer Agent credits
|
|
Fidelity Treasury Money Market Fund
|
$31
|
$-
|
Daily Money Class
|
-
|
1
|
Fidelity Tax-Exempt Money Market Fund
|
6
|
|
Capital Reserves Class
|
-
|
- A
|
Year ended
October 31, 2023
|
Year ended
October 31, 2022
|
|
Fidelity Treasury Money Market Fund
|
||
Distributions to shareholders
|
||
Capital Reserves Class
|
$70,178
|
$7,806
|
Daily Money Class
|
97,889
|
11,250
|
Advisor C Class
|
3,474
|
401
|
Fidelity Treasury Money Market Fund
|
1,570,509
|
220,105
|
Total
|
$1,742,050
|
$239,562
|
Fidelity Tax-Exempt Money Market Fund
|
||
Distributions to shareholders
|
||
Capital Reserves Class
|
$891
|
$122
|
Daily Money Class
|
1,123
|
160
|
Fidelity Tax-Exempt Money Market Fund
|
31,316
|
5,893
|
Premium Class
|
46,876
|
7,661
|
Total
|
$80,206
|
$13,836
|
Shares
|
Shares
|
Dollars
|
Dollars
|
|
Year ended
October 31, 2023
|
Year ended
October 31, 2022
|
Year ended
October 31, 2023
|
Year ended
October 31, 2022
|
|
Fidelity Treasury Money Market Fund
|
||||
Capital Reserves Class
|
||||
Shares sold
|
12,131,652
|
9,132,711
|
$12,131,652
|
$9,132,711
|
Reinvestment of distributions
|
48,166
|
4,877
|
48,166
|
4,877
|
Shares redeemed
|
(11,822,665)
|
(9,136,531)
|
(11,822,665)
|
(9,136,531)
|
Net increase (decrease)
|
357,153
|
1,057
|
$357,153
|
$1,057
|
Daily Money Class
|
||||
Shares sold
|
9,349,993
|
5,924,283
|
$9,349,993
|
$5,924,283
|
Reinvestment of distributions
|
65,866
|
7,459
|
65,866
|
7,459
|
Shares redeemed
|
(8,387,127)
|
(5,837,369)
|
(8,387,127)
|
(5,837,369)
|
Net increase (decrease)
|
1,028,732
|
94,373
|
$1,028,732
|
$94,373
|
Advisor C Class
|
||||
Shares sold
|
80,820
|
141,870
|
$80,820
|
$141,870
|
Reinvestment of distributions
|
3,413
|
396
|
3,413
|
396
|
Shares redeemed
|
(101,716)
|
(97,275)
|
(101,716)
|
(97,275)
|
Net increase (decrease)
|
(17,483)
|
44,991
|
$(17,483)
|
$44,991
|
Fidelity Treasury Money Market Fund
|
||||
Shares sold
|
196,812,913
|
141,392,543
|
$196,812,913
|
$141,392,543
|
Reinvestment of distributions
|
1,092,120
|
149,964
|
1,092,120
|
149,964
|
Shares redeemed
|
(188,211,090)
|
(142,440,166)
|
(188,211,090)
|
(142,440,166)
|
Net increase (decrease)
|
9,693,943
|
(897,659)
|
$9,693,943
|
$(897,659)
|
Fidelity Tax-Exempt Money Market Fund
|
||||
Capital Reserves Class
|
||||
Shares sold
|
8,857
|
7,441
|
$8,857
|
$7,441
|
Reinvestment of distributions
|
854
|
116
|
854
|
116
|
Shares redeemed
|
(20,175)
|
(7,087)
|
(20,175)
|
(7,087)
|
Net increase (decrease)
|
(10,464)
|
470
|
$(10,464)
|
$470
|
Daily Money Class
|
||||
Shares sold
|
65,526
|
21,523
|
$65,526
|
$21,523
|
Reinvestment of distributions
|
941
|
137
|
941
|
137
|
Shares redeemed
|
(49,881)
|
(30,324)
|
(49,881)
|
(30,324)
|
Net increase (decrease)
|
16,586
|
(8,664)
|
$16,586
|
$(8,664)
|
Fidelity Tax-Exempt Money Market Fund
|
||||
Shares sold
|
539,348
|
267,433
|
$539,348
|
$267,433
|
Reinvestment of distributions
|
28,641
|
5,490
|
28,641
|
5,490
|
Shares redeemed
|
(658,494)
|
(384,606)
|
(658,494)
|
(384,606)
|
Net increase (decrease)
|
(90,505)
|
(111,683)
|
$(90,505)
|
$(111,683)
|
Premium Class
|
||||
Shares sold
|
2,631,151
|
1,359,383
|
$2,631,151
|
$1,359,383
|
Reinvestment of distributions
|
38,867
|
6,439
|
38,867
|
6,439
|
Shares redeemed
|
(2,242,166)
|
(1,055,216)
|
(2,242,166)
|
(1,055,216)
|
Net increase (decrease)
|
427,852
|
310,606
|
$427,852
|
$310,606
|
The Example is based on an investment of $1,000 invested at the beginning of the period and held for the entire period (May 1, 2023 to October 31, 2023).
|
Annualized Expense Ratio- A
|
Beginning Account Value May 1, 2023
|
Ending Account Value October 31, 2023
|
Expenses Paid During Period- C May 1, 2023 to October 31, 2023
|
|||||||
Fidelity® Treasury Money Market Fund
|
||||||||||
Capital Reserves Class
|
.95%
|
|||||||||
Actual
|
$ 1,000
|
$ 1,022.00
|
$ 4.84
|
|||||||
Hypothetical-B
|
$ 1,000
|
$ 1,020.42
|
$ 4.84
|
|||||||
Daily Money Class
|
.70%
|
|||||||||
Actual
|
$ 1,000
|
$ 1,023.30
|
$ 3.57
|
|||||||
Hypothetical-B
|
$ 1,000
|
$ 1,021.68
|
$ 3.57
|
|||||||
Advisor C Class
|
1.45%
|
|||||||||
Actual
|
$ 1,000
|
$ 1,019.50
|
$ 7.38
|
|||||||
Hypothetical-B
|
$ 1,000
|
$ 1,017.90
|
$ 7.38
|
|||||||
Fidelity® Treasury Money Market Fund
|
.42%
|
|||||||||
Actual
|
$ 1,000
|
$ 1,024.70
|
$ 2.14
|
|||||||
Hypothetical-B
|
$ 1,000
|
$ 1,023.09
|
$ 2.14
|
|||||||
Fidelity® Tax-Exempt Money Market Fund
|
||||||||||
Capital Reserves Class
|
.95%
|
|||||||||
Actual
|
$ 1,000
|
$ 1,013.10
|
$ 4.82
|
|||||||
Hypothetical-B
|
$ 1,000
|
$ 1,020.42
|
$ 4.84
|
|||||||
Daily Money Class
|
.70%
|
|||||||||
Actual
|
$ 1,000
|
$ 1,014.40
|
$ 3.55
|
|||||||
Hypothetical-B
|
$ 1,000
|
$ 1,021.68
|
$ 3.57
|
|||||||
Fidelity® Tax-Exempt Money Market Fund
|
.42%
|
|||||||||
Actual
|
$ 1,000
|
$ 1,015.80
|
$ 2.13
|
|||||||
Hypothetical-B
|
$ 1,000
|
$ 1,023.09
|
$ 2.14
|
|||||||
Premium Class
|
.30%
|
|||||||||
Actual
|
$ 1,000
|
$ 1,016.40
|
$ 1.52
|
|||||||
Hypothetical-B
|
$ 1,000
|
$ 1,023.69
|
$ 1.53
|
|||||||
Fidelity Treasury Money Market Fund
|
20.09%
|
Fidelity Treasury Money Market Fund
|
$419,259,206
|
Fidelity Treasury Money Market Fund
|
$1,742,049,911
|
A special meeting of shareholders was held on October 18, 2023. The results of votes taken among shareholders on the proposal before them are reported below. Each vote reported represents one dollar of net asset value held on the record date for the meeting.
|
||
Proposal 1
|
||
To elect a Board of Trustees.
|
||
# of
Votes
|
% of
Votes
|
|
Abigail P. Johnson
|
||
Affirmative
|
42,892,679,953.840
|
95.590
|
Withheld
|
1,979,119,732.260
|
4.410
|
TOTAL
|
44,871,799,686.100
|
100.000
|
Jennifer Toolin McAuliffe
|
||
Affirmative
|
42,858,549,134.710
|
95.510
|
Withheld
|
2,013,250,551.390
|
4.490
|
TOTAL
|
44,871,799,686.100
|
100.000
|
Christine J. Thompson
|
||
Affirmative
|
42,849,861,172.220
|
95.490
|
Withheld
|
2,021,938,513.880
|
4.510
|
TOTAL
|
44,871,799,686.100
|
100.000
|
Elizabeth S. Acton
|
||
Affirmative
|
42,793,745,005.380
|
95.370
|
Withheld
|
2,078,054,680.720
|
4.630
|
TOTAL
|
44,871,799,686.100
|
100.000
|
Laura M. Bishop
|
||
Affirmative
|
42,860,211,575.030
|
95.520
|
Withheld
|
2,011,588,111.070
|
4.480
|
TOTAL
|
44,871,799,686.100
|
100.000
|
Ann E. Dunwoody
|
||
Affirmative
|
42,792,175,103.300
|
95.370
|
Withheld
|
2,079,624,582.800
|
4.630
|
TOTAL
|
44,871,799,686.100
|
100.000
|
John Engler
|
||
Affirmative
|
42,853,487,483.070
|
95.500
|
Withheld
|
2,018,312,203.030
|
4.500
|
TOTAL
|
44,871,799,686.100
|
100.000
|
Robert F. Gartland
|
||
Affirmative
|
42,933,692,565.980
|
95.680
|
Withheld
|
1,938,107,120.120
|
4.320
|
TOTAL
|
44,871,799,686.100
|
100.000
|
Robert W. Helm
|
||
Affirmative
|
42,979,439,951.430
|
95.780
|
Withheld
|
1,892,359,734.670
|
4.220
|
TOTAL
|
44,871,799,686.100
|
100.000
|
Arthur E. Johnson
|
||
Affirmative
|
42,945,649,027.550
|
95.710
|
Withheld
|
1,926,150,658.550
|
4.290
|
TOTAL
|
44,871,799,686.100
|
100.000
|
Michael E. Kenneally
|
||
Affirmative
|
42,927,276,758.880
|
95.670
|
Withheld
|
1,944,522,927.220
|
4.330
|
TOTAL
|
44,871,799,686.100
|
100.000
|
Mark A. Murray
|
||
Affirmative
|
42,982,668,481.060
|
95.790
|
Withheld
|
1,889,131,205.040
|
4.210
|
TOTAL
|
44,871,799,686.100
|
100.000
|
Carol J. Zierhoffer
|
||
Affirmative
|
42,897,095,403.190
|
95.600
|
Withheld
|
1,974,704,282.910
|
4.400
|
TOTAL
|
44,871,799,686.100
|
100.000
|
Proposal 1 reflects trust wide proposal and voting results.
|
||
 |
Item 2.
Code of Ethics
As of the end of the period, October 31, 2023, Fidelity Newbury Street Trust (the trust) has adopted a code of ethics, as defined in Item 2 of Form N-CSR, that applies to its President and Treasurer and its Chief Financial Officer. A copy of the code of ethics is filed as an exhibit to this Form N-CSR.
Item 3.
Audit Committee Financial Expert
The Board of Trustees of the trust has determined that Elizabeth S. Acton is an audit committee financial expert, as defined in Item 3 of Form N-CSR. Ms. Acton is independent for purposes of Item 3 of Form N-CSR.
Item 4.
Principal Accountant Fees and Services
Fees and Services
The following table presents fees billed by PricewaterhouseCoopers LLP (“PwC”) in each of the last two fiscal years for services rendered to Fidelity Tax-Exempt Money Market Fund and Fidelity Treasury Money Market Fund (the “Fund(s)”):
Services Billed by PwC
October 31, 2023 FeesA
| | Audit Fees | Audit-Related Fees | Tax Fees | All Other Fees |
| Fidelity Tax-Exempt Money Market Fund | $33,200 | $2,600 | $2,100 | $1,100 |
| Fidelity Treasury Money Market Fund | $40,500 | $3,000 | $2,100 | $1,300 |
October 31, 2022 FeesA
| | Audit Fees | Audit-Related Fees | Tax Fees | All Other Fees |
| Fidelity Tax-Exempt Money Market Fund | $31,700 | $2,500 | $2,000 | $1,100 |
| Fidelity Treasury Money Market Fund | $37,400 | $2,900 | $2,000 | $1,300 |
A Amounts may reflect rounding.
The following table(s) present(s) fees billed by PwC that were required to be approved by the Audit Committee for services that relate directly to the operations and financial reporting of the Fund(s) and that are rendered on behalf of Fidelity Management & Research Company LLC ("FMR") and entities controlling, controlled by, or under common control with FMR (not including any sub-adviser whose role is primarily portfolio management and is subcontracted with or overseen by another investment adviser) that provide ongoing services to the Fund(s) (“Fund Service Providers”):
Services Billed by PwC
| | October 31, 2023A | October 31, 2022A |
| Audit-Related Fees | $8,284,200 | $7,914,600 |
| Tax Fees | $1,000 | $1,000 |
| All Other Fees | $- | $- |
A Amounts may reflect rounding.
“Audit-Related Fees” represent fees billed for assurance and related services that are reasonably related to the performance of the fund audit or the review of the fund's financial statements and that are not reported under Audit Fees.
“Tax Fees” represent fees billed for tax compliance, tax advice or tax planning that relate directly to the operations and financial reporting of the fund.
“All Other Fees” represent fees billed for services provided to the fund or Fund Service Provider, a significant portion of which are assurance related, that relate directly to the operations and financial reporting of the fund, excluding those services that are reported under Audit Fees, Audit-Related Fees or Tax Fees.
Assurance services must be performed by an independent public accountant.
* * *
The aggregate non-audit fees billed by PwC for services rendered to the Fund(s), FMR (not including any sub-adviser whose role is primarily portfolio management and is subcontracted with or overseen by another investment adviser), and any Fund Service Provider for each of the last two fiscal years of the Fund(s) are as follows:
| Billed By | October 31, 2023A | October 31, 2022A |
| PwC | $13,600,000 | $12,894,800 |
A Amounts may reflect rounding.
The trust's Audit Committee has considered non-audit services that were not pre-approved that were provided by PwC to Fund Service Providers to be compatible with maintaining the independence of PwC in its(their) audit of the Fund(s), taking into account representations from PwC, in accordance with Public Company Accounting Oversight Board rules, regarding its independence from the Fund(s) and its(their) related entities and FMR’s review of the appropriateness and permissibility under applicable law of such non-audit services prior to their provision to the Fund(s) Service Providers.
Audit Committee Pre-Approval Policies and Procedures
The trust’s Audit Committee must pre-approve all audit and non-audit services provided by a fund’s independent registered public accounting firm relating to the operations or financial reporting of the fund. Prior to the commencement of any audit or non-audit services to a fund, the Audit Committee reviews the services to determine whether they are appropriate and permissible under applicable law.
The Audit Committee has adopted policies and procedures to, among other purposes, provide a framework for the Committee’s consideration of non-audit services by the audit firms that audit the Fidelity funds. The policies and procedures require that any non-audit service provided by a fund audit firm to a Fidelity fund and any non-audit service provided by a fund auditor to a Fund Service Provider that relates directly to the operations and financial reporting of a Fidelity fund (“Covered Service”) are subject to approval by the Audit Committee before such service is provided.
All Covered Services must be approved in advance of provision of the service either: (i) by formal resolution of the Audit Committee, or (ii) by oral or written approval of the service by the Chair of the Audit Committee (or if the Chair is unavailable, such other member of the Audit Committee as may be designated by the Chair to act in the Chair’s absence). The approval contemplated by (ii) above is permitted where the Treasurer determines that action on such an engagement is necessary before the next meeting of the Audit Committee.
Non-audit services provided by a fund audit firm to a Fund Service Provider that do not relate directly to the operations and financial reporting of a Fidelity fund are reported to the Audit Committee periodically.
Non-Audit Services Approved Pursuant to Rule 2-01(c)(7)(i)(C) and (ii) of Regulation S-X (“De Minimis Exception”)
There were no non-audit services approved or required to be approved by the Audit Committee pursuant to the De Minimis Exception during the Fund’s(s’) last two fiscal years relating to services provided to (i) the Fund(s) or (ii) any Fund Service Provider that relate directly to the operations and financial reporting of the Fund(s).
The Registrant has not retained, for the preparation of the audit report on the financial statements included in the Form N-CSR, a registered public accounting firm that has a branch or office that is located in a foreign jurisdiction and that the Public Company Accounting Oversight Board (the “PCAOB”) has determined that the PCAOB is unable to inspect or investigate completely because of a position taken by an authority in the foreign jurisdiction.
The Registrant is not a “foreign issuer,” as defined in 17 CFR 240.3b-4.
Item 5.
Audit Committee of Listed Registrants
Not applicable.
Item 6.
Investments
(a)
Not applicable.
(b)
Not applicable.
Item 7.
Disclosure of Proxy Voting Policies and Procedures for Closed-End Management Investment Companies
Not applicable.
Item 8.
Portfolio Managers of Closed-End Management Investment Companies
Not applicable.
Item 9.
Purchase of Equity Securities by Closed-End Management Investment Company and Affiliated Purchasers
Not applicable.
Item 10.
Submission of Matters to a Vote of Security Holders
There were no material changes to the procedures by which shareholders may recommend nominees to the trust’s Board of Trustees.
Item 11.
Controls and Procedures
(a)(i) The President and Treasurer and the Chief Financial Officer have concluded that the trust’s disclosure controls and procedures (as defined in Rule 30a-3(c) under the Investment Company Act) provide reasonable assurances that material information relating to the trust is made known to them by the appropriate persons, based on their evaluation of these controls and procedures as of a date within 90 days of the filing date of this report.
(a)(ii) There was no change in the trust’s internal control over financial reporting (as defined in Rule 30a-3(d) under the Investment Company Act) that occurred during the period covered by this report that has materially affected, or is reasonably likely to materially affect, the trust’s internal control over financial reporting.
Item 12.
Disclosure of Securities Lending Activities for Closed-End Management
Investment Companies
Not applicable.
Item 18.
Recovery of Erroneously Awarded Compensation
(a)
Not applicable.
(b)
Not applicable.
Item 19.
Exhibits
| (a) | (1) | Code of Ethics pursuant to Item 2 of Form N-CSR is filed and attached hereto as EX-99.CODE ETH. |
| (a) | (2) | |
| (a) | (3) | Not applicable. |
| (b) | |
SIGNATURES
Pursuant to the requirements of the Securities Exchange Act of 1934 and the Investment Company Act of 1940, the registrant has duly caused this report to be signed on its behalf by the undersigned, thereunto duly authorized.
Fidelity Newbury Street Trust
| By: | /s/Laura M. Del Prato |
| | Laura M. Del Prato |
| | President and Treasurer |
| | |
| Date: | December 21, 2023 |
Pursuant to the requirements of the Securities Exchange Act of 1934 and the Investment Company Act of 1940, this report has been signed below by the following persons on behalf of the registrant and in the capacities and on the dates indicated.
| By: | /s/Laura M. Del Prato |
| | Laura M. Del Prato |
| | President and Treasurer |
| | |
| Date: | December 21, 2023 |
| By: | /s/John J. Burke III |
| | John J. Burke III |
| | Chief Financial Officer |
| | |
| Date: | December 21, 2023 |
Exhibit EX-99.CERT
I, Laura M. Del Prato, certify that:
1.
I have reviewed this report on Form N-CSR of Fidelity Newbury Street Trust;
2.
Based on my knowledge, this report does not contain any untrue statement of a material fact or omit to state a material fact necessary to make the statements made, in light of the circumstances under which such statements were made, not misleading with respect to the period covered by this report;
3.
Based on my knowledge, the financial statements, and other financial information included in this report, fairly present in all material respects the financial condition, results of operations, changes in net assets, and cash flows (if the financial statements are required to include a statement of cash flows) of the registrant as of, and for, the periods presented in this report;
4.
The registrant's other certifying officer(s) and I are responsible for establishing and maintaining disclosure controls and procedures (as defined in Rule 30a-3(c) under the Investment Company Act of 1940) and internal control over financial reporting (as defined in Rule 30a-3(d) under the Investment Company Act of 1940) for the registrant and have:
a.
Designed such disclosure controls and procedures, or caused such disclosure controls and procedures to be designed under our supervision, to ensure that material information relating to the registrant, including its consolidated subsidiaries, is made known to us by others within those entities, particularly during the period in which this report is being prepared;
b.
Designed such internal control over financial reporting, or caused such internal control over financial reporting to be designed under our supervision, to provide reasonable assurance regarding the reliability of financial reporting and the preparation of financial statements for external purposes in accordance with generally accepted accounting principles;
c.
Evaluated the effectiveness of the registrant's disclosure controls and procedures and presented in this report our conclusions about the effectiveness of the disclosure controls and procedures, as of a date within 90 days prior to the filing date of this report based upon such evaluation; and
d.
Disclosed in this report any change in the registrant’s internal control over financial reporting that occurred during the period covered by this report that has materially affected, or is reasonably likely to materially affect, the registrant’s internal control over financial reporting; and
5.
The registrant's other certifying officer(s) and I have disclosed to the registrant's auditors and the audit committee of the registrant's board of directors (or persons performing the equivalent functions):
a.
All significant deficiencies and material weaknesses in the design or operation of internal control over financial reporting which are reasonably likely to adversely affect the registrant's ability to record, process, summarize, and report financial information; and
b.
Any fraud, whether or not material, that involves management or other employees who have a significant role in the registrant's internal control over financial reporting.
Date:
December 21, 2023
/s/Laura M. Del Prato |
Laura M. Del Prato |
President and Treasurer |
I, John J. Burke III, certify that:
1.
I have reviewed this report on Form N-CSR of Fidelity Newbury Street Trust;
2.
Based on my knowledge, this report does not contain any untrue statement of a material fact or omit to state a material fact necessary to make the statements made, in light of the circumstances under which such statements were made, not misleading with respect to the period covered by this report;
3.
Based on my knowledge, the financial statements, and other financial information included in this report, fairly present in all material respects the financial condition, results of operations, changes in net assets, and cash flows (if the financial statements are required to include a statement of cash flows) of the registrant as of, and for, the periods presented in this report;
4.
The registrant's other certifying officer(s) and I are responsible for establishing and maintaining disclosure controls and procedures (as defined in Rule 30a-3(c) under the Investment Company Act of 1940) and internal control over financial reporting (as defined in Rule 30a-3(d) under the Investment Company Act of 1940) for the registrant and have:
a.
Designed such disclosure controls and procedures, or caused such disclosure controls and procedures to be designed under our supervision, to ensure that material information relating to the registrant, including its consolidated subsidiaries, is made known to us by others within those entities, particularly during the period in which this report is being prepared;
b.
Designed such internal control over financial reporting, or caused such internal control over financial reporting to be designed under our supervision, to provide reasonable assurance regarding the reliability of financial reporting and the preparation of financial statements for external purposes in accordance with generally accepted accounting principles;
c.
Evaluated the effectiveness of the registrant's disclosure controls and procedures and presented in this report our conclusions about the effectiveness of the disclosure controls and procedures, as of a date within 90 days prior to the filing date of this report based upon such evaluation; and
d.
Disclosed in this report any change in the registrant’s internal control over financial reporting that occurred during the period covered by this report that has materially affected, or is reasonably likely to materially affect, the registrant’s internal control over financial reporting; and
5.
The registrant's other certifying officer(s) and I have disclosed to the registrant's auditors and the audit committee of the registrant's board of directors (or persons performing the equivalent functions):
a.
All significant deficiencies and material weaknesses in the design or operation of internal control over financial reporting which are reasonably likely to adversely affect the registrant's ability to record, process, summarize, and report financial information; and
b.
Any fraud, whether or not material, that involves management or other employees who have a significant role in the registrant's internal control over financial reporting.
Date:
December 21, 2023
/s/John J. Burke III |
John J. Burke III |
Chief Financial Officer |
Exhibit EX-99.906CERT
Certification Pursuant to Section 906 of the Sarbanes-Oxley Act of 2002 (subsections (a) and (b) of section 1350, chapter 63 of title 18, United States Code)
In connection with the attached Report of Fidelity Newbury Street Trust (the “Trust”) on Form N-CSR to be filed with the Securities and Exchange Commission (the “Report”), each of the undersigned officers of the Trust does hereby certify that, to the best of such officer’s knowledge:
1.
The Report fully complies with the requirements of 13(a) or 15(d) of the Securities Exchange Act of 1934; and
2.
The information contained in the Report fairly presents, in all material respects, the financial condition and results of operations of the Trust as of, and for, the periods presented in the Report.
Dated: December 21, 2023
/s/Laura M. Del Prato |
Laura M. Del Prato |
President and Treasurer |
Dated: December 21, 2023
/s/John J. Burke III |
John J. Burke III |
Chief Financial Officer |
A signed original of this written statement required by Section 906, or other document authenticating, acknowledging, or otherwise adopting the signature that appears in typed form within the electronic version of this written statement required by Section 906, has been provided to the Trust and will be retained by the Trust and furnished to the Securities and Exchange Commission or its staff upon request.
Fidelity Investments
FIDELITY FUNDS’
CODE OF ETHICS
FOR PRESIDENT, TREASURER
AND PRINCIPAL ACCOUNTING OFFICER
2023
FIDELITY FUNDS’ CODE OF ETHICS FOR
PRESIDENT, TREASURER AND PRINCIPAL ACCOUNTING OFFICER
I. Purposes of the Code/Covered Officers
This document constitutes the Code of Ethics (Code) adopted by the Fidelity Funds (Funds) pursuant to Section 406 of the Sarbanes-Oxley Act of 2002. The Code applies to the Fidelity Funds’ President and Treasurer, and Chief Financial Officer (Covered Officers). Fidelity’s Ethics Office, within Enterprise Compliance, administers the Code.
The purposes of the Code are to deter wrongdoing and to promote, on the part of the Covered Officers:
·
honest and ethical conduct, including the ethical handling of actual or apparent conflicts of interest between personal and professional relationships;
·
full, fair, accurate, timely and understandable disclosure in reports and documents that the Fidelity Funds submit to the Securities and Exchange Commission (SEC), and in other public communications by a Fidelity Fund;
·
compliance with applicable laws and governmental rules and regulations;
·
the prompt internal reporting to an appropriate person or persons identified in the Code of violations of the Code; and
·
accountability for adherence to the Code.
Each Covered Officer should adhere to a high standard of business ethics and should be sensitive to situations that may give rise to actual as well as apparent conflicts of interest.
II.
Covered Officers Should Handle Ethically
Actual and Apparent Conflicts of Interest
Overview. A “conflict of interest” occurs when a Covered Officer’s private interest interferes with the interests of, or their service to, the Fidelity Funds. For example, a conflict of interest would arise if a Covered Officer, or a member of their family, receives improper personal benefits as a result of their position with the Fidelity Funds.
Certain conflicts of interest arise out of the relationships between Covered Officers and the Fidelity Funds and already are subject to conflict of interest provisions in the Investment Company Act of 1940 (Investment Company Act) and the Investment Advisers Act of 1940 (Investment Advisers Act). For example, Covered Officers may not individually engage in certain transactions (such as the purchase or sale of securities or other property) with a Fidelity Fund because of their status as “affiliated persons” of the Fund. Separate compliance programs and procedures of the Fidelity Funds, Fidelity Management & Research Company (FMR) and the other Fidelity companies are designed to prevent, or identify and correct, violations of these provisions. This Code does not, and is not intended to, repeat or replace these programs and procedures, and such conflicts fall outside of the parameters of this Code.
Although typically not presenting an opportunity for improper personal benefit, conflicts arise from, or as a result of, the contractual relationship between the Fidelity Funds and FMR (or another Fidelity company) of which the Covered Officers are also officers or employees. As a result, this Code recognizes that the Covered Officers will, in the normal course of their duties (whether formally for the Fidelity Funds, FMR or another Fidelity company), be involved in establishing policies and implementing decisions that have different effects on the Fidelity Funds, FMR and other Fidelity companies. The participation of the Covered Officers in such activities is inherent in the contractual relationship between the Fidelity Funds and FMR (or another Fidelity company) and is consistent with the performance by the Covered Officers of their duties as officers of the Fidelity Funds. Thus, if performed in conformity with the provisions of the Investment Company Act and the Investment Advisers Act, such activities will be deemed to have been handled ethically. In addition, it is recognized by the Funds’ Board of Trustees (Board) that the Covered Officers also may be officers or employees of one or more other Fidelity Funds covered by this Code.
Other conflicts of interest are covered by the Code, even if such conflicts of interest are not subject to provisions in the Investment Company Act and the Investment Advisers Act. The following list provides examples of conflicts of interest under the Code, but Covered Officers should keep in mind that these examples are not exhaustive. The overarching principle is that the personal interest of a Covered Officer should not be placed improperly before the interest of a Fidelity Fund.
* * *
Each Covered Officer must:
·
not use their personal influence or personal relationships improperly to influence investment decisions or financial reporting by any Fidelity Fund whereby the Covered Officer would benefit personally to the detriment of any Fidelity Fund;
·
not cause a Fidelity Fund to take action, or fail to take action, for the individual personal benefit of the Covered Officer rather than the benefit of the Fidelity Fund;
·
not engage in any outside business activity, including serving as a director or trustee, that prevents the Covered Officer from devoting appropriate time and attention to the Covered Officer’s responsibilities with the Fidelity Funds;
·
not have a consulting or employment relationship with any of the Fidelity Funds’ service providers that are not affiliated with Fidelity; and
·
not retaliate against any employee or Covered Officer for reports of actual or potential misconduct, which are made in good faith.
With respect to other fact patterns, if a Covered Officer is in doubt, other potential conflict of interest situations should be described immediately to the Fidelity Ethics Office for resolution. Similarly, any questions a Covered Officer has generally regarding the application or interpretation of the Code should be directed to the Fidelity Ethics Office immediately.
III. Disclosure and Compliance
·
Each Covered Officer should familiarize themself with the disclosure requirements generally applicable to the Fidelity Funds.
·
Each Covered Officer should not knowingly misrepresent, or cause others to misrepresent, facts about any Fidelity Fund to others, whether within or outside Fidelity, including to the Board and auditors, and to governmental regulators and self-regulatory organizations;
·
Each Covered Officer should, to the extent appropriate within their area of responsibility, consult with other officers and employees of the Fidelity Funds, FMR and the Fidelity service providers, and with the Board’s Compliance Committee, with the goal of promoting full, fair, accurate, timely and understandable disclosure in the reports and documents the Fidelity Funds file with, or submit to, the SEC and in other public communications made by the Fidelity Funds; and
·
It is the responsibility of each Covered Officer to promote compliance with the standards and restrictions imposed by applicable laws, rules and regulations.
IV. Reporting and Accountability
Each Covered Officer must:
·
upon receipt of the Code, and annually thereafter, submit to the Fidelity Ethics Office an acknowledgement stating that they have received, read, and understand the Code; and
·
notify the Fidelity Ethics Office promptly if they know of any violation of the Code. Failure to do so is itself a violation of this Code.
The Fidelity Ethics Office shall take all action it considers appropriate to investigate any actual or potential violations reported to it. Upon completion of the investigation, if necessary, the matter will be reviewed with senior management or other appropriate parties, and a determination will be made as to whether any action should be taken as detailed below. The Covered Officer will be informed of any action determined to be appropriate. The Fidelity Ethics Office will inform the Personal Trading Committee of all Code violations and actions taken in response. Without implied limitation, appropriate remedial, disciplinary or preventive action may include a written warning, a letter of censure, suspension, dismissal or, in the event of criminal or other serious violations of law, notification of the SEC or other appropriate law enforcement authorities. Additionally, other legal remedies may be pursued.
The policies and procedures described in the Code do not create any obligations to any person or entity other than the Fidelity Funds. The Code is intended solely for the internal use by the Fidelity Funds and does not constitute a promise, contract or an admission by or on behalf of any Fidelity Fund as to any fact, circumstance, or legal conclusion. The Fidelity Funds, the Fidelity companies and the Fidelity Head of Ethics retain the discretion to decide whether the Code applies to a specific situation, and how it should be interpreted.
V. Oversight
Material violations of this Code will be reported promptly by FMR (or another Fidelity company) to the Board’s Compliance Committee. In addition, at least once each year, FMR (or another Fidelity company) will provide a written report to the Board, which describes any issues arising under the Code since the last report to the Board, including, but not limited to, information about material violations of the Code and action taken in response to the material violations.
VI. Other Policies and Procedures
This Code shall be the sole code of ethics adopted by the Fidelity Funds for purposes of Section 406 of the Sarbanes-Oxley Act. Other Fidelity policies or procedures that cover the behavior or activities of Covered Officers are separate requirements applying to the Covered Officers (and others) and are not part of this Code.
VII. Amendments
Any material amendments or changes to this Code must be approved or ratified by a majority vote of the Board, including a majority of the Trustees who are not interested persons of the Fidelity Funds.
VIII. Records and Confidentiality
Records of any violation of the Code and of the actions taken as a result of such violations will be kept by the Fidelity Ethics Office. All reports and records prepared or maintained pursuant to this Code will be considered confidential and shall be maintained and protected accordingly. Except as otherwise required by law or this Code, such matters shall not be disclosed to anyone other than the Fidelity Ethics Office, the Personal Trading Committee, the Board, appropriate personnel at the relevant Fidelity company or companies and the legal counsel of any or all of the foregoing.
2023