| Q2 2025 Financial Results Conference Call August 6th, 2025 Veeco Instruments |

| Safe Harbor This presentation contains “forward-looking statements”, within the meaning of the safe harbor provisions of the U.S. Private Securities Litigation Reform Act of 1995, as amended, that are based on management’s expectations, estimates, projections and assumptions. Words such as “expects,” “anticipates,” “plans,” “believes,” “scheduled,” “estimates” and variations of these words and similar expressions are intended to identify forward-looking statements. Forward-looking statements include, but are not limited to, those regarding anticipated growth and trends in our businesses and markets, industry outlooks and demand drivers, our investment and growth strategies, our development of new products and technologies, our business outlook for current and future periods, our ongoing transformation initiative and the effects thereof on our operations and financial results; and other statements that are not historical facts. These statements and their underlying assumptions are subject to risks and uncertainties and are not guarantees of future performance. Factors that could cause actual results to differ materially from those expressed or implied by such statements include, without limitation: global trade issues, including the effects of foreign and domestic tariffs and the ongoing trade disputes between the U.S. and China, and changes in trade and export license policies; the level of demand for our products; global economic and industry conditions; global conflicts; our dependency on third-party suppliers and outsourcing partners; the timing of customer orders; our ability to develop, deliver and support new products and technologies; our ability to expand our current markets, increase market share and develop new markets; the concentrated nature of our customer base; cybersecurity attacks and our ability to safeguard sensitive information and protect our intellectual property rights in key technologies; the effects of regional or global health epidemics; our ability to achieve the objectives of operational and strategic initiatives and attract, motivate and retain key employees; the variability of results among products and end-markets, and our ability to accurately forecast future results, market conditions, and customer requirements; the impact of our indebtedness, including our convertible senior notes and our capped call transactions; and other risks and uncertainties described in our SEC filings on Forms 10-K, 10-Q and 8-K, and from time-to-time in our other SEC reports. All forward-looking statements speak only to management’s expectations, estimates, projections and assumptions as of the date of this presentation. The Company does not undertake any obligation to update or publicly revise any forward-looking statements to reflect events, circumstances or changes in expectations after the date of this presentation. |
| Bill Miller, Ph.D. CEO Overview |

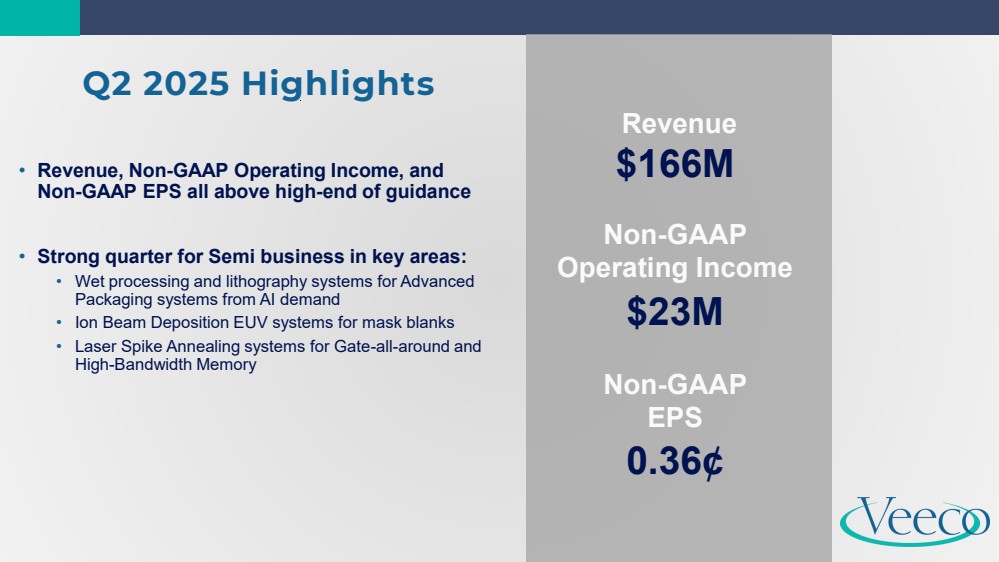
| Q2 2025 Highlights • Revenue, Non-GAAP Operating Income, and Non-GAAP EPS all above high-end of guidance • Strong quarter for Semi business in key areas: • Wet processing and lithography systems for Advanced Packaging systems from AI demand • Ion Beam Deposition EUV systems for mask blanks • Laser Spike Annealing systems for Gate-all-around and High-Bandwidth Memory Revenue $166M Non-GAAP Operating Income $23M Non-GAAP EPS 0.36¢ |
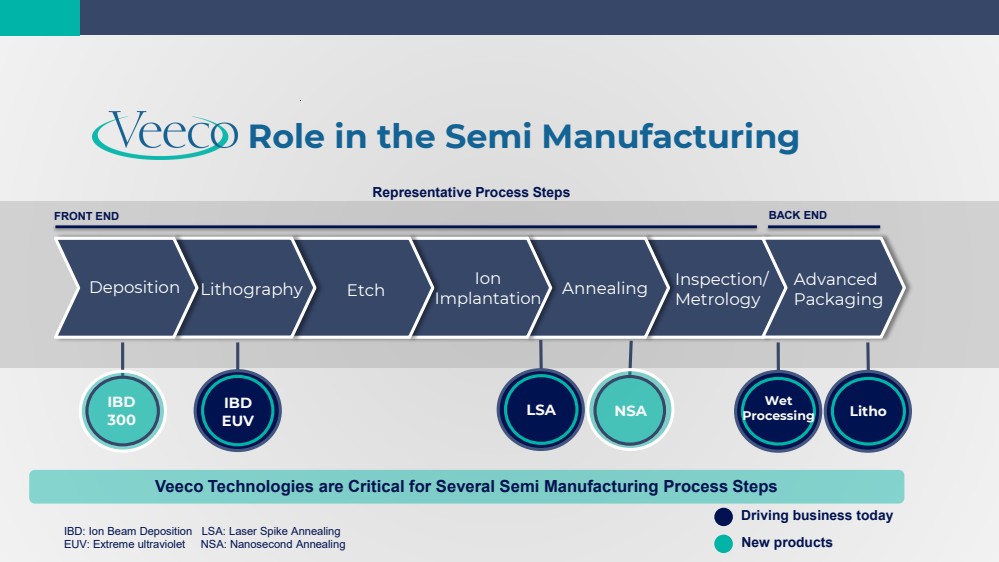
| Role in the Semi Manufacturing Deposition Lithography Ion Implantation Etch Annealing Inspection/ Metrology Advanced Packaging IBD 300 IBD EUV LSA NSA Wet Processing Litho New products FRONT END BACK END Driving business today Representative Process Steps Veeco Technologies are Critical for Several Semi Manufacturing Process Steps IBD: Ion Beam Deposition LSA: Laser Spike Annealing EUV: Extreme ultraviolet NSA: Nanosecond Annealing |
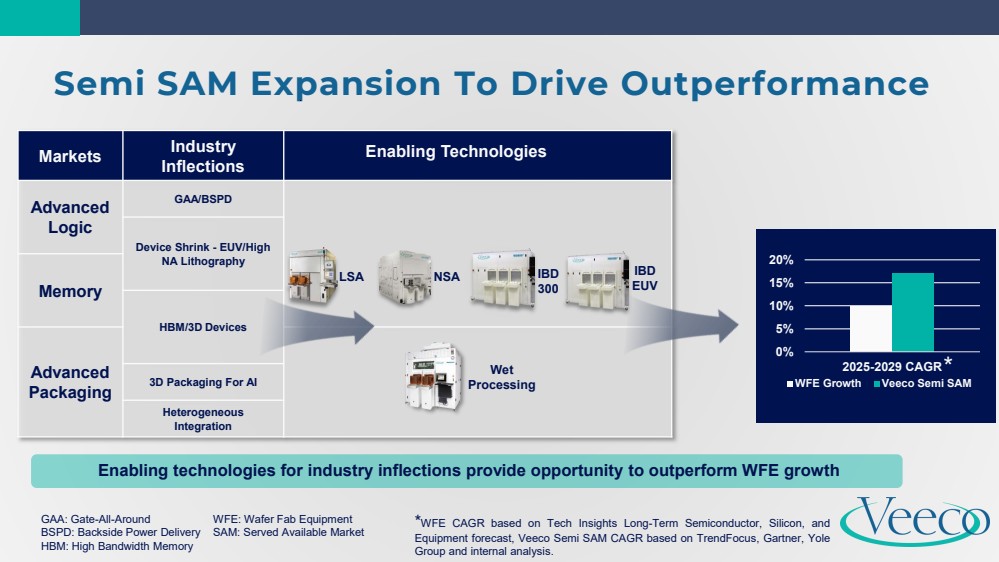
| Semi SAM Expansion To Drive Outperformance Markets Industry Inflections Advanced Logic GAA/BSPD Device Shrink - EUV/High NA Lithography Memory HBM/3D Devices Advanced Packaging 3D Packaging For AI Heterogeneous Integration LSA NSA IBD 300 Wet Processing IBD EUV 0% 5% 10% 15% 20% 2025-2029 CAGR WFE Growth Veeco Semi SAM Enabling Technologies Enabling technologies for industry inflections provide opportunity to outperform WFE growth *WFE CAGR based on Tech Insights Long-Term Semiconductor, Silicon, and Equipment forecast, Veeco Semi SAM CAGR based on TrendFocus, Gartner, Yole Group and internal analysis. * GAA: Gate-All-Around WFE: Wafer Fab Equipment BSPD: Backside Power Delivery SAM: Served Available Market HBM: High Bandwidth Memory |
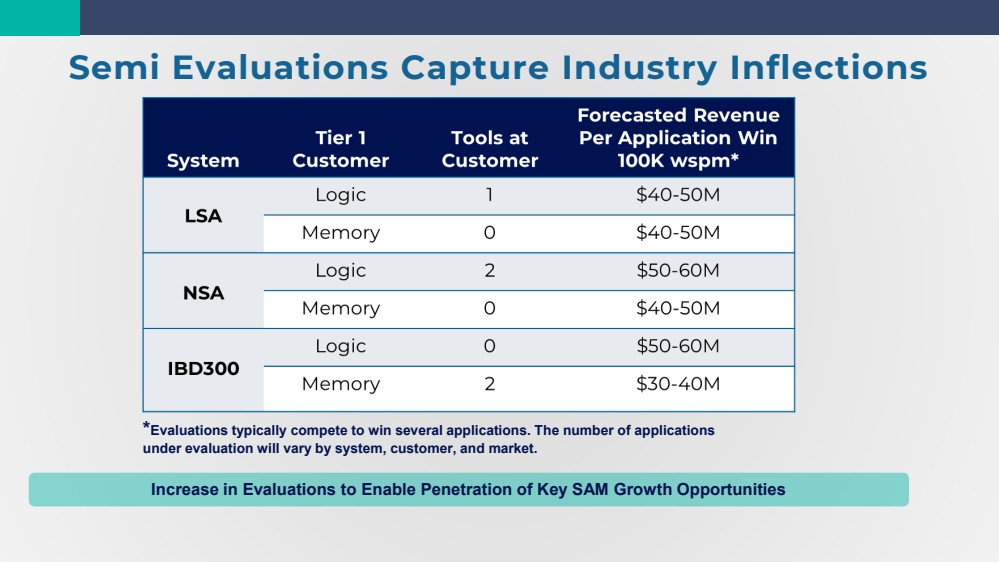
| Semi Evaluations Capture Industry Inflections Increase in Evaluations to Enable Penetration of Key SAM Growth Opportunities *Evaluations typically compete to win several applications. The number of applications under evaluation will vary by system, customer, and market. |
| John Kiernan CFO Financial Overview |

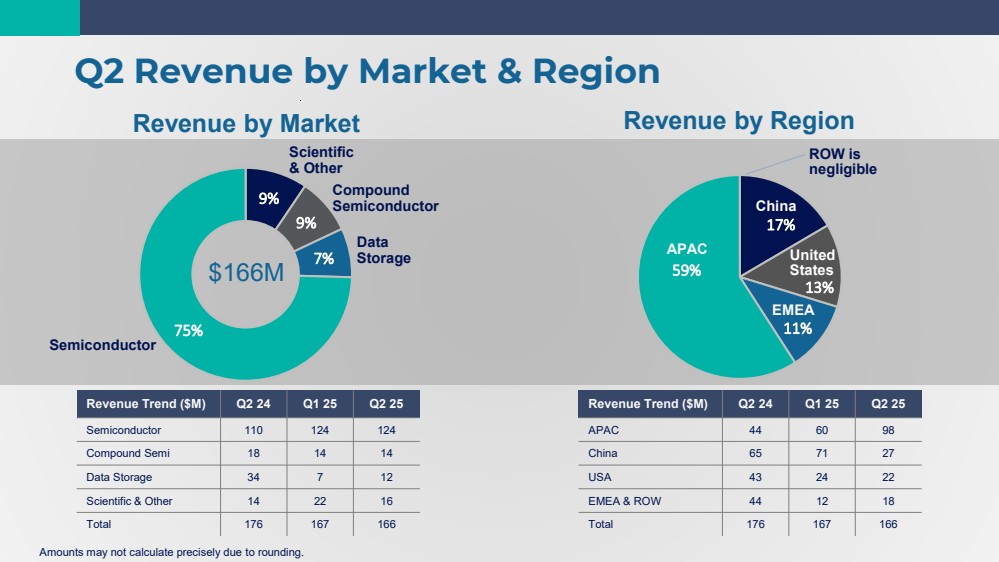
| Q2 Revenue by Market & Region Revenue by Market Revenue by Region Scientific & Other Semiconductor Compound Semiconductor Data Storage EME A APAC China United States ROW is negligible 9% 9% 7% 75% 17% 13% 11% 59% United States EMEA APAC China $166M Amounts may not calculate precisely due to rounding. Revenue Trend ($M) Q2 24 Q1 25 Q2 25 Semiconductor 110 124 124 Compound Semi 18 14 14 Data Storage 34 7 12 Scientific & Other 14 22 16 Total 176 167 166 Revenue Trend ($M) Q2 24 Q1 25 Q2 25 APAC 44 60 98 China 65 71 27 USA 43 24 22 EMEA & ROW 44 12 18 Total 176 167 166 |
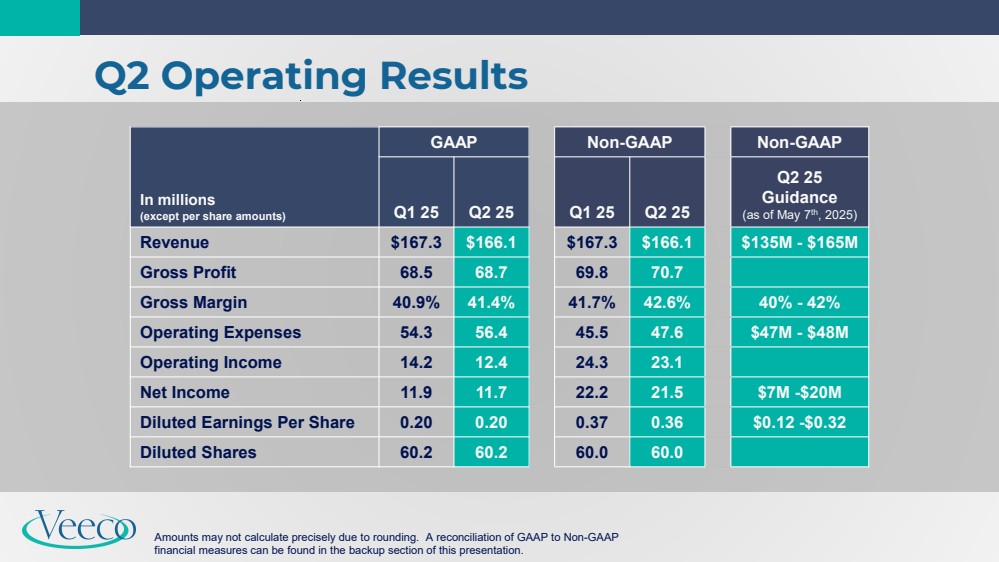
| In millions (except per share amounts) GAAP Non-GAAP Non-GAAP Q1 25 Q2 25 Q1 25 Q2 25 Q2 25 Guidance (as of May 7th, 2025) Revenue $167.3 $166.1 $167.3 $166.1 $135M - $165M Gross Profit 68.5 68.7 69.8 70.7 Gross Margin 40.9% 41.4% 41.7% 42.6% 40% - 42% Operating Expenses 54.3 56.4 45.5 47.6 $47M - $48M Operating Income 14.2 12.4 24.3 23.1 Net Income 11.9 11.7 22.2 21.5 $7M -$20M Diluted Earnings Per Share 0.20 0.20 0.37 0.36 $0.12 -$0.32 Diluted Shares 60.2 60.2 60.0 60.0 Q2 Operating Results Amounts may not calculate precisely due to rounding. A reconciliation of GAAP to Non-GAAP financial measures can be found in the backup section of this presentation. |
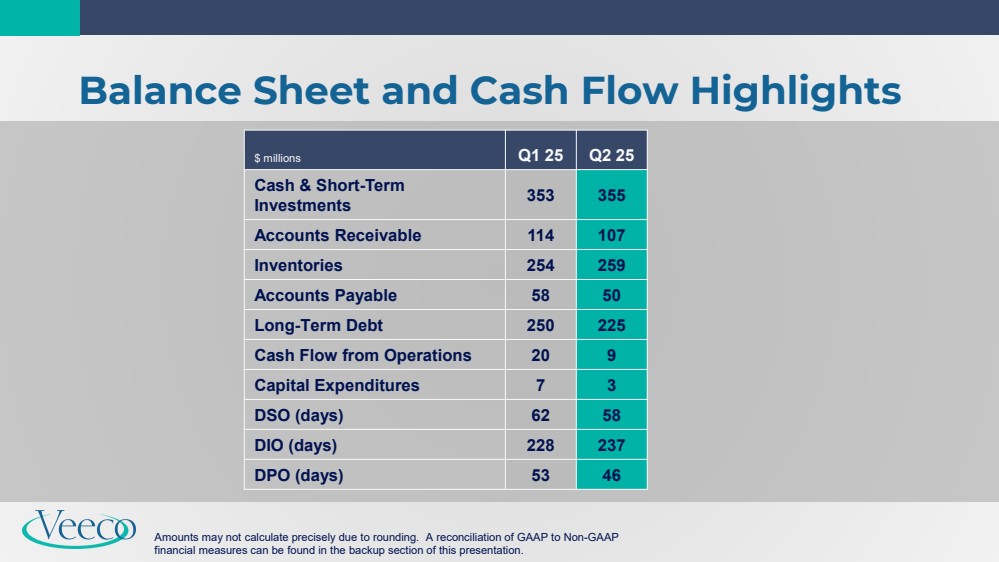
| Balance Sheet and Cash Flow Highlights $ millions Q1 25 Q2 25 Cash & Short-Term Investments 353 355 Accounts Receivable 114 107 Inventories 254 259 Accounts Payable 58 50 Long-Term Debt 250 225 Cash Flow from Operations 20 9 Capital Expenditures 7 3 DSO (days) 62 58 DIO (days) 228 237 DPO (days) 53 46 Amounts may not calculate precisely due to rounding. A reconciliation of GAAP to Non-GAAP financial measures can be found in the backup section of this presentation. |
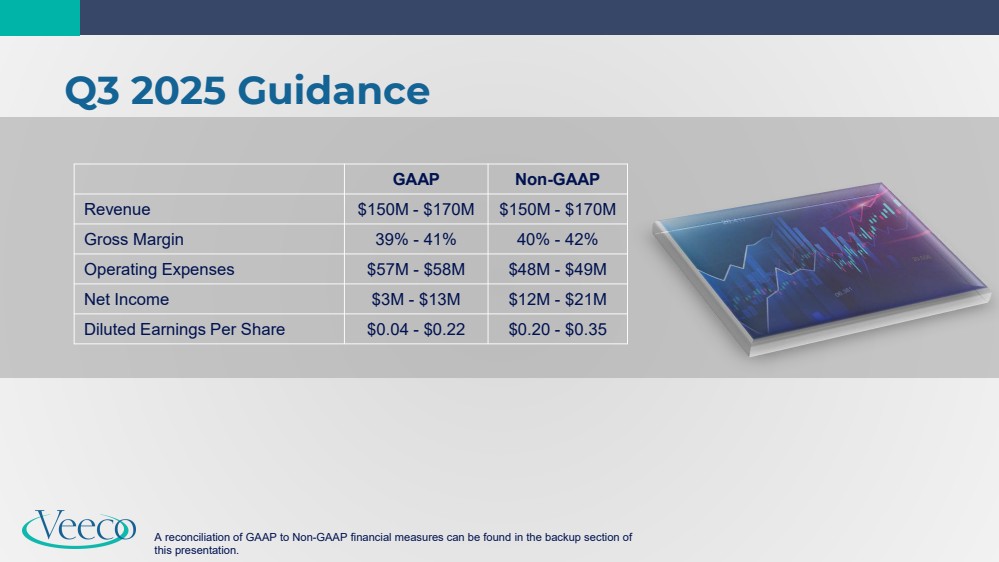
| Q3 2025 Guidance GAAP Non-GAAP Revenue $150M - $170M $150M - $170M Gross Margin 39% - 41% 40% - 42% Operating Expenses $57M - $58M $48M - $49M Net Income $3M - $13M $12M - $21M Diluted Earnings Per Share $0.04 - $0.22 $0.20 - $0.35 A reconciliation of GAAP to Non-GAAP financial measures can be found in the backup section of this presentation. |
| Q&A |

| Backup & Financial Tables |

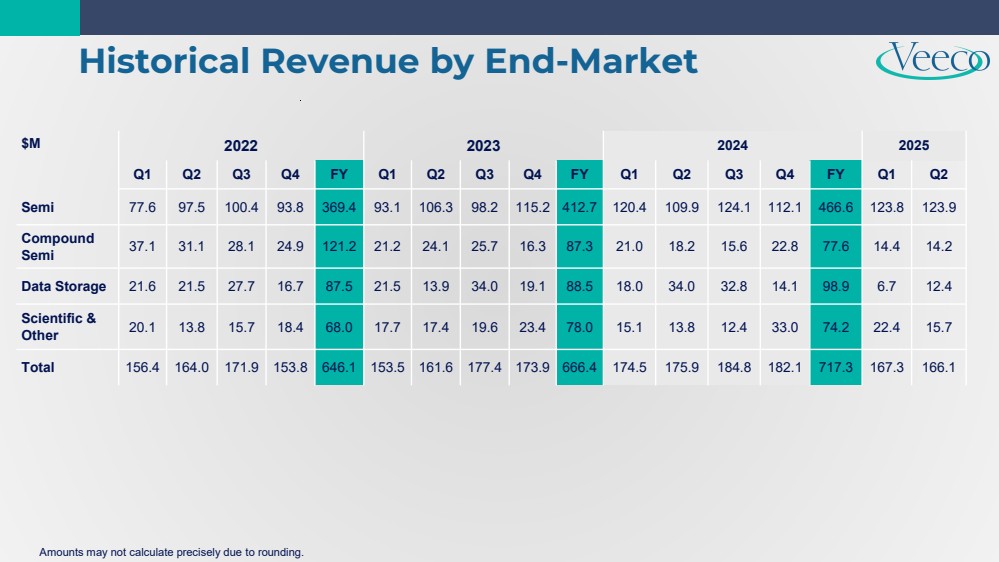
| Historical Revenue by End-Market $M 2022 2023 2024 2025 Q1 Q2 Q3 Q4 FY Q1 Q2 Q3 Q4 FY Q1 Q2 Q3 Q4 FY Q1 Q2 Semi 77.6 97.5 100.4 93.8 369.4 93.1 106.3 98.2 115.2 412.7 120.4 109.9 124.1 112.1 466.6 123.8 123.9 Compound Semi 37.1 31.1 28.1 24.9 121.2 21.2 24.1 25.7 16.3 87.3 21.0 18.2 15.6 22.8 77.6 14.4 14.2 Data Storage 21.6 21.5 27.7 16.7 87.5 21.5 13.9 34.0 19.1 88.5 18.0 34.0 32.8 14.1 98.9 6.7 12.4 Scientific & Other 20.1 13.8 15.7 18.4 68.0 17.7 17.4 19.6 23.4 78.0 15.1 13.8 12.4 33.0 74.2 22.4 15.7 Total 156.4 164.0 171.9 153.8 646.1 153.5 161.6 177.4 173.9 666.4 174.5 175.9 184.8 182.1 717.3 167.3 166.1 Amounts may not calculate precisely due to rounding. |
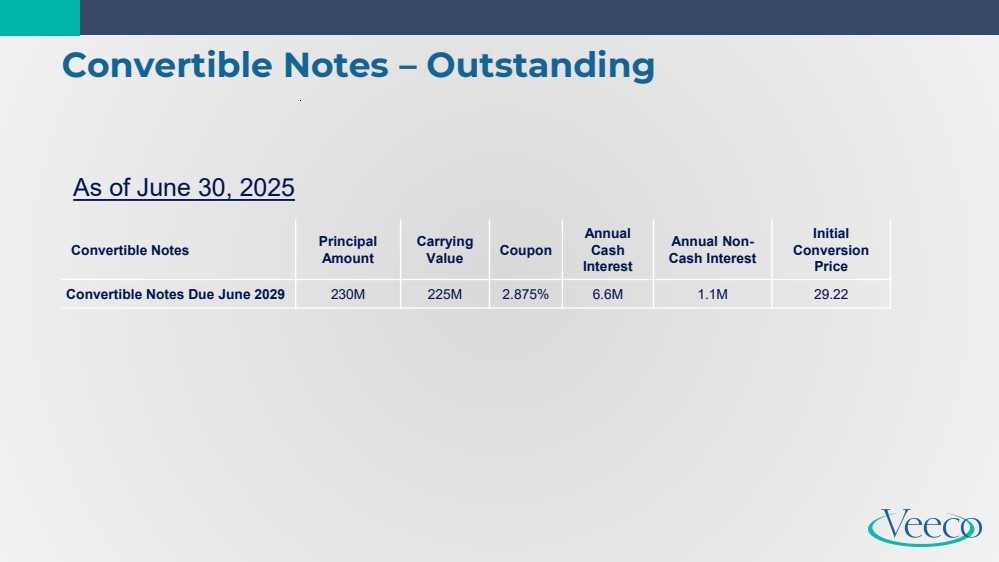
| Convertible Notes – Outstanding Convertible Notes Principal Amount Carrying Value Coupon Annual Cash Interest Annual Non-Cash Interest Initial Conversion Price Convertible Notes Due June 2029 230M 225M 2.875% 6.6M 1.1M 29.22 As of June 30, 2025 |
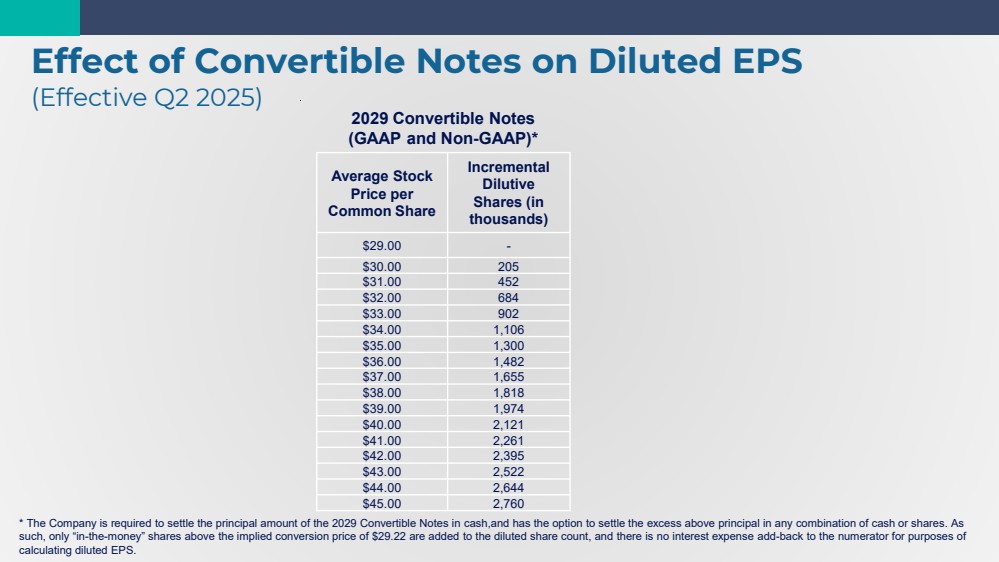
| Effect of Convertible Notes on Diluted EPS (Effective Q2 2025) * The Company is required to settle the principal amount of the 2029 Convertible Notes in cash,and has the option to settle the excess above principal in any combination of cash or shares. As such, only “in-the-money” shares above the implied conversion price of $29.22 are added to the diluted share count, and there is no interest expense add-back to the numerator for purposes of calculating diluted EPS. 2029 Convertible Notes (GAAP and Non-GAAP)* Average Stock Price per Common Share Incremental Dilutive Shares (in thousands) $29.00 - $30.00 205 $31.00 452 $32.00 684 $33.00 902 $34.00 1,106 $35.00 1,300 $36.00 1,482 $37.00 1,655 $38.00 1,818 $39.00 1,974 $40.00 2,121 $41.00 2,261 $42.00 2,395 $43.00 2,522 $44.00 2,644 $45.00 2,760 |
| Note on Reconciliation Tables These tables include financial measures adjusted for the impact of certain items; these financial measures are therefore not calculated in accordance with U.S. generally accepted accounting principles (“GAAP”). These Non-GAAP financial measures exclude items such as: share-based compensation expense; charges relating to restructuring initiatives; non-cash asset impairments; certain other non-operating gains and losses; and acquisition-related items such as transaction costs, non-cash amortization of acquired intangible assets, incremental transaction-related compensation, and certain integration costs. These Non-GAAP financial measures may be different from Non-GAAP financial measures used by other companies. Non-GAAP financial measures should not be considered a substitute for, or superior to, measures of financial performance prepared in accordance with GAAP. By excluding these items, Non-GAAP financial measures are intended to facilitate meaningful comparisons to historical operating results, competitors' operating results, and estimates made by securities analysts. Management is evaluated on key performance metrics including Non-GAAP Operating Income, which is used to determine management incentive compensation as well as to forecast future periods. These Non-GAAP financial measures may be useful to investors in allowing for greater transparency of supplemental information used by management in its financial and operational decision-making. In addition, similar Non-GAAP financial measures have historically been reported to investors; the inclusion of comparable numbers provides consistency in financial reporting. Investors are encouraged to review the reconciliation of the Non-GAAP financial measures used in this news release to their most directly comparable GAAP financial measures. |
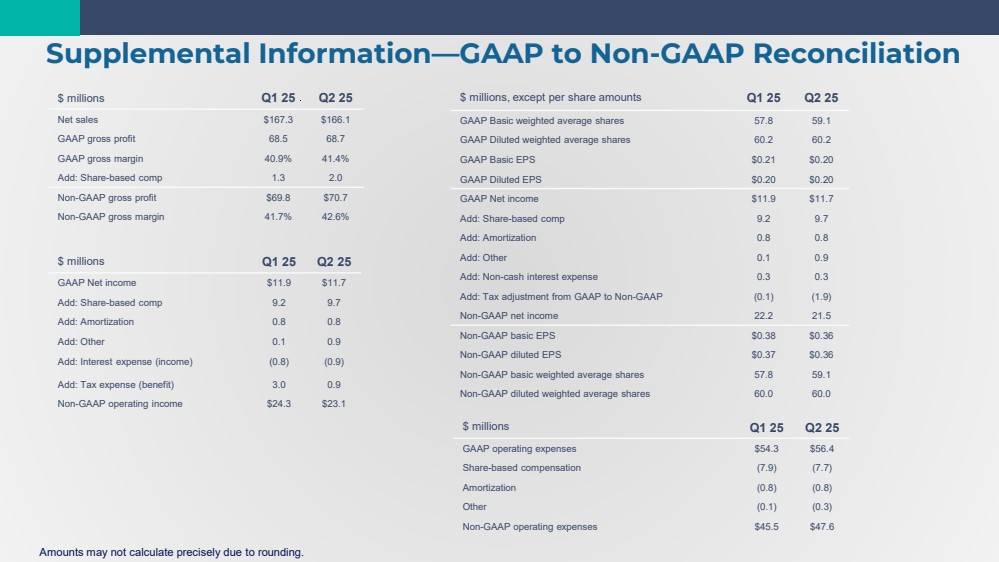
| Supplemental Information—GAAP to Non-GAAP Reconciliation $ millions Q1 25 Q2 25 Net sales $167.3 $166.1 GAAP gross profit 68.5 68.7 GAAP gross margin 40.9% 41.4% Add: Share-based comp 1.3 2.0 Non-GAAP gross profit $69.8 $70.7 Non-GAAP gross margin 41.7% 42.6% $ millions Q1 25 Q2 25 GAAP Net income $11.9 $11.7 Add: Share-based comp 9.2 9.7 Add: Amortization 0.8 0.8 Add: Other 0.1 0.9 Add: Interest expense (income) (0.8) (0.9) Add: Tax expense (benefit) 3.0 0.9 Non-GAAP operating income $24.3 $23.1 $ millions, except per share amounts Q1 25 Q2 25 GAAP Basic weighted average shares 57.8 59.1 GAAP Diluted weighted average shares 60.2 60.2 GAAP Basic EPS $0.21 $0.20 GAAP Diluted EPS $0.20 $0.20 GAAP Net income $11.9 $11.7 Add: Share-based comp 9.2 9.7 Add: Amortization 0.8 0.8 Add: Other 0.1 0.9 Add: Non-cash interest expense 0.3 0.3 Add: Tax adjustment from GAAP to Non-GAAP (0.1) (1.9) Non-GAAP net income 22.2 21.5 Non-GAAP basic EPS $0.38 $0.36 Non-GAAP diluted EPS $0.37 $0.36 Non-GAAP basic weighted average shares 57.8 59.1 Non-GAAP diluted weighted average shares 60.0 60.0 $ millions Q1 25 Q2 25 GAAP operating expenses $54.3 $56.4 Share-based compensation (7.9) (7.7) Amortization (0.8) (0.8) Other (0.1) (0.3) Non-GAAP operating expenses $45.5 $47.6 Amounts may not calculate precisely due to rounding. |
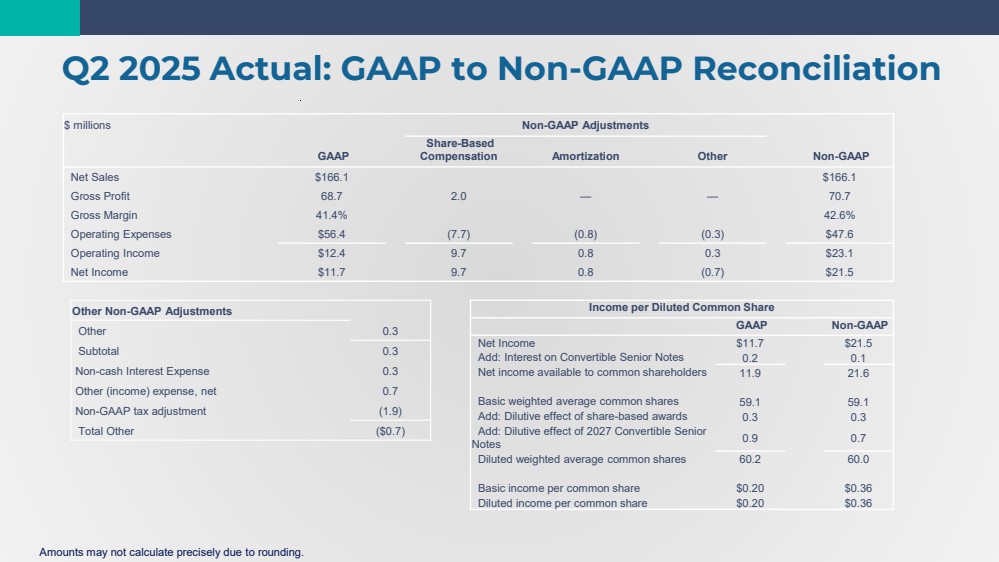
| $ millions Non-GAAP Adjustments GAAP Share-Based Compensation Amortization Other Non-GAAP Net Sales $166.1 $166.1 Gross Profit 68.7 2.0 — — 70.7 Gross Margin 41.4% 42.6% Operating Expenses $56.4 (7.7) (0.8) (0.3) $47.6 Operating Income $12.4 9.7 0.8 0.3 $23.1 Net Income $11.7 9.7 0.8 (0.7) $21.5 Q2 2025 Actual: GAAP to Non-GAAP Reconciliation Income per Diluted Common Share GAAP Non-GAAP Net Income $11.7 $21.5 Add: Interest on Convertible Senior Notes 0.2 0.1 Net income available to common shareholders 11.9 21.6 Basic weighted average common shares 59.1 59.1 Add: Dilutive effect of share-based awards 0.3 0.3 Add: Dilutive effect of 2027 Convertible Senior Notes 0.9 0.7 Diluted weighted average common shares 60.2 60.0 Basic income per common share $0.20 $0.36 Diluted income per common share $0.20 $0.36 Other Non-GAAP Adjustments Other 0.3 Subtotal 0.3 Non-cash Interest Expense 0.3 Other (income) expense, net 0.7 Non-GAAP tax adjustment (1.9) Total Other ($0.7) Amounts may not calculate precisely due to rounding. |
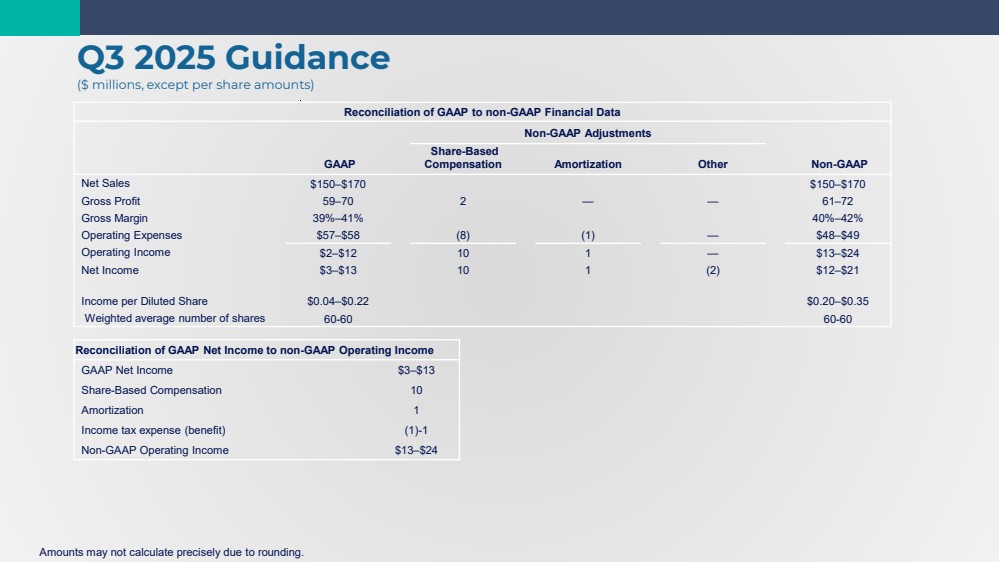
| Reconciliation of GAAP to non-GAAP Financial Data Non-GAAP Adjustments GAAP Share-Based Compensation Amortization Other Non-GAAP Net Sales $150–$170 $150–$170 Gross Profit 59–70 2 — — 61–72 Gross Margin 39%–41% 40%–42% Operating Expenses $57–$58 (8) (1) — $48–$49 Operating Income $2–$12 10 1 — $13–$24 Net Income $3–$13 10 1 (2) $12–$21 Income per Diluted Share $0.04–$0.22 $0.20–$0.35 Weighted average number of shares 60-60 60-60 Q3 2025 Guidance ($ millions, except per share amounts) Reconciliation of GAAP Net Income to non-GAAP Operating Income GAAP Net Income $3–$13 Share-Based Compensation 10 Amortization 1 Income tax expense (benefit) (1)-1 Non-GAAP Operating Income $13–$24 Amounts may not calculate precisely due to rounding. |