SEMIANNUAL REPORT
September 30, 2023
NICHOLAS FUND, INC.

WWW.NICHOLASFUNDS.COM
| UNITED STATES |
| SECURITIES AND EXCHANGE COMMISSION |
| Washington, D.C. 20549 |
| FORM N-CSR |
| CERTIFIED SHAREHOLDER REPORT OF REGISTERED |
| MANAGEMENT INVESTMENT COMPANIES |
Investment Company Act file number 811-01728
| Nicholas Fund, Inc. | |
|
| |
| (Exact Name of Registrant as specified in charter) | |
| 411 East Wisconsin Avenue, Suite 2100, Milwaukee, Wisconsin 53202 | |
| (Address of Principal Executive Offices) | (Zip Code) |
| Jennifer R. Kloehn, Senior Vice President and Treasurer | |
| 411 East Wisconsin Avenue, Suite 2100 | |
| Milwaukee, Wisconsin 53202 | |
|
| |
| (Name and Address of Agent for Service) | |
Registrant's telephone number, including area code: 414-272-4650
Date of fiscal year end: 03/31/2024
Date of reporting period: 09/30/2023
Item 1. Report to Stockholders.
SEMIANNUAL REPORT
September 30, 2023
NICHOLAS FUND, INC.
WWW.NICHOLASFUNDS.COM
NICHOLAS FUND, INC.
November 2023
Dear Fellow Shareholders,
For the six-months ended September 30, 2023, Nicholas Fund (the “Fund”) returned 7.97% compared to 5.18% of the Standard & Poor’s 500 Index (“S&P 500”), 9.28% for the Russell 1000 Growth Index, and the Morningstar Large Cap Growth category return of 7.04% over the same period.
For the twelve-months ended September 30, 2023, Nicholas Fund returned 27.94%, compared to the S&P 500 return of 21.62%, and 27.72% for the Russell 1000 Growth Index. For the period ending September 30, 2023, the Fund’s Morningstar Risk-Adjusted Return rank within the Morningstar Large Growth Category was in the top 1% over 3-years (out of 1125 funds), 11% over 5-years (out of 1040 funds), and 56% over the trailing 10-years (out of 810 funds).
Returns for the Fund and selected indices are provided in the chart below for the period ended September 30, 2023.
| Average Annual Total Return | |||||||||||||||||
| 6 Month | 1 | Year | 3 | Year | 5 | Year | 10 | Year | 50 | Year | |||||||
| Nicholas Fund, Inc. | 7.97 | % | 27.94 | % | 10.78 | % | 11.28 | % | 10.91 | % | 11.25 | % | |||||
| Standard & Poor’s 500 Index | 5.18 | % | 21.62 | % | 10.15 | % | 9.92 | % | 11.91 | % | 10.08 | % | |||||
| Russell 1000 Growth Index | 9.28 | % | 27.72 | % | 7.97 | % | 12.42 | % | 14.48 | % | N/A | ||||||
| Consumer Price Index | 1.88 | % | 3.69 | % | 5.75 | % | 4.04 | % | 2.79 | % | 3.91 | % | |||||
| Ending value of $10,000 invested | |||||||||||||||||
| in Nicholas Fund, Inc. | $11,812 | $12,794 | $13,594 | $17,067 | $28,172 | $2,061,572 | |||||||||||
| Fund’s Expense Ratio (from 07/29/23 Prospectus): 0.71% | |||||||||||||||||
Performance data quoted represents past performance and is no guarantee of future results. The investment return and principal value of an investment will fluctuate so that an investor’s shares, when redeemed, may be worth more or less than their original cost. Current performance of the Fund may be lower or higher than the performance quoted. Performance data current to the most recent month-end may be obtained by visiting www.nicholasfunds.com/returns.html.
The Fund’s returns are reduced by expenses while the market indices are not. The ending values above illustrate the performance of a hypothetical $10,000 investment made in the Fund over the timeframes listed. Assumes reinvestment of dividends and capital gains. Returns shown do not reflect the deduction of taxes that a shareholder would pay on Fund distributions or the redemption of Fund shares. These figures do not imply any future performance.
The market advance in the first part of 2023 was primarily driven by outsized returns in mega-cap technology stocks, along with expectations of an economic slowdown and the end of Federal Reserve’s current tightening cycle. The Fed reinforced its commitment to a 2% inflation target and stated interest rates may need to stay higher for longer to achieve that goal. That view was reinforced by stronger than expected economic growth as GDP grew at 4.9% in the 3Q23, following 2.1% growth in 2Q23 and 2.2% in 1Q23. Interest rates moved higher as well with the Treasury 2-year reaching 5.14% and the Treasury 10-year hitting 4.63%, with a trend suggesting higher rates to come. During the period, growth stock performance continued to exceed that of value stocks by a significant margin. The returns of the Russell 1000 Growth Index continue to be largely driven by a select group of mega-cap stocks including Apple, Microsoft, NVIDIA, Amazon, Google, and Tesla. This group of stocks contributed a majority return of 6.88% to the Russell 1000 Growth Index total return of 9.28%, for the six-month period ending September 30, 2023.
Wall Street estimates called for weaker earnings in the 3Q23 followed by a rebound in the 4Q23. Consensus for 3Q23 earnings at the end of September suggested -0.8% earnings growth, with +6.2% growth in the 4Q23. Estimates are constantly adjusted with 78% of S&P 500
companies that had reported 3Q23 earnings experiencing positive surprises to expectations. The current 3Q23 estimate of +2.7% EPS growth represents a significant upward revision from earlier estimates as reported by FactSet.
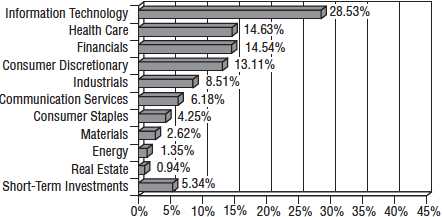
As of September 30, 2023, the portfolio held 60 stocks and ended with 5.3% cash. The largest sector weights were focused on Info Technology 28.4%, Health Care 14.6%, Financials 14.5%, Consumer Discretionary 13.1%, and Industrials 8.5%. The Weighted Average Market Cap was $441.8 billion, and the Forward P/E was 24.9x.
The Fund’s outperformance during the six-month period was generated from security selection and the impact of weighting primarily in the Consumer Staples and Information Technology sectors relative to the S&P 500 Index. Security selection within these sectors was the primary driver for the positive effect on relative performance. In addition, the portfolio benefited from an underweight position in the Utilities, Real Estate, and Communication Services sectors. The leading detractor during the six-month period resulted from the portfolio’s holdings in the Consumer Discretionary sector, which were impacted by higher interest rates and deterioration in the sales mix between unit pricing and unit growth.
The growth in 2023 has relied on consumer strength, which seems to have some vulnerabilities emerging that may weaken further in the near future. We maintain our view that the economy is vulnerable to an economic slowdown or recession in 2024. We continue to trim positions that have earned significant outperformance and redeploy proceeds into stocks we consider attractive with reasonable valuations. We anticipate market returns to be more modest in the quarters ahead as economic growth slows and corporate earnings growth moderates. As always, we will rely on our long-held discipline and philosophy as we strive to attain our investment objective of increasing the value of your investment over the long term (“long-term growth”).
We appreciate your investment in the Fund.
Thank you for your continued support.
Sincerely,

Mutual fund investing involves risk. Principal loss is possible. Investing in small- and medium-sized companies involves greater risks than those associated with investing in large company stocks, such as business risk, stock price fluctuations and liquidity.
Earnings growth is not representative of the Fund’s future performance.
Opinions expressed are subject to change at any time, are not guaranteed and should not be considered investment advice.
Please refer to the Schedule of Investments in the report for complete Fund holdings information. Fund holdings and sector allocations are subject to change and should not be considered a recommendation to buy or sell any security.
The S&P 500 Index is a broad-based unmanaged index of 500 stocks, which is widely recognized as representative of the equity market in general. The Russell 1000® Growth Index measures the performance of the large-cap growth segment of the U.S. equity universe. It includes those Russell 1000 companies with higher price-to-book ratios and higher forecasted growth values.
The Consumer Price Index represents changes in prices of all goods and services purchased for consumption by urban households. One cannot invest directly in an index.
Morningstar Risk-Adjusted Return is adjusted for risk by calculating a risk penalty for each investment’s return based on “expected utility theory,” a commonly used method of economic analysis. Although the math is complex, the basic concept is relatively straightforward. It assumes that investors are more concerned about a possible poor outcome than an unexpectedly good outcome; and those investors are willing to give a small portion of an investment’s expected return in exchange for greater certainty. This concept is the basis for how Morningstar adjusts for risk. A “risk penalty” is subtracted from each investment’s total return, based on the variation in its month-to-month return during the rating period, with an emphasis on downward variation. The greater the variation, the larger the penalty. If two funds have the exact same return, the one with more variation in its return is given the larger risk penalty.
Basis Point (bp): A unit equal to 1/100th of 1% and is used to denote the change in a financial instrument.
Earnings growth: The annual rate of growth of earnings from investments.
Earnings Per Share (EPS): The net income available to common shareholders less dividends on preferred stock divided by the weighted average number of shares outstanding.
Gross Domestic Product (GDP): The monetary value of all the finished goods and services produced within a country’s borders in a specific time period.
Price-to-Earnings (PE): PE is a valuation ratio of a company’s current share price compared to its per-share earnings.
Weighted Average Market Cap: A measure of the mean size of a portfolio’s holdings. It is a sum calculated by multiplying the weight of each security in a portfolio by their respective market capitalizations.
Must be preceded or accompanied by a prospectus.
The Nicholas Funds are distributed by Quasar Distributors, LLC.
Financial Highlights (NICSX)
For a share outstanding throughout each period
| Six Months | ||||||||||||||||||
| Ended | ||||||||||||||||||
| 09/30/2023 | Years Ended March 31, | |||||||||||||||||
| (unaudited) | 2023 | 2022 | 2021 | 2020 | 2019 | |||||||||||||
| NET ASSET VALUE, | ||||||||||||||||||
| BEGINNING OF PERIOD | $ | 75.77 | $ | 80.56 | $ | 80.14 | $ | 56.53 | $ | 65.11 | $ | 62.10 | ||||||
| INCOME (LOSS) FROM | ||||||||||||||||||
| INVESTMENT OPERATIONS | ||||||||||||||||||
| Net investment income(1) | .15 | .21 | .15 | .33 | .33 | .38 | ||||||||||||
| Net gain (loss) on securities | ||||||||||||||||||
| (realized and unrealized) | 5.83 | (3.43 | ) | 10.51 | 28.49 | (3.33 | ) | 7.14 | ||||||||||
| Total from investment | ||||||||||||||||||
| operations | 5.98 | (3.22 | ) | 10.66 | 28.82 | (3.00 | ) | 7.52 | ||||||||||
| LESS DISTRIBUTIONS | ||||||||||||||||||
| From net investment income | (.07 | ) | (.19 | ) | (.20 | ) | (.34 | ) | (.34 | ) | (.39 | ) | ||||||
| From net capital gain | (2.78 | ) | (1.38 | ) | (10.04 | ) | (4.87 | ) | (5.24 | ) | (4.12 | ) | ||||||
| Total distributions | (2.85 | ) | (1.57 | ) | (10.24 | ) | (5.21 | ) | (5.58 | ) | (4.51 | ) | ||||||
| NET ASSET VALUE, | ||||||||||||||||||
| END OF PERIOD | $ | 78.90 | $ | 75.77 | $ | 80.56 | $ | 80.14 | $ | 56.53 | $ | 65.11 | ||||||
| TOTAL RETURN | 7.97 | %(2) | (3.86 | )% | 13.42 | % | 51.97 | % | (5.90 | )% | 13.07 | % | ||||||
| SUPPLEMENTAL DATA: | ||||||||||||||||||
| Net assets, end of period (millions) | $ | 3,430.7 | $ | 3,256.2 | $ | 3,582.6 | $ | 3,353.3 | $ | 2,370.2 | $ | 2,737.5 | ||||||
| Ratio of expenses | ||||||||||||||||||
| to average net assets. | .71 | %(3) | .71 | % | .71 | % | .71 | % | .72 | % | .72 | % | ||||||
| Ratio of net investment income | ||||||||||||||||||
| to average net assets. | .36 | %(3) | .30 | % | .18 | % | .46 | % | .49 | % | .60 | % | ||||||
| Portfolio turnover rate | 8.48 | %(3) | 15.61 | % | 11.49 | % | 16.74 | % | 15.36 | % | 12.76 | % | ||||||
| (1) |
Computed based on average shares outstanding. |
| (2) |
Not annualized. |
| (3) |
Annualized. |
The accompanying notes to financial statements are an integral part of these highlights.
– 4–
Top Ten Equity Portfolio Holdings
September 30, 2023 (unaudited)
| Percentage | ||
| Name | of Net Assets | |
| Alphabet Inc. Class C | 5.12 | % |
| Microsoft Corporation | 4.20 | % |
| Apple Inc. | 2.91 | % |
| Amazon.com, Inc. | 2.60 | % |
| O’Reilly Automotive, Inc. | 2.20 | % |
| Aon plc Class A | 2.15 | % |
| Adobe Incorporated | 2.13 | % |
| Mastercard Incorporated Class A | 2.13 | % |
| Home Depot, Inc. | 2.02 | % |
| Thermo Fisher Scientific Inc. | 1.98 | % |
| Total of top ten | 27.44 | % |
Sector Diversification (as a percentage of portfolio)
September 30, 2023 (unaudited)
– 5–
Fund Expenses
For the six month period ended September 30, 2023 (unaudited)
As a shareholder of the Fund, you incur two types of costs: (1) transaction costs and (2) ongoing costs, including management fees and other operating expenses. The following table is intended to help you understand your ongoing costs (in dollars) of investing in the Fund and to compare these costs with those of other mutual funds.
The example is based on an investment of $1,000 made at the beginning of the period and held for the entire period.
The first line of the table below provides information about the actual account values and actual expenses. You may use the information in this line, together with the amount you invested, to estimate the expenses that you paid over the period. Simply divide your account value by $1,000 (for example, an $8,600 account value divided by $1,000 = 8.6), then multiply the result by the number in the first line under the heading entitled “Expenses Paid During Period” to estimate the expenses you paid on your account during this period.
The second line of the table below provides information about hypothetical account values and hypothetical expenses based on the Fund’s actual expense ratio and an assumed rate of return of 5% per year before expenses, which is not the Fund’s actual return. The hypothetical account values and expenses may not be used to estimate the actual ending account balance or expenses you paid for the period. You may use this information to compare the ongoing costs of investing in the Fund with other funds. To do so, compare this 5% hypothetical example with the 5% hypothetical examples that appear in the shareholder reports of other funds.
Please note that the expenses shown in the table are meant to highlight your ongoing costs only and do not reflect any transactional costs, such as wire fees. Therefore, the second line of the table is useful in comparing ongoing costs only, and will not help you determine the relative total costs of owning different funds. In addition, if these transactional costs were included, your costs would have been higher.
| Beginning | Ending | Expenses Paid | ||||
| Account Value | Account Value | During Period* | ||||
| 03/31/23 | 09/30/23 | 04/01/23 – 09/30/23 | ||||
| Actual | $ | 1,000.00 | $ | 1,079.70 | $ | 3.69 |
| Hypothetical | 1,000.00 | 1,021.45 | 3.59 | |||
| (5% return before expenses) | ||||||
| * Expenses are equal to the Fund’s six-month annualized expense ratio of 0.71%, | ||||||
| multiplied by the average account value over the period, multiplied by 183 then | ||||||
| divided by 366 to reflect the one-half year period. | ||||||
– 6–
Schedule of Investments
September 30, 2023 (unaudited)
| Shares or | |||
| Principal | |||
| Amount | Value | ||
| COMMON STOCKS — 94.89% | |||
| Communication Services – Media & Entertainment — 6.19% | |||
| 1,333,245 | Alphabet Inc. Class C* | $ | 175,788,353 |
| 468,690 | Trade Desk, Inc. Class A* | 36,628,124 | |
| 212,416,477 | |||
| Consumer Discretionary – Consumer Discretionary | |||
| Distribution & Retail — 9.56% | |||
| 701,950 | Amazon.com, Inc.* | 89,231,884 | |
| 229,105 | Home Depot, Inc. | 69,226,367 | |
| 83,176 | O’Reilly Automotive, Inc.* | 75,595,339 | |
| 657,130 | TJX Companies Inc | 58,405,714 | |
| 88,800 | Ulta Beauty Inc.* | 35,471,160 | |
| 327,930,464 | |||
| Consumer Discretionary – Consumer Services — 3.58% | |||
| 27,655 | Chipotle Mexican Grill, Inc.* | 50,659,259 | |
| 117,600 | McDonald’s Corporation | 30,980,544 | |
| 450,000 | Starbucks Corporation | 41,071,500 | |
| 122,711,303 | |||
| Consumer Staples – Consumer Staples | |||
| Distribution & Retail — 1.73% | |||
| 105,000 | Costco Wholesale Corporation | 59,320,800 | |
| Consumer Staples – Food, Beverage & Tobacco — 2.53% | |||
| 195,000 | Constellation Brands, Inc. Class A | 49,009,350 | |
| 545,040 | Mondelez International, Inc. Class A | 37,825,776 | |
| 86,835,126 | |||
| Energy – Energy — 1.36% | |||
| 1,700,000 | Enterprise Products Partners L.P. | 46,529,000 | |
| Financials – Banks — 1.35% | |||
| 319,170 | JPMorgan Chase & Co. | 46,286,033 | |
| Financials – Financial Services — 11.07% | |||
| 491,620 | Fiserv, Inc.* | 55,533,395 | |
| 446,792 | Global Payments Inc. | 51,555,329 | |
| 395,000 | Intercontinental Exchange, Inc. | 43,457,900 | |
| 184,755 | Mastercard Incorporated Class A | 73,146,352 | |
| 164,740 | S&P Global, Inc. | 60,197,643 | |
| 634,650 | Charles Schwab Corp | 34,842,285 | |
| 265,030 | Visa Inc. Class A | 60,959,550 | |
| 379,692,454 | |||
| Financials – Insurance — 2.15% | |||
| 227,270 | Aon Plc Class A | 73,685,479 | |
The accompanying notes to financial statements are an integral part of this schedule.
– 7–
Schedule of Investments (continued)
September 30, 2023 (unaudited)
| Shares or | |||
| Principal | |||
| Amount | Value | ||
| COMMON STOCKS — 94.89% (continued) | |||
| Health Care – Health Care Equipment & Services — 8.88% | |||
| 605,000 | Alcon AG | $ | 46,621,300 |
| 1,110,000 | Boston Scientific Corporation* | 58,608,000 | |
| 663,345 | DexCom, Inc.* | 61,890,089 | |
| 183,615 | Laboratory Corporation of America Holdings | 36,915,796 | |
| 150,765 | Stryker Corporation | 41,199,551 | |
| 117,760 | UnitedHealth Group Incorporated | 59,373,414 | |
| 304,608,150 | |||
| Health Care – Pharmaceuticals, | |||
| Biotechnology& Life Sciences — 5.82% | |||
| 98,635 | Eli Lilly and Company | 52,979,818 | |
| 273,460 | Johnson & Johnson | 42,591,395 | |
| 351,752 | Merck & Co., Inc. | 36,212,868 | |
| 134,363 | Thermo Fisher Scientific Inc. | 68,010,520 | |
| 199,794,601 | |||
| Industrials – Capital Goods — 5.29% | |||
| 1,005,000 | Fastenal Company | 54,913,200 | |
| 650,000 | Fortive Corp. | 48,204,000 | |
| 235,705 | Honeywell International Inc. | 43,544,142 | |
| 151,040 | Illinois Tool Works Inc. | 34,786,022 | |
| 181,447,364 | |||
| Industrials – Commercial & Professional Services — 3.24% | |||
| 115,420 | Cintas Corporation | 55,518,174 | |
| 1,291,170 | Copart, Inc.* | 55,636,515 | |
| 111,154,689 | |||
| Information Technology – Semiconductors & | |||
| Semiconductor Equipment — 7.26% | |||
| 353,061 | Advanced Micro Devices, Inc.* | 36,301,732 | |
| 77,160 | KLA Corporation | 35,390,206 | |
| 60,200 | Lam Research Corporation | 37,731,554 | |
| 116,250 | NVIDIA Corporation | 50,567,588 | |
| 372,750 | Skyworks Solutions, Inc. | 36,749,423 | |
| 328,330 | Texas Instruments Incorporated | 52,207,753 | |
| 248,948,256 | |||
| Information Technology – Software & Services — 18.41% | |||
| 143,640 | Adobe Incorporated* | 73,242,036 | |
| 224,805 | Atlassian Corp Class A* | 45,300,456 | |
| 158,260 | Cadence Design Systems, Inc.* | 37,080,318 | |
| 263,050 | CrowdStrike Holdings, Inc. Class A* | 44,029,309 | |
| 456,475 | Microsoft Corporation | 144,131,981 | |
The accompanying notes to financial statements are an integral part of this schedule.
– 8–
Schedule of Investments (continued)
September 30, 2023 (unaudited)
| Shares or | |||||
| Principal | |||||
| Amount | Value | ||||
| COMMON STOCKS — 94.89% (continued) | |||||
| Information Technology – | |||||
| Software & Services — 18.41% (continued) | |||||
| 176,125 | Palo Alto Networks, Inc.* | $ | 41,290,745 | ||
| 80,000 | Roper Technologies, Inc. | 38,742,400 | |||
| 249,335 | Salesforce, Inc.* | 50,560,151 | |||
| 83,460 | ServiceNow, Inc.* | 46,650,802 | |||
| 113,910 | Synopsys, Inc.* | 52,281,273 | |||
| 272,010 | Workday, Inc. Class A* | 58,441,349 | |||
| 631,750,820 | |||||
| Information Technology – Technology | |||||
| Hardware & Equipment — 2.91% | |||||
| 583,760 | Apple Inc. | 99,945,549 | |||
| Materials – Materials — 2.62% | |||||
| 202,240 | Sherwin-Williams Company | 51,581,312 | |||
| 190,310 | Vulcan Materials Company | 38,446,426 | |||
| 90,027,738 | |||||
| Real Estate – Real Estate Management & Development — 0.94% | |||||
| 435,570 | CBRE Group, Inc. Class A* | 32,171,200 | |||
| TOTAL COMMON STOCKS | |||||
| (cost $1,648,870,824) | 3,255,255,503 | ||||
| SHORT-TERM INVESTMENTS — 5.35% | |||||
| Money Market Deposit Account – 0.44% | |||||
| $ | 15,172,294 | U.S. Bank Money Market, 5.27% | 15,172,294 | ||
| Money Market Fund – 1.42% | |||||
| 48,744,512 | Morgan Stanley Liquidity Funds Government Portfolio | ||||
| (Institutional Class), 7-day net yield, 5.264% | 48,744,512 | ||||
| U.S. Government Securities – 3.49% | |||||
| 40,000,000 | U.S. Treasury Bill 10/03/2023, 1.777% | 39,994,170 | |||
| 40,000,000 | U.S. Treasury Bill 10/17/2023, 4.725% | 39,912,178 | |||
| 40,000,000 | U.S. Treasury Bill 11/02/2023, 5.065% | 39,817,674 | |||
| 119,724,022 | |||||
| TOTAL SHORT-TERM INVESTMENTS | |||||
| (cost $183,627,184) | 183,640,828 | ||||
| TOTAL INVESTMENTS | |||||
| (cost $1,832,498,008) – 100.24% | 3,438,896,331 | ||||
| LIABILITIES, NET OF OTHER ASSETS – (0.24)% | (8,209,510 | ) | |||
| TOTAL NET ASSETS | |||||
| (basis of percentages disclosed above) – 100% | $ | 3,430,686,821 | |||
| * Non-income producing security. | |||||
The accompanying notes to financial statements are an integral part of this schedule.
– 9–
Statement of Assets and Liabilities
September 30, 2023 (unaudited)
| ASSETS | ||
| Investments in securities at value (cost $1,832,498,008) | $ | 3,438,896,331 |
| Receivables — | ||
| Investment securities sold | 10,765,407 | |
| Dividend and interest | 1,792,934 | |
| Capital stock subscription | 159,521 | |
| Total receivables | 12,717,862 | |
| Other | 90,685 | |
| Total assets | 3,451,704,878 | |
| LIABILITIES | ||
| Payables — | ||
| Investment securities purchased | 15,694,417 | |
| Due to adviser — | ||
| Management fee | 1,896,872 | |
| Accounting and administration fee | 35,321 | |
| Total due to adviser | 1,932,193 | |
| Capital stock redemption | 3,207,252 | |
| Other payables and accrued expense | 184,195 | |
| Total liabilities | 21,018,057 | |
| Total net assets | $ | 3,430,686,821 |
| NET ASSETS CONSIST OF | ||
| Paid in capital | $ | 1,695,508,736 |
| Accumulated distributable earnings | 1,735,178,085 | |
| Total net assets | $ | 3,430,686,821 |
| NET ASSET VALUE PER SHARE ($.50 par value, | ||
| 200,000,000 shares authorized), offering price | ||
| and redemption price (43,478,735 shares outstanding) | $ | 78.90 |
The accompanying notes to financial statements are an integral part of this statement.
– 10 –
Statement of Operations
For the six months ended September 30, 2023 (unaudited)
| INCOME | ||
| Dividend (net of foreign taxes of $21,381) | $ | 14,501,882 |
| Interest | 4,015,963 | |
| Total income | 18,517,845 | |
| EXPENSES | ||
| Management fee | 11,274,657 | |
| Transfer agent fees | 320,554 | |
| Administration services | 212,497 | |
| Accounting & pricing services | 111,398 | |
| Custodian fees | 88,390 | |
| Insurance | 53,847 | |
| Postage and mailing | 47,390 | |
| Printing | 29,853 | |
| Registration fees | 27,050 | |
| Directors’ fees | 22,725 | |
| Audit and tax fees | 17,980 | |
| Legal fees | 6,110 | |
| Other operating expenses | 9,728 | |
| Total expenses | 12,222,179 | |
| Net investment income | 6,295,666 | |
| NET REALIZED GAIN ON INVESTMENTS | 123,020,376 | |
| CHANGE IN NET UNREALIZED APPRECIATION (DEPRECIATION) | ||
| ON INVESTMENTS | 129,867,673 | |
| Net realized and unrealized gain on investments | 252,888,049 | |
| Net increase in net assets resulting from operations | $ | 259,183,715 |
The accompanying notes to financial statements are an integral part of this statement.
– 11 –
Statements of Changes in Net Assets
For the six months ended September 30, 2023 (unaudited)
and the year ended March 31, 2023
| Six Months | ||||||
| Ended | ||||||
| 09/30/2023 | Year Ended | |||||
| (unaudited) | 03/31/2023 | |||||
| INCREASE (DECREASE) IN | ||||||
| NET ASSETS FROM OPERATIONS | ||||||
| Net investment income | $ | 6,295,666 | $ | 9,354,508 | ||
| Net realized gain on investments | 123,020,376 | 125,729,741 | ||||
| Change in net unrealized | ||||||
| appreciation (depreciation) on investments | 129,867,673 | (285,834,016 | ) | |||
| Net increase (decrease) in net assets | ||||||
| resulting from operations | 259,183,715 | (150,749,767 | ) | |||
| DISTRIBUTIONS TO SHAREHOLDERS | ||||||
| From investment operations | (121,301,620 | ) | (68,729,673 | ) | ||
| CAPITAL SHARE TRANSACTIONS | ||||||
| Proceeds from shares issued | ||||||
| (394,374 and 368,791 shares, respectively) | 31,643,469 | 26,489,708 | ||||
| Reinvestment of distributions | ||||||
| (1,445,623 and 899,409 shares, respectively) | 111,616,568 | 63,853,771 | ||||
| Cost of shares redeemed | ||||||
| (1,338,181 and 2,764,006 shares, respectively) | (106,668,352 | ) | (197,284,012 | ) | ||
| Change in net assets derived | ||||||
| from capital share transactions | 36,591,685 | (106,940,533 | ) | |||
| Total increase (decrease) in net assets | 174,473,780 | (326,419,973 | ) | |||
| NET ASSETS | ||||||
| Beginning of period | 3,256,213,041 | 3,582,633,014 | ||||
| End of period | $ | 3,430,686,821 | $ | 3,256,213,041 | ||
The accompanying notes to financial statements are an integral part of these statements.
– 12 –
Notes to Financial Statements
September 30, 2023 (unaudited)
| These financial statements have been prepared pursuant to reporting rules for interim |
| financial statements. Accordingly, these financial statements do not include all of the |
| information and footnotes required by U.S. generally accepted accounting principles |
| (“GAAP”) for annual financial statements. These financial statements should be read in |
| conjunction with the financial statements and financial highlights and notes in the Fund’s |
| Annual Report on Form N-CSR for the year ended March 31, 2023. |
| These financial statements have not been audited. Management believes that these financial |
| statements include all adjustments (which, unless otherwise noted, include only normal |
| recurring adjustments) necessary for a fair presentation of the financial results for each |
| period shown. |
| (1) Summary of Significant Accounting Policies — |
| Nicholas Fund, Inc. (the “Fund”) is organized as a Maryland corporation and is registered |
| as an open-end, diversified management investment company under the Investment |
| Company Act of 1940, as amended. The primary objective of the Fund is long-term |
| growth. The following is a summary of the significant accounting policies of the Fund: |
| (a) Equity securities traded on a stock exchange will ordinarily be valued on the basis |
| of the last sale price on the date of valuation on the securities principal exchange, |
| or if in the absence of any sale on that day, the closing bid price. For securities |
| principally traded on the NASDAQ market, the Fund uses the NASDAQ Official |
| Closing Price. Investments in shares of open-end mutual funds, including money |
| market funds, are valued at their daily net asset value. Debt securities, excluding |
| short-term investments, are valued at their current evaluated bid price as |
| determined by an independent pricing service, which generates evaluations on the |
| basis of dealer quotes for normal institutional-sized trading units, issuer analysis, |
| bond market activity and various other factors. Short-term investments are valued |
| using evaluated bid prices. Securities for which market quotations may not be |
| readily available are valued at their fair value as determined in good faith by |
| procedures adopted by the Board of Directors. The Board of Directors has |
| delegated fair value responsibilities to Nicholas Company, Inc., the Fund’s adviser. |
| The Fund did not maintain any positions in derivative instruments or engage in |
| hedging activities during the period. Investment transactions for financial statement |
| purposes are recorded on trade date. |
| In accordance with Accounting Standards Codification (“ASC”) 820-10, “Fair Value |
| Measurement” (“ASC 820-10”), fair value is defined as the price that the Fund |
| would receive upon selling an investment in a timely transaction to an independent |
| buyer in the principal or most advantageous market of the investment. ASC 820-10 |
| established a three-tier hierarchy to maximize the use of observable market data |
| and minimize the use of unobservable inputs and to establish classification of fair |
| value measurements for disclosure purposes. Inputs refer broadly to the |
| assumptions that market participants would use in pricing the asset or liability, |
| including assumptions about risk, for example, the risk inherent in a particular |
| valuation technique used to measure fair value such as a pricing model and/or the |
| risk inherent in the inputs to the valuation technique. Inputs may be observable or |
– 13 –
Notes to Financial Statements (continued)
September 30, 2023 (unaudited)
| unobservable. Observable inputs are inputs that reflect the assumptions market |
| participants would use in pricing the asset or liability based on market data |
| obtained from sources independent of the reporting entity. Unobservable inputs are |
| inputs that reflect the reporting entity’s own assumptions about the assumptions |
| market participants would use in pricing the asset or liability based on the best |
| information available in the circumstances. The three-tier hierarchy of inputs is |
| summarized in the three broad levels listed below. |
| Level 1 – quoted prices in active markets for identical investments |
| Level 2 – other significant observable inputs (including quoted prices for |
| similar investments, interest rates, benchmark yields, bids, offers, |
| transactions, spreads and other relationships observed in the |
| markets among market securities, underlying equity of the issuer, |
| proprietary pricing models, credit risk, etc.) |
| Level 3 – significant unobservable inputs (including the Fund’s own |
| assumptions in determining the fair value of investments) |
| The inputs or methodology used for valuing securities are not necessarily an |
| indication of the risk associated with investing in those securities. |
| The following is a summary of the inputs used as of September 30, 2023 in valuing |
| the Fund’s investments carried at value: |
| Investments | ||
| Valuation Inputs | in Securities | |
| Level 1 — | ||
| Common Stocks(1) | $ | 3,255,255,503 |
| Money Market Deposit Account | 15,172,294 | |
| Money Market Fund | 48,744,512 | |
| Level 2 — | ||
| U.S. Government Securities | 119,724,022 | |
| Level 3 — | ||
| None | — | |
| Total | $ | 3,438,896,331 |
| (1) See Schedule of Investments for further detail by industry. |
| The Fund did not hold any Level 3 investments during the period. | |
| (b) | Net realized gain (loss) on portfolio securities was computed on the basis of |
| specific identification. | |
| (c) | Dividend income is recorded on the ex-dividend date, and interest income is |
| recognized on an accrual basis. Non-cash dividends, if any, are recorded at value | |
| on date of distribution. Generally, discounts and premiums on long-term debt | |
| security purchases, if any, are amortized over the expected lives of the respective | |
| securities using the effective yield method. | |
| (d) | Provision has not been made for federal income taxes or excise taxes since the |
| Fund has elected to be taxed as a “regulated investment company” and intends to |
– 14 –
Notes to Financial Statements (continued)
September 30, 2023 (unaudited)
| distribute substantially all net investment income and net realized capital gains on | |
| sales of investments to its shareholders and otherwise comply with the provisions | |
| of Subchapter M of the Internal Revenue Code applicable to regulated investment | |
| companies. | |
| (e) | Dividends and distributions paid to shareholders are recorded on the ex-dividend |
| date. Distributions from net investment income are generally declared and paid at | |
| least semiannually. Distributions of net realized capital gain, if any, are declared and | |
| paid at least annually. | |
| The amount of distributions from net investment income and net realized capital | |
| gain are determined in accordance with federal income tax regulations, which may | |
| differ from U.S. GAAP for financial reporting purposes. Financial reporting records | |
| are adjusted for permanent book-to-tax differences to reflect tax character. | |
| The tax character of distributions paid during the six months ended September 30, | |
| 2023 and the year ended March 31, 2023 was as follows: |
| 09/30/2023 | 03/31/2023 | ||||
| Distributions paid from: | |||||
| Ordinary income | $ | 2,772,454 | $ | 8,204,580 | |
| Long-term capital gain | 118,529,166 | 60,525,093 | |||
| Total distributions paid | $ | 121,301,620 | $ | 68,729,673 |
| The following information for the Fund is presented on an income tax basis as of |
| March 31, 2023. |
| Investment cost for federal tax purposes | $ | 1,766,264,880 | ||
| Unrealized appreciation | $ | 1,519,536,178 | ||
| Unrealized depreciation | (26,468,457 | ) | ||
| Net unrealized appreciation | $ | 1,493,067,721 |
| The difference between financial statement and tax-basis cost is attributable | |
| primarily to holdings in partnership interests. | |
| The Fund had no material uncertain tax positions and has not recorded a liability for | |
| unrecognized tax benefits as of September 30, 2023. Also, the Fund recognized no | |
| interest and penalties related to uncertain tax benefits during the period ended | |
| September 30, 2023. At September 30, 2023, the fiscal years 2020 through 2023 | |
| remain open to examination in the Fund’s major tax jurisdictions. | |
| (f) | The Fund is considered an investment company under U.S. GAAP and follows the |
| accounting and reporting guidance applicable to investment companies in the | |
| Financial Accounting Standards Board (“FASB”) ASC 946, “Financial Services – | |
| Investment Companies.” U.S. GAAP guidance requires management to make | |
| estimates and assumptions that effect the amounts reported in the financial | |
| statements and accompanying notes. Actual results could differ from estimates. | |
| (g) | In the normal course of business the Fund enters into contracts that contain |
| general indemnification clauses. The Fund’s maximum exposure under these |
– 15 –
Notes to Financial Statements (continued)
September 30, 2023 (unaudited)
| arrangements is unknown, as this would involve future claims against the Fund that | |||
| have not yet occurred. Based on experience, the Fund expects the risk of loss to be | |||
| remote. | |||
| (h) | In connection with the preparation of the Fund’s financial statements, management | ||
| evaluated subsequent events after the date of the Statement of Assets and | |||
| Liabilities of September 30, 2023. There have been no material subsequent events | |||
| since September 30, 2023 that would require adjustment to or additional disclosure | |||
| in these financial statements. | |||
| (2 | ) | Related Parties — | |
| (a) | Investment Adviser and Management Agreement — | ||
| The Fund has an agreement with Nicholas Company, Inc. (with whom certain | |||
| officers and directors of the Fund are affiliated) (the “Adviser”) to serve as | |||
| investment adviser and manager. Under the terms of the agreement, a monthly fee | |||
| is paid to the Adviser based on an annualized fee of 0.75% of the average net asset | |||
| value up to and including $50 million and 0.65% of the average net asset value in | |||
| excess of $50 million. | |||
| The Adviser may be paid for accounting and administration services rendered by its | |||
| personnel, subject to the following guidelines: (i) up to five basis points, on an | |||
| annual basis, of the average net asset value of the Fund up to and including | |||
| $2 billion and up to three basis points, on an annual basis, of the average net asset | |||
| value of the Fund greater than $2 billion, based on the average net asset value of | |||
| the Fund as determined by valuations made at the close of each business day of | |||
| each month, and (ii) where the preceding calculation results in an annual payment | |||
| of less than $50,000, the Adviser, in its discretion, may charge the Fund up to | |||
| $50,000 for such services. | |||
| (b) | Legal Counsel — | ||
| A director of the Adviser is affiliated with a law firm that provides services to the | |||
| Fund. The Fund incurred expenses of $3,360 for the period ended September 30, | |||
| 2023 for legal services rendered by this law firm. | |||
| (3 | ) | Investment Transactions — | |
| For the period ended September 30, 2023, the cost of purchases and the proceeds from | |||
| sales of investment securities, other than short-term obligations, aggregated | |||
| $139,936,252 and $279,162,171, respectively. | |||
– 16 –
Historical Record
(unaudited)
| Net | |||||||||||
| Investment | Dollar | Growth of | |||||||||
| Net | Income | Capital Gain | Weighted | an Initial | |||||||
| Asset Value | Distributions | Distributions | Price/Earnings | $10,000 | |||||||
| Per Share | Per Share(2) | Per Share(2) | Ratio(3) | Investment(4) | |||||||
| July 14, 1969(1) | $ | 6.59 | $ | — | $ | — | — | $ | 10,000 | ||
| March 31, 1985 | 29.24 | 0.6420 | 1.5760 | 13.2 times | 69,858 | ||||||
| March 31, 1986 | 35.26 | 0.5750 | 0.6100 | 15.8 | 87,699 | ||||||
| March 31, 1987 | 39.94 | 0.8820 | 0.1870 | 16.3 | 102,387 | ||||||
| March 31, 1988 | 32.15 | 1.8400 | 4.0340 | 14.1 | 98,557 | ||||||
| March 31, 1989 | 35.27 | 1.0250 | 0.4510 | 13.2 | 113,155 | ||||||
| March 31, 1990 | 37.72 | 0.9240 | 1.0540 | 14.9 | 127,360 | ||||||
| March 31, 1991 | 42.99 | 0.7900 | 0.2250 | 16.9 | 149,180 | ||||||
| March 31, 1992 | 49.68 | 0.6790 | 0.8240 | 19.4 | 178,011 | ||||||
| March 31, 1993 | 52.91 | 0.6790 | 2.0420 | 18.5 | 200,098 | ||||||
| March 31, 1994 | 51.10 | 0.8175 | 1.0470 | 16.7 | 200,182 | ||||||
| March 31, 1995 | 52.22 | 0.7070 | 3.3170 | 17.2 | 221,970 | ||||||
| March 31, 1996 | 63.81 | 0.5650 | 4.0945 | 21.0 | 293,836 | ||||||
| March 31, 1997 | 67.11 | 0.4179 | 5.3166 | 21.7 | 336,973 | ||||||
| March 31, 1998 | 93.98 | 0.3616 | 5.8002 | 30.0 | 508,762 | ||||||
| March 31, 1999 | 85.20 | 0.5880 | 8.2716 | 31.7 | 509,446 | ||||||
| March 31, 2000 | 84.56 | 0.3114 | 5.9433 | 37.3 | 543,813 | ||||||
| March 31, 2001 | 54.11 | 0.1900 | 19.2500 | 26.6 | 452,780 | ||||||
| March 31, 2002 | 53.74 | 0.2360 | — | 23.8 | 451,627 | ||||||
| March 31, 2003 | 40.37 | 0.1585 | — | 16.4 | 340,547 | ||||||
| March 31, 2004 | 56.14 | 0.0905 | — | 19.4 | 474,406 | ||||||
| March 31, 2005 | 60.05 | 0.0678 | 0.4100 | 19.4 | 511,476 | ||||||
| March 31, 2006 | 61.49 | 0.2512 | 5.3194 | 18.4 | 574,151 | ||||||
| March 31, 2007 | 57.85 | 0.8173 | 4.3310 | 16.6 | 588,783 | ||||||
| March 31, 2008 | 45.03 | 0.2283 | 9.9501 | 17.4 | 550,664 | ||||||
| March 31, 2009 | 27.71 | 0.1714 | 4.6096 | 12.1 | 376,093 | ||||||
| March 31, 2010 | 44.00 | 0.0939 | — | 19.1 | 598,760 | ||||||
| March 31, 2011 | 48.18 | 0.0297 | 3.7458 | 17.9 | 716,234 | ||||||
| March 31, 2012 | 47.85 | 0.1844 | 3.3515 | 18.7 | 769,243 | ||||||
| March 31, 2013 | 55.01 | 0.0144 | 2.6127 | 20.1 | 934,800 | ||||||
| March 31, 2014 | 65.28 | 0.3265 | 2.7697 | 21.0 | 1,166,414 | ||||||
| March 31, 2015 | 71.57 | 0.2066 | 5.6554 | 21.5 | 1,393,972 | ||||||
| March 31, 2016 | 61.78 | 0.3937 | 3.4892 | 16.8 | 1,272,980 | ||||||
| March 31, 2017 | 65.52 | 0.4386 | 1.7763 | 22.2 | 1,398,599 | ||||||
| March 31, 2018 | 62.10 | 0.4061 | 9.2027 | 23.9 | 1,539,955 | ||||||
| March 31, 2019 | 65.11 | 0.3917 | 4.1213 | 23.8 | 1,741,281 | ||||||
| March 31, 2020 | 56.53 | 0.3365 | 5.2417 | 22.5 | 1,638,615 | ||||||
| March 31, 2021 | 80.14 | 0.3380 | 4.8738 | 33.1 | 2,490,274 | ||||||
| March 31, 2022 | 80.56 | 0.1990 | 10.0384 | 27.1 | 2,824,387 | ||||||
| March 31, 2023 | 75.77 | 0.1885 | 1.3778 | 27.6 | 2,715,286 | ||||||
| September 30, 2023 | 78.90 | 0.0651 | (a) | 2.7810 | (a) | 29.8 | 2,931,677 |
| (1) |
Date of Initial Public Offering. |
| (2) |
Rounded. |
| (3) |
Based on latest 12 months accomplished earnings. |
| (4) |
Assuming reinvestment of all distributions. |
| (a) |
Paid on June 7, 2023 to shareholders of record on June 6, 2023. |
– 17 –
Approval of Investment Advisory Contract
(unaudited)
In May 2023, the Board of Directors of the Fund renewed the one-year term of the Investment Advisory Agreement by and between the Fund and the Adviser through May 2024. In connection with the renewal of the Investment Advisory Agreement, no changes to the amount or manner of calculation of the management fee or the terms of the agreement were proposed by the Adviser or adopted by the Board. For the fiscal year ended March 31, 2023, the management fee was 0.65% and the Fund’s total expense ratio (including the management fee) was 0.71%. In renewing the Investment Advisory Agreement, the Board carefully considered the following factors on an absolute basis and relative to the Fund’s peer group (i) the Fund’s expense ratio, which was low compared to the overall peer group; (ii) the Fund’s performance on a short-term and long-term basis; (iii) the Fund’s management fee; (iv) the range and quality of the services offered by the Adviser. The peer group fund data included large-cap blend and growth focused funds with similar asset sizes and a prospectus objective of growth. In terms of the peer group data used for performance comparisons, the Fund was ranked 4th, 10th, 8th and 25th out of 34 funds for the one-, three-, five- and ten-year periods ending March 31, 2023. The Fund had the sixteenth lowest expense ratio among its peer group. The Board also reviewed the Fund’s risk/return profile as measured by standard deviation and the Fund’s Morningstar rankings.
The Board considered the range of services to be provided by the Adviser to the Fund under the Advisory Agreement. The Board discussed the nature, extent, and quality of the services to be provided by the Adviser and concluded that the services provided were consistent with the terms of the advisory agreement and the needs of the Fund, and that the services provided were of a high quality. The Board considered the investment performance of the Fund and the Adviser. Among other things, the Board noted its consideration of the Fund’s performance relative to peer funds. The Board reviewed the actual relative short-term and long-term performance of the Fund. The Board agreed that the Fund demonstrated strong long-term performance relative to its benchmarks and peers. The Board also discussed the extent to which economies of scale would be realized, and whether such economies were reflected in the Fund’s fee levels and concluded that the Adviser had been instrumental in holding down Fund costs, citing consistently low fees relative to comparable funds.
The Board considered the cost of services provided by the Adviser. The Board also considered the profits realized by the Adviser in connection with the management and distribution of the Fund, as expressed by the Adviser’s management in general terms. The Board expressed the opinion that given the Board’s focus on performance and maintaining a low fee structure that the Adviser’s profits were not relevant. The Board also noted that the Fund had a relatively low net expense ratio as compared to its peer group.
The Board determined that the Adviser had fully and adequately carried out the terms and conditions of its contract with the Fund. The Board expressed satisfaction with the Fund’s performance, management’s control of expenses and the rate of the management fee for the Fund and the overall level of services provided to the Fund by the Adviser.
– 18 –
Liquidity Risk Management Program
(unaudited)
The Fund has adopted and implemented a liquidity risk management program (the “Program”) in accordance with Rule 22e-4 under the 1940 Act. The Program seeks to assess and manage the Fund’s liquidity risk, i.e., the risk that the Fund is unable to satisfy redemption requests without significantly diluting remaining investors’ interests in the Fund. The Board of Directors of the Fund has designated Nicholas Company, Inc., the Fund’s investment adviser, to administer the Program. Certain aspects of the Program rely on third parties to perform certain functions, including the provision of market data and application of models.
The Program is comprised of various components designed to support the assessment and/or management of liquidity risk, including: (1) the periodic assessment (no less frequently than annually) of certain factors that influence the Fund’s liquidity risk; (2) the periodic classification (no less frequently than monthly) of the Fund’s investments into one of four liquidity categories that reflect an estimate of their liquidity under current market conditions; (3) a 15% limit on the acquisition of “illiquid investments” (as defined under Rule 22e-4); (4) for a Fund that does not invest primarily in “highly liquid investments” (as defined under Rule 22e-4), the determination of a minimum percentage of the Fund’s assets that will generally be invested in highly liquid investments (a “Highly Liquid Investment Minimum”); and (5) periodic reporting to the Board of Directors.
At a meeting of the Board of Directors on February 10, 2023, Nicholas Company, Inc. provided a written report to the Board addressing the operation, and the adequacy and effectiveness of the implementation, of the Program, including, as applicable, the operation of any Highly Liquid Investment Minimum and any material changes to the Program, for the period from January 1, 2022, through December 31, 2022 (the “Reporting Period”). Among other things, the annual report discussed: (1) the results of stress tests designed to assess liquidity under a hypothetical stressed scenario involving elevated redemptions; and (2) an assessment of the methodologies used to classify investments into one of four liquidity categories. The report concluded that the Program was reasonably designed to assess and manage liquidity risk and was adequately and effectively implemented during the Reporting Period.
There can be no assurance that the Program will achieve its objectives under all circumstances in the future. Please refer to the Fund’s prospectus for more information regarding the Fund’s exposure to liquidity risk and other risks to which it may be subject.
– 19 –
Information on Proxy Voting
(unaudited)
A description of the policies and procedures that the Fund uses to determine how to vote proxies relating to portfolio securities is available, without charge, upon request by calling 800-544-6547 or 414-276-0535. It also appears in the Fund’s Statement of Additional Information, which can be found on the SEC’s website, www.sec.gov. A record of how the Fund voted its proxies for the most recent twelve-month period ended June 30, also is available on the Fund’s website, www.nicholasfunds.com, and the SEC’s website, www.sec.gov.
Quarterly Portfolio Schedule
(unaudited)
The Fund files its complete schedule of investments with the SEC for the first and third quarters of each fiscal year as an exhibit to its reports on Form N-PORT. The Fund’s Form N-PORT reports are available on the SEC’s website at www.sec.gov and may be reviewed and copied at the SEC’s Public Reference Room in Washington, D.C. Information on the operation of the Public Reference Room may be obtained by calling 800-SEC-0330.
– 20 –
Privacy Policy
(unaudited)
Nicholas Fund, Inc. respects each shareholder’s right to privacy. We are committed to safeguarding the information that you provide us to maintain and execute transactions on your behalf.
We collect the following non-public personal information about you:
| * |
Information we receive from you on applications or other forms, whether we receive the form in writing or electronically. This includes, but is not limited to, your name, address, phone number, tax identification number, date of birth, beneficiary information and investment selection. |
| * |
Information about your transactions with us and account history with us. This includes, but is not limited to, your account number, balances and cost basis information. This also includes transaction requests made through our transfer agent. |
| * |
Other general information that we may obtain about you such as demographic information. |
WE DO NOT SELL ANY NON-PUBLIC PERSONAL INFORMATION ABOUT CURRENT OR FORMER SHAREHOLDERS.
INFORMATION SHARED WITH OUR TRANSFER AGENT, A THIRD-PARTY COMPANY, ALSO IS NOT SOLD.
We may share, only as permitted by law, non-public personal information about you with third party companies. Listed below are some examples of third parties to whom we may disclose non-public personal information. While these examples do not cover every circumstance permitted by law; we hope they help you understand how your information may be shared.
We may share non-public personal information about you:
| * |
With companies who work for us to service your accounts or to process transactions that you may request. This would include, but is not limited to, our transfer agent to process your transactions, mailing houses to send you required reports and correspondence regarding the Fund and its Adviser, the Nicholas Company, Inc., and our dividend disbursing agent to process fund dividend checks. |
| * |
With a party representing you, with your consent, such as your broker or lawyer. |
| * |
When required by law, such as in response to a subpoena or other legal process. |
The Fund and its Adviser maintain policies and procedures to safeguard your non-public personal information. Access is restricted to employees who the Adviser determines need the information in order to perform their job duties. To guard your non-public personal information we maintain physical, electronic, and procedural safeguards that comply with federal standards.
In the event that you hold shares of the Fund with a financial intermediary, including, but not limited to, a broker-dealer, bank, or trust company, the privacy policy of your financial intermediary would govern how your non-public personal information would be shared with non-affiliated third parties.
– 21 –
Automatic Investment Plan — An Update
(unaudited)
The Nicholas Family of Funds’ Automatic Investment Plan provides a simple method to dollar cost average into the fund(s) of your choice.
Dollar cost averaging involves making equal systematic investments over an extended time period. A fixed dollar investment will purchase more shares when the market is low and fewer shares when the market is high. The automatic investment plan is an excellent way for you to become a disciplined investor.
The following table illustrates what dollar cost averaging can achieve. Please note that past performance is no guarantee of future results. Nicholas Company recommends dollar cost averaging as a practical investment method. It should be consistently applied for long periods so that investments are made through several markets cycles.
| Nicholas Fund | |||||
| $1,000 initial investment on | 07/14/1969 | * | 09/30/2013 | ||
| Number of years investing $100 each month | |||||
| following the date of initial investment | 54.2 | 10 | |||
| Total cash invested | $ | 66,100 | $ | 13,000 | |
| Total dividend and capital gain distributions reinvested . | $ | 3,357,272 | $ | 7,762 | |
| Total full shares owned at 09/30/2023 | 57,041 | 300 | |||
| Total market value at 09/30/2023 | $ | 4,500,593 | $ | 23,712 | |
The results above assume purchase on the last day of the month. The Nicholas Automatic Investment Plan actually invests on the date specified by the investor. Total market value includes reinvestment of all distributions.
| * |
Date of Initial Public Offering. |
– 22 –
Nicholas Funds Services Offered
(unaudited)
| • | IRAs | |
| • Traditional | • SIMPLE | |
| • Roth | • SEP | |
| • | Coverdell Education Accounts | |
| • | Automatic Investment Plan | |
| • | Direct Deposit of Dividend and Capital Gain Distributions | |
| • | Systematic Withdrawal Plan | |
| • | Monthly Automatic Exchange between Funds | |
| • | Telephone Purchase and Redemption | |
| • | Telephone Exchange | |
| • | 24-hour Automated Account Information (800-544-6547) | |
| • | 24-hour Internet Account Access (www.nicholasfunds.com) | |
Please call a shareholder representative for further information on the above services or with any other questions you may have regarding the Nicholas Funds (800-544-6547).
– 23 –
Directors and Officers
DAVID O. NICHOLAS, President and Director
JOHN A. HAUSER, Director
DAVID P. PELISEK, Director
JULIE M. VAN CLEAVE, Director
JENNIFER R. KLOEHN, Senior Vice President,
Treasurer and Chief Compliance Officer
LAWRENCE J. PAVELEC, Senior Vice President and Secretary
MICHAEL L. SHELTON, Senior Vice President
JEFFREY J. STRONG, Senior Vice President
Investment Adviser
NICHOLAS COMPANY, INC.
Milwaukee, Wisconsin
www.nicholasfunds.com
414-276-0535 or 800-544-6547
Accountant
Dividend Disbursing Agent
Transfer Agent
U.S. BANCORP FUND SERVICES, LLC
Milwaukee, Wisconsin
414-276-0535 or 800-544-6547
Distributor
QUASAR DISTRIBUTORS, LLC
Milwaukee, Wisconsin
Custodian
U.S. BANK N.A.
Milwaukee, Wisconsin
Independent Registered Public Accounting Firm
DELOITTE & TOUCHE LLP
Milwaukee, Wisconsin
Counsel
MICHAEL BEST & FRIEDRICH LLP
Milwaukee, Wisconsin
This report is submitted for the information of shareholders of the Fund. It is not authorized for distribution to prospective investors unless preceded or accompanied by an effective prospectus.
Item 2. Code of Ethics.
Applicable only to annual reports.
Item 3. Audit Committee Financial Expert.
Applicable only to annual reports.
Item 4. Principal Accountant Fees and Services.
Applicable only to annual reports.
Item 5. Audit Committee of Listed Registrants.
Not applicable to this filing.
Item 6. Schedule of Investments.
The schedule of investments in securities of unaffiliated issuers is included as part of the report to shareholders filed under Item 1 of this Form N-CSR.
Item 7. Disclosure of Proxy Voting Policies and Procedures for Closed-End Management Investment Companies.
Applicable only to annual reports filed by closed-end funds.
Item 8. Portfolio Managers of Closed-End Management Investment Companies.
Applicable only to annual reports filed by closed-end funds.
Item 9. Purchases of Equity Securities by Closed-End Management Investment Companies and Affiliated Purchasers.
Applicable only to closed-end funds.
Item 10. Submission of Matters to a Vote of Security Holders.
Not applicable to this filing.
Item 11. Controls and Procedures.
(a) The Fund’s principal executive officer and principal financial officer, or persons performing similar functions, have concluded that the registrant’s disclosure controls and procedures (as defined in Rule 30a-3(c) under the Investment Company Act of 1940, as amended (the “1940 Act”) are effective, based on their evaluation of these controls and procedures as of a date within 90 days of the filing date of the report that includes the disclosure required by this paragraph, based on their evaluation of these controls and procedures required by Rule 30a-3(b) under the 1940 Act and Rules 13a-15(b) or 15d-15(b) under the Securities Exchange Act of 1934, as amended.
(b) There were no changes in the registrant’s internal controls over financial reporting (as defined in Rule 30a-3(d) under the 1940 Act) that occurred during the period covered by this report that have materially affected, or are reasonably likely to materially affect, the registrant’s internal control over financial reporting.
Item 12. Disclosure of Securities Lending Activities for Closed-End Management Investment Companies.
Applicable only to closed-end funds.
Item 13. Exhibits.
(a)(1) Sarbanes-Oxley Code of Ethics for Principal Executive and Senior Financial Officers (that is the subject of the disclosure required by Item 2).
Applicable only to annual reports.
(a)(2) Certifications of Principal Executive Officer and Principal Financial Officer pursuant to Rule 30a-2(a) under the Investment Company Act of 1940, attached hereto as EX-99.CERT.
(a)(3) Any written solicitation to purchase securities under Rule 23c-1 under the Act sent or given during the period covered by the report by or on behalf of the registrant to 10 or more person. Applicable only to closed-end funds.
(a)(4) Change in the registrant’s independent public accountant.
Not applicable to this filing.
(b) Certifications of Principal Executive Officer and Principal Financial Officer pursuant to Rule 30a-2(b) under the Investment Company Act of 1940, attached hereto as EX-99.906 CERT.
SIGNATURES
Pursuant to the requirements of the Securities Exchange Act of 1934 and the Investment Company Act of 1940, the registrant has duly caused this report to be signed on its behalf by the undersigned, thereunto duly authorized.
(Registrant) Nicholas Fund, Inc.
By: /s/ David O. Nicholas
Name: David O. Nicholas
Title: Principal Executive Officer
Date: November 29, 2023
Pursuant to the requirements of the Securities Exchange Act of 1934 and the Investment Company Act of 1940, this report has been signed by the following persons on behalf of the registrant and in the capacities and on the dates indicated.
By: /s/ David O. Nicholas
Name: David O. Nicholas
Title: Principal Executive Officer
Date: November 29, 2023
By: /s/ Jennifer R. Kloehn
Name: Jennifer R. Kloehn
Title: Principal Financial Officer
Date: November 29, 2023
I, David O. Nicholas, certify that:
1. I have reviewed this report on Form N-CSR of Nicholas Fund, Inc.;
2. Based on my knowledge, this report does not contain any untrue statement of a material fact or omit to state a material fact necessary to make the statements made, in light of the circumstances under which such statements were made, not misleading with respect to the period covered by this report;
3. Based on my knowledge, the financial statements, and other financial information included in this report, fairly present in all material respects the financial condition, results of operations, changes in net assets, and cash flows (if the financial statements are required to include a statement of cash flows) of the registrant as of, and for, the periods presented in this report;
4. The registrant's other certifying officer(s) and I are responsible for establishing and maintaining disclosure controls and procedures (as defined in Rule 30a-3(c) under the Investment Company Act of 1940) and internal control over financial reporting (as defined in Rule 30a-3(d) under the Investment Company Act of 1940) for the registrant and have:
(a) Designed such disclosure controls and procedures, or caused such disclosure controls and procedures to be designed under our supervision, to ensure that material information relating to the registrant, including its consolidated subsidiaries, is made known to us by others within those entities, particularly during the period in which this report is being prepared;
(b) Designed such internal control over financial reporting, or caused such internal control over financial reporting to be designed under our supervision, to provide reasonable assurance regarding the reliability of financial reporting and the preparation of financial statements for external purposes in accordance with generally accepted accounting principles;
(c) Evaluated the effectiveness of the registrant's disclosure controls and procedures and presented in this report our conclusions about the effectiveness of the disclosure controls and procedures, as of a date within 90 days prior to the filing date of this report based on such evaluation; and
(d) Disclosed in this report any change in the registrant's internal control over financial reporting that occurred during the period covered by this report that has materially affected, or is reasonably likely to materially affect, the registrant's internal control over financial reporting; and
5. The registrant's other certifying officer(s) and I have disclosed to the registrant's auditors and the audit committee of the registrant's board of directors (or persons performing the equivalent functions):
(a) All significant deficiencies and material weaknesses in the design or operation of internal control over financial reporting which are reasonably likely to adversely affect the registrant's ability to record, process, summarize, and report financial information; and
b) Any fraud, whether or not material, that involves management or other employees who have a significant role in the registrant's internal control over financial reporting.
|
Date: 11/29/2023 |
/s/ David O. Nicholas |
|
|
David O. Nicholas |
|
|
|
Principal Executive Officer |
|
I, Jennifer R. Kloehn, certify that:
1. I have reviewed this report on Form N-CSR of Nicholas Fund, Inc.;
2. Based on my knowledge, this report does not contain any untrue statement of a material fact or omit to state a material fact necessary to make the statements made, in light of the circumstances under which such statements were made, not misleading with respect to the period covered by this report;
3. Based on my knowledge, the financial statements, and other financial information included in this report, fairly present in all material respects the financial condition, results of operations, changes in net assets, and cash flows (if the financial statements are required to include a statement of cash flows) of the registrant as of, and for, the periods presented in this report;
4. The registrant's other certifying officer(s) and I are responsible for establishing and maintaining disclosure controls and procedures (as defined in Rule 30a-3(c) under the Investment Company Act of 1940) and internal control over financial reporting (as defined in Rule 30a-3(d) under the Investment Company Act of 1940) for the registrant and have:
(a) Designed such disclosure controls and procedures, or caused such disclosure controls and procedures to be designed under our supervision, to ensure that material information relating to the registrant, including its consolidated subsidiaries, is made known to us by others within those entities, particularly during the period in which this report is being prepared;
(b) Designed such internal control over financial reporting, or caused such internal control over financial reporting to be designed under our supervision, to provide reasonable assurance regarding the reliability of financial reporting and the preparation of financial statements for external purposes in accordance with generally accepted accounting principles;
(c) Evaluated the effectiveness of the registrant's disclosure controls and procedures and presented in this report our conclusions about the effectiveness of the disclosure controls and procedures, as of a date within 90 days prior to the filing date of this report based on such evaluation; and
(d) Disclosed in this report any change in the registrant's internal control over financial reporting that occurred during the period covered by this report that has materially affected, or is reasonably likely to materially affect, the registrant's internal control over financial reporting; and
5. The registrant's other certifying officer(s) and I have disclosed to the registrant's auditors and the audit committee of the registrant's board of directors (or persons performing the equivalent functions):
(a) All significant deficiencies and material weaknesses in the design or operation of internal control over financial reporting which are reasonably likely to adversely affect the registrant's ability to record, process, summarize, and report financial information; and
b) Any fraud, whether or not material, that involves management or other employees who have a significant role in the registrant's internal control over financial reporting.
|
Date: 11/29/2023 |
/s/ Jennifer R. Kloehn |
|
|
Jennifer R. Kloehn |
|
|
|
Principal Financial Officer |
|
EXHIBIT 99.906 CERTIFICATION
Pursuant to Section 906
of the Sarbanes-Oxley Act of 2002
Registrant: Nicholas Fund, Inc.
Form: N-CSR Semiannual Report dated September 30, 2023
I, David O. Nicholas, hereby certify that to the best of my knowledge:
1. The Report fully complies with the requirements of Section 13(a) or 15(d) of the Securities Exchange Act of 1934 (15 U.S.C. 78m(a) or 78o(d)); and
2. The information contained in the Report fairly presents, in all material respects, the financial condition and results of operations of the Company.
|
Date: |
11/29/2023 |
|
|
|
/s/ David O. Nicholas |
|
|
|
David O. Nicholas, President (Chief Executive Officer) |
|
I, Jennifer R. Kloehn, hereby certify that to the best of my knowledge:
1. The Report fully complies with the requirements of Section 13(a) or 15(d) of the Securities Exchange Act of 1934 (15 U.S.C. 78m(a) or 78o(d)); and
2. The information contained in the Report fairly presents, in all material respects, the financial condition and results of operations of the Company.
|
Date: |
11/29/2023 |
|
|
|
/s/ Jennifer R. Kloehn |
|
|
|
Jennifer R. Kloehn, Treasurer (Chief Financial Officer) |
|
This certificate is furnished pursuant to the requirements of Form N-CSR and shall not be deemed "filed" for purposes of Section 18 of the Securities Exchange Act of 1934, or otherwise subject to the liability of that section, and shall not be deemed to be incorporated by reference into any filing under the Securities Act of 1933 or the Securities Exchange Act of 1934.