Exhibit 13(a)

WELCOME INVESTORS INVESTOR PRESENTATION DECEMBER 2023
Exhibit 13(a)
WELCOME INVESTORS INVESTOR PRESENTATION DECEMBER 2023
Scan for Disclaimer & Documentation Phoenix Capital Group Holdings, LLC (the “Company”) conducts offerings pursuant to Rule 506(c) under Regulation D and Rule 251(a)(2) under Regulation A of the Securities Act of 1933, as amended (the “Securities Act”). Offerings under Regulation D and Regulation A of the Securities Act are exempt from the registration requirements of the Securities Act. Rule 506(c) under Regulation D – The Company’s offerings under Regulation D are open to “ACCREDITED INVESTORS” only, as such term is defined in Rule 501 under Regulation D. For the avoidance of doubt, individuals (i.e., natural persons) may qualify as “accredited investors” based on wealth and income thresholds, as well as other measures of financial sophistication. For example, individuals may qualify as “accredited investors” if they have (i) net worth over $1 million, excluding primary residence (individually or with spouse/partner), or (ii) income over $200,000 (individually) or $300,000 (with spouse/partner) in each of the prior two years, and reasonably expect the same for the current year. In addition, certain entities (i.e., not natural persons) may qualify as “accredited investors.” With respect to the Company’s offerings under Regulation D, the Company has posted a private placement memorandum (including supplements, exhibits, and other materials) on its website, which can be accessed via the following link: https://phxcapitalgroup.com/investment-offerings/. Before you invest in the Company’s offerings under Regulation D, you should read the private placement memorandum in full for more information about the Company and offering, including the risks associated with the business and securities and the definition of “accredited investor” included therein. Rule 251(a)(2) under Regulation A (Tier 2) – The Company’s offerings under Regulation A are Tier 2 offerings that are open to the general public. Pursuant to Rule 251(d)(2)(i)(C), no sale of securities may be made to an investor that is not an “accredited investor” if the aggregate purchase price to be paid by such investor for the securities is more than 10% of the greater of (i) for individuals (i.e., natural persons), such person’s net worth (excluding primary residence) or annual income, and (ii) for entities (i.e., not natural persons), such entity’s revenue or net assets (as of the entity’s most recent fiscal year end). With respect to the Company’s offerings under Regulation A, the Company has filed an offering statement (together with any related amendments and supplements thereto, the “offering circular”) on Form 1-A (File No. 024-11723) with the Securities and Exchange Commission. You can obtain these documents for free by visiting EDGAR on the SEC website at www.sec.gov. Alternatively, copies can be obtained from the Company’s website, which can be accessed via the following link: https://phxcapitalgroup.com/investment-offerings/. Before you invest in the Company’s offerings under Regulation A, you should read the offering circular in full for more information about the Company and offering, including the risks associated with the business and securities and the description of the investment limitations therein. Importantly, qualification of the offering circular by the SEC does not mean that the SEC has assessed or approved the accuracy of the offering circular or the merits of the securities offered. During any period in which the offering circular is pending qualification by the SEC (i) no money or other consideration will be solicited, and if sent, will not be accepted, (ii) no securities shall be sold and no offers to buy securities shall be accepted until such filed offering circular is qualified by the SEC, and any such offer may be withdrawn or revoked, without obligation or commitment of any kind, at any time before notice of its acceptance given after the qualification date, and (iii) any indication of interest tendered to the Company involves no obligation or commitment of any kind. The Company’s offerings under Regulation A are continuous pursuant to Rule 251(d)(3) under Regulation A. Investors in the Company’s offerings will be clients of the Company and not Dalmore Group, LLC (“Dalmore”), a registered broker-dealer and member FINRA/SIPC. Dalmore’s role is to facilitate back office and regulatory functions related to the Company’s offerings under Regulation A and Dalmore acts only as the broker/dealer of record for the Company’s offerings under Regulation A and Regulation D. Dalmore is not providing investment advice or recommendations, or legal or tax advice. The Company does not intend for the materials set forth on its website and presentations to constitute an offer to sell or a solicitation of an offer to buy any security. The Company intends all offers to be made only by the private placement memorandum (in the case of the Company’s offerings under Regulation D) or the offering circular (in the case of the Company’s offerings under Regulation A). Investing is subject to certain risks and should be made only by persons or entities able to bear the risk of and to withstand the total loss of their investment. Investors should always conduct their own due diligence and consult with a reputable financial advisor, attorney, accountant, and any other professional that can help them to understand and assess the risks associated with any investment opportunity. Major risks, including those related to the potential loss of some or all principal, are disclosed in the private placement memorandum (in the case of the Company’s offerings under Regulation D) or the offering circular (in the case of the Company’s offerings under Regulation A). The materials set forth on the Company’s website and presentations were prepared by the Company and the analyses contained in it are based, in part, on certain assumptions made by and information obtained from the Company and/or from other sources. The information may not be comprehensive and has not been subject to any independent audit or review. The Company’s internal estimates have not been verified by an external expert, and we cannot guarantee that a third party using different methods would obtain or generate the same results. The Company does not make any representation or warranty, express or implied, in relation to the fairness, reasonableness, adequacy, accuracy or completeness of the information, statements or opinions, whichever their source, contained in such materials or any oral information provided in connection with its presentations or discussions with investors, or any data it generates and accept no responsibility, obligation or liability (whether direct or indirect, in contract, tort or otherwise) in relation to any of such information. The information and opinions contained in the materials are provided as of the date specified therein, are subject to change without notice and do not purport to contain all information that may be required to evaluate the Company. The Company and its affiliates, officers, employees and agents expressly disclaim any and all liability which may be based on the materials and any errors therein or omissions therefrom. Neither the Company nor any of its affiliates, officers, employees or agents makes any representation or warranty, express or implied, that any transaction has been or may be affected on the terms or in the manner stated in the materials, or as to the achievement or reasonableness of estimates, prospects or returns, if any. You are cautioned not to give undue weight to such estimates. Numerical figures in the materials have been subject to rounding adjustments. Accordingly, numerical figures shown as totals in various tables may not be arithmetic aggregations of the figures that precede them. DISCLAIMER
“The materials include forward looking statements that reflect the Company’s current views with respect to, among other things, the Company’s growth, operations and financial performance. Forward looking statements include all statements that are not historical facts. These forward looking statements relate to matters such as the Company’s industry, business strategy, goals, and expectations concerning our market position, future operations, margins, profitability, capital expenditures, liquidity, and capital resources and other financial and operating information. These forward-looking statements are generally identifiable by forward looking terminology such as “expect,” “believe,” “anticipate,” “outlook,” “could,” “target,” “project,” “intend,” “plan,” “seek,” “estimate,” “should,” “will,” “approximately,” “predict,” “potential,” “may,” and “assume,” as well as variations of such words and similar expressions referring to the future. Oral information provided in connection with the Company’s presentations or discussions with investors may similarly include forward looking statements. The forward looking statements contained in the materials, including but not limited to any outlook, targets or projections, are based on management’s current expectations and are not guarantees of future performance. The forward looking statements are subject to various risks, uncertainties, assumptions, or changes in circumstances that are difficult to predict or quantify. For example, projections included in the materials assume the Company has continued access to adequate sources of capital to fund operations. The Company’s expectations, beliefs, and projections are expressed in good faith, and the Company’s management believe there is a reasonable basis for them. However, there can be no assurance that management’s expectations, beliefs, and projections will result or be achieved. Actual results may differ materially from these expectations due to changes in global, regional, or local economic, business, competitive, market, regulatory, and other factors, many of which are beyond our control. Management believes that these factors include but are not limited to the risk factors the Company has identified in its offering circular under “Risk Factors.” Factors or events that could cause our actual results to differ may emerge from time to time, and it is not possible for us to predict all of them. The Company may not actually achieve the plans, intentions or expectations disclosed in such forward looking statements and you should not place undue reliance on the Company’s forward looking statements. The Company undertakes no obligation to publicly update or revise any forward looking statement, whether as a result of new information, future developments or otherwise, except as may be required by any applicable securities laws. SEC generally permits oil and gas companies, in filings made with the SEC, to disclose proved reserves, which are reserve estimates that geological and engineering data demonstrate with reasonable certainty to be recoverable in future years from known reservoirs under existing economic and operating conditions, and certain probable and possible reserves that meet the SEC’s definitions for such terms. The Company discloses estimated proved reserves and estimated probable reserves in its filings with the SEC. The Company’s estimated reserves are prepared by the Company’s internal reservoir engineer and comply with definitions promulgated by the SEC. These estimated reserves are not audited by an independent petroleum engineering firm. Additional information on the Company’s estimated reserves is contained in the Company’s filings with the SEC. In these materials, the Company may use the terms “resources,” “resource potential” or “potential resources,” which SEC guidelines prohibit from including in filings with the SEC. “Resources,” “resource potential” or “potential resources” refer to the Company’s internal estimates of hydrocarbon quantities that may be potentially discovered through exploratory drilling or recovered with additional drilling or recovery techniques. Such terms do not constitute reserves within the meaning of the Standards Pertaining to the Estimating and Auditing of Oil and Gas Reserves Information promulgated by the Society of Petroleum Engineers or SEC rules and do not include any proved reserves. Actual quantities that may be ultimately recovered will differ substantially. Factors affecting ultimate recovery include the scope of drilling programs, which will be directly affected by the availability of capital, drilling and production costs, availability of drilling services and equipment, drilling results, lease expirations, transportation constraints, regulatory approvals and other factors and actual drilling results, including geological and mechanical factors affecting recovery rates. Estimates may change significantly as development of properties provide additional data. In addition, our production forecasts and expectations for future periods are dependent upon many assumptions, including estimates of production, decline rates from existing wells and the undertaking and outcome of future drilling activity, which may be affected by significant commodity price declines or drilling cost increases. Estimated proved reserves and estimated probable reserves do not represent or measure the fair value of the respective properties or the fair market value at which a property or properties could be sold for. In the event of any such sale, proceeds to the Company may be significantly less than the value of the estimated reserves. Certain materials contain “non-GAAP financial measures” that are financial measures that either exclude or include amounts that are not excluded or included in the most directly comparable measures calculated and presented in accordance with accounting principles generally accepted in the United States (“GAAP”). Specifically, the Company presents “EBITDA” as a supplemental measure of financial performance that is not required by, or presented in accordance with, GAAP. The Company believes this measure can assist investors in comparing the Company’s operating performance across reporting periods on a consistent basis by excluding items that it does not believe are indicative of its core operating performance. Management believes these non GAAP measures are useful in highlighting trends in the Company’s operating performance, while other measures can differ significantly depending on long term strategic decisions regarding capital structure, capital investments, etc. Management uses these non-GAAP measures to supplement GAAP measures of performance in the evaluation of the effectiveness of the Company’s business strategies, to make budgeting decisions. Management supplements GAAP results with non-GAAP financial measures to provide a more complete understanding of the factors and trends affecting the business than GAAP results alone provide. However, this measure should not be considered as an alternative to net income (loss) as a measure of financial performance or cash provided by operating activities as a measure of liquidity, or any other performance measure derived in accordance with GAAP. The presentation of this measure has limitations as an analytical tool and should not be considered in isolation, or as a substitute for the Company’s results as reported under GAAP. The Phoenix Capital Group designed logo, and our other registered or common law trademarks, service marks, or trade names appearing in the materials are the property of the Company. Solely for convenience, trademarks, tradenames, and service marks referred to in the materials appear without the ®, TM, and SM symbols, but those references are not intended to indicate, in any way, that the Company will not assert, to the fullest extent under applicable law, its rights to these trademarks, tradenames, and service marks. The materials may contain additional trademarks, tradenames, and service marks of other companies that are the property of their respective owners. The Company does not intend our use or display of other companies’ trademarks, trade names, or service marks to imply relationships with, or endorsement or sponsorship of the Company by, these other companies. Scan for Disclaimer & Documentation DISCLAIMER

Matt comes to Phoenix Capital Group with over 20 years of Capital Markets experience as both an investment banker and a C-level executive with three fast-growing public companies. Born and raised in Southern California, Matt moved to Colorado with his family in 2011. Matt is a graduate of the University of Southern California Marshall School of Business with an emphasis in Finance and Management. Matt has been a lifelong student of Capital Markets. His tenured experience in both finance and corporate executive roles is a well-suited addition to the Phoenix Capital Group team. Matt was involved in over 100 debt and equity financings and a party to a dozen M&A transactions on both the buy and sell sides. Working closely with upper management on the near-term and long-term capital requirements of organizations, Matt employs a strategic approach to maximize stakeholder value. Matt is married with three children, 19, 16, and 14. When he’s not attending his children’s numerous sporting events, he enjoys deep sea fishing and all outdoor activities, as well as cheering on his USC Trojans in any sporting event. MATT WILLER M A N A G I N G D I R E C T O R , C A P I T A L M A R K E T S , P A R T N E R The best part of my job is building relationships. Matt Willer
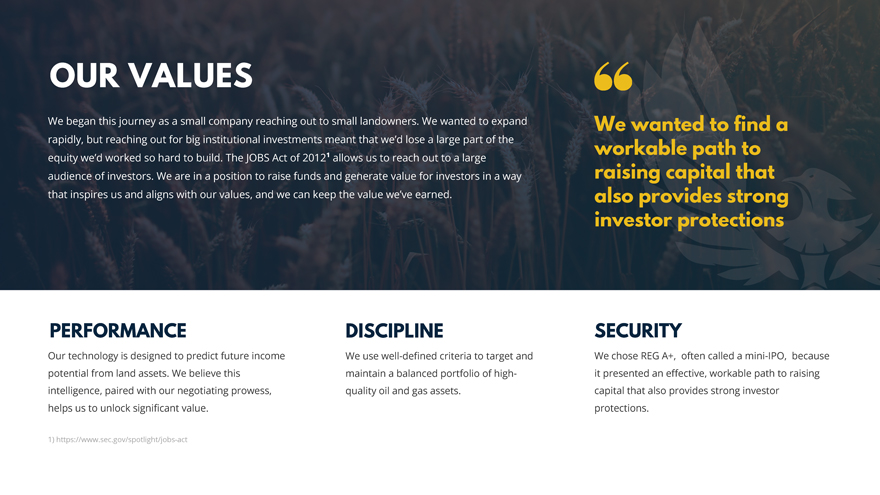
Our technology is designed to predict future income potential from land assets. We believe this intelligence, paired with our negotiating prowess, helps us to unlock significant value. PERFORMANCE We use well-defined criteria to target and maintain a balanced portfolio of high-quality oil and gas assets. DISCIPLINE SECURITY We chose REG A+, often called a mini-IPO, because it presented an effective, workable path to raising capital that also provides strong investor protections. We began this journey as a small company reaching out to small landowners. We wanted to expand rapidly, but reaching out for big institutional investments meant that we’d lose a large part of the equity we’d worked so hard to build. The JOBS Act of 2012¹ allows us to reach out to a large audience of investors. We are in a position to raise funds and generate value for investors in a way that inspires us and aligns with our values, and we can keep the value we’ve earned. We wanted to find a workable path to raising capital that also provides strong investor protections OUR VALUES 1) https://www.sec.gov/spotlight/jobs-act 1

POLLQUESTION 1
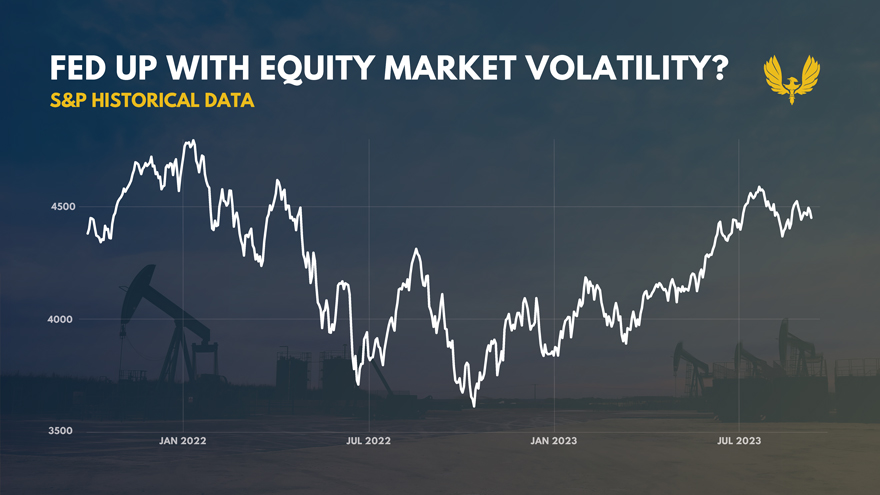
FED UP WITH EQUITY MARKET VOLATILITY? S&P HISTORICAL DATA
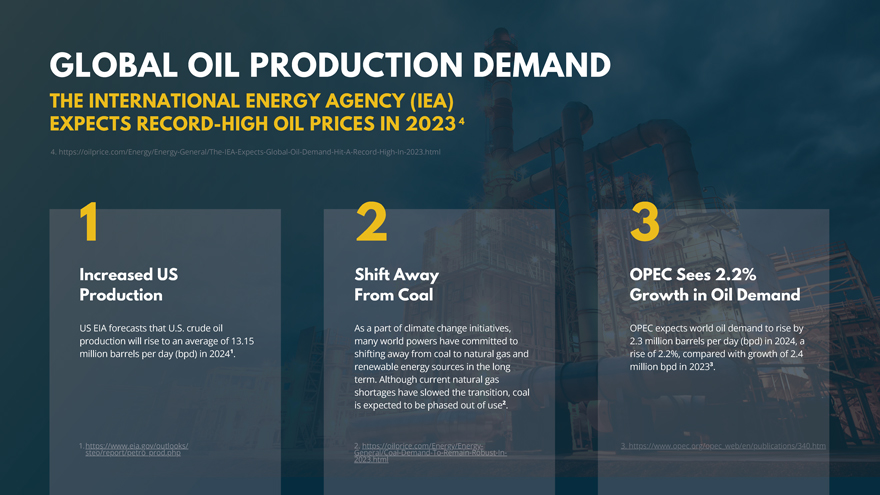
GLOBAL OIL PRODUCTION DEMAND THE INTERNATIONAL ENERGY AGENCY (IEA) EXPECTS RECORD-HIGH OIL PRICES IN 2023 US
EIA forecasts that U.S. crude oil production will rise to an average of 13.15 million barrels per day (bpd) in 2024¹. Increased US Production 1 As a part of climate change initiatives, many world powers have committed to shifting away from
coal to natural gas and renewable energy sources in the long term. Although current natural gas shortages have slowed the transition, coal is expected to be phased out of use². Shift Away From Coal 2 OPEC expects world oil demand to rise by
2.3 million barrels per day (bpd) in 2024, a rise of 2.2%, compared with growth of 2.4 million bpd in 2023³. OPEC Sees 2.2% Growth in Oil Demand 3
https://www.eia.gov/outlooks/ steo/report/petro_prod.php
1. 2.
https://oilprice.com/Energy/Energy- 3.
https://www.opec.org/opec_web/en/publications/340.htm General/Coal-Demand-To-Remain-Robust-In- 2023.html
4.
https://oilprice.com/Energy/Energy-General/The-IEA-Expects-Global-Oil-Demand-Hit-A-Record-High-In-2023.html
4
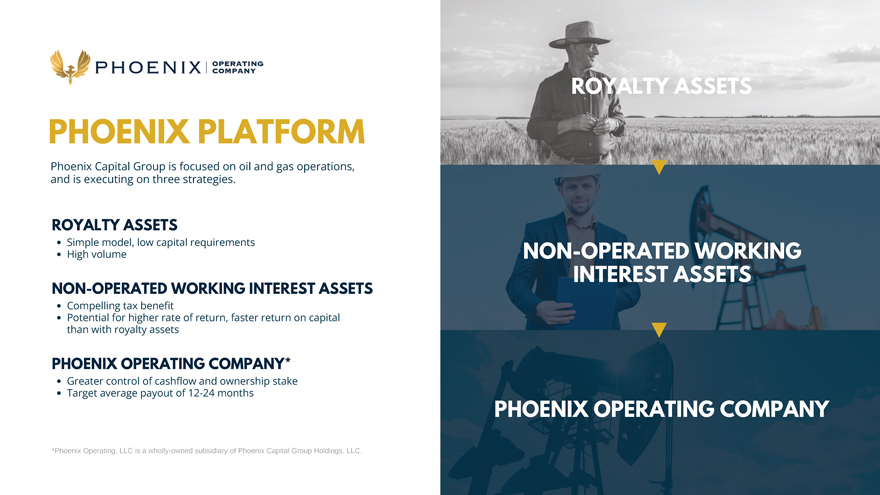
PHOENIX OPERATING COMPANY NON-OPERATED WORKING INTEREST ASSETS ROYALTY ASSETS Phoenix Capital Group is focused on oil and gas operations, and is executing on three strategies. PHOENIX PLATFORM *Phoenix Operating, LLC is a wholly-owned subsidiary of Phoenix Capital Group Holdings, LLC. Simple model, low capital requirements High volume ROYALTY ASSETS Compelling tax benefit Potential for higher rate of return, faster return on capital than with royalty assets NON-OPERATED WORKING INTEREST ASSETS Greater control of cashflow and ownership stake Target average payout of 12-24 months PHOENIX OPERATING COMPANY*
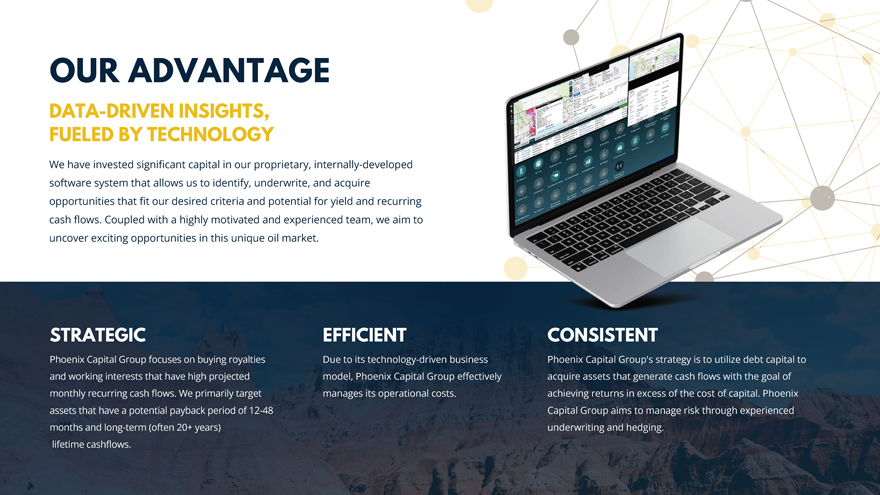
Due to its technology-driven business model, Phoenix Capital Group effectively manages its operational costs. EFFICIENT Phoenix Capital Group’s strategy is to utilize debt capital to acquire assets that generate cash flows with the goal of achieving returns in excess of the cost of capital. Phoenix Capital Group aims to manage risk through experienced underwriting and hedging. Phoenix Capital Group focuses on buying royalties and working interests that have high projected monthly recurring cash flows. We primarily target assets that have a potential payback period of 12-48 months and long-term (often 20+ years) lifetime cashflows. STRATEGIC We have invested significant capital in our proprietary, internally-developed software system that allows us to identify, underwrite, and acquire opportunities that fit our desired criteria and potential for yield and recurring cash flows. Coupled with a highly motivated and experienced team, we aim to uncover exciting opportunities in this unique oil market. OUR ADVANTAGE DATA-DRIVEN INSIGHTS, FUELED BY TECHNOLOGY CONSISTENT

LEADERSHIP TEAM 100+ EMPLOYEES | 4 OFFICES IRVINE, CA Marketing, Finance, Technology DENVER, CO HQ, Capital Markets, Investor Relations, Acquisitions, Operating CASPER, WY Acquisitions DALLAS, TX Operations, Capital Markets, Acquisitions Lindsey Wilson Chief Operating Officer, Partner OPERATIONS Curtis Allen Chief Financial Officer, Partner FINANCE Kris Woods Chief Technology Officer, Partner TECHNOLOGY Matt Willer Managing Director, Capital Markets, Partner INVESTMENTS Justin Arn Chief Land & Title Officer, Partner LAND Sean Goodnight Chief Acquisitions Officer, Partner MINERALS Tom Kruk VP of Mineral Acquisitions, Partner MINERALS Adam Ferrari Chief Executive Officer EXECUTIVE Brandon Allen VP of Reservoir Engineering, Partner OPERATING Brynn Ferrari Chief Marketing Officer MARKETING David Scadden SVP of Operations, Partner OPERATING
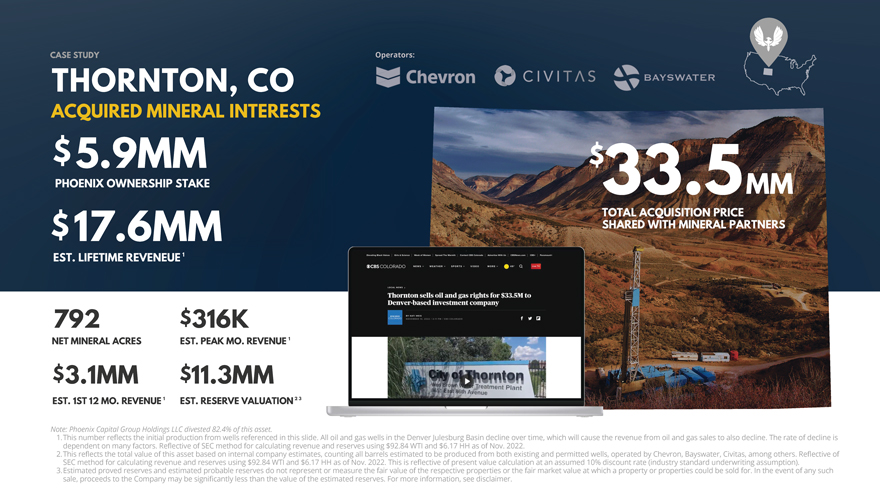
ACQUIRED MINERAL INTERESTS THORNTON, CO CASE STUDY 33.5 $ 3.1MM $ EST. PEAK MO. REVENUE 316K $ 792 NET MINERAL ACRES 11.3MM $ Note: Phoenix Capital Group Holdings LLC divested 82.4% of this asset. This number reflects the initial production from wells referenced in this slide. All oil and gas wells in the Denver Julesburg Basin decline over time, which will cause the revenue from oil and gas sales to also decline. The rate of decline is dependent on many factors. Reflective of SEC method for calculating revenue and reserves using $92.84 WTI and $6.17 HH as of Nov. 2022. This reflects the total value of this asset based on internal company estimates, counting all barrels estimated to be produced from both existing and permitted wells, operated by Chevron, Bayswater, Civitas, among others. Reflective of SEC method for calculating revenue and reserves using $92.84 WTI and $6.17 HH as of Nov. 2022. This is reflective of present value calculation at an assumed 10% discount rate (industry standard underwriting assumption). Estimated proved reserves and estimated probable reserves do not represent or measure the fair value of the respective properties or the fair market value at which a property or properties could be sold for. In the event of any such sale, proceeds to the Company may be significantly less than the value of the estimated reserves. For more information, see disclaimer. 1. 2. 17.6MM $ EST. LIFETIME REVENEUE Operators: 1 EST. RESERVE VALUATION 2 3 EST. 1ST 12 MO. REVENUE 1 1 5.9MM PHOENIX OWNERSHIP STAKE $ TOTAL ACQUISITION PRICE SHARED WITH MINERAL PARTNERS MM3.
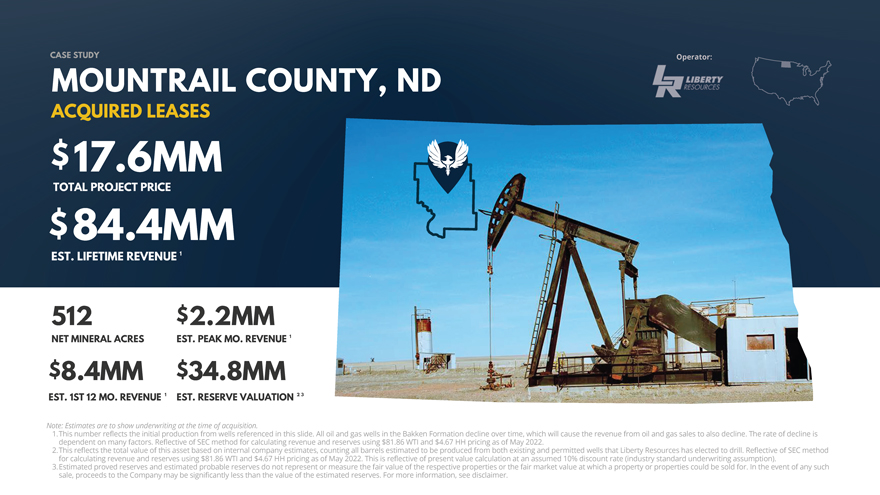
8.4MM $ EST. PEAK MO. REVENUE 2.2MM $ 512 NET MINERAL ACRES EST. RESERVE VALUATION 34.8MM $ Note: Estimates are to show underwriting at the time of acquisition. This number reflects the initial production from wells referenced in this slide. All oil and gas wells in the Bakken Formation decline over time, which will cause the revenue from oil and gas sales to also decline. The rate of decline is dependent on many factors. Reflective of SEC method for calculating revenue and reserves using $81.86 WTI and $4.67 HH pricing as of May 2022. This reflects the total value of this asset based on internal company estimates, counting all barrels estimated to be produced from both existing and permitted wells that Liberty Resources has elected to drill. Reflective of SEC method for calculating revenue and reserves using $81.86 WTI and $4.67 HH pricing as of May 2022. This is reflective of present value calculation at an assumed 10% discount rate (industry standard underwriting assumption). Estimated proved reserves and estimated probable reserves do not represent or measure the fair value of the respective properties or the fair market value at which a property or properties could be sold for. In the event of any such sale, proceeds to the Company may be significantly less than the value of the estimated reserves. For more information, see disclaimer. 1. 2. Operator: EST. 1ST 12 MO. REVENUE 84.4MM $ EST. LIFETIME REVENUE ACQUIRED LEASES MOUNTRAIL COUNTY, ND CASE STUDY 17.6MM TOTAL PROJECT PRICE $ 2 3 1 1 13.
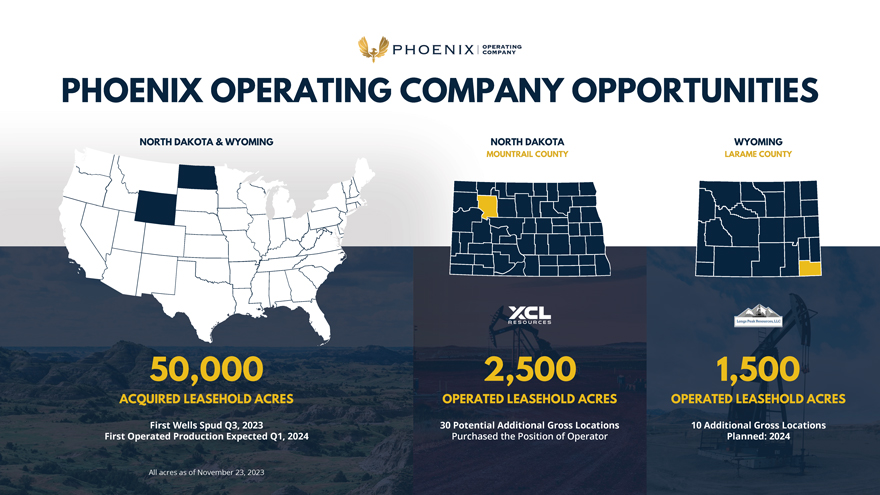
PHOENIX OPERATING COMPANY OPPORTUNITIES NORTH DAKOTA & WYOMING NORTH DAKOTA WYOMING MOUNTRAIL COUNTY LARAME COUNTY 50,000 ACQUIRED LEASEHOLD ACRES First Wells Spud Q3, 2023 First Operated Production Expected Q1, 2024 2,500 OPERATED LEASEHOLD ACRES 30 Potential Additional Gross Locations Purchased the Position of Operator 1,500 OPERATED LEASEHOLD ACRES 10 Additional Gross Locations Planned: 2024 All acres as of November 23, 2023
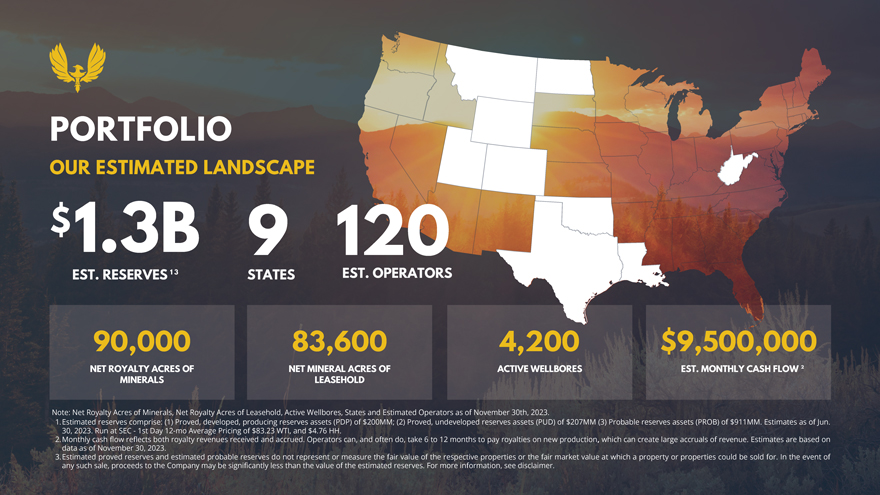
PORTFOLIO OUR ESTIMATED LANDSCAPE NET ROYALTY ACRES OF MINERALS 90,000 ACTIVE WELLBORES 4,200 NET MINERAL ACRES OF LEASEHOLD 83,600 Estimated reserves comprise: (1) Proved, developed, producing reserves assets (PDP) of $200MM; (2) Proved, undeveloped reserves assets (PUD) of $207MM (3) Probable reserves assets (PROB) of $911MM. Estimates as of Jun. 30, 2023. Run at SEC—1st Day 12-mo Average Pricing of $83.23 WTI, and $4.76 HH. Monthly cash flow reflects both royalty revenues received and accrued. Operators can, and often do, take 6 to 12 months to pay royalties on new production, which can create large accruals of revenue. Estimates are based on data as of November 30, 2023. Estimated proved reserves and estimated probable reserves do not represent or measure the fair value of the respective properties or the fair market value at which a property or properties could be sold for. In the event of any such sale, proceeds to the Company may be significantly less than the value of the estimated reserves. For more information, see disclaimer. 1. 2. 9 STATES 120 EST. OPERATORS $9,500,000 EST. MONTHLY CASH FLOW EST. RESERVES 1.3B $ 1 3 2 Note: Net Royalty Acres of Minerals, Net Royalty Acres of Leasehold, Active Wellbores, States and Estimated Operators as of November 30th, 2023.3.
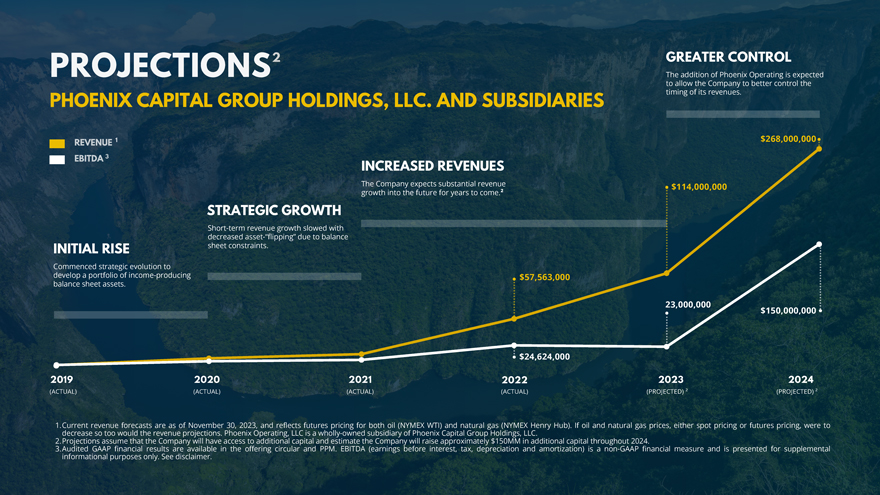
$57,563,000 $24,624,000 The addition of Phoenix Operating is expected to allow the Company to better control the timing of its revenues. GREATER CONTROL Commenced strategic evolution to develop a portfolio of income-producing balance sheet assets. INITIAL RISE INCREASED REVENUES The Company expects substantial revenue growth into the future for years to come.² $268,000,000 Current revenue forecasts are as of November 30, 2023, and reflects futures pricing for both oil (NYMEX WTI) and natural gas (NYMEX Henry Hub). If oil and natural gas prices, either spot pricing or futures pricing, were to decrease so too would the revenue projections. Phoenix Operating, LLC is a wholly-owned subsidiary of Phoenix Capital Group Holdings, LLC. Projections assume that the Company will have access to additional capital and estimate the Company will raise approximately $150MM in additional capital throughout 2024. Audited GAAP financial results are available in the offering circular and PPM. EBITDA (earnings before interest, tax, depreciation and amortization) is a non-GAAP financial measure and is presented for supplemental informational purposes only. See disclaimer. 1. 2. $114,000,000 23,000,000 $150,000,000 (PROJECTED) ² (PROJECTED) ² (ACTUAL) (ACTUAL) (ACTUAL) (ACTUAL) PHOENIX CAPITAL GROUP HOLDINGS, LLC. AND SUBSIDIARIES 2019 2021 2020 2022 2023 2024 Short-term revenue growth slowed with decreased asset-“flipping” due to balance sheet constraints. STRATEGIC GROWTH 3.
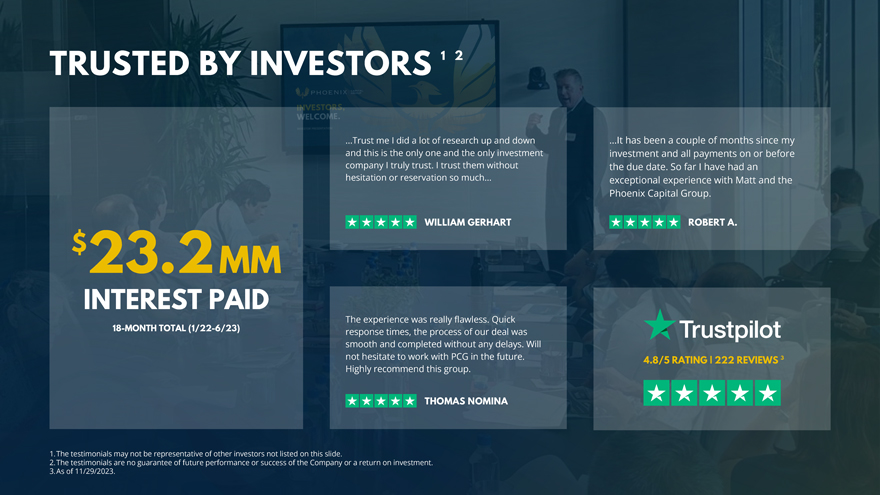
ROBERT A. ...It has been a couple of months since my investment and all payments on or before the due date. So far I have had an exceptional experience with Matt and the Phoenix Capital Group. THOMAS NOMINA The experience was really flawless. Quick response times, the process of our deal was smooth and completed without any delays. Will not hesitate to work with PCG in the future. Highly recommend this group. WILLIAM GERHART ...Trust me I did a lot of research up and down and this is the only one and the only investment company I truly trust. I trust them without hesitation or reservation so much... TRUSTED BY INVESTORS ¹ ² 4.8/5 RATING | 222 REVIEWS INTEREST PAID $ 23.2 MM 18-MONTH TOTAL (1/22-6/23) The testimonials may not be representative of other investors not listed on this slide. The testimonials are no guarantee of future performance or success of the Company or a return on investment. As of 11/29/2023. 1. 2. 33.
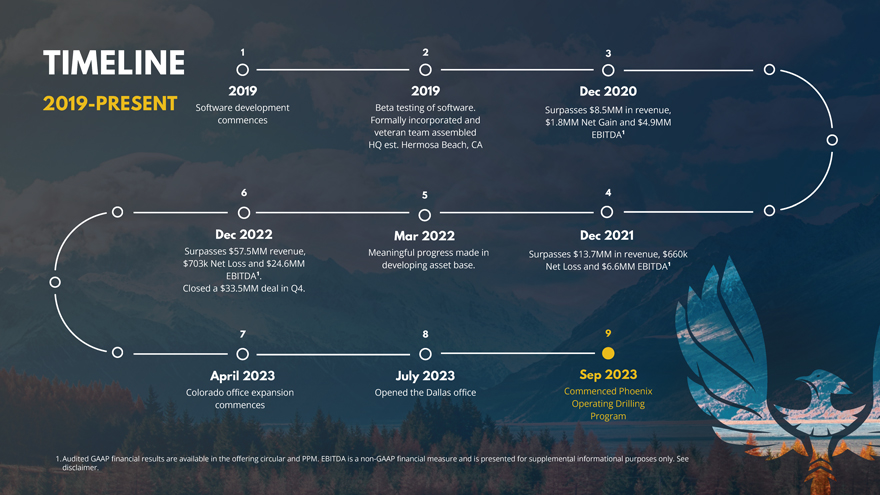
2 2019 Beta testing of software. Formally incorporated and veteran team assembled HQ est. Hermosa Beach, CA 5 Mar 2022 Meaningful progress made in developing asset base. 8 July 2023 Opened the Dallas office Dec 2020 Surpasses $8.5MM in revenue, $1.8MM Net Gain and $4.9MM EBITDA¹ 4 TIMELINE 2019-PRESENT 1 2019 Software development commences 9 Sep 2023 Commenced Phoenix Operating Drilling Program Dec 2021 Surpasses $13.7MM in revenue, $660k Net Loss and $6.6MM EBITDA¹ 3 6 Dec 2022 Surpasses $57.5MM revenue, $703k Net Loss and $24.6MM EBITDA¹. Closed a $33.5MM deal in Q4. Audited GAAP financial results are available in the offering circular and PPM. EBITDA is a non-GAAP financial measure and is presented for supplemental informational purposes only. See disclaimer. 7 April 2023 Colorado office expansion commences1.

POLL QUESTION 2
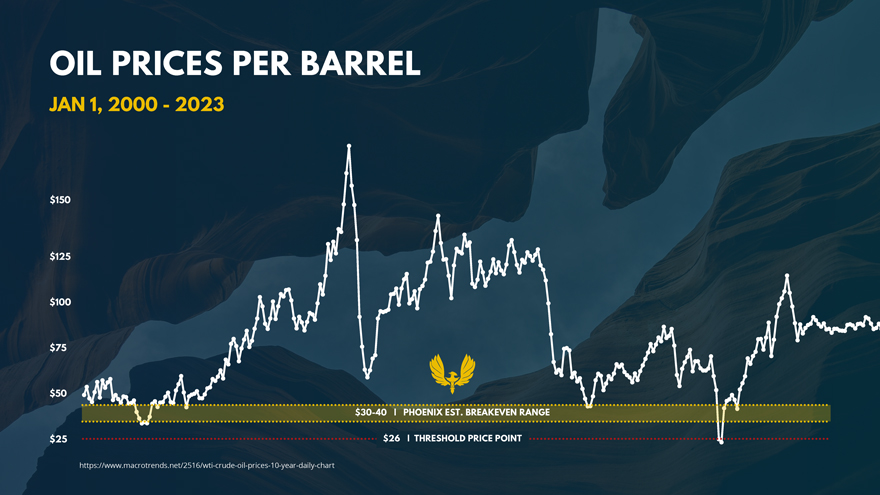
$26 | THRESHOLD PRICE POINT $30-40 | PHOENIX EST. BREAKEVEN RANGE OIL PRICES PER BARREL JAN 1, 2000—2023 $150 $125 $100 $75 $50 $25 https://www.macrotrends.net/2516/wti-crude-oil-prices-10-year-daily-chart

GET UP TO Accredited investors can get yields from 9-13% annually. Non-accredited investors can get 9% annual yield (currently fully-subscribed). STABLE YIELD INVESTORS ARE PAID MONTHLY $298M LIABILITIES TARGET PER-BARREL HEDGE PRICE RANGE $50-55 ESTIMATED BREAKEVEN PER-BARREL RANGE $30-40 Estimated reserves comprise: (1) Proved, developed, producing reserves assets (PDP) of $200MM; (2) Proved, undeveloped reserves assets (PUD) of $207MM (3) Probable reserves assets (PROB) of $911MM. Estimates as of Jun. 30, 2023. Run at SEC—1st Day 12-mo Average Pricing of $83.23 WTI, and $4.76 HH. Total liabilities are based on unaudited June 30, 2023 financials. Hedging can manage risk but does not eliminate risk or ensure success. Estimated proved reserves and estimated probable reserves do not represent or measure the fair value of the respective properties or the fair market value at which a property or properties could be sold for. In the event of any such sale, proceeds to the Company may be significantly less than the value of the estimated reserves. For more information, see disclaimer. 1. 2.3. $1.3B ESTIMATED RESERVES 1 4 3 24.

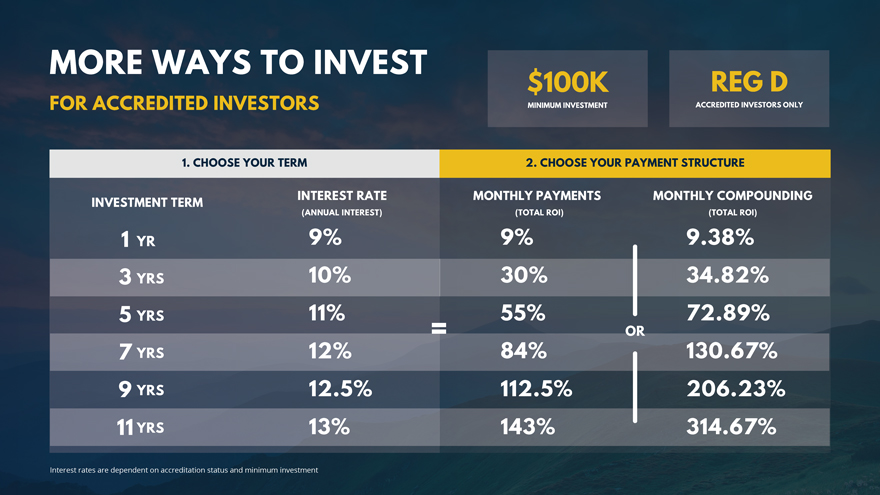
REGULATION A+ HIGH YIELDS MINIMUM INVESTMENT 5 K $ INVESTMENT TERM = 3 YRS WITH MONTHLY PAYMENTS OF .75% 27 TOTAL ROI % ANNUAL INTEREST % 9 INTEREST RATE RETURNS CURRENTLY FULLY SUBSCRIBED Interest rates are dependent on accreditation status and minimum investment
REGULATION A+ HIGH YIELDS MINIMUM INVESTMENT 5 K $ INVESTMENT TERM = 3 YRS WITH MONTHLY PAYMENTS OF .75% 27 TOTAL ROI % ANNUAL INTEREST % 9 INTEREST RATE RETURNS CURRENTLY FULLY SUBSCRIBED Interest rates are dependent on accreditation status and minimum investment
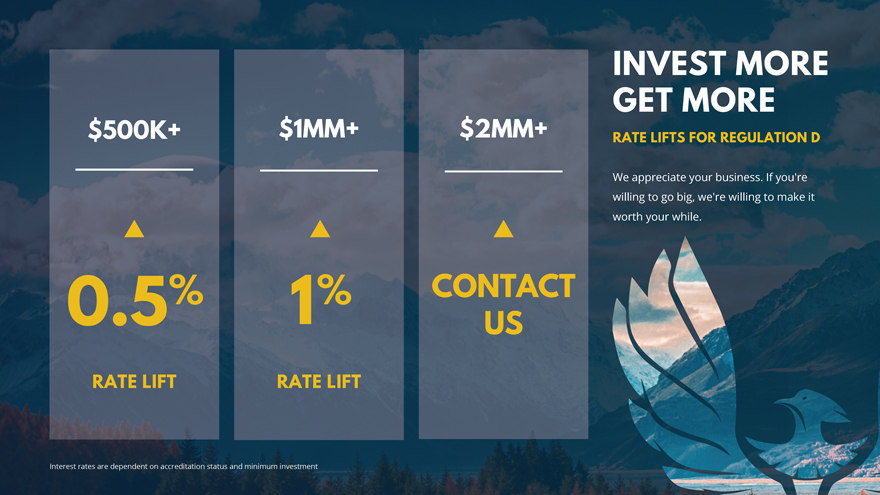
$1MM+ $500K+ RATE LIFT 0.5 % RATE LIFT 1 % INVEST MORE GET MORE RATE LIFTS FOR REGULATION D We appreciate your business. If you’re willing to go big, we’re willing to make it worth your while. CONTACT US $2MM+ Interest rates are dependent on accreditation status and minimum investment

GOT ANNUITIES? GOT CDs? PHOENIX CAPITAL GROUP WILL COVER UP TO 2% OF YOUR INVESTMENT AMOUNT TOWARD SURRENDER FEES. The reimbursement of up to 2% of investment proceeds only applies to investment proceeds derived directly from an annuity or CD that has a surrender fee applied once the funds are withdrawn. Any other investment proceeds (such as cash or proceeds from the sale of other assets) included with the annuity or CD proceeds are not considered when calculating the credit of up to 2%. Annuities are long term investments that generally have surrender fees during a fixed number of years after initial purchase. You should speak to your annuity issuer or financial professional for details regarding the current percentage and amount of the surrender charge before withdrawing funds. Banks Certificates of Deposits (CD) typically charge a fee for withdrawing funds prior to its maturity date. You should contact your bank to understand the percentage and dollar amount of any fees they may charge.Brokered CDs can be bought and sold in the secondary market and prices are affected by broader market interest rate changes. You should consider potential market price changes and related tax implications if you are selling a brokered CD at a profit or loss. 1. 2. 3.
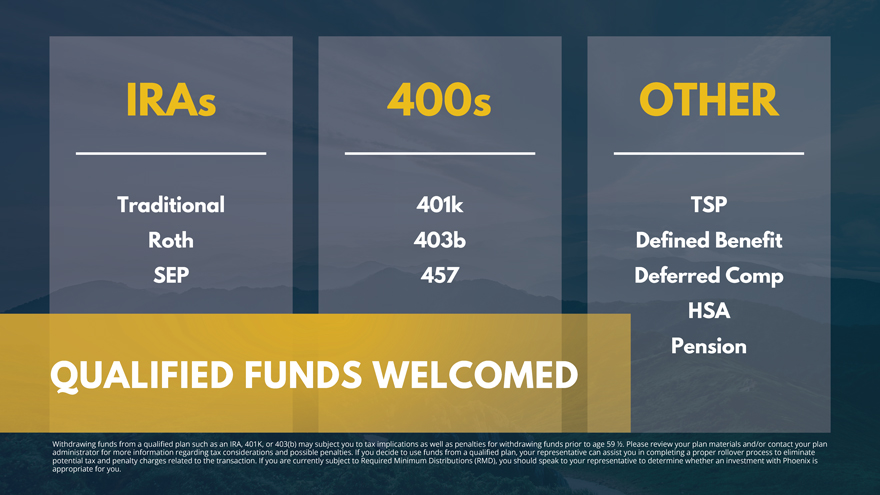
Traditional Roth SEP 401k 403b 457 TSP Defined Benefit Deferred Comp HSA Pension IRAs 400s OTHER QUALIFIED FUNDS WELCOMED Withdrawing funds from a qualified plan such as an IRA, 401K, or 403(b) may subject you to tax implications as well as penalties for withdrawing funds prior to age 59 1⁄2. Please review your plan materials and/or contact your plan administrator for more information regarding tax considerations and possible penalties. If you decide to use funds from a qualified plan, your representative can assist you in completing a proper rollover process to eliminate potential tax and penalty charges related to the transaction. If you are currently subject to Required Minimum Distributions (RMD), you should speak to your representative to determine whether an investment with Phoenix is appropriate for you.
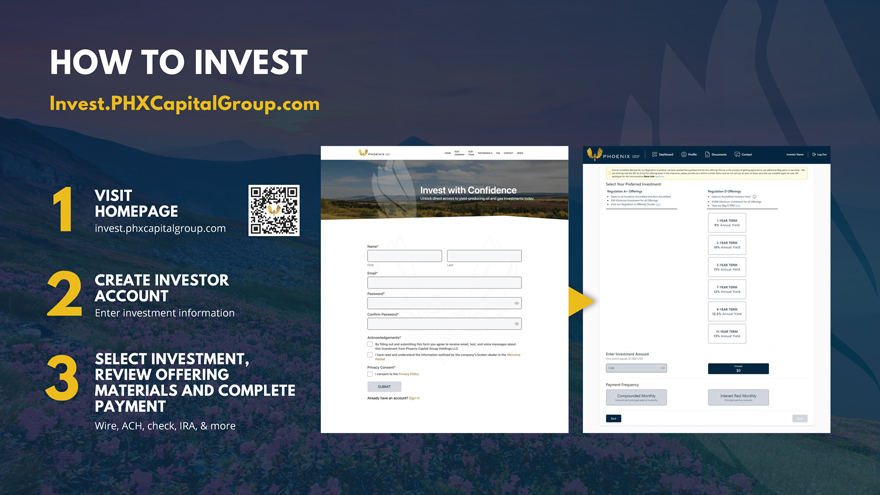
1 VISIT HOMEPAGE invest.phxcapitalgroup.com 2 CREATE INVESTOR ACCOUNT Enter investment information 3 SELECT INVESTMENT, REVIEW OFFERING MATERIALS AND COMPLETE PAYMENT Wire, ACH, check, IRA, & more HOW TO INVEST Invest.PHXCapitalGroup.com

OUR PARTNERS WE CAN’T DO IT ALONE BROKER DEALER FINRA & SIPC SECURITIES COUNSEL INDENTURE TRUSTEE ISSUER BANK

POLL QUESTION 3

Rated 4.8/5—222 Reviews Rated 4.7/5—43 Reviews A+ BOOK A MEETING CALENDLY.COM/PHOENIXCAPITALGROUP Review statistics and ratings listed here are as of 11/29/23 Rated 4.85/5—98 Reviews

MATT WILLER MANAGING DIRECTOR, CAPITAL MARKETS, PARTNER Matt Willer [720] 408-1850 mwiller@phxcapitalgroup.com invest.phxcapitalgroup.com