UNITED STATES
SECURITIES AND EXCHANGE COMMISSION
Washington, D.C. 20549
FORM N-CSR
CERTIFIED SHAREHOLDER REPORT OF REGISTERED
MANAGEMENT INVESTMENT COMPANIES
| Investment Company Act file number | 811-22680 |
| Ultimus Managers Trust |
| (Exact name of registrant as specified in charter) |
| 225 Pictoria Drive, Suite 450 Cincinnati, Ohio | 45246 |
| (Address of principal executive offices) | (Zip code) |
Khimmara Greer
| Ultimus Fund Solutions, LLC 225 Pictoria Drive, Suite 450 Cincinnati, Ohio 45246_ |
| (Name and address of agent for service) |
| Registrant's telephone number, including area code: | (513) 587-3400 |
| Date of fiscal year end: | May 31 | |
| Date of reporting period: | November 30, 2022 |
Form N-CSR is to be used by management investment companies to file reports with the Commission not later than 10 days after the transmission to stockholders of any report that is required to be transmitted to stockholders under Rule 30e-1 under the Investment Company Act of 1940 (17 CFR 270.30e-1). The Commission may use the information provided on Form N-CSR in its regulatory, disclosure review, inspection, and policymaking roles.
A registrant is required to disclose the information specified by Form N-CSR, and the Commission will make this information public. A registrant is not required to respond to the collection of information contained in Form N-CSR unless the Form displays a currently valid Office of Management and Budget ("OMB") control number. Please direct comments concerning the accuracy of the information collection burden estimate and any suggestions for reducing the burden to the Secretary, Securities and Exchange Commission, 450 Fifth Street, NW, Washington, DC 20549-0609. The OMB has reviewed this collection of information under the clearance requirements of 44 U.S.C. § 3507.
| Item 1. | Reports to Stockholders. |
(a).
Institutional Class (ADLVX)
SEMI-ANNUAL
REPORT
November 30, 2022
(Unaudited)
Managed by
Adler Asset Management, LLC
For
information or assistance in opening an account,
please call toll-free 1-800-408-4682.
| ADLER VALUE FUND | |
| LETTER TO SHAREHOLDERS (Unaudited) | December 16, 2022 |
Dear Shareholder,
On August 16, 2018, the Adler Value Fund (the “Fund”) commenced operations. Adler Asset Management, LLC (the “Adviser”) is the Fund’s investment adviser.
Returns
The table below shows the total returns for the Fund and its benchmark, the S&P 500 Value Index, for the six-month, one-year, three-year annualized, and cumulative since inception periods ended November 30, 2022.
| Total Returns to 11/30/2022 | ||||
| Six Months | Cumulative | |||
| Ended | Three-Year | Since | ||
| 11/30/2022 | One-Year | Annualized | Inception | |
| Adler Value Fund | -3.18% | -1.84% | 10.57% | 48.35% |
| S&P 500 Value | 2.17% | 5.59% | 8.79% | 47.15% |
Performance for the Six-Month Period
During the six-month period ended November 30, 2022, the Fund underperformed its benchmark. The Fund’s more defensive holdings performed well. As recession fears have gripped the equity markets, the Fund’s deeper value, more cyclical names have not performed as well. Value stocks can and do operate in industries impacted by a potential economic slowdown with the equity market re-pricing certain stocks. The Adviser remains confident in the catalysts for the Fund’s holdings as we move through this period of economic uncertainty.
Commentary
As the six-month period progressed, equity, fixed-income, foreign exchange, and commodities markets continued to react to economic data that either validated or refuted market expectations around three key themes:
| ● | Pace of Federal Reserve interest rate increases; |
| ● | Rate of inflation; and |
| ● | Probability, timing, and severity of a potential recession. |
Investment Approach
In selecting investments for the Fund, the Adviser uses a focused-value strategy to invest in companies that, in its opinion, appear to be undervalued by the equity market but where catalysts exist, in the opinion of the Adviser, to close these valuation gaps. The Adviser seeks to exploit perceived market misjudgments in pricing by buying equity securities that appear to be undervalued because of a temporary aversion to these out-of-favor issuers.
The Adviser maintains a watch list of companies and reviews each company’s financial condition and prospects, including factors such as (but not limited to): expected future earnings, cash flow, the ability and willingness to return capital to shareholders, competitive
1
position, quality of the business franchise, and the reputation, experience, and competence of a company’s management and board of directors. The Adviser considers these factors both while the company is on the watch list and also at the time of purchase. Not all companies, at the time of purchase, are on the Adviser’s watch list, and a company may be added to the Fund’s portfolio following a precipitating event.
When added to the Fund’s portfolio, a company will generally be trading at a significant discount to its 52-week or all-time high. The Adviser’s contrarian approach, buying what it believes are fundamentally sound companies that are out-of-favor with the market, is industry, sector and market capitalization agnostic, and typically will result in a portfolio containing the securities of fewer than thirty issuers.
Portfolio Developments
The following is a discussion of recent developments concerning two of the Fund’s portfolio holdings.
Tenneco (TEN) is a leading designer, manufacturer, and marketer of automotive products for original equipment and aftermarket customers. Through its four business groups, Motorparts, Performance Solutions, Clean Air and Powertrain, Tenneco delivers solutions for the light vehicle, commercial truck, off-highway, industrial, motorsport and aftermarket. The cash sale of TEN closed at $20.00 per share during the six-month period.
Twitter (TWTR) is a leading social media company. The cash sale of TWTR closed at $54.20 per share during the six-month period.
In closing, I want to thank shareholders for their confidence in the Fund’s Adviser. The Adviser continues to assess companies that fit the Fund’s investment approach.
David
Adler
Adler Asset Management, LLC
December 16, 2022
2
Past performance is not predictive of future performance. Investment results and principal value will fluctuate so that shares, when redeemed, may be worth more or less than their original cost. Current performance may be higher or lower than the performance data quoted. Performance data current to the most recent month-end are available by calling 1-800-408-4682.
An investor should consider the investment objectives, risks, charges and expenses of the Fund carefully before investing. The Fund’s prospectus contains this and other important information. To obtain a copy of the Fund’s prospectus please visit the Fund’s website at www.adlervaluefund.com or call 1-800-408-4682 and a copy will be sent to you free of charge. Please read the prospectus carefully before you invest. The Fund is distributed by Ultimus Fund Distributors, LLC.
The Letter to Shareholders seeks to describe some of the Adviser’s current opinions and views of the financial markets. Although the Adviser believes it has a reasonable basis for any opinions or views expressed, actual results may differ, sometimes significantly so, from those expected or expressed. The securities held by the Fund that are discussed in the Letter to Shareholders were held during the period covered by this Report. They do not comprise the entire investment portfolio of the Fund, may be sold at any time, and may no longer be held by the Fund. For a complete list of securities held by the Fund as of November 30, 2022, please see the Schedule of Investments section of the semi-annual report. The opinions of the Fund’s adviser with respect to those securities may change at any time.
Statements in the Letter to Shareholders that reflect projections or expectations for future financial or economic performance of the Fund and the market in general and statements of the Fund’s plans and objectives for future operations are forward-looking statements. No assurance can be given that actual results or events will not differ materially from those projected, estimated, assumed, or anticipated in any such forward-looking statements. Important factors that could result in such differences, in addition to factors noted with such forward-looking statements, include, without limitation, general economic conditions, such as inflation, recession, and interest rates. Past performance is not a guarantee of future results.
3
| ADLER VALUE FUND |
| PORTFOLIO INFORMATION |
| November 30, 2022 (Unaudited) |
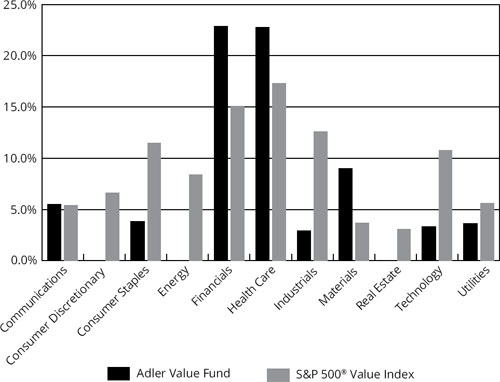
Sector
Diversification
(% of Net Assets)
| Top 10 Equity Holdings | ||
| % of Net | ||
| Security Description | Assets | |
| Bristol-Myers Squibb Company | 6.8% | |
| Pfizer, Inc | 5.3% | |
| Charles Schwab Corporation (The) | 5.0% | |
| Cigna Corporation | 4.7% | |
| Aflac, Inc. | 4.7% | |
| Valvoline, Inc. | 4.6% | |
| O-I Glass, Inc. | 4.1% | |
| Jackson Financial, Inc. - Class A | 3.8% | |
| PG&E Corporation | 3.6% | |
| Equitable Holdings, Inc. | 3.6% | |
4
| ADLER VALUE FUND |
| SCHEDULE OF INVESTMENTS |
| November 30, 2022 (Unaudited) |
| COMMON STOCKS — 71.8% | Shares | Value | ||||||
| Communications — 5.5% | ||||||||
| Cable & Satellite — 0.9% | ||||||||
| Altice USA, Inc. - Class A (a) | 3,400 | $ | 15,504 | |||||
| Comcast Corporation - Class A | 600 | 21,984 | ||||||
| 37,488 | ||||||||
| Entertainment Content — 1.9% | ||||||||
| Paramount Global - Class B | 4,000 | 80,320 | ||||||
| Publishing & Broadcasting — 2.7% | ||||||||
| iHeartMedia, Inc. - Class A (a) | 13,700 | 110,148 | ||||||
| Consumer Staples — 3.8% | ||||||||
| Beverages — 1.1% | ||||||||
| Diageo plc - ADR | 250 | 46,638 | ||||||
| Household Products — 2.7% | ||||||||
| Spectrum Brands Holdings, Inc. | 2,100 | 111,867 | ||||||
| Financials — 20.9% | ||||||||
| Banking — 2.3% | ||||||||
| Citigroup, Inc. | 2,000 | 96,820 | ||||||
| Broker-Dealers — 6.5% | ||||||||
| Charles Schwab Corporation (The) | 2,500 | 206,350 | ||||||
| XP, Inc. - Class A (a) | 3,595 | 62,948 | ||||||
| 269,298 | ||||||||
| Insurance — 12.1% | ||||||||
| Aflac, Inc. | 2,700 | 194,211 | ||||||
| Equitable Holdings, Inc. | 4,700 | 149,178 | ||||||
| Jackson Financial, Inc. - Class A | 4,300 | 160,605 | ||||||
| 503,994 | ||||||||
| Health Care — 22.8% | ||||||||
| Biotech & Pharma — 18.1% | ||||||||
| Bayer AG - ADR | 8,800 | 128,128 | ||||||
| Bristol-Myers Squibb Company | 3,500 | 280,980 | ||||||
| Pfizer, Inc. | 4,400 | 220,572 | ||||||
| Viatris, Inc. | 10,935 | 120,613 | ||||||
| 750,293 | ||||||||
| Health Care Facilities & Services — 4.7% | ||||||||
| Cigna Corporation | 600 | 197,334 | ||||||
5
| ADLER VALUE FUND |
| SCHEDULE OF INVESTMENTS (Continued) |
| COMMON STOCKS — 71.8% (Continued) | Shares | Value | ||||||
| Industrials — 2.9% | ||||||||
| Industrial Support Services — 2.9% | ||||||||
| Grainger (W.W.), Inc. | 200 | $ | 120,612 | |||||
| Materials — 9.0% | ||||||||
| Chemicals — 4.6% | ||||||||
| Valvoline, Inc. | 5,800 | 191,284 | ||||||
| Containers & Packaging — 4.4% | ||||||||
| Berry Global Group, Inc. | 200 | 11,720 | ||||||
| O-I Glass, Inc. (a) | 10,400 | 170,664 | ||||||
| 182,384 | ||||||||
| Technology — 3.3% | ||||||||
| Technology & Electronics — 2.5% | ||||||||
| Corning, Inc. | 3,000 | 102,390 | ||||||
| Technology Hardware — 0.8% | ||||||||
| Diebold Nixdorf, Inc. (a) | 15,300 | 32,895 | ||||||
| Utilities — 3.6% | ||||||||
| Electric Utilities — 3.6% | ||||||||
| PG&E Corporation (a) | 9,600 | 150,720 | ||||||
| Total Common Stocks (Cost $2,543,042) | $ | 2,984,485 | ||||||
6
| ADLER VALUE FUND |
| SCHEDULE OF INVESTMENTS (Continued) |
| PREFERRED STOCKS — 2.0% | Shares | Value | ||||||
| Financials — 2.0% | ||||||||
| Banking — 2.0% | ||||||||
| Itau Unibanco Holding S.A. - ADR (Cost $80,145) | 16,800 | $ | 83,664 | |||||
| PURCHASED OPTION | Notional | |||||||||||||||
| CONTRACTS — 3.4% | Strike Price | Contracts | Value | Value | ||||||||||||
| Call Option Contracts — 3.4% | ||||||||||||||||
| Altice USA, Inc. - Class A, 01/20/23 | $ | 10.00 | 30 | $ | 13,680 | $ | 300 | |||||||||
| Altice USA, Inc. - Class A, 01/20/23 | 11.00 | 10 | 4,560 | 50 | ||||||||||||
| Altice USA, Inc. - Class A, 01/20/23 | 12.00 | 20 | 9,120 | 50 | ||||||||||||
| Bristol-Myers Squibb Company, 03/17/23 | 67.50 | 10 | 80,280 | 13,625 | ||||||||||||
| Bristol-Myers Squibb Company, 03/17/23 | 72.50 | 10 | 80,280 | 9,175 | ||||||||||||
| Citigroup, Inc., 01/20/23 | 47.50 | 10 | 48,410 | 2,870 | ||||||||||||
| Corning, Inc., 01/20/23 | 32.00 | 20 | 68,260 | 5,700 | ||||||||||||
| Corning, Inc., 01/20/23 | 35.00 | 10 | 34,130 | 1,040 | ||||||||||||
| Corning, Inc., 01/20/23 | 37.00 | 30 | 102,390 | 990 | ||||||||||||
| Diebold Nixdorf, Inc., 02/17/23 | 3.00 | 25 | 5,375 | 375 | ||||||||||||
| Diebold Nixdorf, Inc., 05/19/23 | 2.00 | 15 | 3,225 | 975 | ||||||||||||
| Diebold Nixdorf, Inc., 05/19/23 | 2.50 | 25 | 5,375 | 1,250 | ||||||||||||
| Equitable Holdings, Inc., 01/20/23 | 25.00 | 5 | 15,870 | 3,475 | ||||||||||||
| Equitable Holdings, Inc., 01/20/23 | 30.00 | 55 | 174,570 | 13,887 | ||||||||||||
| iHeartMedia, Inc. - Class A, 01/20/23 | 12.50 | 15 | 12,060 | 113 | ||||||||||||
| iHeartMedia, Inc. - Class A, 01/20/23 | 15.00 | 30 | 24,120 | 225 | ||||||||||||
| iHeartMedia, Inc. - Class A, 01/20/23 | 17.50 | 10 | 8,040 | 75 | ||||||||||||
| iHeartMedia, Inc. - Class A, 01/20/23 | 20.00 | 30 | 24,120 | 225 | ||||||||||||
| iHeartMedia, Inc., - Class A, 04/21/23 | 7.50 | 25 | 20,100 | 4,562 | ||||||||||||
| Itau Unibanco Holding S.A. - ADR, 01/20/23 | 4.50 | 10 | 4,980 | 1,132 | ||||||||||||
| Itau Unibanco Holding S.A. - ADR, 01/20/23 | 5.00 | 20 | 9,960 | 1,402 | ||||||||||||
7
| ADLER VALUE FUND |
| SCHEDULE OF INVESTMENTS (Continued) |
| PURCHASED OPTION | ||||||||||||||||
| CONTRACTS — 3.4% | Notional | |||||||||||||||
| (Continued) | Strike Price | Contracts | Value | Value | ||||||||||||
| Call Option Contracts — 3.4% (Continued) | ||||||||||||||||
| Jackson Financial, Inc., - Class A, 01/20/23 | $ | 25.00 | 5 | $ | 18,675 | $ | 6,750 | |||||||||
| Jackson Financial, Inc., - Class A, 01/20/23 | 30.00 | 35 | 130,725 | 30,100 | ||||||||||||
| MultiPlan Corporation, 01/20/23 | 5.00 | 110 | 16,390 | 550 | ||||||||||||
| MultiPlan Corporation, 01/20/23 | 7.50 | 10 | 1,490 | 250 | ||||||||||||
| O-I Glass, Inc., 12/16/22 | 12.00 | 5 | 8,205 | 2,250 | ||||||||||||
| Paramount Global - Class B, 01/20/23 | 30.00 | 10 | 20,080 | 50 | ||||||||||||
| Pfizer, Inc., 01/20/23 | 47.00 | 30 | 150,390 | 11,700 | ||||||||||||
| Pfizer, Inc., 01/20/23 | 50.00 | 40 | 200,520 | 7,520 | ||||||||||||
| PG&E Corporation, 01/23/23 | 10.00 | 10 | 15,700 | 5,650 | ||||||||||||
| Spectrum Brands Holdings, Inc., 01/20/23 | 75.00 | 15 | 79,905 | 3,638 | ||||||||||||
| Valvoline, Inc., 12/19/22 | 30.00 | 20 | 65,960 | 6,100 | ||||||||||||
| Viatris, Inc., 01/20/23 | 10.00 | 40 | 44,120 | 5,000 | ||||||||||||
| Viatris, Inc., 01/20/23 | 12.50 | 50 | 55,150 | 500 | ||||||||||||
| Viatris, Inc., 01/20/23 | 15.00 | 160 | 176,480 | 400 | ||||||||||||
| Total Purchased Option Contracts (Cost $213,662) | $ | 1,732,695 | $ | 141,954 | ||||||||||||
| MONEY MARKET FUNDS — 22.4% | Shares | Value | ||||||
| Federated Hermes Treasury Obligations Fund - Service Shares, 3.41% (b) (Cost $929,422) | 929,422 | $ | 929,422 | |||||
| Investments at Value — 99.6% (Cost $3,766,271) | $ | 4,139,525 | ||||||
| Other Assets in Excess of Liabilities — 0.4% | 15,370 | |||||||
| Net Assets — 100.0% | $ | 4,154,895 | ||||||
| (a) | Non-income producing security. |
| (b) | The rate shown is the 7-day effective yield as of November 30, 2022. |
ADR - American Depositary Receipt
AG - Aktiengesellschaft
plc - Public Limited Company
S.A. - Société anonyme
See accompanying notes to financial statements.
8
| ADLER VALUE FUND |
| STATEMENT OF ASSETS AND LIABILITIES |
| November 30, 2022 (Unaudited) |
| ASSETS | ||||
| Investments in securities: | ||||
| At cost | $ | 3,766,271 | ||
| At value (Note 2) | $ | 4,139,525 | ||
| Receivable from Adviser (Note 4) | 11,152 | |||
| Dividends receivable | 11,882 | |||
| Other assets | 12,135 | |||
| Total assets | 4,174,694 | |||
| LIABILITIES | ||||
| Payable for investment securities purchased | 5,716 | |||
| Payable to administrator (Note 4) | 7,030 | |||
| Other accrued expenses | 7,053 | |||
| Total liabilities | 19,799 | |||
| NET ASSETS | $ | 4,154,895 | ||
| NET ASSETS CONSIST OF: | ||||
| Paid-in capital | $ | 3,535,295 | ||
| Accumulated earnings | 619,600 | |||
| NET ASSETS | $ | 4,154,895 | ||
| PRICING OF INSTITUTIONAL SHARES (Note 2) | ||||
| Net assets applicable to Institutional Shares | $ | 4,154,895 | ||
| Shares of Institutional Shares outstanding (no par value, unlimited number of shares authorized) | 154,895 | |||
| Net asset value, offering and redemption price per share (Note 2) | $ | 26.82 |
See accompanying notes to financial statements.
9
| ADLER VALUE FUND |
| STATEMENT OF OPERATIONS |
| For the Six Months Ended November 30, 2022 (Unaudited) |
| INVESTMENT INCOME | ||||
| Dividends | $ | 41,221 | ||
| Foreign withholding tax on dividends | (724 | ) | ||
| Total investment income | 40,497 | |||
| EXPENSES | ||||
| Investment advisory fees (Note 4) | 19,452 | |||
| Fund accounting fees (Note 4) | 15,196 | |||
| Administration fees (Note 4) | 15,000 | |||
| Legal fees | 11,635 | |||
| Trustees’ fees and expenses (Note 4) | 9,731 | |||
| Audit and tax services fees | 8,361 | |||
| Registration and filing fees | 6,983 | |||
| Transfer agent fees (Note 4) | 6,000 | |||
| Compliance fees (Note 4) | 6,000 | |||
| Custodian and bank service fees | 4,804 | |||
| Shareholder reporting expenses | 4,208 | |||
| Insurance expense | 1,490 | |||
| Postage and supplies | 582 | |||
| Other expenses | 4,046 | |||
| Total expenses | 113,488 | |||
| Less fee reductions and expense reimbursements by the Adviser (Note 4) | (89,173 | ) | ||
| Net expenses | 24,315 | |||
| NET INVESTMENT INCOME | 16,182 | |||
| REALIZED AND UNREALIZED LOSSES ON INVESTMENTS | ||||
| Net realized losses on investments transactions | (7,667 | ) | ||
| Net change in unrealized appreciation (depreciation) on investments | (135,934 | ) | ||
| NET REALIZED AND UNREALIZED LOSSES ON INVESTMENTS | (143,601 | ) | ||
| NET DECREASE IN NET ASSETS RESULTING FROM OPERATIONS | $ | (127,419 | ) |
See accompanying notes to financial statements.
10
| ADLER VALUE FUND |
| STATEMENTS OF CHANGES IN NET ASSETS |
| Six Months | ||||||||
| Ended | ||||||||
| November 30, | Year Ended | |||||||
| 2022 | May 31, | |||||||
| (Unaudited) | 2022 | |||||||
| FROM OPERATIONS | ||||||||
| Net investment income | $ | 16,182 | $ | 132,311 | ||||
| Net realized gains (losses) from investment transactions | (7,667 | ) | 433,006 | |||||
| Net change in unrealized appreciation (depreciation) on investments | (135,934 | ) | (639,008 | ) | ||||
| Net decrease in net assets resulting from operations | (127,419 | ) | (73,691 | ) | ||||
| DISTRIBUTIONS TO SHAREHOLDERS (NOTE 2) | ||||||||
| Institutional Shares | — | (326,422 | ) | |||||
| FROM CAPITAL SHARE TRANSACTIONS | ||||||||
| Institutional Shares | ||||||||
| Proceeds from shares sold | 79,950 | 556,469 | ||||||
| Net asset value of shares issued in reinvestment of distributions to shareholders | — | 326,422 | ||||||
| Payments for shares redeemed | — | (75,104 | ) | |||||
| Net increase in Institutional Shares net assets from capital share transactions | 79,950 | 807,787 | ||||||
| TOTAL INCREASE (DECREASE) IN NET ASSETS | (47,469 | ) | 407,674 | |||||
| NET ASSETS | ||||||||
| Beginning of period | 4,202,364 | 3,794,690 | ||||||
| End of period | $ | 4,154,895 | $ | 4,202,364 | ||||
| CAPITAL SHARES ACTIVITY | ||||||||
| Institutional Shares | ||||||||
| Shares sold | 3,166 | 18,654 | ||||||
| Shares reinvested | — | 11,295 | ||||||
| Shares redeemed | — | (2,634 | ) | |||||
| Net increase in shares outstanding | 3,166 | 27,315 | ||||||
| Shares outstanding, beginning of period | 151,729 | 124,414 | ||||||
| Shares outstanding, end of period | 154,895 | 151,729 | ||||||
See accompanying notes to financial statements.
11
| ADLER VALUE FUND |
| INSTITUTIONAL SHARES |
| FINANCIAL HIGHLIGHTS |
Per Share Data for a Share Outstanding Throughout Each Period
| Six Months | ||||||||||||||||||||
| Ended | ||||||||||||||||||||
| November 30, | Year Ended | Year Ended | Period Ended | Period Ended | ||||||||||||||||
| 2022 | May 31, | May 31, | May 31, | July 31, | ||||||||||||||||
| (Unaudited) | 2022 | 2021 | 2020(a) | 2019(b) | ||||||||||||||||
| Net asset value at beginning of period | $ | 27.70 | $ | 30.50 | $ | 19.82 | $ | 20.41 | $ | 20.00 | ||||||||||
| Income (loss) from investment operations: | ||||||||||||||||||||
| Net investment income | 0.11 | (c) | 0.95 | (c) | 0.07 | (c) | 0.49 | (d) | 0.15 | |||||||||||
| Net realized and unrealized gains (losses) on investments | (0.99 | ) | (1.35 | ) | 10.92 | (0.88 | ) | 0.26 | ||||||||||||
| Total from investment operations | (0.88 | ) | (0.40 | ) | 10.99 | (0.39 | ) | 0.41 | ||||||||||||
| Less distributions from: | ||||||||||||||||||||
| Net investment income | — | (2.30 | ) | (0.31 | ) | (0.20 | ) | — | ||||||||||||
| Net realized gains | — | (0.10 | ) | — | — | — | ||||||||||||||
| Total distributions | — | (2.40 | ) | (0.31 | ) | (0.20 | ) | — | ||||||||||||
| Net asset value at end of period | $ | 26.82 | $ | 27.70 | $ | 30.50 | $ | 19.82 | $ | 20.41 | ||||||||||
| Total return (e) | (3.18 | %) (f) | (1.64 | %) | 55.78 | % | (2.01 | %) (f) | 2.05 | % (f) | ||||||||||
| Net assets at end of period (000’s) | $ | 4,155 | $ | 4,202 | $ | 3,795 | $ | 1,458 | $ | 1,447 | ||||||||||
| Ratios/supplementary data: | ||||||||||||||||||||
| Ratio of total expenses to average net assets | 5.83 | % (g) | 5.65 | % | 8.42 | % | 13.01 | % (g) | 11.82 | % (g) | ||||||||||
| Ratio of net expenses to average net assets (h) | 1.25 | % (g) | 1.25 | % | 1.25 | % | 1.25 | % (g) | 1.26 | % (g)(i) | ||||||||||
| Ratio of net investment income to average net assets (h) | 0.83 | % (g) | 3.23 | % (j) | 0.27 | % | 2.93 | % (d)(g) | 0.81 | % (g) | ||||||||||
| Portfolio turnover rate | 12 | % (f) | 45 | % | 0 | % (k) | 4 | % (f) | 0 | % | ||||||||||
| (a) | Fund changed fiscal year to May 31. |
| (b) | Represents the period from the commencement of operations (August 16, 2018) through July 31, 2019. |
| (c) | Per share net investment income has been determined on the basis of average number of shares outstanding during the period. |
| (d) | During the period ended May 31, 2020, the Fund received a large special dividend distribution from NortonLifeLock, Inc. Had the Fund not received this special dividend distribution, the net investment income per share and ratio of net investment income to average net assets would have been $0.33 and 1.97%(g) lower, respectively. |
| (e) | Total return is a measure of the change in value of an investment in the Fund over the periods covered. The returns shown do not reflect the deduction of taxes a shareholder would pay on Fund distributions, if any, or the redemption of Fund shares. The total returns would be lower if the Adviser had not reduced fees and reimbursed expenses (Note 4). |
| (f) | Not annualized. |
| (g) | Annualized. |
| (h) | Ratio was determined after advisory fee reductions and expense reimbursements (Note 4). |
| (i) | Includes federal excise taxes of 0.01% of average net assets with respect to the period ended July 31, 2019. |
| (j) | During the year ended May 31, 2022, the Fund received a large special dividend distribution from Meredith Corporation. Had the Fund not received this special dividend distribution, the net investment income per share and ratio of net investment income to average net assets would have been $0.82 and 2.79% lower, respectively. |
| (k) | Percentage rounds to less than 1%. |
See accompanying notes to financial statements.
12
| ADLER VALUE FUND |
| NOTES TO FINANCIAL STATEMENTS |
| November 30, 2022 (Unaudited) |
1. Organization
Adler Value Fund (the “Fund”) is a non-diversified series of Ultimus Managers Trust (the “Trust”), an open-end investment company established as an Ohio business trust under a Declaration of Trust dated February 28, 2012. Other series of the Trust are not incorporated in this report.
The investment objective of the Fund is to seek to achieve long-term growth of capital.
The Fund currently offers one class of shares: Institutional Class shares (sold without any sales loads or distribution fees and subject to a $2,500 initial investment for all accounts, except for an IRA for which the minimum initial investment is $1,000).
2. Significant Accounting Policies
The Fund follows accounting and reporting guidance under Financial Accounting Standards Board Accounting Standards Codification Topic 946, “Financial Services – Investment Companies.” The following is a summary of the Fund’s significant accounting policies used in preparation of its financial statements. These policies are in conformity with accounting principles generally accepted in the United States of America (“GAAP”).
New accounting pronouncements – In October 2020, the Securities and Exchange Commission (the “SEC”) adopted new regulations governing the use of derivatives by registered investment companies (“Rule 18f-4”). The Fund was required to comply with Rule 18f-4 by August 19, 2022. Rule 18f-4 imposes limits on the amount of derivatives a fund can enter into, eliminates the asset segregation framework previously used by funds to comply with Section 18 of the 1940 Act, tracks derivatives as senior securities and requires funds whose use of derivatives is more than a limited specified exposure amount to establish and maintain a comprehensive derivatives risk management program and appoint a derivatives risk manager. The Fund is currently complying with Rule 18f-4.
Securities valuation – The Fund values its portfolio securities at market value as of the close of regular trading on the New York Stock Exchange (the “NYSE”) (normally 4:00 p.m. Eastern Time) on each day the NYSE is open for business. The Fund generally values its listed securities on the basis of the security’s last sale price on the security’s primary exchange, if available, otherwise at the exchange’s most recently quoted mean price. NASDAQ-listed securities are valued at the NASDAQ Official Closing Price. Option contracts are valued at the closing price on the exchanges on which they are primarily traded; if no closing price is available at the time of valuation, the option will be valued at the mean of the closing bid and ask prices for that day. Investments representing shares of money market funds and other open-end investment companies not traded on an exchange are valued at their net asset value (“NAV”) as reported by such companies. When using a quoted price and when the market is considered active, the security will be classified as Level 1 within the fair value hierarchy (see next page). In the event that market quotations are not readily available or are considered unreliable due to market or other events, the Fund values its securities and other assets at fair value in accordance with
13
| ADLER VALUE FUND |
| NOTES TO FINANCIAL STATEMENTS (Unaudited) (Continued) |
procedures established by and under the general supervision of the Board of Trustees of the Trust (the “Board”). Under these procedures, the securities will be classified as Level 2 or 3 within the fair value hierarchy, depending on the inputs used. Unavailable or unreliable market quotes may be due to the following factors: a substantial bid-ask spread; infrequent sales resulting in stale prices; insufficient trading volume; small trade sizes; a temporary lapse in any reliable pricing source; and actions of the securities or futures markets, such as the suspension or limitation of trading. As a result, the prices of securities used to calculate the Fund’s NAV may differ from quoted or published prices for the same securities.
GAAP establishes a single authoritative definition of fair value, sets out a framework for measuring fair value, and requires additional disclosures about fair value measurements.
Various inputs are used in determining the value of the Fund’s investments. These inputs are summarized in the three broad levels listed below:
| ● | Level 1 – quoted prices in active markets for identical securities |
| ● | Level 2 – other significant observable inputs |
| ● | Level 3 – significant unobservable inputs |
The inputs or methods used for valuing securities are not necessarily an indication of the risks associated with investing in those securities. The inputs used to measure fair value may fall into different levels of the fair value hierarchy. In such cases, for disclosure purposes, the level in the fair value hierarchy within which the fair value measurement falls in its entirety is determined based on the lowest level input that is significant to the fair value measurement.
The following is a summary of the Fund’s investments based on the inputs used to value the investments as of November 30, 2022:
| Level 1 | Level 2 | Level 3 | Total | |||||||||||||
| Common Stocks | $ | 2,984,485 | $ | — | $ | — | $ | 2,984,485 | ||||||||
| Preferred Stocks | 83,664 | — | — | 83,664 | ||||||||||||
| Purchased Option Contracts | 30,695 | 111,259 | — | 141,954 | ||||||||||||
| Money Market Funds | 929,422 | — | — | 929,422 | ||||||||||||
| Total | $ | 4,028,266 | $ | 111,259 | $ | — | $ | 4,139,525 | ||||||||
Refer to the Fund’s Schedule of Investments for a listing of the common and preferred stocks by sector and industry type. The Fund did not have any assets or liabilities that were measured at fair value on a recurring basis using significant unobservable inputs (Level 3) as of or during the six months ended November 30, 2022.
Share valuation – The NAV per share of each class of the Fund is calculated daily by dividing the total value of the assets attributable to that class, less liabilities attributable to that class, by the number of shares outstanding of that class. The offering price and redemption price per share of each class of the Fund is equal to the NAV per share of such class.
14
| ADLER VALUE FUND |
| NOTES TO FINANCIAL STATEMENTS (Unaudited) (Continued) |
Investment income – Dividend income is recorded on the ex-dividend date. Non-cash dividends included in dividend income, if any, are recorded at the fair value of the security received. Interest income is accrued as earned. Withholding taxes on foreign dividends, if any, have been recorded in accordance with the Fund’s understanding of the applicable country’s tax rules and rates.
Investment transactions – Investment transactions are accounted for on the trade date.
Realized gains and losses on investments sold are determined on a specific identification basis.
Common expenses – Common expenses of the Trust are allocated among the Fund and the other series of the Trust based on the relative net assets of each series, the number of series in the Trust, or the nature of the services performed and the relative applicability to each series.
Distributions to shareholders – Distributions to shareholders arising from net investment income and realized capital gains, if any, are declared and paid annually to shareholders. The amount of distributions from net investment income and net realized capital gains are determined in accordance with federal income tax regulations, which may differ from GAAP. Dividends and distributions to shareholders are recorded on the ex-dividend date. For the year ended May 31, 2021, the tax character of distributions paid to shareholders was ordinary income of $313,110 and long-term capital gain of $13,312. There were no distributions paid to shareholders during the six months ended November 30, 2022.
Purchased option contracts – The Fund may use option contracts in any manner consistent with its investment objectives and as long as its use is consistent with relevant provisions of the 1940 Act. The Fund may use options for speculative purposes as well as for the purpose of seeking to reduce the overall investment risk that would otherwise be associated with the securities in which the Fund invests. When the Fund purchases a call or put option, an amount equal to the total premium (the premium plus the commission) paid by the Fund is recorded as an asset on the Fund’s Statement of Assets and Liabilities and is subsequently marked-to-market daily. Premiums paid in the purchase of options which expire are treated as realized losses. Premiums paid in the purchase of call options which are exercised increase the cost of the security purchased. Premiums paid in the purchase of put options which are exercised decrease the proceeds used to calculate the realized capital gain or loss on the sale of the security.
Estimates – The preparation of financial statements in conformity with GAAP requires management to make estimates and assumptions that affect the reported amounts of assets and liabilities and disclosure of contingent assets and liabilities as of the date of the financial statements and the reported amounts of increase (decrease) in net assets from operations during the reporting period. Actual results could differ from those estimates.
15
| ADLER VALUE FUND |
| NOTES TO FINANCIAL STATEMENTS (Unaudited) (Continued) |
Federal income tax – The Fund has qualified and intends to continue to qualify as a regulated investment company under the Internal Revenue Code of 1986, as amended (the “Code”). Qualification generally will relieve the Fund of liability for federal income taxes to the extent 100% of its net investment income and net realized capital gains are distributed in accordance with the Code.
In order to avoid imposition of the excise tax applicable to regulated investment companies, it is also the Fund’s intention to declare as dividends in each calendar year amounts equal to at least 98% of its net investment income (earned during the calendar year) and 98.2% of its net realized capital gains (earned during the 12 months ended October 31) plus undistributed amounts from prior years.
The following information is computed on a tax basis for each item as of May 31, 2022:
| Tax cost of investments | $ | 3,684,442 | ||
| Gross unrealized appreciation | $ | 762,930 | ||
| Gross unrealized depreciation | (253,745 | ) | ||
| Net unrealized appreciation | 509,185 | |||
| Undistributed long-term gains | 257,372 | |||
| Accumulated capital and other losses | (19,538 | ) | ||
| Distributable earnings | $ | 747,019 | ||
Net qualified late year ordinary losses represent losses incurred after December 31, 2021. These losses are deemed to arise on the first day of the Fund’s next taxable year. For the year ended May 31, 2022, the Fund qualified late year ordinary losses of $19,538.
The federal tax cost, unrealized appreciation (depreciation) as of November 30, 2022 is as follows:
| Tax cost of investments | $ | 3,766,274 | ||
| Gross unrealized appreciation | 857,353 | |||
| Gross unrealized depreciation | (484,102 | ) | ||
| Net unrealized appreciation | 373,251 | |||
The difference between the federal income tax cost of investments and the financial statement cost of investments is due to certain timing differences in the recognition of capital gains or losses under income tax regulations and GAAP. These “book/tax” differences are temporary in nature and are due to the tax deferral of losses on wash sales.
The Fund recognizes the tax benefits or expenses of uncertain tax positions only when the position is “more likely than not” to be sustained assuming examination by tax authorities. Management has reviewed the Fund’s tax positions for the current and all open tax periods (generally, three years) and has concluded that no provision for unrecognized tax benefits or expenses is required in these financial statements. The Fund identifies its major tax jurisdiction as U.S. federal.
16
| ADLER VALUE FUND |
| NOTES TO FINANCIAL STATEMENTS (Unaudited) (Continued) |
3. Investment Transactions
During the six months ended November 30, 2022, cost of purchases and proceeds from sales of investment securities, other than short-term investments, were $358,924 and $397,844, respectively.
4. Transactions with Related Parties
INVESTMENT ADVISORY AGREEMENT
The Fund’s investments are managed by Adler Asset Management, LLC (the “Adviser”) pursuant to the terms of an Investment Advisory Agreement. Under the Investment Advisory Agreement, the Fund pays the Adviser an investment advisory fee, computed and accrued daily and paid monthly, at the annual rate of 1.00% of its average daily net assets.
Pursuant to an Expense Limitation Agreement (“ELA”) between the Fund and the Adviser, the Adviser has agreed, until December 1, 2023, to reduce its investment advisory fees and reimburse other expenses to limit total annual operating expenses (exclusive of brokerage costs; taxes; interest; borrowing costs such as interest and dividends expenses on securities sold short; costs to organize the Fund; acquired fund fees and expenses; and extraordinary expenses such as litigation and merger or reorganization costs and other expenses not incurred in the ordinary course of the Fund’s business) to an amount not exceeding 1.25% of the Fund’s average daily net assets of the Institutional Class shares. Accordingly, during the six months ended November 30, 2022, the Adviser did not collect any of its investment advisory fees and reimbursed other operating expenses totaling $69,721.
Under the terms of the ELA, investment advisory fee reductions and expense reimbursements by the Adviser are subject to repayment by the Fund for a period of three years after such fees and expenses were incurred, provided that the repayments do not cause the Fund’s total annual operating expenses to exceed the lesser of (i) the expense limitation then in effect, if any, and (ii) the expense limitation in effect at the time the expenses to be repaid were incurred. As of November 30, 2022, the Adviser may seek recoupment of investment advisory fee reductions and expense reimbursements no later than the dates as stated below:
| May 31, 2023 | $ | 86,012 | ||
| May 31, 2024 | 179,743 | |||
| May 31, 2025 | 180,253 | |||
| November 30, 2025 | 89,173 | |||
| Total | $ | 535,181 | ||
17
| ADLER VALUE FUND |
| NOTES TO FINANCIAL STATEMENTS (Unaudited) (Continued) |
OTHER SERVICE PROVIDERS
Ultimus Fund Solutions, LLC (“Ultimus”) provides administration, fund accounting, compliance and transfer agency services to the Fund. The Fund pays Ultimus fees in accordance with the agreements for such services. In addition, the Fund pays out-of-pocket expenses including, but not limited to, postage, supplies, and certain costs related to the pricing of the Fund’s portfolio securities.
Under the terms of a Distribution Agreement with the Trust, Ultimus Fund Distributors, LLC (the “Distributor”) serves as principal underwriter to the Fund. The Distributor is a wholly-owned subsidiary of Ultimus. The Distributor is compensated by the Adviser (not the Fund) for acting as principal underwriter.
Certain officers and a Trustee of the Trust are also officers of Ultimus and are not paid by the Fund for serving in such capacities.
TRUSTEE COMPENSATION
Effective October 17, 2022, each member of the Board (a “Trustee”) who is not an “interested person” (as defined by the 1940 Act, as amended) of the Trust (“Independent Trustee”) receives a $1,300 annual retainer from the Fund, paid quarterly, except for the Board Chairperson who receives a $1,700 annual retainer from the Fund, paid quarterly and the Audit Committee Chairperson who receives a $1,500 annual retainer from the Fund, paid quarterly. Each Independent Trustee also receives from the Fund a fee of $550 for each Board meeting attended plus reimbursement for travel and other meeting-related expenses. Prior to October 17, 2022, no annual retainer was designated specifically for the Audit Committee Chairperson.
PRINCIPAL HOLDER OF FUND SHARES
As of November 30, 2022, the following shareholder owned of record 25% or more of the outstanding shares of the Fund:
| NAME OF RECORD OWNER | % Ownership | |
| David R. Adler | 60% |
A beneficial owner of 25% or more of the Fund’s outstanding shares may be considered a controlling person. That shareholder’s vote could have a more significant effect on matters presented at a shareholders’ meeting.
18
| ADLER VALUE FUND |
| NOTES TO FINANCIAL STATEMENTS (Unaudited) (Continued) |
5. Derivative Transactions
The location on the Statement of Assets and Liabilities of the derivative positions of the Fund are as follows:
| Average | ||||||||||||||||
| Fair Value | Monthly | |||||||||||||||
| Notional Value | ||||||||||||||||
| Six Months | ||||||||||||||||
| Ended | ||||||||||||||||
| Type of | Asset | Liability | November 30, | |||||||||||||
| Derivative | Risk | Location | Derivatives | Derivatives | 2022* | |||||||||||
| Equity call options purchased | Equity | Investments in securities at value | $ | 141,954 | $ | — | $ | 1,568,677 | ||||||||
| * | The average monthly notional value generally represents the Fund’s derivative activity throughout the period. |
Realized and unrealized gains and losses associated with transactions in derivative instruments for the Fund during the six months ended November 30, 2022 are recorded in the following locations on the Statement of Operations:
| Change in | ||||||||||||||
| Unrealized | ||||||||||||||
| Type of | Realized | Appreciation | ||||||||||||
| Derivative | Risk | Location | Losses | Location | (Depreciation) | |||||||||
| Equity call options purchased | Equity | Net realized losses on investment transactions | $ | (18,758 | ) | Net change in unrealized appreciation (depreciation) on investments | $ | (88,164 | ) | |||||
6. Contingencies and Commitments
The Fund indemnifies the Trust’s officers and Trustees for certain liabilities that might arise from their performance of their duties to the Fund. Additionally, in the normal course of business, the Fund enters into contracts that contain a variety of representations, warranties, and general indemnifications. The Fund’s maximum exposure under these arrangements is unknown, as this would involve future claims that may be made against the Fund that have not yet occurred. However, based on experience, the Fund expects the risk of loss to be remote.
19
| ADLER VALUE FUND |
| NOTES TO FINANCIAL STATEMENTS (Unaudited) (Continued) |
7. Subsequent Events
The Fund is required to recognize in the financial statements the effects of all subsequent events that provide additional evidence about conditions that existed as of the date of the Statement of Assets and Liabilities. For non-recognized subsequent events that must be disclosed to keep the financial statements from being misleading, the Fund is required to disclose the nature of the event as well as an estimate of its financial effect, or a statement that such an estimate cannot be made. Management has evaluated subsequent events through the issuance of these financial statements and has noted no such events except for the following:
On December 27, 2022, the Fund paid a long-term capital gain distribution of $1.6617 per share to shareholders of record on December 23, 2022.
20
| ADLER VALUE FUND |
| LIQUIDITY RISK MANAGEMENT PROGRAM (Unaudited) |
The Fund has adopted and implemented a written liquidity risk management program (the “Program”) as required by Rule 22e-4 (the “Liquidity Rule”) under the Investment Company Act of 1940, as amended. The Program is reasonably designed to assess and manage the Fund’s liquidity risk, taking into consideration, among other factors, the Fund’s investment strategy and the liquidity of its portfolio investments during normal and reasonably foreseeable stressed conditions; its short- and long-term cash flow projections; and its cash holdings and access to other funding sources. The Fund’s Board of Trustees (the “Board”) approved the appointment of the Liquidity Administrator Committee, comprising of the Fund’s Adviser and certain Trust officers, to be responsible for the Program’s administration and oversight and for reporting to the Board on at least an annual basis regarding the Program’s operation and effectiveness. The annual written report assessing the Program (the “Report”) was presented to the Board at the October 17 – 18, 2022 Board meeting and covered the period from June 1, 2021 to May 31, 2022 (the “Review Period”).
During the Review Period, the Fund did not experience unusual stress or disruption to its operations related to purchase and redemption activity. Also, during the Review Period, the Fund held adequate levels of cash and highly liquid investments to meet shareholder redemption activities in accordance with applicable requirements. The Report concluded that the Program is reasonably designed to prevent violation of the Liquidity Rule and the Program has been effectively implemented.
21
| ADLER VALUE FUND |
| ABOUT YOUR FUND’S EXPENSES (Unaudited) |
We believe it is important for you to understand the impact of costs on your investment. As a shareholder of the Fund, you incur ongoing costs, including management fees and other operating expenses. The following examples are intended to help you understand your ongoing costs (in dollars) of investing in the Fund and to compare these costs with the ongoing costs of investing in other mutual funds.
A mutual fund’s ongoing costs are expressed as a percentage of its average net assets. This figure is known as the expense ratio. The expenses in the table below are based on an investment of $1,000 made at the beginning of the most recent period June 1, 2022) and held until the end of the period (November 30, 2022).
The table below illustrates the Fund’s ongoing costs in two ways:
Actual fund return – This section helps you to estimate the actual expenses that you paid over the period. The “Ending Account Value” shown is derived from the Fund’s actual return, and the fourth column shows the dollar amount of operating expenses that would have been paid by an investor who started with $1,000 in the Fund. You may use the information here, together with the amount you invested, to estimate the expenses that you paid over the period.
To do so, simply divide your account value by $1,000 (for example, an $8,600 account value divided by $1,000 = 8.6), then multiply the result by the number given for the Fund under the heading “Expenses Paid During Period.”
Hypothetical 5% return – This section is intended to help you compare the Fund’s ongoing costs with those of other mutual funds. It assumes that the Fund had an annual return of 5% before expenses during the period shown, but that the expense ratio is unchanged. In this case, because the return used is not the Fund’s actual return, the results do not apply to your investment. The example is useful in making comparisons because the SEC requires all mutual funds to calculate expenses based on a 5% return. You can assess the Fund’s ongoing costs by comparing this hypothetical example with the hypothetical examples that appear in shareholder reports of other funds.
Note that expenses shown in the table are meant to highlight and help you compare ongoing costs only. The Fund does not charge sales loads.
The calculations assume no shares were bought or sold during the period. Your actual costs may have been higher or lower, depending on the amount of your investment and the timing of any purchases or redemptions.
22
| ADLER VALUE FUND |
| ABOUT YOUR FUND’S EXPENSES (Unaudited) (Continued) |
More information about the Fund’s expenses can be found in this report. For additional information on operating expenses and other shareholder costs, please refer to the Fund’s prospectus.
| Beginning | Ending | |||||||
| Account Value | Account Value | Expenses | ||||||
| June 1, | November 30, | Net Expense | Paid During | |||||
| Institutional Class | 2022 | 2022 | Ratio(a) | Period(b) | ||||
| Based on Actual Fund Return | $1,000.00 | $968.20 | 1.25% | $6.17 | ||||
| Based on Hypothetical 5%Return (before expenses) | $1,000.00 | $1,018.80 | 1.25% | $6.33 |
| (a) | Annualized, based on the Fund’s most recent one-half year expenses. |
| (b) | Expenses are equal to the Fund’s annualized net expense ratio multiplied by the average account value over the period, multiplied by 183/365 (to reflect the one-half year period). |
23
| ADLER VALUE FUND |
| OTHER INFORMATION (Unaudited) |
A description of the policies and procedures that the Fund uses to vote proxies relating to portfolio securities is available without charge upon request by calling 1-800-408-4682, or on the SEC’s website at www.sec.gov. Information regarding how the Fund voted proxies relating to portfolio securities during the most recent 12-month period ended June 30, 2022 is also available without charge upon request by calling 1-800-408-4682, or on the SEC’s website at www.sec.gov.
The Trust files a complete listing of portfolio holdings for the Fund with the SEC as of the end of the first and third quarters of each fiscal year as an exhibit to its reports on Form N-PORT. These filings are available upon request by calling 1-800-408-4682. Furthermore, you may obtain a copy of the filings on the SEC’s website at www.sec.gov and the Fund’s website at www.adlervaluefund.com.
24
| ADLER VALUE FUND |
| CUSTOMER PRIVACY NOTICE |
| FACTS | WHAT DOES THE ADLER VALUE FUND (the “Fund”) DO WITH YOUR PERSONAL INFORMATION? |
| Why? | Financial companies choose how they share your personal information. Federal law gives consumers the right to limit some but not all sharing. Federal law also requires us to tell you how we collect, share, and protect your personal information. Please read this notice carefully to understand what we do. |
| What? | The types of personal information we collect and share depend on the product or service you have with us. This information can include: |
| ■ Social Security number | |
| ■ Assets | |
| ■ Retirement Assets | |
| ■ Transaction History | |
| ■ Checking Account Information | |
| ■ Purchase History | |
| ■ Account Balances | |
| ■ Account Transactions | |
| ■ Wire Transfer Instructions | |
| When you are no longer our customer, we continue to share your information as described in this notice. |
| How? | All financial companies need to share your personal information to run their everyday business. In the section below, we list the reasons financial companies can share their customers’ personal information; the reasons the Fund chooses to share; and whether you can limit this sharing. |
| Does the | Can you limit | |
| Reasons we can share your personal information | Fund share? | this sharing? |
| For our everyday business purposes – | ||
| Such as to process your transactions, maintain your account(s), respond to court orders and legal investigations, or report to credit bureaus | Yes | No |
| For our marketing purposes – | ||
| to offer our products and services to you | No | We don’t share |
| For joint marketing with other financial companies | No | We don’t share |
| For our affiliates’ everyday business purposes – | ||
| information about your transactions and experiences | No | We don’t share |
| For our affiliates’ everyday business purposes – | ||
| information about your creditworthiness | No | We don’t share |
| For nonaffiliates to market to you | No | We don’t share |
| Questions? | Call 1-800-408-4682 |
25
| ADLER VALUE FUND |
| CUSTOMER PRIVACY NOTICE (Continued) |
| Who we are | |
| Who
is providing this notice? |
Adler Value Fund
Ultimus Fund Distributors, LLC (Distributor)
Ultimus Fund Solutions, LLC (Administrator) |
| What we do | |
| How
does the Fund protect my personal information? |
To protect your personal information from unauthorized access and use, we use security measures that comply with federal law. These measures include computer safeguards and secured files and buildings.
Our service providers are held accountable for adhering to strict policies and procedures to prevent any misuse of your nonpublic personal information. |
| How
does the Fund collect my personal information? |
We collect your personal information, for example, when you
■ Open an account
■ Provide account information
■ Give us your contact information
■ Make deposits or withdrawals from your account
■ Make a wire transfer
■ Tell us where to send the money
■ Tell us who receives the money
■ Show your government-issued ID
■ Show your driver’s license
We also collect your personal information from other companies. |
| Why
can’t I limit all sharing? |
Federal law gives you the right to limit only
■ Sharing for affiliates’ everyday business purposes – information about your creditworthiness
■ Affiliates from using your information to market to you
■ Sharing for nonaffiliates to market to you
State laws and individual companies may give you additional rights to limit sharing. |
| Definitions | |
| Affiliates | Companies related by common ownership or control. They can be financial and nonfinancial companies. |
| ■ Adler Asset Management, LLC, the investment adviser to the Fund, could be deemed to be an affiliate. | |
| Nonaffiliates | Companies not related by common ownership or control. They can be financial and nonfinancial companies |
| ■ The Fund does not share with nonaffiliates so they can market to you. | |
| Joint marketing | A formal agreement between nonaffiliated financial companies that together market financial products or services to you. |
| ■ The Fund does not jointly market. | |
26
This page intentionally left blank.
This page intentionally left blank.
ADLER-SAR-22

EVOLUTIONARY TREE INNOVATORS FUND
I Class Shares (INVNX)
A Class Shares (INVTX)
Semi-Annual Report
November 30, 2022
(Unaudited)
| EVOLUTIONARY TREE INNOVATORS FUND | |
| LETTER TO SHAREHOLDERS (Unaudited) | December 20, 2022 |
Dear Fellow Shareholders,
As we exit 2022, the markets are still grappling with a collection of macro and geopolitical headwinds—namely, heightened inflation, the Federal Reserve raising rates, Putin’s war in Ukraine, and a potential recession forthcoming. However, there are glimmers of stabilization, which may set the stage for better news over time. We believe we are starting to see early signs that certain holdings in the Fund are nearing “terra firma,” supported by a combination of strong underlying business growth, evolutionary shifts/trends, and innovation-based catalysts.
To be clear, we are not “calling the bottom” in the markets (no one can time the market or the economy), but we are starting to see some stabilization for a subset of growth and innovation companies, particularly the quality innovators. To use a colloquialism, these would be the “babies thrown out with the bathwater.” The common theme for these companies is that they generally have resilient businesses and can grow despite a recessionary environment, with growth often driven by specific new products or services that are still early in adoption (what we call innovation catalysts).
For newer investors to the Evolutionary Tree Innovators Fund, we provide below a brief overview of our investment approach and why we focus on long-term drivers such as innovation versus trying to predict or side-step movements in the market or economy. For investors that are more familiar with our innovation-focused strategy, please jump to the sections on our perspective on the current environment and why we believe the underlying companies owned in the Fund are well positioned, as a group, to drive sustainable growth.
How Our Approach Enables Investors to Access Leading and Quality Innovative Businesses
The Evolutionary Tree Innovators Fund was launched to provide an attractive pathway for investing in important innovations and secular trends, or evolutionary shifts as we call them. The Fund and its adviser apply an innovation and evolution-focused framework to investing. We believe the development of innovation and its resultant pattern of evolutionary change is the primary engine of growth for companies, industries, and the economy—and, in turn, is the underlying driver of long-term wealth creation. While investors are currently focused on near-term macro drivers, such as the Fed, inflation, and the war in Ukraine, we believe innovation can still drive growth for leading innovators and remains critically important for long-term investors.
The Fund seeks to identify important innovations that are driving secular growth and evolutionary shifts for companies, industries, and the economy, and own the leading innovators at the forefront. The Fund defines an evolutionary shift as when an industry shifts from an old generation (of a product, service, or business model) over to a “next generation” or new offering that provides advantages versus the “old way” of doing things. The Fund invests in a focused portfolio of 25-35 quality innovative businesses.
1
Examples of innovations that we believe contribute to sustainable growth include technological innovation, product innovation, service or experience innovation, process or cost innovation, and/or business model innovation. In addition to contributing to sustaining growth for leading innovative businesses, new innovations may also enable innovators to take market share, create competitive advantage, and/or enhance profitability over time. Innovation is the root cause of value creation.
Perspective on the Volatile Markets and Near-term Economic Environment
While day-to-day volatility continues in the markets, the Fund experienced some stabilization in the first half of the fiscal year (May 31 through November 30) relative to prior periods, but slightly lagged its benchmark. During the first half of the fiscal year, the I Class of the Fund declined 3.00% versus the broader S&P 500 Index return of 2.61%.
The bear market has also shifted, from primarily penalizing growth equities earlier in the year to broadening out to value and cyclical stocks, and with higher rates, even bonds are now in a severe bear market. In short, the pain has expanded to most investment styles and asset classes. Given that growth stocks entered the bear market first (starting last year) and are thus potentially much further along in the retrenchment process, it is conceivable that they will have an opportunity to be one of the first to emerge out of the bear market.
Why is growth showing early signs of stabilization? We believe investors are beginning to show renewed interest in embracing secular growth companies for two reasons. First, with a slowing economy, investors are looking for companies that can grow through a potential recession, and this “search for growth” naturally brings them to innovative companies benefiting from secular trends and driving sustainable growth with new products and services. The holdings in the Fund continue delivering well-above-average growth (approximately 30% revenue growth, on a weighted-average basis) with stable-to-improving profitability, while preserving solid balance sheets. Second, increasingly investors are beginning to appreciate that, after a significant pullback, stock prices and valuations for quality companies may now be reaching attractive levels.
Our Views on Putting the Macro and Market Environment into Perspective
| 1. | While inflation is high currently, it is likely at or near peak levels and will ease gradually over time, particularly as the global economy slows. Signs of easing inflation will start to stabilize the markets and, in particular, growth stocks. We may already be seeing signs of this dynamic. It is early, but some progress is being made. |
| 2. | A slowing economy, driven by the ending of one-time pandemic subsidies and monetary policy tightening by the Fed, will begin to ease prices across a growing number of cost inputs. The recent pullback in commodity prices is already revealing this potential. |
| 3. | Technology companies, particularly software companies, are a part of the solution to the labor shortage issue, as companies look to drive cost efficiencies. Quality technology leaders may be attractively valued, in our opinion. Our 8 investment criteria lead us to quality innovators, including those in the enterprise software space. |
2
| 4. | Healthcare companies, almost a quarter of the Fund, are showing relative resilience in this economy as demand for advanced treatments continues despite the slow economy. In addition to strong demand, healthcare holdings are benefiting from a number of innovation catalysts (new products being launched). |
| 5. | A slower economy will hurt cyclical industries, which we avoid, while highlighting the value of secular growth industries and innovators, which can generally grow through difficult economic environments. Innovative businesses have multiple growth drivers such as new products, services, and market share gains— independent of the economy. |
| 6. | We believe “growth is the new value,” and lower valuations may entice investors to re-embrace growth and innovation over time. The timing of this process is unknown, particularly given the collection of macro headwinds, but we believe patience will be rewarded. |
While Inflation Remains Too High, We Are Starting to See Signs of Progress by the Fed’s Tightening Campaign
The primary driver of so much of the volatility in the markets is related to high inflation, which has led to one of the fastest tightening cycles. Until inflation is brought in check, the markets are likely to remain highly volatile. However, it is important to note that we are actually seeing early signs of progress by the Fed in reducing the sources of inflation. In fact, a number of key components of inflation have seen pretty dramatic declines from peak levels, most notably the price of oil/gasoline, shipping costs, and various commodities. There are other inputs that remain stubbornly high, such as the price of food and rent. So, the Fed has more work to do, but, again, progress is being made.
Equally important to bringing down inflation across key inputs is the Fed’s focus on preventing inflation expectations from becoming entrenched longer-term, which could lead to runaway inflation and the dreaded “stagflation” environment of high inflation plus low growth. This is one of the reasons the Fed is raising rates so aggressively—to cut off the conversion of short-term inflation into long-term “stickier” inflation. As long-term investors, this is a goal we support, even if it creates some short-term pain.
One method to track progress on this front is to study consumer inflation expectations, and the New York Fed conducts such a survey (source: www.newyorkfed.org). The good, but early, news is that we are starting to see a step in the right direction, as both 1-year and 3-year inflation expectations by consumers have peaked and are clearly coming down. The 1-year expectation of 5-6% remains too high, but is down from near 7%, while consumer inflation expectations for 3-years out are quite low.
Innovative Businesses Have Fuel—Innovation and Trends—to Power Through Recessionary Environments
We believe quality innovators that have developed and are launching new products and services may be less impacted from a recession than cyclical companies that are highly dependent on growth in the broader economy.
In general, we have found that the companies that are most protected, at least on a relative basis, are the ones that offer mission critical and highly essential products and services. One example is Service Now, an enterprise software company, that enables companies
3
to deliver phenomenal customer service experiences using its cloud-based platform. Companies are literally running big parts of their businesses on this platform. Second, companies that sell to larger organizations with stable IT budgets can also be more insulated. For example, Axon, a dominant leader in body cameras, tasers, and software technology for police departments, is benefiting from expanded funding for police tech (at both the federal and local levels) to promote transparency, accountability, and improved officer effectiveness.
In addition, companies with longer-duration contracts may also see less impact from short-term economic slumps. A great example here is nCino, which developed the Bank Operating System, a cloud-based platform for banks to manage workflows for multiple lines of business. New rollouts of nCino’s suite of offerings across loan origination or retail bank departments often take years to implement and then are used for many, many years. Companies with technology platforms and suites, such as nCino, are also fairly protected because they represent solutions for driving worker productivity, reducing complexity, and lowering costs—goals that are embraced by clients during recessionary periods.
Lastly, companies with strong and/or growing profitability with robust balance sheets are better insulated from recessions, especially in a rising rate environment. Well-funded businesses typically have balance sheets and/or strong cash flow generation that funds their growth and allows them to out-invest their competitors. As a result, these quality innovators often emerge from a recession stronger, as weaker competitors under-invest.
To be clear, no company is completely immune from the negative impact of recessions. We believe, however, that it will be the highly innovative companies that will have the fuel to drive above-average growth, on average, through recessionary environments, especially relative to less-innovative companies or those that are highly cyclical.
In addition to new innovations fueling growth for quality innovators, there is a second force that is often ignored, but equally as powerful in sustaining growth for certain businesses. This force is secular trends, or what we call evolutionary shifts: when an industry shifts from an older generation of an offering (e.g., product, service, or business model) to a next-generation offering that provides advantages to customers versus the “old way.” These shifts or secular trends can take years, even decades, to play out as consumers shift gradually over time. All of our investment holdings benefit from different secular trends, often driven by the underlying innovations they develop. Key point: In a recessionary environment, these shifts and trends are still moving forward, providing another wind at the back of these innovative businesses and helping to sustain growth.
A few standout examples illustrate this dynamic. Airbnb, for one, is driving a shift away from traditional hotels to alternative accommodations, not to mention the consumer shift toward spending more on experiences. The shift to alternative accommodations also benefits from the “trade down” effect that happens in recessions, when consumers are looking for great value. Another example is Stryker, a leader in medtech, that benefits from the shift toward less invasive and even robotic surgery for knee and hip replacements. Lastly, both Microsoft and Amazon’s AWS benefit from the shift from on-premise datacenters toward the use of public cloud-based infrastructure-as-a-service (IaaS), a shift that most companies are embracing on their Digital Transformation journeys.
4
Recent Innovation Catalysts May Further Sustain Growth & Resilience, Especially in Healthcare
Innovators continue to innovate, even in a recessionary-like environment. When innovative businesses announce a major update on a new innovation in their pipeline or when they launch a new product or service, this is considered a “catalyst”, and investors often take notice because it drives another wave of growth. In recent months, we have seen a number of new catalysts that have benefited our healthcare holdings, which comprise up to a quarter of the Fund. This was a primary driver of a rebound in a number of biotech and medtech companies held in the Fund during the quarter.
We own companies, such as Sarepta and Argenx, both biotech companies that offer treatments for severe diseases, where new treatments are often desperately needed. We have seen important new catalysts for both companies. Argenx gained FDA approval for its new treatment, Vyvgart, for an autoimmune disease called myasthenia gravis, and this launch is exceeding expectations. It also reported positive phase 3 clinical results for Vyvgart in a second large autoimmune indication, immune thrombocytopenia (ITP). Sarepta, meanwhile, has reported updates on its clinical trials for Duchenne’s muscular dystrophy (DMD), which showed strong safety and potential functional benefits for patients that normally lose their ability to move. The FDA has encouraged Sarepta to file early using an accelerated approval process, with potential launch in 2023.
Another innovation catalyst that benefited the Fund was the recent FDA approval of Revance’s Botox competitor, Daxxify, which has shown twice the durability of Botox (injected every 6 months vs every 3 months for Botox). Revance also just recently filed for FDA approval for Daxxify in cervical dystonia, a new therapeutic indication, which is supported by positive Phase 3 clinical trial results, also with the extended 6-month duration.
We have tended to overweight the Fund to healthcare-related companies because they are often some of the most innovative companies in our economy, especially those with breakthrough treatments. But healthcare companies are also some of the most resilient during recessionary times. Healthcare spending tends to be quite resilient because demand is fairly inelastic. It generally does not change much based on the economy, so demand tends to be pretty consistent. Second, the FDA and its approval process is unaffected by the economy, and we are actually seeing the FDA become more accommodative to new drug approvals, especially for treatments that offer important breakthrough benefits for patients with an unmet medical need. We are also seeing a growing number of acquisitions of biotech companies by larger pharmaceutical companies, which can, at times, provide a valuation floor for quality biotech companies.
The bottom line: The healthcare holdings are great examples—despite all the macro headwinds—of how innovation catalysts are driving strong growth (such as with Argenx’s launch of Vyvgart) or enabling companies to report important updates on their R&D pipeline (such as Sarepta), which may set these companies up for future approvals and growth. We like that these dynamics offer catalysts or idiosyncratic growth drivers that are not reliant on the broader economy.
5
Concluding Thoughts
While the markets continue to deal with a number of macro and geopolitical issues, there is underlying fundamental strength across the Fund holdings. This strength is tied directly to continued solid business growth, multi-year secular trends, and specific innovation catalysts. And, while inflation remains high currently, we are starting to see early signs of progress of bringing this down over time by the Fed. We are going to be patient and ride through these temporary storms, stay focused on our core investment strategy, and continue ownership of quality innovative businesses.
Thank you for your continued interest in, and support of, the Evolutionary Tree Innovators Fund.
6
Past performance is not predictive of future performance. Investment results and principal value will fluctuate so that shares, when redeemed, may be worth more or less than their original cost. Current performance may be higher or lower than the performance data quoted. Performance data current to the most recent month-end are available by calling 1-833-517-1010.
An investor should consider the investment objectives, risks, charges and expenses of the Fund carefully before investing. The Fund’s prospectus contains this and other important information. To obtain a copy of the Fund’s prospectus please visit the Fund’s website at mutualfund.evolutionarytree.com or call 1-833-517-1010 and a copy will be sent to you free of charge. Please read the prospectus carefully before you invest. The Fund is distributed by Ultimus Fund Distributors, LLC.
The Letter to Shareholders seeks to describe some of the Adviser’s current opinions and views of the financial markets. Although the Adviser believes it has a reasonable basis for any opinions or views expressed, actual results may differ, sometimes significantly so, from those expected or expressed. The securities held by the Fund that are discussed in the Letter to Shareholders were held during the period covered by this Report. They do not comprise the entire investment portfolio of the Fund, may be sold at any time, and may no longer be held by the Fund. For a complete list of securities held by the Fund as of November 30, 2022, please see the Schedule of Investments section of the semi-annual report. The opinions of the Fund’s adviser with respect to those securities may change at any time.
Statements in the Letter to Shareholders that reflect projections or expectations for future financial or economic performance of the Fund and the market in general and statements of the Fund’s plans and objectives for future operations are forward-looking statements. No assurance can be given that actual results or events will not differ materially from those projected, estimated, assumed, or anticipated in any such forward-looking statements. Important factors that could result in such differences, in addition to factors noted with such forward-looking statements, include, without limitation, general economic conditions, such as inflation, recession, and interest rates. Past performance is not a guarantee of future results.
7
| EVOLUTIONARY TREE INNOVATORS FUND |
| PORTFOLIO INFORMATION |
| November 30, 2022 (Unaudited) |
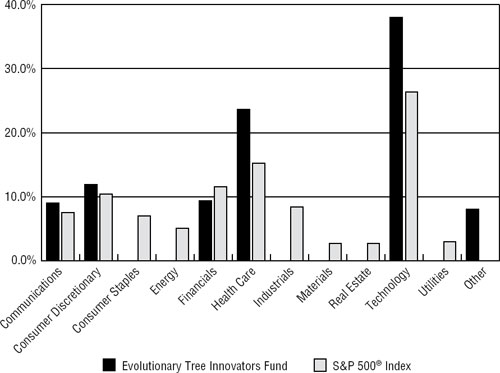
Sector Diversification (% of Net Assets)
| Top 10 Equity Holdings | ||
| % of | ||
| Security Description | Net Assets | |
| HubSpot, Inc. | 6.9% | |
| Microsoft Corporation | 6.7% | |
| Amazon.com, Inc. | 6.7% | |
| ServiceNow, Inc. | 6.6% | |
| Sarepta Therapeuctics, Inc. | 5.8% | |
| Alphabet, Inc. - Class A | 5.7% | |
| nCino, Inc. | 5.5% | |
| Inspire Medical Systems, Inc. | 5.1% | |
| Airbnb, Inc. - Class A | 3.5% | |
| Axon Enterprise, Inc. | 3.3% | |
8
| EVOLUTIONARY TREE INNOVATORS FUND |
| SCHEDULE OF INVESTMENTS |
| November 30, 2022 (Unaudited) |
| COMMON STOCKS — 92.0% | Shares | Value | ||||||
| Communications — 9.0% | ||||||||
| Digital Media — 9.0% | ||||||||
| Alphabet, Inc. - Class A (a) | 12,755 | $ | 1,288,127 | |||||
| Bumble, Inc. - Class A (a) | 14,016 | 341,430 | ||||||
| Trade Desk, Inc. (The) - Class A (a) | 7,634 | 398,037 | ||||||
| 2,027,594 | ||||||||
| Consumer Discretionary — 12.0% | ||||||||
| Consumer Leisure — 3.5% | ||||||||
| Airbnb, Inc. - Class A (a) | 7,630 | 779,328 | ||||||
| E-Commerce — 8.5% | ||||||||
| Amazon.com, Inc. (a) | 15,660 | 1,511,817 | ||||||
| Sea Ltd. - ADR (a) | 7,098 | 414,310 | ||||||
| 1,926,127 | ||||||||
| Financials — 9.4% | ||||||||
| Financial Services — 9.4% | ||||||||
| Block, Inc. - Class A (a) | 4,561 | 309,099 | ||||||
| Charles Schwab Corporation (The) | 6,435 | 531,145 | ||||||
| Tradeweb Markets, Inc. - Class A | 9,770 | 600,464 | ||||||
| Visa, Inc. - Class A | 3,135 | 680,295 | ||||||
| 2,121,003 | ||||||||
| Health Care — 23.6% | ||||||||
| Biotechnology — 9.5% | ||||||||
| argenx SE - ADR (a) | 1,069 | 425,430 | ||||||
| Arrowhead Pharmaceuticals, Inc. (a) | 13,133 | 422,882 | ||||||
| Sarepta Therapeutics, Inc. (a) | 10,617 | 1,303,874 | ||||||
| 2,152,186 | ||||||||
| Life Sciences Tools & Services — 1.8% | ||||||||
| Charles River Laboratories International, Inc. (a) | 1,775 | 405,712 | ||||||
| Medical Technology — 7.5% | ||||||||
| Inspire Medical Systems, Inc. (a) | 4,791 | 1,157,362 | ||||||
| Stryker Corporation | 2,365 | 553,150 | ||||||
| 1,710,512 | ||||||||
9
| EVOLUTIONARY TREE INNOVATORS FUND |
| SCHEDULE OF INVESTMENTS (Continued) |
| COMMON STOCKS — 92.0% (Continued) | Shares | Value | ||||||
| Health Care — 23.6% (Continued) | ||||||||
| Pharmaceuticals — 4.8% | ||||||||
| Ascendis Pharma A/S - ADR (a) | 3,423 | $ | 421,234 | |||||
| Revance Therapeutics, Inc. (a) | 30,382 | 659,593 | ||||||
| 1,080,827 | ||||||||
| Technology — 38.0% | ||||||||
| Application Software — 20.2% | ||||||||
| HubSpot, Inc. (a) | 5,170 | 1,566,665 | ||||||
| Microsoft Corporation | 5,932 | 1,513,491 | ||||||
| ServiceNow, Inc. (a) | 3,588 | 1,493,684 | ||||||
| 4,573,840 | ||||||||
| Business Services — 1.6% | ||||||||
| Fiverr International Ltd. (a) | 10,010 | 352,052 | ||||||
| Data & Analytics — 3.2% | ||||||||
| MongoDB, Inc. (a) | 1,366 | 208,575 | ||||||
| Snowflake, Inc. - Class A (a) | 3,636 | 519,584 | ||||||
| 728,159 | ||||||||
| Defense IT & Services — 1.8% | ||||||||
| CACI International, Inc. - Class A (a) | 1,324 | 413,485 | ||||||
| Financial Services Technology — 5.5% | ||||||||
| nCino, Inc. (a) | 47,786 | 1,248,170 | ||||||
| Infrastructure Software — 1.3% | ||||||||
| Gitlab, Inc. - Class A (a) | 7,480 | 295,834 | ||||||
| IT Services — 1.1% | ||||||||
| DigitalOcean Holdings, Inc. (a) | 8,111 | 241,951 | ||||||
| Law Enforcement Technology — 3.3% | ||||||||
| Axon Enterprise, Inc. (a) | 4,115 | 757,284 | ||||||
| Total Common Stocks (Cost $22,116,910) | $ | 20,814,064 | ||||||
10
| EVOLUTIONARY TREE INNOVATORS FUND |
| SCHEDULE OF INVESTMENTS (Continued) |
| MONEY MARKET FUNDS — 5.2% | Shares | Value | ||||||
| First American Treasury Obligations Fund - Class X, 3.75% (b) (Cost $1,168,776) | 1,168,776 | $ | 1,168,776 | |||||
| Investments at Value — 97.2% (Cost $23,285,686) | $ | 21,982,840 | ||||||
| Other Assets in Excess of Liabilities — 2.8% | 645,407 | |||||||
| Net Assets — 100.0% | $ | 22,628,247 | ||||||
A/S - Aktieselskab
ADR - American Depositary Receipt
SE - Societe Europaea
| (a) | Non-income producing security. |
| (b) | The rate shown is the 7-day effective yield as of November 30, 2022. |
See accompanying notes to financial statements.
11
| EVOLUTIONARY TREE INNOVATORS FUND |
| STATEMENT OF ASSETS AND LIABILITIES |
| November 30, 2022 (Unaudited) |
| ASSETS | ||||
| Investments in securities: | ||||
| At cost | $ | 23,285,686 | ||
| At value (Note 2) | $ | 21,982,840 | ||
| Receivable for capital shares sold | 40,130 | |||
| Receivable for investment securities sold | 663,366 | |||
| Receivable from Adviser (Note 4) | 8,612 | |||
| Dividends receivable | 8,888 | |||
| Other assets | 33,178 | |||
| Total assets | 22,737,014 | |||
| LIABILITIES | ||||
| Payable for capital shares redeemed | 51,081 | |||
| Payable for investment securities purchased | 39,487 | |||
| Payable to administrator (Note 4) | 9,003 | |||
| Accrued distribution fees (Note 4) | 358 | |||
| Other accrued expenses | 8,838 | |||
| Total liabilities | 108,767 | |||
| NET ASSETS | $ | 22,628,247 | ||
| NET ASSETS CONSIST OF: | ||||
| Paid-in capital | $ | 38,272,657 | ||
| Accumulated deficit | (15,644,410 | ) | ||
| NET ASSETS | $ | 22,628,247 | ||
| NET ASSET VALUE PER SHARE: | ||||
| I CLASS SHARES | ||||
| Net assets applicable to I Class Shares | $ | 20,342,622 | ||
| I Class Shares of beneficial interest outstanding (unlimited number of shares authorized, no par value) | 1,574,283 | |||
| Net asset value, offering price and redemption price per share (Note 2) | $ | 12.92 | ||
| A CLASS SHARES | ||||
| Net assets applicable to A Class Shares | $ | 2,285,625 | ||
| A Class Shares of beneficial interest outstanding (unlimited number of shares authorized, no par value) | 177,257 | |||
| Net asset value and redemption price per share (Note 2) | $ | 12.89 | ||
| Maximum sales charge | 5.75 | % | ||
| Maximum offering price per share (Note 2) | $ | 13.68 |
See accompanying notes to financial statements.
12
| EVOLUTIONARY TREE INNOVATORS FUND |
| STATEMENT OF OPERATIONS |
| For the Six Months Ended November 30, 2022 (Unaudited) |
| INVESTMENT INCOME | ||||
| Dividends | $ | 22,296 | ||
| Foreign withholding tax on dividends | (129 | ) | ||
| Total investment income | 22,167 | |||
| EXPENSES | ||||
| Management fees (Note 4) | 69,038 | |||
| Registration and filing fees | 30,905 | |||
| Fund accounting fees (Note 4) | 17,769 | |||
| Legal fees | 15,395 | |||
| Transfer agent fees (Note 4) | 13,998 | |||
| Administration fees (Note 4) | 13,935 | |||
| Trustees’ fees and expenses (Note 4) | 9,731 | |||
| Audit and tax services fees | 8,163 | |||
| Compliance fees (Note 4) | 6,000 | |||
| Shareholder reporting expenses | 5,264 | |||
| Custodian and bank service fees | 4,615 | |||
| Postage and supplies | 4,353 | |||
| Distribution fees - A Class Shares (Note 4) | 1,157 | |||
| Other expenses | 11,369 | |||
| Total expenses | 211,692 | |||
| Less fee reductions and expense reimbursements by the Adviser (Note 4) | (126,872 | ) | ||
| Net expenses | 84,820 | |||
| NET INVESTMENT LOSS | (62,653 | ) | ||
| REALIZED AND UNREALIZED GAINS (LOSSES) ON INVESTMENTS | ||||
| Net realized losses on investment transactions | (1,866,320 | ) | ||
| Net change in unrealized appreciation (depreciation) on investments | 1,207,440 | |||
| NET REALIZED AND UNREALIZED LOSSES ON INVESTMENTS | (658,880 | ) | ||
| NET DECREASE IN NET ASSETS RESULTING FROM OPERATIONS | $ | (721,533 | ) |
See accompanying notes to financial statements.
13
| EVOLUTIONARY TREE INNOVATORS FUND |
| STATEMENTS OF CHANGES IN NET ASSETS |
| Six Months Ended | ||||||||
| November 30, | Year Ended | |||||||
| 2022 | May 31, | |||||||
| (Unaudited) | 2022 (a) | |||||||
| FROM OPERATIONS | ||||||||
| Net investment loss | $ | (62,653 | ) | $ | (322,012 | ) | ||
| Net realized losses from investment transactions | (1,866,320 | ) | (11,787,013 | ) | ||||
| Net change in unrealized appreciation (depreciation) on investments | 1,207,440 | (4,408,728 | ) | |||||
| Net decrease in net assets resulting from operations | (721,533 | ) | (16,517,753 | ) | ||||
| FROM DISTRIBUTIONS TO SHAREHOLDERS (Note 2) | ||||||||
| I Class Shares | — | (1,387,004 | ) | |||||
| CAPITAL SHARE TRANSACTIONS | ||||||||
| I Class Shares | ||||||||
| Proceeds from shares sold | 12,420,445 | 36,442,525 | ||||||
| Net asset value of shares issued in reinvestment of distributions to shareholders | — | 1,343,272 | ||||||
| Payments for shares redeemed | (2,869,566 | ) | (36,331,845 | ) | ||||
| Net increase in I Class Shares net assets from captial share transactions | 9,550,879 | 1,453,952 | ||||||
| A Class Shares | ||||||||
| Proceeds from shares sold | 2,346,345 | 1,000 | ||||||
| Payments for shares redeemed | (20,402 | ) | — | |||||
| Net increase in A Class Shares net assets from capital share transactions | 2,325,943 | 1,000 | ||||||
| TOTAL INCREASE (DECREASE) IN NET ASSETS | 11,155,289 | (16,449,805 | ) | |||||
| NET ASSETS | ||||||||
| Beginning of period | 11,472,958 | 27,922,763 | ||||||
| End of period | $ | 22,628,247 | $ | 11,472,958 | ||||
| (a) | For Class A Shares, represents the period from commencement of operations (February 28, 2022) through May 31, 2022. |
See accompanying notes to financial statements.
14
| EVOLUTIONARY TREE INNOVATORS FUND |
| STATEMENTS OF CHANGES IN NET ASSETS (Continued) |
| Six Months Ended | ||||||||
| November 30, | Year Ended | |||||||
| 2022 | May 31, | |||||||
| (Unaudited) | 2022 (a) | |||||||
| CAPITAL SHARES ACTIVITY | ||||||||
| I Class Shares | ||||||||
| Shares sold | 937,083 | 1,514,240 | ||||||
| Net asset value of shares issued in reinvestment of distributions to shareholders | — | 57,063 | ||||||
| Shares redeemed | (224,244 | ) | (1,806,474 | ) | ||||
| Net increase (decrease) in shares outstanding | 712,839 | (235,171 | ) | |||||
| Shares outstanding, beginning of period | 861,444 | 1,096,615 | ||||||
| Shares outstanding, end of period | 1,574,283 | 861,444 | ||||||
| A Class Shares | ||||||||
| Shares sold | 178,857 | 55 | ||||||
| Shares redeemed | (1,655 | ) | — | |||||
| Net increase in shares outstanding | 177,202 | 55 | ||||||
| Shares outstanding, beginning of period | 55 | — | ||||||
| Shares outstanding, end of period | 177,257 | 55 | ||||||
| (a) | For Class A Shares, represents the period from commencement of operations (February 28, 2022) through May 31, 2022. |
See accompanying notes to financial statements.
15
| EVOLUTIONARY TREE INNOVATORS FUND |
| I CLASS SHARES |
| FINANCIAL HIGHLIGHTS |
Per Share Data for a Share Outstanding Throughout Each Period
| Six Months | ||||||||||||
| Ended | ||||||||||||
| November 30, | Year Ended | Year Ended | ||||||||||
| 2022 | May 31, | May 31, | ||||||||||
| (Unaudited) | 2022 | 2021 (a) | ||||||||||
| Net asset value at beginning of period | $ | 13.32 | $ | 25.46 | $ | 20.00 | ||||||
| Income (loss) from investment operations: | ||||||||||||
| Net investment loss (b) | (0.05 | ) | (0.24 | ) | (0.18 | ) | ||||||
| Net realized and unrealized gains (losses) on investments | (0.35 | ) | (11.18 | ) | 5.64 | |||||||
| Total from investment operations | (0.40 | ) | (11.42 | ) | 5.46 | |||||||
| Less distributions from: | ||||||||||||
| Net realized gains | — | (0.72 | ) | — | ||||||||
| Net asset value at end of period | $ | 12.92 | $ | 13.32 | $ | 25.46 | ||||||
| Total return (c) | (3.00 | %) (d) | (46.09 | %) | 27.30 | % (d) | ||||||
| Net assets at end of period (000’s) | $ | 20,343 | $ | 11,472 | $ | 27,923 | ||||||
| Ratios/supplementary data: | ||||||||||||
| Ratio of total expenses to average net assets | 2.23 | % (e) | 1.59 | % | 1.65 | % (e) | ||||||
| Ratio of net expenses to average net assets (f) | 0.97 | % (e) | 1.00 | % (g) | 0.97 | % (e) | ||||||
| Ratio of net investment loss to average net assets (f) | (0.71 | %) (e) | (0.99 | %) | (0.97 | %) (e) | ||||||
| Portfolio turnover rate | 37 | % (d) | 169 | % | 33 | % (d) | ||||||
| (a) | Represents the period from the commencement of operations (September 9, 2020) through May 31, 2021. |
| (b) | Per share net investment loss has been determined on the basis of average number of shares outstanding during the period. |
| (c) | Total return is a measure of the change in value of an investment in the Fund over the period covered. The returns shown do not reflect the deduction of taxes a shareholder would pay on Fund distributions, if any, or the redemption of Fund shares. The total return would be lower if the Adviser had not reduced fees and reimbursed expenses (Note 4). |
| (d) | Not annualized. |
| (e) | Annualized. |
| (f) | Ratio was determined after advisory fee reductions (Note 4). |
| (g) | Includes 0.03% of borrowing costs (Note 5). |
See accompanying notes to financial statements.
16
| EVOLUTIONARY TREE INNOVATORS FUND |
| A CLASS SHARES |
| FINANCIAL HIGHLIGHTS |
Per Share Data for a Share Outstanding Throughout Each Period
| Six Months | ||||||||
| Ended | ||||||||
| November 30, | Period Ended | |||||||
| 2022 | May 31, | |||||||
| (Unaudited) | 2022 (a) | |||||||
| Net asset value at beginning of period | $ | 13.31 | $ | 18.27 | ||||
| Loss from investment operations: | ||||||||
| Net investment loss (b) | (0.06 | ) | (0.05 | ) | ||||
| Net realized and unrealized losses on investments | (0.36 | ) | (4.91 | ) | ||||
| Total from investment operations | (0.42 | ) | (4.96 | ) | ||||
| Net asset value at end of period | $ | 12.89 | $ | 13.31 | ||||
| Total return (c) | (3.16 | %) (d) | (27.15 | %) (d) | ||||
| Net assets at end of period (000’s) | $ | 2,286 | $ | 1 | ||||
| Ratios/supplementary data: | ||||||||
| Ratio of total expenses to average net assets | (6.18 | %) (e) | 3706.34 | % (e) | ||||
| Ratio of net expenses to average net assets (f) | 1.22 | % (e) | 1.22 | % (e) | ||||
| Ratio of net investment loss to average net assets (f) | (0.91 | %) (e) | (1.21 | %) (e) | ||||
| Portfolio turnover rate | 37 | % (d) | 169 | % (g) | ||||
| (a) | Represents the period from the commencement of operations (February 28, 2022) through May 31, 2022. |
| (b) | Per share net investment loss has been determined on the basis of average number of shares outstanding during the period. |
| (c) | Total return is a measure of the change in value of an investment in the Fund over the period covered. The returns shown do not reflect the deduction of taxes a shareholder would pay on Fund distributions, if any, or the redemption of Fund shares. The total return would be lower if the Adviser had not reduced fees and reimbursed expenses (Note 4). |
| (d) | Not annualized. |
| (e) | Annualized. |
| (f) | Ratio was determined after advisory fee reductions (Note 4). |
| (g) | Portfolio turnover rate for the year ended May 31, 2022 and is calculated at the Fund level. |
See accompanying notes to financial statements.
17
| EVOLUTIONARY TREE INNOVATORS FUND |
| NOTES TO FINANCIAL STATEMENTS |
| November 30, 2022 (Unaudited) |
1. Organization
Evolutionary Tree Innovators Fund (the “Fund”) is a non-diversified series of Ultimus Managers Trust (the “Trust”). The Trust is an open-end management investment company established as an Ohio business trust under a Declaration of Trust dated February 28, 2012. Other series of the Trust are not incorporated in this report.
The investment objective of the Fund is to seek to achieve long-term growth of capital.
The Fund currently offers two classes of shares: I Class Shares (sold without any sales loads and distribution and/or service fees and requiring a $50,000 initial investment) and A Class Shares (sold subject to an initial maximum front end sales load of 5.75% and a distribution (12b-1) fee of up to 0.25% of the average daily net assets attributable to A Class Shares, requiring a $ 1,000 initial investment and for purchases of $1,000,000 or more, a front end sales load is not charged but a 1% contingent deferred sales charge (“CDSC”) may be charged if redeemed during the first 18 months) (each a “Class”). Each share class represents an ownership interest in the same investment portfolio.
2. Significant Accounting Policies
The Fund follows accounting and reporting guidance under Financial Accounting Standards Board Accounting Standards Codification Topic 946, “Financial Services – Investment Companies.” The following is a summary of the Fund’s significant accounting policies used in the preparation of its financial statements. These policies are in conformity with accounting principles generally accepted in the United States of America (“GAAP”).
Securities valuation – The Fund values its portfolio securities at market value as of the close of regular trading on the New York Stock Exchange (the “NYSE”) (normally 4:00 p.m. Eastern time) on each business day the NYSE is open for business. The Fund values its listed securities on the basis of the security’s last sale price on the security’s primary exchange, if available, otherwise at the exchange’s most recently quoted mean price. NASDAQ-listed securities are valued at the NASDAQ Official Closing Price. When using a quoted price and when the market for the security is considered active, the security will be classified as Level 1 within the fair value hierarchy (see below). In the event that market quotations are not readily available or are considered unreliable due to market or other events, the Fund values its securities and other assets at fair value in accordance with procedures adopted by the Board of Trustees (the “Board”). Under these procedures, the securities will be classified as Level 2 or 3 within the fair value hierarchy, depending on the inputs used. Unavailable or unreliable market quotes may be due to the following factors: a substantial bid-ask spread; infrequent sales resulting in stale prices; insufficient trading volume; small trade sizes; a temporary lapse in any reliable pricing source; and actions of the securities or futures markets, such as the suspension or limitation of trading. As a result, the prices of securities used to calculate the Fund’s net asset value (“NAV”) may differ from quoted or published prices for the same securities.
18
| EVOLUTIONARY TREE INNOVATORS FUND |
| NOTES TO FINANCIAL STATEMENTS (Continued) |
GAAP establishes a single authoritative definition of fair value, sets out a framework for measuring fair value, and requires additional disclosures about fair value measurements.
Various inputs are used in determining the value of the Fund’s investments. These inputs are summarized in the three broad levels listed below:
| ● | Level 1 – quoted prices in active markets for identical securities |
| ● | Level 2 – other significant observable inputs |
| ● | Level 3 – significant unobservable inputs |
The inputs or methods used for valuing securities are not necessarily an indication of the risks associated with investing in those securities. The inputs used to measure fair value may fall into different levels of the fair value hierarchy. In such cases, for disclosure purposes, the level in the fair value hierarchy within which the fair value measurement falls in its entirety is determined based on the lowest level input that is significant to the fair value measurement.
The following is a summary of the Fund’s investments based on the inputs used to value the investments as of November 30, 2022, by security type:
| Level 1 | Level 2 | Level 3 | Total | |||||||||||||
| Common Stocks | $ | 20,814,064 | $ | — | $ | — | $ | 20,814,064 | ||||||||
| Money Market Funds | 1,168,776 | — | — | 1,168,776 | ||||||||||||
| Total | $ | 21,982,840 | $ | — | $ | — | $ | 21,982,840 | ||||||||
Refer to the Fund’s Schedule of Investments for a listing of the common stocks by sector and industry type. The Fund did not hold any derivative instruments or any assets or liabilities that were measured at fair value on a recurring basis using significant unobservable inputs (Level 3) as of or during the six months ended November 30, 2022.
Share valuation – The NAV per share of each class of shares of the Fund is calculated daily by dividing the total value of the assets attributable to that class, less liabilities attributable to that class, by the number of shares outstanding of that class. The offering price and redemption price per share of I Class Shares is equal to the NAV per share. The maximum offering price per share of A Class Shares of the Fund is equal to the NAV per shares plus a sales load equal to 5.75% as a percentage of offering price. A Class Shares purchases of $1,000,000 or more, a front end sales load is not charged, but a CDSC of 1% may be charged if redeemed during the first 18 months of purchase.
Investment income – Dividend income is recorded on the ex-dividend date. Non-cash dividends included in dividend income, if any, are recorded at the fair market value of the security received. Interest income is accrued as earned. Withholding taxes on foreign dividends have been recorded in accordance with the Fund’s understanding of the applicable country’s tax rules and rates.
19
| EVOLUTIONARY TREE INNOVATORS FUND |
| NOTES TO FINANCIAL STATEMENTS (Continued) |
Investment transactions – Investment transactions are accounted for on the trade date. Realized gains and losses on investments sold are determined on a specific identification basis.
Allocation between classes – Investment income earned, realized capital gains and losses, and unrealized appreciation and depreciation are allocated daily to each class of a Fund based upon its proportionate share of total net assets of that Fund. Class-specific expenses are charged directly to the class incurring the expense. Common expenses which are not attributable to a specific class are allocated daily to each class of shares of a Fund based upon its proportionate share of total net assets of that Fund.
Common expenses – Common expenses of the Trust are allocated among the Fund and the other series of the Trust based on the relative net assets of each series, the number of series in the Trust, or the nature of the services performed and the relative applicability to each series.
Distributions to shareholders – The Fund distributes to shareholders any net investment income dividends and net realized capital gains on an annual basis. The amount of such dividends and distributions are determined in accordance with federal income tax regulations, which may differ from GAAP. Dividends and distributions to shareholders are recorded on the ex-dividend date. There were no distributions paid to shareholders by the Fund during the six months ended November 30, 2022. For the year ended May 31, 2022, the tax character of distributions paid to shareholders was ordinary income.
Estimates – The preparation of financial statements in conformity with GAAP requires management to make estimates and assumptions that affect the reported amounts of assets and liabilities and disclosure of contingent assets and liabilities as of the date of the financial statements and the reported amounts of increase (decrease) in net assets from operations during the reporting period. Actual results could differ from those estimates.
Federal income tax – The Fund has qualified and intends to continue to qualify as a regulated investment company under the Internal Revenue Code of 1986, as amended (the “Code”). Qualification generally will relieve the Fund of liability for federal income taxes to the extent 100% of its net investment income and net realized capital gains are distributed in accordance with the Code.
In order to avoid imposition of the excise tax applicable to regulated investment companies, it is also the Fund’s intention to declare as dividends in each calendar year amounts equal to at least 98% of its net investment income (earned during the calendar year) and 98.2% of its net realized capital gains (earned during the twelve months ended October 31) plus undistributed amounts from prior years, if any.
20
EVOLUTIONARY TREE INNOVATORS FUND NOTES TO FINANCIAL STATEMENTS (Continued) |
The following information is computed on a tax basis for each item as of May 31, 2022:
| Cost of investments | $ | 16,195,237 | ||
| Gross unrealized appreciation | $ | 177,338 | ||
| Gross unrealized depreciation | (5,009,426 | ) | ||
| Net unrealized depreciation | (4,832,088 | ) | ||
| Accumulated capital and other losses | (10,090,789 | ) | ||
| Accumulated deficit | $ | (14,922,877 | ) | |
Post-October losses, incurred after October 31, 2021 and net qualified late year losses, incurred after December 31, 2021, and within the current taxable year are deemed to arise on the first day of a Fund’s next taxable year. For the year ended May 31, 2022, the Fund deferred $10,012,886 and $77,903 of post-October and qualified late year losses, respectively, to June 1, 2022 for federal income tax purposes.
The federal tax cost, unrealized appreciation (depreciation) as of November 30, 2022 is as follows:
| Tax cost of investments | $ | 25,813,707 | ||
| Gross unrealized appreciation | $ | 1,226,049 | ||
| Gross unrealized depreciation | (5,056,916 | ) | ||
| Net unrealized depreciation | $ | (3,830,867 | ) | |
The difference between the federal income tax cost of investments and the financial statement cost of investments is due to certain timing differences in the recognition of capital gains or losses under income tax regulations and GAAP. These “book/tax” differences are temporary in nature and are primarily due to the tax deferral of losses on wash sales.
The Fund recognizes the tax benefits or expenses of uncertain tax positions only when the position is “more likely than not” of being sustained assuming examination by tax authorities. Management has reviewed the Fund’s tax positions for the current and all open tax years (generally, three years) and has concluded that no provision for unrecognized tax benefits or expenses is required in these financial statements. The Fund identifies its major tax jurisdiction as U.S. Federal.
3. Investment Transactions
During the six months ended November 30, 2022, cost of purchases and proceeds from sales of investment securities, other than short-term investments, amounted to $16,868,644 and $5,987,491, respectively.
21
| EVOLUTIONARY TREE INNOVATORS FUND |
| NOTES TO FINANCIAL STATEMENTS (Continued) |
4. Transactions with Related Parties
INVESTMENT ADVISORY AGREEMENT
The Fund’s investments are managed by Evolutionary Tree Capital Management, LLC (the “Adviser”) pursuant to the terms of an Investment Advisory Agreement. The Fund pays the Adviser a management fee, computed and accrued daily and paid monthly, at the annual rate of 0.80% of average daily net assets.
Pursuant to an Expense Limitation Agreement (“ELA”) between the Fund and the Adviser, the Adviser has agreed contractually, until October 31, 2024, to reduce its management fees and reimburse other expenses to the extent necessary to limit total annual fund operating expenses (exclusive of brokerage costs, taxes, interest, borrowing costs such as interest and dividend expenses on securities sold short, costs to organize the Fund, acquired fund fees and expenses, extraordinary expenses such as litigation and merger or reorganization costs and other expenses not incurred in the ordinary course of the Fund’s business) to an amount not to exceed 0.97% of average daily net assets attributable to I Class Shares and 1.22% of average daily net assets attributable to A Class Shares. Accordingly, during the six months ended November 30, 2022, the Adviser did not collect any of its management fees and reimbursed other expenses in the amount of $57,834.
Under the terms of the ELA, management fee reductions and/or expense reimbursements by the Adviser are subject to repayment by the Fund for a period of three years after such date that fees and expenses were incurred, provided that the repayments do not cause total annual fund operating expenses to exceed (i) the expense limitation then in effect, if any, and (ii) the expense limitation in effect at the time the expenses to be repaid were incurred. Prior to October 31, 2024, this agreement may not be modified or terminated without the approval of the Fund’s Board of Trustees. This agreement will terminate automatically if the Fund’s investment advisory agreement with the Adviser is terminated. As of November 30, 2022, the Adviser may seek repayment of management fee reductions no later than the dates as stated below:
| May 31, 2024 | $ | 108,771 | ||
| May 31, 2025 | 198,946 | |||
| November 30, 2025 | 126,872 | |||
| Total | $ | 434,589 | ||
OTHER SERVICE PROVIDERS
Ultimus Fund Solutions, LLC (“Ultimus”) provides administration, fund accounting, compliance and transfer agency services to the Fund. The Fund pays Ultimus fees in accordance with the agreements for such services. In addition, the Fund pays out-of-pocket expenses including, but not limited to, postage, supplies and certain costs related to the pricing of the Fund’s portfolio securities.
22
| EVOLUTIONARY TREE INNOVATORS FUND |
| NOTES TO FINANCIAL STATEMENTS (Continued) |
Under the terms of a Distribution Agreement with the Trust, Ultimus Fund Distributors, LLC (the “Distributor”) serves as principal underwriter to the Fund. The Distributor is a wholly-owned subsidiary of Ultimus. The Distributor is compensated by the Adviser (not the Fund) for acting as principal underwriter. As of November 30, 2022, the Distributor did not collect any fees related to CDSC fees on redemptions of A Class Shares.
Certain officers and a Trustee of the Trust are also officers of Ultimus.
DISTRIBUTION PLAN
The Fund has adopted a plan of distribution (the “Plan”) pursuant to Rule 12b-1 under the Investment Company Act of 1940, as amended (the “1940 Act”), which permits A Class Shares of the Fund to directly incur or reimburse the Fund’s principal underwriter for certain expenses related to the distribution of its shares. The annual limitation for payment of expenses pursuant to the Plan is 0.25% of the Fund’s average daily net assets allocable to A Class Shares. The Fund has not adopted a plan of distribution with respect to the I Class Shares. During the period ended November 30, 2022, the A Class Shares incurred $1,157 of distribution fees under the Plan.
TRUSTEE COMPENSATION
Effective October 17, 2022, each member of the Board (a “Trustee”) who is not an “interested person” (as defined by the 1940 Act, as amended) of the Trust (“Independent Trustee”) receives a $1,300 annual retainer from the Fund, paid quarterly, except for the Board Chairperson who receives a $1,700 annual retainer from the Fund, paid quarterly and the Audit Committee Chairperson who receives a $1,500 annual retainer from the Fund, paid quarterly. Each Independent Trustee also receives from the Fund a fee of $550 for each Board meeting attended plus reimbursement for travel and other meeting-related expenses. Prior to October 17, 2022, no annual retainer was designated specifically for the Audit Committee Chairperson and the Audit Committee Chairperson received a $1,300 annual retainer from the Fund.
PRINCIPAL HOLDER OF FUND SHARES
As of November 30, 2022, the following shareholder owned of record more than 25% of the outstanding shares of the Fund:
| NAME OF RECORD OWNERS | % Ownership | |
| Evolutionary Tree Innovators Fund - I Class Shares | ||
| Charles Schwab & Company (for the benefit of its customers) | 84% | |
| Evolutionary Tree Innovators Fund - A Class Shares | ||
| Charles Schwab & Company (for the benefit of its customers) | 100% |
A beneficial owner of 25% or more of the Fund’s outstanding shares may be considered a controlling person. That shareholder’s vote could have a more significant effect on matters presented at a shareholders’ meeting.
23
| EVOLUTIONARY TREE INNOVATORS FUND |
| NOTES TO FINANCIAL STATEMENTS (Continued) |
5. Contingencies and Commitments
The Fund indemnifies the Trust’s officers and Trustees for certain liabilities that might arise from their performance of their duties to the Fund. Additionally, in the normal course of business the Fund enters into contracts that contain a variety of representations and warranties and which provide general indemnifications. The Fund’s maximum exposure under these arrangements is unknown, as this would involve future claims that may be made against the Fund that have not yet occurred. However, based on experience, the Fund expects the risk of loss to be remote.
6. Non-Diversification Risk
The Fund is a non-diversified Fund. As a result, the Fund’s holdings may be more concentrated in a limited number of securities and the value of its shares may be more sensitive than a diversified fund to any single economic, business, political, or regulatory occurrence.
7. Sector Risk
If a Fund has significant investments in the securities of issuers within a particular sector, any development affecting that sector will have a greater impact on the value of the net assets of the Fund than would be the case if the Fund did not have significant investments in that sector. In addition, this may increase the risk of loss in the Fund and increase the volatility of the Fund’s NAV per share. Occasionally, market conditions, regulatory changes or other developments may negatively impact a particular sector. As of November 30, 2022, the Fund had 38.0% of the value of its net assets invested in stocks within the Technology sector.
8. Subsequent Events
The Fund is required to recognize in the financial statements the effects of all subsequent events that provide additional evidence about conditions that existed as of the date of the Statement of Assets and Liabilities. For non-recognized subsequent events that must be disclosed to keep the financial statements from being misleading, the Fund is required to disclose the nature of the event as well as an estimate of its financial effect, or a statement that such an estimate cannot be made. Management has evaluated subsequent events through the issuance of these financial statements and has noted no such events.
24
| EVOLUTIONARY TREE INNOVATORS FUND |
| ABOUT YOUR FUND’S EXPENSES (Unaudited) |
We believe it is important for you to understand the impact of costs on your investment. As a shareholder of the Fund, you incur two types of costs: (1) transaction costs, possibly including front-end and CDSC loads, and (2) ongoing costs, including management fees, Rule 12b-1 distribution fees (if applicable to your class) and other operating expenses. The following examples are intended to help you understand your ongoing costs (in dollars) of investing in the Fund and to compare these costs with the ongoing costs of investing in other mutual funds.
A mutual fund’s ongoing costs are expressed as a percentage of its average net assets. This figure is known as the expense ratio. The expenses in the table below are based on an investment of $1,000 made at the beginning of the most recent period (June 1, 2022) and held until the end of the period (November 30, 2022).
The table below illustrates the Fund’s ongoing costs in two ways:
Actual fund return – This section helps you to estimate the actual expenses that you paid over the period. The “Ending Account Value” shown is derived from the Fund’s actual return, and the fourth column shows the dollar amount of operating expenses that would have been paid by an investor who started with $1,000 in the Fund. You may use the information here, together with the amount you invested, to estimate the expenses that you paid over the period.
To do so, simply divide your account value by $1,000 (for example, an $8,600 account value divided by $1,000 = 8.6), then multiply the result by the number given for the Fund under the heading “Expenses Paid During Period.”
Hypothetical 5% return – This section is intended to help you compare the Fund’s ongoing costs with those of other mutual funds. It assumes that the Fund had an annual return of 5% before expenses during the period shown, but that the expense ratio is unchanged. In this case, because the return used is not the Fund’s actual return, the results do not apply to your investment. The example is useful in making comparisons because the U.S. Securities and Exchange Commission (the “SEC”) requires all mutual funds to calculate expenses based on a 5% return. You can assess the Fund’s ongoing costs by comparing this hypothetical example with the hypothetical examples that appear in shareholder reports of other funds.
Note that expenses shown in the table are meant to highlight and help you compare ongoing costs only.
The calculations assume no shares were bought or sold during the period. Your actual costs may have been higher or lower, depending on the amount of your investment and the timing of any purchases or redemptions.
25
| EVOLUTIONARY TREE INNOVATORS FUND |
| ABOUT YOUR FUND’S EXPENSES (Unaudited) (Continued) |
More information about the Fund’s expenses can be found in this report. For additional information on operating expenses and other shareholder costs, please refer to the Fund’s prospectus.
| Beginning | Ending | |||||||
| Account Value | Account Value | Expenses | ||||||
| June 1, | November 30, | Net Expense | Paid During | |||||
| 2022 | 2022 | Ratio(a) | Period(b) | |||||
| I Class Shares | ||||||||
| Based on Actual Fund Return | $1,000.00 | $970.00 | 0.97% | $4.79 | ||||
| Based on Hypothetical 5% Return (before expenses) | $1,000.00 | $1,020.21 | 0.97% | $4.91 | ||||
| A Class Shares | ||||||||
| Based on Actual Fund Return | $1,000.00 | $968.40 | 1.22% | $6.02 | ||||
| Based on Hypothetical 5% Return (before expenses) | $1,000.00 | $1,018.95 | 1.22% | $6.17 |
| (a) | Annualized, based on the Class’s most recent one-half year expenses. |
| (b) | Expenses are equal to the Class’s annualized net expense ratio multiplied by the average account value over the period, multiplied by 183/365 (to reflect the one-half year period). |
26
| EVOLUTIONARY TREE INNOVATORS FUND |
| DISCLOSURE REGARDING APPROVAL OF INVESTMENT |
| ADVISORY AGREEMENT |
The Board of Trustees (the “Board”), including the Independent Trustees voting separately, has reviewed and approved the continuance of the Fund’s Investment Advisory Agreement with Evolutionary Tree Capital Management, LLC (the “Adviser” or “Evolutionary Tree”) for an additional one-year term (the “Advisory Agreement”). The Board approved the continuance of the Advisory Agreement at a meeting held on July 18 – 19, 2022, at which all of the Trustees were present.
In deciding on whether to approve the continuation of the Advisory Agreement, the Board recalled its review of the materials related to the Fund and Evolutionary Tree at the meeting and throughout the preceding two years and its numerous discussions with Trust Management and Evolutionary Tree about the operations and performance of the Evolutionary Tree Fund during that period. The Board further considered those materials and discussions and numerous other factors, including:
The nature, extent, and quality of the services provided by the Adviser. In this regard, the Board reviewed the services being provided by the Adviser to the Fund including, without limitation, its providing a continuous investment program for the Fund, adhering to the Fund’s investment restrictions, complying with the Trust’s policies and procedures and voting proxies on behalf of the Fund. The Board considered the qualifications and experience of the Adviser’s portfolio manager, as well as the qualifications of other individuals at the Adviser who provide services to the Fund. The Board concluded that the quality, extent, and nature of the services provided by the Adviser to the Fund were satisfactory.
The investment performance of the Fund. In this regard, the Board compared the performance of the Fund with the performance of its benchmark index, custom peer group, and Morningstar category and as compared to other peer funds. The Board also considered the Adviser’s explanation of the recent performance of the Fund. The Board concluded that the investment performance of the Fund has been satisfactory.
The costs of the services provided and profits realized by the Adviser and its affiliates from their relationship with the Fund. In this regard, the Board considered the Fund’s management fee and the Fund’s expense ratio, each as compared to the Fund’s custom peer group and Morningstar category. The Board considered the revenue earned by the Adviser from the Fund and the current and anticipated profitability of the Fund to the Adviser, if any. The Board also considered the Adviser’s past fee reductions and expense reimbursements for the Fund and the indirect benefits that the Adviser received from its management of the Fund. The Board concluded that the advisory fee to be paid to the Adviser by the Fund is reasonable in light of the nature and quality of services provided by the Adviser.
The extent to which economics of scale would be realized as the Fund grows and whether advisory fee levels reflect these economies of scale for the benefit of the Fund’s investors. In this regard, the Board considered that the Fund’s fee arrangements with the Adviser
27
| EVOLUTIONARY TREE INNOVATORS FUND |
| DISCLOSURE REGARDING APPROVAL OF INVESTMENT |
| ADVISORY AGREEMENT (Continued) |
involve both the advisory fee and the Fund’s expense limitation agreement (the “ELA”). The Board determined that while the advisory fee rate remained the same as asset levels increased, the shareholders of the Fund have experienced benefits from the Fund’s ELA and will continue to experience benefits from the Fund’s ELA. The Board concluded that the advisory fee was reasonable in light of the information that was provided to the Trustees by the Adviser with respect to economies of scale.
After further discussion of the factors noted above and in reliance on the information provided by Evolutionary Tree and Trust Management, and taking into account the totality of all factors discussed and information presented at the meeting and previous meetings, the Board indicated its agreement to approve the continuance of the Advisory Agreement and the Fund’s ELA. It was noted that in the Trustees’ deliberations regarding the approval of the continuance of the Advisory Agreement, the Trustees did not identify any particular information or factor that was all-important or controlling, and that each individual Trustee may have attributed different weights to various factors listed above. After full consideration of the above factors as well as other factors, the Board unanimously concluded that approval of the continuance of the Advisory Agreement was in the best interests of the Fund and its shareholders.
28
| EVOLUTIONARY TREE INNOVATORS FUND |
| OTHER INFORMATION (Unaudited) |
A description of the policies and procedures that the Fund uses to vote proxies relating to portfolio securities is available without charge upon request by calling toll-free 1-833-517-1010, or on the SEC’s website at www.sec.gov. Information regarding how the Fund voted proxies relating to portfolio securities during the most recent 12-month period ended June 30 is available without charge upon request by calling toll-free 1-833-517-1010, or on the SEC’s website at www.sec.gov.
The Trust files a complete listing of portfolio holdings for the Fund with the SEC as of the end of the first and third quarters of each fiscal year as an exhibit to Form N-PORT. These filings are available upon request by calling 1-833-517-1010. Furthermore, you may obtain a copy of the filings on the SEC’s website at www.sec.gov and the Fund’s website at www.mutualfund.evolutionarytree.com.
| LIQUIDITY RISK MANAGEMENT PROGRAM (Unaudited) |
The Fund has adopted and implemented a written liquidity risk management program (the “Program”) as required by Rule 22e-4 (the “Liquidity Rule”) under the Investment Company Act of 1940, as amended. The Program is reasonably designed to assess and manage the Fund’s liquidity risk, taking into consideration, among other factors, the Fund’s investment strategy and the liquidity of its portfolio investments during normal and reasonably foreseeable stressed conditions; its short- and long-term cash flow projections; and its cash holdings and access to other funding sources. The Fund’s Board of Trustees (the “Board”) approved the appointment of the Liquidity Administrator Committee, comprising of the Fund’s Adviser and certain Trust officers, to be responsible for the Program’s administration and oversight and for reporting to the Board on at least an annual basis regarding the Program’s operation and effectiveness. The annual written report assessing the Program (the “Report”) was presented to the Board at the October 17 – 18, 2022 Board meeting and covered the period from June 1, 2021 to May 31, 2022 (the “Review Period”).
During the Review Period, the Fund did not experience unusual stress or disruption to its operations related to purchase and redemption activity. Also, during the Review Period, the Fund held adequate levels of cash and highly liquid investments to meet shareholder redemption activities in accordance with applicable requirements. The Report concluded that the Program is reasonably designed to prevent violation of the Liquidity Rule and the Program has been effectively implemented.
29
| CUSTOMER PRIVACY NOTICE |
| FACTS | WHAT DOES THE EVOLUTIONARY TREE INNOVATORS FUND (the “Fund”) DO WITH YOUR PERSONAL INFORMATION? | ||
| Why? | Financial companies choose how they share your personal information. Federal law gives consumers the right to limit some but not all sharing. Federal law also requires us to tell you how we collect, share, and protect your personal information. Please read this notice carefully to understand what we do. | ||
| What? | The types of personal information we collect and share depend on the product or service you have with us. This information can include:
■ Social Security number
■ Assets
■ Retirement Assets
■ Transaction History
■ Checking Account Information
■ Purchase History
■ Account Balances
■ Account Transactions
■ Wire Transfer Instructions
When you are no longer our customer, we continue to share your information as described in this notice. | ||
| How? | All financial companies need to share your personal information to run their everyday business. In the section below, we list the reasons financial companies can share their customers’ personal information; the reasons the Fund chooses to share; and whether you can limit this sharing. | ||
| Reasons we can share your personal information | Does
the Fund share? |
Can
you limit this sharing? | |
For our everyday business purposes – Such as to process your transactions, maintain your account(s), respond to court orders and legal investigations, or report to credit bureaus |
Yes | No | |
For our marketing purposes – to offer our products and services to you |
No | We don’t share | |
| For joint marketing with other financial companies | No | We don’t share | |
For our affiliates’ everyday business purposes – information about your transactions and experiences |
No | We don’t share | |
For our affiliates’ everyday business purposes – information about your creditworthiness |
No | We don’t share | |
| For nonaffiliates to market to you | No | We don’t share | |
| Questions? | Call 1-833-517-1010 | ||
30
| Who we are | |
| Who is providing this notice? | Evolutionary Tree Innovators Fund
Ultimus Fund Distributors, LLC (Distributor)
Ultimus Fund Solutions, LLC (Administrator) |
| What we do | |
| How does the Fund protect my personal information? | To protect your personal information from unauthorized access and use, we use security measures that comply with federal law. These measures include computer safeguards and secured files and buildings.
Our service providers are held accountable for adhering to strict policies and procedures to prevent any misuse of your nonpublic personal information. |
| How does the Fund collect my personal information? | We collect your personal information, for example, when you
■ Open an account
■ Provide account information
■ Give us your contact information
■ Make deposits or withdrawals from your account
■ Make a wire transfer
■ Tell us where to send the money
■ Tell us who receives the money
■ Show your government-issued ID
■ Show your driver’s license
We also collect your personal information from other companies. |
| Why can’t I limit all sharing? | Federal law gives you the right to limit only
■ Sharing for affiliates’ everyday business purposes – information about your creditworthiness
■ Affiliates from using your information to market to you
■ Sharing for nonaffiliates to market to you
State laws and individual companies may give you additional rights to limit sharing. |
| Definitions | |
| Affiliates | Companies related by common ownership or control. They can be financial and nonfinancial companies.
■ Evolutionary Tree Capital Management, LLC, the investment adviser to the Fund, could be deemed to be an affiliate. |
| Nonaffiliates | Companies not related by common ownership or control. They can be financial and nonfinancial companies
■ The Fund does not share with nonaffiliates so they can market to you. |
| Joint marketing | A formal agreement between nonaffiliated financial companies that together market financial products or services to you.
■ The Fund does not jointly market. |
31
This page intentionally left blank.
This page intentionally left blank.
EVOLUTIONARY-SAR-22

KARNER BLUE BIODIVERSITY IMPACT FUND
ButterflyTM Class (KAIBX)
Semi-Annual Report
November 30, 2022
(Unaudited)
| KARNER BLUE BIODIVERSITY IMPACT FUND | |
| LETTER TO SHAREHOLDERS (Unaudited) | January 13, 2023 |
Dear Shareholder,
We are thrilled to report that, in December 2022, delegates to the Convention on Biological Diversity Fifteenth Conference of the Parties (COP15) in Montreal adopted a landmark Global Biodiversity Framework (GBF) that sets forth four goals for 2050, and 23 targets for 2030, to protect the world’s lands and oceans. Although this agreement is not everything we need and want to ensure the future vitality of the planet, it does represent significant progress towards halting biodiversity loss this decade and provides a “line in the sand” from which we can move forward. In recognition of the enormity of the implementation tasks that lie ahead, COP15 delegates emphasized the need for a “whole-of-government and whole-of-society approach” that will “foster the full and effective contributions of women, persons of diverse gender identities, youth, indigenous peoples and local communities, civil society organizations, the private and financial sectors, and stakeholders from all other sectors.”1 Over the next 8 years, this broad coalition will undertake efforts to:2
| ● | implement the effective conservation and management of at least 30% of the world’s lands, inland waters, coastal areas and oceans, with an emphasis on particular importance for biodiversity and ecosystem functioning and services; |
| ● | restore, or commence the restoration of, at least 30% of degraded terrestrial, inland waters, and coastal and marine ecosystems; |
| ● | reduce to near zero the loss of areas of high biodiversity importance, including ecosystems of high ecological integrity; |
| ● | cut global food waste in half and significantly reduce overconsumption and waste generation; |
| ● | reduce by half both excess nutrients and the overall risk posed by pesticides and highly hazardous chemicals; |
| ● | progressively phase out or reform by 2030 subsidies that harm biodiversity by at least $500 billion per year, while scaling up positive incentives for biodiversity’s conservation and sustainable use; |
| ● | mobilize by 2030 at least $200 billion per year in domestic and international biodiversity-related funding from all sources – public and private; |
| ● | raise international financial flows from developed to developing countries, in particular least developed countries, small island developing States, and countries with economies in transition, to at least $20 billion per year by 2025, and to at least $30 billion per year by 2030; |
| 1 | United Nations Convention on Biological Diversity. Nations Adopt Four Goals, 23 Targets for 2030 in Landmark UN Biodiversity Agreement Press Release. December 19, 2022. Retrieved from: https://prod.drupal.www.infra.cbd.int/sites/default/files/2022-12/221219-CBD-PressRelease-COP15-Final_0.pdf |
| 2 | United Nations Convention on Biological Diversity. Nations Adopt Four Goals, 23 Targets for 2030 in Landmark UN Biodiversity Agreement Press Release. December 19, 2022. Retrieved from: https://prod.drupal.www.infra.cbd.int/sites/default/files/2022-12/221219-CBD-PressRelease-COP15-Final_0.pdf |
1
| ● | prevent the introduction of priority invasive alien species, and reduce by at least half the introduction and establishment of other known or potential invasive alien species, and eradicate or control invasive alien species on islands and other priority sites; |
| ● | establish within the GBF a multilateral fund for the equitable sharing of benefits between providers and users of digital sequence information, which has many commercial and non-commercial applications, including pharmaceutical product development, improved crop breeding, taxonomy, and the monitoring of invasive species; and |
| ● | require large and transnational companies and financial institutions to monitor, assess, and transparently disclose their risks, dependencies and impacts on biodiversity through their operations, supply and value chains, and portfolios. |
Virtually every aspect of the GBF has important implications for businesses and investors, but Targets 14 and 15 are particularly noteworthy. Target 14 will help to establish a level playing field for businesses by “ensuring the full integration of biodiversity and its multiple values into policies, regulations,…and, as appropriate, national accounting, within and across all levels of government and across all sectors, in particular those with significant impacts on biodiversity, progressively aligning all relevant public and private activities [and] fiscal and financial flows with the goals and targets of [the] framework.” Then, through the implementation of appropriate “legal, administrative or policy measures”, Target 15 seeks to require large and transnational companies and financial institutions to “(a) regularly monitor, assess and transparently disclose their risks, dependencies and impacts on biodiversity…along their operations, supply and value chains and portfolios, (b) provide information…to consumers to promote sustainable consumption patterns, and (c) report on compliance with access and benefit sharing regulations and measures [related to the use of digital sequence information]…in order to progressively reduce negative impacts on biodiversity, increase positive impacts, reduce biodiversity-related risks to business and financial institutions, and promote actions to ensure sustainable patterns of production.”3
Karner Blue Capital (“KBC”) was represented at COP15 by Andrew Niebler, one of the firm’s co-founders, who attended as a member of the Finance for Biodiversity Foundation delegation. While in Montreal, Mr. Niebler represented Karner Blue Capital at the soft-launch of the Nature Action 100 initiative (NA 100), which aims to drive greater corporate ambition and action on tackling nature loss and biodiversity decline. Investors participating in the NA 100 initiative will focus on companies in key sectors that are systemically important to the goal of reversing nature loss to ensure they are taking timely and necessary actions to protect and restore nature and ecosystems. Ceres and the Institutional Investors Group on Climate Change will co-lead the NA 100 Secretariat and Corporate Engagement workstream and the Finance for Biodiversity Foundation and Planet Tracker will co-lead the NA 100 Technical Advisory workstream. In connection with the NA 100 launch, Mr. Niebler said
| 3 | United Nations Convention on Biological Diversity. Nations Adopt Four Goals, 23 Targets for 2030 in Landmark UN Biodiversity Agreement Press Release. December 19, 2022. Retrieved from: https://prod.drupal.www.infra.cbd.int/sites/default/files/2022-12/221219-CBD-PressRelease-COP15-Final_0.pdf |
2
“[t]he natural world that forms the basis for all life on Earth is a global asset that humanity is drawing down at an unsustainable rate. The need to protect the long-term viability of our planet for future generations is one of the most pressing issues of our time. Nature Action 100 was therefore conceived as an investor-led initiative to bring about a paradigm shift in the relationship between business and nature. Karner Blue Capital thanks, and commends, all investors and partner organizations who have brought this vision to life and are committed to building a shared future for all life on Earth.”4
PERFORMANCE
The Fund seeks to achieve long-term total returns by investing in companies that lead their industries in animal welfare performance. KBC’s strategy to achieve the Fund’s investment objective involves peer-relative evaluations of companies that operate in 19 industries with significant exposure to the five key drivers of biodiversity loss, which are (i) irresponsible land and ocean use, (ii) exploitation and over-use of species, (iii) climate change, (iv) pollution and (v) invasive and introduced species. The Fund’s holdings of companies operating in these industries together comprise at least 65 percent of the Fund’s assets. KBC also assesses companies that operate in other industries and that, in KBC’s opinion, have made significant contributions to the advancement of biodiversity and animal welfare outside of their normal business operations. The companies in this group are referred to as Opportunity Companies and may comprise up to 35 percent of the Fund’s holdings at the time of purchase.
In anticipation of COP15, Morningstar released a report entitled “COP15: A Turning Point for Investor Approaches to Biodiversity” and determined that “[i]t remains rare to find funds that specifically target biodiversity and natural capital as an investment theme. At the time of writing, there are 14 such funds in Morningstar DirectTM, representing USD 1.6 billion of fund assets. All but one of the managers running these funds are domiciled in Europe; Karner Blue, in the United States, is the exception.”5 Barron’s also reported on COP15 prior to the commencement of the convention in an article entitled “Biodiversity is Rising on the ESG Agenda. How to Invest.” As explained by Barron’s, “[a]ccording to Morningstar Direct, there are just 12 U.S. equity funds with a focus on the theme of healthy ecosystems, three of which launched in 2022.”6 The Fund was identified in that article as a top 2022 performer at the time of publication. Additional support for the mainstreaming of biodiversity as an investment theme came from Goldman Sachs in the form of its September 2022 report entitled “Biodiversity: Assessing the Financial Links to Natural Capital”.
| 4 | Nature Action 100. At COP15, investors announce Nature Action 100 to tackle nature loss and biodiversity decline press release. December 11, 2022. Retrieved from: https://www.natureaction100.org/at-cop15- investors-announce-nature-action-100-to-tackle-nature-loss-and-biodiversity-decline/. Additional comments by Mr. Niebler on the adoption of the Global Biodiversity Framework at COP15 appear in a Barron’s article entitled “Nations Agree to Landmark Deal to Save Planet Biodiversity” and a Wall Street Journal article entitled “Companies Must Reduce Impact on Biodiversity Under New U.N. Rules”. |
| 5 | Morningstar. COP15: A Turning Point for Investor Approaches to Biodiversity. December 5, 2022. Retrieved from: https://www.morningstar.com/lp/cop15-biodiversity. |
| 6 | Barron’s. Biodiversity is Rising on the ESG Agenda. How to Invest. December 1, 2022. Retrieved from: https://www.barrons.com/articles/biodiversity-esg-investing-stocks-51669841530. |
3
On a net basis, the ButterflyTM Class outperformed its benchmark, the Morningstar Developed Markets (NR) Index (the “Morningstar Index”), by 498 basis points during the six-month period ended November 30, 2022 (the “Reporting Period”) and by 150 basis points on an annualized basis since inception. The net performance of the Butterfly Class in comparison to the Morningstar Index is shown in the following chart.
Performance Total Return % as of 11.30.22
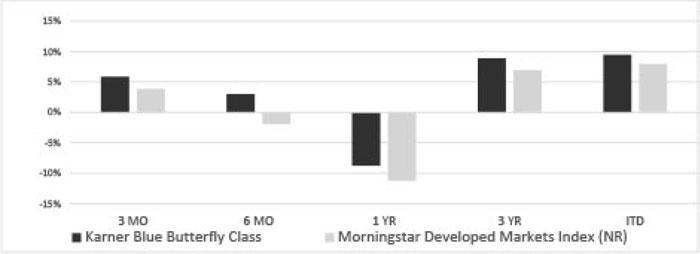
| Total Return Percentage as of 11.30.2022 | 3 MO | 6 MO | 1 YR | 3 YR | ITD 9.17.19 |
| Karner Blue Biodiversity Impact Fund ButterflyTM Class | 5.87 | 3.03 | -8.77 | 8.91 | 9.46 |
| Morningstar Developed Markets Index (NR) | 3.87 | -1.95 | -11.25 | 6.95 | 7.96 |
Returns for periods over one year are annualized. ITD is the inception-to-date return from 9.17.2019 through 11.30.2022.
Source: Ultimus Fund Solutions, LLC
Past performance is not predictive of future performance. Investment results and principal value will fluctuate so that shares, when redeemed, may be worth less than their original cost. An investor should consider the investment objectives, risks, charges, and expenses of the Fund carefully before investing. The Fund’s prospectus contains this and other important information, and it should be read carefully before investing. Current performance may be lower or higher than the performance data quoted. For most recent month-end performance information or to obtain a prospectus, visit www.biodiversityimpactfund.com or call 1-855-KBANIML (855-522-6465).
The Fund’s outperformance during the Reporting Period was primarily attributable to holdings in six solar technology companies – Enphase Energy Inc. (ENPH), Array Technologies Inc. (ARRY), Shoals Technologies Group Inc. (SHLS), First Solar Inc. (FSLR), Stem Inc. (STEM) and SolarEdge Technologies Inc. (SEDG).7 Stock selection
| 7 | In this Semi-Annual Report, these six stocks are classified as Renewable Energy companies based on the Bloomberg Industry Classification System (BICS). In the Fund’s marketing materials, such as the Fund Fact Sheet, these six companies are classified as Technology companies based on the Morningstar industry classification system. |
4
in the Communications Services sector was also positive, but that impact was offset by weak stock selection in the Industrials sector. Sector allocation did not materially impact relative performance during the Reporting Period as positive impacts from the Fund’s underweight allocation to the Communication Services sector and overweight allocation to the Industrials sector were offset by negative impacts from the Fund’s underweight allocation to the Energy sector (oil and gas) and overweight allocation to the Basic Materials sector. From a geographic perspective, outperformance was driven primarily by very strong stock selection in the U.S. – all six of the aforementioned solar technology companies are classified as U.S. companies by Morningstar. The Fund also benefitted from overweight allocations to France, Denmark and Italy and an underweight allocation to Germany.
The three stocks that most positively impacted Fund performance during the Reporting Period were as follows:
| Contribution | |
| to the Fund’s | |
| Return During | |
| the Reporting | |
| Holding | Period |
| Enphase Energy Inc. | 1.83% |
| Array Technologies Inc. | 0.95% |
| Shoals Technologies Group Inc. | 0.86% |
The three stocks that most negatively impacted Fund performance during the Reporting Period were as follows:
| Contribution | |
| to the Fund’s | |
| Return During | |
| the Reporting | |
| Holding | Period |
| Lightning eMotors Inc. | -0.69% |
| GrafTech International Ltd. | -0.47% |
| Tesla Inc. | -0.38% |
During the Reporting Period, the Fund’s positions in Lightning eMotors Inc., GrafTech International Ltd., and Tesla Inc. were liquidated as the original investment thesis for each company failed to materialize. The other three companies listed in the charts above are discussed below.
Enphase Energy Inc. (“Enphase”) was the largest contributor to Fund performance during the Reporting Period, fueled by 20% sequential revenue growth (81% year-over-year) to $635 million in Q3 FY 2022. Quarterly non-GAAP diluted earnings were up 17% sequentially (108% annually) to $1.25 per share. Management also guided Q4 revenue to an estimated $700 million, which was well above consensus expectations of approximately $666 million. Enphase is a global energy technology company that provides solutions spanning solar generation, home energy storage and web-based monitoring and
5
control. The company primarily engages in the design, development, manufacture, and sale of micro inverter systems for the solar photovoltaic industry. These microinverters convert direct current (DC) power into alternating current (AC) at the individual solar panel level and provide advanced energy monitoring and control when combined with Enphase’s proprietary networking and software technologies. By comparison, a central inverter system uses string modules (with or without an optimizer) to convert energy of the entire solar panel array using a single high voltage electrical unit that lacks intelligence about the energy producing capacity of the solar array, which makes microinverters a much more effective and efficient solution. As reported by the International Energy Agency (IEA) in its “World Energy Outlook 2022”, the realization of a carbon-neutral world by 2050 will require an unprecedented installation of clean energy technology for the remainder of this decade, including annual additions of solar photovoltaics that ramp up to 650 gigawatts (GW) by 2030 – more than quadruple the 150 GW single-year solar power installation record achieved in 2021.8 For context, that amount of new solar energy generation capacity in a single year would require the installation of the world’s largest existing solar park roughly every 1.25 days. We therefore maintain a positive outlook on the solar industry in general and Enphase in particular.
Array Technologies Inc. (“Array”) was the second largest contributor to Fund performance during the Reporting Period, driven by 112% year-over-year organic topline growth to $515 million in Q3 2022, dramatically exceeding analyst expectations of $399 million. EPS of $0.18 also exceeded analyst expectations of $0.09, and improved from -$0.09 in Q3 2021. As result, the company raised full year 2022 guidance. Array manufactures and sells ground mounting systems (often referred to as “trackers”) for use in utility-scale solar energy projects, primarily in the U.S. The company offers one primary line of trackers, called DuraTrack, which is compatible with its software product line, SmarTrack. SmarTrack is a machine learning program that adjusts tracker orientation in real time to optimize energy generation. The company focuses on maximizing its users’ returns by offering high power density, terrain adaptability and structural integrity, and simple engineering to minimize failure and downtime. The company views product design as its core competency and outsources much of the manufacturing, which is a key advantage that allows manufacturing to keep pace with rapidly growing demand. Many of the company’s products are patented or have patents pending.
Shoals Technologies Group, Inc. (“Shoals”) was the third largest contributor to Fund performance during the Reporting Period, driven by 52% year-over-year topline growth to $91 million, above consensus estimates of $83 million. EPS of $0.10 also exceeded consensus expectations of $0.08 and last year’s EPS of $0.02. As a result, the company raised full year 2022 guidance. Shoals is a leading provider of electrical balance of system (“EBOS”) solutions for utility-scale solar energy projects, primarily in the United States, and this year the company also entered the vehicle charging market. EBOS components are mission-critical products that have a high consequence of failure, including lost revenue, equipment damage, fire damage, and even serious injury or death. Shoals holds 20 patents that enable it to integrate the functionality of cable assemblies, combiner
| 8 | International Energy Agency (2021). World Energy Outlook 2022. November 2022. Retrieved from: https://iea.blob.core.windows.net/assets/830fe099-5530-48f2-a7c1-11f35d510983/WorldEnergyOutlook2022.pdf |
6
boxes and fusing into a single product using simple push connectors that improve reliability and safety and reduce installation costs by not requiring licensed electricians. The company believes its “system solutions are unique in [the solar] industry because they integrate design and engineering support, proprietary components and innovative installation methods into a single offering that would otherwise be challenging for a customer to obtain from a single provider or at all.”9 Healthy gross margins, sales growth and expectations for product adoption in Europe, Latin America and Australia cause us to maintain a constructive view on this company.
OUTLOOK
Amid persistently high global inflation and rapidly declining growth prospects for most countries, investors grew increasingly concerned during the Reporting Period that tighter monetary policy might not be able to avert the emergence of a stagflationary macroeconomic environment. During the Reporting Period, the headline U.S. Consumer Price Index (“US-CPI”) peaked in June at 9.1% year-over-year and thereafter moderated to 7.1% in November. Throughout 2022, US-CPI excluding the more volatile food and energy categories ranged between 5.9% and 6.6%, roughly three times the average monthly year-over-year core inflation rate during the prior quarter century. The European Union Consumer Price Index meanwhile reached an all-time high of 11.5% year-over-year in October and remained elevated at 11.1% in November. Similar to the trend in headline US-CPI, the U.S. Producer Price Index, which the Federal Reserve monitors closely, reached an all-time high of 11.7% year-over-year in March and eased to 7.4% by the end of the Reporting Period. After insisting for far too long that inflation was a transitory phenomenon due primarily to temporary supply chain disruptions, the Federal Reserve in 2022 earnestly joined the fight to prevent rapidly rising prices from becoming entrenched into inflationary expectations by aggressively accelerating the trajectory of monetary policy tightening. During the Reporting Period, the Federal Reserve implemented an unprecedented pace of rate hikes with four consecutive 75 basis point increases in the Fed Funds rate occurring on June 16, July 27, September 21 and November 2, which was then followed by a 50 basis point increase on December 14. As a result, the Fed Funds rate moved from effectively zero at the start of 2022 to a range of 4.25% to 4.50% at the end of the year. This aggressive monetary policy about-face coincided with plunging expectations for global growth throughout 2022 as shown in the following chart. Notably, as last year ran its course, the 2023 real GDP growth outlook for both the United States and the Euro area slid precipitously from around 2.5% to just 0.5%.
| 9 | Shoals Technologies Group, Inc. Amendment No. 3 to Form S-1 Registration Statement Under the Securities Act of 1933. January 25, 2021. Retrieved from: https://www.sec.gov/Archives/edgar/data/1831651/000119312521015486/d801436ds1a.htm |
7
OECD Forecast for 2022 and 2023 Real Gross Domestic Product (GDP) Growth (%)10
| Region | 2022 Forecast | 2023 Forecast | ||||
| As of 12/2021 | As of 11/2022 | Change | As of 12/2021 | As of 11/2022 | Change | |
| World | 4.5 | 3.1 | -1.4 | 3.2 | 2.2 | -1.0 |
| G20 | 4.7 | 3.0 | -1.7 | 3.3 | 2.2 | -1.1 |
| OECD | 3.9 | 2.8 | -1.1 | 2.5 | 0.8 | -1.7 |
| United States | 3.7 | 1.8 | -1.9 | 2.4 | 0.5 | -1.9 |
| Euro area. | 4.3 | 3.3 | -1.0 | 2.5 | 0.5 | -2.0 |
| Japan. | 3.4 | 1.6 | -1.8 | 1.1 | 1.8 | +0.7 |
| China | 5.1 | 3.3 | -1.8 | 5.1 | 4.6 | -0.5 |
| India | 8.1 | 6.6 | -1.5 | 5.5 | 5.7 | +0.2 |
| Brazil | 1.4 | 2.8 | +1.4 | 2.1 | 1.2 | -0.9 |
The aggressive Federal Reserve tightening occurred at the same time that monetary authorities across the globe pushed interest rates higher to fight the same inflationary forces in their countries. According to a recent report by the World Bank, “central banks around the world [raised interest rates in 2022] with a degree of synchronicity not seen over the past five decades – a trend that is likely to continue well into [2023].”11 The combination of pandemic-related government debt, historic inflation, rising interest rates, a strengthening U.S. dollar and surging commodity prices are pressuring many emerging market economies resulting in the debt of those countries trading at distressed levels and threatening to drag the developing world into a historic series of defaults. As IMF managing director, Kristalina Georgieva, explained at the end of the Reporting Period, “25% of emerging markets [are] in debt distress. China is slowing down, the U.S. is slowing down, the EU is slowing down, which hurts developing countries. But they also suffer from high interest rates and from currency depreciation. They need support.”12 In fact, some traders liken today’s situation to the Latin American debt crisis of the 1980s and describe the sharp sell-off of emerging market debt that occurred in the secondary markets in 2022 as one of the worst in history.13 A significant portion of this debt is held by China and commercial lenders both of which are resisting needed debt restructuring, preferring to delay payments rather than reduce debt loads to help ensure countries have sufficient funding to pay for essential government services. When combined with the food insecurity caused by rising food and energy prices, there is a growing and non-trivial
| 10 | a. | OECD
Economic Outlook. Volume 2021, Issue 2, Table 1.1. December 2021. Retrieved from:
https://www.oecd-ilibrary.org/sites/66c5ac2c-en/1/3/1/index.html?itemId=/content/publication/66c5ac2c- en&_csp_=9b4ecb1aafc11518f34da944ee244a5b&itemIGO=oecd&itemContentType=book. |
| b. | OECD
Economic Outlook. Volume 2022, Issue 2, Table 1.1. November 2022. Retrieved from: https://www.oecd-ilibrary.org/sites/f6da2159-en/1/3/1/index.html?itemId=/content/publication/f6da2159- en&_csp_=761d023775ff288a22ebcaaa183fbd6c&itemIGO=oecd&itemContentType=book |
| 11 | The World Bank. Risk of
Global Recession in 2023 Rises Amid Simultaneous Rate Hikes press release. September 15, 2022. Retrieved from:
https://www.worldbank.org/en/news/press-release/2022/09/15/risk-of-global-recession- in-2023-rises-amid-simultaneous-rate-hikes |
| 12 | Bloomberg News. Emerging-Market is Sliding Into Distress. Just Look at Ghana. December 7, 2022. Retrieved from:https://www.bnnbloomberg.ca/emerging-market-debt-is-sliding-into-distress-just-look-at-ghana-1.1856376 |
| 13 | Bloomberg News. Historic Cascade of Defaults is Coming for Emerging Markets. July 7, 2022. Retrieved from: https://www.bloomberg.com/news/articles/2022-07-07/why-developing-countries-are-facing-a-debt-default-crisis |
8
risk that emerging market countries and developing countries could experience political instability and financial crises with the potential to spill over into the global economy and trigger a recession.
During the Reporting Period, fluctuating exchange rates impacted the Fund, with the dollar steadily gaining strength against the euro through September but then reversing course for the remainder of the year. The euro gains helped to fuel a rally in European stocks, which also benefitted the American Depositary Receipts (ADRs) for European companies that account for the majority of the Fund’s non-U.S. exposure. The strengthening euro also benefited U.S. companies with material European sales. Expectations for continued euro strength seem well-founded given that the European Central Bank has been lagging well behind the Federal Reserve with respect to the implementation of tighter monetary policy due to its concerns over sluggish euro area economic growth. Like the Federal Reserve, which rapidly adopted an inflation-fighting posture at the end of last year, we believe the European Central Bank will need to quickly begin prioritizing its main task, which is to maintain price stability.
In assessing the macroeconomic factors that are driving inflation, we see essentially the same ones that were discussed in our previous report, though trending differently. The war in Ukraine has shifted in favor of Ukrainian forces with the recapture of large amounts of territory from the Russians, which has provided a morale boost to both Ukrainians and supporters of democracy but, unfortunately, has provided little evidence that the war is nearing a conclusion. The upshot is continued pressure on grain prices (which have moderated but are still well above prewar levels) and a dramatic shift in the global energy landscape as Europe continues to extricate itself from Russian energy reliance. U.S. natural gas prices have also been impacted, although they have been trending downward since their August peak. In China, the government’s abandonment of its zero-Covid policy has resulted in very significant Covid outbreaks, which pose a threat to already fragile global supply chains. More broadly, across the globe, Covid has continued to adversely impact the labor supply, constraining economic growth and fueling wage-based inflation. As we noted in our last report:
“The combined impact of early retirements, altered personal priorities amid the pandemic, Covid-related deaths, employee exhaustion, and volatile shifts in consumer demand in response to multiple Covid waves have caused labor market upheaval. Factory workers, truck drivers, warehouse workers, dock workers, hospitality workers and travel/tourism workers are in especially short supply, and companies of all stripes are scrambling to make adjustments to their hiring and retention practices, compensation packages, and work/life balance for employees.”
While the energy crisis in Europe triggered by Russian hostilities is one of the largest drivers of global inflation, it is also fueling secular growth for renewable energy and electrification technologies in Europe and the U.S. As the war in Ukraine dragged on, the European Union increased renewable energy targets in June and then again in September, both in response to the climate change crisis and as a national security measure. Meanwhile, the most significant renewable energy spending bill in U.S. history, the Inflation Reduction Act (“IRA”), became law on August 16, 2022 and the Congressional Budget Office estimated it will generate approximately $386 billion in climate and energy
9
spending and tax breaks over the next 10 years – mainly for new or expanded tax credits to promote clean energy generation, electrification, green technology retrofits for homes and buildings, greater use of clean fuels, environmental conservation, and wider adoption of electric vehicles.14 In just two months after the IRA became law, roughly $28 billion of new manufacturing investment was announced by companies operating primarily in the electric vehicle, battery storage and solar manufacturing sectors, including a new First Solar manufacturing facility in Alabama. First Solar CEO Mark Widmar indicated that the IRA was the key catalyst that led First Solar to site this factory in the U.S. Similarly, REC Silicon “announced an agreement with Mississippi Solar to develop a low-carbon U.S.-based solar supply chain from raw materials to fully assembled modules, noting ‘passage of the Inflation Reduction Act…will drive increases in the U.S. production of polysilicon and metallurgical grade silicon’.”15 We believe that tailwinds from the IRA will help to sustain many of the Fund’s holdings over our investment horizon of 18 to 24 months, and likely well after that.
Indeed, according to a recent report by Credit Suisse, actual government spending under the IRA may be closer to $800 billion over the next decade because “[m]any of the IRA’s most important provisions, such as its incentives for electric vehicles and zero-carbon electricity, are ‘uncapped’ tax credits…[and since] federal spending tends to catalyze private investment, that could send total climate spending across the economy to roughly $1.7 trillion over the next 10 years.” Credit Suisse also anticipates that the IRA will propel the U.S. to become the world’s leading renewable energy provider with a “competitive advantage in low-cost clean electricity and hydrogen production, infrastructure, geologic storage,…carbon capture and storage, wind turbines,…and human capital…[As a result], by 2029, U.S. solar and wind could be the cheapest in the world at less than $5 per megawatt-hour.” Ultimately, Credit Suisse concluded that, for big corporations, the IRA “definitely changes the [energy transition] narrative from risk mitigation to opportunity capture.”16
More generally, we anticipate a significant tailwind for the Fund from the historic Global Biodiversity Framework (GBF) that emerged from this month’s Montreal meeting of the United Nations Convention on Biological Diversity (COP15). As previously noted, Target 15 of the GBF recommends that all large and transnational businesses and financial institutions assess and disclose their biodiversity -related risks, dependencies and impacts. The International Sustainability Standards Board (“ISSB”), an independent, private-sector body that develops and approves sustainability disclosure standards under
| 14 | Committee for a Responsible Federal Budget. What’s in the Inflation Reduction Act? September 7, 2022. Retrieved from: https://www.crfb.org/blogs/whats-inflation-reduction-act |
| 15 | Forbes. $28 Billion in New Clean Energy Manufacturing Investments Announced Since Inflation Reduction Act Passed. October 12, 2022. Retrieved from: https://www.forbes.com/sites/energyinnovation/2022/10/12/ roughly-28-billion-in-new-clean-energy-manufacturing-investments-announced-since-inflation-reduction- act-passed/?sh=54c7367d6159 |
| 16 | The Atlantic. The Climate Economy is About to Explode. October 5, 2022. Retrieved from: https://www. theatlantic.com/science/archive/2022/10/inflation-reduction-act-climate-economy/671659/ |
10
the purview of the International Financial Reporting Standards Foundation, will have a significant role in operationalizing Target 15. Addressing delegates at COP15, Emmanuel Faber, Chair of the ISSB said:
“The ISSB was created to change the current fragmented ESG disclosure landscape into a global common, consistent language of sustainability-related financial disclosures. Our clarification of the fundamental articulation between financial value creation and sustainability, borrowed from concepts in the Integrated Reporting Framework, will ground our standard-setting work and make clear that while our focus is on information for investors, financial value creation is affected by the proper preservation, development and regeneration of all the resources and relationships (including natural and human) needed for a company to achieve its goals.”17
In our view, the unveiling of a new corporate disclosure landscape by the ISSB in early 2023, which will integrate the work of the Task Force on Nature-related Financial Disclosures, and the GBF’s focus on aligning both public and private financial flows with nature-positive outcomes together represent a watershed moment for companies and the financial markets. The increased transparency will make it much more likely that companies that fail to transform their business models to support, and not just deplete, nature will be seen as lagging behind their more proactive peers, and that failure will ultimately be reflected in company valuations as investors punish management teams for their inaction.
While we continue to foresee challenging economic times with conflicting macroeconomic forces driving potentially significant market movements, we also believe the Fund is well-positioned to weather any such volatility and benefit from emerging secular trends and evolving corporate disclosure standards that promote biodiversity preservation and climate change mitigation.
CONCLUSION
On behalf of the entire Karner Blue Capital team we thank you for your investment in the Karner Blue Biodiversity Impact Fund and look forward to continuing to work together with you to build a shared future for all life.
Sincerely,
| Vicki L. Benjamin | Andrew K. Niebler |
| President & Co-Founder | Executive Vice President & Co-Founder |
| Karner Blue Capital, LLC | Karner Blue Capital, LLC |
| 17 | The International Financial Reporting Standards Foundation. ISSB described the concept of sustainability and its articulation with financial value creation, and announces plans to advance work on natural ecosystems and just transition press release. December 14, 2022. Retrieved from: https://www.ifrs.org/news-and-events/news/2022/12/issb-describes-the-concept-of-sustainability/ |
11
Past performance is not predictive of future performance. Investment results and principal value will fluctuate so that shares, when redeemed, may be worth more or less than their original cost. Current performance may be higher or lower than the performance data quoted. Performance data current to the most recent month end are available by calling 1-855-KBANIML (855-522-6465).
An investor should consider the investment objectives, risks, charges, and expenses of the Fund carefully before investing. The Fund’s prospectus contains this and other important information. To obtain a copy of the Fund’s prospectus please visit our website at www.biodiversityimpactfund.com or call 1-855-KBANIML (855-522-6465) and a copy will be sent to you free of charge. Please read the prospectus carefully before you invest. The Karner Blue Biodiversity Impact Fund is distributed by Ultimus Fund Distributors, LLC.
The Letter to Shareholders seeks to describe some of the Adviser’s current opinions and views of the financial markets. Although the Adviser believes it has a reasonable basis for any opinions or views expressed, actual results may differ, sometimes significantly so, from those expected or expressed. The securities held by the Fund that are discussed in the Letter to Shareholders were held during the period covered by this Report. They do not comprise the entire investment portfolio of the Fund, may be sold at any time and may no longer be held by the Fund. For a complete list of securities held by the Fund as of November 30, 2022, please see the Schedule of Investments section of the Semi-Annual Report. The opinions of the Adviser with respect to those securities may change at any time.
Statements in the Letter to Shareholders that reflect projections or expectations for future financial or economic performance of the Fund and the market in general and statements of the Fund’s plans and objectives for future operations are forward-looking statements. No assurance can be given that actual results or events will not differ materially from those projected, estimated, assumed, or anticipated in any such forward- looking statements. Important factors that could result in such differences, in addition to factors noted with such forward-looking statements include, without limitation, general economic conditions, such as inflation, recession, and interest rates. Past performance is not a guarantee of future results.
Karner Blue Biodiversity Impact Fund (the “Fund”) is not sponsored, endorsed, sold or promoted by Morningstar, Inc. or any of its affiliates (all such entities, collectively, “Morningstar Entities”). The Morningstar Entities make no representation or warranty, express or implied, to the owners of the Fund or any member of the public regarding the advisability of investing in equity securities generally or in the Fund in particular or the ability of the Fund to track general equity market performance. THE MORNINGSTAR ENTITIES DO NOT GUARANTEE THE ACCURACY AND/OR THE COMPLETENESS OF THE FUND OR ANY DATA INCLUDED THEREIN AND MORNINGSTAR ENTITIES SHALL HAVE NO LIABILITY FOR ANY ERRORS, OMISSIONS, OR INTERRUPTIONS THEREIN.
12
KARNER BLUE BIODIVERSITY IMPACT FUND
PORTFOLIO INFORMATION
November 30, 2022 (Unaudited)
Portfolio Allocation (% of Net Assets)
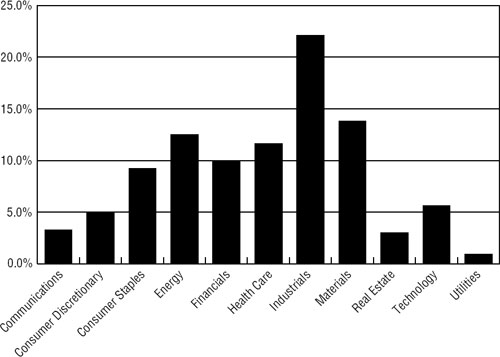
Top 10 Equity Holdings
| % of | |
| Security Description | Net Assets |
| Enphase Energy, Inc. | 3.0% |
| Microsoft Corporation | 2.5% |
| Array Technologies, Inc. | 2.2% |
| Novo Nordisk A/S - ADR | 2.1% |
| Blue Bird Corporation | 2.1% |
| SolarEdge Technologies, Inc. | 2.0% |
| Eaton Corporation plc | 1.9% |
| Livent Corporation | 1.9% |
| Freeport-McMoRan, Inc. | 1.8% |
| Schneider Electric SE - ADR | 1.8% |
13
| KARNER BLUE BIODIVERSITY IMPACT FUND |
| SCHEDULE OF INVESTMENTS |
| November 30, 2022 (Unaudited) |
| COMMON STOCKS — 96.9% | Shares | Value | ||||||
| Communications — 3.3% | ||||||||
| Entertainment Content — 0.5% | ||||||||
| Walt Disney Company (The) (a) | 500 | $ | 48,935 | |||||
| Internet Media & Services — 1.4% | ||||||||
| Alphabet, Inc. - Class A (a) | 1,285 | 129,772 | ||||||
| Telecommunications — 1.4% | ||||||||
| Iridium Communications, Inc. (a) | 2,571 | 136,520 | ||||||
| Consumer Discretionary — 5.0% | ||||||||
| Apparel & Textile Products — 1.1% | ||||||||
| Levi Strauss & Company - Class A | 6,025 | 99,593 | ||||||
| Automotive — 2.6% | ||||||||
| Cie Generale des Etablissements Michelin - ADR | 4,208 | 58,870 | ||||||
| Proterra, Inc. (a) | 21,225 | 117,587 | ||||||
| Tesla, Inc. (a) | 389 | 75,738 | ||||||
| 252,195 | ||||||||
| Home & Office Products — 1.3% | ||||||||
| Panasonic Holdings Corporation - ADR | 13,605 | 126,390 | ||||||
| Consumer Staples — 9.2% | ||||||||
| Beverages — 1.5% | ||||||||
| PepsiCo, Inc. | 785 | 145,625 | ||||||
| Food — 3.2% | ||||||||
| Hershey Company (The) | 625 | 146,981 | ||||||
| TreeHouse Foods, Inc. (a) | 3,180 | 157,188 | ||||||
| 304,169 | ||||||||
| Retail - Consumer Staples — 4.5% | ||||||||
| Kroger Company (The) | 2,930 | 144,127 | ||||||
| Target Corporation | 900 | 150,363 | ||||||
| Walmart, Inc. | 940 | 143,275 | ||||||
| 437,765 | ||||||||
14
| KARNER BLUE BIODIVERSITY IMPACT FUND |
| SCHEDULE OF INVESTMENTS (Continued) |
| COMMON STOCKS — 96.9% (Continued) | Shares | Value | ||||||
| Energy — 12.5% | ||||||||
| Renewable Energy — 12.5% | ||||||||
| Array Technologies, Inc. (a) | 10,145 | $ | 212,436 | |||||
| Enphase Energy, Inc. (a) | 885 | 283,722 | ||||||
| First Solar, Inc. (a) | 600 | 103,518 | ||||||
| Shoals Technologies Group, Inc. - Class A (a) | 5,115 | 148,182 | ||||||
| SolarEdge Technologies, Inc. (a) | 635 | 189,776 | ||||||
| Stem, Inc. (a) | 11,455 | 149,717 | ||||||
| Vestas Wind Systems A/S - ADR | 12,950 | 109,428 | ||||||
| 1,196,779 | ||||||||
| Financials — 9.9% | ||||||||
| Asset Management — 1.4% | ||||||||
| UBS Group AG | 7,175 | 132,307 | ||||||
| Banking — 5.8% | ||||||||
| Bank of Montreal | 1,330 | 130,114 | ||||||
| BNP Paribas S.A. - ADR | 6,142 | 173,143 | ||||||
| Citigroup, Inc. | 2,025 | 98,030 | ||||||
| ING Groep N.V. - ADR | 12,653 | 153,354 | ||||||
| 554,641 | ||||||||
| Institutional Financial Services — 1.6% | ||||||||
| Goldman Sachs Group, Inc. (The) | 405 | 156,391 | ||||||
| Insurance — 1.1% | ||||||||
| AXA S.A. - ADR | 3,825 | 108,133 | ||||||
| Health Care — 11.6% | ||||||||
| Biotech & Pharma — 11.6% | ||||||||
| AstraZeneca plc - ADR | 2,550 | 173,324 | ||||||
| Bristol-Myers Squibb Company | 1,805 | 144,905 | ||||||
| Merck & Company, Inc. | 1,500 | 165,180 | ||||||
| Novartis AG - ADR | 1,585 | 141,953 | ||||||
| Novo Nordisk A/S - ADR | 1,615 | 201,229 | ||||||
| Roche Holding AG - ADR | 3,069 | 125,583 | ||||||
| Sanofi - ADR | 3,645 | 165,301 | ||||||
| 1,117,475 | ||||||||
15
| KARNER BLUE BIODIVERSITY IMPACT FUND |
| SCHEDULE OF INVESTMENTS (Continued) |
| COMMON STOCKS — 96.9% (Continued) | Shares | Value | ||||||
| Industrials — 22.1% | ||||||||
| Commercial Support Services — 1.3% | ||||||||
| Schnitzer Steel Industries, Inc. - Class A | 3,500 | $ | 120,155 | |||||
| Diversified Industrials — 1.9% | ||||||||
| Eaton Corporation plc | 1,145 | 187,150 | ||||||
| Electrical Equipment — 10.3% | ||||||||
| ABB Ltd. - ADR | 4,550 | 143,280 | ||||||
| Carrier Global Corporation | 3,460 | 153,347 | ||||||
| ChargePoint Holdings, Inc. (a) | 7,222 | 89,697 | ||||||
| Daikin Industrials Ltd. - ADR | 9,860 | 161,606 | ||||||
| Prysmian S.p.A - ADR | 9,750 | 170,625 | ||||||
| Schneider Electric SE - ADR | 5,950 | 173,859 | ||||||
| Trimble, Inc. (a) | 1,575 | 94,106 | ||||||
| 986,520 | ||||||||
| Engineering & Construction — 1.8% | ||||||||
| Quanta Services, Inc. | 1,125 | 168,615 | ||||||
| Machinery — 4.2% | ||||||||
| AGCO Corporation | 980 | 130,066 | ||||||
| CNH Industrial N.V. | 9,455 | 151,658 | ||||||
| Deere & Company | 285 | 125,685 | ||||||
| 407,409 | ||||||||
| Transportation Equipment — 2.6% | ||||||||
| Blue Bird Corporation (a) | 16,975 | 200,475 | ||||||
| Lion Electric Company (The) (a) | 18,803 | 52,272 | ||||||
| 252,747 | ||||||||
| Materials — 13.8% | ||||||||
| Chemicals — 1.6% | ||||||||
| Air Products & Chemicals, Inc. | 505 | 156,631 | ||||||
| Construction Materials — 1.6% | ||||||||
| CRH plc - ADR | 3,730 | 150,505 | ||||||
| Forestry, Paper & Wood Products — 0.8% | ||||||||
| Trex Company, Inc. (a) | 1,536 | 70,487 | ||||||
16
| KARNER BLUE BIODIVERSITY IMPACT FUND |
| SCHEDULE OF INVESTMENTS (Continued) |
| COMMON STOCKS — 96.9% (Continued) | Shares | Value | ||||||
| Materials — 13.8% (Continued) | ||||||||
| Metals & Mining — 8.3% | ||||||||
| Fortescue Metals Group Ltd. - ADR | 3,315 | $ | 88,245 | |||||
| Freeport-McMoRan, Inc. | 4,386 | 174,563 | ||||||
| HeidelbergCement AG - ADR | 8,650 | 94,674 | ||||||
| Livent Corporation (a) | 6,620 | 185,294 | ||||||
| MP Materials Corporation (a) | 4,195 | 139,484 | ||||||
| Newmont Corporation | 2,477 | 117,583 | ||||||
| 799,843 | ||||||||
| Steel — 1.5% | ||||||||
| Commercial Metals Company | 2,890 | 142,246 | ||||||
| Real Estate — 3.0% | ||||||||
| REITs — 3.0% | ||||||||
| Gladstone Land Corporation | 4,800 | 98,592 | ||||||
| Prologis, Inc. | 830 | 97,766 | ||||||
| Weyerhaeuser Company | 2,840 | 92,896 | ||||||
| 289,254 | ||||||||
| Technology — 5.6% | ||||||||
| Semiconductors — 1.0% | ||||||||
| Analog Devices, Inc. | 560 | 96,270 | ||||||
| Software — 3.6% | ||||||||
| Autodesk, Inc. (a) | 530 | 107,033 | ||||||
| Microsoft Corporation | 950 | 242,383 | ||||||
| 349,416 | ||||||||
| Technology Hardware — 1.0% | ||||||||
| Murata Manufacturing Company Ltd. - ADR | 6,850 | 93,845 | ||||||
| Utilities — 0.9% | ||||||||
| Electric & Gas Marketing & Trading — 0.9% | ||||||||
| Orsted A/S - ADR | 3,050 | 88,450 | ||||||
| Total Common Stocks (Cost $8,218,542) | $ | 9,306,233 | ||||||
17
| KARNER BLUE BIODIVERSITY IMPACT FUND |
| SCHEDULE OF INVESTMENTS (Continued) |
| MONEY MARKET FUNDS — 2.9% | Shares | Value | ||||||
| First American Government Obligations Fund - Class X, 3.67% (b) (Cost $281,092) | 281,092 | $ | 281,092 | |||||
| Investments at Value — 99.8% (Cost $8,499,634) | $ | 9,587,325 | ||||||
| Other Assets in Excess of Liabilities — 0.2% | 15,734 | |||||||
| Net Assets — 100.0% | $ | 9,603,059 | ||||||
A/S - Aktieselskab
ADR - American Depositary Receipt
AG - Aktiengesellschaft
N.V. - Naamloze Vennootschap
plc - Public Limited Company
S.A. - Societe Anonyme
SE - Societe Europaea
S.p.A. - Societa per Azioni
| (a) | Non-income producing security. |
| (b) | The rate shown is the 7-day effective yield as of November 30, 2022. |
See accompanying notes to financial statements.
18
| KARNER BLUE BIODIVERSITY IMPACT FUND |
| STATEMENT OF ASSETS AND LIABILITIES |
| November 30, 2022 (Unaudited) |
| ASSETS | ||||
| Investments in securities: | ||||
| At cost | $ | 8,499,634 | ||
| At value (Note 2) | $ | 9,587,325 | ||
| Receivable for capital shares sold | 350 | |||
| Receivable from Adviser (Note 4) | 11,626 | |||
| Dividend receivable | 5,278 | |||
| Other assets | 13,617 | |||
| Total assets | 9,618,196 | |||
| LIABILITIES | ||||
| Payable to administrator (Note 4) | 7,576 | |||
| Accrued administrative service fee (Note 4) | 361 | |||
| Other accrued expenses | 7,200 | |||
| Total liabilities | 15,137 | |||
| NET ASSETS | $ | 9,603,059 | ||
| NET ASSETS CONSIST OF: | ||||
| Paid-in capital | $ | 8,706,757 | ||
| Accumulated earnings | 896,302 | |||
| NET ASSETS | $ | 9,603,059 | ||
| NET ASSET VALUE PER SHARE: | ||||
| BUTTERFLYTM CLASS | ||||
| Net assets applicable to ButterflyTM Class | $ | 9,603,059 | ||
| ButterflyTM Class shares of beneficial interest outstanding (unlimited number of shares authorized, no par value) | 806,755 | |||
| Net asset value, offering price and redemption price per share (Note 2) | $ | 11.90 | ||
See accompanying notes to financial statements.
19
| KARNER BLUE BIODIVERSITY IMPACT FUND |
| STATEMENT OF OPERATIONS |
| Six Months Ended November 30, 2022 (Unaudited) |
| INVESTMENT INCOME | ||||
| Dividend income | $ | 55,925 | ||
| Foreign witholding taxes on dividends | (2,485 | ) | ||
| Total investment income | 53,440 | |||
| EXPENSES | ||||
| Investment advisory fees (Note 4) | 35,407 | |||
| Fund accounting fees (Note 4) | 15,443 | |||
| Administration fees (Note 4) | 15,000 | |||
| Legal fees | 12,395 | |||
| Trustees’ fees and expenses (Note 4) | 9,731 | |||
| Transfer agent fees (Note 4) | 9,000 | |||
| Registration and filing fees | 8,216 | |||
| Audit and tax services fees | 8,160 | |||
| Compliance fees (Note 4) | 6,000 | |||
| Shareholder reporting expenses | 4,481 | |||
| Custody and bank service fees | 4,048 | |||
| Insurance expense | 1,626 | |||
| Postage and supplies | 1,192 | |||
| Administrative services fees (Note 4) | 418 | |||
| Other expenses | 9,533 | |||
| Total expenses | 140,650 | |||
| Less fee reductions and expense reimbursements by Adviser (Note 4) | (98,604 | ) | ||
| Net expenses | 42,046 | |||
| NET INVESTMENT INCOME | 11,394 | |||
| REALIZED AND UNREALIZED GAINS (LOSSES) ON INVESTMENTS | ||||
| Net realized losses from: | ||||
| Investments | (380,557 | ) | ||
| Foreign currency transactions (Note 2) | (16 | ) | ||
| Net change in unrealized appreciation (depreciation) on: | ||||
| Investments | 676,374 | |||
| NET REALIZED AND UNREALIZED GAINS ON INVESTMENTS AND FOREIGN CURRENCIES | 295,801 | |||
| NET INCREASE IN NET ASSETS RESULTING FROM OPERATIONS | $ | 307,195 |
See accompanying notes to financial statements.
20
| KARNER BLUE BIODIVERSITY IMPACT FUND |
| STATEMENTS OF CHANGES IN NET ASSETS |
| Six Months Ended | ||||||||
| November 30, | Year Ended | |||||||
| 2022 | May 31, | |||||||
| (Unaudited) | 2022 | |||||||
| FROM OPERATIONS | ||||||||
| Net investment income | $ | 11,394 | $ | 115,028 | ||||
| Net realized gains (losses) from investment and foreign currency translations | (380,573 | ) | 552,591 | |||||
| Net change in unrealized appreciation (depreciation) on investments and currency translation | 676,374 | (1,594,020 | ) | |||||
| Net increase (decrease) in net assets resulting from operations | 307,195 | (926,401 | ) | |||||
| FROM DISTRIBUTIONS TO SHAREHOLDERS (Note 2) | ||||||||
| ButterflyTM Class | — | (1,070,587 | ) | |||||
| CAPITAL SHARE TRANSACTIONS | ||||||||
| ButterflyTM Class | ||||||||
| Proceeds from shares sold | 163,583 | 246,015 | ||||||
| Net asset value of shares issued in reinvestment of distributions to shareholders | — | 439,792 | ||||||
| Payments for shares redeemed | (115,961 | ) | (243,227 | ) | ||||
| Net increase in ButterflyTM Class net assets from capital share transactions | 47,622 | 442,580 | ||||||
| TOTAL INCREASE (DECREASE) IN NET ASSETS | 354,817 | (1,554,408 | ) | |||||
| NET ASSETS | ||||||||
| Beginning of period | 9,248,242 | 10,802,650 | ||||||
| End of period | $ | 9,603,059 | $ | 9,248,242 | ||||
| CAPITAL SHARE ACTIVITY | ||||||||
| ButterflyTM Class | ||||||||
| Shares sold | 15,986 | 18,529 | ||||||
| Shares reinvested | — | 34,386 | ||||||
| Shares redeemed | (10,290 | ) | (18,705 | ) | ||||
| Net increase in shares outstanding | 5,696 | 34,210 | ||||||
| Shares outstanding at beginning of period | 801,059 | 766,849 | ||||||
| Shares outstanding at end of period | 806,755 | 801,059 | ||||||
See accompanying notes to financial statements.
21
| KARNER BLUE BIODIVERSITY IMPACT FUND |
| BUTTERFLYTM CLASS |
| FINANCIAL HIGHLIGHTS |
Per Share Data for a Share Outstanding Throughout Each Period:
| Six Months | ||||||||||||||||
| Ended | ||||||||||||||||
| November 30, | Year Ended | Year Ended | Period Ended | |||||||||||||
| 2022 | May 31, | May 31, | May 31, | |||||||||||||
| (Unaudited) | 2022 | 2021 | 2020 (a) | |||||||||||||
| Net asset value at beginning of period | $ | 11.55 | $ | 14.09 | $ | 10.14 | $ | 10.00 | ||||||||
| Income (loss) from investment operations: | ||||||||||||||||
| Net investment income (b) | 0.01 | 0.15 | 0.15 | 0.10 | ||||||||||||
| Net realized and unrealized gains (losses) on investments and foreign currencies | 0.34 | (1.30 | ) | 3.94 | 0.05 | (c) | ||||||||||
| Total from investment operations | 0.35 | (1.15 | ) | 4.09 | 0.15 | |||||||||||
| Less distributions from: | ||||||||||||||||
| Net investment income | — | (0.10 | ) | (0.14 | ) | (0.01 | ) | |||||||||
| Net realized gains | — | (1.29 | ) | — | — | |||||||||||
| Total distributions | — | (1.39 | ) | (0.14 | ) | (0.01 | ) | |||||||||
| Net asset value at end of period | $ | 11.90 | $ | 11.55 | $ | 14.09 | $ | 10.14 | ||||||||
| Total return (d) | 3.03 | % (e) | (9.07 | %) | 40.49 | % | 1.50 | % (e) | ||||||||
| Net assets at end of period (000’s) | $ | 9,603 | $ | 9,248 | $ | 10,803 | $ | 5,514 | ||||||||
| Ratios/supplementary data: | ||||||||||||||||
| Ratio of total expenses to average net assets | 3.18 | % (f) | 2.85 | % | 3.62 | % | 5.32 | % (f) | ||||||||
| Ratio of net expenses to average net assets (g) | 0.95 | % (f) | 0.92 | % | 0.85 | % | 0.85 | % (f) | ||||||||
| Ratio of net investment income to average net assets (g) | 0.26 | % (f) | 1.11 | % | 1.20 | % | 1.47 | % (f) | ||||||||
| Portfolio turnover rate | 44 | % (e) | 84 | % | 55 | % | 61 | % (e) | ||||||||
| (a) | Represents the period from the commencement of operations (September 17, 2019) through May 31, 2020. |
| (b) | Net investment income per share has been determined on the basis of average number of shares outstanding during the period. |
| (c) | Represents a balancing figure derived from other amounts in the financial highlights table that captures all other changes affecting net asset value per share. This per share amount does not correlate to the aggregrate of the net realized and unrealized losses on the Statement of Operations for the same period. |
| (d) | Total return is a measure of the change in value of an investment in the Fund over the periods covered. The returns shown do not reflect the deduction of taxes a shareholder would pay on Fund distributions, if any, or the redemption of Fund shares. The total returns would be lower if the Adviser had not reduced advisory fees and reimbursed expenses (Note 4). |
| (e) | Not annualized. |
| (f) | Annualized. |
| (g) | Ratio was determined after fee reductions and expense reimbursements (Note 4). |
See accompanying notes to financial statements.
22
| KARNER BLUE BIODIVERSITY IMPACT FUND |
| NOTES TO FINANCIAL STATEMENTS |
| November 30, 2022 (Unaudited) |
1. Organization
Karner Blue Biodiversity Impact Fund (the “Fund”) is a diversified series of Ultimus Managers Trust (the “Trust”), an open-end investment company established as an Ohio business trust under a Declaration of Trust dated February 28, 2012. Other series of the Trust are not incorporated in this report.
The investment objective of the Fund is to seek to achieve long-term total returns by investing in companies that lead their industries in animal welfare performance.
The Fund currently offers one class of shares: Butterfly™ Class shares (sold without any sales loads and distribution and/or shareholder service fees but subject to an administrative service fee of up to 0.10% of the average net assets, and requiring a $2,000 initial investment).
2. Significant Accounting Policies
The following is a summary of the Fund’s significant accounting policies. The policies are in conformity with accounting principles generally accepted in the United States of America (“GAAP”). The Fund follows accounting and reporting guidance under Financial Accounting Standards Board Accounting Standards Codification Topic 946, “Financial Services – Investment Companies.”
Securities valuation – The Fund values its portfolio securities at market value as of the close of regular trading on the New York Stock Exchange (the “NYSE”) (normally 4:00 p.m. Eastern time) on each business day the NYSE is open for business. The Fund values its listed securities on the basis of the security’s last sale price on the security’s primary exchange, if available, otherwise at the exchange’s most recently quoted mean price. NASDAQ-listed securities are valued at the NASDAQ Official Closing Price. When using a quoted price and when the market is considered active, the security will be classified as Level 1 within the fair value hierarchy (see below). In the event that market quotations are not readily available or are considered unreliable due to market or other events, the Fund values its securities and other assets at fair value in accordance with procedures adopted by the Board of Trustees (the “Board”). Under these procedures, the securities will be classified as Level 2 or 3 within the fair value hierarchy, depending on the inputs used. Unavailable or unreliable market quotes may be due to the following factors: a substantial bid-ask spread; infrequent sales resulting in stale prices; insufficient trading volume; small trade sizes; a temporary lapse in any reliable pricing source; and actions of the securities or futures markets, such as the suspension or limitation of trading. As a result, the prices of securities used to calculate the Fund’s net asset value (“NAV”) may differ from quoted or published prices for the same securities.
23
| KARNER BLUE BIODIVERSITY IMPACT FUND |
| NOTES TO FINANCIAL STATEMENTS (Continued) |
GAAP establishes a single authoritative definition of fair value, sets out a framework for measuring fair value, and requires additional disclosures about fair value measurements.
Various inputs are used in determining the value of the Fund’s investments. These inputs are summarized in the three broad levels listed below:
| ● | Level 1 – quoted prices in active markets for identical securities |
| ● | Level 2 – other significant observable inputs |
| ● | Level 3 – significant unobservable inputs |
The inputs or methods used for valuing securities are not necessarily an indication of the risks associated with investing in those securities. The inputs used to measure fair value may fall into different levels of the fair value hierarchy. In such cases, for disclosure purposes, the level in the fair value hierarchy within which the fair value measurement falls in its entirety is determined based on the lowest level input that is significant to the fair value measurement.
The following is a summary of the Fund’s investments and the inputs used to value the investments as of November 30, 2022:
| Level 1 | Level 2 | Level 3 | Total | |||||||||||||
| Common Stocks | $ | 9,306,233 | $ | — | $ | — | $ | 9,306,233 | ||||||||
| Money Market Funds | 281,092 | — | — | 281,092 | ||||||||||||
| Total | $ | 9,587,325 | $ | — | $ | — | $ | 9,587,325 | ||||||||
Refer to the Fund’s Schedule of Investments for a listing of securities by sector and industry type. The Fund did not hold any derivative instruments or any assets or liabilities that were measured at fair value on a recurring basis using significant unobservable inputs (Level 3) as of or during the six months ended November 30, 2022.
Share valuation – The NAV per share of the Fund is calculated daily by dividing the total value of the assets, less liabilities, by the number of shares outstanding. The offering price and redemption price per share of the Fund is equal to the NAV per share of the Fund.
Investment income – Dividend income is recorded on the ex-dividend date. Non-cash dividends included in dividend income, if any, are recorded at the fair market value of the security received. Interest income is accrued as earned. Withholding taxes on foreign dividends have been recorded in accordance with the Fund’s understanding of the applicable country’s rules and tax rates.
Investment transactions – Investment transactions are accounted for on the trade date. Realized gains and losses on investments sold are determined on a specific identification basis.
24
| KARNER BLUE BIODIVERSITY IMPACT FUND |
| NOTES TO FINANCIAL STATEMENTS (Continued) |
Foreign currency translation – Securities and other assets and liabilities denominated in or expected to settle in foreign currencies, if any, are translated into U.S. dollars based on exchange rates on the following basis:
| A. | The fair values of investment securities and other assets and liabilities are translated as of the close of the NYSE each day. |
| B. | Purchases and sales of investment securities and income and expenses are translated at the rate of exchange prevailing as of 4:00 p.m. Eastern time on the respective date of such transactions. |
| C. | The Fund does not isolate that portion of the results of operations caused by changes in foreign exchange rates on investments from those caused by changes in market prices of securities held. Such fluctuations are included with the net realized and unrealized gains or losses on investments. |
Reported net realized foreign exchange gains or losses arise from 1) purchases and sales of foreign currencies, 2) currency gains or losses realized between trade and settlement dates on securities transactions, and 3) the difference between the amounts of dividends and foreign withholding taxes recorded on the Fund’s books and the U.S. dollar equivalent of the amounts actually received or paid. Reported net unrealized foreign exchange gains and losses arise from changes in the value of assets and liabilities, other than investments in securities, that result from changes in exchange rates.
Common expenses – Common expenses of the Trust are allocated among the Fund and the other series of the Trust based on the relative net assets of each series, the number of series in the Trust, or the nature of the services performed and the relative applicability to each series.
Distributions to shareholders – The Fund distributes to shareholders any net investment income dividends and net realized capital gains distributions at least once each year. The amount of such dividends and distributions are determined in accordance with federal income tax regulations, which may differ from GAAP. Dividends and distributions to shareholders are recorded on the ex-dividend date.
The tax character of distributions paid during the periods ended November 30, 2022 and May 31, 2022 was as follows:
| Long-Term | Total | |||||||||||
| Periods Ended | Ordinary Income | Capital Gains | Distributions | |||||||||
| 11/30/2022 | $ | — | $ | — | $ | — | ||||||
| 5/31/2022 | $ | 184,381 | $ | 886,206 | $ | 1,070,587 | ||||||
25
| KARNER BLUE BIODIVERSITY IMPACT FUND |
| NOTES TO FINANCIAL STATEMENTS (Continued) |
Estimates – The preparation of financial statements in conformity with GAAP requires management to make estimates and assumptions that affect the reported amounts of assets and liabilities and disclosure of contingent assets and liabilities as of the date of the financial statements and the reported amounts of increase (decrease) in net assets from operations during the reporting period. Actual results could differ from those estimates.
Federal income tax – The Fund has qualified and intends to continue to qualify as a regulated investment company under the Internal Revenue Code of 1986, as amended (the “Code”). Qualification generally will relieve the Fund of liability for federal income taxes to the extent 100% of its net investment income and net realized capital gains are distributed in accordance with the Code.
In order to avoid imposition of the excise tax applicable to regulated investment companies, it is also the Fund’s intention to declare as dividends in each calendar year at least 98% of its net investment income (earned during the calendar year) and 98.2% of its net realized capital gains (earned during the twelve months ended October 31) plus undistributed amounts from prior years.
The following information is computed on a tax basis for each item as of November 30, 2022:
| Tax cost of investments | $ | 8,597,043 | ||
| Gross unrealized appreciation | $ | 1,572,711 | ||
| Gross unrealized depreciation | (582,429 | ) | ||
| Net unrealized appreciation | 990,282 | |||
| Undistributed ordinary income | 39,594 | |||
| Undistributed long-term capital gains | 172,956 | |||
| Other losses | (306,530 | ) | ||
| Accumulated earnings | $ | 896,302 | ||
The difference between the federal income tax cost of investments and the financial statement cost of investments is due to certain timing differences in the recognition of capital gains or losses under income tax regulations and GAAP. These “book/tax” differences are temporary in nature and are primarily due to the tax deferral of losses on wash sales.
The Fund recognizes the tax benefits or expenses of uncertain tax positions only when the position is “more likely than not” of being sustained assuming examination by tax authorities. Management has reviewed the Fund’s tax positions for the current and all open tax periods (generally, three years) and has concluded that no provision for unrecognized tax benefits or expenses is required in these financial statements. The Fund identifies its major tax jurisdiction as U.S. Federal.
26
| KARNER BLUE BIODIVERSITY IMPACT FUND |
| NOTES TO FINANCIAL STATEMENTS (Continued) |
3. Investment Transactions
During the six months ended November 30, 2022, cost of purchases and proceeds from sales of investment securities, other than short-term investments, amounted to $3,981,892 and $3,831,507, respectively.
4. Transactions with Related Parties
INVESTMENT ADVISORY AGREEMENT
The Fund’s investments are managed by Karner Blue Capital, LLC (the “Adviser”) pursuant to the terms of an Investment Advisory Agreement. The Fund pays the Adviser an investment advisory fee, computed and accrued daily and paid monthly, at the annual rate of 0.80% of average daily net assets.
Pursuant to an Expense Limitation Agreement (“ELA”) between the Fund and the Adviser, the Adviser has contractually agreed, until September 30, 2023, to reduce investment advisory fees and reimburse other operating expenses to limit total annual operating expenses of the Fund (exclusive of brokerage costs; taxes; interest; borrowing costs such as interest and dividend expenses on securities sold short; costs to organize the Fund; acquired fund fees and expenses; extraordinary expenses such as litigation and merger or reorganization costs; and other expenses not incurred in the ordinary course of the Fund’s business) to an amount not exceeding 0.95% of its average daily net assets.
Accordingly, during the six months ended November 30, 2022, the Adviser did not collect any of its investment advisory fees and reimbursed other operating expenses of $63,197.
Under the terms of the ELA, investment advisory fee reductions and expense reimbursements by the Adviser are subject to repayment by the Fund for a period of three years after such fees and expenses were incurred, provided that the repayments do not cause total annual fund operating expenses to exceed the lesser of (i) the expense limitation then in effect, if any, and (ii) the expense limitation in effect at the time the expenses to be repaid were incurred. As of November 30, 2022, the Adviser may in the future seek repayment of investment advisory fee reductions and expense reimbursements in the amount of $615,554 no later than the dates listed below:
| May 31, 2023 | $ | 97,622 | ||
| May 31, 2024 | 217,946 | |||
| May 31, 2025 | 201,382 | |||
| November 30, 2025 | 98,604 | |||
| Total | $ | 615,554 | ||
27
| KARNER BLUE BIODIVERSITY IMPACT FUND |
| NOTES TO FINANCIAL STATEMENTS (Continued) |
OTHER SERVICE PROVIDERS
Ultimus Fund Solutions, LLC (“Ultimus”) provides administration, fund accounting, compliance and transfer agency services to the Fund. The Fund pays Ultimus fees in accordance with the agreements for such services. In addition, the Fund pays out-of-pocket expenses including, but not limited to, postage, supplies and certain costs related to the pricing of its portfolio securities.
Under the terms of a Distribution Agreement with the Trust, Ultimus Fund Distributors, LLC (the “Distributor”) serves as the principal underwriter to the Fund. The Distributor is a wholly-owned subsidiary of Ultimus. The Distributor is compensated by the Adviser, not the Fund.
Certain officers and a Trustee of the Trust are also officers of Ultimus and are not paid by the Fund for serving in such capacities.
ADMINISTRATIVE SERVICES PLAN
The Fund has adopted an Administrative Services Plan (the “Administrative Services Plan”), for the Butterfly™ Class shares of the Fund. The Administrative Services Plan allows the Fund to use the net assets of the Butterfly™ Class shares to pay financial intermediaries that provide services relating to Butterfly™ Class shares. The Administrative Services Plan permits payments for the provision of certain administrative, recordkeeping and other non-distribution related services to Butterfly™ Class shareholders. The Administrative Services Plan permits the Fund to make service fee payments at an annual rate of up to 0.10% of the Fund’s average daily net assets attributable to its Butterfly™ Class shares. During the six months ended November 30, 2022, the Fund incurred $418 of fees under the Administrative Services Plan.
TRUSTEE COMPENSATION
Effective October 17, 2022, each member of the Board (a “Trustee”) who is not an “interested person” (as defined by the 1940 Act, as amended) of the Trust (“Independent Trustee”) receives a $1,300 annual retainer from the Fund, paid quarterly, except for the Board Chairperson who receives a $1,700 annual retainer from each Fund, paid quarterly and the Audit Committee Chairperson who receives a $1,500 annual retainer from the Fund, paid quarterly. Each Independent Trustee also receives from the Fund a fee of $550 for each Board meeting attended plus reimbursement for travel and other meeting-related expenses. Prior to October 17, 2022, no annual retainer was designated specifically for the Audit Committee Chairperson and the Audit Committee Chairperson received a $1,300 annual retainer from the Fund.
28
| KARNER BLUE BIODIVERSITY IMPACT FUND |
| NOTES TO FINANCIAL STATEMENTS (Continued) |
PRINCIPAL HOLDERS OF FUND SHARES
As of November 30, 2022, the following shareholders owned of record 25% or more of the outstanding shares of the Fund:
| Name of Record Owners | % Ownership | |
| Butterfly™ Class | ||
| SEI Private Trust Company (for the benefit of its customers) | 56% |
A beneficial owner of 25% or more of the Fund’s outstanding shares may be considered a controlling person of the Fund. That shareholder’s vote could have a more significant effect on matters presented at a shareholders’ meeting.
5. Foreign Securities Risk
The Fund may invest in American Depositary Receipts (“ADRs”). Investments in ADRs provide exposure to foreign securities that may involve different risks than those of U.S. securities. Foreign securities are subject to individual country risk, less favorable reporting and disclosure risk, currency exchange risk and greater price volatility, and may have higher liquidity risk than U.S. registered securities. As of November 30, 2022, the Fund had 28.1% of its net assets invested in ADRs.
6. Contingencies and Commitments
The Fund indemnifies the Trust’s officers and Trustees for certain liabilities that might arise from their performance of their duties to the Fund. Additionally, in the normal course of business the Fund enters into contracts that contain a variety of representations and warranties and which provide general indemnifications. The Fund’s maximum exposure under these arrangements is unknown, as this would involve future claims that may be made against the Fund that have not yet occurred. However, based on experience, the Fund expects the risk of loss to be remote.
7. Subsequent Events
The Fund is required to recognize in the financial statements the effects of all subsequent events that provide additional evidence about conditions that existed as of the date of the Statement of Assets and Liabilities. For non-recognized subsequent events that must be disclosed to keep the financial statements from being misleading, the Fund is required to disclose the nature of the event as well as an estimate of its financial effect, or a statement that such an estimate cannot be made. Management has evaluated subsequent events through the issuance of these financial statements and has noted no such events except for the following: On December 20, 2022, the Fund paid an ordinary income dividend and a long-term capital gain distribution of $0.0492 and $0.2145 per share, respectively, to shareholders of record on December 19, 2022.
29
| KARNER BLUE BIODIVERSITY IMPACT FUND |
| ABOUT YOUR FUND’S EXPENSES (Unaudited) |
We believe it is important for you to understand the impact of costs on your investment. As a shareholder of the Fund, you incur ongoing costs, including management fees, class-specific expenses (such as distribution fees and administrative services fees) and other operating expenses. The following examples are intended to help you understand your ongoing costs (in dollars) of investing in the Fund and to compare these costs with the ongoing costs of investing in other mutual funds.
A mutual fund’s ongoing costs are expressed as a percentage of its average net assets. This figure is known as the expense ratio. The expenses in the table below are based on an investment of $1,000 made at the beginning of the most recent semi-annual period (June 1, 2022) and held until the end of the period (November 30, 2022).
The table below illustrates the Fund’s ongoing costs in two ways:
Actual fund return – This section helps you to estimate the actual expenses that you paid over the period. The “Ending Account Value” shown is derived from the Fund’s actual return, and the fourth column shows the dollar amount of operating expenses that would have been paid by an investor who started with $1,000 in the Fund. You may use the information here, together with the amount you invested, to estimate the expenses that you paid over the period.
To do so, simply divide your account value by $1,000 (for example, an $8,600 account value divided by $1,000 = 8.6), then multiply the result by the number given for the Fund under the heading “Expenses Paid During Period.”
Hypothetical 5% return – This section is intended to help you compare the Fund’s ongoing costs with those of other mutual funds. It assumes that the Fund had an annual return of 5% before expenses during the period shown, but that the expense ratio is unchanged. In this case, because the return used is not the Fund’s actual return, the results do not apply to your investment. The example is useful in making comparisons because the U.S. Securities and Exchange Commission (the “SEC”) requires all mutual funds to calculate expenses based on a 5% return. You can assess the Fund’s ongoing costs by comparing this hypothetical example with the hypothetical examples that appear in shareholder reports of other funds.
Note that expenses shown in the table are meant to highlight and help you compare ongoing costs only. The Fund does not charge transaction fees, such as purchase or redemption fees, nor does it carry a “sales load.”
The calculations assume no shares were bought or sold during the period. Your actual costs may have been higher or lower, depending on the amount of your investment and the timing of any purchases or redemptions.
30
| KARNER BLUE BIODIVERSITY IMPACT FUND |
| ABOUT YOUR FUND’S EXPENSES (Unaudited) (Continued) |
More information about the Fund’s expenses can be found in this report. For additional information on operating expenses and other shareholder costs, please refer to the Fund’s prospectus.
| Ending | ||||||||
| Beginning | Account Value | Net | Expenses | |||||
| Account Value | November 30, | Expense | Paid During | |||||
| June 1, 2022 | 2022 | Ratio (a) | Period (b) | |||||
| Butterfly™ Class | ||||||||
| Based on Actual Fund Return | $1,000.00 | $1,003.30 | 0.95% | $4.84 | ||||
| Based on Hypothetical 5%Return (before expenses) | $1,000.00 | $1,020.31 | 0.95% | $4.81 |
| (a) | Annualized, based on the most recent one-half year expenses. |
| (b) | Expenses are equal to the annualized expense ratio, multiplied by the average account value over the period, multiplied by 183/365 (to reflect the one-half year period). |
OTHER INFORMATION (Unaudited)
A description of the policies and procedures that the Fund uses to vote proxies relating to portfolio securities is available without charge upon request by calling toll-free 1-855-KBANIML (855-522-6465), or on the SEC’s website at www.sec.gov. Information regarding how the Fund voted proxies relating to portfolio securities during the most recent 12-month period ended June 30 is also available without charge upon request by calling toll-free 1-855-KBANIML (855-522-6465), or on the SEC’s website at www.sec.gov.
The Trust files a complete listing of portfolio holdings for the Fund with the SEC as of the end of the first and third quarters of each fiscal year as an exhibit to its reports on Form N-PORT. These filings are available upon request by calling 1-855-KBANIML (855-522-6465). Furthermore, you may obtain a copy of the filings on the SEC’s website at www.sec.gov and the Fund’s website at www.biodiversityimpactfund.com.
31
| KARNER BLUE BIODIVERSITY IMPACT FUND |
| LIQUIDITY RISK MANAGEMENT PROGRAM (Unaudited) |
The Fund has adopted and implemented a written liquidity risk management program (the “Program”) as required by Rule 22e-4 (the “Liquidity Rule”) under the Investment Company Act of 1940, as amended. The Program is reasonably designed to assess and manage the Fund’s liquidity risk, taking into consideration, among other factors, the Fund’s investment strategy and the liquidity of its portfolio investments during normal and reasonably foreseeable stressed conditions; its short- and long-term cash flow projections; and its cash holdings and access to other funding sources. The Fund’s Board of Trustees (the “Board”) approved the appointment of the Liquidity Administrator Committee, comprising of the Fund’s Adviser and certain Trust officers, to be responsible for the Program’s administration and oversight and for reporting to the Board on at least an annual basis regarding the Program’s operation and effectiveness. The annual written report assessing the Program (the “Report”) was presented to the Board at the October 17 – 18, 2022 Board meeting and covered the period from June 1, 2021 to May 31, 2022 (the “Review Period”).
During the Review Period, the Fund did not experience unusual stress or disruption to its operations related to purchase and redemption activity. Also, during the Review Period, the Fund held adequate levels of cash and highly liquid investments to meet shareholder redemption activities in accordance with applicable requirements. The Report concluded that the Program is reasonably designed to prevent violation of the Liquidity Rule and the Program has been effectively implemented.
32
| CUSTOMER PRIVACY NOTICE |
| FACTS | WHAT DOES THE KARNER BLUE BIODIVERSITY IMPACT FUND (the “Fund”) DO WITH YOUR PERSONAL INFORMATION? | ||
| Why? | Financial companies choose how they share your personal information. Federal law gives consumers the right to limit some but not all sharing. Federal law also requires us to tell you how we collect, share, and protect your personal information. Please read this notice carefully to understand what we do. | ||
| What? | The types of personal information we collect and share depend on the product or service you have with us. This information can include:
■ Social Security number
■ Assets
■ Retirement Assets
■ Transaction History
■ Checking Account Information
■ Purchase History
■ Account Balances
■ Account Transactions
■ Wire Transfer Instructions
When you are no longer our customer, we continue to share your information as described in this notice. | ||
| How? | All financial companies need to share your personal information to run their everyday business. In the section below, we list the reasons financial companies can share their customers’ personal information; the reasons the Fund chooses to share; and whether you can limit this sharing. | ||
| Reasons we can share your personal information | Does
the Fund share? |
Can
you limit this sharing? | |
For our everyday business purposes – Such as to process your transactions, maintain your account(s), respond to court orders and legal investigations, or report to credit bureaus |
Yes | No | |
For our marketing purposes – to offer our products and services to you |
No | We don’t share | |
| For joint marketing with other financial companies | No | We don’t share | |
For our affiliates’ everyday business purposes – information about your transactions and experiences |
No | We don’t share | |
For our affiliates’ everyday business purposes – information about your creditworthiness |
No | We don’t share | |
| For nonaffiliates to market to you | No | We don’t share | |
| Questions? | Call 1-855-KBANIML (855-522-6465) | ||
33
| Page 2 | |
| Who we are | |
| Who is providing this notice? | Karner Blue Biodiversity Impact Fund
Ultimus Fund Distributors, LLC (Distributor)
Ultimus Fund Solutions, LLC (Administrator) |
| What we do | |
| How does the Fund protect my personal information? | To protect your personal information from unauthorized access and use, we use security measures that comply with federal law. These measures include computer safeguards and secured files and buildings.
Our service providers are held accountable for adhering to strict policies and procedures to prevent any misuse of your nonpublic personal information. |
| How does the Fund collect my personal information? | We collect your personal information, for example, when you
■ Open an account
■ Provide account information
■ Give us your contact information
■ Make deposits or withdrawals from your account
■ Make a wire transfer
■ Tell us where to send the money
■ Tell us who receives the money
■ Show your government-issued ID
■ Show your driver’s license
We also collect your personal information from other companies. |
| Why can’t I limit all sharing? | Federal law gives you the right to limit only
■ Sharing for affiliates’ everyday business purposes – information about your creditworthiness
■ Affiliates from using your information to market to you
■ Sharing for nonaffiliates to market to you
State laws and individual companies may give you additional rights to limit sharing. |
| Definitions | |
| Affiliates | Companies related by common ownership or control. They can be financial and nonfinancial companies.
■ Karner Blue Capital, LLC, the investment adviser to the Fund, could be deemed to be an affiliate. |
| Nonaffiliates | Companies not related by common ownership or control. They can be financial and nonfinancial companies
■ The Fund does not share with nonaffiliates so they can market to you. |
| Joint marketing | A formal agreement between nonaffiliated financial companies that together market financial products or services to you.
■ The Fund does not jointly market. |
34
This page intentionally left blank.
This page intentionally left blank.
This page intentionally left blank.
KARNER-SAR-22
KEMPNER MULTI-CAP DEEP VALUE FUND
Institutional Class (FIKDX)
Investor Class (FAKDX)
Semi-Annual Report
November 30, 2022
(Unaudited)
| KEMPNER MULTI-CAP DEEP VALUE FUND | |
| LETTER TO SHAREHOLDERS (Unaudited) | December 2022 |
Fund Objective
The Kempner Multi-Cap Deep Value Fund seeks to generate a total pre-tax return, including capital growth and dividends, greater than the rate of inflation over a minimum three-to five-year period. For the 6-month period ended November 30, 2022, the Fund produced a cumulative return of -3.66% for the Institutional Class Shares and -3.71% for the Investor Class Shares, both net of fees. The Headline CPI inflation rate over the same six-month period was 2.36%. Comparatively, over the same time period, the Lipper Multi Cap Value Funds Classification Index returned 0.34% and the S&P 500 Value Index returned 2.17%.
U.S. Economic Commentary
As has been the case over the last year, our overall economic concern is whether or not the U.S. will be in recession sometime during the next 12 months. We correctly felt that 2022 would escape one. However, we presently analyze that we will indeed be in a relatively mild recession in the year 2023, probably beginning in the 2nd quarter of the year.
There are many pervasive causes of weakness beginning to appear in the economy. Of extreme importance, interest rates have been raised seven times in the past twelve months by the Fed, and by a total of 4.25 basis points to a 4.50 level on Fed funds. Raising interest rates, particularly at this speed, are a jolt to the economy because they increase costs throughout. Further, the Fed seems determined to continue to raise rates until their inflation level is met. This is their major tool to fight inflation and they seem willing to accept an economic slowdown to further tame it. As perspective, the CPI has started to come down from 9.1% in June to 7.1% in November. But the Fed’s goal is 2.0%! This interest rate impediment to growth is the key reason we feel the economy will tip into recession in 2023. But also:
| 1) | There are still excess inventories of goods being sold at discounts and losses. This will continue throughout 2023, we believe. |
| 2) | Corporate revenues are stalling out, and we feel this process will lead to more and more layoffs. |
| 3) | The consumer has already pulled back some, mainly on big ticket items such as cars. This, we believe, will spread to services as well in 2023. |
| 4) | New single housing construction, a major part of the overall economy, has gotten very weak and will continue even though there may be mitigating factors here as the year goes on. |
But why a “mild” one? Because there are still some strengths in the economy.
| 1) | The primary strength is a continually tight labor market. The most recent unemployment numbers show an unemployment rate of only 3.7% which is very strong in terms of U.S. economic history. This is true despite the headlines of cutbacks that we have seen so far, particularly in the high-tech industry. |
| 2) | Corporations still have funds to spend, and will, on capital investments and in trying to retain what have been very hard to get workers. |
| 3) | By most measurements, there are still excess personal savings, which will help consumers continue to spend in 2023, though more slowly than in 2022. |
1
| 4) | Although individual family housing construction is very weak, there is considerable continuing strengths apparent in building multi-family dwellings, which offsets this to some extent. |
However, all in, we feel the weaknesses listed above will overwhelm the continuing strengths sufficiently to lead to a mild recession in 2023.
Portfolio Strategy
Our investment approach continues to be one of investing in deeply undervalued companies and selling when the underlying value becomes realized by other market participants and is reflected in the current price. Due to the strong markets in 2021, we had high liquidity at the beginning of 2022. As the markets declined, stocks cheapened and buying opportunities appeared for individual stocks. In face of this we gradually did what we always do, and committed more and more of our cash buying reserves. We ended the year with unusually low liquidity due to this typical investment process.
Over the past 6 months, we established and/or added to positions in Adidas AG Spon ADR (ADDYY), BHP Group LTD ADR (BHP), Citizens Financial Group (CFG), Comcast Corp. CL A (CMCSA), Cisco Systems Inc. (CSCO), Dow Incorporated (DOW), eBay Incorporated (EBAY), FedEx Corporation (FDX), Fidelity National Info Technology (FIS), Lennar Corp CL B (LEN.B), LVMH Moet Hennessy LV (LVMUY), Michelin Compagne (MGDDY), Micron Technology (MU), Organon & Company (OGN), Pioneer Natural Resources (PXD), RIO Tinto PLC (RIO), Skyworks Solutions Inc. (SWKS), Teradyne Incorporated (TER), Taiwan Semiconductor (TSM), V. F. Corporation (VFC), and Viatris Incorporated (VTRS). We reduced the Fund’s position in Amgen Incorporated (AMGN), Continental AG (CTTAY), and Paramount Global (PARA). We sold entirely out of Bristol-Myers Squibb Company (BMY), Cardinal Health Incorporated (CAH), Corteva Incorporated (CTVA), Merck & Company (MRK), Viatris Incorporated (VTRS), Walgreens Boots Alliance (WBA), Roche Holdings LTD (RHHBY), and Williams-Sonoma Incorporated (WSM).
We continue to scour the equity universe to locate stocks which meet our investment criteria of: 1) a relatively low forecast P/E multiple, usually 15X or less, 2) a dividend yield is paid, or has declared a dividend, 3) public debt, if any, is investment grade, 4) a minimum of $500 million market capitalization, and 5) current stock price that is within 20% of the 52-week low price. In addition to meeting these criteria, stocks are quantitatively and qualitatively analyzed to determine company prospects and reasonableness of valuation.
The portfolio’s underperformance relative to the S&P 500 Value Index for the 6-month period ending November 30, 2022 was attributable to a reversal of the cyclical share outperformance in the first half of the year, and a rebound in growth stocks as the economy continues to open up and inflation has trended lower.
We maintain our long-term focus in the Kempner Multi-Cap Deep Value Fund on areas which we believe are overlooked by the market.
Harris L. Kempner, Jr. and M. Shawn Gault are the portfolio managers for the Kempner Multi-Cap Deep Value Fund.
2
Past performance is not predictive of future performance. Investment results and principal value will fluctuate so that shares, when redeemed, may be worth more or less than their original cost. Current performance may be higher or lower than the performance data quoted. Performance data current to the most recent month end are available by calling 1-800-665-9778.
An investor should consider the investment objectives, risks, charges and expenses of the Fund carefully before investing. The Fund’s prospectus contains this and other important information. To obtain a copy of the Fund’s prospectus please call 1-800-665-9778 and a copy will be sent to you free of charge. Please read the prospectus carefully before you invest. Kempner Multi-Cap Deep Value Fund is distributed by Ultimus Fund Distributors, LLC.
This Letter to Shareholders seeks to describe some of the Adviser’s current opinions and views of the financial markets. Although the Adviser believes it has a reasonable basis for any opinions or views expressed, actual results may differ, sometimes significantly so, from those expected or expressed. The securities held by the Fund that are discussed in the Letter to Shareholders were held during the period covered by this Report. They do not comprise the entire investment portfolio of the Fund, may be sold at any time and may no longer be held by the Fund. For a complete list of securities held by the Fund as of November 30, 2022, please see the Schedule of Investments section of the semi-annual report. The opinions of the Adviser with respect to those securities may change at any time.
Statements in the Letter to Shareholders that reflect projections or expectations for future financial or economic performance of the Fund and the market in general and statements of the Fund’s plans and objectives for future operations are forward-looking statements. No assurance can be given that actual results or events will not differ materially from those projected, estimated, assumed, or anticipated in any such forward-looking statements. Important factors that could result in such differences, in addition to factors noted with such forward-looking statements include, without limitation, general economic conditions, such as inflation, recession, and interest rates. Past performance is not a guarantee of future results.
3
KEMPNER MULTI-CAP DEEP VALUE FUND
PORTFOLIO INFORMATION
November 30, 2022 (Unaudited)
Sector Diversification (% of Net Assets)
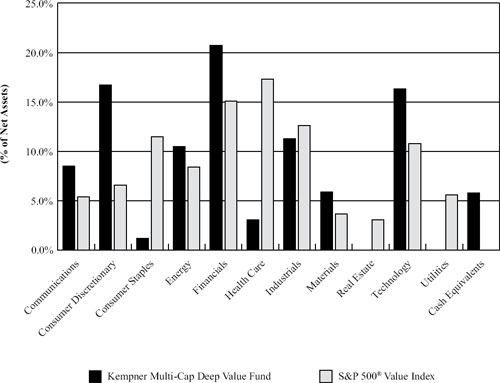
Top 10 Equity Investments
| Security Description | % of Net Assets | |
| General Motors Company | 4.8% | |
| BP plc - ADR | 4.0% | |
| Bank of America Corporation | 3.9% | |
| Lincoln National Corporation | 3.7% | |
| Citigroup, Inc. | 3.3% | |
| Micron Technology, Inc. | 3.2% | |
| Taiwan Semiconductor Manufacturing Company Ltd. - ADR | 2.9% | |
| Shell plc - ADR | 2.9% | |
| Walt Disney Company (The) | 2.9% | |
| Skyworks Solutions, Inc. | 2.9% |
4
| KEMPNER MULTI-CAP DEEP VALUE FUND |
| SCHEDULE OF INVESTMENTS |
| November 30, 2022 (Unaudited) |
| COMMON STOCKS — 93.7% | Shares | Value | ||||||
| Communications — 8.0% | ||||||||
| Cable & Satellite — 2.0% | ||||||||
| Comcast Corporation - Class A | 42,300 | $ | 1,549,872 | |||||
| Entertainment Content — 3.8% | ||||||||
| Paramount Global - Class B | 37,010 | 743,161 | ||||||
| Walt Disney Company (The) (a) | 23,500 | 2,299,945 | ||||||
| 3,043,106 | ||||||||
| Telecommunications — 2.2% | ||||||||
| Deutsche Telekom AG - ADR | 84,869 | 1,733,025 | ||||||
| Consumer Discretionary — 16.7% | ||||||||
| Apparel & Textile Products — 3.8% | ||||||||
| adidas AG - ADR | 20,550 | 1,325,680 | ||||||
| LVMH Moet Hennessy Louis Vuitton SE - ADR | 3,500 | 535,500 | ||||||
| VF Corporation | 34,300 | 1,125,726 | ||||||
| 2,986,906 | ||||||||
| Automotive — 8.6% | ||||||||
| Cie Generale des Etablissements Michelin - ADR | 82,144 | 1,149,195 | ||||||
| Continental AG - ADR | 296,600 | 1,781,469 | ||||||
| General Motors Company | 92,720 | 3,760,723 | ||||||
| Vitesco Technologies Group AG - ADR (a) | 10,090 | 104,931 | ||||||
| 6,796,318 | ||||||||
| E-Commerce Discretionary — 1.9% | ||||||||
| eBay, Inc. | 32,900 | 1,494,976 | ||||||
| Home Construction — 2.4% | ||||||||
| Lennar Corporation - Class B | 26,350 | 1,913,273 | ||||||
| Consumer Staples — 1.2% | ||||||||
| Food — 1.2% | ||||||||
| Ingredion, Inc. | 9,800 | 960,106 | ||||||
| Energy — 10.5% | ||||||||
| Oil & Gas Producers — 8.0% | ||||||||
| BP plc - ADR | 89,120 | 3,199,408 | ||||||
| Pioneer Natural Resources Company | 3,600 | 849,564 | ||||||
| Shell plc - ADR | 39,454 | 2,306,876 | ||||||
| 6,355,848 | ||||||||
| Oil & Gas Services & Equipment — 2.5% | ||||||||
| Schlumberger Ltd. | 38,055 | 1,961,735 | ||||||
5
| KEMPNER MULTI-CAP DEEP VALUE FUND |
| SCHEDULE OF INVESTMENTS (Continued) |
| COMMON STOCKS — 93.7% (Continued) | Shares | Value | ||||||
| Financials — 20.7% | ||||||||
| Banking — 10.8% | ||||||||
| Bank of America Corporation | 81,720 | $ | 3,093,102 | |||||
| Citigroup, Inc. | 54,100 | 2,618,981 | ||||||
| Citizens Financial Group, Inc. | 30,900 | 1,309,542 | ||||||
| Truist Financial Corporation | 32,300 | 1,511,963 | ||||||
| 8,533,588 | ||||||||
| Insurance — 9.9% | ||||||||
| Equitable Holdings, Inc. | 60,150 | 1,909,161 | ||||||
| Everest Re Group Ltd. | 6,200 | 2,095,228 | ||||||
| Hartford Financial Services Group, Inc. (The) | 11,650 | 889,710 | ||||||
| Lincoln National Corporation | 74,850 | 2,914,659 | ||||||
| 7,808,758 | ||||||||
| Health Care — 3.1% | ||||||||
| Biotech & Pharma — 3.1% | ||||||||
| Amgen, Inc. | 2,150 | 615,760 | ||||||
| Organon & Company | 52,843 | 1,374,975 | ||||||
| Viatris, Inc. | 39,100 | 431,273 | ||||||
| 2,422,008 | ||||||||
| Industrials — 11.3% | ||||||||
| Electrical Equipment — 5.3% | ||||||||
| Acuity Brands, Inc. | 11,085 | 2,087,195 | ||||||
| Johnson Controls International plc | 31,549 | 2,096,115 | ||||||
| 4,183,310 | ||||||||
| Machinery — 3.4% | ||||||||
| Caterpillar, Inc. | 7,100 | 1,678,511 | ||||||
| Crane Holdings Company | 9,600 | 1,017,024 | ||||||
| 2,695,535 | ||||||||
| Transportation & Logistics — 2.6% | ||||||||
| FedEx Corporation | 11,400 | 2,077,308 | ||||||
| Materials — 5.9% | ||||||||
| Chemicals — 3.2% | ||||||||
| Dow, Inc. | 15,449 | 787,436 | ||||||
| DuPont de Nemours, Inc. | 9,700 | 683,947 | ||||||
| LyondellBasell Industries N.V. - Class A | 12,500 | 1,062,625 | ||||||
| 2,534,008 | ||||||||
| Metals & Mining — 2.7% | ||||||||
| BHP Group Ltd. - ADR | 6,900 | 433,320 | ||||||
| Kinross Gold Corporation | 160,600 | 663,278 | ||||||
| Rio Tinto plc - ADR | 15,100 | 1,036,464 | ||||||
| 2,133,062 | ||||||||
6
| KEMPNER MULTI-CAP DEEP VALUE FUND |
| SCHEDULE OF INVESTMENTS (Continued) |
| COMMON STOCKS — 93.7% (Continued) | Shares | Value | ||||||
| Technology — 16.3% | ||||||||
| Semiconductors — 11.2% | ||||||||
| Micron Technology, Inc. | 44,400 | $ | 2,559,660 | |||||
| Skyworks Solutions, Inc. | 23,900 | 2,285,318 | ||||||
| Taiwan Semiconductor Manufacturing Company Ltd. - ADR | 28,100 | 2,331,738 | ||||||
| Teradyne, Inc. | 18,000 | 1,682,100 | ||||||
| 8,858,816 | ||||||||
| Technology Hardware — 2.8% | ||||||||
| Cisco Systems, Inc. | 44,520 | 2,213,534 | ||||||
| Technology Services — 2.3% | ||||||||
| Fidelity National Information Services, Inc. | 25,600 | 1,858,048 | ||||||
| Total Common Stocks (Cost $69,854,182) | $ | 74,113,140 | ||||||
| PREFERRED STOCKS — 0.5% | Shares | Value | ||||||
| Communications — 0.5% | ||||||||
| Entertainment Content — 0.5% | ||||||||
| Paramount Global, Series A, 5.75% (Cost $860,830) | 13,500 | $ | 422,415 | |||||
| MONEY MARKET FUNDS — 5.5% | Shares | Value | ||||||
| First American Treasury Obligations Fund - Class X, 3.75% (b) (Cost $4,365,388) | 4,365,388 | $ | 4,365,388 | |||||
| Investments at Value — 99.7% (Cost $75,080,400) | $ | 78,900,943 | ||||||
| Other Assets in Excess of Liabilities — 0.3% | 193,113 | |||||||
| Net Assets — 100.0% | $ | 79,094,056 | ||||||
ADR – American Depositary Receipt
AG – Aktiengesellschaft
N.V. – Naamloze Vennootschap
plc – Public Limited Company
SE – Societe Europaea
| (a) | Non-income producing security. |
| (b) | The rate shown is the 7-day effective yield as of November 30, 2022. |
See accompanying notes to financial statements.
7
| KEMPNER MULTI-CAP DEEP VALUE FUND |
| STATEMENT OF ASSETS AND LIABILITIES |
| November 30, 2022 (Unaudited) |
| ASSETS | ||||
| Investments in securities: | ||||
| At cost | $ | 75,080,400 | ||
| At value (Note 2) | $ | 78,900,943 | ||
| Dividends receivable | 218,043 | |||
| Tax reclaims receivable | 41,608 | |||
| Other assets | 6,078 | |||
| Total assets | 79,166,672 | |||
| LIABILITIES | ||||
| Payable to Adviser (Note 4) | 37,006 | |||
| Payable to administrator (Note 4) | 13,405 | |||
| Accrued distribution fees (Note 4) | 5,549 | |||
| Other accrued expenses | 16,656 | |||
| Total liabilities | 72,616 | |||
| NET ASSETS | $ | 79,094,056 | ||
| NET ASSETS CONSIST OF: | ||||
| Paid-in capital | $ | 71,276,098 | ||
| Accumulated earnings | 7,817,958 | |||
| NET ASSETS | $ | 79,094,056 | ||
| NET ASSET VALUE PER SHARE: | ||||
| INSTITUTIONAL CLASS | ||||
| Net assets applicable to Institutional Class | $ | 62,186,851 | ||
| Institutional Class shares of beneficial interest outstanding (unlimited number of shares authorized, no par value) | 5,687,408 | |||
| Net asset value, offering price and redemption price per share (Note 2) | $ | 10.93 | ||
| INVESTOR CLASS | ||||
| Net assets applicable to Investor Class | $ | 16,907,205 | ||
| Investor Class shares of beneficial interest outstanding (unlimited number of shares authorized, no par value) | 1,547,558 | |||
| Net asset value, offering price and redemption price per share (Note 2) | $ | 10.93 |
See accompanying notes to financial statements.
8
| KEMPNER MULTI-CAP DEEP VALUE FUND |
| STATEMENT OF OPERATIONS |
| For the Six Months Ended November 30, 2022 (Unaudited) |
| INVESTMENT INCOME | ||||
| Dividend income | $ | 1,114,566 | ||
| EXPENSES | ||||
| Investment advisory fees (Note 4) | 221,916 | |||
| Administration fees (Note 4) | 37,599 | |||
| Fund accounting fees (Note 4) | 22,844 | |||
| Distribution fees - Investor Class (Note 4) | 20,010 | |||
| Legal fees | 14,645 | |||
| Transfer agent fees (Note 4) | 14,311 | |||
| Trustees’ fees and expenses (Note 4) | 9,731 | |||
| Registration and filing fees | 9,041 | |||
| Audit and tax services fees | 8,409 | |||
| Compliance service fees (Note 4) | 6,000 | |||
| Custodian and bank service fees | 5,586 | |||
| Shareholder reporting expenses | 3,820 | |||
| Insurance expense | 1,916 | |||
| Postage and supplies | 1,885 | |||
| Other expenses | 8,309 | |||
| Total expenses | 386,022 | |||
| NET INVESTMENT INCOME | 728,544 | |||
| REALIZED AND UNREALIZED LOSSES ON INVESTMENTS | ||||
| Net realized losses from investment transactions | (39,408 | ) | ||
| Net change in unrealized appreciation (depreciation) on investments | (3,742,024 | ) | ||
| NET REALIZED AND UNREALIZED LOSSES ON INVESTMENTS. | (3,781,432 | ) | ||
| NET DECREASE IN NET ASSETS RESULTING FROM OPERATIONS | $ | (3,052,888 | ) |
See accompanying notes to financial statements.
9
| KEMPNER MULTI-CAP DEEP VALUE FUND |
| STATEMENTS OF CHANGES IN NET ASSETS |
| Six Months | ||||||||
| Ended | Year | |||||||
| November 30, | Ended | |||||||
| 2022 | May 31, | |||||||
| (Unaudited) | 2022 | |||||||
| FROM OPERATIONS | ||||||||
| Net investment income | $ | 728,544 | $ | 1,136,029 | ||||
| Net realized gains (losses) from investment transactions | (39,408 | ) | 3,990,397 | |||||
| Net change in unrealized appreciation (depreciation) on investments | (3,742,024 | ) | (7,413,345 | ) | ||||
| Net decrease in net assets resulting from operations | (3,052,888 | ) | (2,286,919 | ) | ||||
| FROM DISTRIBUTIONS TO SHAREHOLDERS (Note 2) | ||||||||
| Institutional Class | (658,647 | ) | (5,383,280 | ) | ||||
| Investor Class | (156,956 | ) | (1,382,525 | ) | ||||
| Decrease in net assets from distributions to shareholders | (815,603 | ) | (6,765,805 | ) | ||||
| CAPITAL SHARE TRANSACTIONS | ||||||||
| Institutional Class | ||||||||
| Proceeds from shares sold | 300,000 | 3,393,328 | ||||||
| Net asset value of shares issued in reinvestment of distributions to shareholders | 441,998 | 439,322 | ||||||
| Payments for shares redeemed | (504,489 | ) | (851,453 | ) | ||||
| Net increase in Institutional Class net assets from capital share transactions | 237,509 | 2,981,197 | ||||||
| Investor Class | ||||||||
| Proceeds from shares sold | 14,066 | 578,111 | ||||||
| Net asset value of shares issued in reinvestment of distributions to shareholders | 131,515 | 1,142,088 | ||||||
| Payments for shares redeemed | (41,972 | ) | (1,295,529 | ) | ||||
| Net increase in Investor Class net assets from capital share transactions | 103,609 | 424,670 | ||||||
| TOTAL DECREASE IN NET ASSETS | (3,527,373 | ) | (5,646,857 | ) | ||||
| NET ASSETS | ||||||||
| Beginning of period | 82,621,429 | 88,268,286 | ||||||
| End of period | $ | 79,094,056 | $ | 82,621,429 | ||||
See accompanying notes to financial statements.
10
| KEMPNER MULTI-CAP DEEP VALUE FUND |
| STATEMENTS OF CHANGES IN NET ASSETS (Continued) |
| Six Months | ||||||||
| Ended | Year | |||||||
| November 30, | Ended | |||||||
| 2022 | May 31, | |||||||
| (Unaudited) | 2022 | |||||||
| CAPITAL SHARES ACTIVITY | ||||||||
| Institutional Class | ||||||||
| Shares sold | 29,791 | 289,165 | ||||||
| Shares issued in reinvestment of distributions to shareholders | 45,135 | 37,216 | ||||||
| Shares redeemed | (49,797 | ) | (71,509 | ) | ||||
| Net increase in shares outstanding | 25,129 | 254,872 | ||||||
| Shares outstanding at beginning of period | 5,662,279 | 5,407,407 | ||||||
| Shares outstanding at end of period | 5,687,408 | 5,662,279 | ||||||
| Investor Class | ||||||||
| Shares sold | 1,372 | 47,703 | ||||||
| Shares issued in reinvestment of distributions to shareholders | 13,424 | 97,283 | ||||||
| Shares redeemed | (4,251 | ) | (105,117 | ) | ||||
| Net increase in shares outstanding | 10,545 | 39,869 | ||||||
| Shares outstanding at beginning of period | 1,537,013 | 1,497,144 | ||||||
| Shares outstanding at end of period | 1,547,558 | 1,537,013 | ||||||
See accompanying notes to financial statements.
11
| KEMPNER MULTI-CAP DEEP VALUE FUND |
| INSTITUTIONAL CLASS |
| FINANCIAL HIGHLIGHTS |
Per Share Data for a Share Outstanding Throughout Each Period
| Six Months | Ten | |||||||||||||||||||||||||||
| Ended | Year | Year | Months | Year | Year | Year | ||||||||||||||||||||||
| Nov. 30, | Ended | Ended | Ended | Ended | Ended | Ended | ||||||||||||||||||||||
| 2022 | May 31, | May 31, | May 31, | July 31, | July 31, | July 31, | ||||||||||||||||||||||
| (Unaudited) | 2022 | 2021 | 2020 (a) | 2019 | 2018 | 2017 | ||||||||||||||||||||||
| Net asset value at beginning of period | $ | 11.48 | $ | 12.79 | $ | 8.77 | $ | 10.70 | $ | 11.01 | $ | 10.47 | $ | 9.18 | ||||||||||||||
| Income (loss) from investment operations: | ||||||||||||||||||||||||||||
| Net investment income | 0.10 | (b) | 0.17 | (b) | 0.15 | (b) | 0.20 | 0.21 | 0.19 | 0.19 | ||||||||||||||||||
| Net realized and unrealized gains (losses) on investments | (0.53 | ) | (0.49 | ) | 4.53 | (1.62 | ) | (0.19 | ) | 1.00 | 1.29 | |||||||||||||||||
| Total from investment operations | (0.43 | ) | (0.32 | ) | 4.68 | (1.42 | ) | 0.02 | 1.19 | 1.48 | ||||||||||||||||||
| Less distributions from: | ||||||||||||||||||||||||||||
| Net investment income | (0.12 | ) | (0.15 | ) | (0.16 | ) | (0.17 | ) | (0.23 | ) | (0.17 | ) | (0.19 | ) | ||||||||||||||
| Net realized gains | — | (0.84 | ) | (0.50 | ) | (0.34 | ) | (0.10 | ) | (0.48 | ) | — | ||||||||||||||||
| Total distributions | (0.12 | ) | (0.99 | ) | (0.66 | ) | (0.51 | ) | (0.33 | ) | (0.65 | ) | (0.19 | ) | ||||||||||||||
| Net asset value at end of period | $ | 10.93 | $ | 11.48 | $ | 12.79 | $ | 8.77 | $ | 10.70 | $ | 11.01 | $ | 10.47 | ||||||||||||||
| Total return (c) | (3.66 | %) (d) | (2.61 | %) | 55.52 | % | (13.99 | %) (d) | 0.43 | % | 11.79 | % | 16.30 | % | ||||||||||||||
| Net assets at end of period (000’s) | $ | 62,187 | $ | 64,995 | $ | 69,143 | $ | 48,552 | $ | 60,228 | $ | 67,725 | $ | 67,863 | ||||||||||||||
| Ratios/supplementary data: | ||||||||||||||||||||||||||||
| Ratio of total expenses to average net assets | 0.97 | % (e) | 0.94 | % | 0.97 | % | 0.99 | % (e) | 0.95 | % | 0.94 | % | 0.84 | % | ||||||||||||||
| Ratio of net investment income to average net assets | 1.99 | % (e) | 1.39 | % | 1.46 | % | 2.37 | % (e) | 2.13 | % | 1.74 | % | 1.98 | % | ||||||||||||||
| Portfolio turnover rate | 18 | % (d) | 33 | % | 21 | % | 27 | % (d) | 17 | % | 25 | % | 18 | % | ||||||||||||||
| (a) | Fund changed fiscal year to May 31. |
| (b) | Per share net income has been determined on the basis of average number of shares outstanding during the period. |
| (c) | Total return is a measure of the change in value of an investment in the Fund over the periods covered. The returns shown do not reflect the deduction of taxes a shareholder would pay on Fund distributions, if any, or the redemption of Fund shares. |
| (d) | Not annualized. |
| (e) | Annualized. |
See accompanying notes to financial statements.
12
| KEMPNER MULTI-CAP DEEP VALUE FUND |
| INVESTOR CLASS |
| FINANCIAL HIGHLIGHTS |
Per Share Data for a Share Outstanding Throughout Each Period
| Six Months | Ten | |||||||||||||||||||||||||||
| Ended | Year | Year | Months | Year | Year | Year | ||||||||||||||||||||||
| Nov. 30, | Ended | Ended | Ended | Ended | Ended | Ended | ||||||||||||||||||||||
| 2022 | May 31, | May 31, | May 31, | July 31, | July 31, | July 31, | ||||||||||||||||||||||
| (Unaudited) | 2022 | 2021 | 2020 (a) | 2019 | 2018 | 2017 | ||||||||||||||||||||||
| Net asset value at beginning of period | $ | 11.47 | $ | 12.77 | $ | 8.76 | $ | 10.69 | $ | 11.00 | $ | 10.46 | $ | 9.17 | ||||||||||||||
| Income (loss) from investment operations: | ||||||||||||||||||||||||||||
| Net investment income | 0.09 | (b) | 0.14 | (b) | 0.13 | (b) | 0.18 | 0.18 | 0.17 | 0.17 | ||||||||||||||||||
| Net realized and unrealized gains (losses) on investments | (0.53 | ) | (0.48 | ) | 4.51 | (1.62 | ) | (0.19 | ) | 1.00 | 1.29 | |||||||||||||||||
| Total from investment operations | (0.44 | ) | (0.34 | ) | 4.64 | (1.44 | ) | (0.01 | ) | 1.17 | 1.46 | |||||||||||||||||
| Less distributions from: | ||||||||||||||||||||||||||||
| Net investment income | (0.10 | ) | (0.12 | ) | (0.13 | ) | (0.15 | ) | (0.20 | ) | (0.15 | ) | (0.17 | ) | ||||||||||||||
| Net realized gains | — | (0.84 | ) | (0.50 | ) | (0.34 | ) | (0.10 | ) | (0.48 | ) | — | ||||||||||||||||
| Total distributions | (0.10 | ) | (0.96 | ) | (0.63 | ) | (0.49 | ) | (0.30 | ) | (0.63 | ) | (0.17 | ) | ||||||||||||||
| Net asset value at end of period | $ | 10.93 | $ | 11.47 | $ | 12.77 | $ | 8.76 | $ | 10.69 | $ | 11.00 | $ | 10.46 | ||||||||||||||
| Total return (c) | (3.71 | %) (d) | (2.79 | %) | 55.09 | % | (14.18 | %) (d) | 0.18 | % | 11.55 | % | 16.06 | % | ||||||||||||||
| Net assets at end of period (000’s) | $ | 16,907 | $ | 17,626 | $ | 19,125 | $ | 12,206 | $ | 14,495 | $ | 14,803 | $ | 15,321 | ||||||||||||||
| Ratios/supplementary data: | ||||||||||||||||||||||||||||
| Ratio of total expenses to average net assets | 1.22 | % (e) | 1.19 | % | 1.22 | % | 1.24 | % (e) | 1.20 | % | 1.19 | % | 1.09 | % | ||||||||||||||
| Ratio of net investment income to average net assets | 1.74 | % (e) | 1.14 | % | 1.21 | % | 2.12 | % (e) | 1.88 | % | 1.49 | % | 1.70 | % | ||||||||||||||
| Portfolio turnover rate | 18 | % (d) | 33 | % | 21 | % | 27 | % (d) | 17 | % | 25 | % | 18 | % | ||||||||||||||
| (a) | Fund changed fiscal year to May 31. |
| (b) | Per share net income has been determined on the basis of average number of shares outstanding during the period. |
| (c) | Total return is a measure of the change in value of an investment in the Fund over the periods covered. The returns shown do not reflect the deduction of taxes a shareholder would pay on Fund distributions, if any, or the redemption of Fund shares. |
| (d) | Not annualized. |
| (e) | Annualized. |
See accompanying notes to financial statements.
13
| KEMPNER MULTI-CAP DEEP VALUE FUND |
| NOTES TO FINANCIAL STATEMENTS |
| November 30, 2022 (Unaudited) |
1. Organization
Kempner Multi-Cap Deep Value Fund (the “Fund”) is a diversified series of Ultimus Managers Trust (the “Trust”). The Trust is an open-end management investment company registered under the Investment Company Act of 1940, as amended (the “1940 Act”). The Fund was reorganized into the Trust on April 28, 2017. Other series of the Trust are not incorporated in this report.
The investment objective of the Fund is to seek to generate a total pre-tax return, including capital growth and dividends, that is greater than the rate of inflation over a three-to-five-year period.
The Fund currently offers two classes of shares: Institutional Class shares (sold without any sales loads and distribution and/or shareholder servicing fees and requiring a $500,000 initial investment) and Investor Class shares (sold without any sales loads, but subject to a distribution and/or shareholder servicing fee of up to 0.25% of the average daily net assets attributable to Investor Class shares and requiring a $500 initial investment). Each share class represents an ownership interest in the same investment portfolio.
2. Significant Accounting Policies
The Fund follows accounting and reporting guidance under Financial Accounting Standards Board Accounting Standards Codification Topic 946, “Financial Services – Investment Companies.” The following is a summary of the Fund’s significant accounting policies used in the preparation of its financial statements. These policies are in conformity with accounting principles generally accepted in the United States of America (“GAAP”).
Securities valuation – The Fund values its portfolio securities at market value as of the close of regular trading on the New York Stock Exchange (the “NYSE”) (normally 4:00 p.m. Eastern time) on each business day the NYSE is open for business. The Fund values its listed securities on the basis of the security’s last sale price on the security’s primary exchange, if available, otherwise at the exchange’s most recently quoted mean price. NASDAQ-listed securities are valued at the NASDAQ Official Closing Price. Investments representing shares of money market funds and other open-end investment companies are valued at their net asset value (“NAV”) as reported by such companies. When using a quoted price and when the market for the security is considered active, the security will be classified as Level 1 within the fair value hierarchy (see below). In the event that market quotations are not readily available or are considered unreliable due to market or other events, the Fund values its securities and other assets at fair value in accordance with procedures adopted by the Board of Trustees (the “Board”). Under these procedures, the securities will be classified as Level 2 or 3 within the fair value hierarchy, depending on the inputs used. Unavailable or unreliable market quotes may be due to the following factors: a substantial bid-ask spread; infrequent sales resulting in stale prices; insufficient trading volume; small trade sizes; a temporary lapse in any reliable pricing source; and actions of the securities or futures markets, such as the suspension or limitation of trading. As a result, the prices of securities used to calculate the Fund’s NAV may differ from quoted or published prices for the same securities.
14
| KEMPNER MULTI-CAP DEEP VALUE FUND |
| NOTES TO FINANCIAL STATEMENTS (Continued) |
GAAP establishes a single authoritative definition of fair value, sets out a framework for measuring fair value, and requires additional disclosures about fair value measurements.
Various inputs are used in determining the value of the Fund’s investments. These inputs are summarized in the three broad levels listed below:
| ● | Level 1 – quoted prices in active markets for identical securities |
| ● | Level 2 – other significant observable inputs |
| ● | Level 3 – significant unobservable inputs |
The inputs or methods used for valuing securities are not necessarily an indication of the risks associated with investing in those securities. The inputs used to measure fair value may fall into different levels of the fair value hierarchy. In such cases, for disclosure purposes, the level in the fair value hierarchy within which the fair value measurement falls in its entirety is determined based on the lowest level input that is significant to the fair value measurement.
The following is a summary of the Fund’s investments based on the inputs used to value the investments as of November 30, 2022 by security type:
| Level 1 | Level 2 | Level 3 | Total | |||||||||||||
| Common Stocks | $ | 74,113,140 | $ | — | $ | — | $ | 74,113,140 | ||||||||
| Preferred Stocks | 422,415 | — | — | 422,415 | ||||||||||||
| Money Market Funds | 4,365,388 | — | — | 4,365,388 | ||||||||||||
| Total | $ | 78,900,943 | $ | — | $ | — | $ | 78,900,943 | ||||||||
Refer to the Fund’s Schedule of Investments for a listing of securities by sector and industry type. The Fund did not hold any derivative instruments or any assets or liabilities that were measured at fair value on a recurring basis using significant unobservable inputs (Level 3) as of or during six months ended November 30, 2022.
Share valuation – The NAV per share of each class of the Fund is calculated daily by dividing the total value of the assets attributable to that class, less liabilities attributable to that class, by the number of shares outstanding of that class. The offering price and redemption price per share of each class of the Fund is equal to the NAV per share of such class.
Investment income – Dividend income is recorded on the ex-dividend date. Non-cash dividends included in dividend income, if any, are recorded at the fair market value of the security received. Interest income is accrued as earned. Withholding taxes on foreign dividends have been recorded in accordance with the Fund’s understanding of the applicable country’s rules and tax rates.
Investment transactions – Investment transactions are accounted for on the trade date. Realized gains and losses on investments sold are determined on a specific identification basis.
15
| KEMPNER MULTI-CAP DEEP VALUE FUND |
| NOTES TO FINANCIAL STATEMENTS (Continued) |
Allocation between classes – Investment income earned, realized capital gains and losses, and unrealized appreciation and depreciation are allocated daily to each class of the Fund based upon its proportionate share of total net assets of the Fund. Class-specific expenses are charged directly to the class incurring the expense. Common expenses which are not attributable to a specific class are allocated daily to each class of shares of the Fund based upon its proportionate share of total net assets of the Fund.
Common expenses – Common expenses of the Trust are allocated among the Fund and the other series of the Trust based on the relative net assets of each series, the number of series in the Trust, or the nature of the services performed and the relative applicability to each series.
Distributions to shareholders – The Fund intends to declare and distribute net investment income dividends on a quarterly basis. In addition, the Fund will declare and distribute net realized capital gains, if any, on an annual basis. The amount of such dividends and distributions are determined in accordance with federal income tax regulations, which may differ from GAAP. Dividends and distributions to shareholders are recorded on the ex-dividend date. The tax character of distributions paid to shareholders by the Fund during the periods ended November 30, 2022 and May 31, 2022 were as follows:
| Period | Ordinary | Long-Term | Total | |||||||||
| Ended | Income | Capital Gains | Distributions | |||||||||
| 11/30/2022 | $ | 815,603 | $ | — | $ | 815,603 | ||||||
| 5/31/2022 | $ | 2,778,664 | $ | 3,987,141 | $ | 6,765,805 | ||||||
Estimates – The preparation of financial statements in conformity with GAAP requires management to make estimates and assumptions that affect the reported amounts of assets and liabilities and disclosure of contingent assets and liabilities as of the date of the financial statements and the reported amounts of increase (decrease) in net assets from operations during the reporting period. Actual results could differ from those estimates.
Federal income tax – The Fund has qualified and intends to continue to qualify as a regulated investment company under the Internal Revenue Code of 1986 (the “Code”). Qualification generally will relieve the Fund of liability for federal income taxes to the extent 100% of its net investment income and net realized capital gains are distributed in accordance with the Code.
In order to avoid imposition of the excise tax applicable to regulated investment companies, it is also the Fund’s intention to declare as dividends in each calendar year amounts equal to at least 98% of its net investment income (earned during the calendar year) and 98.2% of its net realized capital gains (earned during the twelve months ended October 31) plus undistributed amounts from prior years.
16
KEMPNER MULTI-CAP DEEP VALUE FUND NOTES TO FINANCIAL STATEMENTS (Continued) |
The following information is computed on a tax basis for each item as of November 30, 2022:
| Tax cost of investments | $ | 75,080,400 | ||
| Gross unrealized appreciation | $ | 10,596,635 | ||
| Gross unrealized depreciation | (6,776,092 | ) | ||
| Net unrealized appreciation | 3,820,543 | |||
| Accumulated ordinary income | 235,463 | |||
| Undistributed long-term gains | 3,357,117 | |||
| Other gains | 404,835 | |||
| Accumulated earnings | $ | 7,817,958 | ||
The Fund recognizes the tax benefits or expenses of uncertain tax positions only when the position is “more likely than not” of being sustained assuming examination by tax authorities. Management has reviewed the Fund’s tax positions for the current and all open tax years (generally, three years) and has concluded that no provision for unrecognized tax benefits or expenses is required in these financial statements. The Fund identifies its major tax jurisdiction as U.S. Federal.
3. Investment Transactions
During six months ended November 30, 2022, cost of purchases and proceeds from sales of investment securities, other than short-term investments, amounted to $14,389,582 and $12,714,024, respectively.
4. Transactions with Related Parties
INVESTMENT ADVISORY AGREEMENT
The Fund’s investments are managed by Kempner Capital Management, Inc. (the “Adviser”) pursuant to the terms of an Investment Advisory Agreement. The Fund pays the Adviser an investment advisory fee, computed and accrued daily and paid monthly, at the annual rate of 0.59% of average daily net assets.
The Adviser has agreed contractually, until at least December 1, 2023, to reduce its advisory fees and reimburse other expenses to the extent necessary to limit total annual fund operating expenses (exclusive of brokerage costs; taxes; interest; borrowing costs such as interest and dividend expenses on securities sold short; costs to organize the Fund; acquired fund fees and expenses; extraordinary expenses such as litigation and merger or reorganization costs and other expenses not incurred in the ordinary course of the Fund’s business) to an amount not exceeding 1.05% and 1.30% of average daily net assets for Institutional Class and Investor Class shares, respectively.
Advisory fee reductions and expense reimbursements by the Adviser are subject to repayment by the Fund for a period of three years after such fees and expenses were incurred, provided that the repayments do not cause the Fund’s total annual fund operating expenses to exceed the lesser of (i) the expense limitation then in effect, if any, and (ii) the expense limitation
17
| KEMPNER MULTI-CAP DEEP VALUE FUND |
| NOTES TO FINANCIAL STATEMENTS (Continued) |
in effect at the time the expenses to be repaid were incurred. This agreement will terminate automatically if the Investment Advisory Agreement is terminated. During the six months ended November 30, 2022, the Adviser did not reduce its advisory fees or reimburse other expenses of the Fund.
OTHER SERVICE PROVIDERS
Ultimus Fund Solutions, LLC (“Ultimus”) provides administration, fund accounting, compliance and transfer agency services to the Fund. The Fund pays Ultimus fees in accordance with the agreements for such services. In addition, the Fund pays out-of-pocket expenses including, but not limited to, postage, supplies and certain costs related to the pricing of the Fund’s portfolio securities.
Under the terms of a Distribution Agreement with the Trust, Ultimus Fund Distributors, LLC (the “Distributor”) serves as principal underwriter to the Fund. The Distributor is a wholly-owned subsidiary of Ultimus. The Distributor is compensated partially by the Adviser and partially by the Investor Class shares of the Fund for acting as principal underwriter.
A Trustee and certain officers of the Trust are also officers of Ultimus.
DISTRIBUTION PLAN
The Fund has adopted a plan of distribution (the “Plan”), pursuant to Rule 12b-1 under the 1940 Act, which permits Investor Class shares of the Fund to directly incur or reimburse the Fund’s principal underwriter for certain expenses related to the distribution of Investor Class shares. The annual limitation for payment of expenses pursuant to the Plan is 0.25% of the Fund’s average daily net assets allocable to Investor Class shares. The Fund has not adopted a plan of distribution with respect to Institutional Class shares. During the six months ended November 30, 2022, Investor Class shares of the Fund incurred $20,010 of distribution fees under the Plan.
TRUSTEE COMPENSATION
Effective October 17, 2022, each member of the Board (a “Trustee”) who is not an “interested person” (as defined by the 1940 Act, as amended) of the Trust (“Independent Trustee”) receives a $1,300 annual retainer from the Fund, paid quarterly, except for the Board Chairperson who receives a $1,700 annual retainer from each Fund, paid quarterly and the Audit Committee Chairperson who receives a $1,500 annual retainer from the Fund, paid quarterly. Each Independent Trustee also receives from the Fund a fee of $550 for each Board meeting attended plus reimbursement for travel and other meeting-related expenses. Prior to October 17, 2022, no annual retainer was designated specifically for the Audit Committee Chairperson and the Audit Committee Chairperson received a $1,300 annual retainer from the Fund.
18
| KEMPNER MULTI-CAP DEEP VALUE FUND |
| NOTES TO FINANCIAL STATEMENTS (Continued) |
PRINCIPAL HOLDERS OF FUND SHARES
As of November 30, 2022, the following shareholders owned of record 25% or more of the outstanding shares of each class of the Fund:
| NAME OF RECORD OWNERS | % Ownership |
| Institutional Class | |
| Muir & Company (for the benefit of its customers) | 99% |
| Investor Class | |
| Morgan Stanley Smith Barney, LLC (for the benefit of its customers) | 41% |
| Muir & Company (for the benefit of its customers) | 32% |
A beneficial owner of 25% or more of the Fund’s outstanding shares may be considered a controlling person. That shareholder’s vote could have a more significant effect on matters presented at a shareholders’ meeting.
5. Contingencies and Commitments
The Fund indemnifies the Trust’s officers and Trustees for certain liabilities that might arise from their performance of their duties to the Fund. Additionally, in the normal course of business the Fund enters into contracts that contain a variety of representations and warranties and which provide general indemnifications. The Fund’s maximum exposure under these arrangements is unknown, as this would involve future claims that may be made against the Fund that have not yet occurred. However, based on experience, the Fund expects the risk of loss to be remote.
6. Subsequent Events
The Fund is required to recognize in the financial statements the effects of all subsequent events that provide additional evidence about conditions that existed as of the date of the Statement of Assets and Liabilities. For non-recognized subsequent events that must be disclosed to keep the financial statements from being misleading, the Fund is required to disclose the nature of the event as well as an estimate of its financial effect, or a statement that such an estimate cannot be made. Management has evaluated subsequent events through the issuance of these financial statements and has noted no such events except for the following:
The Fund paid the following distributions to shareholders subsequent to November 30, 2022:
| Per Share | ||||||||||||||||
| Record | Ordinary | Short-Term | Long-Term | |||||||||||||
| Date | Ex-Date | Income | Capital Gain | Capital Gain | ||||||||||||
| Institutional Class | 12/28/2022 | 12/29/2022 | $ | 0.0452 | $ | 0.0617 | $ | 0.4662 | ||||||||
| Investor Class | 12/28/2022 | 12/29/2022 | $ | 0.0388 | $ | 0.0617 | $ | 0.4662 | ||||||||
19
| KEMPNER MULTI-CAP DEEP VALUE FUND |
| ABOUT YOUR FUND’S EXPENSES (Unaudited) |
We believe it is important for you to understand the impact of costs on your investment. As a shareholder of the Fund, you incur ongoing costs, including management fees, class-specific expenses (such as distribution fees) and other operating expenses. The following examples are intended to help you understand your ongoing costs (in dollars) of investing in the Fund and to compare these costs with the ongoing costs of investing in other mutual funds.
A mutual fund’s ongoing costs are expressed as a percentage of its average net assets. This figure is known as the expense ratio. The expenses in the table below are based on an investment of $1,000 made at the beginning of the most recent period (June 1, 2022) and held until the end of the period (November 30, 2022).
The table below illustrates the Fund’s ongoing costs in two ways:
Actual fund return – This section helps you to estimate the actual expenses that you paid over the period. The “Ending Account Value” shown is derived from the Fund’s actual return, and the fourth column shows the dollar amount of operating expenses that would have been paid by an investor who started with $1,000 in the Fund. You may use the information here, together with the amount you invested, to estimate the expenses that you paid over the period.
To do so, simply divide your account value by $1,000 (for example, an $8,600 account value divided by $1,000 = 8.6), then multiply the result by the number given for the Fund under the heading “Expenses Paid During Period.”
Hypothetical 5% return – This section is intended to help you compare the Fund’s ongoing costs with those of other mutual funds. It assumes that the Fund had an annual return of 5% before expenses during the period shown, but that the expense ratio is unchanged. In this case, because the return used is not the Fund’s actual return, the results do not apply to your investment. The example is useful in making comparisons because the U.S. Securities and Exchange Commission (the “SEC”) requires all mutual funds to calculate expenses based on a 5% return. You can assess the Fund’s ongoing costs by comparing this hypothetical example with the hypothetical examples that appear in shareholder reports of other funds.
Note that expenses shown in the table are meant to highlight and help you compare ongoing costs only. The Fund does not charge transaction fees, such as purchase or redemption fees, nor does it carry a “sales load.”
The calculations assume no shares were bought or sold during the period. Your actual costs may have been higher or lower, depending on the amount of your investment and the timing of any purchases or redemptions.
20
| KEMPNER MULTI-CAP DEEP VALUE FUND |
| ABOUT YOUR FUND’S EXPENSES (Unaudited) (Continued) |
More information about the Fund’s expenses can be found in this report. For additional information on operating expenses and other shareholder costs, please refer to the Fund’s prospectus.
| Beginning | Ending | Net | Expenses | |||||
| Account Value | Account Value | Expense | Paid During | |||||
| June 1, 2022 | November 30, 2022 | Ratio(a) | Period(b) | |||||
| Institutional Class | ||||||||
| Base on Actual Fund Return | $1,000.00 | $ 963.40 | 0.97% | $4.77 | ||||
| Based on Hypothetical 5%Return (before expenses) | $1,000.00 | $ 1,020.21 | 0.97% | $4.91 | ||||
| Investor Class | ||||||||
| Base on Actual Fund Return | $1,000.00 | $ 962.90 | 1.22% | $6.00 | ||||
| Based on Hypothetical 5%Return (before expenses) | $1,000.00 | $ 1,018.95 | 1.22% | $6.17 | ||||
| (a) | Annualized, based on the Class’s most recent one-half year expenses. |
| (b) | Expenses are equal to the Class’s annualized net expense ratio multiplied by the average account value over the period, multiplied by 183/365 (to reflect the one-half year period). |
21
| KEMPNER MULTI-CAP DEEP VALUE FUND |
| OTHER INFORMATION (Unaudited) |
A description of the policies and procedures that the Fund uses to vote proxies relating to portfolio securities is available without charge upon request by calling toll- free 1-800-665-9778, or on the SEC’s website at www.sec.gov. Information regarding how the Fund voted proxies relating to portfolio securities during the most recent 12-month period ended June 30 is available without charge upon request by calling toll-free 1-800-665-9778, or on the SEC’s website at www.sec.gov.
The Trust files a complete listing of portfolio holdings for the Fund with the SEC as of the end of the first and third quarters of each fiscal year as an exhibit to its reports on Form N-PORT. These filings are available upon request by calling 1-800-665-9778. Furthermore, you may obtain a copy of the filings on the SEC’s website at www.sec.gov.
22
| KEMPNER MULTI-CAP DEEP VALUE FUND |
| DISCLOSURE REGARDING APPROVAL OF INVESTMENT |
| ADVISORY AGREEMENT (Unaudited) |
The Board of Trustees (the “Board”), including the Independent Trustees voting separately, has reviewed and approved the Fund’s Investment Advisory Agreement with Kempner Capital Management, Inc. (the “Adviser” or “Kempner”) for an additional one-year term (the “Advisory Agreement”). The Board approved the Advisory Agreement at a meeting held on July 18 – 19, 2022, at which all of the Trustees were present.
In deciding whether to approve the continuation of the Advisory Agreement, the Board recalled its review of the materials related to the Fund and Kempner throughout the preceding twelve months and its numerous discussions with Trust management and Kempner about the operations and performance of the Fund during that period. The Board further considered those materials and discussions and other numerous factors, including the following:
The nature, extent, and quality of the services provided by the Adviser. In this regard, the Board reviewed the services being provided by the Adviser to the Fund including, without limitation, its providing a continuous investment program for the Fund, adhering to the Fund’s investment restrictions, complying with the Trust’s policies and procedures and voting proxies on behalf of the Fund. The Board considered the qualifications and experience of the Adviser’s portfolio managers who are responsible for the day-to day management of the Fund’s portfolio, as well as the qualifications of other individuals at the Adviser who provide services to the Fund. The Board concluded that the quality, extent, and nature of the services provided by the Adviser to the Fund were satisfactory.
The investment performance of the Fund. In this regard, the Board compared the performance of the Fund with the performance of its benchmark index, custom peer group, and Morningstar category and as compared to the CPI. The Board concluded that the investment performance of the Fund has been satisfactory in light of the Fund’s investment objective.
The costs of the services provided and profits realized by the Adviser and its affiliates from their relationship with the Fund. In this regard, the Board considered the management fee and the Fund’s expense ratio, each as compared to the Fund’s peer group and to the fees charged by the Adviser to other similar clients. The Board considered the revenue earned by the Adviser from the Fund and the current and anticipated profitability of the Fund to the Adviser, if any. The Board also considered the Adviser’s past fee reductions and expense reimbursements for the Fund. The Board concluded that the advisory fee to be paid to the Adviser by the Fund is reasonable in light of the nature and quality of services provided by the Adviser.
The extent to which economics of scale would be realized as the Fund grows and whether advisory fee levels reflect these economies of scale for the benefit of the Fund’s investors. In this regard, the Board considered that the Fund’s fee arrangements with the Adviser involve both the advisory fee and the Fund’s expense limitation agreement (the “ELA”). The Board determined that while the advisory fee rate remained the same as asset levels increased, the shareholders of the Fund have experienced benefits from the Fund’s ELA in the past. The Board concluded that the advisory fee was reasonable in light of the information that was provided to the Trustees by the Adviser with respect to economies of scale.
23
| KEMPNER MULTI-CAP DEEP VALUE FUND |
| DISCLOSURE REGARDING APPROVAL OF INVESTMENT |
| ADVISORY AGREEMENT (Unaudited) (Continued) |
After further discussion of the factors noted above, as well as other factors, and in reliance on the information provided by the Adviser and Trust management, and taking into account the totality of all factors discussed and information presented at the meeting and previous meetings, the Board indicated its agreement to approve the continuance of the Advisory Agreement and the Fund’s ELA. It was noted that in the Trustees’ deliberations regarding the approval of the continuance of the Advisory Agreement, the Trustees did not identify any particular information or factor that was all-important or controlling, and that each individual Trustee may have attributed different weights to various factors listed above. After full consideration of the above factors as well as other factors, the Board unanimously concluded that approval of the continuance of the Advisory Agreement was in the best interests of the Fund and its shareholders.
24
| KEMPNER MULTI-CAP DEEP VALUE FUND |
| LIQUIDITY RISK MANAGEMENT PROGRAM (Unaudited) |
The Fund has adopted and implemented a written liquidity risk management program (the “Program”) as required by Rule 22e-4 (the “Liquidity Rule”) under the Investment Company Act of 1940, as amended. The Program is reasonably designed to assess and manage the Fund’s liquidity risk, taking into consideration, among other factors, the Fund’s investment strategy and the liquidity of its portfolio investments during normal and reasonably foreseeable stressed conditions; its short- and long-term cash flow projections; and its cash holdings and access to other funding sources. The Fund’s Board of Trustees (the “Board”) approved the appointment of the Liquidity Administrator Committee, comprising of the Fund’s Adviser and certain Trust officers, to be responsible for the Program’s administration and oversight and for reporting to the Board on at least an annual basis regarding the Program’s operation and effectiveness. The annual written report assessing the Program (the “Report”) was presented to the Board at the October 17 – 18, 2022 Board meeting and covered the period from June 1, 2021 to May 31, 2022 (the “Review Period”).
During the Review Period, the Fund did not experience unusual stress or disruption to its operations related to purchase and redemption activity. Also, during the Review Period, the Fund held adequate levels of cash and highly liquid investments to meet shareholder redemption activities in accordance with applicable requirements. The Report concluded that the Program is reasonably designed to prevent violation of the Liquidity Rule and the Program has been effectively implemented.
25
| CUSTOMER PRIVACY NOTICE |
| FACTS | WHAT DOES THE KEMPNER MULTI-CAP DEEP VALUE FUND (the “Fund”) DO WITH YOUR PERSONAL INFORMATION? | ||
| Why? | Financial companies choose how they share your personal information. Federal law gives consumers the right to limit some but not all sharing. Federal law also requires us to tell you how we collect, share, and protect your personal information. Please read this notice carefully to understand what we do. | ||
| What? | The types of personal information we collect and share depend on the product or service you have with us. This information can include:
■ Social Security number
■ Assets
■ Retirement Assets
■ Transaction History
■ Checking Account Information
■ Purchase History
■ Account Balances
■ Account Transactions
■ Wire Transfer Instructions
When you are no longer our customer, we continue to share your information as described in this notice. | ||
| How? | All financial companies need to share your personal information to run their everyday business. In the section below, we list the reasons financial companies can share their customers’ personal information; the reasons the Fund chooses to share; and whether you can limit this sharing. | ||
| Reasons we can share your personal information | Does
the Fund share? |
Can
you limit this sharing? | |
| For our everyday business purposes – Such as to process your transactions, maintain your account(s), respond to court orders and legal investigations, or report to credit bureaus | Yes | No | |
| For our marketing purposes – to offer our products and services to you | No | We don’t share | |
| For joint marketing with other financial companies | No | We don’t share | |
| For our affiliates’ everyday business purposes – information about your transactions and experiences | No | We don’t share | |
| For our affiliates’ everyday business purposes – information about your creditworthiness | No | We don’t share | |
| For nonaffiliates to market to you | No | We don’t share | |
| Questions? | Call 1-800-665-9778 |
26
| Page 2 | |
| Who we are | |
| Who is providing this notice? | Kempner Multi-Cap Deep Value Fund
Ultimus Fund Distributors, LLC (Distributor)
Ultimus Fund Solutions, LLC (Administrator) |
| What we do | |
| How does the Fund protect my personal information? | To protect your personal information from unauthorized access and use, we use security measures that comply with federal law. These measures include computer safeguards and secured files and buildings.
Our service providers are held accountable for adhering to strict policies and procedures to prevent any misuse of your nonpublic personal information. |
| How does the Fund collect my personal information? | We collect your personal information, for example, when you
■ Open an account
■ Provide account information
■ Give us your contact information
■ Make deposits or withdrawals from your account
■ Make a wire transfer
■ Tell us where to send the money
■ Tell us who receives the money
■ Show your government-issued ID
■ Show your driver’s license
We also collect your personal information from other companies. |
| Why can’t I limit all sharing? | Federal law gives you the right to limit only
■ Sharing for affiliates’ everyday business purposes – information about your creditworthiness
■ Affiliates from using your information to market to you
■ Sharing for nonaffiliates to market to you
State laws and individual companies may give you additional rights to limit sharing. |
| Definitions | |
| Affiliates | Companies related by common ownership or control. They can be financial and nonfinancial companies.
■ Kempner Capital Management, Inc., the investment adviser to the Fund, could be deemed to be an affiliate. |
| Nonaffiliates | Companies not related by common ownership or control. They can be financial and nonfinancial companies
■ The Fund does not share with nonaffiliates so they can market to you. |
| Joint marketing | A formal agreement between nonaffiliated financial companies that together market financial products or services to you.
■ The Fund does not jointly market. |
27
This page intentionally left blank.
This page intentionally left blank.
KEMPNER-SAR-22
| WAVELENGTH FUND | |
| LETTER TO SHAREHOLDERS (Unaudited) | November 2022 |
Dear Fellow Shareholders:
Since our last shareholder letter, central banks continued to move in an overwhelmingly hawkish direction as they sought to stave off the highest levels of inflation in decades. This synchronization of policy across the globe put pressure on a markedly broad range of financial assets which made diversification a less effective tool for managing risk. As the aggressive monetary tightening flows through markets to underlying economies, however, signs of differentiation are emerging and unfolding into opportunities. Consistent with this dynamic, we seek to actively monetize the extensive set of dislocations across markets as they recalibrate to changing policy conditions and a new economic regime.
What follows is designed to provide a context for returns that fosters a deeper understanding of the investment process that supports them. By doing so we hope to build on the partnership your investment creates.
PERFORMANCE SUMMARY
For the six months ended November 30, 2022, the Wavelength Fund (the “Fund”) delivered a return of -2.92% versus a benchmark return of +1.06% for the S&P / BGCantor 0-3 Month US Treasury Bill Index (which seeks to represent the return from not taking risk in financial markets). While negative, these results were within targeted risk parameters in what proved to be a challenging investment environment across a broad range of financial assets.
WAVELENGTH PHILOSOPHY
We believe that macroeconomic conditions drive asset prices and central banks use interest rates to manage macroeconomic conditions. Based on this fundamental logic, we seek to build a portfolio that is hedged to changes in interest rates by balancing investment exposure between instruments we expect to outperform in rising and falling macroeconomic conditions.
INVESTMENT ENVIRONMENT
As an extension of our investment philosophy, we believe that changing expectations for the economy drive investment decisions, which in turn drive market prices. Since our last letter, economic growth moderated while inflation consistently exceeded both policy targets and the consensus expectations among forecasters. In response, central banks engaged in the broadest and sharpest monetary tightening in decades, disrupting markets across the globe.
After the initial shock of geopolitical conflict and associated supply chain pressures, persistently high levels of inflation led to a recalibration of policy expectations. This dynamic was followed by a reprieve among investors where risk appetite came back into markets and prices largely responded positively through the middle of the summer. The recovery, however, proved only temporary, as uncertainty grew around the policy predicament for the Fed and other central banks. Accordingly, the summer came to a close with a resurgence of selling pressure that created meaningful dislocations across fixed income markets.
1
Heading into autumn, growth conditions proceeded to deteriorate – a logical outcome following the sharpest monetary tightening in decades. An increasing number of economists warned of an oncoming recession, although the depth, breadth and timing of a slowdown remained notably uncertain. This added uncertainty on the growth outlook to existing concerns over inflation which translated into persistently high levels of volatility for financial markets.
With the broad-based macroeconomic transition underway, other more idiosyncratic factors also had an impact over the period. China’s 20th Party Congress showcased their updated strategic priorities, while the Nord Stream pipeline fallout highlighted key risks for Europe in adapting to a new energy landscape. Elsewhere on the continent, the UK’s proposed fiscal easing into a balance of payment crisis was met by a swift market response that could set a precedent for other developed nations facing similar imbalances.
As the period came to a close, underlying economic data started to reflect the impact of central bank policies, and a clearer picture was established for investors who sought to actively adjust portfolios. Fixed income markets in particular stood to benefit from these changing conditions amidst a meaningfully different landscape for potential risks and returns versus where they started the year. Bond markets were thus supported by a widescale redeployment of capital on the back of what we expect to be a more differentiated set of policy conditions heading into a new economic environment.
PERFORMANCE DISCUSSION
Amidst some of the most challenging set of conditions for fixed income markets in decades, risk management proved to be increasingly critical for the portfolio. While the Fund suffered losses as selling pressure overwhelmed most financial assets, actively managing exposures and maintaining a core balance to economic outcomes helped limit downside over the period.
Over the summer months the portfolio experienced a mix of conditions but ultimately suffered losses after participating in the bounce-back through July where many investors redeployed capital. In this context, losses from high yield credit, convertible bonds, emerging market debt and US Treasuries were partially recouped and then given back as selling pressure returned following the Federal Reserve’s annual economic symposium in Jackson Hole. This up-and-down dynamic led to reduced risk exposures within the portfolio until markets recalibrated and further clarity around the path for policy was established.
The third quarter came to a close with the culmination of these conditions as markets were gripped by volatility in a crescendo of hawkish rhetoric from central banks. Differentiation among both markets and policymakers returned heading in the fourth quarter, and the portfolio adapted accordingly, profiting from a rebound in corporate assets and inflation-linked bonds. Building on this performance, the portfolio produced strong results in November amidst a paradigm shift for policy expectations. Upside was driven by emerging market debt, corporate credit, and US Treasuries across the yield curve which rebounded strongly as a new set of expectations for interest rates and economic policies reverberated across financial assets.
2
OUTLOOK
Coming out of an environment where policymakers have overwhelmingly moved in the same hawkish direction, we expect an increasingly differentiated set of approaches where the next decade will look notably different from the last. Factors that supported the most recent expansion – such as low interest rates and globalization – have grown increasingly unstable, and this presents a new set of frictions to drive economic volatility. As central banks toggle back and forth between the growth and inflation sides of their mandates, we expect strategies attempting to time these moves will increasingly come under pressure. Conversely, we believe that approaches built strategically with an understanding of these linkages and a balance to their potential outcomes will be best positioned. Consistent with this, we seek to actively monetize what we see as a deep and broad opportunity set across fixed income as markets adjust to a new economic paradigm that looks markedly different from the last.
Thank you for your trust and commitment through investment.
Sincerely,

Andrew Dassori
Founding
Partner & Chief Investment Officer
Wavelength Capital Management
Past performance is not predictive of future performance. Investment results and principal value will fluctuate so that shares, when redeemed, may be worth more or less than their original cost. Current performance may be higher or lower than the performance data quoted. Performance data current to the most recent month end are available by calling 1-866-896-9292.
An investor should consider the investment objectives, risks, charges and expenses of the Fund carefully before investing. The Fund’s prospectus contains this and other important information. To obtain a copy of the Fund’s prospectus please visit our website at www.wavelengthfunds.com or call 1-866-896-9292 and a copy will be sent to you free of charge. Please read the prospectus carefully before you invest. The Wavelength Interest Rate Neutral Fund is distributed by Ultimus Fund Distributors, LLC.
The Letter to Shareholders seeks to describe some of the Adviser’s current opinions and views of the financial markets. Although the Adviser believes it has a reasonable basis for any opinions or views expressed, actual results may differ, sometimes significantly so, from those expected or expressed. The securities held by the Fund that are discussed in the Letter to Shareholders were held during the period covered by this Report. They do not comprise the entire investment portfolio of the Fund, may be sold at any time and may no longer be held by the Fund. For a complete list of securities held by the Fund as of November 30, 2022, please see the Schedule of Investments section of the Semi-Annual Report. The opinions of the Adviser with respect to those securities may change at any time.
3
Statements in the Letter to Shareholders that reflect projections or expectations for future financial or economic performance of the Fund and the market in general and statements of the Fund’s plans and objectives for future operations are forward-looking statements. No assurance can be given that actual results or events will not differ materially from those projected, estimated, assumed, or anticipated in any such forward-looking statements. Important factors that could result in such differences, in addition to factors noted with such forward-looking statements include, without limitation, general economic conditions, such as inflation, recession, and interest rates. Past performance is not a guarantee of future results.
4
| WAVELENGTH FUND |
| PORTFOLIO INFORMATION |
| November 30, 2022 (Unaudited) |
Portfolio Allocation (% of Net Assets)
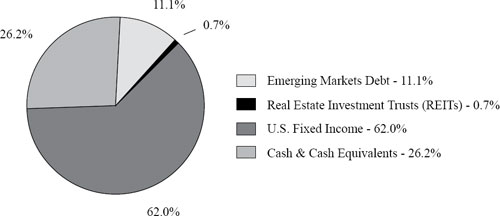
Top 10 Equity Holdings
| % of Net | ||
| Security Description | Assets | |
| Invesco Senior Loan ETF | 12.5% | |
| iShares TIPS Bond ETF | 11.4% | |
| Vanguard Short-Term Inflation-Protected Securities ETF | 11.0% | |
| iShares National Muni Bond ETF | 8.1% | |
| SPDR Bloomberg Short Term High Yield Bond ETF | 7.1% | |
| Vanguard Mortgage-Backed Securities ETF | 6.2% | |
| iShares Broad USD High Yield Corporate Bond ETF | 4.8% | |
| VanEck Emerging Markets High Yield Bond ETF | 4.3% | |
| Vanguard Emerging Markets Government Bond ETF | 4.0% | |
| iShares J.P. Morgan USD Emerging Markets Bond ETF | 2.8% |
5
| WAVELENGTH FUND |
| SCHEDULE OF INVESTMENTS |
| November 30, 2022 (Unaudited) |
| EXCHANGE-TRADED FUNDS — 73.8% | Shares | Value | ||||||
| Emerging Markets Debt — 11.1% | ||||||||
| iShares J.P. Morgan USD Emerging Markets Bond ETF | 36,900 | $ | 3,189,267 | |||||
| VanEck Emerging Markets High Yield Bond ETF | 273,222 | 4,915,264 | ||||||
| Vanguard Emerging Markets Government Bond ETF | 72,372 | 4,511,670 | ||||||
| 12,616,201 | ||||||||
| Real Estate Investment Trusts (REITs) — 0.7% | ||||||||
| Vanguard Real Estate ETF | 9,087 | 800,383 | ||||||
| U.S. Fixed Income — 62.0% | ||||||||
| Invesco Senior Loan ETF | 684,660 | 14,254,621 | ||||||
| iShares Broad USD High Yield Corporate Bond ETF | 153,815 | 5,452,742 | ||||||
| iShares National Muni Bond ETF | 86,500 | 9,188,030 | ||||||
| iShares TIPS Bond ETF | 120,122 | 13,014,017 | ||||||
| SPDR Bloomberg Convertible Securities ETF | 16,079 | 1,071,505 | ||||||
| SPDR Bloomberg Short Term High Yield Bond ETF | 327,000 | 8,119,410 | ||||||
| Vanguard Mortgage-Backed Securities ETF | 154,200 | 7,107,078 | ||||||
| Vanguard Short-Term Inflation-Protected Securities ETF | 260,800 | 12,518,400 | ||||||
| 70,725,803 | ||||||||
| Total Exchange-Traded Funds (Cost $92,398,928) | $ | 84,142,387 | ||||||
6
| WAVELENGTH FUND |
| SCHEDULE OF INVESTMENTS (Continued) |
| MONEY MARKET FUNDS — 26.1% | Shares | Value | ||||||
| DWS Government Money Market Series - Institutional Class, 3.75% (a) | 7,443,766 | $ | 7,443,766 | |||||
| Fidelity Institutional Money Market Government Portfolio - Class I, 3.55% (a) | 7,443,769 | 7,443,769 | ||||||
| Goldman Sachs Financial Square Treasury Obligations Fund -Institutional Class, 3.68% (a) | 7,443,767 | 7,443,767 | ||||||
| Invesco Short-Term Investments Trust - Institutional Class, 3.76% (a) | 7,443,766 | 7,443,766 | ||||||
| Total Money Market Funds (Cost $29,775,068) | $ | 29,775,068 | ||||||
| Investments at Value — 99.9% (Cost $122,173,996) | $ | 113,917,455 | ||||||
| Other Assets in Excess of Liabilities — 0.1% | 156,211 | |||||||
| Net Assets — 100.0% | $ | 114,073,666 | ||||||
| (a) | The rate shown is the 7-day effective yield as of November 30, 2022. |
See accompanying notes to financial statements.
7
| WAVELENGTH FUND |
| SCHEDULE OF FUTURES CONTRACTS |
| November 30, 2022 (Unaudited) |
| Value/Unrealized | ||||||||||||||||
| Expiration | Notional | Appreciation | ||||||||||||||
| FUTURES CONTRACTS | Contracts | Date | Value | (Depreciation) | ||||||||||||
| Commodity Futures | ||||||||||||||||
| E-Mini Gold Future | 4 | 1/27/2023 | $ | 351,980 | $ | 1,023 | ||||||||||
| Index Futures | ||||||||||||||||
| Bloomberg Commodity Index Future | 79 | 12/21/2022 | 916,795 | (7,576 | ) | |||||||||||
| E-Mini Dow CBOT DJIA Future | 6 | 12/16/2022 | 1,037,970 | 84,007 | ||||||||||||
| E-Mini S&P 500 Future | 3 | 12/16/2022 | 612,188 | 32,294 | ||||||||||||
| MSCI Emerging Markets Future | 35 | 12/16/2022 | 1,719,375 | 108,393 | ||||||||||||
| Total Index Futures | 4,286,328 | 217,118 | ||||||||||||||
| Treasury Futures | ||||||||||||||||
| 10-Year U.S. Treasury Note Future | 25 | 3/22/2023 | 2,837,500 | 8,631 | ||||||||||||
| 5-Year U.S. Treasury Note Future | 49 | 3/31/2023 | 5,319,930 | 17,207 | ||||||||||||
| U.S. Treasury Long Bond Future | 28 | 3/22/2023 | 3,556,000 | (11,890 | ) | |||||||||||
| Total Treasury Futures | 11,713,430 | 13,948 | ||||||||||||||
| Total Futures Contracts | $ | 16,351,738 | $ | 232,089 | ||||||||||||
The average monthly notional value of futures contracts during the six months ended November 30, 2022 was $19,274,632.
See accompanying notes to financial statements.
8
| WAVELENGTH FUND |
| STATEMENT OF ASSETS AND LIABILITIES |
| November 30, 2022 (Unaudited) |
| ASSETS | ||||
| Investments in securities: | ||||
| At cost | $ | 122,173,996 | ||
| At value (Note 2) | $ | 113,917,455 | ||
| Cash (Note 2) | 952 | |||
| Margin deposits for futures contracts (Note 2) | 1,304,130 | |||
| Variation margin receivable (Notes 2 and 5) | 136,593 | |||
| Receivable for capital shares sold | 189,659 | |||
| Receivable for investment securities sold | 805,226 | |||
| Dividends and interest receivable | 121,687 | |||
| Other assets | 25,812 | |||
| Total assets | 116,501,514 | |||
| LIABILITIES | ||||
| Variation margin payable (Notes 2 and 5) | 1,914 | |||
| Payable for capital shares redeemed | 2,245,290 | |||
| Payable for investment securities purchased | 113,279 | |||
| Payable to Adviser (Note 4) | 40,542 | |||
| Payable to administrator (Note 4) | 17,105 | |||
| Other accrued expenses | 9,718 | |||
| Total liabilities | 2,427,848 | |||
| NET ASSETS | $ | 114,073,666 | ||
| NET ASSETS CONSIST OF: | ||||
| Paid-in capital | $ | 134,957,511 | ||
| Accumulated deficit | (20,883,845 | ) | ||
| NET ASSETS | $ | 114,073,666 | ||
| Shares of beneficial interest outstanding (unlimited number of shares authorized, no par value) | 11,998,399 | |||
| Net asset value, offering price and redemption price per share (Note 2) | $ | 9.51 |
See accompanying notes to financial statements.
9
| WAVELENGTH FUND |
| STATEMENT OF OPERATIONS |
| For the Six Months Ended November 30, 2022 (Unaudited) |
| INVESTMENT INCOME | ||||
| Dividends | $ | 2,976,855 | ||
| Securities lending income (Note 6) | 332,932 | |||
| Interest | 1,844 | |||
| Total investment income | 3,311,631 | |||
| EXPENSES | ||||
| Investment advisory fees (Note 4) | 644,730 | |||
| Administration fees (Note 4) | 69,088 | |||
| Legal fees | 34,157 | |||
| Fund accounting fees (Note 4) | 22,796 | |||
| Registration and filing fees | 19,354 | |||
| Transfer agent fees (Note 4) | 14,922 | |||
| Networking fees | 12,238 | |||
| Trustees’ fees and expenses (Note 4) | 9,731 | |||
| Audit and tax services fees | 9,013 | |||
| Custody and bank service fees | 8,830 | |||
| Postage and supplies | 8,522 | |||
| Compliance fees (Note 4) | 7,737 | |||
| Insurance expense | 2,243 | |||
| Other expenses | 14,900 | |||
| Total expenses | 878,261 | |||
| Less fee reductions by the Adviser (Note 4) | (206,385 | ) | ||
| Net expenses | 671,876 | |||
| NET INVESTMENT INCOME | 2,639,755 | |||
| REALIZED AND UNREALIZED GAINS (LOSSES) ON INVESTMENTS AND FUTURES CONTRACTS | ||||
| Net realized losses from: | ||||
| Investments | (5,588,686 | ) | ||
| Futures contracts (Note 5) | (2,124,607 | ) | ||
| Net change in unrealized appreciation (depreciation) on: | ||||
| Investments | (444,017 | ) | ||
| Futures contracts (Note 5) | 509,091 | |||
| NET REALIZED AND UNREALIZED LOSSES ON INVESTMENTS AND FUTURES CONTRACTS | (7,648,219 | ) | ||
| NET DECREASE IN NET ASSETS RESULTING FROM OPERATIONS | $ | (5,008,464 | ) |
See accompanying notes to financial statements.
10
| WAVELENGTH FUND |
| STATEMENTS OF CHANGES IN NET ASSETS |
| Six Months | ||||||||
| Ended | Year | |||||||
| November 30, | Ended | |||||||
| 2022 | May 31, | |||||||
| (Unaudited) | 2022 | |||||||
| FROM OPERATIONS | ||||||||
| Net investment income | $ | 2,639,755 | $ | 3,155,576 | ||||
| Net realized gains (losses) from: | ||||||||
| Investments | (5,588,686 | ) | (332,027 | ) | ||||
| Futures contracts (Note 5) | (2,124,607 | ) | (2,843,020 | ) | ||||
| Long-term capital gain distributions from regulated investment companies | — | 10,873 | ||||||
| Net change in unrealized appreciation (depreciation) on: | ||||||||
| Investments | (444,017 | ) | (13,259,966 | ) | ||||
| Futures contracts (Note 5) | 509,091 | (555,090 | ) | |||||
| Net decrease in net assets resulting from operations | (5,008,464 | ) | (13,823,654 | ) | ||||
| DISTRIBUTIONS TO SHAREHOLDERS (Note 2) | (2,522,004 | ) | (5,539,959 | ) | ||||
| CAPITAL SHARE TRANSACTIONS | ||||||||
| Proceeds from shares sold | 20,171,505 | 102,973,904 | ||||||
| Net asset value of shares issued in reinvestment of distributions to shareholders | 1,645,486 | 4,160,165 | ||||||
| Payments for shares redeemed | (60,198,069 | ) | (83,647,047 | ) | ||||
| Net increase (decrease) in net assets from capital share transactions | (38,381,078 | ) | 23,487,022 | |||||
| TOTAL INCREASE (DECREASE) IN NET ASSETS | (45,911,546 | ) | 4,123,409 | |||||
| NET ASSETS | ||||||||
| Beginning of period | 159,985,212 | 155,861,803 | ||||||
| End of period | $ | 114,073,666 | $ | 159,985,212 | ||||
| CAPITAL SHARE ACTIVITY | ||||||||
| Shares sold | 2,130,409 | 9,528,065 | ||||||
| Shares issued in reinvestment of distributions to shareholders | 175,952 | 383,239 | ||||||
| Shares redeemed | (6,343,776 | ) | (8,058,384 | ) | ||||
| Net increase (decrease) in shares outstanding | (4,037,415 | ) | 1,852,920 | |||||
| Shares outstanding at beginning of period | 16,035,814 | 14,182,894 | ||||||
| Shares outstanding at end of period | 11,998,399 | 16,035,814 | ||||||
See accompanying notes to financial statements.
11
| WAVELENGTH FUND |
| FINANCIAL HIGHLIGHTS |
Per Share Data for a Share Outstanding Throughout Each Period
| Six Months | ||||||||||||||||||||||||
| Ended | Year | Year | Year | Year | Year | |||||||||||||||||||
| Nov. 30, | Ended | Ended | Ended | Ended | Ended | |||||||||||||||||||
| 2022 | May 31, | May 31, | May 31, | May 31, | May 31, | |||||||||||||||||||
| (Unaudited) | 2022 | 2021 | 2020 | 2019 | 2018 | |||||||||||||||||||
| Net asset value at beginning of period | $ | 9.98 | $ | 10.99 | $ | 10.35 | $ | 10.26 | $ | 9.97 | $ | 9.99 | ||||||||||||
| Income (loss) from investment operations: | ||||||||||||||||||||||||
| Net investment income (a) | 0.20 | 0.19 | 0.11 | 0.22 | 0.27 | 0.22 | ||||||||||||||||||
| Net realized and unrealized gains (losses) on investments and futures contracts | (0.50 | ) | (0.88 | ) | 0.75 | 0.38 | 0.28 | (0.03 | ) | |||||||||||||||
| Total from investment operations | (0.30 | ) | (0.69 | ) | 0.86 | 0.60 | 0.55 | 0.19 | ||||||||||||||||
| Less distributions from: | ||||||||||||||||||||||||
| Net investment income | (0.17 | ) | (0.16 | ) | (0.10 | ) | (0.23 | ) | (0.26 | ) | (0.21 | ) | ||||||||||||
| Net realized gains | — | (0.16 | ) | (0.12 | ) | (0.28 | ) | — | — | |||||||||||||||
| Total distributions | (0.17 | ) | (0.32 | ) | (0.22 | ) | (0.51 | ) | (0.26 | ) | (0.21 | ) | ||||||||||||
| Net asset value at end of period | $ | 9.51 | $ | 9.98 | $ | 10.99 | $ | 10.35 | $ | 10.26 | $ | 9.97 | ||||||||||||
| Total return (b) | (2.92 | %) (c) | (6.53 | %) | 8.39 | % | 5.92 | % | 5.68 | % | 1.95 | % | ||||||||||||
| Net assets at end of period (000’s) | $ | 114,074 | $ | 159,985 | $ | 155,862 | $ | 81,773 | $ | 53,268 | $ | 48,434 | ||||||||||||
| Ratios/supplementary data: | ||||||||||||||||||||||||
| Ratio of total expenses to average net assets (d) | 1.30 | % (e) | 1.22 | % | 1.25 | % | 1.34 | % | 1.41 | % | 1.55 | % | ||||||||||||
| Ratio of net expenses to average net assets (d)(f) | 0.99 | % (e) | 0.99 | % | 0.99 | % | 0.99 | % | 0.99 | % | 0.99 | % | ||||||||||||
| Ratio of net investment income to average net assets (a)(d)(f) | 3.90 | % (e) | 1.72 | % | 1.02 | % | 2.07 | % | 2.65 | % | 2.17 | % | ||||||||||||
| Portfolio turnover rate | 22 | % (c) | 18 | % | 12 | % | 52 | % | 20 | % | 9 | % | ||||||||||||
| (a) | Recognition of net investment income by the Fund is affected by the timing of the declarations of dividends by the underlying investment companies in which the Fund invests. |
| (b) | Total return is a measure of the change in value of an investment in the Fund over the periods covered. The returns shown do not reflect the deduction of taxes a shareholder would pay on Fund distributions, if any, or the redemption of Fund shares. The total returns would be lower if the Adviser had not reduced advisory fees and/or reimbursed expenses. |
| (c) | Not annualized. |
| (d) | The ratios of expenses and net investment income to average net assets do not reflect the Fund’s proportionate share of expenses of the underlying investment companies in which the Fund invests. |
| (e) | Annualized. |
| (f) | Ratio was determined after advisory fee reductions and/or expense reimbursements (Note 4). |
See accompanying notes to financial statements.
12
| WAVELENGTH FUND |
| NOTES TO FINANCIAL STATEMENTS |
| November 30, 2022 (Unaudited) |
1. Organization
Wavelength Fund (formerly, Wavelength Interest Rate Neutral Fund) (the “Fund”) is a diversified series of Ultimus Managers Trust (the “Trust”), an open-end investment company established as an Ohio business trust under a Declaration of Trust dated February 28, 2012. Other series of the Trust are not incorporated in this report.
The investment objective of the Fund is to seek total return.
2. Significant Accounting Policies
The Fund follows accounting and reporting guidance under Financial Accounting Standards Board Accounting Standards Codification Topic 946, “Financial Services – Investment Companies.” The following is a summary of the Fund’s significant accounting policies used in the preparation of its financial statements. These policies are in conformity with accounting principles generally accepted in the United States of America (“GAAP”).
Regulatory Update – In October 2020, the U.S. Securities and Exchange Commission (the “SEC”) adopted new regulations governing the use of derivatives by registered investment companies (“Rule 18f-4”). The Fund was required to comply with Rule 18f-4 by August 19, 2022. Rule 18f-4 imposes limits on the amount of derivatives a fund can enter into, eliminates the asset segregation framework previously used by funds to comply with Section 18 of the Investment Company Act of 1940, as amended (the “1940 Act”), treats derivatives as senior securities and requires funds whose use of derivatives is more than a limited specified exposure amount to establish and maintain a comprehensive derivatives risk management program and appoint a derivatives risk manager. The Fund is currently adhering to the requirements under Rule 18f-4.
Securities and futures valuation – The Fund values its portfolio securities at market value as of the close of regular trading on the New York Stock Exchange (the “NYSE”) (normally 4:00 p.m. Eastern time) on each business day the NYSE is open. Exchange-traded funds (“ETFs”) are valued at the security’s last sale price on the security’s primary exchange, if available, otherwise at the exchange’s most recently quoted mean price. Investments representing shares of money market funds and other open-end investment companies, except for ETFs, are valued at their net asset value (“NAV”) as reported by such companies. NASDAQ-listed securities are valued at the NASDAQ Official Closing Price. The Fund values its exchange-traded futures contracts at their last sale price as of the close of regular trading on the NYSE. Prices for these futures contracts are monitored daily by Wavelength Capital Management, LLC (the “Adviser”) until the close of regular trading to determine if fair valuation is required.
When using a quoted price and when the market for the security is considered active, a security will be classified as Level 1 within the fair value hierarchy (see below). In the event that market quotations are not readily available or are considered unreliable due to market or other events, the Fund values its securities and other assets at fair value pursuant to the procedures adopted by the Trust’s Board of Trustees (the “Board”). Under these procedures,
13
| WAVELENGTH FUND |
| NOTES TO FINANCIAL STATEMENTS (Continued) |
the securities will be classified as Level 2 or 3 within the fair value hierarchy, depending on the inputs used. Unavailable or unreliable market quotes may be due to the following factors: a substantial bid-ask spread; infrequent sales resulting in stale prices; insufficient trading volume; small trade sizes; a temporary lapse in any reliable pricing source; and actions of the securities or futures markets, such as the suspension or limitation of trading.
GAAP establishes a single authoritative definition of fair value, sets out a framework for measuring fair value, and requires additional disclosures about fair value measurements.
Various inputs are used in determining the value of the Fund’s investments. These inputs are summarized in the three broad levels listed below:
| ● | Level 1 – quoted prices in active markets for identical securities |
| ● | Level 2 – other significant observable inputs |
| ● | Level 3 – significant unobservable inputs |
The inputs or methods used for valuing securities are not necessarily an indication of the risks associated with investing in those securities. The inputs used to measure fair value may fall into different levels of the fair value hierarchy. In such cases, for disclosure purposes, the level in the fair value hierarchy within which the fair value measurement falls in its entirety is determined based on the lowest level input that is significant to the fair value measurement.
The following is a summary of the Fund’s investments and other financial instruments and the inputs used to value the investments and other financial instruments as of November 30, 2022:
| Level 1 | Level 2 | Level 3 | Total | |||||||||||||
| Investments in Securities | ||||||||||||||||
| Exchange-Traded Funds | $ | 84,142,387 | $ | — | $ | — | $ | 84,142,387 | ||||||||
| Money Market Funds | 29,775,068 | — | — | 29,775,068 | ||||||||||||
| Total | $ | 113,917,455 | $ | — | $ | — | $ | 113,917,455 | ||||||||
| Other Financial Instruments | ||||||||||||||||
| Futures Contracts | $ | 232,089 | $ | — | $ | — | $ | 232,089 | ||||||||
| Total | $ | 232,089 | $ | — | $ | — | $ | 232,089 | ||||||||
The Fund did not have any assets or liabilities that were measured at fair value on a recurring basis using significant unobservable inputs (Level 3) as of or during the six months ended November 30, 2022. Other Financial Instruments are future contracts which are valued at the unrealized appreciation (depreciation) as of November 30, 2022.
Cash account – The Fund’s cash is held in a bank account with balances which, at times, may exceed United States federally insured limits by the Federal Deposit Insurance Corporation (“FDIC”). Cash held with a Broker, if any, is not FDIC insured. The Fund maintains these balances with a high-quality financial institution and may incur charges on cash overdrafts.
14
| WAVELENGTH FUND |
| NOTES TO FINANCIAL STATEMENTS (Continued) |
Share valuation – The NAV per share of the Fund is calculated daily by dividing the total value of the Fund’s assets, less liabilities, by the number of shares outstanding. The offering price and redemption price per share of the Fund is equal to the NAV per share.
Investment income – Dividend income is recorded on the ex-dividend date. Interest income, if any, is accrued as earned. Non-cash dividends included in dividend income, if any, are recorded at the fair value of the security received.
Investment transactions – Investment transactions are accounted for on the trade date. Realized gains and losses on investments sold are determined on a specific identification basis.
Common expenses – Common expenses of the Trust are allocated among the Fund and the other series of the Trust based on the relative net assets of each series, the number of series in the Trust, or the nature of the services performed and the relative applicability to each series.
Distributions to shareholders – The Fund distributes to shareholders any net investment income on a quarterly basis and any net realized capital gains at least annually. The amount of such dividends and distributions are determined in accordance with federal income tax regulations, which may differ from GAAP. Dividends and distributions to shareholders are recorded on the ex-dividend date. The tax character of distributions paid during the periods ended November 30, 2022 and May 31, 2022 was as follows:
| Year | Ordinary | Tax-Exempt | Long-Term | Total | ||||||||||||
| Ended | Income | Distributions | Capital Gains | Distributions | ||||||||||||
| 11/30/2022 | $ | 2,522,004 | $ | — | $ | — | $ | 2,522,004 | ||||||||
| 5/31/2022 | $ | 3,482,354 | $ | 144,199 | $ | 1,913,406 | $ | 5,539,959 | ||||||||
Futures contracts – The Fund uses futures contracts to gain exposure to or to hedge against changes in the value of equities, real estate, interest rates or commodities. A futures contract represents a commitment for the future purchase or sale of an asset at a specified price on a specified date. When the Fund purchases or sells a futures contract, no price is paid to or received by the Fund. Instead, the Fund is required to deposit in a segregated asset account an amount of cash or qualifying securities currently ranging from 2% to 10% of the contract amount. This is called the “initial margin deposit.” Subsequent payments, known as “variation margin,” are made or received by the Fund each day, depending on the daily fluctuations in the fair value of the underlying asset. The Fund recognizes an unrealized gain or loss equal to the daily variation margin. If market conditions move unexpectedly, the Fund may not achieve the anticipated benefits of the futures contracts and may realize a loss. The margin deposits for futures contracts and the variation receivable/payable are reported on the Statement of Assets and Liabilities.
15
| WAVELENGTH FUND |
| NOTES TO FINANCIAL STATEMENTS (Continued) |
Estimates – The preparation of financial statements in conformity with GAAP requires management to make estimates and assumptions that affect the reported amounts of assets and liabilities and disclosure of contingent assets and liabilities as of the date of the financial statements and the reported amounts of increase (decrease) in net assets from operations during the reporting period. Actual results could differ from those estimates.
Federal income tax – The Fund has qualified and intends to continue to qualify as a regulated investment company under the Internal Revenue Code of 1986, as amended (the “Code”). Qualification generally will relieve the Fund of liability for federal income taxes to the extent 100% of its net investment income and net realized capital gains are distributed in accordance with the Code.
In order to avoid imposition of the excise tax applicable to regulated investment companies, it is also the Fund’s intention to declare as dividends in each calendar year amounts equal to at least 98% of its net investment income (earned during the calendar year) and 98.2% of its net realized capital gains (earned during the twelve months ended October 31) plus undistributed amounts from prior years.
The following information is computed on a tax basis for each item as of May 31, 2022:
| Tax cost of investments | $ | 192,452,784 | ||
| Gross unrealized appreciation | $ | 530,574 | ||
| Gross unrealized depreciation | (9,276,292 | ) | ||
| Net unrealized depreciation | (8,745,718 | ) | ||
| Undistributed ordinary income | 696,956 | |||
| Accumulated capital and other losses | (5,304,615 | ) | ||
| Total accumulated deficit | $ | (13,353,377 | ) | |
Post-October losses, incurred after October 31, 2021 and within the current taxable year, are deemed to arise on the first day of the Fund’s next taxable year. For the year ended May 31, 2022, the Fund deferred $5,304,615 of post-October losses to June 1, 2022 for federal income tax purposes.
The federal tax cost, unrealized appreciation (depreciation) as of November 30, 2022 is as follows:
| Tax cost of investments | $ | 123,759,879 | ||
| Gross unrealized appreciation | $ | 121,835 | ||
| Gross unrealized depreciation | (9,964,259 | ) | ||
| Net unrealized depreciation | $ | (9,842,424 | ) | |
16
| WAVELENGTH FUND |
| NOTES TO FINANCIAL STATEMENTS (Continued) |
The value of the federal income tax cost of investments may temporarily differ from the financial statement cost. This book/tax difference is due to the recognition of capital gains or losses under income tax regulations and GAAP, primarily the tax deferral of losses on wash sales, the tax treatment of realized and unrealized gains and losses on futures contracts and adjustments to basis on publicly traded partnerships.
The Fund recognizes the tax benefits or expenses of uncertain tax positions only when the position is “more likely than not” to be sustained assuming examination by tax authorities. Management has reviewed the Fund’s tax positions for the current and all open tax years (generally, three years) and has concluded that no provision for unrecognized tax benefits or expenses is required in these financial statements. The Fund identifies its major tax jurisdiction as U.S. Federal.
3. Investment Transactions
During the six months ended November 30, 2022, cost of purchases and proceeds from sales of investment securities, other than short-term investments, were $20,576,437 and $41,725,331, respectively.
4. Transactions with Related Parties
INVESTMENT ADVISORY AGREEMENT
The Fund’s investments are managed by the Adviser pursuant to the terms of an Advisory Agreement. Under the Advisory Agreement, the Fund pays the Adviser an investment advisory fee, computed and accrued daily and paid monthly, at the annual rate of 0.95% of its average daily net assets.
Pursuant to a new Expense Limitation Agreement between the Fund and the Adviser (the “ELA”), the Adviser has agreed, until October 1, 2025, to reduce its investment advisory fees and reimburse other expenses to limit total annual operating expenses (exclusive of brokerage costs; taxes; interest; borrowing costs such as interest and dividends expenses on securities sold short; acquired fund fees and expenses; extraordinary expenses such as litigation and merger or reorganization costs and other expenses not incurred in the ordinary course of the Fund’s business) to an amount not exceeding 0.99% of the Fund’s average daily net assets.
Accordingly, under the ELA, the Adviser, reduced its investment advisory fees in the amount of $206,385 during the six months ended November 30, 2022.
Under the terms of the ELA, investment advisory fee reductions and expense reimbursements by the Adviser are subject to recoupment by the Adviser for a period of three years after such fees and expenses were incurred, provided that the recoupments do not cause total annual operating expenses of the Fund to exceed the lesser of (i) the expense limitation then in effect, if any, and (ii) the expense limitation in effect at the time the expenses to be repaid
17
| WAVELENGTH FUND |
| NOTES TO FINANCIAL STATEMENTS (Continued) |
were incurred. As of November 30, 2022, the Adviser may seek recoupment of investment advisory fee reductions and expense reimbursements in the amount of $1,067,093 no later than the dates as stated below:
| May 31, 2023 | May 31, 2024 | May 31, 2025 | November 30, 2025 | Total | ||||||||||||||
| $ | 124,024 | $ | 321,501 | $ | 415,183 | $ | 206,385 | $ | 1,067,093 | |||||||||
OTHER SERVICE PROVIDERS
Ultimus Fund Solutions, LLC (“Ultimus”) provides administration, fund accounting, compliance and transfer agency services to the Fund. The Fund pays Ultimus fees in accordance with the agreements for such services. In addition, the Fund pays out-of-pocket expenses including, but not limited to, postage, supplies and certain costs related to the pricing of the Fund’s portfolio securities.
Under the terms of a Distribution Agreement with the Trust, Ultimus Fund Distributors, LLC (the “Distributor”) serves as the principal underwriter to the Fund. The Distributor is a wholly-owned subsidiary of Ultimus. The Distributor is compensated by the Adviser (not the Fund) for acting as principal underwriter.
Certain officers and a Trustee of the Trust are also officers of Ultimus.
TRUSTEE COMPENSATION
Effective October 17, 2022, each member of the Board (a “Trustee”) who is not an “interested person” (as defined by the 1940 Act, as amended) of the Trust (“Independent Trustee”) receives a $1,300 annual retainer from the Fund, paid quarterly, except for the Board Chairperson who receives a $1,700 annual retainer from the Fund, paid quarterly and the Audit Committee Chairperson who receives a $1,500 annual retainer from the Fund, paid quarterly. Each Independent Trustee also receives from the Fund a fee of $550 for each Board meeting attended plus reimbursement for travel and other meeting-related expenses. Prior to October 17, 2022, no annual retainer was designated specifically for the Audit Committee Chairperson and the Audit Committee Chairperson received a $1,300 annual retainer from the Fund.
PRINCIPAL HOLDER OF FUND SHARES
As of November 30, 2022, the following shareholder owned of record 25% or more of the outstanding shares of the Fund:
| Name of Record Owner | % Ownership |
| National Financial Services, LLC (for the benefit of its customers) | 43% |
A shareholder owning of record or beneficially 25% or more of the Fund’s outstanding shares may be considered a controlling person. That shareholder’s vote could have a more significant effect on matters presented at a shareholders’ meeting.
18
| WAVELENGTH FUND |
| NOTES TO FINANCIAL STATEMENTS (Continued) |
5. Derivatives Transactions
The Fund’s positions in derivative instruments as of November 30, 2022 are recorded in the following location on the Statement of Assets and Liabilities:
| Derivative Investment Type | Location | |
| Futures contracts | Variation margin receivable (payable) |
The following table sets forth the values of variation margin of the Fund as of November 30, 2022:
| Variation Margin | ||||||||||||
| Type of Derivative and Risk | Receivable | (Payable) | Total | |||||||||
| Asset Derivatives | ||||||||||||
| Futures contracts | ||||||||||||
| Commodity | $ | — | $ | (760 | ) | $ | (760 | ) | ||||
| Index | 91,117 | — | 91,117 | |||||||||
| Treasury | 45,476 | (1,154 | ) | 44,322 | ||||||||
| Total | $ | 136,593 | $ | (1,914 | ) | $ | 134,679 | |||||
The Fund’s transactions in derivative instruments during the six months ended November 30, 2022 are recorded in the following locations on the Statement of Operations:
| Derivative Investment Type | Location | |
| Futures contracts | Net realized losses from futures contracts | |
| Net change in unrealized appreciation (depreciation) on futures contracts |
The following is a summary of the Fund’s net realized losses and net change in unrealized appreciation (depreciation) on derivative instruments recognized on the Statement of Operations during the six months ended November 30, 2022:
| Net Change | ||||||||
| in Unrealized | ||||||||
| Net Realized | Appreciation | |||||||
| Type of Derivative and Risk | Losses | (Depreciation) | ||||||
| Futures contracts | ||||||||
| Commodity | $ | (413,898 | ) | $ | 44,695 | |||
| Index | (354,628 | ) | 341,087 | |||||
| Treasury | (1,356,081 | ) | 123,309 | |||||
| Total | $ | (2,124,607 | ) | $ | 509,091 | |||
19
| WAVELENGTH FUND |
| NOTES TO FINANCIAL STATEMENTS (Continued) |
In the ordinary course of business, the Fund may enter into transactions subject to enforceable netting agreements or other similar arrangements (“netting agreements”). Generally, the right to offset in netting agreements allows the Fund to offset any exposure to a specific counterparty with any collateral received or delivered to that counterparty based on the terms of the agreements. Generally, the Fund manages its cash collateral securities and securities collateral on a counterparty basis.
As of November 30, 2022, the offsetting of financial assets and derivative assets is as follows:
| Gross | Gross | |||||||||||||||||||||||
| Amounts of | Amounts of | |||||||||||||||||||||||
| Recognized | Recognized | |||||||||||||||||||||||
| Assets not | Liabilities | Net Amounts | ||||||||||||||||||||||
| Offset on | not Offset on | Presented on | ||||||||||||||||||||||
| Statement of | Statement of | Derivatives | Statement of | |||||||||||||||||||||
| Assets and | Assets and | Available for | Assets and | Collateral | ||||||||||||||||||||
| Description | Liabilities | Liabilities | Offset | Liabilities | Pledged | Net Amount | ||||||||||||||||||
| Variation margin receivable -futures contracts | $ | 136,593 | $ | — | $ | (1,914 | ) | $ | 134,679 | $ | — | $ | 134,679 | |||||||||||
| Variation margin payable -futures contracts | — | (1,914 | ) | 1,914 | — | — | — | |||||||||||||||||
| Total subject to a master netting or similar arrangement | $ | 136,593 | $ | (1,914 | ) | $ | — | $ | 134,679 | $ | — | $ | 134,679 | |||||||||||
6. Securities Lending
Under the terms of the Securities Lending Agreement (the “SLA”) with U.S. Bank National Association (“U.S. Bank”), U.S. Bank is authorized to loan securities on behalf of the Fund to approved borrowers. The contractual maturity of securities lending transactions are on an overnight and continuous basis. In exchange, the Fund receives cash collateral in the amount of at least 102% of the value of the securities loaned. Any collateral shortfalls due to changes in security market prices are adjusted the next business day. The cash collateral is invested in a short-term investment instrument as noted on the Fund’s Schedule of Investments. Although risk is mitigated by the collateral, the Fund could experience a delay in recovering its securities and possible loss of income or value if the borrower fails to return them. The SLA provides that after predetermined rebates to borrowers, the Fund retains a portion of its net securities lending income and pays U.S. Bank the remaining portion. The Fund manages credit exposure arising from these lending transactions by, in appropriate circumstances, entering into a SLA with U.S. Bank that provides the Fund, in the event of default (such as bankruptcy or borrower’s failure to pay or perform), the right to net rights and obligations under such agreements and liquidate and set off collateral against the net amount owed to the Fund. The Fund’s collateral was invested in the Mount Vernon Liquid Assets Portfolio, LLC
20
| WAVELENGTH FUND |
| NOTES TO FINANCIAL STATEMENTS (Continued) |
(“Mount Vernon”) of which the investment objective is to seek to maximize current income to the extent with the preservation of capital and liquidity and maintain a stable NAV of $1.00 per unit. Additional information regarding Mount Vernon can be found at www.sec.gov. As of November 30, 2022, the Fund is currently not participating in securities lending.
7. Certain Investments and Risks
The securities in which the Fund invests, as well as the risks associated with these securities, are described in the Fund’s prospectus. Among these risks are those associated with investments in shares of ETFs. ETFs issue their shares to authorized participants in return for a specific basket of securities. The authorized participants then sell the ETF’s shares on the secondary market. In other words, ETF shares are traded on a securities exchange based on their market value. Investments in ETFs are subject to the risk that the ETF’s shares may trade at a premium (creating the risk that the Fund pays more than NAV for an ETF when making a purchase) or discount (creating the risk that the Fund receives less than NAV when selling an ETF) to the ETF’s NAV. Investments in ETFs are also subject to index-tracking risk because the total return generated by the securities will be reduced by transaction costs and expenses not incurred by the indices. Certain securities comprising the index tracked by an ETF may, from time to time, temporarily be unavailable, which may further impede the ETF’s ability to track its applicable index or match the index’s performance. To the extent that the Fund invests in an ETF, the Fund incurs additional expenses because the Fund bears its pro-rata portion of such ETF’s advisory fees and operational expenses. Finally, ETF shares are also subject to the risks applicable to the underlying basket of securities. As of November 30, 2022, the Fund had 73.8% of the value of its net assets invested in ETFs.
In order to maintain sufficient liquidity to implement investment strategies, or for temporary defensive purposes, the Fund may at times invest a significant portion of its assets in shares of a money market fund. As of November 30, 2022, the Fund had 26.1% of the value of its net assets invested in shares of money market funds registered under the 1940 Act. An investment in a money market fund is not insured or guaranteed by the Federal Deposit Insurance Corporation or any other government agency, entity or person. While investor losses in money market funds have been rare, they are possible. The Fund incurs additional indirect expenses due to acquired fund fees and expenses to the extent it invests in shares of money market funds. The financial statements for the money market funds held can be found at www.sec.gov.
8. Contingencies and Commitments
The Fund indemnifies the Trust’s officers and Trustees for certain liabilities that might arise from their performance of their duties to the Fund. Additionally, in the normal course of business, the Fund enters into contracts that contain a variety of representations and warranties and which provide general indemnifications. The Fund’s maximum exposure under these arrangements is unknown, as this would involve future claims that may be made against the Fund that have not yet occurred. However, based on experience, the Fund expects the risk of loss to be remote.
21
| WAVELENGTH FUND |
| NOTES TO FINANCIAL STATEMENTS (Continued) |
9. Subsequent Events
The Fund is required to recognize in the financial statements the effects of all subsequent events that provide additional evidence about conditions that existed as of the date of the Statement of Assets and Liabilities. For non-recognized subsequent events that must be disclosed to keep the financial statements from being misleading, the Fund is required to disclose the nature of the event as well as an estimate of its financial effect, or a statement that such an estimate cannot be made. Management has evaluated subsequent events through the issuance of these financial statements and has noted no such events except for the following:
On December 29, 2022, the Fund paid an ordinary income dividend of $0.1438 per share to shareholders of record on December 28, 2022.
22
| WAVELENGTH FUND |
| ABOUT YOUR FUND’S EXPENSES (Unaudited) |
We believe it is important for you to understand the impact of costs on your investment. As a shareholder of the Fund, you incur ongoing costs, including management fees and other operating expenses. The following examples are intended to help you understand your ongoing costs (in dollars) of investing in the Fund and to compare these costs with the ongoing costs of investing in other mutual funds.
A mutual fund’s ongoing costs are expressed as a percentage of its average net assets. This figure is known as the expense ratio. The expenses in the table below are based on an investment of $1,000 made at the beginning of the most recent period (June 1, 2022) and held until the end of the period (November 30, 2022).
The table below illustrates the Fund’s ongoing costs in two ways:
Actual fund return – This section helps you to estimate the actual expenses that you paid over the period. The “Ending Account Value” shown is derived from the Fund’s actual return, and the third column shows the dollar amount of operating expenses that would have been paid by an investor who started with $1,000 in the Fund. You may use the information here, together with the amount you invested, to estimate the expenses that you paid over the period.
To do so, simply divide your account value by $1,000 (for example, an $8,600 account value divided by $1,000 = 8.6), then multiply the result by the number given for the Fund under the heading “Expenses Paid During Period.”
Hypothetical 5% return – This section is intended to help you compare the Fund’s ongoing costs with those of other mutual funds. It assumes that the Fund had an annual return of 5% before expenses during the period shown, but that the expense ratio is unchanged. In this case, because the return used is not the Fund’s actual return, the results do not apply to your investment. The example is useful in making comparisons because the SEC requires all mutual funds to calculate expenses based on a 5% return. You can assess the Fund’s ongoing costs by comparing this hypothetical example with the hypothetical examples that appear in shareholder reports of other funds.
Note that expenses shown in the table are meant to highlight and help you compare ongoing costs only. The Fund does not charge transaction fees, such as purchase or redemption fees, nor does it carry a “sales load.”
The calculations assume no shares were bought or sold during the period. Your actual costs may have been higher or lower, depending on the amount of your investment and the timing of any purchases or redemptions.
23
| WAVELENGTH FUND |
| ABOUT YOUR FUND’S EXPENSES (Unaudited) |
More information about the Fund’s expenses can be found in this report. For additional information on operating expenses and other shareholder costs, please refer to the Fund’s prospectus.
| Beginning | Ending | Expenses | ||||
| Account Value | Account Value | Paid During | ||||
| June 1, 2022 | November 30, 2022 | Period* | ||||
| Based on Actual Fund Return | $1,000.00 | $970.80 | $4.89 | |||
| Based on Hypothetical 5% Return (before expenses) | $1,000.00 | $1,020.10 | $5.01 | |||
| * | Expenses are equal to the Fund’s annualized net expense ratio of 0.99% for the period, multiplied by the average account value over the period, multiplied by 183/365 (to reflect the one-half year period). |
| OTHER INFORMATION (Unaudited) |
A description of the policies and procedures that the Fund uses to vote proxies relating to portfolio securities is available without charge upon request by calling toll- free 1-866-896-9292, or on the SEC’s website at www.sec.gov. Information regarding how the Fund voted proxies relating to portfolio securities during the most recent 12-month period ended June 30 is available without charge upon request by calling toll-free 1-866-896-9292, or on the SEC’s website at www.sec.gov. The Trust files a complete listing of portfolio holdings for the Fund with the SEC as of the end of the first and third quarters of each fiscal year as an exhibit to its reports on Form N-PORT. These filings are available upon request by calling 1-866-896-9292. Furthermore, you may obtain a copy of the filings on the SEC’s website at www.sec.gov and the Fund’s website at www.wavelengthcapital.com.
24
| WAVELENGTH FUND |
| LIQUIDITY RISK MANAGEMENT PROGRAM (Unaudited) |
The Fund has adopted and implemented a written liquidity risk management program (the “Program”) as required by Rule 22e-4 (the “Liquidity Rule”) under the Investment Company Act of 1940, as amended. The Program is reasonably designed to assess and manage the Fund’s liquidity risk, taking into consideration, among other factors, the Fund’s investment strategy and the liquidity of its portfolio investments during normal and reasonably foreseeable stressed conditions; its short- and long-term cash flow projections; and its cash holdings and access to other funding sources. The Fund’s Board of Trustees (the “Board”) approved the appointment of the Liquidity Administrator Committee, comprising of the Fund’s Adviser and certain Trust officers, to be responsible for the Program’s administration and oversight and for reporting to the Board on at least an annual basis regarding the Program’s operation and effectiveness. The annual written report assessing the Program (the “Report”) was presented to the Board at the October 17 – 18, 2022 Board meeting and covered the period from June 1, 2021 to May 31, 2022 (the “Review Period”).
During the Review Period, the Fund did not experience unusual stress or disruption to its operations related to purchase and redemption activity. Also, during the Review Period, the Fund held adequate levels of cash and highly liquid investments to meet shareholder redemption activities in accordance with applicable requirements. The Report concluded that the Program is reasonably designed to prevent violation of the Liquidity Rule and the Program has been effectively implemented.
25
| CUSTOMER PRIVACY NOTICE |
| FACTS | WHAT DOES WAVELENGTH FUND (the “Fund”) DO WITH YOUR PERSONAL INFORMATION? | ||
| Why? | Financial companies choose how they share your personal information. Federal law gives consumers the right to limit some but not all sharing. Federal law also requires us to tell you how we collect, share, and protect your personal information. Please read this notice carefully to understand what we do. | ||
| What? | The types of personal information we collect and share depend on the product or service you have with us. This information can include:
■ Social Security number
■ Assets
■ Retirement Assets
■ Transaction History
■ Checking Account Information
■ Purchase History
■ Account Balances
■ Account Transactions
■ Wire Transfer Instructions
When you are no longer our customer, we continue to share your information as described in this notice. | ||
| How? | All financial companies need to share your personal information to run their everyday business. In the section below, we list the reasons financial companies can share their customers’ personal information; the reasons the Fund chooses to share; and whether you can limit this sharing. | ||
| Reasons we can share your personal information | Does
the Fund share? |
Can
you limit this sharing? | |
For our everyday business purposes – Such as to process your transactions, maintain your account(s), respond to court orders and legal investigations, or report to credit bureaus |
Yes | No | |
For our marketing purposes – to offer our products and services to you |
No | We don’t share | |
| For joint marketing with other financial companies | No | We don’t share | |
For our affiliates’ everyday business purposes – information about your transactions and experiences |
No | We don’t share | |
For our affiliates’ everyday business purposes – information about your creditworthiness |
No | We don’t share | |
| For nonaffiliates to market to you | No | We don’t share | |
| Questions? | Call 1-866-896-9292 | ||
26
| Who we are | |
| Who is providing this notice? | Wavelength Fund
Ultimus Fund Distributors, LLC (Distributor)
Ultimus Fund Solutions, LLC (Administrator) |
| What we do | |
| How does the Fund protect my personal information? | To protect your personal information from unauthorized access and use, we use security measures that comply with federal law. These measures include computer safeguards and secured files and buildings.
Our service providers are held accountable for adhering to strict policies and procedures to prevent any misuse of your nonpublic personal information. |
| How does the Fund collect my personal information? | We collect your personal information, for example, when you
■ Open an account
■ Provide account information
■ Give us your contact information
■ Make deposits or withdrawals from your account
■ Make a wire transfer
■ Tell us where to send the money
■ Tell us who receives the money
■ Show your government-issued ID
■ Show your driver’s license
We also collect your personal information from other companies. |
| Why can’t I limit all sharing? | Federal law gives you the right to limit only
■ Sharing for affiliates’ everyday business purposes – information about your creditworthiness
■ Affiliates from using your information to market to you
■ Sharing for nonaffiliates to market to you
State laws and individual companies may give you additional rights to limit sharing. |
| Definitions | |
| Affiliates | Companies related by common ownership or control. They can be financial and nonfinancial companies.
■ Wavelength Capital Management LLC, the investment adviser to the Fund, could be deemed to be an affiliate. |
| Nonaffiliates | Companies not related by common ownership or control. They can be financial and nonfinancial companies
■ The Fund does not share with nonaffiliates so they can market to you. |
| Joint marketing | A formal agreement between nonaffiliated financial companies that together market financial products or services to you.
■ The Fund does not jointly market. |
27
This page intentionally left blank.
This page intentionally left blank.
WAVELENGTH-SAR-22
(b). Not applicable
Item 2. Code of Ethics.
Not required
Item 3. Audit Committee Financial Expert.
Not required
Item 4. Principal Accountant Fees and Services.
Not required
Item 5. Audit Committee of Listed Registrants.
Not applicable
Item 6. Schedule of Investments.
| (a) | Not applicable [schedule filed with Item 1] |
| (b) | Not applicable |
Item 7. Disclosure of Proxy Voting Policies and Procedures for Closed-End Management Investment Companies.
Not applicable
| Item 8. | Portfolio Managers of Closed-End Management Investment Companies. |
Not applicable
Item 9. Purchases of Equity Securities by Closed-End Management Investment Company and Affiliated Purchasers.
Not applicable
Item 10. Submission of Matters to a Vote of Security Holders.
There has been no material changes to the manner in which shareholders may recommend nominees to the Registrant’s Board of Trustees or the Nominations & Governance Committee (the “Committee”). The Registrant does not have formal procedures by which shareholders may recommend nominees to the Registrant’s Board of Trustees. While the Registrant does not have formal procedure, the Committee shall to the extent required under applicable law, when identifying potential candidates for the position of Independent Trustee, consider any such candidate recommended by a shareholder.
Item 11. Controls and Procedures.
(a) Based on their evaluation of the registrant’s disclosure controls and procedures (as defined in Rule 30a-3(c) under the Investment Company Act of 1940) as of a date within 90 days of the filing date of this report, the registrant’s principal executive officer and principal financial officer have concluded that such disclosure controls and procedures are reasonably designed and are operating effectively to ensure that material information relating to the registrant, including its consolidated subsidiaries, is made known to them by others within those entities, particularly during the period in which this report is being prepared, and that the information required in filings on Form N-CSR is recorded, processed, summarized, and reported on a timely basis.
(b) There were no changes in the registrant’s internal control over financial reporting (as defined in Rule 30a-3(d) under the Investment Company Act of 1940) that occurred during the the period covered by this report that have materially affected, or are reasonably likely to materially affect, the registrant’s internal control over financial reporting.
Item 12. Disclosure of Securities Lending Activities for Closed-End Management Investment Companies.
Not applicable
| Item 13. | Exhibits. |
File the exhibits listed below as part of this Form. Letter or number the exhibits in the sequence indicated.
(a)(1) Any code of ethics, or amendment thereto, that is the subject of the disclosure required by Item 2, to the extent that the registrant intends to satisfy the Item 2 requirements through filing of an exhibit: Not required
(a)(2) A separate certification for each principal executive officer and principal financial officer of the registrant as required by Rule 30a-2(a) under the Act (17 CFR 270.30a-2(a)): Attached hereto
(a)(3) Any written solicitation to purchase securities under Rule 23c-1 under the Act (17 CFR 270.23c-1) sent or given during the period covered by the report by or on behalf of the registrant to 10 or more persons: Not applicable
(a)(4) Change in the registrant’s independent public accountants: Not applicable
(b) Certifications required by Rule 30a-2(b) under the Act (17 CFR 270.30a-2(b)): Attached hereto
Exhibit 99.CERT Certifications required by Rule 30a-2(a) under the Act
Exhibit 99.906CERT Certifications required by Rule 30a-2(b) under the Act
SIGNATURES
Pursuant to the requirements of the Securities Exchange Act of 1934 and the Investment Company Act of 1940, the registrant has duly caused this report to be signed on its behalf by the undersigned, thereunto duly authorized.
| (Registrant) | Ultimus Managers Trust | |||
| By (Signature and Title)* | /s/ Todd E. Heim | |||
| Todd E. Heim, President | ||||
| Date | February 1, 2023 | |||
| Pursuant to the requirements of the Securities Exchange Act of 1934 and the Investment Company Act of 1940, this report has been signed below by the following persons on behalf of the registrant and in the capacities and on the dates indicated. | ||||
| By (Signature and Title)* | /s/ Todd E. Heim | |||
| Todd E. Heim, Principal Executive Officer | ||||
| Date | February 1, 2023 | |||
| By (Signature and Title)* | /s/ Jennifer L. Leamer | |||
| Jennifer L. Leamer, Treasurer and Principal Financial Officer | ||||
| Date | February 1, 2023 | |||
* Print the name and title of each signing officer under his or her signature.
EX-99.CERT
CERTIFICATIONS
I, Todd E. Heim, certify that:
1. I have reviewed this report on Form N-CSR of Ultimus Managers Trust;
2. Based on my knowledge, this report does not contain any untrue statement of a material fact or omit to state a material fact necessary to make the statements made, in light of the circumstances under which such statements were made, not misleading with respect to the period covered by this report;
3. Based on my knowledge, the financial statements, and other financial information included in this report, fairly present in all material respects the financial condition, results of operations, changes in net assets, and cash flows (if the financial statements are required to include a statement of cash flows) of the registrant as of, and for, the periods presented in this report;
4. The registrant’s other certifying officer(s) and I are responsible for establishing and maintaining disclosure controls and procedures (as defined in Rule 30a-3(c) under the Investment Company Act of 1940) and internal control over financial reporting (as defined in Rule 30a-3(d) under the Investment Company Act of 1940) for the registrant and have:
(a) Designed such disclosure controls and procedures, or caused such disclosure controls and procedures to be designed under our supervision, to ensure that material information relating to the registrant, including its consolidated subsidiaries, is made known to us by others within those entities, particularly during the period in which this report is being prepared;
(b) Designed such internal control over financial reporting, or caused such internal control over financial reporting to be designed under our supervision, to provide reasonable assurance regarding the reliability of financial reporting and the preparation of financial statements for external purposes in accordance with generally accepted accounting principles;
(c) Evaluated the effectiveness of the registrant’s disclosure controls and procedures and presented in this report our conclusions about the effectiveness of the disclosure controls and procedures, as of a date within 90 days prior to the filing date of this report, based on such evaluation; and
(d) Disclosed in this report any change in the registrant’s internal control over financial reporting that occurred during the period covered by this report that has materially affected, or is reasonably likely to materially affect, the registrant’s internal control over financial reporting; and
5. The registrant’s other certifying officer(s) and I have disclosed to the registrant’s auditors and the audit committee of the registrant’s board of directors (or persons performing the equivalent functions):
(a) All significant deficiencies and material weaknesses in the design or operation of internal control over financial reporting which are reasonably likely to adversely affect the registrant’s ability to record, process, summarize, and report financial information; and
(b) Any fraud, whether or not material, that involves management or other employees who have a significant role in the registrant’s internal control over financial reporting.
| Date: February 1, 2023 | /s/ Todd E. Heim | |
| Todd E. Heim, Principal Executive Officer |
EX-99.CERT
CERTIFICATIONS
I, Jennifer L. Leamer, certify that:
1. I have reviewed this report on Form N-CSR of Ultimus Managers Trust:
2. Based on my knowledge, this report does not contain any untrue statement of a material fact or omit to state a material fact necessary to make the statements made, in light of the circumstances under which such statements were made, not misleading with respect to the period covered by this report;
3. Based on my knowledge, the financial statements, and other financial information included in this report, fairly present in all material respects the financial condition, results of operations, changes in net assets, and cash flows (if the financial statements are required to include a statement of cash flows) of the registrant as of, and for, the periods presented in this report;
4. The registrant’s other certifying officer(s) and I are responsible for establishing and maintaining disclosure controls and procedures (as defined in Rule 30a-3(c) under the Investment Company Act of 1940) and internal control over financial reporting (as defined in Rule 30a-3(d) under the Investment Company Act of 1940) for the registrant and have:
(a) Designed such disclosure controls and procedures, or caused such disclosure controls and procedures to be designed under our supervision, to ensure that material information relating to the registrant, including its consolidated subsidiaries, is made known to us by others within those entities, particularly during the period in which this report is being prepared;
(b) Designed such internal control over financial reporting, or caused such internal control over financial reporting to be designed under our supervision, to provide reasonable assurance regarding the reliability of financial reporting and the preparation of financial statements for external purposes in accordance with generally accepted accounting principles;
(c) Evaluated the effectiveness of the registrant’s disclosure controls and procedures and presented in this report our conclusions about the effectiveness of the disclosure controls and procedures, as of a date within 90 days prior to the filing date of this report, based on such evaluation; and
(d) Disclosed in this report any change in the registrant’s internal control over financial reporting that occurred during the period covered by this report that has materially affected, or is reasonably likely to materially affect, the registrant’s internal control over financial reporting; and
5. The registrant’s other certifying officer(s) and I have disclosed to the registrant’s auditors and the audit committee of the registrant’s board of directors (or persons performing the equivalent functions):
(a) All significant deficiencies and material weaknesses in the design or operation of internal control over financial reporting which are reasonably likely to adversely affect the registrant’s ability to record, process, summarize, and report financial information; and
(b) Any fraud, whether or not material, that involves management or other employees who have a significant role in the registrant’s internal control over financial reporting.
| Date: February 1, 2023 | /s/ Jennifer L. Leamer | |
| Jennifer L. Leamer, Treasurer and Principal Financial Officer |
EX-99.906CERT
CERTIFICATIONS
Todd E. Heim, Principal Executive Officer, and Jennifer L. Leamer, Principal Financial Officer, of Ultimus Managers Trust (the “Registrant”), each certify to the best of his/her knowledge that:
| 1. | The Registrant’s periodic report on Form N-CSR for the period ended November 30, 2022 (the “Form N-CSR”) fully complies with the requirements of section 13(a) or section 15(d) of the Securities Exchange Act of 1934, as amended; and |
| 2. | The information contained in the Form N-CSR fairly presents, in all material respects, the financial condition and results of operations of the Registrant. |
| PRINCIPAL EXECUTIVE OFFICER | PRINCIPAL FINANCIAL OFFICER | ||
| Ultimus Managers Trust | Ultimus Managers Trust | ||
| /s/ Todd E. Heim | /s/ Jennifer L. Leamer | ||
|
Todd E. Heim, Principal Executive Officer |
Jennifer L. Leamer, Treasurer and Principal Financial Officer | ||
| Date: February 1, 2023 | Date: February 1, 2023 |
A signed original of this written statement required by Section 906, or other document authenticating, acknowledging or otherwise adopting the signature that appears in typed form within the electronic version of this written statement required by Section 906, has been provided to Ultimus Managers Trust and will be retained by Ultimus Managers Trust and furnished to the Securities and Exchange Commission or its staff upon request.
This certification is being furnished to the Securities and Exchange Commission solely pursuant to 18 U.S.C. 1350 and is not being filed as part of the Form N-CSR filed with the Commission.