
4Q22 | FY 2022 Earnings Release
February 16th, 2023
UNITED STATES
SECURITIES AND EXCHANGE COMMISSION
Washington, D.C. 20549
FORM 6-K
REPORT OF FOREIGN PRIVATE ISSUER PURSUANT TO RULE 13a-16 OR 15d-16 UNDER THE SECURITIES EXCHANGE ACT OF 1934
For the month of February 2023
Commission File Number: 001-39155
XP Inc.
(Exact name of registrant as specified in its charter)
Av. Chedid Jafet, 75, Torre Sul, 30th floor,
Vila Olímpia – São Paulo
Brazil 04551-065
+55 (11) 3075-0429
(Address of principal executive office)
Indicate by check mark whether the registrant files or will file annual reports under cover of Form 20-F or Form 40-F:
| Form 20-F |
X |
Form 40-F |
Indicate by check mark if the registrant is submitting the Form 6-K in paper as permitted by Regulation S-T Rule 101(b)(1):
| Yes | No |
X |
Indicate by check mark if the registrant is submitting the Form 6-K in paper as permitted by Regulation S-T Rule 101(b)(7):
| Yes | No |
X |
SIGNATURE
Pursuant to the requirements of the Securities Exchange Act of 1934, the registrant has duly caused this report to be signed on its behalf by the undersigned, thereunto duly authorized.
| XP Inc. | |||||
| By: | /s/ Bruno Constantino Alexandre dos Santos | ||||
| Name: | Bruno Constantino Alexandre dos Santos | ||||
| Title: | Chief Financial Officer | ||||
Date: February 16, 2023
EXHIBIT INDEX
| Exhibit No. | Description |
| 99.1
|
Press Release dated February 16, 2023 - XP Inc. Reports Fourth Quarter and Full-Year 2022 Financial Results. |
| 99.2
|
XP Inc. - 4Q22 Earnings Presentation.
|
| 99.3 | XP Inc. – Consolidated Financial Statements for the years ended December 31, 2022, 2021 and 2020. |
Exhibit 99.1
|
4Q22 | FY 2022 Earnings Release February 16th, 2023
|
 |
XP Inc. Reports Fourth Quarter and Full-Year 2022 Financial Results
São Paulo, Brazil, February 16, 2023 – XP Inc. (NASDAQ: XP) (“XP” or the “Company”), a leading tech-enabled platform and a trusted pioneer in providing low-fee financial products and services in Brazil, reported today its financial results for the fourth quarter and full-year 2022.
To our shareholders
Despite several challenges and uncertainties faced during 2022, the year was marked by important achievements and many lessons learned.
The recent bull market cycle ended in 2021, boosted capital markets and attracted Brazilian investors to more sophisticated investment products.
As the main investment platform in the country and with the largest specialized distribution network, XP Inc. benefited from this scenario and from its scalable and disruptive business model.
Between 2018 and 2021, our Client Assets, Gross Revenue and Net Income expanded by 59%, 58% and 98% per year, respectively, well above the most optimistic forecast by analysts and even ourselves at the IPO.
Over that period, proceeds from the IPO and earnings were mainly invested in: (i) preserving and developing the advisory channel; (ii) strategic acquisitions and (iii) new verticals that are complementing and improving customers' experience, as well as increasing our addressable market.
We have no doubt that these investments will create long-term value and gradually reduce the cyclicality of our business, which can already be seen in the new verticals’ reported results.
The last monetary tightening cycle in Brazil began in 2013 and took the overnight rate close to the current level of 13.75%. Although ten years ago our business was substantially smaller, going back in time allows us to clearly see the evolution of our company from a countercyclical point of view.
In 2014, XP’s net income fell 40% relative to 2013 as 80% of revenues derived from stock trading. With the market worsening, our main KPIs — net inflow and the addition of new clients and IFAs — were strongly affected too. The fact of the matter was that the company’s performance was almost perfectly correlated with the Brazilian stock market.
Returning to the present and analyzing 2022, which resembles 2014 for Brazil, the scenario for XP is quite different. Our revenue grew 10% compared to 2021 and, even amidst many challenges, our net income remained stable.
In short, we evolved from a single product to a diversified portfolio of complementary businesses: Equities, Fixed Income, Mutual Funds, Retirement Plans, International Investments, Structured Products, Insurance, Banking, Cards, Institutional, Corporate, Investment Banking, among others.
We are confident that we can grow consistently over the coming years, and, unlike other growing companies, we have always been profitable and able to overcome difficult times with resilient results.
However, despite the relevant evolution of the business, we humbly recognize that the benign scenario of recent years has influenced the pace of our expansion, mainly in the increase of headcount, which was largely facilitated by the effects of the pandemic.
With a net addition of 1,200 employees in 2020 and 2,500 in 2021, we entered 2022 with a structure which was incompatible with the challenges we would face. The sharp increase in interest rates caused by persistent inflation slowed down client activity and the Retail overall business.
While our main KPIs expanded healthily for such hard year — R$155 billion net inflow and addition of 462 thousand new customers and 2 thousand IFAs — the reduction in hiring and expense adjustments made throughout the year did not prevent margin compression in 2022.
2
| |
Hence, in the fourth quarter, we began a comprehensive adjustment of our cost structure. This adjustment was made possible by the corporate transformation process initiated in 2021 and which involved the formation of business units. The main positive effects of this process are increased agility to respond clients’ demands, more autonomy to managers and, consequently, maximizing the use of XP's resources.
Therefore, a substantially leaner cost structure will be seen in coming quarters and, more importantly, its implementation won’t compromise service quality nor the execution of our strategic plan.
Such changes are aligned with the EBT margin guidance of 26% to 32% for 2023 to 2025, which is expected to converge from the lower end to the top over the period.
In summary, we don't know how long the current monetary cycle will last. However, we are adapting to the new scenario, staying close to our clients and teams, and learning from headwinds.
We started 2023 with a lot of energy and confidence. Brazil still has one of the most concentrated financial systems in the world, and we believe that with resilience, discipline, and a long-term vision, we will continue to gain market share from banks and move towards building the largest and best investment company in Brazil.
In the next paragraphs an update on expenses and return to shareholders will be provided.
Expenses
On the personnel front, we ended 2022 with 6,928 employees. At the end of January 2023, the total number of employees was 6,549, a decrease of 5.5% compared to December.
Adjusted SG&A expenses1 for 2023 are expected to be in the range of R$5.0 billion to R$5.5 billion, comparable to R$5.6 billion for 2022.
Return to Shareholders
Throughout 2022, 18 million shares were repurchased, equivalent to R$1.8 billion, including blocks from Itaú and Itaúsa. The numbers represent 3.2% of total shares and 51% of 2022 Net Income, respectively. In January 2023, another 3 million shares were repurchased.
In 2023, the current buyback program will continue and upon its conclusion a minimum return for shareholders in the form of buyback and/or dividends will be announced.
Conclusion
Finally, I would like to express my gratitude to our executive partners and collaborators.
We know that we have the right people and culture to continue our journey of transforming the Brazilian financial industry and building a better future for our existing and potential clients.
To our shareholders, clients, and business partners, thank you for your trust and always keep in mind that XP is our lifetime project.
Thiago Maffra, CEO
1 - Excludes Revenue from incentives from Tesouro Direto, B3 and others
3
| |
Summary
| Operating Metrics (unaudited) | 4Q22 | 4Q21 | YoY | 3Q22 | QoQ | 2022 | 2021 | YoY | |
| Total Client Assets (in R$ bn) | 946 | 815 | 16% | 925 | 2% | 946 | 815 | 16% | |
| Total Net Inflow (in R$ bn) | 31 | 48 | -36% | 35 | -11% | 155 | 230 | -33% | |
| Annualized Retail Take Rate | 1.22% | 1.49% | -28 bps | 1.33% | -11 bps | 1.29% | 1.44% | -15 bps | |
| Active clients (in '000s) | 3,877 | 3,416 | 14% | 3,805 | 2% | 3,877 | 3,416 | 14% | |
| Headcount (EoP) | 6,928 | 6,192 | 12% | 6,948 | 0% | 6,928 | 6,192 | 12% | |
| IFAs (in '000s) | 12.3 | 10.3 | 20% | 11.6 | 6% | 12.3 | 10.3 | 20% | |
| Retail DATs (in mn) | 2.7 | 2.5 | 8% | 2.3 | 16% | 2.4 | 2.7 | -11% | |
| Retirement Plans Client Assets (in R$ bn) | 61 | 48 | 27% | 58 | 4% | 61 | 48 | 27% | |
| Card's TPV (in R$ bn) | 8.2 | 4.4 | 86% | 6.6 | 24% | 24.9 | 10.4 | 140% | |
| Credit Portfolio (in R$ bn) | 17.1 | 10.2 | 67% | 16.3 | 5% | 17.1 | 10.2 | 67% | |
| Financial Metrics (in R$ mn) | 4Q22 | 4Q21 | YoY | 3Q22 | QoQ | 2022 | 2021 | YoY | |
| Gross revenue | 3,337 | 3,447 | -3% | 3,811 | -12% | 14,036 | 12,799 | 10% | |
| Retail | 2,549 | 2,678 | -5% | 2,629 | -3% | 10,157 | 9,793 | 4% | |
| Institutional | 357 | 326 | 10% | 577 | -38% | 1,919 | 1,277 | 50% | |
| Corporate and Issuer Services | 275 | 333 | -17% | 436 | -37% | 1,295 | 1,213 | 7% | |
| Other | 156 | 110 | 42% | 170 | -8% | 666 | 516 | 29% | |
| Net Revenue | 3,177 | 3,260 | -3% | 3,620 | -12% | 13,348 | 12,077 | 11% | |
| Gross Profit | 2,067 | 2,363 | -13% | 2,615 | -21% | 9,382 | 8,555 | 10% | |
| Gross Margin | 65.1% | 72.5% | -743 bps | 72.2% | -716 bps | 70.3% | 70.8% | -54 bps | |
| EBT | 738 | 1,121 | -34% | 983 | -25% | 3,445 | 3,815 | -10% | |
| EBT Margin | 23.2% | 34.4% | -1,114 bps | 27.2% | -391 bps | 25.8% | 31.6% | -578 bps | |
| Net Income | 783 | 991 | -21% | 1,031 | -24% | 3,580 | 3,592 | 0% | |
| Net Margin | 24.6% | 30.4% | -576 bps | 28.5% | -384 bps | 26.8% | 29.7% | -292 bps | |
| Basic EPS (in R$) | 1.43 | 1.77 | -19% | 1.85 | -23% | 6.44 | 6.42 | 0% | |
| Diluted EPS (in R$) | 1.39 | 1.71 | -19% | 1.80 | -23% | 6.25 | 6.26 | 0% | |
| ROAE¹ | 18.1% | 28.5% | -1032 bps | 24.4% | -629 bps | 22.8% | 28.4% | -562 bps | |
| ROAA² | 2.4% | 4.5% | -210 bps | 3.3% | -93 bps | 3.2% | 4.6% | -143 bps |
1 – Annualized Return on Average Equity.
2 – Annualized Return on Average Adjusted Assets. Adjusted Assets excludes Retirement Plans Liabilities and Float Balance.
4
| |
Discussion of Results
Total Gross Revenue
2022 vs 2021
Gross Revenue totaled R$14 billion in 2022, up 10% versus 2021 and reinforcing the increased resilience of our business model. In a challenging scenario for Retail Equity and Issuer Services revenues, the main positive drivers were (i) Institutional, (ii) Corporate and (iii) Fixed Income, Float and Cards within Retail.
4Q22
Following an all-time high total gross revenue on 3Q22, the 12% sequential decrease was mainly driven by lower Institutional and Corporate & Issuer Services revenues. These lines, which together accounted for 80% of the decline, both had record performance on the previous quarter and benefited from anticipated deal flow and traded volume ahead of the Brazilian elections.
Retail Revenue
2022 vs 2021
While our main KPIs continued to expand, Retail revenue reached R$10.2 billion in 2022. Annual 4% growth was primarily driven by the growth of Fixed Income and Float, benefiting from higher rates, and Cards, in line with higher TPV. These factors compensated for the 21% decline in Equity revenue mostly associated with the 4.5% Selic rate hike during the year.
4Q22
It is important to highlight that, given the key relationship aspect of our advisory business, periods like the last quarter of 2022 pose several headwinds to the performance of Investments (Equity, Fixed Income and Funds).
With high rates, which already make investors less inclined to seek better returns, additional factors such as post-election uncertainty, World Cup, and holidays, further reduced advisor-client interactions recently. Hence, despite the persistence of an adverse scenario in the short term, Retail is expected to improve throughout 2023.
Retail revenue was R$2.5 billion in 4Q22, down 3% QoQ. The main negative drivers offsetting Float and Cards revenue growth were: (i) Equity, with lower Structured Notes revenue and less trading days than 3Q22 (61 vs 65) and (ii) Fixed Income, with lower distribution fees as a relevant part of DCM deals was underwritten by banks rather than distributed to investors.
Retail-related revenues represented 80% in 4Q22 and 71% in 2022 of consolidated Net Income from Financial Instruments, as per the Accounting Income Statement.
Take Rate
Annualized Retail Take Rate was 1.22% on 4Q22 and 1.29% for the full year of 2022. The former was impacted by the dysfunctional environment for Retail, similarly to 1Q22, while the latter comprises the more benign scenarios of 2Q22 and 3Q22.
5
| |
Institutional Revenue
2022 vs 2021
In 2022, Institutional revenue grew 50% versus 2021 mainly due to (i) ongoing investments and focus on expanding our Institutional franchise to better serve global and Brazilian clients with a complete suite of services and (ii) FICC results on 1Q22 and 3Q22, which were boosted by increased volatility and traded volumes due to war in Eastern Europe and elections, respectively.
4Q22
Institutional revenue was R$357 million, down 38% from a record 3Q22.
Institutional revenue accounted for 6% in 4Q22 and 14% in 2022 of consolidated Net Income from Financial Instruments, as per the Accounting Income Statement.
Corporate & Issuer Services Revenue
2022 vs 2021
In 2022, revenue totaled R$1.3 billion, growing 7% YoY on the back of the Corporate business, which expanded more than 3x and compensated for Issuer Services contraction of 33% amidst a weaker deal flow across the board, but especially for ECM, when compared to 2021.
4Q22
Revenue totaled R$275 million in 4Q22, down 17% YoY and 37% QoQ. After a strong 3Q22 for capital market and corporate transactions ahead of elections, companies were less active on 4Q22. Also, as previously mentioned, average DCM distributed volume fell 35% in October-November vs 3Q22, according to Anbima. With a relevant underwritten volume, XP’s market share fell given our distribution leadership and limited balance sheet usage.
Corporate and Issuer Services related revenues represented 5% in 4Q22 and 7% in 2022 of consolidated Net Income from Financial Instruments, as per the Accounting Income Statement.
Other Revenue
2022 vs 2021
Other revenue, representing less than 5% of Total Gross Revenue, totaled R$666 million in 2022, growing 29% versus 2021 mainly due to the higher average Selic.
4Q22
Other revenue grew 42% YoY also due to Selic.
Other revenue accounted for 9% in both 4Q22 and 2022 of consolidated Net Income from Financial Instruments, as per the Accounting Income Statement.
6
| |
Costs of Goods Sold and Gross Margin
2022 vs 2021
COGS reached R$4.0 billion in 2022, up 13% relative to 2021, while Gross Margin fell 50bps mainly because of the positive performance of Cards revenue and its associated investback charge.
4Q22
Gross Margin was 65.1% in 4Q22 versus 72.5% in 4Q21 and 72.2% in 3Q22. Compression was mostly due to (i) sequential mix change, with higher share of Retail driving increase in proportionate commissions, (ii) R$27 million impact of criteria change on interchange fee recognition. As of 4Q22, interchange fees on installment purchases are fully recognized at the time of the transaction, in line with other players in the credit card industry and (iii) Prepaid Expenses write-off of R$35 million regarding contract termination with IFA operations. A R$74 million payment associated to the end of these contracts was recognized in Other Operating Income.
Despite possible quarterly volatility, we expect Gross Margin to remain stable in 2023 vs 2022.
SG&A Expenses
2022 vs 2021
SG&A expenses reached R$5.3 billion in 2022, growing 22% versus 2021. The expansion is mostly associated with the 33% YoY increase in average headcount and its effect on Salary & Taxes and Data Processing, which increased 31% and 52%, respectively.
In 2022, Revenue from incentives from Tesouro Direto, B3 and others, within Other Operating Income, totaled R$285 million. Despite being recurring, this line has components that depend on several and uncorrelated variables. Hence, we prefer to analyze SG&A Expenses excluding the incentives.
Adjusted SG&A expenses are estimated between R$5.0 billion and R$5.5 billion in 2023 versus R$5.6 billion in 2022.
4Q22
SG&A expenses totaled R$1.1 billion in 4Q22, down 22% QoQ, reflecting the ongoing adjustment our cost structure and the positive R$242 million amount on Other Administrative Income, which is related to incentives from Tesouro Direto, B3 and others, and payments received from contract termination with IFA operations.
Net Income and EPS
2022 vs 2021
Net Income and basic EPS were R$3.6 billion and R$6.44, virtually stable relative to 2021. On a diluted basis, EPS for 2022 was R$6.25.
Management estimates Net Income between R$3.8 billion and R$4.4 billion in 2023.
4Q22
In 4Q22, Net Income was R$783 million, down 21% YoY and 24% QoQ. Basic and diluted EPS were R$1.49 and R$1.43, respectively.
7
| |
Other Information
Webcast and Conference Call Information
The Company will host a webcast to discuss its second quarter financial results on Thursday, February 16th, 2023, at 5:00 pm ET (7:00 pm BRT). To participate in the earnings webcast please subscribe at 4Q22 Earnings Web Meeting. The replay will be available on XP’s investor relations website at https://investors.xpinc.com/
Investor Relations Contact
ir@xpi.com.br
Important Disclosure
In reviewing the information contained in this release, you are agreeing to abide by the terms of this disclaimer. This information is being made available to each recipient solely for its information and is subject to amendment. This release is prepared by XP Inc. (the “Company,” “we” or “our”), is solely for informational purposes. This release does not constitute a prospectus and does not constitute an offer to sell or the solicitation of an offer to buy any securities. In addition, this document and any materials distributed in connection with this release are not directed to, or intended for distribution to or use by, any person or entity that is a citizen or resident or located in any locality, state, country or other jurisdiction where such distribution, publication, availability or use would be contrary to law or regulation or which would require any registration or licensing within such jurisdiction.
This release was prepared by the Company. Neither the Company nor any of its affiliates, officers, employees or agents, make any representation or warranty, express or implied, in relation to the fairness, reasonableness, adequacy, accuracy or completeness of the information, statements or opinions, whichever their source, contained in this release or any oral information provided in connection herewith, or any data it generates and accept no responsibility, obligation or liability (whether direct or indirect, in contract, tort or otherwise) in relation to any of such information. The information and opinions contained in this release are provided as at the date of this release, are subject to change without notice and do not purport to contain all information that may be required to evaluate the Company. The information in this release is in draft form and has not been independently verified. The Company and its affiliates, officers, employees and agents expressly disclaim any and all liability which may be based on this release and any errors therein or omissions therefrom. Neither the Company nor any of its affiliates, officers, employees or agents makes any representation or warranty, express or implied, as to the achievement or reasonableness of future projections, management targets, estimates, prospects or returns, if any.
The information contained in this release does not purport to be comprehensive and has not been subject to any independent audit or review. Certain of the financial information as of and for the periods ended of December 31, 2021 and December 31, 2020, 2019, 2018 and 2017 has been derived from audited financial statements and all other financial information has been derived from unaudited interim financial statements. A significant portion of the information contained in this release is based on estimates or expectations of the Company, and there can be no assurance that these estimates or expectations are or will prove to be accurate. The Company’s internal estimates have not been verified by an external expert, and the Company cannot guarantee that a third party using different methods to assemble, analyze or compute market information and data would obtain or generate the same results.
Statements in the release, including those regarding the possible or assumed future or other performance of the Company or its industry or other trend projections, constitute forward-looking statements. These statements are generally identified by the use of words such as “anticipate,” “believe,” “could,” “expect,” “should,” “plan,” “intend,” “estimate” and “potential,” among others. By their nature, forward-looking statements are necessarily subject to a high degree of uncertainty and involve known and unknown risks, uncertainties, assumptions and other factors because they relate to events and depend on circumstances that will occur in the future whether or not outside the control of the Company. Such factors may cause actual results, performance or developments to differ materially from those expressed or implied by such forward-looking statements and there can be no assurance that such forward-looking statements will prove to be correct. These risks and uncertainties include factors relating to: (1) general economic, financial, political, demographic and business conditions in Brazil, as well as any other countries we may serve in the future and their impact on our business; (2) fluctuations in interest, inflation and exchange rates in Brazil and any other countries we may serve in the future; (3) competition in the financial services industry; (4) our ability to implement our business strategy; (5) our ability to adapt to the rapid pace of technological changes in the financial services industry; (6) the reliability, performance, functionality and quality of our products and services and the investment performance of investment funds managed by third parties or by our asset managers; (7) the availability of government authorizations on terms and conditions and within periods acceptable to us; (8) our ability to continue attracting and retaining new appropriately-skilled employees; (9) our capitalization and level of indebtedness; (10) the interests of our controlling shareholders; (11) changes in government regulations applicable to the financial services industry in Brazil and elsewhere; (12) our ability to compete and conduct our business in the future; (13) the success of operating initiatives, including advertising and promotional efforts and new product, service and concept development by us and our competitors; (14) changes in consumer demands regarding financial products, customer experience related to investments and technological advances, and our ability to innovate to respond to such changes; (15) changes in labor, distribution and other operating costs; (16) our compliance with, and changes to, government laws, regulations and tax matters that currently apply to us; (17) other factors that may affect our financial condition, liquidity and results of operations. Accordingly, you should not place undue reliance on forward-looking statements. The forward-looking statements included herein speak only as at the date of this release and the Company does not undertake any obligation to update these forward-looking statements. Past performance does not guarantee or predict future performance.
8
| |
Moreover, the Company and its affiliates, officers, employees and agents do not undertake any obligation to review, update or confirm expectations or estimates or to release any revisions to any forward-looking statements to reflect events that occur or circumstances that arise in relation to the content of the release. You are cautioned not to unduly rely on such forward-looking statements when evaluating the information presented and we do not intend to update any of these forward-looking statements.
Market data and industry information used throughout this release are based on management’s knowledge of the industry and the good faith estimates of management. The Company also relied, to the extent available, upon management’s review of industry surveys and publications and other publicly available information prepared by a number of third-party sources. All of the market data and industry information used in this release involves a number of assumptions and limitations, and you are cautioned not to give undue weight to such estimates. Although the Company believes that these sources are reliable, there can be no assurance as to the accuracy or completeness of this information, and the Company has not independently verified this information.
The contents hereof should not be construed as investment, legal, tax or other advice and you should consult your own advisers as to legal, business, tax and other related matters concerning an investment in the Company. The Company is not acting on your behalf and does not regard you as a customer or a client. It will not be responsible to you for providing protections afforded to clients or for advising you on the relevant transaction.
This release includes our Float, Adjusted Gross Financial Assets, Net Asset Value, and Adjustments to Reported Net Income, which are non-GAAP financial information. We believe that such information is meaningful and useful in understanding the activities and business metrics of the Company’s operations. We also believe that these non-GAAP financial measures reflect an additional way of viewing aspects of the Company’s business that, when viewed with our International Financial Reporting Standards (“IFRS”) results, as issued by the International Accounting Standards Board, provide a more complete understanding of factors and trends affecting the Company’s business. Further, investors regularly rely on non-GAAP financial measures to assess operating performance and such measures may highlight trends in the Company’s business that may not otherwise be apparent when relying on financial measures calculated in accordance with IFRS. We also believe that certain non-GAAP financial measures are frequently used by securities analysts, investors and other interested parties in the evaluation of public companies in the Company’s industry, many of which present these measures when reporting their results. The non-GAAP financial information is presented for informational purposes and to enhance understanding of the IFRS financial statements. The non-GAAP measures should be considered in addition to results prepared in accordance with IFRS, but not as a substitute for, or superior to, IFRS results. As other companies may determine or calculate this non-GAAP financial information differently, the usefulness of these measures for comparative purposes is limited. A reconciliation of such non-GAAP financial measures to the nearest GAAP measure is included in this release.
For purposes of this release:
“Active Clients” means the total number of retail clients served through our XP Investimentos, Rico, Clear, XP Investments and XP Private (Europe) brands, with Client Assets above R$100.00 or that have transacted at least once in the last thirty days. For purposes of calculating this metric, if a client holds an account in more than one of the aforementioned entities, such client will be counted as one “active client” for each such account. For example, if a client holds an account in each of XP Investimentos and Rico, such client will count as two “active clients” for purposes of this metric.
“Client Assets” means the market value of all client assets invested through XP’s platform and that is related to reported Retail Revenue, including equities, fixed income securities, mutual funds (including those managed by XP Gestão de Recursos Ltda., XP Advisory Gestão de Recursos Ltda. and XP Vista Asset Management Ltda., as well as by third-party asset managers), pension funds (including those from XP Vida e Previdência S.A., as well as by third-party insurance companies), exchange traded funds, COEs (Structured Notes), REITs, and uninvested cash balances (Float Balances), among others. Although Client Assets includes custody from Corporate Clients that generate Retail Revenue, it does not include custody from institutional clients (asset managers, pension funds and insurance companies).
Rounding
We have made rounding adjustments to some of the figures included in this release. Accordingly, numerical figures shown as totals in some tables may not be an arithmetic aggregation of the figures that preceded them.
9
| |
Unaudited Managerial Income Statement (in R$ mn) 4
| Managerial Income Statement | 4Q22 | 4Q21 | YoY | 3Q22 | QoQ | 2022 | 2021 | YoY | |
| Total Gross Revenue | 3,337 | 3,447 | -3% | 3,811 | -12% | 14,036 | 12,799 | 10% | |
| Retail | 2,549 | 2,678 | -5% | 2,629 | -3% | 10,157 | 9,793 | 4% | |
| Equities | 995 | 1,296 | -23% | 1,120 | -11% | 4,276 | 5,390 | -21% | |
| Fixed Income | 393 | 484 | -19% | 489 | -20% | 1,886 | 1,619 | 17% | |
| Funds Platform | 311 | 332 | -6% | 282 | 11% | 1,259 | 1,300 | -3% | |
| Retirement Plans | 93 | 74 | 26% | 85 | 10% | 333 | 227 | 47% | |
| Cards | 234 | 86 | 172% | 146 | 61% | 593 | 180 | 229% | |
| Credit | 47 | 36 | 32% | 40 | 18% | 160 | 104 | 54% | |
| Insurance | 31 | 18 | 78% | 21 | 51% | 97 | 60 | 62% | |
| Other | 443 | 353 | 26% | 447 | -1% | 1,553 | 914 | 70% | |
| Institutional | 357 | 326 | 10% | 577 | -38% | 1,919 | 1,277 | 50% | |
| Issuer Services & Corporate | 275 | 333 | -17% | 436 | -37% | 1,295 | 1,213 | 7% | |
| Issuer Services | 140 | 270 | -48% | 228 | -39% | 699 | 1,043 | -33% | |
| Corporate | 135 | 63 | 115% | 207 | -35% | 596 | 170 | 250% | |
| Other | 156 | 110 | 42% | 170 | -8% | 666 | 516 | 29% | |
| Net Revenue | 3,177 | 3,260 | -3% | 3,620 | -12% | 13,348 | 12,077 | 11% | |
| COGS | (1,110) | (896) | 24% | (1,005) | 10% | (3,965) | (3,523) | 13% | |
| Gross Profit | 2,067 | 2,363 | -13% | 2,615 | -21% | 9,382 | 8,555 | 10% | |
| Gross Margin | 65.1% | 72.5% | -7.43 p.p | 72.2% | -7.16 p.p | 70.3% | 70.8% | -0.54 p.p | |
| SG&A | (1,135) | (1,122) | 1% | (1,463) | -22% | (5,317) | (4,364) | 22% | |
| People | (892) | (952) | -6% | (1,057) | -16% | (3,943) | (3,427) | 15% | |
| Non-People | (243) | (170) | 43% | (405) | -40% | (1,374) | (937) | 47% | |
| D&A | (46) | (52) | -13% | (44) | 4% | (206) | (232) | -11% | |
| EBIT | 886 | 1,189 | -25% | 1,109 | -20% | 3,859 | 3,959 | -3% | |
| Interest expense on debt | (150) | (57) | 162% | (128) | 17% | (402) | (136) | 196% | |
| Share of profit or (loss) in joint ventures and associates | 1 | (11) | -113% | 1 | -180% | (12) | (8) | 58% | |
| EBT | 738 | 1,121 | -34% | 983 | -25% | 3,445 | 3,815 | -10% | |
| EBT Margin | 23.2% | 34.4% | -11.1 p.p | 27.2% | -3.9 p.p | 25.8% | 31.6% | -5.8 p.p | |
| Tax Expense (Accounting) | 44 | (130) | -134% | 48 | -7% | 136 | (223) | -161% | |
| Tax expense (Tax Witholding in Funds)¹ | (192) | (157) | 22% | (190) | 1% | (754) | (567) | 33% | |
| Effective tax rate (Normalized) | (15.8%) | (22.5%) | 6.6 p.p | (12.1%) | -3.7 p.p | (14.7%) | (18.0%) | 3.3 p.p | |
| Net Income | 783 | 991 | -21% | 1,031 | -24% | 3,580 | 3,592 | 0% | |
| Net Margin | 24.6% | 30.4% | -5.8 p.p | 28.5% | -3.8 p.p | 26.8% | 29.7% | -2.9 p.p | |
| Adjustments | 110 | 95 | 16% | 118 | -7% | 494 | 411 | 20% | |
| Adjusted Net Income² | 893 | 1,086 | -18% | 1,149 | -22% | 4,075 | 4,003 | 2% | |
| Adjusted Net Margin | 28.1% | 33.3% | -5.2 p.p | 31.7% | -3.6 p.p | 30.5% | 33.1% | -2.6 p.p |
1 – Tax adjustments are related to tax withholding expenses that are recognized net in gross revenue.
2 – See appendix for a reconciliation of Adjusted Net Income.
10
| |
Accounting Income Statement (in R$ mn)
| Accounting Income Statement | 4Q22 | 4Q21 | YoY | 3Q22 | QoQ | 2022 | 2021 | YoY | |
| Net revenue from services rendered | 1,565 | 1,552 | 1% | 1,558 | 0% | 5,940 | 6,196 | -4% | |
| Brokerage commission | 544 | 541 | 1% | 498 | 9% | 2,103 | 2,465 | -15% | |
| Securities placement | 361 | 493 | -27% | 525 | -31% | 1,631 | 1,917 | -15% | |
| Management fees | 412 | 381 | 8% | 361 | 14% | 1,581 | 1,490 | 6% | |
| Insurance brokerage fee | 47 | 33 | 42% | 35 | 35% | 153 | 133 | 15% | |
| Educational services | 6 | 11 | -41% | 6 | 0% | 27 | 71 | -62% | |
| Commission Fees | 237 | 77 | 207% | 135 | 75% | 564 | 193 | 192% | |
| Other services | 102 | 165 | -38% | 143 | -29% | 449 | 532 | -16% | |
| Sales Tax and contributions on Services | (145) | (149) | -3% | (145) | 0% | (568) | (605) | -6% | |
| Net income from financial instruments at amortized cost and at fair value through other comprehensive income | 14 | (543) | n.a. | 563 | -97% | 1,145 | (1,559) | n.a. | |
| Net income from financial instruments at fair value through profit or loss | 1,598 | 2,250 | -29% | 1,499 | 7% | 6,262 | 7,440 | -16% | |
| Total revenue and income | 3,177 | 3,260 | -3% | 3,620 | -12% | 13,347 | 12,077 | 11% | |
| Operating costs | (1,071) | (866) | 24% | (977) | 10% | (3,871) | (3,430) | 13% | |
| Selling expenses | (48) | (64) | -25% | (33) | 46% | (139) | (227) | -39% | |
| Administrative expenses | (1,368) | (1,344) | 2% | (1,503) | -9% | (5,641) | (4,693) | 20% | |
| Other operating revenues (expenses), net | 235 | 233 | 1% | 29 | n.a. | 257 | 324 | -21% | |
| Expected credit losses | (38) | (30) | 26% | (28) | 35% | (94) | (93) | 2% | |
| Interest expense on debt | (150) | (57) | 162% | (128) | 17% | (402) | (136) | 196% | |
| Share of profit or (loss) in joint ventures and associates | 1 | (11) | n.a. | 1 | 4% | (12) | (8) | 58% | |
| Income before income tax | 738 | 1,121 | -34% | 983 | -25% | 3,445 | 3,815 | -10% | |
| Income tax expense | 44 | (130) | n.a. | 48 | -7% | 136 | (223) | n.a. | |
| Net income for the period | 783 | 991 | -21% | 1,031 | -24% | 3,580 | 3,592 | 0% |
11
| |
Balance Sheet (in R$ mn)
| Assets | 4Q22 | 3Q22 | |||
| Cash | 3,553 | 2,601 | |||
| Financial assets | 177,682 | 172,585 | |||
| Fair value through profit or loss | 96,730 | 89,157 | |||
| Securities | 87,513 | 73,101 | |||
| Derivative financial instruments | 9,217 | 16,056 | |||
| Fair value through other comprehensive income | 34,479 | 40,238 | |||
| Securities | 34,479 | 40,238 | |||
| Evaluated at amortized cost | 46,473 | 43,190 | |||
| Securities | 9,272 | 8,060 | |||
| Securities purchased under agreements to resell | 7,604 | 8,047 | |||
| Securities trading and intermediation | 3,271 | 3,983 | |||
| Accounts receivable | 598 | 568 | |||
| Loan Operations | 22,211 | 20,411 | |||
| Other financial assets | 3,517 | 2,121 | |||
| Other assets | 5,761 | 5,509 | |||
| Recoverable taxes | 163 | 165 | |||
| Rights-of-use assets | 258 | 261 | |||
| Prepaid expenses | 4,240 | 4,196 | |||
| Other | 1,099 | 887 | |||
| Deferred tax assets | 1,612 | 1,509 | |||
| Investments in associates and joint ventures | 2,272 | 2,415 | |||
| Property and equipment | 311 | 308 | |||
| Goodwill & Intangible assets | 844 | 815 | |||
| Total Assets | 192,035 | 185,742 |
12
| |
| Liabilities | 4Q22 | 3Q22 | |||
| Financial liabilities | 127,709 | 124,490 | |||
| Fair value through profit or loss | 22,135 | 24,145 | |||
| Securities | 13,529 | 9,469 | |||
| Derivative financial instruments | 8,605 | 14,675 | |||
| Evaluated at amortized cost | 105,574 | 100,345 | |||
| Securities sold under repurchase agreements | 31,790 | 31,429 | |||
| Securities trading and intermediation | 16,063 | 15,374 | |||
| Financing instruments payable | 43,684 | 41,416 | |||
| Accounts payables | 617 | 561 | |||
| Borrowings | 1,866 | 1,901 | |||
| Other financial liabilities | 11,554 | 9,663 | |||
| Other liabilities | 47,169 | 43,664 | |||
| Social and statutory obligations | 968 | 628 | |||
| Taxes and social security obligations | 365 | 249 | |||
| Private pension liabilities | 45,734 | 42,714 | |||
| Provisions and contingent liabilities | 44 | 38 | |||
| Other | 58 | 35 | |||
| Deferred tax liabilities | 111 | 120 | |||
| Total Liabilities | 174,989 | 168,274 | |||
| Equity attributable to owners of the Parent company | 17,039 | 17,465 | |||
| Issued capital | 0 | 0 | |||
| Capital reserve | 19,160 | 15,459 | |||
| Other comprehensive income | (134) | (109) | |||
| Treasury | (1,987) | (681) | |||
| Retained earnings | - | 2,796 | |||
| Non-controlling interest | 6 | 3 | |||
| Total equity | 17,046 | 17,468 | |||
| Total liabilities and equity | 192,035 | 185,742 | |||
13
| |
Float, Adjusted Gross Financial Assets and Net Asset Value
(in R$ mn)
We present Adjusted Gross Financial Assets because we believe this metric captures the liquidity that is, in fact, available to us, net of the portion of liquidity that is related to our Float Balance (and therefore attributable to clients). We calculate Adjusted Gross Financial Assets as the sum of (1) Cash and Financial Assets (comprised of Cash plus Securities – Fair value through profit or loss, plus Securities – Fair value through other comprehensive income, plus Securities – Evaluated at amortized cost, plus Derivative financial instruments, plus Securities (purchased under agreements to resell), plus Loans and Foreign exchange portfolio (assets) less (2) Financial Liabilities (comprised of the sum of Securities loaned, Derivative financial instruments, Securities sold under repurchase agreements and Private pension liabilities), Deposits, Structured Operation Certificates (COE), Financial Bills, Foreign exchange portfolio (liabilities), Credit cards operations and (3) less Float Balance.
It is a measure that we track internally daily, and it more intuitively reflects the effect of the operational profits we generate and the variations between working capital assets and liabilities (cash flows from operating activities), investments in fixed and intangible assets and investments in the IFA Network (cash flows from investing activities) and inflows and outflows related to equity and debt securities in our capital structure (cash flows from financing activities). Our management treats all securities and financial instrument assets, net of financial instrument liabilities, as balances that compose our total liquidity, with subline items (such as, for example, “securities at fair value through profit and loss” and “securities at fair value through other comprehensive income”) expected to fluctuate substantially from quarter to quarter as our treasury manages and allocates our total liquidity to the most suitable financial instruments.
In order to explain how we measure our cash position or generation internally, we are introducing the Net Asset Value concept. Since we are a financial institution, we hold several types of financial instruments with different characteristics, hence the definition of net cash that makes more sense from a business perspective is the Net Asset Value. It is basically the adjusted gross financial assets net of debt instruments.
14
| |
| Adjusted Gross Financial Assets | 4Q22 | 3Q22 | |||
| Assets | 177,761 | 171,130 | |||
| (+) Cash | 3,553 | 2,601 | |||
| (+) Securities - Fair value through profit or loss | 87,513 | 73,101 | |||
| (+) Securities - Fair value through other comprehensive income | 34,479 | 40,238 | |||
| (+) Securities - Evaluated at amortized cost | 9,272 | 8,060 | |||
| (+) Derivative financial instruments | 9,217 | 16,056 | |||
| (+) Securities purchased under agreements to resell | 7,604 | 8,047 | |||
| (+) Loans and credit card operations | 22,211 | 20,411 | |||
| (+) Foreign exchange portfolio | 2,145 | 1,130 | |||
| (+) Energy | 647 | 619 | |||
| (+) Compulsory | 1,119 | 866 | |||
| Liabilities | (146,194) | (140,597) | |||
| (-) Securities | (13,529) | (9,469) | |||
| (-) Derivative financial instruments | (8,605) | (14,675) | |||
| (-) Securities sold under repurchase agreements | (31,790) | (31,429) | |||
| (-) Retirement Plans Liabilities | (45,734) | (42,714) | |||
| (-) Deposits | (20,262) | (21,205) | |||
| (-) Structured Operations | (12,110) | (11,026) | |||
| (-) Financial Bills | (5,676) | (3,566) | |||
| (-) Foreign exchange portfolio | (2,405) | (1,420) | |||
| (-) Credit card operations | (4,987) | (3,996) | |||
| (-) Commitments subject to possible redemption | (1,049) | (1,074) | |||
| (-) Promissory Note | (47) | (20) | |||
| (-) Float | (12,792) | (11,391) | |||
| (=) Adjusted Gross Financial Assets | 18,775 | 19,142 |
| Net Asset Value | 4Q22 | 3Q22 | |||
| (=) Adjusted Gross Financial Assets | 18,775 | 19,142 | |||
| Gross Debt | (9,389) | (9,298) | |||
| (-) Borrowings | (1,866) | (1,901) | |||
| (-) Debentures | (2,029) | (1,956) | |||
| (-) Structured financing | (1,934) | (1,798) | |||
| (-) Bonds | (3,561) | (3,642) | |||
| (=) Net Asset Value | 9,385 | 9,844 |
| Float (=net uninvested clients' deposits) | 4Q22 | 3Q22 | |||
| Assets | (3,271) | (3,983) | |||
| (-) Securities trading and intermediation | (3,271) | (3,983) | |||
| Liabilities | 16,063 | 15,374 | |||
| (+) Securities trading and intermediation | 16,063 | 15,374 | |||
| (=) Float | 12,792 | 11,391 |
15
| |
Reconciliation of Adjusted Net Income (in R$ mn)
| Adjusted Net Income | 4Q22 | 4Q21 | YoY | 3Q22 | QoQ | 2022 | 2021 | YoY | |
| Net Income | 783 | 991 | -21% | 1,031 | -24% | 3,580 | 3,592 | 0% | |
| (+) Share Based Compensation | 181 | 149 | 22% | 186 | -3% | 793 | 658 | 21% | |
| (+/-) Taxes | (71) | (54) | 30% | (68) | 4% | (299) | (247) | 21% | |
| Adj. Net Income | 893 | 1,086 | -18% | 1,149 | -22% | 4,075 | 4,003 | 2% |
16
Exhibit 99.2

1
2 Important Disclosure IN REVIEWING THE INFORMATION CONTAINED IN THIS PRESENTATION, YOU ARE AGREEING TO ABIDE BY THE TERMS OF THIS DISCLAIMER . THIS INFORMATION IS BEING MADE AVAILABLE TO EACH RECIPIENT SOLELY FOR ITS INFORMATION AND IS SUBJECT TO AMENDMENT . This presentation is prepared by XP Inc . (the “Company,” “we” or “our”), is solely for informational purposes . This presentation does not constitute a prospectus and does not constitute an offer to sell or the solicitation of an offer to buy any securities . In addition, this document and any materials distributed in connection with this presentation are not directed to, or intended for distribution to or use by, any person or entity that is a citizen or resident or located in any locality, state, country or other jurisdiction where such distribution, publication, availability or use would be contrary to law or regulation or which would require any registration or licensing within such jurisdiction . This presentation was prepared by the Company . Neither the Company nor any of its affiliates, officers, employees or agents, make any representation or warranty, express or implied, in relation to the fairness, reasonableness, adequacy, accuracy or completeness of the information, statements or opinions, whichever their source, contained in this presentation or any oral information provided in connection herewith, or any data it generates and accept no responsibility, obligation or liability (whether direct or indirect, in contract, tort or otherwise) in relation to any of such information . The information and opinions contained in this presentation are provided as at the date of this presentation, are subject to change without notice and do not purport to contain all information that may be required to evaluate the Company . The information in this presentation is in draft form and has not been independently verified . The Company and its affiliates, officers, employees and agents expressly disclaim any and all liability which may be based on this presentation and any errors therein or omissions therefrom . Neither the Company nor any of its affiliates, officers, employees or agents makes any representation or warranty, express or implied, as to the achievement or reasonableness of future projections, management targets, estimates, prospects or returns, if any . The information contained in this presentation does not purport to be comprehensive and has not been subject to any independent audit or review . Certain of the financial information as of and for the periods ended December 31 , 2019 , 2018 and 2017 has been derived from audited financial statements and all other financial information has been derived from unaudited interim financial statements . A significant portion of the information contained in this presentation is based on estimates or expectations of the Company, and there can be no assurance that these estimates or expectations are or will prove to be accurate . The Company’s internal estimates have not been verified by an external expert, and the Company cannot guarantee that a third party using different methods to assemble, analyze or compute market information and data would obtain or generate the same results . Statements in the presentation, including those regarding the possible or assumed future or other performance of the Company or its industry or other trend projections, constitute forward - looking statements . These statements are generally identified by the use of words such as “anticipate,” “believe,” “could,” “expect,” “should,” “plan,” “intend,” “estimate” and “potential,” among others . By their nature, forward - looking statements are necessarily subject to a high degree of uncertainty and involve known and unknown risks, uncertainties, assumptions and other factors because they relate to events and depend on circumstances that will occur in the future whether or not outside the control of the Company . Such factors may cause actual results, performance or developments to differ materially from those expressed or implied by such forward - looking statements and there can be no assurance that such forward - looking statements will prove to be correct . These risks and uncertainties include factors relating to : ( 1 ) general economic, financial, political, demographic and business conditions in Brazil, as well as any other countries we may serve in the future and their impact on our business ; ( 2 ) fluctuations in interest, inflation and exchange rates in Brazil and any other countries we may serve in the future ; ( 3 ) competition in the financial services industry ; ( 4 ) our ability to implement our business strategy ; ( 5 ) our ability to adapt to the rapid pace of technological changes in the financial services industry ; ( 6 ) the reliability, performance, functionality and quality of our products and services and the investment performance of investment funds managed by third parties or by our asset managers ; ( 7 ) the availability of government authorizations on terms and conditions and within periods acceptable to us ; ( 8 ) our ability to continue attracting and retaining new appropriately - skilled employees ; ( 9 ) our capitalization and level of indebtedness ; ( 10 ) the interests of our controlling shareholders ; ( 11 ) changes in government regulations applicable to the financial services industry in Brazil and elsewhere ; ( 12 ) our ability to compete and conduct our business in the future ; ( 13 ) the success of operating initiatives, including advertising and promotional efforts and new product, service and concept development by us and our competitors ; ( 14 ) changes in consumer demands regarding financial products, customer experience related to investments and technological advances, and our ability to innovate to respond to such changes ; ( 15 ) changes in labor, distribution and other operating costs ; ( 16 ) our compliance with, and changes to, government laws, regulations and tax matters that currently apply to us ; ( 17 ) the negative impacts of the COVID - 19 pandemic on global, regional and national economies and the related market volatility and protracted economic downturn ; and ( 18 ) other factors that may affect our financial condition, liquidity and results of operations . Accordingly, you should not place undue reliance on forward - looking statements . The forward - looking statements included herein speak only as at the date of this presentation and the Company does not undertake any obligation to update these forward - looking statements . Past performance does not guarantee or predict future performance . Moreover, the Company and its affiliates, officers, employees and agents do not undertake any obligation to review, update or confirm expectations or estimates or to release any revisions to any forward - looking statements to reflect events that occur or circumstances that arise in relation to the content of the presentation . You are cautioned not to unduly rely on such forward - looking statements when evaluating the information presented and we do not intend to update any of these forward - looking statements . Market data and industry information used throughout this presentation are based on management’s knowledge of the industry and the good faith estimates of management . The Company also relied, to the extent available, upon management’s review of industry surveys and publications and other publicly available information prepared by a number of third party sources . All of the market data and industry information used in this presentation involves a number of assumptions and limitations, and you are cautioned not to give undue weight to such estimates . Although the Company believes that these sources are reliable, there can be no assurance as to the accuracy or completeness of this information, and the Company has not independently verified this information . The contents hereof should not be construed as investment, legal, tax or other advice and you should consult your own advisers as to legal, business, tax and other related matters concerning an investment in the Company . The Company is not acting on your behalf and does not regard you as a customer or a client . It will not be responsible to you for providing protections afforded to clients or for advising you on the relevant transaction . This presentation also includes certain non - GAAP financial information . We believe that such information is meaningful and useful in understanding the activities and business metrics of the Company’s operations . We also believe that these non - GAAP financial measures reflect an additional way of viewing aspects of the Company’s business that, when viewed with our International Financial Reporting Standards (“IFRS”) results, as issued by the International Accounting Standards Board, provide a more complete understanding of factors and trends affecting the Company’s business . Further, investors regularly rely on non - GAAP financial measures to assess operating performance and such measures may highlight trends in the Company’s business that may not otherwise be apparent when relying on financial measures calculated in accordance with IFRS . We also believe that certain non - GAAP financial measures are frequently used by securities analysts, investors and other interested parties in the evaluation of public companies in the Company’s industry, many of which present these measures when reporting their results . The non - GAAP financial information is presented for informational purposes and to enhance understanding of the IFRS financial statements . The non - GAAP measures should be considered in addition to results prepared in accordance with IFRS, but not as a substitute for, or superior to, IFRS results . As other companies may determine or calculate this non - GAAP financial information differently, the usefulness of these measures for comparative purposes is limited . A reconciliation of such non - GAAP financial measures to the nearest GAAP measure is included in this presentation . For purposes of this presentation : “Active Clients” means the total number of retail clients served through our XP Investimentos, Rico, Clear, XP Investments and XP Private (Europe) brands, with Client Assets above R $ 100 . 00 or that have transacted at least once in the last thirty days . For purposes of calculating this metric, if a client holds an account in more than one of the aforementioned entities, such client will be counted as one “active client” for each such account . For example, if a client holds an account in each of XP Investimentos and Rico, such client will count as two “active clients” for purposes of this metric . “Client Assets” means the market value of all client assets invested through XP’s platform, including equities, fixed income securities, mutual funds (including those managed by XP Gestão de Recursos Ltda . , XP Advisory Gestão Recursos Ltda . and XP Vista Asset Management Ltda . , as well as by third - party asset managers), pension funds (including those from XP Vida e Previdência S . A . , as well as by third - party insurance companies), exchange traded funds, COEs (Structured Notes), REITs, and uninvested cash balances (Floating Balances), among others .

3 Index 1. Introduction 2. FY22 KPIs and Financials 3. Q&A

1 Introduction
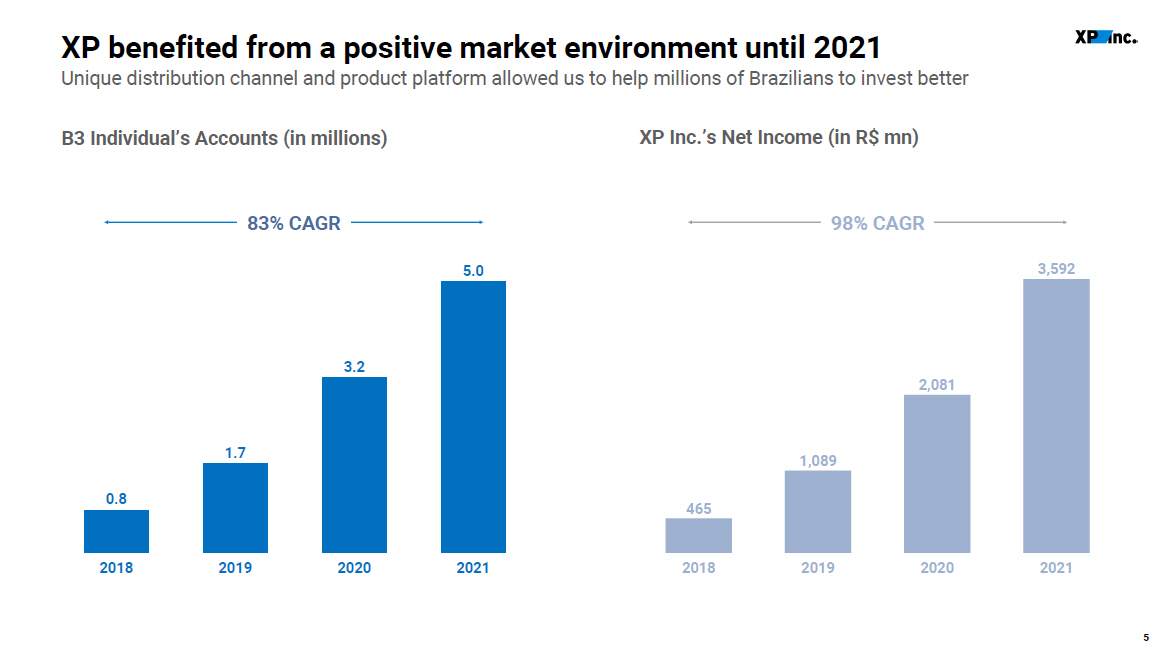
5 0.8 2020 2018 2019 2021 1.7 3.2 5.0 465 1,089 3,592 2018 2021 2019 2020 2,081 B3 Individual’s Accounts (in millions) XP Inc.’s Net Income (in R$ mn) 83% CAGR 98% CAGR XP benefited from a positive market environment until 2021 Unique distribution channel and product platform allowed us to help millions of Brazilians to invest better
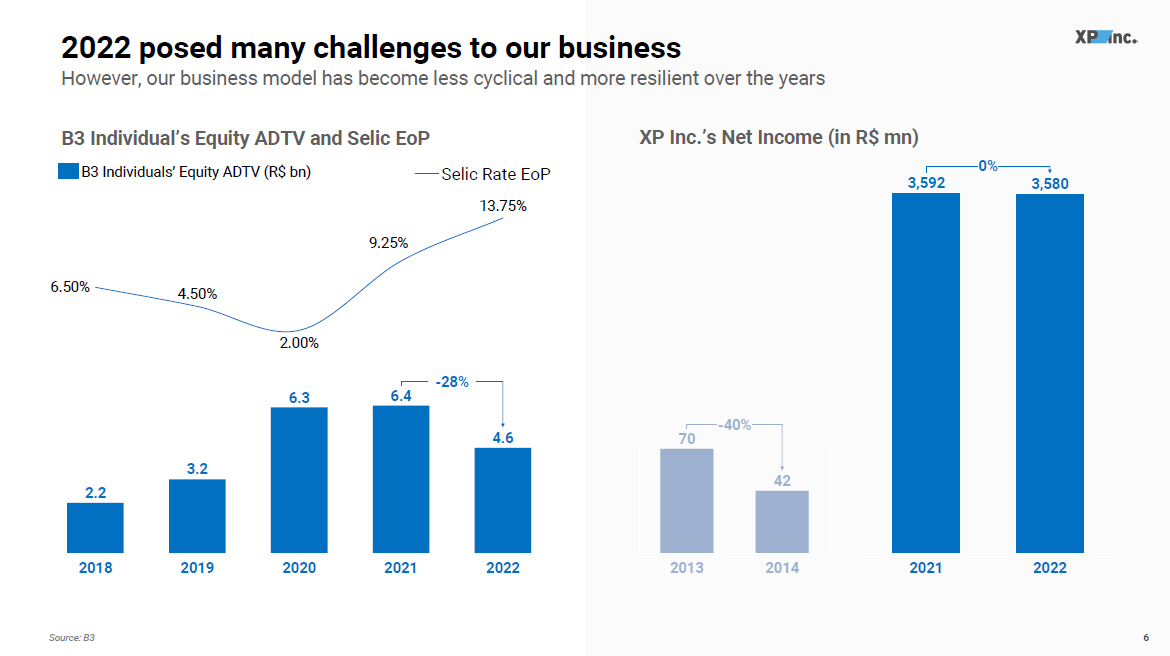
6 2022 posed many challenges to our business Source: B3 B3 Individuals’ Equity ADTV (R$ bn) 6.5 0 % 4.5 0 % 2.0 0 % 9.2 5 % Selic Rate EoP 13.75% 2018 2019 2020 2021 2022 2.2 6.4 3.2 6.3 4.6 - 28% 70 42 2013 2014 - 40% 3,592 2021 2022 3,580 0% However, our business model has become less cyclical and more resilient over the years B3 Individual’s Equity ADTV and Selic EoP XP Inc.’s Net Income (in R$ mn)
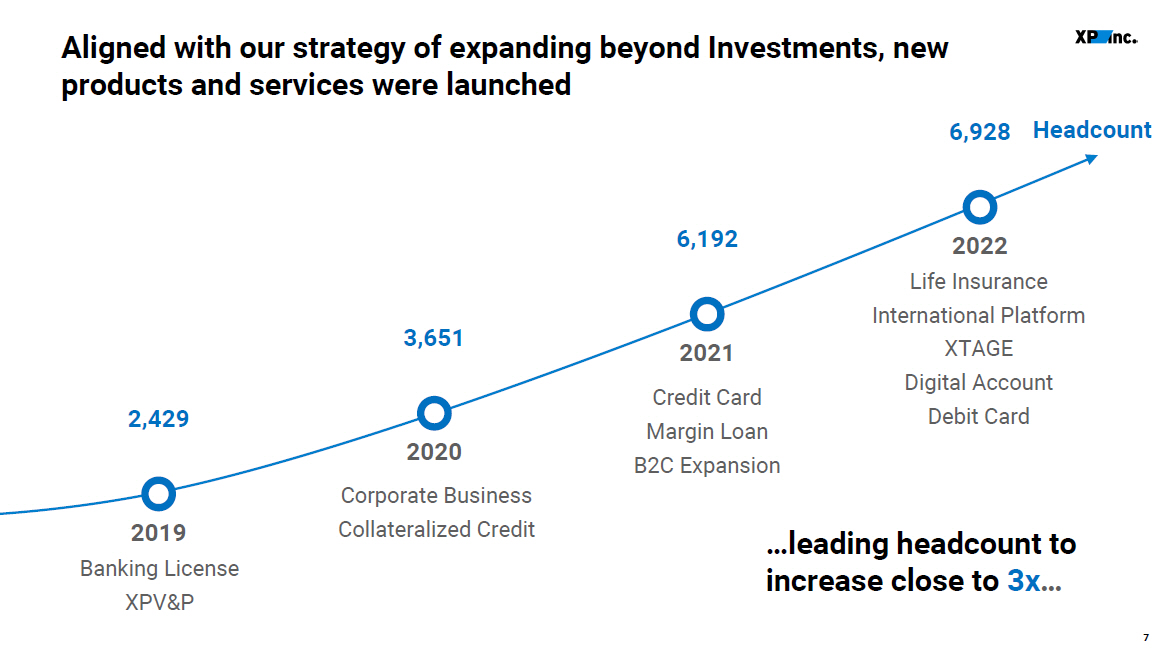
7 Aligned with our strategy of expanding beyond Investments, new products and services were launched 2019 Banking License XPV&P 2020 Corporate Business Collateralized Credit 2021 Credit Card Margin Loan B2C Expansion 2022 Life Insurance International Platform XTAGE Digital Account Debit Card 2,429 3,651 6,192 6,928 Headcount …leading headcount to increase close to 3x …
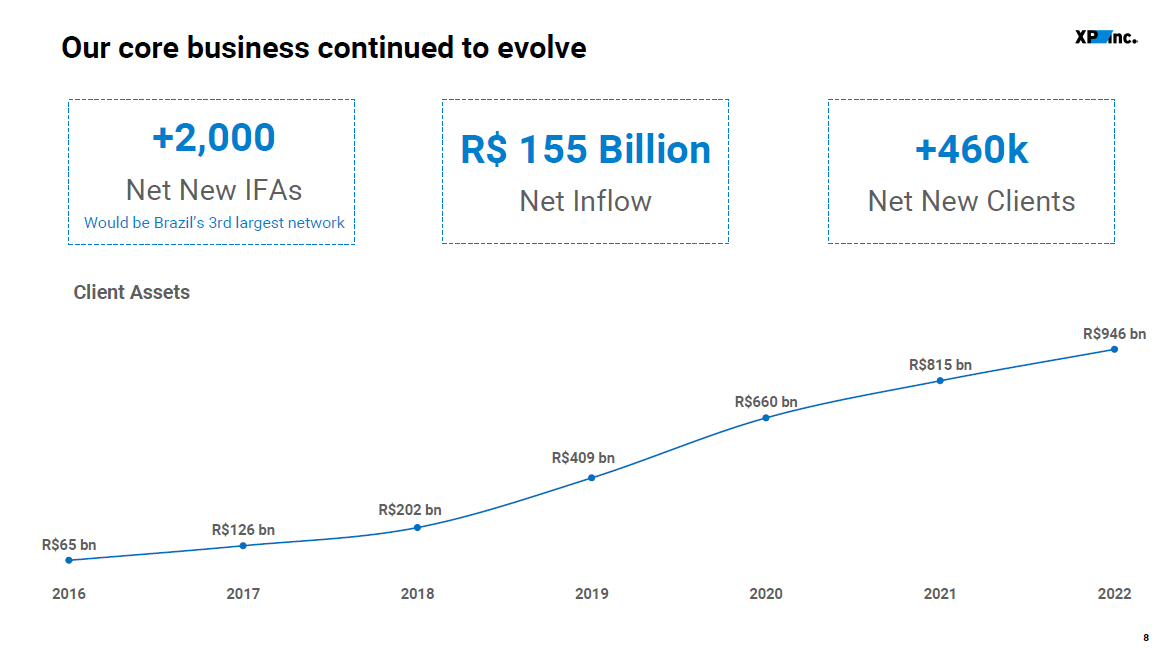
8 Our core business continued to evolve R$ 155 Billion Net Inflow +460k Net New Clients 2016 2017 2018 2019 2020 2021 2022 R$65 bn R$660 bn R$126 bn R$202 bn R$815 bn R$409 bn R$946 bn Client Assets +2,000 Net New IFAs Would be Brazil’s 3rd largest network
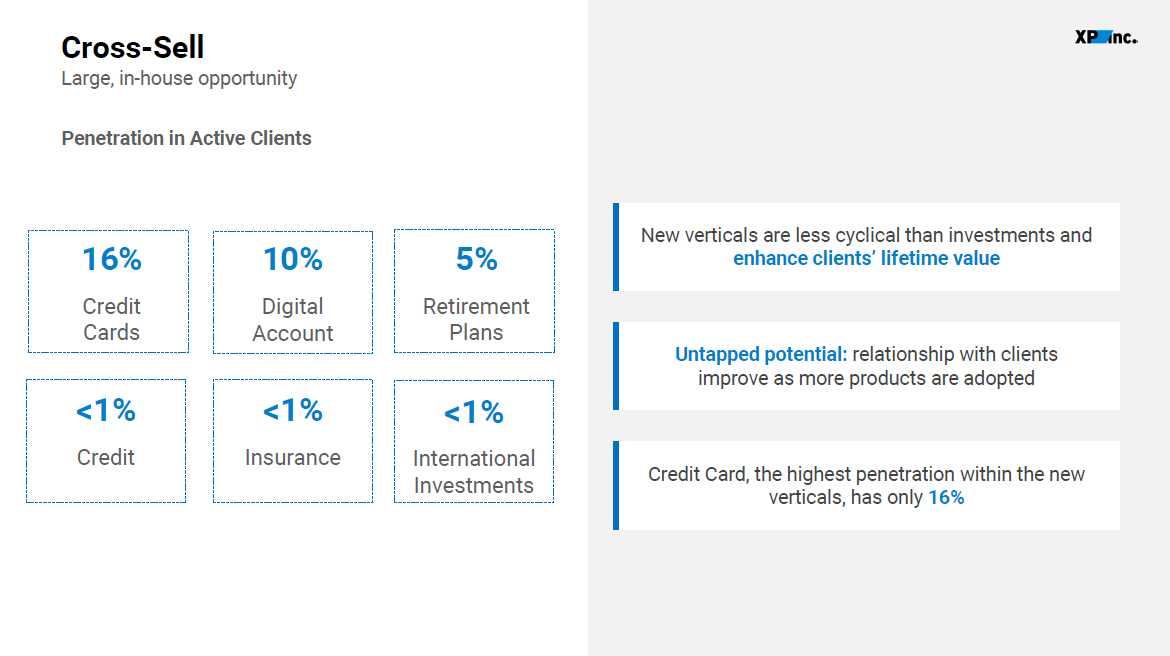
9 Credit Card, the highest penetration within the new verticals, has only 16% New verticals are less cyclical than investments and enhance clients’ lifetime value Cross - Sell Large, in - house opportunity Penetration in Active Clients Untapped potential: relationship with clients improve as more products are adopted 16% Credit Cards 5% Retire m ent Plans <1% Inte r national Investments <1% Credit <1% Insurance 10% Digital Account

10 SG&A Expenses 2023 GUIDANCE SG&A¹ between R$5.0 - 5.5 billion vs FY22 SG&A¹ of R$5.6 billion Adjustments to cost structure with no impact on service level nor strategic plan 2019 2018 3.2 2021 2020 4.7 2022 1.3 1.9 5.6 Note 1 – Excludes Revenue from incentives from Tesouro Direto, B3 and Others. Corporate transformation process allowed for resource optimization and increased efficiency Total SG&A (in R$ bn)¹ Leaner and sustainable cost structure from 2023 onwards 42 . 6 % 37 . 1 % 42 . 0 % 39 . 1 % 39 . 2 % SG&A¹ Expense Ratio (SG&A¹/Net Revenue)

2 FY22 KPIs and Financials
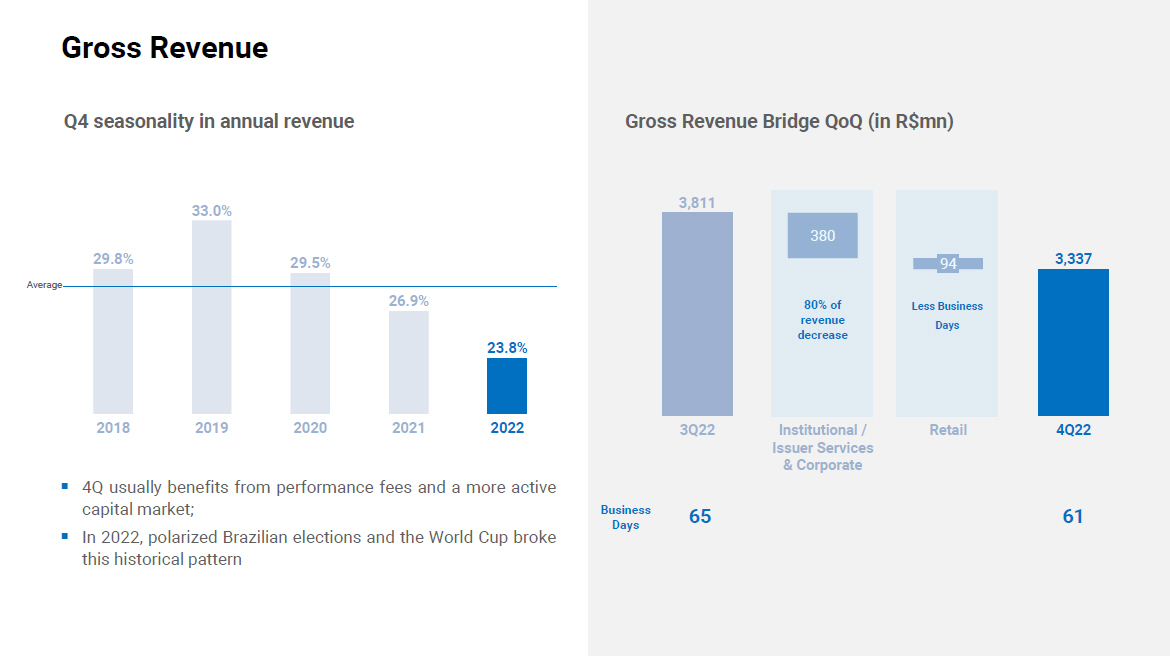
12 Gross Revenue 29.8% 33.0% 29.5% 26.9% 23.8% 2022 2018 2019 2021 2020 Q4 seasonality in annual revenue ▪ 4Q usually benefits from performance fees and a more active capital market; ▪ In 2022, polarized Brazilian elections and the World Cup broke this historical pattern Average 3,811 3,337 380 3Q22 Institutional / Issuer Services & Corporate Retail 4Q22 Bus i ness Days Gross Revenue Bridge QoQ (in R$mn) 80 % of revenue decr e a s e 94 Less Business Days 61 65
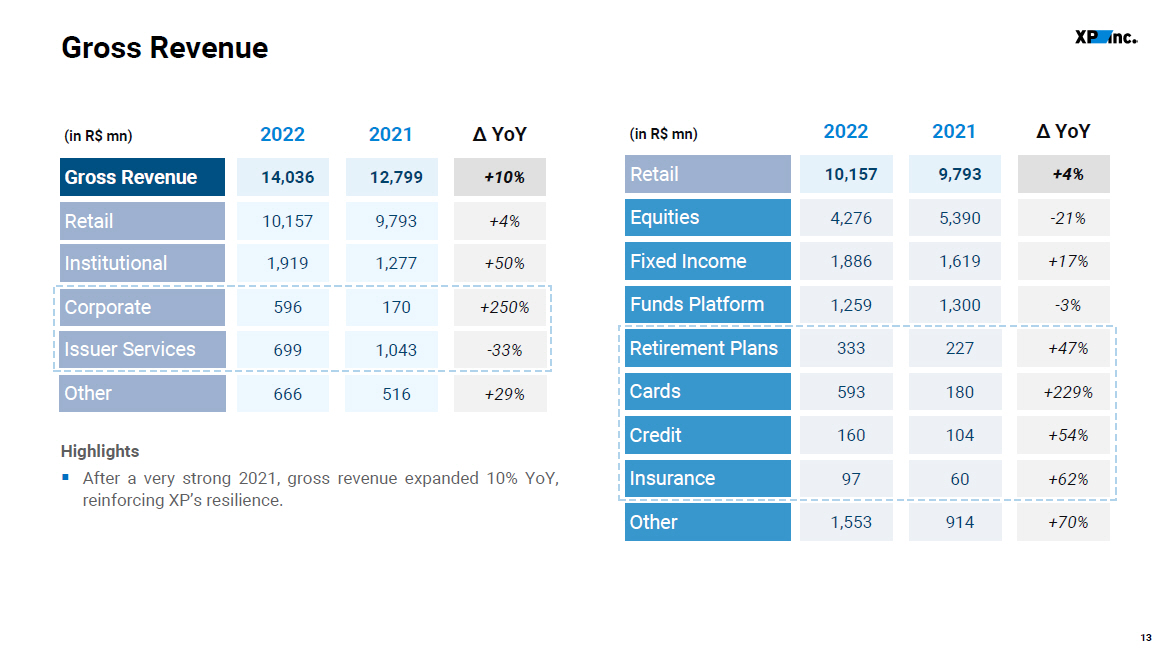
13 Gross Revenue (in R$ mn) 2022 2021 Δ YoY Gross Revenue 14,036 12,799 +10% Retail 10,157 9,793 +4% Institutional 1,919 1,277 +50% Corporate 596 170 +25 0 % Issuer Services 699 1,043 - 33% Other 666 516 +29% Highlights ▪ After a very strong 2021, gross revenue expanded 10% YoY, reinforcing XP’s resilience. (in R$ mn) 2022 2021 Δ YoY Retail 10,157 9,7 9 3 +4% Equities 4,276 5,390 - 21% Fixed Income 1,886 1,619 +17% Funds Platform 1,259 1,300 - 3% Retirement Plans 333 227 +47% Cards 593 180 +229% Credit 160 104 +54% Insurance 97 60 +62% Other 1,553 914 +70%

14 Gross Margin 72.2% 65.1% 2.6% 1.1% 1.5% 1.9% 3Q22 Prepaid E x pense Write - off Com m iss ionabl e Revenue Mix Credit Cards Ot h er 4Q22 Gross Margin YoY Gross Margin Bridge QoQ Highlights ▪ Despite possible quarterly volatility, Gross Margin for 2023 is expected to be in line with 2021 and 2022. 70.8% 2021 2022 70.3% - 0.8 bps Highlights ▪ Gros s Mar g in c o mpre s si o n m a in l y led by i t e m s t h a t a r e expected to normalize going forward.

15 SG&A Expenses 5,500 5,000 425 1,377 1,377 485 Peo p le Non - People 0% 952 892 2021 2022 2023E 4Q21 4Q22 31.6% 25.8% 26 - 32% 34.4% 23.2% Note 1 – Excludes Revenue from incentives from Tesouro Direto, B3 and Others Highlights ▪ SG&A¹ expenses were flat YoY and fell 8% QoQ reflecting the ongoing adjustment of our cost structure. Total SG&A Expenses 1 (in R$ mn) 5,602 4,730 EBT Margin Highlights ▪ SG&A ¹ e x pense s e s tim a t e d be t w e en R $ 5 . 0 bi l l i on and R $ 5 . 5 billion in 2023, versus R$5.6 billion in 2022.
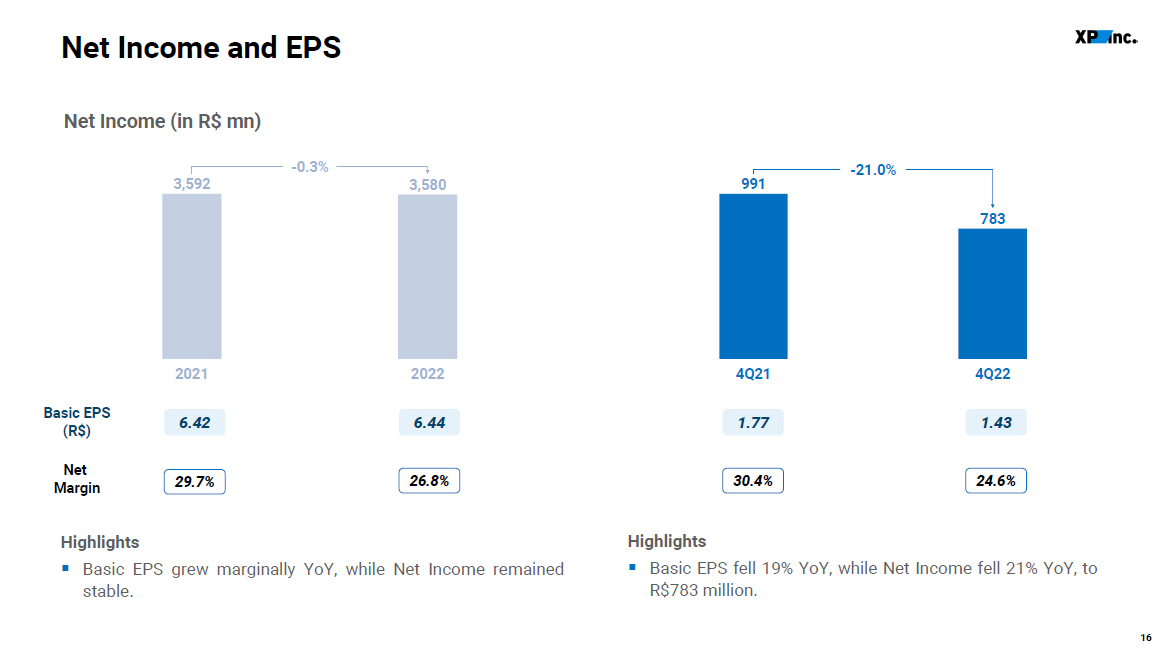
16 Net Income and EPS 991 4Q21 - 21.0% 783 2021 2022 3,580 29.7% 26.8% Net Income (in R$ mn) - 0.3% 3,592 30.4% Net Mar g in 6.42 6.44 1.77 Basic EPS (R$) 4Q22 1.43 24.6% Highlights ▪ Basic EPS fell 19% YoY, while Net Income fell 21% YoY, to R$783 million. Highlights ▪ Ba s ic E P S gr ew margin a l l y YoY, w h i le Net I nc o m e r emained stable.
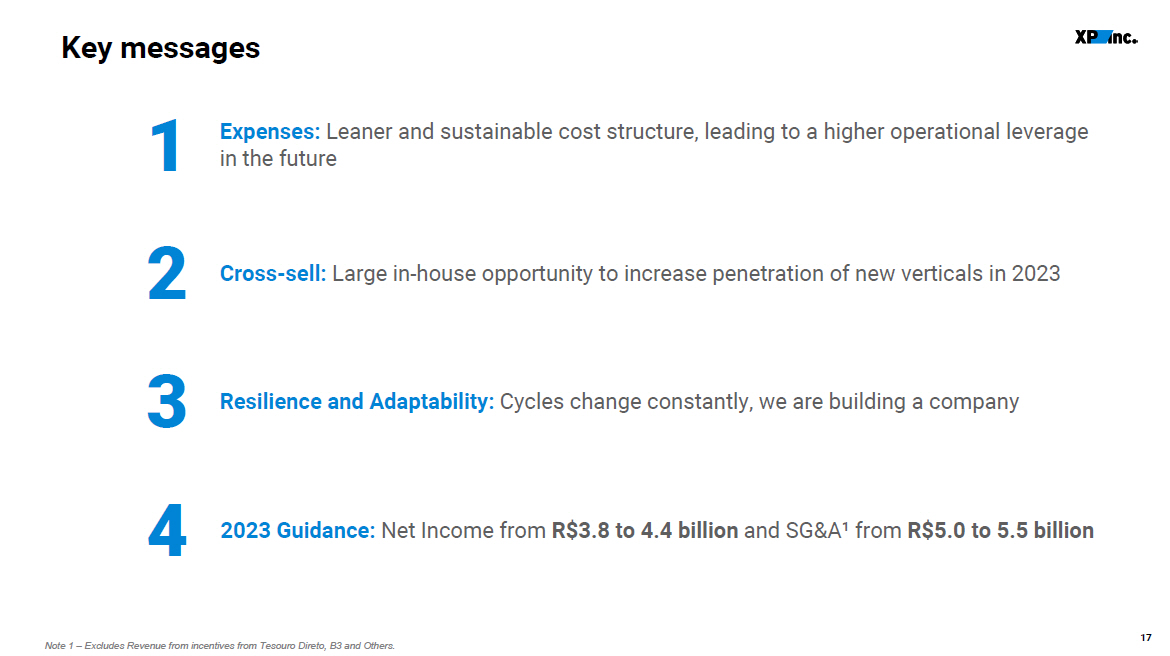
17 Key messages 1 Expenses: Leaner and sustainable cost structure, leading to a higher operational leverage in the future Resilience and Adaptability: Cycles change constantly, we are building a company Cross - sell: Large in - house opportunity to increase penetration of new verticals in 2023 2 3 4 2023 Guidance: Net Income from R$3.8 to 4.4 billion and SG&A¹ from R$5.0 to 5.5 billion Note 1 – Excludes Revenue from incentives from Tesouro Direto, B3 and Others.

Q&A

19 Investor Relations ir@xpi.com.br https://investors.xpinc.com/

Appendix
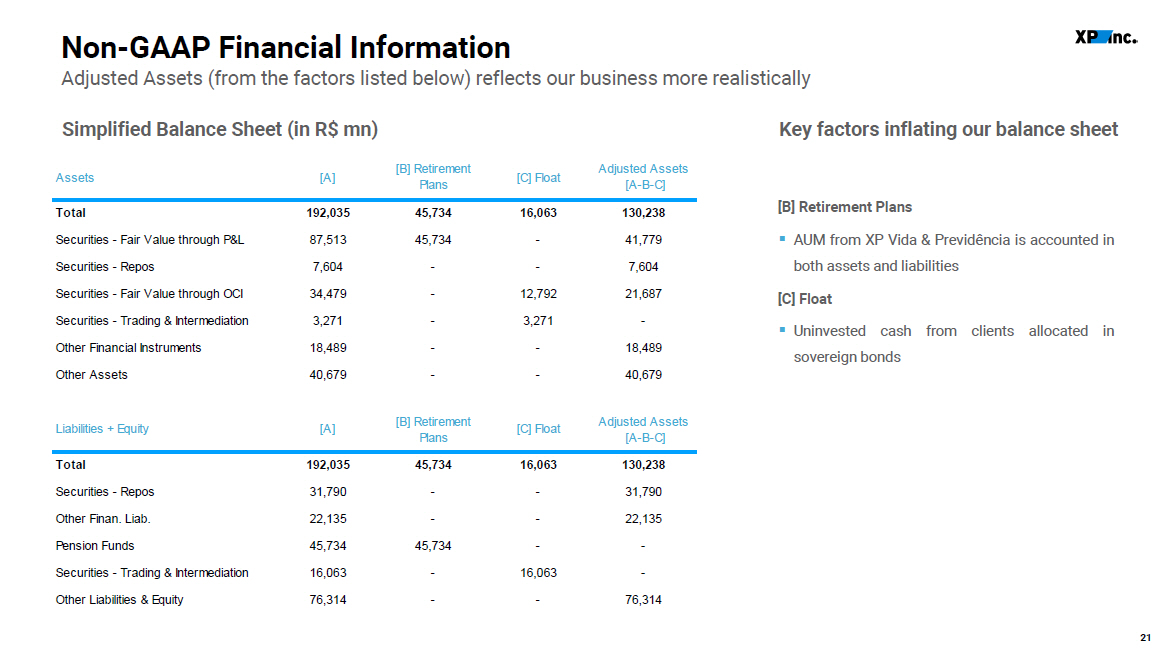
21 Non - GAAP Financial Information Adjusted Assets (from the factors listed below) reflects our business more realistically [B] Retirement Plans ▪ AUM from XP Vida & Previdência is accounted in both assets and liabilities f r o m c l ie n t s allo c at ed in [C] Float ▪ Uninv e st e d c ash sovereign bonds Simplified Balance Sheet (in R$ mn) Key factors inflating our balance sheet Assets [ A ] Plans [ A - B - C ] Total 192,035 45,734 16,063 130 , 23 8 Securities - Fair Value through P&L 87,513 45,734 - 41,779 Securities - Repos 7,604 - - 7,604 Securities - Fair Value through OCI 34,479 - 12,792 21,687 Securities - Trading & Intermediation 3,271 - 3,271 - Other Financial Instruments 18,489 - - 18,489 Other Assets 40,679 - - 40,679 [C] Float [B] Retirement Adjusted Assets Liabilities + Equity [ A ] [B] Retirement Plans [ A - B - C ] Total 192,035 45,734 16,063 130 , 23 8 Securities - Repos 31,790 - - 31,790 Other Finan. Liab. 22,135 - - 22,135 Pension Funds 45,734 45,734 - - Securities - Trading & Intermediation 16,063 - 16,063 - Other Liabilities & Equity 76,314 - - 76,314 [C] Float Adjusted Assets
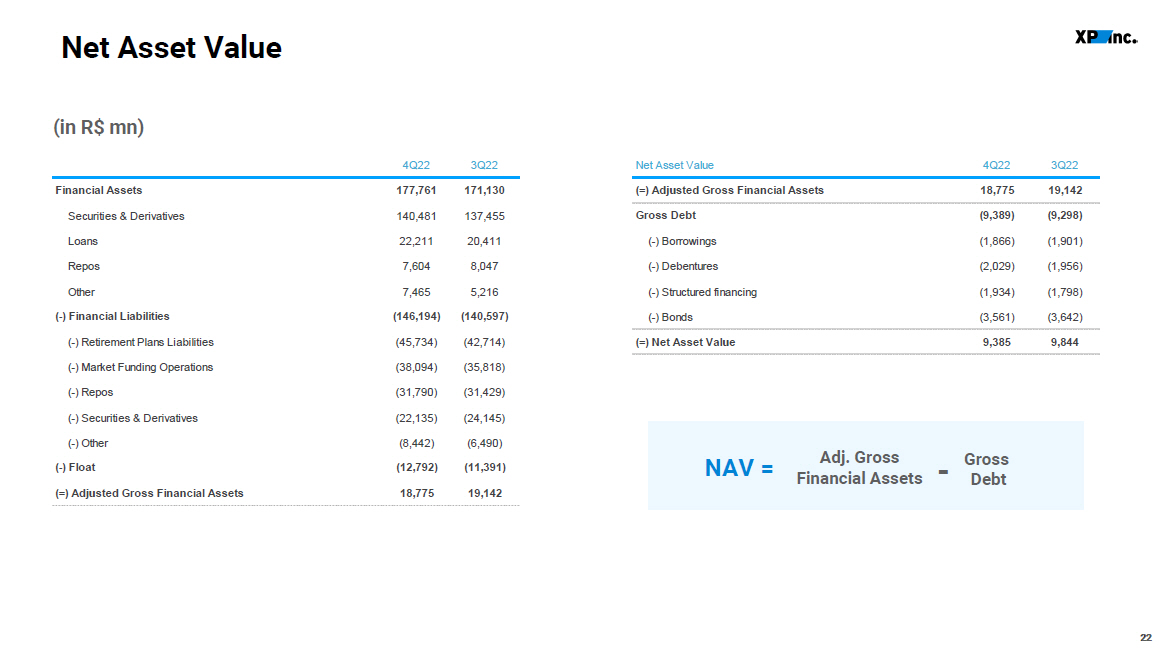
Net Asset Value 2 2 2 2 Adj. G Financial Assets NAV = Debt - ( - ) Float ( 12 , 792 ) (11,391) (=) Adjusted Gross Financial Assets 18 , 77 5 19,142 (in R$ mn) 4 Q 2 2 3Q22 Net Asset Value 4Q22 3Q22 Financial Assets 177 , 76 1 171,130 (=) Adjusted Gross Financial Assets 18,775 19,142 Securities & Derivatives 140 , 48 1 137,455 Gross Debt (9,389) (9,298) Loans 22 , 21 1 20,411 ( - ) Borrowings (1,866) (1,901) Repos 7 , 60 4 8,047 ( - ) Debentures (2,029) (1,956) Other 7 , 46 5 5,216 ( - ) Structured financing (1,934) (1,798) ( - ) Financial Liabilities ( 146 , 194 ) (140,597) ( - ) Bonds (3,561) (3,642) ( - ) Retirement Plans Liabilities ( 45 , 734 ) (42,714) (=) Net Asset Value 9 , 38 5 9,844 ( - ) Market Funding Operations ( 38 , 094 ) (35,818) ( - ) Repos ( 31 , 790 ) (31,429) ( - ) Securities & Derivatives ( 22 , 135 ) (24,145) ( - ) Other ( 8 , 442 ) (6,490) ross Gross

Ŷ
Exhibit 99.3
|
XP Inc. Consolidated financial statements at |

Independent auditor's report
To the Board of Directors and Shareholders
XP Inc.
Opinion
We have audited the accompanying consolidated financial statements of XP Inc. (the "Company") and its subsidiaries, which comprise the consolidated balance sheets as at December 31, 2022 and the consolidated statements of income and of comprehensive income, of changes in equity and of cash flows for the year then ended, and notes to the financial statements, including significant accounting policies and other explanatory information.
In our opinion, the consolidated financial statements referred to above present fairly, in all material respects, the financial position of XP Inc. and its subsidiaries as at December 31, 2022, and their financial performance and their cash flows for the year then ended, in accordance with the International Financial Reporting Standards (IFRS) as issued by the International Accounting Standards Board (IASB).
Basis for opinion
We conducted our audit in accordance with Brazilian and International Standards on Auditing. Our responsibilities under those standards are further described in the "Auditor's responsibilities for the audit of the financial statements" section of our report. We are independent of the Company and its subsidiaries in accordance with the ethical requirements established in the Code of Professional Ethics and Professional Standards issued by the Brazilian Federal Accounting Council, and we have fulfilled our other ethical responsibilities in accordance with these requirements. We believe that the audit evidence we have obtained is sufficient and appropriate to provide a basis for our audit opinion.
Key Audit Matters
Key Audit Matters are those matters that, in our professional judgment, were of most significance in our audit of the financial statements of the current year. These matters were addressed in the context of our audit of the consolidated financial statements as a whole, and in forming our opinion thereon, and we do not provide a separate opinion on these matters. |
 |
PricewaterhouseCoopers Auditores Independentes Ltda., Avenida Brigadeiro Faria Lima, 3732, Edifício B32, 16o
São Paulo, SP, Brasil, 04538-132
T: +55 (11) 4004-8000, www.pwc.com.br
| Why it is a Key Audit Matter | How the matter was addressed in the audit |
| Information technology environment | |
|
The processing of transactions, operations development and business
continuity processes
The inherent risks in information technology, associated with eventual deficiencies in the controls that support the processing and operation, logical accesses, systems change management in the existing technology environments, can, eventually, cause incorrect processing of critical transactions, improper accesses to systems and data, and consequently processing of unauthorized transactions and errors in automated controls of application systems. For this reason, this was considered as a focal area in our audit.
|
With the support of professionals with specialized skill and knowledge, we understood the information technology environment and tested general technology controls. During our planning activities, we considered tests related to systemic development and change management, access, security to programs, systems and data, systems operation/processing and physical security of the data processing center.
We tested automated and technology-dependent controls related to applications in the relevant XP business processes.
Considering the results obtained in the procedures described above and in order to obtain necessary and sufficient evidence in our financial statements audit, it was necessary to carry out additional documental testing in order to assess the integrity and accuracy of the information generated by systems and automated reports and, when necessary, the application of procedures using analytical databases, which allowed us to apply a wider spectrum of testing and evidence gathering.
We also performed unpredictability tests and review procedures for specific access to accounting entries, in addition to the procedures already applied to address the risk of management override of controls.
The results of these procedures provided us with appropriate and sufficient audit evidence considering the consolidated financial statements taken as a whole. |
| Revenue from services rendered (Notes 3(xxii.1) and 28(a)) |
|
|
XP Inc. and its subsidiaries' revenue is substantially comprised of brokerage commission, securities placement and management fees.
These revenues are recognized according to contractual terms that consider the commission percentage for services provided. Revenue recognition requires management
|
We understood the internal controls environment regarding revenue recognition processes.
We also performed a tie-out between analytical information extracted from operational systems and revenue recorded in the accounting ledger. On a sample basis, we inspected supporting evidence of revenue in the accounting ledger and confronted its subsequent financial settlement |
3
|
controls to ensure proper recognition at a certain point in time.
Considering the relevance of these revenues in the consolidated financial statements, associated with eventual deficiencies in the controls, this area was considered as a focus area of our audit. |
with bank statements. In addition, we recalculated selected revenue transactions recognized in the accounting ledger.
Therefore, our audit procedures provided us with appropriate and sufficient audit evidence in the consolidated financial statements taken as a whole. |
Responsibilities of management and those charged with governance for the consolidated financial statements
Management is responsible for the preparation and fair presentation of these consolidated financial statements in accordance with the International Financial Reporting Standards (IFRS) as issued by the International Accounting Standards Board (IASB), and for such internal control as management determines is necessary to enable the preparation of financial statements that are free from material misstatement, whether due to fraud or error.
In preparing the consolidated financial statements, management is responsible for assessing the Company's ability to continue as a going concern, disclosing, as applicable, matters related to going concern and using the going concern basis of accounting unless management either intends to liquidate the Company or to cease operations, or has no realistic alternative but to do so.
Those charged with governance are responsible for overseeing the financial reporting process of the Company and its subsidiaries.
Auditor's responsibilities for the audit of the consolidated financial statements
Our objectives are to obtain reasonable assurance about whether the consolidated financial statements as a whole are free from material misstatement, whether due to fraud or error, and to issue an auditor's report that includes our opinion. Reasonable assurance is a high level of assurance, but is not a guarantee that an audit conducted in accordance with Brazilian and International Standards on Auditing will always detect a material misstatement when it exists. Misstatements can arise from fraud or error and are considered material if, individually or in the aggregate, they could reasonably be expected to influence the economic decisions of users taken on the basis of these financial statements.
As part of an audit in accordance with Brazilian and International Standards on Auditing, we exercise professional judgment and maintain professional skepticism throughout the audit. We also:
| • | Identify and assess the risks of material misstatement of the consolidated financial statements, whether due to fraud or error, design and perform audit procedures responsive to those risks, and obtain audit evidence that is sufficient and appropriate to provide a basis for our opinion. The risk of not detecting a material misstatement resulting from fraud is higher than for one resulting from error, as fraud may involve collusion, forgery, intentional omissions, misrepresentations, or the override of internal control. |
| • | Obtain an understanding of internal control relevant to the audit in order to design audit procedures that are appropriate in the circumstances, but not for the purpose of expressing an opinion on the effectiveness of the internal control of the Company and its subsidiaries. |
4
| • | Evaluate the appropriateness of accounting policies used and the reasonableness of accounting estimates and related disclosures made by management. |
| • | Conclude on the appropriateness of management's use of the going concern basis of accounting and, based on the audit evidence obtained, whether a material uncertainty exists related to events or conditions that may cast significant doubt on the ability of the Company to continue as a going concern. If we conclude that a material uncertainty exists, we are required to draw attention in our auditor's report to the related disclosures in the consolidated financial statements or, if such disclosures are inadequate, to modify our opinion. Our conclusions are based on the audit evidence obtained up to the date of our auditor's report. However, future events or conditions may cause the Company to cease to continue as a going concern. |
| • | Evaluate the overall presentation, structure and content of the consolidated financial statements, including the disclosures, and whether these financial statements represent the underlying transactions and events in a manner that achieves fair presentation. |
| • | Obtain sufficient appropriate audit evidence regarding the financial information of the entities or business activities within the Group to express an opinion on the consolidated financial statements. We are responsible for the direction, supervision and performance of the group audit. We remain solely responsible for our audit opinion. |
We communicate with those charged with governance regarding, among other matters, the planned scope and timing of the audit and significant audit findings, including any significant deficiencies in internal control that we identify during our audit.
We also provide those charged with governance with a statement that we have complied with relevant ethical requirements regarding independence, and to communicate with them all relationships and other matters that may reasonably be thought to bear on our independence, and where applicable, related safeguards.
From the matters communicated with those charged with governance, we determine those matters that were of most significance in the audit of the consolidated financial statements of the current period and are therefore the Key Audit Matters. We describe these matters in our auditor's report unless law or regulation precludes public disclosure about the matter or when, in extremely rare circumstances, we determine that a matter should not be communicated in our report because the adverse consequences of doing so would reasonably be expected to outweigh the public interest benefits of such communication.
São Paulo, February 16, 2023
/s/ PricewaterhouseCoopers
Auditores Independentes Ltda.
PricewaterhouseCoopers
Auditores Independentes Ltda.
CRC 2SP000160/O-5
/s/ Tatiana Fernandes Kagohara Gueorguiev
Tatiana Fernandes Kagohara Gueorguiev
Contadora CRC 1SP245281/O-6
5
XP Inc. and its subsidiaries Consolidated balance sheets at December 31, 2022 and 2021 In thousands of Brazilian Reais |  |
| Assets | Note | 2022 | 2021 | |
| Cash | 3,553,126 | 2,485,641 | ||
| Financial assets | 177,681,987 | 127,745,263 | ||
| Fair value through profit or loss | 96,730,159 | 69,123,669 | ||
| Securities | 7 | 87,513,004 | 58,179,955 | |
| Derivative financial instruments | 8 | 9,217,155 | 10,943,714 | |
| Fair value through other comprehensive income | 34,478,668 | 32,332,377 | ||
| Securities | 7 | 34,478,668 | 32,332,377 | |
| Evaluated at amortized cost | 46,473,160 | 26,289,217 | ||
| Securities | 7 | 9,272,103 | 2,238,807 | |
| Securities purchased under agreements to resell | 6 | 7,603,820 | 8,894,531 | |
| Securities trading and intermediation | 18 | 3,271,000 | 1,405,651 | |
| Accounts receivable | 11 | 597,887 | 469,086 | |
| Loan operations | 10 | 22,211,161 | 12,819,627 | |
| Other financial assets | 20 | 3,517,189 | 461,515 | |
| Other assets | 5,760,811 | 4,688,125 | ||
| Recoverable taxes | 12 | 163,248 | 153,316 | |
| Rights-of-use assets | 16 | 258,491 | 284,509 | |
| Prepaid expenses | 13 | 4,240,107 | 3,982,750 | |
| Other | 1,098,965 | 267,550 | ||
| Deferred tax assets | 24 | 1,611,882 | 1,273,069 | |
| Investments in associates and joint ventures | 15 | 2,271,731 | 2,013,365 | |
| Property and equipment | 16 | 310,894 | 313,964 | |
| Goodwill and Intangible assets | 16 | 844,182 | 820,975 | |
| Total assets | 192,034,613 | 139,340,402 |
The accompanying notes are an integral part of these consolidated financial statements.
1 OF 76
XP Inc. and its subsidiaries Consolidated balance sheets at December 31, 2022 and 2021 In thousands of Brazilian Reais | |
| Liabilities and equity | Note | 2022 | 2021 | |
| Financial liabilities | 127,708,578 | 91,358,151 | ||
| Fair value through profit or loss | 22,134,674 | 14,573,385 | ||
| Securities | 7 | 13,529,265 | 2,665,202 | |
| Derivative financial instruments | 8 | 8,605,409 | 11,908,183 | |
| Evaluated at amortized cost | 105,573,904 | 76,784,766 | ||
| Securities sold under repurchase agreements | 6 | 31,790,091 | 26,281,345 | |
| Securities trading and intermediation | 18 | 16,062,697 | 15,597,555 | |
| Financing instruments payable | 17 | 43,683,629 | 24,429,086 | |
| Accounts payables | 617,394 | 867,526 | ||
| Borrowings | 19 | 1,865,880 | 1,928,782 | |
| Other financial liabilities | 20 | 11,554,213 | 7,680,472 | |
| Other liabilities | 47,172,782 | 33,533,688 | ||
| Social and statutory obligations | 21 | 968,119 | 1,022,212 | |
| Taxes and social security obligations | 22 | 365,419 | 549,651 | |
| Retirement plans liabilities | 23 | 45,733,815 | 31,921,400 | |
| Provisions and contingent liabilities | 27 | 43,541 | 29,308 | |
| Other | 61,888 | 11,117 | ||
| Deferred tax liabilities | 24 | 111,043 | 28,934 | |
| Total liabilities | 174,992,403 | 124,920,773 | ||
| Equity attributable to owners of the Parent company | 17,035,735 | 14,416,836 | ||
| Issued capital | 24 | 23 | ||
| Capital reserve | 19,156,382 | 14,923,315 | ||
| Other comprehensive income | (133,909) | (334,563) | ||
| Treasury shares | (1,986,762) | (171,939) | ||
| Non-controlling interest | 6,475 | 2,793 | ||
| Total equity | 25 | 17,042,210 | 14,419,629 | |
| Total liabilities and equity | 192,034,613 | 139,340,402 |
The accompanying notes are an integral part of these consolidated financial statements.
2 OF 76
XP Inc. and its subsidiaries Consolidated statements of income and of comprehensive income for the years ended December 31, 2022, 2021 and 2020 In thousands of Brazilian Reais, except earnings per share | |
Consolidated statements of income and of comprehensive income of income
| Note |
2022 |
2021 |
2020 |
|||||
| Net revenue from services rendered | 28 | 5,940,456 | 6,196,465 | 5,016,488 | ||||
| Net income (loss) from financial instruments at amortized cost and at fair value through other comprehensive income | 28 | 1,145,395 | (1,559,464) | 183,393 | ||||
| Net income from financial instruments at fair value through profit or loss | 28 | 6,261,539 | 7,440,111 | 2,951,724 | ||||
| Total revenue and income | 13,347,390 | 12,077,112 | 8,151,605 | |||||
| Operating costs | 29 | (3,871,096) | (3,430,109) | (2,645,359) | ||||
| Selling expenses | 30 | (138,722) | (227,483) | (134,915) | ||||
| Administrative expenses | 30 | (5,641,233) | (4,692,698) | (3,013,598) | ||||
| Other operating income (expenses), net | 31 | 256,944 | 324,354 | 171,053 | ||||
| Expected credit losses | 14 | (94,159) | (92,560) | (55,564) | ||||
| Interest expense on debt | (402,303) | (135,732) | (52,671) | |||||
| Share of profit or (loss) in joint ventures and associates | 15 | (12,165) | (7,710) | 862 | ||||
| Income before income tax | 3,444,656 | 3,815,174 | 2,421,413 | |||||
| Income tax expense | 24 | 135,555 | (222,714) | (339,924) | ||||
| Net income for the year | 3,580,211 | 3,592,460 | 2,081,489 | |||||
| Other comprehensive income | ||||||||
| Items that can be subsequently reclassified to income | ||||||||
| Foreign exchange variation of investees located abroad | (19,645) | 20,977 | 57,439 | |||||
| Gains (losses) on net investment hedge | 17,252 | (18,758) | (60,563) | |||||
| Changes in the fair value of financial assets at fair value through other comprehensive income | 218,106 | (549,017) | 24,203 | |||||
| Other comprehensive income (loss) for the period, net of tax | 215,713 | (546,798) | 21,079 | |||||
| Total comprehensive income for the year | 3,795,924 | 3,045,662 | 2,102,568 | |||||
| Net income attributable to: | ||||||||
| Owners of the Parent company | 3,579,050 | 3,589,416 | 2,076,430 | |||||
| Non-controlling interest | 1,161 | 3,044 | 5,059 | |||||
| Total comprehensive income attributable to: | ||||||||
| Owners of the Parent company | 3,794,763 | 3,042,618 | 2,097,509 | |||||
| Non-controlling interest | 1,161 | 3,044 | 5,059 | |||||
| Earnings per share from total income attributable to the ordinary equity holders of the company | ||||||||
| Basic earnings per share | 33 | 6.4438 | 6.4211 | 3.7597 | ||||
| Diluted earnings per share | 33 | 6.2461 | 6.2588 | 3.7138 | ||||
The accompanying notes are an integral part of these consolidated financial statements.
3 OF 76
XP Inc. and its subsidiaries Consolidated statements of changes in equity for the years ended December 31, 2022, 2021 and 2020 In thousands of Brazilian Reais | |
|
Capital reserve |
|||||||||||||||
|
Notes |
Issued Capital |
Additional paid-in capital |
Other Reserves |
Other comprehensive income and Other |
Retained Earnings |
Treasury shares |
Total |
Non-Controlling interest |
Total Equity | ||||||
| Balances at December 31, 2019 | 23 | 5,409,895 | 1,533,551 | 209,927 | - | - | 7,153,396 | 2,563 |
7,155,959
| ||||||
| Comprehensive income for the year | |||||||||||||||
| Net income for the year | - | - | - | - | 2,076,430 | - | 2,076,430 | 5,059 | 2,081,489 | ||||||
| Other comprehensive income, net | - | - | - | 21,079 | - | - | 21,079 | - | 21,079 | ||||||
| Transactions with shareholders - contributions and distributions | |||||||||||||||
| Proceeds from the issuance of shares | 1.1 | - | 1,412,930 | - | - | - | - | 1,412,930 | - | 1,412,930 | |||||
| Transactions costs from proceeds from the issuance of shares | 1.1 | - | (1,649) | - | - | - | - | (1,649) | - | (1,649) | |||||
| Other equity transactions | |||||||||||||||
| Share based plan | 32 | - | - | 232,785 | - | - | - | 232,785 | 6 | 232,791 | |||||
| Other changes in equity | - | - | - | (362) | - | - | (362) | 944 | 582 | ||||||
| Allocations of the net income for the year | |||||||||||||||
| Transfer to capital reserves | - | - | 2,076,430 | - | (2,076,430) | - | - | - | - | ||||||
| Dividends distributed | - | - | - | - | - | - | - | (5,567) | (5,567) | ||||||
| Balances at December 31, 2020 | 23 | 6,821,176 | 3,842,766 | 230,644 | - | - | 10,894,609 | 3,005 | 10,897,614 | ||||||
| Comprehensive income for the year | |||||||||||||||
| Net income for the year | - | - | - | - | 3,589,416 | - | 3,589,416 | 3,044 | 3,592,460 | ||||||
| Other comprehensive income, net | - | - | - | (546,798) | - | - | (546,798) | - | (546,798) | ||||||
| Transactions with shareholders - contributions and distributions | |||||||||||||||
| Private issuance of shares | 25(b) | - | - | 112,642 | - | - | - | 112,642 | - | 112,642 | |||||
| Other equity transactions | |||||||||||||||
| Share based plan | 32 | - | - | 561,455 | - | - | - | 561,455 | 2 | 561,457 | |||||
| Other changes in equity | - | - | (4,140) | (18,409) | - | - | (22,549) | (232) | (22,781) | ||||||
| Treasury shares | - | - | - | - | - | (171,939) | (171,939) | - | (171,939) | ||||||
| Allocations of the net income for the year | |||||||||||||||
| Transfer to capital reserves | - | - | 3,589,416 | - | (3,589,416) | - | - | - | - | ||||||
| Dividends distributed | 25 | - | - | - | - | - | - | - | (3,026) | (3,026) | |||||
| Balances at December 31, 2021 | 23 | 6,821,176 | 8,102,139 | (334,563) | - | (171,939) | 14,416,836 | 2,793 | 14,419,629 | ||||||
| Comprehensive income for the year | |||||||||||||||
| Net income for the year | - | - | - | - | 3,579,050 | - | 3,579,050 | 1,161 | 3,580,211 | ||||||
| Other comprehensive income, net | - | - | - | 215,713 | - | - | 215,713 | - | 215,713 | ||||||
| Transactions with shareholders - contributions and distributions | |||||||||||||||
| Private issuance of shares | 25(b) | 1 | 70,030 | - | - | - | - | 70,031 | - | 70,031 | |||||
| Other equity transactions | |||||||||||||||
| Share based plan | 32 | - | 95,241 | 488,746 | - | - | - | 583,987 | 785 | 584,772 | |||||
| Other changes in equity | - | - | - | (15,059) | - | - | (15,059) | 3,556 | (11,503) | ||||||
| Treasury shares | 25(c) | - | - | - | - | - | (1,814,823) | (1,814,823) | - | (1,814,823) | |||||
| Allocations of the net income for the year | |||||||||||||||
| Transfer to capital reserves | - | - | 3,579,050 | - | (3,579,050) | - | - | - | - | ||||||
| Dividends distributed | 25 | - | - | - | - | - | - | - | (1,820) | (1,820) | |||||
| Balances at December 31, 2022 | 24 | 6,986,447 | 12,169,935 | (133,909) | - | (1,986,762) | 17,035,735 | 6,475 | 17,042,210 | ||||||
The accompanying notes are an integral part of these consolidated financial statements.
4 OF 76
XP Inc. and its subsidiaries Consolidated tatements of cash flows for the years ended December 31, 2022, 2021 and 2020 (In thousands of Brazilian Reais, unless otherwise stated) | |
|
Note |
2022 | 2021 | 2020 | |||||
| Operating activities | ||||||||
| Income before income tax | 3,444,656 | 3,815,174 | 2,421,413 | |||||
| Adjustments to reconcile income before income taxes | ||||||||
| Depreciation of property, equipment and right-of-use assets | 16 | 110,248 | 68,618 | 67,422 | ||||
| Amortization of intangible assets | 16 | 95,629 | 163,112 | 75,839 | ||||
| Loss or write-off of property, equipment, intangible assets and leases, net | 16 | 20,805 | 20,367 | 73,140 | ||||
| Share of profit or (loss) in joint ventures and associates | 15 | 12,165 | 7,710 | (862) | ||||
| Income from share in the net income of associates measured at fair value | 54,301 | (47,291) | - | |||||
| Expected credit losses on financial assets | 78,945 | 92,560 | 55,564 | |||||
| (Reversal of) Provision for contingencies, net | 27 | 12,305 | 5,325 | 2,045 | ||||
| Net foreign exchange differences | (301,697) | 506,510 | 1,478 | |||||
| Share based plan | 32 | 584,772 | 561,457 | 232,791 | ||||
| Interest accrued | 429,222 | 181,731 | 56,923 | |||||
| Changes in assets and liabilities | ||||||||
| Securities (assets and liabilities) | (28,309,585) | (21,857,025) | (42,954,505) | |||||
| Derivative financial instruments (assets and liabilities) | (1,550,061) | 674,837 | 1,023,937 | |||||
| Securities trading and intermediation (assets and liabilities) | (1,423,398) | (5,086,154) | 10,605,139 | |||||
| Securities purchased under agreements to resell | 1,937,077 | (2,269,321) | 2,862,311 | |||||
| Accounts receivable | (157,056) | 37,160 | (46,247) | |||||
| Loan operations | (9,416,502) | (8,918,608) | (3,925,042) | |||||
| Prepaid expenses | (257,357) | (2,589,213) | (1,303,853) | |||||
| Other assets and other financial assets | (3,358,515) | (674,697) | (23,078) | |||||
| Securities sold under repurchase agreements | 5,508,746 | (5,557,999) | 16,200,937 | |||||
| Accounts payable | (308,824) | (133,576) | 564,324 | |||||
| Financing instruments payable | 17,563,948 | 14,408,581 | 5,126,930 | |||||
| Social and statutory obligations | (54,093) | 354,764 | 174,725 | |||||
| Tax and social security obligations | (91,326) | 278,609 | 182,391 | |||||
| Retirement plans liabilities | 13,812,415 | 18,533,487 | 9,628,823 | |||||
| Other liabilities and other financial liabilities | 3,938,385 | 4,271,361 | 1,000,007 | |||||
| Cash from/(used in) operations | 2,375,205 | (3,152,521) | 2,102,552 | |||||
| Income tax paid | (370,862) | (783,816) | (518,971) | |||||
| Contingencies paid | 27 | (2,521) | (2,565) | (1,629) | ||||
| Interest paid | (197,937) | (81,427) | (71,224) | |||||
| Net cash flows from (used in) operating activities | 1,803,885 | (4,020,329) | 1,510,728 | |||||
| Investment activities | ||||||||
| Acquisition of intangible assets | 16 (b) | (82,412) | (217,569) | (146,368) | ||||
| Acquisition of property and equipment | 16 (a) | (44,563) | (135,444) | (145,164) | ||||
| Acquisition of subsidiaries, net of cash acquired | 5 (ii)/37 (iii) | (69,532) | (40,857) | (62,443) | ||||
| Investment in associates and joint ventures | 15 | (174,773) | (756,857) | (228,035) | ||||
| Net cash flows used in investing activities | (371,280) | (1,150,727) | (582,010) | |||||
| Financing activities | ||||||||
| Proceeds from borrowings | 37 | - | 1,570,639 | - | ||||
| Acquisition of treasury shares | 25 | (1,814,823) | - | - | ||||
| Acquisitions of debt securities issued | 37 | 1,890,500 | 4,191,280 | - | ||||
| Payments of borrowings and lease liabilities | 37 | (101,716) | (76,371) | (152,868) | ||||
| Payment of debt securities | 37 | (175,999) | (177,826) | (464,717) | ||||
| Proceeds from the issuance of shares | 1.1/1.2 | - | - | 1,411,281 | ||||
| Transactions with non-controlling interests | 3,556 | (231) | 582 | |||||
| Dividends paid to non-controlling interests | (1,820) | (3,026) | (5,567) | |||||
| Proceeds from SPAC issuance of shares | - | 1,134,797 | - | |||||
| Net cash flows from/(used in) financing activities | (200,302) | 6,639,262 | 788,711 | |||||
| Net increase (decrease) in cash and cash equivalents | 1,232,303 | 1,468,206 | 1,717,429 | |||||
| Cash and cash equivalents at the beginning of the fiscal year | 3,751,861 | 2,660,388 | 887,796 | |||||
| Effects of exchange rate changes on cash and cash equivalents | (16,684) | (376,733) | 55,163 | |||||
| Cash and cash equivalents at the end of the fiscal year | 4,967,480 | 3,751,861 | 2,660,388 | |||||
| Cash | 3,553,126 | 2,485,641 | 1,954,788 | |||||
| Securities purchased under agreements to resell | 6 | 646,478 | 1,071,328 | 593,673 | ||||
| Interbank certificate deposits | 7 | 252,877 | 194,892 | 111,927 | ||||
| Other deposits | 20 | 514,999 | - | - |
The accompanying notes are an integral part of these consolidated financial statements.
5 OF 76
XP Inc. and its subsidiaries Notes to consolidated financial statements December 31, 2022, 2021 and 2020 (In thousands of Brazilian Reais, unless otherwise stated) | |
| 1. | Operations |
XP Inc. (the “Company”) is a Cayman Island exempted company with limited liability, incorporated on August 29, 2019. The registered office of the Company is Ugland House, 121 South Church Street in George Town, Grand Cayman. The Company’s principal executive office is located in the city of São Paulo, Brazil.
XP Inc. is currently the entity which is registered with the U.S. Securities and Exchange Commission (“SEC”). The common shares are trading on the Nasdaq Global Select Market (“NASDAQ-GS”) under the symbol “XP”.
XP Inc. is a holding company controlled by XP Control LLC, which holds 66.8% of voting rights and is controlled by a group of individuals.
XP Inc. and its subsidiaries (collectively, “Group” or “XP Group”) is a leading, technology-driven financial services platform and a trusted provider of low-fee financial products and services in Brazil. XP Group are principally engaged in providing its customers, represented by individuals and legal entities in Brazil and abroad, various financial products, services, digital content and financial advisory services, mainly acting as broker-dealer, including securities brokerage, retirement plans, commercial and investment banking products such as loan operations, transactions in the foreign exchange markets and deposits, through our brands that reach clients directly and through network of Independent Financial Advisers (“IFAs”).
These consolidated financial statements were approved by the Board of Director’s meeting on February 15, 2023.
| 1.1 | Spin-off of Itaú’s investment in XP Inc. |
In January 2021, XP Inc. reached an agreement with Itaúsa S.A. in connection with Itaú’s spin-off of its investment in XP Inc., and entered into two agreements regarding the corporate reorganization announced by Itaú Unibanco Holding S.A. on December 31, 2020 (Itaú Agreements).The U.S. Federal Reserve Board’s (FED) and the Brazilian Central Bank (BACEN) approved the legal and accounting segregation of the Itaú’s investments in XP Inc. to XPart on May 31, 2021 and July 26, 2021, respectively.
On June 22, 2021, XP Inc. filed a registration statement on Form F-4 with the U.S. Securities and Exchange Commission, or the “SEC” as part of the Itaú spin-off of its investment in XP Inc. The prospectus relates to the Class A common shares, or “XP Shares,” of XP Inc., including Class A common shares in the form of Brazilian Depositary Receipts of XP (each representing one XP Share), or the “XP BDRs.”
On October 1, 2021, the corporate reorganization was completed and XPart ceased to exist. On October 4, 2021, XP Inc. started trading its BDR (“Brazilian Depositary Receipts”) under symbol XPBR31, on Brazilian stock exchange B3 (Brasil, Bolsa, Balcão). The impact of this transaction is presented in Note 25 (b) and (c).
| 1.2 | Ukraine conflicts |
In February 2022 the invasion of Ukraine by Russia generated international sanctions taken by the United States and North Atlantic Treaty Organization (“NATO”) that had an impact on regional and global economies. Such events could have an adverse effect on Group’s business and financial performance, through increased worldwide inflation, increased costs of compliance, higher volatility in foreign currency exchange rates and increases in expected credit losses from our clients that sell goods to Russia counterparties. As of December 31, 2022, the business undertaken by the Group has not been materially impacted as a result of the abovementioned situation. The Group will continue monitoring the situation to determine whether material impacts to the operations might arise if the situation escalates.
| 1.3 | Share buy-back program |
In May 2022, the Board of Directors approved a share buy-back program. Under the program, XP may repurchase up to the amount in dollars equivalent to R$1.0 billion of its outstanding Class A common shares over a period beginning on May 12, 2022, continuing until the earlier of the completion of the repurchase or May 12, 2023, depending upon market conditions.
As of November 04, 2022, the Board of Directors approved an amendment to the share buy-back program. Under the amended program, XP Inc may repurchase up to the amount in dollars equivalent to R$2.0 billion of its outstanding Class A common shares (therefore, an increase of the maximum amount of R$1.0 billion compared to the original program). The program period has not been amended, continuing until the earlier of the completion of the repurchase or May 12, 2023, depending upon market conditions.
As of December 31, 2022, the Company purchased 11,920,051 shares (equivalent to R$1,140 million or US$218 million), which were acquired at an average price of US$18.31 per share, with prices ranging from US$14.09 to US$24.85.
As of December 31, 2022, the shares repurchased under the repurchase program corresponded to approximately 2.13% of the entity's capital stock.
6 OF 76
XP Inc. and its subsidiaries Notes to consolidated financial statements December 31, 2022, 2021 and 2020 (In thousands of Brazilian Reais, unless otherwise stated) | |
| 1.4 | Share purchase agreement with Itaú |
On June 8, 2022, XP signed a share purchase agreement with Itaú Unibanco. Under this agreement, XP purchased 1,056,308 outstanding Class B common shares from Itaú Unibanco, equivalent to approximately US$24 million (R$ 117 million), or US$22.65 per share (R$ 110.87 per share) – the same price for which Itaú Unibanco sold 6,783,939 Class A shares on June 7, 2022 to third parties.
On November 10, 2022 XP signed a share purchase agreement with Itaúsa S.A. Under this agreement, XP purchased 5,500,000 outstanding Class A common shares from Itaúsa S.A., equivalent to approximately U$105 million (R$ 562 million), or U$19.10 per share (R$ 102.14 per share). XP utilized its existing cash to fund this share repurchase and the shares are held in treasury.
Those transactions are not part of the share buy-back program (Note 1.3) announced by XP on May 11, 2022.
| 2. | Basis of preparation of the financial statements |
| (i) | Basis of preparation |
The consolidated financial statements of the Group have been prepared in accordance with the International Financial Reporting Standards (“IFRS”) as issued by the International Accounting Standards Board (“IASB”).
The consolidated financial statements have been prepared on a historical cost basis, except for financial instruments that have been measured at fair value.
The preparation of financial statements requires the use of certain critical accounting estimates. It also requires management to exercise its judgment in the process of applying the Group's accounting policies. The areas involving a higher degree of judgment or complexity, or areas where assumptions and estimates are significant to the financial statements, are disclosed in Note 4.
The consolidated financial statements are presented in Brazilian reais (“R$”), our functional currency, and all amounts disclosed in the financial statements and notes have been rounded off to the nearest thousand currency units unless otherwise stated.
The balance sheet is presented in order of liquidity of assets and liabilities. The timing of their realization or settlement is dependent not just on their liquidity, but also on management’s judgements on expected movements in market prices and other relevant aspects. Certain reclassifications of prior period amounts have been made to conform to the current period presentation.
| (ii) | New standards and interpretations not yet adopted |
Certain new accounting standards and interpretations have been published that are not mandatory for the December 31, 2022 reporting period and have not been early adopted by the Group. These amendments or standards are going to be effective for years beginning January 1st, 2023.
IFRS 17 – Insurance Contracts: The group evaluated the impacts of applying this standard and concluded that it is not material to its current operations.
Amendments to IAS 1 – Presentation of Financial Statements: Requires that only information about material accounting policies are disclosed, eliminating disclosures of information that duplicate or summarize IFRS requirements.
Amendments to IAS 8 - Accounting Policies, Changes in Accounting Estimates and Errors – Includes the definition of accounting estimates: monetary amounts subject to uncertainties in their measurement. Accounting estimates are disclosed in Note 4.
Amendments to IAS 12 – Income Taxes: Clarifies that the exemption for accounting for deferred taxes arising from temporary differences generated in the initial recognition of assets or liabilities is not applicable to lease operations.
Possible impacts are being evaluated and will be completed by the date the standard becomes effective. Those changes are not expected to have a material impact on the consolidated financial statements.
7 OF 76
XP Inc. and its subsidiaries Notes to consolidated financial statements December 31, 2022, 2021 and 2020 (In thousands of Brazilian Reais, unless otherwise stated) | |
| (iii) | Basis of consolidation |
The consolidated financial statements comprise the consolidated balance sheets of the Group as of December 31, 2022 and 2021 and the consolidated statements of income and comprehensive income, consolidated statements of cash flows and consolidated statements of changes in equity for each of the years ended December 31, 2022, 2021 and 2020.
a) Subsidiaries
Subsidiaries are all entities (including structured entities) over which the Group has control. The Group controls an entity when the Group is exposed to, or has rights to, variable returns from its involvement with the entity and has the ability to affect those returns through its power to direct the activities of the entity. Subsidiaries are fully consolidated from the date on which control is transferred to the Group. The Group derecognises the assets and liabilities of the former subsidiary from the consolidated statement of financial position from the date that control ceases.
The acquisition method of accounting is used to account for business combinations by the Group (refer to Note 5).
Intercompany transactions, balances and unrealized gains on transactions between Group companies are eliminated. Unrealized losses are also eliminated unless the transaction provides evidence of an impairment of the transferred asset. Accounting policies of subsidiaries have been changed where necessary to ensure consistency with the policies adopted by the Group.
Non-controlling interests in the results and equity of subsidiaries are shown separately in the consolidated statement of income and of comprehensive income, statement of changes in equity and balance sheet respectively.
b) Associates
Associates are companies in which the investor has a significant influence but does not hold control. Investments in these companies are initially recognized at cost of acquisition and subsequently accounted for using the equity method. Investments in associates include the goodwill identified upon acquisition, net of any cumulative impairment loss.
Under the equity method of accounting, the investments are initially recognized at cost and adjusted thereafter to recognize the Group’s share of the post-acquisition profits or losses of the investee in the statement of income, and the Group’s share of movements in other comprehensive income of the investee in other comprehensive income. Dividends received or receivable from associates are recognized as a reduction in the carrying amount of the investment.
Unrealized gains on transactions between the Group and its associates are eliminated to the extent of the Group’s interest in these entities. Unrealized losses are also eliminated unless the transaction provides evidence of an impairment of the asset transferred. Accounting policies of equity-accounted investees have been changed where necessary to ensure consistency with the policies adopted by the Group.
If its interest in the associates decreases, but the Group retains significant influence or joint control, only the proportional amount of the previously recognized amounts in Other comprehensive income is reclassified in income, when appropriate.
c) Interests in associates measured at fair value
The Group has investments in associates measured at fair value in accordance with item 18 of IAS 28 – Investments in Associates and Joint Ventures. These investments are held through XP FIP Managers and FIP Endor, which are considered to be venture capital organizations. In determining whether the funds meet the definition of a venture capital organization, management considered the investment portfolio features and objectives. The portfolio classified in this category has the objective to generate growth in the value of its investments in the medium term and have an exit strategy. Additionally, the performance of these portfolio is evaluated and managed considering a fair value basis of each investment.
| (iv) | Segment reporting |
In reviewing the operational performance of the Group and allocating resources, the Chief Operating Decision Maker of the Group (“CODM”), who is the Group’s Chief Executive Officer (“CEO”) and the Board of Directors (“BoD”), represented by statutory directors holders of ordinary shares of the immediate parent of the Company, reviews selected items of the statement of income and of comprehensive income.
The CODM considers the whole Group as a single operating and reportable segment, monitoring operations, making decisions on fund allocation and evaluating performance based on a single operating segment. The CODM reviews relevant financial data on a combined basis for all subsidiaries. Disaggregated information is only reviewed at the revenue level (Note 28), with no corresponding detail at any margin or profitability levels.
The Group’s revenue, results and assets for this one reportable segment can be determined by reference to the consolidated statement of income and of comprehensive income and consolidated balance sheet.
8 OF 76
XP Inc. and its subsidiaries Notes to consolidated financial statements December 31, 2022, 2021 and 2020 (In thousands of Brazilian Reais, unless otherwise stated) | |
See Note 28 (c) for a breakdown of revenues and income and selected assets by geographic location.
| (v) | Foreign currency translation |
(a) Functional and presentation currency
Items included in the financial statements of each of the Group’s entities are measured using the currency of the primary economic environment in which the entity operates (‘the functional currency’). The consolidated financial statements are presented in Brazilian Reais (“R$”), which is the Group functional and presentation currency.
The functional currency for all the Company’s subsidiaries in Brazil is also the Brazilian reais. Certain subsidiaries outside of Brazil have different functional currencies, including US Dollar ("USD"), Euro ("EUR"), Pound Sterling (“GBP”) and Swiss Franc (“CHF”).
(b) Transactions and balances
Foreign currency transactions are translated into the functional currency using the exchange rates at the dates of the transactions. Foreign exchange gains and losses resulting from the settlement of such transactions and from the translation of monetary assets and liabilities denominated in foreign currencies at year end exchange rates are generally recognized in the statement of income. They are deferred in equity if they relate to qualifying cash flow hedges and qualifying net investment hedges or are attributable to part of the net investment in a foreign operation.
Non-monetary items that are measured at fair value in a foreign currency are translated using the exchange rates at the date when the fair value was determined. Translation differences on assets and liabilities carried at fair value are reported as part of the fair value gain or loss. For example, translation differences on non-monetary assets and liabilities such as equities held at fair value through profit or loss are recognized in the statement of income as part of the fair value gain or loss.
(c) Group companies
The results and financial position of foreign operations (none of which has the currency of a hyperinflationary economy) that have a functional currency different from the presentation currency are translated into the presentation currency as follows:
· assets and liabilities for each balance sheet presented are translated at the closing rate at the date of that balance sheet;
· income and expenses for each statement of income and statement of comprehensive income are translated at average exchange rates (unless this is not a reasonable approximation of the cumulative effect of the rates prevailing on the transaction dates, in which case income and expenses are translated at the dates of the transactions); and
· all resulting exchange differences are recognized in other comprehensive income.
On consolidation, exchange differences arising from the translation of any net investment in foreign entities, and of borrowings and other financial instruments designated as hedges of such investments, are recognized in other comprehensive income. When a foreign operation is sold or any borrowings forming part of the net investment are repaid, the associated exchange differences are reclassified to profit and loss, as part of the gain or loss on sale.
Goodwill and fair value adjustments arising on the acquisition of a foreign operation are treated as assets and liabilities of the foreign operation and translated at the closing rate.
| 3. | Summary of significant accounting policies |
This note provides a description of the significant accounting policies adopted in the preparation of these consolidated financial statements in addition to other policies that have been disclosed in other notes to these consolidated financial statements. These policies have been consistently applied to all periods presented, unless otherwise stated.
9 OF 76
XP Inc. and its subsidiaries Notes to consolidated financial statements December 31, 2022, 2021 and 2020 (In thousands of Brazilian Reais, unless otherwise stated) | |
| (i) | Business combinations |
The acquisition method of accounting is used to account for all business combinations, regardless of whether equity instruments or other assets are acquired. The consideration transferred for the acquisition of a subsidiary comprises the:
· fair values of the assets transferred;
· liabilities incurred to the former owners of the acquired business;
· equity interests issued by the Group;
· fair value of any asset or liability resulting from a contingent consideration arrangement; and
· fair value of any pre-existing equity interest in the subsidiary.
Identifiable assets acquired, and liabilities and contingent liabilities assumed in a business combination are, with limited exceptions, measured initially at their fair values at the acquisition date. The Group recognizes any non-controlling interest in the acquired entity on an acquisition-by-acquisition basis either at fair value or at the non-controlling interest’s proportionate share of the acquired entity’s net identifiable assets.
Acquisition-related costs are expensed as incurred.
The excess of the consideration transferred, amount of any non-controlling interest in the acquired entity and acquisition-date fair value of any previous equity interest in the acquired entity, over the fair value of the net identifiable assets acquired is recorded as goodwill. If those amounts are less than the fair value of the net identifiable assets of the business acquired, the difference is recognized directly in the statement of income as a bargain purchase.
Where settlement of any part of cash consideration is deferred, the amounts payable in the future are discounted to their present value as at the date of exchange. The discount rate used is the entity’s incremental borrowing rate, being the rate at which a similar borrowing could be obtained from an independent financier under comparable terms and conditions.
Contingent consideration, when applicable, is classified either as equity or a financial liability. Amounts classified as a financial liability are subsequently remeasured to fair value with changes in fair value recognized in the statement of income.
If the business combination is achieved in stages, the acquisition date carrying value of the acquirer’s previously held equity interest in the acquirer is remeasured to fair value at the acquisition date. Any gains or losses arising from such remeasurement are recognized in the statement of income.
| (ii) | Financial instruments |
A financial instrument is any contract that gives rise to a financial asset of one entity and a financial liability or equity instrument of another entity.
| 1) | Financial assets |
Initial recognition and measurement
On initial recognition, financial assets are classified as instruments measured at amortized cost, fair value through other comprehensive income (“FVOCI”) or fair value through profit and loss (“FVPL”).
The classification of financial assets at initial recognition is based on either (i) the Group’s business model for managing the financial assets and (ii) the instruments’ contractual cash flows characteristics.
For a financial asset to be classified and measured at amortized cost or FVOCI, it needs to give rise to cash flows that are 'Solely Payments of Principal and Interest' (the "SPPI" criterion) on the principal amount outstanding. This assessment is referred to as the SPPI Test and is performed at an instrument level.
The Group's business model for managing financial assets refers to how it manages its financial assets in order to generate cash flows. The business model considers whether the group’s objective is to receive cash flows from holding the financial assets, from selling the assets or a combination of both.
Purchases or sales of financial assets that require delivery of assets within a time frame set by regulation or market practice (regular way trades) are recognized on the trade date (i.e., the date that the Group commits to purchase or sell the asset).
10 OF 76
XP Inc. and its subsidiaries Notes to consolidated financial statements December 31, 2022, 2021 and 2020 (In thousands of Brazilian Reais, unless otherwise stated) | |
Classification and subsequent measurement
| (i) | Financial assets at FVPL |
Financial assets at FVPL include Securities, financial assets designated upon initial recognition at FVPL, or financial assets mandatorily required to be measured at fair value. This category includes Securities and Derivative financial instruments, including equity instruments which the Group had not irrevocably elected to classify at FVOCI.
Financial assets are classified as fair value through profit and loss if they either fail the contractual cash flow test or in the Group’s business model are acquired for the purpose of selling or repurchasing in the near term. Financial assets may be designated at FVPL on initial recognition if doing so eliminates, or significantly reduces, an accounting mismatch.
Derivative financial instruments, including separated embedded derivatives, are also classified as fair value through profit and loss unless they are designated as effective hedging instruments. Financial assets with cash flows that do not meet the SPPI criteria are classified and measured at FVPL, irrespective of the business model.
Financial assets at FVPL are carried in the statement of financial position at fair value with net changes in fair value recognized in the statement of income. The net gain or loss recognized in the statement of income includes any dividend or interest earned on the financial asset.
A derivative embedded in a hybrid contract, with a financial liability or non-financial host, is separated from the host and accounted for as a separate derivative if: (i) the economic characteristics and risks are not closely related to the host; a separate instrument with the same terms as the embedded derivative would meet the definition of a derivative; (ii) and the hybrid contract is not measured at FVPL. Embedded derivatives are measured at fair value with changes in fair value recognized in the statement of income. Reassessment only occurs if there is either a change in the terms of the contract that significantly modifies the cash flows that would otherwise be required or a reclassification of a financial asset out of the FVPL category.
A derivative embedded within a hybrid contract containing a financial asset host is not accounted for separately. The financial asset host together with the embedded derivative is required to be classified in its entirety as a financial asset at fair value through profit or loss.
Investments held in trust account
The Group has a certain class of securities owned by one of our subsidiaries, which qualify as financial instruments, primarily due to their short-term nature. These securities are classified as FVPL. The Group’s investments held in the trust account are comprised of money market funds and are recognized at fair value with the changes in fair value recognized in the consolidated statements of income. The estimated fair value of the investments held in the trust account is determined using available market information.
| (ii) | Financial assets at FVOCI |
The Group measures financial assets at FVOCI if both of the following conditions are met:
| . | The financial asset is held within a business model with the objective of both holding to collect contractual cash flows and to sell. |
| . | The contractual terms of the financial asset give rise on specified dates to cash flows that meet the SPPI criteria. |
For financial assets at FVOCI, interest income, foreign exchange revaluation and impairment losses or reversals are recognized in the statement of income. The remaining fair value changes are recognized in OCI. Upon derecognition, the cumulative fair value change recognized in OCI is recycled to profit and loss.
The Group's financial assets at FVOCI includes certain debt instruments.
Upon initial recognition, the Group can elect to classify irrevocably equity investments at FVOCI when they meet the definition of equity under IAS 32 - "Financial Instruments: Presentation" and are not financial assets at FVPL.
The classification is determined on an instrument-by-instrument basis.
11 OF 76
XP Inc. and its subsidiaries Notes to consolidated financial statements December 31, 2022, 2021 and 2020 (In thousands of Brazilian Reais, unless otherwise stated) | |
Dividends are recognized as income in the profit and loss when the right of payment has been established, except when the Group benefits from such proceeds as a recovery of part of the cost of the financial asset, in which case, such gains are recorded in OCI. Equity instruments designated at FVOCI are not subject to impairment assessment.
The Group has no equity instruments that have been irrevocably classified under this category.
| (iii) | Financial assets at amortized cost |
A financial asset is measured at amortized cost if both of the following conditions are met:
| . | The financial asset is held within a business model with the objective to hold the financial asset in order to collect contractual cash flows. |
| . | The contractual terms of the financial asset give rise on specified dates to cash flows that meet the SPPI criteria. |
Financial assets at amortized cost are subsequently measured using the Effective Interest Rate ("EIR") method and are subject to impairment. Gains and losses are recognized in the statement of income when the asset is derecognized, modified or impaired.
The Group's financial assets at amortized cost mainly includes ‘Securities’, 'Securities purchased under agreements to resell', 'Securities trading and intermediation', ‘Loan operations’, 'Accounts receivable' and 'Other financial assets’.
The Group reclassifies financial assets only when its business approach for managing those assets changes.
Derecognition
A financial asset (or, where applicable, a part of a financial asset or part of a group of similar financial assets) is primarily derecognized when:
| · | The contractual rights to receive cash flows from the asset have expired. |
| · | The Group has transferred its contractual rights to receive cash flows from the asset or has assumed a contractual obligation to pay the received cash flows in full without material delay to a third party under a "pass-through" arrangement; and either (a) the Group has transferred substantially all the risks and rewards of the asset; or (b) the Group has neither transferred nor retained substantially all the risks and rewards of the asset, but has transferred control of the asset. |
When the Group has transferred its contractual rights to receive cash flows from an asset or has entered into a pass-through arrangement, it evaluates if, and to what extent, it has retained the risks and rewards of ownership. When it has neither transferred nor retained substantially all the risks and rewards of the asset, nor transferred control of the asset, the Group continues to recognize the transferred asset to the extent of its continuing involvement. In that case, the Group also recognizes an associated liability. The transferred asset and the associated liability are measured on a basis that reflects the rights and obligations that the Group has retained.
Continuing involvement that takes the form of a guarantee over the transferred asset is measured at the lower of the original carrying amount of the asset and the maximum amount of consideration that the Group could be required to repay.
Expected credit loss on financial assets
The Group recognizes expected credit losses ("ECLs") for all financial assets not held at FVPL. ECLs are based on internal models that measure the default risk of the debtors considering contract collaterals. For the credit portfolio, the Group classifies assets in three stages to measure the expected credit loss, in which the financial assets migrate from one stage to another in accordance with the changes in credit risk.
Stage 1: all financial assets are initially recognized in this stage. It is understood that a financial asset in this stage does not present a significant increase in risk since initial recognition. The provision for this asset represents the expected loss resulting from possible noncompliance in the next 12 months.
Stage 2: increase of the change in the risk of a default occurring based on internal models since initial recognition or overdue 30 days. If a significant increase in the risk is identified from the initial recognition, and no deterioration is realized, the financial asset falls within this stage. In this case, the amount related to the provision for expected loss reflects the estimated loss of the financial asset's remaining life (lifetime).
12 OF 76
XP Inc. and its subsidiaries Notes to consolidated financial statements December 31, 2022, 2021 and 2020 (In thousands of Brazilian Reais, unless otherwise stated) | |
Stage 3: overdue 90 days. The Group considers a financial asset in default when contractual payments are 90 days past due. However, in certain cases, the Group may also consider a financial asset to be in default when internal or external information indicates that the Group is unlikely to receive the outstanding contractual amounts in full before considering any credit enhancements held by the Group.
Financial assets are written off when there is no reasonable expectation of recovery, such as a debtor failing to engage in a repayment plan with the company. The Group categorizes a loan or receivable for write-off when a debtor fails to make contractual payments more than 360 days past due. Where loans or receivables have been written off, the Group continues to engage in enforcement activity to attempt to recover the receivable due. Where recoveries are made, these are recognised in profit or loss.
For accounts receivables, and other financial contract assets, the Group applies a simplified approach to calculating ECLs. Therefore, the Group does not track changes in credit risk but instead recognizes a loss allowance based on lifetime ECLs. The Group has established a provision that is based on its historical credit loss.
For debt instruments at FVOCI, the Group applies the low credit risk simplification at every reporting date, the Group evaluates whether the debt instrument is considered to have low credit risk using all reasonable and supportable information that is available without undue cost or effort. In making that evaluation, the Group reassesses the internal credit rating of the debt instrument. In addition, the Group considers that there has been a significant increase in credit risk when contractual payments are more than 30 days past due.
| 2) | Financial liabilities |
Initial recognition and measurement
Financial liabilities are classified, at initial recognition, as financial liabilities at FVPL, amortized cost or as Derivative financial instruments designated as hedging instruments in an effective hedge, as appropriate.
All financial liabilities are recognized initially at fair value and, in the case of amortized cost, net of directly attributable transaction costs.
The Group's financial liabilities include 'Securities', 'Derivative financial instruments', 'Securities purchased under agreements to resell', 'Securities trading and intermediation', long-term debts such as 'Borrowings ' and 'Financing Instruments payable – Debt securities', 'Accounts payables' and 'Other financial liabilities’.
Classification and subsequent measurement
| (i) | Financial liabilities at FVPL |
Financial liabilities at FVPL include securities loaned and derivatives financial instruments designated upon initial recognition as at FVPL.
Financial liabilities are classified as securities loaned if they are incurred for the purpose of repurchasing in the near term. This category also includes derivative financial instruments entered by the Group that are not designated as hedging instruments in hedge relationships as defined by IFRS 9. Separated embedded derivatives are also classified as fair value through profit and loss unless they are designated as effective hedging instruments.
Gains or losses on liabilities at fair value through profit and loss are recognized in the statement of income.
Financial liabilities designated upon initial recognition at FVPL are designated at the initial date of recognition, and only if the criteria in IFRS 9 are satisfied. Securities loaned, and derivative financial instruments are classified as fair value through profit and loss and recognized at fair value.
| (ii) | Financial liabilities designated at FVPL |
Classification and subsequent measurement
The Group applied the fair value option as an alternative measurement for selected financial liabilities. Financial liabilities can be irrevocably designated as measured at FVPL if doing so eliminates or significantly reduces an accounting mismatch that would otherwise arise from measuring assets or liabilities or recognizing the gains and losses on them on different bases, or a group of financial instruments is managed and its performance is evaluated on a fair value basis, in accordance with a documented risk management or investment strategy. The amount of change in the fair value of the financial liabilities designated at FVPL that is attributable to changes in the credit risk of that liabilities shall be presented in other comprehensive income. See more information in Note 7(e).
13 OF 76
XP Inc. and its subsidiaries Notes to consolidated financial statements December 31, 2022, 2021 and 2020 (In thousands of Brazilian Reais, unless otherwise stated) | |
| (iii) | Amortized cost |
After initial recognition, these financial liabilities are subsequently measured at amortized cost using the Effective Interest Method (“EIR”) method. Gains and losses are recognized in profit and loss when the liabilities are derecognized as well as through the EIR amortization process.
Amortized cost is calculated by considering any discount or premium on acquisition and fees or costs that are an integral part of the EIR.
This category generally applies to Securities sold under repurchase agreements, ‘Securities trading and intermediation’, 'Borrowings', 'Financing Instruments Payable', 'Accounts payables', ‘Lease liabilities’ and 'Other financial liabilities'.
| (iv) | Commitments subject to possible redemption |
XPAC Acquisition Corp. redeemable shares
The Group accounts for the common stock subject to redemption in cash held by the non-controlling interest holders of XPAC Acquisition Corp., a consolidated subsidiary, as a financial liability measured at amortized cost. The instrument is initially recognized at fair value, net of derivative warrant liabilities component and the corresponding eligible transaction costs. The warrant component issued to the non-controlling interest holders of XPAC Acquisition Corp. are separately accounted as derivatives and measured at fair value with the changes in fair value recorded in the statement of income.
Derecognition
A financial liability is derecognized when the obligation under the liability is discharged, canceled or expires. When an existing financial liability is replaced by another from the same lender on substantially different terms, or the terms of an existing liability are substantially modified, such an exchange or modification is treated as the derecognition of the original liability and the recognition of a new liability. The difference in the respective carrying amounts is recognized in the statement of income.
| 3) | Fair value of financial instruments |
The fair value of financial instruments actively traded in organized financial markets is determined based on purchase prices quoted in the market at the close of business at the reporting date, without deducting transaction costs.
The fair value of financial instruments for which there is no active market is determined by using measurement techniques. These techniques may include the use of recent market transactions (on an arm's length basis); reference to the current fair value of another similar instrument; analysis of discounted cash flows or other measurement models. See Note 34.
| 4) | Derivative financial instruments and hedging activities – IFRS 9 |
Derivative financial instruments are financial contracts, the value of which is derived from the value of the underlying assets, interest rates, indexes or currency exchange rates.
Derivatives are initially recognized at fair value on the date a derivative contract is entered into, and they are subsequently remeasured to their fair value at the end of each reporting period. The accounting for subsequent changes in fair value depends on whether the derivative is designated as a hedging instrument and, if so, the nature of the item being hedged. The group designates certain derivatives as either:
| · | hedges of the fair value of recognized assets or liabilities or a firm commitment (fair value hedges), or |
| · | hedges of a net investment in a foreign operation (net investment hedges). |
| · | hedges of expected cash flows to be paid on recognized liabilities (cash flow hedges). |
At inception of the hedge relationship, the group documents the economic relationship between hedging instruments and hedged items, including whether changes in the cash flows of the hedging instruments are expected to offset changes in the cash flows of hedged items. The group documents its risk management objective and strategy for undertaking its hedge transactions.
14 OF 76
XP Inc. and its subsidiaries Notes to consolidated financial statements December 31, 2022, 2021 and 2020 (In thousands of Brazilian Reais, unless otherwise stated) | |
If the hedge no longer meets the criteria for hedge accounting, the adjustment to the carrying amount of a hedged item for which the effective interest method is used is amortized to profit and loss over the remaining period until maturity, using a recalculated effective interest rate.
| a) | Hedge ineffectiveness |
Hedge effectiveness is determined at the inception of the hedge relationship, and through periodic prospective effectiveness assessments to ensure that an economic relationship exists between the hedged item and hedging instrument.
To evaluate the effectiveness and to measure the ineffectiveness of such strategies, The Group uses the Dollar Offset Method. The Dollar Offset Method is a quantitative method that consists of comparing the change in fair value or cash flows of the hedging instrument with the change in fair value or cash flows of the hedged item attributable to the hedged risk.
| b) | Derivative warrant liabilities |
The Group evaluates if the warrants issued in connection with the Initial Public Offering (the “Public Warrants”) and the Private Placement Warrants issued by XPAC Acquisition Corp. are derivatives or contain features that qualify as embedded derivatives in accordance with IFRS 9 – Financial Instruments. The Group’s derivatives instruments are recorded at Financial instruments measured at fair value through profit or loss. Accordingly, the Group recognizes the warrants as financial liabilities at fair value and remeasures the warrants at fair value at each reporting period. The liabilities are subject to re-measurement at each balance sheet date until exercised, and any change in fair value is recognized in the Group’s consolidated statements of income. The fair value has been measured based on the listed market price of such warrants.
| (iii) | Cash and cash equivalents |
Cash is not subject to a significant risk of change in value and are held for the purpose of meeting short-term cash commitments and not for investments or other purposes. Transactions are considered short-term when they have maturities in three months or less from the date of acquisition. For purposes of consolidated statement of cash flows, cash equivalents refer to collateral held securities purchased under agreements to resell, bank deposit certificates measured at fair value through profit and loss and other deposits that are readily convertible into a known cash amount and for which are no subject to a significant risk of change in value.
| (iv) | Securities purchased under agreements to resell and obligations related to securities sold under repurchase agreements |
The Group has purchased securities with resale agreement (resale agreements) and sold securities with repurchase agreement (repurchase agreement) of financial assets. Resale and repurchase agreements are accounted for under Securities purchased under agreements to resell and Securities sold under repurchase agreements, respectively. The difference between the sale and repurchase prices is treated as interest and recognized over the life of the agreements using the effective interest rate method. The financial assets accepted as collateral in our resale agreements can be used by us, if provided for in the agreements, as collateral for our repurchase agreements or can be sold.
| (v) | Securities trading and intermediation (receivable and payable) |
Refers to transactions at B3 S.A. – Brasil, Bolsa, Balcão (“B3”) on behalf of and on account of third parties. Brokerages on these transactions are classified as revenues and service provision expenses are recognized at the time of the transactions. These balances are offset, and the net amount shown in the balance sheet when, and only when, there is a legal and enforceable right to offset and the intention to liquidate them on a net basis, or to realize the assets and settle the liabilities simultaneously.
Amounts due from and to customers represent receivables for securities sold and payables for securities purchased that have been contracted for but not yet settled or delivered on the balance sheet date, respectively. The due from customers balance is held for collection. These amounts are subdivided into the following items:
| · | Cash and settlement records - Represented by the registration of transactions carried out on the stock exchanges on its own behalf and for customers, which includes any asset liquidity event; and |
| · | Debtors/Creditors pending settlement account - debtor or creditor balances of customers, in connection with transactions with fixed income securities, shares, commodities and financial assets, pending settlement as of the statement of reporting date. Sales transactions are offset and, in the event, the final amount is a credit, it will be recorded in liabilities, on the other hand if this amount is debt, it will be recorded in assets, provided that the offset balances refer to the same counterparty. |
| · | Customer's cash on investment account - represents customer’s cash balances that are held in XP CCTVM. |
These amounts are recognized initially at fair value and subsequently measured at amortized cost. At each reporting date, the Group shall measure the loss allowance on amounts due from customers at an amount equal to the lifetime expected credit losses if the credit risk has increased significantly since initial recognition. If, at the reporting date, the credit risk has not increased significantly since initial recognition, the Group shall measure the loss allowance at an amount equal to 12-month expected credit losses. Significant financial difficulties of the customer, probability that the customer will enter bankruptcy or financial reorganization, and default in payments are all considered indicators that a loss allowance may be required. If the credit risk increases to the point that it is considered to be credit impaired, interest income will be calculated based on the gross carrying amount adjusted for the loss allowance. A significant increase in credit risk is defined by management as any contractual payment which is more than 30 days past due.
15 OF 76
XP Inc. and its subsidiaries Notes to consolidated financial statements December 31, 2022, 2021 and 2020 (In thousands of Brazilian Reais, unless otherwise stated) | |
Any contractual payment which is more than 90 days past due is considered credit impaired. The estimated credit losses for brokerage clients and related activity were immaterial for all periods presented.
| (vi) | Loan operations |
Loan operations consist in arrangements under which clients can borrow stipulated amounts under defined terms and conditions. They are initially measured at its fair value plus transaction costs that are directly attributable to the acquisition and subsequently measured at amortized cost using the effective interest method, less expected credit loss. See note 10 for further information about the Group’s accounting for Loan Operations and Note 3(ii) for a description of the Group’s Expected Losses on Financial Assets.
Interest income from these financial assets is included in Net income from financial instruments at amortized cost using the effective interest rate method. Any gain or loss arising on derecognition of the loan operations is recognized directly in the statement of income and presented in Note 14. Expected credit losses are presented as a separate line item in the statement of income.
| (vii) | Prepaid expenses |
Prepaid expenses are recognized as an asset in the balance sheet. These expenditures include mainly incentives to IFAs, prepaid software licenses, certain professional services and insurance premiums. Prepaid expenses are amortized in profit and loss in the period in which the benefits of such items are realized.
| (viii) | Leases |
Right-of-use assets
The Group recognizes right-of-use assets at the commencement date of the lease (i.e., the date the underlying asset is available for use). Right-of-use assets are measured at cost, less any accumulated depreciation and impairment losses, and adjusted for any remeasurement of lease liabilities.
The cost of right-of-use assets includes the amount of lease liabilities recognized, initial direct costs incurred, and lease payments made at or before the commencement date less any lease incentives received. Unless the Group is reasonably certain to obtain ownership of the leased asset at the end of the lease term, the recognized right-of-use assets are depreciated on a straight-line basis over the shorter of its estimated useful life and the lease term. Right-of-use assets are subject to impairment.
Lease liabilities
At the commencement date of the lease, the Group recognizes lease liabilities measured at the present value of lease payments to be made over the lease term. The lease payments include fixed payments (including in-substance fixed payments) less any lease incentives receivable, variable lease payments that depend on an index or a rate, and amounts expected to be paid under residual value guarantees. The lease payments also include the exercise price of a purchase option reasonably certain to be exercised by the Group and payments of penalties for terminating a lease, if the lease term reflects the Group exercising the option to terminate. The variable lease payments that do not depend on an index or a rate are recognized as expenses in the period on which the event or condition that triggers the payment occurs.
In calculating the present value of lease payments, the Group uses the incremental borrowing rate at the lease commencement date if the interest rate implicit in the lease is not readily determinable. After the commencement date, the amount of lease liabilities is increased to reflect the accretion of interest and reduced for the lease payments made. In addition, the carrying amount of lease liabilities is remeasured if there is a modification, a change in the lease term, a change in the in-substance fixed lease payments or a change in the assessment to purchase the underlying asset.
Short-term leases and leases of low-value assets
The Group applies the short-term lease recognition exemption to its short-term leases of properties (i.e., those leases that have a lease term of 12 months or less from the commencement date and do not contain a purchase option). It also applies the lease of low-value assets recognition exemption to leases that are considered of low value. Lease payments on short-term leases and leases of low-value assets are recognized as expense on a straight-line basis over the lease term.
Significant judgement in determining the lease term of contracts with renewal options
The Group determines the lease term as the non-cancellable term of the lease, together with any periods covered by an option to extend the lease if it is reasonably certain to be exercised, or any periods covered by an option to terminate the lease, if it is reasonably certain not to be exercised.
16 OF 76
XP Inc. and its subsidiaries Notes to consolidated financial statements December 31, 2022, 2021 and 2020 (In thousands of Brazilian Reais, unless otherwise stated) | |
The Group has the option, under some of its leases to lease the assets for additional terms. The Group applies judgement in evaluating whether it is reasonably certain to exercise the option to renew. That is, it considers all relevant factors that create an economic incentive for it to exercise the renewal. After the commencement date, the Group reassesses the lease term if there is a significant event or change in circumstances that is within its control and affects its ability to exercise (or not to exercise) the option to renew (e.g., a change in business strategy).
| (ix) | Property and equipment |
All property and equipment are stated at historical cost less accumulated depreciation and impairment. Historical cost includes expenditures that are directly attributable to the acquisition of the items and, if applicable, net of tax credits. Subsequent costs are included in the asset’s carrying amount or recognized as a separate asset, as appropriate, only when it is probable that future economic benefits associated with the item will flow to the Group and the cost of the item is material and can be measured reliably. All other repairs and maintenance expenditures are charged to profit and loss during the period in which they are incurred. Depreciation is calculated on a straight-line basis over the estimated useful lives of the assets, as follows:
| Annual Rate (%) | |
| Data Processing Systems | 20% |
| Furniture and equipment | 10% |
| Security systems | 10% |
| Facilities | 10% |
| Vehicle | 10% |
Assets’ residual values, useful lives and methods of depreciation are reviewed at each reporting date and adjusted prospectively, if appropriate. An asset’s carrying amount is written down immediately to its recoverable amount, which is the higher of its fair value less costs of disposal and its value in use, if the asset’s carrying amount is greater than its estimated recoverable amount. Gains and losses on disposals or derecognition are determined by comparing the disposal proceeds (if any) with the carrying amount and are recognized in the statement of income.
| (x) | Intangible assets |
| i) | Goodwill |
Goodwill arises on the acquisition of subsidiaries and represents the excess of (i) the consideration transferred; the amount of any non-controlling interest in the acquiree; and the acquisition-date fair value of any previous equity interest in the acquiree over (ii) the fair value of the identifiable net assets acquired. If the total of the consideration transferred, non-controlling interest recognized and previously held interest measured at fair value is less than the fair value of the net assets of the subsidiary acquired, which is the case of a bargain purchase, the difference is recognized directly in the statement of income.
Goodwill impairment reviews are undertaken annually or more frequently if events or changes in circumstances indicate a potential impairment.
17 OF 76
XP Inc. and its subsidiaries Notes to consolidated financial statements December 31, 2022, 2021 and 2020 (In thousands of Brazilian Reais, unless otherwise stated) | |
| ii) | Software and development costs |
Certain direct development costs associated with internally developed software and software enhancements of the Group’s technology platform is capitalized. Capitalized costs, which occur post determination by management of technical feasibility, include external services and internal payroll costs. These costs are recorded as intangible assets when development is complete, and the asset is ready for use, and are amortized on a straight-line basis, during the period which is expected economic benefits generation to the Group. Research and pre-feasibility development costs, as well as maintenance and training costs, are expensed as incurred. In certain circumstances, management may determine that previously developed software and its related expense no longer meets management’s definition of feasible, which could then result in the impairment of such assets.
| iii) | Other intangible assets |
Separately acquired intangible assets are measured at cost on initial recognition. The cost of intangible assets acquired in a business combination corresponds to their fair value at the acquisition date. After initial recognition, intangible assets are stated at cost, less any accumulated amortization and accumulated impairment losses. Internally generated intangible assets other than softwares are not capitalized and the related expenditure is reflected in the statement of income in the period in which the expenditure is incurred.
The useful life of intangible assets is assessed as finite or indefinite. As of December 31, 2022 and 2021, the Group does not hold indefinite life intangible assets, except for goodwill.
Intangible assets with finite useful lives are amortized over their estimated useful lives and tested for impairment whenever there is an indication that their carrying amount may not be recoverable. The period and method of amortization for intangible assets with finite lives are reviewed at least at the end of each fiscal year or when there are indicators of impairment. Changes in estimated useful lives or expected consumption of future economic benefits embodied in the assets are considered to modify the amortization period or method, as appropriate, and treated as changes in accounting estimates.
The amortization of intangible assets with definite lives is recognized in the statement of income in the expense category consistent with the use of intangible assets. The useful lives of the intangible assets are shown below:
| Estimate useful life (years) | |
| Software | 3-5 |
| Internally developed intangible | 3-7 |
| Customer list | 2-8 |
| Trademarks | 10-20 |
Gains and losses resulting from the disposal or derecognition of intangible assets are measured as the difference between the net disposal proceeds (if any) and their carrying amount, and are recognized in profit and loss.
| (xi) | Impairment of non-financial assets |
Assets that have an indefinite useful life, for example goodwill, are not subject to amortization and are tested annually for impairment. Goodwill impairment reviews are undertaken annually or more frequently if events or changes in circumstances indicate a potential impairment. Assets that are subject to depreciation or amortization are reviewed for impairment whenever events or changes in circumstances indicate that the carrying amount may not be recoverable. An impairment loss is recognized when the asset's carrying amount exceeds its recoverable amount. The recoverable amount is the higher of an asset's fair value less costs to sell and its value in use.
For the purpose of assessing impairment, assets are grouped at the lowest levels for which there are separately identifiable cash flows (Cash-generating units (CGU's)). For the purpose of impairment testing, goodwill acquired in a business combination is allocated to each of the CGUs (or groups of CGUs) that is expected to benefit from the synergies of the combination, which are identified at the operating segment level.
Non-financial assets other than goodwill that were adjusted due to impairment are subsequently reviewed for possible reversal of the impairment at the balance sheet date. The impairment of goodwill recognized in the statement of income is not reversible.
18 OF 76
XP Inc. and its subsidiaries Notes to consolidated financial statements December 31, 2022, 2021 and 2020 (In thousands of Brazilian Reais, unless otherwise stated) | |
| (xii) | Taxes |
| i) | Current income and social contribution taxes |
Each of Group’s entities pay Federal Income Tax (IRPJ) and Social Contribution on Net Income (CSLL) under one of two different methods:
| · | Actual Profit Method (“APM”), where the taxpayer calculates both taxes based on its actual taxable income, after computing all income, gains and tax-deductible expenses, including net operating losses of prior years. Taxes calculated under the APM method are due quarterly or annually depending on entity’s adoption through the first collection document of each calendar year. APM annual method requires taxpayers to make monthly prepayments of IRPJ and CSLL during the calendar-year. |
| · | Presumed Profit Method (“PPM”), where the taxpayer calculates IRPJ and CSLL applying a presumed profit margin over the operating revenues. It is important to emphasize that the profit margin is defined by the Brazilian Revenue Service (“RFB”) according to the type of services rendered and/or goods sold. Under the PPM method, both taxes are due on a quarterly basis and no prepayment is required during the quarters. This method can be adopted only by entities with gross revenue up to an annually revised threshold determined by tax authorities. |
The tax rates applicable to APM or PPM are also defined according to entities’ main activity:
| · | Federal Income Tax (IRPJ) – tax rate of 15% calculated on taxable income and a surcharge of 10% calculated on the taxable income amount that exceeds R$ 20 per month (or R$ 240 annually). |
| · | Social Contribution on Net Income (CSLL) – tax rate of 9% calculated on taxable income. However, financial institutions (i.e., XP CCTVM, Banco XP and XP DTVM) and insurance companies (i.e., XP Vida e Previdência) are subject to a higher regular CSLL rate of 15%. |
As of March 2020, Brazilian banks (i.e. Banco XP) were subject to a CSLL rate of 20%, which became the regular applicable rate for banks. As of July 2021, the rate of CSLL was increased by 5% for all Brazilian financial entities until December 2021. Therefore, Brazilian banks were subject to a CSLL rate of 25% and all other financial entities, including insurance companies, are subject to a rate of 20% by means of federal Law 13.148/2021.
As of January 2022, the tax rate returned to the regular percentage of 20% for banks and 15% for all other financial entities, including insurance companies.
As of August 2022, by means of federal Law 14.446 the CSLL rate was increased in 1% for all Brazilian Financial entities until December 2022. Brazilian banks are subject to a CSLL rate of 21% and all other financial entities, including insurance companies, are subject to a rate of 16%.
| ii) | Deferred income tax and social contribution |
Deferred income tax and social contribution are recognized, using the liability method, on temporary differences between the tax bases of assets and liabilities and their carrying amounts in the financial statements. However, deferred taxes are not accounted for if they arise from initial recognition of an asset or liability in a transaction other than a business combination that at the time of the transaction affects neither accounting nor taxable profit and loss.
Deferred tax assets are recognized only to the extent it is probable that future taxable profit will be available against which the temporary differences and/or tax losses can be utilized. In accordance with the Brazilian tax legislation, loss carryforwards can be used to offset up to 30% of taxable profit for the year and do not expire.
Deferred tax is provided on temporary differences arising on investments in subsidiaries, except for a deferred tax liability where the timing of the reversal of the temporary difference is controlled by the Group and it is probable that the temporary difference will not reverse in the foreseeable future.
Deferred tax assets and liabilities are presented net in the statement of financial position when there is a legally enforceable right and the intention is to offset them upon the calculation of current taxes, generally when related to the same legal entity and the same jurisdiction. Accordingly, deferred tax assets and liabilities in different entities or in different countries are generally presented separately, and not on a net basis.
19 OF 76
XP Inc. and its subsidiaries Notes to consolidated financial statements December 31, 2022, 2021 and 2020 (In thousands of Brazilian Reais, unless otherwise stated) | |
| iii) | Sales and other taxes |
Revenues, expenses and assets are recognized net of sales tax, except:
| · | When the sales taxes incurred on the purchase of goods or services are not recoverable from tax authorities, in which case the sales tax is recognized as part of the cost of acquiring the asset or expense item, as applicable. |
| · | When the amounts receivable or payable are stated with the amount of sales taxes included. |
The net amount of sales taxes, recoverable or payable to the tax authority, is included as part of receivables or payables in the balance sheet, and net of corresponding revenue or cost/expense, in the statement of income.
Sales revenues in Brazil are subject to taxes and contributions, at the following statutory rates:
| · | PIS and COFINS are contributions levied by the Brazilian Federal government on gross revenues. These amounts are invoiced to and collected from the Group’s customers and recognized as deductions to gross revenue (Note 28) against tax liabilities, as we are acting as tax withholding agents on behalf of the tax authorities. PIS and COFINS paid on certain purchases may be claimed back as tax credits to offset PIS and COFINS payable. These amounts are recognized as Recoverable taxes (Note 12) and are offset monthly against Taxes payable and presented net, as the amounts are due to the same tax authority. PIS and COFINS are contributions calculated on two different regimes according to Brazilian tax legislation: cumulative method and non-cumulative method. |
The non-cumulative method is mandatory to companies that calculate income tax under the Actual Profit Method (APM). The applicable rates of PIS and COFINS are 1.65% and 7.60%, respectively.
Otherwise, the cumulative method should be adopted by entities under the Presumed Profit Method (PPM) and is also mandatory to Financial and Insurance Companies. The rates applicable to companies under PPM are PIS 0.65% and COFINS 3.00%. Financial entities (i.e., XP CCTVM, Banco XP and XP DTVM) and insurance companies (i.e., XP Vida e Previdência) have a different percentage of COFINS with the surcharge of 1.00%, totaling 4.00%.
The tax on services (“ISS”) is a tax levied by municipalities on revenues from the provision of services. ISS tax is added to amounts invoiced to the Group’s customers for the services the Group renders. These are recognized as deductions to gross revenue (Note 28) against tax liabilities, as the Group acts as agent collecting these taxes on behalf of municipal governments. The rates may vary from 2.00% to 5.00%. Currently, XP Group’s entities are based majoritarily in the cities of São Paulo and Rio de Janeiro then, revenues perceived by those companies are subject to rates defined by those cities’ Laws.
| (xiii) | Equity security loans |
Represent liabilities to return cash proceeds from security lending transactions. Securities lending transactions are used primarily to earn spread income which relates mainly to equity securities received with a fixed term payable, based on the fair value of the securities plus pro rata interest over the period of the equity security loan. Equity securities borrowed are recognized as unrestricted assets on the statement of financial position and may be sold to third parties. The Equity security loans are recorded as a trading liability and measured at fair value with any gains or losses included in the income statement under net fair value gains/(losses) on financial instruments (Note 28 b).
| (xiv) | Debt securities and Borrowings |
Debt securities classified as Debentures, Bonds, Promissory Notes and Borrowings are initially recognized at fair value, net of transaction costs incurred, and subsequently carried at amortized cost. Any differences between the proceeds (net of transaction costs) and the total amount payable is recognized in the statement of income over the period of the borrowings using the effective interest rate method.
Amortized cost is calculated by taking into account any discount or premium on acquisition and fees or costs that are an integral part of the EIR. The EIR amortization is included as interest expense on debt in the statement of income.
| (xv) | Accounts payables |
Accounts payables are obligations to pay for goods or services that have been acquired in the ordinary course of business. Accounts payables are recognized initially at fair value and subsequently measured at amortized cost using the effective interest rate method.
20 OF 76
XP Inc. and its subsidiaries Notes to consolidated financial statements December 31, 2022, 2021 and 2020 (In thousands of Brazilian Reais, unless otherwise stated) | |
| (xvi) | Retirement plans liabilities |
Retirement plans, relates to accumulation of financial resources, called PGBL (Plan Generator of Benefits), a plan that aims at accumulating funds for participant’s retirement in life, and VGBL (Redeemable Life Insurance), a financial product structured as a pension plan. In both products, the contribution received from the participant is applied to a Specially Constituted Investment Fund (“FIE”) and accrues interest based on FIE investments.
The retirement plans offered by the Group do not contain significant insurance risk where the Group accepts significant insurance risk from participants by agreeing to compensate them if a specified uncertain future event adversely affects them. These products also do not contain any discretionary participation features. Therefore, the contracts are accounted for under the scope of IFRS 9 - Financial Instruments (“IFRS 9”).
| (xvii) | Provisions |
Provisions for legal claims (labor, civil and tax) and other risks are recognized when: (i) the Group has a present legal or constructive obligation as a result of past events; (ii) it is probable that an outflow of resources will be required to settle the obligation; and (iii) the amount can be reliably estimated. Provisions do not include future operating losses.
Where there are a number of similar obligations, the likelihood that an outflow will be required in settlement is determined by considering the class of obligations as a whole. A provision is recognized even if the likelihood of an outflow with respect to any one item included in the same class of obligations may be small.
Provisions are measured at the present value of the expenditures expected to be required to settle the obligation using a pre-tax rate that reflects current market assessments of the time value of money and the risks specific to the obligation. The increase in the provision due to the time elapsed is recognized as interest expense.
| (xviii) | Employee benefits |
| i) | Short-term obligations |
Liabilities in connection with short-term employee benefits are measured on a non-discounted basis and are expensed as the related service is provided.
The liability is recognized for the expected amount to be paid under the plans of cash bonus or short-term profit sharing if the Group has a legal or constructive obligation of paying this amount due to past service provided by employees and the obligation may be reliably estimated.
| ii) | Share-based plan |
The establishment of the shared-based plan was approved by the board of Director’s meeting on December 6, 2019.
The Group launched two share-based plans, the Restricted Stock Unit “RSU” and the Performance Share Unit (“PSU”). The shared-based plans are designed to provide long-term incentives to certain employees, directors, and other eligible service providers in exchange for their services. For both plans, management commits to grant shares of XP Inc to the defined participants.
The cost of share-based compensation is measured using the fair value at the grant date. The cost is expensed together with a corresponding increase in equity over the service period or on the grant date when the grant relates to past services.
The total amount to be expensed is determined by reference to the fair value of the tranche shares granted at the grant date, which is also based on:
| • | Including any market performance conditions; |
| • | Including the impact of any non-market performance vesting conditions (i.e. remaining an employee of the entity over a specified time), and; |
| • | Including the impact of any non-vesting conditions (i.e. the requirement for participants to save or hold shares for a specific period of time). |
The total expense is recognized over the vesting period, which is the period over which all of the specified vesting conditions have to be satisfied. At the end of each period, the entity revises its estimates of the number of shares that are expected to vest based on the non-market vesting conditions. The Company recognizes the impact of the revision to original estimates, if any, in the statement of income, with a corresponding adjustment to equity.
21 OF 76
XP Inc. and its subsidiaries Notes to consolidated financial statements December 31, 2022, 2021 and 2020 (In thousands of Brazilian Reais, unless otherwise stated) | |
When the shares are vested, the Company transfers the correspondent number of shares to the participant. The shares received by the participants, net of any directly attributable transaction costs (including withholding taxes) are credited directly to equity.
The significant judgments, estimates and assumptions regarding share-based payments and activity relating to share-based payments are discussed further in Note 32.
| iii) | Profit-sharing and bonus plans |
The Group recognizes a liability and an expense for bonuses and profit-sharing based on a formula that takes into consideration the profit attributable to the owners of the Company after certain adjustments, and distributed based on individual and collective performance, including qualitative and quantitative indicators.
Employee profit-sharing terms are broadly established by means of annual collective bargaining with workers’ unions. The Group recognizes a provision where contractually obliged or where there is a past practice that has created a constructive obligation.
| iv) | Founder Shares |
The issuance of founder shares and warrants by XPAC Acquisition falls within the scope of IFRS 2 as the founders (including management team) are being awarded these shares at a nominal price in exchange for their services, operating as management of the SPAC. As a result, the share-based payment would be measured at the grant date. The founder shares do not carry a specified service period but would be forfeited or otherwise expire worthless if a business combination is not consummated. Therefore, the founders only derive the value from the founder shares when they are converted into Class A shares upon a successful business combination. As of 31 December 2022, no amounts are accrued as such no business combination has occurred.
| (xix) | Share capital |
Common shares are classified in equity. Incremental costs directly attributable to the issue of new shares or options are shown in equity as a deduction, net of tax, from the proceeds.
| (xx) | Treasury shares |
Own equity instruments that are reacquired (treasury shares) are recognized at cost and deducted from equity. No gain or loss is recognized in the statement of income on the purchase, sale, issue or cancellation of the Group’s own equity instruments.
The difference between the sale price and the average price of the treasury shares is recorded as a reduction or increase in Capital Reserves. The cancellation of treasury shares is recorded as a reduction in Treasury shares against Capital Reserves, at the average price of treasury shares at the cancellation date.
| (xxi) | Earnings per share |
Basic earnings per share is calculated by dividing the profit attributable to owners of the Company, excluding any costs of servicing equity other than ordinary and preferred shares by the weighted average number of ordinary and preferred shares outstanding during the year, adjusted for bonus elements in ordinary and preferred shares issued during the year and excluding treasury shares (Note 33).
Diluted earnings per share adjusts the figures used in the determination of basic earnings per share to take into account the after-income tax effect of interest and other financing costs associated with dilutive potential common and preferred shares, and the weighted average number of additional common and preferred shares that would have been outstanding assuming the conversion of all dilutive potential common and preferred shares (Note 33).
| (xxii) | Revenue and income |
| 1) | Revenue from contracts with customers |
Revenue is recognized when the Group has transferred control of the services to the customers, in an amount that reflects the consideration the Group expects to collect in exchange for those services.
The Group applies the following five steps: i) identification of the contract with a customer; ii) identification of the performance obligations in the contract; iii) determination of the transaction price; iv) allocation of the transaction price to the performance obligations in the contract; and v) recognition of revenue when or as the entity satisfies a performance obligation.
Revenue is recognized net of taxes collected from customers, which are subsequently remitted to governmental authorities.
The Group has discretion to involve and contract a third-party provider in providing services to the customer on its behalf. The Group presents the revenues and associated costs to such third-party providers on a gross basis where it is deemed to be the principal and on a net basis where it is deemed to be the agent. Generally, the Group is deemed to be the principal in these arrangements because the Group controls the promised services before they are transferred to customers, and accordingly presents the revenue gross of related costs.
22 OF 76
XP Inc. and its subsidiaries Notes to consolidated financial statements December 31, 2022, 2021 and 2020 (In thousands of Brazilian Reais, unless otherwise stated) | |
The Group main types of revenues contracts are:
| i) | Brokerage commission |
Brokerage commission revenue consists of revenue generated through commission-based brokerage services on each transaction carried out on, for example, the stock exchanges for customers, recognized at a point in time (trade date) as the performance obligation is satisfied.
| ii) | Securities placement |
Securities placement revenue refers to fees and commissions earned on the placement of a wide range of securities on behalf of issuers and other capital raising activities, such as mergers and acquisitions, including related finance advisory services. The act of placing the securities is the sole performance obligation and revenue is recognized at the point in time when the underlying transaction is complete under the engagement terms and it is probable that a significant revenue reversal will not occur.
| iii) | Management fees |
Management fees relate substantially to (i) services as investments advisor from funds, investment clubs and wealth management; and (ii) distributions of quotas from investments funds managed by others. Revenue is recognized over the period of time when this performance obligation is delivered, and generally based on an agreed-upon fixed percentage of the net asset value of each fund on a monthly basis. A part of management fees are performance-based (performance fees), which are recognized for the delivery of asset management services and calculated based on appreciation of the net asset value of the funds, subject to certain thresholds, such as internal rates of returns or hurdle rates in accordance with the terms of the fund’s constitution. Performance fees, which includes variable consideration, are only recognized after an assessment of the facts and circumstances and when it is highly probable that significant reversal of the amount of cumulative revenue recognized will not occur when the uncertainty is resolved.
| iv) | Insurance brokerage fee |
Refers to insurance brokerage, capitalization, retirement plans and health insurance through the intermediation of the sale of insurance services.
Revenues are recognized after the provision of brokerage services to insurers. Products that were sold through XP Corretora de Seguros are inspected monthly, and amounts received from commission are recognized as revenue at a point in time as the performance obligation is satisfied.
| v) | Educational services |
Educational revenue relates to advising and consulting on finance, financial planning, business management and the development of courses and business training programs in the national territory through the development and management of courses.
| vi) | Commissions fees |
Commissions fees are recognized when XP provides or offers services to customers, in an amount that reflects the consideration XP expects to collect in exchange for those services. A five-step model is applied to account for revenues: i) identification of the contract with a customer; ii) identification of the performance obligations in the contract; iii) determination of the transaction price; iv) allocation of the transaction price to the performance obligations in the contract; and v) revenue recognition, when performance obligations agreed upon in agreements with clients are met. Incremental costs and costs to fulfill agreements with clients are recognized as an expense as incurred.
23 OF 76
XP Inc. and its subsidiaries Notes to consolidated financial statements December 31, 2022, 2021 and 2020 (In thousands of Brazilian Reais, unless otherwise stated) | |
| vii) | Interchange Fee |
Interchange fees revenue represents fees for authorizing and providing settlement on credit and debit card transactions processed through the Visa networks and is determined as a variable percentage - depending on the type of establishment in which the customer buys - of the total payment processed when the Group’s customers use XP’s cards. The fees are recognized on completion of the transaction and once the Group has completed its performance obligations under the contract.
| viii) | Other services |
Other services refer to revenue related to finance advisory services, advertisements on the Group’s website and sponsorship on events held by the Group.
| 2) | Net income from financial instruments |
Net income from financial instruments include realized gains and losses on the sales of investments, unrealized gains and losses resulting from our investments measured at fair value and interest earned on both cash balances and investments in connection with our trading activities. These gains and losses are outside the scope of IFRS 15 but in scope of IFRS 9 – Financial Instruments, and the related accounting policies are disclosed in Note 3.
| 4. | Significant accounting judgements, estimates and assumptions |
The preparation of the financial statements according to accounting policies described in Note 3 requires Management to make judgments, estimates and assumptions that affect the application of accounting policies and the reported amounts for assets, liabilities, revenues and expenses. Actual results may differ from these estimates.
Information about uncertainties on assumptions and estimates that have a significant risk of resulting in a material adjustment in the future fiscal year is included as follows:
| (i) | Estimation fair value of certain financial assets |
The fair value of financial instruments that are not traded in an active market is determined using valuation techniques. The Group uses its judgment to select a variety of methods and make assumptions that are mainly based on market conditions existing at the end of each reporting period.
| (ii) | Expected credit losses on financial assets |
The expected credit losses for financial assets are based on assumptions about risk of default and expected loss rates. The Group uses judgement in making these assumptions and selecting the inputs to the impairment calculation, based on the Group’s history and existing market conditions, as well as forward-looking estimates at the end of each reporting period.
| (iii) | Recognition of deferred tax asset for carried-forward tax losses |
Deferred tax assets are recognized for all unused tax losses to the extent that sufficient taxable profit will likely be available to allow the use of such losses. Significant judgment from management is required to determine the amount of deferred tax assets that can be recognized, based on the likely timing and level of future taxable profits, together with future tax planning strategies.
The Group has concluded that the deferred assets will be recoverable using the estimated future taxable income based on the approved business plans and budgets for the subsidiaries where a deferred tax asset has been recognized.
| (iv) | Property and equipment and intangible assets useful lives |
Property and equipment and intangible assets include the use of estimates to determine the useful life for depreciation and amortization purposes. Useful life determination requires estimates in relation to the expected technological advances and alternative uses of assets. There is a significant element of judgment involved in making technological development assumptions, since the timing and nature of future technological advances are difficult to predict.
| (v) | Impairment of non-financial assets, including goodwill |
The Group assesses, at each reporting date, whether there is an indication that an asset may be impaired. Intangible assets with indefinite useful lives and goodwill are tested for impairment annually at the level of the CGU, as appropriate, and when circumstances indicate that the carrying value may be impaired.
24 OF 76
XP Inc. and its subsidiaries Notes to consolidated financial statements December 31, 2022, 2021 and 2020 (In thousands of Brazilian Reais, unless otherwise stated) | |
Impairment exists when the carrying value of an asset or cash generating unit exceeds its recoverable amount, which is the higher of its fair value less costs to sell and its value in use. Technological obsolescence, suspension of certain services and other changes in circumstances that demonstrate the need for recording a possible impairment are also regarded in estimates.
| (vi) | Provision for contingent liabilities |
Provisions for the judicial and administrative proceedings are recorded when the risk of loss of administrative or judicial proceedings is considered probable and the amounts can be reliably measured, based on the nature, complexity and history of lawsuits and the opinion of legal counsel internal and external.
Provisions are made when the risk of loss of judicial or administrative proceedings is assessed as probable and the amounts involved can be measured with sufficient accuracy, based on best available information. They are fully or partially reversed when the obligations cease to exist or are reduced. Given the uncertainties arising from the proceedings, it is not practicable to determine the timing of any outflow (cash disbursement).
| (vii) | Share-based payments |
Estimating fair value for share-based payment transactions requires determination of the most appropriate valuation model, which depends on the terms and conditions of the grant. This estimate also requires determination of the most appropriate inputs to the valuation model, including the expected life of the share option or appreciation right.
Making estimates requires management to exercise significant judgment. It is at least reasonably possible that the estimate of the effect of a condition, situation or set of circumstances that existed at the date of the consolidated financial statements, which management considered in formulating its estimate, could change in the near term due to one or more future confirming events.
| 5. | Group structure |
| (i) | Subsidiaries |
The following are the direct and indirect interests of Company in its subsidiaries for the purposes of these consolidated financial statements:
| % of Group’s interest (i) | |||||
| Entity name | Country of incorporation | Principal activities | 2022 | 2021 | 2020 |
| Directly controlled | |||||
| XP Investimentos S.A. | Brazil | Holding | 100.00% | 100.00% | 100.00% |
| XPAC Sponsor LLC | Cayman | Special Purpose Acquisition (SPAC) Sponsor | 100.00% | 100.00% | - |
| XProject LTD (ii) | Cayman | Holding | 100.00% | 100.00% | - |
| Indirectly controlled | |||||
| XP Investimentos Corretora de Câmbio, Títulos e Valores Mobiliários S.A. | Brazil | Broker-dealer | 100.00% | 100.00% | 100.00% |
| XP Vida e Previdência S.A. (iii) | Brazil | Retirement plans and insurance | 100.00% | 100.00% | 100.00% |
| Banco XP S.A. | Brazil | Multipurpose bank | 100.00% | 100.00% | 100.00% |
| XP Controle 3 Participações S.A. | Brazil | Financial Holding | 100.00% | 100.00% | 100.00% |
|
XPE Infomoney Educação Assessoria Empresarial e Participações Ltda.
|
Brazil | Digital content services | 100.00% | 100.00% | 100.00% |
|
Tecfinance Informática e Projetos de Sistemas Ltda.
|
Brazil | Rendering of IT services | 99.73% | 99.73% | 99.76% |
|
XP Corretora de Seguros Ltda.
|
Brazil | Insurance Broker | 99.99% | 99.99% | 99.99% |
|
XP Gestão de Recursos Ltda.
|
Brazil | Asset management | 95.60% | 94.90% | 94.80% |
| XP Finanças Assessoria Financeira Ltda. | Brazil | Investment consulting service | 99.99% | 99.99% | 99.99% |
| Infostocks Informações e Sistemas Ltda. | Brazil | Mediation of information systems | 100.00% | 99.99% | 99.99% |
| XP Advisory Gestão Recursos Ltda. | Brazil | Asset management | 99.55% | 99.54% | 99.50% |
| XP Vista Asset Management Ltda. | Brazil | Asset management | 99.99% | 99.50% | 99.45% |
25 OF 76
XP Inc. and its subsidiaries Notes to consolidated financial statements December 31, 2022, 2021 and 2020 (In thousands of Brazilian Reais, unless otherwise stated) | |
| % of Group’s interest (i) | |||||
| Entity name | Country of incorporation | Principal activities | 2022 | 2021 | 2020 |
| XP Controle 4 Participações S.A. | Brazil | Insurance holding | 100.00% | 100.00% | 100.00% |
| Leadr Serviços Online Ltda. | Brazil | Social media | - | - | 99.99% |
| Spiti Análise Ltda. | Brazil | Investment Advisor | - | - | 100.00% |
| Chamaleon Bravery Unipessoal LDA | Portugal | Investment Advisor | - | - | 100.00% |
| XP Investments UK LLP | UK | Inter-dealer broker and Organized Trading Facility (OTF) | 100.00% | 100.00% | 100.00% |
| XP Private Holding UK Ltd | UK | Investment advisor | 100.00% | 100.00% | 100.00% |
| XP Private (Europe) S.A. | Switzerland | Investment advisor | - | - | 100.00% |
| XP Holding UK Ltd | UK | International financial holding | 100.00% | 100.00% | 100.00% |
| XP Investments US, LLC | USA | Broker-dealer | 100.00% | 100.00% | 100.00% |
| Xperience Market Services LLC | USA | Non-operational | - | - | 100.00% |
| XP Holding International LLC | USA | International financial holding | 100.00% | 100.00% | 100.00% |
| XP Advisory US | USA | Investment advisor | 100.00% | 100.00% | 100.00% |
| XP PE Gestão de Recursos Ltda. | Brazil | Asset management | 98.70% | 98.70% | 98.70% |
| XP LT Gestão de Recursos Ltda. | Brazil | Asset management | 96.00% | 92.00% | 92.00% |
| Carteira Online Controle de Investimentos Ltda. - ME (ii) | Brazil | Investment consolidation platform | 100.00% | 99.99% | 99.99% |
| Antecipa S.A. | Brazil | Receivables Financing Market | 100.00% | 100.00% | 100.00% |
| XP Allocation Asset Management Ltda. | Brazil | Asset management | 99.99% | 99.99% | 99.99% |
| Track Índices Consultoria Ltda. (v) | Brazil | Index Provider | - | 100.00% | 100.00% |
| XP Eventos Ltda. | Brazil | Media and Events | 100.00% | 99.90% | 99.00% |
| DM10 Corretora de Seguros Ltda. | Brazil | Insurance Broker | 100.00% | 100.00% | 100.00% |
|
XP Comercializadora de Energia Ltda. (ii)
|
Brazil | Energy trading | 100.00% | 100.00% | - |
| XPAC Acquisition Corp. (vi) | US | Special Purpose Acquisition (SPAC) | 20.00% | 20.00% | - |
| XP Distribuidora de Títulos e Valores Mobiliários | Brazil | Securities dealer | 100.00% | 100.00% | - |
| Instituto de Gestão e Tecnologia da Informação Ltda. (iv) (ii) | Brazil | Educational content services | 100.00% | 100.00% | - |
|
Xtage Intermediação S.A.
|
Brazil | Digital Assets | 100.00% | 100.00% | - |
|
XP Ativos Digitais Intermediações S.A. (iv)
|
Brazil | Digital Assets | 100.00% | - | - |
| Habitat Capital Partners (ii) | Brazil | Asset Management | 99.99% | - | - |
| XP Administradora de Benefícios Ltda. (iv) | Brazil | Individual health plan intermediation | 100.00% | - | - |
| BTR Administração e Corretagem de Seguros S.A. (ii) | Brazil | Retirement plans and insurance | 100.00% | - | - |
| Consolidated investments funds | |||||
| Falx Fundo de Investimento Multimercado Crédito Privado Investimento no Exterior | Brazil | Investment fund | 100.00% | 100.00% | 100.00% |
| Gladius Fundo de Investimento Multimercado Investimento no Exterior | Brazil | Investment fund | 100.00% | 100.00% | 100.00% |
| Scorpio Debentures Incentivadas Fundo de Investimento Multimercado Crédito Privado | Brazil | Investment fund | 100.00% | 100.00% | 100.00% |
| Galea Fundo de Investimento Multimercado Crédito Privado Investimento no Exterior | Brazil | Investment fund | - | - | 100.00% |
| Javelin Fundo de Investimento Multimercado Crédito Privado Investimento no Exterior | Brazil | Investment fund | 100.00% | 100.00% | 100.00% |
| Spatha Fundo de Investimento Multimercado Crédito Privado Investimento no Exterior | Brazil | Investment fund | - | - | 100.00% |
| Frade Fundo de Investimento em Cotas de Fundos de Investimento em Direitos Creditórios NP | Brazil | Investment fund | 100.00% | 100.00% | 100.00% |
26 OF 76
XP Inc. and its subsidiaries Notes to consolidated financial statements December 31, 2022, 2021 and 2020 (In thousands of Brazilian Reais, unless otherwise stated) | |
| % of Group’s interest (i) | |||||
| Entity name | Country of incorporation | Principal activities | 2022 | 2021 | 2020 |
| Frade III Fundo de Investimento em Cotas de Fundo de Investimento Multimercado Crédito Privado | Brazil | Investment fund | 100.00% | 100.00% | 100.00% |
| Balista Debentures Incentivadas Fundo de Investimento Multimercado Crédito Privado | Brazil | Investment fund | - | - | 100.00% |
| Coliseu Fundo de Investimento Multimercado Crédito Privado Investimento no Exterior | Brazil | Investment fund | 100.00% | 100.00% | 100.00% |
| NIMROD Fundo de Investimento Multimercado Crédito Privado Investimento no Exterior | Brazil | Investment fund | 100.00% | 100.00% | 100.00% |
| XP High Yield Fund SP | Cayman | Investment fund | 100.00% | 100.00% | 100.00% |
| XP International Fund SPC | Cayman | Investment fund | 100.00% | 100.00% | 100.00% |
| XP Managers Fundo de Investimento em Participações Multiestratégia | Brazil | Investment fund | 100.00% | 100.00% | 100.00% |
| XP Alesia Fund SP CL Shares - Brazil Internacional Fund SPC. | Cayman | Investment fund | 100.00% | 100.00% | - |
| Newave Fundo de Investimento em Participações Multiestratégia. | Brazil | Investment fund | 90.13% | 100.00% | - |
| Endor Fundo de Investimento em Participações Multiestratégia Investimento no Exterior | Brazil | Investment fund | 100.00% | 100.00% | - |
| XP Phalanx CT Fund (iv) | Cayman Islands | Digital Assets | 100.00% | - | - |
(i) The percentage of participation represents the Group’s interest in total capital and voting capital of its subsidiaries.
(ii)New subsidiaries acquired in 2020, 2021 and 2022. See further details in Note 5 (ii) below.
(iii) Subsidiaries incorporated in 2018 for operating in the retirement plans and life insurance business, which is regulated by the Superintendency of Private Insurance (SUSEP) in Brazil.
(iv) New subsidiaries and investment funds incorporated in the year.
(v) Subsidiaries and investment funds closed or consolidated by other funds during the year.
(vi) Subsidiaries which the Group holds operational control. The operational control refers to relevant rights the Company have over the subsidiary, that includes, among other topics, the right to nominate the directors and propose the target entity for merger.
27 OF 76
XP Inc. and its subsidiaries Notes to consolidated financial statements December 31, 2022, 2021 and 2020 (In thousands of Brazilian Reais, unless otherwise stated) | |
| (ii) | Business combinations and other developments |
| (a) | Acquisitions in 2022 |
| (i) | Habitat |
On February 25, 2022, we entered into a binding agreement to acquire 100% of the total capital of Habitat Capital Partners Asset Management, a manager focused on real estate funds. The asset was created with a focus on real estate operations outside the major Brazilian centers and with a strategy of monitoring the entire process in-house, from securitization to control of collection processes. The closing occurred in May 2022 and the total consideration is R$65,353. The fair value of the identifiable assets acquired and liabilities assumed as of the acquisition date were:
| Habitat | |
| Assets | |
| Cash | 275 |
| Accounts Receivable | 4,977 |
| Securities | 240 |
| Property and equipment | 251 |
| Other assets | 1,063 |
| 6,806 | |
| Liabilities | |
| Tax and social security obligations | (1,424) |
| Other liabilities | (66) |
| Total identifiable net assets at fair value | 5,316 |
| Goodwill arising on acquisition | 60,037 |
| Purchase consideration transferred | 65,353 |
| Analysis of cash flows on acquisition | |
| Net cash acquired with the subsidiary | (275) |
| Payable in installments | (8,495) |
| Contingent consideration | (21,400) |
| Net of cash flow on acquisition (investing activities) | 35,183 |
As of December 31, 2022, an additional amount of R$18,230 was paid, amounting to a total of R$53,413 since the acquisition date. The remaining installments shall be paid at the end of March 2023. The goodwill recognized includes the value of expected synergies arising from the acquisition, which is not separately recognized. In addition, the Group incurred direct costs for the business combinations which were expensed as incurred.
| (ii) | BTR Benefícios e Seguros |
On August 15, 2022, the Group exercised its call options over the equity of BTR Benefícios e Seguros (“BTR”) which allowed the Group to acquire up to 100% of the total share of the company. This acquisition will allow the Group to further strengthen its operations on the Health and Benefits front, with a focus on corporate customers. The management of health plans today is a priority topic on the corporate market agenda as it represents, in Brazil, one of the largest costs to most companies. The closing occurred on October 03, 2022, and the total consideration paid, in cash, was R$1,254. This acquisition is not considered material for XP Inc. consolidated financial statements. No goodwill was recognized in this transaction.
| (b) | Acquisitions in 2021 |
Instituto de Gestão e Tecnologia da Informação Ltda (“IGTI”)
On November 5, 2021 the Group entered into an agreement to acquire 100% of total share capital of Instituto de Gestão e Tecnologia da Informação LTDA (“IGTI”). The acquisition was concluded on the same date. IGTI operates in the development and coordination of teaching activities, scientific research activities and educational services. The total consideration is R$46,382. The fair value of the identifiable assets acquired and liabilities assumed as of the acquisition date were:
28 OF 76
XP Inc. and its subsidiaries Notes to consolidated financial statements December 31, 2022, 2021 and 2020 (In thousands of Brazilian Reais, unless otherwise stated) | |
| IGTI | |
| Assets | |
| Cash | 346 |
| Property and equipment | 633 |
| Intangible assets | 17,264 |
| Other assets | 178 |
| 18,421 | |
| Liabilities | |
| Accounts payable | (561) |
| Tax and social security obligations | (834) |
| Other liabilities | (1,338) |
| Total identifiable net assets at fair value | 15,688 |
| Goodwill arising on acquisition | 25,694 |
| Contingent consideration | 5,000 |
| Purchase consideration transferred | 46,382 |
| Analysis of cash flows on acquisition | |
| Net cash acquired with the subsidiary | (346) |
| Payable in installments | (5,000) |
| Contingent consideration | (5,000) |
| Net of cash flow on acquisition (investing activities) | 36,036 |
The goodwill recognized includes the value of expected synergies arising from the acquisition, which is not separately recognized. In addition, the Group incurred in direct costs for the business combinations which were expensed as incurred.
Investments in XProject
On August 23, 2021 the Group entered into an agreement, to acquire 100% of total share capital of UFUK Empreendimentos e Participações S.A. later referred to as XProject Participações S.A. The company is a holding which has an objective to acquire participation as a partner or a shareholder in other companies in Brazil and abroad. This acquisition is not considered material for XP Inc. consolidated financial statements.
Investments in XP Energia
On May 4, 2021 the Group entered into an agreement to acquire 100% of total share capital of Solis Comercializadora de Energia Ltda. later denominated XP Comercializadora de Energia Ltda (“XP Energia”). The company's objective is to operate in the wholesale electricity trade, through brokerage, representation, intermediation, purchase, sale, import and export; provision of intermediation services between energy buyers and sellers, among other related services. This acquisition is not considered material for XP Inc. consolidated financial statements. The purchase price was mostly allocated to goodwill, representing the value of expected synergies arising from the acquisition.
The results of operations of the businesses acquired for periods prior to acquisition dates, individually and in the aggregate, were not material to the Company´s consolidated statements of income and, accordingly, pro forma information has not been presented.
| (c) | Other developments |
| (i) | SPAC Transactions |
On August 3, 2021, XPAC Acquisition Corp. (a subsidiary of XP Inc), completed its initial public offering (“IPO”), offering an aggregate price of R$1,134,797 which included the exercise of the underwriter over-allotment option over a portion of shares. XPAC is a special purpose acquisition company, incorporated as a Cayman Islands exempted company for the purpose of effecting a merger, share exchange, asset acquisition, share purchase, reorganization or similar business combination with one or more businesses. On April, 2022, the Group signed a Business Combination Agreement (“BCA") with the Brazilian biotechnology company SuperBac, which will thus be listed on the US stock exchange. The business combination has a legal term of 24 months since the IPO to be completed and, thus, must be concluded no later than August 2023. The transaction needs to be approved by the spac’s shareholders in a special shareholder meeting. The financial impact of this transaction on the consolidated financial statements is presented in Note 7a (iii), Note 8 (i), and Note 20b (iii).
29 OF 76
XP Inc. and its subsidiaries Notes to consolidated financial statements December 31, 2022, 2021 and 2020 (In thousands of Brazilian Reais, unless otherwise stated) | |
| (ii) | Minority stake acquisitions |
XP Inc. entered in agreements through its proprietary funds to acquire a minority stake in (i) Suno Controle S.A. and TMRF Consultoria LTDA., companies within the same economic group which produces free financial content including analyses, news, books, courses, among others, and also distributes paid content through a digital ecosystem, offering personal financial data consolidation, investment recommendations, and advisory; (ii) Estratégia & Timing, which main activity is advisory, consulting, guidance and educational operational assistance in the financial area for business and investment management; (iii) Etrnity which is a holding company used as an exclusive vehicle to participate, directly or indirectly, in companies that act or will act in the financial and capital markets; (iv) AZ Quest which is one of the largest and most traditional independent asset management companies in Brazil; (v) Direto S.A., a real estate loan startup, (vi) Inside, with content on product reviews linked to variable income and with accessible language for the retail public and (vii) Oriz Participações S.A., a holding company which operates with wealth management and will leverage XP's Wealth Services business as a mature, robust and high-end solution to serve the most sophisticated wealth managers, strengthening XP's presence in the Private High and Ultra High segments.
The total fair value consideration recorded for those acquisitions during the period ended December 31, 2022, is R$ 332,114 (Note 15).
| (iii) | New digital assets trading platform |
On May 12, 2022, XP announced the creation of XTage, a new trading platform for digital assets in collaboration with Nasdaq, a global leading technology company serving the capital markets and other industries. The trading platform is fully integrated into XP Inc´s ecosystem, giving customers a frictionless process to invest using existing XP services.
(iv) Share purchase agrément signed with Banco Modal S.A
On January 6, 2022, the Group entered into a binding agreement to acquire up to 100% of the total share of Banco Modal which will be paid with up to 19.5 million newly issued XP Inc. Class A shares or Brazilian Depository Receipts (BDR), implying a premium of 35% over Banco Modal’s last thirty days average price. The companies share the common goal of exceeding clients’ expectations and democratizing access to high quality and low-cost financial products and services. The acquisition is expected to deliver solid and sustainable accretion to the shareholders of both companies. As of December 31, 2022, the acquisition is pending approval of the Brazilian Central Bank (BACEN) and the Securities and Exchange Commission (SEC). The transaction was approved by Administrative Council for Economic Defense (CADE) in July 2022.
30 OF 76
XP Inc. and its subsidiaries Notes to consolidated financial statements December 31, 2022, 2021 and 2020 (In thousands of Brazilian Reais, unless otherwise stated) | |
| 6. | Securities purchased (sold) under resale (repurchase) agreements |
| a) | Securities purchased under resale agreements |
|
2022 |
2021 | ||
| Collateral held | 834,975 | 3,322,254 | |
| National Treasury Notes (NTNs) (i) | 645,188 | 2,671,122 | |
| National Treasury Bills (LTNs) (i) | - | 544,546 | |
| Debentures (ii) | 84,065 | 37,688 | |
| Real Estate Receivable Certificates (CRI) (ii) | 82,633 | 43,397 | |
| Other | 23,089 | 25,501 | |
| Collateral repledge | 6,771,526 | 5,574,846 | |
| National Treasury Bills (LTNs) (i) | 227,713 | - | |
| National Treasury Notes (NTNs) (i) | 2,842,159 | 1,556,303 | |
| Debentures (ii) | 929,346 | 906,519 | |
| Real Estate Receivable Certificates (CRI) (ii) | 2,019,639 | 2,586,893 | |
| Financial credit bills (LF) (ii) | - | 525,131 | |
| Agribusiness Receivables Certificates (CRA) | 101,091 | - | |
| Agribusiness Credit Bill | 171,730 | - | |
| Other | 479,848 | - | |
| Expected Credit Loss (iii) | (2,681) | (2,569) | |
| Total | 7,603,820 | 8,894,531 |
(i) Investments in purchase and sale commitments collateral-backed by sovereign debt securities refer to transactions involving the purchase of sovereign debt securities with a commitment to sale originated mainly in the subsidiaries XP CCTVM, Banco XP and in exclusive funds
(ii) Refers to fixed-rate fixed-income assets, which are low-risk investments collateral-backed..
(iii) The reconciliation of gross carrying amount and the expected credit loss segregated by stages are presented in the Note 14.
As of December 31, 2022, securities purchased under resale agreements were carried out at average interest rates of 13.65% p.a. (9.15% p.a. as of December 31, 2021).
As of December 31, 2022, the amount of R$ 646,478 (December 31, 2021 - R$ 1,071,328), from the total amount of collateral held portfolio, is being presented as cash equivalents in the statements of cash flows.
31 OF 76
XP Inc. and its subsidiaries Notes to consolidated financial statements December 31, 2022, 2021 and 2020 (In thousands of Brazilian Reais, unless otherwise stated) | |
| b) | Securities sold under repurchase agreements |
|
2022 |
2021 | ||
| National Treasury Bills (LTNs) | 8,569,145 | 3,325,188 | |
| National Treasury Notes (NTNs) | 12,347,218 | 10,098,672 | |
| Financial Treasury Bills (LFTs) | 533,509 | 7,515,712 | |
| Debentures | 1,831,846 | 553,953 | |
| Real Estate Receivable Certificates (CRI) | 6,471,410 | 4,324,155 | |
| Financial credit bills (LF) | 1,111,890 | 463,665 | |
| Agribusiness Receivables Certificates (CRA) | 925,073 | - | |
| Total | 31,790,091 | 26,281,345 |
As of December 31, 2022, securities sold under repurchase agreements were agreed with average interest rates of 13.65% p.a. (December 31, 2021 – 9.14% p.a.).
32 OF 76
XP Inc. and its subsidiaries Notes to consolidated financial statements December 31, 2022, 2021 and 2020 (In thousands of Brazilian Reais, unless otherwise stated) | |
| 7. | Securities |
| a) | Securities classified at fair value through profit and loss are presented in the following table: |
|
2022 |
2021 | ||||||||||||||
| Gross carrying amount |
Fair value |
Group portfolio | Retirement plan assets (i) |
Gross carrying amount |
Fair Value |
Group portfolio |
Retirement plan assets (i) | ||||||||
| Financial assets | |||||||||||||||
| At fair value through profit or loss | |||||||||||||||
|
Available portfolio |
86,273,732 |
86,336,920 |
40,648,295 | 45,688,625 | 56,899,391 | 56,985,365 | 24,982,206 | 32,003,159 | |||||||
| Brazilian onshore sovereign bonds | 25,262,407 | 25,127,998 | 22,799,302 | 2,328,696 | 15,577,753 | 15,582,410 | 12,708,187 | 2,874,223 | |||||||
| Investment funds | 42,274,069 | 42,274,069 | 2,389,131 | 39,884,938 | 28,494,662 | 28,494,662 | 2,184,461 | 26,310,201 | |||||||
| Stocks issued by public-held company | 5,494,957 | 5,494,957 | 5,155,761 | 339,196 | 4,768,724 | 4,768,724 | 4,059,183 | 709,541 | |||||||
| Debentures | 5,013,524 | 4,990,882 | 2,768,843 | 2,222,039 | 4,493,406 | 4,522,150 | 3,091,370 | 1,430,780 | |||||||
| Structured transaction certificate | 243,790 | 285,560 | 285,560 | - | 235,794 | 270,225 | 270,225 | - | |||||||
| Bank deposit certificates (ii) | 525,778 | 541,294 | 523,859 | 17,435 | 352,770 | 356,313 | 331,605 | 24,708 | |||||||
| Agribusiness receivables certificates | 1,998,287 | 1,984,686 | 1,964,977 | 19,709 | 573,374 | 579,224 | 579,224 | - | |||||||
| Certificate of real estate receivable | 1,799,625 | 1,803,111 | 1,800,671 | 2,440 | 568,347 | 575,717 | 575,717 | - | |||||||
| Financial credit bills | 663,589 | 738,028 | 16,981 | 721,047 | 663,236 | 669,819 | 28,661 | 641,158 | |||||||
| Real estate credit bill | 2,299,236 | 2,302,124 | 2,302,124 | - | - | - | - | - | |||||||
| Others (iv) | 698,470 | 794,211 | 641,086 | 153,125 | 1,171,325 | 1,166,121 | 1,153,573 | 12,548 | |||||||
| Investments held in trust accounts | 1,176,084 | 1,176,084 | 1,176,084 | - | 1,194,590 | 1,194,590 | 1,194,590 | - | |||||||
| US government bonds (iii) | 1,176,084 |
1,176,084 |
1,176,084 | - | 1,194,590 | 1,194,590 | 1,194,590 | - | |||||||
| Total | 87,449,816 | 87,513,004 | 41,824,379 | 45,688,625 | 58,093,981 | 58,179,955 | 26,176,796 | 32,003,159 | |||||||
| (i) | Those financial products represent investment contracts that have the legal form of retirement plans, which do not transfer substantial insurance risk to the Group. Therefore, contributions received from participants are accounted for as liabilities and an asset of the participant in the linked Specially Constituted Investment Fund (“FIE”). Besides assets which are presented segregated above, as retirement plan assets, the Group has proprietary assets to guarantee the solvency of our insurance and pension plan operations, under the terms of CNSP Resolution No. 432/2021, presented as Group portfolio, within investment funds line. As of December 31, 2022, those assets represent R$183,732 (December 31, 2021 - R$106,425). |
| (ii) | Bank deposit certificates include R$252,877 (December 31, 2021 – R$194,892) presented as cash equivalents in the statements of cash flows. |
| (iii) | Related to investments received through IPO transactions derived by XPAC Acquisition Corp. These funds are restricted for use and may only be used for purposes of completing an initial business combination or redemption of public shares as set forth in XPAC Acquisition Corp. trust agreement. |
| (iv) | Mainly related to bonds issued and traded overseas and other securities. |
33 OF 76
XP Inc. and its subsidiaries Notes to consolidated financial statements December 31, 2022, 2021 and 2020 (In thousands of Brazilian Reais, unless otherwise stated) | |
| b) | Securities at fair value through other comprehensive income are presented in the following table: |
|
2022 |
2021 | ||||||
|
Gross carrying amount |
Fair value |
Gross carrying amount |
Fair value | ||||
| Financial assets | |||||||
| At fair value through other comprehensive income | |||||||
| Brazilian onshore sovereign bonds | 33,532,740 | 32,931,403 | 32,725,011 | 31,868,878 | |||
| Brazilian offshore sovereign bonds | 1,379,129 | 1,321,258 | 458,755 | 463,499 | |||
| Corporate bonds | 238,730 | 226,007 | - | - | |||
| Total | 35,150,599 | 34,478,668 | 33,183,766 | 32,332,377 | |||
| c) | Securities evaluated at amortized cost are presented in the following table: |
|
2022 |
2021 | ||||||
|
Gross carrying amount |
Book value |
Gross carrying amount |
Book value | ||||
| Financial assets | |||||||
| At amortized cost (i) | |||||||
| Brazilian onshore sovereign bonds | 5,835,971 | 5,834,628 | - | - | |||
| Foreign sovereign bonds | 1,743,688 | 1,742,311 | 1,871,273 | 1,868,776 | |||
| Rural product note | 507,131 | 506,927 | 328,638 | 328,638 | |||
| Debentures | - | - | 41,393 | 41,393 | |||
| Commercial notes | 1,188,237 | 1,188,237 | - | - | |||
| Total | 9,275,027 | 9,272,103 | 2,241,304 | 2,238,807 | |||
(i) Includes expected credit losses in the amount of R$ 2,924 (December 31, 2021 – R$ 2,497). The reconciliation of gross carrying amount and the expected credit loss segregated by stages are presented in the Note 14.
| d) | Securities on the financial liabilities classified at fair value through profit or loss are presented in the following table: |
|
2022 |
2021 | ||||||
|
Gross carrying amount |
Fair value |
Gross carrying amount |
Fair value | ||||
| Financial liabilities | |||||||
| At fair value through profit or loss | |||||||
| Securities loaned | 13,048,246 | 13,048,246 | 2,146,398 | 2,146,398 | |||
| e) | Debentures designated at fair value through profit or loss are presented in the following table: |
On May 6, 2021, XP Investimentos, issued non-convertible Debentures, in the aggregate amount of R$ 500,018, with the objective of funding the Group’s working capital for the construction of “Vila XP” at São Roque, State of São Paulo and designated this instrument as fair value through profit or loss in order to align it with the Group’s risk management and investment strategy. The principal amount is due on April 10, 2036. The accrued interest is payable every month from the issuance date and is calculated based on the IPCA (brazilian inflation index) plus 5% p.a.
|
2022 |
2021 | ||||||
|
Gross carrying amount |
Fair value |
Gross carrying amount |
Fair Value | ||||
| Financial liabilities | |||||||
| At fair value through profit or loss | |||||||
| Debentures | 567,838 | 481,019 | 536,881 | 518,804 | |||
Unrealized gains/(losses) due to own credit risk for liabilities for which the fair value option has been elected are recorded in other comprehensive income. Gain/(losses) due to own credit risk were not material for the period ended December 31, 2022.
34 OF 76
XP Inc. and its subsidiaries Notes to consolidated financial statements December 31, 2022, 2021 and 2020 (In thousands of Brazilian Reais, unless otherwise stated) | |
Determination of own credit risk for items for which the fair value option was elected
The debenture’s own credit risk is calculated as the difference between its yield and its benchmark rate for similar Brazilian federal securities.
e.1) Difference between aggregate fair value and aggregate remaining contractual principal balance outstanding
The following table reflects the difference between the aggregate fair value and the aggregate remaining contractual principal balance outstanding as of December 31, 2022 for instruments for which the fair value option has been elected.
|
2022 | ||||||
|
Contractual principal outstanding |
Fair value |
Fair value/(under) contractual principal outstanding | ||||
| Long-term debt | ||||||
| Debentures | 567,838 | 481,019 | (86,819) |
| f) | Below is presented the securities classified by maturity: |
|
Assets |
Liabilities | ||||||
|
2022 |
2021 |
2022 |
2021 | ||||
| Financial assets | |||||||
| At fair value through PL and at OCI | |||||||
| Current | 73,569,049 | 47,431,624 | 13,048,246 | 2,146,398 | |||
| Non-stated maturity | 49,001,359 | 31,425,792 | 13,048,246 | 2,146,398 | |||
| Up to 3 months | 18,739,708 | 4,556,261 | - | - | |||
| From 4 to 12 months | 5,827,982 | 11,449,571 | - | - | |||
| Non-current | 48,422,623 | 43,088,235 | 481,019 | 518,804 | |||
| After one year | 48,422,623 | 43,088,235 | 481,019 | 518,804 | |||
| Evaluated at amortized cost | |||||||
| Current | 7,952,328 | 1,891,889 | - | - | |||
| Up to 3 months | 3,327,313 | 1,698,760 | - | - | |||
| From 4 to 12 months | 4,625,015 | 193,129 | - | - | |||
| Non-current | 1,319,775 | 349,415 | - | - | |||
| After one year | 1,319,775 | 349,415 | - | - | |||
| Total | 131,263,775 | 92,761,163 | 13,529,265 | 2,665,202 |
The reconciliation of expected loss to financial assets at amortized cost – securities segregated by stage according with to IFRS 9 is demonstrated in Note 14.
| 8. | Derivative financial instruments |
The Group trades derivative financial instruments with various counterparties to manage its overall exposures (interest rate, foreign
currency and fair value of financial instruments) and to assist its customers in managing their own exposures.The fair value of derivative
financial instruments, comprised of futures, forward, options, and swaps operations, is determined in accordance with the following criteria:
35 OF 76
XP Inc. and its subsidiaries Notes to consolidated financial statements December 31, 2022, 2021 and 2020 (In thousands of Brazilian Reais, unless otherwise stated) | |
| • | Swap – These operations swap cash flow based on the comparison of profitability between two indexers, thus, the agent assumes both positions – put in one indexer and call on another. |
| • | Forward - at the market quotation value, and the installments receivable or payable are fixed to a future date, adjusted to present value, based on market rates published at B3. |
| • | Futures – Foreign exchange rates, prices of shares and commodities are commitments to buy or sell a financial instrument at a future date, at a contracted price or yield and may be settled in cash or through delivery. Daily cash settlements of price movements are made for all instruments. |
| • | Options - option contracts give the purchaser the right to buy or sell the instrument at a fixed price negotiated at a future date. Those who acquire the right must pay a premium to the seller of the right. This premium is not the price of the instrument, but only an amount paid to have the option (possibility) to buy or sell the instrument at a future date for a previously agreed price. |
Positions with derivative financial instruments as of December 31, 2022 and 2021 are shown below:
|
2022 | ||||||
|
Notional |
Fair Value |
% |
Up to 3 months |
From 4 to 12 months |
Above 12 months |
|
| Assets | ||||||
| Options | 1,253,758,408 | 5,542,340 | 94 | 1,209,290 | 1,931,618 | 2,401,432 |
| Swap contracts | 32,705,136 | 2,828,613 | 2 | 62,729 | 350,012 | 2,415,872 |
| Forward contracts | 16,058,162 | 549,953 | 1 | 352,796 | 132,119 | 65,038 |
| Future contracts |
34,679,065 |
296,249 |
3 |
73,621 |
222,628 |
- |
| Total |
1,337,200,771 |
9,217,155 |
100 |
1,698,436 |
2,636,377 |
4,882,342 |
| Liabilities | ||||||
| Options | 852,098,826 | 7,086,946 | 84 | 1,387,988 | 1,781,457 | 3,917,501 |
| Swap contracts | 13,755,838 | 839,421 | 1 | 44,526 | 261,669 | 533,226 |
| Forward contracts | 13,548,954 | 511,167 | 1 | 150,119 | 224,932 | 136,116 |
| Future contracts | 140,039,765 | 161,574 | 14 | 53,421 | 72,349 | 35,804 |
| Others (i) |
84,184 |
6,301 |
- |
6,301 |
- |
- |
| Total |
1,019,527,567 |
8,605,409 |
100 |
1,642,355 |
2,340,407 |
4,622,647 |
| (i) | Related to Public Warrants liabilities issued by XPAC Acquisition Corp. |
Below is the composition of the Derivative financial instruments portfolio (assets and liabilities) by type of instrument, stated fair value and by maturity:
|
2021 | ||||||
|
Notional |
Fair Value |
% |
Up to 3 months |
From 4 to 12 months |
Above 12 months | |
| Assets | ||||||
| Swap contracts | 75,380,631 | 2,577,311 | 14 | 73,016 | 259,300 | 2,244,995 |
| Forward contracts | 88,107,328 | 1,601,167 | 16 | 404,764 | 216,895 | 979,508 |
| Future contracts | 11,932,285 | 194,910 | 2 | 21,891 | 3,275 | 169,745 |
| Options |
371,849,357 |
6,570,326 |
68 |
1,474,816 |
2,281,088 |
2,814,421 |
| Total |
547,269,601 |
10,943,714 |
100 |
1,974,487 |
2,760,558 |
6,208,669 |
| Liabilities | ||||||
| Options | 311,295,196 | 8,112,055 | 69 | 1,941,553 | 1,937,725 | 4,232,777 |
| Forward contracts | 44,968,097 | 1,057,426 | 18 | 62,935 | 68,398 | 926,093 |
| Future contracts | 13,041,450 | 157,710 | 10 | 6 | 4,814 | 152,890 |
| Swap contracts | 82,520,691 | 2,561,327 | 3 | 113,754 | 240,005 | 2,207,568 |
| Others (i) |
84,184 |
19,665 |
- |
19,665 |
- |
- |
| Total |
451,909,618 |
11,908,183 |
100 |
2,137,913 |
2,250,942 |
7,519,328 |
(i) Related to Public Warrants liabilities issued by XPAC Acquisition Corp.
36 OF 76
XP Inc. and its subsidiaries Notes to consolidated financial statements December 31, 2022, 2021 and 2020 (In thousands of Brazilian Reais, unless otherwise stated) | |
Derivatives financial instruments by index:
|
2022 |
2021 |
||||
|
Notional |
Fair Value |
Notional |
Fair Value |
||
| Swap Contracts | |||||
| Asset Position | |||||
| Interest | 20,616,960 | 739,698 | 66,123,491 | 1,799,953 | |
| Foreign exchange | 1,647,089 | 15,906 | 1,978,886 | 16,013 | |
| Share | 10,302,018 | 2,054,430 | 7,278,254 | 761,345 | |
| Commodities | 139,069 | 18,579 | - | - | |
| Liability Position | |||||
| Interest | 13,106,906 | (630,539) | 75,207,636 | (2,461,848) | |
| Foreign exchange | 648,932 | (208,882) | 5,888,850 | (28,509) | |
| Share | - | - | 1,424,205 | (70,970) | |
| Forward Contracts | |||||
| Asset Position | |||||
| Foreign exchange | 15,516,883 | 213,311 | 81,544,253 | 282,775 | |
| Share | 305,614 | 306,516 | 4,603,031 | 412,097 | |
| Interest | 233,977 | 30,126 | 906,295 | 906,295 | |
| Commodities | 1,688 | - | 1,053,749 | - | |
| Liability Position | |||||
| Foreign exchange | 13,548,954 | (511,167) | 42,367,576 | (139,642) | |
| Interest | - | - | 906,302 | (906,302) | |
| Share | - | - | 11,482 | (11,482) | |
| Commodities | - | - | 1,682,737 | - | |
| Future Contracts | |||||
| Purchase commitments | |||||
| Foreign exchange | 6,041,572 | 1,182 | 155,487 | 194,910 | |
| Interest | 26,020,396 | 291,057 | 11,629,715 | - | |
| Share | 180,720 | - | 147,083 | - | |
| Commodities | 2,436,377 | 4,010 | - | - | |
| Commitments to sell | |||||
| Interest | 111,237,614 | (111,008) | 12,188,922 | (157,710) | |
| Foreign exchange | 25,134,918 | (20,290) | 705,334 | - | |
| Share | 3,006,462 | (23,268) | 147,083 | - | |
| Commodities | 660,771 | (7,007) | 111 | - | |
| Options | |||||
| Purchase commitments | |||||
| Foreign exchange | 237,680,984 | 1,352,521 | 25,973,934 | 2,248,676 | |
| Share | 462,926,358 | 2,394,104 | 72,883,420 | 3,146,174 | |
| Interest | 544,855,750 | 1,681,487 | 272,987,997 | 1,160,526 | |
| Commodities | 8,295,316 | 114,228 | 4,006 | 14,950 | |
| Commitments to sell | |||||
| Foreign exchange | 234,719,499 | (1,504,068) | 24,541,428 | (3,080,095) | |
| Share | 26,017,420 | (4,245,924) | 13,690,202 | (2,788,089) | |
| Interest | 590,924,462 | (1,223,999) | 272,383,162 | (2,129,996) | |
| Commodities | 437,445 | (112,956) | 680,404 | (113,875) | |
| Others | |||||
| Liability Position | |||||
| Share | 84,184 | (6,301) | 84,184 | (19,665) | |
| Assets | 9,217,155 | 10,943,714 | |||
| Liabilities |
(8,605,409) |
(11,908,183) |
|||
| Net |
611,746 |
(964,469) |
|||
37 OF 76
XP Inc. and its subsidiaries Notes to consolidated financial statements December 31, 2022, 2021 and 2020 (In thousands of Brazilian Reais, unless otherwise stated) | |
| 9. | Hedge accounting |
The Group has three types of hedge relationships: hedge of net investment in foreign operations, fair value hedge and cash flow hedge. For hedge accounting purposes, the risk factors measured by the Group are:
| · | Interest Rate: Risk of volatility in transactions subject to interest rate variations; |
| · | Currency: Risk of volatility in transactions subject to foreign exchange variation; |
| · | Stock Grant Charges: Risk of volatility in XP Inc stock prices, listed on NASDAQ. |
The structure of risk limits is extended to the risk factor level, where specific limits aim at improving the monitoring and understanding processes, as well as avoiding concentration of these risks.
The structures designed for interest rate and exchange rate categories take into account total risk when there are compatible hedging instruments. In certain cases, management may decide to hedge a risk for the risk factor term and limit of the hedging instrument.
The designated coverage ratio effectiveness range is 80 to 125% of the risk factor eligible for coverage. Sources of ineffectiveness are in general related to the counterparty’s credit risk and possible mismatches of terms between the hedging instrument and the hedged item, such as the hedged item and hedging instrument occur or are settled at different dates.
| a) | Hedge of net investment in foreign operations |
In the period ended December 31, 2022, the objective for the Group was to hedge the risk generated by the US$ variation from investments in our subsidiaries in the United States, XP Holdings International and XP Advisors Inc.
The Group has entered into derivatives contracts to protect against changes in future cash flows and exchange rate variation of net investments in foreign operations.
The Group undertakes risk management through the economic relationship between hedge instruments and hedged items, in which it is expected that these instruments will move in opposite directions, in the same proportions, with the aim of neutralizing the risk factors.
| Hedged item | Hedge instrument | |||||||||
| Book Value | Variation in | |||||||||
| Strategies | Assets | Liabilities | value recognized in Other comprehensive income | Notional value | Variation in the amounts used to calculate hedge ineffectiveness | |||||
| 2022 | ||||||||||
| Foreign exchange risk | ||||||||||
| Hedge of net investment in foreign operations | 395,594 | - | (17,281) | 414,043 | 18,480 | |||||
| Total | 395,594 | - | (17,281) | 414,043 | 18,480 | |||||
| 2021 | ||||||||||
| Foreign exchange risk | ||||||||||
| Hedge of net investment in foreign operations | 310,069 | - | 19,474 | 440,022 | (18,758) | |||||
| Total | 310,069 | - | 19,474 | 440,022 | (18,758) | |||||
| 2020 | ||||||||||
| Foreign exchange risk | ||||||||||
| Hedge of net investment in foreign operations | 245,986 | - | 52,299 | 349,218 | (60,563) | |||||
| Total | 245,986 | - | 52,299 | 349,218 | (60,563) | |||||
38 OF 76
XP Inc. and its subsidiaries Notes to consolidated financial statements December 31, 2022, 2021 and 2020 (In thousands of Brazilian Reais, unless otherwise stated) | |
| b) | Fair value hedge |
The Group’s fair value strategy consists of hedging the exposure to variation in fair value on the receipt, payment of interests and exchange variation on assets and liabilities.
The group applies fair value hedges as follows:
| · | Hedging the exposure of fixed-income securities carried out through structured operations certificates. The market risk hedge strategy involves avoiding temporary fluctuations in earnings arising from changes in the interest rate market in Reais. Once this risk is offset, the Group seeks to index the portfolio to the CDI, through the use of derivatives (DI1 Futuro). The hedge is contracted in order to neutralize the total exposure to the market risk of the fixed-income funding portfolio, excluding the portion of the fixed-income compensation represented by the credit spread of Banco XP S.A., seeking to obtain the closest match deadlines and volumes as possible. |
| · | Hedging to protect the change in the fair value of the exchange and interest rate risk of the component of future cash flows arising from the XP Inc bond issued (financial liability) recognized in the balance sheet of XP Inc in July 2021 by contracting derivatives. |
| · | Hedging the exposure of fixed-income securities carried out through sovereign and corporate bonds issued in local or foreign currencies, mainly US Dollars. The market risk hedge strategy involves avoiding temporary fluctuations in statement of income arising from changes in the interest rate market. Once this risk is offset, the Group seeks to index the portfolio to the CDI, through the use of derivatives. |
The effects of hedge accounting on the financial position and performance of the Group are presented below:
| Hedged item | Hedge instrument | |||||||||
| Book Value | Variation in | |||||||||
| Strategies | Assets | Liabilities | value recognized in Other comprehensive income | Notional value | Variation in the amounts used to calculate hedge ineffectiveness | |||||
| 2022 | ||||||||||
| Interest rate and foreign exchange risk | ||||||||||
| Structured notes | - | 10,648,559 | 726,798 | 10,663,672 | (734,656) | |||||
| Issued bonds | - | 3,889,699 | 323,881 | 3,646,613 | (362,994) | |||||
| Fixed income bonds | 3,589,909 | - | (163,541) | 3,577,084 | 165,164 | |||||
| Total | 3,589,909 | 14,538,258 | 887,138 | 17,887,369 | (932,486) | |||||
| Hedged item | Hedge instrument | |||||||||
| Book Value | Variation in | |||||||||
| Strategies | Assets | Liabilities | value recognized in Other comprehensive income | Notional value | Variation in the amounts used to calculate hedge ineffectiveness | |||||
| 2021 | ||||||||||
| Interest rate and foreign exchange risk | ||||||||||
| Structured notes | - | 7,635,838 | 493,728 | 7,608,546 | (481,464) | |||||
| Issued bonds | - | 1,628,492 | 12,462 | 1,689,453 | (13,727) | |||||
| Total | - | 9,264,330 | 506,190 | 9,297,999 | (495,191) | |||||
| c) | Cash flow hedge |
In March 2022, XP Inc recorded a new hedge structure, in order to neutralize the impacts of XP share price variation on highly probable labor tax payments related to share-based compensation plans using SWAP-TRS contracts. The transaction has been elected for hedge accounting and classified as cash flow hedge in accordance with IFRS 9. Labor tax payments are due upon delivery of shares to employees under share-based compensation plans and are directly related to share price at that time.
39 OF 76
XP Inc. and its subsidiaries Notes to consolidated financial statements December 31, 2022, 2021 and 2020 (In thousands of Brazilian Reais, unless otherwise stated) | |
The effects of hedge accounting on the financial position and performance of the Group are presented below:
| Hedged item | Hedge instrument | |||||||||
| Book Value | Variation in | |||||||||
| Strategies | Assets | Liabilities | value recognized in Other comprehensive income | Notional value | Variation in the amounts used to calculate hedge ineffectiveness | |||||
| 2022 | ||||||||||
| Market price risk | ||||||||||
| Long term incentive plan taxes | - | 262,756 | 346,900 | 261,818 | (348,248) | |||||
| Total | - | 262,756 | 346,900 | 261,818 | (348,248) | |||||
The table below presents, for each risk factor and hedging instruments categories, the nominal value and the adjustments to the fair value of the hedging instruments and the book value of the hedged object:
| 2022 | |||||||
| Book Value | |||||||
| Hedge Instruments | Notional amount | Assets | Liabilities | Variation in fair value used to calculate hedge ineffectiveness | Hedge ineffectiveness recognized in income | ||
| Interest rate risk | |||||||
| Futures | 17,604,185 | 3,589,909 | 14,218,543 | (890,103) | (41,295) | ||
| Foreign exchange risk | |||||||
| Futures | 697,227 | 395,594 | 319,715 | (23,903) | (2,825) | ||
| Market price risk | |||||||
| Swaps | 261,818 | - | 262,756 | (348,248) | (1,348) | ||
|
2021 | ||||||
|
Notional amount |
Book value |
Variation in fair value used to calculate hedge ineffectiveness |
Hedge ineffectiveness recognized in income | |||
|
Hedge Instruments |
Assets |
Liabilities | ||||
| Interest rate risk | ||||||
| Futures | 8,861,195 | - | 8,830,343 | (491,649) | 10,995 | |
| Foreign exchange risk | ||||||
| Futures | 876,826 | 310,069 | 433,987 | (22,300) | 720 | |
The table below presents, for each strategy, the notional amount and the fair value adjustments of hedging instruments and the book value of the hedged item:
|
December 31, 2022 |
December 31, 2021 |
December 31, 2020 | ||||||||||
|
Strategies |
Hedge instruments |
Hedge item |
Hedge instruments |
Hedge item |
Hedge instruments |
Hedge item | ||||||
|
Notional amount |
Fair value adjustments |
Book value |
Notional amount |
Fair value adjustments |
Book value |
Notional amount |
Fair value adjustments |
Book value | ||||
| Hedge of fair value | 17,887,369 | (932,486) | 887,138 | 9,297,999 | (495,191) | 506,190 | 2,188,732 | (47,923) | 46,795 | |||
| Hedge of net investment in foreign operations | 414,043 | 18,480 | (17,252) | 440,022 | (18,758) | 19,474 | 349,218 | (60,563) | 52,299 | |||
| Hedge of cash flow | 261,818 | (348,248) | 346,900 | - | - | - | - | - | - | |||
| Total | 18,563,230 | (1,262,254) | 1,216,786 | 9,738,021 | (513,949) | 525,664 | 2,537,950 | (108,486) | 99,094 | |||
40 OF 76
XP Inc. and its subsidiaries Notes to consolidated financial statements December 31, 2022, 2021 and 2020 (In thousands of Brazilian Reais, unless otherwise stated) | |
The table below shows the breakdown notional value by maturity of the hedging strategies:
|
2022 | |||||||
|
0-1 year |
1-2 years |
2-3 years |
3-4 years |
4-5 years |
5-10 years |
Total | |
| Hedge of fair value | 229,368 | 707,421 | 2,773,333 | 5,913,477 | 5,930,291 | 2,333,479 | 17,887,369 |
| Hedge of net investment in foreign operations | 381,958 | - | 32,085 | - | - | - | 414,043 |
| Hedge of cash flow | 261,818 | - | - | - | - | - | 261,818 |
| Total | 873,144 | 707,421 | 2,805,418 | 5,913,477 | 5,930,291 | 2,333,479 | 18,563,230 |
|
2021 | |||||||
|
0-1 year |
1-2 years |
2-3 years |
3-4 years |
4-5 years |
5-10 years |
Total | |
| Hedge of fair value | 136,636 | 276,219 | 478,745 | 972,199 | 4,510,125 | 2,924,075 | 9,297,999 |
| Hedge of net investment in foreign operations | 384,217 | - | - | 55,805 | - | - | 440,022 |
| Total | 520,853 | 276,219 | 478,745 | 1,028,004 | 4,510,125 | 2,924,075 | 9,738,021 |
|
2020 | |||||||
|
0-1 year |
1-2 years |
2-3 years |
3-4 years |
4-5 years |
5-10 years |
Total | |
| Hedge of fair value | 1,977 | 13,375 | 94,099 | 44,843 | 672,978 | 1,361,460 | 2,188,732 |
| Hedge of net investment in foreign operations | - | - | 146,547 | 202,671 | - | - | 349,218 |
| Total | 1,977 | 13,375 | 240,646 | 247,514 | 672,978 | 1,361,460 | 2,537,950 |
| 10. | Loan operations |
Following are the breakdown of the carrying amount of loan operations by class, sector of debtor, maturity and concentration:
| Loans by type | 2022 | 2021 | |
| Pledged asset loan | 20,198,764 | 11,789,419 | |
| Retail | 10,932,086 | 7,296,172 | |
| Companies | 5,311,675 | 1,887,649 | |
| Credit card | 3,955,003 | 2,605,598 | |
| Non-pledged loan | 2,061,774 | 1,054,618 | |
| Retail | 309,468 | 117,032 | |
| Companies | 546,678 | 937,586 | |
| Credit card | 1,205,628 | - | |
| Total loans operations | 22,260,538 | 12,844,037 | |
| Expected Credit Loss (Note 10) | (49,377) | (24,410) | |
| Total loans operations, net of Expected Loss | 22,211,161 | 12,819,627 |
| By maturity | 2022 | 2021 | |
| Due in 3 months or less | 2,496,982 | 2,539,387 | |
| Due after 3 months through 12 months | 7,211,321 | 2,081,563 | |
| Due after 12 months | 12,552,235 | 8,223,087 | |
| Total loans operations | 22,260,538 | 12,844,037 | |
| By concentration | |||
| Largest debtor | 814,284 | 227,229 | |
| 10 largest debtors | 2,458,714 | 1,162,802 | |
| 20 largest debtors | 3,241,494 | 1,721,591 | |
| 50 largest debtors | 4,484,877 | 2,793,814 | |
| 100 largest debtors | 5,615,708 | 3,899,644 |
41 OF 76
XP Inc. and its subsidiaries Notes to consolidated financial statements December 31, 2022, 2021 and 2020 (In thousands of Brazilian Reais, unless otherwise stated) | |
XP Inc offers loan products through Banco XP to its customers. The loan products offered to its customers are mostly collateralized by customers’ investments on XP platform and credit product strictly related to investments in structured notes, in which the borrower is able to operate leveraged, retaining the structured note itself as guarantee for the loan.
At December 31, 2021 and 2022 expected credit losses were recognized in relation to all financial assets, in accordance with the Group’s expected credit losses model.
The reconciliation of gross carrying amount and the expected credit losses in loan operations segregated by stage according with IFRS 9 is included in Note 14. These stages are periodically reassessed in accordance with XP Inc.’s credit risk policy.
| 11. | Accounts receivable |
| 2022 | 2021 | ||
| Customers (a) | 522,117 | 419,532 | |
| Dividends and interest receivable on equity capital - Funds | 82,545 | 3,593 | |
| Other (b) | 28,011 | 52,492 | |
| (-) Expected credit losses on accounts receivable (Note 14(b)) | (34,786) | (6,531) | |
| Total | 597,887 | 469,086 | |
(a) Refers to receivables from management fees arising from the distribution of funds and amounts receivable related to service provision, which have an average term of 30 days. There is no concentration on the balances receivable as of December 31, 2022 and 2021.
(b) Mainly related to accounts receivable from B3.
The reconciliation of gross carrying amount and the expected credit loss in Accounts receivable segregated by stage according with IFRS 9 is included in Note 14.
| 12. | Recoverable taxes |
| 2022 | 2021 | ||
| Prepayments of income taxes (IRPJ and CSLL) | 142,708 | 146,636 | |
| Contributions over revenue (PIS and COFINS) | 19,453 | 5,654 | |
| Taxes on services (ISS) | 1,087 | 1,026 | |
| Total | 163,248 | 153,316 | |
| Current | 163,248 | 153,316 | |
| Non-current | - | - | |
| 13. | Prepaid expenses |
| 2022 | 2021 | ||
| Commissions and premiums paid in advance (a) | 3,863,986 | 3,737,354 | |
| Marketing expenses | 16,893 | 28,147 | |
| Services paid in advance | 48,775 | 41,990 | |
| Other expenses paid in advance | 310,453 | 175,259 | |
| Total | 4,240,107 | 3,982,750 | |
| Current | 789,609 | 251,973 | |
| Non-current | 3,450,498 | 3,730,777 |
| (a) | Mostly comprised by long term investment programs implemented by XP CCTVM through its network of IFAs. These commissions and premiums paid are recognized at the signing date of each contract and are amortized in the Group’s income statement, linearly, according to the investment term period. |
42 OF 76
XP Inc. and its subsidiaries Notes to consolidated financial statements December 31, 2022, 2021 and 2020 (In thousands of Brazilian Reais, unless otherwise stated) | |
| 14. | Expected Credit Losses on Financial Assets and Reconciliation of carrying amount |
| a) | Reconciliation of carrying amount of Financial Assets |
It is presented below the reconciliation by stage of gross carrying amount of Financial assets through other comprehensive income and Financial assets measured at amortized cost – that have their ECLs (Expected Credit Losses) measured using the three-stage model and the low credit risk simplification.
| Stage 1 | Balance at December 31, 2021 | Acquisition / (Settlements) | Transfer to stage 2 | Transfer to stage 3 | Transfer from stage 2 | Transfer from stage 3 | Closing balance December 31, 2022 |
| Financial assets at fair value through other comprehensive income | |||||||
| Securities | 32,339,904 | 2,810,695 | - | - | - | - | 35,150,599 |
| Financial assets amortized cost | |||||||
| Securities | 2,241,304 | 7,033,723 | - | - | - | - | 9,275,027 |
| Securities purchased under agreements to resell | 8,897,100 | (1,290,599) | - | - | - | - | 7,606,501 |
| Loans and credit card operations | 12,153,549 | 9,522,224 | (945,055) | (12,373) | 449,698 | 5 | 21,168,048 |
| Total on-balance exposures | 55,631,857 | 18,076,043 | (945,055) | (12,373) | 449,698 | 5 | 73,200,175 |
| Off-balance exposures (credit card limits) | 1,307,986 | 3,639,893 | (241,705) | - | 53,124 | - | 4,759,298 |
| Total exposures | 56,939,843 | 21,715,936 | (1,186,760) | (12,373) | 502,822 | 5 | 77,959,473 |
| Stage 2 | Balance at December 31, 2021 | Acquisition / (Settlements) | Transfer to stage 1 | Transfer to stage 3 | Transfer from stage 1 | Transfer from stage 3 | Closing balance December 31, 2022 |
| Financial assets amortized cost | |||||||
| Loans and credit card operations | 686,994 | (102,544) | (449,698) | (6,642) | 945,055 | 5 | 1,073,17 |
| Total on-balance exposures | 686,994 | (102,544) | (449,698) | (6,642) | 945,055 | 5 | 1,073,170 |
| Off-balance exposures (credit card limits) | 59,408 | 7,548 | (53,125) | - | 241,705 | 3 | 255,539 |
| Total exposures | 746,402 | (94,996) | (502,823) | (6,642) | 1,186,760 | 8 | 1,328,709 |
| Stage 3 | Balance at December 31, 2021 | Acquisition / (Settlements) | Transfer to stage 1 | Transfer to stage 2 | Transfer from stage 1 | Transfer from stage 2 | Closing balance December 31, 2022 |
| Financial assets amortized cost | |||||||
| Loans and credit card operations | 3,494 | (3,180) | (5) | (5) | 12,373 | 6,642 | 19,319 |
| Total on-balance exposures | 3,494 | (3,180) | (5) | (5) | 12,373 | 6,642 | 19,319 |
| Off-balance exposures (credit card limits) | 5 | (2) | - | (3) | - | - | - |
| Total exposures | 3,499 | (3,182) | (5) | (8) | 12,373 | 6,642 | 19,319 |
43 OF 76
XP Inc. and its subsidiaries Notes to consolidated financial statements December 31, 2022, 2021 and 2020 (In thousands of Brazilian Reais, unless otherwise stated) | |
| Consolidated Stages | Balance at December 31, 2021 | Purchases / (Settlements) | Closing balance December 31, 2022 | |||
| Financial assets at fair value through other comprehensive income | ||||||
| Securities | 32,339,904 | 2,810,695 | 35,150,599 | |||
| Financial assets amortized cost | ||||||
| Securities | 2,241,304 | 7,033,723 | 9,275,027 | |||
| Securities purchased under agreements to resell | 8,897,100 | (1,290,599) | 7,606,501 | |||
| Loans and credit card operations | 12,844,037 | 9,416,500 | 22,260,537 | |||
| Total on-balance exposures | 56,322,345 | 17,970,319 | 74,292,664 | |||
| Off-balance exposures (credit card limits) | 1,367,399 | 3,647,438 | 5,014,837 | |||
| Total exposures | 57,689,744 | 21,617,757 | 79,307,501 |
| Stage 1 | Balance at December 31, 2020 | Acquisition / (Settlements) | Transfer to stage 2 | Transfer to stage 3 | Transfer from stage 2 | Transfer from stage 3 | Closing balance December 31, 2021 |
| Financial assets at fair value through other comprehensive income | |||||||
| Securities | 19,047,899 | 13,292,005 | - | - | - | - | 32,339,904 |
| Financial assets amortized cost | |||||||
| Securities | 1,829,791 | 411,513 | - | - | - | - | 2,241,304 |
| Securities purchased under agreements to resell | 6,627,779 | 2,269,321 | - | - | - | - | 8,897,100 |
| Loans and credit card operations | 3,599,808 | 9,013,279 | (667,692) | (3,494) | 211,648 | - | 12,153,549 |
| Total on-balance exposures | 31,105,277 | 24,986,118 | (667,692) | (3,494) | 211,648 | - | 55,631,857 |
| Off-balance exposures (credit card limits) | - | 1,334,467 | (59,408) | (5) | 32,932 | - | 1,307,986 |
| Total exposures | 31,105,277 | 26,320,585 | (727,100) | (3,499) | 244,580 | - | 56,939,843 |
| Stage 2 | Balance at December 31, 2020 | Acquisition / (Settlements) | Transfer to stage 1 | Transfer to stage 3 | Transfer from stage 1 | Transfer from stage 3 | Closing balance December 31, 2021 |
| Financial assets amortized cost | |||||||
| Loans and credit card operations | 325,621 | (94,671) | (211,648) | - | 667,692 | - | 686,994 |
| Total on-balance exposures | 325,621 | (94,671) | (211,648) | - | 667,692 | - | 686,994 |
| Off-balance exposures (credit card limits) | 35,810 | (2,878) | (32,932) | - | 59,408 | - | 59,408 |
| Total exposures | 361,431 | (97,549) | (244,580) | - | 727,100 | - | 746,402 |
44 OF 76
XP Inc. and its subsidiaries Notes to consolidated financial statements December 31, 2022, 2021 and 2020 (In thousands of Brazilian Reais, unless otherwise stated) | |
| Stage 3 | Balance at December 31, 2020 | Acquisition / (Settlements) | Transfer to stage 1 | Transfer to stage 2 | Transfer from stage 1 | Transfer from stage 2 | Closing balance December 31, 2021 |
| Financial assets amortized cost | |||||||
| Loans and credit card operations | - | - | - | - | 3,494 | - | 3,494 |
| Total on-balance exposures | - | - | - | - | 3,494 | - | 3,494 |
| Off-balance exposures (credit card limits) | - | - | - | - | 5 | - | 5 |
| Total exposures | - | - | - | - | 3,499 | - | 3,499 |
| Consolidated Stages | Balance at December 31, 2020 | Derecognition | Purchases / (Settlements) | Closing balance December 31, 2021 | |||
| Financial assets at fair value through other comprehensive income | |||||||
| Securities | 19,047,899 | - | 13,292,005 | 32,339,904 | |||
| Financial assets amortized cost | |||||||
| Securities | 1,829,791 | - | 411,513 | 2,241,304 | |||
| Securities purchased under agreements to resell | 6,627,779 | - | 2,269,321 | 8,897,100 | |||
| Loans and credit card operations | 3,925,429 | - | 8,918,608 | 12,844,037 | |||
| Total on-balance exposures | 31,430,898 | - | 24,891,447 | 56,322,345 | |||
| Off-balance exposures (credit card limits) | 35,810 | - | 1,331,589 | 1,367,399 | |||
| Total exposures | 31,466,708 | - | 26,223,036 | 57,689,744 |
The following table presents the gross carrying amount of Financial assets measured at amortized cost that have their ECLs measured using the simplified approach:
| Operations | 2022 | 2021 |
| Financial assets amortized cost | ||
| Securities trading and intermediation | 3,376,179 | 1,487,639 |
| Accounts Receivable | 632,673 | 475,617 |
| Other financial assets | 3,568,298 | 511,181 |
| Total | 7,577,150 | 2,474,437 |
45 OF 76
XP Inc. and its subsidiaries Notes to consolidated financial statements December 31, 2022, 2021 and 2020 (In thousands of Brazilian Reais, unless otherwise stated) | |
| b) | Expected credit loss |
The table below presents the changes in ECLs, measured according to the three stage model, for assets classified as Financial assets through other comprehensive income and Financial assets measured at amortized cost in the period ended December 31, 2022 and December 31, 2021, segregated by stages:
| Stage 1 |
ECL at December 31, 2021 |
Increase / (Reversal) | Transfer to stage 2 | Transfer to stage 3 | Transfer from stage 2 | Transfer from stage 3 |
ECL at December 31, 2022
|
| Financial assets at fair value through other comprehensive income | |||||||
| Securities | 7,527 | 550 | - | - | - | - | 8,077 |
| Financial assets amortized cost | |||||||
| Securities | 2,497 | 427 | - | - | - | - | 2,924 |
| Securities purchased under agreements to resell | 2,569 | 112 | - | - | - | - | 2,681 |
| Loans and credit card operations | 13,957 | 21,827 | (6,940) | (8,624) | 1,092 | - | 21,312 |
| Total on-balance exposures | 26,550 | 22,916 | (6,940) | (8,624) | 1,092 | - | 34,994 |
| Off-balance exposures (credit card limits) | 726 | 5,413 | (1,394) | - | 55 | - | 4,800 |
| Other off-balance exposures | - | 15,214 | - | - | - | - | 15,214 |
| Total exposures | 27,276 | 43,543 | (8,334) | (8,624) | 1,147 | - | 55,008 |
| Stage 2 | ECL at December 31, 2021 | Increase / (Reversal) | Transfer to stage 1 | Transfer to stage 3 | Transfer from stage 1 | Transfer from stage 3 | ECL at December 31, 2022 |
| Financial assets amortized cost | |||||||
| Loans and credit card operations | 7,242 | (127) | (1,091) | (5,308) | 6,940 | - | 7,656 |
| Total on-balance exposures | 7,242 | (127) | (1,091) | (5,308) | 6,940 | - | 7,656 |
| Off-balance exposures (credit card limits) | 288 | (198) | (56) | - | 1,394 | - | 1,428 |
| Total exposures | 7,530 | (325) | (1,147) | (5,308) | 8,334 | - | 9,084 |
| Stage 3 | ECL at December 31, 2021 | Increase / (Reversal) | Transfer to stage 1 | Transfer to stage 3 | Transfer from stage 1 | Transfer from stage 3 | ECL at December 31, 2022 |
| Financial assets amortized cost | |||||||
| Loans and credit card operations | 2,197 | (1,948) | - | - | 8,624 | 5,308 | 14,181 |
| Total on-balance exposures | 2,197 | (1,948) | - | - | 8,624 | 5,308 | 14,181 |
| Total exposures | 2,197 | (1,948) | - | - | 8,624 | 5,308 | 14,181 |
46 OF 76
XP Inc. and its subsidiaries Notes to consolidated financial statements December 31, 2022, 2021 and 2020 (In thousands of Brazilian Reais, unless otherwise stated) | |
| Consolidated Stages | ECL at December 31, 2021 | Increase / (Reversal) | ECL at December 31, 2022 | |||
| Financial assets at fair value through other comprehensive income | ||||||
| Securities | 7,527 | 550 | 8,077 | |||
| Financial assets amortized cost | ||||||
| Securities | 2,497 | 427 | 2,924 | |||
| Securities purchased under agreements to resell | 2,569 | 112 | 2,681 | |||
| Loans and credit card operations | 23,396 | 19,753 | 43,149 | |||
| Total on-balance exposures | 35,989 | 20,842 | 56,831 | |||
| Off-balance exposures (credit card limits) | 1,014 | 5,214 | 6,228 | |||
| Other off-balance exposures | - | 15,214 | 15,214 | |||
| Total exposures | 37,003 | 41,270 | 78,273 |
| Stage 1 |
ECL at December 31, 2020 |
Increase / (Reversal) | Transfer to stage 2 | Transfer to stage 3 | Transfer from stage 2 | Transfer from stage 3 |
ECL at December 31, 2021 |
| Financial assets at fair value through other comprehensive income | |||||||
| Securities | 8,855 | (1,328) | - | - | - | - | 7,527 |
| Financial assets amortized cost | |||||||
| Securities | 1,087 | 1,410 | - | - | - | - | 2,497 |
| Securities purchased under agreements to resell | 370 | 2,199 | - | - | - | - | 2,569 |
| Loans and credit card operations | 5,648 | 17,207 | (6,926) | (2,197) | 225 | - | 13,957 |
| Total on-balance exposures | 15,960 | 19,488 | (6,926) | (2,197) | 225 | - | 26,550 |
| Off-balance exposures (credit card limits) | - | 1,014 | (288) | - | - | - | 726 |
| Total exposures | 15,960 | 20,502 | (7,214) | (2,197) | 225 | - | 27,276 |
| Stage 2 | ECL at December 31, 2020 | Increase / (Reversal) | Transfer to stage 1 | Transfer to stage 3 | Transfer from stage 1 | Transfer from stage 3 | ECL at December 31, 2021 |
| Financial assets amortized cost | |||||||
| Loans and credit card operations | 1,453 | (912) | (225) | - | 6,926 | - | 7,242 |
| Total on-balance exposures | 1,453 | (912) | (225) | - | 6,926 | - | 7,242 |
| Off-balance exposures (credit card limits) | - | - | - | - | 288 | - | 288 |
| Total exposures | 1,453 | (912) | (225) | - | 7,214 | - | 7,530 |
47 OF 76
XP Inc. and its subsidiaries Notes to consolidated financial statements December 31, 2022, 2021 and 2020 (In thousands of Brazilian Reais, unless otherwise stated) | |
| Stage 3 | ECL at December 31, 2020 | Increase / (Reversal) | Transfer to stage 1 | Transfer to stage 3 | Transfer from stage 1 | Transfer from stage 3 | ECL at December 31, 2021 |
| Financial assets amortized cost | |||||||
| Loans and credit card operations | - | - | - | - | 2,197 | - | 2,197 |
| Total on-balance exposures | - | - | - | - | 2,197 | - | 2,197 |
| Total exposures | - | - | - | - | 2,197 | - | 2,197 |
| Consolidated Stages | ECL at December 31, 2020 | Derecognition | Increase / (Reversal) | ECL at December 31, 2021 | |||
| Financial assets at fair value through other comprehensive income | |||||||
| Securities | 8,855 | - | (1,328) | 7,527 | |||
| Financial assets amortized cost | |||||||
| Securities | 1,087 | - | 1,410 | 2,497 | |||
| Securities purchased under agreements to resell | 370 | - | 2,199 | 2,569 | |||
| Loans and credit card operations | 7,101 | - | 16,295 | 23,396 | |||
| Total on-balance exposures | 17,413 | - | 18,576 | 35,989 | |||
| Off-balance exposures (credit card limits) | - | - | 1,014 | 1,014 | |||
| Total exposures | 17,413 | - | 19,590 | 37,003 |
The table below presents the ECLs for the financial assets measured according to simplified approach in the period ended December 31, 2022 and December 31, 2021:
| Expected Credit Losses | 2022 | 2021 |
| Financial assets amortized cost | ||
| Securities trading and intermediation | 105,179 | 81,988 |
| Accounts Receivable | 34,786 | 6,531 |
| Other financial assets | 51,109 | 49,666 |
| Total | 191,074 | 138,185 |
48 OF 76
XP Inc. and its subsidiaries Notes to consolidated financial statements December 31, 2022, 2021 and 2020 (In thousands of Brazilian Reais, unless otherwise stated) | |
| c) | Expected credit losses segregated by products |
It is presented below the expected credit losses for 2022 and 2021, segregated by products:
| Expected Credit Losses | 2022 | 2021 |
| Financial assets at fair value through other comprehensive income | 8,077 | 7,527 |
| Securities | 8,077 | 7,527 |
| Financial assets amortized cost | 239,828 | 166,647 |
| Securities | 2,924 | 2,497 |
| Securities purchased under agreements to resell | 2,681 | 2,569 |
| Loans and credit card operations | 43,149 | 23,396 |
| Securities trading and intermediation | 105,179 | 81,988 |
| Accounts Receivable | 34,786 | 6,531 |
| Other financial assets | 51,109 | 49,666 |
| Total losses for exposures | 247,905 | 174,174 |
| Off-balance exposures (credit card limits) | 6,228 | 1,014 |
| Other off-balance exposures | 15,214 | - |
| Total exposures | 269,347 | 175,188 |
| 15. | Investments in associates and joint ventures |
Set out below the associates and joint ventures of the Group as of December 31, 2022 and 2021.
| Entity | 2020 | Equity | Equity in earnings | Other comprehensive income | Goodwill (i) | 2021 |
| Equity-accounted method | ||||||
| Associates (ii.a) | 790,744 | (24,257) | (10,930) | (7,251) | - | 748,306 |
| Joint ventures (ii.b) | 1,197 | 69 | (1,235) | (31) | - | - |
| Measured at fair value | ||||||
| Associates (iii) | 1,221,424 | 356,302 | (54,301) | - | - | 1,523,425 |
| Total | 2,013,365 | 332,114 | (66,466) | (7,282) | - | 2,271,731 |
| Entity | 2020 | Equity | Equity in earnings | Other comprehensive income | Goodwill (i) | 2021 |
| Equity-accounted method | ||||||
| Associates (ii.a) | 697,924 | 33,036 | (5,862) | (20,641) | 86,287 | 790,744 |
| Joint ventures (ii.b) | 1,983 | - | (1,848) | 1,062 | - | 1,197 |
| Measured at fair value | ||||||
| Associates (iii) | - | 1,174,133 | 47,291 | - | - | 1,221,424 |
| Total | 699,907 | 1,207,169 | 39,581 | (19,579) | 86,287 | 2,013,365 |
(i) Refers to acquisitions of associates and joint ventures. The goodwill recognized includes the amount of expected synergies arising from the investments and includes an element of contingent consideration.
(ii) As of December 31, 2022 and December 31, 2021, includes the interests in the total and voting capital of the following companies:
(a) Associates - Wealth High Governance Holding de Participações S.A. (49.9% of the total and voting capital on December 31, 2022 and 2021); Primo Rico Mídia, Educacional e Participações Ltda. (29.26% of the total and voting capital on December 31, 2022 and 2021); NK112 Empreendimentos e Participações S.A. (49.9% of the total and voting capital on December 31, 2022 and 2021).
49 OF 76
XP Inc. and its subsidiaries Notes to consolidated financial statements December 31, 2022, 2021 and 2020 (In thousands of Brazilian Reais, unless otherwise stated) | |
(b) Joint ventures – the Group’s stake in DuAgro was sold to the market during the last quarter of 2022.
(iii) As mentioned in Note 2 (iv)(c), the Group measures the investments held through our investment funds at fair value. The fair value of investments is presented in the statement of income as Net income/(loss) from financial instruments at fair value through profit or loss. Contingent consideration amounts related to the investments at fair value held through our investment funds are presented in Note 20.
| 16. | Property, equipment, intangible assets and leases |
(a) Property and equipment
| Data processing system | Furniture and equipment | Security systems | Facilities | Fixed assets in progress |
Other |
Total | |
| Balance as of January 1, 2020 | 34,447 | 27,756 | 1,544 | 78,717 | - | - | 142,464 |
| Additions | 15,457 | 5,539 | 1,239 | 2,650 | 120,279 | - | 145,164 |
| Write-offs | (2,432) | (6,191) | (535) | (41,376) | (963) | - | (51,497) |
| Transfers | (2,411) | 516 | (820) | 14,279 | (17,706) | - | (6,142) |
| Depreciation in the year | (11,179) | (5,004) | (425) | (9,349) | - | - | (25,957) |
| Balance as of December 31, 2020 | 33,882 | 22,616 | 1,003 | 44,921 | 101,610 | - | 204,032 |
| Cost | 53,871 | 32,592 | 2,158 | 54,890 | 101,610 | - | 245,121 |
| Accumulated depreciation | (19,989) | (9,976) | (1,155) | (9,969) | - | - | (41,089) |
| Balance as of January 1, 2021 | 33,882 | 22,616 | 1,003 | 44,921 | 101,610 | - | 204,032 |
| Additions | 37,469 | 93 | 229 | 4 | 63,250 | 34,399 | 135,444 |
| Write-offs | (298) | (728) | (170) | (375) | (729) | - | (2,300) |
| Transfers | 5 | (15) | 15 | - | - | - | 5 |
| Foreign Exchange | (31) | 245 | (327) | 3 | - | - | (110) |
| Depreciation in the year | (13,096) | (3,990) | (60) | (5,353) | (35) | (573) | (23,107) |
| Balance as of December 31, 2021 | 57,931 | 18,221 | 690 | 39,200 | 164,096 | 33,826 | 313,964 |
| Cost | 89,376 | 31,813 | 1,584 | 54,535 | 164,096 | 34,399 | 375,803 |
| Accumulated depreciation | (31,445) | (13,592) | (894) | (15,335) | - | (573) | (61,839) |
| Balance as of January 1, 2022 | 57,931 | 18,221 | 690 | 39,200 | 164,096 | 33,826 | 313,964 |
| Additions | 10,775 | 152 | 1,542 | 245 | 31,849 | - | 44,563 |
| Write-offs | - | - | - | - | (1,179) | - | (1,179) |
| Transfers | 101 | 41 | - | 104 | (15,264) | - | (15,018) |
| Foreign Exchange | 21 | (58) | - | (407) | - | - | (444) |
| Depreciation in the year | (18,774) | (3,649) | (93) | (5,019) | (17) | (3,440) | (30,992) |
| Balance as of December 31, 2022 | 50,054 | 14,707 | 2,139 | 34,123 | 179,485 | 30,386 | 310,894 |
| Cost | 101,101 | 31,291 | 2,557 | 54,553 | 179,485 | 34,399 | 403,386 |
| Accumulated depreciation | (51,047) | (16,584) | (418) | (20,430) | - | (4,013) | (92,492) |
50 OF 76
XP Inc. and its subsidiaries Notes to consolidated financial statements December 31, 2022, 2021 and 2020 (In thousands of Brazilian Reais, unless otherwise stated) | |
(b) Intangible assets
| Software | Goodwill | Customer list | Trademarks | Other intangible assets |
Total | |
| Balance as of January 1, 2020 | 66,310 | 382,500 | 60,599 | 16,488 | 27,555 | 553,452 |
| Additions | 117,129 | - | 1,188 | - | 28,051 | 146,368 |
| Business combination (Note 5(ii)) | 8,143 | 91,866 | 2,181 | 3,314 | - | 105,504 |
| Write-offs | (22,064) | - | - | - | - | (22,064) |
| Transfers | 2,857 | - | - | - | 3,285 | 6,142 |
| Amortization in the year | (57,222) | - | (5,683) | (9,054) | (3,881) | (75,840) |
| Balance as of December 31, 2020 | 115,153 | 474,366 | 58,285 | 10,748 | 55,010 | 713,562 |
| Cost | 219,029 | 474,366 | 76,050 | 52,616 | 55,010 | 877,071 |
| Accumulated amortization | (103,876) | - | (17,765) | (41,868) | - | (163,509) |
| Balance as of January 1, 2021 | 115,153 | 474,366 | 58,285 | 10,748 | 55,010 | 713,562 |
| Additions | 146,761 | - | 40,000 | - | 30,808 | 217,569 |
| Business Combination (Note 5(ii)) | 1,734 | 68,379 | - | 485 | - | 70,598 |
| Write-offs | (13,536) | - | - | (1,000) | (2,675) | (17,211) |
| Transfers | 51,994 | - | - | 485 | (52,484) | (5) |
| Foreign Exchange | (971) | - | - | 341 | 204 | (426) |
| Amortization in the year | (148,803) | - | (5,796) | (8,492) | (21) | (163,112) |
| Balance as of December 31, 2021 | 152,332 | 542,745 | 92,489 | 2,567 | 30,842 | 820,975 |
| Cost | 303,724 | 542,745 | 116,050 | 88,877 | 30,918 | 1,082,314 |
| Accumulated amortization | (151,392) | - | (23,561) | (86,310) | (76) | (261,339) |
| Balance as of January 1, 2022 | 152,332 | 542,745 | 92,489 | 2,567 | 30,842 | 820,975 |
| Additions | 13,655 | - | 13,000 | - | 55,757 | 82,412 |
| Business Combination (Note 5(ii)) | - | 60,037 | - | - | - | 60,037 |
| Write-offs | (7,337) | (156) | (12,133) | - | - | (19,626) |
| Transfers | 10,125 | (7,404) | (21,189) | 18,468 | - | - |
| Foreign Exchange | (3,986) | - | - | - | (1) | (3,987) |
| Amortization in the year | (76,450) | - | (10,663) | (8,495) | (21) | (95,629) |
| Balance as of December 31, 2022 | 88,339 | 595,222 | 61,504 | 12,540 | 86,577 | 844,182 |
| Cost | 276,195 | 595,222 | 141,252 | 25,000 | 86,674 | 1,124,343 |
| Accumulated amortization | (187,856) | - | (79,748) | (12,460) | (97) | (280,161) |
(c) Impairment test for goodwill
Given the interdependency of cash flows and the merger of business practices, all Group’s entities are considered a single cash generating unit (“CGU”) and, therefore, a goodwill impairment test is performed at the single operating level. Therefore, the carrying amount considered for the impairment test represents the Company’s equity.
The Group tests whether goodwill has suffered any impairment on an annual basis or more frequently if there is an impairment indicator. For the years ended December 31, 2022 and 2021, the recoverable amount of the single CGU was determined based on value-in-use calculations which require the use of assumptions. The calculations use cash flow projections based on financial budgets approved by management covering a four-year period.
Cash flows beyond the four-year period are extrapolated using the estimated growth rates, which are consistent with forecasts included in industry reports specific to the industry in which the Group operates.
The Group performed its annual impairment test as of December 31, 2022 and 2021 which did not result in the need to recognize impairment losses on the carrying value of goodwill.
51 OF 76
XP Inc. and its subsidiaries Notes to consolidated financial statements December 31, 2022, 2021 and 2020 (In thousands of Brazilian Reais, unless otherwise stated) | |
Key assumptions used in value-in-use calculations and sensitivity to changes in assumptions are:
| Assumption | Approach used to determine values |
| Sales | Average annual growth rate over the four-year forecast period; based on management’s expectations of market development. |
| Budgeted gross margin | Based on management’s expectations for the future. |
| Other operating costs | Fixed costs, which do not vary significantly with sales volumes or prices. Management forecasts these costs based on the current structure of the business, adjusting for inflationary increases but not reflecting any future restructurings or cost saving measures. The amounts disclosed above are the average operating costs for the four-year forecast period. |
| Annual capital expenditure | Expected cash costs. This is based on the experience of management, and the planned refurbishment expenditure. No incremental revenue or cost savings are assumed in the value-in-use model as a result of this expenditure. |
| Long-term growth rate | This is the weighted average growth rate used to extrapolate cash flows beyond the budget period. The rates are consistent with forecasts included in industry reports. |
| Pre-tax discount rates | Reflect specific risks relating to the relevant segments and the countries in which they operate. |
The long-term growth rate utilized in the impairment test of goodwill is 3.30%.
Discount rates represent the current market assessment of the risks specific to the Group, taking into consideration the time value of the money and risks of the underlying assets that have not been incorporated in the cash flow estimates. The discount rate calculation is based on the specific circumstances of the Group and is derived from its weighted average cost of capital (WACC). The WACC take into account both debt and equity. The cost of equity is derived from the expected return on investment by the Group’s investors. The cost of debt is based on the interest-bearing borrowings the Group has. Adjustments to the discount rate are made to factor in the specific amount and timing of the future tax flows in order to reflect a pre-tax discount rate. The average pre-tax discount rate applied to cash flow projections is 13.83 % (December 31, 2021 – 9.82%).
d) Leases
Set out below are the carrying amounts of the Group’s right-of-use assets and lease liabilities and the movements during the period:
| Right-of-use assets | Lease liabilities | ||
| As of January 1, 2021 | 183,134 | 208,448 | |
| Additions (i) | 116,248 | 116,248 | |
| Depreciation expense | (45,511) | - | |
| Write-offs | (856) | - | |
| Interest expense | - | 17,488 | |
| Revaluation | 25,305 | 24,234 | |
| Effects of exchange rate | 6,189 | 7,486 | |
| Payment of lease liabilities | - | (55,349) | |
| As of December 31, 2021 | 284,509 | 318,555 | |
| Current | - | 71,925 | |
| Non-current | 284,509 | 246,630 |
52 OF 76
XP Inc. and its subsidiaries Notes to consolidated financial statements December 31, 2022, 2021 and 2020 (In thousands of Brazilian Reais, unless otherwise stated) | |
| As of January 1, 2022 | 284,509 | 318,555 | |
| Additions (i) | 49,764 | 49,853 | |
| Depreciation expense | (79,256) | - | |
| Interest expense | - | 22,794 | |
| Revaluation | 8,929 | (89) | |
| Effects of exchange rate | (5,455) | (5,820) | |
| Payment of lease liabilities | - | (99,655) | |
| As of December 31, 2022 | 258,491 | 285,638 | |
| Current | - | 69,722 | |
| Non-current | 258,491 | 215,916 |
(i) Additions to right-of-use assets in the period include prepayments to lessors and accrued liabilities.
The Group did not recognize rent expense from short-term leases and low-value assets in December 31, 2022 (R$ 1,021 – December 31, 2021). The total rent expense of R$ 14,491 (R$ 17,795 – December 31, 2021), includes other expenses related to leased offices such as condominiums.
| 17. | Financing instruments payable |
| 2022 | 2021 | ||
| Market funding operations (a) | 38,093,772 | 20,122,206 | |
| Deposits | 20,261,532 | 9,898,630 | |
| Demands deposits | 803,031 | 229,691 | |
| Time deposits | 19,445,276 | 9,662,694 | |
| Interbank deposits | 13,225 | 6,245 | |
| Financial bills | 5,675,596 | 2,587,738 | |
| Structured operations certificates | 12,109,576 | 7,635,838 | |
| Others | 47,068 | - | |
| Debt securities (b) | 5,589,857 | 4,306,880 | |
| Debentures | 2,028,681 | 169,094 | |
| Bond | 3,561,176 | 4,137,786 | |
| Total | 43,683,629 | 24,429,086 | |
| Current | 19,794,572 | 8,018,854 | |
| Non-Current | 23,889,057 | 16,410,232 |
| (a) | Market funding operations |
| Maturity - 2022 | ||||||||
| Class | Within 30 days | From 31 to 60 days | From 61 to 90 days | From 91 to 180 days | From 181 to 360 days | After 360 days | Total | |
| Demand deposits | 803,031 | - | - | - | - | - | 803,031 | |
| Others | - | - | 1,031 | 13,053 | 32,984 | - | 47,068 | |
| Time deposits | 3,604,494 | 4,273,475 | 5,187,106 | 1,382,514 | 2,016,732 | 2,980,955 | 19,445,276 | |
| Interbank deposits | - | - | - | 3,092 | - | 10,133 | 13,225 | |
| Financial bills | - | - | 2,390 | 1,637,547 | 405,901 | 3,629,758 | 5,675,596 | |
| Structured operations certificates | - | - | 5,720 | 35,773 | 261,019 | 11,807,064 | 12,109,576 | |
| Total | 4,407,525 | 4,273,475 | 5,196,247 | 3,071,979 | 2,716,636 | 18,427,910 | 38,093,772 |
53 OF 76
XP Inc. and its subsidiaries Notes to consolidated financial statements December 31, 2022, 2021 and 2020 (In thousands of Brazilian Reais, unless otherwise stated) | |
| Maturity - 2021 | ||||||||
| Class | Within 30 days | From 31 to 60 days | From 61 to 90 days | From 91 to 180 days | From 181 to 360 days | After 360 days | Total | |
| Demand deposits | 229,691 | - | - | - | - | - | 229,691 | |
| Time deposits | 751,676 | 520,694 | 712,092 | 3,231,965 | 2,341,770 | 2,104,497 | 9,662,694 | |
| Interbank deposits | - | 3,125 | - | - | - | 3,120 | 6,245 | |
| Financial bills | - | - | - | 10,945 | 6,164 | 2,570,629 | 2,587,738 | |
| Structured operations certificates | 1,510 | 3,940 | 5,428 | 9,120 | 21,640 | 7,594,200 | 7,635,838 | |
| Total | 982,877 | 527,759 | 717,520 | 3,252,030 | 2,369,574 | 12,272,446 | 20,122,206 |
| (b) | Debt securities |
The total balance is comprised of the following issuances:
| 2022 | 2021 | |||||||
| Up to 1 year | 1-5 years | Total | Up to 1 year | 1-5 years | Total | |||
| Bonds (i) | Fixed rate | 128,710 | 3,432,466 | 3,561,176 | - | 4,137,786 | 4,137,786 | |
| Debentures (ii) (iii) | Floating Rate | 106,118 | 1,922,563 | 2,028,681 | 169,094 | - | 169,094 | |
| Total | 234,828 | 5,355,029 | 5,589,857 | 169,094 | 4,137,786 | 4,306,880 | ||
| Current | 234,828 | 169,094 | ||||||
| Non- Current | 5,355,029 | 4,137,786 | ||||||
| (i) | XP Inc Bonds |
On July 1, 2021, XP Inc. concluded the issuance of a gross of US$750 million senior unsecured notes with net proceeds of US$739 million (R$ 3,697 million) with maturity on July 1, 2026 and coupon at the rate of 3.250% per year, which will be guaranteed by XP Investimentos S.A.
| (ii) | XP Energia issuance |
On December 8, 2021, XP Energia issued non-convertible Debentures in the amount of R$485,511. The Debentures series has a maximum authorized issuance up to R$1,000,000. The objective is to fund the Group’s working capital and treasury investments related to wholesale electricity trade business. The principal amount is due and will be paid on the maturity date of December 8, 2023. The interest rate is CDI+2.5% annually payable. On December 31, 2022, the total amount is R$ 736,431, out of which R$ 106,118 is held by entities outside the Group and as such is included in the consolidated financial statement.
| (iii) | XP Investimentos debentures |
On July 19, 2022, XP Investimentos issued non-convertible debentures in the amount of R$1,800,000 (R$900,000 of series 1 and R$900,000 of series 2). The debentures series, added together, has a maximum authorized issuance up to R$1,800,000. The principal amount is due and will be paid on the maturity date as follow: (i) June 23, 2024 (series 1) and (ii) June 23, 2025 (series 2). The interest rates for series 1 and series 2 debentures are CDI+1.75% and CDI+1.90%, respectively. On December 31, 2022, the total amount is R$ 1,922,563.
54 OF 76
XP Inc. and its subsidiaries Notes to consolidated financial statements December 31, 2022, 2021 and 2020 (In thousands of Brazilian Reais, unless otherwise stated) | |
| 18. | Securities trading and intermediation |
Represented by operations at B3 on behalf of and on account of third parties, with liquidation operating cycle between D+1 and D+3.
| 2022 | 2021 | ||
| Cash and settlement records | 1,394,451 | 107,246 | |
| Debtors pending settlement | 1,980,341 | 1,380,393 | |
| (-) Expected losses on Securities trading and intermediation (a) | (105,179) | (81,988) | |
| Other | 1,387 | - | |
| Total Assets | 3,271,000 | 1,405,651 | |
| Cash and settlement records | 171,659 | 365,700 | |
| Creditors pending settlement | 2,401,828 | 1,997,702 | |
| Customer’s cash on investment account | 13,489,210 | 13,234,153 | |
| Total Liabilities | 16,062,697 | 15,597,555 |
| (a) | The reconciliation of gross carrying amount and the expected loss segregated by stage according to IFRS 9 is included in Note 14. |
| 19. | Borrowings |
| Annual Interest rate % | Maturity | 2022 | 2021 | ||||
| Financial institution (i) | 2.55% | May 2023 | 1,586,052 | 1,651,871 | |||
| Financial institution (ii) | CDI (*)+ 0.74% | April 2023 | 279,828 | 276,911 | |||
| Third parties | 1,865,880 | 1,928,782 | |||||
| Total borrowings | 1,865,880 | 1,928,782 | |||||
| Current | 1,865,880 | 1,661,067 | |||||
| Non-current | - | 267,715 | |||||
(*) Brazilian Interbank Offering Rate (CDI).
(i) Loan agreement with Banco Nacional de México. On May 2022, the loan agreement was rolled over for 1 year, amending the maturity to May 2023.
(ii) Loan agreement entered into on March 28, 2018 with the International Finance Corporation (IFC). The principal amount is due on the maturity date and accrued interests payable at every six months.
Some of the obligations above contain financial covenants, which have certain performance conditions. The Group has complied with these covenants throughout the reporting period (Note 36 (ii)).
| 20. | Other financial assets and financial liabilities |
| a) | Other financial assets |
| 2022 | 2021 | ||
| Foreign exchange portfolio | 2,145,174 | 331,563 | |
| Receivables from IFAs | 172,884 | 177,895 | |
| Compulsory and other deposits at central banks | 1,119,169 | - | |
| Other financial assets | 131,071 | 1,723 | |
| (-) Expected losses on other financial assets (i) | (51,109) | (49,666) | |
| Total |
3,517,189 |
461,515 | |
| Current | 2,791,244 | 331,563 | |
| Non-current | 725,945 | 129,952 |
(i) The reconciliation of gross carrying amount and the expected loss according to IFRS 9 is presented in Note 14.
55 OF 76
XP Inc. and its subsidiaries Notes to consolidated financial statements December 31, 2022, 2021 and 2020 (In thousands of Brazilian Reais, unless otherwise stated) | |
| b) | Other financial liabilities |
| 2022 | 2021 | ||
| Foreign exchange portfolio | 2,405,429 | 425,409 | |
| Structured financing (i) | 1,933,522 | 2,415,400 | |
| Credit cards operations | 4,987,390 | 2,522,833 | |
| Contingent consideration (ii) | 566,930 | 743,443 | |
| Commitments subject to possible redemption (iii) | 1,049,130 | 1,080,721 | |
| Lease liabilities | 285,638 | 318,555 | |
| Others | 326,174 | 174,111 | |
| Total |
11,554,213 |
7,680,472 | |
| Current | 11,014,262 | 5,860,674 | |
| Non-current | 539,951 | 1,819,798 |
(i) Financing for maintenance of financial assets required to perform financial transactions.
(ii) Contractual contingent considerations mostly associated with the investment acquisition. The maturity of the total contingent consideration payment is up to 5 years and the contractual maximum amount payable is R$ 1,143 (the minimum amount is zero).
(iii) Related to the IPO transaction of XPAC Acquisition Corp. that occurred on August 3, 2021. The capital issued by XPAC Acquisition Corp. includes conditionally redeemable Class A ordinary shares that feature redemption rights that are either within the control of the holder or subject to redemption upon the occurrence of uncertain events not solely within the Company’s control. The noncontrolling shareholders of XPAC Acquisition Corp. have the right to redeem their shares in cash at the earliest of (i) upon the completion of XPAC Acquisition Corp’s initial business combination or (ii) 24 months from the closing of the IPO transaction.
| 21. | Social and statutory obligations |
Social and statutory obligations are mainly composed from the Group sharing program for its employees which does not extend to the Executive Board. As of December 31, 2022, the balance of unrealized gains on the balance sheet under the "Social and statutory obligations” line item is R$ 968,119 (R$ 1,022,212 as of December 31, 2021).
|
2022
|
2021
| ||
| Obligations to non-controlling interest |
40,646 |
106,648 | |
| Employee profit-sharing (a) | 794,761 | 776,713 | |
| Salaries and other benefits payable | 132,712 | 138,851 | |
| Total |
968,119 |
1,022,212 |
| (a) | The Group has a bonus scheme for its employees based on a profit-sharing program as agreed under collective bargaining with the syndicate, which does not extend to the Executive Board. The bonus is calculated at each half of the year and payments are made in February and August. |
56 OF 76
XP Inc. and its subsidiaries Notes to consolidated financial statements December 31, 2022, 2021 and 2020 (In thousands of Brazilian Reais, unless otherwise stated) | |
| 22. | Tax and social security obligations |
|
2022
|
2021
| ||
| Income Tax (IRPJ and CSLL) (i) |
143,133
|
273,395
| |
| Taxes on long term incentive plan (ii) | 120,194 | 155,454 | |
| Contributions over revenue (PIS and COFINS) | 11,475 | 32,140 | |
| Taxes on services (ISS) | 20,042 | 23,260 | |
| Contributions for Social Security (INSS) | 24,927 | 20,318 | |
| Others | 45,648 | 45,084 | |
| Total | 365,419 | 549,651 | |
| Current | 365,419 | 549,651 | |
|
Non-current |
- | - |
(i) The Group income tax liability is presented net of tax assets which the entities are allowed to offset during the current year. The line includes current Corporate Income Tax (CIT) liability of R$ 164,767 (R$ 298,088 - 2021), taxes that XP is responsible to pay on behalf of its clients (i.e., withholding taxes over client’s investments) in the amount of R$ 20,741 (R$ 17,561 – 2021) and withholding taxes assets of R$ 42,375 (R$ 42,254 - 2021).
(ii) The amount classified as "Taxes on long term incentive plan" includes mostly contributions to Brazilian Social Security Programs FGTS and INSS.
| 23. | Retirement plans liabilities |
As of December 31, 2022, active plans are principally accumulation of financial resources through products PGBL and VGBL structured in the form of variable contribution, for the purpose of granting participants with returns based on the accumulated capital in the form of monthly withdraws for a certain term or temporary monthly withdraws.
In this respect, such financial products represent investment contracts that have the legal form of retirement plans, but which do not transfer insurance risk to the Group. Therefore, contributions received from participants are accounted for as liabilities and balance consists of the balance of the participant in the linked Specially Constituted Investment Fund (“FIE”) at the reporting date (Note 7a (i)).
Changes in the period
|
2022 |
2021 | |
| As of January, 1 | 31,921,400 | 13,387,913 |
| Contributions received | 3,007,321 | 3,056,032 |
| Transfer with third party plans | 10,580,681 | 16,854,605 |
| Withdraws | (3,441,303) | (1,468,710) |
| Other provisions (Constitution/Reversion) | 54,828 | 14,680 |
| Monetary correction and interest income |
3,610,888 |
76,880 |
| As of December, 31 |
45,733,815 |
31,921,400 |
57 OF 76
XP Inc. and its subsidiaries Notes to consolidated financial statements December 31, 2022, 2021 and 2020 (In thousands of Brazilian Reais, unless otherwise stated) | |
| 24. | Income tax |
(a) Deferred income tax
Deferred tax assets (DTA) and deferred tax liabilities (DTL) are comprised of the main following components:
|
Balance Sheet |
Net change in the year | ||||
|
2022 |
2021 |
2022 |
2021 |
2020 | |
| Tax losses carryforwards | 575,120 | 108,138 | 455,221 | 100,756 | (9,764) |
| Goodwill on business combinations (i) | 6,376 | 12,429 | (6,053) | (10,409) | 535 |
| Provisions for IFAs’ commissions | 71,986 | 76,974 | (4,988) | (17,570) | 26,503 |
| Revaluations of financial assets at fair value | (214,456) | 173,740 | (239,041) | 190,520 | (42,039) |
| Expected credit losses (ii) | 58,208 | 43,931 | 14,277 | 24,487 | 13,778 |
| Profit sharing plan | 269,949 | 260,865 | 9,084 | 96,057 | 23,672 |
| Net gain on hedge instruments | (11,169) | 28,124 | (39,293) | 7,137 | 57,371 |
| Share-based compensation | 566,721 | 385,594 | 181,127 | 269,618 | 113,025 |
| Other provisions |
178,104 |
154,340 |
23,764 |
86,845 |
34,211 |
| Total |
1,500,839 |
1,244,135 |
256,704 |
747,441 |
217,292 |
| Deferred tax assets | 1,611,882 | 1,273,069 | |||
| Deferred tax liabilities | (111,043) | (28,934) | |||
(i) For tax purposes, goodwill is amortized over 5 years on a straight-line basis when the entity acquired is sold or merged into another entity.
(ii) Include expected credit loss on accounts receivable, loan operations and other financial assets.
The changes in the net deferred tax were recognized as follows:
|
2022 |
2021 |
2020 | |
| At January 1 | 1,244,135 | 496,694 | 279,401 |
| Foreign exchange variations | 5,786 | (16,949) | 6,373 |
| Charges to statement of income | 397,792 | 387,551 | 196,498 |
| Tax relating to components of other comprehensive income |
(146,874) |
376,839 |
14,422 |
| At December 31 |
1,500,839 |
1,244,135 |
496,694 |
58 OF 76
XP Inc. and its subsidiaries Notes to consolidated financial statements December 31, 2022, 2021 and 2020 (In thousands of Brazilian Reais, unless otherwise stated) | |
Unrecognized deferred taxes
Deferred tax assets are recognized for tax losses to the extent that the realization of the related tax benefit against future taxable profits is probable. The Group did not recognize deferred tax assets of R$ 12,705 (2021 - R$ 39,446) mainly in respect of losses from subsidiaries overseas and that can be carried forward and used against future taxable income.
(b) Income tax expense reconciliation
The tax on the Group's pre-tax profit differs from the theoretical amount that would arise using the weighted average tax rate applicable to profits of the consolidated entities. The following is a reconciliation of income tax expense to profit (loss) for the year, calculated by applying the combined Brazilian statutory rates at 34% for the year ended December 31:
|
2022 |
2021 |
2020 | |
|
Income before taxes |
3,444,656 | 3,815,174 | 2,421,413 |
| Combined tax rate in Brazil (a) |
34.00% |
34.00% |
34.00% |
| Tax expense at the combined rate | 1,171,183 | 1,297,159 | 823,280 |
| Loss (income) from entities not subject to deferred taxation | 245 | 554 | (12,470) |
| Effects from entities taxed at different rates | 62,596 | 146,377 | 35,377 |
| Effects from entities taxed at different taxation regimes (b) | (1,343,757) | (1,128,400) | (443,579) |
| Intercompany transactions with different taxation regimes | (46,674) | (79,055) | (74,289) |
| Tax incentives | (5,346) | (21,036) | (14,354) |
| Non-deductible expenses (non-taxable income) | 3,758 | 25,216 | 49,640 |
| Effect from Social Contribution on net equity rate increase | 985 | - | - |
| Others |
21,455 |
(18,101) |
(23,681) |
|
Total |
(135,555) |
222,714 |
339,924 |
| Current | 262,236 | 610,265 | 536,422 |
| Deferred |
(397,791) |
(387,551) |
(196,498) |
| Total expense |
(135,555) |
222,714 |
339,924 |
| (a) | Considering that XP Inc. is domiciled in Cayman and there is no income tax in that jurisdiction, the combined tax rate of 34% demonstrated above is the current rate applied to XP Investimentos S.A. which is the holding company of all operating entities of XP Inc. in Brazil. |
| (b) | Certain eligible subsidiaries adopted the PPM tax regime and the effect of the presumed profit of subsidiaries represents the difference between the taxation based on this method and the amount that would be due based on the statutory rate applied to the taxable profit of the subsidiaries. Additionally, some entities and investment funds adopt different taxation regimes according to the applicable rules in their jurisdictions. |
Other comprehensive income
The tax (charge)/credit relating to components of other comprehensive income is as follows:
|
Before tax |
(Charge) / Credit |
After tax | |
| Foreign exchange variation of investees located abroad | 57,439 | - | 57,439 |
| Gains (losses) on net investment hedge | (91,762) | 31,199 | (60,563) |
| Changes in the fair value of financial assets at fair value |
40,979 |
(16,776) |
24,203 |
| As of December 31, 2020 |
6,656 |
14,423 |
21,079 |
| Foreign exchange variation of investees located abroad | 20,978 | - | 20,978 |
| Gains (losses) on net investment hedge | (29,701) | 10,942 | (18,759) |
| Changes in the fair value of financial assets at fair value |
(914,914) |
365,897 |
(549,017) |
| As of December 31, 2021 |
(923,637) |
376,839 |
(546,798) |
| Foreign exchange variation of investees located abroad | (19,645) | - | (19,645) |
| Gains (losses) on net investment hedge | 26,154 | (8,902) | 17,252 |
| Changes in the fair value of financial assets at fair value |
356,078 |
(137,972) |
218,106 |
| As of December 31, 2022 |
362,587 |
(146,874) |
215,713 |
59 OF 76
XP Inc. and its subsidiaries Notes to consolidated financial statements December 31, 2022, 2021 and 2020 (In thousands of Brazilian Reais, unless otherwise stated) | |
| 25. | Equity |
| (a) | Issued capital |
The Company has an authorized share capital of US$ 35 thousand, corresponding to 3,500,000,000 authorized shares with a par value of US$ 0,00001 each of which:
| · | 2,000,000,000 shares are designated as Class A common shares and issued; and |
| · | 1,000,000,000 shares are designated as Class B common shares and issued. |
The remaining 500,000,000 authorized but unissued shares are presently undesignated and may be issued by our board of directors as common shares of any class or as shares with preferred, deferred or other special rights or restrictions. Therefore, the Company is authorized to increase capital up to this limit, subject to approval of the Board of Directors.As of December 31, 2022, the Company had R$24 of issued capital which were represented by 447,801,661 Class A common shares and 112,717,094 Class B common shares.
| (b) | Additional paid-in capital and capital reserve |
Our Class A and Class B common shares, have the following rights:
| · | Each holder of a Class B common share is entitled, in respect of such share, to 10 votes per share, whereas the holder of a Class A common share is entitled, in respect of such share, to one vote per share. |
| · | Each holder of Class A common shares and Class B common shares vote together as a single class on all matters (including the election of directors) submitted to a vote of shareholders, except as provided below and as otherwise required by law. |
| · | Class consents from the holders of Class A common shares and Class B common shares, as applicable, shall be required for any modifications to the rights attached to their respective class of shares the rights conferred on holders of Class A common shares shall not be deemed to be varied by the creation or issue of further Class B common shares and vice versa; and |
| · | the rights attaching to the Class A common shares and the Class B common shares shall not be deemed to be varied by the creation or issue of shares with preferred or other rights, including, without limitation, shares with enhanced or weighted voting rights. |
The Articles of Association provide that at any time when there are Class A common shares in issue, Class B common shares may only be issued pursuant to: (a) a share split, subdivision of shares or similar transaction or where a dividend or other distribution is paid by the issue of shares or rights to acquire shares or following capitalization of profits; (b) a merger, consolidation, or other business combination involving the issuance of Class B common shares as full or partial consideration; or (c) an issuance of Class A common shares, whereby holders of the Class B common shares are entitled to purchase a number of Class B common shares that would allow them to maintain their proportional ownership and voting interests in XP Inc.
Below is a summary of the issuances and conversions of shares during 2022 and 2021:
| Class A (prior common shares) | Class B (prior preferred shares) | Total Shares | |||
| As of December 31, 2020 | 377,764,985 | 181,293,980 | 559,058,965 | ||
| Transfer of classes | 45,898,991 | (45,898,991) | - | ||
| Follow on offering | 489,759 | - | 489,759 | ||
| As of December 31, 2021 | 424,153,735 | 135,394,989 | 559,548,724 | ||
| Transfer of classes | 22,677,895 | (22,677,895) | - | ||
| Issuance of shares | 970,031 | - | 970,031 | ||
| As of December 31, 2022 | 447,801,661 | 112,717,094 | 560,518,755 |
On October 8, 2021 XP Inc issued 489,759 Class A common shares (R$ 112,642) as part of our acquisition of a minority stake of Jive Investments (non-cash transaction).
On January 10, 2022, XP Inc issued 445,328 Class A common shares (R$ 70,030) as part of our acquisition of a minority stake of Vista Capital (non-cash transaction).
As mentioned in Note 32, the Board of Directors approved in December 2019 a share based long-term incentive plan, in which the maximum number of shares should not exceed 5% of the issued and outstanding shares. As of December 31, 2022, the outstanding number of shares reserved under the plans is 13,684,424 restricted share units (“RSUs”) (2021 – 15,153,830) and 2,527,242 performance restricted units (“PSUs”) (2021 - 2,966,060) to be issued at the vesting date.
60 OF 76
XP Inc. and its subsidiaries Notes to consolidated financial statements December 31, 2022, 2021 and 2020 (In thousands of Brazilian Reais, unless otherwise stated) | |
During the year ended December 31, 2022, XP Inc issued 524,703 Class A common shares (R$ 95,241) in connection with vestings occurred under the share based long-term incentive plan.
The additional paid-in capital refers to the difference between the purchase price that the shareholders pay for the shares and their par value. Under Cayman Law, the amount in this type of account may be applied by the Company to pay distributions or dividends to members, pay up unissued shares to be issued as fully paid, for redemptions and repurchases of own shares, for writing off preliminary expenses, recognized expenses, commissions or for other reasons. All distributions are subject to the Cayman Solvency Test which addresses the Company’s ability to pay debts as they fall due in the natural course of business.
| (c) | Treasury Shares |
The Group recognized amounts of treasury shares as a result of: (i) the merger of XPart into XP Inc., which was settled through XP Inc.’s own shares; (ii) the share buy-back program, approved in May 2022; (iii) the share purchase agreement with Itaú Unibanco, signed on June 2022; and (iv) the share purchase agreement with Itaúsa S.A., signed on November 2022. The treasury shares are registered as a deduction from equity until the shares are canceled or reissued.
As of December 31, 2022, the Group held 19,203,135 shares in treasury (726,776 – December 31, 2021) with an amount of R$ 1,986,762 (R$ 171,939 - December 31, 2021).
| (d) | Dividends distribution |
The Group has not adopted a dividend policy with respect to future distributions of dividends. The amount of any distributions will depend on many factors such as the Company's results of operations, financial condition, cash requirements, prospects and other factors deemed relevant by XP Inc. board of directors and, where applicable, the shareholders.
For the years ended December 31, 2022 and 2021 XP Inc. did not declare and paid dividends to the shareholders.
Non-controlling shareholders of some XP Inc’s subsidiaries received dividends in the year ended in December 31, 2022.
| (e) | Other comprehensive income |
Other comprehensive income is comprised of changes in the fair value of financial assets at fair value through other comprehensive income, while these financial assets are not realized. Also includes gains (losses) on net investment hedge and foreign exchange variation of investees located abroad.
| 26. | Related party transactions |
Transactions and remuneration of services with related parties are carried out in the ordinary course of business and under commutative conditions, including interest rates, terms and guarantees, and do not involve risks greater than normal collection or present other disadvantages.
| (a) | Key-person management compensation |
Key management includes executive statutory directors, members of the Board of Directors and Executive Boards. The compensation paid or payable to key management for their services is shown below:
|
2022
|
2021
|
2020
| ||||
|
Fixed compensation
|
7,837
|
8,801
|
6,335
| |||
| Variable compensation | 60,781 | 44,362 | 55,909 | |||
| Total | 68,618 | 53,163 | 62,244 |
In 2022 and 2021, the Board of Directors approved the grant of performance share unit (“PSUs”) to certain directors (Note 32). The executive statutory directors of XP Inc control XP Control LLC.
61 OF 76
XP Inc. and its subsidiaries Notes to consolidated financial statements December 31, 2022, 2021 and 2020 (In thousands of Brazilian Reais, unless otherwise stated) | |
| (b) | Transactions with related parties |
The main transactions carried with related parties for year-end balances arising from such transactions are as follows:
|
Assets/(Liabilities) |
Revenue/(Expenses) | |||||
|
Relation and transaction |
2022 |
2021 |
2022 |
2021 |
2020 | |
| Shareholders with significant influence (i) | (3,562,079) | (2,096,701) | (160,835) | (60,177) | (53,881) | |
| Securities | 238,088 | 194,892 | 24,770 | 4,270 | 9,629 | |
| Securities purchased under agreements to resell | - | - | 9,370 | 19,098 | - | |
| Accounts receivable and Loans operations | 476 | 9,205 | 1,330 | 744 | 505 | |
| Securities sold under repurchase agreements | (3,800,643) | (2,300,798) | (196,305) | (84,268) | (62,951) | |
| Borrowings | - | - | - | (21) | (1,064) | |
(i) These transactions are mainly related to Itaúsa S.A. Group.
Transactions with related parties also includes transactions among the Company and its subsidiaries in the course of normal operations, including services rendered such as: (i) education, consulting and business advisory; (ii) financial advisory and financial consulting in general; (iii) management of resources and portfolio management; (iv) information technology and data processing; and (v) insurance. The effects of those transactions have been eliminated and do not have effects on the consolidated financial statements.
| 27. | Provisions and contingent liabilities |
The Company and its subsidiaries are party to judicial and administrative litigations before various courts and government bodies, arising from the normal course of operations, involving tax, civil and labor matters and other issues. Periodically, Management evaluates the tax, civil and labor risks, based on legal, economic and tax supporting data, in order to classify the risks as probable, possible or remote, in accordance with the chances of them occurring and being settled, taking into consideration, case by case, the analyses prepared by external and internal legal advisors.
|
2022 |
2021 | |
| Tax contingencies | - | 10,374 |
| Civil contingencies | 20,419 | 12,539 |
| Labor contingencies | 7,908 | 6,395 |
| Other provisions (i) |
15,214 |
- |
| Total provision |
43,541 |
29,308 |
| Judicial deposits (ii) | 12,077 | 11,202 |
(i) The Group recorded a provision for the credit risk exposure related to probable future payments expected to occur in the ordinary course of its operations.
(ii) There are circumstances in which the Group is questioning the legitimacy of certain litigations or claims filed against it. As a result, either because of a judicial order or based on the strategy adopted by Management, the Group might be required to secure part or the whole amount in question by means of judicial deposits, without this being characterized as the settlement of the liability. These amounts are classified as “Other assets” on the consolidated balance sheets and referred above for information.
Changes in the provision during the year
| 2022 | 2021 | 2020 | |
| Balance at January 1 | 29,308 | 19,711 | 15,193 |
| Monetary correction | 4,449 | 6,837 | 4,102 |
| Provision | 23,844 | 8,457 | 3,499 |
| Reversed | (11,539) | (3,132) | (1,454) |
| Payments | (2,521) | (2,565) | (1,629) |
| Balance at December 31 | 43,541 | 29,308 | 19,711 |
Nature of claims
| a) | Tax |
As of December 31, 2022, the Group does not have tax claims classified as probable risk of loss (December 31, 2021 - R$ 10,374).
62 OF 76
XP Inc. and its subsidiaries Notes to consolidated financial statements December 31, 2022, 2021 and 2020 (In thousands of Brazilian Reais, unless otherwise stated) | |
| b) | Civil |
Most of the civil and administrative claims involve matters that are normal and specific to the business and refer to demands for indemnity primarily due to: (i) financial losses in the stock market; (ii) portfolio management; and (iii) alleged losses generated from the liquidation of customers assets in portfolio due to margin cause and/or negative balance. As of December 31, 2022, there were 181 (December 31, 2021 - 105) civil and administrative claims for which the likelihood of loss has been classified as probable, in the amount of R$ 20,419 (December 31, 2021 - R$ 12,539).
| c) | Labor |
Labor claims to which the Group is party primarily concern: (i) the existence (or otherwise) of a working relationship between the Group and IFAs; and (ii) severance payment of former employees. As of December 31, 2022, the Company and its subsidiaries are the defendants in 28 cases (December 31, 2021 - 18) involving labor matters for which the likelihood of loss has been classified as probable, in the amount of R$ 7,907 (December 31, 2021 - R$ 6,395).
Contingent liabilities - probability of loss classified as possible
In addition to the provisions mentioned above, the Company and its subsidiaries are party to several labor, civil and tax contingencies in progress, in which they are the defendants, and the likelihood of loss, based on the opinions of the internal and external legal advisors, is considered possible. The contingencies amount to approximately R$ 893,745 (December 31, 2021 - R$ 487,121).
Below these claims are summarized by nature:
|
2022 |
2021 | |
| Tax (i) (ii) | 543,463 | 228,602 |
| Civil (iii) | 335,644 | 232,775 |
| Labor |
14,638 |
25,744 |
| Total |
893,745 |
487,121 |
| (i) | Employees Profit Sharing Plans: At the end of years 2015, 2019 and 2021 tax authorities issued assessments against the Group claiming mainly for allegdelly unpaid social security contributions on amounts due and paid to employees as profit sharing plans related to calendar years of 2011, 2015, 2017 and 2018. According to the tax authorities the Group profit sharing plans did not comply with the provisions of Law 10,101/00. |
| a. | Tax assessment related to 2011: The first and the second administrative appeals were denied, and currently the Group awaits for the judgment of the special appeal by the Superior Court of the Administrative Council of Tax Appeals (“CARF”). There are other favorable CARF precedents on the subject and the Group obtained legal opinions that support the Group’s defense and current practice. The amount claimed is R$ 19,545. |
| b. | Tax assessment related to 2015: The first administrative appeal was denied, and currently the Group awaits for the judgment of the second appeal by the CARF. There are other favorable CARF precedents on the subject and the Group obtained legal opinions that support the Group’s defense and current practice. The amount claimed is R$ 49,818. |
| c. | Tax assessment related to 2017: In addition to the claim related to the employees profit sharing plan tax authorities are also challenging the dedutibiliy for Corporate Income Tax (IRPJ) and Social Contribution of Net Profits (CSLL) purposes of the amounts paid under such plan to the members of the Group’s Council. An administrative appeal was filed against the assessment, which is awaiting judgment by the Federal Revenue Service of Brazil (“RFB”). The total amount claimed is R$107,614. |
| d. | Tax assessment related to 2018: The Group will appeal against the assessement. The total amount claimed is R$129,444 and the risk of loss for this claim was classified as possible. |
| e. | In June 2022, the Group was notified by the Public Labor Ministry for allegedly unpaid FGTS (Fund for Severance Indeminity Payment) on the amounts paid to employees under profit sharing plans related to years 2015 to 2020. According to the tax authorities the Group profit sharing plans did not comply with the provisions of Law 10,101/00. The Group presented its administrative defense and awaits for the judgmente of the appeal. The total amount claimed is R$ 131,785. The risk of loss for this claim was classified as possible. |
63 OF 76
XP Inc. and its subsidiaries Notes to consolidated financial statements December 31, 2022, 2021 and 2020 (In thousands of Brazilian Reais, unless otherwise stated) | |
| (ii) | Amortization of goodwill: The Group also received three tax assessments in which the tax authorities challenge the dedutibiliy for Corporate Income Tax (IRPJ) and Social Contribution of Net Profits (CSLL) of the expenses deriving from the amortization of goodwill registered upon the acquisitions made by the Group between 2013 and 2016. According to the tax authorities the respective goodwill was registered in violation of Laws 9.532/97 and 12.973/14, respectively. Currently, the three proceedings are pending judgment by the first instance of RFB. Also, the Group have filed two lawsuits to prevent the issuance of new tax assessments related to such goodwill for other periods. |
| (iii) | The Group is defendant in 688 (December 31, 2021 – 586) civil and administrative claims by customers and investment agents, mainly related to portfolio management, risk rating, copyrights and contract termination. The total amount represents the collective maximum value to which the Group is exposed based on the claims’ amounts monetarily restated. |
| 28. | Total revenue and income |
| a) | Net revenue from services rendered |
Revenue from contracts with customers derives mostly from services rendered and fees charged at daily transactions from customers, therefore mostly recognized at a point in time. Disaggregation of revenue by major service lines are as follows:
|
2022
|
2021
|
2020
| |
|
Major service lines |
|||
| Brokerage commission | 2,102,878 | 2,465,217 | 2,139,985 |
| Securities placement | 1,631,399 | 1,917,403 | 1,429,824 |
| Management fees | 1,580,770 | 1,489,736 | 1,224,125 |
| Insurance brokerage fee | 153,230 | 133,070 | 112,802 |
| Educational services | 27,371 | 71,295 | 118,272 |
| Commissions Fees | 563,987 | 192,923 | 90,804 |
| Other services |
449,121 |
532,035 |
386,780 |
| Gross revenue from services rendered | 6,508,756 | 6,801,679 | 5,502,592 |
| (-) Sales taxes and contributions on revenue (i) |
(568,300) |
(605,214) |
(486,104) |
| Net revenue from services rendered |
5,940,456 |
6,196,465 |
5,016,488 |
(i) Mostly related to taxes on services (ISS) and contributions on revenue (PIS and COFINS).
| b) | Net income from financial instruments |
| 2022 | 2021 | 2020 | |
|
Net Income of financial instruments at fair value through profit or loss |
6,326,080 |
7,555,132 |
3,020,698 |
| Net Income of financial instruments measured at amortized cost and at fair value through other comprehensive income | 1,201,253 | (1,558,060) | 188,196 |
| (-) Taxes and contributions on financial income |
(120,399) |
(116,425) |
(73,777) |
|
7,406,934 |
5,880,647 |
3,135,117 |
| c) | Disaggregation by geographic location |
Breakdown of total net revenue and income and selected assets by geographic location:
| 2022 | 2021 | 2020 | |||
| Brazil | 12,855,909 | 11,723,976 | 7,454,304 | ||
| United States | 449,447 | 332,046 | 655,817 | ||
| Europe | 42,034 | 21,090 | 41,484 | ||
| Total Revenue and Income |
13,347,390 |
12,077,112 | 8,151,605 | ||
| 2022 | 2021 | ||||
| Brazil | 8,649,964 | 7,698,115 | |||
| United States | 488,158 | 106,736 | |||
| Europe | 49,496 | 1,746 | |||
| Selected assets (i) |
9,187,618 |
7,806,597 |
64 OF 76
XP Inc. and its subsidiaries Notes to consolidated financial statements December 31, 2022, 2021 and 2020 (In thousands of Brazilian Reais, unless otherwise stated) | |
| (i) | Selected assets are total assets of the Group, less: cash, financial assets and deferred tax assets, which are presented by geographic location. |
None of the clients represented more than 10% of our revenues for the periods presented.
| 29. | Operating costs |
| 2022 | 2021 | 2020 | |||
| Commission and incentive costs | 2,813,308 | 2,719,611 | 2,087,197 | ||
| Operating losses | 70,956 | 35,844 | 31,295 | ||
| Other costs |
986,832 |
674,654 | 526,867 | ||
| Clearing house fees | 427,844 | 411,605 | 344,278 | ||
| Third parties’ services | 53,779 | 88,431 | 92,997 | ||
| Credit card cashback | 262,429 | 91,093 | - | ||
| Other (i) | 242,780 | 83,525 | 89,592 | ||
| Total |
3,871,096 |
3,430,109 |
2,645,359 |
(i) Other cost includes operational losses incurred in the ordinary course of the Group’s business and other costs.
| 30. | Operating expenses by nature |
| 2022 | 2021 | 2020 | |||
| Selling expenses |
138,722 |
227,483 | 134,915 | ||
| Advertising and publicity | 138,722 | 227,483 | 134,915 | ||
| Administrative expenses |
5,641,233 |
4,692,698 | 3,013,598 | ||
| Personnel expenses |
3,943,284 |
3,427,220 | 2,138,470 | ||
| Compensation | 1,597,229 | 1,416,247 | 846,742 | ||
| Employee profit-sharing and bonus | 1,540,172 | 1,362,046 | 807,640 | ||
| Executives profit-sharing | 100,732 | 143,763 | 194,419 | ||
| Benefits | 195,763 | 130,187 | 75,302 | ||
| Social charges | 487,237 | 358,878 | 208,151 | ||
| Other | 22,151 | 16,099 | 6,216 | ||
| Other taxes expenses | 71,396 | 53,603 | 44,029 | ||
| Depreciation of property and equipment and right-of-use assets | 110,248 | 68,618 | 67,422 | ||
| Amortization of intangible assets | 95,629 | 163,112 | 75,839 | ||
| Other administrative expenses |
1,420,676 |
980,145 | 687,838 | ||
| Data processing | 685,946 | 450,796 | 322,659 | ||
| Technical services | 188,986 | 167,984 | 101,389 | ||
| Third parties' services | 397,585 | 249,514 | 168,019 | ||
| Rent expenses | 14,491 | 16,498 | 17,955 | ||
| Communication | 27,076 | 30,041 | 29,311 | ||
| Travel | 40,243 | 13,282 | 9,923 | ||
| Legal and judicial | 9,873 | 9,292 | 6,976 | ||
| Other |
56,476 |
42,738 | 31,606 | ||
| Total |
5,779,955 |
4,920,181 | 3,148,513 |
65 OF 76
XP Inc. and its subsidiaries Notes to consolidated financial statements December 31, 2022, 2021 and 2020 (In thousands of Brazilian Reais, unless otherwise stated) | |
| 31. | Other operating income/(expenses), net |
| 2022 | 2021 | 2020 | |||
| Other operating income |
353,834 |
413,665 | 377,480 | ||
| Revenue from incentives from Tesouro Direto, B3 and others (a) | 284,661 | 366,163 | 352,879 | ||
| Interest received on tax | 15,436 | 7,604 | 5,521 | ||
| Recovery of charges and expenses | 5,945 | 4,473 | 1,798 | ||
| Reversal of operating provisions | 11,704 | 7,422 | 1,366 | ||
| Other | 36,088 | 28,003 | 15,916 | ||
| Other operating expenses |
(96,890) |
(89,311) | (206,427) | ||
| Legal, administrative proceedings and agreement with customers | (8,563) | (3,667) | (45,277) | ||
| Losses on write-off and disposal of assets | (6,794) | (4,377) | (52,102) | ||
| Tax incentive expenses | (5,780) | (10,788) | (8,136) | ||
| Fines and penalties | (4,574) | (1,378) | (16,995) | ||
| Associations and regulatory fees | (15,118) | (11,714) | (13,524) | ||
| Charity | (34,005) | (30,171) | (41,654) | ||
| Other |
(22,056) |
(27,216) | (28,739) | ||
| Total |
256,944 |
324,354 | 171,053 |
(a) Includes incentives received from third parties, mainly due to the joint development of retail products, and also the association of such entities with the XP ecosystem.
| 32. | Share-based plan |
| a) | Share-based Plan |
The establishment of the Plan was approved by the Board of Director’s meeting on December 6, 2019 and the first grant of RSUs and PSUs was on December 10, 2019.
Under the Plan, stocks are awarded at no cost to the recipient upon their grant date. Both RSUs and PSU, are usually granted in a annual basis, their vesting conditions are service-related and they vest at a rate determined in each granted date. The limit to vest is determined at the grant date of each new grant. After the vesting periods, common shares will be issued to the recipients.
Under the Performance Share Unit, stocks are granted to eligible participants and their vesting period and conditions are determined at each new grant, also based on the total shareholder return (TSR), including share price growth, dividends and capital returns.
If an eligible participant ceases its relationship with the Group, within the vesting period, the rights will be forfeited, except in limited circumstances that are approved by the board on a case-by-case basis.
b) Fair value of shares granted
Estimating fair value for share-based payment transactions requires determination of the most appropriate valuation model and underlying assumptions, which depends on the terms and conditions of the grant and the information available at the grant date.
The Group uses certain methodologies to estimate fair value which include the following:
• Estimation of fair value based on equity transactions with third parties close to the grant date; and
• Other valuation techniques including share pricing models such as Monte Carlo.
These estimates also require determination of the most appropriate inputs to the valuation models including assumptions regarding the expected life of a share-based payment or appreciation right, expected volatility of the price of the Group’s shares and expected dividend yield.
c) Outstanding shares granted and valuation inputs
The maximum number of shares available for issuance under the share-based plan shall not exceed 5% of the issued and outstanding shares. As of December 31, 2022, the outstanding number of Company reserved under the plans were 16,211,666 (December 31, 2021 – 18,119,890) including RSUs 13,684,424 (December 31, 2021 – 15,153,830) and 2,527,242 PSUs (December 31, 2021 - 2,966,060).
Set out below are summaries of XP Inc's RSU and PSU activity for 2022 and 2021.
| RSUs | PSUs | Total | ||||
| (In thousands, except weighted-average data, and where otherwise stated) | Number of units | Number of units | Number of units | |||
| Outstanding, January 1, 2021 | 11,079,736 | 2,819,912 | 13,899,648 | |||
| Granted | 5,709,046 | 230,086 | 5,939,132 | |||
| Forfeited | (1,634,952) | (83,938) | (1,718,890) | |||
| Outstanding, December 31, 2021 | 15,153,830 | 2,966,060 | 18,119,890 | |||
| Outstanding, January 1, 2022 | 15,153,830 | 2,966,060 | 18,119,890 | |||
| Granted | 814,745 | - | 814,745 | |||
| Forfeited | (1,559,670) | (438,818) | (1,998,488) | |||
| Vested | (724,481) | - | (724,481) | |||
| Outstanding, December 31, 2022 | 13,684,424 | 2,527,242 | 16,211,666 |
66 OF 76
XP Inc. and its subsidiaries Notes to consolidated financial statements December 31, 2022, 2021 and 2020 (In thousands of Brazilian Reais, unless otherwise stated) | |
As of December 31, 2022, total compensation expense of the plans was R$ 793,249 (2021 - R$654,876), including R$ 189,295 (2021 - R$93,421) of tax provisions, and does not include any tax benefits on total share-based compensation expense once this expense is not deductible for tax purposes. The tax benefits will be perceived when the shares are converted into common shares.
The original weighted-average grant-date fair value of RSU and PSU shares was US$27 and US$ 34.56 respectively. In May 2020, the Company decided to update the measurement condition of its PSU shares, replacing the TSR measurement from US Dollars (US$) to Brazilian Reais (R$), being therefore subject to exchange variation. The weighted-average grant-date fair value of PSU shares for the updated plan was US$52.41. The incremental fair value will be recognized as an expense over the period from the modification date to the end of the vesting period. All other conditions of the PSU shares plan have not been modified. The average grant date fair value in the year ended December 31, 2022 was US$ 40.41.
| 33. | Earnings per share (basic and diluted) |
Basic earnings per share is calculated by dividing net income for the period attributed to the owners of the parent by the weighted average number of ordinary shares outstanding during the period.
Diluted earnings per share is calculated by dividing net income attributable to owners of XP Inc by the weighted average number of shares outstanding during the year plus the weighted average number of shares that would be issued on conversion of all dilutive potential shares into shares. The shares in the share-based plan are the only shares with potential dilutive effect.
The following table presents the calculation of net income applicable to the owners of the parent and basic and diluted EPS for the years ended December 31, 2022, 2021 and 2020.
|
2022 |
2021 |
2020 | |||
|
Net Income attributable to owners of the Parent
|
3,579,050
|
3,589,416
|
2,076,430
| ||
| Basic weighted average number of outstanding shares (i) (iii) | 555,429 | 559,004 | 552,291 | ||
| Basic earnings per share - R$ |
6.4438 |
6.4211 |
3.7597 | ||
| Effect of dilution | |||||
| Shared-based plan (ii) (iii) | 17,577 | 14,496 | 6,817 | ||
| Diluted weighted average number of outstanding shares (iii) | 573,006 | 573,499 | 559,108 | ||
| Diluted earnings per share - R$ |
6.2461 |
6.2588 |
3.7138 |
| (i) | See on note 25, the number of XP Inc.’s outstanding common shares during the year. |
| (ii) | See on note 32, the number of shares granted and forfeited during the year regarding XP Inc.’s Share-based plan. |
| (iii) | Thousands of shares. |
| 34. | Determination of fair value |
The Group measures financial instruments such as certain financial investments and derivatives at fair value at each balance sheet date.
Level 1: The fair value of financial instruments traded in active markets is based on quoted market prices at the end of the reporting period. The financial instruments included in the level 1 consist mainly in public financial instruments and financial instruments negotiated on active markets (i.e. stock exchanges).
Level 2: The fair value of financial instruments that are not traded in active markets is determined using valuation techniques, which maximize the use of observable market data and rely as little as possible on entity-specific estimates. If all significant inputs required to fair value as an instrument are directly or indirectly observable, the instrument is included in level 2. The financial instruments classified as level 2 are composed mainly from private financial instruments and financial instruments negotiated in a secondary market.
Level 3: If one or more of the significant inputs is unobservable, the instrument is included in level 3. This is the case for unlisted equity securities.
67 OF 76
XP Inc. and its subsidiaries Notes to consolidated financial statements December 31, 2022, 2021 and 2020 (In thousands of Brazilian Reais, unless otherwise stated) | |
Specific valuation techniques used to value financial instruments include:
| · | Financial assets (other than derivatives) – The fair value of securities is determined by reference to their closing prices on the date of presentation of the consolidated financial statements. If there is no market price, fair value is estimated based on the present value of future cash flows discounted using the observable rates and market rates on the date of presentation. |
| · | Swap – These operations swap cash flow based on the comparison of profitability between two indexers. Thus, the agent assumes both positions – put in one indexer and call on another. |
| · | Forward – at the market quotation value, and the installments receivable or payable are fixed to a future date, adjusted to present value, based on market rates published at B3. |
| · | Futures – Foreign exchange rates, prices of shares and commodities are commitments to buy or sell a financial instrument at a future date, at a contracted price or yield and may be settled in cash or through delivery. Daily cash settlements of price movements are made for all instruments. |
| · | Options – option contracts give the purchaser the right to buy or sell the instrument at a fixed price negotiated at a future date. Those who acquire the right must pay a premium to the seller. This premium is not the price of the instrument, but only an amount paid to have the option (possibility) to buy or sell the instrument at a future date for a previously agreed price. |
| · | Others: Derivatives – the warrant liabilities issued by XPAC Corporation Corp. contain features that qualify as embedded derivatives. The fair value of Public Warrants issued in connection with the Initial Public Offering have been measured based on the listed market price of such warrants. |
| · | Other financial assets and liabilities – Fair value, which is determined for disclosure purposes, is calculated based on the present value of the principal and future cash flows, discounted using the observable rates and market rates on the date the financial statements are presented. |
| · | Loans operations – Fair value is determined through the present value of expected future cash flows discounted using the observable rates and market rates on the date the financial statements are presented. |
| · | Contingent consideration – Fair value of the contingent consideration liability related to acquisitions is estimated by applying the income approach and discounting the expected future payments to selling shareholders under the terms of the purchase and sale agreements. |
All of the resulting fair value estimates are included in level 2, except for unlisted equity securities, contingent consideration liability and certain financial assets, where the fair values have been determined based on present values and the discount rates used were adjusted for counterparty or own credit risk.
Below are the Group financial assets and liabilities by level within the fair value hierarchy. The Group assessment of the significance of a particular input to the fair value measurement requires judgment and may affect the valuation of fair value assets and liabilities and their placement within the fair value hierarchy levels:
| 2022 | ||||||||||
| Level 1 | Level 2 | Level 3 | Fair Value | Book Value | ||||||
| Financial Assets | ||||||||||
| Financial assets at Fair value through profit or loss | ||||||||||
| Securities | 73,022,643 | 14,490,361 | - | 87,513,004 | 87,513,004 | |||||
| Derivative financial instruments | 296,249 | 8,920,906 | - | 9,217,155 | 9,217,155 | |||||
| Investments in associates measured at fair value | - | - | 1,523,425 | 1,523,425 | 1,523,425 | |||||
| Fair value through other comprehensive income | ||||||||||
| Securities | 34,478,668 | - | - | 34,478,668 | 34,478,668 | |||||
| Evaluated at amortized cost | ||||||||||
| Securities | 7,579,658 | 1,695,368 | - | 9,275,026 | 9,272,103 | |||||
| Securities purchased under agreements to resell | - | 7,172,777 | - | 7,172,777 | 7,603,820 | |||||
| Securities trading and intermediation | - | 3,271,000 | - | 3,271,000 | 3,271,000 | |||||
| Accounts receivable | - | 597,887 | - | 597,887 | 597,887 | |||||
| Loan operations | - | 20,874,930 | - | 20,874,930 | 22,211,161 | |||||
| Other financial assets | - | 3,517,189 | - | 3,517,189 | 3,517,189 | |||||
| Financial liabilities | ||||||||||
| Fair value through profit or loss | ||||||||||
| Securities loaned | 13,048,246 | 481,019 | - | 13,529,265 | 13,529,265 | |||||
| Derivative financial instruments | 167,874 | 8,437,535 | - | 8,605,409 | 8,605,409 | |||||
| Evaluated at amortized cost | ||||||||||
| Securities sold under repurchase agreements | - | 31,370,050 | - | 31,370,050 | 31,790,091 | |||||
| Securities trading and intermediation | - | 16,062,697 | - | 16,062,697 | 16,062,697 | |||||
| Financing instruments payable | - | 43,669,798 | - | 43,669,798 | 43,683,629 | |||||
| Borrowings | - | 1,814,714 | - | 1,814,714 | 1,865,880 | |||||
| Accounts payables | - | 617,394 | - | 617,394 | 617,394 | |||||
| Other financial liabilities | - | 10,987,283 | 566,930 | 11,554,213 | 11,554,213 | |||||
68 OF 76
XP Inc. and its subsidiaries Notes to consolidated financial statements December 31, 2022, 2021 and 2020 (In thousands of Brazilian Reais, unless otherwise stated) | |
| 2021 | ||||||||||
| Level 1 | Level 2 | Level 3 | Fair Value | Book Value | ||||||
| Financial Assets | ||||||||||
| Financial assets at Fair value through profit or loss | ||||||||||
| Securities | 49,677,779 | 8,502,176 | - | 58,179,955 | 58,179,955 | |||||
| Derivative financial instruments | 194,911 | 10,748,803 | - | 10,943,714 | 10,943,714 | |||||
| Investments in associates measured at fair value | - | - | 1,221,424 | 1,221,424 | 1,221,424 | |||||
| Fair value through other comprehensive income | ||||||||||
| Securities | 32,332,377 | - | - | 32,332,377 | 32,332,377 | |||||
| Evaluated at amortized cost | ||||||||||
| Securities | 1,870,205 | 671,977 | - | 2,542,182 | 2,238,807 | |||||
| Securities purchased under agreements to resell | - | 9,124,719 | - | 9,124,719 | 8,894,531 | |||||
| Securities trading and intermediation | - | 1,405,651 | - | 1,405,651 | 1,405,651 | |||||
| Accounts receivable | - | 469,086 | - | 469,086 | 469,086 | |||||
| Loan operations | - | 12,844,037 | - | 12,844,037 | 12,819,627 | |||||
| Other financial assets | - | 461,515 | - | 461,515 | 461,515 | |||||
| Financial liabilities | ||||||||||
| Fair value through profit or loss | ||||||||||
| Securities loaned | 2,146,398 | 518,804 | - | 2,665,202 | 2,665,202 | |||||
| Derivative financial instruments | 157,710 | 11,750,473 | - | 11,908,183 | 11,908,183 | |||||
| Evaluated at amortized cost | ||||||||||
| Securities sold under repurchase agreements | - | 26,276,252 | - | 26,276,252 | 26,281,345 | |||||
| Securities trading and intermediation | - | 15,597,555 | - | 15,597,555 | 15,597,555 | |||||
| Financing instruments payable | - | 23,974,348 | - | 23,974,348 | 24,429,086 | |||||
| Borrowings | - | 1,932,859 | - | 1,932,859 | 1,928,782 | |||||
| Accounts payables | - | 867,526 | - | 867,526 | 867,526 | |||||
| Other financial liabilities | - | 6,937,029 | 743,443 | 7,680,472 | 7,680,472 | |||||
As of December 31, 2022, and 2021 the total contingent consideration liability is reported at fair value and is dependent on the profitability of the acquired associate and businesses. The total contingent consideration is classified within Level 3 of the fair value hierarchy. The contingent consideration liability represents the maximum amount payable under the purchase and sale agreements discounted using an appropriate rate, which includes the Brazilian risk free rate. Changes in an average discount rate of 12.82% by 100 bps would increase/decrease the fair value of contingent consideration liability by R$8,787.
The investments held through our investees which are considered to be venture capital investments are classified as Level 3 of the fair value hierarchy. The inputs used by the Group are derived for discounted rates for these investments using a capital asset model to calculate a pre-tax rate that reflects current market assessments of the time value of money and the risk specific to the asset. Change in the discount rate by 100 bps would increase/decrease the fair value by R$ 15,523.
Transfers into and out of fair value hierarchy levels are analyzed at the end of each consolidated financial statement. As of December 31, 2022, the Group had no transfers between Level 2 and Level 3.
69 OF 76
XP Inc. and its subsidiaries Notes to consolidated financial statements December 31, 2022, 2021 and 2020 (In thousands of Brazilian Reais, unless otherwise stated) | |
| 35. | Management of financial risks and financial instruments |
(a) Overview
The Group is exposed to the following risks:
| (i) | Credit risk; |
| (ii) | Liquidity risk; |
| (iii) | Market risk; |
| · | Currency risk; |
| · | Interest rate risk; |
| · | Price risk. |
| (iv) | Operating risk. |
(b) Risk management structure
Management has overall responsibility for establishing and supervising the risk management structure of the Group. Risk Management is under a separated structure from business areas, reporting directly to senior management, to ensure exemption of conflict of interest, and segregation of functions appropriate to good corporate governance and market practices.
The risk management policies of the Group are established to identify and analyze the risks faced, to set appropriate risk limits and controls, and to monitor risks and adherence to the limits. Risk management policies and systems are reviewed regularly to reflect changes in market conditions and in the activities of the Group. The Group, through its training and management standards and procedures, developed a disciplined and constructive control environment within which all its employees are aware of their duties and obligations.
Regarding the subsidiary XP CCTVM and the other subsidiaries components of XP Prudential Conglomerate (Brazilian Central Bank oversight definition), the organizational structure is based on the recommendations proposed by the Basel Accord, in which procedures, policies and methodology are formalized consistent with risk tolerance and with the business strategy and the various risks inherent to the operations and/or processes, including market, liquidity, credit and operating risks. The Group seeks to follow the same risk management practices as those applying to all companies.
Such risk management processes are also related to going concern management procedures, mainly in terms of formulating impact analyses, business continuity plans, contingency plans, backup plans and crisis management.
(c) Credit risk
Credit risk is defined as the possibility of losses associated with the failure, by the borrower or counterparty, of their respective financial obligations under the agreed terms, the devaluation of the credit agreement resulting from the deterioration in the borrower's risk rating, the reduction gains or remuneration, the advantages granted in the negotiation and the costs of recovery.
The Risk Management document establishes its credit policy based on the composition of the portfolio by security, by internal rating of issuer and/or the issue, by the current economic activity, by the duration of the portfolio, by the macroeconomic variables, among others.
The Credit Analysis department is also actively involved in this process and it is responsible for assessing the credit risk of issues and issuers with which it maintains or intends to maintain credit relationships, also using an internal credit risk allocation methodology (rating) to classify the likelihood of loss of counterparties.
For the loan operations XP Inc uses client’s investments as collaterals to reduce potential losses and protect against credit risk exposure by managing these collaterals so that they are always sufficient, legally enforceable (effective) and viable, XP monitors the value of the collaterals. The Credit Risk Management provides subsidies to define strategies as risk appetite, to establish limits, including exposure analysis and trends as well as the effectiveness of the credit policy.
The loans operations have a high credit quality and the Group often uses risk mitigation measures, primarily through client’s investments as collaterals, which explains the low provision ratio.
The Group's policies regarding obtaining collateral have not significantly changed during the reporting period and there has been no significant change in the overall quality of the collateral held by the Group since the prior period.
Management undertakes credit quality analysis of assets that are not past due or reduced to recoverable value. As of December 31, 2022, and 2021 such assets were substantially represented by Loan operations and Securities purchased under agreements to resell of which the counterparties are Brazilian banks with low credit risk, securities issued by the Brazilian government, as well as derivative financial instruments transactions, which are mostly traded on the stock exchange (B3 S.A. – Brasil, Bolsa, Balcão) and which, therefore, have its guarantee.
The carrying amount of the financial assets representing the maximum exposure to credit risk is shown in the table below:
70 OF 76
XP Inc. and its subsidiaries Notes to consolidated financial statements December 31, 2022, 2021 and 2020 (In thousands of Brazilian Reais, unless otherwise stated) | |
|
2022 |
2021 | |
|
Financial assets |
||
| Securities purchased under agreements to resell | 7,603,820 | 8,894,531 |
| Securities | 131,263,775 | 92,751,139 |
| Public securities | 63,895,371 | 48,246,922 |
| Private securities | 67,368,404 | 44,504,217 |
| Derivative financial instruments | 9,217,155 | 10,943,714 |
| Securities trading and intermediation | 3,271,000 | 1,405,651 |
| Accounts receivable | 597,887 | 469,086 |
| Loan operations | 22,211,161 | 12,819,627 |
| Other financial assets | 3,517,189 | 461,515 |
| Off-balance exposures (credit card limits) | 5,014,845 | 1,367,399 |
| Total |
182,696,832 |
129,112,662 |
(d) Liquidity risk
Liquidity risk is the possibility that the institution will not be able to efficiently honor its expected, unexpected, current or future obligations.
Liquidity management operates in line with the Group's strategy and business model, being compatible with the nature of operations, the complexity of its products and the relevance of risk exposure. This liquidity management policy establishes actions to be taken in cases of liquidity contingency, and these must be sufficient to generate a new meaning for cash within the required minimum limits.
The group maintains an adequate level of liquidity at all times, always working with a minimum cash limit. This is done through management that is compatible and consistent with your ability obtaining resources in the market, with its budgetary targets for the evolution of the volume of its assets and is based on the management of cash flows, observing the minimum limits of daily cash balances and cash needs projections, in the management of stocks of highly liquid assets and simulations of adverse scenarios.
Risk structure and management are the responsibility of the Risk department, reporting to the Executive Board, thus avoiding any conflict of interest with departments that require liquidity.
(d1) Maturities of financial liabilities
The tables below summarizes the Group’s financial liabilities into groupings based on their contractual maturities:
| 2022 | ||||||
| Liabilities | Up to 1 month | From 2 to 3 months | From 3 to 12 months | From 1 to 5 years | Above 5 years | Contractual cash flow |
| Securities loaned | 13,048,246 | - | - | - | 481,019 | 13,529,265 |
| Derivative financial instruments | 796,909 | 845,446 | 2,340,407 | 4,507,132 | 115,515 | 8,605,409 |
| Securities sold under repurchase agreements | 31,790,091 | - | - | - | - | 31,790,091 |
| Securities trading and intermediation | 16,062,697 | - | - | - | - | 16,062,697 |
| Financing instruments payable | 4,407,525 | 9,469,722 | 5,917,325 | 23,078,719 | 810,338 | 43,683,629 |
| Borrowings | - | - | 1,865,880 | - | 1,865,880 | |
| Accounts payables | 617,394 | - | - | - | - | 617,394 |
| Other financial liabilities |
5,959,212 |
534,835 |
4,432,215 |
627,951 |
- |
11,554,213 |
| Total |
72,682,074 |
10,850,003 |
14,555,827 |
28,213,802 |
1,406,872 |
127,708,578 |
71 OF 76
XP Inc. and its subsidiaries Notes to consolidated financial statements December 31, 2022, 2021 and 2020 (In thousands of Brazilian Reais, unless otherwise stated) | |
| 2021 | ||||||
| Liabilities | Up to 1 month | From 2 to 3 months | From 3 to 12 months | From 1 to 5 years | Above 5 years | Contractual cash flow |
| Securities loaned | 2,146,398 | - | - | - | 518,804 | 2,665,202 |
| Derivative financial instruments | 758,821 | 1,379,092 | 2,250,942 | 6,436,008 | 1,083,320 | 11,908,183 |
| Securities sold under repurchase agreements | 26,281,345 | - | - | - | - | 26,281,345 |
| Securities trading and intermediation | 15,597,555 | - | - | - | - | 15,597,555 |
| Financing instruments payable | 982,877 | 1,245,279 | 5,790,698 | 15,525,061 | 885,171 | 24,429,086 |
| Borrowings | - | - | 1,661,067 | 267,715 | - | 1,928,782 |
| Accounts payables | 867,526 | - | - | - | - | 867,526 |
| Other financial liabilities |
5,856,309 |
- |
4,365 |
1,819,798 |
- |
7,680,472 |
| Total |
52,490,831 |
2,624,371 |
9,707,072 |
24,048,582 |
2,487,295 |
91,358,151 |
(e) Market risk
Market risk is the risk that the fair value or future cash flows of a financial instrument will fluctuate because of changes in market prices. Market risk comprises mainly three types of risk: foreign exchange variation, interest rates and share prices.
The aim of market risk management is to control exposure to market risks, within acceptable parameters, while optimizing return.
Market risk management for operations is carried out through policies, control procedures and prior identification of risks in new products and activities, with the purpose to maintain market risk exposure at levels considered acceptable by the Group and to meet the business strategy and limits defined by the Risk Committee.
The main tool used to measure and control the exposure risk of the Group to the market, mainly in relation to their trading assets portfolio, is the Maps Luna program, which calculates the capital allocation based on the exposure risk factors in the regulations issued by Brazil Central Bank (“BACEN”) for financial institutions, which are taken as a basis for the verification of the risk exposure of the assets of the Group.
In order to comply with the provisions of the regulatory body, the financial institutions of the Group make daily control of the exposure by calculating the risk portions, recording the results in Document 2011 - Daily Statement of Capital Requirements (DDR) in BACEN Circular Letter No, 3,331/08, submitting it daily to this institution.
With the formalized rules, the Risk Department has the objective of controlling, monitoring and ensuring compliance with the pre-established limits, and may refuse, in whole or in part, to receive and/or execute the requested transactions, upon immediate communication to customers, in addition to intervening in cases of non-compliance and reporting all atypical events to the Committee.
In addition to the control performed by the tool, the Group adopt guidelines to control the risk of the assets that mark the Treasury operations so that the own portfolios of the participating companies are composed by assets that have low volatility and, consequently, less exposure to risk. In the case of non-compliance with the operational limits, the Treasury Manager shall take the necessary measures to reframe as quickly as possible.
(e1) Currency risk
The purpose of Group’s management of foreign exchange exposure is to mitigate the effects arising from variation in foreign exchange rates, which may present high volatility periods.
The currency (or foreign exchange) risk arises from positions that are sensitive to oscillations in foreign exchange rates. These positions may be originated by financial instruments that are denominated in a currency other than the functional currency in which the balance sheet is measured or through positions in derivative instruments (for negotiation or hedge) and investments in subsidiaries abroad.
The Group hold interest in XP Holding International LLC, XP Advisors Inc, and XP Holding UK Ltd, whose equity as of December 31, 2022
was US$ 74,150 thousand (US$ 52,905 thousand as of December 31, 2021), US$ 5,744 thousand (US$ 2,658 thousand as of December 31, 2021)
and GBP 6,967 thousand (GBP 1,918 thousand as of December 31, 2021) respectively.
The risk of the XP Holding International LLC and XP Advisors Inc is hedged with the objective of minimizing the volatility of the functional currency (BRL) against the US$ arising from foreign investment abroad (see Note 9).
The foreign currency exposure risk of XP Holding UK Ltd is not hedged.
(e2) Interest rate risk
It arises from the possibility that the Group incurs in gains or losses arising from fluctuations in interest rates on its financial assets and liabilities.
72 OF 76
XP Inc. and its subsidiaries Notes to consolidated financial statements December 31, 2022, 2021 and 2020 (In thousands of Brazilian Reais, unless otherwise stated) | |
Below are presented the risk rates that the Group is exposed:
| · | Selic/DI |
| · | IGPM |
| · | IPCA |
| · | PRE |
| · | Foreign exchange coupon |
(e3) Price risk
Price risk is the risk arising from the change in the price of the investment fund portfolio and of shares listed on the stock exchange, held in the portfolio of the Group, which may affect its profit and loss. The price risk is controlled by the management of the Group, based on the diversification of its portfolio and/or through the use of derivatives contracts, such as options or futures.
(e4) Sensitivity analysis
According to the market information, the Group performed the sensitivity analysis by market risk factors considered relevant. The largest losses, by risk factor, in each of the scenarios were presented with an impact on the profit and loss, providing a view of the exposure by risk factor of the Group in exceptional scenarios. The following sensitivity analyzes do not consider the functioning dynamics of risk and treasury areas, since once these losses are detected, risk mitigation measures are quickly triggered, minimizing the possibility of significant losses.
| 2022 | ||||
| Trading portfolio |
Exposures |
Scenarios | ||
| Risk factors |
Risk of variation in: |
I |
II |
III |
| Fixed interest rate | Fixed interest rate in Reais | (174) | (231,438) | (483,589) |
| Exchange coupons | Foreign currencies coupon rate | (15) | (5,407) | (10,418) |
| Foreign currencies | Exchange rates | (2,089) | 22,825 | (120,873) |
| Price indexes | Inflation coupon rates | (118) | (19,523) | (40,147) |
| Shares | Shares prices | (4,689) | (46,927) | (242,687) |
| Seed Money (i) | Seed Money |
(6,685) |
(167,106) |
(334,211) |
|
(13,770) |
(447,576) |
(1,231,925) | ||
| 2021 | ||||
| Trading portfolio |
Exposures |
Scenarios | ||
| Risk factors |
Risk of variation in: |
I |
II |
III |
| Fixed interest rate | Fixed interest rate in Reais | (285) | (110,555) | (204,607) |
| Exchange coupons | Foreign currencies coupon rate | (35) | (5,578) | (11,325) |
| Foreign currencies | Exchange rates | (364) | 177,203 | 384,340 |
| Price indexes | Inflation coupon rates | (248) | (53,407) | (103,602) |
| Shares | Shares prices | (1,483) | (131,753) | 92,024 |
| Seed Money (i) | Seed Money |
(6,203) |
(155,068) |
(310,136) |
|
(8,618) |
(279,158) |
(153,306) | ||
| (i) | Related to seed money strategy, which includes several risk factors that are disclosed in aggregate. |
Scenario I: Increase of 1 basis point in the rates in the fixed interest rate yield, exchange coupons, inflation and 1 percentage point in the prices of shares and currencies;
Scenario II: Project a variation of 25 percent in the rates of the fixed interest yield, exchange coupons, inflation, both rise and fall, being considered the largest losses resulting by risk factor; and
Scenario III: Project a variation of 50 percent in the rates of the fixed interest yield, exchange coupons, inflation and interest rates, both rise and fall, being considered the largest losses resulting from the risk factor.
(f) Operating risk
Operational risk is characterized by the possibility of losses resulting from external events or failure, deficiency or inadequacy of internal processes, people and systems, including legal risk. Operational risk events include the following categories: internal fraud; external fraud; labor demands and poor workplace safety; inappropriate practices relating to customers, products and services; damage to physical assets owned or used by XP; situations that cause the interruption of XP's activities; and failures in information technology systems, processes or infrastructure.
73 OF 76
XP Inc. and its subsidiaries Notes to consolidated financial statements December 31, 2022, 2021 and 2020 (In thousands of Brazilian Reais, unless otherwise stated) | |
The Group's main objective is to ensure the identification, classification and monitoring of situations that may generate financial losses, given the companies' reputation, as well as any regulatory assessment due to the occurrence of an operational risk event, XP adopts the model of 3 lines of defense, in which the main responsibility for the development and implementation of controls to deal with operational risks is attributed to the Management within each business unit, seeking to manage mainly:
| (i) | Requirements of segregation of functions, including independent authorization for transactions; |
| (ii) | Requirements of reconciliation and monitoring of transactions; |
| (iii) | Compliance with legal and regulatory requirements; |
| (iv) | Documentation of controls and procedures; |
| (v) | Requirements of periodic assessment of the operating risks faced and the adequacy of the controls and procedures for dealing with the identified risks; |
| (vi) | Development of contingency plans; |
| (vii) | Professional training and development; and |
| (viii) | Ethical and business standards; |
In addition, the Group's financial institutions, in compliance with the provisions of Article 4, paragraph 2, of Resolution No, 3,380/06 of the National Monetary Council (“CMN”) of June 27, 2006, have a process that covers institutional policies, procedures, contingency and business continuity plans and systems for the occurrence of external events, in addition to formalizing the single structure required by the regulatory agency.
| 36. | Capital Management |
The Group’s objectives when managing capital are to safeguard its ability to continue as a going concern, so that it can continue to provide returns for shareholders and benefits for other stakeholders and maintain an optimal capital structure to reduce the cost of capital. In order to maintain or adjust the capital structure, the Group may adjust the amount of dividends paid to shareholders, return capital to shareholders, issue new shares or sell assets to reduce debt.
The Group also monitors capital based on the net debt and the gearing ratio. Net debt is calculated as total debt (including borrowings, lease liabilities, structured financing and debentures as shown in the consolidated balance sheet) less cash and cash equivalent (including cash, securities purchased under agreements to resell and certificate deposits as shown in the consolidated statement of cash flows). The gearing ratio corresponds to the net debt expressed as a percentage of total capital.
The net debt and corresponding gearing ratios as of December 2022 and 2021 were as follows:
| 2022 | 2021 | |||
| Group debt (Note 37) (i) | 8,175,437 | 7,073,021 | ||
| Structured financing (Note 20 (b)) | 1,933,522 | 2,415,400 | ||
| Total debt | 10,108,959 | 9,488,421 | ||
| Cash | (3,553,126) | (2,485,641) | ||
| Securities purchased under agreements to resell (Note 6 (a)) | (646,478) | (1,071,328) | ||
| Certificate deposits (Securities) (Note 7 (a)) | (252,877) | (194,892) | ||
| Deposits at Central Bank (Note 20 (a)) | (514,999) | - | ||
| Net debt | 5,141,479 | 5,736,560 | ||
| Total equity | 17,035,735 | 14,416,836 | ||
| Total capital | 22,177,214 | 20,153,396 | ||
| Gearing ratio % | 23.18% | 28.46% |
| (i) | Includes Debentures and Bonds designated as fair value through profit or loss. See Note 7(e) and 17, respectively. |
| (i) | Minimum capital requirements |
Although capital is managed considering the consolidated position, certain subsidiaries are subject to minimum capital requirement from local regulators.
The subsidiary XP CCTVM, leader of the Prudential Conglomerate (which includes Banco XP and XP DTVM), under BACEN regulation regime, is required to maintain a minimum capital and follow aspects from the Basel Accord.
The subsidiary XP Vida e Previdência operates in retirement plans business and is oversight by the SUSEP, being required to present Adjusted Shareholders' Equity (PLA) equal to or greater than the Minimum Required Capital (“CMR”), CMR is equivalent to the highest value between base capital and Venture Capital Liquidity (“CR”).
74 OF 76
XP Inc. and its subsidiaries Notes to consolidated financial statements December 31, 2022, 2021 and 2020 (In thousands of Brazilian Reais, unless otherwise stated) | |
On December 31, 2022 the subsidiaries XP CCTVM and XP Vida e Previdência were in compliance with all capital requirements.
There is no requirement for compliance with a minimum capital for the other Group companies.
| (ii) | Financial covenants |
In relation to the long-term debt contracts, including multilateral instruments, recorded within “Borrowing and lease liabilities” and “Debentures” (Notes 19, 20 and 7), the Group is required to comply with certain performance conditions, such as profitability and efficiency indexes.
As of December 31, 2022, the amount of debt contracts under financial covenants is R$ 279,828 (December 31, 2021 – R$ 446,005). The Group has complied with these covenants throughout the reporting period.
Eventual failure of the Group to comply with such covenants may be considered as breach of contract and, as a result, considered for early settlement of related obligations.
| 37. | Cash flow information |
| (i) | Debt reconciliation |
|
Debt securities (i) |
||||||||||
|
Borrowings |
Lease liabilities |
Debentures and Notes |
Bonds |
Total | ||||||
| Total debt as of January 1, 2020 | 382,078 | 255,406 | 835,230 | - | 1,472,714 | |||||
| Acquisitions/Issuance | - | 55,820 | - | - | 55,820 | |||||
| Write-off | - | (78,321) | - | - | (78,321) | |||||
| Payments | (95,395) | (57,473) | (400,000) | - | (552,868) | |||||
| Repurchase | - | - | (64,717) | - | (64,717) | |||||
| Revaluation | - | (10,050) | - | - | (10,050) | |||||
| Net foreign exchange differences | - | 23,610 | - | - | 23,610 | |||||
| Interest accrued | 11,892 | 19,456 | 21,473 | - | 52,821 | |||||
| Interest paid | (14,488) | - | (56,736) | - | (71,224) | |||||
| Total debt as of December 31, 2020 | 284,087 | 208,448 | 335,250 | - | 827,785 | |||||
| Total debt as of January 1, 2021 | 284,087 | 208,448 | 335,250 | - | 827,785 | |||||
| Acquisitions/Issuance | 1,570,639 | 116,248 | 500,018 | 3,691,262 | 5,878,167 | |||||
| Payments | (21,022) | (55,349) | (177,826) | - | (254,197) | |||||
| Revaluation | - | 24,234 | - | - | 24,234 | |||||
| Net foreign exchange differences | 73,426 | 7,486 | - | 431,250 | 512,162 | |||||
| Interest accrued | 21,689 | 17,488 | 60,919 | 74,798 | 174,894 | |||||
| Interest paid | (37) | - | (12,386) | (69,004) | (81,427) | |||||
| Total debt as of December 31, 2021 | 1,928,782 | 318,555 | 705,975 | 4,128,306 | 7,081,618 | |||||
| Total debt as of January 1, 2022 | 1,928,782 | 318,555 | 705,975 | 4,128,306 | 7,081,618 | |||||
| Acquisitions/Issuance | - | 49,853 | 1,890,500 | - | 1,940,353 | |||||
| Payments | (2,061) | (99,655) | (175,999) | - | (277,715) | |||||
| Revaluation | - | (89) | - | - | (89) | |||||
| Net foreign exchange differences | (87,158) | (5,820) | - | (218,607) | (311,585) | |||||
| Interest accrued | 69,593 | 22,794 | 203,275 | 129,113 | 424,775 | |||||
| Interest paid | (43,276) | - | (27,232) | (127,429) | (197,937) | |||||
| Total debt as of December 31, 2022 | 1,865,880 | 285,638 | 2,596,519 | 3,911,383 | 8,659,420 | |||||
(i) Debt securities includes Debentures measured at FVPL presented in Note 7(e) and does not include fair value adjustments of (i) Debentures - R$ 86,819 (R$ 18,077 - 2021) and (ii) Bonds - R$ 350,207 (R$ 9,480 - 2021).
75 OF 76
XP Inc. and its subsidiaries Notes to consolidated financial statements December 31, 2022, 2021 and 2020 (In thousands of Brazilian Reais, unless otherwise stated) | |
| (ii) | Non-cash investing and financing activities |
Non-cash investing and financing activities disclosed in other notes are: (i) related to business acquisitions through accounts payables (R$7,490) and contingent consideration (R$4,175) – see Note 5 and (ii) related to acquisition of investment in associates (Note 15) through accounts payables (R$72,755), contingent consideration (R$14,556) and through private issuance of shares (R$70,030 – see Note 25).
| (iii) | Investing cashflow reconciliation from prior periods transactions |
As of December 31, 2022, acquisition of subsidiaries, net of cash acquired presented on cash flow investing activities includes installments of business acquisitions ocurred in 2020, in the total amount of R$14,865.
76 OF 76