ITEM 1. SCHEDULE OF INVESTMENTS.
The Schedule(s) of Investments is attached herewith.
Partners Group Private Equity (Master Fund), LLC
(a Delaware Limited Liability Company)
Consolidated Schedule of Investments —
December 31, 2022 (Unaudited)
The unaudited consolidated schedule of investments of Partners Group Private Equity (Master Fund), LLC (the “Fund”), a Delaware limited liability company that is registered under the Investment Company Act of 1940, as amended (the “Investment Company Act”), as a non-diversified, closed-end management investment company, as of December 31, 2022, is set forth below:
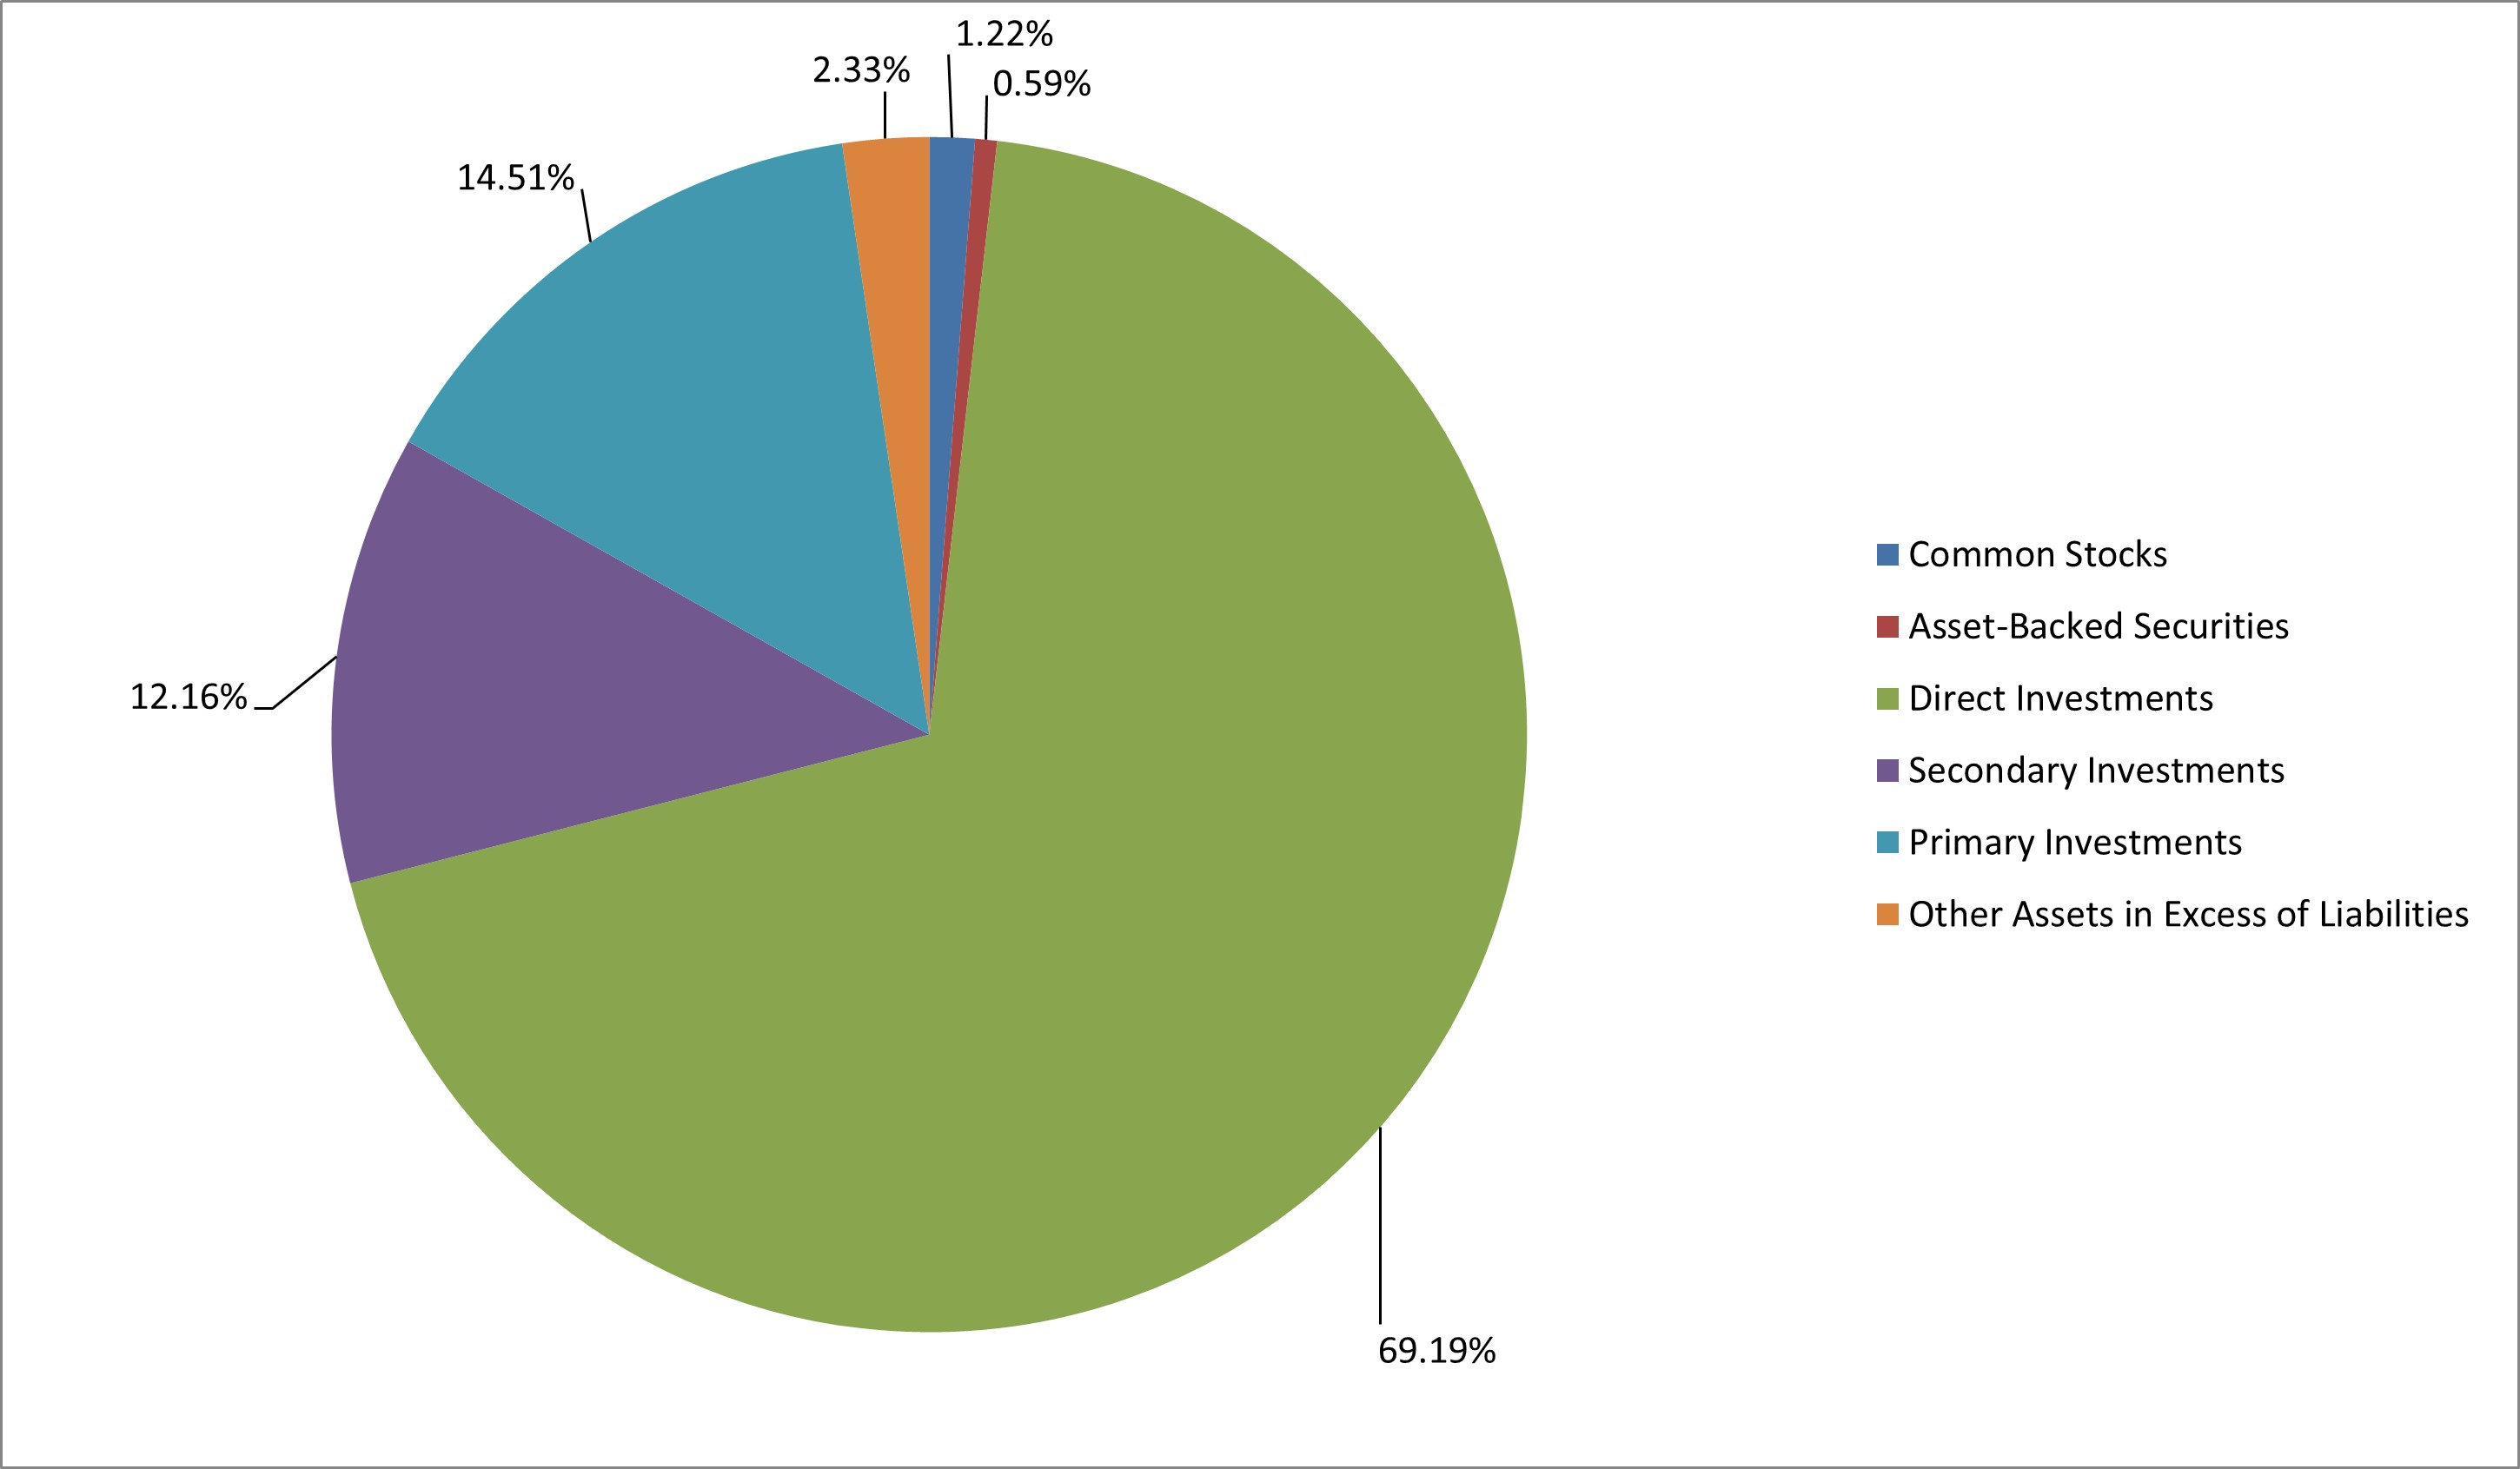
INVESTMENT PORTFOLIO AS A PERCENTAGE OF TOTAL NET ASSETS
Partners Group Private Equity (Master Fund), LLC (a Delaware Limited Liability Company) |
Consolidated Schedule of Investments — December 31, 2022 (Unaudited) |
INVESTMENT PORTFOLIO AS A PERCENTAGE OF TOTAL NET ASSETS
| Industry | Acquisition Date | Shares | Fair Value | |||||||||
| Common Stocks (1.22%) | ||||||||||||
| North America (0.69%) | ||||||||||||
| American Tower Corp. | Communication | 05/29/20 | 21,933 | $ | 4,646,506 | |||||||
| American Water Works Co., Inc. | Utilities | 02/16/16 | 47,317 | 7,212,530 | ||||||||
| Ares Capital Corp. | Diversified Financial Services | 02/16/16 | 229,577 | 4,237,991 | ||||||||
| Ares Management Corp. | Diversified Financial Services | 06/28/19 | 43,580 | 2,981,744 | ||||||||
| Atmos Energy Corp. | Utilities | 02/16/16 | 62,457 | 7,002,054 | ||||||||
| Blackstone Group, Inc. | Diversified Financial Services | 07/12/19 | 45,845 | 3,401,699 | ||||||||
| Brookfield Asset Management, Inc. | Diversified Financial Services | 07/18/22 | 6,164 | 176,693 | ||||||||
| Brookfield Business Partners LP | Diversified Financial Services | 03/17/22 | 48,729 | 911,310 | ||||||||
| Brookfield Corp. | Diversified Financial Services | 12/12/22 | 24,654 | 775,122 | ||||||||
| Canadian National Railway Co. | Transportation | 05/14/19 | 58,386 | 6,913,711 | ||||||||
| CMS Energy Corp. | Utilities | 11/01/19 | 68,163 | 4,316,763 | ||||||||
| Crown Castle International Corp. | Communication | 02/16/16 | 31,741 | 4,306,619 | ||||||||
| Enbridge, Inc. | Utilities | 02/16/16 | 55,486 | 2,165,816 | ||||||||
| Equinix Inc. | Diversified Financial Services | 07/31/20 | 5,388 | 3,528,871 | ||||||||
| Fifth Street Finance Corp. | Diversified Financial Services | 04/07/21 | 356,943 | 2,452,198 | ||||||||
| Fortis Inc. | Utilities | 12/18/17 | 99,204 | 3,960,109 | ||||||||
| Golub Capital BDC Inc. | Diversified Financial Services | 02/24/22 | 142,000 | 1,867,300 | ||||||||
| HarbourVest Global Private Equity | Diversified Financial Services | 12/21/18 | 82,676 | 2,232,346 | ||||||||
| KKR & Co., Inc. | Diversified Financial Services | 02/16/16 | 71,534 | 3,319,893 | ||||||||
| Onex Corporation | Diversified Financial Services | 02/16/16 | 17,576 | 845,152 | ||||||||
| Republic Services Inc. | Commercial & Professional Services | 08/28/17 | 46,358 | 5,979,255 | ||||||||
| TC Energy Corp. | Utilities | 11/01/19 | 45,416 | 1,805,918 | ||||||||
| TransDigm Group, Inc. | Industrials | 12/01/22 | 6,746 | 4,245,730 | ||||||||
| Union Pacific Corp. | Transportation | 06/29/16 | 17,379 | 3,597,974 | ||||||||
| Waste Management Inc. | Utilities | 07/02/20 | 26,716 | 4,191,206 | ||||||||
| Total North America (0.69%) | 87,074,510 | |||||||||||
| Western Europe (0.53%) | ||||||||||||
| 3i Group Plc | Diversified Financial Services | 10/01/20 | 175,294 | 2,826,178 | ||||||||
| Aena SA | Transportation | 12/21/18 | 41,641 | 5,210,474 | ||||||||
| Apax Global Alpha Ltd. | Diversified Financial Services | 01/19/21 | 485,904 | 1,094,012 | ||||||||
| BBGI SICAV S.A. | Diversified Financial Services | 03/21/19 | 2,696,279 | 5,078,346 | ||||||||
| Cellnex Telecom SA | Communication | 05/15/19 | 179,250 | 5,912,303 | ||||||||
| Elia System Operator SA/NV | Utilities | 11/03/22 | 18,839 | 2,668,787 | ||||||||
| EQT AB | Diversified Financial Services | 04/06/20 | 40,418 | 856,432 | ||||||||
| Gimv N.V. | Diversified Financial Services | 02/12/16 | 31,933 | 1,498,823 | ||||||||
| HBM Healthcare Investments AG | Diversified Financial Services | 04/07/20 | 4,834 | 1,049,961 | ||||||||
| HgCapital Trust PLC | Diversified Financial Services | 02/12/16 | 1,520,977 | 6,366,014 | ||||||||
| HICL Infrastructure Co Ltd. | Diversified Financial Services | 03/30/16 | 2,076,718 | 4,046,301 | ||||||||
| ICG Graphite Enterprise Trust PLC | Diversified Financial Services | 02/12/16 | 119,861 | 1,692,434 | ||||||||
| Intermediate Capital Group PLC | Diversified Financial Services | 12/12/16 | 98,453 | 1,359,366 | ||||||||
| Investment AB Kinnevik | Diversified Financial Services | 04/06/20 | 145,117 | 1,997,525 | ||||||||
| Investor AB | Diversified Financial Services | 08/28/17 | 160,160 | 2,894,390 | ||||||||
| National Grid PLC | Utilities | 02/12/16 | 378,176 | 4,536,584 | ||||||||
| NB Private Equity Partners Ltd. | Diversified Financial Services | 11/06/19 | 137,871 | 2,644,839 | ||||||||
| Orsted AS | Utilities | 06/15/21 | 8,156 | 739,088 | ||||||||
| Pantheon International Participations Plc | Diversified Financial Services | 11/04/19 | 480,330 | 1,502,031 | ||||||||
| Terna Rete Elettrica Nazionale SpA | Utilities | 01/05/18 | 774,420 | 5,685,246 | ||||||||
The accompanying notes are an integral part of these Consolidated Financial Statements.
Partners Group Private Equity (Master Fund), LLC (a Delaware Limited Liability Company) |
Consolidated Schedule of Investments — December 31, 2022 (Unaudited) (continued) |
| Industry | Acquisition Date | Shares | Fair Value | |||||||||
| Public Investments (continued) | ||||||||||||
| Common Stocks (continued) | ||||||||||||
| Western Europe (continued) | ||||||||||||
| Vinci SA | Transportation | 02/12/16 | 83,197 | $ | 8,277,662 | |||||||
| Total Western Europe (0.53%) | 67,936,796 | |||||||||||
| Total Common Stocks (Cost $141,919,790)(1.22%) | $ | 155,011,306 | ||||||||||
Asset-Backed Securities (0.59%)
| Interest | Acquisition Date | Maturity Date | Investment Type | Principal | Fair Value** | |||||||||||
| North America (0.25%) | ||||||||||||||||
| ARES LI CLO Ltd. ***, + | 6.85% + L^^ | 07/26/21 | 07/15/34 | Series 2019-51A, Class ER | 500,000 | 455,956 | ||||||||||
| CIFC Funding 2021-VI Ltd. ***, + | 6.25% + L^^ | 09/22/21 | 10/15/34 | Series 2021-6A, Class E | 1,500,000 | 1,350,268 | ||||||||||
| CIFC Funding 2022-IV Ltd. **, + | 7.00% + SFvv | 04/20/22 | 07/16/35 | Series 2022-4A, Class E | 1,250,000 | 1,222,112 | ||||||||||
| CIFC Funding Ltd. ***, + | 7.27% + SFvv | 04/05/22 | 04/21/35 | Series 2022-3A, Class E | 1,000,000 | 946,095 | ||||||||||
| Dryden 95 CLO Ltd. ***, + | 6.15% + L^^ | 08/02/21 | 08/20/34 | Series 2021-95A, Class E | 1,500,000 | 1,292,162 | ||||||||||
| Madison Park Funding LX Ltd. + | 5.50% + SFvv | 11/28/22 | 10/25/35 | Series 2022-60A, Class D | 1,000,000 | 1,000,562 | ||||||||||
| Madison Park Funding LX Ltd. + | 8.95% + SFvv | 11/28/22 | 10/25/35 | Series 2022-60A, Class E | 1,250,000 | 1,213,442 | ||||||||||
| Magnetite CLO Ltd. ***, + | 6.20% + L^^ | 10/01/21 | 10/25/34 | Series 2021-30A, Class E | 1,625,000 | 1,487,158 | ||||||||||
| Magnetite XXIV Ltd. ***, + | 3.05% + SFvv | 02/04/22 | 04/15/35 | Series 2019-24A, Class DR | 2,600,000 | 2,427,488 | ||||||||||
| Magnetite XXIV Ltd. ***, + | 6.40% + SFvv | 02/04/22 | 04/15/35 | Series 2019-24A, Class ER | 4,000,000 | 3,640,521 | ||||||||||
| Magnetite XXVI Ltd. ***, + | 5.95% + L^^ | 08/02/21 | 07/25/34 | Series 2020-26A, Class ER | 1,000,000 | 911,096 | ||||||||||
| Neuberger Berman CLO XXI Ltd. ***, + | 3.30% + L^^ | 04/02/21 | 04/20/34 | Series 2016-21A, Class DR2 | 500,000 | 477,997 | ||||||||||
| Neuberger Berman CLO XXI Ltd. ***, + | 6.46% + L^^ | 04/02/21 | 04/20/34 | Series 2016-21A, Class ER2 | 1,000,000 | 899,395 | ||||||||||
| Neuberger Berman Loan Advisers CLO 45 Ltd. ***, + | 6.25% + L^^ | 10/07/21 | 10/14/35 | Series 2021-45A, Class E | 1,000,000 | 905,942 | ||||||||||
| Neuberger Berman Loan Advisers CLO 49 Ltd. ***, + | 7.00% + SFvv | 05/03/22 | 07/25/34 | Series 2022-49A, Class E | 1,440,000 | 1,334,428 | ||||||||||
| Ocean Trails CLO IX ***, + | 7.45% + L^^ | 09/22/21 | 10/15/34 | Series 2020-9A, Class ER | 3,500,000 | 3,238,222 | ||||||||||
| Ocean Trails CLO XII Ltd. ***, + | 8.11% + SFvv | 05/13/22 | 07/20/35 | Series 2022-12A, Class E | 1,000,000 | 940,155 | ||||||||||
| Southwick Park CLO LLC ***, + | 6.25% + L^^ | 11/16/21 | 07/20/32 | Series 2019-4A, Class ER | 1,800,000 | 1,585,578 | ||||||||||
| Symphony CLO XXV Ltd. ***, + | 3.60% + L^^ | 03/12/21 | 04/19/34 | Series 2021-25A, Class D | 1,000,000 | 916,783 | ||||||||||
| Symphony CLO XXV Ltd. ***, + | 6.50% + L^^ | 03/12/21 | 04/19/34 | Series 2021-25A, Class E | 1,750,000 | 1,575,664 | ||||||||||
| Symphony CLO XXXIII Ltd. ***, + | 7.10% + SFvv | 04/27/22 | 04/24/35 | Series 2022-33A, Class E | 1,250,000 | 1,167,033 | ||||||||||
The accompanying notes are an integral part of these Consolidated Financial Statements.
Partners Group Private Equity (Master Fund), LLC (a Delaware Limited Liability Company) |
Consolidated Schedule of Investments — December 31, 2022 (Unaudited) (continued) |
| Interest | Acquisition Date | Maturity Date | Investment Type | Principal | Fair Value** | |||||||||||
| Public Investments (continued) | ||||||||||||||||
| Asset-Backed Securities (continued) | ||||||||||||||||
| North America (continued) | ||||||||||||||||
| Tallman Park CLO Ltd. ***, + | 6.35% + L^^ | 04/09/21 | 04/20/34 | Series 2021-1A, Class E | 1,500,000 | $ | 1,384,856 | |||||||||
| Wellman Park CLO Ltd. ***, + | 6.25% + L^^ | 05/10/21 | 07/15/34 | Series 2021-1A, Class E | 1,000,000 | 916,687 | ||||||||||
| Total North America (0.25%) | 31,289,600 | |||||||||||||||
| Western Europe (0.34%) | ||||||||||||||||
| AGL CLO 23 Ltd. + | 5.93% + SFvv | 11/02/22 | 01/20/36 | Series 2022-23A, Class D | 2,000,000 | 1,979,845 | ||||||||||
| Aurium CLO IX DAC ***, + | 6.70% + E## | 02/23/22 | 10/28/34 | Series 9A, Class E | 1,750,000 | 1,587,314 | ||||||||||
| Aurium CLO V Designated Activity Co. ***, + | 3.50% + E## | 03/08/21 | 04/17/34 | Series 5A, Class DR | 1,000,000 | 944,404 | ||||||||||
| Aurium CLO V Designated Activity Co. ***, + | 6.16% + E## | 03/08/21 | 04/17/34 | Series 5A, Class ER | 1,500,000 | 1,360,973 | ||||||||||
| Aurium CLO VII DAC ***, + | 5.86% + E## | 02/04/22 | 05/15/34 | Series 7A, Class E | 1,521,243 | 1,335,079 | ||||||||||
| Avoca CLO XXV DAC ***, + | 6.14% + E## | 10/20/21 | 10/15/34 | Series 25A, Class E | 1,600,000 | 1,435,736 | ||||||||||
| Avoca CLO XXVI DAC ***, + | 9.12% + E## | 02/23/22 | 04/15/35 | Series 26A, Class F | 1,200,000 | 1,020,588 | ||||||||||
| Avoca CLO XXVI DAC ***, + | 6.51% + E## | 02/23/22 | 04/15/35 | Series 26A, Class E | 750,000 | 671,062 | ||||||||||
| Blackrock European CLO IV DAC ***, + | 4.80% + E## | 04/26/22 | 07/15/30 | Series 4A, Class E | 1,502,600 | 1,353,527 | ||||||||||
| Blackrock European CLO VIII DAC ***, + | 3.30% + E## | 02/03/22 | 01/20/36 | Series 8A, Class DR | 1,000,000 | 938,328 | ||||||||||
| Blackrock European CLO VIII DAC ***, + | 6.26% + E## | 02/03/22 | 01/20/36 | Series 8A, Class ER | 2,500,000 | 2,251,170 | ||||||||||
| Blackrock European CLO XI DAC + | 3.00% + E## | 10/27/22 | 07/17/34 | Series 11A, Class D | 1,002,067 | 931,486 | ||||||||||
| Boyce Park CLO Ltd. ***, + | 6.25% + SFvv | 01/28/22 | 04/21/35 | Series 2022-1A, Class E | 2,625,000 | 2,317,390 | ||||||||||
| Boyce Park CLO Ltd. ***, + | 3.10% + SFvv | 01/28/22 | 04/21/35 | Series 2022-1A, Class D | 2,500,000 | 2,298,198 | ||||||||||
| Carlyle Euro CLO 2021-1 DAC ***, + | 6.12% + E## | 05/01/21 | 04/15/34 | Series 2021-1A, Class D | 333,000 | 301,433 | ||||||||||
| Carlyle Euro CLO 2021-2 DAC ***, + | 6.25% + E## | 09/27/21 | 10/15/35 | Series 2021-2A, Class D | 3,000,000 | 2,673,754 | ||||||||||
| Carlyle Global Market Strategies 2015-1 Ltd. ***, + | 0.00% | 01/20/22 | 01/16/33 | Series 2015-1A, Class SUB | 3,000,000 | 1,192,081 | ||||||||||
| Carlyle Global Market Strategies 2015-1 Ltd. ***, + | 5.50% + E## | 01/20/22 | 01/16/33 | Series 2015-1A, Class DR | 1,502,063 | 1,354,144 | ||||||||||
| Carysfort Park CLO ***, + | 6.14% + E## | 03/12/21 | 07/28/34 | Series 2021-1A, Class D | 500,000 | 453,117 | ||||||||||
| CVC Cordatus Loan Fund + | 6.16% + E## | 11/07/22 | 01/15/37 | Series 26A, Class D1 | 1,100,000 | 1,120,271 | ||||||||||
| CVC Cordatus Loan Fund + | 7.73% + E## | 11/07/22 | 01/15/37 | Series 26A, Class D2 | 400,000 | 409,472 | ||||||||||
| Edmondstown Park CLO DAC + | 6.19% + E## | 11/18/22 | 07/21/35 | Series 1A, Class D | 1,100,000 | 994,474 | ||||||||||
| Edmondstown Park CLO DAC + | 6.77% + E## | 11/18/22 | 07/21/35 | Series 1A, Class E | 1,250,000 | 1,272,980 | ||||||||||
| Elm Park CLO ***, + | 6.16% + E## | 03/26/21 | 04/15/34 | Series 1A, Class DRR | 666,000 | 602,578 | ||||||||||
| Elm Park CLO ***, + | 3.50% + E## | 03/26/21 | 04/15/34 | Series 1A, Class CRR | 1,000,000 | 958,893 | ||||||||||
| Madison Park EUR Funding XVI DAC ***, + | 6.02% + E## | 04/15/21 | 05/25/34 | Series 16A, Class E | 1,406,000 | 1,247,431 | ||||||||||
| Octagon 58 Ltd. ***, + | 7.20% + SFvv | 04/21/22 | 07/15/37 | Series 2022-1A, Class E | 2,140,000 | 2,108,742 | ||||||||||
| Otranto Park CLO ***, + | 7.05% + E## | 03/04/22 | 05/15/35 | Series 1A, Class E | 1,172,000 | 1,075,667 | ||||||||||
| Otranto Park CLO ***, + | 4.15% + E## | 03/04/22 | 05/15/35 | Series 1A, Class D | 750,000 | 733,012 | ||||||||||
| Palmer Square European Loan Funding 2021-1 DAC ***, + | 5.95% + E## | 08/02/21 | 04/15/31 | Series 2021-1A, Class E | 714,000 | 672,217 | ||||||||||
The accompanying notes are an integral part of these Consolidated Financial Statements.
Partners Group Private Equity (Master Fund), LLC (a Delaware Limited Liability Company) |
Consolidated Schedule of Investments — December 31, 2022 (Unaudited) (continued) |
| Interest | Acquisition Date | Maturity Date | Investment Type | Principal | Fair Value** | |||||||||||
| Public Investments (continued) | ||||||||||||||||
| Asset-Backed Securities (continued) | ||||||||||||||||
| Western Europe (continued) | ||||||||||||||||
| Palmer Square European Loan Funding 2021-2 DAC ***, + | 8.05% + E## | 10/15/21 | 07/15/31 | Series 2021-2A, Class F | 375,000 | $ | 333,120 | |||||||||
| Palmer Square European Loan Funding 2021-2 DAC ***, + | 5.90% + E## | 10/15/21 | 07/15/31 | Series 2021-2A, Class E | 625,000 | 582,185 | ||||||||||
| Palmer Square European Loan Funding 2022-1 DAC ***, + | 5.90% + E## | 02/03/22 | 10/15/31 | Series 2022-1A, Class E | 667,000 | 617,675 | ||||||||||
| Palmer Square European Loan Funding 2022-1 DAC ***, + | 8.05% + E## | 02/03/22 | 10/15/31 | Series 2022-1A, Class F | 500,000 | 441,923 | ||||||||||
| Palmer Square European Loan Funding 2022-1 DAC ***, + | 7.37% + E## | 03/17/22 | 10/15/31 | Series 2022-2A, Class E | 1,500,000 | 1,449,639 | ||||||||||
| Valley Stream Park CLO Ltd. + | 5.71% + SFvv | 11/01/22 | 10/20/34 | Series 2022-1A, Class D | 1,500,000 | 1,503,587 | ||||||||||
| Vesey Park CLO DAC ***, + | 7.16% + E## | 05/09/22 | 11/16/32 | Series 1A, Class D | 1,017,104 | 935,855 | ||||||||||
| Voya Euro CLO V DAC ***, + | 5.81% + E## | 08/06/21 | 04/15/35 | Series 5A, Class E | 417,000 | 371,068 | ||||||||||
| Total Western Europe (0.34%) | 43,830,418 | |||||||||||||||
| Total Asset-Backed Securities (Cost $84,827,463)(0.59%) | $ | 75,120,018 |
Private Equity Investments (95.86%)
Direct Investments * (69.19%)
Direct Equity (60.28%)
| Investment Type | Acquisition Date | Shares | Fair Value** | |||||||||
| Asia - Pacific (6.09%) | ||||||||||||
| AAVAS Financiers Limited +, a, e | Common equity | 03/28/18 | 3,891,752 | $ | 78,524,909 | |||||||
| Argan Mauritius Limited +, a, e | Common equity | 05/09/16 | 106,215 | 20,501,736 | ||||||||
| KKR Pebble Co-Invest L.P. +, a, c, e | Limited partnership interest | 05/13/21 | — | 20,725,032 | ||||||||
| Kowloon Co-Investment, L.P. +, a, c | Limited partnership interest | 11/04/15 | — | 6,988,110 | ||||||||
| Murra Warra Asset Hold Trust +, a, b, e | Common equity | 09/10/18 | 13,186,543 | 22,565,584 | ||||||||
| Murra Warra II Asset Hold Trust +, a, b, e | Common equity | 07/30/20 | 18,628,227 | 16,164,243 | ||||||||
| Murra Warra II Project Hold Trust +, a, b, e | Common equity | 07/30/20 | 10 | 4,041,061 | ||||||||
| Murra Warra Project Hold Trust +, a, b, e | Common equity | 09/10/18 | 429,366 | 5,641,395 | ||||||||
| Partners Terra Pte. Ltd. +, a, b, e | Common equity | 05/14/21 | 4,372,335 | 4,808,344 | ||||||||
| PG Esmeralda Pte. Ltd. +, a, b, e | Common equity | 03/03/21 | 5,433,284 | 5,463,462 | ||||||||
| PG Esmeralda Pte. Ltd. +, a, b, e | Preferred equity | 03/03/21 | 488,996 | 49,171,211 | ||||||||
| PG Esmeralda Pte. Ltd. +, a, b, e | Preferred equity | 09/26/22 | 63,417 | 7,944,117 | ||||||||
| PG Loa Pte. Ltd. +, a | Common equity | 04/25/22 | 1,209,388 | 1,204,637 | ||||||||
| PG Loa Pte. Ltd. +, a | Preferred equity | 04/25/22 | 22,978,363 | 22,888,103 | ||||||||
| Sunsure Energy Private Limited +, a, b, c, e | Member interest | 12/27/22 | — | 7,228,256 | ||||||||
| Sunsure Energy Private Limited +, a, b, e | Common equity | 12/27/22 | 481,884 | 481,884 | ||||||||
| Sunsure Energy Private Limited +, a, b, e | Preferred equity | 12/27/22 | 1,927,535 | 1,927,535 | ||||||||
| Touchstone Co-Investment, L.P. +, a, c | Limited partnership interest | 06/24/19 | — | 1,082,457 | ||||||||
| Touchstone Co-Investment, L.P. +, a, c, e | Limited partnership interest | 12/18/18 | — | 1,880,612 | ||||||||
| TPG Upswing Co-Invest, L.P. +, a, c | Limited partnership interest | 01/10/19 | — | 32,325,236 | ||||||||
| Zenith Longitude Limited +, a, b, e | Common equity | 08/13/21 | 26,838,037 | 461,686,241 | ||||||||
| Total Asia - Pacific (6.09%) | 773,244,165 | |||||||||||
| North America (29.86%) | ||||||||||||
| Alliant Insurance Services, Inc. +, a, c | Limited partnership interest | 12/01/21 | — | $ | 27,493,770 | |||||||
| AP VIII Prime Security Services Holdings, L.P. +, a, c, e | Limited partnership interest | 05/02/16 | — | 11,715,794 | ||||||||
| Astorg VII Co-Invest ERT +, a, c | Limited partnership interest | 04/28/21 | — | 62,930,191 | ||||||||
The accompanying notes are an integral part of these Consolidated Financial Statements.
Partners Group Private Equity (Master Fund), LLC (a Delaware Limited Liability Company) |
Consolidated Schedule of Investments — December 31, 2022 (Unaudited) (continued) |
| Investment Type | Acquisition Date | Shares | Fair Value** | |||||||||
| Private Equity Investments (continued) | ||||||||||||
| Direct Investments * (continued) | ||||||||||||
| Direct Equity (continued) | ||||||||||||
| BCPE Hercules Holdings, L.P. +, a, c | Limited partnership interest | 07/30/18 | — | $ | 42,722,680 | |||||||
| BI Gen Holdings, Inc. +, a | Common equity | 01/01/21 | 14,561 | 310,820 | ||||||||
| Burger Bossco Holdings, Inc. +, a | Preferred equity | 12/31/20 | 300 | 1 | ||||||||
| Burger Bossco Holdings, Inc. +, a | Common equity | 01/01/21 | 145 | 3 | ||||||||
| CapitalSpring Finance Company, LLC +, a | Common equity | 03/01/17 | 3,020,546 | 2,637,691 | ||||||||
| CB Poly Holdings, LLC +, a, e | Preferred equity | 08/16/16 | 171,270 | 55,776,809 | ||||||||
| CB Titan MidCo Holdings, Inc. +, a | Common equity | 01/01/21 | 56,634 | 35,047 | ||||||||
| CBI Parent, L.P. +, a, b | Common equity | 01/06/21 | 1,145,918 | 54,086,860 | ||||||||
| CBI Parent, L.P. +, a, b, c | Member interest | 10/17/22 | — | 5,696,339 | ||||||||
| CD&R Mercury Co-Investor, L.P. +, a, c, e | Limited partnership interest | 10/14/20 | — | 232,982,586 | ||||||||
| Confluent Health, LLC +, a, b, e | Common equity | 06/24/19 | 27,246 | 60,649,378 | ||||||||
| ConvergeOne Investment L.P. +, a | Common equity | 07/03/19 | 3,120 | 961,416 | ||||||||
| Cowboy Topco, Inc. +, a | Common equity | 05/18/22 | 1,348,750 | 1,351,802 | ||||||||
| Cure Holdings, LLC +, a | Common equity | 05/13/21 | 238,834 | 1,245,356 | ||||||||
| Cure Holdings, LLC +, a, e | Common equity | 05/13/21 | 2,723 | 12,850 | ||||||||
| Dermatology Holdings, L.P. +, a, b, c, e | Limited partnership interest | 04/01/22 | — | 129,772,872 | ||||||||
| DIF VI Co-Invest Project 2C C.V. +, a, c, e | Limited partnership interest | 03/15/22 | — | 53,375,413 | ||||||||
| ECP Parent, LLC +, a, b | Common equity | 11/15/21 | 105,520,023 | 159,938,706 | ||||||||
| EdgeCore Holdings, L.P. +, a, b, c, e | Limited partnership interest | 11/10/22 | — | 39,083,333 | ||||||||
| Encore Holdings LP +, a, b, c, e | Limited partnership interest | 07/01/22 | — | 53,700,167 | ||||||||
| EnfraGen LLC +, a, b, e | Common equity | 09/17/19 | 37,786 | 58,566,804 | ||||||||
| EQT Infrastructure IV Co-Investment (B) SCSp +, a, c | Limited partnership interest | 03/09/20 | — | 125,239,476 | ||||||||
| EQT IX Co-Investment (F) SCSp +, a, c, e | Limited partnership interest | 11/15/21 | — | 120,833,852 | ||||||||
| EQT VIII Co-Investment (C) SCSp +, a, c, e | Limited partnership interest | 01/25/19 | — | 141,798,564 | ||||||||
| EXW Coinvest L.P. +, a, c | Limited partnership interest | 06/17/16 | — | 19,664,690 | ||||||||
| FRP Investors II, L.P. +, a, c, e | Limited partnership interest | 09/16/22 | — | 47,765,155 | ||||||||
| Halo Parent Newco, LLC +, a | Preferred equity | 02/22/22 | 1,109 | 17,512,827 | ||||||||
| Icebox Holdco I Inc. +, a, b, c | Member interest | 03/01/22 | — | 63,404,199 | ||||||||
| Icebox Parent L.P. +, a, b, c | Limited partnership interest | 12/22/21 | — | 121,264,229 | ||||||||
| Idera Parent L.P. +, a, b, c, e | Limited partnership interest | 03/02/21 | — | 217,751,687 | ||||||||
| KDOR Merger Sub Inc. +, a | Common equity | 05/11/18 | 481 | 1 | ||||||||
| KENE Holdings, L.P. +, a, c | Limited partnership interest | 08/08/19 | — | 382,717 | ||||||||
| KKR Cavalry Co-Invest Blocker Parent L.P. +, a, c, e | Limited partnership interest | 03/24/22 | — | 48,310,306 | ||||||||
| KKR Enterprise Co-Invest AIV A L.P. +, a, c, e | Limited partnership interest | 07/31/20 | — | 880,074 | ||||||||
| KKR Enterprise Co-Invest L.P. +, a, e | Common equity | 10/09/18 | 9,684 | — | ||||||||
| KPOCH Holdings, L.P. +, a, b, c | Limited partnership interest | 11/10/22 | — | 187,525,500 | ||||||||
| KPSKY Holdings L.P. +, a, b, c | Limited partnership interest | 10/19/21 | — | 56,625,575 | ||||||||
| KSLB Holdings, LLC +, a | Common equity | 07/30/18 | 252,000 | 1 | ||||||||
| LTF Holdings, Inc. +, a, e | Common equity | 01/06/20 | 3,464,630 | 41,367,674 | ||||||||
| Matterhorn Topco, L.P. +, a | Common equity | 05/19/21 | 88,040 | 10,789,144 | ||||||||
| MHS Acquisition Holdings, LLC +, a, b | Common equity | 03/10/17 | 356 | 665,436 | ||||||||
| MHS Acquisition Holdings, LLC +, a, b | Preferred equity | 03/10/17 | 35,285 | 361,443 | ||||||||
| MHS Blocker Purchaser L.P. +, a, b, c | Limited partnership interest | 03/10/17 | — | 79,397,525 | ||||||||
| Milestone Investment Holdings, LLC +, a, e | Common equity | 09/23/21 | 22,293,150 | 28,665,050 | ||||||||
| Multiplan Corp. +, a | Common equity | 06/07/16 | 1,438,764 | 1,640,191 | ||||||||
| NC Ocala Co-Invest Alpha, L.P. +, a, c | Limited partnership interest | 11/24/21 | — | 70,279,695 | ||||||||
| NDES Holdings, LLC +, a | Preferred equity | 09/19/11 | 500,000 | 2,793,364 | ||||||||
| OHCP IV SF COI, L.P. +, a, b, c, e | Limited partnership interest | 01/31/18 | — | 48,994,986 | ||||||||
| OMNIA Coinvest L.P. +, a, c, e | Limited partnership interest | 10/23/20 | — | 19,244,978 | ||||||||
| Onex Fox, L.P. +, a, c, e | Limited partnership interest | 04/25/19 | — | 67,055,402 | ||||||||
| Orion Opportunity L.P. +, a, c, e | Limited partnership interest | 09/01/21 | — | 39,178,461 | ||||||||
| Patriot SPV, L.P. +, a, c | Limited partnership interest | 03/18/21 | — | 54,055,774 | ||||||||
| PG BRPC Investment, LLC +, a, b, e | Common equity | 08/01/19 | 32,079 | 80,671,697 | ||||||||
The accompanying notes are an integral part of these Consolidated Financial Statements.
Partners Group Private Equity (Master Fund), LLC (a Delaware Limited Liability Company) |
Consolidated Schedule of Investments — December 31, 2022 (Unaudited) (continued) |
| Investment Type | Acquisition Date | Shares | Fair Value** | |||||||||
| Private Equity Investments (continued) | ||||||||||||
| Direct Investments * (continued) | ||||||||||||
| Direct Equity (continued) | ||||||||||||
| PG Delta HoldCo, LLC +, a, b, e | Common equity | 06/24/21 | 30,481 | $ | 53,749,318 | |||||||
| Raptor Holding Parent, L.P. +, a | Common equity | 04/01/22 | 11,209 | 1,331,333 | ||||||||
| Real Hero Topco, L.P. +, a, c | Limited partnership interest | 04/01/21 | — | 12,328,729 | ||||||||
| Safari Co-Investment L.P. +, a, c, e | Limited partnership interest | 03/14/18 | — | 10,698,364 | ||||||||
| SC Landco Parent, LLC +, a | Common equity | 11/28/16 | 2,672 | 485,957 | ||||||||
| SC Landco Parent, LLC +, a | Preferred equity | 04/21/17 | — | 1 | ||||||||
| Shermco Intermediate Holdings, Inc. +, a, e | Common equity | 06/05/18 | 11,525 | 1,426,597 | ||||||||
| Shingle Coinvest L.P. +, a, c, e | Limited partnership interest | 05/29/18 | — | 198,478,199 | ||||||||
| SIH RP HoldCo L.P. +, a, e | Common equity | 09/10/19 | 5,995,126 | 62,362,382 | ||||||||
| SLP West Holdings Co-Invest Feeder II, L.P. +, a, c | Limited partnership interest | 08/18/17 | — | 27,114,575 | ||||||||
| SnackTime PG Holdings, Inc. +, a, b, e | Common equity | 05/23/18 | 12 | 27,381,828 | ||||||||
| SnackTime PG Holdings, Inc. +, a, b, c, e | Member interest | 05/23/18 | — | 20,308,707 | ||||||||
| Specialty Pharma Holdings LP +, a, b, c | Limited partnership interest | 04/01/21 | — | 95,248,074 | ||||||||
| Starfish Intermediate, Inc. +, a | Preferred equity | 06/06/22 | 7,136,374 | 189,606,936 | ||||||||
| Stonepeak Tiger (Co-Invest) Holdings (I-B) L.P. +, a, c, e | Limited partnership interest | 08/17/21 | — | 32,124,671 | ||||||||
| SureWerx Topco, L.P. +, a, b, c, e | Limited partnership interest | 12/28/22 | — | 51,287,146 | ||||||||
| T-VIII Mercury Co-Invest L.P. +, a, c, e | Limited partnership interest | 07/29/21 | — | 5,321,193 | ||||||||
| Thermostat Purchaser, L.P. +, a, b, c | Limited partnership interest | 08/31/21 | — | 73,537,364 | ||||||||
| TKC Topco LLC +, a | Common equity | 10/14/16 | 4,632,829 | 201,926 | ||||||||
| VEEF II Co-Invest 2-A, L.P. +, a, c | Limited partnership interest | 03/15/22 | — | 4,259,445 | ||||||||
| Velocity Holdings US LP +, a, c, e | Limited partnership interest | 08/31/22 | — | 22,813,600 | ||||||||
| VEPF VII Co-Invest 2-A, L.P. +, a, c, e | Limited partnership interest | 04/06/21 | — | 91,768,907 | ||||||||
| WHCG Purchaser, L.P. +, a, b, c | Limited partnership interest | 06/22/21 | — | 34,216,837 | ||||||||
| Woof Parent L.P. +, a | Common equity | 12/21/20 | 1,441 | 2,826,216 | ||||||||
| Total North America (29.86%) | 3,788,044,666 | |||||||||||
| Rest of World (1.74%) | ||||||||||||
| Carlyle Retail Turkey Partners, L.P. +, a, c | Limited partnership interest | 07/11/13 | — | $ | 5,726,315 | |||||||
| Zabka Polska SA +, a | Preferred equity | 09/25/19 | — | 98,617 | ||||||||
| Zabka Polska SA +, a | Common equity | 09/25/19 | 2,551,723 | 211,830,393 | ||||||||
| Zabka Polska SA +, a, e | Preferred equity | 09/25/19 | 120,777,003 | 3,077,915 | ||||||||
| Total Rest of World (1.74%) | 220,733,240 | |||||||||||
| South America (0.03%) | ||||||||||||
| Centauro Co-Investment Fund, L.P. +, a, c | Limited partnership interest | 11/28/13 | — | $ | 3,382,536 | |||||||
| Total South America (0.03%) | 3,382,536 | |||||||||||
| Western Europe (22.56%) | ||||||||||||
| Ark EquityCo SAS +, a, c, e | Limited partnership interest | 02/21/22 | — | $ | 12,442,597 | |||||||
| Aston Lux Acquisitions S.à.r.l. +, a, c | Limited partnership interest | 11/28/19 | — | 3,466,646 | ||||||||
| Aston Lux Acquisitions S.à.r.l. +, a | Common equity | 01/11/21 | 218,625 | 236,195 | ||||||||
| Astorg VIII Co-Invest Open Health +, a, c, e | Limited partnership interest | 08/04/22 | — | 22,842,616 | ||||||||
| Bock Capital JVCo Nature S.à.r.l. +, a, b | Common equity | 07/01/21 | 12,590,000,000 | 118,426,918 | ||||||||
| Camelia Investment 1 Limited +, a, b | Preferred equity | 10/12/17 | 6,768,617,529 | 134,007,148 | ||||||||
| Camelia Investment 1 Limited +, a, b | Common equity | 10/12/17 | 86,516 | 33,154,278 | ||||||||
| Capri Acquisitions Topco Limited +, a | Common equity | 11/01/17 | 8,345,985 | 69,605,540 | ||||||||
| CD&R Market Co-Investor, L.P. +, a, c, e | Limited partnership interest | 11/10/21 | — | 52,519,372 | ||||||||
| Ciddan S.à.r.l. +, a | Preferred equity | 09/15/17 | 23,249,522 | 27,544,534 | ||||||||
| Ciddan S.à.r.l. +, a | Common equity | 09/15/17 | 12,263,242 | 72,034,491 | ||||||||
| Climeworks AG +, a | Common equity | 04/25/22 | 63,085 | 480,620 | ||||||||
| Climeworks AG +, a, e | Preferred equity | 04/25/22 | 7,823,400 | 62,744,089 | ||||||||
| EQT Jaguar Co-Investment SCSp +, a, b, c, e | Limited partnership interest | 11/30/18 | — | 117,128,296 | ||||||||
| EQT VIII Co-Investment (D) SCSp +, a, c, e | Limited partnership interest | 10/01/19 | — | 194,567,629 | ||||||||
| Fides S.p.A +, a | Common equity | 12/15/16 | 78,505 | 495,501 | ||||||||
The accompanying notes are an integral part of these Consolidated Financial Statements.
Partners Group Private Equity (Master Fund), LLC (a Delaware Limited Liability Company) |
Consolidated Schedule of Investments — December 31, 2022 (Unaudited) (continued) |
| Investment Type | Acquisition Date | Shares | Fair Value** | |||||||||
| Private Equity Investments (continued) | ||||||||||||
| Direct Investments * (continued) | ||||||||||||
| Direct Equity (continued) | ||||||||||||
| Global Blue Group Holding AG +, a | Common equity | 09/11/20 | 97,250 | $ | 444,691 | |||||||
| Global Blue Holding L.P. +, a, c | Limited partnership interest | 07/31/12 | — | 8,691,378 | ||||||||
| Green DC LuxCo S.à.r.l. +, a, b, c, e | Member interest | 01/20/22 | — | 9,208,766 | ||||||||
| Green DC LuxCo S.à.r.l. +, a, b | Common equity | 01/20/22 | 19,595,288 | 51,712,927 | ||||||||
| KKR Matterhorn Co-Invest L.P. +, a, c | Limited partnership interest | 11/02/12 | — | 731,626 | ||||||||
| KKR Pegasus Co-Invest L.P. +, a, c | Limited partnership interest | 07/07/22 | — | 12,426,513 | ||||||||
| KKR Sprint Co-Invest L.P. +, a, c | Limited partnership interest | 09/29/22 | — | 42,843,749 | ||||||||
| KKR Traviata Co-invest L.P. +, a, c | Limited partnership interest | 12/18/19 | — | 123,865,729 | ||||||||
| Luxembourg Investment Company 261 S.à.r.l. +, a | Common equity | 07/31/18 | 1,480 | 54,553,253 | ||||||||
| Luxembourg Investment Company 261 S.à.r.l. +, a, c | Member interest | 07/31/18 | — | 57,636,866 | ||||||||
| Luxembourg Investment Company 285 S.à.r.l. +, a, b | Preferred equity | 08/22/19 | 7,865,820 | 22,721,360 | ||||||||
| Luxembourg Investment Company 285 S.à.r.l. +, a, b, c | Member interest | 08/22/19 | — | 20,026,497 | ||||||||
| Luxembourg Investment Company 285 S.à.r.l. +, a, b | Common equity | 08/22/19 | 6,999,953 | 6,498,551 | ||||||||
| Luxembourg Investment Company 293 S.à.r.l. +, a, b, e | Common equity | 06/26/19 | 9,789,622 | 32,933,279 | ||||||||
| Luxembourg Investment Company 293 S.à.r.l. +, a, b, c, e | Member interest | 06/26/19 | — | 5,604,062 | ||||||||
| Luxembourg Investment Company 314 S.à.r.l. +, a, b | Common equity | 08/22/19 | 192,000 | 1 | ||||||||
| Luxembourg Investment Company 414 S.à.r.l. +, a, b, c, e | Member interest | 07/02/21 | — | 50,692,980 | ||||||||
| Luxembourg Investment Company 414 S.à.r.l. +, a, b, e | Common equity | 07/02/21 | 12,111,360 | 33,104,200 | ||||||||
| Luxembourg Investment Company 430 S.à.r.l. +, a, b, c, e | Member interest | 05/10/21 | — | 69,886,770 | ||||||||
| Luxembourg Investment Company 430 S.à.r.l. +, a, b, e | Common equity | 05/10/21 | 52,594,635 | 14,808,813 | ||||||||
| Magnesium Co-Invest SCSp +, a, c, e | Limited partnership interest | 05/19/22 | — | 85,200,530 | ||||||||
| Mauritius (Luxemburg) Investments S.à.r.l. +, a | Common equity | 10/19/21 | 11,698 | 1 | ||||||||
| May Co-Investment S.C.A. +, a, b | Common equity | 11/09/20 | 1,059,375 | 51,222,217 | ||||||||
| Montagu LuxCo +, a | Common equity | 02/22/22 | 450,000 | 52,346,671 | ||||||||
| Nerve Co-Invest SCSp +, a, c, e | Limited partnership interest | 01/27/21 | — | 35,681,635 | ||||||||
| Oakley Capital V Co-Investment (A) SCSp +, a, c, e | Limited partnership interest | 12/12/22 | — | 42,703,756 | ||||||||
| Orbiter Investments S.à.r.l. +, a, e | Common equity | 12/17/21 | 5,977,270 | 173,247,519 | ||||||||
| OT Luxco 3 & Cy S.C.A. +, a | Warrants | 12/01/17 | — | 1,365,723 | ||||||||
| PG Investment Company 1 S.à.r.l. +, a, b, c | Member interest | 10/28/21 | — | 89,859,331 | ||||||||
| PG Investment Company 1 S.à.r.l. +, a, b, e | Common equity | 10/28/21 | 12,822,040 | 7,741,056 | ||||||||
| PG Investment Company 18 S.à.r.l. +, a, b, e | Preferred equity | 07/07/22 | 113,856,528 | 121,474,730 | ||||||||
| PG Investment Company 18 S.à.r.l. +, a, b, e | Common equity | 07/07/22 | 12,650,106 | 1 | ||||||||
| PG Investment Company 24 S.à.r.l. +, a, b, e | Common equity | 07/13/22 | 930,286 | 316 | ||||||||
| PG Investment Company 24 S.à.r.l. +, a, b, e | Preferred equity | 07/13/22 | 101,367,616 | 109,674,955 | ||||||||
| PG Lion Management Warehouse S.C.S +, a, b, c | Limited partnership interest | 08/22/19 | — | 857,302 | ||||||||
| PG TLP S.à.r.l. +, a, b, c, e | Member interest | 04/14/21 | — | 15,302,374 | ||||||||
| PG TLP S.à.r.l. +, a, b, e | Common equity | 04/14/21 | 6,377,426 | 81,987,545 | ||||||||
| PG Wave Limited +, a, b, e | Common equity | 02/03/22 | 53,215,581 | 70,655,218 | ||||||||
| Pharmathen GP S.à.r.l. +, a, b | Common equity | 01/20/22 | 110,300 | 1 | ||||||||
| Pharmathen Topco S.à.r.l. +, a, b | Preferred equity | 01/20/22 | 98,858,068 | 105,917,364 | ||||||||
| Pharmathen Topco S.à.r.l. +, a, b | Common equity | 01/20/22 | 79,910 | 1 | ||||||||
| Polyusus Lux XVI S.à.r.l. +, a, b, e | Common equity | 05/23/18 | 44,442,345 | — | ||||||||
| Polyusus Lux XVI S.à.r.l. +, a, b, e | Preferred equity | 05/23/18 | 244,659,996 | 4,249,133 | ||||||||
| Polyusus Lux XVI S.à.r.l. +, a, b, c, e | Member interest | 10/03/22 | — | 1,186,844 | ||||||||
| Polyusus Lux XXIII S.à.r.l. +, a, e | Preferred equity | 04/11/22 | 1,155,552 | 64,151 | ||||||||
| Polyusus Lux XXIII S.à.r.l. +, a, e | Preferred equity | 08/19/21 | 13,114,964 | 201,994 | ||||||||
| Polyusus Lux XXIII S.à.r.l. +, a, e | Common equity | 08/19/21 | 4,383,568 | 3 | ||||||||
| Refresco 2 Co-Invest SCSp +, a, c | Limited partnership interest | 07/12/22 | — | 35,512,035 | ||||||||
| Root JVCo S.à.r.l. +, a, b, c | Member interest | 09/29/20 | — | 37,433,052 | ||||||||
| Root JVCo S.à.r.l. +, a, b | Common equity | 09/29/20 | 1,969,352 | 19,581,370 | ||||||||
| Root JVCo S.à.r.l. +, a, b | Preferred equity | 09/29/20 | 6,731,408 | 30,445,931 | ||||||||
| S.TOUS, S.L +, a | Common equity | 10/06/15 | 622 | 18,740,581 | ||||||||
| Stark Perseus Investment +, a | Common equity | 02/26/21 | 963,052 | 2,071,406 | ||||||||
The accompanying notes are an integral part of these Consolidated Financial Statements.
Partners Group Private Equity (Master Fund), LLC (a Delaware Limited Liability Company) |
Consolidated Schedule of Investments — December 31, 2022 (Unaudited) (continued) |
| Investment Type | Acquisition Date | Shares | Fair Value** | |||||||||
| Private Equity Investments (continued) | ||||||||||||
| Direct Investments * (continued) | ||||||||||||
| Direct Equity (continued) | ||||||||||||
| Stark Perseus Topco +, a, c, e | Member interest | 02/26/21 | — | $ | 12,390,353 | |||||||
| Stark Perseus Topco +, a, e | Common equity | 02/26/21 | 26,921,454 | 43,058,511 | ||||||||
| Surfaces SLP (SCSp) +, a, b, c | Limited partnership interest | 10/01/20 | — | 37,227,151 | ||||||||
| Veonet Co-Invest SCSp (Lux) +, a, c, e | Limited partnership interest | 03/09/22 | — | 35,320,317 | ||||||||
| Total Western Europe (22.56%) | 2,862,809,559 | |||||||||||
| Total Direct Equity (60.28%) | $ | 7,648,214,166 | ||||||||||
| Direct Debt (8.91%) | ||||||||||||
| Interest | Acquisition Date | Maturity Date | Investment Type | Principal | Fair Value** | |||||||||||
| Asia - Pacific (0.47%) | ||||||||||||||||
| BYJU's Alpha, Inc. +, a | Cash 5.50% + L (0.75% Floor)^^ | 01/19/22 | 11/24/26 | Senior | $ | 2,382,000 | $ | 1,920,904 | ||||||||
| FFML Holdco Limited +, a | Cash 6.25% + BBSY (0.75% Floor)†† | 11/30/22 | 11/30/28 | Senior | 12,373,591 | 12,193,156 | ||||||||||
| Fugue Finance B.V. +, a | Cash 3.25% + E## | 08/24/20 | 08/30/24 | Senior | 1,299,487 | 1,140,228 | ||||||||||
| Genesis Care Finance Pty Ltd. +, a | Cash 5.00% + L (1.00% Floor)^^ | 07/28/20 | 05/14/27 | Senior | 2,139,500 | 782,255 | ||||||||||
| Global Academic Group Limited +, a | Cash 6.00% + BBSY (0.50% Floor)†† | 07/26/22 | 07/26/27 | Senior | 12,728,400 | 12,821,245 | ||||||||||
| Global Academic Group Limited +, a | Cash 6.00% + BBSY (0.50% Floor)†† | 07/29/22 | 07/29/27 | Senior | 4,651,970 | 4,505,270 | ||||||||||
| Greencross Limited +, a | Cash 5.75% + L (0.75% Floor)^^ | 03/22/22 | 03/23/28 | Senior | 10,339,369 | 10,184,603 | ||||||||||
| ICON Cancer Care +, a | Cash 7.25% + BBSY (0.50% Floor)† | 04/12/22 | 03/29/30 | Second Lien | 10,284,819 | 8,890,751 | ||||||||||
| Snacking Investments BidCo Pty Limited +, a | Cash 4.00% + SF (1.00% Floor)v | 01/15/20 | 12/18/26 | Senior | 1,264,250 | 1,235,804 | ||||||||||
| Stiphout Finance, LLC +, a | Cash 3.00% + L (1.00% Floor)^ | 10/30/15 | 10/30/25 | Senior | 4,681,981 | 4,652,886 | ||||||||||
| Voyage Australia Pty Ltd +, a | Cash 3.50% + L (0.50% Floor)^^ | 07/23/21 | 06/18/28 | Senior | 1,678,500 | 1,598,771 | ||||||||||
| Total Asia - Pacific (0.47%) | 59,925,873 | |||||||||||||||
| North America (5.58%) | ||||||||||||||||
| 8th Avenue Food & Provisions, Inc. +, a | Cash 3.75% + L^ | 11/13/18 | 10/01/25 | Senior | $ | 1,440,000 | $ | 1,209,830 | ||||||||
| Acrisure LLC +, a | Cash 3.75% + L (0.50% Floor)^ | 08/18/21 | 02/13/27 | Senior | 2,172,500 | 2,069,306 | ||||||||||
| Acrisure LLC +, a | Cash 3.50% + L^ | 03/27/20 | 02/15/27 | Senior | 1,853,629 | 1,743,904 | ||||||||||
| Acrisure LLC +, a | Cash 4.25% + L (0.50% Floor)^ | 12/08/21 | 02/15/27 | Senior | 990,000 | 960,711 | ||||||||||
| ADMI Corp. +, a | Cash 3.75% + L (0.50% Floor)^ | 07/14/21 | 12/23/27 | Senior | 1,382,500 | 1,262,831 | ||||||||||
| Air Medical Group Holdings, Inc. +, a | Cash 4.75% + L (1.00% Floor)^ | 02/25/21 | 10/02/25 | Senior | 982,500 | 694,510 | ||||||||||
| AIT Buyer, LLC +, a | Cash 7.50% + L (0.75% Floor)^^ | 04/06/21 | 03/30/29 | Second Lien | 6,860,000 | 6,570,801 | ||||||||||
| AIT Worldwide Logistics, Inc. +, a | Cash 4.75% + L (0.75% Floor)^^ | 04/19/21 | 03/31/28 | Senior | 2,574,000 | 2,372,108 | ||||||||||
| Alliant Holdings Intermediate, LLC +, a | Cash 3.25% + L^ | 06/03/19 | 05/09/25 | Senior | 1,254,500 | 1,239,935 | ||||||||||
| Alliant Holdings Intermediate, LLC +, a | Cash 3.50% + L (0.50% Floor)^ | 12/08/21 | 11/05/27 | Senior | 1,580,000 | 1,546,425 | ||||||||||
| Amneal Pharmaceuticals, Inc. +, a | Cash 3.50% + L^^ | 06/03/22 | 05/04/25 | Senior | 2,976,491 | 2,676,446 | ||||||||||
| Apex Group Treasury Limited +, a | Cash 3.75% + L (0.50% Floor)^^ | 08/27/21 | 07/27/28 | Senior | 2,076,735 | 1,988,474 | ||||||||||
| Apex Tool Group +, a | Cash 5.25% + SF (0.50% Floor)v | 02/22/22 | 02/08/29 | Senior | 995,000 | 859,272 | ||||||||||
| Applovin Corporation +, a | Cash 3.25% + L^^ | 03/24/21 | 08/15/25 | Senior | 979,592 | 945,615 | ||||||||||
| Applovin Corporation +, a | Cash 3.00% + L (0.50% Floor)^^ | 12/08/21 | 10/25/28 | Senior | 1,389,500 | 1,323,499 | ||||||||||
| AQA Acquisition Holding, Inc. +, a | Cash 4.25% + L (0.50% Floor)^^ | 03/18/21 | 03/03/28 | Senior | 1,083,500 | 1,041,969 | ||||||||||
| AqGen Island Holdings, Inc. +, a | Cash 6.50% + L (0.50% Floor)^^ | 08/19/21 | 08/02/29 | Second Lien | 7,049,750 | 6,192,007 | ||||||||||
| athenahealth Group, Inc. +, a | Cash 3.50% + SF (0.50% Floor)vv | 02/23/22 | 02/15/29 | Senior | 2,814,685 | 2,548,303 | ||||||||||
| athenahealth Group, Inc. +, a, e, f | Cash 3.50% + SF (0.50% Floor)vv | 01/27/22 | 02/15/29 | Senior | 478,261 | (2,391 | ) | |||||||||
| athenahealth Group, Inc. +, a, e, f | Cash 3.50% + SF (0.50% Floor)vv | 02/23/22 | 02/15/29 | Senior | 119,565 | 3,309,250 | ||||||||||
The accompanying notes are an integral part of these Consolidated Financial Statements.
Partners Group Private Equity (Master Fund), LLC (a Delaware Limited Liability Company) |
Consolidated Schedule of Investments — December 31, 2022 (Unaudited) (continued) |
| Interest | Acquisition Date | Maturity Date | Investment Type | Principal | Fair Value** | |||||||||||
| Private Equity Investments (continued) | ||||||||||||||||
| Direct Investments * (continued) | ||||||||||||||||
| Direct Debt (continued) | ||||||||||||||||
| Banff Guarantor Inc. +, a | Cash 5.50% + L (0.50% Floor)^^ | 01/31/22 | 02/27/26 | Second Lien | $ | 1,700,000 | $ | 1,571,973 | ||||||||
| Banff Merger Sub Inc. +, a | Cash 3.75% + L^ | 01/31/22 | 10/02/25 | Senior | 2,808,428 | 2,695,459 | ||||||||||
| Barracuda Networks, Inc. +, a | Cash 7.00% + SF (0.50% Floor)vv | 05/17/22 | 08/15/30 | Second Lien | 4,000,000 | 3,655,000 | ||||||||||
| Bausch & Lomb Inc. +, a | Cash 3.25% + SF (0.50% Floor)vv | 05/18/22 | 05/10/27 | Senior | 3,283,500 | 3,132,163 | ||||||||||
| Bella Holding Company, LLC +, a | Cash 3.75% + L (0.75% Floor)^ | 05/13/21 | 04/01/28 | Senior | 3,555,000 | 3,364,807 | ||||||||||
| BI Gen Holdings, Inc. +, a | Cash 4.25% + L^^ | 10/04/18 | 09/05/25 | Senior | 1,436,500 | 1,371,857 | ||||||||||
| BI Gen Holdings, Inc. +, a | Cash 8.13% + L (1.00% Floor)^^ | 12/21/20 | 08/31/26 | Second Lien | 1,950,000 | 1,950,000 | ||||||||||
| Blackhawk Network Holdings, Inc. +, a | Cash 3.00% + L^^ | 08/12/19 | 06/15/25 | Senior | 962,217 | 940,139 | ||||||||||
| BlueConic Holding, Inc. +, a | Cash 5.75% + L (0.75% Floor)^^ | 01/27/22 | 01/27/28 | Senior | 18,912,000 | 18,109,990 | ||||||||||
| Brookfield WEC Holdings, Inc. +, a | Cash 2.75% + L (0.50% Floor)^ | 09/12/18 | 08/01/25 | Senior | 974,878 | 962,644 | ||||||||||
| Brown Group Holding, LLC +, a | Cash 3.75% + SF (0.50% Floor)vv | 06/09/22 | 07/02/29 | Senior | 997,500 | 995,864 | ||||||||||
| Burger Bossco Intermediate, Inc. +, a | Cash 4.25% + L (1.00% Floor)^ | 01/01/21 | 04/25/24 | Senior | 151,600 | 124,312 | ||||||||||
| Burger Bossco Intermediate, Inc. +, a | PIK 10.00% + L (1.00% Floor)^^ | 12/31/20 | 04/25/25 | Second Lien | 342,377 | 1 | ||||||||||
| Campaign Monitor (UK) Limited +, a | Cash 7.90% + L (1.00% Floor)^^ | 01/01/21 | 11/06/25 | Second Lien | 183,333 | 180,745 | ||||||||||
| Campaign Monitor (UK) Limited +, a | Cash 8.90% + L (1.00% Floor)^^ | 01/01/21 | 11/06/25 | Second Lien | 1,466,667 | 1,445,963 | ||||||||||
| CapitalSpring Finance Company, LLC +, a | Cash 8.00% | 03/01/17 | 02/10/23 | Mezzanine | 4,863,488 | 4,345,590 | ||||||||||
| CapitalSpring Finance Company, LLC +, a | PIK 5.00% | 03/01/17 | 02/10/23 | Mezzanine | 3,401,088 | 2,560,119 | ||||||||||
| Carestream Dental Equipment, Inc. +, a | Cash 4.50% + L (0.50% Floor)^^ | 11/26/21 | 09/01/24 | Senior | 1,376,009 | 1,295,927 | ||||||||||
| Carestream Dental Equipment, Inc. +, a | Cash 8.00% + L (1.00% Floor)^^ | 11/26/21 | 09/01/25 | Second Lien | 3,000,000 | 2,820,000 | ||||||||||
| Cengage Learning, Inc. +, a | Cash 4.75% + L (1.00% Floor)^^ | 08/06/21 | 07/14/26 | Senior | 1,382,500 | 1,246,414 | ||||||||||
| Central Parent, Inc. +, a | Cash 4.50% + SF (0.50% Floor)vv | 07/12/22 | 07/06/29 | Senior | 1,000,000 | 992,670 | ||||||||||
| Charlotte Buyer Inc +, a | Cash 5.25% + SF (0.50% Floor)vv | 08/16/22 | 02/11/28 | Senior | 1,000,000 | 950,420 | ||||||||||
| Charter NEX US, Inc. +, a | Cash 4.25% + L (0.75% Floor)^^ | 05/31/19 | 12/01/27 | Senior | 1,438,195 | 1,399,658 | ||||||||||
| Cheniere Energy Partners +, a | Cash 3.75% + L (0.50% Floor)^^ | 06/09/21 | 06/04/28 | Senior | 3,250,500 | 3,240,342 | ||||||||||
| Clydesdale Acquisition Holdings, Inc. +, a | Cash 4.25% + SF (0.50% Floor)vv | 04/19/22 | 04/13/29 | Senior | 1,293,500 | 1,235,131 | ||||||||||
| CommScope, Inc. +, a | Cash 3.25% + L^ | 04/26/19 | 04/06/26 | Senior | 2,455,962 | 2,321,498 | ||||||||||
| ConnectWise, LLC +, a | Cash 3.50% + L (0.75% Floor)^^ | 10/06/21 | 09/29/28 | Senior | 1,683,000 | 1,603,057 | ||||||||||
| Conservice Midco, LLC, +, a | Cash 4.25% + L^ | 05/18/20 | 05/13/27 | Senior | 1,661,750 | 1,616,401 | ||||||||||
| Conterra Ultra Broadband Holdings, Inc. +, a | Cash 4.70% + L (1.00% Floor)^ | 06/06/19 | 04/30/26 | Senior | 1,640,569 | 1,582,805 | ||||||||||
| ConvergeOne Holdings, Inc. +, a | Cash 5.00% + L^ | 03/27/19 | 01/04/26 | Senior | 2,887,500 | 1,692,147 | ||||||||||
| ConvergeOne Holdings, Inc. +, a | Cash 8.50% + L^ | 04/15/19 | 01/04/27 | Second Lien | 31,200,000 | 14,040,000 | ||||||||||
| Convergint Tech LLC +, a | Cash 6.75% + L (0.75% Floor)^ | 04/12/21 | 03/30/29 | Second Lien | 1,400,000 | 1,243,662 | ||||||||||
| Cornerstone OnDemand, Inc. +, a | Cash 3.75% + L (0.50% Floor)^ | 10/22/21 | 10/16/28 | Senior | 1,191,000 | 1,068,923 | ||||||||||
| Critical Start +, a | Cash 5.25% + SF (0.75% Floor)vv | 05/18/22 | 05/18/28 | Senior | 8,180,667 | 8,150,915 | ||||||||||
| Critical Start, Inc. +, a, e | Cash 6.00% + SF (0.75% Floor)vv | 05/18/22 | 05/18/28 | Senior | 1,798,333 | (32,323 | ) | |||||||||
| Crown Subsea Communications Holding, Inc. +, a | Cash 5.00% + L (0.75% Floor)^^ | 05/05/21 | 04/27/27 | Senior | 4,487,671 | 4,390,423 | ||||||||||
| CSC Holdings, LLC +, a | Cash 2.50% + L^ | 08/11/21 | 04/15/27 | Senior | 3,455,584 | 3,097,067 | ||||||||||
| CSC Holdings, LLC +, a | Cash 2.25% + L^ | 12/07/18 | 01/15/26 | Senior | 2,892,342 | 2,709,314 | ||||||||||
| DCert Buyer, Inc. +, a | Cash 4.00% + L^ | 10/24/19 | 10/16/26 | Senior | 1,948,674 | 1,886,736 | ||||||||||
| Deerfield Dakota Holding, LLC +, a | Cash 3.75% + SF (1.00% Floor)vv | 06/01/20 | 04/09/27 | Senior | 975,000 | 913,000 | ||||||||||
| Delta Topco, Inc. +, a | Cash 3.75% + L (0.75% Floor)^^ | 01/06/21 | 12/01/27 | Senior | 2,068,500 | 1,917,499 | ||||||||||
| Dentive Capital, LLC +, a | Cash 6.75% + SF (0.75% Floor)vv | 12/23/22 | 12/22/28 | Senior | 10,125,421 | 9,821,658 | ||||||||||
| DexKo Global Inc. +, a | Cash 3.75% + L (0.50% Floor)^^ | 10/07/21 | 09/22/28 | Senior | 254,943 | 229,413 | ||||||||||
| Dexko Global, Inc. +, a | Cash 3.75% + L (0.50% Floor)^^ | 10/07/21 | 10/04/28 | Senior | 1,333,057 | 1,199,565 | ||||||||||
The accompanying notes are an integral part of these Consolidated Financial Statements.
Partners Group Private Equity (Master Fund), LLC (a Delaware Limited Liability Company) |
Consolidated Schedule of Investments — December 31, 2022 (Unaudited) (continued) |
| Interest | Acquisition Date | Maturity Date | Investment Type | Principal | Fair Value** | |||||||||||
| Private Equity Investments (continued) | ||||||||||||||||
| Direct Investments * (continued) | ||||||||||||||||
| Direct Debt (continued) | ||||||||||||||||
| DG Investment Intermediate Holdings 2, Inc. +, a, e, f | Cash 4.75% + SF (0.75% Floor)vv | 11/15/22 | 03/31/28 | Senior | $ | 997,500 | $ | 960,094 | ||||||||
| DG Investment Intermediate Holdings 2, Inc. +, a | Cash 3.50% + L (0.75% Floor)^ | 04/23/21 | 03/31/28 | Senior | 1,280,542 | 1,227,720 | ||||||||||
| Diamond Parent Holdings Corp. +, a | Cash 6.25% + L (1.00% Floor)^^ | 12/23/16 | 08/04/25 | Senior | (31,186 | ) | — | |||||||||
| Diamond Parent Midco Inc. +, a | Cash 6.25% + L (1.00% Floor)^^ | 09/01/22 | 08/04/25 | Senior | 29,289,835 | 29,042,348 | ||||||||||
| Dwyer Instruments, LLC +, a | Cash 6.00% + L (0.75% Floor)^^ | 07/01/22 | 07/21/27 | Senior | 10,990,866 | 213,797 | ||||||||||
| EAB Global, Inc. +, a | Cash 4.00% + SF (0.75% Floor)v | 08/25/21 | 11/19/26 | Senior | 4,125,758 | 2,100,605 | ||||||||||
| ECI Macola/Max Holding, LLC +, a | Cash 3.75% + L (0.75% Floor)^^ | 09/13/21 | 11/09/27 | Senior | 1,674,372 | 1,611,583 | ||||||||||
| Element Materials Technology Group US Holdings Inc.(EM Midco 2 US LLC) +, a, f | Cash 4.25% + SF (0.50% Floor)vv | 08/17/22 | 06/22/29 | Senior | 315,789 | 309,343 | ||||||||||
| Element Materials Technology Group US Holdings Inc.(EM Midco 2 US LLC) +, a | Cash 4.25% + SF (0.50% Floor)vv | 08/17/22 | 06/22/29 | Senior | 684,211 | 670,242 | ||||||||||
| Endurance International Group Holdings, Inc. +, a | Cash 3.50% + L (0.75% Floor)^^ | 04/28/21 | 02/10/28 | Senior | 3,841,500 | 3,466,954 | ||||||||||
| Engineered Machinery Holdings, Inc. +, a | Cash 3.75% + L (0.75% Floor)^^ | 08/16/21 | 05/21/28 | Senior | 1,584,000 | 1,536,234 | ||||||||||
| Envision Healthcare Holdings, Inc. +, a | Cash 4.50% + SF (1.00% Floor)v | 04/29/22 | 04/29/28 | Second Lien | 42,188,402 | 35,024,436 | ||||||||||
| Epiq Systems +, a | Cash 4.75% + SF (0.75% Floor)v | 06/02/22 | 04/26/29 | Senior | 3,990,000 | 3,685,762 | ||||||||||
| Evergreen Services Group +, a | Cash 6.00% + SF (0.75% Floor)vv | 06/15/22 | 06/14/29 | Senior | 7,969,459 | 8,008,277 | ||||||||||
| Evergreen Services Group, LLC +, a, e | Cash 6.00% + SF (0.75% Floor)vv | 06/15/22 | 06/14/29 | Senior | 1,377,912 | 1,384,623 | ||||||||||
| Explorer Holdings, Inc. +, a | Cash 8.00% + L (0.50% Floor)^ | 02/04/20 | 02/04/28 | Second Lien | 16,625,443 | 15,627,916 | ||||||||||
| Explorer Holdings, Inc. +, a, e | Cash 8.00% + L (0.50% Floor)^ | 02/04/20 | 02/04/28 | Second Lien | 2,866,456 | 2,694,468 | ||||||||||
| Filtration Group Corporation +, a | Cash 3.50% + L (0.50% Floor)^ | 11/01/21 | 10/21/28 | Senior | 2,073,750 | 2,040,912 | ||||||||||
| First Student Bidco Inc. +, a | Cash 3.00% + L (0.50% Floor)^^ | 08/11/21 | 08/21/28 | Senior | 1,093,975 | 992,098 | ||||||||||
| First Student Bidco, Inc. +, a | Cash 4.00% + SF (0.50% Floor)vv | 08/05/22 | 07/21/28 | Senior | 1,000,000 | 952,500 | ||||||||||
| Flynn Restaurant Group LP +, a | Cash 4.25% + L (0.50% Floor)^ | 12/10/21 | 11/22/28 | Senior | 2,282,750 | 2,146,732 | ||||||||||
| Galls, LLC +, a | Cash 6.25% + L (1.00% Floor)^^ | 12/22/20 | 01/31/25 | Senior | 515,345 | 486,347 | ||||||||||
| GFL Environmental Inc. +, a | Cash 3.00% + L (1.00% Floor)^ | 12/05/18 | 05/30/25 | Senior | 1,181,805 | 1,183,690 | ||||||||||
| GHX Ultimate Parent Corporation +, a | Cash 3.25% + L (1.00% Floor)^^ | 01/01/21 | 06/22/24 | Senior | 1,915,935 | 1,879,207 | ||||||||||
| Gopher Resource, LLC +, a | Cash 3.25% + L (1.00% Floor)^ | 07/09/21 | 03/06/25 | Senior | 1,899,226 | 1,103,129 | ||||||||||
| Great American Outdoors Group, LLC +, a | Cash 3.75% + L (0.75% Floor)^^ | 05/14/21 | 03/06/28 | Senior | 1,764,169 | 1,699,115 | ||||||||||
| GTT Communications, Inc. +, a | Cash 2.75% + L^^^ | 07/02/18 | 05/31/25 | Senior | — | 1 | ||||||||||
| Heartland Dental Holdings, Inc. +, a, e | Cash 3.50% | 05/15/18 | 04/30/25 | Senior | 2,193,807 | 2,093,551 | ||||||||||
| Heartland Dental Holdings, Inc. +, a | Cash 3.50% + L^ | 05/15/18 | 04/30/25 | Senior | 607,561 | 563,057 | ||||||||||
| Heartland Dental, LLC +, a | Cash 4.00% + L^ | 06/21/21 | 04/30/25 | Senior | 987,500 | 920,103 | ||||||||||
| Heartland Home Services, Inc. +, a | Cash 6.75% + SF (1.00% Floor)v | 11/08/22 | 12/15/26 | Senior | 12,000,000 | 11,786,503 | ||||||||||
| Help/Systems Holdings Inc. +, a | Cash 6.75% + L (0.75% Floor)^^ | 11/05/21 | 11/19/27 | Second Lien | 3,600,000 | 3,060,000 | ||||||||||
| Help/Systems Holdings Inc. +, a | Cash 4.00% + L (0.75% Floor)^^ | 06/25/21 | 11/19/26 | Senior | 4,125,758 | 3,730,716 | ||||||||||
| Hornblower Sub, LLC +, a | Cash 4.50% + L^^ | 05/01/19 | 04/27/25 | Senior | 938,763 | 661,162 | ||||||||||
| Husky Injection Molding Systems Ltd. +, a | Cash 3.25% + L (1.00% Floor)^^ | 07/15/19 | 03/28/25 | Senior | 962,119 | 901,308 | ||||||||||
| Hyland Software Inc. +, a | Cash 3.50% + L (0.75% Floor)^^ | 10/27/20 | 07/01/24 | Senior | 2,961,497 | 2,927,810 | ||||||||||
| Idera, Inc. +, a, b | Cash 3.75% + L (0.75% Floor)^ | 12/17/18 | 06/27/24 | Senior | 1,248,155 | 1,180,286 | ||||||||||
| Imperial Dade +, a | Cash 4.63% + SF (0.50% Floor)vv | 06/24/22 | 06/11/26 | Senior | 992,500 | 967,688 | ||||||||||
| Indy US Bidco, LLC +, a | Cash 3.75% + L (0.75% Floor)^^ | 03/29/21 | 03/06/28 | Senior | 982,563 | 858,927 | ||||||||||
| INNIO Group Holdings GmbH +, a | Cash 3.25% + E### | 11/30/18 | 10/31/25 | Senior | 1,415,436 | 1,244,844 | ||||||||||
The accompanying notes are an integral part of these Consolidated Financial Statements.
Partners Group Private Equity (Master Fund), LLC (a Delaware Limited Liability Company) |
Consolidated Schedule of Investments — December 31, 2022 (Unaudited) (continued) |
| Interest | Acquisition Date | Maturity Date | Investment Type | Principal | Fair Value** | |||||||||||
| Private Equity Investments (continued) | ||||||||||||||||
| Direct Investments * (continued) | ||||||||||||||||
| Direct Debt (continued) | ||||||||||||||||
| Integrity Marketing Acquisition, LLC +, a, e | Cash 5.75% + SF (0.75% Floor)vv | 06/21/22 | 08/27/25 | Senior | $ | 16,506,158 | $ | 15,969,708 | ||||||||
| Iris Holdings Inc. +, a | Cash 4.75% + SF (0.50% Floor)vv | 06/15/22 | 06/28/28 | Senior | 2,244,375 | 2,046,780 | ||||||||||
| KCIBT Intermediate II, Inc. +, a | Cash 1.00% + L (1.00% Floor)^^ + PIK 4.25% + L (1.00% Floor)^^ | 12/23/20 | 06/01/25 | Senior | 242,679 | 171,118 | ||||||||||
| KENE Acquisition, Inc. +, a | Cash 8.25% + L^^ | 12/15/21 | 08/08/27 | Second Lien | 175,500 | 167,684 | ||||||||||
| KENE Acquisition, Inc. +, a | Cash 8.25% + L (1.00% Floor)^^ | 01/01/21 | 08/09/27 | Second Lien | 1,462,500 | 1,397,368 | ||||||||||
| KENE Acquisition, Inc. +, a | Cash 8.25% + L^^ | 08/05/22 | 08/09/27 | Second Lien | 984,997 | 941,130 | ||||||||||
| Kingpin Intermediate Holdings LLC +, a | Cash 3.50% + L (1.00% Floor)^ | 10/05/18 | 07/03/24 | Senior | 1,313,639 | 1,313,639 | ||||||||||
| Knowlton Development Corporation Inc. +, a | Cash 3.75% + L^^ | 06/24/22 | 12/22/25 | Senior | 1,492,248 | 1,442,817 | ||||||||||
| KSLB Holdings, LLC +, a | Cash 8.75% + L (1.00% Floor)^ | 01/01/21 | 07/30/26 | Second Lien | 3,212,308 | 2,620,952 | ||||||||||
| LBM Acquisition, LLC +, a | Cash 3.25% + L (0.75% Floor)^ | 09/07/21 | 12/17/27 | Senior | 3,253,167 | 2,834,843 | ||||||||||
| LogMeIn, Inc. +, a | Cash 4.75% + L^ | 09/03/20 | 08/31/27 | Senior | 4,950,000 | 3,206,362 | ||||||||||
| LSCS Holdings, Inc. +, a | Cash 4.50% + L (0.50% Floor)^^ | 02/14/22 | 12/16/28 | Senior | 2,574,000 | 2,466,214 | ||||||||||
| LTI Holdings, Inc. +, a | Cash 3.50% + L^ | 10/22/18 | 09/06/25 | Senior | 957,500 | 918,898 | ||||||||||
| Magenta Buyer LLC +, a | Cash 8.25% + L (0.75% Floor)^^ | 10/13/21 | 07/27/29 | Second Lien | 2,000,000 | 1,590,000 | ||||||||||
| Magenta Buyer LLC +, a | Cash 5.00% + L (0.75% Floor)^^ | 08/02/21 | 07/27/28 | Senior | 3,465,000 | 2,983,157 | ||||||||||
| Marnix SAS +, a | Cash 4.00% + L (0.50% Floor)^^ | 12/17/21 | 08/04/28 | Senior | 1,477,500 | 1,408,250 | ||||||||||
| Maverick Bidco, Inc. +, a | Cash 6.75% + L (0.75% Floor)^^ | 05/26/21 | 05/18/29 | Second Lien | 6,603,000 | 6,173,805 | ||||||||||
| McAfee Inc. +, a | Cash 4.00% + S>> | 03/09/22 | 03/01/29 | Senior | 2,593,500 | 2,421,214 | ||||||||||
| Medline Borrower, L.P. +, a | Cash 3.25% + L (0.50% Floor)^^ | 11/03/21 | 10/23/28 | Senior | 1,091,750 | 1,039,461 | ||||||||||
| Mercury Borrower, Inc. +, a | Cash 6.50% + L (0.50% Floor)^^ | 04/11/22 | 08/02/29 | Second Lien | 900,000 | 790,497 | ||||||||||
| Messer Industries GmbH, Inc. +, a | Cash 2.50% + L^^ | 04/26/19 | 03/01/26 | Senior | 1,039,185 | 1,031,880 | ||||||||||
| Michaels Stores, Inc. +, a | Cash 4.25% + L (0.75% Floor)^^ | 04/26/21 | 04/15/28 | Senior | 2,164,250 | 1,876,286 | ||||||||||
| Mirion Technologies, Inc. +, a | Cash 2.75% + L (0.50% Floor)^^ | 11/05/21 | 10/20/28 | Senior | 1,176,000 | 1,157,102 | ||||||||||
| Mitchell International, Inc. +, a | Cash 3.75% + L (0.50% Floor)^ | 10/21/21 | 10/15/28 | Senior | 3,771,500 | 3,486,695 | ||||||||||
| Mitchell International, Inc. +, a | Cash 6.50% + L (0.50% Floor)^ | 10/26/21 | 10/15/29 | Second Lien | 1,000,000 | 835,625 | ||||||||||
| MJH Healthcare Holdings, LLC +, a | Cash 3.50% + SF (0.50% Floor)v | 04/08/22 | 01/28/29 | Senior | 1,691,500 | 1,632,455 | ||||||||||
| MKS Instruments, Inc +, a | Cash 2.75% + SF (0.50% Floor)vv | 08/26/22 | 08/17/29 | Senior | 997,500 | 988,059 | ||||||||||
| National Spine & Pain Centers, LLC +, a | Cash 7.00% + SF (1.00% Floor)v | 11/14/22 | 02/28/23 | Senior | 28,762 | 28,730 | ||||||||||
| National Spine & Pain Centers, LLC +, a | Cash 5.00% + L (1.00% Floor)^ | 01/01/21 | 06/02/24 | Senior | 525,863 | 340,449 | ||||||||||
| Navicure, Inc. +, a | Cash 4.00% + L^^ | 11/19/19 | 10/22/26 | Senior | 2,929,785 | 2,885,838 | ||||||||||
| NEP Group, Inc. +, a | Cash 3.25% + L^^ | 02/10/22 | 10/20/25 | Senior | 1,964,194 | 1,703,123 | ||||||||||
| NEP Group, Inc. +, a | Cash 4.00% + L (0.50% Floor)^^ | 12/06/21 | 10/20/25 | Senior | 1,881,000 | 1,647,060 | ||||||||||
| Netsmart, Inc. +, a | Cash 3.75% + L (1.00% Floor)^ | 07/16/18 | 10/01/27 | Senior | 2,216,656 | 2,140,459 | ||||||||||
| Nexstar Broadcasting +, a | Cash 2.50% + L^ | 10/02/19 | 09/21/26 | Senior | 776,330 | 771,381 | ||||||||||
| NortonLifeLock Inc. +, a | Cash 2.00% + SF (0.50% Floor)vv | 09/20/22 | 09/12/29 | Senior | 2,400,000 | 2,364,504 | ||||||||||
| NSM Top Holdings Corp. +, a | Cash 5.25% + L^ | 11/26/19 | 11/16/26 | Senior | 1,455,000 | 1,311,923 | ||||||||||
| NSPC Intermediate II, LLC +, a | Cash 8.00% + SF (1.00% Floor)vv | 12/27/22 | 02/28/23 | Senior | 9,587 | 9,577 | ||||||||||
| nThrive Health Inc. +, a | Cash 4.00% + L (0.50% Floor)^^ | 05/24/22 | 12/18/28 | Senior | 1,985,000 | 1,688,907 | ||||||||||
| Oceankey (U.S.) II Corp. +, a | Cash 3.50% + L (0.50% Floor)^ | 01/06/22 | 12/15/28 | Senior | 1,885,750 | 1,731,590 | ||||||||||
| OEConnection LLC +, a | Cash 4.00% + L^^ | 10/28/19 | 09/25/26 | Senior | 2,929,093 | 2,798,499 | ||||||||||
| OneDigital Borrower LLC +, a | Cash 4.25% + L (0.50% Floor)^^ | 12/11/20 | 11/16/27 | Senior | 2,533,704 | 2,400,684 | ||||||||||
| OneDigital Borrower LLC +, a | Cash 4.50% + L (0.75% Floor)^^ | 12/11/20 | 11/16/27 | Senior | 231,103 | 218,970 | ||||||||||
| Osmose Utilities Services, Inc. +, a | Cash 3.25% + L (0.50% Floor)^^ | 09/01/21 | 06/23/28 | Senior | 2,468,750 | 2,350,164 | ||||||||||
| PAI Holdco, Inc. +, a | Cash 3.50% + L (1.00% Floor)^^ | 11/09/20 | 10/22/27 | Senior | 1,182,000 | 1,048,292 | ||||||||||
| Panther BF Aggregator 2 L.P. +, a | Cash 3.25% + L^ | 05/14/19 | 04/30/26 | Senior | 1,014,249 | 997,347 | ||||||||||
| Pascal Midco 2, LLC +, a | Cash 6.00% + L (0.75% Floor)^^ | 07/01/22 | 07/21/27 | Senior | 10,990,866 | 10,771,049 | ||||||||||
| Pearl Intermediate Parent, LLC +, a | Cash 2.75% + L^ | 03/16/18 | 02/14/25 | Senior | 3,617,140 | 3,389,466 | ||||||||||
The accompanying notes are an integral part of these Consolidated Financial Statements.
Partners Group Private Equity (Master Fund), LLC (a Delaware Limited Liability Company) |
Consolidated Schedule of Investments — December 31, 2022 (Unaudited) (continued) |
| Interest | Acquisition Date | Maturity Date | Investment Type | Principal | Fair Value** | |||||||||||
| Private Equity Investments (continued) | ||||||||||||||||
| Direct Investments * (continued) | ||||||||||||||||
| Direct Debt (continued) | ||||||||||||||||
| Pearl Intermediate Parent, LLC +, a | Cash 6.25% + L^ | 01/01/21 | 02/13/26 | Second Lien | $ | 2,400,000 | $ | 2,217,000 | ||||||||
| PECF USS Intermediate Holding III Corporation +, a | Cash 4.25% + L (0.50% Floor)^^ | 10/07/22 | 12/15/28 | Senior | 994,975 | 833,361 | ||||||||||
| Peraton Corp. +, a | Cash 3.75% + L (0.75% Floor)^^ | 04/12/21 | 02/01/28 | Senior | 1,929,725 | 1,887,917 | ||||||||||
| PetVet Care Centers, LLC +, a | Cash 3.25% + L^ | 04/12/19 | 02/14/25 | Senior | 1,151,880 | 1,080,964 | ||||||||||
| PetVet Care Centers, LLC +, a | Cash 3.50% + L (0.75% Floor)^^ | 08/18/21 | 02/14/25 | Senior | 984,733 | 928,505 | ||||||||||
| PG&E Corporation +, a | Cash 4.50% + L (1.00% Floor)^^ | 08/11/20 | 06/23/25 | Senior | 1,950,000 | 1,937,812 | ||||||||||
| Phoenix Newco, Inc. +, a | Cash 3.50% + L (0.50% Floor)^^ | 12/07/21 | 11/15/28 | Senior | 2,977,500 | 2,874,121 | ||||||||||
| Pluto Acquisition I, Inc. +, a | Cash 7.00% + L (0.50% Floor)^ | 07/02/21 | 12/14/29 | Senior | 3,700,000 | 1,138,660 | ||||||||||
| PODS, LLC. +, a | Cash 3.00% + L (0.75% Floor)^ | 04/16/21 | 03/31/28 | Senior | 1,277,331 | 1,212,666 | ||||||||||
| Polaris Newco, LLC +, a | Cash 4.00% + L (0.50% Floor)^ | 06/15/21 | 06/02/28 | Senior | 1,188,000 | 1,087,020 | ||||||||||
| Potters Industries, LLC +, a | Cash 4.00% + L (0.75% Floor)^^ | 12/17/20 | 12/14/27 | Senior | 982,500 | 965,306 | ||||||||||
| Pre-Paid Legal Services, Inc. +, a | Cash 7.00% + L (0.50% Floor)^^ | 01/18/22 | 12/14/29 | Senior | 3,700,000 | 3,472,497 | ||||||||||
| Pregis TopCo LLC +, a | Cash 3.75% + L (0.75% Floor)^ | 12/23/20 | 07/31/26 | Senior | 987,500 | 960,344 | ||||||||||
| Pretium PKG Holdings, Inc. +, a | Cash 6.75% + L (0.50% Floor)^^ | 10/05/21 | 10/01/29 | Second Lien | 1,800,000 | 1,122,759 | ||||||||||
| Procera Networks, Inc. +, a | Cash 4.50% + L^^ | 11/20/18 | 10/31/25 | Senior | 1,144,395 | 1,089,321 | ||||||||||
| Project Boost Purchaser, LLC +, a | Cash 3.50% + L^^ | 07/19/19 | 06/01/26 | Senior | 1,741,500 | 1,683,264 | ||||||||||
| Project Leopard Holdings, Inc. +, a | Cash 5.25% + SF (0.50% Floor)vv | 06/15/22 | 07/20/29 | Senior | 3,000,000 | 2,747,250 | ||||||||||
| Prometric Holdings, Inc. +, a | Cash 7.50% + L (1.00% Floor)^ | 01/29/18 | 01/29/26 | Second Lien | 14,154,350 | 14,781,379 | ||||||||||
| Quintiles IMS Inc. +, a | Cash 2.00% + E (0.50% Floor)## | 06/22/18 | 06/11/25 | Senior | 2,803,629 | 2,567,132 | ||||||||||
| Radiate HoldCo, LLC +, a | Cash 3.50% + L (0.75% Floor)^ | 07/16/19 | 09/25/26 | Senior | 990,000 | 808,761 | ||||||||||
| Radiology Partners, Inc. +, a | Cash 4.25% + L^ | 09/11/18 | 07/09/25 | Senior | 2,403,933 | 2,029,075 | ||||||||||
| Radwell Parent, LLC +, a, e | Cash 6.75% + SF(0.75% Floor)vv | 12/01/22 | 04/01/29 | Senior | 1,206,529 | (9,990 | ) | |||||||||
| Radwell Parent, LLC +, a | Cash 6.50% + SF (0.75% Floor)vv | 12/01/22 | 04/01/29 | Senior | 6,001,484 | 5,821,439 | ||||||||||
| Radwell Parent, LLC +, a | Cash 5.75% + SF (0.75% Floor)vv | 04/06/22 | 04/01/29 | Senior | 14,111,669 | 13,758,877 | ||||||||||
| RBMedia +, a | Cash 4.00% + L^^ | 06/17/22 | 08/29/25 | Senior | 2,000,000 | 1,960,890 | ||||||||||
| RC Buyer, Inc. +, a | Cash 6.50% + L (0.75% Floor)^^ | 08/03/21 | 07/26/29 | Second Lien | 2,800,000 | 2,538,676 | ||||||||||
| RealPage, Inc. +, a | Cash 3.00% + L (0.50% Floor)^ | 04/26/21 | 04/24/28 | Senior | 3,950,000 | 3,764,350 | ||||||||||
| Red Planet Borrower, LLC +, a | Cash 3.75% + L (0.50% Floor)^^ | 10/04/21 | 10/02/28 | Senior | 2,172,500 | 1,370,847 | ||||||||||
| Redstone Holdco 2 L.P. +, a | Cash 4.75% + L (0.75% Floor)^^ | 05/10/21 | 04/27/28 | Senior | 3,755,172 | 2,635,661 | ||||||||||
| Redstone Holdco 2 L.P. +, a | Cash 7.75% + L (0.75% Floor)^^ | 05/03/21 | 04/16/29 | Second Lien | 3,000,000 | 1,520,640 | ||||||||||
| Refficiency Holdings LLC +, a | Cash 4.00% + L (0.75% Floor)^ | 02/04/21 | 12/16/27 | Senior | 1,479,625 | 1,403,173 | ||||||||||
| Refficiency Holdings LLC +, a | Cash 3.75% + L (0.75% Floor)^ | 02/04/21 | 12/16/27 | Senior | 289,717 | 274,747 | ||||||||||
| Rent-A-Center, Inc. +, a | Cash 4.00% + L (0.75% Floor)^^ | 03/02/21 | 02/17/28 | Senior | 982,500 | 949,341 | ||||||||||
| Restaurant Technologies, Inc. +, a | Cash 4.25% + SF (0.50% Floor)vv | 04/06/22 | 04/02/29 | Senior | 3,474,495 | 3,419,772 | ||||||||||
| Restoration Hardware, Inc. +, a | Cash 3.25% + SF (0.50% Floor)vv | 05/24/22 | 10/20/28 | Senior | 4,488,750 | 4,223,622 | ||||||||||
| RLG Holdings, LLC +, a | Cash 4.25% + L (0.75% Floor)^^ | 07/19/21 | 07/10/28 | Senior | 1,980,000 | 1,869,457 | ||||||||||
| Rocket Software, Inc. +, a | Cash 4.25% + L^ | 12/05/18 | 11/28/25 | Senior | 2,620,905 | 2,526,225 | ||||||||||
| Rough Country, LLC +, a | Cash 3.50% + L (0.75% Floor)^^ | 08/03/21 | 07/26/28 | Senior | 1,876,250 | 1,802,054 | ||||||||||
| S2P Acquisition Borrower, Inc +, a | Cash 4.00% + SFv | 10/07/19 | 08/14/26 | Senior | 967,500 | 942,466 | ||||||||||
| Sabre GLBL Inc. +, a | Cash 3.50% + L (0.50% Floor)^ | 08/09/21 | 12/17/27 | Senior | 1,871,500 | 1,710,084 | ||||||||||
| Safe Fleet Holdings LLC +, a, b | Cash 3.75% + SF (0.50% Floor)vv | 03/04/22 | 02/23/29 | Senior | 3,870,750 | 3,752,228 | ||||||||||
| SCIH Salt Holdings, Inc. +, a | Cash 4.00% + L (1.00% Floor)^^ | 04/17/20 | 03/16/27 | Senior | 803,336 | 782,963 | ||||||||||
| Senneca Holdings, Inc. +, a | PIK 11.00% | 01/01/21 | 05/11/26 | Second Lien | 1,276,647 | 3 | ||||||||||
| Senneca Holdings, Inc. +, a | PIK 10.00% | 01/01/21 | 11/11/25 | 1.5 Lien | 1,261,667 | 1 | ||||||||||
| Shearer's Foods, LLC +, a | Cash 3.50% + L (0.75% Floor)^^ | 09/25/20 | 09/23/27 | Senior | 32,997 | 31,554 | ||||||||||
| Shearer's Foods, LLC +, a | Cash 3.50% + L (1.00% Floor)^^ | 05/17/18 | 09/23/27 | Senior | 3,065,163 | 2,959,749 | ||||||||||
| Shearer's Foods, LLC +, a | Cash 7.75% + L (1.00% Floor)^^ | 10/14/20 | 09/22/28 | Second Lien | 960,000 | 897,600 | ||||||||||
| Shermco Intermediate Holdings, Inc. +, a | Cash 4.50% + L (1.00% Floor)^ | 06/05/18 | 06/05/24 | Senior | 25,424,249 | 25,519,695 | ||||||||||
| Skopima Consilio Parent LLC +, a | Cash 4.00% + L (0.50% Floor)^^ | 05/18/21 | 04/30/28 | Senior | 6,616,250 | 6,275,976 | ||||||||||
| Sorenson Communications, LLC +, a | Cash 5.50% + L (0.75% Floor)^^ | 03/23/21 | 03/12/28 | Senior | 2,475,000 | 2,370,592 | ||||||||||
| Sound Inpatient Physicians, Inc +, a | Cash 3.00% + L^ | 08/23/18 | 06/27/25 | Senior | 1,333,500 | 1,091,536 | ||||||||||
The accompanying notes are an integral part of these Consolidated Financial Statements.
Partners Group Private Equity (Master Fund), LLC (a Delaware Limited Liability Company) |
Consolidated Schedule of Investments — December 31, 2022 (Unaudited) (continued) |
| Interest | Acquisition Date | Maturity Date | Investment Type | Principal | Fair Value** | |||||||||||
| Private Equity Investments (continued) | ||||||||||||||||
| Direct Investments * (continued) | ||||||||||||||||
| Direct Debt (continued) | ||||||||||||||||
| Sovos Compliance, LLC +, a | Cash 4.50% + L (0.50% Floor)^^ | 08/16/21 | 08/11/28 | Senior | $ | 1,432,549 | $ | 1,323,317 | ||||||||
| Sovos Compliance, LLC +, a, f | Cash 4.50% + L (0.50% Floor)^^ | 08/16/21 | 08/11/28 | Senior | 249,085 | 230,093 | ||||||||||
| SSH Group Holdings, Inc. +, a | Cash 4.25% + L^^ | 06/05/19 | 07/30/25 | Senior | 3,358,467 | 3,289,501 | ||||||||||
| SSH Group Holdings, Inc. +, a | Cash 8.25% + L^^ | 01/01/21 | 07/30/26 | Second Lien | 3,072,688 | 2,692,812 | ||||||||||
| Star US Bidco, LLC +, a | Cash 4.25% + L (1.00% Floor)^ | 04/24/20 | 03/17/27 | Senior | 1,263,822 | 1,206,950 | ||||||||||
| SuperMoose Borrower, LLC +, a | Cash 3.75% + L^^ | 10/16/18 | 08/29/25 | Senior | 960,000 | 831,360 | ||||||||||
| Tank Holding Corp. +, a, e | Cash 6.00% + SF (0.75% Floor)vv | 03/31/22 | 03/31/28 | Senior | 795,545 | 129,130 | ||||||||||
| Tank Holdings Corporation +, a | Cash 6.00% + L (0.75% Floor)^ | 04/11/22 | 03/31/28 | Senior | 21,438,270 | 20,366,356 | ||||||||||
| TecoStar Holdings, Inc. +, a | Cash 8.50% + L (1.00% Floor)^^ | 01/01/21 | 11/01/24 | Second Lien | 525,000 | 481,714 | ||||||||||
| Telenet Financing USD LLC +, a | Cash 2.00% + L^ | 04/27/20 | 04/30/28 | Senior | 2,400,000 | 2,341,800 | ||||||||||
| Tivity Health Inc +, a | Cash 6.00% + SF (0.75% Floor)vv | 06/28/22 | 06/28/29 | Senior | 15,611,873 | 15,592,302 | ||||||||||
| TLP Acquisition Holdings, LLC +, a | Cash 8.00% + L (1.00% Floor)^ | 02/26/19 | 02/26/26 | Mezzanine | 43,551,847 | 42,435,989 | ||||||||||
| Tory Burch LLC +, a | Cash 3.50% + L (0.50% Floor)^ | 04/30/21 | 04/16/28 | Senior | 985,000 | 912,770 | ||||||||||
| Trident TPI Holdings, Inc. +, a | Cash 4.00% + L (0.50% Floor)^^ | 09/22/21 | 09/15/28 | Senior | 1,679,662 | 1,616,976 | ||||||||||
| Trilon Group, LLC +, a | Cash 5.75% + SF (0.75% Floor)vv | 06/02/22 | 05/27/29 | Senior | 10,486,875 | 10,481,318 | ||||||||||
| Trilon Group, LLC +, a, e | Cash 5.75% + SF (0.75% Floor)vv | 06/02/22 | 05/27/29 | Senior | 1,050,000 | 443,412 | ||||||||||
| Triton Water Holdings, Inc. +, a | Cash 3.50% + L (0.50% Floor)^^ | 04/19/21 | 03/31/28 | Senior | 1,379,002 | 1,287,126 | ||||||||||
| UKG Inc. +, a | Cash 3.25% + L (0.75% Floor)^^ | 07/13/20 | 05/04/26 | Senior | 980,119 | 934,788 | ||||||||||
| Upstream Newco, Inc. +, a | Cash 4.25% + L^ | 08/04/21 | 11/20/26 | Senior | 3,447,500 | 2,996,464 | ||||||||||
| Utz Quality Foods, LLC +, a | Cash 3.00% + L^^ | 01/29/21 | 01/20/28 | Senior | 3,626,009 | 3,598,814 | ||||||||||
| VeriFone Systems, Inc. +, a | Cash 4.00% + L^^ | 09/25/18 | 08/20/25 | Senior | 3,551,705 | 3,272,577 | ||||||||||
| Virtusa Corporation +, a | Cash 3.75% + SF (0.75% Floor)vv | 02/28/22 | 02/11/28 | Senior | 2,183,500 | 2,113,442 | ||||||||||
| Vision Solutions, Inc. +, a | Cash 4.25% + L (0.75% Floor)^^ | 05/06/21 | 04/24/28 | Senior | 3,851,250 | 3,199,426 | ||||||||||
| Vision Solutions, Inc. +, a | Cash 7.25% + L (0.75% Floor)^^ | 09/07/21 | 04/23/29 | Second Lien | 2,300,000 | 1,715,662 | ||||||||||
| VS Buyer, LLC +, a | Cash 3.00% + L^^ | 04/10/20 | 02/28/27 | Senior | 1,945,000 | 1,895,159 | ||||||||||
| Weld North Education LLC +, a | Cash 3.75% + L (0.75% Floor)^^ | 01/06/21 | 12/15/27 | Senior | 1,274,000 | 1,251,387 | ||||||||||
| Whatabrands LLC +, a | Cash 3.25% + L (0.50% Floor)^ | 08/05/21 | 07/21/28 | Senior | 2,970,000 | 2,877,187 | ||||||||||
| Woof Holdings, Inc. +, a | Cash 7.25% + L (0.75% Floor)^^ | 01/08/21 | 12/22/28 | Second Lien | 7,200,000 | 6,536,988 | ||||||||||
| WP CityMD Bidco LLC +, a | Cash 3.25% + L (0.50% Floor)^^ | 09/01/19 | 12/22/28 | Senior | 5,903,117 | 5,898,276 | ||||||||||
| WWEX UNI TopCo Holdings, LLC +, a | Cash 4.00% + L (0.75% Floor)^^ | 08/03/21 | 07/26/28 | Senior | 2,673,000 | 2,454,897 | ||||||||||
| Zacapa S.à.r.l. +, a | Cash 4.25% + SF (0.50% Floor)vv | 07/31/18 | 07/02/25 | Senior | 2,224,689 | 2,144,745 | ||||||||||
| Zayo Group Holdings, Inc. +, a | Cash 3.00% + L^ | 04/24/20 | 03/09/27 | Senior | 2,919,474 | 2,378,583 | ||||||||||
| Total North America (5.58%) | 707,566,515 | |||||||||||||||
| Rest of World (0.27%) | ||||||||||||||||
| AI Sirona (Luxembourg) Acquisition S.à.r.l. +, a | Cash 4.50% + L^ | 10/05/18 | 07/10/25 | Senior | $ | 22,171,514 | $ | 18,921,215 | ||||||||
| AI Sirona (Luxembourg) Acquisition S.à.r.l. +, a | Cash 3.25% + E# | 10/05/18 | 09/29/25 | Senior | 2,401,128 | 2,058,806 | ||||||||||
| AI Sirona (Luxembourg) Acquisition S.à.r.l. +, a | Cash 7.25% + E# | 10/11/18 | 09/28/26 | Second Lien | 13,678,916 | 11,494,152 | ||||||||||
| Gems Education +, a | Cash 5.00% + L (1.00% Floor)^^^ | 08/15/22 | 07/31/26 | Senior | 1,995,000 | 1,983,529 | ||||||||||
| Total Rest of World (0.27%) | 34,457,702 | |||||||||||||||
| Western Europe (2.59%) | ||||||||||||||||
| Acuris Finance US, Inc. +, a | Cash 4.00% + L (0.50% Floor)^^ | 03/11/21 | 02/16/28 | Senior | $ | 677,083 | $ | 666,927 | ||||||||
| AD Education +, a | PIK 8.50% | 06/21/22 | 03/30/29 | Mezzanine | 11,891,373 | 11,776,604 | ||||||||||
| AEA International Holdings (Luxembourg) S.a.r.l. +, a | Cash 3.75% + L (0.50% Floor)^^ | 09/15/21 | 09/07/28 | Senior | 2,277,000 | 2,259,922 | ||||||||||
| AI Convoy (Luxembourg) S.à.r.l. +, a | Cash 3.50% + L (1.00% Floor)^^ | 05/20/20 | 01/18/27 | Senior | 1,842,334 | 1,820,456 | ||||||||||
| AI PLEX AcquiCo GmbH +, a | Cash 4.75% + L^^^ | 08/23/19 | 07/31/26 | Senior | 4,844,774 | 4,063,555 | ||||||||||
| Albion Financing 3 S.à.r.l. +, a | Cash 5.25% + L (0.50% Floor)^^ | 01/14/22 | 08/17/26 | Senior | 2,475,000 | 2,353,317 | ||||||||||
| Alcumus +, a | Cash 5.75% + S>> | 06/29/22 | 03/09/29 | Senior | 1,984,236 | 1,866,187 | ||||||||||
The accompanying notes are an integral part of these Consolidated Financial Statements.
Partners Group Private Equity (Master Fund), LLC (a Delaware Limited Liability Company) |
Consolidated Schedule of Investments — December 31, 2022 (Unaudited) (continued) |
| Interest | Acquisition Date | Maturity Date | Investment Type | Principal | Fair Value** | |||||||||||
| Private Equity Investments (continued) | ||||||||||||||||
| Direct Investments * (continued) | ||||||||||||||||
| Direct Debt (continued) | ||||||||||||||||
| Alcumus +, a, e | Cash 5.75% + S>> | 03/09/22 | 03/09/29 | Senior | $ | — | $ | — | ||||||||
| Altice France S.A. +, a | Cash 4.00% + L^^ | 01/27/21 | 08/14/26 | Senior | 2,948,823 | 2,751,016 | ||||||||||
| Anticimex +, a | Cash 3.50% + L (0.50% Floor)^^ | 01/21/22 | 11/16/28 | Senior | 2,673,000 | 2,586,127 | ||||||||||
| Asgard Investments B.V. +, a | Cash 5.75% + E## | 03/15/22 | 03/15/29 | Senior | 13,721,320 | 13,040,524 | ||||||||||
| Aston Finco S.à.r.l. +, a | Cash 4.25% + L^^ | 11/14/19 | 10/09/26 | Senior | 2,723,000 | 2,462,562 | ||||||||||
| Aston Finco S.à.r.l. +, a | Cash 8.25% + L^^ | 10/25/19 | 10/09/27 | Second Lien | 36,733,592 | 30,335,779 | ||||||||||
| Auris Luxembourg III S.à.r.l. +, a | Cash 3.75% + L^ | 04/04/19 | 02/27/26 | Senior | 963,712 | 864,931 | ||||||||||
| Babar Bidco +, a | Cash 4.00% + E### | 12/04/20 | 11/17/27 | Senior | 1,214,051 | 1,028,235 | ||||||||||
| BK LC Lux SPV S.à.r.l. +, a | Cash 3.25% + L (0.50% Floor)^^^ | 07/09/21 | 04/28/28 | Senior | 1,866,750 | 1,825,336 | ||||||||||
| CD&R Firefly Bidco Limited +, a | Cash 4.75% + S>>> | 08/31/18 | 06/23/25 | Senior | 5,199,152 | 4,431,361 | ||||||||||
| CD&R Firefly Bidco Limited +, a | Cash 8.35% + S>>> | 06/21/18 | 06/18/26 | Second Lien | 44,095,247 | 36,935,027 | ||||||||||
| CEP V Investment 22 S.à.r.l. (Lux) +, a | PIK 8.25% + L^^^ | 02/28/22 | 08/31/30 | Mezzanine | 6,648,197 | 6,104,406 | ||||||||||
| Cidron Kuma 2 S.à.r.l. +, a | Cash 7.00% + E (0.50% Floor)### | 01/01/21 | 02/28/26 | Second Lien | 1,146,938 | 928,422 | ||||||||||
| Compass IV Limited +, a | Cash 4.00% + E### | 07/06/18 | 05/09/25 | Senior | 341,033 | 191,018 | ||||||||||
| Constellation Automotive Group Limited +, a | Cash 4.75% + S>>> | 09/03/21 | 07/28/28 | Senior | 1,387,192 | 837,564 | ||||||||||
| Constellation Automotive Limited +, a | Cash 7.50% + S>>> | 10/18/21 | 07/30/29 | Second Lien | 1,372,084 | 496,983 | ||||||||||
| Constellation BidCo GmbH +, a | Cash 6.00% + E## | 10/26/22 | 06/27/29 | Senior | 26,760,488 | 27,852,037 | ||||||||||
| CTEC III GmbH +, a | Cash 3.75% + E## | 03/29/18 | 03/07/25 | Senior | 4,055,926 | 3,227,422 | ||||||||||
| Dragon Bidco Limited +, a | Cash 6.00% + S>> | 03/09/22 | 03/09/29 | Senior | 8,941,459 | 7,940,970 | ||||||||||
| EG Group Limited +, a | Cash 4.00% + L^ | 05/22/18 | 02/07/25 | Senior | 1,347,758 | 1,295,102 | ||||||||||
| Envirotainer +, a | Cash 6.00% + E## | 07/29/22 | 07/27/29 | Senior | 8,191,195 | 8,362,074 | ||||||||||
| Envirotainer +, a | Cash 6.00% + L (0.75% Floor)^^ | 07/29/22 | 07/27/29 | Senior | 4,089,559 | 3,978,557 | ||||||||||
| Envirotainer +, a, e | Cash 6.00% + E## | 07/29/22 | 07/27/29 | Senior | — | — | ||||||||||
| Fusilli AcquiCo S.à.r.l. +, a | Cash 6.00% + E### | 01/27/22 | 10/12/23 | Senior | 1,114,648 | 817,122 | ||||||||||
| Grupo Iberica de Congelados, SA +, a | Cash 7.00% + E# | 06/28/19 | 11/28/24 | Senior | 1,094,459 | 839,737 | ||||||||||
| HIG Finance 2 Limited +, a | Cash 3.25% + L (0.75% Floor)^ + P 2.25% (1.75% Floor) | 10/05/21 | 11/12/27 | Senior | 3,168,197 | 3,090,687 | ||||||||||
| HNVR Holdco Limited +, a | Cash 5.50% + E### | 01/25/22 | 09/12/27 | Senior | 1,691,173 | 1,396,094 | ||||||||||
| Holding Socotec SAS +, a | Cash 4.00% + L (0.75% Floor)^^ | 09/10/21 | 06/30/28 | Senior | 1,485,000 | 1,403,941 | ||||||||||
| Hunter Douglas NV +, a | Cash 3.50% + SF (0.50% Floor)vv | 03/07/22 | 02/26/29 | Senior | 1,791,000 | 1,584,874 | ||||||||||
| Hunter Holdco 3 Limited +, a | Cash 4.25% + L (0.50% Floor)^^ | 08/26/21 | 08/19/28 | Senior | 3,085,188 | 3,035,053 | ||||||||||
| Hurtigruten AS +, a | Cash 8.00% + E## | 01/10/22 | 06/22/23 | Senior | 1,697,931 | 1,440,385 | ||||||||||
| IGT Holding IV AB +, a | Cash 3.50% + L(0.50% Floor)^^^ | 07/21/21 | 03/31/28 | Senior | 1,866,750 | 1,834,082 | ||||||||||
| International Park Holdings B.V. +, a | Cash 3.50% + L^^ | 11/16/21 | 06/13/24 | Senior | 2,967,557 | 2,771,775 | ||||||||||
| ION Trading Finance Limited +, a | Cash 4.75% + L (1.00% Floor)^^ | 05/25/21 | 04/01/28 | Senior | 2,758,000 | 2,623,051 | ||||||||||
| Loire UK Midco 3 Limited +, a | Cash 3.75% + L (0.75% Floor)^^^ | 07/09/21 | 04/21/27 | Senior | 1,273,917 | 1,197,482 | ||||||||||
| Loire UK Midco 3 Limited +, a | Cash 3.25% + L^^^ | 06/08/20 | 04/21/27 | Senior | 1,365,391 | 1,283,468 | ||||||||||
| Mar Bidco S.à.r.l. +, a | Cash 4.25% + L^^ | 07/30/21 | 07/06/28 | Senior | 2,962,500 | 2,710,687 | ||||||||||
| Matador Bidco S.à.r.l. +, a | Cash 4.75% + L^ | 11/12/19 | 10/15/26 | Senior | 3,352,679 | 3,315,380 | ||||||||||
| Nomad Foods Limited +, a | Cash 3.75% + SF (0.50% Floor)vv | 12/09/22 | 11/12/29 | Senior | 1,184,960 | 1,183,603 | ||||||||||
| Osmosis Buyer Limited +, a | Cash 4.00% + L (0.50% Floor)^^ | 08/03/21 | 07/30/28 | Senior | 3,491,250 | 3,297,049 | ||||||||||
| OT Luxco 3 & Cy S.C.A. +, a | Cash 8.75% + E (1.00% Floor)###; PIK 9.00% | 05/31/17 | 05/31/27 | Mezzanine | 29,558,262 | 27,433,294 | ||||||||||
| Paradocs Holding S.à.r.l. +, a | Cash 3.75% + L (0.75% Floor)^^ | 06/02/21 | 02/17/28 | Senior | 1,866,750 | 1,818,915 | ||||||||||
| PEARLS (Netherlands) Bidco B.V. +, a | Cash 4.00% + SFvvv | 03/30/22 | 03/01/29 | Senior | 1,488,750 | 1,449,670 | ||||||||||
| Pegasus BidCo B.V. +, a | Cash 4.25% + SF (0.50% Floor)vv | 05/05/22 | 07/12/29 | Senior | 2,765,370 | 2,682,409 | ||||||||||
| Rainbow Jvco Ltd. +, a | Cash 7.25% + E##; PIK 7.25% | 02/24/22 | 02/24/30 | Mezzanine | 9,256,340 | 8,429,634 | ||||||||||
| RivieraTopco S.à.r.l. +, a | PIK 8.50% + E (1.00% Floor)### | 01/01/21 | 05/08/24 | Mezzanine | 2,049,873 | 1,689,196 | ||||||||||
| Sapphire Bidco B.V. +, a | Cash 3.00% + E## | 05/25/18 | 05/05/25 | Senior | 2,271,578 | 2,041,204 | ||||||||||
The accompanying notes are an integral part of these Consolidated Financial Statements.
Partners Group Private Equity (Master Fund), LLC (a Delaware Limited Liability Company) |
Consolidated Schedule of Investments — December 31, 2022 (Unaudited) (continued) |
| Interest | Acquisition Date | Maturity Date | Investment Type | Principal | Fair Value** | |||||||||||
| Private Equity Investments (continued) | ||||||||||||||||
| Direct Investments * (continued) | ||||||||||||||||
| Direct Debt (continued) | ||||||||||||||||
| Seren Bidco AB +, a | Cash 7.25% + SR ¤¤ | 11/16/21 | 11/16/29 | Second Lien | $ | 16,653,255 | $ | 13,697,030 | ||||||||
| Sevetys Invest +, a, e | Cash 6.25% + E## | 12/16/22 | 12/07/28 | Senior | 670,269 | 655,208 | ||||||||||
| Sevetys Invest +, a | Cash 6.25% + E## | 12/16/22 | 12/07/28 | Senior | 14,645,246 | 14,316,167 | ||||||||||
| Sitel Group +, a | Cash 3.75% + L (0.50% Floor)^^ | 10/15/21 | 08/28/28 | Senior | 1,777,500 | 1,759,281 | ||||||||||
| Spinnaker DebtCo Limited +, a | Cash 6.25% + E## | 12/21/22 | 12/14/29 | Senior | 15,346,207 | 14,880,018 | ||||||||||
| Starfruit Finco B.V. +, a | Cash 2.75% + L^^ | 11/14/18 | 10/01/25 | Senior | 2,760,353 | 2,727,919 | ||||||||||
| Summer (BC) Bidco B LLC +, a | Cash 4.50% + L (0.75% Floor)^^ | 09/08/21 | 12/04/26 | Senior | 987,500 | 919,200 | ||||||||||
| Sunshine Luxembourg VII S.à.r.l. +, a | Cash 3.75% + L (0.75% Floor)^^ | 10/22/19 | 10/01/26 | Senior | 2,736,263 | 2,627,195 | ||||||||||
| team.blue Finco S.à.r.l. +, a | Cash 3.75% + E### | 06/25/21 | 03/27/28 | Senior | 4,056,317 | 3,435,738 | ||||||||||
| Vertical Midco GmbH +, a | Cash 3.50% + L^^^ | 09/09/20 | 07/30/27 | Senior | 3,910,607 | 3,772,836 | ||||||||||
| Virgin Media Bristol, LLC +, a | Cash 2.50% + L^ | 02/07/18 | 01/31/28 | Senior | 5,486,250 | 5,417,995 | ||||||||||
| Ziggo Financing Partnership +, a | Cash 2.50% + L^ | 02/27/20 | 04/30/28 | Senior | 2,500,000 | 2,443,562 | ||||||||||
| Total Western Europe (2.59%) | 328,303,362 | |||||||||||||||
| Total Direct Debt (8.91%) | $ | 1,130,253,452 | ||||||||||||||
| Total Direct Investments (69.19%) | $ | 8,778,467,618 | ||||||||||||||
| Secondary Investments *, c (12.16%) | ||||||||||||||||
| Acquisition Date | Fair Value | |||||
| Asia - Pacific (1.17%) | ||||||
| Baring Asia Private Equity Fund IV, L.P. +, a, e | 11/24/09 | $ | 5,492 | |||
| CVC Capital Partners Asia Pacific III, L.P. +, a, e | 01/11/13 | 219,782 | ||||
| MBK Partners Colonel Fund, L.P. +, a, e | 09/20/21 | 86,455,732 | ||||
| TPG Asia VII (B), L.P. +, a, e | 12/07/18 | 20,483,108 | ||||
| TRG Growth Partnership (Offshore) II, L.P. +, a, e | 08/02/10 | 154,415 | ||||
| TRG Growth Partnership (Offshore), L.P. +, a, e | 08/02/10 | 5,343 | ||||
| TRG Growth Partnership II, L.P. +, a, e | 07/08/10 | 459,327 | ||||
| Yunfeng Capital Fund III, L.P. +, a, e | 05/18/21 | 37,126,991 | ||||
| Yunfeng Capital Fund IV, L.P. +, a, e | 05/31/21 | 3,532,216 | ||||
| Total Asia - Pacific (1.17%) | 148,442,406 | |||||
| North America (8.82%) | ||||||
| Abingworth Bioventures V, L.P. +, a, e | 06/30/12 | $ | 29,963 | |||
| Apollo Investment Fund VII, L.P. +, a, e | 07/01/10 | 19,170 | ||||
| Apollo Overseas Partners (Delaware) VII, L.P. +, a, e | 10/01/09 | 8,669 | ||||
| Ares PE Extended Value Fund, L.P. +, a, e | 11/14/19 | 40,452,980 | ||||
| Avenue Golden Continuation Fund PV, L.P. +, a, e | 04/26/22 | 21,987,749 | ||||
| Bain Capital Fund X, L.P. +, a, e | 06/30/11 | 4,607,371 | ||||
| Berkshire Fund VIII, L.P. +, a, e | 09/03/21 | 34,999,839 | ||||
| Berkshire Fund X-A, L.P. +, a, e | 09/03/21 | 8,848,639 | ||||
| Bertram Growth Capital II-A, L.P. +, a, e | 09/30/15 | 182,947 | ||||
| Centerbridge Seaport Acquisition Fund, L.P. +, a, e | 05/12/22 | 105,702 | ||||
| Clayton, Dubilier & Rice Fund VIII, L.P. +, a, e | 03/29/12 | 1,839,143 | ||||
| DST Opportunities Access Offshore L.P. +, a, e | 09/30/20 | 10,864,696 | ||||
| ECP Terra-Gen Growth Fund, L.P. +, a, e | 03/23/21 | 3,713,216 | ||||
| EETF Sidecar, L.P. +, a, e | 04/30/21 | 7,653,551 | ||||
| EnCap Energy Co-Investment Fund I-C, L.P. +, a, e | 04/30/21 | 1,467,846 | ||||
| EnCap Energy Transition Fund I, L.P. +, a, e | 04/30/21 | 4,027,875 | ||||
| Energy Capital Partners Credit Solutions II, L.P. +, a, e | 02/03/21 | 2,735,542 | ||||
| Energy Capital Partners III, L.P. +, a, e | 02/01/21 | 5,608,859 | ||||
| Frazier Healthcare VI, L.P. +, a | 06/30/12 | 154,181 | ||||
| FS Equity Partners V, L.P. +, a, e | 08/07/12 | 891,926 | ||||
The accompanying notes are an integral part of these Consolidated Financial Statements.
Partners Group Private Equity (Master Fund), LLC
(a Delaware Limited Liability Company)
Consolidated Schedule of Investments —
December 31, 2022 (Unaudited) (continued)
| Acquisition Date | Fair Value | |||||
| Private Equity Investments (continued) | ||||||
| Secondary Investments *, c (continued) | ||||||
| North America (continued) | ||||||
| GA Continuity Fund I L.P. (Bermuda) +, a, e | 06/30/21 | $ | 64,187,160 | |||
| General Atlantic Investment Partners 2021, L.P. +, a, e | 07/02/21 | 3,326,081 | ||||
| General Atlantic Investment Partners 2022, L.P. +, a, e | 12/01/22 | — | ||||
| Genstar Capital Partners V, L.P. +, a, e | 09/30/15 | 56,397 | ||||
| Green Equity Investors Side CF, L.P. +, a, e | 04/16/21 | 44,358,814 | ||||
| Gridiron Energy Feeder I, L.P. +, a, e | 05/15/17 | 35,415,668 | ||||
| Gryphon Partners 3.5, L.P. +, a, e | 05/21/13 | 503,945 | ||||
| Gryphon Partners IV L.P. +, a, e | 02/08/16 | 24,598,934 | ||||
| H.I.G. Bayside Debt & LBO Fund II, L.P. +, a, e | 12/30/10 | 219,064 | ||||
| Icon Partners IV, L.P. +, a, e | 05/26/21 | 33,849,150 | ||||
| Icon Partners V, L.P. +, a, e | 12/27/21 | 75,693,811 | ||||
| Insight Venture Partners Continuation Fund, L.P. +, a, e | 09/09/19 | 54,169,753 | ||||
| Investcorp Private Equity 2007 Fund, L.P. +, a, e | 03/31/11 | 8,474 | ||||
| KKR Associates Indigo Equity Partners, L.P. +, a | 06/09/22 | 121,987,113 | ||||
| KSL Capital Partners CV I, L.P. +, a, e | 05/23/22 | 33,241,141 | ||||
| Lee Equity Partners II, L.P. +, a, e | 06/30/17 | 5,824,059 | ||||
| Lee Equity Partners Realization Fund, L.P. +, a | 06/30/17 | 11,244,021 | ||||
| LEP Captive Co-Invest II, L.P. +, a | 07/01/22 | 14,431,625 | ||||
| Madison Dearborn Capital Partners V, L.P. +, a, e | 03/31/11 | 236,509 | ||||
| Madison Dearborn Capital Partners VIII, L.P. +, a, e | 03/15/21 | 6,058,995 | ||||
| MidOcean Partners III, L.P. +, a, e | 06/30/11 | 927 | ||||
| Monomoy Capital Partners II, L.P. +, a, e | 09/30/15 | 519,512 | ||||
| New Enterprise Associates 17, L.P. +, a, e | 09/30/20 | 6,272,733 | ||||
| Northgate Growth Fund, L.P. +, a, e | 12/20/19 | 5,848,183 | ||||
| NVP VIII PG, L.P. +, a, e | 05/31/19 | 91,324,401 | ||||
| Oak Investment Partners XII, L.P. +, a | 06/28/12 | 133,347 | ||||
| Pamlico Capital GP II, LLC +, a | 03/31/14 | 2,523 | ||||
| Providence Equity Partners IV, L.P. +, a, e | 06/30/11 | 782 | ||||
| Providence Equity Partners V, L.P. +, a, e | 06/30/11 | 6,820 | ||||
| Providence Equity Partners VI-A, L.P. +, a, e | 06/30/11 | 709,382 | ||||
| Providence Equity Partners VII-A, L.P. +, a, e | 06/30/13 | 1,686,973 | ||||
| PT2, L.P. +, a, e | 12/21/21 | 9,825,079 | ||||
| Revelstoke EPIC Fund I, L.P. +, a, e | 11/20/19 | 95,542,689 | ||||
| Samson Partners, L.P. +, a, e | 12/21/20 | 40,165,082 | ||||
| Silver Lake Partners III, L.P. +, a, e | 03/31/13 | 966,447 | ||||
| Silver Lake Partners V, L.P. +, a, e | 09/30/20 | 5,731,333 | ||||
| Silver Lake Partners VI, L.P. +, a, e | 09/30/22 | 19,197,874 | ||||
| SL SPV-1, L.P. +, a | 12/01/17 | 2,958,156 | ||||
| SL SPV-2, L.P. +, a | 06/30/10 | 8,676,298 | ||||
| Sun Capital Partners V, L.P. +, a, e | 09/30/13 | 3,327,221 | ||||
| TA Atlantic & Pacific VI, L.P. +, a, e | 09/30/15 | 120,077 | ||||
| TA XI, L.P. +, a, e | 09/30/15 | 953,183 | ||||
| TCV VII (A), L.P. +, a, e | 09/30/13 | 604,613 | ||||
| TorQuest Partners Fund (U.S.) II, L.P. +, a, e | 09/30/15 | 233,657 | ||||
| TPG Partners V, L.P. +, a, e | 07/11/11 | 14,980 | ||||
| TPG Partners VI, L.P. +, a, d, e | 12/31/12 | 1,445,501 | ||||
| Trident VIII, L.P. +, a, e | 09/30/22 | 28,730,726 | ||||
| Vistria Fund III, L.P. +, a, e | 07/29/19 | 15,781,024 | ||||
| Vistria Fund IV, L.P. +, a, e | 10/01/22 | 32,865,723 | ||||
| Warburg Pincus Private Equity X, L.P. +, a | 09/28/12 | 221,258 | ||||
| Welsh, Carson, Anderson & Stowe XII, L.P. +, a, e | 12/31/18 | 61,069,681 | ||||
The accompanying notes are an integral part of these Consolidated Financial Statements.
Partners Group Private Equity (Master Fund), LLC
(a Delaware Limited Liability Company)
Consolidated Schedule of Investments —
December 31, 2022 (Unaudited) (continued)
| Acquisition Date | Fair Value | |||||
| Private Equity Investments (continued) | ||||||
| Secondary Investments *, c (continued) | ||||||
| North America (continued) | ||||||
| Welsh, Carson, Anderson & Stowe XIII, L.P. +, a, e | 12/20/18 | $ | 3,960,424 | |||
| Total North America (8.82%) | 1,118,507,187 | |||||
| Western Europe (2.17%) | ||||||
| 3i Eurofund Vb, L.P. +, a | 06/30/11 | $ | 82,271 | |||
| 3i Growth Capital B, L.P. +, a, e | 10/01/14 | 73,296 | ||||
| Abingworth Bioventures III, L.P. +, a, e | 09/30/15 | 8,626 | ||||
| Abingworth Bioventures V Co-Investment Growth Equity Fund, L.P. +, a, e | 06/30/12 | 25,570 | ||||
| Advent International GPE VI, L.P. +, a | 04/30/11 | 311,248 | ||||
| Apax Europe VI - A, L.P. +, a, e | 07/01/11 | 55,148 | ||||
| Apax Europe VII - B, L.P. +, a, e | 04/30/11 | 11,288 | ||||
| Astorg IQ-EQ Fund SCSp +, a, e | 01/13/22 | 18,714,654 | ||||
| BC European Capital IX, L.P. +, a, e | 09/30/14 | 2,920,906 | ||||
| Carlyle Europe Partners II, L.P. +, a, e | 12/28/12 | 19,301 | ||||
| Carlyle Europe Partners III, L.P. +, a, e | 09/30/14 | 160,979 | ||||
| CCP IX L.P. No.2 +, a | 09/30/14 | 168,814 | ||||
| CD&R Value Building Partners I, L.P. +, a | 12/17/21 | 48,116,096 | ||||
| Daiwa ICP European Infrastructure 1, L.P. +, a, e | 12/22/22 | 41,002,087 | ||||
| EPIC I-b Fund SLP +, a, e | 11/30/20 | 19,673,093 | ||||
| ESP Golden Bear Europe Fund +, a, e | 12/31/16 | 3,787,769 | ||||
| Galileo III FCPR +, a, e | 09/30/15 | 30,433 | ||||
| Graphite Capital Partners VII, L.P. +, a, e | 09/30/15 | 187,005 | ||||
| Italian Private Equity Fund IV, L.P. +, a, e | 01/29/16 | 15,468 | ||||
| KKR European Fund III, L.P. +, a, e | 11/01/10 | 162,387 | ||||
| Montagu+ SCSp +, a, e | 12/06/21 | 39,918,445 | ||||
| Permira Europe II, L.P. +, a | 11/29/13 | 25,147 | ||||
| Permira Europe III, L.P. +, a | 09/30/13 | 57,378 | ||||
| Permira IV, L.P. +, a | 09/30/15 | 6,770,859 | ||||
| Permira VII L.P. +, a, e | 09/29/22 | 29,840,695 | ||||
| Rivean Special Opportunity Fund I Coöperatief U.A. +, a, e | 11/29/22 | 31,780,938 | ||||
| Riverside Europe Fund IV, L.P. +, a, e | 09/30/14 | 462,405 | ||||
| STG Alternative Investments S.C.A. SICAV-RAIF +, a, e | 09/17/21 | 18,329,032 | ||||
| Trilantic Capital Partners V (Europe) S.C.A., SICAR +, a, e | 11/20/20 | 11,454,380 | ||||
| Trilantic Europe VI SCSp +, a, e | 12/10/20 | 1,852,338 | ||||
| Total Western Europe (2.17%) | 276,018,056 | |||||
| Total Secondary Investments (12.16%) | $ | 1,542,967,649 | ||||
| Primary Investments *, c (14.51%) | ||||||
| Asia - Pacific (1.03%) | ||||||
| Baring Asia Private Equity Fund V, L.P. +, a, e | 12/01/10 | $ | 2,161,543 | |||
| BGH Capital Fund I +, a, e | 03/01/18 | 14,494,227 | ||||
| BGH Capital VCLP II +, a, e | 02/01/22 | — | ||||
| CMC Capital Partners IV, L.P. +, a, e | 12/03/21 | — | ||||
| CPEChina Fund III, L.P. +, a, e | 03/28/18 | 35,781,551 | ||||
| CVC Capital Partners Asia VI L.P. +, a, e | 12/23/22 | — | ||||
| Hony Capital Fund VIII, L.P. +, a, e | 10/30/15 | 8,474,307 | ||||
| Hony Capital Partners V, L.P. +, a, e | 12/15/11 | 4,119,293 | ||||
| J-STAR No.4-C, L.P. +, a, e | 08/02/19 | 19,782,685 | ||||
| J-STAR No.5-B, L.P. +, a, e | 02/28/22 | 51,344 | ||||
| Kedaara Capital III Limited +, a, e | 06/17/21 | 2,059,575 | ||||
| KKR Asian Fund IV SCSp +, a, e | 05/29/20 | 2,471,568 | ||||
| Primavera Capital Fund III L.P. +, a, e | 05/09/18 | 13,018,072 | ||||
| Primavera Capital Fund IV, L.P. +, a, e | 05/20/21 | 4,283,354 | ||||
The accompanying notes are an integral part of these Consolidated Financial Statements.
Partners Group Private Equity (Master Fund), LLC
(a Delaware Limited Liability Company)
Consolidated Schedule of Investments —
December 31, 2022 (Unaudited) (continued)
| Acquisition Date | Fair Value | |||||
| Private Equity Investments (continued) | ||||||
| Primary Investments *, c (continued) | ||||||
| Asia - Pacific (continued) | ||||||
| Southern Capital Fund IV L.P. +, a, e | 01/26/18 | $ | 1,942,007 | |||
| The Baring Asia Private Equity Fund VII, L.P. +, a, e | 07/10/18 | 9,979,368 | ||||
| TPG Asia VIII (B), L.P. +, a, e | 07/01/22 | — | ||||
| Trustbridge Partners VI, L.P. +, a, e | 04/12/18 | 11,145,925 | ||||
| Total Asia - Pacific (1.03%) | 129,764,819 | |||||
| North America (9.11%) | ||||||
| Advent Global Technology, L.P. +, a, e | 06/25/19 | $ | 2,770,074 | |||
| AEA Investors Fund VII L.P. +, a, e | 02/08/19 | 3,309,823 | ||||
| American Industrial Partners Capital Fund VII, L.P. +, a, e | 03/29/19 | 16,190,786 | ||||
| Apollo Investment Fund IX, L.P +, a, e | 06/01/17 | 30,707,058 | ||||
| Apollo Investment Fund VIII, L.P. +, a, e | 06/28/13 | 4,150,526 | ||||
| Ares Corporate Opportunities Fund IV, L.P. +, a, e | 04/19/12 | 4,072,484 | ||||
| Ares Corporate Opportunities Fund V, L.P. +, a, e | 12/28/15 | 9,861,408 | ||||
| Ares Corporate Opportunities Fund VI, L.P. +, a, e | 06/02/20 | 1,704,037 | ||||
| Avista Capital Partners II, L.P. +, a, e | 01/01/14 | 49,586 | ||||
| Bain Capital Fund XII, L.P. +, a, e | 06/30/17 | 19,666,681 | ||||
| Bain Capital Fund XIII, L.P. +, a, e | 08/07/20 | 5,725,529 | ||||
| Barings Transportation Fund, L.P. +, a, e | 09/23/21 | 11,856,472 | ||||
| Berkshire Fund IX, L.P. +, a, e | 03/18/16 | 14,158,383 | ||||
| Caltius Partners V-A, L.P. +, a, e | 12/02/14 | 6,078,654 | ||||
| Carlyle Partners VII, L.P. +, a, e | 11/29/17 | 56,188,505 | ||||
| Carlyle Partners VIII, L.P. +, a, e | 09/10/21 | 1,349,317 | ||||
| Centerbridge Seaport Acquisition Fund, L.P. +, a | 04/27/22 | 778,906 | ||||
| Clayton, Dubilier & Rice Fund IX, L.P. +, a, e | 07/31/13 | 9,988,743 | ||||
| Clayton, Dubilier & Rice Fund X, L.P. +, a, e | 12/13/16 | 26,290,921 | ||||
| Clayton, Dubilier & Rice Fund XI, L.P. +, a, e | 05/15/20 | 12,983,797 | ||||
| Clayton, Dubilier & Rice Fund XII, L.P. +, a, e | 09/02/22 | — | ||||
| Clearlake Capital Partners V, L.P. +, a, e | 12/15/17 | 35,673,391 | ||||
| Clearlake Capital Partners VI, L.P. +, a, e | 12/10/19 | 21,870,003 | ||||
| Clearlake Capital Partners VII, L.P. +, a, e | 09/23/21 | 5,994,821 | ||||
| Crescent Mezzanine Partners VI, L.P. +, a, e | 03/30/12 | 664,911 | ||||
| Cressey & Company Fund VII-A L.P. +, a, e | 06/30/22 | — | ||||
| ECP V, L.P. +, a, e | 08/19/22 | — | ||||
| Frazier Healthcare Growth Buyout Fund X, L.P. +, a, e | 03/10/21 | 5,089,262 | ||||
| Genstar Capital Partners IX, L.P. +, a, e | 02/21/19 | 22,091,694 | ||||
| Genstar Capital Partners VI, L.P. +, a, e | 09/01/12 | 1,819,983 | ||||
| Genstar Capital Partners VII, L.P. +, a, e | 06/26/15 | 6,793,349 | ||||
| Genstar Capital Partners VIII, L.P. +, a, e | 03/23/17 | 33,050,589 | ||||
| Genstar Capital Partners X, L.P. +, a, e | 04/01/21 | 5,574,448 | ||||
| Genstar X Opportunities Fund, L.P. +, a, e | 08/13/21 | 1,632,841 | ||||
| GoldPoint Mezzanine Partners IV, L.P. +, a, e | 12/30/15 | 9,251,279 | ||||
| Green Equity Investors IX, L.P. +, a, e | 03/01/22 | — | ||||
| Green Equity Investors Side VIII, L.P. +, a, e | 10/18/19 | 28,126,897 | ||||
| Gryphon Heritage Partners, L.P. +, a, e | 12/17/20 | 8,236,329 | ||||
| Gryphon Partners V, L.P. +, a, e | 02/23/18 | 9,359,355 | ||||
| Gryphon Partners VI, L.P. +, a, e | 12/17/20 | 7,312,762 | ||||
| Harvest Partners IX, L.P. +, a, e | 09/24/21 | 1,832,701 | ||||
| Harvest Partners VII, L.P. +, a, e | 12/14/15 | 12,032,865 | ||||
| Harvest Partners VIII, L.P. +, a, e | 12/19/18 | 25,486,691 | ||||
| Hellman & Friedman Capital Partners VII, L.P. +, a, e | 06/30/14 | 489,184 | ||||
| Hellman & Friedman Capital Partners X, L.P. +, a, e | 05/10/21 | 7,443,727 | ||||
| HGGC Fund IV, L.P. +, a, e | 04/08/22 | 1,516,598 | ||||
The accompanying notes are an integral part of these Consolidated Financial Statements.
Partners Group Private Equity (Master Fund), LLC
(a Delaware Limited Liability Company)
Consolidated Schedule of Investments —
December 31, 2022 (Unaudited) (continued)
| Acquisition Date | Fair Value | |||||
| Private Equity Investments (continued) | ||||||
| Primary Investments *, c (continued) | ||||||
| North America (continued) | ||||||
| Icon Partners IV, L.P. +, a, e | 09/01/21 | $ | 5,772,472 | |||
| Icon Partners V, L.P. +, a, e | 12/27/21 | 7,440,381 | ||||
| Insight Partners XII (Co-Investors), L.P. +, a, e | 06/07/21 | 1,075,694 | ||||
| Insight Partners XIII, L.P. +, a, e | 12/23/22 | — | ||||
| Insight Venture Partners X, L.P. +, a, e | 07/06/18 | 14,686,315 | ||||
| Insight Venture Partners XI, L.P. +, a, e | 12/17/19 | 7,761,307 | ||||
| Insight Ventures Partners XII, L.P. +, a, e | 06/07/21 | 3,969,524 | ||||
| Jade Equity Investors II, L.P. +, a, e | 03/01/22 | — | ||||
| KKR Americas Fund XII L.P. +, a, e | 01/31/18 | 29,122,163 | ||||
| KKR Associates Indigo Equity Partners, L.P. +, a | 10/01/22 | 1,757,718 | ||||
| KKR North America Fund XI, L.P. +, a, e | 02/01/12 | 3,983,370 | ||||
| KKR North America Fund XIII, SCSP +, a, e | 04/06/21 | 2,671,627 | ||||
| Kleiner Perkins Caufield & Byers XIX LLC +, a, e | 03/05/20 | 9,893,583 | ||||
| Kohlberg TE Investors IX, L.P. +, a, e | 12/20/19 | 16,839,954 | ||||
| Kohlberg TE Investors VIII, L.P. +, a, e | 08/04/16 | 23,771,672 | ||||
| Leeds Equity Partners VI, L.P. +, a, e | 11/25/16 | 16,252,690 | ||||
| Lerer Hippeau Select Fund III, L.P. +, a, e | 12/20/19 | 7,860,123 | ||||
| Lerer Hippeau VII, L.P. +, a, e | 12/20/19 | 3,306,949 | ||||
| Lux Total Opportunities, L.P. +, a, e | 05/28/21 | 1,777,414 | ||||
| Lux Ventures VII, L.P. +, a, e | 05/28/21 | 536,451 | ||||
| Madison Dearborn Capital Partners VIII, L.P. +, a, e | 03/20/20 | 5,743,124 | ||||
| Nautic Partners IX-A, L.P. +, a, e | 03/12/19 | 8,053,938 | ||||
| Nautic Partners VII-A, L.P. +, a, e | 06/27/14 | 2,445,776 | ||||
| Nautic Partners X-A, L.P. +, a, e | 07/19/21 | 2,832,061 | ||||
| NEA 18 Venture Growth Equity, L.P. +, a, e | 12/22/21 | 811,393 | ||||
| New Enterprise Associates 14, L.P. +, a, e | 05/04/12 | 8,560,101 | ||||
| New Enterprise Associates 17, L.P. +, a, e | 06/06/19 | 8,496,350 | ||||
| New Enterprise Associates 18, L.P. +, a, e | 12/22/21 | 641,230 | ||||
| New Mountain Capital V, L.P. +, a, e | 06/29/17 | 49,099,561 | ||||
| New Mountain Partners VI, L.P. +, a, e | 10/16/20 | 10,293,413 | ||||
| NexPhase Capital Fund III-A, L.P. +, a, e | 09/01/16 | 23,091,555 | ||||
| Oak Hill Capital Partners IV, L.P. +, a, e | 04/28/17 | 10,242,727 | ||||
| Oak Hill Capital Partners V, L.P. +, a, e | 12/21/18 | 35,188,518 | ||||
| Oak Hill Capital Partners VI, L.P. +, a, e | 02/25/22 | 1 | ||||
| Pamlico Capital V, L.P. +, a, e | 02/03/20 | 1,784,891 | ||||
| PennantPark Credit Opportunities Fund II, L.P. +, a, e | 08/03/12 | 1,712,489 | ||||
| Revelstoke Capital Partners Fund III, L.P +, a, e | 02/23/22 | 3,248,182 | ||||
| Silver Lake Partners IV, L.P. +, a, e | 07/30/12 | 15,255,256 | ||||
| Silver Lake Partners V, L.P. +, a, e | 03/31/17 | 49,095,334 | ||||
| Silver Lake Partners VI, L.P. +, a, e | 06/04/20 | 3,780,256 | ||||
| Silver Lake Partners VII, L.P. +, a, e | 05/26/22 | — | ||||
| Spark Capital Growth Fund IV, L.P. +, a, e | 10/14/21 | 999,899 | ||||
| Spark Capital VII, L.P. +, a, e | 10/14/21 | 1,009,374 | ||||
| Sumeru Equity Partners Fund, L.P. +, a, e | 04/27/15 | 5,573,618 | ||||
| Summit Partners Growth Equity Fund XI, L.P. +, a, e | 10/01/21 | 525,942 | ||||
| TA Select Opportunities Fund II-B, L.P. +, a, e | 05/27/21 | 1,013,602 | ||||
| TA XIII-B, L.P. +, a, e | 05/02/19 | 18,750,923 | ||||
| TA XIV-B, L.P. +, a, e | 05/27/21 | 6,159,498 | ||||
| TCV X, L.P. +, a, e | 08/31/18 | 13,113,685 | ||||
| TCV XI (A), L.P. +, a, e | 10/02/20 | 4,853,947 | ||||
| Thompson Street Capital Partners IV, L.P. +, a, e | 12/10/15 | 6,121,433 | ||||
| Thompson Street Capital Partners V, L.P. +, a, e | 05/04/18 | 7,599,734 | ||||
| Thompson Street Capital Partners VI, L.P. +, a, e | 06/11/21 | 6,340,333 | ||||
The accompanying notes are an integral part of these Consolidated Financial Statements.
Partners Group Private Equity (Master Fund), LLC
(a Delaware Limited Liability Company)
Consolidated Schedule of Investments —
December 31, 2022 (Unaudited) (continued)
| Acquisition Date | Fair Value | |||||
| Private Equity Investments (continued) | ||||||
| Primary Investments *, c (continued) | ||||||
| North America (continued) | ||||||
| TPG Partners IX, L.P. +, a, e | 12/23/22 | $ | — | |||
| TPG Partners VII, L.P. +, a, e | 03/01/16 | 9,933,883 | ||||
| TPG Partners VIII, L.P. +, a, e | 01/31/19 | 9,333,194 | ||||
| Trident IX, L.P. +, a, e | 11/19/21 | 3,285,559 | ||||
| Trident VII, L.P. +, a, e | 09/22/16 | 38,027,411 | ||||
| Trident VIII, L.P. +, a, e | 04/05/19 | 23,209,717 | ||||
| Vista Equity Partners Fund VII, L.P. +, a, e | 08/31/18 | 20,897,337 | ||||
| Vista Equity Partners Fund VIII, L.P. +, a, e | 04/28/22 | 1 | ||||
| Vistria Fund II, L.P. +, a, e | 12/19/17 | 12,060,139 | ||||
| Vistria Fund III, L.P. +, a, e | 06/19/19 | 15,781,024 | ||||
| Vistria Fund IV, L.P. +, a, e | 03/31/21 | 11,800,065 | ||||
| Warburg Pincus Global Growth 14, L.P. +, a, e | 01/31/22 | 1,928,946 | ||||
| Warburg Pincus Global Growth, L.P. +, a, e | 11/20/18 | 11,671,377 | ||||
| Welsh, Carson, Anderson & Stowe XII, L.P. +, a, e | 12/19/14 | 15,542,890 | ||||
| Welsh, Carson, Anderson & Stowe XIII, L.P. +, a, e | 12/20/18 | 14,257,526 | ||||
| Welsh, Carson, Anderson & Stowe XIV, L.P. +, a, e | 01/19/22 | 155,256 | ||||
| West Street Offshore Infrastructure Partners IV +, a, e | 11/02/22 | 2,810,974 | ||||
| Windjammer Senior Equity Fund IV, L.P. +, a, e | 02/06/13 | 5,084,426 | ||||
| Total North America (9.11%) | 1,155,922,646 | |||||
| Rest of World (0.81%) | ||||||
| Advent Latin American Private Equity Fund VI-H L.P. +, a, e | 10/17/14 | $ | 9,838,311 | |||
| Altra Private Equity Fund II, L.P. +, a | 12/07/12 | 1,163,199 | ||||
| Patria - Brazilian Private Equity Fund IV, L.P. +, a, e | 06/30/11 | 5,975,256 | ||||
| Polish Enterprise Fund VIII, L.P. +, a, e | 09/15/17 | 85,819,726 | ||||
| Total Rest of World (0.81%) | 102,796,492 | |||||
| Western Europe (3.56%) | ||||||
| Adagia Capital Europe S.L.P. +, a, e | 06/01/21 | $ | 2,570,309 | |||
| Advent International GPE IX-C, L.P. +, a, e | 05/31/19 | 25,441,468 | ||||
| Advent International GPE VII-B, L.P. +, a, e | 07/01/12 | 2,518,479 | ||||
| Advent International GPE VIII-C, L.P +, a, e | 03/22/16 | 12,089,353 | ||||
| Advent International GPE X (USD) +, a, e | 05/31/22 | 530,473 | ||||
| Apax X USD L.P. +, a, e | 07/16/19 | 16,785,683 | ||||
| Apax XI USD L.P. +, a, e | 06/30/22 | — | ||||
| Astorg Mid-Cap +, a, e | 02/22/21 | 1,491,265 | ||||
| Astorg VI, FCPI +, a, e | 06/30/16 | 4,816,010 | ||||
| Astorg VIII S.à.r.l. +, a, e | 12/17/21 | 2,160,178 | ||||
| Axcel VI K/S +, a, e | 02/21/20 | 14,969,723 | ||||
| Bain Capital Europe Fund IV, L.P. +, a, e | 09/01/14 | 4,416,947 | ||||
| Bain Capital Europe Fund VI, SCSp +, a, e | 06/30/22 | — | ||||
| BC Partners XI, L.P. +, a, e | 12/15/21 | 11,419,093 | ||||
| CapVest Equity Partners III B, L.P. +, a, e | 08/30/13 | 3,204,941 | ||||
| Capvis Equity V L.P. +, a, e | 01/17/18 | 22,096,877 | ||||
| Carlyle Europe Partners IV, L.P. +, a, e | 08/27/13 | 738,170 | ||||
| Carlyle Europe Partners V, L.P. +, a, e | 04/23/18 | 5,325,294 | ||||
| CD&R Value Building Partners I, L.P. +, a | 12/17/21 | 5,984,953 | ||||
| Charterhouse Capital Partners XI +, a, e | 11/26/21 | 1,088,373 | ||||
| CVC Capital Partners VI (A) L.P. +, a, e | 07/05/13 | 9,613,718 | ||||
| CVC Capital Partners VIII, L.P. +, a, e | 06/19/20 | 1,335,833 | ||||
| DPE Deutschland IV +, a, e | 08/24/20 | 2,901,301 | ||||
| EQT IX, L.P. (USD) +, a, e | 05/15/20 | 18,439,746 | ||||
| EQT Mid-Market (No.1) Feeder L.P. +, a, e | 07/01/16 | 21,921,669 | ||||
The accompanying notes are an integral part of these Consolidated Financial Statements.
Partners Group Private Equity (Master Fund), LLC
(a Delaware Limited Liability Company)
Consolidated Schedule of Investments —
December 31, 2022 (Unaudited) (continued)
| Acquisition Date | Fair Value | |||||
| Private Equity Investments (continued) | ||||||
| Primary Investments *, c (continued) | ||||||
| Western Europe (continued) | ||||||
| Gilde Buy-Out Fund VI C.V. +, a, e | 06/28/19 | $ | 16,416,100 | |||
| Graphite Capital Partners IX L.P. +, a, e | 04/11/18 | 8,835,038 | ||||
| Hg Genesis 10 L.P. +, a, e | 04/14/22 | 108,708 | ||||
| Hg Saturn 3 L.P. +, a, e | 02/25/22 | 285 | ||||
| Hg Saturn I L.P. +, a, e | 06/28/18 | 19,067,115 | ||||
| HgCapital 8 L.P. +, a, e | 12/19/16 | 23,139,627 | ||||
| HgCapital Mercury 2 +, a, e | 02/15/17 | 14,993,682 | ||||
| Index Ventures Growth III (Jersey) L.P. +, a, d | 03/18/15 | 21,157,478 | ||||
| KKR European Fund V (EUR) SCSp +, a, e | 11/05/18 | 27,741,677 | ||||
| KKR European Fund VI (USD) +, a, e | 11/01/21 | 2 | ||||
| Livingbridge 7 L.P. +, a, e | 09/04/20 | 10,274,378 | ||||
| MCH Iberian Capital Fund V FCR +, a, e | 12/10/21 | 9,102,744 | ||||
| Nordic Capital Evo GP, SCSp +, a, e | 06/30/21 | 889,737 | ||||
| Nordic Capital IX, L.P. +, a, e | 07/18/17 | 37,305,189 | ||||
| Nordic Capital X, L.P. +, a, e | 09/30/20 | 13,927,893 | ||||
| Nordic Capital XI, L.P. +, a, e | 05/01/22 | — | ||||
| Oakley Capital Fund V, SCSp +, a, e | 04/28/22 | 1,314,079 | ||||
| PAI Europe VI-1, L.P. +, a, e | 03/12/15 | 6,848,092 | ||||
| PAI Partners VIII-1 SCSp +, a, e | 12/17/21 | — | ||||
| Permira VII L.P. +, a, e | 06/21/19 | 21,700,157 | ||||
| Permira VIII SCSp +, a, e | 02/10/22 | 65,224 | ||||
| Sixth Cinven Fund (No.3) L.P. +, a, e | 05/01/16 | 7,162,910 | ||||
| The Eighth Cinven Fund, L.P. +, a, e | 07/05/22 | — | ||||
| The Paragon Partners Fund IV GmbH & Co. KG +, a, e | 04/29/22 | — | ||||
| The Seventh Cinven Fund, L.P. +, a, e | 04/16/19 | 19,952,841 | ||||
| Vitruvian Investment Partnership V +, a, e | 10/07/22 | — | ||||
| Total Western Europe (3.56%) | 451,862,812 | |||||
| Total Primary Investments (14.51%) | $ | 1,840,346,769 | ||||
| Total Private Equity Investments (Cost $9,256,839,192)(95.86%) | $ | 12,161,782,036 | ||||
| Total Investments (Cost $9,483,586,445)(97.67%) | 12,391,913,360 | |||||
| Other Assets in Excess of Liabilities (2.33%) | 295,953,948 | |||||
| Net Assets (100.00%) | $ | 12,687,867,308 | ||||
| * | Direct Investments are private investments directly into the equity or debt of selected operating companies, often together with the management of the company. Primary Investments are investments in newly established private equity partnerships where underlying portfolio companies are not known as of the time of investment. Secondary Investments are portfolios of assets on the secondary market. |
| ** | The Fair Value of any Direct Investment may not necessarily reflect the current or expected future performance of such Direct Investment or the Fair Value of the Fund’s interest in such Direct Investment. Furthermore, the Fair Value of any Direct Investment has not been calculated, reviewed, verified or in any way approved by such Direct Investment or its general partner, manager or sponsor (including any of its affiliates). Please see below for further details regarding the valuation policy of the Fund. |
| *** | Security exempt from registration under Rule 144A of the Securities Act of 1933, as amended. These securities may be sold in certain transactions in reliance on an exemption from registration (normally to qualified institutional buyers). At December 31, 2022, the aggregate value of these securities is $63,471,787 or 0.50% of the Fund's net assets. |
The accompanying notes are an integral part of these Consolidated Financial Statements.
Partners Group Private Equity (Master Fund), LLC
(a Delaware Limited Liability Company)
Consolidated Schedule of Investments —
December 31, 2022 (Unaudited) (continued)
| ^ | The interest rate on these loans is subject to the greater of a LIBOR floor or 1 month LIBOR plus a base rate. The 1 month LIBOR as of December 31, 2022 was 4.39%. |
| ^^ | The interest rate on these loans is subject to the greater of a LIBOR floor or 3 month LIBOR plus a base rate. The 3 month LIBOR as of December 31, 2022 was 4.77%. |
| ^^^ | The interest rate on these loans is subject to the greater of a LIBOR floor or 6 month LIBOR plus a base rate. The 6 month LIBOR as of December 31, 2022 was 5.14%. |
| # | As of December 31, 2022, 1 month EURIBOR was 1.88%. |
| ## | As of December 31, 2022, 3 month EURIBOR was 2.13%. |
| ### | As of December 31, 2022, 6 month EURIBOR was 2.69%. |
| + | The fair value of the investment was determined using significant unobservable inputs. |
| >> | As of December 31, 2022, 3 month Sterling Overnight Interbank Average Rate was 2.74%. |
| >>> | As of December 31, 2022, 6 month Sterling Overnight Interbank Average Rate was 2.14%. |
| ¤ ¤ | As of December 31, 2022, 3 month Stockholm Interbank Offered Rate was 2.70%. |
| vv | As of December 31, 2022, 3 month Secured Overnight Financing Rate was 3.62%. |
| vvv | As of December 31, 2022, 6 month Secured Overnight Financing Rate was 2.89%. |
| a | Private equity investments are generally issued in private placement transactions and as such are generally restricted as to resale. Each investment may have been purchased on various dates and for different amounts. The date of the first purchase is reflected under Acquisition Date as shown in the Schedule of Investments. Total fair value of restricted investments as of December 31, 2022 was $12,161,782,079, or 95.85% of net assets. As of December 31, 2022, the aggregate cost of each investment restricted to resale was $15,568,606, $10,621,500, $22,700,000, $2,204,592, $14,353,176, $8,872,006, $2,218,001, $3,600,295, $4,471,885, $5,441,192, $48,970,725, $6,341,681, $1,209,387, $22,978,362, $7,228,256, $481,884, $1,927,535, $863,084, $1,512,517, $16,300,545, $150,775,861, $24,784,703, $10,273,030, $44,578,381, $35,317,661, $150,000, $1, $0, $4,168,272, $17,127,003, $56,634, $114,607,802, $5,604,217, $122,578,028, $27,243,271, $3,120,000, $1,348,750, $3,602,070, $27,230, $119,978,433, $43,783,284, $107,123,942, $39,083,333, $48,685,202, $38,614,270, $94,861,790, $103,079,624, $56,985,983, $9,367,970, $47,761,620, $15,617,280, $62,584,962, $122,197,451, $151,690,905, $250,000, $219,375, $47,583,000, $1,111,078, $9,683,864, $187,500,000, $61,566,000, $252,000, $83,828,190, $8,804,000, $317,827, $172,633, $37,921,967, $22,612,605, $5,266,696, $60,480,000, $2,162,157, $23,266,740, $15,306,665, $45,225,381, $40,484,909, $38,022,703, $32,126,730, $31,364,705, $1,120,924, $13,722,831, $6,996,130, $3, $1, $1,201,846, $52,454,049, $46,801,951, $28,417,946, $55,007,013, $14,874,473, $90,515,558, $178,485,000, $31,828,128, $51,287,146, $4,987,424, $71,817,900, $4,632,829, $3,546,000, $22,340,802, $64,480,546, $68,399,200, $1,441,200, $7,026,869, $101,309, $69,246,328, $17,408,823, $6,195,472, $12,009,114, $3,792,769, $264,490, $21,810,718, $149,423,941, $89,101,353, $33,206, $83,976,881, $78,503,589, $27,818,080, $14,672,982, $463,974, $60,571,021, $68,887,918, $88,276,348, $866,635, $1,045,423, $3,833,799, $8,703,000, $52,429,641, $9,986,562, $11,664,382, $39,292,014, $92,759,254, $21,615,986, $48,949,162, $17,052,864, $17,052,864, $3,377,868, $18,476,616, $4,520,077, $7,793, $52,258,764, $9,222,920, $64,619,159, $15,139,432, $76,735,181, $13,620, $40,775,356, $51,009,931, $41,607,840, $43,509,034, $93,625,880, $0, $97,483,897, $6,616,483, $115,745,971, $128,601, $1,135,700, $102,497,783, $1,063,586, $5,337,259, $89,653,795, $72,269,706, $1,773, $112,190,937, $88,912, $6,275,980, $23,877,358, $1,183,250, $40,573, $764,865, $254,955, $33,400,016, $36,261,531, $2,436,246, $26,015,343, $12,156,155, $1,038,330, $12,231,850, $32,673,281, $34,731,898, $26,215,597, $2,352,123, $12,006,394, $1,272,506, $2,117,177, $12,550,897, $4,586,992, $10,113,207, $10,144,067, $1,256,564, $4,681,981, $1,664,810, $1,438,436, $2,155,412, $1,846,163, $983,959, $1,376,947, $979,469, $6,811,367, $2,533,152, $1,249,092, $1,578,335, $2,861,354, $2,071,380, $990,535, $979,592, $1,386,490, $1,075,281, $7,049,858, $2,802,074, $-2,108, $3,319,968, $1,693,251, $2,741,622, $3,883,499, $3,196,980, $3,526,659, $1,433,416, $1,963,663, $965,073, $18,581,100, $973,317, $973,914, $151,275, $342,373, $183,333, $1,449,582, $4,868,284, $3,444,074, $1,367,472, $2,966,567, $1,372,159, $971,562, $933,722, $1,436,008, $3,241,124, $1,263,764, $2,384,316, $1,675,934, $1,606,112, $1,636,249, $2,830,183, $30,052,689, $1,393,989, $1,185,956, $8,039,974, $-32,323, $4,453,624, $3,435,596, $2,875,983, $1,946,531, $968,631, $2,061,295, $9,822,994, $253,835, $1,327,520, $957,600, $1,275,534, $1, $28,911,154, $191,006, $2,169,018, $1,670,965, $314,258, $680,931, $3,820,607, $1,577,484, $42,114,091, $3,917,843, $7,818,700, $1,364,500, $16,388,138, $2,843,440, $2,069,315, $1,089,491, $925,262, $2,262,943, $489,603, $1,175,819, $1,910,324, $1,546,576, $1,757,193, $78,906, $2,254,843, $606,245, $984,418, $11,765,093, $3,600,000, $4,136,364, $936,750, $945,484, $2,925,370, $1,247,258, $961,741, $978,794, $1,414,679, $16,341,096, $2,075,987, $215,759, $171,930, $1,440,613, $961,875, $1,313,165, $1,460,670, $3,158,899, $3,226,061, $4,886,883, $2,562,479, $955,464, $1,982,215, $3,436,135, $1,471,118, $6,575,008, $2,581,788, $1,086,305, $900,000, $1,037,945, $2,147,089, $1,182,090, $3,747,363, $991,132, $1,684,483, $978,349, $28,762, $525,325, $2,922,526, $1,931,123, $1,866,860, $2,216,005, $774,152, $2,388,401, $1,446,195, $9,587, $1,897,840, $1,869,314, $2,918,977, $2,508,016, $226,621, $2,458,763, $1,175,541, $1,009,020, $10,789,000, $3,621,975, $2,390,707, $913,694, $1,922,215, $1,136,037, $981,678, $1,934,170, $2,964,652, $1,674,500, $1,272,316, $1,183,195, $975,147, $3,666,573, $984,212, $1,784,353, $1,141,949, $1,735,706, $2,799,086, $14,747,998, $2,811,104, $988,753, $2,395,818, $-9,990, $5,823,353, $13,917,440, $1,970,975, $2,787,773, $3,939,192, $2,163,291, $3,724,827, $2,954,863, $1,468,343, $286,897, $978,712, $3,395,126, $4,281,740, $1,973,487, $2,602,939, $1,872,338, $964,755, $1,867,810, $3,853,332, $798,096, $1,259,201, $1,240,535, $32,821, $3,095,150, $944,789, $26,086,829, $6,566,944, $2,458,119, $1,332,187, $1,429,600, $248,505, $3,360,854, $2,746,586, $1,255,889, $958,978, $118,565, $21,051,168, $520,890, $2,395,826, $15,390,308, $43,153,917, $977,166, $1,676,056, $10,335,858, $450,970, $1,373,579, $971,131, $3,440,944, $3,619,214, $3,538,214, $2,163,849, $3,835,947, $2,292,224, $1,945,000, $1,269,229, $2,957,647, $7,083,134, $5,883,295, $2,650,851, $2,214,194, $2,914,778, $21,996,953, $2,298,061, $13,543,731, $1,927,856, $675,773, $12,218,137, $2,258,282, $1,836,580, $4,541,441, $2,444,694, $1,937,391, $0, $2,949,001, $2,661,213, $13,413,674, $2,706,939, $35,990,832, $958,494, $1,172,679, $1,863,926, $5,188,643, $44,353,034, $6,655,594, $1,128,243, $230,496, $1,375,404, $1,359,847, $26,106,354, $3,873,437, $8,740,866, $1,395,306, $7,996,156, $3,991,837, $0, $1,094,327, $1,021,296, $3,140,914, $1,584,456, $1,478,799, $1,782,938, $3,044,147, $1,688,439, $1,862,967, $2,908,917, $2,752,575, $1,269,004, $1,365,391, $2,950,700, $3,334,650, $1,137,974, $3,476,796, $30,005,061, $1,861,814, $1,485,409, $2,738,883, $9,275,633, $1,978,076, $2,330,990, $16,296,905, $651,953, $14,245,052, $1,769,958, $14,810,820, $2,739,297, $981,737, $2,728,795, $4,048,033, $3,856,008, $5,494,283, $2,500,000, $10,380, $1,153,354, $46,460,919, $12,470,857, $106,700, $53,395, $412,425, $35,407,779, $3,798,024, $1, $81,845, $1, $28,418,629, $15,471,262, $800,155, $16,043,322, $8,055,913, $1, $6,478, $2, $8,006,084, $2,569,506, $2,690,285, $261,659, $2,074,818, $2,770,820, $520,548, $1, $1,158,141, $58,620,943, $3,639,257, $0, $1, $20,035,028, $24,613,529, $1, $232,406, $1, $31,457,032, $73,811,111, $20,103,801, $1, $122,097,000, $25,647,367, $413,420, $1, $14,384,874, $3, $5,256,902, $1, $1, $4,886,753, $5,282,000, $43,519,849, $1,099,657, $2, $8, $413,158, $86,122, $1, $9,327,441, $43,714,451, $34,549,063, $5, $3,494,299, $23,746,227, $2,999,266, $4,036,296, $16,389,363, $1, $1, $1, $889,332, $1,082,285, $92,213, $26,595,776, $11,483,556, $32,565,340, $1, $1, $2,672,206, $3, $1, $1, $856,679, $2,178, $10,549, $332,524, $12,740,471, $14,455, $62,947, $1,602,831, $2,229,508, $52,466,457, $40,744,933, $8,657,498, $1, $1, $1, $1, $3,761, $32,560,553, $101,953, $390,786, $2,326,146, $31,390,084, $30,860,812, $158,479, $11,931,312, $8,480,119, $1,970,934, $1, $12,847,405, $0, $0, $23,826,490, $0, $7,988,502, $6,100,912, $16,154,083, $48,642, $2,112,853, $2,379,470, $8,949,971, $4,411,504, $2,730,824, $4,138,763, $0, $7,725,199, $2,352,860, $3,258,373, $12,321,615, $19,974,772, $1, $1, $6,145,956, $1,464,799, $150,358, $11,851,489, $6,325,000, $7,369,624, $6,189,273, $3,055,896, $47,665,770, $1,509,984, $988,701, $26,103, $1,204,381, $12,542,950, $0, $1, $14,962,769, $6,211,568, $1, $0, $0, $4,482,000, $9,212,577, $1, $78,078, $2,897,944, $5,405,593, $1,576,681, $5,625,851, $0, $26,115,192, $5,504,758, $5,412,845, $6,693,451, $2,223,062, $1,086,662, $17,624,773, $487, $8,177,565, $1,398,140, $5,364,532, $7,255,319, $1,143,000, $0, $4,481,938, $4,856,299, $4,742,358, $0, $15,292,764, $1,760,359, $255,116, $2,817,985, $6,525,000, $12,919,416, $9,418,414, $3,465,967, $4,050,000, $3,150,000, $1,875,000, $506,250, $4,964,403, $5,221,316, $1, $2,920,241, $990,000, $31,463, $6,834,572, $702,000, $11,767,268, $9,888,917, $1, $962,414, $27,739,800, $0, $2,219,017, $1, $2,994,047, $1,017,698, $29,435,207, $3,776,970, $0, $1,134,750, $1,064,000, $1, $566,384, $1,100,000, $9,337,500, $6,670,000, $6,593,111, $5,118,512, $14,307, $3,192,550, $6,379,895, $0, $160,679, $6,810,070, $3,620,635, $16,113,685, $17,353,890, $15,908,787, $0, $257,148, $11,483,556, $11,516,438, $2,000,000, $8,722,500, $1, $9,619,943, $155,256, $2,810,974, $1, $4,384,202, $2,637,866, $4,737,450, $45,421,557, $2,871,773, $17,775,897, $250,001, $2,691,549, $640,500, $14,852,720, $0, $1,877,507, $1, $2,264,821, $11,793,068, $709,778, $0, $11,422,952, $1, $19,118,587, $1, $4,120,204, $6,526,076, $868,784, $362,788, $1,236,217, $2,940,227, $16,025,029, $1, $15,893,236, $7,342,610, $115,355, $174,548, $8,407,896, $1, $1, $1, $23,807,231, $0, $11,606,752, $7,776,177, $937,515, $21,920,904, $11,625,328, $0, $1,387,034, $47,864, $0, $21,924,435, $0, $1,592,749, $0, $0, $17,167,048, $0 and $2,070,000, respectively, totaling $9,256,839,192. |
The accompanying notes are an integral part of these Consolidated Financial Statements.
Partners Group Private Equity (Master Fund), LLC
(a Delaware Limited Liability Company)
Consolidated Schedule of Investments —
December 31, 2022 (Unaudited) (continued)
| b | Represents an affiliated issuer. |
| c | Investment does not issue shares. |
| d | Non-income producing. |
| e | Investment has been committed to but has not been fully funded by the Fund. |
| f | Security or a portion thereof is unsettled at December 31, 2022. |
Legend:
| £ | - British Pound |
| € | - Euro |
| BBSY | - Bank Bill Swap Rate |
| C | - Chinese Yuan |
| E | - EURIBOR |
| Fr. | - Swiss Franc |
| I | - Indian Rupee |
The accompanying notes are an integral part of these Consolidated Financial Statements.
Partners Group Private Equity (Master Fund), LLC
(a Delaware Limited Liability Company)
Consolidated Schedule of Investments —
December 31, 2022 (Unaudited) (continued)
| L | - LIBOR |
| PIK | - Payment-in-kind |
| S | - Sterling Overnight Interbank Average Rate |
| SF | - Secured Overnight Financing Rate |
| SR | - Stockholm Interbank Offered Rate |
| zl | - Polish Zloty |
| A summary of outstanding financial instruments at December 31, 2022 is as follows: | |
Forward Foreign Currency Contracts
| Settlement Date | Counterparty | Currency Purchased | Currency Sold | Value | Unrealized Appreciation (Depreciation) | ||||||||||||||
| January 4, 2023 | Barclays | $ | 70,375,349 | € | 69,620,000 | $ | 73,541,492 | $ | (3,166,143 | ) | |||||||||
| January 4, 2023 | Barclays | $ | 70,385,458 | € | 69,630,000 | $ | 73,552,056 | $ | (3,166,598 | ) | |||||||||
| January 4, 2023 | Barclays | € | 80,000,000 | $ | 84,507,040 | $ | 84,506,167 | $ | (873 | ) | |||||||||
| January 4, 2023 | Barclays | € | 59,250,000 | $ | 62,588,027 | $ | 62,587,381 | $ | (646 | ) | |||||||||
| January 11, 2023 | Barclays | $ | 70,408,391 | € | 69,620,000 | $ | 73,579,021 | $ | (3,170,630 | ) | |||||||||
| January 11, 2023 | Barclays | $ | 70,418,504 | € | 69,630,000 | $ | 73,589,590 | $ | (3,171,086 | ) | |||||||||
| January 11, 2023 | Barclays | € | 80,000,000 | $ | 84,551,720 | $ | 84,549,292 | $ | (2,428 | ) | |||||||||
| January 11, 2023 | Barclays | € | 59,250,000 | $ | 62,621,118 | $ | 62,619,319 | $ | (1,799 | ) | |||||||||
| January 18, 2023 | Barclays | $ | 70,441,412 | € | 69,620,000 | $ | 73,610,852 | $ | (3,169,440 | ) | |||||||||
| January 18, 2023 | Barclays | $ | 70,451,530 | € | 69,630,000 | $ | 73,621,425 | $ | (3,169,895 | ) | |||||||||
| January 18, 2023 | Barclays | $ | 61,889,938 | I | 4,990,000,000 | $ | 60,288,577 | $ | 1,601,361 | ||||||||||
| January 18, 2023 | Barclays | € | 80,000,000 | $ | 84,589,872 | $ | 84,585,867 | $ | (4,005 | ) | |||||||||
| January 18, 2023 | Barclays | € | 59,250,000 | $ | 62,649,374 | $ | 62,646,408 | $ | (2,966 | ) | |||||||||
| January 18, 2023 | Barclays | I | 4,990,000,000 | $ | 60,286,815 | $ | 60,288,576 | $ | 1,761 | ||||||||||
| January 25, 2023 | Barclays | $ | 70,473,910 | € | 69,620,000 | $ | 73,651,955 | $ | (3,178,045 | ) | |||||||||
| January 25, 2023 | Barclays | $ | 70,484,033 | € | 69,630,000 | $ | 73,662,534 | $ | (3,178,501 | ) | |||||||||
| January 25, 2023 | Barclays | $ | 61,861,549 | I | 4,990,000,000 | $ | 60,279,793 | $ | 1,581,756 | ||||||||||
| January 25, 2023 | Barclays | € | 59,250,000 | $ | 62,685,552 | $ | 62,681,389 | $ | (4,163 | ) | |||||||||
| January 25, 2023 | Barclays | € | 80,000,000 | $ | 84,638,720 | $ | 84,633,100 | $ | (5,620 | ) | |||||||||
| January 25, 2023 | Barclays | I | 2,495,000,000 | $ | 30,151,422 | $ | 30,139,897 | $ | (11,525 | ) | |||||||||
| January 25, 2023 | Barclays | I | 2,495,000,000 | $ | 30,125,937 | $ | 30,139,897 | $ | 13,960 | ||||||||||
| February 1, 2023 | Barclays | $ | 68,394,584 | € | 69,800,000 | $ | 74,583,792 | $ | (6,189,208 | ) | |||||||||
| February 8, 2023 | Barclays | $ | 68,617,395 | € | 70,000,000 | $ | 74,828,793 | $ | (6,211,398 | ) | |||||||||
| February 15, 2023 | Barclays | $ | 68,562,571 | € | 70,000,000 | $ | 74,858,468 | $ | (6,295,897 | ) | |||||||||
| February 22, 2023 | Barclays | $ | 68,670,329 | € | 70,000,000 | $ | 74,888,799 | $ | (6,218,470 | ) | |||||||||
| March 1, 2023 | Bank of America | $ | 98,464,603 | € | 95,000,000 | $ | 101,714,637 | $ | (3,250,034 | ) | |||||||||
| March 1, 2023 | Bank of America | $ | 98,463,786 | € | 95,000,000 | $ | 101,714,637 | $ | (3,250,851 | ) | |||||||||
| March 8, 2023 | Bank of America | $ | 62,712,325 | zl | 289,600,000 | $ | 65,567,394 | $ | (2,855,069 | ) | |||||||||
| March 8, 2023 | Bank of America | $ | 75,951,775 | Fr. | 71,000,000 | $ | 77,221,889 | $ | (1,270,114 | ) | |||||||||
| March 8, 2023 | Barclays | $ | 101,099,827 | € | 97,500,000 | $ | 104,434,352 | $ | (3,334,525 | ) | |||||||||
| March 8, 2023 | Barclays | $ | 98,508,474 | € | 95,000,000 | $ | 101,756,548 | $ | (3,248,074 | ) | |||||||||
| March 8, 2023 | Barclays | $ | 94,430,608 | £ | 80,000,000 | $ | 96,348,988 | $ | (1,918,380 | ) | |||||||||
| March 15, 2023 | Bank of America | $ | 62,705,956 | zl | 289,600,000 | $ | 65,514,550 | $ | (2,808,594 | ) | |||||||||
| March 15, 2023 | Bank of America | $ | 76,007,430 | Fr. | 71,000,000 | $ | 77,270,926 | $ | (1,263,496 | ) | |||||||||
| March 15, 2023 | Bank of America | $ | 98,551,604 | € | 95,000,000 | $ | 101,792,951 | $ | (3,241,347 | ) | |||||||||
| March 15, 2023 | Barclays | $ | 109,778,028 | £ | 93,000,000 | $ | 112,010,505 | $ | (2,232,477 | ) | |||||||||
| March 22, 2023 | Bank of America | $ | 94,528,992 | £ | 80,000,000 | $ | 96,356,133 | $ | (1,827,141 | ) | |||||||||
| March 22, 2023 | Bank of America | $ | 98,814,326 | € | 95,000,000 | $ | 101,829,761 | $ | (3,015,435 | ) | |||||||||
| April 5, 2023 | Barclays | $ | 62,995,424 | € | 59,250,000 | $ | 63,566,486 | $ | (571,062 | ) | |||||||||
| April 5, 2023 | Barclays | $ | 85,057,112 | € | 80,000,000 | $ | 85,828,166 | $ | (771,054 | ) | |||||||||
The accompanying notes are an integral part of these Consolidated Financial Statements.
Partners Group Private Equity (Master Fund), LLC
(a Delaware Limited Liability Company)
Consolidated Schedule of Investments —
December 31, 2022 (Unaudited) (continued)
| Settlement Date | Counterparty | Currency Purchased | Currency Sold | Value | Unrealized Appreciation (Depreciation) | ||||||||||||||
| April 12, 2023 | Barclays | $ | 85,101,272 | € | 80,000,000 | $ | 85,865,592 | $ | (764,320) | ||||||||||
| April 12, 2023 | Barclays | $ | 63,028,130 | € | 59,250,000 | $ | 63,594,205 | $ | (566,075) | ||||||||||
| April 12, 2023 | Barclays | $ | 29,925,755 | I | 2,495,000,000 | $ | 29,934,967 | $ | (9,212) | ||||||||||
| April 19, 2023 | Barclays | $ | 85,138,680 | € | 80,000,000 | $ | 85,902,957 | $ | (764,277) | ||||||||||
| April 19, 2023 | Barclays | $ | 63,055,835 | € | 59,250,000 | $ | 63,621,878 | $ | (566,043) | ||||||||||
| April 19, 2023 | Barclays | $ | 29,913,556 | I | 2,495,000,000 | $ | 29,924,030 | $ | (10,474) | ||||||||||
| April 26, 2023 | Barclays | $ | 85,185,704 | € | 80,000,000 | $ | 85,940,486 | $ | (754,782) | ||||||||||
| April 26, 2023 | Barclays | $ | 63,090,662 | € | 59,250,000 | $ | 63,649,672 | $ | (559,010) | ||||||||||
| April 26, 2023 | Barclays | $ | 29,899,934 | I | 2,495,000,000 | $ | 29,913,148 | $ | (13,214) | ||||||||||
| April 26, 2023 | Barclays | $ | 29,923,961 | I | 2,495,000,000 | $ | 29,913,148 | $ | 10,813 | ||||||||||
| $ | (85,974,745) | ||||||||||||||||||
The accompanying notes are an integral part of these Consolidated Financial Statements.
The information contained in this section should be read in conjunction with the Fund’s audited consolidated financial statements contained in its annual report for the year ended March 31, 2022.
Investments held by the Fund include short-term investments, direct equity and debt investments in operating companies (“Direct Investments”) and primary and secondary investments in private equity funds (“Primary Investments” and “Secondary Investments”, respectively, and together, “Private Equity Fund Investments”; Direct Investments and Private Equity Fund Investments, collectively, “Private Equity Investments”).
Partners Group (USA) Inc. (the “Adviser”) determines the fair value of the Fund’s Private Equity Investments in conformity with U.S. generally accepted accounting principles (“U.S. GAAP”) and the Fund's valuation procedures (the “Valuation Procedures”), which have been approved by the board of managers of the Fund (the “Board”). As authorized by the Valuation Procedures, the Adviser values the Fund’s Private Equity Investments in consultation with its affiliates. The Valuation Procedures require evaluation of all relevant factors reasonably available to the Adviser and its affiliates at the time the Fund’s Private Equity Investments are valued.
The Valuation Procedures are implemented by the Adviser and State Street Bank and Trust Company, as the Fund’s administrator (the “Administrator”). Both the Adviser and the Administrator are subject to the oversight of, and report to, the Board. The Adviser and the Administrator monitor and review the methodologies of the various third-party pricing services that are employed by the Fund.
The Adviser and certain of its affiliates act as investment advisers to clients other than the Fund. However, the valuation attributed to a Private Equity Investment held by the Fund and the valuation attributable to the same Private Equity Investment held by another client or by one of its affiliates or by a client of one of its affiliates might differ due to differences in accounting, regulatory and other factors applicable to the Fund and to such other client or the Adviser’s affiliate.
In conformity with U.S. GAAP, investments are classified in their entirety based on the lowest level of input that is significant to the fair value measurement. Estimated fair values may differ from the values that would have been used if a ready market existed or if the investments were liquidated at the valuation date. A three-level hierarchy is used to distinguish between (A) inputs that reflect the assumptions market participants would use in pricing an asset or liability developed based on market data obtained from sources independent of the reporting entity (observable inputs) and (B) inputs that reflect the reporting entity’s own assumptions about the assumptions market participants would use in pricing an asset or liability developed based on the best information available in the circumstances (unobservable inputs). This distinction determines the classification of fair value measurements for disclosure purposes.
The various types of inputs used in determining the value of the Fund’s investments are summarized below for each of the three levels:
| ● | Level 1 – Pricing inputs are quoted prices available in active markets for identical investments as of the measurement date. The type of investments included in Level 1 include marketable securities that are primarily traded on a securities exchange. The fair value is determined to be the last sale price on the determination date, or, if no sales occurred on any such date, the mean between the closing bid and ask prices on such date. In accordance with authoritative guidance, the Fund does not apply a blockage discount to the quoted price for these investments, even in situations where the Fund holds a large position in an investment and a sale could reasonably impact the quoted price. |
| ● | Level 2 – Pricing inputs are observable inputs other than quoted prices in active markets (i.e., not Level 1 inputs). Fair value is determined through the use of models or other valuation methodologies through direct or indirect corroboration with observable market data. Investments that are generally included in this category include corporate notes, convertible notes, warrants and restricted equity securities. The fair value of legally restricted equity securities may be discounted depending on the likely impact of the restrictions on liquidity and the Adviser’s estimates. |
| ● | Level 3 – Pricing inputs are unobservable for the investment and include situations where there is little, if any, market activity for the investment. The inputs into the determination of fair value require significant management judgment and/or estimation. Investments that are included in this category are equity and debt investments that are privately owned, as well as convertible notes and warrants that are not actively traded. The fair value for investments using Level 3 pricing inputs is based on the Adviser’s estimates that consider a combination of various factors and performance measurements. These factors and measurements include the timing of the transaction; the market in which the investment operates; comparable market transactions; operational performance and projections of the investments; various performance multiples as applied to earnings before interest, taxes, depreciation and amortization or a similar measure of earnings for the latest reporting period or a forward period; brokers quotes; and discounted cash flow analysis. |
Due to the inherent uncertainty of estimates, fair value determinations based on estimates may materially differ from the values that would have been used had a ready market for the securities existed. The following is a summary of the Fund's investments classified in the fair value hierarchy as of December 31, 2022:
| Investments | Level 1 | Level 2 | Level 3 | Total | ||||||||||||
| Common Stocks | $ | 155,011,306 | $ | — | $ | — | $ | 155,011,306 | ||||||||
| Asset-Backed Securities | — | — | 75,120,018 | 75,120,018 | ||||||||||||
| Direct Investments: | — | — | — | — | ||||||||||||
| Direct Equity | 43,007,865 | 78,969,600 | 7,526,236,701 | 7,648,214,166 | ||||||||||||
| Direct Debt | — | — | 1,130,253,452 | 1,130,253,452 | ||||||||||||
| Total Direct Investments | $ | 43,007,865 | $ | 78,969,600 | $ | 8,656,490,153 | $ | 8,778,467,618 | ||||||||
| Secondary Investments | — | — | 1,542,967,649 | 1,542,967,649 | ||||||||||||
| Primary Investments | — | — | 1,840,346,769 | 1,840,346,769 | ||||||||||||
| Total Investments | $ | 198,019,171 | $ | 78,969,600 | $ | 12,114,924,589 | $ | 12,391,913,360 | ||||||||
| Other Financial Instruments | ||||||||||||||||
| Assets | ||||||||||||||||
| Foreign Currency Exchange Contracts | $ | 3,209,651 | $ | — | $ | — | $ | 3,209,651 | ||||||||
| Total Assets | $ | 3,209,651 | $ | — | $ | — | $ | 3,209,651 | ||||||||
| Liabilities | ||||||||||||||||
| Foreign Currency Exchange Contracts | $ | 89,184,396 | $ | — | $ | — | $ | 89,184,396 | ||||||||
| Total Liabilities | $ | 89,184,396 | $ | — | $ | — | $ | 89,184,396 | ||||||||
| Total Investments Net of Foreign Currency Exchange Contracts | $ | 112,044,426 | $ | 78,969,600 | $ | 12,114,924,589 | $ | 12,305,938,615 | ||||||||
The following is a reconciliation of the amount of the account balances on April 1, 2022 and December 31, 2022 of those investments in which significant unobservable inputs (Level 3) were used in determining value:
Balance as of April 1, 2022 | Realized Gain/(Loss) | Net Change in Unrealized Appreciation/ (Depreciation) | Gross Purchases | Gross Sales | Net
(Premium) | Net Transfers In or Out of Level 3 | Balance as of December 31, 2022 | |||||||||||||||||||||||||
| Asset-Backed Securities | $ | 61,117,277 | $ | — | $ | (7,864,886 | ) | $ | 21,864,318 | $ | — | $ | 3,309 | $ | — | $ | 75,120,018 | |||||||||||||||
| Direct Investments: | ||||||||||||||||||||||||||||||||
| Direct Equity Investments | $ | 6,314,372,047 | $ | 257,782,739 | $ | (120,345,299 | ) | $ | 1,297,552,826 | $ | (429,889,665 | ) | $ | — | $ | 206,764,053 | $ | 7,526,236,701 | ||||||||||||||
| Direct Debt Investments | 979,534,628 | $ | (6,330,198 | ) | $ | (71,557,192 | ) | $ | 442,303,808 | $ | (215,531,424 | ) | $ | 1,833,830 | $ | — | $ | 1,130,253,452 | ||||||||||||||
| Total Direct Investments* | $ | 7,293,906,675 | $ | 251,452,541 | $ | (191,902,491 | ) | $ | 1,739,856,634 | $ | (645,421,089 | ) | $ | 1,833,830 | $ | 206,764,053 | $ | 8,656,490,153 | ||||||||||||||
| Secondary Investments* | 1,172,952,139 | $ | (2,544,197 | ) | $ | 29,363,383 | $ | 422,996,767 | $ | (79,800,443 | ) | $ | — | $ | — | $ | 1,542,967,649 | |||||||||||||||
| Primary Investments* | 1,753,246,965 | $ | (4,787,622 | ) | $ | 3,586,556 | $ | 222,982,567 | $ | (134,681,697 | ) | $ | — | $ | — | $ | 1,840,346,769 | |||||||||||||||
| Total | $ | 10,281,223,056 | $ | 244,120,722 | $ | (166,817,438 | ) | $ | 2,407,700,286 | $ | (859,903,229 | ) | $ | 1,837,139 | $ | 206,764,053 | $ | 12,114,924,589 | ||||||||||||||
| * | For the purposes of the tables above: (i) “Direct Investments” are private investments directly in the equity or debt of selected operating companies, often together with the management of the investee operating company; (ii) “Primary Investments” are investments in newly established private equity partnerships where underlying portfolio companies are generally not known as of the time of investment; and “Secondary Investments” are single or portfolios of assets acquired on the secondary market. However, in the private equity market sector the term “Secondary Investments” is generally understood to mean Private Equity Fund Investments acquired in the secondary market. Notwithstanding the foregoing, if the Fund reasonably determines that the strict application of the above definitions would not reflect the economic substance of any investment, the Fund may re-classify such investment as it deems appropriate. |
Changes in inputs or methods used for valuing investments may result in transfers in or out of levels within the fair value hierarchy. The inputs or methods used for valuing investments may not necessarily be an indication of the risk associated with investing in those investments. Transfers between levels of the fair value hierarchy are reported at the beginning of the reporting period in which they occur. For the nine months ended December 31, 2022, transfers out of Level 3 were due to increased price transparency.
The amount of the net change in unrealized appreciation (depreciation) for the nine months ended December 31, 2022 relating to investments in Level 3 assets still held at December 31, 2022 is $3,556,951, which is included as a component of net change in accumulated unrealized depreciation on investments on the Consolidated Statement of Operations.
The following is a summary of quantitative information about significant unobservable valuation inputs approved by the Adviser for Level 3 Fair Value Measurements for investments held as of December 31, 2022:
| Type of Security | Fair
Value at December 31, 2022 (000’s)* | Valuation Technique(s) | Unobservable Input | Range (weighted average) | |||||||
| Asset-Backed Securities | $ | 75,120 | Reported fair value | Reported fair value | n/a | ||||||
| Direct Investments: | |||||||||||
| Direct Equity | $ | 145,987 | Discounted cash flow | Discount factor | 8.89% – 10.48% (9.62%) | ||||||
| 6,743,063 | Market comparable companies | Enterprise value to EBITDA multiple | 5.00x – 34.00x (16.46x) | ||||||||
| 67,055 | Market comparable companies | Price to book ratio | 1.68x – 1.68x (1.68x) | ||||||||
| 52,131 | Exit price | Recent transaction price | n/a | ||||||||
| 205,937 | Recent financing/transaction | Recent transaction price | n/a | ||||||||
| 4,808 | Replacement cost | Recent transaction price | n/a | ||||||||
| 3,124 | Reported fair value | Reported fair value | n/a | ||||||||
| 184,052 | Market comparable companies | Enterprise value to sales multiple | 2.60x – 22.30x (10.48x) | ||||||||
| Direct Debt | $ | 652,015 | Broker quotes | Indicative quotes for an inactive market | n/a | ||||||
| 434,801 | Discounted cash flow | Discount factor | 9.00% – 35.00% (12.58%) | ||||||||
| 1 | Exit price | Recent transaction price | n/a | ||||||||
| 45,618 | Recent financing/transaction | Recent transaction price | n/a | ||||||||
| Primary
and Secondary Investments | $ | 3,395,954 | Adjusted reported net asset value | Reported net asset value | n/a | ||||||
| (10,461 | ) | Adjusted reported net asset value | Fair value adjustments | n/a | |||||||
| * | Level 3 fair value includes accrued interest. |
Level 3 Direct Equity Investments valued using an unobservable input are directly affected by a change in that input. For Level 3 Direct Debt Investments, the Fund estimates fair value utilizing earnings and multiples analysis or an analysis of discounted cash flows that considers the credit risk and interest rate risk of the particular investment. For Direct Investments, significant increases or decreases in these inputs in isolation would result in a significantly lower or higher fair value measurements.
Forward Foreign Currency Exchange Contracts
The Fund may enter into forward foreign currency exchange contracts to manage foreign exchange rate risk. These contracts for the purchase or sale of a specific foreign currency at a fixed price on a future date may be entered into as a hedge against either specific transactions or portfolio positions. The objective of the Fund’s foreign currency hedging transactions is to reduce the risk that the U.S. Dollar value of the Fund’s foreign currency denominated investments will decline due to changes in foreign currency exchange rates. All forward foreign currency exchange contracts are “marked-to-market” daily at the applicable translation rates resulting in unrealized gains or losses. Realized gains or losses are recorded at the time the forward foreign currency exchange contract is offset by entering into a closing transaction or by the delivery or receipt of the currency. The potential inability of counterparties to meet the terms of their contracts and unanticipated movements in the value of a foreign currency relative to the U.S. Dollar are risks inherent in forward foreign exchange contracts.
During the nine months ended December 31, 2022, the Fund entered into 169 long/short forward foreign currency exchange contracts. The Fund had $202,239,119 in net realized gains and $(83,998,548) change in net unrealized appreciation (depreciation) on forward foreign currency contracts. The outstanding forward foreign currency exchange contract amounts at December 31, 2022 are representative of contract amounts during the period.
Affiliated Investments
Under Section 2(a)(3) of the Investment Company Act, a portfolio company is considered "affiliated" with the Fund if the Fund owns five percent or more of such portfolio company's outstanding voting securities. The Fund held at least five percent of the outstanding voting securities of the following portfolio companies as of December 31, 2022:
| Shares/ Principal as of December 31, 2022 | Fair Value as of March 31, 2022 | Gross Additions(1) | Gross Reductions(2) | Realized Gains/ Losses | Change in Unrealized Gains (Losses) | Fair Value as of December 31, 2022 | Affiliated Income/ Accretion of Discount | |||||||||||||||||||||||||
| Non-Controlled Affiliates | ||||||||||||||||||||||||||||||||
| Bock Capital JVCo Nature S.à.r.l. | 12,590,000,000 | $ | 191,870,309 | $ | - | $ | - | $ | - | $ | (73,443,391 | ) | $ | 118,426,918 | $ | - | ||||||||||||||||
| Camelia Investment 1 Limited | 6,768,704,045 | 183,582,149 | - | - | - | (16,420,723 | ) | 167,161,426 | - | |||||||||||||||||||||||
| CBI Parent, L.P. | 1,145,918 | 105,132,373 | 5,604,217 | - | - | (50,953,391 | ) | 59,783,199 | - | |||||||||||||||||||||||
| Confluent Health, LLC | 27,246 | 69,586,969 | - | - | - | (8,937,591 | ) | 60,649,378 | - | |||||||||||||||||||||||
| Dermatology Holdings, L.P.(3) | - | - | 119,978,433 | - | - | 9,794,439 | 129,772,872 | - | ||||||||||||||||||||||||
| Ecom Express Private Limited | 63,417 | - | 6,473,508 | (131,827 | ) | - | 1,602,436 | 7,944,117 | - | |||||||||||||||||||||||
| ECP Parent, LLC | 105,520,023 | 166,994,406 | - | - | - | (7,055,700 | ) | 159,938,706 | - | |||||||||||||||||||||||
| EdgeCore Holdings, L.P.(3) | - | - | 39,083,333 | - | - | - | 39,083,333 | - | ||||||||||||||||||||||||
| Encore Holdings LP(3) | - | - | 48,685,202 | - | - | 5,014,965 | 53,700,167 | - | ||||||||||||||||||||||||
| EnfraGen LLC | 37,786 | 58,429,298 | - | - | - | 137,506 | 58,566,804 | - | ||||||||||||||||||||||||
| EQT Jaguar Co-Investment SCSp(3) | - | 112,788,690 | - | - | - | 4,339,606 | 117,128,296 | - | ||||||||||||||||||||||||
| Green DC LuxCo S.à.r.l. | 19,595,288 | 61,132,640 | - | - | - | (210,947 | ) | 60,921,693 | - | |||||||||||||||||||||||
| Huntress Co-Investment L.P.(3)(4) | - | 50,389,883 | - | (26,349,381 | ) | 4,149,670 | (28,190,172 | ) | - | 15,902,367 | ||||||||||||||||||||||
| Icebox Holdco I Inc(3) | - | 62,801,819 | - | - | - | 602,380 | 63,404,199 | - | ||||||||||||||||||||||||
| Icebox Parent LP(3) | - | 127,590,920 | 313 | - | - | (6,327,004 | ) | 121,264,229 | - | |||||||||||||||||||||||
| Idera, Inc. | 1,248,155 | 1,237,560 | 431 | (9,528 | ) | 8 | (48,185 | ) | 1,180,286 | 82,749 | ||||||||||||||||||||||
| Idera Parent LP(3) | - | 248,243,835 | - | - | - | (30,492,148 | ) | 217,751,687 | 192,886 | |||||||||||||||||||||||
| KPOCH Holdings, L.P.(3) | - | - | 187,500,000 | - | - | 25,500 | 187,525,500 | - | ||||||||||||||||||||||||
| KPSKY Holdings L.P.(3) | - | 64,375,872 | - | - | - | (7,750,297 | ) | 56,625,575 | - | |||||||||||||||||||||||
| Luxembourg Investment Company 285 S.à.r.l.(5) | 14,865,773 | 71,230,531 | - | - | - | (21,984,123 | ) | 49,246,408 | - | |||||||||||||||||||||||
| Luxembourg Investment Company 293 S.à.r.l. | 9,789,622 | 45,721,830 | - | - | - | (7,184,489 | ) | 38,537,341 | - | |||||||||||||||||||||||
| Luxembourg Investment Company 314 S.à.r.l.(5) | 192,000 | 1 | - | - | - | - | 1 | - | ||||||||||||||||||||||||
| Luxembourg Investment Company 414 S.à r.l. | 12,111,360 | 79,988,131 | - | - | - | 3,809,049 | 83,797,180 | - | ||||||||||||||||||||||||
| Luxembourg Investment Company 430 S.à r.l. | 50,548,848 | 78,443,091 | 2,933,140 | - | - | 3,319,352 | 84,695,583 | (108 | ) | |||||||||||||||||||||||
| May Co-Investment S.C.A. | 1,059,375 | 52,163,274 | - | - | - | (941,057 | ) | 51,222,217 | - | |||||||||||||||||||||||
| MHS Acquisition Holdings, LLC | 35,641 | 650,979 | - | - | - | 375,900 | 1,026,879 | - | ||||||||||||||||||||||||
| MHS Blocker Purchaser L.P.(3) | - | 50,333,181 | - | - | - | 29,064,344 | 79,397,525 | - | ||||||||||||||||||||||||
| Murra Warra Asset Hold Trust | 13,186,543 | 21,951,762 | - | - | - | 613,822 | 22,565,584 | - | ||||||||||||||||||||||||
| Murra Warra II Asset Hold Trust | 18,628,227 | 14,636,008 | 222,081 | - | - | 1,306,154 | 16,164,243 | - | ||||||||||||||||||||||||
| Murra Warra II Project Hold Trust | 10 | 3,659,002 | 55,520 | - | - | 326,539 | 4,041,061 | - | ||||||||||||||||||||||||
| Murra Warra Project Hold Trust | 429,366 | 5,487,942 | - | - | - | 153,453 | 5,641,395 | - | ||||||||||||||||||||||||
| OHCP IV SF COI, L.P.(3) | - | 37,604,433 | 43,848 | - | - | 11,346,705 | 48,994,986 | - | ||||||||||||||||||||||||
| Onecall Holdings, L.P.(3)(4) | - | 174,527,006 | - | (225,820,522 | ) | 165,757,410 | (114,463,894 | ) | - | - | ||||||||||||||||||||||
| Partners Terra Pte. Ltd. | 4,372,335 | 1,739,362 | 2,604,371 | - | - | 464,611 | 4,808,344 | - | ||||||||||||||||||||||||
| PG BRPC Investment, LLC | 32,079 | 74,128,478 | - | - | - | 6,543,219 | 80,671,697 | - | ||||||||||||||||||||||||
| PG Delta Holdco, LLC | 30,481 | 22,911,377 | 10,944,000 | - | - | 19,893,941 | 53,749,318 | - | ||||||||||||||||||||||||
| PG Esmeralda Pte. Ltd. | 5,922,280 | 70,006,910 | - | - | - | (15,372,237 | ) | 54,634,673 | - | |||||||||||||||||||||||
| PG Investment Company 1 S.à r.l. | 12,822,040 | 100,293,522 | - | - | - | (2,693,135 | ) | 97,600,387 | - | |||||||||||||||||||||||
| PG Investment Company 18 S.à.r.l. | 126,506,634 | - | 115,874,572 | - | - | 5,600,159 | 121,474,731 | - | ||||||||||||||||||||||||
| PG Investment Company 24 S.à.r.l. | 102,297,902 | - | 103,633,483 | - | - | 6,041,788 | 109,675,271 | - | ||||||||||||||||||||||||
| PG Lion Management Warehouse S.C.S(3)(5) | - | 1,824,104 | - | - | - | (966,802 | ) | 857,302 | - | |||||||||||||||||||||||
| PG TLP S.à r.l. | 6,377,426 | 102,493,011 | 1 | (2,016,886 | ) | (305,116 | ) | (2,881,091 | ) | 97,289,919 | - | |||||||||||||||||||||
| PG Wave Limited | 53,215,581 | 70,043,185 | - | - | - | 612,033 | 70,655,218 | - | ||||||||||||||||||||||||
| Pharmathen GP S.à r.l. | 110,300 | 1 | - | - | - | - | 1 | - | ||||||||||||||||||||||||
| Pharmathen Topco S.à r.l. | 98,937,978 | 113,377,360 | - | - | - | (7,459,995 | ) | 105,917,365 | - | |||||||||||||||||||||||
| Polyusus Lux XVI S.à.r.l. | 289,102,341 | 10,971,703 | 1,183,251 | (333,654 | ) | (62,325 | ) | (6,322,998 | ) | 5,435,977 | - | |||||||||||||||||||||
| Root JVCo S.à r.l. | 8,700,760 | 72,946,306 | - | - | - | 14,514,047 | 87,460,353 | - | ||||||||||||||||||||||||
| Safe Fleet Holdings LLC(6)(7) | 3,870,750 | 3,854,506 | 1,758 | (29,250 | ) | 135 | (74,921 | ) | 3,752,228 | 180,820 | ||||||||||||||||||||||
| SnackTime PG Holdings, Inc. | 12 | 70,468,471 | 28,775 | - | - | (22,806,711 | ) | 47,690,535 | - | |||||||||||||||||||||||
| Specialty Pharma Holdings LP(3) | - | 109,536,317 | - | - | - | (14,288,243 | ) | 95,248,074 | - | |||||||||||||||||||||||
| Sunsure Energy Private Limited | 9,637,675 | - | 9,637,675 | - | - | - | 9,637,675 | - | ||||||||||||||||||||||||
| SureWerx Topco, L.P.(3) | - | - | 51,287,146 | - | - | - | 51,287,146 | - | ||||||||||||||||||||||||
| Surfaces SLP (SCSp)(3) | - | 52,221,892 | - | - | - | (14,994,741 | ) | 37,227,151 | - | |||||||||||||||||||||||
| Thermostat Purchaser, L.P.(3) | - | 72,743,417 | - | - | - | 793,947 | 73,537,364 | - | ||||||||||||||||||||||||
| WHCG Purchaser, LP(3) | - | 55,125,583 | - | - | - | (20,908,746 | ) | 34,216,837 | - | |||||||||||||||||||||||
| Zenith Longitude Limited | 26,838,037 | 312,293,782 | 887,700 | - | - | 148,504,759 | 461,686,241 | 19,387,343 | ||||||||||||||||||||||||
| Total Non-Controlled Affiliates | $ | 3,457,533,181 | $ | 706,662,758 | $ | (254,691,048 | ) | $ | 169,539,782 | $ | (208,372,078 | ) | $ | 3,870,672,595 | $ | 35,746,057 | ||||||||||||||||
| (1) | Gross additions may include increases in the cost basis of investments resulting from new portfolio investments, the accretion of discounts and the exchange of one or more existing securities for one or more new securities. |
| (2) | Gross reductions may include decreases in the cost basis of investments resulting from principal collections related to investment repayments or sales and the exchange of one or more existing securities for one or more new securities. |
| (3) | Investment does not issue shares. |
| (4) | Investment was exited during the period ended December 31, 2022. |
| (5) | Luxembourg Investment Company 285 S.à.r.l, Luxembourg Investment Company 314 S.à.r.l and PG Lion Management Warehouse S.C.S. are related to the same investment. |
| (6) | As of December 31, 2022, the Fund no longer had ownership of five percent or more of outstanding voting securities. |
| (7) | This investment is associated with OHCP IV SF COI, L.P. |
Subsequent Events
Management has evaluated the impact of all subsequent events on the Fund and determined that there were no subsequent events that require disclosure in the consolidated financial statements.