UNITED STATES
SECURITIES AND EXCHANGE COMMISSION
Washington, D.C. 20549
FORM 6-K
REPORT OF FOREIGN PRIVATE ISSUER PURSUANT TO RULE 13a-16 OR 15d-16
UNDER THE SECURITIES EXCHANGE ACT OF 1934
For the month of April 2025
Commission File Number: 001-31528
IAMGOLD Corporation
(Translation of registrant's name into English)
150 King Street West; Suite 2200
Toronto, Ontario, Canada M5H 1J9
Tel: (416) 360-4710
(Address of principal executive offices)
Indicate by check mark whether the registrant files or will file annual reports under cover Form 20-F or Form 40-F.
☐ Form 20-F ☒ Form 40-F
SUBMITTED HEREWITH
Exhibits
|
Exhibit |
Description |
|
|
NI 43-101 Technical Report on the Nelligan Gold Project, Québec, effective December 31, 2024 |
||
| 99.3 | Consent of Qualified Person - Lance Engelbrecht |
SIGNATURES
Pursuant to the requirements of the Securities Exchange Act of 1934, the registrant has duly caused this report to be signed on its behalf by the undersigned, thereunto duly authorized.
|
|
IAMGOLD CORPORATION |
|
|
|
(Registrant) |
|
|
|
|
|
|
Date: April 3, 2025 |
By: |
/s/ Annie Torkia Lagacé |
|
|
|
Annie Torkia Lagacé |
|
|
Title: |
Chief Legal and Strategy Officer |
|
IAMGOLD Corporation | Nelligan Project |
April 2, 2025 |
|
NI 43-101 Technical Report |
SLR Project No.: 233.065260.00001 |
NI 43-101 Technical Report on the Nelligan Gold Project, Québec
SLR Project No.: 233.065260.00001
Prepared by
SLR Consulting (Canada) Ltd.
55 University Ave., Suite 501
Toronto, ON M5J 2H7
for
IAMGOLD Corporation
150 King Street West, Suite 2200
Toronto ON M5H 1J9
Canada
Effective Date - December 31, 2024
Signature Date - April 2, 2025
| Prepared by: Marie-Christine Gosselin, P.Geo. Lance Engelbrecht, P.Eng. Peer Reviewed by: Luke Evans, M.Sc., P.Eng. |
Approved by: Project Manager Marie-Christine Gosselin, P.Geo Project Director Luke Evans, P.Geo. |
| i |
|
IAMGOLD Corporation | Nelligan Project |
April 2, 2025 |
|
NI 43-101 Technical Report |
SLR Project No.: 233.065260.00001 |
Table of Contents
| 1.0 Summary | 1-1 |
| 1.1 Executive Summary | 1-1 |
| 1.2 Economic Analysis | 1-5 |
| 1.3 Technical Summary | 1-6 |
| 2.0 Introduction | 2-1 |
| 2.1 Sources of Information | 2-1 |
| 2.2 List of Abbreviations | 2-2 |
| 3.0 Reliance on Other Experts | 3-1 |
| 4.0 Property Description and Location | 4-1 |
| 4.1 Ownership | 4-3 |
| 4.2 Mineral Tenure | 4-4 |
| 4.3 Permits and Authorization | 4-7 |
| 4.4 Environmental and Community Considerations | 4-7 |
| 4.5 Mining Rights in Quebec | 4-8 |
| 5.0 Accessibility, Climate, Local Resources, Infrastructure and Physiography | 5-1 |
| 5.1 Accessibility | 5-1 |
| 5.2 Climate | 5-1 |
| 5.3 Local Resources | 5-1 |
| 5.4 Infrastructure | 5-3 |
| 5.5 Physiography | 5-3 |
| 6.0 History | 6-1 |
| 6.1 Prior Ownership | 6-1 |
| 6.2 Exploration History | 6-1 |
| 6.3 Historical Mineral Resource Estimates | 6-4 |
| 7.0 Geological Setting and Mineralization | 7-1 |
| 7.1 Regional Geology | 7-1 |
| 7.2 Local Geology | 7-4 |
| 7.3 Property Geology | 7-14 |
| 8.0 Deposit Types | 8-1 |
| 8.1 Intrusion Related Gold Deposit | 8-2 |
| 8.2 Orogenic Gold Deposit | 8-2 |
| 9.0 Exploration | 9-1 |
| 9.1 Exploration by IAMGOLD (2014-2024) | 9-1 |
| i |
|
IAMGOLD Corporation | Nelligan Project |
April 2, 2025 |
|
NI 43-101 Technical Report |
SLR Project No.: 233.065260.00001 |
| 9.2 Geochemical Sampling | 9-4 |
| 9.3 Geophysical Surveys | 9-8 |
| 9.4 Thin Section Petrography | 9-11 |
| 9.5 Hyperspectral Analysis | 9-11 |
| 10.0 Drilling | 10-1 |
| 10.1 Drilling by IAMGOLD (2014-2024) | 10-1 |
| 10.2 Core Recovery | 10-4 |
| 10.3 Drilling Pattern and Density | 10-5 |
| 10.4 SLR Comments | 10-5 |
| 11.0 Sample Preparation, Analyses, and Security | 11-1 |
| 11.2 Density Determination | 11-5 |
| 11.3 Core Handling, Storage and Security | 11-5 |
| 11.4 Quality Assurance and Quality Control Programs | 11-5 |
| 12.0 Data Verification | 12-1 |
| 12.1 SLR Audit of the Drill Hole Database | 12-1 |
| 12.2 SLR Site Visit | 12-2 |
| 13.0 Mineral Processing and Metallurgical Testing | 13-1 |
| 13.1 Characterization and Preliminary Metallurgical Test work | 13-1 |
| 14.0 Mineral Resource Estimates | 14-1 |
| 14.1 Summary | 14-1 |
| 14.2 Resource Database | 14-1 |
| 14.3 Geological Interpretation | 14-2 |
| 14.4 Resource Assays | 14-6 |
| 14.5 Compositing | 14-7 |
| 14.6 Trend Analysis | 14-9 |
| 14.7 Search Strategy and Grade Interpolation Parameters | 14-11 |
| 14.8 Bulk Density | 14-12 |
| 14.9 Block Models | 14-14 |
| 14.10 Cut-off Grade and Whittle Parameters | 14-14 |
| 14.11 Classification | 14-15 |
| 14.12 Block Model Validation | 14-19 |
| 14.13 Mineral Resource Reporting | 14-23 |
| 14.14 Comparison with Previous Estimate | 14-27 |
| 15.0 Mineral Reserve Estimates | 15-1 |
| ii |
|
IAMGOLD Corporation | Nelligan Project |
April 2, 2025 |
|
NI 43-101 Technical Report |
SLR Project No.: 233.065260.00001 |
| 16.0 Mining Methods | 16-1 |
| 17.0 Recovery Methods | 17-1 |
| 18.0 Project Infrastructure | 18-1 |
| 19.0 Market Studies and Contracts | 19-1 |
| 20.0 Environmental Studies, Permitting, and Social or Community Impact | 20-1 |
| 21.0 Capital and Operating Costs | 21-1 |
| 22.0 Economic Analysis | 22-1 |
| 23.0 Adjacent Properties | 23-1 |
| 23.1 Anik Property | 23-1 |
| 23.2 Lac Surprise Property | 23-3 |
| 23.3 Philibert | 23-3 |
| 23.4 Joe Mann | 23-4 |
| 23.5 Monster Lake Property | 23-5 |
| 23.6 Muus and Muus East Properties | 23-5 |
| 24.0 Other Relevant Data and Information | 24-1 |
| 25.0 Interpretation and Conclusions | 25-1 |
| 25.1 Geology and Mineral Resources | 25-1 |
| 25.2 Mineral Processing | 25-1 |
| 26.0 Recommendations | 26-1 |
| 26.1 Geology and Mineral Resources | 26-1 |
| 27.0 References | 27-1 |
| 28.0 Date and Signature Date | 28-1 |
| 29.0 Certificate of Qualified Person | 29-1 |
| 29.1 Marie-Christine Gosselin | 29-1 |
| 29.2 Lance Engelbrecht | 29-2 |
| 30.0 Appendix A | 30-1 |
| 30.1 Mineral Tenure Information | 30-1 |
Tables
| Table 1-1: Summary of Nelligan Mineral Resource Estimate - December 31, 2024 | 1-2 |
| Table 4-1: Summary of Mineral Tenure Information | 4-4 |
| Table 6-1: Summary of Historical Work Completed by Previous Operators | 6-2 |
| Table 9-1: Mapping and Rock Sampling Completed by IAMGOLD (2014-2022) | 9-1 |
| Table 9-2: Hyperspectral Lithotypes Defined at the Project | 9-13 |
| iii |
|
IAMGOLD Corporation | Nelligan Project |
April 2, 2025 |
|
NI 43-101 Technical Report |
SLR Project No.: 233.065260.00001 |
| Table 10-1: Summary of Drilling Conducted on the Project (1978-2024) | 10-1 |
| Table 11-1: Historical and IAMGOLD QA/QC Sample Insertion Rates | 11-7 |
| Table 11-2: Summary of CRM Samples used in the 2012 to 2024 QA/QC Programs | 11-9 |
| Table 12-1: Summary of Data Verification Discrepancies | 12-2 |
| Table 13-1: Gold Deportment Study Results | 13-2 |
| Table 13-2: Gold Recovery Rates According to the Scenarios Tested | 13-3 |
| Table 13-3: Comminution Test Results | 13-4 |
| Table 13-4: Flotation Test Results | 13-5 |
| Table 14-1: Summary of Nelligan Mineral Resources - December 31, 2024 | 14-1 |
| Table 14-2: Nelligan Drilling Database Comparison | 14-2 |
| Table 14-3: Assay and Capping Statistics Summary | 14-6 |
| Table 14-4: Composites Descriptive Statistics | 14-7 |
| Table 14-5: Stable Estimation Domains Experimental Variograms | 14-11 |
| Table 14-6: Search Ellipse Geometry and Sample Selection Strategy | 14-12 |
| Table 14-7: Density by Mineralized Domain | 14-13 |
| Table 14-8: Nelligan Block Model Parameters | 14-14 |
| Table 14-9: Cut-off Grade and Pit Optimization Parameters | 14-15 |
| Table 14-10: Mineral Resource Classification Parameters | 14-16 |
| Table 14-11: Wireframe to Block Model Volume Confirmation | 14-22 |
| Table 14-12: Gold Statistics for NN, ID3, and OK Block models - Unconstrained by Pit Shell | 14-23 |
| Table 14-13: Summary of Nelligan Mineral Resources - December 31, 2024 | 14-25 |
| Table 14-14: Nelligan Mineral Resource Reporting at Various Cut-Off Values | 14-26 |
| Table 14-15: Comparison between 2023 and 2024 Nelligan Mineral Resource Estimate | 14-28 |
Figures
| Table 1-2: Proposed Exploration Budget | 1-5 |
| Figure 4-1: Location of the Nelligan Gold Project | 4-2 |
| Figure 4-2: Location of Mineral Claims | 4-5 |
| Figure 5-1: Nelligan Property Access | 5-2 |
| Figure 5-2: Core Shack Facility in Chibougamau | 5-3 |
| Figure 7-1: Regional Geology | 7-2 |
| Figure 7-1b: Regional Geology Legend | 7-3 |
| Figure 7-2: Local Geology - Abitibi Greenstone Belt | 7-6 |
| iv |
|
IAMGOLD Corporation | Nelligan Project |
April 2, 2025 |
|
NI 43-101 Technical Report |
SLR Project No.: 233.065260.00001 |
| Figure 7-3: Stratigraphy of the Synvolcanic Period and Transition to the Syntectonic Period | 7-8 |
| Figure 7-4: Interpretation of the Southern Portion of the Metal-Earth Seismic Transect (2017) in the Chibougamau Area | 7-11 |
| Figure 7-5: Structural Map of the South Portion of the Chapais-Chibougamau Gold Camp | 7-12 |
| Figure 7-6: Geological Map of the South Portion of the Chapais-Chibougamau Gold Camp | 7-13 |
| Figure 7-7: Property Geology | 7-16 |
| Figure 7-8: Principal Lithological Units and Structures | 7-19 |
| Figure 7-9: Relationship of Alteration Domains, Dominant Minerals Zonation, and Gold Mineralization | 7-23 |
| Figure 7-10: Low Grade Phase 1 Domains, Principal Structures and Silicified Zones | 7-24 |
| Figure 7-11: Fine Grained Disseminated (Pyrite I) and Coarse Grained (Pyrite II) Fractured and Recrystallized | 7-26 |
| Figure 7-12: High Grade Zones Morphology and Sygmoidal Structure of Second Mineralization Phase | 7-27 |
| Figure 7-13: Nelligan Polyphase Mineralization | 7-28 |
| Figure 7-14: Example of Polyphase Mineralization in Renard Zone, Hole NE-24-230C at 461 m | 7-29 |
| Figure 8-1: Classification of the Mineralizing Systems based on Physical Characteristics | 8-1 |
| Figure 8-2: Tectono-metallogenic Evolution from Synvolcanic to Syntectonic Periods in accordance with an Orogenic Cycle for the Chapais-Chibougamau Mining Camp | 8-1 |
| Figure 8-3: IRGD Proposed Classification of Zoning and Relationship with Other Gold Deposit Types | 8-3 |
| Figure 9-1: Location and Assay Results of Rock Samples | 9-3 |
| Figure 9-2: Assay Results of the Till Sample Survey, 2020 and 2021 | 9-5 |
| Figure 9-3: Location and Assay Results of the Till Sample Survey, 2022 | 9-6 |
| Figure 9-4: Soil Samples Collected in 2022 - 2024 | 9-7 |
| Figure 9-5: OreVision Induced Polarization Survey Completed in 2021 | 9-9 |
| Figure 9-6: Induced Polarization Surveys Conducted in 2024 | 9-10 |
| Figure 10-1: Drilling Summary | 10-2 |
| Figure 11-1: Sample Preparation Process Workflow for ALS Global | 11-3 |
| Figure 11-2: Sample Preparation Process Workflow of ODM Till Sample | 11-4 |
| Figure 11-3: Nelligan CRM Z-Score | 11-10 |
| Figure 11-4: Control Chart of CRM SF67 for Gold in AGAT: 2014 - 2016 | 11-11 |
| Figure 11-5: Control Chart of CRM Oxi121 for Gold in ALS: 2016 - 2017 | 11-12 |
| v |
|
IAMGOLD Corporation | Nelligan Project |
April 2, 2025 |
|
NI 43-101 Technical Report |
SLR Project No.: 233.065260.00001 |
| Figure 11-6: Control Chart of CRM OREAS 221 for Gold in ALS: 2019 - 2024 | 11-12 |
| Figure 11-7: Results of Coarse Blank Samples Sent to ALS: 2016 - 2024 | 11-13 |
| Figure 11-8: Pulp Duplicates HARD Plots and Scatter Plot in AGAT: 2014 - 2016 | 11-15 |
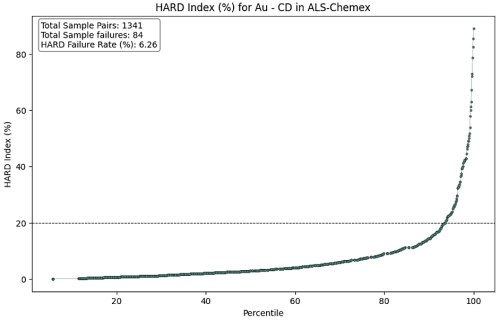
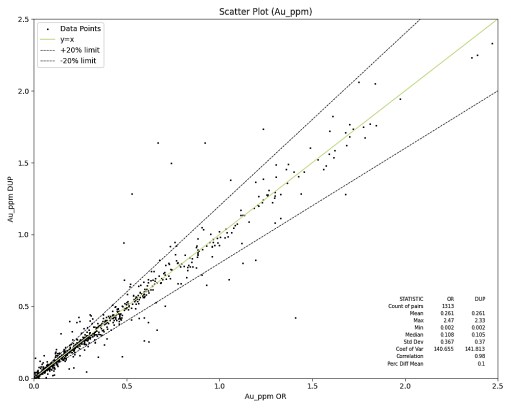
| Figure 11-9: Coarse Duplicates HARD Plots and Scatter Plot in ALS: 2016 - 2024 | 11-16 |
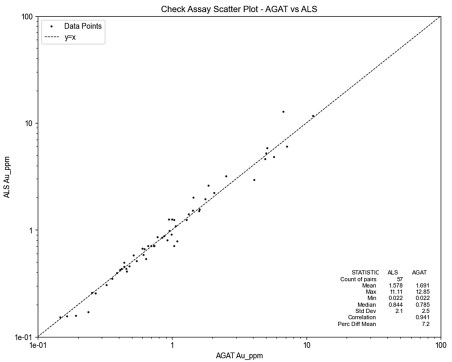
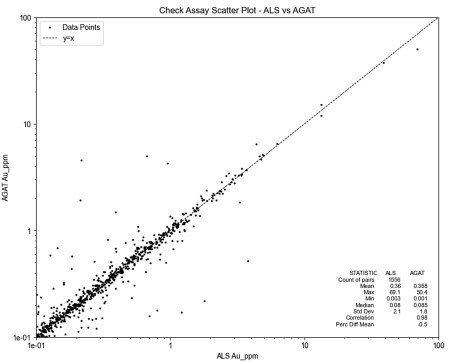
| Figure 11-10: Scatter Plots for Gold Pulp External Checks: 2015-2024 | 11-17 |
| Figure 13-1: Cyanidation Leach Extraction of Gold at 21 Nelligan Samples | 13-6 |
| Figure 14-1: Nelligan Litho-Structural Model | 14-3 |
| Figure 14-2: Nelligan Mineralization Domains and Grouped High Grade Wireframes | 14-5 |
| Figure 14-3: Gold Grade Contouring of Renard and Footwall Zones | 14-10 |
| Figure 14-4: Classified Resource Blocks Above the Cut-off Grade Inside the Nelligan Resource Pit Shell | 14-17 |
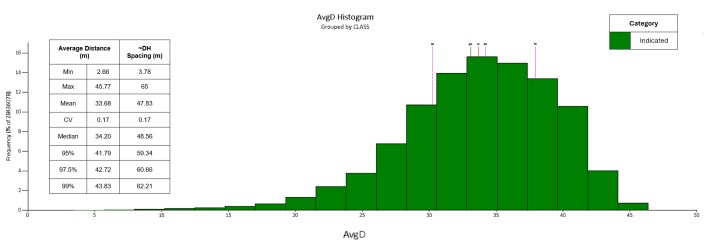
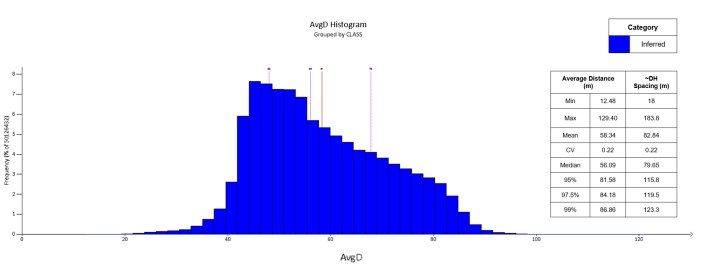
| Figure 14-5: Average Distance from Blocks to Closest Sample by Category, Unconstrained by the Resource Pit Shell | 14-18 |
| Figure 14-6: Nelligan Interpolated Block Grades and Composites | 14-20 |
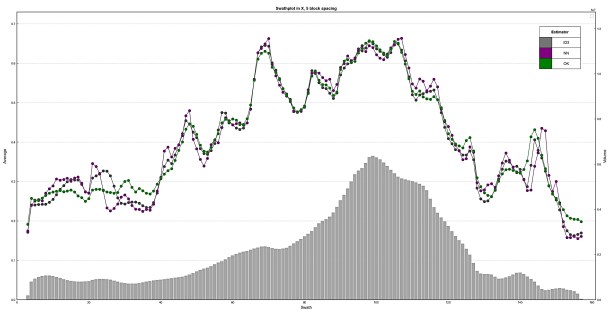
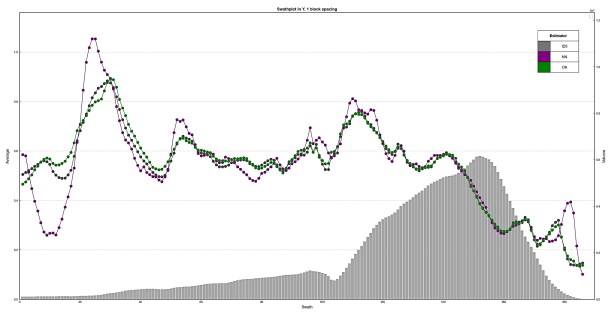
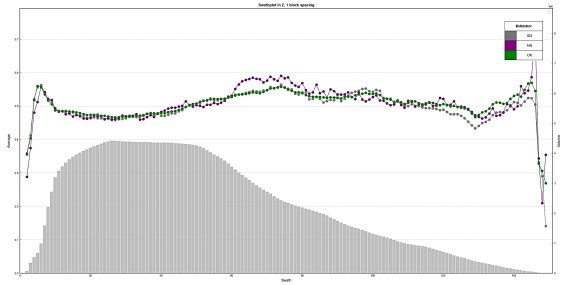
| Figure 14-7: Nelligan Swath Plots for All Domains in X, Y, and Z Directions | 14-21 |
| Figure 14-8: Nelligan Classified Mineral Resource Blocks above Cut-off Grade and within the Resource Pit Shell | 14-24 |
| Figure 14-9: Grade Tonnage Curve- Nelligan Indicated Resources in Pit Shell | 14-27 |
| Figure 23-1: Adjacent Properties to the Nelligan Project | 23-2 |
| Table 26-1: Proposed Exploration Budget | 26-2 |
Appendix Tables
| Table A 1: Mineral Tenure Information | 30-1 |
| vi |
|
IAMGOLD Corporation | Nelligan Project |
April 2, 2025 |
|
NI 43-101 Technical Report |
SLR Project No.: 233.065260.00001 |
1.0 Summary
1.1 Executive Summary
SLR Consulting (Canada) Ltd. (SLR) was retained by IAMGOLD Corporation (IAMGOLD) to prepare an independent Technical Report on the Nelligan Gold Project (Nelligan or the Project), located in northwestern Québec, Canada, Canada. The purpose of this Technical Report is to support the disclosure of an updated Mineral Resource estimate. This Technical Report conforms to NI 43-101 Standards of Disclosure for Mineral Projects. SLR visited the property from September 11 to September 13, 2024.
IAMGOLD is a mid-tier gold producer and developer headquartered in Canada, operating mines across North America and West Africa. The Project is situated approximately 45 km south of the town of Chapais, in the Chapais-Chibougamau area of Québec. On February 13, 2024, IAMGOLD finalized the acquisition of all issued and outstanding common shares of Vanstar Mining Resources Inc. (Vanstar) in exchange for approximately 12.0 million of its own common shares. Prior to this transaction, Vanstar held a 25% stake in the Nelligan Gold Project. With the acquisition completed, IAMGOLD now holds full ownership of the Project, securing a 100% interest.
The Project is located in the northeastern Abitibi Sub-province of the Archean Superior Province, near the Grenville Front. It lies within the southern Chibougamau mining camp and is characterized by volcanic and sedimentary rocks from two volcano-sedimentary cycles. The mineralization occurs within strongly altered sedimentary rocks, with predominant alteration types including silicification, carbonatization (dolomite + ankerite ± siderite ± calcite), potassic alteration, and, less frequently, albitization and hematization.
The deposit consists of thirteen main gold zones (Dan, Dan_B, Liam, Liam_B, Liam_C, Z36_B, Z36_C, Z36_D, Z36_W, Renard, Renard_2, Footwall, and Footwall_East), which are sub-parallel and dip southward. Slightly conjugated to these mineralized zones are higher grade mineralization zones. Its complex mineralization displays features of both intrusion-related and orogenic gold deposits. The geological modelling and grade estimation for the Project were conducted using Leapfrog Geo and Edge software by Seequent.
The resource estimate is based on 330 diamond drill holes. The block model's gold grade estimates and quantities were classified in accordance with the CIM Definition Standards for Mineral Resources and Mineral Reserves (CIM, 2014). The classification approach accounted for drill hole spacing, geological confidence, and continuity within each resource category.
A summary of Mineral Resources, effective December 31, 2024, for the Project is presented in Table 1-1. Indicated Mineral Resources at the property are estimated to total 103 million tonnes (Mt) at a gold grade of 0.95 grams per tonne (g/t) and containing 3.13 million ounces (Moz) of gold. Inferred Mineral Resources are estimated to total 166 Mt at a gold grade of 0.96 g/t and containing 5.16 Moz of gold.
| 1-1 |
|
IAMGOLD Corporation | Nelligan Project |
April 2, 2025 |
|
NI 43-101 Technical Report |
SLR Project No.: 233.065260.00001 |
Table 1-1: Summary of Nelligan Mineral Resource Estimate - December 31, 2024
|
Category |
Tonnage |
Grade |
Contained Metal |
|
Indicated |
103 |
0.95 |
3.13 |
|
Inferred |
166 |
0.96 |
5.16 |
|
Notes: 1. CIM (2014) definitions were followed for Mineral Resources. 2. Mineral Resources are estimated at a cut-off grade of 0.35 g/t Au. 3. Mineral Resources are estimated using a long-term gold price of US$1,800 per ounce, and a US$/C$ exchange rate of 1:1.25. 4. Bulk density varies from 2.71 tonnes per cubic metres (t/m3) to 2.75 t/m3 for the estimation domains and 2.0 t/m3 for the overburden. 5. Gold metallurgical recovery is 83%. 6. Mineral Resources are constrained by an optimized resource shell. 7. Mineral Resources that are not Mineral Reserves do not have demonstrated economic viability. 8. Numbers may not add due to rounding. |
|||
The Qualified Person (QP) is not aware of any environmental, permitting, legal, title, taxation, socio-economic, marketing, political, or other relevant factors that could materially affect the Mineral Resource estimate.
1.1.1 Conclusions
1.1.1.1 Geology and Mineral Resources
SLR offers the following conclusions:
• Since the 2022 block modelling exercise, IAMGOLD has successfully completed 63 diamond drill holes, increasing the total drill holes in the database to 330 for a total of 108,267.19 metres (m). The recent drilling programs have contributed to a significant increase in the Project's Mineral Resources.
• The overall precision and accuracy of the current gold assays are considered acceptable and sufficient for inclusion in the 2024 Mineral Resource estimate.
• The Project shows strong potential for resource growth, warranting further exploration and technical studies.
• The geology and characteristics of gold mineralization at the property are well understood, providing a solid foundation for ongoing and future work.
• Indicated Mineral Resources at the Project are estimated to total 103 Mt at a gold grade of 0.95 g/t and containing 3.13 Moz of gold. Inferred Mineral Resources at Nelligan are estimated to total 166 Mt at a gold grade of 0.96 g/t Au and containing 5.16 Moz of gold.
1.1.1.2 Mineral Processing
• Preliminary metallurgical test work has been completed on samples of material from the Nelligan deposit. The test work included exploratory mineralogical analysis, test work using whole-ore cyanidation, gravity concentration, cyanidation of gravity concentration tails, flotation, and cyanidation of flotation concentrate (with concentrate re-grind) and tails.
| 1-2 |
|
IAMGOLD Corporation | Nelligan Project |
April 2, 2025 |
|
NI 43-101 Technical Report |
SLR Project No.: 233.065260.00001 |
• Mineralogical analysis indicated that gold occurred as free or liberated and partially liberated gold, as well as locked within pyrite.
• Comparative testing using the different flowsheets on three samples showed that flotation followed by cyanidation of the flotation tails and of the re-ground flotation concentrate resulted in better gold extractions that flowsheets not including flotation.
• Comparative testing of 15 additional samples from different zones within the deposit in 2021 also resulted in a higher gold extractions on average by flotation and cyanidation of flotation products than by whole-ore cyanidation.
• Grind sensitivity test work indicated that there is a relationship between gold extraction and grind size.
• Comminution test work showed that there is significant variability amongst the samples in terms of comminution characteristics.
• In 2022, 21 samples were subjected to whole-ore cyanidation after grinding to a P80 of 75 µm. The test work showed that gold leaching was mostly complete within 24 hours, however, overall extraction varied widely, from 49% to 91%.
1.1.2 Recommendations
1.1.2.1 Geology and Mineral Resources
SLR is of the opinion that there is good potential to increase the resource base at the Project and that additional exploration and technical studies are warranted.
SLR makes the following recommendations:
1 Over the next two years, carry out exploration activities to improve resource potential, and complete a resource update along with a scoping study, including:
a) A proposed multi-phased core drilling program of 30,000 m, encompassing infill, expansion, and conversion drilling. This program should focus on infill drilling within the resource area to more accurately delineate mineralization and upgrade the classification from Inferred to Indicated, as well as expansion drilling to extend mineral resources both laterally and at depth.
b) Geological and mineralogical studies to enhance understanding of gold mineralization controls and refine chemical process applications in metallurgy.
c) Metallurgical test work to assess variability in gold mineralization and determine optimal processing and extraction methods.
d) Geotechnical studies to support project design, risk assessment, and cost estimation during the scoping phase.
e) Completion of a comprehensive scoping study.
The total cost of the recommended work program is estimated at C$13,090,000 (Table 1-2). SLR has reviewed and agrees with IAMGOLD's proposed exploration budget
2 Utilize potential areas of the mineralization (MIN) wireframes as exploration targets to convert potential material into categorized material (e.g., Inferred or Indicated).
| 1-3 |
|
IAMGOLD Corporation | Nelligan Project |
April 2, 2025 |
|
NI 43-101 Technical Report |
SLR Project No.: 233.065260.00001 |
3 Continue upgrading and improving the high grade (HG) mineralization wireframe model with new data to achieve a more refined and polished model.
4 Investigate low core recovery intervals, assess their impact on the density of mineralized domains, and determine how to accurately represent these intervals in future block modelling and engineering work.
5 Investigate observed grade trends and plunges at the Project following additional exploration drilling
6 Implement field duplicates to help monitor grade variability during sampling.
7 Reduce the types of certified reference materials (CRMs) to three categories: high grade, medium grade, and low grade. This streamlined approach will effectively monitor laboratory performance while providing sufficient coverage to detect emerging biases or systematic issues over extended periods.
8 Collect additional density samples in domains where the current sample count is insufficient to ensure a proper understanding of density. Extend sampling to non-mineralized lithologies and maintain sampling efforts in all mineralized zones.
| 1-4 |
|
IAMGOLD Corporation | Nelligan Project |
April 2, 2025 |
|
NI 43-101 Technical Report |
SLR Project No.: 233.065260.00001 |
Table 1-2: Proposed Exploration Budget
| Description | Units | Total Cost (C$) |
| Phase 1 | ||
| Diamond drilling (infill, expansion and conversion, all inclusive) | 15,000 m | $4,500,000 |
| Geological studies | $300,000 | |
| Metallurgical testing | $500,000 | |
| Phase 1 Total | $5,300,000 | |
| Phase 2 | ||
| Diamond drilling (infill, expansion and conversion, all inclusive) | 15,000 m | $4,500,000 |
| Geological Studies | $400,000 | |
| Update resource model | $150,000 | |
| Additional metallurgical testing | $250,000 | |
| Geotechnical studies | $500,000 | |
| Scoping study | $800,000 | |
| Phase 2 Total | $6,600,000 | |
| Total Phases 1 & 2 | $11,900,000 | |
| Contingency (10%) | $1,190,000 | |
| Grand Total | $13,090,000 |
1.1.2.2 Mineral Processing
1 Test work should continue to be conducted using samples representing the whole deposit to evaluate comminution and metallurgical characteristics.
2 Conduct additional grind-recovery test work to determine the optimum primary grind size.
3 Conduct additional gravity concentration test work to determine if gravity recovery would be beneficial to incorporate into the flowsheet.
4 Complete sufficient flowsheet comparative test work to allow for a trade-off study to be completed to determine the optimum flowsheet for taking forward into later stages of study.
5 If a flowsheet incorporating flotation and cyanidation of flotation products is chosen, additional re-grind test work on the flotation concentrate should be completed to determine the optimum concentrate re-grind size.
1.2 Economic Analysis
This section is not applicable for this Technical Report.
| 1-5 |
|
IAMGOLD Corporation | Nelligan Project |
April 2, 2025 |
|
NI 43-101 Technical Report |
SLR Project No.: 233.065260.00001 |
1.3 Technical Summary
1.3.1 Property Description and Location
Nelligan is located in the Nord-du-Québec region of Québec, Canada, approximately 60 km southwest of Chibougamau and 45 km south of Chapais. It spans multiple townships and is mapped on NTS sheets 32G/07 and 32G/08. The deposit is situated to the south side of Caopatina Lake at coordinates 522824 E; 5473541 N (UTM NAD 83 Zone 18).
1.3.2 Land Tenure
The Project comprises 265 active claims across seven distinct claim blocks: Nelligan, Émile, Miron, Opawica, Nemenjiche, Nelligan North, and IAMGOLD. These claims, covering a total of 14,850.25 hectares(ha), are fully registered to IAMGOLD under Québec's mining title management system (GESTIM). The claims were acquired through various agreements, some of which include net smelter return (NSR) royalties retained by the original vendors.
The Nelligan Block consists of 84 active claims spanning 4,705.40 ha. Initially acquired by Vanstar through purchases and map designation, certain claims were later sold or allowed to lapse. While eight original claims from 2010 are subject to a 2% NSR (with 1% purchasable for C$1.0 million), this royalty is now cancelled and the remaining 76 claims have no royalty obligations.
The Émile Block includes 60 contiguous claims over 3,361.91 ha. Acquired in stages between 2014 and 2016, a subset of 21 claims is subject to a 1% NSR royalty payable to Pierre Gervais, while the remaining 39 claims have no royalty obligations.
The Miron Block, covering 784.40 ha, consists of 14 claims acquired by Vanstar between 2015 and 2017. These claims, located along the western edge of the Project, are free of royalty obligations.
The Opawica Block includes four claims covering 223.90 ha. IAMGOLD acquired this block from Mosaic Minerals Corp. in February 2023 for C$150,000. Mosaic retains a 0.5% NSR, while Stellar AfricaGold holds an existing 2% NSR, of which 1% can be repurchased for C$1.0 million.
The Nemenjiche Block consists of 54 claims covering 3,026.46 ha. Acquired by IAMGOLD from Jean Audet (40%), Jean Robert (30%), and Les Explorations Carat Inc. in July 2023 for C$100,000, the vendors retained a 1% NSR, with 0.5% eligible for buyback at C$500,000.
The Nelligan North Block comprises six claims totaling 335.80 ha, acquired in February 2024 from Jean Audet (40%), Jean Robert (30%), and Les Explorations Carat Inc. for C$10,000. The vendors retained a 1% NSR, with 0.5% available for buyback at C$500,000.
IAMGOLD has also acquired 43 claims covering 2,412.38 ha between 2016 and 2024 by map designation. These claims, located south and southeast of the Émile Property, are not subject to any royalty payments.
IAMGOLD has obtained all necessary permits, authorizations and certifications from government agencies to allow exploration on the property, including drilling and mechanized stripping programs.
1.3.3 Existing Infrastructure
There is no permanent infrastructure on the property.
| 1-6 |
|
IAMGOLD Corporation | Nelligan Project |
April 2, 2025 |
|
NI 43-101 Technical Report |
SLR Project No.: 233.065260.00001 |
1.3.4 History
The Project's ownership history dates back to an option agreement between Vanstar and IAMGOLD in 2014. Through staged payments and exploration expenditures, IAMGOLD gradually increased its stake, reaching 75% by 2022. In 2023, IAMGOLD acquired all of Vanstar's outstanding shares, fully consolidating ownership of the Project. As a result, Vanstar's 25% interest was transferred to IAMGOLD in 2025, making IAMGOLD the sole owner of all project claims.
Exploration at Nelligan dates back to the 1950s, with early prospecting, mapping, and geophysical surveys driven by interest in the nearby Joe Mann deposit. Significant exploration began in the late 1970s, with companies such as Falconbridge, SOQUEM, and various juniors companies conducting geophysical surveys, drilling, and geochemical sampling. From 2012 to 2014, Vanstar identified key gold-bearing zones through magnetic surveys and drilling, leading to the 2014 option agreement with IAMGOLD.
Mineral resource estimates were first completed in 2019 by InnovExplo, reporting 3.19 Moz of inferred gold at 1.02 g/t Au. In 2023, SRK Consulting updated the estimate, identifying 1.99 Moz at 0.84 g/t Au in the Indicated category and 3.60 Moz at 0.87 g/t Au in the Inferred category, with a lower cut-off grade of 0.35 g/t Au.
1.3.5 Geology and Mineralization
The Project is located in the northeastern corner of the Abitibi Sub-province of the Archean Superior Province, approximately 15 km west of the metamorphic border of the Mesoproterozoic aged Grenville Province, named as Grenville Front. The Abitibi Greenstone Belt is located in the southern part of the Superior craton, Canada and is composed of Greenschist- to sub-greenschist-grade rocks.
The Project is hosted within the southern portion of the Chibougamau mining camp, known as Caopatina-Desmaraisville segment, which is bordered to the north by the Archean Opatica sub-province, to the east by the Proterozoïc Grenville front and to the south by a large cover of magmatic rocks known as Hébert pluton. The area is composed of volcanic and sedimentary rocks resulting from two complete volcano-sedimentary cycles.
The Project is located along a major shear corridor on the northern part of the property, stretching for a strike length of four kilometres. The mineralization consists of two principal phases: The first phase is characterized by pervasive sericite-silica-potassic alteration, and is associated with fine-grained, disseminated automorphic pyrite (Pyrite I). This phase is believed to be caused by intrusion-related hydrothermal fluids, generating low-grade mineralized domains (50 ppb to 500 ppb Au) over large areas, particularly within the Renard and Zone 36 domains. These zones are primarily controlled by N70 D2 shear zones and exhibit a sigmoid shape, with structures aligned along N70 but also influenced by N100 to N110 conjugated structures.
The second phase of mineralization is attributed to orogenic hydrothermal fluids, marked by the presence of carbonates (calcite and dolomite) and medium-grained pyrite (Pyrite II), which are expressed in veinlets and stockworks, occasionally becoming semi-massive. This event is associated with higher-grade gold content (one gram per tonne to 10 g/t Au) and results in thick mineralized zones (five metres to 15 m in thickness). These veins are structurally controlled by D1, D2, and D3 deformation phases. The second phase crosscuts the first, potentially remobilizing gold locally. The zones of high-grade mineralization exhibit sigmoid shapes and are localized in areas with lower pressure, defined by multiple deformation phases. Recent petrographic studies have confirmed the distinct characteristics of both mineralization events.
| 1-7 |
|
IAMGOLD Corporation | Nelligan Project |
April 2, 2025 |
|
NI 43-101 Technical Report |
SLR Project No.: 233.065260.00001 |
The Nelligan deposit is comprised of five major mineralized zones, subdivided into 13 distinct subzones. The Dan Zone (Dan, Dan_B) is the southernmost and consists of two mineralized envelopes, mainly silicified and altered with hematization, potassic alteration, and fracture-controlled albitization. The Liam Zone, to the north of the Dan Zone, includes subzones Liam, Liam B, and Liam C, characterized by quartz-sericite schist and silicified zones with gold associated with silicification and potassic alteration. Zone 36 spans 1.5 kilometers with four mineralized envelopes (Z36_B, Z36_C, Z36_D and Z36_W), the largest being Z36_C, which features intense silicification and carbonate-filled breccias.
The Renard Zone (Renard, Renard_2) is the principal zone of the deposit, extending three kilometres with significant silicification, sericite, and potassic alteration. This zone is offset by cross-cutting shear zones, creating sigmoidal shapes. Lastly, the Footwall Zone (FW), the northernmost zone, extends over four kilometres and hosts quartz-carbonate veinlets with sub-automorphic pyrite, associated with visible gold in some areas. The Footwall East Zone (FW_E) is the eastern extension of this zone, displaced by a cross-cutting structure.
The various styles of alteration and mineralization makes it atypical and relatively hard to categorize into a single deposit type since many of the characteristics of mineralization could individually be representative of different deposit models. The Nelligan deposit presents significant similarities with an Intrusion-Related Gold Deposit (IRGD) and orogenic gold deposit models.
1.3.6 Exploration
Between 2014 and 2024, IAMGOLD conducted comprehensive exploration programs on the Project, including geological mapping, prospecting, geochemical surveys, geophysical surveys, and drilling. This work aimed to better understand the mineralization and improve targeting for future exploration efforts.
The geological mapping and prospecting activities focused on the Nelligan, Émile, and Miron claim blocks. Over the years, IAMGOLD mapped outcrops and trenches, collecting numerous rock and channel samples. While many samples yielded low gold values, some higher grade results were identified, particularly in the 2020 and 2024 campaigns, with a few reaching values above 100 ppb Au. Additionally, a geochemical program involving till and soil sampling was carried out to define gold targets and potential mineralized zones, with results indicating the presence of multiple targets, including one likely related to Nelligan itself.
Several geophysical surveys were performed between 2015 and 2024, including VTEM, UAV magnetic, and IP surveys, all aimed at identifying anomalies and understanding the project's mineralization. The IP surveys in 2015, 2021, and 2024, in particular, helped pinpoint chargeable and conductive areas associated with gold mineralization.
IAMGOLD also utilized advanced techniques such as petrographic analysis and hyperspectral scanning of drill cores. These studies revealed insights into the mineralogy and alterations at Nelligan, including the presence of gold-bearing hydrothermal alterations and detailed lithotype compositions.
Overall, the extensive exploration work has improved the understanding of the Project, providing critical data for future drilling and resource evaluation.
1.3.7 Mineral Resources
The Mineral Resource estimate for the Project was prepared by SLR using drill hole data available as of September 24, 2024. This estimate incorporates data from 330 drill holes, totaling 108,267.19 m, completed between 1978 and 2024 by IAMGOLD, Vanstar, and previous operators.
| 1-8 |
|
IAMGOLD Corporation | Nelligan Project |
April 2, 2025 |
|
NI 43-101 Technical Report |
SLR Project No.: 233.065260.00001 |
Mineralization domains were defined in Leapfrog Geo software, including 13 low grade mineralized zones at a cut-off grade of 0.1 g/t Au and 37 high grade zones at one gram per tonne of gold. The 13 low grade zones are named Dan, Dan_B, Liam, Liam_B, Liam_C, Z36_B, Z36_C, Z36_D, Z36_W, Renard, Renard_2, Footwall, and Footwall_East. Exploratory data analysis was performed in Leapfrog, while variography was conducted using both Leapfrog Edge and Supervisor v8.15 software. A sub-block model estimation was constructed in Leapfrog Edge using 1.5 m composites and a multi-pass inverse distance cubed (ID3) interpolation method. Block classification was based on local drill hole spacing, requiring a minimum of three drill holes, with classification guided by continuity models (variograms) and adjusted for geological consistency and cohesive classification boundaries.
Validation of the wireframes and block model included volume comparisons, statistical analysis against composites, ordinary kriging (OK), and nearest neighbour (NN) estimates, swath plots, and visual inspections in 3D, longitudinal, cross-sectional, and plan views.
An open-pit Mineral Resource shell was optimized using Geovia Whittle software on a regularized 5 m x 5 m x 5 m block model, incorporating mining costs and other parameters. Classified material from the regularized model within the optimized pit shell and above a cut-off grade of 0.35 g/t Au was reported as Mineral Resources.
1.3.8 Mineral Processing
Three test work programs have been completed on samples from the Nelligan deposit since 2019.
In 2019, SGS performed metallurgical, mineralogical, and environmental test work on three composite samples from the Renard Zone and Zone 36. The test work included mineralogical analysis, screened metallics assays for gold and silver, analysis for sulphur and whole-rock analysis, and a gold deportment study, as well as metallurgical tests including carbon-in-leach (CIL) cyanidation of whole ore, flotation followed by cyanidation, gravity separation with cyanidation of gravity tails, and whole-ore cyanidation. Environmental tests included acid-base accounting (ABA).
The gold deportment study found that while there were significant amounts of liberated gold, gold was primarily contained in pyrite, with varying levels of liberation and locking. The best gold extraction results were obtained using flotation followed by concentrate regrinding and cyanidation, achieving approximately 84% gold recovery in the concentrate with a total mass pull of 17%. Regrinding the flotation concentrate to 10 µm improved gold recovery further.
In 2021, SGS tested 15 additional samples to assess gold recovery using flotation and regrinding before cyanidation versus whole-ore cyanidation. Gold content of the samples ranged from 0.55 g/t to 1.80 g/t, and sulphur levels varied from 1.8% to 7.2%. Pyrite, the primary gold host, was well-liberated at a P80 of 75 µm. Grindability tests showed significant variability, with semi-autogenous grinding (SAG) indices ranging from moderately hard to very soft. The presence of mica complicated the production of ultra-fine grind sizes during concentrate re-grinding. Results indicated that a flowsheet incorporating flotation and regrinding improved gold recovery by 2.2% to 9.3% compared to direct cyanidation of whole ore.
In 2022, ALS Metallurgy Kamloops analyzed 21 additional samples for cyanidation by bottle roll testing at a target P80 of 75 µm. Gold extraction after 48 hours averaged 72%, ranging from 49% to 91%. Most gold was extracted within the first 24 hours, with low cyanide and lime consumption.
| 1-9 |
|
IAMGOLD Corporation | Nelligan Project |
April 2, 2025 |
|
NI 43-101 Technical Report |
SLR Project No.: 233.065260.00001 |
The test work is preliminary in nature, and additional test work is necessary to select the optimum flow sheet and operating conditions for processing.
| 1-10 |
|
IAMGOLD Corporation | Nelligan Project |
April 2, 2025 |
|
NI 43-101 Technical Report |
SLR Project No.: 233.065260.00001 |
2.0 Introduction
SLR Consulting (Canada) Ltd. (SLR) was retained by IAMGOLD Corporation (IAMGOLD) to prepare an independent Technical Report on the Nelligan Gold Project (Nelligan or the Project), located in northwestern Québec, Canada. The purpose of this Technical Report is to support the disclosure of a Mineral Resource estimate. This Technical Report conforms to NI 43-101 Standards of Disclosure for Mineral Projects.
IAMGOLD is a mid-tier gold producer and developer headquartered in Canada, operating mines across North America and West Africa. The Project is situated approximately 45 km south of the town of Chapais, in the Chapais-Chibougamau area of Québec. On February 13, 2024, IAMGOLD finalized the acquisition of all issued and outstanding common shares of Vanstar Mining Resources Inc. (Vanstar) in exchange for approximately 12.0 million of its own common shares. Prior to this transaction, Vanstar held a 25% stake in the Nelligan Gold Project. With the acquisition completed, the IAMGOLD now holds full ownership of the Project, securing a 100% interest.
The Project is an advanced exploration-stage gold project located in the northeastern Abitibi Sub-province of the Archean Superior Province, near the Grenville Front. Situated within the southern Chibougamau mining camp, the Project area hosts a complex geological setting composed of volcanic and sedimentary sequences from two distinct volcano-sedimentary cycles. Gold mineralization is primarily associated with intensely altered sedimentary rocks, where key alteration assemblages include silicification, carbonatization, and potassic alteration, with localized occurrences of albitization and hematization.
2.1 Sources of Information
This Technical Report was prepared by Marie-Christine Gosselin, P.Geo. and Lance Engelbrecht, P.Eng., who are independent Qualified Persons (QPs). Gosselin's sections were prepared under the supervision of Luke Evans, M.Sc., P.Eng., ing, from SLR. Ms. Gosselin, SLR Senior Resource Geologist, is responsible for sections 1-12 and 14-30 of this report and Lance Engelbrecht, SLR Technical Manager - Metallurgy and Principal Metallurgist, is responsible for section 13, and relevant subsections of 1, 25, and 26.
A site visit was carried out by Marie-Christine Gosselin, P.Geo., from September 11 to September 13, 2024. SLR visited outcrops of the deposit, as well as the core logging facilities. High quality 3D models prepared by the IAMGOLD team were also reviewed and discussed during the site visit.
Discussions were held with personnel from IAMGOLD:
• Marie-France Bugnon, P.Geo., General Exploration Director
• Lisa Ragsdale, P.Geo., Director Geology
• Maxime Douëllou, P.Geo., Project Geologist
• Shana Dickenson, P.Geo., District Senior Geologist
• Adrien Zamparutti, P.Geo., Senior Geologist
• Raphaël Turlot, P.Geo., Exploration Geologist
The documentation reviewed, and other sources of information, are listed at the end of this Technical Report in Section 27.0 References.
| 2-1 |
|
IAMGOLD Corporation | Nelligan Project |
April 2, 2025 |
|
NI 43-101 Technical Report |
SLR Project No.: 233.065260.00001 |
2.2 List of Abbreviations
Units of measurement used in this Technical Report conform to the metric system. All currency in this Technical Report is US dollars (US$) unless otherwise noted.
|
µ |
micron |
kVA |
kilovolt-amperes |
|
µg |
microgram |
kW |
kilowatt |
|
a |
annum |
kWh |
kilowatt-hour |
|
A |
ampere |
L |
litre |
|
bbl |
barrels |
lb |
pound |
|
Btu |
British thermal units |
L/s |
litres per second |
|
°C |
degree Celsius |
m |
metre |
|
C$ |
Canadian dollars |
M |
mega (million); molar |
|
cal |
calorie |
m2 |
square metre |
|
cfm |
cubic feet per minute |
m3 |
cubic metre |
|
cm |
centimetre |
MASL |
metres above sea level |
|
cm2 |
square centimetre |
m3/h |
cubic metres per hour |
|
d |
day |
mi |
mile |
|
dia |
diameter |
min |
minute |
|
dmt |
dry metric tonne |
m |
micrometre |
|
dwt |
dead-weight ton |
mm |
millimetre |
|
°F |
degree Fahrenheit |
mph |
miles per hour |
|
ft |
foot |
MVA |
megavolt-amperes |
|
ft2 |
square foot |
MW |
megawatt |
|
ft3 |
cubic foot |
MWh |
megawatt-hour |
|
ft/s |
foot per second |
oz |
Troy ounce (31.1035g) |
|
g |
gram |
oz/st, opt |
ounce per short ton |
|
G |
giga (billion) |
ppb |
part per billion |
|
Gal |
Imperial gallon |
ppm |
part per million |
|
g/L |
gram per litre |
psia |
pound per square inch absolute |
|
Gpm |
Imperial gallons per minute |
psig |
pound per square inch gauge |
|
g/t |
gram per tonne |
RL |
relative elevation |
|
gr/ft3 |
grain per cubic foot |
s |
second |
|
gr/m3 |
grain per cubic metre |
st |
short ton |
|
ha |
hectare |
stpa |
short ton per year |
|
hp |
horsepower |
stpd |
short ton per day |
|
hr |
hour |
t |
metric tonne |
|
Hz |
hertz |
tpa |
metric tonne per year |
|
in. |
inch |
tpd |
metric tonne per day |
|
in2 |
square inch |
US$ |
United States dollar |
|
J |
joule |
USg |
United States gallon |
|
k |
kilo (thousand) |
USgpm |
US gallon per minute |
|
kcal |
kilocalorie |
V |
volt |
|
kg |
kilogram |
W |
watt |
|
km |
kilometre |
wmt |
wet metric tonne |
|
km2 |
square kilometre |
wt% |
weight percent |
|
km/h |
kilometre per hour |
yd3 |
cubic yard |
|
kPa |
kilopascal |
yr |
year |
| 2-2 |
|
IAMGOLD Corporation | Nelligan Project |
April 2, 2025 |
|
NI 43-101 Technical Report |
SLR Project No.: 233.065260.00001 |
3.0 Reliance on Other Experts
This Technical Report has been prepared by SLR for IAMGOLD. The information, conclusions, opinions, and estimates contained herein are based on:
• Information available to SLR at the time of preparation of this Technical Report.
• Assumptions, conditions, and qualifications as set forth in this Technical Report.
For the purpose of this Technical Report, SLR has relied on ownership information provided by IAMGOLD and discussed in Section 4.2 and the Executive Summary of this Technical Report. SLR has not researched property title or mineral rights for the Nelligan property and expresses no opinion as to the ownership status of the property.
SLR has relied on IAMGOLD for guidance on applicable taxes, royalties, and other government levies or interests, applicable to revenue or income from the Nelligan. This information was relied on in Section 1 and Section 4.
Except for the purposes legislated under provincial securities laws, any use of this Technical Report by any third party is at that party's sole risk.
| 3-1 |
|
IAMGOLD Corporation | Nelligan Project |
April 2, 2025 |
|
NI 43-101 Technical Report |
SLR Project No.: 233.065260.00001 |
4.0 Property Description and Location
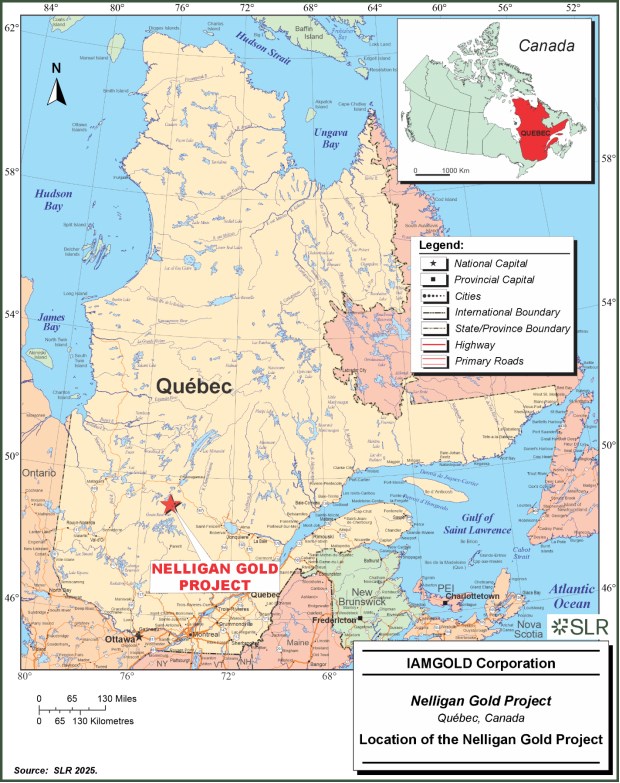
The Project is located in the Nord-du-Québec administrative region in the Province of Québec, Canada, approximately 60 km southwest of the town of Chibougamau and 45 km south of the town of Chapais, in the Chapais-Chibougamau area of Québec (Figure 4-1).
The Project is located in the Hazeur, Gamache, Rohault, Crisafy and Pambrun townships on the National Topographic System (NTS) map sheets 32G07 and 32G08. The deposit centroid is located on the south side of Caopatina lake at coordinates 522824 E; 5473541 N (UTM NAD 83 Zone 18).
| 4-1 |
|
IAMGOLD Corporation | Nelligan Project |
April 2, 2025 |
|
NI 43-101 Technical Report |
SLR Project No.: 233.065260.00001 |
Figure 4-1: Location of the Nelligan Gold Project
| 4-2 |
|
IAMGOLD Corporation | Nelligan Project |
April 2, 2025 |
|
NI 43-101 Technical Report |
SLR Project No.: 233.065260.00001 |
4.1 Ownership
4.1.1 IAMGOLD-Vanstar Agreement
On November 17, 2014, Vanstar and IAMGOLD entered into an option agreement allowing the latter to acquire up to 80% of the Project, as it existed at the time, subject to certain conditions. The agreement specified that IAMGOLD could earn an initial interest of 50% on ownership by making instalment payments of C$500,000 and incurring C$4,000,000 in exploration expenditures over a period of 4.5 years. In addition, IAMGOLD could earn an additional 25% to 30% interest by conducting pre-feasibility and feasibility studies (PFS and FS, respectively) and making additional cash payments of C$500,000.
On February 22, 2018, the original agreement was replaced by an Amending Agreement where Vanstar granted IAMGOLD an exclusive and irrevocable first option to acquire an undivided 51% interest in the Project which, from that point on, included the Nelligan, Miron, and Émile properties, by paying to Vanstar an additional amount of C$2,150,000 on the date of the Amending Agreement.
Following the exercise of the first option of the Amending Agreement, IAMGOLD earned an additional 24% interest in consideration of cash payments totalling C$2,750,000 over a four year period, as well as the completion by March 2022 of a NI 43-101 compliant Mineral Resource Estimate and the filing of a supporting Technical Report. The C$2,750,000 sum was completely paid out in December 2019, in advance to the fourth anniversary of the acquisition of the 51% interest. These conditions being met, 50% of the 2% NSR royalty on the original claims of the Project acquired from the original owners in February 2017 have been cancelled by Vanstar.
Having vested to hold an aggregate undivided 75% interest, IAMGOLD retained a further option to earn an additional 5% interest, to hold an 80% interest in the Project, by completing and delivering a feasibility study. Vanstar would then retain a 20% undivided non-contributory carried interest until the commencement of commercial production, after which: (1) the 20% undivided interest became participating; and (2) Vanstar would pay its attributable portion of the total development and construction costs to the commencement of commercial production from 80% of its share of any ongoing distributions from the joint venture. Vanstar would also retain the 1% NSR royalty on the original claims of the Project.
On December 5, 2023, IAMGOLD announced it had entered into a definitive arrangement agreement with Vanstar pursuant to which IAMGOLD agreed to acquire all of the issued and outstanding common shares of Vanstar by way of a court-approved plan of arrangement under the Canada Business Corporations Act. Pursuant to the Arrangement Agreement, Vanstar's shareholders received 0.2008 of an IAMGOLD common share for each Vanstar share. Based on the five day volume weighted average price of IAMGOLD shares on the TSX as of December 1, 2023, the consideration to Vanstar's shareholders and option holders implied a total transaction value of approximately $31.1 million (based on the Bank of Canada daily exchange rate as of December 1, 2023).
On February 13, 2024, the transaction closed and the 1% NSR royalty held by Vanstar on selected claims of the Project was cancelled due to the transaction. Vanstar's 25% interest was subsequently transferred in the name of IAMGOLD on February 6, 2025 and all the Project claims are now 100% owned by IAMGOLD.
| 4-3 |
|
IAMGOLD Corporation | Nelligan Project |
April 2, 2025 |
|
NI 43-101 Technical Report |
SLR Project No.: 233.065260.00001 |
4.2 Mineral Tenure
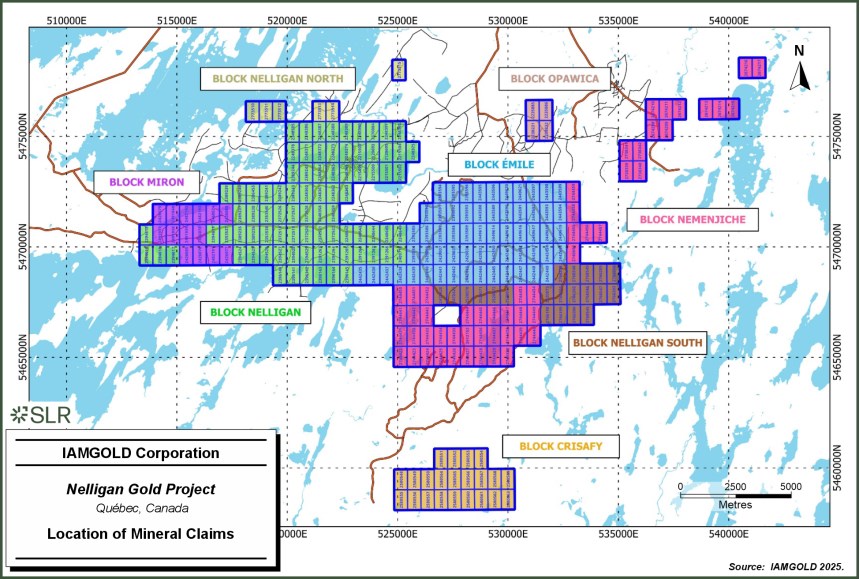
The Project consists of 265 active claims located within seven claim blocks, named Nelligan, Émile, Miron, Opawica, Nemenjiche, Nelligan North, and IAMGOLD, totaling 14,850.25 ha (Table 4-1 and Figure 4-2). Exclusive exploration rights (claims) were staked by electronic map designation. A detailed list of mining titles is presented in Appendix A.
Table 4-1: Summary of Mineral Tenure Information
|
Claim Block |
Status |
Company |
Start Date |
Expiration Date |
Area |
|
Nelligan |
Active |
IAMGOLD Corporation 100% |
9/11/2007 to 8/21/2014 |
6/11/2025 to 12/9/2026 |
4,705.40 |
|
Émile |
Active |
IAMGOLD Corporation 100% |
10/31/2013 to 6/16/2016 |
10/30/2025 to 12/29/2026 |
3,361.91 |
|
Miron |
Active |
IAMGOLD Corporation 100% |
4/9/2015 to 5/9/2017 |
5/8/2025 to 4/8/2027 |
784.40 |
|
Opawica |
Active |
IAMGOLD Corporation 100% |
6/2/2010 to 6/15/2010 |
4/13/2026 |
223.90 |
|
Nemenjiche |
Active |
IAMGOLD Corporation 100% |
6/2/2021 to 3/6/2023 |
6/1/2025 to 3/5/2026 |
3,026.46 |
|
Nelligan North |
Active |
IAMGOLD Corporation 100% |
6/20/2023 |
6/19/2026 |
335.80 |
|
IAMGOLD |
Active |
IAMGOLD Corporation 100% |
12/1/2016 to 10/11/2024 |
5/14/2026 to 10/10/2027 |
2,412.38 |
|
Total |
|
|
|
|
14,850.25 |
According to GESTIM, Québec's mining title management system, the Project claims are registered 100% to IAMGOLD.
The mining claims are subject to terms under several agreements as described in the following sections.
| 4-4 |
|
IAMGOLD Corporation | Nelligan Project |
April 2, 2025 |
|
NI 43-101 Technical Report |
SLR Project No.: 233.065260.00001 |
Figure 4-2: Location of Mineral Claims
| 4-5 |
|
IAMGOLD Corporation | Nelligan Project |
April 2, 2025 |
|
NI 43-101 Technical Report |
SLR Project No.: 233.065260.00001 |
4.2.1 Nelligan Block
In September 2010, Vanstar signed an agreement for the acquisition of the Nelligan property comprised of 12 claims from two independent prospectors in consideration of a cash payment of C$4,160 and the issue of 225,000 common shares, valued at C$42,750. The vendors have retained a 2% net smelter return (NSR) royalty from which 1% can be purchased for an amount of C$1.0M. An additional 80 claims were acquired by Vanstar by map designation to form the original Nelligan project. In 2012, 52 of the 92 originally acquired claims were not renewed when they expired.
In 2013, Vanstar acquired 35 claims by map designation and 23 additional claims were acquired for 350,000 common shares of Vanstar, valued at C$30,750. No royalty was retained.
On January 13, 2014, four of the 12 original claims were sold by Vanstar to Stellar AfricaGold Inc. (Stellar AfricaGold). On May 28, 2014, Vanstar acquired four claims for a cash consideration of C$2,000 and 60,000 common shares of Vanstar valued at C$5,400. On June 30, 2014, Vanstar acquired nine claims for a cash consideration of C$4,500 and the issuance of 80,000 common shares valued at C$8,000. No royalty was retained.
During 2015, 23 claims were not renewed as agreed between Vanstar and IAMGOLD.
In February 2017, Vanstar signed an agreement with the two prospectors to re-purchase their 2% NSR royalty granted on the remaining eight claims acquired originally in 2010, in exchange for the issuance in their favour of 1,200,000 common shares of Vanstar valued at C$72,000 and a payment of C$75,000. In May 2017, this agreement was amended so that the cash payment of C$75,000 was replaced by the issue of two convertible debentures of C$37,500 for a 36-month term bearing interest at the rate of 10% per year. The Nelligan Block currently comprises 84 active claims in two blocks of contiguous claims and covering a total surface area of approximately 4,705.40 ha. Apart from the eight original claims acquired in 2010, the remaining 76 claims of the Nelligan Block are not subject to any royalty payment.
4.2.2 Émile Block
In November 2014, Vanstar signed an agreement to acquire 100% of the Émile property consisting of 13 claims in exchange for the issue of 400,000 common shares valued at C$22,000. In February 2015, Vanstar acquired five additional claims by map designation.
In May 2016, Vanstar acquired a 100% interest in 33 claims, which were included in the Émile Block, in consideration of 1,000,000 common shares, valued at C$60,000. Of those, a sub-block of 21 claims is subject to a 1% NSR royalty payable to Pierre Gervais.
In June 2016, Vanstar acquired nine additional claims through map designation.
The Émile Block currently comprises 60 contiguous active claims covering a total surface area of approximately 3,361.91 ha with 39 claims not subject to any royalty payment.
4.2.3 Miron Block
The Miron property was originally aggregated by Vanstar in April 2015, comprising six claims located along the western edge of the Nelligan Project acquired through map designation.
In October 2016 and 2017, Vanstar acquired one and seven additional claims, respectively, through map designation.
The Miron Block currently comprises 14 contiguous active claims covering a total surface area of approximately 784.40 ha and they are not subject to any royalty payment.
| 4-6 |
|
IAMGOLD Corporation | Nelligan Project |
April 2, 2025 |
|
NI 43-101 Technical Report |
SLR Project No.: 233.065260.00001 |
4.2.4 Opawica Block
On September 15, 2021, IAMGOLD signed an option agreement with Mosaic Minerals Corp. (Mosaic) to acquire 100% of the Opawica property consisting of four claims, in consideration of an aggregate payment of C$150,000. IAMGOLD completed this purchase in February 2023, and Mosaic has retained a 0.5% NSR. The Opawica claims are also subject to an existing royalty of 2% NSR payable to Stellar AfricaGold from which parts of 1% NSR can be purchased from time to time for an aggregate of C$1,000,000.
The Opawica claims currently cover a total surface area of approximately 223.90 ha.
4.2.5 Nemenjiche Block
On July 13, 2023, IAMGOLD signed a purchase agreement with Jean Audet (40%), Jean Robert (30%) and Les Explorations Carat Inc., the vendors, to acquire 100% of the Nemenjiche property consisting of 54 claims, in consideration of one cash purchase price of C$100,000. The vendors have retained a 1% NSR royalty from which 0.5% NSR can be reduced by paying an amount of C$500,000.
The Nemenjiche claims currently cover a total surface area of approximately 3,026.46 ha.
4.2.6 Nelligan North Block
On February 28, 2024, IAMGOLD signed a purchase agreement with Jean Audet (40%), Jean Robert (30%) and Les Explorations Carat Inc (the vendors), to acquire 100% of the Nelligan North property consisting of six claims, in consideration of one cash purchase price of C$10,000. The vendors have retained a 1% NSR royalty from which 0.5% NSR can be reduced by paying an amount of C$500,000.
The Nelligan North claims currently cover a total surface area of approximately 335.80 ha.
4.2.7 IAMGOLD Claims (Nelligan South and Crisafy)
From December 2016 to November 2024, IAMGOLD has acquired 43 claims by map designation, 21 located at the south and southeast of the Émile Property, and 22 forming an isolated block located further south of the Émile property.
The IAMGOLD claims currently cover a total surface area of approximately 2,412.38 ha and they are not subject to any royalty payment.
4.3 Permits and Authorization
IAMGOLD has obtained all necessary permits, authorizations and certifications from government agencies to allow exploration on the property, including drilling and mechanized stripping programs.
4.4 Environmental and Community Considerations
Environmental disturbances on the Project are largely related to drilling activities. The QP is not aware of any environmental liabilities on the property. IAMGOLD has all required permits to conduct the proposed work on the property. The QP is not aware of any other significant factors and risks that may affect access, title, or the right or ability to perform the proposed work program on the property.
| 4-7 |
|
IAMGOLD Corporation | Nelligan Project |
April 2, 2025 |
|
NI 43-101 Technical Report |
SLR Project No.: 233.065260.00001 |
The Project is located in Eeyou Istchee James Bay territory on Category III lands belonging to the Government of Québec and is subject to the James Bay and Northern Québec Agreement. Mineral exploration is allowed under specific conditions. The issuers shall be submitted to the Environmental Regime, which takes into account the Hunting, Fishing and Trapping Regime. On Category III lands, Eeyou Istchee peoples have exclusive rights to harvest certain species of wildlife and to conduct trapping activities. Each hunting area has a tallyman.
The issuer has regularly communicated with the Eeyou Istchee James Bay Regional Government (EIJBRG) and the First Nations where the Project is located, Oujé-Bougoumou and Waswanipi, to inform and consult on these matters.
4.5 Mining Rights in Quebec
As defined by the Ministry of Natural Resources and Forestry (MRNF) website (www.mrn.gouv.qc.ca), the exclusive exploration right (known previously as the claim) is the only valid exploration right in Quebec. The exclusive exploration right gives the holder an exclusive right to search for mineral substances in the public domain, except within sand, gravel, clay, and other loose deposits, on the land subjected to the claim.
An exclusive exploration right can be obtained by map designation, henceforth the principal method for acquiring an exclusive exploration right, or by staking on lands that have been designated for this purpose. The accepted means to submit a notice of map designation for an exclusive exploration right is through GESTIM Plus (www.gestim.mines.gouv.qc.ca).
The term of a claim is three years from the day the claim is registered, and it can be renewed indefinitely for successive two-year periods providing the holder meets all the conditions set out in the Mining Act, including the obligation to invest a minimum amount required in exploration work determined by the regulation. The Mining Act includes provisions to allow any amount disbursed to perform work in excess of the prescribed requirements to be applied to the subsequent terms of the exclusive exploration right.
The MRNF has put in force in 2024 a new authorization that must be obtained before carrying out impact-causing exploration work (includes drilling, trenching, and other impact exploration works). The purpose of the new authorization, known as the "Authorisation pour Travaux d'exploration à Impacts" ( ATI )authorization, is to ensure that the concerns of neighbouring local municipalities and Indigenous communities are taken into consideration while fostering a predictable framework conducive to mining development investments and providing for better control over the impact on their living environment from impact-causing exploration work. The ATI is based on a desire for transparency and harmonious conciliation of different land uses. It also allows the MRNF to impose conditions and obligations for work to be done on land covered by claims, so that the concerns about proposed mining exploration activities expressed by local municipalities and Indigenous communities are taken into consideration. IAMGOLD has detained in 2024 a valid ATI for its drilling campaign.
Any exclusive exploration right holder to specific mineral substances as described under Section 5 of the Mining Act can obtain a mining lease. The application must demonstrate that the deposit is mineable. The surface area of a mining lease must not exceed 100 ha unless the circumstances warrant an exception deemed acceptable by the MRNF. A written application must be submitted that includes a report certified by a geologist or engineer describing the nature and extent of the deposit and its likely value. Mining leases have a duration of 20 years and are renewable by 10-year periods.
| 4-8 |
The holder of a mining lease or concession has surface rights in most circumstances. On public lands, surface rights are limited to mining purposes only. If the land is privately owned, the holder must obtain the owner's permission to access the land and carry out work. They may acquire these rights through amicable agreement or, if necessary, by expropriation. The lease or concession holder must obtain the consent of the lessee of the land surface or pay him compensation. In the event of a disagreement, a court can determine this compensation.
| 4-9 |
|
IAMGOLD Corporation | Nelligan Project |
April 2, 2025 |
|
NI 43-101 Technical Report |
SLR Project No.: 233.065260.00001 |
5.0 Accessibility, Climate, Local Resources, Infrastructure and Physiography
5.1 Accessibility
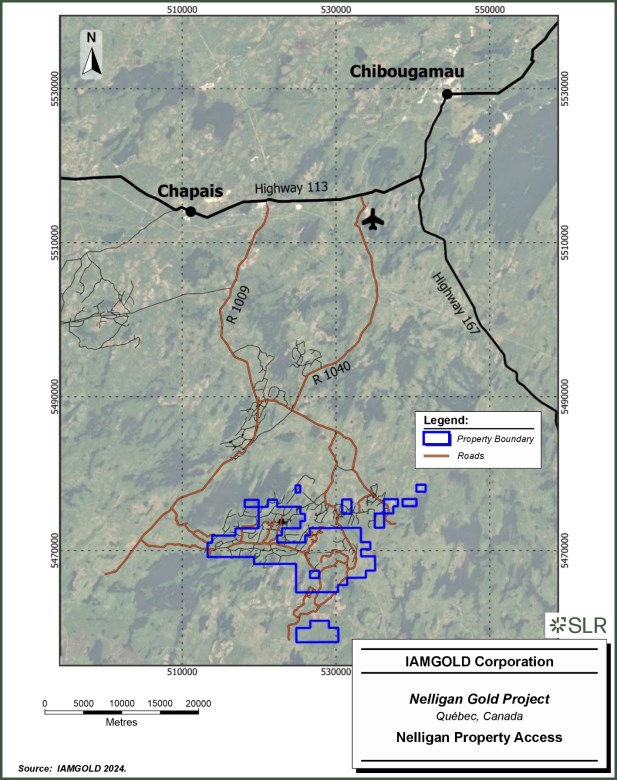
Nelligan is located in the Nord-du-Québec administrative region in the northern part of the province of Québec, Canada. The Project is approximately 45 km south of the town of Chapais, 60 km southwest of the town of Chibougamau, and 280 km northeast of the town of Val-d'Or.
The Project is situated south of Caopatina Lake, accessible by Highway 113 from Chapais or Chibougamau, followed by the Barette-Sud (R1009) logging road and a series of smaller logging roads (Figure 5-1). From Chapais, it is an 85 km drive taking approximately 90 minutes.
Mining and drilling operations may be carried out year-round with some limitations in specific areas of the Project. Surface exploration work (mapping, channel sampling) can be carried out between mid-May to mid-October. From January to April, lakes are typically frozen and suitable for drilling. Conditions may be difficult when the snow melts in May and for a few weeks during moose hunting season in the fall.
5.2 Climate
The Project lies within the Abitibi plains ecoregion of the boreal shield ecozone. The climate is continental and is characterized by short mild summers and long cold winters, with mean monthly temperatures ranging from -25°C in January to 21°C in July. Peak temperatures can reach -40°C in the winter and 30°C in the summer. Mean annual precipitation ranges from 24 mm in February to 95 mm in July. Precipitation is considerable year-round, although February through April are drier. Climatic conditions do not seriously hinder exploration or mining activities, with only some seasonal adjustments for certain types of work (e.g., conducting mapping in summer and drilling boggy areas in winter).
5.3 Local Resources
Various services are available at Chibougamau, a forestry and mining town with a population of approximately 7,500 accessed by Highway 113. Services include hotels, motels, restaurants, gas stations, building supplies, a post office, hospital and police services, and sports facilities. The town of Chapais, another forestry and mining town, has an approximate population of 1,500. Both localities also offer multiple services and workers specialized in mining, diamond drilling, and exploration. Chibougamau and Chapais are former mining towns with approximately 60 years of mining history.
The area is equipped with various highway connections (to Val-d'Or or Montreal), railroad connections, and high voltage powerlines. The region is covered by the Chibougamau/Chapais airport that has weekly flight connections to Montreal and other north-of-Quebec localities.
A greater range of services is available at Val -d'Or, Québec, located 440 road kilometres from the Project. Val-d'Or is a gold mining town with a population of approximately 32,000 and is serviced by daily flights from Montreal.
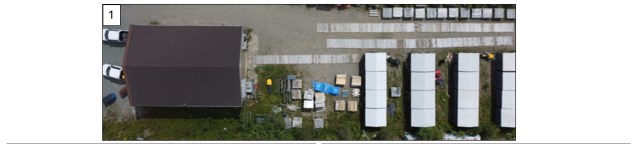
IAMGOLD uses a core logging facility located in the town of Chibougamau (Figure 5-2).
| 5-1 |
|
IAMGOLD Corporation | Nelligan Project |
April 2, 2025 |
|
NI 43-101 Technical Report |
SLR Project No.: 233.065260.00001 |
Figure 5-1: Nelligan Property Access
| 5-2 |
|
IAMGOLD Corporation | Nelligan Project |
April 2, 2025 |
|
NI 43-101 Technical Report |
SLR Project No.: 233.065260.00001 |
Figure 5-2: Core Shack Facility in Chibougamau
5.4 Infrastructure
There is no permanent infrastructure on the property.
5.5 Physiography
Based on the vegetation zones map of Québec, the Project lies within the boreal zone and the continuous boreal forest subzone. Forest cover is typical of the taiga biome, including areas dominated by sparse black spruce, birch, and poplar forests, in addition to large areas of peat bog devoid of trees.
The region has typical boreal forest fauna with moose, bears, and other mammals. Bird species include partridges, sharp-tailed grouse, black duck, wood duck, hooded merganser, and pileated woodpecker.
Most of the area is relatively flat and has a high rate of lake coverage. The overall drainage level is very poor, and the property has significant coverage of wetlands and bog.
The approximate elevation of the Project varies from 381 MASL to 411 MASL. The Project is covered by thick glacial deposits. Typical outcrop exposure on the Project is poor and the average thickness of overburden is between 10 m and 50 m.
| 5-3 |
|
IAMGOLD Corporation | Nelligan Project |
April 2, 2025 |
|
NI 43-101 Technical Report |
SLR Project No.: 233.065260.00001 |
6.0 History
Information in this section is largely sourced from the MRNF spatial reference geomining information system (SIGEOM) database, the Technical Report completed by InnovExplo Inc. (2019), the Technical Report completed by SRK (2023), and from other IAMGOLD internal reports.
6.1 Prior Ownership
The original claims of the Nelligan Property were acquired in September 2010 by Vanstar who successively acquired additional claims through purchase agreements signed with individuals or through map-designated staking to constitute the Nelligan Block as known today. Details on ownership history are described in section 4.1.1 of this Technical Report.
The ownership history of the Nelligan property prior to Vanstar's involvement is complex due to the property's divisions, some of which have undergone ownership changes while others have remained unchanged. SLR's understanding of past ownership is based on available data from historical exploration activities conducted on the property. The information below represents to the extent known, the ownership history as inferred from exploration records and is approximated:
Falconbridge Nickel Mines, 1977-1978
Patino Mines Ltd., 1978
Mines Northgate Patino Inc., 1982-1984
Société d'Exploration Minière Pontiac, 1986
SOQUEM, 1987-1988
Exploration Muscocho, 1987-1988
Exploration Noramco, 1988
Abbey Exploration, 1989
2736-1179 Quebec Inc., 1994
SOQUEM and Ressources Unifiées Oasis Inc., 1994-1995
Ressources Unifiées Oasis Inc., 1996
Table Jamésienne de consertation minière, 2005
6.2 Exploration History
A summary of the historical exploration completed by previous operators is summarized in Table 6-1.
| 6-1 |
|
IAMGOLD Corporation | Nelligan Project |
April 2, 2025 |
|
NI 43-101 Technical Report |
SLR Project No.: 233.065260.00001 |
Table 6-1: Summary of Historical Work Completed by Previous Operators
|
Year |
Company |
Type of Work |
Areas of Interest |
|
1977 |
Falconbridge Nickel Mines |
- Geophysical: EM and Mag surveys |
Hazeur and Gamache townships |
|
1978 |
Falconbridge Nickel Mines |
- Geophysical: Gravity survey |
Hazeur and Gamache townships |
|
- Diamond Drilling: 1 hole; 76 m |
|||
|
Patino Mines Ltd |
- Geophysical: Mag and HEM surveys |
Hazeur township |
|
|
1982 |
Mines Northgate Patino Inc |
- Geological survey |
Hazeur township |
|
1983 |
Mines Northgate Patino Inc |
- Geophysical: HEM survey |
Hazeur and Gamache townships |
|
1984 |
Mines Northgate Patino Inc |
- Geophysical: Max-Min survey |
Hazeur township |
|
1986 |
Société d'Exploration Minière Pontiac |
- Geological: Overburden stripping, boulder sampling and prospecting |
Hazeur and Gamache townships |
|
1987 |
SOQUEM |
- Geophysical: EM and VLF surveys |
Hazeur township |
|
Exploration Muscocho |
- Geophysical: Gradiometer survey |
||
|
1988 |
SOQUEM |
- Diamond drilling: 13 holes |
Hazeur township |
|
Exploration Noramco |
- Diamond drilling: 7 holes |
||
|
Exploration Muscocho |
- Diamond drilling: 13 holes |
||
|
- Geochemistry: Hummus biochemical |
|||
|
1989 |
Abbey exploration |
- Geophysical: EM, VLF and Mag surveys |
Hazeur and Gamache townships |
|
1994 |
2736-1179 Quebec Inc |
- Diamond drilling: 2 holes |
Hazeur township |
|
SOQUEM and Ressources Unifiées Oasis Inc. |
- Diamond drilling: 4 holes |
Hazeur township |
|
|
1995 |
Syndicat du Beep Mat |
- Geophysical: Beep Mat survey (231 samples) |
Hazeur and Gamache townships |
|
SOQUEM and Ressources Unifiées Oasis Inc. |
- Diamond drilling: 10 holes |
Hazeur township |
|
|
1996 |
Ressources Unifiées Oasis Inc. |
- Geochemistry: Till sampling |
Hazeur township |
|
2005 |
Table Jamésienne de consertation minière |
Till and eskers survey and analysis |
Hazeur and Gamache Townships |
|
2012 |
Vanstar |
- Geophysical: Magr survey |
Hazeur and Gamache townships |
|
2012 |
Vanstar |
Diamond drilling 6 holes : 714 m |
Liam Zone |
|
2013 |
Vanstar |
- Diamond drilling: 11 holes; 1,968 m |
Discoveries and Mila zones |
|
- Diamond drilling: 9 holes; 1,406 m |
Mostly on Liam Zone |
||
|
2014 |
Vanstar |
- Geophysical: Mag survey |
Hazeur and Gamache townships |
|
- Diamond drilling: 15 holes; 2,400 m |
Liam, Dan and 36 zones |
||
|
Note: Mag = magnetic |
|||
| 6-2 |
|
IAMGOLD Corporation | Nelligan Project |
April 2, 2025 |
|
NI 43-101 Technical Report |
SLR Project No.: 233.065260.00001 |
6.2.1 Historical Operators (1977-2012)
The first documented work completed on the Project property was in 1951 by Wright-Hargreaves Mines Limited and Paymaster. Prospecting, mapping, and geophysical work were conducted after gold was discovered in the Joe Mann deposit, 18 km east-northeast of the Project. The Joe Mann discovery (historical production of 1.08 Moz of gold and 22.5 Mlb of copper from 1956 to 2003) sparked great interest in the Chibougamau-Chapais area (Harris 1951; Low1906), however, significant exploration work did not occur until the late 1960s.
In 1952, the first local magnetic (Mag) survey was performed by Kerromac Mining Co. Ltd in Hazeur Township, as well as detailed prospecting and exploration work on a portion of the Project. In 1958, subsequent geophysical magnetic and electromagnetic (EM) surveys were completed by New Jersey Zinc, leading to the first trenching on the Project in 1959 (Low 1906). In 1964, iron prospecting by McAdam and Flanagan took place after the publication of the Lac Surprise aeromagnetic survey over Gamache and Hazeur townships. Detailed geophysical work targeted aeromagnetic anomalies. In 1965, a 152 m hole was drilled, yielding poor results for iron prospects, and McAdam and Flanagan performed no further work (Duquette 1965). The authors of various reports during this period mentioned the difficulties caused by the thick overburden cover and sparse outcrops.
In 1977, Falconbridge Nickel Mines conducted EM surveys with horizontal loops using a 300 ft to 400 ft cable combined with a Mag survey. A gravity survey was performed the following year to refine potential targets. In 1978, nine holes were drilled for 734 m on different geophysical anomalies, of which one of the holes (777-5) was drilled on the Project (Lavoie 1977; Lavoie 1978; Simoneau et al. 1978). From 1978 to 1982, Patino Mines Limited conducted some geological and geophysical surveys (Helicopter EM, Mag, and Max-Min) (Larivière 1982; Murdy 1978; Kennedy 1983; Kennedy 1984). From 1983 to 1984, SOQUEM conducted geophysical surveys (Helicopter EM, Magnetic, Induced Polarization [IP]), prospecting, drilling and boulder prospecting (Thériault, 1984). In 1986, Société d'Exploration Minière Pontiac and SOQUEM performed a variety of work in the area, including overburden stripping, boulder sampling and prospecting, which led to the discovery of the Tour de Feu showing (2.2 g/t gold) in the northeast part of the Project (Grenier, 1986).
From 1987 to 1988, SOQUEM continued its fieldwork with mapping, trenching, and drilling. A total of 17 holes were drilled for 1,910 m (DDH 87-01 to 88-17), 13 of which were on the Project (Miron1988). SOQUEM compiled the geophysical reports and performed a heliborne combined Mag, EM, and Very-Low-Frequency (VLF) survey over the Lac Surprise area, covering part of the Project (De Carle 1987; Hubert 1988).
In 1988, Exploration Muscocho performed a gradiometer survey and drilled 13 holes. They also conducted a biochemical survey on their Hazeur Iron Property in the same year (Brodie-Brown and Zuiderveen 1988). Exploration Noramco drilled seven holes (Tremblay 1988). In 1989, Abbey Exploration carried out several geophysical surveys on the Project (Killin 1989). In 1994, 2736-1179 Quebec Inc. conducted a drilling program consisting of four holes for 1,213 m, two of which were drilled on the Project (AD-94-1, D 1-94) but neither yielded significant results (Fournier 1994).
From 1994 to 1996, SOQUEM and Ressources Unifiées Oasis Inc., both part of the Syndicat du Beep Mat, completed work as contractors while the property was optioned by a group comprising Pontiac Exploration Inc., Ressources Abbey, and R.W. Metcalfe. An extensive Beep Mat survey was performed. Eighteen holes were drilled for 1,557 m (1138-94-01, 1138-94-04 to 1138-94-20), four of which were on the Project (De Chavigny 1994). An additional 19 holes were drilled in 1995, 10 of which were on the Project (Chainey 1995a;1995b;1995c; 1995d; 1996). In 1996, Ressources Unifiées Oasis Inc. conducted a till sampling program in the northwestern part of the Project (Chainey 1996b).
| 6-3 |
|
IAMGOLD Corporation | Nelligan Project |
April 2, 2025 |
|
NI 43-101 Technical Report |
SLR Project No.: 233.065260.00001 |
6.2.2 Vanstar (2012-2014)
In 2012, Vanstar carried out a drilling program on the Lac d'Eu showing for a total of 11 holes totalling 1,968 m (Tazerout 2012a; 2012b). Following the results of a detailed geophysical survey (ground magnetic; Lambert 2013), Vanstar developed new drill targets that led to the discoveries of Liam (hole NE-13-04) and Mila zones (hole NE-13-01) in 2013.
Between 2013 and 2014, additional drilling was completed on these targets demonstrating the continuity of the Liam zone and allowing the additional gold discoveries of the Dan zone. During the 2013 and 2014 period, Vanstar drilled 24 holes for a total of 3,806 m (Lambert 2014; Kelly, 2014a, 2014b; Boivin, 2014).
In November 2014, Vanstar and IAMGOLD concluded an option agreement on the Project.
6.3 Historical Mineral Resource Estimates
There are no relevant historical resource estimates for the Project.
| 6-4 |
|
IAMGOLD Corporation | Nelligan Project |
April 2, 2025 |
|
NI 43-101 Technical Report |
SLR Project No.: 233.065260.00001 |
7.0 Geological Setting and Mineralization
The Project is located in the northeastern corner of the Abitibi Sub-province (terrane) of the Archean Superior Province, approximately 15 km west of the metamorphic border of the Mesoproterozoic aged Grenville Province, named as Grenville Front (Figure 7-1).
7.1 Regional Geology
A large part of the general geological information was modified from Turcotte, 2015. IAMGOLD has completed systematic geological mapping over the last decade and has revised the geological interpretation with accumulated information from drilling to obtain a more detailed regional to local geological model.
7.1.1 Archean Superior Province
The Archean Superior Province (Superior Province) forms the core of the North American continent and is surrounded by provinces of Paleoproterozoic age to the west, north, and east, and by the Grenville Province of Mesoproterozoic age to the southeast. Tectonic stability has prevailed since approximately 2.6 Ga in large parts of the Superior Province. Proterozoic and younger activity is limited to rifting of the margins, emplacement of numerous mafic dyke swarms (Buchan and Ernst 2004), compressional reactivation, large-scale rotation at approximately 1.9 Ga, and failed rifting at approximately 1.1 Ga. Except for the northwest and northeast Superior margins that were pervasively deformed and metamorphosed at 1.9 Ga to 1.8 Ga, the craton has escaped ductile deformation.
A first-order feature of the Superior Province is its linear sub-provinces, or "terranes", of distinctive lithological and structural character, accentuated by subparallel boundary faults (Card and Ciesielski 1986). Trends are generally east-west in the south, west-northwest in the northwest, and northwest in the northeast. The Project is located within the Abitibi terrane.
The Abitibi terrane hosts some of the richest mineral deposits of the Superior Province (Figure 7-1), including the giant Kidd Creek massive sulphide deposit (Hannington et al. 1999) and the large gold camps of Ontario and Québec (Robert and Poulsen 1997; Poulsen et al. 2000). Within the Abitibi terrane, the Project is located in the Matagami-Chibougamau mineral belt, which extends eastward from the Detour Lake area in Ontario through the Québec towns of Joutel, Matagami, Chapais, and Chibougamau. The belt is characterized by Zn-Cu massive sulphide deposits (Faure et al. 1990), Cu-Au vein deposits, and local but important lode gold deposits (Lacroix et al. 1990). Of minor importance are metasedimentary iron deposits, layered intrusion Ti-V deposits, copper porphyry deposits, and intrusion-hosted nickel deposits (Card and Poulsen 1998).
| 7-1 |
|
IAMGOLD Corporation | Nelligan Project |
April 2, 2025 |
|
NI 43-101 Technical Report |
SLR Project No.: 233.065260.00001 |
Figure 7-1: Regional Geology
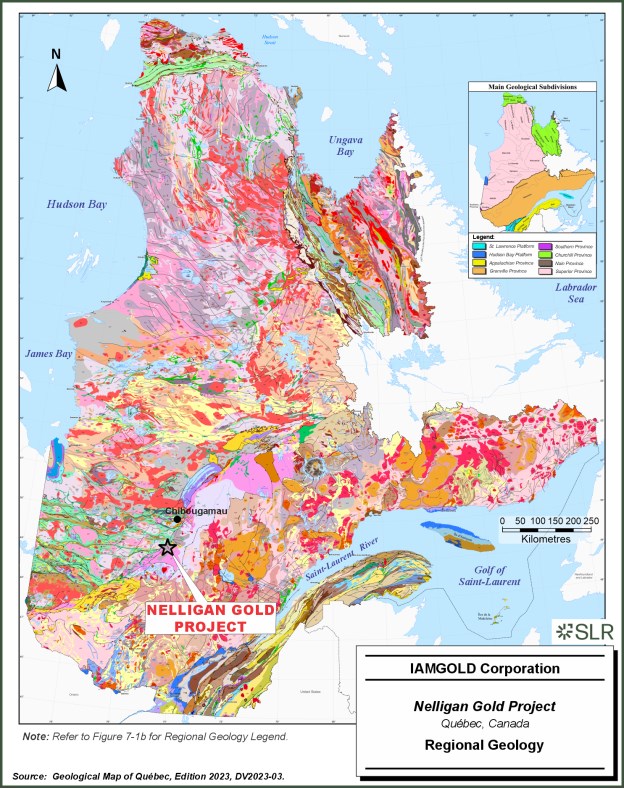
| 7-2 |
|
IAMGOLD Corporation | Nelligan Project |
April 2, 2025 |
|
NI 43-101 Technical Report |
SLR Project No.: 233.065260.00001 |
Figure 7-1b: Regional Geology Legend
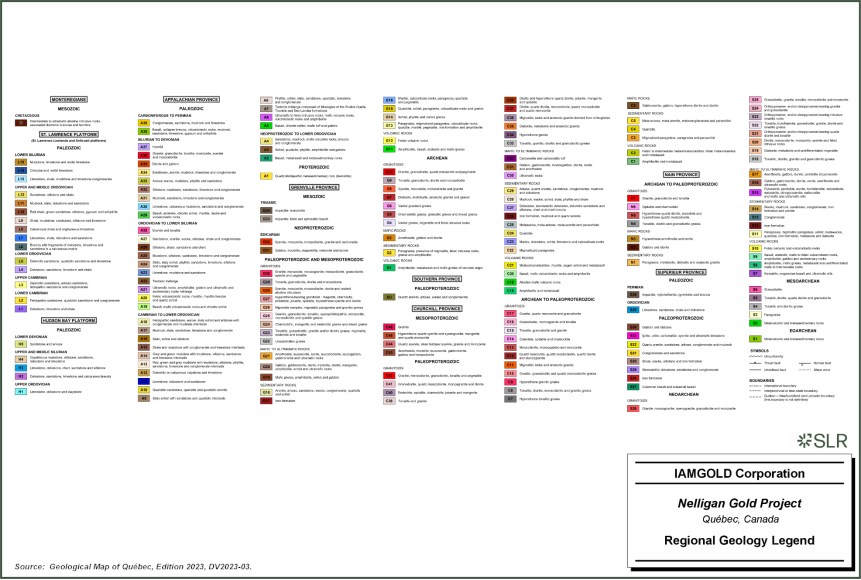
| 7-3 |
|
IAMGOLD Corporation | Nelligan Project |
April 2, 2025 |
|
NI 43-101 Technical Report |
SLR Project No.: 233.065260.00001 |
7.2 Local Geology
7.2.1 Abitibi Greenstone Belt
Previously, the Abitibi Greenstone Belt was subdivided into northern and southern parts based on stratigraphic and structural criteria (Dimroth et al. 1982; Ludden et al. 1986; Chown et al., 1992). Previous publications used an allochthonous model of greenstone belt development that portrayed the belt as a collage of unrelated fragments. Thurston et al. (2008) presented the first geochronologically constrained stratigraphic and/or lithotectonic map (Figure 7-2) covering the entire breadth of the Abitibi Greenstone Belt from the Kapuskasing Structural Zone eastward to the Grenville Province. According to Thurston et al. (2008), Superior Province greenstone belts consist of mainly volcanic units unconformably overlain by largely sedimentary Timiskaming-style assemblages, and field and geochronological data indicate that the Abitibi Greenstone Belt developed autochthonously.
The Abitibi Greenstone Belt is composed of east-trending synclines of largely volcanic rocks and intervening domes cored by synvolcanic and/or syntectonic plutonic rocks (gabbro-diorite, tonalite, and granite) alternating with east-trending bands of turbiditic wackes (Ayer et al. 2002; Daigneault et al. 2004; Goutier and Melançon 2007). Most of the volcanic and sedimentary strata dip vertically and are generally separated by abrupt, east-trending faults with variable dip. Some of these faults, such as the Porcupine-Destor Fault, display evidence for overprinting deformation events including early thrusting, later strike-slip and extension events (Goutier 1997; Bateman et al. 2008). Two ages of unconformable successor basins occur: early, widely distributed Porcupine-style basins of fine-grained clastic rocks, followed by Timiskaming-style basins of coarser clastic and minor volcanic rocks which are largely proximal to major strike-slip faults, such as the Porcupine-Destor, Larder-Cadillac, and similar faults in the northern Abitibi Greenstone Belt (Ayer et al. 2002; Goutier and Melançon, 2007). In addition, the Abitibi Greenstone Belt is cut by numerous late-tectonic plutons from syenite and gabbro to granite with lesser dykes of lamprophyre and carbonatite.
The metamorphic grade in the greenstone belt displays greenschist to sub-greenschist facies (Jolly 1978; Powell et al. 1993; Dimroth et al. 1983; Benn et al. 1994) except around plutons where amphibolite grade prevails (Jolly 1978).The following more detailed description of the new subdivision of the Abitibi Greenstone Belt is mostly modified and summarized from Thurston et al. (2008) and references therein. The Abitibi Greenstone Belt is now subdivided into seven discrete volcanic stratigraphic episodes on the basis of groupings of numerous U-Pb zircon ages. New U-Pb zircon ages and recent mapping by the Ontario Geological Survey and Géologie Québec clearly show similarity in timing of volcanic episodes and ages of plutonic activity between the northern and southern Abitibi Greenstone Belt as indicated in Figure 7-2. These seven volcanic episodes are listed from oldest to youngest:
• Pre-2,750 Ma volcanic episode 1
• Pacaud Assemblage (2,750 Ma - 2,735 Ma)
• Deloro Assemblage (2,734 Ma - 2,724 Ma)
• Stoughton-Roquemaure Assemblage (2,723 Ma - 2,720 Ma)
• Kidd-Munro Assemblage (2,719 Ma - 2,711 Ma)
• Tisdale Assemblage (2,710 Ma - 2,704 Ma)
• Blake River Assemblage (2,704 Ma - 2,695 Ma)
| 7-4 |
|
IAMGOLD Corporation | Nelligan Project |
April 2, 2025 |
|
NI 43-101 Technical Report |
SLR Project No.: 233.065260.00001 |
Two types of successor basins are present in the Abitibi Greenstone Belt: early turbidite-dominated (Porcupine Assemblage; Ayer et al. 2002) laterally extensive basins, succeeded by aerially more restricted alluvial-fluvial or Timiskaming-style basins (Thurston and Chivers 1990). The geographic limit (Figure 7-2) between the northern and southern parts of the Abitibi Greenstone Belt has no tectonic significance but is herein provided merely for reader convenience and is similar to the limits between the internal and external zones of Dimroth et al. (1982) and that between the Central Granite-Gneiss and Southern Volcanic zones of Ludden et al. (1986). The boundary passes south of the wackes of the Chicobi and Scapa groups with a maximum depositional age of 2,698.8 ± 2.4 Ma (Ayer et al. 1998 and 2002b).
The Abitibi Subprovince is bounded to the south by the Larder Lake-Cadillac Fault Zone, a major crustal structure that separates the Abitibi and Pontiac sub-provinces (Figure 7-2; Chown et al. 1992; Mueller et al. 1996; Daigneault et al. 2002, Thurston et al. 2008). The Abitibi Sub-province is bounded to the north by the Opatica Sub-province (Figure 7-2) a complex plutonic-gneiss belt formed between 2,800 Ma and 2,702 Ma (Sawyer and Benn 1993; Davis et al. 1995). It is mainly composed of strongly deformed and locally migmatized, tonalitic gneisses and granitoid rocks (Davis et al. 1995).
Recent seismic profiles (Lithoprobe) reinterpretation and new profiles surveyed at regional scale (Metal-Earth seismic transects in 2017) suggest that the Opatica sub-province, north of Abitibi and Baie James, represents amphibolite-grade middle crust extending below the Abitibi greenstones and both the Opatica and Abitibi rocks are considered as one contiguous terrane (Benn 2006; Benn and Moyen 2008; Maleki et al. 2020; Cheraghi et al. 2021).
The Abitibi Sub-province is interpreted as forming during the accretion of juvenile arc terranes (Dimroth et al. 1983; Card and Ciesielski 1986; Ludden et al. 1986; Desrochers et al. 1993; Daigneault et al. 2004) and dislocation of the stratigraphic succession by regional thrust faults registering vertical stretch (Bleeker et al. 2008; Lin et al. 2013; Gapais et al. 2014).
Structuration of the Abitibi belt has followed several stages:
• The construction period, with the formation of mafic crust mostly represented by tholeiites, komatiites, and transitional to calc-alkaline facies;
• The maturation period, with the intruding of tonalite-dominated magmatic systems (TTD-TTG suites) represented by felsic volcanics, pyroclastic rocks mostly calc-alkaline, and subordinates tholeiitic to transitional calc-alkaline volcanic rocks; and
• The cratonization period, including a succession of sedimentation and deformation events (Mathieu 2021).
| 7-5 |
|
IAMGOLD Corporation | Nelligan Project |
April 2, 2025 |
|
NI 43-101 Technical Report |
SLR Project No.: 233.065260.00001 |
Figure 7-2: Local Geology - Abitibi Greenstone Belt
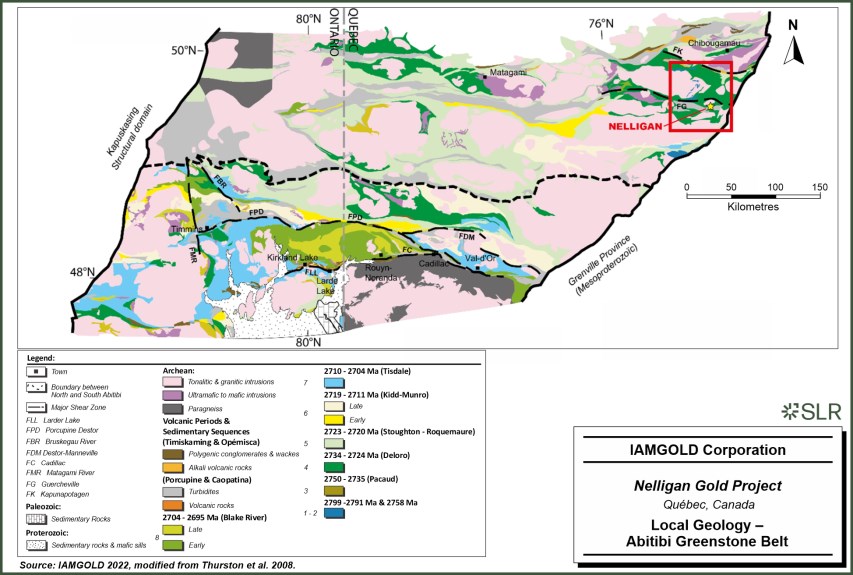
| 7-6 |
|
IAMGOLD Corporation | Nelligan Project |
April 2, 2025 |
|
NI 43-101 Technical Report |
SLR Project No.: 233.065260.00001 |
7.2.2 Local Stratigraphy and Synvolcanic Period
The Project is located in the eastern part of the Caopatina-Desmaraisville segment of the Abitibi Greenstone Belt, south of the Chibougamau and Chapais mining camps, more specifically between the Guercheville North Deformation Zone to the north and the Remick Deformation Zone to the south, and the Grenville Front to the east (Figure 7-3 to Figure 7-5). The geological setting and mineralization context in the Chibougamau region has long served as a reference framework for understanding the Caopatina-Desmaraisville segment (Guha et al. 1991; Pilote et al. 1996).
Numerous studies have been carried out on the Project area, notably: Holmes (1952, 1959); Lyall (1953, 1959); Duquette (1970); MERQ (1977); Gobeil and Racicot (1982); Gobeil and Racicot (1983); Racicot et al. (1984); Tait et al. (1986); MERQ (1989); Champagne (1989), Chown et al. (1991a, 1991b); Guha et al. (1991); Tait (1992a, 1992b); MERQ (1993); Pilote et al. (1996); Chown et al. (1998); Dion and Simard (1998,1999); Goutier and Melançon (2007); Leclerc et al. (2011, 2012); and Faure (2012). The following description of the eastern part of the Caopatina-Desmaraisville segment is mostly modified and summarized from Dion and Simard (1999) and Faure (2012) and retains the references therein.
The eastern part of the Caopatina-Desmaraisville segment is underlain by the 2,734 Ma to 2,724 Ma Deloro Assemblage (Figure 7-3). Several volcanic cycles are distinguished in this area (Daigneault and Allard 1990; Guha et al. 1991; Leclerc et al. 2012.; Leclerc et al. 2017):
The first volcanic cycle consists of the Chrissie Formation represented by a lower member of basalts and an upper member of felsic volcanics containing the oldest rhyolites of the Abitibi (2,798.7 ± 0.7 and 2,791 + 3.7 / - 2.8 Ma) (Davis and Dion 2012; David and Dion 2010).
The Roy Group consists of two volcanic cycles:
1 The first cycle includes Obatogamau and Waconichi formations. The Obatogamau formation consists of large sequences of mafic lavas. Volcaniclastic rocks, pyroclastic rocks, and felsic flows of the Waconichi Formation mark the end of volcanic cycle I.
2 The second cycle of the Roy Group includes the Bruneau and the Blondeau formations, composed of tholeiitic basalts for the Bruneau Formation and calc-alkaline basalts, volcaniclastic and sedimentary rocks for the Blondeau Formation.
The Opémisca Group (dated between 2,704 Ma and 2,690 Ma) discontinuously overlies of the Roy Group and was deposited in shear-zone-bounded basins along the axes of synclines. This group records the erosional process of the early stages of the accretionary system with volcanism linked to transitional TTD-TTG suites and depositional sequences of polygenic conglomerates, arkoses, and more distal sediments (Leclerc et al. 2017).
| 7-7 |
|
IAMGOLD Corporation | Nelligan Project |
April 2, 2025 |
|
NI 43-101 Technical Report |
SLR Project No.: 233.065260.00001 |
Figure 7-3: Stratigraphy of the Synvolcanic Period and Transition to the Syntectonic Period
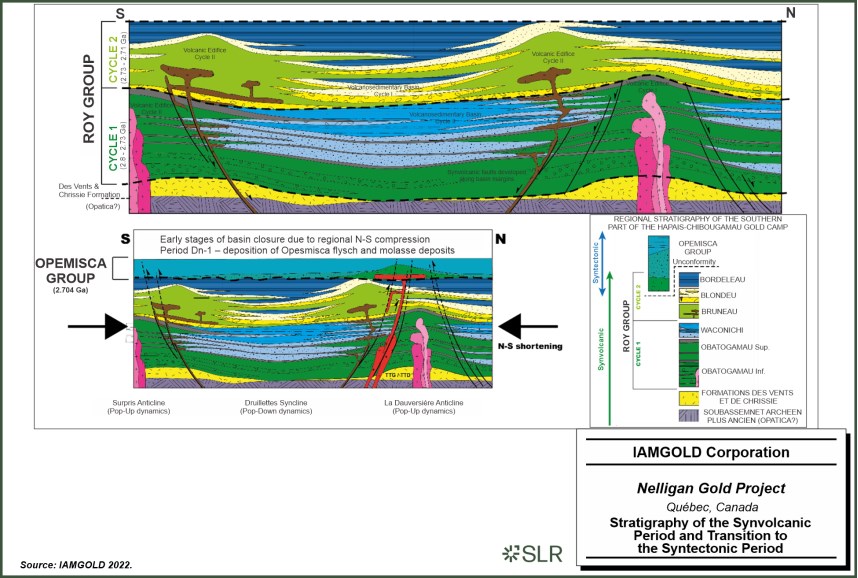
| 7-8 |
|
IAMGOLD Corporation | Nelligan Project |
April 2, 2025 |
|
NI 43-101 Technical Report |
SLR Project No.: 233.065260.00001 |
Several regional early-deformation folds are preserved in the region (Daigneault and Allard 1990). These folds, associated with Kenoran orogeny, more precisely during an early-stage Dn-1 period, are oriented north-south to north-northwest, but without the development of schistosity. One of these folds, the Monster Lake anticline, is located between the Eau Jaune Complex and Fancamp Deformation Corridor. This pinched and verticalized anticline is involved in the Megane gold deposit (owned by IAMGOLD) as a deep structural fluid-flow drain. Both limbs are cut by the regional schistosity.
The Nelligan deposit is regionally hosted on the north limb of the Druillettes Syncline, a pinched east-west sedimentary basin filled by the basin-restricted Caopatina Formation dated 2,707.3 ±2.3 Ma (coeval to Cycle II and Opémisca Group) (Leclerc et al. 2012). The north limb of the syncline is composed of alternations of mafic lava flows, mafic sills, mafic to felsic volcanoclastics, and detritical sequences.
The only mine in the eastern part of the Caopatina-Desmaraisville segment was the former Joe Mann mine (Figure 7-5), which produced 4,754,375 t at grades of 8.26 g/t Au and 0.3% Cu (Houle 2011).
7.2.3 Deformation and Syntectonic Period
The presented structural model applied to the south of the Chibougamau terrane is modified and summarized from Daigneault et Allard (1990), Leclerc et al. (2011), Faure (2012), Leclerc et al. (2017), and Mathieu (2021).
Following the development of the north-south early folds (Dn-1 to D1), the main deformation occurred and was characterized by north-south shortening, called the syntectonic period (Figure 7-4).
This structural episode was the origin of the east-west tectonic grain marked by the direction of large folds axes, the regional schistosity, and the large deformation corridor shown by longitudinal faults. Regional schistosity is well developed and is generally east-west trending, except near the felsic intrusions where it seems to mold itself to the contacts of these intrusions (Figure 7-5). This schistosity is the dominant planar element in the region.
The syntectonic period is divided in three main deformation events mostly related to terrane assembly between 2,701 Ma and 2,690 Ma:
• D1: a preliminary and spread over time compressional event initiated prior to molassic basins (e.g., Opémisca Group),
• D2: the main north-south shortening event,
• D3-D4: the waning stages of D2.
The transition from the synvolcanic to syntectonic period is characterized by (D1), a regional progressive north-south compression induced by accretionary arc system (late maturation to early cratonization stages) and resulted in a collisional system with the formation of regional east-west folds from the uplift of volcanic assemblages (anticlines) and the pinching/plunging of sedimentary basins (synclines) (Figure 7-4). A variety of mantle- and crustal-derived magmas formed during the syntectonic period and were driven by crustal faults (Mathieu et al. 2020). This tectonic episode developed in the region of the Nelligan deposit, in the south part of the Chibougamau terrane, and several structural blocks separated by intense verticalized deformation zones demonstrating evidence for dominant reverse stretching. The resultant structural blocks include, listed from north to south:
| 7-9 |
|
IAMGOLD Corporation | Nelligan Project |
April 2, 2025 |
|
NI 43-101 Technical Report |
SLR Project No.: 233.065260.00001 |
• The Chapais Syncline, hosting Opémisca sediments dipping and grading to the south;
• The La Dauversière Anticline, a strongly deformed and sliced bloc exposing mostly Cycle I volcanic rocks of Roy Group and reversed grading Cycle II volcano-sediments on its northern limb;
• The Druillettes Syncline, an open to pinched syncline hosting the Caopatina Formation and the Nelligan deposit; and
• The Opawica anticline to the extreme south, hosting the Surprise and Hébert plutons and volcanic rocks strongly amphibolitized.
east-west major deformation corridors are originally related to synvolcanic inherited crustal faults reactivated with reverse faulting during first stages of convergence, and then verticalized during the D1 period at the end of the compressional period (Figure 7-4 through Figure 7-6).
The east-west La Dauversière anticline is structurally limited to the north by the east-west Kapunapotagen Deformation Corridor (KDC), and to the south by the Guercheville Deformation Corridor (GDC). The KDC is a large shear zone registering reverse faulting toward north. The GDC is another strongly sheared reverse faulting system dipping vertically to the south, except for the northern branch around the syntectonic Hazeur pluton where the GDC is subvertical or dipping to the north (Figure 7-4). The anticline is also crosscut by a northeast-southwest major shear zone dipping strongly to the southeast, the Fancamp Deformation Corridor (FDC). The FDC is implied in a primary northwest verging thrust cross-cutting obliquely the fold to accommodate the late stages of the collisional system (Figure 7-3 and Figure 7-4).
The Druillettes Syncline is bordered to the north by several east-west intense shear zones of the GDC, which is transposed along stratigraphic contacts.
The main east-west structures crosscutting the Project are differentiated branches of the Guercheville South Deformation Corridor. These large shear zones and associated secondary structures are developed along lithologic contacts, preferentially along volcanogenic turbidites and volcanic-sedimentary contacts. The compression of the east-west syncline resulted in the training of secondary thrust-folds completely pinched and verging to the north, slicing the northern limb. These secondary folds have been confirmed by the symmetric inversion of the volcano-sedimentary sequences, definition of marker horizons, and normal or reverse grading figures within the beddings on outcrop and in drill cores (IAMGOLD internal data).
The south of the Druillettes syncline is limited by the east-west Remick and Doda deformation corridors acting as south-verging regional thrusts compressing the southern limb of the syncline against the Opawica Anticline prior the intrusion of the Surprise tonalite.
| 7-10 |
|
IAMGOLD Corporation | Nelligan Project |
April 2, 2025 |
|
NI 43-101 Technical Report |
SLR Project No.: 233.065260.00001 |
Figure 7-4: Interpretation of the Southern Portion of the Metal-Earth Seismic Transect (2017) in the Chibougamau Area
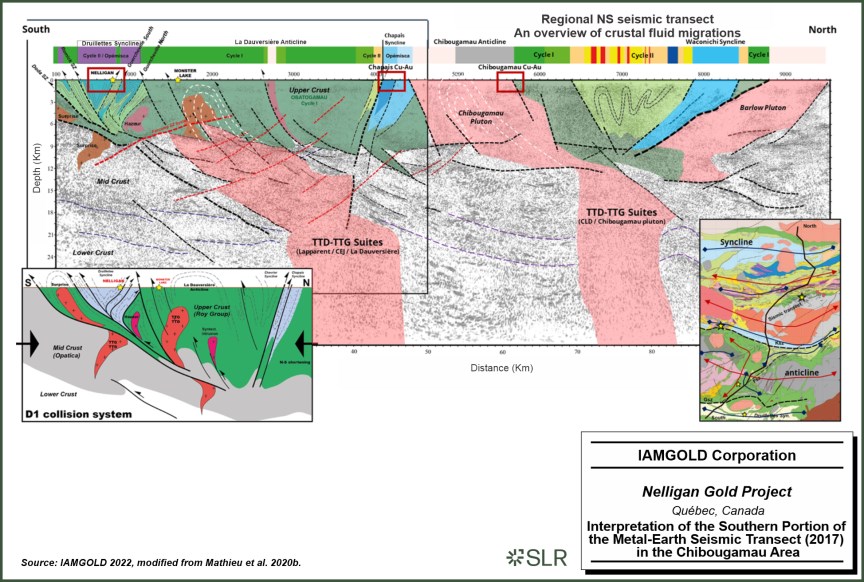
| 7-11 |
|
IAMGOLD Corporation | Nelligan Project |
April 2, 2025 |
|
NI 43-101 Technical Report |
SLR Project No.: 233.065260.00001 |
Figure 7-5: Structural Map of the South Portion of the Chapais-Chibougamau Gold Camp
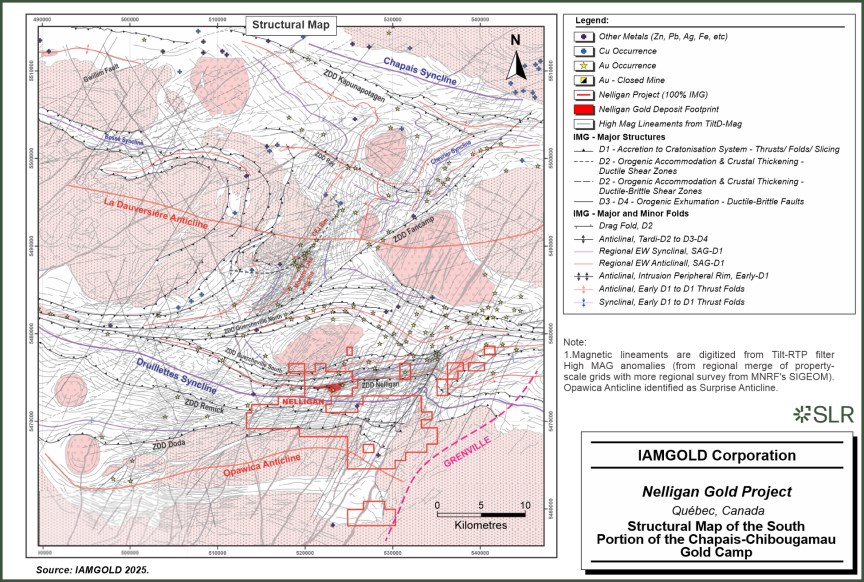
| 7-12 |
|
IAMGOLD Corporation | Nelligan Project |
April 2, 2025 |
|
NI 43-101 Technical Report |
SLR Project No.: 233.065260.00001 |
Figure 7-6: Geological Map of the South Portion of the Chapais-Chibougamau Gold Camp
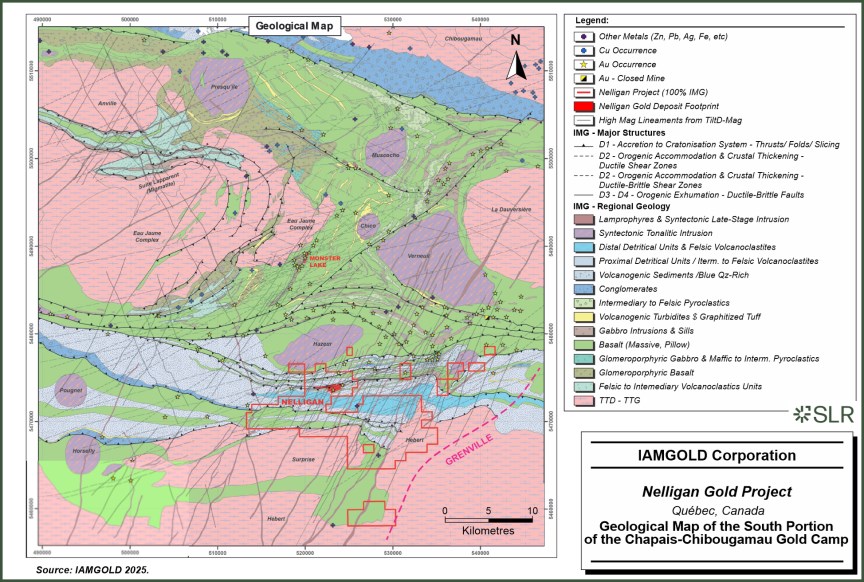
| 7-13 |
|
IAMGOLD Corporation | Nelligan Project |
April 2, 2025 |
|
NI 43-101 Technical Report |
SLR Project No.: 233.065260.00001 |
The end of the D1 period is marked by the development of a regional penetrative foliation trending mainly east-west and crosscutting all the secondary parasitic thrust-folds developed within the regional east-west folds, but also molding the syntectonic intrusions emplaced during these late stage period of crustal thickening (Figure 7-4 and Figure 7-5).
The Guercheville South deformation corridor acted as a back-thrust system developed on the north limb of the Druillettes syncline (Figure 7-4 and Figure 7-5).During the (D2) syntectonic period, these large east-west deformation corridors such as the Guercheville corridor, with schistosity transposed to stratigraphy, are activated as major ductile high strain bands (S0-S1 corridors with locally C transposed and absorbing a lot of stress) all along this ductile to brittle reverse-sinistral transpression period. At regional scale and mostly affecting the volcanic and sedimentary assemblages, many ductile shear zones are progressively developed and chronologically ordered following the development model of ephemeral C and C' shear bands during this cratonization process (Finch et al. 2019) (Figure 7-5). Structures are grouped based on their orientation: NE-WS (N60° to 70° trending) and its conjugate NW-SE (N110° trending) are related to C fabrics, NNE-SSW (N45° to N30° trending) acting as C' structures, and late stage (D3-D4) NNE-SSW (N20° trending) as C'' structures. N350° and N10° cleavages and dry faults are mainly related to younger Grenvillian orogeny. With the transition from a ductile to a more-ductile-brittle domain during this end of this period and in relation with local accommodation, several inherited C' structures (N45° to N30° trending shear zones like the Dan Fault in Nelligan deposit) are reactivated as dextral antithetic R' structures according to the Riedel fracturation model and induced favorable dilation zones for fluid circulation and mineralized processes (Daigneault 1996, and IAMGOLD internal data).
The (D2) shear zones are characterized by intense schistosity, mylonitic zones and driving potassic alteration (sericite-rich, Si and Ank halos) with polymetallic signature derived from a more regional magmato-hydrothermal system, probably linked to deep partial melting initiated with the collision and the crustal thickening process of the orogen.
The (D3-D4) structures are characterized by more discrete hydraulic breccias, typical from fault-valve systems and carbonate+chlorite-rich fluids. these late-stage structures contributed to the metallogenic refining of older mineralization as synvolcanic to transitional Intrusion-Related Gold Deposit (IRGD) systems (epithermal or porphyry domains) or synvolcanic Volcanic Massive Sulphide (VMS) deposits (Mathieu et al., 2021). The source of these hydrothermal fluids is presumed to be generated from devolatilization reactions of buried volcanic or sedimentary host rocks.
7.3 Property Geology
Most of the host rocks in the Property stratigraphy can be classified as volcano-sedimentary units, which represent a typical geology from Archean greenstone belts. The lithostratigraphic units observed on the Project are mostly from the Blondeau and Bruneau formations and from the Caopatina group, both located at the end for the second cycle of volcanism in the Chibougamau area. The Project is located within the Druillettes Syncline, which represents a large regional E-W regional fold (Figure 7-7). Major regional E-W deformations corridors are identified on the Project.
The center of the Druillettes Syncline contains volcano-sedimentary material that could be associated to the upper Blondeau and the Caopatina formations. Most of the series is dominated by fine to medium grained clastic sediments, wacke, and sandstones interbedded with tuffaceous material from intermediate composition than present various volcanic textures from pyroclastic flows and crystal tuffs to laminated ash tuffs. Iron formation type units are also observed and marked by very strong magnetic signature in the center of the property. These units are typically marked by massive centimetric magnetite layers interbedded with light gray fine grained laminated sandstone. On the top of the sequence and locally observed, a polygenic conglomerate is interbedded in non-continuous lenses with strong granulometry lateral variations coming from channel type dynamic of deposit.
| 7-14 |
|
IAMGOLD Corporation | Nelligan Project |
April 2, 2025 |
|
NI 43-101 Technical Report |
SLR Project No.: 233.065260.00001 |
On the flanks of the Druillettes Syncline, the stratigraphy is dominated by volcanic material. Most of the southern part of the property is dominated by chloritized mafic volcanics with minor interbedded greywacke. Mafic volcanics are mostly comprised of basalt and some locally present clastic layers with mafic to intermediate chloritized matrix. These volcanic units are impacted by major E-W shear zones that locally bring mafic volcanics to a high grade of metamorphism (amphibolite) with up to 20% coarse grained garnets. An argillitic and graphitic layer is also identified on the south margin of the Doda shear zone. This layer presents a thickness varying from one metre to 10 m and typically hosts semi-massive primary pyrite.
Additionally, the Project is bordered by two major tonalitic intrusions: the Hazeur Pluton to the north and the Surprise Pluton to the south. North-east oriented mafic and magnetic centimetric to metric dykes are also identified on the field and interpreted from magnetic surveys.
| 7-15 |
|
IAMGOLD Corporation | Nelligan Project |
April 2, 2025 |
|
NI 43-101 Technical Report |
SLR Project No.: 233.065260.00001 |
Figure 7-7: Property Geology
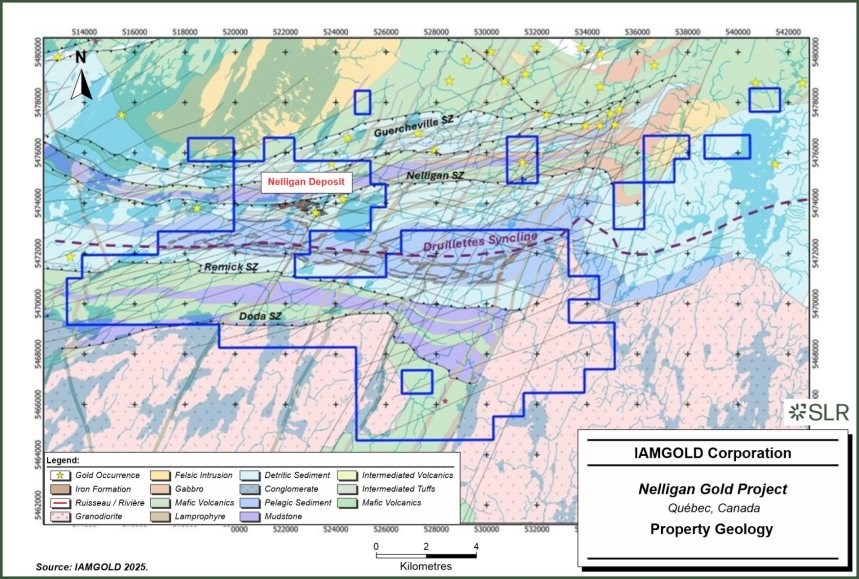
| 7-16 |
|
IAMGOLD Corporation | Nelligan Project |
April 2, 2025 |
|
NI 43-101 Technical Report |
SLR Project No.: 233.065260.00001 |
7.3.1 Lithologies
The Nelligan deposit is located on the north flank of the Druillettes Syncline at the contact between the volcano-sedimentary units and the mafic volcanic series. The deposit is principally hosted by the volcano-sedimentary detritic unit historically described as crystal tuff. From the south to the north, several volcanics and sedimentary units have been identified (Figure 7-8):
7.3.1.1 Conglomerate
Two types of conglomeratic units are identified on the Project property. The first unit is supported by a dark grey matrix (more than 50% of dark grey to black) and medium sized, polygenic rounded clasts. Clasts are moderately stretched by regional deformation. The second unit is dominated by polygenetic clastic material. The clasts are mostly constituted of felsic to intermediate volcanic material. This matrix is hematite altered and strongly stretched by deformation.
7.3.1.2 Sandstones
The sandstone is detritic with various sedimentary facies from fine grained well sorted laminated texture to heterogeneous medium grained and badly sorted granulometry. Most of the grains (60% to 90%) are made of quartz. The sandstone units are locally laminated and usually present an overprinting schistosity. This unit is identified in relatively small layers with a thickness ranging from one metre to two metres to 20 m to 25 m.
7.3.1.3 Crystal Tuff
The principal unit is a sub-porphyric intermediate crystal tuff composed of 10% to 50% of millimetric subautomorph plagioclases that presents pseudo morphosis of quartz at variable alteration intensity levels. The crystals are hosted in a fine grained to aphanitic dark grey matrix that is altered by a micaceous alteration which is expressed by the apparition of biotite, phlogopite, and locally, muscovite. This unit can by identified over thicknesses ranging from 50 m to 150 m in the Nelligan deposit with a subvertical plunging along a N80 global orientation.
Another unit of crystal tuff type is identified on the property and on the Nelligan deposit. It is a fine grained dark grey crystal tuff with 10% to 20% of randomly oriented potassic millimetric feldspars (sanidine) in a dark grey to black aphanitic matrix. The unit presents a significant porosity that locally represents up to 10% of the volume.
Intermediate Ash Tuff
This unit is a volcano sedimentary lithology, mostly fine grained dark grey and locally laminated. The material is principally ashy but presents variable amount of monogenic dark grey to black fine lapilis. The texture is laminated but irregular with millimetric to centimetric small bands. Some metric crystal tuffs and pyroclastic flows can be interbedded.
7.3.1.4 Mafic Volcanics
A fine grained to aphanitic volcanic rock with a dark green chlorite alteration of the matrix is identified in metric to pluri-metric layers in the stratigraphy. The texture is variable for massive and homogeneous fine-grained lava to more tuffaceous and brecciated mafic material. The mafic volcanics layers are typically injected by 10% to 15% of quartz-carbonate stockworks. The unit also presents a magnetite alteration expressed by various amounts of fine grained disseminated magnetite, typically 2% and locally up to 10%.
| 7-17 |
|
IAMGOLD Corporation | Nelligan Project |
April 2, 2025 |
|
NI 43-101 Technical Report |
SLR Project No.: 233.065260.00001 |
7.3.1.5 Mafic Intrusives
Mafic intrusive rocks represent a minor lithology composed of fine-grained intrusive rock, with a relatively low thickness varying from 20 cm to two metres. The units are fine grained with homogenous texture. The rock is principally constituted of 30% of plagioclases feldspars with fine grained ferromagnesian minerals in the matrix, and can present locally up to 20% of biotite. Mafic intrusive rocks commonly exhibit strong pervasive carbonates (calcite) alteration.
| 7-18 |
|
IAMGOLD Corporation | Nelligan Project |
April 2, 2025 |
|
NI 43-101 Technical Report |
SLR Project No.: 233.065260.00001 |
Figure 7-8: Principal Lithological Units and Structures
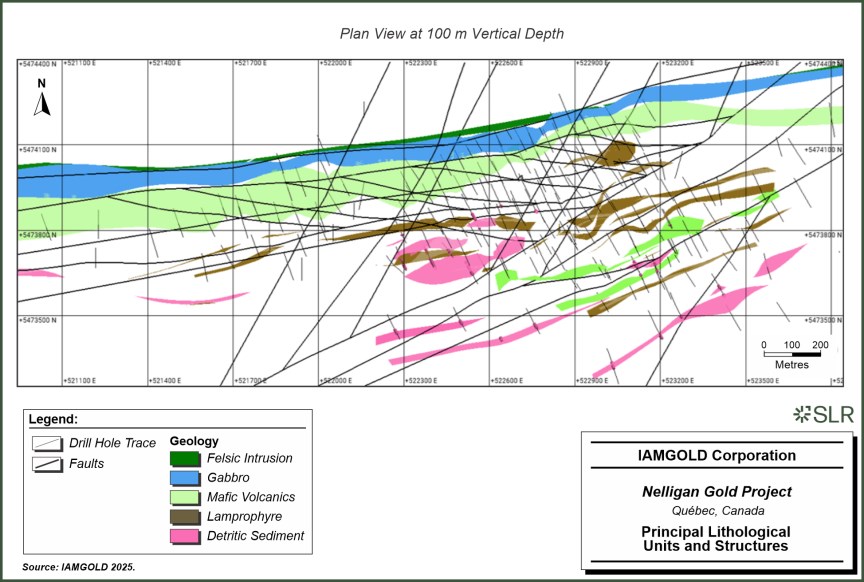
| 7-19 |
|
IAMGOLD Corporation | Nelligan Project |
April 2, 2025 |
|
NI 43-101 Technical Report |
SLR Project No.: 233.065260.00001 |
7.3.2 Alteration
In term of alteration, the Nelligan deposit presents various types of hydrothermal alteration types with different facies, characteristics, and chronology.
7.3.2.1 Silicification Alteration
Silica is one of the principal forms of alteration expressed by a strong increase of the silica content that overprints most of the primary mineral textures. Various types of ghost textures are generated through this alteration, depending on the nature of the altered host rock (laminations, pyroclastic flows). The intensity varies from very weak alteration of the host rock matrix to complete replacement and a total loss of the primary textures. This alteration is well constrained at the centre of the deposit and makes consistent and continuous silicified zones. These units are crosscut by carbonates, breccias, and stockwork veining associated with pyrite stringers. The silicified units have variable thickness ranging from 10 m to 100 m and can extend along strike for several kilometres through the Nelligan deposit.
7.3.2.2 Hematite Alteration
On the hanging wall of the silicified units, the dominant alteration is hematite. The hematite alteration is well constrained to ductile-brittle structures from D1 and D2 events. It is well marked by a strong red color that overprints the host rock texture with variable intensity.
The hematite alteration is geometrically well constrained, occurring on the E-W major shear zone at the hanging wall of the Renard Zone (Silicified unit) and various host rocks on the south part of the Nelligan deposit. Within this structure the hematite alteration is associated with micro-breccia textures and late carbonates injections. The hematite alteration is also present with iron formations, polygenic conglomerates, and other magnetite bearing formations.
7.3.2.3 Biotite-Phlogopite Alteration
A micaceous alteration characterized by a biotite-phlogopite alteration is observed on the footwall of the silicified units. A pervasive dark brown intense alteration overprints primary lithological textures at the footwall contact of the silicified zones and can be logged as the phlogopite zone. The intensity of the micaceous alteration progressively declines to the northern edge of the deposit and becomes a weak dark brown to dark green alteration of the host rock's matrix. In most cases, the micaceous alteration is associated with carbonates (Calcite-dolomite) and locally fine grained disseminated pyrite, particularly in the footwall zone.
7.3.2.4 Carbonate Alteration
The carbonate alteration is expressed in various forms on the Nelligan deposit. It is present in multiples units filling the latest cross-cutting structures. It is typically observed as fracture filling and as a breccia in the silicified zones, veins and fractures filling along shear zones, or stockworks and veinlet carbonates in hematized tectonics or mafic intrusive. Finally, carbonates, mostly calcite, can be identified as a very fine grained pervasive matrix alteration in the intermediate crystal tuffs from the footwall zone.
7.3.2.5 Sericite Alteration
The sericite alteration is mostly constrained to N70 and N50 structures with various level of intensity. It is marked by a typical quartz-sericite schist facies that has a limited thickness (one metre to 20 m). The sericite alteration can be pervasive around this shear zone. Several macroscopic observations show a cross-cutting relationship of the sericite alteration by silicification, indicating the sericite is relatively early. It is typically related to D2 shear zones that are identified as quartz sericite schists.
| 7-20 |
|
IAMGOLD Corporation | Nelligan Project |
April 2, 2025 |
|
NI 43-101 Technical Report |
SLR Project No.: 233.065260.00001 |
7.3.3 Deformation
In term of tectonic structures, the principal regional deformation phases D1, D2, and D3-D4 are well identified on the property and easily observable on outcrops and drill core (oriented core).
The first deformation phase (D1) is well marked on the property by several regional intense shear corridors that behave as inverse thrusts, such as the Remick and Doda shear zones in the south of Nelligan property and the-Guercheville shear zones in the north. D1 also leads to the generation of the Druillettes Syncline, which affects all of the primary lithological units on the property and vertical stratigraphic contacts.
The second phase of deformation (D2) is also well identified on the property and marked by multiple strike slip ductile shear zones oriented from N70 to N50. This phase affects all stratigraphic series and cross-cuts the D1 phase. It is expressed by observable offsets on stratigraphic markers. These structures are locally associated with conjugated N110 oriented shear zones. It is also observed that D1 inherited structures reactivate during D2 with a dominant dextral strike slip component.
The third phase (D3-D4) is marked by ductile brittle structures that overprint all units including, the D1 and D2 events. It is typically expressed by localized ductile brittle strike slip sub vertical faults, oriented N20 to N30, with minor spatial offsets. These structures are associated with late intruding, strongly carbonatized mafic lamprophyres dykes.
7.3.4 Metamorphism
Overall, all of the units identified on the property present variable intensity of metamorphism. Globally, the south and north margins of the Druillettes Syncline are dominated by amphibolite facies marked by increased contents of biotite, amphibole, and garnets, whereas the center of the syncline is more preserved and is globally dominated by green schist facies. It is notable that throughout the property, the facies show local variability in metamorphism, from green schist to amphibolite, on a relatively small area that is spatially related to intense regional shear zones such as the Doda, Remick, or Nelligan deformation zones.
7.3.5 Mineralization
The Nelligan gold deposit is located on the northern part of the property along a major shear corridor, identified as the Nelligan deformation zone on the north flank of the Druillettes Syncline. The deposit footprint has a strike length of four kilometres and a vertical depth of 0.7 km to 1.0 km.
The mineralization of the deposit can be generally separated in two principal phases of gold mineralization.
7.3.5.1 Phase One Mineralization
Overall, it is interpreted that a first phase of mineralization is expressed by sericite-silica-potassic pervasive alteration with variable intensity, principally controlled by D2 structures and associated to fine grained disseminated automorphic pyrite that is described and interpreted as Pyrite I. It is also believed that Pyrite I is produced by reducing pre-existing disseminated magnetite in the northern part of the Nelligan deposit and is the result of an oxydo-reduction front on the south edge of the mineralized zones (Figure 7-9).
| 7-21 |
|
IAMGOLD Corporation | Nelligan Project |
April 2, 2025 |
|
NI 43-101 Technical Report |
SLR Project No.: 233.065260.00001 |
Therefore, the first phase of mineralization is identified as a distinct hydrothermal event that is hypothesized to be associated with intrusion related hydrothermal fluids, as it presents numerous characteristics of this genetic model (high fO2 fluid, strong potassic alteration, and typical geochemical signature). The direct observable consequence is the generation of relatively large domains varying from 10 m to 100 m thickness but with a low gold content (50 ppb to 500 ppb Au). These mineralized domains are geometrically associated with the first phase alteration of silica and sericite, and the first phase of mineralization, Pyrite I. Renard Zone and Zone 36 mineralized domains are the principal examples (Figure 7-10). Modelling of these domains is principally based on the interpretation of the silica and potassic alteration of the different protoliths. In term of structural control, these domains are consistent with N70 D2 shear zones and present a large sigmoid shape that is inherited from the strike slip component of D2. It is therefore aligned along N70 structures but also controlled by N100 to N110 conjugated structures.
These mineralized zones are divided into several sub-domains due to overprinting deformation and resultant structures. Overall, the low grade mineralized zones are sub-parallel with an average orientation of 80° and 65° dipping to the south. The cross-cutting structures affect the geometry of the mineralized zones, with local offset in the deposit resulting in several mineralized domains sub-parallel to each other.
| 7-22 |
|
IAMGOLD Corporation | Nelligan Project |
April 2, 2025 |
|
NI 43-101 Technical Report |
SLR Project No.: 233.065260.00001 |
Figure 7-9: Relationship of Alteration Domains, Dominant Minerals Zonation, and Gold Mineralization
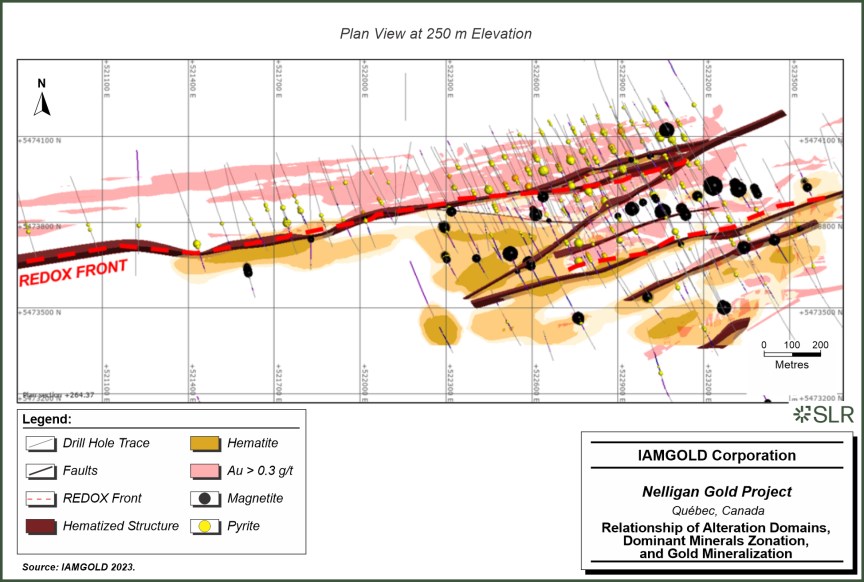
| 7-23 |
|
IAMGOLD Corporation | Nelligan Project |
April 2, 2025 |
|
NI 43-101 Technical Report |
SLR Project No.: 233.065260.00001 |
Figure 7-10: Low Grade Phase 1 Domains, Principal Structures and Silicified Zones
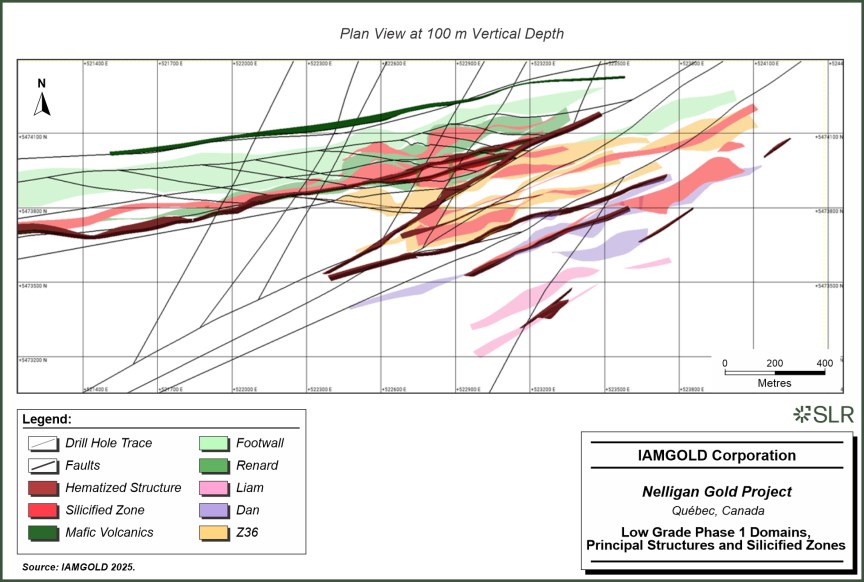
| 7-24 |
|
IAMGOLD Corporation | Nelligan Project |
April 2, 2025 |
|
NI 43-101 Technical Report |
SLR Project No.: 233.065260.00001 |
7.3.5.2 Phase Two Mineralization
A second hydrothermal mineralization event is also observed at the Nelligan deposit. It is generally identified by the presence of carbonates, such as dolomite, but principally calcite associated with a secondary xenomorph medium grained pyrite, Pyrite II, which is present in veinlets and stockworks but can locally become semi-massive. Genetically, this event is interpreted to be more related to typically orogenic hydrothermal fluids (high CO2 content expressed by carbonates, and well constrained structural control).
On macroscopy, this second hydrothermal event presents various observable textures and morphologies. In pre-altered units, such as the silica zones of Renard Zone and Zone 36, the second hydrothermal event forms a series of hydraulic breccia zones filled by a quartz-calcite matrix and sub-automorphic medium to coarse grained pyrite (Pyrite II). Pyrite II from sample LM23-001 of drill hole NE-18-98 at 441.5 m of the Renard Zone is shown in the thin section of Figure 7-11. In more plastic units, such as the deformed intermediate crystal tuffs (Footwall Zone), the second hydrothermal event has materialized by variable amount of quartz-calcite ± dolomite ± chlorite millimetric to centimetric veinlets, which rarely present visible gold. These veinlets have a strong structural control, mostly by D1 and D2 phases, but are also associated with D3. A series of thick mineralized zones (ranging from five metres to 15 m thickness globally) with higher gold content, typically ranging from one gram per tonne to 10 g/t Au, are the result of the phase two mineralization event. Chronologically, it is observed that that this event cross-cut the phase one mineralization and potentially remobilized gold locally.
These high grade zones have been modelled and present sigmoid shapes that are consistent with the structural model (Figure 7-12). They can be considered as a series of lenses with a dominant ductile behaviour that is mostly localized in lower pressures zones, defined by the multiple deformation phases. Both mineralization phases are illustrated in a cross-section in Figure 7-13. An example of the polyphase mineralization is showed in Figure 7-14, which shows intense pervasive silicification cross-cut by calcite veinlets and breccias with associated secondary pyrite.
| 7-25 |
|
IAMGOLD Corporation | Nelligan Project |
April 2, 2025 |
|
NI 43-101 Technical Report |
SLR Project No.: 233.065260.00001 |
Figure 7-11: Fine Grained Disseminated (Pyrite I) and Coarse Grained (Pyrite II) Fractured and Recrystallized
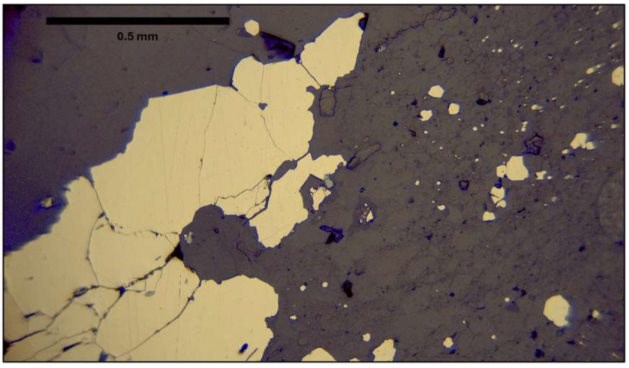
| 7-26 |
|
IAMGOLD Corporation | Nelligan Project |
April 2, 2025 |
|
NI 43-101 Technical Report |
SLR Project No.: 233.065260.00001 |
Figure 7-12: High Grade Zones Morphology and Sygmoidal Structure of Second Mineralization Phase
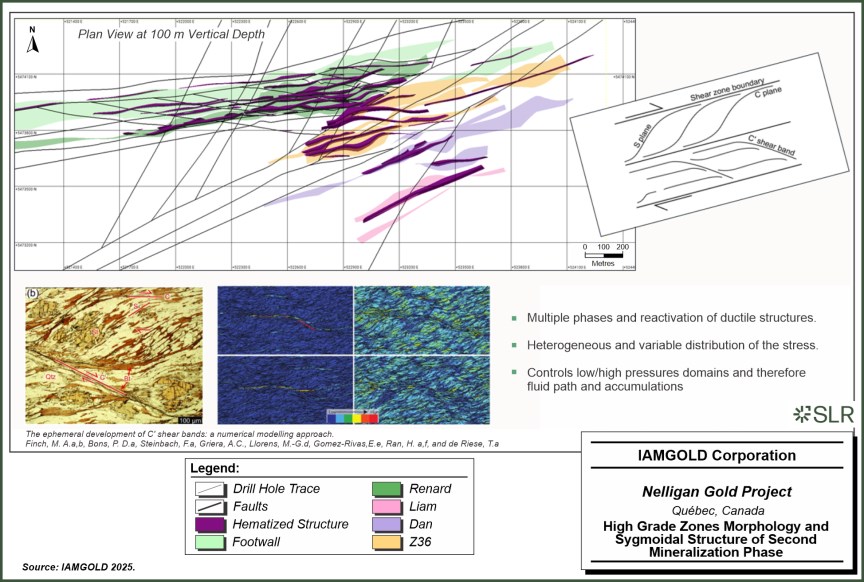
| 7-27 |
|
IAMGOLD Corporation | Nelligan Project |
April 2, 2025 |
|
NI 43-101 Technical Report |
SLR Project No.: 233.065260.00001 |
Figure 7-13: Nelligan Polyphase Mineralization
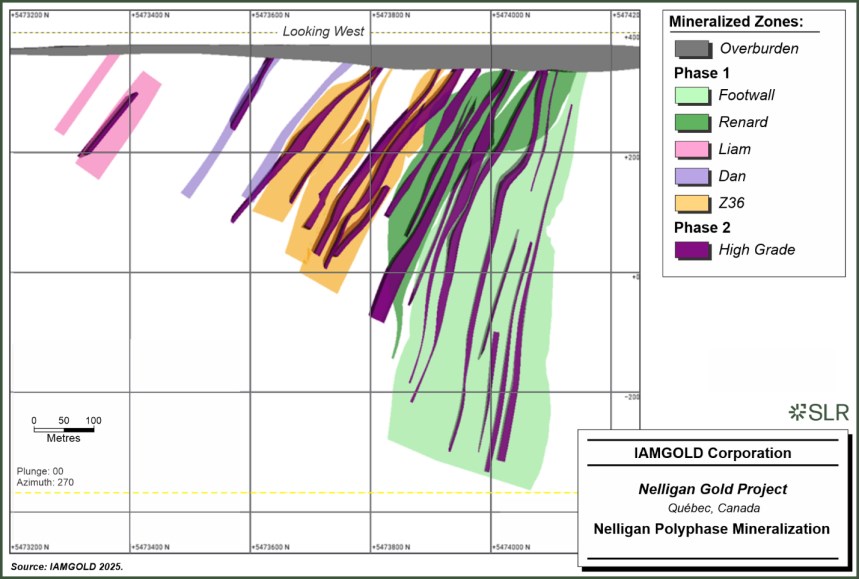
| 7-28 |
|
IAMGOLD Corporation | Nelligan Project |
April 2, 2025 |
|
NI 43-101 Technical Report |
SLR Project No.: 233.065260.00001 |
Figure 7-14: Example of Polyphase Mineralization in Renard Zone, Hole NE-24-230C at 461 m
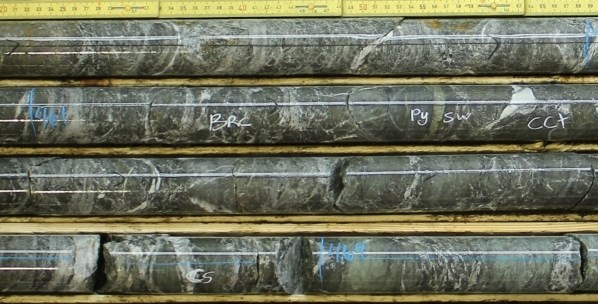
7.3.6 Mineralized Zones
7.3.6.1 Dan Zone
The Dan Zone is the southernmost of the mineralized zones in the resource area. It includes two tabular mineralized envelopes, the first 800 m long with an average thickness of 30 m to 40 m, and the second 400 m long with an average thickness of five metres. Mineralization is principally hosted in clastic sedimentary rocks, namely conglomerates.
The entire zone is silicified. Pervasive hematization and potassic alteration are common, and the intensity ranges from moderate to strong. Fracture-controlled albitization is also present. A hematite and silica alteration halo occurs around the silicified zone; distal, pervasive, and weak in some places, fracture controlled in others.
7.3.6.2 Liam Zone
The Liam Zone (including subzones Liam, Liam B and Liam C) is located on the north side of the Dan Zone. The Liam Zone extends on strike for 1,400 m and extends vertically to 250 m with an average thickness of 35 m. The Liam Zone has two parallel mineralized zones, called the Liam B and Liam C Zones, both of which are approximately 75 m thick with a lateral extent of 300 m. The Liam subzones are oriented N80, dipping 70° to the south.
The Liam Zone is mostly marked by quartz-sericite schist and sub-parallel silicified zones. The gold grade is principally associated with silicification and potassic alteration.
7.3.6.3 Zone 36
Zone 36 consists of four mineralized envelopes, covering a 1.5 km strike length. The principal zone is Zone 36 C which has 1.2 km lateral extent and a known vertical depth of 300 m. The average thickness of this zone is 80 m. The other three zones that comprise Zone 36 (Zone 36 B, Zone 36 D, and Zone 36 W) are thinner, with an average thickness of 25 m. The mineralized zones of Zone 36 are oriented N80 with an average dip of 65° to the south.
| 7-29 |
|
IAMGOLD Corporation | Nelligan Project |
April 2, 2025 |
|
NI 43-101 Technical Report |
SLR Project No.: 233.065260.00001 |
Zone 36 exhibits intense silicification with carbonate and fracture filling breccias. The intensity of the silicification is variable.
7.3.6.4 Renard Zone
The Renard Zone is located north of the Dan Zone, Zone 36, and Liam Zone, in the centre of the Nelligan deposit. It is the principal zone of the deposit, with 3,000 m of lateral extent and an average thickness of 100 m. The zone is oriented N80 with a consistent dip of 75° to the south.
The Renard Zone is composed of a major silicified unit with local sericite and potassic alteration, carbonate filling breccias and multiple pyrite stringers. Two areas of pyrite are observable, the first being a fine-grained, disseminated automorph and the second being sub-automorphic to xenomorphic and associated with carbonates, breccias, and injection textures.
It is notable that the Renard Zone is offset by late cross-cutting structures, principally N30 and N110 oriented shear zones and faults. This results in sigmoidal shapes of the silicified zones within the Renard Zone. The Renard 2 subzone is interpreted to be an offset of the Renard Zone, displaced by a N110 oriented structure. It has a very similar macroscopic description and is geometrically associated to the Renard Zone.
7.3.6.5 Footwall Zone
The Footwall Zone is the most northern mineralized zone of the deposit. It extends over four kilometres strike length with a vertical depth of 500 m and an average thickness of 150 m. The Footwall Zone is hosted in a coarse grained, heterogeneous volcanic-sedimentary unit and presents various intensities of micaceous alteration, mostly phlogopite and biotite in the matrix.
This altered unit is cross-cut by a set of quartz-carbonate (calcite) veinlets with sub automorphic pyrite that is associated with the gold grade. Locally, visible gold has been observed in these veinlets. The Footwall Zone presents various levels of alteration and mineralization intensity.
The Footwall East Zone is interpreted to be the eastern extension of the Footwall Zone, which has been displaced by a N40 oriented D2 cross cutting structure.
| 7-30 |
|
IAMGOLD Corporation | Nelligan Project |
April 2, 2025 |
|
NI 43-101 Technical Report |
SLR Project No.: 233.065260.00001 |
8.0 Deposit Types
The Nelligan deposit is hosted in typical Archean volcano-sedimentary rocks of the Caopatina Formation and associated with major crustal deformation zones, however, the various styles of alteration and mineralization make it atypical and relatively hard to categorize into a single deposit type since many of the characteristics of mineralization could individually be representative of different deposit models.
The main alteration types on the Project are silicification, carbonatization, potassic alteration, and occasionally albitization and hematization. The best gold intervals correspond to intense, pervasive silicification that locally obliterates the protolith. Hydrothermalism is structurally controlled and pervasive alteration is driven by main ductile structures or host rock porosity (i.e., the feldspath-rich crystal tuff layers) with intense bleaching and replacement of felspathic crystals by silica (pseudomorphosis textures). Also, the late-stage ductile-brittle deformation phase developed cataclastic or crackle-breccia textures through the competent silicified zones, increasing the dilation conditions within the silicified zones and leading to an intense sulphide remobilization and gold content increase.
Deformation is mainly ductile, represented by schistic and mylonitic textures. Conglomerate clasts are strongly flattened and stretched, and when present, the quartz- carbonate veins are sheared and folded.
At present, the categorization of the Nelligan deposit model is based on two major components. An early-stage hydrothermal event that could be intrusion-related with polymetallic assemblage and a secondary post-intrusion event related to fault-valve orogenic mineralization processes, well constrained to the latest phases of deformation D3 to D4 and crosscutting earlier phases of structurally controlled (Late D1) to D2 magmatic hydrothermalism (Figure 8-1). Figure 8-2 is a Pressure-Temperature (PT) diagram scheme proposed by IAMGOLD to highlight the multi-stage deformation phases occurring during the orogenic cycle from synvolcanic to syntectonic periods and the mineralization process influenced by magmatism, metamorphism, and deformation leading to the remobilization of gold in economic deposits. This categorization is supported by recent work completed by Mathieu (2021). The Nelligan deposit shares characteristics with the Intrusion-Related Gold System (IRGS) overprinted by the Orogenic Gold System (OGS) group (Figure 8-2).
| 8-1 |
|
IAMGOLD Corporation | Nelligan Project |
April 2, 2025 |
|
NI 43-101 Technical Report |
SLR Project No.: 233.065260.00001 |
Figure 8-1: Classification of the Mineralizing Systems based on Physical Characteristics
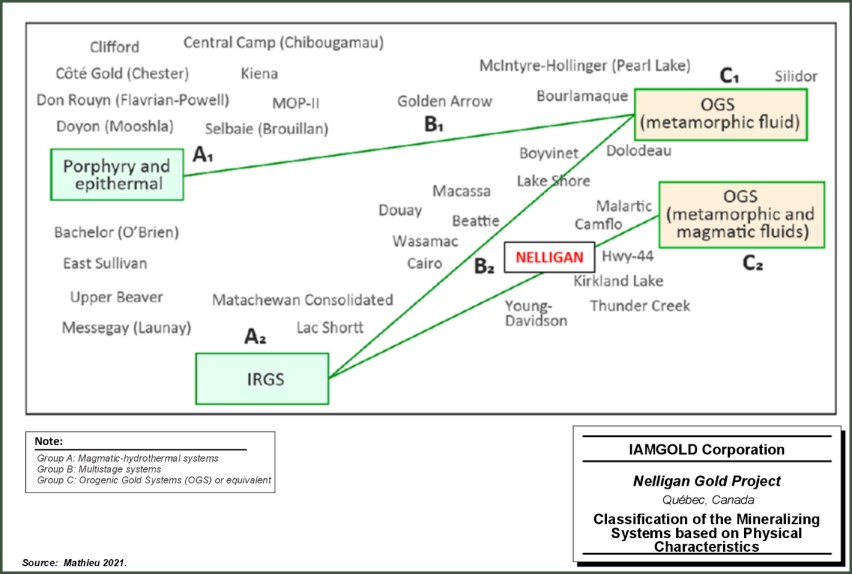
| 8-2 |
|
IAMGOLD Corporation | Nelligan Project |
April 2, 2025 |
|
NI 43-101 Technical Report |
SLR Project No.: 233.065260.00001 |
Figure 8-2: Tectono-metallogenic Evolution from Synvolcanic to Syntectonic Periods in accordance with an Orogenic Cycle for the Chapais-Chibougamau Mining Camp
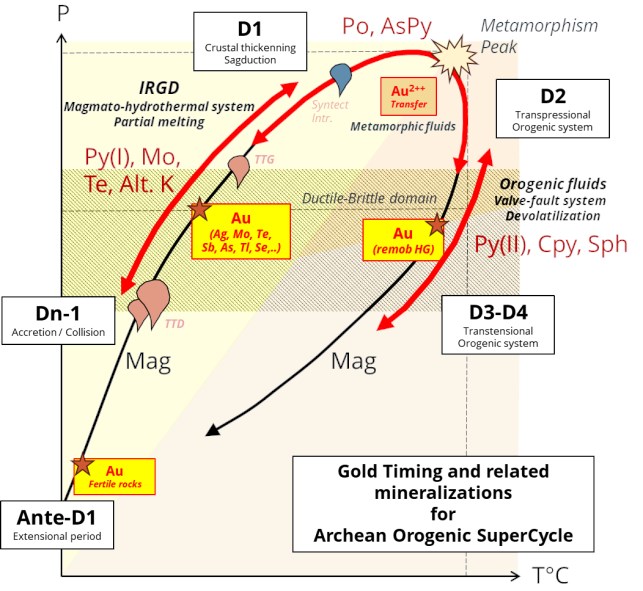
Source: IAMGOLD, internal data.
Note:
1. Dn-1 to D1: The accretion-collision period with ductile accommodation, secondary pinched thrust-folds, and fertile TTG-TTD suites are related to crustal thickening and related partial melting process (IRGD signature of primary gold mineralization).
2. D2: The maturation-cratonization period and a strong structural control of hydrothermalism, syntectonic TTG suites, and transition from ductile to ductile-brittle domain in association with a regional reverse-dominant transpressive system (destabilization of primary IRGD mineralization Py(I) in Po, release of gold, As input from sediments to form Aspy, etc.).
3. D3-D4: The orogenic periods related to transtensive ductile-brittle deformation along inherited fault pattern, Ca-rich fault-valve system inducing metallogenic refining of IRGD systems (high grade gold remob), and post-peak decompression periods.
| 8-3 |
|
IAMGOLD Corporation | Nelligan Project |
April 2, 2025 |
|
NI 43-101 Technical Report |
SLR Project No.: 233.065260.00001 |
8.1 Intrusion Related Gold Deposit
The Nelligan deposit presents significant similarities with an IRGD model. Clear markers of potassic alteration are visible within the Nelligan deposit and an association with hematization implies high oxygen fugacity fluid that is usually related to intrusions. Locally, rare porphyric dykes have also been observed and crosscutting relationships imply relatively early emplacement.
IRGD models are characterized with a typical geochemical signature with several representative chemical pathfinders and traces elements. At the Nelligan deposit scale, the inductively coupled plasma (ICP) data collected by IAMGOLD highlights that gold mineralization presents a significant correlation with arsenic, antimony, molybdenum and tellurium and there is a typical zoning over the deposit with silver and zinc bearing veins.
Zoning is well defined in IRGD models, as described by Hart and Goldfarb (2005), Azevedo et al. (2022), and Poulsen et al. (2000) (Figure 8-3).
8.2 Orogenic Gold Deposit
The Nelligan deposit also presents various typical characteristics of an orogenic gold deposit. The general context is based on greenschist-amphibolite facies transition, the ductile-brittle deformation and the spatial relationship with major crustal events are typical markers. The quartz-carbonate veinlets and the carbonate breccia zones that are associated with gold mineralization are also significant criteria. From Groves et al. (1998), geochemical associations that are observed in some areas of the deposit (Au-As-Te) are typical of orogenic mesozonal gold deposits.
| 8-4 |
|
IAMGOLD Corporation | Nelligan Project |
April 2, 2025 |
|
NI 43-101 Technical Report |
SLR Project No.: 233.065260.00001 |
Figure 8-3: IRGD Proposed Classification of Zoning and Relationship with Other Gold Deposit Types
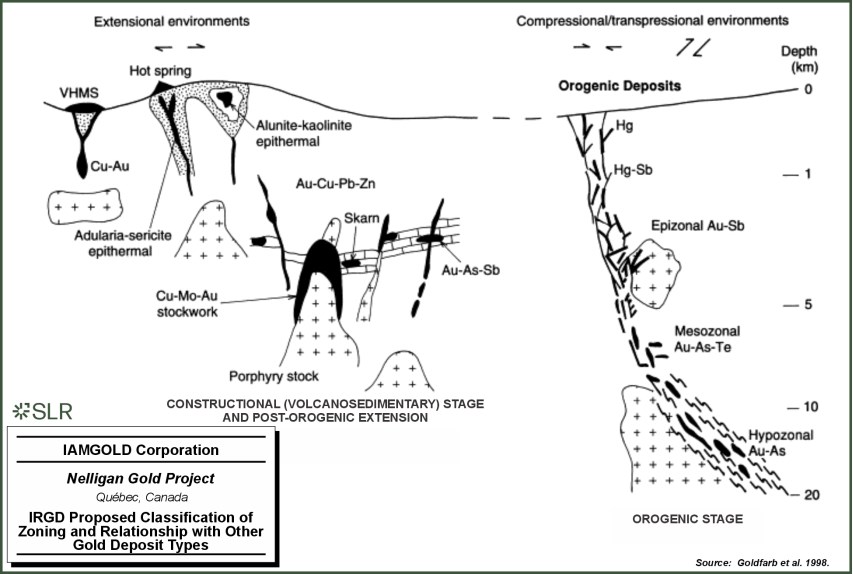
| 8-5 |
|
IAMGOLD Corporation | Nelligan Project |
April 2, 2025 |
|
NI 43-101 Technical Report |
SLR Project No.: 233.065260.00001 |
9.0 Exploration
This section presents the exploration programs completed by IAMGOLD between 2014 and 2024. Exploration work conducted by previous operators is summarized in Section 6.0.
9.1 Exploration by IAMGOLD (2014-2024)
Between 2014 and 2024, IAMGOLD completed multi-staged exploration programs on the Project including prospecting, geological mapping, soil and till geochemical surveys, geophysical surveys, thin section and hyperspectral analyses, metallurgical studies, and extensive core drilling. Details regarding trenching and core drilling, and metallurgical studies are discussed in Sections 10.0 and 13.0, respectively.
9.1.1 Geological Mapping and Prospecting
IAMGOLD has conducted geological mapping and prospecting across the Project, with more concentrated exploration efforts within the Nelligan, Émile, and Miron claim blocks (Table 9-1).
Table 9-1: Mapping and Rock Sampling Completed by IAMGOLD (2014-2022)
| Year | Outcrops Mapped |
Trenches Mapped |
Rock Samples |
Channel Samples |
Target Area |
| 2015 | 47 | - | 39 | - | Nelligan |
| 2018 | - | - | 10 | - | Two southernmost claims |
| 2019 | 323 | - | 86 | - | Nelligan, Émile, and Miron |
| 2020 | 72 | 4 | 74 | 65 | Nelligan |
| 2021 | 15 | 3 | 3 | 130 | Nelligan and Émile |
| 2022 | - | - | 222 | - | Nelligan |
| 2023 | 99 | 2 | 103 | 46 | Nelligan and Émile |
| 2024 | 357 | 2 | 358 | 100 | Nelligan, Émile, Miron, and Crisafy |
| Total | 913 | 11 | 895 | 341 |
In August 2018, geological mapping was completed over the two southernmost claims, with a total of 10 grab samples taken from laminated mudrock units; these did not return significant gold values (IAMGOLD 2018).
In August 2019, geological mapping targeted the Nelligan, Émile, and Miron claim blocks, with a total of 323 outcrops found and 86 grab samples collected. Folded iron formation was mapped within the Émile claim block, consistent with the magnetic high documented in the geophysical survey completed in 2018.
Between July 3, 20201 to October 25, 2020, a total of 72 outcrops and two trenches were mapped and 38 surface samples were collected on the Nelligan claim block. The best gold result from this work came back from a massive, slightly deformed biotite rich vein of 25 cm to 30 cm, oriented N60° to 80°, and hosted in a mudrock without any apparent mineralization. Sample IMGVD40770 was taken on the NE20° to 162° outcrop and returned a value of 0.234 g/t Au.
| 9-1 |
|
IAMGOLD Corporation | Nelligan Project |
April 2, 2025 |
|
NI 43-101 Technical Report |
SLR Project No.: 233.065260.00001 |
On the Émile claim block, the mapping and sampling work took place from September 19, 2020 to October 23, 2020. The purpose of this campaign was the systematic inventory of outcrops that were not previously explored by IAMGOLD, detailed geological mapping and detailed stripping mapping, and sampling. A total of five outcrops and one stripping were described during this program. Two surface samples and 36 channel samples were collected and analyzed by ALS Global in Val d'Or. No significant results were returned. Additionally, 65 channel samples were collected. No significant results were returned.
Between May 15, 2021 to June 28, 2021, the objective was to continue the systematic identification and sampling of outcrops not yet explored by IAMGOLD, as well as to conduct the detailed mapping of three trenches. A total of 15 outcrops and three trenches were described during the spring program of 2021. One trench was located on the Nelligan claim block and two were located on the Émile claim block. These trenches were all excavated in 2019 but could not be mapped before the arrival of the first snow. Three surface samples and 130 channel samples were collected. No significant results were returned.
Between June 8, 2022 to July 21, 2022, the principal objective was to sample existing outcrops for geochemistry assay. The description of the outcrops was also updated to refine the geological mapping of the property. In total, 222 samples were collected and analyzed for gold and 48 elements. One sample returned a value of 0.54 g/t Au, located approximately 1.5 km north of the Nelligan deposit. Rock geochemistry will be used for future interpretation and diamond drilling targeting.
Mapping and sampling work took place over 29 days between July 23, 2023 and October 12, 2023. The objectives of the survey were to identify new outcrops in areas of interest or underexplored areas, to revise outcrops already known to IAMGOLD n the most prospective areas, and to increase the content of the Project's geoscience database. A total of 103 grab samples and 46 channel samples were collected, described, and sent for analysis to ALS Val d'Or during the 2023 surface campaign.
Overall, few significant values are obtained, with two samples yielding 52 ppb Au (IMGVD69558 and IMGVD695560), one sample yielding 0.199 g/t Au (IMGVD69559), and one sample yielding 2.04 g/t Au (IMGVD69561).
Mapping and sampling work took place over 43 days between May 23, 2024 and September 22, 2024. The purpose of the survey was to identify new outcrops in both areas of interest and underexplored areas, as well as on the mining claims acquired in 2023, to increase the content of the Project's geoscience database. A total of 358 grab samples and 100 channel samples were collected, described, and sent for assay to ALS Val d'Or during the 2024 surface campaign.
Overall, few significant values were obtained for rock samples, and 15 samples reported values above the anomalous threshold of 20 ppb Au, of which four had values greater than 100 ppb (IMGVD77639 with 107 ppb Au, IMGVD77692 with 115 ppb Au, IMGVD78086 with 118 ppb Au, and IMGVD78087 with 158 ppb Au). Nelligan rock sample locations and results are shown in Figure 9-1.
| 9-2 |
|
IAMGOLD Corporation | Nelligan Project |
April 2, 2025 |
|
NI 43-101 Technical Report |
SLR Project No.: 233.065260.00001 |
Figure 9-1: Location and Assay Results of Rock Samples
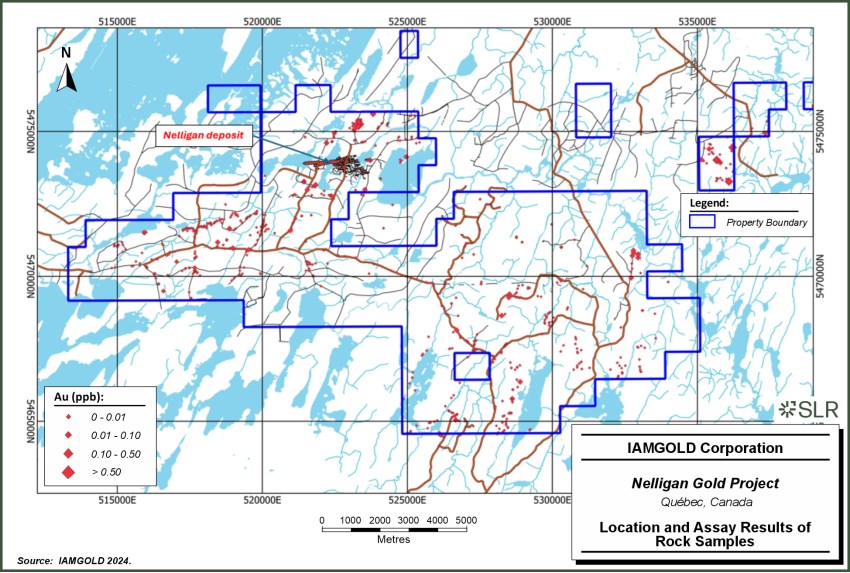 .
.
| 9-3 |
|
IAMGOLD Corporation | Nelligan Project |
April 2, 2025 |
|
NI 43-101 Technical Report |
SLR Project No.: 233.065260.00001 |
9.2 Geochemical Sampling
9.2.1 Till Sampling
The till sampling program was carried out by SL Exploration Inc. in 2020 and 2021 and includes a total of 128 samples of glacial sediments collected across the Project (Figure 9-2). In 2022, an infill sampling program was completed with a total of 58 samples collected.
The samples typically weighed 10 kg to 12 kg and were sent to the Overburden Drilling Management Limited (ODM) laboratory, in Ottawa, for sample preparation (heavy and fine fraction concentrates separation), followed by a visible gold grain counting and neutron activation dense fraction analysis. In parallel, a one kilogram aliquot was processed by ALS Minerals for fine fraction analysis.
Results of the 2020-2021 visible gold grain count show 13 significant results from 20 grains to 81 grains, while the analysis of the dense fraction shows several grades of more than 200 ppb Au, up to a maximum of 5,770 ppb Au. The tracing of anomalous contours and the interpretation of the results defines five gold targets. One of these targets could be explained by either the presence of the Nelligan deposit recently discovered by drilling on the property, or from a separate, closer source located south of the Nelligan deposit.
A geochemical survey was conducted from June 15, 2022 to June 22, 2022. A total of 71 stations were visited and 58 samples were collected (Figure 9-3). Samples weighing 12 kg were collected in the C horizon. These samples were sent for a gold grain count and a fine fraction analysis to ODM laboratory.
9.2.2 Soil Sampling
In 2022, a soil sampling survey was completed on the south edge of the Nelligan property. In total, 80 samples of B horizon were taken and were sent for mobile metal ion (MMI) preparation and inductively coupled plasma mass spectrometry (ICP-MS) analysis (Figure 9-4).
A geochemical survey was conducted by SL exploration from July 12, 2023 to July 17, 2023. During the work, 793 stations were visited, and 668 samples were collected. 500g samples were collected in the B horizon at a constant depth. 658 samples were analysed by the SGS Canada Inc (SGS), in Quebec. These samples were sent for MMI phased array analysis of the fine fraction.
A geochemical survey was conducted from May 26, 2024 to May 30, 2024. During the work, 479 stations were visited, which returned 417 samples, and 16 duplicates were collected, for a total of 433 samples. Samples weighing 500g were collected in the B horizon at a constant depth. These samples were sent to the SGS laboratory for MMI multi-element analysis of the fine fraction. The 2024 campaign identified potential exploration targets on the Nelligan property.
Minor historical MMI survey were also conducted in 2016 and 2019 to test the response of the Nelligan deposit, with no significant results.
| 9-4 |
|
IAMGOLD Corporation | Nelligan Project |
April 2, 2025 |
|
NI 43-101 Technical Report |
SLR Project No.: 233.065260.00001 |
Figure 9-2: Assay Results of the Till Sample Survey, 2020 and 2021
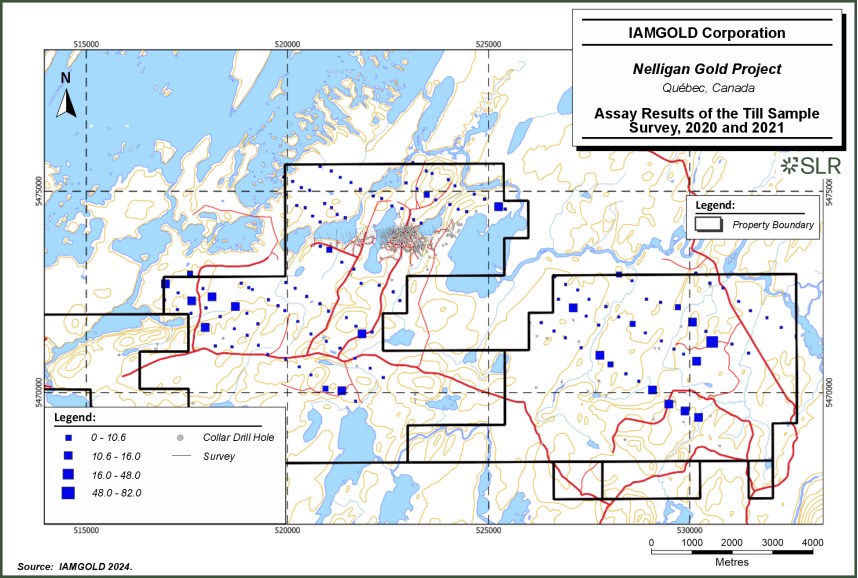
| 9-5 |
|
IAMGOLD Corporation | Nelligan Project |
April 2, 2025 |
|
NI 43-101 Technical Report |
SLR Project No.: 233.065260.00001 |
Figure 9-3: Location and Assay Results of the Till Sample Survey, 2022
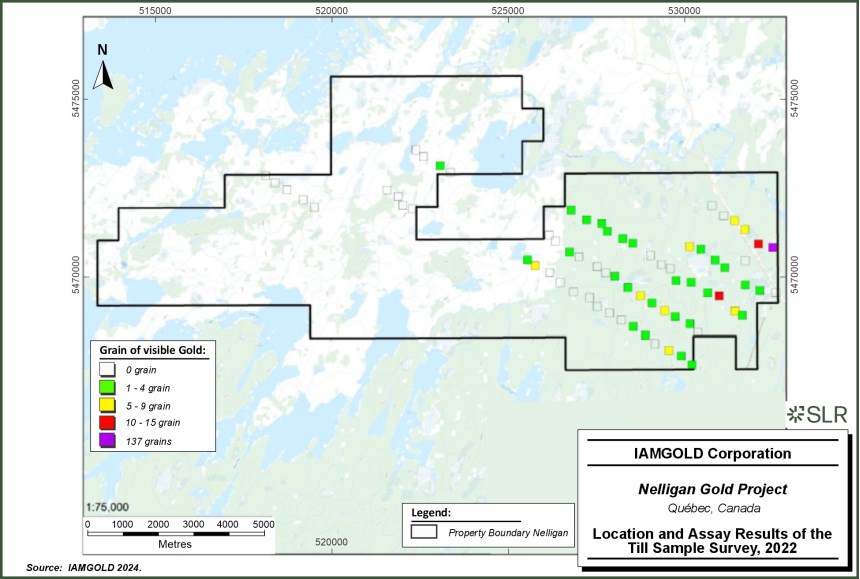
| 9-6 |
|
IAMGOLD Corporation | Nelligan Project |
April 2, 2025 |
|
NI 43-101 Technical Report |
SLR Project No.: 233.065260.00001 |
Figure 9-4: Soil Samples Collected in 2022 - 2024
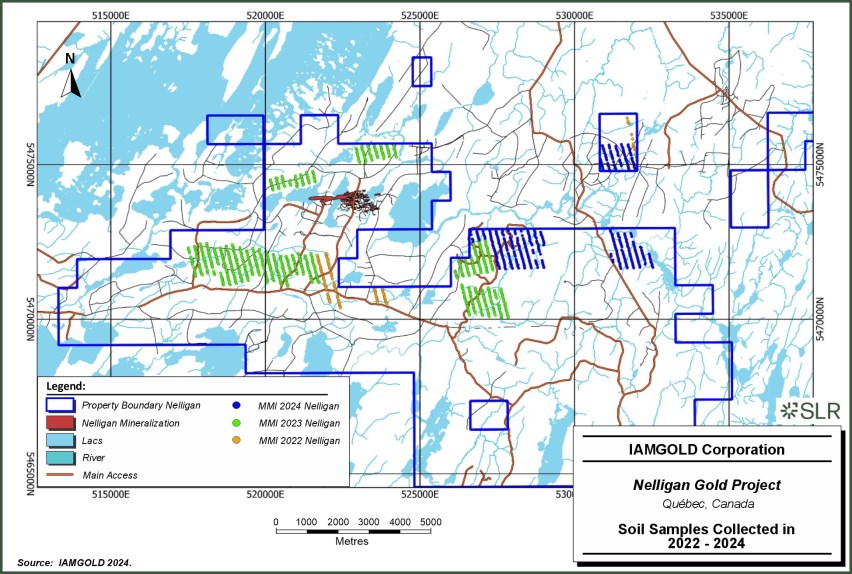
| 9-7 |
|
IAMGOLD Corporation | Nelligan Project |
April 2, 2025 |
|
NI 43-101 Technical Report |
SLR Project No.: 233.065260.00001 |
9.3 Geophysical Surveys
IAMGOLD conducted various geophysical surveys including IP, Versatile Time Domain Electromagnetics (VTEM) and Unmanned Aerial Magnetic (UAV) geophysical surveys between 2015 and 2022.
9.3.1 Versatile Time-Domain Electromagnetic Survey
In 2015, IAMGOLD commissioned Geotech Ltd. to complete a helicopter borne VTEM Plus survey. This work was completed between July 8 2015 to 10, 2015 and involved 573 line-kilometres. Discovery of faults on the Miron and Nelligan claim blocks through geological mapping efforts confirmed the faulted interpretation based on the VTEM survey.
9.3.2 Unmanned Aerial Magnetic Survey
Stratus Aeronautics performed a magnetic survey from September 29, 2018 to October 3, 2018, by UAV. The UAV survey was part of a research project supported by IAMGOLD in partnership with the École de Technologie Supérieure and the Natural Sciences and Engineering Research Council of Canada (NSERC). The results yielded a response for the folded iron formations. A contour map of the magnetism survey on the Project was produced using the survey results (IAMGOLD 2018).
9.3.3 Induced Polarization Survey
IAMGOLD commissioned Abitibi Geophysics to conduct an IP OreVision survey in 2015 on the Liam Zone. The survey consisted of 11.6 km of reading over five lines-oriented NNW-SSE.
The vertical sections of 3D inverse resistivity show the presence of non-polarizable conductors in the bedrock. These could represent faults or shear zones. The chargeability sections, by contrast, are characterized on all lines by a strongly polarizable structure that appears sub-horizontal between chainages 2+00N and approximately 7+00N.
IAMGOLD commissioned Abitibi Geophysics to conduct an IP OreVision survey over the Project, which was carried out between January to February and March to April 2021. The survey covered a large portion of the Nelligan property across two survey grids for Émile and Nelligan claim blocks (Figure 9-5). The objective of the survey was to detect responses in the vicinity of known mineralized zones and to delineate new anomalies that may host gold mineralization.
The survey was conducted with a line-spacing of 50 m and n-spacings, where n = 1 m to 20 m. A three-dimensional inversion was performed and produced a model of these physical properties to an approximate depth of 400 m below the surface.
Results from the survey identified several distinctive resistive and conductive axes within the Project. Specific targets of interest were likely areas within chargeable and conductive wacke units. Although not of primary importance, areas that are resistive and chargeable may also merit further investigation.
In 2024, IAMGOLD commissioned TMC Geophysics to carry out an IP survey on their Nelligan property (Figure 9-6). The campaign took place between February 29, 2024 and March 10, 2024, and consisted of 15.85 line-km of IP using the pole-dipole electrode array. Two grids were surveyed on the Miron area and on the Tour de Feu area.
| 9-8 |
|
IAMGOLD Corporation | Nelligan Project |
April 2, 2025 |
|
NI 43-101 Technical Report |
SLR Project No.: 233.065260.00001 |
Figure 9-5: OreVision Induced Polarization Survey Completed in 2021
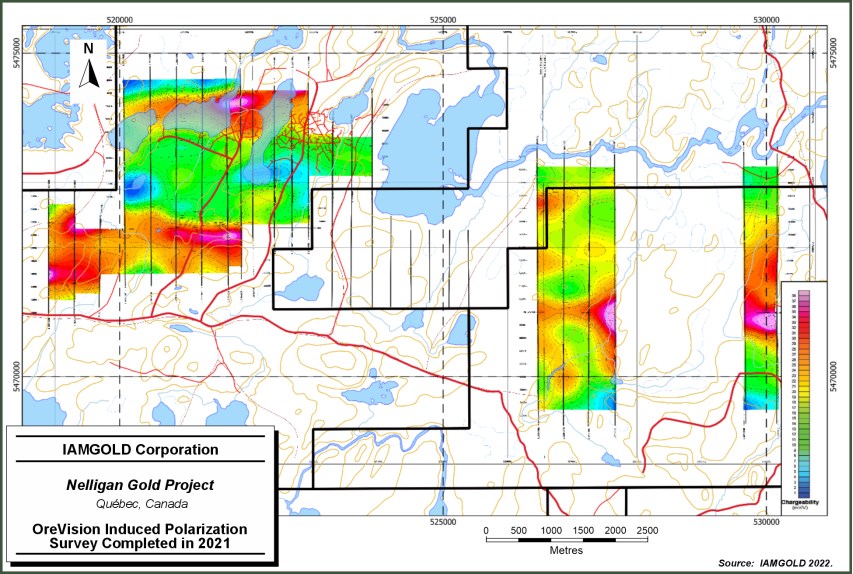
| 9-9 |
|
IAMGOLD Corporation | Nelligan Project |
April 2, 2025 |
|
NI 43-101 Technical Report |
SLR Project No.: 233.065260.00001 |
Figure 9-6: Induced Polarization Surveys Conducted in 2024
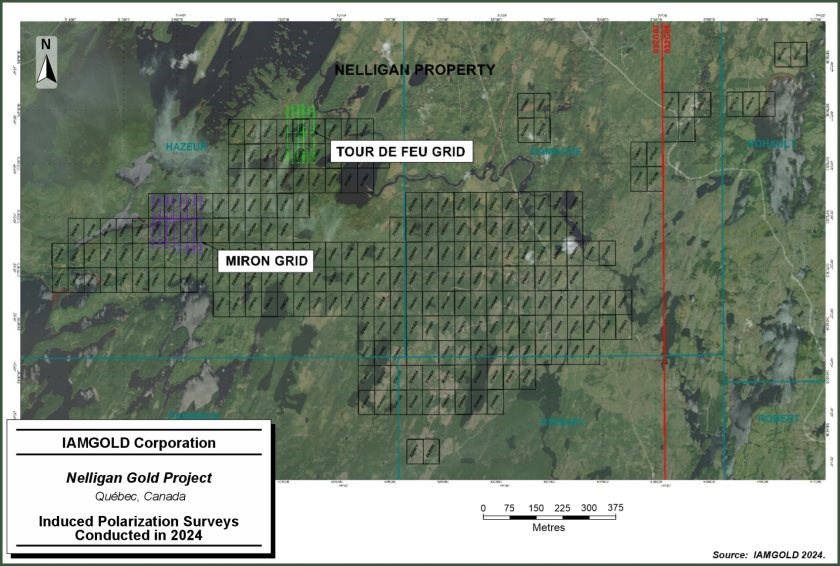 .
.
| 9-10 |
|
IAMGOLD Corporation | Nelligan Project |
April 2, 2025 |
|
NI 43-101 Technical Report |
SLR Project No.: 233.065260.00001 |
9.4 Thin Section Petrography
In 2017, COREM completed a petrographic description of 20 samples collected from the Project. Each sample was chosen by IAMGOLD to provide a better understanding of the Project's mineralization and alteration. Mineral identification was performed on polished thin sections of those samples using transmitted and polarizing light and using reflected light for oxides, sulphides, and gold. Gold grains were analyzed with a scanning electron microscope (SEM). Modal mineralogical analysis was also performed.
The results of this study revealed the fine-grained nature of gold (<10 μm to 40 μm), which occurs with traces of silver, and locally as electrum. Reddish colour within the rock appeared to be due to potassic alteration, rather than previously thought hematite alteration described in the field. Additionally, the white to beige coloured alteration correlated with significant carbonate (dolomite) rather than previously thought albitization as described in the field. The host rocks for these samples were strongly altered sedimentary rocks. Although locally intrusive rock textures were suspected, they could not be confirmed.
In 2024, Geox has been mandated by IAMGOLD to carry out a description of petrographic samples from the Project. Drill core sampling was conducted by the IAMGOLD exploration team. Thin Sections were positioned and were made by Vancouver Petrographics Inc.(VanPetro). The observations were made with a MeijiTechno petrographic microscope equipped with an Infinity 8 camera.
The petrographic observations conducted in this studied confirmed most of the macroscopic observations and description of the principal units and alteration identified on Nelligan deposit. In terms of hydrothermal events, the mineral associations that were observed confirm a potassic metasomatism and also a potential Fe-Mg based fluid that is expressed by biotite and carbonates. This is consistent with macroscopic interpretation where potassic dominant fluid (marked by K-feldspar and sericitic alteration) is mostly cross-cut by phlogopite-calcite/dolomite veinlets. Biotite is very abundant but can have both metamorphic and hydrothermal origins.
These observations confirm that most of the gold that is observed seems to be linked to a tardive hydrothermal event that would correspond to the Fe-Mg-carbonates event base on relative chronology. It remains uncertain whether the fluid from the hydrothermal event contributes to the global content of gold by remobilizing and concentrating the gold brought by the previous potassic dominated hydrothermal events.
9.5 Hyperspectral Analysis
Between September 7, 2021 and October 14, 2021, 16 boreholes from the Project were scanned using a geoLOGr analyzer sourced from Hyperspectral Intelligence Inc (HII). The majority of holes selected were focused within the Renard Zone. The hyperspectral data collected from the drill core using the geoLOGr was used to produce spectral logs that show the distribution of spectrally distinct mineral assemblages (i.e., lithotype) identified along the surface of the drill core.
The geoLOGr hyperspectral rock analyzer consists of a sensor head mounted on an extendable and height adjustable, wheel-based metal frame. The sensor head contains a shortwave infrared ([SWIR]: 900 nanometres to 2,500 nanometres) point spectrometer that collects hyperspectral data in a continuous mode. It also contains a proximity sensor, a digital linescan camera, an alignment laser, as well as halogen and Light Emitting Diode (LED) light sources. The sensor head moves at a constant speed over the centerline of the drill core, collecting reflectance spectra and continuous linescan RGB colour photos. After one row of drill core has been scanned, the geoLOGr is moved by a technician to the next row. Once the hyperspectral data and drill core photographs are collected and uploaded to a secure cloud storage repository, the data are processed by HII using proprietary software tools developed to produce spectral logs that show the distribution of different lithotypes along the surface of the drill core.
| 9-11 |
|
IAMGOLD Corporation | Nelligan Project |
April 2, 2025 |
|
NI 43-101 Technical Report |
SLR Project No.: 233.065260.00001 |
In total, six different lithotypes were identified in these drill cores, with one lithotype identifying rocks that contain a high abundance of quartz/silica, which is believed to correlate with zones of increased mineralization.
A description of the main SWIR minerals identified in each lithotype is provided in Table 9-2. It is important to note that the minerals listed in the legend are representative of the dominant SWIR-active minerals. This classification confirms most of the macroscopic description of the intervals that were surveyed as the SWIR defined lithotypes are consistent with the described lithology and alterations. Furthermore, this survey will help to define more detailed composition of the complex alterations on the Nelligan deposit and can also provide information on mineralogical features that are visually challenging to describe.
| 9-12 |
|
IAMGOLD Corporation | Nelligan Project |
April 2, 2025 |
|
NI 43-101 Technical Report |
SLR Project No.: 233.065260.00001 |
Table 9-2: Hyperspectral Lithotypes Defined at the Project
| Lithotype | Main SWIR Minerals | Summary |
| Lithotype 1A | Phlogopite | Comprised mainly of mafic minerals, these three lithotype have differing relative abundances of phlogopite, Mg-chlorite, with additional minor phengite. |
| Lithotype 1B | Mg-chlorite & phengite | |
| Lithotype 1C | Mg-chlorite | |
| Lithotype 2A | White mica mix (HC: 2227 nm) |
Each lithotype is comprised on a mixture of white micas - mainly phengitic illite and muscovite illite - with both high (HC) and low (LC) illite crystallinities. These lithotypes also contain chlorite and hornblende. The white mica trough position indicates a very high celadonite component. |
| Lithotype 2B | White mica mix (LC: 2227 nm) |
|
| Lithotype 2C | White mica mix (HC: 2227 nm) + Mg-chlorite + hornblende | |
| Lithotype 2D | White mica mix (HC: 2227 nm) + Mg-chlorite + hornblende | |
| Lithotype 3A | Phengite (2229 nm) |
These lithotypes are dominated by phengite, phengitic illite with low crystallinity, and muscovite. These lithotypes have a stronger SWIR response compared to Lithotype 2, which can make the rocks look brighter. White mica trough located at long wavelengths is consistent with phengite that has a very high celadonite component. |
| Lithotype 3B | Phengite (2223 nm) |
|
| Lithotype 3C | Phengite (2218 nm) |
|
| Lithotype 3D | Phengitic illite (LC: 2218 nm) |
|
| Lithotype 3E | Muscovite (2214 nm) |
|
| Lithotype 4A | Quartz/Silica ± Dolomite | These spectra resemble spectra collected from quartz and silica, with variable amounts of dolomite. |
| Lithotype 4B | Quartz/Silica ± Dolomite | |
| Lithotype 5 | Hornblende | Spectra consistent with mafic minerals, like hornblende. |
| Lithotype 6 | Dolomite | Carbonate spectra that closely resemble dolomite. |
| Source: Hyperspectral Intelligence Inc, 2021 | ||
| 9-13 |
|
IAMGOLD Corporation | Nelligan Project |
April 2, 2025 |
|
NI 43-101 Technical Report |
SLR Project No.: 233.065260.00001 |
10.0 Drilling
The Mineral Resources estimate discussed herein is solely informed from the core drilling information. A total of 330 core drillholes have been completed on the Project since 1978 (Table 10-1).
This section presents the drilling programs completed by IAMGOLD between 2014 and 2024. Drilling programs conducted by previous operators (prior to December 2014) are discussed in detail in Section 6.0.
Table 10-1: Summary of Drilling Conducted on the Project (1978-2024)
| Company | Year | Type | Holes Drilled |
Length (m) |
| Historical Operators | 1978-1995 | Core | 23 | 3,807 |
| Vanstar | 2012 | Core | 11 | 1,968 |
| Vanstar | 2013 | Core | 9 | 1,406 |
| Vanstar | 2014 | Core | 15 | 2,401 |
| IAMGOLD | 2014 | Core | 3 | 585 |
| IAMGOLD | 2015 | Core | 7 | 2,516 |
| IAMGOLD | 2016 | Core | 8 | 13,362 |
| IAMGOLD | 2017 | Core | 7 | 3,242 |
| IAMGOLD | 2018 | Core | 32 | 13,362 |
| IAMGOLD | 2019 | Core | 50 | 17,528 |
| IAMGOLD | 2020 | Core | 17 | 7,561 |
| IAMGOLD | 2021 | Core | 28 | 9,534 |
| IAMGOLD | 2022 | Core | 8 | 4,950 |
| IAMGOLD | 2023 | Core | 36 | 10,349 |
| IAMGOLD | 2024 | Core | 27 | 13,477 |
| Total | 315 | 108,267 |
10.1 Drilling by IAMGOLD (2014-2024)
IAMGOLD completed 272 core drillholes (approximately 98,686 m) since their involvement with the Project, in December 2014.
From 2015 to 2019, IAMGOLD drilled 104 holes totaling 38,834 m in the Liam, Dan, and Zone 36 areas, leading to the discovery of the Renard Zone. This drilling confirmed the extensions of the mineralized bodies and reinforced the Project's potential.
Several exploration holes were also drilled during this period. Most of the drilling conducted between 2017 and 2024 focused on testing geophysical anomalies, geological and structural targets, and defining gold mineralized zones within the first 600 m to 800 m from the surface. Figure 10-1 shows a summary of the drilling completed by previous operators and IAMGOLD.
| 10-1 |
|
IAMGOLD Corporation | Nelligan Project |
April 2, 2025 |
|
NI 43-101 Technical Report |
SLR Project No.: 233.065260.00001 |
Figure 10-1: Drilling Summary
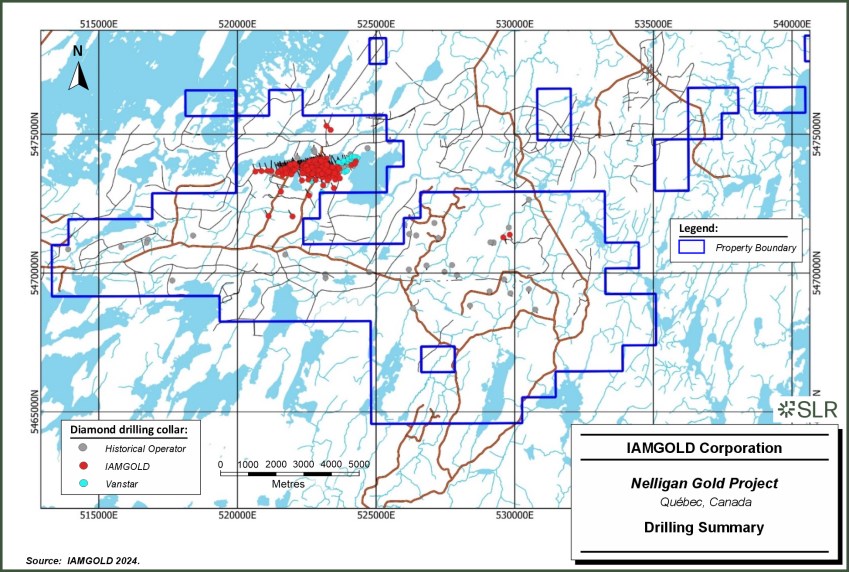 .
.
| 10-2 |
|
IAMGOLD Corporation | Nelligan Project |
April 2, 2025 |
|
NI 43-101 Technical Report |
SLR Project No.: 233.065260.00001 |
The geological data gathered during the drilling campaigns from 2018 to 2021 confirmed the continuity of the Renard Zone, Footwall Zone, Liam Zone, and Zone 36 with consistent gold grades. Additionally, it underscored the potential for extending the resource westward and at depth.
During the winter of 2022, most drilling focused on extending the depth of the Renard Zone and Footwall Zone, along with Zone 36. Drill holes NE-22-192 to NE-22-196 successfully intercepted mineralization at depth, expanding the footprint of the Nelligan deposit. Additionally, holes NE-22-197 and NE-22-198 effectively filled a drilling gap between the Renard Zone and its interpreted western extension.
From 2023 to 2024, a total of 48 holes for 24,272 m of diamond drilling were completed on the project mostly concentrated on Nelligan deposit. The diamond drilling successfully extended the footprint of the mineralized zones on both eastern and western extensions and also at depth. These drilling campaigns also conducted infill drilling within the mineralized zones. It is notable that holes like NE-24-222 or NE-24 25A confirmed eastern pending high-grade shoots within the Renard Zone and Footwall Zone.
10.1.1 Drilling Procedures
Chibougamau Diamond Drilling Ltd, based in Chibougamau, Québec, carried out the drilling programs from 2017 to 2019. Forages Hébert, based in Amos, Québec, conducted the 2020 drilling program, while Forage G4, based in Val-d'Or, Québec, handled the drilling programs in 2021 and 2022. Forage Orbit -Garant, based in Val-d'Or, Québec, completed the diamond drilling campaigns of 2023 and 2024.
The drilling was performed using NQ caliber (47.6 mm core diameter) with a conventional surface drill rig.
The core from the Project was oriented by the drillers using a Reflex ACT III electronic orientation tool. At the end of each run, they marked the core with a short line representing the bottom of the hole, corresponding to the in-situ underside of the core, before removing it from the core spring and core tube.
The casings were left intact after drilling except for holes drilled on a lake that were removed. A displacement plug was installed approximately 15 m below the casing to prevent surface water flow. The casing was then covered with a steel cap, and a steel marker was used to identify the drillhole collar.
10.1.1.1 Surveying
A handheld Garmin GPSMAP 62s was used to locate the planned drill holes. The drill rig azimuth is aligned using a compass or the GPS aligning device TN14. The initial dip of the hole was measured with a clinometer. After completion, all collars were surveyed by a land surveyor using a digital global positioning system (DGPS) (GNSS Leica GS15).
The downhole dip and azimuth were surveyed using a Reflex EZ-Trac unit in both single shot and multi shot modes. Reflex surveys began below the casing depth, with single-shot readings taken every 30 m until the hole was completed. Upon reaching the targeted depth, a downhole survey was conducted in multi-shot mode every three metres. The drilling contractors handled the instrument, and the survey data was electronically transferred via USB drive and imported to the drilling database by an IAMGOLD geologist.
All drilling programs employed drill core orientation methodology using the Reflex ACT III System.
| 10-3 |
|
IAMGOLD Corporation | Nelligan Project |
April 2, 2025 |
|
NI 43-101 Technical Report |
SLR Project No.: 233.065260.00001 |
10.1.2 Logging Procedures
An IAMGOLD technician transported the core boxes to the logging facility once a day, where they were opened and cleaned. The hole length was verified, and the core was oriented. Magnetic susceptibility readings, using an SM-30 m, along with core recovery and rock quality designation (RQD), were measured and recorded for every three metre drill run in the drilling database.
Core Alignment: Drill core is aligned using orientation marks taken every three metres by the drilling crew. The core is placed on a metal wedge over three metres and orientation lines were extended along the entire length whenever possible. The reference line is marked as valid when the marks for the drillers are lined up between the drilling runs.
Core Recovery and RQD: Technicians records core recovery and RQD measurements in an excel sheet over three metre intervals. Core recovery was calculated as a percentage for each three metre drilling run, while RQD measured the degree of natural jointing or fracturing in the rock mass. The data is then imported in the database by an IMAGOLD geologist.
Geological Description: A registered geologist or engineer completes and/or supervised the geological description of the core, including lithologies, major structures, alterations veining and mineralization. Each geological element is described in an appropriate table of the database using the GeoticLog software. The software is an interface that permit to populate a Microsoft access format database. Once a drill hole is completely described, the geologist imports related data into the database (RQD, magnetic susceptibility, density, collar information, drill hole survey) and the pertinent information of the drill hole. Photographs of the core were taken and archived.
Core Sampling: The logging geologist identified core sampling intervals, typically ranging from 0.5 m to 1.5 m, with exceptions up to 3.0 m when core recovery was below 60%. Lithological and structural contacts were used as sampling boundaries. The geologist identifies the sample with red marks on the core for top and bottom of the sampling interval. A paper tag is displayed on the core labelling the interval with a unique reference tracking number. The sample number and interval are then entered in the database by the geologist.
Core Cutting: An IAMGOLD technician used a pneumatic table saw to cut the core of each selected interval in half. The top half was bagged and tagged for laboratory shipment, while the bottom half was retained as a witness sample. Both half of the core are identified with a tracking number.
Orientation Measurements: Core orientation lines were used to measure the structures encountered within the hole, serving as a baseline at the beta angle (0° to 360°) clockwise looking down the hole. Accurate beta angle measurements were made using a kenometer. -Both angles (alpha and beta) were then entered into GeoticLog, along with the hole orientation survey data. The absolute orientations can then be calculated in the software using the orientation of the drill hole. The orientation line also serves as a reference during sawing for better sample homogeneity.
10.2 Core Recovery
The Project is characterized by local fractured and heavily weathered zones with poor core recovery and low RQD. Such areas can locally reach core lengths of six metres with core recovery of less than 60% and may include mineralized intervals. IAMGOLD has used both NQ and HQ sized core barrels without much improvement. Similarly, triple-tube drilling was attempted in a single hole, which was unsuccessful. IAMGOLD has improved core recoveries in these zones by using a refined mix of drilling muds and ensuring the drillers were well-skilled.
| 10-4 |
|
IAMGOLD Corporation | Nelligan Project |
April 2, 2025 |
|
NI 43-101 Technical Report |
SLR Project No.: 233.065260.00001 |
10.3 Drilling Pattern and Density
Drilling in the Project is designed to intersect mineralized domains perpendicular to capture the true thickness as much as possible. The drilling pattern spacing varies from 50 m to 200 m within the Nelligan deposit resource area. In the center of deposit, the drill spacing ranges from approximately 50 m to 100 m. The current drilling is sufficiently dense to interpret the geometry and the boundaries of gold mineralization with confidence.
10.4 SLR Comments
The QP notes that there are several intervals with low core recovery, which could potentially impact the reliability of the assay intervals in these cases. It is SLR's understanding that IAMGOLD is actively investigating additional methods to improve core recovery, particularly in areas with intensely fractured and heavily weathered zones.
| 10-5 |
|
IAMGOLD Corporation | Nelligan Project |
April 2, 2025 |
|
NI 43-101 Technical Report |
SLR Project No.: 233.065260.00001 |
11.0 Sample Preparation, Analyses, and Security
11.1.1 Historical Period (1977 - 2012)
Limited documentation on sample preparation, analysis, or security procedures exists for this early phase.
11.1.2 Vanstar Period (2012 - 2014)
During this period, Vanstar employed Laboratoire Expert Inc. in Rouyn-Noranda for assay services. Sample analyses included fire assay (FA) with atomic absorption (AA) finish, detecting gold down to 0.05 g/t.
11.1.3 IAMGOLD Period (2014 - 2024)
Sample analysis was split between AGAT Laboratories (AGAT) in Val-d'Or, Québec, and ALS Global (ALS) in Val-d'Or, Québec. AGAT was used from January 2015 until March 2016 and ALS was used from March 2016 to present. Both are commercial laboratories that are independent of IAMGOLD with no interests in the Project. Both laboratories received ISO/IEC 17025 accreditation through the Standards Council of Canada (SCC). Both laboratories implemented FA with AA for initial assays, upgrading to gravimetric or metallic sieve analysis for samples surpassing certain thresholds to manage nugget effects.
11.1.3.1 Drill Core Samples
At the drill site, cores are placed in wooden boxes, marked with depth indicators, and transported by an IAMGOLD technician to the logging facility. Logging and sampling are conducted under the supervision of registered professionals, including geologists and/or engineers.
Samples are typically 0.5 m to 1.5 m in length, avoiding geological contacts, with exceptions up to 3.0 m for poor recovery intervals. The core is cut lengthwise with a diamond-blade saw along a geologist-drawn line, preserving orientation. The top half is bagged and tagged for shipment to the laboratory, while a corresponding tag is stapled in the box for reference.
Sample bags, containing up to four samples each, are sealed and marked to prevent non-protocol handling or alteration of the samples. If tampering is suspected, laboratory personnel notify IAMGOLD.
The sample preparation and analysis at AGAT were similar to those used at ALS (Figure 11-1). Sample preparation and analysis at ALS consisted of:
• Dried and weighed (WEI-21).
• Crushed to +90% passing two millimetres (mm) (CRU-32).
• Split to 1,000 g with a riffle splitter (SPL-21).
• Pulverized to 95% passing 106 μm mesh (PUL-35a).
• 50 g pulp analyzed by FA with AA (Au-AA24).
• If >5 g/t Au, re-assayed by FA with gravimetric finish (Au-GRA22).
| 11-1 |
|
IAMGOLD Corporation | Nelligan Project |
April 2, 2025 |
|
NI 43-101 Technical Report |
SLR Project No.: 233.065260.00001 |
• If >10 g/t Au, metallic sieve analysis performed.
• Visible gold samples sent directly for metallic sieve (Au-SCR24).
• Results provided in Excel, prioritizing metallic sieve and gravimetric values.
11.1.3.2 Rock Samples
Rock samples collected by IAMGOLD between 2014 and 2024 followed a similar preparation as core samples and were submitted to ALS Minerals in Val d'Or for analytical testing for gold by FA with AA finish.
11.1.3.3 Till Samples
Till samples weighing approximately 10 kg to 12 kg were sent to the ODM laboratory in Ottawa, Ontario, for sample preparation followed by visible gold grain counting and neutron activation dense fraction analysis (INAA). In parallel, a one kilogram aliquot was processed by ALS for fine fraction analysis by inductively coupled plasma atomic emission spectroscopy (ICP-AES) of gold.
Sample preparation (Figure 11-2) consisted of drying the sample at 60°C; followed by sieving to separate a fine fraction between 0.25 mm to 2.0 mm. A 50 g subsample of the fine fraction was sent to ALS Laboratories, in Ontario for analysis. The remainder of the 0.25 mm to 2.0 mm fraction was sorted by shaking table, then separated by dense liquors, followed by a magnetic/paramagnetic separation to produce a heavy mineral concentrate. A 50 g subsample of the heavy mineral concentrate was sent to Activation Laboratories Ltd. (Actlabs) for analysis, and the remaining concentrate was used for gold grain account.
At Actlabs, dense mineral concentrates were analyzed for gold by titration. Gold and 33 additional elements (included but not limited to Ag, As, Ba, Br, Ca, Co, Cr, Cs, Fe, Hf, Hg, Ir, Mo, Na, Ni, Rb, Sb, Sc, Se, Sr, Ta, Th, U, W, Zn, La, Lu) were analyzed by neutron activation (INAA - code 3A).
In parallel, a smaller till sample (one kilogram) was submitted to ALS in Vancouver, B.C. for determination of gold by pyro-analysis with ICP-AES finish (code Au-ICP21) on 30 g of fine fraction screened at 64 μm.
ALS is an accredited laboratory meeting the international standards ISO 9001:2015 and ISO/IFC17025:2005 with a UKAS 4028 certification number. The ALS quality management system also operates in accordance with CAN-P-1579 for mineral analysis testing laboratories. The management system and methods are accredited by the Standards Council of Canada.
Actlabs is an accredited laboratory meeting the international standards ISO 9001:2000 with certification no. CERT-0032482, and the Canadian Association for Accreditation of Laboratories Inc. Standard ISO/IFC170252005 Accreditation No. A3200. Management system and methods are accredited by the Standards Council of Canada.
ODM is an accredited laboratory based in Ottawa, Ontario, Canada. ODM holds a Certificate of Authorization from the Professional Geoscientists of Ontario and is specialized in mineral extractions, preparing research-grade mineral separates for geochronology and isotopic studies.
| 11-2 |
|
IAMGOLD Corporation | Nelligan Project |
April 2, 2025 |
|
NI 43-101 Technical Report |
SLR Project No.: 233.065260.00001 |
Figure 11-1: Sample Preparation Process Workflow for ALS Global
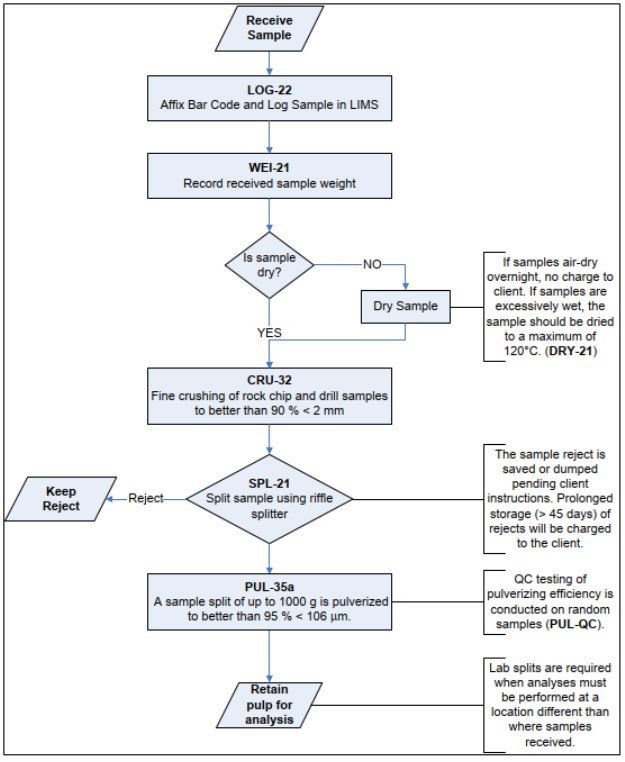
Source: IAMGOLD 2024.
| 11-3 |
|
IAMGOLD Corporation | Nelligan Project |
April 2, 2025 |
|
NI 43-101 Technical Report |
SLR Project No.: 233.065260.00001 |
Figure 11-2: Sample Preparation Process Workflow of ODM Till Sample
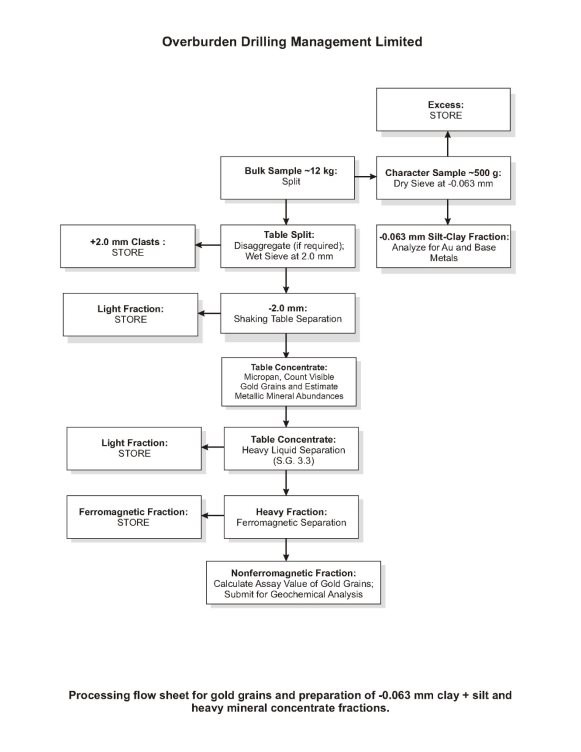
Source: IAMGOLD 2024.
| 11-4 |
|
IAMGOLD Corporation | Nelligan Project |
April 2, 2025 |
|
NI 43-101 Technical Report |
SLR Project No.: 233.065260.00001 |
11.1.3.4 Soil Samples
Soil samples collected from the B horizon were sent to SGS for MMI preparation and were analyzed by ICP-MS for gold.
11.2 Density Determination
In 2018, IAMGOLD collected systematic bulk density measurements on the Project, totaling 3,032 measurements. These were taken at intervals of at least 30 m or closer if major lithological changes occurred. Additionally, 209 measurements were taken from 11 boreholes drilled before 2018.
IAMGOLD used the standard weight-in-water / weight-in-air method for core samples. Density was calculated by comparing the mass of the sample in air to its mass in water, using the formula:
| d = | M |
| M - Ms |
where (M) is the dry rock mass and (Ms) is the mass in water. (d) is Density.
A CP-87 Adam Nimbus precision balance (±0.02 g) was used for measurements, with a setup allowing direct and submerged weighing. The procedure followed IAMGOLD guidelines, ensuring clean water and precise tank levels. Measurements were taken on half-core samples, generally every 30 m or at lithological changes, excluding heavily fractured rock.
Quality control included using Troemner standard weights (100 g to 0.5 g) and a quartz crystal with a known density of 2.65. Calibration involved measuring these reference materials every five samples, ensuring accuracy within ±2 standard deviations (SD) of the certified values.
11.3 Core Handling, Storage and Security
11.3.1 Core and Sample Storage
Drill core is stored in wooden boxes at the drill site, labeled by drilling crews, and transported to Chibougamau. An IAMGOLD technician then takes the core boxes to the logging facility where they are opened and displayed on logging tables. At the end of each drilling program, the core is palletized and moved from the Chibougamau logging and core storage facilities to IAMGOLD's secure storage facility in Rouyn-Noranda (Destor).
11.3.2 Sample Shipping
Each core is logged, photographed, and subsequently cut with half retained on-site for reference. Samples are securely transported to ALS - by Transport Transcol from Chibougamau to Val d'Or. The IAMGOLD team ensures chain of custody during this process.
11.4 Quality Assurance and Quality Control Programs
Quality assurance (QA) consists of evidence that the assay data has been prepared to a degree of precision and accuracy within generally accepted limits for the sampling and analytical method(s) to support its use in a mineral resource estimate. Quality control (QC) consists of procedures used to ensure that an adequate level of quality is maintained in the process of collecting, preparing, and assaying the exploration drilling samples. In general, QA/QC programs are designed to prevent or detect contamination and allow assaying (analytical), precision (repeatability), and accuracy to be quantified. In addition, a QA/QC program can disclose the overall sampling-assaying variability of the sampling method itself.
| 11-5 |
|
IAMGOLD Corporation | Nelligan Project |
April 2, 2025 |
|
NI 43-101 Technical Report |
SLR Project No.: 233.065260.00001 |
11.4.1 QA/QC Protocols
11.4.1.1 Vanstar Work (2012 - 2014)
For this historical work, the insertion rate of control samples was calculated from the drill hole database that includes approximately 14% of control samples that were inserted within core sampling streams (Table 11-1).
• An average of one blank and one standard every 100 samples.
• A total of 9% of the samples were coarse duplicates, and 3% pulp duplicates.
During this period 4,878 samples, including 692 control samples, were shipped to Laboratoire Expert Inc. in Rouyn-Noranda.
11.4.1.2 Current Work - IAMGOLD (2014 - 2024)
Since IAMGOLD's involvement in the Project, QA/QC protocols have been implemented, including the insertion of blanks, standards, and duplicates in core sample streams at an overall rate of one in 25, resulting in a general insertion rate of 15% (Table 11-1). These protocols also included regular check assays at a secondary laboratory. No field duplicates have been inserted into drilling sample streams. The QP recommends inserting field duplicates as part of the regular IAMGOLD QA/QC protocols to monitor precision during core sampling.
During IAMGOLD's period, a total of 69,334 samples, including 10,632 control samples, were submitted to either AGAT or ALS laboratories.
Observations from SLR's review of the IAMGOLD QA/QC database, encompassing data from historical work to the 2024 drilling campaign, are presented in the following discussion.
| 11-6 |
|
IAMGOLD Corporation | Nelligan Project |
April 2, 2025 |
|
NI 43-101 Technical Report |
SLR Project No.: 233.065260.00001 |
Table 11-1: Historical and IAMGOLD QA/QC Sample Insertion Rates
|
Phase |
Primary |
Blank |
Blank % |
CRM |
CRM % |
Coarse |
Coarse |
Pulp |
Pulp |
Check |
Check |
QC |
Grand |
Overall |
|
Historical |
4,186 |
48 |
1% |
29 |
1% |
458 |
9% |
157 |
3% |
- |
- |
692 |
4,878 |
14% |
|
2014 |
939 |
35 |
3% |
18 |
2% |
- |
- |
77 |
7% |
- |
- |
130 |
1,069 |
12% |
|
2015 |
2,179 |
89 |
3% |
89 |
3% |
85 |
3% |
205 |
8% |
45 |
2% |
513 |
2,692 |
19% |
|
2016 |
2,294 |
107 |
4% |
95 |
3% |
77 |
3% |
225 |
8% |
14 |
0% |
518 |
2,812 |
18% |
|
2017 |
6,264 |
452 |
6% |
270 |
3% |
225 |
3% |
647 |
8% |
232 |
3% |
1,826 |
8,090 |
23% |
|
2018 |
8,682 |
395 |
4% |
375 |
4% |
192 |
2% |
218 |
2% |
146 |
1% |
1,326 |
10,008 |
13% |
|
2019 |
11,194 |
499 |
4% |
488 |
4% |
244 |
2% |
286 |
2% |
241 |
2% |
1,758 |
12,952 |
14% |
|
2020 |
4,835 |
216 |
4% |
208 |
4% |
119 |
2% |
127 |
2% |
134 |
2% |
804 |
5,639 |
14% |
|
2021 |
3,208 |
142 |
4% |
138 |
4% |
67 |
2% |
80 |
2% |
144 |
4% |
571 |
3,779 |
15% |
|
2022 |
5,956 |
262 |
4% |
259 |
4% |
146 |
2% |
150 |
2% |
171 |
2% |
988 |
6,944 |
14% |
|
2023 |
6,448 |
283 |
4% |
275 |
4% |
139 |
2% |
144 |
2% |
312 |
4% |
1,153 |
7,601 |
15% |
|
2024 |
6,703 |
293 |
4% |
293 |
4% |
143 |
2% |
140 |
2% |
176 |
2% |
1,045 |
7,748 |
13% |
|
Total |
62,888 |
2,821 |
4% |
2,537 |
3% |
1,895 |
3% |
2,456 |
3% |
1615 |
2% |
11,324 |
74,212 |
15% |
| 11-7 |
|
IAMGOLD Corporation | Nelligan Project |
April 2, 2025 |
|
NI 43-101 Technical Report |
SLR Project No.: 233.065260.00001 |
11.4.1.3 Certified Reference Materials
Results of the regular submission of CRMs (standards) are used to identify potential issues with specific sample batches and long-term biases associated with the primary assay laboratory. SLR reviewed the results from 10 different standards used between 2012 and 2024.
A total of 2,537 CRMs, sourced from either Rocklabs or OREAS, were inserted into streams of drilling samples and submitted to Lab Expert, AGAT, or ALS. The upper and lower control limits were determined using three standard deviations above and below the mean value. No significant failures were observed following this criterion, and overall, good accuracy was noted for all participating laboratories, with most biases ranging between -2.7% and 2.7%. Biases of -15% (AGAT, CRM Oxi121) and 70% (ALS, CRM SJ80) were potentially due to mislabeling cases and an insufficient number of CRMs inserted between 2016 and 2017, as observed in Table 11-2.
Additionally, the CRMs cover a good range of gold grades analyzed by the FA-AA method. The QP noted, however, that up to seven types of CRMs with similar grade ranges were inserted in 2024 alone. The QP recommends reducing this number to only three types-high grade, medium grade, and low grade CRMs. This reduction will be sufficient to monitor laboratory performance and track potential emerging biases or systematic failures over extended timeframes. Using fewer CRMs will generate higher sample counts for each CRM that will be more informative statistically.
| 11-8 |
|
IAMGOLD Corporation | Nelligan Project |
April 2, 2025 |
|
NI 43-101 Technical Report |
SLR Project No.: 233.065260.00001 |
Table 11-2: Summary of CRM Samples used in the 2012 to 2024 QA/QC Programs
|
Lab |
CRM |
Period |
Sample |
Bias |
EV |
Mean |
SD |
Outlier |
Outliers |
|
Lab Expert Inc. |
SP73 |
(2012, 2012) |
14 |
-0.19 |
18.14 |
18.11 |
0.29 |
0 |
0 |
|
SQ36 |
(2012, 2012) |
8 |
-0.34 |
30.04 |
29.94 |
0.39 |
0 |
0 |
|
|
AGAT |
OxF125 |
(2014, 2015) |
7 |
-1.42 |
0.81 |
0.79 |
0.02 |
0 |
0 |
|
SF67 |
(2014, 2016) |
41 |
-2.07 |
0.84 |
0.82 |
0.13 |
1 |
2.4 |
|
|
SK78 |
(2014, 2016) |
30 |
-0.28 |
4.13 |
4.12 |
0.11 |
0 |
0 |
|
|
OXF125 |
(2015, 2015) |
29 |
1.04 |
0.81 |
0.81 |
0.02 |
0 |
0 |
|
|
Oxi121 |
(2016, 2016) |
6 |
-15 |
1.83 |
1.56 |
0.5 |
0 |
0 |
|
|
ALS |
OREAS 217 |
(2015, 2022) |
491 |
-0.22 |
0.34 |
0.34 |
0.01 |
5 |
1 |
|
Oxi121 |
(2016, 2017) |
89 |
-1.27 |
1.83 |
1.81 |
0.05 |
0 |
0 |
|
|
SF67 |
(2016, 2017) |
61 |
-0.91 |
0.84 |
0.83 |
0.1 |
1 |
1.6 |
|
|
SK78 |
(2016, 2017) |
77 |
-2.36 |
4.13 |
4.04 |
0.48 |
1 |
1.3 |
|
|
SE68 |
(2017, 2017) |
51 |
1.73 |
0.6 |
0.61 |
0.08 |
1 |
2 |
|
|
SF85 |
(2017, 2017) |
27 |
-2.66 |
0.85 |
0.83 |
0.02 |
0 |
0 |
|
|
SH82 |
(2017, 2017) |
33 |
-0.76 |
1.33 |
1.32 |
0.11 |
1 |
3 |
|
|
SJ80 |
(2017, 2017) |
8 |
-70.7 |
2.66 |
0.78 |
0.02 |
0 |
0 |
|
|
OREAS 229 |
(2018, 2019) |
7 |
-1.62 |
12.11 |
11.91 |
1 |
0 |
0 |
|
|
OREAS 220 |
(2018, 2022) |
433 |
-0.18 |
0.87 |
0.86 |
0.06 |
3 |
0.7 |
|
|
OREAS 215 |
(2018, 2024) |
186 |
-1.38 |
3.54 |
3.49 |
0.17 |
3 |
1.6 |
|
|
OREAS 221 |
(2018, 2024) |
474 |
0.75 |
1.06 |
1.07 |
0.04 |
6 |
1.3 |
|
|
OREAS 211 |
(2022, 2024) |
123 |
-0.16 |
0.77 |
0.77 |
0.02 |
2 |
1.6 |
|
|
OREAS 214 |
(2022, 2024) |
31 |
-1.91 |
3.03 |
2.97 |
0.16 |
0 |
0 |
|
|
OREAS 230 |
(2022, 2024) |
255 |
-0.22 |
0.34 |
0.34 |
0.01 |
3 |
1.2 |
|
|
OREAS 229b |
(2023, 2023) |
3 |
2.79 |
11.95 |
12.28 |
0.5 |
0 |
0 |
|
|
OREAS 233 |
(2024, 2024) |
25 |
1.1 |
1.05 |
1.06 |
0.02 |
0 |
0 |
|
|
OREAS 239 |
(2024, 2024) |
9 |
-0.25 |
3.55 |
3.54 |
0.07 |
0 |
0 |
|
|
Notes: 1. Au in ppm 2. EV: Expected Value 3. SD: Standard Deviation |
|||||||||
Overall, the CRM results indicate good performance, consistent with the certified values. All CRMs were initially reviewed for overall performance using z-score plots, which included all laboratories and both CRM series (OREAS and Rocklabs). Rocklabs' CRMs were used until May 2018. Occasional mislabeling was observed, as shown in Figure 11-3, however, the insignificant number of outliers does not significantly affect the overall assessment of the CRMs.
| 11-9 |
|
IAMGOLD Corporation | Nelligan Project |
April 2, 2025 |
|
NI 43-101 Technical Report |
SLR Project No.: 233.065260.00001 |
Figure 11-3: Nelligan CRM Z-Score
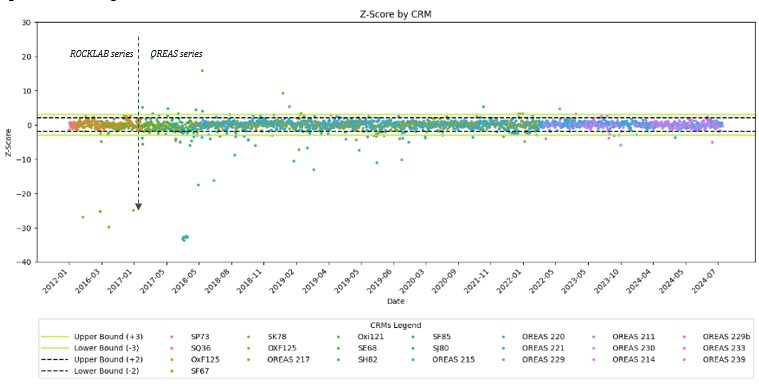
| 11-10 |
|
IAMGOLD Corporation | Nelligan Project |
April 2, 2025 |
|
NI 43-101 Technical Report |
SLR Project No.: 233.065260.00001 |
SLR selected three CRMs for an in-depth review, representing the low, average, and high gold grade ranges. These were selected based on their sample size and extended periods of use.
Figure 11-4 to Figure 11-6 present the results for 41 samples of SF67, 89 samples of Oxi121, and 474 samples of OREAS 221. The CRM SF67 shows an acceptable bias of -2.1%, with only one sample outside the mean ± 3SD threshold. Similarly, the CRM Oxi121 resulted in a bias of -1.3% without any failures. CRM OREAS 221 displays good levels of scatter with a slightly positive bias of 0.7%, five failures slightly falling under the lower limit, and one potential mislabeling case at 0.6 g/t Au.
Figure 11-4: Control Chart of CRM SF67 for Gold in AGAT: 2014 - 2016
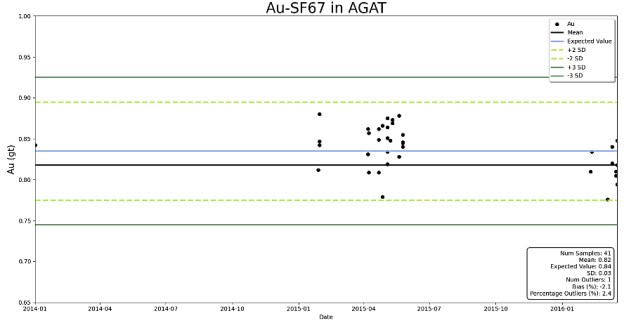
| 11-11 |
|
IAMGOLD Corporation | Nelligan Project |
April 2, 2025 |
|
NI 43-101 Technical Report |
SLR Project No.: 233.065260.00001 |
Figure 11-5: Control Chart of CRM Oxi121 for Gold in ALS: 2016 - 2017
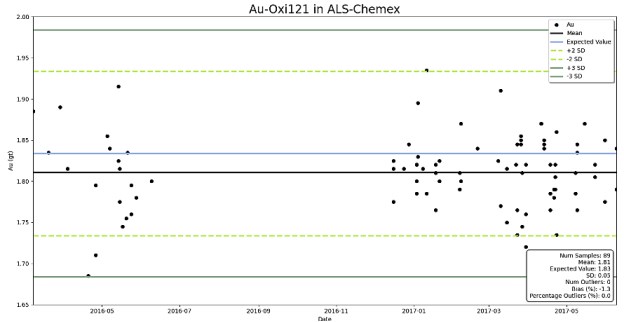
Figure 11-6: Control Chart of CRM OREAS 221 for Gold in ALS: 2019 - 2024
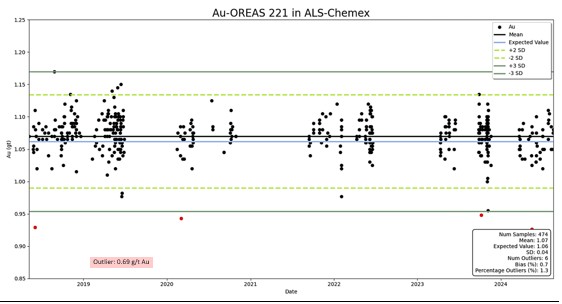
The QP recommends continuously monitoring the CRM data using long timeline charts to ensure early detection of potential emerging biases that may require re-analysis. This approach will help promptly identify and rectify any biases that could affect the reliability of the results.
| 11-12 |
|
IAMGOLD Corporation | Nelligan Project |
April 2, 2025 |
|
NI 43-101 Technical Report |
SLR Project No.: 233.065260.00001 |
11.4.1.4 Blank Material
The regular submission of blank material is used to assess contamination, either during sample preparation or analysis, and to identify sample numbering errors. Coarse blanks consisted of barren rock (decorative quartz pebbles). Each blank sample was placed into a plastic sample bag and assigned a unique identification number. These blanks were sent to all the laboratories and underwent the same sample preparation and analytical procedures as the core samples.
A total of 85 coarse blanks were submitted to Lab Expert between 2012 and 2014, 117 coarse blanks were submitted to AGAT between 2014 and 2016, and 2,619 coarse blanks were shipped to ALS between 2016 and 2024. Blank assay results exceeding 10 times the detection limit are considered failures. A review of the coarse blanks sent to ALS indicates no significant contamination during the preparation stage, with only eight blank samples, or 0.3% of the total, exceeding the acceptance limit (Figure 11-7).
Figure 11-7: Results of Coarse Blank Samples Sent to ALS: 2016 - 2024
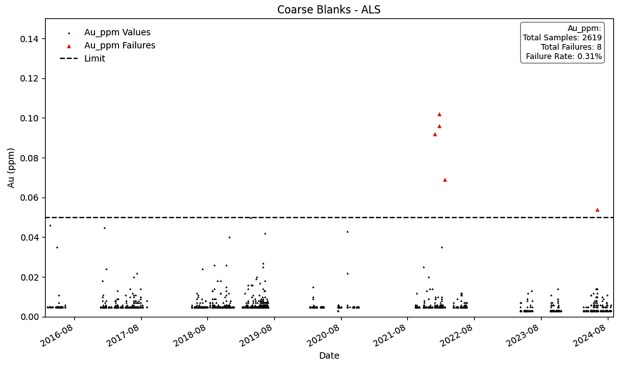
11.4.1.5 Duplicates
Field Duplicates
IAMGOLD submitted coarse and pulp duplicate samples in the sample stream to assess the grade variability and homogeneity during crushing and pulverization stages. IAMGOLD did not include field duplicates in their quality control program.
A total of 1,895 coarse duplicate sample pairs (Au FA3) and 2,456 pulp duplicate samples (Au FA2) were available for review, spanning from 2012 to 2024. Half Absolute Relative Differences (HARD) plots and scatter plots were performed on the duplicate pairs, yielding generally acceptable rates for both duplicate types across all participating laboratories.
| 11-13 |
|
IAMGOLD Corporation | Nelligan Project |
April 2, 2025 |
|
NI 43-101 Technical Report |
SLR Project No.: 233.065260.00001 |
HARD analysis of 235 pulp duplicates analyzed by AGAT between 2015 and 2016, as presented in Figure 11-8, showed a 29% failure rate. Most failures, however, were related to the dispersion of low gold grade samples, below 0.1 g/t Au. Only 12.8% of the total samples had significant gold grades. Conversely, pulp duplicates sent to ALS between 2016 and 2024 showed failure rates within acceptable limits.
Figure 11-9 presents the analysis of 1,341 coarse duplicates analyzed by ALS between 2016 and 2024, showing a good HARD failure rate of 6.3%, a correlation of 0.98, and a mean difference of 0.1% between pairs.
| 11-14 |
|
IAMGOLD Corporation | Nelligan Project |
April 2, 2025 |
|
NI 43-101 Technical Report |
SLR Project No.: 233.065260.00001 |
Figure 11-8: Pulp Duplicates HARD Plots and Scatter Plot in AGAT: 2014 - 2016
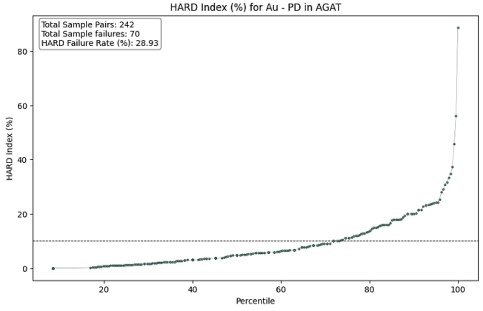 |
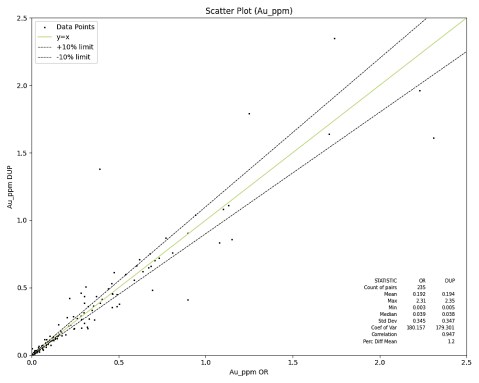 |
| 11-15 |
|
IAMGOLD Corporation | Nelligan Project |
April 2, 2025 |
|
NI 43-101 Technical Report |
SLR Project No.: 233.065260.00001 |
Figure 11-9: Coarse Duplicates HARD Plots and Scatter Plot in ALS: 2016 - 2024
|
|
|
|
11.4.1.6 External Laboratory Checks
As part of the IAMGOLD QA/QC program, pulp samples are routinely submitted to a third-party laboratory to verify the accuracy and precision of primary assay results, using the same analytical procedures. A total of 1,615 pulp samples were submitted to umpire laboratories and evaluated using scatter plots and statistical analysis.
| 11-16 |
|
IAMGOLD Corporation | Nelligan Project |
April 2, 2025 |
|
NI 43-101 Technical Report |
SLR Project No.: 233.065260.00001 |
Fifty-seven pulp check assays were initially analyzed by AGAT between 2015 and 2016 and then shipped to ALS as the umpire laboratory, resulting in a correlation of 0.94, indicating an average reproducibility of gold values. Similarly, 1,556 check assays were primarily analyzed by ALS between 2017 and 2024 and then shipped to AGAT as the umpire laboratory. In general, a very good correlation of 0.98 and a difference of -0.5% between means were observed as displayed in Figure 11-10.
The QP recommends continuing to monitor the check assays periodically, prioritizing gold grade ranges of interest. The QP is of the opinion that the results of the check assays support the use of the primary assays in the Mineral Resource estimation.
Figure 11-10: Scatter Plots for Gold Pulp External Checks: 2015-2024
|
|
| 11-17 |
|
IAMGOLD Corporation | Nelligan Project |
April 2, 2025 |
|
NI 43-101 Technical Report |
SLR Project No.: 233.065260.00001 |
|
|
11.4.2 Conclusions and Recommendations
Based on the review of data spanning from 2012 to 2024, the conclusions and recommendations from SLR are as follows:
• No major contamination occurrences were identified during preparation at any of the participating laboratories.
• CRMs exhibited good performance across all participating laboratories (bias <5%), with control limits set at ±3SD from the mean. Only a few mislabeling cases were observed. The QP recommends reducing CRM types to three: high grade, medium grade, and low grade CRMs, as this reduction will be sufficient to monitor laboratory performance and track potential emerging biases or systematic failures over extended timeframes.
• Pulp and coarse duplicates presented acceptable precision levels for gold mineralization at both AGAT and ALS laboratories. The QP recommends implementing field duplicates to help monitor grade variability during sampling.
• The external check assay results indicate good reproducibility of gold values for both primary laboratories: AGAT and ALS.
The QP is of the opinion that, based on the Nelligan QA/QC program results, the overall precision and accuracy of the current gold assays are considered acceptable and sufficient for inclusion in the 2024 Mineral Resource estimate.
| 11-18 |
|
IAMGOLD Corporation | Nelligan Project |
April 2, 2025 |
|
NI 43-101 Technical Report |
SLR Project No.: 233.065260.00001 |
12.0 Data Verification
12.1 SLR Audit of the Drill Hole Database
Data verification of the drill hole database involved cross-checking against original digital sources, conducting digital queries, and reviewing IAMGOLD's QA/QC procedures and results, as detailed in Section 11. IAMGOLD provided assay certificates for database validation. Values from 646 assay certificates, spanning from 2015 to 2024, were compared to the Nelligan database assay table. A total of 56,883 samples were cross-checked, representing approximately 90.5% of the total samples in the assay database. The QP notes that no major issues were identified during this review, as presented in Table 12-1.
Furthermore, standard data integrity checks were performed on Nelligan's drill hole database using software tools, which included the following:
• Intervals exceeding the total drill hole length (from-to inconsistencies).
• Negative length intervals (from-to errors).
• Inconsistent or missing downhole survey records.
• Overlapping or out-of-sequence intervals (from-to issues).
• Undefined intervals within analyzed sequences (missing samples or results).
• Mismatched drill hole labels across database tables.
• Invalid data formats or values outside the acceptable range.
These steps ensured the database's integrity and its reliability for Mineral Resource estimation.
The QP concludes that the discrepancies are not significant and would not adversely impact the Mineral Resource estimation. Furthermore, the database is considered consistent, robust, and adheres to industry standard practices in database management. SLR concludes that the database is suitable for Mineral Resource estimation purposes.
| 12-1 |
|
IAMGOLD Corporation | Nelligan Project |
April 2, 2025 |
|
NI 43-101 Technical Report |
SLR Project No.: 233.065260.00001 |
Table 12-1: Summary of Data Verification Discrepancies
|
Year |
No. Samples |
No. Samples |
No. Discrepancies |
% Discrepancies |
|
Unknown |
2,206 |
- |
- |
- |
|
1989 |
1 |
- |
- |
- |
|
1995 |
164 |
- |
- |
- |
|
2000 |
55 |
- |
- |
- |
|
2012 |
1,306 |
- |
- |
- |
|
2013 |
583 |
- |
- |
- |
|
2014 |
939 |
- |
- |
- |
|
2015 |
2,183 |
1,724 |
- |
- |
|
2016 |
2,294 |
2,189 |
- |
- |
|
2017 |
6,132 |
5,972 |
- |
- |
|
2018 |
8,682 |
8,682 |
- |
- |
|
2019 |
11,194 |
11,194 |
- |
- |
|
2020 |
4,830 |
4,830 |
- |
- |
|
2021 |
4,970 |
4,970 |
- |
- |
|
2022 |
4,193 |
4,193 |
- |
- |
|
2023 |
6,447 |
6,448 |
5 |
0.1% |
|
2024 |
6,703 |
6,680 |
- |
- |
|
Total |
62,882 |
56,883 |
5 |
0.01% |
12.2 SLR Site Visit
Marie-Christine Gosselin, P.Geo., an independent QP and SLR Project Geologist, conducted a site visit from September 11 to September 13, 2024. During her visit, she inspected the core storage facility, reviewed drill core and outcrops, and engaged in geological discussions with Maxime Douëllou, P.Geo., Project Geologist for Nelligan, and Shana Dickenson, P.Geo., a Principal District Geologist for IAMGOLD. The QP examined selected mineralized intersections that correspond to all mineralized domains and mineralization styles as well as host rocks from drill core available.
During the visit, the QP also examined drill hole collars, took GPS coordinates for drill hole collars, and reviewed QA/QC and density sampling procedures.
The QP is of the opinion that the drilling, logging, and sampling procedures at the Project were conducted in accordance with industry best practices.
| 12-2 |
|
IAMGOLD Corporation | Nelligan Project |
April 2, 2025 |
|
NI 43-101 Technical Report |
SLR Project No.: 233.065260.00001 |
13.0 Mineral Processing and Metallurgical Testing
SLR has relied on information provided in the 2024 Technical Report (SRK 2023) by Rémi Lapointe, Metallurgy Director for IAMGOLD Corporation at that time, for this section of the Technical Report.
13.1 Characterization and Preliminary Metallurgical Test work
In 2019, basic metallurgical, mineralogical and environmental test work was carried out on samples from the two main zones of the Project by SGS (SGS 2019). Three composites were used, including two from the Renard Zone and one from Zone 36W.
Mineralogy testing included screened metallics for gold and silver, sulphur, whole rock analysis (ICP), and graphitic carbon. A gold deportment study was also completed to provide information on gold distribution, grain size, liberation, and mineral associations. Metallurgical testing included standard preg-robbing tests (Whole + carbon in leach [CIL]), flotation followed by cyanidation of the tails (Flotation + CN), gravity separation followed by gravity tailing cyanidation (Gravity + CN Gravity Tails), and whole-ore cyanidation (Whole + CN). Environmental testing included acid-base accounting (ABA).
The gold deportment study results showed that gold is primarily contained within pyrite. For Composite 1 (Comp 1), 38.5% was locked in pyrite; for Composite 2 (Comp 2), 21.7%; and for Composite 3 (Comp 3), 64%. The study also showed that Composite 3, from Zone 36W, contained finer gold compared to the Renard Zone composites (Table 13-1).
| 13-1 |
|
IAMGOLD Corporation | Nelligan Project |
April 2, 2025 |
|
NI 43-101 Technical Report |
SLR Project No.: 233.065260.00001 |
Table 13-1: Gold Deportment Study Results
|
Sample |
Gold |
Association |
Number |
Gold |
Size Range |
Average |
Gold Mineral Abundance |
Minerals Associated with Exposed |
|
Comp 1 |
1.18 |
Liberated |
20 |
30 |
0.6 - 53.2 |
10.9 |
Native Gold (approx. 83%), Calaverite (approx. 13%), Electrum (approx. 3%), Pertzite, and |
Altaite/Pyrite (41.9%), Pyrite (40.2%), Dolomite (13.1%), Barite (3.5%), and Tennantite/Pyrite, FeAs/Altaite, Sulphur/Pyrite (<1%) |
|
Exposed |
51 |
31.4 |
0.6 - 37.3 |
3.3 |
||||
|
Locked |
76 |
38.5 |
0.6 - 4.4 |
1.6 |
||||
|
|
147 |
100 |
|
3.5 |
||||
|
Comp 2 |
1.36 |
Liberated |
17 |
20.3 |
1.0 - 32.8 |
8 |
Native Gold (approx. .73%), Calaverite (approx. 9%), Pertzite (approx. 8%), |
Pyrite (45.0%), Silicates (19.4%), Calcite (9.91%), Altaite/Silicates (8.74%), Altaite/Pyrite (5.95%), Sulphur/Silicates (3.17%), Tennantite/Pyrite (3.07%), Altaite/Calcite (2.14%), and other gold minerals (<2%) |
|
Exposed |
49 |
58 |
0.6 - 7.9 |
2.3 |
||||
|
Locked |
108 |
21.7 |
0.6 - 6.7 |
1.6 |
||||
|
|
174 |
100 |
|
2.4 |
||||
|
Comp 3 |
0.8 |
Liberated |
5 |
18.1 |
1.1 - 28.8 |
8 |
Native Gold (approx.75%), Au-Ag-Te (approx. 11%), Pertzite (approx. 10%), Calaverite (approx. .2%), and other gold minerals (approx. 2%) |
Pyrite (62.7%), Dolomite (24.5%), Silicates/Pyrite (5.44%), Chalcopyrite/Pyrite (4.15%), and trace amounts (<2%), of Silicates, Dolomite/Pyrite, Rutile/Chalcopyrite/Pyrite, Rutile/ Iron oxides/Pyrite, Tennantale/Pyrite |
|
Exposed |
26 |
18.2 |
0.8 - 4.1 |
2.1 |
||||
|
Locked |
104 |
63.7 |
0.6 - 6.6 |
1.5 |
||||
|
|
135 |
100 |
|
1.8 |
||||
|
Source: SGS 2019. |
||||||||
| 13-2 |
|
IAMGOLD Corporation | Nelligan Project |
April 2, 2025 |
|
NI 43-101 Technical Report |
SLR Project No.: 233.065260.00001 |
Following this study, several flowsheets were tested to assess gold recovery. The best results were obtained using flotation with an average recovery of approximately 94% of the sulphides and 84% of the gold in the concentrate, with an average mass pull of 17%. With 16% gold remaining in the flotation tails, it was necessary to leach the tails to verify the possibility of further recovery. By regrinding the concentrate to a P80 of 15 µm and separately leaching the concentrate and tails, it was possible to enhance the gold recovery rate as shown in Table 13-2.
Table 13-2: Gold Recovery Rates According to the Scenarios Tested
|
Tests |
Au Recovery (%) |
|||||||
|
Flotation+CN |
Whole+CIL |
Whole+CN |
Whole+CN |
Gravity+CN Gravity |
||||
|
500 ppm |
500 ppm |
1000 ppm |
500 ppm |
500 ppm |
1000 ppm |
|||
|
Renard |
Comp 1 |
90.4 |
80.7 |
81.7 |
83.5 |
79.8 |
85.3 |
80.5 |
|
Comp 2 |
93.5 |
86.1 |
86.0 |
86.1 |
83.2 |
88.9 |
87.6 |
|
|
Zone 36W |
Comp 3 |
78.1 |
71.0 |
72.4 |
74.3 |
67.1 |
78.3 |
77.8 |
|
Source: SGS 2019. |
||||||||
Combined with the gold deportment study, results showed that to be able to access the gold, which is very fine and partially locked within sulphide minerals, it would be necessary to utilize ultra-fine grinding, which would be uneconomical to realize on the entire feed. The flotation of the ore followed by regrinding the concentrate before leaching, appeared to be the most attractive solution.
In 2021, 15 variability samples (VT-1 to VT-15) were sent to SGS. The objective of this program was to provide a comprehensive characterization of samples representing different zones of the Nelligan deposit and to evaluate the impact on gold recovery when using flotation and regrinding before cyanidation. The test work also evaluated the impact of the grind size of primary grinding and of flotation concentrate regrinding.
The characterization showed that the gold head grades of the samples varied from 0.55 g/t to 1.85 g/t, and the +150 mesh size fraction (when stage crushed to minus 10 mesh) containing from 1.24 % to 3.56 % of the total gold content in screened metallics analysis. None of the samples contained more than 0.05% of graphitic carbon. Sulphur contents varied from 1.8% to 7.2%. Pyrite contents varied from 3.3% to 17.9%. Fairly significant concentrations of micas (5.2% to 29%) were measured in the samples. The main gold occurrence was native gold (62% to 99%).
Pyrite was well liberated and well exposed when the ore was ground to a P80 of approximately 75 μm. Pyrite particle size varied from 5 μm to 140 μm, with more that 40% being between 30 μm to 60 μm.
The grindability tests showed that significant variability exists between the different samples provided: semi-autogenous grinding (SAG) Mill Comminution (SMC) A x b indices varied from 30 to 75, equating to moderately hard to very soft. The data is included in Table 13-3.
| 13-3 |
|
IAMGOLD Corporation | Nelligan Project |
April 2, 2025 |
|
NI 43-101 Technical Report |
SLR Project No.: 233.065260.00001 |
Table 13-3: Comminution Test Results
|
Sample |
A |
b |
A x b |
Hardness |
ta |
SCSE |
Hardness |
DWi |
Mia |
Mih |
Mic |
Relative |
|
VT-01 |
74.0 |
0.68 |
50.3 |
42 |
0.48 |
8.93 |
41 |
5.39 |
16.3 |
11.5 |
6.0 |
2.71 |
|
VT-02 |
96.1 |
0.37 |
35.6 |
71 |
0.33 |
10.62 |
72 |
7.79 |
21.3 |
16.2 |
8.4 |
2.78 |
|
VT-03 |
77.5 |
0.39 |
30.2 |
84 |
0.28 |
11.42 |
83 |
9.07 |
24.3 |
19.1 |
9.9 |
2.75 |
|
VT-04 |
77.1 |
0.45 |
34.7 |
74 |
0.32 |
10.77 |
75 |
8.11 |
21.9 |
16.9 |
8.7 |
2.79 |
|
VT-05 |
71.3 |
0.43 |
30.7 |
84 |
0.28 |
11.49 |
84 |
9.14 |
24.0 |
18.9 |
9.8 |
2.80 |
|
VT-06 |
81.5 |
0.51 |
41.6 |
58 |
0.40 |
9.66 |
54 |
6.42 |
18.9 |
13.9 |
7.2 |
2.68 |
|
VT-07 |
70.0 |
0.80 |
56.0 |
34 |
0.53 |
8.54 |
33 |
4.89 |
15.0 |
10.4 |
5.4 |
2.72 |
|
VT-13 |
72.0 |
0.83 |
59.8 |
31 |
0.56 |
8.34 |
29 |
4.59 |
14.2 |
9.7 |
5.0 |
2.74 |
|
VT-14 |
85.6 |
0.51 |
43.7 |
54 |
0.41 |
9.58 |
52 |
6.32 |
18.2 |
13.3 |
6.9 |
2.75 |
|
VT-15 |
74.1 |
1.01 |
74.8 |
19 |
0.69 |
7.68 |
19 |
3.75 |
11.8 |
7.8 |
4.0 |
2.79 |
|
*ta = JK abrasion parameter, SCSE = SAG Circuit Specific Energy, DWi = JK Drop Weight index, Mi = work indices for grinding of coarse particles in tumbling mills (Mia), grinding in high pressure grinding rolls (Mih), and size reduction in conventional crushers (Mic). The ta value reported as part of the SMC procedure was an estimate. Source: SGS Canada Inc. 2021. |
||||||||||||
Bond rod mill indices ranged from 7.1 kWh/t to 11.7 kWh/t (SGS database hardness percentiles from 3 to 22), Bond ball mill indices ranged from 9.3 kWh/t to 12.9 kWh/t (SGS database hardness percentiles from 7 to 34), and Bond abrasion Ai indices varied from 0.16 g to 0.72 g (SGS database abrasion percentiles from 33 to 92).
When flotation concentrates were subjected to the IsaMill bench scale testing, the resulting signature plot(s) determined that high energy was required to produce a final grind size of approximately 10 μm. This was likely related to the concentration of mica in the samples.
Metallurgical test work has shown that, for most of the ore samples, a higher gold recovery is achieved when a rougher concentrate is produced by flotation at a feed P80 of approximately 75 μm, and then reground to a P80 of approximately 25 μm, prior to cyanidation of the concentrate and of the flotation tail. Lower gold extraction was achieved from whole ore cyanidation at a P80 of approximately 53 µm.. Gold extractions were higher by 2.2% to 9.3% in the flowsheet incorporating flotation. Regrinding the flotation concentrate to a P80 of approximately 10 μm versus a P80 of approximately 25 μm, resulted in higher gold extraction by between 0.7% to 5.3%.
Table 13-4 summarizes the impact of flotation and regrind of concentrate and tail on the overall recovery.
| 13-4 |
|
IAMGOLD Corporation | Nelligan Project |
April 2, 2025 |
|
NI 43-101 Technical Report |
SLR Project No.: 233.065260.00001 |
Table 13-4: Flotation Test Results
|
Test No. |
Zone |
Gold Extraction (%) |
CN1 vs Overall |
||||
|
Whole Ore |
Flotation |
Flotation Tail |
Flotation |
Overall |
|||
|
VT1 |
36W |
69.0 |
84.1 |
79.9 |
73.1 |
74.2 |
5.2 |
|
VT2 |
36W |
70.0 |
80.8 |
75.8 |
78.9 |
78.3 |
8.3 |
|
VT3 |
Dan |
94.7 |
93.3 |
84.4 |
98.5 |
97.6 |
2.9 |
|
VT4 |
Liam |
88.6 |
85.6 |
83.5 |
95.6 |
93.9 |
5.2 |
|
VT5 |
Liam |
91.8 |
96.6 |
75.8 |
95.3 |
94.6 |
2.9 |
|
VT6 |
Renard |
82.3 |
82.3 |
78.7 |
91.1 |
88.9 |
6.6 |
|
VT7 |
Renard FW |
84.4 |
79.6 |
78.3 |
88.7 |
86.6 |
2.2 |
|
VT8 |
Renard |
90.5 |
85.4 |
80.4 |
95.4 |
93.2 |
2.8 |
|
VT9 |
Renard |
75.9 |
82.9 |
74.2 |
80.9 |
79.8 |
3.9 |
|
VT10 |
Renard |
83.9 |
85.2 |
81 |
89.7 |
88.4 |
4.5 |
|
VT11 |
Renard |
85.6 |
79.5 |
80.3 |
90.6 |
88.5 |
2.9 |
|
VT12 |
Renard |
83 |
82.5 |
68.8 |
91.9 |
87.8 |
4.8 |
|
VT13 |
Renard |
82.9 |
83.2 |
70.1 |
90.6 |
87.1 |
4.2 |
|
VT14 |
Renard |
84.5 |
90.2 |
76.7 |
92 |
90.5 |
6 |
|
VT15 |
Renard 1 |
76.9 |
77.5 |
69.7 |
91 |
86.2 |
9.3 |
|
Average |
82.9 |
84.6 |
77.2 |
89.6 |
87.7 |
4.8 |
|
|
Source: SGS Canada Inc. 2021. |
|||||||
Solid-liquid separation test work indicated that the bulk flotation concentrates responded well to Magnafloc 10 flocculant for products at two different grind sizes.
The cyanidation test program also explored the impact of varying leach parameters such as the maintained free cyanide concentration, the total leach time, and lead nitrate dosages.
Environmental testing was performed on five selected samples: one sample (VT-5 CN1 Residue) was acid-generating based on the Net Acid Generation test procedure, while the ABA test showed all of the samples were potentially acid generate generating.
In summer 2022, 21 samples (VT-16 to VT-36), which had been crushed to pass 6-mesh, were transferred to ALS Metallurgy Kamloops laboratory. The samples were homogenized and split into one kilogram test charges for the metallurgical study.
Two representative head cuts were split from each of the 21 Nelligan samples and assayed for gold by fire assay. The head assay results are summarized in Figure 13-1. Gold contents ranged between 0.46g/t and 1.67 g/t.
Each of the 21 samples were tested using similar test conditions to evaluate the cyanidation leach extraction of gold. This involved conducting cyanidation bottle roll testing at 75 μm P80 at 50% solids by weight, pH 11, and maintaining a sodium cyanide concentration of 300 ppm NaCN for 48 hours. Oxygen was sparged into the bottle headspace prior to each measurement interval.
| 13-5 |
|
IAMGOLD Corporation | Nelligan Project |
April 2, 2025 |
|
NI 43-101 Technical Report |
SLR Project No.: 233.065260.00001 |
Figure 13-1: Cyanidation Leach Extraction of Gold at 21 Nelligan Samples
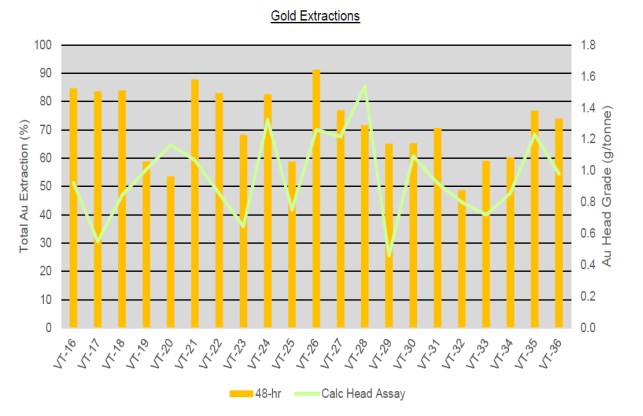
Source: ALS 2022.
The average gold extraction after 48 hours was 72%, ranged from 49% in sample VT-32 to approximately 91% for sample VT-26. For all the samples, most of the gold was extracted within 24 hours. Cyanide consumptions were relatively low, measuring between 0.03 kg/t to 0.35 kg/t, and lime consumption was on average approximately 0.5 kg/t.
The test work has shown that grind size has a significant effect on gold extraction, and that fine grinding would likely be necessary to maximize extraction. Additional grind sensitivity and flotation test work is necessary to assess the most appropriate flow sheet for processing material from the deposit.
A preliminary gold recovery of 83% has been used for resource estimation based on test work results for whole-ore cyanidation until additional metallurgical testing is completed.
| 13-6 |
|
IAMGOLD Corporation | Nelligan Project |
April 2, 2025 |
|
NI 43-101 Technical Report |
SLR Project No.: 233.065260.00001 |
14.0 Mineral Resource Estimates
14.1 Summary
SLR was engaged to prepare a Mineral Resource estimate for the Nelligan deposit, focusing on an open pit mining scenario. The estimate was derived exclusively from the 330 diamond drill holes that are contained in the database. Wireframes were constructed using Leapfrog Geo, and grade interpolation into blocks was performed using the inverse distance cubed (ID3) method in Leapfrog Edge software. Block classification as Indicated or Inferred was determined based on drill hole spacing criteria. SLR validated the results using industry-standard validation practices.
To satisfy the requirements for Reasonable Prospects for Eventual Economic Extraction (RPEEE), in accordance with the Canadian Institute of Mining, Metallurgy, and Petroleum (CIM) Definition Standards for Mineral Resources and Mineral Reserves, dated May 10, 2014 (CIM (2014) definitions), an optimized resource shell for reporting the Mineral Resources was developed using GEOVIA Whittle software at the breakeven cut-off grade of 0.23 g/t Au, and Mineral Resources were reported using an elevated cut-off grade of 0.35 g/t Au.
A summary of the Nelligan Mineral Resource estimate as of December 31, 2024, is presented in Table 14-1. The classification of the Mineral Resources was conducted in accordance with CIM (2014) definitions.
Table 14-1: Summary of Nelligan Mineral Resources - December 31, 2024
|
Category |
Tonnage |
Grade |
Contained Metal |
|
Indicated |
103 |
0.95 |
3,125 |
|
Inferred |
166 |
0.96 |
5,161 |
|
Notes: 9. CIM (2014) definitions were followed for Mineral Resources. 10. Mineral Resources are estimated at a cut-off grade of 0.35 g/t Au. 11. Mineral Resources are estimated using a long-term gold price of US$1,800 per ounce, and a US$/C$ exchange rate of 1:1.25. 12. Bulk density varies from 2.71 tonnes per cubic metres (t/m3) to 2.75 t/m3 for the estimation domains and 2.0 t/m3 for the overburden. 13. Gold metallurgical recovery is 83%. 14. Mineral Resources are constrained by an optimized resource pit shell. 15. Mineral Resources that are not Mineral Reserves do not have demonstrated economic viability. 16. Numbers may not add due to rounding. |
|||
The Qualified Person (QP) is not aware of any environmental, permitting, legal, title, taxation, socio-economic, marketing, political, or other relevant factors that could materially affect the Mineral Resource estimate.
14.2 Resource Database
The drill hole database for the Nelligan deposit was compiled and provided by IAMGOLD, with a review conducted by SLR. It includes datasets such as gold assay results, lithological logs, alteration characteristics, collar locations, downhole deviation surveys, mineralization details, density measurements, structural observations, magnetic susceptibility readings, inductively coupled plasma (ICP) multi-element analyses, RQD values, and recovery rates, all organized into separate tables. The Nelligan database was incorporated into a Seequent Leapfrog 2024.1.1 project, and a supplementary Microsoft Access file was also provided to SLR.
| 14-1 |
|
IAMGOLD Corporation | Nelligan Project |
April 2, 2025 |
|
NI 43-101 Technical Report |
SLR Project No.: 233.065260.00001 |
The Nelligan database contains data from diamond drilling conducted from 1978 to 2024, comprising 330 drill holes with a cumulative length of 108,267.19 m and 65,391 samples. The final version of the database, provided on September 24, 2024, includes drill hole NE-24-238 as the most recent addition. A total of 63 drill holes were added since the last Mineral Resource Estimate in 2022. A summary is presented in Table 14-2.
Table 14-2: Nelligan Drilling Database Comparison
|
Mineral Resource |
Mineral Resource |
Drill Holes Up to |
2022-2024 Drill |
Total Drill Holes |
|
2022 |
NE-22-198 |
267 |
- |
267 |
|
2024 |
NE-24-238 |
267 |
63 |
330 |
14.3 Geological Interpretation
Geologists at IAMGOLD developed a litho-structural model for the Nelligan deposit in Leapfrog (Figure 14-1) using an implicit modelling approach supplemented with manual inputs, such as polylines and points, to refine the results. The modeled lithologies include overburden (OVB), lamprophyre and mafic dykes (I3-BO), hematized tectonics (T4), carbonate horizon (SVN QZ-CB), phlogopite alteration (T5), silicification (S10), quartz-sericite schist (M8 QZ-SR), tuff and pseudo banded-iron formation (S3-S9), conglomerates (S4), laminated ash tuff (TU2), intermediate crystal tuff (TX2) and mafic volcanics (V3B). For clarity, the overburden is excluded from Figure 14-1.
| 14-2 |
|
IAMGOLD Corporation | Nelligan Project |
April 2, 2025 |
|
NI 43-101 Technical Report |
SLR Project No.: 233.065260.00001 |
Figure 14-1: Nelligan Litho-Structural Model
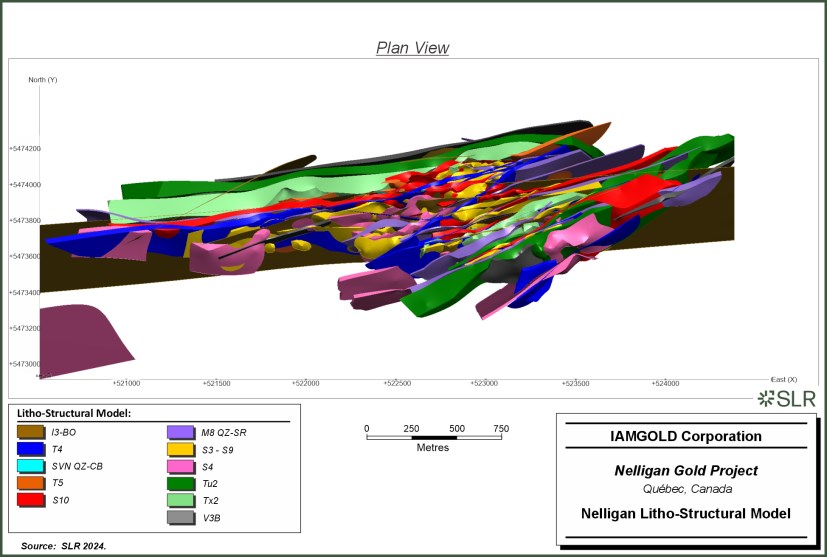
| 14-3 |
|
IAMGOLD Corporation | Nelligan Project |
April 2, 2025 |
|
NI 43-101 Technical Report |
SLR Project No.: 233.065260.00001 |
IAMGOLD also provided SLR with models for resource zones (MIN) and high grade veins (HG). SLR refined the MIN model, which includes a total of 13 resource zones, by updating the selection of intervals, redefining zone boundaries, and addressing interactions between the zones. These updates also ensured that the MIN zones met the minimum wireframe cut-off grade of 0.1 g/t Au. Boundary extensions were restricted to a maximum of 100 m from a drill hole or were truncated at the midpoint between an economic and a non-economic drill hole.
The HG zones are a new addition in the December 31, 2024 Mineral Resource estimate and were not included in the previous estimate. SLR refined the HG vein model by reviewing and updating the interval selection to align with the geological interpretation and by ensuring that the modelled zones respected the minimum cut-off grade of 1.0 g/t Au, although no minimum thickness was applied. The HG veins were interpreted and modelled as being parallel to, or locally conjugate with, the MIN zones. A total of 37 high grade veins were created. As with the MIN zones, boundary extensions for the HG veins did not exceed 100 m from a drill hole and were cut halfway between an economic and a non-economic drill hole.
The MIN model was integrated with the 37 individually modelled HG veins to create the final estimation domains used for Mineral Resource estimation. This combined model ensures that both the broader MIN zones and the discrete HG veins are represented in a unified framework, optimizing the accuracy of the estimation process. The combined model is illustrated in Figure 14-2 and for the ease of visualization, the individual HG veins were grouped together.
SLR confirmed the appropriateness of the wireframes for use in Mineral Resource estimation.
| 14-4 |
|
IAMGOLD Corporation | Nelligan Project |
April 2, 2025 |
|
NI 43-101 Technical Report |
SLR Project No.: 233.065260.00001 |
Figure 14-2: Nelligan Mineralization Domains and Grouped High Grade Wireframes
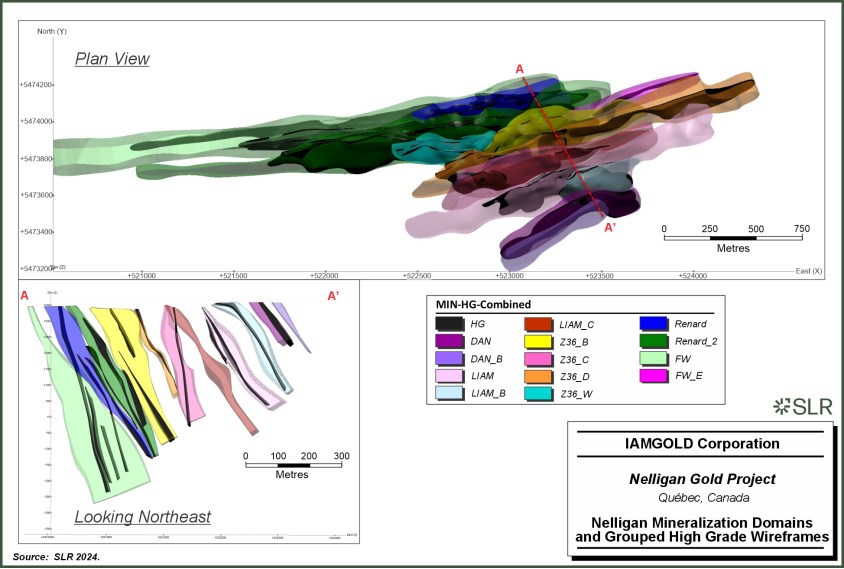
| 14-5 |
|
IAMGOLD Corporation | Nelligan Project |
April 2, 2025 |
|
NI 43-101 Technical Report |
SLR Project No.: 233.065260.00001 |
The HG wireframes included in the 2024 model represent a significant addition, enhancing the understanding of high grade mineralization within the deposit. To further improve the accuracy and reliability of the resource model, it is recommended to continue upgrading and refining the HG mineralization wireframe model. Incorporating new data as it becomes available will allow for a more detailed and polished representation of high grade zones, contributing to more precise resource estimates and improved planning for future exploration and development.
14.4 Resource Assays
14.4.1 Treatment of High Grade Assays
To minimize the influence of erratic high grade assays that could disproportionately affect surrounding lower grade samples, capping was applied prior to compositing. SLR determined appropriate capping domains and thresholds for the Nelligan deposit using statistical methods, including histograms, decile analysis, probability plots, disintegration, and spatial examination of high grade assay distributions. These capped values were applied prior to compositing.
Capping was initially reviewed across all lithologies, however, some lithologies lacked sufficient samples to provide a reliable statistical basis for determining appropriate capping levels. SLR then evaluated capping by MIN zones and on the HG vein grouped domain, which yielded a more robust distribution of data. HG veins with the most samples exceeding 25 g/t Au, such as O4 and O7, were individually analyzed to ensure the selected capping levels were neither excessively high nor overly restrictive. This detailed review confirmed that the chosen capping thresholds were appropriate and did not unduly limit the data. Table 14-3 summarizes the descriptive statistics for both raw (uncapped) and capped assays.
Table 14-3: Assay and Capping Statistics Summary
|
Capping |
|
Raw Assays |
Capped Assays |
|||||||
|
Count |
Min |
Max |
Average |
CV |
Cap |
No. |
Average |
CV |
% Metal |
|
|
HG |
6,989 |
0.0011 |
224 |
2.17 |
2.24 |
25 |
30 |
2.06 |
1.38 |
5.07 |
|
FW |
16,319 |
0.0011 |
33.8 |
0.30 |
1.62 |
5 |
14 |
0.29 |
1.29 |
3.33 |
|
FW_E |
429 |
0.0011 |
2.54 |
0.21 |
1.37 |
1.5 |
5 |
0.20 |
1.26 |
4.76 |
|
RENARD |
6,918 |
0.0011 |
32 |
0.35 |
2.01 |
4 |
12 |
0.33 |
1.05 |
5.71 |
|
RENARD_2 |
3,041 |
0.0011 |
26.9 |
0.36 |
1.60 |
3 |
5 |
0.35 |
0.97 |
2.78 |
|
DAN |
269 |
0.0011 |
4.02 |
0.36 |
1.47 |
3 |
2 |
0.35 |
1.39 |
2.78 |
|
DAN_B |
71 |
0.002 |
5.21 |
0.50 |
1.63 |
3 |
3 |
0.45 |
1.31 |
10.0 |
|
LIAM |
1,524 |
0.0011 |
42.5 |
0.40 |
3.03 |
4 |
11 |
0.36 |
1.41 |
10.0 |
|
LIAM_B |
357 |
0.004 |
8.7 |
0.41 |
2.20 |
4 |
5 |
0.37 |
1.60 |
9.76 |
|
LIAM_C |
933 |
0.0011 |
20.2 |
0.42 |
2.57 |
5 |
9 |
0.37 |
1.71 |
11.90 |
|
Z36_B |
2,795 |
0.0011 |
66.1 |
0.47 |
3.78 |
6 |
10 |
0.41 |
1.54 |
12.77 |
|
Z36_C |
2,419 |
0.0011 |
39.8 |
0.44 |
2.62 |
5 |
16 |
0.40 |
1.59 |
9.09 |
|
Z36_D |
2,437 |
0.0011 |
10.08 |
0.32 |
1.35 |
2.5 |
11 |
0.31 |
1.06 |
3.12 |
|
Z36_W |
1,311 |
0.0011 |
11.65 |
0.33 |
1.67 |
2 |
9 |
0.31 |
1.11 |
6.06 |
| 14-6 |
|
IAMGOLD Corporation | Nelligan Project |
April 2, 2025 |
|
NI 43-101 Technical Report |
SLR Project No.: 233.065260.00001 |
14.4.2 High Grade Restriction
High grade restriction was not applied in this Project because the inclusion of HG domains in this year's Mineral Resource estimate effectively mitigated the potential smearing of high grade values. By constraining high grade assays within dedicated high grade vein domains, the model ensures that these values are appropriately isolated, and their influence is limited to the specific zones where they occur. This approach provides a controlled and geologically consistent estimate, eliminating the need for additional high grade restrictions.
14.5 Compositing
Before grade estimation, capped assay values were composited using a fixed interval length of 1.5 m, as selected by SLR. Compositing was conducted within the MIN and individual HG wireframes, starting at the point where the drill hole entered the wireframe and continuing to the exit point. Intervals shorter than 20% of the compositing length (0.3 m) were merged with the preceding interval (add to previous option) to maintain consistency. The HG veins were composited individually to ensure that each vein retained its distinct sample population, preventing the sharing of samples between veins that were adjacent or in close proximity.
Table 14-4 presents descriptive statistics for capped composite values.
Table 14-4: Composites Descriptive Statistics
|
Capping |
Estimation |
Count |
Length (m) |
Minimum |
Maximum |
Mean (g/t |
SD |
CV |
|
DAN |
DAN |
193 |
278.84 |
0.00 |
2.59 |
0.35 |
0.41 |
1.17 |
|
DAN_B |
DAN_B |
49 |
72.60 |
0.00 |
3.00 |
0.45 |
0.54 |
1.20 |
|
FW |
FW |
13,430 |
20,025.59 |
0.00 |
5.00 |
0.29 |
0.35 |
1.20 |
|
FW_E |
FW_E |
361 |
539.13 |
0.00 |
1.50 |
0.20 |
0.25 |
1.21 |
|
LIAM |
LIAM |
1,134 |
1,656.33 |
0.00 |
4.00 |
0.36 |
0.44 |
1.23 |
|
LIAM_B |
LIAM_B |
270 |
393.98 |
0.00 |
3.74 |
0.37 |
0.52 |
1.40 |
|
LIAM_C |
LIAM_C |
667 |
972.87 |
0.00 |
5.00 |
0.37 |
0.57 |
1.54 |
|
RENARD |
RENARD |
4,930 |
7,219.81 |
0.00 |
4.00 |
0.33 |
0.32 |
0.95 |
|
RENARD_2 |
RENARD_2 |
2,226 |
3,271.39 |
0.00 |
3.00 |
0.35 |
0.31 |
0.88 |
|
Z36_B |
Z36_B |
2,047 |
3,033.21 |
0.00 |
6.00 |
0.41 |
0.58 |
1.41 |
|
Z36_C |
Z36_C |
1,784 |
2,642.01 |
0.00 |
5.00 |
0.40 |
0.58 |
1.44 |
|
Z36_D |
Z36_D |
1,859 |
2,739.65 |
0.00 |
2.50 |
0.31 |
0.31 |
0.98 |
|
Z36_W |
Z36_W |
982 |
1,456.92 |
0.00 |
2.00 |
0.31 |
0.32 |
1.02 |
| 14-7 |
|
IAMGOLD Corporation | Nelligan Project |
April 2, 2025 |
|
NI 43-101 Technical Report |
SLR Project No.: 233.065260.00001 |
|
Capping |
Estimation |
Count |
Length (m) |
Minimum |
Maximum |
Mean (g/t |
SD |
CV |
|
HG |
O1 |
298 |
425.02 |
0.02 |
21.80 |
1.65 |
1.95 |
1.18 |
|
O2 |
57 |
80.95 |
0.03 |
20.40 |
2.89 |
4.43 |
1.53 |
|
|
O3 |
376 |
545.04 |
0.09 |
25.00 |
1.82 |
2.44 |
1.34 |
|
|
O4 |
667 |
967.55 |
0.03 |
25.00 |
2.64 |
3.10 |
1.18 |
|
|
O5 |
372 |
546.63 |
0.06 |
24.60 |
2.13 |
2.73 |
1.28 |
|
|
O6 |
179 |
256.16 |
0.06 |
17.15 |
1.83 |
2.06 |
1.12 |
|
|
O7 |
457 |
666.18 |
0.02 |
25.00 |
2.10 |
2.91 |
1.39 |
|
|
O8 |
231 |
339.70 |
0.09 |
25.00 |
1.91 |
2.42 |
1.27 |
|
|
O9 |
99 |
142.86 |
0.10 |
25.00 |
2.01 |
2.97 |
1.48 |
|
|
O11 |
114 |
159.91 |
0.22 |
20.90 |
2.19 |
2.59 |
1.18 |
|
|
O12 |
131 |
188.50 |
0.19 |
17.21 |
2.29 |
2.44 |
1.07 |
|
|
O13 |
240 |
337.33 |
0.00 |
16.78 |
2.04 |
2.23 |
1.10 |
|
|
O14 |
237 |
344.34 |
0.00 |
20.40 |
2.54 |
2.99 |
1.18 |
|
|
O15 |
66 |
94.50 |
0.04 |
11.67 |
2.51 |
2.35 |
0.93 |
|
|
O16 |
112 |
162.30 |
0.51 |
6.84 |
1.91 |
1.28 |
0.67 |
|
|
O17 |
75 |
109.98 |
0.12 |
10.80 |
1.53 |
1.76 |
1.15 |
|
|
O18 |
134 |
193.28 |
0.07 |
16.96 |
1.80 |
2.00 |
1.11 |
|
|
O19 |
40 |
58.15 |
0.47 |
25.00 |
2.57 |
4.07 |
1.58 |
|
|
O20 |
211 |
307.28 |
0.17 |
25.00 |
1.61 |
2.05 |
1.27 |
|
|
O21 |
139 |
195.46 |
0.16 |
22.90 |
2.25 |
2.48 |
1.10 |
|
|
O22 |
35 |
49.95 |
0.11 |
3.87 |
1.42 |
0.75 |
0.53 |
|
|
O23 |
148 |
217.41 |
0.13 |
24.10 |
1.82 |
2.37 |
1.30 |
|
|
O24 |
65 |
87.53 |
0.04 |
10.74 |
1.79 |
1.98 |
1.11 |
|
|
O25 |
191 |
280.52 |
0.12 |
25.00 |
1.87 |
2.91 |
1.56 |
|
|
O26 |
56 |
78.45 |
0.37 |
14.11 |
2.49 |
2.46 |
0.99 |
|
|
O27 |
45 |
65.74 |
0.19 |
7.01 |
1.65 |
1.41 |
0.86 |
|
|
O29 |
37 |
51.69 |
0.25 |
3.75 |
1.60 |
0.67 |
0.42 |
|
|
O30 |
92 |
131.21 |
0.05 |
8.91 |
1.46 |
1.35 |
0.93 |
|
|
O31 |
64 |
93.37 |
0.05 |
5.22 |
1.43 |
1.04 |
0.73 |
|
|
O32 |
32 |
46.75 |
0.08 |
12.85 |
2.19 |
2.63 |
1.20 |
|
|
O33 |
35 |
48.41 |
0.00 |
4.19 |
1.41 |
0.92 |
0.65 |
|
|
O34 |
24 |
33.70 |
0.60 |
10.46 |
2.72 |
2.68 |
0.99 |
|
|
O35 |
10 |
15.00 |
0.65 |
4.15 |
1.98 |
1.19 |
0.60 |
|
|
O36 |
33 |
45.82 |
0.26 |
6.58 |
1.90 |
1.38 |
0.73 |
|
|
O37 |
16 |
22.46 |
0.54 |
10.90 |
2.04 |
2.52 |
1.23 |
|
|
O38 |
19 |
24.35 |
0.75 |
3.41 |
1.49 |
0.65 |
0.44 |
|
|
O41 |
38 |
51.45 |
0.13 |
12.02 |
2.09 |
2.41 |
1.16 |
|
|
Notes: 1. SD: Standard deviation 2. CV: Coefficient of variation |
||||||||
| 14-8 |
14.6 Trend Analysis
14.6.1 Grade Contouring
Gold grade continuity at the Project was analyzed by creating a series of numeric grade shells in Leapfrog for each zone within the mineralized envelopes. This analysis revealed several moderately plunging trends, predominantly oriented towards the east or southeast, with occasional variations plunging towards the southwest or northeast.
Figure 14-3 illustrates examples of grade contours for the Renard Zone and FW Zone. These identified trends provided valuable guidance for experimental variography and the configuration of the search ellipses.
| 14-9 |
|
IAMGOLD Corporation | Nelligan Project |
April 2, 2025 |
|
NI 43-101 Technical Report |
SLR Project No.: 233.065260.00001 |
Figure 14-3: Gold Grade Contouring of Renard and Footwall Zones

| 14-10 |
|
IAMGOLD Corporation | Nelligan Project |
April 2, 2025 |
|
NI 43-101 Technical Report |
SLR Project No.: 233.065260.00001 |
14.6.2 Variography
Variograms were prepared for all resource domains in their original units, with additional variograms generated in normal-scored units for selected cases. The trend analysis from grade contouring was instrumental in guiding the preferential directions of the variograms. Stable variograms were successfully obtained for FW, Renard, Renard_2, Z36_B, Z36_D, and the HG veins, which were grouped together for modelling. For estimation domains where stable variograms could not be developed, the variogram of the nearest domain with reliable variography was used to establish the variable orientation global plunge. Although inverse distance was used for interpolation, the variogram-defined directions played a key role in shaping the variable orientation. Details of the stable variogram models obtained are provided in Table 14-5.
Table 14-5: Stable Estimation Domains Experimental Variograms
|
Domain |
Rotations1 |
Nugget |
Variances2 |
Structure 1 |
Structure 2 |
Structure 1 |
Structure 2 |
|
FW |
76/173/52 |
0.30 |
0.41, 0.29 |
Spherical |
Exponential |
(48,85,2) |
(230,150,9) |
|
Renard |
59/170/76 |
0.15 |
0.51, 0.34 |
Spherical |
Spherical |
(30,75,5) |
(200,170,10) |
|
Renard_2 |
49/163/70 |
0.30 |
0.41, 0.29 |
Spherical |
Spherical |
(20,80,3) |
(150,130,8.5) |
|
Z36_B |
61/160/60 |
0.10 |
0.20, 0.70 |
Spherical |
Spherical |
(70,30,2.75) |
(145,100,8) |
|
Z36_D |
61/160/62.5 |
0.10 |
0.58, 0.32 |
Spherical |
Exponential |
(105,90,6.5) |
(200,180,7) |
|
HG (grouped) |
75.5/176.5/58 |
0.40 |
0.23, 0.37 |
Spherical |
Exponential |
(33,100,2.5) |
(135,110,5.5) |
|
Notes: 1. Leapfrog rotation (Dip, Dip Azimuth, Pitch) 2. Variance for structures 1 and 2 (C1, C2) 3. Ranges in Major, Semi-Major and Minor directions |
|||||||
14.7 Search Strategy and Grade Interpolation Parameters
The Nelligan block model for gold grades was developed using tailored interpolation strategies for distinct domains. Within the mineralized wireframe, interpolation was completed in three passes. Gold grades were estimated using 1.5 m composites and the ID3 method. This approach was selected to maintain local grade variability, particularly in mineralized wireframes that may include internal dilution or lower grade intervals. No outlier restrictions were applied during the estimation process. Hard boundaries were implemented across all domains to ensure consistency in grade interpolation.
Details of the search ellipse geometry and sample selection strategy for each interpolation pass are provided in Table 14-6.
| 14-11 |
|
IAMGOLD Corporation | Nelligan Project |
April 2, 2025 |
|
NI 43-101 Technical Report |
SLR Project No.: 233.065260.00001 |
Table 14-6: Search Ellipse Geometry and Sample Selection Strategy
|
Domain |
Pass |
Ellipsoid Radii |
Ellipsoid |
No. of |
Max |
Outlier |
|||
|
Max |
Intermediate |
Min |
Min |
Max |
|||||
|
HG1 |
1 |
135 |
110 |
5 |
VO |
9 |
15 |
4 |
NA |
|
2 |
270 |
220 |
10 |
|
5 |
16 |
4 |
|
|
|
3 |
540 |
440 |
20 |
|
4 |
16 |
- |
|
|
|
FW |
1 |
200 |
150 |
10 |
|
9 |
15 |
4 |
|
|
2 |
400 |
300 |
20 |
|
5 |
16 |
4 |
|
|
|
3 |
800 |
600 |
40 |
|
4 |
16 |
- |
|
|
|
Renard |
1 |
200 |
170 |
10 |
|
9 |
15 |
4 |
|
|
2 |
400 |
340 |
20 |
|
5 |
16 |
4 |
|
|
|
3 |
600 |
510 |
30 |
|
4 |
16 |
- |
|
|
|
Renard_2 |
1 |
150 |
115 |
10 |
|
9 |
15 |
4 |
|
|
2 |
300 |
230 |
20 |
|
5 |
16 |
4 |
|
|
|
3 |
450 |
345 |
30 |
|
4 |
16 |
- |
|
|
|
FW_E, DAN, DAN_B, LIAM |
1 |
200 |
150 |
10 |
|
9 |
15 |
4 |
|
|
2 |
400 |
300 |
20 |
|
5 |
16 |
4 |
|
|
|
3 |
600 |
450 |
30 |
|
4 |
16 |
- |
|
|
|
LIAM_B, LIAM_C |
1 |
125 |
110 |
15 |
|
9 |
15 |
4 |
|
|
2 |
250 |
220 |
30 |
|
5 |
16 |
4 |
|
|
|
3 |
375 |
330 |
45 |
|
4 |
16 |
- |
|
|
|
Z36_B, Z36_C, Z36_W |
1 |
150 |
100 |
10 |
|
9 |
15 |
4 |
|
|
2 |
300 |
200 |
20 |
|
5 |
16 |
4 |
|
|
|
3 |
450 |
300 |
30 |
|
4 |
16 |
- |
|
|
|
Z36_D |
1 |
150 |
100 |
10 |
|
9 |
15 |
4 |
|
|
2 |
300 |
200 |
20 |
|
5 |
16 |
4 |
|
|
|
3 |
600 |
400 |
40 |
|
4 |
16 |
- |
|
|
|
Note: 1. All HG veins are estimated individually but they all share the same search strategy. |
|||||||||
14.8 Bulk Density
A density table was included in the Leapfrog project and provided to SLR as part of the database. Average density values for each zone ranged from 2.55 grams per cubic centimetre (g/cm³) to 2.75 g/cm³ within the mineralized domains, which are considered reasonable for this type of mineralization. All density samples were measured on-site by the IAMGOLD team. The density database includes 4,112 valid measurements from drill holes of the Nelligan deposit. While 4,112 density samples were available, in total only 2,473 could be directly attributed to specific zones.
| 14-12 |
|
IAMGOLD Corporation | Nelligan Project |
April 2, 2025 |
|
NI 43-101 Technical Report |
SLR Project No.: 233.065260.00001 |
Assigned density values were determined based on the average readings for each domain, by proximal vein, or using the overall dataset average in areas lacking direct measurements. The assigned values for individual veins are summarized in Table 14-7. The overburden was assigned a density of 2.0 g/cm³, a value deemed reasonable for the material type.
The QP recommends collecting additional density samples in domains where the current sample count is insufficient to develop a reliable understanding of the density. Further sampling is also advised for non-mineralized lithologies and should continue in all mineralized zones.
Table 14-7: Density by Mineralized Domain
| DOM | Count | Mean (g/cm3) |
Minimum (g/cm3) |
Maximum (g/cm3) |
SD (g/cm3) |
CV |
| FW | 763 | 2.75 | 2.47 | 4.70 | 0.09 | 0.03 |
| FW_E | 5 | 2.75 | 2.70 | 2.79 | 0.04 | 0.01 |
| HG | 431 | 2.75 | 2.33 | 3.70 | 0.13 | 0.05 |
| RENARD | 495 | 2.74 | 1.78 | 3.39 | 0.14 | 0.05 |
| RENARD_2 | 179 | 2.72 | 2.45 | 3.17 | 0.10 | 0.04 |
| LIAM | 27 | 2.71 | 2.51 | 2.86 | 0.08 | 0.03 |
| LIAM_B | 10 | 2.73 | 2.59 | 2.93 | 0.10 | 0.04 |
| LIAM_C | 57 | 2.73 | 2.56 | 3.02 | 0.08 | 0.03 |
| DAN | 8 | 2.71 | 2.58 | 2.84 | 0.09 | 0.03 |
| DAN_B | 2 | 2.55 | 2.36 | 2.74 | 0.27 | 0.11 |
| Z36_B | 149 | 2.75 | 2.28 | 3.52 | 0.17 | 0.06 |
| Z36_C | 146 | 2.72 | 2.07 | 3.13 | 0.12 | 0.05 |
| Z36_D | 117 | 2.71 | 2.36 | 3.15 | 0.14 | 0.05 |
| Z36_W | 84 | 2.71 | 2.31 | 2.93 | 0.09 | 0.03 |
| Notes: 1. SD: Standard deviation 2. CV: Coefficient of variation |
||||||
At the Project, numerous low core recovery intervals were identified, which can introduce uncertainties in the interpretation of density and other critical geological parameters. These intervals may affect the accuracy of resource estimates and subsequent engineering designs. Addressing this issue is essential to ensure the robustness of the block model and the reliability of engineering studies. Therefore, the QP recommends investigating these low core recovery intervals, assess their impact on the density of mineralized domains, and develop appropriate methods to accurately represent them in future block modelling and engineering workflows.
| 14-13 |
|
IAMGOLD Corporation | Nelligan Project |
April 2, 2025 |
|
NI 43-101 Technical Report |
SLR Project No.: 233.065260.00001 |
14.9 Block Models
A block model was developed in Seequent's Leapfrog 2024.1.1 software to support the Nelligan Mineral Resource estimate. The model was constructed as an octree sub-block model with a base block size of 5 m wide x 5 m deep x 5 m high and rotated using a Leapfrog rotation with an azimuth of 352°to align parallel to the average strike of the Nelligan deposit. For reporting purposes and Whittle pit optimization, the model was regularized to a resolution of 5 m x 5 m x 5 m.
The block size and rotation were selected to ensure compatibility with open pit planning requirements and to accommodate the drill hole spacing at Nelligan. These parameters provide sufficient resolution to accurately model the mineralization. A summary of the Nelligan block model parameters is provided in Table 14-8.
Table 14-8: Nelligan Block Model Parameters
|
Type |
X |
Y |
Z |
|
Base Point (m) |
520,630 |
5,472,520 |
395 |
|
Boundary Size (m) |
3,990 |
1,800 |
870 |
|
Parent Block Size (m) |
5 |
5 |
5 |
|
Min. Sub-block Size (m) |
0.625 |
0.625 |
0.625 |
|
Rotation (°) |
352 |
||
14.10 Cut-off Grade and Whittle Parameters
Metal prices used for reserves are based on consensus, long term forecasts from banks, financial institutions, and other sources. For resources, metal prices used are slightly higher than those for reserves.
To demonstrate RPEEE in compliance with CIM (2014) standards, an optimized pit shell was generated using Whittle software to constrain the Nelligan Mineral Resources. The Whittle pit design was derived from the regularized block model, with dimensions of 5 m x 5 m x 5 m, selected to align with a reasonable mining size for the Project. The regularization process resulted in an approximate 0.75% increase in Mineral Resources at a 0.35 g/t Au cut-off grade compared to the results obtained from the sub-block model. The QP has determined that reporting Mineral Resources using the regularized block model constrained by the Whittle pit shell satisfies RPEEE requirements.
Cost assumptions and technical parameters for the Nelligan deposit are outlined in Table 14-9. Based on these inputs, the breakeven cut-off grade is 0.23 g/t Au, however, the Nelligan Mineral Resources were reported at an elevated cut-off grade of 0.35 g/t Au and are constrained by the optimized Mineral Resource shell. Only classified blocks located within the Mineral Resource pit shell have been included in the reported Mineral Resources.
| 14-14 |
|
IAMGOLD Corporation | Nelligan Project |
April 2, 2025 |
|
NI 43-101 Technical Report |
SLR Project No.: 233.065260.00001 |
Table 14-9: Cut-off Grade and Pit Optimization Parameters
|
Parameter |
Units |
Values |
|
Gold Price |
$US/oz |
1,800 |
|
Exchange rate |
$US/$C |
1:1.25 |
|
Transport & Refining Cost |
$US/oz |
5.72 |
|
Royalty |
% |
0 |
|
Processing Rate |
ktpa |
13,140 |
|
Metallurgical Recovery |
% |
83 |
|
Dilution |
% |
0 |
|
Mining Cost |
US$/t mined |
6.24 |
|
Incremental Mining Cost |
US$/t/5 m bench |
0.012 |
|
Processing Cost |
US$/t milled |
7.97 |
|
General & Administration (G&A) |
US$/t milled |
3.26 |
|
Stay in Business Capital |
US$/t milled |
0 |
|
Closure Cost |
US$/t milled |
0 |
|
Cut-off Grade1 |
g/t Au |
0.35 |
|
Overall Slope Angle |
° |
45 |
|
Note: 1. The break-even cut-off grade is calculated at 0.23 g/t Au. An elevated cut-off grade of 0.35 g/t Au is used for Mineral Resources reporting. 2. ktpa = kilo tonne per annum |
||
14.11 Classification
Definitions for resource categories used in this Technical Report are consistent with those defined by CIM (2014) and adopted by NI 43-101. In the CIM classification, a Mineral Resource is defined as "a concentration or occurrence of solid material of economic interest in or on the Earth's crust in such form, grade or quality and quantity that there are reasonable prospects for eventual economic extraction". Mineral Resources are classified into Measured, Indicated, and Inferred categories. A Mineral Reserve is defined as the "economically mineable part of a Measured and/or Indicated Mineral Resource" demonstrated by studies at Pre-Feasibility or Feasibility level as appropriate. Mineral Reserves are classified into Proven and Probable categories.
SLR developed a classification approach at the Nelligan deposit, generating classification solids based on drill hole spacing. The specific criteria for classification within each domain are detailed in Table 14-10. Drill hole spacing was calculated by determining the average distance to the closest composite from three drill holes and multiplying it by the square root of two (approximately 1.42). It is important to note that lower-grade material and some drill holes, which fall outside the Inferred material spacing criteria, were included to ensure continuity. Waste has not been classified.
The blocks classified above the 0.35 g/t Au cut-off grade within the Nelligan Mineral Resource pit shell are shown in Figure 14-4. Additionally, Figure 14-5 illustrates the distribution of classified blocks, with the average distances calculated from the closest informing sample, taking into account a minimum of three drill holes.
| 14-15 |
|
IAMGOLD Corporation | Nelligan Project |
April 2, 2025 |
|
NI 43-101 Technical Report |
SLR Project No.: 233.065260.00001 |
Table 14-10: Mineral Resource Classification Parameters
|
Classification |
Criteria |
|
Indicated |
Up to 60 m drill hole spacing, inside the domain wireframes. Minimum of three drill holes. |
|
Inferred |
Up to 120 m drill hole spacing, inside the domain wireframes. Minimum of three drill holes. |
During the classification process, only material meeting the criteria outlined in Table 14-10 was used to classify material into Indicated or Inferred categories. Material that fell outside these criteria but remained within the mineralization domains was flagged as potential material. This flagged material represents an opportunity for further assessment and exploration. The QP recommends using these potential areas within the mineralization (MIN) wireframes as exploration targets for conversion to Inferred resources.
| 14-16 |
|
IAMGOLD Corporation | Nelligan Project |
April 2, 2025 |
|
NI 43-101 Technical Report |
SLR Project No.: 233.065260.00001 |
Figure 14-4: Classified Resource Blocks Above the Cut-off Grade Inside the Nelligan Resource Pit Shell
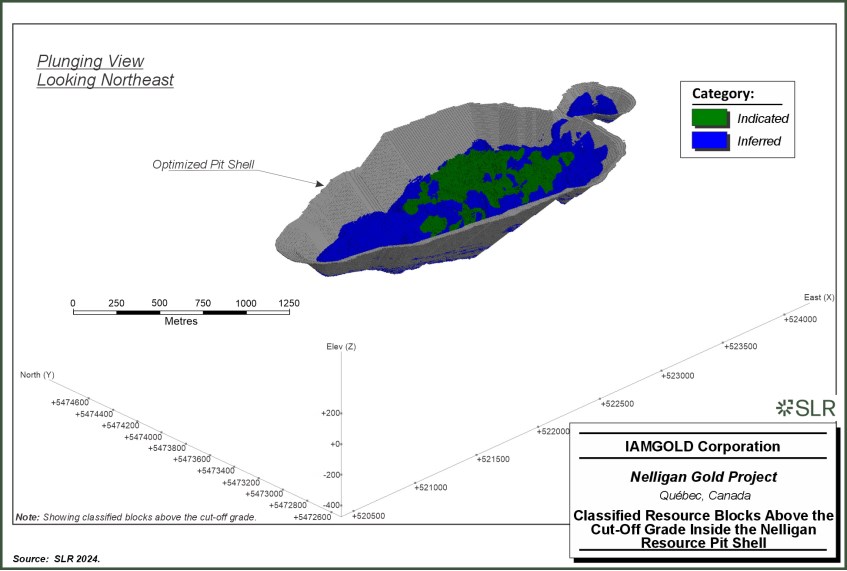
| 14-17 |
|
IAMGOLD Corporation | Nelligan Project |
April 2, 2025 |
|
NI 43-101 Technical Report |
SLR Project No.: 233.065260.00001 |
Figure 14-5: Average Distance from Blocks to Closest Sample by Category, Unconstrained by the Resource Pit Shell
|
|
|
|
Source: SLR 2024.
| 14-18 |
|
IAMGOLD Corporation | Nelligan Project |
April 2, 2025 |
|
NI 43-101 Technical Report |
SLR Project No.: 233.065260.00001 |
14.12 Block Model Validation
SLR employed both visual and statistical methods to validate the block model attributes, domain flagging, and interpolated block grades at Nelligan. The validation checks included:
• Visual inspection comparing composite and block grades (Figure 14-6).
• Comparison of mean swath plots for ID3, ordinary kriging (OK), and nearest neighbour (NN) methods (Figure 14-7).
• Verification of wireframe to block model volume (Table 14-11).
• Block statistics comparison between NN, OK, and ID3 (Table 14-12).
After completing these validation procedures, the QP is of the opinion that the Mineral Resource estimate for Nelligan is suitable for public disclosure. Key observations supporting this conclusion include:
• The analysis of grade distributions, mean comparisons, and swath plots indicates that the estimation process is functioning as intended. The boundary conditions and use of input data are appropriate, with no significant instances of over-extrapolation in the grade estimates. Additionally, the grade smoothing aligns with expectations based on the input data.
• Volume comparisons confirm that the block model accurately represents the in situ mineralization in terms of volume.
| 14-19 |
|
IAMGOLD Corporation | Nelligan Project |
April 2, 2025 |
|
NI 43-101 Technical Report |
SLR Project No.: 233.065260.00001 |
Figure 14-6: Nelligan Interpolated Block Grades and Composites
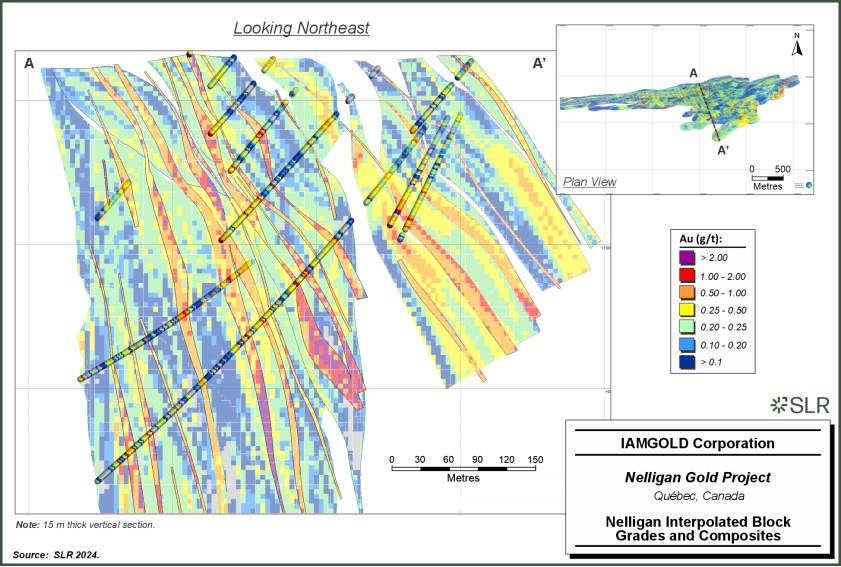
| 14-20 |
|
IAMGOLD Corporation | Nelligan Project |
April 2, 2025 |
|
NI 43-101 Technical Report |
SLR Project No.: 233.065260.00001 |
Figure 14-7: Nelligan Swath Plots for All Domains in X, Y, and Z Directions
|
|
|
|
| 14-21 |
|
IAMGOLD Corporation | Nelligan Project |
April 2, 2025 |
|
NI 43-101 Technical Report |
SLR Project No.: 233.065260.00001 |
|
|
Source: SLR 2024.
Table 14-11: Wireframe to Block Model Volume Confirmation
|
Domain |
Wireframe |
Block Model |
Δ |
|
DAN |
4,344,200 |
4,344,080 |
100.003% |
|
DAN_B |
1,669,700 |
1,669,697 |
100.000% |
|
FW |
162,480,000 |
162,483,148 |
99.998% |
|
FW_E |
10,648,000 |
10,647,884 |
100.001% |
|
HG1 |
36,143,000 |
36,143,591 |
99.998% |
|
LIAM |
12,679,000 |
12,679,515 |
99.996% |
|
LIAM_B |
3,661,500 |
3,661,581 |
99.998% |
|
LIAM_C |
6,572,900 |
6,572,902 |
100.000% |
|
RENARD |
31,715,000 |
31,714,595 |
100.001% |
|
RENARD_2 |
9,951,800 |
9,952,209 |
99.996% |
|
Z36_B |
17,324,000 |
17,323,633 |
100.002% |
|
Z36_C |
15,035,000 |
15,035,727 |
99.995% |
|
Z36_D |
20,962,000 |
20,962,359 |
99.998% |
|
Z36_W |
3,995,200 |
3,995,171 |
100.001% |
|
Total |
337,181,300 |
337,186,092 |
99.999% |
|
Note: 1. Grouped for ease of reporting. |
|||
| 14-22 |
|
IAMGOLD Corporation | Nelligan Project |
April 2, 2025 |
|
NI 43-101 Technical Report |
SLR Project No.: 233.065260.00001 |
Table 14-12: Gold Statistics for NN, ID3, and OK Block models - Unconstrained by Pit Shell
|
Domain |
Mean |
Maximum |
CV |
|||||||||
|
Capped |
ID |
OK |
NN |
Capped |
ID |
OK |
NN |
Capped |
ID |
OK |
NN |
|
|
DAN |
0.35 |
0.40 |
0.39 |
0.33 |
2.59 |
2.50 |
1.49 |
2.59 |
1.17 |
0.71 |
0.45 |
1.06 |
|
DAN_B |
0.45 |
0.34 |
0.36 |
0.40 |
3.00 |
2.98 |
1.44 |
3.00 |
1.20 |
0.84 |
0.48 |
0.88 |
|
FW |
0.29 |
0.29 |
0.29 |
0.28 |
5.00 |
4.88 |
1.94 |
5.00 |
1.20 |
0.67 |
0.49 |
1.27 |
|
FW_E |
0.20 |
0.20 |
0.20 |
0.19 |
1.50 |
1.49 |
0.73 |
1.50 |
1.21 |
0.58 |
0.38 |
1.25 |
|
HG1 |
2.06 |
2.08 |
2.07 |
2.16 |
25.00 |
24.98 |
13.65 |
25.00 |
1.24 |
0.72 |
0.46 |
1.23 |
|
LIAM |
0.36 |
0.35 |
0.37 |
0.32 |
4.00 |
3.97 |
2.58 |
4.00 |
1.22 |
0.79 |
0.56 |
1.17 |
|
LIAM_B |
0.37 |
0.38 |
0.39 |
0.42 |
3.74 |
2.76 |
1.78 |
3.74 |
1.40 |
0.70 |
0.59 |
1.36 |
|
LIAM_C |
0.38 |
0.50 |
0.51 |
0.52 |
5.00 |
4.90 |
3.14 |
5.00 |
1.52 |
0.89 |
0.65 |
1.70 |
|
RENARD |
0.33 |
0.31 |
0.32 |
0.32 |
4.00 |
3.90 |
2.87 |
4.00 |
0.95 |
0.64 |
0.48 |
1.03 |
|
RENARD_2 |
0.35 |
0.35 |
0.35 |
0.35 |
3.00 |
2.82 |
1.29 |
3.00 |
0.88 |
0.51 |
0.38 |
0.87 |
|
Z36_B |
0.41 |
0.40 |
0.39 |
0.41 |
6.00 |
5.96 |
4.42 |
6.00 |
1.41 |
0.93 |
0.82 |
1.40 |
|
Z36_C |
0.41 |
0.42 |
0.42 |
0.45 |
5.00 |
4.98 |
3.59 |
5.00 |
1.42 |
0.88 |
0.71 |
1.45 |
|
Z36_D |
0.31 |
0.27 |
0.28 |
0.28 |
2.50 |
2.49 |
2.15 |
2.50 |
0.98 |
0.66 |
0.56 |
1.15 |
|
Z36_W |
0.31 |
0.31 |
0.31 |
0.30 |
2.00 |
1.99 |
1.78 |
2.00 |
1.02 |
0.60 |
0.52 |
1.02 |
|
Note: 1. Grouped for ease of reporting. 2. CV: Coefficient of variation |
||||||||||||
14.13 Mineral Resource Reporting
Mineral Resources for the Nelligan deposit are reported in accordance with the estimation methodologies and classification criteria outlined in this Technical Report. The open pit Mineral Resources are constrained within an optimized pit shell and reported at an elevated cut-off grade of 0.35 g/t Au. The economic input parameters used to generate the optimized pit shell are detailed in Table 14-9. Reporting was done on the regularized model which shows better continuity at the cut-off grade by allowing some dilution to be included and is also more manageable than the sub-block model, which has a much higher block count.
The pit shell was generated using inter-ramp angles (IRA) of 45° for all walls. While mining costs were incorporated into the pit optimization process, they were not factored into the calculation of the discard cut-off grade.
Figure 14-8 presents the Nelligan Mineral Resource classified blocks above the 0.35 g/t Au cut-off grade and inside the Mineral Resource shell. Mineral Resources were classified in accordance with CIM (2014) definitions and are summarized by estimation domains in Table 14-13
| 14-23 |
|
IAMGOLD Corporation | Nelligan Project |
April 2, 2025 |
|
NI 43-101 Technical Report |
SLR Project No.: 233.065260.00001 |
Figure 14-8: Nelligan Classified Mineral Resource Blocks above Cut-off Grade and within the Resource Pit Shell
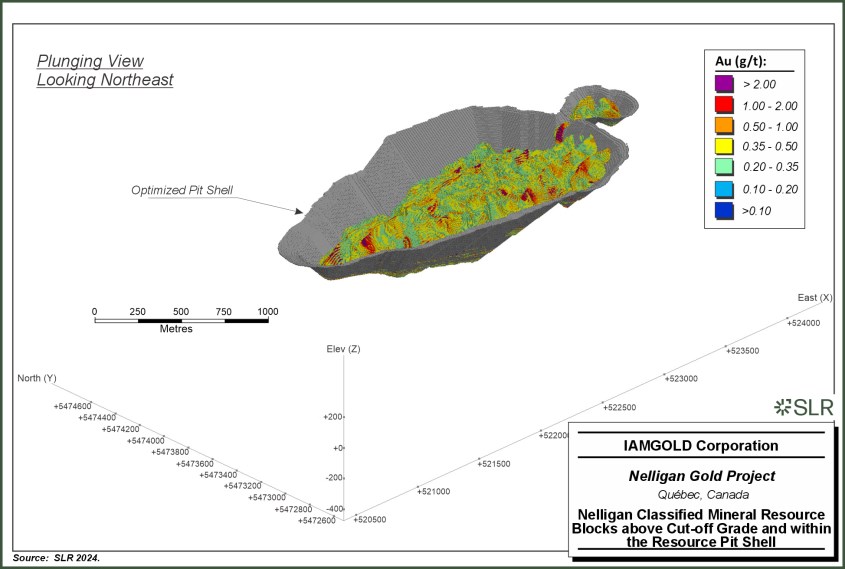
| 14-24 |
|
IAMGOLD Corporation | Nelligan Project |
April 2, 2025 |
|
NI 43-101 Technical Report |
SLR Project No.: 233.065260.00001 |
Table 14-13: Summary of Nelligan Mineral Resources - December 31, 2024
|
Category |
Domain |
Tonnage |
Grade |
Contained Metal |
|
Indicated |
FW |
26 |
0.63 |
522 |
|
HG9 |
29 |
1.70 |
1,574 |
|
|
LIAM |
2 |
0.72 |
38 |
|
|
LIAM_B |
0 |
0.77 |
4 |
|
|
LIAM_C |
1 |
0.68 |
22 |
|
|
RENARD |
19 |
0.69 |
432 |
|
|
RENARD_2 |
10 |
0.60 |
192 |
|
|
Z36_B |
5 |
0.70 |
118 |
|
|
Z36_C |
4 |
0.68 |
90 |
|
|
Z36_D |
4 |
0.58 |
70 |
|
|
Z36_W |
3 |
0.58 |
57 |
|
|
MZ Dilution10 |
0 |
0.68 |
5 |
|
|
Total |
103 |
0.95 |
3,125 |
|
|
Inferred |
DAN |
2 |
0.69 |
43 |
|
DAN_B |
1 |
0.77 |
16 |
|
|
FW |
59 |
0.62 |
1,189 |
|
|
FW_E |
0 |
0.50 |
3 |
|
|
HG |
43 |
1.83 |
2,540 |
|
|
LIAM |
6 |
0.69 |
124 |
|
|
LIAM_B |
3 |
0.67 |
60 |
|
|
LIAM_C |
3 |
0.69 |
71 |
|
|
RENARD |
16 |
0.69 |
353 |
|
|
RENARD_2 |
4 |
0.60 |
70 |
|
|
Z36_B |
11 |
0.78 |
273 |
|
|
Z36_C |
11 |
0.72 |
248 |
|
|
Z36_D |
7 |
0.60 |
137 |
|
|
Z36_W |
1 |
0.69 |
24 |
|
|
MZ Dilution |
0 |
0.76 |
8 |
|
|
Total |
166 |
0.96 |
5,161 |
|
|
Notes: 1. CIM (2014) definitions were followed for Mineral Resources. 2. Mineral Resources are estimated at a cut-off grade of 0.35 g/t Au. 3. Mineral Resources are estimated using a long-term gold price of US$1,800 per ounce, and a US$/C$ exchange rate of 1:1.25. 4. Bulk density varies from 2.71 t/m3 to 2.75 t/m3 for the estimation domains and 2.0 t/m3 for the overburden. 5. Gold metallurgical recovery is 83%. 6. Mineral Resources are constrained by an optimized resource pit shell. 7. Mineral Resources that are not Mineral Reserves do not have demonstrated economic viability. 8. Numbers may not add due to rounding. 9. High grade mineralization domains grouped for ease of reporting. 10. Block edges dilution from the regularization of the unmineralized domains. |
||||
| 14-25 |
|
IAMGOLD Corporation | Nelligan Project |
April 2, 2025 |
|
NI 43-101 Technical Report |
SLR Project No.: 233.065260.00001 |
Table 14-14 presents the sensitivity to cut-off grade for material categorized as Indicated and Inferred within the Mineral Resource pit shell. Figure 14-9 illustrates the sensitivity to cut-off grade using a grade tonnage curve for Indicated material inside the Mineral Resource pit shell.
Table 14-14: Nelligan Mineral Resource Reporting at Various Cut-Off Values
|
Cut-Off Grade |
Indicated Resources |
Inferred Resources |
||||
|
Tonnage |
Grade |
Contained Metal |
Tonnage |
Grade |
Contained Metal |
|
|
0.25 |
134 |
0.80 |
3,420 |
220 |
0.80 |
5,671 |
|
0.30 |
117 |
0.87 |
3,277 |
191 |
0.88 |
5,422 |
|
0.35 |
103 |
0.95 |
3,125 |
166 |
0.96 |
5,161 |
|
0.40 |
90 |
1.02 |
2,974 |
145 |
1.05 |
4,903 |
|
0.45 |
80 |
1.10 |
2,830 |
127 |
1.14 |
4,662 |
|
0.50 |
71 |
1.18 |
2,697 |
113 |
1.22 |
4,447 |
|
Note: Mineral Resources of 2024 are estimated at a cut-off grade of 0.35 g/t Au. |
||||||
| 14-26 |
|
IAMGOLD Corporation | Nelligan Project |
April 2, 2025 |
|
NI 43-101 Technical Report |
SLR Project No.: 233.065260.00001 |
Figure 14-9: Grade Tonnage Curve- Nelligan Indicated Resources in Pit Shell
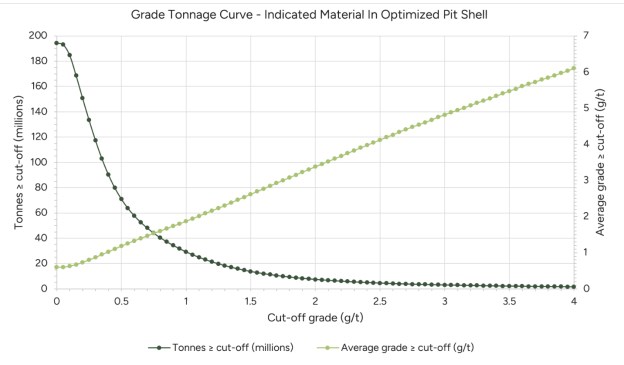
14.14 Comparison with Previous Estimate
A comparison of the current Mineral Resource estimate for the Nelligan deposit with the updated SRK estimate from 2023, based on the 2022 block model, is presented in Table 14-15. The 2023 update reflects a pit optimization at a gold price of US$1,700/oz, compared to US$1,500/oz used in 2022. Recent drilling campaigns, including both infill and extension programs, have led to significant growth in the Mineral Resource. Indicated contained metal showed the most increased by 55.8%, while Inferred contained metal rose by approximately 32.7%. The overall tonnage has also expanded (24%) as a result of these drilling efforts. The overall average grade showed significant increase, rising by 12.5% in the Indicated category and 13.5% in the Inferred category, resulting in an overall increase of 12.6%.
In summary, as of December 31, 2024, the total contained metal in the Nelligan Mineral Resource has increased by 40.6%.
| 14-27 |
|
IAMGOLD Corporation | Nelligan Project |
April 2, 2025 |
|
NI 43-101 Technical Report |
SLR Project No.: 233.065260.00001 |
Table 14-15: Comparison between 2023 and 2024 Nelligan Mineral Resource Estimate
|
Category |
2023 |
2024 |
Δ |
||||||
|
Tonnage |
Grade |
Contained |
Tonnage |
Grade |
Contained |
Tonnage |
Grade |
Contained |
|
|
Indicated |
74.5 |
0.84 |
2,006 |
103 |
0.95 |
3,125 |
38.0% |
12.5% |
55.8% |
|
Inferred |
142.6 |
0.85 |
3,889 |
166 |
0.96 |
5,161 |
16.7% |
13.5% |
32.7% |
|
Notes: 1. CIM (2014) definitions were followed for Mineral Resources. 2. Mineral Resources are estimated at a cut-off grade of 0.35 g/t Au. 3. Mineral Resources with an effective date of December 31, 2024 are estimated using a long-term gold price of US$1,800 per ounce, and a US$/C$ exchange rate of 1:1.25. 4. Mineral Resources with an effective date of December 31, 2023 are estimated using a long-term gold price of US$1,700 per ounce, and a US$/C$ exchange rate of 1:1.25. 5. In 2024, Bulk density varies from 2.71 tonnes per cubic metres (t/m3) to 2.75 t/m3 for the estimation domains and 2.0 t/m3 for the overburden. 6. In 2023, Bulk density varies from 2.70 tonnes per cubic metres (t/m3) to 2.75 t/m3 for the estimation domains and 2.0 t/m3 for the overburden. 7. Gold metallurgical recovery is 83%. 8. Mineral Resources are constrained by an optimized resource pit shell. 9. Mineral Resources that are not Mineral Reserves do not have demonstrated economic viability. 10. Numbers may not add due to rounding. |
|||||||||
| 14-28 |
|
IAMGOLD Corporation | Nelligan Project |
April 2, 2025 |
|
NI 43-101 Technical Report |
SLR Project No.: 233.065260.00001 |
15.0 Mineral Reserve Estimates
This section is not applicable for this Technical Report.
| 15-1 |
|
IAMGOLD Corporation | Nelligan Project |
April 2, 2025 |
|
NI 43-101 Technical Report |
SLR Project No.: 233.065260.00001 |
16.0 Mining Methods
This section is not applicable for this Technical Report.
| 16-1 |
|
IAMGOLD Corporation | Nelligan Project |
April 2, 2025 |
|
NI 43-101 Technical Report |
SLR Project No.: 233.065260.00001 |
17.0 Recovery Methods
This section is not applicable for this Technical Report.
| 17-1 |
|
IAMGOLD Corporation | Nelligan Project |
April 2, 2025 |
|
NI 43-101 Technical Report |
SLR Project No.: 233.065260.00001 |
18.0 Project Infrastructure
This section is not applicable for this Technical Report.
| 18-1 |
|
IAMGOLD Corporation | Nelligan Project |
April 2, 2025 |
|
NI 43-101 Technical Report |
SLR Project No.: 233.065260.00001 |
19.0 Market Studies and Contracts
This section is not applicable for this Technical Report.
| 19-1 |
|
IAMGOLD Corporation | Nelligan Project |
April 2, 2025 |
|
NI 43-101 Technical Report |
SLR Project No.: 233.065260.00001 |
20.0 Environmental Studies, Permitting, and Social or Community Impact
This section is not applicable for this Technical Report.
| 20-1 |
|
IAMGOLD Corporation | Nelligan Project |
April 2, 2025 |
|
NI 43-101 Technical Report |
SLR Project No.: 233.065260.00001 |
21.0 Capital and Operating Costs
This section is not applicable for this Technical Report.
| 21-1 |
|
IAMGOLD Corporation | Nelligan Project |
April 2, 2025 |
|
NI 43-101 Technical Report |
SLR Project No.: 233.065260.00001 |
22.0 Economic Analysis
This section is not applicable for this Technical Report.
| 22-1 |
|
IAMGOLD Corporation | Nelligan Project |
April 2, 2025 |
|
NI 43-101 Technical Report |
SLR Project No.: 233.065260.00001 |
23.0 Adjacent Properties
At the effective date of this report, the GESTIM database contains records for numerous mineral exploration properties in the area of the Project (Figure 23-1).
All the information presented in this section for properties adjacent to the Project come from the public domain and have not been verified by SLR. The QP has not relied upon any information from the adjacent properties in the preparation of this report and information from adjacent properties is not necessarily indicative of the mineralization at the Nelligan.
23.1 Anik Property
Owned by Exploration Kintavar Inc. (Kintavar), the Anik property is located along the eastern and northern boundaries of the Project and comprises 96 claims grouped into three blocks of 81, 13, and two claims. On May 28, 2020, Kintavar announced it had entered into an Option Agreement to grant IAMGOLD an option to earn up a 75% interest in the Anik Project in consideration for staged cash payments totalling C$600,000 and the completion of C$4,000,000 in exploration expenditures on the Project over a period of five years for the First Option. A Second Option to acquire an additional 5% interest in the property has been granted to IAMGOLD upon the delivery of a pre-feasibility study within five years of the exercise of the First Option. Previous letter of intent (LOI) signed in January 2019 with the TomaGold spin-out corporation, Monster Exploration, to sell the Anik property did not materialize. IAMGOLD is currently in its fifth year of the Anik Option Agreement.
The Anik property (Charbonneau and Pelletier 2016) is an exploration project on which gold anomalies were identified in iron formations hosted in a sedimentary sequence (Duquette 1965). The STR-91-03 trench discovered in 1991 returned values of 22.1 g/t gold and 66.6 g/t gold (Pelletier 2015). In 2014, the Orbi, Bobby, Kovi, and Mirador sectors were discovered. Subsequent drilling on the Bobby Zone revealed downward extension and returned gold values of 0.41 g/t Au over 56.5 m, including one gram per tonne Au over 15 m (Pelletier and Cayer 2016) and 1.28 g/t gold over 7.96 m, including 3.06 g/t Au over 1.54 m (Pelletier 2017).
A National Instrument 43-101 compliant technical report on the Anik property, documenting the gold potential and exploration activities, was prepared by Inlandsis Consultants and filed in December 2016. Inlandsis Consultants concluded that low grade but continuous mineralization is present on the project. They recommended that the compilation of historical data be completed, the interpretation updated, exploration targets generated, and follow-up sampling conducted through field work (Charbonneau and Pelletier 2016).
Since summer 2020, IAMGOLD has carried out continuous exploration works including compilation and targeting, geological mapping and rock sampling, glacial till sampling and soil geochemistry surveys, and some IP geophysics in different parts of the Anik property. Since 2021, IAMGOLD has conducted four short drilling programs for 18 holes and a total of 6,200 m completed. The drilling programs targeted four areas of interest. IAMGOLD intersected 2.82 g/t Au over 6.3 m in the extension of the Nelligan deposit stratigraphic sequence which now extends for more than seven kilometres to the east, directly on the Anik property (Kintavar press release, June 15, 2022).
| 23-1 |
|
IAMGOLD Corporation | Nelligan Project |
April 2, 2025 |
|
NI 43-101 Technical Report |
SLR Project No.: 233.065260.00001 |
Figure 23-1: Adjacent Properties to the Nelligan Project
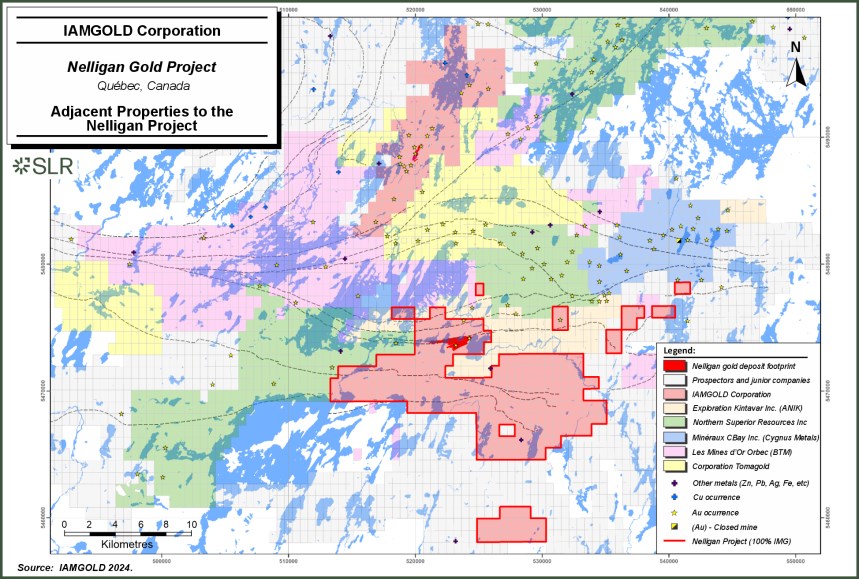
| 23-2 |
|
IAMGOLD Corporation | Nelligan Project |
April 2, 2025 |
|
NI 43-101 Technical Report |
SLR Project No.: 233.065260.00001 |
23.2 Lac Surprise Property
Wholly owned by Northern Superior Resources Inc. (Northern Superior), the Lac Surprise property is an exploration project located along the western boundary of the Nelligan Gold Project. It consists of 333 claims (18,555 ha). Most of the following information can be found on the Northern Superior web site.
In September 2019, a drill program consisting of 10 holes totalling 3,000 m was initiated to confirm the extension of the Renard Zone from the Nelligan Gold Project and to test the extensions of the Black Phoenix Zone (Northern Superior news release of September 10, 2019).
In the first half of 2021, Northern Superior initiated and completed a 26 borehole (7,011 m) core borehole program (Northern Superior press releases, March 15 and August 17, 2021). This program follows on the success of a core drill program, completed in the fall of 2020, with the important discovery of the Falcon Gold Zone (FGZ) identified within the northeastern part of the Lac Surprise property (see Northern Superior press release, November 5 and December 22, 2020).
In winter and fall 2022, Northern Superior completed additional drilling programs to better define the FGZ and announced the discovery of a three-kilometre-long mineralized zone, north and east of the recently discovered FGZ (see Northern Superior press release, June 14 and October 21, 2022). According to Northern Superior, the results on the FGZ continued to show robust thickness and strong vertical continuity and has highlighted the similarities to the Nelligan gold deposit (see Northern Superior press release, January 16, 2023 and June 6, 2023). This gold zone is located in the western extension of the Nelligan structural corridor.
23.3 Philibert
The Philibert property consists of 110 mining titles (5,392.57 ha) located directly north of the Anik property. Following several drilling programs, Société québécoise d'exploration minière (SOQUEM ) published in 1990 a historical mineral resource estimate of 1.4 Mt at 5.3 g/t Au (Rachidi and Duplessis 2023). These resources are considered historical in nature and should not be relied upon. It is unlikely they conform to current NI 43-101 requirements or follow CIM Definition Standards, and they have not been verified to determine their relevance or reliability.
From 1983 to 2014, SOQUEM conducted multiple drill programs and several geophysical surveys (magnetic survey, very low frequency - très basse fréquence (TBF), IP) as well as prospecting and trenching programs on the Philibert property. Several gold occurrences were discovered and are hosted in highly silicified and altered shear zones traversing gabbro sills. Some of the assay highlights include: 5.62 g/t Au over 4.8 m including 7.67 g/t Au over 2.8 m for Zone 179; 2.45 g/t Au over 11.5 m for Zone 182 ; 4.45 g/t Au over 13.2 m for Zone 37-2, 7.63 g/t Au over 6.0 m for Zone Ai (Gagnon et al. 2013); 2.36 g/t Au over 25.8 m for Zone 106 (hole 981-14-297); and 6.42 g/t Au over 3.5 m for Zone 37-1 (Gagnon 2014). After the 2014 program, SOQUEM recommended that a mineral resource estimate be generated (Gagnon 2014).
In March 2019, Royal Fox Gold entered in an agreement with SOQUEM to acquire 75% up to 100% of the Philibert project and focused on the assessment of the open pit potential on the current identified historical mineral resources and on the main structural corridor underexplored.
In November 2022, Northern Superior announced the successful completion of its acquisition of all the issued and outstanding common shares of Royal Fox Gold resulting in the acquisition of the right to acquire the Philibert gold project (see Northern Superior press release, November 4, 2022). Since then, Northern Superior has reported positive drilling results from the ongoing drilling programs on the Arctic Fox Zone (see Northern Superior press release, November 15, 2022, January 11, 2023, October 29, 2024, and March 3, 2025).
| 23-3 |
|
IAMGOLD Corporation | Nelligan Project |
April 2, 2025 |
|
NI 43-101 Technical Report |
SLR Project No.: 233.065260.00001 |
In September 2023, Northern Superior published that it has filed the technical report pursuant to a Mineral Resource Estimate prepared in accordance with the National Instrument 43-101 for the Philibert gold property. The Mineral Resource estimate, independently prepared by GoldMinds Geoservices Inc., comprises a total Indicated and Inferred Mineral Resources of 278,900 oz Au Indicated and 1,708,800 oz Au Inferred and has an effective date of August 4, 2023. The mineral resource was estimated at a cut-off grade of 0.35 g/t Au (Rachidi and Duplessis 2023).
The Philibert project is currently owned at 75% by Northern Superior, pending a payment of C$3.5 million due to SOQUEM in March 2026 for the acquisition of the remaining 25%.
23.4 Joe Mann
The Joe Mann property hosts the former Joe Mann mine and consists of a total of 75 claims, two mining concessions, and one mining lease (for a total of 2,781 ha). It is located northeast of the Nelligan Gold Project.
The current Joe Mann property results from an agreement between CBAY Minerals Inc. (a subsidiary of Doré Copper Mining [DCM]) and SOQUEM on 22 of these claims (65% CBAY and 35% SOQUEM, 767 ha) and from another option agreement between DCM and Ressources Jessie and Legault Metals Inc., amended in 2022, to acquire a 100% interest in the 55 mineral titles including the majority of the former Joe Mann Mine (the Joe Mann Option Property). On December 31, 2024, Cygnus Metals acquired all of the issued and outstanding common shares of DCM by way of a Canadian statutory plan of arrangement, finalizing the integration of the two companies into a unified, dual-listed critical minerals company. Since January 1, 2025, Cygnus is the operator of the Joe Mann Option Property.
Several gold occurrences delineate the gold corridor that hosts the Joe Mann mine. The mine is located in the northeastern part of the property and was in underground operation from 1956 to 1959, 1974 to 1975, and 1987 to 2007. The mineralization is characterized by east-west striking shear hosted veins hosted mainly in a gabbro sill with one zone in a rhyolite. The production total was 1.2 Moz at a grade of 8.26 g/t Au, , 28.7 Mlb Cu at a grade of 0.25%Cu, and approximately 607,000 oz Ag at a grade of 5 g/t Ag (Wilson and Gosselin 2021). The mine had a historical mineral reserve of 1,525,838 t at 11.0 g/t Au and 0.28% Cu as of December 31, 1987 (Dion and Simard 1988). A recent Mineral Resource estimate was completed in September 2021 with an effective date as July 21, 2021. Inferred Mineral Resources are estimated to total 608,000 t at grades of 6.78 g/t Au and 0.24% Cu, for 133,000 oz Au and 3,281,000 lb Cu contained. A supporting NI 43-101 Technical Report was filed on SEDAR.
The Meston Lake gold occurrence is located to the west of the Joe Mann mine and has a historical mineral resource estimate of 1.235 Mt at 6.25 g/t Au (Northern Miner, March 28, 1974). This "resource" is historical in nature and should not be relied upon. It is unlikely they conform to current NI 43 101 requirements or follow CIM Definition Standards, and it has not been verified to determine its relevance or reliability. It is included in this section for illustrative purposes only and should not be disclosed out of context.
The Joe Mann property is part of the Chibougamau Hub-and-Spoke strategy of Cygnus Minerals.
| 23-4 |
|
IAMGOLD Corporation | Nelligan Project |
April 2, 2025 |
|
NI 43-101 Technical Report |
SLR Project No.: 233.065260.00001 |
23.5 Monster Lake Property
The Monster Lake property is owned 100% by IAMGOLD. The property is characterized by gold mineralization associated with northeast and northwest shear zones cutting mafic volcanic and intrusive rocks.
In an underground mining scenario, the Monster Lake Project contains estimated Indicated Resources of 239,000 t at 11.0 g/t Au for 84,200 oz Au and Inferred Resources of 1,053,000 t at 14.4 g/t Au for 488,500 oz Au (see IAMGOLD news releases dated October 23, 2024 and February 20, 2025). A supporting NI 43-101 Technical Report was filed on SEDAR on December 06, 2024).
23.6 Muus and Muus East Properties
The Muus property is located to the northwest of the Nelligan Gold Project, centered on the junction of the South Guercheville Deformation Corridor and its North branch below the Des Vents. The Muus East property is located to the northeast. These properties consist of four blocks of 480 claims (26,544 ha) and are wholly owned by Les Mines d'or Orbec (Orbec), new name of Blue Thunder Mining Corporation).
Several historical gold occurrences are present on these properties. The Lac des Vents showing is characterized by mineralization composed of 1% to 5% cubic pyrite in quartz clusters. A grab sample returned a gold value of 2.56 g/t Au (Grenier 1986). The Welb (Rrk) outcrop, characterized by mineralization composed of 1% to 2% disseminated pyrite and traces of chalcopyrite contained in a smoky quartz veins stockwork, returned several gold values including a grab sample of one metre grading eight grams per tonne gold (Morasse, 1989). In 2019, ground sampling and airborne Mag surveys were completed on the Muus property followed by several prospecting, mapping and ground geophysical surveys from 2019 to 2022. Blue Thunder has carried out a few drilling programs with the most recent one in fall 2022 with five holes (for a total of 1,251 m) testing two target areas (see new release of December 15, 2022).
More recently, Orbec initiated an exploration program on defining drill targets within the extension of the structure which hosts the Nelligan gold deposit. A high-definition magnetic survey followed by drilling will test some favorable structures identified on the property (see news release of December 16, 2024, and March 17, 2025).
| 23-5 |
|
IAMGOLD Corporation | Nelligan Project |
April 2, 2025 |
|
NI 43-101 Technical Report |
SLR Project No.: 233.065260.00001 |
24.0 Other Relevant Data and Information
No additional information or explanation is necessary to make this Technical Report understandable and not misleading.
| 24-1 |
|
IAMGOLD Corporation | Nelligan Project |
April 2, 2025 |
|
NI 43-101 Technical Report |
SLR Project No.: 233.065260.00001 |
25.0 Interpretation and Conclusions
25.1 Geology and Mineral Resources
SLR offers the following conclusions:
• Since the 2022 block modelling exercise, IAMGOLD has successfully completed 63 diamond drill holes, increasing the total drill holes in the database to 330 for a total of 108,267.19 metres (m). The recent drilling programs have contributed to a significant increase in the Project's Mineral Resources.
• The overall precision and accuracy of the current gold assays are considered acceptable and sufficient for inclusion in the 2024 Mineral Resource estimate.
• The Project shows strong potential for resource growth, warranting further exploration and technical studies.
• The geology and characteristics of gold mineralization at the property are well understood, providing a solid foundation for ongoing and future work.
• Indicated Mineral Resources at the Project are estimated to total 103 Mt at a gold grade of 0.95 g/t and containing 3.13 Moz of gold. Inferred Mineral Resources at Nelligan are estimated to total 166 Mt at a gold grade of 0.96 g/t Au and containing 5.16 Moz of gold.
25.2 Mineral Processing
• Preliminary metallurgical test work has been completed on samples of material from the Nelligan deposit. The test work included exploratory mineralogical analysis, test work using whole-ore cyanidation, gravity concentration, cyanidation of gravity concentration tails, flotation, and cyanidation of flotation concentrate (with concentrate re-grind) and tails.
• Mineralogical analysis indicated that gold occurred as free or liberated and partially liberated gold, as well as locked within pyrite.
• Comparative testing using the different flowsheets on three samples showed that flotation followed by cyanidation of the flotation tails and of the re-ground flotation concentrate resulted in better gold extractions that flowsheets not including flotation.
• Comparative testing of 15 additional samples from different zones within the deposit in 2021 also resulted in a higher gold extractions on average by flotation and cyanidation of flotation products than by whole-ore cyanidation.
• Grind sensitivity test work indicated that there is a relationship between gold extraction and grind size.
• Comminution test work showed that there is significant variability amongst the samples in terms of comminution characteristics.
• In 2022, 21 samples were subjected to whole-ore cyanidation after grinding to a P80 of 75 µm. The test work showed that gold leaching was mostly complete within 24 hours, however, overall extraction varied widely, from 49% to 91%.
| 25-1 |
|
IAMGOLD Corporation | Nelligan Project |
April 2, 2025 |
|
NI 43-101 Technical Report |
SLR Project No.: 233.065260.00001 |
26.0 Recommendations
26.1 Geology and Mineral Resources
SLR is of the opinion that there is good potential to increase the resource base at the Project and that additional exploration and technical studies are warranted.
SLR makes the following recommendations:
1 Over the next two years, carry out exploration activities to improve resource potential, and complete a resource update along with a scoping study, including:
a) A proposed multi-phased core drilling program of 30,000 m, encompassing infill, expansion, and conversion drilling. This program should focus on infill drilling within the resource area to more accurately delineate mineralization and upgrade the classification from Inferred to Indicated, as well as expansion drilling to extend mineral resources both laterally and at depth.
b) Geological and mineralogical studies to enhance understanding of gold mineralization controls and refine chemical process applications in metallurgy.
c) Metallurgical test work to assess variability in gold mineralization and determine optimal processing and extraction methods.
d) Geotechnical studies to support project design, risk assessment, and cost estimation during the scoping phase.
e) Completion of a comprehensive scoping study.
The total cost of the recommended work program is estimated at C$13,090,000 (Table 26-1). SLR has reviewed and agrees with IAMGOLD's proposed exploration budget
2 Utilize potential areas of the mineralization (MIN) wireframes as exploration targets to convert potential material into categorized material (e.g., Inferred or Indicated).
3 Continue upgrading and improving the high grade (HG) mineralization wireframe model with new data to achieve a more refined and polished model.
4 Investigate low core recovery intervals, assess their impact on the density of mineralized domains, and determine how to accurately represent these intervals in future block modelling and engineering work.
5 Investigate observed grade trends and plunges at the Project following additional exploration drilling
6 Implement field duplicates to help monitor grade variability during sampling.
7 Reduce the types of certified reference materials (CRMs) to three categories: high grade, medium grade, and low grade. This streamlined approach will effectively monitor laboratory performance while providing sufficient coverage to detect emerging biases or systematic issues over extended periods.
8 Collect additional density samples in domains where the current sample count is insufficient to ensure a proper understanding of density. Extend sampling to non-mineralized lithologies and maintain sampling efforts in all mineralized zones.
| 26-1 |
|
IAMGOLD Corporation | Nelligan Project |
April 2, 2025 |
|
NI 43-101 Technical Report |
SLR Project No.: 233.065260.00001 |
Table 26-1: Proposed Exploration Budget
|
Description |
Units |
Total Cost |
|
Phase 1 |
|
|
|
Diamond drilling (infill, expansion and conversion, all inclusive) |
15,000 m |
$4,500,000 |
|
Geological studies |
|
$300,000 |
|
Metallurgical testing |
|
$500,000 |
|
Phase 1 Total |
|
$5,300,000 |
|
Phase 2 |
|
|
|
Diamond drilling (infill, expansion and conversion, all inclusive) |
15,000 m |
$4,500,000 |
|
Geological Studies |
|
$400,000 |
|
Update resource model |
|
$150,000 |
|
Additional metallurgical testing |
|
$250,000 |
|
Geotechnical studies |
|
$500,000 |
|
Scoping study |
|
$800,000 |
|
Phase 2 Total |
|
$6,600,000 |
|
Total Phases 1 & 2 |
|
$11,900,000 |
|
Contingency (10%) |
|
$1,190,000 |
|
Grand Total |
|
$13,090,000 |
26.1.1.1 Mineral Processing
1 Test work should continue to be conducted using samples representing the whole deposit to evaluate comminution and metallurgical characteristics.
2 Conduct additional grind-recovery test work to determine the optimum primary grind size.
3 Conduct additional gravity concentration test work to determine if gravity recovery would be benefitial to incorporate into the flowsheet.
4 Complete sufficient flowsheet comparative test work to allow for a trade-off study to be completed to determine the optimum flowsheet for taking forward into later stages of study.
5 If a flowsheet incorporating flotation and cyanidation of flotation products is chosen, additional re-grind test work on the flotation concentrate should be completed to determine the optimum concentrate re-grind size.
| 26-2 |
|
IAMGOLD Corporation | Nelligan Project |
April 2, 2025 |
|
NI 43-101 Technical Report |
SLR Project No.: 233.065260.00001 |
27.0 References
Ayer, J.A., Trowell, N.F., Amelin, Y., and Corfu, F., 1998, Geological compilation of the Abitibi greenstone belt: Toward a revised stratigraphy based on compilation and new geochronology results: Ontario Geological Survey Miscellaneous Paper 169, p. 4-1-4-14.
Ayer, J.A., Amelin, Y., Corfu, F., Kamo, S., Ketchum, J.F., Kwok, K., and Trowell, N.F., 2002, Evolution of the Abitibi greenstone belt based on U-Pb geochronology: Autochthonous volcanic construction followed by plutonism, regional deformation and sedimentation: Precambrian Research, v. 115, p. 63-95.
Ayer, J.A., Ketchum, J., and Trowell, N.F., 2002b, New geochronological and neodymium isotopic results from the Abitibi greenstone belt, with emphasis on the timing and the tectonic implications of Neoarchean sedimentation and volcanism: Ontario Geological Survey Open File Report 6100, p. 5-1-5-16.
Azevedo, C., Jébrak, M., Genna, D., Pinti, D. L. 2022. Evidence of gold related to Neoarchean alkaline magmatism in the Abitibi greenstone belt (Canada) from mineral parageneses and microscale trace element geochemistry on pyrite. Ore Geology Reviews, 145. 104878 doi:10.1016/j.oregeorev.2022.104878
Bateman, R., Ayer, J.A., and Dubé, B., 2008, The Timmins-Porcupine gold camp, Ontario: Anatomy of an Archean greenstone belt and ontogeny of gold mineralizations. Economic Geology, v. 103, p. 1285-1308.
Benn, K., Miles, W., Ghassemi, M. R., Gillet, J., 1994. Crustal structure and kinematic framework of the north-western Pontiac Subprovince, Québec: an integrated structural and geophysical study. Canadian Journal; of Earth Sciences, Vol. 31, pages 271-281.
Benn, K. 2006. Tectonic delamination of the lower crust during Late Archean collision of the Abitibi-Opatica and Pontiac Terranes, Superior Province, Canada. In Archean geodynamics and environments. Edited by K. Benn, K.C. Condie, and J.-C. Mareschal. Geophysical Monograph, Vol. 164, pp. 267-282.
Benn, K., and Moyen, J.-F. 2008. The Late Archean Abitibi-Opatica terrane, Superior Province: A modified oceanic plateau. In When did plate tectonics begin on planet Earth? Edited by K.C. Condie and V. Pease. Geological Society of America, Special Paper 440, pp. 173-197.
Bleeker, W.B., van Breemen, O., and Berger, B. 2008. The Pipestone Thrust and the fundamental architecture of the south-central Abitibi greenstone belt, Superior craton, Canada [online]. In Quebec 2008 Joint annual meeting GAC-MAC-SEG-SGA abstract database, session SY8: Abitibi. Available from http:// www.gac.ca/activities/abstracts/2973_Abst...pdf [accessed 30 June 2010].
Boivin, M., 2014. Rapport de compilation et d'interprétation géophysique couvrant le secteur d'intérêt du projet Nelligan Chibougamau, Québec. Vanstar Mining Ressources Inc. GM68306. 11p.
Brodie-Brown, H., Zuiderveen, J., 1988. Diamond drill record, Hazeur Iron. GM48483. 116p.
Buchan, K. L., and Ernst, R. E., 2004. Diabase dyke swarms and related units in Canada and adjacent regions (with accompanying notes). Geological Survey of Canada, Map 2022A, 1:5,000,000.Card, K.D., and Ciesielski, A. 1986. Subdivisions of the Superior Province of the Canadian Shield. Geoscience Canada, 13: 5-13.
| 27-1 |
|
IAMGOLD Corporation | Nelligan Project |
April 2, 2025 |
|
NI 43-101 Technical Report |
SLR Project No.: 233.065260.00001 |
Card, K.D., and Poulsen, K.H., 1998, Geology and mineral deposits of the Superior Province of the Canadian shield, in Lucas, S., and St-Onge, M.R., eds., Geology of the Precambrian Superior and Grenville Provinces and Precambrian Fossils in North America: Geological Survey of Canada, Geology of Canada 7, p. 13-194.
Chainey, D., 1995a. Rapport des résultats des forage (95-1 à 95-12) effectué en février et mars 1995 sur la propriété Pontiac de Ressources Unifiées Oasis et SOQUEM. GM54435. 55p.
Chainey, D., 1995b. Rapport des résultats des forage (95-13 à 95-18) effectué en juin et juillet 1995 sur la propriété Pontiac de Ressources Unifiées Oasis et SOQUEM. GM54434. 53p.
Chainey, D., 1995c. Rapport des résultats des forage (95-1 à 95-12) effectué en février et mars 1994 sur la propriété Pontiac de Ressources Unifiées Oasis et SOQUEM. GM55026. 55p.
Chainey, D., 1995d. Rapport préliminaire projet Pontiac mars 1995. GM55025. 5p.
Chainey, D., 1996. Rapport des résultats d'un forage (95-19) effectué en novembre 1995 sur la propriété Pontiac de Ressources Unifiées Oasis et SOQUEM. GM53900. 22p.
Champagne, P., 1989. Géochimie de l'indice aurifère Erratix, Chibougamau. Mémoire présenté à l'Université du Québec à Chicoutimi comme exigence partielle de la Maîtrise en Sciences Appliquées (M.Sc.A.). 130 pages.
Charbonneau, R., Pelletier, M., 2016 Technical Report on Anik Property, Chibougamau Chapais Area, Quebec, Canada. Rapport indépendant, publication interne, 52 pages.
Cheraghi S., Malehmir A., Naghizadeh M., David S., Mathieu L., Bedeaux P. 2021. Seismic imaging across fault systems in the Abitibi greenstone belt - an analysis of pre- and post-stack migration approaches in the Chibougamau area, Quebec, Canada. EGU Solid Earth. 22p.
Chown, E. H., Daigneault, R., and Mueller, W., 1991a. Part 1: Geological Setting of the Eastern Extremity of the Abitibi belt. In Litho-Tectonic Framework and associated mineralization of the eastern extremity of Abitibi Greenstone Belt, Quebec (Field Trip 3). Edited by j. Guha, E. H. Chown and R. Daigneault. Geological Survey of Canada. Open File 2158. pp. 1-32.
Chown, E. H., Daigneault, R., Lauzière, K., Mueller, W., and Tait, L, 1991b. Geology of the Caopatina Segment. In Litho-Tectonic Framework and associated mineralization of the eastern extremity of Abitibi Greenstone Belt, Quebec (Field Trip 3). Edited by j. Guha, E. H. Chown and R. Daigneault. Geological Survey of Canada. Open File 2158. pp. 82-96.
Chown, E. H., Daigneault, R., Mueller, W., and Mortensen, J., 1992. Tectonic evolution of the Northern Volcanic Zone of Abitibi Belt. Canadian Journal of Earth Sciences, v. 29, pp. 2211-2225.
CIM. 2014. Canadian Institute of Mining, Metallurgy and Petroleum (CIM) Definition Standards for Mineral Resources and Mineral Reserves, adopted by the CIM Council on May 10, 2014.
Daigneault, R. 1996. Couloirs de déformation de al Sous-Province de l'Abitibi. Ministère des Ressources Naturelles, MB 96-33, Québec.
| 27-2 |
|
IAMGOLD Corporation | Nelligan Project |
April 2, 2025 |
|
NI 43-101 Technical Report |
SLR Project No.: 233.065260.00001 |
Daigneault, R., and Allard, G.O., 1990. Le Complexe du Lac Doré et son environnement géologique (région de Chibougamau-sous-province de l'Abitibi). Ministère de l'Énergie des Mines et des Ressources du Québec. 275p. MM 89-03.
Daigneault, R., Mueller, W.U., Chown, E.H., 2004. Abitibi greenstone belt plate tectonics: the diachronous history of arc development, accretion and collision. In Eriksson, P.G., Altermann, W., Nelson, D.R., Mueller, W.U., Catuneanu, O. (Eds.). The Precambrian Earth: Tempos and Events, Series: Developments in Precambrian geology, vol. 12, Elsevier, p. 88-103.
Daigneault, R., Mueller, W.U., Chown, E. H., 2002. Oblique Archean subduction: accretion and exhumation of an oceanic arc during dextral transpression, Southern Volcanic Zone, Abitibi Subprovince, Canada. Precambrian Research 115: 261-290.
David, J. et Dion, C., 2010. Géochronologie d'échantillons recueillis par géologie Québec, année 2009−2010. Ministère des Ressources naturelles et Faune du Québec, 33 pages, GM-64849.
Davis, W.J., Machado, N., Gariépy, C., Sawyer, E.W., and Benn, K., 1995. U-Pb geochronology of the Opatica tonalite-gneiss belt and its relationship to the Abitibi greenstone belt, Superior Province, Québec. Canadian Journal of Earth Sciences, 32: 113-127.
Davis, W.D. et Dion, C., 2012. Datation ID-TIMS d'échantillons recueillis en 2011-2012 par Géologie Québec. Ministère des Ressources naturelles et Faune du Québec, 26 pages, GM 66443.
De Carle, R.J., 1987. Report on combined helicopter borne magnetic, electromagnetic and VLF survey Lac Surprise project Chibougamau area, Quebec. SOQUEM. GM45666. 78p.
De Chavigny, P., Chainey, D. and Trudeau, Y., 1994. Campagne de sondage hiver 1994 Propriété Pontiac. SOQUEM. GM52837. 154p.
Desrochers, J.-P., Hubert, C., Ludden, J.N., and Pilote, P. 1993. Accretion of Archean oceanic plateau fragments in the Abitibi, Greenstone belt, Canada. Geology, 21(5): 451-454.
Deshaies, M., 2019. Metallurgical Testwork Results of Nelligan Project. IAMGOLD Corporation. Internal Report. 13 p.
Dimroth, E, Imrech, L., Rocheleau, M., Goulet, N., 1982. Evolution of the south-central part of the Archean Abitibi Belt, Quebec. Part I: stratigraphy and paleostratigraphic model. Canadian Journal of Earth Sciences, Vol. 19, pages 1729-1758.
Dimroth, E., Imreh, L., Goulet, N., and Rocheleau, M. 1983. Evolution of the south-central part of the Archean Abitibi belt, Quebec. Part 2 - Tectonic evolution and geomechanical model. Canadian Journal of Earth Sciences, 20: 1355-1373.
Dion, C. and Simard, A., 1998. Geological and Metallogenic Compilation of the Caopatina Segment. In Geology and Metallogeny of the Chapais-Chibougamau Mining District: a New Vision of the Discovery Potential. Proceedings of the Chapais-Chibougamau 1998 Symposium. Editor: P. Pilote. pp. 51-53. DV 98-04.
Dion, C. and Simard, A., 1999. Compilation et synthèse géologique et métallogénique du Segment de Caopatina, région de Chibougamau. Ministère des Ressources naturelles. 80 pages. MB 99-33.
Duquette, 1965. Surprise Lake - Airborne Magnetic Survey, Geological Survey of Canada, Map 1842G, 4 p.
| 27-3 |
|
IAMGOLD Corporation | Nelligan Project |
April 2, 2025 |
|
NI 43-101 Technical Report |
SLR Project No.: 233.065260.00001 |
Duquette, G., 1970. Archean Stratigraphy and Ore Relationships in the Chibougamau District. Department of Natural resources, Mines Branch. Gouvernement du Quebec. Special Paper 8. 22 pages. ES-008.
Faure, S., Jébrack, M., and Bouillon, J. J., 1990. Géologie et minéralisation en Zn-Cu-Ag-Au des Mines Selbaie. Dans La ceinture polymétallique du Nord-Ouest québécois, (éd.) M. Rive, P. Verpaelst, Y. Gagnon, J. M. Lulin, G. Riverin et A. Simard. L'Institut canadien des mines et de la métarllurgie, Volume Spécial 43, p. 363-372.
Faure, S., 2012. Réévaluation de la géologie et des modèles d'exploration pour l'or dans le segment Caopatina-Desmaraisville, sud de Chibougamau. Rapport, Projet CONSOREM 2012-02, 57 p.
Finch M.A., Bons P.D., Steinbach F., Griera A., Llorens M.-G., Gomez-Rivas E., Ran H., de Riese T. 2020. The ephemeral development of C′ shear bands: A numerical modelling approach. Journal of structural geology. Elsevier. 12p.
Fournier, R., 1994. Journaux de sondages. 2736-1179 Quebec Inc. GM53406. 18p.
Gagnon, J-F., 2014. Rapport d'exploration Hiver 2014 Propriété Philibert (0981-2) Feuilet 32G/07. 720 pages. GM68957
Gapais D., Jaguin J., Cagnard F", Boulvais P. 2014. Pop-down tectonics, fluid channelling and ore deposits within ancient hot orogens. Tectonophysics 618 (2014) 102-106. 6p.
Gobeil, A., and Racicot, D., 1982. Région des lacs Caopatina et des Vents. Ministère de l'Énergie et des Ressources du Québec. DP 82-18.
Gobeil, A., and Racicot, D., 1983. Carte Lithostratigraphique de la région de Chibougamau. Ministère de l'Énergie et des Ressources du Québec. 14 pages. MM 83-02.
Goutier, J., 1997, Géologie de la région de Destor: Ministère des Ressources naturelles du Québec 37 pages. RG 96-13.
Goutier, J., and Melançon, M., 2007, Compilation géologique de la Sous-province de l'Abitibi (version préliminaire): Ministère des Ressources naturelles et de la Faune du Québec.
Grenier, J., 1986. Travaux de scalpage, de dééGuha, J., Chown, E.H., et Daigneault, R., 1991. Litho-tectonic framework and associated mineralization of the eastern extremity of the Abitibi Greenstone Belt, Québec (Field Trip 3). Geological Survey of Canada, Open File 2158, 131 pages.
Hannington, M. D., Barrie T. C., and Bleeker, W., 1999. The giant Kidd Creek volcanogenic massive sulphide deposit, western Abitibi Subprovince, Canada. In Hannington, M. D., eds., Volcanic-Associated massive Sulfide Deposits: Processes and Examples in Modern and Ancient Harris, J.J., 1951. The Stewart Group. Wright-Heargreaves Mines Limited. GM01343. 3p.
Groves, D.I., Goldfarb R.J., M Gebre-Mariam, S.G Hagemann, F Robert. 1998. Orogenic gold deposits: A proposed classification in the context of their crustal distribution and relationship to other gold deposit types, Ore Geology Reviews, Volume 13, Issues 1-5, Pages 7-27, ISSN 0169-1368.
Hart C.J.R., and Goldfarb, R.J., 2005. Distinguishing intrusion-related from orogenic gold systems. Preceedings of Scientific Conference on Minerals, New Zealand, 10 p.
Houle, P., 2011. Nouvelle vision du potentiel aurifère de la région Chapais-Chibougamau. Présentation publique dans le cadre du Symposium Mines Baie-James 2011. (http://www.mrn.gouv.qc.ca/mines/quebec-mines/2011-03/31mai/am/01-patrick.pdf).
| 27-4 |
|
IAMGOLD Corporation | Nelligan Project |
April 2, 2025 |
|
NI 43-101 Technical Report |
SLR Project No.: 233.065260.00001 |
Holmes, W. S., 1952. Preliminary Report on Fancamp-Hauy Area, Abitibi-East County. Geological Surveys Branch, Department of Mines, Province of Quebec, Canada. 12 pages. RP-271.
Holmes, W. S., 1959. Fancamp-Hauy Area, Abitibi-East Electoral District. Geological Surveys Branch, Department of Mines, Province of Quebec, Canada. 46 pages. RG-084.
Hubert, J.M., 1988. Vérification au sol d'anomalies électromagnétiques d'un levé héliporté projet Surprise. GM46552. 6p.
IAMGOLD Report, 2018. Report on Exploration Activities on Nelligan Property - September 2018. IAMGOLD Corporation. Internal Report. 7p.
InnovExplo. 2019. NI 43-101 Technical Report and Initial Mineral Resource Estimate for the Nelligan Project, Québec, Canada. December 4, 2019. Filed on SEDAR/available at www.sedar.com.
Jolly, W. T., 1978. Metamorphic history of the Archean Abitibi Belt. In Metamorphism in the Canadian Shield. Geological Survey of Canada, Paper 78-10, pp. 63-78.
Kelly, D., 2014a. Forages 2013-2014, Propriété Nelligan. GM68304. 247p.
Kelly, D., 2014b. Forages au diamant, Propriété Nelligan. GM68503. 25p.
Kennedy, I., 1983. Projet Hazeur, levé HEM. GM40094. 10p.
Killin, K., 1989. Logistics report on combined helicopter-borne magnetic, electromagnetic and VLF-EM. Abbey exploration. GM48705. 36p.
Lacroix, S., Simard, A., Pilote, P., and Dubé, L. M., 1990. Regional geologic elements and mineral resources of the Harricana-Turgeon Belt, Abitibi of NW Quebec. In The Northwestern Quebec Polymetallic Belt, (ed.) M. Rive, P. Verpaelst, Y. Gagnon, J. M. Lulin, G. Riverin et A. Simard. Canadian Institute of Metallurgy, Special Volume 43, p. 313-326.Lambert, G., 2014. Levés magnétométriques champ total (Janvier-Février 2014). Vanstar Mining Resources Inc. GM68319. 11p.
Larivière, L., 1982. Rapport géologique Canton Hazeur. Mines Northgate Patino Inc. GM39182. 6p.
Lavoie, C., 1977. Report on geophysical surveys on part of the property owned by Falconbridge Nickel Mines Limited. GM33500. 15p.
Lavoie, C., 1978. Report on E.M.H. and gravity surveys on part of the property owned by Falconbridge Nickel Mines Limited. GM33657. 11p.
Leclerc, F., Bédard, J.H., Harris, L.B., McNicoll, V.J., Goulet, N., Roy, P., and Houle, P., 2011. Tholeiitic to calc-alkaline cyclic volcanism in the Roy Group, Chibougamau area, Abitibi greenstone belt-revised stratigraphy and implications for VHMS exploration: Canadian Journal of Earth Sciences, v. 48, p. 661−694.
Leclerc, F., Harris, L. B., Bedard, J. H., van Breemen, O., and Goulet, N.: Structural and stratigraphic controls on magmatic, volcanogenic, and shear zone-hosted mineralization in the Chapais-Chibougamau mining camp, northeastern Abitibi, Canada, Eco. Geol., 107, 963-989, 2012.
Leclerc, F., Roy, P. Houle, P., Pilote, P. Bédard, J. Harris, L.B., McNicoll, V.J., Van Breemen, O., David, J. and Goulet, N., 2017. Géologie de la region de Chibougamau. Ressources naturelles du Québec. RG 2015-03.
| 27-5 |
|
IAMGOLD Corporation | Nelligan Project |
April 2, 2025 |
|
NI 43-101 Technical Report |
SLR Project No.: 233.065260.00001 |
Lin S., Parks J., Heaman L.M, Simonetti A., Corkery M.T. 2013. Diapirism and sagduction as a mechanism for deposition and burial of"Timiskaming-type" sedimentary sequences, Superior Province: Evidence from detrital zircon geochronology and implications for theBorden Lake conglomerate in the exposed middle to lower crust in theKapuskasing uplift. Precambrian Research 238 (2013) 148-157.
Low, A.P., 1906. Geological Report on the Chibougamau Mining Region in the Southern Part of the Province of Quebec. No. 923, 66 p.
Ludden, J., Hubert, C., and Garie'py, C. 1986. The tectonic evolution of the Abitibi greenstone belt. Geological Magazine, 123(02): 153-166.
Lyall H. B., 1953. Preliminary Report on Brongniart-Lescure Area, Abitibi-East County. Geological Surveys Branch, Department of Mines, Province of Quebec, Canada. 12 pages. RP-285.
Lyall H. B., 1959. Brongniart-Lescure Area, Electoral District of Abitibi-East. Geological Surveys Branch, Department of Mines, Province of Quebec, Canada. 38 pages. RG-085.
Maleki A., Smith R., Eshaghi E., Mathieu L., Snyder D., Naghizadeh M. 2020. Potential-field modelling of the prospective Chibougamau area (northeastern Abitibi subprovince, Quebec, Canada) using geological, geophysical, and petrophysical constraints. NRC Research Press. 16p.
Mathieu, L., Crépon, A., Kontak, D.J. 2020. Tonalite-dominated magmatism in the Abitibi subprovince, Canada, and significance for Cu-Au magmatic-hydrothermal systems. Minerals 2020, 10, 242.
Mathieu L., Madon B., Hamilton M.A. 2020. Physico-chemical parameters of Neoarchean syntectonic magmatism: the example of the Muscocho Pluton, Abitibi Subprovince, Ore Geology Reviews (2020).
Mathieu, L., Snyder, D. B., Bedeaux, P., Cheraghi, S., Lafrance, B., Thurston, P., and Sherlock, R.: Deep into the Chibougamau area, Abitibi Subprovince: structure of a Neoarchean crust revealed by seismic reflection profiling, Tectonics, 38, 1-25, 2020b.
Mathieu, L. Intrusion-Associated Gold Systems and Multistage Metallogenic Processes in the Neoarchean Abitibi Greenstone Belt. Minerals 2021, 11, 261. https://doi.org/10.3390/min11030261Miron, G., 1988. Synthèse des travaux d'exploration Avril-Décembre 1987. SOQUEM. GM49908. 93p.
MERQ, 1977. Levé EM (Input) - Région de La Dauversière. Flying and compilation by Questor Surveys Ltd. Ministère de l'Énergie et des Ressources du Québec. DP-496.
MERQ, 1989. Traitement des données géophysiques (aéromagnétiques) - Lac à l'Eau Jaune, 32G/10, Cartes 2100 A et B. Compilation par SIAL Géosciences Inc.. Ministère de l'Énergie et des Resources du Québec. DV 89-10.
MERQ, 1993. Traitement des données géophysiques (aéromagnétiques) - Lac Verneuil, Parties des découpures SNRC : 32G/07, 08, 09, 10. Cartes 2200 A, B, C. Levé et compilation par Val-d'Or Géophysique Ltée. Ministère de l'Énergie et des Resources du Québec. DV 93-24.
MERQ-OGS, 1984, Lithostratigraphic map of the Abitibi subprovince: Ontario Geological Survey and Ministère de l'Énergie et des Ressources, Québec, Map 2484 and DV 83-16.
Miron, G., 1988. Synthèse des travaux d'exploration Avril-Décembre 1987. SOQUEM. GM49908. 93p.
| 27-6 |
|
IAMGOLD Corporation | Nelligan Project |
April 2, 2025 |
|
NI 43-101 Technical Report |
SLR Project No.: 233.065260.00001 |
Montsion, R., Thurston, P., Ayer, J., 2018, 1:2 000 000 Scale Geological Compilation of the Superior Craton - Version 1: Mineral Exploration Research Centre, Harquail School of Earth Sciences, Laurentian University Document Number MERC-ME-2018-017.
Morasse S., 1989. Summary report of trenching, geological mapping and chanlle sampling programs - Welb - RRK Property, Druillettes Township. Homestake Mining Canada Limited. GM49844. 43 pages.Mueller, W. U., Daigneault, R., Mortensen, J, Chown, E. H., 1996a. Archean terrane docking: upper crust collision tectonics, Abitibi Greenstone Belt, Québec, Canada. Tectonophysics 265:127-150.
Murdy, A., 1978. Report on Hazeur Township. Patino Mines Limited. GM33832. 10p.
Pelletier, M. 2015 RAPPORT DES TRAVAUX 2014 PROPRIÉTÉ ANIK Secteur Chapais‐Chibougamau. Ressources Géoméga, 134 pages, GM 68842.
Pelletier, M. (2017) RAPPORT TECHNIQUE DES TRAVAUX 2015‐2016 PROPRIÉTÉ ANIK Secteur Chapais‐Chibougamau. Ressources Géoméga, 190 pages, GM 70023.
Pelletier, M., Cayer, A. 2016. RAPPORT DE CAMPAGNE DE FORAGE AUTOMNE 2014 - HIVER 2015 PROPRIÉTÉ ANIK. Ressources Géoméga, 576 pages, GM 69876.
Pilote, P., Dion, C. et Morin, R., 1996. Géologie et évolution métallogénique de la région de Chibougamau : gîtes de type Cu-Au-Mo porphyriques aux gisements filoniens mésothermaux aurifères. Ministère des Ressources naturelles du Québec, 172 pages. MB 96-14.
Poulsen, K. H., Robert, F., and Dubé, B., 2000. Geological classification of Canadian cold deposits. Geological Survey of Canada, Bulletin 540, 106p.
Powell, W. D., Carmichael, D. M., and Hodgon, C. J., 1993. Thermobarometry in a subgreenschist to greenschist transition in metabasite of the Abitibi greenstone belt, Superior Province, Canada. Journal of Metamorphic Geology, Vol. 11, pages 165-178.
Rachidi M., Duplessis C., 2023. Independent Technical Report by Goldman Geoservices Inc. for Northern Superior Resources Inc. - Mineral Resources Estimation of the Philibert Project, Québec, Canada. Effective date of 2023-09-22. 123 pages.
Racicot, D., Chown, E. H., and Hanel, T., 1984. Plutons of the Chibougamau-Desmaraisville Belt: A Preliminary Survey. In Chibougamau: Stratigraphy and mineralization. Proceedings of the Chibougamau symposium and field trip sponsored by the Geology Division of CIM ; edited by Jayanta Guha and Edward H. Chown. Canadian Institute of Metallurgy, Special Volume 34, p. 178-187.
Robert, F., and Poulsen, K. H., 1997. World-class Archean gold deposits in Canada: An overview. Australian Journal of Earth Sciences, vol. 44, pages 329-351.
Sawyer, E. W., and Benn, K., 1993. Structure of the high-grade Opatica Belt and adjacent lowgrade Abitibi Subprovince, Canada: An Archean mountain front. Journal of Structural Geology, v.15, p. 1443-1458.
SGS Canada Inc., 2019. An Investigation into the Recovery of Gold from Nelligan Project Samples. Prepared for IAMGOLD corporation by SGS Canada Inc. dated September 25, 2019, Project 17382-01.
SGS Canada Inc., 2021. Metallurgical Testwork on Samples from the Nelligan Project. Prepared for IAMGOLD Corporation by SGS Canada Inc. dated June 9, 2021, Project 17382-02, 467 p.
| 27-7 |
|
IAMGOLD Corporation | Nelligan Project |
April 2, 2025 |
|
NI 43-101 Technical Report |
SLR Project No.: 233.065260.00001 |
Simoneau, D., Cormier, M. and Cloutier, J.P., 1978. Diamond Drilling Program Hazeur-Gamache Townships, Quebec. Falconbridge Nickel Mines Limited. GM33659. 76p.
Sloan, R., 2022. Metallurgical Test Work on Composites From the Nelligan Deposit. Prepared for IAMGOLD Corporation by ALS Metallurgy, dated September 29, 2022, 126 p.
SRK. 2023. Independent Technical Report for the Nelligan Gold Project, Quebec, prepared for IAMGOLD Corporation and Vanstar Mining Resources Inc. February 22, 2023. Filed on SEDAR/available at www.sedar.com.
Tait, L., Pilote, P., and Chown, E. H., 1986. Géologie de la région du lac à l'Eau Jaune. Ministère de l'Énergie et des Ressources du Québec. DP 86-09.
Tait, L., 1992a. Géologie de la région du lac à l'Eau Jaune (Territoire-du-Nouveau-Québec). Ministère de l'Énergie et des Ressources du Québec. ET 90-08.
Tait, L., 1992b. Géologie de la région du lac à l'Eau Jaune (Territoire-du-Nouveau-Québec). Ministère de l'Énergie et des Ressources du Québec. 80 pages. MB 91-29.
Tazerout, H., 2012a. Rapport de la campagne de forage 2012 Canton Hazeur, Quebec, Canada. Vanstar Mining Resources Inc. GM66674. 175p.
Tazerout, H., 2012b. Journaux de forage, Projet Nelligan. Vanstar Mining Resources Inc. GM67200. 58p.
Thériault, G., 1984. Rapport de la campagne d'exploration 1983-1984 Projet Philibert. GM41259. 335p.
Thurston, P.C., and Chivers, K.M., 1990, Secular variation in greenstone sequence development emphasizing Superior province, Canada: Precambrian Research, v. 46, p. 21-58.
Thurston, P.C., Ayer, J.A., Goutier, J., and Hamilton, M.A., 2008, Depositional gaps in the Abitibi greenstone belt stratigraphy: A key to exploration for syngenetic mineralization. Economic Geology, v. 103, p. 1097−1134.
Turcotte, B., 2015. Technical report for the Monster Lake Project (according to National Instrument 43-101 and Form 43-101F1) as of September 15, 2014, Val-d'Or, Québec, Canada. Prepared by InnovExplo Inc. for IAMGOLD Corporation, 151 pages. SEDAR Website.
Wilson V., Gosselin M.-C., 2021. Technical Report on the Joe Mann Project, Northwest Québec, Canada SLR Project No: 233.03410.R0000 - September 10, 2021. For Doré Copper Mining Corp. p. 124.
| 27-8 |
|
IAMGOLD Corporation | Nelligan Project |
April 2, 2025 |
|
NI 43-101 Technical Report |
SLR Project No.: 233.065260.00001 |
28.0 Date and Signature Date
This report titled "NI 43-101 Technical Report on the Nelligan Gold Project, Québec" with an effective date of December 31, 2024 was prepared and signed by the following authors:
| (Signed & Sealed) Marie-Christine Gosselin | |
| Dated at Québec City, QC | Marie-Christine Gosselin, P.Geo. |
| April 2, 2025 | |
| (Signed & Sealed) Lance Engelbrecht | |
| Dated at Toronto, ON | Lance Engelbrecht, P.Eng. |
| April 2, 2025 |
| 28-1 |
|
IAMGOLD Corporation | Nelligan Project |
April 2, 2025 |
|
NI 43-101 Technical Report |
SLR Project No.: 233.065260.00001 |
29.0 Certificate of Qualified Person
29.1 Marie-Christine Gosselin
I, Marie-Christine Gosselin, P.Geo., as an author of this report entitled "NI 43-101 Technical Report on the Nelligan Gold Project, Québec" with an effective date of December 31, 2024, prepared for IAMGOLD Corporation, do hereby certify that:
1. I am a Senior Resource Geologist with SLR Consulting (Canada) Ltd, of Suite 501, 55 University Ave., Toronto, ON M5J 2H7.
2. I am a graduate of Université Laval, Québec, QC in 2014 with a Bachelor of Science degree in Geology.
3. I am registered as a Professional Geologist with l'Ordre des Géologues du Québec (Reg.#02060) and with Professional Geoscientists of Ontario (Reg.#3799). I have worked as a geologist for a total of eleven years since my graduation. My relevant experience for the purpose of the Technical Report is:
• Lithology and mineralization modelling.
• Mineral resource estimation.
• Target generation and drill hole planning.
• Data analysis.
• Experience as Production Geologist, Exploration Geologist and Resource Geologist with porphyry copper, sediment hosted copper, Canadian Archaean gold, skarns and VMS deposits, in Canada, Chile and Mexico.
• Experienced user of Leapfrog Geo, Vulcan, and ArcGIS.
4. I have read the definition of "qualified person" set out in National Instrument 43-101 (NI 43-101) and certify that by reason of my education, affiliation with a professional association (as defined in NI 43-101) and past relevant work experience, I fulfill the requirements to be a "qualified person" for the purposes of NI 43-101.
5. I visited the Nelligan Gold Project on September 11, 2024 to September 13, 2024.
6. I am responsible for sections 1-12 and 14-30, as well as overall preparation of the Technical Report.
7. I am independent of the Issuer applying the test set out in Section 1.5 of NI 43-101.
8. I have had no prior involvement with the property that is the subject of the Technical Report.
9. I have read NI 43-101, and the Technical Report has been prepared in compliance with NI 43-101 and Form 43-101F1.
10. At the effective date of the Technical Report, to the best of my knowledge, information, and belief, the Technical Report contains all scientific and technical information that is required to be disclosed to make the Technical Report not misleading.
Dated this 2nd day of April, 2025
(signed) Marie-Christine Gosselin
Marie-Christine Gosselin, P.Geo.
| 29-1 |
|
IAMGOLD Corporation | Nelligan Project |
April 2, 2025 |
|
NI 43-101 Technical Report |
SLR Project No.: 233.065260.00001 |
29.2 Lance Engelbrecht
I, Lance Engelbrecht, P.Eng., as an author of this report entitled "NI 43-101 Technical Report on the Nelligan Gold Project, Québec" with an effective date of December 31, 2024, prepared for IAMGOLD Corporation, do hereby certify that:
1. I am Technical Manager - Metallurgy and Principal Metallurgist with SLR Consulting (Canada) Ltd, of Suite 501, 55 University Ave., Toronto, ON M5J 2H7.
2. I am a graduate of the University of the Witwatersrand, Johannesburg, South Africa in 1992 with a Bachelor of Science degree in Engineering, Metallurgy and Materials (Mineral Processing Option).
3. I am registered as a Professional Engineer in the Provinces of Ontario (Reg.# 100540095) and Newfoundland and Labrador (Reg.# 10730). I have worked as a metallurgist for a total of 30 years since my graduation. My relevant experience for the purpose of the Technical Report is:
• Review and report as a metallurgical consultant on numerous mining operations and projects for due diligence and regulatory requirements.
• Preparation of conceptual, prefeasibility, and feasibility studies for projects around the world including for precious metals, base metals, and rare earths, as well as test work interpretation, recommendations, and supervision.
• Management and operational experience at Canadian and international milling, smelting, and refining operations.
4. I have read the definition of "qualified person" set out in National Instrument 43-101 (NI 43-101) and certify that by reason of my education, affiliation with a professional association (as defined in NI 43-101) and past relevant work experience, I fulfill the requirements to be a "qualified person" for the purposes of NI 43-101.
5. I have not visited the Nelligan Gold Project.
6. I am responsible for Section 13, including relevant subsections in 1, 25, and 26 of the Technical Report.
7. I am independent of the Issuer applying the test set out in Section 1.5 of NI 43-101.
8. I have had no prior involvement with the property that is the subject of the Technical Report.
9. I have read NI 43-101, and the Technical Report has been prepared in compliance with NI 43-101 and Form 43-101F1.
10. At the effective date of the Technical Report, to the best of my knowledge, information, and belief, the Section Nos. in the Technical Report for which I am responsible contain all scientific and technical information that is required to be disclosed to make the Technical Report not misleading.
Dated this 2nd day of April 2025
(signed) Lance Engelbrecht
Lance Engelbrecht, P.Eng.
| 29-2 |
|
IAMGOLD Corporation | Nelligan Project |
April 2, 2025 |
|
NI 43-101 Technical Report |
SLR Project No.: 233.065260.00001 |
30.0 Appendix A
30.1 Mineral Tenure Information
Table A 1: Mineral Tenure Information
| 30-1 |
|
IAMGOLD Corporation | Nelligan Project |
April 2, 2025 |
|
NI 43-101 Technical Report |
SLR Project No.: 233.065260.00001 |
Landscape placeholder - for table A1.
| 30-2 |

| SLR Consulting (Canada) Ltd. 55 University Ave., Suite 501, Toronto, ON M5J 2H7 |
April 2, 2025
Consent of Qualified Person
I, Marie-Christine Gosselin, P.Geo., do hereby consent to the public filing of the report titled "Technical Report on the Nelligan Gold Project, Québec" (the 'Technical Report') that has an effective date of December 31, 2024, prepared for IAMGOLD Corporation ("IAMGOLD") and dated April 2, 2025, and to the use of extracts from, or the summary of, the Technical Report in the news release of IAMGOLD dated February 20, 2025 (the News Release).
I also certify that I have read the News Release and that it fairly and accurately represents the information in the Technical Report that supports the News Release.
Regards,
(signed) Marie-Christine Gosselin
Marie-Christine Gosselin, P.Geo.
Senior Resource Geologist
| SLR Consulting (Canada) Ltd. 55 University Ave., Suite 501, Toronto, ON M5J 2H7 |
April 2, 2025
Consent of Qualified Person
I, Lance Engelbrecht, P.Eng., do hereby consent to the public filing of the report titled "Technical Report on the Nelligan Gold Project, Québec" (the 'Technical Report') that has an effective date of December 31, 2024, prepared for IAMGOLD Corporation ("IAMGOLD") and dated April 2, 2025, and to the use of extracts from, or the summary of, the Technical Report in the news release of IAMGOLD dated February 20, 2025 (the News Release).
I also certify that I have read the News Release and that it fairly and accurately represents the information in the Technical Report that supports the News Release.
Regards,
(signed) Lance Engelbrecht
Lance Engelbrecht, P.Eng.
Technical Manager - Metallurgy and Principal Metallurgist